Table of Contents
List of Tables
- Table 1. MONTHLY RAINFALL, IN INCHES.
- Table 2. DAYS WITH RAIN.
- Table 4. AUCKLAND (ALBERT PARK, 160 FT.).
- Table 5. TAIHAPE (2,157 FT.).
- Table 6. WELLINGTON (ALTITUDES VARIOUS).
- Table 7. HOKITIKA (12 FT.).
- Table 8. CHRISTCHURCH (22 FT.).
- Table 9. DUNEDIN (240 FT.).
- Table 10. GORE (245 FT.).
- Table 11. BRIGHT SUNSHINE (HOURS).
THE 1938 edition of the New Zealand Official Year-Book is the forty-sixth number of the volume.
New material appearing in this issue includes an Appendix giving some preliminary results of the 1936 Census of Population; while another feature of special interest is an analysis of certain statistics of dairy-farms collected by the Census and Statistics Department late in 1936.
Additions have been made to the scope of several sections, notably in oases of topics now assuming an added importance. For example, the section on Local Government has been expanded by the inclusion of a brief résumé of the development of local government, together with a description of the functions of the various local-governing authorities. The subsection on Agricultural Production has been largely recast, as have the Descriptive and Historical sections at the commencement of the volume.
The wide variety of subjects covered in a reference work of this nature necessitates brevity of treatment if the size of the volume is to be kept within reasonable limits. Subjects of national importance must, however, be treated adequately; while changes of note affecting the subject-matter of the various sections must be recorded. In these circumstances, difficulty is experienced in maintaining a proper balance as between the treatment of various subjects. The re-introduction in this issue of the section on Statistical Organization (which includes a comprehensive Statistical Bibliography) will, it is hoped, facilitate easy reference to alternative sources of information in respect of subjects which are possibly inadequately treated in the Year-Book.
I wish to record my appreciation of the assistance rendered by members of my staff and by officers of other Government Departments. The exacting editorial duties have again been undertaken by Mr. G. E. F. Wood, M.A., Chief Compiler, to whom my special thanks are due.
J. W. BUTCHER,
Government Statistician.
Census and Statistics Department, Wellington, C.1, New Zealand, 15th December, 1937.
[Following are certain important statistical data for later periods than are included in the body of the Year-Book. The page numbers relate to the appropriate pages in this Year-Book containing more complete information in respect of earlier periods.]
POPULATION (pp. 52–79):—
Estimated population (inclusive of Maoris but exclusive of Cook and other Pacific Islands)—
| As at 30th September— | ||
|---|---|---|
| 1936. | 1937. | |
| Males | 800,665 | 808,280 |
| Females | 776,418 | 783,694 |
| Totals | 1,577,083 | 1,591,974 |
| MIGRATION (pp. 58–64):— | 1st April to 31st October— | |
|---|---|---|
| 1936. | 1937. | |
| * Excluding through passengers. | ||
| Passenger arrivals* | 14,944 | 18,385 |
| Passenger departures* | 16,892 | 19,308 |
| VITAL STATISTICS (pp. 80–146):— | 1st January to 30th September— | |
|---|---|---|
| Numbers— | 1936. | 1937. |
| Births | 18,458 | 19,138 |
| Deaths | 9,780 | 10,120 |
| Marriages | 9,994 | 10,650 |
| Infant Deaths | 580 | 603 |
| Corresponding yearly rates— | ||
|---|---|---|
| Births (per 1,000 mean population) | 16.51 | 16.98 |
| Deaths (per 1,000 mean population) | 8.75 | 8.98 |
| Marriages (per 1,000 mean population) | 8.94 | 9.45 |
| Infant mortality (per 1,000 live births) | 31.42 | 31.51 |
| TOTAL TRADE (pp. 217–224):— | 1936. | 1937. |
|---|---|---|
| Commodity exports— | £ | £ |
| October | 2,567,301 | 2,903,435 |
| Ten months ended 31st October | 48,608,907 | 58,187,404 |
| Twelve months ended 31st October | 56,408,113 | 66,330,437 |
| Commodity imports— | ||
|---|---|---|
| October | 3,996,082 | 4,623,401 |
| Ten months ended 31st October | 35,880,718 | 46,604,991 |
| Twelve months ended 31st October | 42,139,322 | 54,983,159 |
| Excess of exports— | ||
|---|---|---|
| † Excess of imports. | ||
| October | -1,428,781† | -1,719,966† |
| Ten months ended 31st October | 12,728,189 | 11,582,413 |
| Twelve months ended 31st October | 14,268,791 | 11,347,278 |
PRINCIPAL EXPORTS (pp. 229–230, 241–242).
| — | Twelve Months ended 31st October, | |||
|---|---|---|---|---|
| 1936. | 1937. | |||
| Quantity. | Value. | Quantity. | Value. | |
| £ | £ | |||
| Butter (cwt.) | 2,788,598 | 15,422,572 | 3,049,199 | 16,610,502 |
| Cheese (cwt.) | 1,644,526 | 4,899,475 | 1,688,910 | 5,500,914 |
| Frozen meats— | ||||
| Beef (cwt.) | 525,123 | 647,524 | 505,890 | 645,275 |
| Lamb (carcases) | 2,661,719 | 8,583,166 | 2,740,023 | 9,189,144 |
| Mutton (carcases) | 906,612 | 1,713,722 | 862,109 | 1,606,465 |
| Pork (cwt.) | 607,995 | 1,584,273 | 588,423 | 1,675,644 |
| Chilled beef (cwt.) | 228,257 | 367,866 | 303,527 | 517,451 |
| Sheep-skins (number) | 12,590,279 | 1,684,754 | 12,800,193 | 2,284,537 |
| Wool (bales) | 907,786 | 12,910,614 | 838,907 | 19,240,426 |
| Gold (oz.) | 175,511 | 1,463,479 | 168,855 | 1,406,398 |
| Timber (sup. ft.) | 30,393,097 | 289,497 | 17,211,425 | 195,151 |
IMPORTS—PRINCIPAL ITEMS (pp. 255–261).
| — | Twelve months ended 31st October, | |
|---|---|---|
| 1936. | 1937. | |
| £ | £ | |
| Sugar | 672,225 | 656,649 |
| Tea | 752,254 | 823,252 |
| Tobacco, cigars, and cigarettes | 756,335 | 925,664 |
| Hosiery | 220,695 | 431,771 |
| Miscellaneous apparel and ready-made clothing | 1,216,287 | 1,784,160 |
| Miscellaneous drapery | 344,851 | 456,024 |
| Boots, shoes, and slippers | 482,071 | 710,154 |
| Cotton, silk, and artificial silk piece-goods | 2,746,209 | 3,279,444 |
| Woollen piece-goods | 784,143 | 1,152,734 |
| Iron and steel: Bar, bolt, and rod | 367,656 | 531,221 |
| Galvanized plate and sheet | 464,601 | 702,375 |
| Electrical machinery (including wireless apparatus) | 2,098,699 | 3,147,970 |
| Timber | 401,989 | 520,425 |
| Printing-paper | 688,460 | 602,636 |
| Motor-vehicles and motor-cycles | 4,242,915 | 6,038,955 |
| Motor-spirit | 1,521,720 | 1,830,546 |
| Rubber tyres for motor-vehicles and motor-cycles | 675,241 | 820,192 |
| AGRICULTURE (pp. 389–402):— | 1936–37. | 1937–38. (Estimates). |
|---|---|---|
| Areas sown (p. 391)— | Acres. | Acres. |
| Wheat | 224,637 | 188,000 |
| Oats | 315,704 | 285,600 |
| Barley | 25,512 | 30,500 |
| Potatoes | 22,462 | 21,700 |
| PASTORAL PRODUCTION (pp. 403–428):— | 1936–37. | 1937–38. (Pre-estimate). |
|---|---|---|
| Wool production (greasy basis), lb. | 302,900,000 | 313,000,000 |
| FRUIT PRODUCTION (p. 400):— | 1935–36. Bushels. | 1936–37. Bushels. |
|---|---|---|
| Apples | 3,301,500 | 2,902,200 |
| Pears | 384,300 | 251,100 |
| Peaches | 284,700 | 227,800 |
| Apricots | 66,100 | 106,300 |
| Plums | 94,000 | 96,100 |
| Sweet oranges | 6,900 | 10,400 |
| Poorman oranges | 30,000 | 37,400 |
| Lemons | 148,200 | 177,700 |
| Other fruits | 118,500 | 54,600 |
| Totals | 4,434,200 | 3,863,600 |
FACTORY PRODUCTION—CERTAIN PRINCIPAL INDUSTRIES (pp. 515–522).
| Industry. | 1935–36. | 1936–37. |
|---|---|---|
| * Excluding establishments exclusively engaged in malting. | ||
| Meat freezing and preserving— | ||
| Total persons engaged No. | 7,692 | 7,665 |
| Salaries and wages paid £ | 1,634,185 | 1,865,282 |
| Value of output £ | 17,514,049 | 20,769,869 |
| Added value £ | 3,058,566 | 3,551,616 |
| Grain-milling— | ||
| Total persons engaged No. | 728 | 743 |
| Salaries and wages paid £ | 164,546 | 169,291 |
| Value of output £ | 2,302,061 | 2,348,855 |
| Added value £ | 493,681 | 493,550 |
| Biscuit, confectionery, and sugar-boiling works— | ||
| Total persons engaged No. | 2,862 | 3,127 |
| Salaries and wages paid £ | 314,717 | 392,606 |
| Value of output £ | 1,688,191 | 1,964,130 |
| Added value £ | 813,122 | 992,743 |
| Breweries and malthouses*— | ||
| Total persons engaged No. | 868 | 990 |
| Salaries and wages paid £ | 218,907 | 253,874 |
| Value of output (including beer duty) £ | 1,925,877 | 2,320,867 |
| Added value £ | 834,053 | 978,087 |
| Soap and candle works— | ||
| Total persons engaged No. | 492 | 553 |
| Salaries and wages paid £ | 89,187 | 107,259 |
| Value of output £ | 574,191 | 578,569 |
| Added value £ | 296,128 | 279,091 |
| Tanning— | ||
| Total persons engaged No. | 543 | 571 |
| Salaries and wages paid £ | 104,888 | 117,755 |
| Value of output £ | 519,157 | 614,113 |
| Added value £ | 210,692 | 217,565 |
| Superphosphates and chemical fertilizers— | ||
| Total persons engaged No. | 690 | 753 |
| Salaries and wages paid £ | 149,020 | 186,208 |
| Value of output £ | 1,360,123 | 1,498,228 |
| Added value £ | 539,428 | 597,020 |
| Boot and shoe manufacturing— | ||
| Total persons engaged No. | 2,788 | 3,108 |
| Salaries and wages paid £ | 360,684 | 438,084 |
| Value of output £ | 1,140,646 | 1,384,186 |
| Added value £ | 534,340 | 648,442 |
| Woollen mills— | ||
| Total persons engaged No. | 2,632 | 2,792 |
| Salaries and wages paid £ | 360,782 | 405,484 |
| Value of output £ | 1,005,830 | 1,230,829 |
| Added value £ | 592,741 | 653,292 |
| Hosiery factories— | ||
| Total persons engaged No. | 1,012 | 1,226 |
| Salaries and wages paid £ | 114,379 | 146,623 |
| Value of output £ | 461,653 | 564,990 |
| Added value £ | 248,236 | 258,715 |
| TRANSPORT (pp. 284–336):— | Twelve Months ended October— | ||
|---|---|---|---|
| 1936. | 1937. | ||
| * As at, 30th September. | |||
| Shipping (pp. 284–290)— | |||
| Overseas, inwards | Number | 641 | 617 |
| Tonnage | 2,875,570 | 2,890,675 | |
| Overseas, outwards | Number | 640 | 610 |
| Tonnage | 2,842,918 | 2,836,527 | |
| Railways (pp. 291–301)— | |||
| Net ton-miles run | Number | 476,000,000 | 542,000,000 |
| Passenger journeys | Number | 20,918,590 | 21,912,050 |
| Operating revenue | £ | 6,616,411 | 7,378,757 |
| Operating expenditure | £ | 5,908,103 | 6,989,919 |
| Road (pp. 309–324)— | |||
| Motor-vehicles licensed* | 217,782 | 241,063 | |
| Six Months ended 30th September— | |||
|---|---|---|---|
| 1936. | 1937. | ||
| CONSOLIDATED FUND (pp. 548–550): — | £ | £ | |
| Revenue | 11,456,511 | 13,563,661 | |
| Expenditure | 13,645,470 | 14,243,761 | |
OTHER PRINCIPAL STATISTICAL SERIES.
| Item. | 1936. | 1937. |
|---|---|---|
| Prices index numbers (pp. 738–759):— | ||
| Retail— | Month of October. | |
| Food (1926–30 = 1000) | 894 | 985 |
| All groups (1926–30 = 1000) | 876 | 938 |
| Wholesale—All groups (1909–13 = 1000) | 1,425 | 1529 |
| Export—All groups (1909–13 = 1000) | 1,262 | 1486 |
| Share prices—All groups (1926 = 1000) | 957 | 977 |
| Mortgages registered (pp. 704–707) £ | 1,676,811 | 1,578,785 |
| Mortgages discharged (pp. 704–707) £ | 1,777,999 | 1,613,277 |
| Land-transfers registered (p. 350) £ | 1,623,410 | 2,446,291 |
| Pensions (pp. 590–607):— | ||
| Old-age— | ||
| Number | 47,743 | 57,861 |
| Annual value £ | 2,475,000 | 3,279,513 |
| War— | ||
| Number | 23,435 | 23,902 |
| Annual value £ | 1,519,000 | 1,544,766 |
| Family allowances— | ||
| Number | 10,316 | 7,681 |
| Annual value £ | 145,000 | 101,453 |
| Banking:— | ||
| Trading banks— | ||
| Debits, weekly average (excluding Government), (p. 648) £ | 14,782,859 | 18,237,762 |
| Ratio of advances to deposits (p. 646) Per cent. | 75.96 | 80.87 |
| Reserve Bank— | 29th November. | |
| Net reserve ratio (p. 640) Per cent. | 76.08 | 74.77 |
| Reserve— | ||
| Gold (p. 640) £ | 2,801,790 | 2,801,791 |
| Exchange (p. 640) £ | 16,578,681 | 16,586,526 |
| Net note circulation (p. 649) £ | 8,668,765 | 9,547,346 |
| 25th October. | ||
| Overseas funds of banks (p. 650) £ | 31,451,278 | 28,024,490 |
| 25th September. | ||
| Number of unemployed males (p. 804) | 49,419 | 36,450 |
| Title. | Latest No. | Month of Issue. | Price per Copy. | Postage (extra). | |
|---|---|---|---|---|---|
| * £1 1s. per annum (post free). | |||||
| s. | d. | d. | |||
| New Zealand Official Year-Book | 1938 | Jan., 1938 | 7 | 6 | 6 |
| Annual Statistical Reports— | |||||
| Population and Buildings | 1935–36 | Jan., 1937 | 2 | 6 | 2 |
| Vital Statistics | 1935 | Jan., 1937 | 5 | 0 | 5 |
| Justice | 1936 | Sept., 1937 | 2 | 6 | 2 |
| Trade and Shipping (Part I) | 1936 | Sept., 1937 | 20 | 0 | 6 |
| Trade and Shipping (Part II) | 1935 | Dec., 1936 | 3 | 6 | 4 |
| Agricultural and Pastoral Production | 1935–36 | Jan., 1937 | 2 | 6 | 2 |
| Factory and Building Production | 1935–36 | April, 1937 | 3 | 6 | 3 |
| Insurance | 1935 | Mar., 1937 | 2 | 0 | 2 |
| Miscellaneous (Prices, Wage-rates and Hours of Labour, Unemployment, Industrial Accidents, Tramways, Banking, Building Societies, Bankruptcy, Commercial Afforestation, Incomes and Income-tax, Statistical Summary) | 1935 | Aug., 1937 | 4 | 0 | 4 |
| Local Authorities Handbook of New Zealand (published annually) | 1937 | Nov., 1937 | 7 | 6 | 6 |
| Monthly Abstract of Statistics | 2 | 6* | 1 | ||
| Volumes of 1936 Census Results— | |||||
| Increase and Location of Population | 1936 | Sept., 1937 | 4 | 6 | 4 |
| Dependencies | 1936 | Sept., 1937 | 1 | 6 | 1 |
| Poultry | 1936 | Sept., 1937 | 1 | 6 | 1 |
| (Other volumes to follow) | |||||
NOTE.—This list is subject to revision from time to time. Publications are obtainable from the Government Printer, Wellington.
Table of Contents
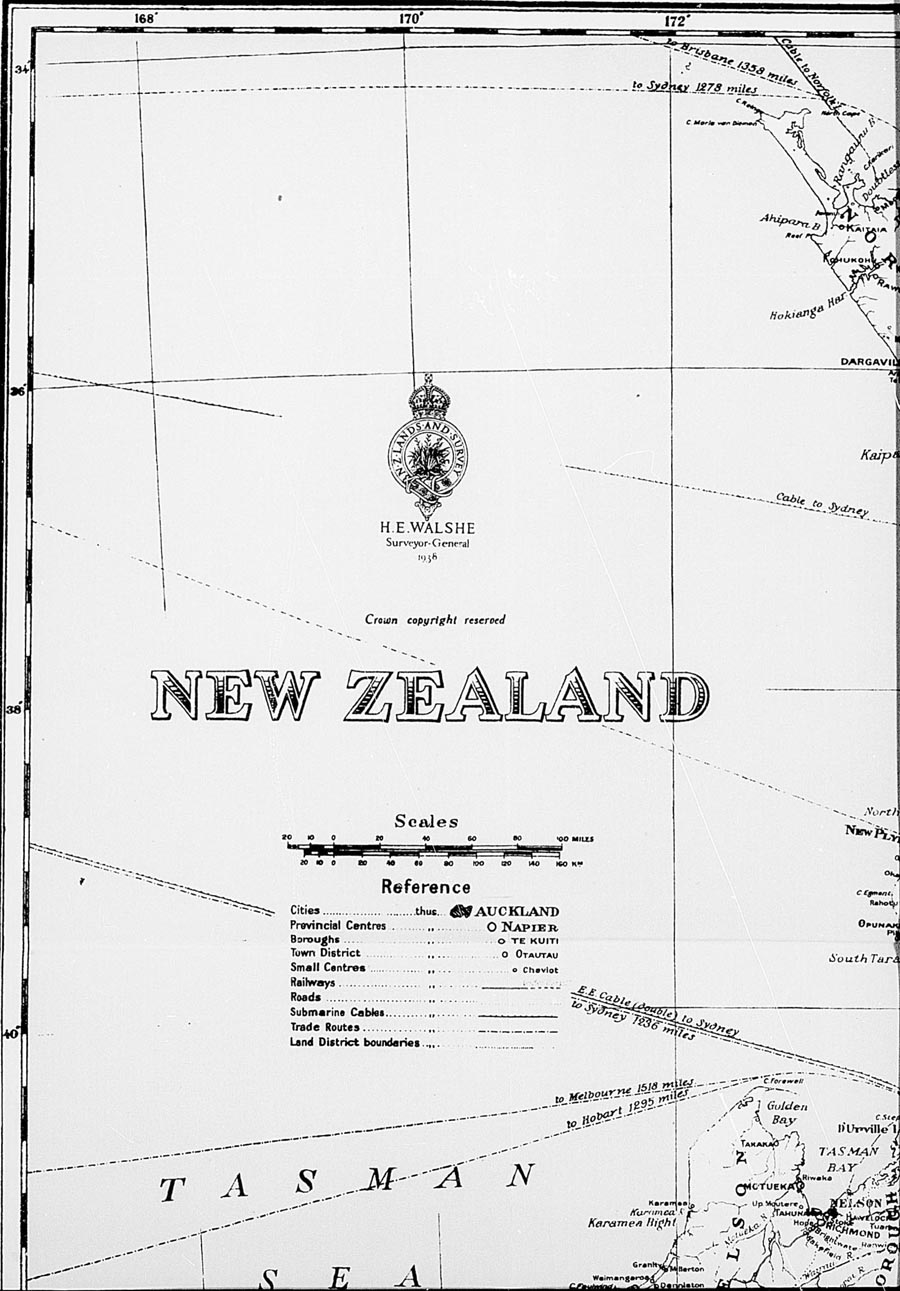
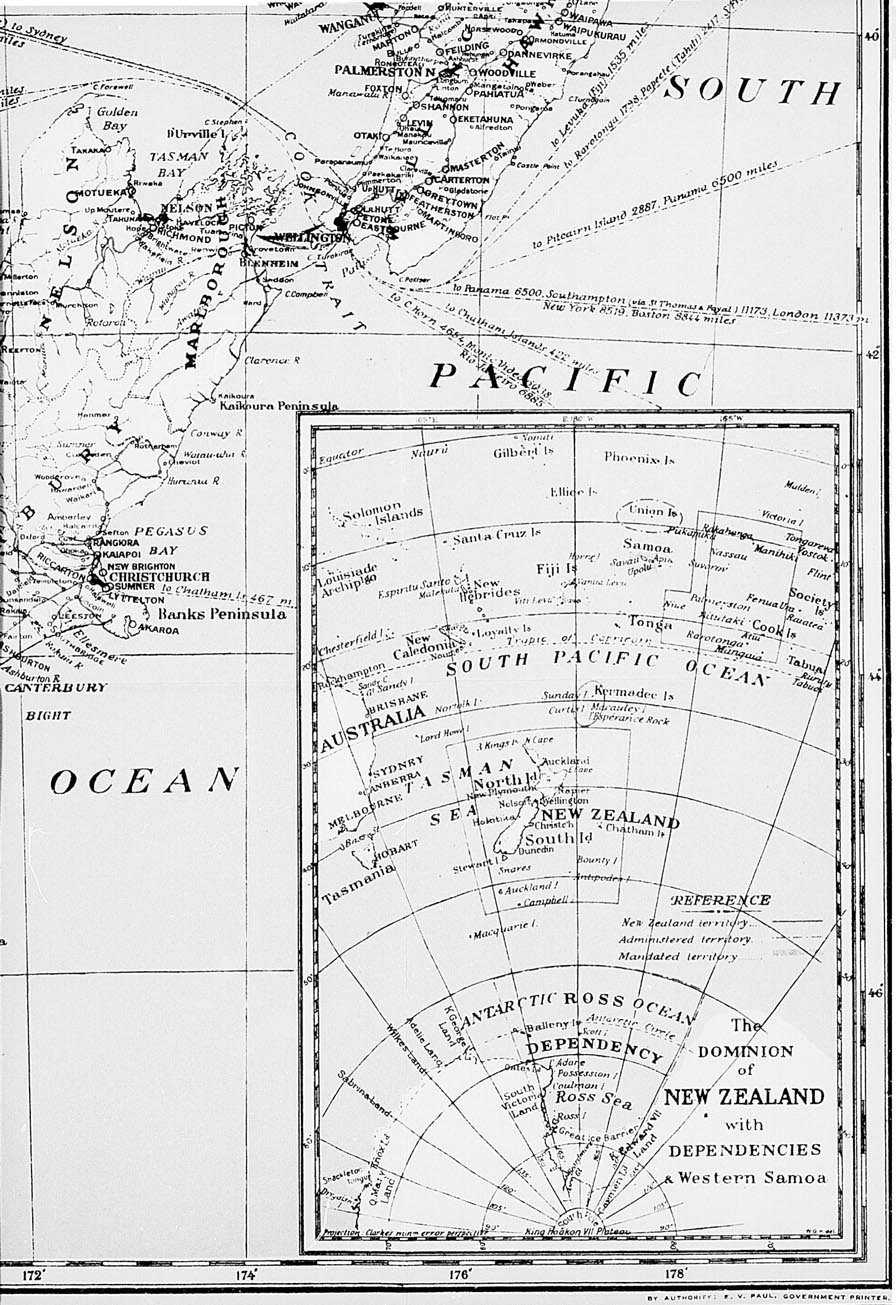
CONSISTING of two large and several smaller islands, the Dominion of New Zealand lies in the South Pacific Ocean some 1,200 miles to the eastward of Australia. With South America some 6,000 miles distant to the east and the Antarctic-Continent 1,600 miles distant to the south, the Islands are, for their size, among the world's most isolated. For statistical purposes the following classification of the administrative area is the most convenient:
Islands forming the Dominion proper (total area, 103,415 square miles):—
Square Miles. North Island and adjacent islets 44,281 South Island and adjacent islets 58,092 Stewart Island and adjacent islets 670 Chatham Islands 372 In all further references in this volume, unless the context indicates the contrary, Chatham Islands and Stewart Island are included with the South Island. It should be noted also that statistics for “the Dominion” and for “New Zealand” refer to the above group of islands, unless it is expressly stated that the outlying islands, group (b), and/or the annexed islands, group (c), are included. This definition is in accord with popular usage.
Outlying islands (total area, 307 square miles) included within the geographical boundaries of New Zealand as proclaimed in 1847, but none of which is inhabited:—
Square Miles. Three Kings Islands 3 Auckland Islands 234 Campbell Island 44 Antipodes Islands 24 Bounty Islands 0½ Snares Islands 1 Solander Island 0½ Islands (total area, 212 square miles) annexed to New Zealand:—
Kermadec Islands, annexed in 1887 (area, 13 square miles).
Cook and other Pacific Islands, annexed in 1901:—
Cook Islands (area, 84 square miles)—
Rarotonga. Aitutaki. Mangaia. Mauke (or Parry). Atiu. Takutea. Mitiaro. Manuae (or Hervey Islands). Islands outside the Cook Group (area, 115 square miles)—
Niue (or Savage). Rakahanga (or Reirson). Palmerston (or Avarau). Pukapuka (or Danger). Penrhyn (or Tongareva). Suwarrow (or Anchorage). Manihiki (or Humphrey). Nassau.
The total area of the foregoing groups is 103,934 square miles. Elsewhere in this issue (viz., in the section on land tenure, settlement, &c.) the aggregate area of the Dominion appears as 66,390,196 acres—i.e., 103,735 square miles. The matter area does not include the Cook and other Pacific Islands annexed in 1901.
As well as exercising jurisdiction over the areas already mentioned, the Dominion also administers the Union Islands, the Ross Dependency, and Western Samoa (which is held on a mandate from the League of Nations). Jointly with the Imperial Government and the Government of Australia, New Zealand is responsible for the mandate over the Island of Nauru. The administrative appointments for the island are made by the Australian Government, but New Zealand appoints a representative to the British Phosphates Commission, which controls the working of the phosphate deposits.
The relevant Proclamations, &c., defining from time to time the administrative area of the Dominion are given in the following paragraphs.
The Proclamation of British sovereignty over New Zealand, dated the 30th January, 1840, gave as the boundaries of what was then the colony the following degrees of latitude and longitude: On the north, 34° 30' S. lat.; on the south, 47° 10' S. lat.; on the east, 179° 0' E. long.; on the west, 166° 5' E. long. These limits excluded small portions of the extreme north of the North Island and of the extreme south of Stewart Island.
In April, 1842, by Letters Patent, and again by the Imperial Act 26 and 27 Vict., c. 23 (1863), the boundaries were altered so as to extend from 33° to 53° of south latitude and from 162° of east longitude to 173° of west longitude. By Proclamation bearing date the 21st July, 1887, the Kermadec Islands, lying between the 29th and 32nd degrees of south latitude and the 177th and 180th degrees of west longitude, were declared to be annexed to and to become part of the then olony of New Zealand.
By Proclamation of the 10th June, 1901, the Cook Group of islands, and all the other islands and territories situate within the boundary-lines mentioned in the following schedule, were included as from the 11th June, 1901:—
A line commencing at a point at the intersection of the 23rd degree of south latitude and the 156th degree of longitude west of Greenwich, and proceeding due north to the point of intersection of the 8th degree of south latitude and the 156th degree of longitude west of Greenwich; thence due west to the point of intersection of the 8th degree of south latitude and the 167th degree of longitude west of Greenwich; thence due south to the point of intersection of the 17th degree of south latitude and the 167th degree of longitude west of Greenwich; thence due west to the point of intersection of the 17th degree of south latitude and the 170th degree of longitude west or Greenwich; thence due south to the point of intersection of the 23rd degree of south latitude and the 170th degree of longitude west of Greenwich; and thence due east to the point of intersection of the 23rd degree of south latitude and the 156th degree of longitude west of Greenwich.
By Imperial Order in Council of the 30th July, 1923, the coasts of the Ross Sea (in the Antarctic regions), with the adjacent islands and territories, were declared a British settlement within the meaning of the British Settlements Act, 1887, and named the Ross Dependency. The dependency is uninhabited.
By Imperial Orders in Council of the 4th November, 1925, the Union or Tokelau Islands (consisting of the islands of Fakaofu, Nukunono, and Atafu, and the small islands, islets, rocks, and reefs depending on them, a total area of only four square miles) were excluded from the Gilbert and Ellice Islands Colony, and placed under the administration of the Governor-General of New Zealand. In accordance with a provision of the second of these Orders in Council, the Governor-General's authority and power in connection with the administration of the islands were, by New Zealand Order in Council of the 8th March, 1926, delegated to the Administrator of Western Samoa.
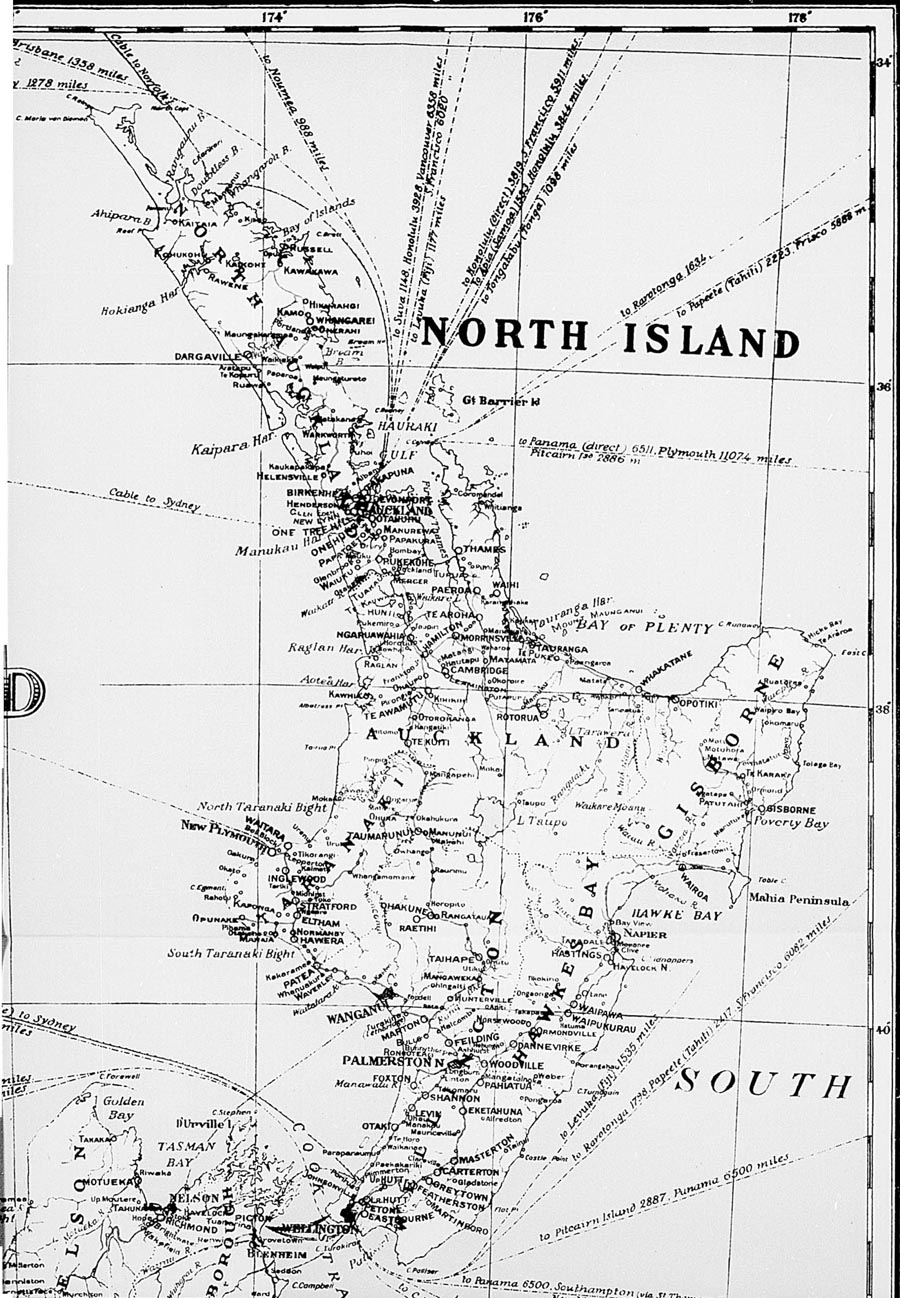
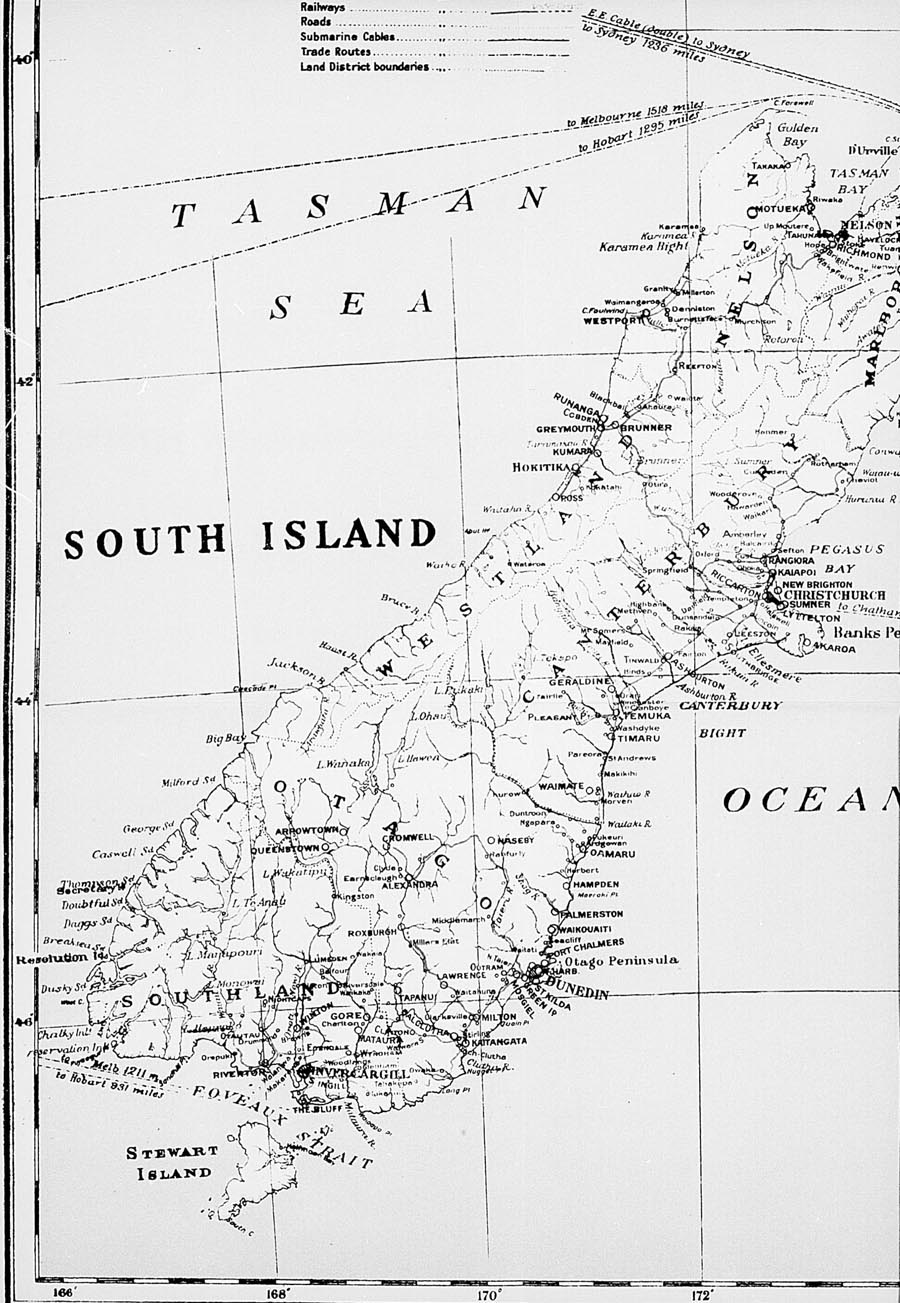
Since the combined length of the North and South Islands extends just over a thousand miles, and since the width of neither Island exceeds 280 miles at its broadest point, New Zealand possesses a long coast-line in proportion to its area. With the exception of the low-lying North Auckland peninsula, the length of the New Zealand land-mass lies along a south-westerly-north-easterly axis, and is thus parallel to the direction of its mountain-chains.
By reason of the latter fact the coast-line is, on the whole, not greatly indented; and, as a consequence, New Zealand is not well endowed with natural harbours. In the North Island, Auckland and Wellington are the only two safe natural harbours of which the fullest commercial use can be made. On the east coast of the North Auckland peninsula several deep and sheltered harbours exist, but as the surrounding country is comparatively undeveloped and the area somewhat remote they are of little economic consequence at present. In the South Island the Marlborough Sounds and the West Coast Sounds form perfect land-locked harbours, but owing to their situations and to the rugged nature of the terrain (especially in the latter locality) they have little or no commercial utility. Where vital localities have not been endowed with ideal harbours it has been necessary to improve existing facilities by dredging and by breakwater-construction, &c. In this manner efficient ports, capable of accommodating overseas vessels, have been formed in Lyttelton, Otago, and Bluff harbours. On the west coast of both Islands the strong ocean-drifts and high seas cause shoaling at river-mouths and harbour-entrances so that these are useless for any hut the smallest vessels, while on the east coast of the South Island similar circumstances prevail, due to the large quantities of shingle brought down by the rivers being spread along the coast by ocean currents.
Since the mountainous nature of the country makes the haulage of goods to and from the better-equipped natural harbours both costly and difficult, the construction of further ports at various points along the coasts of both Islands has been necessary, either by dredging river-mouths or by harbour-construction work.
The mountainous nature of New Zealand is one of its most striking physical characteristics. In the North Island the higher mountains occupy approximately one-tenth of the surface; but, with the exception of the four volcanic peaks of Egmont (8,260 ft.), Ruapehu (9,175 ft.), Ngauruhoe (7,515 ft.), and Tongariro (6,458 ft.), they do not exceed an altitude of 6,000 ft. Of these four volcanoes only the first-named can be classed as extinct. Other volcanoes include Mount Tarawera and White Island, each of which has, upon one occasion within historical times, erupted with disastrous consequences. Closely connected with the volcanic system are the multitudinous hot springs and geysers.
The South Island is much more mountainous than the North, but shows fewer manifestations of recent volcanic activity. Along almost the entire length of the Island runs the massive chain known as the Southern Alps, which attain their greatest height in Mount Cook (12,349 ft.), while no fewer than seventeen peaks exceed 10,000 ft.
The position and trend of the mountains in New Zealand exert considerable influence on the economic life of the Dominion. Attention has already been drawn to the relation between the direction of the mountains and the nature of the coast-line, while in the article dealing with climate (post) explanation is made of the effect of mountains on climatic conditions. To the existence of mountain barriers can be attributed the groupings of the population in the intermontane plains and valleys; and, as has been mentioned, such barriers, by placing restrictions on internal transport, have necessitated the construction of several artificial ports.
As may be expected, the higher mountains of the South Island have exerted a greater influence on the economic development of the country than those of the North Island. For many years the Southern Alps were an effective barrier to communication by land between the east and west coasts, while their climatic effects on the Canterbury plains and Otago plateaux determined the types of cultivation undertaken. Moreover, the existence of much open country above the timber-line led to the development of pastoral holdings on a large scale. While the mountains in the North Island are not as high nor as extensive as those of the South Island, in the early days they effectively isolated various portions of the coastal plains and valleys. Their effect on climatic conditions, however, is considerably less, the rainfall being more evenly distributed. Due to this more even distribution of the rainfall, and to the existence of considerable areas of lower relief, the foothills of the mountain systems were heavily wooded, and so proved a hindrance to agrarian development.
In the 1931 issue of the Year-Book was given a list, not claimed as exhaustive, of 223 named peaks of 7,500 ft. or more in altitude. Below is a list of the peaks, restricted to the three largest volcanic cones in the North Island and to mountains of a minimum height of 9,000 ft. in the South Island. The list has been compiled from various sources, and does not purport to be free from omissions.
| Mountain or Peak. | Height (Feet). |
|---|---|
| North Island. | |
| Ruapehu | 9,175 |
| Egmont | 8,260 |
| Ngauruhoe | 7,515 |
| South Island. | |
| Kaikoura Ranges— | |
| Tapuaenuku | 9,465 |
| Alarm | 9,400 |
| Southern Alps— | |
| Cook | 12,349 |
| Tasman | 11,475 |
| Dampier | 11,287 |
| Silberhorn | 10,757 |
| Lendenfeldt | 10,450 |
| David's Dome | 10,443 |
| Malte Brun | 10,421 |
| Torres | 10,376 |
| Teichelmann | 10,370 |
| Sefton | 10,354 |
| Haast | 10,294 |
| Elie de Beaumont | 10,200 |
| Douglas Peak | 10,107 |
| La Perouse | 10,101 |
| Haidinger | 10,059 |
| De la Beche | 10,058 |
| The Minarets | 10,058 |
| Aspiring | 9,975 |
| Hamilton | 9,915 |
| Glacier Peak | 9,865 |
| Aiguilles Rouges | 9,731 |
| Nazomi | 9,716 |
| Darwin | 9,715 |
| Chudleigh | 9,686 |
| Annan | 9,667 |
| Lowe | 9,653 |
| Haeckel | 9,649 |
| Le Receveur | 9,562 |
| Goldsmith | 9,532 |
| Big Mac | 9,511 |
| Conway Peak | 9,510 |
| Bristol Top | 9,508 |
| Walter | 9,507 |
| Grey | 9,490 |
| Green | 9,307 |
| Hutton | 9,297 |
| D'Archiac. | 9,279 |
| Bell | 9,276 |
| Hochstetter Dome | 9,258 |
| Earnslaw | 9,250 |
| Nathan | 9,200 |
| Barnicoat | 9,183 |
| Sibbald | 9,181 |
| Arrowsmith | 9,171 |
| Spencer | 9,167 |
| The Footstool | 9,073 |
| Rudolf | 9,039 |
| The Dwarf | 9,025 |
| Darran Range— | |
| Tutoko | 9,691 |
| Madeline | 9,042 |
In keeping with the dimensions of her mountain system, New Zealand possesses, in the South Island, a glacial system of some magnitude. Of the glaciers the largest is the Tasman, which, with others of comparable size, rises in the more elevated area surrounding Mount Cook. Flowing down the eastern slope of the range, this glacier has a length of 18 miles and a width of 1¼ miles. In common with other glaciers on the eastern slope, of which the more important are the Murchison (11 miles), the Mueller (8 miles), the Godley (8 miles), and the Hooker (7¼ miles), its rate of flow is slow, while its terminal face is at an altitude of just over 2,000 ft. On the western slope of the range, owing to the greater snow precipitation, the glaciers are more numerous and descend to lower levels, while the steeper slope gives them a faster rate of flow. The two largest of these are the Fox and the Franz Josef, with lengths of 9¾ miles and 8½ miles respectively, and terminal faces at altitudes of 670 ft. and 690 ft.
As will be realized, these glaciers are an important tourist attraction, and as such have definite economic significance. Moreover, those glaciers on the eastern slopes which feed rivers utilized for irrigation and hydro-electric purposes are valuable in that they help to ensure a steady volume of water in such rivers.
Though numerous, few New Zealand rivers are of sufficient length or volume to be navigable. Moreover, owing to the high relief of the country, they are mostly swift-flowing, while, as mentioned previously, nearly all are obstructed at their mouths by bars. For the purpose of internal communication, therefore, they are of little economic utility, and only in two or three isolated instances have they been thus consistently used. With improved roading conditions, however, their traffic has become negligible even in these cases.
As sources of hydro-electric power, New Zealand rivers are of considerable importance, since their rapid rate of flow and dependable volume of ice-free water make them entirely suitable for such utilization. At the present time the Waikato and the Mangahao rivers in the North Island and the Waitaki River in the South are used for major hydro-electric schemes. The characteristics just mentioned are also important for purposes of irrigation, but, owing to the reliable rainfall, there are few areas other than in Canterbury and Otago where the rivers are so utilized.
In the 1932 Year-Book appears an account of the rivers of New Zealand by Professor R. Speight, M.Sc., F.G.S., Curator of the Canterbury Museum.
Space in this issue is, however, available only for a list of the more important rivers, with their approximate lengths, the latter being supplied by the Department of Lands and Survey. Figures in parentheses indicating the approximate discharge, in cubic feet per minute, are shown for the largest rivers.
| Flowing into the Pacific Ocean— | Miles. |
|---|---|
| Piako | 60 |
| Waihou (or Thames) | 90 |
| Rangitaiki | 95 |
| Whakatane | 60 |
| Waiapu | 55 |
| Waipaoa | 50 |
| Wairoa | 50 |
| Mohaka | 80 |
| Ngaururoro | 85 |
| Tukituki | 65 |
| Flowing into Cook Strait— | |
| Ruamahanga | 70 |
| Hutt | 35 |
| Otaki | 30 |
| Manawatu (over 600,000) | 100 |
| Rangitikei | 116 |
| Turakina | 65 |
| Wangaehu | 85 |
| Wanganui (over 500,000) | 140 |
| Waitotara | 50 |
| Patea | 65 |
| Flowing into the Tasman Sea— | |
| Waitara | 65 |
| Mokau | 75 |
| Waikato (over 800,000) | 220 |
| Wairoa (over 250,000) | 95 |
| Hokianga | 40 |
| Flowing into Cook Strait— | Miles. |
|---|---|
| Aorere | 45 |
| Takaka | 45 |
| Motueka | 75 |
| Wai-iti | 30 |
| Pelorus | 40 |
| Wairau | 105 |
| Awatere | 70 |
| Flowing into the Pacific Ocean— | |
| Clarence | 125 |
| Conway | 30 |
| Waiau-uha | 110 |
| Hurunui | 90 |
| Waipara | 40 |
| Ashley | 55 |
| Waimakariri (low water 80,000; normal flood 500,000) | 93 |
| Selwyn | 55 |
| Rakaia | 95 |
| Ashburton | 67 |
| Rangitata | 75 |
| Opihi | 50 |
| Pareora | 35 |
| Waihao | 45 |
| Waitaki | 135 |
| Kakanui | 40 |
| Shag | 45 |
| Taieri | 125 |
| Clutha (over 2,000,000) | 210 |
| Flowing into Foveaux Strait— | |
| Mataura | 120 |
| Oreti | 105 |
| Aparima | 65 |
| Waiau | 115 |
| Plowing into the Tasman Sea— | |
| Cleddau and Arthur | 20 |
| Hollyford | 50 |
| Cascade | 40 |
| Arawata | 45 |
| Haast | 60 |
| Karangarua | 30 |
| Cook | 25 |
| Waiho | 20 |
| Wataroa | 35 |
| Wanganui | 35 |
| Waitaha | 25 |
| Hokitika | 40 |
| Arahura | 35 |
| Taramakau | 45 |
| Grey | 75 |
| Buller (nearly 1,000,000) | 105 |
| Mokihinui | 30 |
| Karamea | 45 |
| Heaphy | 25 |
The discovery in 1861 that the beds of numerous rivers in the South Island contained extensive deposits of alluvial gold was of considerable importance in the economic development of the country. Not only did it lead to an increase in population and in wealth, but it also led to the rapid exploration of large tracts of remote country watered by the numerous streams. The exploitation of these deposits has been carried on with varying degrees of success up to the present time by both manual and mechanical means.
A further factor in connection with rivers is that, owing to the very successful acclimatization of English fresh-water fish, the rivers now provide exceptionally fine fishing and have thus become one of the country's major tourist attractions.
In considering New Zealand's numerous lakes, a distinction can be made, especially from the scenic viewpoint, between the lakes of the two Islands. Surrounded by extremely rugged country the larger lakes of the South Island are distinguished by the grandeur of their alpine settings, while those of the North Island, situated on a volcanic plateau, are of interest by reason of the neighbouring thermal activity. Due to the excellence of their fresh-water fishing, the latter possess an added tourist attraction. In both Islands the larger lakes are situated at high altitudes, and their consequent remoteness renders them unsuitable as a means of communication. In their functions as reservoirs the lakes of both Islands are of vital importance for the maintenance of the streams draining them and as a means of flood-prevention. More especially is this the case where hydro-electric schemes are involved, Lakes Waikaremoana and Taupo in the North Island, and Lakes Coleridge, Pukaki, and Tekapo in the South Island, being of particular significance in this respect.
A detailed article on the lakes of New Zealand, also by Professor It. Speight, will be found in the 1932 Year-book. The more important lakes are stated below.
| Lake. | Length, in Miles. | Greatest Breadth, in Miles. | Area, in Square Miles. | Drainage Area, in Square Miles. | Approximate Volume of Discharge, in Cubic Feet per Second. | Height above Sea-level, in Feet. | Greatest Depth, in Feet. |
|---|---|---|---|---|---|---|---|
| North Island. | |||||||
| Taupo | 25 | 17 | 238 | 1,250 | 5,000 | 1,211 | 534 |
| Rotorua | 7½ | 6 | 32 | 158 | 420 | 915 | 84 |
| Rotoiti | 10¾ | 2¼ | 14 | 26 | 500 | 913 | 230 |
| Tarawera | 6½ | 6½ | 15 | 75 | 1,032 | 285 | |
| Waikaremoana | 12 | 6¼ | 21 | 128 | 772 | 2,015 | 846 |
| Wairarapa | 10 | 4 | 27 | 1,250 | 64 | ||
| South Island. | |||||||
| Rotoiti | 5 | 2 | 2¾ | 86 | 1,997 | 228 | |
| Rotoroa | 7 | 2½ | 8 | 146 | 1,470 | ||
| Brunner | 5 | 4 | 16 | 145 | 280 | 357 | |
| Kanieri | 5 | 1¾ | 8 | 11 | 422 | 646 | |
| Coleridge | 11 | 3 | 18 | 70 | 1,667 | 680 | |
| Tekapo | 12 | 4 | 32 | 580 | 5,000 | 2,323 | 620 |
| Pukaki | 10 | 5 | 31 | 515 | 6,000 | 1,588 | |
| Ohau | 10 | 3 | 23 | 424 | 5,000 | 1,720 | |
| Hawea | 20 | 5 | 48 | 518 | 5,700 | 1,062 | |
| Wanaka | 30 | 4 | 75 | 960 | 922 | ||
| Wakatipu | 52 | 3 | 112 | 1,162 | 13,000 | 1,016 | 1,242 |
| Te Anau | 33 | 6 | 132 | 1,320 | 12,660 | 694 | 906 |
| Manapouri | 12 | 6 | 56 | 416 | 596 | 1,458 | |
| Monowai | 12 | 1 | 12 | 51 | 700 | 600 | |
| Hauroko | 20 | 3 | 25 | 195 | 1,800 | 611 | |
| Poteriteri | 17 | 2 | 17 | 162 | 96 | ||
| Waihola | 4½ | 1⅛ | 3⅓ | 2,200 | (Tidal) | 52 | |
| Ellesmere | 16 | 10 | 107½ | 745 | (Tidal) | 45 |
The following article on the geology of New Zealand was prepared by Dr. J. Henderson, M.A., F.R.S.N.Z., Director of the Geological Survey:—
New Zealand is a small country, but its geological history is as complex and as ancient as that of a continent. Land, though from age to age it varied greatly in area, outline, and elevation, must have persisted in the New Zealand area from the oldest Palæozoic or earlier. Long periods—during which gentle regional oscillations and warpings, aided by the slow-acting forces of denudation, brought about gradual changes—were interrupted by great revolutions when earth-stresses ridged the crust into mountains and quickly altered the whole configuration of the land and sea-floor. For New Zealand the important geological periods are those that followed the two latest mountain-building movements—the Kaikoura deformation of late Tertiary time, and the Hokonui deformation of the early Cretaceous, The deposits laid down in the intervening period of relative crustal stability cover a large proportion of the land, and contain all the coal and most of the limestone of the Dominion. The soils on which grow the forests, pastures, and crops are of post-Tertiary age, and the great bulk of the gold has been won from deposits formed during the same period.
The oldest known fossiliferous rocks in New Zealand are the Ordovician slates and greywackes of west Nelson and south-west Otago. Lower unfossiliferous beds of the same great system extend southward from the northern area and outcrop in the Westport, Reefton, Greymouth, Ross, and Okarito districts. Above the fossil-bearing beds, but probably also of Ordovician age, are the black phyllites, quartzites, and marbles which outcrop continuously from Takaka to Mount Owen, and are again exposed in the upper basins of the Matakitaki, Maruia, and Grey Rivers. The similar rocks of western Otago probably also belong to this group. The complex of gneisses and schists of the same region, intruded by acid and basic plutonics, and usually considered of Archæan age, resembles the part of the Ordovician strata of western Nelson that has been similarly invaded and metamorphosed and may well be of early Palæozoic age. Different authorities assign the mica, chlorite, and quartz schists of Central Otago to ages that range from the Archæan to the Triassic. They are certainly Palæozoic or older, since they grade upward into greywackes that, at Clinton, contain Permian fossils.
Devonian rocks are certainly known only in the Baton, Wangapeka, and Reefton districts. These beds, fossils from which have lately been examined in England, cover only small areas. But the old Geological Survey mapped wide tracts of country in Nelson and Otago, covered with beds of the Te Anau Series, as Devonian, and the correlation may well be correct, though the rocks are entirely unfossiliferous.
The Maitai Series, which forms the ranges on the south-east side of the Nelson lowlands, are probably of Carboniferous or Permo-Carboniferous age. Their position in the time scale and their correlation with rocks in other parts of New Zealand have provoked much discussion. Permian strata, as already stated, occur in Otago, where the area they cover may be considerable.
Richly fossiliferous late Triassic rocks are known in the Kawhia-Mokau district, near the City of Nelson, and at several localities in Canterbury and Otago. Except in Nelson and Canterbury, strata that contain fossils referable to several stages of the Jurassic succeed without observed unconformity. The broad belt of greywacke and argillite that forms the mountains of Canterbury and Marlborough, and continues as a narrower belt through Wellington to northern Hawke's Bay, is usually referred to the Trias-Jura. Similar rocks outcrop in the centre of the North Island and at many points in North Auckland. There are Upper Triassic molluscs in these beds at several localities, and the vertebra of a saurian with Triassic rather than Permian affinities was found near Wellington. Lithologically the greywackes and argillites of this vast series differ somewhat from the rocks of similar type belonging to the Jurassic and Maitai series; they are therefore thought to be of older Triassic age, but may well range into the Permian. The schists occurring with them in the Kaimanawa, Kaikoura, Moorhouse, and Kirkliston Ranges are probably older.
The thick conglomerates conformably overlying the younger Jurassic shales of the Port Waikato, Kawhia, and Coromandel regions belong to either the youngest Jurassic or the oldest Cretaceous. Strata of early and middle Cretaceous age occur east of the main axis of New Zealand at several points from Marlborough to East Cape. Late Cretaceous beds are much more widely distributed, being known in North Auckland and in many localities along the eastern side of both Islands. They contain thick layers of black shale that give many indications of oil, which, however, has not yet been found in commercial amount. The oldest known workable coal-seams in New Zealand, those at Broken River, Malvern Hills, Shag Point, and Kaitangata, and perhaps some near Greymouth, are in young Cretaceous beds.
Tertiary rocks form the greater part of the North Island and are widely distributed in the South. As a whole they are weaker and more readily weathered than the older strata, and hence have given rise to less rugged country, now mostly cleared and grassed and forming productive pastoral land.
Eocene rocks are present in North Auckland, and probably also in the Gisborne, Hawke's Bay, and east Wellington districts. In the South Island they occur on the West Coast and in Canterbury and Otago, in which regions they contain valuable coal-seams worked at Westport, Reefton, Greymouth, Mount Somers, and Milton. Of the same age are the auriferous “cements” of the Tuapeka district that greatly enriched the gravels of the neighbouring streams and are themselves worked for gold.
In Oligocene time the maximum subsidence during the Tertiary occurred, and but little of the New Zealand area remained above sea-level at its close. The thick limestones of the Oamaru district and the contemporaneous limestone prominent in many parts of New Zealand are the younger deposits of his age. The older beds contain the extensive coal-measures of the North Auckland, Waikato, Charleston, and other coalfields.
Miocene strata cover large areas in both islands, and also outcrop in the Wanganui, Gisborne, and Hawke's Bay regions. In north Taranaki, the Murchison basin, and parts of the West Coast thick coal-measures of this age contain workable seams of brown coal.
During the Pliocene the New Zealand area, which had been intermittently rising since the close of the Oligocene, was greatly elevated and deformed. The earth-blocks from which the present mountains have been carved were uplifted from, or from near, sea-level, and New Zealand as it now is was roughly shaped out. In the South Island the deposits of this period are chiefly gravels deposited in structural depressions; but in the North Island, and especially in its southern half, there are thick and extensive shoal-water marine sediments. These, and the underlying Miocene strata, are the source of the petroleum found at New Plymouth.
The Pleistocene was a period of regional oscillation. While the land was high the mountains of the South Island were intensely glaciated, and great ice-streams, carrying vast bodies of debris, descended into the low country; after the highlands had been reduced in height through both denudation and decided subsidence the glaciers rapidly retreated, and are to-day represented by comparatively small remnants far in the mountains. While the ice was melting, the rivers of the South Island were unusually active in transporting waste to the lowlands and the sea. At this time, too, as well as somewhat earlier, the volcanoes of the North Island ejected an abundant supply of fragmentary material, much of which was borne away by the streams and used in building plains.
The deposits of Pleistocene and Recent age are in New Zealand of greater economic importance than those of all other ages. The plains, river-flats, and lowlands generally were formed or profoundly modified during this period, and the soils that cover them produced. During the same time practically all the gold won from the gravels of the South Island was liberated from a hard matrix and concentrated into workable deposits, and the rich bonanzas of the lodes of Hauraki were formed by secondary enrichment. The land-oscillations of the period are also of economic importance, for New Zealand's abundant water-power is derived from streams that have not yet, owing to the recency of land-uplift, cut their valleys to grade. On the other hand, land-depression has provided harbours and valuable artesian basins in many parts of the Dominion.
Plutonic rocks intrude many of the Palræozoic and Mesozoic strata, and some of the formations show evidence of contemporaneous volcanic action. Of the plutonic rocks granite is much the mos prominent, and it outcrops at many points in west Nelson, Westland, Otago, and Stewart Island. In Nelson there were at least two periods of intrusion, probably corresponding with the great mountain-folding movements of the late Palæozoic and early Cretaceous times. The auriferous lodes of Reefton and other localities on the West Coast probably originated from the cooling magmas that formed the younger granites. Basic and ultra-basic rocks, the latter now largely altered to serpentine, occur in Nelson, Westland, Otago, and, to a less extent, in North Auckland.
Though volcanoes are known to have existed in Mesozoic and Palæozoic times, they seem to have been more active during the Tertiary than in any earlier age. The vast pile of flow and fragmental rocks that form the Hauraki Peninsula and the range that continues it southward to Tauranga belong to this period. The gold-silver veins extensively worked at Coromandel, Thames, and Waihi are in these rocks, which southward are smothered by the rhyolitic pumice that vents in the Taupo-Rotorua zone ejected during the late Pliocene and Pleistocene. Thick showers of pumice from this region cover a large part of the centre of the North Island, and streams have carried the finer material to practically all the low-lying parts of the island. The volcanoes are still alive, as is evidenced by the steam-vents, hot springs, and geysers found in the depressed zone extending from Ruapehu to White Island. The volcanic rocks of Taranaki probably range from the Miocene to the Pleistocene in age. The basalts and scoria cones that occur so abundantly between Kawhia and the Bay of Islands belong to the most part to the late Pliocene and Pleistocene, though cones at Auckland City are probably Recent.
In the South Island the volcanoes appear to be quite dead, for the hot springs at Hanmer and near the alpine chain are due to other causes. In the middle Tertiary, however, there were outbursts at many points, the chief eruptions being at Banks Peninsula and about Dunedin.
In a short article it is impossible to give an adequate idea of what geological workers have accomplished in New Zealand, or of what they have yet to do in order that the wisest use may be made of the country's mineral and agricultural resources. For good general accounts the treatises of Professors Park and Marshall should be consulted, and for more detailed information the bulletins of the Geological Survey and the many papers that have appeared in the “Transations” of the New Zealand Institute (now the Royal Society of New Zealand).
THE following article deals with earthquakes in New Zealand. The first section of the article has been prepared by Dr. J. Henderson, Director of the Geological Survey, and the remaining sections by Mr. R. C. Hayes, Acting-Director of the Dominion Observatory.
Earthquake and volcanic activity are manifestations of the adjustments constantly occurring in the earth's crust. In the not far distant past, geologically speaking, a more or less continuous belt of mountains was raised up round the border of the great sunken area of the Pacific, and this belt as a whole is characterized by “chronic and acute seismicity.” At times the earthquakes occur within the belt itself, though a large proportion have their epicentres on its submerged frontal slope.
The South Island of New Zealand and the eastern part of the North Island are on the crest of the great mountain ridge or crustal fold which forms a portion of the real border of the Pacific. This ridge maintains a relatively straight course north-north-east for 1,600 miles across the floor of the Pacific, nearly to Samoa. The Auckland Peninsula, part of a decidedly weaker fold, meets the main fold nearly at right angles in the Rotorua-Taupo volcanic region. The earthquakes of this seismically sensitive district, though they may be locally severe, are not usually felt far from their points of origin. On the other hand, the tectonic earthquakes that occur along the main earth-fold shake largo areas, some of them being recorded on instruments throughout the world. These are caused by the slipping of earth-blocks against their neighbours along fractures.
Many great fault-zones have been traced for long distances, but a few only have been active since European occupation. The Hawke's Bay earthquake of 1931 raised an area sixty miles long in a north-east direction and in parts ten miles wide. The uplift was greatest along the south-east edge of the area—for miles amounting to 6 ft. or more. Numerous levels on the Heretaunga Plain and along the railway north of Napier show that the uplift decreased north-westward, so that the area was slightly tilted in that direction. The ground east of the uplifted area sank, and parts of the Napier and Wairoa flats are over a foot lower than before the earthquake.
In 1929 movement along a north-trending fault seven miles west of Murchison raised the ground east of the fault by about 15 ft., and caused it to shift north-west by about 9 ft. The uplift gradually decreases eastward and dies out sixteen miles from the fault, facts indicating a slight tilt of the earth-block toward the east. Recent levellings show that the block is sinking somewhat irregularly, a movement, no doubt, causing some of the innumerable local after-shocks felt in the area over many months. Other sensible earth-movements occurred in connection with the Taupo earthquake series of 1922,* the Amuri earthquake of 1888,† the Wellington earthquake of 1855,‡ probably the Awatere earthquake of 1848.§ There is also definite evidence of geologically recent differential movement of earth-blocks at several widely separated points in both Islands.
A comparison between the records of destructive earthquakes in New Zealand and similar records in other seismic countries shows that the seismicity of New Zealand in general is surprisingly high. This, however, is due to the occurrence of a large number of earthquakes of the semi-destructive type, with comparatively few of the disastrous type.
During the period 1835–1934 sixty-nine destructive earthquakes are known to have occurred in New Zealand, forty-nine of which were of the semi-destructive type (not exceeding intensity R.-F. 8). There were fourteen of intensity 9, and six of intensity 10.*
The distribution of earthquakes throughout New Zealand itself during the period 1848–1934 shows that the region of intense seismic activity, where earthquakes are frequent and occasionally severe, includes the eastern and southern parts of the North Island and the northern part of the South Island.†
The Auckland Peninsula, South Canterbury, and Eastern Otago appear to have been comparatively free from earthquakes during the past hundred years. Although the seismic history of the Fiord region of the South Island is not very well known, there are records of sealers having experienced violent earthquakes in those parts in 1792, 1810, and 1826–27.** Also there is some record of violent earthquakes having occurred near Auckland in 1834–35.††
It is thus evident that, although some parts of New Zealand have experienced no severe earthquakes during the past hundred years, no assurance can be given that such will not occur there in the future.
The following table, compiled for some of the main centres in New Zealand, shows—(1) The mean annual frequency of all earthquakes during the period 1848–1934 ¶; and (2) the number of destructive earthquakes during the period 1835–1934‡‡:—
| Centre. | Mean Number of Shocks per Year. | Number of Earthquakes of Intensity R.-F. 8 or over. |
|---|---|---|
| Auckland | 0.3 | 1 |
| New Plymouth | 2.7 | 6 |
| Napier | 3.3 | 5 |
| Wanganui | 4.1 | 10 |
| Masterton | 2.0 | 6 |
| Wellington | 7.8 | 14 |
| Nelson | 3.7 | 5 |
| Westport | 4.9 | 3 |
| Christchurch | 2.0 | 3 |
| Dunedin | 1.0 | |
| Invercargill | 0.6 |
*P. G. MORGAN: N.Z. Geological Survey; Annual Report for the year 1923, p. 10.
†ALEXANDER McKAY: Reports of Geological Explorations during 1888–89. Wellington, 1800.
‡New Zealand Government Gazette, Wellington, Vol. 2, No. 14, 17th October, 1855, p. 110. Sir CHARLES LYELL, “The Principles of Geology,” tenth edition, 1868, Vol. 2, p. 82. London: John Murray.
§New Zealand Government Gazette, Wellington, Vol. 1, No. 27, 13th November, 1848, and Vol. 1, No. 29, 20th November, 1848. H. S. CAPMAN in Westminster Review, Vol. 51, 1849.
‖ L. BASTINGS: “Destructive Earthquakes in New Zealand, 1835–1934,” N.Z. Jour. Sci. & Tech., Vol. 17, No. 1, July, 1935. Dominion Observatory Bulletin 103.
¶ L. BASTINGS and R. C. HAYES: “Earthquake Distribution in New Zealand, 1848–1934,” N.Z. Jour. Sci. & Tech., Vol. 10, No. 5, March, 1935. Dominion Observatory Bulletin 95.
**R. McNAB: “Murihiku and the Southern Islands” (1907). R. TAYLOR: “Te Ika a Maul,” London, 1855.
†† Australasian Association for the Advancement of Science, Vol. 3, 1891, p. 531.
‡‡ R. C. HAYES: “The Seismicity of New Zealand Cities and Towns,” N.Z. Jour. of Sci. & Tech., 1936. Dominion Observatory Bulletin 111.
Although there appears to be no regular annual variation in the frequency of New Zealand earthquakes, the mean monthly numbers over a long period indicate that earthquakes are on the average most frequent in March and least so in January. The mean monthly numbers follow approximately the mean annual variation of atmospheric pressure in New Zealand.*
The total number of earthquakes reported felt in New Zealand, and the maximum intensities reported in each of the years 1921 to 1936 inclusive, are as follows:—
| Year. | Number of Earthquakes reported felt. | Maximum Intensity of Heaviest Shock, B.-F. Scale. |
|---|---|---|
| 1921 | 91 | 8 |
| 1922 | 1,187 | 8 |
| 1923 | 76 | 6 |
| 1924 | 70 | 7 |
| 1925 | 76 | 8 |
| 1926 | 173 | 8 |
| 1927 | 107 | 8 |
| 1928 | 80 | 8 |
| 1929 | 678 | 10 |
| 1930 | 748 | 8 |
| 1931 | 432 | 10 |
| 1932 | 313 | 9 |
| 1933 | 108 | 7 |
| 1934 | 230 | 9 |
| 1935 | 150 | 7 |
| 1936 | 123 | 6 |
The figures in the above table, giving the number of reported earthquakes, require careful interpretation. In years of major earthquakes, such as 1929 and 1931, many of the numerous after-shocks are liable to be passed unnoticed, while during a period of quiescence there is a tendency for all shocks, however slight, to be reported. This leads to an undue emphasis being placed upon earthquake activity during a comparatively quiet period. The great number of earthquakes reported in 1922 is due to the swarm of local shocks which occurred in the Taupo region in the latter half of that year. Also, although there was no major earthquake in 1930, a large number of shocks occurred in that year, due mainly to the continuation of after-shocks of the Buller earthquake of 17th June, 1929.
During the period 1848–1935 the number of deaths recorded in New Zealand as duo directly or indirectly to earthquakes was 284. Of these, 255 were due to the Hawke's Bay earthquake of 3rd February, 1931. A table giving details of the number of deaths due to earthquakes in New Zealand was published in the 1936 issue of the Year-Book.
Earthquakes in New Zealand are recorded by means of seismographs, and also by a system of non-instrumental reports. The main seismograph stations are located at the Dominion Observatory, Wellington, and the Magnetic Observatory, Christchurch. The Dominion Observatory acts as a central station for eleven other subsidiary stations in New Zealand and one at the Chatham Islands. The subsidiary stations are operated by officers of other Government Departments, by Engineers of some of the Electric-power Boards, and by private individuals. The station at Apia, Samoa, is under the direct control of Apia Observatory.
*R. C. HAYES: “Earthquake Frequency in New Zealand,” N.Z. Jour. Sci. & Tech., Vol. 10, No. 5, 1935. Dominion Observatory Bulletin 104.
The system of non-instrumental earthquake reports was inaugurated in 1888, At first it was confined to a selected number of telegraph-offices distributed throughout the Dominion, but in recent years more telegraph-offices have been added, and a number of lighthouse-keepers and several private observers have also taken up the work. There are at present 115 non-instrumental reporting stations. This system of recording earthquakes depends entirely on personal observations. Special forms are used, on which information is required concerning the observed time of an earthquake, the direction and duration of the movement, and any other particulars likely to be of value in estimating its intensity. The Dominion Observatory collects and summarizes all such reports of earthquakes felt in New Zealand.
Information regarding earthquakes obtained from the seismograph records of all the New Zealand stations, and from the reports furnished by non-instrumental stations, is published in a monthly seismological bulletin. This bulletin includes provisional earthquake epicentres in New Zealand and in the south-west Pacific generally. The New Zealand epicentres are determined solely from the records and reports of the New Zealand stations, while the determination of those in other parts of the south-west Pacific requires the use of additional data from Apia and the Australian seismograph stations.
The Dominion Observatory also publishes special bulletins dealing with the results of research work in seismology. All seismological publications are distributed to the chief seismological stations and institutions throughout the world.
Earthquake activity in New Zealand has been decreasing during the past three years. In 1936 there were 123 earthquakes reported felt in some part of the Dominion. Of these, 87 were felt in some part of the North Island and 40 in some part of the South Island. The maximum intensity reported was 6 on the Rossi-Forel scale. This is the lowest maximum reported in any year since 1923.
The following table gives the number of earthquakes reported felt, and the maximum intensities reported, for each month during the year 1936:—
| Month. | Number of Earthquakes reported felt. | Maximum Intensity, R.-F. Scale. | Locality of Maximum. | |||
|---|---|---|---|---|---|---|
| North Island. | South Island. | Both Islands. | Total for New Zealand. | |||
| 1936. | ||||||
| January | 7 | 1 | 8 | 4 | Te Kuiti, Cheviot. | |
| February | 2 | 5 | 7 | 5 | Masterton, Invercargill. | |
| March | 8 | 2 | 10 | 4+ | Opotiki, Takaka, Reefton. | |
| April | 8 | 8 | 5 | Rongotea. | ||
| May | 13 | 3 | 1 | 15 | 6 | Waipiro Bay, Tokomaru Bay, Cheviot. |
| June | 2 | 3 | 5 | 5 | Wanganui, Opotiki, Hanmer Springs. | |
| July | 12 | 11 | 2 | 21 | 6 | Opotiki, Farewell Spit, |
| August | 5 | 3 | 8 | 5 | Hastings, Half-moon Bay. | |
| September | 1 | 2 | 3 | 6 | Ohakune, Kahurangi Point. | |
| October | 12 | 5 | 17 | 6 | Tokaanu, Kahurangi Point. | |
| November | 10 | 2 | 1 | 11 | 5 | Hawera, Karamea. |
| December | 7 | 3 | 10 | 6 | Waipiro Bay, Kahurangi Point. | |
| Totals | 87 | 40 | 4 | 123 | 6 | |
The next table gives the total number of earthquakes reaching various degrees of maximum intensity:—
| Month. | Intensity (Rossi-Forel Scale). | Totals. | |||||||||
|---|---|---|---|---|---|---|---|---|---|---|---|
| 1. | 2. | 3. | 4. | 5. | 6. | 7. | 8. | 9. | 10. | ||
| 1936. | |||||||||||
| January | 5 | 1 | 1 | 1 | 8 | ||||||
| February | 1 | 6 | 7 | ||||||||
| March | 4 | 1 | 5 | 10 | |||||||
| April | 1 | 5 | 1 | 1 | 8 | ||||||
| May | 2 | 4 | 2 | 4 | 3 | 15 | |||||
| June | 1 | 3 | 1 | 5 | |||||||
| July | 8 | 8 | 4 | 1 | 21 | ||||||
| August | 2 | 4 | 1 | 1 | 8 | ||||||
| September | 2 | 1 | 3 | ||||||||
| October | 2 | 11 | 2 | 1 | 1 | 17 | |||||
| November | 3 | 4 | 2 | 2 | 11 | ||||||
| December | 3 | 3 | 2 | 1 | 1 | 10 | |||||
| Totals | 32 | 46 | 26 | 13 | 6 | 123 | |||||
Of the 123 earthquakes reported felt in 1936 only 11 were sufficiently well recorded by seismographs to enable their epicentres to be determined. Particulars of these earthquakes are given in the following table, which also includes three earthquakes not reported felt in any part of New Zealand:—
| Date. | Time (N.Z.M.T) | Approximate Position of Epicentre. | Remarks. | |
|---|---|---|---|---|
| Lat. | Long. | |||
| 1936. | H. M. | ° | ° | |
| Mar. 6 | 19 32 | 42.6 S. | 171.5 E. | Felt at Westport and Reefton, R.-F. 4. |
| May 15 | 07 41 | 40.4 S. | 172.4 E. | Felt in north-west part of South Island, R.-F. 4. |
| May 24 | 02 09 | 42.8 S. | 173.3 E. | Felt in parts of Canterbury and Westland, maximum R.-F. 6. |
| May 24 | 03 02 | 40.0 S. | 180.0 | Felt in central districts, and in eastern districts from Waipiro Bay to Christ-church, maximum R.-F. 6. Deep focus. |
| July 9 | 21 51 | 40.7 S. | 179.4 W. | Felt over most of North Island and in northern half of South Island, maximum R.-F. 6. Deep focus. |
| Sept. 4 | 22 20 | 40.3 S. | 173.5 E. | Felt in north-west part of South Island, R.-F. 5. |
| Sept. 14 | 15 12 | 38.3 S. | 177.2 E. | Deep focus. Not reported felt. |
| Oct. 11 | 05 10 | 42.5 S. | 175.5 E. | Not reported felt. |
| Oct. 11 | 12 30 | 42.5 S. | 177.5 E. | Not reported felt. |
| Oct. 18 | 21 11 | 40.7 S. | 172.0 E. | Felt in north-west part of South Island, R.-F. 3. |
| Oct. 28 | 03 46 | 39.8 S. | 175.8 E. | Felt fairly extensively in southern half of North Island, maximum R.-F. 4. |
| Nov. 9 | 23 59 | 39.5 S. | 180.0 | Felt in eastern districts of North Island, R.-F. 4. |
| Nov. 23 | 05 09 | 41.4 S. | 172.8 E. | Felt in northern part of South Island and about Cook Strait, maximum R.-F. 5. |
| Dec. 12 | 07 38 | 40.7 S. | 172.4 E. | Felt at Kahurangi Point and Westport, maximum R.-F. 6. |
The following article on the climate of New Zealand has been prepared by Dr. E. Kidson, O.B.E., D.Sc., F.R.S.N.Z., Director of Meteorological Services:—
The New Zealand Meteorological Office is located at Wellington. Weather forecasts, based on observations at 9 a.m. and 3 p.m., are issued at noon and 5 p.m. respectively. The midday forecast is telegraphed to approximately one hundred country centres, where it is displayed at the post-offices. District forecasts are broadcast at 1 p.m. from the stations of the National Broadcasting Service at Auckland, Wellington, Christchurch, and Dunedin. The evening forecast is broadcast from these stations at 7 p.m. and 9 p.m. approximately. The 7 p.m. broadcast from Wellington includes weather reports from a series of observation stations distributed through the Dominion and the surrounding area. Regular reports are also broadcast for the information of aircraft.
Rainfall data from approximately four hundred stations are printed monthly in the New Zealand Gazette. Observations of temperature, pressure, sunshine, wind, &c., from about forty-five stations are published annually by the Meteorological Office. Papers on various aspects of the climate and weather of the Dominion are published from time to time as “Meteorological Office Notes.”
New Zealand lies wholly within the Temperate Zone, and it is also wholly and at all seasons within the zone of prevailing westerly winds though they are stronger and more persistent farther southward. Owing to its isolation and its narrowness in the direction of the prevailing winds, its climate is predominantly marine in character. Nevertheless, the modifications due to the height and continuity of the main ranges and the general high relief of the country are quite considerable, especially in the South Island. There is, for example, a very great variation in the rainfall from the western to the eastern side of the Southern Alps, and for so narrow a country, features of a continental type are rather strongly developed in the ulterior of the South Island. By breaking up the prevailing winds and causing the air at different levels to mix, mountains tend, also, to prevent the stratification of the air into layers of different density. Consequently very extensive and persistent cloud-sheets are seldom experienced. New Zealand therefore enjoys a high percentage of sunshine, a factor of great importance in the climate of a country with so high a rainfall.
The principal current in the surrounding ocean waters is from south-west to north-east. Off the west coast of the South Island, however, the current divides, one branch turning southwards to Foveaux Strait, while others pass through Cook Strait and round the northern extremity of the Dominion. The rather small range in climate from north to south is probably accounted for by this current.
According to the widely accepted classification of climates developed by W. Köppen, New Zealand has the climatic formula Cfb, denoting a cool-temperate moist climate without marked seasonal variations in temperature or precipitation. Under the same formula are classified southern Victoria and Tasmania and parts of southern Chile in the Southern Hemisphere, much of Europe, Japan and Korea, and a strip of the west coast of North America in the Northern Hemisphere. Generally, however, it is a climate characteristic of the ocean rather than the land areas of the Temperate Zone.
Tables 1 to 10 appearing in the following pages relate to varying, but usually lengthy, periods. In Table 11 the duration covered by the respective averages for that table is given.
Of all the climatic elements, probably the one that exerts the greatest influence on our lives is rainfall. It causes us much personal discomfort, but the production of the food by which we live depends directly on the availability of moisture from this source. Maps showing the distribution of mean annual rainfall appear in issues of the Year-Book prior to 1934.
The controlling influence of topography on rainfall in New Zealand is very conspicuous. Areas exposed to the westerly winds have heavier rains than those protected from them by mountain ranges. Next, the greater the altitude, the greater in general is the precipitation. There must be a limit beyond which precipitation begins to decrease again with altitude, but this has not yet been determined in this country. The indications are that precipitation is heaviest between 3,000 ft. and 4,000 ft. The annual total varies from about 13 in. at Galloway in Central Otago to over 200 in. in parts of the Southern Alps and on Mount Egmont.
The distribution of the precipitation throughout the year is little less important than its total amount, the effect of rainfall in winter, for example, being very different from that in summer. There are three principal factors controlling the annual variation of rainfall in New Zealand. The first of these is the proximity to the high-pressure belt in the subtropics. In this belt the rainfall year is divided into a dry summer and a wet winter season. We will call this distribution type A. As the distance from the high-pressure belt increases, the contrast between summer and winter decreases, so that by the time southern New Zealand Is reached the variation due to this factor is small. The next most important factor is the influence of the prevailing westerly winds. These bring rains to the areas exposed to them, while areas which are protected from them by mountain ranges have little rain when the westerlies are blowing. Now, the westerly winds are strongest in spring, the maximum flow being in October. There is a temporary drop in February, followed by a partial recovery in the autumn, but the flow is least in winter. The regime of the westerly winds, therefore, tends to produce a second type of annual variation, type C, in which the rainfall is heaviest in spring, decreases somewhat in the late summer, increases again in the autumn, and decreases to a minimum in winter.
The third factor is the convection which takes place during periods of light winds, clear skies, and intense sunshine, especially when the preceding winds have brought cold air over the land from the South. After conditions of the type mentioned have endured for several days, the convection is likely to be so intense as to produce local showers. These are often heavy, sometimes accompanied by thunder, and occasionally of the nature of local cloud-bursts. Rainfall of this type is most common in the interior of continents. Being caused by solar radiation, it is most frequent when solar radiation is strongest—namely, in summer. According to type B. therefore, we would have a relatively wet summer and a dry winter.
Table Table 1. MONTHLY RAINFALL, IN INCHES.
| — | Jan. | Feb. | Mar. | April. | May. | June. | July. | Aug. | Sept. | Oct. | Nov. | Dec. | Year. |
|---|---|---|---|---|---|---|---|---|---|---|---|---|---|
| Cape Maria van Diemen | 1.71 | 2.88 | 2.03 | 3.86 | 4.83 | 4.62 | 3.90 | 3.73 | 2.84 | 2.56 | 1.61 | 1.05 | 36.31 |
| Auckland | 2.74 | 3.04 | 3.01 | 3.54 | 4.66 | 4.95 | 5.07 | 4.23 | 3.71 | 3.72 | 3.31 | 2.91 | 44.89 |
| Rotorua | 4.21 | 3.70 | 3.51 | 4.52 | 5.72 | 5.23 | 5.05 | 4.97 | 5.13 | 5.24 | 4.14 | 3.76 | 55.18 |
| Tolaga Bay | 3.21 | 4.42 | 4.73 | 5.49 | 7.71 | 6.38 | 6.70 | 6.06 | 3.60 | 3.26 | 2.96 | 3.03 | 57.55 |
| Riversdale, Inglewood | 7.56 | 6.07 | 7.12 | 8.09 | 9.74 | 10.29 | 10.21 | 8.80 | 9.69 | 10.39 | 9.22 | 7.57 | 104.75 |
| Napier | 3.02 | 2.76 | 3.16 | 2.78 | 3.71 | 3.51 | 3.82 | 3.50 | 2.22 | 2.23 | 2.43 | 2.31 | 35.45 |
| Waitatapia, Bulls | 2.43 | 2.50 | 2.46 | 3.00 | 3.53 | 3.18 | 3.25 | 2.68 | 2.78 | 3.63 | 3.22 | 2.71 | 35.37 |
| Ditton, near Masterton | 3.14 | 2.96 | 3.58 | 3.67 | 5.45 | 4.98 | 5.59 | 4.78 | 3.71 | 4.36 | 3.56 | 3.01 | 48.79 |
| Wellington | 2.81 | 2.67 | 3.11 | 3.53 | 3.98 | 4.19 | 4.71 | 3.82 | 3.11 | 3.41 | 2.90 | 2.84 | 41.08 |
| Nelson | 2.80 | 2.59 | 2.96 | 2.99 | 3.06 | 3.54 | 3.52 | 3.03 | 3.69 | 3.49 | 2.99 | 2.98 | 37.64 |
| Marshlands, Blenheim | 2.19 | 2.20 | 2.25 | 2.27 | 2.94 | 3.19 | 3.58 | 2.66 | 2.71 | 2.50 | 2.35 | 1.99 | 30.83 |
| Hanmer | 3.93 | 3.19 | 3.28 | 3.30 | 4.39 | 3.56 | 4.44 | 3.41 | 4.65 | 3.87 | 3.61 | 3.94 | 45.57 |
| Hokitika | 9.89 | 7.14 | 9.74 | 9.29 | 9.71 | 9.30 | 8.87 | 9.27 | 9.21 | 11.83 | 10.73 | 10.44 | 115.42 |
| Christchurch | 2.20 | 1.71 | 1.98 | 1.85 | 2.53 | 2.68 | 2.69 | 1.85 | 1.74 | 1.69 | 1.92 | 2.15 | 24.99 |
| Peel Forest | 4.84 | 4.05 | 4.38 | 3.54 | 2.51 | 2.75 | 3.42 | 2.57 | 3.77 | 3.85 | 4.01 | 4.85 | 44.54 |
| Oamaru | 2.04 | 1.74 | 1.80 | 1.76 | 1.59 | 2.01 | 1.74 | 1.75 | 1.66 | 1.73 | 1.91 | 2.24 | 21.97 |
| Clyde | 1.82 | 1.06 | 1.50 | 1.42 | 1.00 | 0.93 | 0.92 | 0.80 | 1.05 | 1.62 | 1.35 | 1.79 | 15.26 |
| Dunedin | 3.42 | 2.71 | 2.94 | 2.74 | 3.11 | 3.16 | 3.01 | 3.09 | 2.75 | 3.12 | 3.25 | 3.54 | 30.84 |
| Invercargill | 3.96 | 3.11 | 3.89 | 4.14 | 4.34 | 3.63 | 3.28 | 3.25 | 3.27 | 4.50 | 4.41 | 4.07 | 45.85 |
A rainfall regime of type A in a fairly pure form is experienced in the part of the Auckland Province, north, roughly, of Kawhia and Tauranga, and on the eastern side of the main ranges from Cook Strait to East Cape. It is still dominant in the lower country about the Tasman and Golden Bays, and in Marlborough and North Canterbury. Type C is developed strongly in Westland and the south-west Fiord country. It is shown fairly well by Hokitika, but much more distinctly if the date for a number of West Coast stations be combined. It is dominant in the far South, in the mountains of Nelson, and in the portion of the North Island not yet referred to. In this latter area, however, types A and C combine in varying proportions. Most districts show the effect of the westerly winds in a relatively high rainfall in October, but this is least noticeable in the low country east of the main ranges. The areas where type C dominates are those with the heaviest rainfall. Type B is dominant in the interior and southern portions of Canterbury and the central and eastern portions of Otago, and is especially characteristic of the dry areas of the provinces mentioned. The summer rains of this type are of great importance to the farming communities in the interior of Canterbury and Otago. The regime of annual rainfall experienced had an important influence in determining the nature of the primitive vegetation in the various districts.
Table Table 2. DAYS WITH RAIN.
| — | Jan. | Feb. | Mar. | April. | May. | June. | July. | Aug. | Sept. | Oct. | Nov. | Dec. | Year. |
|---|---|---|---|---|---|---|---|---|---|---|---|---|---|
| Auckland | 10.3 | 9.8 | 11.1 | 14.1 | 18.7 | 19.5 | 20.9 | 19.4 | 17.6 | 16.6 | 15.9 | 11.8 | 185.7 |
| New Plymouth | 12.7 | 10.4 | 11.9 | 13.3 | 17.7 | 17.6 | 18.8 | 18.4 | 17.6 | 18.4 | 16.3 | 14.2 | 187.3 |
| Napier | 7.8 | 7.5 | 7.7 | 8.0 | 10.4 | 11.1 | 12.0 | 11.9 | 9.8 | 8.8 | 8.5 | 7.7 | 111.2 |
| Wellington | 10.7 | 8.9 | 11.2 | 12.8 | 16.4 | 17.0 | 18.1 | 17.1 | 15.1 | 14.1 | 12.8 | 12.0 | 166.2 |
| Marshlands, Blenheim | 7.1 | 5.8 | 6.8 | 7.5 | 8.5 | 8.4 | 9.9 | 9.0 | 8.5 | 9.5 | 8.2 | 7.8 | 97.0 |
| Hokitika | 13.3 | 11.4 | 14.3 | 15.2 | 15.4 | 15.3 | 15.9 | 15.6 | 16.9 | 19.2 | 17.8 | 16.3 | 186.6 |
| Christchurch | 9.7 | 7.7 | 9.2 | 9.6 | 11.7 | 12.6 | 13.2 | 11.3 | 10.0 | 9.7 | 10.3 | 9.8 | 124.8 |
| Clyde | 7.7 | 5.1 | 6.1 | 6.0 | 5.7 | 5.6 | 5.1 | 5.8 | 6.1 | 7.9 | 7.0 | 7.9 | 76.0 |
| Dunedin | 14.3 | 11.2 | 12.7 | 12.8 | 13.5 | 13.0 | 13.1 | 13.0 | 13.7 | 14.3 | 14.5 | 14.7 | 160.8 |
| Half-moon Bay | 18.5 | 16.2 | 17.8 | 18.0 | 20.4 | 19.9 | 19.7 | 19.0 | 18.6 | 20.2 | 20.8 | 18.2 | 227.3 |
Next to the amount and the annual variation of precipitation, the frequency with which it falls is its most important characteristic. In Table 2 the average number of days with rain in each month is given for some representative stations. A day with rain is one on which 0.005 in. or more is measured. Generally speaking, there is a fairly close relationship in New Zealand between the amount of rain and the number of rain days, but the latter is not directly proportional to the rainfall. There are considerable areas on the west coast of the South Island, for instance, which have ten or more times as much rain as the driest portions of the interior, but only about double the number of rain days. Marlborough seems to have a small number of wet days compared with its rainfall. To the south of New Zealand there is a rapid increase in cloudiness, showers fall with great frequency, and the number of rain days becomes high. New Zealand is extremely fortunate in that, even where the rainfall is very heavy, intervals between rains are almost everywhere sufficiently frequent and prolonged to ensure adequate drainage, while there is enough sunshine to dry the soil surface. Otherwise, large areas in the west and south would be covered with peat.
Temperature is no less important than rainfall in determining the living conditions of a country and the yield from its soil. But it is much less variable, and in the Southern Hemisphere especially, is largely determined by latitude. Its influence is therefore taken much more for granted. The specification of the temperature of a place is, however, not so simple a matter as might appear. Many different factors are involved in the determination of the precise temperatures experienced in any locality. The sea, for instance, responds very slowly to both daily and yearly changes in the amount of heat received from the sun, while on the land the response is rapid. Consequently, the nearer a station is to the sea the smaller are its daily and yearly fluctuations of temperature. It is to this effect that the principal difference between a continental and a marine climate is due. Although New Zealand is narrow, the high ranges shield the country to the east of them to a considerable extent, so that there is a nearer approach to continental conditions than would otherwise be expected, particularly in the interior of Canterbury and Otago. Again, on plain country the air tends to stagnate, especially at night. At night-time the surface layer cools rapidly through radiation from the ground, while during the day it becomes heated by the sun. There is less stagnation in the warm layer of the daytime than in the cold layer of the night. Consequently, stations on level plains or plateaux tend to be subject to frost and to have a relatively low mean temperature. The effect is accentuated near the slopes of hills because the cold air flows away down the slopes to lower levels. The hills, therefore, gain freedom from frost at the expense of the plains. In windy situations, also, the susceptibility to frost is lowered owing to the prevention of stagnation. Apart from the effects due to air-drainage and windiness, the temperature decreases with altitude. In temperate latitudes the fall is about 9° F. per kilometre. It is unsound, therefore, to compare, for example, temperatures recorded at Thorndon, Wellington, which was only 12 ft. above sea-level, with those at the present meteorological station at Kelburn, which is at an altitude of 415 ft., without making allowance for this difference in altitude. Such a procedure would lead to the erroneous conclusion that the climate had become colder. If charts of mean temperature are to be prepared it is clear that they will be very complicated, especially in a mountainous country like New Zealand, owing to this effect of altitude. It is usual, therefore, to simplify matters by applying a correction at the rate of 9° F. per kilometre or approximately 2.7° F. per 1,000 ft. This has been done in Table 3. The Rotorua values, for example, have been increased by 2.5° F., the station being 925 ft. above sea-level. If the actual temperature is required, it can be found by reversing this process.
In New Zealand publications it has been the general practice to derive monthly mean temperatures from the means of the daily maximum and minimum. But, even on the average, the mean of the maximum and minimum differs slightly from the true mean for the day. The correction to the mean for the day has been determined from the records of thermographs with fair accuracy at Wellington and more roughly at several other places.
In Table 3, therefore, the temperatures are reduced to sea-level and mean of day. For the remainder of the temperature tables the observed readings have been used without correction. All are in Fahrenheit degrees.
Table Table 3. MEAN TEMPERATURE REDUCED TO SEA-LEVEL.
| — | Jan. | Feb. | Mar. | April. | May. | June. | July. | Aug. | Sept. | Oct. | Nov. | Dec. | Year. |
|---|---|---|---|---|---|---|---|---|---|---|---|---|---|
| Waipoua | 61.7 | 62.2 | 60.7 | 57.4 | 54.1 | 51.5 | 49.2 | 49.7 | 51.4 | 53.2 | 55.8 | 58.6 | 55.4 |
| Auckland | 64.9 | 65.2 | 63.3 | 59.6 | 56.1 | 53.4 | 51.5 | 51.9 | 53.8 | 55.9 | 58.8 | 62.3 | 58.0 |
| Rotorua | 64.7 | 64.4 | 61.4 | 56.7 | 52.4 | 49.3 | 47.8 | 48.9 | 51.9 | 55.3 | 58.6 | 62.0 | 56.1 |
| New Plymouth | 62.9 | 62.9 | 61.2 | 57.8 | 54.4 | 51.4 | 49.7 | 50.1 | 52.2 | 54.2 | 56.8 | 60.4 | 56.2 |
| Napier | 64.1 | 63.3 | 60.9 | 57.7 | 52.6 | 48.8 | 47.4 | 48.4 | 51.5 | 55.6 | 58.6 | 61.3 | 55.9 |
| Taihape | 63.7 | 63.2 | 60.9 | 57.0 | 51.9 | 48.7 | 47.4 | 48.2 | 51.0 | 54.5 | 56.6 | 60.3 | 55.3 |
| Masterton | 63.1 | 62.2 | 59.6 | 55.1 | 50.4 | 47.0 | 46.0 | 47.0 | 50.4 | 53.8 | 56.5 | 60.5 | 54.3 |
| Wellington | 61.7 | 61.6 | 59.7 | 56.2 | 52.5 | 49.4 | 47.7 | 48.4 | 51.2 | 53.6 | 56.1 | 59.5 | 54.8 |
| Nelson | 61.8 | 61.4 | 58.9 | 55.1 | 50.1 | 46.3 | 45.3 | 46.3 | 49.7 | 52.9 | 56.0 | 59.0 | 53.6 |
| Hanmer | 62.5 | 62.3 | 59.6 | 54.7 | 48.3 | 44.2 | 43.1 | 45.1 | 50.1 | 54.1 | 56.5 | 60.1 | 53.4 |
| Hokitika | 58.8 | 58.8 | 57.0 | 53.4 | 48.9 | 45.7 | 44.5 | 45.6 | 48.9 | 51.5 | 53.4 | 56.7 | 51.9 |
| Christchurch | 60.4 | 59.9 | 57.0 | 52.7 | 47.7 | 43.1 | 42.3 | 43.9 | 48.4 | 52.4 | 55.7 | 59.0 | 51.9 |
| Ophir | 62.0 | 61.5 | 57.3 | 51.4 | 42.4 | 36.6 | 37.5 | 41.4 | 46.8 | 52.1 | 54.7 | 59.4 | 50.3 |
| Dunedin | 58.1 | 57.8 | 55.9 | 52.4 | 48.1 | 45.1 | 43.8 | 45.6 | 48.9 | 51.4 | 53.3 | 55.8 | 51.4 |
| Invercargill | 56.6 | 56.4 | 54.0 | 50.3 | 45.7 | 42.3 | 41.3 | 43.5 | 47.0 | 50.4 | 51.8 | 54.4 | 49.5 |
The stations given in the above table were chosen with a view to illustrating the effect of changing latitude, the difference between east and west coasts, especially in the South Island, and the contrast between coastal and inland conditions. Waipoua is in the Auckland Peninsula, north of Dargaville, and Ophir in Central Otago.
Table Table 4. AUCKLAND (ALBERT PARK, 160 FT.).
| — | Jan. | Feb. | Mar. | April. | May. | June. | July. | Aug. | Sept. | Oct. | Nov. | Dec. | Year. |
|---|---|---|---|---|---|---|---|---|---|---|---|---|---|
| Mean daily maximum | 72.6 | 72.9 | 70.9 | 66.9 | 62.1 | 58.6 | 57.0 | 57.8 | 60.1 | 63.2 | 66.0 | 69.3 | 64.8 |
| Mean highest maximum | 78.6 | 78.6 | 76.4 | 72.2 | 67.3 | 64.0 | 62.5 | 62.8 | 65.4 | 68.6 | 72.0 | 75.7 | 79.7 |
| Absolute highest max. | 81.5 | 85.0 | 79.0 | 77.4 | 71.0 | 67.0 | 65.0 | 67.0 | 70.0 | 72.0 | 76.0 | 79.5 | 85.0 |
| Mean daily minimum | 59.7 | 60.4 | 58.5 | 55.3 | 51.3 | 48.1 | 46.2 | 46.2 | 48.9 | 51.7 | 54.1 | 56.8 | 53.1 |
| Mean lowest minimum | 51.8 | 53.0 | 51.5 | 46.4 | 42.7 | 39.5 | 38.1 | 39.1 | 41.7 | 44.3 | 47.1 | 49.4 | 37.3 |
| Absolute lowest min. | 48.0 | 48.0 | 46.0 | 41.0 | 38.0 | 36.5 | 35.0 | 35.5 | 37.8 | 41.0 | 41.0 | 43.5 | 35.0 |
| Days of frost in screen | 0.0 | ||||||||||||
| Days of ground frost | 0.1 | 0.7 | 0.1 | 1.0 |
Table Table 5. TAIHAPE (2,157 FT.).
| — | Jan. | Feb. | Mar. | April. | May. | June. | July. | Aug. | Sept. | Oct. | Nov. | Dec. | Year. |
|---|---|---|---|---|---|---|---|---|---|---|---|---|---|
| Mean daily maximum | 68.0 | 67.3 | 64.6 | 59.9 | 52.8 | 48.5 | 47.4 | 48.8 | 52.8 | 57.4 | 59.6 | 64.3 | 57.6 |
| Mean highest maximum | 78.0 | 77.3 | 74.4 | 69.0 | 62.2 | 58.2 | 57.1 | 57.4 | 62.0 | 66.6 | 69.9 | 74.9 | 79.5 |
| Absolute highest max. | 87.3 | 81.0 | 78.0 | 75.5 | 69.8 | 65.0 | 61.0 | 61.8 | 67.0 | 73.4 | 75.8 | 82.0 | 87.3 |
| Mean daily minimum | 50.0 | 49.8 | 48.2 | 44.9 | 40.7 | 37.6 | 36.4 | 36.6 | 39.1 | 42.1 | 44.0 | 47.0 | 43.0 |
| Mean lowest minimum | 39.5 | 39.5 | 38.2 | 34.6 | 31.9 | 29.2 | 28.0 | 28.7 | 30.0 | 32.0 | 34.4 | 37.0 | 26.4 |
| Absolute lowest min. | 31.9 | 32.0 | 34.8 | 30.0 | 27.0 | 20.4 | 24.0 | 25.4 | 25.5 | 25.0 | 31.4 | 30.2 | 20.4 |
| Days of frost in screen | 0.2 | 1.4 | 3.6 | 6.0 | 4.2 | 2.5 | 0.5 | 0.2 | 18.6 | ||||
| Days of ground frost | 0.2 | 0.5 | 0.6 | 2.4 | 5.3 | 8.5 | 12.0 | 11.2 | 6.0 | 2.6 | 1.0 | 0.6 | 51.1 |
Table Table 6. WELLINGTON (ALTITUDES VARIOUS).
| — | Jan. | Feb. | Mar. | April. | May. | June. | July. | Aug. | Sept. | Oct. | Nov. | Dec. | Year. |
|---|---|---|---|---|---|---|---|---|---|---|---|---|---|
| Mean daily maximum | 69.3 | 69.3 | 66.9 | 62.9 | 58.3 | 54.8 | 53.1 | 54.3 | 57.5 | 60.4 | 63.2 | 66.7 | 61.3 |
| Mean highest maximum | 78.1 | 77.7 | 74.9 | 70.2 | 65.3 | 61.3 | 59.6 | 61.5 | 64.5 | 68.0 | 71.0 | 75.0 | 79.8 |
| Absolute highest max. | 85.0 | 88.0 | 80.5 | 74.0 | 71.0 | 69.0 | 66.0 | 66.0 | 69.0 | 75.5 | 80.5 | 83.6 | 88.0 |
| Mean daily minimum | 55.7 | 55.8 | 54.2 | 51.3 | 47.2 | 44.1 | 42.4 | 42.8 | 45.7 | 48.4 | 50.3 | 53.8 | 49.1 |
| Mean lowest minimum | 46.4 | 46.7 | 44.1 | 41.2 | 37.4 | 34.5 | 33.3 | 33.4 | 36.2 | 38.4 | 40.9 | 44.7 | 32.3 |
| Absolute lowest min. | 39.4 | 40.5 | 39.1 | 35.7 | 31.9 | 29.9 | 28.6 | 29.2 | 31.0 | 34.0 | 35.8 | 38.4 | 28.6 |
| Days of frost in screen | 0.0 | 0.2 | 0.4 | 0.4 | 0.0 | 1.4 | |||||||
| Days of ground frost | 0.0 | 0.1 | 0.2 | 1.0 | 2.6 | 5.4 | 7.8 | 6.7 | 3.1 | 1.3 | 0.5 | 0.1 | 28.6 |
Table Table 7. HOKITIKA (12 FT.).
| — | Jan. | Feb. | Mar. | April. | May. | June. | July. | Aug. | Sept. | Oct. | Nov. | Dec. | Year. |
|---|---|---|---|---|---|---|---|---|---|---|---|---|---|
| Mean daily maximum | 66.4 | 66.5 | 64.7 | 61.2 | 56.8 | 53.3 | 52.6 | 53.6 | 56.4 | 58.7 | 60.6 | 63.8 | 59.5 |
| Mean highest maximum | 73.5 | 72.5 | 71.3 | 67.7 | 63.7 | 59.5 | 58.6 | 59.5 | 62.3 | 64.7 | 67.0 | 70.9 | 75.9 |
| Absolute highest max. | 79.0 | 82.4 | 84.5 | 74.0 | 71.5 | 63.5 | 65.0 | 67.1 | 67.6 | 70.5 | 74.1 | 79.0 | 84.5 |
| Mean daily minimum | 53.2 | 53.1 | 51.0 | 47.1 | 41.9 | 38.5 | 36.8 | 38.0 | 42.3 | 45.7 | 47.9 | 51.5 | 45.6 |
| Mean lowest minimum | 43.2 | 43.5 | 40.6 | 36.5 | 32.1 | 29.9 | 29.0 | 29.8 | 32.2 | 35.2 | 38.4 | 41.9 | 28.1 |
| Absolute lowest min. | 35.0 | 37.0 | 35.0 | 31.0 | 28.5 | 26.0 | 25.5 | 26.0 | 27.0 | 30.0 | 32.0 | 33.0 | 25.5 |
| Days of frost in screen | 0.0 | 0.9 | 4.0 | 6.9 | 4.6 | 0.7 | 0.1 | 17.2 | |||||
| Days of ground frost | 0.2 | 0.1 | 0.5 | 2.4 | 6.9 | 12.4 | 16.1 | 13.8 | 5.9 | 2.4 | 0.7 | 0.2 | 61.9 |
Table Table 8. CHRISTCHURCH (22 FT.).
| — | Jan. | Feb. | Mar. | April. | May. | June. | July. | Aug. | Sept. | Oct. | Nov. | Dec. | Year. |
|---|---|---|---|---|---|---|---|---|---|---|---|---|---|
| Mean dally maximum | 70.4 | 69.2 | 66.4 | 62.1 | 55.8 | 51.1 | 50.3 | 52.3 | 57.6 | 62.4 | 65.8 | 69.2 | 61.0 |
| Mean highest maximum | 86.6 | 83.7 | 81.4 | 75.7 | 68.7 | 62.5 | 61.5 | 64.9 | 70.6 | 76.1 | 79.8 | 84.0 | 88.4 |
| Absolute highest max. | 95.7 | 94.1 | 89.8 | 82.3 | 77.8 | 69.3 | 70.0 | 70.0 | 81.1 | 87.8 | 86.8 | 92.3 | 95.7 |
| Mean daily minimum | 52.8 | 52.5 | 49.7 | 45.0 | 39.9 | 36.0 | 35.1 | 36.3 | 40.5 | 44.0 | 47.1 | 50.8 | 44.3 |
| Mean lowest minimum | 41.2 | 40.9 | 37.2 | 32.3 | 28.6 | 26.1 | 26.0 | 26.7 | 29.4 | 32.1 | 35.4 | 39.0 | 24.7 |
| Absolute lowest min. | 34.0 | 34.2 | 30.4 | 25.6 | 21.3 | 21.5 | 22.7 | 23.0 | 25.5 | 26.0 | 30.8 | 33.0 | 21.3 |
| Days of frost in screen | 0.0 | 0.7 | 4.0 | 9.2 | 10.1 | 8.2 | 2.6 | 0.5 | 0.0 | 35.4 | |||
| Days of ground frost | 0.3 | 0.2 | 1.4 | 5.4 | 12.3 | 16.9 | 17.7 | 17.3 | 10.4 | 6.5 | 3.6 | 0.9 | 92.9 |
Table Table 9. DUNEDIN (240 FT.).
| — | Jan. | Feb. | Mar. | April. | May. | June. | July. | Aug. | Sept. | Oct. | Nov. | Dec. | Year. |
|---|---|---|---|---|---|---|---|---|---|---|---|---|---|
| Mean daily maximum | 66.5 | 65.9 | 63.1 | 58.9 | 53.3 | 49.3 | 47.9 | 50.3 | 55.1 | 59.1 | 61.0 | 64.5 | 58.0 |
| Mean highest maximum | 81.5 | 80.5 | 77.3 | 71.8 | 64.4 | 59.3 | 57.4 | 61.5 | 66.8 | 73.0 | 75.3 | 78.0 | 84.3 |
| Absolute highest max. | 94.0 | 90.0 | 85.0 | 85.0 | 72.0 | 68.0 | 66.0 | 70.0 | 77.0 | 83.0 | 86.0 | 88.0 | 94.0 |
| Mean daily minimum | 49.7 | 49.5 | 47.8 | 44.8 | 41.0 | 38.6 | 37.4 | 38.2 | 40.6 | 42.9 | 44.9 | 48.0 | 43.6 |
| Mean lowest minimum | 41.3 | 41.5 | 39.1 | 36.7 | 33.8 | 31.2 | 30.5 | 31.2 | 33.0 | 34.8 | 37.0 | 40.0 | 29.4 |
| Absolute lowest min. | 36.0 | 37.0 | 34.0 | 31.0 | 29.0 | 24.0 | 23.0 | 27.0 | 29.0 | 31.0 | 32.0 | 35.0 | 23.0 |
| Days of frost in screen | 0.1 | 1.4 | 1.7 | 1.1 | 0.2 | 4.5 | |||||||
| Days of ground frost | 0.1 | 0.0 | 0.7 | 5.9 | 11.0 | 12.4 | 0.5 | 4.7 | 1.0 | 0.3 | 0.1 | 45.7 |
Table Table 10. GORE (245 FT.).
| — | Jan. | Feb. | Mar. | April. | May. | June. | July. | Aug. | Sept. | Oct. | Nov. | Dec. | Year. |
|---|---|---|---|---|---|---|---|---|---|---|---|---|---|
| Mean daily maximum | 69.0 | 68.9 | 66.1 | 60.1 | 53.7 | 47.7 | 47.1 | 51.7 | 56.8 | 60.9 | 63.1 | 66.4 | 59.3 |
| Mean highest maximum | 84.9 | 84.3 | 80.2 | 73.8 | 64.9 | 58.4 | 57.1 | 62.0 | 68.6 | 73.0 | 77.6 | 80.9 | 87.9 |
| Absolute highest max. | 93.0 | 91.5 | 89.0 | 82.0 | 70.0 | 67.0 | 62.0 | 69.0 | 76.0 | 79.0 | 86.0 | 95.0 | 95.0 |
| Mean daily minimum | 46.7 | 46.0 | 44.0 | 40.4 | 35.7 | 32.4 | 31.6 | 33.2 | 37.5 | 40.8 | 42.2 | 44.9 | 39.6 |
| Mean lowest minimum | 35.1 | 34.9 | 32.9 | 29.2 | 25.9 | 23.5 | 22.9 | 24.6 | 28.2 | 30.8 | 32.6 | 35.0 | 21.4 |
| Absolute lowest min. | 30.0 | 30.0 | 29.0 | 25.0 | 21.0 | 18.0 | 20.0 | 18.0 | 25.0 | 27.0 | 30.0 | 31.0 | 18.0 |
| Days of frost in screen | 0.1 | 0.3 | 0.5 | 1.9 | 6.7 | 13.1 | 15.4 | 11.1 | 3.7 | 1.5 | 0.3 | 0.1 | 54.7 |
| Days of ground frost | 0.8 | 1.4 | 3.2 | 6.0 | 13.0 | 22.0 | 21.4 | 19.9 | 11.1 | 6.1 | 3.2 | 1.1 | 109.2 |
The above tables (Nos. 4 to 10) relate to temperature extremes. The first line gives the average of the maximum temperatures as observed each day, the second the average of the highest temperatures observed in each month and the year, and the third the highest yet recorded. Corresponding information regarding minimum temperatures follows. Next comes the average number of days on which the minimum temperature in the thermometer screen falls below 32° F. This gives some idea of the susceptibility to severe frosts, such as would affect fruit-trees. The last line gives the number of ground frosts. According to the British Convention, a ground frost is recorded when the grass minimum thermometer falls below 30.4° F., damage being unlikely at higher temperatures. In the preparation of these tables some of the older records have, for various reasons, been discarded.
In Table 11 are listed for each month and the year the average number of hours of sunshine at all places from which a sufficiently long record is available. The greatest amounts are recorded at places protected from the prevailing winds by high mountain ranges. The excellence of New Zealand's climate, particularly for the growth of pasture, is undoubtedly due to the abundance of sunshine combined with a high rainfall and an absence of extreme temperatures.
Table Table 11. BRIGHT SUNSHINE (HOURS).
| Station. | Number of Years. | Jan. | Feb. | Mar. | April. | May. | June. | July. | Aug. | Sept. | Oct. | Nov. | Dec. | Year. |
|---|---|---|---|---|---|---|---|---|---|---|---|---|---|---|
*Jordan sunshine-recorder used until February, 1933. | ||||||||||||||
| Waipoua State Forest | 9 | 196.8 | 155.0 | 150.1 | 132.0 | 101.5 | 82.1 | 96.5 | 127.9 | 116. 1 | 133.2 | 139.4 | 156.8 | 1,587.4 |
| Auckland | 27 | 225.3 | 191.1 | 181.9 | 148.8 | 133.4 | 117.3 | 120.4 | 151.2 | 152.5 | 172.3 | 192.3 | 204.0 | 1,990.5 |
| Waihi | 26–27 | 246.6 | 198.1 | 188.5 | 149.5 | 140.2 | 115.7 | 123.1 | 150.2 | 162.8 | 180.2 | 206.4 | 238.4 | 2,099.7 |
| Cambridge | 8 | 237.8 | 196.3 | 200.4 | 148.4 | 141.5 | 117.8 | 109.2 | 154.1 | 166.8 | 182.9 | 197.7 | 210.8 | 2,063.7 |
| Rotorua | 24–27 | 239.4 | 193.0 | 184.5 | 147.7 | 137.2 | 119.1 | 123.2 | 144.2 | 151.8 | 176.7 | 202.7 | 218.2 | 2,037.7 |
| New Plymouth | 19–21 | 255.5 | 222.7 | 221.6 | 166.4 | 159.4 | 132.7 | 141.5 | 169.0 | 169.5 | 174.5 | 212.1 | 241.0 | 2,265.9 |
| Napier | 27–29 | 260.0 | 206.7 | 209.2 | 188.1 | 156.1 | 148.6 | 143.1 | 180.5 | 205.2 | 226.7 | 239.1 | 260.8 | 2,424.1 |
| Palmerston N. | 9 | 202.2 | 182.9 | 173.1 | 139.5 | 132.8 | 108.1 | 105.9 | 134.7 | 133.3 | 149.1 | 178.4 | 209.3 | 1,849.3 |
| Masterton | 21–22 | 232.1 | 201.4 | 182.8 | 160.7 | 126.8 | 106.8 | 109.7 | 146.3 | 106.5 | 190.4 | 217.1 | 228.9 | 2,069.5 |
| Wellington | 30 | 229.9 | 208.5 | 190.2 | 155.3 | 130.3 | 106.5 | 107.8 | 141.7 | 164.9 | 178.8 | 206.5 | 228.8 | 2,049.2 |
| Nelson | 15 | 203.1 | 228.0 | 225.5 | 186.2 | 175.1 | 157.0 | 171.7 | 189.1 | 207.5 | 215.0 | 250.9 | 256.6 | 2,525.7 |
| Blenheim | 22–23 | 241.8 | 209.8 | 196.9 | 163.2 | 162.2 | 139.8 | 147.4 | 178.4 | 190.3 | 204.5 | 234.2 | 214.6 | 2,283.1 |
| Hanmer Springs | 24–27 | 207.9 | 189.7 | 190.7 | 156.6 | 126.1 | 104.6 | 106.6 | 144.9 | 166.8 | 180.4 | 200.6 | 209.8 | 1,984.7 |
| Hokitika | 24 | 212.1 | 186.9 | 185.0 | 136.9 | 136.0 | 113.4 | 131.8 | 148.0 | 152.8 | 159.6 | 179.4 | 203.8 | 1,945.7 |
| Christchurch | 8–9 | 208.8 | 188.6 | 170.9 | 126.6 | 133.0 | 96.4 | 120.8 | 144.4 | 166.7 | 183.4 | 207.2 | 208.8 | 1,955.0 |
| Sumner | 10–13 | 201.1 | 182.9 | 183.9 | 145.1 | 130.6 | 112.2 | 124.7 | 149.2 | 171.6 | 191.6 | 204.8 | 211.8 | 2,009.5 |
| Lincoln | 27–30 | 213.2 | 192.9 | 177.7 | 144.9 | 134.1 | 112.7 | 117.1 | 148.1 | 174.6 | 194.7 | 210.4 | 210.5 | 2,030.9 |
| Ashburton | 17–21 | 193.0 | 167.1 | 159.3 | 119.8 | 124.4 | 105.1 | 112.8 | 127.9 | 154.6 | 160.7 | 182.2 | 189.0 | 1,796.5 |
| Lake Tekapo | 10–12 | 268.1 | 229.3 | 237.7 | 186.9 | 161.8 | 126.4 | 143.8 | 167.1 | 198.0 | 222.6 | 239.5 | 273.1 | 2,454.3 |
| Fairlie | 9–12 | 180.7 | 173.1 | 173.4 | 135.4 | 144.4 | 119.8 | 134.1 | 154.4 | 109.1 | 179.5 | 180.3 | 162.0 | 1,900.2 |
| Timaru | 12 | 184.6 | 166.1 | 185.5 | 123.0 | 139.1 | 124.1 | 129.1 | 146.6 | 166.8 | 165.5 | 183.4 | 174.5 | 1,888.3 |
| Oamaru | 8–9 | 177.8 | 171.2 | 171.1 | 124.4 | 129.9 | 112.7 | 124.6 | 141.7 | 158.1 | 169.8 | 175.0 | 165.6 | 1,821.9 |
| Waimate* | 19 | 170.0 | 173.9 | 181.8 | 147.3 | 148.1 | 133.6 | 140.2 | 158.3 | 179.7 | 179.0 | 195.0 | 178.2 | 1,985.7 |
| Queenstown | 7 | 228.9 | 209.1 | 195.4 | 130.5 | 91.5 | 70.9 | 98.4 | 118.0 | 164.5 | 200.0 | 213.3 | 246.3 | 1,966.8 |
| Waipiata | 12 | 233.1 | 202.3 | 202.7 | 164.0 | 151.2 | 123.9 | 139.5 | 152.3 | 180.6 | 192.5 | 205.9 | 219.3 | 2,107.9 |
| Alexandra | 8 | 236.5 | 216.6 | 212.6 | 160.9 | 127.9 | 98.2 | 120.7 | 152.9 | 187.4 | 215.5 | 212.0 | 234.4 | 2,175.6 |
| Dunedin | 16–19 | 184.8 | 162.3 | 148.9 | 123.7 | 102.5 | 89.2 | 100.8 | 123.2 | 149.1 | 162.7 | 167.4 | 172.7 | 1,687.3 |
| Gore | 18–19 | 221.8 | 182.0 | 166.1 | 125.4 | 115.1 | 93.2 | 113.1 | 141.8 | 159.9 | 176.3 | 199.8 | 215.0 | 1,909.5 |
| Invercargill | 17–19 | 193.8 | 156.8 | 130.3 | 98.2 | 80.3 | 74.1 | 87.0 | 114.5 | 132.6 | 140.7 | 165.2 | 178.8 | 1,564,3 |
Tables giving monthly averages for a number of stations under each of the heads distinguished below, will be found on page 25 of the 1933 edition of the Year-Book.
Fog.—Fog does not play an important part in New Zealand weather. Most of the fogs recorded are shallow radiation fogs occurring only in the early morning. During the approach of cyclonic depressions, however, widespread and persistent fog is a frequent occurrence. Occasionally, parts of the coast are affected by fog in calm weather. The landlocked harbours and estuaries of North Auckland appear to be unusually susceptible.
Snow.—Snow is rare at sea-level, especially in the North Island. In the interior and at high altitudes it occurs more frequently. On the summits of the ranges in the whole length of the South Island and on the highest peaks in the North Island snow falls, on the average, on over thirty days per annum. In the interior of the South Island there is a considerable area of settled country which is subject to half that number. Towards the coast, however, the number falls off rapidly. Data regarding snow lying are scanty. In the North Island any snow falling on the low levels almost invariably melts as it falls, but on the high plateaux it may lie, especially in the hollows, for from one to three weeks during the year. In the South Island it practically never lies at low levels on the north or west coasts, but on the east coast does so on a few days in some years. At altitudes between 500 ft. and 1,000 ft. in the interior of the South Island the average number of days appears to be between seven and fourteen. Railway traffic is seldom interfered with by snow, even to a minor extent.
Hail.—Hail is experienced more frequently as the latitude increases, and on the west coast than on the east, the rise in frequency in the extreme south-west and about Foveaux Strait being very marked. It occurs more often in spring than at other times of the year. The majority of the hailstorms recorded, however, are harmless, the stones being quite small. Occasionally severe hailstorms are experienced in New Zealand, the stones reaching a diameter of from ½ in. upwards. These are usually associated with thunderstorms, and are probably little less numerous on the east coast than the west or in the North Island than in the South.
Thunder.—Thunderstorms are more numerous in the North than in the South and on the west than on the east side of the main ranges. They are very rare in eastern districts in winter.
Strong Winds.—Averages give the number of days of strong winds experienced per year as: Auckland, 31.5; New Plymouth, 25.7; Wellington, 57.7; Hokitika, 38.3; and Dunedin, 16.3 days. These figures include a proportion of high winds (force 7 on the Beaufort scale) as well as gales (force 8 and over). The figures for Wellington show the effect of the concentration of the winds through Cook Strait.
January.—In the North Island the weather was very wet, with more than the average cloudiness. In the far north north-easterly gales and some flooding occurred. In the South Island conditions were reversed, the rainfall being much below average, especially in Canterbury and on the West Coast. Temperatures were slightly above normal.
February was the wettest February recorded in New Zealand and, indeed, one of the wettest months on record. Most of Westland, the Mackenzie country, the interior of Otago, and Southland had less than the average rainfall, but elsewhere from two to four times the average was recorded. Flooding occurred at times over practically the whole of the North Island. From the 1st to 2nd it was of record proportions in parts of the Auckland Province. In south Marlborough, Canterbury, and north-eastern Otago also there were severe floods. In Canterbury the floods of the 19th to 21st were the most severe since 1923, and the Ashley River rose to unprecedented heights. There was a great flush of growth of grass, and the milk yields became high. Conditions were, however, unfavourable for fattening lambs or for haymaking. Most crops were adversely affected. Some damage was done to the wheat crop, which would otherwise have been excellent. In many cases the grain sprouted, both standing and in the stook. Temperatures were generally somewhat below normal. From the 1st to the 2nd the North Island was visited by a cyclone of tropical origin, which was the most severe in its history. Very severe damage was done by the wind, which in places reached whole gale force. The Manawatu district, and particularly Palmerston North, suffered the worst. Not only was the precipitation extraordinarily heavy, but for a rain so widespread the rate of fall was still more remarkable. The resultant flooding was responsible for serious losses of stock as well as much other damage. Abnormal tidal effects were produced.
March was a very cold month. Though not nearly so heavy as in February, the rainfall was above average in most districts. Pasture was abundant, but was rank and soft. The growth of other vegetation was generally checked and conditions were unfavourable for flowering and fruiting processes. The northern half of the North Island was again affected by a severe cyclone of tropical origin between the 25th and 27th.
Severe gales and remarkably high tides were experienced from Auckland northwards, causing much damage, but the amount of rainfall was surprisingly small.
April.—For the first eighteen days the weather was warm and, except in western and southern portions of the South Island, there was very little rain. In consequence, stock and vegetation thrived. Pastures hardened considerably in most districts and, for the first time during the year, lambs began to fatten well. Cold, wet, and stormy weather after the 18th, however, caused a setback.
May.—On the 2nd a south-westerly storm occurred which for extent and severity was one of the most notable in the history of the country. There followed a spoil of fine weather unprecedented for the time of year. The winds, though light, were mainly southerly, and mean temperatures consequently very low. Frosts and morning fogs were numerous and some snow fell on the ranges, but conditions were not really severe. The month was, on the whole, a good one for stock and pastures.
June was very dry in most districts. Some sharp frosts occurred in the North Island during the first week, but owing to winds being very light, with an absence of severe southerlies, the month was generally a very mild one. Though checked in much of the North Island, there was unusual growth of pasture elsewhere, and, for the time of year, the quality was good. Stock were in good condition.
July.—Rainfall was above average in most districts, but the reverse was the case in the Far North, in parts of Taranaki and Hawke's Bay, and on the west coast of the South Island. Temperatures were rather low and, in the North Island, unusually numerous and sharp frosts were experienced. There were several intervals of very stormy weather, with numerous hailstorms and snow down to low levels. On the 6th, following the passage of a cyclone across the South Island, pressure in the extreme south fell to 28.3 in., the lowest value recorded at sea-level in New Zealand.
August.—A storm which commenced at the end of the preceding month was still raging at the beginning of August. A strong, cold southerly wind was blowing on the 1st and snowstorms were widespread. Around Wellington the snow was unusually thick and extended to low levels. It was some days before it finally disappeared. Several days of cold weather with sharp frosts followed the snowstorm. Another severe storm occurred towards the end of the month, causing heavy, general rains, followed by southerly gales and much snow and hail. Most of the country had considerably more than the average rainfall. Mean temperatures were amongst the highest ever experienced in August.
September was a typical spring month with a persistence of strong and squally westerly winds and frequent rain in districts with a westerly aspect. As regards total rainfall, conditions varied greatly from district to district, and over the country as a whole the fall approximated the average. Temperatures were rather low. Though growth of vegetation was retarded in western and southern districts of the South Island and much of the North, in Hawke's Bay, about Wellington, and in Nelson and the Marlborough Sounds there was rapid growth. A good ambing season was being experienced.
October, except in the first ten or eleven days, was very mild. A rather sharp frost on the 15 th following a cold rain caused very serious damage to fruit and tomato crops in the Hastings district. Except in parts of the Wairarapa and southern Hawke's Bay, vegetation grew rapidly and there was ample feed for stock. Rainfall exceeded the average over most of the west coast of the South Island and the Nelson and Marlborough Provinces, but elsewhere it was below. Temperatures were well above normal.
In November the weather was dull, wet, and changeable. Rainfall exceeded the average in almost all parts, while temperatures were above normal. There was consequently a lush growth of pasture and, except that lambs failed to fatten well on the soft feed, stock were in splendid condition. The wet weather interfered with shearing.
December.—Though the first half was generally fine and much hay was gathered, the last part was wet. Shearing and farm work were again delayed. Stock were in good condition, but feed was soft and rather too plentiful. Rainfall was rather above average and temperatures below. North-easterly gales, heavy rain, and some flooding in the Auckland Province were associated with a cyclonic depression which approached northern New Zealand on the 30th.
Year.—Over the greater part of the country the total rainfall for the year was above average. In considerable areas the excess was 10 in. and upwards. Nevertheless, there were a number of small areas where somewhat less than the average was recorded. Temperatures were slightly below normal in most districts, but a little above in Otago and Southland. In no case did the departures amount to as much as 1° F. The year was remarkable for the variability of weather conditions and the number of new records of intensity created for various types of weather. In temperature, however, there were no great extremes. The amount of bright sunshine was below normal in most districts.
At no time was there serious shortage of pasture over any large portion of the country, but, on the contrary, in many parts there was throughout the year a superabundance. The milk yield was therefore good, and stock fared well. The feed was, however, too soft for lambs to fatten very satisfactorily. The lambing season was an excellent one in spite of the rather low temperatures and the high rainfall. The yield of wheat was high, but much of the crop was damaged by sprouting. The 1936 apple crop was good, but the prospects for the 1937 one were less so. The cold, dull, and wet weather of the late summer was responsible for considerable irregularity in the blossoming of many trees, shrubs, and flowering plants.
(The observations were taken at 9 a.m., mean time.)
| Station. | Temperatures in Shade. | Hours of Sunshine. | Rainfall. | |||||||
|---|---|---|---|---|---|---|---|---|---|---|
| Mean Dally Maximum. | Mean Dally Minimum | Approx. Mean Temperature. | Extremes for 1936. | Absolute Maximum. | Absolute Minimum. | Total Fall. | Number of Days. | |||
| Maximum and Month. | Minimum and Month. | |||||||||
* On two days sunshine was not recorded at Massey College. | ||||||||||
| °F. | °F. | °F. | °F. | °F. | °F. | °F. | Inches. | |||
| Waipoua State Forest | 65.0 | 49.1 | 57.0 | 80.0 Feb. | 28.0 Aug. | 1,694.2 | 71.00 | 210 | ||
| Riverhead | 64.1 | 46.8 | 55.5 | 78.1 Jan. | 21.7 June | 62.03 | 188 | |||
| Auckland | 64.6 | 53.0 | 58.8 | 79.0 Jan. | 35.5 Aug. | 80.5 | 33.2 | 2,234.7 | 52.54 | 174 |
| Waihi | 63.9 | 47.6 | 55.7 | 81.5 Jan. | 24.0 July | 89.0 | 21.0 | 1,934.2 | 97.59 | 164 |
| Te Aroha | 66.7 | 48.6 | 57.6 | 84.0 Jan. | 25.2 June | 95.0 | 21.0 | 53.43 | 177 | |
| Morrinsville | 66.0 | 44.8 | 55.4 | 82.3 Feb. | 21.8 June | 45.82 | 165 | |||
| Tauranga | 65.7 | 47.1 | 56.4 | 80.8 Jan. | 25.9 Aug. | 87.0 | 22.5 | 2,437.0 | 63.59 | 168 |
| Hamilton East | 65.4 | 44.7 | 55.1 | 90.0 Jan. | 22.0 June | 94.4 | 22.0 | 50.42 | 173 | |
| Rotorua | 62.9 | 45.6 | 54.3 | 81.6 Jan. | 24.6 July | 98.0 | 21.0 | 1,908.7 | 67.53 | 146 |
| Whakarewarewa | 63.8 | 44.2 | 54.0 | 82.0 Jan. | 23.3 July | 91.0 | 22.0 | 60.09 | 153 | |
| New Plymouth | 63.1 | 49.5 | 56.3 | 78.7 Jan. | 31.8 Sept. | 89.0 | 27.0 | 2,069.8 | 62.97 | 187 |
| Karioi | 58.9 | 38.3 | 48.6 | 77.0 Jan. | 16.0 July | 81.2 | 11.5 | 53.98 | 170 | |
| Napier | 64.1 | 48.4 | 56.2 | 85.6 Jan. | 28.0 July | 94.0 | 27.5 | 2,291.7 | 48.59 | 141 |
| Hastings | 66.7 | 45.2 | 56.0 | 86.2 Dec. | 24.2 July | 92.4 | 20.0 | 40.98 | 135 | |
| Taihape | 57.4 | 43.0 | 50.2 | 77.2 Jan. | 25.3 July | 87.8 | 20.4 | 44.37 | 180 | |
| Palmerston North | 63.4 | 47.4 | 55.4 | 81.0 Feb. | 27.0 {Jun. Jul.} | 91.0 | 23.0 | 45.31 | 151 | |
| Massey College, Palmerston North* | 61.9 | 46.8 | 54.4 | 82.5 Feb. | 25.0 Sept. | 87.0 | 21.2 | 1,843.7 | 43.21 | 154 |
| Tangimoana | 62.7 | 46.2 | 54.5 | 81.0 Jan. | 27.2 Aug. | 87.6 | 20.5 | 38.40 | 138 | |
| Pahiatua | 61.9 | 45.0 | 53.5 | 81.6 Feb. | 21.0 July | 87.0 | 21.0 | 54.17 | 172 | |
| Masterton | 64.0 | 43.5 | 53.8 | 84.2 Feb. | 22.3 July | 95.4 | 20.0 | 2,077.3 | 47.14 | 152 |
| Wellington | 59.7 | 48.2 | 54.0 | 79.1 Feb. | 33.2 Aug. | 88.0 | 28.0 | 1,984.7 | 56.80 | 173 |
| Nelson | 62.8 | 46.0 | 54.4 | 80.0 Dec. | 27.1 Aug. | 92.0 | 25.0 | 2,279.9 | 43.47 | 122 |
| Appleby, Nelson | 62.5 | 45.7 | 54.1 | 79.4 Dec. | 23.0 Aug. | 84.8 | 23.0 | 40.83 | 121 | |
| Blenheim | 64.9 | 43.8 | 54.4 | 84.8 Jan. | 23.5 Aug. | 92.5 | 23.5 | 2,352.5 | 26.78 | 131 |
| Golden Downs | 61.1 | 40.0 | 50.6 | 79.5 Jan. | 17.2 Aug. | 85.5 | 17.2 | 53.91 | 115 | |
| Waihopai | 62.3 | 42.9 | 52.6 | 81.8 Jan. | 23.8 Aug. | 91.6 | 23.0 | 38.50 | 130 | |
| Hanmer Springs | 60.8 | 38.7 | 49.7 | 84.5 Feb. | 14.0 July | 97.0 | 8.2 | 1,855.3 | 59.04 | 153 |
| Balmoral Plantation | 61.9 | 41.1 | 51.5 | 91.0 Jan. | 17.5 Aug. | 92.2 | 12.0 | 29.22 | 112 | |
| Hokitika | 59.9 | 45.2 | 52.5 | 77.5 Jan. | 26.0 Aug. | 84.5 | 25.5 | 1,681.4 | 109.93 | 200 |
| Lake Coleridge | 60.2 | 41.7 | 51.0 | 79.8 Dec. | 16.5 July | 93.0 | 12.0 | 40.69 | 145 | |
| Methven | 58.7 | 43.1 | 50.9 | 78.0 Jan. | 25.0 Aug. | 89.0 | 23.0 | 52.67 | 147 | |
| Christchurch | 59.5 | 44.3 | 51.9 | 81.8 April | 26.0 June | 95.7 | 21.3 | 1,886.0 | 30.14 | 140 |
| Lincoln | 61.1 | 43.9 | 52.5 | 83.6 April | 25.6 July | 98.4 | 20.4 | 1,789.1 | 38.82 | 121 |
| Ashburton | 59.9 | 40.9 | 50.4 | 79.9 Jan. | 19.4 Aug. | 94.0 | 19.2 | 1,658.5 | 40.38 | 153 |
| Lake Tekapo | 56.7 | 37.5 | 47.1 | 78.3 Jan. | 14.2 Aug. | 90.0 | 4.0 | 2,324.9 | 29.73 | 92 |
| Fairlie | 59.7 | 37.7 | 48.7 | 85.7 Jan. | 17.0 Aug. | 93.0 | 7.6 | 1,869.1 | 32.81 | 121 |
| Timaru | 59.8 | 43.5 | 51.6 | 89.4 Jan. | 24.8 July | 99.0 | 23.0 | 1,758.4 | 30.74 | 101 |
| Queenstown | 58.4 | 41.2 | 49.8 | 81.4 Feb. | 23.2 Aug. | 90.2 | 20.4 | 2,016.4 | 35.37 | 149 |
| Ophir | 59.8 | 38.8 | 49.3 | 84.0 Jan. | 17.3 May | 94.0 | 1.0 | 17.62 | 111 | |
| Waipiata | 58.2 | 38.8 | 48.5 | 81.0 Jan. | 21.0 (Jun. Jul.) | 96.0 | 5.6 | 2,075.0 | 18.18 | 124 |
| Alexandra | 60.5 | 41.0 | 50.8 | 85.3 Jan. | 23.5 June | 91.5 | 12.2 | 2,102.5 | 12.59 | 102 |
| Manorburn Dam | 52.7 | 34.7 | 43.7 | 75.0 Feb. | 9.0 Aug. | 93.0 | 0.5 | 19.41 | 129 | |
| Dunedin | 58.6 | 43.8 | 51.2 | 84.0 Jan. | 29.5 Sept. | 94.0 | 23.0 | 1,742.7 | 48.06 | 103 |
| Gore | 60.7 | 39.5 | 50.1 | 83.0 Jan. | 24.0 Aug. | 95.0 | 18.0 | 1,787.7 | 40.09 | 180 |
| Invercargill | 58.1 | 42.7 | 50.4 | 81.0 Feb. | 26.0 Aug. | 90.0 | 19.0 | 1,580.0 | 48.69 | 247 |
For 1936 the mean pressure at 9 a.m., in inches, reduced to sea-level and standard gravity, was: Waipoua, 29.935; Auckland, 29.979; Rotorua, 29.944; Wellington, 29.938; Nelson, 29.948; Hokitika, 29.945; Christchurch, 29.900; Dunedin, 29.886.
The following article on the New Zealand flora is by Dr. W. R. B. Oliver, D.Sc., F.R.S.N.Z., Director of the Dominion Museum:—
Though the unique features of the flora of New Zealand are frequently emphasized, it should not be thought that there are not other floras which might be described as having equally peculiar characteristics. Taking the plants of the whole world, differentiation has proceeded in all areas so that each is unique in some respects, and as a general rule the quality of uniqueness is most impressed in those areas which for a long time have been isolated, thus giving evolution the opportunity to proceed unhampered by intercrossing with adjacent floras. The peculiar features of a flora are consequently an expression of its past history; and so those regions, such as South Africa, Western Australia, South America, and New Zealand, which, for considerable periods in their history, have been cut off from the remainder of the world, developed floras with many characteristics of surpassing interest. New Zealand is far distant from any continental mass and has maintained such a relation for a long period, probably throughout the whole of the Tertiary Era. Briefly, the peculiar features of the plants of New Zealand are a high degree of endemism; great development of certain genera such as the koromikos (Hebe), karamus (Coprosma), wild Spaniards (Aciphylla), daisy trees (Olearia), mountain daisies (Celmisia), and native brooms (Carmichaelia); the absence or poor development of many of the largest genera of plants, such as Astragalus, Acacia, Eucalyptus, Euphorbia, Mesembryanthemum, Selaginella, although some are highly developed in Australia; the presence of an element, known as Antarctic, containing species related to those in South America and the islands of the Southern Ocean; certain peculiar life-forms, such as the dense cushion plants, known as vegetable sheep; and the high proportion of species with persistent juvenile stages considerably different from the adult forms.
In the following account a select number of species are mentioned for their interest in one way or another. Among the many important discoveries of the late Dr. L. Cockayne, however, was the fact that many of the individual plants in the vegetation are in reality hybrids between the ordinary “species” of the taxonomist. The prevalence of hybrids is, in fact, much more general than is apparent to the untrained eye. In a list recently published, Cockayne and H. H. Allan record nearly five hundred native hybrids. Some, such as the crosses among the beeches (Nothofagus) and tutus (Coriaria), take, in places, a prominent part in the vegetative covering.
Taking the vascular plants—that is, flowering-plants, conifers, ferns, and lycopods—as a whole, by far the larger portion show affinities directly or indirectly with the plants of the Malayan region. Coming under this head are most of the conifers, especially the kauri (Agathis) and the two principal genera of podocarps (Dacrydium, Podocarpus), and practically all the endemic genera for which the flora is so justly famed. It is necessary to mention only such important examples as Carmichaelia, Anisotome, Aciphylla, Haastia, Raoulia, Stilbocarpa, Entelea, and Myosotidium. The presence of this element is justification for stating that the basis of the New Zealand flora is Malayan, and that it came to the country by way of an ancient land connection. Supporting evidence of such a land bridge is found in the presence in New Zealand of some flightless species of birds and the tuatara lizard; also, in former times, of the large wingless moas.
Another important element in the New Zealand flora may be described as Australian, as it includes species either identical with or related to those found in Australia or Tasmania. Some belong to endemic genera, some are odd species belonging to large and characteristic Australian genera such as Phebalium, Persoonia, Myoporum, and Epacris; and there are over 250 species common to both sides of the Tasman Sea. About a fourth of these are widely distributed in many other parts of the world. Some of the Australian species may have come to New Zealand with the Malayan element; others may have been accidentally carried by ocean currents, wind, or birds.
Of exceptional interest is the element in the New Zealand flora known as Antarctic, because of its remarkable distribution and the fact that it has given rise to much controversy among biologists. Taking any of the southern continental lands, we find a considerable number of species related to those in the other cold temperate regions. Thus, in the New Zealand region there are about 70 species of vascular plants whose relations are with those in South America and the islands of the Southern Ocean. The most conspicuous of the Antarctic plants in New Zealand are the beeches (Nothofagus), fuchsias, broadleafs (Griselinia), wild Irishman (Discaria), pukatea (Laurelia), and ourisias. Some botanists explain the presence of the Antarctic element in New Zealand by an ancient southern land connection; others think that equally ancient dispersal from the north and accidental dispersal overseas are sufficient to account for them. All of these methods may have played their part.
The internal distribution of the plants of New Zealand deserves brief notice. Some species occupy quite limited areas even on the mainland. Examples are Cassinia amoena in the North Cape Peninsula, Pittosporum Dallii near Boulder Lake, Hebe oblusata north of Manukau Harbour, Coprosma obconica in the Wairoa Gorge, and several species in the mountains of the South Island. More often, species of limited distribution are confined to islands; in fact, most of the islands at some distance from the coast have one or more species peculiar to them. Conspicuous examples are Homolanthus polyandrus in the Kermadec Islands, Davallia Tasmani at the Three Kings. Xeronema Callistemon on the Poor Knights Islands and Hen Island, Myosotidium hortensia in the Chatham Islands, and species of Pleurophyllum and Stilbocarpa in the Subantarctic Islands.
Perhaps of more importance than these cases of isolated distribution is the circumstance that on the main islands considerable numbers of species have their southern or northern limits at about the same latitude. Two critical boundaries in this connection are 38° S. lat. in the North Island, and 42° S. lat. in the South Island. On this basis New Zealand may be divided into three botanical districts; and if other evidence be taken into account a number of provinces may be defined. The northern botanical province, which extends from the Three Kings Islands to 38° S. lat., is especially well-marked, having nearly 100 species which are confined to it or extend but a short distance beyond its southern border. Of especial interest are the kauri (Agathis australis), taraire (Beilschmiedia taraire), makamaka (Ackama rosaefolia), mangrove (Avicennia officinalis), pohutukawa (Metrosideros excelsa), and mairehau (Phebalium nudum).
A brief review may now be made of the principal groups of plants found in New Zealand. The vascular plants, which comprise ferns, lycopods, and their allies, conifers, and flowering-plants, almost entirely form the land vegetation of physiognomic importance. It is these which clothe the ground and are thus of so much importance to the beauty of the landscape. Lichens are dominant in certain rocky situations, especially near the coast, and these plants, together with mosses and liverworts, are conspicuous members of the interior of scrub and forest in humid climates. Algae take undisputed possession of rocky coasts below tide marks, but on muddy bottoms a flowering-plant, the sea wrack (Zostera), covers wide areas in sheltered situations.
Beginning with the flowering-plants, of which there are over 1,600 species, we find that the daisy family, Compositae, generally placed in the highest position in the flora, contains about 260 species. This is a world-wide family of over 13,000 species. The New Zealand species show some peculiar features and include some exceedingly interesting kinds. The leathery-leaved Pachystegia insignis, the purple-flowered species of Pleurophyllum, and the edelweiss-like Leucogenes, form a remarkable series, Raoulia and Haastia include the wonderful cushion-like species known as vegetable sheep, characteristic of the drier mountains of the South Island. Smaller species of similar growth extend as far north as the Tararuas, and as far south as Stewart Island. The mountain daisies, Celmisia, run into over 60 species; and there are over 40 species of daisy-trees, Olearia. Notable members of this genus are the holly-leaved daisy-tree (O. ilicifolia) and the tete-a-weka (O. angustifolia). Senecio includes about 35, species belonging to New Zealand, several being trees of considerable height. The puheretaiko or mutton-bird shrub (S. rotundifolius) forms a coastal scrub in Stewart Island and the fiord district.
The Australian family, Stylidiaceae, includes only a few New Zealand species, but among them are the bog cushion plants Donatia, and Phyllachne.
The blue-bell family, Campanulaceae, which comprises about 1,000 species found in all parts of the world, is represented in New Zealand by 17 species, one of which (Wahlenbergia cartilaginea) is a fleshy plant characteristic of mountain shingle slips, and another (W. Matthewsii) has rather large pale lilac flowers.
The madder family, Rubiaceae, of over 5,000 species, mainly tropical and subtropical, includes the genus Coprosma, of about 90 species, of which 40 are found in New Zealand. The species of this genus range from forest trees of moderate height to creeping shrubs, and have inconspicuous flowers but bright berries of different colours. The best-known species are the taupata (C. repens), a coastal plant much used for hedges, the karamu (C. robusta), and the kanono (C. australis).
A characteristic Australian family is Myoporaceae, with one representative only in New Zealand, the well-known coastal tree, ngaio (Myoporum laetum).
The speedwell family, Scrophulariaceae, comprises over 2,600 species, mainly found in temperate climates. In New Zealand it has developed chiefly in the four genera: Hebe, 66 species; Veronica, 13 species; Ourisia, 10 species; and Euphrasia, 13 species. The Hebes or koromikos are shrubs with handsome racemes of pale-lilac to white flowers and are conspicuous in all the natural scrubs of the Dominion, but are especially in evidence in mountainous localities. The willow-leaved koromiko (H. salicifolia), in one or other of its forms, is found throughout New Zealand in lowland forests and scrub. Several species of Hebe, known as whip-cord koromikos, are remarkable for the fact that the leaves are reduced and scale-like, resembling those of the cypress. The large flowering-heads of Ourisia are conspicuous objects in the mountains.
The mangrove, Avicennia officinalis, is found in tidal estuaries throughout the eastern hemisphere. In New Zealand it occurs from the North Cape to Kawhia and Opotiki. Another member of this family, Verbenaceae, is the puriri (Vitex lucens), a handsome tree with extremely hard wood.
The borage family, Boraginaceae, of 1,600 mostly north temperate species, is represented in New Zealand by 31 species of forget-me-not (Myosotis), and by Myosotidium hortensia. This last species is confined to the Chatham Islands, and is remarkable for the large reniform leaves, sometimes a foot across, and the large heads of blue flowers.
There are 24 species of gentians, family Gentianaceae, in New Zealand. They are mainly mountain plants, and many have showy flowers, mostly white with radiating purple veins. Elsewhere the genus, which comprises some 350 species, is mainly north temperate, but extends all along the Andes.
The four species of olive, family Oleaceae, found in New Zealand, include the black maire, Olea Cunninghamii, and the white maire, O. lanceolata, notable for their hard timber.
The heath family, Ericaceae, widely spread in temperate regions, is poorly represented in Australia and New Zealand. Gaultheria, with 100 species in America, has but 8 in New Zealand. Instead of Ericaceæ, however, there is present in Australia and New Zealand, and almost confined thereto, an allied family, Epacridaceae, containing some 300 species. The most conspicuous members in New Zealand are the various kinds of grass trees, Dracophyllum, of which there are over 30 species. Some are trees, but mostly they are shrubs and take a prominent part in subalpine scrubs. The leaves are grass-like and the flowers are borne in racemes or panicles. Two of the largest members are the neinei (D. latifolium) of the North Island, and D. Traversii of the South Island.
The cornel family, Cornaceae, contains two species of the genus Griselinia, otherwise Chilean. They have large, shining, dark-green leaves, and one, the broadleaf (G. littoralis), produces a durable timber.
The world-wide carrot family, Umbelliferae, is represented in New Zealand by over 80 species, but over half of them belong to the genera Aciphylla and Anisotome. The species of Aciphylla have branched, sword-like leaves arising at ground-level as a dense tuft. Some are 2 ft. in length, and, being rigid, are formidable objects to man or beast. From the centre rises an equally armoured spike of small flowers. Anisotome includes unarmed herbs, more or less aromatic, with compound leaves and conspicuous compound umbels. With the exception of a few species in Australia, Aciphylla and Anisotome are confined to New Zealand.
The ivy family, Araliaceae, mainly tropical in distribution, is represented in New Zealand by 25 species, all but three being trees. The three herbs belong to the remarkable genus Stilbocarpa, and have leaves 1½ ft. in diameter. The trees include the large-leaved puka, Meryta Sinclairii, of tropical affinities. Those belonging to the genus Pseudopanax, some of which are known as lance-woods, pass through juvenile forms with straight, unbranched stems bearing narrow and deflexed, toothed leaves up to 3 ft. in length.
The evening primrose family, Onagraceae, found in many temperate climates, is represented in New Zealand by about 40 species of willow-herbs and three species of Fuchsia. The latter is an American genus of over 60 species, and by what method the New Zealand forms reached New Zealand is a question of great interest to biologists. The common New Zealand kotukutuku, Fuchsia excorlicata, is a tree, usually deciduous, with papery bark.
The myrtle family, Myrtaceae, is widespread, but most abundant in South America and Australia. In New Zealand there are 17 species or shrubs and trees belonging to this family. The most common are the manuka, Leptospermum scoparium, and the kanuka, L. ericoides. One or both of these cover extensive areas in situations ranging from swamps to sand-dunes. They form dense thickets and, in some places, forest. The various species of rata (Metrosideros) produce an abundance of brush-like red or white flowers. Most conspicuous along the shores of the northern portion of the Dominion is the pohutukawa, M. excelsa, which, in midsummer, is covered with crimson flowers. Equally conspicuous are the northern and southern ratas, M. robusta and M. umbellata, lofty forest trees producing durable timber. The northern rata begins life as a seedling high up on another tree, such as a rimu, and, reaching the ground with its roots, clasps the stem of its host, finally killing and replacing it. Some of the species of Metrosideros are climbers. Their woody, cable-like stems, sometimes 6 in. in diameter, enable the foliage to expand among the tops of the tallest trees.
The mallow family, Malvaceae, of tropical and subtropical distribution, includes a few trees inhabiting New Zealand. They are known as lace-barks and ribbon-woods on account of the lattice-like strands of the bast. The Maori used this bark for textile work. The species of Hoheria or lace-barks bear, in late summer, a profusion of white flowers. One species is deciduous.
The small tropical family Elaeocarpaceae contains two species of Elaeocarpus, a large Malayan genus, one of them being the hinau, which bears large clusters of pendant flowers. The makomako, Aristotelia serrata, is a common tree which springs up in abundance in forest clearings.
The karaka, Corynocarpus laevigata, is a handsome tree with shining dark-green foliage and large orange drupes. The kernel contains a virulent poison, but the flesh is edible. The Maori treated the kernel so as to render it innocuous. The family, Corynocarpaceae, contains one genus of three species, two of which are natives of New Caledonia.
The small tropical family, Coriariaceae, is represented in New Zealand by about five species of Coriaria, one of which is the well-known tutu, C. arborea, the leaves of which are poisonous to stock. The tutu appears abundantly in clearings and on bracken-covered hills.
Although the family Meliaceae contains 600 species, mainly tropical, only one, the kohekohe, Dysoxylon spectabile, is found in New Zealand. The flowers are borne during mid-winter on the trunks and branches. The timber is easily worked, and on account of its brown colour is responsible for the name “New Zealand cedar” being given to this species.
The bean family, Leguminosae, one of the largest in the world, contains a number of New Zealand species, but, as in the carrot family, most of them belong to genera highly peculiar to the Dominion. There are over 20 species of Carmichaelia and a few of some related genera, all of broom-like habit—that is, having leafless twigs and paniculate flowers. Some of the species bear large clusters of blooms of great beauty. Notable members of this family are the three species of kowhai, Edwardsia. The genus is tropical and subtropical; but the New Zealand species have South American affinities. All the species have showy yellow flowers much sought after by honey-sucking birds, and the common kowhai, E. microphylla, produces a durable timber known to saw-millers as New Zealand lignum vitae.
The rose family, Rosaceae, is in New Zealand chiefly noted for its species of Acaena, of infamous reputation. The plant flourishes in pastures, and its burrs collect in great clots on the wool of sheep, causing much loss to sheep-farmers.
The subtropical family, Cunoniaceae, is represented in New Zealand by three species of trees. One, the kamahi, Weinmannia racemosa, is excessively abundant in forests south of the Waikato district, and its ally, the tawhero, W. sylvicola, replaces it in the north.
Pittosporaceae is a family of trees and shrubs which, with the exception of Pittosporum, is confined to Australia. This genus is well represented in New Zealand, where it includes 23 species. Some, such as the kohuhu, P. tenuifolium, and karo, P. crassifolium, are extensively used as hedge plants. A remarkable and beautiful species is P. Dallii. It is distinguished by its serrated leaves and large white flowers.
The large family of saxifrages, Saxifragaceae, with numerous herbaceous genera in northern temperate regions, is represented in New Zealand by three genera only, each containing one or two species of trees. Carpodetus, the putaputaweta, is the most common. In early summer the trees are covered with large clusters of small white flowers.
The cress family, Cruciferae, is of world-wide distribution and of numerous species. It is, however, little in evidence in New Zealand but contains the peculiar genera of mountain plants, Pachycladon and Notothlaspi. A species of Lepidium, now almost eaten out by stock, was formerly abundant along the seashore, and was used as a vegetable by the crews of Captain Cook's ships.
Another world-wide family of plants, that of the buttercups, Ranunculaceae, contains in New Zealand 9 species of Clematis, over 40 of Ranunculus, and a few others. The species of Ranunculus are especially characteristic of the subalpine and alpine zones and contain some very peculiar forms. Some are found only on mountain screes and some reach almost the upper limit of vegetation. The mountain buttercup, R. Lyallii, possesses large, circular, peltate leaves, and the largest flowers of any species belonging to the genus. During the summer months the puawhananga (Clematis indivisa) displays masses of large white flowers over the surrounding foliage.
A tropical family of root parasites, Balanophoraceae, has in New Zealand a single member, the pua-reinga (Dactylanthus Taylori). The host tree responds by forming rosettes with radiating flutings and considerably wider than the diameter of the roots themselves.
Of woody parasites, New Zealand possesses 11 members of the mistletoe family, Loranthaceae. Members of the genus Elytranthe are conspicuous objects among the tops of beech-trees on account of their clusters of scarlet or yellow flowers.
The large Australian and South African family of proteas, Proteaceae, is represented in New Zealand by only 2 members. One is the toru (Persoonia toru), a small tree belonging to an Australian genus of 60 species, and the other is the rewarewa (Knightia excelsa), a lofty tree with relatives in New Caledonia. The wood of the rewarewa is beautifully variegated and is much used for inlaying and cabinet work.
The mulberry family, Moraceae, widely represented in the tropics, extends to New Zealand only in three species of Paratrophis. Most common is the turepo or milk-tree, P. microphylla, and all exude a white latex when bruised.
The beech family, Fagaceae, which is best represented in the northern temperate zone, has in New Zealand 5 species of small-leaved beeches, referred to the genus Nothofagus, a very close ally of the northern Fagus. The other members of Nothofagus are found in Australia, Tasmania, and temperate South America. The New Zealand beeches are the dominant members of large areas of upland forest in the main islands. They provide a considerable proportion of the timber milled in the Dominion. The species are the red beech (N. fusca), silver beech (N. Menziesii), black beech (N. Solandri), mountain beech (N. cliffortioides), and hard beech (N. truncata).
Of monocotyledonous plants the orchids, family Orchidaceae, are among the most specialized, and may be mentioned first. New Zealand is relatively poor in species, there being only 66 known kinds, whereas the world total is about 8,000. Most of the New Zealand forms are ground species, some inconspicuous. The large epiphytic genera Dendrobium and Rulbophyllum are represented by 1 and 2 species respectively, and there are 3 species of the Polynesian Earina and 1 of the Australian Sarcochilus. All New Zealand epiphytes occasionally grow on rocks or even on the ground.
The world-wide lily family, Liliaceae, extends to New Zealand in a comparatively small number of genera, but, like other cosmopolitan families, some of these are noteworthy. Phormium contains the celebrated New Zealand flax, P. tenax, and another smaller species, P. Colensoi. The larger species is found in swamps and wet places. It is a noble plant with sword-like leaves from 6 ft. to 10 ft. long, overtopped by the erect flower-heads. It is now extensively cultivated for its fibre. Xeronema Callistemon, with red, brush-like flowers and iris-like leaves, is confined to islands off the coast of the North Auckland Peninsula. Its only relative is found in New Caledonia. Conspicuous in swamps, scrub, and low forest are the species of Cordyline, palm-like plants bearing clusters of small white flowers. The most plentiful is the ti-rahau or cabbage-tree, C. australis; but the most remarkable, on account of its wide, elastic leaves, is the toii, C. indivisa, found on the forest border or in the more open parts of cool forests. Perched in great clusters on tall forest trees are various species of Astelia and Collospermum, in habit like large tussock grasses.
Palms constitute an immense family, Palmaceae, of over 1,100 species, and are essentially tropical or subtropical. Only 2 species are found in New Zealand, one, the nikau (Rhopalostylis sapida), extending as far south as Banks Peninsula and Hokitika, and the other (R. Cheesemanii) confined to the Kermadec Islands.
The grasses, family Gramineae, of which there are over 120 species in New Zealand, include the large pampas-like toetoe, Arundo conspicua. As its specific name implies, it is a conspicuous species. It is especially abundant in swamps and in coastal localities. Other notable grasses are the various species of Danthonia which, over wide areas in the mountains, form the dominating feature—namely, large tussocks of narrow waving leaves. The smaller species of Danthonia, notably D. pilosa and D. semiannularis, are important pasture grasses. Many of the New Zealand grasses are also found in Australia, and among them the spinifex, S. hirsutus, abundant as a sand-binding species along the outer dunes.
Many of the sedges, family Cyperaceae, of which there are over 120 species in New Zealand, form large tussocks with tall brown panicles. Unlike the grasses, they are conspicuous in scrubs and forests. Chief among these are the various species of Gahnia. A beautiful species, Cladium Sinclairii, has flat, shining leaves and adds much to the beauty of wet cliffs. The genus Uncinia, with 14 species in New Zealand, must be mentioned on account of the fact that it is found in south temperate regions and islands generally, and because the fruit is furnished with peculiar hooks enabling it to become entangled in the hair or wool of animals. There are 55 species of the genus Carex in New Zealand, some, such as G. ternaria, forming dense thickets in swamps.
The class of cone-bearing trees, or gymnosperms, is represented in New Zealand by two families, one, Araucariaceae, containing two genera of truly cone-bearing trees, Agathis and Libocedrux, and the other, Podocarpaceae, containing 17 species with nutlike fruits surrounded more or less by the fleshy scales.
The kauri (Agathis australis) for more than a century has been world-famed for its timber. A straight bole, up to 80 ft. or more in height, carries an immense rounded head of dark-green, shining leaves. The kauri is found only in the northern part of the North Island, and only a few areas of considerable extent now exist. The timber is still an important product. The resin, which is obtained from the living tree and also dug from the ground where kauri forests formerly existed, is of value in making varnishes and for other purposes. In former times the value of the resin exported was greater than that of the timber.
Libocedrus contains two cypress-like trees with brown bark which falls in long, thin strips. One species, the kawaka (L. plumosa), is more northern in distribution than the other, the pahautea (L. Bidwillii).
Of the podocarps, the three New Zealand genera extend to Malaya and other regions. They include the rimu (Dacrydium cupressinum), which is cut for timber more than is any other species of tree in New Zealand; the totara (Podocarpus totara), a handsome tree with pungent leaves and producing a useful timber, the favourite of the Maoris for canoes and house carvings; the matai (P. spicatus), the miro (P. ferruginus), and the kahikatea (P. dacrydioides), all producing valuable timber; the tanekaha (Phyllocladus trichomanoides), a tall tree with leaf-like branches, the true leaves being fully developed only in the seedlings; and the silver pine (D. Colensoi), and yellow pine (D. intermedium), of bog-forests.
Ferns are the glory of the New Zealand forests. They are, of course, most in evidence in damp forests. Here the undergrowth in places may consist mostly of ferns. In addition, they may clothe most of the tree trunks and branches, and, as tree-ferns, take a part in the upper canopy of foliage. There are 145 species, distributed over 12 families, found in New Zealand.
The filmy ferns, family Hymenophyllaceae, are included in the genera Hymenophyllum, Trichomanes, and Cardiomanes. In moist forests a dozen or more species often may be obtained in a single locality. Their delicate leaves cover ground, logs, and trunks alike. They vary from the broad-leaved H. dilatatum, which may reach a height of 2 ft., to the minute H. minimum, less than 1 in. tall. One species, the kidney fern, Cardiomanes reniforme, has undivided, reniform leaves fringed with the spore-producing organs.
A single species, Loxsoma Cunninghamii, with the leaves whitish below, represents the family Loxsomaceae in New Zealand, where it is confined to the Auckland Province. The only other members of the family are found in tropical America.
The family Dicksoniaceae has three representatives in New Zealand, all belonging to the genus Dicksonia. All are tree-ferns, but in one species, D. lanata, the trunk usually lies along the ground. The wheki, D. squarrosa, is perhaps the most common tree-fern in New Zealand.
Another family of tree-ferns is Cyatheaceae. It includes the tall and stately black tree-fern or mamaku (Cyathea medullaris), and the smaller silver tree-fern or ponga (C. dealbata). In one species, Alsophila Colensoi, the trunk almost always is prostrate.
Most ferns belong to the family Polypodiaceae, which is represented in New Zealand by about 90 species. All the ordinary ferns, including the bracken, Pteridium esculentum, belong to this family. The most prevalent genera are Polystichum, Dryopteris, Asplenium, Blechnum, Hypolepis, Adiantum, Pteris, and Polypodium, all widely distributed. Only one genus of Polypodiacae, Leptolepia, is confined to New Zealand.
The king fern, Todea barbara, and two species of Leptopteris, with finely-divided filmy leaves, and hence called crape ferns, represent the family Osmundaceae in New Zealand. The horse-shoe ferns, family Marattiaceae, have a single representative, the para (Marattia fraxinea), in the North Island.
The lycopods, family Lycopodiaceae, include the New Zealand and Australian genus Phylloglossum containing only a single species, P. Drummondii, and twelve species of Lycopodium. A related family, Psilotaceae, contains the two species Tmesipteris tannensis and Psilotum triquetrum.
In a country with a greatly diversified land surface and considerable range in climatic conditions, one may expect a great variety in the nature of the plant covering. Such actually is the case in New Zealand, where the plant formations range from warm, temperate rain forest to alpine rock associations at the limit of plant growth.
When organized European settlement first began in New Zealand, about 1840, it has been estimated that 60 per cent. of the land surface was under forest. The forest has now been reduced to under 20 per cent., mainly by the clearing of kauri, podocarp, and broad-leaved lowland forests. The mountainous regions, where there is a preponderance of beech forests, naturally have suffered the least.
In a broad sense the forest may be divided into three main types: (1) Coniferous forests; (2) broad-leaved forests; (3) beech forests.
The coniferous forests fall into two groups—kauri and podocarp. Kauri forests are confined to the northern portion of the North Island. The occurrence of kauri resin in the ground in places now occupied by swamp or scrub indicates that in pre-European times this formation covered an area considerably greater than it does at the present day. Kauri forest occurs in patches, some of considerable size, among the broad-leaved forests, mainly taraire. The kauri is dominant and determines the physiognomy of the formation. Its immense heads of foliage in clumps and its greater height make the stands of kauri easily recognizable from a distance. The large trees associated with the kauri include the taraire, tawa, tawhero, northern rata, rimu, totara, hinau, and others. Underneath are tree-ferns, nikau palms, and various small trees, including the mairehau, neinei, kanono, and Alseuosmia macrophylla, while the large tussock sedge, Gahnia xantkocarpa, and especially the liliaceous tussock. Astelia trinervia, are conspicuous plants in the undergrowth.
Of the podocarp forests, that in which rimu is dominant or extremely common is the most frequent. A considerable mixture of trees, including other podocarps, such as matai and miro, and many kinds of broad-leaved trees, make up the main tier of the forest. Small trees, often with large leaves laxly disposed, form a second tier, while ferns often dominate the undergrowth. The totara, sometimes occurring as immense trees, dominates smaller areas than does the rimu, and prefers drier soil. At higher levels its smooth-barked ally, Podocarpus Hallii, replaces it. On wet ground, often growing in water, the principal podocarp is the kahikatea. Its straight mast-like trunks impress the visitor to-day as they did when viewed by Captain Cook and his botanists in 1769. In boggy places other podocarps, such as the silver pine or the yellow pine, may be dominant.
Broad-leaved forest covers wide areas in the North Island. In the north the taraire is the dominant tree. Elsewhere its congener, the tawa, takes the principal place. These forests in their interior are much like the podocarp forests, the associated trees, shrubs, and ferns being mostly the same species. Taraire forest interdigitates with kauri forest and the associated species are identical. Tawa forests south of 38° S. lat. lack many species which do not extend farther south than the taraire forest region. Other widely-distributed types of broad-leaved forests are those in which the kamahi and the southern rata are the principal trees. Southern rata forest is essentially a South Island community, and generally contains a considerable proportion of kamahi. In damp situations, as in deep gullies, the pukatea is the principal tree; on drier hillsides the northern rata is sometimes most in evidence. Its habit of strangling its host has the effect of its gradually replacing rimu forest.
The beech forests are characterized by the dominance of one or more species of Nothofagus. They are poorer in species than the coniferous or broad-leaved forests, while ferns and epiphytes are not such conspicuous features. They occur over wide areas of mountainous country in both the main islands, though curiously enough are absent from Mount Egmont, and from West-land between the Taramakau and Paringa Rivers. The mountain beech forms a rather dry type of forest, which occurs on both the wet but cold mountains and on the drier foothills, especially those east of the Southern Alps. The silver beech forms a distinctly moist forest, and mixes freely with podocarps, other species of beech, and broad-leaved trees. In appearance and in variety of associated species silver beech forest much resembles podocarp forest. The red beech, black beech, and hard beech occur mixed or individually dominating in extensive areas in both islands.
Taking the meaning of scrub in the ordinary sense—namely, a closed formation of shrubs—there are in New Zealand several kinds differing in both floristic and ecological composition. The most widely distributed of the scrubs is that in which manuka or kanuka is dominant, and, in places, almost the only shrub present. It occurs in swamps, bogs, poor pumice and clay lands; also on good fertile soil. Its ubiquity is due to the readiness of these two species quickly to take possession of unoccupied land, and its presence in the bettor-class soils is without doubt due to the fact that these areas were formerly occupied by forest which has disappeared before Maori or European. Given time, forest will again supersede the manuka or kanuka scrub. Sometimes species of Dracophyllum—for instance, D. subulatum on the Rangitaiki plains—are dominant in a scrub much resembling dwarf manuka scrub.
Coastal scrubs are best developed on islands, where some characteristic species form almost pure associations. Such are the pohutukawa and taupata in the north, the puheretaiko and tete-a-weka in the south, and Olearia Lyallii in the Southern Islands.
Above the forest-line on all the higher mountains a belt of scrub is found between forest and tussock. It is usually dense to the point of being impenetrable. The dominant species varies with exposure and district, but usually one or more of the following are conspicuous: Olearia Colensoi, Senecio elaeagnifolius, various species of Coprosma, Dracophyllum, and Hebe, Phyllocladus alpinus, Cassinia Vauvilliersii, Aristotelia fruticosa, and Suttonia divaricata.
On the mountain-sides above the dense scrub and tussock only scattered plants, both shrubs and herbs, occur in sheltered places. Here and in other open places a highly peculiar type of shrub is found. It takes the form of a dense cushion, the outer surface of which is the truncated tips of abbreviated tightly-packed branches with their dense clothing of woolly, scale-like leaves. The large species, some of which are 3 ft. or 4 ft. in diameter, are known as “vegetable sheep” (Raoulia eximia. Haastia Sinclairii).
Leaving aside the various associations of plants in water, bogs, swamps, near fumaroles, on sand-dunes, shingly river-beds, and so on this account may be closed by a reference to the tussock-grass lands of the Dominion. The area under tussock is now considerably larger than at the period of early European settlement, owing to the burning-off of scrub. Tussock occurs on all high mountains above the scrub-line, and also over vast areas east of the main divide in the South Island. Two main divisions may be recognized: one is dominated by Festucu Novae Zealandiae and Poa caespitosa, the other by the large tussocks of Danthonia Raoulii. With these are associated a few shrubs, various herbs, and here and there a fern. At the higher levels are grasslands composed of mat-forming species (Danthonia australis, Poa acicularifolia, Triodia exigua, and others) and various low-growing herbs.
Plants introduced to New Zealand during the period of European occupation now take such a prominent part in the plant covering that a few remarks must be made about them. About 600 species are sufficiently well established to be considered naturalized. They occur mostly in settled districts, but in clearings and along tracks far in the native forest a few exotic species are occasionally found. The introduced plants cannot establish themselves in unbroken forest, but, in the area under settlement, especially in the scrubs, grassland, and swamps, many have become permanent members of these formations, and, in places, certain exotic species such as gorse, broom, lupin, blackberry, and some others, dominate new communities.
For the guidance of those desiring further information on the flora and plant covering of New Zealand, the following works should be consulted: “Plants of New Zealand.” by R. M. Laing and E. W. Blackwell, ed. 3, 1927; “Manual of the New-Zealand Flora,” by T. F. Cheeseman, ed. 2, 1925; “The Trees of New Zealand.” by L. Cockayne and E. Phillips-Turner, 1928; “The Forest Flora of New Zealand,” by T. Kirk, 1889; “New Zealand Trees and Shrubs and how to Identify Them,” by H. H. Allan, 1928; “New Zealand Ferns,” by H. B. Dobbie, ed. 3, 1931: “New Zealand Plants and their Story,” by L. Cockayne, ed. 3, 1927; “The Vegetation of New Zealand,” by L. Cockayne, ed. 2, 1928; “The Cultivation of New Zealand Plants.” by L. Cockayne, 1923; “The New Zealand Nature Book,” Vol. 2, by W. Martin, 1929; and numerous articles published in the Transactions of the New Zealand Institute and of the Royal Society of New Zealand.
The following brief article on the fauna of New Zealand, originally prepared by Mr. James Drummond, F.L.S., F.Z.S., was revised by him in 1935:—
New Zealand's native fauna has attracted the attention of investigators in nearly all parts of the world. Its special interest lies in its manifold peculiarities, in the incongruous characters possessed by some of its members, and in the ancient types found in different classes.
Beginning with the mammalia, the Dominion is surprisingly inadequately represented. Its only land-mammals, except seals, are two bats. One of these, the long-tailed bat, belongs to a genus (Chalinolobus) which is found in the Australian and Ethiopian zoological region's, and to a species (morio) found in the south-east of Australia as well as in New Zealand; but the other, the short-tailed bat (Mystacops tuberculatus), belongs to a genus peculiar to this Dominion.
At one time it was believed that the Maori dog (Cards familiaris, variety maorium, the “kuri” of the Maoris) and the Maori rat (Mus exulans, the Maori “kiore”) were indigenous to New Zealand, but it is now generally believed that these two animals were introduced by the Maoris when they made their notable migrations from their legendary Hawaiki. The dog was highly prized as a domestic pet, and the rat as food. Both could easily be taken across the sea in the large canoes used in those days. The dog, without doubt, is extinct. It was small, with a pointed nose, pricked ears, and very small eyes. In colour it was white, black, brown, or parti-coloured, and it had long hair, short legs, a short bushy tail, and no loud bark, but only a whine. The Maoris lavished upon it an abundance of affection. When dead its flesh was used for food, its skin for clothing, and its hair for ornaments. Opinions differ in regard to the approximate date of its extinction, and investigations in this respect are made somewhat difficult by the fact that for some years “wild dogs,” as they were called—probably a cross between the Maori dog and dogs brought by Europeans—infested several districts in both the North Island and the South Island, and were confused with the Maori dog. It is probable that the pure Maori dog became extinct about 1885. The Maori rat, a forest-dweller, is not as plentiful as it was when Europeans first came to New Zealand, but it still lives in the forests.
The long-tailed species of bat was once fairly plentiful, especially in the forests, where it makes its home in hollow trees. Large numbers also at one time were found under old bridges across streams, notably at the River Avon, in Christ-church. It is not very rare now, and specimens sometimes are found in the forests and in caves. The short-tailed species probably is not extinct, but rare. Little is known of its habits.
The sea-lion, the sea-elephant, the sea-leopard, and the fur-seal are found on islands within the Dominion's boundaries. In the early days of colonization scaling was a great industry, and yielded large profits to some of the adventurous men who took part in it.
Amongst the sea-mammals whales are the most important. At one time extensive whaling was carried on in New Zealand' waters, three hundred vessels, chiefly from America, sometimes visiting the country in one year. The industry began about 1795, reached the height of its prosperity between 1830 and 1840, and then began to dwindle. In recent years an effort was made to revive the industry, but results were not encouraging. Only two Whaling-stations are established in New Zealand at present: both are on a small scale, and the catches have a low average. The older of the two stations is at Whangamumu, Bay of Islands; it takes hump-back whales near the coast. Southern right whales are taken there occasionally; these and blue or fin whales are rare at that station. The more modern station is in Tory Channel, Queen Charlotte Sound, where during the three months of winter hump-backs are taken and a few southern right whales.
By its strange behaviour a Risso's dolphin (Grampus griseus) became famous under the title of “Pelorus Jack.” It made a practice of following steamers in the vicinity of Pelorus Sound. So much interest was taken in this dolphin by the public, zoologists, and learned societies that it was protected by an Order in Council issued in 1904 tinder the Sea-fisheries Act. Pelorus Jack has not been seen since 1916. It was the only member of the genus Grampus recorded in New Zealand waters.
In contrast with the species of land-mammals, the members of the next class, Aves, were remarkably plentiful when settlement began. Bush and grass fires, rats, cats, stoats, and weasels, and the ruthless use of the gun reduced their numbers, but they still stand as probably the most interesting avifauna in the world. They include a comparatively large number of absolutely flightless birds. No living birds in New Zealand are wingless, but the kiwi (Apteryx), the weka (Gallirallus), the kakapo parrot (Strigops), and the takahe (Notornis Hochstetteri)* cannot use their wings for flight, while a duck belonging to the Auckland Islands (Nesonetta) is practically in the same plight. There are several species of birds whose wings are so weak that they can make only short flights.
*Better known as Notornis Mantelli.
Other notable birds are the kea (Nestor notabilis), which is accused of killing sheep on stations in the South Island; the tui (Prosthemadera Novae Zealandiae), which affords one of the most beautiful sights in the New Zealand forests, and charms visitors with its silvery notes; the huia (Heteralocha acutirostris), the only species known in which there is a wide divergence in the shape of the bills in the two sexes, the male's being short and straight, while the female's is curved, pliant, and long; and the wry-hilled plover (Anarhynchus frontalis), the only bird known to possess a bill turned to one side. Cormorants or shags (Phalacrocorax) and penguins (Impennes) are exceptionally well represented in the avifauna. New Zealand may be regarded as the headquarters of the penguins, as all the genera except one are found within the boundaries of this Dominion. The oldest fossil penguin known is from the Eocene and Oligocene rocks of New Zealand. New Zealand probably was the centre from which penguins were dispersed to other countries.
Several species of shore-birds make remarkable migrations to New Zealand from regions around the North Pole. They nest there, but spend the spring and summer in New Zealand, leaving the Dominion for their northern homes in the autumn. A few miss the general migration and stay in New Zealand all winter. They probably join the outward-bound flocks in the following autumn. The most famous of these migrants, the bar-tailed or Pacific godwit (Limosa lapponica) known in New Zealand by its Maori name kuaka, nests on the tundras of Eastern Siberia and in Kamchatka and Western Alaska. The Hudsonian godwit (Limose haemastica), the Pacific golden plover (Pluvialis dominicus), the knot (Canutus canutus) and several species of sandpipers are on the list; and the parasitic jaeger or Arctic skua, which nests as far north as Greenland, Spitzbergen, and Franz Josef Land, sometimes spends the summer in New Zealand. Two species of cuckoos—the shining cuckoo (Lamprococcyx lucidus) and the long-tailed cuckoo (Urodynamis taitensis)—arrive in New Zealand from unknown northern homes, probably on Pacific, islands, in the spring, and leave the Dominion about April. Both are parasitical, imposing on small birds the duties of hatching and rearing young cuckoos. In seine respects the kiwi is the most remarkable bird in New Zealand. It is the only bird known with nostrils at the tip of the bill, instead of at, the base. Its plumage is hair-like in appearance. It lays an immense egg compared with the size of its body. Its structure is very generalized. Sir Richard Owen once suggested that it seemed to have borrowed its head from one group of birds, its legs from another, and its wings from a third.
The takahe (Notornis), a large, heavily built rail, is one of the rarest birds. Only four individuals have been recorded. Two of the skins are in the British Museum, one is in the Dresden Museum, and one remains in New Zealand in the Otago Museum, Dunedin. The fourth Notornis was caught by two guides (Messrs. D. and J. Ross) at Notornis Bay, Lake Te Anau, in 1898. There is reason to believe that this species still exists in the wild country of the southern sounds.
An eagle, a goose, and a large rail are amongst New Zealand's extinct birds. In this class are the moas. Dr. W. R. B. Oliver has divided them into twenty-one species. The tallest stood 12 ft. high. Their remains show that they were very plentiful. The cause and time of their extinction are still subjects of controversy. A mass of knowledge has been collected about them; all this with theories and Maori traditions has been recorded in Mr. T. Lindsay Buick's “The Mystery of the Moa” (1931). It should be read with Dr. Oliver's erudite essay on the moas in “New Zealand Birds” (1930).
Reptilian life is restricted to about fifteen species of lizards and to the tuatara (Sphenodon punctatus). This is a lizard-like creature, the only surviving representative of the order Rhynchocephalia. The tuatara is found in no other country. It has been destroyed to a large extent by wild pigs, cats, and dogs, and is now seldom found except on a few islands off the coast of the mainland.
The amphibians are represented by two species of frogs. One, Liopelma Hochstetteri, has been recorded from only a few districts in the Auckland Province. The other, Liopelma Hamiltoni, has been recorded from only Stephen Island, a small island in Cook Strait, notable as one of the refuges of the tuatara.
About 310 species of fish have been found in New Zealand waters. Many of these are used for food. Several species, notably the mudfish (Neochanna apoda), which is sometimes discovered buried 4 ft. deep in clay in places where rivers have overflowed in flood, and in swampy places, are interesting. Some of the genera are peculiar to New Zealand, but some also occur in Australian and South American wafers.
Amongst the invertebrates one of the peculiarities is the fact that the Dominion has few butterflies, although it is well supplied with moths. It has a red admiral butterfly (Vanessa), named after the European species, which it resembles, and a copper butterfly (Chrysophanus), which is very plentiful. In the forests there is that strange growth, the “vegetable caterpillar.” The Dominion has native bees and ants, dragon-flies, sober-coloured beetles, and representatives of other orders of insects. The katipo spider, which lives mostly on or near the sea-beach, is well known locally. Amongst the mollusca there is a large and handsome land-snail (Paryphanta) and Amphibola, an air-breathing snail, peculiar to the Dominion, which lives in brackish water, mainly in estuaries. There are about twenty species of univalves and twelve of bivalves in the fresh-water shells, and many species in the marine shells, including the paper nautilus (Argonauta).
Perhaps the most interesting of all the invertebrates is Peripatus, an ancient type of creature which survives in New Zealand and in parts of Australia, Africa, South America, the West Indies, New Britain, the Malay Peninsula, and Sumatra. Zoologically, it belongs to the air-breathing divise the phylum Arthropoda, and has been placed in a special class, Prototrachea or Onychophora. It is about 3 in. long, has many feet, loves moisture, shuns light, and moves slowly.
On the arrival of Europeans the whole face of the fauna changed. The first European animal introduced was the pig, liberated by Captain Cook in Queen Charlotte Sound in 1773. With settlement, sheep, cattle, horses, and other domestic animals were brought, some for utility, some for pleasure, such as songbirds, and some for sport, such as deer, trout, pheasants, and quail.
Twenty-four species of introduced birds have established themselves. Some succeeded so well that they created a small-bird nuisance. In 1906 the German owl, little owl, or brown owl (Athene noctua) was successfully introduced to help to check the small introduced birds. It is accused of killing native small birds. New Zealand farmers regard the starling as the most useful introduced bird. They condemn the house-sparrow as the most destructive, and next to it the skylark. Many species of injurious insects have been accidentally introduced. The small cabbage white butterfly (Pieris rapae) appeared in 1930. It spread rapidly, and in 1935 a chalcid (Pteromalus puparum), which parasitises the butterfly's pupæ, was introduced to control it.
Acclimatization in New Zealand is marked by several great and irretrievable mistakes. The worst of these are the introduction of rabbits, stoats, and weasels.
Table of Contents
WHEN New Zealand was discovered by Europeans in 1642 it was found to be inhabited by a race of Polynesians called Maoris, who had migrated to these islands many centuries previously. At what time the discovery of New Zealand was made by the Maoris, and from what country they came, cannot be stated accurately, for being an unlettered people they had only oral records of their history. The origins of the Maori people prior to their final migration are even more obscure, but in accordance with the general tradition of the Polynesian race, it would seem that from Asia they migrated eastward by way of Malaysia to the Pacific. According to their mythology their Pacific home was the island of Hawaiki—the position of which is now unknown—and from there, many generations ago, one of their chiefs, after a long voyage, reached the northern island of New Zealand. Returning to his home with a glowing description of the country he had discovered, this chief persuaded a number of his people to set out in a fleet of double canoes for the new land. This migration was followed by others, and from comparisons of the tribal legends it has been possible to obtain a definite knowledge of the subsequent division and history of the numerous tribes after their occupation of New Zealand. On their arrival the Maoris found inhabitants on the East Coast of the North Island of similar racial origins to themselves. Known to the Maoris as Morioris, “inferior people,” this race was driven to the South Island and to the Chatham Islands. Through absorption by the dominant Maoris, this race finally became extinct by the death of their last member during the last decade. Of their history nothing is known, and their origins remain a mystery.
Coming from tropical latitudes, the Maoris mainly confined themselves to the warmer North Island, and when discovered by Europeans were in a high state of neolithic civilization, with marked superiority in the arts of wood-carving and military engineering. Their principal social unit was the family group, which has been described as a “consanguineous subclan” (Best), and from combinations of the numerous groups were formed the subtribes and tribes. With highly developed social and ritualistic customs they were communistic within the subtribes, in their system of land-tenure, as well as in their methods of cultivation. Inter-tribal and intra-tribal warfare was common, and as individuals they displayed exceptional courage and intelligence.
The Maori language is a very pure dialect of the Polynesian—the common tongue of all the eastern Pacific islands.
On the 13th December, 1642, Abel Janszoon Tasman, a navigator of the Dutch East India Company, discovered the country to which he gave the name of “Staaten Land,” and which later became known as “Nieuw Zeeland.” Tasman had left Batavia on the 14th August, 1642, and, after having discovered Tasmania, he steered eastward and sighted the west coast of the South Island, described by him as a high, mountainous country. Sailing north, he had the misfortune to come into conflict with the Maoris at Golden Bay on the north coast of the South Island, so that though he continued his northward journey until he reached the northern tip of the country he did not again attempt to land. His exploration was, of necessity, very cursory, for having explored only part of one coast he had no knowledge of the country's extent or shape.
There is no record of any European visit to New Zealand after Tasman's departure until Captain Cook sighted land on the 6th October, 1768, at Young Nick's Head. On his first voyage Cook spent six months exploring the New Zealand coast-line, and he completely circumnavigated the North and South Islands. His activities can be best described by saying “he found New Zealand a line on the map, and left it an archipelago” (Reeves). Not only was Cook's ability shown by his cartographical accuracy, but also in his peaceful dealings with the truculent Natives. He returned to New Zealand again in 1773, in 1774, and in 1777.
Several other explorers also visited New Zealand during the latter portion of the eighteenth century, amongst whom may be mentioned M. de Surville (December, 1769). M. Marion du Fresne (1772), Captains Vancouver and Broughton (1791), Captain Raven (1792–93), Alejandro Malaspina and José de Bustamente y Guerra (1793). Lieutenant Hanson (1793).
So far as is known, the first instance of Europeans being left in New Zealand to their own resources occurred in 1792, when Captain Haven of the “Britannia” landed a sealing-party at Facile Harbour, on the west coast of the South Island, where they remained a little over twelve months before being called for.
In the years that followed, whaling-stations sprang up along the coast, and a trade with New South Wales begun, not only in whale-oil and seal-skins, but also in flax and timber—to say nothing of the disreputable traffic in dried tattooed heads. Attracted to the Islands were deserters from whaling-vessels and escaped convicts from Australia, who in the absence of any jurisdiction soon became notorious for their extreme lawlessness. In 1814 Samuel Marsden, chaplain to the Governor of New South Wales, obtained permission to send two of his proteges, Kendall and Hall, to the Bay of Islands to consider the desirability of establishing a mission-station. Later they returned to Sydney for Marsden, who arrived in New Zealand to preach his first sermon at the Hay of Islands on Christmas Day, 1814. Of the many admirable activities undertaken by the missionaries, their action in having the Maori language “reduced to a rational orthography” (Beaglehole) deserves special mention.
The immediate effect of European contacts on the Maoris was the outburst of a series of tribal wars waged with the more destructive musket. The advantage originally lying with coastal tribes, the wars continued until all tribes were equally well armed. Following representations for protection from Maori chiefs, the New South Wales Government appointed, in 1832, Mr. James Busby as British Resident at Russell. Owing to the failure to supply him with any means of exerting authority, his appointment was ineffective. Finally the disorder became so intolerable that even the missionaries, who were opposed to annexation, made representations for British sovereignty.
On the 29th January, 1840, Captain William Hobson, R.N., arrived at the Hay of Islands, empowered, with the consent of the Natives, to proclaim the sovereignty of Queen Victoria over the Islands of New Zealand, and to assume the government thereof. Hobson formally read his commissions at Kororareka on 30th January, 1840, and on 6th February of the same year a compact called the Treaty of Waitangi was entered into, whereby all rights and powers of sovereignty were ceded to the Queen, all territorial rights being secured to the chiefs and their tribes.
On 21st May, 1840, Hobson proclaimed British sovereignty in the case of the North Island by virtue of the Treaty of Waitangi, and in the case of the South Island and Stewart Island by right of discovery. New Zealand remained a dependency of New South Wales until the 3rd May, 1841, when it was created a separate colony by Royal Charter dated the 16th November, 1840.
Simultaneously with Hobson's arrival in Russell there had landed in Wellington a body of settlers brought out by the New Zealand Company. This company, whose moving spirit was Edward Gibbon Wakefield, was endeavouring to “systematize colonization” by transplanting sections of English society into virgin country. It was hoped that, by producing a proper balance of capitalists and artisans, self-contained communities could be successfully established. However, owing to the unsatisfactory nature of the land-purchases, considerable difficulty was experienced in these initial settlements, and friction grew up not only between the settlers and the Natives, but also between the Governor and the settlers. Before his death in 1843 Hobson had transferred his capital from Russell to Auckland, but this transfer was of no assistance to the colonists, who had extended their settlements to Wanganui, New Plymouth, and Nelson. In 1865 the scat of government was removed to Wellington.
Following the death of Hobson, the existence of the colony became precarious for, through lack of funds and weak administration, Maori aggression became a real menace. To cope with the situation, the Colonial Office appointed Captain George Grey as Governor. Being well equipped with troops and funds, as well as being a man of vigour and perception, Grey soon restored order and confidence among both the settlers and the Natives. During Grey's term two further organized settlements were made. In co-operation with the New Zealand Company the Free Church of Scotland sponsored the Dunedin Settlement of 1848, and the Church of England the Canterbury settlement of 1850. These settlements—owing to their more favoured situations, their satisfactory land-purchase agreements, and their freedom from Native trouble—achieved a greater measure of success in carrying out the company's avowed aims.
Also during Grey's term steps were taken to draft a constitution for the colony. An Act granting representative institutions was passed by the Imperial Parliament on the 30th June, 1852, and was published in New Zealand by Proclamation on the 17th January, 1853. Under it the constitution of a General Assembly was provided for, to consist of a Legislative Council and a House of Representatives. Provision was also made for the division of the country into provinces, each province having an elected Council and an appointed Superintendent.
After Grey's departure the question of relationship with the Maoris again came to the fore through the land-purchasing activities of the settlers—a situation aggravated by subsequent lack of consideration for the Maori system of land-tenure. Following an incident at Waitara in the Taranaki district, where a dispute arose concerning land titles, war broke out in 1860 and lasted spasmodically till 1870. The recall of Grey did not solve the problem, as Grey, an autocrat, could not work with the elected Ministers, nor did his presence prevent the confiscation of land belonging to the Maoris, whether friendly or hostile. It was under the sympathetic administration of Sir Donald McLean as Native Minister that the dispute finally died down.
These hostilities were confined to the North Island; and, in the meantime, in 1861 large alluvial deposits of gold had been discovered in the South Island—leading to a tremendous influx of population and an alteration of the economic structure of the country. This discovery, by its increase in wealth, allowed the South Island to obtain a lead in commercial and political development which it long maintained. Moreover, with the subsequent agrarian expansion, especially in the development of the large pastoral holdings, the country ceased to be merely agriculturally self-sufficient, but began to develop a substantial export trade, mainly in wool.
These factors, together with freedom from strife with the Native population, led after 1870 to a quickening in political activities. Under the leadership of Sir Julius Vogel a policy of extensive borrowing for railway and road construction was begun, and the Provincial Assemblies, whose parochialism had frequently proved obstructive, were abolished. In 1877 the Education Act was passed, making education free, compulsory, and secular, and during that decade the first cable was laid between Australia and New Zealand. At this time party politics began to enter into the parliamentary system, and the slump conditions which prevailed in the “eighties” (due to a fall in the world price-level) intensified the political atmosphere. By the abolition of plural voting in 1889, and the introduction of female suffrage in 1803, the way was opened for a practical expression of political convictions by all adult members of the community.
In 1891 John Ballance, as leader of the Liberal party, became Premier, to be followed on his death in 1893 by Richard John Seddon, and during the next decade the legislative essays of this party evoked world-wide interest. The main aim of the legislation was social justice, and its principal manifestations were in land-division, the establishment of the Arbitration Court, and the introduction of old-age pensions. The policy of land-division aimed at closer land-settlement, and it was achieved by the compulsory subdivision of large estates, with subsequent loans to small independent farmers wishing to establish themselves, in inaugurating the Arbitration Court the object was to eliminate strikes by giving labour a recognized bargaining status; and the enactment was in accord with the enlightened code of labour legislation passed at that time.
With the commencement of the refrigerated trade in 1882, the policy of closer settlement progressed rapidly, since the production of frozen meat and dairy-produce for export encouraged more intensive farming. There thus arose a new farming class which in 1912, some six years after Seddon's death, was mainly responsible for the overthrow of the Liberal regime. In the meantime the country had ceased to be a colony and had been raised to the status of a Dominion, this change taking place from 26th September, 1907.
The policy of the succeeding Reform party, whose leader was William Ferguson Massey, was one favouring agricultural production. Farming interests were given constant encouragement by a series of enactments of which the extension of rural-credit facilities was typical. Two years after the advent of the Reform party the Great War broke out, leading to the formation of a Coalition Government and an Imperial commandeer of exports. The casualty lists in proportion to the population were heavy, while the cordiality of imperial relationship was greatly enhanced as a result of war activities. One noteworthy outcome of the war commandeer was the establishment, after the war of Control Boards to regulate the export of pastoral products.
Though the effects of the post-war depression during the period 1921–24 showed themselves in an increase in unemployment and slight wage-reductions, no drastic legislation was necessary to stabilize economic conditions. During the following years the price-level rose; and, from the administrative side, it was characterized by extensive public-works expenditure, with particular attention to hydro-electric schemes and highways.
Owing to the encouragement given to farming, pastoral production constantly expanded, so that New Zealand became one of the world's greatest exporters of pastoral produce. As a consequence, her national income was extremely sensitive to price-fluctuations of these products; so that, with the advent of the depression in 1930, her economic position became extremely vulnerable. In order to produce balanced budgets, both public and private, various legislative remedies were attempted. In particular, enactments were provided for unemployment relief, for the suspension of the Industrial Conciliation and Arbitration Act, for the establishment of a Reserve Bank, for a mortgage moratorium, for raising the exchange-rate, and for reductions in interest-rates and wages. With the recovery in price-levels and consequent general economic revival, amendments were made to several of these Acts, removing the more stringent measures. The election of the first Labour Government in 1935 has led to a change in administrative policy, the preoccupation at present being mainly with social problems. Further amendments have also been made to the emergency legislation, certain restrictive measures having been removed, while other adjustments have been put on a permanent footing.
Of the constitutional events in recent years the passing by the Imperial Parliament of the Statute of Westminster in December, 1931, was of major importance. The draft of this statute was submitted for the confirmation of the various Dominion Legislatures before its passage through the Imperial Parliament. The statute grants complete autonomy to the various Dominions, but it does not automatically apply. In other words, its operation in any Dominion requires specific adoption by the Legislature of that Dominion. Up to the present time (September, 1937) the statute has not been adopted by the New Zealand Parliament.
Due to limitations of space, the foregoing is but a brief résumé of New Zealand history. For detailed information, reference should be made to the many excellent books dealing with the subject, of which the more recent ones are listed in the General Bibliography rearing in Appendix C of this volume.
The powers, duties, and responsibilities of the Governor - General and the Executive Council under the present system of responsible government are set out in Royal Letters Patent and Instructions thereunder of the 11th May, 1917, published in the New Zealand Gazette of the 24th April, 1919 (p. 1,213). In the execution of the powers and authorities vested in him the Governor-General must be guided by the advice of the Executive Council, but, if in any case he sees sufficient cause to dissent from the opinion of the Council, he may act in the exercise of his powers and authorities in opposition to the opinion of the Council, reporting the matter to His Majesty without delay, with the reasons for his so acting.
In any such case any member of the Executive Council may require that there be recorded in the minutes of the Council the grounds of any advice or opinion that he may give upon the question.
The present Executive Council consists of thirteen members in addition to the Governor - General. Two members, exclusive of His Excellency or the presiding member, constitute a quorum.
Under the Civil List Act, 1920, His Excellency the Governor-General receives an honorarium of £5,000 per annum, an allowance of £2,000 per annum for the salaries and expenses of his establishment (exclusive of the Official Secretary), and an allowance of £500 per annum for travelling-expenses.
The Civil List Act, 1908, authorized salaries of £1,600 for the Prime Minister, £1,300 for the Minister of Railways, and £1,000 to each of six (increased in 1915 to eight and in 1917 to ten) other members holding portfolios. The Civil List Act, 1920, authorized salaries of £2,000 for the Prime Minister, and £1,300 to each of ten other members holding one or more ministerial offices.
A reduction of 10 per cent. was made in 1922, while Ministerial salaries were again reduced in 1931 (by 10 per cent.), and in 1932, when a further reduction of 15 per cent. was made. Restoration to the 1930 level was effected from 1st July, 1936. The present Government, shortly after assuming office, instituted a scheme whereby the services of all parliamentary representatives of the Government party might be co-opted to assist Ministers in bringing the Government's policy into effect. As part of this plan, Ministers are sharing a portion of their authorized salaries with other Government parliamentary representatives.
It is of service also to mention that, for the first time in the history of the New Zealand Parliament, provision has been made for the appointment of Parliamentary Under-Secretaries. The authorizing statute is the Civil List Amendment Act, 1936, which, inter alia, provides for a salary of £000 per annum to any person holding office as a Parliamentary Under-Secretary. The Act also provides for the extension of the number of Ministers, other than the Prime Minister, from ten to eleven (without, however, increasing the aggregate amount which may be paid in Ministerial salaries).
The Imperial Act under which the earliest appointments were made to the Legislative Council under a system of responsible government provided that the first appointees should be not less than ten in number. The number actually summoned for the first session (held at Auckland from 24th May, 1854) was sixteen, of whom only fourteen attended. The number increased irregularly for thirty years. In 1885 and 1886 it stood at fifty-three, but has not since reached that limit. The number on the roll at present (September, 1937) is 38.
An Act of the Imperial Parliament in 1868 provided that future appointments of Councillors should be made by the Governor (not by the Sovereign). Until 1891 members were appointed for life, but since that year appointments have been made for seven years only, members, however, being eligible for reappointment. Prior to 1891 the Speaker was appointed by the Governor, but the Council now elects its own Speaker, who holds office for five years. The Chairman of Committees was formerly elected every session, but in 1928 the standing orders were amended to provide for a three years' term of office. Speaker and Chairman are both eligible for re-election.
Provision for an elective Legislative Council is contained in the Legislative Council Act, 1914, which may be brought into operation at a date to be specified by Proclamation.
The qualifications for membership of the Legislative Council are the same as for the House of Representatives, with the proviso that a person may not at the same time be a member of both Houses.
Before the year 1892 the honorarium of Councillors was understood to be for the session, not for the year, and formed the subject of a special vote every session, the amount varying in different sessions. By the Payment of Members Act, 1892, the honorarium was made annual, not sessional, and was fixed at £150 a year. The amount was raised in 1904 to £200, and in 1920 to £350, but was reduced in 1922 to £315, in 1931 to £283 10s., and in 1932 to £255 3s. In 1934 the salary was raised to £267 19s., in 1935 to £288 Is., and from 1st July, 1936, to £315 (the level ruling between 1922 and 1931). The Speaker now receives £720 per annum, and the Chairman of Committees £450. Besides the honorarium, members are allowed travelling-expenses actually incurred in going to and from Parliament at the opening and closing of each session.
Subject to certain exemptions, members not attending the Council are able to be fined.
The number of members constituting the House of Representatives is eighty—seventy-six Europeans and four Maoris. They are designated “Members of Parliament.” The number was originally fixed by the Constitution Act as not more than forty-two and not less than twenty-four, and the first Parliament called together in 1854 consisted of forty members. Legislation passed in 1858 fixed the number of European members at forty-one; in 1860, at fifty-three; in 1862, at fifty-seven; in 1865, at seventy: in 1867, at seventy-two; in 1870, at seventy-four; in 1875, at eighty-four; in 1881, at ninety-one; in 1887, at seventy; and in 1900, at seventy-six. By the Maori Representation Act, 1867, which is still in force, as embodied in the Electoral Act, 1927, four Maori members were added, three for the North Island and one for the South.
After each population Census the Dominion is divided anew into seventy-six European electorates, according to population distribution, with an allowance for rural population. The “country quota” is computed on the basis that 28 per cent. is added to the rural population, which for electoral purposes means population other than that contained in a city or borough of over 2,000 inhabitants or in any area within five miles of the chief post-offices at Auckland, Wellington, Christ-church, or Dunedin. The “country quota” first appeared in 1881, to the equivalent of an addition of 33⅓ per cent. to the country population. It was reduced in 1887 to 18 per cent., but was increased in 1889 to the present 28 per cent.
Quinquennial Parliaments, instituted under the Constitution Act, were abolished by the Triennial Parliaments Act, 1879, which fixed the term at three years General elections have been held at three-yearly intervals since 1881, with the exception that the term of the nineteenth Parliament was during the Great War extended to five years by special legislation, and that of the twenty-fourth Parliament to four years. The Electoral Amendment Act, 1934, provided for a permanent extension to four years.
Under the Electoral Act, 1927, every registered elector of either sex, but no other person, is qualified to be a candidate. It is provided, however, that a person shall not be so elected who is disqualified as an elector under any of the provisions of the Act, or is an undischarged bankrupt, or is a member of the Legislative Council, or is a contractor to the public service of New Zealand to whom any public money above the sum of £50 is payable, directly or indirectly (but not as a member of a registered company or incorporated body), in any one financial year. Under the Electoral Act public servants were prohibited from being elected, but this prohibition has been removed by the Political Disabilities Removal Act, 1936, which provided that if elected they immediately cease to be public servants.
The payment made to members of the House of Representatives is £450 per annum, subject to certain deductions for absence not due to sickness or other unavoidable cause. Travelling-expenses to and from Wellington at the opening and closing of each session are also allowed. The rate of payment for several years prior to 1920 was £300 per annum, but was increased in that year to £500, 10-percent. reductions, however, being made in 1922, 1931, and 1932, with restorations of 5 per cent. in 1934, 7½ per cent. in 1935, the rate being restored to £450—the 1922 level—from 1st July, 1936.
The election of a Speaker is the first business of a new House after the members have been sworn. A Chairman of Committees is elected as soon after as is convenient. Both Speaker and Chairman of Committees hold office until a dissolution, and receive payment until the first meeting of a new Parliament. The Speaker's remuneration is £900 per annum, plus sessional allowance of £100 and free sessional quarters, and that of the Chairman of Committees £675 per annum.
Twenty members, inclusive of the Speaker, constitute a quorum.
Since the abolition of plural voting in 1889 and the introduction of women's suffrage in 1893 every person twenty-one years of age or over has had the right to exercise a vote in the election of Members for the House of Representatives. To be registered as an elector a person must have resided for one year in the Dominion, and for three months in the electoral district for which he claims to vote. A system of compulsory registration of electors was introduced at the end of 1924.
There are, of course, slight exceptions to the foregoing, for, if a person is classified as one of the following, he or she is not entitled to register as an elector or to vote:—
An alien:
A mentally defective person:
A person convicted of an offence punishable by death or by imprisonment for one year or upwards within any part of His Majesty's dominions, or convicted in New Zealand as a public defaulter, or under the Police Offences Act, 1927, as an idle and disorderly person or as a rogue and vagabond, unless such offender has received a free pardon, or has undergone the sentence or punishment to which he was adjudged for such offence.
Maoris are qualified to vote only at elections of the four members representing the Maori race. A Maori half-caste may register on the roll of a European electoral district; and if so, may not then vote at an election of Maori members.
For the system of local-government administration a modified form of franchise exists, property qualification being necessary for the exercising of votes on financial issues.
Table of Contents
NEW ZEALAND was proclaimed a British Crown colony in 1840. Official statistical records of the country commenced with the following year, 1841, in the shape of reports compiled for the information of the Colonial Office, and known by immemorial custom as “Blue-books.” These reports, which continued until 1852, were prepared in manuscript form in triplicate, and consisted of a collection of tables, compiled by various Government authorities, and illustrating the work of their Departments.
Two factors retarded the development of the statistics of the blue-books: in the first place, they were not intended for general publication; secondly, there appeared a lack of co-ordination between the Departments furnishing the returns and the office collating and ultimately issuing them.
It was not long, however, before the need of authoritative statistics was felt both for present use and also as a record of the development of the country and its various provinces and settlements. Accordingly, in 1849, “Statistics of New Munster,” compiled under the superintendence of Alfred Domett, were printed by Order of the Legislative Council. Again, “Statistics of Nelson,” covering the period 1843–54, were issued in 1855. Various other publications were issued dealing with some individual province or settlement. In the year 1853 a constitution granted by the Imperial Parliament came into force, and from this date the fragmentary and inchoate statistical works find a new complexion. Five years later the Registrar-General, who had been entrusted with the task of compiling annually statistics of the whole colony, produced a volume dealing with the years 1853, 1854, 1855, and 1856.
One of the many ways in which statistics may be classified is as to source from which obtained, and in this respect they divide naturally into two classes—i.e., as to whether they are compiled from the records (obtained primarily for some other purpose) of a Government Department or other similar authority, or from data collected by questionnaire from individual persons, &c.
As indicated above, the statistics included in the early blue-books belong in the main to the first of these two categories. Certain items, however, notably population figures, would be more correctly placed in the second category, though the system of collection was exceedingly crude and the scope of inquiry very limited. As a matter of fact, the population figures prior to 1851 appear to have been compiled in each settlement by the local Resident Magistrate by the simple method of ascertaining from the head of each house the number of persons in the household. From such small beginnings, however, has grown the Dominion's present comprehensive system of collection of statistical data.
The proper collection of statistics from the public on the voluntary basis which appears to have existed in the “forties” could be maintained only with a very small population, and with the simplest of inquiries. With the increase of population and the desire to obtain fuller information than in the past, it was found advisable as early as 1851 to pass an Ordinance providing for the collection of statistics in the form of recurrent censuses.
Following the passing of the Census Ordinance of 1851 by the General Government, several of the provinces into which New Zealand was divided passed Census Ordinances of their own, the necessity for which is not apparent, as other provinces took censuses under the authority of the 1851 Ordinance.
This Ordinance gave way in 1858 to the Census Act of that year, which was amended in 1860, 1867, 1873, and 1876, and was in its turn repealed in 1877, when a new Act was passed, consolidating and extending the law relating to census-taking. The Act of 1877 was amended in 1880 and again in 1890; also, in effect, in 1895, when the Agricultural and Pastoral Statistics Act was passed, making provision for the annual collection of agricultural and pastoral statistics, which had formerly been collected quinquennially under the Census Act. In 1908 the Census Act and amendments and the Agricultural and Pastoral Statistics Act were consolidated in the Statistics Act, 1908, as part of the general consolidation of statutes. The Statistics Act, 1908, was replaced two years later by the Census and Statistics Act, 1910, which was amended in 1915 by the Census and Statistics Amendment Act of that year. The Act of 1910 was superseded by the Census and Statistics Act, 1926, which with slight amendments contains the present law on the subject of statistical inquiry.
Considerations of space prevent the tabulation of the various alterations to and extensions of statistical services involved in the foregoing enactments; but amendments to the legislative basis on which the Department is founded followed as a natural consequence of the growth of the world-wide realization of the importance and value of statistics.
The Census and Statistics Act, 1920, provides not only for the taking of the quinquennial population census, but also for the collection of statistical information under numerous specific heads, and contains a general authority to the Governor-General to extend the system of collection to cover any other items in respect of which statistical information may be found necessary or advisable.
The Census Postponement Act of 1930, an economy measure, dispensed with the statutory requirement that a census be taken in the year 1931. The first census under the 1926 Act was thus postponed until 1936, ten years distant in time from the previous census.
The early blue-books appear to have been compiled by the Colonial Secretary. After the granting of responsible government, the Registrar-General was entrusted with the collection of statistics, a function which he retained until 1910. The Census and Statistics Act, 1910, provided for the appointment of a Government Statistician, who has since been the authority charged with the administration of the Act. The 1910 Act laid down that the Government Statistician was to be an officer of the Registrar-General's Department, but this proviso was cancelled in 1915 by the amending Act of that year, whereupon the Census and Statistics Office came into existence as a separate branch of the Department of Internal Affairs. In 1931 the Office became a branch of the Department of Industries and Commerce, and in 1936 it was created a separate Department.
Ministerial control of the Census and Statistics Office was by the Census and Statistics Act, 1910, placed in the Minister of Internal Affairs. By the Finance Act (No. 2), 1931, the definition of “Minister” in the Census and Statistics Act was altered to mean the Minister of Industries and Commerce. From September, 1931, however, there has been a separate Minister in charge of Census and Statistics, and this position was given legislative recognition by section 45 of the Finance Act, 1936.
Until comparatively recent years there was very little statistical collection apart from the quinquennial census, the annual collection (on legislative authority) of the agricultural and pastoral statistics, the collection on a voluntary basis of returns of private schools, savings-banks, &c., and the obtaining of statistical information from other Government Departments. It should be noted, however, that the census was formerly the means used for the collection of certain data (as, for instance, concerning factory production), now obtained annually.
Since the passing of the Census and Statistics Act in 1910, and more especially since the formation of the Census and Statistics Office in 1915, the system of statistical collection has expanded considerably, not only in regard to the regular activities of the Department, but also for the obtaining of data required for some special purpose. During the war and post-war periods, for instance, the provisions of the Census and Statistics Act were utilized for the collection of information as to stocks, consumption, requirements, &c., of numerous commodities, including flour, wheat, oats, coal, oils, wire, iron, steel, copper, twine, turnip-seed, and medical requisites.
The range of subjects concerning which statistical data are regularly collected by the Census and Statistics Department is indicated by the following list:—
By direct questionnaire: Population census; agricultural and pastoral statistics (main collection); areas sown in wheat, oats, barley, and potatoes; threshings of wheat and oats; potato-yields (post-harvest collection); stocks of flour, wheat, and oats; detailed statistics of live-stock; stocks of wool; detailed statistics of commercial orchards; eggs and egg-pulp in cool store; factory production; electric tramways; electric power; fire insurance; life insurance; accident insurance; finances and loans of local-governing bodies; building-permits; building and constructional operations; forestation and plantation operations; building societies; port cargo statistics; banks of issue; private savings-banks; wholesale, retail, and share prices; private assignments; employment, short time, and overtime in factories; consumption and stocks of coal; hospital patients; benevolent institutions.
From or through other Government Departments in the form of individual returns, cards, &c.; Births; marriages; deaths; orphanhood; migration; inquests; civil and criminal cases in Courts; prisons; divorce; bankruptcy; port shipping returns; deceased persons' estates; sheep returns; State advances to local bodies; totalizator investments, &c.; deposits with building and investment societies and trading companies; incomes and income-tax; land transfers and mortgages; industrial disputes; industrial accidents; award rates of wages; and joint-stock companies.
The list quoted above refers only to sources of data from which both primary and secondary tabulations are made by the Census and Statistics Department. In addition to the sources mentioned, statistical returns compiled by other Government Departments—e.g., statistics of trade, public finance, &c., are utilized by the Census and Statistics Department for further analysis and for correlation with other branches of statistical inquiry.
When New Zealand ceased to be a Crown colony in 1853 the annual despatch of the blue-books to the Colonial Office in London was discontinued. During the next few years several volumes of statistical tables appeared, compiled by various Provincial Governments, and in 1858 the Registrar-General published a volume for the colony as a whole, covering the years 1853, 1854, 1855, and 1856. This volume was the first of a regular annual series which were issued with gradual expansion, formerly by the Registrar-General's Department, and from 1915 to 1920 by the Census and Statistics Office. As indicating the expansion of the country and of its statistical organization it may be mentioned that, while the statistics of the four years 1853–56 were contained in a single volume, the statistics for 1920, the last year of publication in the old form, occupied four volumes aggregating nearly 1,200 pages.
Closely allied to the annual volumes of Statistics were the volumes of Census Statistics which were regularly compiled and published after each census of New Zealand from 1858 to 1916, for the first four occasions as part of the Statistics, but later (commencing with 1871) as separate publications.
With each volume of Statistics, commencing with that for 1853–56, went a brief report on the statistics presented. Developing slowly at first, the ultimate result was a fairly comprehensive report on the statistics, not only those presented, but the whole statistics (so far as compiled) of the colony. A similar report on census matters was included in each volume of Census Statistics.
Parallel with the statistical reports came, in 1875, an issue of another type—“The Official Handbook of New Zealand, a Collection of Papers by Experienced Colonists on the Colony as a Whole, and on the Several Provinces,” edited by Julius Vogel, C.M.G. (afterwards Sir Julius Vogel, K.C.M.G.), at that time Premier of the colony. The purpose of this book differed from that of the statistical reports. Its aim was to give “a New Zealand view of New Zealand to those who may think of making the colony their homes or the theatre of business operations.” Its well-written articles, generously illustrated with woodcuts and photographs, made this early volume interesting reading. Printed in London, it was circulated largely in England.
In 1884 a new and revised edition of this handbook was compiled by Mr. William Gisborne, and edited by the Agent-General of the day (Mr. F. D. Bell, afterwards Sir Francis Bell). The purpose of this edition was similar to that of its predecessor, although in form it approximated more closely to the modern type.
Another example of a handbook composed for some special purpose was that of Dr. Hector, issued for the Melbourne International Exhibition of 1880.
By the year 1889 the annual report on the statistics had reached considerable proportions, and it was decided by the Registrar-General to issue it as a separate publication. He remarks in the preface to the 1889 volume of Statistics as follows: “The report has now reached about the size of the original Victorian Year-Book, and it has been deemed desirable to publish it in octavo size to make it more convenient for general reference.” A similar decision, it may be added, was made in regard to the quinquennial Census Report.
For 1889 and 1890 the Report on the Statistics was accordingly issued as a separate publication with several new features. The following year (1891) was a census year, and the place of the usual statistical report for that year was taken by a separate “Report on the Results of a Census of the Colony of New Zealand taken for the Night of the 5th April, 1891,” the first of a series of reports which have been published after each census since.
In 1892 the Report on the Statistics reappeared, remodelled and considerably enlarged, and under the title of the “New Zealand Official Handbook.” The Handbook achieved a very considerable success, and the Government gave instructions for the preparation annually of a similar volume, to be called the “New Zealand Official Year-Book.” The compilation remained in the hands of the Registrar-General until 1910, when on the passing of the Census and Statistics Act of that year the Year-Book and other statistical publications came under the control of the Government Statistician.
The demy octavo size adopted in 1889, when the Report on the Statistics was first issued as a separate publication, was retained for the Official Handbook, and, up to the 1920 number, for the Year-Book. This size, however, was not altogether satisfactory from the point of view of economy of space or for the display of tabular matter, and in the next issue gave way to the royal octavo size.
A change was also made at the same time in the year-number of the book. Formerly the book had been designated by the year of compilation, though in recent years it had not appeared until early in the following year. The book now bears the year of publication.
A new policy adopted in 1921 in regard to the publication of the Annual Statistics involved the reintroduction of the report to accompany the tabular matter. In lieu of presenting the statistics in one comprehensive publication, these now form the tabular matter for eight separate annual reports, each covering a definite branch of statistical inquiry, and including introductory and explanatory letterpress in addition to the tables.
A similar policy is also now followed in the case of the census results. In addition to the complete report published separately after the completion of the census tabulation, each volume of tables contains also an introductory discussion of the results disclosed.
The full list of the regular publications of the Census and Statistics Department is as follows:—
| Title. | Periodicity of Issue. |
|---|---|
| New Zealand Official Year-Book | Annual. |
| Annual Statistical Reports— | |
| Population and Buildings | Annual. |
| Vital Statistics | Annual. |
| Justice | Annual. |
| Trade and Shipping (Part I) | Annual. |
| Trade and Shipping (Part II) | Annual. |
| Agricultural and Pastoral Production | Annual. |
| Factory and Building Production | Annual. |
| Insurance | Annual. |
| Miscellaneous (Prices, Wage-rates and Hours of Labour, Unemployment, Industrial Accidents, Tramways, Banking, Building Societies, Bankruptcy, Commercial Afforestation, Incomes and Income-tax, Statistical Summary) | Annual. |
| Local Authorities Handbook of New Zealand | Annual. |
| Monthly Abstract of Statistics | Monthly. |
| Volumes of Census Results | Normally quin-quennial. |
| Published in New Zealand Gazette— | |
| Estimated Yields of Wheat, Oats, and Barley | Annual. |
| Estimated Areas under Wheat, Oats, Barley, and Potatoes | Annual. |
| Stocks—Flour, Wheat, and Oats | Annual. |
The principal publication of the Census and Statistics Department is the New Zealand Official Year-Book, which, as its title implies, is the official book of general reference on the different branches of the Dominion's activities and the various aspects of its social and economic characteristics and progress. Necessarily, much of the information given in the Year-Book is of a condensed character, owing to the wide range of subjects covered. The Local Authorities Handbook, the annual Statistical Reports, and the census publications contain much more detailed information on the particular subjects they deal with, while the Monthly Abstract of Statistics contains the latest statistical information available on a variety of subjects, giving monthly or quarterly figures in most cases, together with letterpress discussion on the principal features and articles presenting new annual matter as it becomes available.
The various publications of the Census and Statistics Department—notably the New Zealand Official Year-Book—contain summaries of statistical information collected from various governmental and other sources, as well as data compiled de novo by the Department.
The detailed publication of statistics in these volumes is, however, confined to the statistics actually compiled by the Census and Statistics Department, so that the list of publications contained under the preceding heading is by no means a complete bibliography of sources of statistical information. A wealth of statistical data is contained in the various departmental reports presented to Parliament, while other governmental and semi-governmental institutions regularly publish statistical matter illustrative of their activities.
The regular publication of original statistics by universities, private organizations, or firms is not developed in New Zealand to anything like the same extent as in some other countries, notably the United States of America, and it would appear that New Zealand as a nation is not statistically conscious. Reviews and interpretations of official and other statistics, however, find a place in several periodicals, the regular series of bulletins issued by the Canterbury Chamber of Commerce and the interpretations of official economic statistics included in the Journal of the Auckland Chamber of Commerce being notable examples.
Following are lists (not claimed to be exhaustive) of official and other publications of importance from a statistical point of view.
ANNUAL. PARLIAMENTARY PAPERS.
| Subject. | Report. | |
|---|---|---|
| Number. | Title. | |
* In four parts. | ||
| Meteorology, seismology, geological survey, &c. | H.–34 | Report of Scientific and Industrial Research Department. |
| Public health, hospitals, &c. | H.-31 | Report on Public Health. Hospitals, and Charitable Aid. |
| H.-7 | Report on Mental Hospitals. | |
| Education | E.-1 | Report of Minister of Education. |
| E.-2 | Report on Primary and Post-primary Education. | |
| E.-3 | Report on Education of Native Children. | |
| E.-4 | Report on Child Welfare, State Care of Children, Special Schools, and Infant-life Protection. | |
| E.-7 | Report on Higher Education. | |
| Justice | H.-16 | Report on Police Force. |
| H.-20 | Prisons Report. | |
| H.-20A | Report of Prisons Board. | |
| H.-20B | Report on Offenders' Probation. | |
| Defence | H.-19 | Report of General Officer Commanding. |
| H.-5 | Report on New Zealand Naval Forces. | |
| External trade | H.-44 | Report of Department of Industries and Commerce. |
| Shipping | H.-15 | Report of Marine Department. |
| Railways | D.-2 | Railways Statement. |
| D.-1 | Public Works Statement. | |
| Roads and road transport | D.-1 | Public Works Statement. |
| H.-40 | Report of Transport Department. | |
| Air transport | H.-40 | Report of Transport Department. |
| Postal and telegraphic | F.-1 | Report of Post and Telegraph Department. |
| Broadcasting | F.-3 | Report of Broadcasting Service. |
| F.-1 | Report of Post and Telegraph Department. | |
| Lands | H.-3 | Report of Land Transfer and Deeds Registration Department. |
| C.-1A | Report on Surveys. | |
| C.-4 | Report on Swamp Drainage. | |
| C.-6 | Report on Scenery Preservation. | |
| C.-8 | Report on Drainage Operations in Hauraki Plains. | |
| Crown lands | C.-1 | Report on Settlement of Crown Lands. |
| C.-5 | Report on Land for Settlements Act. | |
| C.-9 | Report on Discharged Soldiers' Settlement. | |
| C.-14 | Report on National Endowments. | |
| Native lands | G.-9 | Report on Native Land Courts, &c. |
| G.-3, 4 | Accounts of East Coast Native Trust Lands. | |
| G.-10 | Report of Board of Native Affairs. | |
| Agricultural and pastoral production | H.-29 | Report of Department of Agriculture. |
| H.-23 | Annual Sheep Returns. | |
| H.-34 | Report of Scientific and Industrial Research Department. | |
| Forestry | C.-3 | Report of State Forest Service. |
| C.-12 | Report on Kauri-gum Industry. | |
| Fisheries | H.-15 | Report of Marine Department. |
| H.-22 | Report of Internal Affairs Department. | |
| Mining | C.-2 | Mines Statement. |
| C-2A | Report on State Coal-mines. | |
| C.-12 | Report on Kauri-gum Industry. | |
| H.-34 | Report of Scientific and Industrial Research Department. | |
| Factory production | H.-44 | Report of Department of Industries and Commerce. |
| Public finance | B.-1* | Public Accounts. |
| B.-2 | Report and Accounts of Public Debt Commission. | |
| B.-6 | Financial Statement (Budget). | |
| B.-7 | Appropriations chargeable on Consolidated Fund and other Accounts. | |
| B.-7A | Appropriations chargeable on Public Works Fund. | |
| B.-10 | Public Securities held. | |
| D.-1 | Public Works Statement. | |
| State advances | B.-13 | Report of State Advances Corporation. |
| B.-14 | Report of Rural Intermediate Credit Board. | |
| Pensions | H.-18 | Report of Pensions Department. |
| Superannuation | H.-26 | Report of Public Service Superannuation Board. |
| E.-8 | Report on Teachers' Superannuation Fund. | |
| D.-5 | Report on Government Railways Superannuation Fund. | |
| National Provident Fund | H.-17 | Report of National Provident Fund Board. |
| Local bodies | H.-22 | Report of Internal Affairs Department. |
| Banking | B.-15 | Balance-sheet of Bank of New Zealand. |
| B.-16 | Report of the Reserve Bank of New Zealand. | |
| F.-1 | Report of Post and Telegraph Department. | |
| Insurance | H.-8 | Report of Government Insurance Commissioner. |
| H.-6 | Report of State Fire Insurance Office. | |
| H.-6A | Report of Accident Insurance Branch of the State Fire Insurance Office. | |
| H.-12 | Report on Fire Brigades. | |
| Friendly societies | H.-1 | Report of Registrar of Friendly Societies. |
| Trade-unions | H.-11 | Report of Labour Department. |
| Unemployment | H.-11 | Report of Labour Department. |
| Industrial disputes | H.-11 | Report of Labour Department. |
| Industrial accidents | H.-11 | Report of Labour Department. |
| D.-2 | Railways Statement. | |
| C.-2 | Mines Statement. | |
| Electric-power | D.-1 | Public Works Statement. |
| Public Trust Office | B.-9, 9A | Report and Accounts of the Public Trust Office. |
| Patents, designs, and trademarks | H.-10 | Report of Commissioner of Patents, &c. |
| Inspection of machinery | H.-15 | Report of Marine Department. |
| Dependencies | A.-3 | Report on Cook Islands. |
| A.-4 | Report on Western Samoa. | |
| A.-6 | Report on Niue Island. | |
| Public Service | H.-14 | Report of Public Service Commissioners. |
RECENT SPECIAL REPORTS OF STATISTICAL INTEREST PRESENTED TO PARLIAMENT.
| 1932. | |
| B.-3 | Report of the Economic Committee. |
| B.-4 and 4A | Report of the National Expenditure Commission. |
| 1933. | |
| A.-6 | Statement on the (World) Monetary and Economic Conference, London. |
| 1934. | |
| B.-3 | Report of the Monetary Committee. (NOTE.—A separate appendix contains evidence heard by and statements presented to the Committee.) |
| H.-28 | Report of Tariff Commission. |
| H.–28A | Statement on Customs Tariff. |
| H.-30 | Report of Dairy Industry Commission. |
| 1935. | |
| H.-30 | Report of Departmental Committee on National Compulsory Super-annuation and Health Insurance. |
| I.-13A | Report on Commercial Trusts Amendment Bill by Industries and Commerce Committee, together with Minutes of Evidence. |
| 1936. | |
| H.-33A | Voting at General Election, 1935. |
| H.-33B | Voting at Local Option and National Prohibition Polls, 1935. |
| H.-44A | Report on Cook Islands Fruit Industry. |
A list of regularly issued reports, periodicals, &c., containing original statistical data, follows:—
| Subject. | Title of Publication. | Periodicity of Issue. | Produced by or under Authority of. |
|---|---|---|---|
| Meteorology, seismology, geological survey, &c. | Meteorological Observations | Annual | Department of Scientific and Industrial Research. |
| New Zealand Journal of Science and Technology | Monthly | Department of Scientific and Industrial Research. | |
| New Zealand Journal of Agriculture | Monthly | Department of Agriculture. | |
| Public-health, hospitals, &c. | Appendix to the Annual Report of the Department of Health | Annual | Department of Health. |
| External trade | News Bulletin | Periodically | Department of Industries and Commerce. |
| Quarterly Bulletin | Quarterly | Department of Industries and Commerce. | |
| Agricultural and pastoral production | New Zealand Journal of Agriculture | Monthly | Department of Agriculture. |
| New Zealand Journal of Science and Technology | Monthly | Department of Scientific and Industrial Research. | |
| Report of New Zealand Dairy Board | Annual | New Zealand Dairy Board. | |
| Report of New Zealand Meat-producers Board | Annual | New Zealand Meat-producers Board. | |
| Report of New Zealand Fruit-export Control Board | Annual | New Zealand Fruit-export Control Board. | |
| Dalgety's Wool Review for Australia and New Zealand | Annual | Dalgety and Co., Ltd. | |
| Produce Notes | Monthly | Economic Section, Department of Agriculture. | |
| Annual Review | Annual | Pyne, Gould, and Guinness, Ltd. | |
| Public finance | Abstract of the Revenue and Expenditure of the Public Account | Quarterly | Supplement to the New Zealand Gazette. |
| Prices, &c. | Dairy Produce Circular | Weekly | Primary Products Marketing Department. |
| New Zealand Meat-producers Board Press Communique | Weekly | New Zealand Meat-producers Board. | |
| Meat and Wool | Monthly | New Zealand Pastoral and Stud Stock Industries. | |
| Official Record of the Stock Exchange of New Zealand | Monthly | Stock Exchange Association of New Zealand. | |
| Dependencies | Trade, Commerce, and Shipping of the Territory of Western Samoa | Annual | Collector of Customs, Samoa. |
| General | New Zealand in a Nutshell—Facts and Figures | Annual | Department of Industries and Commerce, Tourist and Publicity. |
| New Zealand Gazette.— | |||
| Assets and Liabilities of Reserve Bank | Weekly. | ||
| Assets and Liabilities of Trading Banks. | Monthly. | ||
| Abstract of Railways Working Account | Four-weekly. |
Table of Contents
POPULATION censuses were taken during 1936 in New Zealand and in all its inhabited dependencies. For New Zealand proper the census related to the night of Tuesday, 24th March, 1936, and recorded a total of 1,573,810, inclusive of 82,326 Maoris. The annexed Kermadec Islands had a population of 2. For the Cook Islands and Niue Island the effective date of the census was 30th April, 1936, and the population was 16,350 (Cook Islands, 12,246; Niue Island, 4,104). The Tokelau Islands, where a census was taken by the Western Samoan Administration for 4th November, 1936, had a population of 1,170. The same date was selected by the Administration for its census of Western Samoa, the population being recorded as 55,946. All the outlying islands (vide page 1) are uninhabited at present, as is also the huge Ross Dependency situated in Antarctic regions. The total population of New Zealand and dependencies at the 1936 censuses was, therefore, 1,047,278.
Further 1936 census figures will be found later in this section or in other portions of this volume, but for details it will be necessary to refer to the census volumes published separately. The following summary gives, where available, figures more recent than those of the census.
| — | Date. | Males. | Females. | Total. |
|---|---|---|---|---|
* Not available. | ||||
| New Zealand proper (exclusive of Maoris) | 31 Mar., 1937 | 762,111 | 740,626 | 1,502,737 |
| Maoris | 31 Mar., 1937 | 43,900 | 40,574 | 84,474 |
| Totals, New Zealand proper | 31 Mar., 1937 | 806,011 | 781,200 | 1,587,211 |
| Kermadec Islands | 31 Mar., 1937 | 7 | 7 | |
| Cook Islands and Niue | Census, 1936 | 8,367 | 7,983 | 16,350 |
| Tokelau Islands | Census, 1936 | 568 | 602 | 1,170 |
| Mandated Territory of Western Samoa | Census, 1936 | * | * | 55,946 |
| Total | 1,660,684 | |||
In common with almost all countries, the chief instrument in compiling population data in New Zealand is the census, which in this country is taken quinquennially. The minutiæ of the distribution of population, together with analyses of various population characteristics, compiled from census data will be found in the official publications compiled after each census.
The basis adopted for the census, and virtually throughout population statistics in New Zealand, is that of the population present, which may be defined as the population present at the place of enumeration and at the time of the enumeration.
Intercensal figures of total population are based on the customary equation:—Population = Population (census) + Births and immigration — Deaths and emigration.
The comparative shortness of the interval between the census enumerations, combined with New Zealand's insular position and the completeness of her registration system, prevents serious intercensal errors in statements of the total population of New Zealand. Paucity of data regarding internal movements of population permits of occasional significant errors in the estimates of the population of towns, provincial districts, &c. Though such errors rarely attained serious dimensions prior to the last decade, the omission of the 1931 census, combined with the disturbance of population resulting from the unprecedented economic depression, inevitably resulted in more significant errors during this period.
The fact that all migration to and from the Dominion must be waterborne over lengthy distances, and that it centres in a few ports, facilitates the compilation of accurate statistics of external migration. Records of passenger traffic by sea and air between the North and South Islands are also maintained.
Residents of the Cook Islands, Niue, Western Samoa, and the Tokelau Group are not included in the population statistics quoted throughout this section, except in the first table. Further information will be found in the section relating to dependencies.
Separate statistics of the Maori population are given towards the end of this section
The outstanding note of the history of population movement in New Zealand is that of unbroken growth. That it has not been invariably regular is well attested by the accompanying table, and by the fifty years' record shown in the later section of this edition entitled “Statistical Summary.”
| Date of Census. | Population (excluding Maoris). | Numerical Increase. | Percentage Increase. | Average Annual Percentage Increase. |
|---|---|---|---|---|
* See letterpress. NOTE.—The census due to be taken in 1931 and proclaimed for 21st April of that year was abandoned owing to financial stringency. | ||||
| December, 1851 | 26,707 | |||
| December, 1858 | 59,413 | 32,706 | 122.46 | 12.14 |
| December, 1861 | 99,021 | 39,608 | 66.67 | 18.70 |
| December, 1864 | 172,158 | 73,137 | 73.86 | 20.54 |
| December, 1867 | 218,668 | 46,510 | 27.02 | 8.15 |
| February, 1871 | 256,393 | 37,725 | 17.25 | 5.11 |
| March, 1874 | 299,514 | 43,121 | 16.82 | 5.32 |
| March, 1878 | 414,412 | 114,898 | 38.36 | 8.43 |
| April, 1881 | 489,933 | 75,521 | 18.22 | 5.58 |
| March, 1886* | 576,524 | 86,591 | 17.67 | 3.32 |
| April, 1891 | 624,474 | 47,950 | 8.32 | 1.60 |
| April, 1896 | 701,101 | 76,627 | 12.27 | 2.33 |
| March, 1901 | 770,312 | 69,211 | 9.87 | 1.91 |
| April, 1906 | 886,000 | 115,688 | 15.02 | 2.79 |
| April, 1911 | 1,005,589 | 119,589 | 13.50 | 2.60 |
| October, 1916 | 1,096,228 | 90,639 | 9.01 | 1.57 |
| April, 1921 | 1,214,677 | 118,449 | 10.81 | 2.31 |
| April, 1926 | 1,344,469 | 129,792 | 10.69 | 2.05 |
| March, 1936 | 1,491,484 | 147,015 | 10.93 | 1.05 |
Commencing with the 1926 census all half-caste European-Maoris were included with the Native population in lieu of the previous practice of treating as Europeans such half-castes as were living in European fashion, and as Maoris those half-castes who were living in Native fashion. The figures in the above table have been corrected from 1886 onwards, to accord with the present practice. Lack of data prevents adjustment for years prior to 1886. The increase from 1881 to 1886 is, therefore, very slightly understated.
The “European” population now looks in retrospect down a vista of well over one hundred years. At the opening of the nineteenth century there existed a more or less fluctuating population of perhaps one hundred; by 1839 it had swelled to a total of about a thousand whalers, sealers, traders, missionaries, adventurers and settlers. Activities of the colonizing companies and societies in the “forties” brought rapid changes and swiftly rising numbers, to be enhanced in the “sixties” by the gold rushes of the period.
The most significant period is possibly that of the “seventies,” marked by a vigorous developmental policy of public works and assisted immigration. The record year 1874, which saw a rise in population of 46,000 (including 32,000 assisted immigrants), was, and still is, the high-water mark of population gains. Both 1874 and 1875 showed a ratio of growth far in advance of any level subsequently attained.
In the late “eighties” and early “nineties” came economic depression and, consequently, comparative stagnation in population. In the four “March” years 1887–88, 1888–89, 1890–91, and 1891–92, and also in 1927–28 emigrants exceeded immigrants, these being the only such occasions in the history of the country, until the recent depression, when departures exceeded arrivals in 1931–32 and subsequent “March” years. The exodus during 1936–37 was very small (an excess of 353 departures) and may be attributed to persons proceeding to England for the Coronation.
From the middle “nineties” rising world prices and the new frozen-meat trade brought a return of prosperity and moderate, but steady, increase of population. Development of secondary industries and the remarkable expansion of dairying provided an economic foundation for increasing numbers.
The average annual population increment during the ten immediate post-war years exceeded 30,000, while for the next eight years the average per annum was under 13,000. Apart from war years, which were affected by movements of troops, the year 1934–35 showed the lowest absolute increase since 1891, and the lowest relative increase ever recorded. Some improvement, however, has been recorded during 1935–36 and 1936–37.
Up to the “seventies” New Zealand was dependent on migration for the greater portion of her increase of population, but since then natural increase—i.e., excess of births over deaths—has been the principal factor.
A table is appended showing for each five-yearly period from 1861 the excess of births over deaths and of immigration over emigration. Maoris are not included, nor, prior to 1921, are crews of vessels. Figures for years later than 1920 have not been adjusted consequent upon the censuses. While there thus exist discrepancies with total population increases given elsewhere, such discrepancies do not impair the use of the table.
| Period. | Excess of Births over Deaths. | Excess of Arrivals over Departures. | Total Increase. | ||||||
|---|---|---|---|---|---|---|---|---|---|
| Males. | Females. | Both Sexes. | Males. | Females. | Both Sexes. | Males. | Females. | Both Sexes. | |
* Decrease. † Departure and return of troops of Expeditionary Force not included in migration figures. | |||||||||
| 1861–65 | 7,625 | 8,985 | 16,610 | 63,285 | 29,884 | 93,169 | 70,910 | 38,869 | 109,779 |
| 1866–70 | 15,663 | 17,779 | 33,442 | 11,167 | 9,369 | 20,536 | 26,830 | 27,148 | 53,978 |
| 1871–75 | 19,409 | 21,129 | 40,538 | 46,501 | 35,445 | 81,946 | 65,910 | 56,574 | 122,484 |
| 1876–80 | 30,143 | 32,808 | 62,951 | 31,870 | 22,917 | 54,787 | 62,013 | 55,725 | 117,738 |
| 1881–85 | 32,362 | 35,046 | 67,408 | 15,958 | 13,001 | 28,959 | 18,320 | 48,047 | 96,367 |
| 1886–90 | 30,781 | 33,544 | 64,325 | -4,911* | -3,791* | -8,702* | 25,870 | 29,753 | 55,623 |
| 1891–95 | 27,255 | 30,630 | 57,885 | 9,917 | 5,403 | 15,320 | 37,172 | 36,033 | 73,205 |
| 1890–1900 | 28,097 | 31,437 | 59,534 | 7,320 | 3,318 | 10,638 | 35,417 | 34,755 | 70,172 |
| 1901–05 | 32,515 | 36,223 | 68,738 | 31,223 | 14,223 | 45,446 | 63,738 | 50,446 | 114,184 |
| 1900–10 | 38,681 | 43,067 | 81,748 | 25,454 | 15,512 | 40,966 | 64,135 | 58,579 | 122,714 |
| 1911–15† | 42,323 | 46,682 | 89,005 | 1,356 | 17,905 | 35,561 | 59,979 | 64,587 | 124,566 |
| 1916–20† | 35,248 | 41,359 | 76,607 | 6,979 | 7,875 | 14,854 | 42,227 | 49,234 | 91,461 |
| 1921–25 | 41,876 | 44,868 | 86,744 | 26,732 | 23,256 | 49,988 | 68,608 | 68,124 | 136,732 |
| 1926–30 | 36,886 | 40,456 | 77,342 | 14,758 | 9,869 | 24,627 | 51,644 | 50,325 | 101,969 |
| 1931–35 | 30,715 | 33,237 | 63,952 | -5,256* | -4,662*, | -9,918* | 25,459 | 28,575 | 54,034 |
| 1936 | 5,458 | 6,323 | 11,781 | 499 | -273 | 226 | 5,957 | 6,050 | 12,007 |
| Totals, 1861–1936 | 455,037 | 503,573 | 958,610 | 299,152 | 199,251 | 498,403 | 754,189 | 702,824 | 1,457,013 |
The table shows clearly the irregularity of the migration increase and the comparative steadiness of the natural increase. With a stable birth-rate the natural increase would show mounting numbers, whereas actually the peak occurred in 1911–15 and the shrinking birth-rate has reduced numbers accruing from this source.
The trend of population movement in past decades has been in the direction of a decline in the rate of population increase, the decline quickening in recent years. There appears no indication at present of any radical alteration in the trend, and it has become of the greatest moment to consider, in general terms at least, what a continuance of this trend would mean. Baldly stated, it implies that New Zealand is facing at only a few years' distance the possibility of a stationary, and even of a declining population. Remarks under this head apply, it should be observed, to population other than Maori.
This prospect would present entirely novel features to New Zealand, where unbroken growth has been recorded in every year from the settlement of 1840. There have been, it is true, variations in the rate of increase—for example, from the high levels of the gold rushes in the “sixties” and the assisted immigration and public-works measures of the “seventies” to the lower strata reached in the depression-caused outflow of 1888–91—yet the numbers of the population at the end of the year have always been some thousands, at least, in excess of those at the year's beginning.
It is inevitable that much of the economy of New Zealand has been planned on the assumption of steadily increasing numbers, and it is unnecessary to indicate the vast and widespread effect of the removal of the “safety-valve” which continued growth affords. A secondary yet highly important factor is the redistribution of the population in major age divisions.
Apart from the question of annexation of territory, or alteration of nationality, or other laws affecting the determination of population, there are only two sources from which increase in the population of the State is possible—viz., excess of births over deaths (natural increase) and excess of overseas arrivals over departures (net migration increase). Except in the earliest stages of a country's development, or in exceptional circumstances—such as those of the recent vast immigration of Chinese into Manchuria—the former is naturally the more important source. It is also, for numerous reasons, the more desirable source. Since 1875, three-fourths of the increase in New Zealand's population (other than Maori) has come from excess of births over deaths, and one-fourth from the net migration increase.
The natural-increase ratio was formerly unusually high in New Zealand, the annual average, for instance, reaching 29.41 per 1,000 of mean population in the quinquennium 1876–80 (see subsection relating to “Births”). Comparison with the 1936 figure of 7.89 per 1,000 is sufficiently striking. The erstwhile favourable ratio of natural increase in New Zealand was due to its exceptionally low death-rate, now and for very many years the lowest in the world. It is out of the question to expect further considerable fails in the death-rate; in fact, with the less favourable age-constitution of the population a potential rise must be envisaged.
The nominal natural-increase ratio of the past year (7.89 per 1,000 of mean population in 1936) gives the impression of a still substantial margin of increase in population. While this is correct in one sense, it yet obscures the more important aspect, which is that the proportions at reproductive ages are not being maintained. Based on expectation-of-life figures calculated for 1931, an “equilibrium” birth-rate of over 15 per 1,000 of mean population is required to maintain even a stationary population, and should the death-rate increase a higher birth-rate would be necessary. It is clear that even the nominal margin of increase is precariously low, and will vanish in a few years if the present trend continues. With economic improvement during 1936 there has come a small rise in the birth-rate; it remains to be seen whether this heralds a substantial recovery during the next few years. Calculations by the Kuczynski technique, using the female population and female births of the year 1936, give a gross reproductive rate of 1.044, which on the basis of a life-table compiled for the year 1931, reduces to a net reproduction rate of 0.967. The position is thus that in 1936 the rate of reproduction was insufficient to maintain the population at its 1936 level.
That the net migration has during 1931–35 been a debit to the population does not in itself appear of great significance, but would seem to have been a temporary phase associated with unfavourable economic conditions. A similar reversal of the normal trend in migration occurred during the years 1888–91—a depression period. The calendar year 1936 shows a small surplus of arrivals. The question of the resumption of immigration has many problems which need not be discussed here. No serious attempt has ever been made to calculate an “optimum” population for New Zealand. It is not, in fact, practicable within the limits of our present knowledge. It is, however, a very generally accepted proposition that New Zealand can ultimately maintain with benefit a considerably larger population than she has at present. Concepts are necessarily either vague or without serious foundation: a common tendency, particularly of those who work from the dubious territory of comparisons of population and gross area, is to exaggerate the potential population capacity.
In the past the population of New Zealand has been derived almost wholly from the British Isles, whether directly or indirectly, and upon resumption of immigration the same preferences would undoubtedly exist. It has, however, become clear that this source of recruitment of additional population—upon anything over a small scale—may within a few years be no longer available.
In Britain, as in New Zealand and, indeed, in many other countries, the rate of growth of population has slackened, and, unless some drastic changes in migration occur, a declining population is imminent. Statisticians agree that, subject to certain qualifications, the population of England and Wales is now almost at its peak and must decline. One authority* places the population of England and Wales in 1976 as 28,500,000 (it is now 40,900,000); another† has placed the 1976 figure several millions in excess of the former estimate. These estimates are admittedly subject to the maintenance of certain conditions, and long-term forecasts of population indeed serve only limited purposes. That the population of England, however, will decline in the near future, possibly to a considerable extent, seems inevitable. The consequences to New Zealand, both from the viewpoint of a failure as a recruiting source of population (for migration from England is probably unlikely to receive encouragement if the population falls) and from that of declining consumption by the principal export customer of New Zealand, are sufficiently obvious in their more immediate implications.
The following table is interesting as showing the early excess of males and the gradual equalization of the sexes in New Zealand. The figures quoted are exclusive of Maoris, and have not been adjusted as has the second table in this section.
| Census Year. | Males. | Females. | Females to 1,000 Males. |
|---|---|---|---|
| 1861 | 61,062 | 37,959 | 622 |
| 1871 | 150,356 | 106,037 | 705 |
| 1881 | 269,605 | 220,328 | 817 |
| 1891 | 332,877 | 293,781 | 883 |
| 1901 | 405,992 | 366,727 | 903 |
| 1911 | 531,910 | 476,558 | 896 |
| 1916 | 551,775 | 547,674 | 993 |
| 1921 | 623,243 | 595,670 | 956 |
| 1926 | 686,384 | 658,085 | 959 |
| 1936 | 756,226 | 735,258 | 972 |
The preponderance of males in the early years of New Zealand was doubtless due to the fact that the difficulties of pioneering and the remoteness of the country from Europe were such as to deter female immigration to a greater extent than male. This was accentuated by the character of the early industries. Gold-mining and coal-mining, for instance, would attract large numbers of men but few women. The effect of this early preponderance of males no doubt still exists, but in an ever-diminishing degree, its gradual elimination being effected by the passing of the earlier settlers.
*Dr. G. Leybourne.
† Dr. E. C. Snow.
Of the two sources from which the Dominion's population has been recruited—viz., migration and natural increase—the effect of the former has hitherto been to give in the aggregate a considerable preponderance of males, and of the latter to give a regular preponderance of females. In the period 1921–36 the gain through external migration provided 8,500 more males than females; hut in the same period natural increase was responsible for 20,000 more females than males. The surplus of males at present, exclusive of the Native population, is 21,485.
As already noted, the intercensal statements of total Dominion population prepared from the records of vital statistics and of external migration have been by virtue of the favourable position of the Dominion in this respect relatively accurate, and the 1936 census results have afforded a further demonstration of this. The same degree of accuracy does not persist, however, for Maori and European elements. Results for the censuses of 1921 and 1926 suggested that numbers of Maori-European children of at least half Maori blood have been counted in birth statistics as Europeans. In consequence, the Maori population had been slightly understated, and the European population overstated to a corresponding degree. The 1936 census results afforded further support to this view. Accordingly the statements of population at intercensal dates, 1921–36, have been revised and the four tables following give revised figures. For fuller details of revised statements (including the annual estimates of population of towns, provincial districts, &c.) reference should be made to the 1936–37 edition of the annual “Statistical Report on Population and Buildings.”
| Year ended 31st March, | Population (excluding Maoris) at End of Year. | Increase during Year. | Mean Population for Year. | |||
|---|---|---|---|---|---|---|
| Males. | Females. | Total. | Numerical. | Per Cent. | ||
| 1926 | 690,870 | 660,982 | 1,351,852 | 28,767 | 2.17 | 1,334,959 |
| 1927 | 701,294 | 672,004 | 1,373,298 | 21,446 | 1.59 | 1,357,248 |
| 1928 | 707,608 | 680,196 | 1,387,804 | 14,506 | 1.06 | 1,378,134 |
| 1929 | 715,238 | 688,379 | 1,403,617 | 15,833 | 1.14 | 1,393,606 |
| 1930 | 723,058 | 696,728 | 1,419,786 | 16,169 | 1.15 | 1,409,031 |
| 1931 | 733,565 | 706,941 | 1,440,506 | 20,720 | 1.46 | 1,428,127 |
| 1932 | 739,378 | 713,101 | 1,452,479 | 11,973 | 0.83 | 1,445,804 |
| 1933 | 743,474 | 719,223 | 1,462,697 | 10,218 | 0.70 | 1,455,943 |
| 1934 | 747,614 | 724,828 | 1,472,442 | 9,745 | 0.65 | 1,466,149 |
| 1935 | 751,641 | 729,373 | 1,481,014 | 8,572 | 0.58 | 1,475,487 |
| 1936 | 756,417 | 735,143 | 1,491,560 | 10,546 | 0.71 | 1,484,106 |
| 1937 | 762,111 | 740,620 | 1,502,737 | 11,177 | 0.75 | 1,495,335 |
As population figures for the calendar year are in demand for numerous purposes, figures are given also for years ending 31st December.
| Calendar Year. | Population (excluding Maoris) at End of Year. | Increase during Year. | Mean Population for Year. | |||
|---|---|---|---|---|---|---|
| Males. | Females. | Total. | Numerical. | Per Cent. | ||
| 1926 | 696,753 | 668,328 | 1,365,081 | 21,323 | 1.59 | 1,351,901 |
| 1927 | 706,168 | 678,449 | 1,384,617 | 19,530 | 1.43 | 1,373,879 |
| 1928 | 713,608 | 686,632 | 1,400,240 | 15,623 | 1.13 | 1,389,676 |
| 1929 | 721,891 | 695,343 | 1,417,234 | 16,994 | 1.21 | 1,405,485 |
| 1930 | 731,109 | 705,002 | 1,436,111 | 18,877 | 1.33 | 1,423,178 |
| 1931 | 737,889 | 712,282 | 1,450,171 | 14,060 | 0.98 | 1,442,550 |
| 1932 | 742,116 | 717,890 | 1,460,006 | 9,835 | 0.68 | 1,453,436 |
| 1933 | 746,330 | 723,678 | 1,470,008 | 10,002 | 0.69 | 1,463,680 |
| 1934 | 750,745 | 728,244 | 1,478,989 | 8,981 | 0.61 | 1,473,293 |
| 1935 | 754,168 | 733,737 | 1,487,905 | 8,916 | 0.60 | 1,481,674 |
| 1936 | 760,667 | 739,991 | 1,500,658 | 12,753 | 0.86 | 1,492,344 |
The figures given in the two preceding tables show the population exclusive of Maoris. The following table shows the population inclusive of Maoris:—
| — | Population (including Maoris) at End of Year. | Mean Population for Year. | ||
|---|---|---|---|---|
| Males. | Females. | Total. | ||
| Years ended 31st March. | ||||
| 1927 | 735,162 | 702,970 | 1,438,132 | 1,420,838 |
| 1928 | 742,044 | 711,777 | 1,453,821 | 1,443,551 |
| 1929 | 750,446 | 720,664 | 1,471,110 | 1,460,363 |
| 1930 | 759,259 | 729,944 | 1,489,203 | 1,478,027 |
| 1931 | 770,611 | 741,089 | 1,511,700 | 1,498,416 |
| 1932 | 777,369 | 748,176 | 1,525,545 | 1,517,940 |
| 1933 | 782,622 | 755,406 | 1,538,028 | 1,530,119 |
| 1934 | 787,965 | 762,160 | 1,550,125 | 1,542,651 |
| 1935 | 793,221 | 767,771 | 1,560,992 | 1,554,297 |
| 1936 | 799,303 | 774,624 | 1,573,927 | 1,565,263 |
| 1937 | 806,011 | 781,200 | 1,587,211 | 1,578,757 |
| Years ended 31st December. | ||||
| 1920 | 730,471 | 699,198 | 1,429,669 | 1,413,743 |
| 1927 | 740,474 | 709,882 | 1,450,356 | 1,439,004 |
| 1928 | 748,641 | 718,729 | 1,467,370 | 1,456,075 |
| 1929 | 757,830 | 728,304 | 1,486,134 | 1,473,419 |
| 1930 | 767,910 | 738,899 | 1,506,809 | 1,493,019 |
| 1931 | 775,648 | 747,114 | 1,522,762 | 1,514,215 |
| 1932 | 780,934 | 753,801 | 1,534,735 | 1,527,062 |
| 1933 | 786,374 | 760,750 | 1,547,124 | 1,539,590 |
| 1934 | 791,997 | 766,376 | 1,558,373 | 1,551,532 |
| 1935 | 796,732 | 772,957 | 1,569,689 | 1,562,233 |
| 1936 | 804,304 | 780,313 | 1,584,617 | 1,575,231 |
Statistics of external migration have been recorded in New Zealand since 1860. Since 1st April, 1921, they have been compiled from individual statements obtained from each person entering or leaving the Dominion.
Commencing with the year 1933–34, the year ending 31st March has been adopted as a standard for the statistical expression of external migration in place of the calendar year formerly in use. The principal reason for the change is the avoidance of the partition of a season's migration movement into two statistical years as was inevitable with the calendar year ending in the middle of the summer flow of tourists and immigrants.
Including crews of vessels, 88,872 persons from overseas arrived in New Zealand during the year ended 31st March, 1937, which, compared with 1935–36, shows an increase of 7,387. During the same period 89,292 persons departed. This figure, compared with the corresponding one for 1935–36, shows an increase of 6,639.
In addition to the above, there were also 9,861 “through passengers” who called at a port of New Zealand en route to their destination, and 5,949 “tourists on cruising liners.” These latter, as the term indicates, were persons who visited New Zealand in the course of a cruise, the length of stay being only a few days.
Migration in 1936–37, therefore, continued to show an excess of departures, the excess amounting to 420 as compared with 1,168 in 1935–36. A considerable portion of the exodus towards the end of 1936—37 was undoubtedly due to the Coronation ceremonies in England.
The numbers of arrivals and departures during the last ten years are given in the table following. Crews of vessels, through passengers, and tourists on cruising liners have not been taken into account in this table.
| Year ended 31st March. | Arrivals. | Departures. | Excess of Arrivals over Departures. | ||||
|---|---|---|---|---|---|---|---|
| Males. | Females. | Total. | Males. | Females. | Total. | ||
* Excess of depart urea. | |||||||
| 1928 | 19,453 | 16,384 | 35,837 | 20,718 | 16,354 | 37,072 | -1,235* |
| 1929 | 18,784 | 16,015 | 34,799 | 18,335 | 15,753 | 34,088 | 711 |
| 1930 | 18,515 | 15,324 | 33,839 | 16,803 | 14,651 | 31,454 | 2,385 |
| 1931 | 16,718 | 14,023 | 30,741 | 13,980 | 11,652 | 25,632 | 5,109 |
| 1932 | 9,696 | 8,195 | 17,891 | 11,800 | 9,263 | 21,063 | -3,172* |
| 1933 | 9,760 | 8,953 | 18,713 | 11,663 | 9,645 | 21,308 | -2,595* |
| 1934 | 10,045 | 9,642 | 19,687 | 11,401 | 10,621 | 22,022 | -2,335* |
| 1935 | 12,655 | 12,246 | 24,901 | 14,080 | 13,971 | 28,051 | -3,150* |
| 1936 | 13,375 | 13,561 | 26,936 | 13,826 | 14,224 | 28,050 | -1,114* |
| 1937 | 16,041 | 15,629 | 31,670 | 15,547 | 16,476 | 32,023 | -353* |
The excess of “crew” arrivals over “crew” departures, neither of which are included above, provides an annual increment of several hundred to the population of New Zealand.
The monthly figures for 1935–36 and 1936–37 are as follows, the excess of passenger arrivals or of passenger departures for each month being also shown:—
| Month. | Arrival. | Departures | Excess of Arrivals. | Excess of Departures. | ||||
|---|---|---|---|---|---|---|---|---|
| 1935–36. | 1936–37. | 1635–36. | 1936–37. | 1935–36. | 1936–37. | 1935–36. | 1936–37. | |
| April | 2,042 | 1,747 | 3,201 | 2,991 | 1,159 | 1,244 | ||
| May | 1,410 | 1,621 | 2,660 | 3,160 | 1,250 | 1,539 | ||
| June | 1,142 | 1,364 | 1,779 | 2,073 | 637 | 709 | ||
| July | 1,625 | 1,886 | 2,179 | 1,928 | 554 | 42 | ||
| August | 1,400 | 2,171 | 1,564 | 1,848 | 323 | 164 | ||
| September | 2,151 | 2,416 | 1,449 | 1,786 | 702 | 630 | ||
| October | 2,317 | 2,862 | 1,663 | 2,229 | 654 | 633 | ||
| November | 2,835 | 3,460 | 1,580 | 1,539 | 1,255 | 1,921 | ||
| December | 3,213 | 4,094 | 2,342 | 3,000 | 871 | 1,094 | ||
| January | 3,021 | 4,015 | 2,350 | 2,915 | 671 | 1,100 | ||
| February | 3,398 | 3,144 | 2,670 | 3,450 | 728 | 306 | ||
| March | 2,382 | 2,890 | 4,613 | 5,104 | 2,231 | 2,214 | ||
| Totals | 26,936 | 31,670 | 28,050 | 32,023 | 1,114 | 353 | ||
In general, arrivals exceed departures in the spring and summer months, while the contrary holds for the autumn and winter periods.
The following table gives an analysis of the various classes of passenger arrivals during the last five years. It is, therefore, exclusive of crews of vessels, a source from which conies a steady increment of population. The average annual excess of crew arrivals over departures in the five years 1932–33 to 1936–37 was 206 and in the preceding five years 752.
In these tables, as has been noted above, “through” passengers and tourists on cruising liners have not been included.
| — | 1932–33. | 1933–34. | 1934–35. | 1935–36. | 1936–37. |
|---|---|---|---|---|---|
| Immigrants intending permanent residence | 1,494 | 1,428 | 1,579 | 1,915 | 2,807 |
| New Zealand residents returning from abroad | 9,139 | 8,420 | 12,091 | 12,194 | 14,027 |
| Tourists | 5,983 | 7,441 | 8,378 | 9,927 | 11,348 |
| Persons on commercial business | 948 | 1,034 | 1,137 | 1,267 | 1,395 |
| Persons visiting the Dominion in connection with entertainments, sports, &c. | 353 | 297 | 392 | 552 | 569 |
| Others (officials, &c., of other countries) | 258 | 316 | 371 | 305 | 566 |
| Persons in transit | 488 | 711 | 895 | 755 | 908 |
| No information available | 50 | 40 | 58 | 21 | 50 |
| Totals | 18,713 | 19,687 | 24,901 | 26,936 | 31,670 |
The New Zealand Government suspended from early in 1927 the major portion of its scheme of granting assisted passages to migrants from the British Isles, and this is partly responsible for the diminished number of immigrants, since govern-mentally assisted immigrants in years preceding 1927 formed more than half of the total. There were 11 assisted immigrants in 1936–37, as against none in 1935–36 and 11,239 in 1926–27; while the numbers of those who migrated to New Zealand without State assistance amounted to 2,796, 1,915, and 6,898 for the years 1936–37, 1935–36, and 1926–27 respectively.
The succeeding table gives an analysis of passenger departures, and thus furnishes the reverse of its predecessor:—
| — | 1932–33. | 1933–34. | 1934–35. | 1935–36. | 1936–37. |
|---|---|---|---|---|---|
| New Zealand residents departing permanently | 2,950 | 3,160 | 3,592 | 4,331 | 3,972 |
| New Zealand residents departing temporarily | 8,717 | 9,293 | 13,531 | 11,630 | 14,148 |
| Visitors to the Dominion departing | 9,540 | 9,531 | 10,884 | 12,046 | 13,854 |
| No information available | 101 | 38 | 44 | 43 | 49 |
| Totals | 21,308 | 22,022 | 28,051 | 28,050 | 32,023 |
The following table gives the age-distribution of immigrants and emigrants for the twelve months ended 31st March, 1937:—
| Age, in Years. | Permanent Arrivals. | Permanent Departures. | Excess of Departures over Arrivals. | ||||
|---|---|---|---|---|---|---|---|
| Males. | Females. | Total. | Males. | Females. | Total. | ||
* Excess of arrivals over departures. | |||||||
| 0–14 | 265 | 253 | 518 | 247 | 251 | 498 | -20* |
| 15–24 | 333 | 240 | 573 | 465 | 372 | 837 | 264 |
| 25–34 | 422 | 330 | 752 | 532 | 609 | 1,141 | 389 |
| 35–44 | 259 | 220 | 479 | 287 | 329 | 616 | 137 |
| 45–59 | 182 | 154 | 336 | 234 | 340 | 574 | 238 |
| 60 or over | 68 | 71 | 139 | 123 | 181 | 304 | 165 |
| Unspecified | 2 | 8 | 10 | 1 | 1 | 2 | -8* |
| Totals | 1,531 | 1,276 | 2,807 | 1,889 | 2,083 | 3,972 | 1,165 |
Of the 2,807 new immigrants during the year 1936–37 intending to settle in the Dominion, the vast majority (2,468, or 88 per cent.) came from British countries, mainly from the British Isles, Australia, Canada, Fiji, and India. The majority of immigrants from foreign countries came from China, Yugoslavia, the United States of America, and Germany.
The following table shows for each of the last five years the principal countries whence arrived for new immigrants who intended permanent residence in the Dominion:—
| Country of Last Permanent Residence. | 1932–33. | 1933–34. | 1934–35. | 1935–36. | 1936–37. |
|---|---|---|---|---|---|
| British Isles | 449 | 468 | 491 | 653 | 892 |
| India | 62 | 80 | 45 | 73 | 103 |
| Union of South Africa | 21 | 14 | 5 | 10 | 24 |
| Canada | 51 | 37 | 57 | 71 | 89 |
| Australia | 627 | 598 | 707 | 785 | 1,182 |
| Other British countries | 131 | 111 | 93 | 128 | 178 |
| Denmark | 2 | 1 | 18 | 2 | |
| Germany | 5 | 5 | 38 | ||
| Italy | 6 | 8 | 22 | 19 | 12 |
| Switzerland | 3 | 2 | 2 | 5 | 6 |
| Yugoslavia | 21 | 12 | 27 | 36 | 83 |
| China | 7 | 17 | 19 | 40 | 76 |
| United States of America | 42 | 44 | 51 | 25 | 49 |
| Other foreign countries and unspecified | 67 | 36 | 42 | 65 | 73 |
| Totals | 1,494 | 1,428 | 1,579 | 1,915 | 2,807 |
Of the New Zealand residents who left the Dominion permanently, the great majority (94 per cent.) went to British countries. Foreign countries, other than China and the United States of America, recorded only very small figures.
Of the total of 2,807 new immigrants intending permanent residence who arrived during 1936–37, 375 (males 212, females 163) were of foreign nationality. The chief nationalities represented among the alien immigrants were as follows (total figures for the five years preceding being given in parentheses): United States, 43 (108); Yugoslavia, 95 (130); Italy, 10 (65); China, 73 (37); Germany, 53 (48); Poland, 16 (45); and France, 10 (26).
The number of foreign nationals among New Zealand residents departing permanently during the year ended March, 1937, was 172 (136 males and 36 females), or 4.3 per cent. of the total.
A noticeable feature in regard to foreign nationals is the relative disparity of the sexes as between arrivals and departures. Of the arrivals 57 per cent. were males and 43 per cent. females, whereas of the departures 79 per cent. were males and 21 per cent. females.
Although race aliens comprise comparatively small proportions of the total arrivals and departures, they are by no means unimportant. The principal race aliens with whom New Zealand is concerned are Chinese, Indians, and Syrians, and the first two are shown separately from other race aliens. The definition of the term “race alien,” as used in connection with these statistics, is “a person of other than European race.”
Permanent arrivals of race aliens in 1936–37 comprised 58 Indians, 73 Chinese, and 60 of other races. Departures were 34 Indians, 90 Chinese, and 29 of other races. In the last ten years permanent arrivals have aggregated 139 Chinese, 373 Indians, and 217 others; and the permanent departures 433 Chinese, 98 Indians, and 177 others.
It should be noted that the figures quoted above include all persons of mixed European and race alien origin.
The total arrivals and departures of race aliens during each of the last ten years are as follows:—
| Year ending 31st March, | Arrivals. | Departures. | ||||||
|---|---|---|---|---|---|---|---|---|
| Chinese. | Indians. | Others. | Totals. | Chinese. | Indians. | Others. | Totals. | |
| 1928 | 545 | 152 | 231 | 928 | 656 | 131 | 231 | 1,018 |
| 1929 | 427 | 188 | 306 | 921 | 602 | 146 | 247 | 995 |
| 1930 | 458 | 191 | 265 | 914 | 521 | 167 | 219 | 907 |
| 1931 | 375 | 162 | 247 | 784 | 542 | 157 | 255 | 954 |
| 1932 | 327 | 117 | 133 | 577 | 461 | 140 | 142 | 743 |
| 1933 | 240 | 81 | 148 | 469 | 340 | 112 | 150 | 602 |
| 1934 | 222 | 107 | 152 | 481 | 349 | 92 | 132 | 573 |
| 1935 | 273 | 130 | 140 | 543 | 228 | 104 | 153 | 485 |
| 1936 | 309 | 158 | 283 | 750 | 218 | 109 | 256 | 583 |
| 1937 | 343 | 178 | 298 | 819 | 218 | 111 | 258 | 587 |
The general scheme of Governmental assistance to immigrants, which has been restricted in varying degrees since May, 1927, is based on nomination by a person who is already domiciled in New Zealand, and who undertakes to find employment for his nominee and guarantees that such nominee will reside at least five years in New Zealand. Further details will be found in the 1931 or preceding issues of the Year-Book.
Various systems of assisted immigration have been in force since 1871, with the exception of the period 1892 to 1903 (inclusive). The numbers of assisted immigrants during each of the last ten calendar years are as follows:—
| Year | Number. |
|---|---|
| 1927 | 5,899 |
| 1928 | 2,220 |
| 1929 | 1,878 |
| 1930 | 1,405 |
| 1931 | 489 |
| 1932 | 77 |
| 1933 | 9 |
| 1934 | 1 |
| 1935 | Nil |
| 1936 | 9 |
The total to 31st December, 1936, is 226,238, of which number all have come from the United Kingdom with the exception of 3,909 from the Continent of Europe, spread over the five years 1874 to 1878 (inclusive).
In the following analysis of migration increase the figures given are annual averages for the periods quoted:—
| Period. | Governmentally assisted Immigrants. | Immigrants not Governmentally assisted. | Total Net Migration Increase. |
|---|---|---|---|
| 1909–13 | 3,479 | 7,095 | |
| 1920–24 | 7,549 | 6,200 | 9,683 |
| 1925–29 | 5,808 | 5,708 | 6,571 |
| 1930–34 | 396 | 2,541 | -415 |
| 1935–36 | 5 | 2,149 | -825 |
With certain specified exceptions, no person over the age of sixteen years may land in New Zealand unless in possession of a passport or some other document satisfactorily establishing his or her nationality and identity. Exemption from this requirement (which is additional to the requirements of the Immigration Restriction and Undesirable Immigrants Exclusion Acts) may be granted by the Minister of Internal Affairs.
In the case of a person coming from a foreign country the passport must, with certain exceptions, have been issued or vised by the British Ambassador or a British Consul in that country, and in the case of a person coming from any part of the British dominions the issue or visé must have been by some public official duly authorized in that behalf.
Certain exceptions are made with respect to persons coming to New Zealand from the Cook Islands and Western Samoa. In their case the only requirement is the possession of a permit to visit New Zealand granted by the Resident Commissioner of the Cook Islands or the Administrator of Samoa, as the case may be. The regulations, further, do not apply to a British subject arriving in New Zealand as the master or a member of the crew of the vessel in which he arrives, or to a British subject arriving from the Commonwealth of Australia.
With the exception of British subjects travelling to the Commonwealth of Australia, the Cook Islands, or Western Samoa, all persons travelling to places beyond the seas are required to be in possession of a passport or similar document to facilitate landing thereat. British passports are issued, under the direction of His Excellency the Governor-General, by the Department of Internal Affairs. They are valid for five years and may be renewed for any number of years not exceeding five. Subject to the Immigration Regulations in force in the various countries of the Empire, they are valid for travelling anywhere within the British Empire, including territories under British protection or mandate, but not Palestine or Transjordan, for which the passport must be specially endorsed, or the Aden Protectorate, for which both an endorsement and a visa are required.
The legislation respecting the restriction of immigration into New Zealand is contained in the Immigration Restriction Act, 1908, and its amendments, and the Undesirable Immigrants Exclusion Act, 1919. It is administered by the Customs Department.
Subject to certain exemptions, the following classes of persons are prohibited from landing in New Zealand:—
Persons not of British birth and parentage, unless in possession of permits issued by the Customs Department. (Note.—A person is not deemed to be of British birth and parentage by reason that he or his parents or either of them is a naturalized British subject, or by reason that he is an aboriginal Native or the descendant of an aboriginal Native of any dominion (other than New Zealand), colony, possession, or protectorate of His Majesty.)
Idiots or insane persons.
Persons suffering from contagious diseases which are loathsome or dangerous.
Persons arriving in New Zealand within two years after the termination of a period of imprisonment for a serious offence.
Persons who are considered by the Attorney-General to be disaffected or disloyal, or of such a character that their presence in New Zealand would be injurious to the peace, order, and good government of the Dominion.
Aliens of the age of fifteen years or over who refuse or neglect to take an oath (or make an affirmation) of obedience to the laws of New Zealand.
Provision is made in the law to permit persons covered by clause (1) above to pay temporary visits to New Zealand for the purposes of business, pleasure, or health. Temporary permits are normally restricted to a period not exceeding six months, but may be extended if the proper authorities consider that the circumstances warrant such action. A deposit of £10 is required in respect of such temporary permits, and is returned on the departure of the visitor if the conditions of the temporary permit are complied with. The Collector of Customs may also require, if he so decides, a deed to be entered into by some person or persons resident in New Zealand approved by him guaranteeing to pay all expenses that may be incurred by the Crown or any public body for the visitor's maintenance, relief, arrest, or detention in New Zealand or his deportation therefrom.
Provision is also made whereby, under certain conditions, students may be allowed to enter New Zealand temporarily.
When persons arrive in New Zealand who are lunatic, idiotic, deaf, dumb, blind, or infirm, and are likely to become a charge upon the public or upon any public or charitable institution, the master, owner, or charterer of the ship by which such persons come to New Zealand may be called on to enter into a bond for £100 for each such person, guaranteeing payment of any expenses which may be incurred for his support and maintenance by or in any such institution within a period of five years.
Every person of and over the age of fifteen years who lands in New Zealand must, unless exempted by the Minister of Customs, make and deliver to an officer of Customs a declaration giving the following particulars: Name, age, nationality, race or people to which he belongs, residence, particulars of children under fifteen years of age arriving with him, and (if not domiciled in New Zealand) occupation, and places of birth of himself and father.
The British Nationality and Status of Aliens (in New Zealand) Act, 1928, which was reserved for Royal assent, came into force on the 1st July, 1929. This Act made important alterations in the naturalization law of New Zealand, and made provision for the adoption of Part II of the British Nationality and Status of Aliens Act, 1914 (Imperial). A fairly detailed account of its effects will be found on pp. 92–95 of the 1931 issue of the Year-Book.
The British Nationality and Status of Aliens (in New Zealand) Amendment Act, 1934–35, was assented to on 26th March, 1935. This Act does two things: In the first place, it brings the New Zealand law into conformity with the law of the United Kingdom by the formal adoption as part of the law of New Zealand of section 10 of the Imperial Act of 1914 (as re-enacted by the British Nationality and Status of Aliens Act, 1933).
The provisions of section 10, as re-enacted in 1933, and containing modifications incidental to its application in New Zealand, are quoted:—
“10. (1) Subject to the provisions of this section, the wife of a British subject shall be deemed to be a British subject, and the wife of an alien shall be doomed to be an alien.
“(2) Where a woman has (whether before or after the commencement of this Act) married an alien, and was at the time of her marriage a British subject, she shall not, by reason only of her marriage, be deemed to have ceased to be a British subject unless, by reason of her marriage, she acquired the nationality of her husband.
“(3) Where a man has, during the continuance of his marriage, ceased (whether before or after the commencement of this Act) to be a British subject, his wife shall not, by reason only of that fact, be deemed to have ceased to be a British subject unless, by reason of the acquisition by her husband of a new nationality, she also acquired that nationality.
“(4) Where a man ceases, during the continuance of his marriage, to be a British subject and, by reason of his acquisition of a new nationality, his wife also acquires that nationality, she may, whether her marriage is still continuing or not, at any time within the period of twelve months from the date on which she so acquired that nationality, or at such later time as the Minister of Internal Affairs may in special circumstances allow, make a declaration that she desires to retain British nationality, and thereupon she shall be deemed to have remained a British subject.
“(5) Where, after the end of the year nineteen hundred and thirty-four, a certificate of naturalization is granted to an alien, his wife, if not already a British subject, shall not be deemed to be a British subject, unless, within the period of twelve months from the date of the certificate, or within such longer period as the Minister of Internal Affairs may in special circumstances allow, she makes a declaration that she desires to acquire British nationality.
“(6) Where an alien is a subject of a State at war with His Majesty, it shall be lawful for his wife, if she was at birth a British subject, to make a declaration that she desires to resume British nationality, and thereupon the Minister of Internal Affairs, if he is satisfied that it is desirable that she be permitted to do so, may grant her a certificate of naturalization.”
In the second place, the New Zealand Act referred to goes further than the Imperial Act. It allows to a woman who has lost her British nationality by reason of her marriage to an alien, the right while she remains in New Zealand to claim the same privileges as if she had remained a British subject. The legislation does not seek to alter the fact that such a woman has in law ceased to be a British subject: it merely says that upon making the prescribed declaration she is while she remains in New Zealand, entitled to all the rights and privileges and is subject to all the duties and obligations of a natural-born British subject.
During 1936, 18 women took advantage of section 3 of the Act and made the necessary declaration. The nationalities of the husbands were as follows: Norwegian, 4; Polish, German, and Swiss, 2 each; and Swedish, Danish, Latvian, French, Spanish, Portuguese, Chinese, and United States, 1 each.
During the year 1936 certificates of naturalization in New Zealand were granted to 230 persons of the undermentioned birthplaces, as compared with 116 in the previous year. In addition, 45 children were included in the certificates of their parents, and certificates under the 1928 legislation were issued to 3 males previously naturalized in New Zealand. The birthplaces of these were Syria, United States, and Yugoslavia.
| Country of Birth. | Males. | Females. | Total. | Children.* |
|---|---|---|---|---|
* Children Included in certificate of parent; additional to preceding figures. | ||||
| England | 1 | 1 | 2 | 2 |
| Scotland | 1 | 1 | ||
| Norway | 10 | 10 | ||
| Sweden | 16 | 2 | 18 | |
| Denmark | 17 | 1 | 18 | |
| Iceland | 1 | 1 | ||
| Russia | 10 | 1 | 11 | 2 |
| Finland | 2 | 2 | ||
| Latvia | 1 | 1 | ||
| Poland | 7 | 7 | 6 | |
| Germany | 12 | 2 | 14 | |
| Holland | 3 | 3 | ||
| Belgium | 2 | 2 | ||
| France | 3 | 4 | 7 | |
| Spain | 1 | 1 | ||
| Switzerland | 1 | 1 | ||
| Italy | 32 | 32 | 17 | |
| Czechoslovakia | 2 | 2 | ||
| Hungary | 1 | 1 | ||
| Austria | 1 | 1 | ||
| Yugoslavia | 71 | 1 | 72 | 18 |
| Greece | 5 | 5 | ||
| Syria | 3 | 3 | ||
| Palestine | 1 | 1 | ||
| Arabia | 1 | 1 | ||
| China | 1 | 1 | ||
| United States | 7 | 7 | ||
| New Caledonia | 1 | 1 | ||
| Society Islands | 2 | 2 | ||
| Western Samoa | 2 | 2 | ||
| Totals | 212 | 18 | 230 | 45 |
There were also fifty-four cases in which declarations were made by wives of naturalized British subjects who desired to acquire British nationality.
In the ten years 1927–36 1,259 subjects or citizens of other nations obtained certificates of naturalization in New Zealand. The following table exhibits the principal countries involved:—
| Country of Birth. | No. |
|---|---|
| Yugoslavia | 368 |
| Italy | 134 |
| Denmark | 108 |
| Germany | 97 |
| Sweden | 86 |
| Norway | 59 |
| Russia | 46 |
| Switzerland | 45 |
| United States | 38 |
| Poland | 36 |
| Finland | 33 |
| France | 25 |
| Greece | 24 |
| Syria | 22 |
| Holland | 16 |
| Belgium | 13 |
| Latvia | 12 |
| Austria | 11 |
| Western Samoa | 10 |
| Estonia | 5 |
| Hungary | 5 |
| Other countries | 66 |
| Total | 1,259 |
In 1858 the North Island had a larger population than the South', this position being reversed at the succeeding enumerations until 1901, in which year the North Island was found to have slightly the larger total, a position which it has since considerably improved upon. The Maori War which broke out in 1860 retarded settlement in the North, while a largo area of land reserved for the Maoris was for many years a serious hindrance to the development of this portion of the Dominion. The South Island was practically free from Maori troubles, and settlement was more rapid, though much of the land was disposed of in large areas. The discovery of gold in Otago in 1861 and on the West Coast in 1864 attracted to these localities considerable numbers of miners.
| Census Year. | Population (excluding Maoris). | Proportions per Cent. | |||
|---|---|---|---|---|---|
| North Island. | South Island.* | Total. | North Island. | South Island.* | |
* Including Stewart Island and Chatham Islands. | |||||
| 1881 | 193,047 | 296,886 | 480,933 | 39.40 | 60.60 |
| 1886 | 250,482 | 328,000 | 578,482 | 43.30 | 56.70 |
| 1891 | 281,474 | 345,184 | 626,658 | 44.92 | 55.08 |
| 1896 | 340,638 | 362,722 | 703,360 | 48.43 | 51.57 |
| 1901 | 390,579 | 382,140 | 772,719 | 50.55 | 49.45 |
| 1906 | 476,737 | 411,841 | 888,578 | 53.65 | 46.35 |
| 1911 | 563,733 | 444,735 | 1,008,468 | 55.90 | 44.10 |
| 1916 | 651,072 | 448,377 | 1,099,449 | 59.22 | 40.78 |
| 1921 | 741,255 | 477,658 | 1,218,913 | 60.81 | 39.19 |
| 1926 | 831,813 | 512,656 | 1,344,469 | 61.87 | 38.13 |
| 1936 | 938,939 | 552,545 | 1,491,484 | 62.95 | 37.05 |
The natural increase of European population (i.e., excess of births over deaths) for the South Island during the 1926–36 intercensal period was 47,181, but the total net increase was only 39,889. For the North Island the natural increase was 92,130, and the total net increase 107,120. Allowing for the fortuitous presence in the South Island in 1926 of 2,000 or 3,000 North Island residents visiting the Dunedin Exhibition the margin is reduced, but the existence of a northward drift of population is still evident.
Statistics of passenger migration between the North and South Islands are compiled from returns supplied by Collectors of Customs and are of use in the compilation of population estimates. The following table shows inter-Island migration for ten years ending 31st March. These figures have not been adjusted to give effect to corrections indicated by the 1936 census.
| Year. | Arrivals in North Island. | Arrivals in South Island. | Excess in favour of North Island. |
|---|---|---|---|
| 1927–28 | 140,126 | 137,961 | 2,165 |
| 1928–29 | 145,146 | 145,179 | -33 |
| 1929–30 | 147,490 | 143,857 | 3,633 |
| 1930–31 | 135,730 | 135,318 | 412 |
| 1931–32 | 110,295 | 108,921 | 1,374 |
| 1932–33 | 100,573 | 99,823 | 750 |
| 1933–34 | 109,544 | 108,754 | 790 |
| 1934–35 | 121,005 | 118,022 | 3,643 |
| 1935–36 | 128,352 | 125,935 | 2,417 |
| 1936–37 | 144,832 | 141,101 | 3,731 |
Of the 144,832 passengers from the South Island in 1936–37, 144,796 landed at Wellington, including 110,624 from Lyttelton, 20,050 from Nelson, and 14,122 from Picton.
The 141,101 passengers who landed in the South Island for the same period included 107,238 at Lyttelton, 19,825 at Nelson, and 14,038 at Picton, the passengers in these instances all arriving from Wellington. One-day inter-Island excursion (return) trips are not included in the above figures.
In addition to the above sea-borne passengers, a considerable number of persons were carried by two air services operating between the North and South Islands. For the year ended 31st March, 1937, the arrivals in the North Island were 8,475 and in the South Island 8,101. A certain number of passengers are carried by private aeroplanes or by aeroplanes belonging to aero clubs, but particulars of these are not available.
The approximate areas and the populations, inclusive of Maoris, of the various provincial districts are as follows:—
| Provincial District. | Area (Square Miles). | Census Population. | Estimated Population as at 1st April, 1837. | |||
|---|---|---|---|---|---|---|
| 1901. | 1921. | 1926 | 1936. | |||
* Including certain Maori wives of Europeans, provincial district not specified. | ||||||
| Auckland | 25,400 | 204,899 | 408,351 | 469,458 | 546,970 | 555,476 |
| Hawke's Bay | 4,260 | 39,604 | 63,628 | 70,353 | 76,968 | 77,600 |
| Taranaki | 3,750 | 40,465 | 65,244 | 71,848 | 77,652 | 78,400 |
| Wellington | 10,870 | 146,326 | 254,695 | 281,020 | 316,446 | 319,800 |
| Marlborough | 4,220 | 13,746 | 18,289 | 18,793 | 19,149 | 19,700 |
| Nelson | 10,870 | 38,067 | 47,734 | 50,878 | 59,481 | 59,100 |
| Westland | 4,880 | 14,566 | 14,253 | 15,260 | 18,676 | 18,800 |
| Canterbury | 13,940 | 144,195 | 199,969 | 215,079 | 234,399 | 234,735 |
| Otago— | ||||||
| Otago portion | 14,050 | 125,782 | 137,062 | 149,921 | 151,213 | 150,700 |
| Southland portion | 11,170 | 48,016 | 62,439 | 65,529 | 72,856 | 72,900 |
| Totals | 103,410 | 815,862* | 1,271,664 | 1,408,139 | 1,573,810 | 1,587,211 |
The foregoing table illustrates the wide disparities in the size of the provincial districts, whether measured by area or by population. The 1926 to 1936 growth of population is given below both in absolute numbers and as a percentage of the 1926 totals. The figures include Maoris.
| Numbers. | Per Cent. | |
|---|---|---|
| Auckland | 77,512 | 16.51 |
| Hawke's Bay | 6,615 | 9.40 |
| Taranaki | 5,804 | 8.08 |
| Wellington | 35,426 | 12.61 |
| Marlborough | 356 | 1.89 |
| Nelson | 8,603 | 16.91 |
| Westland | 3,416 | 22.39 |
| Canterbury | 19,320 | 8.98 |
| Otago— | ||
| Otago | 1,292 | 0.86 |
| Southland | 7,327 | 11.18 |
| Dominion | 165,671 | 11.77 |
Between 1906 and 1926 Auckland's ratio of growth was higher than that of any other provincial district, and in the period reviewed above it is surpassed only by two relatively small districts. The Auckland increase absorbed 47 per cent. of the total increase of population in the Dominion. Of its total of 78,000, 12,000 was credited to North Auckland, 25,000 to Auckland City with its suburbs and neighbouring counties, 20,000 to the Waikato and southern districts, 8,000 to the Thames-Tauranga area, 10,000 to the Taupo - Bay of Plenty area, and 3,000 to the East Coast.
In the Hawke's Bay Provincial District growth was more marked in the north (6,000) than in the south (1,000).
Northern Taranaki increased its population by 4,000, and the southern portion by 2,000, this giving a rather higher rate of increase to the north.
The percentage increase for Wellington was a little over the Dominion level, hut was not evenly distributed. The total gain of 35,000 was derived mainly from the 30,000 increment to Wellington City with its suburbs and neighbouring counties. Manawatu-Horowhenua contributed 6,000 and Wairarapa-Bush under 1,000. Wanganui-Rangitikei nominally declined by over 1,000, although virtually the population was about stationary, since the 1926 figures were temporarily swelled by a Maori gathering.
Marlborough recorded a population almost stationary, as it did also at the preceding census. In the fifty years 1886–1936 the population of Marlborough has increased by only 60 per cent.
To Nelson fell the second highest rate of growth of any provincial district between 1926 and 1936. Some part of this appears to be due to the revival of gold-mining, caused by the high price-level of gold. To a minor extent the 1936 figures were swelled by fruit and hop pickers. Its gain of 9,000 was derived as follows: North, 6,000; west, 2,000; and east, 1,000.
The smallest of the provincial districts, West-land, disclosed the greatest relative growth between 1926 and 1936, in part due to revived interest in gold-mining. In common with all gold-mining areas, Westland has experienced vicissitudes in population, and had in 1936 a population only 16 per cent. greater than in 1886. In recent years steady growth has been made.
In Canterbury the major portion (15,000) of the decennial gain of 19,000 belonged to Christchurch City with its suburbs and the adjoining counties. North Canterbury increased by 1,000, central by 1,000, and south by 2,000.
Otago, as apart from Southland, showed an almost stationary population. In 1926, however, several thousand visitors to the Exhibition were included in the population, and with allowance for these the increase would rise to about 3 per cent. or 4 per cent. The Exhibition visitors affect only Dunedin City and environs, which showed a nominal decline of 3,000; whereas the Otago West and North area gained 4,000 (largely through mining operations), and Otago South remained stationary.
Southland was one of the three districts (the others were Westland and Nelson) to average a greater annual rate of growth 1926 to 1936 than in 1921 to 1926. The eastern portion increased by 6,000 and the western portion by 1,000.
On 24th March, 1936, somewhat over one-third (38.5 per cent.) of the population of the Dominion (excluding Maoris) was included in the four principal urban areas—Auckland, Wellington, Christchurch, and Dunedin—and over one-half (51.7 per cent.) in these or in the ten secondary urban areas. In the following table urban population means the population in cities and boroughs, while rural population covers counties, all town districts, and extra-county islands. The continuance of urban drift is noticeable, but with a marked slackening in pace.
| Census. | Population. | Per Cent. | ||||
|---|---|---|---|---|---|---|
| Rural. | Urban. | Migratory. | Rural. | Urban. | Migratory. | |
* Figures exclude military and Internment camps. | ||||||
| Excluding Maoris— | ||||||
| 1881 | 292,036 | 194,981 | 2,916 | 59.61 | 39.80 | 0.59 |
| 1886 | 328,144 | 245,612 | 4,726 | 56.72 | 42.46 | 0.82 |
| 1891 | 352,991 | 270,343 | 3,305 | 56.33 | 43.14 | 0.53 |
| 1896 | 392,678 | 307,294 | 3,381 | 55.83 | 43.69 | 0.48 |
| 1901 | 418,746 | 350,202 | 3,763 | 54.19 | 45.32 | 0.49 |
| 1906 | 459,492 | 424,614 | 4,467 | 51.71 | 47.79 | 0.50 |
| 1911 | 497,858 | 505,398 | 5,008 | 49.37 | 50.13 | 0.50 |
| 1916* | 501,956 | 585,306 | 3,463 | 46.02 | 53.66 | 0.32 |
| 1921 | 531,694 | 681,988 | 5,231 | 43.62 | 55.95 | 0.43 |
| 1926 | 552,344 | 785,040 | 7,085 | 41.08 | 58.39 | 0.53 |
| 1936 | 602,519 | 884,293 | 4,672 | 40.40 | 59.29 | 0.31 |
| Including Maoris— | ||||||
| 1926 | 610,446 | 790,555 | 7,138 | 43.35 | 56.14 | 0.51 |
| 1936 | 677,087 | 892,024 | 4,699 | 43.02 | 56.68 | 0.30 |
Another conception of urban and rural population is presented in the next table, which covers the last seven censuses. Maoris are omitted, as data are not available over the whole period. The great bulk of Maoris inhabit rural communities. In the case of the larger centres there are numerous suburban boroughs and town districts; consequently, as regards the fourteen urban areas the centre has been taken as including all cities, boroughs, and town districts within the territory of the present urban area. In other instances the “centre” is a borough or town district.
| Centres of | 1901. | 1906. | 1911. | 1916. | 1921. | 1926. | 1936. |
|---|---|---|---|---|---|---|---|
| Population. | |||||||
| 1,000–2,499 | 41,814 | 47,002 | 54,895 | 65,706 | 80,120 | 84,792 | 82,516 |
| 2,500–4,999 | 33,478 | 31,982 | 37,192 | 46,159 | 56,487 | 49,594 | 51,779 |
| 5,000–9,999 | 36,834 | 50,450 | 51,326 | 44,838 | 23,306 | 32,073 | 48,292 |
| 10,000–24,999 | 10,637 | 33,005 | 62,715 | 82,770 | 128,984 | 155,105 | 172,885 |
| 25,000 or over | 214,098 | 254,138 | 302,943 | 349,271 | 401,710 | 472,603 | 531,568 |
| Total urban | 336,861 | 416,577 | 509,071 | 588,744 | 690,607 | 794,167 | 887,060 |
| Rural | 432,095 | 467,529 | 494,389 | 498,518 | 523,075 | 543,217 | 699,752 |
| Grand total (excluding migratory) | 768,956 | 884,106 | 1,003,460 | 1,087,262 | 1,213,682 | 1,337,384 | 1,486,812 |
| Per Cent. | |||||||
| 1,000–2,409 | 5.44 | 5.32 | 5.47 | 6.04 | 6.60 | 6.34 | 5.55 |
| 2,500–4,999 | 4.35 | 3.62 | 3.71 | 4.25 | 4.65 | 3.71 | 3.48 |
| 5,000–9,999 | 4.79 | 5.71 | 5.11 | 4.13 | 1.92 | 2.40 | 3.25 |
| 10,000–24,999 | 1.38 | 3.73 | 6.25 | 7.61 | 10.63 | 11.60 | 11.68 |
| 25,000 or over | 27.85 | 28.74 | 30.19 | 32.12 | 33.10 | 85.33 | 35.76 |
| Total urban | 43.81 | 47.12 | 50.73 | 54.15 | 56.90 | 59.38 | 59.66 |
| Rural | 56.19 | 52.88 | 49.27 | 45.85 | 43.10 | 40.62 | 40.84 |
| Grand total (excluding migratory) | 100.00 | 100.00 | 100.00 | 100.00 | 100.00 | 100.00 | 100.00 |
The comparison is not an exact one, but is sufficiently accurate to indicate the general trend of urbanization. For instance, it is noticeable that in 1901 29 per cent. of the population were in towns of 10,000 population or over; by 1936 the proportion had become 47 per cent.
An important characteristic of the distribution of urban population in New Zealand is what may be termed its decentralization. In place of one great metropolis containing a huge proportion of the population, as in the case of the Australian States—e.g., Victoria, whose capital city (Melbourne), contains over 50 per cent. of the total population of the State—the more highly urbanized portion of the community is localized in four widely separated centres. These four centres have always existed more or less on the same plane, a fact which has played no small part in the development of the country. An interesting feature is the wide gap which has long existed between the four major centres and the next largest towns.
Urban and rural communities are not evenly distributed. The South Island, for example, contains proportionately more rural population than does the North Island.
New Zealand is not alone in experiencing the modern tendency towards urban aggregation: it is, in fact, occurring in almost all countries.
Urban areas afford the best basis of comparison of population-growth in the case of the largest towns, since their boundaries are stable and, of greater significance, they include the suburbs as well as the central city or borough. The following table excludes Maoris—data being lacking in earlier years—but their numbers are too small to exercise any significant effect.
| Urban Area. | 1911. | 1910. | 1921. | 1926. | 1936. |
|---|---|---|---|---|---|
| Auckland | 115,750 | 133,712 | 157,757 | 192,223 | 210,393 |
| Wellington | 82,800 | 95,235 | 107,488 | 121,527 | 149,382 |
| Christchurch | 87,400 | 92,733 | 105,670 | 118,501 | 132,282 |
| Dunedin | 67,200 | 68,716 | 72,255 | 85,095 | 81,848 |
| Hamilton | 5,700 | 8,980 | 13,798 | 16,538 | 19,373 |
| Gisborne | 10,700 | 12,660 | 14,450 | 14,789 | 15,521 |
| Napier | 13,000 | 15,131 | 17,187 | 18,066 | 18,443 |
| Hastings | 8,750 | 11,018 | 12,990 | 14,460 | 17,715 |
| New Plymouth | 8,600 | 9,795 | 12,645 | 15,931 | 18,194 |
| Wanganui | 16,250 | 19,517 | 23,523 | 26,129 | 25,312 |
| Palmerston North | 11,900 | 14,006 | 16,885 | 19,709 | 23,953 |
| Nelson | 8,875 | 9,962 | 10,632 | 11,752 | 13,545 |
| Timaru | 12,475 | 13,716 | 15,507 | 16,822 | 18,805 |
| Invercargill | 15,700 | 17,862 | 19,210 | 21,849 | 25,682 |
In the remaining observations under this head the population is inclusive of Maoris.
In the decade 1926–36 the greatest absolute increase (28,000) was shown by Wellington urban area. Not only the city, but also all its suburbs, recorded marked growth. The city increased by 17.00 per cent., Lower Hutt by 100.45 per cent. (the greatest rate of any town during the decade), Petone by 17.45 per cent., Eastbourne by 23.52 per cent., and Johnsonville by 33.13 per cent.
Auckland, the largest centre of population in New Zealand, increased its population by 18,000, but with marked disparities in the records of the numerous local-governing districts which make up the urban area. For the city the increase was only 5.87 per cent. Suburban local districts showing the greatest relative growth were: Mount Roskill (50.90 per cent.), New Lynn (28.71), Otahuhu (27.41), One Tree Hill (21.22), and Takapuna (19.67). Newmarket, Devonport, and North-cote receded slightly in population.
Christchurch urban area added 14,000 to its population in the decade. The city increased by 10.66 per cent., Riccarton by 17.77 per cent., New Brighton by 16.61 per cent., and Sumner by 4.87 per cent.; but Lyttelton showed a 12 per-cent. decline.
Dunedin urban area shows a nominal decline of 3,000 in the period 1926–36. Actually, however, the population showed a very slight increase when allowance is made for the abnormal number of visitors to the Exhibition which swelled the 1926 totals. Adjusted figures would give Dunedin City an increase of under 1 per cent., St. Kilda also under 1 per cent., Green Island about 10 per cent., and West Harbour and Port Chalmers declines of 4 per cent. and 15 per cent. respectively.
Of the secondary urban areas, the greatest growth was recorded by Hastings and Palmerston North. Wanganui afforded the unusual feature of a slight decline.
Of boroughs outside the urban areas, the greatest relative movement was shown as under:—
| Increases. | Increase per Cent. |
|---|---|
| Brunner | 61.49 |
| Motueka | 43.64 |
| Alexandra | 42.79 |
| Rotorua | 38.99 |
| Upper Hutt | 35.54 |
| Te Awamutu | 33.17 |
| Tauranga | 32.88 |
| Matamata | 30.73 |
| Bluff | 26.90 |
| Patea | 22.74 |
| Whakatane | 22.56 |
| Mataura | 21.36 |
| Decreases. | Decrease per Cent. |
|---|---|
| Akaroa | 16.26 |
| Shannon | 14.60 |
| Kaitangata | 11.12 |
| Thames | 10.26 |
| Taihape. | 9.91 |
| Arrowtown | 9.42 |
| Ross | 8.89 |
| Foxton | 8.81 |
| Eketahuna | 7.92 |
| Eltham | 6.87 |
| Kaiapoi | 6.60 |
| Kumara | 5.48 |
As is natural, the preceding cases are chiefly these of the smaller boroughs. Of the towns of the second class (i.e., ranking next to the fourteen urban areas) Greymouth (19.76 per cent.), Gore (18.39 per cent.), Whangarei (12.75 per cent.), Ashburton (11.89 per cent.), and Masterton (11.47 per cent.) had the highest proportionate growth.
It will be noted that the above table does not contain merely one type of town, but includes ports, farming centres, mining towns, and a semi-suburban town. The figures for Rotorua and Motueka are swelled by the presence in 1936 of more non-residents than is usual.
Town districts, through their relatively small size, are subject to more rapid movements in population. These exhibiting the highest rate of growth during 1926–36 were: Ohura (66.91 per cent.), Tahunanui (49.91), Kaitaia (49.14), Papatoetoe (48.16), Warkworth (44.16), and Howick (40.61). These declining in population included Rangataua (-34.98 per cent.), Kohukohu (-26.76), Rawene (-15.48), Manunui (-15.02), and Wyndham (-14.96).
Of the 26 dependent (i.e., forming parts of counties) town districts, 12 increased in population during 1926–36, 12 lost population, and in 2 cases no precise figure can be given.
Independent town districts are larger bodies than the dependent, and of the 1936 total of 38, 25 gained population, 11 lost population, 1 could not be accurately measured, and 1 remained exactly stationary.
Of the 124 boroughs 96 gained population and 28 (14 in each Island) lost population during 1926–36.
During the same intercensal interval 11 of the North Island's 76 counties and 13 of the South Island's 53 counties lost population, the remainder gaming in numbers. The following observations refer to counties, exclusive of boroughs and town districts within their limits.
In the Auckland Peninsula all counties showed increases, mostly at a rate well over the Dominion average (11.77 per cent.). The highest rates were these of Waitemata (42.14 per cent.), Whangaroa (37.66 per cent.), Hokianga (35.49 per cent.), and Bay of Islands (34.58 per cent.). The Waikato also showed heavy gains, particularly Otorohanga (39.77 per cent.), Raglan (34.69 per cent.), Waikato (33.59 per cent.), and Waipa (32.35 per cent.). In the King-country gains were substantial, though relatively less than in the Waikato. Further north, Piako (33.61 per cent.) and Tauranga (25.20 per cent.), showed the highest ratios of increase; but all counties in this area increased at a rate above the Dominion average. To the east Taupo (67.08 per cent.) and Whakatane (61.95 per cent.) developed remarkably. On the East Coast, Waiapu (25.74 per cent.) and Matakaoa (22.04 per cent.) increased substantially (through gains to the Native population), but other counties moved more slowly, Waikohu (-6.65 per cent.) actually declining.
In Hawke's Bay, movement ranged from 23.38 per cent. increase in Wairoa to a decline in Weber of 11.27 per cent.
Egmont (19.21 per cent.) disclosed the highest rate of growth in Taranaki, while three counties recorded decreased population.
In Wellington only Hutt County (29.12 per cent.), which contains some suburban population, increased at a rate above the Dominion level, while six counties lost population, the most noticeable being Waimarino, where a decrease of 25.58 per cent. took place owing mainly to the closing-down of sawmills.
Of Marlborough's four counties, three showed a low rate of growth, while the fourth (Sounds, -8.05 per cent.) declined.
All counties in Nelson gained population, notably Murchison (37.56 per cent.) and Waimea (36.35 per cent.).
Westland Comity (32.14 per cent.) showed more growth than Grey (13.08 per cent.).
In Canterbury the suburban counties of Heathcote (21.48 per cent.) and Waimairi (20.17) showed the most growth apart from Chatham Islands (24.91 per cent.). Seven counties lost population, the greatest relative declines being Akaroa (-6.46 per cent.) and Selwyn (-5.69 per cent.).
For Otago, the gold-mining revival placed Lake (56.72 percent.) and Vincent (32.81 per cent.) in pride of place. Three counties, including Waihemo (-7.89), retrogressed.
Southland and Wallace counties showed moderate gains, but Stewart Island (-2.53) lost population.
The population of each of the fourteen urban areas (cities or boroughs, plus their suburbs), as estimated for 1st April, 1937, was as follows:—
URBAN AREAS.—ESTIMATED POPULATION (INCLUDING MAORIS), 1ST APRIL, 1937.
| Urban Area. | Population (including Maoris). |
|---|---|
* Excludes a small area which, though part of the borough, is not within the urban area. | |
| Auckland. | |
| Auckland City | 103,000 |
| Birkenhead Borough | 3,430 |
| Northcote Borough | 2,370 |
| Takapuna Borough | 7,350 |
| Devonport Borough | 9,770 |
| New Lynn Borough | 3,540 |
| Mount Albert Borough | 19,900 |
| Mount Eden Borough | 18,650 |
| Newmarket Borough | 2,980 |
| One Tree Hill Borough | 8,140 |
| Onehunga Borough | 11,200 |
| Otahuhu Borough | 5,550 |
| Ellerslie Town District | 2,710 |
| Remainder of urban area | 15,610 |
| Total | 214,200 |
| Wellington. | |
| Wellington City | 116,700 |
| Lower Hutt Borough | 16,500 |
| Petone Borough | 11,000 |
| Eastbourne Borough | 2,340 |
| Johnsonville Town District | 1,750 |
| Remainder of urban area | 3,410 |
| Total | 151,700 |
| Christchurch. | |
| Christchurch City | 92,700 |
| Riccarton Borough | 5,440 |
| New Brighton Borough | 5,270 |
| Sumner Borough | 3,260 |
| Lyttelton Borough* | 3,180 |
| Remainder of urban area | 23,350 |
| Total | 133,200 |
| Dunedin. | |
| Dunedin City | 64,900 |
| St. Kilda Borough | 7,740 |
| Green Island Borough* | 2,280 |
| West Harbour Borough | 1,860 |
| Port Chalmers Borough | 2,130 |
| Remainder of urban area | 3,190 |
| Total | 82,100 |
| Hamilton. | |
| Hamilton Borough | 17,100 |
| Remainder of urban area | 2,800 |
| Total | 19,900 |
| Gisborne. | |
| Gisborne Borough | 13,700 |
| Remainder of urban area | 2,300 |
| Total | 16,000 |
| Napier. | |
| Napier Borough | 15,500 |
| Taradale Town District | 1,220 |
| Remainder of urban area | 2, 180 |
| Total | 18,900 |
| Hastings. | |
| Hastings Borough | 13,000 |
| Havelock North Town District | 1,160 |
| Remainder of urban area | 4,140 |
| Total | 18,300 |
| New Plymouth. | |
| New Plymouth Borough | 16,900 |
| Remainder of urban area | 1,900 |
| Total | 18,800 |
| Wanganui. | |
| Wanganui City | 23,200 |
| Remainder of urban area | 2,600 |
| Total | 25,800 |
| Palmerston North. | |
| Palmerston North City | 22,550 |
| Remainder of urban area | 1,850 |
| Total | 24,400 |
| Nelson. | |
| Nelson City | 11,300 |
| Tahunanui Town District | 860 |
| Remainder of urban area | 1,540 |
| Total | 13,700 |
| Timaru. | |
| Timaru Borough | 17,500 |
| Remainder of urban area | 1,400 |
| Total | 18,900 |
| Invercargill. | |
| Invercargill City | 21,500 |
| South Invercargill Borough | 1,160 |
| Remainder of urban area | 3,340 |
| Total | 26,000 |
COUNTIES.—ESTIMATED POPULATION (INCLUDING MAORIS) AND AREA, 1ST APRIL, 1937.
(NOTE.—“Administrative Counties” do not include boroughs or town districts independent of county control, but include dependent town districts.)
| Administrative County. | Population (including Maoris). | Approximate Area, in Square Miles. |
|---|---|---|
| North Island— | ||
| Mangonui | 8,130 | 960 |
| Whangaroa | 2,580 | 240 |
| Hokianga | 8,810 | 613 |
| Bay of Islands | 10,210 | 820 |
| Whangarei | 11,820 | 1,046 |
| Hobson | 6,540 | 746 |
| Otamatea | 5,240 | 421 |
| Rodney | 5,060 | 477 |
| Waitemata | 13,780 | 606 |
| Eden | 10,400 | 14 |
| Great Barrier Island | 460 | 110 |
| Manukau | 9,780 | 240 |
| Franklin | 13,920 | 551 |
| Raglan | 10,110 | 936 |
| Waikato | 12,690 | 648 |
| Waipa | 12,510 | 435 |
| Otorohanga | 5,550 | 600 |
| Kawhia | 2,260 | 330 |
| Waitomo | 7,730 | 1,119 |
| Taumarunui | 3,690 | 878 |
| Matamata | 9,320 | 930 |
| Piako | 10,440 | 444 |
| Ohinemuri | 3,360 | 222 |
| Hauraki Plains | 4,880 | 231 |
| Thames | 2,830 | 419 |
| Coromandel | 2,680 | 439 |
| Tauranga | 9,800 | 624 |
| Rotorua | 5,650 | 989 |
| Taupo | 3,790 | 3,272 |
| Whakatane | 10,080 | 1,677 |
| Opotiki | 4,630 | 1,537 |
| Matakaoa | 1,880 | 295 |
| Waiapu | 6,480 | 793 |
| Uawa | 1,760 | 256 |
| Waikohu | 3,330 | 947 |
| Cook | 7,980 | 791 |
| Wairoa | 7,540 | 1,373 |
| Hawke's Bay | 16,020 | 1,673 |
| Waipawa | 3,560 | 524 |
| Waipukurau | 1,020 | 121 |
| Patangata | 2,740 | 658 |
| Dannevirke | 4,920 | 426 |
| Woodville | 1,950 | 156 |
| Weber | 380 | 118 |
| Ohura | 2,150 | 427 |
| Whangamomona | 1,300 | 447 |
| Clifton | 2,920 | 451 |
| Taranaki | 6,480 | 229 |
| Inglewood | 3,400 | 187 |
| Egmont | 4,640 | 239 |
| Stratford | 5,350 | 419 |
| Eltham | 3,600 | 207 |
| Waimate West | 2,800 | 83 |
| Hawera | 5,870 | 191 |
| Patea | 3,900 | 591 |
| Kaitieke | 3,300 | 550 |
| Waimarino | 2,860 | 882 |
| Waitotara | 3,700 | 468 |
| Wanganui | 3,880 | 460 |
| Rangitikei | 9,540 | 1,675 |
| Kiwitea | 2,450 | 359 |
| Pohangina | 1,370 | 259 |
| Oroua | 3,890 | 190 |
| Manawatu | 5,280 | 264 |
| Kairanga | 5,410 | 184 |
| Horowhenua | 7,340 | 544 |
| Pahiatua | 2,840 | 288 |
| Akitio | 1,160 | 321 |
| Eketahuna | 2,050 | 311 |
| Mauriceville | 770 | 115 |
| Masterton | 3,420 | 586 |
| Castlepoint | 630 | 203 |
| Wairarapa South | 2,990 | 440 |
| Featherston | 3,960 | 953 |
| Hutt | 9,110 | 462 |
| Makara | 4,400 | 117 |
| Total | 411,050 | 43,807 |
| South Island— | ||
| Sounds | 1,090 | 505 |
| Marlborough | 7,680 | 1,920 |
| Awatere | 1,810 | 1,243 |
| Kaikoura | 3,000 | 705 |
| Amuri | 2,650 | 2,256 |
| Cheviot | 1,410 | 327 |
| Waimea | 12,430 | 1,538 |
| Takaka | 2,050 | 456 |
| Collingwood | 1,520 | 562 |
| Buller | 6,400 | 1,950 |
| Murchison | 1,820 | 1,412 |
| Inangahua | 3,940 | 949 |
| Grey | 5,700 | 1,579 |
| West land | 5,600 | 4,410 |
| Waipara | 2,700 | 937 |
| Kowai | 2,060 | 157 |
| Ashley | 780 | 309 |
| Rangiora | 3,300 | 96 |
| Eyre | 1,880 | 175 |
| Oxford | 1,680 | 318 |
| Tawera | 920 | 941 |
| Malvern | 3,010 | 250 |
| Paparua | 5,780 | 136 |
| Waimairi | 14,520 | 48 |
| Heathcote | 5,950 | 20 |
| Halswell | 2,120 | 40 |
| Mount Herbert | 440 | 66 |
| Akaroa | 1,660 | 169 |
| Chatham Islands | 710 | 372 |
| Wairewa | 1,030 | 170 |
| Springs | 1,840 | 91 |
| Ellesmere | 3,330 | 230 |
| Selwyn | 1,600 | 954 |
| Ashburton | 13,070 | 2,460 |
| Geraldine | 5,920 | 690 |
| Levels | 4,960 | 263 |
| Mackenzie | 3,140 | 2,739 |
| Waimate | 7,170 | 1,383 |
| Waitaki | 10,170 | 2,392 |
| Waihemo | 1,290 | 338 |
| Waikouaiti | 4,530 | 312 |
| Peninsula | 2,810 | 40 |
| Taieri | 5,980 | 903 |
| Bruce | 4,470 | 520 |
| Clutha | 7,300 | 990 |
| Tuapeka | 4,820 | 1,388 |
| Maniototo | 3,010 | 1,340 |
| Vincent | 4,800 | 2,922 |
| Lake | 2,400 | 3,872 |
| Southland | 27,170 | 3,736 |
| Wallace | 10,060 | 3,727 |
| Fiord | 20 | 3,035 |
| Stewart Island | 500 | 670 |
| Total | 236,000 | 59,011 |
| Grand total | 647,050 | 102,818 |
BOROUGHS.—ESTIMATED POPULATION (INCLUDING MAORIS) AND AREA, 1ST APRIL, 1937.
| Borough. | Population (including Maoris). | Approximate Area, in Acres. |
|---|---|---|
| North Island— | ||
| Whangarei | 7,230 | 3,326 |
| Dargaville | 2,200 | 2,800 |
| Birkenhead | 3,430 | 3,084 |
| Northcote | 2,370 | 1,190 |
| Takapuna | 7,350 | 2,780 |
| Devonport | 9,770 | 1,100 |
| New Lynn | 3,540 | 1,395 |
| Auckland (City) | 103,000 | 18,259 |
| Newmarket | 2,980 | 175 |
| Mount Eden | 18,650 | 1,476 |
| Mount Albert | 19,900 | 2,430 |
| One Tree Hill | 8,140 | 2,450 |
| Onehunga | 11,200 | 1,876 |
| Otahuhu | 5,550 | 1,345 |
| Pukekohe | 2,560 | 3,470 |
| Huntly | 1,980 | 803 |
| Ngaruawahia | 1,420 | 1,112 |
| Hamilton | 17,100 | 3,740 |
| Cambridge | 2,230 | 1,280 |
| Te Awamutu | 2,300 | 1,162 |
| Te Kuiti | 2,520 | 1,668 |
| Taumarunui | 2,680 | 1,925 |
| Matamata | 1,370 | 934 |
| Morrinsville | 1,850 | 950 |
| Te Aroha | 2,400 | 2,783 |
| Paeroa | 2,180 | 1,419 |
| Waihi | 3,950 | 4,094 |
| Thames | 4,260 | 2,712 |
| Tauranga | 3,540 | 998 |
| Te Puke | 970 | 1,047 |
| Rotorua | 6,300 | 3,288 |
| Whakatane | 1,770 | 1,438 |
| Opotiki | 1,460 | 772 |
| Gisborne | 13,700 | 3,378 |
| Wairoa | 2,530 | 1,603 |
| Napier | 15,500 | 2,024 |
| Hastings | 13,000 | 2,612 |
| Waipawa | 1,160 | 1,710 |
| Waipukurau | 2,070 | 1,040 |
| Dannevirke | 4,410 | 1,300 |
| Woodville | 1,040 | 1,054 |
| Waitara | 1,990 | 1,587 |
| New Plymouth | 16,900 | 4,070 |
| Inglewood | 1,270 | 703 |
| Stratford | 3,810 | 2,016 |
| Eltham | 1,890 | 1,599 |
| Hawera | 4,700 | 897 |
| Patea | 1,420 | 1,420 |
| Ohakune | 1,390 | 2,079 |
| Raetihi | 1,180 | 958 |
| Taihape | 2,170 | 1,923 |
| Wanganui (City) | 23,200 | 5,726 |
| Marton | 2,760 | 1,415 |
| Feilding | 4,610 | 2,090 |
| Palmerston N. (City) | 22,550 | 4,851 |
| Foxton | 1,600 | 1,271 |
| Shannon | 950 | 844 |
| Levin | 2,690 | 1,332 |
| Otaki | 1,750 | 1,390 |
| Pahiatua | 1,680 | 720 |
| Eketahuna | 730 | 948 |
| Masterton | 9,220 | 2,973 |
| Carterton | 1,940 | 1,265 |
| Greytown | 1,190 | 1,927 |
| Featherston | 1,050 | 760 |
| Martinborough | 960 | 1,070 |
| Upper Hutt | 3,970 | 2,165 |
| Lower Hutt | 16,500 | 3,706 |
| Petone | 11,000 | 1,132 |
| Eastbourne | 2,340 | 1,546 |
| Wellington (City) | 116,700 | 16,289 |
| Total | 585,670 | 164,674 |
| South Island— | ||
| Picton | 1,380 | 1,052 |
| Blenheim | 5,040 | 1,640 |
| Nelson (City) | 11,300 | 4,966 |
| Richmond | 1,140 | 2,600 |
| Motueka | 1,720 | 3,050 |
| Westport | 4,250 | 760 |
| Brunner | 1,000 | 5,700 |
| Runanga | 1,650 | 1,186 |
| Greymouth | 8,220 | 2,522 |
| Kumara | 480 | 842 |
| Hokitika | 2,710 | 674 |
| Ross | 440 | 4,196 |
| Rangiora | 2,250 | 877 |
| Kaiapoi | 1,590 | 877 |
| Riccarton | 5,440 | 728 |
| Christchurch (City) | 92,700 | 10,363 |
| New Brighton | 5,270 | 1,651 |
| Sumner | 3,260 | 3,797 |
| Lyttelton | 3,230 | 2,461 |
| Akaroa | 510 | 233 |
| Ashburton | 5,730 | 1,130 |
| Geraldine | 950 | 566 |
| Temuka | 1,920 | 795 |
| Timaru | 17,500 | 2,673 |
| Waimate | 2,310 | 715 |
| Oamaru | 7,510 | 1,375 |
| Hampden | 310 | 630 |
| Palmerston | 800 | 900 |
| Waikouaiti | 600 | 1,958 |
| Port Chalmers | 2,130 | 500 |
| West Harbour | 1,860 | 2,020 |
| Dunedin (City) | 64,900 | 15,227 |
| St. Kilda | 7,740 | 462 |
| Green Island | 2,290 | 861 |
| Mosgiel | 2,110 | 965 |
| Milton | 1,410 | 315 |
| Kaitangata | 1,360 | 1,280 |
| Balclutha | 1,550 | 605 |
| Tapanui | 310 | 129 |
| Lawrence | 670 | 615 |
| Roxburgh | 470 | 515 |
| Naseby | 210 | 112 |
| Alexandra | 870 | 815 |
| Cromwell | 740 | 806 |
| Arrowtown | 270 | 457 |
| Queenstown | 930 | 270 |
| Gore | 4,650 | 1,940 |
| Mataura | 1,510 | 1,272 |
| Winton | 880 | 505 |
| Invercargill (City) | 21,500 | 5,627 |
| South Invercargill | 1,160 | 2,257 |
| Bluff | 2,050 | 2,110 |
| Riverton | 910 | 718 |
| Total | 313,690 | 101,300 |
| Grand total | 899,360 | 265,974 |
TOWN DISTRICTS.—ESTIMATED POPULATION (INCLUDING MAORIS) AND AREA, 1ST APRIL, 1937.
| Town District. | Population (including Maoris). | Approximate Area, in Acres. |
|---|---|---|
* Constituted a borough from 20th May, 1937. * Parent county shown in parentheses. | ||
| (a) Town Districts not forming Parts of Counties. | ||
| North Island— | ||
| Kaitaia | 810 | 1,123 |
| Kaikohe | 690 | 1,167 |
| Hikurangi | 1,030 | 960 |
| Kamo | 460 | 852 |
| Warkworth | 640 | 1,420 |
| Helensville | 960 | 1,300 |
| Henderson | 1,150 | 1,265 |
| Glen Eden | 1,300 | 1,265 |
| Ellerslie | 2,710 | 735 |
| Howick | 780 | 1,091 |
| Papatoetoe | 2,480 | 1,267 |
| Manurewa | 1,530 | 1,960 |
| Papakura | 1,810 | 2,010 |
| Waiuku | 850 | 1,275 |
| Tuakau | 700 | 1,265 |
| Leamington | 540 | 1,330 |
| Otorohanga | 720 | 314 |
| Manunui | 780 | 1,251 |
| Putaruru | 810 | 975 |
| Mount Maunganui | 540 | 935 |
| Taradale | 1,220 | 1,380 |
| Havelock North | 1,160 | 835 |
| Ohura | 470 | 815 |
| Opunake* | 1,070 | 676 |
| Manaia | 820 | 510 |
| Rangataua | 310 | 734 |
| Mangaweka | 390 | 955 |
| Hunterville | 590 | 791 |
| Waverley | 680 | 484 |
| Bulls | 530 | 677 |
| Johnsonville | 1,750 | 842 |
| Total | 30,080 | 32,459 |
| South Island— | ||
| Tahunanui | 860 | 520 |
| Leeston | 560 | 391 |
| Tinwald | 690 | 1,525 |
| Pleasant Point | 570 | 730 |
| Wyndham | 570 | 680 |
| Lumsden | 540 | 1,264 |
| Otautau | 590 | 954 |
| Nightcaps | 610 | 285 |
| Total | 4,990 | 6,349 |
| Grand total | 35,070 | 38,808 |
| (b) Town Districts forming Parts of Counties.* | ||
| North Island— | ||
| Kohukohu (Hokianga) | 380 | 1,020 |
| Rawene (Hokianga) | 350 | 280 |
| Russell (Bay of Islands) | 390 | 1,066 |
| Kawakawa (Bay of Islands) | 520 | 280 |
| Onerahi (Whangarei) | 430 | 990 |
| Mercer (Franklin) | 310 | 1,000 |
| Raglan (Raglan) | 380 | 428 |
| Te Kauwhata (Waikato) | 360 | 1,290 |
| Ohaupo (Waipa) | 270 | 1,283 |
| Kihikihi (Waipa) | 330 | 523 |
| Kawhia (Kawhia) | 240 | 470 |
| Turua (Hauraki Plains) | 270 | 1,263 |
| Te Karaka (Waikohu) | 350 | 700 |
| Patutahi (Cook) | 280 | 1,275 |
| Ormondville (Dannevirke) | 270 | 1,255 |
| Kaponga (Eltham) | 410 | 558 |
| Normanby (Hawera) | 350 | 260 |
| Rongotea (Manawatu) | 250 | 218 |
| Total | 6,140 | 14,159 |
| South Island— | ||
| Havelock (Marlborough) | 260 | 210 |
| Takaka (Takaka) | 470 | 585 |
| Southbridge (Ellesmere) | 410 | 531 |
| Outram (Taieri) | 390 | 886 |
| Clinton (Clutha) | 440 | 930 |
| Edendale (Southland) | 440 | 696 |
| Total | 2,410 | 3,838 |
| Grand total | 8,550 | 17,997 |
The following adjacent islands not attached to any county were inhabited at the census of 1936:—
| Island. | Population (including Maoris) | ||
|---|---|---|---|
| M. | F. | Total. | |
* Included in Waitemata County from 28th May, 1936. | |||
| Kukutango* | 7 | 5 | 12 |
| Pakatoa | 1 | 7 | 8 |
| Rotoroa | 34 | 6 | 40 |
| Little Barrier | 2 | 1 | 3 |
| Tiritiri | 4 | 6 | 10 |
| Rakino | 4 | 1 | 5 |
| Brown's | 5 | 5 | |
| Pahiki | 7 | 2 | 9 |
| Mokohinau | 7 | 6 | 13 |
| Ponui | 13 | 22 | 35 |
| Waiheke | 346 | 347 | 693 |
| Rangitoto | 12 | 10 | 22 |
| Motutapu | 30 | 6 | 36 |
| Motuihi | 93 | 54 | 147 |
| Kawau | 46 | 38 | 84 |
| Motuhora | 6 | 4 | 10 |
| Motutara | 16 | 7 | 23 |
| Moturekareka | 1 | 1 | |
| Cuvier | 8 | 6 | 14 |
| Great Mercury | 2 | 3 | 5 |
| Motiti | 56 | 47 | 103 |
| Kapiti | 5 | 8 | 13 |
| Graves | 5 | 2 | 7 |
| Somes | 1 | 5 | 6 |
| Tata | 1 | 1 | |
| Ripa | 1 | 2 | 3 |
| Quarantine | 2 | 2 | |
| Dog | 2 | 3 | 5 |
| Centre | 7 | 3 | 10 |
| Totals | 724 | 601 | 1,325 |
Adjacent to the main Islands are many smaller islands, some of which are of considerable area and are under cultivation; others are but islets used as sites for lighthouses, while others, again, are barren and unfitted for human habitation. Some of these islands are included within the boundaries of counties, and their populations are included in the county figures.
The total area of the Dominion of New Zealand is approximately 103,934 square miles. Omitting the annexed islands and certain uninhabited outlying islands, the area of the land-mass remaining is 103,415 square miles. This calculation, it should be explained, includes all inland waters—viz., lakes, rivers, harbours, estuaries, &c. It should be noted also that there is a great deal of high mountainous country in New Zealand, particularly in the South Island, while there are also great areas of broken, swampy, or hilly country either incapable of effective use or which can be used profitably only for pastoral purposes, afforestation, or the like.
Using the latter figure as a base, the density of population in 1937 may be quoted as 15.35 persons to the square mile.
The area and population of individual towns and counties will be found in preceding tables in this section. At the 1936 census density of population in the various provincial districts was—
| Persons per Square Mile. | |
|---|---|
| Auckland | 21.53 |
| Hawke's Bay | 18.07 |
| Taranaki | 20.71 |
| Wellington | 29.11 |
| Marlborough | 4.54 |
| Nelson | 5.47 |
| Westland | 3.83 |
| Canterbury | 16.81 |
| Otago—Otago | 10.76 |
| Southland | 6.52 |
Attention must be drawn to the necessity for the exercise of discretion in the use of data concerning density of population, particularly in comparing one country with another. Areas may be calculated in many ways, while area itself may have little relationship to potentiality of use. In the case of urban population, it is impossible to obtain the aggregate area of sites actually in occupation by business promises, residences, &c. Many boroughs contain within their boundaries largo reserves which, with farming and other unbuilt-on land, tend to disguise the actual relation of population to area.
A record of early statistics of Maoris is given in Vol. XIV of the 1926 Census Results. The first official general census was taken in 1857–58, and others occurred in regular sequence from 1874 onwards. Owing to inherent difficulties the earlier census records make no pretence towards complete accuracy, and oven some later enumerations hardly claim to be more than approximations which approach the truth as nearly as possible.
Available statistical evidence points to a decline in the numbers of the Native race since the advent of Europeans, but this decline was commonly exaggerated by early writers. Of later years an unmistakable increase has been noted. This gain, however, has been accompanied by a very considerable dilution of blood.
The Maori population recorded at the census of 24th March, 1936, was 82,326, which is an increase of 18,656 on the 1926 total. The percentage increase was 29.30, equivalent to an average annual increase of 2.60 per cent. These percentages, it will be noted, are considerably higher than the corresponding figures for the European population—viz., 10.93 per cent. and 1.05 per cent. For the year 1936–37 the net increase of the Maori population was 2.56 per cent., which compares with 0.75 per cent. for the European population.
The census record is as follows:—
| Year. | No. |
|---|---|
* Includes half-castes, vide second page of this section | |
| 1857–58 | 56,049 |
| 1874 | 45,470 |
| 1878 | 43,595 |
| 1881 | 44,097 |
| 1886 | 41,969 |
| 1891 | 41,993 |
| 1896 | 39,854 |
| 1901 | 43,143 |
| 1906 | 47,731 |
| 1911 | 49,844 |
| 1916 | 49,776 |
| 1921 | 52,751 |
| 1926 | 63,670* |
| 1936 | 82,326* |
Of the 82,326 Maoris at the census of 24th March, 1936, 79,097 were in the North Island. Auckland Provincial District contains the bulk (59,215), particularly in the Auckland Peninsula and Poverty Bay regions. Hawke's Bay contains 6,633; Taranaki, 4,280; and Wellington, 8,969. In the South Island Maoris do not attain any numerical significance.
The 1926 Census Results, of which Volume XIV is devoted to a more comprehensive statistical survey of the characteristics of the Maori population than was previously possible, show that a total of 69,780 persons possessed some degree of Maori blood. Of these, 45,429 were classed as of full Maori blood, this term including all persons ranging from over seven-eighths Maori blood to unmixed Native descent. As noted in the Census Results, the degree of miscegenation is probably understated, and the number of Maoris of pure Maori descent is unlikely to exceed 50 per cent. of the total. The 1926 census analysis is as follows:—
| Counted in the Maori population— | |
| Full Maori | 45,429 |
| Three-quarter-caste | 6,632 |
| Half-caste | 11,306 |
| Maori-European, n.o.d. | 303 |
| Total | 63,670 |
| Counted in the non-Maori population— | |
| Quarter-caste | 6,053 |
| Maori-Polynesian | 39 |
| Maori-Japanese | 9 |
| Maori-Chinese | 9 |
| Total | 6,110 |
The sources of the data quoted herein comprise official publications, bulletins issued by the League of Nations, publications of the International Institute of Statistics, and the Statesman's Year-Book. So far as can be ascertained with some pretension to comparative accuracy—the various estimates of the population of the Chinese Empire, for instance, vary to the extent of considerably over 100 millions—the world population is 2,095 millions. The inhabitants of the Dominion therefore comprise about one thirteen-hundredth part of the population of the world. Details for continents as given in the Statistical Year-Book of the League of Nations are:—
| 1913. | 1936. | |
|---|---|---|
| Europe | 498,000,000 | 528,000,000 |
| Asia | 978,000,000 | 1,145,000,000 |
| Africa | 134,000,000 | 148,000,000 |
| North America | 134,000,000 | 178,000,000 |
| South America | 56,000,000 | 86,000,000 |
| Oceania | 8,000,000 | 10,000,000 |
| Totals | 1,808,000,000 | 2,095,000,000 |
As a useful indication of the comparative size of various countries, the following index of population has been prepared:—
| Country. | Population (000 omitted). | Year. | Index of Population (New Zealand = 1). |
|---|---|---|---|
* According to the Chinese Ministry of the Interior. Some authorities consider the population is probably not in excess of 350,000,000, and is stationary. | |||
| England and Wales | 40,839 | 1936 | 26 |
| Scotland | 4,966 | 1936 | 3 |
| Northern Ireland | 1,280 | 1937 | 0.8 |
| Irish Free State | 2,966 | 1936 | 2 |
| India (including Native States) | 370,500 | 1936 | 233 |
| Ceylon | 5,617 | 1936 | 4 |
| Union of South Africa | 9,531 | 1936 | 6 |
| Canada | 11,028 | 1936 | 7 |
| Newfoundland | 290 | 1936 | 0.2 |
| Australia | 6,820 | 1937 | 4 |
| New South Wales | 2,689 | 1937 | 2 |
| Victoria | 1,856 | 1937 | 1 |
| Queensland | 985 | 1937 | 0.6 |
| South Australia | 588 | 1937 | 0.4 |
| Western Australia | 453 | 1937 | 0.3 |
| Tasmania | 233 | 1937 | 0.1 |
| New Zealand | 1,587 | 1937 | 1 |
| Austria | 0,758 | 1936 | 4 |
| Belgium | 8,300 | 1936 | 5 |
| Bulgaria | 0,254 | 1937 | 4 |
| Czechoslovakia | 15,187 | 1936 | 10 |
| Denmark | 3,723 | 1936 | 2 |
| Estonia | 1,130 | 1936 | 0.7 |
| Finland | 3,787 | 1936 | 2 |
| France | 41,906 | 1936 | 26 |
| Germany | 67,105 | 1936 | 42 |
| Greece | 6,839 | 1936 | 4 |
| Hungary | 8,989 | 1937 | 6 |
| Italy | 42,831 | 1937 | 27 |
| Latvia | 1,965 | 1937 | 1 |
| Lithuania | 2,527 | 1937 | 2 |
| Netherlands | 8,557 | 1937 | 5 |
| Norway | 2,895 | 1937 | 2 |
| Poland | 34,221 | 1937 | 22 |
| Portugal | 7,301 | 1937 | 5 |
| Rumania | 19,423 | 1937 | 12 |
| Russia (Soviet Union) | 173,000 | 1936 | 109 |
| Sweden | 6,267 | 1937 | 4 |
| Switzerland | 4,163 | 1936 | 3 |
| Spain | 24,849 | 1936 | 16 |
| Yugoslavia | 15,174 | 1937 | 10 |
| China* | 457,835 | 1936 | 288 |
| Japan | 70,256 | 1936 | 44 |
| Turkey | 16,250 | 1936 | 10 |
| Abyssinia | 7,600 | 1937 | 5 |
| Egypt | 15,515 | 1936 | 10 |
| Mexico | 18,852 | 1936 | 12 |
| United States | 128,429 | 1936 | 81 |
| Argentina | 12,561 | 1937 | 8 |
| Brazil | 42,395 | 1937 | 27 |
| Chile | 4,552 | 1937 | 3 |
Table of Contents
REGISTRATION of births in New Zealand dates from 1848, consequent upon the passing, in 1847, of a Registration Ordinance which made provision for a record of births and deaths being kept by the State. Under this Ordinance many registrations were effected, some of births, as far back as 1840. Compulsory registration did not, however, come into force until 1855.
The law as to registration of births is now embodied in the Births and Deaths Registration Act, 19–4, a consolidation of the then existing legislation. The provisions generally as to registration are that a birth may be registered within sixty-two days without fee. After sixty-two days and within six months a birth is registrable only after solemn declaration made before the Registrar by the parent or some person present at birth, and on payment of a late fee of 5s., which may, however, be remitted at the discretion of the Registrar-General. When six months have elapsed a birth may be registered with a Registrar of Births within one month after conviction of one of the responsible parties for neglect, but an information for such neglect must be laid within two years of date of birth. Power is given by the Act of 1924 for the Registrar-General to register an unregistered birth which occurred in New Zealand, irrespective of the time that may have elapsed, a fee of 5s. being payable and satisfactory evidence on oath and such other proof as the Registrar-General may deem necessary being required.
Registration of still-births, previously not provided for, was made compulsory from the 1st March, 1913.
Although sixty-two days are allowed for the registration of a birth, it is compulsory to notify the birth to the Registrar within a much shorter interval—viz., forty-eight hours if in a city or borough and twenty-one days in every other case.
Particulars now required to be registered are: Date and place of birth; name and sex of child; names, ages, and birthplaces of parents; occupation of father; maiden name of mother; date and place of parents' marriage; and ages and sex of previous issue (distinguishing living and dead) of the marriage. The father of an illegitimate child is not required to give information or to be registered. A child born out of New Zealand but arriving before attaining the age of eighteen months may be registered within six months of arrival.
In the successive Registration Acts special provision was made for exemption from the necessity of registration in the case of births and deaths of Maoris, though registration could be effected if desired. Section 20 of the Births and Deaths Registration Amendment Act, 1912 (now section 60 of the Births and Deaths Registration Act, 1924), empowered the making of regulations to provide for the registration of births and deaths of Maoris. Regulations were made accordingly, and Maori births and deaths became registrable as from the 1st March, 1913. The number of Registrars of Maori Births and Deaths in the Dominion is over 200, most of these being in the North Island, where the great majority of the Maori population is located. Every Native settlement of any size is within easy reach of one of these Registrars. Maori registrations are entered in a separate register, and the figures of births given in the following pages do not include these of Maoris, which are dealt with at the end of this subsection.
Birth statistics are compiled from the records of the Registrar-General. The births covered by a year's statistics are these registered during the year irrespective of the year of birth. The figures do not include still-births, except in the special classification on pages 94 and 95.
After fifteen years of successive declines in the birth-rate, a small increase was recorded for the year 1936. Since more prosperous times began to be experienced a few years ago, the marriage-rate has shown a substantial annual acceleration, and this, no doubt, has been the principal factor in establishing a reversal in trend of the birth-rate for 1936.
The numbers and rates of births (children born alive) for each of the last twenty years are as follows:—
| Year. | Number. | Rate per 1,000 of Population. |
|---|---|---|
| 1917 | 28,239 | 25.69 |
| 1918 | 25,860 | 23.44 |
| 1919 | 24,483 | 21.42 |
| 1920 | 29,921 | 25.09 |
| 1921 | 28,567 | 23.34 |
| 1922 | 29,006 | 23.17 |
| 1923 | 27,967 | 21.94 |
| 1924 | 28,014 | 21.57 |
| 1925 | 28,153 | 21.17 |
| 1926 | 28,473 | 21.06 |
| 1927 | 27,881 | 20.29 |
| 1928 | 27,200 | 19.57 |
| 1929 | 26,747 | 19.03 |
| 1930 | 26,797 | 18.83 |
| 1931 | 26,622 | 18.45 |
| 1932 | 24,884 | 17.12 |
| 1933 | 24,334 | 16.63 |
| 1934 | 24,322 | 16.51 |
| 1935 | 23,965 | 16.17 |
| 1936 | 24,837 | 16.64 |
There is a most noticeable fall in the rate in the later years of the period covered by the table, as compared with the earlier. The fall of 9.05 per 1,000 of population between 1917 and 1936 is equivalent to a decline of 35 per cent. in the birth-rate. The following diagram shows, inter alia, the marked decline in the birthrate since about 1880:—
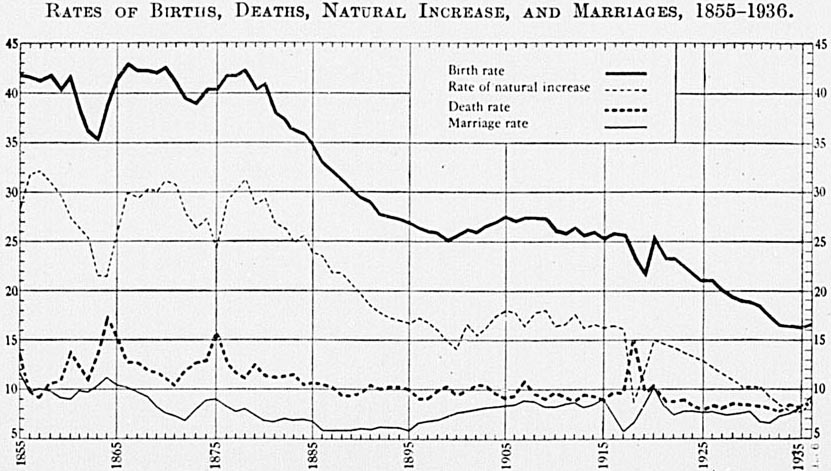
Comparisons of birth-rates over a series of years or between different countries are usually made on the basis of the “crude” rates—i.e., the number of births per 1,000 of the mean population, irrespective of sex or age.
The “crude” rates do not permit of allowance being made for variations in the proportion of women of the child-bearing ages, and it is advisable and of interest to supplement the table of “crude” rates with a computation of the legitimate birth-rate per 1,000 married women between 15 and 45 years of age, or the total birth-rate per 1,000 of all women of these ages. The following table gives both rates for New Zealand in each census year from 1878 to 1926:—
| Year. | Number of Women 15 and under 45. | Number of Births. | Birth-rate per 1,000 Women 15 and under 45. | |||
|---|---|---|---|---|---|---|
| Married. | Total. | Legitimate. | Total. | Legitimate. | Total. | |
| 1878 | 50,999 | 80,313 | 17,341 | 17,770 | 340.0 | 221.3 |
| 1881 | 57,461 | 96,144 | 18,198 | 18,732 | 315.0 | 194.8 |
| 1886 | 62,709 | 117,895 | 18,697 | 19,299 | 298.2 | 163.7 |
| 1891 | 63,172 | 131,271 | 17,635 | 18,273 | 279.2 | 139.2 |
| 1896 | 69,816 | 158,214 | 17,778 | 18,612 | 254.6 | 117.6 |
| 1901 | 79,420 | 183,387 | 19,554 | 20,491 | 246.2 | 111.7 |
| 1906 | 98,249 | 212,598 | 23,120 | 24,252 | 235.3 | 114.1 |
| 1911 | 119,390 | 240,714 | 25,276 | 26,354 | 211.7 | 109.5 |
| 1916 | 141,322 | 267,300 | 27,363 | 28,509 | 193.6 | 106.7 |
| 1921 | 150,400 | 288,477 | 27,309 | 28,567 | 181.6 | 99.0 |
| 1926 | 161,739 | 313,363 | 27,000 | 28,473 | 166.9 | 90.9 |
The legitimate rate per 1,000 married women between the ages of 15 and 45 is seen to have fallen by over 50 per cent. between 1878 and 1926, while an even greater fall is shown for the total rate on the basis of all women of the ages mentioned. The greater fall in the latter rate than in the former is due to the fact that among women of the child-bearing ages the proportion of married women is considerably lower nowadays than in the earlier years covered.
A greater proportion of women formerly married at younger ages than they do at present, and a study of the figures for successive censuses reveals considerable changes in the age-constitution of married women within the child-bearing ages. As the birth-rate varies with age, the change in age-constitution over the period is a factor which should be taken into account. This was done in the computation of index-numbers of birth-rates published in the 1933 (page 80) and earlier issues of the Year-Book.
The decline of the birth-rate in New Zealand has been accompanied by a decrease in the death-rate. Nevertheless, the nominal rate of natural increase of population has fallen from 31.19 per 1,000 of mean population in 1870 to 7.89 in 1936. Acceptance of this figure without consideration of the effect of the changing age-constitution will give an erroneous view of the present margin of increase and of the probable trend of population growth in the future. (See section on Population.)
| Period. | Annual Rates per 1,000 living. | ||
|---|---|---|---|
| Births. | Deaths. | Natural Increase. | |
| 1871–1875 | 39.88 | 12.67 | 27.21 |
| 1876–1880 | 41.21 | 11.80 | 29.41 |
| 1881–1885 | 36.36 | 10.95 | 25.41 |
| 1886–1890 | 31.15 | 9.85 | 21.30 |
| 1891–1895 | 27.68 | 10.15 | 17.53 |
| 1896–1900 | 25.75 | 9.55 | 16.20 |
| 1901–1905 | 26.60 | 9.91 | 16.69 |
| 1906–1910 | 27.06 | 9.75 | 17.31 |
| 1911–1915 | 25.98 | 9.22 | 16.76 |
| 1916–1920 | 24.32 | 10.73 | 13.59 |
| 1921–1925 | 22.22 | 8.62 | 13.60 |
| 1926–1930 | 19.76 | 8.60 | 11.16 |
| 1931–1935 | 16.98 | 8.23 | 8.75 |
| 1936 | 16.64 | 8.75 | 7.89 |
New Zealand's position in the following table is much higher on the basis of natural-increase rate than it would be on that of the birth-rate.
BIRTH AND NATURAL-INCREASE RATES.
| Country. | Quinquennium. | Annual Rates per 1,000. | |
|---|---|---|---|
| Births. | Natural Increase. | ||
* Registration urea. | |||
| Egypt | 1930–34 | 42.7 | 16.2 |
| Yugoslavia | 1930–34 | 32.9 | 14.6 |
| South Africa | 1931–35 | 24.1 | 14.3 |
| Japan | 1931–35 | 31.6 | 13.8 |
| Argentina | 1931–35 | 25.0 | 13.6 |
| Bulgaria | 1932–36 | 28.3 | 13.5 |
| Greece | 1930–34 | 30.0 | 13.3 |
| Poland | 1932–36 | 26.6 | 12.4 |
| Ceylon | 1931–35 | 36.8 | 12.3 |
| Rumania | 1932–36 | 32.4 | 12.1 |
| Netherlands | 1932–36 | 20.7 | 11.9 |
| Portugal | 1932–36 | 28.6 | 11.9 |
| Canada | 1931–35 | 21.5 | 11.7 |
| Uruguay | 1931–35 | 21.4 | 11.1 |
| Lithuania | 1932–36 | 24.8 | 10.8 |
| Spain | 1931–35 | 26.5 | 10.4 |
| Italy | 1932–36 | 23.2 | 9.4 |
| Chile | 1932–36 | 33.9 | 8.7 |
| New Zealand | 1932–36 | 16.6 | 8.3 |
| Australia | 1932–36 | 16.7 | 7.6 |
| Denmark | 1932–36 | 17.6 | 6.8 |
| Hungary | 1932–36 | 21.7 | 6.4 |
| United States* | 1931–35 | 17.2 | 6.3 |
| Finland | 1931–35 | 18.4 | 5.8 |
| Northern Ireland | 1931–35 | 19.8 | 5.6 |
| Irish Free State | 1931–35 | 19.2 | 5.3 |
| Germany | 1931–35 | 16.5 | 5.3 |
| Czechoslovakia | 1932–36 | 18.8 | 5.2 |
| Scotland | 1931–35 | 18.2 | 5.0 |
| Norway | 1932–36 | 14.9 | 4.7 |
| Switzerland | 1931–35 | 16.4 | 4.6 |
| Latvia | 1932–36 | 18.0 | 4.1 |
| Belgium | 1931–35 | 16.7 | 3.8 |
| England & Wales | 1931–35 | 15.0 | 3.0 |
| Sweden | 1932–36 | 14.0 | 2.4 |
| Estonia | 1931–35 | 16.5 | 1.5 |
| France | 1931–35 | 16.5 | 0.7 |
| Austria | 1932–36 | 13.8 | 0.5 |
With the exception of one year (1800), there has always been a preponderance of males in the number of children born in New Zealand. The proportions are usually shown by stating the number of births of male children to every 1,000 female births. This number has been as high as 1,113 (in 1859), and as low as 991 (in 1860).
But little significance can be attached to any figures prior to 1870, on account of the comparatively small number of births. The period preceding 1870 exhibits violent fluctuations in the proportion of males, which tend to disappear as the total of births grows larger. The extreme range since 1870 has been from 1,016 male per 1,000 female births in 1878 to 1,081 in 1923.
| Year. | Number of Births of | Male Births per 1,000 Female Births. | Year. | Number of Births of | Male Births per 1,000 Female Births. | ||
|---|---|---|---|---|---|---|---|
| Males. | Females. | Males. | Females. | ||||
| 1917 | 14,329 | 13,910 | 1,030 | 1927 | 14,291 | 13,590 | 1,052 |
| 1918 | 13,124 | 12,736 | 1,030 | 1928 | 14,082 | 13,118 | 1,073 |
| 1919 | 12,587 | 11,896 | 1,058 | 1929 | 13,645 | 13,102 | 1,041 |
| 1920 | 15,434 | 14,487 | 1,065 | 1930 | 13,713 | 13,084 | 1,048 |
| 1921 | 14,576 | 13,991 | 1,042 | 1931 | 13,766 | 12,856 | 1,071 |
| 1922 | 14,897 | 14,109 | 1,056 | 1932 | 12,824 | 12,060 | 1,063 |
| 1923 | 14,531 | 13,436 | 1,081 | 1933 | 12,419 | 11,915 | 1,042 |
| 1924 | 14,295 | 13,719 | 1,042 | 1934 | 12,554 | 11,768 | 1,067 |
| 1925 | 14,518 | 13,635 | 1,064 | 1935 | 12,316 | 11,640 | 1,057 |
| 1926 | 14,649 | 13,824 | 1,060 | 1936 | 12,608 | 12,229 | 1,031 |
The gradual increase in the proportion of males born is illustrated by taking the average ratios of successive decennial periods. The apparent cessation in the increase, as shown by the figures for the period 1916–25 as compared with the preceding, is due to the low masculinity recorded in the last two war years, when (it may be remarked in passing) the proportion of first births to total births was abnormally low.
| Period. | Male Births to 1,000 Female Births. |
|---|---|
| 1856–1865 | 1,062 |
| 1866–1875 | 1,043 |
| 1876–1885 | 1,045 |
| 1886–1895 | 1,045 |
| 1896–1905 | 1,054 |
| 1906–1915 | 1,055 |
| 1916–1925 | 1,053 |
| 1926–1935 | 1,057 |
It would appear that the proportion of males is somewhat higher for first births than for the general average of all children. Of 81,693 legitimate first births registered during the ten years 1927–36 (excluding plural births), 42,075 were of males and 39,618 of females, the proportion of males per 1,000 females being 1,062.
The sexes of first-born for various age-groups of the mother for the aggregate of the ten years 1927–36 are as follows:—
| Age of Mother, in Years. | Males. | Females. | Females per 1,000 |
|---|---|---|---|
| Under 20 | 3,702 | 3,456 | 1,071 |
| 20 and under 25 | 16,997 | 15,815 | 1,074 |
| 25 and under 30 | 13,602 | 13,116 | 1,035 |
| 30 and under 35 | 5,462 | 5,040 | 1,083 |
| 35 and under 40 | 1,831 | 1,703 | 1,075 |
| 40 and over | 481 | 488 | 985 |
| Totals | 42,075 | 39,618 | 1,062 |
In the ten years covered there were 678 cases of twin first births, in 229 cases the children were both males, in 244 both females, and in the remaining 205 of opposite sex. Four cases of triplets (in one case, all females; in two cases, two females and one male; and in the other, two males and one female) were recorded as first births during the period.
Further light on the question of sexes of children may be thrown by some figures extracted from the records of births registered in the ten years 1927–36 in cases where the child was shown to be the fourth-born of a family in which the three previously born children were still living. In the following statement showing the sex-nativity order up to the fourth child, families in which plural births occurred among the first four children have been excluded.
| First-born. | Second-born. | Third-born. | Fourth-born. | Number of cases. |
|---|---|---|---|---|
| Male | Male | Male | Male | 1,410 |
| Male. | Male. | Male. | Male. | 1,410 |
| Male. | Male. | Male. | Female. | 1,278 |
| Male. | Male. | Female. | Male. | 1,167 |
| Male. | Male. | Female. | Female. | 1,168 |
| Male. | Female. | Male. | Female. | 1,096 |
| Male. | Female. | Female. | Male. | 1,134 |
| Male. | Female. | Female. | Female. | 1,094 |
| Female. | Female. | Female. | Female. | 1,064 |
| Female. | Female. | Female. | Male. | 1,193 |
| Female. | Female. | Male. | Female. | 1,084 |
| Female. | Female. | Male. | Male. | 1,152 |
| Female. | Male. | Female. | Female. | 1,069 |
| Female. | Male. | Female. | Male. | 1,143 |
| Female. | Male. | Male. | Female. | 1,118 |
| Female. | Male. | Male. | Male. | 1,014 |
Of the 18,328 families covered, in 9,491 the first child was a male and in 8,837 a female, the number of males per 1,000 females being thus 1,074. The proportion is reduced for subsequent births. The figures are as follows:—
| Child. | Males. | Females. | Males per 1,000 Females. |
|---|---|---|---|
| First | 9,491 | 8,837 | 1,074 |
| Second | 9,367 | 8,961 | 1,045 |
| Third | 9,296 | 9,032 | 1,029 |
| Fourth | 9,357 | 8,971 | 1,043 |
The fact that there is a higher masculinity rate among first-born children than among later issue serves to explain the increasing masculinity of births in successive decennia referred to previously, when it is remembered that the average number of children to a family has fallen heavily during the period, and the proportion of first-born children correspondingly increased.
The sex-proportions of illegitimate births are generally supposed to be more nearly equal than these of legitimate births. However, although little reliance can be placed on the figures for New Zealand by reason of the small numbers represented, it may be stated that the average for the period 1927–36 was 1,058 males per 1,000 females.
The number of cases of multiple births and the proportion per 1,000 of the total (living births only) during the last ten years were—
| Year. | Total Births. | Total Cases. | Cases of Twins. | Cases of Triplets. | Multiple Cases per 1,000 of Total Cases. |
|---|---|---|---|---|---|
* Including one case of quadruplets. | |||||
| 1927 | 27,881 | 27,548 | 331 | 1 | 12.05 |
| 1928 | 27,200 | 26,919 | 273 | 4 | 10.29 |
| 1929 | 26,747 | 26,470 | 275 | 1 | 10.43 |
| 1930 | 26,797 | 26,488 | 305 | 2 | 11.59 |
| 1931 | 26,622 | 26,332 | 288 | 1 | 10.98 |
| 1932 | 24,884 | 24,618 | 260 | 3 | 10.68 |
| 1933 | 24,334 | 24,079 | 251 | 2 | 10.51 |
| 1934 | 24,322 | 24,060 | 258 | 2 | 10.81 |
| 1935 | 23,965 | 23,685 | 275 | 2* | 11.70 |
| 1936 | 24,837 | 24,608 | 225 | 2 | 9.22 |
Counting only cases where both children were born alive, there were 225 cases of twin births (450 children) registered in 1936. There were also two cases of triplets.
The number of accouchements resulting in living births was 24,608, and on the average one mother in every 108 gave birth to twins (or triplets).
When still-births are taken into account, however, the total number of accouchements for the year 1936 is increased to 25,298, and the number of cases of multiple births to 269. On this basis the proportion of mothers giving birth to twins or triplets is increased to one in 94.
The following table shows the sexes in individual oases of twin births for the same decade:—
| Year. | Total Cases. | Both Males. | Both Females. | Opposite Sexes. |
|---|---|---|---|---|
| 1927 | 331 | 112 | 104 | 115 |
| 1928 | 273 | 95 | 71 | 107 |
| 1929 | 275 | 95 | 92 | 88 |
| 1930 | 305 | 101 | 97 | 107 |
| 1931 | 288 | 101 | 89 | 98 |
| 1932 | 260 | 87 | 80 | 93 |
| 1933 | 251 | 70 | 73 | 108 |
| 1934 | 258 | 89 | 80 | 89 |
| 1935 | 275 | 83 | 90 | 102 |
| 1936 | 225 | 82 | 71 | 72 |
During the ten years 1927–36 there wore nineteen cases of triplets. In three cases all three children were males, in six cases all were females, in two cases there were two males and one female, and in eight cases two of the three children were females.
On 6th March, 1935, quadruplets were born in Dunedin, one child being a male and the remaining three females. A previous case of quadruplets occurred at Ngaruawahia in 1919, all being males. In earlier years no specific note would have been made of such instances, and it is impossible to state whether the above represents all quadruple births which have occurred in New Zealand.
Information as to the relative ages of parents of legitimate living children whose births were registered in 1936 is shown in the following table:—
| Age of Mother, in Years. | Age of Father, in Years. | ||||||||||
|---|---|---|---|---|---|---|---|---|---|---|---|
| Under 21. | 21 and under 25. | 25 and under 30. | 30 and under 35. | 35 and under 40. | 40 and under 45. | 45 and under 50. | 50 and under 55. | 55 and under 65. | 65 and over. | Total | |
* Including thirty-three cases where plural births would have been registered had not one child been still-born. | |||||||||||
| Single Births. | |||||||||||
| Under 21 | 116 | 676 | 514 | 135 | 35 | 13 | 4 | 2 | 4 | 1,499 | |
| 21 and under 25 | 60 | 1,186 | 2,492 | 948 | 240 | 52 | 19 | 11 | 6 | 1 | 5,015 |
| 25 and under 30 | 9 | 314 | 3,240 | 2,869 | 970 | 224 | 84 | 39 | 14 | 2 | 7,765 |
| 30 and under 35 | 1 | 30 | 558 | 2,225 | 1,530 | 554 | 175 | 88 | 24 | 5 | 5,190 |
| 35 and under 40 | 43 | 326 | 1,100 | 696 | 396 | 125 | 84 | 9 | 2,779 | ||
| 40 and under 45 | 1 | 28 | 119 | 349 | 269 | 119 | 49 | 7 | 941 | ||
| 45 and over | 1 | 5 | 36 | 22 | 10 | 74 | |||||
| Totals | 186 | 2,206 | 6,848 | 6,531 | 3,995 | 1,893 | 983 | 406 | 191 | 24 | 23,263* |
| Multiple Births. | |||||||||||
| Under 21 | 1 | 1 | 2 | 4 | |||||||
| 21 and under 25 | 1 | 7 | 14 | 3 | 1 | 26 | |||||
| 25 and under 30 | 4 | 30 | 30 | 4 | 3 | 1 | 72 | ||||
| 30 and under 35 | 1 | 13 | 37 | 25 | 4 | 4 | 1 | 1 | 86 | ||
| 35 and under 40 | 3 | 11 | 6 | 7 | 27 | ||||||
| 40 and under 45 | 1 | 2 | 3 | 1 | 1 | 8 | |||||
| Totals | 2 | 13 | 59 | 73 | 42 | 15 | 15 | 2 | 2 | 223 | |
| Grand totals | 188 | 2,219 | 6,907 | 6,604 | 4,037 | 1,908 | 998 | 408 | 193 | 24 | 23,486* |
Information as to the previous issue of the existing marriage, required in connection with the registration of births in New Zealand, is useful not only for record purposes, but also as providing valuable data for statistical purposes. Tables are given in the annual “Report on Vital Statistics” containing detailed information as to number of previous issue in connection with (1) age of mother, and (2) duration of marriage. The former table for the year 1936 is here summarized.
| Age of Mother. | Number of Previous Issue. | Total. | ||||||||
|---|---|---|---|---|---|---|---|---|---|---|
| 0. | 1. | 2. | 3. | 4. | 5. | 6 and under 10. | 10 and under 15. | 15 and over. | ||
* This number represents 23,263 single cases and 223 multiple cases. | ||||||||||
| Under 21 | 1,200 | 260 | 34 | 9 | 1,503 | |||||
| 21 and under 25 | 2,921 | 1,399 | 514 | 156 | 46 | 5 | 5,041 | |||
| 25 and under 30 | 3,134 | 2,325 | 1,256 | 635 | 306 | 109 | 71 | 1 | 7,837 | |
| 30 and under 35 | 1,221 | 1,360 | 1,078 | 685 | 429 | 221 | 267 | 15 | 5,276 | |
| 35 and under 40 | 377 | 465 | 486 | 458 | 320 | 244 | 402 | 53 | 1 | 2,806 |
| 40 and under 45 | 72 | 93 | 122 | 113 | 119 | 115 | 241 | 73 | 1 | 949 |
| 45 and over | 8 | 3 | 4 | 7 | 8 | 11 | 21 | 11 | 1 | 74 |
| Totals | 8,933 | 5,905 | 3,494 | 2,063 | 1,228 | 705 | 1,002 | 153 | 3 | 23,486* |
In computing previous issue, multiple births have been given their full significance, the numbers at the head of the columns relating to children born alive. In the following table this procedure has been followed not only for the previous issue but also for children covered by the 1936 registrations, who are also taken into account in the computation of the averages.
| Age of Mother, in Years. | Total Mothers. | Total Issue. | Average Issue. |
|---|---|---|---|
| Under 21 | 1,503 | 1,862 | 1.24 |
| 21–24 | 5,041 | 8,172 | 1.62 |
| 25–29 | 7,837 | 16,885 | 2.15 |
| 30–34 | 5,276 | 15,704 | 2.98 |
| 35–39 | 2,806 | 11,556 | 4.12 |
| 40–44 | 949 | 5,261 | 5.55 |
| 45 and over | 74 | 491 | 6.64 |
| Totals | 23,486 | 59,931 | 2.55 |
It should be stressed that the averages are no more than they purport to be—viz., the average number of children (including these registered in 1936) born up to the present time to these mothers of legitimate children whose births were registered during the year. They do not purport to represent, nor do they represent, the average issue of all women of the ages shown. Furthermore, they represent issue born to the existing marriage only. The averages for the last five years were as follows: 1932, 2.75; 1933, 2.75; 1934, 2.69; 1935, 2.64; and 1936, 2.55. This falling trend in the average issue of mothers giving birth to children is a measure of the tendency towards smaller families. The acceleration in the decline for 1936, however, is the result of the abnormal proportion of first births registered during that year.
The serious effect of a steadily declining birth-rate upon the population of a country is now receiving increasing attention, not only in New Zealand but in many other countries where a similar state of affairs is being experienced.
While there are manifold aspects of the problem, the birth statistics compiled annually in New Zealand do not furnish adequate data for a comprehensive study and, indeed, the quantity of material that it is possible to utilize is, as regards many aspects, insufficient to permit reliable conclusions to be drawn therefrom.
Nevertheless, in view of the increasing importance now attaching to this phase of the Dominion's vital statistics, an attempt has been made to analyse the birth statistics for 1936 a little more fully than it has been found possible to do previously. As a result, some light may be thrown upon several important questions relating to the reproductivity of the country's population.
It has already been shown that the average issue of married women in New Zealand is definitely declining. It is of value, however, to discover what sections of the population are contributing most to this decline. Certain indications are obtainable from statistics of average issue of parents who had issue born to them during 1936, analysed according to the occupation of the father. A similar analysis was made for the year 1925, and a summary of the results obtained for the two years is given in the following table;—
| Occupations of Fathers in Industrial Groups. | Average Number of Children. | |
|---|---|---|
| 1925. | 1936. | |
| Fishing and trapping | 3.95 | 2.53 |
| Agricultural and pastoral farming | 3.23 | 2.76 |
| Forestry | 3.38 | 2.80 |
| Mining and quarrying | 3.39 | 2.75 |
| Processes relating to minerals | 2.58 | 2.74 |
| Processes relating to chemical, animal, and vegetable products | 3.23 | 2.78 |
| Processes relating to metals, machines, conveyances, &c. | 2.66 | 2.19 |
| Processes relating to fibrous materials, textiles, and dress | 2.75 | 2.27 |
| Processes relating to food, drink, and tobacco | 2.91 | 2.24 |
| Processes relating to wood, basketware, and furniture | 2.51 | 2.16 |
| Processes relating to paper, stationery, printing, &c. | 2.36 | 2.01 |
| Construction and repair of buildings, roads, &c. | 2.95 | 2.62 |
| Transport and communication | 2.83 | 2.60 |
| Commerce and finance | 2.73 | 2.15 |
| Public administration, clerical, and professional | 2.31 | 2.02 |
| Entertainment, sport, and recreation | 2.80 | 2.67 |
| Personal or domestic service | 2.62 | 2.40 |
| Dependent on public or private support | 1.50 | 1.00 |
| Other and indefinite occupations | 3.25 | 2.89 |
| Totals | 2.96 | 2.55 |
There has been a general decrease in the average for every industrial group except that of processes relating to minerals. While the decline has been small, the general trend appears to have been to reduce the higher averages recorded in 1925 to a level more equal to the average for all occupations in 1936.
The figures of average number of issue quoted above are not by any means a criterion of the average number of children in a New Zealand family, representing, as they do, only the average family to date of these parents who had children born to them during 1925 or 1936. The figures for the latter year, in fact, are somewhat vitiated by the abnormal proportion of first births registered during the year. Nevertheless, they may serve as a legitimate index for a comparison of the relative reproductivity of different industrial groups and occupations.
An analysis of the 1936 figures by individual occupations reveals some interesting variations, though the differences are somewhat small. The general average number of issue for all fathers of children whose births were registered in 1936 was 2.55, but amongst the individual occupations are found the following instances with figures higher than the general average: Trainer, 3.87; engine-driver, 3.07; dairy-farmer, 3.5; surfaceman, 3.32; railway guard, porter, 3.23; watersider, 3.20; caretaker, 3.10; bush sawmiller, 2.99; motor mechanic, 2.97; drover, 2.97: labourer, 2.90; and conductor, motorman, 2.93. Among the low averages, on the other hand, may be found the following: Watchmaker and jeweller, 1.77; civil engineer, 1.81; chemist, 1.84; journalist, 1.89; compositor, 1.91; clerk, 1.92; solicitor, 1.95; civil servant, salesman, telegraph operator, and garage hand, 1.97; plasterer, 4.98; and insurance manager, printer and publisher, joiner, and accountant, 2.00. These figures, when considered in conjunction with wage-rates and other economic factors, make interesting reading. Due allowance, of course, most be made for the probable average-age factor of the father in any particular group of occupations. Care has been exercised to select only these occupations where there were sufficient eases in the group to permit of a reliable comparison being made.
It would appear from figures extracted of births registered during the year 1936 that there is undoubtedly some considerable difference in the reproductivity rate of mothers of various nationalities. Unfortunately, for many nationalities, there is hardly a sufficient number of cases of births occurring in one year to possess enough positive significance for inclusion in these pages.
Of a total of 115,370 accouchements resulting in legitimate births during the five years 1932–37, the issue of no fewer than 40,644, or 35 per cent., were firstborn children, and in 18,658 of these cases, or 46 per cent., the birth occurred within twelve months, and in 29,590, or 73 per cent., within two years after the marriage of the parents. In the remaining 27 per cent. of cases where there was any issue to the marriage, two years or more had elapsed before the birth of the first child.
In view of the abnormal conditions operating during the last few years, and particularly as a result of the heavy increase in the number of marriages during each of the three years 1934 to 1936, it is not surprising to find the proportion of first births for both 1935 and 1936 showing a definite increase. In fact, the proportion of first births to total births in 1936 was phenomenal, and attained a level greatly in excess of that for any other year. The proportion of first births occurring within one year of the marriage of the parents, however, was lower in 1936 than for many years past. The high rate of depression-postponed marriages mentioned above would naturally produce this effect. The figures for each of the last five years are:—
| Year. | Total Legitimate Cases. | Total Legitimate First Cases. | Proportion of First Cases to Total Cases. | First Cases within One Year after Marriage. | First Cases within Two Years after Marriage. | ||
|---|---|---|---|---|---|---|---|
| Number. | Proportion to Total First Cases. | Number. | Proportion to Total First Cases. | ||||
| Per Cent. | Per Cent. | Per Cent. | |||||
| 1932 | 23,366 | 7,950 | 34.02 | 3,664 | 46.09 | 5,744 | 72.25 |
| 1933 | 22,963 | 7,766 | 33.81 | 3,639 | 46.86 | 5,596 | 72.06 |
| 1934 | 22,905 | 7,925 | 34.60 | 3,665 | 46.25 | 5,788 | 73.03 |
| 1935 | 22,650 | 8,070 | 35.63 | 3,709 | 45.96 | 5,936 | 73.56 |
| 1936 | 23,486 | 8,933 | 38.04 | 3,981 | 44.57 | 6,526 | 73.05 |
| Totals for five years | 115,370 | 40,644 | 35.23 | 18,658 | 45.91 | 29,590 | 72.80 |
During the five years there were 8,790 cases of legitimate births within seven months after marriage, a period which may be regarded as a minimum in a consideration of extra-marital conception; also 5,680 cases of illegitimate births were registered, and if these latter are all regarded as first births (which is not entirely the case), the following position is shown:—
| Year. | Total Legitimate First Cases. (a) | Illegitimate Cases. (b) | Legitimate Cases within Seven Months after Marriage. (c) | Proportion of (c) to (a). (d) | Proportion of (b) + (c) to Total of (a) + (b). (e) |
|---|---|---|---|---|---|
| Per Cent. | Per Cent. | ||||
| 1932 | 7,950 | 1,252 | 1,830 | 23.02 | 33.49 |
| 1933 | 7,766 | 1,116 | 1,762 | 22.69 | 32.40 |
| 1934 | 7,925 | 1,155 | 1,756 | 22.16 | 32.06 |
| 1935 | 8,070 | 1,035 | 1,674 | 20.74 | 29.75 |
| 1936 | 8,933 | 1,122 | 1,768 | 19.79 | 28.74 |
| Totals for five years | 40,644 | 5,680 | 8,790 | 21.62 | 31.24 |
The figures quoted in the above table indicate a continued decrease in the proportion of extra-maritally conceived cases.
Apart from the tendency to restrict the size of families (already commented upon), it would appear that postponement of the birth of the first child is becoming a feature of modern times. Statistics of first births over a number of years indicate that the proportion occurring within one year of marriage is gradually declining. The following table illustrates this point.
FIRST BIRTHS, DURATION OF MARRIAGE OF PARENTS.
| Duration of Marriage in Years. | Proportion per Cent. of Total First Births. | |||
|---|---|---|---|---|
| 1914. | 1924. | 1934. | 1936. | |
| Under 1 year | 52.95 | 50.06 | 46.25 | 44.57 |
| 1 and under 2 years | 28.62 | 26.64 | 26.79 | 28.49 |
| 2 and under 3 years | 9.02 | 10.43 | 10.24 | 11.73 |
| 3 and under 4 years | 3.43 | 5.51 | 6.16 | 5.42 |
| 4 and under 5 years | 1.88 | 3.03 | 3.96 | 3.19 |
| 5 and under 10 years | 3.26 | 3.36 | 5.49 | 5.52 |
| 10 years and over | 0.84 | 0.97 | 1.11 | 1.08 |
| Total | 100.00 | 100.00 | 100.00 | 100.00 |
The proportions for 1936 are, no doubt, slightly affected by post-depression influences. For the years covered by the foregoing table the average duration of marriage before the birth of the first child was—1914, 1.63 years; 1924, 1.76 years; 1934, 1.85 years; and 1936, 1.84 years.
The following table showing the average duration of marriage before the birth of the first child in conjunction with the occupational grouping of the father, is of interest.
AVERAGE DURATION OF MARRIAGE BEFORE THE BIRTH OF THE FIRST CHILD, 1930.
| Occupations of Fathers in Industrial Groups. | Total Fathers. | Average Duration of Marriage in Years. |
|---|---|---|
(NOTE.—Cases where the duration of marriage was ten years or over have been omitted from the above calculations.) | ||
| Fishing and trapping | 30 | 1.11 |
| Agricultural and pastoral farming | 1,867 | 1.61 |
| Forestry | 99 | 1.43 |
| Mining and quarrying | 148 | 1.58 |
| Processes relating to minerals | 15 | 1.40 |
| Processes relating to metals, machines, conveyances, &c. | 590 | 1.83 |
| Processes relating to fibrous materials, textiles, and dress | 106 | 1.75 |
| Processes relating to food, drink, and tobacco | 235 | 1.04 |
| Processes relating to wood, basketware, and furniture | 133 | 1.50 |
| Processes relating to paper, stationery, printing, &c. | 85 | 1.85 |
| Processes relating to chemical, animal, and vegetable products | 55 | 2.03 |
| Construction and repair of roads, buildings, &c. | 789 | 1.76 |
| Transport and communication | 829 | 1.71 |
| Commerce and finance | 1,022 | 1.89 |
| Public administration, clerical, and professional | 1,071 | 2.21 |
| Entertainment, sport, and recreation, etc. | 33 | 1.57 |
| Personal and domestic service | 190 | 1.70 |
| Other and indefinite occupations | 1,550 | 1.49 |
| Totals | 8,847 | 1.73 |
The greatest average elapsed time before the birth of the first child according to the above statistics was recorded for the public administration, clerical, and professional group. The “Other and Indefinite Occupations” group, which contains a great number of fathers of the general-labourer category, indicates a relatively short period of elapsed time before the advent of issue after marriage.
Another item of interest extracted from the 1930 birth statistics is a table of first births occurring to mothers in different age-groups expressed as a proportion per cent. of the total first births. A comparison has also been computed on the same basis with the years 1914, 1924, and 1934.
FIRST BIRTHS BY AGE OF MOTHER.
| Age of Mother. | First Births, Proportion per Cent. at each Age-group to Total First Births. | |||
|---|---|---|---|---|
| 1914. | 1924. | 1934. | 1936. | |
| Under 20 | 6.73 | 7.55 | 8.90 | 7.91 |
| 20 and under 25 | 35.89 | 38.16 | 40.39 | 38.22 |
| 25 and under 30 | 35.01 | 32.59 | 32.79 | 35.08 |
| 30 and under 35 | 15.61 | 14.68 | 13.10 | 13.67 |
| 35 and under 40 | 5.52 | 5.33 | 3.79 | 4.22 |
| 40 and under 45 | 1.16 | 1.59 | 0.99 | 0.81 |
| 45 and over | 0.08 | 0.10 | 0.04 | 0.09 |
| Total | 100.00 | 100.00 | 100.00 | 100.00 |
First births are now occurring in greater proportions at the younger ages of mothers. The trend in this direction was slightly interrupted in 1936 by the inclusion in the figures for that year of a large proportion of births to mothers whose marriage had been unduly postponed on account of economic factors. The figures of average ages of mothers for the above years are as follows: 1914, 26.55; 1924, 26.39; 1934, 25.90; and 1936, 2604.
The births of 1,126 children (601 males, 525 females) registered in 1936 were illegitimate. The numbers for each of the last ten years, with the percentages they bear to the total births registered, are as follows:—
| Year. | Number. | Percentage to Total Births. |
|---|---|---|
| 1927 | 1,387 | 4.97 |
| 1928 | 1,383 | 5.08 |
| 1929 | 1,327 | 4.96 |
| 1930 | 1,371 | 5.12 |
| 1931 | 1,315 | 4.94 |
| 1932 | 1,262 | 5.07 |
| 1933 | 1,119 | 4.60 |
| 1934 | 1,161 | 4.77 |
| 1935 | 1,046 | 4.36 |
| 1936 | 1,126 | 4.43 |
While the proportion of illegitimate to total births has fluctuated considerably during the last decade, the trend for the latter half of the period appears to be definitely towards a decline, the average proportion for 1932–36 being 4.65 as against an average of 5.01 for the period 1927–31. Probably a better criterion of the trend in the illegitimate birth-rate is afforded by the movement in the proportion of illegitimate births per 1,000 unmarried women—i.e., spinsters, widows, and divorced women—at the reproductive ages. The figures for each census from 1891 to 1926 are as follows:—
| Year. | Unmarried Women aged 15–45 Years. | Illegitimate Births. | Illegitimate-birth Rate per 1,000 Unmarried Women. |
|---|---|---|---|
| 1891 | 68,990 | 638 | 9.25 |
| 1896 | 89,722 | 834 | 9.30 |
| 1901 | 105,420 | 937 | 8.89 |
| 1906 | 116,506 | 1,132 | 9.72 |
| 1911 | 116,726 | 1,078 | 9.24 |
| 1916 | 125,461 | 1,159 | 9.24 |
| 1921 | 136,539 | 1,258 | 9.21 |
| 1926 | 151,624 | 1,473 | 9.71 |
Included in the total of 1,126 illegitimate births in 1936 were four cases of twins, the number of accouchements being thus 1,122, including one case registered with the Registrar-General. From the following table it will be seen that of the 1,122 mothers 374, or 33 per cent., were under twenty-one years of age.
ILLEGITIMATE BIRTHS, 1936.—AGES OF MOTHERS.
| Age. | Cases. | Age. | Cases. | Age. | Cases. |
|---|---|---|---|---|---|
| Years. | Years. | Years. | |||
| 13 | 2 | 25 | 56 | 37 | 10 |
| 14 | 11 | 26 | 46 | 38 | 12 |
| 15 | 6 | 27 | 44 | 39 | 14 |
| 16 | 30 | 28 | 36 | 40 | 8 |
| 17 | 51 | 29 | 20 | 41 | 5 |
| 18 | 75 | 30 | 32 | 42 | 9 |
| 19 | 90 | 31 | 20 | 43 | 3 |
| 20 | 109 | 32 | 19 | 44 | 3 |
| 21 | 91 | 33 | 18 | 45 | 2 |
| 22 | 90 | 34 | 18 | 46 | 1 |
| 23 | 85 | 35 | 18 | 47 | 1 |
| 24 | 68 | 36 | 19 | ||
| Total | 1,122 |
The Births and Deaths Registration Amendment Act, 1930, directs the omission of the word “illegitimate” from the register when the birth of an illegitimate child is registered. The word “illegitimate” appearing in any entry made prior to the passing of the Act is deemed to be expunged and deleted, and must also be omitted from any certified copy of an entry.
An important Act was passed in 1894 and re-enacted in 1908, intituled the Legitimation Act. Under this Act any child born out of wedlock whose parents afterwards intermarry is deemed to be legitimized by such marriage on the birth being registered in the manner prescribed by the Act. For legitimation purposes a Registrar must register a birth when called upon to do so by any person claiming to he the father of an illegitimate child; but such person is required to make a solemn declaration that he is the father, and must also produce evidence of marriage between himself and the mother of the child.
Prior to the passing, on the 6th February, 1922, of the Legitimation Amendment Act, 1921–22, legitimation could he effected only if at the time of the birth of the child there existed no legal impediment to the intermarriage of the father and mother, but the legal-impediment proviso was repealed by that amendment.
The amendment of 1921–22 also provides for legitimation by the mother in the event of the death of the father after the intermarriage of the parents. In such a case the application for legitimation is heard by a Magistrate, and upon his certifying that it has been proved to his satisfaction that the husband of the applicant was the father of the child, the child is registered as the lawful issue of the applicant and her husband.
The number of legitimations in each of the last ten years, and the total since the Act of 1894 came into force, are:—
| Year. | Number of Children legitimized. | ||
|---|---|---|---|
| Previously registered. | Not previously registered. | Total. | |
| 1926 | 230 | 115 | 345 |
| 1927 | 204 | 108 | 312 |
| 1928 | 247 | 102 | 349 |
| 1929 | 261 | 66 | 327 |
| 1930 | 234 | 111 | 345 |
| 1931 | 292 | 92 | 384 |
| 1932 | 236 | 95 | 331 |
| 1933 | 309 | 95 | 404 |
| 1934 | 284 | 94 | 378 |
| 1935 | 276 | 63 | 339 |
| 1936 | 327 | 85 | 412 |
| Totals to 1936 | 5,757 | 2,729 | 8,486 |
The Births and Deaths Registration Act contains provision for the registration of adopted children. The Clerk of the Court by which any adoption order is made is required to furnish to the Registrar-General particulars of the order, including the full name and place of birth of the child, as well as the full names and addresses of both the natural and the adopting parents. If the child's birth has been registered in New Zealand a note of the adoption order is made on it, and a new entry is made in the prescribed form in the register of births, particulars of the adopting parents being substituted for those of the natural parents.
During the year 1936 the registration of 413 adopted children (206 males and 207 females) was effected, as compared with 340 in 1935, 338 in 1934, 332 in 1933, and 337 in 1932.
The registration of still-births was made compulsory in New Zealand as from the 1st March, 1913. A still-born child is defined as one “which has issued from its mother after the expiration of the twenty-eighth week of pregnancy and which was not alive at the time of such issue.” Still-births are not included either as births or as deaths in the various numbers and rates shown in this subsection and in that relating to deaths.
The registrations of still-births during each of the last ten years are as follows:—
| Year. | Males. | Females. | Total. | Male Still-births per 1,000 Female Still-births | Percentage of Still-births to | |
|---|---|---|---|---|---|---|
| Living Births. | All Births. | |||||
| 1927 | 506 | 372 | 878 | 1,360 | 3.15 | 3.05 |
| 1928 | 424 | 415 | 839 | 1,022 | 3.08 | 2.99 |
| 1929 | 501 | 369 | 870 | 1,358 | 3.25 | 3.15 |
| 1930 | 470 | 395 | 865 | 1,190 | 3.23 | 3.13 |
| 1931 | 430 | 379 | 809 | 1,135 | 3.04 | 2.95 |
| 1932 | 430 | 316 | 746 | 1,361 | 3.00 | 2.91 |
| 1933 | 417 | 305 | 722 | 1,367 | 2.97 | 2.88 |
| 1934 | 387 | 300 | 687 | 1,290 | 2.82 | 2.75 |
| 1935 | 393 | 345 | 738 | 1,139 | 3.08 | 2.99 |
| 1936 | 424 | 308 | 732 | 1,377 | 2.95 | 2.86 |
Masculinity is in general much higher among still-births than among living births, though an exception to the rule occurred in 1928. The figures for the ten years covered by the above table show the rate for still-births to have been 1,260 males per 1,000 females. The rate for individual years has ranged between 1,726 (in 1914) and 1,022 (in 1928).
Tabulation of the relative ages of the parents of the still-born children in 1936 does not appear to disclose any significant features. The median age of the mothers was 30, as compared with 28 in the case of living births. The percentage of illegitimates among still-born infants (6.01) was higher than among infants born alive (4.43).
Of the living legitimate births registered in 1936, 38 per cent. were first births, while of legitimate still-births no less than 45 per cent. were first births. It would thus appear that there is a considerably greater probability of still-births occurring to mothers having their first accouchement than those having subsequent accouchements.
The following table, based on the figures for the five years 1932–36, indicates that this is so, and further demonstrates the effect of the increasing age of the mother in the causation of still-births. While for women between 20 and 25 the proportion of still-births to living births was 2 per cent. for all births and a little higher for first births, for women aged forty and over it was 6½ per cent. for all births and 11 per cent. for first births.
LEGITIMATE BIRTHS, 1932–36.—PERCENTAGE OF STILL TO LIVING.
| Age of Mother, in Years. | All Births. | First Births. | Percentage of Still to Living. | |||
|---|---|---|---|---|---|---|
| Living. | Still. | Living. | Still. | All Births. | First Births. | |
| Under 20 | 4,093 | 90 | 3,474 | 83 | 2.20 | 2.39 |
| 20 and under 25 | 27,764 | 556 | 16,079 | 395 | 2.00 | 2.46 |
| 25 and under 30 | 37,396 | 945 | 13,725 | 514 | 2.53 | 3.74 |
| 30 and under 35 | 25,802 | 811 | 5,253 | 295 | 3.14 | 5.62 |
| 35 and under 40 | 14,614 | 589 | 1,675 | 133 | 4.03 | 7.94 |
| 40 and over | 5,701 | 371 | 438 | 48 | 6.51 | 10.96 |
| Totals | 115,370 | 3,362 | 40,644 | 1,468 | 2.91 | 3.61 |
The next table shows the percentage of still-births to living births according to nativity order of legitimate births registered in the five years 1932.36. The column for mothers of all ages shows a fairly definite gradation, the second child having the best chance of being born alive, and the probability of a still-birth increasing thereafter.
LEGITIMATE BIRTHS, 1932–36.—PERCENTAGE OF STILL TO LIVING.
| Nativity Order. | Living Births. | Still-births. | Percentage of Still to Living. | |||
|---|---|---|---|---|---|---|
| Mothers of All Ages. | Mothers aged 35–40. | Mothers of All Ages. | Mothers aged 35–40. | Mothers of All Ages. | Mothers aged 35–40. | |
| First | 40,644 | 1,705 | 1,468 | 133 | 3.61 | 7.80 |
| Second | 28,980 | 2,567 | 540 | 75 | 1.86 | 2.92 |
| Third | 18,113 | 2,725 | 415 | 93 | 2.29 | 3.44 |
| Fourth | 10,675 | 2,443 | 281 | 66 | 2.63 | 2.70 |
| Fifth | 7,436 | 1,767 | 210 | 58 | 2.82 | 3.28 |
| Sixth | 3,926 | 1,342 | 136 | 58 | 3.46 | 4.32 |
| Seventh | 2,514 | 972 | 99 | 37 | 3.94 | 3.81 |
| Eighth | 1,571 | 655 | 67 | 25 | 4.26 | 3.21 |
| Ninth | 1,020 | 435 | 52 | 22 | 5.10 | 5.06 |
| Tenth | 647 | 264 | 42 | 14 | 6.49 | 5.30 |
It will be observed that the rates shown in the column for mothers aged 35–40 are, in most instances, materially higher than the rates for all mothers. This circumstance in itself suggests that the age of the mother is probably a more important factor contributing to the still-birth rate than the number of previous accouchements. The cause of the steady increase noted in the case of mothers of all ages—from the second child upwards—is to be found in the fact of increasing age rather than the number of previous issue. The special risks that attend a first birth account for the relatively high figures shown for first births, while the influence of increasing age is particularly assertive in respect of first births to mothers aged 35–40.
The number of births of Maoris registered with Registrars of Maori Births and Deaths during 1936 was 3,535 (1,764 males, 1,771 females). The births of forty-eight males and forty-seven females recorded as of Maori race were registered under the main Act, and the total of 3,630 represents a rate of 44 per 1,000 of Maori population, a figure nearly three times as high as the general (i.e., non-Maori) birth-rate for the year. Registrations in each of the last five years were as follows:—
| Year. | Number of Births. | Rate per 1,000 of Mean Population. | ||
|---|---|---|---|---|
| Males. | Females. | Total. | ||
| 1932 | 1,383 | 1,362 | 2,745 | 37.28 |
| 1933 | 1,536 | 1,412 | 2,948 | 38.84 |
| 1934 | 1,576 | 1,405 | 2,981 | 38.10 |
| 1935 | 1,759 | 1,492 | 3,251 | 40.36 |
| 1936 | 1,812 | 1,818 | 3,630 | 43.79 |
There is reason to believe that the number of Maori births is somewhat understated, and that both number and rate are actually higher than shown above. For population purposes, half-castes and persons between half and full blood rank as Maoris; but it is not always possible to ensure that this practice is followed in the registration of births (and of deaths).
MARRIAGE may be solemnized in New Zealand only on the authority of a Registrar's certificate, either by a person whose name is on the list of officiating ministers under the Marriage Act, or before a duly appointed Registrar or Deputy Registrar of Marriages. Marriage by an officiating minister can be solemnized only between 8 o'clock in the forenoon and 8 o'clock in the evening. Marriage before a Registrar can be celebrated at any time during the hours the office of the Registrar is open for the transaction of public business. Prior to the passing of the Marriage Amendment Act, 1920, the limits in all cases were 8 a.m. and 4 p.m.
Notice of intended marriage must be given to a Registrar of Marriages by one of the parties to the proposed marriage, and one of the parties must have resided for three full days in the district within which the marriage is to be solemnized. In the case of a person under twenty-one years of age, not being a widow or widower, the consent of parent or guardian is necessary before the Registrar's certificate can be issued. A schedule to the Guardianship of Infants Act, 1926, sets out the person or persons whose consent is required in various circumstances. In cases where double consent is required, section 8 provides for dispensing with the consent of one party if this cannot be obtained by reason of absence, inaccessibility, or disability. In similar cases where the consent of only one person is necessary, consent may be given by a Judge of the Supremo Court. Consent of the Court may also be given in cases of refusal by any person whoso consent is required.
If a declaration is made in any case that there is no parent or lawful guardian resident in the Dominion, then a certificate may be issued by the Registrar (without the necessity of Court proceedings) after the expiration of fourteen days following the date on which the notice of intended marriage was given.
The system of notice and certificate has obtained in New Zealand since 1855. Officiating ministers and Registrars are required to send to the Registrar-General returns of all marriages solemnized, and as the returns come in they are checked off with the entries in the Registrars' lists of notices received and certificates issued. In case of the non-arrival of a marriage return corresponding to any entry in the list of notices, inquiries are made as to whether solemnization has been effected.
The marriage of a man with his deceased wife's sister was legalized in New Zealand in the year 1881, and the marriage of a woman with her deceased husband's brother in 1901. Marriage with a deceased wife's niece or a deceased husband's nephew was rendered valid in 1929.
An important provision is contained in section 7 of the Marriage Amendment Act, 1920, which reads as follows:—
Every person commits an offence against this Act, and is liable on summary conviction to a fine of one hundred pounds, who—
Alleges, expressly or by implication, that any persons lawfully married are not truly and sufficiently married; or
Alleges, expressly or by implication, that the issue of any lawful marriage is illegitimate or born out of true wedlock.
“Alleges” in this section means making any verbal statement, or publishing or issuing any printed or written statement, or in any manner authorizing the making of any verbal statement, or in any manner authorizing or being party to the publication or issue of any printed or written statement.
A person shall not be deemed to make an allegation contrary to the provisions of this section by reason only of using in the solemnization of a marriage a form of marriage service which at the commencement of this Act was in use by the religious denomination to which such person belongs, or by reason only of the printing or issue of any book containing a copy of a form of marriage service in use at the commencement of this Act by any religious denomination.
An amendment to the Marriage Act in 1933 prohibited the marriage of persons under the age of sixteen years, and also made provision enabling women to become officiating ministers for the purposes of the Marriage Act.
Particulars regarding divorce will be found at the close of this subsection.
The movement of the marriage-rate since 1855 is shown by the diagram on p. 81. The numbers and rates of marriages during each of the last twenty years are here given:—
| Year | Number | Rate per 1,000 of Population. |
|---|---|---|
| 1917 | 6,417 | 5.84 |
| 1918 | 6,227 | 5.65 |
| 1919 | 9,519 | 8.33 |
| 1920 | 12,175 | 10.21 |
| 1921 | 10,635 | 8.69 |
| 1922 | 9,556 | 7.63 |
| 1923 | 10,070 | 7.90 |
| 1924 | 10,259 | 7.90 |
| 1925 | 10,419 | 7.84 |
| 1926 | 10,680 | 7.90 |
| 1927 | 10,478 | 7.63 |
| 1928 | 10,537 | 7.58 |
| 1929 | 10,967 | 7.80 |
| 1930 | 11,075 | 7.78 |
| 1931 | 9,817 | 6.81 |
| 1932 | 9,896 | 6.81 |
| 1933 | 10,510 | 7.18 |
| 1934 | 11,256 | 7.64 |
| 1935 | 12,187 | 8.23 |
| 1936 | 13,808 | 9.25 |
The low rates for 1931 and 1932 are indicative of the effect of the period of financial stringency and depression. The partial recovery in 1933 probably reflects an acceptance of the unlikelihood of an early return to prosperity and an adjustment to the changed conditions. The recovery continued in 1934, accompanying an improving trend in economic conditions. In 1935 the future outlook was very much brighter, and consequently a further impetus was given to the marriage-rate, while in 1936 the highest rate ever recorded in New Zealand, with the exception of the postwar year 1920, was established. The number of marriages during 1936 creates a new record for the Dominion and represents an increase of 13 per cent. over the previous year.
Since the age-constitution of the population alters considerably over a period of years the actual marriage-rate based on the total population does not necessarily provide a proper comparison. A complementary method is to ascertain the rate among unmarried females in each age-group and to standardize the results on the basis of the distribution of the unmarried female population in a basic year.
| Year. | Rate per 1,000 of Total Population. | Rate per 1,000 Unmarried Females aged 15 Years and over. | |
|---|---|---|---|
| Actual | Standardized. | ||
| 1881 | 6.6 | 73.9 | 80.7 |
| 1886 | 6.0 | 55.1 | 60.4 |
| 1891 | 6.0 | 48.3 | 50.3 |
| 1896 | 6.8 | 47.3 | 48.0 |
| 1901 | 7.8 | 50.2 | 49.0 |
| 1906 | 8.5 | 55.6 | 53.7 |
| 1911 | 8.7 | 59.1 | 59.1 |
| 1916 | 7.5 | 50.7 | 54.3 |
| 1921 | 8.7 | 59.7 | 63.9 |
| 1926 | 7.9 | 53.1 | 62.6 |
A comparison of the latest available rates in various countries is given in the next table.
| Country. | Quinquennium. | Average Yearly Rate. |
|---|---|---|
| Union of S. Africa | 1931–35 | 9.35 |
| Germany | 1930–34 | 9.06 |
| Bulgaria | 1931–35 | 9.00 |
| Rumania | 1931–35 | 8.94 |
| Denmark | 1931–35 | 8.72 |
| Hungary | 1931–35 | 8.51 |
| Poland | 1931–35 | 8.33 |
| Latvia | 1931–35 | 8.29 |
| Yugoslavia | 1930–34 | 8.27 |
| Czechoslovakia | 1931–35 | 8.18 |
| England and Wales | 1931–35 | 8.07 |
| Belgium | 1930–34 | 8.00 |
| Estonia | 1931–35 | 7.87 |
| New Zealand | 1932–36 | 7.81 |
| Lithuania | 1930–34 | 7.74 |
| Switzerland | 1931–35 | 7.72 |
| Australia | 1932–36 | 7.70 |
| Japan | 1931–35 | 7.62 |
| France | 1931–35 | 7.35 |
| Sweden | 1931–35 | 7.33 |
| Netherlands | 1931–35 | 7.21 |
| Scotland | 1931–35 | 7.13 |
| Finland | 1931–35 | 6.84 |
| Chile | 1931–35 | 6.82 |
| Greece | 1930–34 | 6.81 |
| Italy | 1931–35 | 6.78 |
| Austria | 1931–35 | 6.78 |
| Spain | 1930–34 | 6.68 |
| Portugal | 1931–35 | 6.57 |
| Norway | 1931–35 | 6.50 |
| Canada | 1931–35 | 6.44 |
| Argentina | 1930–34 | 6.20 |
| Northern Ireland | 1931–35 | 6.10 |
| Uruguay | 1930–34 | 5.42 |
| Irish Free State | 1931–35 | 4.62 |
Annual averages for the decade 1927–36 give marriages as follows: March quarter, 2,527; June quarter, 3,131: September quarter, 2,389; December quarter, 3,006.
The Easter and Christmas seasons are apparently regarded as the most suitable times of the year for entering the matrimonial state, and, judging by the quarterly figures for an average year, Faster would appear to predominate slightly.
The marriages contracted in each month of 1936, commencing with January, were as follows: 955, 1,031, 864, 1,913, 830, 1,324, 939, 964, 1,000, 1,129, 949, 1,010, total for year, 13,808.
The 1936 proportions per cent. of the total marriages for the various days of the week were: Sunday, 0.5: Monday, 10 6; Tuesday, 12.3; Wednesday, 28.8; Thursday, 12 2; Friday, 50; Saturday, 30 6.
The total number of persons married during the year 1936 was 27,616, of whom 25,407 were single, 1,245 widowed, and 964 divorced. The figures for each of the last ten years, but showing the sexes separately, are given in the table following:—
| Year. | Single. | Widowed. | Divorced. | Total Persons married. | |||
|---|---|---|---|---|---|---|---|
| Bridegroom. | Bride. | Bridegroom. | Bride. | Bridegroom. | Bride. | ||
| 1927 | 0,488 | 9,647 | 696 | 494 | 294 | 337 | 20,956 |
| 1928 | 9,570 | 9,742 | 658 | 471 | 309 | 324 | 21,074 |
| 1929 | 9,944 | 10,179 | 721 | 458 | 302 | 330 | 21,934 |
| 1930 | 10,038 | 10,230 | 709 | 476 | 328 | 369 | 22,150 |
| 1931 | 8,856 | 9,026 | 644 | 419 | 317 | 372 | 19,634 |
| 1932 | 8,930 | 9,162 | 642 | 376 | 324 | 358 | 19,792 |
| 1933 | 9,519 | 9,710 | 656 | 400 | 335 | 400 | 21,020 |
| 1934 | 10,198 | 10,449 | 706 | 400 | 352 | 407 | 22,512 |
| 1935 | 11,044 | 11,276 | 720 | 464 | 423 | 447 | 24,374 |
| 1936 | 12,579 | 12,828 | 788 | 457 | 441 | 523 | 27,616 |
The position is more easily seen by studying the percentages given in the next table:—
| Year. | Bridegrooms | Brides. | ||||
|---|---|---|---|---|---|---|
| Single. | Widowed. | Divorced. | Single. | Widowed. | Divorced. | |
| Per Cent | Per Cent. | Per Cent | Per Cent. | Per Cent | Per Cent. | |
| 1927 | 90.55 | 6.64 | 2.81 | 92.07 | 4.71 | 3.22 |
| 1928 | 90.82 | 6.25 | 2.93 | 92.46 | 4.17 | 3.07 |
| 1929 | 90.67 | 6.58 | 2.75 | 92.81 | 4.18 | 3.01 |
| 1930 | 90.64 | 6.40 | 2.96 | 92.37 | 4.30 | 3.33 |
| 1931 | 90.21 | 6.56 | 3.23 | 91.94 | 4.27 | 3.79 |
| 1932 | 90.24 | 6.49 | 3.27 | 92.58 | 3.80 | 3.62 |
| 1933 | 90.57 | 6.24 | 3.19 | 92.38 | 3.81 | 3.81 |
| 1934 | 90.60 | 6.27 | 3.13 | 92.83 | 3.55 | 3.62 |
| 1935 | 90.62 | 5.91 | 3.47 | 92.52 | 3.81 | 3.67 |
| 1936 | 91.10 | 5.71 | 3.19 | 92.90 | 3.31 | 3.79 |
During the period 1927–36 the number of divorced persons remarrying increased from 30 per 1,000 persons married to 35, an appreciable advance. The fall in the number of widowed persons remarrying—from 57 per 1,000 persons married in 1927 to 45 per 1,000 in 1936—is due probably to the high figure in the earlier year having been an indirect outcome of the war and, to a certain extent, of the influenza epidemic.
The relative conjugal condition of bridegrooms and brides for each of the last ten years is next given:—
| Year. | Marriages between Bachelors and | Marriages between Widowers and | Marriages between Divorced Men and | ||||||
|---|---|---|---|---|---|---|---|---|---|
| Spinsters. | Widows. | Divorced Women. | Spinsters. | Widows. | Divorced Women. | Spinsters. | Widows. | Divorced Women. | |
| 1927 | 9,025 | 244 | 219 | 419 | 199 | 78 | 203 | 51 | 40 |
| 1928 | 9,112 | 249 | 209 | 409 | 183 | 66 | 221 | 39 | 49 |
| 1929 | 9,478 | 234 | 232 | 477 | 192 | 52 | 224 | 32 | 46 |
| 1930 | 9,540 | 245 | 253 | 446 | 191 | 72 | 244 | 40 | 44 |
| 1931 | 8,379 | 217 | 260 | 415 | 159 | 70 | 232 | 43 | 42 |
| 1932 | 8,496 | 195 | 239 | 419 | 147 | 76 | 247 | 34 | 43 |
| 1933 | 9,068 | 187 | 264 | 411 | 168 | 77 | 231 | 45 | 59 |
| 1934 | 9,737 | 185 | 276 | 447 | 177 | 82 | 265 | 38 | 49 |
| 1935 | 10,551 | 219 | 274 | 442 | 195 | 83 | 283 | 50 | 90 |
| 1936 | 12,032 | 193 | 354 | 477 | 218 | 93 | 319 | 46 | 76 |
Taking the whole period covered by the foregoing table, it is found that, while 3,425 divorced men remarried, the corresponding number for women was 3,867. In the case of widowed persons, however, in spite of the fact that widows greatly exceed widowers, only 4,415 widows remarried, as compared with 6,940 widowers. It would appear that in the case of divorced persons, women are more likely to remarry than men, while in the case of the widowed the converse holds.
Included amongst the widows in 1936 were sixteen women, and amongst the widowers fifteen men, who elected to go through the form of marriage with other persons under the protection of the provisions of section 224, subsection (5), of the Crimes Act, which reads: “No one commits bigamy by going through a form of marriage if he or she has been continually absent from his or her wife or husband for seven years then last past, and is not proved to have known that his wife or her husband was alive at any time during those seven years.”
During the last ten years the numbers of persons married under the protection of the above subsection was 254, comprising 84 men and 170 women.
Of the 27,616 persons married in 1936 2,649, or 9 per cent., were under twenty-one years of age; 8,831, or 32 per cent., were returned as twenty-one and under twenty-five; 8,996, or 33 per cent., as twenty-five and under thirty; 4,971, or 18 per cent., as thirty and under forty; and 2,169, or 8 per cent., as forty years of age or over. The following table relates to the year 1936:—
| Age of Bride, in Years. | Age of Bridegroom, in Years. | Total Bride-grooms. | ||||||
|---|---|---|---|---|---|---|---|---|
| Under 21. | 21 and under 25. | 25 and under 30. | 30 and under 35. | 35 and under 40. | 40 and under 45. | 45 and over. | ||
| Under 21 | 233 | 122 | 11 | 4 | 370 | |||
| 21 and under 25 | 1,108 | 1,851 | 483 | 42 | 9 | 1 | 3,494 | |
| 25 and under 30 | 697 | 2,452 | 1,832 | 298 | 41 | 9 | 1 | 5,330 |
| 30 and under 35 | 173 | 655 | 905 | 449 | 101 | 15 | 1 | 2,299 |
| 35 and under 40 | 40 | 171 | 290 | 228 | 133 | 43 | 9 | 914 |
| 40 and under 45 | 15 | 51 | 77 | 106 | 107 | 67 | 27 | 450 |
| 45 and over | 13 | 35 | 68 | 101 | 139 | 135 | 460 | 951 |
| Total brides | 2,279 | 5,337 | 3,666 | 1,228 | 530 | 269 | 499 | 13,808 |
There have been some considerable changes in the proportions of men and women marrying at the various age-periods. To illustrate the extent to which these figures have varied since the beginning of the century, a table is given showing the proportions of men and women married at each age-period to every 100 marriages in quinquennia from 1900 to 1934, and also for the years 1935 and 1936:—
| Period. | Under 21. | 21 and under 25. | 25 and under 30. | 30 and under 35. | 35 and under 40. | 40 and under 45. | 45 and over. | Total. |
|---|---|---|---|---|---|---|---|---|
| Males. | ||||||||
| 1900–04 | 1.67 | 24.75 | 38.42 | 18.63 | 8.05 | 3.58 | 4.90 | 100.00 |
| 1905–09 | 1.79 | 23.42 | 39.25 | 18.78 | 8.47 | 3.38 | 4.91 | 100.00 |
| 1910–14 | 1.94 | 22.04 | 38.04 | 20.75 | 8.54 | 3.90 | 4.79 | 100.00 |
| 1915–19 | 3.26 | 21.40 | 33.04 | 67 | 10.47 | 5.02 | 7.14 | 100.00 |
| 1920–24 | 3.13 | 24.66 | 32.21 | 17.73 | 10.24 | 5.43 | 6.60 | 100.00 |
| 1925–29 | 3.49 | 28.04 | 34.49 | 14.33 | 7.70 | 4.48 | 7.47 | 100.00 |
| 1930–34 | 3.46 | 27.28 | 37.02 | 15.14 | 6.10 | 3.61 | 7.39 | 100.00 |
| 1935 | 2.85 | 25.07 | 38.74 | 16.77 | 6.57 | 3.32 | 6.68 | 100.00 |
| 1936 | 2.68 | 25.30 | 38.60 | 16.65 | 6.62 | 3.26 | 6.89 | 100.00 |
| Females. | ||||||||
| 1900–04 | 16.92 | 39.75 | 27.33 | 9.26 | 3.40 | 1.53 | 1.81 | 100.00 |
| 1905–09 | 16.15 | 37.10 | 28.53 | 10.18 | 4.21 | 1.80 | 2.03 | 100.00 |
| 1910–14 | 15.60 | 34.90 | 28.52 | 11.57 | 5.04 | 2.05 | 2.32 | 100.00 |
| 1915–19 | 15.21 | 35.01 | 26.17 | 11.39 | 6.06 | 2.98 | 3.18 | 100.00 |
| 1920–24 | 15.99 | 35.47 | 26.21 | 10.66 | 5.53 | 2.98 | 3.16 | 100.00 |
| 1926–29 | 18.61 | 37.88 | 23.67 | 8.93 | 4.65 | 2.82 | 3.44 | 100.00 |
| 1930–34 | 18.67 | 38.51 | 24.79 | 8.22 | 3.85 | 2.40 | 3.56 | 100.00 |
| 1935 | 17.03 | 37.57 | 27.27 | 8.72 | 3.96 | 1.90 | 3.55 | 100.00 |
| 1936 | 16.51 | 38.65 | 26.55 | 8.89 | 3.84 | 1.95 | 3.61 | 100.00 |
A perusal of the above table reveals the fact that greater proportions of marriages are now being celebrated at both the younger and the older age-groups. The 1935 and 1936 figures, however, illustrate the forced postponement of a number of marriages in the earlier years of the depression, resulting in a proportion of marriages falling in later groups than would normally have been the case.
For many years the average ago (arithmetic mean) at marriage for both males and females, more particularly the latter, showed a tendency to increase. However, after reaching its maximum in the three years 1917, 1918, and 1919, the average age has since decreased considerably. For reasons already mentioned, the average age is tending to increase again in more recent years. The figures for each of the last ten years are given.
MEAN AGE AT MARRIAGE.
| Year | Bridegrooms | Brides. |
|---|---|---|
| 1927 | 29.92 | 26.25 |
| 1928 | 29.87 | 26.17 |
| 1929 | 29.80 | 26.10 |
| 1930 | 28.47 | 26.13 |
| 1931 | 29.83 | 26.02 |
| 1932 | 29.71 | 26.04 |
| 1933 | 29.72 | 25.83 |
| 1934 | 29.86 | 26.15 |
| 1935 | 29.94 | 26.27 |
| 1936 | 29.97 | 26.32 |
The average ages of bachelors and spinsters at marriage are considerably lower than those shown in the preceding table, which covers all parties and is naturally affected by the inclusion of remarriages of widowed and divorced persons. The average ages of grooms and brides of the various conditions in each of the last five years were:—
| Year. | Bridegrooms. | Brides. | ||||
|---|---|---|---|---|---|---|
| Bachelors. | Divorced. | Widowers. | Spinsters. | Divorced. | Widows. | |
| Years. | Years. | Years. | Years. | Years. | Years. | |
| 1932 | 27.95 | 41.00 | 48.38 | 24.85 | 36.40 | 47.28 |
| 1933 | 27.98 | 41.50 | 48.85 | 24.65 | 36.14 | 44.17 |
| 1934 | 28.17 | 40.29 | 49.07 | 25.06 | 35.92 | 44.64 |
| 1935 | 28.18 | 41.05 | 50.28 | 25.08 | 36.58 | 45.35 |
| 1936 | 28.29 | 41.30 | 50.47 | 25.20 | 35.79 | 46.86 |
The foregoing figures give the average age at marriage, but these do not correspond with the modal or popular age, if the age at which the most marriages are celebrated may be so termed. For several years prior to 1918 age 26 held pride of place for bridegrooms and age 21 for brides. The latter has continued right through to 1936 without alteration, but in the case of bridegrooms the most popular age has varied, and for 1936 stands at 24.
Of every 1,000 men married in 1935, 27 were under twenty-one years of age, while 165 in every 1,000 brides were under twenty-one.
In 233 marriages in 1936 both parties were given as under twenty-one years of age, in 2,046 marriages the bride was returned as a minor and the bridegroom as an adult, and in 137 marriages the bridegroom was a minor and the bride an adult.
| Year. | Age in Years. | Total. | |||||||
|---|---|---|---|---|---|---|---|---|---|
| 14. | 15. | 16. | 17. | 18. | 19. | 20. | Number. | Rate per 100 Marriages. | |
| Bridegrooms. | |||||||||
| 1932 | 2 | 8 | 44 | 115 | 218 | 387 | 3.91 | ||
| 1933 | 4 | 38 | 89 | 209 | 340 | 3.24 | |||
| 1934 | 2 | 4 | 26 | 116 | 203 | 351 | 3.12 | ||
| 1935 | 7 | 35 | 99 | 206 | 347 | 2.85 | |||
| 1936 | 4 | 43 | 118 | 205 | 370 | 2.68 | |||
| Brides. | |||||||||
| 1932 | 9 | 67 | 206 | 403 | 541 | 673 | 1,899 | 19.19 | |
| 1933 | 3 | 7 | 73 | 191 | 429 | 586 | 688 | 1,977 | 18.81 |
| 1934 | 73 | 195 | 398 | 568 | 718 | 1,952 | 17.34 | ||
| 1935 | 86 | 203 | 409 | 583 | 795 | 2,076 | 17.03 | ||
| 1936 | 87 | 199 | 439 | 692 | 862 | 2,279 | 16.51 | ||
The continuous decline in the proportions of minors married (both brides and bridegrooms) illustrated in the foregoing table is probably, to some extent, a depression phenomenon. It will be observed that the number of marriages of minors shows a material increase in 1936; but that the rate per 100 marriages fell still further.
Of the 13,808 marriages registered in 1936, Church of England clergymen officiated at 3,604, Presbyterians at 3,720, Methodists at 1,456, and Roman Catholics at 1,609, while 2,368 marriages were celebrated before Registrars.
The following table shows the proportions of marriages by ministers of the principal denominations in the last ten years:—
| Denomination. | Percentage of Marriages. | |||||||||
|---|---|---|---|---|---|---|---|---|---|---|
| 1927. | 1928. | 1929. | 1930. | 1931. | 1932. | 1933. | 1934. | 1935. | 1936. | |
| Church of England | 27.68 | 27.03 | 27.18 | 26.03 | 25.82 | 25.54 | 25.47 | 25.52 | 26.07 | 26.10 |
| Presbyterian | 26.77 | 26.91 | 27.13 | 26.47 | 25.71 | 26.63 | 26.73 | 26.58 | 26.79 | 26.94 |
| Methodist | 9.73 | 9.77 | 10.19 | 9.89 | 9.59 | 10.27 | 10.52 | 10.50 | 10.43 | 10.55 |
| Roman Catholic | 11.19 | 11.45 | 11.34 | 11.06 | 10.73 | 10.81 | 11.06 | 11.50 | 11.40 | 11.65 |
| Other denominations | 5.57 | 5.26 | 4.84 | 5.16 | 5.53 | 5.84 | 6.28 | 7.92 | 8.39 | 7.61 |
| Before Registrars | 19.06 | 19.58 | 19.32 | 20.49 | 22.62 | 20.91 | 19.94 | 17.98 | 16.92 | 17.15 |
| Total | 100.00 | 100.00 | 100.00 | 100.00 | 100.00 | 100.00 | 100.00 | 100.00 | 100.00 | 100.00 |
The foregoing figures must not be taken as an exact indication of the religions of the parties married, as it does not necessarily follow that one or both of the parties are members of the Church whose officiating minister performed the ceremony, and persons married before Registrars may belong, in greater or lesser proportion, to any or none of the denominations.
The number of names on the list of officiating ministers under the Marriage Act is (August, 1937) 2,172, and the denominations to which they belong are shown hereunder:—
| Denomination. | Number. |
|---|---|
| Church of England | 470 |
| Presbyterian Church of New Zealand | 432 |
| Roman Catholic Church | 363 |
| Methodist Church of New Zealand | 304 |
| Salvation Army | 114 |
| Baptist | 76 |
| Associated Churches of Christ | 37 |
| Congregational Independent | 33 |
| Brethren | 21 |
| Seventh-day Adventist | 11 |
| Latter-day Saints | 22 |
| Lutheran Church | 2 |
| Evangelical Lutheran Concordia Conference | 4 |
| British Israel Church | 7 |
| Church of Christ | 5 |
| Hebrew Congregation | 5 |
| Catholic Apostolic Church | 2 |
| Liberal Catholic Church | 7 |
| Unitarian | 4 |
| Assemblies of God | 16 |
| Spiritualist Churches of New Zealand | 13 |
| Ratana Church of New Zealand | 147 |
| Ringatu Church | 48 |
| Church of the Seven Rules of Jehovah | 2 |
| Others | 27 |
| Total | 2,172 |
The Ringatu Church, the Church of the Seven Rules of Jehovah, and the Ratana Church of New Zealand are Maori denominations.
In cases where both parties to a marriage are of the Native race there is no necessity under the Marriage Act to comply with the provisions of that Act, though the parties are at liberty to take advantage thereof. Considerable inconvenience, however, was found to exist on account of the non-registration of Maori marriages, and a section was inserted in the Native Land Act, 1909, and re-enacted in 1931, whereby it was laid down that Maori marriages must be celebrated either under the provisions of the Marriage Act or in the presence of a registered officiating minister, but without complying with the other requirements of the Marriage Act. Ministers solemnizing the latter class of marriages must send returns to the Registrar-General.
Returns of 640 marriages in which both parties were of the Native race were received during the year 1936. The figures for each of the last ten years are as follows:—
| Year. | Under Native Land Act. | Under Marriage Act. | Total. |
|---|---|---|---|
| 1927 | 231 | 87 | 318 |
| 1928 | 285 | 97 | 382 |
| 1929 | 315 | 121 | 436 |
| 1930 | 345 | 74 | 419 |
| 1931 | 358 | 79 | 437 |
| 1932 | 514 | 82 | 596 |
| 1933 | 478 | 79 | 557 |
| 1934 | 446 | 86 | 532 |
| 1935 | 489 | 68 | 557 |
| 1936 | 514 | 126 | 640 |
Maori marriages are not included in the numbers shown elsewhere in this subsection, nor are they taken into account in the computation of marriage-rates.
The provisions as to dissolution of marriage are contained in the Divorce and Matrimonial Causes Act, 1928, which consolidated and amended the then existing legislation on the subject.
A brief historical account of divorce legislation will be found in the 1931 issue of the Year-Book; the present position is outlined in the following résumé.
Any married person, domiciled in New Zealand for two or more years at the time of filing the petition, may obtain a divorce on one or more of the following grounds:—
Adultery.
Wilful desertion for three years.
Habitual drunkenness for four years, coupled with (wife's petition) failure to support or habitual cruelty, or with (husband's petition) neglect of, or self-caused inability to discharge, domestic duties.
Sentence of seven years' imprisonment for attempting to murder, or for wounding or doing actual bodily harm to petitioner or child.
Murder of child of petitioner or respondent.
Insanity and confinement as a lunatic for seven out of ten years preceding the petition.
Insanity for seven years, and confinement for three years preceding the petition.
Failure to comply with a decree of Court for restitution of conjugal rights.
Parties have separated under an agreement, written or verbal, which has been in force for three years.
Parties have been separated by a decree of judicial separation or a separation order which has been in force for three years. (An amendment in 1930 removed the restriction imposed by the principal Act (which permitted only New Zealand decrees or orders) and extended the provision to cover similar decrees or orders made in any country.)
Husband guilty of rape, sodomy, or bestiality since marriage.
A deserted wife whose husband was domiciled in New Zealand at the time of desertion is considered, for the purpose of the Divorce and Matrimonial Causes Act, 1928, as retaining her New Zealand domicile. Where a wife petitions on grounds (i) and (j), her New Zealand domicile is retained if her husband was domiciled in the Dominion at the date of the agreement, decree, or order.
The amending Act of 1930 establishes a New Zealand domicile for a wife petitioning for divorce where she has been living apart from her husband for three years, has been living in New Zealand for three years preceding the petition, and has the intention of residing in New Zealand permanently.
Figures showing the operations of the Supreme Court in its divorce jurisdiction during each of the last ten years are as follows:—
| Year. | Dissolution or Nullity of Marriage. | Judicial Separation. | Restitution of Conjugal Rights. | ||||
|---|---|---|---|---|---|---|---|
| Petitions filed. | Decrees Nisi. | Decrees Absolute. | Petitions filed. | Decrees for Separation. | Petitions filed. | Decrees for Restitution. | |
| 1927 | 722 | 629 | 540 | 4 | 1 | 91 | 72 |
| 1928 | 785 | 653 | 572 | 5 | 3 | 109 | 79 |
| 1929 | 843 | 718 | 635 | 2 | 130 | 107 | |
| 1930 | 839 | 724 | 620 | 1 | 96 | 79 | |
| 1931 | 766 | 683 | 591 | 5 | 1 | 108 | 94 |
| 1932 | 785 | 653 | 612 | 5 | 1 | 88 | 75 |
| 1933 | 804 | 683 | 648 | 1 | 118 | 77 | |
| 1934 | 839 | 762 | 683 | 1 | 97 | 89 | |
| 1935 | 867 | 742 | 653 | 1 | 94 | 80 | |
| 1936 | 1,099 | 933 | 849 | 5 | 1 | 133 | 104 |
In 998 of the 1,099 cases covered by divorce petitions filed during 1936 the parties had been married in New Zealand.
The next table gives the grounds (dissolution or nullity cases) of petition, Decrees may relate to petitions filed prior to 1936.
| Grounds. | Petitions filed. | Decrees Nisi granted. | Decrees Absolute granted. | |||
|---|---|---|---|---|---|---|
| Husbands' Petitions. | Wives' Petitions. | Husbands Petitions. | Wives' Petitions. | Husbands' Petitions. | Wives' Petitions. | |
| Adultery | 121 | 54 | 88 | 47 | 81 | 47 |
| Bigamy | ||||||
| Desertion | 100 | 117 | 65 | 115 | 70 | 99 |
| Drunkenness, with cruelty, failure to maintain, &c. | 2 | 5 | 1 | 3 | 1 | 2 |
| Insanity | 10 | 2 | 6 | 1 | 6 | 2 |
| Malformation | 1 | 1 | ||||
| Non-compliance with order for restitution of conjugal rights | 70 | 32 | 65 | 25 | 57 | 25 |
| Separation for not less than three years | 232 | 353 | 183 | 333 | 149 | 310 |
| Totals | 536 | 563 | 409 | 524 | 364 | 485 |
The figures shown for decrees nisi include oases where both nisi and absolute decrees were granted during the year, while those for decrees absolute cover all such granted during the year whether the antecedent decree nisi was granted in 1936 or in a previous year. The fairly substantial overall increase of 27 per cent. over the 1935 total is recorded in 1936. The principal increases were, according to grounds for divorce, insanity (69 per cent.), and separation (33 per cent.). The total figures for insanity, however, are rather small to permit of comparison.
In 345 of the 1,099 cases where petitions for dissolution were filed during 1936 there was no living issue of the marriage. The number of living issue was 1 in 324 cases, 2 in 197 cases, 3 in 106 cases, and 4 or more in 127 cases.
The table which follows shows the duration of marriage in all cases for which petitions for dissolution were filed in the last five years:—
| Duration of Marriage, in Years. | Husbands' Petitions. | Wives' Petitions. | ||||||||
|---|---|---|---|---|---|---|---|---|---|---|
| 1932. | 1933. | 1934. | 1935. | 1936. | 1932. | 1933. | 1934. | 1935. | 1936. | |
| Under 5 | 58 | 49 | 56 | 50 | 73 | 40 | 53 | 50 | 45 | 54 |
| 5 and under 10 | 103 | 106 | 114 | 123 | 159 | 128 | 126 | 128 | 143 | 197 |
| 10 and under 15 | 80 | 95 | 99 | 86 | 122 | 124 | 102 | 116 | 109 | 129 |
| 15 and under 20 | 37 | 56 | 64 | 62 | 78 | 54 | 63 | 79 | 81 | 87 |
| 20 and under 30 | 54 | 64 | 40 | 52 | 73 | 73 | 65 | 57 | 75 | 81 |
| 30 and over | 17 | 14 | 14 | 30 | 31 | 17 | 11 | 22 | 11 | 15 |
| Totals | 349 | 384 | 387 | 403 | 536 | 436 | 420 | 452 | 464 | 563 |
The number of children concerned in the divorce petitions of their parents during each of the last five years was as follows: 1932, 1,177; 1933, 1,221; 1934, 1,216; 1935, 1,286; and 1936, 1,667.
COMPULSORY registration of deaths was instituted in New Zealand in 1855. As in the case of births, a system of non-compulsory registration had obtained since 1848.
Until the year 1876 the only information provided for in the death-registration entry was the date, place, and cause of death, and the name, sex, age, and occupation of deceased. The Registration of Births and Deaths Act, 1875, required information to be recorded as regards parentage, conjugal condition, and issue of deceased. Particulars as to burial had also to be entered, as well as more detailed information regarding cause of death. Subsequent amendments to the Act have made it requisite to give additional information concerning issue, and, in the case of married males, age of widow.
Every death occurring in New Zealand is required to be registered within three days alter the day of the death if in a city or borough, or seven days in any other case. There is a penalty up to £10 for neglect, the undertaker in charge of the funeral being solely responsible for registration. Prior to 1913 the undertaker was primarily looked to for registration, but, in addition, the occupier of the house and every other person present at the death were also responsible parties.
The law does not impose any limit of time after which a death may not be registered as it does in the case of a birth. It is not necessary to effect a death-registration entry in the case of a still-born child, though an entry must be made in the register of births.
Any person burying, or permitting or taking part in the burial of, the body of any deceased person without a certificate of cause of death signed by a duly registered medical practitioner, a Coroner's order to bury the body, or a Registrar's certificate of registration of the death, renders himself liable to a fine of £10.
Prior to 1937 a medical practitioner was required to give the certificate of cause of death to the person required to give information for the purpose of registering the death (the undertaker or other person in charge of the burial). By section 11 of the Statutes Amendment Act, 1936, however, the medical practitioner is now required to deliver the certificate forthwith direct to the Registrar of the district in which the death occurred. It is now the duty of the medical practitioner, on signing a certificate of cause of death, to give written notice of the signing to the undertaker or other person having charge of the burial.
In the new form of medical certificate outlined by this amendment, provision is made for an additional statement to be filled in by the medical practitioner in any case where, in his opinion, the death has occurred in any circumstances of suspicion. The practitioner is required to report such case forthwith to the Coroner, and an indication that this has been done must he made in the space provided on the certificate.
The following table shows the number of deaths and the death-rate per 1,000 of the mean population during each of the last twenty years:—
| Year. | Number. | Rate per 1,000. |
|---|---|---|
| 1917 | 10,528 | 9.58 |
| 1918 | 16,364 | 14.84 |
| 1919 | 10,808 | 9.46 |
| 1920 | 12,109 | 10.15 |
| 1921 | 10,682 | 8.73 |
| 1922 | 10,977 | 8.77 |
| 1923 | 11,511 | 9.04 |
| 1924 | 10,767 | 8.30 |
| 1925 | 11,026 | 8.30 |
| 1926 | 11,819 | 8.74 |
| 1927 | 11,613 | 8.45 |
| 1928 | 11,811 | 8.50 |
| 1929 | 12,314 | 8.76 |
| 1930 | 12,199 | 8.57 |
| 1931 | 12,047 | 8.35 |
| 1932 | 11,683 | 8.04 |
| 1933 | 11,701 | 7.99 |
| 1934 | 12,527 | 8.50 |
| 1935 | 12,217 | 8.25 |
| 1936 | 13,056 | 8.75 |
A long-range review of the death-rate is afforded by the graph at page 81.
The death-rate has been maintained at a remarkably low level for the last decade. It gradually climbed during the three years 1927 to 1929, reaching its maximum since 1923 in the latter year. The years following have witnessed a distinct reversal of that trend, until in 1933 the lowest death-rate in the history of the Dominion was recorded. It should be noted as a probable contributing factor that epidemics of the principal infectious diseases were conspicuously absent during these years. The 1936 record of deaths registered is not so favourable. With the exception of 1918, the year of the influenza pandemic, there has never been such a high total of deaths registered in the Dominion in one year. Nevertheless, the death-rate still remains on a comparatively satisfactory low level, being little above the average rate for the last ten years—8–75 as compared with 8.42.
The fall in the birth-rate (resulting in fewer infants at risk relatively to total population) combined with the fall in the rate of infant mortality, is also partly responsible for the position disclosed by the death-rate figures.
The death-rates of males and females for the last ten years are shown separately in the next table.
| Year. | Deaths per 1,000 of Population. | Male Deaths to every 100 Female Deaths. | Male Rate expressed as Index Number of Female Rate (=100). | ||
|---|---|---|---|---|---|
| Males. | Females. | Total. | |||
| 1927 | 9.28 | 7.58 | 8.45 | 128 | 123 |
| 1928 | 9.24 | 7.72 | 8.49 | 125 | 120 |
| 1929 | 9.65 | 7.82 | 8.75 | 128 | 123 |
| 1930 | 9.40 | 7.69 | 8.56 | 127 | 122 |
| 1931 | 9.05 | 7.59 | 8.34 | 124 | 119 |
| 1932 | 8.55 | 7.47 | 8.02 | 119 | 114 |
| 1933 | 8.70 | 7.23 | 7.98 | 123 | 120 |
| 1934 | 9.21 | 7.73 | 8.48 | 124 | 119 |
| 1935 | 8.89 | 7.53 | 8.22 | 122 | 118 |
| 1936 | 9.45 | 8.03 | 8.75 | 121 | 118 |
An examination of the total number of deaths registered in each quarter of the decade 1927–36 gives the following annual averages: March quarter, 2,666; June quarter, 2,931; September quarter, 3,489; and December quarter, 3,031.
A classification according to month of death shows that in 1936 the most deaths occurred during August, July, October, and June, with totals of 1,261, 1,242, 1,213, and 1,179 respectively. Excluding December, a proportion of deaths occurring in that month not being registered till January, February had the least number of deaths (887), followed by January and March, with 966 and 976 respectively.
The least number of deaths on any one day, again excluding December, was 19, this number occurring on the 30th March. The greatest number (59) occurred on the 18th July.
The deaths registered during the year 1936 are tabulated below according to age:—
| Ages. | Males. | Females. | Total. |
|---|---|---|---|
| Under 1 month | 309 | 245 | 554 |
| 1–2 months | 42 | 31 | 73 |
| 3–5 months | 23 | 31 | 54 |
| 6–11 months | 41 | 47 | 88 |
| 1 year | 59 | 46 | 105 |
| 2 years | 22 | 26 | 48 |
| 3 years | 32 | 18 | 50 |
| 4 years | 22 | 19 | 41 |
| 5–9 years | 96 | 75 | 171 |
| 10–14 years | 70 | 46 | 116 |
| 15–19 years | 100 | 69 | 169 |
| 20–24 years | 175 | 126 | 301 |
| 25–29 years | 133 | 150 | 283 |
| 30–34 years | 138 | 132 | 270 |
| 35–39 years | 189 | 165 | 354 |
| 40–44 years | 225 | 189 | 414 |
| 45–49 years | 335 | 253 | 588 |
| 50–54 years | 456 | 361 | 817 |
| 55–59 years | 631 | 465 | 1,096 |
| 60–64 years | 717 | 498 | 1,215 |
| 65–69 years | 786 | 662 | 1,448 |
| 70–74 years | 741 | 652 | 1,393 |
| 75–79 years | 768 | 630 | 1,398 |
| 80–84 years | 592 | 521 | 1,113 |
| 85–89 years | 328 | 298 | 626 |
| 90–94 years | 98 | 117 | 215 |
| 95–99 years | 19 | 34 | 53 |
| 100 years | 1 | 1 | |
| 102 | 2 | 2 | |
| Totals | 7,150 | 5,906 | 13,056 |
The following table indicates the changes that have occurred over a period of fifty years in the age-distribution of persons dying:—
| Ages, in Years. | Number of Deaths | Percentage to Total. | ||||||||
|---|---|---|---|---|---|---|---|---|---|---|
| 1886. | 1896. | 1906. | 1916. | 1936. | 1886. | 1896. | 1906. | 1916. | 1936. | |
| Under 1 | 1,899 | 1,439 | 1,506 | 1,446 | 769 | 30.95 | 22.37 | 18.06 | 13.65 | 5.89 |
| 1 and under 5 | 593 | 414 | 359 | 616 | 244 | 9.67 | 6.43 | 4.31 | 5.81 | 1.87 |
| 5 and under 10 | 260 | 185 | 174 | 313 | 171 | 4.24 | 2.88 | 2.09 | 2.95 | 1.31 |
| 10 and under 15 | 168 | 130 | 125 | 164 | 116 | 2.74 | 2.02 | 1.50 | 1.55 | 0.89 |
| 15 and under 20 | 205 | 257 | 228 | 235 | 169 | 3.34 | 3.99 | 2.73 | 2.22 | 1.29 |
| 20 and under 25 | 253 | 313 | 306 | 301 | 301 | 4.12 | 4.87 | 3.67 | 2.84 | 2.31 |
| 25 and under 30 | 252 | 279 | 369 | 376 | 283 | 4.11 | 4.34 | 4.42 | 3.55 | 2.17 |
| 30 and under 35 | 256 | 230 | 315 | 416 | 270 | 4.17 | 3.58 | 3.78 | 3.92 | 2.07 |
| 35 and under 40 | 260 | 249 | 339 | 479 | 354 | 4.24 | 3.87 | 4.07 | 4.52 | 2.71 |
| 40 and under 45 | 266 | 248 | 304 | 457 | 414 | 4.34 | 3.86 | 3.64 | 4.31 | 3.17 |
| 45 and under 50 | 278 | 289 | 327 | 459 | 588 | 4.53 | 4.49 | 3.92 | 4.33 | 4.50 |
| 50 and under 55 | 300 | 307 | 380 | 487 | 817 | 4.89 | 4.77 | 4.56 | 4.60 | 0.26 |
| 55 and under 60 | 237 | 426 | 424 | 525 | 1,096 | 3.86 | 6.62 | 5.08 | 4.96 | 8.39 |
| 60 and under 65 | 231 | 405 | 535 | 611 | 1,215 | 3.77 | 6.30 | 6.42 | 5.77 | 9.31 |
| 65 and under 70 | 198 | 389 | 714 | 711 | 1,448 | 3.23 | 6.05 | 8.56 | 6.71 | 11.09 |
| 70 and under 75 | 178 | 308 | 731 | 850 | 1,393 | 2.90 | 4.79 | 8.77 | 8.02 | 10.67 |
| 75 and under 80 | 164 | 281 | 599 | 960 | 1,398 | 2.67 | 4.37 | 7.18 | 9.06 | 10.71 |
| 80 and over | 134 | 283 | 604 | 1,190 | 2,010 | 2.18 | 4.40 | 7.24 | 11.23 | 15.39 |
| Unspecified | 3 | 0.05 | ||||||||
| Totals | 6,135 | 6,432 | 8,339 | 10,596 | 13,056 | 100.00 | 100.00 | 100.00 | 100.00 | 100.00 |
Some remarkable changes in the age-distribution of persons dying have occurred during the last fifty years. The total deaths in 1936 were more than twice as numerous as in 1886, but the number of deaths under one year in 1936 was less than half of the corresponding number recorded in 1886. This is an eloquent tribute to the efficacy of the steps taken to preserve infant fife (a subject which is dealt with later on in this subsection), as over the fifty-year period the annual number of births increased by 29 per cent.
The enormous reduction in deaths from the principal epidemic diseases of early childhood over a long period of years has resulted in a greater proportion of children surviving to adult life. A similar, though not quite so pronounced, decline in the fatal incidence of tuberculosis, which is largely confined to early and middle adult life, has also tended to ensure a greater proportion of persons attaining old age.
The movement in the proportions of deaths occurring at the different age-groups is very striking. The results of two main factors are illustrated. First, the health measures, already commented upon, which have achieved an immense saving of young life; and, second, the exposure of a greater proportion of the population to the diseases of old age.
There appears to be little likelihood of any further drastic reduction in the death-rate from the diseases of infancy and early adult life; and, unless public-health measures meet with more success in the prolongation of the human life-span through the amelioration of the degenerative diseases of old age, the time cannot be far distant when the death-rate will begin to advance fairly rapidly.
The next table shows that the fall in the death-rate during recent years has been common to all ages, except age 85 and over, and to both sexes.
The table is further of interest as showing that the female rate for the various age-groups is almost invariably lower than the male rate. The rapid increase in the death-rate at successive age-groups is well exemplified.
DEATH-RATES PER 1,000, BY AGE-GROUPS.
| Year. | Under 1. | 1 and under 5. | 5 and under 15. | 15 and under 25. | 25 and under 35. | 35 and under 45. | 45 and under 55. | 55 and under 65. | 65 and under 75. | 75 and under 85. | 85 and over. |
|---|---|---|---|---|---|---|---|---|---|---|---|
| Males. | |||||||||||
| 1901 | 78.60 | 6.81 | 1.89 | 3.52 | 3.97 | 6.16 | 11.94 | 23.12 | 50.59 | 126.26 | 280.00 |
| 1911 | 63.48 | 5.36 | 1.91 | 2.42 | 3.87 | 6.27 | 11.02 | 20.83 | 53.22 | 116.21 | 281.21 |
| 1921 | 53.10 | 4.78 | 1.85 | 2.44 | 3.56 | 5.55 | 9.61 | 19.96 | 46.17 | 102.84 | 257.70 |
| 1926 | 43.55 | 3.60 | 1.30 | 2.32 | 3.33 | 4.98 | 9.30 | 19.15 | 49.43 | 128.13 | 330.54 |
| 1936 | 34.11 | 2.80 | 1.26 | 2.04 | 2.22 | 4.34 | 8.64 | 18.69 | 43.38 | 113.94 | 268.26 |
| Females. | |||||||||||
| 1901 | 63.87 | 5.50 | 1.64 | 3.58 | 4.72 | 6.70 | 10.62 | 19.44 | 43.32 | 107.02 | 285.30 |
| 1911 | 48.74 | 5.37 | 1.48 | 2.76 | 4.34 | 4.92 | 8.38 | 17.89 | 40.44 | 104.84 | 221.90 |
| 1921 | 42.31 | 4.49 | 1.31 | 2.34 | 3.38 | 4.46 | 8.00 | 14.88 | 36.81 | 94.42 | 230.05 |
| 1926 | 35.73 | 4.00 | 1.30 | 1.95 | 3.14 | 3.98 | 7.34 | 15.02 | 39.26 | 109.48 | 284.72 |
| 1936 | 30.12 | 2.36 | 0.95 | 1.50 | 2.46 | 3.57 | 6.68 | 14.38 | 38.62 | 95.04 | 254.39 |
| Both Sexes. | |||||||||||
| 1901 | 71.40 | 6.17 | 1.77 | 3.55 | 4.33 | 6.40 | 11.37 | 21.63 | 47.87 | 117.97 | 282.52 |
| 1911 | 56.31 | 5.36 | 1.70 | 2.58 | 4.09 | 5.64 | 9.82 | 19.55 | 47.74 | 111.73 | 251.81 |
| 1921 | 47.82 | 4.64 | 1.58 | 2.39 | 3.47 | 5.10 | 8.85 | 17.59 | 41.90 | 99.00 | 245.21 |
| 1926 | 39.76 | 3.80 | 1.30 | 2.14 | 3.23 | 4.48 | 8.37 | 17.22 | 44.64 | 119.19 | 308.76 |
| 1936 | 32.15 | 2.58 | 1.11 | 1.78 | 2.34 | 3.95 | 7.66 | 16.62 | 41.04 | 104.42 | 261.14 |
The average (arithmetic mean) age at death of persons of either sex in each of the last ten years was as follows:—
| Year. | Males. | Females. |
|---|---|---|
| 1927 | 52.59 | 52.35 |
| 1928 | 52.33 | 52.68 |
| 1929 | 53.15 | 54.27 |
| 1930 | 54.23 | 54.47 |
| 1931 | 54.14 | 55.48 |
| 1932 | 55.79 | 56.05 |
| 1933 | 56.17 | 56.45 |
| 1934 | 56.99 | 57.75 |
| 1935 | 56.95 | 57.79 |
| 1936 | 57.12 | 57.70 |
For reference to, or records of, the various series of life-tables constructed on New Zealand's mortality experience, ranging from 1880 to 1922, recourse may be had to issues of the Year-Book for 1915, 1926, and 1927, and to the General Report on the Census of 1921. The following data on expectation of life or average after-lifetime, which are quoted by courtesy of the compilers, are from a life-table constructed by L. I. Dublin, Ph.D and A. J. Lotka, D.Sc., of the Metropolitan Life Insurance Co. of New York, U.S.A., and published in the Statistical Bulletin of that company. The table is based upon New Zealand experience of the year 1931, data regarding deaths and age-constitution of the population having been supplied by the Census and Statistics Department. As the 1931 census was not taken, details of age-distribution were derived from the annual inter-censal age-estimates with a consequent potentiality of error.
| Age | Males | Females. |
|---|---|---|
| 0 | 65.04 | 67.88 |
| 5 | 63.35 | 65.30 |
| 10 | 58.75 | 60.67 |
| 15 | 54.11 | 55.88 |
| 20 | 49.61 | 51.28 |
| 25 | 45.21 | 46.80 |
| 30 | 40.78 | 42.45 |
| 35 | 36.37 | 38.14 |
| 40 | 32.07 | 33.80 |
| 45 | 27.83 | 29.45 |
| 50 | 23.73 | 25.24 |
| 55 | 19.87 | 21.13 |
| 60 | 16.22 | 17.30 |
| 65 | 12.86 | 13.82 |
| 70 | 9.87 | 10.63 |
| 75 | 7.38 | 7.88 |
| 80 | 5.45 | 5.63 |
| 85 | 3.52 | 3.60 |
| 90 | 1.89 | 2.00 |
| 95 | 0.84 | 0.97 |
Expectation of life at age 0 is steadily increasing in New Zealand, and is, so far as is known, higher than that of any other country. Brief figures are quoted:—
| Period. | Males | Females. |
|---|---|---|
| Years | Years. | |
| 1891–1895 | 55.29 | 58.09 |
| 1896–1900 | 57.37 | 59.95 |
| 1901–1905 | 58.09 | 60.55 |
| 1906–1910 | 59.17 | 61.76 |
| 1911–1915 | 60.96 | 63.48 |
| 1921–1922 | 62.70 | 65.43 |
| 1931 | 65.04 | 67.88 |
Examination of data of universal character shows that New Zealand has the lowest death-rate in the world, the Netherlands ranking second in this respect. Rates for certain of the principal countries are quoted below.
| Country. | Quinquennium. | Average Rate per 1,000. |
|---|---|---|
* Registration area. | ||
| New Zealand | 1932–36 | 8.3 |
| Netherlands | 1932–36 | 8.8 |
| Australia | 1932–36 | 9.1 |
| Canada | 1931–35 | 9.7 |
| Union of South Africa | 1931–35 | 9.8 |
| Norway | 1932–36 | 10.3 |
| Uruguay | 1931–35 | 10.3 |
| Denmark | 1932–36 | 10.8 |
| United States* | 1931–35 | 10.9 |
| Germany | 1931–35 | 11.2 |
| Argentina | 1931–35 | 11.4 |
| Sweden | 1932–36 | 11.5 |
| Switzerland | 1931–35 | 11.8 |
| England and Wales | 1931–35 | 12.0 |
| Finland | 1931–35 | 12.6 |
| Belgium | 1931–35 | 12.9 |
| Scotland | 1931–35 | 13.2 |
| Austria | 1932–36 | 13.3 |
| Czechoslovakia | 1932–36 | 13.6 |
| Italy | 1932–36 | 13.7 |
| Irish Free State | 1931–35 | 13.9 |
| Latvia | 1932–36 | 13.9 |
| Lithuania | 1932–36 | 14.0 |
| Northern Ireland | 1932–36 | 14.2 |
| Poland | 1932–36 | 14.3 |
| Bulgaria | 1932–36 | 14.8 |
| Estonia | 1931–35 | 14.9 |
| Hungary | 1932–36 | 15.3 |
| France | 1931–35 | 15.7 |
| Spain | 1931–35 | 16.2 |
| Greece | 1931–35 | 16.5 |
| Portugal | 1932–36 | 16.8 |
| Japan | 1931–35 | 17.9 |
| Yugoslavia | 1930–34 | 18.4 |
| Rumania | 1932–36 | 20.3 |
| Ceylon | 1931–35 | 24.5 |
| Chile | 1932–36 | 25.2 |
| Egypt | 1931–35 | 26.9 |
For the purpose of ascertaining the true movement of the death-rate in New Zealand, a system of standardization was introduced some years ago the age- and sex-constitution of the population as disclosed at the census of 1911 being taken as the basis. The population and deaths of each year are divided, each sex separately, into five-yearly groups of ages (with one group only for ages 80 and over), and the rates for the various age-groups ascertained and weighted according to the proportion which the respective groups bore to the total population at the census of 1911. The following table gives both recorded and standardized death-rates.
| Year. | Recorded Rates. | Standardized Rates. | ||||
|---|---|---|---|---|---|---|
| Males. | Females. | Total. | Males. | Females. | Total. | |
| 1875 | 16.56 | 15.07 | 15.92 | 19.03 | 15.36 | 17.30 |
| 1880 | 12.05 | 10.73 | 11.46 | 13.81 | 11.47 | 12.70 |
| 1885 | 11.51 | 9.67 | 10.67 | 13.38 | 10.06 | 12.36 |
| 1890 | 10.51 | 8.68 | 9.66 | 12.26 | 10.11 | 11.25 |
| 1895 | 10.81 | 8.89 | 9.91 | 12.26 | 10.07 | 11.22 |
| 1900 | 10.33 | 8.43 | 9.43 | 11.04 | 9.29 | 10.21 |
| 1905 | 10.18 | 8.24 | 9.27 | 10.49 | 8.61 | 9.60 |
| 1910 | 10.67 | 8.63 | 9.71 | 10.67 | 8.46 | 9.62 |
| 1915 | 10.19 | 7.87 | 9.06 | 10.19 | 7.87 | 9.09 |
| 1920 | 11.11 | 9.15 | 10.15 | 10.83 | 8.84 | 9.89 |
| 1925 | 9.09 | 7.46 | 8.29 | 8.68 | 6.77 | 7.78 |
| 1930 | 9.40 | 7.69 | 8.56 | 8.64 | 6.48 | 7.62 |
| 1935 | 8.89 | 7.53 | 8.22 | 7.64 | 5.78 | 6.76 |
| 1936 | 9.45 | 8.03 | 8.75 | 7.94 | 7.25 | 7.61 |
For purposes of international comparisons, a standard population, based on the age-distribution of the population of 19 European countries at their censuses nearest to the year 1900, has been compiled by the International Institute of Statistics, and is used in the following table of New Zealand rates.
| Year. | Recorded Rates. | International Standardized Rates. | |||||
|---|---|---|---|---|---|---|---|
| Males. | Females. | Both Sexes. | Males. | Females. | Both Sexes. | ||
| Without Distinction between Sexes. | With Distinction between Sexes. | ||||||
| 1901 | 10.80 | 8.71 | 9.81 | 11.81 | 11.21 | 11.64 | 11.51 |
| 1911 | 10.46 | 8.21 | 9.39 | 10.79 | 9.74 | 10.40 | 10.26 |
| 1921 | 9.75 | 7.66 | 8.73 | 9.65 | 8.63 | 9.23 | 9.14 |
| 1926 | 9.66 | 7.77 | 8.74 | 9.51 | 8.66 | 9.17 | 9.09 |
| 1929 | 9.65 | 7.82 | 8.75 | 9.28 | 8.39 | 8.86 | 8.78 |
| 1930 | 9.40 | 7.69 | 8.56 | 8.94 | 8.11 | 8.58 | 8.52 |
| 1931 | 9.05 | 7.59 | 8.34 | 8.55 | 7.85 | 8.24 | 8.20 |
| 1932 | 8.55 | 7.47 | 8.02 | 7.98 | 7.68 | 7.87 | 7.83 |
| 1933 | 8.70 | 7.23 | 7.98 | 8.05 | 7.29 | 7.73 | 7.67 |
| 1934 | 9.21 | 7.73 | 8.48 | 8.40 | 7.69 | 8.10 | 8.04 |
| 1935 | 8.89 | 7.53 | 8.22 | 7.99 | 7.32 | 7.71 | 7.65 |
| 1936 | 9.45 | 8.03 | 8.75 | 8.29 | 7.63 | 8.01 | 7.96 |
An interesting point brought out by the use of this method in New Zealand is that the male standardized rate has now for a number of years been actually lower than the corresponding recorded rate. In 1934 the standardized death-rate for females also reached for the first time a lower level than the recorded rate, which position also held in 1935 and 1936.
The table following shows the number of living issue left by married men or widowers whose deaths were registered during the ten years 1927–36, the information being given according to age of father and of issue.
| — | Number of Issue left by Fathers, aged— | |||||||
|---|---|---|---|---|---|---|---|---|
| Under 30. | 30 and under 40. | 40 and under 50. | 50 and under 60. | 60 and under 70. | 70 and under 80. | 80 and over. | Totals. | |
| Age of issue, in years— | ||||||||
| Under 5 | 533 | 1,358 | 1,305 | 503 | 116 | 12 | 3,827 | |
| 5 and under 10 | 111 | 1,506 | 2,542 | 1,451 | 377 | 76 | 14 | 6,077 |
| 10 and under 15 | 4 | 747 | 3,122 | 3,028 | 1,051 | 232 | 34 | 8,218 |
| 15 and under 21 | 3 | 135 | 3,005 | 5,002 | 3,465 | 962 | 170 | 13,642 |
| 21 and over | 1 | 1,140 | 11,197 | 28,451 | 143,708 | 36,031 | 120,528 | |
| Unspecified | 7 | 3 | 2 | 12 | ||||
| Totals | 651 | 3,747 | 11,121 | 22,084 | 33,462 | 44,990 | 36,249 | 152,304 |
| Married men or widowers who died— | ||||||||
| Leaving issue | 389 | 1,581 | 3,472 | 6,155 | 8,418 | 9,589 | 7,090 | 36,694 |
| Without, leaving issue | 186 | 403 | 788 | 1,236 | 1,545 | 1,526 | 942 | 6,626 |
| Totals | 575 | 1,984 | 4,260 | 7,391 | 9,963 | 11,115 | 8,032 | 43,320 |
Taking all deaths of married men or widowers, whether leaving issue or not it is found that the average living issue is 3.52, as compared with 3.80 for the period 1917–26.
Average numbers of issue left by married men or widowers during the decade 1927–36 were: Fathers aged under 30, 1.13; aged 30–39, 1.89; 40–49, 2.61; 50–59, 2.99; 60–69, 3.36; 70–79, 4.05; 80 or over, 4.51. Averages are universally lower than in the preceding decade.
In 1936, among men who left any issue under age 16, the average number of such issue was 2.10. The average for all married men or widowers who died during the year was, however, only 0.40.
Of 943 cases where issue under 16 years of age was left by married men or widowers during 1936, a widow was also left in 912 cases, the aggregate children under 16 in these 912 cases being 1,916, and the average per widow 2.10. By the deaths of their fathers, children under 16 to the number of 57 were left without either parent, and for 4 children there was no information as to whether the mother was alive or dead.
The foregoing figures and table all refer to children partially or completely orphaned in the case of families where only the father died during the year 1936 or the decade 1927–36. An attempt has now been made, however, for the first time in New Zealand to tabulate similar information for families of which the mother died during the year 1936. Altogether 4,430 married women or widows died during 1936, leaving a total issue of 15,009, or an average living issue of 3.39. Considering only these mothers who left issue, the average issue left was 4.04. The average issue under 16 years of age left by all married women or widows who died during the year 1936 was 0.36.
The following summary tables of the numbers and ages of issue under the age of 16 years left by married men, widowers, married women, and widows during the year 1936 are of considerable interest:—
(a) AGES OF ISSUE UNDER SIXTEEN LEFT BY THE DEATH OF EITHER PARENT, 1936.
| Age of Issue. | Numbers of Is left at Ages specified by | ||||||
|---|---|---|---|---|---|---|---|
| Married Men. | Widowers. | Married Women. | Widows. | Total Married Men and Widowers. | Total Married Women and Widows. | Total Widows and Widowers. | |
| 0 | 44 | 59 | 44 | 59 | |||
| 1 | 65 | 39 | 65 | 39 | |||
| 2 | 63 | 46 | 2 | 63 | 48 | 2 | |
| 3 | 80 | 1 | 61 | 2 | 81 | 63 | 3 |
| 4 | 83 | 3 | 70 | 1 | 86 | 71 | 4 |
| 5 | 92 | 2 | 81 | 1 | 94 | 82 | 3 |
| 6 | 95 | 2 | 59 | 1 | 97 | 60 | 3 |
| 7 | 118 | 4 | 78 | 1 | 122 | 79 | 5 |
| 8 | 142 | 3 | 76 | 3 | 145 | 79 | 6 |
| 9 | 112 | 4 | 85 | 9 | 116 | 94 | 13 |
| 10 | 154 | 6 | 83 | 6 | 160 | 89 | 12 |
| 11 | 149 | 7 | 101 | 5 | 156 | 106 | 12 |
| 12 | 197 | 6 | 88 | 8 | 203 | 96 | 14 |
| 13 | 161 | 5 | 114 | 6 | 166 | 120 | 11 |
| 14 | 188 | 6 | 114 | 8 | 194 | 122 | 14 |
| 15 | 177 | 8 | 108 | 7 | 185 | 115 | 15 |
| Totals— | |||||||
| Under 16 | 1,920 | 57 | 1,262 | 60 | 1,977 | 1,322 | 117 |
| 16 and over | 9,942 | 4,522 | 9,988 | 3,699 | 14,464 | 13,687 | 8,221 |
| Unspecified | 1 | 1 | |||||
| Grand totals | 11,863 | 4,579 | 11,250 | 3,759 | 16,442 | 115,009 | 8,338 |
(b) NUMBER OF ISSUE UNDER SIXTEEN LEFT BY THE DEATH OF EITHER PARENT, 1936.
| Number of Issue. | Families under Sixteen Years of Age left by | ||||||
|---|---|---|---|---|---|---|---|
| Married Men. | Widowers. | Married Women. | Widows. | Total Married Men and Widowers. | Total Married Women and Widows. | Total Widows and Widowers. | |
| 1 | 409 | 17 | 282 | 14 | 426 | 296 | 31 |
| 2 | 236 | 5 | 174 | 10 | 241 | 184 | 15 |
| 3 | 140 | 2 | 74 | 4 | 142 | 78 | 6 |
| 4 | 71 | 2 | 37 | 1 | 73 | 38 | 3 |
| 5 | 29 | 2 | 22 | 2 | 31 | 24 | 4 |
| 6 | 20 | 1 | 18 | 21 | 13 | 1 | |
| 7 | 4 | 6 | 4 | 6 | |||
| 8 | 3 | 4 | 3 | 4 | |||
| 9 | 2 | 2 | |||||
| Totals | 914 | 29 | 612 | 31 | 943 | 643 | 60 |
From section (a) of the above table it will be seen that during 1936 no fewer than 1,920 children under 16 years of age were left fatherless, although their mother was still alive at the time of the father's death; 1,262 were left without a mother, but with their father living: thus a total of 3,182 were loft with only one parent. By the death of their father 57 children, and by the death of their mother 60 children, were left without either parent, making a total of 117 true orphans under 16 years of age during 1936. In this total, of course, there might possibly be a few cases where both the father and the mother died during 1936, and in any such cases the number of children left would be duplicated, as they would be included in the figures of issue left upon the death of each parent.
Section (b) of the table indicates that in a total of 60 families there were 117 children under 16 years of age left as true orphans during 1936, equivalent to an average of 1.95 per family. The average number of children under 16 years of age left fatherless per family was 2.10; motherless, 2.06; and in all cases with only one parent, 2.09. These averages, of course, relate only to these families in which there were any children under 16 years of age.
Of the 43,320 married men or widowers whose deaths were registered during the ten years 1927–36, 11,121 were shown to have been widowers and 31,683 to have left widows, while in the remaining 516 cases there was no information on the point. Of the married men leaving widows, 27,010 had living issue also at time of death, and 4,673 had no living issue. In 9,431 cases widowers left issue, and in 1,690 cases no issue. In 253 of the 516 cases where no information was given as to whether a widow was left, there was living issue, and in 263 cases there was no living issue.
New Zealand has the lowest rate of infant mortality in the world, a fact attributable partly to such matters as climate, virility of the race, comparative absence of densely settled areas, &c., and partly to legislative and educative measures, the latter conducted by the State as well as by various organizations.
The following table, giving infant mortality rates in various countries for the latest available quinquennial period, clearly shows the favourable position occupied by New Zealand:—
| Country. | Quinquennium. | Deaths under One Year per 1,000 Births. |
|---|---|---|
* Registration area. | ||
| New Zealand | 1932–36 | 32 |
| Australia | 1932–36 | 41 |
| Netherlands | 1932–36 | 42 |
| Norway | 1931–35 | 44 |
| Switzerland | 1932–36 | 48 |
| Sweden | 1931–35 | 50 |
| Iceland | 1931–35 | 51 |
| United States* | 1931–35 | 59 |
| England and Wales | 1932–36 | 61 |
| South Africa | 1932–36 | 63 |
| Irish Free State | 1932–36 | 69 |
| Denmark | 1932–36 | 71 |
| Germany | 1932–36 | 71 |
| Finland | 1931–35 | 72 |
| France | 1931–35 | 73 |
| Canada | 1931–35 | 75 |
| Northern Ireland | 1932–36 | 79 |
| Scotland | 1932–36 | 81 |
| Latvia | 1932–36 | 84 |
| Belgium | 1931–35 | 86 |
| Estonia | 1932–36 | 92 |
| Uruguay | 1930–34 | 99 |
| Austria | 1931–35 | 99 |
| Italy | 1931–35 | 105 |
| Spain | 1931–35 | 112 |
| Greece | 1930–34 | 119 |
| Japan | 1931–35 | 120 |
| Czechoslovakia | 1932–36 | 128 |
| Poland | 1932–36 | 136 |
| Lithuania | 1932–36 | 141 |
| Bulgaria | 1932–36 | 145 |
| Portugal | 1931–35 | 146 |
| Hungary | 1932–36 | 152 |
| Egypt | 1931–35 | 165 |
| British India | 1931–35 | 170 |
| Ceylon | 1931–35 | 183 |
| Chile | 1932–36 | 252 |
Not only has New Zealand had for many years the lowest rate of infant mortality in the world, but the rate for the Dominion has shown steady and rapid improvement, more particularly during the last twenty years. Much of the success achieved has been due to the activities of the Royal New Zealand Society for the Health of Women and Children. Founded at Dunedin in 1907, this society has since extended its Plunket system throughout New Zealand, and its methods are being adopted to an ever-increasing extent in other countries.
The deaths of infants under one year of age for each of the last ten years are shown in the following table:—
| Year. | Number. | Rate per 1,000 Births. | ||||
|---|---|---|---|---|---|---|
| Males. | Females. | Total. | Males. | Females. | Total. | |
| 1927 | 610 | 470 | 1,080 | 42.68 | 34.58 | 38.74 |
| 1928 | 609 | 375 | 984 | 43.25 | 28.59 | 36.18 |
| 1929 | 548 | 364 | 912 | 40.16 | 27.78 | 34.10 |
| 1930 | 525 | 399 | 924 | 38.28 | 30.50 | 34.48 |
| 1931 | 526 | 330 | 856 | 38.21 | 25.67 | 32.15 |
| 1932 | 426 | 351 | 777 | 33.22 | 29.10 | 31.22 |
| 1933 | 455 | 315 | 770 | 36.64 | 26.44 | 31.64 |
| 1934 | 456 | 325 | 781 | 36.32 | 27.62 | 32.11 |
| 1935 | 444 | 329 | 773 | 30.05 | 28.24 | 32.26 |
| 1936 | 415 | 354 | 769 | 32.92 | 28.95 | 30.90 |
The favourable reputation of New Zealand's infant-mortality rate was further enhanced during 1936, when after a stabilizing period of four or five years, the characteristic downward trend was resumed with the creation of a new low record.
The pronounced fall in New Zealand's infant mortality rate during the last two decades has not been accompanied by an increase in the death-rate of children between the ages of one and ten years. There has, on the contrary, been a substantial fall, as is shown by the following figures. The numbers and rates given refer to annual averages for the quinquennia mentioned.
| Quinquennium. | 1 and under 5. | 5 and under 10. | ||
|---|---|---|---|---|
| Number of Deaths. | Rate.* | Number of Deaths. | Rate.* | |
* For 10,000 children at ages shown. | ||||
| 1894–1898 | 440 | 68 | 186 | 22 |
| 1899–1903 | 504 | 76 | 194 | 23 |
| 1904–1908 | 444 | 37 | 172 | 19 |
| 1909–1913 | 447 | 49 | 193 | 18 |
| 1914–1918 | 547 | 53 | 266 | 22 |
| 1919–1923 | 465 | 44 | 245 | 19 |
| 1924–1928 | 403 | 38 | 203 | 15 |
| 1929–1933 | 305 | 29 | 175 | 13 |
| 1934–1936 (3 years) | 245 | 25 | 154 | 12 |
The increase in 1914–18 as compared with 1909–13 is due to the fact that during the latter period New Zealand experienced several minor epidemics, principally of diphtheria. The influenza epidemic in 1918 also somewhat affected the rate.
Since 1921 a distinction has been made between legitimate and illegitimate children in the New Zealand statistics of infant mortality. The proportion of illegitimate infants among these dying within the first year of life has been found to be greater (in some years substantially so) than the proportion of illegitimate births to total births, in spite of the fact that legitimations and adoptions would tend to reduce the number which would be termed illegitimate in the death entries. The year 1930 constitutes an exception.
| Year. | Total Deaths under One Year. | Deaths of Illegitimate Infants under One Year. | Proportion of Illegitimates in Total Deaths under One Year. | Proportion of Illegitimates in Total Births. |
|---|---|---|---|---|
| Per Cent. | Per Cent. | |||
| 1927 | 1,080 | 77 | 7.13 | 4.97 |
| 1928 | 984 | 56 | 5.69 | 5.08 |
| 1929 | 912 | 72 | 7.89 | 4.96 |
| 1930 | 924 | 47 | 5.09 | 5.12 |
| 1931 | 856 | 60 | 7.01 | 4.94 |
| 1932 | 777 | 54 | 6.95 | 5.07 |
| 1933 | 770 | 42 | 5.45 | 4.60 |
| 1934 | 781 | 41 | 5.25 | 4.77 |
| 1935 | 773 | 53 | 6.86 | 4.36 |
| 1936 | 769 | 50 | 6.50 | 4.53 |
Normally the excess of the male over the female rate of infant mortality holds for each of the four divisions of the first year of life shown in the next table. The discrepancy is, however, somewhat greater in the first half of the year than in the second.
| Year. | Male Deaths per 1,000 Male Births. | Female Deaths per 1,000 Female Births. | ||||||
|---|---|---|---|---|---|---|---|---|
| Under 1 Month. | 1 and under 3 Months. | 3 and under 6 Months. | 6 and under 12 Months. | Under 1 Month. | 1 and under 3 Months. | 3 and under 6 Months. | 6 and under 12 Months. | |
| 1927 | 27.92 | 5.39 | 4.13 | 5.24 | 23.62 | 4.27 | 2.43 | 4.26 |
| 1928 | 30.46 | 4.62 | 3.98 | 4.19 | 20.05 | 2.67 | 2.52 | 3.35 |
| 1929 | 27.48 | 4.84 | 2.86 | 4.98 | 18.85 | 3.51 | 206 | 3.36 |
| 1930 | 26.76 | 5.83 | 2.19 | 3.50 | 21.17 | 3.22 | 2.29 | 3.82 |
| 1931 | 26.95 | 4.50 | 2.33 | 4.43 | 18.12 | 1.87 | 2.10 | 3.58 |
| 1932 | 21.99 | 3.98 | 3.35 | 3.90 | 20.56 | 2.57 | 2.16 | 3.81 |
| 1933 | 26.89 | 3.70 | 2.66 | 3.39 | 18.55 | 3.02 | 2.94 | 1.93 |
| 1934 | 26.37 | 3.66 | 2.71 | 3.58 | 19.12 | 2.22 | 2.97 | 3.31 |
| 1935 | 24.28 | 4.71 | 2.92 | 4.14 | 19.66 | 2.40 | 3.26 | 2.92 |
| 1936 | 24.51 | 3.33 | 1.82 | 3.26 | 20.03 | 2.54 | 2.54 | 3.84 |
Even when the effect of the male excess among infants born is eliminated, the number of male deaths per 100 female deaths in the first month of life during the ten years 1927–36 is found to be 132; between one and three months, 158; between three and six months, 115; between six and twelve months, 119; and for the whole of the first year, 131.
The rates per 1,000 births for the two sexes in conjunction are now given for each of the last five years.
| Year. | Under 1 Month. | 1 and under 3 Months. | 3 and under 6 Months. | 6 and under 12 Months. | Total under 1 Year |
|---|---|---|---|---|---|
| 1932 | 21.30 | 3.29 | 2.77 | 3.86 | 31.22 |
| 1933 | 22.81 | 3.37 | 2.79 | 2.67 | 31.64 |
| 1934 | 22.86 | 2.96 | 2.84 | 3.45 | 32.11 |
| 1935 | 22.03 | 3.59 | 3.09 | 3.55 | 32.26 |
| 1936 | 22.31 | 2.94 | 2.18 | 3.53 | 30.96 |
Infant deaths may be grouped roughly into two main classes—viz., these occurring within one month of birth and these who survive the first month of life but perish before attaining the first anniversary of their birth. Deaths in the first class are due principally to causes operating before the actual birth of the infant. The second group, generally speaking, contains the deaths of these infants who have succumbed to causes arising from post-natal influences, such as the various epidemic diseases, faulty feeding, diseases of the respiratory system, &c. The first group naturally presents the greatest problem to the infant-welfare worker, and the history of the comparatively rapid decline of the infant-mortality rate in New Zealand is largely an illustration of the effective measures adopted towards combating the post-natal causes of death in infancy.
The next table shows that, whereas in the quinquennium 1931–35 the death-rate under one month of age was 25 per cent. lower than in the quinquennium 1881–85, the rate for children who had survived the first month of life was only a little more than one-seventh as high as in the “eighties.” In other words, where the Dominion formerly lost between the ages of one month and one year more than sixty children out of every thousand it lost in 1931–35 only ten.
| Period. | Deaths per 1,000 Births. | Deaths between 1 and 12 Months per 1,000 Children who survive 1 Month. | ||
|---|---|---|---|---|
| Under 1 Year. | Under 1 Month. | Between 1 and 12 Months. | ||
| 1881–1885 | 90.60 | 29.77 | 60.83 | 62.70 |
| 1886–1890 | 84.09 | 27.57 | 56.52 | 58.13 |
| 1891–1895 | 87.60 | 30.34 | 57.26 | 58.93 |
| 1896–1900 | 80.06 | 30.38 | 49.68 | 51.24 |
| 1901–1905 | 74.77 | 30.64 | 44.13 | 45.54 |
| 1906–1910 | 69.62 | 30.28 | 39.34 | 40.57 |
| 1911–1915 | 53.63 | 29.28 | 24.35 | 25.05 |
| 1916–1920 | 48.62 | 28.16 | 20.46 | 21.05 |
| 1921–1925 | 42.75 | 27.48 | 15.27 | 15.70 |
| 1926–1930 | 36.70 | 24.82 | 11.88 | 12.18 |
| 1931–1935 | 31.88 | 22.34 | 9.54 | 9.76 |
| 1936 | 30.96 | 22.31 | 8.65 | 8.85 |
The decrease by two-thirds in the general rate, and by nearly six-sevenths in the rate between one and twelve months, and the relatively lower movement of the rate under one month, are well indicated in the accompanying diagram.
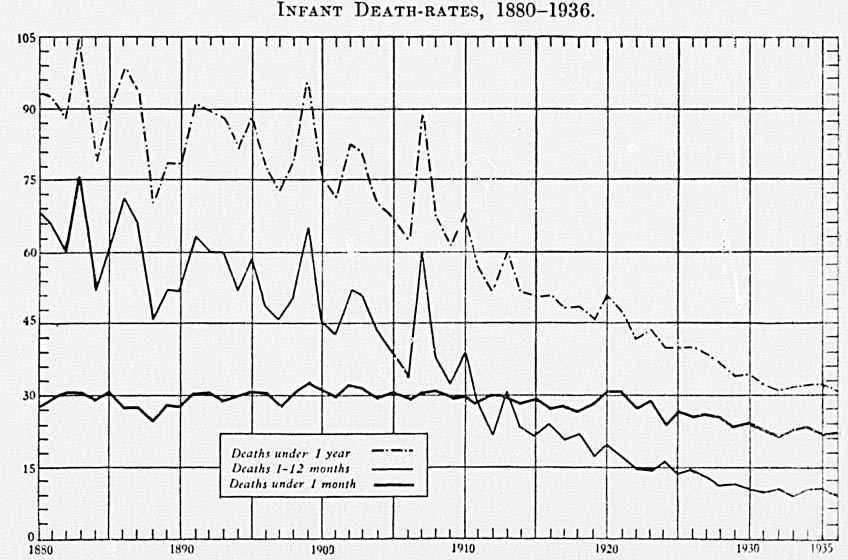
As stated above, the death-rate for infants under the age of one month has shown little improvement in recent years, while a heavy reduction has taken place in the mortality-rate after the first month of life. It would appear, therefore, that on the one hand the diseases that can be combated openly, such as epidemic diseases, respiratory diseases, and diseases due to faulty nourishment, &c. (i.e., diseases of the digestive system), have shown a definite response to the strenuous campaigns launched against them; while, on the other hand, many infants are evidently non-viable at birth. This point is accentuated by the following table, which shows the rates for further divisions of the first month of life.
DEATHS UNDER ONE MONTH PER 1,000 LIVE BIRTHS.
| Year. | Under 1 Day. | 1 Day and under 2 Days. | 2 Days and under 1 Week. | Total under 1 Week. | 1 Week and under 2 Weeks. | 2 Weeks and under 3 Weeks. | 3 Weeks and under 1 Month. | Total under 1 Month. |
|---|---|---|---|---|---|---|---|---|
| 1927 | 8.03 | 3.62 | 7.71 | 19.36 | 3.27 | 1.72 | 1.48 | 25.83 |
| 1928 | 8.46 | 3.71 | 8.24 | 20.41 | 2.94 | 1.10 | 0.99 | 25.44 |
| 1929 | 7.37 | 3.37 | 7.66 | 18.40 | 1.83 | 1.53 | 1.50 | 23.26 |
| 1930 | 8.36 | 3.28 | 7.46 | 19.10 | 2.76 | 1.31 | 0.86 | 24.03 |
| 1931 | 7.14 | 3.79 | 6.76 | 17.69 | 2.74 | 1.47 | 0.79 | 22.69 |
| 1932 | 6.59 | 3.50 | 6.35 | 16.44 | 2.61 | 1.25 | 1.00 | 21.30 |
| 1933 | 8.01 | 2.88 | 6.99 | 17.88 | 2.63 | 1.27 | 1.03 | 22.81 |
| 1934 | 9.09 | 3.37 | 6.29 | 18.75 | 2.63 | 0.70 | 0.78 | 22.86 |
| 1935 | 8.18 | 3.00 | 6.72 | 17.90 | 2.25 | 1.46 | 0.42 | 22.03 |
| 1936 | 9.14 | 3.10 | 5.72 | 17.96 | 2.62 | 1.05 | 0.68 | 22.31 |
Two-fifths (227) of the 554 deaths under one month in 1936 occurred within twenty-four hours of birth, and four-fifths (446) within one week. The following table gives, for each of the last five years, detailed information as to the number of deaths at various periods of the first year of life:—
| Year. | Under 1 Day. | 1 Day and under 2 Days. | 2 Days and under 1 Week. | 1 Week and under 2 Weeks. | 2 Weeks and under 3 weeks. | 3 Weeks and under 1 Month. | 1 Month and under 2 Months. | 2 Months under 3 Months. | 3 Months and under 6 Months. | 6 Months and under 9 Months. | 9 Months and under 12 Months. | Total. |
|---|---|---|---|---|---|---|---|---|---|---|---|---|
| Males. | ||||||||||||
| 1932 | 89 | 47 | 86 | 30 | 15 | 15 | 34 | 17 | 43 | 29 | 21 | 126 |
| 1933 | 128 | 38 | 102 | 40 | 14 | 12 | 25 | 21 | 33 | 15 | 27 | 455 |
| 1934 | 129 | 48 | 95 | 39 | 12 | 8 | 26 | 20 | 34 | 29 | 16 | 456 |
| 1935 | 120 | 40 | 93 | 27 | 16 | 3 | 25 | 33 | 36 | 30 | 21 | 444 |
| 1936 | 123 | 40 | 84 | 40 | 15 | 7 | 28 | 14 | 23 | 21 | 20 | 415 |
| Females. | ||||||||||||
| 1932 | 75 | 40 | 72 | 35 | 16 | 10 | 18 | 13 | 26 | 25 | 21 | 351 |
| 1933 | 67 | 32 | 68 | 24 | 17 | 13 | 25 | 11 | 35 | 10 | 13 | 315 |
| 1934 | 92 | 34 | 58 | 25 | 5 | 11 | 13 | 13 | 35 | 21 | 18 | 325 |
| 1935 | 76 | 32 | 68 | 27 | 19 | 7 | 20 | 8 | 38 | 25 | 9 | 329 |
| 1936 | 104 | 37 | 58 | 25 | 11 | 10 | 15 | 16 | 31 | 24 | 23 | 354 |
| Both Sexes. | ||||||||||||
| 1932 | 164 | 87 | 158 | 65 | 31 | 25 | 52 | 30 | 69 | 54 | 42 | 777 |
| 1933 | 195 | 70 | 170 | 64 | 31 | 25 | 50 | 32 | 68 | 25 | 40 | 770 |
| 1934 | 221 | 82 | 153 | 64 | 17 | 19 | 39 | 33 | 69 | 50 | 34 | 781 |
| 1935 | 196 | 72 | 161 | 54 | 35 | 10 | 45 | 41 | 74 | 55 | 30 | 773 |
| 1936 | 227 | 77 | 142 | 65 | 26 | 17 | 43 | 30 | 54 | 45 | 43 | 769 |
Some remarkable changes are disclosed by the next table, which gives the infant mortality rates for various groups of causes in quinquennial groups over a period of sixty years. If a comparison be made between the averages of the first and last quinquennia given—1872–76 and 1932–36—it is found that the general infant mortality rate shows a decline of 71 per cent., while even greater decreases are recorded for tuberculosis (96 per cent.), convulsions (94 per cent.), gastric and intestinal diseases (95 per cent.), epidemic diseases (89 per cent.), and respiratory diseases (74 per cent.). The rate for diseases of early infancy shows a decrease of only 30 per cent. in 1932–36 as compared with 1872–76, but of 33 per cent. as compared with 1917–21, and the figures indicate that some measure of success has already attended the steps taken in recent years to cope with ante-natal conditions.
The increase shown for malformations and the decrease for tuberculosis are probably somewhat less than is indicated by the figures. In the earlier years covered by the table the latter heading included all deaths from hydrocephalus, many of which were no doubt due to congenital hydrocephalus, which is now included among the malformations. A proportion of the deaths from hydrocephalus in the earlier years would also probably be due to meningitis. The most striking features of the figures for the years 1932–36 in the table are the maintenance of the increased level in the death-rate for malformations and a further drop in the rate from diseases peculiar to early infancy. The following table shows quinquennial average death-rates of infants under one year of age, per 1,000 live births.
INFANT MORTALITY RATES FOR PRINCIPAL CAUSES.
| Period. | Epidemic Diseases. | Tuberculosis. | Infantile Convulsions. | Respiratory Diseases. | Gastric and Intestinal Diseases. | Malformations. | Early Infancy. | Other Causes | Totals. |
|---|---|---|---|---|---|---|---|---|---|
| 1872–1876 | 13.5 | 5.5 | 9.7 | 12.9 | 24.2 | 1.2 | 25.0 | 17.3 | 109.3 |
| 1877–1881 | 10.2 | 5.2 | 7.5 | 12.3 | 19.8 | 1.4 | 21.9 | 15.3 | 93.6 |
| 1882–1886 | 9.3 | 4.7 | 7.9 | 11.8 | 19.1 | 1.2 | 25.5 | 12.3 | 91.8 |
| 1887–1891 | 8.9 | 3.7 | 6.3 | 10.5 | 18.5 | 1.3 | 24.7 | 8.8 | 82.7 |
| 1892–1896 | 9.8 | 3.3 | 6.6 | 11.0 | 16.6 | 1.4 | 24.9 | 11.2 | 84.8 |
| 1897–1901 | 6.1 | 2.6 | 5.6 | 10.0 | 17.2 | 1.5 | 26.2 | 9.7 | 78.9 |
| 1902–1906 | 5.5 | 1.5 | 4.1 | 9.7 | 15.3 | 1.3 | 27.6 | 7.9 | 72.9 |
| 1907–1911 | 5.9 | 1.3 | 3.3 | 7.6 | 15.5 | 1.9 | 26.7 | 6.3 | 68.5 |
| 1912–1916 | 3.6 | 0.6 | 2.2 | 5.1 | 7.4 | 3.9 | 26.2 | 3.5 | 52.5 |
| 1917–1921 | 3.2 | 0.5 | 1.9 | 4.7 | 4.5 | 4.3 | 26.1 | 2.9 | 48.1 |
| 1922–1926 | 1.8 | 0.4 | 1.3 | 4.3 | 2.8 | 4.8 | 22.4 | 3.3 | 41.1 |
| 1927–1931 | 1.5 | 0.3 | 0.5 | 3.7 | 1.7 | 5.0 | 19.4 | 3.1 | 35.2 |
| 1932–1936 | 1.5 | 0.2 | 0.6 | 3.3 | 1.2 | 5.0 | 17.5 | 2.4 | 31.7 |
Two out of every three deaths of infants under one year of ago are due to causes coming within the groups “Early Infancy” and “Malformations,” and premature birth alone is responsible for approximately one-third of the total infant mortality.
In accordance with international practice, New Zealand's infant mortality rate represents the number of deaths of infants actually born alive expressed as a proportion per 1,000 live births. This method, however, takes no account of still-births. Reference has been made in an earlier paragraph to the effect on the infant mortality rate of efforts made towards the reduction of these ante-natal influences which generally cause death to ensue during the early weeks of the first year of life. The fact that still-births are also the result of such ante-natal influences should not be lost sight of, and for this and other reasons it is of interest to compute rates for infant mortality and still-births in conjunction, as in the following table. In the computation of the rates for numbers inclusive of still-births, the latter are taken into account in both births and deaths.
DEATHS OF INFANTS UNDER ONE YEAR PER 1,000 BIRTHS.
| Year. | Exclusive of Still-births. | Inclusive of Still-births. | ||||
|---|---|---|---|---|---|---|
| Males. | Females. | Total. | Males. | Females. | Total. | |
| 1927 | 42.68 | 34.58 | 38.74 | 75.42 | 60.31 | 68.08 |
| 1928 | 43.25 | 28.59 | 36.18 | 71.21 | 58.38 | 65.01 |
| 1929 | 40.16 | 27.78 | 34.10 | 74.16 | 54.41 | 64.53 |
| 1930 | 38.28 | 30.50 | 34.48 | 70.15 | 58.91 | 64.67 |
| 1931 | 38.21 | 25.67 | 32.15 | 67.34 | 53.57 | 60.80 |
| 1932 | 33.22 | 29.10 | 31.22 | 64.58 | 53.89 | 59.42 |
| 1933 | 36.64 | 26.44 | 31.64 | 67.93 | 50.74 | 59.55 |
| 1934 | 36.32 | 27.62 | 32.11 | 65.14 | 51.79 | 58.70 |
| 1935 | 36.05 | 28.24 | 32.26 | 65.86 | 56.19 | 61.17 |
| 1936 | 32.92 | 28.95 | 30.96 | 64.28 | 52.80 | 58.70 |
The still-birth rate in New Zealand has shown a falling tendency in recent years, and this, combined with the falling infant-mortality rate, has resulted in a steady improvement in the rate for all infant deaths, including still-births. In 1936 both infant-mortality and still-birth rates decreased, so that the total rate also records an appreciable decrease. Whereas, however, the rate computed on the usual method indicates a decrease of 20 per cent. during the period covered by the table, the inclusion of still-births reduces the improvement to 14 per cent.
Since 1908, the classification of causes of death in New Zealand has been on the basis of the international classification initiated by Dr. Jacques Bertillon and used by the principal European and American countries and the Commonwealth of Australia.
A comparison of the causes of deaths in 1936, grouped in accordance with the classes of the international classification, and the proportion per 10,000 of population of each sex, are given in the following table. The classification adopted is in accordance with the Fourth Revision (1929) of the International List of Causes of Death.
| Class. | Number of Deaths. | Proportion per 10,000 of Mean Population. | ||||
|---|---|---|---|---|---|---|
| Males. | Females. | Total. | Males. | Females. | Total. | |
| I. Infectious and parasitic diseases | 565 | 475 | 1,040 | 7.47 | 6.46 | 6.97 |
| II. Cancer and other tumours | 885 | 955 | 1,840 | 11.70 | 12.98 | 12.33 |
| III. Rheumatic diseases, diseases of nutrition and of endocrine glands, and other general diseases | 144 | 250 | 394 | 1.90 | 3.40 | 2.64 |
| IV. Diseases of the blood and blood-forming organs | 60 | 65 | 125 | 0.79 | 0.88 | 0.84 |
| V. Chronic poisonings and intoxications | 10 | 1 | 11 | 0.13 | 0.01 | 0.07 |
| VI. Diseases of the nervous system and of organs of special sense | 494 | 556 | 1,050 | 6.53 | 7.55 | 7.03 |
| VII. Diseases of the circulatory system | 2,324 | 1,797 | 4,121 | 30.72 | 24.43 | 27.62 |
| VIII. Diseases of the respiratory system | 624 | 419 | 1,043 | 8.25 | 5.70 | 6.99 |
| IX. Diseases of the digestive system | 342 | 277 | 619 | 4.52 | 3.77 | 4.15 |
| X. Diseases of the genito-urinary system | 473 | 336 | 809 | 6.25 | 4.55 | 5.42 |
| XI. Pregnancy, labour, and the puerperal state | 92 | 92 | 1.25 | 0.62 | ||
| XII. Diseases of the skin and cellular tissue | 16 | 13 | 29 | 0.21 | 0.18 | 0.19 |
| XIII. Diseases of the bones and of organs of locomotion | 17 | 8 | 25 | 0.23 | 0.11 | 0.17 |
| XIV. Congenital malformations | 90 | 81 | 171 | 1.19 | 1.10 | 1.15 |
| XV. Early infancy | 244 | 189 | 433 | 3.22 | 2.57 | 2.90 |
| XVI. Senility | 200 | 181 | 381 | 2.64 | 2.46 | 2.55 |
| XVII. Violence or accident | 654 | 210 | 864 | 8.64 | 2.86 | 5.79 |
| XVIII. Causes not determined | 8 | 1 | 9 | 0.01 | 0.06 | |
| Totals | 7,150 | 5,906 | 113,056 | 94.50 | 80.27 | 87.49 |
Class VII, diseases of the circulatory system, is the most important as regards numerical strength, for included in it are diseases of the heart which easily rank first among individual causes of death in New Zealand. Next in order comes Class II (cancer and other tumours).
The next table shows the numbers of deaths and the death-rates per 10,000 of mean population from certain principal causes, following the abridged international list of causes of death.
(a) Numbers.
| Causes of Death. | 1927. | 1928. | 1929. | 1930. | 1931. | 1932. | 1933. | 1934. | 1935. | 1936. |
|---|---|---|---|---|---|---|---|---|---|---|
| Typhoid and paratyphoid fever | 11 | 16 | 22 | 7 | 10 | 11 | 6 | 1 | 10 | 8 |
| Measles | 29 | 12 | 1 | 2 | 17 | 46 | 1 | 3 | ||
| Scarlet fever | 16 | 55 | 27 | 16 | 11 | 6 | 4 | 8 | 8 | 8 |
| Whooping-cough | 41 | 26 | 17 | 33 | 36 | 44 | 18 | 40 | 42 | 47 |
| Diphtheria | 58 | 72 | 92 | 58 | 55 | 40 | 27 | 26 | 33 | 20 |
| Influenza | 131 | 242 | 297 | 131 | 221 | 67 | 103 | 186 | 110 | 140 |
| Tuberculosis of the respiratory system | 533 | 569 | 524 | 529 | 501 | 488 | 476 | 491 | 471 | 540 |
| Other forms of tuberculosis | 135 | 130 | 118 | 120 | 116 | 127 | 135 | 130 | 105 | 140 |
| Syphilis | 26 | 37 | 37 | 43 | 34 | 35 | 48 | 47 | 44 | 45 |
| Malaria | 2 | 2 | 1 | 1 | 1 | 2 | ||||
| Other infectious and parasitic diseases | 99 | 95 | 122 | 104 | 90 | 115 | 78 | 102 | 57 | 89 |
| Cancer and other malignant tumours | 1,324 | 1,374 | 1,467 | 1,452 | 1,493 | 1,472 | 1,624 | 1,699 | 1,656 | 1,762 |
| Tumours, non-malignant | 79 | 77 | 78 | 72 | 95 | 89 | 90 | 98 | 86 | 78 |
| Chronic rheumatism and gout | 24 | 21 | 25 | 28 | 13 | 33 | 23 | 25 | 23 | 18 |
| Diabetes mellitus | 188 | 167 | 201 | 223 | 227 | 229 | 229 | 250 | 226 | 238 |
| Alcoholism | 15 | 16 | 18 | 11 | 12 | 10 | 9 | 9 | 5 | 7 |
| Other general diseases and chronic poisonings | 276 | 283 | 277 | 227 | 242 | 242 | 240 | 261 | 251 | 267 |
| Progressive locomotor ataxia and general paralysis of the insane | 52 | 60 | 55 | 53 | 44 | 36 | 41 | 41 | 38 | 49 |
| Cerebral hæmorrhage, embolism, and thrombosis | 664 | 643 | 634 | 659 | 634 | 611 | 677 | 729 | 721 | 760 |
| Other diseases of the nervous system and organs of special sense | 380 | 288 | 299 | 280 | 246 | 238 | 237 | 256 | 284 | 241 |
| Diseases of the heart | 2,150 | 2,315 | 2,533 | 2,897 | 2,817 | 2,935 | 3,098 | 3,348 | 3,459 | 3,646 |
| Other diseases of the circulatory system | 325 | 440 | 476 | 464 | 435 | 469 | 440 | 403 | 480 | 475 |
| Bronchitis | 303 | 228 | 314 | 268 | 203 | 207 | 177 | 217 | 199 | 202 |
| Pneumonia | 520 | 652 | 715 | 647 | 506 | 504 | 422 | 473 | 481 | 642 |
| Other diseases of the respiratory system | 257 | 215 | 186 | 210 | 192 | 170 | 190 | 200 | 183 | 199 |
| Diarrhoea and enteritis | 91 | 110 | 82 | 77 | 74 | 68 | 60 | 58 | 81 | 60 |
| Appendicitis | 92 | 107 | 100 | 99 | 105 | 101 | 108 | 116 | 107 | 119 |
| Diseases of the liver and biliary passages | 152 | 130 | 96 | 123 | 106 | 118 | 106 | 120 | 124 | 124 |
| Other diseases of the digestive system | 305 | 298 | 343 | 298 | 294 | 282 | 283 | 303 | 299 | 316 |
| Nephritis | 409 | 455 | 537 | 567 | 579 | 580 | 561 | 560 | 528 | 591 |
| Other diseases of the genitourinary system | 235 | 204 | 195 | 191 | 182 | 193 | 212 | 196 | 211 | 218 |
| Puerperal septicæmia | 70 | 56 | 49 | 57 | 47 | 39 | 40 | 59 | 31 | 23 |
| Other diseases of the puerperal state | 67 | 78 | 80 | 79 | 80 | 62 | 68 | 59 | 70 | 69 |
| Diseases of the only and cellular tissue, and of the bones and organs of locomotion | 94 | 78 | 108 | 69 | 70 | 56 | 65 | 57 | 60 | 54 |
| Congenital debility, malformations, premature birth, and other diseases of early infancy | 747 | 712 | 677 | 682 | 623 | 595 | 601 | 589 | 571 | 604 |
| Senility | 806 | 544 | 518 | 418 | 426 | 439 | 337 | 456 | 354 | 381 |
| Suicide | 199 | 202 | 221 | 193 | 226 | 240 | 200 | 181 | 149 | 149 |
| Homicide | 22 | 10 | 9 | 11 | 13 | 25 | 14 | 20 | 8 | 17 |
| Accidental deaths | 656 | 744 | 725 | 773 | 926 | 663 | 609 | 642 | 622 | 698 |
| Cause of death not specified or ill-defined | 32 | 48 | 39 | 26 | 62 | 44 | 27 | 24 | 27 | 9 |
| Totals | 11,613 | 11,811 | 12,314 | 12,199 | 12,047 | 11,683 | 11,701 | 12,527 | 12,217 | 13,056 |
(b) Rates per 10,000 of Mean Population.
| Causes of Death. | 1927. | 1928. | 1929. | 1930. | 1931. | 1932. | 1933. | 1934. | 1935. | 1936. |
|---|---|---|---|---|---|---|---|---|---|---|
| Typhoid and paratyphoid fever | 0.08 | 0.12 | 0.16 | 0.05 | 0.07 | 0.08 | 0.04 | 0.01 | 0.07 | 0.05 |
| Measles | 0.21 | 0.09 | 0.01 | 001 | 0.12 | 0.31 | 0.01 | 0.02 | ||
| Scarlet fever | 0.12 | 0.40 | 0.19 | 0.11 | 0.08 | 0.04 | 0.03 | 0.05 | 0.05 | 0.05 |
| Whooping-cough | 0.30 | 0.19 | 0.12 | 0.23 | 0.25 | 0.30 | 0.12 | 0.27 | 0.28 | 0.32 |
| Diphtheria | 0.42 | 0.52 | 0.65 | 0.41 | 0.38 | 0.28 | 0.18 | 0.18 | 0.22 | 0.13 |
| Influenza | 0.95 | 1.74 | 2.11 | 0.92 | 1.53 | 0.46 | 0.70 | 1.26 | 0.74 | 0.94 |
| Tuberculosis of the respiratory system | 3.88 | 4.09 | 3.73 | 3.72 | 3.47 | 3.36 | 3.25 | 3.33 | 3.18 | 3.62 |
| Other forms of tuberculosis | 0.98 | 0.94 | 0.84 | 0.84 | 0.80 | 0.87 | 0.92 | 0.88 | 0.71 | 0.94 |
| Syphilis | 0.19 | 0.27 | 0.26 | 0.30 | 0.24 | 0.24 | 0.33 | 0.32 | 0.30 | 0.30 |
| Malaria | 0.01 | 0.01 | 0.01 | 0.01 | 0.01 | 0.01 | ||||
| Other infectious and parasitic diseases | 0.72 | 0.68 | 0.87 | 0.73 | 0.62 | 0.79 | 0.53 | 0.69 | 0.38 | 6.60 |
| Cancer and other malignant tumours | 9.64 | 9.89 | 10.44 | 10.20 | 10.35 | 10.13 | 11.10 | 11.53 | 11.18 | 11.81 |
| Tumours, non-malignant | 0.58 | 0.55 | 0.55 | 0.51 | 0.66 | 0.61 | 0.61 | 0.67 | 0.58 | 0.52 |
| Chronic rheumatism and gout | 0.17 | 0.15 | 0.18 | 0.20 | 0.09 | 0.23 | 0.16 | 0.17 | 0.16 | 0.12 |
| Diabetes mellitus | 1.37 | 1.20 | 1.43 | 1.57 | 1.57 | 1.58 | 1.56 | 1.70 | 1.53 | 1.60 |
| Alcoholism | 0.11 | 0.12 | 0.13 | 0.08 | 0.08 | 0.07 | 0.06 | 0.06 | 0.03 | 0.05 |
| Other general diseases and chronic poisonings | 2.01 | 2.04 | 1.97 | 1.60 | 1.68 | 1.67 | 1.64 | 1.77 | 1.69 | 1.79 |
| Progressive locomotor ataxia and general paralysis of the insane | 0.38 | 0.43 | 0.39 | 0.37 | 0.31 | 0.25 | 0.28 | 0.28 | 0.26 | 0.33 |
| Cerebral hæmorrhage, embolism, and thrombosis | 4.83 | 4.63 | 4.51 | 4.63 | 4.39 | 4.20 | 4.63 | 4.95 | 4.87 | 5.09 |
| Other diseases of the nervous system and organs of special sense | 2.77 | 2.07 | 2.13 | 1.97 | 1.71 | 1.64 | 1.62 | 1.74 | 1.92 | 1.62 |
| Diseases of the heart | 15.65 | 16.66 | 18.02 | 20.36 | 19.53 | 20.19 | 21.17 | 22.72 | 23.35 | 24.43 |
| Other diseases of the circulatory system | 2.37 | 3.17 | 3.39 | 3.26 | 3.02 | 3.23 | 3.01 | 2.74 | 3.24 | 3.18 |
| Bronchitis | 2.20 | 1.64 | 2.23 | 1.88 | 1.41 | 1.42 | 1.21 | 1.47 | 1.34 | 1.35 |
| Pneumonia | 3.78 | 4.69 | 5.09 | 4.55 | 3.51 | 3.47 | 2.88 | 3.21 | 3.25 | 4.30 |
| Other diseases of the respiratory system | 1.87 | 1.55 | 1.32 | 1.48 | 1.33 | 1.17 | 1.30 | 1.36 | 1.24 | 1.33 |
| Diarrhoea and enteritis | 0.66 | 0.79 | 0.58 | 0.54 | 0.51 | 0.47 | 0.41 | 0.39 | 0.55 | 0.40 |
| Appendicitis | 0.67 | 0.77 | 0.71 | 0.70 | 0.73 | 0.69 | 0.74 | 0.79 | 0.72 | 0.80 |
| Diseases of the liver and biliary passages | 1.11 | 0.94 | 0.68 | 0.86 | 0.73 | 0.81 | 0.72 | 0.81 | 0.84 | 0.83 |
| Other diseases of the digestive system | 2.22 | 2.14 | 2.44 | 2.09 | 2.04 | 1.94 | 1.93 | 2.06 | 2.02 | 2.12 |
| Nephritis | 2.98 | 3.27 | 3.82 | 3.98 | 4.01 | 3.99 | 3.83 | 3.80 | 3.56 | 3.96 |
| Other diseases of the genitourinary system | 1.71 | 1.47 | 1.39 | 1.34 | 1.26 | 1.33 | 1.45 | 1.33 | 1.42 | 1.46 |
| Puerperal septicemia | 0.51 | 0.40 | 0.35 | 0.40 | 0.33 | 0.27 | 0.27 | 0.40 | 0.21 | 0.16 |
| Other diseases of the puerperal state | 0.49 | 0.56 | 0.57 | 0.56 | 0.55 | 0.43 | 0.46 | 0.40 | 0.47 | 0.46 |
| Diseases of the skin and cellular tissue, and of the bones and organs of locomotion | 0.68 | 0.56 | 0.77 | 0.48 | 0.48 | 0.38 | 0.44 | 0.39 | 0.40 | 0.36 |
| Congenital debility, malformations, premature birth, and other diseases of early infancy | 5.44 | 5.12 | 4.82 | 4.79 | 4.32 | 4.09 | 4.11 | 4.00 | 3.85 | 4.05 |
| Senility | 5.87 | 3.91 | 3.69 | 2.94 | 2.95 | 3.02 | 2.31 | 3.10 | 2.39 | 2.55 |
| Suicide | 1.45 | 1.45 | 1.57 | 1.36 | 1.57 | 1.65 | 1.37 | 1.23 | 1.00 | 1.00 |
| Homicide | 0.16 | 0.07 | 0.06 | 0.08 | 0.09 | 0.17 | 0.10 | 0.13 | 0.05 | 0.11 |
| Accidental deaths | 4.77 | 5.35 | 5.16 | 5.43 | 6.42 | 4.56 | 4.16 | 4.36 | 4.20 | 4.68 |
| Cause of death not specified or ill-defined | 0.23 | 0.35 | 0.28 | 0.18 | 0.43 | 0.30 | 0.18 | 0.16 | 0.18 | 0.06 |
| Totals | 84.53 | 84.99 | 87.61 | 85.72 | 83.51 | 80.38 | 79.94 | 85.03 | 82.45 | 87.49 |
Detailed information concerning the various causes of death is given in the “Annual Report on Vital Statistics.” The statistics for acute poliomyelitis (infantile paralysis), tuberculosis, cancer, puerperal causes, and violence—causes which are of special interest and significance—are discussed in the following pages.
Acute poliomyelitis, or infantile paralysis as it is colloquially termed, periodically appears in epidemic form in this country, the most recent invasion being in the summer season of 1936–37. The incidence of the disease first became abnormal in late November, 1936, and by the end of December it was evident that more than ordinary precautions would be necessary to prevent a major epidemic. The actual extent of the epidemic as measured by the number of notifications received and cases treated in hospitals is discussed in the following Subsection D.—Morbidity. Attention in this subsection is confined to the mortality aspect.
The first fatal case in 1936 occurred on 3rd November, and this was followed by five deaths towards the end of December. Five deaths occurred in January, 1937, and only two in February, but in each of the next three months seven cases resulted fatally. It would appear that the outbreak was on the decline in June as only four deaths were registered during that month, while the number of notifications also declined.
The figures of fatal cases of acute poliomyelitis occurring during the epidemic are too few to permit reliable conclusions to be drawn therefrom, but an impression of the course of the epidemic over the country during the period 1st November, 1936, to 30th June, 1937, may be gained from the following table:—
| Month. | Auckland. | Hawke's Bay. | Taranaki. | Wellington. | Marlborough. | Nelson | Westland. | Canterbury. | Otago. | Southland. | Totals. |
|---|---|---|---|---|---|---|---|---|---|---|---|
| 1936. | |||||||||||
| November | 1 | 1 | |||||||||
| December | 5 | 5 | |||||||||
| 1937. | |||||||||||
| January | 4 | 1 | 5 | ||||||||
| February | 2 | 2 | |||||||||
| March | 1 | 1 | 1 | 3 | 1 | 7 | |||||
| April | 1 | 1 | 1 | 1 | 2 | 1 | 7 | ||||
| May | 2 | 1 | 4 | 7 | |||||||
| June | 2 | 1 | 1 | 4 | |||||||
| Totals | 5 | 2 | 2 | 1 | 1 | 3 | 10 | 10 | 4 | 38 |
As far as mortality from the disease is concerned the South Island suffered most, especially the Canterbury and Otago Provincial Districts, the latter probably being the originating source of the epidemic.
The earliest record of deaths classified as due to infantile paralysis is for the year 1908. Prior to that year deaths from this cause were evidently included under the heading of some disease of the spinal cord or central nervous system, probably cerebro-spinal meningitis. From 1908 to June, 1937, no fewer than 521 deaths have been registered in New Zealand as due to infantile paralysis or acute poliomyelitis. The details of registration for each year are as follows:—
| Year. | Number of Deaths. | ||
|---|---|---|---|
| Males. | Females. | Total. | |
| 1908 | 1 | 2 | 3 |
| 1909 | 1 | 2 | 3 |
| 1910 | 3 | 1 | 4 |
| 1911 | 1 | 1 | |
| 1912 | 2 | 2 | |
| 1913 | 2 | 2 | |
| 1914 | 16 | 9 | 25 |
| 1915 | 2 | 2 | 4 |
| 1916 | 76 | 47 | 123 |
| 1917 | 6 | 4 | 10 |
| 1918 | 2 | 2 | 4 |
| 1919 | 1 | 1 | |
| 1920 | 1 | 1 | 2 |
| 1921 | 8 | 3 | 11 |
| 1922 | 6 | 3 | 9 |
| 1923 | 2 | 2 | |
| 1924 | 8 | 14 | 22 |
| 1925 | 91 | 82 | 173 |
| 1926 | 7 | 4 | 11 |
| 1927 | 0 | 1 | 7 |
| 1928 | 10 | 7 | 17 |
| 1929 | 5 | 2 | 7 |
| 1930 | 2 | 3 | 5 |
| 1931 | 4 | 1 | 5 |
| 1932 | 12 | 7 | 19 |
| 1933 | 6 | 2 | 8 |
| 1934 | 2 | 2 | |
| 1935 | 1 | 1 | |
| 1936 | 3 | 2 | 5 |
| 1937 (six months) | 24 | 9 | 33 |
| Totals | 304 | 217 | 521 |
A feature of the above record is the predominance of male deaths. Major epidemics occurred in 1916, 1925, and to a lesser extent in 1937. Other years when the disease took an abnormally heavy toll of life were 1914, 1924, 1928, and 1932. It must be remembered that “infantile paralysis” is a summer disease, and consequently a calendar year frequently breaks the full period of an epidemic as measured by the annual totals of deaths registered.
The respective death-rates per 10,000 of population for each of the major and minor epidemic years are as follows:—
| Year. | Males. | Females. | Total. |
|---|---|---|---|
| 1914 | 0.28 | 0.17 | 0.23 |
| 1916 | 1.38 | 0.86 | 1.12 |
| 1924 | 0.12 | 0.22 | 0.17 |
| 1925 | 1.34 | 1.26 | 1.30 |
| 1928 | 0.14 | 0.10 | 0.12 |
| 1932 | 0.16 | 0.10 | 0.13 |
| 1937 (six months) | 0.32 | 0.12 | 0.22 |
With the exception of 1924, there has been a higher death-rate for males than for females in each year.
The title “infantile paralysis” has been attached to the malady on account of the fact that young children are usually the principal sufferers. However, the disease is by no means confined to the very young, and a feature of the 1936–37 epidemic has been the comparatively large proportion of older children and adults that have been attacked.
In the three major epidemics that have visited the Dominion the proportions which deaths of persons 15 years of age, or over, represent among total deaths from the disease, have been—for 1916, 37.4 per cent.; for 1925, 15.6 per cent.; and for 1936–37, 63.6 per cent.
Some impression of the fatal incidence of acute poliomyelitis throughout the world in recent years may be gathered from the following international table of death-rates per 100,000 of population for each of the ten years 1925–34, 1935 figures being added for certain countries for which preliminary figures are available.
ACUTE POLIOMYELITIS.—DEATH-RATE PER 100,000 of POPULATION.
| Countries. | 1925. | 1926. | 1927. | 1928. | 1929. | 1930. | 1931. | 1932. | 1933. | 1934. | 1935.* |
|---|---|---|---|---|---|---|---|---|---|---|---|
* Preliminary figures. | |||||||||||
| Africa— | |||||||||||
| Union of South Africa | 0.5 | 0.5 | 0.9 | 0.5 | 0.6 | 0.7 | 0.9 | 0.4 | 1.1 | 1.9 | |
| America— | |||||||||||
| Canada | 1.0 | 1.0 | 2.0 | 1.9 | 1.5 | 2.1 | 2.2 | 1.6 | 0.7 | 0.8 | 0.6 |
| Chile | 0.0 | 0.0 | 0.0 | 0.0 | 0.3 | 0.8 | 1.3 | 0.2 | 0.1 | 0.0 | 0.3 |
| United States | 1.5 | 0.8 | 1.9 | 1.2 | 0.7 | 1.2 | 1.8 | 0.7 | 0.6 | 0.7 | |
| Uruguay | 0.1 | 0.0 | 0.2 | 0.3 | 0.1 | 0.1 | 0.1 | 0.2 | 0.2 | 0.1 | |
| Asia— | |||||||||||
| Japan | 0.7 | 0.6 | 0.6 | 0.7 | 0.7 | 0.7 | 0.6 | 0.6 | 0.7 | 0.7 | |
| Australasia— | |||||||||||
| Australia | 1.0 | 0.6 | 0.4 | 0.8 | 1.0 | 0.6 | 0.8 | 1.5 | 0.3 | 0.5 | 0.5 |
| New Zealand | 13.0 | 0.8 | 0.5 | 1.2 | 0.5 | 0.4 | 0.3 | 1.3 | 0.5 | 0.1 | 0.1 |
| Europe— | |||||||||||
| Austria | 0.2 | 1.0 | 0.5 | 0.4 | 0.3 | 0.2 | |||||
| Belgium | 0.2 | 0.7 | 0.4 | 0.3 | |||||||
| Czechoslovakia | 0.1 | 0.2 | 0.2 | 0.1 | 0.1 | 0.1 | 0.2 | 0.2 | 0.1 | 0.1 | 0.1 |
| Denmark | 0.7 | 0.3 | 0.1 | 0.3 | 0.3 | 0.3 | 0.1 | 0.4 | 1.1 | 2.9 | 0.5 |
| England and Wales | 0.4 | 0.6 | 0.5 | 0.4 | 0.4 | 0.4 | 0.2 | 0.4 | 0.5 | 0.3 | 0.4 |
| Estonia | 0.3 | 0.2 | 0.2 | 0.0 | 0.0 | 0.0 | |||||
| Finland | 0.1 | 0.0 | 0.1 | 1.0 | 0.5 | 0.6 | 0.3 | 1.0 | |||
| Germany | 0.1 | 0.3 | 0.6 | 0.2 | 0.3 | 0.2 | 0.3 | 0.6 | 0.4 | ||
| Greece | 0.1 | 0.1 | 0.0 | 0.0 | 0.5 | 0.4 | 0.7 | ||||
| Hungary | 0.2 | 0.1 | 1.7 | 0.8 | 0.2 | 0.2 | |||||
| Iceland | 0.0 | 2.0 | 2.9 | 5.8 | 0.9 | 0.9 | 0.0 | 13.0 | 0.9 | 0.9 | |
| Irish Free State | 0.4 | 0.4 | 0.4 | 0.1 | 0.2 | 0.3 | 0.3 | 0.3 | 0.2 | 0.1 | 0.2 |
| Italy | 1.5 | 1.3 | 1.1 | 1.2 | 1.3 | 0.9 | 1.0 | 0.9 | 0.6 | 0.7 | 0.7 |
| Netherlands | 0.1 | 0.2 | 0.2 | 0.2 | 1.0 | 0.7 | 0.2 | 0.3 | 0.3 | 0.2 | 0.1 |
| Northern Ireland | 0.5 | 0.1 | 0.2 | 0.4 | 0.2 | 0.2 | |||||
| Norway | 2.8 | 1.2 | 0.9 | 0.7 | 1.6 | 0.2 | 0.5 | 0.7 | 1.2 | 2.1 | |
| Scotland | 0.4 | 0.5 | 0.5 | 0.7 | 0.4 | 0.4 | 0.3 | 0.4 | 0.5 | 0.1 | 0.2 |
| Sweden | 1.8 | 1.1 | 0.9 | 0.8 | 1.9 | 0.8 | 0.4 | 1.9 | 1.4 | ||
| Switzerland | 0.7 | 0.4 | 0.7 | 0.6 | 0.9 | 0.5 | 1.4 | 0.7 | 0.7 | 0.4 | 1.1 |
New Zealand's experience of acute poliomyelitis appears to be of a more sporadic nature than that of many other countries, especially Canada, United States of America, and the European countries of Italy, Norway, and Sweden, all of which maintain a uniform death-rate on a relatively high level. During the period covered by the table the only other country to suffer such a severe outbreak of the disease as was experienced by New Zealand in 1925 was Iceland in 1932.
The death-rate from tuberculosis of the respiratory system has been decreasing gradually during recent years, with occasional upward fluctuations. The rate for 1936, however, of 3.62 per 10,000 of population represents an abnormal reversal of trend difficult to account for. It is possible, of course, that some of the unusual increase represents a carry-over from the previous year, when the lowest rate on record was established.
A graph on the succeeding page illustrates the decline in the tuberculosis death-rate since 1875.
Of the 540 persons who died from tuberculosis of the respiratory system in 1936, 401, or 74 per cent., were known to have been born in the Dominion. In two cases the country of birth was not known or not stated, and in the remaining 137 cases the deceased person had been born outside New Zealand. Two of the last-mentioned had been in New Zealand less than a year and one less than five years.
In addition to the 540 deaths from tuberculosis of the respiratory system during 1936, there were 140 deaths from other forms of tuberculosis, including—
| Tuberculosis of meninges and central nervous system | 51 |
| Tuberculosis of intestines and peritoneum | 21 |
| Tuberculosis of vertebral column | 10 |
| Tuberculosis of genito-urinary system | 18 |
| Disseminated tuberculosis | 31 |
Tuberculosis claims its victims at a comparatively early age. Of these dying from this cause in 1936, persons under the age of 20 years formed 11 per cent., and these under 45 years 63 per cent.
AGES OF PERSONS WHO DIED FROM TUBERCULAR DISEASES, 1936.
| Ages, in Years. | Males. | Females. | Total. |
|---|---|---|---|
| Under 5 | 10 | 9 | 19 |
| 5 and under 10 | 7 | 9 | 16 |
| 10 and under 15 | 5 | 5 | 10 |
| 15 and under 20 | 16 | 15 | 31 |
| 20 and under 25 | 23 | 59 | 82 |
| 25 and under 30 | 34 | 44 | 78 |
| 30 and under 35 | 31 | 38 | 69 |
| 35 and under 40 | 37 | 32 | 69 |
| 40 and under 45 | 28 | 29 | 57 |
| 45 and under 50 | 35 | 15 | 50 |
| 50 and under 55 | 38 | 11 | 49 |
| 55 and under 60 | 40 | 20 | 60 |
| 60 and under 65 | 29 | 6 | 35 |
| 65 and under 70 | 17 | 6 | 23 |
| 70 and under 75 | 13 | 8 | 21 |
| 75 and under 80 | 4 | 5 | 9 |
| 80 and over | 2 | 2 | |
| Totals | 367 | 313 | 680 |
The average annual death-rate from tubercular diseases in certain of the principal countries of the world during the latest available period of five years is next shown.
| Country. | Period. | Death-rates (per 10,000). |
|---|---|---|
* Registration area. | ||
| New Zealand | 1932–36 | 4.2 |
| Union of South Africa | 1930–34 | 4.3 |
| Australia | 1931–35 | 4.5 |
| Netherlands | 1932–36 | 5.6 |
| United States* | 1930–34 | 6.3 |
| Ceylon | 1930–34 | 6.4 |
| Canada | 1931–35 | 6.5 |
| Denmark | 1929–33 | 6.8 |
| Scotland | 1931–35 | 8.0 |
| England and Wales | 1931–35 | 8.1 |
| Belgium | 1925–29 | 9.7 |
| Germany | 1924–28 | 10.0 |
| Italy | 1930–34 | 10.1 |
| Switzerland | 1931–35 | 10.8 |
| Northern Ireland | 1932–36 | 10.9 |
| Irish Free State | 1931–35 | 12.3 |
| Norway | 1930–34 | 12.3 |
| Sweden | 1928–32 | 12.5 |
| Spain | 1926–30 | 13.9 |
| Uruguay | 1925–29 | 14.3 |
| Lithuania | 1925–29 | 14.5 |
| France | 1929–33 | 15.0 |
| Czechoslovakia | 1929–33 | 16.0 |
| Austria | 1925–29 | 16.4 |
| Hungary | 1931–35 | 17.6 |
| Japan | 1931–35 | 18.7 |
| Estonia | 1925–29 | 23.2 |
| Finland | 1924–28 | 24.4 |
| Chile | 1928–32 | 24.9 |
Cancer is annually responsible for more deaths in New Zealand than can be assigned to any cause other than diseases of the heart. The increasing prevalence of cancer is causing no little concern in the Dominion, as indeed it is throughout the civilized world.
The following diagram illustrates, on the one hand, the increase in the cancer death-rate, and, on the other, the decrease in the rate of deaths from tuberculosis:—
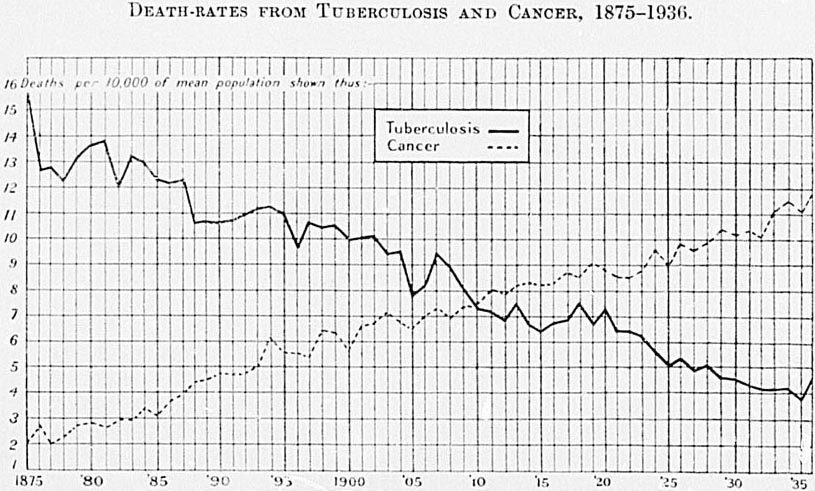
In 1930 there were 1,702 deaths from cancer in the Dominion, a proportion of 11.81 per 10,000 of population. The standardized cancer death-rate for 1936 shows an increase of 0.16, while the recorded death-rate shows an increase of 0.63 per 10,000.
| Year. | Number of Deaths from Cancer. | Recorded Death-rate. | Standardized Death-rate.* |
|---|---|---|---|
* On basis of age distribution in 1911. | |||
| 1927 | 1,324 | 9.64 | 8.16 |
| 1928 | 1,374 | 9.89 | 8.18 |
| 1929 | 1,467 | 10.44 | 8.53 |
| 1930 | 1,452 | 10.20 | 8.16 |
| 1931 | 1,493 | 10.35 | 8.14 |
| 1932 | 1,472 | 10.13 | 7.77 |
| 1933 | 1,624 | 11.10 | 8.34 |
| 1934 | 1,699 | 11.53 | 8.48 |
| 1935 | 1,656 | 11.18 | 8.10 |
| 1936 | 1,762 | 11.81 | 8.26 |
The following table shows the proportion of deaths from cancer to the 10,000 of mean population in some of the principal countries of the world. The rates are an annual average of the latest available period of five years.
CANCER DEATH-RATES IN CERTAIN COUNTRIES.
| Country. | Period. | Death-rate per 10,000 of Population. |
|---|---|---|
* Registration area. | ||
| Ceylon | 1930–34 | 0.9 |
| Greece | 1923–27 | 2.4 |
| Lithuania | 1925–29 | 3.0 |
| Chile | 1928–32 | 5.9 |
| Spain | 1926–30 | 6.9 |
| Japan | 1931–35 | 6.9 |
| Italy | 1930–34 | 7.5 |
| Uruguay | 1925–29 | 7.7 |
| Estonia | 1925–29 | 7.8 |
| Belgium | 1925–29 | 8.8 |
| Union of South Africa | 1930–34 | 8.9 |
| France | 1929–33 | 9.6 |
| Canada | 1931–35 | 9.8 |
| United States* | 1930–34 | 10.3 |
| Australia | 1931–35 | 10.5 |
| Hungary | 1931–35 | 10.7 |
| New Zealand | 1932–36 | 11.1 |
| Irish Free State | 1931–35 | 11.4 |
| Czechoslovakia | 1929–33 | 11.6 |
| Germany | 1924–28 | 11.6 |
| Sweden | 1926–30 | 11.9 |
| Northern Ireland | 1932–36 | 12.5 |
| Netherlands | 1932–36 | 12.6 |
| Norway | 1930–34 | 12.9 |
| Denmark | 1929–33 | 14.4 |
| Austria | 1925–29 | 14.8 |
| Switzerland | 1931–35 | 15.1 |
| Scotland | 1931–35 | 15.3 |
| England and Wales | 1931–35 | 15.5 |
The following summary shows the types of cancer returned in the death entries for the year 1936:—
| Type. | Deaths. | ||
|---|---|---|---|
| Males. | Females. | Total. | |
| Carcinoma | 720 | 798 | 1,518 |
| Adeno–carcinoma | 19 | 20 | 39 |
| Sarcoma | 24 | 22 | 46 |
| Lympho-sarcoma | 10 | 2 | 12 |
| Melanotic-sarcoma | 3 | 2 | 5 |
| Fibre-sarcoma | 1 | 6 | 7 |
| Osteo-sarcoma | 2 | 1 | 3 |
| Glio-sarcoma | 1 | 1 | |
| Epithelioma | 34 | 18 | 52 |
| Hypernephroma | 7 | 3 | 10 |
| Scirrhus cancer | 2 | 10 | 12 |
| Myelomata | 1 | 1 | |
| Rodene ulcer | 11 | 6 | 17 |
| Endothelioma | 1 | 2 | 3 |
| Cancer | 7 | 6 | 13 |
| Malignant ulcer | 1 | 1 | |
| Malignant tumour | 8 | 8 | 16 |
| Malignant papilloma | 1 | 1 | |
| Malignant disease | 3 | 1 | 4 |
| Malignant growth | 1 | 1 | |
| Totals | 855 | 907 | 1,762 |
The parts of the body most commonly attacked in New Zealand are the stomach and liver. Among females the genital and mammary organs rank high as the site of the disease. Full details of location are published in the “Annual Report on Vital Statistics.” A summary for 1936 gives results under:—
| Seat of Disease. | Males. | Females. | Total. |
|---|---|---|---|
| Buccal cavity and pharynx | 66 | 21 | 87 |
| Digestive tract and peritoneum | 505 | 412 | 917 |
| Respiratory organs | 62 | 25 | 87 |
| Uterus | 103 | 103 | |
| Other female genital organs | 57 | 57 | |
| Breast | 197 | 197 | |
| Urinary organs and male genital organs | 144 | 25 | 169 |
| Skin | 29 | 16 | 45 |
| Other or unspecified organs | 49 | 51 | 100 |
| Totals | 855 | 907 | 1,762 |
Ninety-three per cent. of the deaths from cancer during 1930 were at ages 45 years and upwards, and 51 per cent. at ages 65 years and upwards. Females predominate generally at the younger and males at the older ages.
There has been very little movement in the standardized cancer death-rate for persons under 65 years of age. For persons over 65, however, the standardized death-rate increased fairly rapidly in the earlier years of the Dominion's history, and reached its maximum in the quinquennium 1926–30, at about the time when the age-constitution of the population of New Zealand for the first time approximated that of the older countries of Europe. The figures suggest that cancer, while undoubtedly increasing in numerical incidence, is not doing so out of proportion to the population exposed to the cancer risk. Improvement in diagnosis of cancer has also been responsible for some of the recorded numerical increase in cancer, but this factor has probably become more stabilized in recent years.
AGES OF PERSONS WHO DIED FROM CANCER, 1936.
| Ages, in Years. | Males. | Females. | Total. |
|---|---|---|---|
| Under 5 | 3 | 2 | 5 |
| 5 and under 10 | 1 | 3 | 4 |
| 10 and under 15 | 2 | 2 | |
| 15 and under 20 | 4 | 4 | |
| 20 and under 25 | 5 | 3 | 8 |
| 25 and under 30 | 1 | 1 | 2 |
| 30 and under 35 | 9 | 12 | 21 |
| 35 and under 40 | 14 | 15 | 29 |
| 40 and under 45 | 21 | 35 | 56 |
| 45 and under 50 | 40 | 82 | 122 |
| 50 and under 55 | 61 | 107 | 168 |
| 55 and under 60 | 98 | 124 | 222 |
| 60 and under 65 | 119 | 114 | 233 |
| 65 and under 70 | 142 | 132 | 274 |
| 70 and under 75 | 131 | 118 | 249 |
| 75 and under 80 | 119 | 96 | 215 |
| 80 and over | 89 | 69 | 158 |
| Totals | 855 | 907 | 1,762 |
In point of numbers of deaths, puerperal accidents and diseases do not rank high among causes of death. Nevertheless, deaths from puerperal causes are of special importance and significance.
During the 44-year period from 1872 to 1915 the death-rate from puerperal causes exceeded 5 per 1,000 live births on only 14 occasions, but after 1915 did not fall below this figure until 1925. The rate for 1920 (when the proportion of births was high) was the third highest on record, having been exceeded only in 1884 and 1885, but the highest rate since 1920 has been 5.14 per 1,000 recorded in 1922. The rate for each of the last twenty years is as follows:—
| Year. | Proportion per 1,000 Live Births. |
|---|---|
| 1917 | 5.98 |
| 1918 | 5.18 |
| 1919 | 5.06 |
| 1920 | 6.48 |
| 1921 | 5.08 |
| 1922 | 5.14 |
| 1923 | 5.11 |
| 1924 | 5.00 |
| 1925 | 4.65 |
| 1926 | 4.25 |
| 1927 | 4.91 |
| 1928 | 4.93 |
| 1929 | 4.82 |
| 1930 | 5.08 |
| 1931 | 4.77 |
| 1932 | 4.06 |
| 1933 | 4.44 |
| 1934 | 4.85 |
| 1935 | 4.21 |
| 1936 | 3.70 |
Commencing with 1916, special inquiry has been made in all cases where a woman of child-bearing age has been returned as having died of such causes as septicæmia, peritonitis, nephritis, &c. (without qualification), with the result that in each year several of such cases are found to be puerperal, and are now so classed. During 1928 the system of investigating possible puerperal eases was still further extended, and this would tend to maintain the death-rate from these causes on the high level recorded in 1927. It is particularly gratifying to note that tin-rate for 1936 of 3.70 per 1,000 live births is the third lowest rate ever recorded in New Zealand, the lowest figures being for 1912 and 1913, when the rates were 3.64 and 3.58 respectively.
The rate of deaths from puerperal causes is frequently, though not quite accurately, referred to as “the maternal death-rate.” It should be noted, however, that the class provided for puerperal causes in the international classification covers all deaths from accidents and diseases of pregnancy and parturition, and is not limited to deaths resulting from accouchements of normal women after more or less normal pregnancies. If it were possible to exclude certain types of puerperal cases a true maternal death-rate would result—considerably lower than that shown for all puerperal accidents and diseases. Full distinction cannot, however, be made, but it may be mentioned that the 92 deaths from puerperal causes during 1936 included 23 from abortion, of which 14 became septic cases. Including these 14 deaths from septic abortion there were 23 deaths from puerperal septicæmia in 1936.
The next table shows the deaths from puerperal causes during each of the last five years, classified in the divisions into which such causes are divided in the international classification.
In view of the unenviable position New Zealand has held for some time as regards the death-rate from septic abortion, the sudden decrease in the mortality from this cause during 1930 is a welcome feature of the year's vital statistics.
| Group. | Number of Deaths. | Rate per 1,000 Live Births. | ||||||||
|---|---|---|---|---|---|---|---|---|---|---|
| 1932. | 1933. | 1934. | 1935. | 1936. | 1932. | 1933. | 1934. | 1935. | 1936. | |
| Abortion with septic conditions | 26 | 26 | 42 | 23 | 14 | 1.04 | 1.07 | 1.73 | 0.96 | 0.56 |
| Abortion without septic conditions specified | 8 | 7 | 5 | 8 | 9 | 0.32 | 0.29 | 0.20 | 0.33 | 0.36 |
| Ectopic gestation | 3 | 5 | 4 | 4 | 5 | 0.12 | 0.21 | 0.16 | 0.17 | 0.21 |
| Other accidents of pregnancy | 6 | 1 | 1 | 6 | 0.24 | 0.04 | 0.04 | 0.25 | ||
| Puerperal hæmorrhage | 8 | 9 | 9 | 9 | 19 | 0.32 | 0.37 | 0.37 | 0.38 | 0.76 |
| Puerperal septicæmia | 13 | 14 | 17 | 8 | 9 | 0.52 | 0.57 | 0.70 | 0.33 | 0.36 |
| Puerperal albuminuria and eclampsia | 17 | 20 | 15 | 21 | 18 | 0.68 | 0.82 | 0.62 | 0.88 | 0.72 |
| Other toxæmias of pregnancy | 6 | 9 | 15 | 13 | 12 | 0.24 | 0.37 | 0.62 | 0.54 | 0.48 |
| Puerperal phlegmasia alba dolens, embolus, sudden death | 6 | 6 | 6 | 3 | 1 | 0.24 | 0.25 | 0.25 | 0.12 | 0.04 |
| Other accidents of childbirth | 7 | 11 | 4 | 6 | 5 | 0.29 | 0.45 | 0.16 | 0.25 | 0.21 |
| Other conditions of the puerperal state | 1 | 0.05 | ||||||||
| Totals | 101 | 108 | 118 | 101 | 92 | 4.06 | 4.44 | 4.85 | 4.21 | 3.70 |
Puerperal septicæmia (excluding septic abortion) has in recent years declined appreciably in fatal incidence, there being only nine deaths registered in 1936 from this cause as against an average for the previous quinquennium of fourteen. Further evidence of the remarkable improvement in the incidence of puerperal sepsis (excluding septic abortion) is afforded by the fact that for the five years 1932–36 deaths from this cause comprised only 12 per cent. of the total deaths from all puerperal causes, whereas in the previous quinquennium 1927–31 puerperal sepsis was responsible for 26 per cent. of the total puerperal deaths.
Figures are now available for twenty countries of the death-rates from puerperal septicemia, septic abortion, and all puerperal causes per 1,000 live births for the five years 1931–35, and the quinquennial average rates for the period are shown in the following table.
| Country. | Death-rate per 1,000 Live Births. | |||
|---|---|---|---|---|
| Septic Abortion. | Other Puerperal Sepsis. | All Puerperal Causes. | ||
| Including Septic Abortion. | Excluding Septic Abortion. | |||
| Norway | 0.52 | 0.66 | 2.75 | 2.23 |
| Sweden | 0.77 | 0.93 | 3.37 | 2.60 |
| Japan | 0.02 | 0.67 | 2.68 | 2.67 |
| Italy | 0.19 | 0.95 | 2.87 | 2.69 |
| Netherlands | 0.32 | 0.65 | 3.11 | 2.80 |
| Estonia | 0.59 | 0.56 | 3.54 | 2.95 |
| New Zealand | 1.18 | 0.56 | 4.45 | 3.28 |
| Denmark | 0.33 | 0.97 | 3.81 | 3.48 |
| Germany (1932–33) | 1.53 | 1.01 | 5.36 | 3.68 |
| Switzerland | 0.64 | 0.87 | 4.49 | 3.85 |
| England and Wales | 0.43 | 1.33 | 4.31 | 3.87 |
| Australia | 1.36 | 0.83 | 5.45 | 4.09 |
| Irish Free State | 0.11 | 1.35 | 4.47 | 4.36 |
| Canada | 0.55 | 1.20 | 5.05 | 4.50 |
| Union of South Africa | 0.61 | 1.74 | 5.11 | 4.50 |
| Greece | 0.08 | 2.91 | 5.23 | 5.16 |
| United States of America | 0.95 | 1.37 | 6.22 | 5.26 |
| Northern Ireland | 0.19 | 1.87 | 5.53 | 5.34 |
| Scotland | 0.37 | 2.15 | 6.13 | 5.76 |
| Chile | 0.40 | 3.30 | 8.11 | 7.72 |
When deaths from septic abortion are excluded from the puerperal mortality figures, a measure of what may be termed the true maternal mortality rates of the various countries can be obtained. On this basis, for the quinquennium 1931–35, New Zealand had the seventh lowest rate of the twenty countries covered by the above table.
The stigma of a high septic abortion mortality rate lies upon New Zealand at the present time, as, in spite of enormous reductions in this rate in 1935 and 1936, the average rate for this country for the five years 1931–35 placed New Zealand third highest in the list of countries for which comparable information is available.
The figures quoted in the above table, however, cannot be taken at their face values, as wide variations in methods of assignment of deaths due to puerperal causes exist in different countries, particularly as regards the registration of deaths from abortion. The general tendency in most countries is for the statistics relating to puerperal mortality to be much lower than would be the case if these statistics were established on a basis akin to that adopted in New Zealand.
Deaths from external causes, apart from suicide, claim approximately 5 per cent. of the total deaths. Deaths from external causes in each of four years at quinquennial intervals are given in the next table.
| Causes of Death. | Number of Deaths. | Rate par 1,000,000 of Mean Population. | ||||||
|---|---|---|---|---|---|---|---|---|
| 1921. | 1926. | 1931. | 1936. | 1921. | 1926. | 1931. | 1936. | |
* The number and rate under this heading is accentuated by the inclusion of 249 deaths caused by the earthquake of 3rd February, 1931. | ||||||||
| Homicide | 15 | 14 | 13 | 17 | 12 | 10 | 9 | 11 |
| Accidental causes— | ||||||||
| Poisoning | 14 | 13 | 27 | 5 | 11 | 10 | 19 | 3 |
| Conflagration | 17 | 14 | 11 | 4 | 14 | 10 | 8 | 3 |
| Burns and scalds | 39 | 31 | 34 | 20 | 32 | 23 | 23 | 14 |
| Died under anaesthetic, asphyxia, &c. | 10 | 20 | 11 | 10 | 8 | 15 | 8 | 7 |
| Drowning | 130 | 165 | 126 | 115 | 106 | 122 | 87 | 77 |
| Firearms | 19 | 14 | 23 | 15 | 16 | 10 | 16 | 10 |
| Falls | 49 | 81 | 98 | 138 | 40 | 60 | 68 | 93 |
| In mines and quarries | 6 | 17 | 12 | 14 | 5 | 13 | 8 | 9 |
| Crushing | 173 | 293 | 515* | 308 | 142 | 217 | 357* | 206 |
| Injuries by animals | 10 | 6 | 3 | 6 | 8 | 4 | 2 | 4 |
| Fractures (causes not specified) | 41 | 24 | 16 | 2 | 34 | 18 | 11 | 1 |
| Other | 54 | 30 | 50 | 61 | 44 | 22 | 35 | 41 |
| Totals | 577 | 722 | 939 | 715 | 472 | 534 | 651 | 479 |
The number of deaths recorded from all accidental causes in 1936 was 698, corresponding to a rate of 4.68 per 10,000 of population. Although this represents, by comparison with 1921, an increase of 136 in the number of deaths, the death-rate has increased by only 0.82 per 10,000 of population. Noticeable decreases are shown for drowning, burns and scalds, and fractures (causes not specified). Part of the large increase between 1921 and 1936 in the death-rate from accidental falls is due to fuller information being obtained in a proportion of eases formerly classified under the heading of “fractures (causes not specified).”
In view of the steady rise in the number of deaths attributable to transport accidents, it is advisable to reduce the figures and rates to their respective headings. In classifying deaths under these various subheadings the rule of assignment is that in fatalities due to collisions of railway-trains and electric tram-cars with motor-vehicles the death is assigned to the railway-train or electric tram-car as being the heavier and more powerful vehicle. In the case of collisions between motor-vehicles and horse-drawn vehicles the death is assigned to the motor-vehicle.
In the following table the number and rate of deaths resulting from railway, tramway, and motor-vehicle accidents during each of the last ten years are given.
| Year. | Deaths due to Accident. | Rate per Million of Populations. | ||||
|---|---|---|---|---|---|---|
| Railway. | Tramway. | Motor-vehicle. | Railway. | Tramway. | Motor-vehicle. | |
| 1927 | 42 | 8 | 138 | 31 | 6 | 100 |
| 1928 | 44 | 10 | 176 | 32 | 7 | 127 |
| 1929 | 49 | 5 | 178 | 35 | 4 | 127 |
| 1930 | 63 | 8 | 220 | 44 | 6 | 155 |
| 1931 | 40 | 9 | 159 | 28 | 6 | 110 |
| 1932 | 27 | 9 | 159 | 19 | 6 | 109 |
| 1933 | 31 | 7 | 120 | 21 | 5 | 82 |
| 1934 | 31 | 5 | 152 | 21 | 3 | 103 |
| 1935 | 21 | 7 | 166 | 14 | 5 | 112 |
| 1936 | 41 | 10 | 202 | 27 | 7 | 147 |
Deaths from motor-vehicle accidents record an appreciable increase up to 1930, but this trend was reversed during the depression years, largely due to a great reduction in the number of motor-vehicles on the road during these years. The figures (which do not include deaths of Maoris) are exclusive of accidents where persons have been killed in collisions between motor-vehicles and trains or trams. With the advent of more prosperous times, the toll of the motor-vehicle is again mounting, although, fortunately, scarcely in proportion to the tremendous increase in motor-vehicular traffic on the highways of the Dominion. For 1936 there were 13 deaths from such accidents, bringing the total number of deaths in cases where a motor-vehicle was an agent up to 215. The corresponding figure for 1935 was 174. Further data regarding accidents will be found elsewhere in this volume (see Index). A later section is devoted wholly to statistics of industrial accidents.
The suicidal deaths in 1936 numbered 149—males 114, females 35—the death-rate per 10,000 of mean population being 1.00.
| Year. | Number of Suicidal Deaths. | Rate per 10,000 of Population. | ||||
|---|---|---|---|---|---|---|
| Males. | Females. | Total. | Males. | Females. | Total. | |
| 1932 | 194 | 46 | 240 | 2.61 | 0.64 | 1.65 |
| 1933 | 156 | 44 | 200 | 2.09 | 0.61 | 1.36 |
| 1934 | 142 | 39 | 181 | 1.89 | 0.54 | 1.23 |
| 1935 | 114 | 35 | 149 | 1.51 | 0.48 | 1.00 |
| 1936 | 114 | 35 | 149 | 1.51 | 0.48 | 1.00 |
The proportion of suicidal deaths is gradually increasing, as is evidenced by the following table presenting, for annual averages of various quinquennia, the suicide-rate per 10,000 of mean population:—
| Annual average during | Males. | Females. | Both Sexes. |
|---|---|---|---|
| 1895–99 | 1.48 | 0.31 | 0.93 |
| 1900–04 | 1.66 | 0.31 | 1.02 |
| 1905–09 | 1.62 | 0.34 | 1.02 |
| 1910–14 | 1.83 | 0.41 | 1.16 |
| 1915–19 | 1.79 | 0.40 | 1.10 |
| 1920–24 | 1.92 | 0.46 | 1.20 |
| 1925–29 | 2.17 | 0.56 | 1.38 |
| 1930–34 | 2.28 | 0.55 | 1.43 |
A comparison of the average annual rates for the latest quinquennial periods available for the undermentioned countries is as follows:—
| Country. | Quinquennium. | Rate per 10,000 of Population. |
|---|---|---|
* Registration area. | ||
| Irish Free State | 1931–35 | 0.35 |
| Northern Ireland | 1932–36 | 0.48 |
| Ceylon | 1930–34 | 0.59 |
| Chile | 1928–32 | 0.66 |
| Norway | 1930–34 | 0.67 |
| Lithuania | 1925–29 | 0.67 |
| Netherlands | 1932–36 | 0.83 |
| Spain | 1929–33 | 0.84 |
| Canada | 1931–35 | 0.90 |
| Italy | 1930–34 | 0.91 |
| Scotland | 1931–35 | 1.02 |
| Uruguay | 1925–29 | 1.13 |
| South Africa | 1930–34 | 1.18 |
| Australia | 1931–35 | 1.20 |
| England and Wales | 1931–35 | 1.35 |
| New Zealand | 1932–36 | 1.36 |
| Belgium | 1925–29 | 1.52 |
| Sweden | 1928–32 | 1.55 |
| United States* | 1930–34 | 1.59 |
| Denmark | 1929–33 | 1.77 |
| France | 1929–33 | 1.94 |
| Finland | 1930–34 | 2.05 |
| Japan | 1931–35 | 2.16 |
| Germany | 1924–28 | 2.45 |
| Estonia | 1925–29 | 2.48 |
| Switzerland | 1931–35 | 2.68 |
| Czechoslovakia | 1929–33 | 2.95 |
| Hungary | 1931–35 | 3.29 |
| Austria | 1925–29 | 3.45 |
Deaths of Maoris are not included in the statistics quoted in preceding pages of this subsection. Their omission is due principally to the fact that a considerably lower standard of accuracy and completeness of data exists in the case of Maori registrations than in the general death records. Registrations of Maori deaths during each of the last five years have been as follows:—
| Year. | Numbers. | Rates per 1,000 of Maori Population. | ||||
|---|---|---|---|---|---|---|
| Males. | Females. | Total. | Males. | Females. | Total. | |
| 1932 | 619 | 573 | 1,192 | 16.18 | 16.20 | 16.19 |
| 1933 | 613 | 548 | 1,161 | 15.54 | 15.03 | 15.29 |
| 1934 | 660 | 623 | 1,283 | 16.24 | 16.57 | 16.40 |
| 1935 | 750 | 697 | 1,447 | 17.90 | 18.03 | 17.96 |
| 1936 | 847 | 755 | 1,602 | 19.64 | 18.99 | 19.33 |
As indicated on p. 95, the number and rate of Maori deaths are probably slightly under-stated.
The rates for the two sexes are much more nearly equal for Maoris than for the rest of the population, the female rate being indeed higher than the male in three of the five years shown above.
Until recently, the only statistics available concerning Maori deaths were merely numbers of deaths according to sex. A tabulation was, however, made in 1925 for the five years 1920–24 on the basis of age and cause of death, and summarized statistics were prepared and published in the 1926 and 1927 numbers of the Year-Book. Annual tabulations are now made, and the statistics for the year 1936 may be found in the “Annual Report on Vital Statistics.” The ages of Maoris whose deaths were registered during the year 1936 are as follows:—
| Age, in Years. | Males. | Females | Total. |
|---|---|---|---|
| Under 1 | 229 | 170 | 399 |
| 1 and under 5 | 124 | 117 | 241 |
| 5 and under 10 | 39 | 40 | 79 |
| 10 and under 15 | 26 | 27 | 53 |
| 15 and under 20 | 24 | 46 | 80 |
| 20 and under 25 | 31 | 47 | 78 |
| 25 and under 30 | 23 | 18 | 41 |
| 30 and under 38 | 25 | 23 | 48 |
| 35 and under 46 | 25 | 24 | 49 |
| 40 and under 45 | 26 | 28 | 44 |
| 45 and under 56 | 30 | 32 | 62 |
| 50 and under 55 | 36 | 16 | 52 |
| 55 and under 60 | 27 | 26 | 53 |
| 60 and under 65 | 28 | 34 | 62 |
| 65 and under 70 | 38 | 34 | 72 |
| 70 and under 75 | 35 | 14 | 9 |
| 75 and under 80 | 29 | 15 | |
| 88 and under 85 | 20 | 16 | |
| 85 and under 96 | 13 | 6 | 19 |
| 90 and under 95 | 9 | 8 | 17 |
| 95 and under 100 | 2 | 1 | 3 |
| 100 and over | 4 | 11 | 15 |
| Unspecified | 4 | 2 | 6 |
| Totals | 847 | 755 | 1,602 |
With the exception of diphtheria and scarlet fever (only 3 deaths of Maoris from this disease being during the last ten years), epidemic and infectious diseases generally exact a much heavier toll proportionately among Maoris than among the general population, the most noteworthy example being tuberculosis, particularly of the respiratory system. Other diseases of the respiratory system also show much higher rates for Maoris than for Europeans, and the same state of affairs is disclosed for diarrhœal diseases and stomach complaints.
On the other hand, there is a much lower mortality among Maoris from certain diseases which rank high as causes of death among the European population. Principal among these are cancer, heart-disease and other diseases of the circulatory system, nephritis, the group of general diseases which includes diabetes and exophthalmic goitre, and the group of diseases of the nervous system which includes apoplexy and cerebral hæmorrhage. Malformations show lower rates for Maoris than for Europeans, but the indefinite nature of the data in the registration entries covering the deaths of many infants may be partly responsible. The figures of deaths from malformations and the group “early infancy” taken in conjunction indicate a much higher rate for Maoris from these causes as a whole than for Europeans.
A summary is here given showing deaths from the principal causes and groups of causes.
| Causes of Death. | Number of Deaths. | Rate per 10,000 of Mean Maori Population. | ||||||||
|---|---|---|---|---|---|---|---|---|---|---|
| 1932. | 1933. | 1934. | 1935. | 1936. | 1932. | 1933. | 1934. | 1935. | 1936. | |
| Typhoid fever | 10 | 11 | 10 | 19 | 27 | 1.36 | 1.45 | 1.28 | 2.36 | 3.26 |
| Measles | 14 | 13 | 1 | 1 | 1.84 | 1.66 | 0.12 | 0.12 | ||
| Whooping-cough | 62 | 17 | 27 | 57 | 56 | 8.42 | 2.24 | 3.45 | 7.08 | 6.76 |
| Diphtheria | 3 | 2 | 2 | 5 | 2 | 0.41 | 0.26 | 0.26 | 0.62 | 0.24 |
| Influenza | 29 | 19 | 46 | 41 | 38 | 3.94 | 2.50 | 5.88 | 5.09 | 4.58 |
| Dysentery | 6 | 10 | 10 | 12 | 6 | 0.81 | 1.32 | 1.28 | 1.49 | 0.72 |
| Pulmonary tuberculosis | 240 | 204 | 241 | 243 | 243 | 32.60 | 26.87 | 30.80 | 30.17 | 29.32 |
| Other forms of tuberculosis | 51 | 55 | 54 | 59 | 86 | 6.93 | 7.25 | 6.90 | 7.32 | 10.37 |
| Cancer | 25 | 27 | 21 | 46 | 43 | 3.40 | 3.56 | 2.68 | 5.71 | 5.19 |
| Cerebral hémorrhage | 15 | 16 | 16 | 21 | 20 | 2.04 | 2.11 | 2.04 | 2.61 | 2.41 |
| Convulsions (under five years) | 12 | 18 | 7 | 15 | 14 | 1.63 | 2.37 | 0.89 | 1.86 | 1.69 |
| Heart-diseases | 73 | 86 | 109 | 84 | 103 | 9.91 | 11.33 | 13.93 | 10.43 | 12.43 |
| Bronchitis | 37 | 30 | 28 | 25 | 51 | 5.03 | 3.95 | 3.58 | 3.10 | 6.15 |
| Broncho-pneumonia | 51 | 67 | 75 | 112 | 148 | 6.93 | 8.83 | 9.59 | 13.90 | 17.86 |
| Pneumonia | 114 | 120 | 162 | 169 | 170 | 15.48 | 15.81 | 20.70 | 20.98 | 20.51 |
| Diarrhoea and enteritis | 33 | 22 | 28 | 57 | 58 | 4.48 | 2.90 | 3.58 | 7.08 | 7.00 |
| Nephritis | 13 | 14 | 14 | 16 | 28 | 1.77 | 1.84 | 1.79 | 1.99 | 3.38 |
| Senility | 92 | 83 | 84 | 87 | 88 | 12.49 | 10.93 | 10.74 | 10.80 | 10.62 |
| Violence— | ||||||||||
| Suicide | 7 | 10 | 8 | 6 | 13 | 0.95 | 1.32 | 1.02 | 0.74 | 1.57 |
| Accident | 78 | 56 | 72 | 76 | 80 | 10.59 | 7.38 | 9.20 | 9.43 | 9.05 |
| Homicide | 2 | 2 | 1 | 0.26 | 0.26 | 0.12 | ||||
| Cold, cough, chest trouble, &c. | 8 | 2 | 1 | 4 | 3 | 1.09 | 0.26 | 0.13 | 0.50 | 0.36 |
| Stomach trouble, internal, trouble, &c. | 1 | 5 | 1 | 0.13 | 0.66 | 0.13 | ||||
| Ill-defined or not specified | 38 | 29 | 26 | 34 | 28 | 5.16 | 3.82 | 3.32 | 4.22 | 3.38 |
| Other causes | 194 | 242 | 226 | 257 | 296 | 26.35 | 31.88 | 28.89 | 31.90 | 35.71 |
| Totals | 1,192 | 1,161 | 1,283 | 1,447 | 1,602 | 161.90 | 152.94 | 163.98 | 179.62 | 193.28 |
As stated earlier, the records of Maori births and deaths are not nearly so accurate and complete as these covering the non-Maori population. This is particularly the case as regards causes of deaths, in spite of the fact that considerable improvement has been effected in the last few years.
From 1925 onwards information has been obtained as to whether the cause of death has been certified by a medical practitioner or Coroner's inquest. As a further indication of the improvements achieved in the specifying of the causes of deaths of Maoris, it may be said that in 1925, out of a total of 867 deaths, 446 or 51 per cent. were definitely shown to have been certified, while in 1936 the proportion so certified was 1,095 out of 1,602 registrations, equivalent to 68 per cent.
As regards infant mortality, the Maori rate is much higher than the European, principally owing to the ravages of epidemic diseases, tuberculosis, respiratory diseases, and diarrhœal diseases. The infant mortality rate for the first year of life was, for the ten years 1927–36, 104 per 1,000 births in the case of Maoris, as compared with 33 per 1,000 among European infants, and this in spite of the fact that for the first month of life the Maori rate is on the average slightly lower than the European rate. It is during the succeeding eleven months that the heaviest toll of Maori infant life is taken.
The numbers and rates per 1,000 live births for the last ten years are given in the next table, the European figures being also shown, for comparative purposes.
| Year. | Maoris. | Europeans. | ||
|---|---|---|---|---|
| Number of Deaths under One Year. | Rate per 1,000 Births. | Number of Deaths under One Year. | Rate per 1,000 Births. | |
| 1927 | 236 | 157.86 | 1,080 | 38.74 |
| 1928 | 218 | 118.16 | 984 | 36.18 |
| 1929 | 174 | 78.52 | 912 | 34.10 |
| 1930 | 188 | 88.51 | 924 | 34.48 |
| 1931 | 221 | 95.59 | 856 | 32.15 |
| 1932 | 262 | 95.45 | 777 | 31.22 |
| 1933 | 273 | 92.61 | 770 | 31.64 |
| 1934 | 279 | 93.59 | 781 | 32.11 |
| 1935 | 355 | 109.20 | 773 | 32.26 |
| 1936 | 399 | 109.92 | 769 | 30.96 |
The next table shows for the year 1936 principal causes of deaths of Maori infants under 1 year, classified according to age.
| Cause of Death. | Under 1 Day. | 1 Day and under 2 Days. | 2 Days and under 1 Week. | 1 Week and under 2 Weeks. | 2 Weeks and 3 Weeks. | 3 Weeks and under 1 Months. | 1 Month and under 2 Months. | 2 Months and under 3 Months. | 3 Months and under 6 Months. | 6 months and under 9 Months. | 9 Months and 12 Months. | Total. |
|---|---|---|---|---|---|---|---|---|---|---|---|---|
| Measles | 1 | 1 | ||||||||||
| Whooping-cough | 2 | 8 | 9 | 11 | 11 | 41 | ||||||
| Influenza | 1 | 1 | 4 | 6 | ||||||||
| Dysentery | 1 | 1 | 2 | |||||||||
| Tuberculosis | 1 | 4 | 5 | 3 | 13 | |||||||
| Venereal disease | 2 | 2 | ||||||||||
| Infantile convulsions | 4 | 2 | 1 | 7 | ||||||||
| Bronchitis | 1 | 4 | 3 | 5 | 7 | 7 | 27 | |||||
| Broncho-pneumonia | 2 | 8 | 8 | 16 | 16 | 19 | 69 | |||||
| Pneumonia | 1 | 1 | 5 | 4 | 26 | 12 | 11 | 60 | ||||
| Other respiratory diseases | 1 | 2 | 2 | 1 | 6 | |||||||
| Diseases of the stomach | 1 | 2 | 2 | 5 | ||||||||
| Diarrhœa and enteritis | 5 | 4 | 11 | 5 | 7 | 32 | ||||||
| Hernia, intestinal obstruction | 1 | 1 | ||||||||||
| Congenital malformations | 2 | 2 | 2 | 1 | 1 | 1 | 6 | 2 | 1 | 18 | ||
| Congenital debility, &c. | 5 | 1 | 2 | 1 | 4 | 3 | 2 | 2 | 4 | 24 | ||
| Injury at birth | 1 | 1 | 1 | 3 | ||||||||
| Premature birth | 19 | 7 | 6 | 4 | 4 | 1 | 4 | 1 | 46 | |||
| Other causes peculiar to early infancy | 8 | 1 | 1 | 1 | 1 | 1 | 1 | 14 | ||||
| Accident | 1 | 1 | 2 | 4 | ||||||||
| Other defined causes | 1 | 1 | 3 | 5 | 3 | 13 | ||||||
| Unspecified or ill-defined | 1 | 3 | 1 | 5 | ||||||||
| Totals | 31 | 11 | 15 | 12 | 9 | 3 | 36 | 35 | 100 | 77 | 70 | 399 |
DEATH-RATES are of great value as indicating the relative healthiness of different countries or for different years. The statistics of causes of registered deaths are of further use as showing the incidence of fatal diseases or accidents, and as indicating in a general way the relative rise or fall of diseases over a series of years. For instance, the fall in the incidence of tuberculosis and the increase in cancer (discussed in Subsection C of this section) can be readily traced from the records of deaths attributed to these causes in different years.
In comparisons of healthiness based on death-rates, however, the effect of the advance of medical science in recent years is not taken into account. It is common knowledge that many diseases regarded a few decades ago as incurable now show a fair percentage of recoveries. Similarly, the death-rates in epidemics are in general much lower now than formerly, owing partly to the steps taken to prevent the spread of the disease, partly to the necessity of early notification in most countries, and partly to increased medical knowledge. Again, many diseases seldom or never result fatally.
Of recent years much attention has been devoted in different countries to the possibility or otherwise of obtaining reliable statistics of morbidity. In New Zealand certain diseases are notifiable, but beyond this and the statistics of industrial accidents given in Section XLII practically the only record other than that of fatality is the information ascertainable from the returns of discharges from public hospitals. The sickness experience of friendly societies' members is mentioned briefly in Section XXX. In the absence of full statistics of sickness, however, information from the sources mentioned is of considerable value, and gives a fair indication of the prevalence of the more important diseases.
Notifications of notifiable diseases during 1930 are shown for each month of the year in the following table:—
| Disease. | January. | February. | March. | April. | May. | June. | July. | August. | September. | October. | November. | December. | Total. |
|---|---|---|---|---|---|---|---|---|---|---|---|---|---|
| Scarlet fever | 48 | 63 | 108 | 122 | 123 | 78 | 97 | 137 | 110 | 87 | 84 | 95 | 1,152 |
| Diphtheria | 31 | 41 | 36 | 36 | 48 | 59 | 53 | 63 | 51 | 38 | 32 | 25 | 513 |
| Enteric fever | 10 | 3 | 6 | 2 | 6 | 3 | 6 | 13 | 5 | 2 | 5 | 61 | |
| Pulmonary tuberculosis | 103 | 71 | 80 | 61 | 82 | 77 | 68 | 79 | 81 | 87 | 75 | 70 | 934 |
| Cerebro-spinal meningitis | 2 | 3 | 2 | 3 | 1 | 1 | 12 | ||||||
| Acute poliomyelitis | 1 | 1 | 85 | 87 | |||||||||
| Pneumonic influenza | 6 | 2 | 3 | 3 | 5 | 4 | 30 | 8 | 5 | 5 | 6 | 77 | |
| Erysipelas | 19 | 16 | 16 | 21 | 22 | 27 | 38 | 39 | 22 | 21 | 27 | 23 | 291 |
| Puerperal fever— | |||||||||||||
| Ordinary | 8 | 3 | 8 | 8 | 6 | 13 | 8 | 6 | 8 | 8 | 10 | 9 | 95 |
| Following abortion | 5 | 13 | 15 | 13 | 6 | 9 | 14 | 8 | 11 | 8 | 6 | 13 | 121 |
| Eclampsia | 9 | 5 | 9 | 9 | 8 | 9 | 9 | 6 | 9 | 5 | 10 | 9 | 97 |
| Tetanus | 2 | 1 | 1 | 1 | 2 | 1 | 2 | 2 | 3 | 15 | |||
| Hydatids | 5 | 4 | 6 | 4 | 4 | 4 | 7 | 2 | 2 | 4 | 4 | 3 | 49 |
| Trachoma | 1 | 1 | 1 | 1 | 2 | 6 | |||||||
| Ophthalmia neonatorum | 4 | 2 | 3 | 2 | 3 | 1 | 3 | 2 | 20 | ||||
| Lethargic encephalitis | 3 | 1 | 1 | 1 | 1 | 7 | |||||||
| Food poisoning | 10 | 5 | 3 | 3 | 2 | 9 | 32 | ||||||
| Dysentery | 2 | 34 | 20 | 1 | 4 | 1 | 62 | ||||||
| Undulant fever | 1 | 1 | 2 | 1 | 2 | 3 | 1 | 4 | 15 | ||||
| Actinomycosis | 1 | 1 | |||||||||||
| Anthrax | 1 | 1 | |||||||||||
| Lead-poisoning | 1 | 2 | 1 | 4 | |||||||||
| Totals | 266 | 221 | 292 | 288 | 317 | 322 | 328 | 394 | 313 | 281 | 266 | 364 | 3,652 |
The foregoing figures are exclusive of notifications of diseases of Maoris, figures for whom are far from complete. The following show the notifications of principal diseases among Maoris during 1936: Diphtheria, 15; enteric fever, 136; tuberculosis, 214; influenza, 10; puerperal fever, 22; trachoma, 8; bacillary dysentery, 32; hydatids, 8; ophthalmia-neonatorum, 7; other, 16; and total, 468.
A quinquennial summary of notifications (exclusive of Maori notifications) of certain principal diseases is now given. Substantial proportionate increases, as compared with 1935, are recorded during 1936 for scarlet fever, pulmonary tuberculosis, acute poliomyelitis, and erysipelas.
| Disease. | 1932. | 1933. | 1934. | 1935. | 1936. |
|---|---|---|---|---|---|
| Scarlet fever | 829 | 783 | 762 | 863 | 1,152 |
| Diphtheria | 802 | 963 | 436 | 747 | 513 |
| Enteric fever | 195 | 106 | 51 | 87 | 61 |
| Pulmonary tuberculosis | 904 | 890 | 824 | 808 | 934 |
| Cerebro-spinal meningitis | 16 | 12 | 19 | 10 | 12 |
| Acute poliomyelitis | 148 | 43 | 14 | 8 | 87 |
| Erysipelas | 233 | 226 | 239 | 252 | 291 |
| Puerperal fever and septic abortion | 252 | 220 | 299 | 257 | 216 |
Information as to case-fatality in regard to the three first-mentioned diseases above is given in the next table for each of the last ten years:—
| Year. | Diphtheria. | Scarlet Fever. | Enteric Fever. | ||||||
|---|---|---|---|---|---|---|---|---|---|
| Cases notified. | Deaths. | Case-fatality. | Cases notified. | Deaths. | Case-fatality. | Cases notified. | Deaths. | Case-fatality. | |
| Per Cent. | Per Cent. | Per Cent. | |||||||
| 1927 | 1,446 | 58 | 4.10 | 2,185 | 16 | 0.73 | 270 | 11 | 4.07 |
| 1928 | 1,600 | 72 | 4.50 | 6,127 | 55 | 0.90 | 290 | 16 | 5.52 |
| 1929 | 1,687 | 92 | 5.45 | 4,848 | 27 | 0.56 | 278 | 22 | 7.91 |
| 1930 | 1,440 | 58 | 4.03 | 2,244 | 16 | 0.71 | 149 | 7 | 4.70 |
| 1931 | 1,327 | 55 | 4.14 | 1,304 | 11 | 0.84 | 161 | 10 | 6.21 |
| 1932 | 802 | 40 | 4.99 | 829 | 6 | 0.72 | 195 | 11 | 5.64 |
| 1933 | 963 | 27 | 2.80 | 783 | 4 | 0.51 | 106 | 6 | 5.66 |
| 1934 | 436 | 26 | 5.96 | 762 | 8 | 1.05 | 51 | 1 | 1.96 |
| 1935 | 747 | 33 | 4.42 | 863 | 8 | 0.93 | 87 | 10 | 11.49 |
| 1936 | 513 | 20 | 3.90 | 1,152 | 8 | 0.69 | 61 | 8 | 13.11 |
Although scarlet fever was more prevalent in 1936 than in 1935, the case-fatality rate indicated that the virulence of this disease was less in 1936. Enteric fever records the highest fatality rate for the period in 1936.
The notifications of acute poliomyelitis record a substantial increase for 1936, on account of the epidemic of this disease which first became apparent in December of that year. From December, 1936, until the end of June, 1937, no fewer than 819 notifications (including Maoris) of acute poliomyelitis were received by the Health Department. Of this total, 585, or 71 per cent., were designated as definitely paralysed cases. The highest monthly total of notifications occurred in April, as may be seen from the following summary of notifications of acute poliomyelitis received during each month from December, 1936, to June, 1937:—
| Month. | Notifications of Acute Poliomyelitis. | ||
|---|---|---|---|
| Males. | Females. | Total. | |
| 1936. | |||
| December | 42 | 43 | 85 |
| 1937. | |||
| January | 36 | 33 | 69 |
| February | 32 | 21 | 53 |
| March | 61 | 44 | 105 |
| April | 135 | 111 | 246 |
| May | 98 | 63 | 161 |
| June | 62 | 38 | 100 |
| Total | 466 | 353 | 819 |
The public hospitals to which the following statistics relate include all these hospitals under the control of the various Hospital Boards; two hospitals which are also old people's homes (Greytown and Reefton); five special infectious diseases hospitals; the various tuberculosis institutions and special sanatoria (including Queen Mary Hospital, Hanmer, and King George V Hospital, Rotorua); and such public maternity hospitals as have also provision for emergency general cases. All St. Helens Hospitals, private hospitals, and solely maternity hospitals, are excluded. Out-patients are not covered by the statistics; which, however, relate to all in-patients—whether European or Maori.
During the year 1936 the total admissions to public hospitals in-New Zealand numbered 93,500. There were 4,944 patients in hospital at the beginning of the year, the total cases dealt with during the year being thus 98,444, equal to 621 per 10,000 of mean population, including Maoris; or, in other words, an equivalent to one person out of every sixteen in the Dominion receiving some degree of treatment in public hospitals in 1936.
A table is appended showing for each of the last eight years the total number of patients treated, and the proportion of population:—
| Year. | Total Patients treated. | Rate per 10,000 of Mean Population. |
|---|---|---|
| 1929 | 83,812 | 564 |
| 1930 | 81,065 | 538 |
| 1931 | 79,176 | 520 |
| 1932 | 79,143 | 516 |
| 1933 | 83,817 | 542 |
| 1934 | 88,085 | 565 |
| 1935 | 93,173 | 594 |
| 1936 | 98,444 | 621 |
Up to the close of 1929 patients (i.e., in-patients) treated in public hospitals had shown marked increases annually, not only in numerical totals but also in ratio to population. The three years subsequent to 1929 reversed this position by recording successive declines in both number and ratio to population.
Some part of this decline is attributable to the diminution in the incidence of the principal epidemic diseases, in particular scarlet fever, and, to a lesser extent, diphtheria. The special fever hospitals in the large centres were virtually empty during these years, and in one case actually closed. Another partial explanation may be in changes of administration policy by some controlling authorities.
The significance of the coincidence of the downward movement with the progress of the depression commencing in 1930 suggests that the major cause is inherent in the direct and indirect phenomena of the depression. Comparative impoverishment may in some instances have acted as a deterrent where normally such persons would have entered hospitals for treatment. For similar reasons others might become out-patients instead of in-patients. There is also the possibility that in individual cases the enforced changes in living conditions (e.g., change to outdoor work) may have resulted in improved health.
The decline between 1929 and 1932 in the number of in-patients, it will be observed, is due chiefly to males, their numbers in 1932 being exceeded by females for the first time. The fall in total patients treated was checked in 1933, when a rise of over 4,500 was recorded in the number of in-patients treated, followed by further increases of over 4,000 in 1934, 5,000 in 1935; and a further 5,000 in 1936, when a record total was established. The increases have been spread over the majority of the most important diseases treated. Lowering of fees in some cases; slightly improved financial conditions; delayed effect of depression exigencies on the health and stamina, particularly of the poorer classes, may all be contributory factors.
From figures given in the Appendix to the Annual Report of the Department of Health, it would appear that the average duration in hospital in respect of each admission was approximately twenty-two days. On this basis, sickness as represented by treatment of in-patients in the public hospitals alone aggregated approximately 309,000 weeks for the year 1936.
Of the 98,444 persons treated as in-patients in public hospitals in 1936, 60,024 were discharged as recovered, 24,156 as relieved, and 4,150 as unrelieved. Deaths in hospital numbered 4,952, and 5,162 patients were still in hospital at the end of the year.
The numbers of admissions, discharges, and deaths for each of the last five years were—
| Year. | Admissions. | Discharges. | Deaths. | Total Discharges and Deaths. | ||
|---|---|---|---|---|---|---|
| Recovered. | Relieved. | Unrelieved. | ||||
| 1932 | 74,589 | 48,812 | 18,524 | 3,438 | 3,882 | 74,656 |
| 1933 | 79,336 | 50,737 | 20,907 | 3,525 | 4,036 | 79,205 |
| 1934 | 83,473 | 52,791 | 22,793 | 3,428 | 4,383 | 83,395 |
| 1935 | 88,483 | 56,821 | 23,349 | 3,562 | 4,497 | 88,229 |
| 1936 | 93,500 | 60,024 | 24,156 | 4,150 | 4,952 | 93,282 |
The following percentage analysis of total cases dealt with during each of the five years is of interest:—
| Year. | Discharged as | Died. | Remaining at End of Year. | ||
|---|---|---|---|---|---|
| Recovered. | Relieved. | Unrelieved. | |||
| 1932 | 61.67 | 23.45 | 4.33 | 4.90 | 5.65 |
| 1933 | 60.53 | 24.94 | 4.21 | 4.82 | 5.50 |
| 1934 | 59.93 | 25.88 | 3.89 | 4.98 | 5.32 |
| 1935 | 60.98 | 25.06 | 3.82 | 4.83 | 5.31 |
| 1936 | 60.97 | 24.54 | 4.22 | 5.03 | 5.24 |
From the following table it will be seen that, while for the earlier years males considerably outnumber females among hospital patients, the proportion has been gradually reduced until in 1932, for the first time, and in each year since until 1936, females were in the majority. The death-rate is invariably higher among male than among female patients, chiefly due to a higher average incidence of serious types of diseases and of occupational accident cases among male patients than among female patients.
| Year. | Discharges and Deaths. | Deaths. | Death-rate per 1,000 Cases. | |||||
|---|---|---|---|---|---|---|---|---|
| Males. | Females. | Males per 100 Females. | Males. | Females. | Males per 100 Females. | Males. | Females. | |
| 1927 | 36,290 | 131,677 | 115 | 2,352 | 1,430 | 164 | 65 | 45 |
| 1928 | 38,824 | 36,438 | 107 | 2,333 | 1,599 | 146 | 60 | 44 |
| 1929 | 40,985 | 37,786 | 108 | 2,569 | 1,556 | 160 | 63 | 41 |
| 1930 | 39,557 | 36,687 | 108 | 2,471 | 1,508 | 164 | 62 | 41 |
| 1931 | 37,867 | 36,755 | 103 | 2,313 | 1,509 | 153 | 61 | 41 |
| 1932 | 37,093 | 37,563 | 99 | 2,345 | 1,537 | 153 | 63 | 41 |
| 1933 | 39,317 | 39,888 | 99 | 2,432 | 1,604 | 152 | 62 | 41 |
| 1934 | 41,380 | 42,015 | 98 | 2,619 | 1,764 | 148 | 63 | 42 |
| 1935 | 44,106 | 44,123 | 100 | 2,675 | 1,822 | 147 | 61 | 41 |
| 1936 | 46,941 | 46,341 | 101 | 2,973 | 1,979 | 150 | 63 | 42 |
The ages of patients who were discharged from, or who died in public hospitals during 1934 and 1935 are as shown in the following summary:—
| Ages of Patients, in Years. | 1935. | 1936. | ||||
|---|---|---|---|---|---|---|
| Males. | Females. | Total. | Males. | Females. | Total. | |
| Under 5 | 4,402 | 3,203 | 7,605 | 4,545 | 3,423 | 7,968 |
| 5 and under 10 | 4,720 | 3,948 | 8,668 | 5,252 | 4,199 | 9,451 |
| 10 and under 15 | 3,486 | 2,872 | 6,358 | 3,627 | 2,992 | 6,619 |
| 15 and under 25 | 7,531 | 9,783 | 17,314 | 7,768 | 10,437 | 18,205 |
| 25 and under 35 | 5,933 | 9,783 | 15,716 | 6,202 | 9,778 | 15,980 |
| 35 and under 45 | 4,809 | 5,730 | 10,539 | 4,953 | 5,978 | 10,931 |
| 45 and under 55 | 4,919 | 3,915 | 8,834 | 5,285 | 3,951 | 9,236 |
| 55 and under 65 | 4,072 | 2,576 | 6,648 | 4,539 | 2,924 | 7,463 |
| 65 and over | 4,172 | 2,232 | 6,404 | 4,682 | 2,556 | 7,238 |
| Unspecified | 62 | 81 | 143 | 88 | 103 | 191 |
| Totals | 44,106 | 44,123 | 88,229 | 46,941 | 46,341 | 93,282 |
As explained in the preceding subsection, the international classification of diseases and causes of death is used in New Zealand. The following table covers all patients discharged from or dying in public hospitals during the year 1936:—
| Class. | Discharges. | Deaths. | Total Discharges | ||||
|---|---|---|---|---|---|---|---|
| Recovered. | Relieved. | Unrelieved. | Males. | Females. | Males. | Females. | |
| I. Infectious and parasitic diseases | 4,340 | 2,337 | 473 | 409 | 292 | 4,225 | 3,626 |
| II. Cancer and other tumours | 1,244 | 1,245 | 612 | 398 | 299 | 1,673 | 2,125 |
| III. Rheumatic diseases, diseases of nutrition and of endocrine glands, and other general diseases | 1,259 | 1,508 | 189 | 59 | 98 | 1,103 | 2,010 |
| IV. Diseases of the blood and blood-forming organs | 108 | 244 | 25 | 39 | 26 | 206 | 236 |
| V. Chronic poisonings and intoxications | 233 | 135 | 19 | 10 | 339 | 58 | |
| VI. Diseases of the nervous system and of organs of special sense | 2,433 | 2,397 | 688 | 251 | 219 | 3,207 | 2,781 |
| VII. Diseases of the circulatory system | 1,271 | 1,796 | 159 | 563 | 326 | 2,450 | 1,665 |
| VIII. Diseases of the respiratory system | 4,601 | 1,723 | 119 | 408 | 216 | 4,302 | 2,765 |
| IX. Diseases of the digestive system | 19,269 | 3,144 | 378 | 234 | 164 | 11,915 | 11,274 |
| X. Diseases of the genito-urinary system | 4,689 | 2,442 | 337 | 218 | 88 | 2,732 | 5,042 |
| XI. Pregnancy, labour, and puerperal state | 7,165 | 510 | 172 | 58 | 7,905 | ||
| XII. Diseases of the skin and cellular tissue | 2,668 | 668 | 43 | 7 | 7 | 2,014 | 1,379 |
| XIII. Diseases of the bones and of the organs of locomotion | 1,387 | 1,345 | 137 | 21 | 5 | 1,929 | 966 |
| XIV. Congenital malformations | 115 | 167 | 66 | 20 | 23 | 205 | 186 |
| XV. Early infancy | 179 | 32 | 8 | 28 | 42 | 146 | 143 |
| XVI. Senility | 20 | 105 | 102 | 54 | 26 | 186 | 121 |
| XVII. Violence or accident | 7,617 | 3,597 | 161 | 253 | 89 | 9,071 | 2,646 |
| XVIII. Ill-defined diseases | 1,426 | 761 | 462 | 1 | 1 | 1,238 | 1,413 |
| Totals | 60,024 | 24,156 | 4,150 | 2,973 | 1,979 | 46,941 | 46,341 |
In the succeeding table the data are reduced to percentages: and, in addition, the ratio of deaths to total cases is given.
| Class. | Discharges. | Deaths. | Total Discharges and Deaths. | Percentage of Deaths to Total Discharges and Deaths. | ||||
|---|---|---|---|---|---|---|---|---|
| Recovered. | Relieved. | Unrelieved. | Males. | Females. | Males. | Females. | ||
| I | 7.23 | 9.67 | 11.40 | 13.76 | 14.76 | 9.00 | 7.82 | 8.93 |
| II | 2.07 | 5.15 | 14.75 | 13.39 | 15.11 | 3.56 | 4.59 | 18.35 |
| III | 2.10 | 6.24 | 4.55 | 1.98 | 4.95 | 2.35 | 4.34 | 5.04 |
| IV | 0.18 | 1.01 | 0.60 | 1.31 | 1.31 | 0.44 | 0.51 | 14.70 |
| V | 0.39 | 0.56 | 0.46 | 0.34 | 0.72 | 0.13 | 2.53 | |
| VI | 4.05 | 9.92 | 16.58 | 8.44 | 11.07 | 6.83 | 6.00 | 7.85 |
| VII | 2.12 | 7.44 | 3.83 | 18.94 | 16.47 | 5.22 | 3.59 | 21.61 |
| VIII | 7.67 | 7.13 | 2.87 | 13.72 | 10.92 | 9.16 | 5.97 | 8.83 |
| IX | 32.10 | 13.02 | 9.11 | 7.87 | 8.29 | 25.38 | 24.33 | 1.72 |
| X | 7.81 | 10.11 | 8.12 | 7.33 | 4.45 | 5.82 | 10.88 | 3.93 |
| XI | 11.94 | 2.11 | 4.14 | 2.93 | 17.00 | 0.73 | ||
| XII | 4.44 | 2.77 | 1.04 | 0.24 | 0.35 | 4.29 | 2.98 | 0.41 |
| XIII | 2.31 | 5.57 | 3.30 | 0.71 | 0.25 | 4.11 | 2.08 | 0.89 |
| XIV | 0.19 | 0.69 | 1.59 | 0.67 | 1.16 | 0.44 | 0.40 | 10.99 |
| XV | 0.30 | 0.13 | 0.19 | 0.94 | 2.12 | 0.31 | 0.30 | 24.22 |
| XVI | 0.03 | 0.44 | 2.46 | 1.82 | 1.31 | 0.40 | 0.26 | 26.06 |
| XVII | 12.69 | 14.89 | 3.88 | 8.51 | 4.50 | 19.33 | 5.71 | 2.92 |
| XVIII | 2.38 | 3.15 | 11.13 | 0.03 | 0.05 | 2.64 | 3.05 | 0.01 |
| Totals | 100.00 | 100.00 | 100.00 | 100.00 | 100.00 | 100.00 | 100.00 | 5.31 |
A summary is now given of the principal diseases treated in public hospitals during the year 1936. All figures given (including deaths) are inclusive of Maoris.
It should be noted that the disease or condition for the treatment of which a patient is admitted to hospital is not necessarily that which would rank as the cause of death in the death statistics. Cystitis, for instance, ranks comparatively high in hospital cases as the condition immediately affecting the patient, but is frequently only the consequence of some more important disease, which would take precedence of cystitis in the statistics of causes of death. Generally speaking, the hospital returns show only the disease or condition for which the patient is treated.
SUMMARY OF PRINCIPAL DISEASES TREATED IN PUBLIC HOSPITALS DURING 1936.
| Diseases. | Total Deaths registered in the Dominion. | Total Cases in Public Hospitals. | Deaths in Public Hospitals. | ||
|---|---|---|---|---|---|
| Number. | Proportion of Total Deaths in Dominion. | Proportion of Total Cases in Public Hospitals. | |||
* See letterpress ante. | |||||
| Per Cent. | Per Cent. | ||||
| Typhoid and paratyphoid fever | 35 | 188 | 34 | 97.14 | 18.09 |
| Measles | 4 | 16 | 1 | 25.00 | 6.25 |
| Scarlet fever | 8 | 886 | 7 | 87.50 | 0.79 |
| Whooping-cough | 103 | 266 | 24 | 23.30 | 9.02 |
| Diphtheria | 22 | 526 | 21 | 95.45 | 3.99 |
| Influenza | 178 | 982 | 47 | 26.40 | 4.79 |
| Erysipelas | 7 | 211 | 6 | 85.71 | 2.84 |
| Infantile paralysis | 5 | 38 | 5 | 100.00 | 13.16 |
| Pulmonary tuberculosis | 783 | 1,808 | 360 | 45.98 | 19.91 |
| Tuberculous meningitis | 85 | 63 | 52 | 61.18 | 82.54 |
| Other forms of tuberculosis | 141 | 761 | 65 | 46.10 | 8.54 |
| Venereal diseases | 49 | 760 | 27 | 55.10 | 3.55 |
| Septicæmia (non-puerperal) | 13 | 785 | 19 | * | 2.42 |
| Hydatids | 18 | 135 | 9 | 50.00 | 6.67 |
| Other infectious or parasitic diseases | 63 | 426 | 24 | 38.10 | 5.63 |
| Cancer | 1,805 | 2,352 | 648 | 35.90 | 27.55 |
| Non-malignant tumours | 81 | 1,446 | 49 | 60.49 | 3.39 |
| Rheumatism and gout | 70 | 1,040 | 29 | 41.43 | 2.79 |
| Diabetes | 242 | 820 | 91 | 37.60 | 11.10 |
| Exophthalmic goitre | 62 | 568 | 21 | 33.87 | 3.70 |
| Other goitres | 6 | 489 | 9 | * | 1.84 |
| Other general diseases | 32 | 196 | 7 | 21.88 | 3.57 |
| Anæmias | 46 | 298 | 24 | 52.17 | 8.05 |
| Leukemia (Hodgkin's disease) | 64 | 75 | 29 | 45.31 | 38.67 |
| Other diseases of the blood and blood-forming organs | 16 | 69 | 12 | 75.00 | 17.39 |
| Alcoholism | 7 | 361 | 9 | * | 3.45 |
| Chronic poisonings | 4 | 36 | 1 | 25.00 | 2.78 |
| Diseases of the spinal cord | 72 | 127 | 14 | 19.44 | 11.02 |
| Cerebral hæmorrhage, apoplexy | 776 | 532 | 291 | 37.50 | 54.70 |
| Diseases of the eyes | 1,209 | 1 | * | 0.08 | |
| Diseases of the ears and mastoid process | 28 | 1,082 | 20 | 71.43 | 1.85 |
| Other nervous diseases | 237 | 3,038 | 144 | 60.77 | 4.74 |
| Diseases of the heart | 3,749 | 2,347 | 817 | 21.79 | 34.81 |
| Diseases of the arteries | 459 | 233 | 57 | 12.41 | 24.46 |
| Diseases of the veins | 13 | 682 | 2 | 15.38 | 0.29 |
| Other diseases of the circulatory system | 19 | 853 | 13 | 68.42 | 1.52 |
| Bronchitis | 253 | 1,565 | 71 | 28.06 | 4.54 |
| Broncho-pneumonia | 389 | 944 | 183 | 47.04 | 19.39 |
| Pneumonia | 571 | 1,661 | 262 | 45.88 | 15.77 |
| Pleurisy | 40 | 689 | 30 | 75.00 | 4.35 |
| Asthma | 34 | 553 | 11 | 32.35 | 1.99 |
| Other diseases of the respiratory system | 153 | 1,655 | 67 | 43.79 | 4.05 |
| Diseases of the mouth | 8 | 1,562 | 3 | 37.50 | 0.19 |
| Diseases of pharynx and tonsils | 31 | 9,014 | 10 | 32.26 | 0.11 |
| Ulcer of stomach and duodenum | 110 | 1,088 | 63 | 57.27 | 5.79 |
| Other diseases of the stomach | 21 | 901 | 6 | 28.57 | 0.67 |
| Diarrhoea and enteritis | 118 | 1,066 | 42 | 35.59 | 3.94 |
| Appendicitis | 130 | 4,908 | 78 | 60.00 | 1.59 |
| Hernia, intestinal obstruction | 107 | 1,969 | 84 | 78.50 | 4.27 |
| Other diseases of the intestines | 21 | 1,002 | 14 | 66.67 | 1.40 |
| Diseases of the liver (excluding hydatids) | 64 | 100 | 31 | 48.44 | 31.00 |
| Diseases of the gall-bladder and biliary passages | 65 | 1,279 | 34 | 52.31 | 2.66 |
| Peritonitis | 34 | 193 | 23 | 67.65 | 11.92 |
| Other diseases of the digestive system | 18 | 107 | 10 | 55.56 | 9.34 |
| Nephritis | 618 | 501 | 145 | 23.46 | 28.94 |
| Other diseases of the kidneys | 73 | 1,191 | 47 | 64.38 | 3.95 |
| Urinary calculi | 13 | 470 | 3 | 23.08 | 0.64 |
| Diseases of the bladder | 13 | 551 | 6 | 46.16 | 1.09 |
| Diseases of the urethra | 3 | 252 | 8 | * | 3.17 |
| Diseases of the prostate | 104 | 519 | 73 | 70.19 | 14.07 |
| Diseases of other male genital organs | 802 | 2 | * | 0.25 | |
| Diseases of the female genital organs | 18 | 3,194 | 22 | * | 0.69 |
| Diseases of the breast | 294 | ||||
| Normal labour | 3,902 | ||||
| Septic abortion | 16 | 164 | 12 | 75.00 | 7.32 |
| Puerperal septicemia | 15 | 108 | 13 | 86.67 | 12.04 |
| Other puerperal diseases and accidents | 81 | 3,731 | 33 | 40.74 | 0.88 |
| Diseases of the skin | 33 | 3,393 | 14 | 42.42 | 0.41 |
| Osteomyelitis | 23 | 541 | 17 | 73.91 | 3.14 |
| Other diseases of the bones, &c. | 6 | 2,354 | 9 | * | 0.38 |
| Malformations | 193 | 391 | 43 | 22.28 | 11.00 |
| Early infancy | 520 | 289 | 70 | 13.46 | 24.22 |
| Senile debility, &c. | 469 | 307 | 80 | 17.06 | 26.06 |
| Burns and scalds | 30 | 587 | 27 | 90.00 | 4.60 |
| Fractures, dislocations, &c. | 6 | 4,655 | 211 | 4.53 | |
| Other external causes | 922 | 6,475 | 104 | 11.28 | 1.61 |
| Unspecified or ill-defined | 33 | 2,651 | 2 | 6.06 | 0.08 |
| Totals | 14,658 | 93,282 | 4,952 | 33.78 | 5.31 |
Certain aspects of the outbreak of acute poliomyelitis, or, as it is more commonly designated, infantile paralysis, that occurred in New Zealand towards the close of the year 1936 have already been commented upon in Subsection C.
The hospital statistics, however, provide a further source of information, and, inasmuch as in times of epidemic the majority of cases of this disease are immediately sent to a public hospital for isolation and treatment, these figures afford a fairly accurate picture of the course and extent of the epidemic, as well as a comparison with the incidence of the disease in past years.
The records along these lines extend back to 1914 only, but as two major epidemics of infantile paralysis occurred during the period 1914 to 1935, as well as subsidiary outbursts of the disease, a useful history is thus available. The fact that infantile paralysis or, technically, acute poliomyelitis is constantly present in more or less virulent form is evident from the following table, which shows the number of eases treated in the public hospitals of the Dominion in each year from 1914 to 1936, and for the first three months of 1937, together with the corresponding morbidity rates per 100,000 of the mean population.
| Year. | Number of Cases treated. | Rate per 100,000 of Mean Population. | ||||
|---|---|---|---|---|---|---|
| Males. | Females. | Total. | Males. | Females. | Total. | |
| 1914 | 35 | 15 | 50 | 5.88 | 2.75 | 4.39 |
| 1915 | 4 | 4 | 8 | 0.68 | 0.72 | 0.70 |
| 1916 | 354 | 219 | 573 | 61.28 | 38.32 | 49.86 |
| 1917 | 45 | 34 | 79 | 7.90 | 5.87 | 6.88 |
| 1918 | 24 | 29 | 53 | 4.24 | 4.94 | 4.60 |
| 1919 | 10 | 7 | 17 | 1.67 | 1.18 | 1.43 |
| 1920 | 30 | 28 | 58 | 4.72 | 4.62 | 4.67 |
| 1921 | 134 | 97 | 231 | 20.51 | 15.56 | 18.09 |
| 1922 | 209 | 140 | 349 | 31.34 | 21.93 | 26.74 |
| 1923 | 112 | 85 | 197 | 16.52 | 13.07 | 14.83 |
| 1924 | 52 | 47 | 99 | 7.53 | 7.10 | 7.32 |
| 1925 | 700 | 552 | 1,252 | 98.93 | 81.55 | 90.43 |
| 1926 | 111 | 79 | 190 | 15.36 | 11.43 | 13.44 |
| 1927 | 86 | 54 | 140 | 11.70 | 7.67 | 9.73 |
| 1928 | 63 | 37 | 100 | 8.47 | 5.19 | 6.87 |
| 1929 | 70 | 32 | 102 | 9.31 | 4.44 | 6.92 |
| 1930 | 41 | 20 | 61 | 5.38 | 2.74 | 4.09 |
| 1931 | 27 | 24 | 51 | 3.49 | 3.24 | 3.37 |
| 1932 | 96 | 75 | 171 | 12.33 | 10.03 | 11.20 |
| 1933 | 59 | 54 | 113 | 7.52 | 7.16 | 7.34 |
| 1934 | 45 | 26 | 71 | 5.70 | 3.42 | 4.58 |
| 1935 | 7 | 25 | 32 | 0.88 | 3.25 | 2.05 |
| 1936 | 19 | 19 | 38 | 2.36 | 2.43 | 2.40 |
| 1937 (3 months) | 111 | 99 | 210 | 13.77 | 12.67 | 13.23 |
The recent epidemic really commenced in December, 1936, although one fatal case was recorded in November. Unfortunately, complete returns are not available at the time of going to press for the quarter ended 30th June, 1937, by which time the epidemic had abated considerably.
The epidemic waves are clearly defined in the above table, the most virulent outbreaks being in 1916 and 1925, with waves of lesser intensity in 1921–22 and, of course, 1936–37. It must be remembered, however, when considering the above figures that the numbers relate to cases treated, and not to individual persons suffering from the disease. The very nature of the disease necessitates in a fairly large proportion of eases that do not succumb in the initial stages subsequent visits to hospital for treatment of the resultant paralysis—in other words, the figures for each year include a certain proportion of duplicate admissions for residual or old infantile paralysis. This factor probably accounts for the comparatively high total of cases recorded for the first year or two succeeding the year of a major outbreak.
The sex-incidence of the disease is remarkable. With the exception of 1915, 1918, 1935, and 1936—four years of comparative quiescence—the morbidity rate of males is consistently higher than that of females, and in the major epidemic years remarkably so.
While the disease is principally confined to young children under fifteen years of age, there has been a considerable incidence amongst older children, while not a few adults have been afflicted.
The proportion of cases under fifteen years has not remained constant throughout the period, as may be seen from the next table, which gives the proportion per cent. in each year from 1914 to 1937.
Generally speaking, the proportion of cases under fifteen years of age reaches the highest levels during times of epidemic. As the years in between represent a greater number of paralysis sequelæ cases, the average age would naturally tend to increase in these years.
| Year. | Total Cases. | Cases under 15 Years. | |
|---|---|---|---|
| Number. | Percentage of Total. | ||
| 1914 | 50 | 40 | 80 |
| 1915 | 8 | 8 | 100 |
| 1916 | 573 | 496 | 86 |
| 1917 | 79 | 60 | 76 |
| 1918 | 53 | 43 | 81 |
| 1919 | 17 | 12 | 71 |
| 1920 | 58 | 55 | 95 |
| 1921 | 231 | 219 | 94 |
| 1922 | 349 | 314 | 90 |
| 1923 | 197 | 164 | 83 |
| 1924 | 99 | 86 | 87 |
| 1925 | 1,252 | 1,111 | 89 |
| 1926 | 190 | 163 | 86 |
| 1927 | 140 | 119 | 85 |
| 1928 | 100 | 65 | 65 |
| 1929 | 102 | 72 | 71 |
| 1930 | 61 | 42 | 69 |
| 1931 | 51 | 39 | 76 |
| 1932 | 171 | 136 | 80 |
| 1933 | 113 | 87 | 77 |
| 1934 | 71 | 61 | 86 |
| 1935 | 32 | 26 | 81 |
| 1936 | 38 | 23 | 61 |
| 1937 (3 months.) | 210 | 156 | 74 |
| Total, 1914 to 1937 | 4,245 | 3,597 | 85 |
A feature of the 1936–37 epidemic, however, has been the abnormally large proportion of fatal cases over fifteen years of age. No less than 71 per cent. of the fatal cases in the 1936–37 epidemic were fifteen years of age or over.
The next table shows the admissions into hospitals in each provincial district during each week since the outbreak of the epidemic in December, 1936, until the end of March, 1937.
| Admissions during Week ended | Auckland. | Hawke's Bay. | Taranaki. | Wellington. | Marlborough. | Nelson. | Westland. | Canterbury. | Otago. | Southland. | Totals. |
|---|---|---|---|---|---|---|---|---|---|---|---|
| 1936. | |||||||||||
| 12th December | 3 | 3 | |||||||||
| 19th December | 29 | 29 | |||||||||
| 26th December | 3 | 1 | 14 | 18 | |||||||
| Totals, December | 3 | 1 | 46 | 50 | |||||||
| 1937. | |||||||||||
| 2nd January | 1 | 1 | 1 | 14 | 17 | ||||||
| 9th January | 2 | 1 | 3 | 35 | 41 | ||||||
| 16th January | 6 | 1 | 2 | 15 | 1 | 25 | |||||
| 23rd January | 1 | 5 | 13 | 1 | 20 | ||||||
| 30th January | 1 | 1 | 1 | 3 | 7 | 1 | 14 | ||||
| Totals, January | 10 | 2 | 4 | 14 | 84 | 3 | 117 | ||||
| 6th February | 1 | 3 | 4 | 1 | 9 | ||||||
| 13th February | 1 | 3 | 4 | ||||||||
| 20th February | 2 | 1 | 2 | 1 | 6 | ||||||
| 27th February | 1 | 2 | 2 | 10 | 15 | ||||||
| Totals, February | 2 | 1 | 1 | 7 | 11 | 12 | 34 | ||||
| 6th March | 1 | 3 | 2 | 1 | 7 | ||||||
| 13th February | 1 | 1 | 2 | 4 | |||||||
| 20th February | 2 | 1 | 1 | ||||||||
| 27th February | 1 | 1 | |||||||||
| Totals, March | 3 | 5 | 4 | 1 | 13 | ||||||
| Grand totals | 12 | 3 | 2 | 7 | 1 | 1 | 27 | 145 | 10 | 214 |
The epidemic first became manifest in Otago early in December. Towards the end of that month it became obvious that strenuous methods would have to be adopted to prevent a major outbreak from sweeping over the Dominion, as, although the disease was still mainly confined to Otago, spasmodic cases had begun to appear elsewhere—in Wellington and Canterbury Provincial Districts. January saw the epidemic spread more extensively in Canterbury, and a distinct invasion of the North Island, especially Auckland. The next month Southland began to suffer more acutely, the situation easing slightly in Otago and Canterbury. The March figures are not very reliable, as they represent admissions of only such cases as were also discharged during that month. Actually the real peak of the outbreak did not occur until April, but figures of hospital admissions are not available as yet later than March, 1937.
Table of Contents
THE law relating to public health in New Zealand is contained in the Health Act, 1920, which repealed the consolidated Public Health Act, 1908, and its amendments. A full account of the Act was given in the 1927 issue of the Year-Book.
For the administration of the Act there is established a Department of Health, with a Director-General of Health as chief administrative officer. The Department comprises Divisions of Public Hygiene, Hospitals, Nursing, School Hygiene, Child Welfare, and Maori Hygiene, each of which is under the supervision of a Director.
For purposes of local administration the country is divided into health districts, each of which is under the charge of a Medical Officer of Health, who must be a medical practitioner with special qualifications in public health. These officers are entrusted with wide powers, and act as advisers of the local governing bodies in matters affecting the public health.
In addition to being charged with the administration of the Health Act, the Department controls the registration of medical practitioners, nurses, midwives and maternity nurses, opticians, masseurs, and plumbers. It supervises the sale of food and drugs (including poisons and “dangerous” drugs), and protects the public against exploitation by fraud in connection with alleged remedies. The Department also administers the law covering the control of cemeteries and crematoria.
The medical and dental inspection and treatment of school-children are carried out by special divisions of the Department.
The system of notification of certain diseases has been in force in New Zealand for many years, and the list of notifiable diseases has undergone several alterations. The list at present is as follows:—
Notifiable infectious diseases mentioned in Part I of First Schedule of Health Act, 1920:—
Anthrax.
Cerebro-spinal fever (cerebro-spinal meningitis).
Cholera.
Dengue.
Diphtheria.
Erysipelas.
Enteric fever (typhoid fever, paratyphoid fever).
Leprosy.
Plague (bubonic or pneumonic).
Puerperal fever (puerperal septicæmia and puerperal sapræmia).
Scarlet fever (scarlatina).
Smallpox (variola, including varioloid, alastrim, amaas, Cuban itch, and Philippine itch).
Typhus.
Yellow fever.
Notifiable infectious diseases declared by Gazette notice:—
Dysentery (amœbic and bacillary).
Encephalitis lethargica.
Fulminant influenza.
Pneumonic influenza.
Septicæmic influenza.
Ophthalmia neonatorum.
Acute poliomyelitis (infantile paralysis).
Trachoma (granular conjunctivitis, granular ophthalmia, granular eyelids).
Tuberculosis (pulmonary).
Septicæmia consequent on abortion or miscarriage.
Syphilis.*
Gonorrhœa.*
Soft chancre.*
Undulant fever.
Puerperal fever, involving any form of puerperal sepsis other than or in addition to puerperal septicæmia and puerperal sapræmia.
Any form of sepsis or sapræmia following abortion or miscarriage.
* In certain circumstances. (See letterpress post.)
Notifiable diseases, other than infectious, mentioned in Second Schedule:—
Actinomycosis.
Ankylostomiasis (hookworm disease).
Bilharziosis (endemic hæmaturia, Egyptian hæmaturia).
Beriberi.
Hydatids.
Food poisoning (botulismus, ptomaine poisoning).
Chronic lead poisoning.
Phosphorus poisoning.
Tetanus.
Notifiable disease, other than infectious, declared by Gazette notice:—Eclampsia.
By Gazelle notice dated the 29th November, 1924, syphilis, gonorrhœa, and soft chancre were declared to he infectious diseases within the meaning of the Health Act, 1920. On the 9th July, 1925, regulations were made under the Health Act, 1920, and the Social Hygiene Act, 1917, providing for the compulsory notification of these diseases in certain circumstances, and for the treatment of these affected by venereal disease in a communicable form.
Under these regulations it is encumbent upon a medical practitioner, or a medical officer of a hospital, who has been treating any person suffering from venereal disease in a communicable form to notify the Director-General of Health if such person fails for more than two weeks (after the date fixed in that behalf by the medical practitioner or medical officer) to attend for treatment, unless he is known in the meantime to have placed himself under treatment of some other qualified person.
If the Director-General of Health has reason to believe (either from a notification, as provided for above, or otherwise) that any person is suffering from venereal disease in a communicable form, he may require such person to submit himself for examination to some medical practitioner, and to supply a medical certificate as to the state of his health in relation to venereal disease. If a medical certificate is not supplied within the time specified, or if the certificate does not definitely disclose whether or not the person to whom it relates is suffering from venereal disease in a communicable form, the Director-General of Health may authorize two medical practitioners to examine such person.
In cases where a medical certificate is not obtainable, or where the certificate shows the person to be suffering from venereal disease in a communicable form, the Director-General of Health may, if he thinks such a course necessary or expedient in the public interest, authorize a Medical Officer of Health to make an order, under section 84 of the Health Act, 1920, for the removal of such person to a hospital or other place where he may be effectively isolated. On the other hand, on application being made to a Magistrate, an order for examination by two medical practitioners (to be named in the order) is made, and if their report shows that the person is free from venereal disease in a communicable form, the Magistrate then makes an order for his release.
Where treatment is not conveniently obtainable at a public hospital or public clinic, the Director-General of Health may authorize a registered medical practitioner to administer free treatment if the patient is unable to pay. In such cases fees for service are paid by the State according to a scale laid down.
It is an offence for any person, while suffering from venereal disease in a communicable form, to engage in any employment, or to act in any capacity, in or about any factory, shop, hotel, restaurant, house, or other place, if by reason thereof any food intended for consumption by any other person is exposed to infection from venereal disease or is likely to be so affected. If any person suffering from the disease knowingly infects, or does or suffers any act likely to infect, any other person, he is liable to imprisonment for twelve months, together with a fine of £100.
It is the duty of every medical practitioner who is consulted by any person, sixteen years of age or over, suffering from venereal disease in a communicable form, to give such person a notice setting forth the requirements for treatment and for not infecting others, and expressly warning him or her against marrying until medically certified as cured.
Every precaution is taken for the maintenance of secrecy and the avoidance of publicity in the carrying-out of the regulations. Every person concerned in the administration of the regulations is liable to a penalty of £50 if he divulges any information which comes to his knowledge in respect of any person suffering, or suspected to be suffering, from venereal disease.
In addition to the powers of conferring degrees of Bachelor and Master of Surgery and Bachelor and Doctor of Medicine, the Senate of the New Zealand University has power to grant diplomas in public health, and to make regulations for the examination of candidates for such diplomas. The examination for the diploma in public health is held in two parts, which may be taken separately or at the same time. Diplomas granted 1914–28 numbered 17; since 1928 three candidates have taken the course and passed the examination in 1934, 1936, and 1937 respectively.
Under the Medical Practitioners Act, 1914, as amended by the Medical Practitioners Amendment Act, 1924, is constituted the Medical Council of New Zealand, consisting of the Director-General of Health and six other registered medical practitioners. One of the six members is appointed on the recommendation of the New Zealand Branch of the British Medical Association.
The Council deals with all applications for registration under the Act, which enacts that every person shall be entitled to registration who satisfies the Council that he is a graduate in medicine and surgery of the University of New Zealand; or registered on the register kept in accordance with the provisions of the Acts regulating the registration of medical practitioners in the United Kingdom, or eligible for registration on such last-mentioned register; or the holder, after a course of not less than five years' study, of a foreign diploma approved by the Council. The Council may, however, refuse to approve any diploma (even in the case of persons registered or eligible for registration in the United Kingdom) unless it appears that New Zealand graduates are, without further examination, entitled to registration in the country granting the diploma. It may also require the holder of a foreign diploma to pass an examination in medicine and surgery to be prescribed and conducted by the Senate of the New Zealand University.
Applicants who are refused registration have the right of appeal to the Supreme Court. The fee for registration is £2, payable on deposit of evidence of qualification. Under the Finance Act, 1932–33 (No. 2), an annual practising certificate (fee 5s.) is required.
The Medical Council is vested with disciplinary powers, including the suspension of a medical practitioner from practice. Right of appeal to the Supreme Court is provided. The Supreme Court, on the motion of the Medical Council, may order the removal of a name from the register in cases where a medical practitioner is guilty of grave misconduct or is convicted of an indictable offence punishable by imprisonment with hard labour for a term of two years or upwards. The number of medical practitioners on the register on 31st March, 1937, was 1,435. During 1936, 20 names were removed and 52 added, of whom 44 had New Zealand qualifications.
The Dentists Act, 1936, provides for the constitution of a Dental Council consisting of:—
The Director-General of Health.
Two dentists appointed on recommendation by the Minister of Health.
One dentist, being a member of the Faculty of Dentistry in the University of Otago, appointed on the recommendation of the Minister.
One dentist appointed upon election by postal vote of these dentists whose registered addresses are in the North Island.
One dentist appointed upon election by postal vote of these dentists whose registered addresses are in the South Island.
One medical practitioner, being a member of the Faculty of Medicine in the University of Otago, appointed on the recommendation of the Minister.
One medical practitioner nominated in that behalf by the New Zealand Branch of the British Medical Association and appointed on the recommendation of the Minister.
Every adult person is entitled to be registered as a dentist who satisfies the Dental Council that he is the holder of a qualification in dentistry obtained from the University of New Zealand; or that he is the holder of a qualification approved by the Dental Council and obtained from a university or other institution in the United Kingdom or in some other part of His Majesty's dominions (in the latter case, however, the Council may require a further examination); or the holder of an approved foreign qualification, but the Council may refuse to approve any foreign qualification if New Zealand graduates in dentistry are not accepted for registration without further examination in the country concerned, or the Council may require the applicant to pass a further examination.
Application for registration should be made to the Secretary, Dental Council of New Zealand, Department of Health, Wellington. The fee for initial registration is £2. If a provisional practising certificate is required there is a further fee of 5s. A fee of £1 per annum is payable for an annual practising certificate if the applicant desires to practise.
The number on the register at the end of 1936 was 924, 28 names having been added and 32 removed during the year.
The Nurses and Midwives Registration Act, 1925, as amended in 1930, provides for a Nurses and Midwives Registration Board, consisting of the Director-General of Health or his deputy; the Director of the Division of Nursing (who is Registrar of the Board); a registered medical practitioner; a registered nurse and a registered midwife, and one other person recommended by the New Zealand Trained Nurses' Association or a similar body; and one person nominated by the Hospital Boards Association.
Every person who has attained the age of twenty-two years and is certified as having undergone not less than three years and three months' training in a general hospital “approved” by the Board as a training-school under the Act, and who has passed the prescribed hospital and State examination, is entitled to registration. The number of nurses on the register at 31st March, 1937, was 4,639.
The Act also provides for the registration of midwives and maternity nurses.
The requirements for training are as follows:—
Maternity Nurses.—In the case of a person who is a registered nurse the period of training is six months, and in the case of any other person is a period of eighteen months. At the end of this time the candidate is eligible to sit for the State Maternity Examination.
Midwives.—No person shall be accepted for training as a midwife until such person has been registered as a maternity nurse; the duration of the course of training will be then a period of six months, at the end of which the candidate is eligible to sit for the State Midwifery Examination.
The number of registered midwives on the 31st March, 1937, was 1,952, and the number of registered maternity nurses 1,407.
The Opticians Act, 1928, provides for the constitution of an Opticians Board, consisting of the Director-General of Health (the Registrar), two persons engaged in practice as opticians in New Zealand, and a registered medical practitioner with special knowledge of diseases of the eyes.
The Board deals with all applications for registration under the Act. On payment of the prescribed fee (£5), every person is entitled to registration as an optician who satisfies the Board that—
He has received satisfactory training qualifying him to practise as an optician, and is the holder of a certificate of qualification recognized by the Board, or
He has passed an examination under the Act, both theoretical and practical, after a course of not less than three years' training in New Zealand as prescribed by regulations.
Under the Finance Act, 1932–33 (No. 2), an annual practising certificate (fee 10s.) is required.
Regulations pursuant to the Opticians Act, 1928, have been prepared, prescribing the conditions and period of training and the syllabus for the examination conducted by the Opticians Board.
The number of opticians upon the register at 31st March, 1937, was 263.
Under the Masseurs Registration Act, 1920, and the Masseurs Registration Amendment Act, 1924, there is constituted the Masseurs Registration Board of New Zealand, consisting of the Director-General of Health, a registered medical practitioner, and two persons engaged in the practice of massage in New Zealand.
The Board deals with all applications for registration (fee £3) under the Act. It is necessary for applicants to be in possession of approved certificates for the three branches of massage: (1) Massage; (2) medical electricity; (3) remedial exercises and other branches of physiotherapy.
Under the Finance Act, 1932–33 (No. 2), an annual practising certificate (fee 10s.) is required.
The number of masseurs on the register at 31st March, 1937, was 568.
The Plumbers Board of New Zealand, constituted under the Plumbers Registration Act, 1912, consists of five members—viz., the Director-General of Health or his deputy (Chairman); the Director of Education; a city or borough engineer nominated by the Municipal Association of New Zealand; a master plumber and a journeyman plumber elected by their respective associations.
The functions of the Board are to decide what persons may be registered under the Act, and in what districts sanitary plumbing may be performed only by registered plumbers. It also decides the scope of the examinations to be held as a part of the process of securing registration.
The main principles underlying the Act are that of securing trained and certificated sanitary plumbers, and that such registered plumbers shall not be required to pay any license fee or pass any examination under any local authorities controlling sanitary-plumbing works.
Under the Finance Act, 1932–33 (No. 2), an annual license fee of 5s. is payable by registered plumbers if doing any sanitary plumbing.
The total of names on the register at 31st March, 1937, was 2,599.
In order to make better provision for the sale of food and drugs in a pure state the Sale of Food and Drugs Act was passed by the Legislature, and came into force on the 1st January, 1908. The Act is administered by the Health Department, and provides for the analysis, by public analysts, of any article of food or drink, or of any drug, which may be sold, offered for sale, or exposed for sale, and for the inspection of any place where there is any food or drug intended for sale. If any such article be proved to be unfit for human consumption, or likely to cause injury to health if consumed, heavy penalties may be inflicted on the person or persons responsible. Stringent measures are provided for the prevention of adulteration of food, drink, or drugs, and for the inspection of places where such goods are manufactured or packed. The selling of light-weight bread is an offence under the Act, as is also the taking back of bread after it has been in the possession of the purchaser for more than an hour.
Considerable progress has been made in following out the purposes of the Act, all the commonly used foodstuffs being standardized, and the labelling of packages being controlled by regulations, which are revised and added to as the necessity arises.
An amendment of the Act in 1924 marks a noteworthy advance in legislation of this kind, and has been used to good effect in controlling all kinds of publicity concerning any food or drug whereby a purchaser is likely to be deceived in regard to the properties of such food or drug, whether it is dealt with by a regulation or not.
The definition of “drug” includes medicines used externally or internally by man, anaesthetics, soaps, ointments, disinfectants, and tobacco.
Any person may, on payment of the prescribed fee, together with the cost of the sample, require any authorized officer to purchase a sample of any food or drug and to submit it for analysis.
Statistics compiled by the Department of Health show that during the year 1936, 7,926 samples of milk were examined, resulting in 189 warnings and 86 prosecutions. The figures for the previous year were 8,131, 236, and 75 respectively. Other foodstuffs sampled—1935 figures in parentheses—numbered 887 (1,006), warnings being 21 (40), and prosecutions 3 (9).
The administration of the Weights and Measures Act is among the functions of the Department of Labour; the correct weighing of bread, butter, and other foodstuffs coming within the scope of this Act.
Section 2 of the Quackery Prevention Act, 1908, enacts that every person commits an offence who publishes or causes to be published any statement which is intended by the defendant or any other person to promote the sale of any article as a medicine, preparation, or appliance for the prevention, alleviation, or cure of any human ailment or physical defect, and which is false in any material particular relating to the ingredients, composition, structure, nature, or operation of that article, or to the effects which have followed or may follow the use thereof.
The penalty inflicted is a fine not exceeding £100 in the case of a first conviction, and not exceeding £200 for every subsequent conviction. The object of the Act is to prevent the exploitation of the public by means of medicines or treatment alleged to cure all and sundry complaints and ailments.
In order to carry out New Zealand's obligations under the Geneva Convention (League of Nations), the Dangerous Drugs Act, 1927, was enacted. The dealing in and use of prepared opium is prohibited, and the production, manufacture, sale, And distribution of other dangerous drugs are subject to a license granted by the Director-General of Health or some other lawful authority. Provisions are made to prevent illicit traffic in drugs of a habit-forming nature. Suitable regulations are now in force to give effect to the provisions of the Act, and follow lines similar to the regulations in England and Australia.
The Poisons Act, 1934, is aimed principally at preventing deaths from misadventure arising from two main causes. First, the careless use of industrial and farm poisons through loose packing or handling in bottles commonly used for foodstuffs, beverages, or harmless medicines. Second, the increasing tendency by the public to use certain of the newer drugs having hypnotic or pain-reducing properties or supposed to be effective for slimming, &C. Regulations providing machinery for carrying out the Act have been passed on the lines of the provisions in force in Great Britain.
The Pharmaceutical Society of New Zealand, constituted by the Pharmacy Act, 1908, consists of about 700 members. These are known as “registered chemists,” and no chemist shop may be opened in the Dominion except under the charge of one of these.
The society is governed by the Pharmacy Board, 59 Cambridge Terrace, Wellington, set up by the Act, consisting of ten members elected by members of the society. The main function of the Pharmacy Board is to administer the Pharmacy Act and its amendments in the interests of the public and of the members of the society, also to watch such other legal provisions generally as may have a bearing upon pharmacy.
The society has reciprocity agreements with the societies of Great Britain and all the Australian States: that is to say, a member registered after passing the full examination of a reciprocating country can be registered in any other on payment of the fees, and on complying with prescribed formalities.
The Pharmacy Board holds examinations annually for those who wish to obtain the necessary qualifications entitling them to registration. Candidates must also serve four years' apprenticeship. The first Official College of Pharmacy was opened in Wellington in 1933. A complete course, embracing all the subjects set for the professional examinations, is available for students.
The Society has a Benevolent Fund, which is used for the relief of members who may be in needy circumstances, or of their relatives who may be unprovided for.
In addition to the statutory organization set up by the Pharmacy Act, members of the Pharmaceutical Society have another organization known as the Chemists' Defence Association, Limited, which provides an indemnity guarantee for its members, deals with matters of general interest not covered by the Act, and governs ethical questions as between pharmacists and medical men and the public generally. There is also a Chemists' Service Guild governing the purely business side of pharmacy.
By the Cemeteries Amendment Act of 1926 the administration of cemeteries is placed under the control of the Minister of Health. The Department of Health, with its Inspectors always in the field, is able to give the various matters closer attention than had been possible previously. Steps are being taken to ensure proper methods of plotting and keeping records, the importance of which has not been sufficiently recognized in the more sparsely populated areas, but the necessity for which will become more apparent as time goes on.
Regulations are in force to facilitate the procedure in cremations, providing also for special methods as carried out according to the rites of any religious denomination elsewhere than in a crematorium. Due precautions are provided for in all cases to ensure against any untoward development in connection with the cremation of any body.
School medical work in New Zealand is carried out by the Division of School Hygiene, which is responsible for the supervision of all measures for safeguarding the health of school-children and for ensuring a satisfactory environment at school.
The School Medical Service in New Zealand was placed on a definite basis in 1912, when three full-time School Medical Officers were appointed. Prior to that date regular examinations were restricted to some of the larger secondary and private schools. There is now a permanent staff consisting of a Director, twelve School Medical Officers, and twenty-eight school nurses. In addition, five Medical Officers of Health act as part-time School Medical Officers.
The Health Act, 1920, section 139, gives the necessary authority for the medical examination of children attending the primary schools, but the duties and powers of the School Medical Officers are defined in the Education Act, 1914, section 134.
The School Medical Service aims at securing for each child three complete physical examinations during his school-life, but special examinations are carried out when parents, teachers, or the School Medical Officers consider them necessary. It is recognized that medical treatment must be available for every child in need of it.
If defects are found, the practice of the School Medical Officer is to notify the parents of their existence, the choice of medical attendant being left entirely to the parents. If the parents are unable for financial reasons, or are too Apathetic, to obtain the necessary advice and treatment, it is the duty of the School Medical Service to see that it is carried out. This is done through the medium of the school nurse, who acts as a link between the school and the home, the treatment being given at the nearest hospital. The work of the service, however, is essentially educational and preventive.
As preventive measures in dealing with malnutrition in school-children, special attention has been given to the extension of two activities—firstly, the supply of a milk ration to children at school; and, secondly, health camps. Both of these measures are being developed throughout the Dominion. An effort is made to keep under supervision children who are tuberculosis contacts. In nearly all centres throughout the Dominion School Medical Officers conduct regular medical examinations of kindergarten schools. The examination of Native schools since the establishment of the East Cape and North Auckland Health Districts has been greatly extended. An arrangement by which the district nurse acts as school nurse in these areas has resulted in a more intensive attack on many minor health problems. A considerable amount of work is done in co-operation with the Education Department and also with the Mental Hospitals Department in regard to children suspected of mental backwardness or defect in order to determine whether special provision for their welfare, either educational or institutional, is indicated. A great amount of work has been done with the object of ascertaining the incidence and distribution of goitre throughout the Dominion, and this problem continues to receive attention.
The School Medical Officers work in association with the Medical Officers of Health in regard to the control of infectious disease. Preventive treatment for diphtheria by means of inoculation with toxin anti-toxin, and more recently with anatoxin, has been carried out to a considerable extent during the last few years.
The School Medical Service also works in close co-operation with the Child Welfare Branch of the Education Department, under the supervision of which are all measures for the protection of destitute and neglected children, also the regulations governing juvenile employment. It also co-operates with the officers of the Education Department in the supervision of school-buildings and sanitation.
The New Zealand School Dental Service, instituted in 1921, is conducted by the Dental Division of the Department of Health. By the end of 1936 school dental clinics had been established at 252 centres in the Dominion. Each clinic deals with the children of certain schools in its vicinity, and these are organized into a “dental group,” the local administration of which is in the hands of a dental clinic committee composed of local residents. Besides undertaking various duties in connection with local administration, these committees have to undertake the important task of raising funds to meet a certain proportion of the cost of operating the clinics. Treatment of the children in the clinics is carried out by dental nurses specially trained for the work by the Department.
At the end of December, 1936, there were 164 trained dental nurses in the service, and in addition there were 79 probationer dental nurses in training. Some 90,000 children, belonging to 1,629 schools, are under systematic treatment at the various clinics. These children are kept under constant observation, and are being maintained dentally fit from the time they enter school until they pass out of the Fourth Standard. For this purpose they are re-examined at frequent and regular intervals (approximately twice a year), and necessary treatment is carried out.
Particular attention is given to instructing the children in the principles of dental hygiene, and the Department aims at securing the co-operation of both the children and their parents in an endeavour to reduce the prevalence of dental disease.
The following is a summary of the treatment performed in the service during the year 1936: Fillings, 498,121; extractions, 72,088; other operations, 154,860.
PRIOR to the abolition of the provinces in 187G hospital maintenance was left to the care of the several Provincial Councils, each of which had a system of its own. On the change-over to the county form of government in the following year all of these diverse systems came under the charge of the Central Government, and many difficulties and incongruities occurred. Gradually there grew up a system of excessive demands upon the Government, and in 1885 an attempt to reduce a somewhat chaotic state of affairs to some semblance of order and uniformity took shape in the Hospitals Act of that year, which provided for the constitution of special hospital districts and Boards. Several amendments based on the result of experience were passed in later years, and the present law relating to the subject is embodied in the Hospitals and Charitable Institutions Act, 1926, as amended in 1928, 1929, 1932, and 1936.
The management of affairs in each hospital district is entrusted to a Hospital Board, consisting of not more than twenty or fewer than eight members representing the contributory local authority districts comprising the hospital area. Members are elected at the ordinary general election of the contributory authorities.
Subject to the consent of the Minister of Health, a Hospital Board has power to establish, control, and manage any of the following institutions: Hospitals, charitable institutions, maternity homes, convalescent homes, sanatoria, habitual inebriates' homes, reformatory institutions for the reception of women and girls, and any other institutions for any purpose which the Governor-General by Order in Council may declare to be a public charitable purpose. It may grant charitable aid to indigent, sick, or infirm persons; may provide medical, surgical, and nursing attention for persons not inmates of an institution; and may grant financial assistance to medical and nursing associations and private philanthropic institutions approved by the Minister.
It is the duty of every Hospital Board to provide and maintain such hospitals as the Director-General of Health considers necessary in any part of the district for (a) the reception, relief, &c., of any persons suffering from infectious diseases; (b) the reception, &c., of persons suffering from other than infectious diseases.
No rating-powers are given to Hospital Boards, but under the Hospitals and Charitable Institutions Act the estimated net expenditure (excluding Government subsidy) of a Board is apportioned by the Board among the contributory local authorities within its district in proportion to the capital value of the rateable property in each contributory district.
At the beginning of each financial year the Hospital Board prepares an estimate of its payments for the year, deducting therefrom all estimated receipts by way of patients' fees, voluntary contributions, bequests, income from endowments, and, generally, deducting all other estimated receipts except the amount to be raised by levy on the contributory local authorities and Government subsidy on such levy. The levies on contributory local authorities are apportioned in relation to the rateable capital value of each local district. On levies for maintenance purposes a scale is in operation ranging from 14s. to 26s. per £1, and averaging throughout the Dominion £1 for £1. The principle of the scale is to give relatively greater assistance where the requirements are high in proportion to the rateable capital value of the hospital district. To this end the levy of each Board for maintenance purposes is determined as sixteen-fortieths of its estimated maintenance requirements plus the amount bearing to four-fortieths of the net estimated requirements of all Boards the same proportion as the rateable capital value of the hospital district boars to the aggregate rateable capital value of all hospital districts. After the levy of each Board is thus determined, the remainder of the Board's requirements is met by Government subsidy, with the limitation of fourteen thirty-fourths as the minimum subsidy and twenty-six forty-sixths as the maximum subsidy.
Levies on contributory local authorities and Government subsidy each form about one-third of the total maintenance receipts of Hospital Boards, the remainder being chiefly patients' fees and other recoveries on account of relief.
The above remarks apply to levies for maintenance purposes. As regards capital works, the net requirements are met by levy and by subsidy in equal amounts; the subsidy, in other words, being at the rate of £1 for £1. Where the expenditure is very heavy, Boards may have recourse to loans.
A Government subsidy was formerly payable on voluntary contributions and bequests, but this has been discontinued since March, 1932.
The following is a summary of the receipts and payments of Hospital Boards for the last two years ended 31st March.
| — | 1934–35. | 1935–36. |
|---|---|---|
| Receipts. | £ | £ |
| Voluntary contributions and bequests | 29,023 | 16,091 |
| Levies | 602,461 | 621,755 |
| Subsidies | 595,518 | 614,138 |
| Patients' payments and charitable-aid recoveries | 413,033 | 436,187 |
| Rent, interest, and dividends | 26,329 | 26,060 |
| Loans | 75,101 | 126,093 |
| Sale of capital assets | 839 | 13,679 |
| Miscellaneous receipts | 17,253 | 27,280 |
| Totals | 1,759,557 | 1,881,283 |
| Payments. | ||
| Hospital maintenance | 990,141 | 1,096,487 |
| Charitable aid | 284,052 | 300,120 |
| Medical associations or medical men in outlying districts | 9,303 | 10,324 |
| District nursing | 10,187 | 11,394 |
| Administration | 68,312 | 74,487 |
| Amounts paid to other Boards or separate institutions | 73,743 | 80,093 |
| Rents, rates, and taxes | 3,961 | 2,542 |
| Interest | 60,727 | 53,522 |
| Contributions to National Provident Fund for super-annuation of employees | 15,425 | 17,597 |
| Capital works | 81,412 | 198,857 |
| Loan-repayments or payments to sinking fund | 63,619 | 62,497 |
| Miscellaneous payments | 12,307 | 18,759 |
| Amounts invested on account of funds for special purposes | 716 | 16,648 |
| Totals | 1,673,905 | 1,943,327 |
Although the figures in the last preceding statement relate to receipts and payments, the official returns of Hospital Boards have since 1916–17 been supplied on the basis of an Income and Expenditure Account and Balance-sheet.
The following, showing the sources of revenue for the last two financial years for which figures are available relate not only to Hospital Boards, but also to Government institutions and the Mercury Bay Hospital Trustees.
| — | 1934–35. | 1935–36. | ||
|---|---|---|---|---|
| Amount. | Percentage of Total. | Amount. | Percentage of Total. | |
| £ | £ | |||
| Contributable by Government | 652,180 | 38.8 | 685,630 | 39.3 |
| Levies on local authorities | 601,715 | 35.8 | 621,271 | 35.6 |
| Voluntary contributions | 26,008 | 1.5 | 16,964 | 1.0 |
| Recoveries from those assisted | 355,530 | 21.1 | 372,519 | 21.4 |
| Rents, interest, and dividends | 25,632 | 1.5 | 20,804 | 1.5 |
| Miscellaneous revenue | 21,003 | 1.3 | 20,232 | 1.2 |
| 1,682,134 | 100.0 | 1,743,420 | 100.0 | |
| Cash in bank (other than loan-money) | 52,760 | 78,865 | ||
| Totals | 1,734,894 | 1,822,285 | ||
With the exception of “Recoveries from those assisted,” which is a purely cash figure, the above particulars and those below relating to expenditure are taken from the Income and Expenditure Accounts and Balance-sheets.
To ascertain the total receipts for the year 1935–36 the sum of £124,099 (receipts and cash in hand from loans for capital purposes) should be added, making the aggregate £1,946,384.
The amount contributable by the Government consists of subsidies on maintenance levies, £560,582; subsidies on capital levies, £60,726; cost of maintaining Government institutions, £26,510; patients' fees paid to Boards or remitted in respect of Government institutions, £34,316; and special payments to Boards, £3,496, making a total of £685,630.
The maintenance expenditure for the last two financial years was made up as follows:—
| — | 1934–35. | 1935–36. | ||
|---|---|---|---|---|
| Amount. | Percentage. | Amount. | Percentage. | |
| £ | £ | |||
| Hospital maintenance | 1,047,993 | 69.1 | 1,150,761 | 70.1 |
| Charitable relief— | ||||
| Indoor | 105,741 | 7.0 | 112,973 | 6.9 |
| Outdoor | 176,894 | 11.7 | 187,267 | 11.4 |
| Medical associations | 9,743 | 0.6 | 9,918 | 0.6 |
| District nursing | 10,239 | 0.7 | 11,685 | 0.7 |
| Ambulances | 7,343 | 0.5 | 8,389 | 0.5 |
| Miscellaneous maintenance expenditure | 8,982 | 0.6 | 10,126 | 0.6 |
| Administration | 76,977 | 5.1 | 80,981 | 4.9 |
| Interest on loans | 58,466 | 3.8 | 52,322 | 3.2 |
| National Provident Fund | 14,705 | 0.9 | 17,233 | 1.1 |
| Totals | 1,517,083 | 100.0 | 1,641,655 | 100.0 |
Capital expenditure for the year 1935–36 totalled £279,449, this amount including £64,071 in respect of amortization of loan-money. The total expenditure for the year, excluding amounts paid from one Board or departmental institution to another, was thus £1,921,104.
The average annual cost of maintenance of general hospitals per occupied bed was as follows in the years shown: —
| Year. | Provisions. | Surgery and Dispensary. | Domestic and Establishment. | Salaries and Wages. | Miscellaneous. | Total Maintenance. |
|---|---|---|---|---|---|---|
| £ | £ | £ | £ | £ | £ | |
| 1910–11 | 22.7 | 8.7 | 26.7 | 38.8 | 2.7 | 99.6 |
| 1914–15 | 25.0 | 10.7 | 27.0 | 43.5 | 1.9 | 108.1 |
| 1919–20 | 40.4 | 15.4 | 43.2 | 52.4 | 0.3 | 151.7 |
| 1924–25 | 40.9 | 14.9 | 50.4 | 77.0 | 8.4 | 191.6 |
| 1930–31 | 40.7 | 18.0 | 52.6 | 91.4 | 1.8 | 204.5 |
| 1932–33 | 31.3 | 15.4 | 41.9 | 82.1 | 2.7 | 173.4 |
| 1933–34 | 29.4 | 16.5 | 40.6 | 79.4 | 2.6 | 168.5 |
| 1934–35 | 29.8 | 16.6 | 41.1 | 80.2 | 3.5 | 171.2 |
| 1935–36 | 31.7 | 17.8 | 44.5 | 85.4 | 3.9 | 183.3 |
Charitable-aid expenditure has been as follows during the last ten years:—
| Year. | Indoor Relief. | Outdoor Relief. | Total. |
|---|---|---|---|
| £ | £ | £ | |
| 1926–27 | 112,726 | 92,922 | 205,648 |
| 1927–28 | 112,755 | 112,519 | 225,274 |
| 1928–29 | 110,874 | 134,864 | 245,738 |
| 1929–30 | 114,532 | 140,065 | 254,597 |
| 1930–31 | 119,774 | 192,073 | 311,847 |
| 1931–32 | 99,688 | 269,632 | 369,320 |
| 1932–33 | 98,788 | 195,883 | 294,671 |
| 1933–34 | 103,316 | 172,692 | 276,008 |
| 1934–35 | 105,741 | 176,894 | 282,635 |
| 1935–36 | 112,973 | 187,267 | 300,240 |
The sharp rise in outdoor relief which took place during 1930–31 and the succeeding year is attributable mainly to the provision of relief necessitated by unemployment. As from 1932–33 Hospital Boards were relieved of responsibility for the bulk of unemployment relief.
The following shows, for triennial periods, the average annual net maintenance requirements of Hospital Boards—i.e., the average estimated deficit which is provided for by levies on the local authorities and Government subsidy thereon:—
| Average of Triennium. | Amount. £ |
|---|---|
| 1925–28 | 979,333 |
| 1926–29 | 1,074,138 |
| 1927–30 | 1,156,254 |
| 1928–31 | 1,193,380 |
| 1929–32 | 1,156,699 |
| 1930–33 | 1,116,503 |
| 1931–34 | 1,075,146 |
| 1932–35 | 1,086,479 |
| 1933–36 | 1,100,228 |
| 1934–37 | 1,173,581 |
The following shows the total cost to the public funds of hospitals and charitable aid for the past decade, as represented by levies and subsidies for both capital and maintenance purposes; including also subsidies on voluntary contributions (while in force) and expenditure out of the Health Department's own vote:—
| Year. | Levies made. | Subsidies payable. | Expenditure out of Department's Vote. | Total. | Amount per Head of Population. |
|---|---|---|---|---|---|
| £ | £ | £ | £ | s. d. | |
| 1926–27 | 562,718 | 588,573 | 132,568 | 1,283,859 | 18 1 |
| 1927–28 | 626,127 | 654,902 | 158,165 | 1,439,194 | 19 11 |
| 1928–29 | 675,238 | 698,105 | 158,040 | 1,531,383 | 21 0 |
| 1929–30 | 688,279 | 718,025 | 177,465 | 1,583,769 | 21 5 |
| 1930–31 | 695,264 | 707,581 | 188,670 | 1,591,515 | 21 3 |
| 1931–32 | 564,135 | 559,077 | 152,724 | 1,275,936 | 16 10 |
| 1932–33 | 578,901 | 604,043 | 128,524 | 1,311,468 | 17 5 |
| 1933–34 | 586,318 | 584,479 | 142,852 | 1,313,649 | 17 0 |
| 1934–35 | 601,715 | 593,998 | 118,132 | 1,313,845 | 16 11 |
| 1935–36 | 621,271 | 621,308 | 127,106 | 1,369,685 | 17 6 |
The amount of patients' fees received per occupied bed in Hospital Boards' Hospitals in 1913–14 was £23.4; in 1935–36, exclusive of fees received from other Boards, it was £46.7. Receipts during the past five years have been as follows:—
| Total. | Amount per Occupied Bed. | |
|---|---|---|
| £ | £ | |
| 1931–32 | 308,164 | 60.5 |
| 1932–33 | 280,251 | 56.6 |
| 1933–34 | 276,310 | 51.5 |
| 1934–35 | 257,102 | 45.9 |
| 1935–36 | 272,449 | 46.7 |
Included in these fees are amounts paid by the Government, which in 1935–36 amounted to £33,708.
During the year 1935–36 fifteen new loans aggregating £108,450 were authorized for terms ranging from five to twenty years.
The amount of loans outstanding at the 31st March, 1936, was £1,125,589. This amount, however, is reduced by a sum of £103,676 standing to the credit of sinking funds, making the net amount of loan-money £1,021,913.
Subsection D of the preceding section contains statistics of inpatients treated at public hospitals other than maternity hospitals. In the following table the figures are inclusive of maternity hospitals, sanatoria, &c., and relate to the financial year instead of to the calendar year:—
| Year. | Inpatients treated. | Average Number of Occupied Beds. | Beds available. | |||
|---|---|---|---|---|---|---|
| Total Number. | Proportion per 1,000 of Population. | Number. | Proportion per 1,000 of Population. | Number. | Proportion per 1,000 of Population. | |
| 1910–11 | 25,191 | 24.1 | 2,025 | 1.9 | 3,222 | 3.1 |
| 1926–27 | 75,708 | 53.3 | 5,318 | 3.7 | 7,847 | 5.5 |
| 1927–28 | 79,842 | 55.3 | 5,608 | 3.9 | 8,007 | 5.6 |
| 1928–29 | 87,888 | 60.2 | 6,134 | 4.2 | 8,457 | 5.8 |
| 1929–30 | 89,761 | 60.7 | 6,057 | 4.1 | 8,577 | 5.8 |
| 1930–31 | 89,147 | 59.5 | 5,912 | 3.9 | 8,803 | 5.9 |
| 1931–32 | 85,562 | 56.4 | 5,564 | 3.7 | 8,646 | 5.7 |
| 1932–33 | 85,646 | 56.0 | 5,395 | 3.5 | 8,416 | 5.5 |
| 1933–34 | 91,062 | 59.0 | 5,677 | 3.7 | 8,698 | 5.6 |
| 1934–35 | 96,276 | 61.9 | 5,873 | 3.8 | 8,746 | 5.6 |
| 1935–36 | 100,592 | 64.3 | 6,101 | 3.9 | 8,842 | 5.6 |
The number of institutions coming under the head of public hospitals at 31st March, 1936, was 130, comprising 69 general hospitals (2 of which were also old people's homes, and 2 special hospitals), 1 chronic hospital, 2 convalescent hospitals, 44 maternity hospitals, 5 tuberculosis sanatoria, 1 tuberculosis prevention institution, 2 chronic-tubercular hospitals, 2 tuberculosis dispensaries, and 4 infectious-diseases hospitals. A comparison of beds and patients for the last five years is given: —
| 1931–32. | 1932–33. | 1933–34. | 1934–35. | 1935–36. | |
|---|---|---|---|---|---|
* In addition, dental cases treated during the year and attendances were: Auckland, 4,164, 13,674; Wellington, 8,628, 19,107; Christchurch, 6,061, 20,107; and Timaru, 1,148, 4,429. | |||||
| Number of institutions | 140 | 133 | 131 | 129 | 130 |
| Number of beds— | |||||
| General | 4,633 | 4,605 | 4,769 | 4,851 | 4,958 |
| Children's cots | 999 | 986 | 1,041 | 1,051 | 1,094 |
| Maternity | 612 | 610 | 604 | 597 | 603 |
| Tuberculosis | 1,133 | 1,044 | 1,094 | 1,098 | 1,089 |
| Infectious disease | 1,269 | 1,171 | 1,190 | 1,149 | 1,098 |
| Totals | 8,646 | 8,416 | 8,698 | 8,746 | 8,842 |
| Average number of occupied beds per diem | 5,564 | 5,395 | 5,677 | 5,873 | 6,101 |
| Inpatients treated during year | 85,562 | 85,646 | 91,062 | 96,276 | 100,592 |
| Deaths during year | 3,850 | 3,818 | 4,068 | 4,399 | 4,567 |
| Outpatients— | |||||
| Number | 86,873 | 83,285 | 81,599 | 109,382 | 115,512* |
| Attendances | 442,041 | 387,087 | 386,796 | 495,232 | 492,671* |
The Private Hospitals Act, which came into force on the 1st January, 1907, is now embodied in the Hospitals and Charitable Institutions Act, 1926, Part III of which provides for the licensing, management, and inspection of private hospitals. All such institutions must be licensed, and every application for a license must be accompanied by a full description and plan of the house proposed to be used, together with a statement showing the number and class of cases proposed to be received. The license shall state whether it is in respect of a lying-in private hospital or a surgical and medical private hospital, or if for both classes of cases; and no private hospital may be used for any purpose other than that in respect of which the license is granted and purposes reasonably incidental thereto.
For every private hospital there must be a resident manager, either the licensee or some person appointed by the licensee, and in every case the manager must be a legally qualified medical practitioner or a registered nurse in the case of a surgical and medical hospital, or a registered midwife in the case of a lying-in hospital, or a registered nurse and midwife, or a registered nurse having as resident assistant a registered midwife, in the case of a hospital licensed for both purposes. No license may be granted in respect of a house not previously licensed until such house and annexed buildings have been approved by the Director-General of Health, and no addition may be made to any private hospital until it has been so approved. No license may be granted until the character and fitness of the applicant have been proved satisfactory. The license must be renewed on the 1st January of each year.
In every private hospital there must be kept a register of patients showing particulars as to name, age, abode, and date of reception of each patient, date when such patient left, or, in the event of death, the date thereof, name of medical practitioner attending, and such other details as may be prescribed. Inquiry may be made at any time as to the management, conduct, and equipment of any private hospital, and if such inquiry prove unsatisfactory the license may be revoked. Provision is made for the inspection of private hospitals in the same manner as for public institutions of the like nature.
The total number of private hospitals licensed in the Dominion is 312, of which 95 are medical and surgical hospitals, 34 medical, surgical, and maternity institutions, and 157 maternity hospitals. These hospitals provide 1,375 beds for medical and surgical cases, and 993 beds for maternity cases.
There were in 1935 five State maternity (St. Helens) hospitals open for the use of women in cases where the husband's income does not exceed £5 per week, and in cases of large families £6 per week. The charge for this service is 6s. per day, plus confinement-fee of £1 1s.
Two St. Helens Hospitals—Wanganui and Gisborne—were during the year 1933 handed over to the control of the Wanganui and Cook Hospital Boards respectively.
This service is given under the supervision of the Medical Superintendent, who is also responsible for the conduct of all abnormal cases and for the supervision of the ante-natal and post-natal care of all patients attending. There is also an outpatient department attached to each hospital, which provides (at a charge of £2) nursing services for patients not entering the institution. If the patient is confined by the District Midwife the charge is £2 10s.
The statistics given below for the year 1936 cover only the five State maternity (St. Helens) hospitals.
| Hospital, and Year of Opening. | Number of Beds. | Confinements in Institution. | Confinements attended Outside. | |||
|---|---|---|---|---|---|---|
| Total Live-births. | Total Stillbirths. | Deaths of Mothers. | Deaths of Infants in Hospital. | |||
| Auckland (1906) | 32 | 631 | 27 | 3 | 11 | 70 |
| Wellington (1905) | 26 | 518 | 24 | 7 | 21 | |
| Christchurch (1907) | 15 | 355 | 20 | 6 | 77 | |
| Dunedin (1905) | 15 | 163 | 4 | 1 | ||
| Invercargill (1918) | 12 | 279 | 6 | 1 | 3 | |
| Totals | 100 | 1,946 | 81 | 4 | 28 | 168 |
During the ten years ended December, 1936, total live-births in State maternity (St. Helens) hospitals numbered 21,671; still-births, 660; deaths of mothers, 52; deaths of infants in hospital, 306; and confinements attended outside, 3,740.
There were as at 31st March, 1936, seventy-one public maternity hospitals or maternity wards attached to public hospitals under control of Hospital Boards or Hospital Trustees. These maternity hospitals and wards provide 530 beds. They are open to any district residents irrespective of income, the charges varying from £1 10s. to £5 5s. per week for those who are able to pay. At most of these institutions patients may be attended by the midwives in charge of the institution, under the supervision of the medical superintendent of the hospital, or in some instances may engage their own medical attendants.
For the reception of single girls there are special charitable institutions at Auckland, Wellington, Christchurch, and Invercargill, in addition to those established by the Salvation Army at the four chief centres and at Napier and Gisborne.
Twenty-three Hospital Boards have midwives doing district work, in most cases in conjunction with other health work. In addition, there are thirty-two District nurses appointed for the purpose of attending the Maori population, part of whoso work is the attendance on Maori women during confinement.
Thirty-nine free public ante-natal clinics have been established in various parts of New Zealand in connection with State or public maternity hospitals or maternal welfare societies, such as the Plunket Society. These clinics are conducted by registered midwives and registered nurses who have been specially trained for this purpose, and they work in conjunction with the medical attendants or midwives engaged to attend the patients during labour. The training of midwives in New Zealand includes training in ante-natal work. The total attendances at the various free clinics in New Zealand during 1936 were 36,272. Several thousand copies of the pamphlet “Suggestions to Expectant Mothers” have been distributed free, mainly through these clinics. This pamphlet gives simple instructions for the maintenance of health during pregnancy and information regarding the necessary preparation for confinements to be conducted in private houses.
Every effort is being made to impress the public with the importance of parental hygiene and systematic ante-natal care throughout pregnancy. Addresses and lectures are delivered by Medical Officers of the Department of Health to nurses and societies interested in this subject. So that there will be definite co-operation between the midwife and the ante-natal clinic, and in order that the midwife may be informed of the clinical methods adopted by the Health Department, refresher courses of lectures, given particularly on ante-natal work, are available to all registered midwives and maternity nurses.
One hundred and twenty-one institutions classed under the heading of benevolent and orphan asylums furnished returns to the Census and Statistics Department for the year 1936. These institutions, which are conducted by Hospital Boards, religious bodies, and other public or semi-public organizations, are alike in that they provide accommodation on a benevolent or charitable basis, but differ largely in the classes of persons to whom they afford assistance. The generic name covers old people's homes, maternity and refuge homes for women and girls, orphanages, homes for the infirm or afflicted, “prison gate” homes, and an institute for the blind. Some of the orphanages deal with cases similar to those dealt with by the special schools under the control of the Education Department, and a few of the women's institutions receive offenders committed to them by the Court. The following table relates to the year 1936.
| Controlling Authorities. | Number of Institutions. | Inmates at 1st January. | Admissions during Year. | Births in Institutions during Year. | Discharges during Year. | Deaths in Institutions during Year. | Inmates at 31st December. | Total Inmates during Year. |
|---|---|---|---|---|---|---|---|---|
| Hospital Boards | 25 | 1,456 | 1,540 | 259 | 1,454 | 306 | 1,495 | 3,255 |
| Church of England | 17 | 683 | 271 | 45 | 319 | 4 | 676 | 999 |
| Roman Catholic Church | 16 | 1,514 | 489 | 466 | 70 | 1,467 | 2,003 | |
| Presbyterian Church | 16 | 464 | 103 | 96 | 13 | 458 | 567 | |
| Methodist Church | 5 | 169 | 101 | 117 | 153 | 270 | ||
| Baptist Church | 1 | 54 | 23 | 26 | 51 | 77 | ||
| Brethren | 1 | 21 | 33 | 34 | 20 | 54 | ||
| Salvation Army | 25 | 836 | 2,039 | 463 | 2,450 | 12 | 876 | 3,338 |
| Undenominational associations, &c. | 15 | 609 | 709 | 383 | 1,107 | 15 | 579 | 1,701 |
| Totals | 121 | 5,806 | 5,308 | 1,150 | 6,069 | 420 | 5,775 | 12,264 |
In many cases there is a variation in the class of inmate provided for by the different controlling bodies. For instance, none of the homes under the supervision of the Roman Catholic Church, the Presbyterian Church, the Methodist Church, the Baptist Church, or the Brethren are maternity homes of any description. The four last-mentioned churches control children's homes and orphanages only, while the Church of England caters chiefly for children, although some maternity cases are dealt with. Again, the Hospital Boards concentrate chiefly upon old people's homes, while the Salvation Army deals with all types, and is the only body that conducts extensively the “prison-gate” or industrial type of institution. Factors such as these affect the demands made upon the different institutions for accommodation or relief.
The ages and sexes of all inmates in the institutions at 31st December, 1936, were as follows: —
| Age-group. | Males. | Females. | Total. |
|---|---|---|---|
| Under 5 years | 248 | 209 | 457 |
| 5 and under 10 years | 450 | 379 | 829 |
| 10 and under 15 years | 659 | 617 | 1,276 |
| 15 and under 17 years | 87 | 198 | 285 |
| 17 and under 25 years | 51 | 290 | 341 |
| 25 and under 35 years | 76 | 142 | 218 |
| 35 and under 45 years | 86 | 100 | 186 |
| 45 and under 55 years | 157 | 127 | 284 |
| 55 and under 65 years | 284 | 129 | 413 |
| 65 years and over | 974 | 434 | 1,408 |
| Unspecified | 59 | 19 | 78 |
| Totals | 3,131 | 2,644 | 5,775 |
Some remarkable differences in the sex proportions at the various age-groups are apparent in the foregoing table. The first three groups, which relate to infants and young children, naturally show relatively little disparity. The next two groups, covering ages 15 and under 25 years, shows a large excess of females. The female figures for this group, of course, are greatly swollen by the inclusion of girls and young women seeking refuge in maternity homes. The figures are also affected by the fact that the majority of boys who have spent most of their lives in orphanages obtain outside employment at these ages. The former influence continues to be in evidence in the following age-group also. From 45 onwards a distinct male excess is observed.
The overwhelming majority of males dependent upon charitable aid at these later ages is indeed remarkable, although the “prison-gate” and industrial type of home no doubt swells the numbers at this stage.
The next table contains information concerning inmates of orphanages and of a few other institutions which provide for both children and older people. The figures relate to inmates under the age of twenty-one who were remaining in the institutions at 31st December, 1936.
| Age, in Completed Years. | Legitimate. | No Information as to Legitimacy. | Illegitimate. | Total. | ||||
|---|---|---|---|---|---|---|---|---|
| Father and Mother both Alive. | Father Dead, Mother Alive. | Father Alive, Mother Dead. | Father and Mother both Dead. | No Information as to Orphanhood | ||||
| 0 | 8 | 2 | 13 | 23 | ||||
| 1 | 15 | 1 | 7 | 32 | 55 | |||
| 2 | 23 | 5 | 1 | 27 | 56 | |||
| 3 | 29 | 2 | 9 | 2 | 1 | 24 | 67 | |
| 4 | 47 | 2 | 13 | 3 | 15 | 80 | ||
| 5 | 51 | 4 | 27 | 1 | 2 | 20 | 105 | |
| 6 | 95 | 8 | 36 | 3 | 1 | 23 | 166 | |
| 7 | 75 | 10 | 47 | 5 | 1 | 4 | 19 | 161 |
| 8 | 99 | 13 | 48 | 8 | 1 | 24 | 193 | |
| 9 | 85 | 16 | 56 | 8 | 1 | 22 | 188 | |
| 10 | 110 | 23 | 71 | 16 | 1 | 35 | 256 | |
| 11 | 90 | 26 | 70 | 13 | 4 | 3 | 27 | 233 |
| 12 | 93 | 21 | 94 | 16 | 2 | 2 | 27 | 255 |
| 13 | 79 | 25 | 79 | 21 | 5 | 2 | 28 | 239 |
| 14 | 59 | 19 | 60 | 21 | 3 | 1 | 23 | 186 |
| 15 | 34 | 16 | 49 | 20 | 1 | 1 | 13 | 134 |
| 16 | 20 | 7 | 25 | 10 | 2 | 12 | 76 | |
| 17 | 10 | 3 | 13 | 1 | 1 | 3 | 31 | |
| 18 | 3 | 3 | 4 | 2 | 6 | 18 | ||
| 19 | 2 | 1 | 1 | 2 | 1 | 5 | 12 | |
| 20 | 4 | 2 | 2 | 1 | 3 | 12 | ||
| Totals | 1,031 | 200 | 718 | 151 | 26 | 19 | 401 | 2,546 |
Contrary to what might generally be expected, the above figures reveal that the largest group is that covering children both of whose parents were shown to have been alive. Cases where both parents were dead were in the minority.
THERE are eight public mental hospitals in the Dominion maintained wholly or in part out of the public revenue. There is also one private hospital licensed for the reception of the mentally afflicted.
The patients on the register at the end of 1936 were distributed as shown below. Numbers given throughout this subsection are inclusive of Maoris. Figures for Maoris are also given separately toward the end of the subsection.
| Mental Hospital. | Males. | Females. | Total. |
|---|---|---|---|
| Auckland | 721 | 559 | 1,280 |
| Kingseat (Papakura) | 297 | 286 | 583 |
| Tokanui | 327 | 284 | 611 |
| Porirua | 839 | 652 | 1,491 |
| Nelson | 482 | 364 | 846 |
| Hokitika | 221 | 237 | 458 |
| Christchurch | 752 | 644 | 1,366 |
| Seacliff and Waitati | 704 | 480 | 1,184 |
| Ashburn Hall (private mental hospital) | 14 | 27 | 41 |
| Totals | 4,357 | 3,503 | 7,860 |
The number of patients remaining at the end of each of the last five years is shown in the following table: —
| Year. | Patients remaining at 31st December. | Proportion per 10,000 of Total Population. | ||||
|---|---|---|---|---|---|---|
| Males. | Females. | Total. | Males. | Females. | Total. | |
| 1932 | 3,903 | 2,980 | 6,883 | 49.98 | 39.53 | 44.85 |
| 1933 | 4,065 | 3,217 | 7,282 | 51.69 | 42.29 | 47.07 |
| 1934 | 4,133 | 3,300 | 7,433 | 52.18 | 43.06 | 47.70 |
| 1935 | 4,282 | 3,405 | 7,687 | 53.74 | 44.05 | 48.97 |
| 1936 | 4,357 | 3,503 | 7,860 | 54.17 | 44.89 | 49.60 |
| Average of five years | 4,148 | 3,281 | 7,429 | 52.37 | 42.79 | 47.66 |
The total number of patients under oversight, care, or control during 1936 was 9,227 (males 4,942, females 4,285), as against 8,734 in 1935. The average number resident in mental hospitals was 7,114 in 1935 and 7,288 in 1936.
The total admissions to mental hospitals during the year 1936 were 1,109 (553 males and 556 females), this number not including 431 transfers from one institution to another. The causes of insanity as assigned on admission are given.
| Heredity | 86 |
| Congenital | 174 |
| Previous attack | 171 |
| Puberty and adolescence | 44 |
| Climacteric | 30 |
| Puerperal state | 11 |
| Senility | 122 |
| Involution | 43 |
| Mental stress, prolonged | 215 |
| Toxic | 13 |
| Syphilis | 35 |
| Drug addiction | 1 |
| Constitutional | 5 |
| Alcohol | 23 |
| Encephalitis | 2 |
| Epilepsy | 30 |
| Organic brain-disease | 17 |
| Arterio-sclerosis | 50 |
| Traumatic | 3 |
| III health | 34 |
| Totals, excluding transfers (431) | 1,109 |
Of the 1,109 persons admitted to mental hospitals during 1936, those admitted for the first time to any mental hospital in New Zealand numbered 948 (males 483, females 465), and those readmitted 161 (males 70, females 91).
The figures for 1936 represent one first admission for every 1,660 persons in the mean population of the Dominion. The number of first admissions and the rate per 10,000 of mean population for each of the last five years were as follows:—
| Year. | Number of First Admissions. | Proportion per 10,000 of Mean Population. | ||||
|---|---|---|---|---|---|---|
| Males. | Females. | Total. | Males. | Females. | Total. | |
| 1932 | 489 | 395 | 884 | 6.29 | 5.27 | 5.79 |
| 1933 | 486 | 458 | 944 | 6.21 | 6.05 | 6.13 |
| 1934 | 405 | 423 | 828 | 5.14 | 5.54 | 5.34 |
| 1935 | 501 | 410 | 911 | 6.31 | 5.33 | 5.83 |
| 1936 | 483 | 465 | 948 | 6.04 | 5.99 | 6.01 |
| Average of five years | 473 | 430 | 903 | 6.00 | 5.64 | 5.82 |
Persons labouring under mental defect, but capable of understanding the meaning of the procedure, may seek admission to a mental hospital as voluntary boarders. At the beginning of 1936 there were 359 patients on the books (199 males, 160 females), and during the year 303 (160 males, 143 females) were admitted. If a voluntary boarder should after admission show mental defect sufficiently pronounced and sustained to render it improper to classify him any longer as such, application for a reception order is made to a Magistrate. During the year 1936, 41 (21 males, 20 females) were transferred from the voluntary to the ordinary register, and 7 males and 10 females died, while 248 (137 males, 111 females) were discharged, leaving 356 on the records at the end of the year (194 males, 162 females).
A summary is attached showing the ages of patients in mental hospitals at the end of 1936.
| Age, in Years. | Males. | Females. | Total. |
|---|---|---|---|
| 1 and under 5 | 22 | 7 | 29 |
| 5 and under 10 | 67 | 50 | 117 |
| 10 and under 15 | 168 | 73 | 241 |
| 15 and under 20 | 239 | 161 | 400 |
| 20 and under 30 | 621 | 421 | 1,042 |
| 30 and under 40 | 721 | 533 | 1,254 |
| 40 and under 50 | 744 | 719 | 1,463 |
| 50 and under 60 | 845 | 761 | 1,606 |
| 60 and under 70 | 586 | 468 | 1,054 |
| 70 and under 80 | 245 | 227 | 472 |
| 80 and under 90 | 53 | 47 | 100 |
| 90 and over | 6 | 3 | 9 |
| Unknown | 40 | 33 | 73 |
| Totals | 4,357 | 3,503 | 7,860 |
The next table gives the average number resident, those who were discharged as recovered, and those who died, during the period 1932–36.
| Year. | Average Number Resident. | Discharged as recovered. | Died. | ||
|---|---|---|---|---|---|
| Number. | Per Cent. of Number admitted. | Number. | Per Cent. of Average Number Resident. | ||
| 1932 | 6,419 | 301 | 28.10 | 388 | 6.4 |
| 1933 | 6,741 | 261 | 23.37 | 345 | 5.12 |
| 1934 | 6,938 | 260 | 26.45 | 436 | 6.28 |
| 1935 | 7,114 | 253 | 23.67 | 435 | 6.11 |
| 1936 | 7,288 | 270 | 24.34 | 465 | 6.38 |
| Average of five years | 6,900 | 269 | 25.14 | 414 | 6.00 |
The table following shows the length of residence in mental hospitals of patients who died and of patients who were discharged recovered during the year 1936. Of those discharged recovered, 52 per cent. had been inmates for less than one year.
| Length of Residence. | Patients who died. | Patients discharged recovered. | ||||
|---|---|---|---|---|---|---|
| Males. | Females. | Total. | Males. | Females. | Total. | |
| Under 1 month | 20 | 26 | 46 | 2 | 1 | 3 |
| 1 month and under 3 months | 27 | 11 | 38 | 14 | 11 | 25 |
| 3 months and under 6 months | 16 | 15 | 31 | 15 | 14 | 29 |
| 6 months and under 9 months | 12 | 13 | 25 | 17 | 20 | 37 |
| 9 months and under 12 months | 11 | 11 | 22 | 23 | 25 | 48 |
| 1 year and under 2 years | 27 | 20 | 47 | 19 | 49 | 68 |
| 2 years and under 3 years | 14 | 7 | 21 | 14 | 13 | 27 |
| 3 years and under 5 years | 17 | 18 | 35 | 8 | 7 | 15 |
| 5 years and under 7 years | 13 | 20 | 33 | 8 | 5 | 13 |
| 7 years and under 10 years | 21 | 8 | 29 | 1 | 3 | 4 |
| 10 years and under 12 years | 10 | 7 | 17 | |||
| 12 years and under 15 years | 8 | 13 | 21 | |||
| 15 years and over | 46 | 38 | 84 | 1 | 1 | |
| Died during absence | 10 | 6 | 16 | |||
| Totals | 252 | 213 | 465 | 121 | 149 | 270 |
Old age and diseases of the circulatory system are the principal causes of death among mental hospital patients. The figures for the principal causes and groups of causes for the year 1936 are as follows:—
| Tuberculosis | 30 |
| Cancer | 15 |
| Other general diseases | 22 |
| General paralysis of the insane | 26 |
| Epilepsy | 26 |
| Other diseases of the nervous system | 55 |
| Diseases of the circulatory system | 117 |
| Diseases of the respiratory system | 39 |
| Diseases of the digestive system | 19 |
| Diseases of the genito-urinary system | 5 |
| Old age | 87 |
| External causes | 8 |
| Died while on leave | 16 |
| Total | 465 |
A table is added showing for all admissions since 1876 the percentages of patients discharged (as recovered and relieved, separately), died, and remaining.
| — | Males. | Females. | Both Sexes. |
|---|---|---|---|
* Includes a small number of patients discharged whose condition was not improved. | |||
| Discharged— | Per Cent. | Per Cent. | Per Cent. |
| Recovered | 34.51 | 39.88 | 36.81 |
| Relieved* | 9.68 | 11.45 | 10.44 |
| Died | 37.29 | 28.88 | 33.68 |
| Remaining at end of 1936 | 18.52 | 19.79 | 19.07 |
| Total admissions 1876–1936 | 100.00 | 100.00 | 100.00 |
A license may be granted to enable a private mental hospital to receive patients for treatment. Stringent conditions are attached to the issue of such licenses, which may be revoked at any time. The Director-General has wide powers in the regulation and control of private institutions, which are placed practically on the same footing as public mental hospitals in regard to inspection and other matters.
There is only one licensed private institution in the Dominion, that at Wakari (Ashburn Hall), near Dunedin, established in 1882. Particulars of admissions, discharges, deaths, and patients remaining, for the last five years, are as follows. These figures are included in preceding tables.
| Year. | Admissions. | Discharges. | Deaths. | Patients remaining at End of Year. |
|---|---|---|---|---|
| 1932 | 6 | 10 | 3 | 36 |
| 1933 | 12 | 9 | 3 | 36 |
| 1934 | 13 | 7 | 3 | 39 |
| 1935 | 10 | 9 | 4 | 36 |
| 1936 | 11 | 4 | 2 | 41 |
The number of Maoris admitted as patients to mental hospitals is small. The figures for the last five years are—
| Year. | Admitted during Year. | Remaining at End of Year. | ||||
|---|---|---|---|---|---|---|
| Males. | Females. | Totals. | Males. | Females. | Totals. | |
| 1932 | 15 | 11 | 26 | 53 | 49 | 102 |
| 1933 | 14 | 13 | 27 | 64 | 47 | 111 |
| 1934 | 17 | 14 | 31 | 68 | 54 | 122 |
| 1935 | 12 | 6 | 18 | 75 | 43 | 118 |
| 1936 | 18 | 16 | 34 | 82 | 59 | 141 |
The above figures are also included in the tables covering all inmates of mental hospitals.
The total expenditure on maintenance of mental hospitals (not including the cost of new buildings and additions), and receipts from patients and for sale of produce, &c., during the last five years were as follows:—
| Year. | Total Expenditure. | Receipts from Patients, Sale of Produce, &c. | Net Expenditure. | ||
|---|---|---|---|---|---|
| Total. | Per Head of Mean Population. | ||||
| £ | £ | £ | s. | d. | |
| 1932–33 | 404,010 | 163,963 | 240,047 | 3 | 1½ |
| 1933–34 | 401,220 | 167,720 | 233,500 | 3 | 0½ |
| 1934–35 | 424,119 | 171,677 | 252,442 | 3 | 3 |
| 1935–36 | 462,318 | 182,735 | 279,583 | 3 | 7 |
| 1936–37 | 524,310 | 189,847 | 334,463 | 4 | 3 |
Table of Contents
THE provision of educational facilities in New Zealand dates back into the first years of British settlement in the country. Immediately after the advent of the first missionaries, schools for the instruction of the Native youth were established. Later, as a European population settled in the country, the need for a means of educating the white children arose, and finally the necessity for some co-ordinated scheme for the whole colony asserted itself. This was consummated in the Education Act of 1877, which Act is the basis of the system of education obtaining in the Dominion at the present day.
A very full and informative historical account of educational legislation and progress in New Zealand is given in Parliamentary Paper I.–8A of the 1930 session.
The passing of the Education Act of 1877 marked the foundation of the present system of free, compulsory,* and secular education. The outstanding feature of the Act was the establishment of (1) a central Department of Education controlled by a Minister of the Crown; (2) twelve education districts governed by Boards; and (3) school districts, which came under the jurisdiction of School Committees. On the Department was the onus of administering the annual appropriations by distributing to the Boards funds for the erection and maintenance of schools and the establishment of training or normal schools, and also the payment of capitation to the Boards at the rate of £3 15s. for each scholar in average daily attendance.
Education Boards were to be elected by School Committees, and to consist of nine members, three of whom were to retire annually. In the Boards were vested all property and endowments, and rents from these became part of the Board funds. The Boards were required to administer funds in carrying out the building arrangements for which grants were provided by the Department; in paying the salaries of teachers; and in granting to School Committees money for general educational purposes. The appointment and removal of teachers were in their hands, and the Act also gave the Boards power to establish scholarships, and to provide for secondary education in district high schools. Fees were, however, payable to Education Boards by pupils receiving secondary instruction. School Committees of seven members were to be elected annually. Generally the Committee had the management of educational matters within its own district, and out of the money received from the Board made payments incidental to the administration of the Committee's functions. In addition to these provisions the Act of 1877 specified the course of instruction to be given in the schools throughout the whole country. Inspectors, who were officers of the Education Boards, were appointed to examine and report on the school-work.
In the main the principles of the Act of 1877 are operative to-day. Several amendments made in succeeding years necessitated a consolidating measure in 1904. Among the principal alterations and additions that had been made up to that date were: The provision in 1900 for a comprehensive scheme of manual and technical instruction; the introduction of physical drill into the curriculum in 1901; and, in 1903, the institution of National Scholarships to be awarded by the Department and the introduction of a system of free places in secondary schools and district high schools for scholars who have completed the primary course. Up to the year 1901 also, each Board had its own scale of staffs and salaries, but an Act of 1901 fixed the relation of the number and the remuneration of teachers in a school to the number of pupils in attendance. In 1905 each education district was divided into three wards, each returning three members, one of whom in each ward retired annually.
* Every child between the ages of seven and fourteen years is required to be enrolled as a pupil of either a public or a registered school. The parents of a child of school age are liable to a penalty of £2 if such child is improperly enrolled at other than a public or registered school. There are statutory exemptions from attendance in certain circumstances.
No outstanding changes beyond the consolidation of education legislation in 1908 were made until 1914. By the Education Act of that year the whole of the law relating not only to public but also to secondary, technical, and special schools was recast. The principal changes involved the reorganization of the Department of Education, and the Inspector-General of Schools became Director of Education. Inspectors of Schools, who had hitherto been officers of the several Education Boards, became officers of the central Department, a provision, it may be noted, that had been deleted from the Bill of 1877. Provision was made for the constitution of fewer education districts in lieu of the thirteen then existing, and by an Act of 1915 nine were created. Every education district is divided into urban areas and a rural area. An urban area consists of a borough or a group of boroughs having more than eight thousand inhabitants; and the rural area, which comprises the rest of the district, is divided into three wards. The members for each ward of the rural area and for all urban areas are, as previously, elected by the members of the several School Committees. The number of members for the rural area of an Education Board is six—two for each ward. The number of members for each urban area is two for each sixty thousand or part of sixty thousand inhabitants. School Committees are elected by the householders, and hold office for two years. Prior to 1934 the term of tenure was one year.
Under the Act, a graded list of certificated teachers is compiled annually. Except in special cases, all teaching appointments are governed by the position of the applicants on the list, and it is also to some extent the basis for the determination of the rate of salary payable.
Amending legislation, mainly of an administrative character, has been enacted at various times since 1914. By the Education Amendment Act, 1921–22, the registration of all private schools is compulsory, and teachers in both public and private schools are required to take the oath of allegiance.
The Education Amendment Act, 1924, provided for the amalgamation of the governing bodies of secondary and technical schools, and the creation of a Teachers' Register. The Education Amendment Act, 1926, discontinued the system of issuing licenses to teach.
Part II (Education Amendment) of the Finance Act, 1931 (No. 2), abolished the Council of Education, District Advisory Committees, and also Junior and Senior National Scholarships, at the same time authorizing the establishment of bursaries for secondary or higher education.
By Part V (Education Amendment) of the Finance Act, 1932, no child under the age of six years could be enrolled in a public school. By the same Act minor changes were made in the sections of the Education Act, 1914, dealing with teachers' salaries.
The Education Amendment Act, 1932–33, provided for consolidation and amendment of the law in respect to the appointment and transfer of teachers in public schools, the establishment of intermediate schools and departments (previously junior high schools and departments), the amendment of the existing provisions governing the dismissal of teachers, the establishment of training colleges and authorization of advances to training college students with conditions as to their repayment, the enrolment of a child in a public school in the first four weeks of the term in which he reaches the age of six years, the compulsory attendance of a child at special classes if deemed to require special tuition, authority to regulate admissions to schools other than public schools, and the making of regulations for fixing terms and holidays and defining the public holidays in schools and training colleges.
In addition to minor amendments the Education Law Amendment Act, 1933, substituted biennial for annual elections of school committees.
Various minor amendments were made by the Education Law Amendment Act, 1934–35.
The Education Amendment Act, 1936, altered the definition of school age, permitted the enrolment of children in public and Native schools on reaching the age of five years, validated Orders in Council fixing the basis of computation of grants to be made to Education Boards and amending regulations increasing the allowances payable to training college students, authorized Education Boards to pay increased honoraria to Chairmen of Education Boards, empowered Education Boards to expend moneys for maintenance or improvement of school-grounds from the special fund for the maintenance and repair of schools and teachers' residences, made provision for the establishment of special classes in the homes of crippled children, amended the provisions as to the appointment of teachers to fill advertised positions, provided for the discontinuance of the proficiency examination and of the grant of certificates of proficiency and competency, and made retrospective the effect of proposed regulations increasing the allowances of student teachers in technical schools. The programme of primary instruction at present provided by the Act includes English, arithmetic, geography, history and civics, drawing and handwork (including needlework), nature - study and elementary science, physical instruction, moral instruction and health, and singing.
The number of scholars and students receiving instruction in the educational institutions of the Dominion is shown in the following summary. The table refers to roll numbers as at the end of the year in all cases except Technical Classes which are as at 1st July.
| Class of Institution. | 1933. | 1934. | 1935. | 1936. |
|---|---|---|---|---|
* A change in nomenclature was made in 1933, the term “junior high school” being replaced by “intermediate school.” | ||||
| Primary Education. | ||||
| Public (State) schools | 200,641 | 199,745 | 197,326 | 210,172 |
| Intermediate schools* and departments | ||||
| Native village schools | 7,340 | 7,587 | 7,876 | 9,175 |
| Native mission schools | 552 | 535 | 570 | 638 |
| Registered private primary schools | 26,428 | 26,636 | 26,869 | 27,709 |
| Lower departments of secondary schools | 178 | 168 | 200 | 214 |
| Correspondence classes (primary) | 1,319 | 1,326 | 1,444 | 1,658 |
| Chatham Islands | 149 | 157 | 163 | 166 |
| Total primary | 236,607 | 236,154 | 234,448 | 249,732 |
| Post-primary Education. | ||||
| Secondary schools | 13,309 | 13,487 | 13,648 | 14,002 |
| Combined schools | 1,929 | 1,919 | 1,974 | 1,986 |
| Secondary departments of district high schools | 4,389 | 4,365 | 4,593 | 4,070 |
| Secondary scholars at intermediate schools* | 122 | |||
| Technical high schools | 7,149 | 7,183 | 7,323 | 7,422 |
| Maori secondary (boarding) schools | 302 | 333 | 373 | 408 |
| Registered private and endowed secondary schools | 4,063 | 4,146 | 4,508 | 4,809 |
| Correspondence classes (secondary) | 355 | 396 | 519 | 758 |
| Total secondary | 31,618 | 31,829 | 32,938 | 33,455 |
| Technical Classes (excluding Technical High Schools and Technical Day Schools). | ||||
| Conducted by Education, Secondary, or High School Boards | 2,213 | 2,342 | 2,555 | 3,185 |
| Conducted by Technical School Boards | 6,524 | 6,951 | 7,992 | 8,992 |
| Conducted by University colleges | 341 | 304 | 286 | 304 |
| Total technical | 9,078 | 9,597 | 10,833 | 12,481 |
| University Education. | ||||
| University colleges | 3,960 | 3,910 | 4,109 | 4,377 |
| University students exempt from lectures | 846 | 811 | 709 | 590 |
| Lincoln Agricultural College | 44 | 53 | 67 | 41 |
| Massey Agricultural College | 235 | 285 | 220 | 210 |
| Total University | 5,085 | 5,059 | 5,105 | 5,218 |
| Total scholars and students | 282,388 | 282,639 | 283,324 | 300,886 |
In addition to the above, 1,701 children below school age were on the rolls of 34 kindergarten schools conducted by the New Zealand Free Kindergarten Association.
Public primary schools, including district high schools and 16 intermediate schools or departments, numbered 2,460 in 1936, 42 less than in 1935. The number of registered private primary schools from which returns were received by the Education Department was 309. Aided or endowed colleges, grammar schools, and high schools in operation numbered 42, combined secondary and technical high schools 6, technical high schools and technical day schools 21, registered private secondary schools 54, and University colleges 4. The number of primary and secondary schools established for the education of the Native race was 160.
The figures tabulated below concern pupils in public schools, and from 1927 to 1929 also include pupils of three junior high schools (now termed intermediate schools) which are administered by the Auckland Education Board. From 1930 to 1933 Forms I and II pupils and since 1934 all pupils of intermediate schools and departments have been included. Thus all pupils receiving primary instruction are accounted for in the figures from 1930 onwards.
| Year. | Population at 31st December (excluding Maoris). | Number of Schools (including Intermediate Schools and Departments). | Pupils at End of Year. | Mean of Average Weekly Roll. | Average Attendance, Whole Year. | Average Attendance as Percentage of Weekly Roll. |
|---|---|---|---|---|---|---|
| 1927 | 1,384,617 | 2,601 | 219,945 | 214,242 | 191,090 | 89.2 |
| 1928 | 1,400,240 | 2,598 | 218,794 | 214,394 | 193,420 | 90.2 |
| 1929 | 1,417,234 | 2,597 | 217,961 | 213,210 | 193,978 | 90.9 |
| 1930 | 1,436,111 | 2,601 | 218,479 | 212,702 | 196,082 | 92.2 |
| 1931 | 1,450,171 | 2,534 | 218,442 | 213,059 | 197,324 | 92.6 |
| 1932 | 1,460,006 | 2,528 | 207,280 | 210,078 | 193,701 | 92.2 |
| 1933 | 1,470,008 | 2,531 | 200,641 | 195,935 | 182,017 | 92.9 |
| 1934 | 1,478,989 | 2,548 | 199,745 | 194,812 | 177,947 | 91.3 |
| 1935 | 1,487,905 | 2,502 | 197,326 | 192,466 | 178,086 | 92.5 |
| 1936 | 1,500,658 | 2,460 | 210,172 | 203,631 | 187,660 | 92.2 |
Of the 2,460 schools shown above for 1936, 1,941 had average attendances of not more than eighty, and of these 861 had averages ranging from one to twenty.
The following figures show the number of schools and intermediate schools or departments as at 31st December, 1936, and the number of pupils at the end of each of the last five years. The latter figures are exclusive of the secondary departments of district high schools.
| District. | Schools at End of 1936. | Pupils at End of— | ||||
|---|---|---|---|---|---|---|
| 1932. | 1933. | 1934. | 1935. | 1936. | ||
| Auckland | 750 | 64,822 | 62,700 | 63,005 | 62,774 | 67,285 |
| Taranaki | 164 | 11,524 | 11,212 | 11,288 | 10,980 | 11,617 |
| Wanganui | 208 | 15,782 | 15,277 | 14,903 | 14,724 | 15,699 |
| Hawke's Bay | 184 | 15,442 | 14,870 | 14,694 | 14,550 | 15,376 |
| Wellington | 239 | 27,347 | 26,360 | 26,371 | 25,871 | 27,414 |
| Nelson | 136 | 6,529 | 6,328 | 6,299 | 6,308 | 6,771 |
| Canterbury | 371 | 34,813 | 33,858 | 33,589 | 32,956 | 34,999 |
| Otago | 233 | 19,608 | 18,957 | 18,560 | 18,133 | 19,197 |
| Southland | 175 | 11,413 | 11,079 | 11,036 | 11,030 | 11,814 |
| Totals | 2,460 | 207,280 | 200,641 | 199,745 | 197,326 | 210,172 |
In each of the education districts are located Inspectors of Schools, who form part of the staff of the Department of Education. The total number of primary-school Inspectors on the 31st December, 1936, was 38, allocated as follows: Auckland, 11; Taranaki, 2; Wanganui, 3; Hawke's Bay, 3; Wellington, 4; Nelson, 2; Canterbury, 6; Otago, 4; Southland, 3.
The following table relates to pupils on the rolls of the public schools and Forms I and II of intermediate schools and departments of the Dominion at the 1st July, 1936:—
| Age. | 1936. | Percentage of Total Pupils. | ||||||
|---|---|---|---|---|---|---|---|---|
| Boys. | Girls. | Total. | 1932. | 1933. | 1934. | 1935. | 1936. | |
| 5 and under 6 years | 9,157 | 8,496 | 17,653 | 7.6 | 1.0 | 1.0 | 1.4 | 8.6 |
| 6 and under 7 years | 11,228 | 10,735 | 21,963 | 11.2 | 11.7 | 11.6 | 11.5 | 10.8 |
| 7 and under 8 years | 11,828 | 11,260 | 23,088 | 11.8 | 12.4 | 12.5 | 12.4 | 11.3 |
| 8 and under 9 years | 12,165 | 11,347 | 23,512 | 11.5 | 12.8 | 12.6 | 12.5 | 11.5 |
| 9 and under 10 years | 12,462 | 11,784 | 24,246 | 11.7 | 12.3 | 12.8 | 12.6 | 11.9 |
| 10 and under 11 years | 12,466 | 11,777 | 24,243 | 12.4 | 12.6 | 12.4 | 13.0 | 11.9 |
| 11 and under 12 years | 12,717 | 11,874 | 24,591 | 11.9 | 13.1 | 12.5 | 12.4 | 12.1 |
| 12 and under 13 years | 11,566 | 10,634 | 22,200 | 11.1 | 11.9 | 12.3 | 11.8 | 10.9 |
| 13 and under 14 years | 8,335 | 6,907 | 15,242 | 7.0 | 8.3 | 8.3 | 8.5 | 7.5 |
| 14 and under 15 years | 3,562 | 2,413 | 5,975 | 3.0 | 3.1 | 3.3 | 3.2 | 2.9 |
| 15 and under 16 years | 740 | 300 | 1,040 | 0.7 | 0.7 | 0.6 | 0.6 | 0.5 |
| 16 years and over | 78 | 41 | 119 | 0.1 | 0.1 | 0.1 | 0.1 | 0.1 |
| Totals | 106,304 | 97,568 | 203,872 | 100.0 | 100.0 | 100.0 | 100.0 | 100.0 |
In 1936 21,819 pupils (11,364 boys and 10,455 girls) left public primary schools as against 22,108 (11,526 boys and 10,582 girls) in 1935. Of those leaving in 1936, 17,600, or 81 per cent., had passed Form II (Standard 6), and 4,219, or 19 per cent., had not passed that standard. The corresponding percentages in 1935 were 80 and 20.
Elementary handwork is taught by the staff in practically every school in the Dominion. The boys of Forms I and II (Standards 5 and 6) receive instruction from special teachers in woodwork or metalwork. The girls of similar standards also receive instruction from special instructors in domestic subjects, including cookery and domestic hygiene. Subjects relating to nature-study and general elementary science are taught by the staff under the supervision of itinerant instructors specially qualified in the work.
Up to the year 1930 annual grants were made to Education Boards on a capitation and subsidy basis for libraries in public schools. It was possible to reinstate in 1935 the grants at a rate somewhat lower than that enjoyed previously. These grants were maintained in 1936, and largely increased in 1937.
Since 1922, correspondence classes have been conducted for the primary education of children who would otherwise not be able to obtain any schooling. The classes are provided for the benefit of children in particularly isolated localities, but pupils are also enrolled who are unable to attend a public school through illness or physical disability. In 1928 preliminary arrangements were made for the establishment of a secondary department, and in February, 1920, post-primary courses in English, mathematics, geography, history, agriculture, Latin, and book-keeping were made available. The children taking those courses comprise ex-primary pupils living in remote districts, whose only opportunity of obtaining a secondary education is by means of correspondence. The courses provide instruction for public examinations, including the University Entrance and Training College Entrance Examinations. In some cases pupils of remote primary schools, on completion of their primary course, receive instruction in secondary subjects through their teacher, the papers being supplied by the Correspondence School. The benefit of correspondence tuition has now been extended to young persons in employment, including teachers of small public schools, junior assistants in Native schools, Post Office cadets, and others who are unable to attend post-primary schools for evening classes. A special feature is made of practical agriculture, a special assistant being appointed for this purpose.
At the end of 1936 there were 2,416 pupils on the roll of the correspondence classes, 1,658 being in the primary department and 758 in the secondary. The staff of the schools consists of a headmaster, 25 secondary and 33 primary assistant teachers, 9 of whom are engaged in the infant department, and 4 specialists engaged exclusively in teaching needlework. There are also 25 office assistants.
An illustrated paper, called the School Journal, is published by the Education Department monthly for use as the chief reader in primary schools and intermediate schools and departments, and is supplied to all schools and institutions under the Department's control. Since the year 1936 it has been supplied free to registered private schools. Of the last issue of the School Journal for the year 1936 the number of copies printed was—Part I, 68,000; Part II, 72,000; Part III, 67,000: total, 207,000.
A monthly Gazette is published by the Department. In addition to containing articles by leading educationists, it is a medium for the prompt dissemination of official information and for the advertisement of vacancies. Copies are distributed to educational authorities and to public schools throughout the Dominion.
Over 600 schools now “listen-in” to talks given from the YA stations at Auckland, Wellington, Christchurch, and Dunedin. The last-mentioned station re-broadcasts the Wellington programme.
Free passes on the railway to the nearest public or private school are granted to children living near a railway-line but out of reach of a primary school, and the same privilege is enjoyed by pupils having to travel to attend secondary schools, combined schools, district high schools, and technical high schools, and also by free-place holders travelling to attend technical schools or classes other than at technical high schools.
Education Boards are also authorized to make provision when necessary for the conveyance of pupils to primary schools by road or water. From the beginning of 1934 Education Boards were authorized to reinstate the grants made in the case of pupils who were obliged to live away from home in order to attend school. The Department has now approved payment for special conveyance services or travel by ordinary passenger services or for board allowance to enable pupils resident in remote localities to attend post-primary schools. The expenditure on these services for the last five years is shown in the following table:—
| — | 1932. | 1933. | 1934. | 1935. | 1936. | ||||||
|---|---|---|---|---|---|---|---|---|---|---|---|
| Rail. | Other* | Rail. | Other* | Rail. | Other, Including Board. | Rail. | Other, including Board. | Rail. | Other, Including Board. | Total. | |
* Boarding-allowance was not paid in 1932 and 1933. | |||||||||||
| £ | £ | £ | £ | £ | £ | £ | £ | £ | £ | £ | |
| Public primary | 7,212 | 67,781 | 6,703 | 63,042 | 6,699 | 63,517 | 6,581 | 70,700 | 4,704 | 82,415 | 87,119 |
| Private primary | 2,012 | 1,980 | 1,988 | 2,004 | 1,491 | 1,491 | |||||
| Native | 43 | 2,727 | 35 | 3,069 | 50 | 4,045 | 49 | 4,823 | 38 | 6,703 | 6,741 |
| Secondary departments of district high schools | 1,200 | 735 | 1,207 | 687 | 1,183 | 715 | 1,196 | 708 | 673 | 1,120 | 1,793 |
| Secondary | 4,300 | 280 | 4,572 | 90 | 4,353 | 153 | 4,387 | 3,098 | 3,419 | 6,517 | |
| Combined | 684 | 513 | 578 | 681 | 419 | 919 | 1,338 | ||||
| Technical | 5,940 | 5,833 | 6,093 | 6,151 | 3,984 | 1,250 | 5,234 | ||||
| Private secondary | 983 | 892 | 931 | 1,089 | 825 | 825 | |||||
| Totals | 22,380 | 71,523 | 21,735 | 66,888 | 21,875 | 68,430 | 22,138 | 70,231 | 15,232 | 95,826 | 111,058 |
Physical education, including swimming and life-saving, is recognized as part of the primary and post-primary school curriculum. In the public schools a period of not less than fifteen minutes a day is devoted to the subject, and in post primary schools at least one hour a week. Corrective classes are held in the larger schools for the purpose of remedying physical defects of the children.
The medical and dental inspection of school-children and the scheme of school dentistry are dealt with in Section VIA of this publication.
Of the 6,113 adult teachers at the end of 1936, 97.1 per cent. held teachers certificates. Probationers have not been appointed since 1931. The average number of pupils for each adult teacher was 30. The table following relates to adult teachers as at 31st December, 1936, but excludes 151 teachers in intermediate schools and departments:—
| Education District. | Sole Teachers. | Heads of Schools. | Assistant Teachers. | Total Number of Adult Teachers. | Percentage of Male to Female Adult Teachers. | |||
|---|---|---|---|---|---|---|---|---|
| M. | F. | M. | F. | M. | F. | |||
| Auckland | 253 | 112 | 320 | 39 | 238 | 936 | 1,898 | 74.6 |
| Taranaki | 42 | 37 | 61 | 23 | 25 | 178 | 366 | 53.8 |
| Wanganui | 71 | 47 | 76 | 9 | 43 | 224 | 470 | 67.9 |
| Hawke's Bay | 54 | 48 | 66 | 11 | 47 | 219 | 445 | 60.1 |
| Wellington | 42 | 80 | 81 | 22 | 111 | 423 | 759 | 44.6 |
| Nelson | 45 | 46 | 34 | 6 | 20 | 91 | 242 | 69.2 |
| Canterbury | 94 | 107 | 141 | 20 | 145 | 482 | 989 | 62.4 |
| Otago | 65 | 69 | 80 | 11 | 91 | 254 | 570 | 70.7 |
| Southland | 70 | 31 | 60 | 12 | 41 | 160 | 374 | 84.2 |
| Totals | 736 | 577 | 919 | 153 | 761 | 2,967 | 6,113 | 65.4 |
Omitting schools with fewer than twenty-one pupils the ratio of adult men teachers to adult women teachers in 1936 was 100 to 169. The proportion of men to women in charge of schools with not more than twenty scholars was 100 to 83. If the adult teacher of all public schools are taken, it is found that the ratio of men teachers to women teachers was 100 to 153 in 1936.
Information as to the Teachers' Superannuation Fund will be found in the section of this book dealing with Pensions, Superannuation, &c.
As from the beginning of 1936 the training of teachers was resumed in four training colleges situated respectively at Auckland, Wellington, Christchurch, and Dunedin. The normal course of training for Division A students is a period of two years at the training college, followed by a further period of one year as a probationary assistant attached to a public school.
The table following relates to the number of students in training at the end of 1936:—
| Training College. | Division A. | Division C. | All Students. | ||||
|---|---|---|---|---|---|---|---|
| M. | F. | M. | F. | M. | F. | Total. | |
| Auckland— | |||||||
| First year | 92 | 114 | 17 | 26 | 109 | 140 | 249 |
| Second year | 54 | 119 | 54 | 119 | 173 | ||
| Wellington— | |||||||
| First year | 56 | 104 | 8 | 12 | 64 | 116 | 180 |
| Second year | 13 | 22 | 13 | 22 | 35 | ||
| Christchurch— | |||||||
| First year | 62 | 111 | 14 | 16 | 76 | 127 | 203 |
| Second year | 41 | 68 | 41 | 68 | 109 | ||
| Dunedin— | |||||||
| First year | 48 | 78 | 11 | 17 | 59 | 95 | 154 |
| Second year | 27 | 48 | 27 | 48 | 75 | ||
| Totals | 393 | 664 | 50 | 71 | 443 | 735 | 1,178 |
By the Education Amendment Act, 1921–22, every private school was required to apply for registration before the 13th July, 1922, and no private school can now be established unless application is first made to the Department of Education for registration, and certain precedent conditions of efficiency and suitability of staff, premises, equipment, and curriculum are required to be fulfilled.
At the end of the year 1936 the number of registered private primary schools was 309, with a total roll number of 27,709 and an average attendance of 24,714 for the year.
| Year. | Number of Schools. | Roll at End of Year. | Average Yearly Attendance. | Teachers. | ||||
|---|---|---|---|---|---|---|---|---|
| Males. | Females. | Total. | Males. | Females. | Total. | |||
| 1932 | 309 | 12,510 | 13,900 | 26,410 | 23,837 | 107 | 850 | 957 |
| 1933 | 309 | 12,575 | 13,853 | 26,428 | 23,526 | 106 | 868 | 974 |
| 1934 | 307 | 12,762 | 13,874 | 26,636 | 23,385 | 98 | 891 | 989 |
| 1935 | 310 | 12,971 | 13,898 | 26,869 | 23,930 | 109 | 866 | 975 |
| 1936 | 309 | 13,398 | 14,311 | 27,709 | 24,714 | 115 | 877 | 992 |
The majority of the schools included in the preceding table are Roman Catholic, the figures for Roman Catholic schools for 1936 being—Schools, 224; scholars on roll at end of year, 23,728 (males 11,611, females 12,117); average yearly attendance, 21,222; teachers, 755 (males 49, females 706).
In addition to the 309 registered private primary schools there were 54 private secondary schools on the register at the end of 1936, with a total roll number of 4,241.
The number of Native village schools in operation at the end of 1936 was 140. In addition, there are twenty private schools at which education for Maori boys and girls is provided. Included in the twenty are ten boarding-schools which provide courses for primary and secondary education. Instruction is imparted by means of the English language only.
On the rolls of the 140 village schools at the end of 1936, there were 9,175 children (including 1,145 Europeans). The average attendance for the year was 8,140, the percentage of regularity being 900, and the average weekly roll number 9,041. The total number of pupils on the rolls of the Native mission schools was 638, and on those of the secondary schools 408. The total roll number of all the Native schools inspected by officers of the Education Department was 10,221.
The following table gives the principal statistics of Native village schools during the last ten years:—
| Year. | Number of Schools at End of Year. | Mean of Average Weekly Roll. | Average Attendance Whole Year. | Average Attendance as Percentage of Weekly Roll. | Number of Teachers. | |
|---|---|---|---|---|---|---|
| Males. | Females. | |||||
| 1927 | 134 | 6,655 | 5,817 | 87.4 | 104 | 193 |
| 1928 | 134 | 6,770 | 5,964 | 88.1 | 102 | 194 |
| 1929 | 137 | 6,955 | 6,252 | 899 | 104 | 203 |
| 1930 | 138 | 7,079 | 6,437 | 90.9 | 111 | 211 |
| 1931 | 139 | 7,499 | 6,804 | 90.5 | 111 | 212 |
| 1932 | 135 | 7,524 | 6,848 | 91.0 | 108 | 219 |
| 1933 | 137 | 7,346 | 6,581 | 89.6 | 114 | 218 |
| 1934 | 138 | 7,523 | 6,799 | 90.4 | 119 | 221 |
| 1935 | 138 | 7,816 | 7,098 | 90.8 | 120 | 218 |
| 1936 | 140 | 9,041 | 8,140 | 90.0 | 126 | 269 |
Three Inspectors of Schools attached to the Education Department are engaged in the inspection of Native schools, mission schools, and secondary schools for Maoris.
Besides the children of the Maori race who were receiving instruction in the Native schools there were 10,534 attending public schools, so that the total number of primary pupils of Maori race (including those in the mission schools) was 19,202.
Since 1923 the Education Department has established sixteen intermediate schools (formerly termed junior high schools) or departments. Two are attached to district high schools, one to a district high school department, one to a technical school, seven to secondary schools, and five are separate establishments. Pupils on the rolls of intermediate schools or departments at the end of 1936 numbered 4,307, as against 4,224 in 1935. The average attendance during the year was 4,135, The ages of the pupils on the roll at the 1st July, 1936, were—
| Age, in Years. | Boys. | Girls. | Total. |
|---|---|---|---|
| Under 11 | 49 | 62 | 111 |
| 11 and under 12 | 500 | 438 | 938 |
| 12 and under 13 | 792 | 740 | 1,532 |
| 13 and under 14 | 638 | 513 | 1,151 |
| 14 and under 15 | 330 | 206 | 536 |
| 15 and under 16 | 84 | 54 | 138 |
| 16 and under 17 | 10 | 3 | 13 |
| 17 and under 18 | 1 | 1 | |
| Totals | 2,404 | 2,016 | 4,420 |
Until 1904 secondary schools were established by special (local) Acts of the General Assembly, and the majority of schools giving post-primary education have been so constituted. At the present time the provisions of the Education Act, 1914, allow of the Minister of Education establishing such schools, and, in general the minimum number of prospective pupils must be sixty in the case of secondary schools, twenty in the case of the secondary department of a district high school, and forty in the case of a technical high school. The Education Amendment Act, 1924, provided that secondary and technical schools could be combined and be placed under a single governing body. In 1927 New Plymouth, and in 1931 Nelson and Napier, technical and secondary schools were combined under single controlling authorities. In 1931 Napier, and in 1932 New Plymouth and Nelson, combined schools were operating under regulations for these schools. Secondary schools and combined schools are controlled by a Board of Governors, district high schools by the Education Board of the district, and technical high schools either by a Board of Managers or by the Education Board of the district acting in a similar capacity. Free places are granted to suitably qualified pupils. A junior free place at a post-primary school is tenable for two years, with a possible extension to three years. Senior free places are tenable up to the age of nineteen. Since 1931 all applications for extensions of free places have been approved where parents were unable to pay fees.
In addition to the five classes of institutions referred to, there are also fifty-four registered private secondary schools, two endowed secondary schools, and eight Maori secondary schools which provide for post-primary education.
The secondary schools are regularly inspected by four Inspectors and the technical schools by two Inspectors, all of whom are attached to the Education Department. The combined schools are inspected by both secondary and technical inspectors.
The number of schools providing post-primary education during the last five years is set out in the accompanying table.
| Year. | Secondary Schools. | Combined Schools. | Secondary Departments of District High Schools. | Technical High Schools. | Maori Secondary Schools. | Endowed and Private Secondary Schools. | Total. |
|---|---|---|---|---|---|---|---|
* Endowed schools previously in “secondary schools” now included in “endowed and private secondary schools.” | |||||||
| 1932 | 38 | 6 | 80 | 21 | 10 | 54* | 209 |
| 1933 | 38 | 6 | 81 | 21 | 10 | 55* | 211 |
| 1934 | 38 | 6 | 82 | 21 | 10 | 55* | 212 |
| 1935 | 38 | 6 | 85 | 21 | 10 | 56* | 216 |
| 1936 | 40 | 6 | 84 | 21 | 8 | 56* | 215 |
The number of pupils at the end of each year of the last decade is shown in the following table; no account is taken of lower departments of secondary schools, and in the case of district high schools only the secondary department is included.
| Year. | Secondary Schools. | Combined Schools. | District High Schools. | Technical High Schools. | Maori Secondary Schools. | Endowed and Private Secondary Schools. | Correspondence Classes. | Total. |
|---|---|---|---|---|---|---|---|---|
| 1927 | 14,190 | 3,443 | 5,703 | 524 | 2,932 | 26,792 | ||
| 1928 | 15,038 | 3,673 | 6,061 | 533 | 3,430 | 28,735 | ||
| 1929 | 15,498 | 3,869 | 6,114 | 533 | 3,698 | 98 | 29,810 | |
| 1930 | 16,149 | 4,115 | 6,953 | 535 | 3,825 | 166 | 31,743 | |
| 1931 | 15,428 | 448 | 4,672 | 7,397 | 448 | 4,141 | 286 | 32,820 |
| 1932 | 13,446 | 1,975 | 4,345 | 7,106 | 346 | 4,053 | 325 | 31,596 |
| 1933 | 13,309 | 1,929 | 4,389 | 7,149 | 302 | 4,063 | 355 | 31,496 |
| 1934 | 13,487 | 1,919 | 4,365 | 7,183 | 333 | 4,146 | 396 | 31,829 |
| 1935 | 13,648 | 1,974 | 4,593 | 7,323 | 373 | 4,508 | 519 | 32,938 |
| 1936 | 14,002 | 1,986 | 4,070 | 7,422 | 408 | 4,809 | 758 | 33,455 |
At the end of 1936, of the total scholars attending secondary schools, 7,297 were boys and 6,705 girls; combined schools, 1,116 and 870; secondary departments of district high schools, 1,961 and 2,109; technical schools, 4,062 and 3,360; endowed and registered private schools, 2,399 and 2,410; and Maori secondary schools, 232 and 176.
Of the scholars attending Government schools, no less than 99 per cent. were receiving free tuition in 1936. The following table shows, as at 1st July, a summary of the free places held in post-primary schools for the last three years:—
| Class of School and Free Place. | 1934. | 1935. | 1936. | ||||||
|---|---|---|---|---|---|---|---|---|---|
| Boys. | Girls. | Total. | Boys. | Girls. | Total. | Boys. | Girls. | Total. | |
| Secondary schools— | |||||||||
| Junior free pupils | 4,925 | 4,625 | 9,550 | 5,130 | 4,834 | 9,964 | 5,261 | 5,085 | 10,346 |
| Senior free pupils | 2,884 | 2,097 | 4,981 | 2,747 | 2,021 | 4,768 | 2,869 | 2,262 | 5,131 |
| Combined schools— | |||||||||
| Junior free pupils | 759 | 595 | 1,354 | 801 | 608 | 1,409 | 852 | 629 | 1,481 |
| Senior free pupils | 473 | 291 | 764 | 445 | 300 | 745 | 426 | 298 | 724 |
| District high schools— | |||||||||
| Junior free pupils | 1,870 | 1,759 | 3,629 | 1,960 | 1,976 | 3,936 | 1,741 | 1,803 | 3,544 |
| Senior free pupils | 767 | 533 | 1,300 | 763 | 568 | 1,331 | 585 | 577 | 1,162 |
| Technical high schools— | |||||||||
| Junior free pupils | 3,877 | 3,109 | 6,986 | 4,020 | 3,191 | 7,211 | 4,102 | 3,377 | 7,479 |
| Senior free pupils | 983 | 814 | 1,797 | 961 | 781 | 1,742 | 853 | 743 | 1,596 |
| Correspondence school— | |||||||||
| Junior free pupils | 159 | 232 | 391 | 206 | 322 | 528 | 280 | 416 | 696 |
| Senior free pupils | 28 | 24 | 52 | 11 | 21 | 32 | 19 | 50 | 69 |
| Totals | 16,725 | 14,079 | 30,804 | 17,044 | 14,622 | 31,666 | 16,988 | 15,240 | 32,228 |
Regulations which came into force in January, 1918, provided for the award of bursaries to dependants of killed or disabled members of the New Zealand Expeditionary Forces. To qualify for a war bursary a child must be eligible for—
Free education at technical classes; or
A free place at a secondary school, district high school, or technical high school; or
A University National bursary.
Four hundred and fifty-seven bursaries were current in 1936.
The following table indicates the number of adult teachers employed in the post-primary schools mentioned. The principals are included except in the case of district high schools, the figures for which apply to assistants in the secondary department only.
| Year. | Secondary Schools. | District High Schools. | Technical High Schools. | Combined Schools. | Grand Totals. | ||||
|---|---|---|---|---|---|---|---|---|---|
| Males. | Females. | Males. | Females. | Males. | Females. | Males. | Females. | ||
| 1932 | 336 | 265 | 115 | 93 | 240 | 145 | 60 | 38 | 1,292 |
| 1933 | 336 | 261 | 118 | 89 | 246 | 141 | 59 | 37 | 1,287 |
| 1934 | 347 | 264 | 126 | 98 | 250 | 147 | 58 | 38 | 1,328 |
| 1935 | 348 | 268 | 129 | 100 | 255 | 149 | 58 | 39 | 1,346 |
| 1936 | 365 | 289 | 121 | 84 | 264 | 148 | 58 | 42 | 1,371 |
These departments may be held in connection with secondary schools for pupils who have not passed Form II, provided that no part of the cost of instruction or of the maintenance of the department is met out of the income from the endowments of the school or from Government grants. Six secondary schools have lower departments attached to them. Some of the pupils board at the school hostels.
At the end of 1936 the number of schools was 6; of pupils, 214 (94 boys, 120 girls); and of teachers, 9.
Technical classes for part-time day and evening students were held at eighty-eight centres during 1936. The number of individual students was as follows:—
| Classes conducted by Education or High School Boards | 3,185 |
| Classes conducted by Technical School Boards or by Managers | 8,992 |
| Classes conducted by University colleges | 304 |
| Total | 12,481 |
Of the above number, 7,104 (4,885 males and 2,219 females) held free places.
Technical high schools numbered twenty-one in 1936. These schools are of secondary grade, and provide general, industrial, domestic, agricultural, commercial, and art courses. The courses of instruction being taken by pupils at technical high schools at 1st July in each of the last five years were as follows:—
| Course. | 1932. | 1933. | 1934. | 1935. | 1936. |
|---|---|---|---|---|---|
| Industrial | 2,663 | 2,378 | 2,420 | 2,596 | 2,672 |
| Commercial and general | 3,759 | 3,862 | 4,031 | 4,178 | 4,344 |
| Domestic | 1,400 | 1,474 | 1,533 | 1,385 | 1,302 |
| Agricultural | 502 | 524 | 468 | 465 | 429 |
| Art | 462 | 468 | 459 | 425 | 416 |
| Totals | 8,786 | 8,706 | 8,911 | 9,049 | 9,163 |
Technological examinations were conducted by the Department in 1936 on behalf of the City and Guilds of London Institute at eleven centres. The total number of entries was 217, and the number of passes was 116. The Education Department also held its own examinations in technological subjects in 1936. The examinations were conducted on account of 69 candidates who sat for examination, 10 of whom were successful in securing passes in the preliminary, 23 in the intermediate examination, and 15 in the final examination.
Information in regard to free places in technical schools is given under the heading of “Post-primary Schools.”
The Child Welfare Act of 1925 provided for the creation of a special branch of the Education Department, known as the Child Welfare Branch. The Act was passed to make better provision with respect to the maintenance, care, and control of children who are specially under the protection of the State, and to provide generally for the protection and training of indigent, neglected, or delinquent children.
An important section of the Act provided for the establishment of Children's Courts, to be presided over by Stipendiary Magistrates or Justices specially authorized to exercise jurisdiction in these Courts. Provision was also made for the appointment of honorary associates of either sex, whose function it is to consider all the facts concerning children brought before the Courts and to advise the presiding Magistrate or Justice as to what action should be taken. The appointment of Child Welfare Officers for the investigation of all cases coming before the Courts was also provided for. The functions of such officers are carried out mainly by the regular officers employed by the Department, but in outlying districts the services of a number of honorary child welfare officers are utilized for this important work.
The principle of dealing with children in the privacy of the Magistrate's room had been followed for many years throughout the Dominion, and the Child Welfare Act was designed to give legality to such a practice. Very wide discretionary powers are given to the Magistrates of these special Courts in dealing with children. The ordinary procedure of requiring the child to plead, of taking evidence on oath, and, in fact, of hearing the particular charge may be dispensed with altogether. Wherever practicable the Children's Court is held in premises apart from the ordinary Police Court, and no newspaper is permitted to publish either the names of children appearing before these Courts or any particulars that are likely to identify a child.
A child was originally defined for purposes of the Act as one under sixteen years of age. This age was raised to seventeen in 1927.
In order to provide for the greater protection of infants of unmarried mothers and for the assistance and guidance of the mothers themselves, there is provision for Child Welfare Officers, on being notified of such births, to investigate each case and to render such assistance as is required, either in placing the child in a suitable foster-home or in advising the mother in the matter of affiliation proceedings, or in assisting her in obtaining employment, &c. By an amending Act in 1927 provision was made for the inspection and registration of all private institutions for children.
In addition to the work in connection with the maintenance and education of destitute, neglected, and delinquent children committed by the Courts, the Child Welfare Branch (1) supervises all infants and young children under the age of six years who are living apart from their parents: (2) makes inquiry through its field officers, for the information of Magistrates, of all applications for the adoption of children; (3) supervises all children and young persons placed under the field officers by order of the Court; and (4) provides for the maintenance, education, and training of all afflicted children who are deaf, blind, or mentally backward, or have speech-defects.
The following figures (which are exclusive of children dealt with as preventive cases, 1,182 in 1936) indicate the numbers under control during each of the last five years. In addition there wore (1936) 21 children at the New Zealand Institute for the Blind, for whom the Education Department made payment.
| 1932. | 1933. | 1934. | 1935. | 1936. | |
|---|---|---|---|---|---|
| Boarded out, institutions, receiving-homes, and in hospitals, or convalescent homes, &c | 4,104 | 4,031 | 3,993 | 4,022 | 3,980 |
| Under supervision | 864 | 850 | 917 | 892 | 863 |
| Infant-life protection | 996 | 923 | 816 | 836 | 830 |
| Deaf children | 120 | 116 | 127 | 116 | 111 |
| Feeble-minded children | 264 | 239 | 282 | 240 | 253 |
| Totals | 6,348 | 6,159 | 6,135 | 6,106 | 6,037 |
The Child Welfare Act authorizes Children's Courts to place children under the supervision of Child Welfare Officers in cases where it appears undesirable or unnecessary to remove them from their own homes, and generally in all cases where friendly contact with the parents as well as the children is sufficient to bring about a readjustment of the home conditions or the correction of incipient anti-social traits in the children. In this important work the Department received valuable assistance from certain of the private social service organizations.
The number of cases dealt with by the Courts last year was 2,584 and of these 667 were placed under supervision and dealt with as indicated in the foregoing paragraph. The number actually admitted to institutions, such as receiving-homes, special schools, training-farms, &c., was 432; but all these, with the exception of 136 who required long periods of training or were regarded as unfit for placing out, were suitably provided for in the community before the close of the year. The remainder of the children were dealt with in a manner not calling for supervision by a Child Welfare Officer.
At the end of the year 1936 the number of children boarded out in foster-homes was 2,663, as compared with 2,660 at the end of the preceding year. The boarding-out rate is 16s. per week for infants under twelve months, and 14s. for children over that age still attending school. The department provides free medical and dental treatment and medicines, also school books and stationery.
The Boys' Training Farm at Weraroa provides for boys of all ages—usually from fourteen years upwards—who require a period of reformative detention in an institution.
An institution at Otekaike is available for the education of mentally-backward boys. Older lads, under capable supervision, are employed in farm-work, garden and orchard work, and in the bootmaking, basketmaking, matmaking, and carpentering shops. Girls are provided for at the Special School at Richmond, and employed in housework and laundry-work, sewing, knitting, &c., and in outside occupations, such as gardening and flower-growing.
In order to meet the requirements of children who are retarded in their development owing to physical or other defects special classes have been established. These classes provide for children in certain public hospitals, for hard-of-hearing children and speech defectives, for under-nourished and physically defective children, and for children who are unable to benefit from ordinary class instruction.
Infant-fife protection is carried out under the supervision of trained nurses who are fully qualified in the care and feeding of infants and young children. Very many infants dealt with under this system are illegitimate.
A residential school at Sumner exists for the teaching of deaf children, and special classes are established in the main centres for the education of hard-of-hearing children and for the correction of defective speech among children. Classes are also conducted for adults.
Provision is made for blind children and also for blind adults at the New Zealand Institute for the Blind at Auckland.
Control of higher education in New Zealand is vested in the New Zealand University, founded by the New Zealand University Acts of 1870, 1874, and 1875.
The University was formerly an examining, not a teaching body, with four teaching institutions affiliated to it—the Auckland University College, founded in 1882; Victoria University College, founded in 1897 at Wellington; Canterbury University College, founded in 1873 at Christchurch; and Otago University, founded in 1869 at Dunedin. By the New Zealand University Amendment Act, 1926, the constitution of the University has been altered so that it now actually consists of the four University colleges. Each of the colleges, besides providing the usual University courses, specializes in certain directions: Otago University has medical and dental schools, a school of mining and metallurgical engineering, and a school of home science; Canterbury University College has a school of engineering (mechanical, electrical, and civil); Auckland University College has a school of architecture, a school of commerce, and a school of engineering up to and including the second professional examination; and Victoria University College specializes in law and science. There are also two Agricultural Colleges—viz., Massey and Lincoln—attached to the University.
In 1930 a New Zealand University Amendment Act was passed to enable the New Zealand University to discharge its functions under the Law Practitioners Amendment Act, 1930. For this purpose a Council of Legal Education was established to make recommendations to the Academic Board of the University with respect to any matter relating to legal education. Further, the Senate of the University in making or altering statutes concerning legal education must first consider any recommendations made by the Academic Board or the Council of Legal Education.
The growth of University education is seen from the annexed table. In 1936 there were 4,377 students actually in attendance at the four University colleges. Of these, 469 were graduates, 3,517 undergraduates, and 391 unmatriculated students. In addition there were 590 students attached to the various University colleges, but exempt from lectures.
| Year. | Students attending Lectures. | Exempt Students. | Total. | ||
|---|---|---|---|---|---|
| Males. | Females. | Males. | Females. | ||
| 1927 | 3,014 | 1,348 | 397 | 119 | 4,878 |
| 1928 | 2,975 | 1,280 | 435 | 112 | 4,802 |
| 1929 | 2,908 | 1,220 | 386 | 109 | 4,623 |
| 1930 | 2,879 | 1,284 | 508 | 130 | 4,801 |
| 1931 | 2,973 | 1,236 | 488 | 172 | 4,869 |
| 1932 | 2,945 | 1,204 | 589 | 174 | 4,912 |
| 1933 | 2,892 | 1,068 | 631 | 215 | 4,806 |
| 1934 | 2,905 | 1,005 | 603 | 208 | 4,721 |
| 1935 | 3,019 | 1,090 | 552 | 157 | 4,818 |
| 1936 | 3,229 | 1,148 | 490 | 100 | 4,967 |
Professors attached to the various University colleges in 1936 numbered 66, of whom Auckland bad 15; Victoria, 14; Canterbury, 13; and Otago, 24. In addition there was a considerably larger number of full-time lecturers, part-time lecturers, and assistants.
University Junior Scholarships and University National Scholarships are of the value of £25 per annum plus tuition fees, and are tenable for three years. In the case of holders living away from home a further sum of £35 per annum is allowed. The number of University Junior and National Scholarships awarded in 1936 was thirty-two. Taranaki Scholarships are of the annual value of £60, and the Senate may, at its discretion, extend the tenure from three to four years. The above scholarships are awarded on the results of the Entrance Scholarships Examination. There are also some thirty or forty local and privately endowed scholarships awarded on the results of the same Entrance Scholarship Examination.
Scholarships awarded during the degree course are the Senior University (£60 per annum), Sir George Grey (£50 per annum), and John Tinline Scholarships (£60 per annum). The various colleges have also private scholarships for which their own students may compete. The chief scholarships awarded at the end of the University course are the Rhodes Scholarships, the 1851 Exhibition Scholarship, the Medical Travelling Scholarship, the Engineering Travelling Scholarship, the Travelling Scholarship in Architecture, the Post-graduate Travelling Scholarships in Arts and in Science, the French Travelling Scholarship, the Law Travelling Scholarship, Shirtcliffe Scholarship, and the National Research Scholarships. All except the last-named are tenable abroad. In view of the financial stringency some of the scholarships were suspended during 1936 and earlier. The Research Scholarships are each of the value of £100' per annum.
So far, fifty Rhodes Scholarships have been granted, of which fourteen have been gained by students of Auckland University College, nine by students of Victoria University College, eleven by students of Canterbury University College, fifteen by students of Otago University, and one by a student of Massey College.
The Science Research Scholarship offered annually by the Royal Commission for the Exhibition of 1851 has been awarded to thirty-five graduates, nine from Auckland University College, seven from Victoria University College, eleven from Canterbury University College, and eight from the University of Otago.
Since 1932 University national bursaries entitled the holders to the payment of tuition and examination fees (not exceeding £10 per annum). A bursary is tenable for a three (or possibly four) years' course at a University college or at a school of agriculture recognized by the University. The number of University national bursaries (excluding agricultural) held in 1936 was 288. Domestic-science bursaries, tenable at the Otago University, may be awarded under the regulations for technical instruction. Bursaries of this kind were held by seventeen students in 1936. During 1936 there were thirteen holders of engineering bursaries and six holders of architectural bursaries.
Agricultural bursaries may be awarded to qualified candidates in order to enable them to obtain the necessary practical training for positions as teachers or instructors of agriculture. During 1936 four bursars were in attendance at Canterbury Agricultural College (Lincoln), eight at Massey Agricultural College (Palmerston North), three at Auckland University College, and three at Victoria University College, Wellington.
Fine arts bursaries of an annual value of £60, tenable at Canterbury College School of Art, were established in 1936.
From the table given below will be seen the number of students who received free University education during each of the last ten years:—
| Year. | Junior University, University National, and Taranaki Scholarships. | Senior University Scholarships. | University and Educational Bursaries. | Training-college Studentships. | Other. | Total. |
|---|---|---|---|---|---|---|
* University bursaries only. | ||||||
| 1927 | 83 | 18 | 1,076 | 749 | 149 | 2,075 |
| 1928 | 81 | 20 | 1,127 | 567 | 98 | 1,893 |
| 1929 | 84 | 21 | 1,161 | 708 | 109 | 2,083 |
| 1930 | 84 | 19 | 1,162 | 645 | 99 | 2,009 |
| 1931 | 92 | 19 | 1,186* | 558 | 84 | 1,939 |
| 1932 | 102 | 17 | 1,184* | 493 | 61 | 1,857 |
| 1933 | 99 | 19 | 749* | 248 | 76 | 1,191 |
| 1934 | 110 | 21 | 580* | 126 | 837 | |
| 1935 | 108 | 21 | 435* | 258 | 117 | 939 |
| 1936 | 109 | 18 | 292* | 669 | 117 | 1,205 |
The Workers' Educational Association, which works in conjunction with the four University colleges, conducts tutorial and preliminary classes for working men and women in such subjects as economics, sociology, psychology, industrial history, English literature, English composition, modern history, electricity, hygiene, &c. Each of the University colleges received Government financial assistance for this purpose during the year 1936. Members of the staffs of the University colleges and other educationists act as tutors of the classes. The classes are held for the most part in the large cities, although to an increasing extent classes are being arranged in the smaller towns.
In addition, the association (since 1932) has provided a motor-car which serves as a travelling library. The car is equipped with a radio-receiving set and lantern for projecting slides. The finance for this car was provided by the Carnegie Corporation. The motor-car is used solely in the Canterbury rural district.
The Box Scheme which was inaugurated in the Canterbury District in 1924 now serves the whole of the Dominion. It is mainly confined to the rural areas. Under this scheme each box contains the copies of a lecture, gramophone records, &c., and is passed on from group to group.
The number of candidates who actually presented themselves for the various examinations conducted by the Education Department during the last five years is given below: —
| Examination. | 1932. | 1933. | 1934. | 1935. | 1936. |
|---|---|---|---|---|---|
| Intermediate | 8,422 | 1,308 | 1,026 | 996 | 1,012 |
| Teachers' D, C, and B | 294 | 135 | 99 | 102 | 87 |
| Training College Entrance Examination | 483 | 314 | 308 | 684 | 845 |
| School Certificate | 4,197 | 4,307 | 4,402 | ||
| London University Examinations | 2 | 2 | 3 | 2 | 2 |
| Handicraft Teachers' Certificate | 28 | 27 | 17 | 13 | 16 |
| Technological Examinations | 129 | 83 | 64 | 67 | 69 |
| Naval Cadetships | 2 | 1 | 6 | 1 | 2 |
| Aircraft Apprenticeships | 7 | 4 | 1 | 3 | 2 |
| Totals | 9,367 | 1,874 | 5,721 | 6,175 | 6,437 |
The University conducted examinations in 1936 in the faculties of arts, science, medicine, public health, dentistry, home science, law, engineering, commerce, agriculture, forestry, and music; for diplomas in journalism, in banking, and in insurance; and for admission to the legal and accountancy professions. There were 9,336 entrants for the degree examinations in 1936, compared with 9,480 in 1935. The number of candidates for the University Entrance Examination in the last five years has been: 1932, 4,725; 1933, 4,738; 1934, 4,610; 1935, 4,602; 1936, 4,774.
Out of public funds £3,975,725 was spent on education for the financial year ended 31st March, 1937. This sum includes amounts paid from; reserves revenue, but not revenues received by certain secondary schools and university colleges from endowments, fees, &c., which are available for educational purposes. Direct income of post-primary schools and university colleges in 1936–37 from reserves vested in them amounted to £56,541. The following shows the expenditure from public funds for each branch or service of education for each of the last five years:—
| Service. | 1932–33. | 1933–34. | 1934–35. | 1935–36. | 1936–37. |
|---|---|---|---|---|---|
| £ | £ | £ | £ | £ | |
| General administration | 29,520 | 29,647 | 32,358 | 35,882 | 37,336 |
| Elementary education | 1,822,482 | 1,833,591 | 1,886,905 | 2,011,610 | 2,458,306 |
| Secondary education and technical instruction | 548,796 | 529,802 | 597,976 | 682,917 | 802,777 |
| Training colleges, &c. | 108,827 | 34,323 | 12,669 | 55,359 | 154,894 |
| Higher education | 54,519 | 56,722 | 63,739 | 71,895 | 90,252 |
| Native schools | 73,330 | 79,700 | 91,792 | 100,077 | 126,886 |
| Physical instruction | 2,276 | 1,155 | 1,749 | 1,425 | 2,680 |
| School for the deaf | 4,520 | 4,812 | 4,906 | 5,531 | 6,365 |
| Education of the blind | Cr. 20 | 168 | 1,067 | 1,414 | 1,587 |
| Schools for the mentally backward | 10,310 | 11,434 | 12,650 | 14,476 | 18,630 |
| Child welfare | 113,076 | 111,631 | 107,549 | 105,128 | 104,734 |
| Material and stores | Cr. 873 | Cr. 495 | Cr. 455 | Cr. 64 | 439 |
| Miscellaneous services | 48,769 | 48,055 | 58,262 | 171,020 | 170,839 |
| Totals | 2,815,532 | 2,740,545 | 2,871,167 | 3,256,670 | 3,975,725 |
There is now given a series of comparative figures which show the cost of education during the last ten years.
| Year ended 31st March, | Expenditure from Public Funds. | Expenditure per Head of Mean Population. |
|---|---|---|
| £(000) | s. d. | |
| 1928 | 3,770 | 52 3 |
| 1929 | 3,886 | 53 3 |
| 1930 | 4,058 | 54 11 |
| 1931 | 4,102 | 54 9 |
| 1932 | 3,410 | 44 11 |
| 1933 | 2,816 | 36 10 |
| 1934 | 2,741 | 35 6 |
| 1935 | 2,871 | 36 11 |
| 1936 | 3,257 | 41 7 |
| 1937 | 3,976 | 50 4 |
In 1933 the Carnegie Corporation of New York set up a committee to report on the proposal to found a Council for Educational Research. This committee called a conference of representative educationists to consider the proposal, and approached educational authorities for their co-operation. In view of the unanimous support of the proposal, the committee recommended the foundation of the Council, and in November, 1933, the Carnegie Corporation appropriated a substantial grant for the purpose, payable in five yearly grants, beginning in 1933–34. A constitution of the Council was agreed upon, also the following objects: —
To promote by its own efforts, or in co-operation with existing bodies, the cause of research and investigation in education in New Zealand.
To discover what educational researches have been made in New Zealand, and to publish (in full or in summary form) those that the Council may determine to be useful.
To make grants to assist in carrying out any research or investigation approved by the Council.
To assist other educational bodies in the selection of students qualified to carry out research either in New Zealand or abroad.
To take any action that in the opinion of the Council will assist any educational research.
The Council's activities are under the control of a permanent officer (the Director), who is assisted by local branches, with headquarters at Auckland, Wellington, Christchurch, and Dunedin.
Table of Contents
THE law relating to the jurisdiction of Magistrates and Justices of the Peace in civil matters was consolidated by the Magistrates' Courts Act, 1928. Under this statute the ordinary civil jurisdiction of a Magistrate is limited to claims not exceeding £300; or, where the parties agree in writing that the Court shall have jurisdiction, to claims not exceeding £500. Justices of the Peace may hear and decide certain civil cases when the sum in dispute does not exceed £20. The numbers of plaints entered and of cases tried, and the amounts sued for and for which judgment was recorded, in the lower Courts during the last ten years are shown in the following table: —
| Year. | Plaints entered. | Cases tried. | |||
|---|---|---|---|---|---|
| Number. | Total Amount sued for. | Number. | Total Amount claimed. | Total Amount for which Judgment entered. | |
| £ | £ | £ | |||
| 1927 | 83,369 | 1,400,129 | 55,676 | 960,549 | 786,299 |
| 1928 | 85,243 | 1,463,769 | 55,751 | 951,916 | 774,912 |
| 1929 | 87,182 | 1,431,256 | 56,668 | 911,667 | 772,247 |
| 1930 | 96,770 | 1,542,434 | 63,120 | 1,010,026 | 879,839 |
| 1931 | 91,595 | 1,544,601 | 62,945 | 1,047,511 | 889,978 |
| 1932 | 75,261 | 1,244,236 | 52,886 | 861,088 | 762,171 |
| 1933 | 64,681 | 1,065,499 | 44,669 | 766,503 | 687,009 |
| 1934 | 57,957 | 848,389 | 40,883 | 619,243 | 536,637 |
| 1935 | 59,105 | 871,413 | 40,094 | 588,844 | 504,448 |
| 1936 | 54,085 | 767,897 | 37,911 | 523,553 | 440,828 |
In terms of money the 1931 level for plaints, for cases tried, and for judgments entered is the highest on record. The numbers of plaints and of cases tried were highest in 1930. In respect of cases tried the figures for 1936 show a substantial all-round decrease, being the lowest recorded since 1920.
The numbers of actions commenced, cases tried, and judgments entered, together with the total amount for which judgments were recorded, in the Supreme Court of New Zealand in its civil jurisdiction during the last decade were as follows:—
| Year. | Number of Actions commenced. | Cases tried. | Judgments recorded. | ||
|---|---|---|---|---|---|
| With Jury. | Without Jury. | Number. | Amount. | ||
| £ | |||||
| 1927 | 1,826 | 52 | 506 | 935 | 316,936 |
| 1928 | 1,433 | 41 | 370 | 683 | 270,632 |
| 1929 | 1,446 | 44 | 410 | 643 | 207,399 |
| 1930 | 1,454 | 64 | 392 | 659 | 260,870 |
| 1931 | 1,481 | 74 | 453 | 706 | 311,400 |
| 1932 | 1,263 | 70 | 422 | 562 | 215,697 |
| 1933 | 1,147 | 54 | 418 | 493 | 148,119 |
| 1934 | 900 | 50 | 346 | 364 | 200,805 |
| 1935 | 931 | 88 | 303 | 383 | 148,155 |
| 1936 | 934 | 128 | 284 | 443 | 176,636 |
The number of bodies on which inquests were held in 1936 was 1,640, including 142 Maoris. In 1,175 cases the bodies were of males, and in 465 of females.
| Nature of Verdict. | Males. | Females. | Total. |
|---|---|---|---|
| Diseases and natural causes | 504 | 307 | 811 |
| Accident | 534 | 121 | 655 |
| Homicide | 9 | 7 | 16 |
| Suicide | 128 | 30 | 158 |
| Totals | 1,175 | 465 | 1,640 |
Of the accidental deaths the most common forms are injuries by motor-vehicles, railways and other forms of land transport, and drowning. The verdicts show that in 1936 285 deaths, or 44 per cent. of the total accidental deaths, were due to injuries by vehicles, including railway tramways, while 129 deaths, or 20 per cent., were due to drowning.
The inquests on suicidal for each of the last ten years are—
| Year. | Inquests on Suicides. | ||
|---|---|---|---|
| Males. | Females. | Total. | |
| 1927 | 169 | 22 | 191 |
| 1928 | 159 | 52 | 211 |
| 1929 | 180 | 48 | 228 |
| 1930 | 163 | 35 | 198 |
| 1931 | 199 | 29 | 228 |
| 1932 | 200 | 50 | 250 |
| 1933 | 162 | 44 | 206 |
| 1934 | 150 | 35 | 185 |
| 1935 | 111 | 39 | 150 |
| 1936 | 128 | 30 | 158 |
In case of fire causing the destruction of any building, ship, or merchandise, or any stack of grain, pulse, or hay, or any growing crop, a Coroner may hold an inquiry into the cause of such fire, the procedure being similar to that of inquests into cause of death.
During 1936 only one inquest was held on a fire, the verdict being that there was insufficient evidence to determine the cause.
During the five years 1932–36, 29 fire inquests were held. In 13 cases the verdict was arson, in 3 cases accident, and in 13 cases there was insufficient evidence to determine the cause.
The Police Force in New Zealand is a national body maintained wholly by the General Government. As at present constituted, it was established under the provisions of the Police Force Act, 1886, which came into operation on 1st September of that year. Prior to that date police duty in New Zealand had been carried out by members of the Armed Constabulary, which was then disbanded, some of its members being transferred to the newly constituted Police Force and others to the Permanent Militia. The Police Force Act, 1886, consolidated in 1908, was revised and brought up to date by the Police Force Act, 1913, which, with minor amendments in 1919 and 1924, is the statute under which the Force now functions.
The Commissioner of Police, with headquarters at Wellington, has, subject to the directions of the Minister in Charge of the Police Department, the general superintendence and control of the Police Force. The Dominion is divided into fifteen districts, each under the charge of a Superintendent or Inspector of Police, who is responsible to the Commissioner for the maintenance of good order and the proper execution of police duty therein. Districts are divided into subdistricts under the charge of sergeants or constables, and cities and towns where regular beat duty is performed are divided into beats, patrolled by constables under the supervision of sergeants.
The principal duty of the Police Force as defined by the Police Force Act is “the preservation of peace and order, the prevention of crime, and the apprehension of offenders against the peace.” In addition to the enforcement of the criminal law and the provisions of the Police Offences Act, there are several statutes of a regulatory nature which the police are called upon to administer, wholly or partly, such as the Arms Act, Licensing Act, Gaming Act, Dangerous Drugs Act, Motor-vehicles Act, Pawnbrokers Act, Second-hand Dealers Act, &c. They also undertake inquiries and other duties on behalf of other Departments of the Government Service, principally the Pensions Department. Registrar-General's Office, Internal Affairs Department, and Education Department (Child Welfare Branch).
Police in country districts in many cases hold such additional appointments as Clerks and Bailiffs of Magistrates' Courts, Inspectors of Factories, Probation Officers, Inspectors of Sea-fishing, Kauri-gum Rangers, and collectors of Agricultural and Pastoral Statistics.
Recruits for the Police Force must he between the ages of twenty-one and thirty years, not less than 5 ft. 9 in. high, and have a normal chest measurement of not less than 38 in. They must have passed the Fifth Standard Examination under the Education Act or an examination of equal or higher grade. They must be of good moral character, smart, active, intelligent, and free from bodily complaint or infirmity. The selection of recruits is made by the Commissioner after exhaustive inquiries have been made into the character, antecedents, and qualifications of the applicants. Before appointment they undergo a course of training in the Training Depot, in which they are drilled and receive instructions in the duties they will be called upon to perform.
Appointments to vacancies in the higher ranks of the Force are made from those members of the next lower rank who have qualified by examination, efficiency, and seniority for such promotion.
Members who show an aptitude for detective duty are detailed for service in the Detective Branch which is attached to each district headquarters and undertakes the investigation and detection of the more serious crimes.
On the 31st March, 1937, the number of permanent members of the Police Force in New Zealand was 1,200 of all ranks, being an increase of 36 during the year. The total was made up as follows: 1 commissioner, 4 superintendents, 16 inspectors, 5 sub-inspectors, 28 senior sergeants, 99 sergeants, 956 constables, 3 senior detectives, 17 detective-sergeants, and 71 detectives. There were also 56 temporary constables, 15 police surgeons, 7 matrons, 3 district constables, and 1 Native constable.
The following table shows the number of stations and of police in each police district. Temporary constables are included, but not district or Native constables.
| Police District. | No. of Stations. | No. of Police. |
|---|---|---|
| Whangarei | 15 | 34 |
| Auckland | 46 | 276 |
| Hamilton | 25 | 74 |
| Gisborne | 16 | 36 |
| Napier | 18 | 60 |
| New Plymouth | 15 | 41 |
| Wanganui | 19 | 46 |
| Palmerston North | 17 | 49 |
| Wellington | 30 | 199 |
| Nelson | 12 | 32 |
| Greymouth | 20 | 44 |
| Christchurch | 38 | 151 |
| Timaru | 13 | 43 |
| Dunedin | 36 | 106 |
| Invercargill | 22 | 49 |
There were also 9 officers attached to headquarters, I was on loan to the Cook Islands Administration, 2 to the Samoan Administration, and 3 on leave prior to retirement.
The proportion of police to population is 1 to every 1,265 persons, and the expenditure (exclusive of the cost of buildings) on the whole Police Force for the year ended the 31st March, 1937, was 6s. 3d. per head of population.
The following table shows the growth of the Police Force during the last ten years: —
| Year ended 31st March, | Officers. | Non-commissioned Officers. | Detectives. | Constables. | Total. | Police to Population (including Maoris). | Cost per Head of Population. |
|---|---|---|---|---|---|---|---|
| s. | d. | ||||||
| 1928 | 23 | 127 | 54 | 913 | 1,117 | 1 to 1,302 | 5 9¾ |
| 1929 | 23 | 128 | 56 | 948 | 1,155 | 1 to 1,274 | 6 1¾ |
| 1930 | 22 | 127 | 54 | 943 | 1,146 | 1 to 1,299 | 6 1 |
| 1931 | 25 | 120 | 65 | 959 | 1,169 | 1 to 1,293 | 6 0½ |
| 1932 | 25 | 123 | 65 | 944 | 1,157 | 1 to 1,319 | 5 5 |
| 1933 | 24 | 121 | 67 | 983 | 1,195 | 1 to 1,287 | 5 6½ |
| 1934 | 23 | 124 | 72 | 992 | 1,211 | 1 to 1,280 | 5 6¼ |
| 1935 | 28 | 127 | 74 | 990 | 1,219 | 1 to 1,281 | 5 7 |
| 1936 | 26 | 123 | 77 | 1,000 | 1,226 | 1 to 1,284 | 5 9¼ |
| 1937 | 25 | 127 | 91 | 1,012 | 1,255. | 1 to 1,265 | 6 3 |
Maoris are included in the statistics relating to Magistrates' Courts in the following pages, as well as in those for the Supreme Court and for Prisons. Separate figures relating to offences by Maoris are given towards the end of this section.
Persons charged in Magistrates' Courts may be brought before the Court either on summons, or after arrest, according to the nature of the offence and to other circumstances. Of the total of 50,928 cases in 1936, 11,544 (males 11,008, females 536) were “arrest” and 39,384 (males 37,035, females 2,349) were “summons” cases.
The following table shows the number of criminal charges dealt with in Magistrates' Courts during each of the last ten years.
| Year. | Number. | Per 1,000 of Mean Population. | ||||
|---|---|---|---|---|---|---|
| Against Males. | Against Females. | Totals. | Against Males. | Against Females. | Totals. | |
| 1927 | 53,256 | 2,983 | 56,239 | 72.46 | 4.24 | 39.08 |
| 1928 | 52,604 | 3,110 | 55,714 | 70.80 | 4.36 | 38.26 |
| 1929 | 53,121 | 3,005 | 56,126 | 70.70 | 4.16 | 38.09 |
| 1930 | 54,723 | 3,067 | 57,790 | 71.90 | 4.19 | 38.71 |
| 1931 | 49,829 | 2,650 | 52,479 | 64.57 | 3.57 | 34.66 |
| 1932 | 50,224 | 2,801 | 53,025 | 64.60 | 3.74 | 34.72 |
| 1933 | 44,811 | 2,620 | 47,431 | 57.23 | 3.46 | 30.81 |
| 1934 | 43,771 | 2,992 | 46,763 | 55.50 | 3.92 | 30.14 |
| 1935 | 44,580 | 2,979 | 47,559 | 56.18 | 3.88 | 30.44 |
| 1936 | 48,043 | 2,885 | 50,928 | 60.07 | 3.72 | 32.33 |
The next table shows the results in all cases heard during each of the last three years, and similar information concerning distinct cases—i.e., counting only the principal offence in cases where a person is charged simultaneously with two or more offences.
| Result of Hearing. | Total Cases. | Distinct Cases. | ||||
|---|---|---|---|---|---|---|
| 1934. | 1935. | 1936. | 1934. | 1935. | 1936. | |
| Dismissed or withdrawn for want of prosecution or of evidence | 4,221 | 4,224 | 4,165 | 2,643 | 2,580 | 2,628 |
| Dismissed on the merits | 2,186 | 2,222 | 2,112 | 1,620 | 1,616 | 1,571 |
| Admonished and discharged | 1,242 | 1,449 | 1,478 | 789 | 1,029 | 1,009 |
| Committed for trial | 589 | 543 | 400 | 283 | 277 | 219 |
| Committed for sentence | 821 | 784 | 883 | 297 | 259 | 295 |
| Summarily convicted | 37,704 | 38,337 | 41,890 | 30,351 | 31,483 | 34,331 |
| Totals | 46,763 | 47,559 | 50,928 | 35,983 | 37,244 | 40,053 |
The summary convictions for the year 1936 represent a rate of 26.59 per 1,000 of mean population. The figures for the last ten years are—
| Year. | Number. | Per 1,000 of Mean Population. |
|---|---|---|
| 1927 | 45,930 | 31.92 |
| 1928 | 45,139 | 31.00 |
| 1929 | 46,309 | 31.43 |
| 1930 | 47,247 | 31.65 |
| 1931 | 42,092 | 27.80 |
| 1932 | 42,366 | 27.74 |
| 1933 | 37,671 | 24.47 |
| 1934 | 37,704 | 24.30 |
| 1935 | 38,337 | 24.54 |
| 1936 | 41,890 | 26.59 |
The great bulk of the cases dealt with in New Zealand are in respect of comparatively trivial offences—drunkenness and offences against traffic regulations accounting for about half of the total convictions. An analysis of traffic offences is given later in this section.
A classification of convictions during the last five years according to principal offences and groups of offences is next given.
| — | 1932. | 1933. | 1934. | 1935. | 1936. |
|---|---|---|---|---|---|
| Offences against the person | 541 | 578 | 537 | 516 | 656 |
| Offences against property (including forgery) | 6,766 | 5,688 | 5,619 | 5,989 | 5,951 |
| Drunkenness (including issue of prohibition orders) | 5,236 | 4,584 | 4,509 | 4,319 | 5,755 |
| Offensive conduct or language, obstruction, &c., of police, and vagrancy | 1,863 | 1,506 | 1,428 | 1,363 | 1,228 |
| Breaches of traffic regulations, &c. | 14,887 | 13,490 | 13,915 | 14,634 | 15,729 |
| Other offences against good order | 1,205 | 1,259 | 1,440 | 1,464 | 1,672 |
| Breaches of Licensing Act | 2,686 | 2,561 | 2,649 | 2,834 | 3,213 |
| Breaches of Destitute Persons Act | 2,887 | 2,483 | 2,211 | 2,241 | 2,482 |
| Breaches of Impounding Act | 604 | 489 | 446 | 561 | 381 |
| Breaches of Child Welfare Act | 352 | 338 | 336 | 390 | 333 |
| Breaches of Arms Act | 440 | 422 | 370 | 390 | 294 |
| Breaches of Employment Promotion Act | 2,298 | 1,408 | 931 | 606 | 561 |
| Unlicensed wireless sets | 782 | 1,110 | 1,047 | 932 | 983 |
| Other offences | 1,819 | 1,755 | 2,266 | 2,098 | 2,652 |
| Totals | 42,366 | 37,671 | 37,704 | 38,337 | 41,890 |
In the preceding table offences are necessarily grouped, but in the case of convictions in 1936 certain individual offences are distinguished below.
| I.—PERSON. | |
| Common assault | 506 |
| Attempted suicide | 79 |
| Indecent assault on female | 36 |
| Aggravated assault | 4 |
| Unlawful carnal knowledge | 17 |
| Indecent assault on male | 2 |
| II.—PROPERTY. | |
| Theft (not further defined) | 3,777 |
| Fraud and false pretences | 638 |
| Wilful damage, &c. | 540 |
| Breaking and entering and attempts | 277 |
| Unlawful conversion of vehicle | 470 |
| Receiving stolen property | 85 |
| Unlawful conversion of property | 55 |
| Horse, cattle, and sheep stealing | 37 |
| Embezzlement | 30 |
| III.—FORGERY, ETC. | |
| Forgery | 57 |
| Uttering | 6 |
| IV.—GOOD ORDER. | |
| Breaches of by-laws | 594 |
| Gambling | 650 |
| Vagrancy | 178 |
| Sunday trading | 202 |
| Cruelty to animals | 71 |
The 333 convictions under the Child Welfare Act in 1936 included 32S in respect of children not under proper control or in indigent circumstances.
Unemployment legislation came into force late in 1930. In 1931, there were 1,071 convictions for breaches of the Act, and the number rose to 2,29S in 1932. Since then there has been a gradual fall, the figure for 1936 being only 561. Of these 22S were for failing to pay levies, always the principal charge under the Act. The remainder were for false declaration (308), failing to register (3), employing person in arrears with levy (6), employer failing to deduct emergency charge (9), failing to pay emergency charge on “other income” (3), and other breaches of the Act (4). The number of convictions for making false declaration show a marked increase over the figures for 1935, while other breaches show a substantial decrease.
A summary of punishments following summary convictions for the year 1936 is given.
| Punishment. | Offences against the Person. | Offences against Property.* | Offences against Good Order. | Other Offences. | Totals. |
|---|---|---|---|---|---|
* Including forgery and offences against the currency. | |||||
| Released under Offenders Probation Act | 33 | 747 | 46 | 34 | 860 |
| Convicted and discharged | 86 | 988 | 2,141 | 849 | 4,064 |
| Convicted and ordered to come up for sentence | 84 | 472 | 192 | 179 | 927 |
| Committed to care of Child Welfare Superintendent | 10 | 354 | 5 | 260 | 629 |
| Placed under supervision of Child Welfare Officer | 46 | 1,354 | 34 | 61 | 1,495 |
| Committed to institution under Child Welfare Act | 1 | 90 | 1 | 22 | 114 |
| Committed to Borstal institution, Salvation Array Home, &c. | 6 | 89 | 28 | 19 | 142 |
| Fined | 303 | 832 | 19,852 | 6,988 | 27,975 |
| Imprisonment in lieu of fine | 13 | 80 | 465 | 150 | 708 |
| Peremptory imprisonment | 72 | 930 | 351 | 843 | 2,196 |
| Whipping | 4 | 4 | |||
| Bound over | 2 | 7 | 1 | 10 | |
| Order made | 11 | 1,262 | 1,493 | 2,766 | |
| Totals | 656 | 5,951 | 24,384 | 10,899 | 41,890 |
Criminal cases in the Supreme Court are of two classes—viz., those in which the accused person has pleaded guilty in the lower Court and has been committed to the Supreme Court for sentence, and those actually tried in the Supreme Court.
The following table gives a summary of criminal cases dealt with in the Supreme Court during each of the last five years. Maoris are included in this and following tables.
| Year. | Tried in Supreme Court. | Sentences in Case of Committal for Sentence. | Total Sentences. | ||||||
|---|---|---|---|---|---|---|---|---|---|
| Indictments and Informations. | Convictions. | ||||||||
| M. | F. | M. | F. | M. | F. | M. | F. | Total. | |
| (a) Total Cases. | |||||||||
| 1932 | 1,023 | 16 | 577 | 7 | 1,084 | 42 | 1,661 | 49 | 1,710 |
| 1933 | 912 | 33 | 493 | 11 | 997 | 12 | 1,490 | 23 | 1,513 |
| 1934 | 789 | 39 | 384 | 25 | 768 | 36 | 1,152 | 61 | 1,213 |
| 1935 | 781 | 40 | 338 | 25 | 775 | 10 | 1,113 | 35 | 1,148 |
| 1936 | 502 | 29 | 284 | 11 | 879 | 4 | 1,163 | 15 | 1,178 |
| (b) Distinct Persons. | |||||||||
| 1932 | 321 | 11 | 205 | 6 | 415 | 10 | 620 | 16 | 636 |
| 1933 | 302 | 15 | 183 | 8 | 332 | 7 | 515 | 15 | 530 |
| 1934 | 250 | 15 | 160 | 9 | 318 | 3 | 478 | 12 | 490 |
| 1935 | 271 | 17 | 149 | 9 | 307 | 7 | 456 | 16 | 472 |
| 1936 | 207 | 13 | 139 | 6 | 314 | 3 | 451 | 9 | 460 |
Of the 220 distinct persons indicted during 1936, 145 were convicted and 56 acquitted. In the case of 13 persons no bill was returned or the prosecution otherwise not proceeded with, 5 persons were found insane, and 1 was awaiting trial at the end of the year.
The next table summarizes the offences of persons convicted or sentenced in the Supreme Court during the last five years: —
| Year. | Total Convictions or Sentences. | Distinct Persons convicted or sentenced. | ||||||||
|---|---|---|---|---|---|---|---|---|---|---|
| Offences against the Person. | Offences against Property. | Forgery and Offences against the Currency. | other Offences | Totals. | Offences against the Person. | Offences against Property. | Forgery and Offences against the Currency. | Other Offences | Totals. | |
| 1932 | 203 | 1,150 | 255 | 102 | 1,710 | 138 | 395 | 52 | 51 | 636 |
| 1933 | 233 | 1,024 | 185 | 71 | 1,513 | 122 | 327 | 54 | 28 | 531 |
| 1934 | 215 | 768 | 191 | 39 | 1,213 | 139 | 284 | 47 | 20 | 490 |
| 1935 | 216 | 803 | 95 | 34 | 1,148 | 143 | 277 | 35 | 17 | 472 |
| 1936 | 287 | 796 | 74 | 21 | 1,178 | 176 | 250 | 21 | 13 | 460 |
The following were the offences for which persons were convicted or sentenced in the Supreme Court during 1936:—
I.—PERSON.
| Indecent assault | 29 |
| Indecent assault on male | 23 |
| Attempted rape | 4 |
| Carnal knowledge and attempts | 40 |
| Incest | 9 |
| Unnatural offences and attempts | 7 |
| Murder | 1 |
| Manslaughter | 1 |
| Negligent driving causing bodily injury | 3 |
| Wounding with intent | 2 |
| Aggravated assault | 15 |
| Common assault | 2 |
| Assault with intent to rob | 5 |
| Procuring abortion and attempts | 3 |
| Bigamy | 10 |
II.—PROPERTY.
| Breaking and entering | 79 |
| Theft | 43 |
| Robbery | 4 |
| Burglary | 25 |
| Breaking and entering by night | 20 |
| In possession of house-breaking instruments | 2 |
| Horse, cattle, or sheep stealing | 7 |
| Receiving stolen property | 8 |
| Fraud and false pretences | 24 |
| Embezzlement | 21 |
| Arson and attempts | 16 |
| Other | 1 |
III.—FORGERY, ETC.
| Forgery | 20 |
| Uttering | 1 |
IV AND V.—OTHER OFFENCES.
| Indecent, &c., conduct | 1 |
| Selling liquor without a license | 1 |
| Cruelty to animals | 1 |
| Personation under Electoral Act | 1 |
| False declarations | 6 |
| Escaping from lawful custody | 1 |
| Breach of probation | 1 |
Fifty Maoris were included in the 460 distinct offenders sentenced in the Supreme Court in 1936, and 313 others (including 4 women) were born in New Zealand. In 44 cases the birthplace was England or Wales, in 22 Scotland, in 8 Ireland, and in 13 Australia.
SUPREME COURT.—OFFENCES AND PUNISHMENTS OF DISTINCT PERSONS, 1936.
| Sentence. | Offences against the Person. | Offences against Property. | Forgery and Offences against the Currency. | Other Offences. | Totals. |
|---|---|---|---|---|---|
| Ordered to come up for sentence | 5 | 3 | 1 | 9 | |
| Discharged | 1 | 1 | |||
| Released under Offenders Probation Act | 33 | 56 | 8 | 5 | 102 |
| Fined | 6 | 2 | 2 | 2 | 12 |
| Declared habitual criminal only | |||||
| Death | 1 | 1 | |||
| Imprisonment or detention— | |||||
| Imprisonment | 92 | 119 | 5 | 4 | 220 |
| Imprisonment and reformative detention | 1 | 1 | |||
| Imprisonment and declared habitual criminal | 1 | 5 | 6 | ||
| Reformative detention only | 33 | 45 | 6 | 1 | 85 |
| Detention in Borstal institution | 3 | 20 | 23 | ||
| Reformative detention and declared habitual criminal | |||||
| Imprisonment and flogging | |||||
| Total persons sentenced | 176 | 250 | 21 | 13 | 460 |
| Length of sentence of imprisonment or detention— | |||||
| 10 and under 15 years | |||||
| 7 and under 10 years | 2 | 2 | |||
| 5 and under 7 years | 3 | 4 | 7 | ||
| 3 and under 5 years | 16 | 17 | 33 | ||
| 2 and under 3 years | 37 | 57 | 2 | 96 | |
| 1 and under 2 years | 34 | 64 | 4 | 1 | 103 |
| 6 months and under 1 year | 13 | 35 | 5 | 53 | |
| Under 6 months | 25 | 12 | 4 | 41 | |
| Indefinite | |||||
| Totals, imprisonment or detention | 130 | 189 | 11 | 5 | 335 |
Of the offenders, 35 were under twenty years of age, 125 between twenty and twenty-five, 94 between twenty-five and thirty, 114 between thirty and forty, 45 between forty and fifty, 39 between fifty and sixty, and 8 sixty or over.
Under the provisions of the Judicature Amendment Act, 1913, the Court of Appeal consists of two divisions, called the First Division and the Second Division, each division consisting of five Judges of the Supreme Court, who are appointed as members of either division by the Governor-General in Council on the recommendation of three Judges of the Supreme Court, including the Chief Justice. The same division does not exercise the jurisdiction of the Court of Appeal at two successive sittings, but exercises its jurisdiction separately, except that in cases of importance involving special difficulty the Chief Justice and one other Judge may recommend, for the approval of the Governor-General in Council, that a joint sitting of both divisions may be held. The Chief Justice or, in his absence, the senior Judge presides. The decision of the Court must be in accordance with the majority of the Judges present, but if the Judges present are equally divided in opinion the judgment, &c., appealed from is deemed to be affirmed.
Under an amendment of 1933, special sittings of the Court of Appeal may be held at times and places appointed by Order in Council. This authority may be exercised only on a certificate of not less than three Judges (of whom the Chief Justice shall be one) that it is not expedient to delay hearing the appeal or other proceeding. For a special sitting any three or more Judges may exercise the jurisdiction of the Court.
In addition to the ordinary appeals from the Supreme Court, certain other proceedings arising in inferior Courts may, on an order of the Supreme Court, be removed into the Court of Appeal for argument. All decisions of the Court of Appeal are final unless leave is granted to appeal to His Majesty in Council (i.e., the Privy Council).
In criminal cases questions of law may be reserved by the Supreme Court for the Court of Appeal, and upon a refusal by the Court to reserve any question the person aggrieved may move the Court of Appeal for leave to appeal. Any person aggrieved may also (after conviction) apply to the Court of Appeal for a new trial upon leave being granted by the Supreme Court. Any person has now the right to apply to the Court of Appeal against a sentence passed in the Supreme Court where such person has been convicted upon an indictment or sentenced for any crime on a plea of “Guilty.”
During the last five years 18 Crown criminal cases were brought before the Appeal Court, and in 10 instances convictions were affirmed. There were 98 civil appeals, of which 55 were allowed, and also 65 cases removed to the Appeal Court, resulting in 50 judgments for plaintiff and 15 for defendants.
Particulars concerning applications during the last five years for leave to appeal against sentences under the provisions of the Crimes Amendment Act, 1920, are: Applications filed, 186; granted, 31; refused, 155. In 29 cases the sentence was varied as a result of the appeal.
There are fourteen prisons and State reformatories and three Borstal institutions in New Zealand, as well as 23 minor prisons and police-gaols. In addition to these there are the police-stations which, under section 17 of the Statute Law Amendment Act, 1917, may be deemed to be prisons for any period (which must not exceed seven days) during which prisoners are detained there undergoing sentence.
On the 1st January, 1936, the various institutions had 1,150 persons under detention (males, 1,097; females, 53). During the year 3,813 were received (males, 3,629; females, 184) and 4,001 discharged or transferred (males, 3,816; females, 185). At the end of the year 962 (males, 910; females, 52) remained in confinement. The daily average number of persons in confinement during the year was 1,050 (males, 1,005; females, 45).
| At 31st December, | Persons in Gaol. | Proportion per 10,000 of Population. | |||
|---|---|---|---|---|---|
| Undergoing Sentence. | On Remand and awaiting Trial, &c. | Total. | Undergoing Sentence. | Total in Confinement. | |
| 1927 | 1,483 | 66 | 1,549 | 10.23 | 10.68 |
| 1928 | 1,435 | 49 | 1,484 | 9.78 | 10.11 |
| 1929 | 1,342 | 53 | 1,395 | 9.03 | 9.39 |
| 1930 | 1,523 | 46 | 1,569 | 10.11 | 10.41 |
| 1931 | 1,614 | 43 | 1,657 | 10.60 | 10.88 |
| 1932 | 1,522 | 61 | 1,583 | 9.92 | 10.31 |
| 1933 | 1,410 | 32 | 1,442 | 9.11 | 9.32 |
| 1934 | 1,199 | 37 | 1,236 | 7.69 | 7.93 |
| 1935 | 1,112 | 38 | 1,150 | 7.08 | 7.33 |
| 1936 | 915 | 47 | 962 | 5.77 | 6.07 |
The 4,001 discharges during the year includes 1,187 transfers of inmates to other prisons or to the police and 5 who died during the year. Prisoners discharged on expiration of sentence numbered 1,835, 41 were released on bail, 593 were set free on the recommendation of the Prisons Board, and 117 released on special remission. Debtors discharged during the year numbered 110, and 38 lunatics were transferred to mental hospitals. The remaining 75 discharges represented persons who had been in prison on remand or awaiting trial, and who were known to have been acquitted.
In the following table persons in confinement at the end of each of the last five years are classified according to nature of sentence:—
| Year. | Hard Labour or Simple Imprisonmnent. | Habitual Criminals. | Detained for Reformative Purposes. | Detained in Borstal Institution. | On Remand, awaiting Trial, &c. | Totals. | ||
|---|---|---|---|---|---|---|---|---|
| Under Three Months. | Three Months and under One Year. | One Year and over. | ||||||
* Including 1 awaiting execution. | ||||||||
| 1932 | 80 | 213 | 483 | 55 | 347 | 343 | 61 | 1,583* |
| 1933 | 57 | 240 | 448 | 45 | 287 | 333 | 32 | 1,442 |
| 1934 | 67 | 190 | 429 | 42 | 278 | 193 | 37 | 1,236 |
| 1935 | 68 | 142 | 372 | 54 | 292 | 184 | 38 | 1,150 |
| 1936 | 83 | 147 | 292 | 75 | 174 | 144 | 47 | 962 |
The total number of new receptions—counting each person once every time received—in the various institutions during the year 1936 was 3,813 (males, 3,629; females, 184), as compared with 4,159 (males, 3,986; females, 173) in 1935. Taking into account the 38 cases where persons were in prison awaiting trial or sentence at the beginning of the year brings this figure up to 3,851, the gross total of receptions. Included here, however, are debtors and lunatics (133), and deducting these gives 3,718, the gross total of receptions of prisoners sentenced for, or persons charged, with criminal offences. Of these, 833 were received on transfer from other institutions or in transitu between institutions, so that the net total of receptions of prisoners sentenced for or persons charged with criminal offences is 2,885. In 551 cases persons charged with criminal offences were handed to the police for trial or sentence and not returned to prison, and 47 persons remained in prison at the end of the year awaiting trial or sentence, so that the number of receptions of prisoners actually undergoing sentence for criminal offences—still counting each prisoner once every time received—was 2,287. Deducting from this figure multiple receptions of the same person (497), there remains, as the total number of distinct prisoners received under sentence for criminal offences, 1,790 (males, 1,704; females, 86), a decrease of 368 as compared with the previous year. Of the total of 1,790, 199 (males, 190, females, 9) were Maoris.
The number of distinct persons received into prison under sentence of imprisonment during the last ten years, with the proportion per 10,000 of mean population, is given in the next table. Debtors and lunatics received into gaol are omitted.
| Year. | Number. | Per 10,000 of Population. | Year. | Number. | Per 10,000 of Population. |
|---|---|---|---|---|---|
| 1927 | 2,711 | 18.84 | 1932 | 3,401 | 22.27 |
| 1928 | 2,548 | 17.50 | 1933 | 2,731 | 17.74 |
| 1929 | 2,596 | 17.62 | 1934 | 2,376 | 15.31 |
| 1930 | 2,864 | 19.18 | 1935 | 2,158 | 13.81 |
| 1931 | 3,203 | 21.15 | 1936 | 1,790 | 11.36 |
The following table shows the sexes and ages of distinct prisoners received into prison under sentence during the year 1936, and distinguishes between Maoris and others:—
| Age, in Years. | Excluding Maoris. | Maoris. | Including Maoris. | ||||||
|---|---|---|---|---|---|---|---|---|---|
| Males. | Females. | Total. | Males. | Females. | Total. | Males. | Females. | Total. | |
| Under 21 | 85 | 14 | 99 | 41 | 4 | 45 | 126 | 18 | 144 |
| 21 and under 25 | 169 | 9 | 178 | 56 | 3 | 59 | 225 | 12 | 237 |
| 25 and under 30 | 208 | 6 | 214 | 40 | 40 | 248 | 6 | 254 | |
| 30 and under 35 | 205 | 2 | 207 | 16 | 16 | 221 | 2 | 223 | |
| 35 and under 40 | 195 | 4 | 199 | 14 | 1 | 15 | 209 | 5 | 214 |
| 40 and under 45 | 158 | 7 | 165 | 7 | 1 | 8 | 165 | 8 | 173 |
| 45 and under 50 | 138 | 12 | 150 | 5 | 5 | 143 | 12 | 155 | |
| 50 and under 55 | 138 | 14 | 152 | 5 | 5 | 143 | 14 | 157 | |
| 55 and under 60 | 108 | 4 | 112 | 1 | 1 | 109 | 4 | 113 | |
| 60 and under 65 | 71 | 5 | 76 | 3 | 3 | 74 | 5 | 79 | |
| 65 and under 70 | 22 | 22 | 22 | 22 | |||||
| 70 and under 75 | 11 | 11 | 11 | 11 | |||||
| 75 and under 80 | 3 | 3 | 3 | 3 | |||||
| 80 and over | 2 | 2 | 2 | 2 | |||||
| Not stated | 1 | 1 | 2 | 2 | 3 | 3 | |||
| Totals | 1,514 | 77 | 1,591 | 190 | 9 | 199 | 1,704 | 86 | 1,790 |
Ages and offences of distinct persons received into prison under sentence during 1936 are summarized in the next table.
| Age, in Years. | Offences against the Person. | Theft and other Offences against Property | Drunkenness. | Vagrancy. | Other Offences. | Totals. | ||
|---|---|---|---|---|---|---|---|---|
| Sexual Offences. | Assaults. | Other. | ||||||
| Under 21 | 7 | 7 | 1 | 97 | 1 | 7 | 24 | 144 |
| 21 and under 25 | 23 | 9 | 1 | 119 | 12 | 6 | 67 | 237 |
| 25 and under 30 | 14 | 15 | 3 | 119 | 20 | 6 | 77 | 254 |
| 30 and under 35 | 10 | 18 | 3 | 76 | 30 | 6 | 80 | 223 |
| 35 and under 40 | 8 | 9 | 2 | 69 | 33 | 6 | 87 | 214 |
| 40 and under 45 | 3 | 6 | 4 | 42 | 41 | 5 | 72 | 173 |
| 45 and under 50 | 8 | 5 | 1 | 31 | 48 | 4 | 58 | 155 |
| 50 and under 55 | 7 | 4 | 3 | 27 | 59 | 8 | 49 | 157 |
| 55 and under 60 | 3 | 4 | 22 | 49 | 6 | 29 | 113 | |
| 60 and under 65 | 2 | 12 | 39 | 7 | 19 | 79 | ||
| 65 and over | 1 | 1 | 27 | 9 | 38 | |||
| Not stated | 1 | 2 | 3 | |||||
| Totals | 83 | 80 | 19 | 615 | 359 | 61 | 573 | 1,790 |
The final table of this category supplies statistics of ages and previous convictions of distinct persons received into prison under sentence during 1936.
| Age, in Years. | Number of Previous Convictions. | Total previously convicted. | Not previously convicted. | Total Distinct Prisoners. | |||||
|---|---|---|---|---|---|---|---|---|---|
| One. | Two. | Three. | Four. | Over Four. | Number mot stated. | ||||
| Under 21 | 23 | 20 | 5 | 3 | 9 | 60 | 84 | 144 | |
| 21 and under 25 | 51 | 23 | 13 | 7 | 36 | 1 | 131 | 106 | 237 |
| 25 and under 30 | 37 | 21 | 16 | 10 | 66 | 2 | 152 | 102 | 254 |
| 30 and under 35 | 26 | 19 | 14 | 8 | 77 | 144 | 79 | 223 | |
| 35 and under 40 | 28 | 17 | 16 | 15 | 84 | 160 | 54 | 214 | |
| 40 and under 45 | 17 | 7 | 9 | 9 | 80 | 2 | 124 | 49 | 173 |
| 45 and under 50 | 21 | 6 | 9 | 9 | 76 | 3 | 124 | 31 | 155 |
| 50 and under 55 | 13 | 12 | 7 | 3 | 80 | 3 | 118 | 39 | 157 |
| 55 and under 60 | 10 | 9 | 8 | 4 | 61 | 92 | 21 | 113 | |
| 60 and under 65 | 5 | 2 | 8 | 1 | 55 | 71 | 8 | 79 | |
| 65 and over | 3 | 3 | 3 | 2 | 17 | 1 | 29 | 9 | 38 |
| Not stated | 1 | 1 | 2 | 3 | |||||
| Totals | 234 | 140 | 108 | 71 | 641 | 12 | 1,206 | 584 | 1,790 |
Included among the 962 prisoners undergoing sentence at the 31st December, 1936, were 143 persons (121 males, 22 females) detained in Borstal institutions under the provisions of the Prevention of Crime (Borstal Institutions Establishment) Act, 1924. This Act, which is an adaptation of Part I of the Prevention of Crime Act, 1908 (Imperial), as amended by the Criminal Justice Administration Act, 1914, is designed to prevent crime, and provides for the detention of young offenders in a special class of reformative institution. An offender between the ages of fifteen and twenty-one years (twenty-three in certain cases), who would otherwise be liable to sentence of imprisonment by the Supreme Court or sentence of imprisonment of not less than one month by a Magistrate, may be made the subject of an order of detention of from two to five years by a Judge of the Supreme Court, and from one to three years by a Magistrate, without a conviction being recorded in the latter case. Inmates may be transferred from prisons, reformatory homes, State reformatory institutions, and institutions under the Child Welfare Act, 1925, to Borstal institutions, and from Borstal institutions to prisons. The Minister of Justice has power to release an offender undergoing detention on condition that he is placed under the supervision or authority of a probation officer, or of a society or person (to be specified) who may be willing to take charge of the case.
The following table shows the distinct prisoners received in prison during 1936 after being sentenced to detention for reformative purposes or having been declared habitual criminals, classified according to sentences:—
| Original Sentence. | Sentenced to Reformative Detention for a Period of | Declared Habitual Criminals. | Totals. | ||
|---|---|---|---|---|---|
| Under Two Years. | Two and under Five Years. | Five Years and over. | |||
| Reformative detention only | 43 | 50 | 4 | 97 | |
| Declared habitual criminals only | |||||
| Hard labour— | |||||
| Under 1 year | 3 | 1 | 1 | 5 | |
| 1 year and under 2 years | 1 | 2 | 3 | ||
| 2 years and under 3 years | 4 | 4 | |||
| 3 years and under 4 years | 1 | 1 | |||
| 4 years and under 5 years | |||||
| 5 years and under 7 years | 1 | 1 | |||
| Totals | 46 | 52 | 4 | 9 | 111 |
For the purposes of the Crimes Amendment Act of 1910 there is constituted a Prisons Board, the members of which are appointed by the Governor-General in Council for a period of three years, and may be reappointed. As at present constituted, the Board consists of a Judge of the Supreme Court, as President, and six other members.
It is the duty of the Board to make inquiry from time to time as to whether there is reasonable cause for belief that any habitual criminal, habitual offender, or other person under sentence of imprisonment or reformative detention is sufficiently reformed to be released on probation or discharged, or for granting discharge to any person who has been released on probation; and to make recommendations as to the release or discharge of any habitual criminal, habitual offender, or other person under sentence of imprisonment or reformative detention, and as to the conditions which may be imposed on any such release or probation. The Board is required to take into consideration, at least once a year, the case of every habitual criminal, habitual offender, or person under sentence of reformative detention. Other classes of prisoners may not apply for and are not entitled to consideration until they have served at least half the sentence (or five years in the case of those sentenced to terms exceeding ten years), and no case is to be considered until six months after the date of reception into prison.
The following table shows the number of cases considered by the Board during each of the last five years:—
| Year. | Borstal Detention. | Reformative Detention. | Hard Labour. | Habitual Criminals and Offenders. | Habitual Criminals for Remission of Hard Labour. | Probationers for Discharge from Probation or Variation of Terms. | Totals. | |
|---|---|---|---|---|---|---|---|---|
| Crimes Amendment Act. | Offender Probationers. | |||||||
| 1932 | 553 | 489 | 384 | 71 | 9 | 18 | 1,524 | |
| 1933 | 581 | 562 | 392 | 63 | 8 | 33 | 1,639 | |
| 1934 | 418 | 480 | 400 | 62 | 2 | 8 | 24 | 1,394 |
| 1935 | 345 | 488 | 407 | 76 | 3 | 17 | 23 | 1,359 |
| 1936 | 367 | 474 | 367 | 83 | 6 | 14 | 11 | 1,322 |
Of the cases considered in 1936, recommendations were made for release on probation in 595 cases, and for discharge from prison or from probation in 30 cases. Eight probationers under the Offenders Probations Act were ordered discharge. In 30 cases petitions were declined, and 6 habitual criminals had remissions of their hard labour sentence. The remaining 653 cases were deferred.
Legislation on this subject dates from 1886. Under the Offenders Probation Act of 1920 probation may be granted for “any offence punishable by imprisonment, whether on indictment or otherwise.” Formerly there were numerous important exceptions. The maximum period of probation was fixed in 1920 at five years.
The conditions of release on probation include the necessity for a person on probation to report to the Probation Officer on specified days not more than one month apart, and to notify his address and any change of address. The nature and place of his employment must be made known to and be approved of by the Probation Officer, and he must not commit any offence against the law. The Probation Officer may warn him not to associate with any particular person or class of persons.
A breach of the conditions of the probationary license renders the offender liable to imprisonment or fine, and in addition he may, in respect of the original offence, be either committed to prison or again released on probation.
The following figures are taken from successive returns prepared by the Chief Probation Officer:—
| Year. | Number admitted to Probation. |
|---|---|
| 1927 | 586 |
| 1928 | 615 |
| 1929 | 557 |
| 1930 | 650 |
| 1931 | 750 |
| 1932 | 726 |
| 1933 | 620 |
| 1934 | 664 |
| 1935 | 605 |
| 1936 | 585 |
The following table gives the ages and terms of probation of offenders dealt with under the provisions of the Act during the year 1936:—
| Age, in Years. | 6 Months or under. | 1 Year. | 18 Months. | 2 Years. | 3 Years. | 4 Years. | 5 Years. | Totals. |
|---|---|---|---|---|---|---|---|---|
| Under 20 | 5 | 60 | 37 | 15 | 117 | |||
| 20 and under 25 | 9 | 91 | 6 | 83 | 8 | 197 | ||
| 25 and under 30 | 7 | 42 | 2 | 32 | 7 | 90 | ||
| 30 and under 40 | 9 | 43 | 2 | 45 | 5 | 104 | ||
| 40 and under 50 | 2 | 16 | 18 | 1 | 1 | 38 | ||
| 50 and under 60 | 1 | 9 | 17 | 2 | 29 | |||
| 60 and over | 2 | 4 | 4 | 10 | ||||
| Totals | 35 | 265 | 10 | 236 | 38 | 1 | 585 |
Offences committed by juvenile offenders constitute a class worthy of special consideration. The Child Welfare Amendment Act, 1927, altered the definition of “child” to cover persons under seventeen years of age, instead of sixteen as formerly. Figures of juvenile cases in Magistrates' Courts during each of the last five years are as follows:—
| Year. | Total Cases. | Dismissed or withdrawn for want of Prosecution or of Evidence. | Dismissed on the Merits. | Admonished and discharged. | Committed for Trial or Sentence. | Summarily convicted. |
|---|---|---|---|---|---|---|
| 1932 | 3,071 | 88 | 45 | 1,159 | 4 | 1,775 |
| 1933 | 2,956 | 82 | 48 | 1,194 | 4 | 1,628 |
| 1934 | 3,185 | 90 | 83 | 1,058 | 2 | 1,952 |
| 1935 | 3,579 | 77 | 92 | 1,303 | 2,107 | |
| 1936 | 3,853 | 110 | 71 | 1,297 | 2 | 2,373 |
The principal of the offences against the person in 1936 was indecent assault, which was responsible for 20 cases (13 convictions), and common assault, 11 cases (7 convictions).
Theft was the principal offence against property, 1,571 charges being dealt with in 1936, resulting in 1,041 convictions. These figures do not include housebreaking and stealing, which was the offence in 354 cases (282 convictions).
Wilful damage, trespass, &c., is also an important class of offence in juvenile cases, being responsible for 474 charges (158 convictions) in 1936. In 283 cases (211 convictions) the charge was unlawfully converting vehicle to own use.
In the “Other” offences the effect of the introduction of the Child Welfare Act, 1925, is very noticeable, the number of cases for 1936 (485) being over five times that recorded for 1925 (88). Over 68 per cent. of the cases in this class were brought under the Child Welfare Act, the number of cases of children not under proper control or in indigent circumstances being 331, and the resulting convictions 303. In connection with these convictions orders were made for committal to the care of the Superintendent, Child Welfare Branch, or for supervision by a Child Welfare Officer in 283 cases, while in 14 cases the children concerned were committed to an institution under the Child Welfare Act.
Offences by juveniles are seldom of a very serious nature, and even when a conviction is recorded Magistrates frequently adopt the course of discharging the offender or of ordering him to come up for sentence when called upon. It is found that in very few cases does the future conduct of the convicted person render it necessary for him to be brought before the Magistrate again for sentence.
MAGISTRATES' COURTS.—PUNISHMENTS OF JUVENILE OFFENDERS, 1936.
| Punishment. | Against the Person. | Against Property.* | Against Good Order. | Other. | Totals. |
|---|---|---|---|---|---|
* Including forgery and offences against the currency. | |||||
| Released on probation | 6 | 6 | |||
| Convicted and discharged | 1 | 28 | 16 | 6 | 51 |
| Convicted and ordered to come up for sentence | 4 | 4 | 8 | ||
| Committed to care of Child Welfare Superintendent | 8 | 331 | 4 | 243 | 586 |
| Placed under supervision of Child Welfare Officer | 37 | 1,283 | 28 | 56 | 1,404 |
| Committed to institution under Child Welfare Act | 77 | 14 | 91 | ||
| Committed to Borstal Institution | 1 | 12 | 4 | 17 | |
| Fined | 2 | 17 | 168 | 7 | 194 |
| Whipped | 4 | 4 | |||
| Order made | 5 | 1 | 6 | 12 | |
| Total summary convictions | 53 | 1,767 | 217 | 336 | 2,373 |
| Total charges brought | 74 | 2,779 | 515 | 485 | 3,853 |
Very few juvenile cases find their way to the Supreme Court, and, beyond the information disclosed by the Magistrates' Courts returns as to committals for sentence or trial, no statistics of such cases in the higher Court are available. Statistics of ages of persons sentenced show, however, that no persons under seventeen years of age were sentenced in the Supreme Court during 1936.
Nine distinct persons (including one female) under seventeen years of age were received into Borstal institutions during 1936.
Of the 41,890 summary convictions in Magistrates' Courts in 1936 only 2,409, or 5.75 per cent., were of females, the following being the principal offences:—
| Common assault | 12 |
| Attempted suicide | 26 |
| Theft | 353 |
| Fraud and false pretences | 63 |
| Receiving stolen property | 7 |
| Wilful damage, &c. | 18 |
| Drunkenness | 160 |
| Negligently driving motor-vehicle | 152 |
| Vagrancy | 44 |
| Breaches of regulations for lighting vehicles | 164 |
| Non-registration, &c., of motor-vehicles | 119 |
| Breaches of parking regulations | 116 |
| Speeding, &c. | 58 |
| Other minor traffic offences | 28 |
| Application for prohibition order | 33 |
| Offensive conduct or language | 47 |
| Sunday trading | 54 |
| Breaches of by-laws, &c. | 46 |
| Indigent, &c., child | 151 |
| Other charges under Child Welfare Act | 4 |
| Unlicensed wireless sets | 225 |
| Breaches of prohibition orders | 22 |
| Other breaches of Licensing Act | 154 |
| Allowing horses, cattle, &c., to wander | 42 |
| Selling adulterated milk | 15 |
| Charges under Destitute Persons Act | 29 |
| Failing to clear noxious weeds | 26 |
In addition to the 2,409 summary convictions of women in Magistrates' Courts during 1936 there were 44 committals to the Supreme Court—17 for trial and 27 for sentence. The Supreme Court statistics show that 29 charges against females were dealt with during the year, resulting in 11 convictions, representing 6 different persons. In addition, 3 women were sentenced after committal for sentence in respect of 4 offences.
The number of distinct female prisoners received into prison during 1936 was 86, the principal offences of these being—vagrancy, 19; drunkenness, 14; and theft, 19. The actual number of receptions of female prisoners during the year was 184, this number including 16 Maoris, and the daily average number of women prisoners in gaol was 45. Two reformatories (at Addington and Point Halswell) house women prisoners only. There is also a Borstal institution at Point Halswell (Wellington) for women only.
The number of summary convictions of Maoris brought before Magistrates' Courts for the last five years is shown in the following table:—
| Year. | Class of Offence. | |||||
|---|---|---|---|---|---|---|
| Against the Person. | Against Property. | Against Good Order. | Other Offences. | Totals. | ||
| Drunkenness.* | Other. | |||||
* Excluding prohibition-order cases. | ||||||
| 1932 | 56 | 569 | 141 | 356 | 287 | 1,409 |
| 1933 | 61 | 396 | 120 | 381 | 272 | 1,230 |
| 1934 | 81 | 518 | 159 | 469 | 350 | 1,577 |
| 1935 | 55 | 562 | 195 | 456 | 384 | 1,652 |
| 1936 | 119 | 653 | 369 | 750 | 452 | 2,343 |
The number of Maoris convicted and sentenced in the Supreme Court, which exhibits the extent of serious crime amongst the Native race, is not very great, the total number convicted and sentenced during the last five years being only 202. The 50 convictions or sentences during 1936 were made up as follows: 30 for offences against the person (including 16 for unlawful carnal knowledge), 20 for property offences (including 14 for burglary and breaking and entering). Thirty-eight of these were sent up from the Magistrates' Courts for sentence, the remaining 12 being tried and convicted in the Supreme Court.
The number of distinct Maori prisoners received into gaol under sentence during 1936 was 199 (including 9 women), as compared with 226 in 1935.
The extent to which convictions for drunkenness swell the total of convictions is obvious from the information given earlier in this section. The number of convictions for drunkenness, including drunkenness with disorderly conduct, drunk in charge of vehicle or of horse, and habitual drunkenness, during 1936 totalled 4,544 (males, 4,384; females, 160). The convictions in each of the last four years are the lowest recorded since 1895, when they numbered 4,792. In 1895, however, the proportion of convictions for drunkenness per 1,000 of the mean population was 6.52, while in 1936 the proportion was 2.88.
The convictions for drunkenness in 1936 represent 10.84 per cent. of the total convictions during the year. In addition, there were 1,211 technical convictions in cases of applications for the issue of prohibition orders. Prohibition-order cases are not included in the following table, which shows the number of convictions for drunkenness recorded, and the proportion per 1,000 of the mean population of each sex, during the last five years:—
| Year. | Convictions for Drunkenness. | Per 1,000 of Mean Population. | ||||
|---|---|---|---|---|---|---|
| Males. | Females. | Totals. | Males. | Females. | Totals. | |
| 1932 | 3,888 | 185 | 4,073 | 5.00 | 0.25 | 2.67 |
| 1933 | 3,430 | 151 | 3,581 | 4.38 | 0.20 | 2.33 |
| 1934 | 3,292 | 161 | 3,453 | 4.17 | 0.21 | 2.23 |
| 1935 | 3,250 | 125 | 3,375 | 4.10 | 0.16 | 2.16 |
| 1936 | 4,384 | 160 | 4,544 | 5.48 | 0.21 | 2.88 |
Of the total convictions for drunkenness during 1936, 4,337 (4,181 males and 156 females) were arrest cases, while 207 (203 males and 4 females) were cases brought before the Magistrate by summons.
Repeated charges against the same person are included in the totals shown in the preceding table.
The total convictions for all offences in arrest cases in 1936 were 9,651 but the distinct convictions amounted to only 6,770, the former total including 2,881 convictions for multiple charges against the same person at the same time. Of the latter 588 were in respect of charges dealt with at the same time as the offender was convicted of drunkenness, the principal associated offences being—
| Offence. | Number of Convictions. |
|---|---|
| Common assault | 36 |
| Theft | 40 |
| Wilful damage | 68 |
| Indecent, riotous, or offensive conduct | 25 |
| Obscene, threatening, or abusive language | 118 |
| Assaulting, resisting, or obstructing police | 35 |
| Vagrancy | 15 |
| Casting offensive matter | 48 |
| Breach of prohibition order | 102 |
| Unlawfully on licensed premises after hours | 9 |
In addition, there were 33 cases where a prohibition order was issued against a person convicted at the same time for drunkenness.
Any person who has been three times convicted for drunkenness within the nine months immediately preceding any conviction for drunkenness may be declared an habitual drunkard, the number of convictions for habitual drunkenness during 1936 being 20 (including 5 females). A Magistrate may, in addition to or in lieu of a penalty, commit an habitual drunkard to any institution authorized by the Governor-General to receive and detain such persons for any period not being less than twelve months.
The sentences in the 4,544 convictions for drunkenness during the year were: Fined, 2,752; imprisonment in lieu of fine, 396; peremptory imprisonment, 163; committed to Salvation Army Home or other such institution, 13; convicted and discharged, 1,116; released under Offenders Probation Act, 11; other sentences, 93.
Statistics of the consumption of alcoholic liquors in the Dominion will be found in a later section of the Year-Book (Consumption of Commodities).
In keeping with the enormous growth of motor traffic during recent years, there has been a huge increase in minor traffic offences, which constitute a high proportion of the cases dealt with in Magistrates' Courts. However, the number of cases and convictions during 1936 compare quite favourably with figures for the preceding years shown, having regard to the recent increase in motor traffic. With the improvement in economic conditions during 1935 and 1936 there has been an increase in the number of motor-vehicles licensed, those actually licensed on 31st December, 1936, numbering 241,915, an increase of 11 per cent. on the previous year's figure. On the other hand, cases and convictions for traffic offences show an increase of 10 per cent. over those for 1935.
The number of cases and convictions, and the number of convictions per 1,000 of mean population (including Maoris), for this class of offence are shown below:—
| 1933. | 1934. | 1935. | 1936. | |
|---|---|---|---|---|
| Cases | 15,582 | 15,972 | 16,768 | 18,478 |
| Convictions | 14,136 | 14,430 | 15,303 | 16,693 |
| Convictions per 1,000 of mean population | 9.18 | 9.30 | 9.80 | 10.60 |
The convictions for traffic offences in 1936 represent 39.87 per cent. of the total convictions during the year.
The following table shows convictions for traffic offences during the last five years:—
| Offence. | 1932. | 1933. | 1934. | 1935. | 1936. |
|---|---|---|---|---|---|
| Negligent driving causing death | 1 | 1 | |||
| Negligent driving causing bodily injury | 1 | ||||
| Unlawfully converting vehicle to own use | 391 | 344 | 250 | 333 | 470 |
| Drunk in charge of motor-vehicle | 308 | 287 | 253 | 327 | 477 |
| Drunk in charge of other vehicle | 18 | 15 | 12 | 8 | 15 |
| Excessive speed in motor-vehicle | 2,052 | 1,428 | 1,269 | 1,352 | 1,697 |
| Negligent or dangerous driving of motor-vehicle | 2,693 | 2,314 | 2,429 | 2,806 | 3,533 |
| Negligent or dangerous driving of other vehicles | 58 | 33 | 62 | 84 | 20 |
| Riding bicycle on footpath | 354 | 362 | 406 | 381 | 402 |
| Breaches of regulations for the lighting of vehicles | 3,406 | 3,661 | 3,234 | 3,440 | 3,335 |
| Offences relating to the registration, &c., of motor-vehicles | 4,521 | 4,337 | 4,460 | 4,240 | 4,317 |
| Breaches of parking regulations | 949 | 694 | 1,326 | 1,495 | 1,334 |
| Other traffic offences | 854 | 661 | 729 | 836 | 1,091 |
| Total | 15,604 | 14,136 | 14,430 | 15,303 | 16,693 |
The following table shows the number of cases and the results of hearing for the various traffic offences or groups of offences heard in Magistrates' Courts during 1936:—
| Offence. | Total Cases. | Dismissed, or Admonished and Discharged. | Committed to Supreme Court. | Convictions. | Results of Convictions. | ||
|---|---|---|---|---|---|---|---|
| Fined. | Convicted and Discharged. | Other. | |||||
| Negligent driving causing death | 45 | 10 | 34 | 1 | 1 | ||
| Negligent driving causing bodily injury | 17 | 2 | 14 | 1 | 1 | ||
| Unlawfully converting vehicle to own use | 578 | 103 | 5 | 470 | 40 | 53 | 377 |
| Drunk in charge of motor vehicle | 508 | 30 | 1 | 477 | 391 | 7 | 79 |
| Drunk in charge of other vehicle | 15 | 15 | 10 | 1 | 4 | ||
| Excessive speed in motor-vehicle | 1,803 | 106 | 1,697 | 1,679 | 14 | 4 | |
| Negligent or dangerous driving of motor-vehicle | 4,210 | 676 | 1 | 3,533 | 3,391 | 132 | 10 |
| Negligent or dangerous driving of other vehicle | 26 | 6 | 20 | 18 | 2 | ||
| Riding bicycle on footpath | 473 | 71 | 402 | 374 | 27 | 1 | |
| Breaches of regulations for the lighting of vehicles | 3,546 | 211 | 3,335 | 3,083 | 247 | 5 | |
| Offences relating to the registration, &c., of motor-vehicles | 4,648 | 331 | 4,317 | 4,014 | 212 | 91 | |
| Breaches of parking regulations | 1,392 | 58 | 1,334 | 1,272 | 59 | 3 | |
| Other traffic offences | 1,217 | 125 | 1 | 1,091 | 1,018 | 72 | 1 |
| Total | 18,478 | 1,729 | 56 | 16,693 | 15,291 | 826 | 576 |
By far the greater proportion of the cases are for comparatively trivial offences such as breaches of lighting regulations and breaches of regulations for the registration, &c., of motor-vehicles (including driving unlicensed car, and driving without driver's license). These cases result in a far greater proportion of convictions in Magistrates' Courts than the more serious class of traffic offences—viz., negligent driving causing death or endangering human life—which are usually committed to the Supreme Court for trial or sentence.
Dealing only with motor-vehicles, it is found that the total number of convictions for traffic offences during 1936 was 11,360 (which total excludes motor-vehicles without lights, &c., and unlawful conversion of motor-vehicles—separate figures not available), and of these 8,039 were in the North Island and 3,321 in the South. The number of motor-vehicles actually licensed on 31st December, 1936, was—North Island, 158,148; South Island, 83,767. The convictions were therefore: North Island 5.08 per cent., South Island 3.96 per cent., of the number of licensed vehicles.
In view of the increasing interest in problems of road transport, the following table showing the number of traffic offences in relation to the number of licensed motor-vehicles and imports of motor-spirit (an indicator of road-usage) is of interest:—
| Year. | Drunk in Charge. | Other Traffic Offences. | All Traffic Offences. | ||||
|---|---|---|---|---|---|---|---|
| Number. | Per 1,000 Motor-vehicles licensed. | Per 1,000,000 Gallons of Motor-spirit imported. | Number. | Number. | Per 1,000 Motor-vehicles licensed. | Per 1,000,000 Gallons of Motor-spirit imported. | |
| 1927 | 294 | 1.88 | 6.12 | 14,985 | 15,279 | 97.9 | 318.0 |
| 1928 | 304 | 1.79 | 5.57 | 15,957 | 16,261 | 95.6 | 298.1 |
| 1929 | 418 | 2.27 | 6.69 | 16,349 | 16,767 | 91.0 | 268.5 |
| 1930 | 435 | 2.26 | 6.37 | 17,710 | 18,145 | 94.4 | 265.6 |
| 1931 | 403 | 2.15 | 6.52 | 14,732 | 15,135 | 80.9 | 244.7 |
| 1932 | 308 | 1.64 | 5.27 | 15,296 | 15,604 | 83.0 | 267.0 |
| 1933 | 287 | 1.52 | 5.18 | 13,849 | 14,136 | 74.8 | 255.0 |
| 1934 | 253 | 1.26 | 3.91 | 14,177 | 14,430 | 71.9 | 223.2 |
| 1935 | 327 | 1.51 | 5.01 | 14,976 | 15,303 | 70.6 | 234.4 |
| 1936 | 477 | 1.97 | 5.49 | 16,216 | 16,693 | 69.0 | 192.2 |
While there has been a considerable increase in the number of traffic offences in the last three years, the ratio of total offences to the number of vehicles on the road and to usage of motor-spirit shows an improvement. Convictions for drunkenness in charge of a motor-vehicle, on the other hand, show an increase, both absolutely and relatively to road-usage.
The increase in motor traffic has focussed attention on problems of traffic accidents, and a special road-safety campaign is being conducted. In addition to publicity measures adopted with the object of preventing accidents, special provisions have been made to see that traffic regulations are strictly enforced. The stricter enforcement of these regulations will no doubt result, in the initial stages, in a greater number of convictions for traffic offences. Although the effects of this campaign would not be fully reflected in the 1936 statistics, it is worthy of mention that convictions during the first two quarters of 1937 include a considerably greater number of traffic offences than in the same period of last year.
So far all criminal statistics in this section relate to offenders who have been brought before the Courts, no account being taken of those cases where offences have been reported to the police but in which no arrest or summons resulted.
The following figures relating to offences reported are taken from the reports of the Police Department during the years 1932–36:—
| Year. | Number of Offences reported. | Offences in which Arrests or Summonses resulted. | |
|---|---|---|---|
| Number. | Percentage of those reported. | ||
| 1932 | 35,368 | 32,006 | 90.49 |
| 1933 | 33,302 | 30,133 | 90.42 |
| 1934 | 32,286 | 29,427 | 91.16 |
| 1935 | 33,168 | 30,601 | 92.26 |
| 1936 | 35,448 | 33,052 | 93.24 |
It will be seen that in cases where a crime is definitely established as such and reported to the police, an arrest or summons usually follows. The proportion of arrests and summonses varies with the offence however, and this suggests that certain classes of offence would not be recognized as offences or come before the public at all but for the arrest or summons, while other classes of offence are only too obvious, but the offender is sometimes not apprehended. Examples of the former class are most of the sexual offences, while assaults and offences against property come into the latter.
The following table shows some of the principal offences during the period, the number of offences reported, and the number of arrests and summonses which resulted.
| Offences. | 1932. | 1933. | 1934. | 1935. | ||||
|---|---|---|---|---|---|---|---|---|
| Reported. | Resulting in Arrest of Summons. | Reported. | Resulting in Arrest or Summons. | Reported. | Resulting in Arrest of Summons. | Reported. | Resulting in Arrest or Summons. | |
| Murder and attempts | 17 | 15 | 25 | 15 | 17 | 5 | 17 | 12 |
| Manslaughter | 8 | 8 | 5 | 5 | 6 | 6 | 5 | 5 |
| Negligent driving causing death or injury | 38 | 37 | 24 | 24 | 37 | 36 | 38 | 36 |
| Attempted suicide | 71 | 71 | 65 | 65 | 76 | 74 | 73 | 71 |
| Assaults, wounding &c. | 628 | 609 | 637 | 621 | 473 | 457 | 513 | 499 |
| Sexual offences | 224 | 220 | 279 | 271 | 274 | 265 | 338 | 327 |
| Robbery, breaking and entering, theft and receiving | 9,837 | 7,179 | 9,106 | 6,480 | 7,535 | 6,123 | 7,225 | 5,432 |
| Forgery, embezzlement and fraud | 1,383 | 1,284 | 1,101 | 1,005 | 1,439 | 1,380 | 1,403 | 1,321 |
| Arson and attempts | 35 | 28 | 21 | 14 | 17 | 11 | 31 | 23 |
In the following table some of the more serious offences dealt with during 1935 are set out, and the cases followed from the reporting of the offence to its final disposal.
| Offences. | Number reported. | Offences resulting in | ||||
|---|---|---|---|---|---|---|
| Arrest or Summons. | Committal for Trial. | Summary Conviction. | Dismissal. | Conviction after Committal for Trial. | ||
| Murder | 11 | 6 | 6 | 2 | ||
| Negligent driving causing death or injury | 38 | 36 | 31 | 3 | 2 | 13 |
| Attempted suicide | 73 | 71 | 66 | 5 | ||
| Aggravated assaults, wounding, &c. | 16 | 14 | 10 | 3 | 1 | 8 |
| Common assault | 490 | 483 | 2 | 430 | 51 | 2 |
| Sexual— | ||||||
| Unnatural offence and attempts | 15 | 15 | 13 | 1 | 1 | 13 |
| Incest | 21 | 21 | 19 | 2 | 19 | |
| Rape and attempts | 20 | 19 | 15 | 3 | 1 | 8 |
| Unlawful carnal knowledge and attempts | 103 | 102 | 91 | 7 | 4 | 69 |
| Indecent assault | 130 | 122 | 68 | 46 | 8 | 41 |
| Indecent assault on male | 47 | 46 | 36 | 8 | 2 | 15 |
| Robbery and stealing from the person | 17 | 9 | 6 | 1 | 2 | 5 |
| Burglary and breaking and entering | 1,325 | 938 | 447 | 447 | 44 | 387 |
| Embezzlement | 73 | 71 | 24 | 43 | 4 | 23 |
| Theft (other, undefined and attempts) | 6,697 | 5,023 | 144 | 4,619 | 260 | 120 |
| Receiving stolen property | 215 | 215 | 38 | 138 | 39 | 34 |
| Fraud and false pretences | 1,139 | 1,071 | 119 | 908 | 44 | 64 |
| Forgery, uttering, &c. | 190 | 178 | 132 | 36 | 10 | 66 |
Eleven deaths occurred as a result of murder, being five less than in 1934. Of the offenders, six were arrested, four committed suicide, and in one case no arrest was made. Of the six arrested and committed for trial, two were found guilty and sentenced to death, three were acquitted on the grounds of insanity, and one was, owing to mental condition, unable to plead.
Table of Contents
General.—The New Zealand Military Forces are raised, maintained, and organized under the provisions of the Defence Act, 1909, as amended by the Defence Amendment Acts of 1910, 1912, 1915, and 1931. They are divided into the Regular Forces and the Territorial Force.
The Regular Forces.—The Regular Forces are maintained in order to provide commanders and staffs at the various headquarters and military establishments, adjutants, instructional staff and instructional cadres for the Territorial Force, nucleus garrisons for the fixed defences, and maintenance and administrative staffs at ordnance depots. They are raised by voluntary enlistment, and correspond to the Regular Army in Great Britain.
The Territorial Force.—The Territorial Force is maintained for the defence of New Zealand, and is so organized that on mobilization it will be capable of forming the field army and coast defence troops required for that purpose. It is raised on a basis of voluntary service, and corresponds broadly to the Territorial Army in Great Britain.
Liability to Compulsory Service and Training.—The Defence Act, 1909, and amendments provides that all male inhabitants who have resided in New Zealand for six months and are British subjects are liable to be trained as follows:—
From fourteen to seventeen years of age in the Senior Cadets (a period of four years):
From eighteen to twenty-four years of age in the Territorial Force (a period of seven years):
From twenty-five to twenty-nine years of age in the Territorial Force Reserve (a period of five years).
Training in Peace.—Since 1st October, 1930, the compulsory provisions of the Defence Act have not been enforced; but, if the Government so directed, these could be brought into operation again without legislation.
Training in the Territorial Force and Cadets is now purely voluntary. Recruits for the Territorial Force voluntarily engage to serve for three years. Men may extend their service up to the age of thirty-two years, and W.O.s, N.C.O.s, and specially selected men may continue their service for a further period of three years.
The only Cadets trained are those at secondary schools. Practically every secondary school has a Cadet unit.
Liability to Compulsory Service in War.—In time of war all male inhabitants between the ages of seventeen and fifty-five (with certain exceptions mentioned in the Act) are liable to serve in the Militia. The Militia, when embodied, becomes part of the Defence Forces. Both the Territorial Force and the Militia are liable to serve in any part of New Zealand, but cannot be compelled to serve outside it. Any Force raised for service overseas would be recruited on a voluntary basis.
Terms of Service.—(i) Regular Forces: The engagement of personnel in the Regular Forces is voluntary, as with the Regular Army in Great Britain. Men enlist for a term of five years, and re-engagement can be entered upon for permanent service up to fifty-five years of age or until they have completed thirty-five years' service. Extension of service up to sixty years of age may be permitted, if necessary, to enable the soldier to qualify for pension. (ii) The Territorial Force: Service at present is for three years.
Application of the Army Act.—Members of the Regular Forces are subject at all times to the Army Act, except where it is inconsistent with Defence Acts, while members of the Territorial Force are subject only when undergoing training or when on active service.
The Regular Forces.—On 1st August, 19,37, the peace establishment of the Regular Forces was 106 officers and 436 other ranks.
The Territorial Force.—The peace establishment of the Territorial Force on 1st August, 1937, was 565 officers and 7,717 other ranks. Under the provisions of the Defence Act, 1909, this may be increased up to a total of 30,000 all ranks.
The Territorial Force Reserve.—No establishment is laid down for the Territorial Force Reserve.
War and Peace Establishments.—War and peace establishments are based on British establishments as far as is practicable.
The Council of Defence is responsible for advising the Government on matters of policy and for co-ordinating the activities of the three services.
The Council consists of—
The Prime Minister (Chairman):
The Minister of Defence:
Such other members as may be appointed by the Prime Minister:
Chief of the Naval Staff:
Chief of the General Staff:
Chief of the Air Staff:
Secretary (an officer of the Regular Forces).
The Minister of Defence controls and administers the three fighting services through the medium of the Department of Defence, which is divided for the purpose into—
The Naval Department:
The New Zealand Military Forces:
The Air Department.
The Army Hoard and Army Headquarters.—The Army Board is responsible for the command, training, and administration of the New Zealand Military Forces, and consists of—
The Minister of Defence (President):
The Chief of the General Staff (First Member):
The Adjutant and Quartermaster-General (Second Member):
The Army Secretary (Third Member).
Army Headquarters, which is the counterpart in New Zealand of the War Office, is organized as follows:—
The Branch of the General Staff:
The Branch of the Adjutant and Quartermaster-General:
The Finance Branch.
The Military Districts.—New Zealand is divided into three military districts (Northern, Central, and Southern), with headquarters at Auckland, Wellington, and Christchurch. Each military district is under the command of a Colonel of the Regular Forces, who is provided with a suitable staff. Each military district is divided into four areas, and furnishes two battalions and a proportion of other troops. In a national emergency each area would provide additional units up to the extent of the man-power and equipment available. An officer of the Regular Forces is in charge of each area, and is responsible for the inspection, training, and administration of both Territorial and Cadet units therein.
The Regular Forces.—The Regular Forces consist of—
The New Zealand Staff Corps:
The New Zealand Permanent Staff:
The Royal New Zealand Artillery:
The New Zealand Permanent Army Service Corps:
The New Zealand Army Medical Corps:
The New Zealand Army Ordnance Corps:
The General Duty Section of the New Zealand Regular Forces.
[NOTE.—Officers of the New Zealand Staff Corps are liable to be posted for staff or instructional purposes to any arm of the service except artillery, and are trained accordingly.]
The Territorial Force.—The peace establishment of the Territorial Force provides for the following:—
Field Troops—
Four Mounted Rifles Regiments (three horsed, one motorized):
Ten Field Batteries (seven 18-pr., three 4.5 in. howitzers):
Four Medium Batteries (three 6 in. howitzers, one 60–pr.):
Two 3.7 in. Howitzer Batteries:
Three Field Companies Engineers:
Three Signal Depots:
Three Infantry Battalions:
Three Composite Companies, A.S.C.:
Three Field Ambulances.
Coast Defence Troops—
Two Heavy Batteries:
Two Anti-aircraft Gun Sections:
Two Anti-aircraft Searchlight Sections:
Three Infantry Battalions.
The above Force is so designed that in the event of a national emergency it will be capable of expanding to—
One Infantry Division;
One Mounted Rifles Brigade;
One Medium Artillery Brigade;
plus the Coast Defence Troops shown in (ii) above.
The Territorial Force Reserve.—The Territorial Force Reserve is composed of those who served efficiently for three years in the Territorial Force and are under the age of forty-one years.
The Regular Forces.—All ranks of the Regular Forces are called upon to assist in the training of the Territorial Force, and provide in certain cases a permanent nucleus thereto. The officers of the Regular Forces undergo the same examination for promotion, and candidates for the staff colleges the same entrance examinations, as British Regular officers.
In addition to specialist courses, refresher courses are held from time to time for the benefit of officers studying for their promotion examinations.
The Territorial Force.—The annual training prescribed for all units of the Territorial Force consists of—
Fourteen days' training before the annual camp:
Six days' continuous training in camp (during which the minimum of six hours' work is to be performed each day):
The weapon training courses prescribed. These are carried out during half-day parades, included in (i) above.
There are obligatory courses in camp lasting one week for Majors, Captains, and Lieutenants who are preparing for their promotion examinations.
The Territorial Force Reserve.—Officers of the Territorial Force Reserve are liable to be called upon to attend a camp of instruction with their unit once every three years, but owing to financial stringency these officers have not been called up since 1930. Other ranks do no training at all.
The Army School of Instruction.—The Army School of Instruction at Trentham provides for refresher and specialist courses for officers and other ranks of the Regular Forces, besides courses in tactics, staff duties, &c., for senior officers of the Territorial Force.
All recruits for the Regular Forces receive their recruit training at the Army School.
District Schools of Instruction.—Each military district has a training-school at which are held all courses essential for the military education of the junior officers of the Territorial Force. Courses in weapon training, drill, signalling, &c., for all ranks of the Territorial Force are also provided.
[NOTE.—There is no military college in New Zealand like the Royal Military Colleges at Sandhurst, Kingston, and Duntroon, but cadets are sent to the Royal Military College of Australia. These cadets, after completing their courses and receiving their commissions, are sent abroad for further training.
The only Officers Training Corps in New Zealand is the Otago University Medical Company, which consists of medical and dental students.
Rifle clubs exist for the purpose of encouraging individuals who are not members of the Naval. Military, or Air Forces, to learn to shoot. They are affiliated to, but do not form part of, the Territorial Force. All British subjects over the age of eighteen years are eligible to join. A free issue of 200 rounds of ammunition is made to all new members, a further 250 rounds to those who fire and qualify in the annual musketry course prescribed, and a further 50 rounds to those who qualify as marksmen. Other ammunition is provided at quarter-cost.
In order to facilitate administration, the Cadets are organized in battalions, but, except on ceremonial occasions, seldom work as such. The strength of the Cadets on 1st August, 1937, was 366 officers and 16,000 other ranks.
Since the suspension of compulsory military training only Cadets attending secondary schools are trained. The annual training approximates thirty drills of one and a half hours' duration, including a musketry course and a “barracks” lasting five days.
New Zealand supplied ton contingents for service during the South African War, comprising a total of 6,500 officers and men.
Immediately the Great European War broke out an Expeditionary Force was despatched to Western Samoa and occupied those islands, while a larger force in the form of a mixed brigade was despatched to Europe. The latter force was, however, landed in Egypt, and took part in the defence of the Suez Canal. It gave a good account of itself in the desperate campaign on Gallipoli, and after being withdrawn to Egypt was expanded into a Division and a Mounted Brigade. The Division then wont to the western front, while the Mounted Brigade continued to operate against the Turks in Palestine. Both forces became famous for their military qualities, and took part in practically all the great actions of their respective theatres up to the Armistice.
A total of 98,950 troops left New Zealand for service with the New Zealand Expeditionary Forces, and, of these, 16,697 lost their lives on active service. In addition to the 98,950 of all ranks of the New Zealand Expeditionary Forces, 944 British Army Reservists, British Naval Reservists, and others left the Dominion to rejoin their units in the United Kingdom or in a theatre of war. It is also known that 3,370 (not included above) left New Zealand during the period of the war and joined units of the British Forces or the Expeditionary Forces of other Dominions.
On the Armistice being declared in November, 1918, New Zealand had 52,000 troops in the field, while 10,000 more were ready to embark or were under training.
The tremendous amount of transport work involved in the conveyance of these forces to Egypt, France, Britain, Gallipoli, and Samoa was carried out with extraordinary success, not one New Zealand transport having been lost while conveying troops.
The troops provided for foreign service represented nearly 10 per cent. of the total population of the Dominion in 1914, and over 40 per cent. of the male population between the ages of twenty and forty-five years, while it is known that a very large number of other New Zealanders served in the British or Australian Naval or Military Forces.
From the year 1887 to 1909 New Zealand's interest in Naval defence was expressed in a practical way by contributions to assist in maintaining an Imperial Naval Force in Australian and New Zealand waters. From 1887 the sum contributed amounted to £20,000 per annum. In 1903 it was raised to £40,000 per annum; and, in 1908, it was enacted that it should he increased to a sum of £100,000 per annum for ten years as from 12th May, 1909.
The proceedings of the Imperial Conference held in London in 1909 had the effect of focussing greater public interest on the Naval defence problem, with the result that New Zealand undertook to present the battle cruiser “New Zealand” to the Imperial Government. This vessel was commissioned in 1911. She served with the battle cruiser squadrons of the Grand Fleet throughout the war, and took part in the naval actions of Heligoland Bight, Dogger Bank, and Jutland.
In 1911, consequent on arrangements agreed upon at the Imperial Conference of 1909, the Imperial Parliament passed the Naval Discipline (Dominion Naval Forces) Act. This statute provided for the application of the Imperial Naval Discipline Acts to Naval Forces raised by any Dominion, with such modifications and adaptations as may be found necessary to conform to the law in the Dominion. In 1913 New Zealand decided to prepare a naval organization for the express purpose of manning ships to be employed in New Zealand waters. The Naval Defence Act of 1913 was passed to give effect to this decision. This Act empowered the Government to raise and maintain Naval Forces and to govern them by regulations issued under authority of Orders in Council. Transfers of ships and personnel as between the New Zealand Government, the Imperial Government, and other Dominion Governments were authorized. The Imperial Naval Discipline Act and the Admiralty Regulations were applied to the New Zealand Naval Forces, subject to any modifications necessitated by local conditions. The Act provided that whenever Great Britain is engaged in hostilities the Naval Forces of the Dominion pass automatically under the control and disposition of the Government of Great Britain. During periods of strained relations or emergency the Governor-General may by Proclamation place the Naval Forces under Imperial control.
In 1913 H.M.S. “Philomel” was detailed as a sea-going training-ship, while a Naval Adviser to the New Zealand Government was appointed. But war broke out in 1914 before any other executive action could be taken to give effect to the statute. H.M.S. “Philomel” was withdrawn for escort duty and for service in naval operations in the Red Sea and Persian Gulf; and, at the end of the war, she was presented by the Admiralty to the Government of New Zealand as a training-ship. Subsequently she became the nucleus of a Dominion Naval organization.
In the meantime, in 1917, the question of Naval Defence was reconsidered in London, but no effective decisions were taken beyond recognizing that the administration of all Naval Forces in the Empire should follow the same lines in matters of maintenance, armament, methods and principles of training, and organization. At the Imperial Conference held in 1919 the Dominion representatives lost no opportunity of impressing on the Government in Great Britain the importance of Naval defence to New Zealand. At the request of the Dominion representatives, Admiral of the Fleet Viscount (later Earl) Jellicoe, Hying his flag on H.M.S. “New Zealand,” visited the Dominion to report on matters affecting Naval defence. Having considered Lord Jellicoe's report, the Government decided to give effect to the Act of 1913. H.M.S. “Chatham” was lent by the Imperial Government in 1920 for service under the New Zealand Government, and the first batch of New Zealand recruits joined H.M.S. “Philomel” the following year.
The Naval Forces of the Dominion are administered by a Naval Board, consisting of the Minister of Defence as Chairman, one or two Executive Officers of the Royal Navy as Naval members, and Accountant Officer of the Royal Navy as Naval Secretary and member of the Board.
New Zealand, therefore, having followed a consistent attitude towards the problem of Naval defence, by a natural process of evolution departed from the policy of subsidies, and thereupon assumed responsibility for a definite share in the material organization of Naval defence. She undertook to maintain a sea-going Naval Force and a training-centre under her immediate control. It was provided by Order in Council dated 20th June, 1921, that the official designation of this Force should be “The New Zealand Division of the Royal Navy.” Another step was taken in fulfilment of Naval obligations by an enactment passed in 1922 to authorize the formation of a Naval Reserve Force officered by and recruited from volunteers who do not follow the sea as a profession. This Naval Volunteer Force has headquarters at Wellington, Auckland, Christchurch, and Dunedin. It is under the general administration of the Naval Board.
Parliament passed an Act in 1927 binding the Dominion Government to contribute to the construction of the Imperial Naval Base at Singapore. This contribution took the form of an annual subsidy to provide for a total sum of £1,000,000. The last instalment of this sum was paid during the year ended 31st March, 1936. At the same time (in 1927) the Government announced that New Zealand would undertake responsibility for the maintenance of modern cruisers when the Singapore subsidy had lapsed.
The Naval Base of the Division is at Devonport, Auckland. The property in this base was vested in the Auckland Harbour Board, but certain important rights therein were exercised by the New Zealand Naval Board under the terms of two contracts entered into between the Admiralty and the Harbour Board in 1899 and 1903. These contracts gave full rights of use of the machinery and of the Calliope Dock. Certain sections of the area are reserved for Naval purposes. The contracts provided for a subsidy payment of £150,000 to the Harbour Board payable over thirty years in half-yearly instalments until 31st October, 1939. The liability for these annual subsidy payments was assumed by the New Zealand Government in 1921.
H.M.S. “Philomel,” whose engines have been removed, is now based at Devonport. She continues to act as a depot-ship and instructional establishment.
During 1924 and 1925 H.M.S. “Chatham” was relieved by H.M. ships “Dunedin” and “Diomede,” and the oil-tanker “Nucula” was hired from the Admiralty to attend them. Because of the progress made in the formation of the Volunteer Reserve, H.M.S. “Wakakura” (a mine-sweeping trawler) was purchased in 1926 for instructional work with the Volunteer Reserve Divisions.
The Imperial sloops, H.M. ships “Leith” and “Wellington” are also employed on the New Zealand Station. They are maintained by the Admiralty, hut are under the command of the Commodore Commanding New Zealand Division.
In October, 1935, because of representations made to the New Zealand Government by Great Britain relating to the international situation consequent on the Italian invasion of Abyssinia, H.M.S. “Diomede” was placed under the control of the Imperial authorities for service on the East Indies Station. Having served for six months at Aden and in the Red Sea, the ship proceeded to England, where she paid off on 31st March and transferred her New Zealand crew to H.M.S. “Achilles.” This vessel was then commissioned for service in the New Zealand Division. H.M.S. “Leander” was commissioned on 29th April, 1937, and has relieved H.M.S. “Dunedin” for service in the New Zealand Division.
During the same year the Government approved of plans for the lengthening of the Calliope Dock to enable it to accommodate a cruiser of the “Achilles” class. A three-years plan was inaugurated for the reconstruction and modernization of the Naval Base at Auckland, and negotiations were made with the Auckland Harbour Hoard for the purpose of drawing up a new contract to provide for the effective Naval control of the repair facilities to be installed. Under authority of the Naval Defence Amendment Act, 1936, the Crown has purchased the property of the Harbour Board surrounding the Calliope Dock at Devonport, and has entered into a deed of arrangement, dated 22nd December, 1936, with the Harbour Board as to the use of the dock and the provision of certain wharves and other services. The sum of £101,780 is payable under this agreement in three instalments in consideration of the transfer of the property, for outstanding liabilities, for subsidy payments under the Admiralty agreements now cancelled, and for certain wharfage and other works undertaken by the Harbour Hoard in connection with the reconstruction.
The Government also proclaimed part of a public domain at Kauri Point, in Birkenhead Borough, for use as a Naval Armament Depot, and inaugurated there a three-years programme of developmental works. The ammunition and stores now housed at Fort Takapuna will be transferred to Kauri Point in the near future.
Officers.—Officers of the Imperial Service are lent from time to time to the New Zealand Government for service in the ships and establishments of the Division.
Vacancies for warrant officers are filled by the promotion of New-Zealand-recruited ratings when such ratings qualify for promotion.
The Admiralty make provision for the nomination of a limited number of New Zealand Naval cadets into R.N. College, Dartmouth, and of special-entry cadets to the training-cruiser H.M.S. “Frobisher”; candidates are required to pass medical and educational examinations. The nomination of cadets is made by His Excellency the Governor-General on the recommendation of the Director of the Education Department. The age qualification now ruling is—13 years 4 months to 13 years 8 months for R.N. College, Dartmouth; 17 to 18£ years for special-entry cadets.
These cadets are eligible for periods of “loan” service in the New Zealand Division as soon as they have passed the examinations for the rank of Lieutenant.
Arrangements were made in 1935 whereby a very limited number of ratings recruited in New Zealand for the Seamen, Signal, Wireless, and Engine-room Artificer Branches, who display exceptional ability and marked officer-like qualities, are eligible under Imperial Regulations for promotion to commissioned rank in the Imperial Navy. Officers so promoted are eligible for periods of service in the New Zealand Division from time to time.
The Admiralty Regulations also provide for the nomination of a limited number of qualified medical and dental practitioners for entry into the Medical and Dental Branches of the Imperial Service.
Ratings.—Recruiting of New Zealand boys and young men is open for all branches of the Service, provided they are medically fit, give proof of the required educational standard, and possess (where applicable) trade qualifications. The branches of the Service are—
Seamen:
Signal and Telegraphist:
Engine-room Artificer:
Stoker (outstanding Stoker ratings may be qualified as Mechanicians):
Electrical and Ordnance Artificer:
Shipwright:
Joiner, Blacksmith, Plumber, and Painter (in very limited numbers):
Sick Berth:
Writer and Supply:
Cooks and Stewards.
Advertisements are inserted in the press between January and March and in August of each year giving particulars of the numbers required. The recruiting of Seamen, Stokers, Signal and Telegraphist ratings is in the hands of the Defence Department. Recruiting for the remaining branches is effected by the Superintendent of Naval Training, H.M.S. “Philomel,” Auckland. A small pamphlet entitled “How to join the New Zealand Division of the Royal Navy” has been published and may be obtained on application to Navy Office, Wellington; District Defence Offices; and H.M.S. “Philomel.” All candidates are required to hold Sixth Standard certificates.
The term of engagement in the Naval Service is for twelve years, or, if under the age of eighteen years, to serve until the age of thirty.
All ratings are eligible for advancement to Leading, Petty Officer and Chief Petty Officer rates in their respective branches, provided they satisfy the conditions provided for in the regulations.
On completion of the first engagement all ratings may re-engage for two more periods of five years' service provided they are recommended.
Provision is made for the qualification of ratings in technical work connected with Gunnery, Electricity, Torpedoes, Diving, Physical Training, Signals, and Wireless Telegraphy, &c., in the technical schools attached to Naval establishments in Australia and England.
Ratings may qualify for and be promoted to Warrant Officer rank in vacancies. Exceptional men in certain branches are eligible to be considered for promotion to commissioned rank in the Imperial Service.
An “Interchange” system has been devised whereby New Zealand ratings will be drafted for three years' service in the Imperial Home and Mediterranean Fleets once during their service. The object of this scheme is to give the men an opportunity of more varied experience than would be possible if they continued to perform all their service in the New Zealand Division.
On discharge from the permanent Naval Forces all ratings are required to enrol in the Royal Naval Reserve until they are forty years of age.
Ranks and Ratings borne.—On 31st March, 1937, the following numbers of New Zealand entered officers and ratings were borne on the active strength of the Division.
| Officers | 6 |
| Ratings | 588 |
Volunteer Reserves.—The Volunteer Reserves are appropriated to the four Divisional Headquarters at Wellington, Auckland, Christchurch, and Dunedin. Men enrol for a period of four years and may re-enrol for periods of two years up to twenty years' total service. They undergo annual training of seven or fourteen days in H.M. ships of the sea-going squadron or in H.M.S. “Wakakura.” The strength of the Naval Reserve Forces at 31st March, 1937, was—
| Officers. | Listings. | |
|---|---|---|
| Royal Naval Reserve | 12 | 113 |
| Royal Naval Volunteer Reserve | 66 | 543 |
On 1st April, 1937, the administration of Service (and civil) aviation was provided for by the establishment of an Air Department. References to the Royal New Zealand Air Force are included in the section on aviation and air transport (Section XV).
The following statement shows the expenditure on the various arms of the Defence Forces in each of the last ten years:—
| Year. | Military Forces. | Naval Expenditure. | Air Force. | Total. | Per Head of Population. | |
|---|---|---|---|---|---|---|
| £ | £ | £ | £ | s. | d. | |
| 1927–28 | 493,286 | 701,217 | 28,459 | 1,222,902 | 16 | 11 |
| 1928—29 | 448,842 | 677,883 | 83,405 | 1,210,130 | 16 | 6½ |
| 1929–30 | 409,541 | 651,468 | 84,521 | 1,145,530 | 15 | 6½ |
| 1930–31 | 229,413 | 632,240 | 53,500 | 915,153 | 12 | 6 |
| 1931–32 | 156,311 | 504,182 | 24,570 | 685,063 | 9 | 0½ |
| 1932–33 | 180,112 | 521,602 | 23,472 | 725,186 | 9 | 6 |
| 1933–34 | 215,950 | 527,998 | 46,960 | 790,908 | 10 | 3 |
| 1934–35 | 321,686 | 568,454 | 132,230 | 1,022,370 | 13 | 2 |
| 1935–36 | 378,181 | 592,859 | 160,773 | 1,131,813 | 14 | 5½ |
| 1936–37 | 427,635 | 662,675 | 110,808 | 1,201,118 | 15 | 2½ |
Table of Contents
DATA regarding the overseas trade of New Zealand are invested with a special significance in view of the Dominion's relatively high degree of dependence upon its external trade. According to figures compiled by the Secretariat of the League of Nations, New Zealand's total trade per caput is the highest in the world. Parenthetically, it may be observed, as a factor highly relevant in this connection, that New Zealand's overseas debt commitments are also upon a high scale.
In the official annual statistics of the trade of New Zealand the twelve-monthly period adopted is the calendar year. Summarized trade statistics for each of the last fifty calendar years are included in the Statistical Summary at the end of this volume. Monthly figures covering the principal items of export and import are published in the Monthly Abstract of Statistics, so that summarized figures are readily available for any twelve-monthly period. As the production year ends about June and the financial year at 31st March, it is desirable to record the trade for years ended 30th June and 31st March as well as for that ended 31st December.
The following table relates to merchandise only—i.e., it excludes specie, particulars of which will be found at the close of this subsection. Figures are given in New Zealand currency for the latest decennial periods. Up to the end of 1929 New Zealand currency and sterling were at virtual parity, but thenceforward New Zealand currency has been below sterling parity (vide section relating to Banking and Currency). Consequently figures converted to a sterling basis have been appended covering the years from 1930 onwards. Used in conjunction, the two portions of the table will give data for ten years in both currencies.
| Year. | Year ended 31st December. | Year ended 31st March. | Year ended 30th June. | |||
|---|---|---|---|---|---|---|
| Exports. | Imports. | Exports. | Imports. | Exports. | Imports. | |
| £(N.Z.) | £(N.Z.) | £(N.Z.) | £(N.Z.) | £(N.Z.) | £(N.Z.) | |
| 1927 | 48,490,354 | 44,782,666 | 45,681,338 | 48,110,370 | 40,394,582 | 47,297,387 |
| 1928 | 55,570,381 | 44,844,102 | 54,957,031 | 44,405,913 | 55,105,285 | 43,484,408 |
| 1929 | 54,930,003 | 48,734,472 | 50,520,243 | 45,076,865 | 56,110,650 | 40,479,009 |
| 1930 | 44,940,517 | 44,339,654 | 48,411,817 | 49,429,584 | 40,909,213 | 49,295,452 |
| 1931 | 34,950,698 | 26,498,151 | 39,527,009 | 39,833,157 | 36,943,774 | 35,073,948 |
| 1932 | 35,609,919 | 24,646,006 | 33,942,017 | 24,700,421 | 34,668,407 | 24,655,259 |
| 1933 | 41,005,919 | 25,581,306 | 37,510,164 | 25,059,520 | 37,470,657 | 25,290,201 |
| 1934 | 47,342,847 | 31,339,552 | 46,042,570 | 26,135,496 | 49,141,914 | 26,703,380 |
| 1935 | 46,538,381 | 36,317,267 | 44,918,180 | 32,567,785 | 42,953,698 | 34,301,328 |
| 1936 | 56,751,940 | 44,258,886 | 49,675,992 | 37,439,944 | 53,659,963 | 39,459,909 |
| 1937 | 60,234,511 | 47,621,104 | 64,621,474 | 50,076,468 | ||
| £(Stg.) | £(Stg.) | £(Stg.) | £(Stg.) | £(Stg.) | £(Stg.) | |
| 1930 | 43,158,000 | 42,481,000 | 47,933,000 | 49,085,000 | 45,908,000 | 48,448,000 |
| 1931 | 31,852,000 | 24,157,000 | 37,198,000 | 37,056,000 | 34,321,000 | 32,873,000 |
| 1932 | 32,373,000 | 22,406,000 | 30,857,000 | 22,509,000 | 31,517,000 | 22,414,000 |
| 1933 | 32,805,000 | 20,465,000 | 32,677,000 | 22,049,000 | 31,516,000 | 21,613,000 |
| 1934 | 37,874,000 | 25,071,000 | 36,834,000 | 20,908,000 | 39,314,000 | 21,363,000 |
| 1935 | 37,380,000 | 29,170,000 | 35,985,000 | 26,082,000 | 34,450,000 | 27,495,000 |
| 1936 | 45,584,000 | 35,549,000 | 39,900,000 | 30,072,000 | 43,101,000 | 31,695,000 |
| 1937 | 48,381,000 | 38,250,000 | 51,905,000 | 40,222,000 | ||
The total merchandise exports and imports are next given for each month from July, 1936, to June, 1937, and for the twelve-monthly period ending with each such month. By reason of the seasonal nature of the production of the principal commodities exported from the Dominion, approximately two-thirds of the exports are made during the latter half of the production year — i.e., the first six months of the calendar year. Imports are normally spread fairly evenly over the year.
| Month. | Exports. | Imports. | Excess of Exports. | |||
|---|---|---|---|---|---|---|
| New Zealand Currency. | Sterling Equivalent. | New Zealand Currency. | Sterling Equivalent. | On New Zealand Currency Basis. | On Sterling Basis. | |
* Excess of imports. | ||||||
| Monthly Totals. | ||||||
| 1936. | £(000) | £(000) | £(000) | £(000) | £(000) | £(000) |
| July | 4,680 | 3,759 | 3,530 | 2,835 | 1,150 | 924 |
| August | 3,150 | 2,530 | 3,997 | 3,211 | -847* | -681* |
| September | 3,980 | 3,197 | 4,447 | 3,572 | -467* | -375* |
| October | 2,567 | 2,062 | 3,996 | 3,210 | -1,429* | -1,148* |
| November | 3,821 | 3,070 | 4,083 | 3,280 | -262* | -210* |
| December | 4,322 | 3,471 | 4,295 | 3,450 | 27 | 21 |
| 1937. | ||||||
| January | 7,040 | 5,655 | 4,665 | 3,747 | 2,375 | 1,908 |
| February | 7,731 | 6,210 | 3,713 | 2,982 | 4,018 | 3,228 |
| March | 7,509 | 6,031 | 4,606 | 3,699 | 2,903 | 2,332 |
| April | 8,402 | 6,749 | 4,342 | 3,488 | 4,060 | 3,261 |
| May | 5,925 | 4,759 | 4,441 | 3,567 | 1,484 | 1,192 |
| June | 5,494 | 4,413 | 3,961 | 3,181 | 1,533 | 1,232 |
| Twelve-monthly Totals. | ||||||
| 1936. | ||||||
| July | 55,122 | 44,275 | 40,092 | 32,203 | 15,030 | 12,072 |
| August | 55,396 | 44,495 | 40,467 | 32,504 | 14,929 | 11,991 |
| September | 56,687 | 45,532 | 41,746 | 33,531 | 14,941 | 12,001 |
| October | 56,408 | 45,308 | 42,139 | 33,847 | 14,269 | 11,461 |
| November | 56,353 | 45,263 | 43,178 | 34,681 | 13,175 | 10,582 |
| December | 56,752 | 45,584 | 44,259 | 35,549 | 12,493 | 10,035 |
| 1937. | ||||||
| January | 57,694 | 46,340 | 45,327 | 36,407 | 12,367 | 9,933 |
| February | 60,173 | 48,332 | 46,053 | 36,990 | 14,120 | 11,342 |
| March | 60,234 | 48,381 | 47,621 | 38,250 | 12,613 | 10,131 |
| April | 62,500 | 50,200 | 48,405 | 38,879 | 14,095 | 11,321 |
| May | 63,349 | 50,882 | 49,599 | 39,838 | 13,750 | 11,044 |
| June | 64,621 | 51,905 | 50,076 | 40,222 | 14,545 | 11,683 |
Imports of merchandise per caput were highest in the boom year of 1920 with a rate of £49 10s. 11d., the export record of £45 4s. having occurred in the previous year.
The next table shows the total merchandise trade, exports, and imports per head of the population. Values are expressed in terms of New Zealand currency.
| Year. | Exports. | Imports. | Total Trade. | ||||||
|---|---|---|---|---|---|---|---|---|---|
| £ | s. | d. | £ | s. | d. | £ | s. | d. | |
| 1917 | 27 | 8 | 8 | 18 | 1 | 1 | 45 | 9 | 9 |
| 1918 | 24 | 14 | 1 | 20 | 18 | 8 | 45 | 12 | 9 |
| 1919 | 45 | 4 | 0 | 25 | 8 | 3 | 70 | 12 | 3 |
| 1920 | 37 | 7 | 0 | 49 | 10 | 11 | 86 | 17 | 11 |
| 1921 | 35 | 2 | 3 | 33 | 9 | 8 | 68 | 11 | 11 |
| 1922 | 32 | 14 | 9 | 26 | 13 | 8 | 59 | 8 | 5 |
| 1923 | 34 | 11 | 9 | 32 | 13 | 0 | 67 | 4 | 9 |
| 1924 | 38 | 16 | 5 | 35 | 17 | 6 | 74 | 13 | 11 |
| 1925 | 39 | 18 | 1 | 37 | 17 | 4 | 77 | 15 | 5 |
| 1926 | 32 | 0 | 6 | 35 | 4 | 8 | 67 | 5 | 2 |
| 1927 | 33 | 14 | 0 | 31 | 2 | 5 | 64 | 16 | 5 |
| 1928 | 38 | 3 | 3 | 30 | 16 | 0 | 68 | 19 | 3 |
| 1929 | 37 | 5 | 7 | 33 | 1 | 6 | 70 | 7 | 1 |
| 1930 | 30 | 2 | 0 | 29 | 14 | 0 | 59 | 16 | 0 |
| 1931 | 23 | 1 | 8 | 17 | 10 | 0 | 40 | 11 | 8 |
| 1932 | 23 | 6 | 5 | 16 | 1 | 2 | 39 | 7 | 7 |
| 1933 | 26 | 12 | 8 | 16 | 12 | 4 | 43 | 5 | 0 |
| 1934 | 30 | 10 | 3 | 20 | 4 | 0 | 50 | 14 | 3 |
| 1935 | 29 | 15 | 9 | 23 | 4 | 11 | 53 | 0 | 8 |
| 1936 | 36 | 0 | 7 | 28 | 1 | 11 | 64 | 2 | 6 |
The table following facilitates appreciation of the movement of external trade in recent years, both in value and in actual physical volume. For notes regarding its construction reference may be made to the Monthly Abstract of Statistics for December, 1933. Volume of exports and effect of price changes upon exports are dealt with at greater length in the subsection succeeding this.
| Year. | Value. | Volume. | |||||||
|---|---|---|---|---|---|---|---|---|---|
| On Gold Basis. | On Sterling Basis. | On New Zealand Currency Basis. | Exports. | Imports. | Total External Trade. | ||||
| Exports. | Imports. | Exports. | Imports. | Exports. | Imports. | ||||
| 1926 | 100 | 100 | 100 | 100 | 100 | 100 | 100 | 100 | 100 |
| 1927 | 107 | 90 | 107 | 90 | 107 | 90 | 108 | 96 | 102 |
| 1928 | 123 | 90 | 123 | 90 | 123 | 90 | 112 | 100 | 106 |
| 1929 | 122 | 98 | 122 | 98 | 122 | 98 | 116 | 114 | 115 |
| 1930 | 96 | 85 | 96 | 85 | 100 | 89 | 119 | 106 | 112 |
| 1931 | 64 | 44 | 70 | 48 | 77 | 53 | 120 | 69 | 93 |
| 1932 | 52 | 32 | 72 | 45 | 79 | 49 | 132 | 66 | 97 |
| 1933 | 49 | 28 | 72 | 41 | 91 | 51 | 157 | 66 | 109 |
| 1934 | 52 | 31 | 84 | 50 | 105 | 63 | 151 | 83 | 113 |
| 1935 | 49 | 35 | 83 | 59 | 103 | 73 | 153 | 97 | 119 |
| 1936 | 61 | 43 | 101 | 71 | 125 | 89 | 161 | 118 | 136 |
As a debtor country New Zealand has normally a substantial excess of exports over imports, imports having exceeded exports in only three (calendar) years since 1885—viz., in 1908, 1920, and 1926. The figures for the last twenty years-merchandise only—are as follows:—
| Year. | Visible Excess of Exports. | |
|---|---|---|
* Excess of imports. | ||
| £(N.Z.) | £(Stg.) | |
| 1917 | 10,774,942 | 10,774,942 |
| 1918 | 4,348,786 | 4,348,786 |
| 1919 | 23,598,758 | 23,598,758 |
| 1920 | -15,148,487* | -15,148,487* |
| 1921 | 2,084,338 | 2,084,338 |
| 1922 | 7,899,875 | 7,899,875 |
| 1923 | 2,575,810 | 2,575,810 |
| 1924 | 3,981,620 | 3,981,620 |
| 1925 | 2,817,290 | 2,817,290 |
| 1926 | -4,542,839* | -4,542,839* |
| 1927 | 3,713,688 | 3,713,688 |
| 1928 | 10,726,279 | 10,726,279 |
| 1929 | 6,195,591 | 6,195,591 |
| 1930 | 600,863 | 677,000 |
| 1931 | 8,452,547 | 7,695,000 |
| 1932 | 10,963,913 | 9,967,000 |
| 1933 | 15,424,553 | 12,340,000 |
| 1934 | 16,003,295 | 12,803,000 |
| 1935 | 10,221,114 | 8,210,000 |
| 1936 | 12,493,054 | 10,035,000 |
It will be noticed that the balance for the year 1930 is greater on a sterling basis than on a New Zealand currency basis. The apparent anomaly is due to a combination of (1) successive movements in the exchange rate, and (2) the unequal distribution of exports over the year. This combination of factors affects the relationship between the sterling and New Zealand currency figures for other periods also.
The high figure of excess of imports in 1920 is a natural sequence of the much higher excess of exports in the previous year, combined with the filling of delayed orders which in many cases had been duplicated in the meantime. A substantial recovery from the low excess of exports recorded in 1930 is evident from the figures for subsequent years.
The visible balance of trade — i.e., the excess of exports over imports or vice versa—is an essential record valuable for numerous purposes. Nevertheless, it has very definite limitations, and, unfortunately, the focussing of interest on trade between two countries which has been intensified by currency instability and nationalistic tariff movements has resulted in a great ideal of popular misconception of the actual facts.
In the first place, although far from the most important factor, the trade statistics themselves contain inevitable errors. For instance, it is necessary in many instances to assess the value of exports where goods are not sold until arrival at their destination; again, in the case of imports, an arbitrary assumption is made to cover freight, insurance, and handling charges. While errors arising from such sources do not appreciably affect items or totals of exports or imports, they may conceivably cause significant errors in the visible balance of trade, since there is no guarantee that such errors will be of a compensatory nature. In particular, when a small visible balance emerges from a year's trading in commodities, a relatively small margin of error in the assessment of export or import values (or both) may make a quite significant error in the residual balance. The possible error arising from the necessity of pre-estimating the final realization in the case of certain exports is not likely to be of importance in years of relatively stable prices; but, in periods when world prices are fluctuating violently, an appreciable margin of error may result from this cause in the assessment of the total of export valuations for a single year.
Furthermore, there are additional difficulties where trade with individual countries is concerned. The ultimate destination of goods exported is sometimes not known at the time of export. In particular, it is evident from the United Kingdom trade statistics that a considerable proportion of New Zealand's exports to continental countries is recorded in the New Zealand statistics among exports to the United Kingdom. Such produce may be sold on the United Kingdom markets to continental purchasers: while, again, goods may be diverted to continental markets after arrival in the United Kingdom.
Of much greater importance is the fact that the visible trade is not the only factor to be taken into account in considering the balance of payments between countries. Debt payments, capital investments and flow of capital, freight payments, tourist expenditure, and the like are vitally important factors which frequently reverse a credit visible balance of trade into a debit balance of payments. An estimate of New Zealand's balance of payments is given later in this subsection.
The partial disintegration of world trade, accompanied by currency difficulties, which has been such a marked feature of current economic trends, has intensified interest in the bi-lateral aspects of trade statistics as opposed to the multilateral aspect, which latter has been the really significant indication of the external trading relations of a country. In this connection it is perhaps germane to the question of New Zealand's position to draw attention to the fact that an estimated aggregate credit balance (vide “Balance of Payments” immediately following—the estimates are admittedly imperfect) of about 17 millions sterling over the twenty years ended 31st March, 1936, has been accompanied by an increase of some 85 millions sterling in Government and local-body debt domiciled abroad.
The following table shows for the year 1936 the amount of merchandise exports to, and imports from, each of the principal countries trading with the Dominion, the balance of trade in each case also being given. Exports are valued f.o.b. New Zealand ports, and imports at New Zealand import values—i.e., current domestic value in country of origin plus 10 per cent. allowance for freight, &c. The trade balances therefore represent the differences between exports and imports, both at New Zealand ports. Since this is the accepted practice internationally in statistics of trade, it follows that New Zealand trade statistics will yield different results of her trade with any given country than will be obtained from the trade statistics of that country, unless allowance be made for this practice.
| Country. | Exports. | Imports, Country of Shipment. | Balance. (+ = excess of exports; - = excess of imports.) | |
|---|---|---|---|---|
| £(N.Z.) | £(N.Z.) | £(N.Z.) | £(Stg.) | |
| United Kingdom | 45,492,989 | 22,078,959 | +23,414,030 | +18,806,000 |
| Canada | 1,103,008 | 3,317,123 | - 2,214,115 | - 1,779,000 |
| India | 12,5,826 | 546,542 | - 420,716 | - 338,000 |
| Ceylon | 1,401 | 749,710 | - 748,309 | - 601,000 |
| South African Union | 21,855 | 117,329 | - 95,474 | - 76,000 |
| Australia | 1,843,475 | 5,220,399 | -3,376,924 | -2,712,000 |
| Fiji | 102,076 | 109,223 | - 7,147 | - 6,000 |
| Nauru Island | 18,084 | 136,191 | - 118,107 | - 95,000 |
| Other British countries | 254,652 | 388,567 | - 133,915 | - 107,000 |
| Totals, British countries | 48,963,366 | 32,664,043 | + 16,299,323 | +13,092,000 |
| Germany | 272,481 | 672,197 | - 399,716 | - 321,000 |
| France | 1,646,168 | 188,152 | + 1,458,016 | + 1,171,000 |
| Belgium | 618,356 | 394,441 | + 223,915 | + 180,000 |
| Italy | 1,767 | 38,551 | - 36,784 | - 30,000 |
| Sweden | 64,936 | 335,868 | - 270,932 | - 217,000 |
| Japan | 1,554,837 | 1,320,428 | + 234,409 | + 188,000 |
| Dutch East Indies | 1,894 | 1,771,420 | - 1,769,526 | - 1,421,000 |
| United States of America | 2,877,752 | 5,402,661 | -2,524,909 | - 2,028,000 |
| Other foreign countries | 750,383 | 1,471,125 | - 720,742 | -579,000 |
| Totals, foreign countries | 7,788,574 | 11,594,843 | -3,806,269 | - 3,057,000 |
| Totals, all countries | 56,751,940 | 44,258,886 | +12,493,054 | +10,035,000 |
The wide variations in the balance of commodity trade with individual countries merit special mention. It will be observed that a very substantial credit balance (£(N.Z.)23,414,030) resulted from trade in merchandise with the United Kingdom in 1936; whereas an adverse balance is shown in the case of all other British countries, amounting to £7,114,707 in the aggregate. A credit balance of £16,299,323 emerged from commodity trade with British countries as a whole, while trade with foreign countries resulted in an adverse balance of £3,806,269. The credit balance with the United Kingdom is subject to some deduction on account of goods credited in New Zealand exports to the United Kingdom, but re-exported thence to European countries. The assessment of the amount so involved is particularly difficult: but examination of relevant statistics suggests that the total for 1935 would he in the neighbourhood of £(N.Z.)2,000,000. (Data are not yet available from which a figure for 1936 can be estimated.) It will be realized, then, that in consequence of the United Kingdom's entrepot trade in New Zealand produce the actual adverse balance with foreign countries reduces from £3,806,269 to probably less than £1,500,000, while the credit balance with the United Kingdom reduces from £23,414,030 to about £20,000,000.
New Zealand has a heavy adverse balance of trade in respect of invisible items. In fact, the credit balance of £12,493,054 shown in respect of commodity trade in 1936 was only slightly in advance of the amount necessary to achieve an overall balance of payments from the year's external trading. The overseas funds of New Zealand banking institutions (on account of New Zealand business only) were £(N.Z.)8,008,002 lower on 2Sth December, 1936, than on 30th December, 1935. While a substantial portion of this decrease is accounted for by debt repayments during the year from accumulated overseas funds, the amount of the fall exceeds by approximately £(N.Z.)5,000,000 the decrease attributable to known debt repayments.
It is generally recognized that a considerable volume of credits accruing in New Zealand on overseas account has, for some years past, been retained in the Dominion because of the exchange position. Funds so held represent an offset against the large accumulation of New Zealand funds held overseas, The above figures suggest a change during 1930 in the domicile of at least part of these credits temporarily held in the Dominion.
An analysis of the balance of payments (on a March-year basis) follows.
Bound up with the matter of the visible trade balance is the question of the balance of overseas payments. Sufficient data are not available for the presentation of an accurate statement on the subject, but an estimate has been attempted, and the summarized results for the twenty financial years ending with 1935–36 are here given, all figures being expressed in terms of sterling:—
| Year ended 31st March, | Inward Balance on Account of | |||||
|---|---|---|---|---|---|---|
| Visible Merchandise Trade (as recorded). | Visible Trade (Merchandise and Specie). | Visible Trade, plus Interest on Public and Local Bodies' Debt. | Visible Trade, Public and Local Bodies' Interest, and Debt Movement. | All Items other than Public and Local Bodies' Debt Movement. | All Items including Public and Local Bodies' Debt Movement. | |
| £m. | £m. | £m. | £m. | £m. | £m. | |
| 1917 | + 5.1 | + 4.4 | + 0.5 | + 3.0 | - 8.7 | - 6.2 |
| 1918 | +10.4 | +10.3 | + 6.2 | +10.9 | -2.7 | +2.0 |
| 1919 | + 6.3 | + 6.2 | + 1.7 | + 8.4 | - 8.8 | - 2.1 |
| 1920 | +19.2 | +18.9 | +14.3 | +14.1 | +10.9 | +10.7 |
| 1921 | -19.2 | -19.3 | -24.1 | -21.0 | -29.6 | - 26.5 |
| 1922 | 8.0 | + 7.7 | +2.5 | +11.9 | + 0.2 | +9.6 |
| 1923 | + 8.7 | + 8.6 | - 3.0 | + 8.5 | + 0.7 | + 6.2 |
| 1924 | + 7.2 | + 7.3 | + 1.4 | + 8.3 | - 1.3 | + 5.6 |
| 1925 | + 4.8 | + 4.9 | - 1.3 | + 9.5 | - 4.1 | + 6.7 |
| 1926 | - 4.3 | - 4.3 | - 11.1 | - 2.2 | - 13.3 | - 4.4 |
| 1927 | - 2.4 | - 2.5 | - 9.6 | - 2.2 | - 10.5 | - 3.1 |
| 1928 | + 10.6 | + 10.5 | + 3.0 | + 10.6 | - 1.7 | + 9.3 |
| 1929 | + 11.4 | + 12.0 | + 4.0 | + 15.0 | + 1.9 | + 12.9 |
| 1930 | - 1.1 | - 0.6 | - 8.9 | - 11.3 | - 10.7 | - 13.1 |
| 1931 | - 0.5 | - 0.8 | - 9.2 | - 1.2 | - 10.5 | - 2.5 |
| 1932 | + 8.3 | + 9.0 | + 1.1 | + 4.5 | + 0.9 | + 4.3 |
| 1933 | + 10.6 | + 12.3 | + 5.2 | + 4.0 | + 3.5 | + 2.3 |
| 1934 | + 15.9 | + 15.7 | + 8.6 | + 6.4 | + 6.3 | + 4.1 |
| 1935 | + 9.9 | + 11.9 | + 5.0 | + 2.7 | + 3.9 | + 1.6 |
| 1936 | + 9.8 | + 10.2 | + 3.4 | + 0.3 | + 2.9 | - 0.2 |
| Aggregate of twenty years | + 118.7 | + 122.4 | - 4.3 | + 80.2 | -67.3 | + 17.2 |
The first four columns are based wholly on ascertained figures, which, by the way, relate to 90 per cent. of the total inward and outward payments. The balances shown in the fifth and sixth columns, however, are given out only as the best possible with the data at present available. The small net balance (£17.2m.) for all items over the twenty years, taken in conjunction with the probability that London balances on New Zealand account were at 31st March, 1936, substantially higher than at the corresponding date twenty years earlier, indicates that the balance for the period as a whole is not seriously in error, having regard to the magnitude of total inward and outward payments. This close coincidence, however, may be due in part to counterbalancing inaccuracies as between individual items or years.
As indicating the relative importance of trade, of debt increase, and interest payments of the Government and local authorities, and of other items, the following aggregates (in sterling) for the twenty years are given:—
| Inward or Credit Payments. | Outward or Debit Payments. | |
|---|---|---|
| Trade— | £m. | £m. |
| Merchandise | 856.3 | 737.2 |
| Specie | 7.9 | 4.3 |
| Government and local-body debt— | ||
| Increase | 84.5 | |
| Interest | 126.7 | |
| Other items (largely estimated) | 73.2 | 136.5 |
| Totals | 1,021.9 | 1,004.7 |
The figures for the last five years available are given in more detail in the following table. As indicated above, arbitrary assessment has had to be resorted to in the case of certain items, notably interest, &c., on private debt and investments. All the amounts shown in this table are in terms of sterling.
| — | Year ended 31st March, | ||||
|---|---|---|---|---|---|
| 1932. | 1933. | 1934. | 1935. | 1936. | |
| Inward or credit items— | £(000) | £(000) | £(000) | £(000) | £(000) |
| Merchandise exports (f.o.b.) | 30,857 | 32,657 | 36,834 | 35,985 | 39,900 |
| Specie exports | 720 | 1,796 | 373 | 2,939 | 537 |
| Additions to Government and local bodies' debts | 3,371 | ||||
| Interest on inter-Governmental debts | 8 | 7 | 7 | 7 | 6 |
| Other interest and dividend receipts | 239 | 162 | 140 | 161 | 48 |
| Freights | 150 | 170 | 165 | 197 | 236 |
| Passage-money | 250 | 200 | 253 | 317 | 400 |
| Port receipts | 620 | 610 | 627 | 652 | 700 |
| Funds of immigrants | 170 | 80 | 72 | 81 | 103 |
| Expenditure by tourists | 590 | 550 | 563 | 644 | 796 |
| Consular, &c., expenditure | 30 | 30 | 30 | 30 | 30 |
| Reparation receipts | 167 | ||||
| Governmental sales of overseas long-term securities | 1,500 | 7 | 5 | 835 | 30 |
| Net decrease in foreign floating assets on account of short-term credits granted and repaid | 967 | ||||
| Governmental receipts, n.e.i. | 143 | 276 | 273 | 297 | 248 |
| Total credit items | 38,815 | 36,545 | 39,342 | 42,145 | 44,001 |
| Outward or debit items— | |||||
| Merchandise imports (as recorded) | 22,510 | 22,049 | 20,908 | 26,082 | 30,072 |
| Additional allowance for freight, &c. | 204 | 500 | 490 | 245 | |
| Specie imports | 58 | 123 | 647 | 901 | 169 |
| Decreases in Government and local bodies' debts | 1,199 | 2,240 | 2,293 | 3,078 | |
| Interest on Governmental debt | 6,670 | 5,935 | 6,010 | 6,042 | 5,823 |
| Interest on local bodies' debt | 1,235 | 1,165 | 1,090 | 936 | 936 |
| Interest, &c., on private debt and investments | 800 | 800 | 900 | 1,000 | 1,000 |
| Funds of emigrants | 280 | 290 | 320 | 368 | 462 |
| Tourist expenditure | 1,740 | 1,440 | 1,414 | 1,946 | 2,033 |
| Consular, &c., expenditure | 60 | 60 | 60 | 60 | 60 |
| Governmental purchases of overseas long-term securities | 774 | ||||
| Governmental expenditure, n.e.i. | 922 | 711 | 370 | 713 | 599 |
| Total debit items | 34,479 | 34,272 | 35,223 | 40,586 | 44,232 |
As mentioned previously, exports are valued f.o.b., New Zealand ports, while imports are counted at their value in the country of shipment, plus 10 per cent. to cover freight, insurance, &c. This 10-per-cent. allowance was usually on the conservative side, and estimated additional charges were allowed for on the debit side of the above statement. A special investigation into the position in 1936 led to the conclusion that, as far as 1936 is concerned, the 10-per-cent. allowance is adequate to cover this item.
Freight and other charges on exports at the present time are estimated to approximate £(stg.)6,000,000 annually (mostly earned by United Kingdom vessels), but these do not enter into the balance of payments on the basis adopted, exports being, as stated, shown f.o.b., or at their net value to New Zealand. Freight, &c., on imports in 1935–36 is estimated at £2,734,000 (stg.)—i.e., 1/11 of £30,072,000.
There is no Mint in New Zealand, while there is a fairly considerable production of gold bullion. Uncoined gold, therefore, ranks as an ordinary export of the Dominion, along with wool, frozen meat, and dairy-produce. In earlier days this export of gold was much more important than now, amounting in 1863 to 70 per cent. of the total exports, from which figure it shrank steadily to 6 per cent. in 1913. The proportion in recent years has been only about 1 per cent. but, as a combined effect of the falling-oil in commodity values and of the consequential fillip given to the gold-mining industry and to the export of gold contained in old jewellery, gold represented about 2½ per cent. of exports in 1936.
A table is given showing imports and exports of specie during the last ten years. Exports in 1934 were easily a record, mainly due to gold shipments by the Reserve Bank; while imports in the same year were the second highest yet recorded, the high figure being ascribable to importations of silver coinage for the New Zealand currency. The values given represent the face value of the specie.
| Year. | Specie imported. | Specie exported. | Excess of Specie Imports (+) or Exports (-). |
|---|---|---|---|
| £ | £ | £ | |
| 1927 | 280 | +280 | |
| 1928 | 42,164 | 618,100 | -575,936 |
| 1929 | 63,503 | 649,000 | -585,495 |
| 1930 | 363,087 | 175 | +362,912 |
| 1931 | 56,155 | 202,330 | -146,175 |
| 1932 | 55,310 | 1,355,861 | -1,300,551 |
| 1933 | 424,704 | 296,032 | +128,672 |
| 1934 | 1,242,000 | 2,283,900 | -1,041,900 |
| 1935 | 381,821 | 521,000 | -139,179 |
| 1936 | 36,601 | 45,245 | -8,644 |
IN New Zealand the Department of H.M. Customs requires for every package exported a declared statement of the contents, value, and destination.
In all cases exports are valued “free on board at the port of shipment.” In many cases, however, the goods are not sold till arrival at their destination, and in such cases values must be assessed in New Zealand with reference to current prices. Exports of merchandise are valued in terms of New Zealand currency, which has been below sterling parity since the beginning of 1930 (vide section on Banking and Currency). The value of total exports, 1930–36, in sterling will be found in the preceding subsection.
The ultimate destination of the goods is distinguished as far as is practicable, but it is impossible to discover what proportion of the exports is intended for home consumption in the country of destination. In the trade records a distinction is made between exports of New Zealand produce and re-exports of imported goods.
The total merchandise exports (i.e., excluding specie) during the last ten years are given in the following table, classified according to five broad divisions. A table showing specie exports and imports for the same period will be found at the close of the preceding subsection.
| Year. | Food, Drink, and Tobacco. | Raw Materials and Articles mainly unmanufactured. | Articles wholly or mainly manufactured. | Miscellaneous. | Bullion. | Total Merchandise Exports. |
|---|---|---|---|---|---|---|
| £ | £ | £ | £ | £ | £ | |
| 1927 | 27,921,062 | 17,762,194 | 1,749,231 | 492,194 | 571,673 | 48,496,354 |
| 1928 | 31,022,183 | 21,785,683 | 1,851,874 | 381,224 | 529,417 | 55,570,381 |
| 1929 | 32,609,836 | 19,766,705 | 1,547,947 | 485,863 | 519,712 | 54,930,063 |
| 1930 | 31,676,693 | 10,835,146 | 1,494,255 | 345,618 | 588,805 | 44,940,517 |
| 1931 | 25,724,199 | 7,255,749 | 1,107,610 | 254,031 | 609,109 | 34,950,698 |
| 1932 | 25,794,112 | 7,269,946 | 1,093,495 | 239,773 | 1,212,593 | 35,609,919 |
| 1933 | 28,437,190 | 9,784,925 | 1,141,632 | 261,823 | 1,380,349 | 41,005,919 |
| 1934 | 29,210,956 | 15,294,036 | 1,121,438 | 323,069 | 1,393,348 | 47,342,847 |
| 1935 | 33,315,232 | 10,141,651 | 1,209,680 | 357,561 | 1,514,257 | 46,538,381 |
| 1936 | 36,398,204 | 17,214,582 | 1,234,704 | 443,732 | 1,460,718 | 56,751,940 |
The most important class is that for food, drink, and tobacco, which, in the case of exports from New Zealand, is composed almost wholly of foodstuffs, the principal items being butter, cheese, and frozen meat. Of the total exports during the five years 1932–36 this class accounted for 67.4 per cent. Next in order of magnitude is the raw-materials class (mainly wool, hides, skins, and tallow), which during the last five years constituted 26.3 per cent. of the total exports motor that period. The remaining classes do not figure prominently in the table, and during the five years under review accounted for but 6.3 per cent. of the total.
In the following table exports of New Zealand produce—i.e., exclusive of specie and other re-exports—are classified under the main industries, according to a broad division, to illustrate the relative importance of the pastoral, agricultural, forestry, mining, and other industries as far as the export trade is concerned. It must be remembered that in a particular industry the home trade may be relatively more important than the external trade.
PROPORTIONS OF EXPORTS SUPPLIED BY THE MAIN INDUSTRIES.
| Year. | Exports (New Zealand Produce). | Percentage of Total Exports. | ||||||||
|---|---|---|---|---|---|---|---|---|---|---|
| Pastoral. | Agricultural. | Forest. | Mining. | Other. | Pastoral. | Agricultural. | Forest. | Mining. | Other. | |
| £ | £ | £ | £ | £ | Per Cent. | Per Cent. | Per Cent. | Per Cent. | Per Cent. | |
| 1917 | 27,329,599 | 179,902 | 711,188 | 1,274,222 | 1,593,046 | 87.9 | 0.6 | 2.3 | 4.1 | 5.1 |
| 1918 | 24,638,531 | 196,291 | 719,538 | 479,017 | 1,903,633 | 88.2 | 0.7 | 2.6 | 1.7 | 6.8 |
| 1919 | 48,611,240 | 788,187 | 698,849 | 1,668,314 | 1,537,794 | 91.2 | 1.5 | 1.3 | 3.1 | 2.9 |
| 1920 | 41,560,176 | 530,056 | 1,262,894 | 1,103,344 | 1,135,824 | 91.1 | 1.2 | 2.8 | 2.4 | 2.5 |
| 1921 | 40,698,867 | 490,094 | 884,279 | 787,591 | 754,627 | 93.3 | 1.1 | 2.0 | 1.9 | 1.7 |
| 1922 | 38,182,793 | 968,944 | 1,066,054 | 850,469 | 630,888 | 91.6 | 2.3 | 2.6 | 2.0 | 1.5 |
| 1923 | 42,128,295 | 568,356 | 1,080,326 | 937,238 | 657,698 | 92.9 | 1.3 | 2.4 | 2.1 | 1.3 |
| 1924 | 48,944,828 | 431,325 | 937,178 | 787,664 | 819,833 | 94.2 | 0.9 | 1.8 | 1.5 | 1.6 |
| 1925 | 51,370,479 | 467,897 | 1,000,453 | 770,439 | 911,763 | 94.2 | 0.9 | 1.8 | 1.4 | 1.7 |
| 1926 | 40,763,348 | 902,164 | 820,947 | 854,995 | 997,729 | 91.9 | 2.0 | 1.9 | 1.9 | 2.3 |
| 1927 | 44,207,037 | 887,893 | 725,047 | 804,834 | 946,422 | 92.9 | 1.9 | 1.5 | 1.7 | 2.0 |
| 1928 | 51,509,520 | 964,956 | 626,696 | 710,450 | 848,743 | 94.2 | 1.8 | 1.1 | 1.3 | 1.6 |
| 1929 | 50,780,113 | 1,036,700 | 717,088 | 809,676 | 832,436 | 93.8 | 1.9 | 1.3 | 1.5 | 1.5 |
| 1930 | 41,368,145 | 971,259 | 503,170 | 784,125 | 582,707 | 93.6 | 2.2 | 1.1 | 1.8 | 1.3 |
| 1931 | 32,112,634 | 910,937 | 311,656 | 707,126 | 276,891 | 93.6 | 2.6 | 0.9 | 2.1 | 0.8 |
| 1932 | 32,102,218 | 1,043,277 | 321,923 | 1,190,306 | 318,663 | 91.8 | 3.0 | 0.9 | 3.4 | 0.9 |
| 1933 | 37,102,510 | 1,221,979 | 318,891 | 1,374,211 | 391,160 | 91.8 | 3.0 | 0.8 | 3.4 | 1.0 |
| 1934 | 43,336,960 | 1,153,056 | 411,511 | 1,416,911 | 452,855 | 92.7 | 2.4 | 0.9 | 3.0 | 1.0 |
| 1935 | 42,569,666 | 935,821 | 448,686 | 1,573,362 | 524,198 | 92.4 | 2.0 | 1.0 | 3.4 | 1.2 |
| 1936 | 52,671,975 | 1,108,347 | 366,350 | 1,515,679 | 601,454 | 93.0 | 2.0 | 0.6 | 2.7 | 1.1 |
The table demonstrates the tendency of the Dominion to rely mainly upon the pastoral industry for her exports. The percentage supplied by this group was high in the late “nineties,” but in the early years of the present century fell relatively, owing mainly to increased exports of agricultural and mining produce. After 1901, however, the percentage increased almost continuously, till in 1924 and 1926 it amounted to 94.2 per cent. of the total, the highest percentage then recorded, this figure being reached in 1928 also.
Included in the Statistical Summary near the end of this volume are figures showing the main exports from New Zealand during the last fifty years. A more detailed list of commodities is covered by the five-years tables on pp. 236–240. A comparison of values between 1935 and 1936 gives the following results for fourteen principal commodities.
INCREASES OR DECREASES IN THE MAIN EXPORTS IN 1936.
| Commodity (New Zealand Produce). | Value. | Amount of | Percentage. | |||
|---|---|---|---|---|---|---|
| 1935. | 1936. | Increase. | Decrease. | Increase. | Decrease. | |
| £ | £ | £ | £ | Per Cent. | Per Cent. | |
| Wool | 7,097,133 | 13,293,706 | 6,196,573 | 87.3 | ||
| Frozen meat | 12,768,968 | 13,239,414 | 470,446 | 3.7 | ||
| Butter | 13,616,740 | 15,317,576 | 1,700,836 | 12.5 | ||
| Seeds, grass and clover | 215,738 | 249,861 | 34,123 | 15.8 | ||
| Peas | 107,173 | 121,743 | 14,570 | 13.6 | ||
| Casein | 161,700 | 194,907 | 33,207 | 20.5 | ||
| Cheese | 4,376,512 | 5,122,438 | 745,926 | 17.0 | ||
| Dried and pre-served milk | 370,890 | 405,801 | 34,911 | 9.4 | ||
| Sausage-casings | 787,261 | 641,393 | 145,868 | 18.5 | ||
| Apples | 467,422 | 552,902 | 85,480 | 18.3 | ||
| Tallow | 630,638 | 628,310 | 2,328 | 0.4 | ||
| Skins, hides, and pelts | 2,410,828 | 3,314,816 | 903,988 | 37.5 | ||
| Silver | 61,317 | 55,745 | 5,572 | 9.1 | ||
| Gold | 1,441,790 | 1,398,656 | 43,134 | 3.0 | ||
| Coal | 62,910 | 55,217 | 7,693 | 12.2 | ||
| Kauri-gum | 79,113 | 96,161 | 17,048 | 21.5 | ||
| Phormium | 57,553 | 111,528 | 53,975 | 93.8 | ||
| Timber | 364,359 | 265,108 | 99,251 | 36.7 | ||
New Zealand's agriculture is now upon a level barely sufficient to provide for her own needs in the matter of cereals, and only in exceptional years is there a surplus available for export. Agricultural exports showed an abnormal increase from 1899 to 1903, the period which covers the South African War, but their importance then steadily declined. Their lowest level (0.6 per cent. of total exports) was reached in 1916 and 1917. The higher levels recorded from 1926 onwards are attributable mainly to a considerable development in the export of apples; pears, peas, and grass- and clover-seeds also contributing. Forest products, though steady, show a relative downward tendency. Mining products which have declined considerably of late years recorded a marked increase since 1931 due to the enhanced price of gold, which led to greater activity in gold-production and to the export of a large quantity of gold recovered from old jewellery, &c.
In the following table exports during 1936 are grouped in classes in accordance with the statistical classification which has been used for both exports and imports since 1914:—
| No. | Class. | New Zealand Produce. | Reexports. |
|---|---|---|---|
| £ | £ | ||
| I | Foodstuffs of animal origin (excluding live animals) | 35,441,875 | 493 |
| II | Foodstuffs of vegetable origin, and common salt | 871,317 | 6,369 |
| III | Beverages (non-alcoholic), and substances used in making up the same | 2,618 | 7,986 |
| IV | Spirits and alcoholic liquors | 5,964 | 5,417 |
| V | Tobacco and preparations thereof | 23,146 | 2,909 |
| VI | Live animals | 111,103 | 496 |
| VII | Animal substances (mainly unmanufactured), not being foodstuffs | 16,616,956 | 1,644 |
| VIII | Vegetable substances and non-manufactured fibres | 381,825 | 3,097 |
| IXA | Apparel | 1,414 | 9,527 |
| IXB | Textiles | 8,103 | 19,124 |
| IXC | Manufactured fibres | 1,224 | 4,030 |
| X | Oils, fats, and waxes | 670,641 | 211,387 |
| XI | Paints and varnishes | 1,020 | 5,434 |
| XII | Stones and minerals used industrially | 160,531 | 134 |
| XIVA | Metal (unmanufactured and partly manufactured) and ores | 1,506,950 | 6,428 |
| XIVB | Metal manufactures other than machinery and machines | 3,929 | 19,975 |
| XV | Machinery and machines | 29,334 | 45,019 |
| XVIA | Rubber and manufactures thereof (not including tires) | 2 | 1,524 |
| XVIB | Leather and manufactures thereof (including substitutes) | 7,660 | 1,402 |
| XVIIA | Timber | 265,108 | 562 |
| XVIIB | Wood, cane, and wicker manufactures | 1,347 | 1,030 |
| XVIII | Earthenware, china, glass, stoneware, cement, and cement materials | 496 | 1,760 |
| XIXA | Paper | 593 | 1,044 |
| XIXB | Stationery | 14,962 | 8,800 |
| XX | Jewellery, timepieces, and fancy-goods | 321 | 22,175 |
| XXI | Optical, surgical, and scientific instruments | 519 | 16,971 |
| XXIIA | Drugs, chemicals, and druggists' wares | 24,781 | 13,328 |
| XXIIB | Manures | 23,521 | 40 |
| XXIIIA | Vehicles | 247 | 34,577 |
| XXIIIB | Miscellaneous | 45,884 | 35,453 |
| Parcels-post | 40,414 | ||
| Totals, merchandise | 56,263,805 | 488,135 | |
| XIII | Specie (face value) | 45,245 |
Exports for 1936 (including specie and re-exports) are now grouped according to a classification adopted by the British Board of Trade for the compilation of Empire trade statistics. Exports to British and foreign countries are distinguished.
| Commodity (including Re-exports). | United Kingdom. | Other British Countries. | United States of America. | Other Foreign Countries. | Totals. |
|---|---|---|---|---|---|
* Not including bunker coal, £52,700. † Not including bunker oil, £207,284. ‡ Face value. | |||||
| £ | £ | £ | £ | £ | |
| Grain | 71,485 | 52,167 | 3,496 | 289 | 127,437 |
| Milled products | 329 | 642 | 23 | 174 | 1,168 |
| Fish | 2,557 | 167,313 | 912 | 3,865 | 174,647 |
| Meat (including poultry and game) | 13,415,529 | 67,652 | 1,752 | 34,938 | 13,519,871 |
| Butter, cheese, and eggs | 20,045,810 | 130,750 | 102,408 | 183,772 | 20,462,740 |
| Fruits (fresh and dried) | 542,254 | 17,771 | 2 | 49,220 | 609,247 |
| Preserved fruit and vegetables, fruit-pulp, jams, &c. | 420 | 1,769 | 96 | 103 | 2,388 |
| Live animals for food | |||||
| Sugar | 222 | 17,626 | 210 | 1,703 | 19,761 |
| Tea | 42 | 7,085 | 381 | 253 | 7,761 |
| Alcoholic beverages | 556 | 4,715 | 2,271 | 3,684 | 11,226 |
| Tobacco | 19,688 | 5,455 | 729 | 183 | 26,055 |
| Coal* | 198 | 1,083 | 1,236 | 2,517 | |
| Ores, concentrates, and scrap | 21,322 | 10,752 | 335 | 26,203 | 58,612 |
| Iron and steel— | |||||
| Pig, ingots, &c. | 5 | 5 | |||
| Bar, rod, plate, sheet, &c. | 80 | 402 | 576 | 1,058 | |
| Other manufactures or iron and steel | 3,681 | 8,982 | 295 | 5,237 | 18,195 |
| Agricultural implements and machinery | 1,875 | 6,153 | 8 | 225 | 8,261 |
| Electrical machinery and equipment | 4,026 | 13,818 | 2,207 | 457 | 20,508 |
| Other machinery | 7,485 | 35,331 | 1,162 | 1,606 | 45,584 |
| Motor vehicles and parts (excluding motor-bicycles) | 10,815 | 15,984 | 825 | 2,256 | 29,880 |
| Other metals and metal manufactures | 3,287 | 2,238 | 257 | 466 | 6,248 |
| Raw cotton | |||||
| Flax, hemp, and raw jute (including tow) | 42,004 | 63,623 | 1,617 | 4,291 | 111,535 |
| Wool, raw | 7,807,487 | 936,754 | 660,777 | 3,888,688 | 13,293,706 |
| Yarns and threads | 526 | 1,201 | 27 | 1,754 | |
| Cotton piece-goods | 499 | 2,440 | 503 | 3,442 | |
| Woollen piece-goods | 388 | 489 | 6 | 883 | |
| Other piece-goods | 346 | 5,005 | 4,142 | 9,493 | |
| Other textiles | 1,255 | 14,054 | 1,262 | 914 | 17,485 |
| Apparel | 1,698 | 5,452 | 340 | 581 | 8,071 |
| Footwear | 1,400 | 963 | 380 | 140 | 2,883 |
| Chemicals, drugs, dyes, &c. | 47,974 | 27,096 | 8,260 | 151,875 | 235,205 |
| Fertilizers | 10,748 | 4,272 | 8,501 | 40 | 23,561 |
| Earthenware (including, bricks, glass, &c.) | 207 | 1,597 | 200 | 18 | 2,022 |
| Wood, timber, and manufactures thereof (including wood-pulp) | 9,445 | 258,434 | 132 | 36 | 268,047 |
| Newsprint | 62 | 119 | 26 | 207 | |
| Paper and cardboard | 1,592 | 8,635 | 490 | 553 | 11,270 |
| Seeds and nuts for expressing oil therefrom | 4,777 | 4,777 | |||
| Animal and vegetable oils, fats, greases, and waxes | 406,482 | 115,278 | 78,569 | 70,385 | 670,714 |
| Oil—Petroleum, crime and refined† | 64 | 2,316 | 328 | 823 | 3,531 |
| Hides, skins, and furs, undressed | 807,519 | 440,964 | 1,695,730 | 372,247 | 3,316,460 |
| Leather and manufactures thereof (excluding clothing and footwear) | 5,766 | 2,379 | 273 | 644 | 9,062 |
| Other | 1,013,194 | 755,661 | 303,524 | 98,437 | 2,170,816 |
| Total | 44,310,322 | 3,219,197 | 2,877,752 | 4,910,822 | 55,318,093 |
| Gold and silver bullion | 1,182,667 | 251,180 | 1,433,847 | ||
| Total exports (excluding specie) | 45,492,989 | 3,470,377 | 2,877,752 | 4,910,822 | 56,751,940 |
| Specie‡ | 34,200 | 11,045 | 45,245 | ||
The principal items of export may again be regrouped under six definite classes, as in the table following, which shows in more detail the commodities exported from the Dominion. Only New Zealand produce is included.
Practically all the main commodities are homogeneous articles, and it is there fore possible to give the quantities exported. For some purposes, especially for comparisons between recent and more remote years, quantities are preferable to values, since the latter are affected by price-variations.
| Commodity (New Zealand Produce). | 1932. | 1933. | 1934. | 1935. | 1936. |
|---|---|---|---|---|---|
* Ounces of the fineness of 20 carats and upwards. | |||||
| The mine— | |||||
| Coal (ton) | 35,866 | 34,131 | 40,361 | 46,146 | 44,872 |
| Gold* (oz.) | 200,648 | 177,241 | 162,490 | 171,283 | 168,073 |
| Silver (oz.) | 520,647 | 410,091 | 359,540 | 389,263 | 478,859 |
| Other minerals (ton) | 8 | 27 | 47 | 53 | 47 |
| The fisheries— | |||||
| Fish (cwt.) | 20,479 | 32,399 | 56,205 | 55,463 | 61,764 |
| Oysters (doz.) | 29,377 | 106,241 | 204,020 | 197,117 | 136,195 |
| Whalebone (lb.) | |||||
| Whale-oil (gal.) | 30,861 | 28,895 | 35,001 | 71,601 | 71,760 |
| The forest— | |||||
| Fungus (cwt.) | 1,330 | 1,028 | 1,278 | 1,418 | 938 |
| Kauri-gum (ton) | 2,068 | 3,089 | 3,209 | 2,872 | 3,237 |
| Timber, sawn and hewn (sup. ft.) | 27,286,884 | 25,329,404 | 34,530,279 | 39,585,198 | 26,993,334 |
| Pastoral products— | |||||
| Bacon and hams (cwt.) | 874 | 003 | 962 | 738 | 987 |
| Meats, salted and smoked (cwt.) | 1,469 | 1,202 | 4,873 | 725 | 664 |
| Butter (cwt.) | 2,185,545 | 2,635,247 | 2,614,519 | 2,789,298 | 2,796,145 |
| Casein (cwt.) | 42,770 | 48,674 | 57,744 | 65,167 | 80,836 |
| Cheese (cwt.) | 1,790,431 | 1,982,942 | 1,984,496 | 1,727,552 | 1,658,206 |
| Eggs in shell (doz.) | 163,078 | 327,161 | 384,545 | 354,580 | 327,798 |
| Hides and skins (number) | 1,183,229 | 1,456,241 | 1,852,682 | 1,999,473 | 1,899,436 |
| Honey (lb.) | 226,243 | 757,106 | 669,683 | 1,155,247 | 739,956 |
| Live-stock— | |||||
| Cattle (number) | 97 | 29 | 342 | 57 | 28 |
| Horses (number) | 198 | 250 | 336 | 257 | 211 |
| Sheep (number) | 3,578 | 2,333 | 1,844 | 2,283 | 5,545 |
| Pigs (number) | 207 | 75 | 37 | 33 | 47 |
| Preserved meats (cwt.) | 35,387 | 39,453 | 44,348 | 74,256 | 86,006 |
| Frozen meats (cwt.) | 4,645,480 | 5,203,113 | 4,969,447 | 5,206,514 | 5,119,804 |
| Milk, dried and preserved (lb.) | 16,033,175 | 17,640,072 | 21,562,450 | 20,783,080 | 23,742,354 |
| Sausage-casings (cwt.) | 33,679 | 40,404 | 40,397 | 37,429 | 39,429 |
| Rabbit-skins (number) | 6,660,140 | 10,378,388 | 13,035,015 | 13,536,745 | 16,928,931 |
| Sheep-skins and pelts (number) | 13,640,412 | 15,193,799 | 12,193,697 | 14,170,544 | 12,627,581 |
| Tallow (cwt.) | 507,540 | 560,400 | 553,240 | 505,540 | 521,900 |
| Wool (lb.) | 238,179,062 | 286,307,441 | 255,796,783 | 222,661,403 | 314,409,402 |
| Agricultural products— | |||||
| Bran and sharps (ton) | 505 | 1,005 | 1,353 | 165 | 8 |
| Chaff (ton) | 22 | 2 | 13 | 10 | |
| Flour (ton) | 8 | 2 | 7 | 1 | 28 |
| Apples (lb.) | 60,438,518 | 52,406,016 | 57,763,643 | 37,790,819 | 44,806,173 |
| Pears (lb.) | 2,783,376 | 5,130,538 | 4,915,070 | 3,786,790 | 4,530,340 |
| Grain and pulse— | |||||
| Barley (cental) | 15 | 670 | 48 | 13 | |
| Beans (cental) | 468 | 598 | 417 | 859 | 1,546 |
| Peas (cental) | 105,814 | 199,816 | 258,560 | 147,110 | 107,407 |
| Oats (cental) | 1,816 | 7,295 | 21,846 | 38,191 | 2,325 |
| Wheat (cental) | 45 | 603,431 | 77 | 125 | 146 |
| Hops (cwt.) | 1,788 | 5,282 | 3,069 | 3,993 | 4,265 |
| Oatmeal (ton) | 100 | 54 | |||
| Onions (ton) | 2,079 | 880 | 1,891 | 144 | 880 |
| Potatoes (ton) | 1,140 | 4,607 | 917 | 1,072 | 5,803 |
| Seeds (grass and clover) (cwt.) | 34,337 | 80,308 | 48,751 | 71,649 | 79,982 |
| Tobacco, unmanufactured (lb.) | 234 | 42 | 66,419 | 185,405 | |
| Miscellaneous — | |||||
| Ale, stout, and elder (gal.) | 13,865 | 14,582 | 31,636 | 35,701 | 27,519 |
| Leather (cwt.) | 1,979 | 981 | 492 | 377 | 328 |
| Phormium fibre and tow (ton) | 3,850 | 4,402 | 4,173 | 4,101 | 6,209 |
| Sugar (cwt.) | 20,949 | 18,359 | 17,191 | 22,266 | 35,763 |
| Metals, scrap (not precious) (cwt.) | 13,161 | 651,785 | 243,961 | 171,590 | 238,534 |
| Pumice—sand and stone (ton) | 3,166 | 2,387 | 2,491 | 3,300 | 3,242 |
| Blood and blood-and-bone manures (ton) | 1,241 | 2,423 | 2,942 | 2,157 | 1,664 |
The values of these principal exports are tabulated in the following table, and the statement is rendered complete by the addition of a miscellaneous group and the provision of totals for each group and for all combined:—
| Commodity (New Zealand Produce). | 1932. | 1933. | 1934. | 1935. | 1936. |
|---|---|---|---|---|---|
* As recorded. Certain exports of ambergris by parcels-post are not available, but are included in “Miscellaneous—Other” at the end of the table. | |||||
| The mine— | £ | £ | £ | £ | £ |
| Coal | 56,321 | 53,690 | 51,489 | 62,910 | 55,217 |
| Gold | 1,092,288 | 1,281,612 | 1,320,690 | 1,441,790 | 1,398,656 |
| Silver | 40,737 | 36,666 | 39,372 | 61,317 | 55,745 |
| Other minerals | 960 | 2,243 | 5,360 | 7,345 | 6,061 |
| Totals | 1,190,306 | 1,374,211 | 1,416,911 | 1,573,362 | 1,515,67 |
| The fisheries— | |||||
| Fish | 51,307 | 75,019 | 134,311 | 140,683 | 172,713 |
| Oysters | 382 | 1,048 | 1,860 | 2,136 | 1,441 |
| Whalebone | |||||
| Whale-oil | 2,700 | 2,274 | 2,540 | 5,051 | 5,492 |
| Ambergris* | 62 | 222 | 968 | 44 | 1,383 |
| Other | 105 | 124 | 456 | 740 | 648 |
| Totals | 54,556 | 78,687 | 140,135 | 148,654 | 181,677 |
| The forest— | |||||
| Fungus | 5,903 | 3,269 | 3,788 | 5,194 | 5,020 |
| Kauri-gum | 62,137 | 77,973 | 86,917 | 79,113 | 96,161 |
| Timber | 253,883 | 237,528 | 320,527 | 364,359 | 265,108 |
| Other | 121 | 279 | 20 | 61 | |
| Totals | 321,923 | 318,891 | 411,511 | 448,686 | 366,350 |
| Pastoral products— | |||||
| Bacon and hams | 4,368 | 4,674 | 4,945 | 4,530 | 5,832 |
| Meats, salted and smoked | 3,096 | 2,414 | 9,611 | 1,524 | 1,424 |
| Butter | 10,639,053 | 11,648,699 | 10,042,776 | 13,616,740 | 15,317,576 |
| Casein | 59,029 | 93,742 | 149,666 | 161,700 | 194,907 |
| Cheese | 4,951,268 | 4,766,351 | 4,694,459 | 4,376,512 | 5,122,438 |
| Eggs in shell | 7,797 | 15,884 | 18,341 | 22,378 | 22,664 |
| Hides and skins | 309,806 | 601,043 | 697,014 | 740,274 | 847,725 |
| Honey | 7,054 | 21,823 | 19,731 | 33,788 | 20,844 |
| Live-stock— | |||||
| Cattle | 2,170 | 1,777 | 9,316 | 2,950 | 1,550 |
| Horses | 43,577 | 41,815 | 58,774 | 64,037 | 68,082 |
| Sheep | 17,337 | 8,053 | 28,529 | 1,058 | 40,108 |
| Pigs | 497 | 201 | 144 | 178 | 182 |
| Other | 528 | 617 | 1,262 | 140 | 108 |
| Milk, dried and preserved | 269,121 | 315,964 | 407,708 | 370,890 | 405,801 |
| Preserved meats | 96,123 | 105,272 | 127,090 | 216,417 | 273,201 |
| Frozen meats | 8,436,306 | 9,845,627 | 11,886,955 | 12,768,968 | 13,239,414 |
| Sausage-casings | 266,273 | 394,461 | 625,394 | 787,261 | 641,393 |
| Rabbit-Skins | 70,016 | 224,199 | 257,585 | 395,090 | 763,961 |
| Sheep skins and pelts | 694,217 | 1,043,208 | 1,250,091 | 1,275,464 | 1,703,130 |
| Tallow | 462,081 | 516,063 | 480,354 | 630,638 | 628,310 |
| Wool | 5,742,821 | 7,422,266 | 12,516,425 | 7,097,133 | 13,293,706 |
| Other | 19,680 | 28,357 | 50,790 | 49,820 | 79,619 |
| Totals | 32,102,218 | 37,102,510 | 43,336,960 | 42,634,490 | 52,671,975 |
| Agricultural products— | |||||
| Bran and pollard | 1,494 | 3,368 | 4,146 | 599 | 59 |
| Chaff | 183 | 11 | 12 | 96 | 62 |
| Flour | 171 | 39 | 88 | 12 | 532 |
| Fruits— | |||||
| Apples | 755,158 | 655,746 | 716,780 | 467,422 | 552,902 |
| Pears | 44,262 | 65,020 | 62,060 | 57,071 | 55,528 |
| Other | 542 | 9,685 | 210 | 144 | 164 |
| Grain and pulse— | |||||
| Barley | 10 | 329 | 27 | 7 | |
| Beans | 1,009 | 839 | 637 | 1,884 | 4,129 |
| Peas | 80,498 | 123,037 | 138,261 | 107,173 | 121,743 |
| Oats | 1,043 | 2,237 | 7,300 | 11,220 | 1,170 |
| Wheat | 27 | 138,825 | 39 | 66 | 73 |
| Other | 66 | 135 | 4 | 17 | |
| Hops | 7,897 | 23,660 | 21,809 | 27,359 | 28,484 |
| Oatmeal | 4,522 | 2,195 | 9 | 15 | |
| Onions | 20,202 | 4,702 | 10,970 | 1,200 | 6,323 |
| Potatoes | 6,140 | 23,629 | 5,317 | 8,490 | 31,316 |
| Seeds (grass and clover) | 109,632 | 152,458 | 166,511 | 215,738 | 249,861 |
| Seeds (various) | 7,877 | 7,354 | 7,699 | 8,665 | 10,585 |
| Tobacco | 26 | 14 | 6,642 | 18,495 | |
| Other | 2,544 | 8,684 | 11,172 | 22,031 | 26,882 |
| Totals | 1,043,277 | 1,221,979 | 1,153,056 | 935,821 | 1,108,347 |
| Commodity (New Zealand Produce). | 1932. | 1933. | 1934. | 1935. | 1936. |
|---|---|---|---|---|---|
| Miscellaneous (including manufactures)— | £ | £ | £ | £ | £ |
| Ale, stout, and cider | 2,626 | 3,364 | 7,021 | 7,575 | 5,899 |
| Apparel (including hate, caps, hosiery, and millinery) | 1,084 | 1,325 | 1,672 | 1,348 | 1,265 |
| Dairying machinery | 7,574 | 4,115 | 7,926 | 10,229 | 15,478 |
| Blood and blood - and - bone manures | 7,429 | 16,067 | 21,893 | 17,557 | 14,557 |
| Metals, scrap (not precious) | 9,752 | 54,471 | 34,842 | 35,199 | 46,319 |
| Cordage | 1,472 | 1,387 | 808 | 856 | 865 |
| Foods, infants' and invalids' | 10,246 | 8,194 | 13,661 | 12,500 | 13,846 |
| Leather | 9,777 | 9,101 | 5,185 | 5,096 | 7,189 |
| Phormium fibre and tow | 47,312 | 47,632 | 52,018 | 57,553 | 111,528 |
| Pumice, sand and stone | 11,812 | 8,544 | 6,796 | 8,769 | 8,881 |
| Soap | 7,691 | 7,664 | 9,170 | 10,986 | 8,513 |
| Sugar | 15,779 | 13,844 | 12,967 | 16,448 | 20,047 |
| Binder-twine | 189 | 177 | 53 | 172 | 267 |
| Woollen manufactures | 784 | 1,884 | 4,029 | 4,904 | 1,924 |
| Other | 130,580 | 134,704 | 134,679 | 121,528 | 163,199 |
| Totals | 264,107 | 312,473 | 312,720 | 310,720 | 419,777 |
| Totals, New Zealand produce | 34,976,387 | 40,408,751 | 46,771,293 | 46,051,733 | 56,263,805 |
| Re-exports of merchandise | 633,532 | 597,168 | 571,554 | 486,648 | 488,135 |
| Total exports of merchandise | 35,609,919 | 41,005,919 | 47,342,847 | 46,538,381 | 56,751,940 |
| Specie exports (face value) | 1,355,861 | 296,032 | 2,283,900 | 521,000 | 45,245 |
The first exports from New Zealand went naturally to the earlier-developed sister colony, and for a considerable time Australia had a monopoly of our trade. In 1865, 70 per cent., and even in 1871, 44 per cent., of the total exports went to Australia. But since the establishment of direct shipping lines the United Kingdom has absorbed the bulk of New Zealand exports, having taken during the forty years 1875–1914, £365,880,997 (78 per cent.) of a grand total of exports amounting to £469,347,969. This percentage, prior to the Great War, did not vary greatly from year to year, but there have been considerable variations since, 1914.
The principal destinations of New Zealand's exports of merchandise (including re-exports) during the last twenty years are given in the table below. The principal “other countries” in 1936, in order of magnitude, were France, Japan, Belgium, Poland, India, the Netherlands, and Fiji.
| Year. | United Kingdom. | Australia. | Canada. | Pacific Islands (other than Australia). | United States. | Germany. | Other Countries. | Total Merchandise Exports. |
|---|---|---|---|---|---|---|---|---|
| £ | £ | £ | £ | £ | £ | £ | £ | |
| 1917 | 26,023,396 | 1,460,980 | 961,653 | 469,905 | 1,894,317 | 6 | 706,815 | 31,517,072 |
| 1918 | 18,244,250 | 1,803,739 | 1,793,576 | 476,232 | 4,045,648 | 2,117,133 | 28,480,578 | |
| 1919 | 44,312,048 | 2,249,827 | 980,190 | 485,962 | 4,200,861 | 1,679,037 | 53,907,925 | |
| 1920 | 34,354,300 | 2,351,799 | 1,357,774 | 681,703 | 7,456,041 | 23 | 203,726 | 46,405,366 |
| 1921 | 38,716,593 | 2,070,013 | 454,597 | 516,996 | 2,702,104 | 46,162 | 321,995 | 44,828,460 |
| 1922 | 36,154,174 | 2,208,280 | 446,457 | 399,078 | 2,672,775 | 218,338 | 626,847 | 42,725,949 |
| 1923 | 37,324,605 | 2,614,894 | 665,696 | 466,164 | 3,531,272 | 190,600 | 1,146,562 | 45,939,793 |
| 1924 | 41,969,691 | 2,474,879 | 716,543 | 575,530 | 3,278,135 | 1,166,302 | 2,328,143 | 52,509,223 |
| 1925 | 44,066,981 | 2,489,230 | 423,068 | 548,591 | 4,349,758 | 1,614,090 | 1,751,329 | 55,243,047 |
| 1926 | 35,102,087 | 8,048,282 | 861,717 | 514,753 | 3,818,232 | 364,629 | 1,559,224 | 45,268,924 |
| 1927 | 36,877,887 | 3,665,962 | 1,666,598 | 495,402 | 2,681,091 | 1,139,654 | 1,969,760 | 48,496,354 |
| 1928 | 40,510,075 | 2,902,655 | 2,469,150 | 574,866 | 4,160,315 | 1,290,071 | 3,663,249 | 55,570,381 |
| 1929 | 40,417,043 | 2,338,410 | 3,353,975 | 517,958 | 3,553,427 | 1,220,552 | 3,528,698 | 54,930,063 |
| 1930 | 36,015,128 | 1,562,281 | 2,539,212 | 471,974 | 2,116,752 | 401,084 | 1,834,086 | 44,940,517 |
| 1931 | 30,739,976 | 1,167,403 | 256,890 | 302,634 | 920,931 | 309,847 | 1,253,017 | 34,950,698 |
| 1932 | 31,344,670 | 1,444,860 | 244,160 | 265,425 | 690,015 | 289,917 | 1,330,872 | 35,609,919 |
| 1933 | 35,275,909 | 1,393,311 | 560,875 | 232,000 | 1,188,972 | 376,886 | 1,977,966 | 41,005,919 |
| 1934 | 38,629,240 | 1,882,516 | 697,865 | 223,486 | 1,250,364 | 944,310 | 3,715,066 | 47,342,847 |
| 1935 | 38,921,568 | 1,781,811 | 656,984 | 284,035 | 2,468,066 | 165,304 | 2,260,613 | 46,538,381 |
| 1936 | 45,492,989 | 1,843,475 | 1,103,008 | 345,456 | 2,877,752 | 272,481 | 4,816,779 | 56,751,940 |
The statistics quoted in the above table indicate the destination of New Zealand exports as recorded by the Customs Department. In some instances the ultimate destination of exports is not known at the time of export, such goods being entered as exported to the country to which they are being shipped. This consideration applies more particularly to wool, considerable quantities of which are shipped to the United Kingdom, and subsequently re-exported to the Continent. It should be observed, however, that in all instances where the final destination is known at the time of export the exports are credited to that destination in the New Zealand trade statistics. It is possible, of course, that the destination of goods may be diverted while on the water; and this, in fact, happens on occasion in the case of wool. In such cases the actual destination will be different from that to which the goods have been credited in the statistics; but it is quite impossible to keep a record of movements of this nature.
A further point of some importance is the fact that an appreciable quantity of wool is exported each year on an “optional” basis—United Kingdom, option Continent. In such instances, the wool is entered in the New Zealand statistics as exported to the United Kingdom.
It will be realized from the considerations outlined above that the actual final destinations of New Zealand exports may vary appreciably from the classification shown in the table. The qualifications to the statistics as an indication of the final destination of New Zealand exports point, generally speaking, to the conclusion that our exports to Continental countries are somewhat higher than the figures shown; while, on the other hand, our exports to the United Kingdom for retention in that country are lower than the totals quoted in the table.
The table which follows shows for each of ten years the percentage of total exports (excluding specie) taken by each of the principal countries trading with the Dominion. For reasons given above, the proportion credited to the United Kingdom is overstated, and that to other European countries understated.
| Country. | 1927. | 1928. | 1929. | 1930. | 1931. | 1932. | 1933. | 1934. | 1935. | 1936. |
|---|---|---|---|---|---|---|---|---|---|---|
| Per Cent. | Per Cent. | Per Cent. | Per Cent. | Per Cent. | Per Cent. | Per Cent. | Per Cent. | Per Cent. | Per Cent. | |
| United Kingdom | 76.04 | 72.90 | 73.58 | 80.14 | 87.96 | 88.02 | 86.03 | 81.59 | 83.63 | 80.16 |
| Canada | 3.44 | 4.45 | 6.11 | 5.65 | 0.74 | 0.69 | 1.37 | 1.46 | 1.41 | 1.95 |
| India | 0.30 | 0.68 | 0.70 | 0.91 | 0.17 | 0.15 | 0.08 | 0.14 | 0.13 | 0.22 |
| Ceylon | 0.00 | 0.01 | 0.01 | 0.02 | 0.01 | 0.01 | 0.01 | 0.00 | 0.00 | 0.00 |
| South African Union | 0.06 | 0.12 | 0.09 | 0.04 | 0.02 | 0.03 | 0.03 | 0.06 | 0.06 | 0.04 |
| Australia | 7.56 | 5.22 | 4.26 | 3.48 | 3.34 | 4.06 | 3.40 | 3.98 | 3.83 | 3.25 |
| Fiji | 0.25 | 0.23 | 0.23 | 0.24 | 0.25 | 0.25 | 0.21 | 0.18 | 0.19 | 0.18 |
| Other British countries | 0.52 | 0.50 | 0.42 | 0.48 | 0.43 | 0.44 | 0.37 | 0.42 | 0.52 | 0.48 |
| Totals, British countries | 88.17 | 84.11 | 85.40 | 90.96 | 92.92 | 93.65 | 91.50 | 87.83 | 89.77 | 86.28 |
| Germany | 2.35 | 2.32 | 2.22 | 0.89 | 0.89 | 0.82 | 0.92 | 2.00 | 0.36 | 0.48 |
| France | 2.08 | 3.24 | 3.22 | 1.15 | 1.20 | 1.43 | 1.80 | 2.60 | 1.04 | 2.90 |
| Belgium | 0.34 | 0.55 | 0.45 | 0.44 | 0.42 | 0.47 | 0.81 | 1.29 | 1.39 | 1.09 |
| Japan | 0.52 | 1.18 | 0.78 | 0.34 | 0.76 | 0.67 | 0.86 | 1.81 | 0.93 | 2.74 |
| United States of America | 5.53 | 7.51 | 6.51 | 4.71 | 2.66 | 1.94 | 2.91 | 2.64 | 5.30 | 5.07 |
| Other foreign countries | 1.01 | 1.09 | 1.42 | 1.51 | 1.15 | 1.02 | 1.20 | 1.83 | 1.21 | 1.44 |
| Totals, foreign countries | 11.83 | 15.89 | 14.60 | 9.04 | 7.08 | 6.35 | 8.50 | 12.17 | 10.23 | 13.72 |
A little more than four-fifths of New Zealand's exports went to the United Kingdom during 1936. A certain amount of this produce, as indicated previously, is subsequently reshipped, principally to other European countries, the result being that exports to Continental countries are understated to this extent in New Zealand export statistics. The principal commodities, in order of magnitude, taken by the United Kingdom from New Zealand in 1936 were butter, frozen meat, wool, cheese, gold, hides and skins, apples, chilled beef, dried milk, tallow, and sausage-casings.
For the second year in succession the United States ranked second among the Dominion's export customers, taking a total of £2,877,752, an increase of some £400,000 over the 1935 figure. Comparative figures of the principal items in 1936 and 1935 (the latter in parentheses) are as follows: Wool, £660,777 (£302,476); sheep-skins. £929,471 (£570,192); rabbit-skins, £642,932 (£348,784); sausage-casings, £178,906 (£345,279); tallow, £77,993 (£339,858).
Next in importance to the United States in 1936, Australia took exports valued at £1,843,475, representing 3.25 per cent. of the Dominion's total exports. Principal items in 1930 were as follows (1935 figures in parentheses): Wool, £313,809 (£210,801); gold, £203,047 (£263,067); fish, £165,395 (£135,790); cattle-hides, £139,442 (£144,737); sawn timber, £242,570 (£347,960).
Canada took 1.95 per cent. of New Zealand's exports in 1936, representing a value of £1,103,008 which compares with £656,984 in 1935. Wool accounted for £613,766 in 1936 and £197,163 in 1935, other prominent items being as follows (1935 figures in parentheses): Sausage-casings, £157,483 (£223,633); calf-skins, £101,920 (£70,980); sheep-skins, £58,530 (£48,056); cattle-hides, £36,729 (£42,198).
Greatly increased wool exports to France (£1,537,283 in 1936, compared with £354,391 in 1935) brought that country's share of New Zealand's exports up to 2.90 per cent. in 1936. Germany's share, although greater than in 1935, represented but 0.48 per cent. of the total, wool accounting for the bulk with £142,939, an increase of £50,000. Belgium took 1.09 per cent. of the total (a moderate decline), wool being the principal item with £515,974, compared with the 1935 figure of £577,373. Sheep-skins rose from £17,293 to £72,067.
Japan's inactivity on the Australian wool-market in 1936 was reflected in considerably greater purchases in New Zealand, resulting in a three-fold increase in Japan's share of the Dominion's total exports. Wool taken in 1936 amounted to 26,995,798 lb. (£1,265,836), compared with the 1935 figures of 8,519,283 lb. (£241,697). Casein increased from £128,667 to £142,381.
Minor trade in 1936 was as follows (1935 figures in parentheses)—Irish Free State: Hops, £10,705 (£14,003). Hong Kong: Butter, £13,480 (£4,084); fungus, £5,616 (£5,363). India: Butter, £15,743 (£11,664); dried milk and cream, £8,528 (£10,099); tallow, £89,751 (£30,994). Malaya: Dried and preserved milk and cream, £40,375 (£43,711); butter, £27,863 (£17,277). South African Union: Peas, £5,216 (£5,012); wool, £5,614 (£1,390). British West Indies: Butter, £45,866 (£50,406). Fiji: Tinned meats, £15,980 (£9,808); potatoes, £5,845 (£6,212); tea, £5,485 (£4,967); cinematograph films, £5,457 (£6,677); soap, £5,094 (£4,617). Gilbert and Ellice Islands; Tinned meats, £5,682 (£3,761). Papua: Tinned meats, £5,682 (£3,761); mining machinery, £1,097 (£2,903). Tonga: Tinned meats, £10,135 (£8,122); sugar, £3,132 (£1,763); timber, £2,135 (£1,340). Western Samoa: Tinned meats, £11,949 (£8,345); sugar, £6,842 (£7,535); butter, £2,520 (£1,839); timber, £9,511 (£6,911). Bulgaria: Wool, £17,810 (£3,547). Czechoslovakia: Wool, £19,357 (£12,743). Denmark: Cattle-hides, £5,818 (£4,602); wool, £3,275 (£5,382). Greece: Wool, £45,411 (£9,1547). Italy: Wool. £1,366 (£7,768). Netherlands: Apples, £15,110 (£11,030); wool, £32,768 (£15,583); calf-skins, £35,600 (£40,797); cattle-hides, £9,236 (£4,611); tallow, £5,787 (£644). Spain: Wool, £9,730 (£5,787); sheep-skins, £3,898 (£17,280). Poland: Wool, £173,159 (£103,190). Sweden: Wool, £60,139 (£38,473). China: Wool, £18,081 (nil); butter, £7,988 (£5,230). Philippine Islands: Butter, £5,261 (£3,864). Egypt: Wool, £18,636 (£6,519). Argentina: Apples, £8,944 (nil); sheep, £2,705 (£2,606). Brazil: Apples, £5,937 (£11,516). Chile: Sheep, £2,520 (£53). Panama Canal Zone: Butter, £94,198 (£74,830); cheese, £2,550 (£2,799). Uruguay: Potatoes, £23,687 (nil); sheep, £12,143 (£4,403). Hawaii: Butter, £59,436 (£36,700); frozen meat, £4,842 (£4,420); dried milk, £2,313 (nil). Society Islands: Butter, £11,449 (£9,869); tinned meats, £12,285 (£11,317); dried and preserved milk and cream, £7,356 (£6,685). Tutuila: Tinned meats, £4,298 (£4,708); alcoholic liquors, £2,519 (£4,008).
The lack of direct shipping facilities between New Zealand and the Continent has led to the development of a considerable entrepôt trade in New Zealand produce between the United Kingdom and the Continent. Wool is (and has been) the principal commodity entering into this trade, accounting for 65–70 per cent. of the total of such re-exports in 1926–29, and as much as 80 per cent. in 1933 and 1934; while hides and skins account for a considerable proportion of the remainder. Butter and cheese formerly occupied an important place in the trade; but, with the development of agrarian policies by Continental Governments, re-exports of these commodities have fallen off very considerably in recent years. Wool, being a raw material of manufacture, has not been subjected to trade restrictions to the same extent as farm-produced foodstuffs, although the growth in production of substitute fibres and the increased use of “recovered” wool have tended to decrease Continental purchases of New Zealand (and other) raw wools.
In the following table the value of re-exports of New Zealand produce from the United Kingdom during the calendar years 1931–35 is shown. The figures are taken from the official trade statistics of the United Kingdom issued by the Board of Trade.
RE-EXPORTS OF NEW ZEALAND PRODUCE FROM THE UNITED KINGDOM.
| Commodity. | 1931. | 1932. | 1933. | 1934. | 1935. |
|---|---|---|---|---|---|
| £(Stg.) | £(Stg.) | £(Stg.) | £(Stg.) | £(Stg.) | |
| Butter | 217,645 | 365,320 | 195,899 | 185,729 | 427,887 |
| Cheese | 34,208 | 32,183 | 34,295 | 51,201 | 50,712 |
| Casein | 49,729 | 20,384 | 608 | 2,921 | 2,648 |
| Milk-powder, not sweetened | 56,419 | 32,125 | 23,757 | 12,914 | 13,279 |
| Oleo-margarine, oleo-oil, and refined tallow | 1,190 | 1,059 | 2,220 | 3,285 | 6,215 |
| Peas, not fresh | 1,694 | 2,517 | 1,670 | 11,377 | 3,550 |
| Apples | 55,328 | 108,980 | 44,495 | 19,542 | 31,196 |
| Pears | 10,468 | 13,256 | 15,213 | 17,111 | 13,585 |
| Grass and clover seeds | 14,295 | 2,736 | 1,602 | 16,830 | 18,507 |
| Beef, frozen | 12,575 | 5,366 | 4,541 | 5,206 | 9,812 |
| Beef, tinned, canned, &c. (including tongues) and extracts and essences | 1,782 | 2,306 | 755 | 1,598 | 633 |
| Mutton and lamb, frozen | 46,615 | 43,550 | 51,365 | 53,913 | 54,483 |
| Meat, other kinds | 9,429 | 8,240 | 13,675 | 8,521 | 9,489 |
| Sausage-casings | 82,749 | 51,973 | 55,565 | 23,693 | 5,189 |
| Hides | 174,931 | 89,604 | 104,114 | 181,034 | 205,168 |
| Sheep and lamb skins | 186,377 | 177,009 | 281,050 | 281,797 | 369,655 |
| Rabbit-skins | 11,283 | 8,115 | 12,442 | 28,171 | 40,392 |
| Kauri-gum | 39,548 | 11,719 | 5,599 | 7,617 | 8,809 |
| Tallow | 103,105 | 62,720 | 37,453 | 40,790 | 31,507 |
| Phormium-fibre | 1,755 | 549 | 2,640 | 1,635 | 499 |
| Wool, raw; sheep and lambs' wool | 2,970,095 | 2,741,560 | 4,340,189 | 4,365,570 | 2,555,833 |
| All other commodities | 37,482 | 17,040 | 35,657 | 33,970 | 26,938 |
| Totals | 4,118,702 | 3,798,311 | 5,264,804 | 5,354,425 | 3,885,986 |
The above figures indicate the constitution of the United Kingdom's entrepôt trade in New Zealand produce, the movements in the values for individual commodities, and the total value of the trade at United Kingdom values. The figures should not, however, be regarded as directly comparable with the New Zealand statistics of exports to the United Kingdom quoted elsewhere in this section. In the first instance, the re-export statistics quoted above are valued in sterling currency, the basis of valuation being value at United Kingdom ports; secondly, the statistics include a proportion of exports credited in the New Zealand trade statistics as exported to other countries, and merely shipped to the United. Kingdom on account of lack of direct shipping facilities (sec remarks on page 232); thirdly, the United Kingdom statistics for any single year do not cover the identical exports included in the New Zealand statistics for the same year owing to the time-lag.
The table following shows the exports (including re-exports, but excluding specie) for five years according to the countries of destination. Reference should be made to remarks above regarding re-exports of New Zealand produce from the United Kingdom.
DESTINATION OF EXPORTS FROM NEW ZEALAND.
| Country. | 1932. | 1933. | 1934. | 1935. | 1936. |
|---|---|---|---|---|---|
| £ | £ | £ | £ | £ | |
| United Kingdom | 31,344,670 | 35,275,909 | 38,629,240 | 38,921,568 | 45,492,989 |
| British Possessions, Protectorates, Mandated Territories, &c. | |||||
| Europe— | |||||
| Irish Free State | 6,569 | 6,649 | 7,051 | 14,086 | 10,802 |
| Malta and Gibraltar | 9 | 41 | 1 | 35 | |
| 6,578 | 6,690 | 7,052 | 14,086 | 10,837 | |
| Asia— | |||||
| Ceylon | 3,498 | 2,670 | 393 | 1,528 | 1,401 |
| Hong Kong | 14,153 | 15,143 | 16,238 | 11,249 | 22,917 |
| India | 53,378 | 34,326 | 65,161 | 60,956 | 125,826 |
| Malaya | 26,868 | 22,929 | 49,727 | 63,771 | 71,383 |
| Other | 958 | 872 | 302 | 830 | 1,174 |
| 98,855 | 75,940 | 131,821 | 138,334 | 222,701 | |
| Africa— | |||||
| South African Union | 12,120 | 14,427 | 29,152 | 27,504 | 21,855 |
| Other | 488 | 926 | 893 | 398 | 381 |
| 12,608 | 15,353 | 30,045 | 27,902 | 22,236 | |
| America— | |||||
| Canada | 244,160 | 560,875 | 697,865 | 656,984 | 1,103,008 |
| British West Indies | 15 | 20,970 | 42,228 | 53,966 | 48,798 |
| Other | 136 | 72 | 31 | 4,077 | 1,054 |
| 244,311 | 581,917 | 740,124 | 715,027 | 1,152,860 | |
| Pacific islands— | |||||
| Australia | 1,444,860 | 1,393,311 | 1,882,516 | 1,781,811 | 1,843,475 |
| Fiji | 87,393 | 87,035 | 85,493 | 86,191 | 102,076 |
| Gilbert and Ellice Islands | 7,787 | 5,227 | 8,910 | 8,429 | 11,984 |
| Nauru Island | 9,095 | 4,181 | 10,821 | 12,191 | 18,084 |
| Norfolk Island | 8,931 | 1,899 | 3,513 | 1,106 | 337 |
| Papua | 1,504 | 2,297 | 1,867 | 6,816 | 4,290 |
| Solomon Islands | 4,420 | 660 | 867 | 576 | 667 |
| Tonga | 27,266 | 19,407 | 12,948 | 19,104 | 27,215 |
| Western Samoa | 49,438 | 51,348 | 34,652 | 44,567 | 52,549 |
| Other | 748 | 975 | 532 | 838 | 1,066 |
| Foreign Countries and Possessions. | 1,641,442 | 1,566,340 | 2,042,119 | 1,961,629 | 2,061,743 |
| Europe— | |||||
| Belgium | 167,629 | 330,284 | 612,646 | 647,212 | 618,356 |
| Bulgaria | 7 | 3,547 | 17,810 | ||
| Czechoslovakia | 29 | 23 | 1,986 | 12,969 | 20,064 |
| Denmark | 8,989 | 9,404 | 22,092 | 12,098 | 11,219 |
| Finland | 164 | 515 | 5,278 | 9,977 | 1,212 |
| France | 508,960 | 738,176 | 1,228,699 | 484,610 | 1,646,168 |
| Germany | 289,917 | 376,886 | 944,310 | 165,304 | 272,481 |
| Greece | 1,968 | 1,327 | 1,768 | 9,649 | 45,909 |
| Italy | 85,353 | 97,330 | 205,673 | 21,092 | 1,767 |
| Netherlands | 64,484 | 64,827 | 165,074 | 79,615 | 112,539 |
| Poland | 24 | 28,463 | 133,234 | 103,321 | 173,159 |
| Spain | 7,230 | 5,858 | 20,696 | 24,283 | 15,158 |
| Sweden | 20,925 | 33,984 | 117,529 | 47,142 | 64,936 |
| Switzerland | 1,865 | 1,219 | 699 | 2,892 | 1,360 |
| Yugoslavia | 25 | 34 | 217 | 14 | 6,697 |
| Other | 12,145 | 6,052 | 4,845 | 1,109 | 3,580 |
| 1,169,707 | 1,694,382 | 3,464,753 | 1,624,834 | 3,012,415 | |
| Asia— | £ | £ | £ | £ | £ |
| China | 15,413 | 54,564 | 19,099 | 7,718 | 32,854 |
| Dutch East Indies | 5,255 | 5,496 | 2,548 | 2,235 | 1,894 |
| Japan | 236,799 | 354,462 | 856,014 | 432,495 | 1,554,837 |
| Philippine Islands | 1,081 | 413 | 2,493 | 3,945 | 5,983 |
| Other | 51 | 843 | 3,597 | 24 | 757 |
| 258,599 | 415,778 | 883,751 | 446,417 | 1,596,325 | |
| Africa— | |||||
| Egypt | 840 | 5,567 | 15 | 7,687 | 18,906 |
| Other | 32 | 83 | 316 | 175 | 34 |
| 872 | 5,650 | 331 | 7,862 | 18,940 | |
| America— | |||||
| Argentina | 2,979 | 1,638 | 4,079 | 3,401 | 11,797 |
| Brazil | 15,904 | 13,080 | 11,517 | 5,937 | |
| Chile | 8,597 | 25 | 11,500 | 76 | 2,520 |
| Ecuador | 281 | 1,161 | |||
| Panama Canal Zone | 47,025 | 61,346 | 57,140 | 78,179 | 98,047 |
| United States of America | 690,015 | 1,188,972 | 1,250,364 | 2,468,066 | 2,877,752 |
| Uruguay | 14,784 | 41,084 | 10,722 | 14,268 | 36,080 |
| Other | 34 | 20 | 1,695 | 709 | 113 |
| 763,434 | 1,308,989 | 1,348,580 | 2,576,497 | 3,033,407 | |
| Pacific Islands— | |||||
| Hawaii | 33,903 | 19,720 | 14,927 | 41,520 | 67,332 |
| New Caledonia | 27 | 256 | 147 | 3,906 | 1,481 |
| Society Islands | 26,167 | 33,110 | 35,309 | 41,917 | 41,740 |
| Tuamotu Archipelago | 1,674 | 1,005 | 1,894 | 1,182 | 1,299 |
| Tutuila | 4,693 | 4,215 | 11,487 | 14,524 | 15,241 |
| Other | 2,379 | 665, | 1,267 | 1,176 | 394 |
| 68,843 | 58,971 | 65,031 | 104,225 | 127,487 |
Eighty-six per cent. of the total exports from New Zealand went to British countries in 1936. The United States, Belgium, France, and Japan took the bulk of the remainder.
Full details of quantities and values of commodities exported to various countries are given in Part I of the Annual Statistical Report on Trade and Shipping, while in Part II of the same report values of exports of principal commodities to various countries are summarized. The table which follows shows quantities of principal export commodities sent to various destinations during the last five years. Both New Zealand produce and re-exports are covered.
DESTINATION OF MAIN EXPORTS.
| Country to which exported. | 1932. | 1933. | 1934. | 1935. | 1936. |
|---|---|---|---|---|---|
| Wool. | |||||
| lb. | lb. | lb. | lb. | lb. | |
| United Kingdom | 184,587,304 | 213,545,236 | 171,190,802 | 149,895,217 | 183,666,855 |
| India | 215,204 | 52,622 | 2,017 | 57,068 | 159,888 |
| South African Union | 179,331 | 98,012 | 258,106 | 237,162 | 99,914 |
| Canada | 2,867,567 | 5,105,835 | 6,728,879 | 6,140,992 | 13,696,525 |
| Australia | 3,002,534 | 6,087,740 | 8,098,596 | 8,213,554 | 9,232,465 |
| Belgium | 6,632,109 | 13,661,751 | 11,979,015 | 18,545,082 | 12,798,023 |
| Bulgaria | 104,028 | 431,736 | |||
| Czechoslovakia | 31,001 | 311,611 | 390,351 | ||
| Denmark | 323,373 | 225,842 | 292,041 | 141,045 | 58,012 |
| France | 18,256,811 | 19,773,423 | 18,431,509 | 11,815,415 | 37,360,077 |
| Germany | 8,217,872 | 10,070,755 | 14,322,208 | 2,741,283 | 3,519,958 |
| Greece | 20,291 | 257,361 | 1,255,119 | ||
| Italy | 2,823,923 | 2,738,645 | 2,973,237 | 311,051 | 37,367 |
| Netherlands | 1,569,876 | 664,540 | 1,321,168 | 447,757 | 950,041 |
| Poland | 1,443,499 | 2,897,573 | 3,567,049 | 4,578,577 | |
| Spain | 247,361 | 103,941 | 85,962 | 136,840 | 284,444 |
| Sweden | 575,611 | 1,042,998 | 2,408,457 | 1,164,575 | 1,162,817 |
| Yugoslavia | 193,962 | ||||
| China | 22,400 | 27,388 | 71,590 | 324,705 | |
| Japan | 7,534,348 | 9,436,178 | 12,405,766 | 8,519,283 | 26,995,798 |
| Egypt | 205,076 | 591,859 | |||
| United States of America | 1,017,775 | 2,209,992 | 2,267,696 | 9,816,046 | 16,516,754 |
| Other countries | 105,663 | 19,044 | 10,869 | 33,908 | 104,155 |
| Totals | 238,179,062 | 286,307,441 | 255,796,783 | 222,661,403 | 314,409,402 |
| Frozen Meat. | |||||
| Cwt. | Cwt. | Cwt. | Cwt. | Cwt. | |
| United Kingdom | 4,637,711 | 5,189,834 | 4,961,610 | 5,154,757 | 5,105,449 |
| Canada | 3,525 | 2,764 | 2,345 | 1,488 | 366 |
| Australia | 329 | 61 | 2,141 | 573 | 152 |
| Japan | 601 | 608 | 8,705 | ||
| Egypt | 6,230 | ||||
| United States of America | 226 | 996 | 107 | 43,905 | 129 |
| Hawaii | 1,884 | 961 | 278 | 2,659 | 2,193 |
| Pacific inlands (other than Hawaii) | 1,317 | 1,507 | 1,454 | 1,880 | 1,831 |
| Other countries | 488 | 760 | 911 | 644 | 979 |
| Totals | 4,645,480 | 5,203,113 | 4,969,447 | 5,206,514 | 5,119,804 |
| Butter. | |||||
| Cwt. | Cwt. | Cwt. | Cwt. | Cwt. | |
| United Kingdom | 2,156,127 | 2,597,008 | 2,568,056 | 2,696,832 | 2,721,342 |
| Hong Kong | 1,079 | 1,032 | 2,423 | 817 | 2,479 |
| India | 968 | 1,120 | 1,674 | 2,050 | 2,666 |
| Malaya | 363 | 931 | 2,654 | 3,474 | 5,239 |
| British West Indies | 4,556 | 10,043 | 10,200 | 8,410 | |
| Canada | 6,039 | 6,998 | 6,250 | 1,918 | 2,413 |
| Australia | 1,880 | 1,481 | 112 | 151 | 5 |
| China | 1,449 | 1,732 | 1,510 | 1,074 | 1,405 |
| Japan | 603 | 375 | 585 | 85 | 81 |
| Philippine Islands | 188 | 50 | 460 | 774 | 960 |
| Panama Canal Zone | 8,980 | 13,400 | 14,345 | 15,226 | 17,418 |
| United States of America | 3 | 656 | 1,159 | 46,419 | 20,281 |
| Hawaii | 5,234 | 3,493 | 2,754 | 7,510 | 10,659 |
| Society Islands | 938 | 1,361 | 1,361 | 1,458 | 1,493 |
| Other countries | 1,694 | 1,054 | 1,133 | 1,310 | 1,294 |
| Totals | 2,185,545 | 2,635,247 | 2,614,519 | 2,789,298 | 2,796,145 |
| Cheese. | |||||
| Cwt. | Cwt. | Cwt. | Cwt. | Cwt. | |
| United Kingdom | 1,788,989 | 1,980,872 | 1,983,058 | 1,723,197 | 1,654,827 |
| Hong Kong | 83 | 303 | 281 | 265 | 226 |
| British West Indies | 316 | 142 | 68 | ||
| Canada | 3 | 811 | 72 | 1,811 | 1,010 |
| Australia | 129 | 61 | 136 | 177 | 283 |
| Fiji | 251 | 231 | 230 | 205 | 301 |
| China | 745 | 524 | 297 | 219 | 355 |
| Panama Canal Zone | 84 | 33 | 1,057 | 915 | |
| Other countries | 147 | 107 | 106 | 479 | 221 |
| Totals | 1,790,431 | 1,982,942 | 1,984,496 | 1,727,552 | 1,658,206 |
| Dried and Preserved Milk. | |||||
| lb. | lb. | lb. | lb. | lb. | |
| United Kingdom | 13,455,954 | 15,678,296 | 18,477,601 | 17,146,427 | 20,059,782 |
| Ceylon | 16,800 | 11,200 | 3,360 | 20,670 | 8,848 |
| India | 8,220 | 78,509 | 194,800 | 299,748 | 266,630 |
| Malaya | 1,362,574 | 882,206 | 2,181,416 | 2,702,984 | 2,537,934 |
| British West Indies | 303 | 33,439 | 55,557 | 30,556 | |
| Canada | 46,360 | 14,632 | |||
| Australia | 513,319 | 158,204 | 151,919 | 432 | 39,253 |
| Fiji | 28,423 | 38,996 | 22,103 | 25,882 | 24,560 |
| Western Samoa | 21,065 | 25,248 | 13,530 | 13,508 | 15,582 |
| China | 197,728 | 276,683 | 83,023 | 84,374 | 77,633 |
| Dutch East Indies | 16,570 | 26,812 | 31,076 | 18,346 | 5,480 |
| Japan | 48,060 | 24,400 | 15,680 | 29,140 | 83,405 |
| Panama Canal Zone | 168,431 | 134,601 | 39,302 | 33,600 | 80,640 |
| Society Islands | 161,537 | 246,268 | 261,442 | 221,363 | 242,653 |
| Hawaii | 193,902 | ||||
| Other countries | 34,636 | 58,346 | 55,859 | 48,689 | 60,864 |
| Totals | 16,033,317 | 17,640,072 | 21,564,550 | 20,783,080 | 23,742,354 |
| Tallow. | |||||
| Ton. | Ton. | Ton. | Ton. | Ton. | |
| United Kingdom | 20,636 | 23,548 | 20,300 | 9,701 | 15,642 |
| India | 1,626 | 918 | 1,906 | 1,093 | 3,001 |
| Australia | 893 | 1,116 | 678 | 149 | 479 |
| Fiji | 511 | 141 | 72 | 73 | 137 |
| Germany | 377 | 526 | 483 | 395 | |
| Netherlands | 356 | 222 | 70 | 36 | 249 |
| Japan | 473 | 1,088 | 1,470 | 356 | 2,203 |
| United States of America | 131 | 70 | 2,344 | 13,480 | 3,640 |
| Other countries | 374 | 391 | 339 | 389 | 349 |
| Totals | 25,377 | 28,020 | 27,662 | 25,277 | 26,095 |
| Hides (Cattle and Horse). | |||||
| Number. | Number. | Number. | Number. | Number. | |
| United Kingdom | 84,036 | 79,066 | 101,528 1 | 145,613 | 126,834 |
| Canada | 2,852 | 105,744 | 63,573 | 59,823 | 36,867 |
| Australia | 117,874 | 88,585 | 140,170 | 118,122 | 87,680 |
| Belgium | 5,123 | 6,623 | 11,809 | 19,835 | 20,448 |
| Denmark | 650 | 5,250 | 5,781 | 8,163 | |
| Finland | 250 | 600 | 7,498 | 13,993 | 1,300 |
| France | 9,236 | 6,655 | 8,768 | 10,897 | 19,969 |
| Germany | 51,930 | 41,158 | 65,066 | 70,951 | 59,390 |
| Greece | 4,500 | 745 | |||
| Italy | 13,968 | 22,371 | 31,772 | 12,091 | |
| Netherlands | 504 | 6,484 | 5,405 | 6,445 | 11,436 |
| Japan | 318 | 304 | 3,173 | 10,168 | 15,974 |
| Norway | 4,117 | 2,896 | 3,683 | 175 | 472 |
| Turkey | 1,480 | 4,964 | |||
| United States of America | 6,056 | 37,352 | 21,694 | 43,931 | 36,984 |
| Other countries | 3,113 | 1,861 | 2,902 | 6,226 | 7,094 |
| Totals | 304,527 | 401,924 | 477,255 | 524,051 | 432,611 |
| Calf-skins. | |||||
| Number. | Number. | Number. | Number. | Number. | |
| United Kingdom | 2,094 | 17,971 | 16,020 | 33,399 | 27,437 |
| Canada | 277,935 | 315,466 | 259,719 | 373,262 | 575,989 |
| Australia | 316,206 | 101,028 | 337,964 | 178,806 | 66,387 |
| Belgium | 6,251 | 42,520 | 87,757 | 101,158 | 1,000 |
| France | 250 | 5,094 | 9,887 | ||
| Germany | 5,486 | 10,485 | 24,002 | 30,858 | 38,222 |
| Greece | 5,455 | 3,000 | |||
| Netherlands | 18,024 | 97,860 | 205,442 | 139,332 | |
| United States of America | 234,151 | 379,368 | 274,754 | 330,999 | 327,455 |
| Other countries | 3,584 | 120 | 3,829 | 2,447 | 2,025 |
| Totals | 845,707 | 890,687 | 1,109,999 | 1,266,258 | 1,177,847 |
| Opossum-skins. | |||||
| Number. | Number. | Number. | Number. | Number. | |
| United Kingdom | 2,323 | 121,287 | 232,825 | 145,557 | 199,977 |
| Australia | 2,201 | 2,480 | 821 | ||
| Austria | 2,000 | 1,707 | |||
| Germany | 600 | 2,000 | |||
| United States of America | 742 | 30,484 | 500 | 4,808 | |
| Other countries | 1,746 | 55 | |||
| Totals | 3,065 | 156,572 | 240,758 | 146,878 | 204,840 |
| Rabbit-skins. | |||||
| Number. | Number. | Number. | Number. | Number. | |
| United Kingdom | 2,915,008 | 3,578,909 | 3,798,710 | 2,003,541 | 3,533,984 |
| Canada | 237,738 | 29,460 | 9,570 | ||
| Australia | 41,815 | 30,178 | 3,662 | 14,937 | 29,190 |
| Belgium | 158,840 | 177,372 | 20,520 | ||
| France | 357,674 | 375,453 | 340,641 | 124,302 | 213,322 |
| Germany | 16,214 | ||||
| Japan | 13,720 | 20,916 | 3,000 | 9,130 | 2,640 |
| United States of America | 3,331,923 | 6,197,878 | 8,473,592 | 11,332,429 | 13,140,225 |
| Other countries | 300 | 2,420 | |||
| Totals | 6,660,140 | 10,378,388 | 13,035,015 | 13,536,745 | 16,928,931 |
| Sheep-skins (with Wool). | |||||
| Number. | Number. | Number. | Number. | Number. | |
| United Kingdom | 773,734, | 1,216 | 1,300,993 | 1,107,690 | 743,678 |
| India | 10 | 4 | 11,324 | 6,916 | 12 |
| Canada | 60,933 | 155 | 209,258 | 179,587 | 186,769 |
| Australia | 12,966 | 16 | 578 | 2,196 | 6,518 |
| Belgium | 6,490 | 70 | 161,687 | 34,310 | 50,493 |
| France | 628,467 | 1,505,326 | 987,970 | 747,128 | 320,851 |
| Germany | 20,556 | 64,228 | 62,484 | 21,432 | 38,085 |
| Netherlands | 35,423 | 57,838 | 5,663 | 112 | 18,188 |
| Italy | 256 | 1,700 | 1,033 | 17,359 | 532 |
| Spain | 11,955 | 55,343 | 96,858 | 14,783 | |
| Japan | 19,509 | 36,074 | 22,184 | 11,375 | 19,590 |
| United States of America | 82,852 | 239,161 | 131,454 | 176,232 | 380,506 |
| Other countries | 4,056 | 327 | |||
| Totals | 1,641,202 | 3,380,114 | 2,949,971 | 2,405,251 | 1,780,332 |
| Sheep-skins (without Wool). | |||||
| Number. | Number. | Number. | Number. | Number. | |
| United Kingdom | 6,366,383 | 4,044,682 | 3,747,788 | 3,745,669 | 2,715,438 |
| Canada | 75,834 | 44,178 | 69,069 | 163,225 | 62,766 |
| Australia | 365,915 | 257,493 | 217,533 | 293,745 | 143,054 |
| Belgium | 54,384 | 156,400 | 68,019 | 101,832 | 358,160 |
| France | 256,651 | 152,559 | 34,337 | 125,911 | 42,893 |
| Germany | 2,770 | 2,205 | 7,200 | 25,618 | 10,044 |
| Italy | 15,312 | 1,258 | |||
| Netherlands | 1,470 | 5,622 | 30,012 | 3,600 | |
| Sweden | 15,624 | 7,200 | |||
| Japan | 55,739 | 123,578 | 134,670 | 210,546 | 270,172 |
| United States of America | 4,818,510 | 7,032,278 | 4,944,176 | 7,050,353 | 7,232,890 |
| Other countries | 1,554 | 312 | 1,500 | 1,032 | |
| Totals | 11,999,210 | 11,813,685 | 9,243,726 | 11,765,293 | 10,847,240 |
| Sausage-casings. | |||||
| lb. | lb. | lb. | lb. | lb. | |
| United Kingdom | 1,674,248 | 1,023,109 | 936,101, | 1,140,687 | 1,694,071 |
| Canada | 635,627 | 1,276,517 | 974,155 | 1,143,620 | 1,089,739 |
| Australia | 270,302 | 281,721 | 248,245 | 301,380 | 292,221 |
| France | 29,397 | ||||
| Germany | 86,096 | 441,207 | 396,764 | 32,010 | 122 |
| United States of America | 1,105,235 | 1,513,610 | 1,974,103 | 1,563,335 | 1,335,007 |
| Other countries | 560 | 7,126 | 1,175 | 958 | 4,910 |
| Totals | 3,772,068 | 4,543,290 | 4,530,543 | 4,211,387 | 4,416,070 |
| Peas. | |||||
| Cental. | Cental. | Cental. | Cental. | Cental. | |
| United Kingdom | 71,904 | 157,683 | 181,040 | 100,669 | 114,153 |
| Canada | 360 | 617 | 484 | 3,370 | 8,513 |
| Australia | 25,774 | 17,482 | 19,883 | 26,017 | 33,778 |
| South African Union | 1,853 | 5,425 | 6,622 | 5,493 | 5,529 |
| Germany | 182 | 781 | 7,281 | ||
| Netherlands | 10,632 | 39,363 | 462 | ||
| United States of America | 4,742 | 5,698 | 3,601 | 10,148 | 5,421 |
| Other countries | 999 | 1,498 | 286 | 973 | 13 |
| Totals | 105,814 | 199,816 | 258,560 | 147,132 | 167,407 |
| Apples (Fresh). | |||||
| lb. | lb. | lb. | lb. | lb. | |
| United Kingdom | 55,667,270 | 44,668,440 | 44,877,843 | 31,129,773 | 39,494,757 |
| Hong Kong | 4,000 | 91,680 | |||
| India | 12,080 | 68,330 | |||
| Malaya | 240 | 4,000 | 26,000 | ||
| British West Indies | 240 | 20,000 | |||
| Canada | 606,680 | 1,068,680 | 2,052,280 | 1,895,080 | 1,005,400 |
| Australia | 684 | 1,589 | 960 | 23,520 | 6,440 |
| Fiji | 131,656 | 78,018 | 85,584 | 88,257 | 116,600 |
| Western Samoa | 8,890 | 15,810 | 14,843 | 13,489 | 9,175 |
| Belgium | 1,053,000 | ||||
| France | 1,129,960 | 864,480 | |||
| Germany | 1,572,640 | 1,434,400 | 5,076,160 | 1,367,640 | |
| Netherlands | 23,040 | 1,282,600 | 4,088,040 | 882,360 | 1,220,000 |
| Sweden | 25,040 | 133,920 | 37,160 | ||
| China | 4,000 | 6,200 | 58,000 | ||
| Philippine Islands | 38,000 | ||||
| Argentina | 180,800 | 715,360 | |||
| Brazil | 1,222,680 | 1,121,600 | 921,320 | 485,360 | |
| United States of America | 492 | 814,800 | |||
| Uruguay | 1,103,280 | 1,744,720 | 434,280 | 783,240 | |
| Other countries | 18,336 | 11,763 | 8,606 | 28,156 | 49,549 |
| Totals | 60,443,236 | 52,418,952 | 57,764,436 | 37,793,195 | 44,809,451 |
| Seeds (Grass and Clover). | |||||
| Cwt. | Cwt. | Cwt. | Cwt. | Cwt. | |
| United Kingdom | 8,017 | 45,047 | 18,792 | 41,637 | 25,754 |
| Canada | 1,381 | 1,603 | 1,814 | 1,399 | 2,988 |
| Australia | 15,944 | 19,475 | 18,292 | 20,725 | 32,409 |
| Denmark | 148 | 201 | 572 | 64 | 465 |
| Germany | 108 | 467 | 259 | ||
| Netherlands | 322 | 445 | 999 | 1,177 | 1,548 |
| United States of America | 8,691 | 12,824 | 7,975 | 6,286 | 15,865 |
| Other countries | 99 | 385 | 428 | 457 | 1,148 |
| Totals | 34,710 | 80,447 | 49,131 | 71,745 | 80,177 |
| Gold. | |||||
| Oz. | Oz. | Oz. | Oz. | Oz. | |
| United Kingdom | 118,770 | 136,895 | 137,133 | 135,369 | 135,711 |
| Australia | 73,548 | 41,529 | 30,024 | 32,894 | 33,107 |
| United States of America | 25,027 | 8,445 | 4,516 | 96 | |
| Other countries | 205 | 108 | 3 | ||
| Totals | 217,550 | 186,977 | 167,160 | 172,779 | 168,914 |
| Silver. | |||||
| Oz. | Oz. | Oz. | Oz. | Oz. | |
| United Kingdom | 503,298 | 388,604 | 328,336 | 362,611 | 453,610 |
| Australia | 17,929 | 22,658 | 33,612 | 26,652 | 24,979 |
| Totals | 521,227 | 411,262 | 361,948 | 389,263 | 478,589 |
| Kauri-gum. | |||||
| Ton. | Ton. | Ton. | Ton. | Ton. | |
| United Kingdom | 1,252 | 1,537 | 1,979 | 1,827 | 2,002 |
| Canada | 166 | 71 | 136 | 62 | 174 |
| Australia | 91 | 123 | 149 | 145 | 246 |
| Belgium | 54 | 11 | 1 | 57 | |
| France | 68 | 146 | 151 | 114 | 96 |
| Germany | 36 | 248 | 343 | 69 | 95 |
| Italy | 10 | 49 | 55 | 24 | |
| Japan | 26 | 28 | 54 | 20 | 42 |
| United States of America | 344 | 866 | 332 | 568 | 438 |
| Other countries | 21 | 10 | 10 | 42 | 87 |
| Totals | 2,068 | 3,089 | 3,209 | 2,872 | 3,237 |
| Phormium-fibre. | |||||
| Ton. | Ton. | Ton. | Ton. | Ton. | |
| United Kingdom | 915 | 1,840 | 914 | 1,163 | 2,363 |
| Canada | 201 | 45 | 50 | 67 | 45 |
| Australia | 2,085 | 1,857 | 2,607 | 2,419 | 2,965 |
| Germany | 10 | 20 | 5 | 10 | 227 |
| United States of America | 149 | 56 | 50 | ||
| Other countries | 15 | 10 | 15 | 2 | 57 |
| Totals | 3,375 | 3,828 | 3,591 | 3,661 | 5,707 |
| Timber (Sawn and Hewn). | |||||
| Sup. ft. | Sup. ft. | Sup. ft. | Sup. ft. | Sup. ft. | |
| United Kingdom | 288,814 | 104,887 | 572,434 | 475,834 | 379,173 |
| Australia | 26,264,905 | 24,967,356 | 33,207,534 | 37,608,967 | 25,709,215 |
| Fiji | 28,397 | 32,857 | 21,864 | 44,937 | 50,638 |
| Tonga | 315,616 | 50,936 | 66,395 | 82,441 | 126,487 |
| Western Samoa | 347,941 | 656,238 | 650,326 | 1,407,288 | 758,800 |
| Other countries | 46,032 | 28,379 | 51,883 | 22,553 | 19,169 |
| Totals | 27,291,705 | 25,840,653 | 34,570,436 | 39,642,020 | 27,043,482 |
As indicated elsewhere in this section (page 226), farm products account for an extremely high proportion of exports from New Zealand (95–6 per cent. in the calendar year 1936). The farm-production export season fits much more closely to a June year than to a calendar year. The flush of the dairy-production season, the whole harvest season, and most of the wool-selling season occur in the early months of the calendar year. By 30th June the great bulk of the season's farm-produce destined for export is shipped, excepting held-over wool and a certain amount of dairy-produce kept in cool store to equalize shipments. It is desirable, therefore, for some purposes to tabulate New Zealand exports for years ending in June instead of December, a desideratum which, may it be observed, applies to most countries in the Southern Hemisphere.
EXPORTS OF NEW ZEALAND PRODUCE (VALUES) FOR YEARS ENDED 30TH JUNE.
| Commodity. | 1932–33. | 1933–34 | 1934–35. | 1935–36. | 1936–37. |
|---|---|---|---|---|---|
* Not available. † Includes a proportion of chilled beef. | |||||
| £ | £ | £ | £ | £ | |
| Butter | 10,897,894 | 11,830,070 | 10,625,121 | 14,789,649 | 16,434,270 |
| Casein | 67,158 | 141,408 | 146,419 | 179,189 | 233,635 |
| Cheese | 4,808,148 | 4,732,089 | 4,524,024 | 4,509,174 | 5,282,259 |
| Fish | 56,272 | 113,357 | 133,125 | 163,181 | 173,869 |
| Honey | 13,079 | 21,666 | 23,641 | 30,225 | 14,763 |
| Beef, chilled | * | * | * | 335,186 | 426,839 |
| Beef, frozen | †630,781 | †962,145 | †848,159 | 643,546 | 540,413 |
| Lamb, frozen | 6,222,561 | 7,358,435 | 8,832,289 | 7,642,813 | 8,956,063 |
| Mutton, frozen | 1,266,378 | 1,398,709 | 1,905,414 | 1,634,457 | 1,500,376 |
| Pork, frozen | 393,726 | 950,183 | 1,313,502 | 1,507,553 | 1,630,617 |
| Veal, frozen | 113,383 | 184,880 | 62,207 | 154,401 | 192,140 |
| Meats, tinned | 86,518 | 109,646 | 154,984 | 281,610 | 281,450 |
| Sausage-casings | 304,418 | 544,620 | 791,615 | 695,811 | 750,001 |
| Milk, preserved | 39,772 | 52,795 | 96,284 | 117,005 | 120,169 |
| Milk, dried | 316,703 | 282,857 | 271,985 | 332,217 | 193,993 |
| Apples, fresh | 649,553 | 723,264 | 462,401 | 551,305 | 457,619 |
| Pears, fresh | * | * | * | 55,569 | 20,423 |
| Peas | 117,359 | 108,513 | 113,575 | 119,313 | 121,668 |
| Oats | 2,065 | 739 | 17,793 | 948 | 1,336 |
| Wheat | 88,714 | 50,145 | 56 | 88 | 55 |
| Hops | 27,983 | 17,066 | 32,048 | 19,997 | 16,754 |
| Potatoes | 9,887 | 18,112 | 8,221 | 7,539 | 88,975 |
| Calf-skins | 96,178 | 235,259 | 175,655 | 273,440 | 349,378 |
| Hides, horse and cattle | 241,105 | 464,299 | 375,142 | 488, 630 | 512,947 |
| Rabbit-skins | 68,887 | 254,745 | 232,963 | 562,710 | 683,034 |
| Opossum-skins | 309 | 66,457 | 57,889 | 52,281 | 77,004 |
| Sheep-skins, with wool | 268,481 | 652,895 | 306,671 | 452,716 | 585,452 |
| Sheep-skins, without wool | 515,133 | 760,310 | 833,711 | 1,098,315 | 1,638,369 |
| Wool | 6,703,359 | 13,287,458 | 6,327,793 | 12,762,498 | 18,770,643 |
| Phormium-fibre | 47,714 | 45,448 | 47,849 | 85,244 | 128,031 |
| Seeds, grass and clover | 87,332 | 151,045 | 248,323 | 192,941 | 249,297 |
| Tallow | 466,474 | 487,819 | 614,991 | 539,210 | 709,888 |
| Coal | 53,495 | 50,661 | 59,035 | 62,450 | 51,621 |
| Kauri-gum | 59,422 | 86,811 | 89,404 | 78,657 | 145,321 |
| Gold | 1,199,002 | 1,332,049 | 1,385,119 | 1,485,077 | 1,378,684 |
| Silver | 35,119 | 39,763 | 54,292 | 59,159 | 51,093 |
| Leather | 8,309 | 8,095 | 2,678 | 7,024 | 5,978 |
| Timber, sawn | 252,721 | 239,547 | 370,178 | 350,031 | 203,346 |
| Other New Zealand produce | 653,118 | 752,819 | 873,795 | 867,375 | 1,160,963 |
| Totals | 36,868,510 | 48,516,179 | 42,418,351 | 53,188,515 | 64,138,736 |
EXPORTS OF NEW ZEALAND PRODUCE (QUANTITIES) FOR YEARS ENDED 30TH JUNE.
| Commodity. | 1932–33. | 1933–34. | 1934–35. | 1935–36. | 1936–37. |
|---|---|---|---|---|---|
* Not available. † Includes a proportion of chilled beef. | |||||
| Butter cwt. | 2,430,234 | 2,825,889 | 2,575,595 | 2,786,641 | 2,991,357 |
| Casein cwt. | 45,332 | 54,739 | 58,570 | 77,095 | 80,992 |
| Cheese cwt. | 1,919,155 | 1,992,244 | 1,858,733 | 1,620,394 | 1,662,218 |
| Fish cwt. | 23,285 | 46,915 | 54,931 | 61,888 | 53,216 |
| Honey lb. | 469,336 | 742,543 | 806,267 | 1,031,287 | 536,837 |
| Beef, chilled cwt. | * | * | * | 202,235 | 262,076 |
| Beef, frozen cwt. | †674,386 | †933,835 | †754,797 | 550,734 | 432,020 |
| Lamb, frozen cwt. | 2,733,614 | 2,548,898 | 2,796,037 | 2,395,824 | 2,692,071 |
| Mutton, frozen cwt. | 1,081,611 | 906,623 | 1,043,925 | 888,266 | 798,907 |
| Pork, frozen cwt. | 200,288 | 397,031 | 485,677 | 578,166 | 591,299 |
| Veal, frozen cwt. | 102,047 | 142,863 | 54,073 | 115,008 | 127,267 |
| Meats, tinned cwt. | 32,948 | 38,912 | 53,797 | 96,343 | 77,838 |
| Sausage-casings lb. | 4,289,793 | 4,069,635 | 4,444,016 | 4,514,730 | 4,399,395 |
| Milk, preserved lb. | 2,221,529 | 3,073,508 | 6,044,432 | 7,211,609 | 7,106,267 |
| Milk, dried lb. | 19,906,575 | 14,115,564 | 13,432,429 | 17,728,558 | 14,474,881 |
| Apples, fresh lb. | 51,925,100 | 58,270,834 | 37,291,154 | 44,737,425 | 36,555,644 |
| Pears, fresh lb. | * | * | * | 4,532,654 | 1,640,296 |
| Peas cental | 170,282 | 182,680 | 208,516 | 167,421 | 162,109 |
| Oats cental | 6,531 | 1,900 | 58,599 | 1,062 | 2,459 |
| Wheat bushel | 705,580 | 300,240 | 178 | 287 | 182 |
| Hops lb. | 697,349 | 306,073 | 516,002 | 323,514 | 290,810 |
| Potatoes ton | 2,034 | 3,256 | 1,250 | 1,026 | 13,153 |
| Calf-skins No. | 735,068 | 1,059,450 | 1,126,938 | 1,264,992 | 1,190,734 |
| Hides, cattle and horse No. | 328,011 | 470,331 | 452,469 | 529,982 | 438,030 |
| Rabbit-skins No. | 6,599,247 | 12,237,720 | 11,285,835 | 17,866,001 | 14,450,997 |
| Opossum-skins No. | 1,747 | 189,943 | 209,031 | 156,147 | 201,043 |
| Sheep-skins, with wool No. | 2,783,117 | 3,608,152 | 2,239,801 | 2,045,373 | 1,755,276 |
| Sheep-skins, without wool No. | 12,769,429 | 9,352,344 | 11,808,250 | 10,531,862 | 11,813,430 |
| Wool bale | 801,633 | 822,396 | 582,763 | 918,471 | 846,374 |
| Phormium fibre ton | 4,300 | 3,560 | 3,598 | 4,771 | 5,805 |
| Seeds, grass and clover cwt. | 34,910 | 77,535 | 80,936 | 53,847 | 80,812 |
| Tallow ton | 26,510 | 26,507 | 29,434 | 19,941 | 29,567 |
| Coal ton | 33,250 | 38,773 | 43,347 | 47,433 | 39,423 |
| Kauri-gum ton | 1,157 | 3,416 | 3,354 | 2,710 | 3,859 |
| Gold oz. | 193,977 | 172,197 | 165,518 | 177,167 | 165,825 |
| Silver oz. | 436,436 | 406,655 | 393,916 | 428,075 | 465,271 |
| Timber, sawn sup. ft. | 27,499,946 | 26,173,261 | 39,794,879 | 38,059,908 | 18,424,232 |
The forwarding trade of New Zealand has never at any time been of great significance. The bulk of the total amount is made up by various classes of machinery, hardware, metal manufactures, motor-vehicles, and also items such as apparel, books, tobacco, and spirits.
There is, however, a genuine entrepôt trade with the islands of the Pacific, the amount of which is still comparatively small. Exports to Cook Islands, which are treated as part of the Dominion, are not included in the figures of either exports or re-exports.
RE-EXPORTS (EXCLUDING SPECIE) FROM NEW ZEALAND.
| £ | |
|---|---|
| 1916 | 305,150 |
| 1917 | 429,115 |
| 1918 | 543,568 |
| 1919 | 603,541 |
| 1920 | 813,072 |
| 1921 | 1,213,002 |
| 1922 | 1,026,801 |
| 1923 | 567,885 |
| 1924 | 588,395 |
| 1925 | 722,016 |
| 1926 | 929,741 |
| 1927 | 925,121 |
| 1928 | 910,016 |
| 1929 | 754,050 |
| 1930 | 731,111 |
| 1931 | 631,554 |
| 1932 | 633,532 |
| 1933 | 597,168 |
| 1934 | 571,554 |
| 1935 | 486,648 |
| 1936 | 488,135 |
Re-exports of merchandise in 1936 were equal to 0.86 per cent. of total exports of merchandise for the year and to 1.11 per cent. of imports.
The destination of this re-export trade is shown in the following table:—
| Country. | 1932. | 1933. | 1934. | 1935. | 1936. |
|---|---|---|---|---|---|
| £ | £ | £ | £ | £ | |
| United Kingdom | 172,217 | 157,610 | 146,572 | 110,192 | 127,150 |
| Canada | 15,014 | 18,549 | 4,201 | 3,933 | 4,971 |
| Australia | 298,446 | 278,684 | 287,469 | 244,996 | 223,061 |
| Fiji | 37,018 | 39,061 | 37,864 | 34,430 | 28,117 |
| Tonga | 6,737 | 4,725 | 2,638 | 2,877 | 5,333 |
| Western Samoa | 15,743 | 13,652 | 10,199 | 11,820 | 12,137 |
| United States of America | 55,031 | 54,688 | 53,913 | 47,579 | 46,464 |
| Society Islands | 3,009 | 4,321 | 3,931 | 3,840 | 2,973 |
| Other countries | 30,317 | 25,878 | 24,767 | 26,981 | 37,929 |
| Totals (excluding specie) | 633,532 | 597,168 | 571,554 | 486,648 | 488,135 |
The incidence of fluctuating prices over a number of years operates to render the currency aggregate of a country's trade of little value as an indicator of movement in the volume of trade—i.e., from a quantity point of view. Owing to the homogeneous nature of the bulk of the Dominion's exports it is possible, fortunately, in nearly every case to obtain the quantity exported as well as the value. By taking the prices of a selected base year or other period it is then possible to find what the value of the exports of each subsequent year would have been on the basis of prices ruling in the base period. This method is especially suitable for application to New Zealand, and, in point of fact, 98 per cent. of the Dominion's exports can be treated quantitatively, leaving only 2 per cent. to be calculated pro rata.
In the following table the actually recorded exports (exclusive of specie and other re-exports) are shown for 1900 and for each of the last ten years. Values are also shown on the basis of prices ruling in 1900, and index numbers have been computed to show movement in the physical volume of exports of New Zealand produce, both for the total and on a per caput basis.
| Year. | Recorded Value of Exports of New Zealand Produce. | Value at Rates ruling in 1900. | Index Numbers of Volume of Exports. | |||
|---|---|---|---|---|---|---|
| Total. | Per Head. | Total. | Per Head. | Total. | Per Head. | |
| £ | £ | £ | £ | |||
| 1900 | 13,055,249 | 16.27 | 13,055,249 | 16.27 | 1,000 | 1,000 |
| 1927 | 47,571,233 | 33.06 | 25,695,955 | 17.86 | 1968 | 1098 |
| 1928 | 54,660,365 | 37.54 | 26,689,746 | 18.33 | 2,044 | 1,127 |
| 1929 | 54,176,013 | 36.77 | 27,490,079 | 18.66 | 2,106 | 1,147 |
| 1930 | 44,209,406 | 29.61 | 28,220,748 | 18.90 | 2,161 | 1,162 |
| 1931 | 34,319,244 | 22.66 | 28,549,651 | 18.85 | 2,187 | 1159 |
| 1932 | 34,976,387 | 22.90 | 31,819,946 | 20.84 | 2,437 | 1281 |
| 1933 | 40,408,751 | 26.25 | 37,425,928 | 24.31 | 2,867 | 1494 |
| 1934 | 46,771,293 | 30.15 | 35,901,921 | 23.14 | 2,750 | 1,422 |
| 1935 | 46,051,733 | 29.48 | 36,333,405 | 23.26 | 2,783 | 1,430 |
| 1936 | 56,263,805 | 35.72 | 38,189,230 | 24.24 | 2,925 | 1490 |
The effect of prices on the total value of exports is seen at a glance from the accompanying diagram showing the yearly movement since 1900. The curve representing values on the basis of prices ruling in 1900 may also be taken as representing the course of the volume of trade on a quantity basis.
The total volume in 1936 was 192–5 per cent. above that of 1900, and the highest ever recorded. The per caput rate in 1936, representing an increase of 49 per cent. over 1900, was just a little under the record of 1933.
It is necessary to observe that the foregoing table is expressed in terms of New Zealand currency, and consequently, for certain uses, allowance must be made for changes in the external value of New Zealand currency, particularly the depreciation in relation to sterling. This applies also to the graph following.
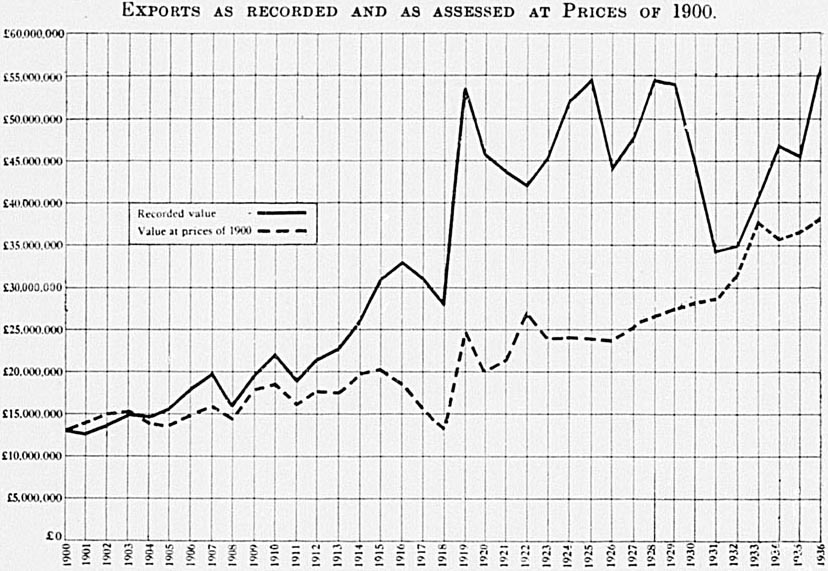
In order to show the effect of changes in price from year to year, and particularly in the latter years, the table following has been compiled by recomputing the values of each year's exports according to the prices of the previous year. In this way it is possible to compare succeeding years directly, instead of comparing each year with a given base. The method used is the same, except that the base is changed.
| Year. | Total Exports (New Zealand Produce). | Effect of Price-changes. | ||
|---|---|---|---|---|
| Recorded Value. | Value at Prices of Previous Year. | Gain. | Loss. | |
| £ | £ | £ | £ | |
| 1927 | 47,571,233 | 48,094,196 | 522,963 | |
| 1928 | 54,660,365 | 49,091,466 | 5,568,899 | |
| 1929 | 54,176,013 | 56,465,248 | 2,289,235 | |
| 1930 | 44,209,406 | 55,655,835 | 11,446,429 | |
| 1931 | 34,319,244 | 44,630,116 | 10,310,872 | |
| 1932 | 34,976,387 | 38,128,569 | 3,152,182 | |
| 1933 | 40,408,751 | 40,999,141 | 590,390 | |
| 1934 | 46,771,293 | 39,039,192 | 7,732,101 | |
| 1935 | 46,051,733 | 55,944,412 | 9,892,679 | |
| 1936 | 56,263,805 | 49,172,261 | 7,091,544 | |
The comparison of each year with the preceding year brings out the advantage or loss resulting from a rise or fall in prices. The gain shown represents the surplus value added by rising prices to the exports of any year, and, similarly, the loss shows how falling prices penalize New Zealand. Figures are in New Zealand currency, and, inter alia, reflect during the last four years the depreciation in relation to sterling.
A study of the figures given in the Statistical Summary at the end of this book, and showing quantities and values of the principal commodities exported over a period of fifty years, will give a good idea of the relative effects of increased volume and of price-movements in the huge growth of external trade during the half-century as measured by the total value of exports.
The following comparison between the year ended 30th June, 1914, and the corresponding periods—1935–36 and 1936–37—is of interest as showing the influence of price variation on the most recent years as contrasted with the year preceding the war.
As mentioned earlier, June years are in many respects preferable to calendar years, as affording a comparison between one season and another.
| Commodity. | Twelve Months ended 30th June, 1914. | Twelve Months ended 30th June, 1936. | Twelve Months ended 30th June, 1937. | ||
|---|---|---|---|---|---|
| Recorded Value. | Value at Prices of 1913–14. | Recorded Value. | Value at Prices of 1913–14. | ||
| £ | £ | £ | £ | £ | |
| Butter | 2,197,771 | 14,789,649 | 15,060,465 | 16,434,270 | 16,166,858 |
| Cheese | 2,317,970 | 4,509,174 | 4,804,797 | 5,282,259 | 4,928,814 |
| Beef, frozen (and chilled) | 561,817 | 978,722 | 1,077,749 | 967,252 | 993,483 |
| Lamb, frozen (whole carcasses) | 2,545,175 | 7,642,813 | 5,233,091 | 8,956,063 | 5,830,170 |
| Mutton, frozen (whole carcasses) | 1,880,583 | 1,634,457 | 1,361,960 | 1,500,376 | 1,224,947 |
| Pork, frozen | 5,843 | 1,507,553 | 1,342,178 | 1,630,617 | 1,372,665 |
| Meat, preserved | 122,078 | 281,610 | 342,199 | 281,450 | 276,471 |
| Sausage-casings | 132,038 | 695,811 | 136,963 | 750,001 | 133,465 |
| Apples | 12,160 | 551,305 | 361,389 | 457,619 | 295,296 |
| Hides | 319,995 | 488,630 | 853,822 | 512,947 | 705,686 |
| Rabbit-skins | 90,350 | 562,710 | 235,617 | 683,034 | 190,580 |
| Sheep-skins (without wool) | 545,037 | 1,098,315 | 790,932 | 1,638,369 | 887,177 |
| Wool | 8,262,153 | 12,762,498 | 13,355,428 | 18,770,643 | 12,036,209 |
| Phormium-flbre | 576,095 | 85,244 | 114,486 | 128,031 | 139,298 |
| Tallow | 711,858 | 539,210 | 572,659 | 709,888 | 849,095 |
| Kauri-gum | 790,338 | 78,657 | 220,647 | 145,321 | 314,197 |
| Gold | 1,485,937 | 1,485,077 | 687,120 | 1,378,684 | 643,132 |
| Timber, sawn | 372,092 | 350,031 | 191,898 | 203,346 | 92,895 |
| Totals | 22,929,290 | 50,041,466 | 46,743,400 | 60,430,170 | 47,130,438 |
| Other N.Z. produce | 1,383,454 | 3,147,049 | 3,708,566 | ||
| Grand totals | 24,312,744 | 53,188,515 | 64,138,736 | ||
In 1929–30, when the decline in prices had not attained such serious dimensions as regards New Zealand products, the recorded value of the commodities dealt with exceeded the value at 1913–14 levels by £9,985,967. Three years later the recorded value of these commodities exported was actually £8,880,425 below the figure it would have attained at 1913–14 prices. In 1935–36, the first occasion since 1929–30, the recorded value exceeded that based on 1913–14 prices, the difference being £3,298,066. A much greater improvement was recorded in 1936–37, when the difference amounted to £13,299,732, wool contributing one-half and lamb one-quarter. The adjusted values afford a reliable comparison of the volume of exports, which has shown a progressive increase during the last four years, the volume in 1936–37 being 0.8 per cent. greater than in 1935–36, and 106 per cent. greater than in 1913–14. The eighteen items utilized in arriving at the foregoing percentage comprise 94 per cent. of the total exports of domestic produce, and therefore may be taken as thoroughly representative of the whole. This growth in volume has been achieved in spite of an increase of over 400,000 in the consuming population of the Dominion, with little increase in the number of those engaged in producing the principal export commodities.
Trade with the Cook Islands and other islands annexed in 1901 is not regarded as external to New Zealand, but merely as interchange between different parts of the Dominion, and it is therefore not included in the account of the external trade. The trade of the Cook Islands (and other annexed islands) with other countries is also omitted from New Zealand trade statistics. Separate return .3 are made of the transactions between the Dominion and the annexed islands, and exports to the islands are summarized below:—
| Year. | Exports. |
|---|---|
| £ | |
| 1927 | 84,652 |
| 1928 | 92,184 |
| 1929 | 79,962 |
| 1930 | 78,512 |
| 1931 | 59,202 |
| 1932 | 56,599 |
| 1933 | 56,254 |
| 1934 | 54,261 |
| 1935 | 53,109 |
| 1936 | 66,857 |
Further particulars regarding the trade of the Islands will be found in the section of this book dealing with Dependencies.
THE statistics of imports are compiled from entries passed at the Customs. The value shown for all merchandise imported is the current domestic value in the country of export at the time of exportation, plus an allowance of 10 per cent. to cover freight, insurance, &c. Import values are expressed in terms of New Zealand currency, in contradistinction to the practice in Year-Books prior to the 1936 issue. In Subsection A will be found (in conjunction with export figures) a summary of import totals for recent years, expressed both in New Zealand currency and in sterling, together with a series of index numbers of the volume of import trade and of the value, expressed in terms of gold, sterling, and New Zealand currency. Import totals are exclusive of specie, except where the contrary is clearly stated. A decennial table of movement of specie will be found at the end of Subsection A.
A classification of imports under five broad divisions is given in the following table for the last ten years. Taken in conjunction with a table based on the same classification which is given in the Exports subsection of this section, the figures show plainly how New Zealand's export trade is derived predominantly from the products of her primary industries, and her import trade consists very largely of manufactured or partly manufactured goods.
| Year. | Food, Drink, and Tobacco. | Raw Materials and Articles mainly unmanufactured. | Articles wholly or mainly manufactured. | Miscellaneous and Unclassified. | Bullion. | Total Merchandise. |
|---|---|---|---|---|---|---|
| £ | £ | £ | £ | £ | £ | |
| 1927 | 7,541,338 | 2,512,613 | 34,462,816 | 263,158 | 2,741 | 44,782,666 |
| 1928 | 7,152,774 | 2,385,876 | 35,001,157 | 299,847 | 4,448 | 44,844,102 |
| 1929 | 6,635,689 | 2,289,483 | 39,496,050 | 306,107 | 7,143 | 48,734,472 |
| 1930 | 6,066,542 | 1,889,673 | 36,121,373 | 259,095 | 2,971 | 44,339,654 |
| 1931 | 4,453,212 | 1,437,495 | 20,460,797 | 144,250 | 2,397 | 26,498,151 |
| 1932 | 4,180,284 | 1,234,754 | 19,072,507 | 156,752 | 1,709 | 24,646,006 |
| 1933 | 4,016,842 | 1,157,532 | 20,257,535 | 147,403 | 2,054 | 25,581,366 |
| 1934 | 4,510,428 | 1,377,410 | 25,241,859 | 207,131 | 2,724 | 31,339,552 |
| 1935 | 5,038,719 | 1,564,163 | 29,497,032 | 214,843 | 2,510 | 36,317,267 |
| 1936 | 5,472,112 | 1,691,797 | 36,848,951 | 241,957 | 4,069 | 44,258,886 |
The principal groups of commodities imported are clothing and textiles, metals and machinery, sugar, tea, alcoholic liquors, tobacco, paper and stationery, oils, motor-vehicles and accessories, chemicals and drugs, manures, and timber. It will be seen that articles wholly manufactured or semi-manufactured account for upwards of 80 per cent. of total merchandise imports. It should not be assumed, however, that items included in this class necessarily compete with New Zealand manufactures. In the first place, a large proportion of imports of manufactured commodities is comprised of goods which cannot be produced economically in New Zealand—e.g., cotton piece-goods, pigments—or products of industries which have never been established in New Zealand—e.g., iron and steel manufactures. A further point to be taken into consideration is the fact that many imports of manufactured or semi-manufactured goods form the raw material of further factory processes in the Dominion—e.g., piece-goods.
Imports for the year 1936 are classified in the following table on the same basis as that used in the case of exports on page 228. The grouping by countries is on the basis of country of origin.
IMPORTS, 1936.
| — | United Kingdom. | Other British Countries. | United States of America. | Other Foreign Countries. | Total Merchandise. |
|---|---|---|---|---|---|
* At face value. | |||||
| £ | £ | £ | £ | £ | |
| Grain | 2,878 | 257,752 | 2,820 | 18,539 | 281,989 |
| Milled products | 57,271 | 179,296 | 49,783 | 595 | 286,945 |
| Fish | 34,204 | 99,533 | 2,131 | 32,436 | 168,304 |
| Meat (including poultry and game) | 362 | 4,114 | 19 | 75 | 4,570 |
| Butter, cheese, and eggs | 156 | 55 | 853 | 1,064 | |
| Fruits, fresh and dried | 14 | 596,377 | 114,212 | 37,114 | 747,717 |
| Preserved fruits and vegetables, fruit-pulp, jams, &c | 27,505 | 154,420 | 3,010 | 4,882 | 189,817 |
| Live animals for food | |||||
| Sugar | 329 | 15,783 | 590,040 | 606,152 | |
| Tea | 10 | 741,072 | 4 | 8,941 | 750,027 |
| Alcoholic beverages | 467,121 | 89,577 | 184 | 129,551 | 686,433 |
| Tobacco | 444,637 | 100,875 | 246,310 | 2,550 | 794,372 |
| Coal | 105,340 | 105,340 | |||
| Ores, concentrates, and scrap | 1,051 | 76 | 50 | 1,824 | 3,001 |
| Iron and steel— | |||||
| Pig, ingots, &c. | 5,150 | 37,155 | 12,737 | 55,042 | |
| Bars, rods, plate, sheet, &c. | 1,309,359 | 434,943 | 4,408 | 1,700 | 1,750,410 |
| Other manufactures of iron and steel | 1,851,244 | 648,118 | 205,725 | 143,926 | 2,849,013 |
| Agricultural implements and machinery | 95,689 | 81,427 | 101,676 | 22,591 | 301,383 |
| Electrical machinery and apparatus | 1,439,444 | 379,067 | 428,256 | 103,623 | 2,350,390 |
| Other machinery | 1,361,134 | 349,456 | 848,046 | 239,568 | 2,798,204 |
| Motor-cars and parts thereof | 3,057,390 | 1,213,429 | 1,221,367 | 6,999 | 5,499,185 |
| Other metals and metal manufactures | 474,950 | 271,165 | 40,827 | 138,900 | 925,842 |
| Cotton, raw | 851 | 596 | 1,447 | ||
| Flax, hemp, and raw jute (including tow) | 494 | 2,770 | 21,752 | 25,016 | |
| Wool, raw | 23 | 15,558 | 15,581 | ||
| Yarns and threads | 390,516 | 56,945 | 706 | 20,095 | 468,262 |
| Cotton piece-goods | 1,564,390 | 20,425 | 18,356 | 287,407 | 1,890,578 |
| Woollen piece-goods | 833,684 | 8,543 | 5 | 10,105 | 852,337 |
| Other piece-goods | 542,068 | 261,723 | 24,975 | 606,067 | 1,434,833 |
| Other textiles | 1,160,632 | 440,111 | 31,258 | 167,388 | 1,799,389 |
| Apparel | 1,180,105 | 274,733 | 54,325 | 333,476 | 1,842,639 |
| Footwear | 322,733 | 216,663 | 11,493 | 65,606 | 616,495 |
| Chemicals, drugs, dyes, &c. | 902,961 | 423,686 | 136,082 | 151,084 | 1,613,813 |
| Fertilizers | 111,727 | 237,473 | 5 | 256,574 | 605,779 |
| Earthenware (including bricks, glass, &c.) | 463,498 | 77,649 | 23,434 | 149,671 | 714,252 |
| Wood, timber, and manufactures thereof (including wood-pulp) | 29,284 | 392,272 | 68,282 | 145,343 | 635,181 |
| Newsprint | 14,390 | 424,706 | 43 | 5,814 | 444,953 |
| Paper and cardboard, &c. | 606,589 | 284,490 | 126,909 | 238,994 | 1,256,982 |
| Seeds and nuts for expressing oil therefrom | 916 | 916 | |||
| Animal and vegetable oils, fats, greases, and waxes | 147,678 | 39,301 | 8,531 | 27,151 | 222,661 |
| Oils—Petroleum, crude and refined | 98, 106 | 5,048 | 834,890 | 1,469,441 | 2,407,485 |
| Hides, skins, and furs (undressed) | 469 | 11,802 | 58,516 | 22,007 | 92,794 |
| Leather and manufactures thereof (except clothing and footwear) | 170,532 | 94,357 | 77,650 | 18,608 | 361,147 |
| Rubber, raw | 7,711 | 7,711 | |||
| Gold and silver bullion | 1,490 | 929 | 1,650 | 4,069 | |
| Other merchandise | 2,680,257 | 1,283,398 | 846,108 | 979,603 | 5,789,366 |
| Total merchandise | 21,851,524 | 10,341,090 | 5,605,379 | 6,460,893 | 44,258,886 |
| Gold and silver coin* | 16,465 | 16,465 | |||
| Other coin* | 20,136 | 20,136 | |||
Since 1911 the statistics of both imports and exports have been classified according to the nature of the commodity, which assembles the items in well-defined classes as shown in the following table, where the imports for the 3'ear 1936 are given under the various classes:—
| No. | Class. | Value in 1936. |
|---|---|---|
* At face value. | ||
| £ | ||
| I | Foodstuffs of animal origin (excluding live animals) | 241,592 |
| II | Foodstuffs of vegetable origin, and common salt | 2,843,309 |
| III | Beverages (non-alcoholic) and substances used in making up the same | 875,470 |
| IV | Spirits and alcoholic liquors | 748,321 |
| V | Tobacco and preparations thereof | 794,372 |
| VI | Live animals | 75,227 |
| VII | Animal substances (mainly unmanufactured), not being foodstuffs | 120,276 |
| VIII | Vegetable substances and non-manufactured fibres | 708,763 |
| IXA | Apparel | 2,710,888 |
| IXB | Textiles | 5,552,860 |
| IXC | Manufactured fibres | 476,886 |
| X | Oils, fats, and waxes | 2,781,026 |
| XI | Paints and varnishes | 415,592 |
| XII | Stones and minerals used industrially | 124,465 |
| XIVA: | Metal, unmanufactured, partly manufactured, and ores | 676,827 |
| XIVB | Metal manufactures, other than machinery and machines | 4,956,110 |
| XV | Machinery and machines | 5,278,501 |
| XVIA | Indiarubber and manufactures thereof (not including tires) | 199,908 |
| XVIB | Leather and manufactures thereof, including substitutes | 361,147 |
| XVIIA | Timber | 430,253 |
| XVI.IB | Wood, cane, and wicker manufactures | 175,566 |
| XVIII | Earthenware, china, glass, stoneware, cement, and cement materials | 861,327 |
| XIXA | Paper | 1,362,667 |
| XIX B | Stationery | 911, 868 |
| XX | Jewellery, time-pieces, and fancy goods | 720,425 |
| XXI | Optical, surgical, and scientific instruments | 626,607 |
| XXIIA | Drugs, chemicals, and druggists' wares | 1,488,350 |
| XXIIB | Manures | 605,779 |
| XXIIIA | Vehicles | 5,924,496 |
| XXIIIB | Miscellaneous | 1,210,008 |
| Total merchandise | 44,258,886 | |
| XIII | Specie* | 36,601 |
Twenty-nine of the thirty merchandise classes show increases as compared with 1935, the merchandise total for 1936 being £7,941,619 greater than the previous year's figure.
The import trade of the Dominion, though spread over more countries than the export trade, is yet confined mainly to the United Kingdom, Australia, the United States, and Canada. In the days of the first settlement Australia was the source from which the young colony drew most of its supplies, and for a long period imports from Australia overshadowed imports from the United Kingdom. The proportion of imports from Australia, however, decreased steadily from 60 per cent. in 1862 to 8 per cent. in 1923. A slight recovery was shown in the two following years, after which there was a progressive decline to less than 7 per cent. in 1929, since when the trend has been upward.
Imports from the United Kingdom comprised between 60 per cent. and 70 per cent. of total imports during the “eighties” and “nineties”; so that, at that time, the United Kingdom and Australia between them supplied approximately 80 per cent. of the total imports of the Dominion. In the decade immediately preceding the war the United Kingdom supplied about 60 per cent. of total imports; but, with the disruption in trading relations during the war, other countries—notably the United States and Japan—increased their share of New Zealand's import trade.
The post-war economy of New Zealand and other countries has been characterized by a marked growth in the diversity of products entering into international trade, despite the fact that in recent years the total quantum of such trade, though recovering, is still materially below the pre-depression levels. Notable examples of important new industries are to be found in the growth of the motor, artificial silk, motion picture, and (more recently) radio industries. International trade in the products of these and certain other new industries became almost a monopoly of the United States; in fact, the dominating position of that country in such spheres of industrial activity has been seriously challenge:; only recently. The traditional position of the United Kingdom in the forefront of manufacturing activity was shaken severely by circumstances arising from the war; her textile industries, for example, being subjected to acute and increasing foreign competition. In the circumstances, it is not surprising to find that the proportion of goods of United Kingdom origin included in New Zealand's imports of merchandise fell from about 60 per cent. before the war to about 46 per cent. in the late “twenties” (the lowest actual percentage being 45–67 per cent. in 1926).
The relative position of the United Kingdom in New Zealand's import trade has improved in the last few years, partly due to New Zealand's tariff policy, in which preference to Empire countries plays an important part. During the last five years about 50 per cent. of our imports of merchandise were of United Kingdom origin, this recovery having been made despite the growth in imports from Australia of certain goods—e.g., iron and steel—which were formerly almost entirely imported from the United Kingdom. A more detailed treatment of changes in the import trade between British and foreign countries is given in a later paragraph under the heading “Imports of British and of Foreign Origin.”
The United States was sending goods to New Zealand almost from the foundation of the colony, and the share of the imports received from that country steadily increased till in the first decade of the present century it was 11 or 12 per cent. The adoption of Imperial preference seems to have caused a temporary drop in the figure to about 7 per cent., though the proportion maintained a steady increase for several years after the war, and, indeed, considerably surpassed its old level. In 1935 and 1936 one-eighth of the total imports came from the United States, this, although representing a slight increase over 1934, being considerably lower than the pre-depression proportion.
India captured the New Zealand jute-market in the early “eighties,” and since then there has been a regular import of corn-sacks, woolpacks, &c. In former times the colony imported its sugar from Fiji, but in late years Fiji has been largely supplanted by the Dutch East Indies and Cuba. Similarly, the import of tea from China has given way to imports from Ceylon.
Imports from Japan have risen very substantially in recent years; imports of Japanese origin totalling £1,328,195 in 1936, as compared with a total of only £332,281 in 1931, and an average of £582,470 in the previous decade. The latest total is still a little below the immediate post-war peak (£1,522,675 in 1920).
The table which follows shows imports from each of the principal countries during the last twenty years.
IMPORTS FROM PRINCIPAL COUNTRIES OF SHIPMENT.
| Year. | United Kingdom. | Australia. | Canada. | India. | Ceylon. | Fiji. | United States. | Japan. |
|---|---|---|---|---|---|---|---|---|
| £ | £ | £ | £ | £ | £ | £ | £ | |
| 1917 | 8,647,361 | 3,657,948 | 757,041 | 612,063 | 353,613 | 1,203,372 | 3,900,658 | 628,822 |
| 1918 | 8,890,660 | 5,117,849 | 930,964 | 712,633 | 319,498 | 939,341 | 4,980,748 | 1,214,865 |
| 1919 | 11,496,574 | 5,062,293 | 1,622,234 | 772,838 | 383,209 | 980,186 | 7,576,314 | 1,258,016 |
| 1920 | 29,767,241 | 10,552,867 | 2,386,915 | 900,577 | 725,278 | 1,824,012 | 11,100,259 | 1,470,071 |
| 1921 | 21,257,654 | 6,482,989 | 1,687,595 | 593,151 | 316,813 | 1,909,102 | 7,746,457 | 593,343 |
| 1922 | 19,246,569 | 4,210,705 | 1,545,037 | 437,851 | 499,705 | 1,459,345 | 4,948,778 | 485,327 |
| 1923 | 23,991,161 | 4,259,323 | 2,930,626 | 732,359 | 701,665 | 859,757 | 6,696,723 | 548,632 |
| 1924 | 24,904,178 | 6,303,073 | 3,909,152 | 726,483 | 822,987 | 984,274 | 7,551,357 | 458,964 |
| 1925 | 27,232,909 | 5,855,489 | 3,906,152 | 888,787 | 836,419 | 1,251,797 | 8,626,959 | 659,146 |
| 1926 | 24,253,610 | 5,059,779 | 3,430,988 | 850,720 | 857,011 | 941,320 | 9,729,251 | 557,113 |
| 1927 | 22,678,582 | 4,264,175 | 2,721,812 | 755,967 | 840,865 | 435,034 | 7,827,755 | 579,984 |
| 1928 | 22,489,716 | 3,868,281 | 3,237,750 | 771,450 | 843,685 | 584,182 | 7,958,761 | 558,033 |
| 1929 | 23,675,442 | 3,631,625 | 4,774,493 | 749,293 | 899,828 | 180,492 | 9,073,263 | 613,235 |
| 1930 | 21,938,786 | 3,383,913 | 3,971,400 | 655,002 | 723,925 | 227,357 | 7,714,785 | 574,678 |
| 1931 | 13,834,744 | 2,284,507 | 1,335,978 | 427,040 | 672,539 | 119,504 | 4,057,022 | 327,205 |
| 1932 | 12,906,420 | 2,571,080 | 1,098,210 | 381,466 | 383,629 | 125,951 | 3,380,898 | 468,471 |
| 1933 | 13,498,745 | 2,807,921 | 1,258,311 | 564,018 | 543,548 | 118,686 | 2,782,533 | 668,863 |
| 1934 | 16,152,762 | 3,532,068 | 2,088,132 | 648,834 | 582,358 | 114,794 | 3,547,446 | 828,482 |
| 1935 | 18,519,600 | 4,295,457 | 2,439,253 | 532,786 | 626,907 | 93,656 | 4,362,516 | 1,078,774 |
| 1936 | 22,078,959 | 5,220,399 | 3,317,123 | 546,542 | 749,710 | 109,223 | 5,402,661 | 1,320,428 |
The figures given in the foregoing table are on the basis of country of shipment. From 1914 onwards, figures are also available showing countries of origin, and a supplementary table on this basis is now given. Both the foregoing and the succeeding tables exclude specie imported.
IMPORTS FROM PRINCIPAL COUNTRIES OF ORIGIN.
| Year. | United Kingdom. | Australia. | Canada. | India. | Ceylon. | Fiji. | United States. | Japan. |
|---|---|---|---|---|---|---|---|---|
| £ | £ | £ | £ | £ | £ | £ | £ | |
| 1917 | 8,416,875 | 2,636,149 | 771,952 | 646,196 | 397,419 | 1,198,589 | 4,294,279 | 693,808 |
| 1918 | 8,601,265 | 4,043,383 | 950,588 | 729,419 | 323,123 | 935,885 | 5,472,122 | 1,266,416 |
| 1919 | 11,173,322 | 3,903,908 | 1,649,550 | 787,669 | 388,428 | 977,319 | 8,053,127 | 1,313,205 |
| 1920 | 28,513,812 | 8,623,685 | 2,453,379 | 940,569 | 729,893 | 1,818,529 | 11,750,690 | 1,522,675 |
| 1921 | 20,634,057 | 8,459,523 | 1,727,503 | 607,926 | 320,188 | 1,906,038 | 8,166,967 | 603,275 |
| 1922 | 18,109,686 | 3,293,632 | 1,556,213 | 441,581 | 501,419 | 1,448,998 | 5,379,372 | 504,955 |
| 1923 | 22,517,695 | 3,653,420 | 2,950,984 | 742,551 | 705,622 | 853,163 | 6,956,602 | 560,064 |
| 1924 | 23,203,825 | 5,651,027 | 3,914,404 | 741,202 | 837,506 | 970,393 | 7,788,593 | 496,835 |
| 1925 | 25,542,652 | 5,248,993 | 3,916,237 | 912,741 | 844,596 | 1,239,456 | 8,885,265 | 693,632 |
| 1926 | 22,749,606 | 4,625,200 | 3,431,533 | 861,578 | 868,821 | 892,894 | 10,000,507 | 582,352 |
| 1927 | 21,463,834 | 3,869,246 | 2,739,826 | 759,829 | 855,048 | 424,785 | 8,079,467 | 591,963 |
| 1928 | 21,247,111 | 3,499,151 | 3,258,828 | 782,144 | 860,886 | 571,728 | 8,204,197 | 576,495 |
| 1929 | 22,496,638 | 3,258,727 | 4,792,820 | 766,756 | 923,748 | 174,894 | 9,319,926 | 625,714 |
| 1930 | 21,102,116 | 3,023,065 | 3,969,037 | 665,428 | 735,421 | 209,667 | 7,893,114 | 589,413 |
| 1931 | 13,306,001 | 2,073,361 | 1,342,321 | 429,132 | 676,290 | 112,955 | 4,227,550 | 332,281 |
| 1932 | 12,575,954 | 2,368,293 | 1,107,074 | 389,443 | 386,318 | 116,645 | 3,565,846 | 476,758 |
| 1933 | 13,126,032 | 2,576,092 | 1,264,932 | 576,915 | 551,388 | 106,096 | 2,952,009 | 675,571 |
| 1934 | 15,789,761 | 3,238,124 | 2,098,610 | 667,552 | 585,689 | 103,166 | 3,749,559 | 836,595 |
| 1935 | 18,283,096 | 3,957,398 | 2,450,457 | 571,630 | 633,594 | 80,090 | 4,535,060 | 1,100,150 |
| 1936 | 21,851,524 | 4,941,376 | 3,326,878 | 554,100 | 750,982 | 95,933 | 5,605,379 | 1,328,195 |
Of the total imports of merchandise in 1936, the eight countries shown above supplied 87 per cent. on the basis of origin and 88 per cent. on the basis of shipment. Other countries which supplied more than one-half of 1 per cent. of the Dominion's imports in 1936 were—
| Country. | Imports according to | |||
|---|---|---|---|---|
| Country of Shipment. | Country of Origin. | |||
| Value. | Per Cent. of Total. | Value. | Per Cent. of Total. | |
| £ | £ | |||
| Dutch East Indies | 1,771,420 | 4.00 | 1,772,642 | 4.01 |
| Germany | 672,197 | 1.52 | 748,427 | 1.69 |
| Sweden | 335,868 | 0.76 | 343,982 | 0.78 |
| Belgium | 394,441 | 0.89 | 409,214 | 0.92 |
About three-quarters of the imports produced on the Continent of Europe are received direct, the balance coming mainly through the United Kingdom. Direct shipments from the United Kingdom in 1936 exceeded by £227,435 the imports of goods produced in that country. In view, however, of the considerable quantities of British goods that enter New Zealand by way of Australia it would not be correct to take that figure as fully measuring the re-export trade done by Great Britain in goods from abroad intended for the Dominion.
Australia acts as a re-exporting centre for a certain proportion of goods received from India and Ceylon. British West Africa and the British West Indies both produce more of the imports than they ship direct. The figures for Canada show a small balance in favour of goods of Canadian origin. Goods of United States origin exceeded direct imports from that country by £202,718 in 1936.
The following table shows for the last ten years the percentage of total imports (excluding specie) from each of the principal countries concerned.
IMPORTS (COUNTRY OF ORIGIN).
| Country. | 1927. | 1928. | 1929. | 1930. | 1931. | 1932. | 1933. | 1934. | 1935. | 1936. |
|---|---|---|---|---|---|---|---|---|---|---|
| Per Cent. | Per Cent. | Per Cent. | Per Cent. | Per Cent. | Per Cent. | Per Cent. | Per Cent. | Per Cent. | Per Cent. | |
| United Kingdom | 47.93 | 47.38 | 46.16 | 47.58 | 50.14 | 50.95 | 51.28 | 50.38 | 50.39 | 49.51 |
| Canada | 6.12 | 7.27 | 9.83 | 8.95 | 5.06 | 4.49 | 4.93 | 6.69 | 6.75 | 7.53 |
| India | 1.70 | 1.74 | 1.58 | 1.50 | 1.62 | 1.58 | 2.25 | 2.13 | 1.58 | 1.26 |
| Ceylon | 1.91 | 1.92 | 1.90 | 1.66 | 2.55 | 1.57 | 2.16 | 1.87 | 1.75 | 1.70 |
| South African Union | 0.27 | 0.23 | 0.20 | 0.22 | 0.29 | 0.34 | 0.20 | 0.18 | 0.15 | 0.27 |
| Australia | 8.64 | 7.80 | 6.69 | 6.81 | 7.81 | 9.59 | 10.03 | 10.33 | 10.90 | 11.20 |
| Fiji | 0.95 | 1.27 | 0.36 | 0.47 | 0.42 | 0.47 | 0.41 | 0.33 | 0.22 | 0.22 |
| Other British countries | 1.07 | 1.00 | 1.06 | 1.20 | 1.63 | 2.12 | 2.13 | 1.92 | 1.57 | 1.26 |
| Totals, British countries | 68.59 | 68.61 | 67.78 | 68.39 | 69.52 | 71.11 | 73.39 | 73.83 | 73.31 | 72.95 |
| Germany | 1.87 | 2.00 | 1.93 | 2.29 | 2.37 | 2.05 | 1.84 | 1.54 | 1.47 | 1.70 |
| France | 1.99 | 1.83 | 1.50 | 1.43 | 1.35 | 1.20 | 0.97 | 0.77 | 0.61 | 0.49 |
| Belgium | 0.89 | 1.11 | 1.20 | 1.06 | 1.20 | 0.80 | 0.68 | 0.44 | 0.60 | 0.91 |
| Japan | 1.32 | 1.28 | 1.28 | 1.33 | 1.26 | 1.94 | 2.64 | 2.67 | 3.03 | 3.01 |
| Dutch East Indies | 1.97 | 2.23 | 2.37 | 1.91 | 3.50 | 3.53 | 3.89 | 4.41 | 3.96 | 3.90 |
| United States of America | 18.04 | 18.30 | 19.12 | 17.82 | 16.04 | 14.55 | 11.62 | 11.98 | 12.50 | 12.52 |
| Other foreign countries | 5.33 | 4.64 | 4.82 | 5.77 | 4.76 | 4.82 | 4.97 | 4.36 | 4.52 | 4.52 |
| Totals, foreign countries | 31.41 | 31.39 | 32.22 | 31.61 | 30.48 | 28.89 | 26.61 | 26.17 | 26.69 | 27.05 |
Prior to the war, imports from the United Kingdom represented about 60 per cent. of the total, and those of United Kingdom origin would appear on this basis to have been about 55 per cent. of the aggregate. The latter are now almost exactly one-half of the total. Since 1929 there has been a progressive increase in the proportion of United Kingdom goods, particularly motor-vehicles, and tires, tubes, and covers entering the Dominion. Although concerned mainly with hardware and soft-goods, the range of the trade is a very wide one indeed.
Ranking next to Great Britain in the list of exporters to New Zealand is the United States of America; of recent years imports from that source have accounted for one-fifth to one-seventh of the total. The highest percentage (2008) was reached in 1926, the lower level of subsequent years being due to decreases in motor-vehicles and motor-spirits. Motor-spirits now make up the greater part of the reduced total, motor-vehicles having undergone a pronounced decline since 1929 in favour of the United Kingdom. In 1929 the United States supplied (on a value basis) 41 per cent. of the motor-cars entering the Dominion, and 53 per cent. of the lorries, trucks, vans, and buses; in 1936 the corresponding percentages were 21 and 34 respectively. Important factors in the decline in trade with the United States have been the high rate of exchange against New Zealand, particularly before the United States currency measures of 1933 and 1934, and the preferential tariff favouring importations of British goods.
Imports of Australian origin in 1936 were nearly £1,000,000 greater than in 1935, Australia's share (on a percentage basis) of the total imports in 1936 being the greatest since 1924. There has been a considerable decline in imports of hardwood timber and of tobacco during recent years, but this has been counteracted by greater imports of other commodities.
Imports of Canadian origin, after a temporary decline during the depression, have risen again with the marked improvement in the motor trade and as a result of the Canada - New Zealand Trade Agreement commencing in May, 1932 (vide next subsection).
The influences tending towards a greater diversion in the sources of New Zealand's imports in the post-war years are briefly referred to in a preceding paragraph (p. 250). The following diagram illustrating the trend in the direction of our imports during the last twenty years shows the effect of such influences, and the recent recovery in imports from Empire sources.
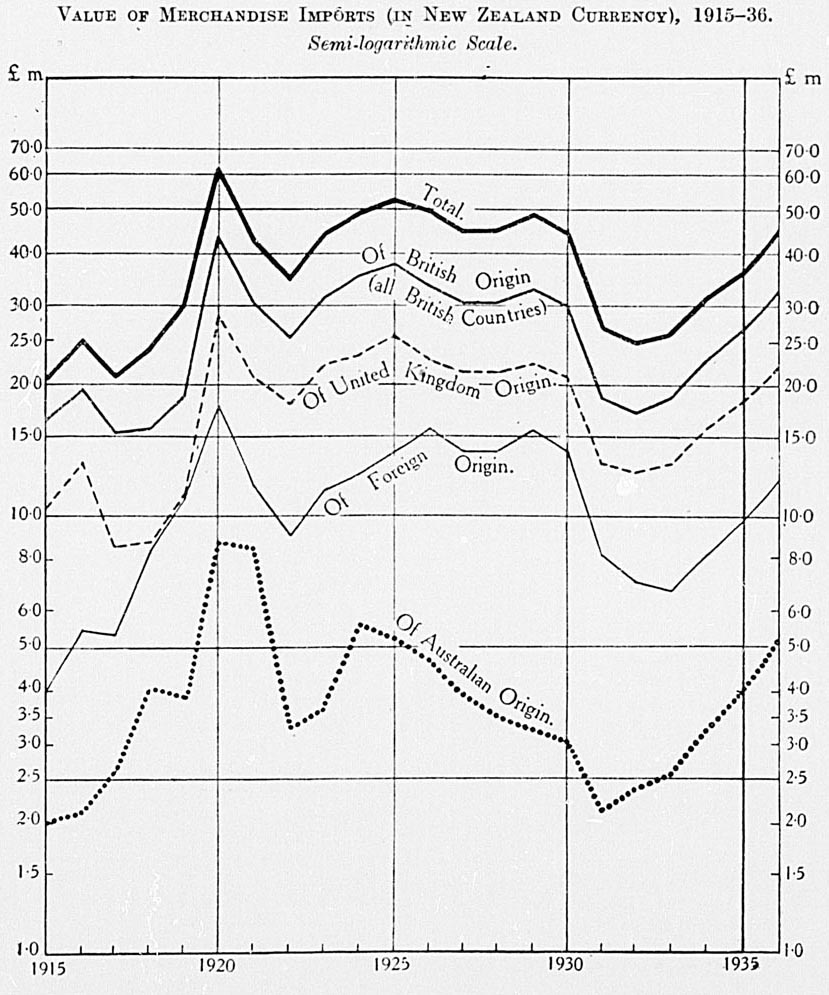
From the tables given under the preceding heading, it will be seen that the great bulk of New Zealand's imports of merchandise are of British origin the proportion of total imports derived from British countries having varied between 73 and 74 per cent. during each of the last three years, as compared with about 68 per cent. in 1927–29. The strong bias towards Imperial preference in the Customs tariff (which, however, is low relative to that of most countries, even for imports of foreign origin), and the virility of Empire manufacturers, notably Australian and United Kingdom, in meeting foreign competition have been important factors contributing to the recent improvement in the proportion of imports of British origin. The Ottawa Agreement, which resulted in increases in the margin of Imperial preference in the tariff on certain commodities, and the placing of several commodities previously dutiable on the free list, if of Empire origin, must also be mentioned as a factor of considerable moment.
One of the outstanding facts brought into relief by the foregoing diagram is the recent marked relative expansion in imports from Australia. It should be noted also that New Zealand's total imports from Australia were higher in 1936 than in any single year since 1925, and more than double the 1931 total. The increase has been achieved despite the fact that New Zealand's imports of certain natural products—e.g., timber and coal—from Australia are now on a considerably lower level than was normal for many years prior to 1930. The decline in imports of these items has been more than compensated for by increased imports from Australia of certain manufactured and semi-manufactured goods, notably iron and steel. Australian industries have advanced under the stimuli of a depreciated currency and tariff protection to the stage when they can compete effectively in the New Zealand market with the manufactured products of the older countries. The comparative nearness of Australia to New Zealand is a very strong factor operating to the benefit of Australian firms in the New Zealand import market, the closeness of personal contact possible between importers and the Australian manufacturers, the short period in which goods can be delivered after ordering, and the intimate knowledge of New Zealand requirements all acting strongly to the mutual advantage of the Australian exporter and the New Zealand buyer. Moreover, the New Zealand market presents a very strong attraction to an Australian firm, since the potential demand in this country is of sufficient size to represent a very profitable addition to the home market. This stimulus does not act with anything like comparable force in the case of United Kingdom and continental manufacturers.
Despite the recent growth in New Zealand's imports from Australia of commodities which compete with the products of the United Kingdom and other countries catering for export markets in manufactured goods, it will be noted from the diagram that the United Kingdom has in recent years more than maintained its share in the New Zealand market. New Zealand's import trade from the Empire as a whole has grown at the expense of its imports from foreign countries—reversing the trend which became evident between 1922 and 1929, during which period imports from foreign countries gained ground—though not to a marked extent.
The predominance of imports from British countries in New Zealand's import trade is very marked, the following table showing the percentage of imports from British and foreign countries for each of the principal members of the British Commonwealth of Nations being of particular interest in this connection:—
| Country. | Percentage of Total Imports. | |
|---|---|---|
| Imports of British Origin. | Imports of Foreign Origin. | |
| New Zealand (1936) | 73.0 | 27.0 |
| Australia (1935–36) | 58.5 | 41.5 |
| South Africa (1936) | 54.1 | 45.9 |
| India (1935–36) | 48.7 | 51.3 |
| United Kingdom (1936) | 39.2 | 60.8 |
| Canada (1935–36) | 31.6 | 68.4 |
It will be seen that imports from British countries form a much higher percentage of total imports in the case of New Zealand than for any of the other countries listed. In respect of imports of United Kingdom origin New Zealand also occupies a leading position, as is illustrated from the following table:—
| Imports of United Kingdom Origin: Per Cent. of Total Imports. | |
|---|---|
| New Zealand, 1936 | 49.5 |
| South Africa, 1936 | 45.7 |
| Australia, 1935–36 | 40.7 |
| India, 1935–36 | 38.9 |
| Canada, 1935–36 | 21.0 |
On a population basis New Zealand is the best customer of the United Kingdom, as is shown by the following summary of a table published by the British Board of Trade. All countries taking United Kingdom exports to the value of £1 per head in 1936 are included.
| Countries to which consigned. | Exports of United Kingdom Merchandise (per Head of Population): Year 1936 | ||
|---|---|---|---|
| British countries— | £ | s. | d. |
| New Zealand | 11 | 0 | 5 |
| Irish Free State | 7 | 1 | 10 |
| Australia | 4 | 15 | 3 |
| South Africa | 3 | 18 | 9 |
| Canada | 2 | 2 | 6 |
| British Malaya | 1 | 17 | 3 |
| Foreign countries— | |||
| Denmark | 3 | 19 | 3 |
| Norway | 2 | 9 | 5 |
| Sweden | 1 | 13 | 2 |
| Netherlands | 1 | 9 | 1 |
| Argentine Republic | 1 | 4 | 0 |
| Belgium | 1 | 2 | 9 |
The table which follows shows by main countries of origin details of the principal imports into New Zealand during each of the last five years.
ORIGIN OF PRINCIPAL IMPORTS.
| Country of Origin. | 1932. | 1933. | 1934. | 1935. | 1936. |
|---|---|---|---|---|---|
| Confectionery. | |||||
| £ | £ | £ | £ | £ | |
| United Kingdom | 28,181 | 25,114 | 25,854 | 24,476 | 25,572 |
| Canada | 102 | 106 | 302 | 383 | 412 |
| Australia | 40,299 | 36,329 | 31,381 | 36,582 | 37,937 |
| France | 390 | 809 | 1,132 | 1,221 | 1,500 |
| United States of America | 711 | 710 | 964 | 2,800 | 1,841 |
| Other countries | 623 | 757 | 935 | 1,093 | 551 |
| Totals | 70,306 | 63,825 | 60,568 | 66,555 | 67,813 |
| Fruits (Dried). | |||||
| South African Union | 30,956 | 15,267 | 4,612 | 3,028 | 20,904 |
| Australia | 229,654 | 137,374 | 255,577 | 293,824 | 329,523 |
| Iraq | 36,542 | 30,695 | 45,591 | 30,530 | 21,051 |
| Turkey | 9,636 | 9,571 | 10,803 | 10,564 | 13,568 |
| United States of America | 93,957 | 85,272 | 51,433 | 61,878 | 65,156 |
| Other countries | 2,733 | 2,347 | 2,478 | 808 | 525 |
| Totals | 403,478 | 280,526 | 370,494 | 400,632 | 450,727 |
| Fruits (Fresh). | |||||
| £ | £ | £ | £ | £ | |
| British West Indies | 6 | 7,802 | 19,739 | 17,861 | |
| Canada | 2,373 | 2,553 | 851 | 1,459 | 1,661 |
| Australia | 106,657 | 45,908 | 93,458 | 80,250 | 94,185 |
| Fiji | 60,313 | 74,969 | 86,654 | 64,113 | 75,628 |
| Norfolk Island | 2,409 | 992 | 903 | ||
| Tonga | 10,269 | 9,941 | 15,503 | 14,295 | 10,645 |
| Western Samoa | 26,708 | 38,012 | 48,698 | 51,417 | 45,411 |
| United States of America | 20,587 | 34,080 | 51,473 | 54,746 | 49,056 |
| Other countries | 5,476 | 5,797 | 1,082 | 1,478 | 2,543 |
| Totals | 234,792 | 212,258 | 305,521 | 288,460 | 296,990 |
| Sugar. | |||||
| United Kingdom | 10,090 | 10,575 | 11,755 | 11,491 | 8,497 |
| Australia | 7,467 | 8,348 | 7,773 | 8,089 | 9,471 |
| Fiji | 52,175 | 25,801 | 11,241 | 9,734 | 10,546 |
| Netherlands | 2,315 | 135 | 756 | 19,531 | 29,423 |
| Dutch East Indies | 485,699 | 558,273 | 526,421 | 580,884 | 402,387 |
| Cuba | 90,218 | 44,543 | 45,539 | 45,524, | 188,206 |
| United States of America | 22,398 | 20,134 | 39,634 | 33,305 | 12,347 |
| Other countries | 2,309 | 3,200 | 3,031 | 2,080 | 2,402 |
| Totals | 672,671 | 671,009 | 646,150 | 710,638 | 663,279 |
| Tea. | |||||
| Ceylon | 369,583 | 529,276 | 567,594 | 610,496 | 723,354 |
| India | 43,417 | 87,849 | 144,472 | 31,540 | 17,716 |
| China | 3,420 | 5,244 | 0,321 | 5,608 | 6,277 |
| Dutch East Indies | 109 | 404 | 4,110 | 113 | |
| Japan | 22 | 46 | 2,496 | 836 | 2,461 |
| Other countries | 427 | 171 | 65 | 106 | |
| Totals | 416,551 | 623,240 | 725,164 | 648,545 | 750,027 |
| Tobacco and Preparations thereof. | |||||
| United Kingdom | 262,672 | 229,082 | 319,363 | 431,251 | 444,637 |
| Australia | 120,903 | 69,849 | 42,068 | 56,033 | 92,841 |
| United States of America | 218,372 | 218,939 | 196,433 | 205,900 | 246,310 |
| Other countries | 4,011 | 5,333 | 6,658 | 11,248 | 10,584 |
| Totals | 605,958 | 523,203 | 564,522 | 704,432 | 794,372 |
| Hosiery. | |||||
| United Kingdom | 233,897 | 197,096 | 153,087 | 108,642 | 104,039 |
| Canada | 82,051 | 71,221 | 86,180 | 61,416 | 103,967 |
| Australia | 35,070 | 35,920 | 17,240 | 13,433 | 19,217 |
| Czechoslovakia | 1,811 | 4,368 | 5,191 | 5,630 | 5,246 |
| Germany | 4,089 | 2,145 | 4,955 | 3,792 | 8,970 |
| Japan | 3,512 | 8,819 | 5,323 | 3,203 | 3,604 |
| United States of America | 2,214 | 408 | 150 | 239 | 921 |
| Other countries | 752 | 264 | 233 | 275 | 572 |
| Totals | 363,996 | 320,241 | 272,359 | 196,630 | 246,536 |
| Hats, Caps, and Millinery. | |||||
| United Kingdom | 104,602 | 92,774 | 91,079 | 90,513 | 112,823 |
| Canada | 955 | 1,261 | 1,146 | 1,737 | 12,966 |
| Australia | 6,028 | 8,289 | 11,120 | 14,201 | 14,273 |
| France | 6,619 | 2,110 | 3,896 | 6,456 | 2,988 |
| Germany | 9,160 | 5,150 | 5,360 | 3,845 | 4,699 |
| Italy | 10,604 | 8,774 | 5,179 | 3,116 | 68 |
| China | 1,241 | 2,880 | 5,709 | 3,970 | 6,170 |
| Dutch East Indies | 3,935 | 866 | 1,635 | 1,487 | 720 |
| 6,024 | 10,570 | 12,449 | 15,180 | 10,998 | |
| United States of America | 1,856 | 862 | 4,556 | 6,677 | 7,084 |
| Other countries | 3,885 | 4,200 | 4,759 | 5,096 | 8,983 |
| Totals | 154,909 | 137,736 | 146,888 | 152,278 | 181,772 |
| Miscellaneous Apparel and Ready-made Clothing. | |||||
| £ | £ | £ | £ | £ | |
| United Kingdom | 768,251 | 736,442 | 789,464 | 843,226 | 900,524 |
| Canada | 12,334 | 6,962 | 9,444 | 16,295 | 36,398 |
| Australia | 17,837 | 31,095 | 43,064 | 40,406 | 64,681 |
| Austria | 3,088 | 3,540 | 4,246 | 2,593 | 3,500 |
| Belgium | 4,074 | 3,360 | 2,981 | 1,726 | 9,014 |
| Czechoslovakia | 4,791 | 8,746 | 15,195 | 16,689 | 23,449 |
| France | 12,688 | 9,468 | 7,933 | 4,818 | 4,347 |
| Germany | 49,351 | 59,863 | 60,872 | 46,908 | 55,550 |
| Hungary | 209 | 91 | 330 | 1,258 | 5,560 |
| Italy | 20,198 | 21,275 | 27,006 | 24,988 | 6,659 |
| Switzerland | 1,535 | 724 | 523 | 591 | 1,103 |
| China | 2,039 | 1,994 | 2,871 | 4,126 | 5,396 |
| Japan | 27,014 | 54,623 | 50,218 | 64,006 | 90,075 |
| United States of America | 12,256 | 5,978 | 19,031 | 32,670 | 42,301 |
| Other countries | 1,124 | 2,756 | 3,023 | 1,587 | 2,228 |
| Totals | 936,789 | 946,917 | 1,036,201 | 1,101,887 | 1,250,785 |
| Boots and Shoes. | |||||
| United Kingdom | 255,272 | 249,200 | 241,390 | 253,597 | 276,363 |
| Canada | 94,039 | 69,688 | 75,350 | 100,380 | 109,546 |
| Australia | 31,384 | 47,324 | 42,431 | 40,841 | 51,471 |
| Malaya | 32,123 | 16,448 | 623 | 5 | 201 |
| Czechoslovakia | 6,470 | 8,776 | 8,469 | 15,465 | 6,295 |
| Japan | 24,447 | 65,551 | 56,032 | 50,140 | 50,875 |
| United States of America | 855 | 426 | 8,074 | 5,125 | 5,099 |
| Other countries | 2,984 | 1,509 | 2,433 | 6,503 | 8,921 |
| Totals | 447,574 | 458,922 | 434,802 | 472,056 | 508,771 |
| Miscellaneous Drapery. | |||||
| United Kingdom | 303,820 | 299,669 | 355,716 | 253,297 | 269,029 |
| Australia | 6,564 | 3,400 | 3,623 | 3,922 | 5,393 |
| France | 8,767 | 8,694 | 9,366 | 8,353 | 9,609 |
| Germany | 13,389 | 11,361 | 10,418 | 10,419 | 16,808 |
| Switzerland | 19,943 | 20,149 | 17,236 | 16,255 | 16,336 |
| China | 9,810 | 5,205 | 6,284 | 8,562 | 16,385 |
| Japan | 3,214 | 12,939 | 15,188 | 13,438 | 19,015 |
| United States of America | 4,024 | 1,332 | 1,364 | 2,197 | 2,712 |
| Other countries | 12,794 | 8,633 | 18,986 | 16,565 | 18,670 |
| Totals | 382,325 | 371,382 | 438,181 | 333,008 | 373,957 |
| Cotton, Linen, and Canvas Piece-goods. | |||||
| United Kingdom | 1,413,861 | 1,499,367 | 1,521,401 | 1,502,767 | 1,575,420 |
| Canada | 1,654 | 3,254 | 2,863 | 8,802 | 10,671 |
| Australia | 5,133 | 1,887 | 8,567 | 7,713 | 6,966 |
| Belgium | 26,430 | 35,880 | 34,143 | 47,432 | 72,068 |
| France | 4,358 | 1,886 | 2,669 | 3,794 | 3,838 |
| Germany | 2,575 | 3,414 | 8,274 | 5,008 | 8,600 |
| Netherlands | 3,254 | 1,315 | 3,505 | 3,373 | 3,692 |
| Switzerland | 1,693 | 8,463 | 4,367 | 3,290 | 3,695 |
| Japan | 26,217 | 62,654 | 89,435 | 141,586 | 268,834 |
| United States of America | 19,047 | 15,610 | 20,563 | 19,882 | 18,356 |
| Other countries | 3,718 | 7,759 | 7,502 | 8,198 | 6,424 |
| Totals | 1,507,940 | 1,641,489 | 1,703,289 | 1,751,845 | 1,978,564 |
| Silk, &c., Piece-goods. | |||||
| United Kingdom | 302,829 | 303,840 | 371,013 | 291,774 | 335,225 |
| Canada | 3,328 | 1,767 | 4,593 | 39,033 | 61,202 |
| Australia | 18,918 | 35,717 | 68,047 | 30,758 | 35,670 |
| Czechoslovakia | 5,768 | 2,276 | 1,665 | 2,781 | 3,704 |
| France | 87,853 | 54,040 | 40,096 | 33,887 | 27,166 |
| Germany | 21,394 | 20,269 | 23,542 | 22,491 | 38,000 |
| Hungary | 111 | 2,156 | 3,081 | 4,481 | 14,564 |
| Italy | 25,133 | 25,149 | 26,944 | 35,019 | 2,465 |
| Switzerland | 26,883 | 29,180 | 12,553 | 7,304 | 11,085 |
| China | 7,277 | 7,806 | 10,186 | 5,997 | 3,265 |
| Japan | 230,132 | 231,138 | 294,273 | 396,450 | 416,005 |
| United States of America | 6,202 | 5,325 | 10,414 | 7,635 | 7,766 |
| Other countries | 4,602 | 6,415 | 9,307 | 1,934 | 8,252 |
| Totals | 740,430 | 725,078 | 875,714 | 879,544 | 964,369 |
| Woollen Piece-goods. | |||||
| £ | £ | £ | £ | £ | |
| United Kingdom | 441,655 | 519,255 | 656,305 | 638,133 | 833,684 |
| Australia | 1,404 | 1,219 | 3,723 | 4,941 | 3,705 |
| France | 2,654 | 1,115 | 533 | 888 | 1,409 |
| Germany | 11,630 | 3,599 | 7,749 | 3,450 | 1,904 |
| Italy | 7,357 | 9,225 | 3,023 | 1,759 | 191 |
| Japan | 10 | 938 | 2,377 | 4,411 | |
| Other countries | 2,640 | 1,500 | 1,633 | 1,145 | 7,033 |
| Totals | 467,340 | 535,923 | 673,904 | 652,693 | 852,337 |
| Paints and Varnishes. | |||||
| United Kingdom | 127,914 | 141,758 | 165,899 | 221,931 | 236,925 |
| Australia | 32,212 | 44,604 | 67,110 | 99,635 | 127,098 |
| Germany | 7,445 | 8,129 | 6,741 | 6,202 | 7,616 |
| United States of America | 19,733 | 15,503 | 26,469 | 34,959 | 32,687 |
| Other countries | 7,956 | 9,067 | 11,601 | 10,361 | 11,266 |
| Totals | 195,260 | 219,061 | 277,820 | 373,088 | 415,592 |
| Iron and Steel.—Bar, Bolt, and Rod. | |||||
| United Kingdom | 62,297 | 52,117 | 100,025 | 97,841 | 118,556 |
| Canada | 729 | 6,332 | 1,487 | 14,805 | |
| Australia | 45,982 | 71,372 | 159,033 | 189,654 | 278,282 |
| Other countries | 835 | 283 | 646 | 358 | 313 |
| Totals | 109,114 | 124,501 | 266,036 | 289,340 | 411,956 |
| Iron and Steel.—Plate and Sheet. | |||||
| United Kingdom | 414,480 | 525,829 | 677,648 | 847,758 | 1,032,049 |
| Australia | 356 | 9,379 | 29,774 | 32,952 | 48,125 |
| Other countries | 2,304 | 2,214 | 2,866 | 3,639 | 4,133 |
| Totals | 417,140 | 537,422 | 710,288 | 884,349 | 1,084,307 |
| Iron and Steel.—Tubes, Pipes, and Fittings. | |||||
| United Kingdom | 214,930 | 167,072 | 255,402 | 312,172 | 362,924 |
| Canada | 13,886 | 22,101 | 33,470 | 52,884 | 64,496 |
| Australia | 2,177 | 6,070 | 6,205 | 4,646 | 15,144 |
| Germany | 2,678 | 1,745 | 2,794 | 2,493 | 4,771 |
| Other countries | 1,054 | 473 | 1,721 | 2,621 | 3,005 |
| Totals | 234,725 | 197,461 | 299,592 | 374,816 | 450,340 |
| Artificers' Tools. | |||||
| United Kingdom | 89,766 | 100,510 | 126,418 | 149,414 | 183,229 |
| Canada | 8,790 | 13,581 | 24,134 | 27,420 | 46,388 |
| Australia | 3,035 | 3,296 | 4,659 | 5,284 | 10,671 |
| Germany | 8,018 | 9,260 | 11,803 | 14,115 | 11,800 |
| United States of America | 12,346 | 10,513 | 30,481 | 48,716 | 73,415 |
| Other countries | 2,379 | 2,923 | 5,039 | 8,420 | 10,226 |
| Totals | 124,334 | 140,083 | 202,534 | 253,369 | 340,674 |
| Fencing-wire.—Plain and Barbed. | |||||
| United Kingdom | 122,297 | 105,203 | 111,395 | 161,394 | 144,953 |
| Canada | 428 | 9,008 | 13,871 | 24,958 | 37,543 |
| Australia | 21,490 | 31,518 | 27,400 | 49,706 | 58,674 |
| United States of America | 5,446 | 23,757 | 14,991 | 9,076 | |
| Other countries | 3,657 | 210 | 318 | 16 | |
| Totals | 147,872 | 151,385 | 176,423 | 251,367 | 250,262 |
| Miscellaneous Hardware. | |||||
| £ | £ | £ | £ | £ | |
| United Kingdom | 252,286 | 260,129 | 342,726 | 423,412 | 536,820 |
| Canada | 16,151 | 6,860 | 9,940 | 21,694 | 50,139 |
| Australia | 18,026 | 24,982 | 50,639 | 44,314 | 83,259 |
| France | 5,224 | 5,510 | 4,753 | 2,164 | 2,406 |
| Germany | 21,390 | 19,944 | 18,043 | 19,160 | 21,034 |
| Sweden | 5,997 | 7,226 | 9,981 | 12,908 | 16,468 |
| Japan | 2,778 | 11,468 | 11,625 | 20,825 | 23,762 |
| United States of America | 20,611 | 15,184 | 34,650 | 100,060 | 78,258 |
| Other countries | 3,751 | 4,744 | 6,728 | 7,437 | 5,749 |
| Totals | 346,214 | 356,047 | 489,085 | 651,974 | 817,895 |
| Agricultural Machinery. | |||||
| United Kingdom | 35,621 | 46,074 | 55,867 | 72,448 | 95,689 |
| Canada | 8,509 | 20,637 | 16,930 | 39,618 | 46,544 |
| Australia | 5,349 | 18,439 | 17,219 | 18,697 | 34,791 |
| France | 625 | 1,791 | 1,354 | 989 | 2,060 |
| Sweden | 674 | 10,792 | 13,232 | 11,384 | 15,889 |
| United States of America | 24,273 | 36,143 | 40,741 | 64,386 | 101,676 |
| Other countries | 1,789 | 2,806 | 3,361 | 3,678 | 4,734 |
| Totals | 76,840 | 136,682 | 148,704 | 211,200 | 301,383 |
| Dairying Machinery. | |||||
| United Kingdom | 43,756 | 62,644 | 67,774 | 51,514 | 55,589 |
| Australia | 19,217 | 19,049 | 24,137 | 20,334 | 25,255 |
| Denmark | 1,636 | 609 | 2,294 | 3,372 | 3,036 |
| Germany | 3,227 | 2,748 | 5,749 | 3,466 | 3,115 |
| Sweden | 111,325 | 63,889 | 40,252 | 46,873 | 67,060 |
| United States of America | 10,942 | 8,768 | 7,254 | 4,364 | 2,688 |
| Other countries | 1,861 | 3,071 | 2,392 | 3,928 | 6,485 |
| Totals | 191,964 | 160,778 | 149,852 | 133,851 | 163,228 |
| Electrical Machinery and Equipment (including Telephones and Accessories). | |||||
| United Kingdom | 555,958 | 517,470 | 630,241 | 873,878 | 1,312,163 |
| Canada | 34,325 | 44,629 | 60,482 | 76,239 | 100,844 |
| Australia | 49,544 | 86,175 | 98,760 | 111,438 | 140,787 |
| Belgium | 2,605 | 1,123 | 3,259 | 3,849 | 4,871 |
| Germany | 16,702 | 12,687 | 13,175 | 16,146 | 20,608 |
| Netherlands | 6,072 | 5,921 | 6,454 | 7,465 | 12,185 |
| Sweden | 9,404 | 7,814 | 9,313 | 20,142 | 29,858 |
| Japan | 1,590 | 8,048 | 8,952 | 11,370 | 16,226 |
| United States of America | 57,365 | 45,199 | 90,100 | 146,506 | 180,619 |
| Other countries | 9,755 | 7,708 | 7,662 | 9,359 | 16,382 |
| Totals | 743,320 | 736,774 | 928,398 | 1,276,392 | 1,834,543 |
| Wireless Apparatus. | |||||
| United Kingdom | 36,781 | 65,471 | 84,008 | 47,015 | 72,966 |
| Canada | 12,654 | 6,809 | 15,455 | 12,603 | 11,486 |
| Australia | 42,132 | 54,008 | 51,604 | 49,713 | 97,609 |
| Belgium | 75 | 15 | 66 | 604 | 55 |
| Germany | 1,094 | 395 | 604 | 518 | 313 |
| Netherlands | 5,912 | 5,185 | 11,311 | 19,349 | 10,074 |
| Sweden | 31 | 45 | 43 | 9 | |
| United States of America | 165,196 | 155,555 | 201,131 | 189,076 | 247,097 |
| Other countries | 236 | 998 | 426 | 525 | 959 |
| Totals | 264,111 | 288,481 | 364,605 | 319,446 | 440,508 |
| Leather and Leather Goods (excluding Soots and Shoes). | |||||
| United Kingdom | 107,465 | 115,657 | 109,902 | 132,059 | 170,532 |
| Canada | 2,482 | 1,582 | 4,915 | 6,728 | 8,574 |
| Australia | 39,672 | 66,664 | 86,290 | 68,465 | 83,605 |
| Germany | 5,317 | 3,456 | 6,707 | 8,280 | 8,625 |
| United States of America | 35,018 | 21,136 | 35,520 | 49,553 | 77,650 |
| Other countries | 3,204 | 5,366 | 8,491 | 10,045 | 12,161 |
| Totals | 193,158 | 213,861 | 251,825 | 275,130 | 361,147 |
| Timber. | |||||
| £ | £ | £ | £ | £ | |
| Canada | 11,494 | 11,870 | 25,113 | 31,015 | 40,522 |
| Australia | 32,095 | 91,635 | 144,506 | 301,306 | 271,021 |
| Sweden | 19,478 | 30,151 | 14,966 | 11,583 | 28,366 |
| Japan | 14,307 | 16,581 | 27,885 | 23,495 | 38,724 |
| United States of America | 6,301 | 7,815 | 16,041 | 21,086 | 35,476 |
| Other countries | 2,602 | 1,780 | 3,527 | 10,025 | 7,144 |
| Totals | 86,277 | 159,832 | 232,038 | 398,510 | 430,253 |
| Earthenware and Chile. | |||||
| United Kingdom | 122,587 | 117,155 | 152,530 | 212,210 | 243,914 |
| Australia | 837 | 1,303 | 1,854 | 3,039 | 2,059 |
| Czechoslovakia | 442 | 355 | 389 | 437 | 1,493 |
| Germany | 859 | 787 | 587 | 1,313 | 1,454 |
| Japan | 11,233 | 32,859 | 27,560 | 26,677 | 30,202 |
| Other countries | 999 | 564 | 527 | 333 | 504 |
| Totals | 136,957 | 153,023 | 183,447 | 244,009 | 279,626 |
| Glass and Glassware. | |||||
| United Kingdom | 74,187 | 72,985 | 111,963 | 140,903 | 177,790 |
| Canada | 1,018 | 2,240 | 3,657 | 3,411 | 3,996 |
| Australia | 19,407 | 30,868 | 43,743 | 57,192 | 64,329 |
| Belgium | 19,103 | 18,303 | 26,497 | 27,707 | 35,758 |
| Czechoslovakia | 8,201 | 9,670 | 14,702 | 23,530 | 33,403 |
| Germany | 4,356 | 5,656 | 7,583 | 10,490 | 20,807 |
| Japan | 4,611 | 10,937 | 9,917 | 14,421 | 17,295 |
| United States of America | 9,755 | 9,140 | 14,629 | 14,603 | 21,205 |
| Other countries | 5,999 | 6,398 | 7,142 | 11,676 | 7,455 |
| Totals | 146,637 | 166,197 | 239,833 | 303,933 | 382,038 |
| Printing-paper. | |||||
| United Kingdom | 224,522 | 177,702 | 167,802 | 165,081 | 178,335 |
| Canada | 205,034 | 242,553 | 288,614 | 323,980 | 432,721 |
| Finland | 2,868 | 3,657 | 6,024 | 3,524 | 4,991 |
| Germany | 7,130 | 5,928 | 8,712 | 15,641 | 22,630 |
| Norway | 5,100 | 11,548 | 11,442 | 11,949 | 10,006 |
| Sweden | 5,297 | 3,402 | 3,728 | 4,005 | 3,403 |
| United States of America | 16,220 | 5,269 | 6,988 | 20,038 | 26,569 |
| Other countries | 3,702 | 4,084 | 5,515 | 6,058 | 6,785 |
| Totals | 469,873 | 454,143 | 498,825 | 550,276 | 685,440 |
| Paper, other than Printing. | |||||
| United Kingdom | 205,908 | 216,923 | 251,594 | 268,946 | 289,134 |
| Canada | 69,604 | 77,898 | 93,861 | 92,482 | 123,559 |
| Australia | 4,220 | 3,420 | 5,897 | 6,997 | 6,393 |
| Austria | 1,713 | 4,269 | 6,186 | 4,731 | 2,416 |
| Belgium | 7,851 | 16,066 | 6,964 | 7,719 | 10,597 |
| Finland | 6,369 | 6,594 | 10,113 | 15,736 | 23,799 |
| Germany | 14,956 | 20,429 | 22,238 | 27,135 | 36,407 |
| Japan | 688 | 1,096 | 722 | 1,019 | 7,757 |
| Netherlands | 8,631 | 8,654 | 9,911 | 7,781 | 7,086 |
| Norway | 26,651 | 22,499 | 26,362 | 26,352 | 32,410 |
| Sweden | 34,349 | 37,838 | 49,272 | 52,157 | 44,440 |
| United States of America | 49,656 | 36,935 | 45,171 | 61,183 | 84,256 |
| Other countries | 5,140 | 4,968 | 5,132 | 6,858 | 8,973 |
| Totals | 435,736 | 457,589 | 532,423 | 579,096 | 677,227 |
| Books, Papers, and Music. | |||||
| United Kingdom | 255,143 | 295,654 | 311,943 | 320,974 | 373,104 |
| Australia | 44,762 | 54,424 | 62,866 | 75,455 | 83,140 |
| United States of America | 31,534 | 27,046 | 30,280 | 36,173 | 54,672 |
| Other countries | 2,876 | 3,245 | 3,601 | 5,315 | 7,223 |
| Totals | 334,315 | 380,369 | 408,690 | 437,917 | 518,139 |
| Miscellaneous Stationery. | |||||
| £ | £ | £ | £ | £ | |
| United Kingdom | 142,456 | 180,366 | 201,420 | 213,352 | 225,754 |
| Canada | 3,668 | 6,175 | 8,473 | 8,042 | 15,988 |
| Australia | 40,774 | 55,974 | 68,948 | 75,610 | 88,241 |
| Germany | 8,596 | 7,630 | 7,337 | 6,824 | 8,130 |
| Japan | 731 | 5,102 | 7,361 | 11,881 | 14,251 |
| United States of America | 37,981 | 32,077 | 32,168 | 31,174 | 31,898 |
| Other countries | 6,952 | 6,789 | 9,605 | 9,031 | 8,452 |
| Totals | 241,158 | 294,113 | 335,312 | 355,914 | 392,714 |
| Fancy Goods, Toys, and Smokers' Requisites (other than Cigarette-papers). | |||||
| United Kingdom | 79,430 | 84,977 | 86,894 | 109,011 | 121,670 |
| Canada | 648 | 1,811 | 3,841 | 6,125 | 9,129 |
| Australia | 4,028 | 7,392 | 10,612 | 12,604 | 16,060 |
| Czechoslovakia | 14,566 | 10,710 | 10,728 | 16,266 | 17,908 |
| France | 5,049 | 3,730 | 4,177 | 3,346 | 5,137 |
| Germany | 16,911 | 17,616 | 11,715 | 12,862 | 15,144 |
| Japan | 12,318 | 39,245 | 39,891 | 45,522 | 52,861 |
| United States of America | 3,740 | 2,354 | 4,337 | 7,746 | 14,651 |
| Other countries | 8,985 | 8,666 | 8,509 | 8,796 | 7,790 |
| Totals | 145,675 | 176,501 | 180,704 | 222,278 | 260,350 |
| Motor-cycles. | |||||
| United Kingdom | 16,467 | 17,605 | 23,708 | 40,268 | 69,446 |
| United States of America | 871 | 651 | 701 | ||
| Totals | 16,467 | 17,605 | 24,579 | 40,919 | 70,147 |
| Motor-cars. | |||||
| United Kingdom | 389,863 | 378,549 | 960,455 | 1,567,559 | 2,080,916 |
| Canada | 54,656 | 77,940 | 395,025 | 439,153 | 714,033 |
| United States of America | 19,278 | 23,959 | 463,856 | 710,454 | 762,876 |
| Other countries | 241 | 250 | 121 | ||
| Totals | 464,068 | 480,698 | 1,819,336 | 2,717,166 | 3,557,946 |
| Motor Lorries, Trucks, Vans, and Buses. | |||||
| United Kingdom | 99,147 | 142,806 | 249,517 | 222,083 | 475,930 |
| Canada | 5,246 | 15,951 | 60,019 | 110,587 | 176,983 |
| United States of America | 10,726 | 25,910 | 133,096 | 157,511 | 335,564 |
| Other countries | 478 | ||||
| Totals | 115,119 | 185,145 | 442,632 | 490,181 | 988,477 |
| Tires, Tubes, and Covers for Motor-vehicles. | |||||
| United Kingdom | 571,670 | 418,739 | 419,410 | 446,069 | 369,062 |
| Canada | 72,797 | 141,121 | 285,594 | 254,626 | 261,807 |
| Australia | 6,417 | 14,031 | 12,922 | 13,561 | 13,654 |
| France | 9,223 | 11,470 | 4,662 | 4,321 | 2,872 |
| Italy | 58 | 991 | 309 | 241 | 56 |
| Japan | 156 | 12,890 | 3,597 | 499 | 503 |
| United States of America | 7,552 | 7,787 | 13,777 | 15,615 | 21,713 |
| Other countries | 206 | 45 | 62 | 111 | 75 |
| Totals | 668,079 | 607,074 | 740,333 | 735,043 | 669,742 |
| Motor-spirit. | |||||
| Dutch East Indies | 243,539 | 289,269 | 659,305 | 623,851 | 1,008,227 |
| Russia | 2 | 113,085 | 36,792 | 125,850 | 145,986 |
| Persia | 57,281 | ||||
| United States of America | 983,495 | 689,283 | 385,146 | 359,523 | 430,862 |
| Other countries | 312 | 98 | 161 | 101 | 107 |
| Totals | 1,227,348 | 1,091,735 | 1,081,404 | 1,109,325 | 1,642,463 |
Trade with the Cook Islands is not included in the export and import totals for the Dominion, but is shown separately in official publications. The following table shows imports into New Zealand from the group. Further particulars of the trade of the islands will be found in the section dealing with Dependencies.
| Year. | Imports. |
|---|---|
| £ | |
| 1927 | 111,095 |
| 1928 | 119,521 |
| 1929 | 124,043 |
| 1930 | 122,156 |
| 1931 | 87,581 |
| 1932 | 89,136 |
| 1933 | 92,910 |
| 1934 | 77,018 |
| 1935 | 67,779 |
| 1936 | 86,873 |
The principal articles imported into New Zealand from the Cook Islands are as follows:—
| Article. | 1932. | 1933. | 1934. | 1935. | 1936. |
|---|---|---|---|---|---|
| Fruits, fresh— | £ | £ | £ | £ | £ |
| Bananas | 38,998 | 29,903 | 31,715 | 22,868 | 38,672 |
| Oranges | 31,318 | 49,527 | 30,109 | 21,089 | 28,689 |
| Tomatoes | 14,276 | 7,192 | 11,765 | 19,096 | 14,080 |
| Other | 646 | 385 | 393 | 285 | 750 |
| Coconuts | 425 | 844 | 779 | 533 | 743 |
| Copra | 1,254 | 1,295 | 1,056 | 1,014 | |
| All other items | 2,219 | 3,764 | 2,257 | 2,852 | 2,925 |
A SUMMARIZED historical account of the Customs tariff of New Zealand, setting forth the principal developments and changes from earliest times to 1930 will be found in the 1931 number of the Year-Book. The tariff has now developed into a complex schedule of duties, and consideration of space prevents a detailed account of the rates of duty now levied on goods imported into New Zealand.
Briefly the Customs tariff, apart from the obtaining of revenue, has for its objects the following:—
The development of New Zealand industries.
The maintenance and extension of markets for New Zealand produce.
The encouragement of intra-Empire trade.
Under the Ottawa agreement of 1932, New Zealand, in common with the other Dominions, was committed to hold an inquiry into the tariff and, if necessary, to revise it in accordance with certain explicitly stated principles. New Zealand undertook to afford protection against United Kingdom products only to industries which are reasonably assured of sound opportunities for success and to grant protection on such a level as to enable the United Kingdom producer to compete on the basis of the relative cost of economical and efficient production.
As soon as possible after the Ottawa Conference dutiable goods, the produce of the United Kingdom or of any British possession except Canada, Union of South Africa, Irish Free State, Newfoundland, or India, were exempted from the surtax on duty previously payable. Reductions were made in the rates of duty charged on confectionery, apparel, hosiery, and silk and artificial silk piece-goods, and additional preference to British countries was granted by the imposition of a duty or an increase in the existing rate on foreign cocoa-beans, raw coffee, cigars, rum, asphalt and bitumen, certain unground spices, and paper.
A Tariff Commission was set up in 1933 to inquire into the Customs tariff and to recommend for the consideration of the Government any alterations therein with a view to implementing the agreement made at Ottawa, and having regard, inter alia, to the financial, economic, and industrial conditions in the Dominion.
On the basis of the report of this Commission, resolutions amending the tariff were introduced on 10th July, 21st August, and 13th September, 1934, and ratified by the Customs Acts Amendment Act, 1934.
Some of the principal alterations made to the British preferential tariff were:—
Protective duties were abolished on: Certain stock foods; nails (as from 1st November, 1936)*; certain iron and steel pipes; linseed oil; white-lead ground in oil (as from 1st November, 1936)*; wireless sets in cabinets; maizena and cornflour in small packages.
* Extended to 1st November, 1937, by Order in Council dated 14th July, 1936, and later to 1st November, 1938, by Order in Council dated 13th October, 1937.
The protective duties were reduced on: Preserved and dried milk; baking powder; coffee essence; confectionery; sauce; soap; hats, caps, and millinery; boots and shoes; leather manufactures; glass bottles; oil engines; manufactured stationery; galvanized iron manufactures; metal office furniture; tinware; furniture and upholstery; paints and varnishes; biscuits; plaster pulp sheets; polishes; apparel; whole maize; vinegar; cement; matches; furs and fur skins; floor-mats and floor-rugs of wool.
The revenue duties were reduced on: Carpets; fancy goods; sporting requisites; jewellery; platedware; tobacco pipes; toilet preparations; pianos and other musical instruments; engines for tractors; cigarettes; table chinaware; oak timber; builders' and cabinetmakers' hardware.
The protective duties were increased on: Maize, ground or crushed; porcelain enamelled cast iron baths; and household gas meters.
Revenue duties were increased on: Cigarette papers.
The protective duty previously payable on motor-car bodies was abolished, and the duties were amended to encourage the assembling of motor-vehicles in New Zealand by a reduction in the rate of duty on vehicles imported unassembled or completely knocked-down.
In addition to the ordinary rates of duty imposed on goods entering the Dominion, additional revenue has been obtained in recent years by a surtax on dutiable imports and a primage duty on goods otherwise free.
The surtax was imposed in 1930 in lieu of a primage duty of 1 per cent. or 2 per cent. ad valorem previously charged on practically all imports whether free or dutiable. This surtax was not, however, applied to dutiable goods of Australian origin, which continued to pay the primage duty of 1 per cent. or 2 per cent.
The rate of surtax was fixed at one-twentieth of the total duty otherwise payable on certain goods (e.g., spirits, tobacco, timber, sugar, motor-spirit), and nine-fortieths of such duty on all other dutiable goods, except wheat and flour, and some other lines which have since been exempted.
As stated above, surtax was not charged on goods the produce of the United Kingdom or any British country except Canada, Union of South Africa, Irish Free State, Newfoundland, or India, on and after the 14th October, 1932, and the primage duty payable on Australian goods in lieu of surtax was also removed as from that date.
A primage duty of 3 per cent. was charged, as from the 31st July, 1931, on imports from all countries which were otherwise free of duty. Certain specified items were, however, exempted from primage duty.
The following is a list of the principal items which are free of duty (and in some cases are also exempt from primage duty) under the Customs Acts Amendment Act, 1934:—
Free in any Case.—Live animals; barley (if to be used as stock-food); bran; pollard; seeds; vegetable butters or fats; currants; dates; figs; prunes; glucose and caramel; nuts, except walnuts; rice; acids, other than acetic; inorganic salts of metallic elements and many other drugs and chemicals; bags and sacks; wool-packs; raw cotton; hatmakers' materials; buttons; needles and pins; wadding; cotton piece-goods for meat-wraps and cheese-bandages; umbrella-makers' materials; upholsterers' materials; coir, flax, and jute yarns; grindery; leather made from goat and kid skins; japanned or enamelled leather; bricks other than firebricks; marble in the rough; grindstones and whetstones; cinema films (subject however to film-hire tax); bookbinders' materials; cardboard and similar boards; parchment and greaseproof paper; printed books, papers, and music; beekeepers' apparatus; percussion caps, detonators, and explosives; hay-rakes, reapers and binders, mowers, and certain other agricultural implements; certain dairying machinery; sewing-machines; iron and other metal in ingots, pigs, or billets; fish and vegetable (other than linseed) oils; kerosene and other refined mineral oils not exceeding in specific gravity 0.860 at 60°F. other than motor-spirit; waxes; cork; crude tanning materials; manures; skins and hides.
Free if British, but dutiable if Foreign.—Bananas, oranges, mandarins, and grapefruit; raisins; infants' and invalids' foods; mustard; salt; cocoa-beans; raw coffee; sago and tapioca; maizena and cornflour; macaroni; acetic acid; cream of tartar; disinfectants; chloroform and other anæsthetics; antiseptics; manufactured dyes; most surgical, dental, optical, and scientific instruments and materials; felt, cotton, linen, and canvas piece-goods; silk and artificial silk piece-goods; leather-cloth; oil baize; sewing, &c., cottons and threads; elastics; plain tape; tailors' lining materials; cotton, silk, and artificial silk yarns; plain tablecloths, towels, and similar plain articles; belting (other than leather); children's boots and shoes; gum boots; rubber hose; most rubber manufactures, except tires for motor-vehicles; sheet glass; lenses; watch-glasses; pianos and certain other musical instruments; gramophone records; artists' materials; paperhangings; sensitized surfaces; waxed paper; paper (other than wrapping) in sheets of size not less than 20 in. by 15 in., or in rolls; ball bearings; bolts and nuts; rivets and washers; buckles; chains; fire-engines, fire-extinguishers, and other fire-extinguishing appliances; adding and computing machines; typewriters; most electrical apparatus; measuring, testing, &c., appliances; sheep-shearing machines; tractors; artificers', &c., tools; machine tools and machinery peculiar to industrial processes; iron and other metal in bars or sheets; wire and wire netting; metal cordage; rails for railways and tramways; under-carriage springs and metal fittings for vehicles; asphalt and bitumen; table chinaware.
An indication of the incidence of Customs taxation on various classes of commodities imported will be found in the last two columns of the table on page 271, where the Customs duty collected in 1936 is distinguished as a proportion of the dutiable imports and total imports in each of the statistical classes.
As previously stated it is impossible to give any account of the range of duties payable on all of the numerous tariff items, but the duty on some of the principal commodities in general use is mentioned hereunder. It should be noted that, in addition, surtax or primage may also be payable.
Tea.—Tea in bulk, when of British origin, was placed on the free list as early as 1907, when the duty on foreign tea was fixed at 2d. per lb. In 1917 a duty of 3d. per lb. was imposed on British tea, the foreign rate being increased to 5d. per lb. British tea in bulk was again placed on the free fist in 1923, and the duty on foreign tea reduced to 2d. Rates of 3d. and 5d. per lb. respectively have been reinstated from 31st July, 1931.
Sugar.—Sugar also was placed on the free list in 1907, prior to which the duty was ½ d. per lb. Refined sugar of foreign origin was charged d. per lb. under the 1921 tariff, the rate being altered in 1923 to 5/16 d. and in 1924 to ¼ d., irrespective of origin. The duty on refined sugar was increased to ¾ d. per lb. in 1931; and raw sugar, which is imported for refinement at Auckland, was made dutiable at ½ d. per lb., or, alternatively, ½ d. per lb. excise duty on manufacture. An additional ½ d. per lb. on both refined and raw sugar was imposed as from 9th February, 1933.
Tobacco.—The present duties on tobacco are as follows: Cigarettes, exceeding in weight 2½ lb. per 1,000, 10s. 6d. per lb.; cigarettes, not exceeding 2½ lb. per 1,000, 25s. 6d. per 1,000. Cigars, 12s. per lb. under the British preferential tariff and 16s. under the general tariff. Manufactured tobacco, cut, 6s. 10d. per lb., and plug, 6s. 8d. per lb. Unmanufactured tobacco for the manufacture of cigarettes, 3s. per lb.; and unmanufactured tobacco for the manufacture of tobacco, cigars, or snuff, 2s. per lb. A duty of ¾ d. British preferential tariff or ¾ d. general tariff is now levied on each sixty cigarette tubes or papers or the equivalent thereof. The excise duties on tobacco, &c., made in New Zealand are shown later under “Excise Duties.”
Alcoholic Beverages.—The rate of duty payable on most spirituous beverages is 40s. per proof gallon, except rum of foreign origin, dutiable at 44s. per proof gallon. Sparkling wine is liable to a duty of 10s. per gallon under the British preferential tariff and 15s. under the general tariff, and still wines to 4s. and 6s. respectively. The present duty on imported beer is 1s. 9d. per gallon under the British preferential tariff and 3s. under the general tariff. The excise duty on beer of local origin is given under “Excise Duties.”
Apparel.—Most apparel pays duty at the rate of 20 per cent. or 25 per cent. under the British preferential tariff and 50 per cent. under the general tariff.
Timber.—Certain types of special timbers and Australian hardwoods, if imported in logs, or rough sawn or rough hewn, are admitted free. Oak timber is free of duty under the British preferential tariff, and dutiable at 6s. per 100 sup. ft. under the general tariff. Other kinds of timber, such as Douglas fir (Oregon pine), redwood, Baltic pine, are subject to the following rates: Logs, round, unworked, 25s. per 100 cubic ft; rough sawn or rough hewn, 7s. 6d. or 9s. 6d. per 100 sup. ft. under the British preferential tariff, and 9s. 6d. or 11s. 6d. under the general tariff; dressed, 19s. per 100 sup. ft. British preferential tariff and 21s. general tariff.
Motor-vehicles.—Motor-vehicles imported in an unassembled or completely knocked-down condition are dutiable at 5 per cent. under the British preferential tariff and 50 per cent. under the general tariff. Assembled motor-vehicles are subject to a duty of 15 per cent. if admissible under the British preferential tariff and 60 per cent. if liable to the general tariff. Special rates apply to vehicles of Canadian origin.
Tires for Motor-vehicles.—Previously dutiable at 10 per cent. ad valorem under the British preferential tariff and 40 per cent. under the general tariff, these were in 1934 made subject to a duty based on the weight of the tires. Pneumatic rubber tires for motor-vehicles, inner tubes of rubber therefor, and moulded rubber strip for repair of such tires are now dutiable at 2£d. per lb. under the British preferential tariff and 8d. per lb. under the general tariff. Solid rubber tires are liable to a duty of ld. per lb. and 4d. per lb. under the British preferential and general tariffs respectively. The duty on tires is earmarked for the maintenance of highways.
Motor-spirits.—Towards the end of 1927 the Motor-Spirits Taxation Act of that year imposed a duty of 4d. per gallon (increased in 1930 to 6d.) on motor-spirits. The proceeds of this tax were devoted to roading purposes. In 1931 and 1933 an increase in duty of 2d. per gallon in each year was made, making the total duty on motor-spirits 10d. per gallon, plus a surtax of ½ d. per gallon on foreign. The proceeds from 6d. per gallon of this tax is earmarked for roading purposes, and the balance (4d. per gallon and surtax) is levied for general purposes and remains in the Consolidated Fund.
Full particulars of the goods which are prohibited or restricted from being imported into New Zealand are contained in the publication entitled “The Customs Tariff of New Zealand.” Some of the more important commodities the importation of which is prohibited, save with the consent of the Minister of Customs, are (as at 19th October, 1937):—
Fruit and vegetables, fresh, grown or produced in Australia.
Onions.
Pumps for motor-spirit.
Stock-foods.
Timber for fruit-cases.
Wheat and wheat-flour.
Wool-packs and wool-pockets.
An important excise duty is that on beer, which up to 1915 was charged at the rate of 3d. per gallon. In that year the beer duty was altered so as to increase according to the specific gravity of the worts used, the rate being 3¾d. per gallon when the specific gravity did not exceed 1,047, and increasing by 1/16 d. per gallon for every unit of specific gravity up to 1,055, and by ⅛d. thereafter. On the 2nd August, 1917, the minimum rate of duty for beer was increased from 3¾d. to 4¾d. per gallon, and further (on the 15th September, 1917) to 5¾d., with a maximum of 6d. per gallon. In 1921 a rate of 11½d. per gallon (increased to 1s. in 1930, and to 1s. 6d. in 1931) was imposed where the specific gravity of the worts used does not exceed 1,047, the rate being increased by 1/16d. for every unit of specific gravity above 1,047. The basic rate of excise duty on beer was reduced from 1s. 3d. to 1s. 3d. per gallon by the Customs Acts Amendment Act, 1934. The specific gravity of distilled water at 60 F. is taken as 1,000, and the specific gravity of the worts is determined in relation thereto.
Cut tobacco is now charged an excise duty of 4s. 6d. per lb.; other tobacco 4s. 4d. per lb. Cigars and snuff pay 4s. per lb., and the excise duty on cigarettes made in New Zealand is 13s. 6d. per 1,000 on cigarettes under 2£lb. per 1,000, and 5s. 6d. per lb. on cigarettes over 2£lb. per 1,000. Imported leaf tobacco used in the manufacture of tobacco, &c., in New Zealand pays on importation a duty of 3s. per lb. if for the manufacture of cigarettes, and 2s. per lb. if for tobacco, cigars, or snuff. An excise duty of 1/2d. is now levied on each sixty cigarette tubes or papers or the equivalent thereof.
The Customs Acts Amendment Act, 1931, imposed an excise duty of 1/2d. per lb. (increased to 1d. per lb. from 9th February, 1933) on sugar manufactured in New Zealand.
Excise duties were formerly levied direct on certain manufactures the preparation of which involved the use of a considerable proportion of spirits. In lieu of excise duty on the finished manufactured article, however, a special schedule of duties has since 1921 been provided on imported alcohol used in manufacturing these articles in licensed warehouses. The present rates are: On alcohol used in the manufacture of perfumed spirits, 36s. per gallon; toilet preparations, 34s.; culinary and flavouring essences, 20s.; medicinal preparations containing more than 50 per cent. of proof spirit, 4s. 6d. per gallon. In similar medicinal preparations containing less than 50 per cent. the alcohol used is duty-free.
The Gold Duty Act of 1858, amended from time to time, first imposed an export duty on gold. Under the Gold Duty Abolition and Mining Property Rating Act of 1890, the export duty on South Island gold was replaced by a system of rating mining property. The consolidating Gold Duty Act of 1908 maintained an export duty of 2s. per ounce of 20 carats fineness on gold produced in or exported from the North Island. A further export duty of 6d. per ounce (on gold of New Zealand origin only, and exclusive of gold produced by alluvial or dredge mining) was levied by the Mining Act of 1926, and this additional duty applied also to South Island gold. The Customs Acts Amendment Act passed in February, 1933, imposed an additional export duty of 12s. 6d. per ounce troy weight of gold of the fineness of 20 carats and upwards, and covered all gold, with certain minor exceptions, wherever produced or exported. Provision was made for reduction, by Order in Council, of the rate of duty in the event of a reduction in the value of gold in New Zealand.
An export duty was also imposed on timber (white-pine and kauri) by Acts of 1901 and 1903, and still operates. The present rates of 5s. per 100 superficial feet on logs, and 3s. or 5s. per 100 superficial feet on flitches were imposed by the Timber Export Duty Order of 23rd June, 1937. This duty is not payable in respect of sawn timbers.
The Customs Department collects the levies imposed on meat and honey exported. The proceeds (less expenses of collection) are, however, handed over to the respective Boards set up to control the export, &c., of these commodities in the interests of the producers. A levy is also made on wool exported and is paid, less cost of collection, &c., to a Wool Publicity Committee to enable it to carry out its functions.
In the earlier years of New Zealand's history the revenue derived from Customs and excise duties produced a greater proportion of the total revenue from taxation than it does to-day. Down to the outbreak of the Great War there was a constant tendency for this proportion to decrease, and the taxation legislation of the war period temporarily accelerated the movement. The percentage rose after 1921–22, but did not regain its pre-war proportions, and of recent years has shown a tendency to fall again. The figures for the last twenty years are as follows:—
| Year ended 31st March, | Total Taxation. | Customs and Excise Duties. | |
|---|---|---|---|
| Amount. | Percentage of Total Taxation. | ||
| £ | £ | Percent. | |
| 1918 | 12,340,853 | 3,601,383 | 29.18 |
| 1919 | 13,801,643 | 4,104,016 | 29.74 |
| 1920 | 16,251,769 | 5,185,728 | 31.91 |
| 1921 | 22,184,414 | 8,769,251 | 39.53 |
| 1922 | 16,370,516 | 5,554,334 | 33.93 |
| 1923 | 15,715,380 | 6,644,420 | 42.28 |
| 1924 | 16,540,438 | 7,870,309 | 47.58 |
| 1925 | 16,549,609 | 8,187,273 | 49.47 |
| 1926 | 17,254,688 | 8,974,235 | 52.01 |
| 1927 | 17,437,827 | S,826,287 | 50.62 |
| 1928 | 17,145,145 | 8,501,245 | 49.58 |
| 1929 | 17,832,033 | 8,565,736 | 48.04 |
| 1930 | 19,471,131 | 9,517,359 | 48.88 |
| 1931 | 18,878,285 | 8,181,076 | 43.34 |
| 1932 | 17,405,622 | 6,545,428 | 37.61 |
| 1933 | 19,703,703 | 6,785,641 | 34.44 |
| 1934 | 21,470,827 | 7,140,478 | 33.26 |
| 1935 | 24,737,939 | 8,094,605 | 32.72 |
| 1936 | 25,476,372 | 8,876,203 | 34.84 |
| 1937 | 31,164,302 | 10,340,838 | 33.18 |
The figures for Customs and excise duties from 1922–23 onwards are exclusive of tire-tax, and for 1927–28 and subsequent years the highways proportion (6d. per gallon) of the motor-spirits tax—two classes of duties collected through the Customs for road-maintenance purposes, and included in total taxation.
In the foregoing table the financial year has been taken for purposes of comparison with total taxation, figures concerning which are not available for calendar years. In subsequent tables the Customs-taxation figures relate to the calendar year, which is the statistical year for most trade purposes.
In the two tables which follow the figures do not include taxes for highway purposes, excise duties, or export duties, and are also exclusive of surtax, primage, and depreciated-currency duties for the years during which these have been in force.
| Year. | Foods and Nonalcoholic Drinks. | Clothing and Textiles. | Alcoholic Drinks and Tobacco. | All other Articles. | Total. |
|---|---|---|---|---|---|
| Amount of Duty collected. | |||||
| £ | £ | £ | £ | £ | |
| 1911 | 147,456 | 682,710 | 1,286,601 | 1,048,890 | 3,165,657 |
| 1916 | 170,009 | 985,335 | 1,390,322 | 1,036,227 | 3,681,893 |
| 1921 | 237,878 | 1,297,121 | 1,930,898 | 1,826,357 | 5,292,254 |
| 1926 | 389,686 | 1,760,408 | 2,679,080 | 3,102,623 | 7,931,797 |
| 1931 | 366,709 | 981,139 | 1,780,305 | 1,360,424 | 4,488,577 |
| 1932 | 314,125 | 900,430 | 1,561,815 | 1,423,872 | 4,200,242 |
| 1933 | 357,157 | 721,050 | 1,463,809 | 1,834,763 | 4,376,779 |
| 1934 | 310,476 | 780,149 | 1,464,281 | 2,471,939 | 5,026,845 |
| 1935 | 321,561 | 761,361 | 1,597,557 | 2,879,052 | 5,559,531 |
| 1936 | 346,167 | 929,727 | 1,866,217 | 3,733,505 | 6,875,616 |
| Year. | Foods and Nonalcoholic Drinks. | Clothing and Textiles. | Alcoholic Drinks and Tobacco. | All other Articles. | Total. |
|---|---|---|---|---|---|
| Percentage of Total Duty collected. | |||||
| Per Cent. | Per Cent. | Per Cent. | Per Cent. | Per Cent. | |
| 1911 | 4.66 | 21.57 | 40.64 | 33.13 | 100.00 |
| 1916 | 4.75 | 27.51 | 38.81 | 28.93 | 100.00 |
| 1921 | 4.49 | 24.51 | 36.49 | 34.51 | 100.00 |
| 1926 | 4.91 | 22.19 | 33.79 | 39.11 | 100.00 |
| 1931 | 8.17 | 21.86 | 39.66 | 30.31 | 100.00 |
| 1932 | 7.48 | 21.44 | 37.18 | 33.90 | 100.00 |
| 1933 | 8.16 | 16.47 | 33.45 | 41.92 | 100.00 |
| 1934 | 6.18 | 15.52 | 29.13 | 49.17 | 100.00 |
| 1935 | 5.78 | 13.70 | 28.74 | 51.78 | 100.00 |
| 1936 | 5.04 | 13.52 | 27.14 | 54.30 | 100.00 |
The Customs and excise duties received during the last five years are shown in more detail in the next table. Primage duties and surtax are included, but not tire-tax or the highways proportion of petrol-tax, which do not really represent Customs taxation, although levied on imports and for the sake of convenience collected through the Customs.
| — | 1932. | 1933. | 1934. | 1935. | 1936. |
|---|---|---|---|---|---|
* Included in other duties. | |||||
| Customs Duties. | £ | £ | £ | £ | £ |
| Spirits | 653,212 | 641,707 | 658,348 | 685,473 | 778,670 |
| Wine | 24,421 | 26,819 | 31,679 | 36,899 | 43,174 |
| Beer | 2,676 | 2,437 | 2,584 | 4,013 | 6,569 |
| Cigars, cigarettes, and snuff | 338,822 | 279,407 | 332,127 | 441,431 | 545,901 |
| Tobacco | 536,214 | 507,080 | 433,532 | 425,114 | 486,311 |
| Tea | 123,592 | 137,793 | 124,065 | 132,254 | 138,494 |
| Motor-spirit | * | * | 1,033,574 | 1,037,161 | 1,416,468 |
| Other duties | 2,521,305 | 2,781,536 | 2,410,936 | 2,797,186 | 3,460,029 |
| Primage | 251,214 | 234,731 | 276,060 | 319,919 | 326,059 |
| Depreciated currency and dumping duties | 7,293 | 494 | 57 | ||
| Surtax | 577,164 | 308,589 | 421,542 | 474,461 | 593,336 |
| Totals, Customs duties | 5,035,913 | 4,920,593 | 5,724,504 | 6,353,911 | 7,795,011 |
| Excise Duties. | |||||
| Alcohol used in perfumed spirit, &c.—New Zealand | 18,713 | 17,730 | 22,886 | 21,375 | 21,586 |
| Cigars, cigarettes, and snuff—New Zealand manufactured | 271,159 | 317,172 | 257,201 | 168,209 | 210,467 |
| Tobacco—New Zealand manufactured | 439,882 | 516,406 | 645,818 | 631,203 | 661,180 |
| Beer—New Zealand | 665,655 | 647,119 | 673,788 | 696,527 | 805,997 |
| Sugar | 318,155 | 595,207 | 664,433 | 657,142 | 683,089 |
| Totals, excise duties | 1,713,564 | 2,093,634 | 2,264,126 | 2,174,456 | 2,382,319 |
| Revenue per head:— | £ s. d. | £ s. d. | £ s. d. | £ s. d. | £ s. d. |
| From Customs duties | 3 6 0 | 3 3 11 | 3 13 10 | 4 1 4 | 4 19 0 |
| From excise duties | 1 2 5 | 1 7 2 | 1 9 2 | 1 7 10 | 1 10 3 |
| Totals | 4 8 5 | 4 11 1 | 5 3 0 | 5 9 2 | 6 9 3 |
The following table furnishes a general view of the ratio of Customs revenue to merchandise imports since 1895, which is taken as the base year:—
| Year. | Merchandise Imports. | Revenue. | Percentage of Revenue to Total Imports. | Index Numbers of Customs Revenue compared with Imports. | |||
|---|---|---|---|---|---|---|---|
| Value. | Value per Head. | Amount. | Actual Value per Head. | Value per Head at 1895 Ratio. | |||
| £ | £ s. d. | £ | £ s. d. | £ s. d. | Per Cent. | ||
| 1895 | 6,115,953 | 8 6 7 | 1,619,970 | 2 4 1 | 2 4 1 | 26.49 | 1,000 |
| 1900 | 10,207,326 | 12 14 6 | 2,170,354 | 2 14 1 | 3 7 4 | 21.26 | 803 |
| 1905 | 12,481,178 | 13 13 4 | 2,652,666 | 2 18 1 | 3 12 4 | 21.25 | 802 |
| 1910 | 16,748,223 | 16 1 11 | 2,954,989 | 2 16 9 | 4 5 2 | 17.64 | 666 |
| 1915 | 20,658,720 | 17 19 6 | 3,190,883 | 2 15 6 | 4 15 2 | 15.45 | 583 |
| 1920 | 61,553,853 | 49 10 11 | 7,953,477 | 6 9 7 | 13 5 6 | 12.92 | 488 |
| 1925 | 52,425,757 | 37 17 4 | 8,287,288 | 5 19 9 | 10 0 7 | 15.81 | 597 |
| 1930 | 44,339,654 | 29 14 0 | 7,776,103 | 5 4 2 | 7 17 4 | 17.54 | 662 |
| 1932 | 24,646,006 | 16 2 10 | 5,035,913 | 3 6 0 | 4 5 6 | 20.43 | 771 |
| 1933 | 25,581,366 | 16 12 4 | 4,920,593 | 3 3 11 | 4 8 0 | 19.24 | 726 |
| 1934 | 31,339,552 | 20 4 0 | 5,724,504 | 3 13 10 | 5 7 0 | 18.27 | 690 |
| 1935 | 36,317,267 | 23 4 11 | 6,353,911 | 4 1 4 | 6 3 2 | 17.50 | 661 |
| 1936 | 44,258,886 | 28 1 11 | 7,795,011 | 4 19 0 | 7 8 10 | 17.61 | 665 |
The figures given in the column “Value per head at 1895 ratio” indicate the amount of revenue per head of population which would have been obtained had the same ratio of Customs taxation to imports prevailed as in 1895.
Substantial reductions in the scale of duties were responsible for the sharp fall in the percentage of revenue to imports between 1895 and 1920. The percentage rose again after 1920, duo partly to heavier taxation and partly to a rise in the proportion of imports from foreign countries. To some extent also the position is affected by a change from the 1st April, 1926, in the system of computation for British preference purposes in the case of articles only partly manufactured in British countries. Allowance must be made over the last three years for the case of sugar, on which excise duty is now paid under the alternative provisions of the tariff, whereas formerly this considerable item was included in Customs revenue.
At the present time nearly one-half of New Zealand's imports are admitted free of duty.
The figures given in the following table are exclusive of specie, which is admitted free. Imports free of duty include items otherwise dutiable but admitted free for Government use, &c.
| Year. | Value of Merchandise Imports. | Percentage of Total. | Customs Duty collected. | |||||
|---|---|---|---|---|---|---|---|---|
| Free. | Dutiable. | Total. | Free. | Dutiable. | Amount. | Percentage of | ||
| Dutiable Imports. | Total Imports. | |||||||
| £ | £ | £ | Per Cent. | Per Cent. | £ | Per Cent. | Per Cent. | |
| 1927 | 18,788,517 | 25,994,149 | 44,782,666 | 41.95 | 58.05 | 8,110,497 | 31.20 | 18.11 |
| 1928 | 20,154,617 | 24,689,485 | 44,844,102 | 44.94 | 55.06 | 7,648,747 | 30.98 | 17.06 |
| 1929 | 20,886,798 | 27,847,674 | 48,734,472 | 42.86 | 57.14 | 8,582,393 | 30.82 | 17.61 |
| 1930 | 20,255,019 | 24,084,635 | 44,339,654 | 45.68 | 54.32 | 7,776,103 | 32.29 | 17.54 |
| 1931 | 12,306,839 | 14,191,312 | 26,498,151 | 46.44 | 53.56 | 5,282,510 | 37.23 | 19.93 |
| 1932 | 11,634,883 | 13,011,123 | 24,646,006 | 47.21 | 52.79 | 5,035,913 | 38.71 | 20.43 |
| 1933 | 12,424,198 | 13,157,168 | 25,581,366 | 48.57 | 51.43 | 4,920,593 | 37.40 | 19.24 |
| 1934 | 15,019,017 | 16,320,535 | 31,339,552 | 47.92 | 52.08 | 5,724,504 | 35.08 | 18.27 |
| 1935 | 17,358,652 | 18,958,615 | 36,317,267 | 47.80 | 52.20 | 6,353,911 | 33.51 | 17.50 |
| 1936 | 20,615,654 | 23,643,232 | 44,258,886 | 46.58 | 53.42 | 7,795,011 | 32.97 | 17.61 |
The next table gives for 1936 detailed figures arranged according to the statistical classification, for the key to which reference should be made to p. 227. The main features of the table are the overwhelming proportion of dutiable goods in the classes covering alcoholic beverages, tobacco, foodstuffs of animal origin, jewellery, timepieces and fancy goods, vehicles, non-alcoholic beverages, and apparel, and the high proportion of free goods in the classes covering live animals, manures, unmanufactured metals, stones and minerals (mainly coal), animal substances other than foodstuffs, rubber and manufactures thereof, and manufactured fibres.
FREE AND DUTIABLE IMPORTS, 1936.
| Class No. | Value of Merchandise Imports. | Percentage of Total. | Customs Duty collected. | |||||
|---|---|---|---|---|---|---|---|---|
| Free. | Dutiable. | Total. | Free. | Dutiable. | Amount. | Percentage of | ||
| Dutiable Imports. | Total Imports. | |||||||
| £ | £ | £ | Per Cent. | Per Cent. | £ | Per Cent. | Per Cent. | |
| I | 276 | 241,316 | 241,592 | 0.11 | 99.89 | 39,602 | 16.41 | 16.39 |
| II | 1,449,727 | 1,393,582 | 2,843,309 | 50.99 | 49.01 | 156,754 | 11.25 | 5.51 |
| III | 59,960 | 815,510 | 875,470 | 6.85 | 93.15 | 149,811 | 18.37 | 17.11 |
| IV | 748,321 | 748,321 | 100.00 | 834,005 | 111.45 | 111.45 | ||
| V | 794,372 | 794,372 | 100.00 | 1,032,212 | 129.94 | 129.94 | ||
| VI | 75,227 | 75,227 | 100.00 | |||||
| VII | 116,592 | 3,384 | 120,276 | 97.19 | 2.81 | 911 | 26.92 | 0.76 |
| VIII | 512,598 | 196,165 | 708,763 | 72.32 | 27.68 | 30,316 | 15.45 | 4.28 |
| IXA | 495,349 | 2,215,539 | 2,710,888 | 18.27 | 81.73 | 502,652 | 22.69 | 18.54 |
| IXB | 2,702,024 | 2,850,836 | 5,552,860 | 48.66 | 51.34 | 427,075 | 14.98 | 7.69 |
| IXC | 422,358 | 54,528 | 476,886 | 88.57 | 11.43 | 9,286 | 17.03 | 1.95 |
| X | 821,891 | 1,959,135 | 2,781,026 | 29.55 | 70.45 | 1,539,357 | 78.57 | 55.35 |
| XI | 167,176 | 248,418 | 415,592 | 40.23 | 59.77 | 34,851 | 14.03 | 8.39 |
| XII | 121,179 | 3,286 | 124,465 | 97.36 | 2.64 | 419 | 12.75 | 0.34 |
| XIVA | 674,059 | 2,768 | 676,827 | 99.59 | 0.41 | 122 | 4.41 | 0.02 |
| XIVB | 3,791,778 | 1,164,332 | 4,956,110 | 76.51 | 23.49 | 234,273 | 20.12 | 4.73 |
| XV | 3,351,469 | 1,927,032 | 5,278,501 | 63.49 | 36.51 | 337,514 | 17.51 | 6.39 |
| XVIA | 179,213 | 20,695 | 199,908 | 89.65 | 10.35 | 3,539 | 17.10 | 1.77 |
| XVIB | 169,791 | 191,356 | 361,147 | 47.01 | 52.99 | 32,556 | 17.01 | 9.01 |
| XVIIA | 275,394 | 154,859 | 430,253 | 64.01 | 35.99 | 47,772 | 30.85 | 11.10 |
| XVIIB | 43,275 | 132,291 | 175,566 | 24.65 | 75.35 | 31,764 | 24.01 | 18.09 |
| XVIII | 420,131 | 441,196 | 861,327 | 48.78 | 51.22 | 73,641 | 16.69 | 8.55 |
| XIXA | 1,170,231 | 192,436 | 1,362,667 | 85.88 | 14.12 | 26,032 | 13.53 | 1.91 |
| XIXB | 623,454 | 288,414 | 911,868 | 68.37 | 31.63 | 59,908 | 20.77 | 6.57 |
| XX | 6,535 | 713,890 | 720,425 | 0.91 | 99.09 | 182,645 | 25.58 | 25.35 |
| XXI | 501,614 | 124,993 | 626,607 | 80.05 | 19.95 | 22,099 | 17.68 | 3.53 |
| XXIIA | 890,109 | 598,241 | 1,488,350 | 59.81 | 40.19 | 119,021 | 19.90 | 8.00 |
| XXIIB | 605,779 | 605,779 | 100.00 | |||||
| XXIIIA | 186,554 | 5,737,942 | 5,924,496 | 3.15 | 96.86 | 868,641 | 15.14 | 14.66 |
| XXIIIB | 781,611 | 428,397 | 1,210,008 | 64.60 | 35.40 | 78,838 | 18.40 | 6.52 |
| Primage and surtax | 919,395 | |||||||
| Totals | 20,615,654 | 23,643,232 | 44,258,886 | 46.58 | 53.42 | 7,795,011 | 32.97 | 17.61 |
The following table shows imports in 1936 according to the nature or rate of duty. The rates shown are exclusive of primage and surtax.
IMPORTS, 1936, BY RATES OF DUTY.
| Nature of Duty. | United Kingdom. | Other British. | Foreign. | Totals. |
|---|---|---|---|---|
| £ | £ | £ | £ | |
| Free (excluding specie) | 11,568,008 | 5,969,297 | 3,078,349 | 20,615,654 |
| Specific duties | 1,912,376 | 1,813,141 | 3,431,301 | 7,156,818 |
| Ad valorem duties— | ||||
| 5 per cent. | 1,148,667 | 48,080 | 20,660 | 1,217,407 |
| 10 per cent. | 388,971 | 382,139 | 749,033 | 1,520,143 |
| 12½ per cent. | 122,413 | 122,413 | ||
| 15 per cent. | 1,652,358 | 713,128 | 1,024,682 | 3,390,168 |
| 20 per cent. | 3,977,040 | 742,279 | 279,739 | 4,999,058 |
| 25 per cent. | 1,203,338 | 286,635 | 878,880 | 2,368,853 |
| 30 per cent. | 291 | 42,458 | 72,365 | 115,114 |
| 32½ per cent. | 103,967 | 103,967 | ||
| 35 per cent. | 117,526 | 138,621 | 256,147 | |
| 40 per cent. | 475 | 27 | 110,704 | 111,206 |
| 45 per cent. | 649,671 | 649,671 | ||
| 50 per cent. | 1,439,548 | 1,439,548 | ||
| 55 per cent. | 28,180 | 28,180 | ||
| 60 per cent. | 164,539 | 164,539 | ||
| Totals ad valorem | 8,371,140 | 2,558,652 | 5,556,622 | 16,486,414 |
| Total merchandise imports | 21,851,524 | 10,341,090 | 12,066,272 | 44,258,886 |
NOTE.—The primage duty of 3 per cent. ad valorem payable on certain otherwise free imports and the surtax of 9/40, or 1/20 of the duty otherwise payable on certain dutiable goods, have been disregarded in the compilation of this table.
Preference to British countries in respect of certain commodities was provided for in the earliest tariff in force in New Zealand—that introduced in 1841. The amended tariff of 1844 involved the dropping of this preference to British goods, but two years later preference was again introduced.
The first definite attempt at reciprocity was made in 1870, when the Colonial Reciprocity Act gave power to the Government to make reciprocal agreements with the Australian States, including Tasmania; but this Act failed to receive the Royal assent and consequently lapsed.
In 1895, however, the Customs Duties Reciprocity Act received the Royal assent, and ratified an agreement which had been tentatively proposed with South Australia, besides giving power to the Government to make further agreements with the other Australian States. In 1907 the New Zealand and South African Customs Treaty was negotiated. A tariff agreement with the Australian Commonwealth has been in operation since 1922, and with Canada since 1932.
Imperial preference proper was introduced in New Zealand by the Preferential and Reciprocal Trade Act, 1903, which followed the lead given by Canada. At first only a few items were covered by the extra duties levied upon goods of foreign origin, but the Tariff Act of 1907 extended this additional preferential duty to a great number of items. The effect of the 1921, 1927, 1930, and 1934 tariffs has been to widen the disparity in the duty as between goods of British and of foreign origin. Under the Ottawa agreement, New Zealand undertook to preserve the existing margins of preference on United Kingdom goods when the margin of preference did not exceed 20 per cent., and where the margin exceeded that figure not to reduce it below 20 per cent. without the consent of the Government of the United Kingdom. In the tariff of 1934, where reductions in duty were made under the British Preferential Tariff, the rates of duty under the general (foreign) tariff were, except in a few cases, retained.
The following are the classes of goods which are deemed to be the produce or manufacture of countries, the produce or manufactures of which are entitled to be entered for duty at British preferential rates:—
Goods wholly the produce of such countries:
Goods wholly manufactured in such countries from unmanufactured raw material and/or from one or more of the imported partly manufactured raw materials which are enumerated in the regulations:
Goods partially manufactured in such countries, provided that the final process of manufacture has been performed in such countries, and also that the expenditure in material produced in such countries and (or) labour performed within such countries in each and every article is not less than one-half of the factory or works cost of such article in its finished state.
The conditions applying to British countries, the products of which are admissible under the British Preferential Tariff pursuant to agreements made by New Zealand with such countries, may be varied to suit the provisions of such agreements.
Prior to the 1st April, 1926, the minimum mentioned in paragraph (c), which is now one-half, was one-fourth.
In the calculation of the proportion of produce or labour none of the following items is to be included or considered:—
Manufacturer's profit, or the profit or remuneration of any trader, agent, broker, or other person dealing in the article in its finished condition:
Royalties:
The cost of outside packages or any cost of packing the goods thereinto:
Administrative and general office expenses:
Any cost of conveying, insuring, or shipping the goods subsequent to their manufacture:
Any other charges incurred subsequent to the completion of the manufacture of the goods.
Tea to be entitled to be entered at British preferential rates must be grown in some part of the British Empire, and the final process of manufacture must also be performed in some British country.
As explained later, certain imports from Australia pay more than corresponding items from other British countries, while, from June, 1931, to 24th May, 1932, the bulk of imports of Canadian origin paid the general rate of duty.
The following table shows the extent of the imports which are affected by preference, by giving the percentage of the total imports and of foreign imports so affected. The proportions increased generally after the tariff changes of 1907, 1917, and 1921. The effect of any change in this direction under the 1927 and 1930 tariffs is hidden, owing to the falling-off of imports, particularly in motor-vehicles—an important item subject to the preferential surtax.
| Year. | Value of Merchandise Imports. | Imports on which Preferential Surtax payable. | Percentage of | |||
|---|---|---|---|---|---|---|
| Total. | Of British Origin. | Of Foreign Origin. | Total Imports. | Foreign Imports. | ||
| £ | £ | £ | £ | Per Cent. | Per Cent. | |
| 1927 | 44,782,666 | 30,717,281 | 14,065,385 | 7,504,474 | 16.76 | 53.35 |
| 1928 | 44,844,102 | 30,768,025 | 14,076,077 | 7,461,963 | 16.63 | 53.01 |
| 1929 | 48,734,472 | 33,031,464 | 15,703,008 | 8,437,217 | 17.30 | 53.73 |
| 1930 | 44,339,054 | 30,317,847 | 14,021,807 | 6,648,142 | 15.00 | 47.41 |
| 1931 | 26,498,151 | 18,401,887 | 8,096,264 | 3,097,995 | 11.09 | 38.20 |
| 1932 | 24,646,006 | 17,510,317 | 7,135,689 | 2,388,118 | 9.09 | 33.47 |
| 1933 | 25,581,366 | 18,759,000 | 6,822,300 | 2,573,045 | 10.06 | 37.72 |
| 1934 | 31,339,552 | 23,139,613 | 8,199,939 | 3,778,155 | 12.06 | 46.08 |
| 1935 | 36,317,267 | 26,603,160 | 9,714,107 | 4,898,063 | 13.49 | 50.42 |
| 1936 | 44,258,886 | 32,192,614 | 12,066,272 | 6,182,656 | 13.97 | 51.24 |
For the purpose of studying better the scope and effect of the preferential surtax, imports for 1936 are classified in the next table into four groups:—
| — | United Kingdom. | Other British Countries. | Foreign Countries. |
|---|---|---|---|
| £ | £ | £ | |
| Free in any case | 3,183,511 | 2,461,031 | 3,078,349 |
| Free when of British origin, but dutiable when of foreign origin | 8,384,497 | 3,507,666 | 3,176,612 |
| Dutiable with same rates whether of British or foreign origin | 908,751 | 362,484 | 2,805,267 |
| Dutiable with a lower rate of duty when of British origin | 9,374,765 | 4,009,309 | 3,006,044 |
| Totals | 21,851,524 | 10,341,090 | 12,066,272 |
Of foreign goods imported in 1936, 26 per cent. were free of duty, as compared with 58 per cent. in 1921. A further 23 per cent. (7 per cent. in 1921), although dutiable, paid no higher rate than if they had been of British origin. This loaves 51 per cent. (35 per cent. in 1921) with the disadvantage of the higher rate of duty applicable to foreign goods. Of the total imports of British origin in 1936, 54 per cent. were classified as free. Of goods of United Kingdom origin, 53 per cent. were free.
As stated above, there was inaugurated in 1907 a reciprocal arrangement with British South Africa whereby products of that country, when imported direct, were admitted into New Zealand at reduced rates of duty, in return for similar concessions granted by South Africa in respect of New Zealand products. This agreement was revised in 1922, the duties on wines being increased and tobacco being deleted from the list. A further alteration, whereby maize and dried apples were deleted from the list, was made in 1925. Dried fruits formerly came under the agreement, being admitted free when the general tariff was 4d. per pound and the British preferential rate 2d. On 1st January, 1934, however, the general tariff was reduced to 2d. and the British rate made free.
The main item of import benefited by the reciprocal arrangement is wine. Sparkling wine is admitted at 9s. 6d. per gallon, as against 15s. under the general and 10s. under British preferential rates. On still wine the rate is 3s. 6d. per gallon, as compared with 6s. under the general and 4s. under the British preferential tariff. Other items specially provided for are feathers, fish, fresh fruit, and tea; while in the case of all other dutiable goods, with the exception of spirits and tobacco, a reduction of 3 per cent. of the duty payable is made.
The following table shows the merchandise trade with South Africa during the last ten years:—
| Year. | Merchandise Imports. | Merchandise Exports to South Africa. | |
|---|---|---|---|
| From South Africa. | Of South African Origin. | ||
| £ | £ | £ | |
| 1927 | 119,305 | 122,597 | 31,251 |
| 1928 | 99,054 | 104,043 | 64,892 |
| 1929 | 98,839 | 100,988 | 51,707 |
| 1930 | 91,693 | 96,032 | 15,589 |
| 1931 | 76,201 | 76,757 | 8,052 |
| 1932 | 84,832 | 84,607 | 12,120 |
| 1933 | 48,791 | 50,646 | 14,427 |
| 1934 | 55,174 | 56,092 | 29,152 |
| 1935 | 54,936 | 55,801 | 27,504 |
| 1936 | 117,329 | 119,405 | 21,855 |
The imports of merchandise of South African origin during the last five years are classified into four divisions in the following table:—
| — | 1932. | 1933. | 1934. | 1935. | 1936. |
|---|---|---|---|---|---|
| £ | £ | £ | £ | £ | |
| Special reduction or remission of duty | 34,935 | 21,101 | 7,924 | 7,124 | 7,313 |
| Reduction of 3 per cent. in duty | 22,554 | 17,475 | 25,512 | 25,441 | 71,041 |
| No reduction | 2,332 | 3,075 | 4,134 | 5,885 | 7,531 |
| Free under general or British preferential tariff | 24,846 | 8,995 | 18,522 | 17,351 | 33,520 |
| Totals | 84,667 | 50,046 | 56,092 | 55,801 | 119,405 |
Of commodities specially provided for in the reciprocal tariff, wine was the only item to benefit in 1936. Dried apricots (£20,623) and bark and other tanning materials (£9,278) accounted for the great bulk of the £33,520 free imports other than under the reciprocal tariff. “Precious stones” is the principal item in the category “reduction of 3 per cent.,” the 1930 figure being £43,250; maize made up most of the remainder with £26,169.
A trade agreement between Australia and New Zealand was first entered into on the 11th April, 1922. Under this agreement, each country granted to goods of the other the benefits of its British preferential tariff, except with regard to certain classes of goods on which special rates were fixed.
During 1933 a Minister of the Commonwealth Government visited New Zealand to discuss the commercial relations between the two countries. A provisional agreement was reached in April, 1933, and confirmed by the Trade Agreement (New Zealand and Australia) Ratification Act, 1933. The new agreement came into operation from 1st December, 1933.
Under the agreement lower duties than those under the British preferential tariff on New Zealand products entering Australia are provided for on many lines, the chief of which are: Stilton cheese; fresh and frozen fish and fish pastes; dried peas; hay; chaff; fresh, smoked, and preserved meats; onions; lucerne-seed; wine; furs; hats; caps; floor-rugs; various agricultural and dairying implements; whale-oil; casein; sugar of milk; and timber.
Duties lower than those under the British preferential tariff in force in New Zealand at the time of the agreement were granted on certain lines of Australian goods, chiefly cotton-seed meal, hay, chaff, oats, dried peas, fish, fish pastes and soups, wine, eucalyptus oil, chamois leather, certain oil-engines, and timber. In addition, a duty of ld. per lb., plus surtax, was imposed on foreign raisins on importation into New Zealand, while Australian raisins were admitted free, except for a primage duty of 3 per cent. ad valorem.
To protect New Zealand industries, the duties on many classes of Australian goods were fixed at rates higher than those in force in 1933 on similar United Kingdom goods. The principal commodities affected are potatoes, fresh cherries, canned fruits, jams, soap, rennet, woollen rugs, woollen blankets, woollen textiles, leather manufactures, leather boots, tiles, tinware, gas heating and cooking appliances, certain kinds of machinery and of metal manufactures.
The agreement provides that goods which are partially manufactured in Australia or New Zealand shall not be regarded as the produce or manufacture of the Commonwealth or the Dominion, as the case may be, unless the expenditure in material produced in either country and/or labour performed within either country represents not less than one-half of the factory or works cost of the goods in their finished state.
Article IX of the agreement provides that where with respect to any goods not specially enumerated in the agreement the rate of duty thereon under the New Zealand British preferential tariff is less than the duty under the Australian British preferential tariff, the New Zealand Government may request the Australian Government to admit into the Commonwealth New-Zealand-produced goods of such class at the rate of duty chargeable on goods of that class under the New Zealand British preferential tariff. If within three calendar months after the receipt of the request the Australian Government does not comply therewith the New Zealand Government may, without further notice, impose on such goods of Australian origin a rate of duty not being greater than the rate of duty for the time being in force in Australia on the like goods under the Australian British preferential tariff. A similar provision is made with respect to the admission of Australian-produced goods into New Zealand.
Merchandise trade between New Zealand and Australia during the last ten years has been as follows:—
| Year. | Imports from Australia. | Imports of Australian Origin. | Exports to Australia. |
|---|---|---|---|
| £ | £ | £ | |
| 1927 | 4,264,175 | 3,869,246 | 3,665,962 |
| 1928 | 3,868,281 | 3,499,151 | 2,902,655 |
| 1929 | 3,631,625 | 3,258,727 | 2,338,410 |
| 1930 | 3,383,943 | 3,023,065 | 1,562,281 |
| 1931 | 2,284,507 | 2,073,361 | 1,167,403 |
| 1932 | 2,571,080 | 2,368,293 | 1,444,860 |
| 1933 | 2,807,921 | 2,576,092 | 1,393,311 |
| 1934 | 3,532,068 | 3,238,124 | 1,882,516 |
| 1935 | 4,295,457 | 3,957,398 | 1,781,811 |
| 1936 | 5,220,399 | 4,941,376 | 1,843,475 |
The rates of duty payable on Australian goods imported into New Zealand and not specifically mentioned in the agreement are automatically affected by changes in the New Zealand British preferential tariff. A modification of the agreement was made in May, 1935, whereunder the duty on certain Australian goods which would otherwise have been reduced or removed from 1st June, 1936, following changes made in the British preferential tariff by the Customs Acts Amendment Act, 1934, remained unaltered.
From October, 1925, reciprocal trade arrangements with respect to certain items of Canada - New Zealand trade were in force, but ceased in May, 1930.
Negotiations between the Canadian and New Zealand Governments bore fruit in a trade agreement which came into force in both countries for a period originally of one year, as from the 24th May, 1932. This agreement has been extended from time to time, and the present date of expiry (if not renewed) is the 30th September, 1938.
Under the present Canadian tariff on New Zealand produce are included, inter alia: Butter, 5 cents per lb.; cheese, 1 cent per lb.; and lamb, mutton, or beef, 3 cents per lb.; while sausage casings, hides and skins, wool, apples, seeds, kauri-gum, and phormium fibre are amongst those admitted free.
The rates of duty payable in New Zealand on certain imports from Canada are -as under: Salmon, 1¾ d. per lb.; silk or artificial silk stockings, 32½ per cent.; boots and shoes, &c., 20 per cent.; electric cooking and heating appliances, 30 per cent.; certain agricultural implements, 35 per cent.; timber, 7s. 6d. or 9s. 6d. (rough sawn) and 19s. (sawn and dressed) per 100 sup. ft. The general tariff rate on such timber was increased by 2s. per 100 sup. ft. to afford preference to Canada and other British countries. Canadian goods not mentioned in the agreement enter New Zealand at the ordinary British preferential rates of duty. In some instances where the British preferential rates of duty were reduced by the 1934 tariff the rates on certain Canadian goods mentioned in the agreement were also reduced to the British-preferential level. Special duties are payable on motor vehicles of Canadian origin, these duties varying according to the Canadian content.
A trade arrangement between the Economic Union of Belgium and Luxemburg and New Zealand was entered into on the 5th December, 1973, and came into force on the 16th December, 1933. The principal provisions of this agreement were: (a) Each country granted most-favoured-nation treatment to the other; (b) New Zealand reduced the duty on certain Belgian goods, chiefly matches (by abolition of surtax), carpets, glassware, sensitized surfaces, and firearms; and (c) Belgium reduced the duty on New Zealand cheddar cheese and fresh apples, and provided for the free admission into Belgium of New Zealand tallow, hides, skins, greasy wool, and phormium fibre.
An extension was made to this agreement, and became operative on and from 1st September, 1936. Reductions in the New Zealand tariff rates were made in respect to maizena and cornflour, cigars, sparkling wines, gloves, belting for machinery, leather manufactures, bevelled and silvered glass, certain cartridges, certain electrical machinery, certain other machinery, and certain pipes and pipe fittings. Surtax was remitted on the above items, and also on wine (other kinds), paper, cartridges, printing-machines, metals, nails, and pipes.
New Zealand produce, upon which a concession in duty or free admission into Belgium is given in the modification to the agreement, is honey, sausage-casings, kauri-gum, and casein.
Details of a trade agreement entered into with Germany were released by the Minister of Customs on 5th October, 1937, when legislation to give effect to this agreement was introduced in the House of Representatives.
The principal provisions of the agreement are: (a) Each country accords most-favoured nation treatment to the other. (b) New Zealand reduced the duty on and/or exempted from surtax certain German goods, viz., wine, other kinds; drugs and chemicals n.e.i.; braids and bindings n.e.i.; lenses, all kinds; artists' materials; camera cases; clocks; pianos, organs, and similar instruments; musical instruments n.e.i.; cameras; photographic goods n.e.i.; emery paper; paperhangings; engines, viz., specially suited for cycles; artificers' tools; field glasses; builders' hardware; kalsomine and distempers in powder form. German goods of the classes mentioned will also be exempt from the surtax of nine-fortieths of the duty payable in respect of goods liable to the general tariff. (c) In return for the concessions granted, Germany has agreed to expend the credits built up by the sale of German goods in New Zealand in the purchase of New Zealand goods. It was agreed that 25 per cent. of the first £400,000 of such credits should be used for the purchase of butter and 5 per cent. in the purchase of apples. Fifty per cent. of any credits in excess of £400,000 is to be expended on the purchase of butter and 20 per cent. on apples, with a limit, in the latter instance, of £60,000 in any one year.
New Zealand is also a party to certain commercial treaties, conventions, or arrangements with countries other than those referred to above. In certain instances these became applicable to New Zealand automatically as a member of the British Empire, while in others New Zealand has become a party signifying her willingness to adhere to treaties negotiated by the United Kingdom. New Zealand has also in some cases entered into agreements with foreign countries by direct negotiation with those countries, and in others the United Kingdom has acted for New Zealand in making trade agreements on her behalf. In some instances the trade involved is insignificant.
By Order in Council of the 21st February, 1934, the duties and exemptions from duty provided for in the Trade Arrangement (Belgium and New Zealand) Ratification Act, 1933, were applied to similar goods the produce or manufacture of the following countries: Argentina, Austria, Brazil, China, Czechoslovakia Egypt, Finland, Germany, Hungary, Italy, Japan, Norway, and Spain. Sweden was added to the list of countries by Order in Council of the 7th June, 1935, and Greece by Order in Council on 22nd October, 1936. The concessions granted to Germany under the agreement mentioned above were also made applicable by an Order in Council dated 11th October, 1937, to all the other “most-favoured nation” countries included in this paragraph.
The Customs (Tariff Preference and General) Regulations, 1936, set out the classes of goods from foreign countries which may be entered at concessional rates of duty applying to any such countries as a result of treaty obligations between New Zealand and such countries,—
Goods wholly the produce of such a country:
Goods wholly manufactured in such a country from unmanufactured raw materials:
Goods partially manufactured in such a country, provided (1) that the final process of manufacture has been performed in that country or in any British country the produce or manufactures of which are entitled to be entered under the British preferential tariff otherwise than pursuant to any agreement or arrangement made between New Zealand and such country; (2) that the expenditure in material, the produce of that country and/or in labour performed in that country on each and every article is not less than one-half of the factory or works cost of such article in its finished state.
NEW ZEALAND has twenty-one ports of entry for Customs purposes, eleven in the North Island and ten in the South.
The following table gives the total value of imports of merchandise for the several ports of entry. Waitara had no overseas imports or exports during the period, Tokomaru Bay no imports, and Tauranga no exports.
| Port. | 1932. | 1933. | 1934. | 1935. | 1936. |
|---|---|---|---|---|---|
| £ | £ | £ | £ | £ | |
| Auckland | 8,876,367 | 9,041,275 | 10,780,915 | 12,136,235 | 15,405,342 |
| Kaipara | 558 | 445 | |||
| Tauranga | 3,191 | 4,520 | 4,592 | 5,544 | 6,715 |
| Gisborne | 85,613 | 86,308 | 93,181 | 103,280 | 111,056 |
| New Plymouth | 422,620 | 420,662 | 388,339 | 471,370 | 543,757 |
| Patea | 11,619 | 8,181 | 7,381 | 8,323 | 9,387 |
| Wanganui | 249,132 | 213,274 | 274,025 | 298,312 | 301,118 |
| Wellington | 8,338,666 | 8,409,280 | 11,031,604 | 13,212,457 | 16,392,427 |
| Napier | 407,957 | 361,948 | 410,884 | 452,536 | 568,516 |
| Wairau (incl. Picton) | 29,151 | 35,531 | 35,203 | 30,792 | 33,347 |
| Nelson | 161,907 | 109,785 | 148,350 | 154,004 | 141,189 |
| Westport | 17,614 | 19,825 | 15,969 | 19,670 | 23,706 |
| Greymouth | 76,843 | 79,918 | 107,961 | 139,193 | 157,914 |
| Hokitika | 5,940 | 4,662 | 6,327 | 6,298 | 4,835 |
| Lyttelton | 3,013,917 | 3,577,358 | 4,081,089 | 4,813,190 | 5,801,214 |
| Timaru | 230,002 | 225,625 | 253,557 | 263,848 | 271,528 |
| Oamaru | 64,376 | 36,351 | 53,420 | 47,710 | 59,395 |
| Dunedin | 2,264,484 | 2,490,448 | 3,096,359 | 3,502,274 | 3,729,818 |
| Invercargill | 386,607 | 456,415 | 549,838 | 652,231 | 697,177 |
| Totals | 24,646,006 | 25,581,366 | 31,339,552 | 36,317,267 | 44,258,886 |
During each of the five years covered by the above table over two-thirds of the imports came in by way of Wellington or Auckland, the actual proportion in 1936 being 71.8 per cent. Over the five years imports into Wellington averaged £11,476,887 annually (35.4 per cent. of the total), and into Auckland £11,248,027 (34.7 per cent.), On the basis of aggregate imports for the five years the next most important ports are Lyttelton, Dunedin, Invercargill, New Plymouth, Napier, Wanganui, and Timaru.
From 1914 to 1921 the Customs Department allocated exports as far as possible to the appropriate district of production, whether exported through the port for such district or not, and no complementary figures are available to show the export trade from each individual port for this period. The system, however, did not prove satisfactory in practice, and the former method of showing exports according to the port at which the goods are placed on board the vessel by which they leave the Dominion was reverted to from the 1st January, 1922.
Over the last five years exports through Auckland averaged £14,680,949 annually (323 per cent. of the total), and through Wellington £10,827,213 annually (23.8 per cent.). Combining imports and exports, Auckland is given place as premier port of New Zealand on this basis. Aggregating exports for the last five years, other important ports are placed in this order: Lyttelton, Napier, New Plymouth, Invercargill, Dunedin, Timaru, Wanganui, and Gisborne.
The following table gives for the last five years the overseas exports according to the port at which they were actually placed on board the overseas vessels. The concentration of the export trade in the ports of Auckland and Wellington is less marked than with the import trade. Nevertheless, in each of the five years shown below, these two ports together accounted for more than half the total exports of the Dominion.
| Port, | 1932. | 1933. | 1934. | 1935. | 1936. |
|---|---|---|---|---|---|
| £ | £ | £ | £ | £ | |
| Auckland | 11,653,717 | 13,438,943 | 13,461,683 | 16,084,922 | 18,765,479 |
| Kaipara | 2,182 | 791 | 2,773 | 2,182 | 1,855 |
| Tokomaru Bay | 240,905 | 197,960 | 222,468 | 179,482 | 270,965 |
| Gisborne | 816,870 | 1,032,656 | 1,244,803 | 932,424 | 992,293 |
| New Plymouth | 2,278,936 | 2,472,394 | 2,489,243 | 3,010,784 | 3,469,063 |
| Patea | 3 | 6 | 6 | ||
| Wanganui | 909,989 | 1,133,800 | 1,392,114 | 1,168,306 | 1,438,811 |
| Wellington | 8,370,662 | 9,524,942 | 11,793,838 | 10,797,933 | 13,648,689 |
| Napier | 2,055,731 | 2,775,738 | 3,097,956 | 2,844,330 | 3,332,698 |
| Wairau (incl. Picton) | 195,957 | 245,460 | 231,342 | 243,479 | 323,147 |
| Nelson | 184,270 | 197,009 | 238,054 | 123,985 | 232,541 |
| Westport | 37,529 | 34,817 | 52,018 | 53,188 | 52,749 |
| Greymouth | 218,797 | 243,151 | 283,677 | 368,311 | 259,973 |
| Hokitika | 18,707 | 20,295 | 24,950 | 35,140 | 27,940 |
| Lyttelton | 3,044,505 | 3,429,544 | 4,298,416 | 3,803,315 | 4,931,875 |
| Timaru | 1,115,070 | 1,467,473 | 1,798,220 | 1,391,247 | 1,620,569 |
| Oamaru | 299,244 | 327,982 | 446,313 | 413,626 | 464,201 |
| Dunedin | 1,767,149 | 2,046,504 | 3,165,812 | 2,418,250 | 3,762,620 |
| Invercargill | 2,351,109 | 2,376,057 | 3,064,935 | 2,639,063 | 3,116,052 |
| Parcels-post | 48,587 | 40,397 | 34,232 | 28,414 | 40,414 |
| Totals | 35,609,919 | 41,005,919 | 47,342,847 | 46,538,381 | 56,751,940 |
The west coast ports of both Islands, as well as Nelson and Wairau in the northern portion of the South Island, send much of their produce to Wellington for loading into overseas vessels.
The following table gives for the aggregate of all ports a summary of the cargo handled.
| Year. | Inwards.* | Transhipments. | Outwards.* | Total Manifest Tonnage. | ||
|---|---|---|---|---|---|---|
| Coastal. | Overseas. | Coastal. | Overseas. | |||
* Excluding transhipments. | ||||||
| Tons. | Tons. | Tons. | Tons. | Tons. | Tons. | |
| 1927 | 2,044,044 | 2,107,024 | 425,444 | 2,098,926 | 785,296 | 7,886,178 |
| 1928 | 2,109,724 | 2,147,103 | 430,925 | 2,207,194 | 799,421 | 8,125,292 |
| 1929 | 2,160,883 | 2,319,471 | 406,054 | 2,176,878 | 853,810 | 8,323,150 |
| 1930 | 2,080,086 | 2,106,784 | 398,739 | 2,115,759 | 801,959 | 7,902,066 |
| 1931 | 1,565,795 | 1,556,275 | 278,927 | 1,637,703 | 723,023 | 6,040,650 |
| 1932 | 1,403,977 | 1,489,347 | 248,536 | 1,488,052 | 829,916 | 5,708,364 |
| 1933 | 1,383,845 | 1,374,774 | 235,722 | 1,447,258 | 995,650 | 5,672,971 |
| 1934 | 1,493,269 | 1,655,838 | 273,814 | 1,540,510 | 953,528 | 6,190,773 |
| 1935 | 1,603,825 | 1,886,316 | 258,266 | 1,626,784 | 936,337 | 6,569,794 |
| 1936 | 1,833,991 | 2,304,836 | 282,067 | 1,835,536 | 1,000,035 | 7,538,532 |
In order to obtain statistics of the total trade of each port a system of monthly returns from the various port authorities was instituted in 1922, showing under some forty headings the quantity of goods handled, distinguishing inwards and outwards cargo, coastal and overseas, and transhipments. The resultant statistics show on a tonnage basis the total trade of each port, including all exports, whether placed on the overseas vessel there, sent to a central port for shipment overseas, or despatched coastwise to another port for consumption in New Zealand. For obvious reasons, total values of goods shipped coastwise cannot he obtained.
For all data given under this head it is advisable to note that the term “ton” does not invariably denote a weight of 2,240 lb. For a portion only of the goods handled is it practicable to obtain the actual weights involved. In other cases close approximations are made by applying uniform formulæ as to the number of bales, cases, sacks, &c., to the ton. In a few instances the tons are “short” tons of 2,000 lb. A considerable portion of trading goods, however, are recorded in “measurement” tons, 40 cubic feet of space being regarded as the equivalent of a ton. As the practice is uniform, comparisons from year to year are not appreciably affected, nor are comparisons between ports, unless there is a radical difference in the class of trade carried on, in which case recourse should be had to consideration of items of trade. Since a much larger proportion of imports are in “measurement” tons, thus artificially swelling the figures, direct comparison of import cargo tonnage with export is invalid.
The following table shows for each port the total cargo inwards and outwards in 1936. The high proportion of transhipments in the case of Wellington is very noticeable.
| Port. | Inwards.* | Transhipments. | Outwards.* | Total Manifest Tonnage. | ||
|---|---|---|---|---|---|---|
| Coastal. | Overseas. | Coastal. | Overseas. | |||
* Excluding transhipments. | ||||||
| Tons. | Tons. | Tons. | Tons. | Tons. | Tons. | |
| Awanui | 6,222 | 2,685 | 8,907 | |||
| Mangonui | 1,844 | 899 | 2,743 | |||
| Russell | 6,991 | 4,999 | 7,221 | 19,211 | ||
| Hokianga | 4,343 | 1,503 | 5,846 | |||
| Whangarei | 34,065 | 2,800 | 94,345 | 131,210 | ||
| Kaipara | 1,895 | 739 | 292 | 2,926 | ||
| Mangawai | 784 | 103 | 887 | |||
| Auckland | 548,564 | 918,052 | 58,728 | 254,408 | 268,474 | 2,106,954 |
| Onehunga | 16,471 | 21 | 33,612 | 50,125 | ||
| Great Barrier | 621 | 365 | 986 | |||
| Port Waikato | 8,626 | 426 | 9,052 | |||
| Raglan | 3,171 | 1,120 | 4,291 | |||
| Kawhia | 1,503 | 495 | 1,998 | |||
| Thames | 8,903 | 2,070 | 10,973 | |||
| Coromandel | 1,096 | 415 | 1,511 | |||
| Tauranga | 15,409 | 2,690 | 18,099 | |||
| Whakatane | 14,497 | 15,167 | 29,664 | |||
| Opotiki | 10,424 | 5,337 | 15,761 | |||
| Tokomaru Bay | 7,532 | 333 | 4,392 | 3,410 | 16,000 | |
| Tolaga Bay | 2,629 | 118 | 1,369 | 641 | 4,875 | |
| Gisborne | 47,397 | 6,813 | 624 | 19,094 | 17,509 | 92,061 |
| Waikokopu | 5,358 | 573 | 1,757 | 7,688 | ||
| Wairoa | 3,132 | 1,909 | 5,041 | |||
| Napier | 72,332 | 27,691 | 5,356 | 21,896 | 54,773 | 187,404 |
| Mokau | 48 | 163 | 211 | |||
| Waitara | 160 | 65 | 225 | |||
| New Plymouth | 54,341 | 69,340 | 5,467 | 57,753 | 186,901 | |
| Patea | 3,955 | 28,129 | 32,084 | |||
| Wanganui | 52,329 | 41,769 | 18,519 | 29,152 | 141,769 | |
| Foxton | 10,817 | 399 | 11,216 | |||
| Wellington | 460,094 | 695,868 | 192,996 | 293,756 | 258,397 | 2,094,107 |
| Picton | 33,037 | 38,342 | 5,892 | 77,271 | ||
| Wairau | 5,621 | 4,385 | 10,006 | |||
| Nelson | 71,290 | 1,812 | 17,327 | 51,981 | 5,712 | 165,449 |
| Waitapu | 3,150 | 1,920 | 5,070 | |||
| Motueka | 7,463 | 19 | 16,158 | 23,659 | ||
| Westport | 9,635 | 195 | 35 | 311,287 | 30,122 | 351,309 |
| Greymouth | 15,570 | 1,611 | 193,856 | 39,762 | 250,799 | |
| Hokitika | 3,376 | 6,085 | 9,461 | |||
| Lyttelton | 129,402 | 276,596 | 2,464 | 217,692 | 82,643 | 711,261 |
| Akaroa | 619 | 45 | 664 | |||
| Timaru | 25,163 | 14,465 | 65,866 | 25,842 | 131,336 | |
| Oamaru | 5,369 | 3,065 | 17,435 | 6,156 | 32,025 | |
| Dunedin | 84,025 | 198,766 | 4,046 | 69,407 | 45,927 | 406,217 |
| Invercargill | 14 | 5 | 19 | |||
| Bluff | 34,017 | 45,254 | 24,034 | 58,892 | 162,197 | |
| Half-moon Bay | 687 | 376 | 1,063 | |||
| Totals | 1,833,991 | 2,304,836 | 282,067 | 1,835,536 | 1,000,035 | 7,538,532 |
The penultimate column of the preceding table shows the quantity of cargo placed on board the overseas vessels at the respective ports, and a table will be found in Section XI showing the number and tonnage of overseas vessels calling at each port. These tables give a good indication of the extent to which each port enters directly into the overseas trade of the Dominion. The following table shows for the year 1936 the total shipment from each port (overseas and coastwise and including transhipments) of nine principal commodities exported overseas by the Dominion, and thus shows the extent to which the various ports handle overseas exports, although the goods may be sent outwards coastwise for transhipment at another port.
| Port. | Wool. | Frozen Meat. | Butter. | Cheese. | Tallow. | Hides, Skins, and Pelts. | Coal. | Fruit, Fresh. | Timber. | All other Goods. | Total. |
|---|---|---|---|---|---|---|---|---|---|---|---|
| Tons. | Tons. | Tons. | Tons. | Tons. | Tons. | Tons. | Tons. | Tons. | Tons. | Tons. | |
| Awanui | 2,685 | 2,685 | |||||||||
| Mangonui | 83 | 517 | 9 | 10 | 280 | 899 | |||||
| Russell | 160 | 6,627 | 1,325 | 337 | 409 | 206 | 470 | 2,680 | 12,220 | ||
| Hokianga | 1,407 | 96 | 1,503 | ||||||||
| Whangarei | 187 | 4,145 | 65 | 154 | 3,550 | 70 | 4,020 | 82,154 | 94,345 | ||
| Kaipara | 292 | 292 | |||||||||
| Mangawai | 14 | 5 | 84 | 103 | |||||||
| Auckland | 21,932 | 41,217 | 116,822 | 16,772 | 9,264 | 9,672 | 3,643 | 6,226 | 12,151 | 343,911 | 581,610 |
| Onehunga | 8 | 4 | 9 | 2 | 206 | 202 | 456 | 32,746 | 33,633 | ||
| Great Barrier | 365 | 305 | |||||||||
| Port Waikato | 380 | 46 | 426 | ||||||||
| Raglan | 499 | 609 | 12 | 1,120 | |||||||
| Kawhia | 207 | 248 | 40 | 495 | |||||||
| Thames | 72 | 1,263 | 22 | 713 | 2,070 | ||||||
| Coromandel | 415 | 415 | |||||||||
| Tauranga | 41 | 11 | 33 | 1 | 2,191 | 413 | 2,690 | ||||
| Whakatane | 39 | 5,655 | 999 | 72 | 120 | 1,975 | 6,307 | 15,167 | |||
| Opotiki | 266 | 3,007 | 93 | 23 | 84 | 164 | 1,700 | 5,337 | |||
| Tokomaru Bay | 2,412 | 2,100 | 261 | 141 | 3,221 | 8,135 | |||||
| Tolaga Bay | 1,012 | 5 | 40 | 1,071 | 2,128 | ||||||
| Gisborne | 6,881 | 10,107 | 3,538 | 85 | 985 | 1,217 | 1,031 | 1 | 13,382 | 37,227 | |
| Waikokopu | 122 | 1,812 | 12 | 50 | 334 | 2,330 | |||||
| Wairoa | 731 | 573 | 152 | 121 | 332 | 1,909 | |||||
| Napier | 24,587 | 24,864 | 5,160 | 145 | 3,201 | 2,627 | 2,497 | 2,786 | 1,500 | 14,658 | 82,025 |
| Mokau | 2 | 158 | 3 | 163 | |||||||
| Waitara | 65 | 65 | |||||||||
| New Plymouth- | 438 | 20,815 | 12,935 | 19,383 | 1,885 | 1,515 | 337 | 5,912 | 63,220 | ||
| Patea | 1,782 | 24,956 | 1,391 | 28,129 | |||||||
| Wanganui | 14,244 | 16,247 | 4,053 | 2,932 | 1,190 | 1,615 | 50 | 1,015 | 6,325 | 47,671 | |
| Foxton | 2 | 397 | 399 | ||||||||
| Wellington | 48,493 | 52,558 | 25,258 | 42,841 | 6,926 | 9,666 | 34,620 | 34,698 | 4,995 | 485,094 | 745,149 |
| Picton | 4,714 | 2,500 | 367 | 748 | 208 | 310 | 1,375 | 34,012 | 44,234 | ||
| Wairau | 665 | 26 | 8 | 18 | 8 | 3,660 | 4,385 | ||||
| Nelson | 1,188 | 1,428 | 1,009 | 5 | 211 | 508 | 8,580 | 33,757 | 48 | 28,286 | 75,020 |
| Waitapu | 152 | 913 | 10 | 845 | 1,920 | ||||||
| Motueka | 152 | 1 | 99 | 34 | 14,124 | 1,767 | 16,177 | ||||
| Westport | 19 | 199 | 45 | 62 | 331,261 | 6,425 | 3,433 | 341,444 | |||
| Greymouth | 16 | 89 | 20 | 168,251 | 63,992 | 1,250 | 233,618 | ||||
| Hokitika | 17 | 4,822 | 1,246 | 6,085 | |||||||
| Lyttelton | 22,057 | 30,559 | 3,721 | 1,380 | 4,210 | 5,188 | 83 | 2,761 | 4,284 | 228,556 | 302,799 |
| Akaroa | 45 | 45 | |||||||||
| Timaru | 8,821 | 13,867 | 275 | 372 | 1,200 | 780 | 932 | 65,461 | 91,708 | ||
| Oamaru | 745 | 5,099 | 525 | 21 | 17,201 | 23,591 | |||||
| Dunedin | 18,972 | 13,071 | 879 | 2,970 | 2,002 | 2,710 | 99 | 2,629 | 321 | 75,727 | 119,380 |
| Invercargill | 1 | 4 | 5 | ||||||||
| Bluff | 11,836 | 20,755 | 572 | 10,626 | 2,152 | 1,707 | 187 | 219 | 6,984 | 27,888 | 82,926 |
| Half-moon Bay | 376 | 376 | |||||||||
| Totals | 191,695 | 264,199 | 194,499 | 125,587 | 35,136 | 38,827 | 553,566 | 100,085 | 117,461 | 1,496,589 | 3,117,638 |
Transhipments of cargo during 1936 totalled 282,067 tons, of which 192,996 tons were transhipped at Wellington.
Transhipments are of four classes, as follows:—
Coastal to Coastal.—Cargo which has been loaded on a vessel at one New Zealand port and is transhipped to another vessel for discharge at another New Zealand port.
Coastal to Overseas.—Cargo which has been loaded on a vessel at a New Zealand port and is transhipped to another vessel for discharge at a port outside of the Dominion.
Overseas to Coastal.—Cargo which has come from overseas and is transhipped to another vessel for discharge at a New Zealand port.
Overseas to Overseas.—Cargo which has come from overseas and is transhipped to another vessel for discharge outside New Zealand.
The first class represents purely coastal trade, but each of the others may be added to the appropriate figures of overseas trade shown previously to ascertain the total tonnage of goods arriving from or departing overseas. The total inwards tonnage from overseas is found to be 2,414,681 and the total outward tonnage going overseas 1,117,585. As stated previously, import and export figures are not on the same basis, and are thus not comparable.
Two tables are appended showing the transhipment trade of each port affected for 1936, and the transhipments of the various items of merchandise, &c.
TRANSHIPMENTS, BY PORTS AND CLASS, 1936.
| Port. | Coastal to Coastal. | Coastal to Overseas. | Overseas to Coastal. | Overseas to Overseas. | Totals. |
|---|---|---|---|---|---|
| Tons. | Tons. | Tons. | Tons. | Tons. | |
| Auckland | 9,964 | 8,484 | 36,492 | 3,788 | 58,728 |
| Onehunga | 21 | 21 | |||
| Tokomaru Bay | 20 | 313 | 333 | ||
| Tolaga Bay | 118 | 118 | |||
| Gisborne | 583 | 41 | 624 | ||
| Napier | 3,690 | 1,255 | 411 | 5,356 | |
| Wellington | 32,751 | 94,322 | 65,509 | 414 | 192,996 |
| Nelson | 11,150 | 5,931 | 246 | 17,327 | |
| Lyttelton | 126 | 1,817 | 521 | 2,464 | |
| Dunedin | 515 | 1,067 | 2,464 | 4,046 | |
| Totals | 58,820 | 113,348 | 105,643 | 4,202 | 282,013 |
TRANSHIPMENTS, BY ITEMS AND CLASS, 1936.
| Item. | Coastal to Coastal. | Coastal to Overseas. | Overseas to Coastal. | Overseas to Overseas. | Totals. |
|---|---|---|---|---|---|
| Tons. | Tons. | Tons. | Tons. | Tons. | |
| Beans and peas | 103 | 852 | 240 | 1,195 | |
| Butter | 19 | 6,567 | 201 | 6,787 | |
| Cement | 2,611 | 4 | 19 | 115 | 2,749 |
| Cheese | 17 | 26,639 | 26,656 | ||
| Coal | 24,848 | 12,064 | 432 | 180 | 37,524 |
| Flour | 1,633 | 1 | 724 | 709 | 3,067 |
| Fruit, preserved | 700 | 1,609 | 5 | 2,314 | |
| Fruit, fresh | 2,288 | 30,696 | 2,233 | 35,217 | |
| Hemp (fibre and tow) | 151 | 151 | |||
| Hides, skins, and pelts | 91 | 4,316 | 20 | 4,427 | |
| Manures, artificial | 1,157 | 817 | 5,680 | 7,654 | |
| Meat, frozen (beef, mutton, and lamb) | 3 | 925 | 928 | ||
| Motor - spirit, kerosene, and other fuel oils | 238 | 29,574 | 29,812 | ||
| Seeds | 269 | 1,849 | 160 | 2,278 | |
| Sugar | 1,896 | 8 | 9 | 1,913 | |
| Tallow | 178 | 4,005 | 4,183 | ||
| Timber | 410 | 461 | 4,233 | 27 | 5,131 |
| Wines, spirits, and beer | 1,165 | 942 | 130 | 2,237 | |
| Wool | 139 | 20,710 | 65 | 20,914 | |
| All other goods | 21,055 | 3,291 | 59,789 | 2,741 | 86,876 |
| Totals | 58,820 | 113,348 | 105,643 | 4,202 | 282,013 |
Table of Contents
THE number and tonnage of vessels on the New Zealand register at 31st December, 1936, were as follows:—
| Port of Registry. | Sailing-vessels. | Steam-vessels. | Motor-vessels. | ||||||
|---|---|---|---|---|---|---|---|---|---|
| Vessels. | Gross Tonnage. | Net Tonnage. | Vessels. | Gross Tonnage. | Net Tonnage. | Vessels. | Gross Tonnage. | Net Tonnage. | |
| Auckland | 32 | 2,159 | 1,701 | 58 | 14,490 | 7,190 | 195 | 14,289 | 6,968 |
| Napier | 5 | 360 | 308 | 10 | 1,394 | 676 | 10 | 2,170 | 1,170 |
| Wellington | 10 | 1,144 | 1,006 | 48 | 103,189 | 55,671 | 23 | 8,162 | 4,313 |
| Nelson | 1 | 19 | 19 | 9 | 7,111 | 3,310 | 11 | 1,317 | 656 |
| Lyttelton | 5 | 1,741 | 1,667 | 12 | 4,691 | 1,992 | 7 | 1,611 | 807 |
| Timaru | 1 | 942 | 488 | 1 | 11 | 3 | |||
| Dunedin | 17 | 21,094 | 12,220 | 9 | 146 | 69 | |||
| Invercargill | 11 | 1,592 | 589 | 8 | 769 | 283 | |||
| Totals | 53 | 5,423 | 4,701 | 166 | 154,503 | 82,136 | 264 | 28,502 | 14,269 |
Auckland is the port of registry of the majority of the vessels forming New Zealand's “mosquito” fleet, the average net tonnage of the 285 vessels on the Auckland register being only 56 tons. At Wellington and Dunedin many of the vessels of the Union Steam Ship Company of New Zealand are registered, while several of the larger vessels of this company employed in both the coastal and foreign trade of the Dominion are registered in the United Kingdom. The registration figures at the end of each of the last ten years are as follows:—
| Year. | Sailing-vessels. | Steam- and Motor-vessels. | Totals. | ||||||
|---|---|---|---|---|---|---|---|---|---|
| Vessels. | Gross Tonnage. | Net Tonnage. | Vessels. | Gross Tonnage. | Net Tonnage. | Vessels. | Gross Tonnage. | Net Tonnage. | |
| 1927 | 90 | 12,654 | 11,418 | 475 | 192,106 | 106,386 | 565 | 204,760 | 117,804 |
| 1928 | 88 | 12,504 | 11,303 | 472 | 181,800 | 99,586 | 560 | 194,304 | 110,889 |
| 1929 | 71 | 9,885 | 5,868 | 470 | 201,563 | 110,649 | 541 | 211,448 | 119,517 |
| 1930 | 65 | 6,685 | 5,892 | 466 | 194,965 | 106,078 | 531 | 201,650 | 111,970 |
| 1931 | 65 | 6,685 | 5,892 | 465 | 193,264 | 104,047 | 530 | 199,949 | 109,939 |
| 1932 | 58 | 6,163 | 5,380 | 461 | 208,589 | 111,985 | 519 | 214,752 | 117,365 |
| 1933 | 56 | 5,588 | 4,809 | 460 | 200 | 106,786 | 516 | 205,729 | 111,365 |
| 1934 | 55 | 5,588 | 4,809 | 441 | 182,903 | 96,570 | 496 | 188,438 | 101,359 |
| 1935 | 52 | 5,421 | 4,726 | 443 | 182,903 | 96,570 | 495 | 179,747 | 96,007 |
| 1936 | 53 | 5,423 | 4,701 | 430 | 183,005 | 96,405 | 483 | 188,428 | 101,106 |
Of the 153 vessels employed in the coastal trade only, 5 were sailing-vessels with an aggregate net tonnage of 173, and 148 steam- and motor-vessels of 27,714 tons. Four of the sailing-vessels were under 50 tons, and the other one of 50 to 100 tons. The 12 vessels employed in both coastal and foreign trade were all steam- or motor-vessels. Very few sailing-vessels are employed in the foreign trade, there being only 1 for 1936, with a tonnage of 785.
In the following table registered vessels in the Dominion have been classified according to whether employed in the coastal or the foreign trade. The totals given here do not agree with those shown previously, as in this table vessels employed exclusively in the “river” trade have not been included.
| Size of Vessel. | Employed in the Coastal Trade only. | Employed partly in the Coastal and partly in the Foreign Trade. | Employed in the Foreign Trade only. | |||
|---|---|---|---|---|---|---|
| Number of Vessels. | Net Tonnage. | Number of Vessels. | Net Tonnage. | Number of Vessels. | Net Tonnage. | |
| Under 50 tons | 62 | 1,249 | ||||
| 50 and under 100 tons | 33 | 2,389 | 4 | 352 | ||
| 100 and under 200 tons | 23 | 3,087 | 1 | 106 | 2 | 292 |
| 200 and under 300 tons | 12 | 3,046 | 2 | 549 | ||
| 300 and under 400 tons | 8 | 2,881 | 1 | 342 | ||
| 400 and under 600 tons | 3 | 1,524 | 1 | 586 | ||
| 600 and under 800 tons | 4 | 2,990 | 2 | 1,539 | ||
| 800 and under 1,000 tons | 4 | 3,393 | 1 | 944 | ||
| 1,000 and under 1,500 tons | 1 | 1,344 | 6 | 7,110 | 2 | 2,351 |
| 1,500 and under 2,000 tons | 2 | 3,355 | 1 | 1,847 | 4 | 7,316 |
| 2,000 tons and over | 1 | 2,629 | 7 | 33,477 | ||
| Totals | 153 | 27,887 | 12 | 10,600 | 22 | 46,271 |
Throughout the remainder of this section all tonnage figures relate to net tonnage. The tonnage of vessels entered and cleared during 1936 amounted to 5,740,742, as compared with 5,188,781 for 1935. The number of vessels increased from 1,236 to 1,267.
Of late years the tendency has been for vessels of a larger size to be employed in the New Zealand trade, in order to cope with the growing imports and exports of the Dominion and for the purposes of the passenger traffic. The increase over a period of years is thus more noticeable in a comparison of tonnage than by comparing the number of vessels.
Considering only vessels entered inwards, the number registered in the United Kingdom represented, in 1936, 42 per cent. of the total, but on a tonnage basis the percentage is found to increase to 51. The average tonnage of the vessels was 5,544. Although vessels registered in New Zealand and other (i.e., other than United Kingdom) British countries comprised 42 per cent. of the total vessels, the tonnage, on the other hand, was only 26 per cent. of the aggregate. The average tonnage was comparatively low, being only 2,755. Foreign vessels constituted 16 per cent. of the number, and 23 per cent. of the tonnage, with an average tonnage for each vessel of 6,518.
The foreign vessels entered inwards consisted of 33 American (369,407 tons), 35 Norwegian (170,405 tons), 27 Japanese, 3 Danish, 3 German, 1 Swedish, and 1 Dutch.
| Year. | United Kingdom. | Other British Countries. | Foreign Countries. | Total. | ||||
|---|---|---|---|---|---|---|---|---|
| Vessels. | Tons. | Vessels. | Tons. | Vessels. | Tons. | Vessels. | Tons. | |
| Entered. | ||||||||
| 1932 | 253 | 1,345,600 | 223 | 496,287 | 98 | 505,769 | 574 | 2,347,656 |
| 1933 | 237 | 1,310,065 | 229 | 636,126 | 101 | 582,062 | 567 | 2,528,253 |
| 1934 | 249 | 1,410,180 | 241 | 681,265 | 95 | 541,593 | 585 | 2,633,038 |
| 1935 | 232 | 1,306,680 | 286 | 701,483 | 91 | 562,949 | 609 | 2,571,112 |
| 1936 | 267 | 1,480,174 | 268 | 738,223 | 103 | 671,311 | 638 | 2,889,708 |
| Cleared. | ||||||||
| 1932 | 248 | 1,332,160 | 226 | 510,011 | 109 | 510,742 | 583 | 2,352,913 |
| 1933 | 233 | 1,299,641 | 227 | 638,188 | 102 | 582,621 | 562 | 2,520,450 |
| 1934 | 241 | 1,386,171 | 244 | 677,364 | 90 | 524,542 | 575 | 2,588,077 |
| 1935 | 235 | 1,322,672 | 292 | 707,675 | 100 | 587,542 | 627 | 2,617,669 |
| 1936 | 263 | 1,461,160 | 262 | 725,328 | 104 | 664,546 | 629 | 2,851,034 |
Particulars of the number and net tonnage of vessels entered and cleared between New Zealand and various countries during the years 1935 and 1936 are given below:—
| Country. | 1935. | 1936. | ||||||
|---|---|---|---|---|---|---|---|---|
| Entered. | Cleared. | Entered. | Cleared. | |||||
| No. | Tonnage. | No. | Tonnage. | No. | Tonnage. | No. | Tonnage. | |
| United Kingdom | 84 | 571,335 | 112 | 694,438 | 87 | 565,764 | 120 | 745,618 |
| Aden | 1 | 5,839 | ||||||
| India | 5 | 26,612 | 2 | 10,920 | 3 | 12,518 | 3 | 16,380 |
| Malaya | 3 | 13,698 | 1 | 3,342 | 3 | 14,061 | 1 | 1,864 |
| Seychelles Islands | 3 | 9,537 | ||||||
| South African Union | 1 | 5,612 | 1 | 6,538 | ||||
| South-west Africa | 7 | 5,056 | ||||||
| Canada | 52 | 250,553 | 23 | 144,214 | 49 | 251,996 | 33 | 199,276 |
| Australia | 275 | 992,258 | 310 | 1,102,314 | 269 | 1,155,082 | 278 | 1,135,831 |
| Fiji | 15 | 18,205 | 18 | 38,062 | 16 | 22,395 | 26 | 53,040 |
| Nauru Island | 17 | 50,868 | 6 | 17,874 | 20 | 62,410 | 20 | 59,268 |
| Gilbert; and Ellice Islands | 8 | 23,859 | 6 | 17,770 | 9 | 27,645 | 7 | 21,563 |
| New Guinea | 1 | 188 | ||||||
| Tonga | 11 | 3,146 | 12 | 6,225 | 9 | 2,574 | 9 | 2,574 |
| Western Samoa | 12 | 9,008 | 13 | 9,802 | 16 | 13,947 | 15 | 12,928 |
| Belgium | 2 | 7,550 | 7 | 21,927 | ||||
| France | 1 | 3,190 | 1 | 3,755 | ||||
| Italy | 2 | 5,996 | ||||||
| Russia (Union of Socialist Soviet Republics) | 3 | 11,059 | 3 | 12,270 | ||||
| Sweden | 1 | 2,558 | ||||||
| Dutch East Indies | 26 | 106,478 | 12 | 54,880 | 29 | 140,908 | 15 | 77,126 |
| Japan | 15 | 50,872 | 16 | 45,031 | 27 | 99,685 | 24 | 87,580 |
| Persia | 1 | 4,037 | ||||||
| Egypt | 1 | 529 | ||||||
| Portuguese East Africa | 3 | 19,741 | ||||||
| Cuba | 1 | 3,118 | 3 | 9,077 | ||||
| Mexico | 3 | 8,962 | 4 | 11,378 | ||||
| Peru | 7 | 5,056 | ||||||
| San Domingo | 1 | 3,001 | ||||||
| Panama | 1 | 4,211 | ||||||
| United States of America | 66 | 397,737 | 84 | 445,020 | 66 | 414,554 | 62 | 404,314 |
| Hawaii | 1 | 5,259 | ||||||
| Guam | 2 | 6,063 | ||||||
| New Caledonia | 4 | 4,196 | 4 | 4,196 | 1 | 1,049 | 3 | 7,368 |
| Tuamotu Archipelago | 2 | 6,321 | 1 | 2,868 | ||||
| Tutuila | 1 | 5,665 | 1 | 3,339 | ||||
| Whale-fisheries | 2 | 3,796 | 2 | 3,796 | ||||
| Totals | 609 | 2,571,112 | 627 | 2,617,669 | 638 | 2,889,708 | 629 | 2,851,034 |
Forty-four per cent. of the vessels and 39 per cent. of the total tonnage inwards during the two years covered by the foregoing table came from Australia, while a somewhat higher proportion of the shipping outwards was cleared for Australia. The United Kingdom ranks second, the United States third, Canada fourth, and the Pacific islands next.
Shipping between New Zealand and certain principal countries for each of the last five years is as follows:—
| Year. | Australia. | United Kingdom. | United States. | Canada. | Fiji. | Pacific Islands (other than Fiji). |
|---|---|---|---|---|---|---|
| Entered. | ||||||
| Tons. | Tons. | Tons. | Tons. | Tons. | Tons | |
| 1932 | 859,231 | 512,593 | 470,985 | 199,093 | 16,650 | 104,038 |
| 1933 | 916,958 | 613,453 | 442,514 | 260,863 | 17,910 | 83,325 |
| 1934 | 914,693 | 715,061 | 410,526 | 282,896 | 18,213 | 75,451 |
| 1935 | 992,258 | 571,335 | 397,737 | 250,553 | 18,205 | 96,742 |
| 1936 | 1,155,082 | 565,764 | 414,554 | 251,996 | 22,395 | 107,625 |
| Cleared. | ||||||
| 1932 | 984,572 | 692,652 | 318,059 | 120,623 | 46,589 | 80,978 |
| 1933 | 1,010,869 | 795,245 | 346,119 | 137,872 | 47,529 | 68,364 |
| 1934 | 1,051,808 | 771,153 | 349,045 | 178,185 | 51,042 | 65,472 |
| 1935 | 1,102,314 | 694,438 | 445,020 | 144,214 | 38,062 | 68,251 |
| 1936 | 1,135,831 | 745,618 | 404,314 | 199,276 | 53,040 | 110,994 |
New Zealand has twenty-one ports of entry for Customs purposes (vide Subsection E of the preceding section), and there are numerous other ports around the coast. A vessel arriving from overseas may call at several ports in the Dominion to discharge and load cargo, and is recorded as an overseas arrival at the first port of call, and as an overseas departure from the port from which it finally sails. Its movements from one port to another in New Zealand are treated as coastwise shipping. The figures in the following table must simply be taken as showing the extent to which various ports are made the first port of arrival or the last port of departure, and not as indicating the relative overseas trade of the various ports.
OVERSEAS SHIPPNG, BY PORTS OF FIRST ARRIVAL AND FINAL DDEPARTURE.
| Port. | Entered. | Cleared. | ||||
|---|---|---|---|---|---|---|
| 1934. | 1935. | 1936. | 1934. | 1935. | 1936. | |
| Tons. | Tons. | Tons. | Tons. | Tons. | Tons. | |
| Kaipara | 1,175 | 1,175 | ||||
| Auckland | 1,527,356 | 1,490,402 | 1,748,142 | 1,192,895 | 1,113,144 | 1,243,143 |
| Gisborne | 22,392 | 5,000 | 17,666 | 6,445 | 7,304 | 7,923 |
| Napier | 23,105 | 818 | 72,506 | 68,725 | 68,692 | |
| New | 72,149 | 100,932 | 12,423 | 30,961 | 24,490 | |
| 13,270 | 9,912 | 5,796 | 11,537 | 68,466 | 44,599 | |
| 611,995 | 608,626 | 614,595 | 763,020 | 787,892 | 866,361 | |
| 12,880 | 13,430 | 9,304 | 3,590 | 5,019 | ||
| Nelson | 19,142 | 6,236 | ||||
| 4,886 | 992 | 3,669 | 71,880 | 52,182 | 72,040 | |
| 1,154 | 166 | 332 | 42,678 | 52,417 | 26,893 | |
| Lyttelton | 62,857 | 79,703 | 83,605 | 100,736 | 64,059 | 117,794 |
| Timaru | 15,138 | 10,532 | 5,429 | 10,190 | 11,740 | 6,999 |
| Oamaru | 20,841 | 40,477 | 14,925 | 4,243 | ||
| Dunedin | 97,910 | 45,841 | 104,866 | 206,561 | 231,574 | 256,214 |
| Bluff | 235,788 | 140,652 | 169,521 | 96,031 | 125,615 | 106,624 |
| Totals | 2,633,038 | 2,571,112 | 2,889,708 | 2,588,077 | 2,617,669 | 2,851,034 |
Tables showing for each port the total shipping entered and cleared, and distinguishing between overseas and coastal vessels, irrespective of whether the former had been entered or cleared overseas or coastwise, are published annually in Part II of the “Annual Statistical Report on Trade and Shipping.”
The movement of overseas and coastal vessels on the New Zealand coast is well illustrated in the following table, which gives the aggregate number and tonnage of the total calls made during each of ten years.
| Year. | Overseas Vessels. | Coastal Vessels. | Total. | |||
|---|---|---|---|---|---|---|
| Number. | Net Tonnage. | Number. | Net Tonnage. | Number. | Net Tonnage. | |
| 1927 | 2,354 | 8,237,451 | 22,123 | 5,633,291 | 24,477 | 13,870,742 |
| 1928 | 2,393 | 8,369,179 | 21,028 | 5,463,604 | 23,421 | 13,832,783 |
| 1929 | 2,407 | 8,752,837 | 20,806 | 5,447,171 | 23,213 | 14,200,008 |
| 1930 | 2,595 | 9,494,306 | 20,238 | 5,150,032 | 22,833 | 14,644,338 |
| 1931 | 2,412 | 8,357,865 | 17,573 | 4,658,136 | 19,985 | 13,016,001 |
| 1932 | 2,183 | 7,940,904 | 17,423 | 5,025,742 | 19,606 | 12,966,646 |
| 1933 | 2,196 | 8,531,207 | 17,981 | 5,247,373 | 20,177 | 13,778,580 |
| 1934 | 2,308 | 8,679,627 | 18,546 | 5,223,909 | 20,854 | 13,903,536 |
| 1935 | 2,568 | 9,105,553 | 18,281 | 4,947,117 | 20,849 | 14,052,670 |
| 1936 | 2,519 | 9,952,124 | 18,314 | 4,859,502 | 20,833 | 14,811,626 |
Overseas vessels show a substantial recovery from the low level of the depression years. The number of visits made by vessels engaged exclusively in the coastal trade reached its peak in 1924, since when there has been a decline. The tonnage has not shown so marked a movement, the figures indicating a tendency to employ a larger type of vessel in this class of trade.
Figures showing the number and tonnage of all vessels entered into each port during 1936 are given in the following table. In this table, however, no distinction is made between overseas and coastal vessels.
| Port. | Number. | Tonnage. |
|---|---|---|
| Parengarenga | 63 | 4,322 |
| Awanui | 127 | 9,088 |
| Mangonui | 67 | 7,771 |
| Whangaroa | 150 | 18,591 |
| Russell | 191 | 116,636 |
| Hokianga | 86 | 9,209 |
| Whangarei | 779 | 126,300 |
| Kaipara | 21 | 5,638 |
| Mangawai | 60 | 2,954 |
| Auckland | 6,705 | 3,054,979 |
| Onehunga | 218 | 28,080 |
| Raglan | 53 | 7,110 |
| Kawhia | 44 | 5,751 |
| Thames | 577 | 40,282 |
| Coromandel | 216 | 14,304 |
| Whitianga | 123 | 7,118 |
| Tauranga | 250 | 25,486 |
| Whakatane | 132 | 10,644 |
| Opotiki | 73 | 6,746 |
| Tokomaru Bay | 182 | 114,643 |
| Tolaga Bay | 133 | 46,258 |
| Gisborne | 328 | 282,117 |
| Waikokopu | 86 | 51,319 |
| Wairoa | 90 | 3,483 |
| Napier | 463 | 574,678 |
| Mokau | 9 | 54 |
| Waitara | 10 | 60 |
| New Plymouth | 267 | 456,839 |
| Patea | 189 | 18,770 |
| Wanganui | 402 | 282,309 |
| Foxton | 81 | 6,485 |
| Wellington | 2,968 | 3,907,073 |
| Picton | 452 | 305,545 |
| Wairau | 129 | 12,719 |
| Havelock | 1 | 20 |
| Nelson | 990 | 336,539 |
| Waitapu | 125 | 4,354 |
| Motueka | 242 | 23,603 |
| Westport | 385 | 255,808 |
| Greymouth | 321 | 141,543 |
| Hokitika | 74 | 4,381 |
| Lyttelton | 1,317 | 2,103,627 |
| Akaroa | 1 | 1,154 |
| Timaru | 385 | 480,289 |
| Oamaru | 169 | 150,823 |
| Dunedin | 559 | 1,180,943 |
| Invercargill | 1 | 9 |
| Bluff | 468 | 567 |
| Half-moon Bay | 71 | |
| Totals | 20,833 | 14,811,626 |
Wellington ranks as the first port of the Dominion as regards aggregate tonnage of shipping entered, followed by Auckland, Lyttelton, Dunedin, Napier, Bluff, Timaru, and New Plymouth in that order. Wellington and Lyttelton are termini of the principal inter-Island steamer-express service, and to this fact is due a large part of the coastwise shipping credited to these two ports.
The number and tonnage of overseas vessels included in the totals quoted above for the various ports concerned are now given. The table covers all vessels engaged in the overseas trade, whether entered overseas or coastwise, and the figures for individual ports differ greatly from those given in a previous table, wherein the tonnage of overseas vessels entered is counted only for the port of first entry in the Dominion.
| Port. | Number. | Tonnage. |
|---|---|---|
| Whangaroa | 1 | 4,542 |
| Russell | 18 | 103,615 |
| Whangarei | 20 | 23,941 |
| Kaipara | 7 | 2,394 |
| Auckland | 575 | 2,590,635 |
| Onehunga | ||
| Raglan | ||
| Tauranga | ||
| Tolaga Bay | 2 | 7,457 |
| Tokomaru Bay | 10 | 67,234 |
| Gisborne | 40 | 191,678 |
| Waikokopu | 6 | 32,854 |
| Napier | 105 | 475,936 |
| New Plymouth | 96 | 410,831 |
| Wanganui | 51 | 208,531 |
| Wellington | 621 | 2,488,486 |
| Picton | 27 | 90,645 |
| Nelson | 19 | 60,267 |
| Westport | 107 | 163,110 |
| Greymouth | 67 | 78,042 |
| Lyttelton | 265 | 1,136,352 |
| Timaru | 97 | 310,469 |
| Oamaru | 27 | 73,243 |
| Dunedin | 225 | 957,958 |
| Bluff | 133 | 473,904 |
| Totals | 2,519 | 9,952,124 |
Overseas vessels are shown to have called at twenty-two ports during 1936, including seven which were not first ports of call for a single overseas vessel. The total entries of the 638 overseas vessels during the year were 2,519, which gives an average of a little more than four ports called at on each visit to the Dominion. Many vessels—as, for instance, those engaged in the transport of timber and coal, and those merely touching at a New Zealand port while en route between Australia and America—call at only one port in the Dominion, while, on the other hand, vessels engaged in the United Kingdom trade generally call at half a dozen or more ports.
The examinations for masters, mates, engineers, &c., of vessels are controlled by the Marine Department, and the regulations relating to these examinations are based upon those of the Imperial Board of Trade, with such modifications as are necessitated by local conditions; but the British Board of Trade recognizes the following New Zealand certificates only as of Imperial validity: Master, extra: master, ordinary (endorsement); master, steamship; first mate and second mate, ordinary (endorsement.) and steamship; first- and second-class steam engineers, and first- and second-class motor engineers. It is a condition of such recognition that candidates must possess service qualifications and pass examinations similar and not inferior to those prescribed by the British Board of Trade.
New regulations for the examination of masters and mates were issued by the Board of Trade on 1st January, 1931, and corresponding regulations were made in New Zealand and came into force on the same date. Since that date masters' and mates' ordinary certificates have not been issued, steamship certificates endorsed to the effect that the holder is eligible to act in a sailing-ship having been substituted therefor.
New regulations relating to the examination of engineers in the Mercantile Marine have been issued, and came into force on the 9th April, 1936.
During 1930–37 some 261 candidates sat for examinations. Of the 178 who passed, 63 were masters, mates, and engineers of seagoing steamships and motor-vessels; 18 were masters and engineers of steamers plying within restricted limits; 3 were masters of seagoing yachts.; 52 were engineers of New Zealand seagoing motor-propelled boats; and 31 were engineers of such boats plying within restricted limits; while 6 passes were registered for the signals examination; 1 for the voluntary signals examination; 1 for the fore and aft endorsement; and 3 for the Sub-Lieutenants (R.N.V.R.) examination.
The Shipping and Seamen Act of 1908, and its amendments, provide for an annual survey by Government surveyors of all vessels, with a view to ensuring their seaworthiness. Certificates of survey were issued in 1936–37 to 155 seagoing steam and motor ships, 382 restricted-limits steam and motor ships, and 2 sailing-vessels. Vessels to the number of 244 were also surveyed for seaworthiness and efficiency under section 226 of the 190S Act.
Along the New Zealand coast there are fifty-one lighthouses of various types. In twenty-three cases the light apparatus is classed as of the dioptric order—i.e., a central lamp sending its rays through a combination of surrounding lenses—while automatic lights are used in the remainder of the coastal lighthouses. The buildings housing the lights are of varying kinds, as necessitated by their respective situations.
Fog-signals of the Diaphone type are established at Pencarrow Head, Godley Head, Taiaroa Head, and Tiri Tiri Island; while radio-beacons have been established at Cape Maria van Diemer., Baring Head, and Tiri Tiri Island.
The most powerful light is that of Stephen Island, which, placed some 600 ft. above high water, is visible at a distance of 32½ nautical miles. Next in order come Cape Brett light (altitude 510 ft.) and East Cape (505 ft.), both visible at 30£ miles; Godley Head (altitude 450 ft.), visibility 29 miles; Cuvier Island light (altitude 390 ft.) and Moko Hinau (altitude 385 ft.), both of which have a visibility of 27 miles. Sixteen other lights have a range of 20 miles or over.
All manually-attended coastal lighthouses are equipped with signalling flags and lamps, the keepers being competent to transmit or receive messages. Coastal lights —i.e., those outside the bounds of the various harbour authorities—are maintained by the Marine Department.
The average cost of erection and equipment of the main coastal lighthouses was about £6,000 per light. The two most costly were Cape Brett Lighthouse (£11,237) on the Auckland Peninsula, and Dog Island Lighthouse (£10,481) in Foveaux Strait. The cost of maintenance of all lighthouses under the control of the Marine Department was for 1936–37—Salaries and wages, £16,547; stores and general maintenance, £9,940; working-expenses of tender, £22,362; administration expenses, £8,075; interest and sinking-fund charges, £12,810; depreciation, £11,779: total, £81,513. Light dues for 1936–37 totalled £98,717.
In the case of any wreck or shipping casualty in New Zealand waters a Collector of Customs, Superintendent of Mercantile Marino, or other person empowered by the Minister of Marine, institutes an inquiry into the cause and circumstances of such casualty. If necessary, a formal investigation is hold by a Magistrate, who has power to cancel or suspend the certificate of any officer from whoso wrongful act or default damage has resulted.
Should any wreck occur on the coast, the Receiver of Wrecks for that district, usually an officer of the Customs, has the necessary authority to be used in the preservation of life and property.
During the year 1936–37 fifty-eight inquiries, four of which were Magisterial, were held into shipping casualties, the number of vessels involved being 61. There were four serious casualties during the year, four lives being lost. A summary of the casualties is given.
| Strandings— | No. | Tonnage. |
| Total loss | 4 | 1,273 |
| Damaged | 13 | 6,234 |
| Undamaged | 6 | 12,688 |
| Collisions— | ||
| Total Loss | Nil. | |
| Damaged | 4 | 1,447 |
| Undamaged | 2 | 925 |
| Fires— | No. | Tonnage. |
| Total loss | 1 | 37 |
| Damaged | 2 | 5,851 |
| Undamaged | 1 | 1,344 |
| Miscellaneous | 28 | 72,480 |
| Total casualties | 61 | 102,279 |
Table of Contents
RAILWAY history in New Zealand dates from the year 1860. In that year a contract was let for the construction of a line from Christchurch to Lyttelton and the first portion of this line was opened on the 1st December, 1863. A line from Invercargill to Bluff Harbour was opened on the 5th February, 1867. The Provincial Council of Auckland in 1863 began the construction of a line from Auckland to Drury.
Although nearly all the railways are State-owned, some were built by private enterprise. Of these the more important were constructed by the Midland and the Wellington-Manawatu Railway Companies.
In the year 1876 the railways of New Zealand passed from the control of the Provincial Governments to the Public Works Department. A few years later the opened lines were handed over to the Working Railways Department, and in 1889 a Board of three Railways Commissioners was appointed. This form of management, however, lasted only for five years, at the end of which period a General Manager, responsible to the Minister of Railways, took over the administration, and this system continued for close on thirty years. In 1925 the system of railway management was reorganized under the control of a Railways Board of three members, but in 1928 the system of control by a General Manager was again reverted to. Three years later legislation was passed constituting the Government Railways Board of five members. This form of management was in operation from 1st June, 1931, to 31st March, 1936, after which date the system of control by a General Manager, responsible to the Minister of Railways, was again introduced.
The development of automatic and electric-power signalling has been greatly extended since its introduction on the New Zealand Railways some years ago. At the present time automatic signalling controlling the safe running of trains is in use on 78 miles 16 chains of double line and 190 miles 41 chains of single line, with further extensions under construction. In addition to automatic signalling, power signalling for the operation of yards has largely superseded the older form of mechanical signalling.
The use of electric power on the New Zealand Railway's is increasing to a great extent for many purposes, including pumping plants for the supply of water for engines outside stations, for driving electrical machinery in the shops, and for the lighting of stations, locomotives, and carriages. There are 21 railway substations, with a total capacity of 12,890 kv.a. The Christchurch-Lyttelton section of railway, including the Lyttelton Tunnel, was electrified in 1928–29, while the Otira-Arthur's Pass section, including the Otira Tunnel, was electrified in 1923. Work in connection with the electrification of the Wellington-Paekakariki section (24 miles 60 chains) is in hand.
The Railways Department owns and operates its own telephone and telegraph communication system, and over all the main lines the running of the trains in controlled from the District Traffic Managers' offices by means of selective telephone equipment. For general communication, the use of automatic telephone exchanges, carrier current telephony, and voice frequency repeaters on the longest lines give a high-grade service between all stations. Selective inter-calling equipment has been introduced on long lines with success, and extensions of modern telephone and telegraph apparatus are being undertaken.
At the 31st March, 1937, there were some 3,320 miles of State railways open for traffic, divided into seven distinct sections, as follows:—
| Section. | Length. Miles. |
|---|---|
| North Island main line and branches | 1,486 |
| Kaihu | 24 |
| Gisborne | 60 |
| Total, North Island | 1,570 |
| South Island main line and branches | 1,594 |
| Westport | 36 |
| Nelson | 64 |
| Picton | 56 |
| Total, South Island | 1,750 |
Government railways are constructed by the Public Works Department, and are transferred to the Railways Department when completed.
The gauge is 3 ft. 6 in., and a steel rail of 70 lb. weight per lineal yard is the standard for the permanent-way, and is in use on 1,906 miles of line. Practically all the remaining mileage is in 53 lb., 55 lb., 56 lb., and 100 lb. steel rails, while 85 lb. rails will soon be in use. Sleepers, which are laid down to the number of 2,300 to the mile, are principally of Australian hardwood and New Zealand silver-pine or totara.
The capital cost of State railways as at the end of each of the last five financial years is given below.
| — | 31st March, 1933. | 31st March, 1934. | 31st March, 1935. | 31st March, 1936. | 31st March, 1937. |
|---|---|---|---|---|---|
* For composition of subsidiary services, see later table in this section. | |||||
| Open for traffic— | £ | £ | £ | £ | £ |
| Railway | 49,744,744 | 52,173,142 | 52,352,985 | 52,462,587 | 52,905,965 |
| Lake Wakatipu steamer service | 17,648 | 17,648 | 17,648 | 17,645 | 17,645 |
| Subsidiary services* | 1,708,661 | 1,708,661 | 1,708,661 | 1,762,931 | 1,762,931 |
| General | 9,896 | 9,896 | 9,896 | 9,896 | 9,896 |
| Total | 51,480,949 | 53,909,347 | 54,089,190 | 54,253,059 | 54,696,437 |
| Lines under construction | 7,747,945 | 5,428,570 | 5,387,953 | 5,358,775 | 5,963,346 |
| Grand total | 59,228,894 | 59,337,917 | 59,477,143 | 59,611,834 | 60,659,783 |
The increase during the year 1936–37 in capital invested in open lines was £443,378. The greater part of the capital expenditure was in connection with the provision of new terminal facilities at Wellington, which comprise three major works—namely, the new Wellington station and yard, the Tawa Flat deviation, and the electrification of the Wellington-Paekakariki and Wellington-Johnsonville sections.
So varied are the geographical features of the Dominion that a great disparity exists in the cost of constructing the individual sections of lines. The numerous mountain-chains and the innumerable rivers fed by the heavy rainfall make railway-construction in general both difficult and expensive, as the next statement shows.
| Section. | Capital Cost of Open Lines to 31st March, 1937. | Capital Cost per Mile (Open Lines). | Net Revenue. | |||
|---|---|---|---|---|---|---|
| Per Mile of Open Line. | Per Cent. of Capital Cost. | |||||
| 1935–36. | 1936–37. | 1935–36. | 1936–37 | |||
* Loss. | ||||||
| North Island— | £ | £ | £ | £ | ||
| Kaihu | 160,240 | 6,677 | -110* | -158* | ||
| Gisborne | 767,026 | 12,784 | -71* | -80* | ||
| Main line and branches | 32,285,605 | 21,727 | 334 | 302 | 1.56 | 1.39 |
| Totals, North Island | 33,212,871 | 21,155 | 312 | 281 | 1.49 | 1.34 |
| South Island— | ||||||
| Westport | 354,692 | 9,853 | 287 | 332 | 2.91 | 3.37 |
| Nelson | 507,733 | 7,933 | -92* | -135* | ||
| Picton | 579,119 | 10,341 | -14* | -5* | ||
| Main line and branches | 18,251,550 | 11,450 | 143 | 76 | 1.25 | 0.66 |
| Totals, South Island | 19,693,094 | 11,253 | 132 | 71 | 1.18 | 0.66 |
| Totals, Railways | 52,905,965 | 15,936 | 217 | 170 | 1.37 | 1.09 |
| Lake Wakatipu steamer service | 17,645 | |||||
| Subsidiary services | 1,762,931 | |||||
| General | 9,896 | |||||
| Grand totals | 54,696,437 | 16,475 | 317 | 272 | 1.94 | 1.65 |
Information as to the rolling-stock in use on the State railways in 1936–37 is given in the following table:—
| Locomotives— | |
| Tender | 368 |
| Tank | 191 |
| Electric | 11 |
| Battery | 5 |
| Total | 575 |
| Passenger-vehicles— | |
| Sleepers | 17 |
| Combination day-sleepers | 7 |
| Saloon | 21 |
| First-class | 236 |
| Second-class | 839 |
| Composite | 353 |
| Ladies' | 4 |
| Postal | 11 |
| Other | 11 |
| Total | 1,499 |
| Wagons— | |
| Horse-boxes | 265 |
| Cattle | 632 |
| Sheep | 2,545 |
| Frozen and chilled meat | 947 |
| Cool-storage | 898 |
| Covered goods | 926 |
| High-side | 14,714 |
| High-side bogie | 405 |
| Low-side | 1,679 |
| Brake-vans | 480 |
| Other | 3,825 |
| Total | 27,316 |
All carriages and wagons required for use on the State railways have, since 1901, been constructed in the railway workshops of the Dominion, with the exception of 2,500 four-wheeled wagons imported from England in 1921–22. Locomotives also are built in the railway workshops ox' the Dominion.
The weights of the locally-built tender-engines in working trim vary from 63 to 135 tons, while those of the tank-engines run from 29½ to 71 tons.
The following engines of more recent construction deal with the bulk of the traffic:—
| Class. | Type. | Traffic. | Weight. | Tractive Force. |
|---|---|---|---|---|
| Tons. | lb. | |||
| AB | 4–6–2 superheated; simple, with tender | Mixed | 85 | 20,000 |
| A | 4–6–2 superheated and saturated; compound, with tender | Mixed | 78 | 17,000 |
| K | 4–8–4 superheated; simple, with tender | Mixed | 135 | 30,815 |
| X | 4–8–2 superheated and saturated; compound, with tender | Goods | 94 | 26,620 |
| WAB | 4–6–4 superheated; simple tank engine | Mixed | 72 | 22,250 |
| C | 2–6–2 superheated; simple, with tender | Shunting | 66 | 13,798 |
Standard carriages are 50 ft. in length, fitted with chair seats to accommodate twenty-nine to forty-four passengers, steam-heated, and lighted by electricity. Some 659 carriages were equipped with electric light at 31st March, 1937. Locomotives to the number of 399 are fitted with electric head-fights. The Westing-house brake is fitted to all rolling-stock with the exception of that on the Kaihu, Picton, Nelson, and Westport Sections.
During 1936–37 seven rail cars were placed in service on the Wellington-Wairarapa service and two on the Christchurch – West Coast service. Six rail cars are at present under construction for the Wellington – New Plymouth service.
The railways have contributed in a great measure towards bringing the Dominion to its present high state of productiveness, have given practical assistance in the development of the country, and have encouraged local industry. For many years a profit of 3 per cent. was regarded as sufficient, and any excess over this rate was followed by reductions in passenger charges or in freights. Consequent on the extension of settlement and the soundness of the Dominion's industries, a rate of 3¾ per cent. was aimed at, commencing with the year 1909–10. During the next twelve years the actual return averaged 4.20 per cent. The year 1921–22 saw a severe depression throughout the country, the return of 1.07 per cent. for that year being the lowest in the history of the railways. For the three years 1922–23 to 1924–25 the return averaged 3.48 per cent.
In 1924 the Government decided upon a financial reorganization of the railways, and an entirely new system of accounts, based on commercial practice, was brought into operation on the 1st April, 1925.
The first and most important step in this direction was the establishment of a separate Working Railways Account into which all earnings are paid and from which all working-expenses, superannuation subsidies, and interest on capital up to the full amount of the net revenue are met. The interest on capital is based on the actual rates payable on the various loans.
The changed financial policy embodied the setting-up of Renewals, Betterments, and Equalization Funds, and also provided for payment of subsidies from the Consolidated Fund for losses on operation of certain developmental lines.
The return for the next four years was 4.35 per cent., 3.99 per cent., 3.64 per cent., and 3.45 per cent.; but in 1929–30 it fell to 161 per cent., duo mainly to the discontinuance of the subsidy on developmental lines which had been paid by the Treasury since 1925. The economic depression which set in during 1930 caused the return for 1930–31 to fall to 1.16 per cent., but in the succeeding years it rose to 1.64 per cent. for 1931–32, 1.65 per cent. for 1932–33, and 2.05 per cent. for 1933–34, falling to 2.01 per cent. in 1934–35, 1.94 per cent. in 1935–36, and 1.65 per cent. in 1936–37.
The total revenue and expenditure of the railways during each of the last tea years are as follows:—
| Year ended 31st March, | Gross Revenue. | Expenditure. | Net Revenue. | Percentage of Net Revenue to Capital Cost. | ||
|---|---|---|---|---|---|---|
| £ | £ | £ | £ | s. | d. | |
| 1928 | 8,524,538 | 6,685,123 | 1,839,415 | 3 | 12 | 10 |
| 1929 | 8,747,975 | 6,849,383 | 1,898,592 | 3 | 9 | 0 |
| 1930 | 8,288,116 | 7,358,859 | 929,257 | 1 | 12 | 4 |
| 1931 | 7,571,537 | 6,882,810 | 688,727 | 1 | 3 | 3 |
| 1932 | 6,508,948 | 5,670,955 | 837,993 | 1 | 12 | 8 |
| 1933 | 6,034,403 | 5,183,859 | 850,544 | 1 | 13 | 0 |
| 1934 | 6,332,711 | 5,247,153 | 1,085,558 | 2 | 1 | 0 |
| 1935 | 6,627,928 | 5,540,437 | 1,087,491 | 2 | 0 | 3 |
| 1936 | 7,004,316 | 5,952,839 | 1,051,477 | 1 | 18 | 10 |
| 1937 | 7,790,651 | 6,886,793 | 903,858 | 1 | 13 | 0 |
Interest on railway capital liability for 1936–37 amounted to £2,309,754, there thus being a deficit of £1,405,896 for the year, as compared with £1,248,574 for the preceding year. A sum of £819,537 was set aside for depreciation and renewals, and is included in the total of expenditure for the year.
The figures in the above table are inclusive of subsidiary services, which in recent years have increased considerably. From 1925–26 to 1928–29 also the figures of receipts are swelled by the inclusion of moneys transferred from the Consolidated Fund to make good losses on branch lines and isolated sections. This provision, however, was then cancelled. In 1931–32 the capital was written down by £10,400,000, which has advantageously affected the return per cent. The revenue and expenditure for the last five years are now given, distinguishing between railway operating and other items:—
| Year ended 31st March, | Revenue. | Expenditure. | Net Operating Revenue. | ||
|---|---|---|---|---|---|
| Railway Operating. | Subsidiary Services. | Railway Operating. | Subsidiary Serviced. | ||
| £ | £ | £ | £ | £ | |
| 1933 | 5,339,075 | 695,328 | 4,833,754 | 350,105 | 505,321 |
| 1934 | 5,628,835 | 703,876 | 4,877,146 | 370,007 | 751,689 |
| 1935 | 5,908,064 | 719,864 | 5,138,588 | 401,849 | 769,476 |
| 1936 | 6,243,519 | 760,797 | 5,523,193 | 429,646 | 720,326 |
| 1937 | 6,903,604 | 887,047 | 6,338,385 | 548,408 | 565,219 |
The various subsidiary services now conducted by the Railways Department, with the revenue and expenditure of each during the last two years are given below. Full working-costs, including interest, are charged against these services, and the interest so charged is taken into miscellaneous receipts as revenue.
| Service. | Revenue. | Expenditure. | ||
|---|---|---|---|---|
| 1935–36. | 1936–37. | 1935–36. | 1936–37. | |
| £ | £ | £ | £ | |
| Lake Wakatipu steamers | 10,598 | 7,112 | 9,399 | 10,855 |
| Refreshment service | 89,132 | 103,351 | 84,976 | 101,125 |
| Bookstall service | 45,797 | 54,417 | 43,042 | 51,245 |
| Advertising service | 31,774 | 34,535 | 29,391 | 31,151 |
| Departmental dwellings | 129,255 | 131,187 | 156,692 | 164,746 |
| Leases of bookstalls, &c. | 17,909 | 19,020 | 11,464 | 12,233 |
| Road services | 103,280 | 198,751 | 94,682 | 177,053 |
| Miscellaneous receipts | 333,052 | 338,674 | ||
| Totals | 760,797 | 887,047 | 429,646 | 548,408 |
In the following table the operating revenue during the last ten years is classified according to the class of traffic, &c., from which it was derived.
| Year ended 31st March, | Passenger-fares. | Parcels, Luggage, and Mails. | Goods and Live-stock. | Labour, Demurrage, &c. | Total. |
|---|---|---|---|---|---|
| £ | £ | £ | £ | £ | |
| 1928 | 2,145,296 | 379,933 | 4,680,135 | 138,481 | 7,343,845 |
| 1929 | 2,124,746 | 378,141 | 4,846,125 | 175,852 | 7,524,864 |
| 1930 | 1,995,927 | 386,792 | 4,904,324 | 186,950 | 7,473,993 |
| 1931 | 1,778,726 | 359,276 | 4,487,357 | 156,029 | 6,781,388 |
| 1932 | 1,339,589 | 316,245 | 4,019,600 | 113,531 | 5,788,965 |
| 1933 | 1,207,296 | 283,822 | 3,745,777 | 102,180 | 5,339,075 |
| 1934 | 1,336,334 | 281,889 | 3,911,245 | 99,367 | 5,628,835 |
| 1935 | 1,368,689 | 292,097 | 4,138,434 | 108,844 | 5,908,064 |
| 1936 | 1,466,617 | 299,964 | 4,359,750 | 117,188 | 6,243,519 |
| 1937 | 1,611,305 | 305,526 | 4,846,417 | 140,356 | 6,903,604 |
Revenue from the carriage of goods and live-stock had been steadily increasing up to 1929–30, but from then until 1932–33 successive declines were recorded, due mainly to the economic depression and to motor competition. Passenger traffic since 1926 has shown a rapid falling-off due in the earlier years to intensive motor competition and later to the depression. During the past four years, however, a definite upward trend has been shown, due to the improvement in economic conditions.
The revenue from passenger-fares during the year 1936–37 represented an expenditure on railway travel of £10s. 5d. per head of mean population, including Maoris. The total railway operating revenue was equal to £4 7s. 5d. per head.
A table is added showing information as to railway revenue in each of the Australian States for the year ended 30th June, 1936. Figures for New Zealand for the year ended 31st March, 1936, are also given.
| State. | Miles of Line open. | Train-miles run (,000 omitted). | Gross Revenue (,000 omitted). | Net. Revenue | |||
|---|---|---|---|---|---|---|---|
| Amount (,000 omitted). | Per Train-mile. | Per Cent. of Capital. | |||||
* Loss. | |||||||
| £ | £ | s. | d. | ||||
| Queensland | 6,567 | 12,386 | 6,697 | 1,484 | 2 | 5 | 4.09 |
| New South Wales | 6,124 | 27,701 | 17,754 | 5,906 | 4 | 3 | 4.11 |
| Victoria | 4,721 | 16,391 | 9,690 | 2,833 | 3 | 5 | 3.70 |
| South Australia | 2,529 | 5,462 | 2,878 | 464 | 1 | 8 | 1.60 |
| Western Australia | 4,358 | 6,095 | 3,446 | 958 | 3 | 2 | 3.79 |
| Tasmania | 645 | 1,659 | 449 | 112* | |||
| Commonwealth Railways | 2,145 | 582 | 388 | ||||
| Totals for Australia | 27,089 | 70,276 | 41,302 | 11,533 | 3 | 3 | 3.41 |
| New Zealand | 3,320 | 11,050 | 7,004 | 1,051 | 1 | 11 | 1.94 |
The net revenue in the case of New Zealand is arrived at after making full provision for renewals and depreciation and subsidies to the Superannuation Fund and Sick-benefit Society.
The total railway expenditure in 1936–37 represented 88.40 per cent. of the gross earnings, and the operating-expenses 91.81 per cent. of operating revenue. It is of interest to trace the movement over a period of years, as in the following statement. The figures for the last eleven years relate to operating revenue and expenditure, while those for previous years show the proportion of total expenditure to gross earnings.
| Year ended 31st March, | Per Cent. |
|---|---|
| 1917 | 60.97 |
| 1918 | 64.91 |
| 1919 | 66.32 |
| 1920 | 71.37 |
| 1921 | 81.59 |
| 1922 | 93.89 |
| 1923 | 81.79 |
| 1924 | 77.37 |
| 1925 | 77.97 |
| 1926 | 81.23 |
| 1927 | 82.96 |
| 1928 | 85.81 |
| 1929 | 84.71 |
| 1930 | 91.62 |
| 1931 | 94.47 |
| 1932 | 91.56 |
| 1933 | 90.54 |
| 1934 | 86.65 |
| 1935 | 86.98 |
| 1936 | 88.46 |
| 1937 | 91.81 |
The operating expenditure under various heads is now given for each of the last ten years.
| Year ended 31st March, | Maintenance of Ways and Works. | Maintenance of Signals. | Maintenance of Rolling-stock. | Locomotive Transportation. | Traffic Transportation. | Head Office and General Charges.* | Total. |
|---|---|---|---|---|---|---|---|
* Including superannuation subsidy. | |||||||
| £ | £ | £ | £ | £ | £ | £ | |
| 1928 | 1,147,067 | 102,871 | 1,380,726 | 1,662,074 | 1,760,459 | 248,922 | 6,302,119 |
| 1929 | 1,111,229 | 112,206 | 1,424,165 | 1,650,793 | 1,825,965 | 250,221 | 6,374,579 |
| 1930 | 1,146,014 | 117,577 | 1,680,919 | 1,755,209 | 1,883,918 | 264,389 | 6,848,026 |
| 1931 | 1,150,329 | 104,464 | 1,502,698 | 1,594,672 | 1,798,490 | 255,490 | 6,406,143 |
| 1932 | 997,629 | 107,585 | 1,270,585 | 1,254,769 | 1,424,520 | 246,565 | 5,301,653 |
| 1933 | 931,273 | 105,586 | 1,188,474 | 1,114,801 | 1,255,280 | 238,340 | 4,833,754 |
| 1934 | 993,207 | 110,298 | 1,220,102 | 1,064,827 | 1,253,833 | 234,879 | 4,877,146 |
| 1935 | 1,047,825 | 137,477 | 1,236,324 | 1,127,160 | 1,360,928 | 228,874 | 5,138,588 |
| 1936 | 1,070,085 | 147,442 | 1,406,685 | 1,201,636 | 1,465,052 | 232,293 | 5,523,193 |
| 1937 | 1,171,963 | 154,108 | 1,565,083 | 1,412,177 | 1,797,058 | 237,996 | 6,338,385 |
In addition to the traffic figures shown in the following table for 1936–37, 4,556,316 passengers were carried by the Railways Department's road services, and 14,749 passengers and 6,999 tons of goods on the Lake Wakatipu steamer service. Passenger train-miles run during the year totalled 5,066,860 and the passenger revenue received represents 76.32d. per train-mile and £490 per mile of line operated.
| Year ended 31st March, | Length open (Miles). | Train-mileage. | Passengers. | Season Tickets issued. | Goods and Live-stock.* | |
|---|---|---|---|---|---|---|
| Including Season-ticket Holders. | Excluding Season-ticket Holders. | |||||
* Live-stock converted to equivalent tonnage. | ||||||
| Tons. | ||||||
| 1928 | 3,180 | 10,838,594 | 25,348,241 | 9,272,547 | 632,741 | 7,358,388 |
| 1929 | 3,287 | 11,113,482 | 25,542,863 | 9,040,981 | 656,155 | 7,613,445 |
| 1930 | 3,287 | 12,022,043 | 25,380,114 | 8,466,779 | 667,419 | 7,788,973 |
| 1931 | 3,322 | 11,281,898 | 22,783,056 | 7,265,912 | 600,431 | 6,957,709 |
| 1932 | 3,315 | 10,168,720 | 19,151,480 | 6,503,566 | 459,063 | 5,824,811 |
| 1933 | 3,315 | 9,828,853 | 18,366,654 | 6,870,570 | 437,775 | 5,490,086 |
| 1934 | 3,320 | 10,163,474 | 19,047,186 | 7,511,346 | 442,742 | 5,642,199 |
| 1935 | 3,320 | 10,626,400 | 19,654,467 | 7,809,035 | 457,546 | 6,023,960 |
| 1936 | 3,320 | 11,050,376 | 20,358,524 | 7,963,824 | 482,146 | 6,188,805 |
| 1937 | 3,320 | 11,868,083 | 21,235,428 | 8,284,956 | 513,063 | 6,813,240 |
Live-stock carried in 1936–37 comprised 436,261 cattle, 694,461 calves, 9,608,601 sheep, and 716,889 pigs, equivalent to a tonnage of 600,333.
Detailed figures showing the number of rail passengers carried during the last five years are given in the following table:—
| — | 1932–33. | 1933–34. | 1934–35. | 1935–36. | 1936–37. |
|---|---|---|---|---|---|
| Ordinary and holiday excursion | 3,025,843 | 3,272,410 | 3,280,370 | 3,285,197 | 3,480,655 |
| Suburban | 2,041,581 | 2,205,172 | 2,221,420 | 2,298,021 | 2,360,962 |
| Other reduced fares | 1,803,146 | 2,033,764 | 2,307,245 | 2,380,606 | 2,443,339 |
| Totals | 6,870,570 | 7,511,346 | 7,809,035 | 7,963,824 | 8,284,956 |
| Season tickets issued— | |||||
| Workers' weekly | 210,269 | 214,819 | 226,877 | 243,120 | 257,843 |
| Weekly twelve-trip | 98,163 | 99,863 | 103,981 | 109,418 | 110,844 |
| Bearer twelve-trip | 77,772 | 76,071 | 73,047 | 72,607 | 72,920 |
| Bearer six-trip | 10,673 | ||||
| School | 25,470 | 25,206 | 25,568 | 26,148 | 25,693 |
| Tourist | 398 | 369 | 373 | 368 | 288 |
| Travellers' annual | 416 | 395 | 376 | 359 | 344 |
| Other | 25,287 | 26,019 | 27,324 | 30,126 | 34,458 |
| Totals | 437,775 | 442,742 | 457,546 | 482,146 | 513,063 |
The following table gives interesting information as to the constitution of the goods traffic for the last five years. The figures are exclusive of steamer traffic on Lake Wakatipu:—
| Commodity. | 1932–33. | 1933–34. | 1934–35. | 1935–36. | 1936–37. |
|---|---|---|---|---|---|
| Tons. | Tons. | Tons. | Tons. | Tons. | |
| Grain | 269,367 | 276,105 | 304,936 | 185,754 | 265,610 |
| Meals | 110,787 | 115,139 | 118,666 | 113,992 | 118,494 |
| Fruit, New Zealand | 44,372 | 41,237 | 47,997 | 36,978 | 43,231 |
| Root crops, fodder | 111,123 | 106,844 | 111,718 | 114,614 | 128,612 |
| Flax, hemp, and tow | 11,057 | 12,715 | 10,695 | 10,315 | 12,275 |
| Seeds | 16,752 | 22,343 | 21,767 | 16,275 | 20,033 |
| Cattle and horses | 119,097 | 134,269 | 136,490 | 171,576 | 180,142 |
| Sheep and pigs | 425,997 | 414,534 | 442,493 | 398,752 | 420,191 |
| Meat | 217,538 | 226,021 | 238,404 | 227,993 | 227,453 |
| Butter | 146,367 | 146,275 | 131,590 | 146,765 | 155,161 |
| Cheese | 95,336 | 89,480 | 78,397 | 71,095 | 75,007 |
| Wool | 149,678 | 152,036 | 126,682 | 162,045 | 158,743 |
| Dairy by-products | 14,868 | 16,666 | 20,784 | 25,308 | 25,138 |
| Fat, hides, skins | 37,458 | 42,142 | 44,792 | 37,035 | 47,039 |
| Fish | 7,808 | 8,591 | 7,858 | 8,434 | 9,974 |
| Agricultural lime | 173,932 | 195,018 | 244,896 | 246,716 | 295,055 |
| Coal, imported | 28,441 | 32,024 | 30,531 | 32,676 | 26,089 |
| Coal, New Zealand hard | 704,984 | 645,461 | 654,170 | 652,637 | 766,209 |
| Coal, New Zealand brown | 681,643 | 752,823 | 756,123 | 802,541 | 840,018 |
| Road-metal | 78,095 | 91,904 | 128,540 | 132,096 | 109,963 |
| Lime and coke | 31,959 | 29,418 | 28,202 | 28,225 | 32,873 |
| Timber, imported | 6,615 | 7,708 | 13,017 | 13,476 | 18,171 |
| Timber, New Zealand | 247,018 | 293,514 | 355,400 | 407,323 | 434,204 |
| Firewood, posts, &c. | 61,886 | 61,583 | 81,349 | 72,543 | 78,736 |
| Benzine, kerosene, &c. | 117,660 | 110,731 | 119,739 | 131,510 | 154,061 |
| Cement | 36,870 | 47,189 | 44,916 | 49,799 | 58,989 |
| Manures | 614,352 | 552,441 | 626,717 | 663,185 | 746,492 |
| Miscellaneous | 929,626 | 1,017,988 | 1,097,091 | 1,229,147 | 1,365,277 |
| Totals | 5,490,686 | 5,642,199 | 6,023,960 | 6,188,805 | 6,813,240 |
A table showing for the various commodities the tonnage carried, ton-miles, average haul, revenue, and revenue per ton-mile during 1936–37 is now given:—
| Commodity. | Tonnage carried. | Per Cent. of Total. | Tons One Mile (,000 omitted). | Average Haul. | Revenue. | Revenue per Ton-mile. |
|---|---|---|---|---|---|---|
| Miles. | £ | d. | ||||
| Grain | 265,610 | 3.89 | 13,481 | 51 | 130,816 | 2.32 |
| Meals | 118,494 | 1.74 | 7,427 | 63 | 69,902 | 2.25 |
| Fruit, New Zealand | 43,231 | 0.64 | 7,934 | 184 | 63,342 | 1.91 |
| Root crops, fodder | 128,612 | 1.89 | 9,221 | 72 | 76,831 | 1.99 |
| Flax, hemp, and tow | 12,275 | 0.18 | 1,033 | 84 | 11,190 | 2.60 |
| Seeds | 20,033 | 0.29 | 1,131 | 56 | 15,107 | 3.20 |
| Cattle and horses | 180,142 | 2.65 | 15,436 | 86 | 200,235 | 3.11 |
| Sheep and pigs | 420,191 | 6.17 | 31,653 | 75 | 406,745 | 3.08 |
| Meat | 227,453 | 3.35 | 7,823 | 34 | 191,759 | 5.88 |
| Butter | 155,161 | 2.28 | 11,408 | 74 | 166,003 | 3.49 |
| Cheese | 75,007 | 1.11 | 3,976 | 53 | 69,970 | 4.23 |
| Wool | 158,743 | 2.33 | 9,975 | 63 | 154,391 | 3.71 |
| Dairy by-products | 25,138 | 0.37 | 2,092 | 83 | 24,158 | 2.76 |
| Fat, hides, skins | 47,039 | 0.609 | 2,188 | 47 | 45,193 | 4.95 |
| Fish | 9,974 | 0.14 | 1,696 | 170 | 15,322 | 2.16 |
| Agricultural lime | 295,055 | 4.33 | 18,833 | 64 | 104,598 | 1.33 |
| Coal, imported | 26,089 | 0.38 | 668 | 26 | 10,445 | 3.75 |
| Coal, New Zealand hard | 766,209 | 11.25 | 32,572 | 43 | 255,456 | 1.88 |
| Coal, New Zealand brown | 840,018 | 12.32 | 104,856 | 125 | 552,484 | 1.26 |
| Road-metal | 109,963 | 1.02 | 3,343 | 30 | 27,934 | 2.00 |
| Lime and coke | 32,873 | 0.48 | 2,670 | 81 | 19,257 | 1.75 |
| Timber, imported | 18,171 | 0.26 | 1,038 | 57 | 16,825 | 3.89 |
| Timber, New Zealand | 434,204 | 6.37 | 51,953 | 120 | 413,677 | 1.91 |
| Firewood, posts, &c. | 78,736 | 1.16 | 6,862 | 87 | 37,471 | 1.31 |
| Benzine, gasoline, kerosene | 154,061 | 2.27 | 13,893 | 90 | 254,069 | 4.38 |
| Cement | 58,989 | 0.86 | 7,442 | 126 | 63,002 | 2.03 |
| Manures | 746,492 | 10.95 | 49,342 | 66 | 365,493 | 1.77 |
| Miscellaneous | 1,365,277 | 20.03 | 76,454 | 56 | 1,148,609 | 3.60 |
| Totals | 6,813,240 | 100.00 | 496,400 | 73 | 4,910,284 | 2.37 |
The total number of freight train-miles run during the year 1936–37 in carrying the above tonnage was 6,801,223. The revenue received represents averages of 14s. 5d. per train-mile, 14s. 5d per ton, and 2.37d. per ton-mile.
The average number of persons employed by the State railways throughout the year ended 31st March, 1937, was 19,115. The staff is divided into two divisions—namely, the first or clerical division, and the second or out-of-door division—and is further classed in four branches, as shown in the following table.:—
| Average, Year ending 31st March, | General. | Traffic. | Maintenance. | Locomotive. | Total. |
|---|---|---|---|---|---|
| 1933 | 1,376 | 4,732 | 3,009 | 5,579 | 14,696 |
| 1934 | 1,386 | 4,663 | 3,194 | 5,728 | 14,971 |
| 1935 | 1,460 | 4,772 | 3,565 | 6,251 | 16,048 |
| 1936 | 1,488 | 4,888 | 3,788 | 6,909 | 17,073 |
| 1937 | 1,823 | 5,553 | 4,073 | 7,666 | 19,115 |
A system of classification, first introduced in 1896, and revised at various times since then, applies to Railway employees. An Appeal Board is constituted to hear grievances of members dissatisfied with decisions respecting promotion, loss of status, or breaches of discipline. The Board consists of a Magistrate and two members of the Railways service, one appointed by the Minister of Railways, and the other elected by the members of the Department. A superannuation fund in connection with the Railways service was established in 1903. Information concerning this is given in the section dealing with “Pensions, Superannuation,” &c. A sick-benefit fund, providing for the payment of weekly allowances for periods up to seventy - eight weeks to employees other than salaried stall who are incapacitated by sickness, was instituted in 1929. The fund is subsidized by the Department at the rate of approximately 10s. to each £1 contributed by members. Reserve funds amounting to £40,959 had been built up at 31st March, 1937.
With the exception of the Ongarue accident in 1923 (when seventeen passengers were killed and twenty-nine more or less severely injured, through a falling boulder derailing the engine), the history of railways in New Zealand has been one of comparative freedom from accidents of a serious nature. A table is given dealing with railway accidents during each of the last five years.
| Year ended 31st March, | To Passengers. | To Employees. | To Others. | Fatal. | Other. | Total. |
|---|---|---|---|---|---|---|
| 1933 | 17 | 1,139 | 54 | 27 | 1,183 | 1,210 |
| 1934 | 12 | 1,289 | 59 | 30 | 1,330 | 1,360 |
| 1935 | 21 | 1,346 | 62 | 28 | 1,401 | 1,429 |
| 1936 | 25 | 1,540 | 47 | 25 | 1,587 | 1,612 |
| 1937 | 59 | 1,859 | 81 | 47 | 1,952 | 1,999 |
Of the 47 persons meeting with fatal accidents, 4 were passengers, 12 were employees, and, of the remainder, 17 were killed at railway-crossings, 7 in accidents on the line, and 7 in shunting operations.
Included in the total accidents (1,999) were 50 train accidents, 54 accidents on line, 122 shunting accidents, 57 railway-crossing accidents, and 504 accidents in railway workshops, while miscellaneous accidents totalled 1,212—mainly minor injuries to employees.
Private railways in New Zealand are mainly restricted to lines whose chief object is to serve collieries or sawmills. The following list has been compiled from inquiries made in 1937, and is possibly not free from minor inaccuracies or omissions. The list refers to private railways open for transport of passengers or goods, and does not cover the numerous railways (mostly serving sawmills and coal-mines) used solely for the transport of goods belonging to the owners of the line. The length of main line is 172 miles 70 chains, brought up to a total of 189 miles 24 chains by the inclusion of branches, sidings, &c., where such information is available.
| Principal use. | Owner. | Location. | Length of Railway.* | |
|---|---|---|---|---|
* Including main line, branches, sidings, and jig line † Sidings additional, but not available. | ||||
| M. | C. | |||
| Coal | Wilton Collieries, Ltd. | Ngaruawahia – Glen Massey Wilton Coal-mine | 6 | 75† |
| Timber and goods | Bartholomew Timber Co., Ltd. | Te Whetu – Bartholomew's Siding | 9 | 40 |
| Ores | Waihi Gold-mining Co., Ltd. | Waihi–Waikino | 7 | 40 |
| Timber | Wellington Industrial Development Co., Ltd. (operated by Taupo Totara Timber Co., Ltd.) | Putaruru–Tokoroa–Mokai | 50 | 4† |
| Stock and mixed goods | Gisborne Harbour Board | Gisborne (Turanganui) | 0 | 60 |
| Mixed goods | Napier Harbour Board | Napier – Port Ahuriri | 3 | 6 |
| Timber | Ellis and Burnand, Ltd. | Mangapehi – Pukemako Bush | 22 | 40 |
| Coal and mixed goods | Castlecliff Railway Co., Ltd. | Wanganui (Castlecliff) | 7 | 75 |
| Road metal | Manawatu County Council | Himitangi-Pukenui | 18 | 0 |
| Coal | Puponga Coal-mine. Ltd. | Puponga | 1 | 75 |
| Coal | Westport Coal Co., Ltd. | Waimangaroa In. – Conn's Creek | 4 | 30 |
| Coal | Burke's Creek Collieries. Ltd. | Reefton – Burke's Creek | 2 | 20 |
| Coal | Paparoa Coal Co., Ltd. | Blackball–Paparoa | 1 | 60 |
| Timber | Stuart, and Chapman, Ltd. | Boss – Duffer's Creek | 15 | 0 |
| Coal, lime, and sand | Ashburton County Council (operated by Blackburn Coal Co., Ltd.) | Mount Somers | 8 | 60 |
| Dunedin City Council | Dunedin (Ocean Beach) | 1 | 33 | |
| Coal | Kaitangata Coal Co., Ltd. | Kaitangata–Stirling | 4 | 0 |
| Coal and goods | Sargood and Cheeseman | Lovell's Flat –Taratu Colliery | 8 | 0† |
| Coal, passengers, and goods | Ohai Hallway Board | Wairio–Birchwood | 16 | 10 |
| Total mileage | 189 | 68 | ||
Table of Contents
ELECTRIC-TRAMWAY services in New Zealand have since their inception been con-trolled by local authorities. This is, however, subject to two exceptions —viz., (1) Auckland, where a public company carried on from 1902 until 1st July, 1919, when the system was taken over by the Auckland City Council; and (2) Dunedin, where a section of the system was until 1921 operated by a private company. Five of the seven electric-tramway systems operating at the present time are controlled by the council of the city or borough concerned. At Christchurch the Christchurch Tramway Board is the controlling body, while at Auckland the City Council has handed over the tramways to the Auckland Transport Board.
The local authorities derive their powers for controlling tramways from the Tramways Act, 1908. There are also special Acts empowering the construction, &c., of tramways in certain places.
| System. | Year of Inauguration. | Length of Track as at 31st March, 1937. | Approximate Population in Area served, April, 1937. | |||
|---|---|---|---|---|---|---|
| Thoroughfare. | Single Line (in-eluding Loops). | |||||
| M. | ch. | M. | ch. | |||
| Auckland | 1902 | 44 | 28 | 86 | 59 | 174,000 |
| New Plymouth | 1916 | 6 | 57 | 7 | 47 | 17,000 |
| Wanganui | 1908 | 14 | 24 | 16 | 64 | 23,000 |
| Wellington | 1904 | 30 | 60 | 48 | 40 | 117,000 |
| Christchurch | 1905 | 46 | 22 | 65 | 9 | 113,000 |
| Dunedin | 1903 | 16 | 52 | 28 | 76 | 73,000 |
| Invercargill | 1912 | 7 | 40 | 9 | 40 | 23,000 |
In addition to the tramway systems shown above, there were formerly tramways in Gisborne and Napier, both of which were closed down, the former in 1929, and the latter after the earthquake of 3rd February, 1931, while the Maori Hill electric tramway (part of the Dunedin system) ceased operating on 1st July, 1936, being replaced by diesel-engined buses. The last-mentioned length of tramway was the first electric tramway constructed in New Zealand, having been opened for traffic on 23rd October, 1900.
Passenger rolling-stock at 31st March, 1937, comprised 736 cars with a capacity of 31,595 passengers, including 11 trackless trains, capacity 418 passengers. The total route mileage was 167 miles, and track mileage (including loops) 263 miles. In addition to the passenger rolling-stock there were 3 water-sprinklers and 2 freight cars.
The principal statistics of tramway operations during the last ten years are given in the two following tables. The closing-down of the Gisborne service in 1929, and the Napier service in 1931, affects somewhat the comparability of the statistics for 1930 onwards with those for previous years.
| Year ended 31st March, | Number of Undertakings. | Number of Employees | Passenger Car miles run. | Passengers carried. | Number of Passengers per Car-mile. |
|---|---|---|---|---|---|
| 1928 | 9 | 3,136 | 18,857,342 | 162,550,482 | 9.64 |
| 1929 | 9 | 3,062 | 16,565,221 | 160,559,313 | 9.69 |
| 1930 | 8 | 2,936 | 16,298,984 | 154,811,262 | 9.50 |
| 1931 | 8 | 2,915 | 16,459,615 | 146,804,970 | 8.92 |
| 1932 | 7 | 2,723 | 15,692,505 | 131,654,286 | 8.39 |
| 1933 | 7 | 2,578 | 15,335,351 | 121,272,951 | 7.91 |
| 1934 | 7 | 2,565 | 15,343,078 | 119,789,384 | 7.81 |
| 1935 | 7 | 2,583 | 15,540,601 | 125,669,502 | 8.09 |
| 1936 | 7 | 2,621 | 15,679,576 | 131,651,395 | 8.40 |
| 1937 | 7 | 3,022 | 15,725,869 | 136,162,156 | 8.66 |
Of grave importance in recent years, particularly since about 1921, has been the competition of motor-omnibuses, taxi-cabs, and private motor-omnibuses, taxi-cabs, and private motor-vehicles. In 1926 partial relief came in the Motor-omnibus Traffic Act, 1926, which prohibited the competition of buses with trams, except where the fare charged per section by buses is 2d. more than the tram fare. The general trend in the number of passengers carried is definitely downward, although the figures of the last three years show improvement from the depression levels of 1933 and 1934.
Notwithstanding the closing down of the Maori Hill system (Dunedin) on 1st July, 1936, the statistics for the year ended 31st March, 1937, show that a greater volume of traffic was handled than was the case in the previous year. A noteworthy feature of the statistics for 1937 is the substantial increase in employees—a reflection of the shorter working week which came into operation during the latter months of 1936.
The financial operations of the tramways are summarized in the following table:—
| Year ended 31st March, | Revenue. | Expenditure. | Percent-age of Expenditure to Revenue. | Capital Outlay. | Accident Funds. | ||
|---|---|---|---|---|---|---|---|
| Sinking Funds. | Depreciation and Renewal Funds. | Accrued Funds. | |||||
| £ | £ | £ | £ | £ | £ | ||
| 1928 | 1,612,964 | 1,574,598 | 97.62 | 5,036,853 | 915,301 | 787,891 | 84,887 |
| 1929 | 1,606,742 | 1,531,551 | 95.32 | 5,137,918 | 1,015,920 | 780,067 | 98,131 |
| 1930 | 1,549,002 | 1,499,740 | 96.17 | 5,297,223 | 1,126,850 | 886,913 | 109,033 |
| 1931 | 1,530,010 | 1,506,151 | 98.44 | 5,596,260 | 1,231,084 | 1,037,977 | 113,603 |
| 1932 | 1,331,173 | 1,379,596 | 103.64 | 5,592,337 | 1,306,912 | 1,042,310 | 112,313 |
| 1933 | 1,232,190 | 1,281,567 | 104.01 | 5,480,302 | 1,410,762 | 1,039,814 | 108,659 |
| 1934 | 1,204,748 | 1,242,630 | 103.14 | 5,488,440 | 1,636,725 | 842,966 | 108,945 |
| 1935 | 1,221,231 | 1,245,954 | 102.02 | 5,508,731 | 1,371,341 | 809,029 | 110,998 |
| 1936 | 1,257,505 | 1,306,256 | 103.88 | 5,528,022 | 1,407,558 | 842,865 | 112,545 |
| 1937 | 1,342,494 | 1,400,597 | 104.33 | 5,524,690 | 1,451,637 | 829,157 | 14,894 |
Figures showing details of the total expenditure during each of the last five years are given in the next table:—
| Year ended 31st March, | Operating Expenditure. | Capital Charges. | Other Expenses. | Total. | ||||
|---|---|---|---|---|---|---|---|---|
| £ | Per Cent. | £ | Per Cent. | £ | Per Cent. | £ | Per Cent. | |
| 1933 | 843,523 | 65.82 | 391,669 | 30.56 | 46,375 | 3.62 | 1,281,567 | 100.00 |
| 1934 | 841,999 | 67.76 | 347,902 | 28.00 | 52,729 | 4.24 | 1,242,630 | 100.00 |
| 1935 | 859,560 | 68.99 | 351,400 | 28.20 | 34,994 | 2.81 | 1,245,954 | 100.00 |
| 1936 | 920,053 | 70.43 | 358,407 | 27.44 | 27,796 | 2.13 | 1,306,256 | 100.00 |
| 1937 | 1,005,787 | 71.81 | 360,797 | 25.76 | 34,013 | 2.43 | 1,400,597 | 100.00 |
An analysis of the capital outlay of tramway undertakings follows, figures for each of the last five years being given:—
| As at 31st March, | Permanent-way. | Electric Equipment of Lints. | Cars and other Vehicles. | Land. | Buildings. | Miscellaneous and Undefined. | Total. |
|---|---|---|---|---|---|---|---|
| Absolute Figures. | |||||||
| £ | £ | £ | £ | £ | £ | £ | |
| 1933 | 2,298,074 | 536,092 | 1,417,391 | 160,959 | 603,933 | 463,853 | 5,480,302 |
| 1934 | 2,302,607 | 538,403 | 1,427,511 | 157,219 | 604,337 | 458,363 | 5,488,440 |
| 1935 | 2,311,023 | 539,177 | 1,439,082 | 157,039 | 604,469 | 457,941 | 5,508,731 |
| 1936 | 2,319,612 | 539,630 | 1,443,608 | 155,828 | 604,540 | 464,804 | 5,528,022 |
| 1937 | 2,319,112 | 539,545 | 1,440,697 | 154,951 | 605,229 | 465,156 | 5,524,690 |
| Proportion of Total. | |||||||
| Per Cent. | Per Cent. | Per Cent. | Per Cent. | Per cent. | Per Cent. | Per Cent. | |
| 1933 | 41.93 | 9.78 | 25.86 | 2.94 | 11.02 | 8.47 | 100.00 |
| 1934 | 41.95 | 9.81 | 26.01 | 2.87 | 11.01 | 8.35 | 100.00 |
| 1935 | 41.95 | 9.79 | 26.12 | 2.85 | 10.97 | 8.32 | 100.00 |
| 1936 | 41.96 | 9.76 | 26.11 | 2.82 | 10.94 | 8.41 | 100.00 |
| 1937 | 41.98 | 9.77 | 26.08 | 2.80 | 10.95 | 8.42 | 100.00 |
A more detailed analysis of tramway statistics for 1936–37 is given in the succeeding paragraphs.
The number of passengers carried per car-mile is a useful guide to the relative volume of traffic handled by the various undertakings. As a highly relevant factor the length of track should be kept in mind.
| System. | Total Passengers carried. | Car-miles run (Passenger Cars and Trailers). | Passengers per Car-mile. | Average Fare per Passenger. |
|---|---|---|---|---|
| d. | ||||
| Auckland | 50,396,190 | 6,077,984 | 8.29 | 2.76 |
| New Plymouth | 1,975,378 | 284,933 | 6.93 | 1.98 |
| Wanganui | 1,698,165 | 398,885 | 4.26 | 2.91 |
| Wellington | 42,886,693 | 4,159,326 | 10.31 | 2.12 |
| Christchurch | 18,600,104 | 2,805,082 | 6.63 | 2.36 |
| Dunedin | 18,119,306 | 1,628,885 | 11.12 | 1.64 |
| Invercargill | 2,486,320 | 370,774 | 6.71 | 1.88 |
| Totals | 136,162,156 | 15,725,869 | 8.66 | 2.33 |
The Auckland and Wellington services provided 72 per cent. of the total traffic revenue for 1936–37, the former returning £579,391, or 43 per cent., of the total, against £380,077, or 29 per cent., in the case of Wellington. Christchurch and Dunedin fall a long way below Auckland and Wellington in traffic revenue.
Following is an analysis of revenue in each centre in 1936–37:—
| System. | Traffic (Passengers and Freight). | Traffic Revenue per Car-mile.* | Other. | Total. | |
|---|---|---|---|---|---|
| Cash. | Concession. | ||||
* Passenger vehicles. | |||||
| £ | £ | d. | £ | £ | |
| Auckland | 519,419 | 59,972 | 22.88 | 5,469 | 584,860 |
| New Plymouth | 7,457 | 8,878 | 13.76 | 398 | 16,733 |
| Wanganui | 17,614 | 3,102 | 12.46 | 1,266 | 21,982 |
| Wellington | 141,635 | 238,442 | 21.93 | 5,197 | 385,274 |
| Christchurch | 88,757 | 94,808 | 15.71 | 4,689 | 188,254 |
| Dunedin | 83,192 | 40,453 | 18.22 | 1,376 | 125,021 |
| Invercargill | 6,586 | 12,874 | 12.60 | 910 | 20,370 |
| Totals | 864,660 | 458,529 | 20.19 | 19,305 | 1,342,494 |
On the expenditure side it is informative, in view of the competition from other means of transport, to note that the total expenditure—covering operating-expenses, capital charges, and other expenditure—was £58,103 above the total revenue for the year. In fact, the Wellington tramway was the only undertaking that recorded an excess of revenue over expenditure. An analysis of the total expenditure incurred in respect of each service in 1936–37 is shown below:—
| System. | Operating Expenditure. | Capital Charges. | Other Expenses. | Total. |
|---|---|---|---|---|
| £ | £ | £ | £ | |
| Auckland | 444,650 | 144,647 | 7,746 | 597,043 |
| New Plymouth | 15,464 | 6,343 | 393 | 22,200 |
| Wanganui | 20,053 | 15,678 | 1,087 | 36,818 |
| Wellington | 293,927 | 78,723 | 9,105 | 381,755 |
| Christchurch | 123,435 | 69,770 | 12,917 | 206,122 |
| Dunedin | 90,545 | 41,240 | 1,690 | 133,481 |
| Invercargill | 17,713 | 4,396 | 1,069 | 23,178 |
| Totals | 1,005,787 | 360,797 | 34,013 | 1,400,597 |
The principal item comprised in the total operating expenditure in 1936–37 is expenses on account of traffic, which represented 60 per cent. Car-maintenance follows traffic expenses in order of magnitude, accounting for 13 per cent. Cost of power was 12 per cent. of the total, and track-maintenance approximately 8 per cent. Management and office expenses accounted for the remaining 7 per cent. The distribution of operating expenditure in 1936–37 was as follows:—
| System. | Power. | Traffic. | Car-maintenance. | Track-maintenance (Including Electrical Equipment). | Management and Office Expenses. | Total. |
|---|---|---|---|---|---|---|
| £ | £ | £ | £ | £ | £ | |
| Auckland | 54,563 | 250,872 | 54,042 | 41,684 | 43,489 | 444,650 |
| New Plymouth | 1,800 | 8,452 | 2,136 | 2,499 | 577 | 15,464 |
| Wanganui | 2,615 | 8,828 | 2,932 | 4,352 | 1,326 | 20,053 |
| Wellington | 32,735 | 185,011 | 42,855 | 21,137 | 12,189 | 293,927 |
| Christchurch | 15,182 | 78,194 | 15,723 | 8,206 | 6,130 | 123,435 |
| Dunedin | 11,207 | 59,560 | 6,520 | 5,508 | 7,750 | 90,545 |
| Invercargill | 2,025 | 9,365 | 2,588 | 2,792 | 943 | 17,713 |
| Totals | 1,120,127 | 600,282 | 126,796 | 86,178 | 72,404 | 1,005,787 |
Annual capital charges in the way of provision for interest and sinking fund and depreciation, reserve, and renewal funds comprised approximately 26 per cent. of the total expenditure during the year ended 31st March, 1937. The magnitude of these charges is not surprising, having regard to the relatively large capital outlay that is a necessity of tramway undertakings. Of the total provision for capital charges for the year ended 31st March, 1937, approximately 59 per cent. consisted of interest charges, and 18 per cent. of tanking fund charges. As the Wanganui tramways are unable to meet capital charges out of revenue, the City Council levies a special rate each year for that purpose. The amounts expended in various capital charges by each system in 1936–37 were:—
| System. | Interest. | Sinking Fund Charges. | Depreciation Fund Charges. | Renewal Fund Charges. | Reserve Fund Charges. | Accident Fund Charges. | Total. |
|---|---|---|---|---|---|---|---|
| £ | £ | £ | £ | £ | £ | £ | |
| Auckland | 111,461 | 26,159 | 7,027 | 144,647 | |||
| New Plymouth | 3,240 | 1,798 | 1,305 | 6,343 | |||
| Wanganui | 9,006 | 6,524 | 148 | 15,678 | |||
| Wellington | 37,285 | 11,873 | 24,595 | 4,970 | 78,723 | ||
| Christchurch | 34,496 | 12,309 | 22,069 | 896 | 69,770 | ||
| Dunedin | 14,587 | 6,836 | 7,481 | 12,336 | 41,240 | ||
| Invercargill | 3,317 | 1,041 | 38 | 4,396 | |||
| Totals | 213,392 | 65,499 | 9,827 | 34,405 | 31,622 | 6,052 | 360,797 |
The following table showing the relationship between revenue and expenditure per car-mile run gives a useful indication of the relative prosperity of the various undertakings:—
| System. | Per Car-mile* run, 1936–37. | ||||
|---|---|---|---|---|---|
| Total Revenue. | Operating-costs. | Capital Charges. | Other Expenditure. | Total Expenditure. | |
* All vehicles. | |||||
| d. | d. | d. | d. | d. | |
| Auckland | 23.08 | 17.54 | 5.71 | 0.31 | 23.56 |
| New Plymouth | 14.09 | 13.03 | 5.34 | 0.33 | 18.70 |
| Wanganui | 13.23 | 12.07 | 9.43 | 0.65 | 22.15 |
| Wellington | 22.23 | 16.96 | 4.54 | 0.53 | 22.03 |
| Christchurch | 16.06 | 10.53 | 5.95 | 1.10 | 17.58 |
| Dunedin | 18.42 | 13.34 | 6.08 | 0.25 | 19.67 |
| Invercargill | 13.19 | 11.47 | 2.84 | 0.69 | 15.00 |
| Weighted average | 20.47 | 15.34 | 5.50 | 0.52 | 21.36 |
Wellington alone shows a surplus of revenue per car-mile run.
At the 31st March, 1937, existing electric tramways represented a capital outlay of £5,524,690.
| System. | Permanent way. | Electric Equipment of Lines. | Cars and other Vehicles. | Land. | Buildings. | Miscellaneous and undefined. | Total. |
|---|---|---|---|---|---|---|---|
| £ | £ | £ | £ | £ | £ | £ | |
| Auckland | 1,069,532 | 221,500 | 522,199 | 28,799 | 178,582 | 66,282 | 2,086,894 |
| New Plymouth | 63,434 | 9,158 | 23,855 | 855 | 5,787 | 1,523 | 104,612 |
| Wanganui | 45,550 | 12,320 | 20,710 | 4,950 | 8,624 | 92,154 | |
| Wellington | 448,905 | 131,662 | 417,141 | 56,176 | 199,644 | 115,883 | 1,369,411 |
| Christchurch | 441,697 | 115,310 | 313,846 | 39,279 | 158,373 | 263,035 | 1,331,540 |
| Dunedin | 205,510 | 41,807 | 103,337 | 29,690 | 49,987 | 8,133 | 438,494 |
| Invercargill | 44,454 | 7,788 | 39,609 | 152 | 7,906 | 1,676 | 101,585 |
| Totals | 2,319,112 | 539,545 | 1,440,697 | 154,951 | 605,229 | 465,156 | 5,524,690 |
It would perhaps be more informative if these figures could be expressed in terms of capital value. Though attempts have been made to obtain data as to the amount of depreciation written off tramway plant, it has not been possible to elicit the required information from all tramway undertakings.
Closely allied to the capital expenditure is the question of accrued funds. At the 31st March, 1937, these totalled 2,395,688. Seventy-eight, thirty-seven, and seventy-six per cent. of sinking funds, depreciation and reserve funds, and accident funds, respectively, are invested in securities outside the tramway undertakings.
Figures of accrued funds as at 31st March, 1937, are as follows:—
| System. | Sinking Funds. | Depreciation and Reserve Funds. | Accident Funds. | Total. |
|---|---|---|---|---|
| £ | £ | £ | £ | |
| Auckland | 858,316 | 134,967 | 2,495 | 995,778 |
| New Plymouth | 21,539 | 21,539 | ||
| Wanganui | 32,379 | 32,379 | ||
| Wellington | 401,610 | 510,858 | 66,765 | 979,233 |
| Christchurch | 116,934 | 939 | 15,631 | 133,504 |
| Dunedin | 28,474 | 136,948 | 30,003 | 195,425 |
| Invercargill | 13,924 | 23,906 | 37,830 | |
| Totals | 1,451,637 | 829,157 | 114,894 | 2,395,688 |
The electrical energy in Auckland, Wellington, Christchurch, and Dunedin is obtained from the hydro-electric works at Horahora-Arapuni, Mangahao-Waikare-moana, Coleridge-Waitaki, and Waipori respectively. These are the largest hydroelectric works functioning in the Dominion, and energy is now obtainable from them at comparatively cheap rates. In using the per-unit cost figures in the next table, due attention should be paid to the fact that, with the exception of Auckland, power is purchased in bulk by the tramway authorities, and is adapted for the use of the trams over the tramway authorities' own distribution systems. In Auckland the whole of the plant installed for the transformation and conversion of power for the tramways is the property of the authority supplying the power—i.e., the Auckland Electric-power Board—the price paid by the tramway authorities being virtually for electricity delivered to the trams.
Figures for the fiscal year ended 31st March, 1937, are:—
| System. | Total Units of Electrical Energy used. | Cost per Unit. | Units per Car-mile.* | Passengers per Car-mile.† |
|---|---|---|---|---|
* All vehicles. † Passenger vehicles. | ||||
| d. | * | |||
| Auckland | 19,391,450 | 0.68 | 3.19 | 8.29 |
| New Plymouth | 841,323 | 0.51 | 2.95 | 6.93 |
| Wanganui | 1,017,900 | 0.58 | 2.55 | 4.26 |
| Wellington | 10,475,321 | 0.75 | 2.52 | 10.31 |
| Christchurch | 7,926,660 | 0.44 | 2.82 | 6.63 |
| Dunedin | 4,687,875 | 0.57 | 2.88 | 11.12 |
| Invercargill | 607,532 | 0.80 | 1.64 | 6.71 |
| Totals | 44,948,061 | 0.64 | 2.86 | 8.66 |
Omnibus services were carried on by tramway authorities in the following centres in 1936–37: New Plymouth, Wanganui, Wellington, Christchurch, and Dunedin. Statistics for the year 1936–37 show that expenditure exceeded revenue by £8,667. Dunedin being the only undertaking that reported revenue in excess of expenditure. Wellington recorded the biggest deficit, £5,067. Persons finding employment during 1936–37 totalled 88, made up as follows: Traffic management and office staff, 63; garage, 25. The number of vehicles in use was 63.
Passengers carried in 1936–37 increased by 787,191 as compared with those carried in 1935–36, while bus-miles run advanced by 170,000. Wellington recorded the heaviest volume of traffic, carrying 1,145,371 passengers, closely followed by Dunedin 1,139,044 passengers, and Christchurch 1,056,705 passengers. New Plymouth and Wanganui carried 356,152 passengers and 122,172 passengers respectively.
| — | Year ended 31st March, | ||||
|---|---|---|---|---|---|
| 1933. | 1934. | 1935. | 1936. | 1937. | |
| Undertakings No. | 6 | 6 | 5 | 5 | 5 |
| Employees No. | 90 | 79 | 58 | 64 | 88 |
| Salaries and wages £ | 24,451 | 18,852 | 15,730 | 18,258 | 26,021 |
| Capital cost of vehicles £ | 108,772 | 109,657 | 80,853 | 85,820 | 122,771 |
| Depreciation reserves £ | 83,494 | 86,301 | 63,256 | 62,385 | 68,924 |
| Total expenditure £ | 72,229 | 56,383 | 41,715 | 47,160 | 61,507 |
| Revenue £ | 43,353 | 39,618 | 36,569 | 41,462 | 52,840 |
| Passengers carried No. | 3,366,228 | 2,939,458 | 2,726,026 | 3,032,253 | 3,819,444 |
| Bus-miles No. | 953,758 | 795,723 | 684,501 | 772,897 | 943,620 |
| Average fare per passenger d. | 3.09 | 3.22 | 3.22 | 3.28 | 3.30 |
| Passengers per bus-mile No. | 3.53 | 3.69 | 3.98 | 3.92 | 4.05 |
There are four cable-tramway systems in the Dominion, one in Wellington and three in Dunedin. The systems, all of which operate on a 3 ft. 6 in. gauge, extend over routes totalling 5 miles 43 chains. The total revenue in 1936–37 amounted to £46,692, while expenditure totalled 43,578. The total revenue derived from traffic during the year was £46,030, showing an average of 1.84d. per passenger carried. The total capital value stood at £146,698 at 31st March, 1937.
| — | Year ended 31st March, | ||||
|---|---|---|---|---|---|
| 1933. | 1934. | 1935. | 1936. | 1937. | |
| Undertakings No. | 4 | 4 | 4 | 4 | 4 |
| Employees, No. | 79 | 75 | 75 | 74 | 80 |
| Salaries and wages £ | 17,985 | 15,395 | 17,099 | 16,892 | 18,732 |
| Capital value £ | 135,234 | 139,046 | 140,856 | 141,692 | 146,698 |
| Expenditure— | |||||
| Operating-expenses £ | 31,438 | 30,162 | 31,627 | 32,338 | 34,816 |
| Capital charges £ | 9,026 | 8,211 | 7,792 | 8,909 | 8,762 |
| Total £ | 40,464 | 38,373 | 39,419 | 41,247 | 43,578 |
| Revenue £ | 45,821 | 44,743 | 45,233 | 46,451 | 46,692 |
| Passengers carried No. £ | 5,976,323 | 5,773,337 | 5,910,645 | 6,079,398 | 6,001,651 |
| Car-miles run (including trailer miles) No. | 393,350 | 384,945 | 386,643 | 388,665 | 384,901 |
| Passengers per car-mile No. | 15 | 15 | 15 | 16 | 16 |
Table of Contents
THE total mileage of formed roads in the Dominion at the 31st March, 1936, was 52,058¼, in addition to which there were 5,812 miles of bridle-tracks and 16,982½ miles of unformed legal roads. Details are given in the following table:—
| — | Counties. | Boroughs. | Town Districts. | Road Districts. | Total. |
|---|---|---|---|---|---|
* Includes 75½ miles unspecified. | |||||
| Roads and streets formed to not less than dray-width and paved or surfaced with— | Miles. | Miles. | Miles. | Miles. | Miles. |
| Bituminous or cement concrete | 138¾ | 233¾ | 10½ | 12 | 395 |
| Bitumen or tar | 1,933¼ | 1,225½ | 71¼ | 16¼ | 3,246¼ |
| Metal or gravel* | 33,167¼ | 1,901¾ | 377 | 861¼ | 36,307¼ |
| Roads and streets formed to not less than dray-width, but not paved or surfaced | 11,640¾ | 198 | 105½ | 165½ | 12,109¾ |
| Total formed roads | 46,880 | 3,559 | 564¼ | 1,055 | 52,058¼ |
| Bridle-tracks | 5,765½ | 21½ | 6½ | 184 | 5,812 |
| Unformed legal roads. | 16,293½ | 377 | 68¼ | 243¾ | 16,982½ |
| Total of all roads | 68,939 | 3,957½ | 639 | 1,3174¼ | 74,852¾ |
The formation of roads in many parts of the Dominion has been attended with considerable expense and difficulties, arising from the configuration of the country and the abundance of rivers. As illustrating the latter aspect, the following table, showing the number and lengths of bridges incorporated in the roads system of the Dominion as at 31st March, 1930, is of interest. Only bridges 25 ft. or over in length have been taken into account, no official enumeration having been made of the innumerable culverts and short bridges.
| Material of which Bridge constructed. | Counties. | Boroughs. | Town Districts. | Road Districts. | Totals. | |||||
|---|---|---|---|---|---|---|---|---|---|---|
| No. | Total Length. | No. | Total Length. | No. | Total Length. | No. | Total Length. | No. | Total Length. | |
| Ft. | Ft. | Ft. | Ft. | Ft. | ||||||
| All concrete or stone | 591 | 49,693 | 62 | 7,511 | 7 | 420 | 9 | 238 | 669 | 57,862 |
| Steel and concrete | 411 | 38,003 | 41 | 7,714 | 4 | 415 | 456 | 46,132 | ||
| Steel, concrete, and timber | 283 | 32,987 | 20 | 1,606 | 303 | 34,593 | ||||
| Steel and timber | 429 | 35,643 | 26 | 4,914 | 2 | 81 | 457 | 40,638 | ||
| Australian hardwood | 1,980 | 205,188 | 80 | 8,406 | 8 | 1,838 | 9 | 310 | 2,077 | 215,742 |
| Native timbers | 2,301 | 162,099 | 54 | 4,068 | 21 | 993 | 5 | 244 | 2,381 | 167,404 |
| Totals | 5,995 | 523,613 | 283 | 34,219 | 42 | 3,747 | 23 | 792 | 6,343 | 562,371 |
The control of roads and bridges in New Zealand comes under the administration of the Minister of Public Works, the main statutes covering roads administration being the Public Works Act, 1928, and the Counties Act, 1920, and amendments. The Main Highways Act receives specific mention later.
Outside of the cities, boroughs, and independent town districts, the local administration is very largely vested in County Councils, and all roads, unless specially exempted and declared Government roads or highways, are controlled by the County Councils or by Road Boards. Local authorities have the assistance and advice of the Public Works Department through its engineers stationed in most of the main centres.
The necessity of constructing new roads and the legalization of these roads is considered and arranged by the local authorities and the Public Works Department conjointly.
The Government assists materially towards the construction of roads and bridges, by grants and subsidies made to the County Councils according to the particular circumstances of each individual case. The county quota of the cost is usually found by raising loans secured by a special rate levied over the area to be served by the road. In this connection it may be noted that local-authority loans are now closely controlled, and under the Local Government Loans Board Act, 1926, a Board has been established consisting of the Secretary to the Treasury, the Engineer-in-Chief of the Public Works Department, and five other persons appointed by the Governor-General. The function of the Board is to consider and investigate all applications from local authorities for developmental loans. The ability of the district concerned to carry the loan and the soundness of the proposal generally are thus fully considered, and, moreover, the operation of the Board tends to exercise a check on excessive borrowing by local authorities. By statutory provision loan-money is devoted solely to expenditure on construction, maintenance and general repairs being financed from revenue derived from rates, &c.
With the exception of State and other highways (for which special provisions have been made, as explained later in this section), the Government's funds for roading purposes, from which the grants and subsidies above referred to may be made, have hitherto been derived,—
For construction work, from the Public Works Fund, consisting mainly of loan-money raised in Great Britain.
For maintenance and repairs, from the Consolidated Fund.
The Finance Act, 1930, made provision for moneys in the Main Highways Account to be appropriated for the construction and maintenance of roads other than main highways, and thus added a third source from which funds for general roading purposes may be furnished by the Government.
For the allocation of Government grants and subsidies to local authorities for road-construction works the Public Works Department ascertains, as early in the financial year as is possible, the approximate amount of Government money which will be available for that year's roading operations. This is then allocated to the several Public Works districts of control on the basis of each district's claim under such factors as area, population, rating, loans raised previously, mileage of roads in use, estimated amount to complete all roads, value of Crown and Native lands suitable for settlement, and mileage of working railways in each district. These district quotas are then in turn allotted, on the same basis and taking similar factors into consideration, to the various counties within each Public Works district. Each local body is then advised of the amount of Government money it is entitled to for the financial year, and in consultation with the District Engineer of the Department it in turn allots its quota to individual roads in order of urgency.
The benefit of the advice of the Government official removes any parochialism which might tend to arise, and by the operation of this scheme no one local authority receives a greater proportion of Government funds than that to which it is justly entitled, nor does one local body benefit at the expense of another.
The allocations by the counties and the Department are subsequently submitted to Parliament for final confirmation and approval.
Maintenance of roads is administered almost entirely by local authorities, the necessary funds being obtained from general rating, but in cases of exceptional circumstances such as those of roads of considerable length in sparsely populated districts where the local rate is totally inadequate to cover efficient maintenance, the Government may grant assistance by way of subsidies from the Consolidated Fund.
Since the advent of modern fast and heavy motor traffic efficient maintenance of roads is becoming increasingly important, and, with a view to protecting the capital expenditure on roads, no opportunity is lost by the Public Works Department of impressing on local authorities their responsibility in this direction. Some years ago the Department instituted a policy of obtaining from local authorities, before issuing any funds for metalling work, a definite assurance that the Council was able and prepared to allot annually from its Revenue Fund sufficient money to maintain the metal efficiently when placed.
On account of New Zealand's climate and configuration damage to roads by heavy rains and floods frequently occurs, and it sometimes happens that the cost of restoration is beyond the financial resources of the County Council. In such cases, the Government, through the Public Works Department, may assist the local body with grants or subsidies from the Consolidated Fund. Local authorities were created for the specific purpose of attending to the maintenance of local public facilities such as roads, bridges, &c., and when flood and storm damage occurs, Government assistance is not extended unless it can be shown that the local authority's position financially is such that financial assistance is deserving. In such circumstances the Government makes a grant towards the cost of restoration.
From the inauguration of the public-works scheme in 1870 until the 31st March, 1937, the sum of 24,000,000 has been expended out of the Public Works Fund on the construction of roads and bridges, &c. Considerable further expenditure has been paid out of other accounts on the construction of roads to open up lands for settlement purposes, and out of the Consolidated Fund for the maintenance of roads. Expenditure out of the Main Highways Account is dealt with farther on in this section.
Prior to the advent of the motor-vehicle only a small proportion of the total road-mileage outside of boroughs was represented by roads with permanent surfacing. This development, however, entirely changed the complexion of the roading problem in New Zealand, as elsewhere, and the demand for better roads arose very shortly after motor transport became an appreciable factor. Later on, with the rapid increase in the use of motor-vehicles, particularly heavy ones, the position became acute, and it was soon quite evident that the type of road that was suitable for slow-moving horse-drawn traffic was inadequate.
In counties where the country was sparsely populated, and the revenue derivable from rates was low, certain lengths of road had in the past been maintained more or less by means of grants or subsidies from the Government. It was found that under the strain of motor traffic the roads, particularly those running parallel with railways, were deteriorating, while the popular clamour that they be improved to meet modern conditions was insistent. This led to the passing of the Main Highways Act in 1922. The Act of 1922 has since been amended in several respects.
For the purposes of the Act a Board called the “Main Highways Board” was set up. The Board consists of six members—viz., two members appointed by the Government, an officer of the Public Works Department, two representatives of county councils, and one representative of owners of motor-vehicles.
An important amending Act passed in October, 1936, provides, inter alia, that the Main Highways Board may, with the approval of the Minister, classify any main highway as a “State highway”; the whole of the cost of construction and maintenance of State highways to be met (with certain exceptions) from the Main Highways Fund. At 31st March, 1937, approximately 4,000 miles of the principal arterial main highways had been classified as State highways.
In 1924 the Dominion was divided into eighteen highway districts, composed of groups of counties, suitable by geographical situation and community of interest for being so grouped.
Consequent upon the provision of additional revenue accruing from the taxation of motor-spirits, the main highway districts were redefined in 1927 to include all boroughs with populations under 6,000. Town districts, both dependent and independent, are also included in the main highways scheme.
For each highway district, there is a District Highway Council, which is an advisory body constituted to include a Public Works Engineer, and one person to represent each constituent county, with an executive of three appointed by the members of the District Council.
The functions of these District Councils are to make recommendations to the Board each year as to which roads within the several districts should be declared main highways, and what works should be done and what expenditure incurred on these highways during the year.
The District Highway Councils are guided by the following considerations when recommending roads for declaration as main highways:—
As to whether the roads may be regarded as arterial in that they carry appreciable volumes of through as well as local traffic:
As to whether the roads connect large centres of population within the highway district:
As to whether the roads carry appreciable traffic to and from seaports or railway centres within or without the highway districts.
The Main Highways Board assumed control of main highways on the 9th June, 1924, on which date the first and principal schedule of main highways was proclaimed.
On the same date 1,046 miles (later increased to 1,637 miles) of main highways were gazetted Government roads, this action being in terms of section 22 of the Act, whereby the Board might declare any main highway to be a Government road, and might provide a greater proportion of the cost of works of (a) construction and reconstruction, and (b) maintenance and repair. The highways which were declared Government roads were chiefly those in districts where settlement was sparse, and where the revenue from rates collectable by the local authorities was insufficient to meet the expenditure necessary for the construction, reconstruction, and maintenance of the highways therein.
An Amendment Act passed in 1928 gave the Board authority to increase subsidies without the necessity of any highway having to be declared a Government road. This amendment became desirable mainly in consequence of increased subsidies being paid by the Board towards the cost of reconstruction and surfacing of main highways adjacent to the large centres of population.
The lengths at 31st March and maintenance-costs during 1930–37 of main highways in each highway district were as follows:—
| Highway District. | Length of Main Highways. | Maintenance Expenditure, 1936–37. | |||||
|---|---|---|---|---|---|---|---|
| Dustless Surface. | Gravel or Macadam Surface. | Clay or Pumice Surface. | Total. | Board. | Local Authorities. | Total. | |
| Miles. | Miles. | Miles. | Miles. | £ | £ | £ | |
| Auckland North | 61 | 924 | 986 | 70,585 | 15,157 | 91,742 | |
| Auckland South | 391 | 895 | 6 | 1,291 | 119,141 | 34,375 | 154,016 |
| Tauranga | 77 | 347 | 300 | 725 | 55,186 | 5,881 | 61,067 |
| Gisborne | 74 | 305 | 379 | 56,841 | 12,563 | 69,404 | |
| Napier | 180 | 557 | 738 | 48,456 | 12,297 | 60,753 | |
| King-country | 29 | 553 | 17 | 600 | 60,846 | 8,976 | 69,822 |
| Taranaki | 326 | 136 | 11 | 473 | 39,793 | 9,449 | 49,242 |
| Wanganui | 107 | 421 | 3 | 530 | 52,899 | 8,598 | 61,497 |
| Wellington West | 207 | 293 | 499 | 49,472 | 11,417 | 60,889 | |
| Wellington East | 132 | 373 | 504 | 42,663 | 11,810 | 54,473 | |
| Totals, North Island | 1,584 | 4,804 | 337 | 6,725 | 601,882 | 131,023 | 732,905 |
| Nelson | 47 | 615 | 10 | 673 | 45,383 | 8,618 | 54,001 |
| West Coast | 28 | 512 | 540 | 70,037 | 6,626 | 76,663 | |
| Canterbury North | 47 | 287 | 334 | 17,677 | 3,783 | 21,460 | |
| Canterbury Central | 148 | 597 | 6 | 750 | 31,674 | 9,324 | 40,998 |
| Canterbury South | 120 | 702 | 821 | 35,863 | 8,519 | 44,382 | |
| Otago Central | 64 | 776 | 840 | 33,258 | 8,404 | 41,662 | |
| Otago South | 49 | 474 | 523 | 23,277 | 9,535 | 32,812 | |
| Southland | 40 | 867 | 908 | 41,680 | 10,191 | 51,871 | |
| Totals, South Island | 543 | 4,830 | 16 | 5,389 | 298,849 | 65,000 | 363,849 |
| Totals, Dominion | 2,127 | 9,634 | 353 | 12,114 | 900,731 | 196,023 | 1,096,754 |
Under the Act of 1922 it was provided that the Main Highways Board should pay one-half of the cost of construction and reconstruction of main highways and one-third of the cost of maintenance and repair. The Main Highways Amendment Act, 1925, however, authorized the Board to increase its subsidy on the cost of maintenance on ordinary main highways from one-third to one-half, retrospective to the 1st April, 1925, while an amending Act passed in 1926 authorized a still further increase to three-fifths. The amendment of 1925 also enabled the Board to inaugurate a special system of graduated subsidies towards the cost of erection of large bridges. The amendment provided for payment by the Board of (a) one-half of the cost up to £10,000, (b) three-fifths of so much of the cost as exceeds £10,000 but does not exceed £20,000, and (c) two-thirds of so much of the cost as exceeds £20,000. It also provided for (a) a more liberal subsidy than £1 for £1 in the case of a major deviation of a main highway, (b) the repair of any extraordinary damage, and (c) certain allowances out of the funds of the Highway Board to be paid to members of the executive bodies of District Highway Councils.
In 1926 the Board was authorized, in special cases, to increase the maintenance subsidy to local authorities without the necessity for declaring the sections of main highways involved to be Government roads in terms of section 22 of the original Act.
A still further amendment passed in 1928 enabled the Board to increase the rates of subsidies, and under this authority the maintenance subsidy was increased to £2 for £1 and bridge subsidies generally were increased to £2 for £1 on expenditure up to £10,000, and £3 for £1 on expenditure in excess of £10,000. The Board may in special cases pay subsidies exceeding these rates.
In August, 1931, a further increase to £3 for £1 was made in the case of maintenance subsidies, this provision being made retrospective to 1st April, 1931.
Until the two separate Funds created by the original Act were amalgamated by the Finance Act (No. 2), 1935, the Main Highways Account was subdivided as under:—
Revenue Fund, which included proceeds of: (a) tax on tires and tubes, as collected through the Customs Department; (b) registration and license fees of motor-vehicles, but not heavy traffic fees; (c) part of the proceeds of motor-spirits taxation. The present total motor-spirits tax is 10d. (or 10½d. for foreign imports) per gallon, of which 4d. (or 4½d. as the case may be) is ordinary Customs revenue. Ninety-two per cent. of the revenue from 6d. per gallon is credited to the Main Highways Account. The remaining 8 per cent. is distributed to cities and boroughs of six thousand or more population for expenditure on streets forming continuations of main highways; and (d) a similar share of mileage tax on (1) motor-vehicles as defined, the motive power of which is not wholly derived from motor-spirits, and (2) trackless trolley buses.
Construction Fund, to which were paid all moneys borrowed for purposes of construction and reconstruction, to a limit of £4,000,000. In addition, sums might be transferred from the Revenue Fund to the Construction Fund in terms of section 15 of the Main Highways Act, 1922.
The Revenue Fund also formerly received an annual transfer of £35,000 from the Consolidated Fund, and the Construction Fund one of at least £200,000 from the Public Works Fund. Both transfers have been discontinued since 1930. Interest is paid on the amount (£1,226,000) transferred from the Public Works Fund up to 31st March, 1930. In addition, subsidies to local authorities in respect of general rates collected are payable out of the Main Highways Account instead of the Consolidated Fund as formerly.
The Finance Act, 1931 (No. 4), as amended by the Finance Act, 1932, authorized the payment to County Councils and Road Boards, out of the Revenue Fund, of a subsidy for the purpose of granting to ratepayers a refund or rebate of 12½ per cent. on the rates levied for the year ended 31st March, 1932. The Finance Act (No. 3), 1934, and the Finance Act, 1935, authorized a similar subsidy of 12½ per cent. on rates levied on farming-lands. The of £255,776 from the Revenue Fund of the Main Highways Account was expended in 1931–32, £178,246 in 1934–35, and £186,388 in 1935–36 in respect of this subsidy.
The Finance Acts, 1932, 1932–33 (No. 2), and 1934 (No. 2), authorized during the financial years ended 31st March, 1933, 1934, and 1935, the retention in the Consolidated Fund of an amount or amounts out of the tax on motor-spirits otherwise payable to the Revenue Fund not exceeding £500,000 in each year. In 1932–33 and 1933–34 the full half-million was so retained, but in 1934–35 only £321,754 was retained.
The following statement outlines the receipts of and payments from the Main Highways Account during the financial year 1936–37:—
| Receipts. | £ |
|---|---|
| Fees and fines under section 24 of Motor-vehicles Act, 1924 | 545,763 |
| Tire-tax | 138,894 |
| Petrol-tax | 1,697,942 |
| Mileage - tax (Finance Act (No. 2), 1932–33) | 3,290 |
| Interest | 5,541 |
| Recoveries and miscellaneous | 159 |
| Loan-money (stock issued) | 853,500 |
| Total | £3,245,089 |
| Payments. | £ |
|---|---|
| Construction | 1,567,898 |
| Maintenance | 940,713 |
| Subsidies to local authorities | 195,085 |
| Commutation of Hutt Road fees | 24,474 |
| Abolition of toll-gates | 1,457 |
| Interest charges | 188,018 |
| Amortization of debt | 93,567 |
| Exchange | 2,747 |
| Subsidy on rates levied on farming-lands | 238 |
| Total | £3,014,197 |
The estimates of amounts required for maintenance and repairs, construction and reconstruction, and all other items are forwarded by the District Highway Councils, and after review by the Board are incorporated in the Estimates, which in turn are submitted to Parliament for approval and for inclusion in the annual appropriations.
The revenue from the licensing of motor-vehicles and from taxes on tires and tubes is apportioned between the North and South Islands in the discretion of the Board, but generally so that the amount apportioned to either Island is fixed by reference to the number of motor-vehicles in that Island. No statutory provision exists in the case of the petrol-tax, which is, however, apportioned approximately on the basis of the relative consumption of petrol in the two Islands.
An analysis of the actual expenditure on maintenance in each Island as compared with the number of motor-vehicles in each Island at the 31st March of each of the last five years gives the following results, expressed in percentages of the Dominion totals:—
| — | 1932–33. | 1933–34. | 1934–35. | 1935–36. | 1936–37. |
|---|---|---|---|---|---|
| North Island— | |||||
| Maintenance expenditure | 62.84 | 63.80 | 65.44 | 64.80 | 66.82 |
| Motor-vehicles | 63.78 | 63.94 | 64.31 | 64.84 | 65.30 |
| South Island— | |||||
| Maintenance expenditure | 37.16 | 36.20 | 34.56 | 35.20 | 33.18 |
| Motor-vehicles | 36.22 | 36.06 | 35.69 | 35.16 | 34.70 |
The following table shows the extent and type of work accomplished on main highways by the Main Highways Board.
| Year. | Formation and Widening. | Gravelling and Metalling. | Tar and Bituminous Sealing. | Road-and Plant-mix Bituminous Surfacing. | Bituminous Macadam (Penetration). | Bituminous Concrete. | Portland-cement Concrete. | Bridges. |
|---|---|---|---|---|---|---|---|---|
| Miles. | Miles. | Miles. | Miles. | Miles. | Miles. | Miles. | Ft. | |
| 1927–28 | 173 | 133 | 83 | 34 | 6 | 7,760 | ||
| 1928–29 | 224 | 185 | 122 | 51 | 14 | 11 | 9,482 | |
| 1929–30 | 173 | 179 | 133 | 39 | 31 | 12 | 7,547 | |
| 1930–31 | 130 | 128 | 95 | 41 | 14 | 9 | 11,175 | |
| 1931–32 | 139 | 69 | 129 | 32 | 9 | 3 | 4,062 | |
| 1932–33 | 56 | 45 | 72 | 8 | 3,178 | |||
| 1933–34 | 44 | 28 | 75 | 7 | 1 | 4,988 | ||
| 1934–35 | 113 | 69 | 172 | 27 | 3 | 2 | 6,641 | |
| 1935–36 | 152 | 98 | 245 | 91 | 2 | 8,718 | ||
| 1936–37 | 272 | 131 | 184 | 67 | 3 | 9,575 | ||
| Totals, from inception to 31st March, 1937 | 1,714 | 1,367 | 1,367 | 185 | 309 | 84 | 66 | 87,136 |
At an early stage in the history of the main highways scheme, the District Highway Councils were advised that the standards of road-construction recommended for adoption should be such as were warranted by the existing or early prospective traffic. To ensure uniformity in construction as far as possible throughout the Dominion standards were laid down for the guidance of local authorities.
As a guide to local authorities in the preparation of proposals the Main Highways Board issued Bulletin No. 2, which comprises a number of typical standard specifications for all classes of road formation and surfacing, together with a series of helpful notes on highway design. These specifications are not laid down as hard-and-fast rules which local authorities must in every case adopt, but are regarded as standard practice, the following of which will result in satisfactory work. The standard of construction in all cases should, of course, be regulated by local conditions, and should be commensurate with the traffic requirements. As much construction work is financed wholly or in part by loan, it is essential that the character of the work should be such as to ensure a life at least equal to the period of the loan.
The average expenditure on maintenance per mile per annum on the whole main highways system by the Main Highways Board and local authorities has been:—
| £ | |
|---|---|
[* NOTE.—This represents average true maintenance expenditure: Figures for previous years relate to expenditure from the Revenue Fund, and include work other than actual maintenance.] | |
| 1927–28 | 119.9 |
| 1928–29 | 100.1 |
| 1929–30 | 128.6 |
| 1930–31 | 103.1 |
| 1931–32 | 92.5 |
| 1932–33 | 70.7 |
| 1933–34 | 78.6 |
| 1934–35 | 100.3 |
| 1935–36 | 122.4 |
| 1936–37 | 90.5* |
The following tabulation shows the amount which has been provided by the Board and by local authorities for expenditure on both maintenance and construction of main highways during the last five years. Maintenance figures exclude indirect charges such as supervision, interest, &c., but include the cost of earthquake and flood damage restoration.
| — | 1932–33. | 1933–34. | 1934–35. | 1935–36. | 1936–37. |
|---|---|---|---|---|---|
| £ | £ | £ | £ | £ | |
| Maintenance by Board | 600,324 | 674,026 | 932,675 | 1,190,179 | 900,731 |
| Maintenance by local authorities | 168,466 | 187,735 | 226,554 | 284,423 | 196,023 |
| Construction by Board | 159,323 | 198,295 | 325,483 | 428,084 | 1,501,261 |
| Construction by local authorities | 43,181 | 55,997 | 57,975 | 78,263 | 103,260 |
| Totals | 971,294 | 1,116,053 | 1,542,687 | 1,980,949 | 2,701,275 |
| Percentages. | Per Cent. | Per Cent. | Per Cent. | Per Cent. | Per Cent. |
| Maintenance by Board | 78.1 | 78.2 | 80.5 | 80.7 | 82.1 |
| Maintenance by local authorities | 21.9 | 21.8 | 19.5 | 19.3 | 17.9 |
| Construction by Board | 78.7 | 78.0 | 84.9 | 84.5 | 93.6 |
| Construction by local authorities | 21.3 | 22.0 | 15.1 | 15.5 | 6.4 |
The use of up-to-date machinery on construction and maintenance of main highways is recognized to be in the interests of economy and efficiency, and, for the purpose of encouraging local bodies to use such plant, power enabling the Main Highways Board to sell roadmaking machinery, plant, equipment, and appliances to local authorities on the hire-purchase system was given by the Main Highways Amendment Act, 1925. As a consequence of this legislation a great number of local authorities have purchased modern roadmaking plant through the Board.
A petrological laboratory was established in Wellington at the beginning of 1925. Full reports are made on the various materials submitted by local authorities for use as road-metal as well as for other purposes.
Tests for bitumens, tars, &c., are carried out by the Dominion Analyst, Wellington, while the testing of steel is carried out by the Public Works and Railways Departments, and at the Canterbury (University College) School of Engineering.
The following statement of the Dominion's annual roading bill has been derived by the Transport Department from various official sources. In some cases estimation has been resorted to, chiefly in regard to the distribution of expenditure under the headings of main highways, urban roads, streets, &c., but it is considered that the figures are sufficiently close to fact to justify their use as a basis for reliable broad conclusions.
ROAD EXPENDITURE.
| Expenditure on | 1930–31. | 1931–32. | 1932–33. | 1933–34. | 1934–35. | 1935–36. |
|---|---|---|---|---|---|---|
| Maintenance— | £ | £ | £ | £ | £ | £ |
| Main highways | 1,326,372 | 1,202,343 | 858,577 | 954,656 | 1,501,539 | 1,632,453 |
| Urban roads and streets | 581,734 | 529,104 | 453,969 | 397,371 | 392,032 | 406,775 |
| Other roads | 1,130,811 | 1,009,702 | 763,648 | 718,255 | 955,409 | 1,098,366 |
| Totals | 3,038,917 | 2,741,149 | 2,076,194 | 2,070,282 | 2,848,980 | 3,137,594 |
| Construction— | ||||||
| Main highways | 838,477 | 540,841 | 261,602 | 276,794 | 411,798 | 624,943 |
| Urban roads and streets | 1,077,380 | 1,338,677 | 1,224,214 | 1,104,047 | 944,235 | 903,918 |
| Other roads | 1,656,395 | 1,489,127 | 1,122,145 | 1,207,234 | 1,137,600 | 1,102,730 |
| Totals | 3,572,252 | 3,368,645 | 2,607,961 | 2,588,075 | 2,493,633 | 2,631,591 |
| Interest and sinking fund charges— | ||||||
| Main highways | 595,845 | 635,930 | 622,128 | 632,846 | 612,129 | 605,403 |
| Urban roads and streets | 615,530 | 640,728 | 642,282 | 585,900 | 554,400 | 580,979 |
| Other roads | 1,125,027 | 1,198,786 | 1,129,482 | 1,136,070 | 1,136,515 | 1,122,408 |
| Totals | 2,336,402 | 2,475,444 | 2,393,892 | 2,354,816 | 2,303,044 | 2,308,790 |
| Grand totals | 8,947,571 | 8,585,238 | 7,078,047 | 7,013,173 | 7,645,657 | 8,077,975 |
In view of the large increase in motor traffic, and of the additional road expenditure necessitated thereby, the following recapitulation of returns from special taxation of motor-vehicles is of direct interest:—
| Yield of | 1931–32. | 1932–33. | 1933–34. | 1934–35. | 1935–36. |
|---|---|---|---|---|---|
* Estimated. | |||||
| £ | £ | £ | £ | £ | |
| Tire-tax | 85,437 | 64,163 | 63,801 | 92,587 | 94,071 |
| Motor-spirits tax | 1,358,623 | 1,263,881 | 1,291,879 | 1,424,809 | 1,596,407 |
| Fees, &c., under Motor vehicles Act, 1924 | 370,126 | 352,561 | 346,250 | 391,660 | 431,896 |
| Heavy-traffic fees | 179,105 | 178,183 | 171,503 | 204,767 | 209,000* |
| Drivers' licenses | 58,860 | 57,132 | 60,358 | 61,385 | 65,000* |
| Mileage tax | 1,597 | 1,396 | 1,756 | ||
| Totals | 2,052,151 | 1,915,920 | 1,935,388 | 2,176,604 | 2,398,130 |
| Proportion per cent. of total to total road bill shown in preceding table | 23.9 | 27.1 | 27.6 | 28.5 | 29.7 |
Included in the figure for motor-spirits taxation for each of the years 1932–33 and 1933–34 is an amount of £500,000, and in 1934–35 an amount of £321,754, which has been retained in the Consolidated Fund and thus diverted from roading purposes. All revenue from this source in 1935–36 was used for roading purposes. Customs duties on motor-vehicles and parts are excluded from the above table. Such taxation is not special taxation, as all imported goods of similar nature pay-duties towards the general expenses of the State.
The total motor-spirits taxation is at the rate of 10d. per gallon—i.e., British preferential tariff (the general tariff pays one-twentieth surtax, and thus equals 10½d.). The first 6d. collected under this head is devoted to road purposes, and this is the figure (including cost of collection) which is quoted in the above table. The remaining 4d. or 4½d. (2d. from October, 1931, and 2d. additional from February, 1933) is ordinary Customs revenue, and was imposed for that purpose, being only a part of increased taxation imposed for the various purposes of Government.
The comparison of the two preceding tables is necessarily not an exact or a complete one. There are numerous items directly or indirectly caused by road traffic which do not appear in the road costs shown. For instance, there are such items as traffic control, increased police duties, cost of collection of petrol and other taxes, general administration charges, examinations for drivers' licenses, hospital maintenance costs resulting from motor-vehicle accidents, &c.
Before the Main Highways Act was passed the Government recognized the reasonableness of motor-vehicle owners contributing towards the cost of the construction and upkeep of the road-surfaces which were required principally for them.
Amongst the funds laid down in the Main Highways Act as being available for the Revenue Fund was a sum to be derived from the licensing of motor-vehicles. When the Main Highways Act was passed it was expected that a Motor-vehicles Act dealing with the registration and licensing of motor-vehicles would be simultaneously passed, but owing to the difficulty of co-ordinating all interests it was not until November, 1924, that the Motor-vehicles Act became law.
This Act provided for the registration and annual licensing of all motor-vehicles.
Registration fees are 10s. for a motor-cycle and 20s. for any other motor-vehicle. License fees include 10s. for a motor-cycle; £2 for a motor-car; £3 for a motor-omnibus; £5 for a traction-engine; and from £2 to £3 for a motor-lorry, according to weight and tires. Other fees include drivers' licenses, 5s.; changes of ownership, 5s.; and manufacturers' and dealers' fees. Heavy-traffic fees are not levied under the Motor-vehicles Act; they are referred to later.
All such fees, except that for a driver's license, which is payable to the local authorities, have in terms of the Motor-vehicles Act to be credited to the Main Highways Account. Heavy-traffic fees are distributed among local bodies.
The Motor-vehicles Amendment Act, 1936, amends the pre-existing law in several important respects. A uniform speed limit of thirty miles per hour is fixed in boroughs and town districts, while authority is taken to extend the operation of this limit to other localities by notice published in the New Zealand Gazette. This speed limit may also be abrogated in specified localities by similar notification. Penalties are provided for careless and inconsiderate driving. The general penalty for offences is increased from £10 to £50; while the pre-existing authority for the issue of regulations is extended to provide for periodical examination of motor-vehicles (fee, 5s.), and for limiting the hours during which, or regulating conditions under which, a person may drive a trade motor-vehicle in use for commercial purposes. Power is taken to issue regulations governing pedestrian and other traffic.
The customary figures of motor-vehicles licensed (quarterly figures are published in the Monthly Abstract of Statistics), show a classification based upon licensing requirements. The figures in the table following have been specially compiled to distinguish completely the actual types of vehicles.
| Type of Vehicle. | Licensed as at 31st March, | |||
|---|---|---|---|---|
| 1934. | 1935. | 1936. | 1937. | |
| Cars | 129,517 | 138,188 | 152,475 | 171,514 |
| Taxis | 1,539 | 1,597 | 1,732 | 1,697 |
| Service cars | 815 | 726 | 699 | 703 |
| Omnibuses | 548 | 661 | 573 | 655 |
| Trucks, 2 tons and under | 20,445 | 22,236 | 24,322 | 26,644 |
| Trucks, over 2 tons | 15,038 | 16,362 | 18,068 | 20,381 |
| Motor-cycles | 24,823 | 24,570 | 24,099 | 24,201 |
| Tractors and traction-engines | 3,960 | 1,035 | 1,271 | 1,318 |
| Trailers | 3,428 | 4,159 | 5,764 | |
| Others | 600 | 659 | 849 | 1,140 |
| Totals | 197,285 | 209,462 | 228,247 | 254,017 |
Dormant registrations are those of vehicles the registration of which has not been cancelled, but which have not been relicensed for the current year. Dormant registrations stand for two years, and are then cancelled if not previously relicensed. The number of dormant registrations is always high in the early months of the registration year, but declines rapidly during the year.
The number of dormant registrations as at the 31st March, 1937, was 24,110, consisting of 14,570 1935–30 and 9,540 1934–35 registrations. Dormant registrations of cars as at the 31st March of the last four years have manifested a remarkable change, the approximate figures being: 1934, 12,100; 1935, 8,700; 1930, 7,900; and 1937, 7,900.
Upon the arbitrary assumption that, of vehicles whose registration is “dormant,” three-fourths of 1935–36 registrations and one-half of 1934–35 registrations still existed as practicable vehicles, the approximate number of motor-vehicles in New Zealand at 31st March, 1937, was 270,000, of which 254,017 were actually upon the roads.
The latest figures available show the number of motor-vehicles licensed as at 30th June, 1937, totals for the previous year being given for purposes of comparison. Licenses are renewable in May, and at 30th June (approximately mid-winter), dormant registrations are particularly numerous.
| Type of Vehicle. | North Island. | South Island. | Dominion. |
|---|---|---|---|
| Cars | 99,270 | 49,597 | 148,867 |
| Light trucks | 13,051 | 6,706 | 19,757 |
| Heavy trucks | 11,030 | 5,193 | 16,223 |
| Passenger trucks | 703 | 311 | 1,014 |
| Omnibuses | 424 | 164 | 588 |
| Taxis | 1,058 | 508 | 1,566 |
| Rental cars | 292 | 191 | 483 |
| Service cars | 337 | 221 | 558 |
| Trailers | 1,360 | 1,417 | 2,777 |
| Dealers' cars | 1,077 | 474 | 1,551 |
| Local authority road vehicles | 1,176 | 722 | 1,898 |
| Government vehicles | 1,488 | 700 | 2,188 |
| Motor-cycles | 8,771 | 4,804 | 13,575 |
| Dealers motor-cycles | 77 | 42 | 119 |
| Totals, 30th June, 1937 | 140,114 | 71,050 | 211,164 |
| Totals, 30th June, 1936 | 124,724 | 64,366 | 189,090 |
In number of motor-vehicles per head of population New Zealand ranks high, and is, in fact, usually credited in statistical compilations as being exceeded in this respect only by the United States and Canada.
A comprehensive traffic survey conducted by the Transport Department in 1934–35 gave the following results:—
| — | Estimated Annual Passenger Mileage. | Estimated Annual Ton-mileage of Goods. | |||
|---|---|---|---|---|---|
| Private Cars. | Public Passenger Vehicles. | Motorcycles. | All Passenger Vehicles. | ||
| (000) | (000) | (000) | (000) | (000) | |
| North Island | 739,515 | 52,248 | 24,175 | 816,938 | 84,322 |
| South Island | 424,123 | 30,843 | 16,249 | 471,215 | 44,214 |
| Total | 1,163,638 | 83,091 | 40,424 | 1,287,153 | 128,536 |
The country of manufacture of motor-vehicles added to the register during each of the last five years is indicated in the table following.
| Country of Manufacture. | Motor-vehicles registered, Year ended 31st March, | ||||
|---|---|---|---|---|---|
| 1932. | 1933. | 1934. | 1935. | 1936. | |
| Motor-cars— | |||||
| United Kingdom | 2,607 | 2,832 | 3,091 | 6,096 | 9,396 |
| U.S.A. or Canada | 3,477 | 1,834 | 2,406 | 6,730 | 10,023 |
| Other countries | 67 | 50 | 54 | 69 | 50 |
| Commercial vehicles— | |||||
| United Kingdom | 447 | 686 | 941 | 1,266 | 1,515 |
| U.S.A. or Canada | 1,574 | 1,149 | 1,471 | 2,791 | 3,785 |
| Other countries | 635 | 805 | 927 | 954 | 1,145 |
| Motor-cycles— | |||||
| United Kingdom | 1,567 | 1,515 | 1,428 | 1,669 | 1,897 |
| U.S.A. or Canada | 483 | 545 | 514 | 542 | 486 |
| Other countries | 8 | 12 | 14 | 22 | 38 |
The post-war period ushered in a rapid development of an already considerable road motor transport which has necessitated extensive legislation, not alone for its control but also for the provision of adequate road-surfaces. Certain principal enactments are referred to briefly in chronological order.
The Customs Amendment Act, 1921, among numerous tariff changes, imposed a tire-tax on rubber tires and tubes, previously duty free. The proceeds are credited to the Main Highways Account. For an account of the moneys derived from this and other highways taxation, vide Section XXVB (Taxation).
The Main Highways Act of 1922 constituted the next landmark. It has been referred to earlier in this section. Two years later came the Motor-vehicles Act, 1924 (amended in 1927, 1934–35, and in 1930), which has received specific mention under the immediately preceding title. At the same time the Public Works Amendment Act, 1924, was passed (later included in the 1928 consolidation of that Act). Under it regulations could be made fixing, in respect of commercial vehicles of over 2 tons gross weight, heavy-traffic fees payable to local bodies for road-maintenance purposes, and also classifying roads and providing other measures. Regulations to this effect were passed in 1925, and are now known as the Heavy Motor-vehicle Regulations, 1932. In the financial year 1935–36 local bodies received £232,094 by way of heavy-traffic fees. Present annual license fees under the heavy motor-vehicle regulations range from £5 2s. to £63 15s. for a pneumatic-tired vehicle, and from £6 to £75 for a vehicle solid-tired on any wheel.
With the object of controlling motor-omnibus competition with tramways, regulations under the Board of Trade Act were issued in 1926. In the same year they were superseded by the Motor-omnibus Traffic Act, itself later repealed by the comprehensive Transport Licensing Act, 1931 (amended in 1933, 1935, and 1936).
The Motor-spirits Taxation Act, 1927, imposed a Customs duty of 4d. per gallon (raised in 1930 to 6d. per gallon; further subsequent increases are not connected with road taxation). From the net proceeds 92 per cent. is paid into the Main Highways Account, and the balance distributed pro rata on a population basis amongst cities or boroughs of a population of 6,000 upwards.
In 1927 the administration of the Motor-vehicles Act, 1924, was transferred to the Public Works Department, which subsequently issued in draft form regulations containing a uniform code of rules for motor-traffic in the Dominion. After full opportunity for criticism by interested parties the regulations were brought into law in 1928, and have now been reissued as the Traffic Regulations, 1936.
The Public Works Act, 1928, contained extensive provisions relating to the construction, maintenance, and use of roads. Almost simultaneously came the Motor-vehicles Insurance (Third-party Risks) Act, 1928, vide Section XXIXB (Accident Insurance).
In 1929 the Transport Department Act constituted the portfolio of Minister of Transport, and also constituted the Transport Department under a Commissioner of Transport. The Act placed the administration of the following Acts under the Transport Department:—
Motor-vehicles Act, 1924.
Motor-omnibus Traffic Act, 1926.
Motor-spirits Taxation Act, 1927.
Motor-vehicles Insurance (Third-party Risks) Act, 1928.
Public Works Act, 1928, in so far as it relates to heavy traffic or to motor-vehicles.
The Transport Licensing Act, 1931, is also under the administration of the Department.
The Transport Licensing Act, passed on the 11th November, 1931, is designed to regulate road motor transport with a view to securing co-ordination between it and other forms of transport and to secure its organization from the standpoint of maximum utility. The Act was substantially amended in 1933, 1935, and 1936, the principal amendment being the abolition from 1st April, 1936, of the Transport Co-ordination Board (set up under an amending Act of 1933), the powers previously exercised by the Board being vested in the Minister of Transport.
The more important provisions of the law as amended are described in the following paragraphs:—
Four metropolitan districts were constituted under the Act, and four licensing bodies appointed (the Auckland Transport Board, and the Wellington, Christchurch, and Dunedin City Councils).
Provision was also made for the division of the remainder of the North and South Islands into transport districts. By Order in Council there are now four transport districts (two in the North Island and two in the South). The dividing boundaries between the districts lie approximately across the middle of each Island from east to west. The four districts, together with the four metropolitan districts, cover the total area of the mainland.
A district licensing authority is constituted for each transport district. Prior to the amending Act of 1936 each district licensing authority consisted of three members, but now the Minister may delegate, and has delegated, these powers to one person.
Motor-vehicle passenger services are not permitted to operate except under license. This does not apply to taxis unless running on defined routes, to carriage of school-children, or to the carriage in certain cases of a private party by contract vehicle on a special occasion; but authority is taken in the 1936 amending Act to extend, at the discretion of the Minister, the definition of a passenger service to include any service by motor-vehicle for the carriage of passengers. This power has been invoked in the case of the Christchurch taxis, which are now under the control of the Christchurch Metropolitan licensing authority.
In considering applications for licenses the licensing authority is required first to have regard to the necessity or desirability of the service in the public interest and to the needs of the district in relation to passenger transport. Should these requirements be fulfilled, the licensing authority must further take into account, inter alia, the financial ability of the applicant, time-tables, fares, existing transport services, transport requirements, vehicles to be used, conditions of roads or streets to be traversed, and representations by the Railways Department, local authorities, other transport owners, &c. In certain circumstances applications by the Government or by local authorities receive preference. Where the Minister of Railways holds a passenger-service license, no licenses are to be granted to any other person in respect of the same route and terminal points without the consent of that Minister. This does not apply to renewals which merely authorize the continuance of existing services to the extent to which they were being carried on at the time of the acquisition by the Minister of the license held by him.
It was the intention of the Legislature first to examine, regulate, and co-ordinate the passenger-transport services of the Dominion, and then, with the administrative experience thus gained, to proceed with the more complicated undertaking of rationalizing the goods-transport services. Regulation of passenger-transport was introduced at a time when adverse economic conditions had brought about intense competition, with its attendant evils. As a result of the Act, unnecessary or undesirable competition was eliminated, time-tables were drawn up and strictly enforced, standards of serviceability of vehicles were imposed, and routes and fare-schedules laid down.
The Transport Licensing Amendment Act, 1935, extended the duration of passenger-service licenses to three years, except in the case of temporary licenses.
The Goods Order, 1933, which brought goods services under the jurisdiction of the Act, has been replaced by the Goods Order, 1936. This Order provides for the licensing of all goods services operating outside the exempted areas around Auckland, Wellington, Christchurch, and Dunedin, and outside a radius of six miles from the chief or main post-office in the following towns:—
| Whangarei. | Hastings. | Nelson. |
| Hamilton. | New Plymouth. | Greymouth. |
| Rotorua. | Wanganui. | Timaru. |
| Gisborne. | Palmerston North. | Oamaru. |
| Napier. | Masterton. | Invercargill. |
Exemption from licensing is extended to a goods service carried on solely—
In connection with funerals; or
In connection with repair or wreckage of vehicles which have met with mishap; or
In the carriage of newspapers.
The rationalization of the goods-service industry has not yet reached the same stage as that obtaining in the passenger-service industry, although a steady improvement is noticeable. Licensees have been restricted to fixed routes or areas, subject to certain provisions enabling them to obtain temporary licenses to perform occasional jobs outside their respective territories.
The 1936 amendment contains several sections consequential to its abolition of the Transport Co-ordination Board. A right of appeal to the Minister against decisions of licensing authorities is given in the amending Act, the decision of the Minister to be final. The investigating powers formerly held by the Board are transferred to the Minister, who is also declared to be the sole issuing authority for commercial aircraft services.
The following table deals with passenger-service licenses for the year ended 31st March, 1937. It covers licenses issued by the four district authorities, and by the four metropolitan authorities.
| — | Continuous. | Seasonal. | Temporary. | Total. |
|---|---|---|---|---|
| Applications— | ||||
| Lodged | 507 | 7 | 4,745 | 5,259 |
| Granted | 470 | 7 | 4,675 | 5,152 |
| Refused | 9 | 69 | 78 | |
| Withdrawn | 13 | 1 | 14 | |
| Deferred | 15 | 15 |
The main passenger-service statistics for the Dominion are as under for the last two years.
| 1935–36. | 1936–37. | |
|---|---|---|
| Vehicle-journeys run | 1,704,192 | 1,669,714 |
| Vehicle-miles covered | 22,029,339 | 22,782,021 |
| Empty trips | 48,726 | 48,351 |
| Passengers carried | 17,949,351 | 21,506,576 |
| Total. | Per Vehicle-mile. | Total. | Per Vehicle-mile. | |
|---|---|---|---|---|
| Operating-costs— | £ | d. | £ | d. |
| Vehicle-running | 447,118 | 4.87 | 461,863 | 4.87 |
| Vehicle standing charges | 288,181 | 3.14 | 354,922 | 3.74 |
| General overhead charges | 96,693 | 1.05 | 131,993 | 1.39 |
| Total | 831,992 | 9.06 | 948,778 | 10.00 |
| Revenue— | £ | d. | £ | d. |
| Passengers | 807,517 | 8.80 | 907,601 | 9.56 |
| Mail contracts | 32,117 | 0.35 | 37,950 | 0.40 |
| Newspapers | 18,671 | 0.20 | 21,473 | 0.23 |
| Goods and parcels | 59,503 | 0.65 | 73,311 | 0.77 |
| Other | 11,672 | 0.13 | 17,453 | 0.18 |
| Total | 929,480 | 10.13 | 1,057,788 | 11.14 |
| £ | d. | £ | d. | |
| Net profits | 97,488 | 1.07 | 109,010 | 1.14 |
| Total assets | 737,050 | 849,758 | ||
| Vehicles (included in “Total assets”) | 354,277 | 370,299 | ||
| Capital and reserves | 479,359 | 608,041 | ||
| Other liabilities | 257,691 | 241,717 | ||
| Total liabilities | 737,050 | 849,758 |
The following table deals with goods-service licenses under the Transport Licensing Act, 1931, for the year ended 31st March, 1937. It covers operations of the four district authorities, and also of post-offices in respect of temporary licenses.
| — | Continuous. | Seasonal. | Temporary. | Total. |
|---|---|---|---|---|
| Applications— | ||||
| Lodged | 2,129 | 52 | 11,181 | 13,362 |
| Granted | 1,750 | 25 | 11,141 | 12,916 |
| Refused | 79 | 1 | 40 | 120 |
| Withdrawn | 47 | 16 | 63 | |
| Deferred | 149 | 3 | 152 |
Statistics of goods-services operating under license during the years 1934–35, 1935–36, and 1936–37 are given:—
| 1934–35. | 1935–36. | 1936–37. | |
|---|---|---|---|
| Vehicle-miles covered | 45,991,000 | 49,465,000 | 56,629,000 |
| £ | £ | £ | |
| Operating costs | 1,822,000 | 1,805,000 | 2,308,000 |
| Revenue | 2,037,000 | 2,070,000 | 2,679,000 |
| Net profit | 215,000 | 265,000 | 371,000 |
| Capital and reserves | 1,505,000 | 1,289,000 | 1,771,000 |
| Other liabilities | 732,000 | 635,000 | 761,000 |
Total operating-expenses in 1936–37 averaged 9.78d. per vehicle-mile, while revenue averaged 11.35d.
It should be noted that the licensed goods-services engaged only a small portion (3,753 out of a total of over 45,000) of the total number of motor-trucks actually on the road.
Half-yearly collections of motor-transport statistics were made by the Census and Statistics Department from November, 1927, to July, 1932. The inquiries covered only regular public services on defined routes, as it was considered that this would give the best indication of changes in the volume and character of the transport business being developed by motor-vehicles on the roads of the Dominion. In 1932 passenger-services were no longer included in the field of inquiry. Detailed results of the data obtained will be found in the 1932 and earlier editions of the Year-Book, and summarized figures, covering the last five collections, in the 1934 number.
Statistics of petrol consumption in New Zealand are given in Section XLIII (Consumption of Commodities).
Statistics of road accidents resulting in fatalities are available for many years, past from the Vital Statistics compiled by the Census and Statistics Department, and these figures (on a calendar-year basis) are discussed briefly in an earlier section (vide p. 131). Further details of fatal motor accidents, compiled by the Transport Department for years ended 31st March, are given below.
| Nature of Accident. | Year ended 31st March, | Total of Five Years. | ||||
|---|---|---|---|---|---|---|
| 1932. | 1933. | 1934. | 1935. | 1936. | ||
| Collisions, motor-vehicle with— | ||||||
| Pedestrian | 30 | 45 | 26 | 46 | 56 | 203 |
| Motor-vehicle | 29 | 39 | 21 | 36 | 45 | 170 |
| Train | 8 | 3 | 9 | 10 | 4 | 34 |
| Tram | 1 | 1 | 2 | 2 | 6 | |
| Bicycle | 11 | 16 | 15 | 23 | 27 | 92 |
| Horse-vehicle or horse under control | 1 | 6 | 4 | 3 | 1 | 15 |
| Fixed object | 15 | 5 | 6 | 7 | 9 | 42 |
| Straying stock | 1 | 2 | 2 | 3 | 8 | |
| Went over bank | 22 | 9 | 18 | 22 | 18 | 89 |
| Otherwise | 31 | 15 | 24 | 23 | 26 | 119 |
| Total accidents | 148 | 140 | 125 | 174 | 191 | 778 |
Of 820 persons killed in the 778 motor accidents during the five years 1932–36, 199 were pedestrians, 211 wore on motor-cycles, 310 were on other motor-vehicles, and 100 were on other vehicles or on horseback. Thirty-three were under five years of age, 45 were between five and ten years, 31 were between ten and fifteen years, 542 were between fifteen and fifty-five years, 162 were fifty-five years or over, and in 7 cases the age was not known.
It is noticeable that Saturday records a distinctly heavier toll of motor-accident fatalities than any other day of the week. The majority of fatal motor accidents occurred in daylight. Of the total of 778 for the five years, 429 occurred in daylight, 75 at dusk, 52 in artificial lighting, and 222 in dark or moonlight.
Since 15th March, 1937, the police have furnished reports regarding each motor accident involving death or personal injury. This class of accident is required by law to be reported to the police. Very full particulars are furnished, and the analyses made are published each month by the Transport Department.
Between 15 th March and 31st October, 1937, 2,152 such accidents were reported, resulting in 2,748 casualties, of which 134 represented fatalities, 412 cases of serious injury, and 2,202 of minor injury.
It is noteworthy that 801, or 66 per cent., of the total accidents recorded happened in urban areas, where speeds are restricted but where traffic may be expected to be of much greater volume than on the rural roads.
Table of Contents
APART from a few isolated experimental flights, there was little active interest in aviation in the Dominion in the very early stages of aeronautical development. There were, however, two aviation companies operating in New Zealand during the years of the Great War. In both instances the activities of the companies were confined to the training of pilots for the Royal Flying Corps (and later the Royal Air Force) and to “joy-riding” tours, while flying exhibitions were given in numerous centres throughout the country.
An Act to control aviation in New Zealand was passed in 1918. This Act empowered the Governor-General in Council to make regulations for the licensing of aircraft and flying schools, and for the issuing of flying-certificates.
During the financial year 1919–20, £25,000 was voted by the Government for aviation purposes, but of this amount only £8,368 was expended. No definite aviation policy had been formulated up to that time; but early in 1920 an Air Board was set up, consisting of three naval and military officers and five senior administrative officers of the Government, to act in an advisory capacity to the Government in all matters concerning aviation in the Dominion. The existing aviation companies were being run at a loss—partly as a result of the cessation of training of pilots as candidates for service in the Royal Air Force—and it was deemed advisable to subsidize these companies in order to keep them in operation until such time as plans for the future development of aviation were drawn up. In September, 1920, an aviation policy was approved by Cabinet dealing with (a) matters of defence, (b) commercial undertakings, and (c) aviation generally.
The necessity for the encouragement of commercial aviation as an essential part of Defence policy was recognized, and arrangements were made for the loan of Defence machines to civil companies for training purposes, while a subsidy scheme was brought into operation. In 1922–23 subsidies amounting to £2,975 were paid to the three aviation companies then in existence. In addition, these companies received £2,700 as payment for refresher courses carried out by Defence officers.
On the 14th June, 1923, the New Zealand Air Force was formed, consisting of (a) the Permanent Air Force, and (b) the New Zealand Air Force—a part of the Territorial Forces of the Dominion; Wigram Aerodrome was purchased as a base, Sir Henry Wigram donating £10,000 towards the purchase price.
Civil aviation in New Zealand did not progress beyond the experimental stage until comparatively recently. Apart from the insufficiency of adequate and well-equipped landing-grounds, the comparative smallness of the country did not encourage the development of civil aviation. After the first pioneer stage there was little activity for several years; but a fillip to aviation in the Dominion was given by the Government's offer in 1929 of financial assistance to approved flying clubs.
Recognizing that the development of civil aviation in New Zealand was being seriously retarded by the cost of providing adequate ground organization, Parliament passed legislation in 1929 empowering local bodies to establish and maintain aerodromes and to make charges for the use thereof. The Act empowered all classes of local authorities and public bodies to contribute towards the cost of establishing such aerodromes and to contribute to the funds of recognized aviation authorities. In September, 1933, a scheme for establishing a chain of landing-grounds throughout the Dominion was approved by the Government. Its objects are to increase the mobility and defensive power of the Royal New Zealand Air Force and to provide for the development and safety of civil aviation.
The scheme, which is still in operation, involves the location and inspection of suitable sites, along the main air routes, by specially qualified engineers of the Public Works Department, working in close collaboration with the Controller of Civil Aviation. Once the areas are selected, engineering surveys are carried out and the grounds levelled by Public Works employees working under skilled supervision. The scheme calls for the close co-operation of the Public Works Department and the Air Department, and involves the expenditure of additional moneys over and above the cost of the labour supplied in order to provide for the cost of surveys, technical supervision, tools, and special items incidental to the scheme. During the last financial year £361,000 was expended on the development of landing-grounds and provision has been made in the current year's estimates for £400,000.
In all there are forty-seven licensed aerodromes complete in New Zealand (some of which were formed before the inauguration of the scheme) and seventy other grounds, including emergency landing-fields, complete or partially complete.
The Public Works Amendment Act, 1935, authorizes the taking of land required for the purposes of aerodromes. Such authority is extended to local authorities, this including an “aviation authority,” which is recognized under section 3 of the Local Authorities Empowering (Aviation Encouragement) Act, 1929. Other provisions deal with fixing the maximum height of obstructions in the vicinity of aerodromes and for their removal where required.
On the 1st April, 1937, the administration of Service and Civil aviation was provided for by the establishment of an Air Department.
The Royal New Zealand Air Force will consist of—
The Regular Air Force;
The Air Force Reserve; and
The Territorial Air Force.
The Regular Air Force consists (31st August, 1937) of permanent and short-service commissioned officers and airmen (thirty-six officers, including three Royal Air Force officers attached, and 160 airmen).
The Air Force Reserve comprises the Reserve of Air Force Officers and the Reserve of Airmen, the latter yet to be formed. In time of war or of imminent national danger this reserve, or any portion thereof, may be transferred to the Regular Air Force.
The Territorial Air Force consists of sixty-eight officers (and airmen when enlisted) who are liable, by voluntary engagement, for training in time of peace, and for continuous service within New Zealand during the continuance of a state of war or of imminent national danger. (This Force is at present organized as a Wing of four squadrons, but is in process of reorganization.) Training is at present carried out at Wigram Aerodrome and consists of two camps per annum, one of six days and one of ten days, together with a limited amount of week-end flying training during the year.
The Regular Air Force is distributed between the administrative headquarters and the two Air Force stations—the Royal New Zealand Air Force Station, Hobsonville, Auckland, which is a combined land and seaplane station, and the Royal New Zealand Air Force Station, Wigram Aerodrome, Christchurch. An additional site, which has been acquired at Ohakea, is at present in course of development.
The Service aircraft at Hobsonville consists of five Vickers Vildebeest Bombers, two Fairey IIIF float-planes, and one D.H. Moth machine; while at Wigram Aerodrome there are seven Vickers Vildebeest Bombers, two Grebe S.S. Fighters, four Hawker Tomtit, and four Avro 626 training-machines, one D.H. Moth,* one Whitney Straight,* and one Percival Gull.
* For the use of the Aerodromes Branch, Public Works Department.
The general statutory law relating to aviation in New Zealand is contained in the Air Navigation Act, 1931. The main purpose of this Act was to enable the Governor-General in Council to make regulations for carrying out the Convention relating to aerial navigation signed at Paris on behalf of the New Zealand Government in 1919. Civil aviation is subject to the Air Navigation Regulations, 1933, their administration being in the hands of the Minister of Defence. The executive officer is the Controller of Civil Aviation, who is an officer of the Air Department. Statutory provisions of localized application are contained in the New Plymouth Airport Act, 1933, and the Napier Airport Act, 1935, which make provision for the control of these airports. This control is to be exercised by Boards consisting of representatives of the aero clubs and local authorities concerned, together with members appointed by the Minister of Defence.
The isolation of New Zealand has up to the present proved a bar to the linking-up of this Dominion by air with the long-distance airway services of the world. The first attempt to fly the Tasman was the ill-fated attempt by Messrs. Hood and Moncrieff in 1928, the first successful flight being made later in the same year by Squadron-Leader (the late Sir Charles) Kingsford Smith, with Flight-Lieutenant C. P. T. Ulm as co-pilot and Messrs. McWilliams and Litchfield as wireless operator and navigator respectively. Trans-Tasman flights have since been made on twenty occasions, of which seven were in single and thirteen in multi-engined planes; and of these flights, seven were in a westward direction (from New Zealand to Australia) and thirteen in an eastward direction. All westward flights, with one exception, have been made in multi-engined planes. That one exception, a flight made by Mr. F. C. Chichester in 1931, was also unique in that it was the only occasion on which a flight was not made in one hop, calls, necessitating great accuracy of navigation, being made at Norfolk and Lord Howe Islands. As yet, however, no final announcement has been made in the matter of a trans-Tasman service.
With the establishment of four air lines of a major nature during the past two years commercial aviation can be said to have become firmly established in New Zealand. Hitherto commercial activities have been limited mainly to air-taxi work (undertaken by aero clubs) and to two scheduled services of a minor nature. However, in December, 1935, Cook Strait Airways commenced an air service across Cook Strait, and a month later Union Airways commenced a two-way daily trunk service from Palmerston North to Dunedin. The former service was extended from Nelson to Hokitika (via Greymouth) in February, 1937, and Union Airways inaugurated the northern trunk service (Auckland–Wellington, via New Plymouth and Palmerston North) in June, 1937. Present indications are that overseas air connections will be established by the end of 1937 or early in 1938.
Legislation controlling the licensing of commercial aircraft services was introduced in 1934, when the Transport Licensing (Commercial Aircraft Services) Act was passed. Under the provisions of this Act the issuing of licenses was placed under the jurisdiction of the Transport Co-ordination Board, set up under the Transport Law Amendment Act of 1933; but on the 3rd March, 1936, this Board ceased to function, its powers being vested in the Minister of Transport in accordance with the Transport Licensing Amendment Act, 1936. All air-transport services must hold licenses under these Acts, except those in which aircraft leave from and return to the same aerodrome without any intermediate stop. Licenses may be issued to commercial aircraft companies for the maintaining of regular timetable schedules or for air-taxi work: while special licenses, available for a period of four years from the passing of the first Act, may be granted to recognized aero clubs in existence when the legislation came into force.
By the Customs (Aircraft) Regulations of 1935 it is necessary for aeroplanes arriving from or departing to other countries to do so at a “Customs aerodrome,” and Customs declarations similar to those required of ships and their passengers are necessary before departure and on arrival of such aeroplanes.
Licenses permitting the operation of regular scheduled services have been granted to four companies as under:—
New Zealand Air Travel, Ltd.
East Coast Airways, Ltd.
Cook Strait Airways, Ltd.
Union Airways of N.Z., Ltd.
Following are some particulars of the companies:—
NEW ZEALAND AIR TRAVEL, LTD.
| Date commenced operations | 18th December, 1934. |
| Number of planes | 2. |
| Description of planes | D.H. Fox Moths. |
| Seating-capacity | 5 (including pilot). |
| Route and periodicity of service | Inchbonnie – Hokitika to Franz Joseph Glacier—thrice weekly. Hokitika to Haast and Okuru—weekly. |
The company is authorized to use Inchbonnie, Greymouth, or Hokitika as ports, but in practice the Hokitika aerodrome is the regular starting-off and terminal port. The company operates a regular mail-service to Okuru—the first regular air-mail service in New Zealand, and one of the few in the world on which no surcharge is made for air transport of mail. A de Haviland Dragonfly aircraft has been purchased by the company to cope with the rapidly increasing traffic.
The following table gives details of operations to 30th June, 1937:—
| — | Mileage. | Passengers. | Goods. | Mails. |
|---|---|---|---|---|
| lb. | lb. | |||
| From 18th Dec., 1934, to 31st March, 1936 | 118,733 | 2,146 | 13,411 | 19,409 |
| Quarter ended 30th June, 1936 | 20,900 | 231 | 1,665 | 8,649 |
| Quarter ended 30th September, 1936 | 14,700 | 285 | 2,666 | 10,245 |
| Quarter ended 31st December, 1936 | 16,800 | 270 | 6,255 | 13,964 |
| Quarter ended 31st March, 1937 | 49,400 | 162 | 3,035 | 12,559 |
| Quarter ended 30th June, 1937 | 36,116 | 461 | 6,344 | 14,412 |
| Totals | 256,649 | 3,555 | 33,376 | 79,238 |
Air Travel (N.Z.), Ltd., also holds a license to conduct a taxi service from Hokitika to any point on the West Coast where a licensed aerodrome is available.
EAST COAST AIRWAYS, LTD.
| Date commenced operations | 16th April, 1935. |
| Number of planes | 2. |
| Description of planes | D.H. Standard Dragons. |
| Seating-capacity | 11 (including pilot, on service trips 6 passengers only are carried). |
| Route and periodicity of service | Gisborne to Napier—two return trips daily. |
This service was suspended for some months (from 18th March to 6th December, 1936) owing to the cancellation of the aerodrome license of the Gisborne terminal. The withdrawal of this license by the Controller of Civil Aviation permitted the necessary alterations and improvements to be made to the previously unsatisfactory landing-field.
The following table gives details of operations to 30th June, 1937:—
| — | Mileage. | Passengers. | Goods. | Mails. |
|---|---|---|---|---|
* Carried on opening day of service only. | ||||
| lb. | lb. | |||
| From 16th April, 1935, to 18th March, 1936 | 129,363 | 3,808 | 247 | 98* |
| From 7th Dec., 1936, to 31st Dec., 1936 | 10,112 | 378 | 39 | 275 |
| Quarter ended 31st March, 1937 | 33,160 | 1,380 | 548 | 1,146 |
| Quarter ended 30th June, 1937 | 32,448 | 1,030 | 389 | 1,068 |
| Totals | 205,083 | 6,596 | 1,223 | 2,587 |
COOK STRAIT AIRWAYS, LTD.
| Date commenced operations | 30th December, 1935. |
| Number of planes | 4. |
| Description of planes | D.H. 89 (Rapides). |
| Seating-capacity | 7 (including pilot). |
| Routes and periodicity of service | (a) Nelson to Wellington and vice versa (direct and via Blenheim); and Wellington to Blenheim and vice versa. Schedule: A total of 11 trips daily. |
| (b) Nelson to Hokitika (via Greymouth); three return trips weekly. |
The headquarters of this company are at Nelson, with terminal facilities at Wellington. The routes flown approximate 300 miles.
The following table gives details of operations to 30th June, 1937:—
| — | Mileage. | Passengers. | Goods. | Mails. |
|---|---|---|---|---|
* From 16th March, 1936, only. | ||||
| lb. | lb. | |||
| From 30th Dec., 1935, to 31st Mar., 1936 | 58,000 | 3,056 | 3,981 | 710* |
| Quarter ended 30th June, 1936 | 57,580 | 3,114 | 5,639 | 3,528 |
| Quarter ended 30th September, 1936 | 59,875 | 2,945 | 4,242 | 4,761 |
| Quarter ended 31st December, 1936 | 69,146 | 3,505 | 5,529 | 5,860 |
| Quarter ended 31st March, 1937 | 85,125 | 4,789 | 7,296 | 6,206 |
| Quarter ended 30th June, 1937 | 88,333 | 3,911 | 7,926 | 6,940 |
| Totals | 418,059 | 21,320 | 34,613 | 28,005* |
UNION AIRWAYS OF N.Z., LTD.
| Date commenced operations | 16th January, 1936. |
| Number of planes | 6. |
| Description of planes | 3 D.H. 86 and 3 Lockheed “Electras” 10A. |
| Seating-capacity | 12 (including 2 pilots). |
| Route and periodicity of service | (a) Palmerston North to Dunedin via Blenheim and Christchurch. One trip both ways daily. |
| (b) Auckland to Wellington via New Plymouth and Palmerston North. One trip both ways daily. |
This company's headquarters are at Milson (Palmerston North), where it has erected the largest commercial hangar in New Zealand to date. Its time-table is run in conjunction with that of Cook Strait Airways, allowing passengers to connect at Blenheim with planes to and from Wellington and Nelson. Both Cook Strait Airways and Union Airways are subsidiary companies of the Union Steam Ship Company of New Zealand, Limited.
The following table shows details of operations to 30th June, 1937:—
| — | Mileage. | Passengers. | Goods. | Mails. |
|---|---|---|---|---|
* From 16th March, 1930, only. | ||||
| lb. | lb. | |||
| From 16th Jan. 1936, to 31st March, 1936 | 71,575 | 1,211 | 861 | 1,055 |
| Quarter ended 30th June, 1936 | 90,090 | 1,638 | 1,166 | 7,751 |
| Quarter ended 30th September, 1936 | 88,500 | 1,521 | 1,753 | 10,545 |
| Quarter ended 31st December, 1936 | 91,270 | 1,978 | 1,943 | 13,464 |
| Quarter ended 31st March, 1937 | 90,280 | 2,055 | 2,298 | 12,424 |
| Quarter ended 30th June, 1937 | 92,685 | 1,949 | 1,856 | 14,369 |
| Totals | 524,400 | 10,352 | 9,877 | 59,608* |
SUMMARY OF OPERATIONS OF REGULAR AIR SERVICES TO 30TH JUNE, 1937.
| — | From | Mileage. | Passengers. | Goods. | Mails. |
|---|---|---|---|---|---|
* From 10th March, 1936, only. | |||||
| lb. | lb. | ||||
| Air Travel (N.Z.), Ltd. | 18/12/34 | 256,649 | 3,555 | 33,376 | 79,238 |
| East Coast Airways, Ltd. | 16/4/35 | 205,083 | 6,596 | 1,223 | 2,587* |
| Cook Strait Airways, Ltd. | 30/12/35 | 418,059 | 21,320 | 34,613 | 28,005* |
| Union Airways of N.Z., Ltd. | 16/1/36 | 524,400 | 10,352 | 9,877 | 59,609* |
| Totals | 1,404,191 | 41,823 | 79,089 | 169,439 | |
At 30th June, 1937, these four companies employed twenty-five pilots and operated fourteen aircraft on their regular services.
In addition to the licenses for their regular services, the above companies have been granted taxi licenses by the Minister of Transport. These permit the company concerned to operate a continuous taxi service to any part of New Zealand from the aerodrome which is the headquarters of the company.
Air-taxi licenses are also held by the following companies (in addition to those held by aero clubs and the regular companies):—
Waikato Aviation Co., Ltd.
Mount Cook and Southern Lakes Tourist Co., Ltd.
New Zealand Aerial Mapping, Ltd.
Southland Airways, Ltd.
The Waikato Aviation Co., Ltd., was granted a license to carry out air-taxi work to any part of the North Island, commencing from or terminating at the Rotorua Aerodrome. The company uses one machine—a Desoutter Cabin monoplane, Mark I, which has a seating-capacity of three (including pilot), or, alternatively, may be used as an ambulance plane.
The Mount Cook and Southern Lakes Tourist Co., Ltd. (formerly the Mount Cook Tourist Co. of New Zealand, Ltd.), although granted a license in 1935, has not yet commenced operations.
New Zealand Aerial Mapping, Ltd., was formed early in 1937 at Hastings with the object of carrying out aerial surveys for municipal bodies. A Monospar S.T. 25 aircraft suitably modified for this type of work was imported from England. The company was granted a continuous taxi license on 2nd June, 1937.
Southland Airways, Limited, with headquarters at Invercargill, operates a Puss Moth aircraft on a continuous taxi license granted by the Minister of Transport on 16th December, 1936.
Regulations governing air-taxi licenses were co-ordinated in October, 1935, following a conference of all parties interested, and such regulations govern both commercial companies and aero clubs. Included therein were the following conditions as to the fares to be charged for air-taxi work: Minimum fares—One passenger, £3 for each 100 miles; two passengers, £3 10s. for each 100 miles; three passengers, £3 15s. for each 100 miles; four passengers, £4 for each 100 miles; but where the flight takes place between two points served by the same licensed regular service the individual fare is in no case to be less than the fare charged by the licensed service plus 10 per cent.
In addition, these regulations enable an air-taxi-license holder to fly between any two licensed aerodromes in New Zealand, thus removing restrictions previously imposed as to which aerodromes air-taxis might fly to or from, and as to which territories they might fly over.
The advancement of commercial flying in New Zealand has necessitated an extension of the activities of the Government Meteorological Office. During the past year the number of recording stations has been increased, while reports for the benefit of aircraft are now issued during the day at three-hourly intervals from 7 a.m. onwards. Forecasts for pilots are broadcast over the YA stations at 6.50 a.m., 10 a.m., and 1 p.m. daily. As yet no night flying of a commercial nature has been undertaken, owing to the lack of facilities both in the matter of lighting of grounds and of radio-beacon apparatus. At the present time radiotelephone contact is maintained by airliners in flight with their termini through Government wireless - telegraph stations controlled by the Post and Telegraph Department.
As mentioned previously, no service has yet been established giving New Zealand air connections with other countries. If present plans and negotiations mature, however, this position will be changed within the next twelve months. In March, 1937, a Pan-American Airways clipper-plane made a survey flight for a trans-Pacific service from San Francisco, and it has been announced that two further survey flights are to be made before the end of 1937. When these flights have been completed it is intended that a regular fortnightly service will be inaugurated. In an agreement entered into with the New Zealand Government it was stipulated that the service was to be of a frequency of not less than twice a month and of not more than twice a week. The route proposed is from Honolulu to Auckland, with stops at Kingman Reef and Pago Pago, and will involve forty hours' flying time spread over three days. By the establishment of this service New Zealand will have direct connection with the U.S.A.–China service; while the Australian air connection with this route will be via New Zealand. Under the agreement signed, allowance has been made for the operation of a British service over a similar route.
The question of a trans-Tasman service has engaged the attention of the Imperial, Australian, and New Zealand Governments for a considerable period. In October, 1936, a conference of representatives of the three countries was held in Wellington, further consideration being given to the matter at the Imperial Conference. While negotiations are not complete, it would seem that a trans-Tasman service will be a reality within the next two years.
Practical interest in aviation was greatly stimulated by the first trans-Tasman flight of Kingsford Smith and Ulm in 1928, and to this flight the aero club movement largely owes its inception. The steady progress made by the movement has been in a great measure due to the scheme initiated by the Government of subsidizing a limited number of light aeroplane clubs. This subsidy takes the form of the loan of light aircraft and payments to clubs on account of pupils who qualify for their “A” flying licenses, and, for the last three years, payments on male pilots renewing licenses. Up to the present the clubs have undertaken most of the air-taxi work in New Zealand, and have also provided certain recreational as well as instructional facilities.
The following are the clubs in receipt of the Government subsidy:—
| Club. | Aerodromes at |
|---|---|
| Auckland | Mangere (Auckland); Te Rapa (Hamilton). |
| Western Federated (North Island) | New Plymouth; Hawera; Wanganui; Stratford. |
| Hawke's Bay and East Coast | Hastings; Napier; Gisborne; Waipukurau. |
| Middle Districts | Milson (Palmerston North); Feilding. |
| Wairarapa and Ruahine | Masterton; Martinborough; Dannevirke. |
| Wellington | Rongotai (Wellington). |
| Marlborough | Blenheim; Nelson. |
| Canterbury | Royal New Zealand Air Force Aerodrome, Wigram (Christchurch); Ashburton. |
| Otago | Mosgiel (Dunedin). |
| Southland | Invercargill. |
| West Coast (South Island) United | Hokitika; Greymouth. |
Some of these aerodromes are owned by the cities or boroughs and leased to the aero clubs.
Statistics indicating the activities of the various clubs are given in the following tables:—
| Club. | Founded. | Hours flown to 31st March, 1937. | Pilots securing at 31st March, 1937. | |
|---|---|---|---|---|
| “A” Licenses. | “B” Licenses. | |||
* Formerly the Manawatu Aero Club, formed 1932. † These figures do not indicate the total number of licenses issued. | ||||
| Auckland | 1928 | 15,154 | 155 | 9 |
| Western Federated (North Island) | 1930 | 7,188 | 92 | 3 |
| Hawke's Bay and East Coast | 1929 | 6,588 | 86 | 2 |
| Middle Districts* | 1936 | 2,756 | 37 | 1 |
| Wairarapa and Ruahine | 1930 | 4,289 | 70 | 2 |
| Wellington | 1930 | 6,885 | 95 | 8 |
| Marlborough | 1928 | 3,510 | 79 | 3 |
| Canterbury | 1930 | 9,465 | 128 | 7 |
| Otago | 1930 | 5,559 | 78 | 5 |
| Southland | 1930 | 4,774 | 73 | 4 |
| West Coast (South Island) United | 1935 | 1,053 | 17 | |
| Totals | 67,221 | 910† | 44† | |
Moreover, the clubs up to 31st March, 1937, had carried approximately 45,000 passengers and had flown approximately 4,700,000 miles since 1928.
The extent of a single year's operations in air-taxi work by aero clubs is given in the table below, the figures being for the year ended 31st December, 1936:—
| Club. | Passengers carried. | ||||
|---|---|---|---|---|---|
| 1st Quarter. | 2nd Quarter. | 3rd Quarter. | 4th Quarter. | Total. | |
| Auckland | 478 | 684 | 765 | 1,184 | 3,111 |
| Western Federated (North Island) | 1 | 6 | 7 | ||
| Hawke's Bay and East Coast | 17 | 35 | 16 | 140 | 208 |
| Middle Districts | 102 | 2 | 104 | ||
| Wairarapa and Ruahine | 99 | 22 | 10 | 31 | 162 |
| Wellington | 210 | 421 | 271 | 163 | 1,065 |
| Marlborough | 30 | 56 | 332 | 168 | 586 |
| Canterbury | 193 | 212 | 58 | 269 | 732 |
| Otago | 580 | 377 | 194 | 510 | 1,661 |
| Southland | 27 | 215 | 102 | 189 | 533 |
| West Coast (South Island) United | 30 | 26 | 6 | 29 | 91 |
| Totals | 1,767 | 2,054 | 1,756 | 2,683 | 8,260 |
| Number of flying-hours | 395 | 335 | 297 | 428 | 1,455 |
A more general idea of the activities of the light aeroplane clubs can be obtained from the following table, the results being for the year ended 31st March, 1937:—
| Club. | Pilots trained. | Number of Aircraft. | Hours flown. | Total Number of Members. | Licenses Valid. | |||
|---|---|---|---|---|---|---|---|---|
| Training. | Commercial. | Associate. | Flying. | Private. | Commercial. | |||
| Auckland | 21 | 9 | 2,064 | 526 | 508 | 154 | 9 | 9 |
| Western Federated (North Island) | 17 | 2 | 1,378 | 2 | 447 | 121 | 68 | 1 |
| Hawke's Bay and East Coast | 22 | 3 | 1,381 | 96 | 146 | 118 | 43 | 1 |
| Middle Districts | 10 | 2 | 828 | 10 | 144 | 71 | 32 | 2 |
| Wairarapa and Ruahine | 11 | 3 | 715 | 29 | 259 | 68 | 23 | 1 |
| Wellington | 15 | 5 | 1,562 | 180 | 284 | 90 | 49 | 4 |
| Marlborough | 12 | 2 | 566 | 127 | 136 | 35 | 26 | 1 |
| Canterbury | 27 | 4 | 2,078 | 188 | 94 | 121 | 69 | 3 |
| Otago | 13 | 2 | 884 | 186 | 169 | 64 | 43 | 5 |
| Southland | 11 | 5 | 878 | 160 | 97 | 97 | 38 | 1 |
| West Coast (South Island) United | 9 | 2 | 589 | 19 | 173 | 38 | 22 | |
| Totals | 168 | 39 | 12,923 | 1,523 | 2,457 | 977 | 2 | 28 |
At 30th June, 1937, there were also ninety-one ground engineers licenses in force.
In furtherance of the policy of subsidizing clubs in respect of pilots trained and licenses renewed, £4,996 was paid by the Government during the financial year ended 31st March, 1937, as compared with £4,480 for 1935–36. The following table indicates the amounts paid to clubs, together with the number of pilots trained and licenses renewed:—
| Club. | Number of Pilots trained for “A” License.* | Number of Licenses renewed and subsidized. | Amount of Subsidy. |
|---|---|---|---|
* Subsidy paid on a maximum of 10 trainees in each club. | |||
| £ | |||
| Auckland | 21 | 20 | 470 |
| Western Federated (North Island) | 17 | 20 | 470 |
| Hawke's Bay and East Coast | 12 | 18 | 461 |
| Middle Districts | 10 | 18 | 461 |
| Wairarapa and Ruahine | 11 | 12 | 434 |
| Wellington | 15 | 20 | 470 |
| Marlborough | 12 | 10 | 425 |
| Canterbury | 27 | 20 | 470 |
| Otago | 13 | 17 | 452 |
| Southland | 11 | 20 | 470 |
| West Coast (South Island) United | 9 | 13 | 413 |
| Totals | 158 | 188 | 4,996 |
For the payment of subsidies on renewal of licenses the pilots must be males and between the ages of eighteen and thirty-five years. Of the total amount paid, £3,550 was paid in respect of 109 pilots trained for “A” licenses, the remainder (£1,446) being for 188 pilots whose licenses were renewed. On 31st March, 1937, there were in force 493 pilots' “A” licenses and 77 “B” licenses.
As mentioned previously, the Government, besides subsidizing clubs for pilots trained, lends machines for training purposes and contributes towards the upkeep and improvements of landing-grounds controlled by the various aero clubs. The stated expenditure on civil aviation during the last five financial years is as follows:—
| £ | |
|---|---|
| 1932–33 | 4,243 |
| 1933–34 | 1,813 |
| 1934–35 | 11,316 |
| 1935–36 | 13,172 |
| 1936–37 | 21,646 |
In addition to the aircraft of the aero clubs and commercial companies there are a number of privately-owned planes in the Dominion. The following are the numbers of each type registered on 30th June, 1937:—
| Commercial planes | 20 |
| Aero club planes | 43 |
| Privately-owned planes | 25 |
| Experimental planes | 3 |
| 91 |
The above list does not include Royal N.Z. Air Force aircraft.
Of the civil aircraft the following list shows the principal makes represented:—
| D.H. 60 Moths (all types) | 36 |
| D.H. 80A (PUSS Moth) | 5 |
| D.H. 83 (Fox Moth) | 2 |
| D.H. 84 (Dragon) | 2 |
| D.H. 86 (Express Air Liner) | 3 |
| D.H. 87A (Hornet Moth) | 1 |
| D.H. 89 (Dragon Rapide) | 4 |
| Miles Hawk | 2 |
| Miles Whitney Straight | 2 |
| Percival Gull | 1 |
| Waco | 3 |
| Monospar S.T. 25 | 2 |
| Avro Avian | 4 |
| Avro 504K | 2 |
| Spartan | 6 |
| Lockheed 10A | 3 |
During the eighteen months ended 30th June, 1937, five fatalities occurred as a result of aeroplane mishaps. For the last seven years such accidents have been responsible for a total of thirty-two deaths, practically all of which occurred in club and private machines.
The history of air-mail service in New Zealand dates back to 1920 and 1921, when several experimental services were operated, principally between Auckland and the North, and between Christchurch and Timaru. These services were not used to a payable extent, however, and were abandoned. Towards the end of 1930 tenders were invited for the conveyance of mail by air once daily each way between Auckland, Wellington, Christchurch, and Dunedin, but none of the tenders received complied with the conditions. The next attempt to establish a service was during 1931–32, when a number of special air-mail flights were carried out by arrangement with the New Zealand Air-mail League, the first for over a decade if occasions of national emergency be disregarded.
It was not, however, until the inauguration of a service between Hokitika and South Westland in January, 1934, that an air-mail service of any permanency was established. The district served in this instance is one which possesses very poor transport facilities; and, though the population is sparse and the area small, the carriage of mails by air has great advantages over a land service. It is for this reason that no surcharge is made on the mail-matter carried by this service, and the sparse population accounts for the small quantity of mail carried—the figures for which are shown in the operations of New Zealand Air Travel, Ltd., in a preceding paragraph on commercial air transport.
On the 16th March, 1936, the first regular air-mail services linking up large centres of population were established between Palmerston North and Dunedin and between Nelson, Blenheim, and Wellington. The rate of postage for inland air-mail correspondence was fixed at 2d. per ounce, an increase of 1d. per ounce on the ordinary letter rate.
A parcels-post service was commenced on the 25th May, 1936, the rates being fixed as under:—
| s. d. | |
|---|---|
| Up to 3 lb. | 2 0 |
| Up to 7 lb. | 3 6 |
| Up to 14 lb. | 5 0 |
| Up to 21 lb. | 8 0 |
| Up to 28 lb. | 10 0 |
When the services were established it was estimated that if all correspondence, the delivery of which would be expedited by air transit, were sent by air mail, 170,000 letters would be convoyed weekly by the two services. Although at the commencement the returns of correspondence forwarded by the air services did not come up to expectations, the increase in postings, as evidenced by the table below, has been marked. The number of parcels conveyed by air is necessarily small but is increasing, and the service fulfils a definite need.
| Four-weekly Period ending | Number Letters flown. | Number Parcels flown. |
|---|---|---|
| 1936. | ||
| 12th April | 75,228 | |
| 10th May | 51,460 | |
| 7th June | 54,642 | 111 |
| 5th July | 62,793 | 230 |
| 2nd Aug. | 61,866 | 311 |
| 30th Aug. | 67,477 | 438 |
| 27th Sept. | 70,072 | 398 |
| 25th Oct. | 76,224 | 522 |
| 22nd Nov. | 76,483 | 402 |
| 20th Dec. | 81,009 | 411 |
| 1937. | ||
| 17th Jan. | 72,348 | 523 |
| 14th Feb. | 83,955 | 295 |
| 14th Mar. | 99,519 | 372 |
| 11th April | 95,282 | 414 |
| 9th May | 103,574 | 450 |
| 6th June | 95,802 | 377 |
| 4th July | 111,897 | 426 |
| 1st Aug. | 114,543 | 601 |
| 22nd Aug. (3 weeks) | 88,250 | 488 |
In addition to the air-mail services established in March, 1936, the despatch of air mails between Napier and Gisborne commenced on the 7th December, 1936, between Nelson, Greymouth, and Hokitika on the 23rd February, 1937, and between Auckland, New Plymouth, Palmerston North, and Wellington on the 27th June, 1937.
Particulars of the air-mail services at present in operation in New Zealand are shown hereunder:—
| Hokitika – South Westland (Bruce Bay – Haast – Okuru)— | |
| Distance | One hundred and forty-five miles. |
| Established | January, 1934. |
| Frequency | Weekly. |
| Nelson–Blenheim–Wellington— | |
| Distance | Nelson–Blenheim, 55 miles; Blenheim–Wellington, 45 miles. |
| Established | 16th March, 1936. |
| Frequency | Between Nelson and Wellington, twice daily; between Blenheim and Wellington, four times daily. |
| Palmerston North – Blenheim – Christchurch – Dunedin— | |
| Distance | Palmerston North – Blenheim, 125 miles; Blenheim–Christchurch, 175 miles; Christchurch–Dunedin, 200 miles. |
| Established | 16th March, 1936. |
| Frequency | Daily. |
| Napier–Gisborne— | |
| Distance | Eighty-five miles. |
| Established | 7th December, 1936. |
| Frequency | Twice daily. |
| Nelson–Greymouth–Hokitika— | |
| Distance | Nelson–Greymouth, 223 miles; Greymouth–Hokitika, 23 miles. |
| Established | 23rd February, 1937. |
| Frequency | Thrice weekly. |
| Wellington – Palmerston North – New Plymouth – Auckland— | |
| Distance | Wellington–Palmerston North, 90 miles; Palmerston North – New Plymouth, 120 miles; New Plymouth – Auckland, 145 miles. |
| Established | 27th June, 1937. |
| Frequency | Daily. |
Although experimental carriage of mails has been made on trans-Tasman flights, the lack of permanent overseas services precludes New Zealand from enjoying full overseas air-mail facilities. At the present time mail is conveyed to Australia by steamer to connect with the Imperial Airways service to the United Kingdom. The reverse procedure takes place for inwards mails; but, owing to lack of regular steamer and air connections, mail-matter is frequently delayed at Sydney. The minimum time taken for the carriage of mails between New Zealand and England, making use of the England-Australia air service, is in the vicinity of seventeen days, as compared with twenty-five to twenty-seven days via America by steamer and rail.
Table of Contents
AT the 31st December, 1936, there were 1,766 post-offices in New Zealand, and at the same date there were 2,475 street letter-boxes in the Dominion.
The following table shows the estimated number of articles posted and delivered during each of the last five years:—
| Year. | Letters and Letter-cards. | Post-cards. | Books and Pattern-packets. | Newspapers. | Parcels. |
|---|---|---|---|---|---|
| 1932 | 246,395,130 | 6,827,012 | 147,208,467 | 33,410,372 | 2,774,416 |
| 1933 | 261,979,312 | 7,053,628 | 155,038,055 | 33,775,389 | 3,286,188 |
| 1934 | 275,063,943 | 7,499,491 | 167,320,615 | 33,485,832 | 3,460,719 |
| 1935 | 288,645,484 | 8,328,714 | 191,066,262 | 34,547,494 | 3,538,725 |
| 1936 | 292,098,761 | 7,665,003 | 194,266,088 | 33,341,059 | 6,726,337 |
The very large increase in the number of parcels in 1936 is partly due to a change in postal practice. Certain types of articles previously classed as packets are now classed as parcels.
Articles which are posted in New Zealand and delivered in the Dominion as well represent, of course, the great bulk of the business, and such articles are necessarily counted twice in the foregoing table. Separate figures of articles posted and delivered during the year 1936 are as follows:—
| Posted. | Delivered. | |
|---|---|---|
| Letters and letter-cards | 141,853,498 | 150,245,263 |
| Post-cards | 3,406,149 | 4,258,854 |
| Books, &c. | 97,641,191 | 96,624,897 |
| Newspapers | 15,393,467 | 17,947,592 |
| Parcels | 3,296,288 | 3,430,049 |
These figures include registered articles, of which 2,214,430 were posted in the Dominion and 2,272,356 were delivered therein.
The average numbers of letters, &c., posted in the Dominion per head of mean population (including Maoris) during each of the last five years are:—
| Year. | Letters and Letter-cards. | Post-cards. | Books and Parcels. | Newspapers. | Total. |
|---|---|---|---|---|---|
| 1932 | 77.44 | 2.02 | 50.98 | 9.73 | 140.17 |
| 1933 | 81.74 | 1.99 | 51.96 | 10.34 | 146.03 |
| 1934 | 85.41 | 2.16 | 56.88 | 9.48 | 153.93 |
| 1935 | 86.46 | 2.27 | 61.57 | 9.52 | 159.82 |
| 1936 | 90.05 | 2.16 | 64.08 | 9.77 | 166.06 |
The rural-mail-delivery system was instituted in the Dominion about 1900, but due to the high comparative cost little progress was made with it until 1922. As from the 1st January of that year a scheme was introduced whereby a nominal fee is charged for this service; the rates are 10s. per annum for a delivery thrice weekly or less frequently, or £1 for a delivery having a greater frequency. These charges do not bear heavily on the farmer, and they enable the Post Office to extend rural-mail-delivery benefits to districts which are without such amenities. Every comparatively well-settled district now has its network of deliveries. The rural-mail carrier delivers and collects correspondence and parcels at or near the gates of farmers living sometimes far removed from post-offices, and sells postage stamps and obtains, as required, money-orders and postal notes. In effect the farmer has what practically amounts to a post-office at his gate.
It is an indication of the popularity of the system that, whereas there were 8,700 rural boxholders in 1920, there were 26,740 on the 31st March, 1937.
The facilities afforded for the transmission of parcels through the Post Office to places within and beyond the Dominion have proved of much convenience to the public. The regulations admit of parcels up to 22 lb. in weight being sent to Great Britain and Northern Ireland, Fiji, French Settlements of Oceania, Egypt, Hong Kong, Jamaica, and Tonga, and of parcels up to 11 lb. in weight being sent to all other countries of the world. Inland parcels may weigh up to 28 lb.
| Year. | Overseas Parcels received. | Overseas Parcels despatched. | ||||
|---|---|---|---|---|---|---|
| Number. | Weight. | Declared Value. | Customs Duty. | Number. | Weight. | |
| lb. | £ | £ | lb. | |||
| 1932 | 151,436 | 999,035 | 603,891 | 147,528 | 42,432 | 157,629 |
| 1933 | 142,571 | 929,223 | 549,195 | 116,159 | 44,244 | 164,922 |
| 1934 | 154,092 | 1,023,133 | 593,714 | 116,835 | 41,498 | 162,777 |
| 1935 | 160,146 | 1,052,921 | 625,735 | 121,641 | 40,056 | 160,584 |
| 1936 | 176,772 | 1,148,108 | 726,691 | 142,659 | 43,008 | 173,646 |
The figures show a great preponderance of inward parcels. Of the parcels received from overseas in 1936 no fewer than 68,860 came from Great Britain (including those from foreign countries via London), while 34,142 came from the United States and 52,165 from Australia and foreign countries via Australia. These countries, to which 13,364, 3,505, and 19,190 parcels respectively were despatched, also ranked highest among countries to which parcels were sent from New Zealand.
There are (July, 1937) 311 publications on the Post Office Register of Newspapers. Of these, some 55 are published daily, 16 being morning papers and 39 evening papers. Twenty-two appear three times per week, 22 twice per week, 67 weekly, 11 fortnightly, 129 monthly, and 5 at irregular intervals.
During 1936 money-orders from places beyond New Zealand numbered 38,354 for the amount of £127,131, while those issued in New Zealand for payment overseas numbered 100,120, and represented an aggregate value of £242,016.
| Calendar Year. | Number of Offices at end of Year. | Money-orders issued. | Money-orders paid. | |||
|---|---|---|---|---|---|---|
| Number. | Value. | Commission. | Number. | Value. | ||
| £ | £ | £ | ||||
| 1932 | 878 | 648,951 | 3,335,552 | 31,629 | 592,843 | 3,264,578 |
| 1933 | 875 | 635,674 | 3,112,729 | 38,772 | 587,684 | 3,112,194 |
| 1934 | 873 | 654,621 | 3,209,713 | 42,310 | 598,316 | 3,157,703 |
| 1935 | 894 | 673,057 | 3,374,029 | 44,029 | 615,890 | 3,301,377 |
| 1936 | 909 | 733,966 | 3,794,648 | 48,433 | 672,291 | 3,688,679 |
The popularity of the postal-note system for remitting small amounts is clearly illustrated in the table given below:—
| Year ended 31st March, | Number of Offices at end of Year. | Postal Notes paid. | Postal Notes issued. | |||
|---|---|---|---|---|---|---|
| Number. | Value. | Commission. | Number. | Value. | ||
| £ | £ | £ | ||||
| 1933 | 1,100 | 2,686,648 | 958,373 | 23,902 | 2,668,697 | 930,355 |
| 1934 | 1,097 | 2,883,070 | 1,061,946 | 26,249 | 2,853,054 | 1,027,434 |
| 1935 | 1,101 | 3,325,561 | 1,140,695 | 29,077 | 3,301,049 | 1,105,793 |
| 1936 | 1,118 | 3,827,417 | 1,293,955 | 33,146 | 3,811,181 | 1,257,622 |
| 1937 | 1,127 | 3,833,288 | 1,378,387 | 34,326 | 3,824,406 | 1,340,628 |
British postal orders issued in the Dominion during the year ended 31st March, 1937, numbered 86,778, of a value of £40,212. Those pail numbered 29,761, and represented £15,091.
Up to the 31st March, 1937, a total sum of £10,160,572 had been expended on telegraph construction, including the construction of telephone exchanges. The amount expended during the financial year 1936–37 was £232,512.
There were 12,094 miles of telegraph and toll pole line in existence at the end of March, 1936, carrying 65,611 miles of wire.
During the year ended 31st March, 1937, the revenue from telegrams and toll communications was £875,614, to which should be added £1,338,958 revenue of telephone exchanges and £42,658 miscellaneous receipts, making a total telegraph and telephone revenue of £2,257,230.
| Year ended 31st March, | Number of Telegrams and Toll Messages forwarded during the Year. | Revenue (including Miscellaneous Receipts). | Value of Government Messages.* | Total Value of Business done during the Year. | |||
|---|---|---|---|---|---|---|---|
| Paid. | Free* Government. | Total. | Telegraph and Toll. | Telephone Exchange. | |||
* Urgent marine telegrams: no payment received. | |||||||
| £ | £ | £ | £ | ||||
| 1933 | 13,105,557 | 32,209 | 13,137,766 | 730,765 | 1,169,512 | 3,296 | 1,903,573 |
| 1934 | 13,255,591 | 31,712 | 13,287,303 | 740,946 | 1,164,711 | 3,289 | 1,908,946 |
| 1935 | 14,038,556 | 31,457 | 14,070,013 | 767,940 | 1,190,773 | 2,667 | 1,961,380 |
| 1936 | 16,002,064 | 31,067 | 16,033,131 | 830,515 | 1,252,964 | 2,191 | 2,085,670 |
| 1937 | 18,260,669 | 30,263 | 18,290,932 | 918,272 | 1,338,958 | 1,783 | 2,259,013 |
For ordinary telegrams the charge is a flat rate of one penny per word, with a minimum charge of sixpence. The charge for letter-telegrams is a flat rate of one shilling for twenty-four words, and one penny for each additional two words. An additional charge of sixpence is made for an urgent telegram, irrespective of the number of words contained in the message. (Letter-telegrams are delivered by post on the morning following the day of lodgment.)
Telephone facilities are extensively utilized in New Zealand. According to data compiled by the Chief Statistician of the American Telephone and Telegraph Co. as for the 1st January, 1936, New Zealand ranks fourth in number of telephones per 100 of population. Leading countries in this respect are: United States of America, 13.69; Canada, 10.99; Denmark, 10.64; New Zealand, 10.59; Sweden, 10.28; Switzerland, 9.59; Australia, 7.92; Norway, 7.05; Hawaii, 6.55; United Kingdom, 5.44; Germany, 4.87; Netherlands, 4.32.
At the 31st March, 1937, there were 348 telephone exchanges in the Dominion. Of this number, 329 are of the magneto type, 2 common battery, and 17 automatic. The automatic exchanges are: Whangarei, Auckland, Hamilton, Hastings, Dannevirke, Stratford, Hawera, Wanganui, Marton, Palmerston North, Masterton, Lower Hutt, Wellington, Blenheim, Christchurch, Oamaru, and Dunedin.
The following statement shows the automatic-exchange equipment installed and in use in the Dominion on the 31st March, 1937:—
| Capacity of Equipment Installed. | Equipment in use. | |
|---|---|---|
| No. | No. | |
| Individual lines | 72,810 | 57,570 |
| Party-lines— | ||
| Two-party | 4,100 | 3,177 |
| Four-party | 2,100 | 1,528 |
| Multi-party | 1,780 | 1,070 |
| Individual-line stations | 56,534 |
| Party-line stations | 14,963 |
| Total of main stations | 71,497 |
| Extension stations | 26,310 |
| Total number of automatic-telephone stations connected | 97,807 |
The following table indicates the growth of the New Zealand telephone, exchange service:—
| — | 1927. | 1931. | 1932. | 1933. | 1934. | 1935 | 1936. | 1937. |
|---|---|---|---|---|---|---|---|---|
| Exchanges | 342 | 349 | 349 | 349 | 349 | 349 | 348 | 348 |
| Subscribers, main stations | 107,882 | 127,606 | 125,826 | 120,511 | 119,689 | 121,841 | 127,056 | 135,853 |
| Toll and service stations | 4,026 | 3,912 | 3,964 | 3,982 | 4,029 | 4,107 | 4,146 | 4,313 |
| Public call offices | 435 | 735 | 745 | 750 | 787 | 796 | 870 | 917 |
| Extension stations | 19,746 | 25,514 | 26,437 | 26,514 | 27,178 | 28,663 | 30,598 | 33,838 |
| Telephone-station totals | 132,089 | 157,767 | 156,972 | 151,757 | 151,683 | 155,407 | 162,670 | 174,921 |
The total number of telephone-stations shows an increase of 42,832, or 32 per cent., during the period covered by the table. Since 1927 the increase in subscribers' stations amounted to 27,971, or about 26 per cent., while extension stations show an increase of 14,092, or over 71 per cent. The demand for public call offices is clearly revealed in the table, these showing an increase from 435 in 1927 to 917 in 1937. The increase in the number of telephone-stations during the year was accelerated to a remarkable extent, the year showing a net gain of 12,251 telephone-stations.
In addition to the above, there are 3,678 stations connected by private telephone-lines with departmental toll-stations, making a grand total of 178,599 telephone-stations in New Zealand on the 31st March, 1937.
The “party” line system of telephone service is extensively used, particularly by those whose premises are situated at a distance from an exchange. In March, 1937, the number of party-line connections was 13,537, with a total of 51,027 stations.
The first public call offices (coin-in-the-slot telephones) erected in the Dominion were installed at Wellington in August, 1910. Of the total of 917 such instruments in use in the Dominion at the 31st March, 1937, the charge in 877 cases is 1d.; in six, 2d.; and in thirty-four, 3d. The revenue of slot telephones during the year ended 31st March, 1937, was £51,026.
The telephone-exchange system included on the 31st March, 1936, 15,860 miles of pole line and 569,605 miles of wire.
The capital expenditure on the equipment, &c., of the telephone exchanges up to the 31st March, 1937, was £8,738,993, equal to an average cost of £49 19s. 2d. for each connection.
The first wireless-telegraph station in New Zealand for communicating with ships at sea was opened at Wellington on the 26th July, 1911.
There are now twenty-four stations under the control of the New Zealand Government, the principal being those at Awarua, Wellington, and Auckland on the New Zealand mainland, at Apia in Western Samoa, at Rarotonga in the Cook Islands, and at the Chatham Islands. Smaller stations on the mainland or on adjacent islands are those at Kawau Island, Milford Sound, Stephens Island, Puysegur Point, and Portland Island, while there are radio-beacon stations at the lighthouses at Cape Maria van Diemen, Portland Island, Stephens Island, Baring Head, and Tiritiri Island.
Communication is effected with outer islands in the Cook Group by Rarotonga-Radio through small feeder-stations at Aitutaki, Atiu, Mangaia, Manihiki, Mauke, and Penrhyn. Small stations at Aleipata, Atafu, Fagamalo, Fakaofo, Salailua, and Tuasivi communicate with Apia-Radio, while Niue communicates with both Apia-Radio and Wellington-Radio.
By means of the radio-stations at Wellington, Apia, Rarotonga, and Niue, communication is maintained between New Zealand and the Pacific islands, the three last-mentioned stations having direct communication with New Zealand. Wellington-Radio has also direct communication with Papeete-Radio (Tahiti) and Nukualofa (Tonga).
The radio business transacted by the New Zealand coast stations during the last five years was as follows:—
| Year ended 31st March, | Forwarded. | Received. | ||||
|---|---|---|---|---|---|---|
| Messages. | Words. | Value. | Messages. | Words. | Value.* | |
* Amount collected by New Zealand. | ||||||
| £ | £ | |||||
| 1933 | 8,591 | 95,192 | 3,394 | 14,543 | 142,650 | 2,689 |
| 1934 | 8,960 | 103,625 | 3,572 | 15,131 | 160,105 | 3,142 |
| 1935 | 9,688 | 129,234 | 3,874 | 16,485 | 189,607 | 3,885 |
| 1936 | 11,332 | 149,686 | 4,345 | 18,703 | 219,979 | 3,996 |
| 1937 | 14,352 | 191,274 | 5,308 | 23,691 | 293,152 | 4,938 |
The foregoing table does not include free (service) messages.
The charges for radio-telegrams to ships at sea are as under:—
To the “Maori,” “Rangatira,” and “Wahine,” while engaged in the Wellington–Lyttelton steamer-express service, and the “Tamahine” while engaged in the Wellington–Picton service: 2d. a word, minimum 1s.
To His Majesty's ships within wireless range of a New Zealand coast station: 3d. a word.
To the “Aorangi,” “Niagara,” and “Wanganella” and to all vessels registered in New Zealand other than the “Rangatira” and “Tamahine”: 4d. a word.
To the majority of vessels registered in Australia when communicated with through New Zealand coast radio-stations: 6d a word.
To most other vessels: 8d. and 11d. a word.
Ship stations registered in New Zealand numbered sixty-seven at 31st March, 1937.
Private radio-stations are governed by the Radio Regulations which were gazetted on the 21st July, 1932.
The licenses for radio receiving-stations are designed to provide for reception from radio-telephone broadcasting stations as well as for experimental reception, and may be obtained at any postal money-order office on payment of the prescribed fee.
The licenses for private experimental (amateur) stations are intended to provide facilities for experimental transmission to those interested in radio science, and are issued subject to the qualifications of the applicants being satisfactory.
The licenses for private experimental (research) stations are intended to provide facilities for the work of pure research in radio science, and are issued only to persons of recognized attainment in the theory or practice of radio-telegraphy, or to universities or other scientific institutions engaged in conducting experiments for the development of the science of radio-telegraphy.
The part of the regulations relating to “Radio-dealers” is intended to provide for the proper control of the sale of apparatus designed and intended for use in connection with wireless telegraphy.
The Pacific cable, opened for traffic between New Zealand and Australia and Fiji on the 9th April, 1902, was completed to Bamfield, Vancouver Island, on the 31st October following, and opened for international business on the 8th December, 1902.
The route is from Auckland to Vancouver, via Norfolk Island, Fiji, and Fanning Island. The Australian connection is at Norfolk Island. The deep-sea portion of the Vancouver – Fanning Island cable is stated to be the longest in the world.
Direct communication between Auckland and Sydney was established on the 31st December, 1912, thus giving the Pacific Cable Board an alternative route to Australia.
Additional facilities were provided between New Zealand and Fiji by the laying, by the Pacific Cable Board, of a new cable between Auckland and Suva. The work was completed on the 12th August, 1923. The duplication of the two northern sections—Vancouver to Fanning Island and Fanning Island to Fiji—was completed on the 20th November, 1920. These new sections were opened for traffic on the 18th December, 1926.
The Pacific Cable Board and the Eastern Extension, Australasia, and China Telegraph Co., Ltd., previously controlling the two cable systems connecting New Zealand with overseas countries were, together with certain cable and wireless services in existence in other British countries, in 1929 absorbed in a merger company now known as Cable and Wireless, Ltd. As a result, the Eastern Co.'s station at Wellington, the New Zealand terminal of the “Eastern” cable, was closed on the 31st May, 1932, from which date all cable traffic to and from New Zealand has been handled by the Pacific cable office at Auckland, where the Pacific cable terminates. One of the two “Eastern” cables previously in use between Wellington and Sydney has been diverted to Auckland, while a portion of the second cable—extending from Wellington to a point a considerable distance out to sea—has been picked up.
The length of submarine cable in use in connection with the inland telegraph and telephone services is 345 nautical miles, containing 2,313 nautical miles of conductors.
The large volume and multifarious nature of the business of the Post and Telegraph Department entail the employment of a large staff. The Department is administered by the Postmaster-General and Minister of Telegraphs, with the Director-General as executive head.
The staff at 31st March, 1937, was as follows: Permanent, 10,212; temporary, 579: total, 10,791. In addition there are 1,668 country postmasters and telephonists who act as such in conjunction with other pursuits and do not rank as officers of the Department. There are also 84 officers of the Railways Department who act as postmasters.
The receipts and payments of the Post and Telegraph Department for the last two financial years are shown in the following table:—
| RECEIPTS. | 1935–36. | 1936–37. |
|---|---|---|
| £ | £ | |
| Postages | 1,047,903 | 1,152,799 |
| Money-order and postal-note commission | 63,482 | 71,767 |
| Private-box and bag rents and rural delivery fees | 51,819 | 51,954 |
| Miscellaneous receipts | 345,568 | 395,007 |
| Paid telegrams | 288,775 | 313,070 |
| Paid tolls | 499,825 | 562,543 |
| Telephone exchanges | 1,252,964 | 1,338,958 |
| Totals | £3,550,336 | £3,886,098 |
| PAYMENTS. | £ | £ |
| Salaries | 1,683,888 | 1,922,278 |
| Conveyance of mails by sea | 98,830 | 106,125 |
| Conveyance of inland mails | 123,021 | 124,149 |
| Conveyance of mails by railway | 82,104 | 91,476 |
| Maintenance of telegraph and telephone lines | 79,706 | 108,174 |
| Depreciation Fund | 120,617 | 182,275 |
| Motor services and workshops | 39,633 | 77,165 |
| Miscellaneous | 371,485 | 396,408 |
| Interest on capital liability | 541,000 | 566,000 |
| Sick-benefit Fund | 1,600 | 5,665 |
| Maintenance of Post and Telegraph buildings | 42,710 | |
| Totals | £3,141,884 | £3,622,425 |
The year 1936–37 commenced with a credit balance of £40,830. Of the gross balance of £304,503 at the end of the year, £3,298 was paid to the Consolidated Fund as profits and £260,000 invested in the Renewal and Replacement of Assets Fund, leaving £41,205 to be carried forward.
Receipts and payments for the past ten years are shown by the following figures:—
| Year ended 31st March, | Receipts. | Payments. |
|---|---|---|
* Does not include payment to Depreciation Fund and interest on capital liability, which were first included in expenditure in 1928–29. | ||
| £ | £ | |
| 1928 | 3,329,511 | 2,299,571* |
| 1929 | 3,445,545 | 2,920,158 |
| 1930 | 3,641,620 | 3,111,199 |
| 1931 | 3,707,420 | 3,304,648 |
| 1932 | 3,715,229 | 2,794,565 |
| 1933 | 3,293,932 | 2,688,119 |
| 1934 | 3,200,414 | 2,648,600 |
| 1935 | 3,342,978 | 2,844,554 |
| 1936 | 3,550,336 | 3,141,884 |
| 1937 | 3,886,098 | 3,622,425 |
Table of Contents
THE surveys of Crown lands, Native lands, and land purchased under the Land for Settlements Act, 1925, or the Discharged Soldiers Settlement Act, 1915, are executed under the authority of the Minister of Lands, and are carried out by staff and contract surveyors registered by the Survey Board constituted under the Surveyors Registration Act, 1928.
In respect of surveys for the purpose of the Land Transfer Act, an additional and special license under the hand of the Surveyor-General is required, in terms of section 177 of the Land Transfer Act, 1915.
Any surveyor or other person, in pursuance of the written authority of the Surveyor-General or of the Chief Surveyor of the district, may enter upon Native land for survey purposes (vide section 501 of the Native Land Act, 1931).
Authority for a surveyor and his assistant to enter on any land for the purpose of making a survey under the Public Works Act must be obtained from the Minister of Public Works, the Minister of Lands, the Surveyor-General or his Deputy, or the local body, as the case may be.
Regulations for conducting the survey of the Dominion lands are made by the Survey Board in terms of the Surveyors' Registration Act, 1928. Power is conferred on the Surveyor-General to make necessary rules.
The Surveyor-General is the custodian of the legal standards of length for survey purposes. All measurements of land affecting titles are to be expressed in terms of the chain of 100 links, and all areas in acres, roods, perches, and decimals of a perch.
Full information as to the New Zealand system of survey will be found in the 1929 number of the Year-Book (pp. 438–44).
The total area of the Dominion, excluding the Cook and other Pacific islands annexed in 1901, but inclusive of the Kermadec Islands and the “outlying islands,” since these form parts of land districts, is 66,390,196 acres. Of this total, 43,199,893 acres were returned in 1937 as being in occupation, including reserves and Native lands leased, but excluding areas within borough boundaries, holdings of less than 1 acre in extent, and Native land held on the communal system.
According to information published by the Lands Department, the following is the condition of the land in the Dominion as at the 31st March, 1937:—
| Acres. | |
|---|---|
* Includes interests acquired by the Crown but not proclaimed. | |
| Total area sold or granted and held on freehold | 21,765,709 |
| Total area reserved for public purposes | 15,654,238 |
| Total area of Crown lands leased under all tenures (exclusive of reserves leased by the Crown) | 17,490,758 |
| Total area of Crown land available for future disposal | 1,722,941 |
| Total area of Native land | 4,545,765* |
| Land unfit for settlement, including rivers, lakes, roads, &C. | 5,210,785 |
| Total | 66,390,196 |
The numbers of holdings and percentages of total holdings in occupation in groups of sizes, as returned at the last five collections, are given below—
| Area, in Acres. | Number of Holdings. | Percentages of Total. | ||||||||
|---|---|---|---|---|---|---|---|---|---|---|
| 1933. | 1934. | 1935. | 1936. | 1937. | 1933. | 1934. | 1935. | 1936. | 1937. | |
| 1 and under 10 | 10,984 | 10,945 | 11,014 | 10,900 | 11,024 | 13.11 | 12.97 | 12.98 | 12.89 | 12.89 |
| 10 and under 50 | 14,459 | 14,649 | 14,739 | 14,563 | 14,755 | 17.20 | 17.36 | 17.37 | 17.22 | 17.26 |
| 50 and under 100 | 11,743 | 12,008 | 12,157 | 12,179 | 12,516 | 14.02 | 14.23 | 14.33 | 14.41 | 14.64 |
| 100 and under 200 | 15,655 | 15,898 | 16,069 | 16,049 | 16,232 | 18.68 | 18.84 | 18.93 | 18.98 | 18.99 |
| 200 and under 320 | 9,481 | 9,500 | 9,533 | 9,542 | 9,620 | 11.32 | 11.26 | 11.23 | 11.29 | 11.25 |
| 320 and under 640 | 10,239 | 10,200 | 10,209 | 10,167 | 10,204 | 12.22 | 12.09 | 12.03 | 12.03 | 11.93 |
| 640 and under 1,000 | 4,184 | 4,175 | 4,151 | 4,162 | 4,175 | 4.99 | 4.95 | 4.89 | 4.92 | 4.88 |
| 1,000 and under 5,000 | 5,986 | 5,944 | 5,941 | 5,935 | 5,909 | 7.14 | 7.05 | 7.00 | 7.02 | 0.91 |
| 5,000 and under 10,000 | 551 | 551 | 555 | 551 | 553 | 0.66 | 0.65 | 0.65 | 0.65 | 0.65 |
| 10,000 and under 20,000 | 295 | 295 | 294 | 295 | 288 | 0.35 | 0.35 | 0.35 | 0.35 | 0.36 |
| 20,000 and under 50,000 | 148 | 149 | 148 | 146 | 148 | 0.18 | 0.18 | 0.17 | 0.17 | 0.17 |
| 50,000 and over | 55 | 54 | 57 | 58 | 58 | 0.07 | 0.07 | 0.07 | 0.07 | 0.07 |
| Totals | 83,780 | 84,368 | 84,867 | 84,547 | 85,482 | 100.00 | 100.00 | 100.00 | 100.00 | 100.00 |
Seventy-five per cent. of the holdings are seen to be not more than one-half a square mile in area. These, however, represent only 14 per cent. of the total area of occupied land in the Dominion. Sixty-eight per cent. of the occupied land is held in areas of over 1,000 acres, and 41 per cent. in areas of over 5,000 acres.
| Sizes of Holdings, in Acres. | 1933. | 1934. | 1935. | 1936. | 1937. |
|---|---|---|---|---|---|
| Acres. | Acres. | Acres. | Acres. | Acres. | |
| 1 and under 10 | 50,639 | 50,710 | 51,162 | 50,666 | 51,238 |
| 10 and under 50 | 363,884 | 369,525 | 372,315 | 370,449 | 374,767 |
| 50 and under 100 | 847,592 | 866,412 | 878,596 | 880,972 | 905,258 |
| 100 and under 200 | 2,190,991 | 2,224,672 | 2,247,660 | 2,245,962 | 2,269,663 |
| 200 and under 320 | 2,369,432 | 2,378,261 | 2,387,045 | 2,388,697 | 2,410,076 |
| 320 and under 640 | 4,621,760 | 4,616,450 | 4,620,674 | 4,612,434 | 4,619,148 |
| 640 and under 1,000 | 3,322,474 | 3,322,397 | 3,300,499 | 3,306,086 | 3,315,020 |
| 1,000 and under 5,000 | 11,629,704 | 11,519,983 | 11,592,077 | 11,533,349 | 11,509,796 |
| 5,000 and under 10,000 | 3,754,123 | 3,771,274 | 3,805,669 | 3,779,128 | 3,786,180 |
| 10,000 and under 20,000 | 4,146,106 | 4,115,552 | 4,110,362 | 4,211,434 | 4,039,847 |
| 20,000 and under 50,000 | 4,555,186 | 4,568,109 | 4,549,725 | 4,559,723 | 4,543,696 |
| 50,000 and over | 4,821,503 | 4,839,663 | 5,188,775 | 5,343,193 | 5,375,204 |
| Totals | 42,673,394 | 42,643,008 | 43,104,559 | 43,282,093 | 43,199,893 |
The following table gives for the last five years available (no classification having been made for 1936–37) the number of holdings in the Dominion classified according to purpose for which used. Figures exclude borough holdings and holdings under 1 acre in extent.
| Class of Holding. | Area, 1929–30. (Latest available.) | Number of Holding. | |||||
|---|---|---|---|---|---|---|---|
| 1931–32. | 1932–33. | 1933–34. | 1934–35. | 1935–36 | |||
| Acres. | Per Cent. | ||||||
| Dairy-farming | 3,484,646 | 8.04 | 38,395 | 138,545 | 42,579 | 41,898 | 40,067 |
| Sheep-farming | 29,673,226 | 68.42 | 15,861 | 14,731 | 14,498 | 16,572 | 15,589 |
| Mixed agricultural and sheep-farming | 1,992,023 | 4.59 | 4,411 | 5,240 | 4,950 | 4,296 | 5,479 |
| Mixed dairying and sheep-farming | 2,801,162 | 3.46 | 7,420 | 7,341 | 6,836 | 5,938 | 7,017 |
| General mixed farming | 421,431 | 0.97 | 4,027 | 3,988 | 3,336 | 2,963 | 4,274 |
| Fruitgrowing | 37,279 | 0.08 | 1,331 | 1,440 | 1,441 | 1,411 | 1,375 |
| Market-gardening | 10,859 | 0.03 | 1,079 | 1,020 | 970 | 906 | 957 |
| Poultry-farming | 2,894 | 0.01 | 217 | 269 | 250 | 276 | 287 |
| Nurseries and seed-gardens | 1,364 | 72 | 78 | 58 | 71 | 80 | |
| Timber-growing | 322,316 | 0.74 | 123 | 95 | 98 | 121 | 131 |
| Flax-growing | 45,976 | 0.11 | 41 | 36 | 32 | 28 | 25 |
| Idle and unused | 1,898,715 | 4.38 | 3,009 | 2,759 | 3,059 | 2,937 | 2,950 |
| Other and unspecified | 2,676,762 | 6.17 | 6,982 | 8,238 | 6,261 | 7,450 | 6,316 |
| Totals | 43,368,653 | 100.00 | 82,968 | 83,780 | 84,368 | 84,867 | 84,547 |
The area of land in occupation as at 31st January in each of the last two years, classified according to tenure, is given in the following table. Freehold land includes land held on deferred payment, if occupied by the owner.
| Land District. | 1936. | 1937. | ||||
|---|---|---|---|---|---|---|
| Freehold. | Leasehold. | Total Area Occupied. | Freehold. | Leasehold. | Total Area Occupied. | |
| Acres. | Acres. | Acres. | Acres. | Acres. | Acres. | |
| North Auckland | 2,304,360 | 704,950 | 3,009,310 | 2,350,191 | 675,164 | 3,025,355 |
| Auckland | 3,405,445 | 1,210,540 | 4,615,985 | 3,414,723 | 1,162,797 | 4,577,520 |
| Gisborne | 989,199 | 979,833 | 1,969,032 | 1,012,801 | 954,297 | 1,967,098 |
| Hawke's Bay | 1,727,350 | 1,012,099 | 2,739,449 | 1,717,925 | 1,006,768 | 2,724,693 |
| Taranaki | 822,823 | 578,741 | 1,401,564 | 824,469 | 566,701 | 1,391,170 |
| Wellington | 3,593,023 | 1,719,585 | 5,312,608 | 3,612,600 | 1,604,451 | 5,217,051 |
| Nelson | 638,520 | 599,376 | 1,237,896 | 638,030 | 590,926 | 1,228,956 |
| Marlborough | 801,113 | 1,627,569 | 2,428,682 | 801,616 | 1,653,664 | 2,455,280 |
| Westland | 151,948 | 1,083,019 | 1,234,967 | 187,256 | 1,015,232 | 1,202,488 |
| Canterbury | 3,165,527 | 4,947,054 | 8,112,581 | 3,158,173 | 4,962,928 | 8,121,101 |
| Otago | 1,744,725 | 6,230,949 | 7,975,674 | 1,712,744 | 6,281,777 | 7,994,521 |
| Southland | 1,470,766 | 1,773,579 | 3,244,345 | 1,474,018 | 1,820,642 | 3,294,660 |
| Totals | 20,814,799 | 22,467,294 | 43,282,093 | 20,904,546 | 22,295,347 | 43,199,893 |
Lands in occupation are not strictly comparable with Crown lands alienated or in process of alienation, for certain lands have passed into the hands of Europeans which were never made waste lands of the Crown. It must also be remembered that not all of the freehold land in the Dominion is in occupation, while (as stated previously) holdings within borough boundaries or under one acre in extent are excluded from the annual statistics.
The land in occupation in the Dominion at the 31st January, 1937, was classified according to condition and use as follows:—
| Acres. | Per Cent. of Total. | |
|---|---|---|
* Includes areas also sown with grasses and clovers | ||
| In grain and pulse crops | 598,699* | 1.39 |
| In green and root crops | 680,524* | 1.58 |
| In fallow | 118,843 | 0.28 |
| In sown grasses and clovers— | ||
| Cut for hay, seed, or ensilage | 639,632 | 1.48 |
| Not cut for hay, seed, or ensilage | 16,610,903 | 38.44 |
| In vineyards and orchards | 25,316 | 0.06 |
| In passion-fruit vines | 497 | |
| In hop-vines | 652 | |
| In market gardens, nurseries, and seed-gardens | 8,750 | 0.02 |
| In tung trees | 5,577 | 0.01 |
| In private gardens and pleasure-grounds | 82,648 | 0.19 |
| In plantations | 815,965 | 1.89 |
| Total area in cultivation | 19,588,006 | 45.34 |
| Unimproved land | 23,611,887 | 54.66 |
| Total area in occupation | 43,199,893 | 100.00 |
Land in cultivation (under crop and in pasture) forms the subject matter of the section on agricultural and pastoral production immediately following. An indication of the condition and geographical distribution of unimproved land is afforded by the following table, which relates to the position in January, 1937.
| Land District. | Phormium (New Zealand Flax). | Tussock and other Native Grasses. | Fern, Scrub, and Second Growth. | Standing Virgin Bush. | Barren and Unproductive Land. | Total Unimproved Occupied Land. |
|---|---|---|---|---|---|---|
| Acres. | Acres. | Acres. | Acres. | Acres. | Acres. | |
| North Auckland | 6,978 | 146,312 | 766,137 | 274,243 | 58,034 | 1,251,704 |
| Auckland | 19,607 | 148,639 | 994,825 | 423,894 | 41,018 | 1,627,983 |
| Gisborne | 265 | 52,590 | 132,989 | 165,392 | 10,918 | 362,154 |
| Hawke's Bay | 140 | 322,364 | 237,930 | 117,910 | 25,624 | 703,968 |
| Taranaki | 224 | 8,746 | 154,668 | 243,473 | 9,409 | 416,520 |
| Wellington | 9,155 | 535,539 | 419,047 | 330,504 | 99,633 | 1,393,878 |
| Nelson | 3,763 | 250,140 | 301,095 | 293,767 | 27,392 | 876,157 |
| Marlborough | 4,500 | 1,218,772 | 286,927 | 184,605 | 370,425 | 2,065,229 |
| Westland | 4,680 | 136,675 | 142,536 | 636,632 | 127,722 | 1,048,245 |
| Canterbury | 2,525 | 4,510,800 | 158,887 | 157,321 | 543,101 | 5,372,634 |
| Otago | 1,721 | 5,412,049 | 452,861 | 245,269 | 393,595 | 6,505,495 |
| Southland | 9,457 | 1,445,558 | 317,152 | 119,155 | 96,598 | 1,987,920 |
| Totals | 63,015 | 14,188,184 | 4,365,054 | 3,192,165 | 1,803,469 | 23,611,887 |
The consolidating Scenery Preservation Act, 1908, with its amendments of 1910, 1915, 1926, and 1933, contains the major legislation dealing with the reservation of land, Crown or private, for scenic, thermal, or historic reserves. The Act is administered by a Scenery Preservation Board through the Department of Lands and Survey.
The Public Reserves, Domains, and National Parks Act, 1928, is also a consolidation of earlier measures. For the purposes of this Act public reserves do not include education reserves (vide next subsection), scenic reserves (supra), State forests (vide Section XIX.—Forestry), land reserved under the Kauri-gum Industry Act, 1908, or reserves under the Tourist and Health Resorts Control Act, 1908. The Act declares the general right of the public to free access to recreational reserves, but gives limited powers—extended by the Local Authorities Empowering (Aviation Encouragement) Act, 1929—to charge for admission.
Any public reserve for health or recreation purposes vested in or acquired by the Crown may be declared a public domain. Public domains are generally administered by Domain Boards, many of which comprise already existing local authorities. Domain Boards may purchase land, and land may also be taken for recreation-grounds under the Public Works Act, 1928. In certain limited instances power is given to charge for admission to public domains.
National parks are administered by National Park Boards, which have power, subject to Ministerial approval, to fix fees for camping or picnicking within the parks.
The following areas are as at 31st March, 1937:—
| Number. | Acres. | |
|---|---|---|
| Reserves under Scenery Preservation Act | 1,030 | 740,646 |
| Public domains | 780 | 75,232 |
| National parks | 8 | 2,986,863 |
No detailed figures are available for the “public reserves” referred to above, which comprise a highly miscellaneous group, ranging from gravel-pits to climatological reserves. The area of reserves controlled by local authorities also is not available, but the estimated value of reserves, gardens, cemeteries, &c., of local-governing authorities in March, 1936, was approximately £3,800,000. As noted above, certain local authorities control public domains.
The historic site of the signing of the Treaty of Waitangi, together with 1,000 acres (with an additional 1,400 acres subsequently) of the adjoining estate, was purchased and presented to the nation as a national monument by Viscount and Lady Bledisloe in May, 1932.
Under the land transfer system introduced in 1870 the title to land is not affected by the execution of documents. Registration is the fundamental principle, and it is only on registration that any interest passes. The Land Transfer Department assumes all responsibility for the registration, and any person named in the register as taking an interest under a registered instrument acquires a practically indefeasible title.
The Land Transfer system of title by registration has great advantages over the older system of title by deeds, even when the deeds are duly registered. The state of a Land Transfer title can be ascertained by a search of the register with very much greater facility than can the state of a title under the other system, and the powers vested in Registrars under the Land Transfer Act enable them to keep the register simple, clear, and free from doubts; the simplicity of searching and of the preparation of instruments under the Land Transfer system enables transactions with land under that system to be carried out at less cost than under the other system; and under the Land Transfer system there is the State guarantee of a practically indefeasible title, as mentioned previously.
These considerations led to the passing in 1924 of the Land Transfer (Compulsory Registration of Titles) Act, which has for its object the bringing under the provisions of the Land Transfer Act, 1915, of all land alienated by the Crown and not already under the provisions of that Act, except lands held by aboriginal Natives of New Zealand under their customs and usages.
The work of bringing all land titles under the provisions of the Land Transfer Act as required by the Land Transfer (Compulsory Registration of Titles) Act, 1924, is still being proceeded with, and has been completed except in the Districts of Auckland and Otago. There are also a few titles in other districts that have been considered unwise to deal with at present owing to grave doubts as to ownership, or for some other reason. Steady progress is shown in the Auckland and Otago Districts, but it will be some time yet before the work in these districts is completed.
Provision has existed since 1841 and is now contained in the Deeds Registration Act, 1908, for the registration of deeds and instruments affecting land which is not subject to the provisions of the Land Transfer Act. Registration is not essential to the validity of the instrument, but it is highly important as a record and to secure priority. The Act provides that every deed shall be void as against any person claiming for valuable consideration under any subsequent deed duly registered unless the earlier deed was registered before the subsequent one. The Department is not responsible for the form or matter of the instruments registered beyond seeing that they are duly stamped and contain a sufficient description of the land to identify it.
Provision is made for the deposit of instruments in the Deeds Registry Office for safe custody and reference, and such deposit operates as a release from any covenant for production.
The Deeds Index and all recorded and deposited instruments are open to public inspection, and certified copies may be obtained on payment of the prescribed fees.
Information as to transactions under the Deeds Registration Act for each of the last ten years is given in the following statement:—
| Year ended 31st March. | Deeds recorded. | Fees. £ |
|---|---|---|
| 1928 | 16,523 | 15,215 |
| 1929 | 13,925 | 12,622 |
| 1930 | 12,834 | 11,601 |
| 1931 | 8,660 | 7,746 |
| 1932 | 4,745 | 4,314 |
| 1933 | 3,616 | 3,081 |
| 1934 | 2,797 | 2,610 |
| 1935 | 2,319 | 2,217 |
| 1936 | 2,354 | 2,290 |
| 1937 | 2,263 | 2,180 |
Information as to applications to bring land under the Land Transfer Act during each of the last ten years is given in the next table:—
| Year ended 31st March. | Applications. | |||
|---|---|---|---|---|
| Number. | Area. | Value. | ||
| Town and Suburban. | County. | |||
| Acres. | Acres. | £ | ||
| 1928 | 244 | 126 | 3,689 | 723,957 |
| 1929 | 204 | 86 | 8,084 | 575,525 |
| 1930 | 133 | 72 | 8,238 | 501,898 |
| 1931 | 83 | 492 | 4,353 | 278,652 |
| 1932 | 42 | 12 | 755 | 139,566 |
| 1933 | 26 | 12 | 2,023 | 38,280 |
| 1934 | 28 | 3 | 302 | 13,477 |
| 1935 | 23 | 2 | 1,093 | 15,725 |
| 1936 | 29 | 12 | 206 | 11,161 |
| 1937 | 24 | 13 | 109 | 6,936 |
The following table shows the number of certificates issued for the last ten years. Included in the totals are those certificates issued in lieu of Crown grants, 664 being the number for 1936–37. Also included in the numbers are certificates (3,336 in 1936–37) issued compulsorily under the Act of 1924.
CERTIFICATES OF TITLE ISSUED.
| Year ended 31st March, | Number. |
|---|---|
| 1928 | 24,383 |
| 1929 | 22,630 |
| 1930 | 20,535 |
| 1931 | 18,189 |
| 1932 | 14,798 |
| 1933 | 12,304 |
| 1934 | 11,354 |
| 1935 | 10,934 |
| 1936 | 11,991 |
| 1937 | 13,145 |
The table next following shows transfers registered under the Land Transfer Act daring each of the last ten years:—
TRANSFERS REGISTERED.
| Year ended 31st March. | Number. | Area. | Consideration-money. | |
|---|---|---|---|---|
| Town and Suburban. | Country. | |||
| Acres. | Acres. | £ | ||
| 1928 | 31,141 | 8,188 | 1,892,819 | 30,157,665 |
| 1929 | 30,760 | 7,599 | 2,161,096 | 31,155,226 |
| 1930 | 32,112 | 7,750 | 1,697,208 | 30,832,305 |
| 1931 | 25,626 | 6,863 | 1,474,040 | 22,068,814 |
| 1932 | 16,943 | 4,113 | 1,214,540 | 13,205,708 |
| 1933 | 15,381 | 4,161 | 990,507 | 11,015,434 |
| 1934 | 15,760 | 4,193 | 1,017,612 | 9,551,205 |
| 1935 | 18,628 | 4,684 | 1,186,617 | 12,197,376 |
| 1936 | 23,044 | 6,174 | 1,393,532 | 15,591,391 |
| 1937 | 25,178 | 7,172 | 1,468,451 | 18,853,823 |
Monthly statistics of transfers registered under the Land Transfer Act are given from April, 1936, onwards in the table which follows, a distinction being made between town and suburban transactions on the one hand and country transactions on the other.
| Month. | Town and Suburban Properties. | Country Properties. | All Properties. | |||
|---|---|---|---|---|---|---|
| Number. | Consideration. | Number. | Consideration. | Number. | Consideration. | |
| 1936–37. | ||||||
| £ | £ | £ | ||||
| April | 1,196 | 672,983 | 494 | 442,716 | 1,690 | 1,115,699 |
| May | 1,543 | 710,369 | 733 | 938,091 | 2,276 | 1,648,460 |
| June | 1,676 | 769,834 | 585 | 789,321 | 2,261 | 1,559,155 |
| July | 1,839 | 972,806 | 723 | 1,310,340 | 2,562 | 2,283,146 |
| August | 1,703 | 867,915 | 673 | 1,097,907 | 2,376 | 1,965,822 |
| September | 1,750 | 1,049,688 | 610 | 786,630 | 2,360 | 1,836,318 |
| October | 1,699 | 939,786 | 564 | 683,624 | 2,263 | 1,623,410 |
| November | 1,631 | 869,394 | 450 | 500,302 | 2,081 | 1,369,696 |
| December | 1,593 | 970,978 | 420 | 523,163 | 2,013 | 1,494,141 |
| January | 737 | 358,016 | 224 | 288,653 | 961 | 646,669 |
| February | 1,554 | 820,324 | 436 | 616,470 | 1,990 | 1,436,794 |
| March | 1,791 | 986,278 | 554 | 888,235 | 2,345 | 1,874,513 |
| Year 1936–37 | 18,712 | 9,988,371 | 6,466 | 8,865,452 | 25,178 | 18,853,823 |
| 1937–38. | ||||||
| April | 1,550 | 971,114 | 446 | 862,099 | 1,996 | 1,833,213 |
| May | 1,591 | 1,160,648 | 430 | 711,401 | 2,021 | 1,872,049 |
| June | 1,785 | 1,294,012 | 495 | 832,463 | 2,280 | 2,126,475 |
| July | 1,856 | 1,130,065 | 601 | 1,019,061 | 2,457 | 2,149,126 |
| August | 1,812 | 1,137,778 | 568 | 962,594 | 2,380 | 2,100,372 |
| September | 1,824 | 1,104,169 | 506 | 806,545 | 2,330 | 1,910,714 |
Information as to mortgages registered under the Land Transfer and Deeds Registration Acts is contained in the section of this book dealing with mortgages.
THE Crown lands are administered under the authority of the Land Act, 1924, the Land for Settlements Act, 1925, and the Discharged Soldiers Settlement Act, 1915, by the Minister of Lands at Wellington, his executive officer being the Under-Secretary of Lands, who is the permanent head of the Department of Lands and Survey. New Zealand is divided into twelve land districts, each being under the local direction of a Commissioner of Crown Lands and a Land Board.
Commissioners of Crown Lands are executive officers of the land districts, having large discretionary powers under the Act. Each is the Chairman of the Land Board of his district, and transacts all its routine business in the sale, letting, and occupation of Crown lands. A Land Board consists of five members—viz., the Commissioner of Crown Lands for the district, three members nominated by the Governor-General, and one member elected by the Crown tenants of the district.
The Boards transact all business connected with the sale, letting, disposal, and occupation of Crown lands, and all matters connected with the management and control of the public lands in their hands. They are the sole judges of the fulfilment of conditions in leases and licenses, and they can declare them forfeit.
A selector may purchase for cash, or on deferred payment, or may select on renewable lease. Every applicant must be of the age of seventeen years or upwards, and may apply for Crown land solely for his own use and benefit, and not directly or indirectly for the use or benefit of any other person. Including the land he applies for, he is not to be the owner, holder, or occupier under any tenure of more than one year's duration, either severally or jointly or in common with any other person or persons, of any land anywhere in New Zealand exceeding in the whole 5,000 acres of land, computed as follows:—
Every acre of first-class land is reckoned as 7½ acres;
Every acre of second-class land is reckoned as 2½ acres;
Every acre of third-class land is reckoned as 1 acre.
Crown land may be selected and occupied under the following tenures and systems:—
Town, suburban, and village lands—
For cash and deferred payment, by public auction;
By lease for terms up to ten years;
By renewable lease for thirty-three years.
Rural land (unimproved), (under optional system)—
For cash, by application;
Purchase by deferred payment;
Renewable lease for sixty-six years.
Village settlements—
Under the three foregoing tenures of optional system.
Special settlements (rural land)—
On renewable lease for sixty-six years and under special regulations.
Land-for-settlement estates (improved rural and pastoral land)—
Under renewable lease for thirty-three years, with right to acquire freehold of 400 acres of first-class land, 1,200 acres of second-class land, or 3,000 acres of third-class land;
For cash or on deferred payment, by auction.
Pastoral land—
By small-grazing-run lease for twenty-one years, with right of renewal (maximum area, 20,000 acres);
By pastoral license on terms up to thirty-five years.
Land within mining districts—
On pastoral licenses under special regulations, with right to acquire the freehold or exchange to a renewable lease;
On occupation leases under special regulations, with similar rights as to purchase of freehold and exchange.
Miscellaneous—
Temporary occupation on terms up to five years;
Sale or occupation for special purposes;
Outlying land.
By the passing of the Land Laws Amendment Act, 1926, it was provided that after the 9th September, 1926, no more Crown lands were to be disposed of under the occupation-with-right-of-purchase tenure, and that any lands which might have been so disposed of could be disposed of by way of sale on deferred payment in addition to the other modes of disposal provided by the Land Act.
Full particulars are given in the Crown Lands Guide, issued periodically and obtainable at any land office, as to the conditions of lease and occupation. Improvements to a certain value are required to be effected on rural land purchased for cash or on deferred payment or held on renewable lease, and residence is compulsory for certain periods on most Crown leaseholds.
National endowments may be disposed of under renewable lease, small-grazing-run lease, or pastoral license. These lands are occupied on the same conditions as ordinary Crown lands.
Owners of renewable leases and small-grazing-run leases of national-endowment lands now have the right to acquire the fee-simple of their holdings on the conditions provided by the Act pertaining to each class of lease. A pastoral licensee of national-endowment land, if the area is not more than sufficient for the maintenance of the licensee and his family, can acquire the fee-simple.
Education endowments are available for leasing under the Education Reserves Act, 1928, which permits of a lease being granted under the Public Bodies' Leases Act, 1908, as well as under the Land Act, 1924. The freehold of the land cannot be acquired.
Public reserves not vested in trustees or a local authority may be leased under the Public Reserves, Domains, and National Parks Act, 1928, for any term not exceeding twenty-one years, with right of renewal for a further term. The freehold of the land cannot be acquired.
The Land Laws Amendment Act, 1929, deals chiefly with the promotion of settlement on undeveloped Crown lands. Power is given for the Crown to develop idle Crown lands, and also for the making of advances to Crown tenants holding undeveloped country for the erection of buildings, purchase of stock (the latter since the Land Laws Amendment Act, 1932), and for clearing, grassing, fencing, &c. Settlers taking up unimproved sections may apply for financial assistance up to £1,250 each, the payments to be made as improvements are effected. The rate of interest has been fixed at 5 per cent. Crown tenants already in occupation of land coming under the designation of undeveloped are also eligible to apply for development advances. Loans approved to 31st March, 1937, numbered 494, totalling £225,462, while in addition £386,871 has been expended by the State in the roading, surveying, and development of various blocks of land to be opened for settlement.
During the year ended 31st March, 1937, an area of 133,255 acres of land was offered for selection under the various tenures provided by the Land Act, Land for Settlements Act, and Education Reserves Act.
Under renewable lease an area of 41,579 acres was offered, 3,101 acres being national endowment, 11,722 acres land for settlements, and 26,756 acres ordinary Crown lands. An area of 29,962 acres was offered under the optional system. The pastoral-run area comprised 40,506 acres.
In addition to the above, a total area of 929 acres of Crown land was set apart for selection by discharged soldiers under the ordinary tenures of the Land Act and the Land for Settlements Act and the special tenures of the Discharged Soldiers Settlement Act. Fuller particulars regarding these lands will be found at the end of this subsection.
The total selections during the year covered an area of 463,178 acres, by 1,342 selectors. These figures include, however, 129 purchases of small town, suburban, and rural lands, aggregating 8,246 acres, offered for sale at auction. The ordinary Crown lands holdings represented 244,678 acres; land for settlements and Cheviot Estate, 11,525 acres; national endowment, 195,800 acres; educational endowments, 8,219 acres; and other endowments, 2,956 acres. Selections by discharged soldiers are included in the foregoing totals.
Areas under this heading include all lands sold for cash or selected on the deferred-payment system, small grazing-runs, and leases under the following tenures: Renewable lease, mining districts land occupation leases, educational-endowment leases, and pastoral licenses in mining districts under special regulations.
| Year ended 31st March. | Sold for Cash. | Deferred-payment Licenses. | Leases and Licenses (Ordinary Settlement). | Small Grazing-runs. | Totals. |
|---|---|---|---|---|---|
| NUMBER. | |||||
| 1933 | 114 | 135 | 477 | 3 | 729 |
| 1934 | 153 | 127 | 312 | 2 | 594 |
| 1935 | 170 | 86 | 266 | 522 | |
| 1936 | 135 | 109 | 229 | 2 | 475 |
| 1937 | 129 | 203 | 279 | 4 | 615 |
| AREA (ACRES). | |||||
| 1933 | 2,032 | 9,583 | 112,981 | 27,431 | 152,027 |
| 1934 | 2,726 | 8,620 | 69,096 | 21,626 | 102,068 |
| 1935 | 12,878 | 3,886 | 81,328 | 98,092 | |
| 1936 | 2,958 | 4,875 | 75,790 | 18,531 | 102,154 |
| 1937 | 8,246 | 15,018 | 58,780 | 10,571 | 92,615 |
National-endowment lands are included in the next table in the figures for the various tenures under which they are held. National-endowment lands of an aggregate area of 6,449,230 acres were held at 31st March, 1937, by 4,311 selectors, the annual rental payable being £137,582. Settlement lands under the Land for Settlements Act, which are dealt with later on in this subsection, are also included.
The following table shows the position at 31st March, 1937:—
| Tenure. | Total Number of Selectors. | Total Area held from the Crown. | Total Yearly Rental or Instalment payable. | Total Area made Freehold. | |
|---|---|---|---|---|---|
| Number of Purchasers. | Area. | ||||
| Acres. | £ | Acres. | |||
| Cash lands | 13,302,811 | ||||
| Deferred payment | 3,787 | 526,374 | 89,274 | 12,086 | 1,389,084 |
| Perpetual leases | 156 | 6,478 | 933 | 3,111 | 865,049 |
| Occupation with right of purchase | 2,434 | 683,378 | 58,075 | 5,248 | 1,331,027 |
| Lease in perpetuity | 7,367 | 1,533,865 | 186,430 | 3,307 | 546,989 |
| Renewable lease | 9,185 | 2,628,124 | 448,484 | 465 | 77,632 |
| Agricultural lease | 9 | 282 | 21 | 1,408 | 140,896 |
| Mining districts land occupation leases | 704 | 16,845 | 1,804 | 167 | 5,024 |
| Homestead | 61 | 80,453 | |||
| Pastoral licenses in mining districts under special regulations | 484 | 98,514 | 2,250 | 102 | 20,427 |
| Small grazing-runs | 766 | 2,503,203 | 101,156 | 74 | 91,475 |
| Pastoral runs | 601 | 8,843,540 | 86,786 | 11 | 24,438 |
| Hanmer Crown leases | 84 | 282 | 247 | ||
| Miscellaneous leases and licenses | 6,559 | 1,011,366 | 37,345 | 143 | 14,384 |
| Totals | 32,136 | 17,852,251 | 1,012,805 | 26,183 | 17,889,689 |
| Thermal-springs leases (Rotorua) | 286 | 915 | 1,524 | 38 | 251 |
| Education endowments— | |||||
| Primary | 3,659 | 757,988 | 113,100 | 5 | 6,839 |
| Secondary | 482 | 39,158 | 12,445 | 1 | 14 |
| Totals | 4,427 | 798,061 | 127,069 | 44 | 7,104 |
| Grand totals | 36,563 | 18,650,312 | 1,139,874 | 26,227 | 17,896,793 |
| Other endowment lands | 1,038 | 352,117 | 19,271 | 10 | 6,490 |
CROWN LAND MADE FREEHOLD, YEAR ENDED 31ST MARCH, 1937.
| Tenure (immediately prior to acquisition of freehold). | Area. | Amount realized. |
|---|---|---|
* Under section 223 of Land Act, 1924. | ||
| Acres. | £ | |
| Cash lands sold | 8,317 | 19,978 |
| Freehold acquired under following tenures:— | ||
| Deferred payment | 29,191 | 122,942 |
| Occupation with right of purchase | 16,402 | 39,347 |
| Lease in perpetuity | 4,579 | 13,399 |
| Perpetual lease | ||
| Mining district land occupation leases | 60 | 271 |
| Renewable lease | 9,293 | 34,401 |
| Pastoral licenses in mining districts under special regulations | 643 | 444 |
| Small grazing-runs | 6,018 | 16,786 |
| Miscellaneous* | 443 | |
| Totals | 74,946 | 247,568 |
Much of the land legislation of recent years has been in the direction of preventing large areas of good land from being acquired or retained by a single individual. Part VI of the Land for Settlements Act, 1925, provides for an agreement being made between the Minister of Lands and the owner in fee-simple of any land for the subdivision of that land, and for the disposal by public tender of the allotments by way of sale or by way of lease with right of purchase.
Section 97 provides for similar agreements between the Minister and the owners of Native freehold land in respect of the disposition by sale or lease of that land.
In Part VII of the Land for Settlements Act, 1925, provision is made whereby the Minister of Lands may at any time in writing notify an owner of land that such land or a portion thereof is required for purposes of settlement. The owner of the land is required, within six months after such notice has been gazetted, to notify the Minister whether he elects (a) to subdivide and offer the land for sale in subdivisions, or (b) to enter into an agreement with the Minister as above, or (c) that the land shall be taken compulsorily under the Act.
In sections 381 and 382 of the Land Act, 1924, provision exists for compulsorily taking private land (not within a borough or town district) in cases where in the opinion of the Dominion Land Purchase Board such land has been acquired by way of aggregation, and where such aggregation is contrary to the public interest. Compensation is payable for all land so taken.
The Small Farms (Relief of Unemployment) Act, 1932–33, which is administered by the Department of Lands and Survey, authorized the Board constituted under the Act to acquire lands for the Crown by way of purchase, or by lease with right of purchase, or by resumption of suitable areas of Crown lands held under lease or license. Where land suitable for the purposes of the Board is, in the opinion of the Board, not being adequately used powers are given by the Act for its compulsory acquisition. A description of small-farms operations is given in Section XL.
The purchase of private lands by the Crown for closer settlement purposes is authorized by the Land for Settlements Act, 1925, a consolidation of former legislation.
The number of estates offered during the year ended 31st March, 1937, was three, of an area of 1,929 acres.
The area purchased during the year ended 31st March, 1937, was 1,930 acres, of a value of £8,721. The total number of estates purchased since the inception of the land-for-settlements scheme is 729, of a total area of 2,129,647 acres, the aggregate amount of purchase-money being £13,931,385. These figures do not include any advances under section 2 of the Discharged Soldiers Settlement Amendment Act, 1917, but include purchases under section 3 of this Act, and under the Land Laws Amendment Act, 1928.
SUMMARY OF ESTATES ACQUIRED TO 31ST MARCH, 1937.
| Land District. | Number. | Area. | Purchase-money. |
|---|---|---|---|
| Acres. | £ | ||
| North Auckland | 53 | 48,924 | 455,060 |
| Auckland | 76 | 376,106 | 1,243,883 |
| Gisborne | 26 | 86,380 | 790,131 |
| Hawke's Bay | 59 | 264,783 | 1,714,292 |
| Taranaki | 26 | 30,978 | 375,881 |
| Wellington | 155 | 160,828 | 2,350,297 |
| Marlborough | 22 | 224,090 | 755,482 |
| Nelson | 14 | 48,821 | 150,473 |
| Westland | 3 | 6,032 | 14,062 |
| Canterbury | 179 | 451,506 | 3,523,526 |
| Otago | 82 | 336,803 | 2,036,018 |
| Southland | 34 | 94,396 | 522,280 |
| Totals | 729 | 2,129,647 | 13,931,385 |
The transfer of certain areas from Crown to settlement lands, and the adjustment of areas to account for ascertained surpluses or deficiencies, bring the total area of settlement lands to 2,271,804 acres at the 31st March, 1937. Of this, 385,761 acres have been sold for cash or made freehold, the number of purchasers being 2,619 and total purchase-money £1,310,663, and 95,959 acres are occupied by roads or by reserves unlet. At the 31st March, 1937, 6,902 selectors were holding a total of 1,830,935 acres, the annual rental for which amounts to £528,419; and the remaining 59,149 acres were unlet. Rent and other payments received during 1936–37 were £540,080, while total receipts from inception to 31st March, 1937, have been £12,782,724.
Part II of the Land Laws Amendment Act, 1928, gives power whereby two or more persons may purchase land acquired on their behalf by the Crown. One property, of an area of 1,591 acres, was purchased during the year ended 31st March, 1937, on behalf of six applicants.
Section 3 of the Land Laws Amendment Act, 1932, provides authority for the making of advances to purchasers of part of private freehold properties up to 90 per cent. of the purchase-money, all such advances to be secured by way of first mortgage.
On the 1st January, 1910, the Land Settlement Finance Act, which is described fully in the 1915 issue of this book, came into force. The associations incorporated now number forty-six. There have been no transactions for several years past.
Under the provisions of the Discharged Soldiers Settlement Act, 1915, and amendments, any person is entitled to the benefits of the Act who was an honourably discharged member of a New Zealand Naval or Expeditionary Force in 1914–18, or was a bona fide resident of New Zealand and served during the war with other British Forces.
There is power to dispose of land under the ordinary tenures of the Land Act, 1924, and the Land for Settlements Act, 1925—i.e., for cash, on deferred payment or on renewable lease under the former Act, and on renewable lease under the latter Act; also under the “special tenures” of the Discharged Soldiers Settlement Act, 1915, which are cash, deferred payment, or a renewable lease with a purchasing clause.
Under the Discharged Soldiers Settlement Act, 1915, 1,235 acres were proclaimed in 1936–37, and a total of 1,454,064 acres has been proclaimed to 31st March, 1937, comprising 614,003 acres of ordinary Crown lands; lands for settlement, 403,173 acres; national-endowment lands, 433,532 acres; and Cheviot Estate, 3,356 acres. Some 702,837 acres of this aggregate fall under section 3 of the Act (ordinary tenures) and 751,227 acres under section 4 (special tenures).
During the year ended 31st March, 1937, eight applications were made under the provisions of the Discharged Soldiers Settlement Act, and allotments were made in the case of eight applicants, the total area being 1,877 acres.
The various systems of financial assistance in connection with the settlement of discharged soldiers were dealt with in the 1924 and previous issues of the Year-Book. Operations at the present time are confined mainly to advances on current account for stocking and developing farms.
The mortgage securities under the Discharged Soldiers Settlement Act have now been transferred to the State Advances Corporation. Reference to these will be found in Section XXIV, Subsection D, dealing with State Advances.
NATIVE land is of two kinds—namely, customary land and Native freehold land. Customary land is land which has never been the subject of a Crown grant and is held by Natives under the customs and usages of the Maori people. It is land in respect of which the ancient customary Native title as recognized and guaranteed by the Treaty of Waitangi has not yet been extinguished. Such land, since it has not been Crown-granted remains vested in the Crown, subject, however, to the customary title of the Natives, and to their right to have the customary title transformed into a freehold title by the Native Land Court. There is little of this class of land now left in the Dominion.
Customary land has always been restricted from alienation except in favour of the Crown. By the Treaty of Waitangi the exclusive right to purchase such land was reserved to the Crown, and in all statutes since passed the alienation of customary land to private individuals has been prohibited, and this prohibition is now extended to the Crown. Native freehold land is the land held by Natives under an English freehold title, though subject to certain restrictions on alienation and other special incidents which are unknown to the ordinary law.
Whether land is Native or European land depends upon the beneficial ownership of it, and not merely on the legal ownership. If land is held by a European upon trust for a Native, it is Native land; if it is held in trust by a Native for a European, it is European land. There are, however, four exceptions to this:—
When land has once become European land, it never again becomes Native land unless by special enactment.
Land purchased by a Native from the Crown for a pecuniary consideration is not Native land. This does not include an exchange of land, with or without a payment of money by way of equality of exchange.
Land held by a Native in severalty may be declared to be European land by the Native Appellate Court.
Under certain circumstances the Native owner may have been declared a European. (The Native Land Amendment Act, 1912, empowered the Governor-General, by Order in Council upon recommendation of the Native Land Court to declare a Native to be a European for the purpose of the Native Land Act or any other Act. Such a person did not lose his right of succession to Native land or property, nor, if he died intestate, were his heirs affected by the change of status. Any such Order in Council did not affect the status as a Native of the wife, husband, or child of the person. These provisions were repealed, without re-enactment, by section 525 of the Native Land Act, 1931, which maintains and defines the status of all Natives previously declared Europeans, but permits revocation of any such Order in Council.)
Even though one of many Native owners may sell, the land remains Native land until all have disposed of their interests, or until the purchaser has had his interests partitioned off. A “Native” means a Maori or half-caste, or a person intermediate in blood between a Maori and a half-caste.
The Native Land Act, 1931, and the Native Purposes Act, 1931, are consolidations, with amendments, of existing legislation.
The Board of Native Affairs constituted under the Board of Native Affairs Act, 1934–35, consists of the Native Minister, the Under-Secretary of the Native Department, the Under-Secretary for Lands, the Valuer-General, the Financial Adviser to the Government, the Director-General of Agriculture, and such other members (not exceeding three) as the Governor-General may appoint.
The chief functions of the Board of Native Affairs include, inter alia, the following:—
The control of the development and settlement of Native land or land owned or occupied by Natives undertaken pursuant to Part I of the Native Land Amendment Act, 1936.
The control of expenditure on farming operations undertaken by Maori Land Boards and the Native Trustee.
The control of investments by—(a) Maori Land Boards; (b) the Native Trustee; and (c) the East Coast Commissioner.
The control of negotiations for the acquisition of Native lands.
The control of expenditure on housing operations under the Native Housing Act, 1935.
The Native Land Court consists of a Chief Judge and such other Judges as the Governor-General thinks fit to appoint. All powers of the Court may be exercised by a single Judge, but there are certain important powers vested exclusively in the Chief Judge. Commissioners are appointed who exercise such jurisdiction of a Judge as the Governor-General authorizes. The chief matters within the jurisdiction of the Court are:—
The investigation of title to customary land, and transforming it into Native freehold land.
The exclusive power of partitioning land among the owners.
The sanctioning of exchanges for other Native land and European land.
Granting probates of wills and succession orders to Natives.
Making orders for the adoption of children.
Appointing trustees for Natives who are minors or under other disability.
The incorporation of the owners of Native land.
The determination of various claims as between Natives.
To grant confirmation of alienation of Native land.
Business dealt with in 1936–37 was as follows:—
| Number of sittings | 111 |
| Number of cases notified | 17,746 |
| Number of cases for which orders were made | 5,676 |
| Number of cases dismissed | 955 |
| Number of cases adjourned sine die | 11,081 |
| Number of partitions made | 469 |
| Area affected (acres) | 57,342 |
| Number of investigations of title | 144 |
| Area affected (acres) | 1,327 |
| Number of succession orders made | 4,527 |
| Number of other orders made | 3,106 |
The Native Appellate Court consists of any two or more Judges of the Native Land Court, provided that two Judges at least shall concur in every decision of the Court. With certain exceptions the Appellate Court determines appeals, whether on law or on fact, from all final orders of the Native Land Court.
There are seven Maori Land Boards, each consisting of two members, viz.—the Judge (or, if there be no Judge of the district, a Commissioner of the Court appointed by the Native Minister), and Registrar of the Native Land Court district, the Judge acting as President. The chief functions of a Maori Land Board are—
To administer certain large areas of Native land vested in those Boards in trust for the Native owners, the Boards having extensive powers of sale, lease, and management.
To act as statutory agent of the Native owners in respect of certain areas of Native land set apart for Native settlement.
To control the administration and disposition of Native land, by resolution of the assembled owners.
To assist Natives in farming their lands.
The total area vested in and administered by the various Maori Land Boards as at the 31st March, 1937, was 653,237 acres.
During the year 1936–37, 1,016 acres of vested land were sold or revested in the Native owners.
With regard to Native freehold land, the Courts during the year approved of leases comprising 31,178 acres, and confirmed transfers (apart from sales to the Crown) affecting 14,752 acres of freehold land.
The ordinary provisions as to alienation of Native land do not affect the power to dispose of land by will, but a Native cannot will to a European except it be a husband or wife or other relative of the person making the will. A Native cannot dispose of customary land, whether by will or otherwise. No alienation of Native land by a Native has any effect until it is confirmed by the Native Land Court.
The Court, before confirming an alienation, must satisfy itself, inter alia, that it is not contrary to the interests of the Native alienating; that no Native is rendered landless; that the consideration is adequate; that the purchase-money is paid or secured; and that the alienation is not otherwise prohibited by law.
A lease cannot be for a longer term than fifty years, and a mortgage must have the approval of the Native Minister to its confirmation by the Native Land Court.
Since 5th April, 1935, the duty of undertaking, controlling, and carrying out all negotiations for the acquisition of Native lands by the Crown, and the performance and completion of all contracts entered into is, by subsection (2) of section 7 of the Native Land Amendment Act, 1932, imposed upon the Board of Native Affairs.
Where Native land is being acquired for general settlement, the Board of Native Affairs must act upon the advice or request of the Dominion Land Purchase Board, referred to in the Land for Settlements Act, 1925, but this requirement is not necessary in the case of land being acquired for Native settlement.
The Native Land Purchase Board mentioned in the 1933 and earlier editions of the Year-Book was abolished by subsection (1) of section 7 of the Native Land Amendment Act, 1932, and the Native Land Settlement Board, referred to in the 1935 edition, was abolished by subsection (2) of section 11 of the Board of Native Affairs Act, 1934–35.
Pending any purchase by the Crown the Governor-General may, by Order in Council, prohibit alienation otherwise than to the Crown. Upon the purchase being completed the land is proclaimed Crown land, and is subject to administration under the Land Act, 1924. Where the land is subject to lease when purchased the option may be extended to the tenant of purchasing the land from the Grown or having a renewable lease granted to him.
Since 1st April, 1910, a total of 1,548,475 acres of Native land has been purchased by the Crown. The total area of Native land alienated by way of sale to the Crown or to other purchasers since 1910 is 3,324,813 acres.
The area of Native land still held by Natives in the North Island is estimated at 3,797,141 acres, and in the whole Dominion at 4,038,861 acres. In many cases the Natives are utilizing their land for pastoral and dairying purposes. Other lands are being farmed for them by Maori Land Boards, by the Native Trustee, and by the East Coast Commissioner.
In the year 1929 legislation was enacted giving sanction to a scheme for the development and settlement of lands owned or occupied by Maoris.
Part I of the Native Land Amendment Act, 1936, which replaces section 522 of the Native Land Act, 1931, imposes on the Board of Native Affairs the duty of undertaking and carrying out this work.
To overcome any delays or difficulties arising from the nature of the titles to the lands proposed to be developed, the Board of Native Affairs is authorized to bring such land under the scope of a development scheme. Upon notification of the fact the owners are prevented from interfering with the work of development, and private alienation of any land within the scheme is prohibited. The funds for development are provided by the Minister of Finance through the Public Works Fund. The Board of Native Affairs is armed with the most comprehensive powers, which it can exercise directly through the Native Department or delegate to any Maori Land Board or to the Native Trustee. The Board is also empowered to direct a Maori Land Board or the Native Trustee to use their funds for development. Power is also taken by arrangement between the Minister of Lands and the Board of Native Affairs to develop Crown lands that adjoin or are surrounded by a Native land-development scheme, thus removing a further obstacle in the way of development.
Special legislative provision has also been made enabling one or other of the Maori Land Boards or the Native Trustee to undertake farming of specified blocks on behalf of the beneficial owners.
Since inception to the 31st March, 1937, the total gross expenditure on development schemes under the control of the Native Department amounted to £1,980,000 (inclusive of interest). The total credits were £1,170,000 and the total net expenditure, £810,000.
The administration of Native funds and Native reserves, formerly conducted by the Public Trustee, was by statute transferred to the Native Trustee as from 1st April, 1921. This was part of a comprehensive scheme which seeks to rehabilitate the Maori by inducing him to farm and manage his own lands. As a further means to this end the Native Trustee with the approval of the Board of Native Affairs advances money to Natives on the security of their lands, the expenditure of this money, and the management of Native farming operations generally, being supervised in a helpful and sympathetic manner. The Native Trustee Act, 1930, consolidated existing legislation.
The Native Trustee administers many reserves of Native land on behalf of the beneficiaries, and grants leases thereof. The beneficial owners of these reserves have no power of alienation other than to the Crown.
The Native Trustee also, where necessary, acts as trustee for Natives who are minors or under other disabilities, administers special funds, and acts as executor or administrator of the estates of deceased Natives.
The funds of the Native Trust Office at the 31st March, 1937, were:—
| Amounts held under— | £ |
| West Coast Settlement Reserves Act, 1892 | 46,347 |
| Native Reserves Act, 1882 | 59,289 |
| Native Land Act, 1931 (Part X) | 87,932 |
| Native Land Act, 1931 (Miscellaneous) | 171,138 |
| Native Trustee Act, 1930 | 24,193 |
| Miscellaneous funds | 72,733 |
| Reserve and Assurance Fund | 97,844 |
| Investment Fluctuation Fund | 6,542 |
| Advance under Native Land Act, 1931 | 84,743 |
| Reserve against unpaid interest, &c. | 3,365 |
| Profit and Loss Appropriation Account | 6,920 |
| Total | £661,046 |
Of the total funds £477,908 was invested in the form of mortgages, £5,100 in local bodies' securities, and £146,553 on overdrafts to estates and accounts.
Commissions, fees, charges, and net interest on investments for the year 1936–37 totalled £19,679. The net profit for the year was £6,920.
Table of Contents
THE Dominion of New Zealand is a country specially favoured for primary production. The soil covering is varied in character, a considerable portion of it being of high fertility; but even the poorer soils are largely capable of profitable utilization by reason of the comparatively mild and equable weather conditions. The best grasses and fodder plants flourish in the congenial environment, and the country has gained a world-wide reputation for the quality of its pastures. Numerous streams intersect the country-side; while cheap hydro-electric power is available, most farming districts having been reticulated in recent years. Electricity is now put to a variety of uses on the farm, but by far the most important is that of providing power for milking-machinery.
A conspicuous feature of New Zealand farming is that the stock do not require to be stalled in the winter, though the pastures are more or less supplemented by fodder crops in the colder months of the year.
New Zealand is primarily a grazing country, and, while more of the land is every year being given up to the cultivation of fodder crops, its future will, no-doubt, be inseparably associated with stock-raising, principally of dairy cattle and of sheep. Though less than a century has elapsed since the settlement of New Zealand, over seventeen million acres of land in the Dominion have been sown down in English grasses. A great proportion of the crops grown in the Dominion, are for the production of such commodities as meat, wool, and dairy-produce.
Grain crops, principally oats and wheat, are grown chiefly in the eastern and southern districts of the South Island. Barley also is grown, but to a very much smaller extent. Much of the crop of oats produced is chaffed for stock-feeding purposes within the country. Root crops, principally turnips, are grown on a large scale for winter feed and for stock-fattening purposes, more particularly in the South Island. Owing to the comparative difficulty of growing large areas of turnips free from disease, other stock-foods are coming into prominence. Mangolds are cultivated to an appreciable extent, and farmers realize the great value-of lucerne. Ensilage-making, particularly in the stack and trench forms, is increasing in the dairying districts. Quite a feature of milk - producing operations is the growing of green fodder crops to maintain the milk-supply during the drier months of the year. It will be seen that live-stock in New Zealand is for the most part maintained on food produced on the farm itself.
The North Island of the Dominion is remarkable for the congenial environment it furnishes for many phases of primary production. In no part is the winter really severe, and the question of stalling stock during the colder months of the year has not to be considered. It is more a grazing than an agricultural country, and practically all the crops raised are used for feeding farm stock. The dominant industries are dairying and sheep-farming. There is probably no finer sheep-country in the world than the limestone downs of Hawke's Bay. It may be said with every confidence that there is more butterfat produced to the acre on many farms in the North Island than on any other area in the world, when it is considered that all the food provided for the stock is produced on the farm itself. The standard of dairy-farming is steadily improving, not only by reason of special fodder being provided for the drier parts of the summer and the colder months of the year, but on account of the fact that the farmer has learned the value of herd testing and culling, and the advantages to be derived from the judicious application of top-dressing fertilizers to pastures.
In various parts of the Island fruitgrowing, principally of apples, pears, and peaches, is being placed on a sound commercial basis. In the northern portion citrus fruits can be successfully produced, and, with the adoption of better storage and marketing methods, lemons in particular are being cultivated on a considerable scale. Outdoor grapes are freely grown. Both the North and the South Islands have established an export trade in apples, and to a lesser extent in pears.
During recent years the Waikato district and the Auckland Provincial District in general have shown themselves to be admirably adapted to the dairy industry, and dairying has made remarkable development. The Auckland District, in fact, has become easily the largest exporter of butter in the Dominion, while it also leads in the production of milk-powder.
With the adoption of improved methods in the treatment of the land, and the demonstration of correct manurial treatment, farming in the Auckland Provincial District has been placed on a much more productive basis. Assisted by a favourable climate, of which a short and mild winter is a feature, stock-raising of all descriptions is being carried On with conspicuous success. The country is eminently adapted for the production of root and fodder crops, and stock can be brought to maturity and fattened for the market at a minimum of cost.
The South Island is the portion of the Dominion where agriculture proper was first established, the settlement of the land being greatly facilitated by the fact that on the eastern, southern, and northern portions large fertile plains, rolling downs, and lulls were available, devoid of the forests which in a very large portion of the North Island had to be cleared before the land could be utilized by the farmer. Agricultural operations in the South have been maintained at a high standard for many years, principally in Otago and Canterbury, many of the pioneers of which districts were British yeomen farmers who brought with them the best methods of the Old Land. So in the breeding of live-stock, many of the original holders of land in the South, and the shepherds and herdsmen they employed, had been well trained in stock-management by live-stock breeders of the Mother-country. The South Island may be fairly said to have been the nursery of the live-stock of the Dominion, and the high quality of the stock bred in the country is in a large measure due to the capacity of the men who founded and developed the flocks and herds in the eastern and southern districts. The growing of the finer wools, and the raising of fat lambs for the frozen-meat industry, are features of primary production in the South Island, while the dairy industry is also well represented, especially in Otago and Southland. The breeding of draught horses of a very fine stamp is carried on to some extert in certain districts.
While the climate in the southern districts of the South Island is not so genial as that in the northern, there are only a few portions where the winter is at all rigorous. The Nelson Provincial District, in the north-west corner of the Island, is noted for its climate. Nelson has a sunshine-record which is equalled in but few parts of the Temperate Zones. The direct is specially suitable for fruitgrowing, which has been developed extensively on commercial lines, and the culture of tobacco-leaf is well established. At the other end of the Island, in Central Otago, a peculiar configuration of the country enables fruitgrowing to be prosecuted with great success. The winter is comparatively severe, but the warm summer sun and the absence of wind make it an ideal environment for fruitgrowing.
In some sections, particularly in Canterbury, Otago, Southland, and Marlborough, grain-growing is prosecuted on a considerable scale. The Canterbury Plains, extending a hundred and fifty miles north and south and running inland for forty miles from the sea, represent an area of over 3,000,000 acres. This region contains the principal grain-growing areas. Wheat, oats, and barley are cultivated to a large extent. In Otago and Southland oats is the grain principally produced. On some of the richer lands the yield of wheat has reached very high figures, even up to SO or 90 bushels per acre, while over 100 bushels to the acre have been recorded for crops of oats. In root crops up to 70 tons per acre of turnips have been secured, while the yield of mangolds has frequently reached 90 tons.
Under the control of the Minister of Agriculture the Department of Agriculture is a service which is mainly concerned in advancing the interests of primary production. Under a Director-General of Agriculture there are Directors of Divisions of Live-stock, Dairy, Fields, and Horticulture, also a Chemistry Section.
While the service is mainly educative, it also carries out important inspection work. Under the Live-stock Division, all meat exported is inspected by qualified officers. Cattle are inspected for tuberculosis and other bovine troubles; sheep and swine also receive attention; slaughterhouses are licensed and controlled; and all stock exported and imported is examined by the veterinarians of the Department. Special instruction and advice are given in poultry-keeping, swine husbandry, and wool growing and handling. The Division is provided with a well-equipped laboratory at Wallaceville, Wellington, mainly devoted to veterinary research, &c.
Instruction in the manufacture of butter, cheese, &c., is given by the Dairy Division. Dairy-produce is inspected and graded prior to shipment, a close supervision being also exercised over the moisture content of butter and cheese, as well as over the weights of such produce; dairy-farm premises are inspected; herd-testing is promoted, and a system of semi-official testing of purebred dairy cows is in operation. Milk-samples are tested for dairy companies and farmers.
The duties of the Fields Division comprise agricultural instruction, the control of experimental areas, advice regarding crops, pastures, and farm-management, co-operative experimental work, hemp-grading, and grain-grading. The Division also has charge of the system of seed certification introduced by the Department.
The Horticulture Division is charged with orchard instructional work and instruction to beekeepers and tobacco-growers, and the inspection of fruit and trees imported and offered for sale. It also inspects orchards and apiaries, inspects fruit for export, and grades export honey.
The Chemistry Section carries out analyses of soils, limestones, fertilizers, water, &c., also the inspection of fertilizers.
The Department's principal farm establishment is the Ruakura Farm of Instruction at Hamilton, in connection with which a farm training-college for youths is also conducted. The Te Kauwhata Horticultural Station, in the lower Waikato district, is mainly devoted to vine-growing and winemaking. There are also several other smaller experimental and demonstration areas.
The agricultural instructional work covers a comprehensive field, farmers being assisted by visits or by letters of advice. Numbers of farmers also co-operate with the Department in conducting experiments on their farms. A monthly Journal, the New Zealand Journal of Agriculture, is published at a low rate of subscription, and bulletins are frequently issued. Any farmer can obtain advice regarding his soil, have seed examined for germination-capacity and purity, milk tested for butterfat content or for the presence of disease, plants identified, and diseases of either animals or plants described and remedies suggested–all these services being rendered free of charge. Among other responsibilities of the Department is the registration of live-stock brands, slaughterhouses, dairies, dairy-factories, fertilizers, orchards, nurseries, apiaries, &c.
Farming occupies such an important position in the economic structure of the Dominion that statistical information relating to farm-production is vested with special interest. The agricultural and pastoral statistics, which form the subject-matter of the next three subsections, deal mainly with the quantitative aspects of farm-production; while, from these statistics and from cognate statistics for other industries, estimates are made of the value of commodity production as a whole—including farm-production (vide Section XLVI). Various other classes of official statistics—for example, prices index numbers—throw some light on the economic position of the farming industry.
The official estimates of the value of agricultural, pastoral, and dairying production do not indicate, nor do they purport to indicate, the amount received by farmers from farm-production. They are necessarily partly based on wholesale prices in the main marketing centres—particularly in the case of agricultural produce.
Reliable statistics as to the returns to the farmer from the various classes of produce are not available over the long period of years for which estimates of value of production have been compiled. For some time past, however, a considerable amount of data as to prices of farm-produce at country railway-stations, &c., has been collected systematically. This, in conjunction with previously existing statistical information, has made possible the estimates here published of the farmer's receipts from sales of farm-produce. These figures afford a more accurate indication of gross farming income than was formerly available. Owing to the difficulty of obtaining certain essential information for earlier years it has not been practicable to extend the inquiry back beyond the 1928–29 production season. However, since interest in economic statistics is largely centred on the experience of the past few years, it is felt that the results of this inquiry—though at present covering eight production years only—will prove of value.
It must be clearly understood that the figures do not purport to show the aggregate net income from farming after all expenses of farm operations have been met. They are intended to afford an indication of the income available to farmers as a whole to meet current expenses of farm-operation, living-costs, interest payments, and all other costs.
It should be explained also that no attempt has been made to exclude from the scope of the compilations that portion of marketable farm-produce which may be consumed on the farm. Similarly that portion of farm-produce which is sold to other farmers as material for further farm-production is in general included. For example, the value of production of grass-seeds is included under the heading “Agricultural Produce,” although—except for exports—almost the whole of this crop is used for the sowing or renewal of pasture lands. An exception, however, occurs in the case of stud stock sold for breeding purposes, no data being available on which to base an estimate of the aggregate annual value of such sales. With this exception, the totals shown for all farm-produce thus represent the total receipts from sales (including sales to other farmers), plus allowance for farm-produce used on the farm. On the other hand, products of kitchen-gardens and of other activities more intimately associated with the home than with the farm do not come within the ambit of this inquiry.
Production of green-fodder crops, turnips, mangolds, or ensilage is not included. The view taken is that production of these crops is a normal and essential part of farm routine to be regarded more in the nature of a farm cost than as production of a saleable commodity. Consequently, the unknown—but, it is believed, very small—proportion sold of the total production of this class of farm-produce is omitted from the totals shown. In the case of production of grasses and clovers cut for hay, it is arbitrarily assumed that 20 per cent. of the total crop comes within the scope of this inquiry, the remainder being omitted for reasons similar to those advanced in the case of green fodder, &c.
The division into the three groups — (1) Agricultural, (2) Pastoral, and (3) Dairying, Poultry, and Bees—has been made entirely on the basis of the nature of the produce.
The principal items included in the Agricultural group are wheat, oats, and other grain crops, potatoes, onions, tobacco, orchard-produce, and produce of market-gardens, nurseries, hop-gardens, &c. The prices at which the various commodities are valued are, in general, the prices f.o.r. country stations in the early months of the years, when the crops are harvested. In cases where only wholesale or export prices are available—as, for example, for fruit-production —appropriate deductions have been made to ensure that the valuations included in the estimate represent, as nearly as the available data permit, gross returns to the growers.
The estimated cost of sacks, cases, and other containers has been deducted from the totals shown; while transport charges from farm to market or commission on sales of agricultural produce are not included under the basis of valuation adopted. The fact that the cost of containers is deducted might be regarded as a departure from the general practice adopted in this investigation of omitting to take account of costs incurred on the farm. It should be noted, however, that price quotations for some important classes of agricultural produce—e.g., wheat—are in ordinary commercial practice on a “sacks extra” basis, so that the exclusion of the value of containers in the case of other crops has the merit of consistency.
The principal items included in the group “Pastoral” are live-stock and wool-production. Slaughterings of live-stock at freezing-works are assessed at the value (alive) at the works; while, in the case of live-stock slaughtered at abattoirs or ordinary slaughterhouses valuations are made on the basis of saleyard prices. In each instance deductions are made to cover the cost of transport from farm to works or saleyards, and of commission on sales of live-stock. The value (on a conservative basis) of live-stock slaughtered for consumption on farms is included. The value of store stock or young lambs sold by one farmer to another is counted only once—that is, when sold for slaughtering as fat stock.
Wool-production is valued at the average prices realized at sales held during each season, the aggregate arrived at representing the value of production in each season at average sale prices ruling during that season. No adjustments are made to cover the unknown increase or decrease in the total ultimate return from the season's production due to higher—or possibly lower—prices realized for wool carried over and sold in a subsequent season. Deductions are made to cover the cost of transport of wool to selling centres, of commission, and of woolpacks.
Since these estimates are designed with a view to measuring farm receipts in each year, no allowance is made for the value of the annual increase or decrease in the Dominion's herds, although this item is included in assessing the estimates of value of production included in Section XLVI of this Year-Book.
The largest individual item included in the Dairying, Poultry, and Bees group is the pay-out to suppliers by butter, cheese, and condensed-milk factories during each of the dairy seasons shown. An estimate of the value of human consumption of raw milk (at farm-gate prices) is also included, together with the value of butter produced on farms for home use or for sale. The available data permit of only a rough estimate of the value of bee-products and of poultry-products, which are included in this group mainly for purposes of convenience.
The following table shows the values (in millions of £N.Z.) arrived at for each of eight production years:—
GROSS FARMING INCOME.
| Production Year. | Agricultural Produce. | Pastoral Produce. | Produce of Dairying, Poultry, and Bees. | All Farm Produce. |
|---|---|---|---|---|
| £m. | £m. | £m. | £m. | |
| 1928–29 | 7.2 | 33.8 | 25.7 | 66.7 |
| 1929.30 | 7.0 | 25.7 | 24.6 | 57.3 |
| 1930–31 | 6.6 | 19.3 | 18.1 | 44.0 |
| 1931–32 | 6.0 | 15.8 | 17.5 | 39.3 |
| 1932–33 | 6.7 | 15.8 | 17.0 | 39.5 |
| 1933–34 | 6.7 | 26.0 | 18.1 | 50.8 |
| 1934–35 | 6.0 | 23.2 | 18.7 | 47.9 |
| 1935–36 | 7.4 | 28.8 | 24.3 | 60.5 |
The extent of the fall in the value of all classes of farm-produce between the years 1928–29 and 1931–32 was £27,400,000. The value of agricultural produce did not fall to anything like the extent observed in the case of the other two groups. A slight recovery is observed in 1932–33, due entirely to the rise of £700,000 in the valuation of agricultural produce—caused mainly by an exceptionally bountiful wheat crop. An all-round recovery is evident in the figures for the 1933–34 season. The 1934–35 season was unsatisfactory in respect of crop production, an exceptionally dry summer being experienced. Wool prices also suffered a set-back, with a consequently lowered value of pastoral production; while in the case of dairy production a somewhat lowered output resulted from checks to the growth of pastures during part of the season. In the latter instance, however, there was some recovery in prices, the value of dairy-produce being slightly higher than in 1933–34. The 1935–36 season was the most satisfactory since 1928–29 in respect of value of farm-produce, all three branches of production showing a sharp recovery from the returns recorded in the previous season.
A clearer idea of changes in the values since 1928–29 is afforded by the following table of index numbers, in which the 1928–29 values are equated to 100.
| Production Year. | Agricultural Produce. | Pastoral Produce. | Produce of Dairying, Poultry, and Bees. | All Farm Produce. |
|---|---|---|---|---|
| 1928–29 | 100 | 100 | 100 | 100 |
| 1929–30 | 97 | 76 | 96 | 86 |
| 1930–31 | 92 | 57 | 70 | 66 |
| 1931–32 | 83 | 47 | 68 | 59 |
| 1932–33 | 93 | 47 | 66 | 59 |
| 1933–34 | 93 | 77 | 70 | 76 |
| 1934–35 | 83 | 69 | 73 | 72 |
| 1935–36 | 103 | 85 | 95 | 91 |
In order to convey an indication of the extent to which the values shown for more recent seasons have been influenced by movements in the volume of production, and by fluctuations in prices received by producers of farm-produce, index numbers have been compiled showing the movements in volume of production and in prices.
For the compilation of these index numbers, a computation was first made for each of the seasons 1929–30 to 1933–34 showing what the aggregate value would have been assuming that prices had remained unchanged at the 1928–29 levels. From the resultant aggregates, index numbers were compiled which measure the movements in the volume of production; for, since prices were assumed to be constant, volume is the only variable factor in the aggregates. The prices index numbers were compiled simply by dividing the value indices by the volume indices, thus eliminating the influence of changing volume on total values.
Following are the index numbers on the base: 1928–29 = 100.
| Production Year. | Agricultural. | Pastoral. | Dairying, &c. | All Farm Produce. | ||||
|---|---|---|---|---|---|---|---|---|
| Volume. | Prices. | Volume. | Prices. | Volume. | Prices. | Volume. | Prices. | |
| 1928–29 | 100 | 100 | 100 | 100 | 100 | 100 | 100 | 100 |
| 1929–30 | 100 | 97 | 100 | 76 | 108 | 89 | 103 | 83 |
| 1930–31 | 112 | 82 | 105 | 54 | 111 | 63 | 108 | 61 |
| 1931–32 | 106 | 78 | 111 | 42 | 114 | 60 | 112 | 53 |
| 1932–33 | 137 | 68 | 117 | 40 | 133 | 50 | 126 | 47 |
| 1933–34 | 121 | 77 | 117 | 66 | 142 | 49 | 126 | 60 |
| 1934–35 | 94 | 88 | 115 | 60 | 138 | 53 | 121 | 59 |
| 1935–36 | 117 | 88 | 123 | 85 | 144 | 66 | 130 | 70 |
The volume of agricultural production, though showing an upward tendency, fluctuates considerably; the exceptional crops of the 1932–33 season being reflected in an index number 37 per cent. higher than the 1928–29 figure, and 29 per cent. higher than the index for the previous season (1931–32). The 1934–35 season was the poorest during the period under review in respect of the volume of crop-production. The volume of pastoral produce has shown a definite upward trend throughout the period. The index number of the volume of dairy, &c., production moved in close sympathy with that for pastoral produce until 1932–33, when a sharp increase was shown in the production of dairy-produce. This upward movement continued in 1933–34, with the result that this group showed in that season an increase of 42 per cent. over the volume of production in 1928–29. The recession in dairy production indicated by the index-number for 1934–35 is directly due to the exceptionally dry season, which checked the growth of pastures.
The 1935—36 season was a most satisfactory one in respect of the volume of production. For both pastoral and dairying production, and also for the aggregate of farm-produce, the volume was higher in 1935–36 than in any of the seven preceding seasons.
The prices indices show, in all cases, considerable falls as compared with prices realized during the 1928–29 season. In 1932–33—the low point in respect of prices of farm-produce—prices of pastoral produce were 60 per cent. below the 1928–29 level, while dairy-produce prices were 50 per cent. below, and agricultural-produce prices 32 per cent. below, prices realized for these classes of farm-produce in 1928–29. Despite an aggregate increase of 26 per cent. in the volume of production of farm-produce as compared with production in the 1928–29 season, the aggregate return was 41 per cent. below the 1928–29 total, prices having fallen by 53 per cent. Both the 1933–34 and 1934–35 seasons show a considerable improvement on the 1932–33 figures. The price-level in 1933–34 showed a sharp increase, due to a substantial recovery in wool-prices, dairy-produce prices remaining depressed. In 1934–35 wool-prices suffered a setback, while dairy-produce prices recovered somewhat. A recovery in wool-prices and a higher level of dairy-produce prices are reflected in the prices index-numbers for 1935–36.
From the aggregate values compiled for the purpose of measuring movements in the volume of farm-production, the following estimates (shown in the form of percentages of total farm-production) of the relative volume of agricultural, pastoral, and dairying, &c., production in each of the years covered by this inquiry have been computed. The percentages of the aggregate values are also shown.
PERCENTAGES OF TOTAL VOLUME AND VALUE OF FARM-PRODUCE.
| Production Year. | Agricultural. | Pastoral. | Dairying, Poultry, and Bees. | All Farm Produce. | ||||
|---|---|---|---|---|---|---|---|---|
| Volume. | Value. | Volume. | Value. | Volume. | Value. | Volume. | Value. | |
| 1928–29 | 14 | 11 | 50 | 51 | 36 | 38 | 100 | 100 |
| 1929–30 | 14 | 12 | 48 | 45 | 38 | 43 | 100 | 100 |
| 1930–31 | 15 | 15 | 48 | 44 | 37 | 41 | 100 | 100 |
| 1931–32 | 13 | 15 | 50 | 40 | 37 | 45 | 100 | 100 |
| 1932–33 | 15 | 17 | 47 | 40 | 38 | 43 | 100 | 100 |
| 1933–34 | 14 | 13 | 46 | 51 | 40 | 36 | 100 | 100 |
| 1934–35 | 9 | 12 | 49 | 48 | 42 | 40 | 100 | 100 |
| 1935–36 | 10 | 12 | 49 | 48 | 41 | 40 | 100 | 100 |
It will be noted that the proportion of agricultural produce to the total volume of farm-production varied, during the period under review, between 9 per cent. in 1934–35 (when harvests were poor) and 15 per cent. in 1930–31 and 1932–33. The volume of agricultural production was comparatively high in 1935–36, but owing to the increase in production in the other groups the relative importance of this group is lower than in the earlier years shown in the table.
The statistics quoted under the previous headings illustrate the growth in farm-production since the 1928–29 season, the fall in gross farming income, and the movement in producers' prices of farm-products. While the fall in gross farming income—despite a considerably enhanced volume of farm-production—suggests in itself a period of difficulty for the farming community, the divergence between price-levels of farm-products and internal price-levels generally is the real crux of the agrarian problem in times of depression. Prices of farm-products are particularly sensitive, since the demand for most products of the soil does not readily respond to price-changes; and, moreover, supply cannot be readily adjusted to changing demand. On the other hand, the cost of debt charges does not fluctuate so readily, while prices of services and of manufactured goods are also less sensitive than prices of farm-products. An indication of the spread between indexes reflecting farming returns and internal price-levels is shown by the figures in the following table:—
| Production Year. | Index Numbers indicative of— | |||
|---|---|---|---|---|
| Farming Returns. | Internal Price-levels. | |||
| Gross Farming Income. | Farm Producers' Prices. | Farm Expenditure Index (Calendar Year). | Retail Prices (Year ending on 31st May). | |
| 1928–29 | 100 | 100 | 100 | 100 |
| 1929–30 | 86 | 83 | 100 | 99 |
| 1930–31 | 66 | 61 | 91 | 94 |
| 1931–32 | 59 | 53 | 76 | 87 |
| 1932–33 | 59 | 47 | 70 | 80 |
| 1933–34 | 76 | 60 | 70 | 80 |
| 1934–35 | 72 | 59 | 70 | 82 |
| 1935–36 | 91 | 70 | 70 | 85 |
While the farm expenditure index (briefly described in Section XXXVI) only partly reflects any increases in costs at the farm caused by a higher volume of farm-production, the considerable proportion of total farm costs made up of fixed charges which do not increase in direct ratio with increases in the volume of farm-production is included in this index. Comparison between the farm expenditure index and the gross farming income index will thus afford a rough comparison of movements in farm costs and returns. It should be noted that these index numbers indicate the position generally, and do not necessarily apply to individual branches of farm-production. Some data on the question of dairy-farm costs are included in Subsection D, (pp. 429–448).
The retail prices all-groups index is the best available indicator of movements in internal prices generally, and, consequently, this index, when compared with the farm-producers' prices index, affords a useful comparison between movements in prices received by the farmer and in internal prices. As will be apparent from the figures shown under the next sub-heading, returns in respect of sales of farm-produce have been governed largely by price-movements overseas, whereas farming-costs are affected more intimately by internal-price movements. Reference should also be made to Section XXII, which contains, infer alia, tables of index - numbers indicating recent movements in prices in a selection of factory industries.
The following statistics illustrating the relative importance of exports and of consumption within New Zealand in the disposal of farm-produce have been compiled by utilizing the statistics of gross farming income, in conjunction with statistics of trade in farm-products.
In the discussion covering the statistics of gross farming income it is explained that these estimates were framed on the basis of “on the farm” values in order that they might indicate the gross receipts by the farmer, after making provision for transport charges and other expenses incurred in the marketing of produce.
In compiling the statistics of the relative importance of the New Zealand market, and of export markets for farm-products, the value of exports has been assessed at the “farm” value of the commodities concerned, and not at the f.o.b. declared value for export. This adjustment has been made in order to ensure that both sets of statistics from which the comparison is made are on the same value basis. It will be realized, then, that the statistics of value given in this statement indicate the gross returns to the farmer from farm-products exported and from consumption of such products within the Dominion.
The statistics of the return to the farmer in respect of New Zealand consumption of farm-produce have been obtained by deducting exports from total production. In these compilations exports of milk-products have been converted to a butterfat equivalent, the return to the farmer being computed on the basis of butterfat pay-out; while, again, the slaughterings represented by exports of meat products have been taken as the basis on which to estimate the farmers' receipts from exports of meat. Where statistics of stocks held over from one season to another are available, adjustment has been made for this factor. Since the estimates of Dominion consumption are thus the residual element in the process of compilation, any lack of correspondence between the statistics of production and of trade will affect the accuracy of these estimates. Statistics of production relate to the production-year for each commodity, or group of commodities, coming within the scope of this investigation. In many instances the production-years do not cover identical twelve-monthly periods, so that the aggregate of production of farm-produce includes statistics for a number of yearly periods ending in different months.
Exports during any one year do not consist entirely of commodities produced within the same twelve-monthly period to which the export statistics relate, and in some instances stocks held over may amount to an appreciable portion of total production. It will be seen, then, that estimates of Dominion consumption of New Zealand farm-produce, based on differences between production and export statistics, cannot be made with any close approach to accuracy for a single year. This is particularly apparent in the case of commodities of which consumption within the Dominion is but a small proportion of total production—e.g., cheese. Consequently the estimates published in this statement are based on the averages of statistics for three production and three export seasons, in order to minimize the effects of any such lack of comparability between the two sets of statistics.
The following table based on the averages of statistics for three production and three export seasons shows the division of gross farming income into returns from exports of farm-produce, and from consumption of such produce within the Dominion.
| Three Production Years. | Annual Average Gross Farming Income from | Percentages of Gross Farming Income from | |||
|---|---|---|---|---|---|
| Total Production. | Exports. | New Zealand Consumption. | Exports. | New Zealand Consumption. | |
| £m. | £m. | £m. | Per Cent. | Per Cent. | |
| Agricultural Produce. | |||||
| 1929–31 | 6.9 | 0.7 | 6.2 | 10 | 90 |
| 1930–32 | 6.5 | 0.7 | 5.8 | 11 | 89 |
| 1931–33 | 6.4 | 0.8 | 5.6 | 13 | 87 |
| 1932–34 | 6.5 | 0.8 | 5.7 | 12 | 88 |
| 1933–35 | 6.5 | 0.8 | 5.7 | 12 | 88 |
| Pastoral Produce. | |||||
| 1929–31 | 26.3 | 20.3 | 6.0 | 77 | 23 |
| 1930–32 | 20.3 | 15.3 | 5.0 | 75 | 25 |
| 1931–33 | 17.0 | 13.0 | 4.0 | 76 | 24 |
| 1932–34 | 19.2 | 15.5 | 3.7 | 81 | 19 |
| 1933–35 | 21.7 | 17.6 | 4.1 | 81 | 19 |
| Dairying, Poultry, and Bees. | |||||
| 1929–31 | 22.8 | 15.2 | 7.6 | 67 | 33 |
| 1930–32 | 20.1 | 13.6 | 6.5 | 68 | 32 |
| 1931–33 | 17.5 | 11.8 | 5.7 | 67 | 33 |
| 1932–34 | 17.5 | 12.3 | 5.2 | 70 | 30 |
| 1933–35 | 17.9 | 12.6 | 5.3 | 70 | 30 |
| All Farm Produce. | |||||
| 1929–31 | 56.0 | 36.2 | 19.8 | 65 | 35 |
| 1930–32 | 46.9 | 29.6 | 17.3 | 63 | 37 |
| 1931–33 | 40.9 | 25.6 | 15.3 | 63 | 37 |
| 1932.34 | 43.2 | 28.6 | 14.6 | 66 | 34 |
| 1933–35 | 46.1 | 31.0 | 151 | 67 | 33 |
Of the total gross farming income during the seven production years 1929 to 1935, 65 per cent. came from exports of farm-produce, while 35 per cent. was accounted for by consumption of such produce within the Dominion.
An indication of movements in the quantity of New Zealand farm-produce exported and consumed in the Dominion is afforded by the following table of index numbers of values at 1928–29 prices, based on the averages of statistics for three production and three export seasons. In instances where statistics of stocks are available adjustment has been made for the carry-over from one season to another. It has been assumed that stocks of butter and cheese carried over are held for export, and that stocks of wheat and oats are subsequently consumed within New Zealand.
| Three Production Years. | Index Numbers of Volume of Farm-production. | |||
|---|---|---|---|---|
| Total. | Exported. | Consumed in New Zealand. | ||
| Total. | Per Head. | |||
| Agricultural Produce. | ||||
| 1929–31 | 100 | 100 | 100 | 100 |
| 1930–32 | 102 | 104 | 103 | 101 |
| 1931–33 | 114 | 122 | 110 | 107 |
| 1932–34 | 117 | 139 | 111 | 107 |
| 1933–35 | 105 | 135 | 103 | 95 |
| Pastoral Produce. | ||||
| 1929–31 | 100 | 100 | 100 | 100 |
| 1930–32 | 104 | 104 | 102 | 101 |
| 1931–33 | 109 | 110 | 106 | 103 |
| 1932–34 | 113 | 115 | 104 | 101 |
| 1933–35 | 114 | 118 | 101 | 97 |
| Dairying, Poultry, and Bees. | ||||
| 1929–31 | 100 | 100 | 100 | 100 |
| 1930–32 | 105 | 105 | 103 | 101 |
| 1931–33 | 112 | 112 | 112 | 110 |
| 1932–34 | 122 | 127 | 113 | 109 |
| 1933–35 | 129 | 136 | 115 | 111 |
| All Farm-produce. | ||||
| 1929–31 | 100 | 100 | 100 | 100 |
| 1930–32 | 104 | 105 | 102 | 101 |
| 1931–33 | 111 | 111 | 110 | 107 |
| 1932–34 | 117 | 120 | 110 | 106 |
| 1933–35 | 119 | 125 | 107 | 101 |
The quantity of New Zealand produced farm commodities consumed in the Dominion was 7 per cent. higher during the three production years ending in June, 1934, than in the three years ending in June, 1931. The falling-off in local consumption—notably of agricultural produce—indicated by the 1933–35 figures is accounted for largely by the exceptionally poor harvest of 1935.
A comparison of the proportions of farm and other produce exported and locally consumed is included in a later section. (Section XLIII.—Consumption of Commodities.)
The difficulties which have beset the farming industry in recent years and the dependence of the farm economy of the Dominion on export markets will be realized from data discussed under the preceding headings. An account of the readjustments in agricultural policy made in order to combat these difficulties follows under the next heading (Recent Developments in Agricultural Policy).
The following summary of farm machinery employed on holdings outside borough boundaries during the last five years is of interest as showing the increasing use being made of electricity and of mechanical equipment:—
| Class of Machinery, &c. | 1933. | 1934. | 1935. | 1936. | 1937. |
|---|---|---|---|---|---|
| Milking-plants | 24,350 | 25,178 | 25,630 | 26,181 | 27,331 |
| Cream-separators | 54,200 | 55,625 | 55,920 | 56,199 | 56,850 |
| Shearing-machines— | |||||
| Plants | 7,936 | 7,894 | 8,174 | 8,468 | 8,867 |
| Stands | 22,562 | 22,482 | 22,982 | 23,526 | 24,229 |
| Agricultural tractors | 4,972 | 5,062 | 5,349 | 5,710 | 6,585 |
| Electric motors | 26,757 | 29,164 | 31,631 | 35,426 | 40,201 |
| Internal-combustion engines | 21,667 | 21,758 | 22,117 | 22,159 | 22,358 |
The 27,331 milking-plants in use in 1937 had a capacity for milking 94,945 cows simultaneously. The total number of cows milked on holdings employing milking-plants was 1,403,755. The aggregate horse-powers of the agricultural tractors, electric motors, and internal-combustion engines shown above were 112,007, 46,710, and 69,431 respectively.
The prosperity of New Zealand is to such a large extent dependent on the well-being of the farming industries that measures designed towards the furthering of farm-production have always occupied a prominent place in the policies of successive Governments. In the early stages of rural development in this country land-settlement schemes to encourage the expansion of the area under cultivation, and State assistance in the form of cheap long-term financing of the purchase and development of lands suitable for farming purposes, were focal points in agricultural policy. Closer settlement of rural areas, with a view to the establishment of a numerous class of independent farmers and the full utilization of farm lands-to the maximum stage of efficiency, has always been a major aim in agricultural planning.
Active intervention by the State in the marketing of primary products was made necessary by the exigencies of the war; but such measures as were designed to this end were naturally of a temporary nature. From 1921 onwards, however, the orderly marketing of the products of the soil has been a definite and important part of the State long-term policy in relation to agriculture. The Meat-export Control Act was passed in the 1921–22 session, while the Dairy-produce Export Control Act followed in 1923. Other statutes of a like nature apply to various other farm-products. A most important measure, the Primary Products Marketing Act, was placed on the statute-book in May, 1936. The Act was designed to make better provision for the marketing in New Zealand, as well as overseas, of dairy-produce and other primary products, and to ensure for producers an adequate remuneration for the services rendered by them to the community. A résumé of the main provisions of the Act appears later in this section. State assistance towards rationalizing marketing was also an important part of the legislative programme designed to cope with agrarian problems arising out of the depression.
Although Governmental assistance in long-term finance to farmers and others was provided for as early as 1894, when the State Advances Act was passed, it was not until 1927 that the State intervened in the short-term rural-credit market; the Rural Intermediate Credit Act passed in that year being designed to add to the then existing facilities for this type of finance. The future administration of this Act is one of the functions of the State Advances Corporation.
For many years the continuous expansion of the area under cultivation was the major cause of a growing volume of farm-production; but as the more favoured localities became fully settled the impetus to a still growing farm output came largely from the application of modern scientific methods to farming operations. Agricultural research and its practical application have been fostered by the Department of Agriculture since its inception, with a consequent improvement in the technique of farm-production generally throughout the Dominion.
Live-stock production has been the predominating type of farming in New Zealand for many years past, although crop-production was very important in the early days of the colony before refrigeration rendered possible the development of export markets for perishable farm-products. The farm-lands of this country are, except in restricted areas, more suited to the growing of pasture grasses than to crop-cultivation; and while the yields of the various crops have shown improvement with advances in farm practice and the improvement in seed types resulting from research activities, the main concentration of effort until recently was towards the raising of the productivity of grass lands and the expansion of areas under pasture.
Crops are normally produced in sufficient quantities to supply home requirements, with the exception that small importations of wheat and flour are sometimes necessary. In the case of the more perishable crops, such as potatoes and onions, there is considerable elasticity in price between one season and another, depending on the scantiness or fruitfulness of the harvest. Exports are normally small, except for apples and, to a lesser extent, pears and grass and clover seeds, in which commodities a considerable export trade has been built up. The export marketing of fruits is controlled by a Board set up after the passing of the Fruit Control Act in 1924. Dominion imports of agricultural produce are limited mainly to tropical foodstuffs, although in years of poor wheat harvests there is a considerable import of wheat — principally from Australia. Again, during the off-season, imports of certain commodities, notably onions, are sometimes necessary. Broadly speaking, however, the Dominion may be regarded as practically self-contained in respect of crop production and consumption. State intervention in the local marketing of agricultural produce was one of the necessary temporary measures taken during the war years. During the post-war period no measures of importance were taken in that direction until comparatively recently, when a considerable surplus of wheat in the 1932–33 season led to the establishment of a Wheat Purchase Board to regulate wheat prices, and to control the purchase and disposal of wheat. The wheat - growers have been protected for some years past from the full impact of outside competition by a sliding scale of duties on imports of wheat and flour, designed to maintain a payable price in the Dominion. The sliding scale of duties was introduced in 1927, replacing the pre-existing tariff. An Order in Council, which came into force in March, 1936, prohibits the importation of wheat or wheat flour except where a written permit has been issued by the Department of Industries and Commerce. It is the intention of the Government to rationalize the wheat industry and to ensure a market for local growers. Investigations towards achieving these objects are being carried out. The import duties on the other principal crops are—Potatoes: General Tariff, £1 per ton; Australian Trade Agreement rate, £2 10s. per ton. Onions: General, £4 per ton*, Australian Trade Agreement rate, £1 per ton. Oats: General, 2s. per cental; Australian Trade Agreement rate, 1s. 6d. per cental. Apples: General, 1½d. per pound; British Preferential Tariff, 1d. per pound. Except in years of poor crops, imports of these commodities are inconsiderable.
* Regulations gazetted in March, 1937, prohibit, importations other than with the consent of the Minister of Customs.
From the statements contained in the preceding paragraph, it will be realized that marketing and other problems arising from crop-production are largely of a purely domestic nature, for there is comparatively little direct competition with or from overseas sources. Attention should, however, be drawn to the fact that the alternations of prosperity and depression in the live-stock industries catering mainly for the export markets affect the acreages under crops—such as wheat, potatoes, and onions, all of which are grown for the Dominion market—so that crop-production for home consumption may be influenced very considerably by conditions in world markets for live-stock products. Marketing and other schemes initiated primarily for the support of the export industries may, if effective, have, indirectly, a considerable beneficial effect on the money returns in respect of crop-production, especially for human consumption. On the other hand, if a policy of restriction of exports of live-stock products became necessary, certain types of crop-production would be seriously affected directly, since a substantial portion of the yields of existing areas devoted to the growing of such crops is utilized for stock-feeding purposes.
While the home market dominates in the disposal of crops, almost 90 per cent. of gross receipts from sales of produce coming from consumption within the Dominion, live-stock production (which accounted during 1929–36 for approximately 87 per cent. of the aggregate gross money returns from farm-production) is particularly dependent upon the export markets—over two-thirds of the total return from live - stock products emanating from sales abroad. The expansion of the volume of live-stock production was, until recently, a dominating force in Government policy measures designed to further farming interests; but the agrarian problems of New Zealand have changed very materially during the past few years, rendering necessary a re-orientation of policy, with a shift of emphasis towards the marketing side of farm economy.
Since the war, world markets have been increasingly affected by the development of national policies aimed at economic self-sufficiency. Specialization demands an increasing interchange of commodities over national borders, while the furtherance of nationalistic ideals of a “balanced economy” must be accompanied in the long-run by a diminishing quantum of world trade. The full consequences of this growth of economic nationalism were partially disguised during the period of comparative prosperity and rapid industrial development; but the advent of the world depression greatly accelerated the process of diminution of world trade.
New Zealand has devoted much attention to the development of the industry to which, by climatic circumstances, she is most peculiarly suited—the production of pastoral products—and is consequently particularly dependent on external trade—the disposal of the large surplus of pastoral produce at remunerative prices being essential to meet the cost of commodity imports and a heavy adverse balance in respect of freight charges, interest on overseas indebtedness, and other invisible items. The collapse in prices in 1930—symptomatic of the development of a world-wide economic crisis—was felt with special severity in primary-producing countries, since the level of prices of farm-products and other relatively unfinished goods fell at a much more rapid rate than prices of finished goods and services. Consequently, a widening disparity between farm costs and farm returns rapidly precipitated an agricultural crisis not only in New Zealand but also in all other countries materially dependent on world markets for farm-produce.
State assistance towards the re-establishment of farming rapidly became a world-wide feature of economic policy, consuming countries endeavouring to check imports of farm-products, as part of a policy to restore trade balances, and at the same time endeavouring to increase the flow of home-produced agricultural products by subsidies and other devices. In exporting countries a variety of measures to cope with a situation of extreme urgency was adopted; direct subsidies on a large scale, currency depreciation, guaranteed returns to producers, and plans for the reduction of farm costs being the main avenues of approach.
The crisis in the agricultural situation in New Zealand passed with the marked improvement in wool-prices in the 1933–34 selling season, while, in 1934–35, dairy-produce prices recovered somewhat; so that, despite a somewhat adverse season in point of volume of farm-production and a setback in wool-prices, the outlook for New Zealand's farming industry had changed materially for the better-With the further improvement that has taken place in the 1935–36 and 1930–37 seasons, the emphasis in the planning of the farm economy of the Dominion has shifted from problems of immediate urgency to long-range plans.
In the following pages an outline of recent legislation and other governmental action having a direct bearing on the farming situation is given. In some instances the statutes have application to other sections of the community as well as the farm population. Reference should be made to a similar article in the-1936 issue of the Year-Book (pp. 321–336) for an account of measures taken between 1929 and 1935 to alleviate the effects of the depression period on the farming community. Only a brief résumeé of the contents of the above article is given in this issue, since changed circumstances—including the advent of a Labour Government in November, 1935—have rendered much of the material of historical rather than of current practical interest.
Recent legislation designed to cope with agrarian problems has three main objectives—(1) The stabilization of future returns from farming operations; (2) the final clearing-up of the burden of excessive indebtedness; and (3) the provision of cheap finance for farming and other purposes. It is of service to note also at this stage that legislation has been placed on the statute-book regulating the wages and conditions of employment of farm workers. (See Section XXXVIII.)
The progressive imposition of import duties on farm-products has reached the stage of amounting to a virtual prohibition of imports in many countries which were previously important avenues for the disposal of exports of such commodities. In addition, the quantitative regulation of farm-produced imports has become a major feature of the economic policies of consuming countries, thus further reducing the potential markets of exporting countries. These developments have created a marketing problem of considerable urgency, and efforts to preserve existing markets and to establish new markets have occupied a prominent place in governmental plans for the re-establishment of the farming industry in the Dominion.
New Zealand's major exports of farm-products are at present practically limited to wool, butter, cheese, and meats. Of these commodities, wool alone has an international market, the problem of disposal of the wool-clip being affected rather by the state of world activity in the woollen-manufacturing industries than by import restrictions and quotas.
New Zealand's export market for butter, cheese, and meats is now practically confined to the United Kingdom. With the decline in consumption of these commodities in continental countries, partly as a result of the decline in purchasing-power caused by the depression and partly as a consequence of the artificial raising of agricultural prices by duties and import restrictions, much produce which previously found an outlet in those countries was diverted to the United Kingdom; while a further factor affecting that market has been the increase in production in the major exporting countries. British plans for the rehabilitation of agriculture were seriously hampered by the increased influx of farm-produce from abroad, with the consequent lowering of prices on a market which became oversupplied, despite increased consumption of certain farm-produced commodities—notably butter. Import duties and restrictions on imports of such products have-in consequence become an integral part of British policy in relation to agriculture.
The necessity for developing new markets as an outlet for part of the Dominion's exports of dairy products and meats has become a major problem, but plans directed towards this end must inevitably take considerable time before reaching fruition. The immediate problem of retaining New Zealand's share in the British market has been the subject of prolonged negotiations over a considerable period. A résumé of the agreements arrived at to that end was included in the 1936 issue of this publication, pp. 329–332. With the increased prosperity in the United Kingdom and the successful launching of plans to protect British agriculture—e.g., the Milk-marketing Scheme—the immediate danger of drastic reduction in our exports of farm products to that country passed. In practice there have been no actual restrictions of New Zealand imports into the United Kingdom apart from relatively minor restrictions on beef shipments and the regulation of marketing of certain other products.
The most significant recent development in the marketing of New Zealand farm-produce is the Primary Products Marketing Act (described under the subheading immediately following), by virtue of which the marketing of dairy-produce for export becomes the sole concern of the Government. The expressed intention of the Government is to centralize the marketing of primary products, guaranteeing a stated price for such products, so that the farmer's energies may be fully directed to farming operations, freed from the anxieties attendant on the varying overseas price of his products and the difficulties of marketing. At the same time it is considered by the Government that centralized control of marketing presents many other advantages. A section in the Primary Products Marketing Act of particular interest in this connection is quoted in full:—
“(1) With a view to facilitating the making by the Government of New Zealand of agreements with the Governments of other countries for the promotion of reciprocal trade, it shall be one of the functions of the Minister, on behalf of the Government of New Zealand, to enter into negotiations, as and when he thinks it opportune so to do, with the accredited representative or with accredited representatives of the Government of the United Kingdom or of any other part of His Majesty's Dominions, or the Government of any other country.”
“(2) The basis of any such agreement shall be that, in consideration of the purchase by the Government of any such country of any primary products of New Zealand, or in consideration of the establishment or maintenance in any such country of favourable marketing conditions for any primary products of New Zealand, the Government of New Zealand will undertake to arrange, through the Reserve Bank of New Zealand, that the whole or a substantial part of the financial credits thereby established in such country will be utilized for the purchase of approved goods or classes of goods being the produce or manufacture of that country.”
The first-hand investigation of marketing problems was the main purpose of a recent visit to the United Kingdom by the Minister of Marketing. A meat agreement with that country was negotiated by the Minister, by which the allocation of imports of New Zealand mutton and lamb into the United Kingdom in the calendar year 1937 has been fixed at 4,010,000 cwt.—the highest allocation yet made to New Zealand by the British Government in respect of mutton and lamb imports. An import allocation of 10,000 tons of New Zealand porkers for 1937 has also been agreed to, this agreement providing for a substantial measure of expansion in the New Zealand export trade in porkers, since exports in 1936 totalled only 13,400 tons. No difficulty is anticipated in obtaining a market in the United Kingdom for the supplies of baconers in sight.
The purpose of this Act is, in the words of the title, “to make better provision for the marketing of dairy-produce and other primary products so as to ensure for producers an adequate remuneration for the services rendered by them to the community.” As a means to that end it is considered by the Government that it is essential in the public interest that producers of primary products should, as far as possible, be protected from the effect of fluctuations in the market-prices of such produce.
The preamble to the Act states, inter alia, that “it is thought that the most effective and appropriate way of affording such protection, so far as relates to primary products intended for export, is to provide that the Government, on behalf of the Crown, shall acquire the ownership of such products at prices to be fixed and promulgated from time to time; and, so far as relates to primary products intended for consumption in New Zealand, is to empower the Government in its discretion either to acquire the ownership thereof at fixed prices or to control the sale and distribution thereof.”
To achieve the objects of the Act, administrative machinery has been set up under the control of a Minister of Marketing, a new Department of State being created, called the Primary Products Marketing Department. The principal functions of this Department are “to make all necessary arrangements” with respect to—
The acquisition, on behalf of the Crown, of any primary products in accordance with the Act, or in accordance with any other lawful authority that may be conferred:
The marketing in New Zealand or overseas of primary products, whether or not such products have been acquired on behalf of the Crown.
Provision for the appointment of a Director of Marketing and one or more Assistant Directors was made in the Act, the Director being the administrative head of the Department. All the functions of the Department may be exercised by the Minister, who may delegate to the Director such of his powers as he thinks fit.
The functions of the Executive Commission of Agriculture, set up under the Agriculture (Emergency Powers) Act, 1934, are transferred to the new Department.
The administrative machinery created by this Act is framed in such a manner that any or all primary products may be brought within the purview of the activities of the Department; but its immediate purpose is to put into action definite plans in respect of dairy-produce, and to assist the Government in formulating plans in respect of other primary products.
The Act contains definite proposals for the marketing of dairy-produce. The most important provisions in this portion of the Act apply to all butter and cheese manufactured from milk or cream delivered to a dairy factory on or at any time after 1st August, 1936. The Minister is empowered to make such arrangements as he thinks proper for the following matters:—
The handling, pooling, transport, and storage of any dairy-produce to which the Act applies:
The shipment of any such dairy-produce that is intended for export on such terms and in such quantities as he thinks fit:
The insurance against loss of any such dairy-produce:
Generally all such matters as are necessary for the exercise of any of the powers expressly conferred in the Act.
All dairy-produce—to which this part of the Act applies—intended for export becomes the property of the Crown as soon as it is placed on board ship. The Act provided that the prices fixed for dairy-produce exported on or before the 31st July, 1937, were to be fixed after taking into account the “prices received in New Zealand in respect of dairy-produce of the same or approximately the same kind, grade, and quality exported from New Zealand during a period of from eight to ten years immediately prior to the thirty-first day of July, nineteen hundred and thirty-five.”
The actual prices declared under this subsection of the Act were announced in the Budget presented by the Minister of Finance on 4th August, 1936. They are given under the next subheading.
In fixing prices of dairy-produce exported after 31st July, 1937, regard is taken of the prices fixed for the 1936–37 season, while the following additional considerations are set out in the Act:—
The necessity in the public interest of maintaining the stability and efficiency of the dairy industry:
The costs involved in the efficient production of dairy-produce:
The general standard of living of persons engaged in the dairy industry in comparison with the general standard of living throughout New Zealand:
The estimated cost to the Department of marketing the dairy-produce concerned, and also the cost of the general administration of the Act:
Any other matters deemed to be relevant.
The procedure in respect of dairy-produce intended for consumption in New Zealand is somewhat different from that specified in respect of exported produce. The Minister may acquire such produce on behalf of the Crown, but is not obliged to do so. The prices in respect of dairy-produce intended for consumption in New Zealand may be fixed by the Governor-General in Council whether it has been or is intended to be acquired by the Crown, or is sold or intended for sale otherwise than to the Crown. The general purpose in fixing such prices is to ensure a return to the producer equivalent to that received in respect of produce for export.
An internal marketing branch of the Primary Products Marketing Department has been created, the Government having taken over the business of one of the largest distributing-houses marketing butter, cheese, eggs, &c. Regulations were gazetted in April, 1937, providing for the licensing of wholesale distributors of butter in the Wellington district, making compulsory the grading of butter for that market, and regulating the flow of supplies to the market through the organized channels. The wholesale price of butter was fixed by the regulations as—
| Per Pound. | |
|---|---|
| d. | |
| For creamery butter and lower than first grade | 13½ |
| For second-grade creamery butter | 12¾ |
| For whey butter | 12½ |
These regulations applied to all butter intended for consumption within the Wellington City area, which is defined as an area within a radius of twenty miles from the General Post Office.
An Order in Council issued on 3rd September, 1937, fixed the net wholesale prices of butter throughout the whole Dominion as follows:—
| Per Pound. | |
|---|---|
| d. | |
| Creamery buttery (first grade) | 14½ |
| Creamery buttery (second grade) | 13¾ |
| Whey butter | 13½ |
These prices, which are designed to afford producers for the local market a price parity with production for export, represent an increase of 1d. per pound over the prices previously fixed for the Wellington area. Regulations were gazetted on 14th October, 1937, for the regulated marketing of butter throughout the whole Dominion, including the licensing of wholesale distributors of butter.
Provision is made in the Act for the opening of a Dairy Industry Account with the Reserve Bank, as an essential prerequisite to the working of the Act. All receipts and all disbursements in connection with the Act are to pass through this account. In another Act, the Reserve Bank Amendment Act, 1936, the bank is empowered, inter alia, to grant to the Government accommodation by way of overdraft in aid of the Dairy Industry Account.
Part III of the Act contains provisions reconstituting the Dairy Board. The number of members is reduced from seven to five, one of whom is appointed by the Governor-General in Council—under pre-existing legislation there were three Government nominees. Dating from the 1st August, 1936, the Board is not to exercise any of its powers, functions, or discretions except with the approval of the Minister of Marketing.
Following the coming into operation of the Primary Products Marketing Act, guaranteed prices in respect of butter and cheese for export were fixed for the 1936–37 season on 4th August, 1936; while the prices for the 1937–38 season were announced on 31st August, 1937. The table following shows the full range of prices fixed for each of the two seasons.
Guaranteed f.o.b. Purchase Prices.
| Grading. | Season. | Season. | ||||
|---|---|---|---|---|---|---|
| 1937–38 (per lb.). | 1936–37 (per lb.). | 1937–38 (per cwt.). | 1936–37 (per cwt.). | |||
| Creamery Butter. | ||||||
| Finest— | d. | d. | s. | d. | s. | d. |
| 94 points and over | 13.375 | 12.6875 | 124 | 10 | 118 | 5 |
| 93 to 93½ points (basic grade) | 13.25 | 12.5625 | 123 | 8 | 117 | 3 |
| First— | ||||||
| 92 to 92½ points | 13.1875 | 12.5 | 123 | 1 | 116 | 8 |
| 90 to 91½ points | 13.00 | 12.3125 | 121 | 4 | 114 | 11 |
| Second | 12.50 | 11.8125 | 116 | 8 | 110 | 3 |
| Whey Butter. | ||||||
| First | 12.25 | 11.5625 | 114 | 4 | 107 | 11 |
| Second | 11.75 | 11.0625 | 109 | 8 | 103 | 3 |
| Cheese. | ||||||
| Finest— | ||||||
| 94 points and over | 7.69625 | 6.96875 | 71 | 10 | 65 | 04 |
| 93 to 93½ points | 7.665 | 6.9375 | 71 | 6½ | 64 | 9 |
| First— | ||||||
| 92 to 92½ points (basic grade) | 7.54 | 6.8125 | 70 | 4½ | 63 | 7 |
| 91 to 91½ points | 7.4775 | 6.75 | 69 | 9½ | 63 | 0 |
| Second | 7.29 | 6.5625 | 68 | 0½ | 61 | 3 |
Each scale of guaranteed prices remains constant throughout the whole season to which it applies. The Crown has full responsibility for the sale of the produce-after its acquisition from the producers, so that any deficit resulting from the sale of the produce overseas is met by the Government. A deficit of approximately £550,000 has been estimated for the 1936–37 season.
The basic price of butter fixed for the 1937–38 season represents an increase of 11/16 d. above the price fixed for that grade in the previous season. Provision was made in the 1936–37 scale of guaranteed prices for differential margins to apply to butter and cheese graded above or below the basic standards (93 to 93½ points in the case of butter and 92 to 92½ points in the case of cheese). These margins remain unaltered for the 1937–38 season.
The basic guaranteed price for cheese was fixed for the 1936–37 season at a level estimated to return to the farmer supplying a cheese-factory 1½d. per pound more for his butterfat than the return in respect of milk or cream delivered at a factory for buttermaking. The differential margin is intended to compensate suppliers for the relatively higher cost of cheese-making and the loss of by-products, such as skim-milk, &c. The Government, after careful consideration of all the circumstances, decided to raise this differential margin to 2d. per pound for the 1937–38 season. The increase in the guaranteed prices for cheese for the 1937–38 season is thus higher than the increase in the prices for butter.
The basic f.o.b. prices for the 1936–37 season were calculated to return to farmers supplying dairy factories working under average conditions 1s. 1.04d. per pound of butterfat in the case of butter and 1s. 2.54d. per pound of butterfat in the case of cheese. It is estimated that the 1937–38 prices of butter and cheese will result in butterfat returns of 1s. 1.88d. for buttermaking and 1s. 3.88d. per pound for cheesemaking.
The Primary Products Marketing Act, a summary of which has been given above, indicates the present Government's plans towards ensuring to the farmer some security in respect of farm returns in the future. Although only dairy-produce has been brought within the scope of the guaranteed-prices plan, the Government envisages the possibility of extending the scheme to other branches of farm production; action having already been taken in respect of apples for export, while the position of other farming industries—e.g., tobacco growing—is being investigated. The priority in making provision for dairy-produce is directly attributable to the fact that dairy-farming is considered to be in more urgent need of immediate protection than the other major branches of the Dominion's farm economy. The provision of farm finance does not come directly within the scope of the above legislation, and it is now proposed to describe briefly the principal governmental measures dealing with this aspect of agricultural organization. The subject falls naturally into two headings—(1) The adjustment of liabilities; and (2) the provision of farm finance.
The burden of farm indebtedness remaining as a legacy from the long period of acute agrarian depression is still one of the major problems of agriculture in New Zealand. The principal measures adopted by the past Government to lighten this burden were the various Mortgagors Relief Acts and the Rural Mortgagors Final Adjustment Act, 1934–35. The Mortgagors Relief Acts were designed to protect the mortgagor (farmer or other) from foreclosure, and also contained provision for the voluntary adjustment of mortgages through the agency of Commissions set up by authority of the legislation. The Rural Mortgagors Final Adjustment Act, 1934–35, represented a definite effort to effect a permanent settlement of excessive farm indebtedness arising from the depression. The Act provided, inter alia, for the final clearing-up of excessive mortgage liability after a period of five years, during which period, however, the farmer mortgagor seeking relief under the Act was required to conduct his farming operations under a system of budgetary control. The legislation of the present Government towards the clearing-up of excessive rural (and other) indebtedness is contained in the Mortgagors and Lessees Rehabilitation Act, 1936. The Act, which applies to all mortgages, is described in some detail in Section XXXII. Certain special provisions in the Act which are intended to apply to farm mortgages only are summarized below:—
The following quotation of section 2 (1) of the Act indicates the intent of the legislation in regard to farmer applicants for relief under its provisions:—
“The general purpose of this Act in relation to farmer applicants is to retain them in the use and occupation of their farms as efficient producers, and to make such adjustments of their liabilities as will ensure that the liabilities secured on any property do not exceed the value of that property, that the rent of any leasehold property does not exceed the rental value of that property, and that the total amount and terms of payment of all their liabilities (whether secured or unsecured) are such that, after allowing for all normal current expenditure and providing for the maintenance of themselves and their families in a reasonable standard of comfort, the applicants may reasonably be expected to meet their liabilities as they become clue, either out of their own moneys or by borrowing on reasonable terms.”
Adjustment Commissions are set up under the Act under the general direction of a Court of Review. These Commissions are empowered, inter alia, to fix basic values of farm lands held by applicants for relief under the legislation. The basic value is defined as the productive value of such lands “increased or reduced by such amount as the Adjustment Commission deems necessary in order to make it a fair value to serve as a basis for the adjustment of the liabilities of the applicant in accordance with this Part of this Act.”
The productive value is defined as the net annual income that can be derived from the lands by the average efficient farmer, capitalized at a rate of interest to be fixed from time to time by the Governor-General in Council. Rates of interest under this section of the Act were fixed by an Order in Council dated 30th November, 1930, as follows:—
The rate of interest for first mortgages of land to be a rate not exceeding 4 per cent. per annum.
The rate of interest for puisne mortgages of land to be a rate not exceeding 6 per cent. per annum.
The rate of interest for mortgages on property other than land to be a rate not exceeding 6 per cent. per annum.
In determining the net annual income, all expenses, including reasonable remuneration for the work performed by the applicant or other person in the production of that income, and interest in stock and chattels used for farm operations are to be deducted from the gross income. Capital expenditure is not to be deducted.
The amount of gross income is to be determined on the basis of “such prices for farm-products as may be fixed for the purposes of this section by the Governor-General by Order in Council; or, in default of any such Order in Council, or in so far as any such Order in Council does not extend, by the Court. The said prices shall be fixed after taking into consideration the prices received in respect of products of the same or approximately the same kind, grade, and quality produced in New Zealand during a period of from eight to ten years immediately prior to the thirty-first day of July, nineteen hundred and thirty-five. The Governor-General may from time to time, by Order in Council, fix prices for the purposes of this section as herein before provided.” Average prices were fixed under this section of the Act by orders of the Court of Review issued on 19th January, 1937, 8th February, 1937, and 17th February, 1937. These Court orders prescribe prices for all the principal farm-products, separate district figures being given in each instance. If the basic value of the applicant's interest in any farm lands is less than the total amount of the principal and other moneys secured on his interest in those lands, the amount so secured is to be reduced to the basic value. The remainder is to be regarded as an adjustable debt; while, in the case of farm mortgages only, all other unsecured debts are also classed as adjustable debts.
With certain specified exceptions, all adjustable debts to which any applicant is subject on the date of the application for adjustment of his liabilities under the Act, “and such of the adjustable debts to which he subsequently becomes subject as the Adjustment Commission determines for the purposes of this section,” shall be deemed to be discharged on a date to be fixed in that behalf by an order of the Adjustment Commission. The provisions for the relief of lessees are similar in import to those outlined in respect of mortgage indebtedness. The Adjustment Commission dealing with any particular application has power to determine whether the farmer is to be permitted to remain in the use and occupation of his farm lands. In determining this, the Commission is enjoined to take into consideration the following factors:—
The conduct of the applicant in relation to the care and management of the lands and the disbursement of his income:
The extent (if any) to which the area of the farm lands exceeds or is less than the area required to enable the applicant to obtain a reasonable standard of comfort for himself and his family:
Whether any relief granted pursuant to the Act would be reasonably likely to enable the applicant to meet his future liabilities in respect of the farm lands:
Any other matters that it deems relevant.
In cases where the Adjustment Commission dispossesses the mortgagor of a property, the Commission has power to sell such property with or without the right of purchase by the mortgagee.
The legislation in its application to farm mortgagors resembles in many respects the Rural Mortgagors Final Adjustment Act, 1934–35, which is consequentially repealed. A major difference is that final adjustment is made without any “stay” for five years under budgetary control as is provided for in the previous Act.
Under the present law all mortgagors or mortgagees (who are also entitled to apply for relief under its provisions), were required to lodge application on or before 31st January, 1937. Extension to not later than 28th February, 1937, was allowed in special circumstances. Full rights of foreclosure, &c., may be exercised in cases where no such application was lodged, since the Mortgagors and Tenants Relief Act is repealed from the date of passage of the present legislation. A saving provision protects mortgagors who have filed applications until such time as the applications have been disposed of by the Adjustment Commissions.
As indicated in the foregoing paragraphs, wide powers are given to the Adjustment Commissions (against whose decisions there is a right of appeal to the Court of Review) towards a final clearing-up of excessive indebtedness. Among the miscellaneous provisions of the Act of particular relevance to the question of farm indebtedness the following may be cited:—
An Adjustment Commission has power to give priority to moneys advanced in respect of farming operations on any farm coming within the scope of the Act—e.g., purchase of seeds, stock, &c. Similar arrangements may be made, where the Commission thinks fit, for securing new loans raised to increase the productive capacity of such lands. The compulsory reduction of interest on mortgages by 20 per cent. (but not to a rate below 5 per cent.) provided for in the National Expenditure Adjustment Act is made permanent; under previous legislation it was clue to expire on 31st March, 1937. A further section confers on a mortgagor the right to negotiate with the mortgagee for a reduction of interest on a mortgage still unexpired. If no agreement can be arrived at, the mortgagor has the right to discharge the debt by payment of the principal in cash and interest up till the date such payment is made.
State policy in respect of the provision of farming (and other) finance was materially altered from its traditional role by the Mortgage Corporation Act, which received assent on 5th April, 1935. The direct provision by the State of long-term finance for farming and other purposes, which had for so long been a feature of New Zealand financial structure, ceased. The present Government, which had opposed the Mortgage Corporation Bill when on the Opposition benches, passed the State Advances Corporation Act in June, 1936. The Act is described in Section XXIVD (State Advances). It is sufficient here to quote the following passage from the 1936 Budget, in which the Minister of Finance defines the objective of the present legislation:—
In a developing agricultural economy the question of farming finance is all important, and New Zealand is no exception. Over forty years ago the State initiated a policy whereby settlers were provided with finance at particularly low interest-rates and for long periods. This system has been the greatest single factor in developing New Zealand's farm lands.
Last year the Government then in office established a Mortgage Corporation, changed the old procedure, limited the scope of the legislation for social service, and introduced private shareholders and share capital and bonds not guaranteed by the State. As with the Reserve Bank, the Government has bought out the shareholders of the Mortgage Corporation, and the institution has again come under direct Government control and responsibility as the State Advances Corporation. Bonds will be State guaranteed, so that money may be raised at the lowest possible rates. Where it is necessary to assist a farmer in financial difficulties, or for purposes of providing homes for wage-earners, a high percentage of the security will be lent. There are safeguards so that loans cannot be used for speculation. The intention is to provide homes and farms for the people at low cost.
The amounts of money expended from the vote of the Department of Agriculture by way of advances, grants, subsidies, &c, towards the assistance (direct and indirect) of the farming industries of the Dominion totalled £388,245. in the financial year 1936–37, the corresponding total for 1935–36 being £310,588. The estimate for this item for the financial year 1937–38 is £467,387. The principal items of expenditure under this heading are shown below:—
| Item. | 1935–36. | 1936–37. | 1937–38. |
|---|---|---|---|
* Includes eradication of noxious weeds, £74,725; assistance to fruit-growers (local market), £40,000. | |||
| £ | £ | £ | |
| Carriage of lime | 70,324 | 99,290 | 96,000 |
| Carriage of fertilizers | 110,976 | 148,699 | 143,000 |
| Carriage of farm-produce | 44,321 | 49,527 | 48,000 |
| Subsidy on superphosphate deliveries | 33,062 | 14,264 | |
| Guarantee on exports of fruit | 12,500 | 12,500 | 25,000 |
| Other | 39,405 | 63,965 | 155,387* |
| Totals | 310,588 | 388,245 | 467,387 |
The above items cover certain miscellaneous expenditure of the Department of Agriculture, some portion of which is recoverable from other Departments, &c. The whole of the expenditure of the Department (£692,267 in 1936–37) is devoted directly or indirectly to the furtherance of farming and associated interests.
The amounts shown in respect of carriage of lime, fertilizers, and farm-products represent amounts paid out of the vote of the Agriculture Department to the Railways Department for the free carriage of lime by rail (which is a long-standing concession granted to farmers) and the cost of special concessions in freight rates on fertilizers and certain farm-products initiated during the depression period.
The falling-away in the use of artificial fertilizers in the autumn and winter of 1931 became so serious as to necessitate national action in an endeavour to restore the practice to an adequate level. The Government, therefore, in October, 1931, commenced a scheme of subsidizing the manufacture of superphosphates in order to reduce considerably the cost-price of this fertilizer to the farmers. This subsidy has been discontinued as from 1st July, 1936, the amount shown in the table in respect of 1936–37 being provided to meet claims up to 30th June, 1936.
As a measure of relief to rural producers, provision was made in the Finance Act (No. 4), 1931, for the payment to County Councils of a subsidy from the Main Highways Fund, the money to be applied to a reduction of 12½ per cent. in county rates levied during the financial year 1931–32. The total amount of subsidies paid to County Councils for this purpose was £250,814. In the 1934 session of Parliament a section was included in the Finance Act (No. 3) making provision for a refund of 12½ per cent. on certain rates levied during the financial year 1934–35. As was the case in 1921, the subsidy was paid to local authorities from the Main Highways Fund, the amounts so paid totalling £178,246. A similar subsidy was paid in 1935–36, the total amount paid in that year being £186,388. In the two latter instances the refund of rates applies both to lands used exclusively or principally for agricultural, horticultural, and pastoral purposes in counties or road districts, and to urban farm lands included in farm-land rolls; whereas the 1931 provision related to all lands used for farming or other purposes situated in counties.
The Agriculture (Emergency Powers) Act, 1934, contains, inter alia, provisions authorizing the expenditure of public moneys for the rehabilitation of the dairy industry. The specified purposes for which public moneys may be so applied include the reconstruction of dairy factories, the eradication of disease from dairy herds, and the general improvement of conditions in and about dairy farms.
While the recent progress of production in the major fields of farming enterprise in the Dominion suggests that the ultimate limit of production of dairy-products, mutton, lamb, and wool is not yet within sight, the growth of difficulties in finding export markets for these products has focussed attention on the possibilities of developing alternative avenues of farm production. Following is a brief outline of recent developments in that direction:—
Pig Products.—New Zealand has a surprisingly small pig population in relation to the number of dairy cattle. In recent years there has been a marked expansion in pig-raising, exports of frozen pork having quadrupled since the 1931–32 export season. The Dairy Commission (1934) in its report, pointed out that pig-production has been stimulated by the low prices ruling for butterfat rather than by recognition by dairy-farmers that pig-raising forms an integral part of the scientific management of dairy farms. While the Commission urged that greater attention should be paid by farmers to this branch of dairy production, and made specific recommendations towards that end, it drew attention to the difficulties of developing an export market for pig products. These difficulties have now been largely removed (vide page 376.)
A Dominion Advisory Pig Industry Committee was established in 1932 to place the industry on a sound footing. The Committee has drafted provisions (gazetted in 1933) for the adoption of a uniform system of grading for the local and export markets; while investigations have been conducted into pig-management methods generally, including the establishment of a pig-recording scheme on a national basis.
The Co-operative Pig-marketing Companies Act, passed in 1933, was designed to encourage the pig industry. By the Co-operative Dairy Companies Act, 1907, provision was first made for the registration of co-operative companies having for their principal object the manufacture of dairy-produce from milk supplied by shareholders. One of the special features of these co-operative companies is the statutory right to require the surrender of shares, and the power to reissue surrendered shares. The present Act is an adaptation, to meet the requirements of the newer industry, of the special provisions of the earlier Act relating to co-operative dairy companies.
Pig-recording clubs have been founded in some rural centres with a view to the selection of suitable breeding types. The movement has the encouragement of and financial assistance from the Meat Producers' Board.
In May, 1937, Cabinet approved of a levy of 2d. per pig on all pigs slaughtered, in order to provide an instructional and advisory service for the pig industry. The levy is expected to yield £8,000 per annum. Investigations are being carried out towards the adoption of a system of grading. By this means it is hoped to establish uniformity in lines of pigs, both for overseas markets and for local curers. The lack of uniform standards has hitherto been a serious hindrance to the development of the industry.
Chilled Beef.—Until recently New Zealand was hindered in the extension of its export trade in beef by the loss of “bloom” and other disadvantages of frozen beef as compared with the chilled product. The discovery of a satisfactory process by which beef may be kept in the chilled state for a much longer period of time than was previously possible has now permitted New Zealand's entry into world markets for chilled beef. An experimental shipment in February, 1933, opened up satisfactorily on arrival at the London market, and since then the chilled-beef industry has become definitely established; during 1936 240,433 cwt. (1935, 110,247 cwt.) were exported.
Poultry Industry.—Measures for the furthering of poultry-production have received a considerable amount of attention in recent years. The Poultry-runs Registration Act was passed in 1933 as a complementary measure to the Poultry Act, 1924. That Act was concerned with the avoidance of disease and the marketing of produce, while the later Act provides for the registration of all commercial poultry-runs whets more than twenty-five head of poultry are kept, and for the constitution of an elective Board whose general function is to organize and develop the poultry industry.
Egg-export committees have been set up in each of the four main centres to control the supply to the local market during the flush production-period by the export of a greater quantity of eggs during that period.
Tobacco Industry.—Considerable progress has been made in the growing of tobacco in the Dominion, the area under this crop having increased from 1,000 acres in 1928–29 to 2,126 acres in 1932–33, dropping during the next two seasons to 1,358 acres in 1934–35, but recovering to 1,518 acres in 1935–36, and to 2,132 acres in 1936–37 (a record).
An important measure affecting this industry was passed in the 1935 session of Parliament. The Act provides for the establishment of a Board to control the industry. Among the functions of the Board will be the granting of licenses to grow tobacco. Without such a license a grower is not permitted to grow tobacco. Raw tobacco is not to be sold, purchased, or manufactured except pursuant to a warrant issued by the Board. A sub-committee of the Board was set up in 1936 with a view to formulating a long-range plan for the tobacco-growing industry, while at the same time the Board is endeavouring to establish and maintain exports.
In November, 1936, the Government, by Order in Council, fixed the price of raw tobacco at 1s. per pound f.o.r. or f.o.b. growers' nearest port. This price operated until 31st March, 1937. In April, 1937, the price was fixed at 1s. 2d. per pound, which price operates until 31st March, 1938.
Consideration is being given to questions of research into diseases of the leaf and to grading; while a survey into costs of production is being carried out (October, 1937) with a view to fixing the prices for the 1937–38 season.
Passion-fruit Industry.—This is a recently established primary industry which has made considerable progress, particularly in North Auckland. While the market for the fruit is limited to local requirements, endeavours are being made to build up an export market for passion-fruit juice.
Citrus Industry.—By Order in Council dated 15 th December, 1932, the importations of all fruit and vegetables (other than dried, canned, pickled, pulped, or bottled fruit and vegetables) grown or produced in the Commonwealth of Australia was prohibited, save with the consent of the Minister of Customs.
This prohibition was varied in August, 1933, to allow South Australian oranges to enter the Dominion, the first shipment arriving on the 26th August in that year; while further importations have since been allowed, and virtually unrestricted import will be permitted in the off-season (December-March). Since the coming into force of these regulations a much improved local market has been obtained for New Zealand lemons, which has encouraged the growers to improve the curing and get-up of this fruit for the market.
By the instructions of the Minister of Industries and Commerce a survey of the grape-fruit industry was carried out during 1933. The local fruit is little known to the public, and is very low in price compared with the imported article. It is hoped that by improving the grading and packing of the fruit, and organizing the marketing on better lines, a much improved demand will be obtained, and that in time the local fruit will entirely replace the imported grape-fruit. This tree seems to be the hardiest of all the citrus family in New Zealand, and it has been successfully established over a considerable part of the North Island, more especially in the Auckland Province, and on a great variety of soils where aspect and shelter were favourable and a reasonable amount of manure and cultural attention given. With the development of the industry, New Zealand grape-fruit should fill a much more important place in the dietary of the people.
Tung Oil Industry.—In recent years considerable attention has been given to the growing of tung-trees in suitable localities in the Dominion. In 1931–32 there were 1,018 acres of these trees in New Zealand, the acreage in 1936–37 being 5,577.
Sugar-beet.—Consideration is being given by the Government to the establishment of a sugar-beet industry in New Zealand. To that end, the Department of Agriculture is carrying out trial growings of beet in suitable areas. The results of these experiments will afford the data necessary to determine the probable-success of beet-growing as a commercial proposition.
In the following paragraphs a brief statement is given of miscellaneous legislative enactments and other governmental action taken with the object of assisting the farming industry. In some instances the subjects are treated in a more condensed form than in the 1936 issue of the Year-Book, to which reference should be made for greater detail.
Agriculture (Emergency Powers) Act, 1934.—This Act was passed with a view to co-ordinating the activities of the various Boards marketing farm-produce; while, in addition, wide powers were granted the Executive Commission of Agriculture set up under the Act to take action towards the betterment of the farming industry generally. The administration of the Act is now in the hands of the Primary Products Marketing Department, to which the powers formerly vested in the Executive Commission of Agriculture have been transferred.
Land-tax Policy.—The previous Government abolished the system of graduated land-tax, with a view to lowering farm costs, during the depression period. The present Government's policy in relation to land-tax is described in Section XXIVB (Taxation). It involves a reversion to the graduated land-tax.
Mortgage Relief Legislation.—The pre-existing legislation has been replaced by the Mortgagors and Lessees Rehabilitation Act, described under a previous heading.
National Expenditure Adjustment Act, 1932.—The provisions of this Act reducing interest-rates have been largely rendered obsolete by the Mortgagors and Lessees Rehabilitation Act. In respect of unexpired mortgages, the reduction of interest by 20 per cent.—but not below 5 per cent.—provided for in the National Expenditure Adjustment Act has now been made permanent in cases to which it may still apply.
The Land Laws Amendment Act, 1931.—This Act, designed to afford relief to Crown tenants, is still in force; as is the Urban Farm Lands Rating Act, 1932, the purpose of which is to reduce the burden of rates on land situated within a borough and used for farming purposes.
Small Farms (Belief of Unemployment) Act, 1932.—This Act is designed to facilitate the settlement of unemployed on small holdings.
Valuation of Land Amendment Act, 1933.—The main purpose of this Act is to adjust inequalities in rating.
The Dairy Industry Amendment Act, 1933.—This Act prohibited the changeover of a factory supplier from one factory to another during the currency of a single season. Such changes were in practice often made between butter and cheese factories, the suppliers concerned endeavouring to take advantage of price-changes as between the pay-out for butter and cheese. The motive for such changes has largely disappeared with the fixation of a set-price difference between butter and cheese in the guaranteed-prices plan, now in operation.
Raising of the Exchange Rate.—The primary object of the raising of the rate from £100(Z.Z.) = £100 sterling to £125(N.Z.) = £100 sterling on 20th January, 1933, was the alleviation of the difficulties of the farming industry. This factor is no longer of import to the dairy-farmer, since guaranteed prices are in operation, but the maintenance of the high rate (£124 10s. since the 1st August, 1934) still continues to benefit other farm producers.
Fruit-export Guarantee Fund.—A section in the Finance Act, 1934—35, authorizes the New Zealand Fruit-export Control Board to establish a special reserve fund for the purpose of minimizing fluctuations in returns from exports of fruit. The Board is authorized to make advances from the fund on account of exports of fruit on the basis of a guaranteed price; and if the net amount realized from sales of such fruit does not cover the amount of the advance, the deficiency is treated as a loan to the producer. The Board is empowered to set off any such deficiency against surpluses accruing to the producer's account in subsequent years. In 1935–36 the Government contributed to the Fruit Board's fund on a pound-for-pound basis up to £12,500, and guaranteed up to 9s. per case (New Zealand currency) on fruit sold in new markets. A State guarantee of 10s. 6d. c.i.f. (New Zealand currency) applied to exports of fruit during the 1936–37 season.
Internal Marketing of Fruit and Vegetables.—Following the consideration by Cabinet of the report of a Committee on the fruit industry appointed by the Minister of Industries and Commerce, an announcement was made in July, 1937. of action contemplated to give effect to the major recommendations of the Committee. An amendment to the Primary Products Marketing Act (see page 376) is presaged, which amendment will bring fruit and vegetables within the provisions of the Act. It is not intended to assume governmental control of the produce marketed, but to direct the sale and distribution of produce through the various markets. A scheme is being formulated for the re-organization of marketing of these products.
Executive Commission of Agriculture.—The executive Commission of Agriculture has made considerable progress towards the rationalization of the farming industries of the Dominion. In particular, much has been done towards the elimination of overlapping in the collection of cream supplies; while the problem of redundant dairy factories in certain dairying districts is receiving attention.
Prices of Fertilizers.—Fertilizers form a very important element in farming-costs; and, since 1931, measures have been taken to keep prices of superphosphates as low as possible. Between October, 1931, and June, 1936, the Government subsidized the manufacture of superphosphates (see Government Subsidies ante); but, as from 1st July, 193G, payment of this subsidy has been discontinued. An alternative scheme has been introduced by regulations dated 14th July, 1936. In these regulations the price is fixed at £3 16s. per ton ex works in the North Island, with a rebate of 4s. 6d. per ton to merchants purchasing for re-sale and of 2s. per ton to dairy companies. For the South Island the prices are £4 2s. ex works in that Island, with rebates of 6s. 6d. to merchants and 4s. to dairy companies.
In the case of imported phosphatic fertilizers the selling-price is fixed at the landed cost plus 6 per cent. in the North Island and plus 8 per cent. in the South Island, additional allowance being made for carriage from the wharf to the place of delivery to the purchaser.
It is estimated by the Minister of Agriculture that the present arrangement represents a saving of £50,000 per annum to farmers in the Dominion as compared with the pre-existing position.
Fixation of Prices of various Farm-products.—Reference to the fixation of prices of various farm and other products will be found in the introductory portion of Section XXXVI: Prices.
Research Activities.—An account of recent developments in agricultural policy would not be complete without reference to the increasing attention being given to research work and its practical application towards the improvement of the quality of New Zealand's farm-produce. For example, seed certification has made great advances in recent years under the direction of the Agriculture Department. The certification of seed types is regarded as a very important step towards the elimination of undesirable strains and the wider use of varieties best suited to individual localities. Problems relating to the farming industry occupy a very important place in the research activities of the Department of Scientific and Industrial Research—soil surveys, research into the mineral-content of pastures, openness in cheese, wheat research, treatment of fruit-juices, plant research, and wool research being samples of the activities of various committees operating under the direction of this Department. An interesting innovation is the recent decision to conduct aerial surveys of various portions of the Dominion. The results of these surveys will provide valuable data for a number of purposes—e.g., defence, forestry—while they will form a valuable adjunct to the soil surveys which it is proposed to conduct in selected rural areas.
The investigation of problems affecting the wool industry has recently occupied the attention of the Governments of New Zealand, Australia, and South Africa. In furtherance of co-operative research, a levy on wool has been struck in each of the countries, the New Zealand levy being 6d. per bale.
Plans for the conducting of research into various aspects of the barley-growing industry are being formulated by a committee appointed by the Government.
In addition to the activities of the Departments of Agriculture and of Scientific and Industrial Research, cognate or related research is conducted by the Cawthron Institute at Nelson, the agricultural colleges at Palmerston North and Lincoln, and the Wheat Research Institute, Christchurch.
Recent Developments in Agrarian Policy.—As indicated in the preceding pages, many changes of importance in relation to farming problems have been made during recent months. The following résumé, in chronological order, indicates the principal events in this connection to date (10th September) during 1937:—
February.—Government takes over Flock House. Wages subsidy to farmers willing to train inexperienced youths between 18 and 20 years of age announced. Weekly cash wages payable by farmers: 18 to 19, £1 7s. 6d. (subsidy to farmer, 10s.): 19 to 20, £1 12s. 6d. (subsidy to farmer, 12s. 6d.): 20 to 21, £1 17s. 6d. (subsidy to farmer, 15s).
March.—Regulations issued providing for grading of onions, fixing wholesale prices thereof, and prohibiting imports except under license. Wages of farm and station hands: Agreement reached between representatives of workers and employers; subsequently incorporated in an Order in Council.
April.—Distribution of milk to school-children: Commencement made in Wellington. Butter-market: Control in Wellington District announced. Report of Committee of inquiry into the fruit and vegetable industry released.
May.—Levy of 2d. per head on all pigs killed brought into effect, with the object of providing an advisory and instructional service to pig industry. Announcement regarding possibilities of sugar-beet industry; results of preliminary trials satisfactory. Marginal payment of 2d. per pound in butterfat pay-out in favour of cheese announced for 1937–38 season; difference in 1936–37 season, 1½d.
June.—Arrangements announced for supply of butter-boxes for next season; satisfactory agreement reached with millers.
July.—Wholesale marketing in Hawke's Bay of butter, cheese, pork, bacon, and small products of dairy-farms taken over by a co-operative company. Meat agreement with United Kingdom announced. Record allocation of mutton and lamb imports from New Zealand. Announcement that Primary Products Marketing Act would be extended to cover fruit and vegetables. Pork quotas to United Kingdom announced; liberal quota allows for expansion of trade.
August.—Guaranteed prices for butter and cheese, 1937–38 season, announced. Extension of control of local wholesale marketing of butter to whole Dominion to operate from 1st November (previously applied to Wellington only).
As indicated in the general remarks included in the introductory portion of the preceding subsection, grassland products account for a very high proportion of the farm output of New Zealand. It must not be assumed, however, on this account that cropping is of minor importance in the economy of the Dominion. Practically the whole of the internal requirements of agricultural products are grown within the country, the only exceptions of note being tropical vegetable products—e.g., tea, sugar, cotton, bananas, &c. In former years wheat was imported in considerable quantities in years of poor harvests, but endeavours are being made to make New Zealand entirely self-supporting in respect of the supply of this major cereal crop.
Fruitgrowing is considerable; home requirements of all the important fruits and berries grown in temperate zones being satisfied by New Zealand orchard production. In the sub-tropical northern portion of New Zealand the growing of citrus fruits has made rapid advances during the past few years, while the grape is cultivated in certain localities. In addition to the supply of local consumption, a substantial export trade in apples—and to a lesser extent in pears—has been developed.
In rural New Zealand and in many urban localities the kitchen-garden supplies a very substantial proportion of family requirements of vegetables; while there is a substantial area planted in market gardens, both inside and outside borough boundaries. The major commercial cash vegetable crops are potatoes and onions, home supplies of the former being adequate, with, in many seasons, a material surplus. Although the importance of vegetable-growing in agricultural production cannot be measured (a material, though unknown, proportion being non-commercial), it will be realized that this branch of crop-production is of no mean consequence, in that the requirements of the people are supplied from New Zealand production.
Coincident with the growth of the stock-raising industries, there has been a considerable increase in areas sown for supplementary fodders. While practically throughout the whole Dominion animals can be grazed in open pasture for the full twelve months of the year, the whiter growth of grass, except in certain favoured localities, requires to be supplemented in order to keep stock in good condition during the colder months. In some districts supplementary fodders are necessary in the hottest summer months. Considerable areas are sown in turnips, mangolds, and green fodder crops—e.g., rape, chou-moellier—while hay and ensilage are produced in the normal routine of stock-farming operations. Lucerne, which corresponds to the alfalfa of certain other countries, is extensively grown. The supply of supplementary fodders is adequate both in quantity and quality, so that the Dominion does not import animal-feeding stuffs to any appreciable extent.
The renewal of pasturage requires the annual raising of very considerable supplies of grass-seeds, which are almost entirely grown in the Dominion. There is a small import of certain classes of seeds, but this is very inconsiderable in relation to requirements; while, on the other hand, a quite considerable export trade—particularly in perennial rye-grass seed—has been developed. While hay and ensilage crops are practically exclusively grown on the farms where they are consumed, there is some degree of localization in the growing of certain other supplementary fodder crops. The bulk of the turnip crop is grown in the South Island; this Island also predominating in the production of rape and kale, since the colder climate necessitates more extensive supplementary feeding than in the North Island.
Cereal-growing is localized to a very considerable extent, the fertile plains of Canterbury supplying upwards of 80 per cent. of New Zealand's wheat crop, almost half the quantity of oats threshed, a similar proportion of barley, and practically the whole linseed crop. Maize-growing is largely confined to three counties in the Auckland and Gisborne land districts, these localities proving very suitable for the production of this crop. The commercial growing of pulse crops is carried out extensively in Canterbury, and to a lesser extent in Marlborough, these land districts producing practically the whole annual yield. The districts of Canterbury, Otago, and Southland supply over 85 per cent. of the total production of grass-seeds. While the Canterbury land district produces the bulk of the commercial potato crop, the growing of potatoes for the early market is of considerable importance in the North Auckland and Auckland land districts.
Commercial orchards in New Zealand are largely confined to certain areas suited by climatic and soil conditions, while access to markets is also an important factor, particularly in respect of small fruits.
The Nelson district is famed for its apple-orchards, a high percentage of the crop from this district being exported. Again, Central Otago is very suited to the growing of stone fruits—notably apricots. In several other districts commercial orchard production is successfully carried out; special mention may be made of the growth of citrus culture in certain northern districts.
Grape-growing is of increasing importance in North Auckland, Auckland, and Hawke's Bay; while a considerable acreage of tung trees has been planted in the North Auckland district.
Tobacco-growing is mainly confined to the Waimea County, in the Nelson district,
A general summary of the areas under cultivation during each of the last ten years follows. The statistics quoted in this and other tables in this subsection relate to holdings of 1 acre or upwards outside borough boundaries. A classification of all occupied lands (including uncultivated areas) is included in the preceding section (Section XVII).
| Year. | Pasture Land.* | Field Crops. | Plantations.† | Orchards | Lying Fallow. | Other Cultivated Land. | Total Cultivated Land. |
|---|---|---|---|---|---|---|---|
* Excluding areas of grasses and clovers cut for seed, hay, or ensilage, which have been included in field crops. † Prior to 1934–35 large areas of State Forest plantations were excluded from the collections. | |||||||
| Acres. | Acres. | Acres. | Acres. | Acres. | Acres. | Acres. | |
| 1927–28 | 16,871,530 | 1,688,760 | 232,082 | 24,987 | 124,187 | 75,604 | 19,017,151 |
| 1928–29 | 16,855,512 | 1,745,592 | 265,911 | 24,538 | 117,944 | 80,604 | 19,090,101 |
| 1929–30 | 16,872,948 | 1,762,792 | 289,020 | 24,861 | 124,565 | 81,888 | 19,156,074 |
| 1930–31 | 16,513,765 | 1,936,149 | 341,591 | 28,134 | 108,415 | 78,824 | 19,006,878 |
| 1931–32 | 16,285,090 | 1,958,671 | 399,307 | 25,755 | 94,159 | 80,619 | 18,849,601 |
| 1932–33 | 16,221,324 | 2,191,670 | 409,860 | 25,317 | 96,018 | 89,436 | 19,033,625 |
| 1933–34 | 16,472,604 | 2,064,037 | 427,471 | 25,069 | 105,766 | 91,801 | 19,186,748 |
| 1934–35 | 16,501,811 | 1,981,804 | 781,684 | 25,087 | 115,832 | 96,301 | 19,502,519 |
| 1935–36 | 16,543,750 | 2,090,745 | 807,877 | 25,072 | 107,109 | 97,005 | 19,671,558 |
| 1936–37 | 16,610,903 | 1,918,855 | 815,965 | 24,856 | 118,843 | 98,584 | 19,588,006 |
In addition to the areas shown as under cultivation, there is a considerable area of occupied land still unimproved. In 1936–37 the total area of unimproved occupied land was 23,611,887 acres. Cultivated land accounted in 1930–37 for 45 per cent. of the total area in occupation, unimproved land accounting for the remaining 55 per cent. The classification of the unimproved land in 1936–37 was as follows: Phormium (New Zealand flax), 63,015 acres; tussock and other native grasses, 14,188,184 acres; fern, scrub, and second growth, 4,365,054 acres; native bush, 3,192,165 acres; barren and unproductive land, 1,803,469 acres. It will be noted that 63,015 acres of phormium—a productive asset—are included in the unimproved land; while, again, an appreciable proportion of the area under tussock and other native grasses is of some economic utility—e.g., for low-grade sheep-grazing, &c.
In the following pages statistics of the principal crops are quoted with explanatory comment. In addition to summary tables, covering in each instance a range of relived items, important individual crops are discussed under separate headings.
The areas under each of the principal field crops for the last five years have been as follows:—
| Crop. | 1932–33. | 1933–34. | 1934–35. | 1935–36. | 1936–37. |
|---|---|---|---|---|---|
* Including turnips and rape mixed. † Excluding wheat, oats, barley, and maize fed off. | |||||
| Acres. | Acres. | Acres. | Acres. | Acres. | |
| Wheat | 305,924 | 294,992 | 230,523 | 252,423 | 224,637 |
| Oats | 424,587 | 364,729 | 336,418 | 363,296 | 315,704 |
| Barley | 23,476 | 29,607 | 28,731 | 27,777 | 25,512 |
| Maize | 15,150 | 17,275 | 16,100 | 17,126 | 13,678 |
| Peas | 22,370 | 30,362 | 25,366 | 24,428 | 17,512 |
| Beans | 93 | 263 | 127 | 177 | 231 |
| Linseed | 333 | 1,441 | 2,930 | 1,806 | 614 |
| Potatoes | 24,605 | 25,028 | 23,001 | 22,958 | 22,462 |
| Turnips* | 472,995 | 478,652 | 449,513 | 441,854 | 431,349 |
| Mangolds | 11,961 | 13,745 | 11,211 | 13,210 | 10,279 |
| Onions | 1,134 | 1,112 | 923 | 928 | 719 |
| Tobacco | 2,126 | 1,803 | 1,358 | 1,518 | 2,132 |
| Green fodder† | 184,992 | 201,508 | 193,942 | 207,212 | 210,662 |
| Grasses and clovers for seed | 135,962 | 93,344 | 133,933 | 134,405 | 96,577 |
| Grasses and clovers for hay, ensilage, &c. | 526,469 | 470,412 | 484,751 | 536,018 | 504,253 |
| Lucerne | 35,867 | 35,906 | 39,087 | 40,857 | 38,802 |
| Other crops | 3,626 | 3,858 | 3,890 | 4,752 | 3,732 |
| Totals | 2,191,670 | 2,064,037 | 1,981,804 | 2,090,745 | 1,918,855 |
The figures quoted in the above table relate to the total area under each field crop. It should be noted that a considerable portion of the area under certain crops, particularly oats, is fed-off and not threshed.
Details of areas, total yields, and yields per acre of the principal grain and pules crops during the last ten years are set out in the following table:—
| Year. | Wheat. | Oats. | Barley. | Maize. | Peas. | Linseed. |
|---|---|---|---|---|---|---|
* Including beans. | ||||||
| AREAS FOR THRESHING. | ||||||
| Acres. | Acres. | Acres. | Acres. | Acres. | Acres. | |
| 1927–28 | 260,987 | 88,223 | 21,091 | 10,291 | 25,128* | 5,213 |
| 1928–29 | 255,312 | 73,101 | 19,500 | 8,986 | 17,893 | 2,800 |
| 1929–30 | 235,942 | 67,722 | 18,229 | 7,957 | 9,855 | 7,757 |
| 1930–31 | 249,014 | 87,152 | 23,952 | 7,168 | 10,558 | 12,200 |
| 1931–32 | 268,756 | 68,690 | 18,245 | 5,965 | 14,701 | 1,765 |
| 1932–33 | 302,531 | 116,206 | 16,336 | 8,153 | 22,370 | 333 |
| 1933–34 | 286,271 | 78,343 | 21,024 | 8,256 | 30,362 | 1,441 |
| 1934–35 | 225,389 | 52,516 | 18,441 | 7,946 | 25,366 | 2,930 |
| 1935–36 | 248,639 | 77,502 | 20,659 | 7,517 | 24,428 | 1,806 |
| 1936–37 | 221,790 | 74,772 | 20,544 | 6,679 | 17,512 | 614 |
| Year. | Wheat. | Oats. | Barley. | Maize. | Peas. | Linseed. |
|---|---|---|---|---|---|---|
* Including beans. † Bushel equivalents in lbs.: Wheat, 60: Oats, 40; Barley, 50; Maize, 56; Peas, 60. | ||||||
| TOTAL YIELDS.† | ||||||
| Bushels. | Bushels. | Bushels. | Bushel. | Bushels. | Cwt. | |
| 1927–28 | 9,541,444 | 3,852,687 | 861,985 | 482,928 | 802,416* | 31,265 |
| 1928–29 | 8,832,864 | 3,065,113 | 781,102 | 456,296 | 527,504 | 23,227 |
| 1929–30 | 7,239,556 | 3,002,288 | 755,007 | 377,955 | 294,242 | 70,377 |
| 1930–31 | 7,579,153 | 3,376,609 | 837,696 | 316,845 | 241,402 | 87,344 |
| 1931–32 | 6,582,698 | 2,818,152 | 537,398 | 258,612 | 309,383 | 12,757 |
| 1932–33 | 11,054,972 | 5,132,183 | 561,017 | 389,432 | 585,418 | 2,705 |
| 1933–34 | 9,036,017 | 3,242,500 | 730,963 | 373,212 | 698,293 | 12,564 |
| 1934–35 | 5,933,245 | 1,890,145 | 484,689 | 373,219 | 436,534 | 17,208 |
| 1935–36 | 8,859,223 | 3,302,642 | 745,380 | 321,222 | 562,733 | 11,535 |
| 1936 37 | 7,168,963 | 3,525,430 | 746,948 | 301,963 | 480,987 | 4,567 |
| YIELDS PER ACRE.† | ||||||
| Bushels. | Bushels. | Bushels. | Bushels. | Bushels. | Cwt. | |
| 1927–28 | 36.56 | 43.66 | 40.87 | 46.93 | 31.93* | 6.00 |
| 1928–29 | 34.60 | 41.93 | 40.06 | 50.78 | 29.48 | 8.30 |
| 1929–30 | 30.68 | 44.33 | 41.42 | 47.50 | 29.86 | 9.07 |
| 1930–31 | 30.44 | 38.74 | 34.97 | 44.20 | 22.86 | 716 |
| 1931–32 | 24.49 | 41.03 | 29.45 | 43.35 | 2,105 | 7.23 |
| 1932–33 | 36.54 | 44.16 | 34.34 | 47.77 | 26.17 | 8.12 |
| 1933–34 | 31.56 | 41.39 | 34.77 | 45.20 | 2,300 | 8.72 |
| 1934–35 | 26.32 | 35.99 | 26.28 | 46.97 | 17.21 | 5.87 |
| 1935–36 | 35.63 | 42.61 | 36.08 | 42.73 | 2,304 | 6.39 |
| 1936–37 | 32.32 | 47.15 | 36.36 | 45.21 | 27.47 | 7.44 |
As will be seen from the above table, wheat (221,790 acres in 1936–37) and oats (74,772 acres in 1936–37) are the grain crops of major importance, these two accounting for 86½ per cent. of the total area under grain and pulse crops for threshing, in the proportions of 64½ per cent. and 22 per cent. respectively. Barley, peas, maize, and linseed follow in that order, representing in all a further 13 per cent.
Minor crops for threshing in 1936–37 included 378 acres of lupins, 267 acres of rye-corn, and 231 acres of beans, the respective yields in bushels being 9,198, 4,923, and 3,966 respectively.
Further statistical details of wheat and oats, the two most important grain crops, follow.
Wheat is the most important grain crop grown in New Zealand. The industry enjoys a sliding scale of Customs duties levied on imports of wheat and flour (vide Section XD: Customs Tariff and Revenue). Even so, wheat production has frequently failed to reach Dominion requirements. Imports of wheat have fluctuated considerably from year to year, as shown in the table appearing under the heading “Consumption of Wheat and Flour.” During the five-year period covered by the table, net imports of wheat averaged 300,000 bushels annually.
The Government is encouraging wheat-growing with a view to making New Zealand entirely self-sufficient in respect of requirements of wheat and wheaten products. An Order in Council which came into force in March, 1936, prohibits the importation of wheat or wheaten flour, except under permit granted by the Minister of Industries and Commerce. With a view to reducing imports of Grade A wheats now necessary for mixing purposes the Wheat Research Institute is endeavouring to encourage the growing in New Zealand of better-quality varieties which do not require blending with imported wheats. With this object in view breeding work is carried out by the Institute, and many promising lines have reached the stage of field trial. A new variety (Cross 7) which has exhibited very desirable qualities for baking, a good yield, and resistance to wind damage, was evolved by the Wheat Research Institute in 1934. Tainui, a variety originating from Portugal, has also given promise of superior quality combined with high yield, and is likely to become an important variety for spring sowing.
Canterbury is the centre of the wheat-growing industry. In the 1936–37 season 84 per cent. of all wheat threshed in the Dominion was grown in that district. Otago is the only other district of any importance as regards wheat, its quota of production in 1936–37 amounting to 10 per cent. of the Dominion total.
Pre - harvest estimates of areas in wheat, oats, barley, and potatoes are published annually in October, followed in February by a forecast of probable production. In the case of wheat, the 1936–37 area under this crop was estimated in October, 1936, at 222,000 acres. The grain yield was estimated in February, 1937, at 7,150,000 bushels. The actual figures were 221,790 acres and 7,168,963 bushels respectively.
CONSUMPTION OF WHEAT AND FLOUR.
| — | 1932. | 1933. | 1934. | 1935. | 1936. |
|---|---|---|---|---|---|
* Excess of exports over imports. | |||||
| Wheat (bushel of 60 lb.). | |||||
| Bushels. | Bushels. | Bushels. | Bushels. | Bushels. | |
| Wheat-production at preceding harvest | 6,582,698 | 11,054,972 | 9,036,017 | 5,933,245 | 8,859,223 |
| Excess of imports over exports | 1,361,250 | –639,019* | 111,725 | 257,777 | 406,882 |
| Change in carry-over | 7,943,948 — 495,735 | 10,415,953 2,531,654 | 9,147,742 136,956 | 6,191,022 – 2,181,926 | 9,266,105 624,696 |
| Estimated total consumption | 8,439,683 | 7,884,299 | 9,010,786 | 8,372,948 | 8,641,409 |
| Converted to flour | 6,140,229 | 6,413,952 | 6,307,872 | 0,341,855 | 6,368,610 |
| Used for sowing (estimated) | 458,886 | 442,488 | 345,785 | 378,635 | 330,956 |
| Apparent farm and other consumption | 1,840,568 | 1,027,859 | 2,357,129 | 1,652,458 | 1,935,843 |
| Flour (ton of 2,000 lb.). | |||||
| Tons. | Tons. | Tons. | Tons. | Tons. | |
| Production | 130,721 | 133,624 | 131,414 | 134,067 | 132,987 |
| Excess of imports over exports | 12,835 | 10,989 | 10,791 | 12,229 | 7,571 |
| Change in carry-over | +2,445 | +359 | +466 | +1,054 | –2,274 |
| Apparent consumption | 141,111 | 144,254 | 141,739 | 145,242 | 142,832 |
Based upon the figures in the preceding table, the average annual consumption of wheat is approximately 8,500,000 bushels. Of this total, somewhat under 6,500,000 bushels are converted into flour, about 400,000 bushels are utilized for the next season's sowings, and about 1,800,000 bushels are used as poultry-food, pig-food, or for other purposes.
Although, as stated above, wheat is the most important grain crop of New Zealand, the area under oats exceeds that under wheat. Of the total area under oats in 1936–37, 87½ per cent. was grown in Canterbury, Otago, and Southland, 5 per cent. in the remainder of the South Island, and 7½ per cent. in the North Island. The greater portion of the oat crop is usually converted into chaff without threshing, but the proportion so dealt with depends partly on the condition of the crop and partly on market conditions. In 1932–33, 27.37 per cent. of the area harvested was threshed: in 1933–34, 21.48 per cent; in 1934–35, 15.61 per cent.; in 1935–36, 21.33 per cent.; and in 1930–37, 23.68 per cent. Canterbury yielded 50 per cent. of the total grain produced in 1930–37, followed by Southland with 20 per cent. and Otago with 20 per cent., these three districts together accounting for 90 per cent. of the total oat-grain yield.
The total and average yields of oaten grain and of chaff, hay, or ensilage for the last ten seasons were as follows:—
| Season. | Grain. | Chaff, Hay, or Ensilage. | ||
|---|---|---|---|---|
| Total Yield. | Average per Acre. | Total Yield. | Average per Acre. | |
* Bushel of 40 lb. | ||||
| Bushels.* | Bushels.* | Tons. | Tons. | |
| 1927–28 | 3,852,687 | 43.66 | 344,322 | 1.71 |
| 1928–29 | 3,065,113 | 41.93 | 333,220 | 1.71 |
| 1929–30 | 3,002,288 | 44.33 | 314,734 | 1.65 |
| 1930–31 | 3,376,609 | 38.74 | 367,198 | 1.64 |
| 1931–32 | 2,818,152 | 41.03 | 309,301 | 1.35 |
| 1932–33 | 5,132,183 | 44.16 | 453,503 | 1.75 |
| 1933–34 | 3,242,500 | 41.39 | 357,862 | 1.64 |
| 1934–35 | 1,890,145 | 35.99 | 315,589 | 1.42 |
| 1935–36 | 3,302,642 | 42.61 | 390,168 | 1.72 |
| 1930–37 | 3,525,430 | 47.15 | 326,672 | 1.74 |
Early in the 1936–37 season only a normal average grain-yield was anticipated, adverse weather conditions prevailing at that time, but a marked general improvement occurring later resulted in a higher average yield than has hitherto been obtained, with the possible exception of the 1911–12 season. In that season, however, the estimated average yield was not verified by a subsequent collection, and the possibility of an over-estimation is therefore apparent.
The production of potatoes is normally adequate to meet the home market. In many seasons the crop has been more than sufficient for home requirements, and exports have been made in considerable quantities. The problem of disposal of such surplus quantities has been rendered difficult in more recent seasons by import restrictions on New Zealand potatoes entering Australia. This difficulty and the problem of utilization of potatoes which are too small for commercial use has directed attention to the possibility of establishing a potato-flour industry, but as yet no definite action has been taken. During 1937 considerable quantities of potatoes have been exported to the Argentine on account of the failure of the South American potato crop. In 1936–37 56 per cent. of the total potato area was in the Canterbury land district. The Dominion figures for the last ten years are as follows:—
| Year. | Area. | Total Yield. | Yield per Acre. |
|---|---|---|---|
| Acres. | Tons. | Tons. | |
| 1927–28 | 21,693 | 121,402 | 5.59 |
| 1928–29 | 21,304 | 123,607 | 5.77 |
| 1929–30 | 23,214 | 130,107 | 5.60 |
| 1930–31 | 28,459 | 151,525 | 5.32 |
| 1931–32 | 23,786 | 116,743 | 4.91 |
| 1932–33 | 24,605 | 129,079 | 5.25 |
| 1933–34 | 25,028 | 131,045 | 5.24 |
| 1934–35 | 23,001 | 109,123 | 4.74 |
| 1935–36 | 22,958 | 121,004 | 5.27 |
| 1936–37 | 22,462 | 126,314 | 5.62 |
The total yield of 126,314 tons in 1936–37 was made up of 87,520 tons of table potatoes, 26,703 tons of seed potatoes, and 12,091 tons of pig, &c., potatoes. The corresponding quantities in 1935–36 were 83,623 tons, 25,005 tons, and 12,376 tons.
A substantial area is planted annually in onions, and there is an appreciable export in the flush of the season. Later in the year, however, substantial quantities are imported; and, as indicated below, there is normally an excess of imports over the whole year. Local production of this commodity thus fails to reach home requirements. Areas, yields, and net importations for the last ten years are as follows:—
| Year. | Area. | Total Yield. | Yield per Acre. | Net Importations (Calendar Year). |
|---|---|---|---|---|
* Not available. † Excess of exports. | ||||
| Acres. | Tons. | Tons. | Tons. | |
| 1927–28 | 703 | 6,117 | 8.70 | 2,531 |
| 1928–29 | 880 | 10,655 | 12.07 | 230 |
| 1929–30 | 870 | 10,263 | 11.80 | 2,444 |
| 1930–31 | 771 | 5,803 | 7.52 | 5,217 |
| 1931–32 | 874 | 7,097 | 8.12 | 206 |
| 1932–33 | 1,134 | 9,203 | 8.12 | 50 |
| 1933–34 | 1,112 | 9,452 | 8.50 | -964† |
| 1934–35 | 923 | 5,592 | 6.06 | 2,546 |
| 1935–36 | 928 | 7,089 | 7.64 | 1,359 |
| 1936–37 | 719 | 5,930 | 8.25 | * |
With a view to stabilizing the industry and ensuring to the growers a steady market at reasonable prices, regulations were issued in March, 1937, under the Board of Trade Act, 1919, setting out certain gradings and specified prices pertaining to all subsequent wholesale dealings in onions. In order to gauge the relationship between supplies and market requirements, the regulations require the furnishing of monthly statements by all growers of ¼ acre or more of onions and by all persons other than onion-growers engaged in the wholesale sale of onions. Imports are how prohibited except with the consent of the Minister of Customs.
Although grass is the main crop of the farmer in New Zealand, it has been found that at certain periods during the year the pastures need supplementing in order that the grassland may not become unduly exhausted, and also in order to maintain stock in a satisfactory condition. In midwinter the grass is at a low-stage of productivity generally, while under dry summer conditions it loses a great amount of its nutritive value. During these periods, therefore, it is necessary that some extra feed should be provided, and this is usually done either by cutting the grass for hay or ensilage when there is an ample surplus on the pastures during the flush of the growing season, or by the provision of green fodder or root crops.
The following table gives detailed figures of the areas of the supplementary fodder crops available during each of the last ten years:—
| Year. | Chaff, Hay, or Ensilage. | Green Fodder. | Root Crops for feeding to Stock. | Total Area of Fodder Crops. | ||
|---|---|---|---|---|---|---|
| Cereal Crops. | Grasses and Clovers, including Lucerne. | Wheat and Oats not harvested. | Other Crops. | |||
| Acres. | Acres. | Acres. | Acres. | Acres. | Acres. | |
| 1927–28 | 203,838 | 280,241 | 14,669 | 216,702 | 472,101 | 1,187,551 |
| 1928–29 | 196,545 | 351,107 | 16,683 | 219,088 | 491,842 | 1,275,265 |
| 1929–30 | 192,660 | 412,588 | 26,240 | 203,438 | 486,969 | 1,321,895 |
| 1930–31 | 228,215 | 443,088 | 56,735 | 190,979 | 506,143 | 1,425,160 |
| 1931–32 | 232,925 | 464,160 | 75,826 | 212,664 | 493,789 | 1,479,364 |
| 1932–33 | 262,970 | 562,336 | 50,300 | 197,633 | 486,800 | 1,560,039 |
| 1933–34 | 221,644 | 506,318 | 74,688 | 217,885 | 494,643 | 1,515,178 |
| 1934–35 | 225,521 | 523,838 | 64,706 | 211,195 | 462,995 | 1,488,255 |
| 1935–36 | 231,036 | 576,875 | 60,023 | 222,458 | 458,265 | 1,548,657 |
| 1936–37 | 190,238 | 543,055 | 54,685 | 220,211 | 443,969 | 1,452,158 |
In 1936–37 grasses and clovers cut for hay or ensilage totalled 504,253 acres, and lucerne 38,802 acres. Oats was the only cereal crop utilized in any quantity for this purpose, the area of oats cut for hay or ensilage being 187,694 acres. The principal green-fodder crops, apart from oats, are rape and/or kale (195,747 acres), and chou moellier (10,148 acres). The area under chou moellier has doubled itself over the last eight years, and the crop is becoming increasingly popular for fodder purposes. Of the cereal crops fed-off to stock during the past year, oats accounted for 53,238 acres of the total area (190,238 acres). Turnips are the principal root crop grown in the Dominion, the total acreage in 1930–37 being 431,349 acres (including 59,864 acres of turnips and rape mixed). Other root crops included 10,279 acres of mangolds and 1,207 acres of carrots and parsnips. Pumpkins and marrows were grown for fodder to the extent of 1,134 acres.
The total and per-acre yields obtained from the various crops cut for chaff, hay, or ensilage are as follows for the last two seasons. In the cases of grasses and clovers cut for hay or ensilage, second or catch crops are taken into account in the yield figures, the total yield including crop from areas which had previously yielded some other crop in the season concerned. These areas cannot be counted twice in the statistics of acreage, and average yields cannot therefore be obtained by the mere division of the total yield by the area figures.
| Crop. | 1935–36. | 1936–37. | ||
|---|---|---|---|---|
| Total Yield. | Yield per Acre. | Total Yield. | Yield per Acre. | |
| Tons. | Tons. | Tons. | Tons. | |
| Wheat | 3,862 | 1.86 | 2,786 | 1.99 |
| Oats | 390,168 | 1.72 | 326,672 | 1.74 |
| Barley | 1,895 | 2.05 | 1,710 | 2.46 |
| Maize | 4,149 | 7.44 | 2,115 | 4.70 |
| Grasses and clovers for hay | 851,263 | 1.88 | 805,835 | 1.89 |
| Grasses and clovers for ensilage | 334,759 | 4.05 | 311,542 | 3.95 |
| Lucerne | 118,479 | 2.90 | 109,643 | 2.83 |
The total area of grasses and clovers cut for seed during the year 1936–37 was 96,577 acres, yielding 809,703 bushels of 20 lb., as against 1,727,233 bushels from 134,405 acres in 1935–36. Canterbury, Otago, and Southland land districts between them provided 88 per cent. of the area cut.
The areas and yields of the principal grass and clover crops harvested for seed during each of the ten years 1927–28 to 1936–37 are given in the tables following:—
AREAS.
| Year. | Rye-grass. | Cocksfoot. | Chewings Fescue. | Crested Dogstail. | Red Cover and Cow-grass. | White Clover. | Brown-top.* |
|---|---|---|---|---|---|---|---|
* Not available prior to 1930–31. | |||||||
| Acres. | Acres. | Acres. | Acres. | Acres. | Acres. | Acres. | |
| 1927–28 | 23,545 | 11,493 | 10,021 | 8,948 | 7,887 | 2,294 | |
| 1928–29 | 26,343 | 11,255 | 9,506 | 5,702 | 9,750 | 3,338 | |
| 1929–30 | 30,055 | 11,729 | 9,808 | 3,404 | 4,703 | 3,710 | |
| 1930–31 | 47,942 | 14,001 | 10,593 | 3,312 | 3,323 | 3,339 | 5,158 |
| 1931–32 | 30,141 | 9,437 | 13,010 | 2,696 | 3,867 | 2,423 | 10,758 |
| 1932–33 | 86,924 | 11,293 | 9,426 | 2,935 | 10,633 | 4,360 | 8,465 |
| 1933–34 | 45,930 | 9,496 | 7,834 | 2,699 | 11,565 | 6,698 | 7,936 |
| 1934–35 | 66,448 | 12,309 | 11,294 | 3,475 | 13,496 | 10,292 | 15,140 |
| 1935–36 | 66,625 | 13,516 | 13,768 | 6,546 | 10,654 | 6,584 | 14,936 |
| 1936 -37 | 29,667 | 12,973 | 11,467 | 4,961 | 11,578 | 9,237 | 15,579 |
A considerable export of grass-seed has been built up during recent years, especially with the United Kingdom, Australia, and the United States of America, the quantity exported to these countries in 1936 amounting to 74,028 cwt., valued at £229,263. The total quantity of locally-produced grass and clover seed exported to all countries amounted to 79,982 cwt., with a recorded value of £249,861.
YIELDS.
| Year | Rye-grass. | Cocksfoot. | Chewings Fescue. | Crested Dogstail. | Red Clover and Cow-grass. | White Clover. | Brown-top.* |
|---|---|---|---|---|---|---|---|
* Not available prior to 1930–31. † Of 20 lb. | |||||||
| Bushels.† | lb. | lb. | lb. | lb. | lb. | lb. | |
| 1927–28 | 523,412 | 1,992,377 | 2,684,601 | 2,116,488 | 2,041,413 | 399,298 | |
| 1928–29 | 564,511 | 2,048,832 | 2,723,124 | 1,276,785 | 1,936,088 | 566,395 | |
| 1929–30 | 641,316 | 2,009,970 | 2,416,381 | 828,894 | 1,040,022 | 604,874 | |
| 1930–31 | 987,466 | 2,666,280 | 2,337,070 | 575,664 | 647,949 | 574,224 | 412,273 |
| 1931–32 | 466,873 | 919,911 | 2,383,941 | 491,348 | 786,782 | 284,333 | 311,358 |
| 1932–33 | 1,796,974 | 2,335,497 | 2,295,763 | 708,609 | 1,738,218 | 568,888 | 188,531 |
| 1933–34 | 758,180 | 724,684 | 1,403,151 | 458,220 | 1,838,736 | 834,552 | 268,877 |
| 1934–35 | 1,095,882 | 1,876,386 | 1,214,230 | 459,588 | 1,894,965 | 1,335,414 | 390,318 |
| 1935–36 | 1,281,710 | 2,374,909 | 2,365,951 | 1,015,956 | 1,807,076 | 786,280 | 299,845 |
| 1936–37 | 412,414 | 1,843,701 | 1,779,420 | 719,999 | 1,882,891 | 1,088,081 | 418,481 |
Grass is by far the most important crop to the farmer, the soils, the climate, and other natural conditions obtaining in the Dominion being very favourable for the growth of grass. Wherever there is light and moisture English grasses thrive when the natural bush and fern are cleared off, and, from the mildness of the winter season, there are very few places where there is not some growth even in the coldest mouths of the year, enabling cattle to be kept all the year round in the open.
At the beginning of the year 1937 there were 17,509,454 acres under artificially sown grasses (including 639,632 acres cut for seed, hay, or ensilage during the preceding season), and in addition 14,188,184 acres of occupied land still remained in tussock or other native grasses, making a total of 31,697,638 acres of grassland in occupation. The following table shows the respective areas occupied by artificially sown grasses and tussock and other naturally established native grasses during the last ten years:—
| Year. | Artificially Sown Pasture Grasses. | Tussock and other Native Grasses. | Total Area under Grass. | |
|---|---|---|---|---|
| Cut for Seed, Hay, or Ensilage. | Not Cut for Seed, Hay, or Ensilage. | |||
| Acres. | Acres. | Acres. | Acres. | |
| 1927–28 | 345,922 | 16,871,530 | 14,091,717 | 31,309,169 |
| 1928–29 | 419,124 | 16,855,512 | 14,131,630 | 31,406,266 |
| 1929–30 | 479,443 | 16,872,948 | 14,182,142 | 31,534,533 |
| 1930–31 | 532,272 | 16,722,213 | 14,124,030 | 31,378,515 |
| 1931–32 | 537,742 | 16,494,917 | 14,294,463 | 31,327,122 |
| 1932–33 | 698,298 | 16,422,163 | 14,137,375 | 31,257,836 |
| 1933–34 | 599,662 | 16,736,828 | 14,014,177 | 31,350,667 |
| 1934–35 | 657,771 | 16,730,403 | 14,184,044 | 31,572,218 |
| 1935–36 | 711,280 | 16,784,822 | 14,242,407 | 31,738,509 |
| 1936–37 | 639,632 | 16,869,822 | 14,188,184 | 31,697,638 |
During the year 1936–37, 09,707 acres of land which had not previously been cultivated were sown down in new pasture, as against 76,672 acres in 1935–36.
As shown in the following table, a total area of 3,326,279 acres of grassland was top-dressed during the twelve months ended 31st January, 1937, an increase of 444,055 acres as compared with the area returned as top-dressed during the preceding twelve months. The figures relate to grassland top-dressed only, fertilizers used in connection with field crops not being included.
| Nature of Top-dressing. | North Island. | South Island. | Dominion. |
|---|---|---|---|
| Acres. | Acres. | Acres. | |
| Artificial fertilizers only | 1,884,729 | 237,657 | 2,122,386 |
| Lime only | 88,213 | 88,550 | 176,763 |
| Both artificial fertilizers and lime | 808,883 | 218,247 | 1,027,130 |
| Totals | 2,781,825 | 541,454 | 3,326,279 |
Top-dressing in New Zealand is carried out mainly on cattle-grazing areas, including, of course, dairy-farms; consequently the North Island, which contains 86 per cent. of the Dominion's cattle, accounts for 84 per cent. of the area top-dressed.
The rapid advance top-dressing has made in the Dominion is evidenced by the following table, showing the areas top-dressed over the last ten years:—
| Year. | Area Top-dressed. | |||
|---|---|---|---|---|
| With Artificial Fertilizer only. | With Lime only. | With both Artificial Fertilizer and Lime. | Total Area Top-dressed. | |
* Not available. | ||||
| Acres. | Acres. | Acres. | Acres. | |
| 1927–28 | * | * | * | 1,952,490 |
| 1928–29 | * | * | * | 2,385,182 |
| 1929–30 | * | * | * | 2,650,748 |
| 1930–31 | * | * | * | 2,871,316 |
| 1931–32 | * | * | * | 2,454,321 |
| 1932–33 | 1,741,035 | 102,952 | 594,127 | 2,438,114 |
| 1933–34 | 1,469,537 | 116,234 | 663,399 | 2,249,170 |
| 1934–35 | 1,703,325 | 145,986 | 834,803 | 2,684,114 |
| 1935–36 | 1,798,714 | 150,585 | 932,585 | 2,881,884 |
| 1936–37 | 2,122,386 | 176,763 | 1,027,130 | 3,326,279 |
The activities of the Department of Agriculture in the treatment of experimental plots in the various aspects of soil and crop requirements, and the subsequent data published thereon, has undoubtedly been an important factor in conveying to the farmer the many advantages to be derived from the scientific treatment of pastures, especially in this regard. That the farmer realizes these advantages is apparent from the increased use being made of top-dressing.
In 1936–37 there were 7,795 acres in market gardens. There were 5,577 acres in tung trees, 652 acres in hop-vines, 460 acres of grape-vines, and 497 acres of passion-fruit vines. Nurseries and seed-gardens occupied 955 acres, while 82,648 acres were in private gardens, grounds, &c. The area in plantations (not virgin bush) was 815,965 acres, made up of 797,721 acres of conifers and 18,244 acres of eucalyptus and other broadleaved trees. State plantations are covered by these figures.
It should be noted that these statistics relate to holdings of 1 acre or upwards outside boroughs, as do all other figures in this subsection.
The figures for market gardens, plantations, &c., for the last ten years are as follows:—
| Year. | Market Gardens. | Nurseries, &c. | Private Gardens, &c. | Plantations. |
|---|---|---|---|---|
| Acres. | Acres. | Acres. | Acres. | |
| 1927–28 | 5,655 | 489 | 68,566 | 232, 083 |
| 1928–29 | 5,855 | 582 | 73,263 | 293,911 |
| 1929–30 | 5,871 | 657 | 74,434 | 289,020 |
| 1930–31 | 6,684 | 1,004 | 70,208 | 341,591 |
| 1931–32 | 7,614 | 984 | 76,247 | 399,307 |
| 1932–33 | 6,852 | 1,003 | 77,886 | 409 860 |
| 1933–34 | 6,634 | 888 | 79,160 | 427,471 |
| 1934–35 | 7,284 | 1,276 | 81,694 | 781,684 |
| 1935–36 | 7,905 | 1,013 | 81,598 | 807,877 |
| 1936 37 | 7,795 | 955 | 82,648 | 815,965 |
A great impetus to the planting of fruit-trees was given by the discovery some years ago that tracts of land, principally in the Nelson land district, which formerly were looked on as being practically useless, were eminently suited for growing fruit, particularly apples. For a time, considerable areas of this and other land were annually added to the Dominion's orchards, but the acreage then declined until it became stabilized in the neighbourhood of the present figure.
In recent years there has been a considerable increase in the area devoted to citrus-culture. The total area under lemons and oranges is estimated to be about 1,615 acres (inclusive of areas situated within borough boundaries), comprising 1,091 acres of lemons and 524 acres of oranges. At the 1st October, 1936, registered orchards contained 96,034 lemon-trees and 46,153 orange-trees, compared with respective totals of 91,000 and 40,900 a year earlier.
The following table shows the area outside borough boundaries which has been returned as under fruit-tree's at each of the last ten annual enumerations:—
| Acres. | |
|---|---|
| 1927–28 | 24,987 |
| 1928–29 | 24,538 |
| 1929–30 | 24,861 |
| 1930–31 | 28,134 |
| 1931–32 | 25,755 |
| 1932–33 | 25,317 |
| 1933–34 | 25,069 |
| 1934–35 | 25,087 |
| 1935–36 | 25,072 |
| 1936–37 | 24,856 |
A classification of 1936–37 orchard areas by sizes (the classification being made to the nearest quarter acre) resulted as follows:—
| Size of Orchard. | Number of Orchards. | Area of Orchards. |
|---|---|---|
| Acres. | ||
| Under 1 acre | 6,318 | 2,516 |
| 1 to 2 acres | 3,051 | 3,750 |
| 2¼ to 3 acres | 349 | 980 |
| 3¼ to 4 acres | 221 | 846 |
| 4¼ to 5 acres | 193 | 940 |
| 5¼ to 10 acres | 630 | 4,914 |
| 10¼ to 15 acres | 267 | 3,368 |
| 15¼ to 20 acres | 136 | 2,463 |
| 20¼ to 25 acres | 56 | 1,287 |
| 25¼ to 30 acres | 22 | 626 |
| 30¼ to 40 acres | 32 | 1,120 |
| 40¼ to 50 acres | 12 | 536 |
| 50 acres and over | 19 | 1,510 |
| Totals | 11,306 | 24,856 |
It is apparent that the majority of orchards are comparatively small, the Dominion average area being but 2.2 acres. Those up to 5 acres represent 90 per cent. of the total number and account for 36 per cent. of the total area.
The total orchard area is shared fairly evenly by both North and South Islands, with six land districts aggregating 88 per cent. of the Dominion acreage. Details of distribution by land districts and average orchard sizes are given in the following table, which is arranged in order of aggregate district areas:—
| Land District (excluding Boroughs). | Number of Orchards. | Area of Orchards. | Average Size. |
|---|---|---|---|
| Acres. | Acres. | ||
| Nelson | 655 | 5,143 | 7.85 |
| North Auckland | 2,479 | 5,140 | 2.08 |
| Otago | 817 | 3,694 | 4.52 |
| Hawke's Bay | 813 | 3,292 | 4.05 |
| Canterbury | 1,672 | 2,560 | 1.53 |
| Auckland | 2,271 | 2,165 | 0.95 |
| Remainder of land districts (six) | 2,599 | 2,862 | 1.10 |
| Totals | 11,306 | 24,856 | 2.20 |
The following table shows for each variety of fruit, the estimated total number of trees hearing and not bearing, together with estimated quantities of fruit produced, sold, and held for sale respectively, on holdings of 1 acre or over outside boroughs for the season 1935–36. Statistics for the 1936–37 season are not yet available, but will be included in the “Late Statistical Information” section following the preface to this volume.
| Variety of Fruit. | Number of Trees bearing. | Quantity of Fruit produced. | Quantity of Fruit sold. | Quantity of Fruit held for Sale. | Number of Trees not bearing. |
|---|---|---|---|---|---|
| Bushels. | Bushels. | Bushels. | |||
| Apples | 1,619,900 | 3,301,500 | 2,605,100 | 372,200 | 259,900 |
| Pears | 144,400 | 384,300 | 321,500 | 27,400 | 18,400 |
| Peaches | 183,900 | 284,700 | 259,200 | 52,600 | |
| Nectarines | 25,200 | 89,700 | 29,900 | 6,200 | |
| Apricots | 67,600 | 66,100 | 58,600 | 12,600 | |
| Plums | 69,500 | 94,000 | 77,300 | 49,100 | |
| Cherries | 20,500 | 14,500 | 12,600 | 10,500 | |
| Quinces | 9,900 | 11,200 | 9,500 | 6,000 | |
| Sweet oranges | 10,100 | 6,900 | 4,600 | 900 | 9,400 |
| Poorman oranges | 11,900 | 30,000 | 24,700 | 3,000 | 8,900 |
| Lemons | 57,600 | 148,200 | 108,600 | 11,700 | 33,700 |
| Other citrus fruits | 1,000 | 200 | 100 | 2,100 | |
| Other tree fruits | 2,600 | 2,900 | 2,300 | 200 | 700 |
| Totals | 2,224,100 | 4,434,200 | 3,5,14,000 | 415,400 | 470,100 |
A good market exists locally for fruit of all descriptions. However, growers of apples and pears are mainly concerned with exports, which are controlled by the New Zealand Fruit-export Control Board. This Board came into being as a result of the Fruit Control Act, 1924, and commenced functioning in 1926.
Since 1911 the Government has assisted the export trade in apples and pears by the provision of guaranteed returns to growers exporting these fruits. Originally at the rate of ld. net per pound, the basis of the guarantee was changed in 1927 to a per-case rate calculated to cover packing and transportation costs. In subsequent years the guarantee rate was annually reviewed by the Government.
In 1935 the guarantee ceased, except in respect of apples and pears exported to new markets. As an inducement to explore and develop new territory, the Government guaranteed an average c.i.f. return of 9s. per case (New Zealand currency) on approved varieties, grades, and sizes of apples and pears exported to approved new markets through the Fruit-export Control Board. The guarantee also provided for transportation-costs in excess of those entailed in shipping fruit to the United Kingdom.
Regarding established markets, the market guarantee for 1935 was given by the Fruit-export Control Board, and the liability of such guarantee was met out of an Export Guarantee Fund which is being built up by the Board. The arrangement was that growers exporting to new or established markets would contribute to this fund a fixed sum per case so as to yield an aggregate contribution of not more than £12,500 in each of the seasons 1935 to 1937 inclusive. The Government undertook to subsidize the fund £1 for £1 up to an equal amount.
A State guarantee of 10s. 6d. per case c.i.f. New Zealand currency applied to exports of fruit during 1936–37, replacing in respect of that season the arrangement made in 1935 (see above). The guarantee applied only to fruit exported; but the Government announced its intention of safeguarding the interests of fruitgrowers other than exporters if it became necessary. The Government has allocated £40,000 to compensate growers for higher wages paid to labour in the production of fruit for the local market.
All fruit intended for export is subjected to a rigid inspection by Government officials. The success of the export trade is to a very large extent due to the good will gained through this inspection, which, in addition to protecting the guarantee interests, assures overseas buyers of high-quality fruit of uniform standard. In 1936 the value of apples exported aggregated £552,902, of which exports to the United Kingdom represented £487,738. Pears exported aggregated £55,528 in value, the United Kingdom likewise receiving the bulk of the fruit. The rapid progress of the export trade can be gauged by comparing the foregoing figures with those for 1927, in which year exports of apples and pears amounted to £264,446 and £8,456 respectively.
The Department of Agriculture assists orchardists by supplying information on fruitgrowing generally, and as to the most up-to-date methods to adopt for the control of diseases and insect pests, pruning, &c. Practical demonstrations of pruning, spraying, and the grading and packing of fruit are given regularly by the Orchard Instructors attached to the Department. A comprehensive scheme of experiments is being conducted by the Department, the operations covering a wide field. These embrace the testing of spraying specifics and other materials for the better and more economic control of diseases and pests, orchard manurial experiments, &c.
The total area in vineyards outside of borough boundaries is 460 acres. The growing of outdoor grapes is chiefly confined to the districts situated between the North Cape and Hawke's Bay. The greater portion of the crop is used for winemaking, several wines of excellent quality being manufactured, but considerable quantities of outdoor-grown grapes are sold for table use.
Passion-fruit is grown to the extent of 497 acres, mainly in the North Auckland Land District, where climatic conditions are favourable to production.
Since 1913 the State has had authority to borrow money for the purpose of making advances for the establishment of cold stores for fruit and of fruit-canning works, and otherwise for the assistance of the fruit-growing industry. (Vide Section XXIVD.)
The Orchard-tax Act, 1927 (amended in 1933 and 1934), continuing legislation dating from 1916, provides for the levying in each year of a tax of 2s. per acre on commercial orchards, with a minimum tax of 5s. Of the proceeds, £850 is paid over to the New Zealand Fruitgrowers' Federation, and the balance credited to the vote of the Department of Scientific and Industrial Research for use as required in assisting the industry. Authority also exists for the imposition of an additional tax in the case of apple, pear, and quince orchards in commercial fruit-growing districts for the purpose of combating fireblight. No tax is payable in respect of any orchard with fewer than 120 fruit-trees.
Commercial orchards registered as at March, 1937, numbered 6,203, 2,741 being taxable and 3,462 non-taxable. The total orchard-tax payable in respect of the year 1936–37 was £2,266.
A Fruit Marketing Committee was appointed by the Minister of Industries and Commerce in July, 1936. The report, which was released in April, 1937, contains far-reaching proposals towards the more orderly marketing of frail and vegetables. Inter alia, the question of price-spreads between the grower and the consumer was thoroughly investigated by the Committee. Following consideration of the Committee's report, Cabinet has decided to give effect to the major recommendations of the Committee by amending the Primary Products Marketing Act (see Subsection A). It is stated that the Act will be extended to bring fruit and vegetables within its scope.
Although the cultivation of tobacco-leaf was initiated only a few years ago, the industry has made marked progress. Certain districts appear to be well suited to the growth of good-quality leaf, and growers are becoming increasingly familiar with the methods and plant required for the production of cured leaf acceptable to manufacturers. Much of the production is in accordance with contracts arranged between local manufacturers and growers. The market for leaf has at present definite limits.
Figures collected from occupiers throughout the Dominion of holdings of 1 acre or more situated outside boroughs show the following areas planted in tobacco and the corresponding yields (where available) in the years specified:—
| Acres. | Yield in Lbs. | |
|---|---|---|
* Not available. | ||
| 1928–29 | 1,000 | * |
| 1929–30 | 1,073 | * |
| 1930–31 | 932 | 722,329 |
| 1931–32 | 1,726 | 1,318,624 |
| 1932–33 | 2,126 | 1,784,676 |
| 1933–34 | 1,803 | 1,239,916 |
| 1934–35 | 1,358 | 1,106,424 |
| 1935–36 | 1,518 | 1,065,693 |
| 1936–37 | 2,132 | 1,514,124 |
Practically the whole of the tobacco crop is produced in Waimea County. From the total Dominion area of 2,132 acres shown above for 1936–37 the yield of leaf was returned as 1,514,124 lb.
The Tobacco-growing Industry Act, 1935, which provides for the regulation of the industry, is briefly referred to in the preceding subsection.
Large areas in various parts of New Zealand are covered with phormium, or New Zealand flax, the fibre of which is largely used for ropemaking, &c. The area of 63,015 acres returned as under phormium in 1936–37 was divided between the North and South Islands in the ratio of three-fifths and two-fifths respectively. The figures for each of the last ten years are as follows:—
| Year | Area. Acres. |
|---|---|
| 1927–28 | 66,492 |
| 1928–29 | 62,704 |
| 1929–30 | 68,260 |
| 1930–31 | 71,219 |
| 1931–32 | 77,437 |
| 1932–33 | 64,206 |
| 1933–34 | 72,853 |
| 1934–35 | 72,823 |
| 1935–36 | 68,933 |
| 1936–37 | 63,015 |
Flax-milling in recent years has recorded a very heavy decline. Statistics of the operations of flax-mills are included in the Factory Production Section, to which reference should be made for details of output, &c.
Since the year 1934 a large woolpack and sacking factory has operated at Foxton, thus providing a fresh avenue for fibre consumption. Arrangements were made by the Government whereby the whole of the output of the factory would be absorbed in the 1936–37 season.
THE numbers of live-stock of various kinds at each of the last five annual enumerations are as shown in the following table. Detailed statistics of live-stock by counties and land districts are contained in the Statistical Report on Agricultural and Pastoral Production issued annually by the Census and Statistics Department.
| — | 1933. | 1934. | 1935. | 1936. | 1937. |
|---|---|---|---|---|---|
| Horses | 276,897 | 273,906 | 272,986 | 276,170 | 277,799 |
| Dairy cows | 1,845,972 | 1,932,511 | 1,952,094 | 1,951,507 | 1,935,524 |
| Cattle (including dairy cows) | 4,192,023 | 4,301,128 | 4,293,499 | 4,254,078 | 4,389,101 |
| Sheep shorn during season | 25,069,409 | 25,017,656 | 25,639,654 | 26,278,477 | 27,319,185 |
| Lambs shorn during season | 2,629,837 | 3,508,008 | 3,529,202 | 3,618,648 | 4,263,403 |
| Lambs tailed during season | 15,015,628 | 15,278,797 | 15,689,492 | 15,696,617 | 16,866,021 |
| Sheep (including lambs) as at 30th April | 27,755,966 | 28,649,038 | 29,076,754 | 30,113,704 | 31,305,818 |
| Pigs | 591,582 | 660,393 | 762,755 | 808,463 | 802,419 |
The live-stock census formerly covered asses, mules, and goats also, but these classes have been dropped since 1930. Numbers in 1930 were: Asses and mules, 218; Angora goats, 9,514; other goats, 29,013.
In the next table the figures of live-stock are given for each land district. Horses, dairy cows, total cattle, and pigs are as at 31st January. Sheep shorn, lambs shorn, and lambs tailed are for the season 1930–37. Sheep are as at 30th April.
| Land District. | Horses. | Dairy Cows. | Total Cattle. | Sheep shorn. | Lambs shorn. | Lambs tailed. | Sheep. | Pigs. |
|---|---|---|---|---|---|---|---|---|
| North Auckland | 30,915 | 387,207 | 700,066 | 982,309 | 246,095 | 541,885 | 1,118,738 | 156,434 |
| Auckland | 45,869 | 618,066 | 1,092,960 | 1,852,583 | 550,320 | 1,287,340 | 2,072,366 | 277,513 |
| Gisborne | 12,946 | 56,626 | 358,827 | 2,168,699 | 759,578 | 1,052,138 | 2,343,300 | 25,189 |
| Hawke's Bay | 16,939 | 73,798 | 366,891 | 3,734,246 | 726,443 | 2,264,479 | 4,127,594 | 29,058 |
| Taranaki | 15,492 | 243,761 | 394,986 | 686,347 | 213,909 | 426,717 | 712,020 | 82,456 |
| Wellington | 37,283 | 276,610 | 846,516 | 6,053,664 | 1,658,174 | 3,850,681 | 6,791,678 | 113,320 |
| Nelson | 5,530 | 35,015 | 72,247 | 378,046 | 15,952 | 163,543 | 440,637 | 19,156 |
| Marlborough | 5,843 | 15,824 | 42,420 | 1,061,515 | 21,239 | 492,756 | 1,130,048 | 8,007 |
| Westland | 2,073 | 16,184 | 47,402 | 71,435 | 6,689 | 54,987 | 82,311 | 6,758 |
| Canterbury | 50,986 | 79,504 | 174,010 | 4,752,444 | 49,476 | 3,187,396 | 5,874,467 | 49,216 |
| Otago | 29,753 | 56,192 | 130,142 | 3,376,000 | 3,738 | 1,927,443 | 3,961,751 | 20,663 |
| Southland | 24,170 | 76,737 | 162,634 | 2,201,897 | 11,790 | 1,616,656 | 2,650,908 | 14,649 |
| Totals | 277,799 | 1,935,524 | 4,389,101 | 27,319,185 | 4,263,403 | 16,866,021 | 31,305,818 | 802,419 |
While the annual collection of agricultural and pastoral statistics covers only areas of 1 acre or over outside borough boundaries, the above tables include an allowance for live-stock within boroughs.
The Dominion is eminently suited for sheep-breeding, practically every description of sheep finding a favourable local habitat. In the hilly and down country of the South Island the Merino has been bred for very many years, and was the original sheep depastured. In fact, the Merino ewe furnished the foundation of he crossbred stock which has made Canterbury mutton famous on British meat-markets. In the early days of the Canterbury meat trade the English Leicester of the original type was the favourite ram for putting to the Merino ewe. Of later years the Lincoln has been largely employed to cross with the Merino, and black-faced rams have been further employed to put to the crossbred ewes. Systematic inbreeding of Merino-longwool half-bred sheep produced the now world-known Corriedale breed, which is the most numerous breed next to Romney Marsh. In the North Island the Romney Marsh sheep, which suits the conditions obtaining in this portion of the Dominion, has become the most popular sheep; it is also increasing in numbers in the South Island. Southdown, Border Leicester, English Leicester, and Lincoln sheep, are other breeds of numerical importance.
The number of sheep at the 30th April reached its previous maximum (30,841,287) in 1930. An annual decline of about 1,000,000 then set in and continued until 1933; since then, however, successive increases have raised the total to the present record figure of 31,305,818.
In the following ten-year table showing sheep distribution by Islands, the Chatham Islands are included in the South Island, as they form portion of the Canterbury-Kaikoura Sheep District.
| Year. | North Island. | South Island. | Total Sheep at 30th April. |
|---|---|---|---|
| 1928 | 14,482,105 | 12,651,705 | 27,133,810 |
| 1929 | 15,588,444 | 13,462,938 | 29,051,382 |
| 1930 | 16,535,913 | 14,305,374 | 30,841,287 |
| 1931 | 15,886,876 | 13,905,640 | 29,792,516 |
| 1932 | 14,946,987 | 13,744,801 | 28,691,788 |
| 1933 | 14,954,029 | 12,801,937 | 27,755,966 |
| 1934 | 15,264,588 | 13,384,450 | 28,649,038 |
| 1935 | 15,749,016 | 13,327,738 | 29,076,754 |
| 1936 | 16,371,844 | 13,741,860 | 30,113,704 |
| 1937 | 17,065,135 | 14,240,683 | 31,305,818 |
The following table shows the number of rams, wethers, breeding-ewes, dry ewes, and lambs in the Dominion for the last five years:—
| Year. | Rams. | Wethers. | Breeding-ewes. | Dry Ewes. | Lambs. | Totals. |
|---|---|---|---|---|---|---|
| Stud Sheep (entered in Flock-book). | ||||||
| 1933 | 13,353 | 226,330 | 6,625 | 160,265 | 406,573 | |
| 1934 | 12,034 | 228,769 | 7,083 | 162,631 | 410,517 | |
| 1935 | 11,249 | 231,605 | 7,292 | 169,041 | 419,187 | |
| 1936 | 12,398 | 249,016 | 7,105 | 174,869 | 443,388 | |
| 1937 | 10,991 | 260,510 | 6,077 | 188,320 | 465,898 | |
| Sheep of a Distinctive Breed but not entered in Flock-book. | ||||||
| 1933 | 450,266 | 1,092,533 | 4,780,723 | 334,039 | 1,941,131 | 8,598,692 |
| 1934 | 455,177 | 1,019,573 | 4,159,764 | 260,361 | 1,782,287 | 7,677,162 |
| 1935 | 459,821 | 996,307 | 3,905,470 | 248,343 | 1,712,159 | 7,322,100 |
| 1936 | 480,005 | 1,158,097 | 5,078,834 | 279,115 | 2,067,708 | 9,063,759 |
| 1937 | 504,653 | 1,138,961 | 4,968,376 | 246,782 | 2,140,345 | 8,999,117 |
| Crossbred and other Sheep not otherwise enumerated. | ||||||
| 1933 | 1,322,650 | 12,202,644 | 657,222 | 4,568,185 | 18,750,701 | |
| 1934 | 1,418,045 | 13,182,893 | 665,712 | 5,294,709 | 20,561,359 | |
| 1935 | 1,485,047 | 13,675,342 | 732,430 | 5,442,648 | 21,335,467 | |
| 1936 | 1,450,548 | 13,341,111 | 578,871 | 5,236,027 | 20,606,557 | |
| 1937 | 1,514,280 | 14,103,191 | 542,658 | 5,680,674 | 21,840,803 | |
| Totals. | ||||||
| 1933 | 463,619 | 2,415,183 | 17,209,697 | 997,886 | 6,669,581 | 27,755,966 |
| 1934 | 467,211 | 2,437,618 | 17,571,426 | 933,156 | 7,239,627 | 28,649,038 |
| 1935 | 471,070 | 2,481,354 | 17,812,417 | 988,065 | 7,323,848 | 29,076,754 |
| 1936 | 492,403 | 2,608,645 | 18,668,961 | 865,091 | 7,478,604 | 30,113,704 |
| 1937 | 515,644 | 2,653,241 | 19,332,077 | 795,517 | 8,009,339 | 31,305,818 |
The average size of the flocks was 923 in 1933, 961 in 1934, 962 in 1935, 984 in 1936, and 1,004 in 1937. A classification according to size shows the following position:—
| Size of Flocks. | 1933. | 1934. | 1935. | 1936. | 1937. |
|---|---|---|---|---|---|
| 1 to 200 | 8,903 | 8,131 | 7,979 | 7,668 | 7,331 |
| 201 to 500 | 7,106 | 6,964 | 7,342 | 7,338 | 7,474 |
| 501 to 1,000 | 6,252 | 6,475 | 6,503 | 6,801 | 7,102 |
| 1,001 to 2,500 | 5,474 | 5,848 | 5,994 | 6,296 | 6,665 |
| 2,501 to 5,000 | 1,607 | 1,670 | 1,695 | 1,750 | 1,850 |
| 5,001 to 10,000 | 554 | 544 | 551 | 578 | 592 |
| 10,001 to 20,000 | 141 | 142 | 149 | 134 | 135 |
| 20,001 and over | 26 | 26 | 25 | 25 | 28 |
| Total flocks | 30,063 | 29,800 | 30,238 | 30,590 | 31,177 |
The following diagram shows the movement in numbers of breeding-ewes and total sheep respectively recorded annually on 30th April since 1916:—
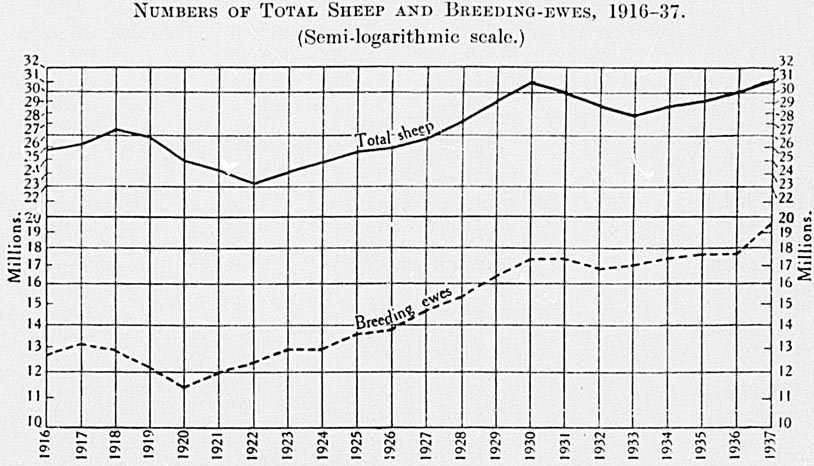
The numbers of the different classes composing the flocks in April, 1937, were as follows:—
| Breed of Sheep. | Stud Sheep entered in Flock-book. | Sheep of a Distinctive Breed, not entered in Flock-book. | Total. |
|---|---|---|---|
| Merino | 23,560 | 1,036,078 | 1,059,638 |
| Lincoln | 2,120 | 23,363 | 25,483 |
| Romney | 206,381 | 3,799,129 | 4,005,510 |
| Border Leicester | 16,502 | 41,425 | 57,927 |
| English Leicester | 21,298 | 37,441 | 58,739 |
| Shropshire | 1,505 | 12,169 | 13,674 |
| Southdown | 126,722 | 215,590 | 342,312 |
| Corriedale | 57,544 | 1,348,702 | 1,406,246 |
| Ryeland | 5,769 | 3,961 | 9,730 |
| Half-bred | 4,338 | 2,477,308 | 2,481,646 |
| Other breeds | 159 | 3,951 | 4,110 |
| Totals | 465,898 | 8,999,117 | 9,465,015 |
| Flock sheep— | |||
| Crossbreds and others not otherwise enumerated | 21,840,803 | ||
| Grand total | 31,305,818 |
The period of decline in total sheep population between 1918 and 1922 was characterized by unusually heavy exports of mutton and lamb. However, reversion to a period of normal activity in the export trade, combined with increasing numbers of breeding-ewes, resulted in flocks rising steadily to nearly 31,000,000 in 1930. That year marked the beginning of a further spate in the export of frozen lamb in particular, and flocks fell away until 1933, when a recovery (since continued) manifested itself, culminating in the present record total of 31,305,818.
The diagram clearly shows the postponed effect on total sheep population produced by a decline in the number of breeding-ewes. Each of the four years marked by a decrease in breeding-ewes has been followed by a reduction in total sheep twelve months later. Breeding-ewes have been rising steadily in number since 1932, and the total for 1937 shows an advance of over 660,000 over the previous record figure established in 1936. In view of these favourable circumstances, it is reasonably safe to predict that the total sheep population will increase still further.
The latest figures obtainable showing the number of sheep in the principal sheep countries for which information is available, are given hereunder:—
| Country. | Number of Sheep. (Thousands.) |
|---|---|
| Australia | 108,632 |
| Russia (U.S.S.R.) | 54,228 |
| United States | 52,576 |
| India (whole) | 43,565 |
| Argentina | 39,330 |
| South African Union | 35,835 |
| New Zealand | 31,306 |
| United Kingdom | 25,035 |
| China | 21,933 |
| Spain | 17,041 |
| Uruguay | 15,406 |
| Turkey | 14,800 |
| Iran (Persia) | 14,582 |
| Rumania | 11,836 |
| Peru | 11,209 |
| Brazil | 10,661 |
| France | 9,788 |
| Yugoslavia | 9,211 |
| Italy | 8,862 |
| Bulgaria | 8,740 |
| French West Africa | 8,648 |
| Greece | 8,185 |
| French Morocco | 8,086 |
| Algeria | 6,416 |
| Chile | 6,263 |
| Bolivia | 5,232 |
| Germany | 4,331 |
| Iraq | 4,005 |
| Mexico | 3,674 |
| Canada | 3,399 |
| Tunis | 3,375 |
| Portugal | 3,274 |
| Kenya | 3,236 |
| Irish Free State | 3,042 |
| Poland | 3,020 |
| British Somaliland | 2,500 |
| Anglo-Egyptian Sudan | 2,250 |
| Manchukuo | 2,208 |
| Italian Somaliland | 2,000 |
Although appearing seventh in order in the preceding table of flocks, in point of actual production of wool New Zealand is the fourth largest in the world and ranks third in the list of principal exporting countries, according to figures collected by the Imperial Economic Committee. With the exception of some 6,000,000 lb. or 7,000,000 lb. annually, the whole of the wool produced in New Zealand is exported.
Statistics of wool-production and of stocks of wool of necessity include not only wool from a variety of breeds of sheep, but also wool in different stages of treatment—greasy, scoured, slipe, washed, &c. Consequently, global statistics of wool-production and of stocks are arrived at by the addition of weights of a variety of types of wool. In view of this, it can readily be seen that the “actual weights” of wool-production or of stocks may give a misleading picture of the true position; and, consequently, it becomes necessary to arrive at a common point in which the various types of wool may be expressed. This common denominator is found in New Zealand, as in international practice, in the expression of the weight of wool on a greasy basis. This involves the estimation of the greasy equivalent of scoured, slipe, and washed wools, and, in the statistics hitherto published in New Zealand such wools have been converted to a greasy basis on the assumption of an average loss of 33⅓ per cent. in weight. The Imperial Economic Committee has been recently investigating the clean yields of the wools of various breeds of sheep, its researches as far as New Zealand wools are concerned being made in collaboration with the New Zealand Department of Agriculture. A more exact basis of conversion of scoured and slipe wools to a greasy basis than was hitherto possible has been made available as a result of these researches. The average clean yield of New Zealand greasy wool, after making allowance for the relative proportions of crossbred, merino, and half-bred wools in the total, is estimated at 68 per cent., while that of scoured wools is estimated at 94 per cent., and that of slipe wools at 82 per cent. On the basis of these figures, the factor for converting scoured wool to a greasy basis is 138.2/100, and for slipe wool 120.6/100.
In the following tables, where conversion to a greasy basis has been necessary, the figures have been computed using the new conversion factors given above. Washed wool, which is of negligible quantity, has been converted on the same basis as scoured, while wool on skins has been taken at an average of 4 lb. per skin.
| Year ended 30th June, | Exports. | Used by New Zealand Mills. | Variation in Stocks. | Estimated Production. | |
|---|---|---|---|---|---|
| Wool. | Wool on Skins. | ||||
| Million Pounds Weight. | |||||
| 1928 | 240.7 | 5.5 | 7.0 | -0.7 | 252.5 |
| 1929 | 244.1 | 4.7 | 6.1 | + 7.8 | 262.7 |
| 1930 | 197.9 | 4.8 | 5.5 | +53.5 | 201.7 |
| 1931 | 233.2 | 6.4 | 5.3 | +13.7 | 258.6 |
| 1932 | 236.9 | 6.8 | 6.1 | +19.7 | 269.5 |
| 1933 | 294.9 | 11.1 | 7.1 | -36.0 | 277.1 |
| 1934 | 297.5 | 14.4 | 6.8 | -29.1 | 289.6 |
| 1935 | 211.8 | 9.0 | 7.1 | +37.1 | 265.0 |
| 1936 | 331.7 | 8.2 | 7.8 | -43.4 | 304.3 |
| 1937 | 300.0 | 7.0 | 7.7 | -11.8 | 302.9 |
The high production of wool attained in 1936 was almost reached in the 1937 season, a fall in total estimated production of less than ½ per cent. being registered.
A reliable indication of the distribution of purchases of New Zealand wool is provided by the following table taken from Dalgety's Annual Wool Review:—
Distribution of Purchases at Sales held in 1936–37 Season.
| Destination. | Bales. |
|---|---|
| United Kingdom | 245,626 |
| Japan, China, India | 122,769 |
| U.S.A. and Canada | 114,513 |
| France | 74,547 |
| Germany and Austria | 26,330 |
| Belgium and Holland | 23,997 |
| Australia and Tasmania | 14,987 |
| Poland and Czechoslovakia | 8,957 |
| Russia, Norway, and Sweden | 3,220 |
| Spain and Denmark | 1,677 |
| Italy and Switzerland | 270 |
| Local scourers | 25,807 |
| Local manufacturers | 24,294 |
| Total | 686,994 |
The following table, compiled from official sources, shows the wool-production of the principal producing countries in the years specified. Production in these countries accounts for approximately 75 per cent. of the world's total, of which New Zealand's share is about 8 per cent.
| Country. | Wool-production (on a greasy basis). | |||||||
|---|---|---|---|---|---|---|---|---|
| 1929–30. | 1930–31. | 1931–32. | 1932–33. | 1933–34. | 1934–35. | 1935–36. | 1936–37. | |
| Million Pounds Weight. | ||||||||
| Principal Exporting Countries — | ||||||||
| Australia | 938 | 913 | 1,007 | 1,063 | 996 | 1,015 | 992 | 990 |
| Argentina | 353 | 301 | 378 | 388 | 385 | 376 | 365 | 385 |
| New Zealand | 262 | 259 | 270 | 277 | 290 | 265 | 304 | 303 |
| South Africa | 309 | 290 | 314 | 330 | 284 | 222 | 251 | 285 |
| Uruguay | 181 | 166 | 104 | 112 | 95 | 117 | 112 | 120 |
| Total of above countries | 2,043 | 1,989 | 2,073 | 2,170 | 2,050 | 1,995 | 2,024 | 2,083 |
| Other Important Countries— | ||||||||
| United States | 401 | 435 | 464 | 441 | 460 | 451 | 453 | 449 |
| Soviet Russia | 394 | 302 | 212 | 142 | 138 | 140 | 167 | 200 |
| United Kingdom | 112 | 111 | 113 | 119 | 120 | 115 | 109 | 108 |
Statistics relating to stocks of wool held in the Dominion on 30th June are compiled from returns obtained from woolbrokers, woollen-mills, freezing-works, wool-scouring works, shipping companies, Harbour Board stores, farmers, and the New Zealand Railways Department. All wool, whether sold or unsold, is required to be accounted for. A little of the wool held by farmers is possibly omitted, but the statistics are complete enough for practical purposes.
Comparative figures since the first complete official collection in 1928 are—
| At 30th June, | Greasy. | Scoured and Washed. | Sliped. | Crutchings, &c. | Wool on Skins. | Unspecified Wool. | Total, converted to Greasy Basis. |
|---|---|---|---|---|---|---|---|
| Thousand Pounds Weight. | |||||||
| 1928 | 5,314 | 1,584 | 4,675 | 3,318 | 550 | 926 | 17,900 |
| 1929 | 8,271 | 2,510 | 6,694 | 4,184 | 733 | 989 | 25,700 |
| 1930 | 52,396 | 4,279 | 10,411 | 6,289 | 697 | 1,324 | 79,200 |
| 1931 | 59,811 | 6,616 | 10,916 | 7,067 | 1,621 | 2,115 | 92,900 |
| 1932 | 74,560 | 6,168 | 15,133 | 7,152 | 1,796 | 2,320 | 112,600 |
| 1933 | 55,581 | 3,986 | 5,352 | 6,459 | 2,090 | 539 | 76,600 |
| 1934 | 27,444 | 4,158 | 5,933 | 3,870 | 1,510 | 1,797 | 47,500 |
| 1935 | 59,910 | 4,972 | 7,504 | 6,826 | 1,452 | 442 | 84,600 |
| 1936 | 21,609 | 2,890 | 7,701 | 4,654 | 763 | 827 | 41,200 |
| 1937 | 10,495 | 2,237 | 6,207 | 5,865 | 896 | 1,529 | 29,400 |
Stocks of wool at the end of the 1936–37 season show a decline of nearly 12,000,000 lb. compared with holdings at the beginning of the season. End of season stocks are the lowest recorded since 1930, attributable, undoubtedly, to the excellent prices realized at the 1930–37 sales, the average price per pound being 15.7 ld., the highest recorded since the 1927–28 season. In previous seasons similar average prices were: 9.13d. (1935–36), 6.54 d. (1934–35), 11.07d. (1933–34), 5.15d. (1932–33), 5.26d. (1931–32), 5.67d. (1930–31), 8.55d. (1929–30), 14.88d. (1928–29), 16.67d. (1927–28), and 12.48d. (1926–27).
Of the total stocks at 30th June, 1937, woolbrokers held 7,300,000 lb. and farmers 1,300,000 lb; both these figures are on a greasy basis. The balance was divided between woollen-mills, freezing-works, wool-scouring works, shipping companies, and railway and Harbour Board stores. The classification is made on the basis of possession and not of beneficial ownership.
Details of wool stocks at 30th June, 1937 (without conversion to a greasy basis) are as follows:—
| — | Greasy. | Scoured. | Washed. | Sliped. | Crutchings, &c. | Wool on Skins. | Unspecified. |
|---|---|---|---|---|---|---|---|
| Thousand Pounds Weight. | |||||||
| Merino | 1,059 | 61 | 3 | 17 | 329 | 18 | |
| Half-bred | 4,380 | 368 | 132 | 857 | 643 | 130 | |
| Corriedale | 247 | 17 | 31 | 98 | 27 | ||
| Other (including crossbred)— | |||||||
| Sheep | 3,572 | 622 | 187 | 2,183 | 4,574 | 381 | |
| Lambs | 804 | 401 | 437 | 2,587 | 221 | 329 | |
| Unspecified | 433 | 9 | 532 | 11 | 1,529 | ||
| Totals | 10,495 | 1,478 | 759 | 6,207 | 5,865 | 896 | 1,529 |
Shipments of wool from the principal exporting countries during the twelve months ended 30th June, 1937, are shown below according to the country to which shipped. The figures represent actual weights shipped to the countries shown, irrespective of the condition of the wool (scoured, greasy, &c.), and without making allowance for subsequent re-exports to other countries. The absence of figures in some cases does not necessarily indicate that no wool was shipped; shipments may be included in the figures for “Other Countries.”
| Country to which shipped. | Shipments from 1st July, 1930, to 30th June, 1937, from | ||||
|---|---|---|---|---|---|
| Australia. | New Zealand. | South Africa. | Argentina.* | Uruguay.* | |
* For 9 months, October to July. † Includes 32.6 million pounds, option Continent. In addition, a further portion of this wool is sold in the United Kingdom, and eventually shipped to continental countries—e.g., France, Germany, and Italy. See remarks on page 221. ‡ Including optional. | |||||
| Millions of Pounds. | |||||
| United Kingdom | 311.2 | 154.8* | 36.5 | 69.0 | 17.1 |
| Japan | 84.5 | 39.5 | 89.2 | 20.5 | 23.5 |
| Belgium | 136.4 | 9.0 | 22.5 | 22.6 | 7.2 |
| Netherlands | 10.0 | 1.6 | 1.5 | ||
| France | 83.6 | 14.1 | 35.2 | 29.9 | 4.5 |
| Germany | 44.3 | 8.5 | 44.8 | 13.8 | 14.5 |
| Austria | 5.7 | ||||
| Italy | 36.5 | 11.5 | 22.3 | 7.5 | |
| United States | 74.6 | 34.4 | 4.8 | 65.1 | 23.6 |
| Canada | 4.1 | 13.6 | |||
| Other countries | 35.8 | 13.2 | 10.7‡ | 12.8 | 1.5 |
| Totals | 826.7 | 287.1 | 255.2 | 257.6 | 100.9 |
The total number of cattle in the Dominion at the enumeration of 1937 was 4,389,101, as against 4,254,078 in 1936. The figures for the two years, according to the classification in use, are as follows:—
| — | 1936. | 1937. | ||
|---|---|---|---|---|
| Number. | Per Cent. of Total. | Number. | Per Cent. of Total. | |
| Bulls two years old and over, for breeding purposes— | ||||
| For dairy purposes | 59,647 | 1.4 | 58,783 | 1.3 |
| For beef purposes | 16,973 | 0.4 | 19,134 | 0.4 |
| Cows and heifers two years and over, for dairying— | ||||
| In milk | 1,823,358 | 42.9 | 1,805,405 | 41.1 |
| Dry | 128,149 | 3.0 | 130,119 | 3.0 |
| Cows and heifers two years old and over, other than for dairying | 610,855 | 14.4 | 668,030 | 15.2 |
| Heifers one and under two years old— | ||||
| Intended for dairying | 322,757 | 7.6 | 291,810 | 6.7 |
| Other | 155,862 | 3.7 | 160,175 | 3.7 |
| Steers two years old and over | 329,812 | 7.7 | 340,182 | 7.8 |
| Steers and bulls one and under two years old | 171,437 | 4.0 | 174,882 | 4.0 |
| Calves under one year old— | ||||
| Heifers Intended for dairying | 287,662 | 6.8 | 331,277 | 7.5 |
| Other | 150,235 | 3.5 | 177,757 | 4.0 |
| Bulls and steers | 197,331 | 4.6 | 231,547 | 5.3 |
| Totals | 4,254,078 | 100.0 | 4,389,101 | 100.0 |
Most of the leading breeds of the cattle of Great Britain are represented in the Dominion by herds bred on sound lines, though the development of the beef breeds in later years has received a check partly owing to the advance taking place in dairying operations and partly through the difficulties of competing with other countries in the British market. There are still very many fine Shorthorn herds of the beef type, while Hereford and Aberdeen-Angus cattle are also largely bred. There are herd-books for each of these breeds.
The breeding of dairy cattle has made great progress in recent years. Herd-book societies are established for the Jersey, Friesian, Ayrshire, Milking Shorthorn, and Red Poll breeds. The various societies have heartily co-operated in a scheme for establishing registers of merit in connection with the certificate-of-record testing of purebred dairy cattle, thus giving a great fillip to the breeding of purebred dairy stock. The dairy-farmer is encouraged to use purebred bulls and thereby to assist materially in raising the standard of the dairy stock of the country. He is now familiar with the value of herd-testing work, and is utilizing this knowledge to improve the quality of his herd.
The foregoing table is noteworthy for the decreases apparent in dairy stock over one year old. Replacement animals tinder one year, however, show a substantial increase, as do also animals in the meat-production classes.
The distribution of total cattle, also dairy cows, is included in the table of livestock given at the beginning of this subsection. The figures show that the dairying and beef-production industries are both largely monopolized by the North Island. This island accounts for 86 per cent. of the total cattle and a similar proportion of dairy cows. Localizing the dairying industry still further, it is found that over half of the dairy cows in the Dominion are in the combined land districts of North Auckland and Auckland. Taranaki and Wellington are relatively and practically equally important as regards the number of dairy cows; between them they account for over one-quarter of the Dominion's dairy cows. In point of density Taranaki takes first position with 174 dairy cows to every 1,000 acres occupied. Auckland coming next with 135, and North Auckland third with 127.
Taking the number of cows other than dairy cows as a guide in regard to beef-production, Wellington Land District easily leads the remainder with over one-quarter of the Dominion total. Gisborne is second, followed by Hawke's Bay, Auckland, and North Auckland in that order. These five together depasture 84 per cent. of all cows reserved for beef-production.
In connection with the enumeration of live-stock, additional information as to breeds of cattle, horses, and pigs was collected thrice in each decade until 1928, since when the inquiry has been discontinued. A summary of the results of the 1928 enumeration as regards cattle (exclusive of a few within borough boundaries) is given in the table following.
| Breed. | Total Cattle. |
|---|---|
| Purebred— | |
| Jersey | 39,379 |
| Guernsey | 70 |
| Friesian | 10,670 |
| Ayrshire | 4,905 |
| Red Poll | 831 |
| Shorthorn (including Milking Shorthorn) | 6,829 |
| Hereford | 4,210 |
| Polled Angus | 4,269 |
| Devon | 116 |
| Crossbred with predominating strain of— | |
| Jersey and other Channel Island breeds | 1,236,289 |
| Friesian | 231,022 |
| Ayrshire | 48,192 |
| Milking Shorthorn | 440,585 |
| Red Poll | 6,909 |
| Other dairy breeds (including unspecified) | 1,286 |
| Shorthorn | 417,493 |
| Hereford | 426,241 |
| Polled Angus | 351,118 |
| Devon | 2,121 |
| Other beef breeds (including unspecified) | 6,164 |
| Total, purebred | 71,279 |
| Total, crossbred | 3,167,420 |
| Dominion totals | 3,238,699 |
The latest available information showing the number of cattle in the main cattle countries of the world is as follows:—
| Country | Number of Cattle. (Thousands.) |
|---|---|
| India (whole) | 160,094 |
| United States | 66,676 |
| Russia (U.S.S.R.) | 56,500 |
| Brazil | 42,539 |
| Argentina | 30,868 |
| China | 22,647 |
| Germany | 20,065 |
| France | 15,762 |
| Australia | 13,853 |
| South African Union | 10,398 |
| Poland | 10,163 |
| Mexico | 10,083 |
| Canada | 8,821 |
| United Kingdom | 8,617 |
| Colombia | 7,972 |
| Uruguay | 7,372 |
| Italy | 7,235 |
| Turkey | 6,100 |
| Madagascar | 6,000 |
| Siam | 5,462 |
| Kenya | 5,225 |
| Tanganyika | 4,793 |
| Dutch East Indies | 4,475 |
| New Zealand | 4,389 |
| Rumania | 4,326 |
| Cuba | 4,317 |
| Czechoslovakia | 4,283 |
| Spain | 4,164 |
| Irish Free State | 4,019 |
| Paraguay | 4,000 |
| Yugoslavia | 3,982 |
| French West Africa | 3,823 |
| Denmark | 3,116 |
| Sweden | 2,950 |
| Nigeria | 2,688 |
| Netherlands | 2,639 |
| Anglo-Egyptian Sudan | 2,500 |
| Southern Rhodesia | 2,461 |
| Chile | 2,388 |
| Austria | 2,349 |
| Uganda Protectorate | 2,223 |
| Venezuela | 2,078 |
| Bolivia | 2,064 |
The Dairy Industry Act, 1908 (a consolidation of previous legislation), with its amendments, may in general terms be described as an Act to regulate the production, collection, treatment, preparation, and manufacture under proper sanitary conditions of dairy-produce—i.e., milk, cream, butter, cheese, and any other product of milk or cream—intended for sale for human consumption or for export.
Inspectors are empowered to inspect premises used for the production or manufacture of dairy-produce. Any defects affecting the cleanliness and sanitation of the premises or the plant, machinery, and apparatus used in connection therewith may be ordered to be remedied to the satisfaction of the Inspector, and until so remedied their use for the purposes of dairy-produce may be forbidden. Inspectors are authorized to condemn any dairy-produce considered unfit for human consumption, and the sale of unwholesome milk or other dairy-produce is prohibited.
Milk or cream purchased for the manufacture of dairy-produce and paid for according to the percentage of butterfat contained therein must have this percentage determined by the Babcock or Gerber test. Owners of dairy factories are required by regulations under the Act to pay different prices for different grades of milk or cream supplied for the manufacture of dairy-produce. Owners are also required to furnish to suppliers a certified annual statement of overrun, and provision is made for an independent investigation by the Audit Department where a supplier is dissatisfied with the statement received.
Dairy-produce intended for export must be sound and wholesome in all respects, and must comply with the requirements of the Act as to inspection, grading, and marking. The export of butter containing more than 16 per cent. of water or less than 80 per cent. of butterfat is prohibited. The export of cheese of which the water-free substance consists of less than 50 per cent. of fats wholly derived from milk is also illegal.
Wide powers are conferred to make regulations prescribing matters of detail with regard to the production, manufacture, sale, and export of dairy-produce. In particular, regulations may be made for the registration of dairies, the licensing of persons carrying on the manufacture of dairy-produce, the registration of brands to be used on dairy-produce, and for the inspection, grading, packing, marking, stamping, and labelling of dairy-produce. Regulations relating to the manufacture and export of dairy-produce are contained in the Dairy-produce General Regulations, 1933, gazetted on the 18th May, 1933, and consolidating all previous regulations on the subject. Further regulations have since been gazetted.
The Act provides for the registration of co-operative dairy companies. Companies so registered are authorized to accept or to compel the surrender of shares issued in certain cases, subject to the rights of shareholders being safeguarded. A dairy company must not include in its registered name the word “co-operative” unless it is entitled to be registered as a co-operative dairy company under the Act.
Under the extension of powers provided by the Dairy Industry Amendment Act, 1933, an important amendment to existing regulations was gazetted on the 22nd February, 1934. The new regulations made it illegal for a supplier of milk or cream to a factory to transfer (without the antecedent consent in writing of the owner or manager of the factory) his supply to another factory during the same season. New regulations were gazetted at the same date, effective from the 1st April, 1934, in respect of managers of dairy factories, under which no uncertificated person may now act as manager. The qualifications necessary for applicants for registration are prescribed, and a Registration Board constituted with a Registrar as executive officer. Provision is made for appeals against the decision of the Board.
The following table shows the number of factories registered under the Dairy Industry Act as at 31st March, 1937, together with the amount of butter and cheese forwarded for export during the preceding twelve months, and the number of suppliers to such factories:—
| District. | Number of Factories. | Forwarded for Export, 1930–37. | Number of Suppliers. | ||||
|---|---|---|---|---|---|---|---|
| Butter. | Cheese. | Dual Plant. | Butter. | Cheese. | Butter. | Cheese and Dual Plant. | |
| Tons. | Tons. | ||||||
| Auckland | 59 | 31 | 4 | 104,603 | 14,582 | 25,793 | 1,434 |
| Hawke's Bay | 9 | 16 | 1 | 7,583 | 3,425 | 4,831 | 613 |
| Taranaki | 20 | 68 | 28 | 15,467 | 40,841 | 3,357 | 4,005 |
| Wellington | 19 | 45 | 5 | 16,000 | 12,234 | 6,744 | 1,724 |
| Nelson | 6 | 2,253 | 1,780 | ||||
| Marlborough | 3 | 5 | 724 | 713 | 833 | 144 | |
| Westland | 7 | 1 | 890 | 13 | 652 | 7 | |
| Canterbury | 9 | 14 | 1 | 2,462 | 1,833 | 7,501 | 551 |
| Otago and Southland | 10 | 77 | 1 | 1,781 | 13,619 | 6,613 | 3,116 |
| Totals, 1936–37 | 142 | 257 | 40 | 151,763 | 87,260 | 58,104 | 11,594 |
| Totals, 1935–36 | 146 | 261 | 42 | 146,851 | 84,971 | 58,541 | 11,717 |
Returns of factory production show that during the 1935–36 factory year 3,322,699 cwt. of butter was produced by dairy factories in the Dominion. In addition to this, 43,880 cwt. of whey butter was manufactured. For the twelve months ended 31st January, 1930 (since when the collection of data has been discontinued), 52,158 cwt. of butter was produced on holdings of 1 acre and over.
Returns from dairy factories give the quantity of cheese manufactured during 1935–36 as 1,769,984 cwt.
Factory production of butter and cheese during each of the last ten factory years was as follows:—
| Factory Year. | Creamery Butter.* | Whey Butter. | Cheese. |
|---|---|---|---|
* Including whey butter where not separately enumerated. | |||
| Cwt. | Cwt. | Cwt. | |
| 1926–27 | 1,708,219 | 28,405 | 1,564,276 |
| 1927–28 | 1,778,999 | 30,489 | 1,550,090 |
| 1928–29 | 1,951,163 | 37,053 | 1,782,237 |
| 1929–30 | 2,254,171 | 32,504 | 1,781,918 |
| 1930–31 | 2,306,842 | 35,212 | 1,857,852 |
| 1931–32 | 2,439,069 | 40,107 | 1,781,782 |
| 1932–33 | 2,926,990 | 47,792 | 2,071,181 |
| 1933–34 | 3,187,212 | 50,826 | 2,135,599 |
| 1934–35 | 3,105,974 | 51,081 | 1,914,458 |
| 1935–36 | 3,322,699 | 43,880 | 1,769,984 |
Pig-raising is an important industry ancillary to dairy-farming. In New Zealand pig-production has till recently been comparatively neglected, but in recent years this branch of the dairying industry has been advancing. Statistics of pig-production, exports of pork, &c., are continued in a later portion of this section (pp. 418–420, 422).
An estimate of the production of butterfat per cow is made each year by the Department of Agriculture. The figures represent the butterfat content of milk-production “at the pail.” including the butterfat content of milk fed to stock spilt, wasted, &c.
The estimated yield per cow, measured in terms of butterfat-production, has been—
| lb. | |
|---|---|
* Provisional estimate. | |
| 1906–07 | 124.79 |
| 1907–08 | 127.66 |
| 1908–09 | 139.25 |
| 1909–10 | 148.45 |
| 1910–11 | 139.46 |
| 1911–12 | 140.10 |
| 1912–13 | 150.78 |
| 1913–14 | 156.52 |
| 1914–15 | 154.07 |
| 1915–16 | 160.52 |
| 1916–17 | 163.96 |
| 1917–18 | 152.23 |
| 1918–19 | 150.64 |
| 1919–20 | 152.04 |
| 1920–21 | 154.25 |
| 1921–22 | 174.97 |
| 1922–23 | 180.62 |
| 1923–24 | 174.10 |
| 1924–25 | 182.09 |
| 1925–26 | 179.40 |
| 1926–27 | 198.50 |
| 1927–28 | 195.38 |
| 1928–29 | 210.84 |
| 1929–30 | 218.05 |
| 1930–31 | 201.05 |
| 1931–32 | 199.65 |
| 1932–33 | 215.10 |
| 1933–34 | 220.80 |
| 1934–35 | 210.00 |
| 1935–36 | 217.93 |
| 1936–37 | 228.56* |
The figures shown in the table represent averages for all dairy cows in the Dominion, whether in milk or dry. Averages for cows in milk for each of the last five seasons were: 1932–33, 231.18 lb.; 1933–34, 234–91 lb.; 1934–35, 224.26 lb.; 1935–36, 233.25 lb.; and 1936–37, 245.05 lb.
The question of butterfat-production per cow is among the subjects to which reference is made in the next subsection (Subsection D.—Dairy-farm Survey).
The total export of butter and cheese in the last ten years, and the total quantity of each commodity sent to the United Kingdom, are given in the next table, The butter-export figures for 1936 exceed the previously existing record established in 1935, while the figures for cheese have fallen below the average of recent years.
| Calendar Year. | Total Export of Butter. | Butter exported to the United Kingdom. | Total Export of Cheese. | Cheese exported to the United Kingdom. |
|---|---|---|---|---|
| Cwt. | Cwt. | Cwt. | Cwt. | |
| 1927 | 1,455,539 | 1,188,664 | 1,492,792 | 1,478,870 |
| 1928 | 1,449,570 | 1,158,234 | 1,567,272 | 1,551,523 |
| 1929 | 1,653,807 | 1,276,841 | 1,779,093 | 1,770,150 |
| 1930 | 1,884,237 | 1,553,725 | 1,812,981 | 1,809,348 |
| 1931 | 1,988,566 | 1,962,320 | 1,636,347 | 1,635,233 |
| 1932 | 2,185,545 | 2,156,127 | 1,790,431 | 1,788,989 |
| 1933 | 2,635,247 | 2,597,008 | 1,982,942 | 1,980,872 |
| 1934 | 2,614,519 | 2,568,056 | 1,984,496 | 1,983,058 |
| 1935 | 2,789,298 | 2,696,832 | 1,727,552 | 1,723,197 |
| 1936 | 2,796,145 | 2,721,342 | 1,658,206 | 1,654,827 |
On a value basis, butter exports greatly exceed those of cheese, the figures for 1936 being £(N.Z.)15,317,576 for butter and £(N.Z.)5,122,438 for cheese. These values do not represent the guaranteed prices, but are the declared export values based on prices ruling in the overseas market.
Prior to legislation enacted in 1936, the dairy industry was controlled by the New Zealand Dairy Board, which consisted of three Government nominees, three representatives of owners of dairy factories, and one appointee of the New Zealand Co-operative Dairy Co., Ltd. Under the Primary Products Marketing Act, 1936, control became vested in the Minister of Marketing. The Primary Products Marketing Department was established, which, under the control of the Minister, became charged with the administration of the Act. The Department has taken over the main functions of the New Zealand Dairy Board, and also the greater part of the Board's staff in New Zealand and London.
The Primary Products Marketing Department has continued the inspection of conditions of loading butter and cheese for export, and proposes to extend the scope of advertising in the United Kingdom on the same lines as hitherto conducted by the New Zealand Dairy Board. In carrying out its marketing work in the United Kingdom, the Department is utilizing the services of efficient London merchants.
Freight rates on butter and cheese, operating from 1st September, 1936, have been fixed as follows::—
| Butter | 2s. 11¼ d. per box net. |
| Cheese | 11/17 d. per pound net. |
The above rates are payable in sterling, and represent an increase of 2½ per cent. over the previous contract rates.
The functions of the New Zealand Dairy Board are now confined to the internal side of the dairy industry and to herd-testing. Its levy has been reduced to 1/56 d. per pound, on butter and 1/100 d. per pound on cheese manufactured. The proceeds are used to subsidize dairy-research work and the distribution of milk to schools.
A summary of the principal provisions of the Primary Products Marketing Act, together with a statement of the guaranteed prices operative in respect of dairy-produce for export, is contained in Subsection A (pp. 376–9).
The following table of monthly arrivals of New Zealand butter and cheese in Great Britain will give an indication of the trend during recent years, the aim being to keep New Zealand dairy-produce on the British market all the year round:—
| Month. | 1929–30. | 1930–31. | 1931–32. | 1932–33. | 1933–34. | 1934–35. | 1935–36. | 1936–37. |
|---|---|---|---|---|---|---|---|---|
| Butter (Boxes of 56 lb). | ||||||||
| August | 95,082 | 232,895 | 193,849 | 271,034 | 357,126 | 296,204 | 306,616 | 325,330 |
| September | 74,385 | 147,357 | 212,458 | 276,392 | 315,250 | 217,495 | 450,679 | 481,990 |
| October | 58,014 | 133,129 | 160,593 | 154,101 | 314,609 | 388,696 | 350,794 | 421,465 |
| November | 209,103 | 299,486 | 253,486 | 425,791 | 489,757 | 427,208 | 361,264 | 376,406 |
| December | 274,928 | 345,128 | 600,660 | 612,010 | 568,348 | 481,507 | 655,698 | 628,561 |
| January | 343,935 | 477,783 | 413,316 | 553,599 | 617,719 | 534,215 | 492,732 | 635,643 |
| February | 292,603 | 340,868 | 426,653 | 386,513 | 575,906 | 550,785 | 576,879 | 540,929 |
| March | 267,425 | 382,839 | 404,309 | 451,256 | 584,206 | 519,114 | 519,228 | 568,970 |
| April | 429,405 | 412,303 | 360,939 | 460,201 | 462,952 | 427,257 | 513,329 | 582,467 |
| May | 255,699 | 313,285 | 397,399 | 504,963 | 591,420 | 413,107 | 473,191 | 390,280 |
| June | 131,005 | 212,270 | 232,791 | 356,137 | 366,626 | 324,899 | 442,585 | 485,051 |
| July | 157,324 | 304,493 | 233,382 | 331,731 | 357,533 | 279,040 | 320,155 | 405,020 |
| Totals | 2,588,908 | 3,601,836 | 3,889,835 | 4,783,728 | 5,601,452 | 4,859,527 | 5,463,150 | 5,842,112 |
| Cheese (Crates of 160lb). | ||||||||
| August | 76,526 | 102,544 | 37,390 | 64,292 | 94,789 | 99,588 | 67,957 | 70,744 |
| September | 39,977 | 70,192 | 44,267 | 73,224 | 79,181 | 74,899 | 75,715 | 76,098 |
| October | 21,706 | 16,674 | 47,652 | 33,768 | 54,597 | 68,362 | 64,615 | 83,224 |
| November | 46,294 | 64,908 | 30,296 | 53,306 | 63,388 | 73,940 | 49,452 | 62,272 |
| December | 99,184 | 133,283 | 135,898 | 138,064 | 112,403 | 111,648 | 105,971 | 107,365 |
| January | 159,562 | 178,977 | 136,516 | 164,893 | 160,480 | 150,553 | 119,174 | 132,714 |
| February | 126,406 | 105,693 | 148,800 | 141,205 | 156,086 | 144,763 | 140,220 | 111,324 |
| March | 134,635 | 156,865 | 130,813 | 156,242 | 154,889 | 125,398 | 117,897 | 131,871 |
| April | 147,286 | 174,355 | 107,280 | 150,699 | 139,372 | 132,445 | 118,048 | 126,297 |
| May | 113,679 | 136,780 | 156,859 | 155,024 | 166,291 | 115,936 | 112,428 | 83,552 |
| June | 88,978 | 64,315 | 95,316 | 121,395 | 112,081 | 101,775 | 130,575 | 102,303 |
| July | 90,420 | 87,809 | 83,699 | 110,478 | 117,796 | 81,980 | 59,874 | 101,842 |
| Totals | 1,144,653 | 1,292,395 | 1,154,786 | 1,362,590 | 1,411,353 | 1,281,287 | 1,161,926 | 1,189,606 |
The following table shows the production of butter and cheese in the principal dairying countries (1936 figures shown below are estimates only):—
| Country. | Butter. | Cheese. | ||||||
|---|---|---|---|---|---|---|---|---|
| Year. | Quantity. | Place on List. | Year. | Quantity. | Place on List. | |||
| Total Production. | Factory Production. | Total Production. | Factory Production. | |||||
* Estimate. | ||||||||
| (000,000) lb. | (000,000) lb. | |||||||
| Argentina | 1936 | 72 | 15 | 1935 | 51 | 15 | ||
| Australia | 1935–36 | 444 | 1 | 1935–36 | 39 | 18 | ||
| Austria | 1934 | 50 | 19 | 1934 | 68* | 11 | ||
| Belgium | 1935 | 141 | 12 | 1934 | 46* | 16 | ||
| Brazil | 1936 | 57 | 17 | 1936 | 64 | 14 | ||
| Canada | 1935 | 357 | 7 | 1935 | 105 | 9 | ||
| Czechoslovakia | 1935 | 26 | 23 | 1935 | 23 | 19 | ||
| Denmark | 1935 | 394 | 5 | 1935 | 66 | 12 | ||
| Egypt | 1935 | 37 | 22 | |||||
| Finland | 1935 | 54 | 18 | 1935 | 17 | 20 | ||
| France | 1935 | 552 | 3 | 1931 | 419 | 4 | ||
| Germany | 1935 | 979 | 2 | 1934 | 785 | 1 | ||
| Irish Free State | 1934 | 187 | 10 | |||||
| Italy | 1934 | 102 | 14 | 1934 | 523 | 3 | ||
| Latvia | 1935 | 46 | 20 | 1935 | 2 | 22 | ||
| Netherlands | 1936 | 230 | 9 | 1935 | 267 | 5 | ||
| New Zealand | 1935–36 | 372 | 6 | 1935–36 | 198 | 6 | ||
| Norway | 1936 | 26 | 23 | 1936 | 41 | 17 | ||
| Russia (U.S.S.R.) | 1935 | 351* | 8 | 1934 | 65 | 13 | ||
| Sweden | 1935 | 144 | 11 | 1935 | 73 | 10 | ||
| Switzerland | 1936 | 61 | 16 | 1936 | 111 | 8 | ||
| Union of Sth. Africa | 1934 | 42 | 21 | 1934 | 10 | 21 | ||
| United Kingdom | 1930 | 106 | 13 | 1936 | 127 | 7 | ||
| United States of America | 1935 | 2,253 | 1 | 1936 | 671 | 2 | ||
The following table, taken mainly from the International Review of Agriculture, shows the quantities of butter and cheese exported from the principal countries engaged in the export trade during the last six calendar years. The New Zealand figures relate to the twelve months ended 30th June following the year shown.
| Country. | 1931. | 1932. | 1933. | 1934. | 1935. | 1936. |
|---|---|---|---|---|---|---|
| Butter (Million Pounds Weight). | ||||||
| New Zealand | 220 | 272 | 317 | 288 | 312 | 335 |
| Denmark | 378 | 348 | 332 | 330 | 305 | 322 |
| Australia | 191 | 229 | 212 | 247 | 257 | 186 |
| Netherlands | 73 | 45 | 63 | 81 | 103 | 133 |
| Estonia, Latvia, Lithuania | 92 | 91 | 76 | 78 | 88 | 95 |
| Irish Free State | 42 | 37 | 45 | 57 | 59 | 58 |
| Russia (U.S.S.R.) | 68 | 68 | 82 | 84 | 65 | 51 |
| Sweden | 43 | 30 | 38 | 51 | 45 | 42 |
| Finland | 38 | 32 | 26 | 24 | 23 | 31 |
| Poland | 27 | 3 | 4 | 10 | 13 | 24 |
| Argentina | 51 | 56 | 31 | 18 | 15 | 23 |
| Country. | 1931. | 1932. | 1933. | 1934. | 1935. | 1936. |
|---|---|---|---|---|---|---|
| Cheese (Million Pounds Weight). | ||||||
| New Zealand | 182 | 215 | 223 | 208 | 181 | 186 |
| Netherlands | 190 | 170 | 141 | 135 | 135 | 125 |
| Canada | 85 | 87 | 74 | 61 | 56 | 82 |
| Italy | 89 | 67 | 53 | 55 | 61 | 43 |
| Switzerland | 54 | 44 | 45 | 39 | 40 | 41 |
| France | 34 | 29 | 25 | 26 | 25 | 23 |
| Denmark | 9 | 15 | 22 | 14 | 15 | 21 |
| Australia | 7 | 9 | 11 | 12 | 15 | 12 |
The position of New Zealand in comparison with her competitors in the butter and cheese markets of the United Kingdom is featured in the following table:—
IMPORTS INTO THE UNITED KINGDOM.
| Country of Origin. | Calendar Year. | |||||
|---|---|---|---|---|---|---|
| 1932. | 1933. | 1934. | 1935. | 1936. | ||
| Quantity. | Per Cent. of Total. | |||||
| Butter (Thousand Hundredweight). | ||||||
| New Zealand | 2,139 | 2,512 | 2,677 | 2,638 | 2,792 | 28.6 |
| Denmark | 2,584 | 2,519 | 2,486 | 2,186 | 2,171 | 22.3 |
| Australia | 1,795 | 1,692 | 2,104 | 2,113 | 1,694 | 17.4 |
| Netherlands | 47 | 146 | 301 | 464 | 746 | 7.6 |
| Russia (U.S.S.R.) | 323 | 563 | 491 | 503 | 415 | 4.3 |
| Irish Free State | 315 | 379 | 468 | 488 | 468 | 4.8 |
| Other countries | 1,161 | 1,021 | 1,168 | 1,216 | 1,466 | 15.0 |
| Totals | 8,364 | 8,832 | 9,695 | 9,608 | 9,752 | 100.0 |
| Cheese (Thousand Hundredweight). | ||||||
| New Zealand | 1,849 | 2,059 | 2,092 | 1,763 | 1,681 | 62.8 |
| Canada | 747 | 630 | 520 | 470 | 603 | 22.5 |
| Netherlands | 170 | 122 | 128 | 199 | 182 | 6.8 |
| Australia | 74 | 93 | 115 | 134 | 91 | 3.4 |
| Other countries | 163 | 136 | 134 | 148 | 119 | 4.5 |
| Totals | 3,003 | 3,040 | 2,989 | 2,714 | 2,676 | 100.0 |
It will be seen that, while New Zealand is fairly closely rivalled in the butter trade by both Denmark and Australia, her supremacy in the cheese trade is unchallenged.
A point of particular interest in the above table is the evidence it affords of a substantial expansion in the consumption of imported butter in the United Kingdom. The relatively low prices ruling during the past few years have stimulated the consumption of butter in that country to a marked extent, while there has been a correspondingly large decrease in the consumption of margarine. Consumption of the latter product is particularly sensitive to price changes in the butter market, and to changes in the average income among the lower-income groups of the population.
The long-term trend of the export markets for dairy products is particularly difficult to prophesy at the present time. As far as the United Kingdom is concerned, the operation of the milk-marketing scheme has resulted in a substantial increase in the home production of milk (partly at the expense of cattle raising). By far the greater proportion of the production of milk in that country (about 80 per cent.) is sold as liquid milk or cream, while production of butter and cheese from the residual quantity, though increasing, forms only a very small percentage of the present requirements of the population. It seems evident that the United Kingdom will still have to rely on imported dairy-products for the great bulk of its supplies. The future of the market for imported butter in that country is, however, affected by the approach of a declining population. Of particular import in this connection is the prospective relative decline in the proportion of young persons in the total population. A factor of particular significance, however, which may for some time to come at least outweigh the effects of the considerations outlined above is the increasing prominence given to the subject of nutrition. An arresting report by Sir John Boyd Orr, entitled “Food, Health, and Income” (issued February, 1936), which makes pointed reference to the inadequacy of diet among the lower-income groups in the United Kingdom, has received wide attention.
The need for expansion of consumption of dairy produce—liquid milk, in particular—is in the forefront of discussions on nutrition; and recognition of this need has found practical expression in the provision recently made in Great Britain, through the agency of the milk-marketing scheme, for the supply of free milk to largo numbers of children in poor circumstances. It is of service to note at this stage that provision has been made in New Zealand for free distribution of milk to schools.
The active interest in nutrition may well prove to be a solution of the difficulties in marketing of dairy products. It is apposite to note in this connection that New Zealand butter is esteemed very highly from a nutritional point of view—the fact that dairy cows are grazed on open pastures the whole year through, and the careful treatment of the product through all stages of production and transport, being important factors contributing to its peculiarly desirable qualities.
The world aspect of nutrition problems is receiving considerable attention by the League of Nations, which has issued valuable reports on the subject. There is ample evidence that the present consumption of dairy products in many countries has been reduced far below the safety limits in respect of nutrition as a result of the operation of import restriction policies.
References to the consumption of dairy produce in New Zealand and in certain other countries will be found in a later section (Section XLIII, Consumption of Commodities).
A special survey of production and employment in the dairying industry was undertaken by the Census and Statistics Department in 1937. The results of this survey form the subject-matter of the next subsection (Subsection D.—Dairy-farm Survey).
In recent years a quickening of interest in pig production as an adjunct to dairy-farming has raised their numbers considerably above those noted previously.
The figures for 1937, which are quoted in the five-yearly table published below, are somewhat below the record level reached in 1936. In this connection it is of interest to note that the number of dairy cows also showed a decrease in 1937.
Attention is directed to the fact that further statistics of pig-production are included in Subsection D of this section (Dairy-farm Survey).
| As at 31st January, | Pigs under Six Months Old. | Pigs Six Months and under One Year Old. | Boars One Year Old and over. | Sows One Year Old and over. | Total Pigs. |
|---|---|---|---|---|---|
| 1932 | 319,467 | 104,156 | 14,384 | 75,409 | 513,416 |
| 1933 | 372,856 | 114,292 | 16,748 | 87,686 | 591,582 |
| 1934 | 422,185 | 121,695 | 18,214 | 98,299 | 660,393 |
| 1935 | 499,499 | 131,048 | 20,415 | 111,793 | 762,755 |
| 1936 | 528,442 | 142,764 | 21,199 | 116,058 | 808,463 |
| 1937 | 518,282 | 149,892 | 21,324 | 112,921 | 802,419 |
The following table shows the classification by breeds as at the special collection conducted in 1928. The figures are exclusive of pigs within borough boundaries.
| Breed. | Pigs under One Year Old. | Boars One Year Old and over. | Sows One Year Old and over. | Totals. |
|---|---|---|---|---|
| Pure Berkshire | 66,441 | 5,772 | 16,545 | 78,758 |
| Pure Yorkshire | 5,599 | 642 | 2,314 | 8,555 |
| Other purebred | 9,520 | 1,491 | 4,545 | 15,556 |
| Crossbred | 410,373 | 7,462 | 59,000 | 476,835 |
| Totals | 481,933 | 15,367 | 82,404 | 579,704 |
The following diagram affords evidence of the movement in numbers of total cattle, dairy cows, and pigs since 1916. The enumeration date in each case is 31st January.
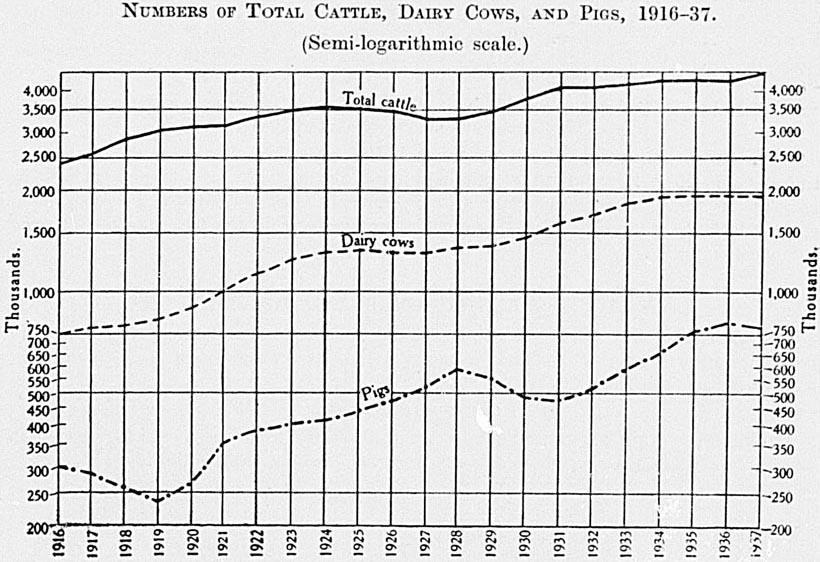
The relationship between the movements in dairy cows and total cattle is fairly uniform. There has been, however, a tendency for dairy cows to constitute an increasing proportion of total cattle. In 1916 the proportion was 31 per cent., as against 44 per cent. in 1937. At the midway point (1926) dairy cows accounted for 38 per cent. of all cattle.
Regarding pigs, the diagram shows two periods of declining numbers — namely, 1916 to 1919 and 1928 to 1931. The lowest figure was 235,000, recorded in 1919. Progress since then, despite the check between 1928 and 1931, has been considerable, culminating in a total of over 800,000 in 1936. While the 1937 total shows a slight decline of less than 1 per cent. below the 1936 figure, this should not be taken as an indication that pig-production is on the decline, as this adjunct to dairying is receiving more attention than hitherto. The diagram clearly indicates the rapid rise in the number of pigs since the half-million mark was passed in 1932.
Although developments to the present stage give cause for satisfaction, New Zealand requires to make up tremendous leeway to reach the stage of development in the pig industry achieved by other dairying countries. This is immediately evident on reference to the following table showing, for the most important countries, the relationship existing between pigs and dairy cows. The latest available figures are quoted in each case.
| Country. | Date of Enumeration. | Number of | ||
|---|---|---|---|---|
| Pigs. | Dairy Cows. | Pigs per 100 Dairy Cows. | ||
* Not specifically designated as dairy cows. | ||||
| (Thousands.) | (Thousands.) | |||
| Germany | Dec., 1936 | 25,862 | 10,099 | 256 |
| Denmark | July, 1936 | 3,503 | 1,615* | 217 |
| United States | Jan., 1937 | 42,774 | 25,041 | 171 |
| Yugoslavia | 1934 | 2,792 | 1,847 | 151 |
| England and Wales | June, 1936 | 3,804 | 2,632 | 145 |
| Italy | Mar., 1930 | 3,318 | 2,389 | 139 |
| Russia (U.S.S.R.) | July, 1936 | 30,400 | 22,100* | 138 |
| Netherlands | Nov., 1935 | 1,629 | 1,435 | 114 |
| Czechoslovakia | Dec., 1936 | 2,745 | 2,437* | 113 |
| Estonia, Latvia, and Lithuania | Dec., 1935 | 2,284 | 2,033 | 112 |
| Argentina | June, 1930 | 3,769 | 3,738 | 101 |
| Canada | Dec., 1935 | 3,950 | 3,932 | 100 |
| France | Dec., 1936 | 7,089 | 8,693* | 82 |
| Sweden | July, 1934 | 1,452 | 1,931* | 75 |
| New Zealand | Jan., 1937 | 802 | 1,936 | 41 |
| Australia | Dec., 1934 | 1,158 | 3,396 | 34 |
The table appearing above emphasizes the need for development of the pig industry in New Zealand to a standard approaching that of other countries in relation to their dairy herds. Such development must eventually proceed along lines calculated to enable the Dominion to participate in the large market offering for bacon-supplies.
Statistics of live-stock slaughterings and meat exports follow. References to consumption within New Zealand of meats and other commodities are contained in a later section (Section XLIII).
Figures showing sheep and lambs slaughtered for food purposes, together with the exports of frozen mutton and lamb, are given in the table following.
| Year ended 31st March, | Slaughterings. | Exports (including Pieces). | ||
|---|---|---|---|---|
| At Abattoirs and Slaughterhouses. | On Farms.* | Total. | ||
* Year ended 31st January. | ||||
| Sheep. | ||||
| Number. | Number. | Number. | Carcases. | |
| 1933 | 3,569,598 | 786,814 | 4,356,412 | 2,354,184 |
| 1934 | 2,867,245 | 688,889 | 3,556,134 | 2,010,084 |
| 1935 | 3,335,943 | 606,880 | 3,942,823 | 2,088,881 |
| 1936 | 2,674,554 | 586,336 | 3,260,890 | 1,810,052 |
| 1937 | 2,901,315 | 562,199 | 3,463,514 | 1,751,178 |
| Totals for five years | 15,348,655 | 3,231,118 | 18,579,773 | 10,014,379 |
| Lambs. | ||||
| 1933 | 9,718,585 | 135,345 | 9,853,930 | 9,056,071 |
| 1934 | 8,726,390 | 99,032 | 8,825,422 | 8,719,301 |
| 1935 | 9,690,054 | 75,572 | 9,765,626 | 9,383,081 |
| 1936 | 8,685,536 | 69,469 | 8,755,005 | 8,365,543 |
| 1937 | 9,294,722 | 63,033 | 9,357,755 | 8,639,493 |
| Totals for five years | 46,115,287 | 442,451 | 46,557,738 | 44,163,489 |
As the United Kingdom provides practically the only market for the mutton and lamb exported from New Zealand, it is interesting to note the extent to which the Dominion contributes to this market in comparison with importations from other countries. The position during the five calendar years up to 1936 is given in the following statement respecting the commodities specified:—
IMPORTS INTO THE UNITED KINGDOM.
| Country of Origin. | Calendar Year. | |||||
|---|---|---|---|---|---|---|
| 1932. | 1933. | 1934. | 1935. | 1936. | ||
| Quantity. | Per Cent. of Total. | |||||
| Frozen Mutton (Thousand Hundredweight). | ||||||
| New Zealand | 1,336 | 999 | 899 | 1,042 | 889 | 66.2 |
| Australia | 191 | 347 | 461 | 424 | 227 | 16.9 |
| Argentina | 354 | 217 | 138 | 150 | 122 | 9.1 |
| Chile | 151 | 140 | 82 | 89 | 96 | 7.1 |
| Uruguay | 32 | 33 | 14 | 6 | 8 | 0.6 |
| Other Countries | 2 | 4 | 3 | 3 | 2 | 0.1 |
| Totals | 2,066 | 1,740 | 1,597 | 1,714 | 1,344 | 100.0 |
| Frozen Lamb (Thousand Hundredweight). | ||||||
| New Zealand | 2,571 | 2,736 | 2,655 | 2,591 | 2,642 | 53.3 |
| Australia | 961 | 957 | 1,166 | 1,360 | 1,272 | 25.6 |
| Argentina | 1,018 | 929 | 784 | 755 | 778 | 15.7 |
| Uruguay | 131 | 139 | 125 | 130 | 118 | 2.4 |
| Chile | 145 | 124 | 124 | 119 | 111 | 2.2 |
| Other countries | 36 | 27 | 28 | 29 | 38 | 0.8 |
| Totals | 4,862 | 4,912 | 4,882 | 4,985 | 4,959 | 100.0 |
The above figures strikingly illustrate the dominant position held by New Zealand mutton and lamb on the United Kingdom market.
Although total importations of mutton exhibit a declining tendency, the quantities supplied by New Zealand and Australia have remained fairly constant from year to year. The falling-away is accounted for by comparatively heavy reductions in supplies emanating from South American countries. Regarding lamb, the import figures show no outstanding features other than a rise in Australian imports and a decline in produce from the Argentine.
New Zealand mutton and lamb form a substantial proportion of the meats sold on the London market, but the Dominion's frozen beef competes under difficulties with chilled and fresh beef from countries nearer the United Kingdom, with the consequence that exports of frozen beef from the Dominion have declined in recent years. However, prospects for expansion are now brighter, as during 1933 several trial shipments of New Zealand chilled beef were despatched to England. The experiments proved very successful, and were followed by larger shipments. In 1934, 33,403 cwt. was forwarded to the United Kingdom. During the following twelve months a further 110,697 cwt. was shipped, followed by 228,263 cwt. during 1936. This quantity represents 45 per cent. of the total quantity of both chilled and frozen beef sent forward during the latter period.
New Zealand chilled beef is rapidly establishing itself as a quality article with United Kingdom retailers, and a steady improvement is being maintained in the quality and condition of arrivals.
The following table, which is exclusive of veal, shows the number and approximate weight of cattle slaughtered for food purposes in each of the last five years, together with the weight of beef exported. In the figures of slaughterings an average weight of 600 lb. per carcase is taken, and the export figures include potted and preserved meats, the greater portion of which is beef.
| Year ended 31st March, | Slaughterings of Cattle. | Exports of Beef. | |||
|---|---|---|---|---|---|
| At Abattoirs and Slaughterhouses. | On Farms.* | Total. | Approximate Weight. | ||
* Year ended 31st January. | |||||
| Number. | Number. | Number. | Cwt. | Cwt. | |
| 1933 | 393,608 | 11,373 | 404,981 | 2,169,541 | 600,258 |
| 1934 | 475,149 | 13,255 | 488,404 | 2,616,450 | 853,488 |
| 1935 | 488,982 | 13,581 | 502,563 | 2,692,302 | 901,282 |
| 1936 | 563,488 | 13,270 | 576,758 | 3,089,775 | 890,702 |
| 1937 | 506,141 | 9,928 | 516,069 | 2,764,655 | 712,987 |
| Totals for five years | 2,427,368 | 61,407 | 2,488,775 | 13,332,723 | 3,958,717 |
During the five years ended the 31st March, 1937, 4,192,973 pigs were slaughtered at abattoirs, bacon-factories, and registered slaughterhouses, and during the quinquennium to the 31st January, 1937, 253,375 were slaughtered by farmers on holdings of 1 acre or over, the total slaughterings during the five years representing approximately 3,442,500 cwt. of pork, bacon, and ham, approximately half of which total was exported. The figures for each year are:—
| Year ended 31st March, | Pigs slaughtered. | Export of Frozen Pork, and Bacon and Ham. | |||
|---|---|---|---|---|---|
| At Abattoirs, &c. | On Farms.* | Total. | Approximate Weight. | ||
* Year ended 31st January. | |||||
| Number. | Number. | Number. | Cwt. | Cwt. | |
| 1933 | 532,123 | 58,484 | 590,607 | 453,000 | 186,646 |
| 1934 | 711,129 | 55,498 | 766,627 | 588,500 | 378,760 |
| 1935 | 892,372 | 48,546 | 940,918 | 731,000 | 451,825 |
| 1936 | 994,839 | 46,891 | 1,041,730 | 818,500 | 569,008 |
| 1937 | 1,062,510 | 43,956 | 1,106,466 | 851,500 | 570,686 |
| Total for five years | 4,192,973 | 253,375 | 4,446,348 | 3,442,500 | 2,156,925 |
As in the case of other frozen meats, New Zealand pork is shipped almost exclusively to the United Kingdom, whose market for this commodity has expanded rapidly. The following figures are of interest as showing the important position occupied by the Dominion in the import trade:—
FROZEN AND CHILLED PORK—IMPORTS INTO THE UNITED KINGDOM.
| Country of Origin. | Calendar Year. | |||||
|---|---|---|---|---|---|---|
| 1932. | 1933. | 1934. | 1935. | 1936. | ||
| Quantity. | Per Cent. of Total. | |||||
| Cwt. | Cwt. | Cwt. | Cwt. | Cwt. | ||
| New Zealand | 131,142 | 278,047 | 414,275 | 490,301 | 579,086 | 56.5 |
| Argentina | 108,854 | 166,017 | 277,526 | 186,842 | 190,371 | 18.6 |
| Australia | 45,480 | 65,567 | 82,425 | 146,751 | 232,510 | 22.7 |
| United States | 32,978 | 83,559 | 290,365 | 77,079 | 10,731 | 1.0 |
| Canada | 19,805 | 18,825 | 27,134 | |||
| Other countries | 2,762 | 10,761 | 13,695 | 14,125 | 12,514 | 1.2 |
| Totals | 341,021 | 622,776 | 1,105,420 | 915,098 | 1,025,212 | 100.0 |
It will be seen that New Zealand's shipments to the United Kingdom of 131,142 cwt. in 1932 were quadrupled in 1936. Quantities received by the United Kingdom from other countries fluctuated considerably from year to year in individual cases.
In international trade, exports of bacon far exceed those of other pig products, with the United Kingdom absorbing most of the exports of other countries. Although New Zealand supplies a substantial proportion of the imports of frozen and chilled pork into the United Kingdom, her contributions of bacon are negligible at present. Bacon formed 76 per cent. of all pig products imported into the United Kingdom in 1936. Of aggregate supplies of bacon, amounting to 333,000 tons, Denmark was responsible for 169,000 tons, or 51 per cent. Canada, Netherlands, Irish Free State, Poland, and Sweden supplied the great bulk of the remainder.
In recent years the veal industry has developed rapidly, mainly as a result of the organization of the “bobby” calf trade. An appreciable increase in exports resulted. As a consequence of British Government meat restrictions, an embargo was placed on the export of “bobby” calf meat as from the 12th July, 1934, but has since been lifted. Special regulations make it an offence to sell or offer for sale any calf which has not been properly and sufficiently fed daily from birth, and require that all calves be fed not earlier than four hours before the time of their removal from the owner's premises.
The following table gives particulars of slaughterings and exports for the past five years:—
| Year ended 31st March, | Slaughterings. | Exports of Veal. | ||
|---|---|---|---|---|
| At Abattoirs and Slaughterhouses. | On Farms.* | Total. | ||
* Year ended 31st January. | ||||
| Number. | Number. | Number. | Cwt. | |
| 1933 | 599,335 | 14,538 | 613,873 | 91,341 |
| 1934 | 941,705 | 12,705 | 954,410 | 134,092 |
| 1935 | 746,771 | 15,986 | 762,757 | 71,356 |
| 1936 | 1,074,656 | 11,575 | 1,086,231 | 110,124 |
| 1937 | 1,045,827 | 8,680 | 1,054,507 | 120,625 |
| Totals for five years | 4,408,294 | 63,484 | 4,471,778 | 527,538 |
The New Zealand Meat-producers' Board was constituted under the provisions of the Meat-export Control Act, 1921–22. It consists of eight members—five representing the producers of meat for export, two representing the Government, and one representing the stock and station agents. Briefly, its objects are to control the export of meat in the interests of the producers.
Since the Board was constituted in 1922 freight charges have been considerably reduced. Rates now current, a three-year contract commencing 1st September, 1936, are (per pound): Mutton (or lamb over 42 lb.), 0.793d.; lamb, 0.929d.; veal, 0.645d.; pork, 0.645d.; beef, 0.645d.; other items at various rates. The rates quoted are in sterling, and are payable in sterling in London. For chilled beef the charge is based on space of chamber, calculated at the frozen-beef rate, plus 10 per cent.
Probably one of the most important functions of the Board is to regulate shipments so as to keep a steady flow of meat to the British markets over the twelve months of the year, having due regard to the months showing the highest consumption of each class of meat. The Board is enabled to carry out this work as it has the freight arrangements for the shipment of New Zealand meat in its hands under its statutory powers.
The Board has been very closely associated with the New Zealand Government in connection with the Ottawa Agreement and the subsequent meat-imports policy of the British Government, the regulation of meat shipments, so far as New Zealand is concerned, being in its hands.
Another very important section of the Board's work comes under the heading of advertising. Along with the Dominion's increasing lamb-production, every effort is being made to expand our trade by advertising, and large sums of money have been spent in the United Kingdom for this purpose.
Other important functions of the Board include supervision of grading, inspection of loading and unloading of vessels, trial shipments to new markets, scientific survey work, and grants to the Royal Agricultural Society and other bodies to encourage production of suitable export types of lambs, pigs, &c.
The Board has taken an active part in the development of the chilled-beef industry and has also encouraged the expansion of the pig industry by grants to recording clubs and in other directions.
The following table shows shipments during each month of the seasons 1934–35 and 1935–36 and the first seven months of the season 1936–37:—
| Month of Shipment. | Shipping Season 1934–35. | Shipping Season 1935–36. | Shipping Season 1936–37. | ||||||
|---|---|---|---|---|---|---|---|---|---|
| Beef. | Mutton. | Lamb. | Beef. | Mutton. | Lamb. | Beef. | Mutton. | Lamb. | |
| Qrs. | Care's. | Care's. | Qrs. | Care's. | Care's. | Qrs. | Care's. | Care's. | |
| November | 35,497 | 34,928 | 227,758 | 21,152 | 91,867 | 221,519 | 12,679 | 32,591 | 193,429 |
| December | 8,910 | 106,657 | 770,249 | 19,944 | 47,008 | 586,421 | 18,626 | 39,494 | 415,793 |
| January | 18,280 | 147,342 | 679,021 | 13,226 | 70,091 | 669,179 | 21,583 | 56,276 | 903,520 |
| February | 42,743 | 244,678 | 1,180,678 | 18,467 | 102,205 | 839,743 | 19,009 | 98,322 | 999,587 |
| March | 36,688 | 279,798 | 1,361,153 | 41,104 | 249,556 | 1,291,334 | 29,121 | 182,007 | 1,040,001 |
| April | 16,727 | 236,808 | 908,805 | 33,476 | 252,011 | 864,376 | 33,251 | 217,324 | 980,151 |
| May | 73,583 | 219,027 | 1,289,303 | 43,488 | 199,844 | 1,122,006 | 33,050 | 143,627 | 1,067,798 |
| June | 62,035 | 158,339 | 985,639 | 29,352 | 126,799 | 809,277 | |||
| July | 33,936 | 111,805 | 470,717 | 38,597 | 191,865 | 1,121,031 | |||
| August | 35,301 | 236,741 | 739,048 | 26,719 | 187,876 | 739,627 | |||
| September | 19,664 | 143,966 | 143,904 | 23,784 | 165,037 | 404,330 | |||
| October | 40,128 | 186,061 | 71,037 | 40,466 | 214,912 | 119,824 | |||
Since 1911, when the peak number of 404,284 was recorded, horses have tended to decline numerically. The foregoing figure includes horses in boroughs; and totals on a similar basis in 1916, 1921, and 1926 were 371,331, 337,259, and 314,867 respectively. The census of 1926 showed that 13,014 horses were in boroughs, but no similar census has since been undertaken.
The following table gives numbers of horses by classes recorded during the past five years, excluding horses in boroughs, as figures for these are not available:—
| — | 1933. | 1934. | 1935. | 1936. | 1937. |
|---|---|---|---|---|---|
| Draught and three-quarter draught | 120,136 | 119,454 | 120,239 | 122,749 | 124,111 |
| Spring-cart (including half-draught) | 47,848 | 47,063 | 46,434 | 47,491 | 48,089 |
| Hacks and light working horses | 82,374 | 80,996 | 79,694 | 78,276 | 77,739 |
| Thoroughbred and other horses | 13,525 | 13,379 | 13,605 | 14,640 | 14,846 |
| Total horses | 263,883 | 260,892 | 259,972 | 263,156 | 264,785 |
The slight decline apparent between 1933 and 1934 in the classes of draught, three-quarter draught, and half-draught horses has been more than made up in the ensuing three years, during which period draught and three-quarter-draught animals have increased by 4,657. As these classes are used for tractive purposes on farms, the fairly substantial increase in their numbers is not without significance.
Usually the number of “thoroughbred and other horses” shows little variation from year to year; however, the relatively high increase of over a thousand occurred between 1935 and 1936, followed by a further increase of over 200 in 1937.
Hacks and light working-horses are diminishing at an appreciable and fairly uniform rate from year to year.
Poultry statistics have been associated with the Census of Population from 1861 onwards, with the exception of the censuses of 1896 and 1901. Until 1936, however, poultry kept by Maori households had not been brought within the ambit of the census. The extension of the inquiry to Maori households on this occasion has, in all probability, furnished the first statistics in existence on this subject. No comparative data are therefore available, but there exists no reason to suspect that the degree of accuracy in recording the poultry of Maoris differs sensibly from that experienced in the case of Europeans.
The total poultry flocks of the Maoris are small (107,361 in all), and their omission from the field of earlier censuses does not appear to have been of significance. In the tables following the poultry kept by Maoris has been included throughout unless otherwise stated.
References to fowls and ducks are intended to cover both male and female birds.
The following numbers were recorded at the last six censuses:—
| Census. | Fowls. | Ducks. | Geese. | Turkeys. |
|---|---|---|---|---|
| 1906 | 2,784,269 | 281,999 | 44,300 | 77,101 |
| 1911 | 3,215,031 | 329,230 | 45,389 | 97,933 |
| 1916 | 3,141,354 | 220,808 | 46,955 | 56,521 |
| 1921 | 3,491,567 | 379,988 | 46,234 | 73,220 |
| 1926 | 3,308,384 | 352,030 | 43,879 | 76,852 |
| 1936 (excluding Maori flocks) | 3,415,793 | 351,608 | 61,418 | 82,896 |
| 1936 (including Maori flocks) | 3,488,516 | 377,791 | 66,667 | 86,102 |
The intercensal movement, 1926–36, is further illustrated by the figures appended. In measuring the movement, poultry kept by Maoris has been omitted from the later figures, since data were not available for the earlier census.
| Per Cent. | |
|---|---|
| Fowls | Increase of 107,409 = 3.25 |
| Ducks | Decrease of 422 = 0.12 |
| Geese | Increase of 17,539 = 39.97 |
| Turkeys | Increase of 6,044 = 7.86 |
| Total poultry | Increase of 130,570 = 3.45 |
Poultry kept in cities, boroughs, and town districts shows a considerable decline on the numbers returned in 1926. The increasing tendency towards the use of flats, and the filling-up of towns, &c., have contributed largely towards the decrease in urban districts.
A summary of poultry statistics since their inception is appended, together with a statement of the number per head of population by way of showing the relative population movement.
| Date of Census. | Number of Poultry. | Poultry per Head of Population. |
|---|---|---|
* Excluding Maori flocks. † Including Maori flocks. | ||
| 1861 (Dec.) | 236,098 | 2.4 |
| 1864 (Dec.) | 378,414 | 2.2 |
| 1867 (Dec.) | 676,065 | 3.1 |
| 1871 (Feb.) | 872,174 | 3.4 |
| 1874 (March) | 1,058,198 | 3.5 |
| 1878 (March) | 1,323,542 | 3.2 |
| 1881 (April) | 1,566,114 | 3.2 |
| 1886 (March) | 1,679,021 | 2.9 |
| 1891 (April) | 1,790,070 | 2.9 |
| 1906 (April) | 3,187,669 | 3.6 |
| 1911 (April) | 3,687,583 | 3.7 |
| 1916 (Oct.) | 3,465,638 | 3.2 |
| 1921 (April) | 3,991,009 | 3.3 |
| 1926 (April) | 3,781,145 | 2.8 |
| *1936 (March) | 3,911,715 | 2.6 |
| † 1936 (March) | 4,019,076 | 2.6 |
The average poultry per head of population in 1936 (2.6) is the lowest recorded since the census of 1864. The earlier censuses were taken in early summer, but for many decades the census date has fallen in autumn, with the exception of the war-time census of 1916, which fell in spring. The substantial continuity of autumn censuses preserves a good degree of comparability in the figures, a consideration of importance, since poultry numbers are subject to seasonal fluctuations.
Of the 166,354 households recorded as keeping poultry at the 1936 census, 159,098 were “European” households and 7,256 were “Maori” households. In 1926 there were 158,856 “European” households keeping poultry, thus recording the very small increase of 242. The number of households with fowls or ducks in 1936 was 165,949, the remaining 405 being cases where geese or turkeys were kept, but not fowls or ducks.
The average number of birds (fowls or ducks) in flocks was 23.3 for New Zealand, although this figure was exceeded in Canterbury (30.4), Otago (29.5), and Marlborough (26.5). Westland had the lowest average, with 17.5. The average flock in rural districts numbered 27.8, as compared with 16.5 in urban districts.
Over 80 per cent. of the flocks were returned for households where less than twenty-four birds were kept, while only 2 per cent. of flocks contained one hundred or more birds.
The distribution of flocks according to size is shown in the table following:—
| Number of Birds in Flock (Fowls or Ducks). | Number. | Per Cent. |
|---|---|---|
| Under 12 | 65,669 | 39.57 |
| 12–24 | 68,479 | 41.26 |
| 25–49 | 21,286 | 12.83 |
| 50–74 | 5,266 | 3.17 |
| 75–99 | 2,030 | 1.22 |
| 100–149 | 1,179 | 0.71 |
| 150–199 | 565 | 0.34 |
| 200–299 | 546 | 0.33 |
| 300–399 | 258 | 0.16 |
| 400–499 | 167 | 0.10 |
| 500–749 | 202 | 0.12 |
| 750–999 | 108 | 0.07 |
| 1,000 or over | 194 | 0.12 |
| Totals | 165,949 | 100.00 |
The North Island contained 58 per cent. of the total poultry, 56 per cent. of the fowls, 72 per cent. of the ducks, 55 per cent. of the geese, and 80 per cent. of the turkeys of the Dominion. In order to compare poultry with population, it may be noted that the North Island contains 65 per cent. of the Dominion's population.
| North Island. | South Island. | New Zealand. | |
|---|---|---|---|
| Fowls | 1,939,581 | 1,548,935 | 3,488,516 |
| Ducks | 271,187 | 106,604 | 377,791 |
| Geese | 36,550 | 30,117 | 66,667 |
| Turkeys | 68,740 | 17,362 | 86,102 |
| Total | 2,316,058 | 1,703,018 | 4,019,076 |
Auckland Provincial District—the largest in New Zealand—occupies the leading position in regard to the number of fowls, ducks, geese, or turkeys, though in proportion to population it has less than its quota of fowls and geese. Over 50 per cent. of turkeys are to be found in Auckland Provincial District, the warmer climate of the North being presumably more suitable for the raising of these birds.
There were 194 flocks of 1,000 or over (fowls and ducks) and of these 62 were situated in Canterbury, 45 each in Auckland and Wellington, and 23 in Otago. Canterbury is the centre of the wheatgrowing industry, and this fact doubtless accounts in part for the number of large flocks and the high average number of birds in flocks.
The following table shows the geographical distribution of fowls and ducks in conjunction with the sex of the birds:—
| Provincial District. | Number of Households keeping Fowls, Ducks, Geese, or Turkeys. | Total Number of Fowls, Ducks, Geese, or Turkeys. | Fowls | Ducks. | ||||
|---|---|---|---|---|---|---|---|---|
| Male Birds. | Female Birds. | Total Birds. | Male Birds. | Female Birds. | Total Birds. | |||
| Auckland | 58,447 | 1,296,961 | 108,800 | 955,735 | 1,064,535 | 30,558 | 143,521 | 174,079 |
| Hawke's Bay | 9,777 | 197,810 | 15,831 | 154,588 | 170,419 | 3,838 | 45,407 | 19,245 |
| Taranaki | 10,962 | 217,991 | 16,140 | 159,855 | 175,995 | 4,932 | 561 | 27,493 |
| Wellington | 25,517 | 603,296 | 45,139 | 483,493 | 528,032 | 9,400 | 970 | 50,370 |
| Marlborough | 2,954 | 80,460 | 6,554 | 66,751 | 73,305 | 995 | 3,741 | 4,736 |
| Nelson | 7,200 | 144,082 | 11,871 | 115,914 | 127,785 | 2,068 | 8,988 | 11,056 |
| Westland | 1,826 | 32,812 | 3,074 | 25,259 | 28,333 | 678 | 2,782 | 3,460 |
| Canterbury | 25,908 | 803,645 | 66,184 | 676,137 | 742,321 | 9,130 | 35,821 | 44,951 |
| Otago— | ||||||||
| Otago portion | 13,637 | 413,804 | 28,724 | 350,522 | 379,246 | 4,576 | 17,168 | 21,744 |
| Southland portion | 10,126 | 228,215 | 17,214 | 180,701 | 197,945 | 3,868 | 16,789 | 20,657 |
| Totals, Dominion | 116,354 | 4,019,076 | 319,561 | 3,168,955 | 3,488,516 | 70,043 | 307,748 | 377,791 |
On the census date there were 36,667 geese in the Dominion (20,495 male birds and 46,172 female birds), and 86,102 turkeys (23,362 male birds and 62,740 female birds).
The total number of poultry returned by Maoris was 107,361 (72,723 fowls, 26,183 ducks, 5,249 geese, and 3,206 turkeys). As contrasted with Europeans, Maoris recorded relatively few birds, the average number of birds per head of Maori population being 1.3, while the European population recorded 2.6 per head. The average number of birds in a flock (fowls or ducks only) was 13.9, which may be compared with 23.7 for the poultry flocks of Europeans. Some 88 per cent. of the total number of Maori flocks of fowls or ducks were of under 25 birds; there were no flocks in excess of 200 birds.
The Poultry Act, 1924, provides for the regulating of poultry-keeping and of the sale and export of poultry and eggs. Provision is made for the appointment of inspectors, on whom certain powers of entry are conferred for purposes of inspection of poultry or eggs intended for export. Poultry are required to be kept under sanitary conditions, and cruelty to poultry is made an offence. Every owner of poultry is required to notify an inspector of any outbreak of disease among his poultry and to comply with the inspector's directions. It is an offence to sell diseased poultry. The Governor-General in Council is empowered to declare diseases, to appoint ports of export, and to appoint grading-stores.
In order to provide moneys for the organization and development of the poultry industry, the Poultry-runs Registration Act was passed in December, 1933. The Act makes compulsory the annual registration of every poultry-run which is defined as land used for the keeping of not less than twenty-five head of poultry (hens and ducks not less than six months old) and the production of eggs for sale. The fee payable annually for registration is 2s. 6d. if the flock is in excess of twenty-four but does not exceed one hundred head. For each additional hundred (or part thereof) an additional 2s. 6d. is payable. A Board is constituted for the administration of the Act.
The dairying-lands of the Dominion are eminently suited for the rearing of bees and very high-grade honey is put on the market from local apiaries. The export trade is, of course, small when compared with the main primary industries, but is capable of considerable development. Honey from the apiaries of the Dominion is much appreciated wherever it is known.
In New Zealand the Department of Agriculture devotes proportionately the same attention to detail in the case of honey for export as is given to butter and cheese forwarded for consumption beyond the Dominion. Honey must be forwarded to grading-stores at Auckland, New Plymouth, Wellington, Lyttelton, Greymouth, Timaru, Dunedin, and Bluff for grading prior to export, and may be exported only through those ports. The Apiaries Act, 1927, which came into operation on 1st January, 1928, was passed to consolidate and amend the law relating to the bee industry. Stringent regulations have been enacted in order to control foul-brood, bee-moths, and other diseases of bees. Beekeepers are required to register their apiaries, and it is an offence to keep bees in an unregistered apiary. Only frame hives may be used.
Registrations under the Apiaries Act show that as at 31st March, 1937, 7,433 beekeepers and 125,573 colonies were registered.
Exports of honey for the last five years were—
| Year. | Quantity. lb. | Value. £ |
|---|---|---|
| 1932 | 226,243 | 7,054 |
| 1933 | 757,106 | 21,823 |
| 1934 | 669,683 | 19,731 |
| 1935 | 1,155,247 | 33,788 |
| 1936 | 739,956 | 20,844 |
A system of control on much the same lines in the case of meat and dairy-produce was introduced by the Honey-export control Act, 1924. The function of the Board set up (after a poll of producers, who decided by a large majority in favour of the scheme) is to control all honey intended for export.
A SPECIAL statistical survey of production and employment on dairy-farms was conducted by the Census and Statistics Department late in 1936. Some 40,000 questionnaires were distributed as widely as possible throughout the dairying districts of the Dominion. As it was desired to limit the field of the survey to farms where dairy-farming was at least a major source of farm income (if not the only source), distribution of the forms was limited to farmers having (a) at least five dairy cows, and (b) supplying at least 1,500 lb. of butterfat, or whole milk to this equivalent, to a dairy factory during the 1935–36 season.
In all, 19,307 completed returns were included in the statistical tabulations, the farms covered by these returns accounting for 41½ per cent. of the total number of dairy cows in the Dominion and 46 per cent. of the total amount of butterfat supplied to dairy factories in the 1935–36 season. From these figures, it is evident that an adequate sample of the dairy industry in the Dominion was covered. All parts of the Dominion contributed to the sample in proportions commensurate with their relative importance in the dairying industry. The statistical analysis of production, employment, &c., on the sample farms may, then, be regarded as applying with a reasonable degree of accuracy to the dairying industry generally. The Dominion Statistics of Agricultural and Pastoral Production in 1935–36 include 39,962 farms classified as dairy-farms. The sample thus covers almost half the total number of dairy-farms in the Dominion.
The period covered by the survey was the 1935–36 dairy-production season. It has been already emphasized that the survey is limited to dairy-farming. Apart from the limitations on the distribution of the questionnaires indicated above, returns from farms where the major source of income was obviously from other than dairying sources were excluded from the tabulations, some 2,200 returns being discarded for this and other reasons—e.g., insufficient information. Even with these limitations a considerable proportion of the farms covered by the statistics are by no means “pure” dairy-farms, nor was it intended to cover only such farms. The sample covers all types of dairy-farms, representing a fair cross-section of the dairying industry. As will be seen from the results of the survey, quite a material proportion of dairy output comes from low-producing farms and from farms where a substantial proportion of the total used area is used for purposes other than dairying. From many points of view, however, it is desirable that separate statistics should be made available for the “modal” and “optimum” dairy-farms. Adequate provision to meet this requirement has been made by the presentation of frequency distribution tables classifying the results according to size of herd, butterfat-production per acre, and other significant indicators of farm types.
In the following pages a résumé of the results of the survey is presented under appropriate headings. The detailed statistical tabulations could not be presented in the Year-Book owing to limitations of space, while only the more significant relationships are brought out in the summary classifications included here. The tables are, however, published in full in the Statistical Report on Agricultural and Pastoral Production for 1936–37.
Among the aspects of the economy of dairy industry on which some light is thrown as a result of the special collection of statistics, the subject of the size of the dairy-farm unit is of considerable interest. The average overall area per farm of the 19,307 farms covered was 169 acres, including 29 acres unused, 49 acres used for purposes other than dairying, and 91 acres used for dairying purposes (65 per cent. of the total used area). It will be inferred from these averages that a moderately sized dairying unit is typical in New Zealand; the distribution of farms according to the size of the area used for dairying confirms this view. The figures are:—
SIZE OF DAIRY-FARMS.
| Area used for Dairying. | Number of Farms. | Percentage of Total. | Area of Farms. | |||
|---|---|---|---|---|---|---|
| Total Area. | Area used. | Area used for Dairying. | ||||
| Acres. | Percentage of Total Used Area. | |||||
| Acres. | Acres. | Acres. | ||||
| Under 20 | 1,170 | 6.06 | 33,261 | 29,277 | 15,230 | 52.02 |
| 20 and under 40 | 2,576 | 13.34 | 209,984 | 169,732 | 73,805 | 43.48 |
| 40 and under 60 | 3,333 | 17.26 | 385,542 | 301,671 | 159,630 | 52.92 |
| 60 and under 80 | 2,799 | 14.50 | 381,818 | 311,573 | 188,417 | 60.47 |
| 80 and under 100 | 2,299 | 11.91 | 320,799 | 274,690 | 201,836 | 73.48 |
| 100 and under 120 | 2,386 | 12.36 | 493,592 | 406,358 | 248,671 | 61.20 |
| 120 and under 140 | 1,237 | 6.41 | 245,215 | 207,185 | 156,490 | 75.53 |
| 140 and under 160 | 1,106 | 5.73 | 300,202 | 245,180 | 163,999 | 66.89 |
| 160 and under 180 | 589 | 3.05 | 138,106 | 121,394 | 98,516 | 81.15 |
| 180 and under 200 | 392 | 2.03 | 97,536 | 88,481 | 73,179 | 82.71 |
| 200 and over | 1,420 | 7.35 | 654,928 | 555,454 | 375,334 | 67.57 |
| Totals | 19,307 | 100.00 | 3,260,983 | 2,710,995 | 1,755,107 | 64.74 |
While a range from under 20 acres to 200 acres and over is provided for in the table, it will be observed that 70 per cent. of the farms have between 20 acres and 120 acres used for dairying purposes. There is no pronounced modal group within these limits, while it should be observed that, even in respect of the number of farms, a considerable proportion (24½ per cent.) of the total is accounted for by farms with 120 acres or upwards used for dairying. That the importance of the larger farms is considerable in relation to production is apparent from the fact that 50 per cent. of the area used for dairying is made up of individual areas of 120 acres or upwards. The corresponding figure (not shown in the above table) for acreages of 200 and upwards is 20 per cent., a not inconsiderable proportion of the total area; but farms where 400 acres or upwards are used for dairying are comparatively few, representing 3 per cent. of the total area used for dairying, and less than ½ per cent. of the number of farms.
It will be observed that a considerable proportion of the area of the farm is in many instances used for purposes other than dairying, this applying particularly to the three lowest groups (up to 60 acres). While dairying is probably the major source of farm income in these groups, it is obviously not the only source. A further fact of interest which emerges from the classification is the very high proportion of the total area used for dairying in some of the higher groups. For example, as much as 827 per cent. of the used area of farms in the 180–200 acre class is used for dairying. Obviously such farms can be regarded as almost “pure” dairy-farms, the only cropping being for fodder purposes, while a few sheep are carried probably in the interest of efficient pasture-management rather than primarily as a source of supplementary income.
The size of the herd is an even more important aspect of dairy-farm economy than the size of the farm. This is particularly the case in relation to labour problems, since the morning and evening milking forms such an important part of the regular farm duties; while many other dairy-farm operations have a direct relationship to the size of the herd. The average number of cows milked per farm during the 1935–36 season was 42, representing one cow for every 216 acres used for dairying purposes. The following table shows the distribution of dairy herds according to size, the number of cows milked, and production of butterfat being also shown in conjunction with the size of the herd. As mentioned above, the size of the labour force is a factor highly relevant in considering the size of the herd; this will be discussed under the caption “Farm Population and Labour Force,” post.
SIZE OF DAIRY HERD.
| Size of Dairy Herd (Number of Cows milked). | Number of Farms. | Area used for Dairying. | Total Cows milked. | Number of Acres used for Dairying per Cow milked. | Butterfat production. | ||
|---|---|---|---|---|---|---|---|
| Total | Per Acre used for Dairying. | Per Cow milked. | |||||
| Acres. | Acres. | lb. | lb. | lb. | |||
| 5 and under 10 | 895 | 14,816 | 6,859 | 2.16 | 1,799,175 | 121.43 | 262.31 |
| 10 and under 20 | 3,403 | 128,033 | 49,280 | 2.60 | 10,297,448 | 80.43 | 208.96 |
| 20 and under 30 | 3,405 | 202,510 | 82,018 | 2.47 | 17,160,860 | 84.74 | 209.23 |
| 30 and under 40 | 3,083 | 240,272 | 104,427 | 2.30 | 23,119,570 | 96.22 | 221.39 |
| 40 and under 50 | 2,501 | 243,838 | 108,789 | 2.24 | 24,462,483 | 100.32 | 224.88 |
| 50 and under 60 | 1,844 | 214,319 | 98,394 | 2.18 | 22,573,866 | 105.33 | 229.42 |
| 60 and under 70 | 1,333 | 173,952 | 84,280 | 2.06 | 19,749,274 | 113.53 | 234.33 |
| 70 and under 80 | 906 | 133,540 | 66,188 | 2.02 | 15,593,373 | 110.77 | 235.59 |
| 80 and under 90 | 579 | 94,348 | 47,936 | 1.97 | 11,095,430 | 117.60 | 231.46 |
| 90 and under 100 | 386 | 70,165 | 35,864 | 1.96 | 8,051,483 | 123.30 | 241.23 |
| 100 and under 120 | 511 | 102,937 | 54,202 | 1.90 | 12,787,577 | 124.23 | 235.92 |
| 120 and under 140 | 222 | 50,941 | 27,895 | 1.83 | 6,540,777 | 128.40 | 234.48 |
| 140 and under 180 | 129 | 35,848 | 19,747 | 1.82 | 4,624,041 | 128.99 | 234.16 |
| 180 and under 220 | 48 | 17,361 | 9,340 | 1.86 | 2,092,154 | 120.51 | 224.00 |
| 220 and under 260 | 29 | 12,080 | 6,794 | 1.78 | 1,603,841 | 132.77 | 236.07 |
| 260 and under 300 | 11 | 5,618 | 2,903 | 1.90 | 659,011 | 117.30 | 222.41 |
| 300 and over | 22 | 14,520 | 9,153 | 1.59 | 2,113,632 | 14.557 | 230.92 |
| Totals | 19,307 | 1,755,107 | 814,129 | 2.16 | 184,924,007 | 105.36 | 227.14 |
Herds of under 30 cows (7,703 in number) represented 40 per cent. of the total herds, but comprised only 17 per cent. of the total cows; while herds of between 30 and 60 cows (7,428) were 38 per cent. of the total, and also had 38 per cent. of the total cows. Only 972 herds—5 per cent.—had 100 cows or over, but they aggregated 130,094 cows, or 16 per cent. of the total.
From the above figures it will be apparent that a considerable proportion of farms on which dairy cows are kept have only moderately sized herds. As indicated, herds of under 30 cows accounted for 40 per cent. of the total number of herds included in the survey. The average butterfat output in this class was 3,800 lb., which, at 1935–36 butterfat-prices, would return to the farmer a gross amount of a little over £200 per annum from an average area of 45 acres used for dairying purposes. It should be noted that only 54 per cent. of the total used area of farms with herds of under 30 cows was used for dairying purposes, this fact pointing to other sources of farm income. Again, in the lowest herd group it is possible that the family income is supplemented by income earned away from the farm.
The figures in the table indicate that the “pure” dairy-farm consists of herds of upwards of 60 cows. As the size of the herd rises the acreage per cow lessens, indicating more efficient farming with greater utilization of fodder crops, &c.
Ignoring the exceptionally high figure for herds of under 9 cows as being of little practical significance—a number of small hand-milked pedigree herds are included in this group—it will be observed that butterfat-production per cow rose with the size of the herd up to the 90–99 cow group. A progressive, though not marked, downward tendency is then shown by these figures. The per-acre returns are highest in the 300 and over cow group, where there would be considerable use of supplementary fodders and, probably, bought feed—e.g., turnips for winter fodder, &c.
The major source of income from dairy-farms is the return from butterfat supplied to dairy factories, excepting in the comparatively small proportion of cases where the farm income is derived from the supply of whole milk or cream for human consumption as such. The butterfat pay-out is the dominant factor determining dairy-farm returns in New Zealand, since whole-milk consumption accounts for less than 5 per cent. of total milk-production, while it should be observed also that the pay-out of cheese-factories, as well as butter-factories, is determined on a butterfat basis.
In the questionnaire distributed to dairy-farmers information as to butterfat-production in the 1935–36 season was asked for under the following headings: (a) Supplied to dairy factories; (b) sold other than to dairy factories; (c) consumed on the farm. The figures include the butterfat content of milk disposed of under any of the three headings, in addition to butterfat sold, &c., as such. The following table shows in summary form the results disclosed by the inquiry:—
| — | Total Effective Production (1935–36 Season). | Averages. | ||
|---|---|---|---|---|
| Per Farm. | Per Cow milked. | Per Acre used for Dairying. | ||
| Butterfat or butterfat content of milk— | lb. | lb. | lb. | lb. |
| Supplied to dairy factories | 180,100,962 | 9,328 | 221 | 102 |
| Sold other than to dairy factories | 1,956,825 | 102 | 2 | 1 |
| Consumed on farm | 2,866,220 | 148 | 4 | 2 |
| Totals | 184,924,007 | 9,578 | 227 | 105 |
It will be apparent that supply to dairy factories accounted for all but a very small proportion of the butterfat-production of the farms included in the survey. Since the tabulations included only farms supplying dairy factories with 1,500 lb. of butterfat or over in the 1935–36 season, the figures shown for butterfat (or butterfat content of milk) sold other than to dairy factories is but small (less than 1 per cent. of total effective production).
While dairy-farmers would be able to supply accurate particulars of butterfat supplied to dairy factories, the figures given in respect of butterfat sold other than to dairy factories are probably not so reliable, though the margin of error should not be very considerable. On the other hand, the assessment of the butterfat content of milk consumed on the farm would in most instances represent an arbitrary estimate.
The total amount of butterfat returned under this heading was 2,866,220 lb., an average of 148 lb. for each farm included in the survey. The total population on these farms was 93,547, so that the butterfat returned as consumed on the farms represents an average for the season of 30.6 lb. per person. A daily consumption of one pint of milk per head would account for practically the whole of this quantity of butterfat. While the actual average quantity of whole milk or cream consumed may represent a little less than a daily consumption of 1 pint of whole milk per head, it will be realized from these figures that the quantity of butterfat returned as consumed on the farm could not have included adequate allowance for whole milk fed to calves or other live-stock. It should be mentioned at this stage that very little home-made butter would be consumed on farms supplying butter-factories (or even dual factories), since the custom in New Zealand is for butter-factory suppliers to buy from the factory butter required for household consumption. The butterfat content of such butter would be returned as “sold to dairy factories,” not as “consumed on the farm.” There is, however, a proportion of cheese-factory suppliers included in the returns. In these cases butter may be produced on the farm for home requirements. This will account for a further part of the quantity of butterfat returned as consumed on the farm.
The analysis shows that the really significant figure is the amount of butterfat (or butterfat content of milk) supplied to dairy factories; but from some points of view the actual production of butterfat “at the pail” is of interest, particularly in relation to herd efficiency. The statistics provided by the dairy-farm survey do not give this complete figure, since, as indicated above, the quantity returned as consumed on the farm was not sufficient to take into account the not inconsiderable amount of butterfat represented by whole milk fed to stock, while no attempt was made to ascertain the quantity spilt, wasted, &c. The Department of Agriculture compiles for each season an estimate of the Dominion total butterfat-production “at the pail.” The Department's estimate for 1935–36 was 233 lb. per cow for all cows milked during the season. Included in this estimate is an allowance of 2 per cent. of total production for whole milk fed to stock, spilt, wasted, &c. The “effective” production arrived at from the dairy-farm survey was 227 lb. per cow milked. Adding to this the proportionate allowance (2 per cent. of total production) estimated by the Department of Agriculture as representing whole milk “fed to stock,” “wasted,” &c., the total productions the pail would work out at 232 lb. This figure agrees remarkably closely with the Department of Agriculture's estimate for all cows milked in 1935–36 (233 lb.).
Turning now to the question of the distribution of butterfat-production, the relationship between butterfat-production and the size of the herd was discussed under the previous heading. Since butterfat forms the major source of dairy-farm income, the distribution of farms according to total production affords an indication of the “spread” in the aggregate productivity of dairy-farms. The figures are:—
BUTTERFAT-PRODUCTION, 1935–36 SEASON.
| Total Production, by Groups. | Number of Farms. | Total Production. | Cows milked. | Production per Cow milked. |
|---|---|---|---|---|
| lb. | lb. | Number. | lb. | |
| 1,500 and under 2,000 | 985 | 1,733,068 | 10,063 | 172.22 |
| 2,000 and under 2,500 | 1,098 | 2,445,736 | 14,067 | 173.86 |
| 2,500 and under 3,000 | 990 | 2,707,126 | 15,230 | 177.75 |
| 3,000 and under 5,000 | 3,224 | 12,719,703 | 67,936 | 187.23 |
| 5,000 and under 7,000 | 2,597 | 15,436,590 | 77,152 | 200.08 |
| 7,000 and under 9,000 | 2,340 | 18,590,365 | 86,871 | 214.00 |
| 9,000 and under 11,000 | 1,939 | 19,240,554 | 85,493 | 225.05 |
| 11,000 and under 13,000 | 1,509 | 18,004,482 | 77,819 | 23.136 |
| 13,000 and under 15,000 | 1,135 | 15,764,776 | 66,185 | 238.19 |
| 15,000 and under 17,000 | 873 | 13,858,231 | 57,448 | 241.23 |
| 17,000 and under 19,000 | 683 | 12,220,882 | 50,129 | 243.79 |
| 19,000 and under 21,000 | 474 | 9,444,511 | 38,006 | 248.50 |
| 21,000 and under 23,000 | 373 | 8,176,671 | 31,934 | 256.05 |
| 23,000 and under 25,000 | 245 | 5,854,261 | 23,327 | 250.97 |
| 25,000 and under 28,000 | 293 | 7,711,481 | 30,242 | 254.99 |
| 28,000 and under 32,000 | 238 | 7,073,147 | 26,922 | 262.73 |
| 32,000 and under 40,000 | 175 | 6,140,009 | 23,696 | 259.12 |
| 40,000 and under 50,000 | 71 | 3,138,329 | 12,823 | 244.74 |
| 50,000 and over | 65 | 4,664,085 | 18,786 | 248.27 |
| Totals | 19,307 | 184,924,007 | 814,129 | 227.14 |
Some 46 per cent. of the total number of farms produced less than 7,000 lb. of butterfat during the 1935–36 season. These low-producing farms contributed less than 20 per cent. of the total butterfat-production of all the farms covered. From the viewpoint of the volume of production the 13,000 lb. group is almost exactly the half-way mark, 49 per cent. of total production coming from farms individually producing less than 13,000 lb. of butterfat in the season, and 51 per cent. from farms producing more than 13,000 lb.
While the majority of the farms covered fall within the low-production groups, it should be observed that farms with a relatively high production were quite numerous, as many as 1,460 farms (7½ per cent. of the total number) producing 21,000 lb. of butterfat or more during the season, while on 65 farms a total output of 50,000 lb. or over was recorded.
The relationship between total butterfat-production and production per cow milked is very interesting. In the first place, a quite marked range of variation is observed, ranging from 172.22 lb. per cow in the 1,500–2,000 lb. group to 262.73 lb. in the 28,000–32,000 lb. group. Each successive group up to the 28,000–32,000 lb. group shows an increase over the preceding group, while the production per cow in the three highest groups is on a somewhat lower scale.
The following table shows the distribution of farms, production, &c., according to production per acre of dairying area:—
EFFECTIVE BUTTERFAT-PRODUCTION, IN PER-ACRE GROUPS.
| Production per Acre of Dairying Area. | Number of Farms. | Total Butterfat Production. | Cows milked. | Production per Cow milked. |
|---|---|---|---|---|
| lb. | lb. | Number. | lb. | |
| Under 25 | 232 | 762,016 | 5,988 | 127.26 |
| 25 and under 50 | 1,703 | 8,071,780 | 52,398 | 154.05 |
| 50 and under 75 | 2,898 | 18,488,275 | 101,804 | 181.61 |
| 75 and under 100 | 3,277 | 27,875,835 | 133,646 | 208.58 |
| 100 and under 125 | 3,215 | 32,510,075 | 143,274 | 226.91 |
| 125 and under 150 | 802 | 32,599,127 | 134,676 | 242.06 |
| 150 and under 175 | 2,198 | 28,861,315 | 112,573 | 256.38 |
| 175 and under 200 | 1,388 | 18,207,770 | 68,020 | 267.68 |
| 200 and under 225 | 812 | 9,883,101 | 35,372 | 279.40 |
| 225 and under 250 | 405 | 4,516,540 | 15,784 | 286.15 |
| 250 and under 275 | 191 | 2,066,966 | 6,906 | 299.30 |
| 275 and under 300 | 76 | 640,140 | 2,183 | 293.24 |
| 300 and over | 110 | 441,058 | 1,505 | 293.06 |
| Totals | 19,307 | 184,924,007 | 814,129 | 227.14 |
The average production per acre of dairying area over the 19,307 farms was 105 lb. of butterfat. The frequency distribution table shows a wide range in per-acre production, 10 per cent. of the total number of farms averaging under 50 lb. to the acre used for dairying; while, at the other end of the scale, 8 per cent. of farms averaged 200 lb. or over to the acre. It will be realized that differences in climate, soil types, and other non-avoidable factors will account for a considerable part of the variations in productivity. There is, however, a definite central grouping, 34 per cent. of the total number of farms falling within the 75–125 lb. per acre classes.
The average effective butterfat-production per cow milked is shown in an earlier paragraph to be 227 lb. (total production including estimate for whole milk fed to stock, wastage, &c., 232 lb.). The distribution of farms (and cows) according to butterfat-production per cow milked is, however, probably of ever greater interest than the overall average production. The figures are given on the page following.
EFFECTIVE BUTTERFAT-PRODUCTION, IN PER-COW GROUPS.
| Effective Butterfat-production per Cow milked. | Number of Farms. | Area used for Dairying. | Cows milked. | Total Butterfat production. | Butterfat production per Acre.* |
|---|---|---|---|---|---|
* Of area used for dairying. | |||||
| lb. | Acres. | Number. | lb. | lb. | |
| Under 100 | 129 | 13,328 | 4,565 | 401,669 | 30.14 |
| 100 and under 120 | 448 | 39,208 | 14,146 | 1,564,359 | 39.90 |
| 120 and under 140 | 806 | 72,478 | 25,807 | 3,368,241 | 46.47 |
| 140 and under 160 | 1,262 | 120,047 | 43,063 | 6,463,858 | 53.84 |
| 160 and under 180 | 1,631 | 155,338 | 62,579 | 10,625,661 | 68.40 |
| 180 and under 200 | 2,006 | 188,024 | 81,345 | 15,429,095 | 82.06 |
| 200 and under 220 | 2,592 | 240,307 | 110,230 | 23,109,552 | 96.17 |
| 220 and under 240 | 2,687 | 255,907 | 123,583 | 28,394,390 | 110.96 |
| 240 and under 260 | 2,613 | 239,325 | 121,735 | 30,353,667 | 126.83 |
| 260 and under 280 | 2,183 | 195,765 | 102,058 | 27,459,309 | 140.27 |
| 280 and under 300 | 1,480 | 130,177 | 68,090 | 19,624,726 | 150.75 |
| 300 and under 320 | 878 | 67,116 | 36,171 | 11,140,078 | 165.98 |
| 320 and under 340 | 363 | 25,792 | 14,241 | 4,666,067 | 180.91 |
| 340 and under 360 | 138 | 8,313 | 4,524 | 1,578,255 | 189.84 |
| 360 and over | 91 | 3,982 | 1,992 | 745,080 | 187.11 |
| Totals | 19,307 | 1,755,107 | 814,129 | 184,924,007 | 105.36 |
The outstanding feature of this table (and of other frequency-distribution tables) is the wide difference between the extremes. On 7½ per cent. of the total number of farms production per cow during the season was under 140 lb, while on slightly over 7½ per cent. of farms a production per cow of 300 lb. or over was attained. The modal group both in respect to the number of farms and the number of cows milked was the 220–240 lb. per cow group.
The distribution of cows milked according to butterfat-production per cow provides an interesting indication of the range of productive efficiency. The extremely high average of 350 lb. or over is recorded for 1992 cows milked (the actual average for these cows was 374 lb.), while, on the other hand, 4,565 cows averaged under 100 lb. during the season (actual average, 88½ lb.). In reference to the latter and other low-production figures it must be pointed out that the inquiry covered all cows milked during the season, some of which may have been milked during part of the season only. Again, some farms are situated on poor dairying land.
The range of variation in butterfat-production per acre shown in the above table is particularly striking, the highest group being as much as six times the lowest group. This remarkable degree of variance is a pointed illustration of the connection between efficiency in herd-management and the effective utilization of pastures. Natural variations in pasture conditions would, of course, account for a considerable degree of variation in per-acre production, but the direct connection shown in the table between production per cow and per acre suggests a wide variation in the quality of herds.
Pig-raising is the industry naturally ancillary to dairy-farming, the return from pigs on an efficiently managed dairy-farm forming a material addition to the income from butterfat-production. Farms supplying butter-factories have a differential advantage in respect of pig-production in that the skim-milk is available for pig - food, whereas this by - product is not available to farmers supplying whole milk for cheese - manufacture. Differentiation between farms supplying cream for buttermaking and those supplying milk for cheesemaking was not made in the special collection of statistics of dairy-farms, so that the following statistics of pig-production in relation to butterfat-production, &c., apply to the dairy industry generally—butter-supply farms will, generally speaking, have higher pig returns than the averages quoted for all farms included in the survey, and cheese-supply farms lower returns from this source.
The pig population of New Zealand is very low relative to the number of dairy cows, a matter which is commented on in the preceding subsection (pp. 419–20). The total number of pigs in the Dominion on 31st January, 1937, was 802,419, representing 41 pigs for every 100 dairy cows in milk. Comparable figures were not collected in the special survey. There were, however, 65 pigs sold during 1935–36 per 100 cows milked on farms included in the survey.
Information was obtained as to (1) the number of sows which farrowed in 1935–36, (2) the number of litters, (3) the number of pigs sold. Following is a résumé of the statistics, which relate to the 1935–36 season:—
| — | Totals. | Per Farm. | Per 100 Cows milked. |
|---|---|---|---|
| Number of sows which farrowed | 47,700 | 2.5 | 6 |
| Number of litters | 75,091 | 3.9 | 9 |
| Number of pigs sold— | |||
| As weaners | 100,473 | 5.2 | 12 |
| As stores | 44,268 | 2.3 | 6 |
| As porkers | 242,040 | 12.5 | 30 |
| As baconers | 131,895 | 6.8 | 16 |
| As choppers or others | 7,066 | 0.4 | 1 |
| Totals | 525,742 | 27.2 | 65 |
The following table shows the relationship between the number of pigs sold and butterfat-production:—
PIGS SOLD IN RELATION TO BUTTERFAT-PRODUCTION (1935–36 SEASON).
| Total Effective Butterfat-production. | Number of Farms. | Butterfat-production. | Number of Cows milked. | Number of Pigs sold. | ||
|---|---|---|---|---|---|---|
| Total. | Per 100 Cows milked. | Per 10,000 lb. of Butterfat produced. | ||||
| lb. | lb. | |||||
| 1,500 and under 2,000 | 985 | 1,733,068 | 10,063 | 6,852 | 68 | 40 |
| 2,000 and under 2,500 | 1,098 | 2,445,736 | 14,067 | 10,171 | 72 | 42 |
| 2,500 and under 3,000 | 990 | 2,707,126 | 15,230 | 11,175 | 73 | 41 |
| 3,000 and under 5,000 | 3,224 | 12,719,703 | 67,936 | 46,263 | 68 | 36 |
| 5,000 and under 7,000 | 2,597 | 15,436,590 | 77,152 | 54,222 | 70 | 35 |
| 7,000 and under 9,000 | 2,340 | 18,590,365 | 86,871 | 59,650 | 69 | 32 |
| 9,000 and under 11,000 | 1,939 | 19,240,554 | 85,493 | 56,116 | 66 | 29 |
| 11,000 and under 13,000 | 1,509 | 18,004,482 | 77,819 | 52,748 | 68 | 29 |
| 13,000 and under 15,000 | 1,135 | 15,764,776 | 66,185 | 43,514 | 66 | 28 |
| 15,000 and under 17,000 | 873 | 13,858,231 | 57,448 | 36,296 | 63 | 26 |
| 17,000 and under 19,000 | 683 | 12,220,882 | 50,129 | 30,961 | 62 | 25 |
| 19,000 and under 21,000 | 474 | 9,444,511 | 38,006 | 21,530 | 57 | 23 |
| 21,000 and under 23,000 | 373 | 8,176,671 | 31,934 | 18,439 | 58 | 23 |
| 23,000 and under 25,000 | 245 | 5,854,261 | 23,327 | 12,980 | 56 | 22 |
| 25,000 and under 28,000 | 293 | 7,711,481 | 30,242 | 16,947 | 53 | 21 |
| 28,000 and under 32,000 | 238 | 7,073,147 | 26,922 | 15,935 | 59 | 23 |
| 32,000 and under 40,000 | 175 | 6,140,009 | 23,096 | 12,491 | 53 | 20 |
| 40,000 and under 50,000 | 71 | 3,138,329 | 12,823 | 7,089 | 55 | 22 |
| 50,000 and over | 65 | 4,664,085 | 18,786 | 13,263 | 71 | 28 |
| Totals | 19,307 | 184,924,007 | 814,129 | 525,742 | 65 | 28 |
The average number of pigs sold for every 100 cows milked during the season was 65, while 28 pigs were sold for every 10,000 lb. of butterfat produced. It will be observed that the number of pigs sold per 100 cows milked and per 10,000 lb. of butterfat produced was greater in the lower fat groups—i.e., on the smaller dairy units—than in the higher groups. Increased butterfat-production on the larger farms was not accompanied by a corresponding increase in pig-production. The results shown in the table would point to a need for greater pig-production on the larger dairying units. It would appear that efforts towards greater efficiency have been concentrated on butterfat-production, while pig-raising has been comparatively neglected.
The following table, showing pigs sold in conjunction with the size of the herd, is informative:—
PIGS SOLD, IN CONJUNCTION WITH THE SIZE OF THE DAIRY HERD.
| Size of Herd milked. | Pigs sold. | |||||
|---|---|---|---|---|---|---|
| Weaners. | Stores. | Porkers. | Baconers. | Choppers and Others. | Total sold. | |
| Number. | Number. | Number. | Number. | Number. | Number. | |
| 5 and under 10 | 2,823 | 312 | 2,469 | 1,507 | 94 | 7,205 |
| 10 20 | 14,532 | 2,943 | 14,730 | 6,654 | 459 | 39,318 |
| 20 " 30 | 18,129 | 4,999 | 25,409 | 10,754 | 706 | 59,997 |
| 30 " 40 | 18,290 | 6,328 | 33,507 | 14,127 | 926 | 73,238 |
| 40 " 50 | 13,949 | 6,830 | 35,099 | 15,443 | 918 | 72,239 |
| 50 " 60 | 8,588 | 5,383 | 32,144 | 15,818 | 876 | 62,809 |
| 60 " 70 | 7,305 | 3,944 | 25,387 | 14,192 | 828 | 51,656 |
| 70 " 80 | 6,035 | 2,934 | 18,436 | 11,027 | 447 | 38,879 |
| 80 " 90 | 3,097 | 2,218 | 13,398 | 8,794 | 389 | 27,896 |
| 90 " 100 | 1,356 | 1,434 | 9,725 | 6,365 | 224 | 19,104 |
| 100 " 120 | 2,870 | 2,881 | 12,533 | 10,565 | 450 | 29,299 |
| 120 " 140 | 1,579 | 1,229 | 6,186 | 6,117 | 303 | 15,414 |
| 140 " 180 | 846 | 693 | 4,659 | 4,575 | 145 | 10,918 |
| 180 " 220 | 356 | 161 | 2,177 | 1,631 | 69 | 4,394 |
| 220 " 260 | 286 | 453 | 1,725 | 1,626 | 71 | 4,161 |
| 260 " 300 | 210 | 50 | 681 | 686 | 56 | 1,683 |
| 300 and over | 222 | 1,476 | 3,715 | 2,014 | 105 | 7,532 |
| Totals | 100,473 | 44,268 | 242,040 | 131,895 | 7,066 | 525,742 |
It will be observed that sales of weaners totalled 100,473, 19 per cent. of the total number of pigs sold. Obviously the bulk of the pigs sold off dairy-farms would be littered on the farms from which they were eventually sold, while sales of weaners to other farmers would represent surplus pigs above the fattening-capacity of the farm on which they were littered. It is interesting to observe that the great bulk of the weaners sold came from farms on which the size of the herd was relatively small. On the larger farms it would be more profitable to fatten the pigs and sell later as porkers or baconers; this is amply borne out by the figures. From the above facts it is clear that the mere number of pigs sold is no necessary criterion of the money returns in respect of pig-production.
It will be seen that the number of porkers sold considerably exceeds the number of baconers. Pigs can be fattened to porker weights more quickly than to the heavier baconer class. Here again it is interesting to observe that the proportion of baconers or porkers is much higher on the larger farms than on the smaller farms. A factor of prime significance in considering the relationship between sales of porkers and of baconers is the fact that the export trade is mostly in porker pigs, although the export baconer trade is now being developed.
While the above statistics of pig-production afford an indication of the extent, of this major source of supplementary income of dairy-farmers, it should be stressed that pig-production is by no means the sole source of supplementary income of the farmers included in the survey. That a material proportion of farming income came from non-dairying sources is suggested by the fact that 35 per cent. of the used area of the 19,307 farms covered by the statistics was used for other than dairying purposes. Statistics of cash crops grown on these farms were not collected, but it was ascertained that 757,985 breeding-ewes lambed on these farms in the 1935–36 season, an average of 39 per farm.
Statistics of dairy-farm population and labour on dairy-farms formed an essential part of the special inquiry into the dairy industry. Casual and temporary hired workers were not covered, the inquiry being limited to persons regularly resident and/or working full time on the farm. Following is a summary of the results:—
| — | Males. | Females. | Total. |
|---|---|---|---|
| Persons regularly resident or working on farm during 1935–36 season— | |||
| (1) Members of family (including occupier and wife)— | |||
| (a) Performing full-time farm-work | 26,655 | 1,934 | 28,589 |
| (b) Regularly performing part-time farm-work | 6,009 | 12,275 | 18,284 |
| (c) Not regularly performing any | 10,192 | 22,515 | 32,707 |
| Total family | 42,856 | 36,724 | 79,580 |
| (2) Farm employees other than members of family and excluding casual and temporary workers | 8,068 | 991 | 9,059 |
| (3) All other regular residents on farm, including domestics, boarders, members of farm employees' families, &c. | 1,929 | 2,979 | 4,908 |
| Total farm population | 52,853 | 40,694 | 93,547 |
Where both owner and share milkers we resident on the farm, it was enjoined that share milkers and their families were to be included under groups (2) and (3). Where, however, the owner was not resident on the farm, then share milkers or managers and their families were to be shown under the appropriate subheadings of group (1). Share milkers' paid employees were to be counted in group (2) in all cases.
At this stage it may be mentioned that of the 19,307 farms dealt with, 714 were stated to be managed by share milkers and 1,359 by managers.
Including managers and share milkers and their families in cases where the owner does not reside on the farm, members of the farmer's family comprise no less than 85 per cent. of the total population on the 19,307 farms. Regular employees, other than members of the farmer's family, who are engaged in farm-work constitute under 10 per cent. of the farm population, and only 24 per cent. of the 37,648 persons working full-time on farm-work.
For farms with herds of under 50, hired labour (including share milkers where the owner is resident) averages 1 person per 5.2 farms or per 137 cows; for herds between 50 and 100, 1 person per 1.2 farms or per 82 cows; for herds between 100 and 180, 2.1 persons per farm person per 57 cows; and for herds over 180, 5.8 persons per farm or 1 person per 44 cows. These averages and the relativity between them are somewhat affected by the differential treatment of share milkers and their families according to whether the owner is or is not resident on the farm, but they serve to indicate the small extent to which hired labour is employed except on the comparatively few big dairy-farms.
If to the 9,059 hired workers regularly employed on farm-work are added the working-farmers themselves and members of their families engaged in full-time farm-work, a total of 37,648 results, this number including 2,925 women.
Males regularly employed on full-time farm duties on the 19,307 farms dealt with total 34,723, and the following statement shows the distribution of this male labour according to the size of the dairy herd, together with the proportion of males engaged on full-time farm-work to farms, to cows, and to total farm population.
| Size of Herd. | Number of Farms | Cows milked. | Total Farm Population. | Males engaged on Full-time Farm-work. | |||||
|---|---|---|---|---|---|---|---|---|---|
| Numbers. | Proportions. | ||||||||
| Family. | Other. | Total. | Per Farm. | Per 100 Cows. | Per 100 Farm. Population. | ||||
| 5 and under 10 | 895 | 6,859 | 3,008 | 651 | 42 | 693 | 0.8 | 10.1 | 23 |
| 10 and under 20 | 3,403 | 49,280 | 13,430 | 3,525 | 226 | 3,751 | 1.1 | 7.6 | 28 |
| 20 and under 30 | 3,405 | 82,018 | 14,380 | 4,223 | 471 | 4,694 | 1.4 | 5.7 | 33 |
| 30 and under 40 | 3,083 | 104,427 | 13,557 | 4,129 | 678 | 4,807 | 1.6 | 4.6 | 35 |
| 40 and under 50 | 2,501 | 108,789 | 12,201 | 3,671 | 959 | 4,630 | 1.9 | 4.3 | 38 |
| 50 and under 60 | 1,844 | 98,394 | 9,407 | 2,852 | 1,005 | 3,857 | 2.1 | 3.9 | 41 |
| 60 and under 70 | 1,333 | 84,280 | 7,210 | 2,219 | 863 | 3,082 | 2.3 | 3.7 | 43 |
| 70 and under 80 | 906 | 66,188 | 5,246 | 1,550 | 703 | 2,253 | 2.5 | 3.4 | 43 |
| 80 and under 90 | 579 | 47,936 | 3,631 | 1,015 | 597 | 1,612 | 2.8 | 3.4 | 44 |
| 90 and under 110 | 386 | 35,864 | 2,632 | 711 | 515 | 1,226 | 3.2 | 3.4 | 47 |
| 100 and under 120 | 511 | 54,202 | 3,692 | 1,049 | 712 | 1,761 | 3.4 | 3.2 | 48 |
| 120 and under 140 | 222 | 27,895 | 1,924 | 483 | 422 | 905 | 4.1 | 3.2 | 47 |
| 140 and under 180 | 129 | 19,747 | 1,381 | 287 | 351 | 638 | 4.9 | 3.2 | 46 |
| 180 and under 220 | 48 | 9,340 | 587 | 125 | 139 | 264 | 5.5 | 2.8 | 45 |
| 220 and under 260 | 29 | 6,794 | 464 | 78 | 122 | 200 | 6.9 | 2.9 | 43 |
| 260 and under 300 | 11 | 2,963 | 229 | 22 | 84 | 106 | 9.6 | 3.6 | 46 |
| 300 and over | 22 | 9,153 | 562 | 65 | 179 | 244 | 11.1 | 2.7 | 43 |
| Totals | 19,307 | 814,129 | 93,547 | 26,655 | 8,068 | 34,723 | 1.8 | 4.3 | 37 |
The average number of males engaged on full-time farm labour shows a regular rise as the size of the herd increases, but an almost equally regular fall with increasing size of herd is shown for male labour per 100 cows. In proportion to total farm population male full-time labour rises steadily to a maximum of 48 per cent. for herds of 100 to 119 cows, but declines slightly thereafter.
In the next summary the dairy-farms are classified according to the number of males engaged on full-time farm-work. It is of interest to note that on 628 of the farms, with a total of 8,522 cows, no full-time male labour was engaged. On these 628 farms, 205 females were engaged full-time, and 647 males and 436 females part-time. Farms with five or more men engaged full-time numbered only 412, or 2 per cent. of the total, and had only 7 per cent. of the total cows.
| Full-time Male Workers. | Number of Farms. | Area used for Dairying. | Butterfat-production. | Cows milked. | Litters of Pigs. | Pigs sold. | Breeding-ewes. | Farm Population. |
|---|---|---|---|---|---|---|---|---|
| Acres. | lb. | |||||||
| Nil | 628 | 19,585 | 1,848,673 | 8,522 | 588 | 5,584 | 4,570 | 2,504 |
| 1 | 8,258 | 493,222 | 46,568,113 | 214,671 | 19,673 | 149,145 | 158,216 | 31,751 |
| 2 | 6,765 | 661,258 | 68,534,565 | 301,775 | 28,211 | 195,839 | 261,630 | 32,893 |
| 3 | 2,537 | 343,136 | 38,835,883 | 165,668 | 14,860 | 99,750 | 163,478 | 15,840 |
| 4 | 707 | 125,149 | 14,992,665 | 63,364 | 5,738 | 38,324 | 76,810 | 5,502 |
| 5 | 233 | 50,574 | 6,099,527 | 25,939 | 2,269 | 13,898 | 38,993 | 2,379 |
| 6 | 93 | 25,540 | 3,155,297 | 13,298 | 1,341 | 8,612 | 31,175 | 1,049 |
| 7 | 34 | 10,965 | 1,532,942 | 6,391 | 714 | 4,012 | 9,691 | 461 |
| 8 | 19 | 8,221 | 957,142 | 4,076 | 404 | 2,226 | 1,987 | 300 |
| 9 | 12 | 4,310 | 609,207 | 2,579 | 207 | 1,373 | 6,290 | 228 |
| 10 or over | 21 | 13,147 | 1,789,993 | 7,846 | 1,086 | 6,979 | 5,145 | 640 |
| Totals | 19,307 | 1,755,107 | 184,924,007 | 814,129 | 75,091 | 525,742 | 757,985 | 93,547 |
The great bulk of the dairy-fanning is carried out on farms with only one or two males engaged on full-time farm-work. Such farms represented 78 per cent. of the total dealt with, and had 69 per cent. of the human population, 63 per cent. of the cows (with 62 per cent. of the butterfat-production), and 55 per cent. of the breeding-ewes. These farms accounted for 64 per cent. of the litters of pigs and 66 per cent. of the pigs sold. Their acreage devoted to dairying was 66 per cent. of the acreage so used on all farms covered.
As stated earlier, the farms covered by the inquiry constitute a large and representative cross-section of the dairy-farms of New Zealand, and account, for 41½ per cent. of the total dairy cows in the Dominion and 46 per cent. of the total butterfat supplied to dairy factories. Allowing for dairy cows on holdings other than dairy-farms, it appears reasonable to assume a total dairy-farm population and labour force approximately double the figures shown for the dairy-farms covered by the present inquiry. This would give totals of about 185,000 for dairy-farm population and 75,000 for persons engaged in full-time dairy-farm work.
In the analysis of dairy-farm population and of labour force it has been shown that hired labour does not form a large proportion of the total labour force on dairy-farms, the hulk of the work being done by the farmer and his family. The nature of dairy-farm work demands considerable part-time labour as help at milking-time, and, consequently, a material proportion of the total daily labour on a dairy-farm is performed by part-time assistants. The extent to which the part-time services of the farmer's family are utilized is broadly indicated by the following classification of persons employed on farms included in the survey:—
| — | Males. | Females. | Total. |
|---|---|---|---|
| Members of family (including occupier and wife)— | |||
| On full-time work | 26,655 | 1,934 | 28,589 |
| On part-time work | 6,009 | 12,275 | 18,284 |
| Hired labour other than family: Full-time work | 8,068 | 991 | 9,059 |
| Totals | 40,732 | 15,200 | 55,932 |
Statistics were not collected as to part-time labour employed apart from members of the occupier's family. Except perhaps in the case of the exceptionally large dairy-farms, very little casual labour would be employed. A detail which may be of some consequence, however, is the lack of data as to part-time employment of members of families of hired labourers—e.g., share milkers' families (where owner is resident on the farm). It will be seen that approximately two-thirds of the labour force consisted of full-time employees and approximately one-third part-time employees. The question of the efficiency of the labour force—particularly in terms of butterfat-production—is the most important aspect of the economy of the dairy industry, and in order to throw some light on this problem it is necessary to convert all labour to a common unit. An obvious unit to adopt is a “full-time male equivalent.” For the purpose of converting all types of labour to this unit it has been assumed that a full-time male worker (whether occupier, member of family of occupier, or hired employee) equals 10 units; a full-time female employee, 6 units; a part-time male employee (family), 3 units; and a part-time female employee (family), 2 units.
The assessment of this scale of “work units” has necessarily been made on a purely arbitrary basis, but several scales have been tried experimentally without giving materially different results. Variation of the scale docs not affect to any appreciable extent the relative results as between different herd classifications. Again, the absolute figures (butterfat, cows milked, &c., per male equivalent) are not seriously altered by a change of the scale, since, after all, two-thirds of the labour force consists of full-time labour. It will be seen that only a moderate allowance has been made for part-time family labour. It is considered that a large proportion of such workers would consist of younger members of the occupier's family who would assist in rounding up the cows, helping in the shed at milking-time, &c. In the assessment for this type of labour regard was also had to the fact that the majority of cows are machine-milked (83 per cent. of total cows milked).
The assessment of productivity per employee has been made on the basis of the size of the herd, this factor being considered the best denominator for the purpose. The following table shows the classification of employees by the size of the herd, together with the “full-time male equivalent” in each class:—
FARM WORKERS IN CONJUNCTION WITH THE SIZE OF THE MILKING HERD.
| Size of Milking Herd. | Number of Workers. | Total Full-time Male Equivalents. | |||||
|---|---|---|---|---|---|---|---|
| Occupier and Members of Family. | Full-time Hired Employees. | ||||||
| Full Time. | Part Time. | ||||||
| Males. | Females. | Males. | Females. | Males | Females. | ||
| Under 10 cows | 651 | 80 | 301 | 317 | 42 | 5 | 898 |
| 10 and under 20 | 3,525 | 292 | 1,146 | 2,108 | 226 | 19 | 4,703 |
| 20 and under 30 | 4,223 | 305 | 1,145 | 2,334 | 471 | 35 | 5,708 |
| 30 and under 40 | 4,129 | 324 | 952 | 2,044 | 678 | 74 | 5,740 |
| 40 and under 50 | 3,671 | 232 | 1,585 | 959 | 61 | 5,397 | |
| 50 and under 60 | 2,852 | 187 | 507 | 1,153 | 1,005 | 86 | 4,400 |
| 60 and under 70 | 2,219 | 132 | 355 | 844 | 863 | 396 | 3,494 |
| 70 and under 80 | 1,550 | 126 | 201 | 630 | 703 | 73 | 2,577 |
| 80 and under 90 | 1,015 | 58 | 167 | 397 | 597 | 71 | 1,819 |
| 90 and under 100 | 711 | 43 | 101 | 231 | 515 | 70 | 1,370 |
| 100 and under 120 | 1,049 | 58 | 117 | 351 | 712 | 140 | 1,985 |
| 120 and under 140 | 483 | 21 | 68 | 128 | 422 | 86 | 1,015 |
| 140 and under 180 | 287 | 16 | 36 | 70 | 351 | 61 | 709 |
| 180 and under 220 | 125 | 7 | 9 | 33 | 139 | 33 | 297 |
| 220 and under 260 | 78 | 1 | 15 | 41 | 122 | 21 | 226 |
| 260 and under 300 | 22 | 2 | 8 | 84 | 18 | 119 | |
| 300 and over | 65 | 2 | 13 | 21 | 179 | 42 | 279 |
| Totals | 26,655 | 1,934 | 6,009 | 12,275 | 8,068 | 991 | 40,736 |
It will be seen that part-time family labour is more important on the smaller farms, while hired labour assumes importance on relatively large farms.
In the next table indicators of labour productivity are shown in conjunction with the size of the milking herds. The percentage used for dairying of the total area of farms in each class is also shown as being highly relevant to the question of labour productivity. As in all other tables, the figures relate to the 1935–36 season.
Certain qualifications must be taken into consideration in interpreting the figures shown in the following table. In the first place, cognizance must be had of the relatively low proportion of total farm area used for dairying in the lowest groups, this fact accounting partly for the low butterfat-yield per full-time male equivalent. Again, the high figures shown for the larger farms must be discounted somewhat by the fact that a certain amount of hired casual labour (which is not included in the table) would be employed for fencing, top-dressing, haymaking, &c. Even when full account is given to these factors, however, the figures are very striking. The amount of butterfat per full-time male equivalent rises practically without exception as the size of the herd increases. A slight check is observed in the 120–140 cow group, while a relatively low figure is shown for the 260–300 group. The farms in the latter group (which numbered eleven only) were not, as a group, typical dairy-farms, the area used for dairying accounting for only 42 per cent. of the total used area.
AVERAGES PER FULL-TIME MALE EQUIVALENT.
| Size of Milking Herd. | Full-time Male Equivalents. | Averages per Full-time Male Equivalent. | Area used for Dairying as Percentage of Total Used Area. | |||
|---|---|---|---|---|---|---|
| Total. | Per Farm. | Butterfat produced in 1935–36. | Area used for Dairying. | Cows milked. | ||
| Number. | Number. | Lb. | Acres. | Number. | ||
| Under 10 cows | 898 | 1.00 | 2,004 | 16.5 | 7.6 | 45 |
| 10 and under 20 | 4,703 | 1.38 | 2,190 | 27.2 | 10.5 | 50 |
| 20 " 30 | 5,708 | 1.68 | 3,006 | 35.5 | 14.4 | 58 |
| 30 " 40 | 5,740 | 1.86 | 4,028 | 41.9 | 18.82 | 65 |
| 40 " 50 | 5,397 | 2.16 | 4,533 | 45.2 | 20.2 | 65 |
| 50 " 60 | 4,400 | 2.39 | 5,130 | 48.7 | 22.4 | 66 |
| 60 " 70 | 3,494 | 2.62 | 5,652 | 49.8 | 24.1 | 73 |
| 70 " 80 | 2,577 | 2.84 | 6,051 | 51.8 | 25.7 | 70 |
| 80 " 90 | 1,819 | 3.14 | 6,100 | 51.92 | 26.4 | 74 |
| 90 " 120 | 1,370 | 3.55 | 6,315 | 51.2 | 26.2 | 73 |
| 100 " 120 | 1,985 | 3.88 | 6,452 | 51.9 | 27.3 | 73 |
| 120 " 140 | 1,015 | 4.57 | 6,444 | 50.2 | 27.5 | 73 |
| 140 " 180 | 709 | 5.50 | 6,522 | 50.6 | 27.9 | 67 |
| 180 " 220 | 297 | 6.19 | 7,044 | 58.5 | 31.4 | 74 |
| 220 " 260 | 226 | 7.79 | 7,097 | 53.5 | 30.1 | 62 |
| 260 " 300 | 119 | 10.82 | 5,538 | 47.2 | 24.9 | 42 |
| 300 cows and over | 279 | 12.68 | 7,576 | 52.0 | 32.8 | 56 |
| All farms | 40,736 | 2.11 | 4,540 | 43.1 | 20.0 | 65 |
The range of variation shown in the table is very considerable. It is note worthy, however, that in the large group of farms with between 70 and 180 cows (2,733 farms fell within these limits) the amount of butterfat per full-time male equivalent varied between comparatively narrow limits (6,051 lb. to 6,522 lb.). The percentage of total area used for dairying did not vary greatly as between these classes (between 70 per cent. and 74 per cent.).
It will be seen that the number of cows milked per full-time male equivalent also varies very considerably. The very low figures shown for the groups up to 30 cows will be accounted for largely by the fact that the majority of cows in these groups were hand-milked. Although only 17 per cent. of the total number of cows milked on all farms were hand-milked, no less than 71 per cent. of cows in the “under 30” group were milked by hand. There is comparatively little variation in the number of cows milked per full-time male equivalent in the middle groups of farms—between the 70 to 180 cow-groups the number varied from 257 to 279 cows, a relatively small variation. The vast majority of cows in these groups were machine-milked.
The statistics of production collected by means of the special survey of dairy-farms cover both main sources of dairying revenue—butterfat-production and pig-returns. In many instances revenue would be earned from sales of surplus stock, but, generally speaking, the vast bulk of dairy-farm income will come from butterfat pay-out and pig-production. By applying a set of standard per-unit values to the statistics of production it is possible to assess roughly the gross receipts of the farms covered by the survey.
The average pay-out per pound of butterfat supplied to all dairy factories in the Dominion during the 1935–36 season was 12.42 d. per pound. This figure is a general average for butter-supply and cheese-supply combined. Since the butterfat produced from the farms included in the survey accounted for 46 per cent. of the total amount supplied to dairy factories in that year, it seems reasonable to assume that butter-supply and cheese-supply farms would be represented in their proper proportions in so large a sample. It may be taken, therefore, that the average pay-out of 12.42 d. can be properly applied to the production on these farms.
The assessment of the money returns from pig-production involves the determination of standard values for the various classes of pigs sold. From examination of statistics of prices realized at sales during 1935–36 the following average values have been assessed as representing fair standard values for the estimation of returns from pig-production:—
| Value per Head. | |||
|---|---|---|---|
| £ | s. | d. | |
| Choppers | 2 | 2 | 6 |
| Baconers | 2 | 7 | 6 |
| Porkers | 1 | 12 | 6 |
| Weaners | 0 | 10 | 0 |
| Stores | 1 | 0 | 0 |
The following table shows the estimated gross money returns from butterfat-production in 1935–36, classified according to the size of the herd. The figures shown in respect of butterfat represent the value of total effective butterfat-production (including the value of butterfat consumed on the farm):—
VALUE OF BUTTERFAT PRODUCED, 1935–36 SEASON. (19,307 sample farms.)
| Size of Herd (Number of cows milked). | Value of Butterfat. | Total Production. | |||
|---|---|---|---|---|---|
| Supplied to Factory. | Sold Elsewhere. | Total sold. | Consumed on Farm. | ||
| £ | £ | £ | £ | £ | |
| 5 and under 10 | 89,840 | 380 | 90,220 | 2,890 | 93,110 |
| 10 and under 20 | 511,620 | 4,930 | 516,550 | 16,340 | 532,890 |
| 20 and under 30 | 854,280 | 13,310 | 867,590 | 20,490 | 888,080 |
| 30 and under 40 | 1,156,540 | 18,240 | 1,174,780 | 21,660 | 1,196,440 |
| 40 and under 50 | 1,231,290 | 13,910 | 1,245,200 | 20,730 | 1,265,930 |
| 50 and under 60 | 1,140,790 | 10,230 | 1,151,020 | 17,180 | 1,168,200 |
| 60 and under 70 | 998,780 | 10,750 | 1,009,530 | 12,490 | 1,022,020 |
| 70 and under 80 | 792,450 | 5,000 | 797,450 | 9,510 | 806,960 |
| 80 and under 90 | 564,170 | 3,040 | 567,210 | 6,980 | 574,190 |
| 90 and under 100 | 437,410 | 5,640 | 443,050 | 4,670 | 447,720 |
| 100 and under 120 | 649,160 | 6,060 | 655,220 | 6,540 | 661,760 |
| 120 and under 140 | 330,020 | 5,290 | 335,310 | 3,170 | 338,480 |
| 140 and under 180 | 235,960 | 810 | 236,770 | 2,530 | 239,300 |
| 180 and under 220 | 107,330 | 140 | 107,470 | 800 | 108,270 |
| 220 and under 260 | 78,670 | 3,540 | 82,210 | 790 | 83,000 |
| 260 and under 300 | 33,460 | 33,460 | 640 | 34,100 | |
| 300 and over | 108,450 | 108,450 | 930 | 109,380 | |
| Totals | 9,320,220 | 101,270 | 9,421,490 | 148,340 | 9,569,830 |
In the next table the estimated gross money returns from sales of pigs are shown:—
ESTIMATED MONEY RETURNS FROM SALES OF PIGS.
(19,307 sample farms.)
| Size of Herd (Number of Cows milked). | Weaners. | Stores. | Porkers. | Baconers. | Choppers and Others. | Total sold. |
|---|---|---|---|---|---|---|
| £ | £ | £ | £ | £ | £ | |
| 5 and under 10 | 1,410 | 310 | 4,010 | 3,580 | 200 | 9,510 |
| 10 and under 20 | 7,270 | 2,940 | 23,940 | 15,800 | 970 | 50,920 |
| 20 and under 30 | 9,060 | 5,000 | 41,290 | 25,540 | 1,500 | 82,390 |
| 30 and under 40 | 9,150 | 6,330 | 54,550 | 33,550 | 1,970 | 105,550 |
| 40 and under 50 | 6,970 | 6,830 | 57,040 | 36,680 | 1,950 | 109,470 |
| 50 and under 60 | 4,290 | 5,380 | 52,230 | 37,570 | 1,860 | 101,330 |
| 60 and under 70 | 3,650 | 3,950 | 41,250 | 33,710 | 1,760 | 84,320 |
| 70 and under 80 | 3,020 | 2,940 | 29,960 | 26,190 | 950 | 63,060 |
| 80 and under 90 | 1,550 | 2,220 | 21,770 | 20,890 | 830 | 47,260 |
| 90 and under 100 | 680 | 1,430 | 15,800 | 15,120 | 480 | 33,510 |
| 100 and under 120 | 1,440 | 2,880 | 20,370 | 25,090 | 960 | 50,740 |
| 120 and under 140 | 790 | 1,230 | 10,050 | 14,530 | 640 | 27,240 |
| 140 and under 180 | 420 | 690 | 7,570 | 10,860 | 310 | 19,850 |
| 180 and under 220 | 180 | 160 | 3,540 | 3,870 | 150 | 7,900 |
| 220 and under 260 | 140 | 450 | 2,800 | 3,860 | 150 | 7,400 |
| 260 and under 300 | 110 | 50 | 1,110 | 1,630 | 120 | 3,020 |
| 300 and over | 110 | 1,480 | 6,040 | 4,780 | 220 | 12,630 |
| Totals | 50,240 | 44,270 | 393,320 | 313,250 | 15,020 | 816,100 |
The following summary table shows, in conjunction with the size of the herd, the estimated money returns from sales of butterfat and pigs, while the value of butterfat consumed on the farm is also shown. The total value of all dairy-produce, whether sold or consumed on the farm, is also given:—
TOTAL MONEY RETURNS FROM DAIRY PRODUCTION. (19,307 sample farms.)
| Size of Herd (Number of Cows milked). | From Butterfat sold. | From Pigs sold. | Total Sales. | Value of Butterfat consumed on Farm. | Total Value. |
|---|---|---|---|---|---|
| £ | £ | £ | £ | £ | |
| 5 and under 10 | 90,220 | 9,510 | 99,730 | 2,890 | 102,620 |
| 10 and under 20 | 516,550 | 50,920 | 567,470 | 16,340 | 583,810 |
| 20 and under 30 | 867,590 | 82,390 | 949,980 | 20,490 | 970,470 |
| 30 and under 40 | 1,174,780 | 105,550 | 1,280,330 | 21,660 | 1,301,990 |
| 40 and under 50 | 1,245,200 | 109,470 | 1,354,670 | 20,730 | 1,375,400 |
| 50 and under 60 | 1,151,020 | 101,330 | 1,252,350 | 17,180 | 1,269,530 |
| 60 and under 70 | 1,009,530 | 84,320 | 1,093,850 | 12,490 | 1,106,340 |
| 70 and under 80 | 797,450 | 63,060 | 860,510 | 9,510 | 870,020 |
| 80 and under 90 | 567,210 | 47,260 | 614,470 | 6,980 | 621,450 |
| 90 and under 100 | 443,050 | 33,510 | 476,560 | 4,670 | 481,230 |
| 100 and under 120 | 655,220 | 50,740 | 705,960 | 6,540 | 712,500 |
| 120 and under 140 | 335,310 | 27,240 | 362,550 | 3,170 | 365,720 |
| 140 and under 180 | 236,770 | 19,850 | 256,620 | 2,530 | 259,150 |
| 180 and under 220 | 107,470 | 7,900 | 115,370 | 800 | 116,170 |
| 220 and under 260 | 82,210 | 7,400 | 89,610 | 790 | 90,400 |
| 260 and under 300 | 33,460 | 3,020 | 36,480 | 640 | 37,120 |
| 300 and over | 108,450 | 12,630 | 121,080 | 930 | 122,010 |
| Totals | 9,421,490 | 816,100 | 10,237,590 | 148,340 | 10,385,930 |
The total value of all dairy-produce sold, and of butterfat consumed, on the 19,307 farms covered by the inquiry is shown to be £10,385,930, an average of £538 per farm. The figures do not include the value of pigs killed on farms, as data were not collected under this heading. The average money returns from butterfat sold and pigs sold was £530. Pig returns on the farms covered by the inquiry averaged l06 d. per pound of butterfat produced. It must be remembered that the average return from pigs on individual farms will vary considerably from this figure, since both butter-supply farms and cheese-supply farms are included in the survey. An indication of the relative importance of butter-supply and cheese-supply in the economy of the dairying industry in New Zealand is afforded by the statistics of butterfat delivered to dairy factories. The total butterfat content of milk and cream processed by dairy factories in the 1935–36 season was 390,540,197 lb., supply for buttermaking accounting for 308,228,834 lb., 79 per cent. of the total, and for cheesemaking 21 per cent. of the total.
The following classification of average money returns according to the size of the herd is of interest:—
MONEY RETURNS (INCLUDING VALUE OF BUTTERFAT CONSUMED ON FARM).
(19,307 sample farms.)
| Size of Herd (Number of Cows milked). | Total Money Returns. | Average Money Returns. | ||||
|---|---|---|---|---|---|---|
| Per Farm. | Per Acre used for Dairying. | Per Cow milked. | Per Full-time Male Equivalent. | Pig Returns per Pound of Butterfat produced. | ||
| £ | £ | £ | £ | £ | d. | |
| 5 and under 10 | 102,620 | 114.7 | 6.9 | 15.0 | 114.3 | 1.27 |
| 10 and under 20 | 583,810 | 171.6 | 4.6 | 11.8 | 124.1 | 1.19 |
| 20 and under 30 | 970,470 | 285.0 | 4.8 | 11.8 | 170.0 | 1.15 |
| 30 and under 40 | 1,301,990 | 422.3 | 5.4 | 12.5 | 226.8 | 1.10 |
| 40 and under 50 | 1,375,400 | 549.9 | 5.6 | 12.6 | 254.8 | 1.07 |
| 50 and under 60 | 1,269,530 | 688.5 | 5.9 | 12.9 | 288.5 | 1.08 |
| 60 and under 70 | 1,106,340 | 830.0 | 6.4 | 13.1 | 316.6 | 1.02 |
| 70 and under 80 | 870,020 | 960.5 | 6.5 | 13.1 | 337.6 | 0.97 |
| 80 and under 90 | 621,450 | 1,073.3 | 6.6 | 13.0 | 341.6 | 1.02 |
| 90 and under 100 | 481,230 | 1,246.7 | 6.9 | 13.4 | 351.3 | 0.93 |
| 100 and under 120 | 712,500 | 1,394.3 | 6.9 | 13.1 | 358.9 | 0.95 |
| 120 and under 140 | 365,720 | 1,647.4 | 7.2 | 13.1 | 360.3 | 1.00 |
| 140 and under 180 | 259,150 | 2,008.9 | 7.2 | 13.1 | 365.5 | 1.03 |
| 180 and under 220 | 116,170 | 2,420.2 | 6.7 | 12.4 | 391.1 | 0.91 |
| 220 and under 260 | 90,400 | 3,117.2 | 7.5 | 13.3 | 400.0 | 1.11 |
| 260 and under 300 | 37,120 | 3,374.5 | 6.6 | 12.5 | 311.9 | 1.10 |
| 300 and over | 122,010 | 5,545.9 | 8.4 | 13.3 | 437.3 | 1.43 |
| All farms | 10,385,930 | 537.9 | 5.9 | 12.8 | 255.0 | 1.06 |
While the averages shown per acre used for dairying and per cow milked are directly comparable as between one herd size and another, the averages per farm and per full-time male equivalent must be interpreted with due regard to variations in the proportion of total used area devoted to dairying purposes. It is interesting to observe that in the 60–80 cow groups, which would cover the vast majority of “pure” dairy-farms, the annual money returns average approximately £13 per cow milked, and from £6 8s. to £6 10s. per acre used for dairying. The money return per full-time male equivalent varies within these groups between £316 and £337 per annum, a remarkably small range of variation. It must be emphasized that the figures shown relate to gross money returns from dairying, including the value of butterfat consumed on the farm (the latter, however, being a minor item). Farm expenses, including, of course, wages of hired employees, would have to be deducted from these figures before the net return to the farmer could be ascertained. The inquiry did not cover this aspect of dairy - farm economy.
Attention should be directed to the relatively high figures shown for the lowest group, 5 and under 10 cows, where the actual highest average per cow milked is recorded. It is probable that a material proportion of these herds would comprise small pedigree herds, hand-milked.
The statistical collection covered certain aspects of dairy-farming not dealt with under the previous headings. Following is a summary of the results disclosed under the various headings:—
Herds Wintered off Farm.—Of the total of 19,307 dairy herds covered by the investigation, 4,759 (24½ per cent.) were wintered off during the winter of 1936. These 4,759 herds totalled 191,189 cows, an average of 40 per herd, as compared with an average of 43 for herds not wintered off. The area devoted to dairying in cases where herds were wintered off was 393,418 acres (2.0 acres per cow), and in those not wintered off 1,301,689 acres (2.1 acres per cow). The total areas of holdings were 692,589 acres and 2,568,394 acres respectively, equal to 3.6 acres per cow in cases where herds were wintered off and 4.1 acres per cow where not wintered off.
Hand-milking and Machine-milking.—Of the 19,307 herds, 12,341 were returned as machine-milked and 6,966 as hand-milked. Hand-milked herds represented (36 per cent. of the total herds covered, but comprised only 17 per cent. of the total cows milked during the season. Of herds of under 30 cows, 77 per cent. (comprising 71 per cent. of the total cows in herds of that size) were hand-milked.
Herd-testing.—Some 2,703 of the herds (14 per cent. of the total) were under test during 1935–36. These herds contained approximately 140,000 cows, 17 per cent. of the total. Cows which had been tested at some time, including those tested in 1935–36, numbered 251,034, 31 per cent. of the total cows covered by the inquiry.
Replacement Heifers.—The number of replacement heifers usually reared annually on the 19,307 farms was 138,728, an average of 7.1 per farm.
Farm-management.—Management of the farm by the owner is the dominant type of farm-management in New Zealand. Absentee ownership is exceptional, as the following table, showing the different types of farm-management, indicates:—
| Managed by | Number of Farms. | Per Cent. of Total. |
|---|---|---|
| Owner | 16,087 | 83.3 |
| Manager | 1,359 | 7.1 |
| Share milker | 714 | 3.7 |
| Lessee | 1,066 | 5.5 |
| Partner | 81 | 0.4 |
| Totals | 19,307 | 100.0 |
It will be observed that 3.7 per cent. of the farms were managed by share milkers. This figure does not indicate the extent of share milking, since, in cases where the owner resided on the farm, share milkers were classified as hired employees. A noteworthy feature disclosed by the statistics is the small extent of tenant farming. Farms returned as leased were 5.5 per cent. of the total, while the 3.7 per cent. of cases where share milkers managed farms are also tenant-occupied in effect, making in all 9.2 per cent. tenant-occupied.
The statistics quoted in the preceding pages of this subsection relate to production, employment, and gross money returns from a sample of 19,307 farms covered by the survey conducted by the Census and Statistics Department. In that survey no attempt was made to cover dairy-farm costs. A statement recently released (September, 1937) by the Minister of Marketing shows details of the working, maintenance, and depreciation costs taken as a basis in fixing the guaranteed price of butter and cheese for the 1937–38 season (see p. 379). A summary of working-expenses on a standard farm supplying a butter factory is as follows, the basic figures in the first column representing the average disclosed by data covering some hundreds of farms. The figures in the second and third columns show costs on an assumed production of 240 lb. of butterfat per cow on a 60–cow farm.
| — | Average Working-expenses. | ||||||
|---|---|---|---|---|---|---|---|
| Per Pound of Butterfat. | Per Cow. | Per Farm. | |||||
| d. | £ | s. | d. | £ | s. | d. | |
| Main working-expenses | 2.917 | 2 | 18 | 4 | 175 | 0 | 0 |
| Total depreciation | 0.965 | 0 | 19 | 4 | 58 | 0 | 0 |
| Sundry overhead expenses | 0.910 | 0 | 18 | 2 | 54 | 10 | 0 |
| Cow and pig food expenses | 0.277 | 0 | 5 | 6 | 16 | 10 | 0 |
| Total | 5.069 | 5 | 1 | 4 | 304 | 0 | 0 |
Details of the make-up of the principal item above (main working-expenses) are as follows:—
| — | Main Working-expenses detailed. | ||||||
|---|---|---|---|---|---|---|---|
| Per Pound of Butterfat. | Per Cow. | Per Farm. | |||||
| d. | £ | s. | d. | £ | s. | d. | |
| Cultivation and harvesting (special costs) | 0.228 | 0 | 4 | 7 | 13 | 15 | 0 |
| Grass and other seeds | 0.132 | 0 | 2 | 8 | 8 | 0 | 0 |
| Fertilizers and lime | 1.107 | 1 | 2 | 2 | 66 | 10 | 0 |
| Fencing repairs and renewals | 0.223 | 0 | 4 | 6 | 13 | 10 | 0 |
| Water-supply and maintenance | 0.069 | 0 | 1 | 5 | 4 | 5 | 0 |
| Drainage maintenance | 0.040 | 0 | 0 | 10 | 2 | 10 | 0 |
| Weeds control | 0.025 | 0 | 0 | 6 | 1 | 10 | 0 |
| Rabbits control | 0.003 | 0 | 0 | 1 | 0 | 5 | 0 |
| Casual labour | 0.094 | 0 | 1 | 11 | 5 | 15 | 0 |
| Covers | 0.044 | 0 | 0 | 11 | 2 | 15 | 0 |
| Veterinary expenses | 0.064 | 0 | 1 | 3 | 3 | 15 | 0 |
| Implements, repairs and maintenance | 0.109 | 0 | 2 | 2 | 6 | 10 | 0 |
| Horse expenses | 0.052 | 0 | 1 | 0 | 3 | 0 | 0 |
| Tractor and truck expenses | 0.079 | 0 | 1 | 7 | 4 | 15 | 0 |
| Buildings expenses | 0.129 | 0 | 2 | 7 | 7 | 15 | 0 |
| Milking-plant repairs | 0.124 | 0 | 2 | 6 | 7 | 10 | 0 |
| Milking power and heating | 0.326 | 0 | 6 | 6 | 19 | 10 | 0 |
| Milking-shed materials | 0.069 | 0 | 1 | 5 | 4 | 5 | 0 |
The statistics quoted in the above tables do not cover (a) labour costs and (b) interest. A return included in the Budget for 1937 shows the make-up of the return to an efficient farmer from the guaranteed price of butterfat for butter-making in the 1937–38 season. The price is made up as follows (in pence per pound of butterfat):—
| Price per Pound for Butterfat. | |
|---|---|
| d. | |
| Working and maintenance costs (see details above) | 5.07 |
| Allowance for interest on capital | 3.06 |
| Labour on farm (including farmer and family) | 7.29 |
| 15.42 | |
| Less return from pigs | 1.54 |
| Butterfat equivalent of guaranteed price for butter | 13.88 |
As indicated in subsection A (p. 379), the guaranteed price for cheese is fixed at a figure calculated to return 2d. per pound of butterfat over the pay-out for buttermaking.
The above figure of l54 d. per pound of butterfat shown as the return from pigs is not directly comparable with the figure of 1.06d. per pound shown in the table on p. 445. The former relates only to dairy-farms supplying butter-factories, while the latter is an overall average covering both butter-supply and cheese-supply farms. Moreover, the figure of l.06 d. is based on pig prices for the 1935–36 season, and the figure of 1.54 d. on the higher prices prevailing in 1937.
In other respects, also, there is no direct comparability between the overall results of the special survey of dairy-farms and the figures used in the fixation of the guaranteed prices. Some of the farms included in the special survey were not entirely or even mainly dairy-farms, and some were small holdings carried on in conjunction with non-farming occupations.
As a case in point may be mentioned the production of butterfat per full-time male labour equivalent. In the fixation of the guaranteed prices for the 1937–38 season this unit was taken—for reasonably efficient dairy-farms—as 6,250 lb. The table on p. 442 shows a wide range of butterfat yield per full-time male equivalent, from 2,004 lb. for herds of under 10 cows to 7,576 lb. for herds of 300 cows or over. The inclusion of numerous small herds and of farms not wholly devoted to dairying had the effect of bringing down the average butterfat-yield per full-time male equivalent to 4,540 lb.
Table of Contents
AT the 31st March, 1937, the area of State forest was 4,103,139 acres, and of provisional State forest 3,762,250 acres, these totals including 727,825 acres and 1,168,740 acres respectively of national-endowment lands. The aggregate area (7,955,389 acres) represents 12 per cent. of the superficial area of the Dominion.
State forests are administered by a Department of State, called the State Forest Service, by authority of the Forests Act, 1921–22, its amendments of 1925 and 1926, and section 17 of the Finance Act, 1924. Section 5 of the Finance Act (No. 2), 1930, authorized the borrowing of a maximum of £1,000,000 for the purposes of the Forests Act, 1921–22. Regulations have been issued under the State Forests Act, 1908, and the Forests Act, 1921–22. Section 23 of the Mining Amendment Act, 1934, provides for payment to the Crown of compensation for damage to any land vested in the Crown resulting from mining operations. Such compensation in respect of State forests may from time to time, as damage is caused, be claimed by the Commissioner of State Forests.
Section 3 of the Mining Act, 1935, restricts the operation of section 66 (f) of the Mining Act, 1926, by providing that no body corporate shall be entitled to exercise the authority to cut timber conferred on the holder of a miner's right except with the consent of the Minister of Mines and the Commissioner of State Forests, and subject to such terms and conditions as may be imposed. It has always been recognized that a miner's right gives the holder thereof the right to cut and remove timber free of charge from unalienated Crown land (including State forest) for mining and for his own domestic use—i.e., for firewood, fencing, and the building of a house for occupation by him. in addition to the individual miner, whose rights have not been affected, this privilege was hitherto enjoyed by commercial organizations.
The State Forest Regulations Amendment, 1936, provided that no timber shall be sold except at such price or at such rates as the Commissioner of State Forests may determine.
The areas of indigenous forests estimated at intervals since the settlement in the Dominion are—
| Acres. | |
|---|---|
| 1,347 | 27,600,000 |
| 1869 | 23,500,000 |
| 1886 | 21,200,000 |
| 1893 | 20,500,000 |
| 1909 | 17,000,000 |
| 1923–32 | 12,600,000 |
The forest policy has a twofold purpose — the maintenance of climatic, soil, and water equilibria, and the supply of timber and other forest - produce. Owing to its influence upon agriculture, the former objective — viz., the conservation of the protection forests — is of the greater national significance. Conservation may be defined as the preservation of the forests by wise use, and the intensive management of these forests will assist to solve the problem of timber-supplies. It is with this latter consideration that the establishment of exotic forests is most intimately associated.
Important features of the timber-supply situation are—
Eighty per cent. of the remaining virgin forests are overmature, and there is no net growth, new growth being offset by decay, &c.:
The conversion of overmature forests into healthy growing stands of indigenous species producing timber to the maximum capacity of the forest soil will necessitate silvicultural management extending over a long period, probably one hundred and fifty years:
Current timber demands are depleting the virgin indigenous forests at such a rate that, without other provision being made, an adequate supply of timber would not be available during the whole of the intervening period:
The establishment of exotic forests to supplement the indigenous forest resources is therefore of great importance, and large forests of exotic trees have accordingly been established during recent years:
The part which exotic forests will ultimately play in the forest economy of the Dominion is difficult to predict. Experience in foreign countries where forestry has been practised over a period of several centuries indicates, however, that exotic species have definite limitations, and for this reason the national policy must envisage the management of the indigenous forests to secure their maximum possible production of timber.
The idea is prevalent that to preserve the existing indigenous forests to posterity it is sufficient to fence them against stock and to protect them from fire: this is entirely erroneous. The composition of the forest gradually changes, one type of forest growth succeeding another. Generally the valuable timber-producing species are replaced by weed species such as kamahi, taraire, rewarewa, &c. Of all the indigenous softwoods amenable to silvicultural treatment kauri is outstanding, and the results of investigations have been most promising. Plans for perpetuating the kauri forests and for rationing the supply of kauri timber are now in operation. Both the remaining virgin stands and the cut-over areas carrying regeneration are being brought under forest working-plans which govern both the extraction of logs and the silvicultural treatment required to maintain the forest in a state of maximum productivity. The first forest to he so treated is the Omahuta State Forest, near Russell, in which permanent extraction routes are now being constructed. Dead and over-mature trees will be extracted along with such large healthy trees as can be removed without endangering subsequent regeneration, and logs will be disposed of on the extraction routes. A minimum diameter cutting-limit of 27 in. breast high has been imposed for virgin stands; and provision has been made for the preservation of exceptionally large trees and other special trees in advantageous situations for seeding purposes to assist regeneration. The more recent examinations and inspections of the kauri forests indicate beyond all possible doubt the feasibility, not merely of preserving to posterity those few magnificent monarchs which the State Forest Service guards in its forests as national monuments, but also of maintaining the kauri forests in full vigour of growth to yield an everlasting supply of this world-famous wood.
In the exotic forests the saw log has always been visualized as the major product, and no State exotic forests have been established for the production of any other particular product. As the population of the Dominion increases, and likewise the consumption of pulp and paper products, it is possible that economically sized pulp-production units may become feasible. Should this prove to be the case, a supply of raw material for the cheaper classes of pulp and paper products, which form the bulk of the trade, may become available from the exotic forests, in the form both of low-grade or unmillable logs and of sawmill waste. But for the utilization of high-grade logs down to 4 in. diameter inside bark (which is the smallest timber usually accepted by pulp-mills) the Scandinavian type of sawmill is as well adapted as the pulping unit, possessing the additional advantages of smaller size and lower outlay.
For the year ended 31st March, 1919, exotic-pine timbers, as judged by quantities sawn, ranked only sixth amongst the timbers of the Dominion. For the year ended 31st March, 1930, they rank as third. During that period the annual cut of rough-sawn exotic-pine timber has increased over eightfold. From 4,000,000 ft. b.m. in 1918–19 it has increased to 34,100,000 ft. b.m. in 1935–36. It is fully anticipated that it will further increase, and will ultimately rank ahead of white-pine and as second only to rimu. It is not improbable that these exotic-pine timbers will eventually gain premier ranking. Only major forest catastrophes, such as nation-wide epidemics of destructive fungous and insect pests, can prevent this development. The low density and easy-working properties of these woods will enable them to replace rimu to a very large extent, and to dominate the markets for practically all classes of framing and light construction timber, just as already the same properties have given them dominance in the boxing and crating markets. Even for finishing-work the exotic softwoods, with their low density and satisfactory glueing properties, will find extensive use as core timber for laminated and other built-up construction. This will assist in effecting economies in the use of the more valuable indigenous timbers, which will be utilized as veneers, &c., rather than in solid.
The management of both indigenous and exotic forests necessitates scientific investigation as a routine operation in connection with both silviculture and utilization. Silvicultural investigations cover the entire field of natural sciences. Soil and botanical investigations have been found fundamental to the establishment of exotic forests, and mycological and entomological investigations have become of considerable importance in combating fungous and insect attack in both indigenous and exotic forests. Likewise, both the intensity of forest management and the efficiency of forest-land use are directly dependent upon the utilization of forest products. Only by ensuring maximum efficiency in harvesting forest crops and their adaptation to modern requirements is it possible to safeguard the economic future of forestry.
With a view to broadening and stabilizing markets for various classes of forest produce, extensive investigations have been undertaken by the State Forest Service. Technical investigations have been made into production methods and wood-using practices, the elimination of waste, and the use of non-commercial species, and many practical improvements have been effected in the every-day utilization of all important locally-grown timbers. Outstanding developments have been the establishment of kiln-drying and modern grading as practicable everyday realities, enabling the locally-grown timbers to replace imported woods hitherto required on account of the lack of kiln-drying facilities, &c. These developments, supported by information gained by the State Forest Service as a result of its investigations into the mechanical and physical properties of the locally-grown woods, have enabled them to be used much more efficiently than hitherto, and to replace to a considerable extent some of the imported timbers. Demonstrations of the effectiveness of wood-preservation have likewise stimulated interest in this important branch of utilization, while laboratory and commercial tests have defined, within close limits the values of various indigenous timbers for pulp and paper making purposes.
TABLE SHOWING PRINCIPAL STRENGTH PROPERTIES OF NEW ZEALAND TIMBERS.
(Tested in the form of small clear specimens: air-dry values adjusted to 12 per cent. moisture content.)
| Common and Botanical Name of Species. | Condition at Test. | Weight per Cubic Foot (Pounds). | Modulus of Rupture in Bending (Pounds per Square Inch). | Modulus of Elasticity in Bending (000 Pounds per Square Inch.) | Maximum Crushing Strength Parallel to Grain (Pounds per Square Inch). | Shear Strength Parallel to Grain (Pounds per Square Inch). |
|---|---|---|---|---|---|---|
| Beech, black (Nothofagus Solandri) | Green | 69 | 9,400 | 1,750 | 4,300 | 1,280 |
| Air-dry | 49 | 14,500 | 1,980 | 8,300 | 1,870 | |
| Beech, hard (Nothofagus truncata) | Green | 69 | 10,300 | 1,870 | 4,600 | 1,420 |
| Air-dry | 48 | 13,700 | 2,100 | 7,000 | 1,980 | |
| Beech, red (Nothofagus fusca) | Green | 61 | 9,100 | 1,720 | 3,900 | 1,260 |
| Air-dry | 44 | 11,400 | 1,930 | 7,600 | 1,850 | |
| Beech, silver (Nothofagus Menziesii) | Green | 55 | 7,600 | 1,280 | 3,400 | 940 |
| Air-dry | 34 | 12,200 | 1,670 | 6,100 | 1,420 | |
| Black moire (Olea Cunninghamii) | Green | 75 | 13,050 | 1,550 | 6,000 | 1,810 |
| Air-dry | 62 | 17,000 | 2,020 | 9,600 | 2,360 | |
| Hinau (Elaeocarpus dentatus) | Green | 70 | 8,800 | 1,590 | 4,300 | 1,380 |
| Air-dry | 45 | 12,300 | 1,610 | 6,600 | 1,610 | |
| Kahikatea (Podocarpus decrydioides) | Green | 51 | 6,300 | 960 | 2,500 | 860 |
| Air-dry | 29 | 9,500 | 1,140 | 5,100 | 1,340 | |
| Kaikawaka (Libocedrus Bidwillii) | Green | 61 | 5,600 | 660 | 2,800 | 750 |
| Air-dry | 27 | 6,400 | 870 | 4,100 | 820 | |
| Kamahi (Weinmannia racemosa) | Green | 55 | 7,800 | 1,250 | 3,400 | 1,290 |
| Air-dry | 40 | 10,800 | 1,420 | 5,800 | 1,920 | |
| Kauri (Agathis australis) | Green | 51 | 7,800 | 1,570 | 3,400 | 940 |
| Air-dry | 36 | 13,100 | 1,890 | 5,600 | 1,220 | |
| Koheko he (Dysoxulum spectabile) | Green | 57 | 7,300 | 1,290 | 3,100 | 790 |
| Air-dry | 34 | 10,900 | 1,400 | 7,100 | 840 | |
| Mangeao (Litsia calicaris) | Green | 62 | 7,600 | 1,330 | 3,300 | 1,030 |
| Air-dry | 39 | 13,300 | 1,620 | 6,600 | 1,560 | |
| Matai (Podocarpus spicatus) | Green | 68 | 9,000 | 1,230 | 4,000 | 1,000 |
| Air-dry | 38 | 10,800 | 1,320 | 6,800 | 1,600 | |
| Miro (Podocarpus ferrugineus) | Green | 54 | 8,400 | 1,420 | 3,800 | 1,150 |
| Air-dry | 36 | 12,900 | 1,570 | 6,600 | 1,690 | |
| Pokaka (Elaeocarpus Hookerianus) | Green | 65 | 6,200 | 1,000 | 3,200 | 1,260 |
| Air-dry | 39 | 10,000 | 1,100 | 5,500 | 1,730 | |
| Pukatea (Laurelia novae-zelandiae) | Green | 61 | 4,200 | 730 | 2,500 | 580 |
| Air-dry | 30 | 11,800 | 1,700 | 4,900 | 1,080 | |
| Rata, Northern (Metrosideros robusta) | Green | 72 | 11,300 | 1,710 | 5,200 | 1,610 |
| Air-dry | 55 | 18,200 | 2,340 | 9,200 | 1,940 | |
| Rata, Southern (Metrosideros lucida) | Green | 79 | 13,000 | 2,150 | 5,800 | 1,640 |
| Air-dry | 71 | 23,000 | 3,150 | 11,500 | 2,570 | |
| Rimu (Dacrydium cupressinum) | Green | 61 | 7,400 | 1,220 | 3,300 | 910 |
| Air-dry | 37 | 11,000 | 1,310 | 5,400 | 1,260 | |
| Silver pine (Dacrydium Colensoi) | Green | 54 | 6,400 | 790 | 3,100 | 840 |
| Air-dry | 39 | 8,500 | 1,070 | 5,800 | 1,320 | |
| Taraire (Beilschmiedia taraire) | Green | 72 | 8,600 | 1,410 | 3,900 | 1,000 |
| Air-dry | 42 | 13,000 | 1,790 | 6,600 | 1,910 | |
| Tanekaha (Phyllocladus trichomanoides) | Green | 68 | 9,300 | 1,390 | 4,600 | 1,210 |
| Air-dry | 42 | 14,100 | 1,620 | 6,500 | 1,400 | |
| Tawa (Beilschmiedia tawa) | Green | 67 | 9,700 | 1,590 | 4,400 | 1,100 |
| Air-dry | 46 | 15,700 | 2,060 | 8,400 | 1,780 | |
| Totara (Podocarpus totara) | Green | 59 | 6,500 | 920 | 3,100 | 810 |
| Air-dry | 30 | 7,600 | 1,070 | 5,500 | 1,120 |
One of the greatest problems of forest-conservation is that of fire-prevention, and fire-fighting methods have been improved by the establishment of fire lookout stations, access tracks, tool caches, improved telephone communication, and the provision of mobile fire-fighting equipment. The general public now realize the value of fire districts as a means of preventing indiscriminate fire-lighting and “burning off” except under expert supervision. Fire districts constituted in the interests of local bodies and private companies now number sixteen, while the fire districts constituted to protect State indigenous and exotic forests total thirty-seven. The total area covered by all fire districts is 3,094,000 acres.
The system continues to work smoothly, and has undoubtedly contributed in no small measure to the comparative freedom from serious forest fires in State forests which has been the fortunate lot of the Dominion for almost the past decade.
The forests of New Zealand, as a whole, belong to that great division of the earth's vegetation entitled rain-forest—a community with its most extreme development in the tropics (vide article on “The Plants of New Zealand” in Section I). New Zealand rain-forest may be naturally divided into the two classes, subtropical rain-forest and subantarctic rain-forest, the former, in regard to its trees, being a mixed community of broad-leaved trees and conifers, and the latter a pure community of one or more of the species of beech (Nothofagus). For practical purposes the names rain-forest proper and beech-forest suffice. Between these two classes there are many intermediates, the one graduating into the other.
Rain-forest proper consists of many kinds of tall, medium-sized, and small trees, together with a dense undergrowth of numerous species of shrubs and ferns. Woody lianes and huge epiphytes are characteristic, and bryophytes abound. This class of forest is generally confined to the coastal, lowland, and montane belts—the upper altitudinal line of the last-named becoming gradually lower in proceeding from north to south.
In regard to appraisal of timber, rain-forest proper is divided into the following groups, to each of which is appended its distribution: The kauri (extending northwards from a line joining Port Waikato to Tauranga); the rimu (throughout all three principal Islands, its heaviest stands in the central part of the North Island and on the west coast of the South Island); the kahikatea (throughout the North and South Islands, occupying low-lying swampy ground); and the totara (throughout, but mainly in the central part of the North Island).
Beech-forest must be divided into milling-forest and protection-forest. The former consists of (1) forest where the hard beech (Nothofagus truncata) and the black beech (Nothofagus Solandri) are present in quantity, or where there is only the latter (this extends from the south of lat. 38° southwards to northern Nelson, Marlborough, and eastern Canterbury); (2) forest where the silver beech (Nothofagus Menziesii) and the red beech (Nothofagus fusca) are either the sole or the principal species; they extend from the Thames mountains through the montane and lower subalpine belts southwards to north-western Nelson, Westland (but absent from the Taramakau River southwards for one hundred miles), and the fiord country of Otago; and (3) forest where the silver beech is pure or nearly so, such principally in southern and western Southland, and extending over the western slopes of the Dividing Range. Protection-forest, where beeches dominate, particularly' the mountain-beech (Nothofagus cliffortioides), is essentially high-mountain forest, but on Mount Egmont and on the western side of the Southern Alps, from somewhat north of the Taramakau River for rather more than one hundred miles southwards, the forest is modified rain-forest proper with thin-bark totara (Podocarpus Hallii) and kaikawaka (Libocedrus Bidwillii) as important trees. In Stewart Island Nothofagus is absent, and the trees of the upper forest are mainly kamahi (Weinmannia racemosa) and southern-rata (Metrosideros lucida).
In addition to the high forests there are scrub forests, of which those made up of manuka (in a wide sense)—Leptospermum scoparium and L. ericoides—are commercially important on account of the value of their wood for fuel, and because, in many instances, they are an early stage of rain-forest.
The foregoing gives merely a general classification of the forests, but, from the aspect of forestry, a division into smaller groups is essential, such to be based on the composition, structure, and life-history of each group. In this regard, altitude, climate, latitudinal change, and the nature of the soil have to be taken into consideration, as well as the combination and forms of the species composing the forest and their arrangement within the forest. In all forests, changes, progressive or retrogressive, are taking place, and, so far as rain-forest proper is concerned (apart from swamp-forest), that of the North Island and the northern part of the South Island is tending towards the dominance of the tawa (Beilschmiedia tawa), and, of the remainder of the South Island and Stewart Island, to that of the kamahi. On the other hand, beech-forest regenerates into similar forest.
Though the forest-trees of New Zealand number about 112, only a few are of value as timber-trees; in fact, at present only six are being used to any extent by sawmillers, and, of these, five are coniferous (softwood) timbers. There are several—e.g., puriri, kohekohe, pukatea—which possess very high qualities, but which are now to be obtained only in such small quantities that they are of little commercial importance.
A brief description of the principal forest-trees, with their distribution and the uses of their timber, is now given. The weights shown for the timber are per cubic foot, air-dry. For a description of additional forest-trees the reader is referred to the 1934 issue of the Year-Book or its immediate predecessors.
KAHIKATEA; WHITE PINE (Podocarpus dacrydioides).—This tree occurs to some extent in all forests except the beech-forests from north to south of the North and South Islands; formerly it was found in almost pure stands in swampy areas, but most of these stands have now been exploited. The average height of the tree is about 120 ft., and the average diameter about 32 in. The sapwood, which comprises the greater part of the log, is white, and the heartwood yellow. The timber (29 lb.) is straight in the grain, easily worked, and long, clean lengths and wide widths can be obtained. The yellow heartwood is durable, but the sapwood is very susceptible to the attacks of the larvae of the white-pine borer. The timber is inodorous, and is at the present time used mainly for butter-boxes, cheese-crates, and other packages.
KAIKAWAKA; MOUNTAIN CEDAR (Libocedrus Bidwillii).—Though the distribution of this tree is often local, its range extends from the Hauraki Gulf to the forests of South Otago. It is most plentiful on the west coast of the South Island. The average height of the tree is about 50 ft., with an average diameter of about 18 in. The timber (27 lb.) is dark red in colour, easy to work, light, and rather weak; it has considerable resemblance to totara, but is not so strong, and generally not so durable. The timber has been used for telegraph-poles, shingles, and palings. It has also been proved suitable for the manufacture of second-grade lead pencils, and at the present time is used for the manufacture of window-frames in the districts where it is obtainable. Being difficult to burn, it is specified for the construction of fireproof doors. Unfortunately, though occurring over a wide area, it is limited in quantity, and, if used freely, the supply would soon be exhausted.
KAURI (Agathis australis).—This, the largest tree of the New Zealand forest and the most celebrated, is rather restricted in its distribution, extending as it does only from a little to the north of lat. 38° S. to the extreme north of the North Island. Its average height is about 100 ft. The maximum diameter which has been measured is 22 ft., and a few trees still exist with diameters of 14 ft. The average diameter is, however, about 40 in. The timber (36 lb.) is light yellowish-brown in colour; it is straight in the grain, strong, easily worked, and remarkably free from knots and defects; probably there is no more generally useful softwood in the world. Though formerly much used for house-building, its present high price confines its use to railway-carriage building, and cabinet and general joinery purposes. Mottled and figured kauri is much prized for cabinet-work. The kauri yields a very valuable resin called kauri-gum. It is regrettable that the remaining stands of this valuable timber-tree are now limited.
MATAI; BLACK PINE (Podocarpus spicatus).—This tree occurs more or less plentifully in forests throughout the North, South, and Stewart Islands. Its average height is about 60 ft., and average diameter about 24 in. The timber (38 lb.) is light yellowish-brown in colour, straight in the grain, and easily worked. In the ground it is of second-rate durability, but it is very durable out of the ground. It is used chiefly for weather-boarding, exterior joinery, and flooring, and for the last mentioned purpose is one of the best timbers in the world.
MIRO (Podocarpus ferrugineus).—This tree occurs in lowland and montane forests from the north of the North Island to the south of Stewart Island, but is most abundant in Southland. The average height is about 65 ft., and the average diameter about 20 in. The timber (30 lb.) is used in house-building, and is often sold as rimu, to which it bears considerable resemblance. The heartwood is brownish in colour, very fine in the grain, easily worked, and of exceptional strength, though not durable in the ground.
RIMU; RED PINE (Dacrydium cupressinum).—This, the principal timber-tree of the New Zealand forest, is to be found more or less in all forests except the pure beech-forests The average height is about 100 ft., and the average diameter about 30 in. The timber (37 lb.) when first cut is reddish-brown, but it changes when seasoned to a light brown with darker and lighter streaks. It is fairly straight in the grain, easily worked, and it is the chief timber used in house-building. It is often beautifully figured, and when so is used for furniture, doors, and panelling. A high grade of kraft pulp may be produced from rimu.
SILVER PINE; YELLOW SILVER PINE; PINK PINE (Dacrydium Colensoi, D. intermedium, D. biforme, and D. Kirkii).—The group of small podocarps, here taken together, is far from well known, while as commercial timbers there is no uniformity in the timber supplied, that of D. Colensoi and D. intermedium being both sold as “silver pine.” In the case of the so- called “yellow silver pine” the timber is white and not yellow. As at present defined, D. Colensoi occurs from near Kaitaia (but only occasionally) to the volcanic plateau, where it is fairly common, and in the South Island it forms (or originally formed) considerable stands in north-western Nelson and in Westland. D. intermedium has much the same range in the North Island, but rather wider (Thames mountains, Ruahine-Tararua Mountains), and in the South Island it occurs in north-western Nelson, south-west Otago, and Stewart Island. D. biforme, except in the southern part of its range, belongs essentially to the mountains, and extends from the volcanic plateau to Stewart Island, but only where the rainfall is high. D. Kirkii is confined to the North Auckland Peninsula from the Manukau Harbour northwards. Considering here only the extremely valuable timber (39 lb.) of the silver-pine, it is whitish when first cut, but darkening to a light yellowish-brown; it is straight in the grain and easy to work. Owing to its extreme durability it has been used mainly for railway-sleepers, telegraph-poles, and posts; it is occasionally beautifully mottled, and is then used for cabinet-work. The remaining supplies are now limited.
TANEKAHA (Phyllocladus trichomanoides).—This tree occurs, but not in great numbers, throughout the North Island and in the South Island in northern Marlborough and Nelson, extending southwards to near Karamea. In height it is from 50 ft. to 70 ft., with a diameter of 1 ft. to 2 ft. The timber (42 lb.) is yellowish-white, free from knots, close-grained, dense, heavy, and very strong, and shrinks very little in seasoning, and for this reason is favoured for the manufacture of astragals in greenhouses, which have to remain straight in varying conditions of heat and moisture. Tanekaha is the strongest New Zealand softwood. It is of uncertain durability in the ground, but is very durable out of the ground. In the past it was used for bridge-building, sleepers, and mine-props. It is now used in railway-carriage construction. The bark is very valuable, for it contains as much as 28 per cent. of tannin.
TOTARA (Podocarpus totara and P. Hallii).—These trees, which are very closely related and hybridize freely, extend throughout all three Islands (P. Hallii only in Stewart Island and subalpine forests), though in many localities the totara is rare. It is most plentiful in the forests of the central portion of the North Island. The average height is about 80 ft., and the average diameter about 30 in. The timber (30 lb.) is reddish when first cut, seasoning to a reddish-brown. It is straight in the grain, easily worked, but somewhat brittle. Its great durability (P. totara is the more durable) has caused it to be much used for railway-sleepers, wharf-piles, telegraph-poles, and posts. Its high price and its freedom from warping and shrinking are now, however, causing it to be used for such special purposes as window and door frames; it is also much used for veranda-posts, flooring, and steps.
BLACK BEECH (Nothofagus Solandri).—This tree occurs in abundance—but not everywhere—in the lowland and montane belts of the North Island southwards from about lat. 38° S. (but absent in south-western Auckland and western Taranaki), and, in the South Island, in northern Marlborough and Nelson, extending southwards through eastern Marlborough and Canterbury to Banks Peninsula and Alford Forest. The timber (49 lb.) is pale-reddish, or greyish, and frequently streaked with black. Probably it is fairly durable when in the ground, and it is suitable—to say the least—for rough buildings, fencing-posts, and structural purposes. At present it is used only for fencing-posts and firewood.
HARD BEECH (N. truncata).—This tree occurs in a few localities in the North Island from Kaitaia southwards to the Thames mountains, whence its distribution is the same as that of N. Solandri. In the South Island it is abundant in northern Marlborough, and extends through Nelson with its southern limit just north of the Taramakau River. Its height ranges from 60 ft. to 100 ft. or more, and its diameter from 2 ft. to 5 ft. Until recently its timber (weight 48 lb.) was confused with that of the red-beech, but it is harder and probably more durable. When first cut it is pinkish in colour. Its uses are the same as those of its near relative, the red-beech. With the black-beech it forms many hybrids.
RED BEECH (N. fusca).—This tree extends from about lat. 37° S. on the Thames mountains southwards throughout the North Island in the montane belt (Mount Egmont excepted), and throughout the South Island where the rainfall is high (except southwards from the Taramakau River for one hundred miles), and in the south of Southland. It is a tell and massive tree, ranging from 60 ft. to rather more than 100 ft. in height, and 3 ft. to 6 ft. in diameter. The timber (44 lb.) when first cut is a pinkish-red in colour, turning to a light brown on seasoning; it is hard, strong, easily split, durable, and of about the same weight as English ash. It is difficult to season, being particularly prone to honeycombing in drying, and for this reason has not been much used for house-building, except at one time on the Otago goldfields, where it has proved very durable; its chief use at present is for posts and mine-props, and it is used to a small extent for sleepers and bridge-work. It is valuable for furniture and bentwood work. With the increasing scarcity of Australian hardwoods it is certain to have a much more extended use in the future.
SILVER BEECH (N. Menziesii).—This tree has much the same distribution as the red-beech, but it ascends higher, and is plentiful in the west of Southland, east of the Divide, extending to the Longwood Range. It also occurs at several places near Dunedin, and in the vicinity of Mount. Cook and on the Blue Mountains. The average height of the tree is about 80 ft., and the average diameter about 2 ft. The Southland timber (34 lb.) is of a pinkish colour when first cut, but it changes to a light brown with exposure. It is straight in the grain, easily worked, and strong; it is however, not durable in contact with the ground. It is now being used for flooring, interior finish, furniture, bentwood work, agricultural implements, bodies of motor-cars, billiard-tables, tool-handles, dowels, rifle-stocks, shoe-heels, casks, barrels, cheese-crates, and packing-cases, and its use for these and in other directions is sure to extend.
BLACK MAIRE (Olea Cunninghamii).—This tree occurs in all forests (except the beech-forests) throughout the North Island, but it is only in the central portion that it is fairly plentiful. In the South Island it is found only in Marlborough, and is very rare. It occasionally reaches a height of 70 ft. and a diameter of 4 ft., but the average height and diameter are 40 ft. and 18 in. respectively. The wood (62 lb.) is light brown, often with dark streaks, and bears considerable resemblance to that of its relative, the European olive. It is extremely dense, heavy, hard, strong, and durable. It has been used to a small extent for framing for machinery and for bridge-building, but owing to its exceptional heat-giving property its chief use has been for firewood.
NORTHERN RATA and SOUTHERN RATA (Metrosideros robusta and M. lucida).—The first-mentioned of these trees is found in most forests below 2,000 ft. in the North Island; it is rather rare in the South Island, being found only occasionally in the lowland forests of Marlborough and Nelson. This tree generally commences life as a “perching-plant” in the forks of other large trees, and therefrom sends down huge roots, which generally envelope and strangle the supporting tree. These roots usually (but not always) coalesce, and so form a huge bole with an average diameter of about 54 in., which is generally hollow. The southern-rata, though found only rarely in the North Island, is plentiful in the South Island and Stewart Island. It has usually the same habit of growth as an ordinary tree; its average height is about 50 ft., and the average diameter is about 20 in. The timber of both trees is reddish-brown in colour, extremely hard, heavy, strong, and (out of the ground) very durable; it is highly valued as firewood. On account of the difficulty of seasoning southern rata (71 lb.) without excessive twisting and warping it has not the same value as the northern species (55 lb.), which is used to a small extent for cross-arms for telegraph-poles and for wheelwrights' work.
TAWA (Beilschmiedia tawa).—This tree is to be found in most forests of the North Island up to an altitude of about 1,700 ft. In the South Island it occurs in the coastal forests of Nelson and Marlborough. The average height of the tree is about 60 ft., and the average diameter about 20 in. The timber is light brownish-white in colour, rather hard, straight in the grain, but somewhat brittle. It is difficult to season satisfactorily, and requires special treatment to ensure fungi-free timber. At present it is used for clothes-pegs and to a small extent only for inside lining and packing-cases, but, if kiln-dried, should find more extensive employment for floating and interior finish. It has been proved suitable for the manufacture of many classes of pulp and paper.
The principal timbers milled in New Zealand at present are rimu and kahikatea. Pinus radiata takes third position, and it is interesting to observe that the production of this species has more than doubled during the last five years The subjoined table gives particulars regarding the output of timber by species for the last five years. Quantities are quoted in board measure feet (superficial feet)—i.e., units of 12 in. x 12 in. x 1 in.
| Species of Timber. | 1931–32. | 1932–33. | 1933–34. | 1934–35. | 1935–36. |
|---|---|---|---|---|---|
| Ft. B.M. | Ft. B.M. | Ft. B.M. | Ft. B.M. | Ft. B.M. | |
| Kauri | 6,891,352 | 5,410,390 | 4,945,843 | 5,552,580 | 7,332,457 |
| Rimu | 71,082,074 | 76,192,513 | 96,125,000 | 125,488,187 | 157,631,153 |
| Kahikatea | 43,161,299 | 47,997,700 | 47,949,396 | 52,294,065 | 52,074,973 |
| Matai | 7,474,867 | 8,160,873 | 10,759,556 | 13,879,629 | 19,068,788 |
| Totara | 5,344,100 | 6,346,942 | 7,197,389 | 8,867,383 | 11,778,411 |
| Beech | 5,756,868 | 5,781,441 | 6,972,717 | 7,725,198 | 8,854,616 |
| Pinus radiata (insignis) | 13,404,700 | 14,676,010 | 21,494,382 | 27,311,373 | 34,104,448 |
| Other and unspecified | 1,077,250 | 1,703,541 | 2,210,617 | 2,663,260 | 2,230,467 |
| Totals | 154,192,510 | 166,269,410 | 197,654,900 | 243,781,675 | 293,075,313 |
| Per Cent. of Total. | Per Cent. of Total. | Per Cent. of Total. | Per Cent. of Total. | Per Cent. of Total. | |
| Kauri | 4.47 | 3.25 | 2.50 | 2.28 | 2.50 |
| Rimu | 46.10 | 45.82 | 48.63 | 51.48 | 53.78 |
| Kahikatea | 27.99 | 28.87 | 24.26 | 21.45 | 17.77 |
| Matai | 4.85 | 4.91 | 5.44 | 5.69 | 6.51 |
| Totara | 3.47 | 3.82 | 3.64 | 3.64 | 4.02 |
| Beech | 3.73 | 3.48 | 3.53 | 3.17 | 3.02 |
| Pinus radiata (insignis) | 8.69 | 8.83 | 10.88 | 11.20 | 11.64 |
| Other and unspecified | 0.70 | 1.02 | 1.12 | 1.09 | 0.76 |
| Totals | 100.00 | 100.00 | 100.00 | 100.00 | 100.00 |
The total of 2,230,467 ft. b.m. shown for “Other and unspecified” species for 1935–36 is made up as follows:—
| Species. | Ft. B.M. |
|---|---|
| Miro | 771,579 |
| Tanekaha | 294,001 |
| Tawa | 277,657 |
| Poplar | 145,268 |
| Rata | 126,475 |
| Yellow pine | 107,072 |
| Hinau | 97,423 |
| Pukatea | 88,093 |
| Blue-gum | 83,755 |
| Puriri | 63,433 |
| Rewarewa | 14,047 |
| Mangeao | 9,851 |
| Taraire | 5,590 |
| Kawaka | 2,545 |
| Unspecified | 143,678 |
| Total | 2,230,467 |
Exports of New Zealand timber during the calendar year 1936 amounted to 26,977,751 ft. b.m., valued at £264,882, the principal species being kahikatea (14,859,613 ft.), rimu (6,094,583 ft.), beech (2,033,058 ft.), Pinus radiata (898,757 ft.), and kauri (937,380 ft.). Imports during the year comprised 18,339,567 ft. b.m., of sawn timber (including 4,220,787 ft. of Oregon pine (Douglas fir), 8,804,682 ft, of Australian hardwoods, 2,114,774 ft, of redwood, and 2,691,135 ft. of oak), valued at £244,666; 4,694,954 ft. b.m. of logs and poles, valued at £68,611; 1,512,944 ft. b.m. of butter-boxes and cheese-crates, valued at £29,311; 210,783 ft. b.m. of cases, valued at £2,066; and laths, sleepers, and other items of a value of £85,599. The figures of exports and imports of timber during the last five years are:—
| Year. | Exports of New Zealand Timber. | Imports of Timber. | ||||
|---|---|---|---|---|---|---|
| Measured in Feet. | Other Items. | Total Value. | ||||
| Quantity. | Value. | Quantity. | Value. | |||
| Ft. B.M. | £(N.Z.) | Ft. B.M. | £(N.Z.) | £(N.Z.) | £(N.Z.) | |
| 1932 | 27,286,884 | 253,883 | 6,982,703 | 83,889 | 2,388 | 86,277 |
| 1933 | 25,829,404 | 237,528 | 10,275,980 | 139,048 | 20,784 | 159,832 |
| 1934 | 34,530,279 | 320,527 | 13,196,999 | 183,908 | 48,130 | 232,038 |
| 1935 | 39,585,198 | 364,359 | 19,360,717 | 252,656 | 145,854 | 398,510 |
| 1936 | 26,977,751 | 264,882 | 24,758,248 | 344,654 | 85,599 | 430,253 |
Under the timber-sales policy in operation for the disposal of the mature timber in State forests the standing timber is appraised and disposed of by public tender as a block sale.
| Year. | Timber sold. | Sale Price. |
|---|---|---|
| Ft. B.M. | £ | |
| 1932–33 | 32,314,954 | 35,693 |
| 1933–34 | 49,026,302 | 52,118 |
| 1934–35 | 65,302,700 | 71,243 |
| 1935–36 | 102,219,800 | 131,447 |
| 1936–37 | 107,429,600 | 124,522 |
Up to and including the financial year 1915–16 the expenditure on afforestation was provided out of rents and royalties received from State Forest reserves and by an annual contribution from the Consolidated Fund. In 1916–17 provision was made for the borrowing of money for forestry purposes, and since that date all receipts and payments are shown in a State Forests Account. Commencing with the year 1933–34, interest on loans is carried forward as a liability to the Consolidated Fund until realization of the plantations.
| — | 1932–33. | 1933–34. | 1934–35. | 1935–36. | 1936–37. |
|---|---|---|---|---|---|
| Receipts. | |||||
| £ | £ | £ | £ | £ | |
| Timber-sales (native forest) | 27,129 | 31,017 | 47,179 | 74,828 | 91,980 |
| Timber royalties and trespass | 3,667 | 3,164 | 5,449 | 5,006 | 6,257 |
| National-endowment allocation | 6,221 | 6,612 | 10,990 | 15,712 | 21,807 |
| Leases—Grazing | 1,637 | 1,816 | 1,646 | 1,757 | 1,692 |
| Sawmill-sites, &c. | 1,412 | 1,348 | 1,417 | 957 | 705 |
| Miscellaneous | 1,587 | 2,206 | 2,125 | 2,844 | 4,252 |
| Nurseries and plantations | 3,542 | 6,546 | 4,094 | 5,874 | 7,097 |
| Totals | 45,195 | 52,709 | 72,900 | 106,978 | 133,790 |
| Payments. | |||||
| Interest and loan expenses | 97,256 | 269 | 172 | 525 | 801 |
| National-endowment and local-body allocations | 7,099 | 7,401 | 9,339 | 16,360 | 27,673 |
| Staff salaries | 34,232 | 32,901 | 34,155 | 41,374 | 51,616 |
| Management, &c., native forests. | 10,580 | 9,757 | 12,985 | 15,438 | 18,472 |
| Nurseries and plantations | 49,348 | 54,292 | 59,136 | 60,642 | 139,761 |
| Research, &c. | 1,017 | 1,022 | 528 | 836 | 567 |
| Land-purchase | 12,646 | 10,542 | 70 | ||
| Miscellaneous | 205 | 202 | 343 | 500 | 84 |
| Totals | 212,383 | 116,386 | 116,658 | 135,745 | 238,974 |
The revenue from indigenous forests is heavily reduced by statutory payments in favour of local bodies and the National Endowment Account, and during recent years the residue has been little more than sufficient to meet the expenses of supervision and management; consequently the establishment of plantations has been financed almost exclusively from loan-moneys.
State afforestation on an organized basis dates from 1896, when an Afforestation Branch of the Lands Department was formed, and forest-tree nurseries were established at Tapanui and Eweburn in the South Island, and at Rotorua in the North Island. Planting commenced in 1898, when a total of 54 acres was established.
Figures of the areas planted each year in the last decade are shown below. Figures in parentheses are areas of direct formation and have been included in the totals with which they are associated.
| Year. | Acres. |
|---|---|
| 1927–28 | 36,792 (2,576) |
| 1928–29 | 60,635 (3,215) |
| 1929–30 | 56,630 (30) |
| 1930–31 | 53,847 (95) |
| 1931–32 | 40,979 |
| 1932–33 | 16,997 (1 1 3) |
| 1933–34 | 30,532 |
| 1934–35 | 12,211 |
| 1935–36 | 12,090 |
| 1936–37 | 6,701 |
The gross area of State exotic forests at the 31st March, 1937, was 592,781 acres, of which the area actually established was 426,163 acres, exclusive of fire-breaks, waste lands, reserves, &c. The new area planted during the year was 6,701 acres. Particulars of State exotic forests are given below.
| Exotic Forest. | Year of Commencement. | New Area planted, 1936. | Total Net Area planted. | Gross Area of Exotic Forest. |
|---|---|---|---|---|
| Acres. | Acres. | Acres. | ||
| Waipoua | 1925 | 294 | 1,364 | 12,600 |
| Puhipuhi | 1904 | 871 | 1,558 | |
| Riverhead | 1926 | 11,029 | 11,956 | |
| Maramarua | 1928 | 12,303 | 14,087 | |
| Tairua | 1930 | 33 | 10,634 | 48,510 |
| Whakarewarewa | 1898 | 8,033 | 10,073 | |
| Waiotapu | 1901 | 7,051 | 7,974 | |
| Kaingaroa | 1913 | 5,568 | 259,193 | 327,931 |
| Erua | 1930 | 224 | 2,937 | 5,592 |
| Karioi | 1927 | 17,196 | 33,689 | |
| Golden Downs | 1927 | 47 | 19,292 | 22,527 |
| Westland | 1922 | 3,000 | 5,839 | |
| Hanmer | 1901 | 74 | 7,775 | 10,372 |
| Balmoral | 1916 | 311 | 21,074 | 24,000 |
| Eyrewell | 1928 | 34 | 18,340 | 19,266 |
| Naseby | 1900 | 3,009 | 4,032 | |
| Dusky | 1898 | 4,470 | 6,866 | |
| Conical Hills | 1903 | 3,612 | 3,798 | |
| Pukerau | 1915 | 565 | 628 | |
| Blue Mountains | 1925 | 8,775 | 9,661 | |
| Pebbly Hills | 1930 | 4,353 | 5,330 | |
| Minor areas | 1875–1935 | 116 | 1,287 | 6,492 |
| Totals | 6,701 | 426,163 | 592,781 |
While many species were experimented with in the initial stages of the work, the chief species used in the North Island were European larch (Larix decidua), Austrian pine (Pinus austriaca), Corsican pine (P. Laricio), Western yellow pine (P. ponderosa), and a number of eucalypts. Of more recent years the species used for planting have been Douglas fir (Pseudotsuga taxifolia), Western yellow pine, insignis pine (P. radiata), Corsican pine, lodge-pole pine (P. Murrayana), and Western red cedar (Thuya plicata).
In the South Island practically all the best-known commercial trees of the Northern Hemisphere have been tried, but many have been discarded as unsuitable for various reasons, until at the present time operations are being conducted with a comparatively small range of conifers which experience has shown will most readily adapt themselves to local conditions. The principal species planted now being used are Western yellow pine, Corsican pine, Douglas fir, insignis pine, lodge-pole pine, and Western red cedar.
Planting operations have practically ceased in all regions except Rotorua, where a new afforestation project in the Bay of Plenty district, known as the Kotoehu State Forest, has been established. The area now set apart for this project is 19,628 acres, which on consolidation it is expected will be increased to about 33,000 acres.
In other districts the State exotic forest activities are now being concentrated upon the consolidation and management of those areas already planted. The large-scale planting of previous years has disclosed the limitations and weaknesses of various species, and experimental planting of new species is fundamental to the provision of possible alternatives should any further weaknesses develop at a later stage in the establishment of the exotic forests. For similar reasons experimental planting of exotics in cut-over forests is also carried out.
The Waitangi Endowment, containing approximately 1,400 acres, is portion of an estate containing the historic site of the signing of the Treaty of Waitangi, presented to the Crown as a national monument by Lord and Lady Bledisloe in 1932.
By authority of the Waitangi Endowment Act, 1932–33, the Commissioner of State Forests is empowered to administer the land as if it were a State forest, and to develop and use the land for afforestation purposes.
The primary object of these afforestation operations, however, is to reclothe a treeless area to form a scenic background for the portion of the estate known as the Waitangi National Trust, which contains the historic site mentioned.
The method first adopted in New Zealand for encouraging the planting of trees for the production of timber was by means of “land grants”—a settler being given a free grant of land if he planted a certain portion of his land with suitable trees. Several largo plantations were established in Canterbury by this method, which, however, was abandoned in the “eighties.” The Selwyn and Ashburton County Councils are the outstanding examples of local authorities which took advantage of this scheme, and are now receiving substantial revenues from their tree plantations.
Under the system of taxation in operation in New Zealand, encouragement is given to the conservation of indigenous forests and plantations and to the establishment of new plantations, by exempting the trees from land-tax and local rates.
The taxes to which indigenous forests and exotic forests are subject are—(a) Land-tax; (b) income-tax; (c) local rates; (d) stamp duties; (e) death duties; (f) levy on sawn timber (indigenous forests only).
Land supporting indigenous forests and plantations is subject to land-tax. The tax, however, is assessed on the unimproved value, which for taxation purposes does not include the value of any trees or the value of the labour or capital expended in planting them.
Local rates on land supporting indigenous forests and plantations are levied on the value of the land only. A County Council is empowered to make an annual levy of ½ d. per hundred feet board measure (superficial feet) on timber in the county converted from the log into sawn timber; but this levy is not applicable to timber cut from plantations.
Appraisements of timber are not liable to stamp duty if made for the Crown, for a local authority, or for the information of one party only.
Licenses granted by the Crown to cut timber are exempt from stamp duty;. other licenses are not exempt.
Land on which trees of any kind are growing is subject to death duties (estate-duty, succession duty, and gift duty), which are assessed on the capital value of the land, which includes the value of the trees.
In 1923 the planting of forests was undertaken by commercial concerns. Two classes of companies have been formed to carry oat the various ventures. The first is the ordinary joint-stock company, where the property is vested in the company and the shareholders receive a pro rata share of the profits according to the amount of capital contributed; the second is a company which is registered with a comparatively small capital, but of which the investing public do not become shareholders. The company contracts with each investor that in consideration of his paying the prescribed amount of cash it will convey to him at the end of a given term a certain area of land duly planted according to a prescribed agreement. The interests of bondholders are watched over by trustees until the time for conveyance to the bondholders arrives. Provision is now contained in the Companies (Bondholders Incorporation) Act, 1934–35, whereby bondholders may receive shares in exchange for their bonds and become entitled to the same proportionate interest in the same property and rights as they would be entitled to under their bonds. Of the thirty-three returns received from companies engaged in afforestation operations during the year ended 31st March, 1936, eleven were from companies organized on the bond-holding basis; but, though in the minority in point of numbers, their aggregate operations were greater than those of joint-stock companies.
The figures for 1935–36 reveal an increase in assets and liabilities from £4,622,797 in 1934–35 to £4,872,923 in 1935–30, or by 5 per cent. Receipts and payments during the period increased by 17 per cent. and 26 per cent. respectively. It will be observed that total assets and liabilities recorded substantial rises between the years 1933–34 and 1934–35. This increase is due chiefly to one company, formerly bond-issuing, being reconstructed as provided by the previously mentioned Act. Any reconstructions under this Act are characterized by increases in share capital and land held for afforestation, with decreases in liabilities to bondholders and other transactions relating to bond-issues.
The following comparative statement shows the classifications of the liabilities and assets of all afforestation companies as at 31st March in each of the last five years:—
| — | 1932. | 1933. | 1934. | 1935. | 1936. |
|---|---|---|---|---|---|
| Liabilities. | |||||
| £ | £ | £ | £ | £ | |
| Paid-up share capital | 833,782 | 962,194 | 960,383 | 2,555,378 | 2,734,909 |
| Loan-money | 4,333 | 18,542 | 11,893 | 49,607 | 86,550 |
| Forfeited Shares Account | 8,433 | 13,325 | 15,241 | 18,060 | 19,991 |
| Mortgages | 140,022 | 127,176 | 132,724 | 131,280 | 103,232 |
| Sundry creditors | 137,388 | 129,879 | 78,812 | 152,648 | 191,012 |
| Bondholders | 1,405,151 | 1,655,938 | 1,733,958 | 1,600,907 | 1,013,939 |
| Other | 232,941 | 249,734 | 314,447 | 108,857 | 123,290 |
| Totals | 2,762,050 | 3,156,788 | 3,247,458 | 4,022,797 | 4,872,923 |
| Assets. | |||||
| Land for afforestation purposes | 510,671 | 518,606 | 470,243 | 1,073,392 | 1,092,157 |
| Land for other purposes | 3,122 | ||||
| Development Account | 957,863 | 979,885 | 745,674 | 990,738 | 1,014,348 |
| Investments | 976,406 | 1,167,455 | 1,414,808 | 1,847,194 | 1,956,583 |
| Goodwill and preliminary expenses | 29,349 | 64,721 | 42,196 | 29,148 | 22,513 |
| Other | 287,761 | 426,121 | 574,537 | 679,203 | 787,322 |
| Totals | 2,762,050 | 3,156,788 | 3,247,458 | 4,622,797 | 4,872,923 |
The following statement shows a classification of the receipts and payments recorded by afforestation companies during each of the last five (March) years. Attention is drawn to the fact that the figures in the following receipts table represent receipts from the cash point of view and should not be confused with revenue.
| — | 1931–32. | 1932–33. | 1933–34. | 1934–35. | 1935–36. |
|---|---|---|---|---|---|
| Receipts. | |||||
| £ | £ | £ | £ | £ | |
| Share capital | 92,730 | 31,338 | 40,910 | 23,764 | 185,090 |
| Instalments on bonds | 454,971 | 501,269 | 425,566 | 288,549 | 257,406 |
| Loan-money | 33,627 | 11,322 | |||
| Investments realized | 3,103 | 399,177 | 376,731 | 444,001 | |
| Other receipts | 79,759 | 76,631 | 104,788 | 101,703 | 67,417 |
| Totals | 627,460 | 612,341 | 970,441 | 824,374 | 965,236 |
| Payments. | |||||
| Tree-raising | 14,884 | 9,929 | 6,494 | 5,680 | 3,958 |
| Establishment charges | 38,903 | 35,811 | 16,946 | 22,909 | 21,175 |
| Maintenance | 25,694 | 18,665 | 18,832 | 20,115 | 22,653 |
| Management, &c. | 95,126 | 67,928 | 66,469 | 66,209 | 84,687 |
| Commission, brokerage | 51,383 | 55,892 | 47,419 | 53,192 | 56,843 |
| Land-purchase | 34,530 | 18,108 | 36,995 | 31,442 | 13,889 |
| Investments | 154,413 | 276,480 | 705,423 | 467,386 | 559,385 |
| Dividends | 17,975 | 16,772 | 16,778 | 24,680 | 16,290 |
| Other | 207,685 | 91,575 | 101,864 | 63,116 | 171,954 |
| Totals | 640,593 | 591,160 | 1,017,220 | 754,729 | 950,834 |
The companies engaged in the sale of forest areas effected sales involving 12,230 acres of land during the twelve months ended 31st March, 1936, making a total of 285,393 acres sold up to that date. The instalments paid during the year in accordance with the contracts of sale amounted to £257,406, while the total instalments paid up to 31st March, 1936, on all bonds amounted to £4,746,984. The total commitments of the investing public on account of contracts entered into during the year amounted to £391,289, bringing the total for this item to £8,197,257 at 31st March, 1936.
Against the foregoing must be set contracts involving 116,204 acres, of a total selling-price of £3,280,939, which have been cancelled by the purchasers. Instalments amounting to £242,345 had been paid up on these cancelled contracts.
The average number of employees engaged during 1935–36 was 355, of whom 27 were engaged in tree-raising, 96 in planting, 79 in maintenance, 117 in fire-prevention, and 36 in management. This number represents a decline of 536 from the peak year (1930). The total wages and salaries paid during 1935–36 was £68,058.
The following table shows particulars regarding the species and number of trees planted during the year ended 31st March, 1936, together with particulars as to the areas planted:—
| Species. | Number of Trees. | New Area planted during the Year. | Total Area planted to 31st March, 1936. | |
|---|---|---|---|---|
| To replace Blanks. | On New Areas. | |||
| Acres. | Acres. | |||
| Pinus radiata (insignis pine) | 1,626,335 | 10,353,074 | 13,018 | 261,502 |
| Pinus ponderosa | 30,000 | 24,014 | ||
| Pinus pinaster | 3,605 | |||
| Pinus Laricio | 128 | |||
| Redwood | 13,700 | 2,727 | ||
| Douglas fir | 1,195 | |||
| Poplar | 642,200 | 625 | 625 | |
| Cupressus macrocarpa | 500 | 97 | ||
| Eucalypts | 2,400 | 1,042 | ||
| Unspecified | 15,500 | 7,000 | 10 | 1,900 |
| Totals, 1935–36 | 1,688,435 | 11,002,274 | 13,653 | 296,835 |
Table of Contents
THE following article is by Mr. A. E. Hefford, M.Sc., Chief Inspector of Fisheries, and Director of Fishery Research, Marine Department:—
With its great length of coast-line, extensive natural harbours, and numerous sheltered bays, New Zealand has from the earliest times been famed for the productivity of its coastal fisheries. Off its more northerly coasts, which come within the influence of the south equatorial current, a rich variety of subtropical fish-life is found, as exemplified by such species as the flying-fish, the sunfish, the swordfish, and several shark species. On the other hand, its southern coasts, washed by the antarctic drift, are the natural haunt of the fur-bearing seal, and yield varieties of fish which are characteristic of cold-water conditions.
Of the many kinds of excellent edible fishes the most important are the flounders of different species (Rhombosolea), which occur in the more shallow and sheltered waters, the snapper (Pagrosomus auratus), which is particularly abundant in the north, the blue cod (Parapercis colias), which provides the staple product of the southern fine fisheries, the groper or hapuku (Polyprion oxygeneios), which is caught on lines in the deeper water from the North Cape to Stewart Island, and the tarakihi (Dactylopagrus macropterus), taken mainly by trawlers in the more off-shore waters of Hauraki Gulf, Bay of Plenty, Hawke's Bay, and in the vicinity of Cook Strait.
The most productive grounds are in relatively shallow water, and, except for groper and ling fishing by means of long lines, most of the fishing is carried on at depths of less than 40 fathoms. Depths of over 100 fathoms occur at comparatively small distance from the coast, and up to the present it is not known to what extent these deeper waters may be productive of marketable fishes. The principal methods of fishing are long-lining for groper (hapuku), ling, “hake” or “kingfish,” and snapper; hand-lining for blue cod; trawling and Danish seining, by which flounders, snapper, tarakihi, gurnard, john-dory, and a variety of other fish are taken. In bays and estuaries set-nets are used for flounders, snapper, and mullet, and seines are also employed principally for the capture of flat-fish and snapper. Though sardines or pilchards (Sardinia neopilchardus) and other species of the herring family are known to occur in large shoals off some parts of the coast, there is as yet no regular fishery for these kinds.
The only information formerly available under this head was a statement compiled by the Chief Inspector of Fisheries giving an approximate estimate of the weight and value of fish landed at the principal fishing-ports for each year, the data being obtained from local officials as annual totals. In the year ended 31st March, 1937, the statistics have been for the first time collected on a new system by which returns of the individual landings from each licensed fishing-boat have been made. From such data the following statement has been compiled, which gives the total quantity and value of fish landed at the principal fishing-ports for the year ended 31st March, 1937. Although the basic data are not absolutely comprehensive and the totals therefore may be somewhat below the true amounts, it is considered that they are very much more accurate than those that have been presented hitherto.
PRINCIPAL KINDS, QUANTITIES, AND VALUE OF FISH CAUGHT.
| Port. | Principal Kinds of Fish caught. | Quantity. | Total Value. |
|---|---|---|---|
| £ | |||
| Russell | Snapper, mullet, hapuku, flounder, kingfish, garfish, tarakihi, gurnard, maumau, crayfish | 1,481 cwt. | 1,227 |
| Whangarei | Snapper, mullet, flounder, hapuku, blue cod | 1,241 cwt. | 1,732 |
| Kaipara | Snapper, flounder, mullet | 1,912 cwt. | 3,852 |
| Auckland District | Snapper, tarakihi, trevally, flounder, gurnard, hapuku, dory, kingfish, blue cod, barracouta, mullet, garfish | 159,371 cwt. | 117,950 |
| Crayfish | 1,325 cwt. | 1,554 | |
| Mussels | 7,019 sacks | 1,827 | |
| Thames | Snapper, gurnard, dory, mullet, flounder, dab, pioke | 15,447 cwt. | 16,690 |
| Mercury Bay | Snapper, tarakihi, hapuku, gurnard, blue cod, flounder, kingfish, crayfish | 1,829 cwt. | 1,345 |
| Tauranga | Snapper, hapuku, trevally, blue cod, tarakihi, mullet, kingfish | 3,988 cwt. | 3,143 |
| Whakatane | Flounder, hapuku, gurnard, snapper, tarakihi | 2,403 cwt. | 2,087 |
| Gisborne | Tarakihi, gurnard, snapper, flounder, sole, kahawai, hapuku | 4,219 cwt. | 4,136 |
| Napier | Tarakihi, snapper, moki, kahawai, gurnard, trevally, hapuku, kingfish, barracouta, john-dory, flounder, sole, brill, warehou | 15,585 cwt. | 15,522 |
| New Plymouth | Snapper, hapuku, kingfish, tarakihi, kahawai, cod, crayfish, gurnard | 2,070 cwt. | 2,581 |
| Wanganui | Blue cod, hapuku, flounder, snapper | 304 cwt. | 408 |
| Wellington | Tarakihi, gurnard, flounder, sole, snapper, ling, warehou, hapuku, moki, butterfish, blue cod, southern kingfish, crayfish, hake, trevally | 54,842 cwt. | 68,721 |
| Picton | Hapuku, moki, butterfish, garfish, crayfish, blue cod, flounder | 3,313 cwt. | 4,866 |
| Blenheim | Red cod, solo, flounder, snapper, moki, hapuku, gurnard, tarakihi, butterfish, crayfish | 2,316 cwt. | 2,462 |
| Nelson District and French Pass | Snapper, flounder, gurnard, bream, hapuku, cod, crayfish | 8,148 cwt. | 9,731 |
| Westport | Sole, hapuku, turbot, flounder, ling, crayfish, snapper | 544 cwt. | 969 |
| Greymouth | Whitebait, flounder, sole, cod, hapuku, snapper, gurnard, hake, tarakihi, turbot | 1,872 cwt. | 1,970 |
| Kaikoura | Hapuku, ling, trumpeter, southern kingfish, cod, hake, tarakihi, crayfish | 3,743 cwt. | 5,594 |
| Akaroa | Hapuku, conger eel, flounder, sole, brill, blue and red cod, crayfish, barracouta, kingfish, moki, butterfish | 3,420 cwt. | 4,534 |
| Lyttelton | Hapuku, barracouta, flounder, sole, gurnard, brill, tarakihi, ling | 15,258 cwt. | 18,475 |
| Timaru | Flounder, sole, brill, hapuku, ling, red cod, gurnard, barracouta | 12,776 cwt. | 16,757 |
| Oamaru and Moeraki | Hapuku, red cod, blue cod, moki, barracouta, ling, crayfish | 3,313 cwt. | 3,937 |
| Dunedin and Otago District | Hapuku, ling, red cod, barracouta, kingfish, blue cod, moki, trumpeter, tarakihi, trevally, mullet, garfish, kahawai, kelpfish, sole, flounder, brill, skate | 21,968 cwt. | 29,353 |
| Bluff and Invercargill | Hapuku, blue cod, flounder | 3,200 cwt. | 4,479 |
| Oysters | 63,412 sacks | 39,632 | |
| Stewart Island | Blue cod, hapuku | 8,690 cwt. | 10,001 |
| Chatham Islands | Blue cod, hapuku | 6,373 cwt. | 4,565 |
The total for Wellington includes 8,739 cwt. caught at the Chatham Islands and shipped direct to Wellington.
The quantity of fish recorded as having been brought in from the fishing-grounds for the year ended 31st March, 1937, was 363,128 cwt., which, with 1,888 cwt. of whitebait, 10,415 sacks of mussels, and 8,868 cwt. of crayfish, represented a wholesale value of £388,744. The wholesale value of the oysters landed from the various beds was £41,472, and in addition the produce of the mainland whale-fisheries was 280 tons of oil.
The following table shows the quantities and values of New Zealand fish and shell-fish exported for each of the last five years (1st April to 31st March).
| — | 1932–33. | 1933–34. | 1934–35. | 1935–36. | 1936–37. | |
|---|---|---|---|---|---|---|
| Fish (frozen) | Cwt. | 19,854 | 34,738 | 46,714 | 54,267 | 50,727 |
| £ | 39,662 | 64,669 | 97,469 | 123,198 | 132,401 | |
| Fish (smoked, dried, pickled, or salted) | Cwt. | 521 | 1,243 | 1,968 | 2,519 | 3,724 |
| £ | 1,216 | 2,377 | 4,064 | 6,816 | 12,069 | |
| Oysters (fresh) | Doz. | 28,101 | 105,941 | 206,660 | 201,782 | 135,533 |
| £ | 349 | 1,045 | 1,895 | 2,170 | 1,447 | |
| Oysters (canned) | Lb. | 51,620 | 128,028 | 95,270 | 172,855 | 331,747 |
| £ | 2,428 | 4,571 | 3,818 | 6,444 | 12,974 | |
| Toheroa (canned) | Lb. | 13,340 | 19,266 | 24,688 | 24,836 | 32,979 |
| £ | 1,209 | 1,619 | 1,867 | 1,683 | 2,425 | |
| Whitebait (Canned) | Lb. | 41,723 | 84,788 | 105,899 | 85,701 | 104,232 |
| £ | 3,954 | 7,497 | 9,561 | 8,662 | 12,109 | |
| Other kinds (canned) | Lb. | 48,123 | 280,228 | 54,561 | 63,901 | 23,783 |
| £ | 2,852 | 16,639 | 3,229 | 4,349 | 1,697 | |
| Value of total exports of New Zealand fish and shell-fish | £51,670 | £98,417 | £121,903 | £153,322 | £175,122 | |
A table showing the various classes of vessels engaged in the fishing industry, together with the number of persons employed, is given below for the year ended 31st March, 1937:—
| — | Whole Time. | Part Time. | Total. |
|---|---|---|---|
| Vessels engaged in fishing for wet fish— | |||
| Steam trawlers | 15 | 10 | 25 |
| Motor trawlers | 40 | 12 | 52 |
| Motor-vessels—Danish seining | 33 | 24 | 57 |
| Motor-vessels—Set-net and line fishing | 498 | 238 | 736 |
| Row-boats | 73 | 192 | 165 |
| Vessels engaged in shell-fishing— | |||
| Oyster-dredging vessels | 8 | 1 | 9 |
| Mussel-dredging vessels | 4 | 2 | 6 |
| Crayfishing-vessels | 22 | 100 | 122 |
| Number of persons employed— | |||
| Fishermen | 1,369 | 718 | 2,087 |
| Others (excluding retailers) | 277 | 116 | 393 |
The principal oyster-beds round the coast of New Zealand are those situated in Foveaux Strait, between South and Stewart Islands, and the rock-oyster beds on the east and west coasts of the Auckland Peninsula. The Foveaux Strait beds are very extensive.
During the 1936 season 63,412 sacks of oysters, valued at £39,632, were dredged from the Foveaux Strait beds, as compared with 49,712 sacks, valued at £31,070, in 1935.
The rock-oyster beds of Auckland were worked for many years under a variety of systems, but owing to stripping of the beds close seasons had frequently to be proclaimed. Prom 1908 the picking and wholesale marketing of rock-oysters from the North Island beds has been undertaken by the State, private picking being prohibited. Oysters picked and sold by the State in 1936 realized £4,965 (1935, £3,762); the cost of picking and selling, including interest and depreciation on the post of the oil-launches used by the Inspectors and ad overhead expenses, was in 1936 £5,615 (1935, £4,542). A profit accrues to the State in most years, and the scheme has, moreover, resulted in the conservation and extension of the beds.
Oyster-cultivation work is being systematically carried on by the Marine Department in the Hauraki Gulf, in the Bay of Islands, and in the Kaipara district.
Marine crayfish occur in abundance off many parts of the New Zealand coast, and are caught in baited traps and nets for supplying the local markets. A small but increasing canning industry is also carried on. An export trade in frozen crayfish-tails, which had begun to develop in 1933 and 1934, has received a setback owing to the restrictions on imports into European markets.
With the enormous development of pelagic whaling that has taken place in recent years, the whaling industry in New Zealand has greatly declined from the important position which it occupied in the early days of the colony. Since 1923 only two stations have remained—one at Whangamumu, near the Bay of Islands, and the other in Tory Channel, Marlborough Sounds—but no commercial operations have been carried on at the former station since 1931. ID 1936 sixty-nine hump-back whales, which produced 280 tons of oil, were caught in the Marlborough Sounds area.
References to whaling operations carried out in the Ross Sea and international whaling statistics appear in the section on “Dependencies.”
The Whaling Industry Act, 1935, was passed in order to give effect to an International Convention for the regulation of whaling and matters incidental thereto.
For many years past the taking of seals has been prohibited, the close season originally declared having been extended from time to time for periods of three years. The latest extension carries the close season to 30th November, 1937.
A fishery that is peculiar to New Zealand both with regard to the product and to the methods of operation, carried on from July to November in the tidal reaches of many rivers, is the whitebait fishery. New Zealand “whitebait” are the young of Galaxias attenuatus, a species that lives for the greater part of its adult life in fresh water, descending to tidal water to spawn in late summer and autumn. The spawn is deposited among grass and similar herbage on the margin of the river above the ordinary high-water mark in a zone that is submerged only at the highest spring tides. Here it remains under cover of the herbage and secure from aquatic enemies until it is once more reached by a spring tide about a fortnight or, it may be, a month later. The young then hatch out, and are carried by the ebb tide to the sea. Here they remain until at the age of about five months the young fish, then about 2 in. long and still possessing the almost glassy transparency of the larval stage, migrate up the rivers in dense shoals. This is the time of the whitebait fishery, when they are caught in nets made of wire gauze or mosquito-netting. The cultivation and drainage of riparian lands have considerably diminished the extent of spawning and feeding areas that were available in earlier times. From these causes, as well as from the intensity of the fishing operations, there are now few rivers where the runs of whitebait show anything like the abundance of former years. The most productive whitebait fisheries are near the mouths of the rivers of the West Coast of the South Island and in the lower reaches of the Waikato River. During the 1936 season the whitebait fishery gave employment to almost three hundred regular fishermen, mostly Maoris, and a greater number of part-time fishers, and produced 2,000 cwt. of whitebait. The canned whitebait packed in the West Coast and Waikato factories is a much-esteemed delicacy.
The erection of the marine fish-hatchery at Portobello, Otago Harbour, was carried out by a Board set up to superintend the work of the hatchery, funds being provided by the State, and grants being made by the Otago Institute, the Australasian Association for the Advancement of Science, and a number of acclimatization societies. Up to 1935 the State made an annual grant towards the maintenance of the hatchery, the buildings and equipment of which have also been added to from time to time.
Experiments have been carried out with a view to introducing certain English food fishes to New Zealand waters—viz., lobsters, edible crabs, and turbot. Valuable work has also been done in the direction of hatching the spawn of various indigenous fishes and in making a study of their life-habits.
The acclimatization projects not having shown any material results, and experience elsewhere having demonstrated the impracticability of artificial propagation of marine fishes, the principal usefulness of the station has been the educational value of the well-stocked aquarium to the visiting public, and the limited facilities it has afforded for marine research and the collection of material for museums and biological laboratories. As a station for research its usefulness has been nullified by the reduction in the grants from Government funds since the financial depression, and since from its situation and for other reasons it is not the most suitable centre for the prosecution of fishery research it is possible that this station may be abandoned in the near future.
Swordfish (striped and black marlin, and occasionally broadbill), mako shark, and other big-game fish occur principally off the east coast of the Auckland Province, and attract both resident and visiting big-game fishermen. The principal centres for this sport are Whangaroa, Russell (Bay of Islands), and Whitianga (Mercury Bay), where specially designed and equipped launches in charge of experienced men may be hired. The season lasts from December to May, the best months usually being February and March. The world's record black marlin swordfish (976 lb.) was caught off the Bay of Islands in February, 1926.
Of fresh - water fishes indigenous to New Zealand the species of most commercial importance at the present time is Galaxies attenuates, which provides the whitebait fishery already mentioned. Other species of Galaxias are known in the streams and lakes of the Dominion. A remarkable mud-fish (Neochanna apoda) belonging to the same family is capable of surviving for long periods without being in water. A small fish belonging to the smelt family, Retropinna retropinna, occurs in abundance in salt, brackish, and fresh water, and there are inland lakes where a purely fresh-water variety of smelt is found. The New Zealand grayling (Prototroctes oxyrhynchus) was found in abundance in many rivers in the earlier years of settlement, but for some unknown reason has become exceedingly rare during recent years. A small fish belonging to the goby family, and very abundant in most rivers and lakes, is the bully. With the exception of the eels, which may attain an extraordinarily large size compared with those of the Northern Hemisphere, all the native fresh-water fishes are small, and are therefore not considered to possess any sporting value except to the most juvenile of anglers. There are two species of eels—Anguilla australis, predominant in the northern rivers and lakes, and Anguilla aucklandi, which is found more abundantly in the South. Both species are found in the southern portion of the North Island and in the northern parts of the South Island. Eels constituted an important food-supply to the Maoris, who devised very efficient traps for their capture as the adult eels migrated to the sea. This fishery is still carried on by the Natives of some districts, and the commercial exploitation of fresh-water eels by Europeans has recently begun.
The following is a complete list of the definitely known indigenous freshwater species:—
| Scientific Name. | European Name. | Maori Name. | Usual Maximum Size. |
|---|---|---|---|
| Inches. | |||
| Galaxias attenuatus | “Minnow” | Inanga | 7 |
| Galaxias fasciatus | Native trout or mountain trout | Kokopu | 10 |
| Galaxias brevipinnis | “Gudgeon” | Taiwharu or kokopu | 6 |
| Galaxias huttoni | Koaro | 6 | |
| Galaxias burrowsii | Canterbury mudfish | 5 to 6 | |
| Neochanna apoda | Mudfish | Hauhau or waikaka | 8 |
| Retropinna retropinna | Smelt | Paraki | 6 |
| Prototroctes oxyrhynchus | Grayling | Upokororo | 12 |
| Cheimarrichthys fosteri | Torrent-fish or shark-bully | Papanoko | 7 |
| Gobiomorphus gobioides | Bully | Toitoi | 6 Feet. |
| Anguilla australis | Short-finned eel | Tuna | 3 to 4 |
| Anguilla aucklandi | Long-finned eel | Tuna | 4 to 5 |
| Geotria australis | Lamprey | Koro-koro or kunakuna | 2 |
The “minnow,” smelt, grayling, and, of course, the eels and lamprey are-migratory fish which spend parts of their lives in the sea or in estuarine tidal waters.
Although most of the above-mentioned indigenous fishes—especially the eels, kokopu, and upokororo—provided an appreciable portion of the food-supplies of the Maoris, and have been a welcome addition to the camp provision of surveyors, bushmen, and prospectors since the pioneering days, there were many among the early settlers to whom the New Zealand rivers and lakes appeared uninteresting and unproductive in comparison with their native salmon and trout streams. By means of private agency in some cases and by more organized efforts on the part of Government and local acclimatization societies, attempts to introduce British salmon and trout were commenced in the early “sixties.” The first brown trout to be established in New Zealand waters were reared in 1807 from ova obtained from Tasmania, where the species had been successfully acclimatized from South of England stock a few years earlier. Further shipments of ova from Tasmania and also from Britain followed, from which the fry were hatched out and liberated by various acclimatization societies, with the result that in the “eighties” and “nineties” most of the rivers and many of the lakes in both North and South Islands carried stocks of brown trout of such phenomenal size and in such abundance that New Zealand's claim to the title of “the Angler's Paradise” was already established. The remarkably rapid growth of trout in New Zealand waters is doubtless due to the abundance of suitable food afforded by the native aquatic fauna and by especially favourable climatic conditions in comparison with the original habitat of the species in the higher latitudes of the Northern Hemisphere, where the long and rigorous winters bring about a more or less complete cessation of feeding and of growth during the coldest months of the year. Sea trout were introduced in the “seventies” and “eighties” and the progeny distributed throughout New Zealand. Our present stocks of European trout have thus been derived from English and Scottish brown trout, sea trout, and the Loch Leven variety, which have doubtless interbred. Some migrate to sea and acquire salmon like characteristics, others are permanent inhabitants of fresh water.
Rainbow-trout ova were imported from California in 1883 and 1884 by the Auckland Acclimatization Society, and there is now scarcely a district to which this species has not been introduced. It has flourished exceedingly in the larger lakes of both Islands. Lake Taupo, with its tributary rivers, principal among which is the Tongariro, is regarded as providing the finest rainbow-trout fishing in the world. The earlier-established brown-trout stocks of Taupo and of many other lakes have declined in the face of the competition of this species. In rivers its establishment has been more uncertain, and some streams have failed to maintain a stock in spite of repeated plantings. In a few the rainbow has succeeded where the brown trout was a comparative failure, those being generally the warmer rivers of the North; while in some, such as the Wanganui, the two species are found together.
The American brook trout or speckled trout was first imported from the United States in 1877, and the latest shipment came from the Solway Fisheries (Scotland) in 1887. From these stocks ova and fry were widely distributed throughout this country. Generally speaking, they have been a failure, partly through being put into unfavourable environments, but probably more through inability to compete in the same waters with the more dominant brown and rainbow species. They still persist, however, in a few streams in well-bushed districts in Canterbury, Otago, and Southland, and have been caught up to 3 lb. in weight in the Pareora River. In 1933 fish of this species, some exceeding .3 lb. in weight, were found spawning in the month of April in a stream flowing from Lake Emily in the Ashburton district.
The Mackinaw trout or great American lake trout was introduced in 1906, and fry were planted in two Canterbury lakes (Pearson and Grasmere). Fish up to 10 lb. weight have been recently taken by anglers in Lake Pearson.
Contemporaneously with the steps taken for the introduction of trout many attempts were made to acclimatize salmon in New Zealand. These failed because the relatively small numbers of ova imported were rendered still loss effective by being subdivided and apportioned among several different districts, no recognition Apparently being given to the considerable degree of mortality occurring during the marine phase in the life of these migratory species. In 1901 the acclimatization of quinnat salmon was undertaken by the Marine Department. Between that year and 1907 five shipments of ova, each consisting of half a million eggs, were made and the fry liberated in the Hakataramea, a tributary of the Waitaki River. Early success was achieved, some quinnat salmon being caught in the Waitaki in 1905. From 1910 onwards mature fish returning to the Hakataramea and other tributaries of the Waitaki have been trapped for hatchery purposes, and the ova used for the introduction of the species to other rivers. The Hokitika River was the first to be stocked, more than three and a half million ova being sent there between 1910 and 1928. No stock of sea-running quinnat salmon has resulted from these undertakings, though in Lake Kanieri, from which a tributary stream runs into the Hokitika River, a stock of small lake-dwelling quinnat salmon was produced. There have been reports, however, of quinnat salmon being taken in some of the remote and inaccessible rivers in South Westland, which may be the result of migration from the Hokitika River, or may be the progeny from the stocking of the Seaforth River with 0,000 quinnat fry in the years 1910 and 1911. Material evidence has recently been obtained that has proved the existence of quinnat salmon in the Okarito River system, South Westland. The Wairau River, Marlborough, has also received fry from over five million eggs, but only a few odd quinnat salmon have ever been seen in this river. By natural migration, however, the species has spread from the Waitaki to all the large rivers of Canterbury, and to some of the small ones, such as the Opihi and Orari. It has also found its way into some of the rivers of the North Island—namely, the Rangitikei and Wanganui on the west coast and the Tukituki and Tarawera Rivers on the east coast, and specimens have been taken in Wellington Harbour and the lower Wairarapa Lake. The principal runs take place between January and May into the large so-called snow-fed rivers of Canterbury—the Waitaki (dividing South Canterbury from North Otago), the Rangitata, Rakaia, and Waimakariri. The Clutha, stocked with fry from Hakataramea ova between 1917 and 1922, also has an annual quinnat run, though apparently few fish are caught until they reach Lake Wanaka, from which the Upper Clutha flows. In this lake and in Lake Wakatipu at the head of a large tributary there are stocks of small quinnat which remain throughout fife in the fresh water.
Ova of the sockeye or red salmon ware imported from Western America in 1902, and fry were planted in the tributaries of Lake Ohau at the headwaters of the Waitaki River system. The species appears to have taken exclusively to a lake-dwelling habit, resulting in the stock of dwarf salmon of this species found at the present time in Lake Ohau.
In 1908 the Marine Department undertook the task of the introduction of Atlantic salmon on more intensive lines than had been the case in the many previous attempts, and concentrated on the Waiau River, which has two largo lakes (Manapouri and Te Anau) at its headwaters. A hatchery was established at Te Anau, near the Upokororo River, into which tributary the earliest fry were liberated. In 1908 150,000 ova were obtained from the Mirimichi River in Eastern Canada. In 1910 just over a million eggs were landed from England, which had been collected from the following sources: 375,000 from the River Tay (Scotland); 125,000 from the Blackwater (Ireland); 55,000 from the Test (England); 110,000 from the Dee (England); and 350,000 from the Rhine (Germany). In 1911 a further million ova, consisting of 400,000 from the River Wye (England) and 600,000 from the Rhine, were landed. The fry were liberated in the Upokororo and tributary streams. Within about ten years evidence of the establishment of the species was obtained, and in 1923 mature Atlantic salmon were trapped in the Upokororo River, and artificially hatched fry were planted in the Wanganui River in the North Island. After an average of more than 450,000 ova each year had been transferred for seven successive years without appreciable result, it was concluded that this river, flowing to the west coast of the North Island, did not afford a suitable habitat for the species. The Upokororo-bred salmon have aroused considerable interest in biological circles in that the majority of them have refrained from migrating to the sea as is their habit in the Northern Hemisphere. For the most part they have moved from the Upokororo River to Lake Te Anau, and have remained there feeding in fresh water for the rest of their lives, although there is no obstacle to their exit down the Waiau River to the sea. They have, in fact, assumed the habits of lake trout. A certain proportion of them have, however, found their way to the sea, and some have been caught in the breakers entering the mouth of the Waiau. No general migration of smolts has ever been observed, and half-grown and maturing salmon are frequently caught feeding not only in the lake but also in the River Waiau between the upper lake (Te Anau) and the lower lake (Manapouri), as well as between Manapouri and the sea. Atlantic salmon in New Zealand attain maturity at an earlier age than is the rule in the Northern Hemisphere. All of them apparently spawn as grilse, and thereafter, owing doubtless to their fresh-water habitat, do not increase very much in weight. The majority of Waiau salmon taken by anglers are between 3 lb. and 5 lb. The highest weight recorded is 17 lb. A 13 lb. fish was taken in 1935.
Besides the above-mentioned members of the salmon and trout family, other species of fish from the Northern Hemisphere which have been acclimatized in New Zealand are the European perch, tench, and carp, and the North American catfish (Ameiurus catus).
The local administration and management of fresh-water fisheries are in the hands of the acclimatization societies, of which there are twenty-eight in the Dominion. Licenses to angle for acclimatized fish are issued by these societies in conformity with the Fishery Acts. A license for the season costs £1 5s., and is available for any part of the Dominion except the Taupo and Rotorua Acclimatization Districts in the thermal-lakes region. For the Taupo district there is a higher scale of license fees as follows: Local residents, £1 10s.; persons domiciled in New Zealand, £2; other persons (from overseas), £6. These are for the whole season. Weekly and day licenses are also available. For Rotorua district the license for the season costs £1, and there are lower fees for half-season, monthly, weekly, and daily licenses. These two acclimatization districts are under the control of the Department of Internal Affairs. Under the legislation of 1936 prescribing an increase in the fee for the ordinary season license from £1 to £1 5s., provision was made for payment into the Consolidated Fund of 10 per cent. of the revenue from trout-fishing licenses for the financing of fresh-water-fishery research. The remaining funds from fishing licenses are used by acclimatization societies for the stocking and protection of fishing waters, and in the case of the Taupo district also for payments to the Natives from whom rights of fishing and access have been purchased.
The ordinary fishing license is available for either trout or salmon fishing. The brown-trout fishing-season opens on the 1st October and closes on the 30th April. In certain rainbow-trout fishing districts—e.g., Taupo and Rotorua—the season opens and closes one month later.
Brown trout may be caught in practically every river and stream in New Zealand, with the exception of those in the extreme north of Auckland. A considerable proportion of riparian land on good fishing waters is public, but, generally speaking, access to private land is freely given to anglers. The selling or letting of the right to fish is forbidden by law. In a country so favoured with numerous trout streams suitable for either wet or dry fly angling or for minnow-fishing, it is difficult to enumerate a list of rivers or even districts that may be labelled as the best. Nowadays the big bags are more easily obtained from the more remote waters in the back-country districts. In most districts certain rivers are limited to artificial-fly fishing only. Several of the Auckland rivers carry rainbow trout only, while in others both rainbow and brown trout fishing may be obtained. The lakes in the thermal region of the North Island, especially Taupo, Rotorua, and Rotoiti, together with Waikaremoana, are notable rainbow-trout waters, but this specks in more recent years has made great headway in several South Island lakes. In Lake Coleridge, sixty miles from Christchurch, Canterbury, rainbow trout, brown trout, lake-dwelling quinnat, and Atlantic salmon have all been caught on a single angling trip. This lake was stocked with 40,000 Atlantic-salmon fry in 1928 in order to ascertain the growth of this species under indubitably “land-locked” conditions. The first specimens captured (in 1930) had attained a weight of rather more than 3 lb. when under two and a quarter years of age. With the exception of this lake, the only water where fishing for Atlantic salmon can be obtained is in the Waiau River system, Southland. Both fly and minnow-fishing methods are used, and large brown or rainbow trout may be taken in the same pools as the salmon. Angling for quinnat salmon is carried on principally in the lower reaches of the large Canterbury rivers—the Waimakariri, Rakaia, Rangitata, and, to a less extent, the Waitaki, Opihi, Hurunui, and others. A spoon bait well sunk is the most successful. Anglers are permitted to sell quinnat salmon on taking out a license, the fee for which is £1 for the season. A limited amount of commercial salmon-seining is carried on in the estuary of the Waimakariri River. The number of licensed nets is restricted to not more than four, and three days—Friday to Sunday inclusive—are prescribed as a weekly close season. The total salmon netted for each of the last five years was 928, 1,157, 732, 246, and 106 (for two nets) respectively; the average weights of the fish were respectively 13.3 lb., 13.3 lb., 12.9 lb., 11.1 lb., and 10.1 lb. The run of fish from the sea begins in January and ends in May, with the maximum in March. Several fish exceeding 40 lb. in weight, and one fish weighing 52 lb., have been taken with rod and line.
Table of Contents
IN no other country of equal size to New Zealand are indications of a greater number of economic minerals to be found; yet, with the exception of iron-ore, the known mineral reserves are not great in comparison with those in many other countries. The coal reserves of the Dominion are considerable, however, and their duration will be extended by the utilization of the enormous water-power resources of the country.
The gold-mining industry, which in its early stages contributed greatly to the progress and settlement of New Zealand, has again come into prominence, mainly on account of the enhanced price of gold. The depression caused a large number of unemployed men to turn their attention to gold prospecting; while dredging activity has recently increased considerably.
In chronological comparisons of values of production or export, particularly in the case of gold, it is important not to overlook the fact that all monetary expressions of value in this section are in terms of New Zealand currency, which since 1939 has been at varying levels below gold-standard and sterling parities.
The law relating to mining and quarrying is contained for the most part in the. Mining Act, 1926, with its amendments of 1927, 1931, 1934, and 1935; the Coal-mines Act, 1925, as amended in 1927, 1933, 1935, and 1936; and the Stone-quarries Act, 1910, as amended in 1911, 1920, and 1922. Numerous provisions for the supervision of the coal-mining industry are contained in the Coal-mines Amendment Bill at present (November, 1937) before the House of Representatives.
The following statement shows the production of metalliferous mines, of stone-quarries under the Stone-quarries Act, and of coal-mines:—
| Mineral. | 1935 | 1936. | ||
|---|---|---|---|---|
| Quantity. | Value. | Quantity. | Value. | |
| £ | £ | |||
| Gold and silver | 603,244 oz. | 1,300,046 | 597,548 oz. | 1,272,587 |
| Platinum | 14 oz. | 79 | 30 oz. | 187 |
| Pig-iron | 4,902 tons | 23,775 | ||
| Stone | 289,274 | 342,861 | ||
| Pumice | 3,300 tons | 8,769 | 3,242 tons | 8,881 |
| Coal | 2,115,184 tons | 2,115,184 | 2,140,217 tons | 2,140,217 |
| Tungsten-ore | 39 7/20 tons | 4,719 | 28 tons | 3,448 |
| Quicksilver | 563 lb. | 132 | ||
| Totals | 3,741,978 | 3,768,181 | ||
The production of gold and silver is of necessity taken together, as separate figures are not available; an estimate of gold-production is, however, given on the next page. Kauri-gum, the (chiefly) fossilized resin of former kauri forests, is counted as a mineral, but is not included in the above table.
The next statement shows the value of New Zealand minerals and allied substances exported:—
| Mineral. | 1934. | 1935. | 1936. | Total from 1st January, 1853, to 31st December, 1936. |
|---|---|---|---|---|
| £ | £ | £ | £ | |
| Gold | 1,320,690 | 1,441,790 | 1,398,656 | 101,574,580 |
| Silver | 39,372 | 61,317 | 55,745 | 3,457,947 |
| Tungsten-ore | 4,462 | 7,083 | 5,563 | 330,113 |
| Antimony-ore | 55,081 | |||
| Quicksilver | 510 | 19,024 | ||
| Other minerals | 6,796 | 8,769 | 8,881 | 558,521 |
| Kauri-gum | 86,917 | 79,113 | 96,161 | 23,362,163 |
| Coal (including bunker) | 51,489 | 62,910 | 55,217 | 7,434,752 |
| Totals | 1,510,236 | 1,660,982 | 1,620,223 | 136,792,181 |
The actual figures of gold-production are not available owing to no distinction being made between gold and silver in the case of certain mines which produce both. The following statement shows bullion-production during 1936:—
| — | Production of Bullion.* | Number of Persons ordinarily employed at Productive and Unproductive Mines and Dredges. | Number of Productive Mines and Dredges. | |
|---|---|---|---|---|
| Quantity. | Value. | |||
* Including a proportion of silver. | ||||
| Oz. | £ | |||
| Quartz-mining | 526,661 | 732,869 | 1,387 | 77 |
| Alluvial milling | 33,618 | 244,640 | 3,495 | 2,928 |
| Dredge mining | 37,269 | 295,078 | 279 | 21 |
| Totals, 1936 | 597,548 | 1,272,587 | 5,161 | 3,026 |
The following table shows the production of bullion and the estimated gold content for the last five years. The substantial increases in the aggregate value of production illustrate what the advance in the price of gold has meant to the industry. The price of gold reached a record level of £(N.Z.)9 5s. 11d. per fine ounce on the 6th March, 1935. The present (4th November, 1937) price of gold is £(N.Z.)8 14s. 4d.
| Year. | Production of Gold and Silver Bullion. | Estimated Gold Content. | Approximate Average London Price of Gold per Ounce.† | ||
|---|---|---|---|---|---|
| Quantity. | Value. | Quantity. | Value. | ||
* Ounces of fineness of 20 carats or upwards. † Fine ounces—i.e., 24 carats. Prices are given in New Zealand currency. | |||||
| Oz.* | £ | Oz.* | £ | £ s. | |
| 1932 | 729,146 | 1,019,814 | 166,354 | 974,734 | 6 9 |
| 1933 | 592,247 | 1,099,579 | 161,755 | 1,063,543 | 7 16 |
| 1934 | 542,863 | 1,195,840 | 160,248 | 1,158,607 | 8 12 |
| 1935 | 603,244 | 1,300,046 | 165,277 | 1,243,552 | 8 17 |
| 1936 | 597,548 | 1,272,587 | 164,575 | 1,233,178 | 8 15 |
It is to be noted that export duties on gold have been raised considerably in recent years (vide Section XD—Customs Tariff and Revenue).
The export of gold (New Zealand produce only) according to districts of production during the last two years, together with the total since April, 1857, when the first parcel was exported, is as shown in the next table. Quantities are in ounces of the fineness of 20 carats and upwards (actually they approach closely to a 24-carat standard; investigation in a fairly recent year gave an actual average of 23.5 carats). The figures comprise gold in the form of bar, dust, ingot, sheet, concentrates, ores, jewellers' sweepings, &c., or contained in or recovered from old jewellery.
| District. | 1935. | 1936. | Total, 1857–1936. | |||
|---|---|---|---|---|---|---|
| Quantity. | Value. | Quantity. | Value. | Quantity. | Value. | |
| Oz. | £ | Oz. | £ | Oz. | £ | |
| Auckland | 70,263 | 602,672 | 72,150 | 608,618 | 8,092,731 | 32,963,885 |
| Wellington | 188 | 706 | ||||
| Marlborough | 759 | 6,210 | 493 | 4,083 | 117,812 | 481,840 |
| Nelson | 6,452 | 54,038 | 7,590 | 62,864 | 1,772,627 | 7,138,808 |
| West Coast | 68,400 | 570,436 | 62,322 | 514,426 | 6,963,209 | 28,682,737 |
| Canterbury | 1 | 8 | 165 | 669 | ||
| Otago | 22,783 | 188,891 | 23,375 | 192,825 | 7,921,070 | 31,935,542 |
| Unknown | 2,625 | 19,585 | 2,143 | 15,840 | 68,957 | 370,393 |
| Totals | 171,283 | 1,441,790 | 168,073 | 1,398,656 | 24,936,759 | 101,574,580 |
With the departure of Britain from the gold standard in September, 1931, and the consequent depreciation of New Zealand currency in terms of gold, the resultant high prices ruling for gold induced a considerable export of old jewellery or metal obtained therefrom. The gold-content of this export in 1935 and 1936 amounted to 3,553 oz. and 2,218 oz. respectively, valued at £26,155 and £16,220. Of the 1936 total, some 1,377 oz. (1935, 2,057 oz.), valued at £9,903 (1935, £15,005), was classed as New Zealand produce, and is therefore included in the preceding table and also in the second table in this section.
The most important gold-mining operations in New Zealand consist in the working of quartz lodes and the extraction of the precious metals therefrom. Quartz-mining in the North Island is conducted mainly in Waihi Borough, whence was derived a great part (£526,083) of the gold exported during 1936, in the South Island quartz-mining operations are carried on principally in the Reefton and Blackwater districts and in Otago. In 1936, 526,661 oz. of bullion, valued at £732,869, was produced from quartz-mines. The average value per ton of ore treated during 1936 amounted to £2 15s. 7d., as compared with £2 18s. 8d. during 1935.
Alluvial gold, the production of which in 1936 was 33,618 oz., valued at £244,640, is found chiefly on the west coast of the South Island and in Otago, where mining operations have been conducted over a total area of 17,000 square miles. Although the production in 1936 was 3,516 oz. lower than in 1935, it was considerably higher than for many years prior to 1932. Activity in prospecting the auriferous alluvium of the West Coast and Otago is being maintained at a greatly enhanced level.
Gold-dredging possibilities present an entirely new aspect not only on account of the price of gold, but also on account of the great depths to which modern machines can work and their low cost of operation per cubic yard. The peak of gold-production from dredging occurred in 1902, when there were about two hundred plants in actual operation, and production probably totalled about 160,000 oz. per annum. Provided the price of gold remains as at present, it is not beyond the realms of possibility again to reach this figure. In 1936, 37,269 oz., valued at £295,078, was produced.
During 1934 a Mining Amendment Act was passed. Several sections of this Act are designed to assist development by increasing the maximum size of dredging claims, and so encouraging the introduction of the large amount of capital necessary to provide modern dredges. Further amendments to the same end were made in the Mining Amendment Act, 1935, and the Statute Amendment Act, 1936.
The number of productive dredges has increased from seven during 1933 to twenty-one by the end of 1936. Two powerful electrically driven dredges, one near Clyde and the other near Alexandra, on the Clutha River, Otago, were under construction in 1936, and commenced operations early in 1937. At Barrytown, near Greymouth, a 1,500-ton electrically driven all-steel dredge, also under construction in 1936, started dredging in May, 1937. Material has been ordered for four other dredges on the West Coast and for another dredge near Cromwell, Otago. Of the total dredge production of £295,078 in 1936, £271,799 was won by fifteen dredges on the West Coast, the largest producer of which was the Rimu Dredge with £97,488. Six dredges in Otago and Southland won gold to the value of £23,279.
The year witnessed greatly increased activity in dredging operations.
The following figures showing the world's gold-production for the last ten years have been compiled from official sources by the American Bureau of Metal Statistics:—
| Year. | Fine Ounces. |
|---|---|
| 1927 | 19,445,612 |
| 1928 | 19,583,153 |
| 1929 | 19,673,022 |
| 1930 | 20,721,981 |
| 1931 | 22,370,718 |
| 1932 | 24,305,683 |
| 1933 | 25,544,706 |
| 1934 | 27,701,242 |
| 1935 | 31,048,270 |
| 1936 | 35,283,135 |
Nearly the whole of the locally produced silver exported from New Zealand, amounting in value up to the end of 1936 to £3,457,947, has been obtained from the refinement of bullion from the quartz-mines, principally those of the Hauraki Goldfield, where gold and silver are found alloyed, the ratio of the two metals in the alloy varying greatly. No other silver-mining operations have been carried out profitably in this country. Estimated production during the last five years has been (fine ounces): 1932, 562,792; 1933,430,492; 1934,382,615; 1935,437,907; and 1936, 432,973.
The most extensive iron-ore deposits occur near Parapara and Onakaka, Golden Bay, in the Nelson Provincial District. The limonite deposit of this locality is of great extent, and it is estimated in “Iron-ore Resources of the World,” published by the International Geological Congress, to contain 64,000,000 metric tons, of which about 30,000,000 tons occur in the Onakaka Block.
In 1921 an iron and steel company constructed a blast-furnace installation on its lease at Onakaka, and, subsequently, a pipe-making plant. A considerable output of excellent quality was maintained for some years, but production ceased in 1931. The plant was re-opened for several months in 1933 and again in November, 1934. During 1934, 1,337 tons of pig iron were produced, and during the first five months of 1935, 4,902 tons. The works have been idle since the end of May, 1935. It is understood that there is a possibility of a large-scale rehabilitation at Onakaka in the near future.
A trial of the Onakaka pig iron carried out during 1931 yielded the exceptionally good test of 35,000 lb., British standard specification showing a test of 28,000 lb.
Several attempts have been made to smelt Taranaki ironsand, but the results have not been quite satisfactory, as the cost was too high.
During 1914 the Government, with a view to stimulating interest in this industry, passed an Act having for its object the payment of fairly large bonuses for the production in New Zealand of pig iron, puddled bar iron, and steel. The time within which these bounties were payable has now expired.
Scheelite, one of the principal ores of tungsten, was for a number of years mined on a fairly extensive scale in conjunction with gold, the principal gold-scheelite mines being those at or near Glenorchy, Paradise, Macrae's, Stoneburn, Hyde, and Barewood, Otago; and at Wakamarina Valley, Marlborough.
Exports which in 1910–19 averaged £26,000 annually fell to a low figure from 1920 onwards. There was no production for several years on account of the continued low values. Early in 1934, as the result of a substantial rise in the price of tungsten, production was resumed at both Glenorchy and Macrae's, and from a total of 513 tons of ore 39 tons of concentrates, valued at £4,678, were recovered in 1934; while in 1935, 496 tons of ore were mined, yielding 39 tons of concentrates, valued at £4,719. The value of scheelite produced in 1936 was £3,448. There is evidence of increased activity in scheelite-mining in 1937.
The total quantity of locally produced ore exported to 31st December, 1936, was 2,607 tons, valued at £330,113.
Ores of copper are found in New Zealand in no fewer than thirty-two localities, but the total recorded copper expert to the end of 1936 amounted in value to only £19,390. There has been no production for a considerable number of years. Prior to the inauguration of systematic records there was a considerable production from mines on Great Barrier and Kawau Islands.
Manganese-ore has been found at Otau, Wairoa, Bay of Islands, Purua Bay, Mangapai, Otonga, Waiheke Island, and Taieri Mouth, and has been mined at Tikiora, near the Bay of Islands, and at Waiheke Island. Fluctuating prices have prevented expansion of this industry, and there has been no production for some years. The total quantity of locally produced manganese-ore exported to the end of 1936 amounted to 19,387 tons, of a value of £62,011.
Cinnabar, the principal ore of mercury, is widely distributed in New Zealand. The most important accumulations are in North Auckland, where for some years efforts were made to place the production on a commercial basis. The deposits are large enough to make this a reasonable expectation. Since mercury-ore bodies are notoriously irregular in form, no reliable estimate of the amount available can be made on the present data.
At Ngawha Springs, North Auckland, production ceased in 1931 owing to difficulties in recovering the mercury and to the substantial fall in price.
A small treatment plant was erected near the New Zealand Quicksilver Mine at Puhipahi during 1934. Twenty-seven tons of cinnabar ore were treated in 1935, yielding 5 cwt. of mercury, valued at £132. No work was done during 1936.
The total quantity of quicksilver of New Zealand origin exported up to the 31st December, 1936, was 87,993 lb., valued at £19,024.
Cassiterite in the form of “stream-tin” occurs near Port Pegasus, Stewart Island, where it has been worked to some extent. “Lode-tin” has been found in the same locality. Small quantities of cassiterite have also been detected in the stream-gravels of the Reefton, Greymouth, and Westport districts. Among other localities in which traces of tin occur are Wet Jacket Arm (Otago) and Campbell Island.
In the published lists of minerals of New Zealand platinum is stated to occur in several places, associated generally with gold in gravel. It is only from Southland, however, that platinum has been exported.
The Customs Department has not kept any separate record of the quantity and value of platinum entered for exportation, the value of this metal exported being included in a general total of exports by parcel-post, by which means platinum has generally been despatched from the Dominion.
From Round Hill and Orepuki 29½ oz. of platinum, valued at £187, was recovered during 1936.
Native sulphur in sufficient quantity to be worked profitably occurs in the thermal districts of the North Island, near Rotorua and Lake Taupo, and at White Island.
Sulphur is mostly disposed of locally as fertilizer, but exports of New Zealand origin to the end of 1936 have aggregated £13,241. No work of any importance was done at any of the sulphur deposits during the past three years.
Active prospecting with the object of developing the extensive asbestos deposits near Takaka has been carried out by the Hume Pipe Co. (Aust.), Ltd.
Coal, varying in grade from anthracite to lignite, occurs in many parts of New Zealand. An estimate of the proved coal resources of New Zealand prepared in 1927 is as follows (millions of tons): Anthracite, very little; bituminous, 206; semi-bituminous, 60; brown, 247; lignite, 150: total, 663. The probable resources are estimated at 1,631,000,000 tons.
The following table summarizes coal-mining operations:—
| Year. | Output. (Tons.) | Persons employed above and below Ground. | Tons raised per Person employed Underground. | Lives lost. | ||
|---|---|---|---|---|---|---|
| Number. | Per Million Tons raised. | Per Thousand Persons employed. | ||||
| Prior to 1927 | 63,959,342 | 402 | 6.29 | |||
| 1927 | 2,366,740 | 5,374 | 593 | 10 | 4.23 | 1.86 |
| 1928 | 2,436,753 | 5,376 | 608 | 9 | 3.69 | 1.67 |
| 1929 | 2,535,864 | 5,497 | 614 | 12 | 4.73 | 2.18 |
| 1930 | 2,542,092 | 5,867 | 574 | 14 | 5.50 | 2.38 |
| 1931 | 2,157,756 | 5,745 | 498 | 4 | 1.85 | 0.69 |
| 1932 | 1,842,022 | 4,636 | 545 | 12 | 6.51 | 2.59 |
| 1933 | 1,821,258 | 4,386 | 570 | 7 | 3.84 | 1.59 |
| 1934 | 2,060,315 | 4,478 | 634 | 8 | 3.88 | 1.78 |
| 1935 | 2,115,184 | 4,231 | 681 | 2 | 0.94 | 0.47 |
| 1936 | 2,140,217 | 4,257 | 678 | 4 | 1.87 | 0.94 |
| Totals to date | 85,977,543 | 484 | 5.63 | |||
The output of the several classes of coal mined in each inspection district during 1936 is summarized as follows:—
| Class of Coal. | Northern (North Island). | West Coast (South Island). | Southern (South Island). | Totals. | Total Output to the End of 1936. |
|---|---|---|---|---|---|
| Tons. | Tons. | Tons. | Tons. | Tons. | |
| Bituminous and sub-bituminous | 62,094 | 796,763 | 858,857 | 49,836,586 | |
| Brown | 733,743 | 46,500 | 369,828 | 1,150,071 | 30,992,459 |
| Lignite | 1,307 | 129,982 | 131,289 | 5,148,498 | |
| Totals, 1936 | 795,837 | 844,570 | 499,810 | 2,140,217 | 85,977,543 |
| Totals, 1935 | 837,620 | 803,653 | 473,911 | 2,115,184 |
For the third year in succession a recovery in output is recorded, the 1936 total representing an increase of 17.5 per cent. above the 1933 figure. The 1936 output was produced from 195 mines, 94 of which were working on freehold lands and produced 964,149 tons, or 45 per cent.; the remaining 101 mines producing 1,176,068 tons, or 55 per cent., from Crown lands.
In recent years the better use of lower-grade coal in many plants has resulted in the displacement, to a certain extent, of the high-calorific-value coals. Cooperative mining continues to be successfully carried out in the Northern and West Coast districts.
To rehabilitate the industry new fields for coal-utilization must be found to offset the replacement of coal by hydro-electricity and fuel-oil, and a search for new avenues is in progress. The most promising avenue in prospect at the moment is the production of oil from coal by the hydrogenation process, and the Government is keeping thoroughly apprised of all latest developments. In the meantime the physical and chemical survey of the coal-resources of the Dominion has commenced.
During the year the carbonizing and briquetting plants at Sockburn and Rotowaro and the briquetting plant at Onehunga were in operation. At Rotowaro the plant operated for eight months during 1936, and production during that period was: Raw coal treated, 30,520 tons; coke produced, 14,988 tons; carbonettes produced, 17,072 tons; tar treated, 210,777 gallons; pitch made, 512 tons; oil produced (light oil, 68,438 gallons; heavy oil, 49,240 gallons), 117,678 gallons. At Onehunga the plant operated ten months during 1936 and produced 1,734 tons of briquettes; and at Sockburn a production of 2,300 tons of briquettes was obtained for the twelve months' operations. Results of briquetting experiments have been published in Bulletin No. 39, New Zealand Department of Scientific and Industrial Research.
In order to reduce the economic waste caused by unmarketable slack coal produced at mines, a Coal-mines Amendment Act was passed in October, 1935. The Minister of Mines is given authority to purchase and store slack, to acquire the necessary plant, &c., for its treatment, and to manufacture and sell any fuel or other products. The coal-owners in one district have installed screens of a smaller mesh than formerly in use, with the result that the waste of slack coal is considerably reduced.
The Coal-mines Act of 1901 provided for the acquisition and working of State coal-mines in New Zealand under the direct control of the Minister of Mines. At the present time two State collieries are in operation.
During 1936–37 the Liverpool Colliery produced 126,810 tons of marketable coal, an increase of 11,550 tons on the previous year's production. The James Colliery produced 39,044 tons of marketable coal during the year, an increase of 5,874 tons on the production for 1935–36.
The disposal, inclusive of stocks on hand at the beginning of the year, was as follows:—
| Supplied to | Tons. |
|---|---|
| Depots | 51,143 |
| Railways | 31,462 |
| Other Government Departments | 6,449 |
| Shipping companies | 8,876 |
| Gas companies | 63,200 |
| Other consumers | 6,754 |
| Total | 167,884 |
The total sales of State coal from the Liverpool mine for the year amounted to 128,290 tons, value £149,416, as compared with 116,215 tons, value £127,839, for 1935–36, an increase of 12,075 tons, value £21,577. The average price realized by the mine on the total sales for the year was £1 3s. 3.5d. per ton, an increase of 1s. 3.5d. on the previous year's average.
The total sales of State coal from the James Mine for the year amounted to 39,594 tons, value £46,817, giving an average of £1 3s. 7.7d. per ton, a decrease of 9.2d. on the previous year's average. As compared with 1935–36, there is an increase in quantity of 7,831 tons, with an increase in value of £8,051. The values for both mines include sales made c.i.f. and f.o.b. as well as f.o.r.
The sales of coal, &c., through the medium of the depots totalled 118,587 tons (value, £179,843), as against 105,601 tons (value, £158,648) for 1935–36. A net profit of £2,115 at the mines and a net profit at the depots, royalties, &c., of £12,443 made a total net profit of £14,558. The sum of £9,178 was transferred to Sinking Fund Account, leaving a balance of £5,380 in the Profit and Loss Account.
The average number of miners, &c., employed in and about the State collieries during the year ended 31st March, 1937, was 392.
The existence of two seams of excellent coal having been located by boring on the State Coal Reserve, near Greymouth, a commencement has been made to open up the new area to maintain the supply of household coal when the James Mine becomes exhausted.
Drilling for petroleum in recent years has been carried out in Taranaki, Hawke's Bay, Canterbury, Southland, and Westland. A considerable number of deep boreholes in search of petroleum have been drilled, the deepest being at Moturoa, near New Plymouth, which attained a depth of approximately 6,000 ft. Petroleum of good quality but in limited quantity has been proved, but up to the present time boring for petroleum in the Dominion has achieved only a small flow.
During the year a production of 157,891 gallons of oil was obtained from Moturoa Nos. 1, 2, and 4 wells at New Plymouth, while at Kotuku a total of 1,188 gallons was collected by Maoriland Oilfields, Ltd., from five shallow boreholes. The total production of crude petroleum to the 31st December, 1936, is estimated at 2,631,337 gallons.
Oil-prospecting operations throughout the Dominion have received very liberal financial assistance from the Government in the form of bonuses, subsidies, and loans.
A Bill dealing with the prospecting for and winning of petroleum is at present (November, 1937) before the House of Representatives.
Production of kauri-gum has decreased very substantially during the past decade. The industry suffered a severe setback through the restriction of European markets during the Great War; and, while some recovery was made in the five years immediately following the war, trade in this commodity has since fallen away.
A system of control of the trade in and export of kauri-gum was provided by the Kauri-gum Control Act, 1925. The Finance Act (No. 2), 1933, provided for the repeal of the Control Act. The property of the Kauri-gum Control Board was vested in the Crown, the Minister of Lands taking over the powers and obligations of the Board.
During 1936, 3,237 tons of kauri-gum, valued at £96,161, was exported, the total quantity of gum exported to the end of 1936 being 434,655 tons, valued at £23,362,163.
Production of kauri-gum can be gauged approximately by export figures or by the following figures showing kauri-gum received at Auckland from the gumfields: 1931–32, 3,004 tons; 1932–33, 2,229 tons; 1933–34, 2,804 tons; 1934–35, 2,858 tons; and 1935–36, 2,392 tons. The assets of the Kauri-gum Industry Account have been realized, and the account abolished by statute.
At Clarendon and Milburn, Otago, considerable deposits of phosphate rock were discovered in 1902 and actively worked up to 1924. A thin bed of phosphatic rock has been identified at Kaikoura and Amuri Bluff, in Marlborough. A similar bed occurs near Port Robinson. Phosphatic nodules are found in the Kaikorai Valley (near Dunedin), at Weka Pass (North Canterbury), and elsewhere. A limestone containing 10.6 per cent. of tricalcic phosphate occurs in the neighbourhood of Onewhero, Waikato district. Other districts where phosphatic material of good quality, though, so far as is known, not in commercial quantity, is found are Amberley, Dipton, Oamaru, Waimate, Wangapeka, Clarence Valley, Tutira Block (Mangaharuru Survey District, Hawke's Bay), and Whangarei.
The development of the New Zealand deposits has no doubt been retarded by the import of phosphate from Nauru Island, reference to which is made in Section XLVII of this volume.
The mineral nephrite, the “pounamu” of the Maori, a deep-green semi-transparent mineral with dark opaque patches, more popularly known as one of the varieties of “greenstone,” whenever observed in situ occurs as rounded segregations in talc or talc-serpentine rocks. These segregations vary up to 2 ft. or even more in lateral dimensions. As a rule they average less than 1 ft. in width. So far as is known, the mineral has been found in its original locus only in the Griffin Range, Turiwhate Survey District, North Westland.
New Zealand possesses a great variety of handsome and durable building-stones scattered throughout both Islands. In Auckland there are basalt, andesite, porphyrite, and quartz biotite-diorite, known in the building trade as Coromandel “granite,” a hard, coarsely crystalline rock, capable of taking a fine polish. In addition there are the Whangarei limestone and the Raglan stone, the former an excellent building-stone, the latter a good freestone. Taranaki has the hornblende andesites of New Plymouth and Mount Egmont, and Wellington the andesites of Ruapehu.
In Nelson there are the granite of Tata Island and Tonga Bay and the marble or crystalline limestones of the Pikiruna (Riwaka) Range. The Parliamentary Buildings at Wellington are constructed of this marble. West Nelson and Westland are well provided with granites and limestones of good quality, well adapted for building purposes; and in the Griffin Range, North Westland, there is found an abundance of finely coloured serpentine, unsurpassed as a decorative stone. Building-stone is scarce in Marlborough, but Canterbury is well supplied, having an abundance of Lyttelton Milestone (andesite) and Mount Somers stone, a limestone of exceptional quality. In Otago there is an abundance of excellent building-stone, ranging from the well-known Oamaru stone to the granite, gneiss, and limestones of Fiordland, all close to deep water. In Southland there are the so-called Ruapuke “granite,” the norite of the Bluff, and the granites of Stewart Island.
The following table relates to quarries under the Stone-quarries Act for the year 1936:—
| Provincial District. | Number of Working Quarries under the Act. | Number of Persons ordinarily employed. | Output of Stone. | ||||||
|---|---|---|---|---|---|---|---|---|---|
| Stone or Gravel for Macadamizing or Ballast. | Stone for Harbour-works. | Building or Monumental Stone. | Limestone for Agriculture. | Limestone for Cement or Mortar. | Miscellaneous. | Value at Quarry. | |||
| Tons. | Tons. | Tons. | Tons. | Tons. | Tons. | £ | |||
| Auckland | 257 | 1,198 | 637,551 | 5,000 | 15,619 | 92,296 | 165,675 | 33,700 | 181,433 |
| Hawke's Bay | 32 | 97 | 42,127 | 27,006 | 10,708 | ||||
| Taranaki | 11 | 56 | 13,041 | 4,148 | 1,856 | ||||
| Wellington | 34 | 153 | 86,362 | 9,852 | 4,639 | 9,326 | 13,000 | 33,979 | |
| Nelson | 21 | 127 | 23,722 | 7,450 | 7,796 | 38,298 | 33,939 | 15,887 | |
| Westland | |||||||||
| Marl borough | |||||||||
| Canterbury | 38 | 350 | 139,067 | 26,777 | 2,560 | 176,483 | 37,044 | 98,998 | |
| Otago | |||||||||
| Southland | |||||||||
| Totals, 1936 | 393 | 1,981 | 941,870 | 49,079 | 22,818 | 317,055 | 241,017 | 80,639 | 342,861 |
| Totals, 1935 | 358 | 2,002 | 985,446 | 70,357 | 26,166 | 288,559 | 182,944 | 55,920 | 2.89,274 |
The Stone-quarries Act, 1910, with amendments, applies to every place, not being a mine, in which persons work in quarrying stone and any part of which has a face more than 15 ft. deep, and also to any tunnel in the construction of which explosives are used. The Act, however, does not apply to any Government operations, or any road or railway cutting, or excavations for buildings.
The following table shows the number of persons employed in or about mines and stone-quarries during each of the last five years:—
| — | 1932. | 1933. | 1934. | 1935. | 1936. |
|---|---|---|---|---|---|
| Metalliferous mines | 3,652 | 6,221 | 6,552 | 6,750 | 5,189 |
| Coal-mines | 4,636 | 4,386 | 4,478 | 4,231 | 4,257 |
| Stone-quarries | 1,888 | 1,711 | 1,818 | 2,002 | 1,981 |
| Totals | 10,176 | 12,318 | 12,848 | 12,983 | 11,427 |
State aid to mining in this Dominion is given in several forms—viz., (1) Geological survey and bulletins; (2) financial aid to prospecting; (3) Government prospecting drills: (4) schools of mines; (5) subsidized roads to mining-fields.
Since the first discovery of coal and of precious metals in New Zealand the Government has employed skilled geologists, who have reported, after examination, on all the known mineral deposits.
During the 1936–37 field season geological mapping was carried out in three districts: Dannevirke, Reefton, and Waikaia. In the Dannevirke Subdivision inflammable gas has long been known, and unsuccessful bores for oil have been drilled. The present work will help to elucidate the structure and sequence of the thick and extensive younger rocks of the area. Other mineral resources in this geologically little-known district are the abundant deposits of limestone and bentonite. The officers of the Geological Survey were the first to recognize the presence of the latter, a swelling clay which has many uses in modern industry.
The Reefton vein-system is being mapped in greater detail than was done twenty years ago at the time of the former systematic survey. This re-study of an important goldfield is undertaken in the hope that the application of modern theories of lode-formation, aided by geophysical and other methods of prospecting, may lead to the discovery of other payable veins and of the faulted portions of veins already worked. The geologist in charge of the Reefton work spent much time in interpreting the geophysical data obtained, in advising on surface prospecting controlled by the Labour Department, and in examining the cores and sludge from a bore being drilled in search of the Progress Lode.
The gold-bearing river and terrace gravels, the sluicing and dredging of which have maintained the miners of the Waikaia and Waikaka for more than seventy years, are nearly exhausted. The older deep leads have been worked to some extent, but the rather complex faulting makes difficult not only their actual exploitation, but also the finding of unworked areas. The survey of the district was undertaken in an endeavour to explain the structure.
In addition to the systematic exploration of the subdivisions named, mapping of the coal-bearing area of the upper Blackburn, in the Westport district, was carried out. Large reserves of coal are popularly believed to exist in this area, but the work undertaken shows the amount of coal available to be disappointingly small. Some preliminary work was carried out in the Greymouth coalfield. This work is the beginning of a much more detailed estimation of the coal resource of New Zealand than has been attempted up to the present.
In connection with a land-utilization scheme for the Hastings-Napier district, several months were occupied in collecting and collating data concerning the abundant underground water resources. Mineral deposits in the Glenorchy and Bendigo districts in Otago, at Kotuku in North Westland, at Ohura in Taranaki, and elsewhere were reported on.
The Dominion Laboratory has, as in past years, carried out the testing and analyses of mineral samples and mine gases, and an investigation was also carried out on stone-dusts suitable for use in mines; prospectors' samples from all parts of the Dominion have been examined for gold and silver and occasionally for other metals (in one notable case, platinum, in the North Island).
As an aid towards the development of the mining industry the Government offers varied and liberal assistance to prospectors in the form of subsidies, expert and technical advice, use of plant, &c. Subject to the provisions of the Mining Act, the holder of a valid miner's right is entitled to prospect for gold or any other metal or mineral (except coal) on any Crown land. He may also obtain authority from the Governor-General to prospect on Native land, and he may also prospect on private land with the consent of the owner. Wardens in mining districts and Commissioners of Crown Lands in other districts may, with the consent of the Minister of Mines, grant prospecting licenses for coal.
During the year ended 31st March, 1937, a total of £4,915 was expended by the Mines Department in subsidies for prospecting (exclusive of £1,485 in connection with the prospecting schemes of the Employment Division of the Labour Department), and 135 persons were given employment thereby.
During the year the Labour Department (Employment Division) continued to assist men to prospect for gold, the net expenditure by the Department for subsidies, supervisors, purchase of equipment, &c., being £178,929, including £5,673 paid to mining companies and syndicates by way of subsidy.
Applications for subsidies made by companies and syndicates are thoroughly investigated by the Alines Department, and special reports furnished to the Labour Department to assist it in coming to decisions. In such cases the amount of the subsidies received is refundable before dividends can be paid. During the year an average of 1,873 men, excluding subsidized men employed by companies and syndicates, have received assistance. Towards the end of the year, the Labour Department, in collaboration with the Mines Department, made available the sum of £8,000, contributed equally by the two Departments, for the purpose of forming special prospecting parties to investigate the possibilities of areas in South Westland and for the investigation and development of the Reefton goldfields. During December the first two parties were organized and commenced operations in South Westland.
From the inception of the Labour Department's prospecting schemes to the 31st March, 1936, 27,717 oz. of gold, excluding gold obtained by subsidized companies and syndicates, was won by subsidized miners. For the twelve months ended 31st March, 1937, 7,600 oz. was obtained, making a total production of 35,317 oz.
Ten mining engineers and other technical officers, including two geologists in charge of the South Westland special prospecting parties, are employed in addition to sixty-five supervisors, and expert advice and assistance are always available to the men.
Prospecting-drills of various types suitable for the conditions existing in the Dominion are lent to bona fide prospectors. A monthly rental is charged for the plant, and the hirer is required to maintain it in good order and condition. Working-expenses are also paid by the hirer, including renewals, &c., and the loss on carbons.
The hirer is required to furnish to the Mines Department weekly reports of boring results.
Considerable use was made of the Government prospecting-drills during 1936, an aggregate of 23,416 ft. being drilled in 604 holes for thirteen parties.
For the education of prospectors and mining students six schools of mines are subsidized by the Government, in addition to the Otago University School of Mines. The schools of mines are situated at Thames, Waihi, Huntly, Westport, Reefton, and Runanga. Six scholarships, tenable for four years, are offered annually by the Mines Department.
The expenditure on these schools by the Government during the year ended the 31st March, 1937, was £4,035, as against £3,536 during the previous year.
The expenditure in the form of subsidies and direct grants upon roads on gold-fields during the year ended 31st March, 1937, amounted to £3,133, as compared with £1,052 during the previous year.
Another form of Government assistance to mining consists of the publication of several leaflets as a guide to the prospector. These leaflets may be obtained on application to the Mines Department, and deal with: (a) Description of fields which may be considered to warrant further examination for gold; (b) description of best ways of seeking for and saving gold; (c) brief summary of statutory procedure to be followed to obtain a right to prospect or mine for metals or minerals under the Mining Act; (d) notes on the taking of samples of mineral deposits and the valuation of mining prospects; (e) notes for drilling and a method of calculating gold value of alluvial deposits. A treatise entitled “Gold-mines of the Hauraki District,” written by Mr. J. F. Downey, M.I.M.M., formerly Inspector of Mines, Waihi, was published during 1935, and should prove of great value to all persons interested in mining in the Thames and Coromandel districts. The treatise is additional to the treatise by Mr. Downey entitled “Quartz Reefs of the West Coast Mining District, New Zealand,” published in 1928.
The Board of Examiners annually conducts examinations of candidates for certificates as first-class and second-class mine-managers, battery-superintendents, and dredgemasters under the Mining Act, and for certificates as first-class and second-class mine-managers and mine-surveyors under the Coal-mines Act. Examinations of candidates for certificates as underviewers and firemen and deputies under the Coal-mines Act are held periodically when necessary. No candidate is permitted to present himself for examination unless he holds an authority from the Secretary to the Board of Examiners. Sixty-one certificates were issued in 1936.
As required by the Coal-mines Act, 1925, the owner of every coal-mine contributes ½ d. per ton on all coal sold, for the relief of coal-miners who may be injured while working, and for the relief of families of coal-miners who may be killed or injured.
Under that Act the Miners' Sick and Accident Funds were as from the 1st April, 1926, abolished and incorporated in the Coal-miners' Relief Fund. All accident relief payments are now made from the Coal-miners' Relief Fund, which is administered by the Public Trustee with the assistance of local committees.
The income from the ½ d. per ton contribution was £4,373 during the twelve months ended 31st March, 1937, as compared with £4,151 during 1935–36, and interest earnings brought the total receipts to £5,219 and £5,023 for the respective years. The total expenditure for the year ended 31st March, 1937, amounted to £4,308 as against £3,881 for the previous year. The amount standing to the credit of the fund as at the 31st March, 1937, was £26,602, as against £25,625 twelve months earlier.
Table of Contents
IN the early days of colonization the development of the potential farming resources of the colony was the major aim of economic enterprise, while the elusive rewards of alluvial-gold mining provided the dominant motive of immigration between the “sixties” and “eighties” of last century. Nevertheless, the very remoteness of the colony rendered necessary the growth of manufacturing enterprises to cope with the needs of a rapidly increasing population, and the earliest statistical records contain evidence of the growing importance of such industries as clothing and boot manufacturing, grain-milling, and printing. Again, the extractive industries, such as sawmilling and flax-milling, were of considerable importance oven in the earliest days of settlement. In addition to providing for local needs, the sawmilling industry rapidly grew into a major export industry, a lively timber trade with Australia developing. Flax-milling also became an export industry of some importance, while it is also of interest to record that untreated flax, spars, and whale-oil were the earliest exports—many years before permanent settlement by whites took place.
With the growth of sheep-raising the fellmongery and wool-scouring industry became a major manufacture, and by the “eighties” this industry was exceeded only by sawmilling in respect of the value of factory output, while another milestone in the history of the Dominion's factory production was the shipment, in 1882, of the first cargo of frozen meat to the United Kingdom. The advent of refrigeration at once widened the scope of farming enterprise, and, at the same time, occasioned a rapid development of factory production, in that industries devoted to processing farm products became of prime importance. The output of meat-freezing works increased from £543,878 in 1885 to £4,928,545 in 1905, being first in order of importance among factory industries in the latter year. Butter and cheese factories (almost exclusively of co-operative ownership) became widely established in the dairying districts, the aggregate value of output of these factories increasing from £43,094 in 1885 to £2,581,639 in 1905. At this point it is of service to note that the value of processed farm products still accounts for a large proportion of the total factory output of the Dominion. In respect of “added value”—i.e., value created by factory processes—the “true” manufacturing industries are, of course, of considerably greater importance in the aggregate than the industries processing farm products.
The growth of industrial enterprise in the Dominion has been dominated to a large extent by the preponderant position of the farming industries. This is but natural, for industrial expansion is limited by the size of the available market. Whereas the Dominion's live-stock products can successfully compete in overseas markets, the purely factory industries find it difficult to compete with the products of large-scale enterprises established in the more densely populated countries, and are, consequently, dependent on a share in the local market in competition with imports. A factor of importance in this connection has been the progressive speeding-up of sea transport, which has favoured the export industries, and, at the same time, intensified overseas competition with industries manufacturing products for Dominion consumption.
Historical records contain ample evidence that the Legislature has been at all times cognizant of the importance of encouraging manufacturing enterprise. During the early days of colonization bounties were offered in many instances to aid the establishment of new industries, while, in the development of the tariff policy, due regard has been given to the protection of local manufactures. The immigration of experienced factory workers was an important phase of immigration policy during the long period when a lack of skilled labour hampered industrial development. Governmental interest in the furtherance of manufacturing has been also manifest in the appointment of Commissions to inquire into the possibilities of industrial expansion in general and in specific industries. Again, the activities of the Department of Industries and Commerce are intimately connected with the development of manufactures, while research into manufacturing processes and potentialities forms an important part of the functions of the Department of Scientific and Industrial Research. With the growth of economic nationalism abroad the necessity of planning industrial activity in such a manner as to achieve a more balanced economy has become increasingly apparent, and, to further this end, a Bureau of Industry was established early in 1936 under the aegis of the Minister of Industries and Commerce.
The Industrial Efficiency Act, passed in October, 1936, legally constitutes the Bureau of Industry and defines its functions, &c. The Act, which applies to all industries (not only manufacturing) contains provision for the registration and licensing of industries; while the bureau may prepare plans for the reorganization of industries, such plans to be submitted to the industries concerned for approval. Power is taken to issue regulations for the reorganization of any industry: but it is explicitly stated in the Act that such regulations will not be gazetted in respect of any industry, unless the Governor-General in Council is satisfied time the material proposals contained in the plan for reorganization or the regulations have been submitted to and approved by the majority of the firms, &c., concerned. Exceptions to this qualification may be made in respect of amending or revoking regulations if the Governor-General is of the opinion that such amendment or revocation is in the public interest. Under the State Advances Corporation Act, 1936, the Corporation is empowered inter alia to advance moneys from its funds for the promotion of industry; the Bureau of Industry is enjoined to co-operate with the State Advances Corporation in considering applications for loans for that purpose.
The following extract from the quarterly bulletin of the Department of Industries and Commerce indicates the progress of the activities of the Bureau up to 31st March, 1937:—
“A considerable amount of initial work has been done in tackling a task which is, undoubtedly, of great responsibility and magnitude. One of the most important functions of the Bureau in its work of organizing industries along efficient lines is that of acting as the licensing authority under the Act. Fourteen industries have already been gazetted, and these are the taking of fish in boats, export of fish, oyster-dredging, manufacture of dry cells, asbestos cement products, rubber tires, electric ranges, motor-spirit pumps, cement, rennet, and phosphatic fertilizers, importation and/or wholesale and retail distribution of motor-spirit, and retail pharmacy establishments. These industries were so gazetted in order that, through licensing in terms of the Act, greater efficiency could be secured to the benefit of the consuming public and to those engaged in the industry concerned. In this connection the Bureau has finalized the method of procedure to be adopted in considering applications for licenses, and, accordingly, is taking the necessary steps in regard to each licensed industry and the applications which have been received. Many decisions have now been given in regard to the granting of licenses or otherwise.
“In addition to endeavouring to obtain greater efficiency in industry through the exercise of its licensing powers, the Bureau, with the same object in view, has given consideration to the formulation of plans for the reorganization or rehabilitation of various industries.
“One of the most important industries which has received such consideration is the flax industry. The Bureau prepared a tentative plan of re-organization. When this plan was first placed before those engaged in the industry, it was evident that although a plan of rehabilitation was desired it was necessary to reconcile many individual interests. The Bureau therefore arranged for the setting-up of a national representative Committee which has held discussions with a special Committee of the Bureau. It is anticipated that a detailed plan will be evolved which will be acceptable to all interests in the industry and to the Government.
“The pharmacy industry is another in which considerable progress towards finalization of an industrial plan has been made which will be submitted to those engaged therein as soon as possible.
“On the recommendation of the Bureau an intensive investigation is at present being made into all phases of the fishing industry by the Fisheries Investigation Commission, which is now taking evidence and making inspections of conditions in different parts of the Dominion.
“The Bureau has also made certain proposals in regard to the kauri-gum industry, which, if the investigations now being made prove satisfactory, may give a brighter future to those engaged in the industry.
“A further duty of the Bureau is to promote new industries, and a number of proposals are now before it. The practice adopted by the Bureau in dealing with the proposals is to appoint a committee of one or more members of the Bureau itself, and the committee works in close collaboration with experts in various Government Departments. These committees hear evidence, and gather all data in connection with the proposals and collate it into a comprehensive report for the Bureau. In connection with these proposed new industries, in view of the short time the Bureau has been established, inquiries have not, in general, reached the stage where any public pronouncement can yet be made.”
Statistics of factory production were collected in New Zealand from 1867 to 1910 in conjunction with the population census; and, commencing with the year 1918–19, the collection became an annual one. An analysis of the statistics for recent years, with a brief summary covering the period 1910–11 to 1935–36, is given in the following pages. More complete statistics will be found in the annual Statistical Report on Factory and Building Production. An account of legislation affecting wages and working conditions of factory employees is included in the section of this Year-Book entitled “Labour Laws and Allied Legislation,” while a further section deals with the subject of accidents in factories. In addition to the data contained in the following pages on the subject of employment in factories, an analysis of monthly data as to factory employment is included in the special section on “Employment and Unemployment.”
It should be noted that in New Zealand the production year does not coincide with the calendar year. In the case of many factory industries a March year is used as the basis of accounting, &c., while in other instances the production year fits more closely to a June year.
In the calculation of “value of products,” the rule is that values at the factory are taken, although prior to 1933–34 an exception existed in the case of dairy-produce exported, in which case gross receipts were included. In all figures shown in this issue of the Year-Book, and in the 1936 and 1937 issues, values of products are on a “factory-door” basis, adjustments having been made to the figures shown for back years.
A study of the statistics of factory production, particularly those for recent years, will reveal that the establishment of new industries and the growth of relatively new industries have been arresting characteristics of the pattern of factory-production activity in recent years. The growth of the motor-assembling and allied industries has been an outstanding example, while, more recently, notable advances have been made in a number of industries—e.g., hosiery-manufacture, radio-assembling, confectionery-making, tobacco-manufacturing, and cigarette-making. These developments have increased the occupational range of factory employment, while assisting materially in the substantial recovery of the factory industries from the effects of the depression period. It has become quite evident that the expansion of our industries is no longer limited to those lines where ready access to raw materials is the deciding factor, and that local manufactures are now catering for the Dominion's needs in many products which were formerly almost exclusively imported.
Evidence is also provided by recent statistics that the vast supplies of hydroelectric power now available are being used in industry to an increasing extent, the reticulation of the Dominion (now almost completed) offering a ready solution of one of the major problems of industrial expansion—the provision of ample supplies of cheap power.
Under the regulations authorizing the collection of statistics of factory production a “factory” is defined as an establishment engaged in the manufacture, repair, or preparation of articles for wholesale or retail trade or for export, which employs at least two hands or uses motive power, with the exception of the following, which are expressly excluded: Bakeries, butcheries, laundries, smithies, waterworks, shops engaged in retail trade only, and farmers or others using motive power for their own individual and private use. The following are, however, required to furnish returns even though employing less than two hands and not using motive power: Tanneries; bacon, butter, cheese, soap, or candle factories; brickyards; and limeworks.
The definition is fairly comprehensive, and includes such industries as, for instance, jewellery and watch repairing and boot, shoe, and saddlery repairing. Small establishments thus engaged were at one time included in the statistics, but they are now excluded unless they are also engaged in actual manufacture and have at least two persons engaged or use motive power.
Other classes of establishments formerly covered by the statistics but excluded from 1921–22 onwards are those engaged in dressmaking and millinery (unless manufacturing wholesale for sale in retail shops), bespoke tailoring, and establishments engaged in tea blending and packing, bottling liquor, stone quarrying and crushing, asphalting, or monumental masonry. The latter industries were excluded to bring the statistics into line with those of other British countries. In addition, returns are not required from plumbers or from builders who make joinery for their own building contracts. Builders are, however, required to furnish annual returns of building and construction, which are dealt with in the next section.
It should be noted that factory-production statistics do not cover, and do not purport to cover, all establishments registered as factories in the Dominion. “One man” businesses are excluded with the exception of tanneries, bacon, butter, cheese, soap, or candle factories, brickyards, or lime-works; some small repair-shops (as explained previously) are excluded even though they may employ two or more hands. The effect of these limitations in the scope of the statistical inquiry is seen from the fact that while for the year 1935–36 16,434 factories, employing 102,275 hands, were registered under the Factories Act, only 5,536 factories (with, however, 86,588 persons engaged) were covered by the statistics of factory production.
The statistics in the table following illustrate the growth of New Zealand's factory production to its present standing:—
| Year. | Number of Establishments. | Persons engaged. | Salaries and Wages paid. | Cost of Materials. | “Other Expenses” (i.e., Expenses of Operation other than Salaries and Wages and Cost of Materials). | Value of Output. | Added Value. |
|---|---|---|---|---|---|---|---|
* Productive employees only. † Not available. | |||||||
| £ | £ | £ | £ | £ | |||
| 1910–11 | 3,483 | 45,924* | 4,786,698* | 18,782,929 | † | 29,317,023 | 10,534,094 |
| 1915–16 | 3,755 | 48,744* | 5,791,704* | 30,197,784 | † | 43,034,033 | 12,836,249 |
| 1920–21 | 4,022 | 69,681 | 13,172,996 | 52,933,494 | † | 77,828,013 | 24,894,519 |
| 1924–25 | 4,538 | 77,183 | 14,945,975 | 51,337,115 | † | 82,479,378 | 31,142,263 |
| 1925–26 | 4,794 | 78,708 | 16,153,822 | 51,668,100 | 8,395,921 | 82,358,851 | 30,690,751 |
| 1926–27 | 5,078 | 78,613 | 16,255,177 | 49,344,442 | 8,646,779 | 80,334,601 | 30,990,159 |
| 1927–28 | 5,156 | 78,620 | 16,053,210 | 54,558,167 | 8,792,721 | 85,059,799 | 30,501,632 |
| 1928–29 | 5,126 | 80,618 | 16,291,212 | 59,136,552 | 9,330,051 | 90,478,232 | 31,341,680 |
| 1929–30 | 5,168 | 82,861 | 16,846,286 | 58,484,245 | 9,954,861 | 90,757,981 | 32,273,736 |
| 1930–31 | 5,194 | 77,914 | 15,617,052 | 48,458,356 | 9,388,626 | 77,745,249 | 29,286,893 |
| 1931–32 | 4,969 | 68,697 | 12,642,935 | 42,343,078 | 8,392,587 | 66,588,744 | 24,245,666 |
| 1932–33 | 4,993 | 68,921 | 12,048,148 | 42,600,490 | 8,222,595 | 66,109,455 | 23,508,965 |
| 1933–34 | 5,028 | 72,651 | 12,106,500 | 46,919,193 | 8,257,261 | 71,770,872 | 24,851,679 |
| 1934–35 | 5,270 | 79,358 | 13,244,373 | 52,084,741 | 9,002,456 | 79,324,473 | 27,239,732 |
| 1935–36 | 5,536 | 86,588 | 14,844,367 | 59,940,393 | 9,606,824 | 90,014,748 | 30,074,355 |
The year 1929–30 saw factory production reach a very high level when 82,861 persons were engaged in industries, the salaries and wages paid amounting to almost £17,000,000, while the value created by factory processes was slightly less than £32,500,000. Severe decreases were recorded during the period 1930–31 to 1932–33—a reflection of world-wide depression in industry and trade. The number of persons engaged in factories in the latter year was 68,921 (approximately fourteen thousand less than in 1929–30), while salaries and wages had declined by £4,800,000 and added value by £8,700,000 from the levels recorded in 1929–30. The partial recovery indicated by the 1933–34 figures was followed by further evidence of improving industrial conditions in 1934–35. The statistics for the year 1935–36 indicate the complete emergence of the factory industries of the Dominion from the depressed conditions that obtained in 1931–32 and 1932–33. Establishments reporting operations in 1934–35 numbered 5,536—the highest yet recorded—representing an increase of 266 over 1934–35. The number of persons engaged, 86,588, constituted a new recorded high level for employment, and represents an increase of 7,230 over the total for 1934–35 and 3,727 more than the previous peak recorded in 1929–30 (82,861). Salaries and wages paid advanced by £1,600,000 over the previous year. The figure for materials used (£59,940,393) is the highest yet registered, while the value of products (£90,014,748) has been eclipsed only in two former years—1928–29 and 1929–30.
In making use of the following summary by provincial districts for the year 1935–36 it is necessary to keep in mind the differences in size and population of the respective provincial districts (vide section on “Population”).
| Provincial District. | Number of Establishments. | Persons engaged. | Salaries and Wages paid. | Cost of Materials. | Other Expenses of Operation. | Value of Output. | Added Value. |
|---|---|---|---|---|---|---|---|
| £ | £ | £ | £ | £ | |||
| Auckland | 1,801 | 29,883 | 5,062,873 | 24,322,457 | 3,519,217 | 34,849,367 | 10,526,910 |
| Hawke's Bay | 267 | 2,928 | 541,975 | 2,979,819 | 404,628 | 4,129,020 | 1,149,201 |
| Taranaki | 309 | 2,720 | 542,923 | 4,839,155 | 376,144 | 5,834,272 | 995,117 |
| Wellington | 1,182 | 20,114 | 3,412,560 | 11,752,852 | 1,994,794 | 18,620,947 | 6,868,095 |
| Marlborough | 75 | 460 | 74,374 | 318,193 | 49,536 | 448,545 | 130,352 |
| Nelson | 177 | 1,478 | 250,087 | 748,494 | 176,374 | 1,280,223 | 531,729 |
| Westland | 110 | 1,722 | 334,515 | 261,403 | 266,690 | 927,235 | 665,832 |
| Canterbury | 803 | 13,623 | 2,293,191 | 7,870,608 | 1,394,486 | 12,375,185 | 4,504,577 |
| Otago | 526 | 10,428 | 1,716,214 | 4,236,910 | 1,016,009 | 7,647,579 | 3,410,669 |
| Southland | 286 | 3,232 | 615,655 | 2,610,502 | 408,946 | 3,902,375 | 1,291,873 |
| Totals | 5,536 | 86,588 | 14,844,367 | 59,940,393 | 9,606,824 | 90,014,748 | 30,074,355 |
It will be observed that the Auckland Provincial District, the largest in population and area, shows the highest figures for factory production. It may be noted that this district produces more than half of the total dairy output of the Dominion. Wellington Provincial District comes second in factory production, Auckland and Wellington combined contributing more than 50 per cent. of the Dominion's total. Their combined population also represents more than half of the Dominion total.
The number of establishments reporting operations in 1935–36 was 5,536 (the highest yet recorded), representing an increase of 266 over that for the previous year (5,270). The industries contributing chiefly to this increase were—Coach-building and motor engineering, 73; clothing, 28; furniture, 23; joinery, 15; printing and publishing, 11; sawmilling, 10.
The following table shows the average (monthly) number of wage-earners and of total persons engaged in each class of industry and the number of establishments operating for the year 1935–36:—
| Class of Industry. | Number of Establishments. | Wage-earning Employees. | Total Persons engaged. | ||
|---|---|---|---|---|---|
| M. | F. | M. | F. | ||
| Animal food | 570 | 9,743 | 231 | 11,678 | 616 |
| Vegetable food | 147 | 2,068 | 1,784 | 2,575 | 1,968 |
| Drinks, narcotics, and stimulants | 275 | 1,464 | 584 | 2,037 | 733 |
| Animal matters (not otherwise classed) | 71 | 736 | 118 | 907 | 159 |
| Working in wood | 620 | 7,399 | 24 | 8,451 | 120 |
| Vegetable produce for fodder | 15 | 34 | 48 | 3 | |
| Paper manufactures | 23 | 252 | 322 | 327 | 356 |
| Heat, light, and power | 145 | 3,292 | 22 | 4,417 | 372 |
| Processes relating to stone, clay, glass, &c. | 259 | 2,162 | 4 | 2,598 | 68 |
| Metals other than gold or silver | 470 | 5,266 | 230 | 6,278 | 471 |
| Precious metals | 39 | 144 | 3 | 186 | 17 |
| Books and publications | 384 | 4,601 | 1,253 | 6,039 | 1,688 |
| Ornaments and minor art products | 45 | 127 | 19 | 162 | 28 |
| Designs, medals, type, and dies | 20 | 127 | 3 | 169 | 11 |
| Machines, tools, and implements | 168 | 1,193 | 159 | 1,480 | 228 |
| Carriages and vehicles | 1,150 | 5,077 | 26 | 6,396 | 335 |
| Harness, saddlery, and leather-ware | 154 | 1,079 | 211 | 1,341 | 248 |
| Ships, boats, and their equipment | 57 | 610 | 263 | 742 | 298 |
| House-furnishings | 332 | 1,776 | 248 | 2,188 | 330 |
| Chemicals and by-products | 93 | 1,012 | 301 | 1,334 | 400 |
| Textile fabrics | 17 | 991 | 1,584 | 1,119 | 1,611 |
| Apparel | 466 | 2,784 | 10,453 | 3,651 | 10,973 |
| Fibrous materials | 43 | 744 | 180 | 826 | 192 |
| Miscellaneous | 33 | 200 | 135 | 248 | 166 |
| Totals | 5,536 | 52,881 | 18,157 | 65,197 | 21,391 |
The distribution of the sexes among the persons engaged shows a considerable preponderance of males. The number of females per hundred males in each of the five years ending 1935–36 has been: 30, 31, 31, 33, and 33.
In the smaller districts there are few industries employing female labour to any great extent; but the male preponderance is considerably smaller in the four main districts, where female labour is in greater demand. In Otago the excess of males is less than in any other district, due to the comparative importance of its woollen-milling industry.
The following figures show that in 1935–36 for every ten wage-earners there was one proprietor (actively engaged), manager, or overseer.
| Group. | 1934–35. | 1935–36. | ||
|---|---|---|---|---|
| Number of Persons. | Per Cent. of Total. | Number of Persons. | Per Cent. of Total. | |
| Proprietors actively engaged | 2,389 | 3.0 | 2,475 | 2.9 |
| Managers, overseers, &c. | 4,564 | 5.8 | 4,846 | 5.6 |
| Accountants, clerks, &c. | 7,738 | 9.7 | 8,229 | 9.5 |
| Wage-earning employees | 64,667 | 81.5 | 71,038 | 82.0 |
| Totals | 79,358 | 100.0 | 86,588 | 100.0 |
An interesting classification of the establishments, according to the number of persons engaged, for the years 1924–25, 1920–30, and 1933–34 to 1935–36 is—
| Year. | 10 or under. | 11–20. | 21–50. | 51–100. | Over 100. | Totals. |
|---|---|---|---|---|---|---|
| Number of Factories. | ||||||
| 1924–25 | 2,972 | 720 | 570 | 155 | 121 | 4,538 |
| 1929–30 | 3,473 | 800 | 591 | 164 | 137 | 5,168 |
| 1933–34 | 3,637 | 679 | 461 | 126 | 125 | 5,028 |
| 1934–35 | 3,725 | 764 | 496 | 143 | 142 | 5,270 |
| 1935–36 | 3,836 | 790 | 583 | 169 | 158 | 5,536 |
| Number of Employees. | ||||||
| 1924–25 | 12,658 | 10,690 | 18,067 | 11,094 | 24,674 | 77,183 |
| 1929–30 | 15,474 | 11,785 | 17,977 | 11,658 | 25,967 | 82,861 |
| 1933–34 | 14,423 | 9,971 | 13,892 | 8,757 | 25,608 | 72,651 |
| 1934–35 | 14,901 | 11,321 | 15,309 | 9,716 | 28,111 | 79,358 |
| 1935–36 | 15,554 | 11,600 | 17,624 | 11,428 | 30,382 | 86,588 |
The very small establishments have more than held their own during the period, while there is definite evidence of a swing-over from the moderately-sized group of establishments to the largest-sized group. Taken as a whole, the figures do not afford evidence of any marked change in the average size of the industrial unit. The advance in the smallest-sized group may be attributed largely to the growth of the motor industry and the consequent establishment of small repairing concerns throughout the Dominion.
The figures relating to the amounts paid as salaries and wages include amounts paid as bonuses and overtime. Figures illustrative of the rise in the aggregate amount paid in salaries and wages will be found in the first table of this section.
The amounts received by male and female employees, and the average amount received per employee of each sex, as recorded in the last five collections, are set out below:—
| Year. | Males. | Females. | Both Sexes. | |||
|---|---|---|---|---|---|---|
| Total. | Average. | Total. | Average. | Total. | Average. | |
| £ | £ | £ | £ | £ | £ | |
| 1931–32 | 11,194,608 | 212 | 1,448,327 | 92 | 12,642,935 | 184 |
| 1932–33 | 10,588,745 | 202 | 1,459,403 | 89 | 12,048,148 | 175 |
| 1933–34 | 10,611,161 | 192 | 1,495,339 | 86 | 12,106,500 | 167 |
| 1934–35 | 11,602,983 | 194 | 1,641,390 | 84 | 13,244,373 | 167 |
| 1935–36 | 13,046,105 | 200 | 1,798,262 | 84 | 14,844,367 | 171 |
Owing to the fact that employees who were engaged for part of the year only could not be excluded from the figures in computing the averages given above, and, further, as it was not practicable to take into consideration other factors which would disturb their accuracy, the averages shown cannot be regarded in other than a general way.
The table following shows the total salaries and wages paid in each class of industry during the year 1935–36.
| Class of Industry. | Males. | Females. |
|---|---|---|
| £ | £ | |
| Animal food | 2,528,006 | 56,001 |
| Vegetable food | 502,204 | 138,611 |
| Drinks, narcotics, and stimulants | 467,159 | 70,394 |
| Animal matters (not otherwise classed) | 190,228 | 13,032 |
| Working in wood | 1,546,339 | 11,431 |
| Vegetable produce for fodder | 7,052 | 372 |
| Paper manufactures | 70,878 | 27,847 |
| Heat, light, and power | 1,096,764 | 46,444 |
| Processes relating to stone, clay, glass, &c. | 496,607 | 7,239 |
| Metals other than gold or silver | 1,108,225 | 35,290 |
| Precious metals | 37,636 | 1,612 |
| Books and publications | 1,403,341 | 172,366 |
| Ornaments and minor art products | 22,157 | 2,197 |
| Designs, medals, type, and dies | 35,315 | 742 |
| Machines, tools, and implements | 254,495 | 17,850 |
| Carriages and vehicles | 1,109,884 | 29,090 |
| Harness, saddlery, and leatherware | 240,064 | 20,270 |
| Ships, boats, and their equipment | 159,310 | 26,538 |
| House-furnishings | 381,803 | 29,385 |
| Chemicals and by-products | 297,576 | 36,899 |
| Textile fabrics | 229,690 | 143,577 |
| Apparel | 689,118 | 885,603 |
| Fibrous materials | 123,914 | 13,533 |
| Miscellaneous | 48,280 | 11,939 |
| Totals | 13,046,105 | 1,798,262 |
Special returns as to employees and wages in a selected week are collected each year. The period covered is the nearest normal week to 31st March, and the data collected include the number of employees engaged at each wage-rate, as well as the total employees and the total earnings during the specified week. Working proprietors, managers, overseers, accountants, and clerks do not come within the scope of the inquiry, which covers wage-earning employees only, and out-workers, if any. All productive employees are covered, irrespective of age or sex, and the figures are therefore inclusive of many young male and female workers receiving low wages. The inclusion of these workers has the effect of making the average earnings lower than would otherwise be the case, and this fact must not be overlooked when the figures are made use of.
| Year. | Total Wage-earning Employees. | Earnings during Specified Week. | ||||
|---|---|---|---|---|---|---|
| Total. | Average. | |||||
| Males. | Females. | Males. | Females. | Males. | Females. | |
| £ | £ | £ s. d. | £ s. d. | |||
| 1926 | 53,900 | 12,287 | 239,169 | 23,345 | 4 8 9 | 1 18 0 |
| 1927 | 53,412 | 12,807 | 236,445 | 24,439 | 4 8 7 | 1 18 2 |
| 1928 | 54,095 | 13,224 | 237,998 | 25,529 | 4 8 0 | 1 18 7 |
| 1929 | 54,651 | 13,696 | 244,543 | 27,051 | 4 9 6 | 1 19 6 |
| 1930 | 57,317 | 14,823 | 262,200 | 27,880 | 4 11 6 | 1 17 7 |
| 1931 | 48,416 | 12,776 | 208,633 | 22,944 | 4 6 2 | 1 15 11 |
| 1932 | 42,291 | 13,143 | 162,695 | 22,812 | 3 17 0 | 1 14 9 |
| 1933 | 43,621 | 13,659 | 160,655 | 22,705 | 3 13 8 | 1 13 3 |
| 1934 | 46,305 | 15,184 | 163,303 | 24,265 | 3 10 6 | 1 12 0 |
| 1935 | 51,804 | 17,204 | 183,770 | 26,958 | 3 10 11 | 1 11 4 |
| 1936 | 57,637 | 19,070 | 217,403 | 30,605 | 3 15 5 | 1 12 1 |
Due attention should also be paid to the fact that, although every endeavour is made to choose comparable weeks each year, certain factors may disturb the comparability of the figures from year to year. An unduly late or early season, abnormally wet weather, &c., would conceivably operate to affect the usefulness of either the number of employees or their earnings as indexes of the volume of employment. In using the average earnings it should be borne in mind that these have been computed from the amount earned during the specified week, and are, of course, affected by overtime and short time.
In the table following a summary showing the number of employees within the various wage-groups is given for the specified weeks covered by the returns in 1926 and 1936:—
| Weekly Rate of Wages. | Males. | Females. | ||
|---|---|---|---|---|
| 1926. | 1936. | 1926. | 1936. | |
| Under 20s. | 1,370 | 3,696 | 1,239 | 4,870 |
| 20s. and under 25s. | 1,749 | 2,201 | 1,265 | 2,157 |
| 25s. and under 30s. | 1,211 | 1,625 | 1,283 | 1,694 |
| 30s. and under 35s. | 1,544 | 1,691 | 1,284 | 1,892 |
| 35s and under 40s. | 985 | 1,035 | 1,061 | 1,257 |
| 40s. and under 45s. | 925 | 1,306 | 1,303 | 3,831 |
| 45s. and under 50s. | 773 | 966 | 2,235 | 1,733 |
| 50s. and under 55s. | 661 | 1,011 | 970 | 788 |
| 55s. and under 60s. | 405 | 661 | 708 | 366 |
| 60s. and under 65s. | 746 | 1,594 | 418 | 230 |
| 65s. and under 70s. | 587 | 1,725 | 198 | 70 |
| 70s. and under 75s. | 821 | 3,651 | 113 | 46 |
| 75s. and under 80s. | 1,913 | 3,833 | 47 | 32 |
| 80s. and under 85s. | 4,342 | 7,185 | 57 | 43 |
| 85s. and under 90s. | 6,054 | 6,912 | 25 | 8 |
| 90s. and under 95s. | 4,542 | 6,386 | 24 | 17 |
| 95s. and under 100s. | 6,011 | 3,517 | 14 | 4 |
| 100s. and under 105s. | 5,057 | 2,961 | 27 | 16 |
| 105s. and under 110s. | 3,397 | 1,356 | 3 | 3 |
| 110s. and under 115s. | 3,027 | 1,211 | 4 | 2 |
| 115s. and under 120s. | 1,134 | 722 | 1 | |
| 120s. and under 130s. | 3,350 | 1,204 | 4 | 5 |
| 130s. and under 140s. | 1,046 | 505 | 3 | 3 |
| 140s. and under 160s. | 1,452 | 442 | 2 | |
| 160s. and over | 798 | 241 | 1 | 1 |
| Totals | 53,900 | 57,637 | 12,287 | 19,070 |
Some noteworthy changes in the distribution of wages have occurred during the last decade. The average weekly wage-rate paid to males has fallen from £4 8s. 9d. in 1926 to £3 15s. 5d. in 1936, while that for females has declined from £1 18s. 0d. to £1 12s. 1d. Another aspect is the largo number of wage-earners employed at under £1 per week in 1936 as compared with the number in 1926. Male wage-earners receiving under £1 in 1936 comprised 6.4 per cent. of the total, while the number in 1926 was 2.5 per cent. The corresponding figures for females were 25.5 per cent. and 10 1 per cent. In 1926 75 per cent. of the total male wage-earners received a weekly wage-rate of £4 and over, but in 1936 only 57 per cent. came within this class.
A supply of cheap motive power is essential for industrial development. New Zealand industries have in the past been somewhat handicapped in this respect, long railway hauls and, in some instances, sea-carriage being involved in the transport of coal from the mines to the factories. The difficulties in the way of obtaining a plentiful supply of cheap motive power have been met by the development of hydro-electric schemes, for which New Zealand is topographically well suited. The State has in recent years developed this phase of the Dominion's resources, and in doing so has provided a margin of power for attracting special industries depending on a supply of cheap motive power, as well as meeting present demands.
The following table shows the numbers and aggregate horse-power of each class of engine used in factories for the years 1921–22, 1926–27, and the last three years:—
| Class of Engine. | 1921–22. | 1926–27. | 1933–34. | 1934–35. | 1935–36. | |
|---|---|---|---|---|---|---|
| Steam | No. | 2,266 | 2,024 | 1,603 | 1,632 | 1,577 |
| H.P. | 101,083 | 134,285 | 132,788 | 144,931 | 142,227 | |
| Coal-gas | No. | 519 | 297 | 104 | 95 | 90 |
| H.P. | 10,295 | 6,858 | 3,079 | 3,215 | 3,755 | |
| Suction gas | No. | 237 | 159 | 80 | 78 | 77 |
| H.P. | 14,181 | 9,455 | 5,173 | 4,937 | 5,142 | |
| Oil | No. | 389 | 321 | 411 | 491 | 478 |
| H.P. | 5,466 | 9,894 | 30,165 | 31,185 | 33,119 | |
| Electric | No. | 5,235 | 11,324 | 17,838 | 19,296 | 21,022 |
| H.P. | 49,571 | 102,816 | 144,584 | 150,437 | 159,869 | |
| Water | No. | 222 | 269 | 241 | 245 | 224 |
| H.P. | 39,104 | 145,431 | 329,758 | 386,518 | 389,055 | |
| Totals | No. | 8,868 | 14,394 | 20,277 | 21,837 | 23,468 |
| H.P. | 219,700 | 408,739 | 645,547 | 721,223 | 733,167 | |
It should be borne in mind that the figures relating to the horse-power represent the indicated horse-power of the engine installed. This may be, and probably is, in many cases quite a different thing from the actual horse-power used. Attention is also directed to the fact that the statistics include the horsepower of turbines, pelton wheels, and other engines used in the generation of electric current. A rapid advance in the electric-supply industry since 1921–22 is indicated by the figures given above for the horse-power of water-engines. Concomitantly with this development of the electric-supply industry, the number and aggregate horse-power of electric motors in factories showed substantial upward movements during the years under review.
| Class of Industry. | 1930–31. | 1935–36. | ||
|---|---|---|---|---|
| Number of Engines. | Horsepower. | Number of Engines. | Horsepower. | |
| Animal food | 4,030 | 66,387 | 4,686 | 69,417 |
| Vegetable food | 887 | 12,143 | 1,132 | 13,498 |
| Drinks, narcotics, and stimulants | 959 | 6,078 | 1,216 | 8,037 |
| Animal matters (not otherwise classed) | 226 | 2,633 | 281 | 3,357 |
| Working in wood | 2,230 | 38,942 | 2,669 | 42,351 |
| Vegetable produce for fodder | 28 | 490 | 33 | 478 |
| Paper manufactures | 94 | 3,904 | 163 | 3,607 |
| Heat, light, and power | 202 | 309,050 | 206 | 497,025 |
| Processes relating to stone, clay, glass, &c. | 894 | 29,265 | 1,098 | 30,717 |
| Metals other than gold or silver | 1,481 | 12,214 | 2,031 | 13,582 |
| Precious metals | 55 | 77 | 67 | 77 |
| Books and publications | 2,143 | 9,388 | 2,511 | 10,082 |
| Ornaments and minor art products | 32 | 56 | 35 | 67 |
| Designs, medals, type, and dies | 67 | 136 | 67 | 126 |
| Machines, tools, and implements | 258 | 1,385 | 503 | 2,119 |
| Carriages and vehicles | 1,771 | 4,959 | 2,201 | 5,273 |
| Harness, saddlery, and leatherware | 353 | 3,012 | 464 | 3,407 |
| Ships, boats, and their equipment | 135 | 1,130 | 169 | 940 |
| House-furnishings | 898 | 4,617 | 1,077 | 4,772 |
| Chemicals and by-products | 538 | 5,865 | 787 | 8,023 |
| Textile fabrics | 221 | 5,724 | 313 | 6,168 |
| Apparel | 931 | 2,760 | 1,423 | 3,515 |
| Fibrous materials | 105 | 2,645 | 176 | 4,006 |
| Miscellaneous | 95 | 787 | 160 | 2,523 |
| Totals | 18,638 | 523,647 | 23,468 | 733,167 |
A drawback to the statistics arises through the lack of information relating to the actual or estimated period during which the engines or motors were in use. This is an important aspect of considerations affecting the quantitative measurement of the motive power in use.
During the year 1935–36 670,943 tons of coal were used in industries covered by the statistics of factory production, an increase of 21,735 tons, or 3 per cent., as compared with the previous year. Of this amount, 600,051 tons represented New Zealand coal, and the remainder (70,892 tons) imported coal.
Four industries utilized 74 per cent. of the total coal used for the year—namely, gas-making, 204,807 tons; butter, cheese, and condensed milk making, 136,116 tons; meat freezing and preserving, 84,465 tons; lime-crushing and cement-making, 70,441 tons.
The value of materials used or operated upon does not afford a very satisfactory basis of comparison as between one industry and another, for the reason that the changes wrought during the process of manufacture vary considerably in degree. For instance, materials used or operated upon in the tanning, fellmongering, and wool-scouring industry were in 1935–36 valued at £1,138,272, while those used in printing, publishing, and bookbinding were valued at £1,076,942. If, however, value of output is considered, it is found that the figure for printing and publishing (£4,040,114) is over £2,500,000 greater than that for tanning, &c. (£1,537,136).
Another point which should be noted is that wide variations exist in the extent of transformation undergone by materials in the factory process. As examples, it is pertinent to observe that the factory constituent in the value of animal foods is but small, whereas the aggregate cost of finished woollen materials is far in excess of the value of untreated wool.
The cost of materials used in the various classes of industries during the last five years is given in the table hereunder:—
| Class of Industry. | 1931–32. | 1932–33. | 1933–34. | 1934–35. | 1935–36. |
|---|---|---|---|---|---|
| £ | £ | £ | £ | £ | |
| Animal food | 23,912,268 | 23,920,191 | 27,201,435 | 30,516,777 | 36,349,442 |
| Vegetable food | 3,802,977 | 3,481,267 | 3,550,554 | 3,502,570 | 3,625,074 |
| Drinks, narcotics, and stimulants | 1,175,609 | 1,142,565 | 1,198,247 | 1,372,782 | 1,344,044 |
| Animal matters (not otherwise classed) | 384,748 | 382,684 | 395,504 | 509,334 | 705,083 |
| Working in wood | 1,053,535 | 1,023,159 | 1,138,587 | 1,247,701 | 1,708,980 |
| Vegetable produce for fodder | 74,130 | 40,130 | 32,552 | 49,620 | 54,473 |
| Paper manufactures | 174,514 | 174,864 | 196,158 | 187,806 | 214,224 |
| Heat, light, and power | 4,149,364 | 4,316,691 | 4,079,104 | 4,170,349 | 4,248,815 |
| Processes relating to stone, clay, glass, &c. | 258,538 | 199,595 | 255,015 | 313,641 | 407,094 |
| Metals other than gold or silver | 894,570 | 831,064 | 950,571 | 1,247,397 | 1,564,795 |
| Precious metals | 27,380 | 29,252 | 35,421 | 41,482 | 47,924 |
| Books and publications | 980,520 | 933,163 | 930,659 | 963,628 | 1,076,942 |
| Ornaments and minor art products | 24,920 | 20,857 | 19,732 | 26,289 | 30,884 |
| Designs, medals, type, and dies | 9,370 | 7,585 | 10,648 | 12,651 | 15,703 |
| Machines, tools, and Implements | 209,768 | 257,643 | 298,269 | 430,988 | 563,131 |
| Carriages and vehicles | 717,813 | 793,292 | 846,262 | 1,117,714 | 1,220,243 |
| Harness, saddlery, and leatherware | 608,901 | 728,791 | 1,212,859 | 1,124,375 | 1,293,637 |
| Ships, boats, and their equipment | 106,036 | 119,602 | 129,381 | 204,199 | 226,001 |
| House-furnishings | 408,292 | 325,548 | 328,378 | 445,665 | 575,647 |
| Chemicals and by-products | 1,060,004 | 1,283,220 | 1,228,126 | 1,295,689 | 1,349,593 |
| Textile fabrics | 285,217 | 352,572 | 407,707 | 499,159 | 452,741 |
| Apparel | 1,825,688 | 1,995,908 | 2,224,870 | 2,484,568 | 2,554,625 |
| Fibrous materials | 136,129 | 169,879 | 171,079 | 160,921 | 191,871 |
| Miscellaneous | 62,787 | 70,968 | 78,075 | 99,436 | 119,427 |
| Totals | 42,343,078 | 42,600,490 | 46,919,193 | 52,084,741 | 59,940,393 |
In considerations affecting the cost of materials used it should be remembered that the semi-primary industries (e.g., meat-freezing and butter and cheese making) account for a very large proportion of the total. In 1935–36, for example, the two industries mentioned accounted for £35,665,969 out of a total of £59,940,393 for cost of materials used. Constituting as they do well over 50 per cent. of the total cost of materials used in all industries, the figures for the semi-primary industries influence the total figures for any year. Indeed, a study of the total cost of materials over a number of years shows that frequent and wide oscillations in primary-produce prices are clearly reflected therein. Again, difficulty has been experienced in determining what actually constitutes materials in connection with the electric-supply industry. For the purpose of factory-production statistics the figure for materials in respect of this industry is deemed to be the total expenditure for the year, less salaries and wages met out of revenue from the sale of energy.
The value of products is calculated upon the current selling-price at the factory, and where goods are actually sold no difficulty is experienced. The stock on hand at the end of the year, however, presents some difficulties; but in such cases it is the practice to estimate the value, basing the estimation on the current selling-price at the factory.
In making use of the gross value of products it must be borne in mind that the figures include the value of raw materials operated upon, which constitutes more than half of the total value; in fact, the cost of materials used has represented no less than 64, 64, 65, 60, and 67 per cent. respectively of the value of the products in the last five years. Where the products of one industry—for example, sawmilling—are treated again in other industries, such as furniture-making, joinery, &c., it must be obvious that part of the value of timber shown as products of the former industry appears again as the materials of the latter industry and enters into the value of joinery and furniture made. Duplication of this kind is apparent in many industries.
The following table shows the gross value of products by classes of industries as recorded in the last five collections:—
| Class of Industry. | 1931–32. | 1932–33. | 1933–34. | 1934–35. | 1935–36. |
|---|---|---|---|---|---|
| £ | £ | £ | £ | £ | |
| Animal food | 29,085,636 | 29,259,659 | 32,757,524 | 35,894,094 | 41,876,431 |
| Vegetable food | 5,641,482 | 5,167,895 | 5,317,505 | 5,307,760 | 5,611,177 |
| Drinks, narcotics, and stimulants | 3,006,870 | 2,788,175 | 3,036,809 | 3,533,230 | 3,217,309 |
| Animal matters (not otherwise classed) | 836,962 | 827,093 | 868,657 | 1,060,040 | 1,271,636 |
| Working in wood | 2,715,715 | 2,689,981 | 3,034,568 | 3,695,762 | 4,651,038 |
| Vegetable produce for fodder | 101,428 | 62,806 | 48,393 | 69,823 | 73,394 |
| Paper manufactures | 375,371 | 384,906 | 414,515 | 436,098 | 450,234 |
| Heat, light, and power | 5,837,744 | 5,950,247 | 5,862,564 | 6,004,384 | 6,248,748 |
| Processes relating to stone, clay, glass, &c. | 1,208,530 | 959,127 | 1,145,871 | 1,319,579 | 1,691,959 |
| Metals other than gold or silver | 2,316,87 | 2,143,215 | 2,313,620 | 2,948,880 | 3,579,137 |
| Precious metals | 75,781 | 77,412 | 85,740 | 97,082 | 111,314 |
| Books and publications | 3,772,323 | 3,473,987 | 3,525,188 | 3,758,937 | 4,040,114 |
| Ornaments and minor art products | 62,108 | 51,984 | 47,846 | 56,704 | 66,435 |
| Designs, medals, type, and dies | 54,639 | 47,368 | 53,538 | 63,134 | 73,843 |
| Machines, tools, and implements | 454,557 | 523,417 | 607,393 | 816,760 | 1,110,187 |
| Carriages and vehicles | 2,016,683 | 1,895,253 | 1,963,497 | 2,570,963 | 3,222,626 |
| Harness, saddlery, and leatherware | 962,069 | 1,143,483 | 1,694,089 | 1,594,333 | 1,833,430 |
| Ships, boats, and their equipment | 307,181 | 326,908 | 334,051 | 439,678 | 485,363 |
| House-furnishings | 918,847 | 737,560 | 743,505 | 940,377 | 1,201,317 |
| Chemicals and by-products | 1,887,658 | 2,235,575 | 2,130,902 | 2,338,137 | 2,449,363 |
| Textile fabrics | 843,269 | 931,018 | 1,028,705 | 1,107,870 | 1,072,159 |
| Apparel | 3,729,362 | 3,975,576 | 4,279,614 | 4,721,677 | 4,963,245 |
| Fibrous materials | 249,460 | 304,930 | 319,558 | 328,881 | 444,998 |
| Miscellaneous | 128,192 | 151,880 | 157,220 | 214,290 | 269,291 |
| Totals | 66,588,744 | 66,109,455 | 71,770,872 | 79,324,473 | 90,014,748 |
As indicated under the heading of “Products,” the value of products is not always a satisfactory measure of either the absolute or the relative importance of a given industry, for the reason that only part of this value is actually created by the manufacturing processes carried on in the industry itself. In many cases by far the larger portion of the value of products represents the value of the materials used. From a manufacturing standpoint, therefore, the best measure of the importance of an industry is the value created by the manufacturing operations carried on within the industry. This value is obtained in New Zealand by deducting the cost of materials used from the gross value of the products, and is referred to as the “added value.” As the basis of the added value is the value of products, it is clear that it must be affected by fluctuations in values, and this fact should not be lost sight of when use is made of these figures.
The table given hereunder shows the added value by classes of industries for each of the last five years:—
| Class of Industry. | 1931–32. | 1932–33. | 1933–34. | 1934–35. | 1935–36. |
|---|---|---|---|---|---|
| £ | £ | £ | £ | £ | |
| Animal food | 5,173,368 | 5,339,468 | 5,556,089 | 5,377,317 | 5,526,989 |
| Vegetable food | 1,838,505 | 1,686,628 | 1,766,951 | 1,745,190 | 1,986,103 |
| Drinks, narcotics, and stimulants | 1,831,261 | 1,645,610 | 1,838,562 | 2,160,448 | 1,873,265 |
| Animal matters (not otherwise classed) | 452,214 | 444,409 | 473,153 | 550,706 | 566,553 |
| Working in wood | 1,662,180 | 1,666,822 | 1,895,981 | 2,448,061 | 2,942,058 |
| Vegetable produce for fodder | 27,298 | 22,676 | 15,841 | 20,203 | 18,921 |
| Paper manufactures | 200,857 | 210,042 | 218,357 | 248,292 | 236,010 |
| Heat, light, and power | 1,688,380 | 1,633,556 | 1,783,460 | 1,834,035 | 1,999,933 |
| Processes relating to stone, clay, glass, &c. | 949,992 | 759,532 | 890,856 | 1,005,938 | 1,284,865 |
| Metals other than gold or silver | 1,422,307 | 1,312,151 | 1,363,049 | 1,701,483 | 2,014,342 |
| Precious metals | 48,401 | 48,160 | 50,319 | 55,600 | 63,390 |
| Books and publications | 2,791,803 | 2,540,824 | 2,594,529 | 2,795,309 | 2,963,172 |
| Ornaments and minor art products | 37,188 | 31,127 | 28,114 | 30,415 | 35,551 |
| Designs, medals, type, and dies | 45,269 | 39,783 | 42,890 | 50,483 | 58,140 |
| Machines, tools, and implements | 244,789 | 265,774 | 309,124 | 385,772 | 547,056 |
| Carriages and vehicles | 1,298,870 | 1,101,961 | 1,117,235 | 1,453,249 | 2,002,383 |
| Harness, saddlery, and leatherware | 353,168 | 414,692 | 481,230 | 469,958 | 539,793 |
| Ships, boats, and their equipment | 201,145 | 207,306 | 204,670 | 235,479 | 259,362 |
| House-furnishings | 510,555 | 412,012 | 415,127 | 500,712 | 625,670 |
| Chemicals and by-products | 827,654 | 952,355 | 902,776 | 1,042,448 | 1,099,770 |
| Textile fabrics | 558,052 | 578,446 | 620,998 | 608,711 | 619,418 |
| Apparel | 1,903,674 | 1,979,668 | 2,054,744 | 2,237,109 | 2,408,620 |
| Fibrous materials | 113,331 | 135,051 | 148,479 | 167,960 | 253,127 |
| Miscellaneous | 65,405 | 80,912 | 79,145 | 114,854 | 149,864 |
| Totals | 24,245,666 | 23,508,965 | 24,851,679 | 27,239,732 | 30,074,355 |
The following table shows various percentages and rates that have been computed in connection with the added value for the last five years:—
| — | 1931–32. | 1932–33. | 1933–34. | 1934–35. | 1935–36. |
|---|---|---|---|---|---|
| £ | £ | £ | £ | £ | |
| Added value per head of mean population | 15.97 | 15.36 | 16.11 | 17.53 | 19.23 |
| Added value per person engaged | 352.94 | 341.10 | 342.07 | 343.25 | 347.33 |
| Added value per £100 expended on salaries and wages | 191.77 | 195.13 | 205.28 | 205.67 | 202.60 |
| Per Cent. | Per Cent. | Per Cent. | Per Cent. | Per Cent. | |
| Percentage of salaries and wages to added value | 52.15 | 51.25 | 48.72 | 48.62 | 49.36 |
| Percentage of added value to cost of materials used | 57.26 | 55.18 | 52.97 | 52.30 | 50.17 |
The next table is of interest as indicating the variations between the percentages which wages bear to added value in a selection of major industrial classes.
| Class of Industry. | 1930–31. | 1931–32. | 1932–33. | 1933–34. | 1934–35. | 1935–36. |
|---|---|---|---|---|---|---|
| Per Cent. | Per Cent. | Per Cent. | Per Cent. | Per Cent. | Per Cent. | |
| Animal food | 53.81 | 48.11 | 46.56 | 44.20 | 44.51 | 46.75 |
| Vegetable food | 35.19 | 34.35 | 37.09 | 35.36 | 33.82 | 32.26 |
| Drinks, narcotics, and stimulants | 31.39 | 27.62 | 30.22 | 26.00 | 23.87 | 28.70 |
| Animal matters (not otherwise classed) | 48.89 | 43.07 | 41.44 | 38.64 | 34.31 | 35.88 |
| Working in wood | 55.61 | 60.43 | 58.32 | 53.92 | 52.18 | 52.95 |
| Heat, light, and power | 62.93 | 63.17 | 61.64 | 57.54 | 57.74 | 57.16 |
| Books and publications | 54.07 | 56.37 | 56.98 | 55.66 | 54.14 | 53.18 |
| Machines, tools, and implements | 60.99 | 62.47 | 58.89 | 54.50 | 54.42 | 49.78 |
| Apparel | 67.33 | 66.43 | 64.85 | 64.22 | 65.71 | 65.38 |
| Fibrous materials | 52.67 | 52.05 | 54.24 | 54.33 | 55.87 | 54.30 |
Some notable variations in the percentages which wages bear to total added value are observed during the period covered. In some instances the percentage has remained remarkably constant, while in others considerable changes as compared with the 1930–31 percentages have taken place. Despite the restoration of wage-cuts in many industries in 1935–36 the percentages shown are in nearly all instances below the 1930–31 figures.
The table below shows the principal items comprised in the figure for expenses of operation other than salaries and wages and cost of materials for the last five years:—
| Item. | 1931–32. | 1932–33. | 1933–34. | 1934–35. | 1935–36. |
|---|---|---|---|---|---|
| £ | £ | £ | £ | £ | |
| Cost of coal | 544,346 | 471,661 | 486,074 | 509,362 | 572,229 |
| Cost of other fuel and power | 484,915 | 520,980 | 536,760 | 597,846 | 610,643 |
| Insurance | 249,608 | 238,276 | 210,865 | 244,497 | 263,897 |
| Depreciation | 1,296,526 | 1,331,015 | 1,345,238 | 1,433,709 | 1,494,919 |
| All other expenses | 5,817,192 | 5,660,663 | 5,678,324 | 6,217,042 | 6,665,136 |
| Totals | 8,392,587 | 8,222,595 | 8,257,261 | 9,002,456 | 9,606,824 |
It is necessary when attempting to gauge the success or otherwise of an industry to take into consideration the figure for “other” expenses. The operating costs of an industry are determined by adding together the salaries and wages, cost of materials used, and other expenses. This result, when contrasted with the value of the output of the industry, indicates either a surplus or a deficit. Total operating costs of factory production for the year 1935–36 amounted to £84,391,584 (salaries and wages, £14,844,367; cost of materials, £59,940,393; other expenses, £9,606,824), while value of output totalled £90,014,748, showing therefore a surplus of £5,623,164. This surplus represents 8.3 per cent. of the amount of capital invested in land, buildings, plant, and machinery.
The values of the fixed assets give some idea as to the permanency and stability of the manufacturing industries in New Zealand, and afford the means of judging to some extent the amount of capital that has been invested therein.
In connection with the statistics of fixed assets, it should be understood that the figures given are of necessity only approximate, the principal reason for this being that where one building houses two or more factories carrying on different industries, an apportionment has to be made between the industries, and this cannot be done with accuracy. Furthermore, in many instances fixed assets are stated at their book value, and this may be an understatement owing to appreciated site value, or an overstatement owing to insufficient allowance being made for depreciation, obsolescence, &c. Where premises occupied are rented or leased it is the practice to ascertain the annual rental value and to estimate the equivalent capital value.
The value of land, buildings, plant, and machinery may be taken as representing approximately the fixed capital, and a classification by classes of industries is therefore interesting, as indicating the amount of this capital invested in the various classes of industry. It is recognized that electric-supply undertakings and gasworks require heavy expenditure on plant and machinery, &c., and it is not surprising that the value of fixed assets employed in the industries coming under the “Heat, light, and power” class is much greater than that for any other class, notwithstanding that the added value in this case is relatively small. It is particularly interesting to note that while the added value in the “Animal food” class amounts to £5,526,989, as against £1,999,933, for heat, light, and power, the fixed capital in the latter case is £33,609,706, while in the former it is £8,781,492—approximately £25,000,000 less. The following table shows the value of land, buildings, plant, and machinery by classes of industries for the last five years available:—
| Class of Industry. | 1931–32. | 1932–33. | 1933–34. | 1934–35. | 1935–36. |
|---|---|---|---|---|---|
| £ | £ | £ | £ | £ | |
| Animal food | 8,740,866 | 8,844,981 | 8,629,093 | 8,616,511 | 8,781,492 |
| Vegetable food | 2,384,911 | 2,368,165 | 2,267,609 | 2,435,745 | 2,527,029 |
| Drinks, narcotics, and stimulants | 1,823,817 | 1,862,864 | 1,860,870 | 1,850,646 | 1,935,087 |
| Animal matters (not otherwise classed) | 535,967 | 517,248 | 528,283 | 484,194 | 495,732 |
| Working in wood | 2,457,975 | 2,396,023 | 2,243,043 | 2,255,792 | 2,353,147 |
| Vegetable produce for fodder | 76,195 | 74,733 | 69,060 | 70,578 | 37,240 |
| Paper manufactures | 288,715 | 270,184 | 283,907 | 298,028 | 318,099 |
| Heat, light, and power | 32,203,007 | 32,197,635 | 31,745,616 | 34,214,699 | 33,609,706 |
| Processes relating to stone, clay, glass, &c. | 2,007,131 | 1,951,844 | 1,802,619 | 1,800,319 | 1,793,078 |
| Metals other than gold or sliver | 2,433,938 | 2,507,229 | 2,410,305 | 2,429,455 | 2,241,034 |
| Precious metals | 99,280 | 97,026 | 90,903 | 92,908 | 93,899 |
| Books and publications | 3,867,008 | 3,842,479 | 3,792,591 | 3,611,252 | 3,595,720 |
| Ornaments and minor art products | 90,718 | 66,906 | 58,029 | 61,475 | 63,127 |
| Designs, medals, type, and dies | 73,201 | 65,686 | 67,467 | 67,295 | 68,821 |
| Machines, tools, and implements | 396,256 | 397,016 | 308,455 | 429,615 | 465,979 |
| Carriages and vehicles | 2,320,144 | 2,241,906 | 2,108,689 | 2,232,850 | 2,555,352 |
| Harness, saddlery, and leatherware | 441,679 | 437,748 | 442,810 | 473,721 | 483,928 |
| Ships, boats, and their equipment | 262,641 | 269,519 | 263,158 | 274,982 | 235,016 |
| House-furnishings | 816,070 | 712,532 | 657,832 | 659,814 | 675,796 |
| Chemicals and by-products | 1,604,766 | 1,723,790 | 1,682,742 | 1,619,049 | 1,634,913 |
| Textile fabrics | 827,420 | 813,301 | 856,095 | 827,976 | 827,629 |
| Apparel | 1,863,261 | 1,863,382 | 1,795,900 | 1,911,844 | 2,005,662 |
| Fibrous materials | 156,219 | 177,150 | 171,410 | 242,494 | 323,073 |
| Miscellaneous | 135,833 | 156,100 | 163,918 | 307,208 | 316,520 |
| Totals | 65,907,018 | 65,855,447 | 64,390,404 | 67,268,450 | 67,438,879 |
Successive substantial increases in the total value of land, buildings, plant, and machinery were a feature of the factory-production statistics until 1930–31. The following three years, 1931–32 to 1933–34. registered decreases, but a definite upward swing was recorded in 1934–35, when the value rose to £67,268,450, due chiefly to the expansion of the electric-supply industry by the opening of the Waitaki power scheme. The total for 1930–36 stands at £67,438,879—the highest figure yet recorded.
The relation between the value of (a) land and buildings, and (b) plant and machinery illustrates the tendency for the latter to increase at a proportionately faster rate than the former. In 1905–6 the proportions per cent. of land and buildings and of plant and machinery to the total fixed assets were 57 and 43 respectively, but these positions are now more than reversed, the percentages in 1935–36 being 36 and 64. Each collection since 1906 has shown a gradual and consistent decrease in the percentage of the value of land and buildings to the total fixed assets. The slight reversal to this tendency apparent in the figures for 1935–36 is unimportant, as it can be largely explained by the different basis (book value in place of capital value) adopted in the computation of the assets of gasworks in the latest collection. The table given hereunder shows the movement during the last five years:—
| Year. | Land and Buildings. | Plant and Machinery. | Total Amount. | ||
|---|---|---|---|---|---|
| Amount. | Per Cent. of Total. | Amount. | Per Cent. of Total. | ||
| £ | £ | £ | |||
| 1931–32 | 22,988,577 | 34.88 | 42,918,441 | 65.12 | 65,907,018 |
| 1932–33 | 22,909,677 | 34.79 | 42,915,770 | 65.21 | 65,855,447 |
| 1933–34 | 22,159,073 | 34.41 | 42,231,331 | 65.59 | 64,390,404 |
| 1934–35 | 23,159,573 | 34.43 | 44,108,877 | 65.57 | 67,268,450 |
| 1935–36 | 23,985,510 | 35.57 | 43,453,369 | 64.43 | 67,438,879 |
Although information as to the amount of capital invested in every factory has been collected for some years, the figures in this respect have been found to be unsatisfactory and have not been made use of. The chief factors militating against the collection of satisfactory information in this connection are the methods of accounting in use in many of the smaller establishments, and the difficulty of apportioning the capital where an establishment is only partly manufacturing. In the case of joint-stock companies the capital figures have been found to be reasonably accurate, and are shown in the following table. The figures in the second column relate to the number of companies, not the number of works.
| Year. | Number of Companies. | Subscribed Capital. | Paid-up Capital. | Percentage of Paid-up Capital to Total Capital. | Loan and Reserve Capital (excluding Bank Overdraft). | Percentage of Loan Capital to Total Capital. | Total Capital. | Paid-up Shares issued Vendors as Part of Purchase Consideration, included under heading “Paid-up Capital.” |
|---|---|---|---|---|---|---|---|---|
| Private Companies. | ||||||||
| £ | £ | £ | £ | £ | ||||
| 1931–32 | 1,452 | 13,676,981 | 12,669,244 | 82.08 | 2,765,616 | 17.92 | 15,434,860 | 2,029,841 |
| 1932–33 | 1,475 | 13,618,302 | 12,783,139 | 80.76 | 3,046,417 | 19.24 | 15,829,856 | 2,010,279 |
| 1933–34 | 1,504 | 13,339,437 | 12,481,897 | 81.23 | 2,883,666 | 18.77 | 15,365,563 | 1,638,559 |
| 1934–35 | 1,584 | 14,135,008 | 13,238,878 | 80.95 | 3,116,480 | 19.05 | 16,355,358 | 1,679,667 |
| 1935–36 | 1,700 | 14,551,380 | 13,715,659 | 80.83 | 3,252,319 | 19.17 | 16,967,978 | 1,674,878 |
| Public and Co-operative Companies. | ||||||||
| 1931–32 | 715 | 25,227,369 | 22,699,824 | 80.58 | 5,471,223 | 19.42 | 28,171,047 | 4,185,640 |
| 1932–33 | 717 | 26,107,748 | 23,660,339 | 80.83 | 5,611,456 | 19.17 | 29,271,795 | 4,145,908 |
| 1933–34 | 718 | 26,017,979 | 23,519,472 | 80.71 | 5,619,780 | 19.29 | 29,139,252 | 3,864,089 |
| 1934–35 | 710 | 24,928,931 | 22,170,229 | 79.56 | 5,694,913 | 20.44 | 27,865 142 | 4,128,644 |
| 1935–36 | 722 | 25,073,948 | 22,432,540 | 82.13 | 4,880,223 | 17.87 | 27,312,763 | 3,421,860 |
| Total (all Companies). | ||||||||
| 1931–32 | 2,167 | 38,904,350 | 35,369,068 | 81.11 | 8,236,839 | 18.89 | 43,605,907 | 6,215,481 |
| 1932–33 | 2,192 | 39,726,050 | 36,443,778 | 80.80 | 8,657,873 | 19.20 | 45,101,651 | 6,156,187 |
| 1933–34 | 2,222 | 39,357,416 | 36,001,369 | 80.89 | 8,503,446 | 19.11 | 44,504,815 | 5,502,648 |
| 1934–35 | 2,294 | 39,063,939 | 35,409,107 | 80.07 | 8,811,393 | 19.93 | 44,220,500 | 5,808 311 |
| 1935–36 | 2,422 | 39,625,328 | 36,148,199 | 81.63 | 8,132,542 | 18.37 | 44,280,741 | 5,096,738 |
In considering the figures given in regard to capital it must be borne in mind that the registered capital is taken in each case, except where the company may not be fully engaged in manufacture (in which case an apportionment is made), and that the capital necessarily includes capital invested in securities outside the company. This excess capital, as it may be called, is more likely to be found in public companies than in private companies, and has the effect of swelling the capital figure for public companies to some considerable extent, beyond the amount actually invested in the various factories.
Out of the 5,536 manufacturing establishments furnishing returns for the year 1935–36, 2,279 were shown to have been in operation prior to 1916, so that, excluding those cases where the date of establishment is unknown, 2,952 of the present establishments came into existence during the last twenty years, at an average rate over this period of 148 per annum. Some 1,384 date from the decade 1916–25; 776 from the quinquennium 1926–30; 088 from 1931–34; and 104 from 1935; while in 305 cases the date of establishment was not given.
New Zealand's industrial progress has been fairly rapid, but industry is as yet organized on a relatively small scale.
The law in the Dominion restricts the membership of a partnership to not more than 20 persons, a private company to not fewer than 2 or more than 25 persons, and a public company to not fewer than 7 persons. Co-operation in industry is characteristic of certain industries engaged in the preparation of primary produce for the market. The principal of these is the butter and cheese making industry. Municipal enterprises are confined mainly to public-utility industries—e.g., gasworks and the generation and distribution of electricity—while the State operates the chief central hydro-electric generating stations and the Government Printing Office.
Information as to the character of organization of the establishments engaged in factory production during 1935–36 is given in the following table.
| Character of Organization. | Number of Establishments. | Persons engaged. | Horsepower available. | Cost of Materials used or operated upon. | Value of Manufactures or Products. | Added Value. | |
|---|---|---|---|---|---|---|---|
| Total. | Per Establishment. | ||||||
| H.p. | £ | £ | £ | £ | |||
| Individual | 1,909 | 9,113 | 15,450 | 1,709,398 | 3,827,037 | 2,117,639 | 1,109 |
| Private firm or partnership | 671 | 4,402 | 9,688 | 768,119 | 1,869,563 | 1,101,444 | 1,641 |
| Public registered company | 501 | 25,720 | 105,964 | 16,753,021 | 27,688,386 | 10,935,365 | 21,827 |
| Private registered company | 1,856 | 39,264 | 88,502 | 16,525,519 | 28,978,462 | 12,452,943 | 6,710 |
| Municipal and General Government | 139 | 3,974 | 488,930 | 4,064,990 | 5,466,042 | 1,401,052 | 10,080 |
| Co-operative and miscellaneous | 460 | 4,115 | 24,633 | 20,119,346 | 22,185,258 | 2,065,912 | 4,491 |
| Totals | 5,536 | 86,588 | 733,167 | 59,940,393 | 90,014,748 | 30,074,355 | 5,433 |
As would be expected, the average size of establishments operated by public registered companies is larger than is the case for any other non-Governmental type of industrial organization, the added value per unit being more than three times as high as that for the next highest type (private registered companies). Private companies, however, hold a very high place, both numerically and in the share they contribute to the total added value created in New Zealand factories (41.41 per cent. in 1935–36, as compared with 36.36 per cent. in the case of public companies). Municipal and general governmental enterprises accounted for 4.66 per cent. of the total added value in 1935–36.
Examination of the statistics of added value over a series of years indicates that private companies have increased appreciably in relative importance, while that of the individual and partnership types of organization have declined, very little change being shown in the percentage of total added value attributable to the operations of public companies, or municipal and general government undertakings.
In the following tables a classification of industries according to the nature of the work carried on is presented. The principal objects of the classification are the segregation of those industries in close association with and dependence on the great primary industries of the Dominion, and the separation from other industries of those representing the provision of public utilities under monopoly conditions. The main basis of the classification is the relationship between the value of the material worked upon and the value of the finished product, as expressed in what is known for statistical purposes as the “added value.” In those industries which may for some purposes be regarded as extensions of the primary industries the raw material undergoes only slight changes in the factory or workshop, with the result that the “added value” created is relatively small. In the genuine manufacturing industries (e.g., boot and shoe manufacturing) the raw material is subjected to much more detailed and elaborate processes. The “added value” in these industries is therefore relatively high.
Group I comprises those industries engaged in the preparation of farm products for the market, with the resulting by-products. In this group the “added value” is relatively small in proportion to the value of the output. The specific industries falling under this category are: Meat freezing and preserving, ham and bacon curing, butter and cheese making, sausage-casing, fellmongering and wool-scouring, boiling-down and manure making.
Group II covers those industries which provide public utility services under monopoly conditions in so far as competition within the industry is concerned. It comprises gasworks and electricity generation and supply.
Group III consists of another portion of what are generally referred to as semi-primary industries. It covers industries arising from the utilization of natural resources. The added value in these industries is large in proportion to the value of output, and represents principally wages. The following industries come within this group: Fish-curing, sawmilling, lime-crushing, brick, tile, and pottery making, concrete-block and fibrous-plaster making, pumice-insulation making, and flax milling.
Group IV comprises all industries for which statistics are available and which do not come under the previous groups. It includes several industries, such as grain-milling, iron-smelting, &c., which may be considered to be on the border-lines of Group I or Group III, and also several industries, such as motor and cycle engineering and repairing, &c., where repair work rather than manufacture in the narrow sense of the term predominates. In general, the industries included in this group may be regarded as “genuine” manufacturing industries.
The following table shows the principal statistics for the various groups enumerated above for the years 1934–35 and 1935–36:—
| Group. | Persons engaged. | Salaries and Wages paid. | Materials used. | Other Expenses of Operation. | Products. | Added Value. | Land, Buildings, Plant, and Machinery. |
|---|---|---|---|---|---|---|---|
| 1934–35. | |||||||
| £ | £ | £ | £ | £ | £ | ||
| I | 12,730 | 2,557,906 | 31,459,836 | 2,373,177 | 37,213,253 | 5,753,417 | 8,921,964 |
| II | 4,637 | 1,058,884 | 4,170,349 | 409,426 | 6,004,384 | 1,834,035 | 34,214,699 |
| III | 8,523 | 1,477,768 | 1,147,420 | 1,269,030 | 4,225,557 | 3,078,137 | 3,649,326 |
| IV | 53,468 | 8,149,815 | 15,307,136 | 4,950,823 | 31,881,279 | 16,574,143 | 20,482,461 |
| Totals | 79,358 | 13,244,373 | 52,084,741 | 9,002,456 | 79,324,473 | 27,239,732 | 67,268,450 |
| 1935–36. | |||||||
| I | 13,175 | 2,748,360 | 37,559,333 | 2,338,570 | 43,512,567 | 5,953,234 | 9,078,347 |
| II | 4,789 | 1,143,208 | 4,248,815 | 384,890 | 6,248,748 | 1,999,933 | 33,609,706 |
| III | 9,965 | 1,823,952 | 1,570,068 | 1,512,911 | 5,340,289 | 3,770,221 | 3,774,949 |
| IV | 58,659 | 9,128,847 | 16,562,177 | 5,370,453 | 34,913,144 | 18,350,967 | 20,975,877 |
| Totals | 86,588 | 14,844,367 | 59,940,393 | 9,606,824 | 90,014,748 | 30,074,355 | 67,438,879 |
Comparisons of Group IV—i.e., “true” factory industries—for the years 1934–35 and 1935–36 reveal that persons engaged in 1935–36 increased by 5,191 in number, or by 9.7 per cent.; salaries and wages paid advanced by £979,032, or by 12.0 per cent,; while materials used rose by 8.2 per cent., value of products by 9.5 per cent., “added value” by 10.7 per cent. other expenses by 8.5 per cent., and value of land, buildings, machinery and plant by 2.4 per cent.
In the next table the principal statistics of factories coming within Group IV—i.e., the “true” manufacturing industries—are shown, classified according to the value of output.
| Factories with Value of Output as under. | Number of Persons engaged. | Value of Products. | Output per Person engaged. | |||||||
|---|---|---|---|---|---|---|---|---|---|---|
| 1934–35. | 1935–36. | 1934–35. | 1935–36. | 1934–35. | 1935–36. | |||||
| Number. | Per Cent. of Total. | Number. | Per Cent. of Total. | £ | Per Cent. of Total. | £ | Per Cent. of Total. | £ | £ | |
| £ | ||||||||||
| Under 500 | 924 | 1.73 | 818 | 1.39 | 191,512 | 0.60 | 177,922 | 0.51 | 207 | 218 |
| 500–099 | 1,663 | 3.11 | 1,606 | 2.74 | 492,227 | 1.54 | 496,320 | 1.42 | 296 | 309 |
| 1,000–2,499 | 4,737 | 8.86 | 4,949 | 8.44 | 1,647,004 | 5.17 | 1,811,345 | 5.19 | 348 | 366 |
| 2,500–4,999 | 5,282 | 9.88 | 5,730 | 9.77 | 2,127,182 | 6.67 | 2,305,350 | 6.60 | 403 | 402 |
| 5,000–9,999 | 6,211 | 11.62 | 6,634 | 11.31 | 2,753,558 | 8.64 | 3,080,193 | 8.82 | 443 | 464 |
| 10,000–14,999 | 3,830 | 7.16 | 4,695 | 8.00 | 1,980,364 | 6.22 | 2,349,630 | 6.73 | 517 | 500 |
| 15,000–19,999 | 3,059 | 5.72 | 3,176 | 5.41 | 1,625,154 | 5.10 | 1,628,985 | 4.67 | 531 | 513 |
| 20,000–19,999 | 9,939 | 18.59 | 11,367 | 19.38 | 5,835,704 | 18.30 | 6,614,263 | 18.94 | 587 | 582 |
| 50,000–99,999 | 7,287 | 13.63 | 8,538 | 14.56 | 4,668,216 | 14.64 | 5,571,302 | 15.96 | 641 | 653 |
| 00,000 and over | 10,536 | 19.70 | 11,146 | 19.00 | 10,560,358 | 33.12 | 10,877,834 | 31.16 | 1,002 | 976 |
| Total | 53,468 | 100.00 | 58,659 | 100.00 | 31,881,279 | 100.00 | 34,913,144 | 100.00 | 596 | 595 |
The position of the larger scale establishments in this group of industries is striking; in respect of both value of products and output per person engaged.
More detailed statistics of the foregoing groups are contained in the Statistical Report on Factory and Building Production, 1935–36.
The amount of overtime worked or short time recorded by industries gives a fairly good though not an infallible indication as to whether an industry has been busy or slack. Statistics in connection with these two phases of factory production have been collected for a number of years, and the tables presented hereunder throw some interesting light on one phase of industrial production during the last ten years.
Overtime needs no explanation, and as particulars of overtime are readily ascertainable from the records kept in the wages-books, the information may be accepted as of a reliable character. For statistical purposes short time is deemed to be time lost through machinery, tools, &c., being out of order, lack of materials, adverse market conditions, and other cognate causes. Time lost through holidays (annual, ordinary, or public holidays) and sickness is not counted as short time, Information as to how much short time is attributable to each cause is not available.
The following table summarizes overtime worked and short time recorded in factories in respect of wage-earning employees.
| Year. | Overtime. | Short Time. | ||||
|---|---|---|---|---|---|---|
| Males. | Females. | Totals. | Males. | Females. | Totals. | |
| Hours. | Hours. | Hours. | Hours. | Hours. | Hours. | |
| 1926–27 | 1,388,503 | 178,780 | 1,567,283 | 954,922 | 163,741 | 1,118,663 |
| 1927–28 | 1,472,869 | 187,429 | 1,660,298 | 1,456,049 | 154,942 | 1,610,991 |
| 1928–29 | 1,532,711 | 213,139 | 1,745,850 | 1,055,337 | 154,233 | 1,209,570 |
| 1929–30 | 1,621,910 | 243,409 | 1,865,319 | 909,063 | 192,897 | 1,101,960 |
| 1930–31 | 1,211,078 | 117,629 | 1,328,707 | 2,723,274 | 722,823 | 3,446,097 |
| 1931–32 | 933,700 | 176,558 | 1,110,258 | 3,789,056 | 1,209,927 | 4,998,983 |
| 1932–33 | 1,072,759 | 331,709 | 1,404,468 | 3,028,668 | 953,722 | 3,982,390 |
| 1933–34 | 1,135,648 | 364,076 | 1,499,724 | 2,597,954 | 747,796 | 3,345,750 |
| 1934–35 | 1,652,065 | 469,214 | 2,121,279 | 1,684,712 | 426,938 | 2,111,650 |
| 1935–36 | 2,035,032 | 654,615 | 2,689,647 | 1,497,132 | 427,565 | 1,924,697 |
Prior to the year 1930–31, the number of hours' overtime worked each year exceeded the number of hours short time recorded. The years 1930–31 to 1933–34 show the reverse, however, to be the case. The substantial fall in overtime registered for the years 1930–31 and 1931–32 was arrested in 1932–33 and 1933–34, and it is symptomatic of a substantial recovery that in 1934–35 and 1935–36 overtime worked exceeded short time recorded. It is interesting to note that 41 per cent. of the total overtime worked was contributed by three industries—the meat-freezing and preserving industry (401,620 hours), clothing (382,209 hours), and coachbuilding and motor engineering (317,441 hours). The meat-freezing and preserving industry also recorded the highest amount of short time (573,088 hours), followed by the sawmilling industry (305,126 hours). Marked seasonal fluctuations occur in the meat-freezing &c., industry, while the sawmilling industry is affected by adverse weather conditions.
The following table gives for overtime and short time the average number of hours per employee affected per week, and the average number of hours during the year for all employees whether or not working overtime or short time.
| Year. | Overtime. | Short Time. | ||||||
|---|---|---|---|---|---|---|---|---|
| Average Number of Hours per Employee affected per Week during which Overtime worked. | Average Number of Hours Overtime during Year for all Employees, whether working Overtime or not. | Average Number of Hours per Employee affected per Week during which Short Time recorded. | Average Number of Hours Short Time during Year for all Employees, whether working Short Time or not. | |||||
| M. | F. | M. | F. | M. | F. | M. | F. | |
| 1926–27 | 5.8 | 5.0 | 26.0 | 14.0 | 12.5 | 19.9 | 17.9 | 12.8 |
| 1927–28 | 6.5 | 6.2 | 27.2 | 14.2 | 11.7 | 16.7 | 26.9 | 11.7 |
| 1928–29 | 5.9 | 5.3 | 28.1 | 15.6 | 11.9 | 16.6 | 19.3 | 11.3 |
| 1929–30 | 5.5 | 5.7 | 28.3 | 16.4 | 12.5 | 15.1 | 15.9 | 13.0 |
| 1930–31 | 5.4 | 5.2 | 25.0 | 9.2 | 13.6 | 15.2 | 56.2 | 56.5 |
| 1931–32 | 5.8 | 7.1 | 22.1 | 13.4 | 15.0 | 14.8 | 89.6 | 92.1 |
| 1932–33 | 5.6 | 6.9 | 24.6 | 24.3 | 13.9 | 14.2 | 69.4 | 69.5 |
| 1933–34 | 5.9 | 6.3 | 24.5 | 24.0 | 13.7 | 13.1 | 56.1 | 49.2 |
| 1934–35 | 6.0 | 5.9 | 31.9 | 26.1 | 11.5 | 11.5 | 32.6 | 24.8 |
| 1935–36 | 5.7 | 5.8 | 35.3 | 34.3 | 10.8 | 9.2 | 26.0 | 22.4 |
The following table, showing an analysis of production costs in 1935–36, together with the value of products for each class of industry, is of interest. The figures are shown in units of £1,000.
| Class of Industry. | Production Costs | Value of Products. | Surplus.* | |||
|---|---|---|---|---|---|---|
| Salaries and Wages paid. | Cost of All Materials used. | Other Expenses of Operation. | Total. | |||
* I.e., Excess of value of products over production costs. | ||||||
| £(000) | £(000) | £ (000) | £(000) | £(000) | £(000) | |
| Animal food | 2,584 | 36,349 | 2,228 | 41,161 | 41,877 | 716 |
| Vegetable food | 641 | 3,625 | 675 | 4,941 | 5,611 | 670 |
| Drinks, narcotics, and stimulants | 538 | 1,344 | 665 | 2,547 | 3,217 | 670 |
| Animal matters (not otherwise classed) | 203 | 705 | 162 | 1,070 | 1,272 | 202 |
| Working in wood | 1,558 | 1,709 | 1,114 | 4,381 | 4,651 | 270 |
| Vegetable produce for fodder | 7 | 54 | 7 | 68 | 74 | 6 |
| Paper manufactures | 99 | 214 | 85 | 398 | 450 | 52 |
| Heat, light, and power | 1,143 | 4,249 | 385 | 5,777 | 6,249 | 472 |
| Processes relating to stone, clay, glass, &c. | 504 | 407 | 512 | 1,423 | 1,692 | 269 |
| Metals other than gold or silver | 1,144 | 1,565 | 580 | 3,289 | 3,579 | 290 |
| Precious metals | 39 | 48 | 13 | 100 | 111 | 11 |
| Books and publications | 1,576 | 1,077 | 982 | 3,635 | 4,040 | 405 |
| Ornaments and minor art products | 24 | 31 | 8 | 63 | 67 | 4 |
| Designs, medals, type, and dies | 36 | 16 | 16 | 68 | 74 | 6 |
| Machines, tools, and implements | 272 | 563 | 135 | 970 | 1,110 | 140 |
| Carriages and vehicles | 1,139 | 1,220 | 421 | 2,780 | 3,223 | 443 |
| Harness, saddlery, and leather-ware | 260 | 1,294 | 141 | 1,695 | 1,834 | 139 |
| Ships, boats, and their equipment | 186 | 226 | 48 | 460 | 485 | 25 |
| House-farnishings | 411 | 576 | 138 | 1,125 | 1,201 | 76 |
| Chemicals and by-products | 335 | 1,349 | 408 | 2,092 | 2,449 | 357 |
| Textile fabrics | 373 | 453 | 163 | 989 | 1,072 | 83 |
| Apparel | 1,575 | 2,555 | 560 | 4,690 | 4,963 | 273 |
| Fibrous materials | 137 | 192 | 105 | 434 | 445 | 11 |
| Miscellaneous | 60 | 119 | 56 | 235 | 269 | 34 |
| Totals | 14,844 | 59,940 | 9,607 | 84,391 | 90,015 | 5,624 |
Following are the results of a special compilation of statistics of prices of factory materials and products in twenty-one industries.
Statistics of prices have been regularly compiled by the Census and Statistics Department for many years past, various series of index numbers having been devised to indicate changes in prices from different aspects of the price mechanism. For example, the retail-prices index numbers deal with the subject of price changes from the consumers' aspect, the export prices indexes from the exporters' viewpoint, and so on. As opportunity has permitted, the field covered by the prices investigations of the Census and Statistics Department has been extended by the introduction of new series of index numbers, comparatively recent examples being the introduction (in 1933) of import-prices index numbers and (in 1935) of index numbers of producers' prices of farm-products.
Recent research in the direction of extending and improving documentation on the subject of price changes has included the compilation of index numbers of prices of commodities used in certain major New Zealand factory industries and of the products of such industries. The relationship between prices paid for materials and prices received for the products of factory industries is a matter of considerable moment; while the broader question of the relativity between changes in prices of factory products (and of materials) and changes in other significant price factors—e.g., retail prices, import prices, and export prices—is no less important. The data already extant—e.g., certain groupings of the wholesale-prices series—afford some indication of the impact of price movements on New Zealand factory industries, but only broad conclusions can be drawn therefrom, and there is a further need of differentiation according to individual industries of importance.
The index numbers contained in the following tables indicate the movements in the average prices of the principal material commodities bought by twenty-one New Zealand factory industries and in prices of the main products of these industries. The price quotations used in respect of materials represent the unit costs to the factories of commodities used in production, while the prices of products represent unit values at the factory door. Distribution charges are thus not included in the prices of products, the figures showing the relationship, from the factory-production point of view, of prices, of materials, and of products.
In the following table index numbers for each of the twenty-one industries are given:—
FACTORY PRODUCTION (TWENTY-ONE INDUSTRIES): INDEX NUMBERS OF PRICES OF THE PRINCIPAL MATERIALS USED.
| Industry. | Year. | ||||||
|---|---|---|---|---|---|---|---|
| 1925–20 to 1929–30. | 1930–31. | 1931–32. | 1932–33. | 1933–34. | 1934–35. | 1935–36. | |
| Meat freezing and preserving | 1,000 | 725 | 512 | 495 | 619 | 771 | 794 |
| Butter, cheese, and condensed - milk manufacture | 1,000 | 681 | 647 | 529 | 535 | 562 | 721 |
| Ham and bacon curing | 1,000 | 873 | 717 | 602 | 687 | 823 | 828 |
| Grain-milling | 1,000 | 957 | 863 | 771 | 735 | 726 | 735 |
| Biscuit and confectionery making | 1,000 | 874 | 895 | 974 | 1,013 | 986 | 1008 |
| Fruit-preserving and jam-making | 1,000 | 902 | 849 | 898 | 822 | 948 | 927 |
| Brewing and malting | 1,000 | 918 | 907 | 904 | 820 | 800 | 789 |
| Aerated - water and cordial manufacture | 1,000 | 855 | 953 | 964 | 1,075 | 1,061 | 1,051 |
| Ice-cream making | 1,000 | 800 | 919 | 692 | 598 | 608 | 601 |
| Sauce, pickle, and vinegar making | 1,000 | 929 | 887 | 966 | 1,133 | 1195 | 1,023 |
| Woollen-milling | 1,000 | 640 | 480 | 480 | 600 | 720 | 640 |
| Boot and shoe making | 1,000 | 940 | 758 | 732 | 786 | 808 | 816 |
| Hosiery-making | 1,000 | 860 | 702 | 667 | 754 | 789 | 772 |
| Clothing-manufacture | 1,000 | 892 | 828 | 813 | 725 | 725 | 688 |
| Soap and candle making | 1,000 | 806 | 689 | 695 | 718 | 719 | 819 |
| Coopering and case-making | 1,000 | 938 | 885 | 889 | 889 | 837 | 837 |
| Tanning | 1,000 | 703 | 515 | 413 | 509 | 522 | 526 |
| Fellmongering and wool-scouring | 1,000 | 497 | 299 | 302 | 583 | 484 | 599 |
| Sail, tent, and oilskin making | 1,000 | 920 | 782 | 802 | 816 | 877 | 917 |
| Chemical fertilizers refining | 1,000 | 956 | 1009 | 1,001 | 950 | 838 | 773 |
| Rope and twine making | 1,000 | 854 | 705 | 637 | 577 | 530 | 560 |
It was not practicable to include all factory industries within the ambit of this survey. In some instances the nature of the products precludes the measurement of unit values of products—for example, in industries where repair work constitutes a considerable proportion of total factory output. Again, in the extractive factory industries—e.g., bush sawmilling, lime-crushing, and cement-making, &c.—the royalty or price paid for materials in situ is but a small proportion of the cost delivered at the factory door. Labour costs and transportation account for the major part of the cost to the factory. Despite the exclusion of the types of industry indicated above, the twenty-one industries covered accounted for 44 per cent. of the value of factory products in 1935–36, 42 per cent. of the added value—i.e., value created by factory processes—and 65 per cent. of the total number of factory employees.
The index numbers are compiled on the base: average prices ruling during the five production-years 1925–26 to 1929–30 = 1000. [NOTE.—The production-year ends on varying dates for different industries, but may be taken in general as corresponding approximately to a March year.] In all forty-nine factory materials and sixty-eight factory products are covered by the index numbers, each price quotation used being an annual weighted average—that is, the total quantity used (or produced) during the year divided into the total cost (or value at the factory door). The weights used in combining the individual price quotations in the compilation of the index numbers represent average quantities used (or produced) during the five years 1925–26 to 1929–30.
Index numbers of prices of the principal products are shown in the next table:—
FACTORY PRODUCTION (TWENTY-ONE INDUSTRIES): INDEX NUMBERS OF PRICES OF PRINCIPAL PRODUCTS.
| Industry. | Year. | ||||||
|---|---|---|---|---|---|---|---|
| 1925–20 to 1929–30. | 1930–31. | 1931–32. | 1932–33. | 1933–34. | 1934–35. | 1935–36. | |
| Meat freezing and preserving | 1,000 | 730 | 579 | 570 | 708 | 783 | 815 |
| Butter, cheese, and condensed-milk manufacture | 1,000 | 686 | 678 | 547 | 547 | 571 | 716 |
| Ham and bacon curing | 1,000 | 989 | 851 | 806 | 841 | 912 | 940 |
| Grain-milling | 1,000 | 972 | 921 | 796 | 782 | 766 | 740 |
| Biscuit and confectionery making | 1,000 | 931 | 929 | 880 | 854 | 866 | 912 |
| Fruit-preserving and jam-making | 1,000 | 945 | 893 | 878 | 899 | 930 | 859 |
| Brewing and malting | 1,000 | 1,053 | 1,053 | 947 | 1,000 | 1,000 | 1,053 |
| Aerated - water and cordial manufacture | 1,000 | 968 | 968 | 968 | 935 | 935 | 935 |
| Ice-cream making | 1,000 | 1,063 | 1,013 | 949 | 899 | 899 | 810 |
| Sauce, pickle, and vinegar making | 1,000 | 1,045 | 1,016 | 986 | 953 | 861 | 836 |
| Woollen-milling | 1,000 | 969 | 783 | 730 | 788 | 789 | 779 |
| Boot and shoe making | 1,000 | 925 | 863 | 769 | 739 | 720 | 689 |
| Hosiery-making | 1,000 | 899 | 737 | 785 | 741 | 782 | 782 |
| Clothing-manufacture | 1,000 | 1099 | 969 | 846 | 917 | 989 | 994 |
| Soap and candle making | 1,000 | 901 | 874 | 835 | 874 | 924 | 983 |
| Coopering and case-making | 1,000 | 996 | 970 | 822 | 795 | 778 | 725 |
| Tanning | 1,000 | 744 | 570 | 602 | 615 | 658 | 637 |
| Fellmongering and wool-scouring | 1,000 | 482 | 358 | 350 | 636 | 475 | 648 |
| Sail, tent, and oilskin making | 1,000 | 749 | 712 | 730 | 851 | 758 | 846 |
| Chemical fertilizers refining | 1,000 | 1018 | 978 | 926 | 907 | 866 | 851 |
| Rope and twine making | 1,000 | 846 | 800 | 703 | 675 | 753 | 804 |
Comparison of the index numbers of prices of materials and of products brings out several points of interest. Generally speaking, the index numbers for both materials and products were in 1935–36 still materially below the 1926–30 levels. The index numbers of prices of materials in the biscuit and confectionery, aerated-water and cordial manufacturing, and sauce, pickle, and vinegar making industries exceeded that level, while, in respect of products, only the brewing and malting industry shows an index higher than the 1926–30 average. As would be expected, a close relationship exists between the index number for materials and products of the butter, cheese, and condensed-milk manufacturing industry; while a similarly close degree of relationship between the two series exists in the case of other industries processing primary products. In all these instances the factory process accounts for but a comparatively small proportion of the total value of products.
While the relationship between prices of materials and of products is an important aspect of the economy of a manufacturing industry, it is not to be inferred that this relationship, though an important one, forms the sole criterion of the relative prosperity of an industry. The volume of production is of course a vital factor in this connection, while, again, the relative importance of labour costs, overhead expenses, &c., varies considerably as between different industries.
In order to present a more compact picture of the changes in prices of factory materials and products, index numbers have been compiled for cognate groups of industries. In compiling the group index numbers each industry is accorded a weight corresponding to its relative importance as a factory industry.
GROUP TRICE INDEX NUMBERS: MATERIALS AND PRODUCTS.
| Industry. | Year. | ||||||
|---|---|---|---|---|---|---|---|
| 1925–26 to 1929–30. | 1930–31. | 1931–32. | 1932–33. | 1933–34. | 1934–35. | 1935–36. | |
| Meat freezing and butter and cheese— | |||||||
| Materials | 1,000 | 699 | 592 | 515 | 569 | 647 | 751 |
| Products | 1,000 | 704 | 637 | 557 | 614 | 660 | 757 |
| Other foods and drink (eight industries)— | |||||||
| Materials | 1,000 | 920 | 851 | 800 | 797 | 812 | 816 |
| Products | 1,000 | 989 | 917 | 855 | 871 | 896 | 893 |
| Clothing, boots, and woollens (four in-industries)— | |||||||
| Materials | 1,000 | 852 | 735 | 719 | 717 | 748 | 715 |
| Products | 1,000 | 1,031 | 895 | 803 | 850 | 890 | 886 |
| Other industries (seven industries)— | |||||||
| Materials | 1,000 | 726 | 614 | 600 | 708 | 640 | 680 |
| Products | 1,000 | 824 | 761 | 719 | 796 | 761 | 814 |
| Weighted average (twenty-one industries)— | |||||||
| Materials | 1,000 | 738 | 635 | 569 | 617 | 673 | 751 |
| Products | 1,000 | 787 | 713 | 638 | 691 | 725 | 794 |
It will be seen that though a substantial uplift has taken place in prices of both materials and products since the low point in 1932–33, the 1935–36 indexes were still materially below the 1925–26 to 1929–30 levels.
The weighted averaged combined index for the twenty - one industries is dominated to a large extent by the importance of the industries engaged in processing primary products, overseas price movements of butter, cheese, and meats being reflected in these figures. The above group indexes, and those quoted earlier for individual industries enable differentiation to be made between the relative movements in prices as between industries largely dependent on overseas markets and those catering solely for the local market. In this connection it will be noted that the indexes for the latter industries are, in general, the higher.
As indicated earlier, changes in the volume of production require to be taken into account in interpreting indexes of prices of materials and products. Indexes of volume of production have been compiled for the twenty-one industries included in this survey by relating the index numbers of prices of products to the values of production in these industries in the years covered. Following are the figures:—
FACTORY PRODUCTION (TWENTY-ONE INDUSTRIES): INDEX NUMBERS OF VOLUME OF PRODUCTION.
| Industry. | Year. | ||||||
|---|---|---|---|---|---|---|---|
| 1925–26 to 1929–30. | 1930–31. | 1931–32. | 1932–33. | 1933–34. | 1934–35. | 1935–36. | |
| Meat freezing and preserving | 1,000 | 1,175 | 1,254 | 1379 | 1,312 | 1,425 | 1,422 |
| Butter, cheese, and condensed-milk manufacture | 1,000 | 1,217 | 1,227 | 1,464 | 1580 | 1,536 | 1,574 |
| Ham and bacon curing | 1,000 | 881 | 820 | 799 | 824 | 809 | 896 |
| Grain-milling | 1,000 | 1,051 | 1,007 | 1,021 | 1,051 | 1,033 | 1,061 |
| Biscuit and confectionery making | 1,000 | 1,106 | 921 | 914 | 1,042 | 1,104 | 1194 |
| Fruit-preserving and jam-making | 1,000 | 1198 | 1,172 | 1083 | 980 | 1,113 | 1,440 |
| Brewing and malting | 1,000 | 864 | 725 | 692 | 663 | 795 | 891 |
| Aerated-water and cordial manufacture | 1,000 | 865 | 597 | 606 | 602 | 774 | 789 |
| Ice-cream making | 1,000 | 1109 | 930 | 983 | 887 | 1,461 | 1,651 |
| Sauce, pickle, and vinegar making | 1,000 | 902 | 853 | 835 | 857 | 1,034 | 1,202 |
| Woollen-milling | 1,000 | 806 | 891 | 1059 | 1079 | 1,157 | 1,125 |
| Boot and shoe making | 1,000 | 1049 | 994 | 1,137 | 1,223 | 1,301 | 1,406 |
| Hosiery-making | 1,000 | 1228 | 1368 | 1349 | 1,514 | 1,632 | 1,712 |
| Clothing-manufacture | 1,000 | 901 | 846 | 1080 | 1093 | 1,140 | 1184 |
| Soap and candle making | 1,000 | 1,000 | 957 | 1,053 | 1009 | 1092 | 1099 |
| Coopering and case-making | 1,000 | 1,252 | 1,131 | 1496 | 1,547 | 1,454 | 1728 |
| Tanning | 1,000 | 1,040 | 1,061 | 1168 | 1,223 | 1,204 | 1,311 |
| Fellmongering and wool-scouring | 1,000 | 753 | 818 | 1,020 | 1129 | 1,261 | 1,100 |
| Sail, tent, and oilskin making | 1,000 | 1008 | 881 | 1,127 | 1,254 | 1846 | 1840 |
| Chemical fertilizers refining | 1,000 | 905 | 863 | 1139 | 1098 | 1249 | 1,273 |
| Rope and twine making | 1,000 | 896 | 719 | 972 | 916 | 806 | 939 |
Some marked differences are observed as between the indexes of the volume of production for the different industries. The continuing increase in pastoral production is reflected in the substantial up-trend in the index numbers of volume of production for the meat freezing and butter and cheese manufacturing industries. In the former case a slight setback is recorded in 1933–34, which was a year of high wool values, while, again, for a portion of that year, killings of certain classes of stock were restricted temporarily owing to marketing difficulties. The volume of production of dairy-produce was affected by adverse weather conditions in 1934–35 causing a temporary check in the upward trend in butter and cheese manufacturing.
Severe decreases in production in several industries are indicated by the indexes for 1931–32 and 1932–33, the index numbers for aerated-water and cordial manufacturing falling to a particularly low level in 1931–32, while an almost equally low point was reached in respect of the volume of production in the brewing and malting industry in 1932–33. A substantial recovery has since been recorded in both industries; but, up to 1935–36, the 1926–30 level of production had not been regained in either instance. As would be expected, the index number for the ice-cream making industry shows marked fluctuations.
In the group of apparel industries relatively low figures were recorded in 1931–32; but, in 1932–33, a sharp increase in the volume of production took place, particularly in the clothing-manufacturing industry. It is noteworthy that over the whole period covered volume of hosiery-manufacture shows a steady year to year increase.
The 1935–36 indexes for seventeen of the twenty-one industries indicate a volume of production above the 1926–30 level—in some instances substantially so. Four of the twenty-one industries show indexes still below that level—ham and bacon curing, aerated-water and cordial manufacture, brewing and malting, and rope and twine making.
The fluctuations in the volume of production in the chemical fertilizers refining industry are of particular interest in view of the close connection this industry with the farming situation (see page 383 re subsidies). A low point was reached in 1931–32, followed by a sharp improvement in 1932–33, a recession in the next year, and, in the last two years, an increase, the 1935–36 index being almost 50 per cent. above the 1931–32 level.
The industries showing the highest volume of production in 1935–36 in relation to the 1926–30 level were—sail, tent, and oilskin making, and coopering and case-making. The high relative level of production in the first instance is attributable mainly to a recent growth in the manufacture in the Dominion of waterproof clothing, which is included in this industry. In the second instance (coopering and casemaking) increases in butter-box making, and the manufacture of cheese-crates are the principal factors causative of the relatively high level of production.
A grouping of the indexes of volume of production into the same groups as the prices index numbers quoted earlier follows:—
GROUP INDEX NUMBERS OF VOLUME OF PRODUCTION.
| Industry. | Year. | ||||||
|---|---|---|---|---|---|---|---|
| 1925–26 to 1920–30. | 1930–31. | 1931–32. | 1932–33. | 1933–34. | 1934–35. | 1935–36. | |
| Meat freezing and butter and cheese | 1,000 | 1,200 | 1,237 | 1,427 | 1,451 | 1480 | 1,507 |
| Other foods and drink (eight industries) | 1,000 | 989 | 914 | 884 | 893 | 929 | 1,015 |
| Clothing, boots, and woollens (four industries) | 1,000 | 919 | 909 | 1,101 | 1,124 | 1178 | 1,214 |
| Other industries (seven industries) | 1,000 | 890 | 834 | 1,047 | 1084 | 1148 | 1,161 |
| Weighted average (twenty -one industries) | 1,000 | 1099 | 1,101 | 1,245 | 1,271 | 1,316 | 1,364 |
The decline in production during the depression in groups of industries catering for the local market and the subsequent recovery is well brought out by the group indexes. While the twenty-one industries covered represent a wide cross-section of manufacturing activity in the Dominion, it was not possible for technical reasons to include, inter alia, two important industries—viz., engineering and bush sawmilling. Owing to the heterogenous nature of the products and the large proportion of repair work, it is not feasible to compile index numbers of the quantum of production in the former instance. Index numbers of the quantity of production of rough-sawn timber on the same base as that used for the industries covered by the tables are as follows: 1925–26 to 1929–30, 1,000; 1930–31, 775; 1931–32, 520; 1932–33, 561; 1933–34, 667; 1934–35, 823; and 1935–36, 989. It will be observed that the quantity of production in this important industry fell off to a greater extent in 1931–32 and 1932–33 than the fall in any of the twenty-one industries covered by this survey. An important consideration is that the industries covered are, in the main, industries producing goods for immediate consumption or export. The depression fall in building construction was greater than the fall in production of consumption goods, a fact which affected adversely not only local consumption of timber, but also the export market for this commodity.
The salient features of a selection of the more important individual industries are discussed in the following paragraphs.
The close relationship which exists between this industry and the primary industries is reflected in the fluctuations which are recorded in meat-freezing statistics from year to year. Fluctuating prices realized on overseas markets, combined with varying climatic conditions in the Dominion, are the main factors responsible for the frequent changing conditions of this industry. The value of production was £16,640,527 in 1928–29, the highest figure recorded up to that year, falling to £10,974,952 in 1931–32. A gradual expansion was in evidence for the next two years, and in 1934–35 the value of output exceeded the 1928–29 total by £216,050, while in 1935–36, duo to an upward turn in prices, a new record level for value of output was established (£17,514,049), this figure being £657,472, or 3 per cent., in excess of that for 1934–35.
The improved conditions prevailing in the industry during 1935–36 were reflected in the figure for the monthly average number of persons engaged, which rose from 7,594 for the year 1934–35 to 7,692. The amount paid in salaries and wages advanced by £98,659, or 6 per cent., and the cost of materials used rose by 4 per cent.
An interesting feature disclosed by the 1934–35 returns for this industry was the establishment of three additional works designed principally for the handling of pigs. This branch of the industry has been making rapid progress, frozen pork contributing over £1,200,000 to the output of freezing-works in 1934–35 and £1,455,000 in 1935–36, a greater value in each year than that of frozen beef.
The volume of production in 1935–36, though below the record level reached in 1933–34, was materially higher than in 1934–35, when an exceptionally dry summer affected dairy production. Prices in 1935–36 were much improved, and this, combined with the higher volume of production, resulted in an increase of 29 per cent. in the value of production as compared with the 1934–35 total. This enabled factories to increase the average payment to suppliers per pound of butterfat from 9.55 d. in 1934–35 to 12.42 d. for the season under review, while the average annual amount paid to suppliers also advanced from £211 to £286.
It is interesting to note that of the total butterfat supplied for butter and cheese making 80 per cent. is used for making butter, leaving 20 per cent. as the proportion contained in milk used for cheesemaking, In 1925–26 these proportions stood at 69 per cent. and 31 per cent. respectively.
The apparent consumption of flour in the Dominion in 1935–36 was 145,242 tons. During that period the fifty-one grain-mills in operation produced 134,067 tons, or 92 per cent. of the amount consumed. The quantity of wheat used by mills was 6,341,855 bushels, 46.76 bushels on the average being required to make a ton of flour. In addition to making flour, mills manufactured 4,091 tons of oatmeal, 3,456 tons of other oaten products for human consumption, 18,158 tons of bran, 35,014 tons of pollard, and other products to the value of £74,163. This industry, which in 1935–36 accounted for an aggregate value of £2,302,061 in the products mentioned, added £493,681 to the value of materials used, the work being done by 728 persons, the salaries and wages of whom amounted to £164,546. Other expenses amounting to £283,393 were also incurred, leaving a balance of £45,742. The amount of capital invested in the industry's fixed assets was £819,597.
Recently steps have been taken by the Government towards the betterment of the industry. The Board of Trade (Flour) Regulations gazetted on 1st April, 1936, and additional regulations since gazetted, aim at the rationalization of the industry. These regulations provide, inter alia, for the establishment of a monthly quota of output to be allotted to each mill, while the Wheat Purchase Committee (see page 373) is required from time to time to fix the sale price of flour. The prices at which milling wheat shall be made available to millers are also declared by the Committee each season under previous regulations. Measures have also been taken to restrict the importation of flour so that the gristing of any necessary imports of wheat will be done in New Zealand mills.
The demand for the products of this industry fluctuates to a considerable extent with the change in spending-power of consumers. This industry, in common with other industries which do not manufacture what may be termed necessities, was greatly affected by the recent economic depression. The average consumption of beer per head of population fell from 9½ gallons during the three years 1926 to 1928 to only 6 gallons for 1932–34, or by more than one-third. However, during 1934–35 industrial conditions greatly improved, and, consequently, brewing production rose by 20 per cent. above the 1933–34 figure. A further appreciable increase in beer-production was manifest in 1935–36, the total beer brewed (exclusive of wastage) totalling 11,500,000 gallons, as compared with 10,600,000 gallons in 1934–35. The 918 persons engaged in this industry during 1935–36 were paid £230,772 in salaries and wages. The total value of products was assessed as £1,999,259, of which £712,740 represented beer duty.
Greater activity was evident in the sawmilling industry during 1935–36 than has been shown for a number of years past—not since 1929–30 have more favourable conditions been experienced. The number of mills reporting operations in the latest collection was 448 as against 438 in 1934–35. Over the year the number of persons engaged increased by 882 to 7,207, and the salaries and wages paid advanced from £1,085,549 to £1,320,843, an increase of 22 per cent.
Increasing by 49,300,000 ft. board measure over 1934–35, the output of rough-sawn timber in 1935–36 totalled 293,100,000 ft. board measure, this volume of production being the highest recorded since 1926–27. Of the various species of timber milled, rimu and kahikatea represented 72 per cent. of the total, the respective percentages being 54 and 18. A striking feature is the steadily increasing quantity of pinus radiata milled, the production of this species for 1935–36 (34,100,000 ft. board measure) being approximately two and one-half times as great as the production in 1932–33 (14,700,000 ft. board measure). The value of rough-sawn timber produced during 1935–36 totalled £2,292,798—an average of 15s. 8d. per 100 ft. board measure, while the value of resawing and planing mill products amounted to £1,445,262.
Reference has already been made on pages 494–495 to the need for an abundant supply of cheap power to facilitate industrial progress. This has been accomplished by the development of hydro-electric power during the last decade, reference to which is to be found in Section XLV of the Year-Book.
The generation and distribution of electric power provided direct employment for 3,912 persons and paid £932,356 in salaries and wages during 1935–36. Some indication of the rapid development which has been taking place may he obtained from the figures showing the capacity of the plants installed. In 1930–31 the total capacity was 309,050 B.h.p.; by 1933–34 the capacity had reached 429,020 B.h.p., while the 1935–36 figure stands at 497,025 B.h.p. A better index to the growth of the industry, however, is the number of units generated, which has steadily increased from 788,000,000 in 1931–32, to 1,032,000,000 in 1935–36. The capital invested in the industry amounted to over £35,700,000 in 1935–36, of which £32,700,000 is invested in fixed assets, and £850,000 in stocks, trading departments, and rolling-stock, while the balance (£2,160,000) represents the floating assets (cash, sundry debtors, &c.).
During 1935–36 the printing and publishing industry showed a substantial improvement over the position ruling in the preceding year. The number of establishments reporting operations was fourteen greater than in 1934–35, and, excluding distributing staff, the industry found employment for 7,403 persons, as against 7,147 in the previous year.
The total cost of materials used during 1935–36 was £1,076,942, as compared with £963,628 in 1934–35. Of this amount, £371,651 represented cost of newsprint and £451,542 cost of paper for job printing, while the cost of ink used totalled £39,557. The value of output (£4,040,114) was £280,000 more than the recorded value in 1934–35, and was made up as follows: Newspapers, £2,094,618; job printing, £1,536,257; other products, £409,239.
Twelve woollen-mills were in operation in 1935–36, employing 2,632 persons, an average of 219 persons per mill. The number of persons engaged showed an increase over the total in 1934–35 (2,532), while the aggregate amount paid in salaries and wages increased by 4 per cent.
Though the volume of production was higher in the aggregate during 1935–36 than was the case in 1934–35, a drop of 4 per cent. in value is recorded. This is accounted for by the fact that the bulk of greasy wool used by mills for their 1935–36 production was purchased during the 1934–35 season when wool prices were below the level ruling in 1933–34. Of the principal products of wollen-mills, tweeds and cloth, blankets, shawls and rugs, and yarn registered increases in quantities as compared with 1934–35, but the production of flannel decreased by 25 per cent.
The manufacture of clothing finds employment for more persons than any other industry covered by these statistics. In 1935–36, 10,296 persons were employed in 318 factories. Of this number, 1,572 were males and 8,724 females, who earned during the year an average of £203 and £81 per annum respectively, the total amount of salaries and wages being £1,025,510. The average weekly rate of wages for 1,102 male wage-earning employees engaged during the week ended on 4th April, 1936, was £3 6s. 2d., the corresponding figure for 8,607 female wage-earners being £1 12s. 4d.
The value added to materials by the processes of manufacture in the industry was £1,508,550, the highest yet recorded, of which salaries and wages accounted for 68 per cent. The total value of products amounted to £3,090,027, but this includes £481,981 received for order work. In cases where factories make up customers' material the amount received for making up the goods is counted in the value of products; but in these instances statistics are not available as to the cost of material supplied by customers. Consequently the cost of materials and value of output (though not added value) are to a certain extent understated in the statistics for this industry.
The manufacture of footwear in the Dominion is an old-established industry for which the value of fixed assets is £394,693, an average of £5,250 per unit. The footwear-requirements of the Dominion in 1935–36 amounted to 5,162,234 pairs, of which 2,801,269 pairs, or 54 per cent., were manufactured locally. Rubber-soled footwear for sports use accounts for a very large proportion of imports of footwear, the local factories supplying the bulk of the requirements of leather footwear. Factories used leather produced locally to the value of £312,806 and £143,546 of imported products. The latest statistics compare very favourably with the corresponding figures a decade ago. In 1925–26 there were 81 factories employing 2,541 persons manufacturing 1,406,523 pairs of boots and shoes and 14,850 pairs of slippers, as compared with 75 factories in 1935–36 employing 2,788 persons manufacturing 1,812,664 pairs of boots and shoes and 988,605 pairs of slippers. While the number of factories has decreased there is greater employment, considerably higher production of boots and shoes, and a phenomenal increase in the production of slippers. The industry created in 1935–36 an added value of £534,340, of which salaries and wages (£360,684) represent 68 per cent.
The principal statistics regarding the leading factory industries for the last three years are set out in the following pages. Fuller details are given in the annual “Statistical Report on Factory and Building Production.”
STATISTICS OF PRINCIPAL INDUSTRIES.
| — | 1933–34. | 1934–35. | 1935–36. | |
|---|---|---|---|---|
* The figures for persons engaged and salaries and wages in 1933–34 include approximately 200 persons engaged other than in factories and the salaries or wages paid to them. † Including milk used (317,824,743 lb. in 1935–36) in making dried whole and skim milk, condensed milk, and casein. ‡ Including butterfat (2,472,439 lb. in 1935–36) contained in milk used for making dried whole milk and condensed milk. * Including beer duty. * Not available. | ||||
| Meat Freezing and Preserving. | ||||
| Number of— | ||||
| Works | 35 | 38 | 38 | |
| Persons engaged | 7,653 | 7,594 | 7,692 | |
| Salaries and wages paid | £ | 1,511,669 | 1,535,526 | 1,634,185 |
| Cost of all materials used | £ | 10,889,530 | 13,909,585 | 14,455,483 |
| Other expenses | £ | 823,359 | 868,928 | 840,275 |
| Frozen mutton— | ||||
| Carcases | No. | 1,995,435 | 2,216,889 | 2,003,064 |
| Value | £ | 1,46.056 | 1,816,003 | 1,570,292 |
| Frozen lamb— | ||||
| Carcases | No. | 8,582,957 | 8,904,983 | 8,716,641 |
| Value | £ | 7,095,262 | 8,188,256 | 8,215,431 |
| Frozen mutton and lamb pieces— | ||||
| Quantity | Cwt. | 12,024 | 77,794 | 6,238 |
| Value | £ | 17,459 | 87,759 | 8,850 |
| Frozen beef— | ||||
| Quantity | Cwt. | 981,757 | 836,799 | 834,345 |
| Value | £ | 924,758 | 820,850 | 953,605 |
| Chilled beef— | ||||
| Quantity | Cwt. | * | 48,966 | 196,059 |
| Value | £ | * | 57,048 | 251,984 |
| Frozen pork— | ||||
| Quantity | Cwt. | * | 492,792 | 569,088 |
| Value | £ | * | 1,200,424 | 1,454,772 |
| Frozen rabbits—Value | £ | 31,663 | 28,066 | 20,411 |
| Preserved meats— | ||||
| Quantity | Cwt. | 46,324 | 53,906 | 91,728 |
| Value | £ | 127,658 | 156,523 | 249,970 |
| Tallow— | ||||
| Quantity | Cwt. | 425,540 | 446,013 | 442,993 |
| Value | £ | 345,744 | 450,656 | 587,045 |
| Bonedust— | ||||
| Quantity | Cwt. | 85,356 | 34,294 | 45,055 |
| Value | £ | 25,468 | 11,431 | 15,765 |
| Other manures— | ||||
| Quantity | Cwt. | 669,351 | 1,154,768 | 674,504 |
| Value | £ | 168,443 | 324,313 | 187,068 |
| Hides and pelts— | ||||
| Quantity | No. | 11,317,533 | 12,550,009 | 12,566,928 |
| Value | £ | 1,087,645 | 1,314,686 | 1,505,215 |
| Wool— | ||||
| Quantity | lb. | 28,664,526 | 31,012,306 | 30,011,269 |
| Value | £ | 1,016,609 | 1,215,617 | 1,171,639 |
| Total value of output | £ | 14,034,747 | 16,856,577 | 17,514,049 |
| Ham and Bacon Curing. | ||||
| Number of— | ||||
| Works | 39 | 43 | 49 | |
| Persons engaged | 427 | 395 | 450 | |
| Salaries and wages paid | £ | 91,000 | 79,993 | 92,444 |
| Pigs dealt with— | ||||
| Number | 209,954 | 189,614 | 207,488 | |
| Cost | £ | 499,903 | 540,052 | 595,579 |
| Cost of other materials used | £ | 30,402 | 36,453 | 40,958 |
| Other expenses | £ | 117,090 | 116,571 | 148,737 |
| Ham and bacon—Quantity | Cwt | 147,130 | 143,575 | 156,605 |
| Lard—Quantity | Cwt. | 8,400 | 9,039 | 7,813 |
| Total value of output | £ | 755,716 | 805,113 | 918,500 |
| Butter, Cheese and Condensed Milk Factories. | ||||
| Number of— | ||||
| Factories | 482 | 485 | 469 | |
| Persons engaged | 4,346* | 3,787 | 4,062 | |
| Salaries and wages paid | £ | 837,991* | 764,640 | 840,554 |
| Number of separators— | ||||
| At home | 60,131 | 60,573 | 60,770 | |
| At factories | 507 | 509 | 520 | |
| Butterfat separated— | ||||
| At home | lb. | 277,245,222 | 268,364,190 | 284,647,443 |
| At butter-factories | lb. | 16,121,240 | 18,096,602 | 22,322,518 |
| Milk received by cheese-factories† | lb. | 2,284,944,727 | 2,098,329,367 | 2,157,424,466 |
| Butterfat received‡ | lb. | 97,130,864 | 86,359,177 | 79,692,296 |
| Value of materials used | £ | 15,749,984 | 15,996,918 | 21,210,486 |
| Other expenses | £ | 1,200,919 | 1,280,562 | 1,228,628 |
| Butter produced (including whey butter)— | ||||
| Quantity | Cwt. | 3,238,038 | 3,157,055 | 3,366,579 |
| Value | £ | 12,679,430 | 13,243,608 | 17,701,771 |
| Cheese produced— | ||||
| Quantity | Cwt. | 2,135,599 | 1,914,458 | 1,769,984 |
| Value | £ | 4,486,510 | 4,066,899 | 4,708,416 |
| Total value of output | £ | 17,911,129 | 18,172,547 | 23,364,594 |
| Grain-mills. | ||||
| Number of— | ||||
| Mills | 53 | 56 | 51 | |
| Persons engaged | 747 | 756 | 728 | |
| Salaries and wages paid | £ | 167,475 | 169,641 | 164,546 |
| Wheat used—Quantity | Bushels | 6,305,515 | 6,271,062 | 6,341,855 |
| Total grain—Cost | £ | 1,675,167 | 1,657,542 | 1,689,678 |
| Cost of other materials | £ | 121,184 | 118,688 | 118,702 |
| Other expenses | £ | 306,097 | 292,296 | 283,393 |
| Flour produced | Tons | 133,624 | 131,414 | 134,067 |
| Oatmeal produced | Tons | 4,588 | 4,139 | 4,091 |
| Other oaten products for human consumption | Tons | 4,055 | 3,242 | 3,456 |
| Total value of output | £ | 2,411,257 | 2,320,611 | 2,302,061 |
| Biscuit and Confectionery Making. | ||||
| Number of— | ||||
| Works | 57 | 57 | 60 | |
| Persons engaged | 2,738 | 2,591 | 2,862 | |
| Salaries and wages paid | £ | 312,012 | 273,078 | 314,717 |
| Flour used | Tons | 3,924 | 5,247 | 4,871 |
| Sugar used | Tons | 6,416 | 6,908 | 6,950 |
| Cost of other materials | £ | 481,313 | 516,701 | 643,574 |
| Other expenses | £ | 312,327 | 235,816 | 281,306 |
| Biscuits and confectionery made | £ | 1,308,081 | 1,387,824 | 1,575,155 |
| Total value of products | £ | 1,379,760 | 1,481,575 | 1,688,191 |
| Fruit-preserving and Jam-making. | ||||
| Number of— | ||||
| Works | 9 | 12 | 17 | |
| Persons engaged | 347 | 371 | 425 | |
| Salaries and wages paid | £ | 48,830 | 48,994 | 56,328 |
| Fruit used | Tons | 3,915 | 4,064 | 4,621 |
| Cost of— | ||||
| Fruit used | £ | 53,590 | 68,136 | 78,272 |
| Sugar and other materials | £ | 80,236 | 111,211 | 134,629 |
| Other expenses | £ | 30,352 | 31,362 | 40,868 |
| Jams and jellies made— | ||||
| Quantity | Cwt. | 34,197 | 47,899 | 53,738 |
| Value | £ | 105,732 | 144,879 | 153,961 |
| Fruit bottled or canned | £ | 52,150 | 66,277 | 92,876 |
| Other products—Value | £ | 99,381 | 90,986 | 114,314 |
| Total value of output | £ | 257,263 | 302,142 | 361,151 |
| Breweries and Malt-houses. | ||||
| Number of— | ||||
| Establishments | 50 | 48 | 49 | |
| Persons engaged | 807 | 847 | 918 | |
| Salaries and wages paid | £ | 193,782 | 212,832 | 230,772 |
| Barley used in production of malt | Bushels | 427,534 | 497,271 | 585,601 |
| Hops used | Cwt. | 3,576 | 4,003 | 4,379 |
| Sugar used | Cwt. | 18,706 | 21,942 | 24,922 |
| Total cost of materials used | £ | 289,095 | 343,008 | 421,453 |
| Other expenses* | £ | 960,086 | 1,006,693 | 1,027,402 |
| Ale brewed | Gallons | 8,141,000 | 9,826,007 | 10,600,648 |
| Stout brewed | Gallons | 696,446 | 773,993 | 900,075 |
| Value of output* | £ | 1,571,352 | 1,766,123 | 1,999,259 |
| Aerated-water and Cordial Factories. | ||||
| Number of— | ||||
| Works | 123 | 127 | 129 | |
| Persons engaged | 507 | 531 | 529 | |
| Salaries and wages paid | £ | 93,981 | 99,878 | 102,698 |
| Total cost of materials used | £ | 70,225 | 88,920 | 96,837 |
| Other expenses | £ | 66,068 | 73,150 | 80,104 |
| Aerated waters—In bottles | Dozen | 1,336,130 | 1,728,782 | 1,661,544 |
| Aerated waters—In bulk | Gallons | 97,858 | 116,415 | 122,957 |
| Cordials—In bottles | Dozen | 37,176 | 52,893 | 51,908 |
| Hop-beer—In bottles | Dozen | 47,937 | 65,102 | 81,313 |
| Hop-beer—In bulk | Gallons | 35,115 | 52,065 | 43,714 |
| Total value of manufactures | £ | 249,789 | 321,176 | 327,106 |
| Sauce, Pickle, and Vinegar Making. | ||||
| Number of— | ||||
| Works | 19 | 18 | 18 | |
| Persons engaged | 237 | 236 | 250 | |
| Salaries and wages paid | £ | 39,940 | 38,345 | 41,583 |
| Cost of materials used | £ | 73,894 | 84,094 | 96,289 |
| Other expenses of manufacture | £ | 32,888 | 38,560 | 41,452 |
| Total value of manufactures | £ | 176,561 | 192,219 | 217,209 |
| Soap and Candle Works. | ||||
| Number of— | ||||
| Works | 24 | 23 | 23 | |
| Persons engaged | 468 | 513 | 492 | |
| Salaries and wages paid | £ | 85,207 | 86,817 | 89,187 |
| Cost of materials used | £ | 210,664 | 236,540 | 278,063 |
| Other expenses | £ | 54,461 | 66,877 | 76,868 |
| Soap manufactured | Tons | 7,350 | 8,649 | 9,115 |
| Soap-powder (including washing-powder) | lb. | 3,181,268 | 3,720,979 | 3,864,698 |
| Candles manufactured | lb. | 2,380,989 | 2,472,825 | 2,302,603 |
| Total value of products | £ | 468,988 | 536,235 | 574,191 |
| Clothing Factories. | ||||
| Number of works | 249 | 290 | 318 | |
| Number of persons engaged— | ||||
| Males | 1,346 | 1,550 | 1,572 | |
| Females | 6,531 | 7,844 | 8,724 | |
| Salaries and wages paid— | ||||
| To males | £ | 275,671 | 315,437 | 319,551 |
| To females | £ | 556,200 | 637,407 | 705,959 |
| Cost of materials used | £ | 1,366,878 | 1,566,631 | 1,581,477 |
| Other expenses | £ | 275,501 | 336,160 | 352,875 |
| Output— | ||||
| Suits | No. | 172,050 | 210,296 | 218,043 |
| Shirts | Dozen | 104,597 | 136,939 | 143,690 |
| Hats and caps (men's and boys') | Dozen | 26,583 | 31,733 | 28,304 |
| Hats (women's) | Dozen | 101,154 | 102,434 | 105,577 |
| Total value of products | £ | 2,631,182 | 2,958,508 | 3,090,027 |
| Hosiery Factories. | ||||
| Number of— | ||||
| Works | 32 | 33 | 33 | |
| Persons engaged | 913 | 998 | 1,012 | |
| Salaries and wages paid | £ | 95,763 | 111,551 | 114,379 |
| Cost of materials used | £ | 204,022 | 225,911 | 213,417 |
| Other expenses | £ | 61,580 | 59,840 | 64,646 |
| Total value of manufactures | £ | 386,746 | 440,089 | 461,653 |
| Boot and Shoe Factories. | ||||
| Number of works | 71 | 76 | 75 | |
| Number of persons engaged— | ||||
| Males | 1,439 | 1,472 | 1,571 | |
| Females | 990 | 1,069 | 1,217 | |
| Salaries and wages paid— | ||||
| To males | £ | 254,419 | 251,439 | 264,082 |
| To females | £ | 81,972 | 93,065 | 96,602 |
| Cost of materials used— | ||||
| New Zealand leather | £ | 280,951 | 289,115 | 312,806 |
| Imported leather | £ | 126,065 | 132,950 | 143,546 |
| Other materials | £ | 134,041 | 140,222 | 149,954 |
| Total | £ | 541,057 | 562,287 | 606,306 |
| Other expenses | £ | 119,988 | 131,398 | 110,229 |
| Manufactures— | ||||
| Adults' boots and shoes | Pairs | 1,440,010 | 1,548,475 | 1,642,731 |
| Children's boots and shoes | Pairs | 153,261 | 149,933 | 169,933 |
| Slippers | Pairs | 689,251 | 833,341 | 988,605 |
| Uppers | Pairs | 1,373 | 2,166 | 1,100 |
| Total value of manufactures | £ | 1,064,544 | 1,102,950 | 1,140,646 |
| Flax-mills. | ||||
| Number of— | ||||
| Mills | 23 | 21 | 29 | |
| Persons engaged | 258 | 316 | 506 | |
| Salaries and wages paid | £ | 35,456 | 42,160 | 69,367 |
| Raw flax used— | ||||
| Quantity | Tons | 41,196 | 39,216 | 59,375 |
| Cost | £ | 15,629 | 11,443 | 18,657 |
| Other materials | £ | 279 | 357 | 1,249 |
| Other expenses | £ | 18,643 | 23,048 | 55,265 |
| Fibre dressed | Tons | 4,770 | 4,860 | 6,770 |
| Tow produced | Tons | 652 | 778 | 1,152 |
| Total value of output | £ | 74,291 | 80,711 | 138,336 |
| Sawmills. | ||||
| Number of— | ||||
| Mills | 422 | 438 | 448 | |
| Persons engaged | 5,323 | 6,325 | 7,207 | |
| Salaries and wages paid | £ | 859,472 | 1,085,549 | 1,320,843 |
| Cost of materials used | £ | 747,256 | 863,824 | 1,187,232 |
| Other expenses | £ | 670,000 | 867,476 | 1,003,967 |
| Sawn timber— | ||||
| Quantity | Ft. | 197,654,900 | 243,781,675 | 293,075,313 |
| Value | £ | 1,357,880 | 1,769,280 | 2,292,798 |
| Posts, rails, &c.—Value | £ | 7,407 | 6,708 | 6,976 |
| Resawing, planed flooring, skirting, &c.— | ||||
| Quantity | Ft. | 38,237,308 | 43,207,248 | 55,724,753 |
| Value | £ | 528,854 | 659,614 | 841,868 |
| Doors and sashes—Value | £ | 65,381 | 115,232 | 160,669 |
| Other products | £ | 392,551 | 429,378 | 442,725 |
| Total value of output | £ | 2,352,073 | 2,980,212 | 3,745,036 |
| Gasworks. | ||||
| Number of— | ||||
| Works | 46 | 46 | 46 | |
| Persons engaged | 1,758 | 1,730 | 1,779 | |
| Salaries and wages paid | £ | 384,202 | 388,331 | 408,959 |
| Coal used— | ||||
| Quantity | Tons | 203,669 | 205,065 | 204,807 |
| Cost | £ | 378,698 | 371,910 | 370,114 |
| Other expenses | £ | 397,611 | 409,426 | 384,890 |
| Total gas generated | 1,000 cub. ft. | 3,832,264 | 3,817,166 | 3,885,165 |
| Gas sold | 1,000 cub. ft. | 3,281,828 | 3,263,004 | 3,324,357 |
| Coke sold | Tons | 64,181 | 64,863 | 66,628 |
| Tar sold | Gallons | 1,994,713 | 2,338,775 | 2,500,127 |
| Total receipts | £ | 1,377,281 | 1,363,922 | 1,380,588 |
| Total expenditure | £ | 1,160,511 | 1,169,667 | 1,163,963 |
| Electric Current (see also Section XLV). | ||||
| Number of— | ||||
| Works | 99 | 98 | 99 | |
| Persons engaged | 3,251 | 3,861 | 3,912 | |
| Salaries and wages paid | £ | 730,483 | 876,462 | 932,356 |
| Horse-power available | H.p. | 429,020 | 496,317 | 497,025 |
| Fuel used— | ||||
| Coal | Tons | 7,805 | 7,740 | 10,495 |
| Crude oil | Tons | 1,043 | 392 | 506 |
| Units generated or purchased | 1,488,620,509 | 1,589,241,570 | 1,763,300,681 | |
| Revenue | £ | 4,485,283 | 4,640,462 | 4,868,160 |
| Expenditure | £ | 4,342,365 | 4,468,992 | 4,612,950 |
| Units retailed | 667,289,250 | 709,553,924 | 775,371,527 | |
| Lime and Cement Works. | ||||
| Number of— | ||||
| Works | 45 | 50 | 57 | |
| Persons engaged | 631 | 704 | 759 | |
| Salaries and wages paid | £ | 130,675 | 144,617 | 165,592 |
| Cost of materials used | £ | 112,300 | 123,301 | 153,893 |
| Other expenses | £ | 213,114 | 194,759 | 244,208 |
| Total value of output | £ | 556,425 | 582,784 | 703,724 |
| Brick, Tile, and Pottery Works. | ||||
| Number of— | ||||
| Works | 43 | 54 | 58 | |
| Persons engaged | 467 | 618 | 777 | |
| Salaries and wages paid | £ | 82,664 | 111,988 | 142,242 |
| Cost of materials used | £ | 14,279 | 20,435 | 27,008 |
| Cost of coal used | £ | 19,213 | 26,019 | 34,425 |
| Other expenses | £ | 81,678 | 104,177 | 110,519 |
| Bricks manufactured— | ||||
| Common | No. | 11,193,556 | 21,328,524 | 26,784,510 |
| Fire | No. | 461,616 | 748,286 | 1,022,477 |
| Total value of all bricks manufactured | £ | 63,465 | 104,878 | 128,541 |
| Value of pottery manufactured | £ | 117,880 | 151,961 | 187,801 |
| Total value of manufactures | £ | 212,263 | 285,164 | 347,562 |
| Tinware and Sheet-metal Works. | ||||
| Number of— | ||||
| Works | 125 | 130 | 127 | |
| Persons engaged | 1,282 | 1,452 | 1,384 | |
| Salaries and wages paid | £ | 197,655 | 214,918 | 204,118 |
| Cost of materials used | £ | 344,350 | 405,105 | 448,354 |
| Other expenses | £ | 88,973 | 95,643 | 93,566 |
| Total value of manufactures and repairs | £ | 675,104 | 763,682 | 792,461 |
| Iron and Brass Foundries. | ||||
| Number of— | ||||
| Works | 44 | 41 | 42 | |
| Persons engaged | 545 | 674 | 791 | |
| Salaries and wages paid | £ | 98,835 | 113,215 | 137,764 |
| Cost of materials used | £ | 65,639 | 89,439 | 124,212 |
| Other expenses | £ | 39,192 | 42,594 | 55,357 |
| Total value of manufactures (including repairs) | £ | 214,780 | 263,844 | 338,951 |
| Engineering-works. | ||||
| Number of— | ||||
| Works | 181 | 196 | 204 | |
| Persons engaged | 2,283 | 2,772 | 3,326 | |
| Salaries and wages paid | £ | 398,721 | 502,118 | 602,668 |
| Cost of materials used | £ | 402,005 | 557,741 | 729,224 |
| Other expenses | £ | 214,646 | 255,520 | 300,276 |
| Total value of manufactures (including repairs) | £ | 1,054,643 | 1,413,701 | 1,784,274 |
| Printing and Publishing Establishments. | ||||
| Number of works | 366 | 373 | 384 | |
| Persons engaged— | ||||
| Males | No. | 6,246 | 6,503 | 6,039 |
| Females | No. | 1,498 | 1,576 | 1,688 |
| Salaries and wages paid— | ||||
| To males | £ | 1,292,641 | 1,356,152 | 1,403,341 |
| To females | £ | 151,491 | 157,326 | 172,366 |
| Cost of materials used | £ | 930,659 | 963,628 | 1,076,942 |
| Other expenses | £ | 911,215 | 955,403 | 981,484 |
| Total value of output | £ | 3,525,188 | 3,758,937 | 4,040,114 |
| Agricultural and Dairying Machinery and Implement Making. | ||||
| Number of— | ||||
| Works | 37 | 44 | 46 | |
| Persons engaged | 532 | 689 | 880 | |
| Salaries and wages paid | £ | 95,301 | 127,124 | 166,227 |
| Cost of all materials used | £ | 159,017 | 253,571 | 340,100 |
| Other expenses | £ | 50,514 | 61,900 | 72,132 |
| Total value of manufactures (including repairs) | £ | 338,049 | 492,925 | 692,141 |
| Coachbuilding and Motor and Cycle Engineering. | ||||
| Number of— | ||||
| Works | 1,024 | 1,077 | 1,150 | |
| Persons engaged | 4,491 | 5,473 | 6,731 | |
| Salaries and wages paid | £ | 693,082 | 889,439 | 1,138,974 |
| Cost of materials used | £ | 846,262 | 1,117,714 | 1,220,243 |
| Other expenses | £ | 304,882 | 353,508 | 420,943 |
| Value of work done— | ||||
| Coachbuilding | £ | 292,790 | 402,239 | 524,953 |
| Motor engineering | £ | 1,670,707 | 2,168,724 | 2,697,673 |
| Tanning. | ||||
| Number of— | ||||
| Works | 13 | 15 | 16 | |
| Persons engaged | 514 | 531 | 543 | |
| Salaries and wages paid | £ | 97,332 | 100,668 | 104,888 |
| Cost of materials used | £ | 284,587 | 294,150 | 308,465 |
| Materials operated upon— | ||||
| Sheep-skins | No. | 209,313 | 178,048 | 196,901 |
| Hides, pelts, &c. | No. | 483,510 | 562,355 | 470,056 |
| Bark used | Tons | 1,791 | 1,796 | 1,726 |
| Cost of bark extract used | £ | 18,093 | 18,366 | 18,490 |
| Other expenses | £ | 60,711 | 63,839 | 71,506 |
| Output— | ||||
| Scoured and slipe wool | lb. | 558,391 | 595,255 | 458,939 |
| Pelts | No. | 233,461 | 258,940 | 176,291 |
| Leather | lb. | 5,209,303 | 5,475,485 | 6,469,262 |
| Basils | lb. | 214,754 | 208,458 | 52,564 |
| Total value of output | £ | 467,362 | 492,604 | 519,157 |
| Woolscouring and Fellmongering. | ||||
| Number of— | ||||
| Works | 34 | 37 | 36 | |
| Persons engaged | 366 | 434 | 397 | |
| Salaries and wages paid | £ | 65,260 | 75,612 | 67,104 |
| Cost of materials used | £ | 824,536 | 704,034 | 829,807 |
| Materials operated upon— | ||||
| Sheep-skins | No. | 565,449 | 1,366,754 | 1,284,533 |
| Greasy wool | lb. | 22,616,996 | 19,742,196 | 17,454,193 |
| Hides, pelts, &c. | No. | 34,343 | 14,050 | 9,976 |
| Other expenses | £ | 36,167 | 35,003 | 35,534 |
| Principal products— | ||||
| Scoured and slipe wool | lb. | 16,651,653 | 17,299,748 | 14,788,504 |
| Pelts | No. | 493,595 | 452,364 | 217,174 |
| Leather | lb. | 269,000 | 327,111 | * |
| Basils | lb. | * | 150 | |
| Pickled pelts | No. | 126,033 | 754,243 | 1,033,642 |
| Total value of all products | £ | 1,025,953 | 855,211 | 1,017,979 |
| Woollen mills. | ||||
| Number of— | ||||
| Mills | 12 | 12 | 12 | |
| Persons engaged | 2,466 | 2,532 | 2,632 | |
| Salaries and wages paid | £ | 326,156 | 345,591 | 360,782 |
| Scoured wool used— | ||||
| Quantity | lb. | 4,037,338 | 4,164,974 | 4,416,768 |
| Cost | £ | 294,105 | 383,665 | 348,532 |
| Cost of other materials used | £ | 81,568 | 76,736 | 64,557 |
| Other expenses | £ | 171,425 | 175,455 | 157,916 |
| Output— | ||||
| Tweed and cloth | Yards | 1,347,793 | 1,363,943 | 1,367,769 |
| Flannel | Yards | 871,302 | 934,137 | 742,354 |
| Blankets | Pairs | 116,301 | 127,112 | 156,936 |
| Rugs and shawls | No. | 46,236 | 43,854 | 60,101 |
| Yarn | lb. | 809,884 | 774,326 | 800,160 |
| Total value | £ | 976,813 | 1,048,849 | 1,005,830 |
| Ship and Boat Building. | ||||
| Number of— | ||||
| Establishments | 24 | 26 | 24 | |
| Persons engaged | 407 | 585 | 556 | |
| Salaries and wages paid | £ | 83,800 | 111,538 | 122,206 |
| Cost of materials used | £ | 36,713 | 73,995 | 83,276 |
| Other expenses | £ | 17,026 | 30,753 | 29,304 |
| Number of vessels built | 4 | 5 | 12 | |
| Total value of manufactures and repairs | £ | 166,811 | 220,534 | 241,482 |
| Furniture-making Works. | ||||
| Number of— | ||||
| Factories | 281 | 285 | 308 | |
| Persons engaged | 1,576 | 1,874 | 2,262 | |
| Salaries and wages paid | £ | 233,300 | 285,081 | 376,261 |
| Cost of materials used | £ | 269,244 | 359,798 | 490,183 |
| Other expenses | £ | 73,385 | 84,317 | 106,150 |
| Total value of manufactures | £ | 616,365 | 773,810 | 1,029,948 |
Table of Contents
WITHIN the short span of a century New Zealand has been transformed from a virgin wilderness into a country whose community enjoys the amenities of modern social and industrial life. In the pioneer stages of colonization, the development of the resources of the Dominion demanded an almost mushroom growth of building and construction activity in the formation of railways, roads, and harbours, in addition to provision for the housing needs of a rapidly growing population. More recently the utilization of vast resources of water-power has involved major schemes of construction of hydro-electric stations in various parts of the Dominion, and the reticulation of practically the whole of the inhabited portion of the country. Land-settlement and the growth of factory industries have both required extensive building and construction works, rural and urban, while the increasing housing needs of a growing population are reflected in a steady long-term growth in the building of dwellings. The increase in trade and industry, with resultant growth of the towns, has been accompanied by extensive construction of factories, shops, offices, warehouses, &c.
With the passing of the early stages of social and industrial development, replacements of obsolete and obsolescent structures and general maintenance have occupied a larger place in recent building and construction activity than was the case formerly; although, indeed, there have been new avenues of industry requiring further major building and construction operations. For example, the recent development of aviation in the Dominion required the formation of a chain of landing-grounds and air-ports, a work which is still being pushed forward; while the growth of motor traffic has necessitated a reorientation of roading policy, much new construction and extensive alterations to the surfaces of existing roads being required. The diversification of the Dominion's factory industries in recent years has involved extensive building operations—particularly in the engineering trades—while modernization of factory equipment and of shop and office accommodation has been responsible for a further appreciable proportion of building activity.
The building and construction industry is particularly sensitive to cyclical fluctuations in business conditions, and it is not surprising to note that in New Zealand marked changes in building activity coincide with the ebb and flow of trade and industry. Governmental policy in regard to public-works construction is, and has been, directed towards accelerating State activity in this direction in times of depression, with a view to alleviating the unemployment problem. While considerable success has been achieved on various occasions, at other times the expansion of public works has been prohibited by the straitened condition of the national finances. During the recent depression this factor resulted in the severe curtailment of public-works expenditure; although considerable assistance was given to private and public building enterprises through the agency of the Unemployment Fund. Private building, both of dwellings and of business premises, suffered a severe setback during the years 1931–33; but since 1933—and more particularly since the beginning of 1935—a substantial revival in building activity has taken place. Available statistics indicate severe fluctuations in private building activity during previous depressions and subsequent periods of recovery.
An interesting feature of building and construction activity in New Zealand is the absence of the marked seasonal decline in the winter months experienced in most countries. The Government in planning public works endeavours, with success, to make the period of greatest activity coincide with the slack season of the year for industry in general. Again, winters are not sufficiently severe, except in a few districts, to interfere materially with the building of dwellings or other construction work.
The function of the State in the stimulation of building and construction enterprise is twofold. Public works, involving both new construction and the maintenance of existing works, are in themselves responsible for a large percentage of the Dominion's total annual building and construction activity. Furthermore, the State encourages private building in various ways. The State Advances Department (see Section XXIVD of this Year-Book) has done much to facilitate home building and land development, while State assistance has been also given in various other forms—e.g., subsidies from the Unemployment (now Employment Promotion) Fund.
While statistical evidence as to the growth of building of dwellinghouses suggests that the rate of growth of dwellings in the Dominion as a whole has kept pace with housing needs directly attributable to the growth of population and the decrease in the size of the average family unit, it seems clear that the considerable variations in population growth, as between different localities, have produced a disparity between available housing and requirements. In several towns where population has declined—mostly in localities where a mushroom growth and subsequent decline have resulted from the gold rushes of the “sixties” and “seventies”—there is ample housing accommodation for the needs of the present population; but, in many instances, the standard of comfort does not conform to-modern requirements. Those towns and cities founded early in the history of New Zealand, and having made steady progress since, form another and more numerous-class. In these localities there is still an appreciable percentage of old houses built in the early days of colonization, which urgently require modernization, or substitution by better-class homes. A third broad division exists in the areas which have progressed rapidly in recent years. In these instances a large proportion of modern homes of a high standard is to be found; but, with the fall in building activity consequent on the depression period, the growth of new buildings has fallen behind the housing requirements of an increasing population, so that there is an urgent need for fresh building on that account.
The question of improving housing-conditions by the erection of new dwelling-houses in localities where a shortage of housing-accommodation exists is receiving the attention of the Government. As a preliminary towards a planned programme of housing reform a Housing Survey Act was placed on the statute-book in 1935, and amended in 1936 (extending the duration of the Act to 31st December, 1937), making provision for a detailed survey of existing housing-accommodation in relation to modern standards of living-requirements. Under the provisions of this Act surveys have been made or are in hand by local bodies, more particularly in the overcrowded areas of the larger cities and towns. It is the purpose of the Government not only to provide for new construction but also to plan remedial measures in regard to deteriorated areas. The formulation of plans for the latter object must of necessity be delayed until the completion of the housing survey and the passing of necessary empowering legislation.
In the meantime a programme of direct home-building by the Government is under way or commencing in about thirty of the principal centres of population. The purpose of this branch of the Government's activities is to provide modern homes of a decent standard to be let at reasonable rentals to people in the lower-income groups. The legislative provision for this programme is contained in the Housing Act, 1919, the administration of which was transferred to the State Advances Corporation by the State Advances Corporation Act, 1936; the latter Act also containing provision for the opening of a special Housing Account with the Reserve Bank. The Statutes Amendment Act of 1936 provides for the necessary authority to acquire land under the Public Works Act, 1928, for the purpose of housing. For the initial operations a sum of £3,500,000 was made available. To give effect to the Government's policy a Director of Housing Construction was appointed in September, 1936, and a special Housing Construction Branch of the State Advances Corporation set up.
Several hundred houses are now (September, 1937) nearing completion in the neighbourhood of the four main centres of population and in two of the provincial towns, while further contracts have been let or are under way in many of the smaller centres. An announcement in the 1937 Budget states that contracts have been let (up to 15 th September) for 1,118 houses and that some fifteen hundred men are now engaged in actual construction work on the State schemes, while this number can be expected to increase appreciably in the near future. Unfortunately the shortage of skilled labour is already becoming a serious problem. The actual construction work is carried out by private contractors, tenders being called by the Housing Construction Branch of the State Advances Corporation for the various contracts.
A scale of rentals at which various classes of houses will be let has been fixed as follows:—
| Per Week. | |
|---|---|
* In two-house units. | |
| £ s. d. | |
| *Three-roomed flat (without sun-porch) | 1 0 0 |
| *Three-roomed flat (with sun-porch) | 1 2 6 |
| Four-roomed house | 1 7 6 |
| Four-roomed house (with sun-porch) | 1 9 0 |
| Five-roomed house | 1 10 6 |
| Five-roomed house (with sun-porch) | 1 12 6 |
| Six-roomed house | 1 13 6 |
In each instance a rebate of 2s. 6d. per week is deductible from the above-rentals for good tenancy.
In addition to the activities briefly outlined above, the housing policy of the Government includes the provision of £1,500,000 to be made available to local, authorities at 3 per cent. per annum for the furtherance of municipal housing schemes. Money has also been made available at 3 per cent. to co-operative-dairy companies for the financing of housing schemes for their employees. Reference to the provisions made for the governmental financing of home-building on behalf of private owners is continued in the section of this Year-Book dealing with State Advances (Section XXIVD); while reference should also be made to the section on Mortgages (Section XXXII) for details of the legislative provisions made for the rehabilitation of certain classes of house-owners from the burden of excessive mortgage indebtedness.
A collection of annual statistics of building permits issued in cities, boroughs, and town districts was initiated in 1921–22; while a monthly collection on a more restricted scale was begun in 1926. Since 1925–26 statistics have been collected directly from builders, affording, inter alia, an analysis of costs, &c., not available from the building permit statistics. It will be realized that these statistics are of too recent origin to give an indication of the long term progress of building and construction. There are, however, extant certain statistical data from which the growth of building activity can be deduced. The following significant criteria have been selected as presenting an informative picture without the intrusion of too much detail:—
Consumption of building materials—
Production, plus imports less exports—i.e., approximate local consumption—of sawn timber.
Imports of corrugated galvanized sheet-iron.
Local production of bricks.
Imports of channel and girder iron (since 1915).
These data are presented in the following table at five-yearly intervals from 1880 to 1930 and annually since 1930.
Relevant data from the population census are shown for each census date since 1871 (the earliest available date).
CONSUMPTION OF CERTAIN IMPORTANT BUILDING MATERIALS.
| Year. | Sawn Timber. | Bricks. | Corrugated Iron. | Channel and Girder Iron.* |
|---|---|---|---|---|
* Not available prior to 1915. | ||||
| Million Ft., B.M. | Millions. | Thousand Cwt. | Thousand Cwt. | |
| 1880 | 139.4 | 28.6 | 4.0 | * |
| 1885 | 184.3 | 34.7 | 6.9 | * |
| 1890 | 127.9 | 16.0 | 81.9 | * |
| 1895 | 157.3 | 19.0 | 117.4 | * |
| 1900 | 214.6 | 41.3 | 227.9 | * |
| 1905 | 272.5 | 70.6 | 296.3 | * |
| 1910 | 231.8 | 63.6 | 355.8 | * |
| 1915 | 195.5 | 49.4 | 255.9 | 73.6 |
| 1920 | 240.6 | 52.6 | 367.4 | 42.4 |
| 1925 | 357.0 | 72.9 | 233.2 | 97.5 |
| 1930 | 307.3 | 57.0 | 353.1 | 171.4 |
| 1931 | 225.5 | 44.5 | 206.6 | 82.2 |
| 1932 | 133.1 | 12.7 | 192.8 | 25.1 |
| 1933 | 149.4 | 9.2 | 200.1 | 28.1 |
| 1934 | 173.8 | 12.7 | 273.4 | 85.0 |
| 1935 | 220.1 | 23.4 | 305.0 | 99.8 |
| 1936 | 284.4 | 29.6 | 424.7 | 112.7 |
Between 1880 and 1885 production of bricks increased by 21.3 per cent. and imports of corrugated sheet-iron by 72.5 per cent. The depression of the “nineties” is reflected in the sharp decreases in the figures for sawn timber and bricks shown for 1890—despite a material increase in population since the 1886 census. Imports of corrugated iron provide an interesting exception, this material evidently coming into use to a greater extent than formerly. An improvement in building activity is suggested by the statistics shown for 1895, building being no doubt stimulated by the fact that the first State Advances Act, passed in 1894, came into operation in 1895. The 1900 statistics indicate a substantial increase in building activity since 1895—considerably in excess of the population increase between the 1896 and 1901 census dates. The year 1905 would appear to have been a “boom” year in respect of building activity, judging by the statistics shown for timber consumption and production of bricks. Imports of corrugated iron also display a material increase, though not to the same extent as other building materials. The depression of 1908–10 is reflected in a fall—as compared with 1905—in the 1910 statistics for timber and bricks; corrugated iron again being an exception.
The abnormal conditions created by the war are reflected in the figures for 1915, while the 1920 and 1925 statistics show substantial increases. In 1930 the effects of the depression on building activity were beginning to be felt, while the statistics from 1931 onwards illustrate the fall in the depression years and the recovery in 1934, 1935, and 1936.
Features of particular interest are the remarkable rise in imports of channel and girder iron between 1920 and 1930—a reflection of the increase of concrete buildings with a steel framework—and the decline in the production of bricks, which reached its maximum (for the years shown) in 1925. Imports of corrugated iron have also declined, the peak year shown in this instance being 1920. The use of this material for walls, fences, &c., was at one time widespread, but it has been largely replaced for these purposes by other materials.
In the following table the number of inhabited private dwellings (including flats, tenements, &c.) at each census date since 1871 is shown, while the movement in these figures is compared with inter-censal increases in population. Hotels and institutions are not included in the dwelling figures shown, nor are Maori dwellings.
| Census of | Number of Private Dwellings. | Inter-censal Increase in | |
|---|---|---|---|
| Private Dwellings. | Population. | ||
| Per Cent. | Per Cent. | ||
| 1871 | 57,182 | ||
| 1874 | 61,356 | 7.30 | 16.82 |
| 1878 | 82,588 | 34.60 | 38.36 |
| 1881 | 95,750 | 15.94 | 18.22 |
| 1886 | 111,971 | 16.94 | 18.07 |
| 1891 | 123,851 | 10.62 | 8.33 |
| 1896 | 141,339 | 14.12 | 12.24 |
| 1901 | 158,898 | 12.42 | 9.86 |
| 1906 | 184,457 | 16.09 | 14.99 |
| 1911 | 215,425 | 16.79 | 13.49 |
| 1916 | 238,066 | 10.51 | 9.02 |
| 1921 | 260,229 | 9.31 | 10.87 |
| 1926 | 299,997 | 15.28 | 10.30 |
| 1936 | 349,905 | 16.64 | 10.93 |
The rate of population growth exceeded that of private dwellings during each inter-censal period between 1871 and 1886; while each census between 1886 and 1916 revealed a greater increase in the number of private dwellings than in population. Except for the first and the last two periods shown in the table (1871–74, 1921–26, and 1926–36) there was, however, little disparity between the inter-censal increases shown by the two sets of figures. The growth in private dwellings between 1916 and 1921 was slightly less than the population increase, the five-yearly period between those years including the later years of the war. The increase in private dwellings between 1921 and 1926 exceeded considerably the population increase, as also was the case between 1926 and 1936. The general trend since 1886 has been for the rate of increase of private dwellings to exceed the population increase, no doubt largely due to the decrease in the size of the average family. The census definition of a private dwelling covers the residence of a family, whether a separate house, a tenement, a fiat, or rooms in a house. From this definition it follows that an increase in private dwellings does not necessarily denote a corresponding increase in housing capacity. The recent increase in flat dwelling, for example, is an influence of importance, since each separate flat is counted as a private dwelling. It will be realized also that regional factors are of very great importance, since many obsolete dwellings will be included in the figures for declining towns; while, again, the rate of increase in dwellings in rapidly-growing localities may be inadequate to cope with the population increase. There has been evidence recently of difficulty in obtaining housing accommodation in several of the larger towns; and, in order to throw some light on this point, a special collection of data was made in conjunction with the semi-annual collection of information regarding rents in twenty-five towns.
An inquiry was instituted as to the number of houses which were available for renting but which were not actually let as at the 16th August, 1937. Returns were received from agents collecting rents from 16,580 unfurnished houses in twenty-five centres of importance. The very paucity of the data given in the table which follows is illuminating, and it may even fall a little short of revealing to the full the extreme scarcity of houses available for renting at the present time, for the reason that vacant houses may be in the hands of more than one agent and thus be duplicated in the returns. A careful scrutiny, however, leads to the conclusion that untenanted houses within the purview of the inquiry are not overstated by more than five at the most.
NUMBER OF UNTENANTED UNFURNISHED HOUSES.
| — | Untenanted, in Hands of Agents approached. | Tenanted (in Hands of same Agents). | Percentage Untenanted of Tenanted. | ||||||
|---|---|---|---|---|---|---|---|---|---|
| Number of Rooms. | |||||||||
| 2. | 3. | 4. | 5. | 6. | 7 and over. | Total. | |||
| Auckland | 2 | 4 | 2 | 3 | 11 | 7,565 | 0.15 | ||
| Wellington | 1 | 3 | 4 | 2,676 | 0.15 | ||||
| Christchurch | 3 | 4 | 6 | 4 | 9 | 26 | 1,833 | 1.42 | |
| Dunedin | 1 | 2 | 1 | 5 | 3 | 3 | 15 | 1,195 | 1.26 |
| Twenty-one other centres | 2 | 4 | 7 | 5 | 1 | 1 | 20 | 3,311 | 0.60 |
| Totals | 5 | 9 | 13 | 20 | 10 | 19 | 76 | 16,580 | 0.46 |
The statistics of occupational and industrial distribution of the population and of unemployment, compiled as part of the census of population, indicate the growth of building and construction activity. Data are available in a comparable form back to the 1891 census, except for unemployment (1896).
PERSONS ENGAGED IN CONSTRUCTION AND REPAIR OF BUILDINGS, ROADS, RAILWAYS, ETC.
| Census of | Wage-earners. | Total Persons engaged. | |||||
|---|---|---|---|---|---|---|---|
| Total. | Employed. | Unemployed. | |||||
| Number. | Inter-censal Increase. | Number. | Per Cent. of Total. | Number. | Inter-censal Increase. | ||
* Decrease. | |||||||
| Per Cent. | Per Cent. | Per Cent. | |||||
| 1891 | 8,836 | 12,601 | |||||
| 1896 | 11,533 | 10,026 | 1,507 | 13.07 | 15,378 | 22.04 | |
| 1901 | 18,315 | 17,438 | 73.93 | 877 | 4.79 | 22,892 | 48.86 |
| 1906 | 25,986 | 24,817 | 42.32 | 1,169 | 4.50 | 31,715 | 38.54 |
| 1911 | 29,371 | 28,502 | 14.85 | 869 | 2.96 | 36,979 | 16.60 |
| 1916 | 20,523 | 19,782 | -30.60* | 741 | 3.61 | 27,319 | -26.12* |
| 1921 | 25,637 | 24,569 | 24.20 | 1,068 | 4.17 | 33,593 | 22.97 |
| 1926 | 34,989 | 33,849 | 37.77 | 1,140 | 3.26 | 43,307 | 28.92 |
The statistics quoted above indicate a steady growth between census dates in both the total number of persons and of wage-earners engaged in the building and construction industry, with one exception (in 1916). The decline on that occasion is, however, attributable to war conditions, including the absence of an appreciable proportion of the male population of the working ages. Unemployment had not attained serious proportions on any census date, with the exception of 1896, when business conditions were abnormally depressed. From the statistics quoted in a later portion of this section (page 537) it will be apparent that the building and construction industry was exceptionally depressed during the years 1931–33, the number of persons engaged falling to very low levels.
The next table, compiled from the census data, indicates the long period changes in the importance of the building and construction industry relative to that of other industries.
| Year. | Total Number of Persons gainfully occupied. | Persons engaged in Building and Construction. | |
|---|---|---|---|
| Number. | Per cent. of Total gainfully occupied Persons. | ||
| 1891 | 252,763 | 12,601 | 4.99 |
| 1896 | 292,932 | 15,378 | 5.25 |
| 1901 | 340,230 | 22,892 | 6.73 |
| 1906 | 399,085 | 31,715 | 7.95 |
| 1911 | 454,117 | 36,979 | 8.14 |
| 1916 | 432,216 | 27,319 | 6.32 |
| 1921 | 506,293 | 33,593 | 6.64 |
| 1926 | 546,839 | 43,307 | 7.92 |
While the somewhat fragmentary statistics of consumption of building materials quoted under a previous heading afford an indirect indication of the long term movement in building and construction activity, direct evidence as to the changes in this industry, prior to 1922, are available only from the census data. Expenditure on public works by the General Government is included in this and previous issues of the Year-Book in the section relating to Public Finance. Statistics of building permits issued in cities, boroughs, and town districts during each March year have been collected since 1921–22—for use, inter alia, as an aid in compiling inter-censal estimates of population. These statistics afford a conspectus of changes in building activity from year to year. It should be noted, however, that only buildings (including business premises, &c.) come within the purview of the returns of building permits; and, moreover, there are two other factors which impair somewhat the accuracy of the figures as a guide to short period fluctuations in building activity:—
Permits may be issued and not made use of for a considerable time after they are taken out. Moreover, in some instances, permits may not be used at all. Neither of these facts should, however, affect seriously the reliability of the statistics as an indication of changes in building activity, since a fee is charged by local authorities for the issue of a permit; and a permit is not likely to be taken out until plans, &c., have been finalised and a definite decision to build arrived at.
A more important consideration, which applies with special force to buildings other than dwelling houses, is the fact that the value shown represents, in the great majority of instances, the total contract price or estimated cost of the whole job. A permit for an exceptionally large building involves building activity spread over many months, whereas in the permit statistics the value is shown in a single year's totals only. This qualification applies with greater force to the monthly statistics, quoted in the next portion of this section, than to the annual statistics.
The scope of the collection was widened by the inclusion in 1926–27 of three road districts—increased to six in 1927–28—in Eden County (suburban to Auckland) and further extended in 1928–29 by the addition of two counties—increased to four in 1929–30—adjacent to Wellington and Christchurch. Of the six road districts in Eden County, two were amalgamated with Auckland City from 1st April, 1928, and one became a borough from 1st April, 1930.
As a result of the extended scope of the returns, the comparison has been somewhat impaired, and the next table shows the figures under two heads—viz., one giving totals for all districts covered in the particular year and the second giving the totals for only cities, boroughs, and town districts.
The aggregate population of the areas covered by the statistics comprises 62 per cent. of the total population of the Dominion. Although 38 per cent. of the population resides in the rural areas outside the ambit of the statistical inquiry, it is probable that, with the exception of several counties adjacent to large towns, building activity in these areas accounts for only a very small percentage of the Dominion total.
BUILDING PERMITS.
| Year ended 31st March, | All Districts covered. | Cities, Boroughs, and Town Districts. | ||||
|---|---|---|---|---|---|---|
| Number of New Private Dwellings. | Value of New Buildings: All Classes. | Total Value All Buildings (including Alterations and Additions). | Number of New Private Dwellings. | Value of New Buildings: All Classes. | Total Value All Buildings (including Alterations and Additions). | |
| No. | £ | £ | No. | £ | £ | |
| 1922 | 4,330 | 4,602,834 | 5,283,012 | 4,330 | 4,602,834 | 5,283,012 |
| 1923 | 5,025 | 6,124,439 | 7,101,681 | 5,025 | 6,124,439 | 7,101,681 |
| 1924 | 6,245 | 7,708,933 | 9,146,479 | 6,245 | 7,708,933 | 9,146,479 |
| 1925 | 5,805 | 7,823,331 | 9,304,160 | 5,805 | 7,823,331 | 9,304,160 |
| 1926 | 6,850 | 8,613,549 | 10,169,530 | 6,850 | 8,613,549 | 10,169,530 |
| 1927 | 7,179 | 9,357,977 | 11,019,389 | 6,752 | 8,944,334 | 10,575,535 |
| 1928 | 5,690 | 8,127,732 | 9,665,216 | 5,388 | 7,843,773 | 9,353,055 |
| 1929 | 5,212 | 7,326,464 | 9,054,421 | 4,871 | 6,988,408 | 8,691,962 |
| 1930 | 5,747 | 7,917,349 | 9,959,877 | 5,228 | 7,362,998 | 9,336,301 |
| 1931 | 3,463 | 4,240,238 | 5,473,395 | 3,200 | 4,056,274 | 5,260,620 |
| 1932 | 1,555 | 1,936,447 | 2,728,486 | 1,415 | 1,847,508 | 2,620,651 |
| 1933 | 1,496 | 1,874,795 | 2,474,866 | 1,306 | 1,773,313 | 2,341,690 |
| 1934 | 2,649 | 3,141,897 | 3,889,890 | 2,416 | 2,987,773 | 3,718,717 |
| 1935 | 2,892 | 2,742,495 | 3,643,688 | 2,655 | 2,612,684 | 3,492,062 |
| 1936 | 4,140 | 4,695,736 | 5,929,803 | 3,835 | 4,468,126 | 5,674,198 |
| 1937 | 4,555 | 4,927,326 | 6,581,233 | 4,207 | 4,675,363 | 6,273,444 |
Prior to 1936–37 each block of flats was included as a single dwelling, but now that more information is available each individual flat is counted as a separate dwelling. Included in the figures for “all districts” in 1936–37 are 421 flats (98 blocks), and of these 417 flats (96 blocks) are included in “cities, boroughs, and town districts.”
The figures shown for the number of new private dwellings erected mirror the recent marked movements in building activity. A peak level was reached in 1925–26, when 6,850 new dwellings were erected in cities, boroughs, or town districts. The low point during the sixteen years covered by the table occurred in 1932–33, when only 1,306 new private dwellings were erected. The 1935–36 statistics reveal a marked increase as compared with the position for some years past, while a further though not so pronounced increase is revealed by the 1936–37 totals. The erection of houses under the Government's housing scheme was commenced in March, 1937, and twenty-two houses are included in the above figures. (See pp. 524–5.)
Considering only cities, boroughs, and town districts, the total value of all building operations reveals marked fluctuations. The total value of £10,575,535 in 1926–27—the peak year covered by the table—probably represents the highest level in the history of the country. The value in 1932–33—the low point since 1921–22—was only 22 per cent. of the 1926–27 maximum. The 1936–37 total is 11 per cent. higher than that for 1935–36 and 168 per cent. higher than 1932–33 (the low point), but only equal to 63 per cent. of the total in 1926–27 (the peak year).
The Dominion aggregate statistics quoted in the preceding paragraphs relate only to the main types of building activity. More detailed statistics are included in the Annual Report on Population and Buildings, where, inter alia, permit statistics for individual towns and certain urban districts are given.
A detailed summary of the Dominion totals for the last three years follows:—
BUILDING PERMITS ISSUED.
| Private dwellings— | |||
| New buildings— | 1934–35. | 1935–36. | 1936–37. |
| Number | 2,892 | 4,140 | 4,555 |
| Value | £1,997,482 | £3,074,774 | £3,437,780 |
| Value of alterations and additions | £327,455 | £421,456 | £527,490 |
| Other buildings— | |||
| New buildings— | |||
| Number | 525 | 771 | 755 |
| Value | £745,013 | £1,620,962 | £1,489,546 |
| Value of alterations and additions | £573,738 | £812,611 | £1,126,417 |
| Total— | |||
| New buildings— | |||
| Number | 3,417 | 4,911 | 5,310 |
| Value | £2,742,495 | £4,695,736 | £4,927,326 |
| Value of alterations and additions | £901,193 | £1,234,067 | £1,653,907 |
Blocks of flats, which numbered thirty-four in 1934–35 and twenty-two in 1935–36, are included with private dwellings, each block being counted as one dwelling; but for 1936–37 the actual number of flats (421) is included. The number of blocks containing these was ninety-eight. New private dwellings for 1936–37 show an increase of £363,006, and alterations, and additions an increase of £106,034 compared with the previous year. Increases both in number and value have been recorded during the last five years, and it is noted that the average value per dwelling has increased considerably. In 1932–33 the average value was £575; in 1933–34, £603; in 1934–35, £691; in 1935–36, £743; and in 1936–37, £812. By treating each flat as a separate dwelling the average value was £755 in 1936–37.
New “other buildings” decreased by sixteen in number and £131,416 in value, while the value of alterations and additions to existing buildings increased by £313,806 on the figures for the previous year.
The following table arranges districts with minimum building values of £50,000 in 1936–37 in descending order:—
| £ | |
|---|---|
| Wellington City | 976,362 |
| Auckland City | 801,821 |
| Christchurch City | 531,386 |
| Dunedin City | 455,261 |
| Invercargill City | 227,142 |
| Lower Hutt Borough | 190,028 |
| Palmerston North City | 170,601 |
| Napier Borough | 142,848 |
| Hamilton Borough | 135,313 |
| Hastings Borough | 132,026 |
| New Plymouth Borough | 118,901 |
| One Tree Hill Borough | 87,651 |
| Hutt County | 84,344 |
| Nelson City | 81,269 |
| Gisborne Borough | 79,112 |
| Waimairi County | 78,625 |
| Timaru Borough | 76,239 |
| Tauranga Borough | 75,241 |
| Greymouth Borough | 73,206 |
| Mount Eden Borough | 65,830 |
| Masterton Borough | 65,080 |
| Mount Albert Borough | 57,090 |
| Ashburton Borough | 56,005 |
| Blenheim Borough | 54,867 |
| Gore Borough | 51,932 |
| Mount Roskill Road District | 50,749 |
While the annual statistics of building permits issued afford an indication of changes in the annual value and volume of building activity, short period movements in building activity are of considerable interest, particularly in times of rapid economic change. With the purpose of providing information as to current changes in building activity, the Census and Statistics Department initiated in 1926 the collection of monthly statistics of building permits issued in the larger towns. Although the monthly returns are not on such a comprehensive basis as the annual collection of these statistics, nevertheless towns with an aggregate population of nearly 800,000 are covered, so that the sample forms a sufficient representation of the Dominion as a whole.
In the first table following, the number of permits for new dwellings and the total value represented by all permits issued in the larger towns are shown for each month since January, 1929; while the statistics are shown in greater detail from January, 1936, in the second table:—
BUILDING PERMITS IN THE LARGER TOWNS.
| Month. | Year. | ||||||||
|---|---|---|---|---|---|---|---|---|---|
| 1929. | 1930. | 1931. | 1932. | 1933. | 1934. | 1935. | 1936. | 1937. | |
[NOTE.—Commencing from April, 1937, each flat has been counted as a new dwelling; prior to that date each block of flats was counted as only one dwelling.] | |||||||||
| New Dwellings. | |||||||||
| No. | No. | No. | No. | No. | No. | No. | No. | No. | |
| January | 388 | 335 | 120 | 94 | 84 | 188 | 233 | 291 | 224 |
| February | 374 | 289 | 113 | 92 | 63 | 162 | 195 | 250 | 238 |
| March | 377 | 324 | 103 | 65 | 90 | 136 | 225 | 255 | 225 |
| April | 377 | 267 | 87 | 63 | 62 | 107 | 204 | 275 | 308 |
| May | 469 | 306 | 93 | 51 | 85 | 113 | 239 | 337 | 354 |
| June | 382 | 300 | 90 | 73 | 47 | 97 | 213 | 340 | 323 |
| July | 482 | 287 | 100 | 79 | 179 | 79 | 226 | 344 | 356 |
| August | 453 | 274 | 91 | 80 | 211 | 149 | 294 | 319 | 415 |
| September | 461 | 272 | 102 | 122 | 233 | 247 | 312 | 273 | 424 |
| October | 475 | 298 | 105 | 119 | 211 | 303 | 321 | 232 | |
| November | 426 | 205 | 101 | 73 | 264 | 246 | 315 | 266 | |
| December | 289 | 143 | 69 | 100 | 203 | 179 | 261 | 209 | |
| All Permits. | |||||||||
| £ | £ | £ | £ | £ | £ | £ | £ | £ | |
| January | 645,120 | 665,956 | 229,606 | 185,946 | 125,312 | 263,829 | 257,191 | 407,961 | 378,427 |
| February | 648,338 | 552,294 | 239,089 | 126,653 | 96,812 | 405,133 | 259,379 | 517,974 | 429,237 |
| March | 652,073 | 826,983 | 257,097 | 124,962 | 301,279 | 613,297 | 332,076 | 458,072 | 486,918 |
| April | 672,284 | 404,106 | 179,044 | 134,196 | 76,028 | 146,822 | 537,172 | 435,463 | 602,064 |
| May | 853,759 | 540,296 | 187,225 | 112,613 | 98,369 | 272,335 | 346,167 | 422,956 | 601,445 |
| June | 840,142 | 516,952 | 208,515 | 120,808 | 146,410 | 151,038 | 282,063 | 512,626 | 540,655 |
| July | 857,948 | 565,086 | 292,309 | 210,342 | 183,886 | 170,753 | 391,384 | 561,382 | 604,377 |
| August | 782,916 | 420,698 | 239,693 | 213,949 | 247,082 | 212,099 | 391,505 | 486,963 | 804,517 |
| September | 827,063 | 435,023 | 237,892 | 213,524 | 590,720 | 297,231 | 416,004 | 440,237 | 706,934 |
| October | 796,792 | 494,986 | 177,357 | 193,746 | 259,923 | 391,883 | 399,403 | 428,725 | |
| November | 766,748 | 314,585 | 153,627 | 191,999 | 264,596 | 327,020 | 486,546 | 491,430 | |
| December | 580,116 | 257,150 | 143,386 | 165,222 | 214,670 | 273,653 | 354,107 | 358,638 | |
The monthly average number of permits issued for the erection of new dwellings in 1929 was 413, while in 1932—the lowest year shown in the table—the average was only eighty-four. The actual low point was reached in June, 1933, when only forty-seven permits were issued for new dwellings.
It will be observed that the statistics of value of all permits display at times violent month to month changes. This is due to the influence on the figures of permits which may be taken out for exceptionally large undertakings in any one month, the actual work being spread over a considerable period. Nevertheless, the figures indicate clearly a sharp fall late in 1930 and during 1931 and 1932. In June, 1932, the late Unemployment Board initiated a building subsidy scheme, which was, no doubt, largely responsible for the improvement evident in the figures for the later months of the year as compared with those for the earlier months. On completion of the building activity stimulated by the subsidy a further setback became apparent, some of the early months of 1933 showing exceptionally low permit figures, particularly in respect of dwellings. The substantial revival indicated by the statistics for the later months of 1933 was due largely to the influence of a second subsidy scheme, which came into operation in June, 1933. The general trend in the statistics since the end of 1933 has been upwards, with minor recessions. Further building subsidy schemes were in operation in 1934, 1935, and 1936, the schemes terminating on 1st October, 1936.
As mentioned earlier in this section, houses erected under the Government's housing scheme are included in the building statistics, the numbers being—March, 1937, 22; April, 35; May, 78; June, 77; July, 117; August, 115; and September, 160. These figures relate to the number of houses of which actual building was commenced during the months shown.
The statistics for the past two years indicate that the volume of building activity is being maintained at a much higher level than for some years past.
DETAILED STATISTICS, JANUARY, 1936, TO SEPTEMBER, 1937.
| Month. | Alterations to Existing Buildings. | New Buildings. | Totals. | |||||
|---|---|---|---|---|---|---|---|---|
| Number. | Value. | Dwellings only. | Totals. | Number. | Value. | |||
| Number. | Value. | Number. | Value. | |||||
| £ | £ | £ | £ | |||||
| January, 1936 | 471 | 75,358 | 291 | 230,647 | 336 | 332,603 | 807 | 407,961 |
| February, 1936 | 571 | 113,621 | 250 | 195,725 | 307 | 404,353 | 878 | 517,974 |
| March, 1936 | 806 | 95,365 | 255 | 204,257 | 305 | 362,707 | 1,111 | 458,072 |
| April, 1936 | 752 | 103,552 | 275 | 222,055 | 299 | 331,911 | 1,051 | 435,463 |
| May, 1936 | 701 | 98,265 | 337 | 269,386 | 376 | 324,691 | 1,077 | 422,956 |
| June, 1936 | 712 | 127,755 | 340 | 279,016 | 370 | 384,871 | 1,082 | 512,626 |
| July, 1936 | 668 | 143,727 | 344 | 303,761 | 437 | 417,655 | 1,105 | 561,382 |
| August, 1936 | 673 | 132,877 | 319 | 279,094 | 361 | 354,086 | 1,034 | 486,963 |
| September, 1936 | 692 | 123,835 | 273 | 230,648 | 314 | 316,402 | 1,006 | 440,237 |
| October, 1936 | 703 | 131,074 | 232 | 186,939 | 262 | 297,651 | 965 | 428,725 |
| November, 1936 | 680 | 165,461 | 266 | 211,845 | 317 | 325,969 | 997 | 491,430 |
| December, 1936 | 495 | 91,277 | 209 | 181,409 | 244 | 267,361 | 739 | 358,638 |
| January, 1937 | 538 | 89,881 | 224 | 216,050 | 277 | 288,546 | 815 | 378,427 |
| February, 1937 | 676 | 77,427 | 238 | 203,587 | 264 | 351,810 | 940 | 429,237 |
| March, 1937 | 719 | 136,813 | 225 | 231,270 | 275 | 350,105 | 994 | 486,918 |
| April, 1937 | 821 | 163,752 | 308 | 255,168 | 346 | 438,312 | 1,167 | 602,064 |
| May, 1937 | 746 | 136,811 | 354 | 301,745 | 389 | 464,634 | 1,135 | 601,445 |
| June, 1937 | 788 | 144,491 | 323 | 312,260 | 349 | 396,164 | 1,137 | 540,655 |
| July, 1937 | 767 | 168,913 | 356 | 334,624 | 383 | 435,464 | 1,150 | 604,377 |
| August, 1937 | 740 | 129,660 | 415 | 385,821 | 458 | 674,857 | 1,198 | 804,517 |
| September, 1937 | 716 | 151,161 | 424 | 407,847 | 466 | 555,773 | 1,182 | 706,934 |
Since the collection of monthly building permit statistics was begun only in 1926, there are only four “normal” years available from which to form an estimate of the normal seasonal fluctuations in building operations. With such a short period, the influence of fortuitous circumstances in the figures for any particular month cannot be entirely eliminated.
The following table, showing the percentage the value of permits issued in each month bears to the annual total, indicates a lack of any marked seasonal element:—
| Month. | 1926. | 1927. | 1928. | 1929. | Average, 1926–29. |
|---|---|---|---|---|---|
| Per Cent. | Per Cent. | Per Cent. | Per Cent. | Per Cent. | |
| January | 6 | 7 | 9 | 7 | 8 |
| February | 8 | 8 | 10 | 7 | 8 |
| March | 10 | 10 | 8 | 7 | 9 |
| April | 8 | 6 | 6 | 8 | 7 |
| May | 7 | 8 | 8 | 10 | 8 |
| June | 11 | 7 | 11 | 9 | 10 |
| July | 8 | 9 | 11 | 10 | 9 |
| August | 8 | 8 | 8 | 0 | 8 |
| September | 10 | 9 | 8 | 9 | 9 |
| October | 9 | 13 | 8 | 9 | 10 |
| November | 9 | 9 | 7 | 9 | 8 |
| December | 6 | 6 | 6 | 6 | 6 |
| Totals | 100 | 100 | 100 | 100 | 100 |
It will be observed that the lowest month is December, due, no doubt to the cessation of work caused by the holiday period; while April (in which, month Easter usually falls) is also a relatively low month. The figures for other months do not show any marked seasonal trend, a noteworthy feature being the relatively high position occupied by the winter months. When activity on construction works is also taken into account, the lack of a winter decline is even more marked, as is illustrated by the employment statistics shown in the Employment and Unemployment section of this Year-Book.
While the building permit statistics give an indication of the movement in building activity in the areas covered by the statistics, they are incomplete in that rural building activity is not covered; while, again, the information so obtained does not give any indication of construction activity apart from buildings. A further point is that an analysis of the distribution of the costs of building is not possible from the permit statistics. Since 1925, however, an annual collection of statistics of building and construction, on the same lines as the returns of factory production, has been made.
The regulations empowering the collection of the statistics define the term “building and contracting establishment” as including establishments engaged in the construction or repair of buildings, wharves, jetties, bridges, or other construction work which employ two or more hands, inclusive of working proprietors. The returns collected refer principally to the year ended 31st March. Where the ordinary financial year ends on a date other than the 31st March, figures are accepted in respect of the financial year, provided the last day falls within the three months immediately preceding or following the 31st March.
The statistics of building and construction do not include the construction of railways, roads, streets, bridges, wharves, buildings, &c., by the General Government or by local authorities, except where, in the case of bridges, wharves, buildings, and other similar constructions, the work has been carried out by contract. Reference to construction by the Public Works Department is made in Section XXIVA. Particulars are included in the following tables in respect of a few local authorities which have a special staff engaged on repairing and making alterations to existing structures.
From the nature of the industry it is obviously impossible to collect returns from all who engage in building operations, and especially from those who only intermittently undertake building contracts or whose operations are small. Nevertheless, the statistics cover a large proportion of building operations throughout the Dominion, all builders and contractors engaged in a large way or on big contracts, and the majority of others regularly undertaking building and construction work, being included among those from whom returns are received.
Special efforts were made to get in touch with all builders for the 1934–35 and 1935–36 collections, and a considerable part of the large increase in the totals shown for these two years is no doubt due to this factor. It is probable that a considerably greater proportion of building activity (both urban and rural) is covered by the statistics for 1934–35 and 1935–36 than was the case in previous years.
During the ten years ended on 31st March, 1936, the value of building permits issued in urban localities was £63,842,031, whereas the value of work done during that period by builders furnishing building and construction returns was £62,311,816.
The explanations given hereunder will be found of assistance in interpreting the terms used in connection with the statistics:—
Average Number of Persons engaged.—This represents the sum of the persons engaged each month during the year covered, divided by twelve.
Cost of Materials used.—Included under this heading is the cost of timber, cement, bricks, &c., used, together with the amounts paid to sub-contractors where work such as plumbing, painting, electrical installation, joinery, &c., was carried out by sub-contractors.
Other Expenses of Operation.—This heading comprises expenditure on fuel and power, insurance, depreciation, &c.
Value of Work done.—This represents the total contract-price of the work actually commenced and finished during the year. Where contracts were not commenced and finished within the period covered, the value of the work done was assessed as being a proportion of the total contract-price equal to the proportion that the total expenditure during the period bears to the total estimated expenditure on the contract.
The figures quoted in the following table illustrate the scope of the inquiry at each annual collection of these statistics:—
| Year. | Establishments. | Persons engaged. | Salaries and Wages. | Cost of Materials (including Payments to Subcontractors). | Value of Buildings completed during Year. | Total Value of Work done. |
|---|---|---|---|---|---|---|
| £ | £ | £ | £ | |||
| 1926–27 | 958 | 10,745 | 2,532,900 | 5,132,828 | 5,412,789 | 8,714,743 |
| 1927–28 | 1,032 | 10,500 | 2,417,669 | 4,968,191 | 5,366,422 | 8,418,463 |
| 1928–29 | 1,457 | 11,703 | 2,736,588 | 6,224,826 | 7,136,848 | 9,704,062 |
| 1929–30 | 1,310 | 11,312 | 2,665,458 | 6,010,113 | 6,790,582 | 9,407,881 |
| 1930–31 | 1,152 | 9,505 | 2,096,420 | 4,600,059 | 5,522,022 | 7,216,627 |
| 1931–32 | 830 | 4,869 | 920,010 | 1,955,138 | 1,815,670 | 3,073,418 |
| 1932–33 | 821 | 3,922 | 662,036 | 1,446,857 | 1,407,090 | 2,227,488 |
| 1933–34 | 829 | 4,459 | 712,399 | 1,707,732 | 1,555,563 | 2,553,719 |
| 1934–35 | 1,319 | 6,852 | 1,177,090 | 3,315,018 | 3,091,850 | 4,715,456 |
| 1935–36 | 1,454 | 8,346 | 1,536,924 | 4,424,342 | 4,371,035 | 6,279,959 |
While the movements in the figures—particularly as between 1934–35 and 1935–36 and previous years—must be interpreted with caution, in view of the variations in the size of the sample, a severe decline in building activity during 1930–31 to 1932–33 is clearly indicated. A review of the last two years shows that the revival that commenced in the building trade during 1934–35 was advanced a further stage during 1935–36. Persons engaged during 1935–36 (excluding sub-contractors and their employees) numbered 8,346, or 22 per cent. more than in 1934–35, while salaries and wages paid increased by 31 per cent. The cost of materials used rose by over £1,100,000, and the value of work done increased from £4,715,456 in 1934–35 to £6,279,959 in 1935–36.
The subjoined table shows the principal statistics for the year 1935–36:—
| Provincial District. | Establishments. | Persons engaged. | Salaries and Wages. | Cost of Materials (including Payments to Subcontractors). | Value of Buildings completed during Year. | Total Value of Work done. |
|---|---|---|---|---|---|---|
| £ | £ | £ | £ | |||
| Auckland | 432 | 2,220 | 406,231 | 1,261,576 | 1,194,606 | 1,732,387 |
| Hawke's Bay | 83 | 471 | 83,728 | 239,361 | 224,796 | 348,213 |
| Taranaki | 50 | 296 | 46,441 | 119,457 | 126,723 | 174,636 |
| Wellington | 323 | 2,155 | 407,992 | 1,126,257 | 1,070,809 | 1,610,828 |
| Marlborough | 15 | 83 | 13,773 | 32,660 | 35,144 | 49,823 |
| Nelson | 38 | 220 | 37,215 | 83,665 | 66,329 | 128,180 |
| Westland | 20 | 137 | 22,389 | 42,582 | 30,129 | 66,246 |
| Canterbury | 246 | 1,450 | 275,098 | 733,351 | 878,090 | 1,081,611 |
| Otago | 153 | 946 | 180,828 | 514,013 | 493,025 | 739,029 |
| Southland | 94 | 368 | 63,229 | 271,420 | 251,384 | 349,006 |
| Totals | 1,454 | 8,346 | 1,536,924 | 4,424,342 | 4,371,035 | 6,279,959 |
Of the total number of persons finding employment in building and construction operations covered by the returns in 1935–36, no fewer than 4,375, or 52 per cent., were located in the Auckland and Wellington Provincial Districts.
The number of persons engaged (including working proprietors, but excluding sub-contractors) and the salaries and wages paid to these during the year 1935–36 are given hereunder. The figure shown in respect of salaries and wages of proprietors is the aggregate amount drawn in lieu of salary or wages.
| — | Persons engaged. | Salaries and Wages paid | ||||
|---|---|---|---|---|---|---|
| Males. | Females. | Total. | To Males. | To Females. | Total. | |
| £ | £ | £ | ||||
| Proprietors | 1,545 | 1,545 | 264,789 | 264,789 | ||
| Managers and overseers | 172 | 172 | 50,914 | 50,914 | ||
| Accountants, clerks, &c. | 89 | 75 | 164 | 14,043 | 6,132 | 20,175 |
| Wage-earners | 6,465 | 6,465 | 1,201,046 | 1,201,046 | ||
| Totals | 8,271 | 75 | 8,346 | 1,530,792 | 6,132 | 1,536,924 |
The following table shows, for each of the last ten years, the number of persons engaged, classified according to occupational status, together with the total salaries and wages paid to each group, and also the average payment received per person engaged.
| Year. | Proprietors. | Managers and overseers. | Accountants, Clerks, &c. | Wage-earners. | Total. |
|---|---|---|---|---|---|
| Persons engaged. | |||||
| 1926–27 | 1,049 | 256 | 236 | 9,204 | 10,745 |
| 1927–28 | 1,146 | 268 | 241 | 8,845 | 10,500 |
| 1928–29 | 1,565 | 254 | 287 | 9,597 | 11,703 |
| 1929–30 | 1,444 | 216 | 286 | 9,366 | 11,312 |
| 1930–31 | 1,281 | 245 | 245 | 7,734 | 9,505 |
| 1931–32 | 923 | 150 | 145 | 3,651 | 4,869 |
| 1932–33 | 900 | 131 | 131 | 2,760 | 3,922 |
| 1933–34 | 896 | 137 | 131 | 3,295 | 4,459 |
| 1934–35 | 1,411 | 142 | 147 | 5,152 | 6,852 |
| 1935–36 | 1,545 | 172 | 164 | 6,465 | 8,346 |
| Salaries and Wages paid. | |||||
| £ | £ | £ | £ | £ | |
| 1926–27 | 313,337 | 107,211 | 43,865 | 2,068,487 | 2,532,900 |
| 1927–28 | 318,412 | 110,116 | 43,460 | 1,945,681 | 2,417,669 |
| 1928–29 | 431,744 | 110,801 | 46,164 | 2,147,879 | 2,736,588 |
| 1929–30 | 401,012 | 102,093 | 47,319 | 2,115,034 | 2,665,458 |
| 1930–31 | 331,413 | 94,941 | 41,815 | 1,628,251 | 2,096,420 |
| 1931–32 | 180,211 | 56,673 | 23,812 | 659,314 | 920,010 |
| 1932–33 | 140,211 | 42,932 | 17,753 | 461,140 | 662,036 |
| 1933–34 | 135,281 | 40,272 | 16,282 | 520,564 | 712,399 |
| 1934–35 | 213,449 | 43,229 | 19,167 | 901,245 | 1,177,090 |
| 1935–36 | 264,789 | 50,914 | 20,175 | 1,201,046 | 1,536,924 |
| Average Amount of Salary or Wages. | |||||
| £ | £ | £ | £ | £ | |
| 1926–27 | 299 | 419 | 186 | 225 | 236 |
| 1927–28 | 278 | 411 | 180 | 220 | 230 |
| 1928–29 | 276 | 436 | 161 | 224 | 234 |
| 1929–30 | 278 | 473 | 165 | 226 | 236 |
| 1930–31 | 259 | 388 | 171 | 211 | 221 |
| 1931–32 | 195 | 378 | 164 | 181 | 189 |
| 1932–33 | 156 | 328 | 136 | 167 | 169 |
| 1933–34 | 151 | 294 | 124 | 158 | 160 |
| 1934–35 | 151 | 304 | 130 | 175 | 172 |
| 1935–36 | 171 | 296 | 123 | 186 | 184 |
The decline in the building trade consequent upon the economic depression is clearly illustrated in the table. The amounts shown above as salaries and wages of proprietors represent amounts drawn in lieu of salaries and wages.
Returns as to employees and wages in a selected week are collected each year. The period covered is the nearest normal week to 31st March, and the data collected include the number of employees engaged at each wage rate, as well as the total employees and the total earnings during the specified week. Working proprietors, managers, overseers, accountants, and clerks do not come within the scope of the return, which covers wage-earning employees only.
The following table gives the number of wage-earning employees engaged at the various weekly rates of wages for the nearest normal week to 31st March in the years 1929, 1931, and 1934 to 1936:—
| Rate of Wages. | Year. | ||||
|---|---|---|---|---|---|
| 1929. | 1931. | 1934. | 1935. | 1936. | |
| Under 20s. | 169 | 79 | 92 | 138 | 205 |
| 20s. and under 25s. | 180 | 180 | 49 | 111 | 151 |
| 25s. and under 30s. | 102 | 84 | 30 | 31 | 84 |
| 30s. and under 35s. | 258 | 238 | 82 | 63 | 100 |
| 35s. and under 40s. | 217 | 163 | 65 | 38 | 45 |
| 40s. and under 45s. | 137 | 91 | 66 | 72 | 83 |
| 45s. and under 50s. | 220 | 240 | 122 | 73 | 50 |
| 50s. and under 55s. | 145 | 96 | 45 | 36 | 35 |
| 55s. and under 60s. | 55 | 50 | 54 | 55 | 37 |
| 60s. and under 65s. | 135 | 53 | 101 | 118 | 85 |
| 65s. and under 70s. | 80 | 22 | 222 | 200 | 194 |
| 70s. and under 75s. | 68 | 80 | 350 | 660 | 613 |
| 75s. and under 80s. | 91 | 66 | 229 | 307 | 373 |
| 80s. and under 85s. | 799 | 724 | 717 | 436 | 530 |
| 85s. and under 90s. | 881 | 449 | 1,308 | 2,227 | 491 |
| 90s. and under 95s. | 319 | 220 | 175 | 489 | 3,120 |
| 95s. and under 100s. | 423 | 348 | 90 | 174 | 512 |
| 100s. and under 105s. | 1,528 | 1,529 | 54 | 72 | 242 |
| 105s. and under 110s. | 347 | 171 | 27 | 34 | 71 |
| 110s. and under 115s. | 1,804 | 1,108 | 43 | 58 | 113 |
| 115s. and under 120s. | 187 | 92 | 12 | 11 | 29 |
| 120s. and under 130s. | 741 | 333 | 19 | 26 | 59 |
| 130s. and under 140s. | 313 | 131 | 4 | 10 | 14 |
| 140s. and under 160s. | 203 | 116 | 4 | 6 | 14 |
| 160s. and over | 77 | 50 | 4 | 5 | 7 |
| Number of employees | 9,479 | 6,713 | 3,964 | 5,451 | 7,257 |
| Aggregate earnings during week | £43,190 | £29,168 | £14,457 | £20,636 | £28,886 |
| Average earnings during week | £4 11s. 2d. | £4 6s. 11d. | £3 12s. 11d. | £3 15s. 9d. | £3 19s. 7d. |
It will be observed from the above that some violent fluctuations have occurred in the average weekly earnings. It is noteworthy also that in 1929 the 110s.–115s. group was the highest individual class, whereas in 1934 and 1935 the group 85s.–90s. contained more wage-earners than any other. In 1936 the group 90s.–95s, was the modal group.
The next table gives the number of wage-earning employees engaged on the fifteenth or nearest representative day for each of the calendar years 1928, 1934, and 1935:—
| Month. | 1928. | 1934. | 1935. |
|---|---|---|---|
| January | 9,464 | 3,788 | 5,286 |
| February | 9,626 | 3,913 | 5,269 |
| March | 9,638 | 4,204 | 5,320 |
| April | 9,373 | 4,154 | 5,569 |
| May | 9,600 | 4,366 | 5,580 |
| June | 9,541 | 4,448 | 5,619 |
| July | 9,571 | 4,489 | 5,852 |
| August | 9,773 | 4,567 | 5,952 |
| September | 9,781 | 4,877 | 6,251 |
| October | 9,854 | 5,475 | 6,757 |
| November | 9,871 | 5,628 | 7,001 |
| December | 9,839 | 5,638 | 6,914 |
The decline in the 1934 and 1935 figures as compared with those for 1928 is very marked, while the absence of a seasonal decline in the winter months is another interesting feature of the statistics.
The value of work done by builders furnishing returns in each year is classified below according to the nature of the work done. The figures shown in respect of bridges, wharves, and “other” construction do not include construction work done by the General Government or by local authorities, except where such work is carried out on contract by private firms or individuals.
| Year. | Buildings. | Bridges, Wharves. | Other Construction. | Jobbing and Repairs. | Total. |
|---|---|---|---|---|---|
| Value. | |||||
| £ | £ | £ | £ | £ | |
| 1926–27 | 6,269,513 | 294,100 | 1,088,183 | 1,062,947 | 8,714,743 |
| 1927–28 | 6,204,966 | 86,965 | 1,009,511 | 1,117,021 | 8,418,463 |
| 1928–29 | 7,666,096 | 201,534 | 344,263 | 1,492,169 | 9,704,062 |
| 1929–30 | 7,294,729 | 197,790 | 280,823 | 1,634,539 | 9,407,881 |
| 1930–31 | 5,230,024 | 233,589 | 289,491 | 1,463,523 | 7,216,627 |
| 1931–32 | 1,873,877 | 92,623 | 161,816 | 945,102 | 3,073,418 |
| 1932–33 | 1,445,628 | 66,319 | 36,735 | 678,806 | 2,227,488 |
| 1933–34 | 1,730,675 | 76,686 | 62,668 | 683,690 | 2,553,719 |
| 1934–35 | 3,560,181 | 110,051 | 114,052 | 931,172 | 4,715,456 |
| 1935–36 | 4,804,374 | 99,941 | 164,225 | 1,211,419 | 6,279,959 |
| Per Cent. of Total. | |||||
| 1926–27 | 71.94 | 3.37 | 12.49 | 12.20 | 100.00 |
| 1927–28 | 73.71 | 1.03 | 11.99 | 13.27 | 100.00 |
| 1928–29 | 79.00 | 2.08 | 3.55 | 15.37 | 100.00 |
| 1929–30 | 77.54 | 2.10 | 2.98 | 17.38 | 100.00 |
| 1930–31 | 72.47 | 3.24 | 4.01 | 20.28 | 100.00 |
| 1931–32 | 60.97 | 3.01 | 5.27 | 30.75 | 100.00 |
| 1932–33 | 64.90 | 2.98 | 1.65 | 30.47 | 100.00 |
| 1933–34 | 67.77 | 3.00 | 2.45 | 26.78 | 100.00 |
| 1934–35 | 75.50 | 2.33 | 2.41 | 19.76 | 100.00 |
| 1935–36 | 76.50 | 1.59 | 2.62 | 19.29 | 100.00 |
Jobbing and repair work accounted for a considerably greater percentage of total work done during 1931–34 than in previous years, or in 1935 and 1936.
Following is an analysis of operating costs and their relationship to the total value of work done during the last ten years:—
| Year. | Operating Costs. | Value of Work done. | |||
|---|---|---|---|---|---|
| Salaries and Wages. | Cost of Materials. | Other Expenses. | Total Costs. | ||
* Difference between total costs and total value of work done. † Excess of costs. | |||||
| Amounts. | |||||
| £ | £ | £ | £ | £ | |
| 1926–27 | 2,532,900 | 5,132,828 | 298,386 | 7,964,114 | 8,714,743 |
| 1927–28 | 2,417,669 | 4,968,191 | 311,744 | 7,697,604 | 8,418,463 |
| 1928–29 | 2,736,588 | 6,224,826 | 286,810 | 9,248,224 | 9,704,062 |
| 1929–30 | 2,665,458 | 6,010,113 | 337,543 | 9,013,114 | 9,407,881 |
| 1930–31 | 2,096,420 | 4,600,059 | 307,867 | 7,004,346 | 7,216,627 |
| 1931–32 | 920,010 | 1,955,138 | 193,756 | 3,068,904 | 3,073,418 |
| 1932–33 | 662,036 | 1,446,857 | 146,373 | 2,255,266 | 2,227,488 |
| 1933–34 | 712,399 | 1,707,732 | 137,658 | 2,557,789 | 2,553,719 |
| 1934–35 | 1,177,090 | 3,315,018 | 181,561 | 4,673,669 | 4,715,456 |
| 1935–36 | 1,536,924 | 4,424,342 | 212,954 | 6,174,220 | 6,279,959 |
| Per Cent. of Total Value. | |||||
| Per Cent. | Per Cent. | Per Cent. | Per Cent. | Per Cent.* | |
| 1926–27 | 29.06 | 58.90 | 3.42 | 91.38 | 8.62 |
| 1927–28 | 28.72 | 59.02 | 3.70 | 91.44 | 8.56 |
| 1928–29 | 28.20 | 64.15 | 2.96 | 95.31 | 4.69 |
| 1929–30 | 28.33 | 63.88 | 3.59 | 95.80 | 4.20 |
| 1930–31 | 29.05 | 63.74 | 4.27 | 97.06 | 2.94 |
| 1931–32 | 29.93 | 63.61 | 6.30 | 99.84 | 0.16 |
| 1932–33 | 29.72 | 64.96 | 6.57 | 101.25 | -1.25† |
| 1933–34 | 27.90 | 66.87 | 5.39 | 100.16 | -0.16† |
| 1934–35 | 24.96 | 70.30 | 3.85 | 99.11 | 0.89 |
| 1935–36 | 24.47 | 70.45 | 3.39 | 98.31 | 1.69 |
The figures shown for salaries and wages relate to the salaries and wages of those directly engaged by builders plus amounts drawn by builders in lieu of salary and wages. Payments to sub-contractors are included in cost of materials, the only possible classification, since the returns are collected from builders but not from sub-contractors—e.g., plumbers, electricians, &c. A considerable proportion of the amounts paid to sub-contractors will be expended in wages, which consideration applies, of course, in the case of other “materials” also.
The marked upward trend in the ratio of total costs to the value of work done indicates the extent to which the industry was affected by the depression. It will be observed that in 1932–33 and 1933–34 costs (including amounts drawn by builders in lieu of wages) exceeded the total value of work done in those years A marked fall in average amounts of salaries and wages of employees and in amounts drawn by proprietors in lieu of salary and wages is indicated by the averages quoted in a preceding table.
A classification of the new buildings included in the returns for the past ten years is given in the following table:—
| Year. | Private Dwellings. | Blocks of Flats.* | Business Premises. | Other. | Total. |
|---|---|---|---|---|---|
* Not classified separately prior to 1930–31, but included in “other.” | |||||
| Number. | Number. | Number. | Number. | Number. | |
| 1926–27 | 3,004 | 531 | 670 | 4,265 | |
| 1927–28 | 2,761 | 548 | 678 | 3,987 | |
| 1928–29 | 3,837 | 735 | 997 | 5,569 | |
| 1929–30 | 3,868 | 783 | 1,454 | 6,105 | |
| 1930–31 | 2,590 | 30 | 457 | 1,058 | 4,135 |
| 1931–32 | 1,068 | 8 | 274 | 528 | 1,878 |
| 1932–33 | 982 | 5 | 216 | 436 | 1,639 |
| 1933–34 | 1,446 | 29 | 187 | 492 | 2,154 |
| 1934–35 | 2,511 | 34 | 322 | 804 | 3,671 |
| 1935–36 | 3,548 | 77 | 428 | 1,025 | 5,078 |
| Value. | |||||
| £ | £ | £ | £ | £ | |
| 1926–27 | 2,759,236 | 1,822,194 | 831,359 | 5,412,789 | |
| 1927–28 | 2,480,685 | 2,046,324 | 839,413 | 5,366,422 | |
| 1928–29 | 3,311,328 | 2,708,969 | 1,116,551 | 7,136,848 | |
| 1929–30 | 3,277,283 | 2,365,036 | 1,148,263 | 6,790,582 | |
| 1930–31 | 2,196,857 | 126,328 | 1,866,388 | 1,332,449 | 5,522,022 |
| 1931–32 | 796,703 | 11,422 | 572,855 | 434,690 | 1,815,670 |
| 1932–33 | 590,096 | 4,427 | 525,155 | 287,412 | 1,407,090 |
| 1933–34 | 869,714 | 30,952 | 394,148 | 260,749 | 1,555,563 |
| 1934–35 | 1,637,564 | 55,936 | 923,202 | 475,148 | 3,091,850 |
| 1935–36 | 2,531,642 | 198,848 | 1,046,599 | 593,946 | 4,371,035 |
A considerable proportion of the buildings classified as “other”' is accounted for by garages erected. Wide variations are shown from year to year in the values quoted for blocks of flats. This is to be expected, since the definition covers a wide variety of building types.
Following is an analysis of the statistics of private dwellings included in the returns for the last six years:—
| Number of Rooms. | Number of Dwellings. | |||||
|---|---|---|---|---|---|---|
| 1930–31. | 1931–32. | 1932–33. | 1933–34. | 1934–35. | 1935–36. | |
| Number. | Number. | Number. | Number. | Number. | Number. | |
| One | 111 | 39 | 54 | 39 | 56 | 90 |
| Two | 103 | 62 | 56 | 53 | 87 | 110 |
| Three | 161 | 99 | 89 | 88 | 138 | 185 |
| Four | 595 | 271 | 287 | 447 | 722 | 919 |
| Five | 1,099 | 369 | 327 | 544 | 972 | 1,510 |
| Six | 346 | 143 | 103 | 191 | 360 | 495 |
| Seven | 80 | 36 | 27 | 48 | 92 | 126 |
| Eight | 43 | 23 | 20 | 19 | 48 | 64 |
| Nine | 21 | 6 | 9 | 7 | 14 | 18 |
| Ten | 19 | 10 | 6 | 4 | 13 | 16 |
| Over ten | 12 | 10 | 4 | 6 | 9 | 15 |
| Totals | 2,590 | 1,068 | 982 | 1,446 | 2,511 | 3,548 |
The classification of number of dwellings according to size shows that, throughout the whole period, five rooms was the most frequent size, followed by four-roomed dwellings. The predominance of four- and five-roomed dwellings is very marked, while only a very small proportion of the totals is accounted for by dwellings of over six rooms. Statistics of values follow:—
| Number of Rooms. | Value of Dwellings. | |||||
|---|---|---|---|---|---|---|
| 1930–31. | 1931–32. | 1932–33. | 1933–34. | 1934–35. | 1935–36. | |
| £ | £ | £ | £ | £ | £ | |
| One | 11,595 | 3,220 | 4,585 | 3,200 | 4,807 | 7,534 |
| Two | 20,881 | 10,559 | 8,638 | 8,214 | 13,861 | 19,342 |
| Three | 62,876 | 32,608 | 24,174 | 24,833 | 39,831 | 56,000 |
| Four | 404,149 | 146,217 | 131,458 | 196,527 | 362,662 | 507,732 |
| Five | 933,133 | 286,866 | 216,911 | 348,833 | 654,433 | 1,080,615 |
| Six | 389,369 | 141,911 | 98,703 | 163,794 | 313,776 | 475,698 |
| Seven | 122,969 | 45,890 | 33,424 | 56,937 | 108,652 | 164,591 |
| Eight | 82,753 | 41,306 | 26,714 | 27,418 | 70,158 | 106,592 |
| Nine | 52,095 | 14,965 | 17,303 | 9,773 | 23,670 | 32,403 |
| Ten | 53,195 | 20,023 | 15,759 | 7,572 | 26,758 | 36,941 |
| Over ten | 63,842 | 53,138 | 12,427 | 22,613 | 18,956 | 44,194 |
| Totals | 2,196,857 | 796,703 | 590,096 | 869,714 | 1,637,564 | 2,531,642 |
The next table affords an indication of the movements in values of dwelling houses. As stated previously, all statistics of value quoted in this section relate to the value of building operations, and do not include the value of the land on which the buildings are erected.
| Number of Rooms. | Private Dwellings: Average Values. | |||||
|---|---|---|---|---|---|---|
| 1930–31. | 1931–32. | 1932–33. | 1933–34. | 1934–35. | 1935–36. | |
| Per Dwelling. | ||||||
| One | 104 | 83 | 85 | 82 | 86 | 84 |
| Two | 203 | 170 | 154 | 154 | 160 | 176 |
| Three | 391 | 329 | 272 | 282 | 289 | 303 |
| Four | 679 | 540 | 458 | 440 | 502 | 552 |
| Five | 849 | 777 | 663 | 641 | 673 | 716 |
| Six | 1,125 | 992 | 958 | 858 | 872 | 961 |
| Seven | 1,537 | 1,275 | 1,238 | 1,186 | 1,181 | 1,306 |
| Eight | 1,924 | 1,796 | 1,336 | 1,443 | 1,464 | 1,666 |
| Nine | 2,480 | 2,494 | 1,923 | 1,396 | 1,691 | 1,800 |
| Ten | 2,800 | 2,002 | 2,627 | 1,893 | 2,058 | 2,309 |
| Over ten | 5,320 | 5,314 | 3,107 | 3,769 | 2,106 | 2,946 |
| Per Room. | ||||||
| One | 104 | 83 | 85 | 82 | 86 | 84 |
| Two | 102 | 85 | 77 | 77 | 80 | 88 |
| Three | 130 | 110 | 91 | 94 | 96 | 101 |
| Four | 170 | 135 | 115 | 110 | 126 | 138 |
| Five | 170 | 156 | 133 | 128 | 135 | 143 |
| Six | 188 | 165 | 160 | 143 | 145 | 160 |
| Seven | 220 | 182 | 177 | 169 | 169 | 187 |
| Eight | 241 | 225 | 167 | 180 | 183 | 208 |
| Nine | 276 | 277 | 214 | 155 | 188 | 200 |
| Ten | 280 | 200 | 263 | 189 | 206 | 231 |
Recent statistics of average value per dwelling show a marked decline as compared with the average values for the years 1929–30 and 1930–31. The fall is in a large measure due to decreased building costs; but the figures suggest also a move towards a cheaper type of dwelling.
The table below gives the number and values of four-, five-, and six-roomed dwellings built, together with the average value per dwelling, in the four main centres—Auckland, Wellington, Christchurch, and Dunedin—for the years 1928–29, 1934–35, and 1935–36:—
| City. | 1928–29. | 1934–35. | 1935–36. | ||||||
|---|---|---|---|---|---|---|---|---|---|
| Four Rooms. | Five Rooms. | Six Rooms. | Four Rooms. | Five Rooms. | Six Rooms. | Four Rooms. | Five Rooms. | Six Rooms. | |
| Number of Dwellings. | |||||||||
| Auckland | 129 | 172 | 55 | 106 | 135 | 59 | 193 | 253 | 95 |
| Wellington | 184 | 358 | 90 | 59 | 87 | 33 | 87 | 199 | 52 |
| Christchurch | 230 | 208 | 63 | 101 | 132 | 43 | 134 | 176 | 58 |
| Dunedin | 62 | 160 | 30 | 68 | 71 | 37 | 86 | 123 | 35 |
| Values. | |||||||||
| £ | £ | £ | £ | £ | £ | £ | £ | £ | |
| Auckland | 87,247 | 137,407 | 59,391 | 47,342 | 81,437 | 50,298 | 90,276 | 168,518 | 90,513 |
| Wellington | 158,975 | 379,038 | 116,821 | 36,064 | 66,410 | 31,131 | 54,777 | 163,413 | 55,495 |
| Christchurch | 159,000 | 176,867 | 64,667 | 57,154 | 92,743 | 37,305 | 79,285 | 129,156 | 60,901 |
| Dunedin | 50,057 | 154,378 | 40,472 | 43,417 | 55,169 | 40,233 | 66,226 | 100,513 | 40,705 |
| Average Value per Dwelling. | |||||||||
| £ | £ | £ | £ | £ | £ | £ | £ | £ | |
| Auckland | 676 | 799 | 1,080 | 447 | 603 | 853 | 499 | 666 | 953 |
| Wellington | 864 | 1,059 | 1,298 | 611 | 763 | 943 | 630 | 821 | 1,067 |
| Christchurch | 691 | 850 | 1,026 | 566 | 703 | 868 | 592 | 734 | 1,050 |
| Dunedin | 807 | 965 | 1,349 | 638 | 777 | 1,087 | 770 | 817 | 1,163 |
The salient feature of the foregoing table is that the average value per dwelling is considerably higher in Wellington and Dunedin than in either Auckland or Christchurch.
It must not be assumed, however, that the variations in the average value per dwelling shown, as between the four centres, are accounted for entirely by differences in building costs. In the first place, there may be quite material differences as between one city and another in the average standard of comfort of dwellings erected in any one year. Furthermore, the minimum requirements embodied in the building regulations in force are not identical in each centre, due partly to differences in terrain, seismicity, &c.
Table of Contents
THE legislation relating to the custody, administration, and audit of the public moneys and securities is contained in the Public Revenues Act, 1926, which consolidated and amended the then existing enactments on the subject. All public moneys, excepting those payable to or received by the Post and Telegraph Department, the Government Insurance Department, the Public Trust Office, the Native Trust Office, the State Advances Corporation, the State Fire and Accident Insurance Office, the various Public Service Superannuation Funds, the National Provident Fund, the National Broadcasting Service, the National Commercial Broadcasting Service, the Dairy Industry Account, and the Internal Marketing Account, are paid into one account at the bank called the “Public Account,” and are carried to one or other of the following funds or accounts in the books of the Treasury: The Consolidated Fund, the Public Works Fund, separate accounts or funds specially created. The Public Account, formerly held at the Bank of New-Zealand, was taken over by the Reserve Bank of New Zealand from 1st August, 1934.
The financial year commences on the 1st day of April and ends on the 31st day of March. The revenue of any financial year is the money received into the Public Account at the bank at Wellington within the year, together with that received into the Public Account at London, of which advice is received in time for inclusion in the accounts for the year. The expenditure is the money paid (a) at the Treasury within the year, (b) by imprestees of which accounts are received at the Treasury within the year, and (c) at London of which advice is received in time for inclusion.
At the end of each financial year the Appropriation Act of that year lapses, but the Minister of Finance is authorized for a period of three months from the commencement of the next financial year to pay money in respect of any service, provided that the amount does not exceed the unexpended balance voted for that purpose in the previous year, together with an amount equal to one-fourth of such vote.
The normal practice is for Parliament to meet at the end of June in each year and to vote supplies from month to month until the estimated expenditure for the year has been approved and the annual Appropriation Act is passed. Where a later session of Parliament is foreseen, a temporary amendment to the provisions set out in the preceding paragraph is made. In the event of a mid-session adjournment supplies in anticipation of the Appropriation Act may be voted for more than one month, as, for instance, at the beginning of June, 1936, when three months' supplies were voted.
In the audit of expenditure both the pre-audit and post-audit systems are in operation. Pre-audit is applied to vouchers in respect of payments on account of salaries of new appointees, temporary officers, and officers claiming more than one month's salary at any time; interest, loan transactions, and return of deposits; unauthorized expenditure; transfers between Government accounts; or expenditure chargeable against the accounts of local bodies. Post-audit is applied to all other payments.
Vouchers must be certified as correct by the proper officer, and forwarded by him to the head of his Department for approval. Vouchers subject to pre-audit are then forwarded to the Audit Office, and on being found correct are sent on to the Treasury to be entered on requisitions for payment. Vouchers subject to post-audit are transmitted by the head of the Department direct to the Treasury. Payment is made by the Treasury, and the claim is afterwards submitted for audit.
Recent years have witnessed the cutting out of many small accounts and their merging with other accounts or funds. Accounts and funds which were included in the Public Account during 1936–37 are listed in the table following, which shows for each, the year's transactions and the balance at the beginning and end of the year. For reasons that will he apparent later, the figures of gross transactions afford no indication of actual receipts and payments.
The State Advances Account is not included, nor are the other funds mentioned separately in the first paragraph on the preceding page. Particulars concerning these funds and the working of the Departments concerned will be found elsewhere in this book.
| Account. | Balance, 1st April, 1936. | Receipts.* | Credits. | Expenditure.* | Balance, 31st March, 1937. |
|---|---|---|---|---|---|
* Excluding credits. | |||||
| Consolidated Fund— | £ | £ | £ | £ | £ |
| Ordinary Revenue | 479,636 | 44,159,915 | 5,166,038 | 43,680,886 | 958,665 |
| Local Bodies | 11,879 | 43,956 | 43,680 | 12,155 | |
| Deposits | 1,383,389 | 5,888,874 | 4,558,041 | 2,714,222 | |
| Public Works Fund— | |||||
| General Purposes | 1,902,651 | 3,585,527 | 1,541,273 | 3,370,152 | 2,118,026 |
| Electric Supply | 217,604 | 6,216,969 | 26,030 | 6,290,939 | 143,634 |
| Electric Supply Sinking Fund | 17,555 | 544 | 4,669 | 13,430 | |
| Bank of New Zealand Shares | 1,859,375 | 164,062 | 164,062 | 1,859,375 | |
| Discharged Soldiers Settlement | 151,751 | 1,196,646 | 1,014,390 | 334,007 | |
| Employment Promotion Fund | 406,711 | 4,260,545 | 31,383 | 4,414,011 | 253,245 |
| Land for Settlements | 328,746 | 823,553 | 95 | 667,696 | 484,603 |
| Loans Redemption | 584,583 | 19,540,130 | 20,050,194 | 74,519 | |
| Main Highways | 89,391 | 3,310,242 | 95,737 | 3,325,306 | 74,327 |
| Public Debt Repayment | 106,387 | 1,624,596 | 1,691,188 | 39,795 | |
| Remittances to London | 11,349,900 | 11,349,900 | |||
| Reserve Fund | 352,497 | 16,205 | 130 | 5,178 | 363,524 |
| Silver and Bronze Coin | 634,753 | 103,463 | 41,581 | 696,635 | |
| State Coal-mines | 75,872 | 252,627 | 1,423 | 258,097 | 70,402 |
| State Coal-mines Sinking Fund | 8,822 | 9,180 | 8,820 | 9,182 | |
| State Forests | 14,565 | 290,395 | 63,945 | 259,608 | 45,352 |
| Working Railways | 1,796,056 | 7,553,990 | 538,535 | 8,048,907 | 1,301,739 |
| Totals | 10,422,823 | 110,391,319 | 7,464,589 | 109,247,305 | 11,566,837 |
Of the total balances of the various accounts (£11,566,837) as at the 31st March 1937, £5,641,183 represented cash, £431,004 imprests, and £5,494,650 investments.
In ascertaining the aggregate net receipts and expenditure of a financial year it is always necessary to deduct substantial amounts from the figures of gross receipts and payments. Special factors operating during 1933–34 swelled the gross transactions to a figure ten times greater than the net receipts and expenditure, while in 1934–35 similar factors operated, swelling the gross figures of receipts and expenditure to five times greater than the net figures.
Many of the accounts have their receipts and expenditure increased through the transfer of moneys from one account to another. Some of these transfers rank as credits, and are not included as receipts or expenditure in the table under the previous heading. The principal transfers between accounts which are treated as credits in reduction of expenditure are recoupments to the Consolidated Fund in respect of interest paid by that fund on loan-money.
There are, however, substantial transfers between accounts (or between items of an account) which rank as receipts of the receiving account. These are not always disclosed in the published statements, but an approximate total can be arrived at. This is found to have been in the neighbourhood of £6,300,000 for the year 1936–37. The principal item was the transfer of £2,333,753, representing motor-vehicles taxation, from the Consolidated Fund to the Main Highways Account. Next in importance was the transfer of £1,624,508 from the Consolidated Fund to the Public Debt Repayment Account in accordance with the scheme of debt-reduction.
On the other hand, the Consolidated Fund received a good deal of revenue from other accounts, the principal items being £903,858 from the Working Railways Account as interest on railway capital liability, and £164,063 by way of dividends first paid into the Bank of New Zealand Shares Account. Payments aggregating £154,867 were made from the Main Highways Account to other accounts or funds, and £66,356 was paid from the Land for Settlements Account to other accounts.
Most payments from one item of the Consolidated Fund to another rank as credits, but receipts of the Printing and Stationery Department from other Government Departments, excluding those with accounts outside the Public Account, constitute an exception. During the year 1936–37, receipts under this heading amounted to £155,000. Interest payments to the Consolidated Fund on balances in the form of investments also constitute an exception, ranking as receipts in that account. Similarly, certain interest payments from the Consolidated Fund to other accounts are treated as receipts, not as credits.
Although, as stated previously, post and telegraph receipts and payments are not included in the Public Account, interest on capital liability, as well as profits of the Post and Telegraph Department, are payable to the Consolidated Fund. As costs of other Departments for postages and for other services performed by the Post and Telegraph Department aggregated approximately £180,000 for the year, this latter amount represents in effect a transfer to the Consolidated Fund revenue from various votes of that fund or of other accounts.
The revenue of the Working Railways Account also includes a considerable amount received from Government Departments and paid out of the Consolidated Fund and other accounts. The amount under this head in 1936–37 was approximately £460,000, exclusive of payments from the Post Office Account.
Included in the gross receipts of the Consolidated Fund are Treasury bill issues and renewals to the aggregate of £11,350,000, while redemptions and renewals of Treasury bills swell the expenditure by a similar amount.
Practically the whole of the receipts and payments of the Loans Redemption Account proper are nominal only, consisting in the main of entries due to the renewal of loan-moneys. A deduction of £17,725,926 must be made on this account from both receipts and expenditure in 1936–37, and a further deduction of £973,650 from each side in respect of sinking funds paid into the account for the redemption of securities.
The Remittances from and to London Accounts merely cover the withdrawal of money in London or Wellington for remittance to or from New Zealand, and are in practically the same category as the Loans Redemption Account, the receipts and payments representing book entries only, and usually balancing. Receipts and expenditure of these two accounts in 1936–37 totalled £11,349,900.
Arising out of the Government purchase of the ordinary share capital of the Reserve Bank of New Zealand and of the State Advances Corporation, both receipts and expenditure of the Consolidated Fund were increased by book entries of £625,000 in the former case and £1,030,728 in the latter.
Further deductions have still to be made from the gross totals before a figure approximately representing true Governmental revenue and expenditure (apart from State advances and other activities not included in the Public Account) can be arrived at. The accounts of local bodies merely record the receipt of moneys collected by the Government on behalf of local bodies and the payment of these to the local bodies concerned. The Deposits Account represents only lodgments and withdrawals of (mainly) non-Government moneys. The two accounts referred to had in 1936–37 an aggregate of £5,932,831 receipts and £4,601,722 payments.
Including small per contra items not already referred to (£66,9 total deductions to be made from aggregate nominal receipts are approximately 400,000, and from payments £54,000,000, leaving net totals of £55,000,000 receipts and £55,200,000 payments for the year.
The gross and net figures of receipts and expenditure are as follows for each of the last five years:—
| Year ended 31st March, | Gross Transactions.* | Credits. | Net Transactions. | ||
|---|---|---|---|---|---|
| Receipts. | Payments. | Receipts. | Payments. | ||
* Excluding credits. † £4.9m. of this was from exchange on sale of surplus sterling assets. | |||||
| £m. | £m. | £m. | £m. | £m. | |
| 1933 | 87.8 | 88.6 | 6.2 | 34.7 | 34.9 |
| 1934 | 396.2 | 380.0 | 6.0 | 37.3 | 37.7 |
| 1935 | 195.5 | 209.0 | 11.2† | 42.5 | 40.7 |
| 1936 | 84.1 | 84.4 | 7.2 | 42.2 | 42.5 |
| 1937 | 110.4 | 109.2 | 7.5 | 55.0 | 55.2 |
The net totals would be still further reduced if only the net increase (£5,109,102 in 1936–37) in debt were taken into account as a receipt, and both receipts and expenditure diminished by the amount of loan-money redeemed.
The Ordinary Revenue Account of the Consolidated Fund covers the ordinary revenue and expenditure of the General Government—i.e., apart from capital items, commercial and special undertakings, advances, &c. Until recent years its operations afforded an: excellent comparison of State revenue and expenditure from year to year, but successive changes in system have largely destroyed the comparability of the figures. The principal of these changes are as follows:—
The removal of railway revenue and expenditure from the Consolidated Fund from 1st April, 1925. Consolidated Fund receipts now include an amount paid by the Working Railways Account as interest on railway capital liability (£903,858 in 1936–37).
Similar action in regard to post and telegraph revenue and expenditure from 1st April, 1928. In addition to interest on capital liability (£566,000 in 1936–37), the Consolidated Fund now (commencing 1931–32) receives Post and Telegraph Department profits (£43,298 in 1936–37, of which £40,000 was in respect of Post Office Savings-bank profits).
Payment of motor-vehicles taxation receipts into the Consolidated Fund since 5th December, 1927, the great bulk of the money being later transferred to the Main Highways Account, into which these receipts were previously paid direct. In 1932–33 £500,000, in 1933–34 £500,000, and in 1934–35 £321,754 of motor-vehicles taxation receipts were retained in the Consolidated Fund.
The transfer of reserve moneys into the Consolidated Fund, £1,494,825 in 1931–32, £2,500,000 in 1932–33, and £2,000,000 in 1933–34,; £2,250,000 of the 1932–33 amount and the whole of the 1933–34 total having been obtained by hypothecation of securities of the Discharged Soldiers Settlement Account.
Exchange charges on overseas payments, in consequence of the depreciation of New Zealand currency in terms of sterling (£1,581,351 in 1936–37).
Profits (£1,364,118 in 1934–35 and £231,271 in 1935–36) from the sale of coined gold, taken over under the Reserve Bank of New Zealand Act.
Fifty years' figures of receipts and expenditure of the Consolidated Fund will be found in the Statistical Summary near the end of this volume. Figures for the last ten years are:—
| Year ended 31st March | Receipts. | Expenditure. | Surplus. |
|---|---|---|---|
* Deficit | |||
| £ | £ | £ | |
| 1928 | 25,123,980 | 24,944,905 | 179,075 |
| 1929 | 23,599,676 | 24,176,928 | -577,252* |
| 1930 | 25,349,861 | 25,200,882 | 148,979 |
| 1931 | 23,068,931 | 24,708,042 | -1,639,111* |
| 1932 | 22,719,733 | 24,860,552 | -2,140,819* |
| 1933 | 22,568,521 | 22,528,379 | 40,142 |
| 1934 | 23,492,749 | 24,202,027 | -709,278* |
| 1935 | 26,126,094 | 24,499,595 | 1,626,499 |
| 1936 | 26,172,368 | 25,890,568 | 281,800 |
| 1937 | 31,147,187 | 30,675,158 | 472,029 |
The Budget estimate of receipts of the Consolidated Fund during the year 1937–38 is £34,778,000 and the estimated expenditure £34,728,000 leaving an estimated surplus of £50,000.
The receipts of the Consolidated Fund are derived principally from taxation and from interest on the Public Debt Redemption Fund and other public moneys, with transfers from the Working Railways Account and from the Post and Telegraph Department in respect of interest on capital liability. An additional source—viz., profits of the Post and Telegraph Department—was added in 1931–32, certain reserve moneys were paid into the Consolidated Fund in 1931–32 and the two following years, and in 1934–35 and 1935–36 the receipts included profits on the sale of coined gold taken over by the Reserve Bank of New Zealand. During the years 1935–36 and 1936–37 receipts have also been augmented by the inclusion of profits of the Reserve Bank of New Zealand. Details of receipts during the last three years are given in the table following:—
| Source. | Year ended 31st March, | ||
|---|---|---|---|
| 1935. | 1936. | 1937. | |
* This excludes unemployment-taxation receipts, which are not paid into the Consolidated Fund For details of taxation receipts see Subsection B. | |||
| £ | £ | £ | |
| Taxation* | 20,176,345 | 21,554,397 | 26,939,338 |
| Registration and other fees | 228,563 | 235,761 | 251,390 |
| Marine | 139,168 | 138,189 | 147,480 |
| Interest on Public Debt Redemption Fund | 632,066 | 615,020 | 385,855 |
| Interest on railway capital liability | 1,088,050 | 1,051,477 | 903,858 |
| Interest on post and telegraph capital liability | 546,000 | 541,000 | 566,000 |
| Interest on other public moneys | 664,130 | 513,949 | 531,405 |
| Profits on sale of gold | 1,364,118 | 231,271 | |
| Reserve bank profits | 73,854 | 103,012 | |
| Post Office Savings-bank profits | 145,750 | 75,000 | 40,000 |
| Post and Telegraph Department profits | 13,000 | 5,000 | 3,298 |
| Tourist and health resorts | 77,308 | 85,652 | 101,809 |
| National-endowment revenue | 147,761 | 146,126 | 152,632 |
| Other territorial revenue | 291,415 | 289,478 | 298,812 |
| Departmental receipts | 467,215 | 527,768 | 597,677 |
| Miscellaneous (including recoveries on account of expenditure of previous years) | 145,205 | 88,426 | 124,621 |
| Totals | £26,126,094 | £26,172,368 | £31,147,187 |
Expenditure under the main heads of permanent appropriations and each head of annual appropriations during the last three years was as follows (the figures are net—i.e., exclusive of credits):—
| Head. | Year ended 31st March, | ||
|---|---|---|---|
| 1935. | 1936. | 1937. | |
| Permanent appropriations— | £ | £ | £ |
| Civil List | 23,100 | 26,516 | 28,473 |
| Debt services— | |||
| Interest | 8,023,812 | 7,730,194 | 7,604,469 |
| Amortization | 1,596,478 | 1,567,933 | 1,701,487 |
| Administration and management | 117,733 | 29,285 | 81,543 |
| Payments on guaranteed loans | 42,605 | 18,543 | Cr. 7,190 |
| For education purposes | 87,207 | 95,968 | 95,525 |
| Transfers to Main Highways Account Revenue Fund | 1,455,143 | 1,975,945 | 2,333,753 |
| Motor-spirits tax paid to borough councils | 110,748 | 109,427 | 154,265 |
| Contribution towards Singapore Naval Base | 100,000 | 100,000 | |
| Exchange | 1,459,159 | 1,593,536 | 1,581,351 |
| Other | 425,777 | 501,102 | 514,823 |
| Totals, permanent appropriations | 13,441,762 | 13,748,449 | 14,088,499 |
| Annual appropriations— | |||
| Legislative | 88,273 | 79,238 | 106,840 |
| Prime Minister's Department | 22,596 | 23,521 | 27,502 |
| Treasury | 37,722 | 41,834 | 40,854 |
| Customs | 87,627 | 96,034 | 112,098 |
| Land and Income Tax | 64,604 | 74,829 | 140,180 |
| Stamp Duties | 81,903 | 87,515 | 91,354 |
| Audit | 26,738 | 29,468 | 36,121 |
| Public Service Commissioner's Office | 4,377 | 4,334 | 6,982 |
| Internal Affairs | 367,802 | 363,658 | 368,004 |
| External Affairs | 95,353 | 136,667 | 158,255 |
| Printing and Stationery | 155,015 | 176,098 | 227,422 |
| Marine | 109,182 | 112,710 | 123,423 |
| Labour | 39,961 | 44,971 | 206,358 |
| Native | 61,583 | 48,918 | 286,956 |
| Valuation | 38,953 | 48,178 | 58,509 |
| Electoral | 5,148 | 85,833 | 11,806 |
| Census and Statistics | 19,771 | 26,205 | 63,809 |
| Justice and Prisons | 239,240 | 251,111 | 273,486 |
| Crown Law Office | 5,625 | 6,273 | 7,419 |
| Police | 435,545 | 453,890 | 496,977 |
| Naval Defence | 437,839 | 462,245 | 632,062 |
| Defence | 465,232 | 552,125 | 560,017 |
| Maintenance of public works and services | 91,845 | 145,492 | 1,174,991 |
| Lands and Survey | 160,215 | 189,652 | 401,900 |
| Agriculture | 539,247 | 591,802 | 692,267 |
| Industries and Commerce, Tourist, and Publicity | 114,224 | 135,667 | 176,808 |
| Scientific and Industrial Research | 53,127 | 59,848 | 97,517 |
| Mines | 19,567 | 19,240 | 28,923 |
| Transport | 27,469 | 25,205 | 28,038 |
| Health | 779,216 | 808,966 | 996,840 |
| Mental Hospitals | 252,442 | 279,670 | 334,636 |
| Education | 2,595,661 | 2,795,098 | 3,396,234 |
| Pensions | 3,439,879 | 3,769,612 | 5,072,735 |
| National Provident and Friendly Societies | 77,538 | 102,866 | 112,545 |
| Services not provided for | 17,314 | 13,346 | 36,791 |
| Totals, annual appropriations | 11,057,833 | 12,142,119 | 16,586,659 |
| Grand totals | £24,499,595 | £25,890,568 | £30,675,158 |
Expenditure from the Consolidated Fund is divided into two main groups, according to whether it is made under permanent or under annual appropriation. The latter heading covers the expenditure under the various departmental votes, while the former covers interest on and amortization of the public debt, exchange, disposal of special taxation for main highways, and expenditure under numerous special Acts. From 1932–33 onwards several items which formerly ranked as permanent appropriations, including expenditure on pensions, superannuation, and Hospital Boards subsidies, have become the subject of annual appropriations.
The amounts shown under the head of “Education Department” do not represent the full payment on education services, expenditure under special Acts and from certain reserves revenue not being included. A statement of public expenditure on education is given at the close of Section VII (Education) of this volume.
A system of Departmental balance-sheets and statements of accounts was inaugurated on commercial lines in 1920 to show the true cost of the various Departments and services, as distinct from payments out of appropriations on the basis referred to at the beginning of this subsection. These balance-sheets and statements of accounts are published annually in Parliamentary Paper B.–1 [Part IV], to which the reader is referred for details of income, expenditure, &c., in respect of the various Departments and services. A State balance-sheet covering all Departments and services, with the exception of the Post Office Savings-bank, the Public Trust Office, and the Insurance Departments, is now included in the publication mentioned. (Vide also Section XXXIV—Wealth.)
For the prosecution of the policy of public works inaugurated in 1870 there was set up a Public Works Fund. For many years all expenditure on public works was borne by this fund, but in course of time separate subsidiary accounts were established to deal with certain special activities. These subsidiary accounts have in general either become merged in the General Purposes Account of the Public Works Fund or have ceased to exist on the completion of the work for which they were called into existence. The Electric Supply Account, with its separate Sinking Fund Account, is the only one now remaining.
The Construction Fund of the Main Highways Account, which was established in 1923–24 to provide finance for the construction, reconstruction, &c., of main highways, was analogous to the Public Works Fund, and its operations were for some years included in the Year-Book statement of public-works receipts and payments. The Construction Fund of the Main Highways Account has now been merged with the Revenue Fund, and the figures of public-works receipts and expenditure quoted below for the last five years are exclusive of operations of the Main Highways Account. Several other accounts formerly treated separately have now been merged in the Public Works Fund.
A summary of the receipts of the Public Works Fund is given below for the last five years. The figures are exclusive of credits, and transfers between the accounts considered are omitted, as are also temporary transfers from other accounts.
| Year ended 31st March, | Loan-money. | Transfers from Other Accounts. | Recoveries on account of Expenditure of Previous Years. | Interest on Investments, &c. | Sales of Electrical Energy. | Land Sales, Repayment of Advances, &c.* | Other and Unspecified. | Total. |
|---|---|---|---|---|---|---|---|---|
* Native-land settlement and settlement of unemployed workers. † Includes Sinking Fund and cash-balance receipts (£472,013) resulting from purchase of Southland Electric-power undertaking. | ||||||||
| £ | £ | £ | £ | £ | £ | £ | £ | |
| 1933 | 1,019,851 | 19,851 | 74,422 | 8,917 | 823,644 | 1,497 | 10,204 | 1,958,386 |
| 1934 | 1,404,565 | 3,445 | 47,092 | 7,278 | 880,374 | 10,237 | 10,784 | 2,363,775 |
| 1935 | 1,647,400 | 378,688 | 7,297 | 932,680 | 23,999 | 10,308 | 3,000,372 | |
| 1936 | 2,250,000 | 58 | 175,017 | 1,148 | 983,204 | 36,315 | 12,383 | 3,458,125 |
| 1937 | 4,980,553 | 36,723 | 5,160 | 1,136,421 | 97,479 | 486,704† | 6,743,040 | |
The expenditure of the Fund is summarized below for the last five years. As in the case of receipts, the figures are exclusive of credits and of transfers between the various accounts.
| Year ended 31st March, | Public Works. | Dairy Industry Loans. | Maintenance and Working-expenses.* | Amortization of Debt. | Interest. | Debt Charges and Expenses. | Other Items. | Total. |
|---|---|---|---|---|---|---|---|---|
* Where shown separately. Board debentures and advances. Flock House Estate. † Amount involved in repayment of Southland Electric-power ‡ Includes an amount of £60,032 expended in the purchase of | ||||||||
| £ | £ | £ | £ | £ | £ | £ | £ | |
| 1933 | 1,632,070 | 79 | 37,876 | 571,369 | 35,503 | 439 | 2,277,336 | |
| 1934 | 1,986,771 | 88 | 20,539 | 561,170 | 3,408 | 439 | 2,572,415 | |
| 1935 | 2,097,499 | 91 | 39,240 | 574,350 | 2,588 | 442 | 2,714,210 | |
| 1936 | 2,266,775 | 10,750 | 90 | 16,670 | 560,002 | 4,051 | 5,305 | 2,863,643 |
| 1937 | 4,042,901 | 30,510 | 44 | 1,551,479† | 530,120 | 385,566 | 60,471‡ | 6,601,091 |
No distinction is now made in the Electric Supply Account between capital and maintenance expenditure out of vote. The item “Departmental” in the Public Works Fund covers both construction and maintenance, and other items also are probably affected.
The principal items of public-works expenditure included in the first column are as follows for the five years:—
| Year ended 31st March, | Railways. | Roads. | Telegraph Extension. | Development of Water-power.* | Public Buildings. | Lands and River Improvement, Irrigation, &c. | Lands Settlement.† | Departmental and other. |
|---|---|---|---|---|---|---|---|---|
* Including maintenance. Native-land settlement. † Settlement of unemployed workers and (from 1933–34) | ||||||||
| £ | £ | £ | £ | £ | £ | £ | £ | |
| 1933 | 160,853 | 396,559 | 99,999 | 589,061 | 90,567 | 107,003 | 118,722 | 69,306 |
| 1934 | 132,111 | 359,671 | 144,160 | 570,323 | 149,392 | 152,622 | 351,594 | 126,898 |
| 1935 | 125,600 | 371,573 | 135,933 | 555,519 | 286,968 | 188,352 | 347,977 | 85,577 |
| 1936 | 258,012 | 444,377 | 195,380 | 529,075 | 346,879 | 136,245 | 218,367 | 138,440 |
| 1937 | 1,019,094 | 913,720 | 232,512 | 763,775 | 654,909 | 98,699 | 204,335 | 155,857 |
The increased figures of expenditure, particularly in the case of railway and road construction, is due to the present Government's policy of public-works development.
In addition to expenditure on roads from the Public Works Fund, there is the expenditure incurred in roading Crown lands and lands purchased for settlement, which is a charge on the Land for Settlements Account, and is included in the values upon which the rentals of the lands are based.
A more detailed statement of the not expenditure out of the Public Works Fund during 1936–37 is now given:—
| £ | |
|---|---|
| Public works, departmental | 137,748 |
| Railways | 1,019,094 |
| Public buildings— | |
| General | 58,565 |
| Courthouses | 2,655 |
| Education buildings | 268,884 |
| Prison buildings and works | 4,621 |
| Police-stations | 7,149 |
| Postal and Telegraph | 158,005 |
| Mental-hospital buildings | 142,109 |
| Health and hospital institutions | 12,921 |
| Lighthouses | 630 |
| Harbour-works | 669 |
| Development of tourist resorts | 16,789 |
| Roads, &c. | 913,720 |
| Telegraph extension | 232,512 |
| Lands, miscellaneous | 62,673 |
| Irrigation and water-supply | 11,061 |
| Swamp-land drainage | 24,965 |
| Settlement of unemployed workers | 92,016 |
| Native land settlement | 112,319 |
| Dairy industry loans | 30,510 |
| Development of water-power | 763,775 |
| Services not provided for | 21 |
| Subsidy to Ellesmere Lands Drainage Board | 439 |
| Administration expenses in connection with Ellesmere lands | 44 |
| Purchase of Flock House Estate | 60,032 |
| Charges of raising loans | 893 |
| Stamp duty | 126 |
| Premiums on conversion | 37 |
| Management charges of consolidated stock, &c. | 4,389 |
| Exchange | 380,121 |
| Interest | 530,120 |
| Southland Electric-power Board debentures and advances repaid | 1,551,479 |
| Total | £6,601,091 |
The total net expenditure of the General Purposes Account of the Public Works Fund from its inception in 1870 to 31st March, 1937, has been £128,369,357, spread over the various classes of public works as follows:—
| Class. | £ |
|---|---|
| Immigration | 3,312,913 |
| Public works, departmental | 3,211,990 |
| Railways | 57,600,966 |
| Roads | 23,899,855 |
| Land-purchases | 2,054,024 |
| Settlement of unemployed workers. | 756,502 |
| Development of mining | 880,855 |
| Telegraph extension | 11,988,430 |
| Public buildings | 12,781,988 |
| Lighthouses, harbour-works, and defences | 1,323,344 |
| Contingent defence | 1,401,080 |
| Rates on Native lands | 68,672 |
| Thermal springs | 14,600 |
| Development of tourist resorts | 733,926 |
| Lands improvement | 980,343 |
| Swamp-land drainage | 80,881 |
| Plant, material, and services | 139,344 |
| Charges and expenses of raising loans | 3,828,307 |
| Coal-mines | 10,835 |
| Interest and sinking fund | 218,500 |
| Irrigation and water-supply | 1,314,241 |
| Motor-transport service | 33,635 |
| Transfer to Main Highways Account Construction Fund | 1,226,000 |
| Native land settlement | 466,866 |
| Dairy industry loans | 41,260 |
| Total | £128,369,357 |
The total receipts of the General Purposes Account to 31st March, 1937, were £130,487,383, of which £114,640,006 represented the proceeds of loans, and £14,555,000 transfers from the Consolidated Fund. The largest item in the residue of £1,292,377 was an amount of £506,820 in respect of sinking funds set free, next in importance being receipts from stamp duties to 31st December, 1876 (£264,658). The balance of the account at 31st March, 1937, was £2,118,026.
Through the closing of several accounts and the merging of these in other accounts or funds, there now remain only two accounts dealing primarily with land-settlement—viz., the Land for Settlements Account and the Discharged Soldiers Settlement Account. The former has numerous and diverse activities in connection with land-settlement, while the latter is mainly concerned with the receipt of principal and interest in respect of advances to returned-soldier settlers and the making of fresh advances from repaid principal moneys.
The principal advances accounts, those relating to State advances to settlers and workers, are, as stated earlier in this subsection, outside the Public Account and are not included here.
A statement of receipts and expenditure of the Land for Settlements Accounts during the last two years is as follows:—
LAND FOR SETTLEMENTS ACCOUNT.
| Receipts. | 1935–36. | 1936–37. |
|---|---|---|
| £ | £ | |
| Sales and capital receipts | 188,519 | 221,803 |
| Rents and interest | 440,755 | 480,693 |
| Sales of produce, live-stock, and miscellaneous | 62,556 | 101,061 |
| Receipts from Hutt Valley Settlement lands | 25,649 | 14,252 |
| Interest on investments | 1,723 | 5,657 |
| Valuation fees in respect of advances | 78 | |
| Recoveries | Dr. 5 | 87 |
| £719,275 | £823,553 | |
| Expenditure. | £ | £ |
| Administration, &c. | 162,905 | 169,888 |
| Interest and other charges | 492,011 | 489,218 |
| Charges on proceeds of sales of Crown lands | 5,251 | 6,793 |
| Charges on proceeds of sales of National Endowment lands | 19 | 42 |
| Transfer of advances to Discharged Soldiers Settlement Account | 1,755 | |
| Exchange | 325 | |
| £660,511 | £667,696 |
A similar statement is next given in respect of the operations of the Discharged Soldiers Settlement Account.
DISCHARGED SOLDIERS SETTLEMENT ACCOUNT.
| Receipts. | 1935–36. | 1936–37. |
|---|---|---|
| £ | £ | |
| Repayment of advances | 1,007,828 | 746,055 |
| Interest and rent | 544,221 | 405,536 |
| Miscellaneous | 1,283 | 703 |
| Transfer from Land for Settlements Account | 1,755 | |
| Interest on investments | 10,215 | 3,322 |
| £ 1,563,547 | £ 1,157,371 | |
| Expenditure. | £ | £ |
| Improvement, &c., of properties | 78,142 | 73,007 |
| Advances made | 509,178 | 465,896 |
| Suspense Account (net) | 2,815 | 2,192 |
| Interest | 465,154 | 232,300 |
| Management charges of consolidated stock | 78 | 309 |
| Principal refunded to Consolidated Fund | 950,000 | 200,000 |
| Charges and expenses of raising loans | 577 | 1,412 |
| £2,005,944 | £975,116 |
Omitting transfers between the two accounts and per contra items where shown, receipts of these two accounts during the year 1936–37 aggregated £1,979,169 and expenditure £1,641,057.
Several important trading operations of the Government are outside the orbit of the Public Account, while certain others are included in the Consolidated Fund; and the Electric Supply Account covers both construction and trading operations. Trading accounts other than those which might be so regarded but have already been dealt with under previous headings are now as follows:—
Working Railways Account.
State Coal-mines Account.
State Forests Account.
The revenue of these three accounts during the last three years was as follows:—
| Item. | Account. | 1934–35. | 1935–36. | 1936–37. |
|---|---|---|---|---|
| £ | £ | £ | ||
| Railway revenue | Working Railways | 6,371,687 | 6,670,250 | 7,513,935 |
| Contributions and subsidy to Railway Employees' Sick Benefit Fund | Ditto | 8,000 | 8,000 | 8,000 |
| Sale of coal and wood, rents, &c. | State Coalmines | 187,971 | 224,913 | 248,668 |
| Forests revenue | State Forests | 71,982 | 106,007 | 132,203 |
| Administration expenses recovered | State Forests | 914 | 976 | 1,560 |
| Loan-money | State Forests | 60,000 | 136,000 | |
| Interest receipts | Various | 42,978 | 39,644 | 35,427 |
| Recoveries on account of expenditure of previous years | State Forests | 368 | 1,675 | 1,220 |
| Totals | £6,743,900 | £7,051,465 | £8,077,013 |
Expenditure during the same three years was composed of the following amounts:—
| 1934–35. | 1935–36. | 1936–37. | |
|---|---|---|---|
| Out of appropriations— | £ | £ | £ |
| Working railways | 5,214,171 | 5,698,279 | 7,137,049 |
| State coal-mines | 173,583 | 201,358 | 245,693 |
| State forests | 113,050 | 127,492 | 227,872 |
| Interest | 1,092,547 | 1,055,254 | 907,065 |
| Exchange | 596 | ||
| Management charges of consolidated stock | 39 | 79 | 220 |
| Charges and expenses of raising or transferring loans | 140 | 461 | 599 |
| Amortization of debt | 8,510 | 18,819 | 9,179 |
| Transfers to other accounts | 4,157 | 7,132 | 10,934 |
| Subsidy to Railway Employees' Sick Benefit Fund | 8,000 | 8,000 | 8,000 |
| Totals | £6,614,197 | £7,117,470 | £8,546,611 |
An Unemployment Fund was set up in 1930–31 to handle receipts of taxation and other revenue for unemployment purposes and the disbursement of moneys for the relief of unemployment. This fund has been superseded by the Employment Promotion Fund, which was established under the Employment Promotion Act of 1936.
Receipts and expenditure on account of employment promotion during the last three years have been as follows:—
| Item. | 1934–35. | 1935–36. | 1936–37. |
|---|---|---|---|
| Receipts. | |||
| £ | £ | £ | |
| Registration levy | 433,665 | 416,335 | 440,562 |
| Employment charge | 4,171,054 | 3,503,691 | 3,784,403 |
| Repayment of loans | 6,242 | 28,990 | 14,863 |
| Interest on loans | 1,287 | 2,105 | 2,524 |
| Interest on investments, &c. | 10,754 | 4,920 | 1,823 |
| Fines | 208 | 208 | 471 |
| Miscellaneous | 229 | 261 | 15,496 |
| Recoveries | 122 | 107 | 403 |
| Total | £4,623,561 | £3,956,617 | £4,260,545 |
| Expenditure. | |||
| Administration | 139,000 | 200,844 | 76,445 |
| Employment grants and subsidies | 3,436,461 | 3,550,451 | 2,657,493 |
| Loans | 22,403 | 58,886 | 28,421 |
| Sustenance payments | 239,983 | 807,095 | 1,557,215 |
| Food, clothing, &c. | 74,285 | 265,048 | 94,313 |
| Exchange | 528 | 123 | |
| Total | £3,912,132 | £4,882,852 | £4,414,010 |
The Main Highways Account is concerned with the construction and maintenance of main highways and the payment of subsidies to local authorities. Its receipts consist mainly of special taxation collected by the Consolidated Fund and paid over, less certain deductions, and moneys borrowed for purposes of construction.
The separate Revenue and Construction Funds of the Main Highways Account were merged into one account as from 1st April, 1936, by the Finance Act (No. 2), 1935. The statement of receipts and expenditure which follows, summarizing the operations of the last three years, covers both the Revenue and Construction Funds for the two earlier years:—
| Item. | 1934–35. | 1935–36. | 1936–37. |
|---|---|---|---|
| Receipts. | |||
| £ | £ | £ | |
| Taxation | 1,455,143 | 1,975,945 | 2,333,753 |
| Loan money | 431,500 | 150,000 | 853,500 |
| Repayment of advances | 12,654 | 14,064 | 14,803 |
| Interest | 8,127 | 6,601 | 4,875 |
| Recoveries on account of expenditure of previous years | 1,979 | 1,588 | 3,152 |
| Miscellaneous | 270 | 188 | 159 |
| Total | £1,909,673 | £2,148,386 | £3,210,242 |
| Expenditure. | |||
| Construction and maintenance of highways | 1,401,784 | 1,807,131 | 2,726,975 |
| Subsidies to local authorities | 359,351 | 184,855 | 195,085 |
| Advances to local authorities | 18,939 | 22,024 | 21,073 |
| Commutation of Hutt Road fees | 25,168 | 23,999 | 24,474 |
| Abolition of toll-gates | 1,793 | 1,663 | 1,457 |
| Interest on transfers from Public Works Fund | 61,300 | 61,300 | 61,300 |
| Subsidies on farm-land rates | 186,388 | ||
| Loan charges | 472 | 893 | |
| Amortization of debt | 75,576 | 85,419 | 93,567 |
| Exchange | 1,920 | ||
| Interest on temporary transfers | 482 | ||
| Total | £1,944,383 | £2,374,699 | £3,125,306 |
ALL revenue collected by means of taxation was until the end of the financial year 1921–22 paid into the Consolidated Fund and applied to general purposes. From 1922–23 to the 5th December, 1927, however, certain items were paid into the Main Highways Account to help to defray the cost of improving and maintaining roads. From the last-mentioned date all such moneys are paid into the Consolidated Fund in the first instance, and (with certain exceptions) transferred to the Main Highways Account. The proceeds of the employment promotion taxation introduced in 1930–31 are paid direct into the Employment Promotion Fund.
A summary of tax collections (total and per head) during the last ten years, is given in the following table. For 1927–28 the figures include amounts paid direct into the Main Highways Account, while for 1930–31 and subsequent years gross collections of employment promotion taxation are included.
| Year ended 31st March, | Total. | Per Head. |
|---|---|---|
* Excluding employment promotion taxation, the total is £26,939,337, equal to £17 1s. 3d. per head. | ||
| £ | £ s. d. | |
| 1928 | 17,145,145 | 11 17 6 |
| 1929 | 17,832,033 | 12 4 3 |
| 1930 | 19,471,131 | 13 3 6 |
| 1931 | 18,878,285 | 12 12 0 |
| 1932 | 17,405,622 | 11 9 4 |
| 1933 | 19,703,703 | 12 17 7 |
| 1934 | 21,470,827 | 13 18 4 |
| 1935 | 24,737,939 | 15 18 4 |
| 1936 | 25,476,372 | 16 5 6 |
| 1937* | 31,164,302 | 19 14 10 |
The following table shows receipts under the various heads of taxation during the last five years:—
| Head. | Revenue for Year ended 31st March, | ||||
|---|---|---|---|---|---|
| 1933. | 1934. | 1935. | 1936. | 1937. | |
| £ | £ | £ | £ | £ | |
| Customs revenue | 6,131,414 | 6,485,014 | 7,423,597 | 8,161,161 | 9,499,254 |
| Beer-duty | 654,227 | 655,464 | 671,008 | 715,042 | 841,584 |
| Motor-vehicles taxation | 1,680,605 | 1,703,527 | 1,910,452 | 2,124,130 | 2,503,111 |
| Land-tax | 498,916 | 498,978 | 492,526 | 458,873 | 1,047,877 |
| Income-tax | 3,556,775 | 2,961,243 | 3,796,477 | 4,581,328 | 6,618,716 |
| Death duties | 1,511,695 | 1,390,742 | 2,205,394 | 1,615,479 | 1,725,135 |
| Bank composition | 268,122 | 279,244 | 218,017 | 34,389 | 14,288 |
| Stamp duty on interest | 309,132 | 78,771 | 68 | 53 | Dr. 98 |
| Duty on instruments | 192,179 | 199,639 | 238,093 | 277,441 | 347,738 |
| Racing taxation | 302,371 | 340,740 | 371,985 | 378,851 | 503,655 |
| Amusements-tax | 53,564 | 48,715 | 49,526 | 56,507 | 70,564 |
| Other stamps taxation | 361,050 | 372,780 | 436,379 | 477,028 | 499,14 |
| Employment promotion taxation | 4,099,662 | 4,413,221 | 4,561,594 | 3,921,975 | 4,224,65 |
| Film-hire tax | 30,102 | 32,960 | 44,491 | 60,657 | 72,209 |
| Sales tax | 38,253 | 1,847,333 | 2,170,503 | 2,462,602 | 3,044,612 |
| Gold-export duty | 15,636 | 117,090 | 102,617 | 106,976 | 108,793 |
| Interest-tax | 45,000 | 44,979 | 43,823 | 41,602 | |
| Mileage-tax residue | 366 | 233 | 57 | 583 | |
| Totals | 19,703,703 | 21,470,827 | 24,737,939 | 25,476,372 | 31,164,302 |
During the earlier years of the depression heavier imposts were made in existing fields of taxation and, in addition, new classes of taxation were imposed, the latter including a sales tax and a scheme of special taxation for the relief of unemployment, both of which are dealt with under subsequent headings.
The taxation receipts for 1936–37 are the highest ever recorded, the figure being nearly £5,700,000 higher than in 1935–36, which previously held the record. The rate per head in 1936–37 (£19 14s. 10d.) displaces the previous record (£17 14s. 4d.) established in 1920–21.
Part of the increase in the case of income-tax is due to the revised scale of rates, which was planned to produce an extra £1,000,000 of revenue, additional to an expected increase of £500,000 from improved business conditions. Actually income-tax receipts increased by £2,000,000. Land-tax was expected to yield £1,300,000, £800,000 of the £850,000 increase being anticipated from the re-introduction of a graduated scale; but land-tax receipts (£1,050,000) fell short of the estimate by £250,000.
The amended scales of income-tax and land-tax represented the only increases in imposts, and two-thirds of the total increase of £5,700,000 in taxation receipts is thus due to the general improvement in business. The improvement is particularly reflected in the figures for Customs revenue, sales tax, motor-vehicles taxation, and employment promotion taxation, in addition to income-tax receipts.
Revenue included under the heading of Customs is exclusive of receipts from tire-tax and from that portion of the petrol-tax which is imposed to provide funds for roading purposes, as referred to under the next heading. Gold-export duty and sales-tax receipts also are not counted as Customs revenue, although collected by the Customs Department.
The following figures show Customs and excise revenue for the last ten years:—
| Year ended 31st March, | Customs Duties.* | Excise Duties.* | Total Customs and Excise Duties. | Proportion of Total Taxation. |
|---|---|---|---|---|
* Excise duties in this table cover only beer-duty; other excise duties are here included with Customs duties. | ||||
| £ | £ | £ | Per Cent. | |
| 1928 | 7,891,621 | 609,624 | 8,501,245 | 49.58 |
| 1929 | 7,954,252 | 611,484 | 8,565,736 | 48.04 |
| 1930 | 8,897,047 | 620,312 | 9,517,359 | 48.88 |
| 1931 | 7,605,976 | 575,100 | 8,181,076 | 43.34 |
| 1932 | 5,904,348 | 641,080 | 6,545,428 | 37.61 |
| 1933 | 6,131,414 | 654,227 | 6,785,641 | 34.44 |
| 1934 | 6,485,014 | 655,464 | 7,140,478 | 33.26 |
| 1935 | 7,423,597 | 671,008 | 8,094,605 | 32.72 |
| 1936 | 8,161,161 | 715,042 | 8,876,203 | 34.84 |
| 1937 | 9,499,254 | 841,584 | 10,340,838 | 33.18 |
For fuller information on the subject of Customs and excise taxation the reader is referred to Section XD of this book.
The Main Highways Act, 1922, laid down that the Revenue Fund (the Revenue and Construction Funds merged as from 1st April, 1936) of the Main Highways Account was to be credited, inter alia, with—
All moneys received as Customs duties imposed in respect of rubber tires, rubber tiring, and inner tubes of rubber for pneumatic tires, n.e.i. (as per the Customs tariff):
All moneys received by the Crown under any Act in respect of the licensing of motor-vehicles.
The tire-tax had been imposed by the Customs Amendment Act, 1921, prior to the passing of which tires had been admitted free. The licensing of motor-vehicles by the Crown became operative in the financial year 1924–25, consequent on the passing of the Motor-vehicles Act, 1924.
A third class of taxation for main-highways purposes was introduced towards the end of 1927 by the Motor-spirits Taxation Act of that year, which imposed a duty of 4d. per gallon on all motor-spirits imported. The rate was increased to 6d. per gallon in 1930. The duty collected is paid into the Consolidated Fund in the first place, and after deduction of expenses of administration and of refunds (which are provided for in cases where the motor-spirit is used otherwise than for motor-vehicles) the residue is divided between (1) the Main Highways Account, and (2) boroughs with a population of 6,000 or over, in the proportions of 92 per cent. and 8 per cent. respectively. An additional 2d. per gallon was imposed from 7th October, 1931, and a further 2d. from 9th February, 1933, but these imposts (totalling 4d. per gallon, or 4½ d. with the surtax of ½ d. per gallon on imports from foreign countries) are for general purposes, and the proceeds are paid into the Consolidated Fund as part of the ordinary Customs revenue. For each of the years 1932–33 (£500,000), 1933–34 (£500,000), and 1934–35 (£321,754), a portion of the petrol-tax receipts otherwise payable to the Main Highways Account was retained in the Consolidated Fund by special legislative authority.
By section 19 of the Finance Act, 1932–33 (No. 2), a mileage-tax was imposed on motor-vehicles using motive-power other than petrol. Part of the receipts is regarded as the equivalent of Customs taxation on petrol and remains in the Consolidated Fund, the balance for highway purposes being divided between the Main Highways Account and the larger boroughs after deduction of administration expenses and of refunds.
Taxation receipts for main-highways purposes have been as follows during the last ten years. Reference may be made also to the section relating to Roads and Road Transport.
| Year ended 31st March, | Fees, &c., under Motor-vehicles Act. | Tire-tax. | Motor-spirits Taxation. | Mileage-tax. | Total. | Proportion of Total Taxation. |
|---|---|---|---|---|---|---|
| £ | £ | £ | £ | £ | Per Cent. | |
| 1928 | 345,510 | 227,451 | 143,516 | 716,477 | 4.18 | |
| 1929 | 244,598 | 196,747 | 802,232 | 1,243,577 | 6.97 | |
| 1930 | 391,368 | 157,474 | 961,948 | 1,510,790 | 7.76 | |
| 1931 | 393,797 | 130,408 | 1,316,385 | 1,840,590 | 9.75 | |
| 1932 | 370,126 | 85,437 | 1,358,623 | 1,814,186 | 10.42 | |
| 1933 | 352,561 | 64,163 | 1,263,881 | 1,680,605 | 8.53 | |
| 1934 | 346,250 | 63,801 | 1,291,879 | 1,597 | 1,703,527 | 7.93 |
| 1935 | 391,660 | 92,587 | 1,424,809 | 1,396 | 1,910,452 | 7.72 |
| 1936 | 431,896 | 94,071 | 1,596,407 | 1,756 | 2,124,130 | 8.34 |
| 1937 | 493,626 | 139,723 | 1,866,186 | 3,576 | 2,503,111 | 8.03 |
A change in the registration year is responsible for the apparent fall in 1928–29 in respect of fees under the Motor-vehicles Act.
All taxation receipts for main-highways purposes are paid into the Consolidated Fund in the first place and then transferred to the Main Highways Account as permanent appropriations.
Except in regard to minor details, the system of land and income taxation in force at the outbreak of the Great War had remained unaltered for many years. Probably the only noteworthy change was the gradual hardening-up of the graduated land-tax, designed to prevent aggregation of land and to compel the cutting-up of large estates rather than to secure additional revenue.
The war taxation of 1915, however, not only included increased rates of 33⅓ per cent. in the case of income-tax, ¼ d. in the pound in the case of land-tax payable on mortgages, and 50 per cent. in the case of graduated land-tax, but also involved an important change of principle. Among the incomes previously exempt from income-tax were those derived directly from land, but in 1915 income-tax was made payable on such incomes.
With the exception of the abolition of the land-tax on mortgages and the substitution of an income-tax in its place, the principles of land-tax assessment were not altered in 1916, nor were the rates increased, but an entirely now scheme known as the excess-profits tax was brought into operation in respect of income-tax, the 1915 system remaining also, with increased rates, for ordinary income-tax. The excess-profits tax being found inequitable and otherwise unsatisfactory, a system of progressive land and income tax, with a special war tax on incomes, was adopted in 1917.
In 1920 a complete revision of the rates of taxation was made. A feature of that year's legislation was the introduction of a deduction from the amount of tax payable of 10 per cent. in respect of tax assessed on the first £2,000 of “earned income.”
In 1923 further alterations were made, the principal being the restoration of the exemption from income-tax of income derived from the direct use or cultivation of land. Reductions in the rates of taxation were also made.
Further reductions in income-tax rates were made in 1924 and 1925, and other alterations in respect of exemptions, method of assessment, &c., were also made. Alterations made in 1927 in the progressive scale of increases in the rate of tax and also in the scale of reduction of exemptions had the effect of slightly increasing income-tax except on the very highest incomes and those below £450.
In 1929 the maximum exemption for mortgages in the computation of land-tax was reduced from £10,000 to £7,500, and special land-tax (additional to ordinary tax) was imposed on farm-lands exceeding £14,000 in unimproved value. At the same time income-tax was provided for in the case of farm-lands in excess of £14,000. From the income-tax assessed in such cases land-tax (including special) was deductible.
In 1930 the special land-tax was discontinued, but income-tax was imposed on profits from farm-lands of an unimproved value of £7,500 or over. Income tax rates were increased by 10 per cent., and in place of the income exemption of 5 per cent. of capital value of land used in the derivation of income, a 5 per cent. allowance on taxable unimproved value, with an allowance for depreciation of premises, was substituted. An increase in the land-tax rates was also made, through the abolition of the deduction (which had been in force for some years) of 5 per cent. from the computed tax.
In 1931 the graduated scale of land-tax was abolished, a flat rate of 1d. in the pound of taxable unimproved value being substituted. To balance the reduction in land-tax and to provide additional revenue, the following alterations were made in respect of income-tax:—
Reduction of general exemption to £260, diminished by £1 for every £3 of income between £260 and £560, and by £1 for every £1 10s. between £560 and £800.
In of surtax to 30 per cent.
position of a special flat-rate tax of 4d. in the pound on incomes of individuals, with a general exemption of £500.
Imposition of a special emergency tax on unearned income of individuals equal to one-third of the income-tax payable on such unearned income.
Elimination of 10-per-cent. deduction on earned income.
Elimination of exemption of 5 per cent. of unimproved value of land used in production of income.
Extension (from 1st April, 1932) of income-tax provisions to farmers with £3,000 unimproved value or over.
Inclusion in assessments (but only for purpose of fixing rate and general exemption) of certain classes of non-assessable income.
Removal of discrimination in tax on income derived from local-body and company debentures issued before and after the 28th August, 1923, with the exception of “free of tax” company debentures.
In 1933 the general exemption was reduced to £210, but a special exemption of £50 (reducible by £1 for every £1 10s. of income over £725) was provided for a married man in respect of his wife if he supports her and if her own income does not exceed £50. A further amendment in 1933 extended this exemption to cover the case of a woman supporting her husband, and made a similar exemption in respect of the employment of a housekeeper by a widower or widow. The £50 exemption in respect of contributions to the support of a widowed mother was extended in 1935 to cover also the case of a widowed mother-in-law.
As part of the programme of the Labour Government, a graduated scale of land-tax was reintroduced as from 1st April, 1936. An amended scale of income-tax, with somewhat heavier imposts for the tax-year 1936–37, was also adopted, and various changes were made in regard to exemptions. Under the amended scale the reduction of exemptions with increasing income is discontinued, as is also the special flat-rate tax on incomes over £500. An innovation in the 1936 legislation is a provision whereby taxpayers may be required to pay their income-tax in instalments instead of in one sum as hitherto.
Statistics of income-tax assessed for the tax-year 1935–36 and recent previous years, according to class of taxpayer, source, and size of income, &c., are given in the section of this Year-Book relating to “Incomes and Income-tax.”
Land-tax is assessed on the unimproved value of land after deductions provided for by statute have been made by way of special exemption. An owner of land the unimproved value of which does not exceed £1,500 is allowed an exemption of £500; and where the unimproved value lies between £1,500 and £2,500 there is a similar exemption, diminished, however, by £1 for every £2 over the £1,500 mark, so that no exemption is allowed when £2,500 is reached.
Where the land is subject to a registered mortgage an alternative scale of exemption is provided—viz., £7,500 in cases where the unimproved value does not exceed £7,500, the exemption of £7,500 being diminished by £1 for every £1 above the margin of £7,500 of unimproved value, and disappearing altogether at £15,000. Where the capital value of the mortgage is less than the amount of deduction provided, such capital value is deducted instead.
No special exemption is allowed in the case of land not situated in a borough, which has been owned by a person for three years and not improved to the extent of £1 per acre or equal to one-third of the unimproved value, when in the opinion of the Commissioner of Taxes it should have been so improved. In the case of such land, also, the rate of land-tax is 50 per cent. more than the ordinary rate.
In lieu of the special exemptions set out above, the Commissioner of Taxes has discretionary powers to grant relief in certain specified cases of hardship. Subject to deductions provided, life tenants are liable to tax, and joint owners are assessed jointly as regards the land held in conjunction, and also severally in respect of each owner's interest in such land and any other land. This liability for joint assessment also applies to companies owning land if half of the paid-up capital or half (in nominal value) of the allotted shares of each company is held by or on behalf of shareholders in the other.
In case of default by a taxpayer in respect of land-tax the amount of tax may be demanded from his successor in title, from a tenant of the taxpayer or his successor, or from a mortgagee of the estate or interest concerned. Land-tax constitutes a charge on the land, and, notwithstanding any disposition of it, such land continues to be liable in the hands of a purchaser or other holder thereof for the payment of the tax so long as the charge remains in force. Registration of the charge is required, and no disposition of the land or of any interest in it may be registered while the charge remains in force. Relief in cases of hardship is provided for.
Where the unimproved value on which land-tax is payable does not exceed £5,000 the present rate of land-tax is 1d. in the pound. This rate is increased by 1/8000 d. for every £1 in excess of £5,000, with, however, a maximum of 6d. in the pound.
Income-tax is payable on the full incomes of registered companies, public authorities, and absentees, and in other cases on income in excess of £210 per annum. Certain specified incomes are wholly exempt from taxation, and a further £50 is deductible from assessable income in respect of a dependent wife or husband whose personal income does not exceed £50. A similar exemption is allowed in respect of a housekeeper employed by a widower or widow; £50 deduction is allowed for each child or grandchild under eighteen years of age who is dependent on the taxpayer, and amounts up to £50 contributed towards the support of the taxpayer's widowed mother or widowed mother-in-law are also deductible from assessable income. Exemption (maximum, 15 per cent.) is allowed for life-insurance premiums and National Provident Fund, superannuation, and similar contributions. By the Unemployment Amendment Act, 1931, amounts paid as unemployment-relief tax were also allowed as a special exemption; but this exemption was discontinued from 1st April, 1936. Allowance is made for depreciation of promises and plant used in the production of income, the scale of depreciation adopted in the case of premises being 3 per cent. for wooden-frame buildings; 2 per cent. for brick, stone, or concrete walled buildings; and 1½ per cent. for buildings of reinforced stone or concrete throughout. A deduction may also be made in respect of any premium paid on account of leased machinery used in the production of income.
Income derived from farm-lands of an unimproved value of £3,000 or over is subject to income-tax, as also is income from (1) Crown land held as small grazing-runs or for pastoral purposes; (2) the extraction, removal, or sale of minerals, timber, or flax; or (3) the business of dealing in agricultural and pastoral products. Otherwise income derived by any person from his direct, use or occupation of land is exempt from income-tax.
Where the income on which tax is payable does not exceed £5,500, the present rate of tax per pound is—
Companies and public authorities, 1s., increased by 1/100 d. for every £1 of such income.
Other taxpayers (who, as stated above, are—with the exception of absentees— exempted in respect of the first £210 of income), 1s. 8d., increased by 1/100 d. for every £1 of such income.
Where the income on which tax is payable exceeds £5,500, the rate per pound is—
Companies and public authorities, 5s. 7d., increased by 1/150 d. for every £1 in excess of £5,500, with a maximum rate of 7s. 6d. in the pound.
Other taxpayers, 6s. 3d., increased by 1/150 d. for every £1 in excess of £5,500 (maximum, 8s. 2d. in the pound).
Except in the case of companies (and, as added in 1935, public authorities), an additional 33⅓ per cent. is imposed in respect of unearned income.
Income derived from debentures of companies, local authorities, and public authorities is taxable at the source unless a certified list of the debenture-holders (with certain other particulars) is furnished. Where such income is taxed at the source an adjustment is obtainable, so that no taxpayer need pay tax on debenture interest at a higher rate than on income from other sources.
In the case, however, of company debentures issued “free of tax,” the liability for tax is placed on the company and no adjustment is obtainable. No exemptions are allowed in respect of debenture income, and the following rates in the pound are in force at present:—
| Companies: Debentures issued “free of income-tax”— | s. d. |
|---|---|
| Debentures issued before 28th August, 1923 | 4 0 |
| Debentures issued after 28th August, 1923 | 6 0 |
| Companies—other cases | 8 2 |
| Local and public authorities | 8 2 |
The additional 33⅓ per cent. for unearned income does not apply in respect of debenture income of the first two classes, but is imposed on the other two classes.
Companies pay tax on their full income (at the appropriate rate for such income) before distribution of dividends. The recipient of income from dividends does not pay income-tax on such part of his income, but the amount is taken into account in fixing the rate of tax to be paid. This provision also applies in the case of income from “tax-free” Government securities or “tax-free” company debentures.
In respect of stock or debentures issued by the Government of New Zealand, or by any local or public authority, or by the Public Trustee as agent of a land-settlement association, interest is not liable to New Zealand income-tax if it is payable out of New Zealand to a person not resident in New Zealand.
As mentioned previously, statistics of income-tax assessed for the tax-year 1935–86 and recent previous years, according to class of taxpayer, source, and size of income, &c., are given in the section of this Year-Book relating to “Incomes and Income-tax.”
The law dealing with these classes of duty is embodied in the Death Duties Act, 1921, as subsequently amended. The main heads of taxation are estate and succession duties, which are generally referred to by the collective title of “death duties.” In addition to these there are gift duties and Native succession duties.
Estate and succession duties are due and payable to the Commissioner of Stamp Duties on assessment, an additional 5 per cent. penalty, together with interest at 5 per cent. per annum, being payable if duty is not paid within three months (this period may be extended in certain cases) after death. Gift duties are payable at the time the gift is made, and Native succession duties before the registration of the succession order by the Native Land Court. Generally the decision of the Commissioner of Stamp Duties in regard to matters of fact incidental to the assessment of duty is final, but there is an appeal on points of law or of fact by way of a case stated to the Supreme Court. An appeal on a question of law may be referred to the Court of Appeal.
The net revenue received from death duties during each of the last five years was—
| Year ended 31st March, | Estate Duty. | Succession Duty. | Gift Duty. | Total Death Duties. |
|---|---|---|---|---|
| £ | £ | £ | £ | |
| 1933 | 1,120,395 | 349,431 | 41,869 | 1,511,695 |
| 1934 | 1,064,563 | 263,147 | 63,032 | 1,390,742 |
| 1935 | 1,740,318 | 419,672 | 45,404 | 2,205,394 |
| 1936 | 1,191,806 | 319,067 | 104,606 | 1,615,479 |
| 1937 | 1,270,090 | 346,157 | 108,888 | 1,725,135 |
When the final balance of the dutiable estate of a deceased person, estimated as at the date of his death, exceeds £1,000 an estate duty is levied on the amount thereof. In the case of any estate the final balance of which does not exceed £10,000, any interest acquired by the wife of the deceased up to the value of £5,000 is exempt from estate duty. The value of any life-insurance policy or policies comprised in the estate is also deductible up to a maximum of £1,000, irrespective of the amount of the estate. The rate of duty on the whole estate must, however, be determined before any deduction is made under either head.
Up to 1920 duty was leviable on property in excess of £500, and the scale of duties ranged from 1 per cent. in cases where the net estate was between £500 and £1,000 to a maximum of 15 per cent. for large estates. The amendment made to the scale in 1920 considerably increased the duty payable, the rates, which were embodied in the Act of 1921, ranging from 1 per cent. on estates not exceeding £2,000 in value to 20 per cent. on estates of more than £100,000. Part II of the Finance Act, 1930, imposed a rate of 30 per cent. on the amount by which the final balance exceeds £100,000. The present scale of duties is as follows:—
| Final Balance of Estate. | Rate per Cent. |
|---|---|
* 20 per cent. on first £100,000, and 30 per cent. on excess over £100,000. | |
| £ £ | |
| 1,000 to 2,000 | 1 |
| 2,000 to 3,000 | 2 |
| 3,000 to 4,000 | 3 |
| 4,000 to 6,000 | 4 |
| 6,000 to 8,000 | 5 |
| 8,000 to 10,000 | 6 |
| 10,000 to 15,000 | 7 |
| 15,000 to 20,000 | 8 |
| 20,000 to 25,000 | 9 |
| 25,000 to 30,000 | 10 |
| 30,000 to 35,000 | 11 |
| 35,000 to 40,000 | 12 |
| 40,000 to 45,000 | 13 |
| 45,000 to 50,000 | 14 |
| 50,000 to 60,000 | 15 |
| 60,000 to 70,000 | 16 |
| 70,000 to 80,000 | 17 |
| 80,000 to 90,000 | 18 |
| 90,000 to 100,000 | 19 |
| Exceeding 100,000 | * |
In addition to the estate duty referred to above, a succession duty is payable by any person who acquires a beneficial interest in the estate of a deceased person either by will or by intestacy. An exemption from duty is made in favour of charitable trusts, and special provision is made that the wife, lineal descendant, or lineal ancestor of a soldier who has met his death on account of the war of 1914–19 is allowed a £5,000 exemption additional to the amounts otherwise provided.
The rates of duty vary according to the nearness of kin of the beneficiary to the deceased person. The rates shown below were introduced in amending legislation in 1920, and, as in the case of the estate duties, are embodied in the 1921 consolidating Act.
| If Successor is | Value of Estate. | Rate per Cent. |
|---|---|---|
* Including step-father, stepmother, half-brother, or half-sister. | ||
| £ | ||
| Wife | Up to 10,000 | Nil. |
| 10,000 to 20,000 | 2 | |
| Over 20,000 | 4 | |
| Husband | Up to 500 | Nil. |
| 500 to 1,500 | 1 | |
| 1,500 to 2,500 | 2 | |
| Over 2,500 | 3 | |
| Father, mother, brother, or sister2 | Up to 500 | Nil. |
| 500 to 20,000 | 5 | |
| Over 20,000 | 10 | |
| Child or lineal descendant | Up to 1,000 | Nil. |
| 1,000 to 5,000 | 1 | |
| 5,000 to 10,000 | 2 | |
| 10,000 to 15,000 | 3 | |
| 15,000 to 20,000 | 3½ | |
| Over 20,000 | 4 | |
| Other relative to 4th degree | Up to 500 | Nil. |
| 500 to 10,000 | 5 | |
| Over 10,000 | 10 | |
| Other person | Up to 500 | Nil. |
| 500 to 20,000 | 10 | |
| Over 20,000 | 20 | |
In respect of moneys exceeding £1,000 that may be payable to persons domiciled out of New Zealand, and where the beneficiary is not the husband or wife of the deceased or a relative of the deceased within the third degree of consanguinity, there is an additional rate equal to 10 per cent. of the excess over £1,000.
Where any succession order is made by the Native Land Court on the death of a Native, no death duty in the ordinary way is payable on the property included in it, but a Native succession duty of 2 per cent. is payable on the value of the property, with a general exemption of £200.
A gift means any disposition of property (situate in New Zealand at the time of the gift) which is made otherwise than by will, whether with or without an instrument in writing, without full and adequate consideration in money or its equivalent. No duty is payable on a gift which, together with the value of all other gilts (not exempt from duty by reason of their nature) made at the same time or within twelve months previously or subsequently by the same donor to the same or any other beneficiary, otherwise than by way of a charitable trust, does not exceed the value of £500. Exemption from gift duty is also provided in cases of voluntary discharge of a mortgage debt where the donor and beneficiary are not connected by ties of blood or marriage. Various other exemptions were made by the Death Duties Amendment Act, 1923.
The amount of the gift duty is payable by either the donor or the beneficiary, but the beneficiary is entitled to be indemnified by the donor unless the terms of the gift provide otherwise. Particulars of any gift made are required to be furnished for assessment of duty within one month of the date of the gift, and in default an additional duty of 50 per cent. is payable. Where duty is payable, the rate is based on the following scale:—
| Value of Gift. | Rate of Duty. |
|---|---|
| Per Cent. | |
| £500 to £1,000 | 2½ |
| £1,000 to £5,000 | 5 |
| £5,000 to £10,000 | 7½ |
| Over £10,000 | 10 |
Prior to 1920 there was a flat rate of 5 per cent. on all gifts exceeding £1,000 in value. Gifts between £500 and £1,000 were made dutiable in 1930.
The term “stamp duties” covers a miscellany of items of taxation imposed by the Stamp Duties Act, 1923, as amended subsequently.
The receipts for the last five years are shown under the various heads of stamp duties revenue used in the public accounts.
| — | Year ended 31st March, | ||||
|---|---|---|---|---|---|
| 1933. | 1934. | 1935. | 1936. | 1937. | |
| £ | £ | £ | £ | £ | |
| Adhesive stamps | 70,104 | 80,581 | 125,955 | 149,575 | 154,527 |
| Duty on instruments | 192,179 | 199,639 | 238,093 | 277,441 | 347,738 |
| Impressed stamps | 168,709 | 173,311 | 186,741 | 197,637 | 211,150 |
| Stamp duty on interest | 309,132 | 78,771 | 68 | 53 | Dr. 98 |
| Licenses to companies | 83,910 | 84,984 | 83,856 | 87,781 | 87,771 |
| Sharebrokers' licenses | 1,583 | 2,178 | 2,051 | 1,980 | 2,068 |
| Bank composition | 268,122 | 279,244 | 218,017 | 34,389 | 14,288 |
| Racing taxation | 302,371 | 340,740 | 371,985 | 378,851 | 503,655 |
| Amusements-tax | 53,564 | 48,715 | 49,526 | 56,507 | 70,564 |
| Lottery duty | 17,306 | 15,245 | 18,000 | 17,762 | 20,153 |
| Oversea-passenger duty | 18,246 | 15,348 | 18,455 | 20,685 | 22,148 |
| Mortgagees' indemnity fees | 1,165 | 1,075 | 1,316 | 1,604 | 1,885 |
| Miscellaneous | 27 | 58 | 5 | 4 | 12 |
| Totals | 1,486,418 | 1,319,889 | 1,314,068 | 1,224,269 | 1,435,861 |
Bank composition (i.e., bank-note tax) yielded diminishing returns from 1st August, 1934, when Reserve Bank notes commenced to replace those of the trading banks. As at 1st August, 1936, trading banks were required to pay to the Reserve Bank amounts equal to their then outstanding notes, and the Reserve Bank assumed liability in respect thereof. As the Reserve Bank is not required to pay note-tax, this item of revenue now disappears.
Racing taxation, amusements-tax, and stamp duty on interest are dealt with in more detail under subsequent headings.
The Government tax on totalizator investments is 5 per cent. of the gross amount passed through the machines. This percentage was substituted in August, 1930 (by Part I of the Finance Act, 1930), for the former rate of 2½ per cent., which had been in force since March, 1910, prior to which the percentage was 1½. A refund of 2½ per cent. (raised from 1¼ per cent. by the Finance Act (No. 2), 1935) of gross, totalizator takings (up to a limit of £500) may be made to a racing club, the Minister of Internal Affairs having the right to specify the purpose or purposes for which the amount refunded in any case is to be applied.
For some years past special provision has been made annually for the racing clubs to retain for their own use a proportion of the totalizator duty payable under the Stamp Duties Act. From 1st April, 1932, to 31st March, 1934, the proportion was one-fifth, for the next twelve months it was one-tenth, and since 1st April, 1935, the former proportion of one-fifth has been reverted to.
From the 1st November, 1915, a tax of 1 per cent. was imposed on the total value of all stakes, and a tax of 2½ per cent. on totalizator dividends, in addition to the tax on totalizator investments. The tax on dividends is computed on the gross amount paid into the totalizator for any horse-race after deducting the club's commission of 12½ per cent. (raised from 10 per cent. by the Finance Act, 1930). From the 22nd December, 1921, the tax on stakes was increased to 10 per cent., and that on dividends to 5 per cent. From the 1st April, 1924, the tax on stakes was reduced to 5 per cent., with a further reduction to 1 per cent. from 1st August, 1935.
The following figures relate to the racing year, which ends on the 31st July:—
| — | Year ended 31st July, | ||||
|---|---|---|---|---|---|
| 1933. | 1934. | 1935. | 1936. | 1937. | |
* Retained by the clubs. | |||||
| Number of racing-days | 319 | 319 | 320 | 320 | 320 |
| Number of races | 2,470 | 2,479 | 2,485 | 2,492 | 2,497 |
| £ | £ | £ | £ | £ | |
| Amount of stakes | 312,788 | 335,985 | 348,815 | 368,112 | 443,538 |
| Totalizator investments | 3,678,251 | 3,904,948 | 4,017,150 | 4,645,968 | 6,220,520 |
| Amount paid in dividends | 3,033,510 | 3,221,812 | 3,314,961 | 3,835,073 | 5,136,248 |
| Government taxes— | |||||
| On totalizator investments | 147,130 | 161,383 | 174,809 | 185,838 | 248,821 |
| On dividends | 160,839 | 170,753 | 175,667 | 203,173 | 272,057 |
| On stakes | 15,639 | 16,799 | 17,441 | 3,681 | 4,436 |
| Totals | 323,608 | 348,935 | 367,917 | 392,692 | 525,314 |
| Percentage of totalizator in vestments retained by clubs | 312,651 | 326,735 | 327,335 | 394,908 | 528,744 |
| Unpaid fractions* | 24,121 | 24,265 | 24,378 | 26,976 | 34,650 |
| Refunds of taxation granted to clubs | 26,271 | 23,619 | 27,630 | 42,718 | 44,752 |
The gross revenue accruing to the State during the 1936–37 racing year is seen to have totalled £525,314. Refunds to racing clubs totalled £44,752 in the racing year 1936–37, as against £42,718 during the preceding twelve months.
For the financial year ended the 31st March, 1937, the gross figure of racing taxation was £503,655, while £43,116 was paid back to clubs by way of refunds.
A form of tax first introduced in 1917 is the amusements-tax, payable on payments for admission to entertainments. The present authority is the Amusements-tax Act, 1922, amended in 1923 and in 1930. “Entertainment” is defined as “any exhibition, performance, amusement, game, or sport to which persons are admitted for payment.” The maximum admission charge on which no tax is payable was originally fixed at 9d., but has been successively altered to 1s., 2s., and (in 1930) 1s. 6d. When the payment for admission exceeds 1s. 6d., but is not more than 3s., the tax is 3d.; thereafter, up to 3s., it is 4d.; up to 3s. 6d., 5d.; and above 3s. 6d., 1d. for each 1s. or part thereof, plus 2d. “Payment for admission” includes reservation charges. Provision is made for exemption in certain specified cases—viz., shows promoted by agricultural, pastoral, horticultural, or poultry societies; meetings held for educational, scientific, patriotic, or philanthropic purposes; and swimming-sports.
The following net amounts have been collected during the last ten years:—
| Year ended 31st March, | Amount collected. |
|---|---|
| £ | |
| 1928 | 63,165 |
| 1929 | 60,586 |
| 1930 | 79,887 |
| 1931 | 105,936 |
| 1932 | 74,763 |
| 1933 | 53,564 |
| 1934 | 48,715 |
| 1935 | 49,526 |
| 1936 | 56,507 |
| 1937 | 70,564 |
Part V of the Finance Act, 1930, imposed, as from 1st July, 1930, a film-hire tax, which is payable monthly by holders of renters' licenses under Part IV of the Cinematograph Films Act, 1928.
The film-hire tax payable is assessed on the net monthly receipts derived by the renter from renting sound-picture films. On British films the tax is 10 per cent., and on foreign films 25 per cent., of the net receipts. Films made wholly in New Zealand are exempt from the tax. The film-hire tax yielded a revenue of £30,102 in 1932–33, £32,960 in 1933–34, £44,491 in 1934–35, £60,657 in 1935–36, and £72,209 in 1936–37.
Towards the provision of funds for the relief of unemployment, an unemployment levy was instituted as from December, 1930. Originally at the rate of £1 10s. per annum, payable quarterly, the levy was imposed on all males of the age of twenty years and over, with certain exceptions.
In 1931 the levy was reduced to £1 per annum, but an “emergency unemployment charge” was imposed at the rate of 1d. for every 6s. 8d. of salaries or wages (other than those of domestic servants in private homes and of relief workers employed by public authorities, with their wages wholly, or (from 1934) partly, borne by the Unemployment Fund. A similar charge was imposed on incomes received from other sources by all males not wholly exempt from the levy and by women with incomes of £250 or over (from any source). In 1932 the emergency unemployment charge was altered to 1d. for every 1s. 8d. of wages, &c., and in the case of income of women other than from salary or wages was made applicable to the portion of such income in excess of £20 per annum. From 1st October, 1934, the emergency unemployment charge was reduced to 1d. for every 2s. or part thereof, and from 1st October, 1935, to 1d. for every 2s. 6d. or part thereof.
An amendment passed in November, 1934, exempted persons under twenty from tax on earned income. Women under twenty; women in receipt of pensions; and men of sixty-five, or women of sixty upwards, or permanently disabled persons whose total incomes (in all cases) do not exceed £104 are exempted from the tax on unearned income. Natives (male and female) of twenty years or over are required to pay tax on unearned income in the same way as if Europeans. The exemption of women in respect of unearned income was increased from £20 to £50.
For the portion of 1930–31 during which the Unemployment Act, 1930, was in force, levy receipts totalled £280,829. Employment promotion taxation yielded £1,217,451 in 1931–32, £4,099,662 in 1932–33, £4,413,221 in 1933–34, £4,561,594 in 1934–35, £3,921,975 in 1935–36, and £4,224,965 in 1936–37. Towards the 1936–37 total the tax on salaries and wages provided £2,590,832, and on other income £1,193,571, the balance of £440,562 representing levy receipts. Corresponding figures for 1935–36 were: Tax on salaries and wages, £2,461,218; on other income, £1,042,410; and levy receipts, £418,347.
Part IV of the National Expenditure Adjustment Act, 1932, imposed a stamp duty of 3d. for every 2s. 6d. of interest derived from New Zealand Government and local-body debentures or other securities, with certain specified exceptions. The duty receipts (less 5 per cent. thereof to cover administrative expenses) in respect of securities of local bodies, the State Advances Department, and the Rural Intermediate Credit Board were payable to the respective authorities. The proportion of the duty accruing to Governmental revenue during the year 1932–33 amounted to £309,132, a further sum of £78,771 being received in the early portion of 1933–34. As will be seen from the following paragraphs, subsequent loan-conversion operations have brought about a diminution in yield from this tax. In 1934–35 and 1935–36 receipts from this source were only £68 and £53 respectively, while refunds during the year 1936–37 were responsible for a debit of £98.
The stamp duty on interest was imposed not only to aid the public revenues, but to assist in equalizing in equity the 20-per-cent. reduction in mortgage interest and in rents. The balance of the equivalent reduction in interest on Government and local-authority securities was to be obtained by an adjustment of income-tax rates on investment income.
In lieu of the imposition of stamp duty on interest, a general conversion of the whole internal public debt on the basis of a 20-per-cent. reduction to a minimum effective rate of 4 per cent., operative from 1st April, 1933, was undertaken; while as a preliminary to conversion a statutory reduction of 20 per cent. to a minimum of 4¼ per cent. was made in the interest on local-authority securities.
Interest on such part of the public debt as continued to bear a higher rate than 4 per cent.—i.e., the small “dissented” balance—was made subject to an interest-tax of 33⅓ per cent., and this provision is also applicable to dissenters from local-authority conversions. Post Office investment certificates are at maturity dutiable at 20 per cent. in respect of interest accruing after 1st April, 1933. A tax of 20 per cent., payable (less 5 per cent. of proceeds) to the Departments concerned, was also imposed on State Advances, Rural Intermediate Credit, and Land Settlement Association securities.
Government receipts from the present interest-tax amounted to £45,000 in 1933–34, £44,979 in 1934–35, £43,823 in 1935–36, and £41,602 in 1936–37.
The 9th February, 1933, marked the inauguration of a sales tax in New Zealand. The tax is at the rate of 5 per cent. of the sale value of the goods to which it applies, a discount of 5 per cent. of the amount of tax otherwise payable being allowed for prompt payment. The tax is not a turnover tax, being payable once only and, so far as possible, at the point where the goods pass to the retailer. The Sales Tax Act is administered by the Customs Department. The net amount yielded by the sales tax has been: 1932–33 (less than two months), £38,253; 1933–34, £1,847,333; 1934–35, £2,170,503; 1935–36, £2,462,602; and 1936–37 £3,044,612.
Numerous classes of goods are exempt from the tax, these being, in the main, commodities of primary production, articles used in the primary industries, machinery for use in manufacture, and foodstuffs for household consumption. Goods exported from the Dominion are exempt, as are also certain commodities (e.g., gold, motor-spirit), subject to special taxation.
Monthly net collections of sales tax to date are as follows:—
| Month. | 1933. | 1934. | 1935. | 1936. | 1937. |
|---|---|---|---|---|---|
| £ | £ | £ | £ | £ | |
| January | 187,649 | 211,137 | 233,103 | 294,431 | |
| February | 10,785 | 143,631 | 157,653 | 186,875 | 194,624 |
| March | 27,469 | 162,416 | 179,568 | 206,101 | 296,637 |
| April | 191,091 | 168,313 | 191,607 | 234,491 | 295,082 |
| May | 119,967 | 165,007 | 194,685 | 233,493 | 309,796 |
| June | 136,733 | 160,877 | 196,571 | 241,154 | 283,094 |
| July | 129,951 | 168,662 | 189,657 | 232,237 | 278,968 |
| August | 134,290 | 185,037 | 201,446 | 252,621 | 301,002 |
| September | 151,796 | 172,945 | 200,300 | 254,669 | 300,714 |
| October | 158,073 | 194,397 | 219,537 | 266,710 | |
| November | 164,829 | 205,256 | 223,808 | 272,543 | |
| December | 166,847 | 202,383 | 223,970 | 277,375 |
The collections during a month relate in general to sales during the preceding month. At the commencement of the scheme, tax on goods sold in February and March, 1933, except in the case of goods imported by retailers, was not payable until April, hence the low figures for February and March and the high aggregate for April.
Local-governing authorities have power under various Acts of the Legislature to impose taxes for general or special purposes, as set out in Section XXVI of this book. The amount of revenue collected by local bodies during the ten years ended 31st March, 1936, was as follows:—
| Year ended 31st March, | Rates. | Licenses and other Taxes. | Total. | Per Head of Population. |
|---|---|---|---|---|
| £ | £ | £ | £ s. d. | |
| 1927 | 5,311,260 | 576,761 | 5,888,021 | 4 2 11 |
| 1928 | 5,615,672 | 507,703 | 6,123,375 | 4 4 10 |
| 1929 | 5,844,495 | 503,265 | 6,347,760 | 4 6 11 |
| 1930 | 6,010,987 | 535,809 | 6,546,796 | 4 8 7 |
| 1931 | 5,637,254 | 535,847 | 6,173,101 | 4 2 5 |
| 1932 | 5,511,818 | 508,857 | 6,020,675 | 3 19 4 |
| 1933 | 5,237,688 | 505,796 | 5,743,484 | 3 15 1 |
| 1934 | 5,541,255 | 489,224 | 6,030,479 | 3 18 2 |
| 1935 | 5,511,442 | 530,591 | 6,042,033 | 3 17 9 |
| 1936 | 5,585,855 | 576,037 | 6,161,892 | 3 18 9 |
The figures are exclusive of wharfage dues, tolls, &c., received by Harbour Boards, such receipts being regarded as in respect of charges for services.
THE Minister of Finance may raise loans, when authorized by Parliament so to do, by the issue of debentures, or scrip, or stock, in New Zealand or elsewhere at his discretion. When raising a loan, the Minister may prescribe the mode and conditions of repayment, the rates of interest (not exceeding the maximum rate fixed by the authorizing Act), and the times and places of payment of principal and interest respectively. Power is given to convert debentures or scrip into consolidated stock, and the Minister may specify the terms of conversion at the time when a loan is raised, or arrange that terms shall be subsequently agreed upon. For the purpose of paying off or renewing at maturity any debenture, scrip, or other security, new debentures or other securities may be issued and disposed of if necessary. Authority also exists for the conversion of loan-money which has not yet-matured, as well as for the redemption and cancellation of securities before maturity. Section 5 of the Finance Act (No. 2), 1934, authorized the Minister of Finance to transfer the management of the public debt to the Reserve Bank of New Zealand, and the transfer was effected as from the 1st October, 1930.
During the war period provision was made for the issue to the public of “Post Office investment certificates” of a face value of £1 and upwards, and in 1920 legislation was enacted which sanctioned a continuous issue of these certificates. Receipts from this source are utilized for the purposes of any loan which may be authorized by Parliament. The term of the certificates, formerly a minimum of five years, was altered in 1927 to such period as the Minister of Finance may determine. Certificates are now issued with a definite currency of six years, the redemption value being calculated at 3 per cent. compound interest. After six months from date of issue the certificates have a graduated redemption value, and, in addition, if not presented for payment at date of maturity, remain interest-bearing (at the maximum rate payable on Post Office Savings-bank deposits) for four years more.
The money composing the public debt has been borrowed on the security of the public revenues of the Dominion. No portion of the public estate is pledged for payment of either principal or interest.
The public debt is domiciled partly in New Zealand and partly in the United Kingdom, with a little in Australia.
In the debt tables the whole debt is shown (is pounds) at its nominal amount, no adjustment having been made on account of the fact that New Zealand currency is at present at a discount on sterling and at a slight premium on Australian currency. If the whole of the debt (£157 millions) domiciled in the United Kingdom were redeemed in cash at the present time, an amount equal to nearly £200 millions in New Zealand currency would be required for the purpose.
Similarly, the present depreciation of New Zealand currency in terms of sterling is not taken into account in reckoning the rate or amount of interest on the debt domiciled in the United Kingdom. Interest is taken at its nominal rate, and the cost of purchasing sterling for payment in London is included in the public accounts as expenditure on exchange.
The gross debt of the General Government stood at £287,670,200 at 31st March, 1937, as compared with £282,561,098 a year earlier.
On only three occasions in the history of New Zealand has a reduction in the gross public debt been effected during the financial year. The first occasion was in 1891–92, when the debt was reduced by £117,282; and the second in 1922–23, when another plight reduction (£101,061) was recorded. The third occasion was in 1934–35, when the huge floating debt of £22,856,981, comprising outstanding Treasury revenue bills amounting to £3,452,109 and Treasury bills for £19,404,872 in respect of the Banks Indemnity (Exchange) Act, were entirely paid off.
The gross indebtedness of the General Government and the rate of indebtedness per head of population (inclusive of Maoris) for each of the last twenty years are given in the following table:—
| As at 31st March, | Amount. | Per Head of Population. |
|---|---|---|
* Including £5,379,105 raised in January, 1929, for expenditure in 1929–30. † Increase mainly floating debt, paid off in 1934–35. | ||
| £ | £ s. d. | |
| 1918 | 150,840,055 | 130 12 11 |
| 1919 | 176,076,260 | 149 8 5 |
| 1920 | 201,170,755 | 162 12 9 |
| 1921 | 206,324,319 | 162 15 7 |
| 1922 | 219,054,385 | 168 6 10 |
| 1923 | 218,953,324 | 165 4 2 |
| 1924 | 221,616,361 | 164 8 5 |
| 1925 | 227,814,647 | 165 2 11 |
| 1926 | 238,855,478 | 169 8 6 |
| 1927 | 245,850,889 | 170 19 0 |
| 1928 | 251,396,252 | 172 18 5 |
| 1929 | 264,191,983* | 179 11 9 |
| 1930 | 267,383,343 | 179 11 0 |
| 1931 | 276,033,358 | 182 12 0 |
| 1932 | 281,942,800 | 184 16 3 |
| 1933 | 282,622,958 | 183 15 2 |
| 1934 | 302,791,996† | 195 6 8 |
| 1935 | 280,581,217 | 179 14 11 |
| 1936 | 282,561,098 | 17.0 10 6 |
| 1937 | 287,670,200 | 181 4 10 |
After the establishment of the Reserve Bank (1st August, 1934), £20,229,700 of sterling funds held by the Government in London were transferred to New Zealand at the current rate of exchange through the Reserve Bank, the credit received (£25,084,828 in New Zealand currency) being sufficient with other funds available to redeem all Treasury bills then outstanding.
The history of the public debt in New Zealand may conveniently and with advantage be divided into four distinct periods—viz., (1) Up to the end of the financial year 1890–91; (2) from the 1st April, 1891, to the 31st March, 1914; (3) from the 1st April, 1914, to the 31st March, 1920; and (4) from the 1st April, 1920, to date.
Up to the 31st March, 1891, loan expenditure had been chiefly concerned with railways and roads, the taking over of the loan liabilities of the Provincial Governments on their abolition, and the Maori War. The year 1891 marks the beginning of a period during which the functions of the State were widely extended, most notably as regards financial assistance to settlers, workers, and local bodies, the repurchase of alienated lands, the working of coal-mines, the establishment of State fire- and accident-insurance offices, and the development of hydro-electric power.
The advent of the war in 1914 created a second point of demarcation in the history of the loan expenditure of the General Government, large sums having to be borrowed for war purposes. A feature of this period was the necessary postponement of all public works, &c., except those of pressing necessity. Expenditure of an unproductive nature occasioned by the war was necessarily continued for some time after the Armistice, but the end of the financial year 1919–20 may be fairly regarded as concluding this period.
The gross indebtedness at the 31st March, 1891, 1914, 1920, and 1937, with the increase between these dates, is as follows:—
| £ | |
|---|---|
* Excluding £4,976,600 raised in March, 1914, for redemptions early in 1914–15. | |
| At 31st. March, 1891 | 38,830,350 |
| Increase to 31st March, 1914 | 55,923,477* |
| At 31st March, 1914 | 94,753,827* |
| Increase to 31st March, 1920 | 106,416,928 |
| At 31st March, 1920 | 201,170,755 |
| Increase to 31st March, 1937 | 86,499,445 |
| At 31st March, 1937 | £287,670,200 |
The public debt figures do not include loans under the Rural Advances Act, 1926, amounting to £4,213,050 at 31st March, 1937, nor an amount of £2,700,000 in respect of Discharged Soldier Settlement securities subject to a deed of hypothecation. This latter amount, which is held departmentally, shows a reduction of £200,000 as compared with the previous year, brought about by a refund to the Consolidated Fund from the Discharged Soldiers Settlement Account.
An amount of £6,225,908, representing outstanding advances by way of overdraft in respect of dairy-produce purchased for export or sale under the authority of the Primary Products Marketing Act, 1936, is similarly not included in the public debt. Advances under this heading, as revealed by the latest (11th October, 1937) published statement of assets of the Reserve Bank, have decreased to £3,606,879.
In addition to the foregoing, there are certain contingent liabilities, consisting of (1) loans guaranteed by the State; (2) liabilities in respect of superannuation funds; and (3) State guarantees in respect of various undertakings.
In regard to the first item, the amount of guaranteed loans outstanding at 31st March, 1937, was £1,700,475, as against which accumulated sinking funds amounted to £360,932. Of the guaranteed loan total of £1,700,475, £1,054,500 is in respect of State Advances Corporation stock and debentures, and £6,400 in respect of land-settlement finance debentures, the remaining loans being those of certain local authorities. Payments on guaranteed loans during the year 1936–37 aggregated £5,868, but as a set-off against this amount credits were received amounting to £13,058, the result being a net credit of £7,190.
As at 31st March, 1934, the total of subsidies (not including accumulated interest) short paid to the Teachers' and Public Service Superannuation Funds, and the excess of subsidies recommended by the Actuary over subsidies paid to the Railways Superannuation Fund, was £4,634,151. This subject is covered in detail in the next section (No. XXV).
The third class of contingent liabilities comprises various items, such as: the State guarantee to policyholders of the Government Insurance Department under the Government Life Insurance Act, 1908; the guarantee to the Reserve Bank under the Finance Act, 1934, in respect of sterling exchange; and certain undertakings under the Mortgage Corporation of New Zealand Act, 1934–35, superseded and amended by the State Advances Corporation Act, 1936.
In classifying the public debt according to nature or purpose the most usual distinction is that made on the basis of whether raised for ordinary purposes, war purposes, the settlement of discharged soldiers, or State advances. The following summary shows that the whole of the increase between 31st March, 1920, and 31st March, 1937, is in respect of the ordinary and State advances debt, the war and discharged soldiers sections showing substantial reductions. The total of war loans amounted to £82,245,673, of which nearly £18,000,000 has been redeemed to the 31st March, 1937.
| Class. | Total. | Per Head. | ||
|---|---|---|---|---|
| 1920. | 1937. | 1920. | 1937. | |
| £ | £ | £ s. d. | £ s. d. | |
| Ordinary | 95,483,658 | 182,936,771 | 77 3 11 | 115 5 2 |
| War | 80,089,025 | 64,626,971 | 64 15 0 | 40 14 4 |
| Discharged soldiers | 11,120,000 | 6,853,339 | 8 19 9 | 4 6 4 |
| State advances | 14,478,072 | 33,253,119 | 11 14 1 | 20 19 0 |
| Total | 201,170,755 | 287,670,200 | 162 12 9 | 181 4 10 |
A more detailed allocation of the debt as at the 31st March, 1937, is now given:—
| £ | |
|---|---|
| Railways | 61,992,417 |
| Hydro-electric schemes | 13,905,509 |
| Post and telegraph | 13,775,637 |
| Public buildings, schools, and sites | 14,023,324 |
| Roads and highways | 29,109,676 |
| Harbours and lighthouses | 2,203,929 |
| State forests | 2,072,697 |
| State advances | 40,659,160 |
| Land settlement and improvement | 25,884,821 |
| Shares in Bank of New Zealand | 875,000 |
| Shares in Reserve Bank of New Zealand | 1,626,081 |
| Investment in State Advances Corporation | 1,031,708 |
| Share in Nauru and Ocean Island phosphates | 389,675 |
| Development of mining | 997,539 |
| Tourist resorts | 665,565 |
| Immigration | 3,317,632 |
| War and defence | 69,502,430 |
| Revenue deficiencies (prior to 1893) | 2,216,856 |
| Old provincial liabilities | 878,739 |
| Miscellaneous | 423,779 |
| Cash and investments in hand | 2,118,026 |
| Total | £287,670,200 |
During the year 1936–37 additional debt to the amount of £8,502,420 was incurred for the following purposes:—
| £ | |
|---|---|
| Expenditure on public works | 4,440,053 |
| Purchase of Southland Electric-power Board undertaking | 1,670,569 |
| Acquisition of shareholders' interest in Reserve Bank and Mortgage Corporation | 1,655,728 |
| Costs, charges, and expenses of dealing with £5,869,988 of London debt | 628,147 |
| Premiums on conversions in New Zealand | 5,862 |
| Housing | 100,000 |
| Raised for redemptions but not used | 2,061 |
Redemptions of long-term debt during the year aggregated £3,393,318, leaving a net increase of £5,109,102.
As a result of the year's operations, the debt domiciled in London decreased by £1,974,914, and in Australia by £700,750, while the debt domiciled in New Zealand increased by £7,784,766. Of the latter amount, £5,613,979 represented departmental investments and the remainder issues to the public in connection with the purchase of the Southland electric-power undertaking and the cancellation of shares in the Reserve Bank and State Advances Corporation. No public issue of stock was made in order to meet public-works expenditure, which was financed from internal resources.
A scheme of conversion of practically the whole of the locally domiciled debt bearing interest higher than 4 per cent. was successfully carried out in the early part of 1933. Holders had the option of dissenting, but, as mentioned in the preceding subsection, interest on the dissented portion was made subject to an interest-tax of 33⅓ per cent. Holders who signified neither assent nor dissent were regarded as having assented.
On the new securities issued in lieu of converted securities the interest-rate is 4 per cent. per annum, except that in the case of securities exempt from income-tax the rate will be 3½ per cent. until expiration of the period of exemption and 4 per cent. thereafter. The new securities are spread over six maturity dates as follows:—
* For securities exempt from Income-tax. | |
|---|---|
| 15th January, 1940. | 15th April, 1949. |
| 15th March, 1943.* | 15th May, 1952.* |
| 15th February, 1946. | 15th June, 1955. |
In cases where interest was reduced by not more than 20 per cent., the new securities issued were for the same amount of principal as the converted securities. Where the reduction of interest amounted to more than 20 per cent., the holder received a premium, the conversion scheme thus involving a slight increase (£491,254) in the aggregate gross debt.
The amount of debt to which the conversion scheme applied was £115,000,000. Actual assent to conversion was given in respect of some £110,000,000, and implied assent to approximately £5,000,000, dissents expressed covering only £480,000, or less than ½ per cent. of the total.
The successful conversion of £5,000,000 5-per-cent. debt into 3½-per-cent. securities at £97 in October, 1933, was the only debt operation undertaken in England during the fiscal year 1933–34.
During 1934–35 and 1935–36 further conversion operations were carried out in respect of external debt, where, of course, it is possible to take action only in the case of loans where the right to repay has accrued. The first comprised £8,989,100 of 4-per-cent. stock, which was converted to 3½-per-cent. stock at par in October, 1934. The second and larger operation concerned £10,135,800 of 5-per-cent. stock maturing in 1945 but with a right to redeem on or after 1st July, 1935. Of this, £8,000,000 was converted to 3-per-cent. stock at £98½, and the remainder (£2,135,800) redeemed.
On 1st August, 1930, the right accrued to redeem £5,869,989 of 6-per-cent. stock, and of this £4,000,000 was converted to 3-per-cent. stock at 98½, and the remainder (£1,869,989) redeemed, mainly by the utilization of funds in the Public Debt Repayment Account.
During the year 1936–37 opportunity was taken to exercise the right to repay £12,426,875 of 4-per-cent. 1937–40 stock and debentures domiciled in New Zealand. Cash and conversion applications totalled £11,440,249, and the balance required for redemption was found by the issue of Treasury bills for £925,000, and by the utilization of £61,626 from debt-repayment resources.
Between the 31st March, 1914, and the 31st March, 1937, the amount of New Zealand's public debt domiciled in London increased from 78 /2 to 157 millions, while that domiciled in New Zealand increased from 17 to 130 millions. The amount domiciled in Australia, never considerable, has declined to negligible proportions. The table following shows, for the total amount outstanding in each of the last ten years, the amount domiciled in London, Australia, and New Zealand.
| At 31st March, | Amount. | Percentage of Total. | ||||
|---|---|---|---|---|---|---|
| London. | Australia. | New Zealand. | London. | Australia. | New Zealand. | |
| £ | £ | £ | Per Cent. | Per Cent. | Per Cent. | |
| 1928 | 139,756,973 | 4,168,850 | 107,470,429 | 55.59 | 1.66 | 42.75 |
| 1929 | 149,346,244 | 4,168,350 | 110,677,389 | 56.53 | 1.58 | 41.89 |
| 1930 | 146,580,502 | 4,276,750 | 116,526,091 | 54.82 | 1.60 | 43.58 |
| 1931 | 154,546,941 | 4,175,350 | 117,311,067 | 55.99 | 1.51 | 42.50 |
| 1932 | 159,641,855 | 3,914,550 | 118,386,395 | 56.62 | 1.39 | 41.99 |
| 1933 | 161,400,703 | 2,868,710 | 118,353,545 | 57.11 | 1.01 | 41.88 |
| 1934 | 160,908,105 | 2,908,150 | 138,975,741 | 53.14 | 0.96 | 45.90 |
| 1935 | 160,972,230 | 2,183,550 | 117,425,437 | 57.37 | 0.78 | 41.85 |
| 1936 | 158,711,930 | 1,592,650 | 122,256,518 | 56.17 | 0.56 | 43.27 |
| 1937 | 156,737,016 | 891,900 | 130,041,284 | 54.48 | 0.31 | 45.21 |
The maturity years of the debt outstanding at the 31st March, 1937, are shown in the following statement, which distinguishes between the various countries of domicile.
| Maturity Date. | Due in London. | Due in Australia. | Due in New Zealand. | Total. | ||
|---|---|---|---|---|---|---|
| From 1st, April. | To 31st March. | Public. | Departmental. | |||
* Government has option to redeem on or after the earlier date on giving notice. † Advances by Imperial Government for State Advances purposes. ‡ Funded debt—repayable by instalments. § The basis of classification between “Public” and “Departmental” debt domiciled in New Zealand has been amended for 1937. Comparable figures on the revised basis as at the 31st March, 1936, are: Public, £68,261,151; Departmental. £53,995,367. | ||||||
| £ | £ | £ | £ | £ | ||
| Overdue | 39,465 | 39,465 | ||||
| Treasury bills | 2,325,000 | 2,325,000 | ||||
| 1925* | 1946 | 2,090,909† | 2,090,909† | |||
| 1937 | 1938 | 92,600 | 751,300 | 843,900 | ||
| 1938 | 1939 | 4,000 | 3,000 | 265,030 | 272,030 | |
| 1938* | 1942 | 2,813,380 | 808,190 | 3,621,570 | ||
| 1939 | 1940 | 17,173,191 | 6,241 | 8,900 | 17,188,332 | |
| 1939* | 1942 | 4,114,505 | 4,114,505 | |||
| 1939* | 1943 | 13,678,215 | 13,678,215 | |||
| 1940 | 1941 | 500,015 | 500,015 | |||
| 1941 | 1942 | 17,300 | 37,100 | 54,400 | ||
| 1942* | 1946 | 9,211,470 | 631,155 | 9,842,625 | ||
| 1942* | 1963 | 10,505,989 | 378,639 | 10,884,628 | ||
| 1943 | 1944 | 7,339,656 | 7,339,656 | |||
| 1944 | 1945 | 7,780,408 | 7,780,408 | |||
| 1945 | 1946 | 22,543,590 | 2,500 | 22,546,090 | ||
| 1946 | 1947 | 540,047 | 1,117,743 | 1,657,790 | ||
| 1946* | 1950 | 8,324,310 | 642,885 | 8,967,195 | ||
| 1947 | 1948 | 11,221,609 | 11,221,609 | |||
| 1947* | 1958 | 19,225,465 | 19,225,465 | |||
| 1948* | 1949 | 10,500 | 10,500 | |||
| 1948* | 1954 | 5,000,000 | 5,000,000 | |||
| 1949 | 1950 | 7,500,000 | 7,500,000 | |||
| 1949* | 1953 | 12,491,090 | 12,491,090 | |||
| 1950 | 1951 | 1,250,000 | 779,000 | 250,950 | 2,279,950 | |
| 1952 | 1953 | 260,000 | 260,000 | |||
| 1952* | 1956 | 12,000,000 | 7,978,310 | 2,124,265 | 22,102,575 | |
| 1952* | 1957 | 6,708,155 | 1,158,160 | 7,866,315 | ||
| 1955 | 1956 | 3,956 | 462,200 | 466,156 | ||
| 1955* | 1961 | 3,989,100 | 3,989,100 | |||
| 1956 | 1957 | 12,900 | 4,460 | 4,009,480 | 4,026,840 | |
| 1956* | 1972 | 5,000,000 | 5,000,000 | |||
| 1957 | 1958 | 7,800 | 19,461,050 | 19,468,850 | ||
| 1958 | 1959 | 18,261,933 | 18,261,933 | |||
| 1959 | 1960 | 10,652,885 | 10,652,885 | |||
| ‡ | 1946 | 577,446‡ | 577,446‡ | |||
| ‡ | 1958 | 23,522,753‡ | 23,522,753‡ | |||
| Totals | 156,737,016 | 891,900 | 70,431,938§ | 59,609,346§ | 287,670,200 | |
The highest and lowest London prices for the principal New Zealand stocks, taken over a range of five years, are quoted.
| Rate per Cent. | Maturing. | Highest. | Lowest. | ||||||||
|---|---|---|---|---|---|---|---|---|---|---|---|
| 1932. | 1933. | 1934. | 1935. | 1936. | 1932. | 1933. | 1934. | 1935. | 1936. | ||
* Redeemed or converted. | |||||||||||
| £ | £ | £ | £ | £ | £ | £ | £ | £ | £ | ||
| 3 | 1945 | 92½ | 95¼ | 100⅜ | 101 1/16 | 101⅜ | 63 3/16 | 90 1/16 | 94 11/16 | 97 | 96¼ |
| 3 | 1952–55 | 99⅜ | 94 | ||||||||
| 3½ | 1940 | 98 15/16 | 100½ | 103 15/16 | 104½ | 103¼ | 73 | 98 5/16 | 100¼ | 98½ | 99½ |
| 4 | 1933–43 | 100 7/16 | 102 7/16 | 102 | * | * | 73 | 99 | 99 7/16 | * | * |
| 4 | 1943–63 | 102 | 102 15/16 | 105 11/16 | 106 7/16 | 104½ | 66 | 100 | 101 | 100 11/16 | 99½ |
| 4½ | 1944 | 104⅞ | 107 | 111 | 110 3/16 | 108½ | 77 7/16 | 101 15/16 | 105 3/16 | 104 5/16 | 102 |
| 4½ | 1945 | 104⅞ | 107 | 111 | 110 3/16 | 108⅝ | 77⅜ | 101 15/16 | 105 3/16 | 104 5/16 | 102 |
| 4½ | 1947 | 106½ | 107 1/16 | 111 1/16 | 111 7/16 | 109 1/16 | 77⅛ | 102 11/16 | 105⅝ | 105 1/16 | 103 |
| 4½ | 1948–58 | 106⅝ | 107 9/16 | 110 13/16 | 111 11/16 | 109¾ | 74 7/16 | 101 15/16 | 105⅞ | 105⅞ | 103 |
| 5 | 1935–45 | 103 | 103⅜ | 102 11/16 | 101½ | * | 84 | 101⅛ | 101 3/16 | 100¼ | * |
| 5 | 1946 | 107½ | 109 11/16 | 115 | 115¼ | 113 7/16 | 84 | 106¾ | 109⅜ | 108 15/1.6 | 105 |
| 5 | 1949 | 110⅞ | 113 7/16 | 116¾ | 117 3/16 | 114¼ | 83 11/16 | 110¼ | 112 3/16 | 111 | 106¼ |
| 6 | 1936–51 | 105 | 107 1/16 | 106⅜ | 105⅞ | * | 96 | 104¾ | 105 3/16 | 101½ | * |
Of the public debt outstanding at 31st March, 1932, only £78,749,156, or 29 per cent. of the total (excluding Treasury bills), bore interest at a rate of 4 per cent. or lower. Chiefly as a result of conversion operations, the corresponding figures at the 31st March, 1937, were £188,291,243 and 66 per cent. The rates of interest on the debt as at the 31st March, 1937, were as given below.
| Rate of Interest. | Debt maturing in— | Total. | Gross Annual Interest Charge. | ||
|---|---|---|---|---|---|
| London. | Australia. | New Zealand. | |||
* Treasury Bills. † Funded debt. | |||||
| Per cent.— | £ | £ | £ | £ | £ |
| 1¼* | 2,325,000 | 2,325,000 | 29,062 | ||
| 2½ | 9,919,000 | 9,919,000 | 247,975 | ||
| 3 | 21,670,380 | 32,654,552 | 54,324,932 | 1,629,747 | |
| 3⅛ | 250,000 | 250,000 | 7,813 | ||
| 3¼ | 500,000 | 500,000 | 16,250 | ||
| 3½ | 26,161,291 | 48,461,422 | 74,622,713 | 2,611,794 | |
| 3¾ | 4,010,470 | 4,010,470 | 150,392 | ||
| 4 | 10,510,989 | 31,828,140 | 42,339,129 | 1,693,565 | |
| 4⅖ | 950 | 950 | 42 | ||
| 4½ | 47,458,547 | 20,300 | 19,235 | 47,498,082 | 2,137,412 |
| 4⅘ | 1,750 | 1,750 | 84 | ||
| £4 19s. 5.88d.† | 24,100,199 | 24,100,199 | 1,193,230 | ||
| 5 | 25,585,610 | 11,420 | 25,597,030 | 1,279,851 | |
| 5½ | 1,250,000 | 871,600 | 19,880 | 2,141,480 | 117,780 |
| Overdue (unpresented) | 39,465 | 39,465 | |||
| Totals | 156,737,016 | 891,900 | 130,041,284 | 287,670,200 | 11,114,997 |
The total annual amount of interest payable on the public debt as at the 31st March, 1937, including the funded debt (payments in respect of which are at present in abeyance), is £11,114,997, which gives an average rate of £3 17s. 3d. per £100. The total interest and the average rate per cent. payable on the debt domiciled in the various markets are:—
| Total. | Average Rate. | |
|---|---|---|
| £ | £ s. d. | |
| London (sterling) | 6,663,089 | 4 5 0 |
| Australia | 48,851 | 5 9 7 |
| New Zealand | 4,403,057 | 3 7 9 |
The actual net interest payments during the last twenty years out of the Consolidated Fund Ordinary Revenue Account are shown in the table following, together with the rate per head of mean population. The figures for recent years have been affected by the discontinuance of payments on the funded debt, by conversion operations, and (adversely) in some years by the existence of Treasury bills of considerable proportions.
| Year ended 31st March, | Amount. | Rate per Head. |
|---|---|---|
| £ | £ s. d. | |
| 1918 | 3,936,080 | 3 8 4 |
| 1919 | 5,409,210 | 4 12 9 |
| 1920 | 6,352,344 | 5 5 2 |
| 1921 | 6,807,217 | 5 8 8 |
| 1922 | 7,390,864 | 5 15 2 |
| 1923 | 7,904,260 | 6 0 7 |
| 1924 | 7,877,597 | 5 18 1 |
| 1925 | 7,865,262 | 5 15 8 |
| 1926 | 8,129,799 | 5 16 10 |
| 1927 | 8,450,794 | 5 18 11 |
| 1928 | 8,397,074 | 5 16 4 |
| 1929 | 8,676,220 | 5 18 10 |
| 1930 | 9,136,301 | 6 3 8 |
| 1931 | 9,266,676 | 6 3 8 |
| 1932 | 9,035,025 | 5 19 1 |
| 1933 | 8,498,681 | 5 11 1 |
| 1934 | 8,836,467 | 5 14 7 |
| 1935 | 8,023,813 | 5 3 3 |
| 1936 | 7,730,194 | 4 18 9 |
| 1937 | 7,604,469 | 4 16 4 |
The above amounts are net payments out of the Consolidated Fund only, and do not comprise the whole of the interest payments in respect of moneys raised by way of loans. For loans raised for the purposes of State advances to settlers, workers, local authorities, &c., the interest, although made a charge upon the Consolidated Fund, is recovered from the receipts derived from interest paid by borrowers. Other loan-money coming within the same category is that raised for land-settlement, State coal-mines, the development of water-power, and a number of other purposes. Such interest does not become a burden upon the taxpayer, and consequently is not included in the figures upon which the rate per head of mean population is calculated.
The gross interest charges borne by the Consolidated Fund during the year ended 31st March, 1937, totalled £10,002,775, of which £2,398,306 was recovered from other accounts, &c. In addition there should be set off against the interest charges certain amounts shown in the public accounts not as recoveries but as revenue. These are interest on railway capital liability (£903,858), interest on post and telegraph capital liability (£566,000), and interest earned on the investment of public moneys (£531,404).
Of the gross interest payments from the Consolidated Fund during 1936–37 £5,294,088 was paid in London, £79,772 in Australia, and £4,628,915 in New Zealand. The figure for payments in London represents interest only, exchange being additional. At the instance of the Imperial Government, no payments have been made for some years past in respect of the funded debt (vide later reference).
Administration and management charges in respect of debt services amounted to £81,543 in 1936–37, and payments on guaranteed loans showed a credit of £7,190. Amortization charges are shown under the next heading.
A brief historical account of the provisions for paying off loan-moneys will be found in the 1931 number of the Year-Book. With certain exceptions, the public debt is now subject to the provisions of the Repayment of the Public Debt Act, 1925. This Act, which repealed the Public Debt Extinction Act, 1910, substituted for the long - term sinking - fund system a method whereby the Dominion's debt reduction resources may be available to purchase and cancel Government securities as the market price is advantageous, or pay them off at maturity, and so ensure an actual reduction in the public debt annually. For this purpose there is issued annually out of the Consolidated Fund a sum equal to ½ per cent. of the debt affected as at the 31st March, plus ½ per cent. of the total amount previously repaid or redeemed under the provisions of the Act. To this is added a sum equal to interest at 3½ per cent. per annum on the debt paid off under the scheme. By this means the bulk of the savings in interest on debt paid off is applied to further repayments of debt, and the debt existing at the commencement of the scheme will be liquidated in about sixty years, while all future loans will be liquidated within a similar period from the date of their inception.
Under the Act of 1925 a capital fund termed “The Public Debt Redemption Fund” was created, consisting of (1) the accumulations of sinking funds, amounting to £11,225,645 (leaving aside the State Advances, Westport Harbour, and other special sinking funds); (2) the amount advanced out of surplus revenue for discharged soldiers settlement, originally £13,500,000, but since reduced to £6,000,000 through £4,850,000 having been transferred to the Consolidated Fund and £2,650,000 written off as a result of the revaluation of the properties of discharged soldiers. The net earnings from the Public Debt Redemption Fund are credited to the Consolidated Fund and applied towards meeting the charge against that fund created by the Act.
The Act does not apply to the whole of the public debt, revenue bills and certain classes of the debt for which there are special amortization provisions being excluded. The latter include funded debt, loans raised for State advances, and loans raised in respect of electric supply. Of the total gross indebtedness of £227,814,647 at the 31st March, 1925, £174,128,135 was subject to the operations of the Act. The amount subject to the operation of the Act as at the 31st March, 1937, was £215,232,294.
To the 31st March, 1937, securities of a nominal value of £14,963,437, had been redeemed under the operation of the Repayment of the Public Debt Act. These transactions have effected a considerable annual saving of interest to the Consolidated Fund.
The following table shows the operations of the Public Debt Repayment Account during each of the twelve years of its existence, together with the interest earnings of the Redemption Fund. In addition to transfers from the Consolidated Fund, the Public Debt Repayment Account is credited with interest earnings (£6,170 to 31st March, 1937) on its investments. On the expenditure side there have been £242 for cost of exchange and transfers of £23,672 to the Consolidated Fund in respect of premiums on exchange. The account had an unexpended balance of £39,795 at 31st March, 1937.
| Year ended 31st March, | Interest on Redemption Fund (paid to Consolidated Fund). | Transfers from Consolidated Fund. | Utilized to redeem and cancel Securities. | Nominal Value of Securities redeemed and Cancelled. | |||
|---|---|---|---|---|---|---|---|
| 1/2 per Cent. of Debt at Beginning of Year or redeemed under Act. | 3½ per Cent. of Debt redeemed. | Total. | |||||
| Prior to Beginning of Year. | During Year.* | ||||||
* Computed from dates of redemption. | |||||||
| £ | £ | £ | £ | £ | £ | £ | |
| 1926 | 897,756 | 870,641 | 2,093 | 872,734 | 870,637 | 889,733 | |
| 1927 | 863,942 | 896,651 | 31,141 | 13,737 | 941,529 | 939,231 | 942,020 |
| 1928 | 878,408 | 919,727 | 64,111 | 9,926 | 993,764 | 998,188 | 999,811 |
| 1929 | 995,202 | 944,454 | 99,105 | 3,369 | 1,046,928 | 1,041,871 | 1,046,000 |
| 1930 | 996,695 | 993,567 | 135,715 | 24,963 | 1,154,245 | 1,158,472 | 1,158,472 |
| 1931 | 858,893 | 1,006,800 | 176,261 | 23,998 | 1,207,059 | 1,209,928 | 1,209,928 |
| 1932 | 699,790 | 1,047,687 | 218,609 | 12,904 | 1,279,200 | 1,243,118 | 1,264,330 |
| 1933 | 620,089 | 1,066,173 | 262,861 | 6,986 | 1,336,020 | 919,850 | 922,310 |
| 1934 | 629,496 | 1,083,209 | 295,141 | 13,912 | 1,392,262 | 1,776,230 | 1,776,270 |
| 1935 | 632,065 | 1,183,761 | 357,311 | 37,221 | 1,578,293 | 1,623,161 | 1,623,161 |
| 1936 | 615,020 | 1,102,160 | 414,121 | 26,806 | 1,543,087 | 1,440,215 | 1,440,215 |
| 1937 | 385,855 | 1,120,673 | 464,529 | 39,306 | 1,624,508 | 1,691,188 | 1,691,188 |
The funds in the Public Debt Repayment Account are not the only source from which debt-redemptions are made. Other accounts provided £1,702,130 for redemption purposes in 1936–37.
At the 31st March, 1922, £27,532,164 of New Zealand's public debt was owing to the British Government, all but £1,191,919 of this being on account of war expenditure. Arrangements were made with the Imperial Government in 1922 for the funding of this debt.
The funding was carried out on an annuity basis of 6 per cent., the total payment each year (payable half-yearly at 1st June and 1st December) being £1,651,930. Interest is at the rate of £4 19s. 5.88d. per cent., the balance of the 6 per cent. going to reduction of the debt.
Under the agreement the original amount of £27,532,164 would have been automatically discharged from the public debt by the end of the financial year 1958–59. The British Government has, however, following the Hoover proposals regarding war debts, voluntarily suspended New Zealand's obligations in respect of the funded-debt payments due in and since December, 1931. On the other hand, a provision that any part of the funded debt may be redeemed at any time was taken advantage of in 1924, when £200,000 was paid off the Naval Defence Loan.
Payments to the end of 1936–37 have been:—
| Year ended 31st March, | Interest. | Principal. | Balance of Debt outstanding. |
|---|---|---|---|
* Half-year only. † Including £200,000 additional, paid off Naval Defence loan. | |||
| £ | £ | £ | |
| 1923* | 684,794 | 141,171 | 27,390,993 |
| 1924 | 1,358,966 | 292,964 | 27,098,029 |
| 1925 | 1,344,212 | 507,718† | 26,590,311 |
| 1926 | 1,318,641 | 333,289 | 26,257,022 |
| 1927 | 1,301,856 | 350,074 | 25,906,948 |
| 1928 | 1,284,224 | 367,706 | 25,539,242 |
| 1929 | 1,265,706 | 386,224 | 25,153,018 |
| 1930 | 1,246,254 | 405,676 | 24,747,342 |
| 1931 | 1,225,822 | 426,108 | 24,321,234 |
| 1932* | 604,930 | 221,035 | 24,100,199 |
| 1933–37 | Nil | Nil | 24,100,199 |
The provisions of the Repayment of the Public Debt Act, 1925, do not apply to the funded debt.
Special sinking funds have been set up in respect of certain classes of debts not covered by the Repayment of the Public Debt Act. The amount remaining in these sinking funds as at 31st March of each of the last ten years was as follows:—
| As at 31st March, | Amount. |
|---|---|
| £ | |
| 1928 | 2,635,766 |
| 1929 | 2,156,561 |
| 1930 | 2,331,423 |
| 1931 | 2,313,673 |
| 1932 | 2,435,117 |
| 1933 | 2,509,545 |
| 1934 | 2,647,985 |
| 1935 | 2,657,832 |
| 1936 | 2,592,458 |
| 1937 | 2,715,960 |
Payments to sinking funds during the year ended 31st March, 1937, totalled £24,793, and the funds earned £15,079 by way of interest. Sinking-fund holdings to the amount of £21,759 were utilized for the redemption of debentures during the year. An amount of £26 was paid by way of administrative fee and expenses in the case of Westport Harbour.
Details of the accrued sinking funds as at 31st March, 1937, were as follows:—
| £ | |
|---|---|
| State advances | 2,263,608 |
| State coal-mines | 9,181 |
| Greymouth Harbour | 109,104 |
| Westport Harbour | 320,636 |
| Electric supply | 13,430 |
| Samoan loan | 1 |
| Total | £2,715,960 |
While the sinking funds were annually increasing it was customary to regard the net-indebtedness figures as giving the best comparison of indebtedness between one year and another. The initiation of the present system of amortization has, however, destroyed the comparison on this basis, and the gross figures now afford a better and more comparable index. The figures of net indebtedness for the last twenty years are as follows:—
| As at 31st March, | Amount. | Per Head of Population. |
|---|---|---|
| £ | £ s. d. | |
| 1918 | 145,868,450 | 126 6 10 |
| 1919 | 170,125,204 | 144 7 5 |
| 1920 | 193,913,191 | 156 15 5 |
| 1921 | 197,561,222 | 155 17 4 |
| 1922 | 208,241,121 | 160 0 8 |
| 1923 | 207,024,048 | 156 4 2 |
| 1924 | 208,595,743 | 154 15 3 |
| 1925 | 214,287,128 | 155 6 9 |
| 1926 | 236,581,216 | 167 16 3 |
| 1927 | 243,407,349 | 169 5 1 |
| 1928 | 248,740,736 | 171 1 11 |
| 1929 | 256,652,371 | 174 9 3 |
| 1930 | 265,051,920 | 177 19 8 |
| 1931 | 273,715,710 | 181 1 4 |
| 1932 | 279,507,683 | 183 4 4 |
| 1933 | 280,113,413 | 182 2 6 |
| 1934 | 300,144,011 | 193 12 6 |
| 1935 | 277,923,385 | 178 0 10 |
| 1936 | 279,968,640 | 177 17 7 |
| 1937 | 284,952,179 | 179 10 7 |
In general the net indebtedness shown in the foregoing table is merely the balance left after deducting the accrued sinking funds from the amount of debentures and stock in circulation. In some years, however, a further deduction has been made on account of loan-money raised towards the end of the financial year for the redemption of debentures falling due early in the succeeding financial year, or (in 1928–29) for expenditure in the next year. The years concerned and the amounts so deducted on this account are—
| Year ended 31st March. | Amount. |
|---|---|
| £ | |
| 1921 | 25 |
| 1922 | 157,870 |
| 1923 | 50,020 |
| 1924 | 46,590 |
| 1925 | 64,680 |
| 1928 | 19,750 |
| 1929 | 5,383,051 |
| 1931 | 3,975 |
| 1937 | 2,061 |
In computing the net indebtedness, no allowance is made for the fact that a portion of the debt is actually held by the Government itself. In the course of the year's financial transactions securities are bought and sold by Treasury accounts, and the investments held as at the 31st March in each year, while forming part of the debt, do not represent amounts due directly or indirectly to the public. Public debt held by Treasury accounts as at the 31st March of the last five years has been: 1933, £3,201,668; 1934, £429,663; 1935, £1,188,555; 1936, £1,081,418; and 1937, £811,840.
The statistics given throughout this subsection refer to the indebtedness of the General Government only, and do not include the debt of local-governing authorities, which are dealt with in the section of this volume relating to local government.
Local-governing authorities had at the 31st March, 1936, a gross indebtedness of £71,525,765, and if this amount be added to the gross debt of the General Government at 31st March, 1936 (£282,561,098) the aggregate becomes £354,086,863. From this total should be deducted approximately £4,800,000 in respect of outstanding loans to local authorities from the State Advances Corporation and the Main Highways Board, and £1,654,097 on account of inscribed debt under the Government Loans to Local Bodies Act, leaving approximately £348,000,000 as the sum total of the public and semi-public debt. This figure represents a rate of £221 per head of population.
The figures relating to local authorities' indebtedness in the foregoing paragraph are inclusive of Hospital Boards, and to this extent differ from those given in the section on local government. Hospital Board indebtedness at 31st March, 1936, totalled £1,125,589.
As is shown in Subsection C of this section, an appreciable proportion of the public debt of New Zealand is represented by money borrowed by the State not for its own requirements, but for the purpose of lending out at easy rates of interest for various defined purposes.
As early as 1892 the Government commenced the purchase of lands for cutting up for sale or lease to private individuals, and two years later the passing of the Advances to Settlers Act, 1894, marked the inauguration of a series of schemes for lending money to settlers, workers, &c., for the purchase of homes, the improvement of farms, and the development of resources and of industries. The schemes varied considerably in detail, but all lay in one of two main classes—those in which the money was advanced on security, and those in which the expenditure was incurred by the Government itself in the first place and recouped from sales or leases. Advances to settlers, workers, and discharged soldiers are the principal examples of the former class, and the purchase of land for settlements (including the settlement of discharged soldiers) is the principal of the latter.
Of the advances proper, most classes are now administered by a Department known as the State Advances Corporation, and the accounts relating to these are not included in the Public Account, nor are they dealt with in Subsection A of this section. The various systems of advances administered by the State Advances Corporation are dealt with in the present subsection, as is also the rural intermediate credits scheme. A brief description of the system of advances to discharged soldiers for settlement purposes is outlined in the section of this book dealing with land tenure and settlement, while particulars of advances for mining purposes are given in the section relating to mining. Mortgage securities under the Discharged Soldiers Settlement Act have now been transferred to the State Advances Corporation and are dealt with in this subsection.
The National Expenditure Adjustment Act, 1932, effected a reduction in the rate of interest on existing mortgages as from 1st April, 1932. The reductions were originally intended to operate for three years only, but the term was extended to five years by the Finance Act, 1934; and the reduction has now been made permanent by a section in the Mortgagors and Lessees Rehabilitation Act, 1936. The standard reduction is 20 per cent. in the case of mortgages entered into on the 1st January, 1930, or within five years immediately preceding, and in the case of earlier mortgages 20 per cent. of the rate of interest (determined in manner laid down) that would have been fixed by the mortgage had it been entered into on the 1st January, 1930. No such deductions were allowed, however, which would have the effect of bringing the net interest rate on chattel mortgages below 6½ per cent. or on other mortgages below 5 per cent.
Legislation of recent years has widened the powers of granting relief to, and otherwise ameliorating the conditions of, mortgagors who have been unable to meet their obligations in full.
Under the Mortgage Corporation of New Zealand Act, 1934–35, the State Advances Department was virtually abolished, practically the whole of its operations being taken over by the Mortgage Corporation. The State Advances Corporation Act, 1936 (described under the next heading), effected what practically amounts to a reversion to the traditional State advances system. The double change in a little over twelve months involved major problems of organization, and renders it difficult to quote comparable statistical date.
As indicated in the preceding paragraph, a definite change in the policy of advances by the State was effected by the Mortgage Corporation of New Zealand Act, 1934–35. This statute authorized the creation of a corporation under a Board composed of directors appointed partly by the State and partly by the shareholders of the Corporation.
By the State Advances Corporation Act, 1936, the private capital invested in the Mortgage Corporation was cancelled, provision being made for repayment to shareholders in respect of shares held in the Corporation. The capital of the Corporation was maintained at £1,000,000, however, by a grant from the Consolidated Fund, while all securities issued by the Corporation carry a State guarantee. The management of the Corporation is vested in a Board of Directors consisting of two joint managing directors appointed by the Governor-General in Council, one or more other directors similarly appointed, and an ex officio member (necessarily a Treasury official) appointed by the Minister of Finance. In the exercise of its powers, the Board is enjoined to have regard to any representations that may be made by the Minister of Finance. Every direction in writing given by the Minister is binding on the Board.
The change in administration and the institution of a State guarantee on securities issued by the Corporation represented the major alterations in the preexisting law. All the functions of the Mortgage Corporation were transferred to the new body, while certain extensions were made—e.g., the administration of the Housing Act, 1919. Following is a résumé of the principal functions of the State Advances Corporation:—
The Corporation administers the State Advances, &c., loans transferred to the pre-existing Mortgage Corporation, viz.—
Mortgages in respect of advances to settlers or workers under the State Advances Act, 1913:
Mortgages in respect of advances under the Rural Advances Act, 1926:
Debentures or other securities vested in the State Advances Superintendent in respect of advances to local authorities under Part III of the Local Bodies' Loans Act, 1926, or corresponding provisions' of former Acts:
Crown mortgages in respect of advances under the Discharged Soldiers Settlement Act, 1915, or any amendments thereof (including advances under section 11 of the Finance Act, 1933):
Crown mortgages in respect of advances made out of the Land for Settlements Account by direction of the Lands Development Board established under Part I of the Land Laws Amendment Act, 1929.
In addition, all other mortgages of land or any other securities held by the State Advances Superintendent or by the Crown as security for loans made out of the State Advances Account or out of the Public Account are now transferred to the Corporation.
The Corporation may advance on mortgage, generally speaking, up to two-thirds of the value of the security, with provision for the extension of the limit in certain specified cases. In such instances the Minister of Finance guarantees the Corporation against any loss attributable to the excess of the loan over two-thirds of the security. In order to provide finance the Corporation may issue bonds, stock, or other securities, which are State guaranteed. In addition to its primary function of providing cheap long-term finance in the form of first mortgages on property, the Corporation may now make loans to local authorities out of the Housing Account for purposes of erecting workers' dwellings; while it may also make advances out of its ordinary account for the development of existing industries or the establishment of new industries.
Loans are, in general, secured by table mortgage for a term not exceeding fifty years, though in certain instances a flat mortgage for a period not exceeding five years may be granted. There is provision for varying the scheme of table mortgages in special circumstances, part of the mortgage (at least one-half), to be in the form of a table mortgage and the remainder a flat mortgage falling due on the date of the last instalment of the table mortgage.
A mortgagor may be required to effect a policy of life insurance as additional security, such policy to be assigned to the Corporation. A mortgagor may not give any subsequent mortgage or any other charge over land subject to any mortgage to the Corporation except with the written authority of the Board.
The Board is required from time to time to fix the rates of interest to be paid under mortgages to the Corporation, so as to make adequate provision to cover the costs of administration and for all other matters incidental to the proper functioning of the Corporation. After such provision as the Minister of Finance thinks proper has been made for the depreciation of securities or other assets and for such other matters as in his opinion are necessary for the efficient conduct of the business of the Corporation, the surplus for each financial year is to be paid into the Public Account unless the Minister, in his discretion, authorizes the Board to credit it, in whole or in part, to the General Reserve Fund of the Corporation.
Each mortgagor is required to pay in cash or to borrow, as an addition to the capital sum, 2 per cent. of any mortgage granted by the Corporation. These amounts, together with the surplus profits referred to above, and certain payments on account of mortgages transferred to the Corporation, form a General Reserve Fund.
The Corporation is empowered to administer the Housing Act, 1919 (see Section XXXVIII—Labour Laws and Allied Legislation), and a brief summary of operations under the Act is given further on in this section. By Order in Council, dated the 5th March, 1937, the Board of Management of the State Advances Corporation Mas constituted the Rural Intermediate Credit Board established under the Rural Intermediate Credit Act, 1927, the date fixed for the change-over being 1st July, 1937.
The State Advances Corporation Act, 1930, provides, as has already been mentioned, for the granting of loans for the development or establishment of industries in the Dominion. Applications under this heading are investigated in the first instance by the Bureau of Industry, but must be approved by the Minister of Finance before being granted. Several applications were received during the year ended 31st March, 1937, but none of these had been granted up to the end of the financial year.
Balance-sheet figures indicate that stock and debentures as at the 31st March, 1937, were valued at £39,774,500, the increase during the year being due principally to the issue of stock to the value of £8,760,000 to the Minister of Finance in respect of discharged soldiers settlement mortgages taken over by the Corporation. The contingent liability to the Crown now stands at £11,715,730. Reserves amount to the substantial total of £3,299,300.
Including current-account advances, the capital outstanding on mortgage accounts as at the 31st March, 1937, was £50,379,573. The average loans outstanding on the respective classes of securities are as follows:—
| £ | |
|---|---|
| Residential | 557 |
| Rural | 1,173 |
| Current account | 458 |
The disposition and appropriation of profits in respect of operations during the year ended 31st March, 1937, are given in the following table:—
| — | Amount. | Percentage of Stock Issue plus Capital. | Percentage of Gross Earnings. | Percentage of Gross Profits. |
|---|---|---|---|---|
| £ | £ s. d. | Per Cent. | Per Cent. | |
| Gross earnings | 1,983,513 | 4 17 4 | 100.00 | |
| Less capital charges—Interest | 1,236,282 | 3 0 8 | 62.33 | |
| Gross profits | 747,231 | 1 16 8 | 37.67 | 100.00 |
| Less— | ||||
| Management expenses and depreciation of fixed assets | 129,882 | 0 6 5 | 6.55 | 17.38 |
| Reserve for losses (ex State and Corporation) | 102,500 | 0 5 0 | 5.17 | 13.72 |
| Dividends | 4,558 | 0 0 3 | 0.23 | 0.61 |
| Surplus for year 1936–37 | 510,291 | 1 5 0 | 25.72 | 68.29 |
| Plus Superannuation Reserve not now required | 14,749 | |||
| Less additional income-tax due 1935–36 | 58,020 | |||
| Surplus due to Crown | £467,020 |
A summary of loan operations (new business) during the year 1936–37 is given in the following table. The lending-rate of the Corporation for loans on mortgage was maintained at 4⅛ per cent. during the year.
| — | Applications. | Loans authorized. | ||
|---|---|---|---|---|
| Number. | Amount. | Number. | Amount. | |
| Urban securities— | £ | £ | ||
| Erection of dwellings— | ||||
| Special loans over 66⅔ per cent. of value of security | 1,854 | 1,463,801 | 525 | 385,708 |
| Ordinary loans | 595 | 404,282 | ||
| Refinancing | 2,187 | 1,590,857 | 1,435 | 404,282 |
| Other purposes | 1,008 | 580,892 | 398 | 272,815 |
| Total urban | 5,049 | 3,635,550 | 2,953 | 1,889,454 |
| Rural securities— | ||||
| Refinancing | 1,890 | 3,784,178 | 974 | 2,154,195 |
| Other purposes | 791 | 871,470 | 212 | 342,217 |
| Total rural | 2,681 | 4,655,648 | 1,186 | 2,496,412 |
| Total urban and rural | 7,730 | 8,291,198 | 4,139 | 4,385,866 |
In addition to the total applications quoted above, there were at the beginning of the year 777 applications, involving a sum of £1,034,000, under consideration; and, if these figures be added, the total of applications under investigation during the year ended 31st March, 1937, numbered approximately 8,500, involving a sum of £9,300,000.
Of the applications considered during the year 1936–37, 1,626 for £1,275,853 in respect of urban property and 1,411 for £2,345,904 in respect of rural property were declined as being unsuitable for various reasons. A large proportion of this number was in respect of mortgagors who were endeavouring to refinance independently of their existing mortgagees, and thus avoid the necessity of taking action under the Mortgagors and Lessees Rehabilitation Act, while in other cases the mortgagor's application was prompted by a mortgagee who was anxious for some other lender to take over the security rather than have his equity reduced under the rehabilitation legislation.
At the close of the year 1936–37, 438 urban applications for £310,295 and 392 rural applications for £665,475 were in course of investigation. For various reasons 501 applications for loans were withdrawn during the year 1936–37, while in a number of cases a smaller loan than that applied for was authorized and accepted.
By Order in Council dated the 5th August, 1930, provision was made for the transfer of mortgages under the Discharged Soldiers Settlement Act. The transfer was carried out district by district from 30th September, 1930, to 31st March, 1937. Details of the mortgage assets transferred are as follows:—
| Investments— | £ | £ |
| Mortgage loans | 9,562,060 | |
| Current accounts | 1,506,814 | |
| 11,068,874 | ||
| Interest receivable— | ||
| Overdue | 329,573 | |
| Accrued | 75,758 | |
| 405,331 | ||
| Interest Postponed Account | 49,248 | |
| Security Protection Account | 3,677 | |
| Realization suspense | 850 | |
| Less liabilities— | £ | 11,527,980 |
| Fire-loss moneys held in suspense | 1,536 | |
| Credits held in suspense | 1,539 | |
| 3,075 | ||
| Net book-value of assets transferred | £11,524,905 |
In consideration of the transfer of these assets, an agreement was reached between the Corporation and the Minister of Finance under which State Advances Corporation 3⅜–per-cent. stock to the value of £8,760,000 was issued to the Crown. The remainder (£2,764,905) represents a contingent liability of the Corporation to the Crown.
Opportunity was given to mortgagors, in respect of the mortgages transferred to the Corporation, for them to have their mortgage liabilities adjusted to the Corporation lending-rate of 4⅛ per cent., provided that they would agree to an addition of 2 per cent. of their liability being added, or paid for in cash if desired, by way of contribution to a General Reserve Fund.
Offers of adjustment were made to some 46,881 mortgagors, of which number 21,804, or 46.51 per cent., had up to the 31st March, 1937, availed themselves of the opportunity provided. In a number of cases the existing rate of interest was round about 4½ per cent., so that with the addition of the amount (2 per cent.) towards the General Reserve there was very little, if anything, to be gained by an adjustment to the new rate of interest. In some other cases the unexpired term of the existing mortgage was too short to prompt mortgagors to accept the offer of adjustment.
In the case of discharged-soldiers-settlement mortgages, offers of adjustment were made to 1,642 mortgagors, of whom 659 up to the 31st March, 1937, had availed themselves of the offer.
The Mortgagors and Lessees Rehabilitation Act of 1936 provides for a final adjustment of mortgages on both rural and urban land. Applications for adjustment under this Act in respect of mortgages held by the Corporation in the various districts were as follows:—
| — | Applications. | ||
|---|---|---|---|
| Farm. | Home. | Total. | |
| Auckland | 1,763 | 1,718 | 3,481 |
| Hawke's Bay - Gisborne | 591 | 307 | 898 |
| Taranaki | 646 | 145 | 791 |
| Wellington | 908 | 1,307 | 2,215 |
| Nelson, Marlborough, and Westland | 487 | 88 | 575 |
| Canterbury | 872 | 567 | 1,439 |
| Otago | 317 | 62 | 379 |
| Southland | 443 | 80 | 523 |
| Total | 6,027 | 4,274 | 10,301 |
The following table, which relates to the position of advances to settlers and workers at June, 1935, is illuminating in view of the financial stresses upon the community during the depression years. Out of 50,884 mortgagors, 20,736, equal to nearly 41 per cent., were in arrears. The original amount of advances in respect of those in arrears was £20,279,400, of which the balance of principal outstanding (i.e., original advances, less instalments repaid) was £17,932,589. The 30,148 mortgagors who were up to date in payments had an aggregate balance of principal outstanding of £18,498,801, out of original advances totalling £24,133,305.
| Percentage of Principal repaid. | Farm, 75 Per Cent. Limit. | Farm, 66⅔ Per Cent. Limit. | Residential, 75 Per Cent. Limit. | Residential, 95 Per Cent. Limit. | Rental Properties, 75 Per Cent. Limit. | Rental Properties, 95 Per Cent. Limit. |
|---|---|---|---|---|---|---|
| Mortgagors up to Date. | ||||||
| 50 per cent. or over | 1,679 | 9 | 6,120 | 62 | 15 | 1 |
| 25 per cent., but under 50 | 1,864 | 21 | 4,900 | 1,217 | 14 | 3 |
| 10 per cent., but under 25 | 2,598 | 85 | 1,505 | 1,539 | 6 | 9 |
| Under 10 per cent. | 1,918 | 1,177 | 1,498 | 3,881 | 14 | 13 |
| Total | 8,059 | 1,292 | 14,023 | 6,699 | 49 | 26 |
| Mortgagors in Arrears. | ||||||
| 50 per cent. or over | 310 | 1,084 | 8 | 38 | 1 | |
| 25 per cent., but tinder 50 | 804 | 6 | 1,968 | 486 | 232 | 69 |
| 10 per cent., but under 25 | 1,461 | 41 | 815 | 1,192 | 209 | 416 |
| Under 10 per cent. | 2,590 | 1,199 | 1,075 | 4,218 | 363 | 2,151 |
| Total | 5,165 | 1,246 | 4,942 | 5,904 | 842 | 2,637 |
| Grand total | 13,224 | 2,538 | 18,965 | 12,603 | 891 | 2,663 |
An appreciable increase in the amount of arrears of principal and interest resulted during the years of financial stringency. The following figures show for the period 1931–32 to 1930–37 the annual increase in the amount of arrears outstanding:—
| £ | |
|---|---|
* Decrease in arrears outstanding. | |
| 1931–32 | 642,184 |
| 1932–33 | 559,210 |
| 1933–34 | 508,132 |
| 1934–35 | 207,671 |
| 1935–36 (8 months) | 191,347 |
| 1930–37 | —38,529* |
By way of adjustment arrears have been capitalized in many instances, and the following table shows the operations in this regard:—
| As at | Book Value of Arrears. | Capitalizations effected during the Year. | Arrears if Capitalization had not been effected. |
|---|---|---|---|
| £ | £ | £ | |
| 1st August, 1935 | 2,552,405 | 2,552,405 | |
| 31st March, 1936 | 2,487,065 | 256,687 | 2,743,752 |
| 31st March, 1937 | 2,039,676 | 408,860 | 2,705,223 |
It should be noted that the figures quoted for arrears are not inclusive of discharged-soldiers-settlement mortgages, the transfer of these not being finalized until the end of the financial year 1936–37.
The Rural Intermediate Credit Act, which was passed during the 1927 session of Parliament came into force on the 1st January, 1928, provided for the setting-up of a special Rural Intermediate Credit Board and the making of advances as follows:—
To members of co-operative rural intermediate credit associations, whose formation (with not less than twenty members and with certain defined objects) is provided for. The application for the loan is received and considered by the association concerned, which, on approving it, applies to the Board to advance the amount required to cover the loan. The term of the loan is not more than five years. An association may arrange with a bank or other approved financial institution for a loan in cases where the term is less than six months.
To persons engaged in farming operations on their own account, or to trustees, executors, or administrators carrying on farming operations the loan (for certain specified purposes and for a term of not more than five years) being advanced direct.
To co-operative societies (with not less than thirty members and with a subscribed capital of at least £2,500) having for their principal objects the production or sale of staple agricultural or pastoral products. In this case the term of the loan is not less than six months nor more than three years.
The Finance Act, 1932–33 (No. 2), authorized the Board, or an association with the consent of the Board, to grant an extension of time or other concession in the case of an existing loan. Every loan granted after 10th March, 1933, by the Board or an association may be repayable upon demand or by instalments, and upon such other conditions as the Board thinks fit. The Board may also carry on the business of discounting farmers' promissory notes and bills of exchange.
The total amount of advance in force at any time to a member in class (a) was originally set down as not to exceed £1,000. This limit was extended to £2,000 by the Rural Intermediate Credit Amendment Act, 1929. In the case of co-operative associations, the amount advanced may be not more than 80 per cent. of the fair market value of the live-stock or produce upon which the loan is secured.
Pursuant to the provisions of Part VI of the State Advances Corporation Act, 1936, the former Rural Intermediate Credit Board went out of office on the 1st July, 1937, and was replaced by the Board of Management of the State Advances Corporation, the members of which now constitute the Rural Intermediate-Credit Board.
Apart from several consequential machinery amendments, the Act also enlarged the scope of the original Act of 1927 by repealing the limitation of £2,000 in respect of direct loans to farmers and also the stipulation requiring a collateral instrument of guarantee in respect of every such loan.
The Board consists of four members, the powers of the Commissioner of Rural Intermediate Credits being exercisable by either or both of the Joint Managing Directors of the Corporation.
The funds of the Board are obtained partly by way of advances from the Consolidated Fund and partly by the issue of debentures.
There are also throughout the Dominion sixteen District Rural Intermediate Credit Boards, to which has been delegated authority to approve applications referred to in classes (a) and (b) up to certain amounts and subject to certain stipulated conditions.
The accounting year under the scheme ends on the 30th June. The following figures show the position at 30th June, 1936:—
| Investments (including loans made on face value of bills and notes discounted) | £ |
| 205,967 | |
| Loans granted but not completed | 15,082 |
| Applications entertained and in course of consideration | 5,952 |
| Total | £227,001 |
The investments referred to above were made up as follows:—
| £ | |
|---|---|
| Advances to associations for preliminary expenses | 814 |
| Advances to associations under Part II of the Act | 161,574 |
| Advances to farmers under Part III of the Act | 42,317 |
| Bills and notes discounted (face value) | 1,262 |
| Total | £205,967 |
From the inception of the scheme on 1st January, 1928, up to the 30th June, 1936, advances made and bills discounted totalled £1,217,064, and the business dealt with up to or under consideration at that date reached the total of £1,238,098.
The interest fixed for advances other than to co-operative rural intermediate credit associations is now 5 per cent. per annum, this being also the discount-rate. In the case of loans to co-operative rural intermediate credit associations the rate charged is 4½ per cent., so that associations may be in a position to make advances to their members at 5 per cent. The Board has imposed conditions as to the manner in which this margin of ½ per cent. is to be employed by the associations.
Advances totalling £400,000 have been received from the Consolidated Fund, and £262,900 had been raised to the 30th June, 1936, by issue of debentures. These debentures have been repaid, and the only borrowed capital now held by the Board is that on loan from the Consolidated Fund. Income from investments during the year ended 30th June, 1936, totalled £10,942, and expenditure for the year was £8,206, resulting in a net profit of £2,736. The income referred to does not include £7,651 earned by investments of the Rural Intermediate Credit Redemption Fund, to which one-third of all advances received from the Consolidated Fund must be allocated and invested in Government securities. The interest earned by the Fund, plus one-half of the net profits on the year's working, is credited to the Redemption Fund, the grand total of which amounted at 30th June, 1936, to £195,258.
The Housing Act of 1919, authorizing the acquisition of land and the erection of dwellings for disposal by way of sale or lease, was originally administered by the Labour Department, but the sections relating to administration were repealed by the State Advances Amendment Act of 1922, and the powers of the Housing Superintendent and of the Housing Board were thereupon transferred to the State Advances Superintendent and to the Stale Advances Board. No provision was made in the Act constituting the Mortgage Corporation of New Zealand for tin-transfer of the administration of the Housing Act, which therefore remained under the jurisdiction the State Advances Superintendent.
Provision was made in section 16 of the State Advances Corporation Act, 1936, for the transference of the powers, functions, duties, and obligations of the State Advances Superintendent and of the State Advances Board to the State Advances Corporation and to the Board of Management respectively.
Under the provisions of the 1936 Act the Housing Account was constituted a separate account, funded from Government sources, and quite distinct from the lending operations of the Corporation. The Corporation is empowered, in connection with housing services, to make such charge against the Housing Account as may from time to time be approved by the Minister of Finance. The Housing Account was opened with the Reserve Bank of New Zealand on the 1st July, 1936, by the transfer of moneys held in the State Advances Account on that date in connection with the Housing Act, 1919.
Assets of the account at the date of transfer were in respect to the following items, and reflected previous expenditure in regard to housing:—
Balances owing by 366 persons under agreements for sale and purchase of houses erected under the Act.
Houses, numbering 137, occupied by tenants on a rental basis.
Residential allotments, to the book value of £23,777, held for building purposes.
Operations during the year ended 31st March, 1937, in respect to the purchase of land for housing purposes amounted to £42,996. The localities in which these purchases were made, were as follows:—
| £ | |
|---|---|
| Whangarei | 605 |
| Auckland | 1,250 |
| Wellington | 25,437 |
| Christchurch | 15,704 |
| Total | £42,996 |
Although up to the 31st March, 1937, no new money had actually been expended on the erection of dwellings, nevertheless, considerable progress has been made towards implementing the Government housing programme (see also Section XXIII—Building and Construction).
In addition to the special provision for housing outlined above, advances for home-building by private owner-occupiers form a very large proportion of tin-total business of the Corporation. Again, provision is made (see page 582) for the extension of the normal security margin in special circumstances.
Table of Contents
A SUMMARY showing the total amount of pensions administered by the Pensions Department during the last two financial years is as follows:—
| Class of Pension. | Annual Value. | Gross Payments. | ||
|---|---|---|---|---|
| As at 31st Mar., 1936. | As at 31st Mar., 1937. | 1935–36. | 1936–37. | |
* Excludes payments under section 45 of Pensions Act, 1926. These are included in old-age pensions. † Pensions for the blind, formerly payable, have been merged with invalidity pensions. | ||||
| £ | £ | £ | £ | |
| War | 1,384,340 | 1,532,424 | 1,349,447 | 1,483,345 |
| Old-age | 1,828,150 | 3,068,293 | 1,718,601 | 2,413,103 |
| Widows' | 321,605 | 464,879 | 311,864 | 412,280 |
| Maori War | 2,107 | 2,106 | 2,577 | 1,972 |
| Miners' | 73,331 | 87,838 | 67,834 | 83,253 |
| Epidemic | 501 | 76 | 907 | 253 |
| Invalidity† | 23,961 | 478,165 | 22,991 | 284,760 |
| Boer War* | 2,086 | 2,131 | 2,127 | 2,067 |
| Civil Service Act | 4,460 | 3,933 | 1,676 | 4,106 |
| Sundry pensions and annuities | 15,065 | 13,101 | 13,053 | 13,892 |
| Family allowances | 144,856 | 125,702 | 149,043 | 130,730 |
| War veterans' allowances | 58,358 | 151,713 | 16,544 | 110,667 |
| Totals | 3,858,820 | 5,930,421 | 3,659,664 | 4,940,428 |
Total payments in 1936–37 represented £3 5s. 9d. per head of mean population other than Maori.
As an illustration of the growth of the pension responsibilities of the State, figures are appended covering total and per caput payments at five-yearly intervals on account of civil pensions and family allowances. Civil pensions comprise old-age, widows', miners', invalidity, epidemic, and Maori war pensions. Only old-age pensions were in force over the whole period.
| Year ended 31st March, | Payments during Year. | |
|---|---|---|
| Total. £ | Per Head of Population.* | |
* Excluding Maoris. | ||
| £ s. d. | ||
| 1900 | 157,343 | 0 4 2 |
| 1905 | 195,475 | 0 4 7 |
| 1910 | 362,496 | 0 7 5 |
| 1915 | 540,049 | 0 9 10 |
| 1920 | 931,520 | 0 16 1 |
| 1925 | 1,132,602 | 0 17 4 |
| 1930 | 1,577,641 | 1 2 4 |
| 1935 | 2,054,829 | 1 7 10 |
| 1936 | 2,273,817 | 1 10 7 |
| 1937 | 3,324,251 | 2 4 6 |
The aggregate amount paid to the 31st March, 1937, in respect of civil pensions and family allowances is £36,225,284.
War and other pensions paid by the Pensions Department in 1936–37 on behalf of car Governments amounted to £223,328 in actual payments for the year.
The National Expenditure Adjustment Act, passed in May, 1932, imposed, inter cilia, reductions in the rates of certain classes of pensions. Apart from certain other provisions, the general effect may be stated as a reduction of 10 per cent. in the case of old-age, widows', and miners' pensions, and family allowances, and 17½ per cent. in the case of war pensions payable to certain classes of dependants of deceased soldiers. Varying reductions (maximum, 30 per cent.) were made in economic pensions. The maximum income limit (including pension) of old-age pensioners who served in the South African War and who receive the additional pension of 5s. per week was reduced by 17½ per cent.
From the 1st April, 1934, the Finance Act (No. 2), 1934, effected a partial restoration of 5 per cent. of existing pension rates in the case of old-age pensions, and of 5 per cent. of the existing maximum income limit (including pension) of old-age pensioners (referred to in the immediately preceding paragraph) who served in the South African War.
The Finance Act, 1935, operative from the 1st August, 1935, completed the restoration of old-age, widows', and miners' pension reductions; completed the restoration to £97 10s. per annum of the maximum income limit (including pension) of old-age pensioners who served in the South African War; and increased by 7½ per cent. of the existing rates pensions for dependants of soldiers whose pensions had been reduced, and economic pensions. A new type of non-contributory pension was provided by the War Veterans' Allowances Act referred to later.
The law was substantially amended by the Pensions Amendment Act, 1936, in the direction of making more liberal both the scope of the Act and the benefits received. The basic rate of the old-age pension was increased from £45 10s. to £52 per annum as from 1st July, 1936, and a further increase to £58 10s. per annum became operative as from 1st December, 1936. Certain disqualifications have been removed, the residential qualification has been reduced from twenty-five years to twenty years, and Chinese or other Asiatics (if British subjects), are now eligible for the pension. The yearly income limit, including pension, has been raised from £97 10s. to £104 from 1st July to 30th November, 1936, and £110 10s. thereafter for single pensioners, and for married pensioners from £143 (joint income of husband and wife, plus pension) to £156 from 1st July to 30th November, 1930, and £169 thereafter. Provision has been made for the payment of a widows' pension to any married woman who has been deserted by her husband, or whose husband is subject to a reception-order under the Mental Defectives Act, 1911, or is detained in an institution under that Act. The rate of widows' pension has been increased. The qualification for miners' pensions has been extended to include any other occupational disease or heart disease, as well as miner's phthisis; and the rate of pension payable to the widow of a miner dying while in receipt of a miners' pension has been increased. The maximum income limit (including pension) of old-age pensioners who served in the South African War and who receive the additional pension of 5s. per week has been increased to £104 per annum from 1st July to 30th November, 1936, and £110 10s. thereafter. One of the most important amendments is that providing for the payment of an invalidity pension to every person of the age of sixteen years or upwards who is totally blind or is permanently incapacitated for work as the result of an accident or by reason of illness or of any congenital defect, and who fulfils certain residential, &c., qualifications. Previously pensions were payable in respect of blindness only, and on more restricted terms.
War pensions and economic pensions generally have been restored by the War Pensions Amendment Act, 1936, to the rates in force immediately prior to 1st April, 1932.
Under the Family Allowances Amendment Act, 1936, the limit for the average weekly income (including allowance) of the applicant and his wife and children has been restored from £35s. to £4.
The history of old-age pensions in New Zealand dates back to 1898, in which year was passed the original Old-age Pensions Act. The law relating to old-age pensions is now contained in the Pensions Act, 1926 (which is a consolidation of previous enactments on the subject), and its amendments.
The qualifications for the old-age pension, as amended in 1936, are briefly as follows:—
The applicant, if a male, must have reached the age of sixty-five, or, if a female, must have reached the age of sixty, except in cases where the applicant is the parent of two or more children under fifteen years of age who are dependent on him (or her). The pension-age in such cases is sixty for men and fifty-five for women, and the pension payable may be any sum up to £13 per annum, in addition to the ordinary pension payable.
The applicant must be resident in New Zealand, and must have resided continuously in the Dominion for the past twenty years.
The applicant must not during the past twelve years have deserted his wife (or her husband, as the case may be) or children under the age of fifteen years.
The applicant must be of good moral character and have lived a sober and reputable life during the past year.
The yearly income (including pension) of the applicant, if single, must not exceed the rate of £110 10s. per annum and, if married, the rate of £169 per annum (joint income of husband and wife, plus pension).
The net value of accumulated property (see below) must be under £590.
The applicant must not have deprived himself or herself of property or income to qualify for a pension.
All residents of New Zealand who fulfil the necessary conditions are eligible for the old-age pension, with the exception of—
Maoris who receive votes other than pensions out of sums appropriated for Native purposes by the Civil List Act, 1920.
Aliens.
The term “alien” is deemed not to include a woman who ceased to be a British subject by reason of marriage with an alien who is since deceased, or from whom she is legally separated. The position of women who have married aliens is further improved in this respect by the British Nationality and Status of Aliens (in New Zealand) Amendment Act, 1934.
The original Act of 1898 provided for a maximum general pension of £18 per annum. This maximum was increased to £26 in 1905, to £39 in 1917, to £45 10s. (in certain cases in 1924; all cases, 1925); in 1932 was reduced to £40 19s.; from the 1st April, 1934, was increased to £43; and from the 1st August, 1935, was restored to £45 10s. By the Pensions Amendment Act, 1936, the maximum general pension was increased to a rate of £52 per annum between 1st July and 30th November, 1936, and £58 10s. thereafter, reducible in both cases by—
£1 for every complete £1 of income over £52.
£1 for every complete £10 of net capital value of accumulated property.
Income includes the reasonable cost of board and lodgings—estimated at a rate not exceeding £26 per year where the applicant is in receipt of free board and lodgings—but does not include—
Any payment by way of funeral benefit from any registered friendly society:
Any money received on the sale or exchange of land or property:
Any money received under an insurance policy on the destruction or damage by fire or otherwise of a building or other property:
Any capital moneys expended for the benefit of the applicant or for the benefit of his wife or her husband or dependent children:
Any principal or capital sum received by an applicant on the intestacy or under the will of the deceased husband or wife of the applicant:
Any moneys not exceeding in the aggregate the sum of £500 that may be received by way of legacy or under any life-assurance policy or as compensation or damages in respect of any accident causing the death of or bodily injury to any person, and that are expended in the purchase of property to be used as a home, or for improvements or renovations to property used as a home, or to pay off any principal sum or interest on a mortgage on any such property, or for any other purposes that the Commissioner of Pensions deems reasonable.
The income of a married applicant for pension purposes is considered to be half of the joint incomes of husband and wife. The joint incomes of a married couple must not exceed, with pension added, the rate of £169 per annum Net accumulated property is the capital value (reduced by £500) of all property owned by an applicant except his interest in any land (including his interest under any mortgage of any estate or interest in land), his interest in any annuity or in any policy of life-insurance, and his furniture or personal effects. The net accumulated property of a husband or wife for pension purposes is half of the total net accumulated properties of both.
The exemption of the total value of the home in the computation of net accumulated property was not provided for prior to 1925, but a substantial allowance was made. If an old-age pensioner is in a mental hospital the whole of the pension is paid to the Mental Hospitals Department towards the pensioner's maintenance.
From the inception of the scheme to 31st March, 1937, 132,198 old-age pensions have been granted. Of these, 63,480 have been discontinued on account of the death of the pensioner, and 14,584 for other reasons. The number of pensions in force on the 31st March, 1937, was 54,134, an increase of 10,825 on the figure for the previous year. The annual liability was £3,068,293, being an average of £56 13s. 7d. per pension. A decennial summary is—
| At 31st March, | Pensioners. | Amount paid during Year. |
|---|---|---|
| £ | ||
| 1928 | 24,875 | 1,010,575 |
| 1929 | 26,110 | 1,060,760 |
| 1930 | 26,909 | 1,107,993 |
| 1931 | 28,995 | 1,158,788 |
| 1932 | 32,317 | 1,277,107 |
| 1933 | 34,932 | 1,271,157 |
| 1934 | 37,507 | 1,350,982 |
| 1935 | 40,141 | 1,519,889 |
| 1936 | 43,309 | 1,718,601 |
| 1937 | 54,134 | 2,413,013 |
The total payments in respect of old-age pensions have aggregated £27,508,721 to the 31st March, 1937. Thirty per cent. of the net revenue from national endowments is apportioned to old-age-pensions expenditure, the total amount so credited to 31st March, 1937, being £860,389.
The Widows' Pensions Act, 1911, came into operation on the 1st January, 1912. The scope of this Act, which is embodied in its amended form in the Pensions Act, 1926, has been widened from time to time by various amendments.
Applicants for widows' pensions must be British subjects of good character with at least one child under fifteen, and applications require to be lodged with the local Registrar of Pensions and to be investigated by a Magistrate, who alone (except as below) has power to grant pensions. Under the 1936 amending Act a pension may be granted to any married woman, as if she were a widow, who has been deserted by her husband and who has taken proceedings for but failed to obtain a maintenance order, or has obtained a maintenance order which has not been complied with, and is unaware of the present whereabouts of her husband. A pension may also be granted to any married woman in respect of whose husband a reception-order under the Mental Defectives Act, 1911, is for the time being in force (whether or not he is detained in an institution under that Act), or to any married woman whose husband is for the time being detained as a voluntary boarder in accordance with Part V of that Act. Previously the extension applied only to a woman whose husband was detained in an institution under the Mental Defectives Act, 1911. It should be noted that the whole of the pension is payable to the wife, none being payable to the Mental Hospitals Department. There were 189 such pensions in force on 31st March, 1937.
An Act of 1924 empowered the Minister in Charge of Pensions to grant, after investigation by a Magistrate, a widows' pension to a mother, otherwise ineligible, having care of her child or children whose father was dead and who were dependent upon her. By the Finance Act (No. 2), 1936, this provision is extended to include cases where the father is subject to a reception-order under the Mental Defectives Act, 1911, or is detained in an institution under that Act, or has failed to make adequate provision for the maintenance of such child or children.
The maximum rate of pension (after 1st. July, 1936) payable is £1 10s. per week to a widow with one child under fifteen years of age, with an additional 10s. per week for each additional child under fifteen, the maximum gross pension payable being £4 10S. per week. The term “child” includes a stepchild or a child legally adopted during the lifetime of the husband of the applicant, and (under the Pensions Amendment Act, 1936) may include any child who is in fact maintained by the applicant and who was maintained by her husband before his death.
The annual amount of the pension as computed above is diminished by £1 for every complete £1 by which the total income of the applicant and of any child or children in respect of whom the pension is payable exceeds £78 per year.
The number of widows' pensions in force on the 31st March, 1937, was 4,753, covering in addition 9,666 children. The figures for the last five years are as follows:—
| Year ended 31st March, | Number at End of Year. | Annual Value. £ | Annual Payments. £ |
|---|---|---|---|
| 1933 | 4,687 | 307,926 | 311,317 |
| 1934 | 4,619 | 301,388 | 302,020 |
| 1935 | 4,505 | 294,437 | 296,565 |
| 1936 | 4,369 | 321,605 | 311,864 |
| 1937 | 4,753 | 464,879 | 412,280 |
The average pension us at 31st March, 1937, was £97 16s. 2d. The total widows' pension payments since the inauguration of the scheme in 1912 have been £5,263,666.
The Military Pensions Act, 1912, was enacted to provide for the payment of an annual pension of £36, increased to a rate of £52 per annum between 1st July and 30th November, 1936, and £58 10s. thereafter, to veterans of the Maori wars who were awarded a medal for active service in those wars. This Act is now embodied in the Pensions Act of 1926, and amendments.
The figures for the last five years are—
| Year ended 31st March, | Number at End of Year. | Annual Value. £ | Annual Payments.£ |
|---|---|---|---|
| 1933 | 106 | 5,194 | 5,831 |
| 1934 | 86 | 4,214 | 4,522 |
| 1935 | 65 | 3,185 | 3,607 |
| 1936 | 43 | 2,107 | 2,577 |
| 1937 | 36 | 2,106 | 1,972 |
The grand total paid in pensions of this class since the institution of this scheme in 1912–13 has been £609,409.
Miners' pensions were provided for by Part IV of the Pensions Act, 1926 (which incorporated the Miner's Phthisis Act, 1915, and amendments), and by a section of the Finance Act, 1929, which extended the grounds on which a claim for pension might be based and increased the amount of pension where there were dependent children.
Under this legislation the pension is payable to any miner, qualified by residence, &c., who is totally incapacitated or seriously and permanently incapacitated for work owing to miner's phthisis (pneumoconiosis) contracted while working as a miner in New Zealand. The term “miner's phthisis” was extended in 1929 to include tuberculosis of the lungs and any other disease of the respiratory organs commonly associated with or a sequel to pneumoconiosis. By the Pensions Amendment Act, 1936, the qualification has been extended to include any “other occupational disease or heart disease.” The weekly pension (from the 1st August, 1935) payable during incapacity is as follows:—
To an unmarried man, £1 5s.
To a married man with wife or children under fifteen years of age dependent on him, £1 5s., plus 10s. in respect of his wife and 10s. in respect of each child.
To a widower with children under fifteen years of age dependent on him, £1 5s., plus 10s. for each child.
The maximum weekly pension is £4 5s. The annual amount payable in respect of any child or children is reducible by £1 for every £1 of income from other sources in excess of £104. Under the Finance Act (No. 2), 1936, in computing the amount of pension payable to a miner, no allowance is payable in respect of his wife for any period in respect of which she is in receipt of a pension under the Pensions Act, 1926.
The qualifications for this class of pension are—
The applicant must be a British subject.
He must have resided continuously in New Zealand for five years immediately prior to his application. By an amendment in 1932, occasional absences not aggregating six months do not constitute an interruption.
He must have been employed as a miner in New Zealand for two years and a half.
He must not have deserted or failed to provide for his wife or children.
He must be of sober habits and good moral character.
The Pensions Amendment Act, 1936, provides that upon the death of a miner while in receipt of a miner's pension his widow is entitled during widowhood to a pension at the rate of 17s. 6d. a week. Where such a miner has died before 1st July, 1936, his widow is entitled to the increased rate of pension as from 1st July, 1936. Previously the widow of any miner who was entitled to a pension under the Act and who died of miner's phthisis was entitled to claim a pension of 17s. 6d. a week for two years (prior to April, 1932, the period was “during widowhood”) following her husband's death; and the Pensions Amendment Act of 1932, as amended by the Finance Act (No. 2), 1935, provided, inter alia, that every widow in receipt of a pension as a miner's widow should on the termination of that pension be entitled to a maximum pension of £40 10s. during widowhood or until entitled to an old-age pension.
The actual reasonable expenses (not exceeding £20) of the funeral of a miner dying of miner's phthisis or other occupational disease or heart disease are also payable.
The average pension in force at 31st March, 1937, was £84 9s. 2d. Pension payments from the commencement of the scheme agg...(unable to read) £903,458. Against this the amount of.... was credited in respect of gold duty up to the 31st March, 1933, this credit has been discontinued. Funeral expenses paid to the 31st March, 1937, have totalled £9,662.
The figures for the last five years are—
| Year ended 31st March, | Unable to read | Annual Liability. | Annual Payment. |
|---|---|---|---|
| .. | £ | £ | |
| 1933 | .. | 56,618 | 62,563 |
| 1934 | .. | 56,184 | 56,810 |
| 1935 | .. | 60,510 | 58,740 |
| 1936 | 851 | 73,331 | 67,834 |
| 1937 | 1,040 | 87,838 | 83,253 |
Of the 1,040 pensions in force at the 31st March, 1937, 861 were being paid to miners and 179 to widows of miners.
The total pensions granted since 1916 have been 2,658. Of these, 1,030 have been discontinued on account of death and 588 for other reasons.
The War Pensions Act, 1915, as amended, provides for the payment of pensions on certain conditions to disabled members of the New Zealand Forces (as defined by the Act) and to dependants of disabled, deceased, or missing members of the Forces.
No person in receipt of a pension under the Pensions Act, 1926 (other than an old-age pension) can now receive a pension under the War Pensions Act, 1915. War pensions (except economic pensions, which were separately dealt with) payable to dependants of a deceased soldier (other than a widow, child, or widowed mother) were diminished by 17½ per cent. as from the 1st April, 1932, but an increase of 7½ per cent. of the then existing rates was granted as from the 1st August, 1935. Under the War Pensions Amendment Act, 1936, the rates of pension are restored as from 1st July, 1936, to the rates in force immediately prior to 1st April, 1932.
Provision is also made in the War Pensions Amendment Act, 1936, whereby the widow of a disabled returned soldier has now the right of pension if she was married to him prior to 1st August, 1936. Previously the widow had a right to a pension only if married prior to or not later than seven years after her husband's, discharge from the Forces.
SUMMARY OF ANNUAL LIABILITY AT 31ST MARCH, 1937.
| Class of Pension. | Number of Pensioners. | Number of Children.* | Annual Value. | Average Pension. |
|---|---|---|---|---|
* I.e., Dependent children under sixteen years of age, covered by War Pensions. | ||||
| £ | £ | |||
| Soldiers (permanent) | 10,647 | 33 | 621,630 | 58 |
| Soldiers (temporary) | 4,444 | 35 | 318,423 | 72 |
| Dependants of disabled soldiers | 3,252 | 5,809 | 262,477 | 81 |
| Widows (without children) | 1,332 | 128,256 | 96 | |
| Widows (with children) | 385 | 740 | 63,314 | 164 |
| Other dependants of deceased soldiers— | ||||
| Parents | 3,441 | 129,399 | 38 | |
| Other adult dependants | 75 | 2,516 | 34 | |
| Guardians of children | 135 | 231 | 6,409 | 47 |
| Totals | 23,711 | 6,848 | 1,532,424 | 65 |
Figures showing the number of pensions, according to class, in each of the last five years are given below:—
| At 31st March, | Soldiers (Permanent). | Soldiers (Temporary). | Dependants (on account of Disablement). | On account of Death. | Total. | |
|---|---|---|---|---|---|---|
| Widows (including Children's Pensions). | Parents and other Dependants. | |||||
| 1933 | 9,548 | 3,615 | 1,744 | 1,388 | 4,809 | 21,104 |
| 1934 | 9,686 | 3,762 | 1,988 | 1,403 | 4,475 | 21,314 |
| 1935 | 9,986 | 3,875 | 2,230 | 1,412 | 4,175 | 21,678 |
| 1936 | 10,301 | 4,263 | 2,658 | 1,584 | 3,825 | 22,631 |
| 1937 | 10,647 | 4,444 | 3,252 | 1,717 | 3,651 | 23,711 |
The total payments on war pensions to the 31st March, 1937, were £26,310,564 the figures for the last ten years being—
| Year ended 31st March, | Pension Payments. |
|---|---|
| £ | |
| 1928 | 1,151,979 |
| 1929 | 1,184,003 |
| 1930 | 1,207,748 |
| 1931 | 1,245,499 |
| 1932 | 1,261,778 |
| 1933 | 1,217,586 |
| 1934 | 1,246,441 |
| 1935 | 1,264,110 |
| 1936 | 1,349,447 |
| 1937 | 1,483,345 |
During the year 1936–37 medical treatment of war pensioners cost £66,871; railway concessions to certain classes of war pensioners cost £1,869; and loading on life-insurance policies of war pensioners due to war-service disabilities amounted to £173.
War pensions payable outside New Zealand (chiefly in Great Britain and Australia) as at 31st March, 1937, numbered 1,765, with an annual liability of £100,969.
By an amendment of the War Pensions Act, 1915, provision was made for the payment of economic pensions to soldiers or their dependants. An “economic pension” is defined under the Act as a supplementary pension granted on economic grounds, and being in addition to any pension payable as a right in respect of the death or disablement of a member of the Forces.
Considerable reductions (maximum, 30 per cent.) in economic pensions were made as from 1st April, 1932. As from 1st August, 1935, an increase of 7½ percent, on the then existing rates was granted, and by the War Pensions Amendment Act, 1936, the rates of pension generally have been restored to those in force immediately prior to 1st April, 1932; an exception is that the maximum rate of pension to disabled soldiers is now £1 5s. per week, as compared with £1 10s. prior to 1st April, 1932.
Economic pensions consist of three classes. Rates, as from 1st July, 1936, are:—
A maximum pension of £1 5s. weekly to disabled soldiers.
A maximum pension of 10s. weekly to widows of soldiers with one child, with an additional 2s. 6d. weekly for each child in excess of one.
A maximum pension of £1 weekly to widowed mothers of deceased soldiers.
In every case the income of the pensioner affects the grant. Soldiers pensioned for minor disabilities do not receive economic pensions.
The total number of economic pensions in force at the 31st March, 1937, was 3,936, of an annual value of £229,670. Payments in respect of economic pensions, are included in the general total of war pensions.
The object of the War Veterans' Allowances Act, 1935, which is deemed part of the War Pensions Act, 1915, is to make provision for returned soldiers (or nurses) who, apart from any wounds or other injuries received during war service, are ageing prematurely or otherwise becoming unemployable by reason of physical' or mental disability. The term “veteran” includes—
Any person who, having been a member of the Forces within the meaning of the principal Act, served overseas as a member of the New Zealand Army Nursing Service, or, in the case of any other member of the Forces, served as such with a unit in actual engagement with the enemy; and
Any other person who, being domiciled in New Zealand at the commencement, of the Great War, served therein as a member of any of His Majesty's Forces other than the New Zealand Forces with a unit in actual engagement with the enemy; and
Any person who, being domiciled in New Zealand at the commencement of the South African War, served therein as a member of a New Zealand contingent raised for service in connection with that war, with a unit in actual engagement with the enemy.
The War Pensions Board is required to be satisfied that an applicant veteran is unfit for permanent employment by reason of physical or mental disability, and that he has resided continuously in New Zealand (irrespective of occasional absences not exceeding six months in the aggregate) for five years immediately preceding his application.
The rates of allowances payable are—
Unmarried veteran (including married veteran whose wife and children are not dependants): £52 per annum, diminished by £1 for each complete £1 of his annual income (not including this allowance) in excess of £26.
Married veteran or widowed veteran with dependent children: £52 per annum in respect of the veteran's personal claim; £39 per annum in respect of his wife; and £13 per annum in respect of each dependent child. These rates are diminished in every case by £1 for every complete £1 of combined annual income (not including this allowance) in excess of £39. The total allowance payable is limited to £143 per annum.
Other provisions of the Act authorize the payment of a gratuity to the widow of a deceased veteran in receipt of an allowance. The receipt of an allowance under this Act does not affect any right to receive a pension under the War Pensions Act.
The total number of pensions in force under this heading at the 31st March, 1937, was fifty-seven, corresponding to an annual liability of £2,131. The amount paid out on claims during the year was £2,067. Pensions are granted under authority of the Defence Act, 1909.
In addition to the war pensions granted to South African veterans, old-age pensioners who served in the South African War may receive an additional old-age pension of 5s. per week in cases where the total income, including pension, does not exceed the rate of £110 10s. per annum. Prior to April, 1932, the total was not to exceed £97 10s., but was then reduced to £79 19s., increased to £84 from 1st April, 1934, restored to £97 10s. as from 1st August, 1935, and increased to £104 from 1st July, 1936, and to the present rate of £110 10s. from 1st December, 1936. The latest increases in the income limit, including pension, were authorized by the Pensions Amendment Act, 1936. Payments referred to in this paragraph are included with old-age pensions and not with South African War pensions.
Section 34 of the Finance Act, 1926, provides for pensions to be paid in the event of the death or disablement of members of the New Zealand Defence or Naval Forces by reason of misadventure suffered in the performance of their duties. The rates under this section are not to exceed the corresponding pension rates under the War Pensions Act, and all applications for pensions of this class are dealt with by the War Pensions Board.
To relieve distress arising out of the influenza epidemic of 1918 a system of pensions was instituted. The number of pensions in force at the 31st March, 1936, was 3, representing an annual liability of £76, the average pension being £25 6s. 4d. The amount paid during the financial year 1936–37 in respect of epidemic pensions was £253, and the total amount paid since the commencement of the scheme £474,087.
The number of pensions is rapidly decreasing, having fallen during the past year by seven, and since the 31st March, 1920, by 936. Only three pensions remained in force at 31st March, 1937.
An important extension of the pensions legislation is contained in Part II of the Pensions Amendment Act, 1936, which provides for the payment of an invalidity pension to every person of the age of sixteen years or upwards who is totally blind, or is permanently incapacitated for work as the result of an accident, or by reason of illness or of any congenital defect, and who satisfies certain other conditions. Prior to the passing of this amendment, pensions on more restricted terms were payable in respect of blindness only. The other conditions referred to are as follows:—
That the applicant has resided continuously in New Zealand for the past ten years. In the case of blind persons, any period of absence for purposes of vocational training or of medical treatment in respect of the eyes, and in all other cases, occasional absences not exceeding six months in the aggregate, are not deemed to be interruptions.
In the case of an applicant in respect of blindness, that he was born blind in New Zealand, or became blind while permanently resident in New Zealand. In the case of every other applicant, that he was born in New Zealand with the condition to which his incapacity for work is attributable, or that he became incapacitated for work by reason of an accident happening in New Zealand or by reason of illness contracted in New Zealand.
That his incapacity for work was not self-induced, or was not in any way brought about with a view to qualifying for an invalidity pension.
That where his incapacity for work is the result of an accident he has no claim outstanding against any employer or against any other person for compensation or damages in respect of such accident.
That he is of good moral character and sober habits.
Applications for invalidity pensions are determined by the Commissioner, who may require applicants or pensioners to be medically examined. If a claim is declined or pension cancelled on medical grounds, there is a right of appeal to a Board of three registered medical practitioners to be appointed for the purpose. The Commissioner may require blind pensioners under the ago of twenty years to undergo occupational training.
The rate of pension is £1 a week, increased by 10s. a week in respect of the applicant's wife if dependent, and a further 10s. a week in respect of each dependent child under the age of sixteen years. In the case of a married man, with a dependent wife or dependent wife and children, or of a widower with dependent children, the annual amount of the pension as above is diminished by £1 for every complete £1 of the total annual income of the applicant and of his wife and dependent children in excess of £104, and also by £1 for every complete £10 of the net capital value of their accumulated property computed as for the old-age pension. In the case of a married woman, the annual amount of the pension is diminished by £1 for every complete £1 of the total annual income of the applicant and her husband in excess of £104, and also by £1 for every complete £10 of the net capital value of their accumulated property. In every other case the annual amount of the pension is diminished by £1 for every complete £1 of the applicant's income in excess of £52, and also by £1 for every complete £10 of accumulated property.
In computing the annual income of any blind person, no account is taken of any personal earnings up to but not exceeding £2 15s. a week.
No pension is payable in excess of £4 a week, except that in the case of a blind pensioner an additional pension equal to 25 per cent. of his earnings is granted, but so that his total receipts in his own right—that is, exclusive of pension in respect of his wife and dependent children—whether derived from pension or personal earnings or from any other source do not exceed the rate of £3 15s. a week.
Under the Finance Act (No. 2), 1936, in computing the amount of an invalidity pension payable to an applicant, no allowance is payable in respect of his wife for any period in respect of which she is in receipt of a pension under the Pensions Act, 1926.
The term “child” includes a stepchild or a child legally adopted by the applicant prior to the date of his application for a pension, and the Commissioner may regard any child who is in fact maintained by the applicant as if such child were a dependent child.
Instalments of pension may be paid to the applicant personally, or may be apportioned between the applicant and his wife and children, or may be paid to any reputable person on his or their behalf.
The provisions relating to invalidity pensions came into operation as from 1st July, 1936. All pensions previously granted in respect of blindness now come under the above provisions as invalidity pensions.
The number of invalidity pensions in force at the 31st March, 1937, was 7,491, representing an annual liability of £478,165, or an average of £63 16s. 8d. per annum.
The Family Allowances Act was passed in the session of 1926, to provide for the granting of allowances towards the maintenance of children by parents of limited income. The Act came into force on the 1st April, 1927.
The allowance is at the rate of 2s. per week for each child in excess of two, the average weekly income of the applicant and his wife and children, including allowance, not to exceed £4 (the maximum from April, 1932, to June, 1936, was £3 5s.) plus 2s. for each child in excess of two. For the purposes of the Act the term “child” in general means a child under the age of fifteen.
The application for the allowance may be made either by the father or by the mother.
The number of claims dealt with during the year ended 31st March, 1937, totalled 1,642, of which 1,131 were granted and 308 rejected, the remaining 203 being held over. Of the rejected claims, 100 represent cases where the income of the family was in excess of the limit. The total number of family allowances in force at the 31st March, 1937, was 9,515, with an annual liability of £125,702. This averages £13 4s. 2d. per annum each. The total amount paid out during the year was £130,730, the aggregate for the nine years during which the Act has been in force being £1,009,326. Altogether, 21,924 family allowances have been granted to 31st March, 1937, and of these 12,409 have been discontinued.
The total number of children of the 9,515 families receiving allowances at 31st March, 1937, was 43,454, and the number in excess of two was 24,424, the average per family being 4.56 and 2.56 respectively. The number of families granted allowances during the year 1936–37, according to the number of children in excess of two, is set out in the following table:—
| Number of Children in Excess of Two. | Number of Families. |
|---|---|
| One | 606 |
| Two | 281 |
| Three | 115 |
| Four | 77 |
| Five | 30 |
| Six | 14 |
| Seven | 6 |
| Nine | 1 |
| Ten | 1 |
Of the 1,131 families granted allowances during the year, 29 had incomes of £1 or under; 196 over £1 and up to £2; 525 over £2 and up to £3; 171 over £3 and up to £4; and 210 over £4. The weekly rates at which allowances were granted were—
| Rate. | Number. |
|---|---|
| 1s. | 4 |
| 2s. | 625 |
| 3s. | 5 |
| 4s. | 279 |
| 5s. | 4 |
| 6s. | 109 |
| 7s. | 1 |
| 8s. | 66 |
| 9s. | 1 |
| 10s. | 22 |
| 12s. | 10 |
| 14s. | 3 |
| 16s. | 1 |
| 18s. | 1 |
In addition to the various classes of pensions enumerated in the foregoing part of this section, the Pensions Department is charged with the payment of pensions under the Civil Service Act, 1908, and other miscellaneous pensions and annuities.
The total number of pensions in force under the Civil Service Act at the 31st March, 1937, was 11 (annual value, £3,933). The total payments daring the year amounted to £4,106. These pensions are granted to ex-officers of the Civil Service, and since the introduction of compulsory contributory superannuation schemes are rapidly dwindling. There were at the 31st March, 1937, 144 classed as “sundry pensions and annuities,” of a total annual value of £13,161. the amount paid out during the year being £13,892. This class covers ex-members of the Legislative Department, and of the Police, Defence, and Naval Forces, certain ex-members of the Legislature, and others, by way of compassionate allowance, &c.
Schemes in force for the provision of superannuation pensions for public servants on their retirement embrace the State Railways, Public Service (including Police), Teachers, and Stipendiary Magistrates. Local bodies are empowered to establish schemes under the Local Authorities Superannuation Act, 1908.
The law relating to the various superannuation schemes, other than those for the Railways Department and local authorities, is contained in the Public Service Superannuation Act, 1927, a consolidation of former legislation on the subject.
The Public Service superannuation scheme, which includes all branches of the Public Service except the Railways Department and that part of the Education service which comes under the operations of the teachers' superannuation scheme, came into force on the 1st January, 1908. The scheme, although optional on the part of public servants permanently employed at that date, is compulsory on all persons permanently appointed thereafter. Certain classes of non-permanent officers may be permitted to join the Fund.
The Police Provident Fund, which was established on the 1st December, 1899, under the Police Provident Act, 1899, was merged in the Public Service Superannuation Fund on the 1st April, 1910.
The fund is administered by a Board, and consists of payments by contributors, interest on investments. Government subsidy, fines imposed on public servants, and proceeds of sales of unclaimed property.
The contributions vary with the age on joining the fund: For ages under thirty they are 5 per cent. of the salary; ages thirty and under thirty-five, 6 per cent.; thirty-five and under forty, 7 per cent.; forty and under forty-five, 8 per cent.; forty-five and under fifty, 9 per cent,; fifty and over, 10 per cent.
The principal benefits are—
A pension for every year of service equal to one-sixtieth of the average annual salary for the last three years, payable (a) after forty years' service, or (b) at age sixty-five, or (c) on retirement owing to ill-health. The maximum pension is not to exceed two-thirds of the salary, nor, in the case of entrants after the 24th December, 1909, £300 per annum.
A pension of £31 per annum to the widow of a contributor or pensioner during widowhood, and £26 per annum for each child under the age of fourteen. Prior to the 1st April, 1925, widows' and children's pensions were £18 and £13 per annum respectively.
Special pensions may be given in the case of members of the Police Force for injuries received on duty.
Females may retire after thirty years' service or at the age of fifty-five. In certain cases, and subject to certain terms and conditions, the Minister in charge of a contributor's Department may reduce the retiring age to sixty years for males and fifty years for females, or may reduce the requisite service to thirty-five years irrespective of age, or may reduce the retiring-age to fifty-five years if length of service is not less than thirty years.
Section 14 of the Finance Act, 1931, as amended by a section of the Finance Act (No. 4), 1931, modified the retiring qualifications to permit of a further reduction of five years in age or service in the case of contributors compulsorily retired through no fault of their own. A specially computed reduced superannuation was provided.* The provisions covered the three major funds.
At the 31st March, 1937, there were 21,890 contributors, paying £310,675 per annum into the fund. The pensioners at the same date numbered 3,716, and were entitled to £499,869 per annum, made up as follows:—
| Number. | Pensions. | |
|---|---|---|
| £ | ||
| Retired for age or length of service | 1,926 | 420,372 |
| Retired for ill health | 323 | 34,147 |
| Police injured on duty | 11 | 1,789 |
| Widows | 1,141 | 35,371 |
| Children | 315 | 8,190 |
| Totals | 3,716 | £499,869 |
The following table contains particulars of the public servants who were contributing to the fund at the 31st March, 1937, grouped according to their respective rates of contribution:—
| Rate per Cent. | Number. | Annual Salary. | Annual Contributions. | ||||||
|---|---|---|---|---|---|---|---|---|---|
| Male. | Female. | Total. | |||||||
| £ | s. | d. | £ | s. | d. | ||||
| 5 | 15,975 | 2,779 | 18,754 | 4,805,478 | 3 | 4 | 240,273 | 18 | 2 |
| 6 | 1,416 | 141 | 1,557 | 506,744 | 11 | 8 | 30,404 | 13 | 6 |
| 7 | 855 | 88 | 943 | 310,640 | 16 | 8 | 221,744 | 17 | 2 |
| 8 | 415 | 41 | 456 | 152,269 | 15 | 10 | 12,181 | 11 | 8 |
| 9 | 141 | 9 | 150 | 53,642 | 1 | 8 | 4,827 | 15 | 9 |
| 10 | 28 | 2 | 30 | 12,422 | 0 | 0 | 1,242 | 4 | 0 |
| Totals | 18,830 | 3,060 | 21,890 | 5,841,197 | 9 | 2 | 310,675 | 0 | 3 |
Accumulated funds at the 31st March, 1937, amounted to £2,997,898, total assets to £3,116,893, and investments to £2,875,187, £1,273,556 being invested in mortgage securities, £1,365,475 in local-body debentures and Government securities, and £236,156 in rural advances and rural intermediate credit bonds. The investment figures include £21,279 invested on Stipendiary Magistrates' account.
Officers who have retired since the initiation of the scheme, and who possessed compensation rights under the Civil Service Act, 1866, would have been entitled to receive the sum of £561,134, the amount of compensation accrued to the date when they joined the Superannuation Fund, had they not become participants in the benefits of the fund. To this amount must be added accretions to the date of retirement, approximately £143,000, for which the Consolidated Fund would otherwise have been liable, and the whole may be fairly set against the total subsidies paid to the fund, amounting to £2,478,494.
The Government subsidy to the fund was originally £20,000 per annum, rising in 1910 to £22,500, and in the next two years to £23,000. In 1913 it was increased to £48,000, and in 1919 to £86,000. In consequence of the position disclosed by the Actuary as at 31st December, 1919, an additional amount of £100,000 was contributed to the fund by the Government, divided between the years 1923–24 and 1924–25. An additional amount of £100,000 was also paid in 1929–30, following the actuarial investigation as at 31st March, 1927; while during the years 1932–33 to 1936–37 additional amounts were paid, mainly to compensate the fund for losses incurred as a direct result of the statutory reduction in interest.
* By the Statutes Amendment Act, 1936, the method of computation is altered so as to increase the annual payment.
The actuarial report for the quadrennium 1930–34 gives the valuation of the fund on 31st March, 1934, as follows:—
| £ | £ | |
|---|---|---|
| Present value of existing pensions and allowances | 4,471,373 | |
| Present value of prospective benefits | 11,001,720 | |
| Less present value of members' contributions | 2,761,470 | |
| 8,240,250 | ||
| Total net liabilities | 12,711,623 | |
| Funds in hand | 2,964,064 | |
| Present value of total liability of State | 9,747,559 | |
| Less present value of present subsidies of £86,000 and £40,000 (if treated as a perpetuity) | 2,800,000 | |
| And less present value of State subsidy under section 114 of the Act | 625,839 | |
| Value of future subsidies to be provided for by the State over and above the present subsidy | £6,321,720 | |
The actuarial report draws special attention to the significance of the deficiency to be made good by the State. It points out that the State liability of £9,747,559 is equivalent to an annual interest income (at 4½ per cent.) of £438,640.
All valuations of the fund prior to 1924 were made on the basis of interest at 4 per cent., a 4½-per-cent. rate being adopted for the last three periods. This rate is, however, considerably lower than that received for many years past, the average rate of interest earned on the mean funds being:—
| Year ended 31st March, | Average Rate per Cent. | ||
|---|---|---|---|
| £ | s. | d. | |
| 1928 | 6 | 1 | 8 |
| 1929 | 5 | 17 | 6 |
| 1930 | 5 | 16 | 11 |
| 1931 | 5 | 16 | 11 |
| 1932 | 5 | 19 | 6 |
| 1933 | 5 | 18 | 9 |
| 1934 | 5 | 11 | 6 |
| 1935 | 5 | 8 | 4 |
| 1936 | 5 | 6 | 5 |
| 1937 | 4 | 18 | 8 |
The total revenue of the fund for the year ended 31st March, 1937, was £617,031, including members' contributions £306,292, interest on investments and on contributions £143,520 (which includes a special payment of £24,136 from the Consolidated Fund to reimburse the Superannuation Fund on account of the statutory reduction of interest on all classes of securities), and Government subsidy £163,930, the last-mentioned including a special payment of £18,770 on account of increased benefits to widows and children. The total amount expended during the year was £553,372, including retiring and other allowances £498,677, refunds of contributions £45,644, transfers to other funds £807, and cost of administration £7,150.
A table is now given showing the progress of the fund for the last five years:—
| Year ended 31st March, | Number of Contributors. | Annual Contributions. | Interest receivable from Investments. | Contributions from Government. | Annual Value of Allowances. | Accumulated Fund. |
|---|---|---|---|---|---|---|
| £ | £ | £ | £ | £ | ||
| 1933 | 17,219 | 225,301 | 166,814 | 104,388 | 482,591 | 2,897,415 |
| 1934 | 17,369 | 227,015 | 157,200 | 143,529 | 488,074 | 2,899,564 |
| 1935 | 18,205 | 240,406 | 153,333 | 149,211 | 489,199 | 2,917,452 |
| 1936 | 19,199 | 263,077 | 151,599 | 147,952 | 497,764 | 2,934,240 |
| 1937 | 21,890 | 310,675 | 142,831 | 163,930 | 499,869 | 2,997,898 |
The scheme of superannuation for teachers came into operation on 1st January, 1906. The benefits were brought into line with those of the Public Service Superannuation Fund in 1908, existing contributors having, however, the right of electing to remain subject to the provisions formerly in force.
There are a few slight differences between the Public Service and the Teachers' Funds, the chief being that where teachers' back service is recognized it need not be continuous, and that a contributor is not deemed to have retired from the Education service by reason of unemployment unless the unemployment extends for twelve months or unless the contributor deliberately retires from the service as distinct from a particular position in the service. In certain circumstances the period of twelve months can be extended by the Board.
The expenditure of the fund for the year ended 31st January, 1937, was £358,763, of which retiring and other allowances represented £323,976, and refunds of contributions £31,481. The revenue for the year was £348,652.
On the 31st January, 1937, there were 8,058 contributors, representing annual contributions amounting to £134,434.
The retiring and other allowances as at 31st January, 1937, were made up of—
| Number. | Amount of Pension. | |
|---|---|---|
| £ | ||
| Retired for age or length of service | 1,444 | 283,396 |
| Retired for ill health | 216 | 27,830 |
| Widows | 299 | 9,277 |
| Children | 79 | 2,054 |
| Totals | 2,038 | £322,557 |
The progress of the fund during the last five years is shown in the following table:—
| Year ended 31st January, | Number of Contributors. | Amount of Contributions received. | Interest received. | Government Subsidy. | Amount paid in Allowances. | Accumulated Fund. |
|---|---|---|---|---|---|---|
| £ | £ | £ | £ | £ | ||
| 1933 | 9,355 | 113,764 | 61,117 | 47,020 | 283,738 | 1,111,642 |
| 1934 | 8,903 | 114,775 | 54,310 | 55,948 | 299,516 | 1,003,185 |
| 1935 | 8,500 | 114,699 | 48,327 | 166,048 | 306,350 | 989,310 |
| 1936 | 8,148 | 119,568 | 46,056 | 170,046 | 313,372 | 974,715 |
| 1937 | 8,058 | 132,631 | 44,187 | 171,800 | 323,976 | 904,605 |
Since the inception of the scheme, the Government has paid £1,608,469 in subsidies to the Fund.
The actuarial report on the Teachers' Superannuation Fund for the four years ending 31st January, 1934, gives the present value of the total liability of the State in respect of the fund at that date as £6,483,816.
The Government Railways Superannuation Fund was established on the 1st January, 1903, by the Government Railways Superannuation Fund Act, 1902, now embodied in the Government Railways Act, 1926.
The pension is here also one-sixtieth of the annual rate of pay for every year of service, but the retiring age is sixty for both males and females (cf. Public Service, supra). The only other difference of importance is that the annual allowances to widows and children are paid only in cases where contributors die before retiring on a pension.
From 1st April, 1924, the moneys belonging to the fund have been separately invested by the Public Trustee. The average rate of interest earned during the year 1936–37 was 5.26 per cent.
The income for the year totalled £472,878, including members' contributions £160,336, interest £64,611, and subsidies from Railways Department £182,704 (including £12,704 on account of increased allowances to widows and children) and Consolidated Fund £65,000. The expenditure during the year amounted to £469,011, of which retiring-allowances represented £420,209, allowances to widows and children £28,618, and refunds of contributions, &c., £20,184.
At the 31st March, 1937, there were 3,270 persons on the fund, receiving allowances involving an annual liability of £437,987.
The progress of the fund during the last five years is shown below:—
| Year ended 31st March, | Number of Contributors. | Amount received from Contributors. | Interest earned by Fund. | Amount received from Government. | Amount paid in Allowances. | Accumulated Fund. |
|---|---|---|---|---|---|---|
| £ | £ | £ | £ | £ | ||
| 1933 | 12,172 | 143,984 | 82,297 | 182,545 | 451,595 | 1,333,245 |
| 1934 | 11,865 | 133,560 | 75,220 | 183,006 | 454,173 | 1,240,831 |
| 1935 | 11,832 | 137,392 | 67,994 | 209,999 | 451,498 | 1,239,705 |
| 1936 | 11,954 | 144,836 | 65,877 | 265,163 | 448,598 | 1,240,984 |
| 1937 | 13,273 | 160,336 | 64,611 | 247,704 | 448,827 | 1,250,861 |
The actuarial report on the Railways Superannuation Fund as at 31st March, 1934, gives the present value of the total liability of the State in respect of the fund at that date as £9,099,898.
The scheme for Magistrates provides for the same rates of contribution as under the Public Service scheme, but gives an annual retiring-allowance for each year of service (whether continuous or not) equal to one-fortieth of the annual salary receivable at the date of retirement, with, however, a limit of twenty-five fortieths. The retiring-age is also increased to sixty-eight, instead of sixty-five.
Members' contributions during the year ended the 31st March, 1937, totalled £1,580, and interest on investments brought in £1,022. Administration expenses during the year were £43, and retiring-allowances were £4,412. The accumulated fund at the 31st March, 1937, amounted to £21,279.
The Local Authorities Superannuation Act, 1908, which came into force on the 10th October, 1908, applies to Borough Councils, County, Councils, Town Boards, Road Boards, Harbour Boards, Fire Boards, tramway companies, or any body possessing rating-powers over any district.
Local authorities have not availed themselves of the provisions of the Act to any great extent, and statistical information as to the various funds which have been initiated under the authority of this statute is not available. Special provisions concerning local authority employees have been subsequently made under the National Provident Fund scheme, referred to under the next heading.
The National Provident Fund was established by Act in 1910, and came into operation on the 1st March, 1911. The Fund is administered by a Board composed of the Minister of Finance as Chairman and four members appointed by the Governor-General, one of whom is the Superintendent of the Fund.
The scheme is open to any person between the ages of sixteen and fifty years residing in New Zealand whose average income during the three years prior to joining has not exceeded £300 per annum. There is no medical examination on entry, and the method of joining is extremely simple, the applicant having merely to fill in a form at a postal money-order office or local office of the Fund, and pay a first weekly contribution.
The following benefits are payable:—
After contributing for twelve months, a payment not exceeding £6 for medical attendance and nursing on the birth of a contributor's child or children.
After contributing for five years, an allowance, after three months' incapacity for work, of 7s. 6d. per week for each child under fourteen years of ago; payable independent of any allowances due from friendly societies. No contributions payable while in receipt of incapacity allowance.
After contributing for five years, an allowance, on the death of a contributor, of 7s. 6d. per week for each child under fourteen years of age, and 7s. 6d. for the widow so long as any child is under fourteen years of age.
On reaching age sixty, a pension of 10s., 20s., 30s., or 40s. per week, according to the scale of contributions. The receipt of a pension under the National' Provident Fund Act originally did not affect a person's claim to the old-age pension under the Pensions Act, but this provision was repealed in respect of persons joining the fund after the passing of the National Expenditure Adjustment Act, 1932 (10th May, 1932).
The maternity allowance is payable only if the combined income of a contributor and wife or husband does not exceed £300 per annum at the time of claim, but this limitation does not debar from the other benefits. The incapacity allowance is not to exceed the pecuniary loss which, in the opinion of the Board, the contributor has probably suffered during incapacity, and the income of a contributor during incapacity, independent of the fund, is not to exceed the rate of £4 per week.
The contributions for each 10s. of weekly pension range from 9d. per week in the case of persons joining at age sixteen to 9s. 4d. per week for persons joining at age fifty.
In the event of a contributor leaving the Fund or dying, all contributions (less, any benefits received) are returnable. If a contributor dies before the first five years are completed his representatives receive the contributions he has paid, less anything he received during lifetime. Should he die after ago sixty, before receiving in benefits a sum equal to the contributions paid in during his lifetime, the difference is returnable to his representatives; and, further, if the allowances paid for widow and children do not exhaust the contributions his representatives are entitled to the residue. If a contributor dies before age sixty, leaving a widow and no children, all the contributions are returnable, less benefits paid out.
The benefits under the Act are guaranteed by the State, which subsidizes the contributions to the extent of one-fourth (in respect of the four years 1930–33, the subsidy was one-fifth) of the amount paid into the Fund.
An important extension of the Fund was made in 1914, when it was provided that the employees of local authorities, &c., could be enrolled in the Fund for superannuation purposes, and an amending Act of 1931 provided certain modifications consequent upon the general reduction in wages and salaries. Another extension of the Fund was made in 1916, whereby members of approved friendly societies, were granted maternity allowances and offered annuities on reduced terms and under special tables.
In 1925 provision was made for the payment out of the National Provident Fund of retiring-allowances to nurses and other members of the permanent staffs of Hospital Boards. The National Provident Fund Act, 1926, which is a consolidation of previous legislation on the subject, imposes on Hospital Boards the obligation to contribute to the Fund on behalf of their permanent officers, and thus places Hospital Boards in a different category from other local authorities, which are empowered, but not obliged, to become contributors.
Schemes of contribution by employers on behalf of employees are provided for by sections of the Finance Act (No. 2), 1927, and the Finance Act, 1929.
Since the inauguration of the Fund in 1911, 93,471 persons (76,704 males and 16,767 females) have entered, and of these 66,897 (males, 54,014; females, 12,883) have discontinued for one reason or another, leaving 26,574 (males, 22,690; females, 3,884) on the books at the 31st December, 1930. Of the 2,781 discontinuances in 1936, 2,262 were on account of withdrawal, lapse, and cancellation, 131 on account of having attained the pension-age, 80 on account of death, and the remainder, 308, were on account of transfers from one class of contribution to another class within the Fund.
The numbers of contributors for the various pension rates as at 31st December, 1936, were as follows, male and female contributors being shown separately:—
| Pension Rate. | Males. | Females. | Total. |
|---|---|---|---|
| 10s. | 15,831 | 681 | 16,512 |
| 20s. | 1,721 | 321 | 2,042 |
| 30s. | 187 | 45 | 232 |
| 40s. | 450 | 87 | 537 |
| Other | 4,501 | 2,750 | 7,251 |
| Totals | 22,690 | 3,884 | 26,574 |
Contributions during the year 1930 amounted to £246,559 and interest to £170,044. Government contributions under the Act totalled £61,624, exclusive of £30,996 for maternity claims through approved friendly societies. The largest item on the expenditure side was £64,740 by way of refund of contributions on lapse, reduction, and withdrawal.
As an emergency measure, the National Provident Fund provided for its own administration expenses during 1931–32 to 1934–35; but, commencing with 1935–36, this item is again met from the Consolidated Fund.
The progress of the National Provident Fund scheme during the last five years is indicated in the following table:—
| Year. | Number of Contributors. | Annual Rate of Contribution payable. | Total Amount of Fund. | Claims during Year. | |||
|---|---|---|---|---|---|---|---|
| Maternity. | Incapacity. | Retiring. | Widows and Children. | ||||
| £ | £ | £ | £ | £ | £ | ||
| 1932 | 26,140 | 233,750 | 3,501,550 | 41,014 | 6,757 | 35,203 | 11,820 |
| 1933 | 24,949 | 225,816 | 3,756,981 | 36,978 | 7,644 | 41,715 | 11,981 |
| 1934 | 25,172 | 231,858 | 4,037,793 | 35,130 | 7,753 | 46,404 | 11,873 |
| 1935 | 25,782 | 239,375 | 4,341,060 | 32,398 | 7,840 | 51,758 | 12,349 |
| 1936 | 26,574 | 251,938 | 4,649,082 | 35,792 | 9,181 | 58,917 | 12,344 |
The amounts required to provide maternity allowances are voted by Parliament annually.
Table of Contents
LOCAL government throughout New Zealand is exercised by a number of local authorities constituted under various Acts of Parliament. These Acts provide for the creation of districts over which the local authorities exercise jurisdiction. Different types of district are distinguishable, each type being identified with a specific function or group of functions. Geographically, the Dominion is divided into 129 counties, which comprise its total area, except for certain small islands which are not included within the boundaries of the adjacent counties. Administratively, boroughs and independent town districts, which are contained within the areas of the several counties, are regarded as separate entities. From an administrative point of view, therefore, the fundamental districts are counties, boroughs, and independent town districts. Upon this foundation a considerable superstructure of districts of other types has been erected. These overlapping districts may be divided into two broad classes: (1) Districts formed from parts of counties—e.g., road districts; and (2) those which are comprised of a group of adjacent districts of other types united for a common purpose—e.g., electric-power districts. The number of local authorities actively functioning at the 1st April, 1937, was 684, made up as follows: County Councils, 125; Borough Councils, 124: Town Boards (independent), 39; Town Boards (dependent), 24; Road Boards, 16; River Boards, 43; Land-drainage Boards, 51; Urban Drainage Boards, 3; Water-supply Boards, 4; Fire Boards, 55; Local Railway Board, 1; Harbour Boards, 44; Electric-power Boards, 41; Hospital Boards, 45; Tramway Board, 1; Transport Board, 1; Gas-lighting Board, 1; and Rabbit Boards, 66. In addition to the foregoing there are 18 District Councils of the Main Highways Board constituted under the Main Highways Act, 1922. These, although not local authorities in the strict sense of the word, are nevertheless intimately connected with certain aspects of local government, and have power to make recommendations of great importance.
Detailed statistics relating to each local body, other than Hospital Boards, are contained in the Local Authorities Handbook, an annual publication of the Census and Statistics Department. Hospital Boards, which supply their returns to the Department of Health, are also omitted from the statistics contained in this section, but summarized data relating to them will be found in Section VIB.
The local-body year now uniformly ends on 31st March, except in the case of most Harbour Boards. In certain cases where the harbour is administered by a County or Borough Council, the year ends on 31st March, but in all other cases on 30th September.
The history of local government in New Zealand may be conveniently divided into two periods associated with two distinct forms of administration—(1) The provincial system, in which the local government of each province was a function of the provincial authorities; and (2) the present county system, which arose on the abolition of the provinces in 1876, and in which the general responsibility for the local government of the whole country was undertaken by the Central Government.
Although New Zealand was at first (1848) divided into the two provinces of New Ulster and New Munster, roughly comprising the North and the South and Stewart Islands respectively, it was not until 1853 that the provincial system really commenced. In that year the two existing provinces were abolished and the colony was divided into the six provinces of Auckland, New Plymouth (altered to Taranaki in 1859), Wellington, Nelson, Canterbury, and Otago. The number was later increased to nine by the carving of Hawke's Bay out of Wellington (1859), Marlborough out of Nelson (1860), and Southland out of Otago (1861). Subsequently it was reduced to eight by the merging of Southland with Otago (1870), and restored to nine again by the separation of Westland from Canterbury in 1874, Westland having been a county independent of Canterbury from 1867. Each province was presided over by a Superintendent and Council, with power to legislate for its own territory, subject, however, to disallowance by the Governor, and also to the exclusion of such matters as Customs duties, postal affairs, Crown lands, superior Courts of law, coinage, and paper currency, which were to be controlled by the General Assembly (central Government). The provinces received from the central Government a capitation allowance for the maintenance of harbours, hospitals, asylums, charitable aid, and police; while each province was expected to provide for the construction and maintenance of roads, bridges, and other public works out of its own revenues, which were derived chiefly from the sale of waste lands.
The Provincial Councils, therefore, were virtually left with the whole responsibility of providing for the details of local administration. The Councils in turn delegated certain of their powers and functions to lesser authorities, and a number of boroughs, towns, and road and highway districts came into being. Owing, however, to the lack of uniformity between the Ordinances of the various Councils on the subject of local government, considerable confusion arose and rendered impossible any satisfactory co-ordination beyond provincial boundaries. Thus main roads were frequently planned without sufficient regard to the linking-up of the country as a whole. In the course of time the purely provincial outlook became inimical to a policy of progress along broad national lines, which became necessary with the extension of settlements and communications to meet the needs of a rapidly increasing population. That the provinces had definitely outlived the period of their usefulness became abundantly clear during the prosecution of the Vogel policy of immigration and public works initiated in 1870, and in 1875 the provinces were abolished (as from 1876) in the face of strong parochial opposition.
In 1876 local government entered upon an entirely new phase, the Central Government assuming the general responsibility for the local administration of the whole country. All existing legislation on the subject was repealed and new measures were introduced, notably the Counties Act, 1876, which divided the country into sixty-three counties, with provision for administration by elective councils having powers considerably less than those enjoyed by the Provincial Councils. Another important enactment of the same year was the Municipal Corporations Act referred to later. While these measures have long since been repealed, it is upon them that the broad structure of the present system is based. The new system brought uniformity where before there had been chaos.
Since the inception of the county system there has been a great expansion of local government throughout the Dominion. With the growth of population there has been a steady increase in the number of counties, boroughs, and town districts, while entirely new types of district have been created to cater for special services. The development of the system is best followed by considering each type of district separately.
Counties.—Although the county system proper dates from 1876, there is record of much earlier attempts to introduce this form of administration. Thus in 1842 Eden County, containing the then capital (Auckland), was proclaimed, while in 1867 Westland was separated from the Province of Canterbury and constituted a county. In general the county organization makes provision for the primary needs of a scattered population within a large area. Formerly, at least, the county council was mainly concerned with the construction and maintenance of main arterial roads, but with the development of transport and communication it has come in for a considerable measure of detail work formerly done by the Road Boards, now practically extinct. The original sixty-three counties have undergone much subdivision with the increase of settlement, and at the present time there are 129 counties, in 125 of which the Counties Act is wholly, and in three partly, in force. The remaining county (Fiord) in practically uninhabited.
Boroughs.—Dealing with the needs of a concentrated population, the borough organization is concerned with a wide range of functions of a purely local nature. The first legislation appeared in 1842 in the form of the Municipal Corporations Ordinance, which provided that any area not exceeding seven square miles and having a population of not less than two thousand should be declared a borough. Only one borough—Wellington—was constituted under this Ordinance, which was subsequently disallowed by the Imperial Government on the ground that it encroached on the rights of the Crown in regard to certain lands. Several boroughs were created later in the most diverse manner under the various Ordinances of the different provinces, and in 1867 the General Assembly passed legislation under which the then existing twenty-one boroughs were entitled to incorporation on the petition of fifty householders. Provision was also made for the constitution of new boroughs on the petition of one hundred ratepayers of any district having at least two hundred and fifty inhabitants and comprising an area not greater than nine square miles, within which no two points were more than six miles distant. The 1867 legislation was repealed by the Municipal Corporations Act, 1876, which provided for the incorporation of the thirty-six boroughs then in existence, and for the creation of new boroughs, as in the Act of 1867. The powers of municipalities were extended, and permitted the construction of tramways, gasworks, and water-supply works; and the borrowing powers of boroughs were placed on a definite and uniform footing. With the growth and centralization of population the number of boroughs has, despite numerous amalgamations of adjacent boroughs, steadily increased to the present total of 124.
Boroughs are now constituted under the Municipal Corporations Act, 1920, which lays down geographical requirements the same as in 1867, but with the stipulation of a minimum population of one thousand. The area restriction may afterwards be exceeded if necessary for merger or amalgamation purposes. A borough containing a population of twenty thousand or more may be proclaimed a city, although the corporation remains unaltered.
Town Districts.—Town districts were in existence in the days of the provinces, but the Town Board, as a distinct type of local-governing body, did not appear until 1882. Provision was made by an enactment of 1881 for the proclamation of a town district on the petition of two-thirds of the resident householders of any settlement of at least fifty householders having an area not exceeding two square miles, and having no two points more than four miles distant from each other—requirements which remain in force at the present time. The town district represents a form of local government intermediate between the county and the borough. It implies a certain concentration of population and the presence of interests which, from their purely local nature, cannot be satisfactorily met by the county organization. In its early stages a town district usually remains subject to county control, although such control is practically confined to the main and county roads in the town district; in such circumstances it is known as a dependent town district. Experience showed that with the development of a town district there was a tendency for friction to arise with the county administration in the matter of finance, and it was further realized that after a certain stage of growth had been reached no useful purpose could be served by continuing the county control. This state of affairs was met by the Town Boards Amendment Act, 1908, which provided that certain town districts should no longer form parts of the counties in which they were situated, and also enabled other town districts on reaching a population of more than five hundred to become independent. On attaining its independence a town district becomes in all respects a separate entity, and, apart from its smaller population, is not essentially different from a borough. The number of town districts at present is sixty-three (thirty-nine independent and twenty-four dependent).
Road Districts.—Although now mainly of historical interest, the road district played a very important part in the scheme of local government in the essentially colonizing days of New Zealand. It was early recognized that with the means of transport and communication in a primitive state the development and maintenance of local public works in country districts could be best carried out by organizations administering comparatively small areas, a vital need being adequate road-connection between the outlying settlements and the more thickly populated centres. This requirement was provided for by Road Boards, the formation of which had the two-fold advantage of relieving the provincial authorities of a mass of detail work, and at the same time ensuring that the needs of the districts would be properly catered for by a management in close touch with local requirements. The essence of the Road Board system may be traced back to the Public Roads and Works Ordinance of New Ulster, 1845, a measure which remained in force until the abolition of the provinces. This Ordinance provided for the declaration of a highway district on a petition of a majority of the resident electors—i.e., freeholders and lessees—to be administered by an elective Highway Commission with power to levy and collect rates. The principal functions of such Commissions were the construction and repair of roads, bridges, waterworks, and other works of public utility. The boundaries of the districts and the rates (on an acreage basis) were determined by a majority of the electors.
Many road districts were created under provincial Ordinances, but instead of being mapped out on some uniform plan in accordance with topographical features they were frequently defined according to the caprices of local owners and occupiers. Much defective organization and many anomalies arose, with a great lack of uniformity in the nature, functions, and powers of the road districts in different parts of the colony. In 1882 the General Assembly repealed all previous measures relating to Road Board government, and made provision for uniformity throughout the country. With greater facility of transport and communication this type of local government has now practically gone out of existence, for, while the Road Board was indispensable at one time, it is generally recognized that it has served its purpose. The number of Road Boards, which in 1883, was as high as 320, now stands at sixteen.
River Districts.—Various Acts of Parliament and provincial Ordinances providing for the protection of areas subject to inundation by flooded rivers were passed between the years 1868 and 1880. In 1884 there was placed on the statute-book a general enactment, known as the River Boards Act, 1884, which repealed the various Acts and Ordinances then in force, and consolidated the law relating to the constitution of River Boards and the construction of river-works. Sixteen districts were deemed to be districts under the new Act, and the Boards of Conservators for such districts were deemed to be duly constituted River Boards. At the present time these districts, which are formed from parts of counties, number forty-nine, including six where there is no River Board in operation.
Land-drainage Districts.—Legislation relating to this type of local authority first appeared in the Land Drainage Act, 1893, providing for the constitution of Land-drainage districts and Boards. The object of the Act was to provide for the drainage of agricultural and pastoral lands, which matters, as in the case of the previous type of local authority, were essentially of a more local nature than the affairs of the county at large, and therefore more suited to management by an administrative body on the spot. Land-drainage districts, of which there are fifty-two in existence at the present time (including one with no Board), are formed similarly to river districts.
Water-supply Districts.—The Water-supply Act of 1891 marks the initiation of water-supply districts. The object of the enactment was to enable County Councils and, in cases where the Counties Act was not in operation, Road Boards, to construct and maintain works for the supply of water in country areas, and to make provision for the cost thereof. There are four such districts in existence.
Urban Drainage Districts.—This type of local district consists of the grouping of a city with a number of adjacent boroughs, and was brought into existence with the object of giving to one authority the general control of drainage matters over the whole area. Obviously, where one main arterial system can be made to serve a number of adjoining districts a maximum of co-ordination and economy is best secured by entrusting the general control of affairs to one authority over the whole drainage system rather than to a number of bodies holding office in different capacities throughout the drainage area. Moreover, the creation of such districts under the control of separate authorities operates to lessen the somewhat numerous and diverse duties falling to the lot of the governing bodies of the larger municipalities. These districts, of which there are three in existence, are constituted by special Acts of Parliament, the earliest one dating from 1875.
Tramway District.—This type of district is similar in formation to the previous type, and is based on the same principle. In all cases but two, however, the tramway systems are owned and controlled by City and Borough Councils, notwithstanding that the permanent-way extends in some cases into areas of adjacent boroughs. The only tramway district in existence at the present time is the Christchurch Tramway District, constituted by special Act of Parliament in 1902.
Transport District.—Similar in principle to the Christchurch Tramway District, the Auckland Transport District—the only one of its type—came into existence in 1929. Previously the tramway and motor-omnibus services of Auckland City, although serving a number of adjoining local districts in addition to the city, were controlled by the City Council. With the creation of the transport district provision was made for control by a Board consisting of members representing the ratepayers of each district within the transport area.
Local Railway District.—Railway ownership and control in New Zealand is recognized as essentially a national concern, and practically the whole of the railway system is owned by the State and controlled by the Railways Department. In certain cases, however, where the Government itself does not feel justified in constructing a railway-line the Local Railways Act, 1914, empowers the Governor-General, subject to certain conditions, to declare a local railway district, and to authorize railway-construction therein by a local Railway Board elected by the ratepayers of the district. Before such authority is given, the Government must be satisfied as to the necessity for a railway, and in this connection consideration is given to a district where the topography is such that the construction of main arterial roads would be extremely difficult and costly. Assurance must also be given as to the probable success of the enterprise. Certain conditions are imposed by the Act. The gauge of the line must be the same as for Government railways, and the Government may enter into an agreement with the Board stipulating that any Government trains or rolling-stock may be run over the Board's line. A power of purchase, subject to twelve months' notice, is also given to the Government. There is only one local railway district in existence at the present time.
Electric-power Districts.—The rapid and extensive development of hydro-electricity in New Zealand during recent years has brought about the establishment of special districts. The policy of the Government generally is to supply power in bulk, leaving reticulation and retail supply in the hands of local authorities. Formerly the latter functions were exercised by boroughs, counties, and town districts; but with the extension of electric supply to the country districts a stronger organization became necessary, and this was provided under the Electric-power Boards Act, 1918. This Act, which is now embodied in the Electric-power Boards Act, 1935, permits a number of local districts to combine for the purpose of electric-power distribution, and to set up a special Electric-power Board to carry out the work, with rating-powers over the district concerned. Progress has been rapid, and at the present time there are forty-one duly constituted districts.
Harbour Boards.—The Marine Boards Act of 1862 provided for the setting-up of local port authorities, but apparently proved unsatisfactory, for after a number of attempts at amendment it was eventually repealed by the Marine Acts of 1866 and 1867, which for the first time put the supervision of harbours on a fairly satisfactory basis. The Superintendent of each province was empowered and required to control local harbour works and operations, especially in respect of licensing watermen and generally controlling vessels plying for hire, licensing and inspecting lighters, ballast-boats, tank-boats, tugs, &c., regulating the berthing, movements, loading, and unloading of vessels at wharves and docks and generally controlling wharves and docks and the levying of charges for the use thereof. This centralized control of harbours was, however, found to be awkward in practice, and a strong movement arose for the vesting of their management in local Boards, the full measure of local control desired being secured with the passing of the Harbour Boards Act, 1870, under which power was given to the Superintendents and Councils of the several provinces to make laws governing the constitution and management of Harbour Boards within their own particular provinces. In 1878, two years after the abolition of the provinces, this Act was repealed by a new enactment, which provided that no new Board was to be constituted except by special Act of Parliament. The constitution of the twenty-two Boards which had been created by virtue of the 1870 Act was duly provided for by the new measure, which was regarded as a special Act for each Board. With the growth of population and trade practically all the available harbours in the Dominion have been brought into use, and at the present time there are forty-five Boards in existence.
Hospital Districts.—Prior to the abolition of the provinces in 1875 hospital maintenance was left to the care of the several Provincial Councils, each of which had a system of its own. On the change-over to the county form of government in the following year all of these diverse systems came under the charge of the Central Government, and many difficulties and incongruities occurred. Gradually there grew up a system of excessive demands upon the Government, and in 1885 an attempt to reduce a somewhat chaotic state of affairs to some semblance of order and uniformity took shape in the Hospitals Act of that year, which provided for the constitution of special hospital districts and Boards. Several amendments, based on the result of experience, were passed in later years, and the present law relating to the subject is embodied in the Hospitals and Charitable Institutions Act, 1926. As in certain other cases, hospital districts consist of a grouping of adjoining districts of other types, the whole district being under the jurisdiction of one authority for that particular service. There were forty-five hospital districts at 1st April, 1937.
Fire Districts.—Prior to the year 1906 measures for the protection of life and property from fire were left in the hands of the various local authorities holding jurisdiction in various capacities over their respective districts. While much good service was rendered under this system, it was realized that, in order to keep pace with growing requirements and to place the question of finance on a more equitable basis, fresh legislation would be necessary. This took shape in the Fire Brigades Act, 1906, a measure which provided for the declaration of any area under the control of a Borough Council or other local authority as a fire district, subject (for the purposes of the Act) to the jurisdiction of a Fire Board. Recognition was also given to the principle that fire-fighting and fire-preventing activities being of considerable advantage to the fire-insurance companies operating in the district, these companies should, in all fairness, be required to give a quid pro quo. Under the old regime, it is true, a number of companies actually did make voluntary contributions, but these donations, in general, were not at all commensurate with the service rendered. It was provided, therefore, that the annual expenditure of a Board, less the Government grant, should be borne—one-half by the local authority (or authorities) holding jurisdiction in the fire district, and one-half by the fire-insurance companies operating therein, these companies being entitled to representation on the Board. At the present time there are fifty-five fire districts in existence.
Rabbit Districts.—A few years after the introduction of rabbits into New Zealand it was realized that the damage caused to agricultural and pastoral lands by these animals was so considerable as to warrant extermination measures, and in 1876 there was placed on the statute-book the Rabbit Nuisance Act, 1876, which empowered the Governor to declare rabbit districts on the petition of ten landowners, and to constitute Rabbit Boards for such districts, with power to direct the destruction of rabbits and to offer bonuses or rewards for such destruction. Although action was at first left to local initiative, an enactment of 1881 provided for the appointment of Government Inspectors to abate the nuisance. In 1882 the local Board system was abolished and administration left wholly in the hands of the Inspectors. Four years later the trustee system, with slight modifications, was revived. The present law relating to the subject is embodied in the Rabbit Nuisance Act, 1928, which entrusts administration to Government Inspectors of Stock, who operate over a wide area; while provision is also made for the constitution of rabbit districts, the Boards of which act in concert with the Inspectors. There are sixty-six rabbit districts at the present time.
Gas-lighting District.—To provide for the extension of the gas service of one borough to meet the needs of an adjoining municipality a special gas-lighting district was constituted. The Board exercising jurisdiction is composed of representatives of the two boroughs concerned.
Main Highways Districts.—A description of the main highways system is given on pages 311–316 of this volume.
Local authorities in New Zealand derive their powers from the Acts under which they are constituted, and also from special empowering Acts. In addition to legislation providing for particular types of local authority or for individual local authorities, there are several statutory measures which are more or less applicable to all local authorities, such as the Local Elections and Polls Act, 1925, and the Local Bodies' Loans Act, 1926. In the case of Harbour Boards, there is in addition to a general Harbours Act a special Act for each Board, which is subordinate to the general Act. Certain types of local authority—Urban Drainage Boards, the Local Railway Board, the Tramway and Transport Boards, and the Gas-lighting Board—derive their principal powers from special constituting Acts.
Local authorities have general powers of entering into contracts for any of the purposes for which they are constituted; of selling and leasing land; and of taking or purchasing any land which may be necessary or convenient for any public work.
The following examples of the delegation of powers of local bodies are of interest. The Napier Borough Council appointed (under section 49 of the Municipal Corporations Act, 1920) two persons to act as a special committee of management, to whom the powers of the Council were delegated. This appointment followed the disastrous Hawke's Bay earthquakes of 3rd February, 1931, and the powers of the committee were extended by section 64 of the Hawke's Bay Earthquake Act, 1931. The committee ceased to function in May, 1933. In view of the financial position of the Thames Borough, the Thames Borough Commissioner Act, 1932, was passed and a Commissioner appointed to administer the borough as from the 21st September, 1932. For similar reasons, section 10 of the Local Legislation Act, 1932–33, provided for the administration of Matakaoa County by a Commissioner whose appointment was made from the 1st May, 1933. The three cases of Napier, Thames, and Matakaoa represent a form of local-authority administration believed to be without precedent in New Zealand.
Various statutory provisions exist for the voluntary amalgamation of local bodies, and these have been availed of from time to time. There have been numerous amalgamations of contiguous boroughs, while reference has already been made (see page 611) to the practical extinction of the one-time numerous road districts which are now merged in county areas. No provision has hitherto existed for compulsory amalgamation such as is contemplated by the Local Government (Amalgamation Schemes) Bill, introduced during the session of 1936 and deferred for consideration. The Bill makes provision for the union of two or more adjoining districts whether or not of like status or constitution, the merger of any district, the transfer of functions from one local authority to another, an adjustment or alteration of boundaries, the conversion of a district into a district of different status or constitution, and any other relevant matters.
The Bill is primarily motivated by a desire to secure greater efficiency in local government. It is also anticipated that there will be some saving in direct administrative and other expenses; but such is not the real object of the Bill, the fundamental purposes of which are the amalgamation of existing counties, boroughs, and town districts where such amalgamation would promote efficiency and the abolition of the smaller ad hoc authorities.
The basis of the Bill lies in the preparation of amalgamation schemes by or on behalf of the local authorities for the different localities. Provision is made for local authorities to work out and submit schemes best suited to the requirements of their localities. Failing such voluntary action the Minister of Internal Affairs may order local authorities to submit schemes, and in the event of default may himself, after consultation with the local authorities concerned, prepare an amalgamation scheme. The Minister has power to refer any scheme to a Commission consisting of a permanent chairman, a departmental officer, and a third person appointed in respect of each inquiry by a majority of the local authorities concerned, or, failing agreement, on the recommendation of the Minister, having regard to the local knowledge of such person.
Under the Local Government Loans Board Act, 1926, all loan proposals of local authorities, except in regard to money borrowed in anticipation of revenue, require the sanction of the Local Government Loans Board. The Board consists of the Secretary to the Treasury, the Engineer-in-Chief of the Public Works Department, and five other members appointed by the Governor-General. In cases where a poll of ratepayers is necessary preparatory to raising a loan, the Board's consent must be obtained before the poll is held. In no case may the Board sanction any application unless provision is made to its satisfaction for repayment of the loan within such period as it deems reasonable, having regard to the probable duration and continuing utility of the works on which the loan-moneys are to be expended.
The principal legislation dealing with the borrowing-powers of local authorities is contained in the Local Bodies' Loans Act, 1926, which is mainly a consolidation of previous measures on the subject. A local authority is thereby empowered to raise a special loan for the construction of any public work, for the purchase of land or buildings, or for the purpose of engaging in any undertaking which the local authority may lawfully enter into. As explained previously, a loan proposal first requires the sanction of the Local Government Loans Board. It must then be sanctioned by the ratepayers at a special poll held for the purpose (except in those cases where a poll is not required to be taken), and the proposal is not deemed to have been carried unless at least three - fifths of the valid votes recorded are in favour of it, save in the case of boroughs and town districts, where a bare majority only is necessary. The properties and revenue of the local authority may be pledged as security for the repayment of any principal sum or interest thereon, or a special rate may be levied for the same purpose.
The borrowing activities of certain types of local authority are subject to special provisions. Under the Hospital and Charitable Institutions Act, 1926, a Hospital Board must first obtain the approval of the Minister of Health before exercising its power to borrow. In the case of Fire Boards the precedent consent of the Minister of Internal Affairs is required, and Rabbit Boards must first seek the approval of the Minister of Agriculture. In both of these cases the amount that may be borrowed is limited by statute. Harbour Boards derive their authority to borrow for harbour-works from special empowering legislation. Similar authority is given for the capital works of Urban Drainage Boards, the Christchurch Tramway Board, the Auckland Transport Board, and the Petone and Lower Hutt Gas-lighting Board.
The Local Authorities Interest Reduction and Loans Conversion Amendment Act, 1934, limits future borrowings to an interest-rate not exceeding 3½ per cent., provided, however, that a different rate may be prescribed by Order in Council under the Local Government Loans Board Act, 1926. County Councils, under conditions specified, are authorized to raise loans for defined areas without taking polls.
The Finance Act (No. 2), 1935, extends the right of applying for a State guarantee of a special loan under the Local Bodies' Loans Act, 1926, to cover also any loans that a local authority is authorized to raise by the latter Act without taking a poll.
Local authorities are largely dependent on revenue from rates to carry out their activities, and even loans raised for special purposes are ultimately liquidated by such revenues—known then as special rates. Three broad classes of rates are distinguished:—
General, for general purposes.
Separate rates are levied for the construction of public works, for the acquisition of land or buildings, or for the benefit of the whole or part of a local district.
A special rate is imposed to secure the repayment of loan-money, being sufficient to produce interest and sinking fund, or interest and instalment of principal, as the case may be. Special rates can be levied only by resolution gazetted, and, unlike general and separate rates, are not subject to any statutory limit.
There are three main systems of rating: (1) Capital (land and improvements) value, (2) annual value, and (3) unimproved value. In a few cases rating is on an acreage basis; and in the case of certain Rabbit Boards the rate is according to the number of sheep or cattle owned.
The Rating Act, 1925, provides that the local authority of any district (other than a district wherein the system of rating on the unimproved value is in force) may from time to time by resolution determine whether the system of rating on the annual value or on the capital value shall be in force in the district. The system of rating is upon the basis that 1s. in the £1 on the annual value is deemed to be equivalent to 3/4d. in the £1 on the capital value of rateable property; or where in a district not rating on the annual value it is necessary for any purpose to ascertain the annual value of any rateable property, then the annual value thereof is equal to 6 per cent. on the capital value of such property. The annual value is deemed to be the letting-value, less 20 per cent. in case of houses, buildings, and other perishable property, and 10 per cent. of land, but in no case is the rateable value to be less than 5 per cent. of the value of the fee-simple.
The Urban Farm Land Rating Act, 1932, with the object of affording some relief to owners of farm lands subject to rating by a borough council, authorizes the preparation of a special farm-land roll, which is deemed part of the valuation roll for rating purposes.
Consequent upon the decline in property values during the depression years, many owners took advantage of the provisions of the Valuation of Land Act permitting individual revaluations. In order to preserve equity in rating, the Valuation of Land Amendment Act, 1933, authorized local authorities to levy rates upon a proportionate part, not being less than 75 per cent., of the values upon the roll. Where individual revaluations have been made, rates are to be levied either upon the new valuation or upon the proportionate part of the value existing prior to revaluation, whichever is the lower.
The Rating on Unimproved Value Act, 1896, was passed to afford local authorities the opportunity of adopting the principle of rating expressed in the title of the measure. The Act is now incorporated in the Rating Act, 1925. It is entirely at the option of the ratepayers of local districts to adopt the system, and provision is made for a return to the old system of rating, if desired, after three years' experience of the new one. The poll is to be taken in the same manner as in the case of a proposal to raise a loan in the district under the Local Bodies' Loans Act, 1926. Under the original Act it was necessary for a minimum number of one-third of the ratepayers to vote, and a majority of their votes carried the proposal. Now the question of adoption or otherwise is decided by a bare majority of the valid votes recorded, irrespective of the number of ratepayers who have voted.
A rescinding proposal can be carried at a poll by the same means as one for adoption, but not until after three years have elapsed; and, vice versa, rejection of a proposal bars its being brought forward for a similar period.
The valuation roll is supplied to the local authority by the Valuer-General under the provisions of the Valuation of Land Act, 1925, and the definitions of “capital value,” “improvements,” “unimproved value,” and “value of improvements” set out in that Act, as subsequently amended, apply also to rating on unimproved value. Provision is made for adjustment of rating-powers given under other Acts by fixing equivalents. Thus a rate of 1s. in the pound on the annual value is to be considered equal to 3/4d. in the pound on the capital value.
It should be noted that some local authorities automatically adopt rating on unimproved value. For example, a town district, borough, or another county formed from part of a county, automatically rates on the system in force in the county at the time of the constitution of the new district; also two boroughs amalgamating adopt the system in force in the district with the greater population, unless their Councils agree to the contrary.
A table is given of systems in force during the fiscal year 1935–36:—
| — | System of Rating. | Total. | ||||
|---|---|---|---|---|---|---|
| Unimproved Value. | Capital Value. | Annual Value. | Acreage Basis. | On Stock. | ||
| * Includes one system based on water consumption. | ||||||
| Counties | 59 | 66 | 125 | |||
| Boroughs | 80 | 18 | 26 | 124 | ||
| Town districts | 30 | 29 | 5 | 64 | ||
| Road districts | 3 | 12 | 15 | |||
| River districts | 13 | 25 | 6 | 44 | ||
| Land-drainage districts | 29 | 21 | 50 | |||
| Electric-power districts | 14 | 27 | 41 | |||
| Water-supply districts | 2 | 3* | ||||
| Urban drainage districts | 2 | 1 | 3 | |||
| Tramway district | 1 | 1 | ||||
| Rabbit districts | 1 | 4 | 53 | 5 | 63 | |
| Totals | 229 | 207 | 32 | 59 | 5 | 533* |
Although the figures referred to indicate that the number of local authorities rating on the unimproved value during 1935–36 was 43 per cent. of the total, yet on a population basis the figures reveal that 59 per cent. of the people of the Dominion are in districts so rating. The position in regard to the four major classes of local authorities at 1st April, 1936 (i.e., the beginning of the 1936–37 financial year), was as follows:—
| District. | Rating on Unimproved Value. | Total for Dominion.* | Ratio of Unimproved Value to Total. | |||
|---|---|---|---|---|---|---|
| No. | Population. | No. | Population. | No. | Population. | |
* Exclusive of migratory, &c., population of 6,035. † Includes the four counties, Eden, Taupo, Sounds, and Fiord, in which the Counties Act is not wholly in force. | ||||||
| Per Cent. | Per Cent. | |||||
| Counties (excluding all town districts) | 59 | 298,219 | 129† | 632,530† | 45.74 | 47.15 |
| Boroughs | 80 | 599,099 | 124 | 892,013 | 64.52 | 67.16 |
| Town districts (independent) | 17 | 17,429 | 38 | 34,153 | 44.74 | 51.03 |
| Town districts (dependent) | 13 | 4,699 | 25 | 9,079 | 52.00 | 51.76 |
For the purposes of the foregoing tables a district is deemed to rate on the unimproved value where the general rate is levied on an unimproved-value basis. In a number of instances, in particular of boroughs, certain of the subsidiary rates are levied on other systems.
Town-planning legislation of 1926 and 1929 provides for the making and enforcement of town, extra-urban, and regional planning schemes. Every town-planning scheme is required to have for its general purpose the development of the city or borough to which it relates (including the reconstruction of an area already built on) in such a way as to promote its healthfulness, amenity, convenience, and advancement. Extra-urban schemes have like objects in regard to their areas.
Regional planning schemes must be preceded by a comprehensive survey of the natural resources of the areas concerned, and of the present and potential uses and values of all lands in relation to public utilities or amenities. Regional schemes envisage the conservation and economic development of natural resources by classification of lands according to their best uses and by the co-ordination of all such public improvements, utilities, services, and amenities as are not limited to the territory of any one local authority.
The principal Act constitutes a Director of Town-planning and a representative Town-planning Board under the Minister of Internal Affairs as chairman. The office of Director is at present in abeyance. A Town-planning Adviser to the Department of Internal Affairs was, however, appointed in February, 1935.
All cities or boroughs with a population of one thousand or over at the census of 1926, together with certain road districts, were required to prepare town-planning schemes and submit them to the Town-planning Board by the end of 1936. Other boroughs may be added by Order in Council, and smaller boroughs may submit schemes voluntarily. Provision is made for a combined scheme by two or more adjoining local authorities.
Counties, inclusive of smaller boroughs and of town districts, comprise rural areas for the purpose of extra-urban schemes. The authority responsible for the scheme is the County Council, or where more than one local authority is concerned a representative committee approved by the Board.
When a town or extra-urban scheme has been approved by the Board it is the duty of the local authorities having jurisdiction to enforce the requirements of the scheme in respect of all new works of any description. The provisions of a regional planning scheme are not obligatory, but are intended to serve as a guide to the local authorities within the region.
One of the most important divisions of the town-planning legislation deals with betterment, which is defined as the increase in property values attributable to the approval or carrying-out of a town-planning scheme. Briefly, one-half of betterment increase in the value of rateable property constitutes a debt payable to the local authority by the owner of the land. Moneys from this source are to be applied, inter alia, to compensate persons whose lands are acquired for town- or extra-urban-planning schemes, or who are otherwise injuriously affected within prescribed limits.
The Housing Survey Act, 1935, was passed in October of that year. Its purpose is to ascertain the extent to which the existing housing-accommodation in the Dominion falls short of reasonable requirements. The Act applies to every borough (or city) or town district whose population was estimated by the Government Statistician to be not less than one thousand at 1st April, 1934, to certain road districts, and to any other local authority prescribed by Order in Council.
Such local authorities are required to make a housing survey, and are given for this purpose power to enter and inspect dwellings or to require occupiers to furnish a written statement within fourteen days of notice being given them. The results of the housing survey are to be reported to the Minister of Finance. In default of the local authority conducting a survey, it may be carried out by the Minister at the expense of the local authority.
The field covered by the survey is in respect of each dwelling:—
Number and sizes of rooms.
Physical condition of dwelling and appurtenances.
Age, sex, and number of occupants.
Owners and occupiers, and rentals of rented houses.
Extent of overcrowding.
Population densities of residential areas.
Any other particulars prescribed by regulations.
Under section 28 of the State Advances Corporation Act, 1936, the Corporation is empowered to make loans to local authorities for the acquisition of land for the erection of workers' dwellings, or for any other purpose in relation to workers' dwellings.
As part of the Government's housing plans, an amount of £1,500,000 has been made available to local bodies at an interest-rate of 3 per cent. for the purpose of erecting municipally owned workers' dwellings for letting at low rentals. Applications by local bodies for loans under this arrangement must be approved by the Local Bodies' Loans Board and the Minister of Finance.
The sources from which the various classes of local authorities secure the moneys necessary to exercise their functions vary greatly according to the nature of the statutory duties of the local authority concerned. Generally, however, receipts fall under one of four main classes—viz., rates; revenue from public utilities, licenses, rents, &c.; revenue receipts from the General Government; and receipts which cannot properly be regarded as revenue.
The receipts of local governing authorities, divided into the various groups shown above, are given for each of the last ten years. As stated earlier, the figures quoted here and elsewhere in this section do not cover the operations of Hospital Boards.
| Year ended 31st March, | Revenue from | Government. | Total Revenue. | Receipts not Revenue. | Total Receipts. | |
|---|---|---|---|---|---|---|
| Rates. | Public Utilities, Licenses, Rents, &c. | |||||
| £ | £ | £ | £ | £ | £ | |
| 1927 | 5,311,260 | 8,621,964 | 332,721 | 14,265,945 | 6,680,176 | 20,946,121 |
| 1928 | 5,615,672 | 9,454,315 | 331,956 | 15,401,943 | 5,667,651 | 21,069,594 |
| 1929 | 5,844,495 | 9,190,655 | 392,921 | 15,428,071 | 6,042,007 | 21,470,078 |
| 1930 | 6,010,987 | 10,309,785 | 436,946 | 16,757,718 | 5,495,427 | 22,253,145 |
| 1931 | 5,637,254 | 10,201,076 | 426,315 | 16,264,645 | 4,432,956 | 20,697,601 |
| 1932 | 5,511,818 | 9,054,187 | 628,064 | 15,194,069 | 4,374,251 | 19,568,320 |
| 1933 | 5,237,688 | 8,462,628 | 450,657 | 14,150,973 | 4,433,294 | 18,584,267 |
| 1934 | 5,541,255 | 8,245,173 | 443,239 | 14,229,667 | 3,821,779 | 18,051,446 |
| 1935 | 5,511,442 | 8,608,064 | 559,223 | 14,678,729 | 3,943,488 | 18,622,217 |
| 1936 | 5,585,855 | 8,976,035 | 576,513 | 15,138,403 | 4,348,534 | 19,486,937 |
Local-governing authorities received by way of rates in the financial year 1935–36 a total amount of £5,585,855, and the sum of £450,745 was raised by licenses and £125,292 by other taxes, making £6,161,892 altogether from taxation, which sum is equivalent to £3 18s. 9d. per head of the mean population (including Maoris).
During 1935–36 rates formed 36.9 per cent. of the revenue proper; public utilities, licenses, rents, and other sources yielded 59.3 per cent.; and 3.8 per cent. came from the general Government.
Of the revenue proper of counties, which amounted to £2,480,051 in 1935–36, no less a sum than £1,463,183, or 59 per cent., was raised by way of rates. Town districts, road districts, river districts, land-drainage districts, and urban drainage districts also rely on taxing for the greater part of their income. In the case of boroughs, electric-power districts, and Harbour Boards, on the other hand, rates supply a considerably lesser proportion of the total revenue. During 1935–36 this source of income accounted for 47 per cent. of the total revenue of boroughs, the corresponding proportion for Harbour Boards and electric-power districts being 12 per cent. and 2 per cent. respectively.
LOCAL GOVERNING AUTHORITIES.—RECEIPTS, 1935–36.
| — | Revenue from | Receipts not Revenue. | Total Receipts. | ||
|---|---|---|---|---|---|
| Rates. | Public Utilities, Licenses, Rents, &c. | Government. | |||
| £ | £ | £ | £ | £ | |
| Counties | 1,463,183 | 640,669 | 376,199 | 1,890,585 | 4,370,636 |
| Boroughs | 3,336,404 | 3,621,687 | 159,506 | 1,557,987 | 8,675,584 |
| Town districts | 104,799 | 41,240 | 7,008 | 81,854 | 234,901 |
| Road districts | 47,602 | 5,842 | 4,025 | 28,591 | 86,060 |
| River districts | 67,767 | 16,111 | 32 | 112,182 | 196,092 |
| Land-drainage districts | 58,809 | 1,486 | 18,983 | 79,278 | |
| Electric-power districts | 43,188 | 2,338,221 | 275,840 | 2,657,249 | |
| Water-supply districts | 3,320 | 21 | 1,833 | 5,174 | |
| Urban drainage districts | 233,644 | 3,127 | 89,189 | 325,960 | |
| Urban transport districts | 10,567 | 737,604 | 23,269 | 771,440 | |
| Railway district | 14,816 | 14,816 | |||
| Gas-lighting district | 47,553 | 47,553 | |||
| Rabbit districts | 26,059 | 5,206 | 16,006 | 6,039 | 53,310 |
| Fire districts | 148,289 | 3,367 | 26,368 | 178,024 | |
| Harbour Boards | 190,513 | 1,354,163 | 10,370 | 235,814 | 1,790,860 |
| Totals | 5,585,855 | 8,976,035 | 576,513 | 4,348,534 | 19,486,937 |
Of the total rates (£5,585,855) collected during 1935–36, general rates levied brought in £2,509,476, and other rates (including penalty on overdue rates) £3,076,379. Of the latter, £2,219,666 was received by boroughs and £629,673 by counties. The whole of the rates collected by Harbour Boards (£190,513) were classed as general rates.
It is of interest to note that for the year 1935–36 the total of all rates collected by counties was equal to £4.67 per £1,000 of rateable capital value (land and improvements). In boroughs it was £12.31, in independent town districts £13.39, and in town districts forming parts of counties £6.10 (excluding rates levied by County Councils).
Sections in successive Finance Acts from 1930 onwards have authorized the remission or postponement in whole or in part of the 10-per-cent. penalty on unpaid rates.
Rates are not the only form of local taxation. Local authorities derive a certain amount of revenue from publicans' licenses, heavy-traffic fees, motor-drivers' licenses, drivers' (other vehicles) licenses, auctioneers' and hawkers' licenses, abattoir fees, building permits, dog-taxes, pound-taxes, tolls, &c. Sources of revenue not classed as taxation are—rents, fines and penalties, market dues, sales of material, sales of light and power from gasworks and electric-supply works, tramway and omnibus receipts, interest on deposits, wharf dues, &c.
Of a total revenue of £3,621,687 accruing to boroughs under this head in 1935–36, £658,346 represented tramway and omnibus receipts, £1,356,808 sales of electric light and power, and £377,726 sales of gas.
A statement of revenue receipts by controlling bodies of local districts from the Government during the last five financial years is given in the next table:—
| — | Year ended 31st March, | ||||
|---|---|---|---|---|---|
| 1932. | 1933. | 1934. | 1935. | 1936. | |
| £ | £ | £ | £ | £ | |
| Rates on Crown and Native lands | 1,538 | 1,242 | 1,052 | 2,527 | 641 |
| One-third receipts from land sold on deferred payment or held on perpetual lease | 5,460 | 4,557 | 5,971 | 7,947 | 5,202 |
| One-fourth of rents from small grazing-runs | 510 | 563 | 567 | 1,004 | 1,909 |
| Timber and flax royalties | 9,480 | 4,945 | 4,375 | 6,513 | 10,196 |
| Goldfields revenue and gold duty | 17,934 | 20,988 | 25,447 | 29,535 | 31,537 |
| Subsidies on rates— | |||||
| Ordinary | 204,644 | 193,366 | 171,078 | 192,411 | 201,624 |
| Special 12½-per-cent. subsidy on rural lands | 253,143 | 178,227 | 186,177 | ||
| Petrol-tax | 101,089 | 99,302 | 100,794 | 103,088 | 116,168 |
| Stamp duty on interest | 105,600 | 104,790 | |||
| Fees and fines | 7,116 | 5,741 | 6,090 | 5,639 | 5,771 |
| Other receipts | 27,150 | 14,353 | 23,075 | 32,332 | 17,288 |
| Total, Revenue Account | 628,064 | 450,657 | 443,239 | 559,223 | 576,513 |
Section 45 of the Finance Act, 1931 (No. 4), as amended by section 39 of the Finance Act, 1932, provided for a subsidy to County Councils and Road Boards of 12½ per cent. of the average annual amount of rates collected during the three years ending March, 1930. This subsidy, which was derived from the Main Highways Account, was in general to be applied as a partial refund or rebate of rates paid or due in respect of the year 1931–32. The Finance Act (No. 3), 1934, authorized payment out of the Main Highways Account not later than the 31st March, 1935, of a similar subsidy of 12½ per cent. of rates made and levied. This applied to farm lands in counties and road districts, and also to urban farm lands within the meaning of the Urban Farm Land Rating Act, 1932. The subsidy was to be devoted to a refund or rebate of 12½ per cent. to ratepayers concerned. The Finance Act, 1935, made similar provision for the 1935–36 year.
Reductions of 10 per cent. from 1st April, 1931, and a further 10 per cent. (on the reduced amount) from 1st April, 1932, were made in the rates of grants or subsidies from the Consolidated Fund to various classes of local authorities by section 7 of the Finance Act, 1931, and section 8 of the National Expenditure Adjustment Act, 1932. These reductions were restored by a section in the Finance Act, 1936, in respect of rates levied for the year ended 31st March, 1936, and for every year thereafter.
In addition to the revenue receipts, there are special grants from the General Government (£2,755,019 in 1935–36) for various local works of a public or semi-public character, including from 1930–31 subsidies from the Employment Promotion Fund, the amount in 1935–36 being £1,795,951. A further class of receipts from the Government is provided by loans from the State Advances Corporation and advances from the Main Highways Account. These totalled £7,170 in 1935–36, bringing the total receipts from Government during 1935–36 to £3,338,702. Of this total, counties received £2,063,961 and boroughs £971,067.
The expenditure of local governing authorities during each of the last ten years has been as follows:—
| Year ended 31st March, | Public Works (Construction and Maintenance). | Hospital Board Levies; | Administration. | Interest on Loans and Overdraft. | Other.* | Total Expenditure. |
|---|---|---|---|---|---|---|
| * Including payments for amortization of debt, the amount for 1935–36 being £1,204,628. | ||||||
| £ | £ | £ | £ | £ | £ | |
| 1927 | 15,831,600 | 565,733 | 941,794 | 3,079,378 | 1,329,052 | 21,747,557 |
| 1928 | 15,200,280 | 629,379 | 965,376 | 3,452,293 | 2,175,839 | 22,423,167 |
| 1929 | 13,298,839 | 677,085 | 964,098 | 3,641,549 | 2,718,453 | 21,300,024 |
| 1930 | 14,486,488 | 685,134 | 1,053,613 | 3,895,632 | 1,940,221 | 22,061,088 |
| 1931 | 14,402,327 | 699,584 | 1,029,017 | 4,021,233 | 2,022,363 | 22,174,524 |
| 1932 | 12,694,508 | 561,905 | 989,366 | 3,963,334 | 1,878,268 | 20,087,381 |
| 1933 | 11,584,311 | 574,960 | 907,659 | 3,877,340 | 1,940,903 | 18,885,173 |
| 1934 | 10,754,446 | 592,092 | 879,276 | 3,476,767 | 2,035,211 | 17,737,792 |
| 1935 | 11,656,773 | 601,448 | 875,317 | 3,362,013 | 2,249,340 | 18,744,891 |
| 1936 | 12,250,661 | 622,512 | 998,998 | 3,243,386 | 2,221,685 | 19,337,242 |
The decline following 1930–31 was achieved in spite of the inclusion in payments for subsequent years of expenditure out of grants from the Employment Promotion Fund, the total grants received from this source in 1935–36 being £1,795,951. Included in “other” payments for 1935–36 is an amount of £235,569 for exchange, the bulk of which related to interest payments.
The expenditure of the various classes of local governing authorities during 1935–36 is shown below:—
| — | Public Works (Construction and Maintenance). | Hospital Board Levies. | Administration. | Interest on Loans and Overdraft. | Amortization of Debt. | Total Expenditure.* |
|---|---|---|---|---|---|---|
* Including other items. † Included in “Construction and Maintenance.” | ||||||
| £ | £ | £ | £ | £ | £ | |
| Counties | 3,264,428 | 301,678 | 292,267 | 329,222 | 139,575 | 4,459,124 |
| Boroughs | 5,526,768 | 309,158 | 433,694 | 1,445,755 | 554,507 | 8,741,740 |
| Town districts | 144,989 | 7,991 | 21,127 | 32,718 | 12,785 | 226,987 |
| Road districts | 53,680 | 3,685 | 7,027 | 12,213 | 3,629 | 90,818 |
| River districts | 145,468 | 14,223 | 22,714 | 11,380 | 194,471 | |
| Land - drainage districts | 39,610 | 7,429 | 18,538 | 7,838 | 73,667 | |
| Electric - power districts | 1,344,378 | † | 610,271 | 232,325 | 2,349,446 | |
| Water - supply districts | 3,508 | 572 | 414 | 240 | 4,761 | |
| Urban drainage districts | 97,381 | 18,706 | 124,521 | 57,299 | 324,874 | |
| Urban transport districts | 548,780 | 33,406 | 148,314 | 40,625 | 824,340 | |
| Railway district | 8,172 | 2,411 | 679 | 11,325 | ||
| Gas-lighting district | 30,085 | 3,280 | 5,662 | 2,588 | 48,683 | |
| Rabbit districts | 44,925 | 7,981 | 338 | 316 | 54,095 | |
| Fire districts | 156,905 | 6,280 | 12,024 | 8,665 | 185,263 | |
| Harbour Boards | 841,584 | 150,595 | 480,003 | 132,856 | 1,747,648 | |
| Totals | 12,250,661 | 622,512 | 998,998 | 3,243,386 | 1,204,628 | 19,337,242 |
The table following gives, in respect of boroughs only, the expenditure on new works out of loan-money hiring the last ten years, classified under various heads:—
| Year ended 31st March, | Streets and Footways. | Drainage and Sanitation. | Waterworks. | Tramways and Bus Services. | Abattoirs, Slaughterhouses, and Pounds. | Lighting and Power Services. | Other Public Works. | Totals |
|---|---|---|---|---|---|---|---|---|
| £ | £ | £ | £ | £ | £ | £ | £ | |
| 1927 | 875,704 | 311,820 | 362,177 | 223,445 | 15,883 | 235,018 | 214,648 | 2,238,695 |
| 1928 | 939,786 | 268,083 | 394,026 | 163,975 | 26,390 | 176,972 | 149,987 | 2,119,219 |
| 1929 | 649,081 | 236,068 | 202,744 | 1,499 | 6,612 | 259,796 | 134,806 | 1,490,606 |
| 1930 | 715,818 | 289,430 | 154,434 | 1,254 | 11,042 | 304,860 | 119,543 | 1,596,381 |
| 1931 | 475,644 | 271,906 | 145,555 | 395 | 14,331 | 308,589 | 120,673 | 1,337,093 |
| 1932 | 359,486 | 222,727 | 85,224 | 988 | 19,265 | 134,056 | 77,504 | 899,250 |
| 1933 | 133,417 | 164,080 | 22,334 | 1,376 | 8,010 | 51,477 | 380,694 | |
| 1934 | 76,862 | 105,729 | 37,062 | 2,319 | 1,819 | 216 | 19,372 | 243,379 |
| 1935 | 79,205 | 126,972 | 144,106 | 3,740 | 3,285 | 1 | 40,130 | 397,439 |
| 1936 | 123,314 | 109,490 | 201,855 | 7,521 | 949 | 47,587 | 490,716 |
The assets and liabilities of local-governing authorities at the end of the financial year 1935–36 are as shown in the table following. Further details are given in the section relating to “Wealth.” The figures shown in the column “Other assets” are taken from the respective balance-sheets, but are far from complete.
| — | Assets. | Liabilities. | ||||
|---|---|---|---|---|---|---|
| Cash Assets. | Other Assets (as estimated in published Balance sheets). | Debentures and other Securities. Net Indebtedness. | Inscribed Stock, i.e., Loans from Treasury under Local Bodies Acts. | Other Liabilities, (Bank Overdrafts, Temporary Loans outstanding Accounts, &c.). | Total Net Liabilities. | |
| £ | £ | £ | £ | £ | £ | |
| Counties | 1,506,048 | 1,829,839 | 5,843,713 | 837,141 | 339,263 | 7,020,117 |
| Boroughs | 4,535,742 | 29,802,805 | 26,537,171 | 706,963 | 997,405 | 28,241,539 |
| Town districts | 97,815 | 501,709 | 644,298 | 4,907 | 17,792 | 666,997 |
| Road districts | 32,346 | 154,625 | 258,466 | 5,068 | 21,778 | 285,312 |
| River districts | 73,049 | 225,442 | 474,072 | 37,413 | 31,493 | 542,978 |
| Land - drainage districts | 56,207 | 63,388 | 333,918 | 61,592 | 18,752 | 414,262 |
| Electric - power districts | 3,923,256 | 13,396,948 | 11,267,887 | 528,837 | 11,796,724 | |
| Water-supply districts | 1,395 | 2,169 | 9,002 | 1,013 | 1 | 10,016 |
| Urban drainage districts | 143,780 | 1,148,888 | 2,417,946 | 191,772 | 2,609,718 | |
| Urban transport districts | 40,015 | 3,684,494 | 2,203,488 | 139,393 | 2,342,881 | |
| Railway district | 507 | 180,267 | 13,500 | 13,500 | ||
| Gas-lighting district | 12,025 | 173,988 | 108,982 | 18,124 | 127,106 | |
| Rabbit districts | 33,467 | 15,731 | 3,936 | 6,026 | 9,962 | |
| Fire districts | 31,729 | 641,003 | 239,189 | 62,705 | 301,894 | |
| Harbour Boards | 1,657,423 | 15,347,553 | 8,390,368 | 208,366 | 8,598,734 | |
| Totals | 12,144,804 | 67,168,849 | 58,732,436 | 1,654,097 | 2,595,207 | 62,981,740 |
It should be noted that the figure for “Other assets” is on the conservative side, inasmuch us no valuations are made for certain items. This applies particularly to roads, which, although representing considerable wealth to the community, do not figure at all in the assets. In this connection it may be mentioned that the greater part of the expenditure of counties and road districts goes in this direction, while in the case of boroughs no less than 32 per cent. of the loan-money expended during the last five years went on streets and footways. Assets of all local authorities as returned for the last ten years are as under:—
| As at 31st March, | Cash Assets. | Other Assets (estimated). |
|---|---|---|
| £ | £ | |
| 1927 | 9,930,581 | 56,999,264 |
| 1928 | 9,648,087 | 60,328,936 |
| 1929 | 10,443,794 | 62,550,235 |
| 1930 | 12,859,676 | 64,509,880 |
| 1931 | 12,194,417 | 66,504,801 |
| 1932 | 12,820,724 | 67,811,808 |
| 1933 | 10,646,336 | 67,323,298 |
| 1934 | 11,176,562 | 67,118,852 |
| 1935 | 11,875,268 | 67,324,158 |
| 1936 | 12,144,804 | 67,168,849 |
Cash assets are made up chiefly of loan balances, reserve investments, and cash in hand. Sinking funds, which amounted to £10,013,643 at 31st March, 1936, do not appear in the foregoing table, but are shown as a deduction from the gross loan indebtedness of local authorities. Other assets are comprised mainly of fixed assets and stocks of stores and materials.
Boroughs are responsible for 43 per cent. of the total assets, Harbour Boards for 21 per cent., and electric-power districts for 22 per cent. Counties show the comparatively low percentage of 4, but this is due to the fact that practically the whole of county expenditure goes on roads, for which no valuation is available.
Prior to 1935–36 it was customary to classify the local-body debt into loans from the State Advances Corporation, loans from the Main Highways Account, inscribed debt—i.e., inscribed stock exchanged for debentures under the Roads and Bridges Construction Act, 1882—and non-governmental loans. The last-mentioned comprise by far the greater part of the debt, and consist mainly of debentures issued to the public. Owing, however, to the operation of the Local Authorities Interest Reduction and Loans Conversion Act, 1932–33, a considerable number of State Advances loans have lost their identity in being included in conversion schemes with non-governmental loans, so that it is no longer possible to show them separately. Loans from the Main Highways Account being comparatively insignificant in total (less than £80,000), it is felt that no useful purpose is served by a separate classification. Commencing with 1935–36, therefore, the debt will appear under two headings only: (1) Debentures and other Securities, and (2) Inscribed Debt. The reason for retaining the identity of inscribed debt is that it is fundamentally different from the usual type of loan. Originating in the early days of the present system of local government, it arose out of a recognition by the general Government that the primary functions of local bodies, such as road-making, were in part of national importance, and money was advanced on very favourable terms. The loans were for long terms at low interest-rates, with no provision for repayment, the position being that as soon as a local body met its final instalment of interest the loan was ipso facto extinguished. Loans of this nature, therefore, are vastly different from what is usually connoted by the term.
The total gross debt of local bodies at 31st March, 1936, was £70,400,176, made up of: Debentures and other securities, £68,746,079; and inscribed debt, £1,654,097. The net indebtedness (i.e., after deducting accumulated sinking funds from debentures and other securities, and making an actuarial estimate of the liability for inscribed debt on an assumed table-loan basis) was £59,238,117.
It is necessary to observe that figures of local-body debt given herein are not quoted in terms of New Zealand currency, except in such instances as refer solely to debt held in New Zealand. Debt held in Australia is expressed in Australian currency, and debt held in the United Kingdom is expressed in sterling. The total is ascertained by adding the three currencies together without conversion to a common basis. Australian currency is at present at a very slight depreciation in comparison with New Zealand currency, and the rate for sterling is approximately £(N.Z.)124½ = £100 London. As, however, the question of immediate repayment is not involved, little gain would be achieved by expressing the figures in New Zealand currency converted at present rates of exchange.
Since 1913–14 the gross debt has increased by £46,626,747. Up to 1918–19 the increase was gradual, being on an average about £850,000 per annum. The following eight years, mainly because of the vigorous prosecution of electric-power and road works, marked a period of intensive borrowing, during which the debt increased by £35,937,297, an amount equal to practically half of the present total, and an average of £4,500,000 per annum. Since the coming into operation of the Local Government Loans Board Act in 1927, borrowing has been on a much lower scale, and during the nine years from April, 1927, to March, 1930, the net increase in the debt aggregated £6,387,929, a yearly average of £709,770. Since 1930–31 there has been an almost progressive decline, the total decrease to the end of 1935–36 being £2,285,860. Part of the decrease since 1932–33 has been due to conversion operations, in which accumulated sinking funds were utilized for repayment purposes.
The following summary of the operations of the Local Government Loans Board since taking office shows concisely the trend of local-body borrowing during recent years:—
| Year. | Total Applications. | Sanctioned. | |
|---|---|---|---|
| New Works. | Redemption Loans. | ||
| £ | £ | £ | |
| 1927–28 | 4,636,649 | 3,212,185 | 1,048,796 |
| 1928–29 | 6,007,045 | 3,866,551 | 809,221 |
| 1929–30 | 4,218,730 | 3,563,842 | 967,875 |
| 1930–31 | 3,840,505 | 1,766,256 | 838,901 |
| 1931–32 | 3,412,365 | 781,195 | 2,483,810 |
| 1932–33 | 2,951,645 | 406,521 | 2,348,231 |
| 1933–34 | 3,884,132 | 917,560 | 2,744,245 |
| 1934–35 | 3,859,363 | 1,585,440 | 2,379,955 |
| 1935–36 | 4,235,926 | 1,550,690 | 2,051,790 |
| 1936–37 | 3,214,608 | 2,411,358 | 430,313 |
| 40,260,968 | 20,061,598 | 16,103,137 | |
The difference—namely, £4,096,233—represents applications referred back or declined by the Board during the period in question. Hospital Boards are included.
The outstanding loans of local authorities at the end of each of the last ten years are shown in the following table:—
| At 31st March, | Debentures and other Securities.* | Inscribed Debt. | Total Debt. | |||
|---|---|---|---|---|---|---|
| Gross Debt. | Net Debt (i.e., less accumulated Sinking Funds). | Gross Debt. | Present Indebtedness (actuarially computed). | Gross Debt. | Net Debt. | |
| * Including loans from State Advances Corporation and from Main Highways Account. | ||||||
| £ | £ | £ | £ | £ | £ | |
| 1927 | 61,822,620 | 55,517,325 | 2,189,627 | 1,006,254 | 64,012,247 | 56,523,579 |
| 1928 | 64,274,429 | 57,138,372 | 2,129,743 | 944,315 | 66,404,172 | 58,082,687 |
| 1929 | 67,216,531 | 59,185,437 | 2,078,088 | 886,686 | 69,294,619 | 60,072,123 |
| 1930 | 67,180,069 | 60,767,014 | 2,027,470 | 828,726 | 71,207,539 | 61,595,740 |
| 1931 | 70,717,009 | 61,393,548 | 1,969,027 | 772,651 | 72,686,036 | 62,166,199 |
| 1932 | 70,477,717 | 60,838,744 | 1,924,565 | 716,162 | 72,402,282 | 61,554,906 |
| 1933 | 70,608,354 | 60,239,863 | 1,867,702 | 662,769 | 72,476,056 | 60,902,632 |
| 1934 | 70,148,177 | 59,245,850 | 1,821,210 | 608,886 | 71,969,387 | 59,854,736 |
| 1935 | 69,504,659 | 58,995,254 | 1,740,799 | 556,596 | 71,245,458 | 59,551,850 |
| 1936 | 68,746,079 | 58,732,436 | 1,654,097 | 505,681 | 70,400,176 | 59,238,117 |
Of recent years loans advanced to local authorities by the State Advances Corporation have been less than the repayments, with the result that the amount outstanding under this head has decreased. In addition to the scheme of State Advances, there exists a system whereby the State guarantee to the payment of interest and principal in the event of default by the local authority may be obtained by the borrowing authority. The amount outstanding in respect of local-body loans guaranteed by the State aggregated £2,704,575 at the 31st March, 1936, sinking funds in respect of these loans totalling £898,700. Included in these figures is one loan (£1,500; sinking fund, £750) to a Hospital Board.
Of the total net indebtedness of £59,238,117 at the 31st March, 1936, boroughs were responsible for £26,760,221, which represents 9.84 per cent. of their rateable capital value. In the case of counties, which have a much less per caput expenditure on public works, the percentage is only 1.97.
The following table shows, per head of the population, the gross debt of local governing authorities and the annual charge thereon for the last ten years.
| As at 31st March, | Population. | Gross Debt. | Annual Loan Charge. | ||||||
|---|---|---|---|---|---|---|---|---|---|
| Amount. | Rate per Head. | Amount. | Rate per Head. | ||||||
| £ | £ | s. | d. | £ | £ | s. | d. | ||
| 1927 | 1,438,132 | 64,012,247 | 44 | 10 | 3 | 4,050,895 | 2 | 16 | 4 |
| 1928 | 1,453,821 | 66,404,172 | 45 | 13 | 6 | 4,255,469 | 2 | 18 | 6 |
| 1929 | 1,471,110 | 69,294,619 | 47 | 2 | 1 | 4,479,180 | 3 | 0 | 11 |
| 1930 | 1,489,203 | 71,207,539 | 47 | 16 | 4 | 4,682,181 | 3 | 2 | 11 |
| 1931 | 1,511,700 | 72,686,036 | 48 | 1 | 8 | 4,828,793 | 3 | 3 | 11 |
| 1932 | 1,525,545 | 72,402,282 | 47 | 9 | 2 | 4,905,467 | 3 | 4 | 4 |
| 1933 | 1,538,028 | 72,476,056 | 47 | 2 | 5 | 4,919,221 | 3 | 4 | 0 |
| 1934 | 1,550,125 | 71,969,387 | 46 | 8 | 7 | 4,449,777 | 2 | 17 | 5 |
| 1935 | 1,560,992 | 71,245,458 | 45 | 12 | 10 | 4,421,506 | 2 | 16 | 8 |
| 1936 | 1,573,810 | 70,400,176 | 44 | 14 | 8 | 4,395,758 | 2 | 15 | 10 |
During the ten years 1925–26 to 1935–36 the gross debt of all local authorities increased by £10,986,422, of which boroughs were responsible for £2,663,588, and electric-power districts for £4,739,233. It should be noted that the debt of electric-power districts shown in the following table does not represent the complete local-body debt on account of electric power, since a considerable portion of the borough debt, and a small part of the county and town district debt also, was incurred for that purpose. The debt of “other districts” at 31st March, 1936, was mainly that of urban transport districts (£3,140,582) and urban drainage districts £2,646,673).
| As at 31st March, | Counties. | Boroughs. | Town Districts. | Road Districts. | Electric-power Districts. | Harbour Boards. | Other Districts. | Total. |
|---|---|---|---|---|---|---|---|---|
| £ | £ | £ | £ | £ | £ | £ | £ | |
| 1927 | 7,215,851 | 30,823,857 | 804,079 | 625,416 | 10,113,400 | 10,257,781 | 4,171,863 | 64,012,247 |
| 1928 | 7,374,706 | 32,874,244 | 831,181 | 688,255 | 10,175,304 | 10,476,883 | 4,483,539 | 66,404,172 |
| 1929 | 7,483,631 | 33,012,519 | 904,780 | 343,390 | 11,986,707 | 10,774,139 | 4,789,453 | 69,294,619 |
| 1930 | 7,624,395 | 32,276,814 | 810,178 | 343,980 | 12,636,351 | 10,468,881 | 7,046,940 | 71,207,539 |
| 1931 | 7,699,175 | 32,894,635 | 835,205 | 274,625 | 13,011,529 | 10,517,396 | 7,453,471 | 72,686,036 |
| 1932 | 7,719,431 | 32,445,623 | 820,219 | 288,375 | 13,121,960 | 10,549,493 | 7,457,181 | 72,402,282 |
| 1933 | 7,610,698 | 32,534,350 | 820,917 | 286,435 | 13,031,930 | 10,620,442 | 7,571,284 | 72,476,056 |
| 1934 | 7,523,017 | 32,094,214 | 810,820 | 287,363 | 13,213,079 | 10,496,533 | 7,544,361 | 71,969,387 |
| 1935 | 7,306,481 | 31,714,600 | 812,996 | 286,596 | 13,399,053 | 10,524,788 | 7,200,944 | 71,245,458 |
| 1936 | 7,065,755 | 31,480,305 | 704,561 | 277,653 | 13,484,988 | 10,218,672 | 7,168,242 | 70,400,176 |
The loans outstanding, other than inscribed debt, at the end of the financial year 1935–36, are shown below, classified according to domicile, and also rate of interest. In the case of loans domiciled in New Zealand, the rates of interest shown are the reduced rates consequent upon the interest-reducing legislation referred to later in this section. Reference should be made to observations on pages 624–25 in regard to the currencies in which local-body debts are expressed.
| Rate of Interest Per Cent. | Domiciled in New Zealand. | Domiciled in United Kingdom. | Domiciled in Australia. | Total. |
|---|---|---|---|---|
| £ | £ | £ | £ | |
| Free of interest | 178,475 | 178,475 | ||
| 3 | 18,000 | 200,000 | 218,000 | |
| 3¼ | 616,032 | 616,032 | ||
| 3⅜ | 42,689 | 42,689 | ||
| 3½ | 2,277,218 | 104,400 | 2,381,618 | |
| 3⅝ | 3,000 | 3,000 | ||
| 3¾ | 431,183 | 431,183 | ||
| 3⅚ | 2,500 | 2,500 | ||
| 3⅞ | 132,274 | 132,274 | ||
| 4 | 936,596 | 392,800 | 1,329,396 | |
| 4⅛ | 574,690 | 574,690 | ||
| 4¼ | 43,278,847 | 156,000 | 433,250 | 43,868,097 |
| 4⅖ | 760,818 | 14,833 | 775,651 | |
| 4½ | 69,640 | 2,036,025 | 14,117 | 2,119,782 |
| 4⅗ | 533,818 | 210,200 | 744,018 | |
| 4 7/10 | 500 | 500 | ||
| 4⅘ | 617,670 | 617,670 | ||
| 5 | 96,099 | 6,600,500 | 18,000 | 6,714,599 |
| 5 1/10 | 40 | 40 | ||
| 5⅕ | 3,390 | 3,390 | ||
| 5¼ | 1,951,000 | 52,000 | 2,003,000 | |
| 5½ | 387 | 1,912,000 | 480,015 | 2,392,402 |
| 5⅝ | 25,000 | 25,000 | ||
| 5 11/16 | 130,000 | 130,000 | ||
| 5¾ | 6,000 | 9,700 | 643,048 | 658,748 |
| 6 | 20,700 | 1,709,300 | 153,625 | 1,883,625 |
| 6½ | 873,700 | 26,000 | 899,700 | |
| Totals | 50,598,066 | 15,947,925 | 2,200,088 | 68,746,079 |
The interest-rates quoted above are those applicable to the amount of debt outstanding. They have not been adjusted to the prices at which the respective loans were raised—e.g., where a loan was issued below par the rate of interest on the sum actually received (omitting the question of flotation expenses) would be higher than the rate shown above. The average rates work out as follows: New Zealand, 4.19 per cent.; United Kingdom, 5.15 per cent.; Australia, 5.28 per cent.: total, 4.45 per cent.
During 1935–36 the amount domiciled in New Zealand decreased by £253,375, that in the United Kingdom by £140,600, and that in Australia by £364,605. The New Zealand domiciled proportion of the total has increased continuously for several years past, and at 31st March, 1936, represented 74 per cent. of the total, the United Kingdom's share being 23 per cent., and Australia's 3 per cent.
A five-year summary of the domicile of loans outstanding, other than inscribed debt, is given hereunder.
| At 31st March, | Amount. | Percentage of Total. | ||||
|---|---|---|---|---|---|---|
| London. | Australia. | New Zealand. | London. | Australia. | New Zealand. | |
| £ | £ | £ | Per Cent. | Per Cent. | Per Cent. | |
| 1932 | 17,362,725 | 7,281,981 | 45,833,011 | 24.64 | 10.33 | 65.03 |
| 1933 | 17,003,321 | 5,729,678 | 47,875,355 | 24.08 | 8.12 | 67.80 |
| 1934 | 16,748,225 | 4,197,906 | 49,202,046 | 23.88 | 5.98 | 70.14 |
| 1935 | 16,088,525 | 2,564,693 | 50,551,441 | 23.15 | 3.69 | 73.16 |
| 1936 | 15,947,925 | 2,200,088 | 50,598,066 | 23.20 | 3.20 | 73.60 |
The increase during recent years in the amount domiciled in New Zealand is mainly duo to the transfer of loans formerly domiciled in Australia, for which reason also the amount domiciled in Australia shows a marked reduction.
Particulars of the annual loan charge of local bodies during each of the last ten years are as follows:—
| At 31st March, | On Debentures and other Securities. | On Inscribed | Total. |
|---|---|---|---|
| £ | £ | £ | |
| 1927 | 3,970,387 | 80,508 | 4,050,895 |
| 1928 | 4,177,306 | 78,163 | 4,255,469 |
| 1929 | 4,403,251 | 75,929 | 4,479,180 |
| 1930 | 4,608,437 | 73,744 | 4,682,181 |
| 1931 | 4,757,481 | 71,312 | 4,828,793 |
| 1932 | 4,835,982 | 69,485 | 4,905,467 |
| 1933 | 4,852,072 | 67,149 | 4,919,221 |
| 1934 | 4,384,557 | 65,220 | 4,449,777 |
| 1935 | 4,359,551 | 61,955 | 4,421,506 |
| 1936 | 4,337,360 | 58,398 | 4,395,758 |
Amortization charges are included in the above, the amount payable during 1936–37 (other than inscribed debt) at 31st March, 1936, being £1,290,316. Interest charges payable during 1936–37 on the debt outstanding at 31st March, 1936, aggregated £3,047,044, payable, according to countries of domicile, as follows: New Zealand, £2,109,727; Australia, £116,084; United Kingdom, £821,233 (plus exchange).
As part of the interest-reduction policy of the Government, Part IV of the National Expenditure Adjustment Act, passed on the 10th May, 1932, imposed, inter alia, a stamp duty of 10 per cent. on interest derived from local authority debentures or other securities. All local authority interest coupons or warrants presented in New Zealand for payment on or after the 14th May, 1932, were chargeable. Interest payments made (as of express right) out of New Zealand were exempted from charge. After deduction of 5 per cent. of the proceeds as administrative charges the net amount of stamp duty collected was returned to the respective local authorities. A hardship clause permitted the Minister of Finance to refund stamp duty where the total annual income of the payer was not in excess of £100. An additional provision allowed payment of stamp duty of this nature to he treated as a special exemption under the Land and Income Tax Act, 1923. The stamp duty was abolished, in so far as it affected interest accruing after 31st March, 1933, by the legislation next mentioned.
A further step towards reduction of interest on local authority debt was taken by the Local Authorities Interest Reduction and Loans Conversion Act, 1932–33, and its amendments of 1933 and 1934. This statute, passed on the 9th March, 1933, followed somewhat similar legislation dealing with the public debt. The principal section of this Act imposed a reduction—by 20 per cent. or to 4¼ per cent. per annum, whichever rate was the higher—in the rate of interest payable in New Zealand on local authorities' securities bearing interest at a rate in excess of 4¼ per cent. Loans domiciled outside New Zealand were again exempted, and rules laid down for the determination of domicile.
The Act also empowered local authorities to draw up individual conversion schemes whereby existing securities could be converted to new securities at a lower and uniform rate of interest. Any such proposals are required to he submitted to the Local Government Loans Board and to receive the consent of the Governor-General given by Order in Council. Where any such conversion scheme is undertaken, and any holder of existing securities signifies his dissent from their conversion as prescribed in the Order in Council, the rate of interest in his case is then further reduced to 33⅓ per cent. below the rate originally prescribed by the securities. Further sections of the Act limit the rate of interest for future loans, empower relief measures in certain cases of hardship, and create necessary machinery for implementing its provisions.
Conversion schemes under the statutory provisions referred to above have proceeded very rapidly and at the 31st December, 1935, no less than 89.9 per cent. of the debt convertible at 31st March, 1933, had been converted.
The provisions of the Local Authorities Interest Reduction and Loans Conversion Act, 1932–33, ceased to operate on 31st December, 1935; but provision is contained in section 20 of the Finance Act (No. 2), 1935, for voluntary conversion to be carried out under the provisions of the principal Act, and applications for conversion are still being received.
The following table classifies loans (other than inscribed debt) according to years of maturity and countries of domicile:—
| Years of Maturity (ended 31st December). | New Zealand. | United Kingdom. | Australia. | Total. |
|---|---|---|---|---|
| £ | £ | £ | £ | |
| Prior to and during 1938 | 3,032,739 | 2,754,100 | 23,500 | 5,810,339 |
| 1939–43 | 6,093,777 | 5,207,800 | 217,951 | 11,519,528 |
| 1944–48 | 7,412,144 | 2,299,725 | 659,960 | 10,371,829 |
| 1949–53 | 8,764,607 | 1,498,000 | 195,089 | 10,457,696 |
| 1954–58 | 9,891,247 | 1,305,000 | 52,812 | 11,249,059 |
| 1959–63 | 10,353,492 | 2,468,300 | 788,309 | 13,610,101 |
| 1964–68 | 4,336,131 | 415,000 | 28,467 | 4,779,598 |
| 1969–73 | 615,982 | 234,000 | 849,982 | |
| 1974 | 78,765 | 78,765 | ||
| Unspecified | 19,182 | 19,182 | ||
| Totals | 50,598,066 | 15,947,925 | 2,200,088 | 68,746,079 |
Table loans account for £11,776,360 of the above total, loans in which a number of debentures are redeemed each year for £32,268,091, and loans with one fixed maturity date for £24,701,628. In the case of table loans the year of maturity is taken as that in which the final instalment is payable. Practically the whole of the debt domiciled abroad is composed of loans with one fixed date of maturity.
Table of Contents
THE existing law relating to the valuation of land in New Zealand is contained in the Valuation of Land Act, 1925 (a consolidation of previous legislation), and its amendments of 1926, 1927, 1932, and 1933. A brief historical account appears in the 1932 and earlier Year-Books.
The work of the Valuation Department is directed by the Valuer-General. The actual work of valuation is done by District Valuers and assistant valuers. The duty of a valuer is to examine each property and to estimate to the best of his ability (1) the unimproved value of the land contained therein, (2) the value of the buildings (if any) or other improvements (if any) upon such land, and (3) the “capital value” of the property. The Valuation of Land Amendment Act, 1927, provides that in boroughs rating on the unimproved value the unimproved value only or the value of improvements only may be ascertained, the capital value being adjusted accordingly.
Under the New Zealand law the increased value attaching to any piece of land which is due to the successful working of other lands in the district, or to State or local body expenditure on public works, or to the general prosperity and development of the country, forms portion of the “unimproved value.” Any increased value, however, which is represented by the improvements effected by the individual possessor, either past or present, does not form part of the “unimproved value.”
Valuers are enjoined not to strain after high values, nor to accept special prices paid for land under exceptional circumstances, but to determine the value neither above nor below the fair selling-value in view of the many and diverse purposes for which the values are used. Land containing or supposed to contain oil, coal, or other mineral deposits is valued as for the surface use only.
The Valuation of Land Act directs the preparation of a valuation roll for each district, setting forth in respect of each separate property the following particulars:—
The name of the owner of the land and the nature of his estate or interest therein, together with the name of the beneficial owner in the case of land held in trust:
The name of the occupier within the meaning of the Rating Act:
The situation, description, and area of the land:
The nature and value of the improvements on the land:
The unimproved value of the land:
The capital value of the land:
Such other particulars as are prescribed.
The district valuation roll so long as it continues in force is by law the roll from which the valuation roll of every local authority rating on the capital or on the unimproved value is framed.
In December 1932, the Urban Farm Land Rating Act (amended in 1933 and 1935) was passed with the object of giving some rating relief to farm lands subject to rates levied by borough (or city) councils, independent town boards, and certain road boards. The Act provides for the preparation of farm-land rolls, which are deemed to be part of the valuation roll for rating purposes.
After the values in a district have been revised a new valuation roll is prepared, and the Valuer-General addresses to each person whose name appears thereon a notice setting forth the values at which his property is entered, and naming a date on or before which all objections (in writing) to the values must be lodged.
The Valuer-General refers objections to values to the District Valuer to enable him to review valuations before the sitting of the Assessment Court. If after careful reconsideration by the District Valuer it is decided that an objection will be allowed or a reasonable compromise effected, the valuation is altered accordingly. On the other hand, if the Valuer-General considers that the valuer's estimates are fair, the objection is heard and determined by the Assessment Court.
The Assessment Court consists of three members, of whom one—the President, who must be a barrister or solicitor of the Supreme Court of New Zealand—is appointed by the Governor-General in Council. Of the other two members of the Court, one is appointed by the Governor-General in Council, and the other by the local authority of the district whose roll has been revised, or by two or more local authorities acting in unison, prodded the appointee is not a member of, or a paid officer of, any local authority. The Valuation of Land Amendment Act, 1927, provides for assessors representing local bodies to be elected (after nomination by two or more ratepayers) by a meeting of ratepayers convened for the purpose.
If the objection to the valuation is allowed, the new valuation is deemed to be entered on the valuation roll, for rating purposes, as on the 31st March of the calendar year following that on which notice of objection was duly given. If the objection is disallowed, the owner may, within fourteen days after the hearing by the Assessment Court, give notice to the Valuer-General that he requires the capital value to be reduced to the value which he (the objector) considers to be the fair selling-value as specified in his notice (but not less than the aggregate amount owing on mortgages or other charges on the land), or the land to be acquired on behalf of His Majesty at that value or sold in the prescribed manner.
If the Valuer-General is of opinion that the Assessment Court has made an unfair reduction in a valuation he may, within fourteen days of the hearing, require the owner to consent to what he (the Valuer-General) considers is the fair selling capital value, and, failing such consent being given within thirty days after notice is delivered at his address, he may, with the approval of the Governor-General in Council, acquire the property at that value on behalf of His Majesty.
The decision of the Assessment Court on any objection is subject to appeal to the Supreme Court on a question of law. On all other questions the decision of the Assessment Court is final. The decision of a majority of the three members constitutes the decision of the Court, but If no two members agree the President's decision is taken.
Owing to the heavy decline in values during the depression years, and the impracticability of a universal revaluation, advantage of the provision enabling new valuations was taken by many owners with the object of reducing their rate-payments. In order to maintain rating equity, the Valuation of Land Amendment Act, 1933, authorized local authorities to levy rates upon a proportionate part (not being under 75 per cent.) of values upon the roll. Where an individual owner has obtained a revaluation, the new figure or the proportionate part of the previously existing figure is taken, whichever is the lower.
General valuations of land for the whole of New Zealand were made periodically up to the year 1897–98. Since that year no general valuations for the whole Dominion have been made, but portions are revalued from time to time. The figures in the following table, showing valuations over a number of years, therefore represent general valuations up to 1897 only, while for subsequent years the figures have been revised to include the latest valuations of small divisions.
GROSS CAPITAL AND UNIMPROVED VALUES.
| Year. | Capital Value (Land and Improvements). | Unimproved Value of Land (included in previous Column). |
|---|---|---|
| £ | £ | |
| 1878 | 99,566,679 | 62,573,868 |
| 1882 | 101,000,000 | |
| 1885 | 113,270,649 | |
| 1888 | 111,137,714 | 75,497,379 |
| 1891 | 122,225,029 | 75,832,465 |
| 1897 | 138,591,347 | 84,401,244 |
| 1902 | 154,816,132 | 94,847,727 |
| 1905 | 197,684,475 | 122,937,126 |
| 1907 | 236,644,536 | 149,682,689 |
| 1909 | 271,516,022 | 172,759,948 |
| 1911 | 293,117,065 | 184,062,798 |
| 1913 | 340,559,728 | 212,963,468 |
| 1915 | 371,076,683 | 230,705,147 |
| 1916 | 389,164,729 | 241,322,255 |
| 1917 | 405,466,071 | 251,087,708 |
| 1918 | 421,383,373 | 260,921,812 |
| 1919 | 445,533,445 | 275,988,409 |
| 1920 | 470,093,697 | 290,880,264 |
| 1921 | 518,584,318 | 317,631,245 |
| 1922 | 544,503,376 | 329,174,337 |
| 1923 | 553,403,794 | 330,790,991 |
| 1924 | 568,500,653 | 333,869,581 |
| 1925 | 587,349,575 | 339,310,260 |
| 1926 | 603,250,306 | 341,047,952 |
| 1927 | 618,264,093 | 341,519,107 |
| 1928 | 631,454,676 | 335,217,075 |
| 1929 | 655,906,887 | 344,757,796 |
| 1930 | 664,571,181 | 338,887,411 |
| 1931 | 667,911,212 | 331,634,774 |
| 1932 | 662,829,264 | 321,798,700 |
| 1933 | 653,707,517 | 314,556,174 |
| 1934 | 650,362,355 | 309,770,390 |
| 1935 | 637,604,203 | 301,137,513 |
| 1936 | 635,801,798 | 295,695,574 |
Valuations showed a rising tendency for many years, reaching a maximum (so far as unimproved values are concerned) about 1926. Revisions subsequent to that year were generally on a somewhat lower scale, and the Dominion aggregate is still being affected by revaluations of districts last valued during peak years.
The values shown in the foregoing table and in that following are the gross values; they include the value not only of rateable properties, but also of churches, schools, unoccupied Crown lands, and other lands exempt from local rating.
GROSS VALUES.
| Year. | Number. | North Island. | South Island. | New Zealand. | |||||
|---|---|---|---|---|---|---|---|---|---|
| Capital Value (Land and Improvements). | Unimproved Value of Land (Included in previous Column). | Capital Value (Land and Improvements). | Unimproved Value of Land (included in previous Column). | Capital Value (Land and Improvements). | Unimproved Value of Land (included in previous Column). | ||||
| Counties. | |||||||||
| £ | £ | £ | £ | £ | £ | ||||
| 1927 | 129 | 220,899,534 | 136,669,081 | 128,528,964 | 93,546,458 | 849,428,498 | 230,215,539 | ||
| 1928 | 129 | 222,034,723 | 128,466,999 | 128,979,600 | 93,112,481 | 351,014,323 | 221,579,480 | ||
| 1929 | 129 | 218,994,624 | 125,113,171 | 128,578,477 | 92,339,116 | 347,673,101 | 217,452,287 | ||
| 1930 | 129 | 217,047,143 | 120,939,949 | 128,369,805 | 90,038,141 | 345,416,948 | 210,978,090 | ||
| 1931 | 129 | 216,904,602 | 119,125,252 | 126,112,667 | 84,989,699 | 343,017,269 | 204,114,951 | ||
| 1932 | 129 | 214,849,109 | 115,921,478 | 123,017,748 | 79,835,599 | 337,866,857 | 195,757,077 | ||
| 1933 | 129 | 212,616,933 | 113,753,386 | 121,051,371 | 78,032,449 | 333,668,307 | 191,785,835 | ||
| 1934 | 129 | 211,394,504 | 111,951,849 | 120,118,124 | 76,809,704 | 331,512,628 | 188,761,553 | ||
| 1935 | 129 | 210,258,539 | 110,798,741 | 119,933,618 | 74,875,011 | 330,192,157 | 185,673,752 | ||
| 1936 | 129 | 208,611,039 | 107,431,506 | 119,127,988 | 73,678,360 | 327,739,027 | 181,109,866 | ||
| Boroughs. | |||||||||
| £ | £ | £ | £ | £ | £ | ||||
| 1927 | 119 | 184,483,849 | 80,253,298 | 75,083,757 | 27,279,451 | 259,567,606 | 107,532,749 | ||
| 1928 | 119 | 193,357,816 | 82,113,910 | 77,546,515 | 27,760,690 | 270,904,331 | 109,874,600 | ||
| 1929 | 119 | 215,559,207 | 92,633,636 | 83,723,057 | 31,178,700 | 299,282,264 | 123,812,336 | ||
| 1930 | 121 | 224,252,976 | 93,192,267 | 85,669,387 | 31,108,515 | 309,922,363 | 124,300,782 | ||
| 1931 | 122 | 228,502,595 | 93,016,638 | 87,312,583 | 31,204,231 | 315,815,178 | 124,220,869 | ||
| 1932 | 122 | 228,332,228 | 91,862,454 | 87,553,541 | 30,934,909 | 315,885,769 | 122,797,363 | ||
| 1933 | 122 | 223,524,940 | 88,941,862 | 87,637,530 | 30,724,359 | 311,162,470 | 119,666,221 | ||
| 1934 | 122 | 221,931,731 | 87,589,828 | 87,736,355 | 30,445,661 | 309,668,086 | 118,035,489 | ||
| 1935 | 124 | 211,900,631 | 82,645,184 | 87,807,000 | 30,220,358 | 299,707,631 | 112,865,542 | ||
| 1936 | 124 | 211,034,009 | 81,707,656 | 89,225,860 | 30,298,525 | 300,259,869 | 112,006,181 | ||
| Independent Town Districts. | |||||||||
| 1927 | 40 | 8,221,372 | 3,387,736 | 1,046,617 | 383,083 | 0,267,989 | 3,770,819 | ||
| 1928 | 42 | 8,468,686 | 3,397,342 | 1,067,336 | 365,653 | 9,536,022 | 3,762,995 | ||
| 1929 | 42 | 7,977,832 | 3,136,377 | 1,073,690 | 356,796 | 9,051,522 | 3,493,173 | ||
| 1930 | 41 | 8,145,644 | 3,277,434 | 1,086,226 | 331,105 | 9,231,870 | 3,608,539 | ||
| 1931 | 40 | 7,936,550 | 2,967,964 | 1,142,215 | 330,990 | 9,078,765 | 3,298,954 | ||
| 1932 | 40 | 7,920,486 | 2,911,419 | 1,156,152 | 332,841 | 9,076,638 | 3,244,260 | ||
| 1933 | 40 | 7,676,696 | 2,752,690 | 1,200,044 | 351,428 | 8,876,740 | 3,104,118 | ||
| 1934 | 41 | 8,009,174 | 2,642,695 | 1,172,467 | 330,653 | 9,181,641 | 2,973,348 | ||
| 1935 | 38 | 6,692,945 | 2,301,141 | 1,011,470 | 297,078 | 7,704,415 | 2,598,219 | ||
| 1936 | 38 | 6,781,090 | 2,281,789 | 1,021,812 | 297,738 | 7,802,902 | 2,579,527 | ||
| Grand Totals. | |||||||||
| 1927 | 413,604,755 | 220,310,115 | 204,659,338 | 121,208,092 | 618,264,093 | 341,519,107 | |||
| 1928 | 423,861,225 | 213,978,251 | 207,593,451 | 121,238,824 | 631,454,676 | 335,217,075 | |||
| 1929 | 442,531,663 | 220,883,184 | 213,375,224 | 123,874,612 | 655,906,887 | 344,757,796 | |||
| 1930 | 449,445,763 | 217,409,650 | 215,125,418 | 121,477,761 | 664,571,181 | 338,887,411 | |||
| 1931 | 453,343,747 | 215,109,854 | 214,567,465 | 116,524,920 | 667,911,212 | 331,634,774 | |||
| 1932 | 451,101,823 | 210,695,351 | 211,727,441 | 111,103,349 | 662,829,264 | 321,798,700 | |||
| 1933 | 443,818,572 | 205,447,938 | 209,888,945 | 109,108,236 | 653,707,517 | 314,556,174 | |||
| 1934 | 441,335,409 | 202,184,372 | 209,026,946 | 107,586,018 | 650,362,355 | 309,770,390 | |||
| 1935 | 428,852,115 | 195,745,066 | 208,752,088 | 105,392,447 | 637,604,203 | 301,137,513 | |||
| 1936 | 426,426,138 | 191,420,951 | 209,375,660 | 104,274,623 | 635,801,798 | 295,695,574 | |||
A summary of rateable values for the year 1936 is next given:—
| — | North Island. | South Island. | New Zealand. | |||
|---|---|---|---|---|---|---|
| Capital Value (Land and improvements). | Unimproved Value of Land (included in previous Column). | Capital Value (Land and Improvements). | Unimproved Value of Land (included in previous Column). | Capital Value (Land and Improvements). | Unimproved Value of Land (included in previous Column). | |
| £ | £ | £ | £ | £ | £ | |
| Counties | 197,133,653 | 102,128,761 | 112,422,211 | 71,229,995 | 309,555,864 | 173,358,756 |
| Boroughs | 190,899,986 | 72,920,088 | 81,165,967 | 27,624,327 | 272,065,953 | 100,544,415 |
| Town districts (independent) | 6,275,336 | 2,143,367 | 928,998 | 267,394 | 7,204,334 | 2,410,761 |
| Totals | 394,308,975 | 177,192,216 | 194,517,176 | 99,121,716 | 588,826,151 | 276,313,932 |
Of the gross capital value, counties represent 51.5 per cent., and boroughs and independent town districts 48.5 per cent. For unimproved value the proportions are 61.2 per cent. and 38.8 per cent. respectively.
On the basis of rateable values, counties possess 52.6 per cent. of capital and 62.7 per cent. of unimproved values, as against 47.4 and 37.3 per cent. for boroughs and independent town districts.
The gross capital and unimproved values for each county, borough, and independent town district as in 1936 are next given.
GROSS CAPITAL AND UNIMPROVED VALUES, 1936.
| County (including Dependent Town Districts). | Capital Value (Land and Improvements). | Unimproved Value of Land (included in previous Column). |
|---|---|---|
| £ | £ | |
| Mangonui | 1,511,148 | 598,700 |
| Whangaroa | 436,039 | 128,010 |
| Bay of Islands | 2,243,939 | 870,054 |
| Hokianga | 1,597,425 | 568,525 |
| Whangarei | 4,814,997 | 1,668,016 |
| Hobson | 2,429,817 | 1,026,398 |
| Otamatea | 2,107,754 | 873,908 |
| Rodney | 1,749,198 | 573,246 |
| Waitemata | 4,716,564 | 2,434,980 |
| Eden | 2,743,592 | 1,022,625 |
| Manukau | 5,030,127 | 2,839,918 |
| Franklin | 5,697,566 | 2,577,639 |
| Great Barrier Island | 150,475 | 93,585 |
| Islands— | ||
| Little Barrier, Waiheke, &c. | 526,876 | 341,434 |
| Waikato | 5,670,280 | 3,095,832 |
| Raglan | 4,009,389 | 1,764,176 |
| Waipa | 6,934,403 | 2,406,648 |
| Coromandel | 669,096 | 309,460 |
| Thames | 727,178 | 369,563 |
| Hauraki Plains | 2,156,207 | 1,038,303 |
| Chinemuri | 790,268 | 395,618 |
| Tauranga | 2,287,760 | 1,005,001 |
| Piako | 4,438,639 | 2,370,999 |
| Matamata | 3,736,937 | 1,781,542 |
| Rotorua | 1,828,564 | 1,345,408 |
| Whakatane | 2,494,315 | 1,424,988 |
| Taupo | 803,608 | 525,002 |
| Taumarunui | 1,156,092 | 487,787 |
| Ohura | 1,019,857 | 335,497 |
| Kawhia | 693,963 | 264,137 |
| Waitomo | 2,779,999 | 1,161,177 |
| Otorohanga | 2,124,853 | 972,989 |
| Island—Motiti | 33,120 | 19,150 |
| Opotiki | 1,641,809 | 589,603 |
| Matakaoa | 626,994 | 205,134 |
| Waiapu | 3,082,513 | 1,148,284 |
| Uawa | 1,261,959 | 535,011 |
| Waikohu | 3,847,353 | 1,704,170 |
| Cook | 5,274,436 | 2,365,732 |
| Wairoa | 3,827,588 | 1,508,803 |
| Hawke's Bay | 10,797,060 | 6,656,795 |
| Waipawa | 3,079,303 | 1,845,828 |
| Waipukurau | 955,008 | 579,084 |
| Dannevirke | 3,488,839 | 2,027,372 |
| Woodville | 1,753,572 | 1,050,720 |
| Patangata | 4,378,023 | 2,932,805 |
| Weber | 633,339 | 356,682 |
| Clifton | 1,362,344 | 777,122 |
| Taranaki | 2,483,930 | 1,184,740 |
| Inglewood | 1,391,045 | 649,002 |
| Egmont | 2,058,692 | 1,085,791 |
| Stratford | 3,110,040 | 1,699,720 |
| Whangamomona | 542,282 | 166,352 |
| Waimate West | 2,086,818 | 1,335,965 |
| Eltham | 2,593,628 | 1,405,865 |
| Hawera | 3,374,870 | 2,065,215 |
| Patea | 3,258,698 | 1,865,212 |
| Waitotara | 2,571,653 | 1,469,052 |
| Waimarino | 1,771,781 | 550,800 |
| Wanganui | 2,318,762 | 1,018,442 |
| Rangitikei | 8,985,095 | 5,137,401 |
| Kiwitea | 2,659,977 | 1,509,625 |
| Pohangina | 1,260,843 | 671,204 |
| Kaitieke | 1,015,274 | 453,780 |
| Manawatu | 3,564,134 | 2,495,938 |
| Oroua | 3,045,937 | 2,075,676 |
| Kairanga | 4,343,090 | 2,698,286 |
| Horowhenua | 5,251,732 | 3,231,857 |
| Islands— | ||
| Kapiti, Mana, and Somes | 17,084 | 13,378 |
| Chatham Islands | 285,795 | 161,880 |
| Pahiatua | 2,326,156 | 1,243,791 |
| Akitio | 1,490,511 | 725,277 |
| Castlepoint | 1,118,847 | 637,829 |
| Eketahuna | 1,833,321 | 993,743 |
| Mauriceville | 614,373 | 333,869 |
| Masterton | 4,325,232 | 2,725,377 |
| Wairarapa South | 3,047,688 | 1,775,954 |
| Featherston | 4,703,508 | 2,983,394 |
| Hutt | 3,730,135 | 1,573,210 |
| Makara | 1,594,818 | 682,202 |
| Collingwood | 445,874 | 265,594 |
| Takaka | 718,039 | 390,355 |
| Waimea | 3,588,219 | 1,576,961 |
| Sounds | 813,575 | 483,483 |
| Marlborough | 4,070,816 | 2,473,618 |
| Awatere | 2,045,479 | 1,343,602 |
| Buller | 1,228,505 | 463,846 |
| Murchison | 540,071 | 219,164 |
| Inangahua | 762,352 | 388,572 |
| Grey | 1,049,237 | 600,871 |
| Westland | 1,037,064 | 577,463 |
| Kaikoura | 1,315,765 | 839,095 |
| Cheviot | 1,451,220 | 1,085,240 |
| Amuri | 2,409,051 | 1,660,961 |
| Waipara | 3,068,970 | 2,325,680 |
| Ashley | 942,740 | 725,415 |
| Kowai | 1,139,670 | 801,255 |
| Oxford | 988,781 | 692,276 |
| Rangiora | 1,540,100 | 1,060,980 |
| Eyre | 1,443,640 | 1,028,070 |
| Waimairi | 4,731,343 | 1,982,052 |
| Paparua | 2,762,677 | 1,725,933 |
| Malvern | 2,421,649 | 1,813,163 |
| Tawera | 442,490 | 322,545 |
| Heathcote | 2,034,235 | 809,105 |
| Halswell | 1,120,820 | 758,660 |
| Selwyn | 1,562,679 | 1,075,069 |
| Springs | 1,207,235 | 889,995 |
| Ellesmere | 2,282,505 | 1,721,505 |
| Mount Herbert | 590,210 | 413,735 |
| Wairewa | 1,121,720 | 824,580 |
| Akaroa | 1,795,995 | 1,282,240 |
| Ashburton | 11,000,210 | 8,388,440 |
| Geraldine | 3,093,645 | 8,074,255 |
| Levels | 3,425,485 | 2,563,375 |
| Mackenzie | 2,492,280 | 1,545,085 |
| Waimate | 6,174,773 | 4,030,408 |
| Waitaki | 6,131,724 | 3,132,426 |
| Maniototo | 1,561,606 | 1,036,836 |
| Waihemo | 800,941 | 586,498 |
| Waikouaiti | 1,282,196 | 763,641 |
| Peninsula | 731,042 | 346,699 |
| Taieri | 2,514,733 | 1,589,933 |
| Tuapeka | 2,452,984 | 1,534,131 |
| Bruce | 1,803,300 | 1,132,676 |
| Clutha | 3,040,619 | 1,693,508 |
| Islands— | ||
| Quarantine and Goat | 3,454 | 900 |
| Vincent | 1,669,878 | 1,033,337 |
| Lake | 741,588 | 478,934 |
| Fiord | 144,293 | 137,513 |
| Wallace | 4,178,134 | 2,284,742 |
| Southland | 12,809,292 | 6,478,145 |
| Stewart Island | 103,410 | 50,035 |
| Islands— | ||
| Antipodes, &c. | 13,880 | 13,880 |
GROSS CAPITAL AND UNIMPROVED VALUES, 1936.
| Borough. | Capital Value (Land and Improvements). | Unimproved Value of Land (included in previous Column). |
|---|---|---|
| £ | £ | |
| Whangarei | 2,589,937 | 909,669 |
| Dargaville | 552,147 | 138,151 |
| Birkenhead | 790,131 | 289,524 |
| Devonport | 2,446,617 | 926,110 |
| AUCKLAND CITY— | ||
| City Portion | 33,024,476 | 16,248,349 |
| Parnell Portion | 2,515,414 | 1,065,006 |
| Grey Lynn Portion | 2,861,092 | 889,237 |
| Arch Hill Portion | 555,259 | 193,365 |
| Eden Terrace Portion | 622,255 | 217,181 |
| Point Chevalier Portion | 1,247,614 | 498,213 |
| Avondale Portion | 1,377,930 | 493,034 |
| Epsom Portion | 3,245,897 | 1,178,333 |
| Remuera Portion | 6,093,001 | 2,306,188 |
| Orakei Portion | 411,530 | 283,120 |
| Tamaki Portion | 2,316,978 | 1,239,425 |
| Total of City | 54,271,440 | 24,611,451 |
| Newmarket | 1,700,114 | 843,438 |
| Onehunga | 2,345,180 | 743,605 |
| Takapuna | 1,936,680 | 721,595 |
| Northcote | 539,455 | 215,352 |
| New Lynn | 522,897 | 107,875 |
| Mount Albert | 4,276,356 | 1,364,417 |
| Mount Eden | 5,998,840 | 2,125,427 |
| One Tree Hill | 3,482,481 | 1,389,272 |
| Otahuhu | 1,465,017 | 428,462 |
| Pukekohe | 884,933 | 384,827 |
| Hamilton | 5,973,042 | 2,430,540 |
| Cambridge | 821,646 | 290,641 |
| Huntly | 375,634 | 96,054 |
| Ngaruawahia | 263,469 | 61,150 |
| Te Awamutu | 743,198 | 249,051 |
| Thames | 731,099 | 178,145 |
| Tauranga | 1,001,072 | 483,921 |
| Paeroa | 539,551 | 171,246 |
| Waihi | 377,828 | 53,032 |
| Te Puke | 279,342 | 89,466 |
| Morrinsville | 501,171 | 132,296 |
| Te Aroha | 787,938 | 283,980 |
| Matamata | 422,260 | 140,305 |
| Rotorua | 1,822,862 | 810,869 |
| Whakatane | 408,871 | 102,512 |
| Taumarunui | 746,067 | 273,333 |
| Te Kuiti | 704,165 | 249,594 |
| Opotiki | 374,334 | 138,471 |
| Gisborne | 4,968,383 | 1,670,315 |
| Wairoa | 602,152 | 188,691 |
| Napier | 4,759,551 | 1,674,902 |
| Hastings | 3,788,611 | 1,380,524 |
| Dannevirke | 1,547,079 | 491,552 |
| Woodville | 194,158 | 53,774 |
| Waipawa | 285,235 | 87,960 |
| Waipukurau | 552,019 | 163,078 |
| New Plymouth | 5,467,195 | 1,706,127 |
| Hawera | 1,461,761 | 582,388 |
| Patea | 160,460 | 57,423 |
| Waitara | 349,926 | 101,508 |
| Inglewood | 300,014 | 69,476 |
| Stratford | 1,022,891 | 349,142 |
| Eltham | 394,880 | 101,638 |
| Wanganui City | 6,760,175 | 2,012,759 |
| Marton | 879,359 | 212,225 |
| Raetihi | 214,556 | 45,842 |
| Ohakune | 129,753 | 17,179 |
| Taihape | 480,745 | 190,520 |
| Feilding | 1,526,926 | 496,036 |
| Palmerston North City | 7,035,445 | 2,393,265 |
| Foxton | 298,620 | 67,435 |
| WELLINGTON CITY— | ||
| City Portion | 32,102,566 | 15,827,354 |
| Wadestown Portion | 1,173,922 | 368,454 |
| Northland Portion | 897,080 | 280,400 |
| Melrose— | ||
| Kilbirnie Portion | 4,802,805 | 1,460,044 |
| Island Bay Portion | 1,809,002 | 515,122 |
| Ohiro Portion | 2,457,015 | 767,850 |
| Onslow Portion | 1,510,500 | 464,165 |
| Karori Portion | 2,128,795 | 640,965 |
| Miramar Portion | 3,365,515 | 898,153 |
| Total of City | 50,247,200 | 21,222,507 |
| Shannon | 173,195 | 58,170 |
| Levin | 798,786 | 216,303 |
| Otaki | 338,215 | 135,868 |
| Pahiatua | 387,527 | 95,747 |
| Masterton | 2,922,350 | 845,227 |
| Carterton | 548,575 | 102,707 |
| Greytown | 232,392 | 54,420 |
| Upper Hutt | 825,155 | 223,020 |
| Lower Hutt | 5,951,016 | 1,897,429 |
| Petone | 3,330,218 | 891,099 |
| Eketahuna | 167,242 | 41,949 |
| Martinborough | 258,086 | 47,940 |
| Featherston | 208,693 | 43,785 |
| Eastbourne | 789,685 | 283,945 |
| Richmond | 281,178 | 117,592 |
| Nelson City | 3,448,725 | 1,289,391 |
| Picton | 410,355 | 149,820 |
| Blenheim | 1,623,208 | 518,833 |
| Motueka | 378,963 | 150,342 |
| Westport | 651,323 | 178,617 |
| Greymouth | 1,611,677 | 386,802 |
| Brunner | 177,049 | 72,818 |
| Kumara | 23,261 | 5,558 |
| Hokitika | 446,535 | 89,246 |
| Ross | 24,868 | 7,452 |
| Runanga | 91,574 | 21,577 |
| Rangiora | 528,520 | 139,705 |
| Kaiapoi | 344,748 | 89,673 |
| CHRISTCHURCH CITY— | ||
| St. Albans Portion | 5,337,345 | 1,750,245 |
| North Richmond Portion | 628,710 | 157,630 |
| Papanui Portion | 1,277,855 | 393,060 |
| Richmond Portion | 400,290 | 121,905 |
| North-east Portion | 1,197,295 | 491,230 |
| North-west Portion | 3,951,510 | 1,965,475 |
| South-east Portion | 2,793,700 | 1,306,390 |
| South-west Portion | 6,362,355 | 3,626,830 |
| Sydenham Portion | 3,121,350 | 1,028,477 |
| Opawa Portion | 345,990 | 120,375 |
| St. Martin's Portion | 282,960 | 85,323 |
| Beckenham Portion | 454,730 | 114,355 |
| Linwood Portion | 1,968,845 | 606,105 |
| North Linwood Portion | 558,955 | 139,820 |
| Avonside Portion | 454,275 | 126,900 |
| East Linwood Portion | 160,960 | 42,855 |
| Woolston Portion | 1,117,000 | 325,242 |
| Spreydon West Portion | 1,046,375 | 298,495 |
| Spreydon East Portion | 1,003,105 | 260,990 |
| Total of City | 32,403,605 | 12,961,702 |
| New Brighton | 919,738 | 305,005 |
| Sumner | 873,910 | 306,882 |
| Lyttelton | 805,420 | 278,585 |
| Akaroa | 129,626 | 50,636 |
| Riccarton | 1,628,943 | 409,222 |
| Ashburton | 1,497,660 | 547,190 |
| Timaru | 5,179,360 | 1,710,754 |
| Geraldine | 211,084 | 50,215 |
| Temuka | 372,190 | 111,440 |
| Waimate | 558,315 | 127,095 |
| Oamaru | 1,671,380 | 556,807 |
| Hampden | 34,764 | 9,699 |
| Naseby | 19,978 | 2,583 |
| Palmerston | 136,548 | 29,328 |
| Waikouaiti | 130,754 | 39,172 |
| Port Chalmers | 382,021 | 119,608 |
| West Harbour | 429,715 | 80,805 |
| DUNEDIN CITY— | ||
| Valley Portion | 1,203,402 | 296,332 |
| Maori Hill Portion | 999,165 | 244,515 |
| Roslyn Portion | 1,831,786 | 479,800 |
| Mornington Portion | 1,294,738 | 266,175 |
| Leith Portion | 4,848,427 | 1,855,832 |
| Central Portion | 5,302,939 | 2,200,870 |
| Caversham Portion | 1,784,765 | 412,280 |
| South Dunedin Portion | 1,161,710 | 278,375 |
| Bay Portion | 1,244,939 | 229,367 |
| Total of City | 19,671,871 | 6,263,546 |
| St. Kilda | 1,639,418 | 420,838 |
| Green Island | 406,730 | 86,675 |
| Mosgiel | 387,840 | 70,890 |
| Roxburgh | 87,135 | 21,715 |
| Lawrence | 71,395 | 8,702 |
| Tapanui | 43,860 | 9,125 |
| Milton | 255,498 | 55,821 |
| Balclutha | 309,920 | 85,115 |
| Kaitangata | 112,731 | 31,543 |
| Cromwell | 86,481 | 16,234 |
| Alexandra | 98,824 | 15,436 |
| Arrowtown | 20,700 | 2,780 |
| Queenstown | 192,270 | 34,425 |
| Gore | 1,103,360 | 281,025 |
| Mataura | 319,585 | 83,470 |
| Winton | 201,080 | 56,970 |
| Invercargill City | 6,049,105 | 1,665,544 |
| South Invercargill | 140,030 | 48,160 |
| Riverton | 189,317 | 48,987 |
| Bluff | 351,715 | 77,370 |
GROSS CAPITAL AND UNIMPROVED VALUES, 1936.
| Town District. | Capital Value (Land and Improvements). | Unimproved Value of Land (Included in previous Column). |
|---|---|---|
| £ | £ | |
| Kaitaia | 170,053 | 44,115 |
| Kaikohe | 183,620 | 54,805 |
| Hikurangi | 174,408 | 41,663 |
| Kamo | 131,437 | 40,915 |
| Warkworth | 102,422 | 19,210 |
| Helensville | 208,979 | 54,782 |
| Henderson | 212,741 | 72,872 |
| Glen Eden | 205,580 | 66,598 |
| Ellerslie | 642,642 | 208,425 |
| Waiuku | 286,925 | 97,765 |
| Howick | 252,005 | 110,600 |
| Papatoetoe | 675,076 | 249,390 |
| Manurewa | 454,425 | 169,188 |
| Papakura | 417,885 | 167,577 |
| Tuakau | 196,503 | 78,695 |
| Leamington | 149,605 | 67,810 |
| Putaruru | 184,025 | 68,335 |
| Otorohanga | 198,270 | 60,773 |
| Taradale | 297,089 | 113,722 |
| Havelock North | 368,631 | 122,192 |
| Opunake | 225,855 | 70,125 |
| Manaia | 121,395 | 25,953 |
| Waverley | 117,735 | 26,245 |
| Ohura | 65,042 | 21,028 |
| Rangataua | 12,531 | 871 |
| Mangaweka | 55,914 | 21,283 |
| Hunterville | 95,405 | 30,925 |
| Bulls | 124,246 | 38,025 |
| Manunui | 71,282 | 25,940 |
| Johnsonville | 379,364 | 111,962 |
| Tahunanui | 199,244 | 57,230 |
| Leeston | 152,540 | 38,245 |
| Tinwald | 137,985 | 51,675 |
| Pleasant Point | 119,315 | 38,980 |
| Nightcaps | 80,935 | 15,140 |
| Otautau | 144,428 | 42,883 |
| Lumsden | 65,440 | 14,055 |
| Wyndham | 121,925 | 39,530 |
Table of Contents
BANKING institutions operating in New Zealand may be enumerated as follows:—
The Reserve Bank of New Zealand.
Six trading banks.
The Post Office Savings-bank.
Five trustee savings-banks.
In addition, a number of trading companies, investment societies, &c., perform quasi-banking functions, accepting deposits and granting credits (short-term and long-term) to clients. In some instances deposits are repayable to the client's order at call—virtually a system of cheque-issuing.
Until the establishment of the Reserve Bank, which commenced to function on 1st August, 1934, each of the six trading banks held the right of note-issue, which is now vested solely in the Reserve Bank.
A full description of banking practice in New Zealand is beyond the scope of a Year-Book section, but those desiring information on this subject may usefully refer to the report of the Parliamentary Monetary Committee, parliamentary paper B.-3 (1934), and to its minutes of evidence, published as an appendix. In the analysis of recent banking movements presented in the following pages the explanatory letterpress contains a résumé of the main features of present banking practice in the Dominion.
The Reserve Bank was constituted by the Reserve Bank of New Zealand Act, 1933 (amended in minor respects by the Finance Act, 1934), with the primary object of exercising control, within defined limits, over monetary circulation and credit in the Dominion. As originally constituted, the Bank had a share capital of £500,000, composed of 100,000 publicly subscribed shares of £5, bearing a cumulative dividend of 5 per cent. Very important changes in the constitution of the Bank were made by the Reserve Bank Amendment Act, 1936, which, inter alia, abolished the subscribed share capital of the Bank, with provision for the repayment to shareholders (either in cash or in Government stock, at the option of the shareholder) of the value of shares held and accrued dividends. The General Reserve Fund of the Bank is maintained at £1,500,000, made up of a contribution of £1,000,000 by the Government at the passing of the original Act, and £500,000 to replace share capital after the passing of the 1936 Amendment Act. It will be seen then that the whole of the reserve fund is now contributed by the State—the Bank being virtually State-owned. Additional powers were conferred on the Reserve Bank by the Finance Act (No. 2), 1936. Following are the more important features of the legislation at present in force defining the management, functions, &c., of the Bank.
The management of the Bank is entrusted to a Board of Directors consisting of the Governor and the Deputy-Governor and seven ordinary members, three appointed by the State and four who were originally appointed by the shareholders. All seven ordinary members of the directorate now hold office during the pleasure of the Governor-General in Council; while provision is made for the retirement of a certain number (one or two) of the present ordinary members each year, who may be reappointed. Ordinary members appointed or reappointed in future cannot hold office continuously for a longer period than five years without reappointment.
The Secretary to the Treasury is an ex officio member with voting-power. All members of the Board (other than the Secretary to the Treasury) must be British subjects by birth, and may not be members of the Legislature, public servants of any Department, or undischarged bankrupts. Not more than one member may act as director of any other bank.
The general function of the Bank is defined in section 10 (1) of the Reserve Bank of New Zealand Amendment Act, 1936, as follows: “It shall be the general function of the Reserve Bank, within the limits of its powers, to give effect as far as may be to the monetary policy of the Government as communicated to it from time to time by the Minister of Finance. For this purpose, and to the end that the economic and social welfare of New Zealand may be promoted and maintained, the Bank shall regulate and control credit and currency in New Zealand, the transfer of moneys to or from New Zealand, and the disposal of moneys that are derived from the sale of any New Zealand products and for the time being are held overseas.” The Bank is empowered under the existing legislation to—
Make and issue bank-notes (see heading in “Coinage and Currency” post).
Buy and sell gold and silver coin and bullion.
Accept money on deposit or current account.
Discount, rediscount, buy, and sell: (a) Bills, notes, &c., whether commercial or agricultural, maturing within one hundred and twenty days from date of document or ninety days after sight; (b) agricultural bills, notes, &c., maturing within six months of acquisition; (c) Treasury bills of any Government, or bills of any local body in any British country, all such bills to be maturing within three months of acquisition.
Grant advances, up to three months, against: (a) Gold coin or bullion or relative documents; (b) Government, local authority, or other approved securities readily marketable in New Zealand; (c) bills, &c., as referred to above; (d) promissory notes of banks in New Zealand. The Bank is also empowered to (e) grant accommodation by way of overdraft to the Government of New Zealand or to any Board or other authority having statutory powers in relation to the marketing of any New Zealand produce for the purpose of financing the purchase and marketing of any such produce.
Buy and sell securities of the New Zealand or United Kingdom Governments, or securities guaranteed by the Government of New Zealand or by the Government of the United Kingdom.
Buy and sell currencies of other countries.
By authority of the Governor-General in Council underwrite any loan proposed to be raised by the New Zealand Government, or by the State Advances Corporation of New Zealand.
Issue and manage loans for the Government or any local authority or public body in New Zealand.
Keep a register of inscribed stock on behalf of a local authority or public body.
Organize a clearing system.
Act as correspondent for overseas banks or as agent of other reserve banks.
Do any other banking business not prohibited by the Act.
Other duties of the Bank in connection with note-issue, exchange, and maintenance of reserves are referred to elsewhere in this section.
On the commencement of business on 1st August, 1934, the Public Account was transferred to the Reserve Bank, and the management of the public debt has been taken over by the Reserve Bank as from the 1st October, 1936.
Inter alia, the Bank is prohibited from engaging in trade; purchasing the shares of other banks (except the Bank for International Settlements); making unsecured loans or advances; purchasing or making advances on real property; paying interest on moneys placed with it on deposit or on current account, except to the Government on Government funds held by the Bank outside New Zealand; renewing bills, except in exceptional circumstances; drawing or accepting bills payable otherwise than on demand. There is also a limit (of one-fourth of the estimated revenue for the year) placed upon the accommodation that can be given Government Departments, local authorities, or public bodies. The Bank may, however, accept Treasury bills up to the total revenue or estimated revenue of the General Government for the year. In computing the amount of accommodation which the Bank may grant the General Government, any securities mentioned in paragraphs 5 (e) or 6 on the opposite page must not be taken into account.
The Bank is required to furnish to the Treasury a weekly statement in prescribed form, and this is directed to be published in the Gazette. A copy of the annual accounts must be laid before Parliament.
The net profits of the Bank are paid to the Consolidated Fund, provided that the Bank's General Reserve Fund is not less than £1,000,000. If the Reserve Fund falls below that level part of the profits must be credited to the Reserve Fund.
An analysis of the liabilities and assets of the Bank on the last Monday in each month since the Bank commenced operations is shown on the next page.
The liabilities of the Bank have not up to the present included any liabilities in currencies other than New Zealand currency (except on isolated occasions for comparatively small amounts), while discounts do not appear among the assets.
The net reserve ratio was at phenomenally high levels in 1934, 1935, and 1936. The ratio fell somewhat towards the end of 1936; but the lowest level reached to date (67.91 per cent., on 28th December, 1936) was still markedly in excess of the statutory obligation of 25 per cent. The trend in 1937 has been upwards with minor recessions, the latest available figure (25th October) being 7886 per cent. As pointed out later in this section (under the caption “Legal Tender and Issue of Notes”), the term “reserve” includes, inter alia, sterling exchange. The relatively minor importance of gold holdings in relation to sterling exchange is striking evidence of the extent to which sterling exchange forms the base of the New Zealand monetary system. A sterling-exchange standard was the de facto position even in the now-distant days when gold was freely circulating, though it is probable that the predominance of sterling exchange in banking reserves was never in the past as high as at present.
LIABILITIES OF RESERVE BANK.
| As at | Capital and General Reserve Fund. | Bank-notes. | Other Demand Liabilities. | Other Liabilities. | Total Liabilities. | ||
|---|---|---|---|---|---|---|---|
| State. | Banks. | Other. | |||||
| 1934. | £ | £ | £ | £ | £ | £ | £ |
| August 27th | 1,500,000 | 7,975,310 | 3,298,174 | 16,510,566 | 1,294 | 29,974 | 29,315,318 |
| December 31st 1935. | 1,500,000 | 9,772,279 | 6,693,087 | 9,071,699 | 5,899 | 39,918 | 27,082,882 |
| March 25th | 1,500,000 | 9,341,392 | 12,033,114 | 4,795,723 | 8,192 | 58,180 | 27,736,601 |
| June 24th | 1,500,000 | 9,111,270 | 13,287,926 | 3,915,165 | 22,511 | 53,808 | 27,890,680 |
| September 30th | 1,500,000 | 8,893,965 | 9,197,925 | 4,644,581 | 545,906 | 71,093 | 24,853,470 |
| December 30th 1936. | 1,500,000 | 10,720,555 | 3,696,061 | 9,078,905 | 362,143 | 113,916 | 26,071,580 |
| January 27th | 1,500,000 | 10,063,689 | 4,510,170 | 10,253,190 | 451,780 | 123,418 | 26,902,247 |
| February 24th | 1,500,000 | 9,854,586 | 5,676,065 | 10,671,358 | 97,510 | 127,516 | 27,927,035 |
| March 30th | 1,500,000 | 10,153,129 | 8,788,905 | 8,991,691 | 122,059 | 144,927 | 29,700,711 |
| April 27th | 1,500,000 | 10,240,246 | 8,584,265 | 8,584,599 | 103,395 | 101,548 | 29,114,053 |
| May 25th | 1,500,000 | 10,156,795 | 8,983,270 | 8,078,108 | 190,165 | 77,757 | 28,986,095 |
| June 29th | 1,500,000 | 10,040,705 | 8,839,632 | 6,697,464 | 258,410 | 89,695 | 27,425,906 |
| July 27th | 1,500,000 | 10,177,703 | 9,128,973 | 6,372,641 | 149,822 | 94,633 | 27,423,772 |
| August 31st | 1,500,000 | 11,148,294 | 6,436,015 | 5,697,438 | 288,682 | 90,498 | 25,160,927 |
| September 28th | 1,500,000 | 11,174,758 | 3,898,063 | 6,873,521 | 241,635 | 105,489 | 23,793,466 |
| October 20th | 1,500,000 | 11,480,334 | 4,083,595 | 7,691,539 | 349,240 | 128,669 | 25,233,377 |
| November 30th | 1,500,000 | 11,838,198 | 3,873,601 | 9,564,645 | 192,702 | 158,755 | 27,132,901 |
| December 28th 1937. | 1,500,000 | 13,641,451 | 3,539,668 | 11,056,206 | 236,398 | 134,058 | 30,107,781 |
| January 25th | 1,500,000 | 13,068,392 | 5,039,524 | 11,887,286 | 385,098 | 133,145 | 32,014,045 |
| February 22nd | 1,500,000 | 12,752,949 | 6,351,440 | 11,741,265 | 233,977 | 144,074 | 32,723,705 |
| March 29th | 1,500,000 | 13,179,255 | 7,887,847 | 8,880,494 | 152,794 | 156,361 | 31,756,751 |
| April 26th | 1,500,000 | 12,956,903 | 7,709,280 | 9,786,620 | 905,541 | 126,686 | 32,985,030 |
| May 31st | 1,500,000 | 12,974,591 | 7,383,790 | 10,133,953 | 971,144 | 123,761 | 33,087,239 |
| June 28th | 1,500,000 | 12,630,838 | 7,361,047 | 9,824,090 | 994,985 | 88,106 | 32,399,066 |
| July 26th | 1,500,000 | 12,590,827 | 6,418,396 | 9,761,806 | 962,459 | 105,524 | 31,339,012 |
| August 30th | 1,500,000 | 12,793,756 | 6,273,483 | 9,905,193 | 654,765 | 93,147 | 31,220,344 |
| September 27th | 1,500,000 | 12,994,386 | 5,153,946 | 8,870,167 | 697,441 | 319,621 | 29,535,561 |
ASSETS OF RESERVE BANK.
| As at | Reserve. | Subsidiary Coin. | Advances. | Investments. | Other Assets. | Total Assets. | Net Reserve Ratio.* | |
|---|---|---|---|---|---|---|---|---|
| Gold. | Exchange. | |||||||
| * I.e.—Reserve, less liabilities in currencies other than New Zealand currency, expressed as a percentage of notes and other demand liabilities. | ||||||||
| 1934. | £ | £ | £ | £ | £ | £ | £ | Per Cent. |
| August 27th | 3,202,179 | 24,487,093 | 108,046 | 1,500,000 | 18,000 | 29,315,318 | 99.65 | |
| December 31st 1935. | 3,001,731 | 22,092,021 | 93,700 | 1,872,111 | 23,319 | 27,082,882 | 98.24 | |
| March 25th | 3,001,731 | 22,434,593 | 177,794 | 2,095,068 | 27,415 | 27,736,601 | 97.16 | |
| June 24th | 2,801,732 | 22,813,024 | 145,975 | 2,094,075 | 35,874 | 27,890,680 | 97.25 | |
| September 30th | 2,801,732 | 19,688,594 | 219,950 | 2,134,536 | 8,658 | 24,853,470 | 96.60 | |
| December 30th 1936. | 2,801,733 | 21,398,949 | 195,812 | 1,639,181 | 35,905 | 26,071,580 | 98.95 | |
| January 27th | 2,801,733 | 22,103,949 | 198,617 | 1,771,470 | 26,478 | 26,902,247 | 98.52 | |
| February 24th | 2,801,733 | 23,113,211 | 199,118 | 1,779,044 | 33,929 | 27,927,035 | 98.54 | |
| March 30th | 2,801,733 | 24,830,181 | 202,162 | 1,828,814 | 37,821 | 29,700,711 | 98.49 | |
| April 27th | 2,801,733 | 24,224,599 | 205,791 | 1,815,595 | 66,335 | 29,114,053 | 98.23 | |
| May 25th | 2,801,733 | 23,737,755 | 200,874 | 1,995,994 | 249,739 | 28,986,095 | 96.83 | |
| June 29th | 2,801,733 | 22,122,319 | 192,158 | 2,036,800 | 272,896 | 27,425,906 | 96.50 | |
| July 27th | 2,801,733 | 22,129,379 | 190,188 | 2,035,320 | 267,152 | 27,423,772 | 96.52 | |
| August 31st | 2,801,733 | 19,799,236 | 184,016 | 65,118 | 2,038,324 | 272,500 | 25,160,927 | 95.89 |
| September 28th | 2,801,733 | 16,835,564 | 170,524 | 1,795,350 | 2,123,577 | 66,718 | 23,793,466 | 88.50 |
| October 20th | 2,801,789 | 16,545,194 | 157,859 | 3,453,337 | 2,186,244 | 88,954 | 25,233,377 | 81.96 |
| November 30th | 2,801,790 | 16,578,681 | 118,726 | 5,094,941 | 2,350,061 | 188,702 | 27,132,901 | 76.08 |
| December 28th 1937. | 2,801,790 | 16,534,425 | 110,903 | 7,859,572 | 2,700,315 | 100,776 | 30,107,781 | 67.91 |
| January 25th | 2,801,790 | 17,901,994 | 154,474 | 7,909,698 | 3,159,850 | 86,239 | 32,014,045 | 68.15 |
| February 22nd | 2,801,790 | 18,804,394 | 158,173 | 8,369,250 | 2,453,050 | 137,048 | 32,723,705 | 69.52 |
| March 29th | 2,801,791 | 19,098,904 | 153,368 | 7,129,783 | 2,453,050 | 119,855 | 31,756,751 | 72.76 |
| April 20th | 2,801,791 | 20,309,013 | 145,908 | 6,749,071 | 2,906,450 | 72,797 | 32,985,030 | 73.70 |
| May 31st | 2,801,791 | 22,327,095 | 111,624 | 4,873,119 | 2,906,450 | 67,160 | 33,087,239 | 79.87 |
| June 28th | 2,801,791 | 21,542,637 | 117,273 | 4,954,993 | 2,906,450 | 75,922 | 32,399,066 | 79.01 |
| July 20th | 2,801,791 | 20,859,070 | 112,126 | 4,577,733 | 2,906,450 | 81,842 | 31,339,012 | 79.58 |
| August 30th | 2,801,791 | 20,555,164 | 101,153 | 4,787,301 | 2,906,450 | 68,485 | 31,220,344 | 78.84 |
| September 27th | 2,801,791 | 19,066,048 | 92,969 | 4,565,647 | 2,906,450 | 102,656 | 29,535,561 | 78.90 |
The Banking Act, 1908, which consolidated the law of New Zealand relating to the general business of banking in the Dominion, provides that the incorporation of banks by Royal Charter shall be as effectual within New Zealand as Acts of the General Assembly. The number of directors is prescribed by the Act, and authority is given to any bank to increase its capital on a resolution of the shareholders. Transfers of shares on which there is any liability must be approved by the directors or their duly appointed attorney or attorneys. A sworn copy of an entry in the books of a bank shall in all legal proceedings be evidence of such entry, and a bank is not required in any legal proceedings to which it is not a party to produce its books before a Court unless ordered by a Judge for special cause. Provision is made for bank holidays and for the destruction of cheques, drafts, bills of exchange, or promissory notes after the expiration of ten, years from the date or due date of such documents.
Part II of the Bills of Exchange Act, 1908, consolidates the law relating to cheques on a bank.
The Companies Act, 1933, with the exception of Part XII (re companies incorporated outside New Zealand) and also of the provisions relating to branch registers, does not apply to banking companies formed within and operating only within the Dominion.
With the establishment of the Reserve Bank of New Zealand, which commenced to function on 1st August, 1924, theirs was inaugurated an entirely new era in banking practice in New Zealand. The function of note-issue has been transferred from the trading banks to the Reserve Bank; while all gold coin or bullion held by trading banks for their own account was required by the Reserve Bank of New Zealand Act, 1933, to be transferred to the Reserve Bank in exchange for equivalent notes of the Reserve Bank or for credit with that Bank. The basis of payment was £3 17s. 10½d. per ounce of standard—i.e., eleven-twelfths fine—gold content, which was the price at which such gold (in actual fact, coin only) had originally been acquired by the banks. Any profit derived from the sale of this gold overseas by the Reserve Bank accrues to the State and not to the Reserve Bank. Consolidated Fund receipts from profits on the sale of gold coin were £1,364,118 in 1934–35 and £231,271 in 1935–36 (1936–37, nil).
While the regulation of currency exchange is now a function of the Reserve Bank, commercial exchange transactions are still carried out through the medium of the trading banks. The Reserve Bank does not compete for this business, its rate being ½ per cent. higher than the trading banks' rate.
Each trading bank is required to maintain with the Reserve Bank a balance of not less than 7 per cent. of its demand liabilities in New Zealand, and 3 per cent. of its time liabilities in New Zealand. These requirements may be varied by the Governor of the Bank, acting with the authority of the Minister of Finance, but not so as to be less than the percentages quoted above.
There are six banks trading in New Zealand, two of these institutions—the Bank of New Zealand and the National Bank of New Zealand—being incorporated by special Acts of the General Assembly of the Dominion. The other four banks, which are predominantly Australian institutions, have in the aggregate much greater capital resources, &c., than the two New Zealand banks. The close Australian affiliations of the Australian banks operating in the Dominion resulted in the past in an interlocking between the Australian and New Zealand financial structures, the separation of New Zealand business being one of the major motives leading up to the foundation of the Reserve Bank.
The Bank of New Zealand is partly State-owned, the New Zealand Government holding preference and long-term mortgage shares to the aggregate value of £2,109,375 out of a total paid-up capital of £6,328,125. Four of the six directors are appointed by the Government, the remaining two by the shareholders. The Bank has branches in London, Australia, Fiji, and Samoa; while its branches and agencies within the Dominion number 221. The other five banks have between them 295 establishments within the Dominion, making a total of 516, or an average of one branch bank to every 3,071 inhabitants.
The statistical tables included in the following pages have been compiled from one or other of the following sources:—
Quarterly returns gazetted under the authority of the Banking Act, 1908. (These returns are now in abeyance.)
Monthly returns gazetted under the authority of the Reserve Bank of New Zealand Act, 1933, and amendments.
Weekly statistics collected under the authority of the Census and Statistics Act, 1926.
Most of the data for back years are compiled from the long-standing quarterly returns, while the monthly returns date from the commencement of the Reserve Bank (August, 1934). Weekly trading bank statistics have been collected by the Census and Statistics Department since April, 1928.
The total paid-up capital of the trading banks, their reserve funds, and the rate of their last dividend, as near as possible to 31st December, 1936, were as follows:—
| Bank. | Paid-up Capital. | Rate per Cent. per Annum of Last Dividend and Bonus. | Reserves. |
|---|---|---|---|
| Bank of New Zealand— | £ | Per Cent. | £ |
| “A” preference shares issued to the Crown (Act of 1920) | 500,000 | 10 | 3,939,890 |
| “B” preference shares issued to the Crown (Act of 1920) | 1,375,000 | 7 3/11 | |
| “C” long-term mortgage shares issued to the Crown | 234,375 | 6 | |
| “D” long-term mortgage shares | 468,750 | 7½ | |
| Ordinary shares | 3,750,000 | 10 | |
| Union Bank of Australia, Ltd. | 4,000,000 | 5½ | 4,996,864 |
| Bank of New South Wales | 8,780,000 | 5¼ | 6,279,499 |
| Bank of Australasia | 4,500,000 | 8 | 4,668,329 |
| National Bank of New Zealand, Ltd. | 2,000,000 | 4 | 1,612,797 |
| Commercial Bank of Australia, Ltd.— | |||
| Ordinary | 2,000,000 | 6⅔ | 2,353,338 |
| Preference | 2,117,350 | 4 |
As observed previously, four of these banks are predominantly Australian institutions, and consequently the statistics of paid-up capital, &c., quoted above are not necessarily indicative of the relative status of the banks in respect of New Zealand business. The reserves of the trading banks have totalled upwards of £20,000,000 during each of the last ten years.
The liabilities of the trading banks for the ten years 1925 to 1934 are shown in the table following, the figures given referring to New Zealand business only. The liabilities shown represent the average of the four quarters of the year.
| Year. | Notes in Circulation. | Bills in Circulation. | Balances due to other Banks. | Deposits. | Total Liabilities.* |
|---|---|---|---|---|---|
| * Including from 1927 transfers from Long-term Mortgage Department in case of Bank of New Zealand. | |||||
| £ | £ | £ | £ | £ | |
| 1925 | 6,775,470 | 312,983 | 924,042 | 52,207,202 | 60,219,697 |
| 1926 | 6,730,421 | 292,370 | 850,256 | 50,135,114 | 58,008,161 |
| 1927 | 6,510,018 | 292,369 | 948,926 | 48,294,096 | 56,321,397 |
| 1928 | 6,374,043 | 307,007 | 1,146,543 | 53,799,221 | 61,850,595 |
| 1929 | 6,433,911 | 327,667 | 850,441 | 57,609,746 | 65,232,866 |
| 1930 | 6,255,717 | 269,294 | 1,024,963 | 56,425,014 | 63,984,419 |
| 1931 | 5,782,354 | 191,417 | 1,798,375 | 53,645,018 | 61,463,034 |
| 1932 | 5,958,268 | 158,866 | 1,566,107 | 52,851,736 | 60,649,208 |
| 1933 | 6,205,429 | 179,427 | 1,111,979 | 57,620,233 | 65,281,375 |
| 1934 | 4,844,826 | 197,882 | 576,863 | 63,417,299 | 69,259,271 |
MONTHLY LIABILITIES OF TRADING BANKS.
| As at | Notes in Circulation. | Demand Liabilities. | Time Liabilities. | Total Liabilities. | ||
|---|---|---|---|---|---|---|
| In New Zealand. | Outside New Zealand. | In New Zealand. | Outside New Zealand. | |||
| 1934. | £ (000). | £ (000). | £ (000). | £ (000). | £ (000). | £ (000). |
| September 24th | 2,716 | 25,772 | 292 | 39,587 | 822 | 69,189 |
| December 31st | 1,486 | 24,178 | 260 | 36,762 | 846 | 63,532 |
| 1935. | ||||||
| March 25th | 854 | 27,674 | 270 | 35,455 | 854 | 65,107 |
| June 24th | 710 | 25,922 | 379 | 35,827 | 906 | 63,744 |
| September 30th | 632 | 24,635 | 408 | 36,751 | 1,114 | 63,540 |
| December 30th | 585 | 27,168 | 541 | 37,136 | 552 | 65,982 |
| 1936. | ||||||
| January 27th | 572 | 28,828 | 412 | 37,034 | 655 | 67,501 |
| February 24th | 560 | 30,469 | 449 | 37,161 | 668 | 69,307 |
| March 30th | 545 | 31,947 | 527 | 36,530 | 585 | 70,134 |
| April 27th | 537 | 32,049 | 592 | 37,311 | 661 | 71,150 |
| May 25th | 528 | 31,584 | 675 | 36,675 | 723 | 70,185 |
| June 29th | 518 | 30,806 | 605 | 36,067 | 777 | 68,773 |
| July 27th | 511 | 30,268 | 878 | 35,614 | 607 | 67,878 |
| August 31st | 29,907 | 833 | 34,893 | 641 | 66,274 | |
| September 28th | 28,935 | 887 | 34,486 | 596 | 64,904 | |
| October 26th | 28,889 | 950 | 34,048 | 549 | 64,436 | |
| November 30th | 29,188 | 1,085 | 33,384 | 716 | 64,373 | |
| December 28th | 31,080 | 783 | 33,124 | 953 | 65,940 | |
| 1937. | ||||||
| January 25th | 35,021 | 1,161 | 32,949 | 751 | 69,882 | |
| February 22nd | 36,737 | 865 | 32,600 | 501 | 70,703 | |
| March 29th | 36,898 | 758 | 31,975 | 446 | 70,077 | |
| April 26th | 38,518 | 891 | 32,464 | 456 | 72,329 | |
| May 31st | 36,667 | 1,157 | 32,505 | 571 | 70,900 | |
| June 28th | 36,053 | 1,255 | 32,948 | 533 | 70,789 | |
| July 26th | 34,825 | 1,425 | 33,304 | 475 | 70,029 | |
| August 30th | 33,699 | 1,169 | 33,361 | 426 | 68,655 | |
| September 27th | 32,890 | 1,027 | 33,051 | 426 | 67,394 | |
Since the Reserve Bank commenced operations the trading banks have been required to submit at monthly intervals a return of liabilities and assets in respect of New Zealand business. An analysis of liabilities at quarterly intervals in 1934 and 1935, and at monthly intervals in 1936 and 1937, is shown on the preceding page.
Notes of trading banks were finally withdrawn from circulation on 1st August, 1936 (see “Coinage and Currency,” post).
Assets are now presented in a manner similar to that in which liabilities are shown. The annual figures represent the average of the four quarters of the year, while the monthly statistics relate to the position on the last Monday in each month.
| Year. | Coin and Bullion. | Notes and Bills discounted. | Debts due, exclusive of Bad Debts. | Balances due from other Banks. | Government Securities. | Total Assets (including others). |
|---|---|---|---|---|---|---|
| £ | £ | £ | £ | £ | £ | |
| 1925 | 7,722,917 | 1,639,168 | 43,659,787 | 1,214,321 | 4,782,170 | 62,128,808 |
| 1926 | 7,797,319 | 1,787,504 | 47,361,756 | 881,845 | 4,654,846 | 65,765,297 |
| 1927 | 7,874,971 | 1,610,368 | 48,421,835 | 978,264 | 4,647,191 | 66,626,676 |
| 1928 | 7,511,833 | 1,286,185 | 44,893,278 | 1,301,907 | 4,790,404 | 62,819,485 |
| 1929 | 7,051,391 | 1,103,149 | 48,175,045 | 955,803 | 4,887,462 | 65,475,529 |
| 1930 | 6,798,556 | 1,173,367 | 52,484,030 | 1,075,334 | 4,777,896 | 69,748,071 |
| 1931 | 6,917,897 | 843,041 | 51,576,486 | 1,832,781 | 4,505,581 | 68,557,120 |
| 1932 | 5,957,944 | 644,953 | 49,610,721 | 1,592,894 | 8,521,017 | 69,015,209 |
| 1933 | 5,105,846 | 814,228 | 44,890,816 | 1,109,257 | 15,266,032 | 69,656,700 |
| 1934 | 3,477,248 | 1,174,407 | 40,215,050 | 6,010,486 | 18,105,025 | 73,509,177 |
MONTHLY ASSETS OF TRADING BANKS.
| As at | Coin and Bullion. | Reserve Bank-Notes. | Balances held in Reserve Bank. | Overseas Assets. | Securities held.* | Advances and Discounts. | Land, Buildings, &c.* | Total Assets.† |
|---|---|---|---|---|---|---|---|---|
* Data as to securities held and land, buildings, &c., were not included in the monthly statements prior to October, 1935. † The figures in this column for dates up to and including September, 30th, 1935, are incomplete. | ||||||||
| 1934. | £ (000). | £ (000). | £ (000). | £ (000). | £ (000). | £ (000). | £ (000). | £ (000). |
| September 24th | 602 | 5,197 | 15,913 | 16,881 | 41,603 | 80,196 | ||
| December 31st | 615 | 4,417 | 9,072 | 19,542 | 44,903 | 78,549 | ||
| 1935. | ||||||||
| March 25th | 788 | 3,959 | 4,724 | 23,918 | 44,573 | 77,962 | ||
| June 24th | 798 | 3,714 | 3,877 | 24,497 | 45,172 | 78,058 | ||
| September 39th | 817 | 3,034 | 4,633 | 21,879 | 47,711 | 78,074 | ||
| December 30th | 745 | 3,691 | 9,676 | 15,783 | 5,057 | 46,567 | 1,490 | 83,009 |
| 1936. | ||||||||
| January 27th | 812 | 3,788 | 10,247 | 17,333 | 5,081 | 45,649 | 1,497 | 84,407 |
| February 24th | 762 | 3,497 | 10,663 | 19,219 | 5,093 | 44,761 | 1,501 | 85,496 |
| March 30th | 755 | 3,593 | 8,938 | 20,370 | 5,389 | 44,919 | 1,508 | 85,472 |
| April 27th | 739 | 3,627 | 8,571 | 22,285 | 5,456 | 45,091 | 1,505 | 87,274 |
| May 25th | 736 | 3,520 | 8,075 | 22,859 | 5,501 | 44,971 | 1,512 | 87,174 |
| June 29th | 733 | 3,337 | 6,686 | 23,217 | 5,622 | 45,077 | 1,537 | 86,209 |
| July 27th | 718 | 3,518 | 6,366 | 22,606 | 5,524 | 45,185 | 1,525 | 85,442 |
| August 31st | 684 | 3,357 | 5,693 | 20,395 | 5,478 | 45,826 | 1,534 | 82,967 |
| September 28th | 653 | 3,403 | 6,865 | 18,676 | 5,464 | 46,000 | 1,540 | 82,601 |
| October 20th | 632 | 3,428 | 7,661 | 16,405 | 5,502 | 47,779 | 1,529 | 82,936 |
| November 30th | 661 | 3,169 | 9,546 | 13,856 | 5,985 | 49,512 | 1,538 | 84,267 |
| December 28th | 526 | 3,198 | 11,040 | 13,282 | 5,997 | 48,282 | 1,541 | 83,866 |
| 1937. | ||||||||
| January 25th | 737 | 4,713 | 11,870 | 12,584 | 7,880 | 47,417 | 1,561 | 86,762 |
| February 22nd | 726 | 4,292 | 11,735 | 13,895 | 7,906 | 45,759 | 1,583 | 85,896 |
| March 29th | 609 | 3,335 | 8,865 | 16,490 | 7,913 | 46,954 | 1,588 | 85,754 |
| April 26th | 716 | 4,236 | 9,785 | 17,630 | 7,859 | 47,485 | 1,596 | 89,307 |
| May 31st | 769 | 3,934 | 10,134 | 16,841 | 7,860 | 48,033 | 1,641 | 89,212 |
| June 28th | 761 | 3,972 | 9,818 | 17,202 | 7,788 | 47,711 | 1,679 | 88,931 |
| July 20th | 752 | 3,945 | 9,755 | 15,955 | 7,810 | 48,171 | 1,712 | 88,100 |
| August 30th | 740 | 3,674 | 9,905 | 13,563 | 7,861 | 49,476 | 1,719 | 86,938 |
| September 27th | 700 | 3,732 | 8,868 | 12,372 | 7,929 | 50,696 | 1,740 | 86,037 |
The total amount of deposits, the amount per head of mean population, the total advances, and the ratio of advances to deposits (weekly averages), for each of the last ten years, are as follows:—
| Year. | Deposits. | Advances. | ||||
|---|---|---|---|---|---|---|
| Total Amount. | Per Head of Population. | Total Amount. | Ratio to Deposits. | |||
| £ | £ | s. | d. | £ | Per Cent. | |
| 1927 | 48,294,096 | 33 | 11 | 3 | 50,032,203 | 103.60 |
| 1928 | 53,799,221 | 36 | 19 | 0 | 46,179,463 | 85.84 |
| 1929 | 57,609,746 | 39 | 2 | 0 | 49,278,194 | 85.54 |
| 1930 | 56,425,014 | 37 | 16 | 0 | 53,657,397 | 95.10 |
| 1931 | 53,645,018 | 35 | 8 | 7 | 52,419,527 | 97.72 |
| 1932 | 52,851,736 | 34 | 12 | 2 | 50,255,674 | 95.09 |
| 1933 | 57,620,233 | 37 | 8 | 6 | 45,705,044 | 79.32 |
| 1934 | 63,417,299 | 40 | 17 | 6 | 41,389,457 | 65.27 |
| 1935 | 61,474,511 | 39 | 7 | 0 | 44,666,541 | 72.66 |
| 1936 | 65,153,972 | 41 | 7 | 3 | 45,918,432 | 70.48 |
A fifty-years table of deposits and advances will be found in the Statistical Summary at the end of this volume.
The average amount on deposit during each month since January, 1933, is shown in the next table: —
| Month. | 1933. | 1934. | 1935. | 1936. | 1937. |
|---|---|---|---|---|---|
| £ | £ | £ | £ | £ | |
| January | 53,860,605 | 61,131,780 | 61,071,903 | 64,956,400 | 65,502,253 |
| February | 55,757,088 | 62,447,445 | 62,012,863 | 66,239,999 | 67,930,728 |
| March | 56,209,529 | 63,626,107 | 61,979,478 | 66,834,807 | 67,701,498 |
| April | 57,043,910 | 64,636,968 | 62,398,925 | 67,903,297 | 69,567,178 |
| May | 57,429,335 | 64,861,047 | 61,869,363 | 67,750,752 | 69,009,296 |
| June | 57,960,953 | 64,791,741 | 61,063,988 | 66,634,017 | 68,232,134 |
| July | 58,227,224 | 64,612,896 | 60,729,075 | 65,627,929 | 67,669,902 |
| August | 58,723,802 | 66,017,841 | 60,435,710 | 64,644,582 | 66,789,583 |
| September | 58,808,768 | 64,744,755 | 60,562,851 | 63,226,587 | 65,441,325 |
| October | 59,075,173 | 62,649,984 | 60,624,353 | 62,515,492 | |
| November | 59,428,618 | 61,335,670 | 61,114,994 | 62,327,959 | |
| December | 59,390,021 | 60,553,764 | 63,285,499 | 63,229,472 |
In the following tables the three different classes of deposits are shown for each month since January, 1933: —
| Month. | 1933. | 1934. | 1935. | 1936. | 1937. |
|---|---|---|---|---|---|
| Government Deposits. | |||||
| £ | £ | £ | £ | £ | |
| January | 2,579,226 | 1,280,706 | 534,907 | 455,800 | 930,275 |
| February | 2,678,433 | 1,050,999 | 555,266 | 473,034 | 886,476 |
| March | 2,211,496 | 1,217,728 | 673,072 | 496,150 | 648,708 |
| April | 2,123,934 | 1,219,094 | 542,697 | 482,578 | 833,695 |
| May | 1,634,459 | 909,249 | 545,459 | 488,277 | 713,444 |
| June | 1,488,993 | 874,242 | 572,167 | 572,381 | 788,994 |
| July | 1,286,985 | 915,375 | 470,891 | 594,048 | 792,787 |
| August | 1,404,536 | 2,338,533 | 449,199 | 689,947 | 784,796 |
| September | 1,050,352 | 1,502,380 | 435,464 | 828,842 | 714,173 |
| October | 1,045,538 | 609,332 | 368,441 | 841,082 | |
| November | 1,280,556 | 525,268 | 391,846 | 896,793 | |
| December | 1,116,910 | 581,947 | 447,304 | 923,975 | |
| Deposits not bearing Interest. | |||||
| £ | £ | £ | £ | £ | |
| January | 16,266,995 | 20,563,171 | 22,956,912 | 25,913,664 | 30,484,946 |
| February | 17,990,869 | 22,009,546 | 24,260,777 | 27,075,222 | 33,004,960 |
| March | 18,424,554 | 22,673,503 | 24,677,401 | 28,307,392 | 33,669,603 |
| April | 18,854,256 | 23,230,744 | 25,098,429 | 28,916,815 | 35,249,771 |
| May | 18,955,936 | 22,983,900 | 24,449,347 | 28,684,616 | 34,428,928 |
| June | 18,766,786 | 22,319,230 | 23,578,323 | 28,033,276 | 33,348,307 |
| July | 18,550,511 | 21,930,115 | 23,214,630 | 27,648,382 | 32,082,537 |
| August | 18,393,066 | 22,175,867 | 22,718,509 | 27,021,073 | 31,119,925 |
| September | 18,204,902 | 22,273,928 | 22,431,391 | 26,366,247 | 29,952,297 |
| October | 18,264,481 | 21,550,223 | 22,514,237 | 26,263,082 | |
| November | 18,571,844 | 21,229,166 | 23,066,244 | 26,641,348 | |
| December | 19,120,142 | 21,717,268 | 24,546,562 | 27,994,176 | |
| Deposits bearing Interest. | |||||
| January | 35,014,384 | 39,287,903 | 37,580,084 | 38,586,936 | 34,087,032 |
| February | 35,087,786 | 39,386,900 | 37,196,820 | 38,691,743 | 34,039,292 |
| March | 35,573,479 | 39,734,876 | 36,629,005 | 38,031,265 | 33,383,187 |
| April | 36,065,720 | 40,187,130 | 36,757,799 | 38,503,904 | 33,483,712 |
| May | 36,838,940 | 40,967,898 | 36,874,557 | 38,577,859 | 33,866,924 |
| June | 37,705,174 | 41,598,269 | 36,913,498 | 38,028,360 | 34,094,833 |
| July | 38,389,728 | 41,767,406 | 37,043,554 | 37,385,499 | 34,794,578 |
| August | 38,926,200 | 41,503,441 | 37,268,002 | 36,933,562 | 34,884,862 |
| September | 39,553,514 | 40,968,447 | 37,695,996 | 36,031,498 | 34,774,855 |
| October | 39,765,154 | 40,490,429 | 37,741,675 | 35,411,328 | |
| November | 39,576,218 | 39,581,236 | 37,656,904 | 34,789,818 | |
| December | 39,152,969 | 38,254,549 | 38,291,633 | 34,311,321 | |
The average amount of advances outstanding during each month since January, 1933, is shown below:—
| Month. | 1933. | 1934. | 1935. | 1936. | 1937. |
|---|---|---|---|---|---|
| £ | £ | £ | £ | £ | |
| January | 49,720,190 | 42,117,157 | 43,006,404 | 45,781,785 | 47,498,841 |
| February | 47,910,384 | 41,053,258 | 42,890,303 | 44,955,068 | 46,452,400 |
| March | 47,565,290 | 41,420,837 | 43,334,610 | 44,685,841 | 46,853,679 |
| April | 47,697,525 | 41,253,837 | 43,874,108 | 44,966,339 | 47,414,172 |
| May | 46,691,322 | 41,622,412 | 43,837,529 | 45,031,522 | 47,452,150 |
| June | 45,898,928 | 41,178,700 | 43,862,382 | 44,670,300 | 47,643,886 |
| July | 44,502,336 | 40,596,940 | 44,105,886 | 45,003,064 | 48,039,177 |
| August | 43,317,138 | 39,579,235 | 44,787,531 | 45,427,855 | 48,825,055 |
| September | 43,440,078 | 40,250,323 | 45,497,726 | 45,762,885 | 50,126,112 |
| October | 43,930,219 | 41,734,153 | 46,682,016 | 47,484,221 | |
| November | 43,850,109 | 42,479,040 | 47,234,645 | 48,547,376 | |
| December | 43,431,073 | 43,173,519 | 46,890,090 | 48,790,525 |
The ratio of advances to deposits follows: —
| Month. | 1933. | 1934. | 1935. | 1936. | 1937. |
|---|---|---|---|---|---|
| Per Cent. | Per Cent. | Per Cent. | Per Cent. | Per Cent. | |
| January | 92.31 | 68.90 | 70.42 | 70.48 | 72.52 |
| February | 85.93 | 65.74 | 69.16 | 67.87 | 68.38 |
| March | 84.62 | 65.10 | 69.92 | 66.86 | 69.21 |
| April | 83.62 | 63.82 | 70.31 | 66.22 | 68.16 |
| May | 81.30 | 64.17 | 70.85 | 66.47 | 68.76 |
| June | 79.19 | 63.56 | 71.83 | 67.04 | 69.83 |
| July | 76.43 | 62.83 | 72.63 | 68.57 | 70.99 |
| August | 73.76 | 59.95 | 74.11 | 70.27 | 73.10 |
| September | 74.70 | 62.17 | 75.12 | 72.38 | 76.60 |
| October | 74.36 | 66.61 | 77.00 | 75.96 | |
| November | 73.79 | 69.26 | 77.29 | 77.89 | |
| December | 73.13 | 71.30 | 74.09 | 77.16 |
Since the provision of Treasury-bill finance has now become largely a function of the Reserve Bank, interest attaches to the following table showing the movement in advances, Government securities held by the trading banks, and deposits. The annual figures shown for 1928–34, and the quarterly figures for 1935, represent weekly averages. Commencing with January, 1936, a statement of the position on the last Monday of each month is shown.
| — | Advances. | Government Securities. | Total Advances and Government Securities. | Total Deposits. | Ratio of Advances (plus Government Securities) to Total Deposits. |
|---|---|---|---|---|---|
| £ | £ | £ | £ | Per Cent. | |
| 1928 | 46,179,464 | 4,790,404 | 50,969,868 | 53,799,220 | 94.74 |
| 1929 | 49,278,195 | 4,887,462 | 54,165,657 | 57,609,746 | 94.02 |
| 1930 | 53,657,398 | 4,777,896 | 58,435,294 | 56,425,014 | 103.56 |
| 1931 | 52,419,527 | 4,505,581 | 56,925,108 | 53,645,018 | 106.11 |
| 1932 | 50,255,674 | 8,521,017 | 58,776,691 | 52,851,736 | 111.21 |
| 1933 | 45,705,044 | 15,266,032 | 60,971,076 | 57,620,233 | 105.82 |
| 1934 | 41,389,457 | 18,105,025 | 59,494,482 | 63,417,299 | 93.81 |
| 1935. | |||||
| March quarter | 43,077,115 | 5,840,390 | 48,917,505 | 61,688,089 | 79.30 |
| June quarter | 43,859,245 | 5,506,312 | 49,365,557 | 61,825,156 | 79.85 |
| Sept. quarter | 44,797,725 | 5,181,642 | 49,979,367 | 60,585,889 | 82.49 |
| December quarter | 46,761,935 | 4,778,862 | 51,540,797 | 61,897,400 | 83.27 |
| 1936. | |||||
| January 27th | 45,495,756 | 4,773,862 | 50,269,618 | 65,222,741 | 77.07 |
| February 24th | 44,569,262 | 4,785,764 | 49,355,026 | 66,937,237 | 73.73 |
| March 30th | 44,604,269 | 5,081,916 | 49,686,185 | 67,858,780 | 73.22 |
| April 27th | 44,919,178 | 5,157,286 | 50,076,464 | 68,690,779 | 72.90 |
| May 25th | 44,811,773 | 5,202,001 | 50,013,774 | 67,540,001 | 74.05 |
| June 29th | 44,886,890 | 5,325,566 | 50,212,456 | 66,082,567 | 75.98 |
| July 27th | 45,029,638 | 5,228,697 | 50,258,335 | 65,200,198 | 77.08 |
| August 31st | 45,591,266 | 5,183,669 | 50,774,935 | 64,098,020 | 79.21 |
| September 28th | 45,847,926 | 5,170,607 | 51,018,533 | 62,738,729 | 81.32 |
| October 26th | 47,608,965 | 5,215,307 | 52,824,272 | 62,253,300 | 84.85 |
| November 30th | 49,311,553 | 5,698,839 | 55,010,392 | 61,871,644 | 88.91 |
| December 28th | 48,107,497 | 5,710,158 | 53,817,655 | 63,272,658 | 85.06 |
| 1937. | |||||
| January 25th | 47,138,959 | 7,592,864 | 54,731,823 | 67,167,897 | 81.48 |
| February 22nd | 45,522,214 | 7,618,144 | 53,140,358 | 68,445,613 | 77.64 |
| March 29th | 46,779,070 | 7,616,644 | 54,395,714 | 67,935,155 | 80.07 |
| April 26th | 47,182,916 | 7,569,041 | 54,751,957 | 70,273,586 | 77.91 |
| May 31st | 47,799,642 | 7,563,601 | 55,363,243 | 68,400,601 | 80.94 |
| June 28th | 47,543,899 | 7,495,513 | 55,039,412 | 68,197,448 | 80.71 |
| July 26th | 48,011,253 | 7,518,421 | 55,529,674 | 67,285,205 | 82.53 |
| August 30th | 49,324,743 | 7,571,304 | 56,896,047 | 66,240,641 | 85.89 |
| September 27th | 50,552,437 | 7,643,497 | 58,195,934 | 65,129,434 | 89.36 |
The following table shows annual aggregates of bank debits and clearings from 1929 to 1936. Debits represent the total amount debited to customers' accounts at all branches, and clearings show the total outward exchanges delivered at all branches. These figures, which have been compiled from the weekly returns furnished by the six trading banks, give a reliable indication of appreciable changes in the volume of business, and strikingly reflect the depressed trade conditions which set in during 1930 and continued downward until the end of 1932. A gradual improvement in business conditions in 1934, and a substantial recovery in 1935 which accelerated rapidly during 1936, are indicated by the figures for these years. Government debits fell to comparatively small proportions as a consequence of the opening of the Reserve Bank.
| Aggregate for Year. | Debits other than Government. | Government Debits. | Clearings. |
|---|---|---|---|
| £ (million). | £ (million). | £ (million). | |
| 1929 | 881 | 262 | 529 |
| 1930 | 792 | 272 | 473 |
| 1931 | 593 | 224 | 343 |
| 1932 | 542 | 206 | 307 |
| 1933 | 559 | 248 | 352 |
| 1934 | 676 | 280 | 430 |
| 1935 | 687 | 73 | 365 |
| 1936 | 817 | 83 | 437 |
Averages of debits and clearings for the four or five weeks ending on the last Monday of each month from January, 1933, onwards are next given: —
| Month. | 1933. | 1934. | 1935. | 1936. | 1937. |
|---|---|---|---|---|---|
| Debits, other than Government. | |||||
| £ | £ | £ | £ | £ | |
| January | 9,595,748 | 11,950,227 | 11,470,226 | 13,544,621 | 16,595,617 |
| February | 12,062,673 | 15,534,017 | 14,578,350 | 16,673,056 | 22,015,860 |
| March | 12,410,702 | 15,202,924 | 15,649,972 | 18,440,331 | 23,066,487 |
| April | 10,826,190 | 14,678,086 | 13,792,505 | 17,033,002 | 22,023,344 |
| May | 10,345,047 | 13,210,976 | 12,864,539 | 16,326,743 | 18,674,237 |
| June | 10,269,160 | 11,733,123 | 11,949,637 | 14,959,241 | 17,236,416 |
| July | 10,641,242 | 11,503,437 | 12,236,331 | 14,868,127 | 16,865,391 |
| August | 9,555,754 | 11,463,777 | 12,149,333 | 14,184,388 | 16,123,596 |
| September | 9,771,228 | 10,624,964 | 12,832,993 | 13,631,191 | 15,951,184 |
| October | 10,677,824 | 12,165,620 | 11,930,131 | 14,782,859 | |
| November | 10,485,810 | 11,717,160 | 13,144,518 | 15,574,172 | |
| December | 12,813,576 | 13,361,564 | 15,444,844 | 18,521,343 | |
| Government Debits. | |||||
| January | 4,017,147 | 4,595,642 | 1,085,952 | 1,239,613 | 1,580,765 |
| February | 5,532,905 | 7,093,669 | 1,442,244 | 1,532,495 | 2,093,516 |
| March | 6,938,325 | 8,170,860 | 1,783,927 | 1,827,417 | 2,304,361 |
| April | 5,895,348 | 8,101,821 | 1,415,449 | 1,466,475 | 1,910,182 |
| May | 4,316,219 | 4,906,241 | 1,325,984 | 1,537,077 | 1,833,203 |
| June | 3,843,415 | 5,117,366 | 1,393,777 | 1,632,102 | 1,717,144 |
| July | 4,742,119 | 4,448,686 | 1,375,438 | 1,633,897 | 1,708,380 |
| August | 4,129,106 | 10,120,410 | 1,404,809 | 1,548,553 | 1,716,369 |
| September | 4,707,625 | 2,776,971 | 1,387,209 | 1,451,624 | 1,605,318 |
| October | 3,798,350 | 4,294,924 | 1,338,133 | 1,590,773 | |
| November | 4,411,347 | 2,017,107 | 1,346,149 | 1,694,309 | |
| December | 5,521,796 | 2,335,326 | 1,575,528 | 1,803,293 | |
| Clearings. | |||||
| January | 5,611,844 | 7,909,670 | 6,242,206 | 7,109,851 | 8,976,148 |
| February | 7,561,863 | 11,038,661 | 8,053,196 | 9,205,432 | 11,922,216 |
| March | 7,561,590 | 11,390,626 | 8,594,435 | 9,928,035 | 12,517,518 |
| April | 6,254,437 | 10,708,604 | 7,062,766 | 8,839,263 | 11,530,341 |
| May | 6,040,910 | 8,494,224 | 6,827,441 | 8,782,345 | 9,968,530 |
| June | 6,209,805 | 8,450,448 | 6,395,567 | 8,215,098 | 9,454,218 |
| July | 7,319,993 | 7,726,973 | 6,391,261 | 8,017,416 | 8,935,042 |
| August | 6,244,509 | 6,546,476 | 6,530,789 | 7,419,259 | 8,740,653 |
| September | 6,581,457 | 5,620,481 | 6,653,138 | 7,399,338 | 8,273,005 |
| October | 6,592,497 | 6,345,642 | 6,351,251 | 7,669,925 | |
| November | 7,121,520 | 6,331,151 | 6,912,669 | 8,293,936 | |
| December | 8,586,918 | 7,084,400 | 8,084,969 | 9,950,267 | |
As indicated elsewhere, the Reserve Bank assumed the note-issuing function on the 1st August, 1934. As from the 10th January, 1935, the notes of the trading banks ceased to be legal tender, while on 1st August, 1936, the liability for the remaining outstanding trading-bank notes was taken over by the Reserve Bank, thus completing the process of the transfer of the note-issue to the Reserve Bank. A resume of legislation dealing with the note-issue is included later in this section under the heading “Coinage and Currency.” The following table shows the position in respect of note-circulation at intervals from September, 1934, to September, 1937.
| As at | Note Issue. | Less Notes held by other Banks. | Net Note Circulation. | ||||
|---|---|---|---|---|---|---|---|
| Notes of Trading Banks. | Notes of Reserve Bank. | Gross Total. | Notes of Trading Banks. | Notes of Reserve Bank. | Total. | ||
| 1934. | £ | £ | £ | £ | £ | £ | £ |
| September 24th | 2,705,731 | 8,664,802 | 11,370,533 | 14,513 | 5,196,684 | 5,211,197 | 6,159,336 |
| December 31st | 1,483,499 | 9,772,279 | 11,255,778 | 5,598 | 4,415,899 | 4,421,497 | 6,834,281 |
| 1935. | |||||||
| March 25th | 852,751 | 9,341,392 | 10,194,143 | 1,845 | 3,955,924 | 3,957,769 | 6,236,374 |
| June 24th | 708,027 | 9,111,270 | 9,819,297 | 746 | 3,714,024 | 3,714,770 | 6,104,527 |
| September 30th | 632,533 | 8,893,965 | 9,526,498 | 343 | 3,032,808 | 3,033,151 | 6,493,347 |
| December 30th | 584,668 | 10,720,555 | 11,305,223 | 546 | 3,689,404 | 3,689,950 | 7,015,273 |
| 1936. | |||||||
| January 27th | 571,767 | 10,063,689 | 10,635,456 | 326 | 3,786,785 | 3,787,111 | 6,848,345 |
| February 24th | 560,059 | 9,854,586 | 10,414,645 | 246 | 3,496,634 | 3,496,880 | 6,917,765 |
| March 30th | 545,254 | 10,153,129 | 10,698,383 | 206 | 3,593,343 | 3,593,549 | 7,104,834 |
| April 27th | 537,624 | 10,240,246 | 10,777,870 | 171 | 3,627,189 | 3,627,360 | 7,150,510 |
| May 25th | 528,062 | 10,156,795 | 10,684,857 | 175 | 3,520,030 | 3,520,205 | 7,164,652 |
| June 20th | 517,745 | 10,040,705 | 10,558,450 | 86 | 3,336,513 | 3,336,599 | 7,221,851 |
| July 27th | 510,529 | 10,177,703 | 10,688,232 | 32 | 3,517,661 | 3,517,693 | 7,170,539 |
| August 31st | 11,148,294 | 11,148,294 | 3,357,012 | 3,357,012 | 7,791,282 | ||
| September 28th | 11,174,758 | 11,174,758 | 3,402,829 | 3,402,829 | 7,771,929 | ||
| October 26th | 11,480,334 | 11,480,334 | 3,427,740 | 3,427,740 | 8,052,594 | ||
| November 30th | 11,838,198 | 11,838,198 | 3,169,433 | 3,169,433 | 8,668,765 | ||
| December 28th | 13,641,451 | 13,641,451 | 3,198,227 | 3,198,227 | 10,443,224 | ||
| 1937. | |||||||
| January 25th | 13,068,392 | 13,068,392 | 4,713,239 | 4,713,239 | 8,355,153 | ||
| February 22nd | 12,752,949 | 12,752,949 | 4,292,195 | 4,292,195 | 8,460,754 | ||
| March 29th | 13,179,255 | 13,179,255 | 3,335,337 | 3,335,337 | 9,843,918 | ||
| April 20th | 12,956,903 | 12,956,903 | 4,236,082 | 4,236,082 | 8,720,821 | ||
| May 31st | 12,974,591 | 12,974,591 | 3,934,530 | 3,934,530 | 9,040,061 | ||
| June 28th | 12,630,838 | 12,630,838 | 3,972,045 | 3,972,045 | 8,658,793 | ||
| July 20th | 12,590,827 | 12,590,827 | 3,945,052 | 3,945,052 | 8,645,775 | ||
| August 30th | 12,793,756 | 12,793,756 | 3,673,779 | 3,673,779 | 9,119,977 | ||
| September 27th | 12,994,386 | 12,994,386 | 3,732,080 | 3,732,080 | 9,262,306 | ||
For reasons indicated in a previous paragraph, notes of trading banks do not appear in the table from August, 1936.
The net note-circulation—that is, the value of bank-notes in active circulation —reached a remarkably high figure in December, 1936, the amount recorded on 28th December being £10,443,224. Successive increases in note-circulation were recorded during each month of 1936, the seasonal tendency towards a slackening in this (and other business indicators) being counteracted by a strong upward cyclic trend in business activity. The note-circulation was particularly buoyant owing to the influence of such factors as the restoration of salary cuts in July, 1936, increased pensions, and increased unemployment benefits, together with a lessened volume of unemployment. The buoyancy in the note-circulation has continued during 1937, this indicator of economic conditions giving an even more favourable showing than bank debits—i.e., the value of cheque transactions—and other statistical measures of the pulse of business. The especially strong position of the note-circulation is indicative of a wider distribution of purchasing-power—a reflection of such governmental measures as a higher-wages policy, increased pensions, greater activity on public works, &c.
It is of interest to compare briefly the recent statistics of note-circulation shown in the above table with corresponding figures for years prior to 1934. In drawing inferences from such a comparison, some allowance may be necessary for changes in spending habits—e.g., a probable increase in the proportion of retail purchases paid for in cash. In the five years immediately preceding the Great War the active note-circulation seldom exceeded £1,700,000, and averaged between £1,500,000 and £1,600,000. At that time gold was circulating freely.
A steady increase in the note-circulation was recorded during the war years, the average net note-circulation reaching £5,450,263 in the December quarter of 1918. The upward tendency continued during the immediate post-war years until, in the December quarter of 1920, the relatively high average of £7,243,683 was recorded. It is interesting to note that this figure was not again reached until December, 1935–fifteen years later. The years 1921 and 1922 saw a falling-off in the note-circulation owing to the depression of those years, while a further factor which came into operation at about that time was the wider use of cheques by the general public. The low point disclosed by the quarterly averages for these years was £5,944,959 in the September quarter of 1922; the figures for 1923 and 1924 show a recovery to approximately £6,500,000, the net note-circulation varying within comparatively narrow limits for several years afterwards.
As stated above, the increased use of cheques would account largely for the comparative stability of the note-circulation during the relatively prosperous years which followed the 1921–22 slump, and no marked upward trend is revealed by the figure until the last two years. The note-circulation fell away during the 1930–33p years to a minimum of £5,496,000 in July, 1931, and seldom exceeded 200,000 during the years following. The 1931–32 fall in the note-circulation was, however, not by any means as severe as the fall in the volume of cheque transactions. The year 1935 witnessed a measure of recovery in the note-circulation—a trend which, as indicated by the table, has since accelerated to a remarkable degree.
| As at | Trading Banks' Overseas Assets. | Reserve Bank's Holdings of Sterling Exchange. | Total Overseas Assets. | Overseas Liabilities of Trading Banks. | Net Overseas Funds. | |
|---|---|---|---|---|---|---|
| In London. | Elsewhere. | |||||
| 1934. | £(N.Z.) | £(N.Z.) | £(N.Z.) | £(N.Z.) | £(N.Z.) | £(N.Z.) |
| July 30th | 8,821,538 | 8,359,977 | 3,399,401 | |||
| August 27th | 11,171,987 | 9,255,542 | 24,487,693 | 44,914,622 | 5,397,243 | 39,017,379 |
| September 24th | 7,751,171 | 9,129,641 | 24,501,380 | 41,382,192 | 1,114,494 | 40,267,698 |
| October 20th | 10,494,570 | 8,943,811 | 23,222,189 | 42,665,570 | 1,016,689 | 41,648,881 |
| November 20th | 10,120,868 | 9,069,119 | 23,607,757 | 42,797,744 | 1,171,662 | 41,626,082 |
| December 31st | 10,618,328 | 8,924,254 | 22,092,021 | 41,634,603 | 1,105,988 | 40,528,615 |
| 1935. | ||||||
| January 28th | 12,234,355 | 7,897,234 | 21,867,952 | 41,999,541 | 1,076,021 | 40,923,520 |
| February 25th | 15,299,786 | 7,351,603 | 21,810,625 | 44,462,014 | 1,090,511 | 43,371,503 |
| March 25th | 16,605,200 | 7,312,980 | 22,434,593 | 46,352,773 | 1,124,037 | 45,228,736 |
| April 29th | 18,266,133 | 7,081,884 | 22,088,845 | 47,436,862 | 1,138,896 | 46,297,966 |
| May 27th | 18,746,113 | 6,242,944 | 22,789,228 | 47,778,285 | 1,197,347 | 46,580,938 |
| June 24th | 18,682,794 | 5,813,844 | 22,813,024 | 47,309,662 | 1,285,808 | 46,023,854 |
| July 29th | 18,034,034 | 5,807,953 | 21,053,702 | 44,895,689 | 1,649,893 | 43,245,796 |
| August 20th | 17,173,501 | 6,024,546 | 20,813,691 | 44,011,738 | 1,553,554 | 42,453,184 |
| September 30th | 10,206,526 | 5,672,475 | 19,688,594 | 41,567,595 | 1,522,008 | 40,045,587 |
| October 28th | 12,293,367 | 5,764,513 | 16,831,482 | 34,889,362 | 913,205 | 33,976,157 |
| November 25th | 12,065,001 | 5,866,810 | 17,458,573 | 35,390,384 | 776,908 | 34,613,476 |
| December 30th | 9,754,717 | 6,028,133 | 21,398,949 | 37,181,799 | 1,093,260 | 36,088,539 |
| 1936. | ||||||
| January 27th | 11,149,879 | 6,183,192 | 22,103,949 | 39,437,020 | 1,067,460 | 38,369,560 |
| February 24th | 12,725,268 | 6,493,639 | 23,113,211 | 42,332,118 | 1,116,551 | 41,215,567 |
| March 30th | 14,143,369 | 6,226,321 | 24,830,181 | 45,199,871 | 1,111,728 | 44,088,143 |
| April 27th | 15,980,160 | 6,305,068 | 24,224,599 | 46,509,827 | 1,252,811 | 45,257,016 |
| May 25th | 16,700,923 | 6,158,044 | 23,737,755 | 46,596,722 | 1,397,517 | 45,199,205 |
| June 20th | 17,316,659 | 5,900,334 | 22,122,319 | 45,339,312 | 1,332,867 | 43,956,445 |
| July 27th | 16,729,219 | 5,876,674 | 22,129,379 | 44,735,272 | 1,485,574 | 43,249,698 |
| August 31st | 14,437,895 | 5,957,121 | 19,799,236 | 40,194,252 | 1,474,224 | 38,720,028 |
| September 28th | 12,890,571 | 5,785,499 | 16,835,564 | 35,511,634 | 1,483,295 | 34,028,339 |
| October 20th | 10,763,469 | 5,641,345 | 16,545,194 | 32,950,008 | 1,498,730 | 31,451,278 |
| November 30th | 8,414,355 | 5,441,537 | 16,578,681 | 30,434,573 | 1,800,663 | 28,633,910 |
| December 26th | 7,907,916 | 5,373,730 | 16,534,425 | 29,816,071 | 1,735,534 | 28,080,537 |
| 1937. | ||||||
| January 25th | 7,361,885 | 5,221,770 | 17,901,994 | 30,485,649 | 1,911,587 | 28,574,062 |
| February 22nd | 8,308,008 | 5,586,754 | 18,804,394 | 32,699,156 | 1,365,763 | 31,333,393 |
| March 29th | 11,048,114 | 5,442,104 | 19,098,904 | 35,589,122 | 1,204,569 | 34,384,553 |
| April 20th | 12,553,776 | 5,076,523 | 20,309,013 | 37,939,312 | 1,346,722 | 36,592,590 |
| May 31st | 11,857,865 | 4,983,080 | 22,327,095 | 39,168,040 | 1,727,154 | 37,440,886 |
| June 28th | 12,174,139 | 5,027,435 | 21,542,637 | 38,744,211 | 1,788,175 | 36,956,036 |
| July 20th | 11,225,913 | 4,729,405 | 20,859,070 | 36,814,388 | 1,900,383 | 34,914,005 |
| August 30th | 9,269,550 | 4,293,700 | 20,555,164 | 34,118,414 | 1,594,899 | 32,523,515 |
| September 27th | 8,147,276 | 4,225,095 | 19,066,048 | 31,438,419 | 1,453,063 | 29,985,356 |
Under section 46 of the Reserve Bank of New Zealand Act, 1933, the trading banks are required to supply returns to the Reserve Bank at monthly intervals, showing, inter alia, overseas assets held and liabilities incurred on account of New Zealand business. From these statements, published in the New Zealand Gazette, and the weekly gazetted statements of assets and liabilities of the Reserve Bank, the foregoing table has been compiled. All the amounts are expressed in New Zealand currency.
The statements of the Reserve Bank do not show, up to the present, any overseas liabilities; and, consequently, no column under this heading is included in the table.
In connection with the Post Office in New Zealand a savings-bank has been conducted since the 1st February, 1867. The minimum deposit receivable, except in certain specified cases, is 1s., and no interest is given on any sum less than £1. The present rate of interest on so much of the deposit as does not exceed £500 is 3 per cent. per annum, and on so much as exceeds £500 and does not exceed £2,000, 2½ per cent. for the amount over £500. No interest is payable to any depositor in respect of any amount of his deposit in excess of £2,000. This provision came into force on the 1st March, 1935.
The Postmaster-General may pay deposits to a maximum of £200 to the legal representative of a deceased depositor without requiring him to take out letters of administration or to prove the will. This provision, together with another provision whereby a depositor may nominate one or more persons to receive part or all of the amount at credit after the depositor's death, enables a widow or orphan to obtain possession of perhaps much-needed funds without either delay or cost.
The number of post-offices open for the transaction of savings-bank business at the 31st March, 1937, was 912. There were 119,339 new accounts opened during the year ended the 31st March, 1937, and 79,153 accounts were closed during the period. The total number of open accounts at the 31st March, 1937, was 880,857, or 56 to every 100 of the population, including Maoris.
| Year ended 31st March, | Number of Depositors at End of Year. | Total Amount of Deposits during Year. | Total Amount of Withdrawals during Year. | Excess of Deposits over Withdrawals. | Interest. | Total Amount to Credit of Depositors, at End of Year. |
|---|---|---|---|---|---|---|
| * Excess of withdrawals over deposits. | ||||||
| £ | £ | £ | £ | £ | ||
| 1928 | 804,725 | 27,611,066 | 30,584,998 | -2,973,932* | 1,747,156 | 47,758,726 |
| 1929 | 828,296 | 27,252,381 | 28,111,940 | -859,559* | 1,745,050 | 48,644,217 |
| 1930 | 852,757 | 28,561,854 | 29,575,994 | -1,014,140* | 1,806,414 | 49,436,491 |
| 1931 | 878,043 | 24,531,569 | 28,063,338 | -3,531,769* | 1,763,825 | 47,668,547 |
| 1932 | 877,090 | 19,463,985 | 25,488,081 | -6,024,096* | 1,611,048 | 43,255,499 |
| 1933 | 797,097 | 16,933,176 | 19,635,928 | -2,702,752* | 1,475,874 | 42,028,621 |
| 1934 | 798,262 | 19,428,853 | 17,818,172 | 1,610,681 | 1,231,089 | 44,870,391 |
| 1935 | 817,617 | 24,179,537 | 20,946,562 | 3,232,975 | 1,320,348 | 49,423,714 |
| 1936 | 840,671 | 25,619,775 | 23,533,596 | 2,086,179 | 1,406,459 | 52,916,352 |
| 1937 | 880,857 | 30,676,969 | 27,042,003 | 3,634,966 | 1,514,220 | 58,065,538 |
Section 26 of the Finance Act, 1932, provided that moneys lying in savings-bank accounts not operated on for twenty-five years should be treated as unclaimed moneys, which are payable into the Consolidated Fund. The consequential closing of many years' accumulations of “dead” accounts (with average deposits of under £1) was responsible for the decrease of 80,000 which occurred in 1932–33 in the number of open accounts.
There was a steady increase in the average amount standing to the credit of each, depositor up to the 31st March, 1921, but a practically continuous fall was recorded to 1932, when the average open account at 31st March was £49 6s. 4d. The average open account at the 31st March, 1937, was £65 18s. 5d., as against £62 18s. 11d. in 1936.
The substantial increases shown in the last four years are in conformity with the improvement in trade and industry and the “easy” monetary situation. It should be noted also that the Post Office interest-rate for small amounts (under £500) at present exceeds the maximum paid by trading banks on fixed deposits.
The securities standing in the name of the Postmaster-General on account of the Post Office Savings-bank Fund on the 31st March, 1937, represented a nominal value of £58,253,279. A summary of the investments is as follows:—
| In New Zealand Government securities | 54,642,145 |
| In Government stock of other British countries | 3,611,134 |
| £58,253,279 |
There are five savings-banks not connected with the Post Office—viz., Auckland, established in 1847; New Plymouth, 1850; Dunedin, 1864; Invercargill, 1864; and Hokitika, 1866. The total amount to the credit of depositors at the 31st March, 1937, was £12,480,125, representing an average account of £50 1s. 6d. Figures for the last ten years are as follows:—
| Year ended 31st March, | Number of Depositors at End of Year. | Total Amount of Deposits during Year. | Total Amount of Withdrawals during Year. | Excess of Deposits over Withdrawals. | Interest. | Total Amount to Credit of Depositors at End of Year. |
|---|---|---|---|---|---|---|
| * Excess of withdrawals over deposits. | ||||||
| £ | £ | £ | £ | £ | ||
| 1928 | 166,694 | 5,787,835 | 5,453,091 | 334,744 | 314,553 | 7,657,407 |
| 1929 | 180,015 | 6,307,509 | 5,839,660 | 467,849 | 352,863 | 8,478,119 |
| 1930 | 193,084 | 6,703,622 | 6,324,762 | 378,860 | 376,526 | 9,233,505 |
| 1931 | 204,467 | 6,555,286 | 6,512,469 | 42,817 | 410,264 | 9,686,586 |
| 1932 | 214,517 | 6,168,032 | 6,133,770 | 29,262 | 416,385 | 10,132,233 |
| 1933 | 212,673 | 5,678,843 | 5,718,258 | -39,415* | 377,720 | 10,470,538 |
| 1934 | 219,732 | 5,817,846 | 5,741,989 | 75,857 | 301,314 | 10,847,709 |
| 1935 | 227,925 | 6,199,211 | 6,073,447 | 125,764 | 312,589 | 11,286,062 |
| 1936 | 238,108 | 6,651,525 | 6,487,282 | 164,243 | 323,177 | 11,773,482 |
| 1937 | 249,227 | 7,609,364 | 7,240,419 | 368,945 | 337,698 | 12,480,125 |
The following table shows the results of the transactions of each of the trustee pavings-banks during the twelve months ended 31st March, 1937.
| Bank. | Number of Depositors at End of Year. | Total Amount of Deposits during Year. | Total Amount of Withdrawals during Year. | Excess of Deposits over Withdrawals. | Interest. | Total Amount to Credit of Depositors at End of Year. |
|---|---|---|---|---|---|---|
| * Excess of withdrawals over deposits. | ||||||
| £ | £ | £ | £ | £ | ||
| Auckland | 176,506 | 4,659,802 | 4,473,450 | 186,352 | 216,811 | 8,021,110 |
| New Plymouth | 15,441 | 553,328 | 463,305 | 90,023 | 23,692 | 891,894 |
| Hokitika | 2,199 | 57,808 | 52,718 | 5,090 | 4,523 | 162,519 |
| Dunedin | 36,380 | 907,232 | 915,543 | -8,311* | 67,839 | 2,365,000 |
| Invercargill | 18,701 | 1,431,194 | 1,335,403 | 95,791 | 24,833 | 1,039,602 |
| Totals | 249,227 | 7,609,364 | 7,240,419 | 368,945 | 337,698 | 12,480,125 |
Statistics of deposits with building and investment societies and trading companies are available at quarterly intervals since April, 1932. The following table shows the amounts at the end of each quarter, classified according to the period of the deposit:—
| As at | Building and Investment Societies. | Trading Companies. | Grand Total. | ||||||
|---|---|---|---|---|---|---|---|---|---|
| At Call. | Three Months and under Two Years. | Two Years or over. | Totals, Building and Investment Societies. | At Call. | Three Months and under Two Years. | Two Years or over. | Totals, Trading Companies. | ||
| 1932. | £ | £ | £ | £ | £ | £ | £ | £ | £ |
| June 30th | 986,953 | 909,605 | 1,488,374 | 3,384,932 | 4,896,608 | 739,073 | 1,134,652 | 6,770,333 | 10,155,265 |
| September 30th | 877,268 | 852,419 | 1,547,555 | 3,277,242 | 4,624,632 | 905,216 | 1,669,510 | 7,199,358 | 10,476,600 |
| December 31st | 801,478 | 813,070 | 1,625,627 | 3,240,175 | 4,202,943 | 943,062 | 1,645,855 | 6,791,860 | 10,032,035 |
| 1933. | |||||||||
| March 31st | 746,240 | 721,865 | 1,650,838 | 3,118,943 | 4,042,547 | 1,008,185 | 1,892,521 | 6,943,253 | 10,062,196 |
| June 30th | 712,192 | 705,736 | 1,752,604 | 3,170,532 | 3,835,539 | 909,712 | 1,705,876 | 6,451,127 | 9,621,659 |
| September 30th | 690,259 | 666,052 | 1,893,359 | 3,249,670 | 3,824,173 | 876,617 | 1,726,644 | 6,427,434 | 9,677,104 |
| December 31st | 600,853 | 651,270 | 1,929,288 | 3,181,411 | 3,630,657 | 929,758 | 1,629,330 | 6,189,745 | 9,371,156 |
| 1934. | |||||||||
| March 31st | 437,257 | 672,578 | 2,128,275 | 3,238,110 | 3,292,740 | 1,004,031 | 1,691,344 | 5,988,115 | 9,226,225 |
| June 30th | 603,603 | 650,000 | 2,063,770 | 3,317,373 | 3,511,445 | 895,335 | 1,748,150 | 6,154,930 | 9,472,303 |
| September 30th | 745,161 | 643,961 | 1,936,580 | 3,325,702 | 3,172,955 | 974,132 | 1,808,241 | 5,955,328 | 9,281,030 |
| December 31st | 591,648 | 613,612 | 2,135,290 | 3,340,550 | 3,178,162 | 1,148,711 | 1,561,880 | 5,888,753 | 9,229,303 |
| 1935. | |||||||||
| March 31st | 621,419 | 612,842 | 1,984,495 | 3,218,756 | 2,756,187 | 1,106,836 | 1,983,391 | 5,846,414 | 9,065,170 |
| June 30th | 637,592 | 672,752 | 2,122,350 | 3,432,694 | 2,971,313 | 982,383 | 1,990,730 | 5,944,426 | 9,377,120 |
| September 30th | 655,987 | 708,598 | 2,124,293 | 3,488,878 | 2,980,347 | 1,074,589 | 1,806,955 | 5,861,891 | 9,350,769 |
| December 31st | 662,756 | 650,730 | 2,245,410 | 3,558,896 | 2,698,463 | 1,067,126 | 1,933,747 | 5,699,336 | 9,258,232 |
| 1930. | |||||||||
| March 31st | 684,599 | 712,219 | 2,218,803 | 3,615,621 | 2,583,167 | 1,077,754 | 1,887,648 | 5,548,569 | 9,164,190 |
| June 30th | 696,850 | 736,455 | 2,442,210 | 3,875,515 | 2,305,111 | 1,184,751 | 1,910,439 | 5,400,304 | 9,275,819 |
| September 30th | 707,473 | 741,331 | 2,375,745 | 3,824,549 | 2,389,693 | 1,251,469 | 1,816,305 | 5,457,467 | 9,282,016 |
| December 31st | 721,934 | 747,366 | 2,439,588 | 3,908,888 | 2,290,653 | 1,203,187 | 1,972,862 | 5,466,702 | 9,375,590 |
| 1937. | |||||||||
| March 31st | 778,907 | 728,413 | 2,481,180 | 3,988,500 | 2,297,438 | 1,100,109 | 1,840,630 | 5,238,177 | 9,226,677 |
| June 30th | 774,365 | 764,171 | 2,559,880 | 4,098,416 | 2,408,162 | 1,304,647 | 1,835,486 | 5,548,295 | 9,646,711 |
In the preceding paragraphs statistics of deposits with each of the various classes of banking institutions are shown. It is of interest to show the position in a summary form in respect of all classes of banks.
| As at 31st March, 1937. | |
|---|---|
| £ | |
| Deposits with trading banks | 67,935,155 |
| Deposits with Post Office Savings-bank | 58,065,538 |
| Deposits with trustee savings-banks | 12,480,125 |
| Total of above | £138,480,818 |
| Per head of population | £87 5s. 0d. |
In addition to the classes of deposit shown above, there were on 31st March, 1937, deposits of £3,988,500 with building and investment societies and of £5,238,177 with trading companies. It should be noted also that other classes of deposit exist—e.g., the Common Fund of the Public Trust Office, deposits with local authorities, &c.
The overdraft rates and the rates of discount current in the Dominion were ½ per cent. higher in 1920 than the corresponding rates ruling prior to the 1914–18 war. A further increase of ½ per cent., following a period when importations had been made on a larger scale then at any previous time in the Dominion's history, was made in January, 1921, the demand on banks for money being very considerable. Another aspect of the position was the rapid diminution—from twenty millions to two millions—in the excess of deposits (other than Government.) over advances during the closing six months of 1920. It is not surprising accordingly to find a further increase in the overdraft (and the discount) rates as from March, 1921. There was no further alteration in the rate until January, 1923, when the overdraft rate was reduced to 6½ per cent., a rate which ruled until April, 1927. As a result of financial stringency, occasioned by adverse trade conditions during 1926–27, both the overdraft and discount rates were increased to 7 per cent. in May, 1927. Vastly improved conditions, brought about by the successful export season of 1927–28 and a diminution in imports, were responsible for the reduction of both rates to 6½ per cent. in July, 1928; but by February, 1930, conditions had so changed that a return was made to 7 per cent. in each instance. This rate remained in force until the 1st November, 1931, when a reduction to 6½ per cent. was made, followed by further reductions to 6 per cent. as from the 1st September, 1932, 5 per cent. as from the 1st May, 1933, and 4½ per cent. as from the 30th November, 1934.
The Reserve Bank's minimum discount or rediscount rate for New Zealand bills was originally 4 per cent., but was reduced to 3½ per cent. from the 29th July, 1935, and to 2½ per cent. on 2nd March, 1936. A further reduction to 2 per cent. was made on 29th June, 1936.
The following is a schedule (since June, 1912) of the rates paid by the Associated Banks in New Zealand for moneys lodged on fixed deposit:—
| Date operative from | Three Months and under Six Months. | Six Months and under Twelve Months. | Twelve Months and under Twenty-four Months. | Twenty-four Months. |
|---|---|---|---|---|
| Per Cent. | Per Cent. | Per Cent. | Per Cent. | |
| 1st June, 1912 | 2 | 3½ | 4 | |
| 20th January 1921 | 3 | 3½ | 4 | 4½ |
| 20th June, 1921 | 3½ | 3¾ | 4 | 4½ |
| 11th December, 1920 | 3¾ | 3¾ | 4 | 4½ |
| 9th May, 1927 | 3¾ | 4 | 4½ | 5 |
| 9th July, 1928 | 3¾ | 3¾ | 4 | 4½ |
| 1st February, 1930 | 3¾ | 3¾ | 4¼ | 5 |
| 22nd April, 1930 | 3¾ | 4 | 4¼ | 5 |
| 1st August, 1931 | 3½ | 3¾ | 4 | 4½ |
| 1st June, 1932 | 3 | 3¼ | 3½ | 4 |
| 2nd December, 1932 | 2½ | 2¾ | 3 | 3¼ |
| 11th July, 1933 | 2 | 2½ | 2¾ | 3 |
| 5th July, 1934 | 1½ | 2 | 2½ | 2¾ |
| 2nd November, 1934 | 1¼ | 1¾ | 2¼ | 2½ |
Following is a statement of the interest rates payable in respect of Post Office Savings-bank deposits since 1914:—
| Date operative from | Amount of Deposit: | ||||
|---|---|---|---|---|---|
| £1–£300. | £300–£500. | £500–£1,000. | £1,000–£2,000. | £2,000–£5,000. | |
* Rate in existence on 1st January, 1914. †See paragraph following. | |||||
| Per Cent. | Per Cent. | Per Cent. | Per Cent. | Per Cent. | |
| 1st January, 1914* | 5 | 4 | 4 | Nil | Nil. |
| 1st January, 1921 | 4 | 4 | 3¼ | 3¼ | 3¼ |
| 1st April, 1928 | 4 | 4 | 3¼ | 3¼ | † |
| 1st August, 1931 | 3¾ | 3¾ | 3¼ | 3¼ | † |
| 1st April, 1933 | 3 | 3 | 3 | 3 | † |
| 1st August, 1933 | 3 | 3 | 2¾ | 2¾ | † |
| 1st August, 1934 | 3 | 3 | 2½ | 2½ | † |
| 1st March, 1935 | 3 | 3 | 2½ | 2½ | Nil. |
Prior to 1st January, 1914, the maximum deposit in the Post Office Savings-bank on which interest was payable was £600; but on that date the maximum was raked to £1,000. Between 1st January, 1921, and 1st April, 1928, interest was allowed on deposits up to a maximum of £5,000; but, as from the latter date, the maximum deposit on which any interest is payable is £2,000. In respect of deposits lodged prior to 1st April, 1928, however, interest at 3¼ per cent. on the excess over £500 was still allowed up to a maximum deposit of £5,000; the rate in respect of the amount between £500 and £5,000 being reduced to 3 per cent. from 1st April, 1933, 2¾ per cent. from 1st August, 1933, and 2½ per cent. from 1st August, 1934. Since 1st March, 1935, interest has not been payable in respect of the excess above £2,000 in any deposit.
Under the provisions of the Savings-banks Act, 1908, which applies to trustee savings-banks only, these banks were required to pay interest at the rate of 5 per cent. on deposits of £1 and upwards, but not on fractions of £1 or on amounts of under £1. The maximum amount of deposits on which interest was to be paid was fixed at £100 for each depositor; but by the Finance Act, 1921–22, the maximum was raised to £200. which figure still stands. The banks were empowered to reduce the rate of interest with the consent of the Governor-General after three months' notice given by an advertisement published in the Gazette.
In the National Expenditure Adjustment Act, 1932, provision is made for the fixation by the Governor-General in Council of the maximum rates of interest payable by savings-banks. Killing rates immediately prior to July, 1932, varied between 4 per cent. and 4½ per cent.; but, by Order in Council, the maximum interest payable was reduced to 3¾ per cent. as from 1st July, 1932, while a further reduction to 3 per cent. was enforced as from 1st April, 1933.
Authority was taken in the National Expenditure Adjustment Act, 1932, to fix by Order in Council the maximum rates of interest payable on deposits with stock-and-station agents, trading companies, and building and investment societies. The maximum rates fixed by subsequent Orders in Council were:—
| Period of Deposit. | Deposits (including Renewals) taken after— | ||
|---|---|---|---|
| 30th June, 1932. | 31st March, 1933. | 31st July, 1934. | |
| Stock-and-station Agencies and Trading Companies. | |||
| Per Cent. | Per Cent. | Per Cent. | |
| At call or under 3 months | 3½ | 3½ | 2½ |
| 3 months and under 6 months | 4 | 4 | 3½ |
| 6 months and under 12 months | 4¼ | 4¼ | 3¾ |
| 1 year and under 2 years | 4½ | 4½ | 4 |
| 2 years and under 3 years | 5 | 5 | 4½ |
| 3 years and over | 5 | 5 | 4¾ |
| Building and Investment Societies. | |||
| At call or under 3 months | 3 | 2½ | 2 |
| 3 months and under 6 months | 3½ | 3 | 2¾ |
| 6 months and under 12 months | 3¾ | 3¼ | 3 |
| 1 year and under 2 years | 4 | 3½ | 3¼ |
| 2 years and under 3 years | 4½ | 4 | 3¾ |
| 3 years and over | 4½ | 4 | 4 |
It is of service at this stage to mention briefly the interest rates payable in respect of certain other classes of deposits. The highest rate of interest payable on moneys in the Common Fund of the Public Trust Office (see Section XLV) was fixed at 3 per cent. by Order in Council dated 31st July, 1934, previous reductions having been made from 5¼ per cent. in 1928 to 4¾ per cent. in 1931, 4 per cent. in 1932, and 3½ per cent. in 1933.
Local authorities may also accept deposits (in practice, only for short periods). The present maximum rates of interest on such deposits were fixed by Order in Council dated 31st July, 1933, at: Call and under three months, 2 per cent.; three and under six months, 2¾ per cent.; six months and over, 3 per cent.
References to rates of interest on mortgages will be found in Section XXXII (Mortgages), while interest on Government debt is referred to in Section XXIVc (State Indebtedness).
The consolidating and amending Coinage Act, 1870 (Great Britain), empowered Her Majesty by Proclamation to direct that the whole or any part of the Act should apply to any British possession with or without modification. On the 1st August, 1896, Her Majesty directed that the Parts of the Act, as amended in 1891, that were set out in the Proclamation should be in force in New Zealand from the promulgation of the Proclamation in New Zealand. By Proclamation of the Administrator of 17th March, 1897, it was declared that Her Majesty's Proclamation should take effect from the publication of the Administrator's Proclamation in the Gazette (25th March, 1897).
The Coinage Act, 1920 (Great Britain) altered the fineness of silver coins. Its provisions were adopted for New Zealand by Proclamation of 14th September, 1920.
Prior to 1935 the coinage of Great Britain, as determined from time to time by Royal Proclamation under the Act of 1870, was the New Zealand coinage. This is still the position in respect of gold coinage (which has disappeared from circulation) and bronze coins.
The Coinage Act, 1933, authorized a special silver and bronze coinage for New Zealand; and in 1935 British silver coins were declared not to be legal tender in New Zealand. The New Zealand copper coinage has not yet been issued.
Section 8 of the Finance Act, 1932–33 (No. 2), authorized the Minister of Finance to arrange with the Master of the Royal Mint (in England) for a special issue of silver and bronze coinage of distinctive design for use in New Zealand. Any coins minted in accordance with this arrangement would conform to the standard Mint requirements of weight, fineness, &c., and were given status as legal tender in New Zealand.
Before proceeding with the arrangement as authorized, the question of possible changes in the coinage system (e.g., to a metric basis) was, inter alia, referred to a committee of investigation appointed in May, 1933. This committee, which included representatives of the Treasury, Audit, Industries and Commerce, and Post and Telegraph Departments, together with representatives of the Associated Banks, of the Associated Chambers of Commerce, of retail interests, and of the New Zealand Numismatic Society, in a report released 1st July, 1933, advocated, in the circumstances prevailing, adherence to coins of the existing face-value and mintage in England.
Arrangements were made under which the Royal Mint agreed to remint free of charge the Imperial and Australian silver coin circulating in the Dominion, replacing it with New Zealand coin of distinctive design, and to allow the New Zealand Government the bullion value of the coin not used in making such replacement.
The profit arising to the New Zealand Government from the recoinage on this basis has been estimated at £650,000. The profit arises from the fact that the Australian coinage and a proportion of the British coinage hitherto in circulation in New Zealand contained a larger proportion of silver than is required in the new coin under the standard set out in the Schedule to the Coinage Act, 1933, which is also the standard governing the present production of Imperial silver coin. The profit would have been much larger had it been possible to repatriate all such coin at its face-value, which was, of course, the value at which New Zealand actually purchased it. The Commonwealth Government agreed to the repatriation at face-value of a proportion of Australian coin circulating in the Dominion.
Up to the 30th June, 1937, New Zealand coins have been imported from the Mint of a total face-value of £2,010,000, and comprised of the following denominations and total face-values:—
| £ | |
|---|---|
| Half-crown | 666,500 |
| Florin | 585,500 |
| Shilling | 354,000 |
| Sixpence | 218,500 |
| Threepence | 185,500 |
The first consignment of New Zealand silver coins, consisting of half-crowns, arrived towards the end of November, 1933, and was put into circulation almost immediately. Since then other shipments have arrived and have been put into circulation. A few crowns have also been minted, but these have not been put into general circulation, being coined purely for numismatists.
By Order in Council of the 3rd May, 1934, New Zealand coins were made subject to the “Trial of the Pyx” in the same manner and by the same jury as in the case of British coins, one silver coin being set aside for this purpose from each journey weight consisting of 60 lb. troy weight. The verdict given was that the coins were within the permitted degrees of variation in weight and fineness.
Up to the 30th June, 1937, New Zealand coin of a nominal value of £2,009,500 had been handed to banks; Imperial coin of a nominal value of £946,813 18s. 9d. and Australian coin of £266,186 nominal value had been forwarded to the Royal Mint; and Australian coin to the nominal value of £82,645 had been forwarded to Australia, for which £82,645 was received. A further amount of £1,000 in Imperial coin was disposed of at face-value to the Royal Mint. Expenses of the Silver and Bronze Coin Account totalled £93,491 to the 30th June, 1937, and the credit balance at that date amounted to £745,675, of which amount £245,675 was held in cash and £500,000 invested in securities.
The Coinage Act, 1933, which came into operation on the 1st December, 1933, repeals section 8 of the Finance Act (No. 2), 1932–33, and makes necessary provisions in respect of silver and of bronze or cupro-nickel coins. The Act makes no provision for the issue of New Zealand gold coins. The denominations of bronze or cupro-nickel coins are to be determined by Proclamation under the Act. Section 5 (4) of the Act authorizes Proclamations declaring that British coins (other than gold coins) shall not be legal tender in New Zealand, and a Proclamation has been issued declaring British silver coins not legal tender in New Zealand on and after the 1st February, 1935; but otherwise the Act does not appear to affect the continued applicability to New Zealand of the Coinage Acts of Great Britain. A schedule to the Act gives the principal requirements of New Zealand silver coins; these are identical with Royal Mint standards.
| Denomination of Coin. | Standard Weight. | Standard Fineness. | Remedy Allowance. | |||
|---|---|---|---|---|---|---|
| Imperial Weight. | Metric Weight. | Weight per Piece. | Millesimal Fineness. | |||
| Grains. | Grammes. | Imperial Grains. | Metric Grammes. | |||
| Crown | 436.36363 | 28.27590 | 500.0 | 2.000 | 0.1296 | 5 |
| Half-crown | 218.18181 | 14.13795 | 500.0 | 1.216 | 0.0788 | |
| Florin | 174.54545 | 11.31036 | 500.0 | 0.997 | 0.0646 | |
| Shilling | 87.27272 | 5.65518 | 500.0 | 0.578 | 0.0375 | |
| Sixpence | 43.63636 | 2.82759 | 500.0 | 0.346 | 0.0224 | |
| Threepence | 21.81818 | 1.41379 | 500.0 | 0.212 | 0.0138 | |
The melting of current gold or silver coins is made an offence by section 48 of the Finance Act, 1920.
In past years certain private tokens, mainly of penny-size, were issued in times of copper shortages. They have long disappeared, and their issue would now be unlawful.
Australian gold coins (the first Mint was established at Sydney in 1855) were not legal tender abroad until the Royal Proclamation of 1866, although they are understood to have circulated in New Zealand during these years. Under the Coinage Act, 1870 (Great Britain) gold coin struck at all the Australian Mints has been an integral part of the currency of Great Britain, distinguished from that struck at the Tower Mint only by an inconspicuous mint-mark. Australian gold coins, therefore, were and still are legal tender in New Zealand. Australian silver and bronze coins have never been legal tender in New Zealand, although in free circulation at face-value both among the general public and into and out of the banks. The quantity of Australian silver currency in circulation was considerable for some years prior to the introduction of the special New Zealand coinage. The infusion of Australian silver coins increased substantially after the depreciation of the Australian pound in 1930.
No other non-legs-tender coin circulates. As noted above, British silver coin ceased to be legal tender from 1st February, 1935.
During the period 1914–19 various Orders in Council (now revoked or lapsed) prohibited absolutely, or without the consent of the Minister of Customs, the exportation to a varying extent of silver coin, and in one instance of gold coin. The Finance Act (No. 3), 1934, authorizes the issue of Proclamations prohibiting the export of coined gold except with the consent of the Minister of Finance. Previous restrictions in respect of gold are referred to under the next sub-title.
The depreciation of the Australian currency in 1930 created a strong incentive for the substitution of British silver coinage circulating in New Zealand by Australian coins. The depreciation of the New Zealand pound to £N.Z.125 = £stg.100 on 20th January, 1933, created a further impetus to this substitution. British silver coins, which would, of course, preserve their face value in England and elsewhere, were exported in considerable quantities. Accordingly, regulations effective from the 2nd April, 1931, were gazetted under the Customs Act, 1913, and its amendment of 1921, prohibiting the import or export of silver coins save with the consent of the Minister of Customs. These regulations were revoked as from the 23rd July, 1931, and were replaced as from the same date by regulations under the Finance Act (No. 2), 1931. Under the new regulations a person entering New Zealand was permitted to bring with him silver coins to the value of £2, and a person departing to take silver coins of a value of £10 if going direct to the British Isles, or, if otherwise, £5. These sums could be increased only by consent of the Minister of Finance. Later amendments, dating from the 30th March, 1933, and still in force, diminished the latter sums to £5 and £2 respectively. With the advent of New Zealand coins the necessity for these regulations has diminished. Although it is intended that the New Zealand issue of subsidiary coinage will eventually replace all previously circulating issues, no copper coinage has as yet been struck. Imperial and Australian copper coins still circulate freely. Regulations were gazetted in August, 1935, prohibiting the export of any bronze or copper coin, or of any coin inferior in value to silver, except with the consent of the Minister of Customs.
The appreciation in the price of gold having led to a temporarily large trade in the realization of jewellery and hoarded coin, and to attempts to melt or export the latter, it became necessary to introduce safeguards. The Board of Trade (Coined Gold) Regulations, 1932, were therefore enacted, whereby a system of licenses for dealers was introduced, evidence of character and suitability being required. To enable purchases of coin to be traced a register is required to be kept, open to police inspection. Under an amendment, effective from the 16th November, 1933, delivery of gold coin in the case of purchases must take place in the presence of a notary public, Justice of the Peace, or officer of the police to whom the purchaser is personally known, and whose signature must be affixed to the record.
By a provision of the Coinage Act, 1870 (Great Britain), made applicable to New Zealand, coins of Great Britain were legal tender in New Zealand to the same extent as in Great Britain—viz., gold, to any amount; silver, for amounts not exceeding £2; bronze, for amounts not exceeding 1s. Section 5 (1) of the Coinage Act, 1933, declares that a tender or payment of money, if made in British coins or New Zealand coins of current weight, shall be a legal tender to the extent quoted above. Under section 5 (4) a Proclamation has been issued declaring that British silver coin shall no longer be legal tender in New Zealand from the 1st February, 1935.
Prior to the establishment of the Reserve Bank under the Reserve Bank of New Zealand Act passed on the 27th November, 1933, the Banking Act, 1908, dealt with the issue of notes generally. The Governor-General could empower any bank to issue and circulate notes, subject to the provisions and restrictions contained in the charter or letters patent under which such bank is incorporated; all such notes to be payable in gold at the office of the bank at the place of issue, and to be a first charge on all assets of the bank.
Under the Bank-note Issue Act, 1893 (amended in 1894 and 1895), certain bank-notes were, for a short period, made legal tender in New Zealand.
On the 5th August, 1914, immediately after the outbreak of the Great War, an amendment to the Banking Act was passed empowering the Governor-General in Council, from time to time, to make a Proclamation declaring “that the notes payable on demand by any bank therein named, and then issued or thereafter to be issued or reissued within New Zealand under any lawful authority in that behalf, shall during the period limited by the Proclamation be everywhere within New Zealand a good and legal tender of money to the amount therein expressed to be payable.” Conditions governing the issue of such Proclamation were Laid down, and the bank might be required to give adequate security that it would redeem the notes in gold on the expiration of the period covered by the Proclamation. Provision was also made for payment by the State Treasury in case of default by the bank. During the period any such Proclamation was in force coined gold could not be exported except with the consent of the Minister of Finance. During the period between 5th August, 1914, and 5th November, 1919, this prohibition also applied to uncoined gold. Immediately on the passing of the amendment referred to, a Proclamation was gazetted declaring notes of all six banks of issue doing business in New Zealand to be legal tender from the 6th August to the 6th September, 1914. Further extensions were made from time to time. Under the Finance Act (No. 3), 1934, this legislation is repealed as from the 10th January, 1935. The position in respect of export of coined gold has been given under the preceding sub-title. That in respect of legal-tender notes is next referred to.
The position in respect of the note-issue was radically altered by the Reserve Bank of New Zealand Act, 1933. Section 15 enacted that on and after a date fixed by Proclamation—the Proclamation was signed on the 26th January, 1934, and fixed the date as the 1st August, 1934—the Reserve Bank had the right to issue bank-notes in New Zealand; and thereupon the authority of every other bank to issue or re-issue bank-notes was terminated, and such banks were required to redeem their outstanding notes in Reserve Bank notes or subsidiary coin to the extent to which the latter was legal tender. On the 1st August, 1936, every other bank carrying on business in New Zealand was required to pay over to the Reserve Bank an amount equal to the value of its then outstanding notes issued or payable in New Zealand, and its liability in respect of such notes to the holders has been assumed by the Reserve Bank. Bank-notes not presented for payment within forty years, commencing 1st April after date of issue in the case of Reserve Bank notes, or after assumption of liability (as above) in other cases, are deemed not to be in circulation, and an amount equal to the value thereof must be paid into the Consolidated Fund as if unclaimed moneys.
Reserve Bank notes are constituted legal tender up to any amount. There is a provision in the existing legislation which requires the Bank, on presentation at its head office in Wellington of notes to any amount not less than £1,000, to give in exchange sterling for immediate delivery in London. On similar presentation of gold or of sterling for immediate delivery in London, in either case to an amount of £1,000 or more, the Bank must give its notes in exchange therefor. These requirements may be suspended at the discretion of the Minister of Finance. The rate of exchange for the above transactions is fixed by the Bank.
The Bank is required at all times to maintain a minimum reserve of not less than 25 per cent. of the aggregate amount of its notes in circulation and other demand liabilities. The term “reserve” includes—
Gold coin and bullion in the unrestricted ownership of the Bank.
Sterling exchange, comprising (1) Deposits at the Bank of England, (2) British Treasury bills of not more than three months unexpired currency, (3) bills of exchange bearing at least two good signatures and of not more than three months unexpired currency.
Net gold exchange, as defined in section 17 (c).
At the request in writing of the Board of Directors, the Minister of Finance may suspend the requirements as to maintenance of the above minimum reserve for a period not exceeding thirty days, with extensions, upon further request, of not more than fifteen days at any one time.
The Reserve Bank may not issue bank-notes of a less denomination than 10s., except with the authority of the Governor-General in Council. The present issue of notes consists of the following denominations: 10s., £1, £5, and £50.
The use of Australian silver has been referred to in an earlier paragraph. Neither Australian nor other overseas paper-money circulates, presumably on account of the exchange fee charged by the banks on receiving it.
No consideration of the amount of credit currency in use at any moment can overlook the very large proportion of payments made by cheque, mainly upon the trading banks, but also upon trustee savings-banks and upon various stock-and-station agencies which act in this respect for their customers in the capacity of banker. Such cheques usually go straight from the payee to the collecting bank, but occasionally in odd localities they pass from hand to hand, as was the custom in earlier days.
At the present time Government postal notes (issued in thirty-nine denominations of from 1s. to £1) sometimes enjoy a certain life in the form of currency.
Although the movement of gold, whether internally or externally, was unrestricted in years prior to the War, certain of the conditions usually considered essential in the full operation of the gold standard were never effective in New Zealand. More correctly, New Zealand was, and still is, upon a sterling-exchange standard. The explanation is that the New Zealand banking system is not self-contained, in that the banks normally hold a large amount of funds in London. In fact, these London balances are the real regulative factor and the key to the whole banking system. This system has evolved out of economic conditions, and, in general, has functioned smoothly without effective legislative regulation.
War conditions caused the abandonment of the gold standard by Great Britain. A return was made in May, 1925, but from September, 1931, Britain again departed from gold. While New Zealand currency was at parity with sterling, except for minor fluctuations above or below parity, no necessity existed for distinction between sterling and New Zealand currency. The latter is entitled to be considered as one of the sterling currencies; but, adopting the convenience of a growing usage, sterling is used herein to refer solely to the currency of Great Britain.
The relationship of New Zealand currency to sterling assumed added significance since December, 1929. Prior to that date the Dominion currency was at virtual parity with British currency, only slight deviations occurring from time to time, but then commenced to depreciate gradually, reaching, in. January of 1931, a level of approximately £110 New Zealand = £100 London for telegraphic transfers. At that level it remained fairly stationary until January, 1933, when as a result of Government intervention (referred to below) it was abruptly depreciated to a further degree.
The unusual significance of the currency level in the case of New Zealand depends chiefly upon its position in regard to overseas trade and to overseas borrowings. The course of development of the Dominion has not reacted a stage where the country is self-contained to an average degree, and the external trade per caput is greater than that of almost all, if not all, other countries. Most of this external trade is with the United Kingdom, while the function of London as an international clearing-house is also of importance in this connection. New Zealand's borrowings overseas, chiefly from the London financial market, have also been upon a high scale, requiring, as noted elsewhere (vide State and also Local Authority Indebtedness), heavy annual payments in London.
The following table gives, in order to complement and interpret other data in this volume, quotations representing the amount of New Zealand currency required to purchase £100 London. The period covered is from January, 1929, to the commencement of Reserve Bank operations (1st August, 1934). Figures are quoted for telegraphic transfer (cable) and sixty-day rates New Zealand on London as sufficiently indicative of the position. The majority of quotations are from The Statist (London), supplemented in a few instances from other sources.
| Operative from | Buying (£100 London). | Selling (£100 London). | ||
|---|---|---|---|---|
| Cable. | Sixty Days. | Cable. | Sixty Days. | |
| * Actually from 15th November, 1928. | ||||
| 1929— | ||||
| 1st January* | 98⅜ | 100¾ | 99½ | |
| 29th July | 98⅝ | 101 | 99¾ | |
| 4th September | 98⅞ | 101¼ | 100 | |
| 30th September | 98⅞ | 101½ | 100¼ | |
| 4th December | 99 | 101¾ | 100½ | |
| 21st December | 99¼ | 102⅛ | 100¾ | |
| 1930— | ||||
| 31st January | 99⅝ | 102⅝ | 101¼ | |
| 18th February | 100⅛ | 103⅛ | 101¾ | |
| 19th March | 100⅝ | 103⅝ | 102¼ | |
| 3rd April | 102½ | 105 | 103⅝ | |
| 1931— | ||||
| 14th January | 105 | 107½ | 106⅛ | |
| 29th January | 107½ | 110 | 108⅝ | |
| 4th June | 107¾ | 110 | 109 | |
| 12th October | 107½ | 110 | 109 | |
| 1932— | ||||
| — March | 107¾ | 110 | 109 | |
| 3rd May | 107⅞ | 110 | 109⅛ | |
| 1933— | ||||
| 20th January to 31st July, 1934 | 124½ | 123½ | 125 | 124⅝ |
From the 1st August, 1934, Reserve Bank quotations for £100 sterling for immediate delivery in London are: Buying rate, £124; selling rate, £125. It was intimated that the policy of the Bank would aim at retaining these rates unchanged for a long period unless there occurred marked changes in existing conditions. To assist in achieving this measure of stability, the Reserve Bank was prepared to enter into forward exchange contracts with the trading banks. While prepared to fulfil its statutory obligations, the Reserve Bank does not desire to compete for exchange business, provided adequate facilities are available elsewhere.
Following the statement of the Reserve Bank's policy, the trading banks adopted an adjusted scale of rates as from the 1st August, 1934. The following, quoted for New Zealand on London, basis £100 London, will serve as an example: Telegraphic transfers—Buying-rate, £124; selling-rate, £124 10s. Sixty days—Buying-rate, £123; selling-rate, £124 2s. 6d. These rates represent a reduction of 10s. per £100 on the rates ruling from the 20th January, 1933, to the 31st July, 1934.
It may be observed that the above exchange rates have not had entirely universal operation. The primary purpose in raising the exchange rates in January, 1933, was to assist the farming community, and the increased exchange was intended only for genuine trading transactions, and did not apply in general to imports of capital, lottery prizes, private investments, &c. Legacies below a certain limit received the premium, and also if the money was intended to be applied to developmental purposes. Cases of hardship were considered on their merits. Revenue, such as interest from overseas investments, received the exchange premium. This position, however., was terminated as from the 1st August, 1934, exchange thenceforward functioning without restriction in this way. As most of the export credits are utilized for financing imports, it is advisable to note that the full exchange rate is not operative in respect of dutiable goods. This arises from the fact that, although Customs duties are assessed in sterling, payment of Customs duties is accepted in New Zealand currency without addition of exchange.
A proportion, although probably not a large one, of exchange business functions through channels other than these of the recognized banking institutions. Exchange rates in such instances are understood to fluctuate more widely than the “official” rates.
Based upon the average of daily London quotations of gold prices during the month of August, 1937, the New Zealand pound was worth 9s. 9¼d. in terms of gold, conversion New Zealand – London being allowed at the ratio 1245 = 100.
Figures given previously link the New Zealand currency to that of Britain, but since the British suspension of the gold standard on the 21st September, 1931, it is necessary to provide complementary data giving the relationship of British currency to gold. For this purpose the following quotations of The Statist's index number (parity = 100) of the value of British currency in terms of the gold standard currencies serve admirably:—
| — | 1931. | 1932. | 1933. | 1934. | 1935. | 1936. |
|---|---|---|---|---|---|---|
| * September 1st–19th, 100.18; September 21st–30th, 82.63. | ||||||
| January | 100.07 | 70.70 | 69.12 | 65.53 | 59.91 | 60.19 |
| February | 100.14 | 71.16 | 70.22 | 62.76 | 59.61 | 60.18 |
| March | 100.11 | 74.58 | 70.39 | 62.39 | 58.03 | 60.19 |
| April | 100.13 | 77.11 | 70.27 | 62.74 | 59.09 | 60.27 |
| May | 100.17 | 75.35 | 69.04 | 62.18 | 59.77 | 60.76 |
| June | 100.26 | 74.94 | 69.45 | 61.59 | 60.07 | 61.29 |
| July | 100.10 | 73.08 | 68.49 | 61.54 | 60.19 | 61.00 |
| August | 100.15 | 71.55 | 67.32 | 61.16 | 60.44 | 61.30 |
| September | * | 71.54 | 64.54 | 60.16 | 60.26 | 61.67 |
| October | 79.74 | 69.99 | 64.45 | 59.96 | 59.90 | |
| November | 76.76 | 67.50 | 65.89 | 60.99 | 60.12 | |
| December | 69.52 | 67.54 | 67.28 | 60.39 | 60.12 | |
Consequent on the breaking up of the gold bloc towards the end of 1936, the “Statist” index number was discontinued; but from the price of gold bullion in terms of sterling it is still possible to calculate the extent of sterling depreciation in relation to gold. On the 12th August, 1937, gold bullion was valued at £6 19s. 6d. (sterling) per fine ounce, so that sterling was equivalent to 60.90 per cent. of gold parity.
The course of exchange Australia on London may be noted briefly. As in the case of New Zealand, depreciation of Australian currency commenced at the end of 1929. The principal movements have been (telegraphic transfer, equivalent of £100 London): 18th December, 1929, £102; 17th February, 1930, £103; 10th March, 1930, £104; 24th March, 1930, £106; 9th October, 1930, £109; 6th January, 1931, £115; 13th January, 1931, £118; 17th January, 1931, £125; 29th January, 1931, £130; 3rd December, 1931, £125. It has remained around the last-quoted figure since that date.
In order to ensure that funds would be available overseas to meet all commitments, arrangements were made with the banks in 1931 for the formation of an exchange pool. Regulations were gazetted in December, 1931, under the Customs Act, 1913, and the Board of Trade Act, 1919, prohibiting the export of goods after the 1st January, 1932, except under license. Conditions of such licenses, inter alia, provided for the proceeds of the sale of goods to be paid to an authorized bank to be remitted to New Zealand at the current rate of exchange at the time of payment to the bank.
The system of export licenses terminated as from the 30th June, 1932.
As a matter of policy the Government arrived at the decision to raise the exchange-rate, New Zealand on London, to a level of approximately £125 New Zealand = £100 London, as from the 20th January, 1933.
At the request of the Government the banks carrying on business in New Zealand raised, as from the date quoted, the rates of exchange based on the rate for the telegraphic transmission of moneys from New Zealand to London. In return the Government undertook to insure the banks against any losses they might sustain by reason of such fixation of the rates of exchange and arising from the purchase and sale of exchange. Legislative sanction was given by the Banks Indemnity (Exchange) Act, passed on the 1st March, 1933.
The Bank of New Zealand was constituted the agent of the Government for this purpose, and was authorized to buy surplus exchange held in London by other banks, or to re-sell to any such bank exchange up to the amount purchased from it under the Act. Sales to or from the Bank of New Zealand were required to be made at the fixed exchange-rate, subject to such concessions as might be mutually agreed upon. Exchange purchased or sold on Government behalf was authorized to be paid for in cash or in Treasury bills, the latter to be discounted at a rate not exceeding the ruling rate fixed for overdrafts on best accounts. Provision was made regarding the issue of Treasury bills, &c. (part under the further authority of section 4 of the Finance Act (No. 2), 1932–33), and the investment of exchange purchased under the Act.
From the 20th January, 1933, to the commencement of Reserve Bank operations, exchange purchased and paid into the New Zealand Government Indemnity Exchange Account in London aggregated £36,208,000. The exchange cost of London funds treated as surplus sterling assets (i.e., additional to Government requirements) was £4,899,703. During the year 1934–35, £20,229,700 of sterling funds held by the Government were transferred to New Zealand, the resultant New Zealand credit of £25,084,828 being utilized to redeem outstanding Treasury bills.
The regulation of currency exchange is now a function of the Reserve Bank, as noted previously. Since the Reserve Bank commenced business the Suspense Account created for operations under the Banks Indemnity (Exchange) Act has been liquidated and the outstanding Treasury bills redeemed. The Act has been repealed, as from the 1st August, 1934, by the Finance Act, 1934, thus terminating the period in which the rate of sterling exchange was fixed by statute. The Finance Act, 1934, provides that any appreciation or depreciation of the assets of the Reserve Bank (expressed in the currency of New Zealand) due to any alteration that may subsequently be made in the exchange rate, while the value of the local currency is not fixed by statute in terms of sterling, shall be credited to or borne by the Consolidated Fund.
Table of Contents
THE statutory provisions affecting life insurance in New Zealand are in the main contained in the Life Insurance Act, 1908, and its amendments of 1920, 1921–22, and 1925; the Inalienable Life Annuities Act, 1910; and the Government Life Insurance Act, 1908, and its amendment of 1912. Any association other than a friendly society which issues policies or grants annuities on human life in New Zealand comes within the scope of the enactments. Every life company must deposit with the Public Trustee money or securities of the statutory character to the value of from £5,000 to £50,000, varying within these limits according to the total amount assured by policies current in its New Zealand business. Deposits aggregating £750,355, representing statutory deposits by life-insurance companies, were held by the Public Trustee as at 31st March, 1936.
In the case of composite offices, provision is made for the receipts of life and annuity business to be treated as a separate fund, and the Act safeguards the interest of the policyholder by making such funds available only for liabilities arising from such business.
The law bearing on industrial assurance has received the attention of the Legis lature in the Life Insurance Amendment Act, 1920. In this class of insurance the premiums must be payable at shorter intervals than three months, and provision is made for its control by regulation. Companies are required to deposit with the Minister of Finance forms of policy tables, rates, and other documents, and policies must contain only such conditions as have been approved by the Governor-General in Council. Restrictions are placed on the forfeiture of policies in default of payments or other requirements.
The most recent legislation on the subject of life insurance is contained in section 26 (2) of the Finance Act, 1932, which provides that the proceeds of a policy shall become “unclaimed moneys” on the expiration of six years from the date on which the company first has reason to suppose the policy has matured by death or the date (if any) on which it otherwise matures, whichever date is the earlier. This provision operates notwithstanding that the policy may provide for legal proof of death, or proof of age, &c.
Annual returns of life assurance are required to he deposited with the Minister of Finance. It is from these returns that the statistical matter following has been compiled.
Fourteen life-assurance offices were operating in the Dominion during 1936. Of these, four only are purely New Zealand institutions—namely, the Government Life Insurance Office, the Provident Life Assurance Co., the Dominion Life Assurance Office of New Zealand, Ltd., and the F.A.M.E. Mutual Insurance and Guaranteed Incomes, Ltd.
The statistics here given relate exclusively to business transacted in the Dominion.
During the period 1923–30 there was a gradual increase in the amount of new insurances, the latter year producing the then record sum of nearly £15,000,000. In 1931, however, there was a decline of approximately £3,500,000, followed by a further drop of a little over £1,000,000 in 1932. The experience of the following two years showed that the downward trend had been arrested, and satisfactory figures were produced. An increase of nearly £3,000,000 in 19.35 saw the previous record established in 1930 exceeded by £430,616. The year 1936, however, resulted in the outstanding increase of £4,643,731 over 1935, the amount underwritten (£20,002,480) being nearly double that of 1932 and 34 per cent. above the 1930 total. The amount discontinued, which reached its peak in 1932, gradually declined up to and including 1935, the 1935 figure being £2,972,473, or 27 percent. below that of 1932. In 1936 a small increase of £46,882 was recorded, but this may be regarded as the natural result of the substantial increase in new business during the two previous years. The net result of the transactions for 1936 was to increase the amount in force by £12,109,537, compared with an addition of £7,346,803 in 1935 and a net decrease of £609,240 in 1932.
Ten years' figures for new business, discontinuances, and amount in force for the combined departments (ordinary and industrial) are given in the table following.
| Year. | Policies issued. | Policies discontinued. | Policies existing at End of Year. |
|---|---|---|---|
| £ | £ | £ | |
| 1927 | 12,544,722 | 7,188,595 | 92,110,221 |
| 1928 | 13,576,831 | 7,612,878 | 98,074,174 |
| 1929 | 14,586,039 | 7,388,794 | 105,271,419 |
| 1930 | 14,928,133 | 8,132,934 | 112,066,618 |
| 1931 | 11,410,699 | 10,774,277 | 112,703,040 |
| 1932 | 10,375,179 | 10,984,419 | 112,093,800 |
| 1933 | 10,737,732 | 9,955,758 | 112,875,774 |
| 1934 | 12,378,243 | 8,697,260 | 116,556,757 |
| 1935 | 15,358,749 | 8,011,946 | 123,903,560 |
| 1936 | 20,002,480 | 8,058,828 | 136,013,097 |
During the ten years from 1926 to 1936 the amount in force has increased by £49,259,003, or by 57 per cent. The increase in the Dominion's population during the same period was 10 per cent. Policies existing at the end of the year represented a rate of 334 per 1,000 of population (other than Maoris) for 1926 and 457 per 1,000 for 1936. The sum assured rose from £64 per head of population in 1926 to £91 per head in 1936. According to a statement prepared in 1933 by the Los Angeles (U.S.A.) Chamber of Commerce, New Zealand occupies third place in the life-insurance world on a per caput basis. United States was ranked first, with Canada, New Zealand, Australia, United Kingdom, Sweden, Italy, Norway, and the Netherlands following in that order.
A table showing the progress of business over a period of ten years is given below:—
| Year. | Policies issued. | Policies discontinued. | Policies existing at End of Year. | ||||||
|---|---|---|---|---|---|---|---|---|---|
| Number. | Sum assured. | Annual Premiums. | Number. | Sum assured. | Annual Premiums. | Number. | Sum assured. | Annual Premiums. | |
| £ | £ | £ | £ | £ | £ | ||||
| 1927 | 24,788 | 9,797,732 | 334,499 | 17,099 | 5,512,913 | 187,813 | 238,124 | 81,072,070 | 2,638,839 |
| 1928 | 26,997 | 10,826,619 | 371,100 | 17,733 | 5,786,691 | 212,017 | 247,388 | 86,111,998 | 2,797,922 |
| 1929 | 28,189 | 11,534,102 | 393,685 | 17,441 | 5,515,811 | 194,040 | 258,136 | 92,130,289 | 2,997,567 |
| 1930 | 28,321 | 11,975,361 | 413,696 | 18,106 | 5,969,955 | 207,937 | 268,351 | 98,135,695 | 3,203,326 |
| 1931 | 24,508 | 9,166,928 | 311,904 | 22,660 | 8,125,699 | 281,384 | 270,199 | 99,176,924 | 3,233,846 |
| 1932 | 22,353 | 8,123,793 | 280,577 | 24,403 | 8,594,783 | 300,341 | 268,149 | 98,705,934 | 3,214,082 |
| 1933 | 24,503 | 8,357,590 | 282,756 | 22,842 | 7,995,447 | 281,020 | 269,810 | 99,068,077 | 3,215,818 |
| 1934 | 28,554 | 9,778,967 | 312,848 | 20,444 | 6,999,072 | 246,476 | 277,920 | 101,847,972 | 3,282,190 |
| 1935 | 35,199 | 12,605,789 | 400,140 | 19,126 | 6,292,730 | 216,015 | 293,993 | 108,161,031 | 3,466,315 |
| 1930 | 46,026 | 16,812,497 | 539,441 | 18,887 | 6,442,382 | 222,380 | 321,132 | 118,697,031 | 3,783,376 |
New assurances effected in 1936 show an increase of £4,206,708 over the 1935 total, and are £4,837,136 above the figures of the earlier record year of 1930. Between 1930 and 1932 there was a decline of £3,851,568, while the following year showed only a slight increase over 1932. During the succeeding two years, however, the volume of business accelerated very rapidly, the increase during that period amounting to £4,248,199, which, added to the outstanding rise in 1936, gives an increase of over 100 per cent. compared with 1932. In 1932 discontinuances actually exceeded new insurances both in number and in sum assured. During the succeeding three years, however, substantial decreases were recorded for discontinuances, the 1935 figure being £2,302,053 below that of 1932. In the year under review a slight rise has taken place, the amount written off being £149,652 above the 1935 total. As indicated earlier, such a result may be expected to follow large new business increases. As a result of the year's transactions, the amount in force has been added to by £10,536,000, as against the previous year's increase of £6,313,059.
The average sum assured per new policy taken out in 1936 was £365, compared with £358 in 1935 and £404 for the average of the pre-depression period 1926–30. In 1930 this figure had reached £422, while in the succeeding four years (1931–34) the amounts were £374, £363, £341, and £342 respectively. The per-policy average premium for new assurances in 1936 was £11 14s. 5d., compared with £13 17s. for the period 1926–30, £14 12s. 2d. in 1930, £12 14s. 6d. in 1931, £12 11s. 1d. in 1932, £11 10s. 10d. in 1933, £10 19s. 2d. in 1934, and £11 7s. 4d. in 1935.
The corresponding figures for total insurances in force are £370 and £11 15s. 8d. respectively.
Particulars of policies discontinued during the last five years are contained in the next table.
| Year. | Death. | Maturity. | Surrender. | Lapse. | Other Causes. | Totals. |
|---|---|---|---|---|---|---|
| Number of Policies. | ||||||
| 1932 | 1,692 | 3,415 | 8,985 | 9,965 | 346 | 24,403 |
| 1933 | 1,704 | 3,504 | 8,196 | 9,127 | 311 | 22,842 |
| 1934 | 1,709 | 3,595 | 6,480 | 8,342 | 318 | 20,444 |
| 1935 | 1,736 | 3,490 | 5,466 | 8,033 | 401 | 19,126 |
| 1936 | 1,860 | 3,805 | 4,747 | 8,129 | 346 | 18,887 |
| Sum assured. | ||||||
| £ | £ | £ | £ | £ | £ | |
| 1932 | 651,514 | 660,457 | 3,166,105 | 3,859,950 | 256,757 | 8,594,783 |
| 1933 | 733,402 | 706,351 | 2,891,905 | 3,377,641 | 286,148 | 7,995,447 |
| 1934 | 739,757 | 739,620 | 2,278,167 | 2,985,448 | 256,080 | 6,999,072 |
| 1935 | 707,790 | 698,865 | 1,835,537 | 2,799,274 | 251,264 | 6,292,730 |
| 1936 | 767,539 | 771,351 | 1,603,076 | 3,065,829 | 234,587 | 6,442,382 |
A noteworthy feature is the continued decline in surrenders. The amount written off on this account reached its peak in 1932, and each succeeding year has recorded an improvement, the 1936 figure being a little over one-half of the 1932 total. Lapses, which showed a steady decline from 1930 to 1935, show a slight increase for 1938, the total for that year being £266,555 above the 1935 figure. Discontinuances by death and maturity show merely normal fluctuations. The total amounts written off represent for 1936 and 1935 5.96 per cent. and 6.18 per cent. respectively of the amount in force at the end of the year immediately preceding.
Reducing the amounts in the foregoing table to a percentage basis, the following result is arrived at:—
| Year. | Death. | Maturity. | Surrender. | Lapse. | Other Causes. | Total. |
|---|---|---|---|---|---|---|
| 1932 | 7.58 | 7.68 | 36.84 | 44.91 | 2.99 | 100.00 |
| 1933 | 9.17 | 8.83 | 36.17 | 42.25 | 3.58 | 100.00 |
| 1934 | 10.57 | 10.57 | 32.55 | 42.65 | 3.66 | 100.00 |
| 1935 | 11.25 | 11.11 | 29.17 | 44.48 | 3.99 | 10,000 |
| 1936 | 11.91 | 11.97 | 24.89 | 47.59 | 3.64 | 100.00 |
The proportions of the amount in force at the end of 1935 written off during 1936 on account of the four main causes give percentages of 0.71, 0.71, 1.48, and 2.83 for death, maturity, surrender, and lapse respectively.
A statement of the income and outgo of all the companies operating in the Dominion, so far as ordinary business only is concerned, further illustrates the progress of business during the last ten years. The ratio of management expenses-to premium and total receipts is also given.
| Year. | Receipts and Expenditure. | Expenses of Management. | ||||
|---|---|---|---|---|---|---|
| Total Receipts, excluding Transfers. | Total Expenditure, excluding Transfers. | Excess of Receipts. | Amount. | Proportion to Premium Receipts. | Proportion to Total Receipts. | |
| £ | £ | £ | £ | Per Cent. | Per Cent. | |
| 1927 | 3,616,367 | 2,460,522 | 1,155,845 | 395,240 | 15.36 | 10.93 |
| 1928 | 3,855,175 | 2,684,344 | 1,170,831 | 419,358 | 15.21 | 10.88 |
| 1929 | 4,139,929 | 2,655,767 | 1,484,162 | 453,396 | 15.32 | 10.95 |
| 1930 | 4,495,000 | 2,863,766 | 1,631,234 | 465,456 | 14.75 | 10.35 |
| 1931 | 4,943,256 | 3,334,250 | 1,609,006 | 426,136 | 13.33 | 8.62 |
| 1932 | 4,726,918 | 3,421,971 | 1,304,947 | 415,289 | 13.12 | 8.79 |
| 1933 | 4,856,162 | 3,547,294 | 1,308,868 | 431,755 | 13.32 | 8.89 |
| 1934 | 5,113,567 | 3,511,518 | 1,602,049 | 467,913 | 13.94 | 9.15 |
| 1935 | 5,386,100 | 3,364,703 | 2,021,397 | 544,079 | 14.90 | 10.10 |
| 1936 | 5,959,761 | 3,632,308 | 2,327,453 | 654,047 | 1,610 | 10.97 |
The increase in management expenses in 1936 is mainly the result of the greatly increased new business and, consequently, the amount of commission payable. New commission amounted to £301,102 compared with £228,249 in 1935, renewable commission £33,991 as against £29,801, while “other” expenses of management totalled £318,954, the comparative figure for 1935 being £286,029. Although the ratio of management expenses to premium income in 1936 was 16.0 per cent. compared with 14.9 per cent. in 1935, the ratio when commissions were excluded was 7.85 per cent. as against 7.83 per cent.
| — | 1932. | 1933. | 1934. | 1935. | 1936. |
|---|---|---|---|---|---|
| Revenue. | £ | £ | £ | £ | £ |
| Renewal premiums | 2,899,216 | 2,936,009 | 2,943,339 | 3,129,608 | 3,341,320 |
| New premiums | 266,857 | 305,145 | 413,441 | 522,645 | 721,065 |
| Consideration for annuities | 31,865 | 123,495 | 140,652 | 169,849 | 193,942 |
| Interest | 1,527,297 | 1,459,669 | 1,549,983 | 1,558,588 | 1,660,646 |
| Other revenue | 1,683 | 31,844 | 66,152 | 5,410 | 42,788 |
| Total revenue | 4,726,918 | 4,856,162 | 5,113,567 | 5,386,100 | 5,959,761 |
| Expenditure. | |||||
| Claims by death and maturity | 1,794,094 | 1,974,649 | 2,051,367 | 1,979,032 | 2,124,988 |
| Annuities | 42,052 | 44,197 | 52,800 | 64,009 | 76,567 |
| Surrenders | 790,030 | 759,255 | 680,432 | 557,141 | 522,782 |
| Cash bonuses | 114,524 | 99,176 | 82,094 | 61,642 | 55,273 |
| Management | 415,289 | 431,755 | 467,913 | 544,079 | 654,047 |
| Taxes | 173,211 | 154,098 | 123,417 | 130,565 | 165,464 |
| Other expenditure | 92,771 | 84,164 | 53,495 | 28,235 | 33,187 |
| Total expenditure | 3,421,971 | 3,547,294 | 3,511, 518 | 3,364,703 | 3,632,308 |
A noticeable increase is shown for receipts by way of interest, this item being little short of the figure recorded in 1931, the year prior to the operation of the National Expenditure Adjustment Act.
The previous peak year for this class of life assurance was reached in 1929, as against 1930 in the case of ordinary life assurance. The 1930 new business figures for industrial assurance showed only a slight fall; but in 1931 a decline to the extent of £808,166, or 26 per cent., was recorded when compared with 1929. In 1932 a slight recovery was experienced, whereas in that year the ordinary department reached its lowest level. A gradual improvement has taken place in each year since 1932, and although the relative increase has not been so great as that shown by ordinary life assurance the 1936 figures are £138,046 above the 1929 total. During the period 1932–34 discontinuances showed a substantial decrease, the figures for the latter year being the lowest recorded since 1927. In 1935 a small increase of £21,028 over 1934 took place, but a reduction of £102,770 in 1936 makes the amount for that year the lowest since 1926.
A summary of the progress of industrial assurance business is given in the following table:—
| Year. | Policies issued. | Policies discontinued. | Policies existing at End of Year. | ||||||
|---|---|---|---|---|---|---|---|---|---|
| Number. | Sum assumed. | Annual Premiums. | Number | Sum assured. | Annual Premiums. | Number. | Sum assured. | Annual Premiums. | |
| £ | £ | £ | £ | £ | £ | ||||
| 1,027 | 51,059 | 2,746,900 | 167,354 | 34,159 | 1,675,682 | 106,804 | 241,883 | 11,038,151 | 668,258 |
| 1928 | 51,162 | 2,750,212 | 168,409 | 37,133 | 1,826,187 | 117,468 | 255,912 | 11,962,176 | 719,199 |
| 1929 | 56,060 | 3,051,937 | 188,530 | 38,203 | 1,872,983 | 120,455 | 273,769 | 13,141,130 | 787,274 |
| 1930 | 53,676 | 2,952,772 | 182,306 | 43,039 | 2,162,979 | 138,231 | 284,406 | 13,930,923 | 831,349 |
| 1931 | 43,173 | 2,243,771 | 140,711 | 51,323 | 2,648,578 | 167,169 | 276,256 | 13,526,116 | 804,891 |
| 1932 | 46,030 | 2,251,386 | 137,739 | 47,148 | 2,389,636 | 152,315 | 275,138 | 13,387,866 | 790,315 |
| 1933 | 52,223 | 2,380,142 | 144,983 | 38,714 | 1,960,311 | 123,559 | 288,647 | 13,807,697 | 811,739 |
| 1934 | 57,338 | 2,599,276 | 158,486 | 35,255 | 1,698,188 | 104,369 | 310,730 | 14,708,785 | 865,856 |
| 1935 | 58,191 | 2,752,960 | 165,212 | 35,195 | 1,719,216 | 104,175 | 333,726 | 15,742,529 | 926,893 |
| 1930 | 64,384 | 3,189,983 | 192,400 | 33,103 | 1,610,446 | 98,588 | 365,007 | 17,316,066 | 1,020,705 |
As a result of the year's transactions, the amount in force has increased by £1,573,537. The average sum assured under each policy of new business effected in 1930 amounted to £55, with an annual premium of £3 7s. 11d. From that year onwards a steady decline was recorded in this respect up to and including 1934, the average for the latter year being £45 and £2 15s. 3d. respectively. The 1935 and 1936 figures, however, show a slight improvement, the average sums assured being £47 and £49.5 and the premiums £2 16s. 9d. and £2 19s. 9d. respectively.
A summary of the number of industrial policies and the sums assured written off according to the several causes is now given in the form of a five-years table.
| Year. | Death. | Maturity. | Surrender. | Lapse. | Other Causes. | Total. |
|---|---|---|---|---|---|---|
| Number of Policies. | ||||||
| 1932 | 1,846 | 8,512 | 4,133 | 32,365 | 292 | 47,148 |
| 1933 | 1,716 | 6,461 | 3,621 | 26,736 | 180 | 38,714 |
| 1934 | 1,885 | 5,861 | 2,585 | 24,697 | 227 | 35,255 |
| 1935 | 1,957 | 5,163 | 2,351 | 25,494 | 230 | 35,195 |
| 1936 | 2,019 | 6,089 | 1,806 | 23,029 | 160 | 33,103 |
| Sum assured. | ||||||
| £ | £ | £ | £ | £ | £ | |
| 1932 | 68,839 | 289,297 | 218,743 | 1,796,307 | 16,450 | 2,389,636 |
| 1933 | 64,032 | 237,290 | 185,078 | 1,463,545 | 10,366 | 1,960,311 |
| 1934 | 68,992 | 212,680 | 129,460 | 1,273,570 | 13,486 | 1,698,188 |
| 1935 | 71,823 | 198,771 | 113,609 | 1,321,049 | 13,964 | 1,719,216 |
| 1936 | 73,932 | 244,643 | 91,986 | 1,195,990 | 9,895 | 1,616,446 |
A feature of industrial life-assurance statistics for recent years is a decline in lapsed policies between 1931 and 1934. Although there was a slight increase in 1935, a further decrease was recorded in 1936, the total for that year being less than in any other year since 1926. Surrenders during 1936 show a further decrease, and the amount written off under this heading is the lowest recorded since 1927.
The amount written off in each year is considerably greater in proportion in the Industrial than in the Ordinary Branch. Whereas in the case of the latter 5.96 per cent. of the amount in force at the end of 1935 became void during 1936, the corresponding percentage for industrial assurance was 1927. The cause showing the greatest difference in this respect is “lapses,” the proportions of total discontinuances for 1936 being 47.59 per cent. for the Ordinary Section and 73.99 per cent. in the Industrial Section, and the percentages of the amount in force at the end of 1935 lapsing being 2.83 and 7.60 respectively. Surrenders, on the other hand, are considerably less in proportion in industrial assurance, the percentage of the amounts in force at the end of 1935 written off on this account during 1936 being 0.58, as against 1.48 in the Ordinary Section.
| Year. | Receipts and Expenditure. | Expenses of Management. | ||||
|---|---|---|---|---|---|---|
| Total Receipts, excluding Transfers. | Total Expenditure, excluding Transfers. | Excess of Receipts. | Amount. | Proportion to Premium Receipts. | Proportion to Total Receipts. | |
| £ | £ | £ | £ | Per Cent. | Per Cent. | |
| 1927 | 723,558 | 503,165 | 220,393 | 229,127 | 35.97 | 31.67 |
| 1928 | 797,797 | 561,260 | 236,537 | 244,457 | 34.98 | 30.64 |
| 1929 | 869,071 | 603,228 | 265,843 | 264,313 | 35.03 | 30.41 |
| 1930 | 944,406 | 700,613 | 243,793 | 275,636 | 33.95 | 29.19 |
| 1931 | 952,302 | 767,129 | 185,173 | 261,467 | 32.34 | 27.46 |
| 1932 | 1,010,507 | 771,068 | 239,439 | 257,728 | 32.38 | 25.50 |
| 1933 | 1,011,174 | 693,676 | 317,498 | 264,624 | 33.20 | 26.17 |
| 1934 | 1,106,939 | 697,683 | 409,256 | 285,111 | 33.73 | 25.76 |
| 1935 | 1,150,183 | 671,534 | 478,649 | 295,800 | 32.81 | 25.70 |
| 1936 | 1,249,560 | 733,358 | 516,202 | 319,454 | 32.71 | 25.57 |
The total receipts for 1936 exceeded the previous year's figure by £99,377, whole expenditure was greater to the extent of £61,824. During the years 1932–34 there was a slight but steady rise in the management-expense ratio, but the figures for 1935 and 1936 show decreases which, in view of the additional amount of new business transacted, must be considered very satisfactory. From the foregoing table it will be seen that the ratio of management expenses to premium income for 1936 was 32.71 per cent. The corresponding ratio in the Ordinary Branch was 16.1 per cent. The difference is largely accounted for by the high cost of collection of premiums in the Industrial Branch, principally in the shape of renewal commission. In the Ordinary Branch commission (new and renewal) was equivalent to 8.25 per cent. of the premium income, and in the Industrial Branch to 21.66 per cent. Excluding commissions, the ratio of management expenses to total income works out at 11.06 per cent. in the Industrial Branch, as against 7.85 per cent. in the Ordinary.
| — | 1932. | 1933. | 1934. | 1935. | 1936. |
|---|---|---|---|---|---|
| Revenue. | £ | £ | £ | £ | £ |
| Premiums | 795,896 | 797,099 | 845,213 | 901,507 | 976,485 |
| Interest | 211,840 | 209,712 | 232,568 | 241,530 | 266,717 |
| Other revenue | 2,771 | 4,363 | 29,158 | 7,146 | 6,358 |
| Total revenue | 1,010,507 | 1,011,174 | 1,106,939 | 1,150,183 | 1,249,560 |
| Expenditure. | |||||
| Claims by death and maturity | 395,408 | 337,019 | 325,274 | 300,657 | 350,672 |
| Surrenders | 62,219 | 55,481 | 39,353 | 42,751 | 30,779 |
| Management | 257,728 | 264,624 | 285,111 | 295,800 | 319,454 |
| Taxes | 21,579 | 20,341 | 18,091 | 19,647 | 24,937 |
| Other payments | 34,134 | 16,211 | 29,854 | 12,679 | 7,516 |
| Total expenditure | 771,068 | 693,676 | 697,683 | 671,534 | 733,358 |
The balance-sheets of the companies transacting industrial business do not in every case apportion their liabilities and assets over ordinary and industrial business, for, although the legislation in force requires separate statements to be furnished of receipts and expenditure, policies issued and discontinued, &c., no such requirement exists in regard to balance-sheets. The figures presented below accordingly refer to both classes of insurance, and, as indicated earlier in this subsection, relate-to New Zealand business only.
The aggregate capital and liabilities at the end of 1936, as compared with the two preceding years, were as follows:—
| 1934. | 1935. | 1936. | |
|---|---|---|---|
| £ | £ | £ | |
| Paid-up share capital | 163,692 | 165,693 | 224,806 |
| Life assurance and annuity funds | 39,991,814 | 41,930,357 | 44,484,971 |
| Depreciation, reserve, and other special funds | 700,014 | 703,989 | 704,488 |
| Claims admitted but not paid | 211,387 | 219,045 | 278,089 |
| Other liabilities | 1,095,107 | 1,162,684 | 1,368,498 |
| Totals | £42,162,014 | £44,181,768 | £47,060,852 |
The aggregate paid-up share capital of all life offices operating in New Zealand (excluding, of course, the five mutual offices and the Government Life Insurance Department) was in 1936 £2,880,898.
The New Zealand assets at the end of each of the five years 1932–36 were as follows:—
| Assets. | 1932. | 1933. | 1934. | 1935. | 1936. |
|---|---|---|---|---|---|
| £ | £ | £ | £ | £ | |
| Mortgages on property | 7,645,662 | 7,652,001 | 7,990,928 | 8,491,518 | 9,361,585 |
| Loans on policies | 5,800,531 | 5,979,782 | 5,896,059 | 5,861,438 | 5,771,671 |
| New Zealand Government securities | 6,949,968 | 7,521,380 | 8,657,147 | 8,263,433 | 9,382,073 |
| Securities of other Governments | 69,744 | 86,730 | 91,608 | 544,821 | 83,895 |
| Municipal and local authorities' securities | 13,525,790 | 14,083,990 | 14,736,437 | 15,626,049 | 17,029,483 |
| Landed and house property | 1,428,225 | 1,444,398 | 1,519,632 | 1,650,918 | 1,863,765 |
| Other investments | 128,188 | 237,749 | 182,793 | 90,929 | 118,703 |
| Loans on personal security | 3,363 | 2,287 | 1,299 | 1,383 | 889 |
| Agents' balances | 7,035 | 4,847 | 6,111 | 11,788 | 6,580 |
| Outstanding premiums | 366,180 | 350,819 | 346,258 | 335,091 | 371,836 |
| Interest accrued, &c. | 546,609 | 540,522 | 507,352 | 484,102 | 486,127 |
| Cash | 367,014 | 562,204 | 978,920 | 1,388,107 | 730,021 |
| Other assets | 1,287,453 | 1,350,791 | 1,247,470 | 1,432,131 | 1,854,224 |
| Totals | 38,125,762 | 39,816,500 | 42,162,014 | 44,181,768 | 47,060,852 |
Noticeable features of the above table are the increases during 1936 in the amounts invested in mortgages, New Zealand Government securities, and municipal and local authorities' securities; and the decreases in the amounts of loans on policies and of cash in hand or on fixed deposit. Owing to the lack of suitable investments during the period 1932–35, the latter item had reached the huge amount of £1,388,107 by the end of 1935, despite the fact that during that year £667,623 was transferred to the companies' head offices overseas. A reduction in this balance of nearly 50 per cent. in one year, specially when transfers totalled £308,358 only, would indicate that insurance companies are now investing freely in suitable securities.
The Life Insurance Department of the New Zealand Government was founded in 1869, at a time when New-Zealanders had comparatively poor facilities for the insurance of their lives. Payment of all policies with the State Office is guaranteed by the Government. Industrial insurance is not transacted by the Department.
The following table gives a synopsis of the activities of the Department for the last ten years in so far as the amount of business transacted is concerned. The amount of new business transacted during 1936 (£2,863,801), establishes a new record for the Department, and is £1,775,356 above the figure for 1932, in which year the effects of the depression were most felt in the insurance field.
| Year. | New Business. | Policies in Force at End of Year. | ||||||
|---|---|---|---|---|---|---|---|---|
| Number of Policies. | Premiums. | Sum assured. | Number of Policies. | Premiums. | Value of Business. | |||
| Sum Assured. | Bonuses. | Total. | ||||||
| £ | £ | £ | £ | £ | £ | |||
| 1927 | 5,578 | 58,006 | 1,791,845 | 66,856 | 595,780 | 19,303,916 | 1,973,434 | 21,277,350 |
| 1928 | 5,802 | 63,138 | 1,915,465 | 68,562 | 617,642 | 19,974,581 | 2,109,890 | 22,084,471 |
| 1929 | 5,735 | 62,414 | 1,918,600 | 70,189 | 642,140 | 20,700,069 | 2,265,539 | 22,965,608 |
| 1930 | 5,780 | 62,137 | 1,946,322 | 71,868 | 665,447 | 21,418,413 | 2,426,621 | 23,845,034 |
| 1931 | 4,033 | 40,529 | 1,506,449 | 71,075 | 660,399 | 21,472,761 | 2,580,587 | 24,053,348 |
| 1932 | 2,979 | 30,520 | 1,088,445 | 68,650 | 638,426 | 20,910,811 | 2,708,948 | 23,619,759 |
| 1933 | 3,572 | 31,579 | 1,295,656 | 67,567 | 625,905 | 20,769,292 | 2,805,177 | 23,574,469 |
| 1934 | 4,682 | 37,107 | 1,661,484 | 68,094 | 625,085 | 21,191,168 | 2,893,453 | 24,084,621 |
| 1935 | 5,670 | 47,944 | 2,005,995 | 69,982 | 638,371 | 22,050,276 | 3,001,016 | 25,051,292 |
| 1936 | 8,419 | 66,769 | 2,863,801 | 74,691 | 670,433 | 23,761,253 | 3,136,722 | 26,897,975 |
The total income of the Department for 1936 was £1,184,700—viz., premium income, £719,197; interest and rents (after payment of land and income tax), £409,001; annuity purchase money, £56,502. Corresponding figures for 1935 were: total income, £1,120,550; premium income, £668,946; interest, &c., £399,338; and annuity purchase money, £52,266.
During the year 1936 payments (including bonus additions) to the value of £331,505 were made on account of matured policies, and £202,758 was paid out to representatives of deceased policyholders. Commission totalled £50,645 and other expenses of management £58,041, making the total expenses £108,686, an increase of £12,103 compared with 1935. This additional expenditure is accounted for almost wholly by the increase in commission consequent upon the record amount of new business transacted. The ratio of expenses to total income was 917 per cent., and to premium income 1401 per cent.
The total assurance, annuity, and endowment funds, apart from special reserves of £444,3.08 amounted at the end of 1936 to £9,952,311, an increase of £373,638 during this year.
The Department's balance-sheet on the 31st December, 1936, showed that the total assets amounted to £10,474,030, and were invested as shown in the following statement, which also gives the distribution of the assets at the end of the four preceding years for purposes of comparison:—
| Class of Investment. | 1932. | 1933. | 1934. | 1935. | 1936. |
|---|---|---|---|---|---|
| * Mainly due and overdue premiums and interest, and interest accrued. | |||||
| £ | £ | £ | £ | £ | |
| Mortgages on freehold property | 3,744,404 | 3,702,317 | 3,801,369 | 3,818,060 | 3,901,032 |
| Loans on policies | 1,269,706 | 1,302,728 | 1,272,175 | 1,257,692 | 1,235,648 |
| Government securities | 2,385,360 | 2,526,810 | 2,520,060 | 2,517,260 | 3,403,545 |
| Rural advances bonds | 85,752 | 168,909 | |||
| Local authorities' securities | 1,201,455 | 1,262,204 | 1,284,335 | 1,249,778 | 1,187,290 |
| Landed and house property | 147,727 | 164,836 | 158,294 | 219,639 | 279,252 |
| Miscellaneous assets* | 240,172 | 247,911 | 243,301 | 228,377 | 216, 697 |
| Cash in hand, on current account, and on deposit | 77,695 | 66,628 | 489,225 | 816,925 | 250,566 |
| Totals | 9,152,271 | 9,442,343 | 9,768,759 | 10,107,731 | 10,474,030 |
The rate of interest realized on the mean funds of the Department, after deduction of land and income tax from interest, was as follows:—
| £ | s. | d. | |
|---|---|---|---|
| 1927 | 5 | 10 | 10 |
| 1928 | 5 | 9 | 9 |
| 1929 | 5 | 10 | 10 |
| 1930 | 5 | 11 | 7 |
| 1931 | 5 | 13 | 4 |
| 1932 | 4 | 10 | 10 |
| 1933 | 4 | 8 | 6 |
| 1934 | 4 | 8 | 10 |
| 1935 | 4 | 6 | 9 |
| 1936 | 4 | 5 | 7 |
IN terms of the Accident Insurance Companies Act, 1908, accident-insurance policies may be issued by any association, whether incorporated or not, provided such association is not established under any Act relating to friendly societies. The principal contingencies for which policies may be issued are in respect of—
Accident, disease, or mental or physical disability;
Employers' liability under statutory or common law;
Charges under the Workers' Compensation Act taking precedence of encumbrances, mortgages, or charges lawfully existing.
With the huge increase in motor traffic an important class of policy—viz., motor-car comprehensive, has come into existence, and has increased rapidly. Compulsory insurance to cover third-party risks was introduced in 1929, and is referred to later on in this subsection. Other important classes of accident-insurance policies are in respect of plate-glass insurance and fidelity-guarantee insurance.
Information relating to cash deposits required from companies transacting accident-insurance business is contained in the next subsection, which deals with the cognate subject of fire insurance.
The number of insurance offices transacting accident business in New Zealand in 1936 was 58, the registered head offices of the companies concerned being domiciled as follows: Great Britain, 21; Australia, 10; Hong Kong, 1; United States, 1; and New Zealand, 25. The number of branches established in the various towns, &c., was 234, and the total number of agencies was 15,143.
Between, the years 1930 and 1933 there was a decline in premium income to the extent of £456,725, or nearly 28 per cent. Subsequent increases of £122,819 for 1934, £119,300 for 1935, and £257,797 for 1936 have resulted in the figure for 1936 establishing a new high level, being £43,191 in excess of the previous record year—1930. The improvement in premium income during 1935 and 1936 has been more than offset by additions of £174,519 and £228,062 respectively to the amounts paid out in claims. In addition to the amount paid out in claims, other expenditure in 1936 was greater than the corresponding figures for 1935 by £68,041, so that the total expenditure for the year exceeded the premium income by £21,491.
| Year. | Number of Offices. | Receipts. | Expenditure. | ||||||
|---|---|---|---|---|---|---|---|---|---|
| Premiums. | Other Receipts. | Total. | Claims. | Commission. | Salaries. | Other Expenses. | Total. | ||
| £ | £ | £ | £ | £ | £ | £ | £ | ||
| 1927 | 47 | 1,279,318 | 81,735 | 1,361,053 | 741,760 | 199,743 | 145,704 | 136,402 | 1,223,609 |
| 1928 | 49 | 1,336,633 | 86,462 | 1,423,095 | 810,277 | 201,726 | 155,400 | 131,608 | 1,299,011 |
| 1929 | 51 | 1,560,241 | 102,479 | 1,662,720 | 915,502 | 222,260 | 167,955 | 143,487 | 1,449,204 |
| 1930 | 51 | 1,635,661 | 109,788 | 1,745,449 | 1,008,493 | 214,507 | 174,461 | 151,514 | 1,548,975 |
| 1931 | 52 | 1,417,855 | 108,415 | 1,526,270 | 957,644 | 181,099 | 161,366 | 156,377 | 1,456,486 |
| 1932 | 53 | 1,225,742 | 93,348 | 1,319,090 | 741,185 | 141,051 | 154,554 | 144,627 | 1,181,417 |
| 1933 | 57 | 1,178,936 | 87,245 | 1,266,181 | 679,826 | 135,052 | 152,080 | 145,380 | 1,112,338 |
| 1934 | 58 | 1,301,755 | 90,886 | 1,392,641 | 717,355 | 154,978 | 164,658 | 164,070 | 1,201,061 |
| 1935 | 58 | 1,421,055 | 91,782 | 1,512,837 | 891,874 | 160,747 | 170,088 | 181,531 | 1,404,240 |
| 1936 | 58 | 1,678,852 | 85,133 | 1,763,985 | 1,119,936 | 194,746 | 198,761 | 186,900 | 1,700,343 |
An interesting review of the expenses incurred in transacting accident insurance is contained in the table following. The fluctuations over a period of ten years are shown in percentages of outgo to income under various heads.
| Year. | Ratio per Cent. of | ||||||
|---|---|---|---|---|---|---|---|
| Claims to Premiums. | Commission to Premiums. | Salaries to Premiums. | Other Expenses to Premiums. | Total Expenses (other than Claims) to Premiums. | Total Expenditure to Premiums. | Total Expenditure to Total Receipts. | |
| 1927 | 57.98 | 15.61 | 11.39 | 10.66 | 37.66 | 95.64 | 89.90 |
| 1928 | 60.62 | 15.09 | 11.63 | 9.85 | 36.57 | 97.19 | 91.28 |
| 1929 | 58.68 | 14.24 | 10.76 | 9.20 | 34.20 | 92.88 | 87.16 |
| 1930 | 61.66 | 13.11 | 10.67 | 9.26 | 3,304 | 94.70 | 88.74 |
| 1931 | 67.54 | 12.77 | 11.38 | 1,103 | 35.18 | 102.72 | 95.43 |
| 1932 | 60.47 | 11.50 | 12.61 | 11.80 | 35.91 | 96.38 | 89.56 |
| 1933 | 57.66 | 11.46 | 12.90 | 12.33 | 36.69 | 94.35 | 87.85 |
| 1934 | 55.11 | 11.91 | 12.65 | 12.60 | 37.16 | 92.27 | 86.24 |
| 1935 | 62.76 | 11.31 | 11.97 | 12.78 | 36.06 | 98.82 | 92.82 |
| 1936 | 66.71 | 11.60 | 11.84 | 11.13 | 34.57 | 101.28 | 96.39 |
The downward movement in the ratio of claims to premiums which commenced in 1932 was arrested in 1935, a sharp rise of 7.65 being recorded by the figures for that year. In the year under review a further increase of 3.95 has taken place, with the result that the ratio is only slightly lower than the previous record of 6754 per cent. established in 1931. The management-expense ratio, which during the period of low premium income showed a rising tendency, has fallen by 259 during the last two years. It is interesting to note that the ratio of salaries to premiums during the years 1931–36 is considerably above that of the pre-depression period, although the substantial increases in premium income in 1934, 1935, and 1936 have resulted in a slightly lower figure for these years. The commission ratio shows a slight increase over the 1935 figure. The movement in this connection, however, has since 1925 been a downward one.
In the following table, particulars of premiums and claims for the three main classes of accident insurance are given for the last five years. It will be noticed that there is an apparent discrepancy between the totals of premiums and claims as shown herein and the figures already quoted. This is accounted for by the fact that, in order to arrive at the net financial results of the year's operations, it is necessary to take into account reinsurance transactions, and up to this stage of the discussion premiums and claims have been taken at the net figure.
| Year. | Employers' Liability. | Personal Accident. | Motor vehicle. | Other Forms. | Totals. |
|---|---|---|---|---|---|
| Premiums. | |||||
| £ | £ | £ | £ | £ | |
| 1932 | 446,086 | 129,685 | 649,444 | 58,611 | 1,283,826 |
| 1933 | 427,376 | 127,673 | 614,202 | 58,520 | 1,227,771 |
| 1934 | 485,931 | 129,559 | 661,725 | 65,139 | 1,342,354 |
| 1935 | 533,087 | 151,522 | 716,734 | 71,092 | 1,472,435 |
| 1936 | 643,705 | 173,496 | 859,306 | 81,878 | 1,758,385 |
| Claims | |||||
| 1932 | 319,053 | 64,069 | 364,731 | 19,830 | 767,683 |
| 1933 | 332,285 | 60,120 | 307,295 | 16,432 | 716,132 |
| 1934 | 314,376 | 57,160 | 383,582 | 15,473 | 770,591 |
| 1935 | 334,714 | 62,155 | 475,027 | 18,282 | 890,178 |
| 1936 | 404,743 | 74,331 | 691,159 | 21,660 | 1,191,893 |
Compared with 1935, gross premium income in 1936 has increased by £285,950, of which motor-vehicle insurance was responsible for £142,572, employers' liability for £110,618, and personal accident for £21,974. Total claims show an increase of £301,715, motor-vehicle insurance accounting for £216,132, employers' liability for £70,029, and personal accident for £12,176.
Reducing the figures for the last three years to a percentage basis, the following results are arrived at:—
| Class of Insurance. | Claims to Premiums. | Premiums to Total Premiums. | Claims to Total Claims. | ||||||
|---|---|---|---|---|---|---|---|---|---|
| 1934. | 1935. | 1936. | 1934. | 1935. | 1936. | 1934. | 1935. | 1936. | |
| Per Cent. | Per Cent. | Per Cent. | Per Cent. | Per Cent. | Per Cent. | Per Cent. | Per Cent. | Per Cent. | |
| Employers' liability | 64.70 | 62.79 | 62.88 | 36.20 | 36.20 | 36.61 | 40.79 | 37.60 | 33.96 |
| Personal accident | 44.12 | 41.02 | 42.84 | 9.65 | 10.29 | 9.86 | 7.42 | 6.98 | 6.23 |
| Motor-vehicle | 57.97 | 66.28 | 80.43 | 49.30 | 48.68 | 48.87 | 49.78 | 53.36 | 57.99 |
| Other forms | 23.75 | 25.72 | 26.45 | 4.85 | 4.83 | 4.66 | 2.01 | 2.06 | 1.82 |
| Totals | 57.41 | 60.46 | 67.78 | 100.00 | 100.00 | 100.00 | 100.00 | 100.00 | 100.00 |
Although the 1936 ratio of claims to premiums for employers' liability insurance is slightly in excess of the 1935 figure, it is still very much below the 1930–33 period, the percentage for the last-mentioned year being 77.75 compared with 6288 for 1936. The 1936 motor-vehicle ratio on the other hand is 1415 above the 1935 figure, and has risen from 50.03 in 1933 to 80.43.
The Mortgagees' Indemnity (Workers' Charges) Act, 1927, provides that when mortgages are presented for stamping an additional stamp duty of 1s. is to be paid, known as a mortgagee's indemnity fee. The indemnity fees are paid into the Consolidated Fund (up to 1930 they were paid into the now defunct Land Assurance Fund), from which losses incurred by mortgagees through the enforcement of charges under the Workers' Compensation Act are met. A section of the Act definitely absolves the mortgagor from any obligation to insure or keep insured the mortgagee against loss of this nature in respect of any mortgage under the Act.
The Motor-vehicles Insurance (Third-party Risks) Act, 1928, requires owners of motor-vehicles to insure against their liability to pay damages on account of the death of or bodily injury to another person.
The payment of the insurance premiums is made annually to Deputy Registrars of Motor-vehicles at the same time as the annual license fee is paid under the Motor-vehicles Act. Owners of motor-vehicles are required to nominate each year the insurance company with which the contract of insurance is to be made, and the contract is deemed to be complete on the payment of the premium.
Rates of premiums prescribed by regulations dated the 14th April, 1934, as amended by regulations dated the 10th April, 1935, include the following: Trailers, 6s.; tractors, traction-engines, 10s.; motor-cycles, £1; private motor-cars, 17s.; private motor-cars used wholly or in part for the purpose of trade or business, £2 1s.; motor-vehicles (other than trailers and motor-cycles) used by fire brigades, 18s.; hearses, ambulances, &c., 18s.; trade motors, £1 7s.; manufacturers' and dealers' motor-vehicles, £1 16s.; public motor-vehicles, £6, with a varying scale upwards according to seating-capacity.
The liability of any insurance company under any contract under this Act is limited to £2,000 in respect of any passenger in the motor-vehicle concerned, and to £20,000 for all claims made by or in respect of passengers. Otherwise there is no limit as to amount.
The liability of the company does not extend to indemnify the owner against—
Any claim made in respect of death of or of injury suffered by any person living with the owner as a member of the same family, or in respect of the death of or of injury suffered by a relative of the owner where the degree of relationship is not more remote than the fourth:
Any claim made in respect of the death of or of injury suffered by any person in the service of the owner at the time of the accident:
Any claim against the owner of a motor-vehicle (not being a vehicle plying for hire or used in the course of the business of carrying passengers for hire) made in respect of the death of or of injury suffered by any person who was at the time of the accident in respect of which the claim has arisen being conveyed in the motor-vehicle, or was driving, or entering, or alighting from, or about to enter or alight from, such motor-vehicle:
Any claim against the owner of a motor-vehicle plying for hire or used in the course of the business of carrying passengers for hire, made in respect of the death of or of injury suffered by any person who (not being a passenger for hire) was at the time of the accident in respect of which the claim has arisen being conveyed in the motor-vehicle, or was driving, or entering, or alighting from, or about to enter or alight from, such motor-vehicle.
The following particulars give the experience of the last five years, with a summary covering the eight years since the inception of this class of insurance. It should be noted that the figures for claims do not represent the amount paid during each year, but refer to accidents happening during each particular period. It should also be noted that the claims figures for the years 1934–37 include amounts on account of the estimated liability in respect of claims still outstanding at 31st May, 1937, and are therefore provisional only. Claims are frequently the subject of lengthy litigation, and until such time as they are finally settled the estimated liability is taken into account. Experience has shown that there is a tendency on the part of the insurance companies to overstate this liability, and the figures when finalized, particularly for the latest years (1936 and 1937), maybe expected to be somewhat less than the amounts now given. After making allowance for this factor, however, the amount of claims paid in respect of the last three years will definitely exceed premium income for these years.
| — | Registration Year ended 31st May, | Total for Eight Years (since inception). | ||||
|---|---|---|---|---|---|---|
| 1933. | 1934. | 1935. | 1936. | 1937. | ||
| £ | £ | £ | £ | £ | £ | |
| Premiums received | 229,133 | 221,734 | 211,709 | 230,696 | 257,559 | 1,862,431 |
| Claims paid and estimated liability in respect of claims outstanding at 31st May, 1937 | 137,013 | 165,743 | 232,394 | 280,938 | 344,777 | 1,710,841 |
| Ratio per cent. of claims paid and outstanding to premiums | 60 | 75 | 110 | 122 | 134 | 92 |
In the year 1901 the Government (Life) Insurance Department opened an Accident Branch. On the 1st January, 1925, the accident business was transferred to the control of the State Fire Insurance Office. Although general accident business was undertaken, the branch was opened more especially to conduct insurance under the Workers' Compensation Act. In recent years, however, other forms of accident insurance have contributed in an increasing scale to the premium income of the office. The main classes now transacted are employers' liability, personal accident, public risk, motor comprehensive, insurances under the Third-party Risks Act, plate glass, and fidelity guarantee, each of which showed a premium increase in 1936. A summary of income and expenditure is contained in the following table:—
| Year. | Income. | Expenditure. | ||||
|---|---|---|---|---|---|---|
| Premiums. | Other. | Total. | Claims. | Other. | Total. | |
| £ | £ | £ | £ | £ | £ | |
| 1927 | 65,560 | 10,895 | 76,455 | 38,972 | 21,228 | 60,200 |
| 1928 | 71,731 | 12,368 | 84,099 | 43,807 | 22,700 | 66,507 |
| 1929 | 81,353 | 13,343 | 94,696 | 49,853 | 26,776 | 76,629 |
| 1930 | 104,935 | 14,861 | 119,796 | 61,041 | 34,224 | 95,265 |
| 1931 | 102,062 | 16,316 | 118,378 | 82,562 | 27,211 | 109,773 |
| 1932 | 87,068 | 15,734 | 102,802 | 63,760 | 26,343 | 90,103 |
| 1933 | 80,207 | 15,239 | 95,446 | 48,593 | 29,099 | 77,692 |
| 1934 | 84,727 | 15,328 | 100,055 | 62,035 | 24,015 | 86,050 |
| 1935 | 97,766 | 17,041 | 114,807 | 66,172 | 26,351 | 92,523 |
| 1936 | 113,649 | 16,123 | 129,772 | 76,471 | 38,005 | 114,476 |
The aggregate premium income for 1936 is greater than in any other year and is £15,883 above the 1935 figure. Claims paid during the year did not show the same proportionate rise, the increase over 1935 being £10,299 only. The net surplus for each of the last three years amounted to—1934. £14,005; 1935, £22,284; and 1936, £15,296.
The ratio of claims to premiums for the year 1936 worked out at 67.29 per cent., as against the previous year's percentage of 67.68. The ratio of working-expenses to premiums for 1936 was 20.37 per cent., compared with 20.80 for 1935.
The total assets at the end of 1936 amounted to £479,271, compared with £446,620 at the end of 1935. New Zealand Government securities represent 37 per cent. of the total assets, and local-authority securities the same proportion. Reserves and funds, which stood at £380,459 at the end of 1935, have been increased to £403,697.
IN the Dominion's legislation four separate classes of fire-insurance offices are distinguished, namely:— (1) Local insurance companies established within the limits of New Zealand; (2) foreign insurance companies established beyond New Zealand; (3) British offices similarly established; and (4) mutual fire-insurance associations. To these may be added the State Fire Insurance Office, established under a separate Act of Parliament.
Part XIV of the Companies Act, 1933, provides for the incorporation with limited liability of local insurance companies formed for the insurance of property other than that of shareholders. Such a company requires a paid-up capital of £50,000 intact, and if the amount of paid-up capital falls below this sum the company may not carry on insurance business except with unlimited liability. Insurance companies established or incorporated overseas require to have a like paid-up capital intact. The transaction of business by such companies is, however, subject also to special legislation as set out below. Mutual associations are referred to specially, at a later stage in this subsection.
Statistics of fire insurance are collected annually by the Census and Statistics Department. For 1936, statistics were collected from 43 offices carrying on business in New Zealand. The head offices of these were distributed as follows: Great Britain, 22; New Zealand, 14; Australia, 5; Hong Kong, 1; United States of America, 1.
Since the passing of the Insurance Companies' Deposits Act of 1922, and its amendment, also of 1922, deposits in cash must be made with the Public Trustee by fire and accident offices. This Act does not apply to life-insurance deposits, requirements for which class of insurance are dealt with in Subsection A.
The actual amounts of the deposits under the Insurance Companies' Deposits Act were: British companies in respect of fire-insurance business, £15,000; employers' liability business, £15,000; and all other classes of business (except life and marine), £5,000. Foreign companies were required to deposit a sum of £35,000, which covered all classes of business (except life and marine). Overseas companies becoming established in New Zealand after the passing of the principal Act are required to make deposits on a somewhat higher scale than the foregoing—viz., British offices, £22,500 on account of fire business, the same for employers' liability insurance business, and £5,000 in respect of all other classes (other than life and marine). A newly established foreign company must deposit the sum of £50,000, and this covers all classes of business other than life and marine.
A further amendment was passed in 1927 requiring agents operating in New Zealand on behalf of underwriters established abroad to make deposits on the same scale as that ruling for companies.
The Finance Act, 1933 (No. 2), further provided that a company which was not already undertaking insurance business in terms of the Motor-vehicles Insurance (Third-party Risks) Act, 1928, must deposit the sum of £10,000 before it could commence to do so.
Except for the provision contained in the preceding paragraph, no deposit is required under this Act from a company constituted in New Zealand under the New Zealand laws.
The amount held by the Public Trustee on the 31st March, 1936, under the Insurance Companies' Deposits Act was £1,137,500, excluding interest accrued but not disbursed. These moneys are invested in the Common Fund of the Public Trust Office, and interest is payable to the respective companies.
The following table indicates generally the extent to which fire-insurance offices have funds available to meet losses and liabilities. Funds of life departments are added for completeness, but by the Life Insurance Act, 1908 (which follows the provisions of the Imperial statute on the subject), life funds must be accounted for separately, and form a security for life-policy holders which is not available for other phases of insurance transacted. The amount of funds (other than life) in New Zealand and elsewhere is, it will be seen, in excess of £310,000,000.
| — | Liabilities. | Total Assets. | ||
|---|---|---|---|---|
| Overseas Companies. | Local Offices. | Mutual Associations.* | ||
| * These figures in the case of mutual associations relate to premium-note capital. | ||||
| £ | £ | £ | £ | |
| Paid-up capital | 30,118,144 | 3,257,041 | 225,536 | 33,600,721 |
| Reserves | 202,874,071 | 6,267,508 | 53,559 | 209,195,138 |
| Other liabilities | 66,552,091 | 858,813 | 3,067 | 67,413,971 |
| Totals | 299,544,306 | 10,383,362 | 282,162 | 310,209,830 |
| Life funds | 617,807,888 | 534 | 617,808,422 | |
| Grand totals | 917,352,194 | 10,383,896 | 282,162 | 928,018,252 |
In the following table the figures for the amount of assets in New Zealand under various heads are given as at the end of each of the last three years.
| Assets in New Zealand. | 1934. | 1935. | 1936. |
|---|---|---|---|
| £ | £ | £ | |
| House and landed property | 1,097,671 | 1,103,029 | 1,097,376 |
| New Zealand Government securities | 6,906,648 | 6,845,777 | 6,643,750 |
| New Zealand local-authority securities | 1,955,376 | 2,004,828 | 2,063,356 |
| Mortgages, &c. | 400,089 | 409,102 | 399,318 |
| Outstanding premiums | 320,258 | 323,323 | 350,397 |
| Cash and other assets in New Zealand | 3,202,197 | 3,127,232 | 2,998,450 |
| Total New Zealand assets | 13,882,239 | 13,813,291 | 13,552,647 |
The adverse trading conditions that existed during the years 1931–33, together with the action of insurance offices generally in reducing the cover on buildings, &c. in conformity with the fall in property-values, resulted in the volume of fire-insurance business transacted falling away to a considerable extent. In 1934, however, a small increase of £2,635,580 over 1933 was disclosed, and the improvement in conditions generally has been reflected by further increases of £7,696,472 and £21,903,226 for 1935 and 1936 respectively. The amount underwritten in 1936 exceeded the previous record established in 1930 by £1,480,138.
| — | 1934. | 1935. | 1936. |
|---|---|---|---|
| * Excluding reinsurances accepted from other offices. | |||
| Offices in New Zealand. | |||
| Number of separate companies | 43 | 43 | 43 |
| Number of branches | 165 | 176 | 173 |
| Number of agencies | 14,264 | 15,015 | 15,298 |
| Amounts underwritten. | |||
| Gross amount of insurance cover in force in New Zealand on 31st December* | £406,513,141 | £414,774,877 | £434,286,787 |
| Number of policies representing the foregoing* | 716,900 | 722,416 | 746,223 |
| Gross amount of new and renewal business underwritten during year* | £445,418,868 | £453,115,340 | £475,018,566 |
| Number of policies representing the foregoing* | 774,179 | 783,000 | 803,295 |
| Premiums. | |||
| Total gross premiums charged on business (new and renewal) underwritten during year* | £1,853,584 | £1,858,392 | £1,882,902 |
| Percentage of gross premiums to total amount of business underwritten | 8s. 4d. | 8s. 2d. | 7s. 11d. |
| Total premiums (as shown above), less premiums refunded to insured other than to other offices | £1,711,841 | £1,721,689 | £1,748,298 |
| Losses. | |||
| Total number of separate fixed losses with which offices were concerned | 5,703 | 6,230 | 6,854 |
| Gross losses | £546,936 | £528,858 | £474,631 |
| Percentage of gross loss to amount underwritten (new and renewal) during year (as shown above) | 0.12 | 0.12 | 0.10 |
| Percentage of gross loss to total premiums, less refunds to insured (as shown above) | 31.95 | 30.72 | 27.15 |
| Average loss | £96 | £85 | £69 |
Despite the substantial increase in the amount underwritten during 1936, the total premiums charged were only £24,510 in excess of the corresponding figure for 1935, the average rate of premium per cent. being 3d. less than in 1935 and 5d. less than in 1934. It is interesting to note that although, as mentioned above, the amount underwritten in 1936 exceeded the corresponding amount in 1930, the premiums charged were less to the extent of £283,426; the average rate per cent. having fallen by 1s. 3d, during the period. Compared with ten years earlier the 1936 rate has fallen from 9s. 10d. to 7s. 11d.
The table set out below shows the premium income and the fire losses, together with the percentage of loss in each year.
| Year. | Premium Income. | fire Losses. | Percentage of Loss. |
|---|---|---|---|
| £ | £ | ||
| 1927 | 1,950,736 | 1,257,515 | 64.5 |
| 1928 | 1,951,069 | 1,343,233 | 68.8 |
| 1929 | 1,980,212 | 1,122,305 | 56.7 |
| 1930 | 2,006,913 | 1,077,951 | 53.7 |
| 1931 | 1,985,375 | 1,073,842 | 54.1 |
| 1932 | 1,908,810 | 814,551 | 42.7 |
| 1933 | 1,780,824 | 591,225 | 33.2 |
| 1934 | 1,711,841 | 546,936 | 32.0 |
| 1935 | 1,721,689 | 528,858 | 30.7 |
| 1936 | 1,748,298 | 474,631 | 27.2 |
The amount paid out during 1936 in respect of fire losses again shows a slight reduction when compared with the previous year. The loss ratio, which is less than one-half of that for the peak years 1927 and 1928, is the lowest recorded since 1919. The number of separate claims with which the several offices were concerned showed an increase of 624 during the year, while the average loss per fire was a little over £16 less than in 1935.
A statement of the total income and outgo, both gross and net, of all offices is now given in respect of New Zealand business. The gross reserve for unexpired risks, it should be noted, is calculated on the assumption that it bears the same proportion to gross premium income as does the actual net reserve to the net premium income.
| — | 1934. | 1935. | 1936. | |||
|---|---|---|---|---|---|---|
| Gross. | Net. | Gross. | Net. | Gross. | Net. | |
| * The gross figures are inclusive of reinsurance premiums from other offices. | ||||||
| Income. | £ | £ | £ | £ | £ | £ |
| Reserve to meet unexpired risks as at beginning of year | 891,707 | 581,493 | 832,808 | 558,547 | 837,043 | 565,445 |
| Amount of fire premiums receivable during year* | 1,955,910 | 1,232,420 | 1,976,022 | 1,253,537 | 1,974,858 | 1,243,638 |
| Interest and dividends on stock, mortgages, &c. | 113,330 | 113,330 | 101,437 | 101,437 | 94,181 | 94,181 |
| Rents | 23,063 | 23,063 | 19,875 | 19,875 | 16,298 | 16,298 |
| Other revenue | 3,806 | 3,806 | 473 | 473 | 967 | 967 |
| Totals | 2,987,816 | 1,954,112 | 2,930,615 | 1,933,869 | 2,923,347 | 1,920,529 |
| Outgo. | ||||||
| Amount of fire losses incurred during year, including adjustment and other expenses of settlement, but less salvage and amounts covered by reinsurance | 546,936 | 402,898 | 528,858 | 387,471 | 474,631 | 338,784 |
| Fire Board levies | 64,760 | 51,494 | 66,735 | 52,508 | 69,038 | 54,984 |
| New Zealand Government taxes | 103,238 | 90,837 | 80,726 | 75,802 | 128,060 | 106,814 |
| Local-authority rates | 3,161 | 2,901 | 3,019 | 2,699 | 2,970 | 2,673 |
| License fees | 6,646 | 6,121 | 6,596 | 5,982 | 6,604 | 5,938 |
| Rents | 23,829 | 22,450 | 23,913 | 22,389 | 23,084 | 22,004 |
| Allowances and commissions on premiums to agents, sub-agents, and others | 208,208 | 102,747 | 216,523 | 101,102 | 214,891 | 91,183 |
| Salaries and wages, including commissions on profits or bonuses | 254,427 | 233,953 | 252,919 | 234,398 | 254,227 | 235,828 |
| Other expenses of management | 144,063 | 130,913 | 140,974 | 132,226 | 130,917 | 125,467 |
| Reserve to meet unexpired risks as at the end of the year | 832,808 | 558,360 | 837,043 | 565,181 | 832,081 | 558,095 |
| Other expenditure | 5,318 | 5,318 | 4,016 | 4,616 | 3,740 | 3,740 |
| Totals | 2,193,454 | 1,607,092 | 2,161,922 | 1,584,374 | 2,140,243 | 1,545,510 |
A summary of the net revenue and expenditure for 1936 of the three classes of offices operating in New Zealand is contained in the next table.
| — | Net Revenue. | Net Expenditure. | |||
|---|---|---|---|---|---|
| Premiums. | Total.* | Claims. | Salaries and Commissions. | Total.* | |
| * Excluding reserves to meet unexpired risks. | |||||
| £ | £ | £ | £ | £ | |
| Overseas companies | 681,947 | 705,794 | 168,523 | 176,607 | 523,235 |
| Local companies | 541,305 | 626,917 | 155,695 | 142,900 | 437,837 |
| Mutual associations | 20,386 | 22,373 | 14,566 | 7,503 | 26,343 |
| Total | 1,243,638 | 1,355,084 | 338,784 | 327,010 | 987,415 |
The net premium income for 1936 shows a decrease of £9,899 compared with 1935, while the total net income is less to the extent of £20,238. The net amount of fire losses, which in 1935 showed a reduction of £15,427 compared with the previous year, has receded still further, the 1936 total being less than that of 1935 by £48,687. The ratio of claims to premiums in 1936 gives a percentage of 27.2 compared with 30.9 in 1935 and 593 five years earlier. Excluding fire losses, the net expenditure in 1936 was £16,909 greater than in 1935, while the result of the year's operations was a surplus of net income over expenditure to the extent of £367,669, compared with similar balances of £356,129 and £322,987 for 1935 and 1934 respectively. It should be noted that these figures are exclusive of reserves to meet unexpired risks.
Under the various heads below will be found the percentage ratio of working-expenses to premium income for the years 1932–36.
| Items. | 1932. | 1933. | 1934. | 1935. | 1936. |
|---|---|---|---|---|---|
| Per Cent. | Per Cent. | Per Cent. | Per Cent. | Per Cent. | |
| Net working-expenses (excluding taxes) to net premium income | 42.50 | 43.17 | 44.67 | 43.98 | 43.27 |
| Net working-expenses (excluding taxes and Fire Board levies) to net premium income | 38.89 | 39.20 | 40.50 | 39.79 | 38.85 |
| Gross working-expenses (excluding taxes) to gross premium income (including reinsurances from other offices) | 34.33 | 35.51 | 36.05 | 35.97 | 35.53 |
| Gross working-expenses (excluding taxes and Fire Board levies) to gross premium income (including reinsurances from other offices) | 31.46 | 32.36 | 32.74 | 32.59 | 32.04 |
The decline in premium income between 1930 and 1934 is clearly reflected in the ratios for these years, this being the factor responsible for the steady upward movement, actual expenditure having remained fairly constant during that period. A small increase in premiums, together with a slightly reduced expenditure, resulted in an improvement in the 1935 ratio when compared with 1934, while in 1936, although there was a slight reduction in premium income, the decrease in working-expenses was sufficient to maintain the downward trend.
It is contended in some quarters that Fire Board levies are not a working-expense, but should be added to the total of fire losses. While this view is not subscribed to in the compilation of the statistics, there is a definite relationship between the items, and it is interesting to note that their exclusion from working-expenses reduces the 1936 ratio on the net figures from 43.27 to 38.85 per cent.
The table following gives figures of fires and losses during each of the last ten years. It should be noted that these figures relate to calendar years, and the figures of losses thus differ somewhat from these shown elsewhere, which refer to varying twelve-monthly periods covered by the accounts of the different offices.
The decrease of £377,227 in the amount of insured fire losses suffered during 1932 was outstanding, while further reductions of £198,162 and £68,928 in 1933 and 1934 disclosed a welcome improvement in the Dominion's fire-loss problem, which during the period 1924–1931 had attained unenviable proportions. A small increase over 1934 was disclosed by the figures for 1935, and in view of the rising trend in property values a further increase in this connection might have been expected. It is satisfactory to note, however, that the anticipated rise not only failed to eventuate, but that there was an actual reduction in the amount for 1936 when compared with 1935.
It is worthy of note that the average loss for the last four years is only a little over one-third of the total for the peak year (1928). The figures quoted herein relate to insured losses only; and in order to arrive at the national property loss by fire some allowance must be made for the uninsured losses. On what is termed a conservative basis, the Inspector of Fire Brigades in his annual report uses the insured-loss figure, plus 12½ per cent., for this purpose, and on this assumption the Dominion's property loss through fire in 1936 is estimated to have amounted to £524,030 compared with £607,410 in 1935, and £1,636,119 in 1928.
| Year. | Separate Fires. | Conflagrations.* | Buildings, &c., affected | Gross Cover.† | Gross Loss. | Ratio of Loss to Cover.† |
|---|---|---|---|---|---|---|
* Included in previous column. For statistical purposes a conflagration is defined as a fire where three or more buildings are affected. † On buildings affected. | ||||||
| £ | £ | Per Cent. | ||||
| 1927 | 5,029 | 46 | 5,366 | 6,555,988 | 1,210,661 | 18.47 |
| 1928 | 4,972 | 44 | 5,275 | 7,661,893 | 1,454,328 | 18.98 |
| 1929 | 5,064 | 36 | 5,312 | 7,060,132 | 1,093,568 | 15.49 |
| 1930 | 4,863 | 54 | 5,145 | 7,058,918 | 1,013,059 | 14.35 |
| 1931 | 4,820 | 56 | 5,086 | 5,732,222 | 1,148,528 | 20.04 |
| 1932 | 4,482 | 29 | 4,678 | 5,528,316 | 771,301 | 13.95 |
| 1933 | 4,352 | 27 | 4,508 | 5,738,218 | 573,139 | 9.99 |
| 1934 | 4,546 | 16 | 4,641 | 4,674,747 | 504,211 | 10.79 |
| 1935 | 5,147 | 26 | 5,286 | 4,863,179 | 539,920 | 11.10 |
| 1936 | 5,318 | 19 | 5,435 | 6,248,835 | 465,804 | 7.45 |
A somewhat disturbing feature is that, although the total amount of loss has been reduced to comparatively small proportions, there has been an actual increase in the number of separate fires during the last three years, the 1936 total being the highest yet recorded since the information has been available.
The next table shows for each of the four principal urban areas and the remainder of the Dominion the fires and losses for 1936:—
| — | Separate Fires. | Conflagrations.* | Buildings affected. | Gross Cover.† | Gross Loss. | Ratio of Loss to Cover.† |
|---|---|---|---|---|---|---|
* Included in previous column. † On buildings affected. | ||||||
| North Island. | £ | £ | Per Cent. | |||
| Auckland urban area | 624 | 2 | 635 | 1,469,389 | 31,081 | 2.12 |
| Wellington urban area | 827 | 1 | 835 | 1,694,023 | 30,407 | 1.79 |
| Secondary urban areas | 524 | 5 | 542 | 541,162 | 65,541 | 12.11 |
| Rest of North Island | 1,109 | 4 | 1,138 | 740,463 | 169,899 | 22.94 |
| Totals for North Island | 3,084 | 12 | 3,150 | 4,445,037 | 296,928 | 6.68 |
| South Island. | ||||||
| Christchurch urban area | 559 | 1 | 565 | 604,377 | 19,474 | 3.22 |
| Dunedin urban area | 542 | 1 | 552 | 439,716 | 22,202 | 5.05 |
| Secondary urban areas | 278 | 280 | 265,851 | 24,632 | 9.27 | |
| Rest of South Island | 799 | 5 | 832 | 475,729 | 100,156 | 21.05 |
| Totals for South Island | 2,178 | 7 | 2,229 | 1,785,673 | 166,464 | 9.32 |
| Anywhere in New Zealand | 56 | 56 | 18,125 | 2,412 | 13.31 | |
| Totals for Dominion | 5,318 | 19 | 5,435 | 6,248,835 | 465,804 | 7.45 |
Compared with 1935, gross fire-loss increases amounting to £8,511, £5,641, and £1,987 are recorded for the Wellington, Christchurch, and Dunedin urban areas respectively, while for Auckland the figures have fallen by £40,179.
Losses in the North Island during the year increased by £77,185 and in the South Island a rise of £2,096 has taken place.
The lower loss ratio in the cases of the principal urban areas as compared with the rest of the Dominion is to be expected in view of the greater fire-brigade facilities for handling fires in the larger centres. Companies usually allow this factor to influence the premium required.
Provision exists for coronial inquiries into fires of suspicious origin, but, as will be seen from page 188, the yearly number of such inquests has been small. In 1932, however, a system was instituted whereby extended inquiries are made by the Police Department into all fires where the possibility of incendiarism is not eliminated or where the cause is obscure. The results of such inquiries are considered by a committee consisting of the Commissioner of Police, the General Manager of the State Fire Office, and the Inspector of Fire Brigades, and should the circumstances warrant it a coroner's inquiry is then recommended.
The following table shows the amount of fire-insurance claims paid per head of population during the period 1932–36, separate figures being given for the various provincial districts and urban areas, and for the North and South Islands:—
| District. | 1932. | 1933. | 1934. | 1935. | 1936. | 1932–36. | ||||||
|---|---|---|---|---|---|---|---|---|---|---|---|---|
| s. | d. | s. | d. | s. | d. | s. | d. | s. | d. | s. | d. | |
| Auckland Provincial District | 12 | 6 | 7 | 9 | 7 | 9 | 8 | 10 | 5 | 5 | 8 | 5 |
| Auckland urban area | 7 | 7 | 6 | 10 | 4 | 6 | 6 | 9 | 2 | 11 | 5 | 9 |
| Hamilton urban area | 7 | 3 | 2 | 10 | 3 | 2 | 3 | 0 | 1 | 3 | 3 | 6 |
| Gisborne urban area | 13 | 10 | 15 | 1 | 11 | 4 | 5 | 11 | 14 | 11 | 12 | 3 |
| Remainder | 17 | 2 | 8 | 7 | 10 | 8 | 11 | 3 | 7 | 4 | 10 | 11 |
| Hawke's Bay Provincial District | 15 | 5 | 8 | 11 | 11 | 8 | 7 | 9 | 17 | 1 | 12 | 2 |
| Napier urban area | 9 | 9 | 7 | 4 | 4 | 10 | 5 | 11 | 40 | 10 | 13 | 10 |
| Hastings urban area | 20 | 1 | 3 | 3 | 8 | 3 | 3 | 0 | 5 | 11 | 8 | 0 |
| Remainder | 16 | 2 | 12 | 8 | 17 | 2 | 11 | 2 | 10 | 0 | 13 | 5 |
| Taranaki Provincial District | 10 | 11 | 10 | 4 | 9 | 8 | 11 | 2 | 4 | 1 | 9 | 3 |
| New Plymouth urban area | 11 | 6 | 9 | 5 | 4 | 9 | 2 | 4 | 3 | 3 | 6 | 2 |
| Remainder | 10 | 9 | 10 | 7 | 11 | 3 | 14 | 1 | 4 | 4 | 10 | 3 |
| Wellington Provincial District | 9 | 11 | 6 | 6 | 5 | 2 | 5 | 11 | 5 | 7 | 6 | 7 |
| Wellington urban area | 6 | 2 | 3 | 9 | 3 | 5 | 2 | 11 | 4 | 0 | 4 | 1 |
| Wanganui urban area | 8 | 5 | 2 | 4 | 1 | 6 | 7 | 8 | 1 | 6 | 4 | 3 |
| Palmerston North urban area | 9 | 11 | 2 | 8 | 2 | 0 | 9 | 0 | 3 | 5 | 5 | 5 |
| Remainder | 15 | 6 | 11 | 11 | 9 | 2 | 8 | 10 | 9 | 2 | 10 | 11 |
| Totals, North Island | 11 | 9 | 7 | 8 | 7 | 4 | 8 | 0 | 6 | 3 | 8 | 2 |
| Urban areas | 8 | 2 | 0 | 7 | 4 | 3 | 5 | 3 | 5 | 1 | 5 | 8 |
| Remainder | 15 | 10 | 10 | 0 | 10 | 11 | 11 | 0 | 7 | 7 | 11 | 0 |
| District. | 1932. | 1933. | 1934. | 1935. | 1936. | 1932–36. | ||||||
|---|---|---|---|---|---|---|---|---|---|---|---|---|
| s. | d. | s. | d. | s. | d. | s. | d. | s. | d. | s. | d. | |
| Marlborough Provincial District | 20 | 6 | 20 | 8 | 17 | 1 | 15 | 4 | 11 | 10 | 17 | 1 |
| Nelson Provincial District | 8 | 10 | 6 | 1 | 5 | 9 | 7 | 1 | 6 | 3 | 6 | 10 |
| Nelson urban area | 3 | 3 | 5 | 9 | 3 | 3 | 2 | 11 | 2 | 10 | 3 | 7 |
| Remainder | 10 | 7 | 6 | 2 | 6 | 6 | 8 | 4 | 7 | 4 | 7 | 9 |
| Westland Provincial District | 12 | 8 | 8 | 10 | 10 | 1 | 6 | 10 | 5 | 11 | 8 | 10 |
| Canterbury Provincial District | 7 | 5 | 8 | 0 | 4 | 2 | 3 | 1 | 4 | 4 | 5 | 5 |
| Christchurch urban area | 8 | 1 | 10 | 6 | 4 | 4 | 2 | 1 | 2 | 11 | 5 | 7 |
| Timaru urban area | 4 | 0 | 1 | 5 | 2 | 1 | 0 | 10 | 2 | 10 | 2 | 3 |
| Remainder | 7 | 1 | 5 | 7 | 4 | 4 | 5 | 1 | 6 | 10 | 5 | 9 |
| Otago Provincial District | 6 | 0 | 6 | 1 | 5 | 5 | 4 | 11 | 4 | 6 | 5 | 5 |
| Dunedin urban area | 3 | 11 | 6 | 2 | 6 | 4 | 4 | 11 | 5 | 5 | 5 | 4 |
| Remainder | 8 | 6 | 6 | 0 | 4 | 5 | 4 | 11 | 3 | 5 | 5 | 6 |
| Southland Provincial District | 12 | 3 | 8 | 11 | 8 | 4 | 13 | 10 | 13 | 0 | 11 | 3 |
| Invercargill urban area | 3 | 4 | 8 | 2 | 6 | 10 | 10 | 1 | 15 | 6 | 8 | 10 |
| Remainder | 17 | 1 | 9 | 3 | 9 | 2 | 15 | 10 | 11 | 8 | 12 | 7 |
| Totals, South Island | 8 | 5 | 7 | 10 | 5 | 10 | 5 | 11 | 6 | 0 | 6 | 10 |
| Urban areas | 5 | 10 | 8 | 1 | 5 | 0 | 3 | 8 | 4 | 10 | 5 | 6 |
| Remainder | 10 | 11 | 7 | 7 | 6 | 8 | 8 | 2 | 7 | 2 | 8 | 1 |
| Grand totals, Dominion | 10 | 7 | 7 | 9 | 6 | 10 | 7 | 3 | 6 | 2 | 7 | 8 |
| Urban areas | 7 | 4 | 6 | 6 | 4 | 6 | 4 | 8 | 5 | 0 | 5 | 7 |
| Remainder | 13 | 11 | 9 | 1 | 9 | 3 | 9 | 11 | 7 | 5 | 9 | 11 |
From 1924 onwards particulars regarding causes of fires Lave been obtained from insurance offices, and the summarized results for the quinquennium 1932–36 are contained in the following table:—
| Cause of Fire. | Urban Areas. | Remainder of Dominion. | Total. | |||
|---|---|---|---|---|---|---|
| Number of Separate Fires. | Loss. | Number of Separate Fires. | Loss. | Number of Separate Fires. | Loss. | |
| * Included in various causes from which spread. | ||||||
| £ | £ | £ | ||||
| Electricity | 2,296 | 75,800 | 724 | 113,190 | 3,020 | 188,990 |
| Gas | 615 | 9,230 | 66 | 2,995 | 681 | 12,231 |
| Naked lights | 317 | 10,521 | 455 | 21,475 | 772 | 31,996 |
| Defective chimneys and kindred causes | 836 | 65,343 | 1,010 | 334,182 | 1,846 | 399,525 |
| Smoking, and careless use of matches | 1,691 | 75,858 | 673 | 57,999 | 2,364 | 133,857 |
| Sparks from fireplaces | 5,730 | 71,953 | 2,783 | 188,843 | 8,513 | 260,796 |
| Heating, boiling-down | 286 | 13,007 | 120 | 11,824 | 406 | 24,831 |
| Use and misuse of highly inflammable spirits and materials | 389 | 40,797 | 198 | 23,620 | 587 | 64,417 |
| Incendiarism and arson | 89 | 26,248 | 103 | 19,036 | 192 | 45,284 |
| Outside causes | 444 | 18,273 | 368 | 37,906 | 812 | 56,179 |
| Other causes | 66 | 2,464 | 28 | 1,835 | 94 | 4,299 |
| Totals, known causes | 12,759 | 409,500 | 6,528 | 812,905 | 19,287 | 1,222,405 |
| Fires spread from other buildings* | 248 | 23,204 | 280 | 81,370 | 528 | 104,574 |
| Floating, travelling, and transit risks | 237 | 12,461 | ||||
| Unknown causes | 1,729 | 661,765 | 2,592 | 957,744 | 4,321 | 1,619,509 |
| Totals | 14,488 | 1,071,265 | 9,120 | 1,770,649 | 23,845 | 2,854,375 |
In all there were 23,845 separate fires during the period. This does not represent the number of buildings, &c., affected, as a fire spreading to other buildings has been counted as one only. Of the total, 237 were on account of floating risks such as motor-cars, &c., and have been excluded from the total of “known” causes. Of the remainder the cause was given in 19,287 cases, leaving 4,321, or 18 per cent. of cases, in which the insurance offices had no knowledge as to the cause of fire. It should also be remembered that in some instances, more especially where a total or semi - total loss was sustained, the actual cause was a matter of conjecture only. These cases, however, are few in number, as the vast majority of total losses are included in the total of unknown causes.
The following table gives particulars of fire losses during the five years 1932–36, classified according to the amount of loss. No fewer than 19,682 fires, out of a total of 23,845, resulted in a loss of less than £100; while in 15,953 cases, or 67 per cent. of the total, the loss per fire was less than £10. The aggregate loss involved in these small fires is small—those under £10 accounting for only 1.56 per cent. of the total loss, and fires in which less than £100 was paid out, 5.66 per cent. On the other hand, only 2.07 per cent. of the total number of fires resulted in a loss of £1,000 or upwards; but the aggregate loss within this category constituted 43.13 per cent. of the total. Corresponding figures for fires in which the loss was £5,000 or over are 0.17 per cent. and 15.27 per cent. respectively.
| Loss Category. | Number of Separate Fires. | Insurance Cover on Buildings, &c., affected. | Amount of Loss. | Average Amount of Loss per Fire. | Proportion of Loss to Total Loss. | |
|---|---|---|---|---|---|---|
| £ | £ | £ | £ | £ | Per Cent. | |
| Under | 10 | 15,953 | 11,735,087 | 44,420 | 3 | 1.56 |
| 10 and under | 25 | 2,020 | 4,071,967 | 30,607 | 15 | 1.07 |
| 25 and under | 50 | 938 | 1,007,985 | 32,866 | 35 | 1.15 |
| 50 and under | 100 | 771 | 1,589,296 | 53,634 | 70 | 1.88 |
| 100 and under | 200 | 878 | 991,124 | 124,813 | 142 | 4.37 |
| 200 and under | 300 | 637 | 563,587 | 155,484 | 244 | 5.45 |
| 300 and under | 400 | 507 | 848,143 | 173,895 | 343 | 6.09 |
| 400 and under | 500 | 487 | 551,815 | 216,005 | 444 | 7.57 |
| 500 and under | 750 | 801 | 1,052,380 | 485,720 | 606 | 17.02 |
| 750 and under | 1,000 | 359 | 586,197 | 305,828 | 852 | 10.71 |
| 1,000 and under | 2,000 | 333 | 1,259,660 | 440,578 | 1,323 | 15.44 |
| 2,000 and under | 3,000 | 76 | 565,508 | 182,972 | 2,408 | 6.41 |
| 3,000 and under | 4,000 | 30 | 259,640 | 103,329 | 3,444 | 3.62 |
| 4,000 and under | 5,000 | 15 | 111,782 | 68,347 | 4,556 | 2.39 |
| 5,000 and over | 40 | 1,259,124 | 435,877 | 10,897 | 15.27 | |
| Totals | 23,845 | 27,053,295 | 2,854,375 | 120 | 100.00 | |
Mutual associations are dealt with by the Mutual Fire Insurance Act, 1908, which allows at least 100 owners of isolated or farm property to subscribe to a declaration and form themselves into a mutual association to insure against loss by fire to an amount in the aggregate of not less than £40,000. Such associations effect insurance on the premium-note principle, and accept premium notes to be assessed for losses in the proportion of the total amount of such notes. The amount of a member's premium notes limits his liability.
In addition to furnishing returns to the Census and Statistics Department, each mutual association (of which there are three in existence) is required to furnish to the Public Trustee a statement of the condition of the association as at the 31st March in each year.
The New Zealand State Fire Office was the first competitive State fire-insurance office in the world, and first opened for business on 4th January, 1905, with a borrowed capital (long since repaid) of £2,000. The income of the office in its first year was £13,135, while in 1936 this figure had risen to £245,419, and reserves and funds at 31st December, 1936, totalled £1,083,391.
Premium income in 1936 showed an increase of £3,089 when compared with 1935, while total income was greater to the extent of £5,889. The annual report of the Office states that the actual increase in premium income is greater than the figures indicate, for the reason that premiums for 1936 are shown less rebate for the month of December, whereas the figures for 1935 are inclusive of rebate. The alteration is consequent upon the operation of a new system of bonuses which came into force on 1st December, 1936. The rebate in operation on that date was made a permanent rating reduction from premiums, and in addition, a further bonus to policyholders ranging up to 25 per cent. was declared. Under the new system bonuses are restricted to these who have been insured with the Office for a period of twelve months or over. Policyholders of two years' standing receive a proportionately larger bonus, while policyholders of three years or over receive a still higher bonus.
Fire losses in 1936 were £9,634 less than in 1933, while the total expenditure-was greater to the extent of £7,150. Apart from claims, the principal items of expenditure were as follows, the corresponding figures for 1935 being shown in parentheses: Bonus rebate, £41,563 (£41,233); working-expenses, £53,347 (£53,779); fire-board contributions, £8,225 (£7,994); income-tax, £41,296 (£23,641).
The ratio of net claims to net premium income gives for 1936 a percentage of 21.44 compared with 26.59 in 1935, 27.30 in 1934, 24.34 in 1933, and 33.75 in 1932.
| Year. | Net Premium Income. | Total Net Income. | Net Losses. | Accumulated Funds. | Assets. |
|---|---|---|---|---|---|
| £ | £ | £ | £ | £ | |
| 1927 | 207,611 | 243,496 | 98,135 | 670,061 | 707,820 |
| 1928 | 211,634 | 252,094 | 81,585 | 744,271 | 771,959 |
| 1929 | 217,991 | 258,995 | 75,317 | 821,091 | 862,285 |
| 1930 | 221,910 | 272,213 | 90,001 | 889,494 | 931,577 |
| 1931 | 216,007 | 265,503 | 112,932 | 918,182 | 977,477 |
| 1932 | 208,493 | 255,242 | 70,444 | 952,299 | 1,000,009 |
| 1933 | 201,351 | 244,257 | 49,005 | 991,087 | 1,060,513 |
| 1934 | 200,581 | 244,376 | 54,751 | 1,016,688 | 1,069,127 |
| 1935 | 199,898 | 239,530 | 53,151 | 1,049,420 | 1,138,948 |
| 1936 | 202,987 | 245,419 | 43,517 | 1,083,391 | 1,170,204 |
Exclusive of Government taxes, which amounted to 2034 per cent., the working-expense ratio to premium income in 1936 was 30 33 per cent., and without Fire Board contributions 2628 per cent. Comparative figures for 1935 were 11.83, 30.90, and 26.90 per cent. respectively.
Table of Contents
THE legislation dealing with friendly societies is contained in the Friendly Societies Act, 1909, and its amendments. Provision is made for the registration of all societies and branches the Registrar of Friendly Societies, and also for the general superintendence by the Government of the administration of the funds of the societies.
A scheme for the extension of State benefits to members of friendly societies, on special terms, was introduced by the Finance Act, 1916, and is now embodied in the National Provident Fund Act, 1926. (Vide Section XXV.)
The table following gives the number of registrations (i.e., of friendly societies proper, or lodges, together with benevolent societies, working-men's clubs, &c., registered under the Act) and of lodge members as at 31st December:—
| Name of Order. | Registrations. | Lodge Members. | ||||
|---|---|---|---|---|---|---|
| 1934. | 1935. | 1936. | 1934. | 1935. | 1936. | |
| * Membership figures relate to “actuarial” societies only (7 in 1930). | ||||||
| Manchester Unity Independent Order of Oddfellows | 259 | 261 | 262 | 34,321 | 35,471 | 36,922 |
| Independent Order of Oddfellows | 216 | 218 | 218 | 12,337 | 12,771 | 13,372 |
| National Independent Order of Oddfellows | 3 | 3 | 3 | 202 | 209 | 211 |
| British United Order of Oddfellows | 1 | 1 | 1 | 83 | 80 | 82 |
| Ancient Order of Foresters | 162 | 161 | 162 | 18,634 | 18,902 | 19,641 |
| United Ancient Order of Druids | 147 | 148 | 148 | 20,886 | 21,260 | 21,751 |
| Independent Order of Rechabites | 68 | 68 | 68 | 5,176 | 5,408 | 5,665 |
| Order of Sons of Temperance | 10 | 10 | 10 | 532 | 551 | 600 |
| Sons and Daughters of Temperance | 1 | 1 | 1 | 155 | 149 | 146 |
| Hibernian - Australasian Catholic Benefit Society | 68 | 83 | 88 | 3,928 | 4,239 | 4,621 |
| Protestant Alliance Friendly Society of Australasia | 16 | 15 | 15 | 937 | 950 | 976 |
| Grand United Order of Oddfellows | 14 | 14 | 13 | 424 | 473 | 508 |
| Isolated friendly societies | 68 | 70 | 73 | 3,093* | 3,149* | 3,564* |
| Working-men's clubs | 13 | 13 | 13 | |||
| International Order of Good Templars | 11 | 11 | 11 | |||
| Specially authorized societies | 16 | 15 | 15 | |||
| Totals | 1,073 | 1,092 | 1,101 | 100,708 | 103,612 | 108,059 |
Annual returns of receipts, expenditure, &c., of lodges are required by law. For the year 1936 the Registrar of Friendly Societies received returns from 945 lodges, with an aggregate membership of 108,059 at the end of the year, as compared with 936 lodges and 103,612 members for 1935. During the year 9,558 members were admitted by initiation, &c., and 1,226 by clearance; 951 died, 1,284 left by clearance, and 4,102 by arrears. &c. The aggregate membership of lodges increased year by year, reaching a peak in 1930, when the total was 107,167. The economic depression probably accounted for the temporary subsequent fall, while the increase of 2,904 in 1935 and of 4,447 in 1936, brought the total number of members on 31st December, 1936 up to a new record level of 108,059.
The statistics given subsequently relate to the lodges (945 in 1936) for which returns were received and tabulated.
In the following statement of the mortality experience for the last five years no account has been taken of age incidence:—
| Year. | Deaths of Members. | Per 1,000 Members at Risk. | Deaths of Members' Wives. | Per 1,000 Members at Risk. |
|---|---|---|---|---|
| 1932 | 834 | 8.00 | 393 | 3.77 |
| 1933 | 852 | 8.39 | 363 | 3.57 |
| 1934 | 935 | 9.26 | 326 | 3.23 |
| 1935 | 887 | 8.64 | 364 | 3.55 |
| 1936 | 951 | 8.95 | 373 | 3.51 |
The number of members sick during 1936 was 22,049, representing 22.4 per cent. of members at risk. The sickness experienced during 1936 aggregated 267,614 six-day weeks, equal to 12 weeks 1 day per sick member, and 2 weeks 4 days for each member at risk.
The total funds of the societies and branches as at the 31st December, 1936, amounted to £4,956,948, made up as follows:—
| Funds. | £ | Assets. | £ |
|---|---|---|---|
| Sick and Funeral Funds | 4,116,121 | Investments at interest | 4,224,633 |
| Surplus Appropriation Funds, &c. | 455,242 | Value of land and buildings | 526,122 |
| Management Funds, goods, &c. | 219,260 | Cash not bearing interest | 142,685 |
| Widow and Orphans' Funds | 33,484 | Value of goods | 22,551 |
| Distress, Benevolent Funds, &c. | 132,841 | Owing by Management Funds | 35,706 |
| Other assets | 5,251 | ||
| £4,956,948 | £4,956,948 |
Dividing the total funds by the number of members at the end of the year it is found that the average capital per member is £45 17s. 5d. There has been over many years a continuous increase in the amount of accumulated funds standing to the credit of friendly societies. The average capital per member has also appreciably increased, the gain in the last ten years amounting to 28 per cent., in spite of an increase in membership of 10 per cent. The slight fall recorded between 1935 and 1936 can be attributed to the sharp increase in membership.
| Year. | Total Funds. | Average Capital per Member. | ||
|---|---|---|---|---|
| £ | £ | s. | d. | |
| 1927 | 3,526,717 | 35 | 17 | 11 |
| 1928 | 3,728,087 | 36 | 18 | 9 |
| 1929 | 3,927,433 | 37 | 7 | 0 |
| 1930 | 4,130,117 | 38 | 10 | 9 |
| 1931 | 4,277,715 | 40 | 9 | 9 |
| 1932 | 4,398,158 | 43 | 1 | 11 |
| 1933 | 4,538,095 | 45 | 5 | 6 |
| 1934 | 4,676,427 | 46 | 8 | 9 |
| 1935 | 4,812,787 | 46 | 9 | 0 |
| 1936 | 4,956,948 | 45 | 17 | 5 |
The funds of friendly societies are held chiefly in the form of mortgages on freehold property, as shown in the next table.
| Year. | Total Funds. | Funds invested at Interest. | Proportion of Funds invested at Interest. | ||||
|---|---|---|---|---|---|---|---|
| Mortgagee on Freehold Property. | Government and Municipal Debentures. | Deposited with Banks. | Other Investments. | Total. | |||
| £ | £ | £ | £ | £ | £ | Per Cent. | |
| 1932 | 4,398,158 | 3,350,709 | 262,155 | 92,971 | 64 162 | 3,769,997 | 85.72 |
| 1933 | 4,538,095 | 3,424,616 | 276,262 | 114,349 | 65,074 | 3,880,301 | 85.51 |
| 1934 | 4,676,427 | 3,501,236 | 268,127 | 148,598 | 68,198 | 3,986,159 | 85.24 |
| 1935 | 4,812,787 | 3,643,412 | 240,363 | 135,827 | 76,030 | 4,095,632 | 85.10 |
| 1936 | 4,956,948 | 3,782,311 | 231,540 | 135,865 | 74,917 | 4,224,633 | 85.23 |
The figures of Sick and Funeral Funds and of interest earnings thereon during 1936 are given for each order in the following table:—
| Order. | Total Worth of Sick and Funeral Funds as at | Average Rate per Cent. of Interest earned. | ||
|---|---|---|---|---|
| 31st December, 1936. | 1st January, 1936. | 1935. | 1936. | |
| £ | £ | £ | £ | |
| M.U.I.O.O.F. | 1,374,586 | 1,390,750 | 4.59 | 4.70 |
| I.O.O.F. | 369,677 | 392,071 | 4.54 | 4.57 |
| N.I.O.O.F. | 5,359 | 5,205 | 3.75 | 3.00 |
| B.U.O.O.F. | 6,350 | 6,395 | 5.20 | 4.90 |
| A.O.F. | 732,128 | 751,295 | 4.18 | 4.45 |
| U.A.O.D. | 1,045,662 | 1,093,509 | 4.49 | 4.49 |
| I.O.R. | 196,039 | 203,182 | 3.51 | 4.66 |
| O.S.T. | 30,661 | 30,756 | 4.14 | 4.99 |
| S.D.T | 11,996 | 12,016 | 4.45 | 4.05 |
| H.A.C.B.S. | 108,551 | 114,141 | 4.00 | 4.46 |
| P.A.F.S.A. | 53,128 | 54,480 | 4.44 | 4.34 |
| G.U.O.O.F. | 4,336 | 5,065 | 3.10 | 3.73 |
| Other societies | 55,093 | 57,256 | 5.08 | 4.98 |
| Totals | 3,993,566 | 4,116,121 | 4.41 | 4.57 |
Receipts and expenditure of Sick and Funeral Funds for 1936 are quoted below. A surplus of £122,555 is recorded for the year.
| Receipts. | £ | Expenditure. | £ |
|---|---|---|---|
| Members' contributions | 196,804 | Sick pay to own members | 163,343 |
| Interest and rent | 181,279 | Funeral donations | 44,253 |
| Repayments by central body | 74,782 | Contributions and levies to central body | 94,837 |
| Other receipts | 29,122 | Other expenditure | 56,999 |
| £481,987 | £359,432 |
Members' contributions averaged £1 17s. 2d. per member, and interest and rent receipts amounted to £1 14s. 3d. per member, reckoned on the mean number of members for the year. Sickness benefits paid averaged £7 8s. 2d. per member sick, or £1 10s. 10d. when averaged over all members, while funeral benefits represented 8s. 4d. per member.
The following table shows the number of friendly societies, their accumulated capital, and the average capital per member in each of the Australian States according to the latest available statistics, and in the Dominion of New Zealand as at 31st December, 1935.
It will be observed that, in respect of capital per member, the New Zealand figure is considerably in excess of that recorded for any of the Australian States.
| — | Date of Return. | Number of Lodges. | Number of Members. | Amount of Funds. | Capital per Member. | ||
|---|---|---|---|---|---|---|---|
| £ | £ | s. | d. | ||||
| New South Wales | 30/6/35 | 2,429 | 204,626 | 4,442,027 | 21 | 14 | 0 |
| Victoria | 30/6/35 | 1,444 | 177,348 | 5,713,954 | 32 | 4 | 4 |
| New Zealand | 31/12/35 | 936 | 103,612 | 4,812,787 | 46 | 9 | 0 |
| South Australia | 30/6/35 | 868 | 89,889 | 2,653,475 | 29 | 10 | 4 |
| Queensland | 30/6/34 | 604 | 66,077 | 1,811,159 | 31 | 9 | 2 |
| Tasmania | 31/12/34 | 186 | 24,231 | 447,328 | 18 | 9 | 3 |
| Western Australia | 30/6/35 | 342 | 23,377 | 566,015 | 24 | 4 | 3 |
Table of Contents
THE law relating to building societies incorporated in the Dominion is contained in the Building Societies Act, 1908, which is a consolidation of legislation most of which has been operative since 1880. The Assistant Registrar of Companies in each district acts as Registrar of Building Societies. Rules, as well as subsequent alterations thereof, must before registration be certified to as conforming to legal requirements by a revising barrister appointed by the Governor-General for the purpose. No stamp duties are payable on any instruments or documents made under the Act.
Building societies are afforded all the powers of an ordinary mortgagee, and where a mortgagor makes default in payment of moneys the society may exercise the usual power of sale through the Registrar of the Supreme Court. No reconveyance is needed to discharge a mortgage made under the Act, a receipt endorsed being a sufficient discharge for this purpose.
Orders in Council of 7th June and 8th August, 1932, of 20th March, 1933, and of 31st July, 1934, made under section 51 of the National Expenditure Adjustment Act, 1932, fixed the maximum interest payable on deposits with building societies. A schedule of maximum rates payable on these and other deposits is given on pages 654–56.
Returns of each society's operations are furnished annually to the Census and Statistics Department. The dates upon which the societies close their accounts vary considerably within the year, but the statistics may be taken as corresponding approximately to the financial years ended on the 31st March.
A distinction is made between permanent and terminating societies. A permanent society is statutorily defined as one which has not by its rules any fixed date or specified result at which it shall terminate, and a terminating society as one which by its rules is to terminate at a fixed date or when a result specified in its rules is attained. In practice a terminating society or group thereof closes when every member so desiring has obtained a loan. There is a considerable difference between the two types of societies, the terminating society being a purely co-operative institution belonging to and managed by the members, proprietary interests being discouraged by placing a limit to the number of shares (usually ten) that any member can hold in any one group. There is, however, nothing to prevent a member from holding the maximum number of shares in more than one group. In the typical terminating society contributions are at the rate of 1s. per week per share, each share entitling a member in due course to £100 of loan, with a maximum of £1,000. It is these contributions, together with premiums on loans mentioned later, which make up the funds from which loans are made. Loans are made to members alternately (roughly) by ballot and by auction, the latter going for the highest premium offered. Security is required for the loans, which are repaid, free of interest, in 12½ years, a weekly instalment of 3s. 1d. per £100 of loan being necessary to achieve this result. The weekly payment of 1s. per share is continued, usually till the end of the group, but sometimes only until the total contributions paid in, plus profits credited to the shareholder, equal the amount owing on the loan. The shareholder's credit balance is then transferred to extinguish the loan. The profit of the society is derived from premiums on loans sold by auction.
Permanent societies are more in the nature of finance companies, and, while both investors and borrowers must be members, the borrower is frequently merely a nominal member. Investments in a permanent society may be made in either large or small amounts. Capital may be raised by shares with a fixed rate of interest or subject to dividends varying according to profits, as will be observed from the statistics which follow, terminating societies do not issue capital shares. Bonds, debentures, and overdraft are other methods of financing. The principal object of a permanent society is to lend money at a profit on land, either freehold or leasehold, and buildings. Table mortgages are usually adopted, the term of repayment varying from 10 to 20 years.
The number of societies in existence in 1936–37 was 99. Of these 57 were permanent and 42 terminating, the latter being comprised of 185 groups. Of recent years there has been considerable growth in permanent building societies, which numbered 45 in 1926–27. For some years the number of terminating societies manifested a decline, although, on the contrary, their activities as measured by the aggregate number of groups was increasing. In the last decade the number of terminating societies remained stationary, but the number of groups advanced from 174 to 185.
A synopsis of the extent to which investments have been made in building-society shares during the last five years is contained in the following table:—
| — | 1932–33. | 1933–34. | 1934–35. | 1935–36. | 1936–37. |
|---|---|---|---|---|---|
| Investing Shares. | |||||
| Number of shares | 274,122 | 253,547 | 253,734 | 278,255 | 297,336 |
| Members holding | 44,655 | 43,642 | 39,579 | 39,612 | 41,468 |
| Aggregate value | £3,666,745 | £3,602,743 | £3,535,032 | £3,569,579 | £3,610,933 |
| Capital Shares. | |||||
| Number of shares | 539,299 | 534,155 | 543,304 | 558,068 | 569,405 |
| Members holding | 5,048 | 5,122 | 5,783 | 5,198 | 5,367 |
| Aggregate value | £1,283,103 | £1,300,313 | £1,325,255 | £1,357,059 | £1,401,976 |
The average value in 1936–37 of each investing share was £12 2s. 10d., as compared with £12 13s. 8d. in 1931–32, and of each capital share £2 9s. 3d., as compared with £2 4s. 3d. five years earlier. The steady and substantial decrease in the number of investing shares and in the number of members holding such shares is a feature of building society statistics of the last quinquennium. A comparison (1936–37) of the distribution of share-money and the number of holders of shares between permanent and terminating societies yields the following results:—
| — | Permanent. | Terminating. | Total. |
|---|---|---|---|
| Investing Shares. | |||
| Number of shares | 202,722 | 94,614 | 297,336 |
| Members holding | 14,993 | 26,475 | 41,468 |
| Aggregate value | £1,539,521 | £2,071,412 | £3,610,933 |
| Capital Shares. | |||
| Number of shares | 569,405 | 569,405 | |
| Members holding | 5,367 | 5,367 | |
| Aggregate value | £1,401,976 | £1,401,976 |
Of the total aggregate value of both investing and capital shares, amounting to £5,012,909, 59 per cent. is held in permanent societies and 41 per cent. in terminating societies. On the other hand, the number of members holding shares in permanent societies is only 43 per cent. of the total, the terminating societies' shareholders representing 57 per cent. It should be pointed out, however, that one person may hold shares in several groups of a terminating society.
Improving conditions are reflected in a growing excess of deposits over deposits repaid (since 1932–33) and in rising advances (since 1933–34).
| — | 1932–33. | 1933–34. | 1934–35. | 1935–36. | 1936–37. |
|---|---|---|---|---|---|
| Receipts. | £ | £ | £ | £ | £ |
| Investors' subscriptions and capital shares | 609,401 | 548,082 | 532,540 | 556,378 | 605,791 |
| Advances repaid | 870,377 | 921,317 | 901,046 | 927,595 | 1,024,674 |
| Deposits | 1,653,963 | 1,414,376 | 1,634,604 | 1,949,620 | 2,203,323 |
| Interest | 273,669 | 234,331 | 238,506 | 249,646 | 276,453 |
| Other receipts | 244,555 | 235,156 | 369,632 | 299,274 | 299,801 |
| Total receipts | 3,651,965 | 3,353,262 | 3,676,328 | 3,982,513 | 4,410,042 |
| Payments. | |||||
| Withdrawals | 569,615 | 592,889 | 573,099 | 490,262 | 536,136 |
| Advances | 848,539 | 840,751 | 909,630 | 1,292,125 | 1,436,818 |
| Expenses of management | 67,341 | 65,007 | 66,571 | 66,473 | 71,216 |
| Deposits repaid | 1,660,561 | 1,368,505 | 1,499,849 | 1,769,811 | 1,851,338 |
| Interest, dividends, &c. | 463,685 | 408,225 | 578,838 | 418,946 | 491,142 |
| Total payments | 3,609,741 | 3,275,377 | 3,627,987 | 4,037,617 | 4,386,650 |
The numbers and amounts of loans at the end of each of the last five years, both of permanent and of terminating societies, were as follows:—
| Year. | Permanent Societies. | Terminating Societies. | Total. | |||
|---|---|---|---|---|---|---|
| Number. | Amount. | Number. | Amount. | Number. | Amount. | |
| £ | £ | £ | ||||
| 1932–33 | 9,928 | 5,290,902 | 7,968 | 2,586,558 | 17,896 | 7,877,460 |
| 1933–34 | 9,954 | 5,202,016 | 7,983 | 2,633,194 | 17,937 | 7,835,210 |
| 1934–35 | 10,606 | 5,238,829 | 7,961 | 2,678,280 | 18,567 | 7,917,109 |
| 1935–36 | 11,540 | 5,807,278 | 7,858 | 2,605,413 | 19,398 | 8,412,691 |
| 1936–37 | 12,277 | 6,214,688 | 7,829 | 2,534,379 | 20,106 | 8,749,067 |
The increase since 1933–34 in loans outstanding is illustrative of renewed activity in borrowing after the depression years. The average amount per loan current at the end of each of the last five years was:—
| Class. | 1932–33. | 1933–34. | 1934–35. | 1935–36. | 1936–37. | ||||||||||
|---|---|---|---|---|---|---|---|---|---|---|---|---|---|---|---|
| £ | s. | d. | £ | s. | d. | £ | s. | d. | £ | s. | d. | £ | s. | d. | |
| Permanent societies | 532 | 18 | 6 | 522 | 12 | 1 | 493 | 19 | 0 | 503 | 4 | 7 | 506 | 4 | 1 |
| Terminating societies | 324 | 12 | 5 | 329 | 17 | 0 | 336 | 8 | 6 | 331 | 11 | 3 | 323 | 14 | 4 |
| All societies | 440 | 3 | 7 | 436 | 16 | 4 | 426 | 8 | 2 | 433 | 13 | 9 | 435 | 2 | 11 |
Particulars of loans granted during each of the last five years are as follows:—
| Year. | Permanent Societies. | Terminating Societies. | |||||
|---|---|---|---|---|---|---|---|
| By Ballot. | By Auction. | ||||||
| Number. | Amount. | Number. | Amount. | Number. | Amount. | Premiums. | |
| £ | £ | £ | £ | ||||
| 1932–33 | 913 | 431,598 | 429 | 214,700 | 297 | 158,154 | 43,589 |
| 1933–34 | 1,002 | 417,564 | 439 | 213,783 | 323 | 155,813 | 36,272 |
| 1934–35 | 1,394 | 515,302 | 421 | 205,836 | 311 | 134,996 | 28,584 |
| 1935–36 | 2,070 | 940,362 | 418 | 209,259 | 319 | 138,025 | 27,625 |
| 1936–37 | 1,978 | 1,053,316 | 572 | 222,895 | 421 | 157,553 | 33,571 |
The premiums on loans auctioned gives an average of £21.3 per cent. for 1936–37, this—assuming the usual loan currency of twelve and a half years—being equivalent to a rate of interest of about 3 per cent. The average premium per cent. declined progressively from £27.6 in 1931–32 to £20.0 per cent. in 1935–36 in sympathy with the general downward trend in interest rates.
The liabilities and assets of building and investment societies for each of the last five years are as follows:—
LIABILITIES.
| Year. | To Shareholders (including Reserve Funds and Undivided Profits). | Deposits. | Appropriations not taken up or in Trust. | To Bankers and other Creditors. | Total Liabilities. |
|---|---|---|---|---|---|
| £ | £ | £ | £ | £ | |
| 1932–33 | 5,959,902 | 2,234,658 | 181,578 | 199,416 | 8,575,554 |
| 1933–34 | 5,923,351 | 2,285,874 | 184,621 | 190,304 | 8,584,150 |
| 1934–35 | 5,907,107 | 2,420,261 | 200,249 | 186,621 | 8,714,238 |
| 1935–36 | 5,992,083 | 2,655,114 | 212,940 | 309,955 | 9,170,092 |
| 1936–37 | 6,090,768 | 3,009,285 | 214,292 | 291,047 | 9,605,392 |
ASSETS.
| Year. | Advances on Mortgage. | Other Investments and Assets. | Cash in Hand and at Bank. | Total Assets. |
|---|---|---|---|---|
| £ | £ | £ | £ | |
| 1932–33 | 7,945,894 | 356,324 | 273,336 | 8,575,554 |
| 1933–34 | 7,881,372 | 429,619 | 273,159 | 8,584,150 |
| 1934–35 | 7,917,538 | 489,511 | 307,189 | 8,714,238 |
| 1935–36 | 8,412,691 | 506,136 | 251,265 | 9,170,092 |
| 1936–37 | 8,749,067 | 611,356 | 244,969 | 9,605,392 |
From April, 1932, figures of deposits with building societies have become available under section 44 of the Building Societies Act, 1908, as amended by the National Expenditure Adjustment Act, 1932. Quarterly statements are published in the Monthly Abstract of Statistics. Investment societies are included with building societies in the following figures, as the two classes are not distinguished in the returns.
The average number of societies furnishing returns for the four quarters of the year ending 31st March, 1937, was 109. During the same fiscal year the amount borrowed (exclusive of renewals) was £1,950,719 and the amount repaid £1,802,486, the corresponding amounts for the previous year being £1,532,516 and £1,281,132 respectively.
The following were the deposits with building and investment societies at 31st March, 1937:—
| Rate of Interest (Per Cent.). | At Call or under Three Months. | Three Months and under Two Years. | Two Years and over. | Total. |
|---|---|---|---|---|
| £ | £ | £ | £ | |
| Nil | 4,014 | 4,014 | ||
| Under 2½ | 267,048 | 28,080 | 295,128 | |
| 2½ and under 3 | 27,015 | 228,961 | 20,000 | 275,976 |
| 3½ and under 3½ | 395,802 | 468,950 | 682,885 | 1,547,637 |
| 3½ and under 4 | 23,346 | 1,460 | 1,038,189 | 1,062,995 |
| 4 and under 4½ | 6,695 | 440 | 688,041 | 695,176 |
| 4½ and under 5 | 41,590 | 200 | 32,556 | 74,346 |
| 5 and under 5½ | 5,793 | 322 | 3,279 | 9,394 |
| 5½ and under 6 | 409 | 409 | ||
| 6 and under 6½ | 293 | 16,230 | 16,523 | |
| 6½ and under 7 | 70 | 70 | ||
| 7 and under 8 | 720 | 720 | ||
| 8 and over | 6,112 | 6,112 | ||
| Totals | 778,907 | 728,413 | 2,481,180 | 3,988,500 |
| Average rate of interest (per cent.) | 2.79 | 2.86 | 3.62 | 3.32 |
Table of Contents
UNDER the Property Law Act a “mortgage” is defined as including a charge on any property for securing money or money's worth; and “mortgage-money” means money or money's worth secured by a mortgage. Under the Land Transfer Act “mortgage” means and includes any charge on land created under the provisions of that Act for securing—
The repayment of a loan or satisfaction of an existing debt;
The repayment of future advances, or repayment or satisfaction of any future or unascertained debt or liability, contingent or otherwise;
The payment to the holders for the time being of any bonds, debentures, promissory notes, or other securities, negotiable or otherwise, made or issued by the mortgagor before or after the creation of such charge;
The payment to any person or persons by yearly or periodical payments or otherwise of an annuity, rent-charge, or sum of money other than a debt.
Where the ownership of land is registered under the Land Transfer Act (as, vide p. 348, the great majority of land titles now are) mortgages on that land are granted by virtue of the provisions of that Act, and take effect as securities and do not operate as transfers of the estate or interest charged. In the case of other land or property a mortgage is granted under what is known as the deeds or deeds-registration system; the mortgage in this instance operating as a conveyance or assignment of the land or property mortgaged, for the mortgagee becomes the registered proprietor of the land, subject to the right of the mortgagor to have the property re-registered in his name on the discharge of his obligations under the mortgage. Although in form a mortgage under the deeds system is a conveyance, in equity it is treated as merely a charge on the land.
Any land covered by the definitions of “land” in the Property Law Act, 1908, and the Land Transfer Act, 1915, may be mortgaged. Where, however, property is subject to restrictions upon alienation, these restrictions usually apply to prevent such property being mortgaged. The following are the main instances in which mortgage of property is forbidden by law:—
Family homes registered under the Family Protection Act, 1908.
Maintenance-moneys under the Family Protection Act, 1908.
Inalienable life annuities (Inalienable Life Annuities Act, 1910).
Various pensions (Pensions Act, 1926).
Property subject to restraint upon anticipation, unless by consent of the Supreme Court.
Property subject to restraint upon alienation in accordance with section 24 of the Property Law Act, 1908.
An infant's property, by the infant (Infants Act, 1908, sections 12 and 13).
A memorandum of discharge vacates the mortgage debt and operates as a deed of reconveyance of the estate and interest of the mortgagee in the mortgaged property “to the person for the time being entitled to the equity of redemption”; but the mortgagee may execute a deed of reconveyance “if he thinks fit and the mortgagor requires it.” The Public Trustee is empowered to receive mortgage-moneys on account of absentee mortgagees, and in the case of a deed of mortgage to execute the necessary memorandum of discharge. A mortgagor may redeem in the following cases:—
Before the due date, on payment of interest for the unexpired term of the mortgage. A special provision in the Mortgagors and Lessees Rehabilitation Act extends the powers of a mortgagor to redeem in certain cases before the due date (vide page 702).
At the due date, in accordance with the provisions of the mortgage.
After the due date, upon giving three months' notice in writing or paying three months' interest in lieu of notice, except where the mortgagee is or has been in possession or has taken steps to enforce his security, in which case the mortgagor may redeem at any time upon payment of all moneys due.
After default and before sale by the mortgagee. If the mortgagee has entered into possession of the mortgaged land or part of it, the mortgagor loses his right of redemption after twenty years from the date of the mortgagee's entering into possession, or after twenty years from the last written acknowledgment of the mortgagor's title or of his right to redeem.
The Property Law Act abolished what was formerly known as the doctrine of consolidation of mortgages. Where a mortgagor is liable under more than one mortgage, he may now pay off one mortgage without being called on to pay off any mortgage or mortgages on property not comprised in the mortgage he is paying off.
Under New Zealand law a mortgagee has no power of foreclosure in respect of realty. The following, however, represent his principal rights:—
He is entitled to the custody of the title-deeds of the property mortgaged.
He may sue on the personal covenant contained in the mortgage-deed.
He may enter and take possession. This right is exercisable either by actually entering upon the land or a part of it or by bringing an action for possession. If there is a tenant whose rights are binding on the mortgagee, the latter can give notice to the tenant to pay the rent to him, and this will be equivalent to taking possession.
He may assign his interest, either absolutely or by way of submortgage.
He may sell, either under the express powers (if any) in the mortgage-deed, of under powers implied by statute, if these have not been negatived in the deed.
Instead of selling, as above, a mortgagee entitled to exercise his power of sale may apply to the Registrar of the Supreme Court to conduct the sale. The mortgagee must state in his application the estimated value of the land, and the date of the sale must be not less than one month and not more than three months from the date of the application. He may bid at the sale and become the purchaser of the land, but in such case the amount paid for the land shall not be less than the value of the land as estimated. If it is, the mortgagor must be allowed in account the full amount of the estimate.
Under the mortgage-relief legislation referred to below these rights are not necessarily enforceable at present.
The economic conditions prevailing in New Zealand consequent upon the world-wide depression commencing in 1929 led to the enactment in the early months of 1931 of legislation designed for the relief of mortgagors. The complexity of the problem necessitated much further legislation, and a consolidating Mortgagors and Tenants Relief Act was passed in December, 1933. The Rural Mortgagors Final Adjustment Act, 1934–35, which was passed in April, 1935, represented a definite attempt on the part of the Government to effect a final clearing-up of the burden of rural indebtedness. Both these enactments, which are described in some detail in the 1936 issue of the Year-Book (pp. 567–70), have been repealed by the Mortgagors and Lessees Rehabilitation Act, 1936, a description of which follows.
Section 2 of the Act is quoted verbatim in order to afford an adequate understanding of the general objectives of the legislation.
“2. (1) The general purpose of this Act in relation to farmer applicants is to retain them in the use and occupation of their farms as efficient producers, and to make such adjustments of their liabilities as will ensure that the liabilities secured on any property do not exceed the value of that property, that the rent of any leasehold property does not exceed the rental value of that property, and that the total amount and terms of payment of all their liabilities (whether secured or unsecured) are such that, after allowing for all normal current expenditure and providing for the maintenance of themselves and their families in a reasonable standard of comfort, the applicants may reasonably be expected to meet their liabilities as they become due, either out of their own moneys or by borrowing on reasonable terms.
“(2) The general purpose of this Act in relation to home applicants is to retain them in the occupation of their homes, and to make such adjustments of their liabilities as will ensure that the liabilities secured on any property do not exceed the value of that property, that the rent of any leasehold property does not exceed the rental value of that property, and that the total amount and terms of payment of these of their liabilities that are secured by adjustable securities or are adjustable debts are such that the applicants may reasonably be expected to meet them as they become due, either out of their own moneys or by borrowing on reasonable terms.
“(3) The general purpose of this Act in relation to applicants who are not farmer applicants or home applicants is to enable them to retain possession of their mortgaged or leasehold property, and to make such adjustments of their liabilities as will ensure that the liabilities secured on any property do not exceed the value of that property, that the rent of any leasehold property does not exceed the rental value of that property, and that the total amount and terms of payment of those of their liabilities that are secured by adjustable securities or are adjustable debts are such that the applicants may reasonably be expected to meet them as they become due, either out of their own moneys or by borrowing on reasonable terms.”
The Act applies to mortgages of the following classes:—
Mortgages that were executed before the passing of the Act:
Mortgages that were in fact operative or designed to take effect before the date of the passing of the Act, though not executed before that date:
Mortgages to which the Act has at any time applied and which have been varied by the parties thereto:
Mortgages that have been executed in replacement or substantial replacement of mortgages to which the Act has at any time applied.
The Act also applies to all leases that were executed before its passage, and to all leases that have been executed in renewal of such leases.
The Governor-General may extend the provisions of the Act by Order in Council to apply to any of the following licenses and other instruments:—
Any license or other instrument for the cutting and removal of timber or flax, or for the extraction of coal or fireclay:
Any way-leave or other easement granted in relation to the rights conferred by any such license or instrument as aforesaid:
Any contract or instrument by virtue of which any person entitled under any license or other instrument to cut timber or flax or extract coal or fireclay from any land is under an obligation to pay, whether periodically or otherwise, to any person any moneys calculated wholly or partially by reference to the quantity of timber or flax cut or to be cut, or to the quantity of coal or fireclay extracted or to be extracted, or fixed as minimum payments, whether or not the person entitled to receive payment under such contract or instrument has any right, title, estate, or interest in such timber, flax, coal, or fireclay, as the case may be, or in the land containing it.
Any specific mortgage or lease, or class of such, may be exempted from the operation of the Act by Order in Council.
A Court of Record, entitled the Court of Review, is set up under the provisions of the Act, consisting of three members appointed by the Governor-General in Council, including the Judge of the Court. It is further provided that no person shall be eligible for the position of Judge unless he is eligible for appointment as a Judge of the Supreme Court. The Judge and one other member constitute a quorum. Provision is also made for the appointment of Registrars, Deputy-Registrars, and other Court officers. The Governor-General in Council may, if he thinks fit, appoint not more than two additional Judges and not more than four additional members of the Court to hold office during his pleasure.
For the purposes of the Act there are established such numbers of Adjustment Commissions as the Governor-General in Council thinks necessary. Every such Commission consists of not more than three members, one of whom (in cases where there are more than one) is Chairman. Orders made by the Commissions in adjustment of mortgages, &c., are registered with the Court of Review, to which Court (and to no other) there is a right of appeal against decisions of the Adjustment Commissions.
Any mortgagor, lessee, or guarantor under a mortgage or lease to which the Act applies could make application for an adjustment of his liabilities. Every such application must contain a complete list of all the creditors and debtors of the applicant, together with a statement of his assets and liabilities and of the securities held by secured creditors. No such application could be filed after 31st January, 1937, although the Court might at its discretion accept applications in special circumstances to 28th February, 1937. Since the previously existing mortgage-relief legislation was repealed by this Act, the full rights of mortgagees are automatically restored in respect of properties in respect of which no application for adjustment was made within the time allowed.
Where a mortgagor or lessee had made default in complying with his obligations under a mortgage or lease but had not filed any application for relief, the mortgagee or lessor or any guarantor in respect of the mortgage or lease could make application—on or before 31st January, 1937—for adjustment of the mortgagor's or lessee's liabilities.
As soon as possible after the filing of any application, the Registrar in whose office the application is made is required to refer the matter to an Adjustment Commission. Mortgagors and lessees are protected from the exercise of rights of foreclosure, &c., in respect of mortgages or leases for which application for adjustment has been made, until such applications have been finally disposed of.
As a preliminary step towards the adjustment of the liabilities of an applicant, the Adjustment Commission first makes an order determining—
Whether the applicant is a farmer applicant, or is a home applicant, or is neither a farmer applicant nor a home applicant:
The value of any property of the applicant other than his interest (if any) in any farm lands:
The basic value of the applicant's interest (if any) in any farm lands:
The basic rent of any property held by the applicant as lessee under any lease:
Whether or not the applicant is entitled to retain any property that is subject to an adjustable security or is comprised in an adjustable lease, or of any part of the property:
The amount of principal and other moneys secured on any property of the applicant by any adjustable security, after allowing for any remissions made.
An adjustable security is defined by the Act as a mortgage to which the Act applies; and, in the case of a farmer applicant, includes any other mortgage and any statutory or other charge on any property belonging to him; and, in the case of any applicant who is not a farmer applicant, includes any other mortgage and any charge on any property belonging to him, if the property is subject to a mortgage to which the Act applies or is comprised in a lease to which the Act applies. In determining the amount secured by such a security the Commission must take accrued interest into account, but it is empowered to remit the whole or any part of such accrued interest due before the date of the order.
Special provisions exist in the case of farm mortgages and leases which do not apply in the case of other mortgages, &c. These provisions are described in Section XVIIIA of this Year Book (pp. 380–82), to which reference should be made.
In determining the value of any property of any applicant other than his interest (if any) in any farm lands, the Adjustment Commission is enjoined to have regard to the values subsisting at the passing of the Act, but to make such increases or reductions in those values as it deems necessary in order to make them fair values to serve as a basis for the adjustment of the liabilities of the applicant.
If the value of any property of any applicant (other than his farm lands, if any) is less than the total amount of the principal and other moneys secured on that property by any adjustable securities, the amount so secured is to be reduced to an amount equal to the value of the property as determined above. The difference becomes an adjustable debt, which the Commission is required to deem discharged on a date to be fixed in that behalf by an order of the Commission. In certain circumstances the Commission may, however, order the payment of part or the whole of an adjustable debt, after taking into consideration such matters as the income of the applicant and possible hardship to the creditor if the order were not made.
The Commission may vary the terms of repayment of securities of an applicant in any manner which in its opinion would be equitable—e.g., the substitution of a table mortgage for a flat mortgage, &c.—having regard to the purpose of the legislation. The Governor-General may from time to time fix rates of interest—which shall be regarded as maxima—for the guidance of Adjustment Commissions in determining the rate of interest chargeable on any adjustable security or any new securities arranged by the Commissions.
Provision is also made for the adjustment of rent payable under leases. The Commission is empowered to determine a basic rent, having regard to the value of the property; the rent payable under an adjustable lease—i.e., one to which the Act applies—being reduced to the basic rent. Arrears of rent become an adjustable debt which is dealt with in the manner indicated above in respect of excess mortgage indebtedness—i.e., it is cancelled—with certain exceptions.
As indicated in a preceding paragraph, the Adjustment Commission may determine whether or not an applicant is entitled to retain farm lands, home premises, or other property. In determining whether or not any applicant is entitled to retain any property (not being farm lands) that is subject to an adjustable security or is comprised in an adjustable lease, or any part of the property, the Adjustment Commission must take into consideration the following matters, namely:—
The conduct of the applicant in relation to the care of the property and the disbursement of his income:
Whether any relief granted pursuant to this Act would be reasonably likely to enable the applicant to meet his future liabilities in respect of the property:
Any other matters that it deems relevant.
The Adjustment Commission may make such orders as it thinks fit for the sale or offering for sale, on such terms and conditions as the Commission may fix in that behalf, either by public auction or public tender, with a right for any mortgagee to become the purchaser; or by private contract, whether to any specified mortgagee, creditor, or other person, or otherwise howsoever—
Of any property of any applicant that is subject to an adjustable security or is comprised in an adjustable lease, if the Adjustment Commission has determined that the applicant shall not be entitled to retain the property, or if the applicant has elected not to retain the property or has abandoned the property:
In the case of a farmer applicant, of any other property, if the Adjustment Commission considers that its sale is desirable for the purposes of the adjustment of the liabilities of the applicant.
If the proceeds of the sale of such property do not meet the commitments on it, the amount remaining unpaid is to be deemed an adjustable debt; while the whole amount of the applicant's liability in respect of such property not offered for sale or of an abandoned property may be deemed an adjustable debt. The latter provision does not, however, release the property from the encumbrance. Provision is made for the adjustment of the liability of guarantors in respect of mortgages or leases coming within the scope of the Act on similar lines to these set out in respect of mortgagors or lessees.
In respect of mortgages, &c., coming within the scope of the legislation, the Court may reopen transactions where creditors have already exercised their rights, but only in respect of actions taken subsequent to 25th August, 1936.
The Court may make orders to protect creditors from acts intended to delay or defeat their claims. An applicant is also restrained from disposing of property or obtaining credit without disclosure while his application is pending.
Notwithstanding anything to the contrary in any other Act, State lending departments and local authorities may agree to adjustment of the liabilities of any mortgagor, lessee, or guarantor in accordance with the provisions of the Act.
It is made lawful for any trustee to agree to an adjustment of the liabilities of any mortgagor, lessee, or guarantor in accordance with the provisions of the Act. No covenant or condition contained in any mortgage (whether executed before or after the passing of the Act) is to have any force or effect to deprive any mortgagor, lessee, or guarantor of any benefits provided for by the Act.
Where the amount secured on any mortgage has been reduced, or where the rent of a property has been reduced or arrears of rent remitted by the operation of the Act, it is not lawful (except with the leave of the Court) for the owner of the land, or the owner of any interest in the land or any part thereof, to sell or otherwise dispose of it before 1st January, 1941.
The mortgagor under any mortgage to which the Act applies could at any time, not later than 31st January, 1937, serve a notice on the mortgagee requiring him to reduce the rate of interest to such rate as might be specified in the notice. If the mortgagee did not do so within one month after the service of the notice the mortgagor might discharge his liability by payment of the principal sum plus interest up to the date of such repayment.
Saving provisions protect a mortgagor to whom relief has been granted under the pre-existing mortgagors' relief legislation or the Rural Mortgagors Final Adjustment Act, 1934–35, until review of the position of the mortgage by an Adjustment Commission.
Shortly after the passage of the Mortgagors and Lessees Rehabilitation Act the Court of Review was constituted, and early in December, 1936, fourteen Adjustment Commissions were appointed. In order to reach finality at a reasonably early date, the Attorney-General, in May, 1937, extended the number of Commissions from fourteen to thirty-three. It was recently announced by the Attorney-General that applications for the adjustment of liabilities numbered 34,306 (farm, 15,476; other applications, 18,830). Up to the date of the announcement (20th September, 1937) 9,269 applications had been disposed of.
The Act does not apply to mortgages (not being for a fixed term, expired or unexpired) securing the repayment of principal moneys repayable on demand, nor to mortgages executed after 1st April, 1932. Under the amending Act a policy for securing a life insurance, endowment, or annuity is not a chattel within the Act, and is, therefore, not subject to its provisions.
The reduction in the rate of interest is 20 per centum, and it originally applied to all such interest accruing on or after 1st April, 1932, and before 1st April, 1935. The operation of the reduction was extended to 1st April, 1937, by the Finance Act, 1934, and made permanent by a section of the Mortgagors and Lessees Rehabilitation Act, 1936. There is provision, however, that the rate of interest shall not be reduced below 6½ per cent. in the case of chattel-mortgages, nor 5 per cent. in the case of other mortgages except in the case of income-tax-free company debentures to which section 171 of the Land and Income Tax Act, 1923, is applicable, where the minimum is 4½ per cent.
Provision was made for an appeal for relief by an aggrieved mortgagee to the Supreme Court or to a Stipendiary Magistrate (if the annual interest does not exceed £300) on the ground that the existing rate of interest was fair in the circumstances, or that adequate concessions had already been given, or that the reduction would cause undue hardship. The Governor-General may from time to time transfer to the Court of Review set up under the Mortgagors and Lessees Rehabilitation Act, 1936, all the functions of the Supreme Court or of a Stipendiary Magistrate under the above provision.
Part III of the National Expenditure Adjustment Act, 1932, had as its purpose reductions in rates of interest payable by mortgagors, and in rents and certain other fixed charges, commensurate with reductions in salaries and wages made by Part I of the Act and by the Finance Act of 1931. An amending Act, passed later in 1932, made certain modifications and enacted some necessary changes in the machinery of the legislation.
The term “mortgage” for the purpose of the Act has a wider meaning than in ordinary usage. It “means any deed, memorandum of mortgage, instrument, or agreement whereby security for the payment of moneys or for the performance of any contract is granted over land or chattels or any interest therein respectively”; and includes company debentures, mortgages of life-insurance policies, agreements for the sale and purchase of land, and customary hire-purchase agreements within the meaning of the Chattels Transfer Act, 1924.
The functions of the Mortgage Corporation set up under the Mortgage Corporation Act, 1934–35, have been transferred to the newly created State Advances Corporation (vide Section XXIVD, State Advances).
Following is a brief résumé of the affairs of the Corporation as at 31st March, 1936 (the transfer to the State Advances Corporation dated from 1st July, 1936). The net value of assets transferred from the State Advances Office to the Corporation was £38,683,795. A classification of mortgages transferred to the Corporation showed that 20,736 mortgagors were in arrear, the balance of principal outstanding being £17,932,589; while 30,148 mortgagors were paid up to date, the balance of principal outstanding in this instance amounting to £18,498,801.
In consideration of the mortgages transferred to the Corporation, stock to the value of £29,800,000 was issued to the Minister of Finance, the balance between the value of the assets transferred and the value of the stock totalling £8,883,795. This amount was carried to the Contingent Liability Account of the Corporation. The interest on the stock issued to the Minister of Finance was at the same rate (3⅜ per cent.) as the first issue of stock and debentures to the public, while the Corporation showed a return to the Crown up to 31st March, 1936, of 2½ per cent. on the Contingent Liability Account.
Loans authorized by the Board of Management of the Corporation from the inception of lending operations up to 31st March, 1936, were as follows:—
| Number. | Amount. | |
|---|---|---|
| Residential— | £ | |
| Erection of dwellings | 373 | 238,585 |
| Refinancing, &c. | 662 | 520,630 |
| Farms | 824 | 1,876,065 |
| Total authorizations | 1,859 | £2,635,280 |
Applications declined by the Board totalled £726,055 in respect of 518 applicants, made up as follows:—
| Number. | Amount. | |
|---|---|---|
| £ | ||
| Residential | 229 | 142,060 |
| Farms | 289 | 583,995 |
The interest due in respect of mortgage securities (excluding local-authority securities) for the period from 1st August, 1935, to 31st March, 1936, as compared with the years ended 31st March, 1934 and 1935, and the cash received for these periods is shown hereunder:—
| — | Interest due. | Net Interest received. | Shortage. | Percentage of Receipts to Interest due. |
|---|---|---|---|---|
| £ | £ | £ | ||
| 1933–34 | 1,966,127 | 1,562,707 | 403,420 | 79.48 |
| 1934–35 | 1,913,611 | 1,711,446 | 202,165 | 89.43 |
| Eight months, 1st August, 1935, to 31st March, 1936 | 1,200,879 | 1,142,947 | 57,932 | 95.16 |
The position showed a marked improvement during the three years.
Statistics covering the operations of the State Advances Corporation will be found in Section XXIVD of this Year-Book.
A table is given showing the amount represented by mortgages registered and discharged during each of the last twenty years.
| Year ended 31st March, | Mortgages registered. | Mortgages discharged. | Year ended 31st March, | Mortgages registered. | Mortgages discharged. |
|---|---|---|---|---|---|
| £ | £ | £ | £ | ||
| 1918 | 18,126,924 | 11,614,517 | 1928 | 33,190,519 | 23,998,840 |
| 1919 | 19,007,286 | 11,040,897 | 1929 | 33,559,932 | 25,269,613 |
| 1920 | 48,442,900 | 23,086,746 | 1930 | 38,869,144 | 28,328,993 |
| 1921 | 66,960,434 | 29,464,132 | 1931 | 30,208,447 | 20,056,691 |
| 1922 | 34,789,324 | 13,234,365 | 1932 | 13,410,581 | 10,036,385 |
| 1923 | 26,031,596 | 14,579,767 | 1933 | 9,161,663 | 8,149,355 |
| 1924 | 37,862,419 | 22,246,512 | 1934 | 7,802,853 | 9,086,847 |
| 1925 | 41,123,966 | 29,733,883 | 1935 | 11,845,634 | 13,732,853 |
| 1926 | 47,093,780 | 33,958,144 | 1936 | 16,227,058 | 17,553,233 |
| 1927 | 39,979,681 | 29,233,329 | 1937 | 19,700,650 | 19,803,446 |
Although the statistics of registrations and discharges afford a valuable index of the movement in mortgage indebtedness over the period, year to year comparisons are affected considerably by the following factors: Duplicate registrations are included prior to 1929–30; from 1929–30 the extent of duplication has been available and the net figures inserted after necessary deductions on that account. Furthermore, the figures include collateral and guarantee mortgages not representing money indebtedness. On the other hand no amount is shown as secured in a proportion of cases where a mortgage is given in anticipation of advances, &c. In addition there are numbers of privately arranged advances which are not registered; and stock and crop liens, bills of sale, and instruments under the Chattels Transfer Act are not included in the statistics.
Many discharges are not registered, particularly in the case of leaseholds and also of second or other further mortgages when the power of sale has been exercised by the first mortgagee. The figures for discharges will be further affected by the high proportion of table mortgages. This will be particularly so in cases where the mortgage is approaching maturity, since the whole amount will remain on the register despite the fact that the actual indebtedness has been considerably reduced.
The total amount for which mortgages were registered, both under the deeds-registration system and under the Land Transfer Act, in each registration district during the last five years is given in the next table.
In addition to a total of 19,582 mortgages which represent the net aggregate of £19,700,650 for 1936–37, there were 2,746 mortgages in which no amount was shown as secured.
Six of the eleven registration districts show increases in the value of mortgages registered during 1936–37, as compared with the previous year, the aggregate increase in the net registrations for the whole Dominion being £3,473,592.
| District. | 1932–33. | 1933–34. | 1934–35. | 1935–36. | 1936–37. |
|---|---|---|---|---|---|
| £ | £ | £ | £ | £ | |
| Auckland | 2,905,872 | 2,397,781 | 2,923,309 | 4,097,884 | 5,806,614 |
| Gisborne | 189,826 | 136,475 | 203,791 | 722,025 | 676,029 |
| Hawke's Bay | 1,048,971 | 649,230 | 1,143,973 | 1,288,455 | 1,457,535 |
| Taranaki | 486,253 | 430,757 | 580,168 | 684,932 | 931,573 |
| Wellington | 2,150,186 | 1,542,479 | 2,750,806 | 4,180,954 | 4,795,219 |
| Nelson | 179,419 | 195,112 | 224,598 | 328,739 | 323,364 |
| Marlborough | 102,873 | 86,044 | 126,472 | 524,462 | 262,483 |
| Canterbury | 1,143,096 | 1,303,782 | 1,987,461 | 2,810,252 | 2,769,382 |
| Otago | 673,796 | 783,499 | 1,334,170 | 1,762,749 | 1,629,208 |
| Southland | 476,871 | 473,139 | 696,997 | 834,419 | 965,297 |
| Westland | 92,259 | 40,429 | 86,945 | 116,787 | 139,396 |
| Gross totals | 9,449,422 | 8,038,727 | 12,058,690 | 17,351,658 | 19,756,100 |
| Duplications | 287,759 | 235,874 | 213,056 | 1,124,600 | 55,450 |
| Net totals | 9,161,663 | 7,802,853 | 11,845,634 | 16,227,058 | 19,700,650 |
Of the gross total of £19,756,100 registered in 1936–37, £19,419,451 or 98.3 per cent., came under the Land Transfer Act. The proportion is now approaching 100 per cent., owing to the operation of the Land Transfer (Compulsory Registration of Titles) Act, 1924 (vide Section XVIIA).
Of the net total of £19,700,650 registered for the financial year 1936–37 mortgages up to £500 in value represented 13 per cent. of the total value registered; from £501 to £1,000, 22 per cent.; from £1,001 to £5,000, 39 per cent.; and above £5,000, 26 per cent. The following table gives the number and amount in each registration district according to the sum secured:—
| District. | £500 and under. | £501 to £1,000. | £1,001 to £5,000. | Over £5,000. | ||||
|---|---|---|---|---|---|---|---|---|
| Number. | Amount. | Number. | Amount. | Number. | Amount. | Number. | Amount. | |
| £ | £ | £ | £ | |||||
| Auckland | 2,559 | 762,474 | 1,639 | 1,203,048 | 1,351 | 2,755,943 | 130 | 1,085,149 |
| Gisborne | 168 | 52,148 | 104 | 75,673 | 62 | 150,707 | 28 | 397,501 |
| Hawke's Bay | 418 | 134,436 | 340 | 242,875 | 194 | 465,149 | 64 | 615,075 |
| Taranaki | 328 | 100,364 | 253 | 183,691 | 241 | 517,896 | 16 | 129,622 |
| Wellington | 1,772 | 480,839 | 1,332 | 978,290 | 836 | 1,804,623 | 151 | 1,531,467 |
| Nelson | 301 | 80,261 | 144 | 101,723 | 55 | 104,630 | 3 | 36,750 |
| Marlborough | 115 | 33,331 | 46 | 34,216 | 33 | 72,886 | 12 | 122,050 |
| Canterbury | 1,543 | 416,269 | 883 | 626,031 | 415 | 927,250 | 84 | 799,832 |
| Otago | 1,549 | 400,211 | 667 | 481,381 | 239 | 500,110 | 32 | 247,506 |
| Southland | 599 | 150,377 | 419 | 299,164 | 206 | 424,026 | 13 | 91,730 |
| Westland | 174 | 41,031 | 58 | 39,706 | 20 | 44,019 | 2 | 14,640 |
| Gross totals | 9,526 | 2,651,741 | 5,885 | 4,265,798 | 3,652 | 7,767,239 | 535 | 5,071,322 |
| Duplications | 2 | 2,000 | 10 | 20,430 | 4 | 33,020 | ||
| Net totals | 9,526 | 2,651,741 | 5,883 | 4,263,798 | 3,642 | 7,746,809 | 531 | 5,038,302 |
In addition to the foregoing, there were 2,746 mortgages registered for which no amount was shown. Excluding these, the average advance for each mortgage registered was £1,006, as compared with £988 in 1935–36.
Figures are available in the case of Land Transfer registrations showing for each registration district the amount advanced on urban and rural properties. No similar data are available in regard to mortgages registered under the deeds system, but, bearing in mind that the latter constituted in 1936–37 less than 2 per cent. of the total, it will be evident that the figures given approximately indicate the character of the securities. The distinction is between “town and suburban” and “country” holdings, but information is not always available to enable a strictly accurate classification to be made. Generally, however, town and suburban mortgages are regarded as such if secured on properties situated within cities or boroughs, and include also mortgages secured on small holdings in the nature of building allotments which are not definitely distinguishable as country properties. Mortgages classified as town and suburban are secured on areas averaging a little less than two-fifths of an acre in extent, as compared with an average area in 1936–37 of some 335 acres in the case of “country” securities.
The value of mortgages on town and suburban property registered in 1936–37 was £1,553,519 less than that on country property. In point of numbers 67 per cent. of the mortgages referred to town and suburban areas, and 33 per cent. to country properties. The average amount secured per acre on rural holdings was £4 5s. 9d., as against £1,839 in the case of town and suburban properties. The average amount of each mortgage on country property was £1,437, as compared with £613 on town and suburban holdings. The following table gives mortgages registered during the year 1936–37 under the Land Transfer Act.
| District. | Town and Suburban. | Country. | ||||
|---|---|---|---|---|---|---|
| Number. | Area. | Amount secured. | Number. | Area. | Amount secured. | |
| Acres. | £ | Acres. | £ | |||
| Auckland | 3,694 | 1,624 | 2,419,868 | 2,706 | 644,247 | 3,162,072 |
| Gisborne | 252 | 150 | 161,423 | 161 | 199,973 | 514,606 |
| Hawke's Bay | 787 | 380 | 480,732 | 408 | 166,267 | 976,803 |
| Taranaki | 457 | 226 | 277,879 | 524 | 96,921 | 653,694 |
| Wellington | 3,285 | 767 | 2,304,011 | 1,333 | 483,858 | 2,491,208 |
| Nelson | 385 | 89 | 214,157 | 196 | 54,617 | 102,641 |
| Marlborough | 134 | 73 | 53,251 | 99 | 122,607 | 209,232 |
| Canterbury | 2,311 | 615 | 1,449,277 | 832 | 266,518 | 1,320,105 |
| Otago | 2,113 | 432 | 980,141 | 502 | 237,474 | 543,658 |
| Southland | 938 | 450 | 490,830 | 479 | 159,191 | 474,467 |
| Westland | 224 | 52 | 101,397 | 55 | 14,651 | 37,999 |
| Totals | 14,580 | 4,858 | 8,932,966 | 7,295 | 2,446,324 | 10,486,485 |
A decennial summary upon similar lines is also given. The low figures of the years following 1930–31 evidence the force of the depression, the decline being approximately equally marked in urban and in rural districts. A measure of recovery is indicated in the statistics from 1934–35 onwards.
| Year ended 31st March, | Number. | Area. | Amount secured. | ||||
|---|---|---|---|---|---|---|---|
| Town and Suburban | Country. | Total. | Town and Suburban. | Country. | Total. | ||
| Acres. | Acres. | Acres. | £ | £ | £ | ||
| 1928 | 34,302 | 7,341 | 3,626,937 | 3,634,278 | 15,633,142 | 13,773,805 | 29,406,947 |
| 1929 | 34,796 | 7,436 | 4,303,858 | 4,311,294 | 15,432,011 | 15,026,604 | 30,458,615 |
| 1930 | 38,862 | 8,052 | 4,206,598 | 4,214,650 | 18,936,219 | 17,681,488 | 36,617,707 |
| 1931 | 32,329 | 6,669 | 3,689,511 | 3,696,180 | 14,262,919 | 14,203,287 | 28,466,206 |
| 1932 | 17,793 | 4,046 | 2,276,959 | 2,281,005 | 5,771,364 | 6,814,783 | 12,586,147 |
| 1933 | 13,257 | 3,231 | 1,784,781 | 1,788,012 | 4,133,507 | 4,806,418 | 8,939,925 |
| 1934 | 12,192 | 2,749 | 1,433,892 | 1,436,641 | 3,873,076 | 3,779,917 | 7,652,993 |
| 1935 | 14,775 | 3,425 | 1,988,174 | 1,991,599 | 5,087,534 | 6,608,107 | 11,695,641 |
| 1936 | 18,679 | 4,601 | 2,558,654 | 2,563,255 | 7,731,745 | 9,325,478 | 17,057,223 |
| 1937 | 21,875 | 4,858 | 2,446,324 | 2,451,182 | 8,932,966 | 10,486,485 | 19,419,451 |
Of the net total (i.e., deducting duplications) of mortgages released in 1936–37, £19,479,003 was under the Land Transfer Act and £324,443 under the deeds-registration system. The corresponding figures for the previous year were £17,183,623 and £369,610 respectively.
The total amount of mortgages discharged for the last three years is as follows:—
| District. | 1934–35. | 1935–36. | 1936–37. | |||
|---|---|---|---|---|---|---|
| Number. | Amount. | Number. | Amount. | Number. | Amount. | |
| £ | £ | £ | ||||
| Auckland | 4,288 | 3,570,720 | 5,673 | 4,556,394 | 6,777 | 6,011,964 |
| Gisborne | 229 | 278,987 | 369 | 979,852 | 526 | 636,381 |
| Hawke's Bay | 878 | 1,286,013 | 1,090 | 1,544,774 | 1,208 | 1,461,797 |
| Taranaki | 759 | 786,943 | 839 | 845,665 | 1,165 | 1,101,360 |
| Wellington | 3,069 | 3,296,574 | 4,208 | 4,579,246 | 4,909 | 5,148,259 |
| Nelson | 401 | 178,956 | 515 | 316,308 | 524 | 213,905 |
| Marlborough | 184 | 231,153 | 201 | 197,474 | 236 | 299,960 |
| Canterbury | 2,175 | 2,251,081 | 2,507 | 2,334,996 | 2,905 | 2,422,573 |
| Otago | 1,761 | 1,088,425 | 2,140 | 1,417,083 | 2,252 | 1,530,387 |
| Southland | 841 | 730,981 | 891 | 785,218 | 1,117 | 839,405 |
| Westland | 143 | 62,702 | 149 | 123,303 | 212 | 148,695 |
| Gross totals | 14,728 | 13,762,535 | 18,582 | 17,680,313 | 21,831 | 19,814,686 |
| Duplications | 4 | 29,682 | 4 | 127,080 | 4 | 11,240 |
| Net totals | 14,724 | 13,732,853 | 18,578 | 17,553,233 | 21,827 | 19,803,446 |
Monthly figures of registrations and discharges are regularly published in the Monthly Abstract of Statistics. The gross totals for each of recent months are as follows:—
| Month. | Mortgages registered. | Mortgagee discharged. | ||
|---|---|---|---|---|
| Number. | Amount. | Number. | Amount. | |
| 1936–37. | £ | £ | ||
| April | 1,510 | 1,502,233 | 1,523 | 1,530,476 |
| May | 2,022 | 1,813,219 | 2,034 | 1,809,663 |
| June | 2,025 | 1,737,800 | 1,975 | 1,670,589 |
| July | 2,258 | 2,193,653 | 2,241 | 1,990,587 |
| August | 1,996 | 1,874,804 | 1,896 | 1,961,965 |
| September | 2,025 | 1,894,743 | 1,931 | 1,796,199 |
| October | 1,936 | 1,676,811 | 1,769 | 1,777,999 |
| November | 1,786 | 1,255,417 | 1,583 | 1,160,042 |
| December | 1,899 | 1,591,482 | 1,751 | 1,491,104 |
| January | 869 | 664,575 | 1,002 | 905,096 |
| February | 1,903 | 1,513,966 | 1,989 | 1,680,600 |
| March | 2,115 | 2,037,397 | 2,137 | 2,040,366 |
| 1937–38. | ||||
| April | 2,118 | 1,984,285 | 2,186 | 1,999,757 |
| May | 1,985 | 1,808,727 | 2,153 | 2,035,734 |
| June | 2,159 | 1,799,976 | 2,235 | 1,876,006 |
| July | 2,254 | 1,735,366 | 2,251 | 1,933,584 |
| August | 2,220 | 1,826,129 | 2,119 | 1,847,767 |
| September | 2,057 | 1,972,041 | 1,965 | 1,669,137 |
Classified according to the various rates of interest, and including duplicate registrations (to the extent of £1,124,600 in 1935–36 and £55,450 in 1936–37) the amounts in the mortgage-deeds registered were—
| Rate per Cent. | 1935–36. | 1936–37. |
|---|---|---|
| * Including State Advances and Rural Intermediate Credits. | ||
| £ | £ | |
| 1 | 211 | 490 |
| 2 | 4,540 | 5,650 |
| 2½ | 12,598 | 10,097 |
| 2¾ | 450 | |
| 3 | 69,391 | 96,262 |
| 3½ | 23,492 | 50,793 |
| 3¾ | 150 | |
| 4 | 1,644,037 | 1,191,303 |
| 4 1/12 | 500 | |
| 4⅛ | 997,104 | 3,848,102 |
| 4⅕ | 1,300 | |
| 4¼ | 2,051,993 | 1,809,052 |
| 4⅓ | 100 | 383 |
| 4⅜ | 1,750 | 3,025 |
| 4½ | 3,616,377 | 4,386,346 |
| 4⅗ | 1,000 | |
| 4⅝ | 2,275 | 40,865 |
| 4¾ | 57,310 | 181,173 |
| 5 | 3,039,177 | 3,059,322 |
| 5⅕ | 6,200 | 25,578 |
| 5¼ | 181,823 | 187,533 |
| 5⅖ | 1,850 | |
| 5½ | 820,555 | 586,913 |
| 5¾ | 6,540 | 4,920 |
| 5⅝ | 700 | |
| 5¾ | 4,750 | 3,380 |
| 5⅘ | 1,000 | |
| 6 | 847,767 | 569,592 |
| 6⅛ | 48,920 | |
| 6¼ | 35,895 | 23,609 |
| 8⅖ | 430 | 144 |
| 6½ | 151,356 | 131,473 |
| 6⅔ | 75 | |
| 8¾ | 2,640 | 1,570 |
| 7 | 167,271 | 177,594 |
| 7½ | 16,825 | 18,792 |
| 7¾ | 335 | |
| 8 | 56,498 | 59,416 |
| 8½ | 460 | 520 |
| 9 | 1,618 | 3,215 |
| 9½ | 150 | 2,250 |
| 10 | 20,972 | 10,196 |
| 10½ | 500 | |
| 11 | 230 | |
| 15 | 195 | 1,000 |
| 17½ | 200 | |
| 20 | 35 | |
| Unspecified* | 3,507,193 | 3,210,462 |
| Totals | 17,351,658 | 19,756,100 |
Exclusive of cases where the rate of interest was not specified, 70 per cent. of the money raised by way of mortgage during 1936–37 was at rates below 5 per cent.; 23 per cent. was at the rate of 5 and under 6 per cent.; 5 per cent. was at 0 and under 7 per cent.; and 2 per cent. was at rates of 7 per cent. or over. The average rate of interest on mortgages registered has been as follows:—
| Year ended 31st March, | Average Rate per Cent. |
|---|---|
| 1913 | 5.76 |
| 1914 | 5.82 |
| 1915 | 5.76 |
| 1916 | 5.74 |
| 1917 | 5.80 |
| 1918 | 5.84 |
| 1919 | 5.84 |
| 1920 | 5.75 |
| 1921 | 5.89 |
| 1922 | 6.42 |
| 1923 | 6.57 |
| 1924 | 6.38 |
| 1925 | 6.30 |
| 1926 | 6.22 |
| 1927 | 6.47 |
| 1928 | 6.46 |
| 1929 | 6.46 |
| 1930 | 6.35 |
| 1931 | 6.25 |
| 1932 | 6.28 |
| 1933 | 5.88 |
| 1934 | 5.56 |
| 1935 | 5.06 |
| 1936 | 4.73 |
| 1937 | 4.60 |
The year 1921–22 witnessed a sharp increase from 5.89 per cent. to 6.42 per cent., coinciding with the financial stringency associated with the post-war trade depression. The peak of 6.57 per cent. was reached in the following year, after which there was a gradual downward trend to 1925–26. The rise after 1925–26 is more apparent than real, and is probably due mainly to the fact that commencing with 1926–27 State Advances mortgages are all treated as unspecified (the rate of interest is generally not shown in the mortgage registration), whereas formerly in some districts they were included as unspecified and in others according to the known interest rate.
The downward trend in rates of interest due to various factors, including legislation to that end (see pages 386 and 703), is reflected in the foregoing table. A closer analysis of the position is given below:—
| Year ended 31st March, | Not exceeding 4 per Cent. | Exceeding 4 per Cent. but not exceeding 5 per Cent. | Exceeding 5 per Cent. but not exceeding 6 per Cent. | Exceeding 6 per Cent. |
|---|---|---|---|---|
| Amount. | ||||
| £ | £ | £ | £ | |
| 1931 | 42,871 | 1,274,618 | 10,458,046 | 11,396,829 |
| 1932 | 47,645 | 1,015,838 | 4,808,267 | 4,478,563 |
| 1933 | 135,614 | 1,883,938 | 3,456,637 | 1,848,899 |
| 1934 | 203,070 | 2,458,744 | 2,450,773 | 861,925 |
| 1935 | 995,255 | 5,765,683 | 2,014,969 | 596,914 |
| 1936 | 1,754,869 | 9,766,086 | 1,868,635 | 454,875 |
| 1937 | 1,354,595 | 13,331,068 | 1,380,466 | 479,509 |
| Percentage of Total. | ||||
| Per Cent. | Per Cent. | Per Cent. | Per Cent. | |
| 1931 | 0.2 | 5.5 | 45.1 | 49.2 |
| 1932 | 0.4 | 9.8 | 46.5 | 43.3 |
| 1933 | 1.9 | 25.7 | 47.2 | 25.2 |
| 1934 | 3.4 | 41.2 | 41.0 | 14.4 |
| 1935 | 10.6 | 61.5 | 21.5 | 6.4 |
| 1936 | 12.7 | 70.5 | 13.5 | 3.3 |
| 1937 | 8.2 | 80.6 | 8.3 | 2.9 |
An interest rate of 5 per cent. or less applied to 88.8 per cent. of the specified amount registered in 1936–37, only 5.7 per cent. of the corresponding amount registered in 1930–31 bearing interest at a rate of 5 per cent. or less.
The following estimates of aggregate nominal value of mortgages relate solely to mortgages of real estate. Mortgages on stock or chattel securities are not included in the figures given hereunder.
Statistics of the registrations of mortgages on land and of the discharges of such mortgages date back to 1873. The amount of mortgages now in force, however, cannot be ascertained directly from the registration figures, for the following reasons:—
No, amount is shown as secured in many cases where a mortgage is given in anticipation of advances.
Many privately-arranged advances are not registered.
The figures include collateral and guarantee mortgages not representing money indebtedness.
Duplicate registrations are included.
Many discharges are not registered.
In the case of table mortgages, the whole amount remains on the register till the last instalment is paid.
The factors leading to overstatement of the amount remaining are much more important than these tending to understatement, and the main source of weakness of the figures, for the purpose of ascertaining the amount in force, is undoubtedly the failure to register many discharges.
In connection with the compilation of the now discontinued statistics of land holdings, from the returns furnished annually to the Commissioner of Taxes for the purposes of land-tax assessment, supplementary statistics of mortgages in force on lands subject to land-tax were compiled as at 31st March, 1928, and 31st March, 1929. At the latter date mortgages on the lands coming within the scope of the investigation—i.e., practically all holdings of an unimproved value of £500 and over—aggregated £160,000,000, of which £120,000,000 was secured on country lands and £40,000,000 on town lands or business-sites.
From a consideration of other data, principally the 1926 census statistics of dwellings and the nature of their occupancy, it would appear that the total mortgage indebtedness on land at 31st March, 1929, was in the vicinity of £225,000,000, of which £125,000,000 would be on country lands and £100,000,000 on town lands and business and residential sites.
If the figure of £225,000,000 be accepted as roughly correct for 1929, it affords a basis for estimating the amount of mortgages on land in force in earlier and later years. Up to 1900 registrations of mortgages under the Land Transfer Act had exceeded registrations of discharges by only £35,000,000, while the somewhat scanty figures of mortgages under the Deeds Registration Act showed small annual totals, with discharges practically balancing registrations of mortgages. It appears reasonable, therefore, to reckon the total mortgages on land which were in force at 31st March, 1900, at £35,000,000.
Interpolating between this figure of £35,000,000 in 1900 and that of £225,000,000 in 1929, it is possible to estimate figures for intervening years from a consideration of the annual registrations of mortgages and discharges. Allowance must be made for the widening degree of divergence between the mortgages nominally remaining on the register and the amount really in force, due to a number of factors, including the increased use of the table type of mortgage.
The calculation, on a similar basis, can be extended to cover years subsequent to 1929, though it is necessary to point out that in the figures for recent years in the following statement no attempt has been made to allow for unregistered reductions (temporary or permanent) in principal amounts that may have been made by arrangement between mortgagor and mortgagee. The allocation between country and town lands has been made on the basis of separate registration statistics for these two classes from 1916 onward, and arbitrarily, though with some regard to the figures of Government valuation of land in boroughs and counties, for earlier years.
| As at 31st March, | On Town and Suburban Lands. | On Country Lands. | Total. |
|---|---|---|---|
| £(m.) | £(m.) | £(m.) | |
| 1900 | 15 | 20 | 35 |
| 1901 | 16 | 21 | 37 |
| 1902 | 18 | 22 | 40 |
| 1903 | 18 | 24 | 42 |
| 1904 | 20 | 25 | 45 |
| 1905 | 22 | 26 | 48 |
| 1906 | 24 | 28 | 52 |
| 1907 | 25 | 32 | 57 |
| 1908 | 28 | 34 | 62 |
| 1909 | 30 | 38 | 68 |
| 1910 | 32 | 40 | 72 |
| 1911 | 33 | 42 | 75 |
| 1912 | 35 | 45 | 80 |
| 1913 | 37 | 48 | 85 |
| 1914 | 40 | 50 | 90 |
| 1915 | 42 | 53 | 95 |
| 1916 | 45 | 55 | 100 |
| 1917 | 45 | 60 | 105 |
| 1918 | 45 | 65 | 110 |
| 1919 | 48 | 67 | 115 |
| 1920 | 55 | 80 | 135 |
| 1921 | 60 | 90 | 150 |
| 1922 | 67 | 98 | 165 |
| 1923 | 70 | 105 | 175 |
| 1924 | 75 | 110 | 185 |
| 1925 | 80 | 115 | 195 |
| 1926 | 85 | 120 | 205 |
| 1927 | 90 | 120 | 210 |
| 1928 | 98 | 122 | 220 |
| 1929 | 100 | 125 | 225 |
| 1930 | 105 | 130 | 235 |
| 1931 | 107 | 133 | 240 |
| 1932 | 110 | 135 | 245 |
| 1933 | 110 | 135 | 245 |
| 1934 | 105 | 135 | 240 |
| 1935 | 105 | 135 | 240 |
| 1936 | 105 | 135 | 240 |
| 1937 | 105 | 135 | 240 |
From the nature of the question and the shortcomings of the statistical data, it will be realized that no close degree of accuracy can be claimed for the foregoing figures, and it will be noticed that movements in recent years are shown only in units of £5,000,000. The figures are presented merely with a view to throwing some light on one aspect of an important question of the day.
In the returns of land, which are required by law to be furnished annually to the Commissioner of Taxes by all owners of land of an aggregate unimproved value in excess of £500, provision is made for showing (for mortgage-exemption purposes) particulars of amounts owing by the taxpayer at noon on the 31st March, secured on the land either by registered mortgage or by agreement to purchase. Although this source of information does not cover all mortgages (owing to exemptions and to neglect to furnish returns in certain cases), nevertheless most informative figures on the question of the incidence of mortgages in conjunction with such matters as area, unimproved value, and location (i.e., urban or rural) are disclosed.
Statistics derived from these tax returns were last compiled for the tax-year 1929–30, since when compilation has not been practicable. A brief summary of the statistics appears in the 1935 Year-Book. More detailed figures will be found in the 1932 Year-Book.
Table of Contents
THE law relating to bankruptcy in New Zealand is contained in the main in the Bankruptcy Act, 1908 (which is a consolidation of previous enactments), and the Bankruptcy Amendment Act, 1927. Jurisdiction in bankruptcy matters is vested in the Supreme Court. The Governor-General, however, may by Proclamation confer similar jurisdiction on a Magistrate's Court in cases where the liabilities do not exceed £300.
All proceedings in bankruptcy are commenced by a petition filed in the Court. A petition may be filed either by the debtor or by a creditor, a fee of £6 being payable. The filing of a debtor's petition is equivalent to an order of Court adjudging the debtor a bankrupt, no order being required in this case. Not less than £30 in the aggregate must be owing by the debtor to the creditor or creditors filing a petition.
Immediately on a debtor's petition being filed or adjudication being made on a creditor's petition, the Registrar of the Court gives notice to the Official Assignee in Bankruptcy, in whom all the property of the bankrupt thereupon vests. The bankrupt must hand over his books to the Official Assignee, make out balance-sheets, give inventories of his property and debts, and generally assist in the realization of his property. The Assignee may summon the bankrupt before himself, or before a Magistrate, to be examined on oath. The Bankruptcy Amendment Act, 1927, forbids (save with the consent of the Court, on the application of the Official Assignee) the publication of a report of any examination of a bankrupt before the Assignee or of any matter arising in the course of such an examination.
The Official Assignee is empowered to sell the bankrupt's property, to claim debts due to the bankrupt estate, to carry on the business of the bankrupt so far as is necessary or expedient for its beneficial winding-up, or to divide the property among the creditors. The bankrupt may be appointed by the Official Assignee to manage his estate or carry on his business on behalf of the creditors.
Creditors may accept a composition in satisfaction of the debts due them. In such a case, after approval of the Court, a deed of composition is executed and filed, and the bankruptcy annulled.
On application being made by the bankrupt, the Court is empowered to grant him an order of discharge, either absolute, suspended, or conditional. The application, which must be made within four months after adjudication, may be opposed either by the Official Assignee or by any creditor who has proved his claim. A public examination of the bankrupt may be demanded by the Assignee or a creditor.
Under the Mortgagors and Lessees Rehabilitation Act, 1936, a mortgagee, creditor, or other person on whom notice has been served under the Act may not, while an application for relief is pending or an order for relief is in force, file or proceed with (without leave of Court) a bankruptcy or winding-up petition against the mortgagor or lessee. This provision was also included in the pre-existing Mortgagors and Tenants Relief Act, 1933.
By the Trustee Amendment Act, 1933, protection is afforded to a trustee who pays trust-moneys to a bankrupt in good faith and without knowledge of the bankruptcy.
Section 14 of the Bankruptcy Amendment Act, 1927, requires the annual compilation of a list showing the names, occupations, and other particulars of all persons who have been adjudged bankrupt since 31st March, 1927, and who have not obtained an order of discharge, or whose order of discharge is suspended for a term, or is subject to conditions remaining unfulfilled.
It was originally laid down that the list was to be published in the New Zealand Gazette, but by section 9 of the Statutes Amendment Act, 1936, this requirement has been discontinued, and the Minister of Justice may now from time to time publish the list, or so much of it as relates to adjudications within any specified period ending on the date of the compilation of the list.
The number of transactions in bankruptcy during the last five years is given below. A fifty-year record of certain principal figures will be found in the Statistical Summary, near the end of this volume.
| Year. | Petitions by Debtors. | Adjudications on Petitions by Creditors. | Cases in which Composition accepted. | Orders of Immediate Discharge granted. | Cases in which Orders of Discharge were suspended. |
|---|---|---|---|---|---|
| 1932 | 539 | 122 | 1 | 279 | 60 |
| 1933 | 371 | 79 | 211 | 24 | |
| 1934 | 275 | 51 | 2 | 156 | 21 |
| 1935 | 218 | 39 | 1 | 214 | 25 |
| 1936 | 225 | 35 | 3 | 164 | 17 |
The general bankruptcy statistics do not cover private assignments and compositions, but relate only to cases dealt with by Official Assignees. Certain statistics of private assignments are now available, and details of these appear at the end of this section.
Debtors are required to file a statement of the extent of their liabilities and assets, but there is usually a marked difference between these statements and the amounts actually realized by the Official Assignee or the debts subsequently proved by creditors. During the last decade the amounts actually realized by Official Assignees averaged 40 per cent. of assets according to debtors' statements, and 14 per cent. of debts proved.
It should be understood that in the following table the figures in each column refer to all transactions under the respective heads during the year, the amounts realized by Assignees and paid in dividends and preferential claims relating partly to the current year's bankruptcies (many of which, however, are not disposed of during the year) and partly to previous bankruptcies.
| Year. | Number of Bankruptcies. | Debtors' Statements of Assets, excluding Amounts secured to Creditors. | Amounts realized by Official Assignees. | Amount of Debts proved. | Amounts paid in Dividends and Preferential Claims. |
|---|---|---|---|---|---|
| £ | £ | £ | £ | ||
| 1927 | 867 | 331,363 | 108,850 | 679,473 | 72,388 |
| 1928 | 806 | 236,264 | 116,613 | 767,327 | 68,763 |
| 1929 | 687 | 233,655 | 91,180 | 502,112 | 54,759 |
| 1930 | 780 | 471,502 | 83,308 | 827,345 | 68,611 |
| 1931 | 848 | 401,649 | 108,809 | 1,042,187 | 63,185 |
| 1932 | 661 | 252,348 | 75,657 | 624,892 | 55,940 |
| 1933 | 450 | 114,817 | 61,723 | 489,895 | 47,884 |
| 1934 | 326 | 72,572 | 44,533 | 258,920 | 33,738 |
| 1935 | 257 | 68,216 | 41,037 | 225,508 | 23,142 |
| 1936 | 260 | 40,557 | 32,983 | 169,866 | 21,520 |
A similar classification by districts for the year 1936 is given below:—
| District or Sub-district. | Number of Bankruptcies. | Debtors' Statements of Assets, excluding Amounts secured to Creditors. | Amounts realized by Official Assignees. | Amount of Debts proved. | Amounts paid in Dividends and Preferential Claims. |
|---|---|---|---|---|---|
| £ | £ | £ | £ | ||
| Whangarei | 11 | 231 | 542 | 3,290 | 895 |
| Auckland | 35 | 3,497 | 6,546 | 31,022 | 3,449 |
| Hamilton | 22 | 7,879 | 3,183 | 11,745 | 1,703 |
| Gisborne | 10 | 2,225 | 711 | 30,028 | 552 |
| Wairoa | 4 | 304 | 700 | 521 | |
| Napier | 31 | 2,230 | 957 | 32,651 | 503 |
| Dannevirke | 3 | 254 | 974 | 1,183 | 780 |
| New Plymouth | 8 | 1,003 | 309 | 1,662 | 322 |
| Hawera | 11 | 16 | 98 | 751 | 263 |
| Wanganui | 7 | 208 | 614 | 1,537 | 343 |
| Taihape | 2 | 209 | 1,264 | 417 | 1,129 |
| Palmerston North | 16 | 7,988 | 700 | 3,827 | 586 |
| Pahiatua | 5 | 884 | 178 | 863 | 148 |
| Masterton | 9 | 3,040 | 2,766 | 6,871 | 2,208 |
| Wellington | 25 | 2,415 | 3,323 | 8,061 | 1,367 |
| Blenheim | 3 | 302 | 1,781 | 1,975 | 1,895 |
| Nelson | 9 | 2,915 | 827 | 6,375 | 463 |
| Westport | 3 | 35 | 35 | 153 | 131 |
| Reefton | 1 | 4 | 2 | 976 | |
| Greymouth | 3 | 672 | 167 | 2,466 | 94 |
| Hokitika | 1 | 20 | 152 | ||
| Christchurch | 15 | 1,864 | 3,980 | 9,207 | 1,417 |
| Timaru | 5 | 103 | 388 | 839 | 453 |
| Oamaru | 1 | 1 | 24 | ||
| Dunedin | 14 | 600 | 1,402 | 6,412 | 1,260 |
| Invercargill | 6 | 1,659 | 1,535 | 7,379 | 1,038 |
| Totals | 260 | 40,557 | 32,983 | 169,866 | 21,520 |
The table following shows for each of the last ten years the average amount of debts proved per estate, and also the average dividend paid.
| Year. | Average Debts proved per Estate. | Proportion of Dividends to Debts. |
|---|---|---|
| £ | Per Cent. | |
| 1927 | 784 | 10.65 |
| 1928 | 952 | 8.96 |
| 1929 | 731 | 10.91 |
| 1930 | 1,061 | 8.29 |
| 1931 | 1,229 | 6.06 |
| 1932 | 945 | 8.95 |
| 1933 | 1,089 | 9.77 |
| 1934 | 794 | 13.05 |
| 1935 | 878 | 10.26 |
| 1936 | 653 | 12.67 |
The total payments in 1936 made from assets realized were—
| £ | |
|---|---|
| Dividends to creditors (excluding preferential and secured claims) | 19,332 |
| Preferential claims (rents, wages, &c.) | 2,188 |
| Secured claims | 1,902 |
| Government commission | 3,526 |
| Costs of actions, solicitors' and supervisors' fees | 2,146 |
| Expenses incurred in carrying on estates | 1,811 |
| Other charges | 2,159 |
| Total | £33,064 |
Balances in bank to the credit of estates aggregated £17,360 on 31st December, 1936, a decrease of £79 during the year.
The following table shows for each of the last five years the number of bankruptcies with various amounts of liabilities:—
| Liabilities. | 1932. | 1933. | 1934. | 1935. | 1936. |
|---|---|---|---|---|---|
| Under £50 | 36 | 16 | 16 | 16 | 14 |
| £50 and under £100 | 43 | 35 | 31 | 19 | 50 |
| £100 and under £250 | 147 | 100 | 77 | 67 | 81 |
| £250 and under £500 | 166 | 95 | 72 | 60 | 44 |
| £500 and under £1,000 | 136 | 98 | 67 | 50 | 37 |
| £1,000 and under £2,000 | 69 | 53 | 29 | 22 | 18 |
| £2,000 and under £5,000 | 45 | 35 | 23 | 20 | 13 |
| £5,000 and over | 19 | 18 | 11 | 3 | 3 |
| Totals | 661 | 450 | 326 | 257 | 260 |
Liabilities in the bulk of failures do not exceed £1,000, the number under this amount in 1936 being 226, representing 87 per cent. of the total.
The following table shows in summarized form the occupations of those adjudged bankrupt in the last five years:—
| 1932. | 1933. | 1934. | 1935. | 1936. | |
|---|---|---|---|---|---|
| * Excluding partnerships (two for 1934, four for 1935, and one for 1930), the occupations of the partners only being shown. | |||||
| Fishing and trapping | 3 | 4 | 2 | 2 | |
| Agricultural and pastoral | 128 | 99 | 53 | 45 | 42 |
| Forestry | 5 | 5 | 4 | 5 | 4 |
| Mining and quarrying | 4 | 3 | 1 | 1 | 2 |
| Processes relating to minerals | 5 | 2 | |||
| Processes relating to chemicals, animal and vegetable products | 2 | 6 | 1 | 1 | |
| Processes relating to metals, tools, jewellery, &c. | 15 | 8 | 6 | 7 | 8 |
| Makers of ships, boats, conveyances, &c. | 14 | 8 | 6 | 7 | 5 |
| Processes relating to fibrous materials, textiles, and dress | 9 | 9 | 5 | 3 | 6 |
| Processes relating to food, drink, and tobacco | 25 | 9 | 16 | 3 | 11 |
| Processes relating to wood, &c., n.e.i. | 13 | 1 | 6 | 6 | 3 |
| Processes relating to paper, stationery, printing, photography | 1 | 3 | 1 | 1 | |
| Construction or repair of buildings, roads, railways, canals | 81 | 36 | 36 | 29 | 41 |
| Transport and communication | 49 | 30 | 28 | 21 | 18 |
| Commerce and finance | 156 | 95 | 79 | 68 | 48 |
| Public administration, clerical, and professional | 20 | 16 | 19 | 13 | 15 |
| Entertainment, sport, and recreation | 8 | 3 | 5 | 2 | 4 |
| Personal or domestic service | 51 | 32 | 21 | 10 | 8 |
| Dependent on public or private support | 20 | 18 | 7 | 9 | 4 |
| Indefinite occupations | 57 | 60 | 30 | 21 | 35 |
| Totals | 661 | 450 | 324* | 253* | 259* |
Of the 1936 total, 79 were employers of labour, 71 were working on their own account but not employing labour, and 109 were working for wages. There were 31 labourers, 18 builders, and 14 farmers.
Official bankruptcies, as explained earlier, do not comprise all financial failures. In order to present a more complete picture of this phase of economic life, the bankruptcy statistics have been supplemented since 1928 by the collection of data relating to private assignments. The statistics cover all operations arising out of deeds of assignment made under section 167 (2) of the Stamp Duties Act, 1923.
If private assignments be added to bankruptcies, the total number of failures in 1936 was 353, made up of 260 bankruptcies and 93 assignments. The corresponding total for 1935 was 363.
The number of bankruptcies in 1936 was the lowest since 1920, and the number of assignments the lowest since statistics of assignments were instituted (1928).
The table following shows private assignment's during 1936. The column for assets realized covers only the proceeds of realization in respect of 1936 assignments fully realized.
| District or Sub-district. | Number. | Assets. | Liabilities. | Assets realized (Completed Estates). | |||
|---|---|---|---|---|---|---|---|
| Completed Estates. | Incomplete Estates. | Completed Estates. | Incomplete Estates. | Completed Estates. | Incomplete Estates. | ||
| * Includes one estate for which no return received. | |||||||
| £ | £ | £ | £ | £ | |||
| Whangarei | 3 | 3 | 4,131 | 826 | 3,971 | 1,764 | 1,045 |
| Auckland | 3 | 14* | 2,741 | 17,189 | 2,723 | 23,075 | 775 |
| Hamilton | 4 | 2 | 2,905 | 4,905 | 5,266 | 3,949 | 1,889 |
| Napier | 1 | 226 | 668 | 158 | |||
| New Plymouth | 1 | 1 | 700 | 1,046 | 965 | 1,509 | 550 |
| Hawera | 1 | 260 | 146 | ||||
| Wanganui | 2 | 507 | 914 | 346 | |||
| Taihape | 1 | 1,090 | 1,538 | 797 | |||
| Palmerston North | 4 | 2 | 1,279 | 1,774 | 1,763 | 2,448 | 825 |
| Pahiatua | 1 | 3,700 | 7,292 | ||||
| Masterton | 2 | 993 | 2,270 | 859 | |||
| Wellington | 4 | 4 | 7,828 | 3,138 | 6,556 | 3,364 | 4,329 |
| Blenheim | 2 | 1 | 300 | 800 | 770 | 2,500 | 250 |
| Nelson | 2 | 199 | 496 | 173 | |||
| Greymouth | 1 | 4,670 | 3,900 | ||||
| Westport | 1 | 1 | 431 | 704 | 651 | 286 | 431 |
| Christchurch | 6 | 10* | 2,179 | 8,515 | 2,793 | 9,549 | 1,409 |
| Ashburton | 1 | 68 | 264 | 60 | |||
| Timaru | 2 | 83 | 370 | 69 | |||
| Dunedin | 8 | 1 | 2,089 | 1,215 | 5,073 | 1,138 | 1,513 |
| Invercargill | 4 | 5,501 | 3,826 | 2,821 | |||
| Totals | 51 | 42 | 33,250 | 48,742 | 40,877 | 60,920 | 18,299 |
Assets of the ninety-one estates for which returns were received were valued at £81,992, and the liabilities were estimated at £101,797. Assets realized in completed estates represented 45 per cent. of liabilities.
The following table classifies estates assigned during the last five years according to the amount of liabilities:—
| Liabilities. | 1932. | 1933. | 1934. | 1935. | 1936. |
|---|---|---|---|---|---|
| Under £100 | 1 | 1 | 1 | ||
| £100 and under £250 | 11 | 11 | 6 | 6 | 10 |
| £250 and under £500 | 39 | 27 | 18 | 25 | 25 |
| £500 and under £1,000 | 53 | 38 | 18 | 22 | 23 |
| £1,000 and under £2,000 | 49 | 38 | 29 | 24 | 20 |
| £2,000 and under £5,000 | 47 | 30 | 9 | 10 | 10 |
| £5,000 and over | 17 | 6 | 9 | 5 | 2 |
| Unspecified | 19 | 15 | 10 | 14 | 2 |
| Totals | 236 | 166 | 99 | 106 | 93 |
Sixty-four per cent. of the specified estates in 1936 show liabilities below £1,000. In the case of official bankruptcies the corresponding figure was 87 per cent.
The occupations of assignors in broad classes during the last five years were as follows:—
| 1932. | 1933. | 1934. | 1935. | 1936. | |
|---|---|---|---|---|---|
| Agricultural and pastoral | 10 | 16 | 3 | 4 | 6 |
| Forestry | 2 | 1 | 1 | ||
| Processes relating to chemicals, animal and vegetable products | 3 | 3 | |||
| Processes relating to metals, tools, jewellery, &c. | 2 | 4 | 3 | 1 | 2 |
| Makers of ships, boats, conveyances, &c. | 5 | 1 | 1 | ||
| Processes relating to fibrous materials, textiles, and dress | 21 | 8 | 2 | 5 | 4 |
| Processes relating to food, drink, and tobacco | 6 | 3 | 3 | 4 | 9 |
| Processes relating to wood, &c., n.e.i. | 10 | 1 | 3 | 1 | 1 |
| Processes relating to paper, stationery, printing, photography | 2 | 1 | 1 | ||
| Construction or repair of buildings, roads, rail ways, canals | 23 | 14 | 9 | 13 | 13 |
| Transport and communication | 10 | 10 | 6 | 3 | 2 |
| Commerce and finance | 131 | 90 | 57 | 62 | 44 |
| Public administration, clerical, and professional | 4 | 6 | 3 | 4 | 6 |
| Entertainment, sport, and recreation | 1 | ||||
| Personal or domestic service | 6 | 6 | 6 | 3 | 2 |
| Dependent on public or private support | 2 | 1 | |||
| Indefinite occupations | 1 | 1 | 3 | 3 | 2 |
| Totals | 236 | 166 | 99 | 106 | 93 |
No fewer than 58 of the assignors in 1936 were employers of labour, 32 were working on their own account, and 3 only were working for wages.
Particular occupations most affected in 1936 were: Drapers (11), storekeepers (9), grocers (9), builders (9), and bakers (6).
Table of Contents
INCLUDED in the Financial Statement of the 28th September, 1937, is a State balance-sheet which is compiled by the Treasury from details recorded in departmental balance-sheets, and from which the following statement of assets and liabilities as at the 31st March, 1936, has been extracted:—
| Assets. | |
|---|---|
| * Total shown for public debt differs from figure shown in Section XXIVc by £2,900,000, representing hypothecation of securities of the Discharged Soldiers Settlement Account. Of the amount shown as public debt, £1,801,418 is held by investments within the Public Account. Interest in respect of this sum is also shown in both assets and liabilities. | |
| £ | |
| Land and buildings, including Crown, settlement, and endowment land, departmental land and buildings | 40,660,489 |
| State forests, nurseries, and plantations | 38,976,424 |
| Railways, including permanent-way and works, rolling-stock, and unopened lines | 59,483,495 |
| Telegraphs, telephones, and wireless systems | 11,198,102 |
| Electrical schemes | 13,249,117 |
| Drainage and irrigation schemes | 4,389,963 |
| Collieries, sawmills, quarries, &c. | 408,864 |
| Armament and military stores, aviation equipment | 2,771,459 |
| Oyster-beds, fish-hatcheries, equipment, &c. | 122,709 |
| Wharves, bridges, harbour - works, lighthouses, &c. | 718,825 |
| Plant, material, and furniture | 2,964,903 |
| Libraries, books, museum exhibits, stationery, stamps, &c. | 222,446 |
| Live and dead stock, farm crops, &c. | 406,449 |
| Government steamers, launches, motor-cars, &c. | 462,156 |
| Advances on loan or mortgage | 15,649,595 |
| Debtors— | |
| Sundry | 2,472,602 |
| Unpaid purchase-price of land and buildings and interest thereon | 2,080,200 |
| Postponed rents, &c. | 316,975 |
| Interest and rent, due and unpaid, and due and accrued* | 1,424,126 |
| Special investments— | |
| Nauru phosphate rights | 565,040 |
| Bank of New Zealand shares | 2,109,375 |
| Reserve Bank of New Zealand | 1,000,000 |
| Public Trust Office (Public Debt Redemption Fund, &c.) | 7,966,689 |
| Crown interest in State Advances Corporation | 41,617,965 |
| Special assets of various accounts— | |
| Native land schemes, &c. | 1,020,105 |
| Unallocated loan charges | 655,788 |
| Payments in advance | 297,197 |
| Properties acquired by Crown and properties in course of realization | 1,045,612 |
| Investments— | |
| Reserve Fund | 324,654 |
| Sinking funds | 1,121,197 |
| Miscellaneous, including investment of Treasury accounts | 6,521,474 |
| National Development Account— | |
| Expenditure on— | |
| Main highways, roads, &c. | 30,861,589 |
| Development of mining | 867,468 |
| Education | 8,467,611 |
| Immigration | 3,318,944 |
| Harbour-works | 1,045,669 |
| Land-development | 840,061 |
| Cost of raising loans | 295,979 |
| Other loan expenditure— | |
| War expenditure | 67,863,693 |
| Naval defence | 1,389,656 |
| Local bodies | 3,037,230 |
| Maori-land settlement | 247,145 |
| Miscellaneous | 4,599,386 |
| Cash— | |
| Public Account | 3,812,109 |
| Receiver-General | 133,443 |
| State Advances Office Account | 736,010 |
| Post Office or Post Office Savings-bank | 682,468 |
| Deposit accounts | 66,758 |
| In hand and in transit | 34,609 |
| Deposit with Bank of International Settlements | 36,023 |
| Public Trust Office | 185,820 |
| Miscellaneous assets | 4,556 |
| £390,750,222 | |
| Liabilities. | |
| Capital— | £ |
| Public debt* | 285,461,098 |
| Rural Advances bonds | 4,213,050 |
| Employment Promotion Fund | 455,100 |
| Public Debt Redemption Fund | 17,225,645 |
| Creditors— | |
| Sundry | 2,730,393 |
| Interest on debentures and stock due and unpaid* | 19,911 |
| Interest on public debt accrued but not due* | 2,280,729 |
| Wages and other payments accrued | 55,478 |
| Payments in advance, &c. | 443,165 |
| Reserves— | |
| General | 4,102,076 |
| Sinking fund and reserves for loan redemption | 3,291,129 |
| Depreciation | 6,723,958 |
| Fire, accident, and marine insurance, bad debts, &c. | 1,014,496 |
| Amount held on deposit | 594,208 |
| Suspense | 209,235 |
| Post Office investment and war-loan certificates | 897,590 |
| Miscellaneous liabilities | 74,743 |
| £329,792,004 | |
| Excess of assets over liabilities | £60,958,218 |
For contingent liabilities in addition to the above, reference should be made to Section XXIVc.
In connection with the balance-sheet, it is to be remembered that many of the assets and liabilities of a State cannot be expressed financially in the manner in which the goodwill of a business concern is assessed, and a State balance-sheet, or even in many cases a departmental balance-sheet, on strictly commercial lines is a practical impossibility.
It is necessary to note that, in order that the public debt may be fully accounted for, nominal assets have been inserted by the Treasury for outstanding loan expenditure on war and other purposes in respect of which no material asset now exists. These are grouped under the heading of “Other loan expenditure.” Again, the National Development Account appearing in the assets statement represents the total expenditure of loan-money on the items enumerated therein, and these are not wholly represented by tangible assets. Even in those cases where items are represented in whole or in part by tangible assets the valuation is more or less arbitrary, and it is doubtful whether such valuations could be sustained at the present day. For instance, the item “Main highways, roads, &c.,” represents the total expenditure on roads, and includes in many cases improvements, &c., of the same road on more than one occasion. The same remark applies to the asset “Harbour-works.” Similar considerations apply to other assets shown, such as land and buildings, State forests, railways, &c., the values of which have probably depreciated owing to the economic conditions ruling. In an occasional instance—e.g., Bank of New Zealand shares—the market-value represents an appreciation on the figure shown.
Partly for the reasons just indicated, and partly because certain State expenditure is already reflected in the value of property (public or private), it is necessary to make certain deductions from the “assets” total in order to obtain a figure to be used as a component unit of an estimate of the value of property or wealth in New Zealand. The following items have been omitted: Drainage and irrigation schemes; main highways, roads, &c.; development of mining; immigration; harbour-works; land-development; cost of raising loans; and “other loan expenditure.” Amounts due to “creditors,” as shown under liabilities, have also been regarded as a deduction from cash assets. From the residue after these omissions and deductions a further arbitrary deduction of 5 per cent. has been made by way of allowance for depreciation. The result is a figure of £254,000,000, which may be accepted as a rough approximation of the value of State property at the 31st March, 1936.
The form of return in use for the collection of statistics of local governing authorities provides for particulars of cash assets and an estimate of other assets being supplied. The figures in respect of the latter are far from complete, no assets apart from cash assets being included by some local authorities, while in other cases no value is assigned to reserves. Nevertheless the following total as at 31st March, 1936, may be taken as an approximate though somewhat conservative estimate of the position:—
| £ | |
|---|---|
| Cash assets | 12,144,804 |
| Other assets (estimated) | 67,168,849 |
| Total | £79,313,653 |
The distribution of assets among the various classes of local authorities will be found in Section XXVI.
It may be stated that, although much of the expenditure of counties, boroughs, town districts, and road districts has been in respect of the construction of streets, roads, and bridges, these items are not included as assets of the respective bodies.
The foregoing figures are exclusive of sinking funds, which at 31st March, 1936, amounted to £10,013,643. The inclusion of sinking funds, as in the following table, which shows the nature of the assets, brings the total assets of these classes of local authorities to £89,327,296.
| £ | |
|---|---|
| Cash assets | 12,144,804 |
| Sinking funds | 10,013,643 |
| Halls, libraries, offices, sundry premises, furniture, &c. | 3,690,543 |
| Electrical-works | 17,854,097 |
| Gasworks | 1,435,842 |
| Tramway-works | 5,626,562 |
| Railway-works | 146,440 |
| Wharves, quays, slips, docks, dredges, boats, tugs, sheds, &c. | 9,803,217 |
| Drainage, sewerage, and water-supply systems | 11,907,617 |
| Reserves, parks, gardens, recreation-grounds, cemeteries, &c. | 3,826,664 |
| Endowments | 3,582,775 |
| Reclaimed land | 4,104,188 |
| Workers' dwellings, roadmen's cottages, &c. | 481,447 |
| Sundry plant, tools, stocks, and materials | 2,363,690 |
| Other and unspecified | 2,345,767 |
| Total | £89,327,296 |
Hospital Boards, which are not included in the foregoing figures, had assets (excluding outstanding fees and subsidies) of a little under £5,000,000 at 31st March, 1936, bringing the total for all local authorities to £94,000,000.
In arriving at the aggregate public wealth of the Dominion, as distinct from private wealth, it is necessary to take into account the fact that of the total indebtedness of local bodies at the 31st March, 1936, £6,000,000 was owing to the General Government. The approximate public wealth of the Dominion based on the foregoing statements of assets would thus be £254,000,000, plus £94,000,000, minus £6,000,000, making a net total of £342,000,000.
Estimates of the private wealth of the Dominion are arrived at on the assumption that the wealth per head of the living is approximately equal to that left by the average person dying. The fact that the younger and more numerous members of the population do not possess as much accumulated wealth as the older members, taken in conjunction with the fact that the death-rate varies with age, renders it necessary for this purpose to divide the population into age-groups. The average wealth of persons dying within any one age-group being known, the average wealth of living persons belonging to that age-group is assumed to be identical, and an estimate of the total private wealth of the Dominion is arrived at by weighting the average wealth of persons in each quinquennial age-group by the number of persons in that group.
The average wealth of deceased persons is obtained by a consideration of the estates certified for stamp duty. The number of estates dealt with in any period, however, is usually equal to about one-third only of the total deaths registered during that period; and as most persons leave some estate, however small, it is necessary to make some allowance for estates which have not passed through the Stamp Duties Office. It should be noted in this connection that estates under £1,000 escape estate duty, and if under £500, succession duty, though many estates of a lower value than the figures indicated are passed for probate or letters of administration. An arbitrary allowance is made for unrecorded estates of persons aged fifteen years or over. No allowance at all is made for estates of persons under fifteen.
To obviate fictitious results due to the infrequency of very large estates in the returns, combined with the lapse of time between death and the certification of the estate, it is necessary to base the estimate on the experience of a series of years. On the other hand, movements in values render it undesirable to take a very long period, and the New Zealand estimate is usually based on the average of the last five years available. In a time of rapidly moving values, even a five-year uncorrected average will give incorrect results. The present figures have accordingly been based upon a triennial average.
Based, then on the estate and death figures for the triennium 1934–36, the aggregate private wealth estimate for the Dominion at the end of 1936 is £693,000,000, of which £476,000,000 represents the wealth of men and £217,000,000 that of women. The total is equal to £462 per head of all population, excluding Maoris, and £698 per head of population aged twenty and over.
It is obvious that estimates of private wealth based on the probate system are approximate only, owing to the various factors involved. For example, part of the wealth of deceased estates consists of insurance policies. In the probate returns the maturity value of the policy is taken, whereas among the living the average surrender value of policies in force is much below the maturity value. Against this, however, is the fact that pensions and annuities enjoyed by the living do not enter into deceased estates, while there is also a pronounced tendency towards conservatism in the valuation of personal property for death duty purposes. Further, a not inconsiderable amount of property is disposed of before death by way of gift and does not appear in the probate returns.
It should be explained that the computation of private wealth relates to the population exclusive of Maoris. The inclusion of Maoris would not affect the per caput rate to any extent, but would involve an addition to the total. An addition for Maoris of 4 per cent. to the aggregate figure previously given for 1936 would bring the estimated private wealth of the Dominion to £721,000,000.
A table is now given showing the number of estates finally passed during 1935 and 1936, classified according to amount. Estates of Maoris are here included.
| Amount. | Number of Estates. | Aggregate Net Value of Estates. | ||
|---|---|---|---|---|
| 1935. | 1936. | 1935. | 1936. | |
| £ £ | £ | £ | ||
| Under 500 | 1,975 | 2,403 | 408,386 | 506,582 |
| 500 and under 1,000 | 986 | 1,232 | 719,062 | 904,320 |
| 1,000 and under 2,000 | 865 | 1,035 | 1,248,077 | 1,487,262 |
| 2,000 and under 3,000 | 400 | 518 | 992,820 | 1,284,147 |
| 3,000 and under 4,000 | 222 | 306 | 766,819 | 1,062,167 |
| 4,000 and under 5,000 | 145 | 165 | 649,011 | 741,708 |
| 5,000 and under 7,500 | 226 | 256 | 1,377,017 | 1,577,705 |
| 7,500 and under 10,000 | 112 | 167 | 959,955 | 1,455,613 |
| 10,000 and under 15,000 | 116 | 130 | 1,447,767 | 1,605,281 |
| 15,000 and under 20,000 | 47 | 63 | 809,475 | 1,087,154 |
| 20,000 and over | 129 | 130 | 6,933,043 | 5,517,247 |
| Totals | 5,223 | 6,405 | 16,311,432 | 17,229,186 |
The table below shows for the period 1932 to 1936 the total number of estates, classified according to age of deceased and amount of estate.
| Age. | Under £500. | £500 to £999. | £1,000 to £1,999. | £2,000 to £2,999. | £3,000 to £3,999. | £,4,000 to £4,999. | £5,000 to £7,499. | £7,500 to £9,999. | £10,000 to £14,999. | £15,000 to £19,999. | £20,000 and over. | Totals. |
|---|---|---|---|---|---|---|---|---|---|---|---|---|
| Under 5 | 3 | 1 | 2 | 6 | ||||||||
| 5 and under 10 | 3 | 2 | 5 | |||||||||
| 10 and under 15 | 8 | 2 | 10 | |||||||||
| 15 and under 20 | 51 | 3 | 4 | 1 | 1 | 60 | ||||||
| 20 and under 25 | 158 | 39 | 12 | 6 | 2 | 1 | 1 | 219 | ||||
| 25 and under 30 | 183 | 62 | 31 | 6 | 4 | 3 | 2 | 3 | 1 | 3 | 298 | |
| 30 and under 35 | 209 | 79 | 51 | 9 | 7 | 5 | 1 | 1 | 1 | 2 | 1 | 366 |
| 35 and under 40 | 244 | 108 | 79 | 21 | 12 | 8 | 8 | 4 | 1 | 2 | 4 | 491 |
| 40 and under 45 | 329 | 150 | 119 | 43 | 18 | 13 | 14 | 8 | 3 | 3 | 1 | 701 |
| 45 and under 50 | 499 | 262 | 227 | 91 | 40 | 21 | 28 | 15 | 9 | 4 | 7 | 1,203 |
| 50 and under 55 | 646 | 378 | 287 | 124 | 72 | 42 | 47 | 31 | 23 | 8 | 10 | 1,668 |
| 55 and under 60 | 782 | 463 | 409 | 163 | 103 | 64 | 70 | 54 | 40 | 14 | 29 | 2,191 |
| 60 and under 65 | 864 | 562 | 509 | 258 | 120 | 89 | 125 | 56 | 58 | 20 | 56 | 2,717 |
| 65 and under 70 | 947 | 657 | 544 | 307 | 163 | 129 | 156 | 89 | 75 | 40 | 70 | 3,177 |
| 70 and under 75 | 1,005 | 700 | 599 | 322 | 197 | 125 | 171 | 108 | 95 | 41 | 88 | 3,451 |
| 75 and under 80 | 999 | 673 | 601 | 313 | 183 | 108 | 190 | 134 | 91 | 44 | 114 | 3,450 |
| 80 and under 85 | 749 | 511 | 416 | 240 | 166 | 99 | 153 | 75 | 75 | 45 | 80 | 2,609 |
| 85 and under 90 | 408 | 285 | 260 | 120 | 73 | 48 | 74 | 44 | 42 | 26 | 53 | 1,433 |
| 90 and under 95 | 158 | 76 | 102 | 53 | 28 | 25 | 28 | 24 | 16 | 9 | 27 | 546 |
| 95 and over | 38 | 18 | 26 | 10 | 9 | 1 | 7 | 2 | 8 | 2 | 5 | 126 |
| Unspecified | 292 | 143 | 107 | 47 | 27 | 19 | 27 | 14 | 17 | 6 | 22 | 721 |
| Totals | 8,575 | 5,174 | 4,385 | 2,133 | 1,225 | 796 | 1,102 | 663 | 558 | 267 | 570 | 25,448 |
| Per cent. | 33.7 | 20.3 | 17.2 | 8.4 | 4.8 | 3.1 | 4.3 | 2.6 | 2.2 | 1.1 | 2.3 | 100.0 |
The public wealth of the Dominion has been estimated (supra) at approximately £342,000,000, and the private wealth, including that of Maoris, at approximately £720,000,000. In the probate figures used as the basis of computation of private wealth, deductions are made on account of debts, mortgages, and other charges against property. As, however, these in general will rank as assets when estates to which the charges are owing are in their turn passed for probate, the general effect is negligible, except in so far as such items as State advances and debts owing overseas are concerned. The State advances outstanding are included in the public-wealth figure.
In the case of the public wealth the figure given practically represents gross assets, no deduction having, of course, been made on account of indebtedness of the General Government and of local governing bodies. Were the whole of this indebtedness owing outside the Dominion, no deduction on this account would be necessary for the purpose of the present computation, which is merely to ascertain an approximation of the wealth of the Dominion, without taking account of the fact that there are external charges against that wealth. In arriving at the sum of public and private wealth, however, it is necessary to make allowance for the indebtedness of the General Government and of local governing bodies within the Dominion, this being included in the private-wealth estimate.
Of the gross public debt at the 31st March, 1936, £122,000,000 was domiciled in New Zealand, and of the gross debt of local governing bodies (other than Hospital Boards), at the same date, £46,000,000 was domiciled in the Dominion, exclusive of the £6,000,000 borrowed from the General Government, allowance for which has already been made in the estimation of the approximate public wealth. The Hospital Boards' debt of £1,126,000 (less £104,000 accrued sinking funds) may be assumed to be mainly domiciled in New Zealand. The debt of the General Government and all local bodies domiciled in New Zealand thus aggregates £169,000,000, which requires to be deducted from the aggregate of public and private wealth in order to arrive at an estimate of the national wealth. The figures, in round numbers, are: —
| £ | |
|---|---|
| Approximate public wealth | 340,000,000 |
| Estimated private wealth | 720,000,000 |
| Total | 1,060,000,000 |
| Less public and local-authority debt domiciled in Dominion | 170,000,000 |
| Estimated national wealth, 1936 | £890,000,000 |
It appears scarcely necessary to recapitulate reasons why the estimate given can be regarded at best as a rough approximation only. No practicable system has yet been devised that will permit of a reliably close estimation of national wealth being arrived at, and the difficulties in this respect are enormously increased during a period of changing values.
The bulk of the wealth of the Dominion is represented by land and improvements thereon, particulars of the valuation of which are given in Section XXVII of this book. Further information concerning the value of land, with particular reference to its utilization and its relative distribution among the population, is obtainable from the annual returns of land which are furnished to the Commissioner of Taxes for the purpose of land-tax assessment. Statistics compiled from these returns are available for the five years 1924–25, 1925–26, 1926–27, 1928–29, and 1929–30, and afford valuable information not only as to the distribution of land on a value basis, but also as to the incidence of land taxation. For a detailed discussion of the statistics compiled from the land-tax returns reference should be made to the 1932 Year-Book; it is possible to repeat here only three concise tables.
It should be explained that in the statistical tabulation it was not found possible to cover each year the whole of the returns for that year, returns under query or not to hand at the time of tabulation being of necessity omitted. Apart from the fact that the actual totals would be somewhat in excess of those shown, the omission of a small percentage does not impair the statistical value of the tables or invalidate conclusions drawn from the figures.
The following table summarizes the principal heads of information from the 1929–30 tabulation. In connection with the division into country, town, and mixed lands, it should be noted that the last-mentioned includes only those cases where less than 75 per cent. (on an unimproved-value basis) is urban or rural respectively. In cases where 75 per cent. or over is urban or rural, as the case may be, the whole has been so classed.
| — | Country or Farming Lands. | Town Lands or Business Sites. | Partly Country and partly Town Lands. | Total. |
|---|---|---|---|---|
| Number of returns | 47,932 | 27,927 | 1,118 | 76,977 |
| Number of taxpayers | 30,448 | 20,108 | 835 | 51,391 |
| Area Acres | 26,058,681 | 342,942 | 466,021 | 26,867,644 |
| Unimproved value of land £ | 166,895,255 | 67,192,768 | 4,968,450 | 239,056,473 |
| Total mortgages £ | 116,841,603 | 38,117,545 | 2,457,145 | 157,416,293 |
| Exemptions— | ||||
| Ordinary £ | 6,303,969 | 6,949,499 | 178,684 | 13,432,152 |
| Mortgage £ | 62,770,792 | 15,918,767 | 1,057,681 | 79,747,240 |
| Hardship £ | 151,417 | 111,638 | 6,237 | 269,292 |
| Total exemptions £ | 69,226,178 | 22,979,904 | 1,242,602 | 93,448,684 |
| Taxable balance £ | 97,669,077 | 44,212,864 | 3,725,848 | 145,607,789 |
| Tax assessed £ | 700,804 | 440,821 | 37,340 | 1,178,965 |
The following table shows the distribution of holdings according to unimproved value for 1928–29 and 1929–30. The insignificant totals for holdings under £500 are due to the fact that, with few exceptions, such are entirely exempt from land-tax. It should be understood that the classification by amount is on the basis of the unimproved value of the land, and not, in the case of taxpayers, on the basis of taxable balance.
| Amount. | Number of Returns. | Number of Taxpayers. | Total Unimproved Value. | |||
|---|---|---|---|---|---|---|
| 1928–29. | 1929–30. | 1928–29. | 1929–30. | 1928–29. | 1929–30. | |
| £ £ | £ | £ | ||||
| Under 500 | 780 | 1,172 | 32 | 378 | 175,306 | 294,772 |
| 500–999 | 23,732 | 26,106 | 15,067 | 17,379 | 17,016,708 | 18,869,506 |
| 1,000–2,499 | 25,669 | 27,204 | 15,548 | 17,042 | 39,756,319 | 42,324,231 |
| 2,500–4,999 | 11,945 | 11,821 | 7,481 | 7,414 | 41,727,353 | 42,548,770 |
| 5,000–7,499 | 6,376 | 4,447 | 4,329 | 3,039 | 44,045,310 | 27,059,748 |
| 7,500–9,999 | 2,144 | 2,056 | 18,455,089 | |||
| 10,000–14,999 | 1,827 | 1,904 | 1,818 | 1,904 | 22,060,934 | 23,071,659 |
| 15,000–19,999 | 788 | 813 | 787 | 813 | 13,552,304 | 13,946,956 |
| 20,000–29,999 | 661 | 714 | 659 | 714 | 16,007,533 | 17,244,468 |
| 30,000–39,999 | 263 | 277 | 263 | 277 | 8,992,104 | 9,482,113 |
| 40,000–49,999 | 111 | 139 | 111 | 139 | 4,890,100 | 6,109,294 |
| 50,000–99,999 | 156 | 195 | 156 | 195 | 10,250,623 | 12,936,622 |
| 100,000 and over | 25 | 41 | 25 | 41 | 3,799,606 | 6,713,245 |
| Totals | 72,333 | 76,977 | 46,276 | 51,391 | 222,274,200 | 239,056,473 |
Area figures are of little value in the case of urban and mixed lands, on account of eighth- and quarter-acre sections being treated in the statistics as having no area at all. The following summary (1929–30), which gives valuable information as to area and value in conjunction, accordingly relates only to lands classified as rural:—
| Area, in Acres. | Number of Returns. | Number of Tax-payers. | Total Area. | Unimproved Value. | ||||||
|---|---|---|---|---|---|---|---|---|---|---|
| Total. | Per Return. | Per Acre. | ||||||||
| Acres. | £ | £ | s. | d. | £ | s. | d. | |||
| Under 5 | 778 | 486 | 1,421 | 1,029,359 | 1,323 | 1 | 8 | 724 | 7 | 10 |
| 5 and under 10 | 1,042 | 689 | 7,139 | 1,008,106 | 967 | 9 | 5 | 141 | 4 | 3 |
| 10 and under 20 | 1,830 | 1,225 | 25,433 | 1,955,627 | 1,068 | 13 | 0 | 76 | 17 | 10 |
| 20 and under 50 | 4,275 | 2,818 | 144,679 | 5,455,948 | 1,276 | 4 | 11 | 37 | 14 | 3 |
| 50 and under 100 | 6,974 | 4,013 | 503,978 | 11,487,866 | 1,647 | 4 | 10 | 22 | 15 | 11 |
| 100 and under 200 | 9,887 | 5,777 | 1,393,750 | 22,166,141 | 2,241 | 19 | 0 | 15 | 18 | 1 |
| 200 and under 320 | 6,611 | 4,071 | 1,661,893 | 18,884,599 | 2,856 | 10 | 10 | 11 | 7 | 8 |
| 320 and under 640 | 7,804 | 5,128 | 3,551,880 | 29,762,781 | 3,813 | 15 | 9 | 8 | 7 | 7 |
| 640 and under 1,000 | 3,295 | 2,177 | 2,626,106 | 16,996,477 | 5,158 | 5 | 3 | 6 | 9 | 5 |
| 1,000 and under 2,000 | 3,100 | 2,173 | 4,274,399 | 22,943,980 | 7,401 | 5 | 8 | 5 | 7 | 4 |
| 2,000 and under 5,000 | 1,560 | 1,205 | 4,663,066 | 19,374,245 | 12,419 | 7 | 9 | 4 | 3 | 1 |
| 5,000 and under 10,000 | 368 | 333 | 2,502,798 | 7,961,896 | 21,635 | 11 | 9 | 3 | 3 | 7 |
| 10,000 and under 30,000 | 187 | 164 | 2,924,151 | 5,869,764 | 31,389 | 2 | 3 | 2 | 0 | 2 |
| 30,000 and under 50,000 | 21 | 19 | 783,158 | 573,543 | 27,311 | 11 | 5 | 0 | 14 | 8 |
| 50,000 and under 100,000 | 8 | 8 | 604,582 | 124,313 | 15,539 | 2 | 6 | 0 | 4 | 1 |
| 100,000 and over | 3 | 3 | 390,248 | 61,295 | 20,431 | 13 | 4 | 0 | 3 | 2 |
| Not stated | 189 | 159 | 1,239,315 | 6,557 | 4 | 5 | ||||
| Totals | 47,932 | 30,448 | 26,058,681 | 166,895,255 | 3,481 | 18 | 4 | 6 | 8 | 1 |
Table of Contents
No complete statistics of annual income are available for New Zealand, but valuable data exist in regard to incomes of those furnishing returns to the Commissioner of Taxes for the purpose of income-tax assessment. In 1923 a system of annual statistics from the particulars on the income-tax returns was inaugurated, and was continued up to and including the tax-year 1931–32, but was then discontinued for reasons of economy. The compilation was resumed for the tax-year 1934–35, and the results were published in an appendix to the Statistical Report on Prices, Wage-rates, &c., for 1934, while the detailed statistical tables for the tax-year 1935–36 are included in the 1935 issue of the same report.
Information concerning the system of income-tax in New Zealand is given earlier under the heading of “Taxation” (vide pp. 556–62). To permit of a proper understanding of the statistics given in the present section, it is advisable to peruse the observations under the reference given. The statistical information relating to income-tax given in this section more properly belongs to the Taxation Section referred to, but it is considered preferable to treat the figures relating to the incidence of tax with those showing the distribution of the incomes on which the tax is assessed.
It should be explained that the incomes returned in any tax-year are those for the preceding income-year; thus, the statistics for the tax-year 1935–36 relate to incomes received during the year 1934–35, which, in general, may be taken as the twelve months ended 31st March, 1935.
The comparability of the statistics of one year with another has been affected by changes in the law and by other factors. In particular, the personal exemption (formerly £300) was reduced to £260 in 1931 and to £210 in 1933; up to 1932–33 returns of income were in general not required from “individuals” with incomes under £250, whereas only those who both have incomes under £200 and are not assessable for tax are now exempted from furnishing returns. Many persons not required to furnish returns actually do so, and in 1931–32 and previous years such persons and their incomes were included in the statistics; for 1934–35 and 1935–36, however, the tabulation was limited to those (1) who had assessable incomes of £200 or over, or (2) who had assessable incomes under £200 but were assessable for tax. The net effect of these changes, and of other changes in the law, should have been (other things being equal) to increase substantially the aggregate number and amounts of incomes covered by the statistics for the 1934—35 and 1935–36 tax-years as compared with earlier years. The figures for the tax-year 1934–35 (income-year 1933–34), however, not only failed to show an increase, but, particularly in aggregate amount of income, showed a decided fall, and thus indicated to some extent the severity of the depression. The succeeding year (1935–36), however, showed a substantial improvement, the following increases over 1934–35 being recorded: Number of returns, 13,911; number of taxpayers, 8,154; assessable income, £6,301,431; taxable balance, £3,318,607; and tax Assessed £615,854.
The following table briefly summarizes the main items of information for each of the last five tax-years available:—
| Item. | 1929–30. | 1930–31. | 1931–32. | 1934–35. | 1935–36. |
|---|---|---|---|---|---|
| Number of returns | 113,838 | 118,757 | 130,704 | 125,662 | 139,573 |
| Number of taxpayers | 55,235 | 58,994 | 80,245 | 63,950 | 72,104 |
| £ | £ | £ | £ | £ | |
| Earned income | 39,099,513 | 39,665,861 | 37,279,802 | 35,097,398 | 38,593,004 |
| Assessable income | 65,380,217 | 66,218,062 | 60,168,392 | 53,194,170 | 59,495,601 |
| Exemptions— | |||||
| Personal | 25,631,881 | 26,879,172 | 23,322,337 | 20,235,036 | 22,372,121 |
| Other | 7,403,776 | 6,538,759 | 5,362,904 | 7,605,737 | 8,451,476 |
| Taxable balance | 32,344,560 | 32,800,131 | 31,483,151 | 25,353,397 | 28,672,004 |
| Tax assessed | 3,322,672 | 3,949,558 | 4,366,757 | 3,648,599 | 4,264,453 |
As stated above, the figures for the two years since the resumption of the statistics are not properly comparable with those for earlier years. Sufficient data exist, however, from which to give an approximate comparison of returns and assessable incomes in the tax-years 1931–32, 1934–35, and 1935–36. The income figures relate to incomes received in 1930–31, 1933–34, and 1934–35 (and assessed in the years following), other than those of persons and firms (Class 1) under £250. The comparison is as follows: —
| Class. | Number of Returns. | Assessable Income. | ||||
|---|---|---|---|---|---|---|
| 1931–32. | 1934–35. | 1935–36. | 1931–32. | 1934–35. | 1935–36. | |
| £ | £ | £ | ||||
| I. Individuals (£250 and over) | 92,350 | 66,769 | 85,329 | 46,650,000 | 33,950,000 | 37,230,000 |
| II. Companies. | 3,287 | 3,811 | 4,332 | 9,960,799 | 9,518,369 | 11,909,611 |
| III. Agents for debenture-holders | 23 | 43 | 85 | 148,556 | 165,348 | 162,853 |
| IV. Non-resident traders | 1,420 | 1,124 | 1,204 | 447,481 | 176,634 | 215,172 |
| Totals | 97,100 | 71,747 | 90,950 | 57,200,000 | 43,800,000 | 49,500,000 |
Of the four classes into which taxpayers are divided, Classes III (agents for debenture-holders) and IV (non-resident traders) are insignificant in point of assessable income, Class I (individuals) includes partnerships and firms other than companies, and also includes absentee individuals other than non-resident traders. The foregoing table gives the actual figures in regard to the number of returns and assessable income for Classes II, III, and IV; but the information for Class I is, as stated previously, confined to incomes of £250 and over.
The total number of returns for Class I in 1935–36 was 133,952, the number of taxpayers 66,483, assessable income £47,207,965, and tax assessed £1,445,316. Comparative figures for 1934–35 were 120,684 returns, 58,972 taxpayers, £43,333,819 assessable income, and £1,443,132 tax assessed. Although there was an increase of £3,874,146 in the amount of assessable income, the amount of tax assessed in this class was only £2,184 in excess of the 1934–35 figure. An examination of the figures reveals that the increases in the number of returns and in the amount of assessable income are spread over the lower income groups, while there is a marked decline in the number of individuals in receipt of £2,000 and upwards. In Class II there were increases of 521 in the number of returns, £2,391,242 in the amount of assessable income, and £607,589 in the amount of tax assessed. The increase in the number of taxpayers in this class is fairly evenly distributed over the various income groups.
The following table shows in percentage form the relative importance of the four classes into which taxpayers are divided: —
| Class. | Number of Returns. | Number of Taxpayers. | Assessable Income. | Taxable Balance. | Tax assessed. | |||||
|---|---|---|---|---|---|---|---|---|---|---|
| 1934–35. | 1935–36. | 1934–35. | 1935–36. | 1934–35. | 1935–36. | 1934–35. | 1935–36. | 1934–35. | 1935–36. | |
| Per Cent. | Per Cent. | Per Cent. | Per Cent. | Per Cent. | Per Cent. | Per Cent. | Per Cent. | Per Cent. | Per Cent. | |
| I | 90.04 | 95.97 | 92.21 | 92.20 | 81.47 | 79.35 | 61.11 | 57.14 | 39.56 | 33.89 |
| II | 3.03 | 3.11 | 5.96 | 6.01 | 17.89 | 20.02 | 37.54 | 41.54 | 59.61 | 65.25 |
| III | 0.03 | 0.06 | 0.07 | 0.12 | 0.31 | 0.27 | 0.65 | 0.57 | 0.36 | 0.32 |
| IV | 0.90 | 0.86 | 1.76 | 1.67 | 0.33 | 0.36 | 0.70 | 0.75 | 0.47 | 0.54 |
| 100.00 | 100.00 | 100.00 | 100.00 | 100.00 | 100.00 | 100.00 | 100.00 | 100.00 | 100.00 | |
The effect of the exemptions and of the lower average level of income in Class I is clearly reflected in the foregoing figures. Although its assessable income is approximately four times as much as that of Class II, its taxable balance is only two-fifths greater, while the amount of tax assessed is only a little over one-half of the amount of the latter class.
In the compilation of the statistics a distinction is made as to the source from which the assessable income is derived, incomes being divided into the ten source groups shown in the following table.
Actual figures as to the amount of assessable income derived from the various sources are not available on account of the fact that in a considerable proportion of cases income is obtained from more than one source. The rule followed in such cases in compiling the statistics is to include the whole income under the principal source from which it is derived. As an indication of the extent to which the figures are affected, source “0” (salary or wages) includes £869,319 unearned income, while £413,851 earned income is included in the total for source “8” (investments and the like).
The following table summarizes for the tax-year 1935–36 (income-year 1934–35) the principal items from the point of view of source from which income was derived: —
| Source. | Number of Returns. | Number of Taxpayers. | Earned Income. | Assessable Income. | Total Income. | Exemptions | Taxable. Balance. |
|---|---|---|---|---|---|---|---|
| £ | £ | £ | £ | £ | |||
| 0. Salary or wages | 98,640 | 37,500 | 30,307,350 | 31,176,609 | 32,088,636 | 24,702,555 | 6,474,114 |
| 1. Following professional occupation on own account | 2,753 | 2,336 | 1,842,206 | 1,962,648 | 2,066,270 | 667,599 | 1,295,049 |
| 2. Commerce, trade, or business | 10,252 | 7,904 | 2,884,915 | 10,736,164 | 10,885,278 | 1,616,520 | 9,119,644 |
| 3. Industry or manufacture | 917 | 867 | 100,551 | 3,153,556 | 3,185,736 | 46,269 | 3,107,287 |
| 4. Farming | 4,673 | 3,516 | 2,619,829 | 2,967,616 | 3,086,630 | 1,073,887 | 1,893,729 |
| 5. Provision of transport or communication | 694 | 489 | 199,172 | 713,041 | 716,409 | 128,161 | 584,880 |
| 6. Building or construction | 500 | 325 | 170,518 | 218,283 | 220,294 | 109,994 | 108,289 |
| 7. Mining or extraction | 153 | 124 | 40,415 | 319,861 | 322,227 | 23,976 | 295,885 |
| 8. Investments and the like | 20,870 | 18,936 | 413,851 | 8,155,324 | 10,008,258 | 2,449,404 | 5,705,920 |
| 9. Provision of or engaging in entertainment | 115 | 107 | 14,197 | 92,439 | 94,053 | 5,232 | 87,207 |
| Totals | 139,573 | 72,104 | 38,593,004 | 59,495,601 | 62,673,791 | 30,823,597 | 28,672,004 |
Whether in Class I alone or in the total of all classes, source 0 is the most important as regards number of incomes, number of taxpayers, and amount of earned and of assessable income. This source also leads in the matter of exemptions—so much so, in fact, that its total of £31,176,669 assessable income shrank to a comparatively low taxable balance of £6,474,114, which was assessed for only £449,639 of tax.
Source 2 (commerce, trade, or business) ranks second in point of assessable income, and comes easily first as regards taxable balance and the amount of tax assessed. Of the totals for this source, 6,861 returns with an assessable income of £3,083,989 come within Class I (individuals), and 2,214 returns showing an assessable income of £7,446,553 in Class II (companies). Companies which derived their income from source 2 are represented by over half of the total company taxpayers with 621/2 per cent. of the aggregate assessable income and 61 per cent. of the tax assessed for Class II. This source ranked only fourth in point of taxable balance and tax assessed in Class I, being exceeded by source 8 (19,768 returns and £7,530,391 assessable income) and source 4 (4,615 returns and £2,904,091 assessable income) in addition to source 0, the figures for which are quoted above. Industry or manufacture (713 returns, £3,047,232 assessable income), second among companies, occupies a very minor position in Class I, the figures being 204 returns with an assessable income of £106,334. Compared with the previous year, each source for 1935–36 showed an increase in assessable income, with the exception of sources 4, 7, and 9. Sources showing the greatest proportionate increase over 1934–35 were source 6, with 68½ per cent. increase; source 3, with 28 per cent.; source 2, with 27 per cent.; source 1, with 16 per cent.; and source 0, with 11 per cent.
The next table deals with percentages and averages, and discloses some interesting results.
| Source. | Percentages. | Averages. | |||||
|---|---|---|---|---|---|---|---|
| Taxpayers to Returns. | Earned Income to Assessable Income. | Taxable Balance to Assessable Income. | Earned Income per Return. | Assessable Income per Return. | Exemption per Return. | Table Balance per Taxpayer. | |
| £ | £ | £ | £ | ||||
| 0 | 38 | 97 | 21 | 307 | 316 | 250 | 173 |
| 1 | 85 | 94 | 66 | 669 | 713 | 242 | 554 |
| 2 | 77 | 27 | 85 | 281 | 1,047 | 158 | 1,154 |
| 3 | 95 | 3 | 99 | 110 | 3,439 | 50 | 3,584 |
| 4 | 75 | 88 | 64 | 561 | 635 | 230 | 539 |
| 5 | 70 | 28 | 82 | 287 | 1,027 | 185 | 1,196 |
| 6 | 65 | 78 | 50 | 341 | 437 | 220 | 333 |
| 7 | 81 | 13 | 93 | 264 | 2,091 | 157 | 2,386 |
| 8 | 91 | 5 | 70 | 20 | 391 | 117 | 301 |
| 9 | 93 | 15 | 94 | 123 | 804 | 45 | 815 |
| Totals | 52 | 65 | 48 | 277 | 426 | 221 | 398 |
A wide range is shown between the different groups, the percentage of taxpayers to incomes varying from 38 per cent. for source 0 to 95 per cent. for source 3, of earned income to assessable income from 3 per cent. for source 3 to 97 per cent. for source 0, and of taxable balance to assessable income from 21 per cent. for source 0 to 99 per cent. for source 3.
A word of warning is desirable in regard to the following table classifying incomes, &c., according to size of assessable income. The forty-nine incomes of £50,000 and over or the 191 of £10,000 or over assessed in the year 1935–36 (that is, received in the year 1934–35) do not purport to be incomes of individual persons, and should not be so read. As a matter of fact, there were only four individuals who had an assessable income of £9,000 or over, while the number whose income amounted to £5,000 or over was thirty-nine, with an aggregate assessable income of £256,379, and assessed for £70,081 tax. In the previous year there were thirteen individuals with an assessable income amounting to £9,000 or over, and sixty-two whose income was £5,000 or upwards; the aggregate assessable income amounting to £463,745, and being assessed for £120,128 tax. The decrease in the higher income groups would appear to be due in some measure to the low prices obtained for wool in the 1934–35 season. In the tax-year 1934–35, which would cover the 1933–34 wool season, there were twenty-nine individuals in source 4 (farming) who returned incomes of £5,000 or over, with aggregate assessable income of £239,210, while the corresponding figures for the year under review were twelve incomes aggregating £80,253.
(Tax-years 1934–35, 1935–36; income-years 1933–34, 1934–35.)
| Size of Assessable Income. | Number of Returns. | Aggregate Assessable Income. | Average Assessable Income (All Classes) 1935–36. | |||
|---|---|---|---|---|---|---|
| 1934–35. | 1935–36. | 1934–35. | 1935–36. | |||
| Total. | Class I. | |||||
| £ £ | £ | £ | £ | £ | ||
| Under 200 | 7,331 | 8,437 | 446,243 | 519,958 | 349,421 | 62 |
| 200–299 | 67,003 | 74,958 | 16,272,274 | 18,310,091 | 18,203,858 | 244 |
| 300–399 | 24,016 | 26,426 | 8,173,806 | 8,995,585 | 8,876,244 | 340 |
| 400–499 | 10,047 | 10,952 | 4,444,173 | 4,841,173 | 4,732,178 | 442 |
| 500–599 | 5,348 | 5,765 | 2,899,828 | 3,125,151 | 2,997,570 | 542 |
| 600–699 | 3,038 | 3,341 | 1,958,924 | 2,150,260 | 2,046, 863 | 644 |
| 700–799 | 1,838 | 2,118 | 1,366,511 | 1,577,058 | 1,481,876 | 745 |
| 800–899 | 1,268 | 1,466 | 1,069,659 | 1,239,291 | 1,152,081 | 845 |
| 900–999 | 985 | 1,026 | 931,647 | 971,103 | 897,867 | 946 |
| 1,000–1,999 | 3,382 | 3,623 | 4,524,317 | 4,891,040 | 4,18,344 | 1,249 |
| 2,000–2,999 | 707 | 709 | 1,704,495 | 1,692,889 | 1,243,256 | 2,388 |
| 3,000–3,999 | 251 | 275 | 859,033 | 941,838 | 477,300 | 3,425 |
| 4,000–4,999 | 137 | 137 | 607,052 | 600,980 | 310,728 | 4,387 |
| 5,000–5,999 | 65 | 61 | 352,397 | 330,056 | 95,321 | 5,411 |
| 6,000–6,999 | 26 | 35 | 166,474 | 228,342 | 71,276 | 6,524 |
| 7,000–7,999 | 22 | 20 | 167,734 | 149,164 | 49,247 | 7,458 |
| 8,000–8,999 | 19 | 19 | 162,042 | 159,986 | 8,420 | |
| 9,000–9,999 | 22 | 14 | 209,233 | 133,336 | 40,535 | 9,524 |
| 10,000–19,999 | 64 | 85 | 930,450 | 1,167,554 | 13,736 | |
| 20,000–29,999 | 29 | 36 | 719,507 | 877,305 | 24,370 | |
| 30,000–39,999 | 14 | 14 | 479,935 | 481,563 | 34,397 | |
| 40,000–49,999 | 9 | 7 | 398,557 | 309,793 | 44,256 | |
| 50,000 and over | 41 | 49 | 4,349,879 | 5,802,085 | 118,410 | |
| Totals | 125,662 | 139,573 | 53,194,170 | 59,495,601 | 47,207,965 | 426 |
Of the 133,952 “individuals” covered by the statistics for the tax-year 1935–36, no fewer than 80,262 (60 per cent.) had assessable incomes of under £300, their incomes aggregating £18,553,279—39 per cent. of the total for the class. Only one-fourth of these individuals had any taxable balance left after the statutory exemptions had been applied, their aggregate taxable balance being only £992,321, or a little over one-twentieth of the aggregate assessable income of individuals under the £300 mark.
Of the 4,332 companies covered, 2,057 (just under one-half) had assessable income under £300. The combined incomes of these 2,057 totalled only £209,705 or less than 2 per cent. of income returned by all companies. A further 1,135 companies returned assessable income between £300 and £1,000, their aggregate assessable income being £637,887. Thus there were 3,192 companies (74 per cent.) with incomes of less than £1,000, and whose total assessable income amounted to £847,592. At the other end of the table are found 185 companies with incomes of £10,000 or over; these represented a little over 4 per cent. of all companies, but had nearly 71 per cent. (£8,491,036) of the aggregate income for Class II.
Of the gross assessable income of £59,495,601, £38,593,004 (65 per cent.) ranked as earned income, and as such was exempted from the special emergency surtax of 33⅓ per cent. on standard rates payable on unearned income of individuals, but not of companies. In the previous tax-year (1934–35) earned income amounted to £35,097,398, the gross assessable income being £53,194,170. Earned income is, of course, practically confined to Class I (where it represented 82 per cent. of all assessable income), no part of the income of companies and of agents for debenture-holders, and only a very small proportion of that of non-resident traders, coming within the definition of earned income. In an earlier table the amount of earned income for each source is given, and, with the exception of £3,488 in Class IV (source 9—provision of or engaging in entertainment), the whole of it comes within Class I (individuals). Among the various source groups for Class I, earned income expressed as a proportion of assessable income ranges from 97 per cent. for source 0 (salary or wages) to only 5 per cent. for source 8 (investments and the like).
Generally speaking, the proportion of earned income falls as the income category increases, though exceptions to the rule are observed. Only £23,589 of the £349,421 assessable income of the 5,742 “individual” taxpayers who had less than £200 income was “earned” income.
Information in regard to total income has been tabulated for the first time for the tax-year 1935—36. While companies (Class II) have a certain amount of tax-free investments, &c., the income from which comprises the difference between “assessable” income and “total” income, it is in Class I that the greater part of the non-assessable income is found. In the latter class non-assessable income amounted to £2,969,769, compared with £203,593 in Class II. The following tables give particulars for Class I (individuals) according to size of income under both heads: —
INCOMES BY SIZE OF ASSESSABLE INCOME, CLASS I (INDIVIDUALS), TAX-YEAR 1935–36 (INCOME-YEAR 1934–35).
| Size of Assessable Income. | Number of Returns. | Total Income. | Assessable Income. |
|---|---|---|---|
| £ £ | £ | £ | |
| Under 200 | 5,742 | 669,206 | 349,421 |
| 200–299 | 74,520 | 18,528,200 | 18,203,858 |
| 300–399 | 26,077 | 9,169,018 | 8,876,244 |
| 400–499 | 10,708 | 4,940,434 | 4,732,178 |
| 500–599 | 5,530 | 3,201,902 | 2,997,570 |
| 600–699 | 3,181 | 2,198,757 | 2,046,863 |
| 700–799 | 1,990 | 1,620,208 | 1,481,876 |
| 800–899 | 1,363 | 1,265,710 | 1,152,081 |
| 900–999 | 949 | 970,919 | 897,867 |
| 1,000–1,999 | 3,118 | 4,811,722 | 4,182,344 |
| 2,000–2,999 | 525 | 1,555,476 | 1,243,256 |
| 3,000–3,999 | 139 | 547,641 | 477,300 |
| 4,000–4,999 | 71 | 388,548 | 310,728 |
| 5,000–5,999 | 18 | 110,064 | 95,321 |
| 6,000–6,999 | 11 | 86,700 | 71,276 |
| 7,000–8,999 | 6 | 67,161 | 49,247 |
| 9,000 and over | 4 | 46,068 | 40,535 |
| Totals, Class I | 133,952 | 50,177,734 | 47,207,965 |
INCOMES BY SIZE OF TOTAL INCOME, CLASS I (INDIVIDUALS), TAX-YEAR 1935–36 (INCOME-YEAR 1934–35).
| Size of Total Income. | Number of Returns. | Total Income. | Assessable Income |
|---|---|---|---|
| £ £ | £ | £ | |
| Under 200 | 5,303 | 310,589 | 291,403 |
| 200–299 | 73,206 | 17,902,228 | 17,853,469 |
| 300–399 | 25,989 | 8,850,230 | 8,740,053 |
| 400–499 | 10,833 | 4,792,679 | 4,669,577 |
| 500–599 | 5,596 | 3,035,929 | 2,913,400 |
| 600–699 | 3,370 | 2,168,091 | 2,039,452 |
| 700–799 | 2,157 | 1,608,169 | 1,486,494 |
| 800–899 | 1,480 | 1,250,222 | 1,129,856 |
| 900–999 | 1,094 | 1,035,003 | 936,324 |
| 1,000–1,999 | 3,672 | 4,933,209 | 4,246,475 |
| 2,000–2,999 | 740 | 1,764,986 | 1,389,530 |
| 3,000–3,999 | 234 | 802,128 | 589,336 |
| 4,000–4,999 | 112 | 493,871 | 349,128 |
| 5,000–5,999 | 63 | 343,327 | 199,502 |
| 6,000–6,999 | 37 | 235,522 | 100,003 |
| 7,000–8,999 | 33 | 257,405 | 135,326 |
| 9,000 and over | 33 | 394,146 | 138,637 |
| Totals, Class I | 133,952 | 50,177,734 | 47,207,965 |
Information regarding the statutory exemptions will be found in Section XXIVB, dealing with taxation. Attention should, however, be drawn to the fact that the personal exemption up to and including 1935–36 was on a graduated scale, the maximum of £210 in 1935–36 being reduced as assessable income increased, and disappearing altogether at £725, Prior to the tax-year 1935–36, statistics of the several exemptions were given in detail, but, owing to the introduction of new matter, tabulation has necessarily been restricted to two headings—viz., “personal” and “total.”
The exemptions are applied in the following order: Personal; children, wife, &c.; life-insurance premiums, &c.; and interest-tax payments. For instance, a married man with two dependent children and an income £250 is entitled to a personal exemption of £210, an exemption of £150 for his wife and two children, plus, say, £12 for superannuation contributions. The application of the personal exemption of £210 and of £40 for wife and children would reduce his taxable balance to “nil,” so that only £40 over and above the personal exemption of £210 would be included in the “total” column.
Payments in respect of employment-promotion taxation were allowed as an exemption up to and including the tax-year 1935–36, but this exemption was then discontinued.
The various exemptions in 1934–35 and 1935–36 applied only to incomes in Class I (individuals), and it is only this class which need be considered in a study of the exemptions and their relative incidence according to size of income.
The fact that amounts are shown under the head of “personal exemption” for incomes above the point at which this exemption disappeared in the tax-year 1935–36 is due to the inclusion in large trust returns of small individual amounts, the recipients of which come within the provisions of the personal exemption.
The following table gives particulars for the tax-year 1935–36 of the amounts of the various exemptions according to size of assessable income, together with some interesting averages: —
| Size of Assessable Income. | Personal. | Total. | Per &100 of Assessable Income. | Per £100 of Total Exemptions. | |||
|---|---|---|---|---|---|---|---|
| Personal. | Other. | Total. | Personal. | Other. | |||
| £ £ | £ | £ | £ | £ | £ | £ | £ |
| Under 200 | 41,482 | 47,870 | 11.9 | 1.8 | 13.7 | 86.7 | 13.3 |
| 200–299 | 15,310,555 | 17,513,088 | 84.1 | 12.1 | 96.2 | 87.4 | 12.6 |
| 300–399 | 4,674,914 | 7,174,514 | 52.7 | 28.1 | 80.8 | 65.2 | 34.8 |
| 400–499 | 1,541,072 | 2,853,121 | 32.6 | 27.7 | 60.3 | 54.0 | 46.0 |
| 500–599 | 584,562 | 1,289,153 | 19.5 | 23.5 | 43.0 | 45.3 | 54.0 |
| 600–699 | 153,925 | 586,015 | 7.5 | 21.1 | 28.6 | 26.3 | 73.7 |
| 700–799 | 19,316 | 291,799 | 1.3 | 18.4 | 19.7 | 6.6 | 93.4 |
| 800–899 | 6,114 | 171,972 | 0.5 | 14.4 | 14.9 | 3.6 | 96.4 |
| 900–999 | 8,332 | 134,545 | 0.9 | 14.0 | 14.9 | 6.2 | 93.8 |
| 1,000–1,999 | 28,015 | 541,857 | 0.7 | 12.3 | 13.0 | 5.2 | 94.8 |
| 2,000–2,999 | 3,157 | 131,407 | 0.2 | 10.3 | 10.5 | 2.4 | 97.6 |
| 3,000–3,999 | 158 | 41,290 | 8.6 | 8.6 | 0.4 | 99.6 | |
| 4,000–4,999 | 111 | 27,660 | 8.9 | 8.9 | 0.4 | 99.6 | |
| 5,000–5,999 | 408 | 6,586 | 0.4 | 6.5 | 6.9 | 6.2 | 93.8 |
| 6,000–6,999 | 7,028 | 9.9 | 9.9 | 100.0 | |||
| 7,000–8,999 | 2,773 | 5.6 | 5.6 | 100.0 | |||
| 9,000 and over | 2,919 | 7.2 | 7.2 | 100.0 | |||
| Totals | 22,372,121 | 30,823,597 | 47.4 | 17.9 | 65.3 | 72.6 | 27.4 |
Exemptions being limited to Class I (individuals), this is the only class in which the assessable income and taxable balance are not identical. The next table gives for Class I particulars of taxable balance in relation to assessable income for the various income categories in the tax-year 1935–36: —
| Size of Assessable Income. | Number of Returns. | Numbers of Taxpayers. | Assessable Income. | Taxable Balance. | Taxable Balance per £100 of Assessable Income. |
|---|---|---|---|---|---|
| £ £ | £ | £ | £ | ||
| Under 200 | 5,742 | 5,742 | 349,421 | 301,551 | 86.3 |
| 200–299 | 74,520 | 16,068 | 18,203,858 | 690,770 | 3.8 |
| 300–399 | 26,077 | 17,822 | 8,876,244 | 1,701,730 | 19.2 |
| 400–499 | 10,708 | 10,073 | 4,732,178 | 1,879,057 | 39.7 |
| 500–599 | 5,530 | 5,477 | 2,997,570 | 1,708,417 | 57.0 |
| 600–699 | 3,181 | 3,160 | 2,046,863 | 1,460,848 | 71.4 |
| 700–799 | 1,990 | 1,971 | 1,481,876 | 1,190,077 | 80.3 |
| 800–899 | 1,363 | 1,357 | 1,152,081 | 980,109 | 85.1 |
| 900–999 | 949 | 941 | 897,867 | 763,322 | 85.0 |
| 1,000–1,999 | 3,118 | 3,099 | 4,182,344 | 3,640,487 | 87.0 |
| 2,000–2,999 | 525 | 524 | 1,243,256 | 1,111,849 | 89.4 |
| 3,000–3,999 | 139 | 139 | 477,300 | 436,010 | 91.3 |
| 4,000–4,999 | 71 | 71 | 310,728 | 283,068 | 91.1 |
| 5,000–5,999 | 18 | 18 | 95,321 | 88,735 | 93.1 |
| 6,000–6,999 | 11 | 11 | 71,276 | 64,248 | 90.1 |
| 7,000–8,999 | 6 | 6 | 49,247 | 46,474 | 94.4 |
| 9,000 and over | 4 | 4 | 40,535 | 37,616 | 92.8 |
| Totals | 133,952 | 66,483 | 47,207,965 | 16,384,368 | 34.7 |
The taxable balance, which represents £34.7 per £100 of assessable income for Class I, rises to £48.2 per £100 if all classes are taken into account. The corresponding figures for 1934–35 were £35.8 and £47.7 respectively.
While the foregoing table shows the taxable balance of the individuals in receipt of the various sizes of assessable income, it does net. indicate the number of individuals with taxable balances of different amounts. This lack in previous tabulations was remedied for the 1934–35 statistics by a special tabulation for Class I according to amount of taxable balance, and this special feature was repeated for the tax-year 1935–36. Particulars for the tax-year 1935–36 are contained in the next table.
| Size of Taxable Balance. | Number of Returns. | Number of Taxpayers. | Assessable Income. | Taxable Balance. | Taxable Balance per £100 of Assessable Income. |
|---|---|---|---|---|---|
| £ £ | £ | £ | £ | ||
| Nil | 66,908 | 16,952,487 | |||
| Under 10 | 4,485 | 3,940 | 947,810 | 23,983 | 2.9 |
| 10–19 | 5,296 | 5,291 | 1,248,458 | 76,302 | 6.1 |
| 20–29 | 4,365 | 4,364 | 1,094,272 | 106,149 | 9.7 |
| 30–39 | 3,683 | 3,683 | 969,497 | 126,700 | 13.1 |
| 40–49 | 3,235 | 3,232 | 884,810 | 143,546 | 16.2 |
| 50–99 | 11,586 | 11,581 | 3,532,421 | 827,361 | 23.4 |
| 100–199 | 12,376 | 12,376 | 4,559,784 | 1,752,033 | 38.4 |
| 200–299 | 6,459 | 6,458 | 2,901,044 | 1,569,724 | 54.1 |
| 300–399 | 3,754 | 3,754 | 1,961,843 | 1,287,268 | 65.6 |
| 400–499 | 2,416 | 2,416 | 1,453,592 | 1,078,069 | 74.2 |
| 500–599 | 1,931 | 1,931 | 1,314,197 | 1,054,244 | 80.2 |
| 600–699 | 1,579 | 1,579 | 1,208,181 | 1,020,681 | 84.5 |
| 700–799 | 1,248 | 1,248 | 1,067,271 | 933,369 | 87.5 |
| 800–899 | 980 | 980 | 935,638 | 828,385 | 88.5 |
| 900–999 | 698 | 697 | 750,296 | 660,888 | 88.1 |
| 1,000–1,999 | 2,369 | 2,369 | 3,551,292 | 3,171,660 | 89.3 |
| 2,000–2,999 | 384 | 384 | 988,122 | 902,678 | 91.4 |
| 3,000–3,999 | 124 | 124 | 466,550 | 427,068 | 91.5 |
| 4,000–4,999 | 48 | 48 | 221,977 | 208,347 | 93.9 |
| 5,000–5,999 | 12 | 12 | 68,964 | 64,198 | 93.1 |
| 6,000–6,999 | 6 | 6 | 39,677 | 37,625 | 94.8 |
| 7,000–7,999 | 4 | 4 | 31,797 | 30,049 | 94.5 |
| 8,000–8,999 | 3 | 3 | 26,527 | 24,623 | 92.8 |
| 9,000 and over | 3 | 3 | 31,458 | 29,418 | 93.5 |
| Totals, Class I | 133,952 | 66,483 | 47,207,965 | 16,384,368 | 34.7 |
Of the 133,952 individuals who furnished returns, no fewer than 66,908 had no taxable balance after the various exemptions bad been applied. These had an aggregate assessable income of £16,952,487—35.9 per cent. of the total for Class I. Of the remainder (67,044) 21,064 had less than £50 taxable balance, with assessable income amounting to £5,144,847 (10.9 per cent.). At the other end of the scale it is found that there were only 2,953 individuals who had a taxable balance of £1,000 or over. Although these represented only 2.2 per cent. of the total number of returns, their aggregate assessable income was 11.5 per cent. of the aggregate for Class I.
The revenue from income-tax during the financial year ended the 31st March, 1936, was £4,581,328. This amount is £316,875 in excess of the total tax shown in the statistical tables as having been assessed for the same year (£4,264,453), the difference being due partly to the imposition of an additional 5 per cent. in the event of late payment, partly to the inclusion of arrears in the total of tax collected, and partly to the omission of a few returns from the statistical tables.
It is of interest to record that the amount of tax assessed for the tax-year 1935–36 £4,264,453) equals 1s. 5d. per pound of assessable income and 3s. per pound of taxable balance.
The amount of tax assessed and the average rates of tax for the various classes were—
| Class. | Tax assessed. | Per £1 of Assessable Income. | Per £1 of Taxable Balance. | |||
|---|---|---|---|---|---|---|
| 1934–35. | 1935–36. | 1934–35. | 1935–36. | 1934–35. | 1935–36. | |
| £ | £ | s. d. | s. d. | s. d. | s. d. | |
| I. Individuals | 1,443,132 | 1,445,316 | 0 8 | 0 7 | 1 10 | 1 9 |
| II. Companies | 2,175,069 | 2,782,658 | 4 7 | 4 8 | 4 7 | 4 8 |
| III. Agents for debenture-holders | 13,215 | 13,645 | 1 7 | 1 8 | 1 7 | 1 8 |
| IV. Non-resident traders | 17,183 | 22,834 | 1 11 | 2 1 | 1 11 | 2 1 |
| Totals | 3,648,599 | 4,264,453 | 1 4½ | 1 5 | 2 10½ | 3 0 |
The low figure of tax assessed per £1 of assessable income for Class I, by comparison with Class II, is not due to a lower scale of rates of taxation. As a matter of fact, for equal amounts of taxable balance the individual paid on the average a slightly higher tax than the company, having to pay an additional 33⅓ per cent. on unearned income and for some years up to and including 1935–36 the now discontinued flat rate of 4d. in the pound on taxable balance in excess of £500. The special emergency tax (33⅓ per cent.) assessment for the tax-year 1935–36 totalled £169,301 and the flat-rate tax (4d. in the pound) assessment £109,158, out of a total assessment of £1,445,316 for individuals.
The explanation of the lower average tax assessed in Class I lies partly in the large exemptions in this class and partly in the predominance of income in the lower groups. The relative effect of the two factors can be fairly well gauged by comparisons of (1) the tax per £1 of assessable income as between Classes I and IV, and (2) the tax per £1 of taxable balance as between Classes I and II.
The following table gives particulars for the tax-year 1935–36 of the total tax assessed according to size of income, together with the average amount of tax assessed per return.
| Size of Assessable Income. | Total Tax assessed. | Tax assessed per Return. | ||||
|---|---|---|---|---|---|---|
| Class I. | Class II. | Classes I-IV. | Class I. | Class II. | Classes I-IV. | |
| £ £ | £ | £ | £ | £ | £ | £ |
| Under 200 | 15,772 | 4,912 | 22,719 | 2.7 | 2.9 | 2.7 |
| 200–299 | 31,401 | 3,391 | 35,676 | 0.4 | 9.6 | 0.5 |
| 300–399 | 73,896 | 3,855 | 78,856 | 2.8 | 13.9 | 3.0 |
| 400–499 | 82,551 | 4,547 | 88,036 | 7.7 | 21.5 | 8.0 |
| 500–599 | 86,454 | 5,939 | 93,443 | 15.6 | 28.4 | 16.2 |
| 600–699 | 89,044 | 5,670 | 95,417 | 28.0 | 38.1 | 28.6 |
| 700–799 | 83,804 | 5,709 | 90,168 | 42.1 | 47.6 | 42.6 |
| 800–899 | 76,337 | 5,630 | 82,783 | 56.0 | 59.3 | 56.5 |
| 900–999 | 63,689 | 5,102 | 69,144 | 67.1 | 69.9 | 67.4 |
| 1,000–1,999 | 418,974 | 66,832 | 490,928 | 134.4 | 140.4 | 135.5 |
| 2,000–2,999 | 190,323 | 63,472 | 254,994 | 362.5 | 354.6 | 359.7 |
| 3,000–3,999 | 94,991 | 81,099 | 180,131 | 683.4 | 628.7 | 655.0 |
| 4,000–4,999 | 67,999 | 58,815 | 129,917 | 957.7 | 933.6 | 948.3 |
| 5,000–5,999 | 24,371 | 53,313 | 81,614 | 1,353.9 | 1,332.8 | 1,337.9 |
| 6,000–6,999 | 18,036 | 38,651 | 58,397 | 1,639.6 | 1,680.5 | 1,668.5 |
| 7,000–7,999 | 15,121 | 37,027 | 41,523 | 2,520.2 | 2,057.1 | 2,076.2 |
| 8,000–8,999 | 36,493 | 47,118 | 2,432.9 | 2,479.8 | ||
| 9,000–9,999 | 12,553 | 33,664 | 39,776 | 3,183.3 | 2,805.3 | 2,841.1 |
| 10,000–19,999 | 324,388 | 333,871 | 3,956.0 | 3,927.9 | ||
| 20,000–29,999 | 236,361 | 238,912 | 6,951.8 | 6,636.4 | ||
| 30,000–39,999 | 127,781 | 127,781 | 9,127.2 | 9,127.2 | ||
| 40,000–49,999 | 90,614 | 90,614 | 12,944.9 | 12,944.9 | ||
| 50,000–99,999 | 622,148 | 625,390 | 18,853.0 | 18,393.8 | ||
| 100,000 and over | 867,245 | 867,245 | 57,816.3 | 57,816.3 | ||
| Totals | 1,445,316 | 2,782,658 | 4,264,453 | 10.8 | 642.3 | 30.6 |
The next table gives another series of average tax assessed according to the size of assessable income, and further illustrates the position.
| Size of Assessable Income. | Per Taxpayer. | Per £100 of Assessable Income. | Per £100 of Taxable Balance. | ||||
|---|---|---|---|---|---|---|---|
| Class I. | Classes I-IV. | Class I. | Class II. | Classes I-IV. | Class I. | Classes I-IV. | |
| £ £ | £ | £ | £ | £ | £ | £ | £ |
| Under 200 | 2.7 | 2.7 | 4.5 | 4.0 | 4.4 | 5.2 | 4.8 |
| 200–299 | 2.0 | 2.2 | 0.2 | 3.9 | 0.2 | 4.5 | 4.5 |
| 300–399 | 4.1 | 4.3 | 0.8 | 4.1 | 0.9 | 4.3 | 4.3 |
| 400–499 | 8.2 | 8.5 | 1.7 | 4.8 | 1.8 | 4.4 | 4.4 |
| 500–599 | 15.8 | 16.4 | 2.9 | 5.2 | 3.0 | 5.1 | 51 |
| 600–099 | 28.2 | 28.7 | 4.4 | 5.9 | 4.4 | 6.1 | 6.1. |
| 700–799 | 42.5 | 43.0 | 5.7 | 6.4 | 5.7 | 7.0 | 7.0 |
| 800–899 | 56.3 | 56.7 | 6.6 | 7.0 | 6.7 | 7.8 | 7.8 |
| 900–999 | 67.7 | 67.9 | 7.1 | 7.4 | 7.1 | 8.3 | 8.3 |
| 1,000–1,999 | 135.2 | 136.2 | 10.0 | 10.0 | 10.0 | 11.5 | 11.3 |
| 2,000–2,999 | 363.2 | 360.2 | 15.3 | 14.5 | 15.1 | 17.1 | 16.3 |
| 3,000–3,999 | 683.4 | 655.0 | 19.9 | 18.4 | 19.1 | 21.8 | 20.0 |
| 4,000–4,999 | 957.7 | 948.3 | 21.9 | 21.2 | 21.6 | 24.0 | 22.7 |
| 5,000–5,999 | 1,353.9 | 1,337.9 | 25.6 | 24.4 | 24.7 | 27.5 | 25.2 |
| 6,000–6,999 | 1,639.6 | 1,668.5 | 25.3 | 25.7 | 25.6 | 28.1 | 26.4 |
| 7,000–7,999 | 2,520.2 | 2,076.2 | 30.7 | 27.7 | 27.8 | 32.5 | 27.8 |
| 8,000–8,999 | 2,479.8 | 28.9 | 29.5 | 30.0 | |||
| 9,000–9,999 | 3,138.3 | 2,841.1 | 31.0 | 29.3 | 29.8 | 33.4 | 30.0 |
| 10,000–19,999 | 3,927.9 | 28.6 | 28.6 | 28.6 | |||
| 20,000–29,999 | 6,636.4 | 28.6 | 27.2 | 27.2 | |||
| 30,000–39,999 | 9,127.2 | 26.5 | 26.5 | 26.5 | |||
| 40,000–49,999 | 12,944.9 | 29.2 | 29.2 | 29.2 | |||
| 50,000–99,999 | 18,393.8 | 27.5 | 26.9 | 26.9 | |||
| 100,000 and over | 57,816.3 | 25.0 | 25.0 | 25.0 | |||
| Totals | 21.7 | 59.1 | 3.1 | 23.4 | 7.2 | 8.8 | 14.9 |
The following table gives aggregate tax assessments for incomes grouped according to the amount of tax assessed, together with averages per £100 of assessable income and of taxable balance respectively: —
| Amount of Tax assessed. | Total Tax assessed. | Per £100 of Assessable Income. | Per £100 of Taxable Balance. | |||||
|---|---|---|---|---|---|---|---|---|
| Class I. | Class II. | Classes I-IV. | Class I. | Class II. | Classes I-IV. | Class I. | Classes I-IV. | |
| £ £ | £ | £ | £ | £ | £ | £ | £ | £ |
| Under 1 | 5,824 | 226 | 6,258 | 0.2 | 3.5 | 0.2 | 3.4 | 3.4 |
| 1 and under 2 | 13,687 | 468 | 14,421 | 0.6 | 3.9 | 0.6 | 3.7 | 3.7 |
| 2 and under 3 | 16,201 | 537 | 16,984 | 0.8 | 3.8 | 0.9 | 4.0 | 4.0 |
| 3 and under 4 | 18,057 | 841 | 19,110 | 1.1 | 3.8 | 1.1 | 4.0 | 3.9 |
| 4 and under 5 | 16,467 | 679 | 17,408 | 1.3 | 3.8 | 1.4 | 4.0 | 4.0 |
| 5 and under 6 | 18,160 | 788 | 19,180 | 1.5 | 3.9 | 1.6 | 4.1 | 41 |
| 6 and under 7 | 16,645 | 722 | 17,588 | 1.7 | 3.8 | 1.8 | 4.1 | 4.1 |
| 7 and under 8 | 17,179 | 959 | 18,373 | 1.9 | 3.9 | 1.9 | 4.0 | 4.0 |
| 8 and under 9 | 15,548 | 736 | 16,478 | 2.0 | 3.8 | 2.1 | 4.2 | 4.2 |
| 9 and under 10 | 14,496 | 842 | 15,526 | 2.2 | 3.8 | 2.2 | 4.2 | 4.1 |
| 10 and under 15 | 57,562 | 3,801 | 62,240 | 2.6 | 4.0 | 2.7 | 4.4 | 4.4 |
| 15 and under 20 | 39,978 | 2,813 | 43,388 | 3.2 | 4.4 | 3.3 | 4.8 | 4.8 |
| 20 and under 30 | 68,713 | 7,078 | 76,743 | 4.1 | 5.0 | 4.2 | 5.5 | 5.5 |
| 30 and under 40 | 63,250 | 6,054 | 69,815 | 5.1 | 5.6 | 5.1 | 6.3 | 6.2 |
| 40 and under 50 | 59,308 | 5,860 | 65,571 | 5.9 | 6.1 | 5.9 | 7.0 | 6.9 |
| 50 and under 60 | 57,625 | 4,689 | 62,856 | 6.7 | 6.7 | 6.7 | 7.7 | 7.8 |
| 60 and under 70 | 48,949 | 4,312 | 53,455 | 7.2 | 7.2 | 7.2 | 8.3 | 8.2 |
| 70 and under 80 | 46,897 | 5,050 | 52,174 | 7.7 | 7.7 | 7.7 | 8.8 | 8.6 |
| 80 and under 90 | 39,239 | 3,740 | 43,312 | 8.2 | 7.8 | 8.2 | 9.3 | 9.2 |
| 90 and under 100 | 36,132 | 3,800 | 40,123 | 8.4 | 8.4 | 8.4 | 9.6 | 9.5 |
| 100 and under 125 | 71,832 | 12,766 | 85,248 | 9.4 | 8.8 | 9.3 | 10.5 | 10.2 |
| 125 and under 150 | 59,792 | 10,491 | 71,378 | 10.1 | 9.6 | 10.1 | 11.4 | 11.1 |
| 150 and under 200 | 98,612 | 18,691 | 119,414 | 11.3 | 10.7 | 11.2 | 12.6 | 12.3 |
| 200 and under 300 | 128,714 | 29,088 | 159,286 | 13.3 | 12.0 | 13.1 | 14.9 | 14.3 |
| 300 and under 400 | 83,084 | 24,921 | 109,702 | 15.7 | 14.3 | 15.4 | 17.3 | 16.6 |
| 400 and under 500 | 64,164 | 25,687 | 91,613 | 17.5 | 15.8 | 17.0 | 19.2 | 18.1 |
| 500 and under 600 | 38,109 | 26,983 | 65,689 | 19.0 | 17.3 | 18.3 | 21.2 | 19.4 |
| 600 and under 700 | 35,528 | 27,050 | 63,219 | 19.8 | 18.8 | 19.3 | 21.8 | 20.4 |
| 700 and under 800 | 26,792 | 19,775 | 47,300 | 22.0 | 18.5 | 20.4 | 24.4 | 21.5 |
| 800 and under 900 | 27,848 | 27,866 | 56,565 | 22.6 | 20.3 | 21.4 | 24.4 | 22.1 |
| 900 and under 1,000 | 18,879 | 18,958 | 37,837 | 24.8 | 21.8 | 23.2 | 26.7 | 24.0 |
| 1,000 and under 2,000 | 83,171 | 127,483 | 222,137 | 27.8 | 22.8 | 23.6 | 30.0 | 24.1 |
| 2,000 and under 3,000 | 25,392 | 110,238 | 135,630 | 30.5 | 28.5 | 28.8 | 32.3 | 29.1 |
| 3,000 and under 4,000 | 13,482 | 129,621 | 149,387 | 35.4 | 26.0 | 24.4 | 37.6 | 24.5 |
| 4,000 and under 5,000 | 111,017 | 111,017 | 27.9 | 27.9 | 27.9 | |||
| 5,000 and under 6,000 | 86,124 | 86,124 | 29.2 | 29.2 | 29.2 | |||
| 6,000 and under 7,000 | 77,285 | 77,285 | 29.3 | 29.3 | 29.3 | |||
| 7,000 and under 8,000 | 111,511 | 111,511 | 27.1 | 27.1 | 27.1 | |||
| 8,000 and under 9,000 | 50,665 | 50,665 | 29.2 | 29.2 | 29.2 | |||
| 9,000 and under 10,000 | 36,705 | 36,705 | 29.2 | 29.2 | 29.2 | |||
| 10,000 and over | 1,645,738 | 1,645,738 | 26.6 | 26.6 | 26.6 | |||
| Totals | 1,445,316 | 2,782,658 | 4,264,453 | 3.1 | 23.4 | 7.2 | 8.8 | 14.9 |
It is of interest to note that of the 133,952 individuals covered by the statistics for 1935–36, 67,469, with assessable income aggregating £17,104,374 (36 per cent. of the total for Class I), were not assessed for tax. Of the 66,483 assessed for tax, 35,809 (54 per cent.), with assessable incomes aggregating £9,940,606 (21 per cent.), were assessed for under £5 of tax. At the other end of the scale, 293 individuals were each assessed for over £500 of tax, and seventy-nine for over £1,000. Comparable figures for 1934–35 were 342 and 114 respectively.
Even among the companies, 1,378 (32 per cent.) had in 1935–36 an assessment of under £5. The aggregate income of these companies was only £72,730—well under 1 per cent. of the assessable income for all companies. Companies which were assessed for over £1,000 of tax numbered 309, a little over 7 per cent. of the total; their aggregate assessable income, however, was £9,298,059 (78 per cent. of the Class II total), and their aggregate tax assessment was £2,486,387 (89 per cent. of company tax). Some sixty companies, with a total assessable income of £6,187,881, were each assessed for over £10,000 of tax (an aggregate of £1,645,738), which constituted 59 per cent. of company tax and 38½ per cent. of the total tax assessed for all classes. In 1934–35, 259 companies were assessed for over £1,000 of tax, while the number of companies assessed for over £10,000 of tax was fifty-one.
The concept of “aggregate private income” is by no means devoid of divergent interpretations. However, as used here, a definition roughly correct is that it comprises the sum total of the incomes of all the individuals of the population, plus the undistributed portion (inclusive of State taxation) of company profits. Under “incomes” are included monetary payments from all sources, such as salaries, wages, revenue from investments, gratuities, pensions, superannuation, &c. In the later estimates, although not in that derived chiefly from the 1926 census records, certain non-monetary emoluments—e.g., free housing, free fuel and lighting, &c., where such are in reality part-payments for services—are given a monetary equivalent and treated as income. Where an individual owns and occupies a dwelling the rental value is not assessed as income. Net receipts (gross receipts, less expenditure incurred in earning them) of business houses, farmers, professional men, landlords, employers of labour, &c., are taken. Capital receipts—e.g., from deceased persons' estates, repayments of debts, &c.—are excluded. It is probable that the estimates tend to understate the aggregate private income, owing to the inclusion in some cases of domestic expenditure or living-costs among expenditure incurred in earning income. No allowance is made on this account in the statistical computation, and the estimates should be regarded as on the conservative side.
From the foregoing description of the scope of the statistics, it will be realized that the term “aggregate private income” as defined, is not identical with the broader concept “national income.”
As estimates at a given date the data quoted possess recognized limitations, but when derived from the same sources the movement from year to year is of serviceable accuracy.
From the 1926 census statistics of income categories, taken in conjunction with the statistics compiled from the income-tax returns for the income-year ended 31st March, 1926, an approximate estimate of the aggregate income of individual members of the community was compiled for the year 1925–26. Allowing for the effect of approximations and arbitrary allocations, the estimated sum total of the income of all individuals for 1925–26 may be set down conservatively as lying between £130 m. and £140 m. In such a computation certain weaknesses exist, reducing any estimate to a rough approximation only. The compilation is discussed at greater length in the 1932 Year-Book. Results are given in detail in Vol. XI of the 1926 census results.
The basis for the estimates of aggregate private income quoted in the table below is provided in the main by the figures of receipts from the emergency employment charge under the Employment Promotion Act. The receipts for any year from the charge on wages relate to wages and salaries of the current year, while those from the charge on their incomes are in respect of incomes during the preceding year. For the 1935–36 computations, therefore, the 1935–36 receipts from the charge on wages and the 1936–37 receipts from that on other incomes are taken.
Certain types of income are not subject to the charge, particulars of these exemptions being given on pages 566–567. For these classes estimates have been prepared—in part upon a more or less arbitrary basis. Amendments to the exemptions are responsible for the movement in some of the items as between 1933–34 and 1934–35.
| 1931–32. | 1932–33. | 1933–34. | 1934–35. | 1935–36. | |
|---|---|---|---|---|---|
| * Four and a half months. | |||||
| Subject to emergency charge— | £ m. | £ m. | £ m. | £ m. | £ m. |
| Wages | 60.5 | 55.0 | 57.3 | 61.2 | 66.2 |
| Other income | 25.0 | 22.3 | 29.0 | 27.4 | 36.0 |
| Wages of persons under twenty | 1.1* | 3.0 | |||
| Wages of exempt relief workers | 2.0 | 2.9 | 2.8 | 2.5 | 2.5 |
| Wages of domestic servants | 1.0 | 1.0 | 1.0 | 0.9 | 0.8 |
| “Other” exempt income of women | 3.1 | 3.1 | 3.1 | 3.5 | 3.5 |
| “Other” exempt income of Maoris | 1.0 | 1.0 | 1.0 | ||
| Undistributed company income (including income-tax payments) | 3.0 | 2.5 | 3.5 | 3.5 | 4.0 |
| Pensions under Pensions Act | 1.7 | 1.7 | 1.8 | 1.8 | 2.0 |
| Other exempt income (including sustenance pay) | 0.5 | 0.5 | 0.5 | 1.2 | 2.0 |
| 97.8 | 90.0 | 100.0 | 103.1 | 120.0 | |
It need scarcely be stressed that the estimates are merely fairly rough approximations.
The increase of £16.9m. in 1935–36 over 1934–35 may be compared with the increase of £17.2m. in estimated value of production (see Section XLVI of this volume). There is, however, no fixed relationship between the aggregate private income and the value of production. It is necessary to make this observation since there appears to be misconception upon the point.
A further substantial increase in aggregate private income will be recorded for 1936–37. Receipts from the tax on wages for the year (£2,610,000) show that wages and salaries subject to the emergency employment charge aggregated £78.3m. as compared with £66.2m. in 1935–36.
Table of Contents
IN New Zealand, as in other countries, increased regulation of prices by Governmental control has been a feature of economic policy in recent years. Nation-wide control of prices of essential commodities was resorted to during the Great War, the motives behind legislation and regulations towards that end being the necessity of purchasing at reasonable prices commodities required for war purposes, and the protection of the consumer from the full force of the abnormal rises in prices caused by the scarcity of many necessary commodities. The success of the legislation in so far as the New Zealand consumer is concerned is to be found in the relatively low war and post-war peaks of price-levels in the Dominion.
The administration of these price-fixing measures was in the hands of the Board of Trade, set up under the provisions of the Cost of Living Act, 1915, regulations being issued from time to time fixing maximum prices for various commodities—g., sugar, timber, wheat, &c. The Board of Trade Act, 1919 (in consolidation and amendment of the pre - existing legislation) contained provisions for the establishment of the Department of Industries and Commerce and for a Board of Trade, the Board to consist of the Minister of Industries and Commerce (President) and not more than four other members. By an amendment in 1923 the Board was abolished, its functions being taken over by the Minister. Authority was also taken under the Act “for the establishment of fixed minimum or maximum prices or rates for any classes of goods or services or otherwise for the regulation or control of such prices or rates.” The Act also includes provisions especially aimed at the prevention of profiteering.
The control of prices initiated during the war years continued in some instances well into the post-war period, the dates of cessation of control in certain important individual eases being: Bacon and ham, February, 1920; butter, August, 1921; sugar, August, 1923. Control of prices of building-materials was resorted to in 1920 and 1921, during a period of acute shortage of these materials.
Control of wheat prices was made necessary shortly after the outbreak of the Great War; fixation of prices of wheat and flour, with Government subsidies on flour and guaranteed prices of wheat, continuing until February, 1923, while control of imports—which was a necessary part of the policy—and “agreed” prices continued until February, 1926. Maximum prices of bread, flour, bran, and Pollard were fixed by Orders in Council until 24th February, 1925, when free-marketing conditions were again resumed. In order to protect wheatgrowers from world competition, a sliding scale of import duties was introduced in 1927 designed to maintain a payable price within the Dominion. From time to time the sliding scale has been altered; but the system remains in operation. On 11th March, 1936, regulations were issued prohibiting the import of wheat or flour, except with the consent of the Department of Industries and Commerce. In 1933 a Wheat-purchase Board was set up, with representatives of the wheat-growers and flour-millers, and under the chairmanship of the Secretary of Industries and Commerce, to control the purchase and distribution of milling-wheat of the 1933 season. All purchases and sales of milling-wheat were to be conducted through the agency of the Board, which fixed its buying and selling prices of milling-wheat. The growers received interim payments during the season, a final distribution being made at the close of the season. The system has operated in each successive season since 1932–33; while, under regulations gazetted on 1st April, 1936, the Board has fixed minimum prices of flour, and may, if it thinks fit, fix prices of wheaten by-products. Authority for the control of output of flour-mills is taken by the same regulations.
Maximum prices of bread in the Dominion are now fixed by regulations under the Board of Trade Act, 1919. An Order in Council dated 12th February, 1936, fixed a maximum price in the four chiurban areas and in certain localities contiguous thereto; the Order applied also in the City of Invercargill and the boroughs of Ashburton, Temuka, Timaru, and Oamaru. This represents the first Governmental fixation of bread prices since the expiry in 1925 of the war and post-war regulations to the same end. Amended regulations came into force on 28th August, 1936, applying maximum prices to the whole Dominion.
The maximum prices at which superphosphates can be sold have been fixed by regulations since October, 1931, as a measure towards the assistance of the farming industry. A lowering of prices was achieved by the payment of a subsidy to the companies, but payment of the subsidy has now been abolished (without a raising of prices).
Prices of woolpacks are fixed by regulations dated 13th May, 1936.
The Motor-spirits (Regulation of Prices) Act, 1933, gives power to fix maximum and minimum prices of motor-spirit; the administration of the Act being a function of the Department of Industries and Commerce. Prices of motor-spirit are still fixed by regulations under this Act.
Extensive regulation of fares has for some years past existed in the realm of transport. In order to control chaotic and uneconomic competition in road services, schedules of fares and freight rates have been fixed for services along specified routes by various regulations under the Transport Licensing Act, 1931; while competition between tramways and bus services has led to the fixation of minimum bus fares in certain localities where these services enter into competition with the tramway services.
The fares chargeable by aircraft services are also the subject of Governmental regulations. Maximum and minimum taxi fares may be fixed by municipalities under the authority of the Municipal Corporations Act, 1933.
The Primary Products Marketing Act, 1936, made provision for the fixation of prices of butter and cheese for export and for local consumption, and regulations in this behalf are issued from time to time.
Regulations have been issued during 1937 fixing wholesale prices of onions.
Following is a table of regulated prices operative at present (September, 1937) in respect of certain important commodities:—
| Commodity. | Unit. | Price. | Remarks. |
|---|---|---|---|
| Wheat (milling)— | £ s. d. | ||
| Tuscan | Bushel | 0 5 2½ | Price to South Island mills. |
| Hunters | Bushel | 0 5 4½ | Price to South Island mills. |
| Pearl | Bushel | 0 5 6½ | Price to South Island mills. |
| Flour | Ton | 13 8 7 | At store main centres or f.o.r. for country delivery. |
| Bread (retail) | 2 lb. loaf | 0 0 5 | Main centres and certain boroughs, &c., Cash; delivery, ½ d. extra (maximum). Best of Dominion, 6d. cash; up to 1/2d. extra allowed for delivery. |
| Superphosphates— | |||
| 44/46 per cent. | Ton | 3 16 0 | Ex works or ex trucks, North Island. |
| 44/46 per cent. | Ton | 4 2 0 | Ex works or ex trucks, South Island. |
| Motor-spirits | Gallon (imp.) | 0 1 7 to 0 1 11½ | Wholesale price, according to locality, for standard spirit. Retail price, approximately 3d. per gallon higher. |
| Woolpacks | Each | 0 3 4 | 42 in. by 27 in. by 27 in., ex store, main ports. |
| Woolpacks | Each | 0 3 7 | 48 in. by 27 in. by 27 in., ex store, main ports. |
| Woolpacks | Each | 0 3 10 | 54 in. by 27 in. by 27 in., ex store, main ports. |
| Butter | Lb. | 0 0 11.75 to 0 1 1.375 | For export, according to grade. |
| Butter | Lb. | 0 1 1.5 to 0 1 2.5 | Wholesale price for local consumption, according to grade. |
| Cheese | Lb. | 0 0 7.29 to 0 0 7.6925 | For export, according to grade. |
| Onions | Ton | 3 15 0 to 5 15 0 | According to grade, f.o.b. or f.o.r. nearest to place where grown. |
Prices of wheat shown in the foregoing statement are present prices (September, 1937). The schedule varies according to the time of the year. The prices shown are those charged to South Island mills; those to North Island being 1½d. per bushel lower to enable price-equalization throughout the Dominion.
The Prevention of Profiteering Act, 1936, was passed to prevent profiteering by prohibiting the making of unreasonable increases in prices (vide Section XXXVIII—Labour Laws and Allied Legislation).
Control of prices of milk in Wellington is in the hands of the Wellington City Council, which was granted a monopoly (with certain minor exceptions) of the sale of milk in Wellington by a local Act passed in 1919. The Auckland Metropolitan Milk Act, 1933, authorizes the Auckland Metropolitan Milk Council to fix prices for milk sold in Auckland City and suburbs. In this instance a monopoly has not been created, though it is an offence to sell or deliver milk in the district except under license from the Council.
Retail-price quotations, from which index numbers are regularly calculated, are collected each month in twenty-five centres of the Dominion, selected as being representative of New Zealand as a whole. These twenty-five centres are distributed over both Islands, from Whangarei in the North to Invercargill in the South, and are representative of both coastal and inland districts, and of both large and small centres. Returns of prices are collected by local Inspectors of Factories, for the most part from representative retailers, and from these data index numbers are compiled in the Census and Statistics Department, Wellington. These index numbers are published each month in the Monthly Abstract of Statistics.
The commodities for which monthly index numbers are compiled are foodstuffs and fuel and lighting, foodstuffs being divided into three groups—groceries, dairy-produce, and meat. Statistics of house-rents have been collected at six-monthly intervals since the inauguration of price statistics in 1914, and later the inquiry was extended to cover clothing and miscellaneous items, figures for which are collected at quarterly intervals.
Separate series of index numbers of retail prices are compiled and published for the following groups:—
Group I.—Groceries.
Group II.—Dairy-produce.
Group III.—Meat.
Group IV.—House-rent.
Group V.—Fuel and light.
Group VI.—Clothing (including drapery and footwear).
In addition, index numbers are compiled and published for the food (that is, the first three) groups combined, and also for all groups combined.
Prior to the year 1931 the retail-price index numbers were compiled on a pre-war base; but during 1931 a series of index numbers was initiated based on the average of prices ruling during the five years 1926–30. In order to permit of the revision being carried out, a collection of household budgets was made in 1930, so that an estimate of the proportionate distribution of expenditure in the various main groups of household expenditure might be made. These data are used in combining the group index numbers in order to arrive at a single figure representing all groups combined. The results of the budget collection were published in some detail in the 1931 issue of the Year-Book (pp. 793–795).
In the compilation of the index numbers for the food groups, rent, and fuel and light, the aggregate expenditure method is used—that is, the retail price of each individual item in these groups is “weighted” according to its average annual consumption in the Dominion during the years 1926 to 1930. In the clothing and drapery and miscellaneous groups the unweighted geometric average of price ratios is used for most subgroups, no reliable data being available as to the consumption of individual items in these groups, except in the case of two subgroups in the miscellaneous group (fares and cleaning supplies), where the aggregate expenditure method is adopted.
The following table shows the annual average index numbers for the three food groups combined, for each of the four chief centres and for the Dominion as a whole, during the last ten years. In the compilation of these indexes each item and separate group (groceries, dairy-produce, and meat) is accorded its proper relative importance in the combined food-groups index number. The average of annual Dominion index numbers for the years 1926 to 1936 equals 1000.
THREE FOOD GROUPS.—INDEX NUMBERS.
| Year. | Auckland. | Wellington. | Christchurch. | Dunedin. | Average of Four Centres. | Dominion Weighted Average. |
|---|---|---|---|---|---|---|
| 1927 | 976 | 978 | 982 | 986 | 981 | 983 |
| 1928 | 1009 | 980 | 990 | 1,006 | 996 | 1,004 |
| 1929 | 1,030 | 984 | 995 | 1009 | 1,005 | 1,013 |
| 1930 | 983 | 959 | 946 | 966 | 964 | 974 |
| 1931 | 848 | 827 | 843 | 829 | 837 | 845 |
| 1932 | 773 | 761 | 770 | 751 | 764 | 775 |
| 1933 | 724 | 719 | 732 | 700 | 719 | 732 |
| 1934 | 781 | 760 | 765 | 743 | 762 | 774 |
| 1935 | 863 | 811 | 814 | 811 | 825 | 835 |
| 1936 | 893 | 848 | 846 | 845 | 864 | 870 |
To obtain a general estimate of the course of prices for the whole Dominion it has been necessary to obtain a weighted average of the index numbers for each of the twenty-five representative centres. Price-indexes for each centre have been weighted in accordance with the number of people in the respective centres, and a composite index number has been obtained, which, though necessarily artificial, represents accurately enough the average level of retail prices in the Dominion.
The twenty-five centres considered have a total population of approximately half that of New Zealand, and they can therefore be regarded as reasonably representative of the Dominion. The four chief centres, which include nearly 40 per cent. of the Dominion's population, account for over 70 per cent. of the population of the twenty-five centres, so that their influence in the Dominion index number is naturally predominating. However, the chief centres not only comprise a great part of the people of the Dominion, but also set the standard which is generally followed throughout the country.
The 1933 index numbers for each of the four cities and the Dominion are the lowest recorded during the last decade, a substantial fall occurring between 1929 and 1933. The Dominion annual average index (732) for 1933 was only 4.1 per cent. above the level in July, 1914. The figures for the three subsequent years, however, generally indicate a restoration of prices to a level in 1936 above that for 1931. For the most recent index numbers refer to “Latest Statistical Information” in the forefront of this volume.
Attention may be drawn in passing to the comparatively small differences recorded between the average index numbers for the four chief centres and the Dominion weighted averages. In this respect, as will be shown later on in this section, the average of the three food groups combined stands in marked contrast to the rent group.
Index numbers of retail prices of groceries in each of the four chief centres are given in the following table, which also shows the unweighted average of the four chief centres and the Dominion weighted average. The average of the Dominion annual index numbers for 1926 to 1930 equals 1000.
| Year. | Auckland. | Wellington. | Christchurch. | Dunedin. | Average of Four Centres. | Dominion Weighted Average. |
|---|---|---|---|---|---|---|
| 1927 | 1,021 | 995 | 989 | 1,006 | 1,003 | 1,015 |
| 1928 | 1,042 | 1,007 | 989 | 1,020 | 1,015 | 1,033 |
| 1929 | 985 | 953 | 932 | 958 | 957 | 973 |
| 1930 | 928 | 922 | 883 | 924 | 914 | 932 |
| 1931 | 899 | 876 | 842 | 887 | 876 | 891 |
| 1932 | 856 | 837 | 804 | 863 | 840 | 857 |
| 1933 | 813 | 780 | 787 | 832 | 803 | 819 |
| 1934 | 815 | 837 | 817 | 850 | 830 | 845 |
| 1935 | 884 | 904 | 858 | 900 | 887 | 899 |
| 1936 | 852 | 871 | 854 | 870 | 860 | 878 |
Prices in the groceries group fell steadily, though slowly, during the decade ending with 1933, the Dominion index number for that year being the lowest recorded during the period. Prices generally rose during 1934 and 1935, but during 1936 there was again an appreciable fall.
The factors underlying the fluctuations in the groceries group will be more clearly understood when it is remembered that the items comprising the group are varied in nature, and may be treated in three subgroups as shown below. The fundamental distinction is that the items comprising Group 1A are almost wholly imported from overseas, while those in Group 1B are almost wholly produced in the country. Sugar is not wholly a product of New Zealand, the raw material being imported and refined at Auckland. The Dominion weighted average index number, 1926–30, equals 1000 in each case.
GROCERIES SUBGROUPS.—INDEX NUMBERS.
| Year. | Auckland. | Wellington. | Christchurch. | Dunedin. | Average of Four Centres. |
|---|---|---|---|---|---|
| Group Ia.—General Groceries. | |||||
| 1932 | 872 | 786 | 787 | 841 | 822 |
| 1933 | 842 | 782 | 777 | 849 | 813 |
| 1934 | 870 | 871 | 857 | 934 | 883 |
| 1935 | 887 | 881 | 869 | 916 | 888 |
| 1936 | 881 | 898 | 872 | 911 | 891 |
| Group Ib.—Bread, Flour, Oatmeal, Potatoes, and Onions. | |||||
| 1932 | 833 | 853 | 783 | 845 | 829 |
| 1933 | 734 | 709 | 725 | 760 | 732 |
| 1934 | 731 | 773 | 740 | 755 | 750 |
| 1935 | 845 | 878 | 807 | 853 | 846 |
| 1936 | 789 | 807 | 792 | 796 | 796 |
| Group Ic.—Sugar. | |||||
| 1932 | 896 | 890 | 907 | 918 | 903 |
| 1933 | 1,113 | 1108 | 1,114 | 1,123 | 1,115 |
| 1934 | 1078 | 1082 | 1087 | 1093 | 1085 |
| 1935 | 1,062 | 1084 | 1,071 | 1081 | 1,075 |
| 1936 | 1083 | 1108 | 1097 | 1,115 | 1,101 |
It is noteworthy that, despite the further depreciation of New Zealand currency on sterling in January, 1933, the average index number for Group 1A (which is comprised almost wholly of imported foodstuffs) was slightly lower in 1933 than in 1932. The 1934 figure, however, showed a substantial increase, since which year no marked change has been recorded.
The very considerable advance in Group 1B in 1935 was due to higher prices for all items in the group, but principally in the case of potatoes. A substantial fall was recorded by this Group in 1936.
The retail prices index numbers for Group 1c (sugar) fell considerably for some years prior to 1932, when a sharp rise was recorded, the effect of the imposition of an increased duty on sugar. A further rise in 1933 synchronized with the raising of the exchange rate; in 1934 prices fell somewhat, while towards the end of 1935 a further increase took place.
The next table shows annual average retail price index numbers for the dairy-produce group. The Dominion weighted average index number for 1926–1930 equals 1000.
| Year. | Auckland. | Wellington. | Christchurch. | Dunedin. | Average of Four Centres. | Dominion Weighted Average. |
|---|---|---|---|---|---|---|
| 1927 | 1,036 | 1,032 | 968 | 1,022 | 1,015 | 1,010 |
| 1928 | 1,032 | 1,025 | 958 | 1,025 | 1,010 | 1,006 |
| 1929 | 1,005 | 1,031 | 943 | 1,024 | 1,001 | 999 |
| 1930 | 942 | 954 | 905 | 954 | 939 | 939 |
| 1931 | 819 | 836 | 766 | 778 | 800 | 807 |
| 1932 | 742 | 761 | 667 | 680 | 713 | 722 |
| 1933 | 652 | 708 | 617 | 625 | 651 | 661 |
| 1934 | 680 | 704 | 612 | 651 | 662 | 666 |
| 1935 | 761 | 787 | 698 | 744 | 748 | 749 |
| 1936 | 821 | 839 | 729 | 789 | 800 | 801 |
Between 1922 and 1929 dairy-produce prices did not fluctuate to any marked extent, the lowest Dominion annual index number during that period being 985 (in 1922) and the highest 1953 (in 1924). Between 1929 and 1933 a marked downward trend in dairy-produce prices is apparent. The 1933 annual average index (661) is considerably below that for any year during the preceding decade, while the 1934 Dominion figure shows a rise of only five points as compared with 1933. For 1935, however, each of the indexes given in the above table shows an increase of over eighty points since the previous year, and this upward trend is continued in 1936 in a somewhat modified degree.
Between the years 1922 and 1929 the general trend of meat prices was upward, the lowest Dominion index number recorded during that period being 813 (in 1922) and the highest 1952 (in 1929). A slight falling off in meat prices in 1930 was followed by a sharp fall in 1931, the index number for the latter year (834) representing a fall of 199 points, or 19.3 per cent., as compared with the 1930 figure. Retail prices of meat in 1931 were still slightly higher than in the year 1922; but during 1932 and 1933 prices fell to a lower level than was recorded during the slump of 1922, the annual average index number for 1933 (714) representing a considerable decrease on the 1922 annual average index number. The year 1934 marked the commencement of a recovery which has since been maintained, and the 1936 index is now approaching the 1927 level, although still considerably below those of the three subsequent years.
MEAT.—INDEX NUMBERS.
| Year. | Auckland. | Wellington. | Christchurch. | Dunedin. | Average of Four Centres. | Dominion Weighted Average. (1926–30 = 1000.) |
|---|---|---|---|---|---|---|
| 1927 | 896 | 924 | 985 | 941 | 937 | 937 |
| 1928 | 966 | 926 | 1,012 | 980 | 971 | 979 |
| 1929 | 1080 | 973 | 1079 | 1,036 | 1,042 | 1,052 |
| 1930 | 1,052 | 990 | 1,023 | 1,005 | 1018 | 1,033 |
| 1931 | 829 | 781 | 897 | 815 | 831 | 834 |
| 1932 | 729 | 702 | 817 | 714 | 741 | 747 |
| 1933 | 705 | 678 | 769 | 650 | 701 | 714 |
| 1934 | 827 | 740 | 838 | 725 | 783 | 796 |
| 1935 | 919 | 756 | 863 | 789 | 832 | 846 |
| 1936 | 977 | 835 | 924 | 866 | 913 | 912 |
For purposes of all the foregoing tables the base period has been taken as the average of the years 1920–30. For some purposes, however, interest centres on the comparison between present prices and those prevailing immediately prior to the outbreak of the Great War. One of the advantages of the aggregate expenditure method is that it enables index numbers computed on one base to be converted by a simple application of the rule of proportion to another base regarded as desirable for some special purpose. The following table relates to the Dominion weighted average for the respective groups:—
| Group. | First Quarter, 1936. | Second Quarter, 1936. | Third Quarter, 1936. | Fourth Quarter, 1936. | Average for Year 1936. | |||||
|---|---|---|---|---|---|---|---|---|---|---|
| Index Number. | Percentage Increase.* | Index Number. | Percentage Increase.* | Index Number. | Percentage Increase.* | Index Number. | Percentage Increase.* | Index Number. | Percentage Increase.* | |
| * Over July, 1914. | ||||||||||
| Groceries (index number, July, 1914: 624) | 870 | 39.4 | 859 | 37.7 | 872 | 39.7 | 910 | 45.8 | 878 | 40.7 |
| Dairy-produce (index number, July, 1914: 719) | 740 | 2.9 | 824 | 14.6 | 825 | 14.7 | 815 | 13.4 | 801 | 11.4 |
| Meat, (index number, July, 1914: 759) | 870 | 14.6 | 882 | 16.2 | 935 | 23.2 | 960 | 26.5 | 912 | 20.2 |
| Three food groups (index number, July, 1914: 703) | 833 | 18.5 | 858 | 22.0 | 884 | 25.7 | 903 | 28.4 | 870 | 23.8 |
Using the weights used in the compilation of the New Zealand food price-index, attempts have been made to determine the relation between food-prices in New Zealand and in other countries, experiments having shown that the use of the weights employed in the computation of the index numbers of the other countries respectively does not greatly affect the result in the case of comparisons between countries with not essentially dissimilar standards of living. The commodities included, though comparatively few, cover the most important foodstuffs. The percentages shown in the second column of figures in the table following are the results, taking food-prices in New Zealand (Dominion weighted average) in February, 1937, as 100.
| Country. | Percentage of Food Prices to New Zealand Food Prices. | |
|---|---|---|
| July, 1914. | February, 1937. | |
| South Africa | 141 | 109 |
| United States | 129 | 117 |
| Canada | 125 | 107 |
| Australia | 105½ | 106 |
In investigating changes in the cost of housing the Census and Statistics Department has traced the movements of house-rent over a series of years. Such normally provide a reasonably accurate indication (and, in effect, the only practical means available) of movements in housing-costs in general, not only for those paying rent, but also for those who own or partially own the dwellings they occupy. It is probable that this latter assumption is less valid in the abnormal conditions existing since 1930.
By reason of the fact that leases, infrequent changes of residence, and the difficulty of departing from customary rents all tend to make the movement of the general level of rents comparatively slow, it has not been deemed necessary to attempt to measure the changes over short periods. The data from which the rent figures are compiled are therefore collected semi-annually only, in the months of February and August. Annual index numbers for rent are computed on the assumption that the February index number represents conditions prevailing during the first four and a half months of the year, the August index conditions prevailing during the next six months, and the index for February of the following year conditions prevailing during the last one and a half months of the year.
HOUSE-RENT.—INDEX NUMBERS.
| Year | Auckland. | Wellington. | Christchurch. | Dunedin. | Average of Four Centres. | Dominion Weighted Average (1926–30 = 1000). |
|---|---|---|---|---|---|---|
| 1927 | 1019 | 1191 | 1,010 | 880 | 1,025 | 1,000 |
| 1928 | 1,004 | 1,261 | 1,004 | 909 | 1,045 | 1,014 |
| 1929 | 985 | 1,336 | 990 | 937 | 1,062 | 1019 |
| 1930 | 953 | 1,326 | 973 | 958 | 1,053 | 1,007 |
| 1931 | 876 | 1,241 | 926 | 936 | 995 | 953 |
| 1932 | 763 | 1,063 | 823 | 846 | 874 | 844 |
| 1933 | 693 | 937 | 748 | 799 | 794 | 766 |
| 1934 | 696 | 929 | 747 | 792 | 791 | 758 |
| 1935 | 719 | 964 | 755 | 802 | 801 | 774 |
| 1936 | 770 | 997 | 777 | 821 | 837 | 804 |
It is advisable to stress that the index numbers in respect of rent indicate the movement in the average rentals of a large number of houses already let, in many cases for some time, and that they do not purport to convoy any statement as to the price at which housing accommodation has been obtainable from time to time by would-be occupants of houses then being relet.
The index numbers for each of the twenty-five towns at each of the last five collections are appended, together with yearly index numbers for 1935 and 1936.
HOUSE-RENT.—INDEX NUMBERS FOR TWENTY-FIVE TOWNS.
| Town. | Yearly Average, 1935. | Yearly Average, 1936. | August, 1935. | February, 1936. | August, 1936. | February, 1937. | August, 1937. |
|---|---|---|---|---|---|---|---|
| Auckland | 719 | 770 | 725 | 738 | 791 | 785 | 793 |
| Wellington | 964 | 997 | 961 | 993 | 996 | 1,015 | 1,026 |
| Christchurch | 755 | 777 | 756 | 771 | 780 | 779 | 808 |
| Dunedin | 802 | 821 | 803 | 810 | 825 | 834 | 837 |
| Whangarei | 696 | 704 | 694 | 687 | 710 | 728 | 763 |
| Hamilton | 754 | 780 | 751 | 763 | 774 | 856 | 884 |
| Rotorua | 778 | 835 | 778 | 832 | 827 | 875 | 871 |
| Waihi | 497 | 528 | 501 | 511 | 551 | 565 | 534 |
| Gisborne | 688 | 695 | 675 | 676 | 706 | 708 | 712 |
| Napier | 780 | 762 | 791 | 776 | 749 | 770 | 778 |
| Dannevirke | 593 | 634 | 612 | 628 | 633 | 656 | 650 |
| New Plymouth | 801 | 814 | 808 | 779 | 840 | 811 | 824 |
| Wanganui | 595 | 615 | 599 | 607 | 617 | 633 | 643 |
| Taihape | 633 | 648 | 628 | 651 | 639 | 671 | 697 |
| Palmerston North | 794 | 822 | 808 | 806 | 829 | 840 | 841 |
| Masterton | 772 | 770 | 776 | 767 | 770 | 776 | 787 |
| Blenheim | 606 | 634 | 614 | 621 | 642 | 637 | 665 |
| Nelson | 755 | 743 | 748 | 736 | 740 | 777 | 778 |
| Greymouth | 659 | 704 | 655 | 692 | 715 | 695 | 724 |
| Ashburton | 698 | 698 | 694 | 691 | 706 | 683 | 698 |
| Timaru | 706 | 738 | 709 | 730 | 735 | 775 | 748 |
| Oamaru | 714 | 728 | 714 | 719 | 724 | 771 | 722 |
| Alexandra | 585 | 583 | 604 | 583 | 582 | 588 | 632 |
| Gore | 635 | 599 | 623 | 598 | 592 | 631 | 654 |
| Invercargill | 674 | 696 | 677 | 685 | 701 | 710 | 702 |
| Dominion weighted average (1926–30 = 1000) | 774 | 804 | 776 | 789 | 812 | 820 | 830 |
House-rents reached a peak level in 1929, since which year the Dominion rent-index number fell at each successive collection up to and inclusive of 1934. Subsequent figures, however, exhibit a definite upward trend, and it appears that at the present time there is a definite shortage of houses for renting (see page 528). Rent and interest charges were compulsorily reduced by 20 per cent. by the National Expenditure Adjustment Act, 1932. The reduction was at first temporary, but has since been made permanent, in cases to which it still applies, by the Mortgagors and Lessees Rehabilitation Act, 1936. The Fair Rents Act, passed in 1936, is a temporary measure designed to prevent undue increases in rents. A comprehensive housing policy, including the building of houses by the Government and local authorities for letting at low rentals, is being put into effect (see Section XXXVIII).
Generally speaking, apart from the consideration of different rates of population-increase, the chief centres have higher rentals than the minor centres. The four largest centres have, however, lower indexes for food than the majority of the smaller towns. The following figures, representing yearly averages for 1936, illustrate this point:—
| Group. | Weighted Average of Four Chief Centres. (a.) | Weighted Average of Twenty-one Smaller Centres. (b.) | Excess of (b) over (a). | Dominion Weighted Average. |
|---|---|---|---|---|
| * Excess of (a) over (b). | ||||
| Groceries | 860 | 920 | 60 | 878 |
| Dairy-produce | 800 | 804 | 4 | 801 |
| Meat | 913 | 910 | 3* | 912 |
| Three food groups | 864 | 883 | 19 | 870 |
| House-rent | 837 | 726 | 111* | 804 |
The following table shows the index numbers for the various groups for each of the twenty - five towns on the base: Dominion weighted average expenditure, 1926–30, equals 1000:—
FOOD GROUPS AND RENT.—INDEX NUMBERS FOR TWENTY-FIVE TOWNS, 1936.
| Town. | Group I: Groceries. | Group II: Dairy-produce. | Group III: Meat. | Groups I–III: Food Groups. | Group IV: House-rent. |
|---|---|---|---|---|---|
| Auckland | 852 | 821 | 977 | 893 | 770 |
| Wellington | 871 | 839 | 835 | 848 | 997 |
| Christchurch | 854 | 729 | 924 | 846 | 777 |
| Dunedin | 870 | 789 | 866 | 845 | 821 |
| Whangarei | 922 | 805 | 995 | 918 | 704 |
| Hamilton | 974 | 801 | 969 | 922 | 780 |
| Rotorua | 1,000 | 842 | 972 | 943 | 835 |
| Waihi | 955 | 790 | 907 | 889 | 528 |
| Gisborne | 957 | 831 | 811 | 863 | 695 |
| Napier | 912 | 853 | 785 | 845 | 762 |
| Dannevirke | 909 | 810 | 803 | 838 | 634 |
| New Plymouth | 910 | 767 | 919 | 872 | 814 |
| Wanganui | 942 | 817 | 940 | 905 | 615 |
| Taihape | 995 | 869 | 883 | 914 | 648 |
| Palmerston North | 906 | 784 | 951 | 889 | 822 |
| Masterton | 948 | 805 | 922 | 896 | 770 |
| Blenheim | 918 | 830 | 969 | 913 | 634 |
| Nelson | 931 | 824 | 955 | 910 | 743 |
| Greymouth | 875 | 846 | 882 | 869 | 704 |
| Ashburton | 841 | 767 | 902 | 844 | 698 |
| Timaru | 867 | 760 | 881 | 842 | 738 |
| Oamaru | 872 | 794 | 857 | 844 | 728 |
| Alexandra | 974 | 853 | 939 | 925 | 583 |
| Gore | 906 | 815 | 984 | 912 | 599 |
| Invercargill | 897 | 781 | 922 | 874 | 696 |
| Weighted average for Dominion | 878 | 801 | 912 | 870 | 804 |
Ashburton, Auckland, and Christchurch are the cheapest in respect of prices of groceries, while Rotorua has the highest index for this group. Taihape, Napier, and Alexandra are dearest in respect of prices of dairy-produce; while the Whangarei index for meat is highest, followed by Gore and Auckland. Christchurch and Timaru show the lowest prices for dairy-produce, while meat is cheapest in Napier, Dannevirke, and Gisborne.
For the purpose of tracing the course of prices in the fuel and light group, a small group of seven items—coal, coke, firewood, kerosene, gas, electricity, and candles—is taken into account for the four chief centres. It is not feasible to extend this index to the remaining twenty-one centres covered by the food and rent indexes.
FUEL AND LIGHT.—INDEX NUMBERS.
| Period. | Auckland. | Wellington. | Christchurch. | Dunedin. | Average of Four Centres (1926–30 = 1000). |
|---|---|---|---|---|---|
| Year. | |||||
| 1927 | 1078 | 979 | 1,061 | 901 | 1,005 |
| 1928 | 1,115 | 974 | 1,054 | 899 | 1,011 |
| 1929 | 1,114 | 968 | 986 | 898 | 992 |
| 1930 | 1,112 | 968 | 988 | 897 | 991 |
| 1931 | 1108 | 951 | 995 | 892 | 987 |
| 1932 | 1,020 | 925 | 993 | 894 | 958 |
| 1933 | 860 | 931 | 987 | 781 | 890 |
| 1934 | 807 | 886 | 976 | 695 | 841 |
| 1935 | 900 | 873 | 974 | 713 | 865 |
| 1936 | 952 | 879 | 955 | 762 | 887 |
| Quarter. | |||||
| First, 1936 | 922 | 881 | 954 | 737 | 874 |
| Second, 1936 | 931 | 879 | 954 | 737 | 875 |
| Third, 1936 | 961 | 878 | 955 | 787 | 895 |
| Fourth, 1936 | 994 | 878 | 956 | 787 | 904 |
| First, 1937 | 1,000 | 878 | 956 | 788 | 906 |
| Second, 1937 | 1,001 | 927 | 962 | 797 | 922 |
| Third, 1937 | 1,004 | 928 | 972 | 812 | 929 |
The average index number for this group for the four chief centres fell sharply between 1922 and 1923, remained practically stationary between 1923 and 1931, and fell in 1932, 1933, and 1934, since when an upward tendency is again in evidence. Fuel and lighting prices are, on the average, substantially lower in Dunedin than in any other centre.
In regard to the method of treatment of the clothing and miscellaneous groups, it is to be explained that, as in the case of fuel and light, the inquiry is in general restricted to the four chief centres; further, except as regards fares, in respect of which accurate weights based on usage in the base period are available, enabling the aggregate-expenditure method to be employed, no satisfactory information is available or procurable which would enable individual weights to be allotted to each item. For this reason the same measure of precision is not possible in the treatment of these groups, bus by selective balancing of representative items and arranging them in representative subgroups a measure of weighting is secured, each subgroup being treated as a separate unit Price ratios are computed, geometric averages of which are compiled for the subgroups and for the complete groups. In order to facilitate the dropping of obsolete items and the inclusion of new items (particularly in the clothing groups), the initial computations of price ratios are based on prices in the immediately preceding collection of the data, the group averages being linked to the 1926–30 base.
The movement of prices of clothing and miscellaneous items from year to year may be traced in the table under the next heading.
From the collection of household budgets in 1930, the average household expenditure under various heads was found to be as follows:—
| Per Cent. | |
|---|---|
| Food | 29.52 |
| Housing | 21.93 |
| Clothing, drapery, and footwear | 12.61 |
| Fuel and light | 6.17 |
| Miscellaneous | 29.77 |
| 100.00 |
These weights are applied to the index numbers of the different groups in the process of arriving at the “all groups” retail price-index, with the exception that the weight applied to the miscellaneous group is 11.08 and not 29.77. Thus 81 per cent. of household expenditure is covered by the index number. The remaining 19 per cent. represents miscellaneous items for which it has been found impossible to obtain reliable price-quotations. Their omission has the effect of giving them the same general average price-movement as the 81 per cent. covered.
The following table shows the index numbers for all groups for each of the last ten years. It should be noted that the annual index numbers given represent the average price-level during each year, not at any of the particular points during the year at which the prices for the respective groups were collected:—
(Base: Dominion weighted average of prices in 1926–30 in twenty-five centres in case of Groups I to IV, and average of prices in 1926–30 in four chief centres in case of Groups V, VI, and VII = 1000.)
| Year. | Food Groups. | Rent. (IV.) | Fuel and Light. (V.) | Clothing, Drapery, and Footwear. (VI.) | Miscellaneous. (VII.) | All Groups combined. (I–VII.) | Increase per Cent. over July, 1914. | |||
|---|---|---|---|---|---|---|---|---|---|---|
| Groceries. (I.) | Dairy-produce. (II.) | Meat. (III.) | Three Food Groups. (I–III.) | |||||||
| * Month of July. | ||||||||||
| 1914* | 624 | 719 | 759 | 703 | 535 | 585 | 686 | 601 | 628 | |
| 1927 | 1,015 | 1,010 | 937 | 983 | 1,000 | 1,005 | 1,017 | 1,033 | 1,001 | 59.4 |
| 1928 | 1,033 | 1,006 | 979 | 1,004 | 1,014 | 1,011 | 995 | 1,002 | 1,006 | 60.2 |
| 1929 | 973 | 999 | 1,052 | 1,013 | 1019 | 992 | 980 | 986 | 1,004 | 59.9 |
| 1930 | 932 | 939 | 1,033 | 974 | 1,007 | 991 | 947 | 986 | 981 | 56.2 |
| 1931 | 891 | 807 | 834 | 845 | 953 | 987 | 869 | 986 | 906 | 44.3 |
| 1932 | 857 | 722 | 747 | 775 | 844 | 958 | 814 | 973 | 838 | 33.4 |
| 1933 | 819 | 661 | 714 | 732 | 766 | 890 | 816 | 976 | 795 | 26.6 |
| 1934 | 845 | 666 | 796 | 774 | 758 | 841 | 832 | 973 | 808 | 28.7 |
| 1935 | 899 | 749 | 846 | 835 | 774 | 865 | 828 | 975 | 837 | 33.3 |
| 1936 | 878 | 801 | 912 | 870 | 804 | 887 | 837 | 982 | 864 | 37.6 |
The index numbers for all groups combined had not fluctuated to any great extent between 1923 and 1930, but during three years a considerable fall took place. In 1934 an upward tendency became manifest, the index for 1936 being 8.7 per cent. above that for 1933.
The diagram which follows illustrates the fluctuations of retail prices and house-rents from 1914 to 1936, and brings out clearly the tendency of rent movements to lag behind those of the other groups.
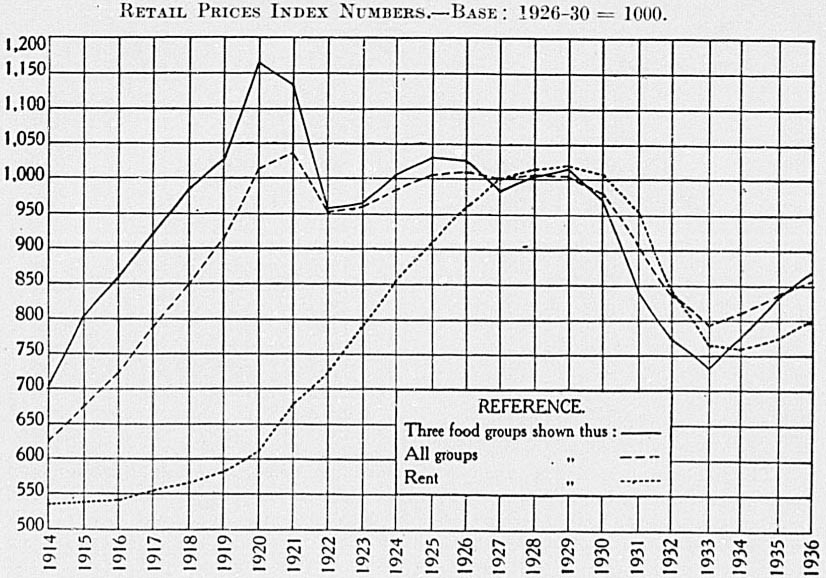
In most countries index numbers of wholesale prices are compiled from the price data available in trade journals or from the published reports of wholesale markets. In New Zealand wholesale markets scarcely exist, and consequently price data for the wholesale-prices investigation have been collected from wholesale merchants and traders, who from the volume of the business they transact are able to supply representative information.
Since 1917 such wholesale-price quotations have been collected monthly, the inquiry being for the most part confined to the four chief centres. In the case of a few commodities (e.g., newsprint), of which there is a local consumption so largo that the article can scarcely be omitted from the price-index, yet for which no actual local market exists, the inclusion of the commodity in the index number has been rendered possible by ascertaining movements of prices from the import statistics. Statistics of imports and exports as a source of price data have, however, been avoided as far as possible, on the that where quotations are obtained from traders care can be taken to &c., quoted for is kept constant. A considerable volume of data as to wholesale prices was secured from merchants and traders (and in a few cases from import figures) by means of retrospective investigations covering the years 1891 to 1917, and sufficient information was secured to permit of the compilation for each year from 1891 onwards of a “general” wholesale-price index number based on the prices of 106 commodities.
During 1926 a revision of the wholesale price-index was effected, specially designed, inter alia, to permit of the inclusion in the index number of several commodities such as motor-spirit, &c., the importance of which had increased enormously since the index was originally instituted. The list of commodities represents a wide range, covering articles of home production and of foreign production, of farm, mine, marine, factory, &c., origin, and representing all stages of production.
The base adopted for purposes of the wholesale-price inquiry is the average of the wholesale prices in the four chief centres during 1909 to 1913, the price quotations from the various merchants being so combined that each return from any given town has the same weight in the averaging process as any other return from that town, while in obtaining Dominion average prices for any given commodity each of the four centres is given the same weight.
WHOLESALE PRICES.—GENERAL INDEX NUMBERS.
| Year. | Index Number. |
|---|---|
| 1891 | 975 |
| 1892 | 953 |
| 1893 | 954 |
| 1894 | 909 |
| 1895 | 902 |
| 1896 | 925 |
| 1897 | 924 |
| 1898 | 953 |
| 1899 | 876 |
| 1900 | 899 |
| 1901 | 913 |
| 1902 | 956 |
| 1903 | 936 |
| 1904 | 904 |
| 1905 | 975 |
| 1906 | 996 |
| 1907 | 996 |
| 1908 | 987 |
| 1909 | 931 |
| 1910 | 964 |
| 1911 | 975 |
| 1912 | 1,021 |
| 1913 | 1,012 |
| 1914 | 1,053 |
| 1915 | 1184 |
| 1916 | 1,273 |
| 1917 | 1449 |
| 1918 | 1,705 |
| 1919 | 1782 |
| 1920 | 2,092 |
| 1921 | 1942 |
| 1922 | 1,665 |
| 1923 | 1598 |
| 1924 | 1,634 |
| 1925 | 1,627 |
| 1926 | 1,553 |
| 1927 | 1478 |
| 1928 | 1492 |
| 1929 | 1488 |
| 1930 | 1449 |
| 1931 | 1,346 |
| 1932 | 1297 |
| 1933 | 1308 |
| 1934 | 1,330 |
| 1935 | 1385 |
| 1936 | 1399 |
The wholesale-price index is purely a commodity index, no attempt having been made to cover the wholesale prices of services such as the supply of electric power, transportation, &c. The index relates only to commodities consumed locally, each item included in the make-up of the index being weighted by a factor representing production, plus imports, less exports (i.e., local consumption). The wholesale-prices index numbers are compiled by the aggregate expenditure method.
The following table shows annual wholesale-price index numbers by groups.
WHOLESALE PRICES.—INDEX NUMBERS BY GROUPS.
| Group. | 1913. | 1931. | 1932. | 1933. | 1934. | 1935. | 1936. |
|---|---|---|---|---|---|---|---|
| 1. Foodstuffs, &c., of vegetable origin— | |||||||
| A. Agricultural produce | 967 | 1,275 | 1,336 | 1080 | 1,171 | 1485 | 1308 |
| B. Fresh fruit and vegetables | 1,031 | 1,104 | 914 | 1,050 | 879 | 1,172 | 1049 |
| C. Milled agricultural products | 982 | 1,645 | 1,436 | 1,341 | 1,321 | 1282 | 1328 |
| D. Other vegetable foodstuffs and groceries | 1,010 | 1,670 | 1783 | 1893 | 1888 | 1851 | 1853 |
| A–D. Four subgroups combined | 991 | 1479 | 1,504 | 1,451 | 1,466 | 1583 | 1,517 |
| 2. Textile manufactures | 1,020 | 1681 | 1,560 | 1,543 | 1597 | 1608 | 1,614 |
| 3. Wood and wood products | 1,072 | 1898 | 1843 | 1858 | 1870 | 1909 | 1989 |
| 4. Animal products— | |||||||
| A. Meats | 1,111 | 1,037 | 815 | 941 | 1096 | 1186 | 1,277 |
| B. Raw animal products (not foods) | 1085 | 649 | 596 | 760 | 950 | 865 | 1080 |
| C. Leather | 1,126 | 1,244 | 1269 | 1,334 | 1,360 | 1,341 | 1,360 |
| D. Manufactured foodstuffs and groceries of animal origin | 1,030 | 1,112 | 1,016 | 946 | 903 | 1094 | 1178 |
| A–D. Four subgroups combined | 1088 | 1,035 | 877 | 950 | 1,047 | 1,142 | 1238 |
| 5. Metals and their products | 932 | 1,061 | 1008 | 1099 | 1,074 | 1049 | 1085 |
| 6. Non-metallic minerals and their products— | |||||||
| A. Mineral oils | 1,004 | 785 | 834 | 903 | 854 | 875 | 894 |
| B. Coals | 1,037 | 1848 | 1824 | 1,701 | 1,717 | 1,766 | 1820 |
| C. Other non-metallic minerals and their products | 1,026 | 1,661 | 1,666 | 1,717 | 1,705 | 1684 | 1668 |
| A–C. Three subgroups combined | 1,022 | 1384 | 1395 | 1380 | 1,364 | 1390 | 1418 |
| 7. Chemicals and manures | 1,030 | 1,101 | 1,063 | 1,047 | 1,060 | 1,061 | 1,044 |
| All groups combined | 1,012 | 1,346 | 1297 | 1308 | 1,330 | 1385 | 1399 |
In the next table index numbers are given by classes from 1927 to 1936. The table also shows the separate index numbers for imported items and locally produced items included in the wholesale-price series. The export price index number is also included for purposes of comparison, but it should be noted that this index is computed by a different method from that adopted in connection with the computing of the wholesale-price index.
These index numbers should be taken for no more than they purport to represent—viz., the movement in wholesale prices of those commodities covered by the wholesale prices inquiry which belong to the respective classes. The figure for Class III, for instance, does not purport to show the movement in building costs, nor should that or imported items be confused with the index number of import prices.
WHOLESALE PRICES.—INDEX NUMBERS BY CLASSES.
| Year. | Consumers' Goods. | Producers' Materials, &c. | Imported Commodities. | Locally-produced Commodities. | All Classes combined. | Index Number of Export Prices. | ||
|---|---|---|---|---|---|---|---|---|
| Class I: Foodstuffs. | Class II: Non-Foods. | Class III: Materials for Building and Construction. | Class IV: Materials for other Industries. | |||||
| Average 1909–13 | 1,000 | 1,000 | 1,000 | 1,000 | 1,000 | 1,000 | 1,000 | 1,000 |
| 1927 | 1459 | 1489 | 1795 | 1428 | 1,376 | 1,562 | 1478 | 1,525 |
| 1928 | 1,515 | 1,466 | 1,744 | 1,444 | 1,346 | 1,613 | 1492 | 1683 |
| 1929 | 1519 | 1,456 | 1,751 | 1,435 | 1,342 | 1608 | 1488 | 1,623 |
| 1930 | 1,430 | 1,433 | 1,764 | 1,412 | 1,332 | 1,545 | 1449 | 1283 |
| 1931 | 1,243 | 1408 | 1691 | 1,322 | 1,330 | 1359 | 1,346 | 984 |
| 1932 | 1180 | 1379 | 1,655 | 1,273 | 1296 | 1298 | 1297 | 892 |
| 1933 | 1,221 | 1390 | 1718 | 1,253 | 1,361 | 1,265 | 1308 | 896 |
| 1934 | 1268 | 1394 | 1,725 | 1,273 | 1,345 | 1319 | 1,330 | 1109 |
| 1935 | 1,522 | 1,410 | 1,746 | 1288 | 1,322 | 1,437 | 1385 | 1,102 |
| 1936 | 1399 | 1,425 | 1806 | 1,314 | 1,332 | 1,455 | 1399 | 1,250 |
Of the total base aggregate expenditure, Class I represented 30.1 per cent., Class II 20.5 per cent., Class III 7.4 per cent., and Class IV 42.0 per cent., while the imported items aggregated 42.8 per cent. of the total.
The all-groups index fell in each successive year from 1928 to 1932, since when the movement has been irregular, but with a decided upward trend, the “all classes” index having risen more than 100 points since 1932. The greatest increase during the four years (219 points) occurred in the “foodstuffs” class, although this index is still considerably below the 1928–29 level.
The diagram on the preceding page shows clearly that it was only during the period 1918–22 that the indexes of prices of imported goods rose appreciably above those for locally produced goods.
For some years past index numbers have been compiled and published at monthly intervals, indicating the direction and extent of fluctuation in the level of prices of New Zealand produce exported. These index numbers are based on the declared values (in New Zealand currency) for export as recorded by the Customs Department.
Formerly each commodity included in the compilation was accorded an importance corresponding to the quantity of that commodity exported during the particular month or year under investigation. For example, the annual index number for the year 1931 indicated the relationship between the total value in that year of exports of items included in the index numbers and the value of the quantities of the various commodities exported in 1931 at the average prices ruling during the years 1909–13, the base period of the investigation. Thus the “weight” or importance of each item in the regimen of the index number varied according to fluctuations in the quantities exported from month to month and from year to year.
Movements in prices, however, are not distributed evenly over the whole field of commodities exported. As a consequence, material fluctuations were caused in the former monthly index numbers, winch were due partly to price-movements, but partly also to fluctuations in the relative quantities of commodities exported from month to month.
In order to remedy this weakness in the index number, the system of compilation was modified; the “weight” allotted to each item included in the new series being the average quantity of that item exported during the previous five exporting seasons—i.e. years ended 30th June. In the revision of the export-price index numbers also the opportunity was taken of revising the grouping of commodities somewhat in order to permit of a closer analysis of the distribution of price-movements among different classes of New Zealand products.
The revised index numbers are shown in the next table, compiled for each group on the base: 1909–13 = 1000.
EXPORT PRICES.—INDEX NUMBERS.
| Calendar Year. | Group I: Dairy-produce. | Group II: Meat. | Group III: Wool. | Group IV: Other Pastoral Produce. | Groups I–IV: All Pastoral and Dairy Produce. | Group V: Agricultural Produce. | Group VI: Timber. | Group VII: Minerals. | Groups I–VII: All Groups combined. |
|---|---|---|---|---|---|---|---|---|---|
| 1914 | 1,031 | 1196 | 1099 | 1,100 | 1095 | 988 | 1,000 | 1009 | 1089 |
| 1915 | 1,206 | 1392 | 1,222 | 1,147 | 1,251 | 1,042 | 1,023 | 1039 | 1239 |
| 1916 | 1,364 | 1,434 | 1,725 | 1380 | 1478 | 1238 | 1090 | 1,063 | 1,460 |
| 1917 | 1,536 | 1,657 | 1,773 | 1965 | 1,663 | 1943 | 1187 | 1095 | 1,655 |
| 1918 | 1,552 | 1,673 | 1,777 | 2,171 | 1691 | 1875 | 1,602 | 1,162 | 1684 |
| 1919 | 1,716 | 1,665 | 1802 | 2,471 | 1787 | 1797 | 1928 | 1199 | 1,776 |
| 1920 | 1819 | 1696 | 1800 | 2,318 | 1824 | 1418 | 2,252 | 1338 | 1806 |
| 1921 | 2,273 | 1909 | 835 | 1297 | 1,725 | 1329 | 2,437 | 1391 | 1,713 |
| 1922 | 1495 | 1,615 | 924 | 1,240 | 1,352 | 1,451 | 2,333 | 1,371 | 1,363 |
| 1923 | 1848 | 2,009 | 1,274 | 1429 | 1619 | 1338 | 2,139 | 1,330 | 1,610 |
| 1924 | 1,661 | 2,015 | 1902 | 1595 | 1806 | 1,377 | 2,383 | 1,304 | 1788 |
| 1925 | 1,520 | 2,218 | 2,234 | 1951 | 1914 | 1,476 | 2,472 | 1,250 | 1893 |
| 1926 | 1409 | 1855 | 1,427 | 1,643 | 1,541 | 1449 | 2,515 | 1182 | 1,540 |
| 1927 | 1,375 | 1,763 | 1,526 | 1,617 | 1529 | 1,417 | 2,409 | 1129 | 1,525 |
| 1928 | 1,476 | 1801 | 1924 | 1805 | 1,700 | 1,350 | 2,338 | 1081 | 1683 |
| 1929 | 1,457 | 1827 | 1,710 | 1,703 | 1,634 | 1,424 | 2,380 | 1078 | 1,623 |
| 1930 | 1,206 | 1,712 | 1,003 | 1,243 | 1279 | 1,267 | 2,447 | 1,062 | 1283 |
| 1931 | 989 | 1,301 | 679 | 767 | 965 | 1,155 | 2,191 | 1,177 | 984 |
| 1932 | 934 | 1109 | 625 | 622 | 870 | 1,102 | 2,073 | 1,162 | 892 |
| 1933 | 839 | 1,165 | 671 | 755 | 867 | 1,157 | 2,110 | 1,416 | 896 |
| 1934 | 767 | 1518 | 1,273 | 888 | 1089 | 1,200 | 2,180 | 1,554 | 1109 |
| 1935 | 913 | 1,576 | 822 | 967 | 1,072 | 1,260 | 2,169 | 1,705 | 1,102 |
| 1936 | 1,046 | 1596 | 1,107 | 1239 | 1228 | 1,321 | 2,148 | 1708 | 1,250 |
Export prices declined sharply in the later months of 1930, the annual average index number for that year (1283) representing a fall of 340 points as compared with the 1929 figure. This rapid downward movement in export prices continued during 1931 and 1932, the annual average figure for the latter year reaching the extremely low level of 892—10.8 per cent. below 1909–13 export prices. Each individual group shared in this collapse with the exception of the minerals group; while the index numbers for wool (625) and “other” pastoral produce (622) were considerably lower than those recorded for any of the other groups. Although the 1933 annual average index was only 4 points above the low figure recorded in 1932, a definite and sustained improvement in the monthly index numbers took place during the latter half of the year. This recovery was maintained during 1934 in a greater or less degree in every group with the exception of that for dairy-produce. In 1935 all groups showed appreciable increases, with the exception of wool (which fell 451 points) and timber. The upward movement was intensified during 1936, three out of the seven groups exhibiting increases in excess of 100 points, while the “all groups” annual index has almost reached the 1930 level, the monthly indexes for the latter half of the year, in fact, only once falling below it.
As previously observed, the calendar year does not coincide at all closely with the farm-production year. This is especially significant in New Zealand, since the great bulk of export goods are farm-produce. For a number of purposes the next table giving annual average export-prices index numbers for years ended 30th June will be more useful. Index numbers are based upon prices in New Zealand currency.
EXPORT PRICES.—INDEX NUMBERS (JUNE YEARS).
| Year ended 30th June, | Group I: Dairy-produce. | Group II: Meat. | Group III: Wool. | Group IV: Other Pastoral Produce. | Groups I–IV: All Pastoral and Dairy Produce. | Group V: Agricultural Produce. | Group VI: Timber. | Group VII: Minerals. | Groups I–VII: All Groups combined. |
|---|---|---|---|---|---|---|---|---|---|
| 1928 | 1,452 | 1768 | 1873 | 1695 | 1,660 | 1,400 | 2,373 | 1083 | 1,647 |
| 1929 | 1499 | 1833 | 1779 | 1825 | 1681 | 1449 | 2,409 | 1082 | 1668 |
| 1930 | 1,341 | 1768 | 1,120 | 1,471 | 1397 | 1,353 | 2,457 | 1,064 | 1397 |
| 1931 | 1029 | 1419 | 726 | 921 | 1,035 | 1219 | 2,441 | 1,065 | 1,052 |
| 1932 | 974 | 1189 | 641 | 671 | 914 | 1158 | 2,166 | 1,107 | 934 |
| 1933 | 857 | 1093 | 621 | 598 | 831 | 1,150 | 2,078 | 1,375 | 861 |
| 1934 | 810 | 1,415 | 1218 | 911 | 1,070 | 1183 | 2,157 | 1485 | 1089 |
| 1935 | 806 | 1,577 | 814 | 844 | 1,014 | 1228 | 2,165 | 1682 | 1,046 |
| 1936 | 993 | 1,573 | 1049 | 1,137 | 1179 | 1,311 | 2,096 | 1,732 | 1,205 |
| 1937 | 1,054 | 1,623 | 1,705 | 1,437 | 1379 | 1,362 | 2,410 | 1,752 | 1397 |
The recovery in wool prices during the 1933–34 selling season is reflected in an increase in the June-year index number for this group, the index number rising from 621 in 1933 to 1218 in 1934. The recession in wool values in 1934–35 caused a fall to 814 in the 1935 index; but during the two following years a remarkable recovery took place, the index rising by more than 100 per cent.
The dairy-produce index for the 1935 June year (806) is the lowest during the ten-yearly period under review; but a substantial increase in dairy-produce prices—particularly of butter—on the London market has since occurred, and the 1937 index is the highest recorded since 1930.
The import-prices index, like other series of New Zealand price-index numbers, is compiled by the aggregate expenditure method, the weight allotted to each individual item in the regimen of the import-prices series representing the average quantity of that commodity imported during the calendar years 1926 to 1930. Owing to the relative rapidity of the changes in the nature of import trade, a series of import-price index numbers tends to lose its representative virtue more speedily than is the case with most other series. The present series was continued back to 1926 only, since sufficient data uniformly comparable with that collected in respect of more recent years were not available beyond that year. While the export-prices index is compiled for monthly as well as for annual periods, only annual index numbers have been compiled in the case of import prices.
In order to avoid any possible confusion between the import-prices index number and the wholesale-prices index number for imported commodities, it seems desirable to draw attention to the fact that the price quotations on which the import-prices index is based are: (a) Declared value of commodities for import—i.e., prices in the exporting country plus 10 per cent. to cover freight, &c.; or (b) wholesale-price quotations (plus allowance for freight, &c.) of suitable representative items in Great Britain and other overseas countries in cases where no New-Zealand data are available as to declared values. These price quotations are converted to a New-Zealand-currency basis, so that the index numbers will be comparable with other series.
The wholesale-price index number for imported commodities, which is based on wholesale-price quotations in the four chief centres, has been substantially higher than the import-prices index since 1929. Increases in Customs duties and the relative stability of handling-costs, overhead charges, and other expenses of marketing imported goods have contributed to this widening of the gap between import prices and wholesale prices of imported commodities. It is desirable to draw attention to the fact that over 200 items are included in the import-prices index as compared with only 112 in the wholesale-prices index for imported commodities.
Notwithstanding the comparatively large number and wide range of commodities covered by the import-prices index the relatively high degree of accuracy in an export-prices or a wholesale-prices index cannot be hoped for in the case of import prices, index numbers of which are for this reason compiled on a three-figure base (100).
The import-prices index has moved in fairly close sympathy with wholesale-prices index numbers for similar groups of commodities in Great Britain. A gradual fall between 1926 and 1930 was followed by a sharp drop between 1930 and 1931. Since the import-prices index number is expressed in New Zealand currency, the fall in overseas wholesale prices has been counteracted to a large extent in its effect on this index by the decline of New Zealand currency in relation to sterling.
Between 1926 and 1929 the per-unit purchasing-power of New Zealand's exports in terms of imported commodities rose considerably, the export-prices index increasing by 6 per cent. during that period, while the import-prices index fell by 14 per cent. This relatively favourable situation was reversed in 1930, a sharp drop in export prices being accompanied by a lesser fall in import prices. Although import prices fell considerably between 1930 and 1933, the fall in export prices was even greater, so that the gap between the import-prices index and the export-prices index widened considerably during that period. In 1934 the import index fell a further two points, while the export index rose fourteen points, the purchasing power of exports in terms of imports being much greater in 1934 than in any of the three years immediately preceding. In 1935 there was no movement in the export index and a fall of one point only in the import index. In 1936 the export-price index rose nine points, and is now, for the first time since 1929, appreciably above the index for imports.
The following table shows index numbers of import, export, wholesale, and retail prices on base 1926 = 100. Each series of index numbers is compiled on a New-Zealand-currency basis.
| Year. | Import Prices. | Export Prices. | Wholesale Prices. | Retail Prices (All Groups). | |||
|---|---|---|---|---|---|---|---|
| Pastoral and Dairy Produce. | All Groups. | Imported Commodities. | Locally produced Commodities. | All Groups. | |||
| 1926 | 100 | 100 | 100 | 100 | 100 | 100 | 100 |
| 1927 | 94 | 99 | 99 | 96 | 95 | 95 | 99 |
| 1928 | 90 | 110 | 109 | 94 | 98 | 96 | 100 |
| 1929 | 86 | 106 | 105 | 93 | 98 | 96 | 99 |
| 1930 | 84 | 83 | 83 | 93 | 94 | 93 | 97 |
| 1931 | 77 | 63 | 64 | 93 | 82 | 87 | 90 |
| 1932 | 75 | 56 | 58 | 90 | 79 | 84 | 83 |
| 1933 | 78 | 56 | 58 | 95 | 77 | 84 | 79 |
| 1934 | 76 | 71 | 73 | 94 | 80 | 86 | 80 |
| 1935 | 75 | 70 | 72 | 92 | 87 | 89 | 83 |
| 1936 | 75 | 80 | 81 | 93 | 88 | 90 | 86 |
Changes in the average level of prices from year to year in each series are indicated by the index numbers quoted above; while, again, the relative movement in prices as between one series and another is also correctly shown. For example, the average level of import prices in 1936 is shown to be in the ratio of 75: 100 of 1926 import prices as compared with an export price ratio of 81: 100 in relation to 1926. It is correct to say that the relative movement since 1926 in export prices compares with that in import prices in the ratio of 81: 75. These figures are not, however, a measure of the extent (if any) to which export prices in 1936 are higher than import prices in that year. The use of 1926 as a base year for all the series included in the table does not imply that prices of all the varied goods included in the separate index numbers were equal in that year; it will be readily apparent that such an assumption would be absurd.
Prices of a large selection of farm-products are included in the official wholesale and export price index numbers. Many of the principal items of farm expenditure, however, are not covered by the wholesale price index, which is purely a commodity index. A special index number is now constructed in which such items as interest-payments, rates and taxes, wages, freight, and commission are included in addition to the material commodities which are bought for use in farm production. Statistics of prices of farm-implements, saddlery, harness, and sundry other commodities not covered by the wholesale prices inquiry are also obtained from merchants and manufacturers of farm machinery, and included in this index, so that practically the whole of the working-expenses of the average farm are now represented. A full description of the method of compilation of this index number is contained in the 1932 issue of the Year-Book.
While the farm-expenditure index indicates the effect of price movements on farm expenditure generally, it is not intended to apply to particular types of farming or to particular localities. Again, the weights used in compiling the index are fixed, the purpose of the index being to measure movements in costs of a standard regimen of commodities and services.
Indexes for the years 1927 to 1930 (on base 1914 = 1000) are given below. The general indexes of wholesale and retail prices, and the export index number for all pastoral and dairy produce combined, are also included on the same base year in order to facilitate comparisons of the movements in the farm-expenditure index with movements in other significant prices index numbers.
| Year. | Farm Expenditure Index. | Pastoral and Dairy Produce Export Price Index. | General Wholesale Price Index. | All Groups Retail Price Index. |
|---|---|---|---|---|
| * Approximate. Recent changes in certain items are incapable of exact measurement. | ||||
| 1914 | 1,000 | 1,000 | 1,000 | 1,000 |
| 1927 | 1,574 | 1396 | 1,404 | 1594 |
| 1928 | 1,642 | 1,553 | 1,417 | 1,602 |
| 1929 | 1,636 | 1492 | 1,413 | 1599 |
| 1930 | 1628 | 1168 | 1,376 | 1,562 |
| 1931 | 1490 | 881 | 1278 | 1,447 |
| 1932 | 1250* | 795 | 1,232 | 1,334 |
| 1933 | 1150* | 792 | 1,242 | 1,266 |
| 1934 | 1150* | 995 | 1,263 | 1287 |
| 1935 | 1150* | 979 | 1,315 | 1,331 |
| 1936 | 1250* | 1,121 | 1329 | 1,376 |
The peak year for the farm-expenditure and wholesale-price index numbers was the year 1920; for retail prices, the year 1921; and for export prices, the year 1925. Although the farm-expenditure index had a relatively low peak-level (1661) this index did not fall to the same extent as the other indexes, the 1933, 1934, and 1935 figure (1150) being still above the 1914 level of prices—in marked contrast to the export-price index number for pastoral and dairy produce, which was, in 1933, 20.8 per cent. below the corresponding figure for the year 1914. The export-price index made a marked recovery during 1934, almost reaching the 1914 level. The fall of sixteen points in 1935 is due to considerably lower prices for wool than those ruling in 1934, particularly in the early months of that year. The 1936 index, showing an increase of 142 points, is the highest since 1930.
It should be observed that comparison of the movements in the farm-expenditure index with corresponding movements in export, wholesale, or retail prices indexes affords only a broad indication of the relativity between movements in prices of goods and services purchased by the farmer and in the prices of farm-products. A closer comparison of the movements in prices of farm-products and in the farm-expenditure index is afforded by the gross farming income and farm producer's prices index numbers (on an “at the farm-gate” basis) published in the table on page 369 of this volume.
The fluctuations in the market value of shares listed on the Stock Exchange form a very sensitive indication of changes in business conditions generally, and an index number of ordinary share prices is thus a valuable complement to other business indicators—such as trade and production statistics, wholesale and export price index numbers, &c. Index numbers of share prices, based on the market prices of forty-eight leading shares on the New Zealand Stock Exchanges, are compiled by the Census and Statistics Department. The selection of the shares for inclusion in the index number was made with the object of reflecting New Zealand economic conditions; and, consequently, only companies whose business is conducted largely or wholly in New Zealand are included. Again, only ordinary shares—the return on which varies directly with the profits of the company in which shares are taken—are considered; preference shares and other investments normally bearing a fixed return being excluded.
The market prices on which the index numbers are based have been extracted from Stock Exchange lists of individual exchanges prior to September, 1929, and from the list of share prices included in the Stock Exchange Gazette, and its successor, the Official Record of the Stock Exchanges of New Zealand, since that month. The prices quoted relate to the last trading day in each month; so that the “monthly” index numbers compiled from these data relate to that day only, while the annual averages represent the average of the monthly index numbers. The base adopted is the average price ruling during the year 1926 (= 1000).
Following are annual index numbers for various groups and all groups combined.
SHARE-PRICE INDEX NUMBERS, INDIVIDUAL GROUPS.
| Group. | 1930. | 1931. | 1932. | 1933. | 1934. | 1935. | 1936. |
|---|---|---|---|---|---|---|---|
| Banks | 883 | 718 | 677 | 742 | 779 | 776 | 721 |
| Insurance | 1,023 | 921 | 919 | 1190 | 1,450 | 1579 | 1,471 |
| Loan and agency | 763 | 517 | 470 | 545 | 660 | 583 | 601 |
| Frozen meat | 835 | 646 | 701 | 835 | 914 | 884 | 829 |
| Woollens | 977 | 792 | 778 | 923 | 1159 | 1,272 | 1,232 |
| Breweries | 1,201 | 773 | 602 | 753 | 989 | 1148 | 1,162 |
| Gas | 1,060 | 1008 | 969 | 1,053 | 1,235 | 1308 | 1189 |
| Timber | 480 | 323 | 348 | 411 | 547 | 623 | 709 |
| Minerals | 991 | 859 | 700 | 753 | 883 | 1,077 | 1,075 |
| Miscellaneous | 855 | 678 | 715 | 889 | 1083 | 1,213 | 1182 |
| All groups combined | 913 | 739 | 703 | 822 | 960 | 1,026 | 986 |
NOTE.—These index numbers are comparable horizontally but not vertically.
In the following table index numbers of market prices of ordinary shares on the last trading-day of each month are shown. This index indicates the average movement in prices of forty-eight ordinary shares in companies operating in New Zealand; each individual share and group of shares included being “weighted” according to its importance in the investment market of the Dominion.
SHARE-PRICE INDEX NUMBERS, ALL GROUPS COMBINED.
| Month. | 1930. | 1931. | 1932. | 1933. | 1934. | 1935. | 1936. | 1937. |
|---|---|---|---|---|---|---|---|---|
| * No list issued for this month. | ||||||||
| January | 957 | 748 | 715 | 722 | 925 | 1,030 | 1,032 | 996 |
| February | 964 | 751 | 680 | 730 | 917 | 1,013 | 1,027 | 993 |
| March | 956 | 779 | 671 | 753 | 923 | 1009 | 984 | 995 |
| April | 945 | 781 | 666 | 773 | 934 | 1039 | 1,007 | 993 |
| May | 950 | 755 | 669 | 795 | 964 | 1,031 | 1,003 | 1009 |
| June | 948 | 742 | 674 | 821 | 938 | 1,036 | 985 | 999 |
| July | 916 | 738 | 708 | 849 | 937 | 1049 | 979 | 1,003 |
| August | 892 | 697 | 738 | 862 | 954 | 1,031 | 962 | 1,013 |
| September | 834 | 686 | 764 | 885 | 987 | 1,017 | 954 | 981 |
| October | 858 | 728 | 745 | 879 | 1,007 | 1018 | 961 | |
| November | 830 | 734 | 725 | 893 | 1,011 | 1,025 | 966 | |
| December | * | 729 | 683 | 900 | 1,020 | 1,020 | 972 | |
| Annual average | 913 | 739 | 703 | 822 | 960 | 1,026 | 986 | |
International comparisons of price indexes can be made only with considerable caution; but, in the case of the indexes of share prices selected for inclusion in the table following, many of the difficulties attendant on such comparisons are lessened by the facts that all series are compiled on the same base year (1926.) and that the method of compilation of each of the indexes is substantially comparable in each case. Naturally enough, the indexes for England, United States, and Canada are based on a much wider selection of shares than the New Zealand or the Australian figures; and, moreover, the volume of transactions on the exchanges in these countries is such that a finer market price can be arrived at than is possible in the Dominion.
The following table shows the highest and lowest monthly indexes for each year from 1930 to 1936, and for the month of May, 1937:—
| Year. | New Zealand (Official). | Australia* (Melbourne Stock Exchange Record). | England (Bankers' Magazine). | Canada (Official). | United States (Standard Statistics Company). |
|---|---|---|---|---|---|
| * May, 1926 = 100. | |||||
| 1929—Highest | 109 | 110 | 124 | 209 | 225 |
| Lowest | 101 | 92 | 110 | 157 | 151 |
| 1930—Highest | 96 | 85 | 111 | 167 | 181 |
| Lowest | 83 | 54 | 89 | 103 | 109 |
| 1931—Highest | 78 | 65 | 90 | 112 | 122 |
| Lowest | 69 | 50 | 67 | 65 | 58 |
| 1932—Highest | 76 | 81 | 73 | 65 | 58 |
| Lowest | 67 | 62 | 59 | 43 | 34 |
| 1933—Highest | 90 | 95 | 85 | 87 | 80 |
| Lowest | 72 | 80 | 72 | 49 | 43 |
| 1934—Highest | 102 | 106 | 88 | 91 | 81 |
| Lowest | 92 | 96 | 84 | 81 | 67 |
| 1935—Highest | 105 | 116 | 90 | 107 | 96 |
| Lowest | 101 | 102 | 83 | 84 | 64 |
| 1936—Highest | 103 | 140 | 104 | 132 | 124 |
| Lowest | 95 | 116 | 93 | 113 | 100 |
| 1937—May | 101 | 141 | 99 | 132 | 116 |
While the index numbers in the above table show the movement in ordinary share prices in each country covered, comparisons of recent index numbers for one country with those for another country should not be made without taking into account the relative exchange value of the various local currencies. For example, the index numbers quoted for New Zealand express the movement in share prices in New Zealand currency, the exchange value of which has depreciated since the beginning of 1930—a factor which should be borne in mind when comparing New Zealand indexes with figures for countries with currencies of higher or lower exchange value than the New Zealand pound. The following table is interesting in this connection, in that it shows the relative values in May, 1937, of an investment of £100 sterling made in 1926 in representative shares on the different stock exchanges.
| Country. | Month of May, 1937. | |||
|---|---|---|---|---|
| Index Number of Share Prices (1926 = 100). | Average Rate of Exchange on London. | Present Value of Shares bought in 1926 for £100 Sterling. | ||
| In Local Currency. | In Sterling. | |||
| * Per £100 sterling. | ||||
| £ | ||||
| England | 94 | £94 | 94 | |
| Canada | 132 | $4.975 | $642 | 129 |
| Australia | 141 | £125.25* | £141 | 113 |
| New Zealand | 101 | £124.25* | £101 | 80 |
| United States | 116 | $4.972 | $564 | 114 |
Table of Contents
THE material used in the compilation of statistics of wage-rates in New Zealand is, with certain exceptions, taken from the awards of the Arbitration Court. It is recognized that the rates specified in such awards are minimum rates, and that wages may in some cases be above the prescribed minima, so that a rise or fall in the award rates does not necessarily involve an immediate change in the wage-rates of those workers who are being paid more than these rates. Nevertheless, for the purpose of tracing the movement in wage-rates over any considerable space of time, the award rates form a more reliable basis than any information which could be collected directly from employers or trade-union secretaries as to the ruling or predominant rates in any industry. As, prior to the passing of the Agricultural Workers Act, 1936, there were no fixed rates of wages for farm employees, these were reported by Inspectors of Factories attached to the Labour Department.
The Industrial Conciliation and Arbitration Amendment Act, 1932, contained, inter alia, a provision that, in the event of parties to an industrial dispute being unable to come to agreement before the Conciliation Council, the award lapses. In cases where district awards have lapsed under this provision figures have been interpolated, based on fluctuations in corresponding rates in other districts. The Industrial Conciliation and Arbitration Amendment Act, 1936, restored the full powers of the Court (see next section).
The award rates for the four principal districts—Northern, Wellington, Canterbury, and Otago and Southland—are in general taken as representative of the ruling wages throughout the Dominion. For such industries as are carried on in the towns these rates are quite satisfactory; in cases where the important centre of an industry is situated outside the geographical boundaries of the four principal districts the award rates for that centre are used. For instance, the rates used for coal-mining and sawmilling in the Canterbury District are those prescribed by the awards for the Westland Industrial District.
The system of compilation of wage-rate index numbers has recently been revised, and the index numbers appearing in the following pages are on a new base—viz., the average of the five years 1926–30, which is the same as that at present in use in the case of the retail-price indexes. The industrial grouping has also undergone some modification, which consists principally of the dispersal of the old groups “Other Manufactures” and “Miscellaneous” amongst existing groups and three which have been introduced (“Provision of Power, Heat, and Light”; “Working in Stone, Clay, Glass, and Chemicals”; and “Working in Skins, Leather, &c.”); while the old group “Textiles and Weaving” has been combined with “Clothing and Footwear.”
The weights used in the computation of the indexes have been derived mainly from three sources—viz., (1) the occupations statistics of the 1926 census, (2) the annual factory production statistics, and (3) the membership rolls of trade-unions registered under the Arbitration Act. Weights have been allocated to the individual occupations included in these computations, and although in some few cases absolute accuracy in weighting cannot be hoped for, the data are sufficiently accurate for the purpose in view, since minor differences in weighting do not affect the accuracy of the index number. Occupations are grouped into industries, with an appropriate weight for each occupation and each industry; while industries are grouped into fourteen principal industrial groups. The weights for the individual occupations and industries have been devised from the census or the factory production statistics; while the industrial-group weighting has been taken partly from these sources and partly from the membership of trade-unions registered under the Arbitration Act. In the case of workers on the land, use was also made of information obtained by means of the annual collections of agricultural and pastoral statistics. Full details of weighting appeared in the “Statistical Report on Prices, Wage-rates, &c.,” for the year 1935.
The following table shows the index numbers of nominal wage-rates of males for each industrial group and all groups combined. The base is the Dominion weighted average wage-rate for all groups combined, 1926–30 = 1000.
| Industrial Group. | 1914. | 1927. | 1928. | 1929. | 1930. | 1931. | 1932. | 1933. | 1934. | 1935. | 1936. |
|---|---|---|---|---|---|---|---|---|---|---|---|
| NOTE.—The index numbers in this table are comparable both vertically and horizontally. Where board and (or) lodging is a usual perquisite attached to any occupation, an allowance estimated to cover the value of such has been added to the money wage-rate. | |||||||||||
| Provision of— | |||||||||||
| Food, drink, &c. | 665 | 1,105 | 1,111 | 1,113 | 1,114 | 1,054 | 995 | 963 | 967 | 991 | 1068 |
| Clothing, footwear, and textiles | 607 | 1,010 | 1,026 | 1,027 | 1,027 | 969 | 923 | 921 | 924 | 927 | 979 |
| Building and construction | 654 | 1,025 | 1029 | 1,031 | 1,031 | 969 | 916 | 898 | 897 | 910 | 979 |
| Power, heat, and light | 656 | 1099 | 1099 | 1097 | 1096 | 1038 | 990 | 973 | 973 | 975 | 1,047 |
| Transport by water | 654 | 1097 | 1097 | 1,106 | 1,135 | 1,073 | 1,025 | 991 | 998 | 1,045 | 1,105 |
| Transport by land | 617 | 1,050 | 1,057 | 1,057 | 1,057 | 988 | 926 | 899 | 920 | 940 | 1008 |
| Accommodation, meals, and personal service | 660 | 972 | 975 | 975 | 976 | 917 | 868 | 828 | 824 | 849 | 928 |
| Working in or on— | |||||||||||
| Wood, wicker, sea-grass, and fibre | 634 | 1069 | 1087 | 1089 | 1087 | 1,006 | 957 | 913 | 899 | 916 | 1,014 |
| Metal | 717 | 1,114 | 1,114 | 1,114 | 1,114 | 1,050 | 987 | 938 | 936 | 952 | 1048 |
| Stone, clay, glass, and chemicals | 584 | 1018 | 1018 | 1,035 | 1,036 | 973 | 935 | 911 | 893 | 886 | 980 |
| Paper, printing, &c. | 757 | 1189 | 1189 | 1189 | 1189 | 1,126 | 1058 | 1,026 | 1019 | 1,051 | 1,130 |
| Skins, leather, &c. | 600 | 1,044 | 1048 | 1048 | 1049 | 980 | 938 | 919 | 905 | 896 | 976 |
| Mines and quarries | 664 | 1048 | 1,040 | 1,040 | 1,040 | 984 | 937 | 928 | 938 | 965 | 1,010 |
| The land (farming pursuits) | 510 | 705 | 821 | 822 | 809 | 701 | 550 | 516 | 528 | 541 | 694 |
| All groups combined | 623 | 985 | 1,016 | 1,017 | 1,017 | 942 | 864 | 833 | 839 | 858 | 950 |
The highest index numbers are recorded in the group “paper, printing, &c.,” the 1936 index in this industry being 1130—i.e., 13 per cent. above the “all groups” level in 1926–30. It is worthy of note that this group is consistently high, due, no doubt, to the preponderance of highly skilled tradesmen.
The lowest index for 1936 is that for the group “working on the land” (694), followed by “accommodation, meals, and personal service” (928). In the latter group, as also in the “transport by water” and “working on the land” groups, the estimated value of board and lodging is, where applicable, added to the money wage-rate in order to make a legitimate comparison with other industries. In the case of waterside workers (an important subgroup of the “water transport” group) this allowance is not, of course, included.
Wage-rates rose steadily and in fairly regular gradations from year to year from 1914 to 1918. When the provisions of the War Legislation and Statute Law Amendment Act providing for the regulation of wages in accordance with movements in the cost of living came into effect the lag between prices and wage-rates was partially eliminated, and consequently sharp increases took place. The effect of the post-war slump subsequently became apparent, and decreases were then recorded. Following the recovery from the slump, the index number rose year by year until in 1929 and in 1930 it reached 1017, the highest level yet recorded. A general order of the Arbitration Court, dated 29th May, 1931, reduced all rates of pay and allowances prescribed by awards and industrial agreements by 10 per cent. The rates of remuneration of apprentices were exempted from this order; and, in addition, flax-mill employees in the Wellington Industrial District, who had already suffered a substantial cut in wages, were exempted. The average rates of pay of agricultural and pastoral workers, although not subject to the Court's order, were considerably below those ruling during previous years. As a consequence of these reductions, a substantial fall occurred in the 1931 annual average index numbers for all groups. This reduction in wage - rates, being on a strictly percentage basis, caused a levelling-up in the group indexes, the relatively higher-paid groups of workers suffering the largest reduction in rates.
The Industrial Conciliation and Arbitration Amendment Act, 1932, made provision for the review of existing awards. During 1932 and 1933 the rates of pay prescribed in several awards were reduced in new awards; and, again, wage-rates of two classes of labour not covered by awards (railway employees and permanent farm hands) suffered further reductions—in 1932 in the former case and in 1932 and 1933 in the latter case. Also in most instances the ruling rates of pay in cases where previously existing awards have been cancelled were below the former award rates. Consequently the general index number of wage-rates fell substantially, the 1933 index (833, on the base: 1926–30 = 1000) being 3.6 per cent. below the 1932 figure, and 18.1 per cent. below the peak level of 1017 recorded in 1929 and 1930. The 1933 index is the lowest annual average index since 1919; but slight increases were recorded in 1934 and 1935.
Complete restoration to the pre-depression level of award (and other) rates of wages and salaries has been effected by the Finance Act, 1936, which was passed early in August. A further measure of importance is the Agricultural Workers Act passed in September, 1936. Both these Acts are discussed in the next section (Labour Laws and Allied Legislation). The effect of the restoration in wages cuts and the provision, for the first time in the history of the Dominion, of standard rates of pay in respect of certain classes of permanent farm labour is reflected in the index numbers of wages-rates for 1936, that for all groups showing an increase of 92 points, or 10.7 per cent. over that for 1935. The full effect of the higher wage-rates in the latter half of 1936 is not disclosed by the index for that year.
With the inauguration of the new series of wage indexes, the computation of separate indexes for the four principal industrial districts has been discontinued, since they have lost a good deal of their original significance with the increasing tendency towards Dominion awards.
The index numbers quoted in the foregoing discussion relate to nominal wage-rates — that is, they are based on actual money rates without any allowance being made for changes in prices during the period under review. It is obvious that this factor is of considerable importance; for a rise in wage-rates may be offset by a fall in the purchasing-power of the monetary unit, while, on the other hand, a fall in money wages may be offset by a rise in the purchasing-power of money. Changes in the index numbers of retail prices are inversely proportional to changes in the purchasing-power of the pound; and index numbers of effective (or “real”) wage-rates can be arrived at by dividing the index numbers for nominal wage-rates by the corresponding index numbers for retail prices covering all groups of domestic expenditure.
The following table compares nominal and effective wage-rates of male workers in each of the last ten years. The base of the index numbers is in each case the average of the five years 1926–30 = 1000:—
| Year. | Retail Prices. | Nominal Wage-rates. | Effective Wage-rates. |
|---|---|---|---|
| 1927 | 1,001 | 985 | 984 |
| 1928 | 1,006 | 1,016 | 1,010 |
| 1929 | 1,004 | 1,017 | 1,013 |
| 1930 | 981 | 1,017 | 1,037 |
| 1931 | 906 | 942 | 1,040 |
| 1932 | 838 | 864 | 1,031 |
| 1933 | 795 | 833 | 1048 |
| 1934 | 808 | 839 | 1038 |
| 1935 | 837 | 858 | 1,025 |
| 1936 | 864 | 950 | 1,100 |
These index numbers afford a measure of the fluctuations in the “real” wage-rates of those in full-time employment; and in normal times this is a reasonably accurate basis of comparison of the relative earning-power from year to year of wage-earners covered by these index numbers.
In considering these figures, it should not be overlooked that the index number of effective wage-rates (in common, of course, with that of nominal wage-rates) is applicable only to wage-earners in full-time employment at award rates of pay, and not to the average of all wage-earners, inclusive of those unemployed or working short time.
It should be noted that under the employment-promotion legislation a wages-tax (1d. for every 6s. 8d. of wages from August, 1931, to April, 1932; 1d. for every 1s. 8d. from May, 1932, to September, 1934; 1d. for every 2s. from October, 1934, to September, 1935; and 1d. for every 2s. 6d. from October, 1935) is now in operation. This has not been taken into account in the compilation of index numbers of effective wage-rates.
The index numbers in the preceding tables being all on a common base, comparisons between movements in the various groups cannot be readily made; an increase in a group in which the index numbers are consistently low being considerably smaller numerically than an increase of the same percentage in one where the index numbers are higher. The following table brings out the movements in the various groups more clearly. The bases are the Dominion average wage-rates for each industrial group respectively, 1926–30 = 1000.
| Industrial Group. | 1926–30. | 1914. | 1932. | 1933. | 1934. | 1935. | 1936. |
|---|---|---|---|---|---|---|---|
| Provision of— | |||||||
| Food, drink, &c. | 1,000 | 601 | 900 | 871 | 875 | 896 | 966 |
| Clothing, footwear, and textiles | 1,000 | 596 | 906 | 904 | 907 | 910 | 961 |
| Building and Construction | 1,000 | 633 | 893 | 875 | 874 | 887 | 954 |
| Power, heat, and light | 1,000 | 600 | 904 | 889 | 889 | 891 | 957 |
| Transport by water | 1,000 | 592 | 928 | 896 | 903 | 945 | 1,000 |
| Transport by land | 1,000 | 588 | 882 | 857 | 877 | 896 | 961 |
| Accommodation, meals, and personal service | 1,000 | 680 | 894 | 853 | 849 | 875 | 956 |
| Working in or on— | |||||||
| Wood, wicker, sea-grass, and fibre | 1,000 | 588 | 889 | 849 | 836 | 851 | 942 |
| Metal | 1,000 | 647 | 891 | 847 | 845 | 860 | 946 |
| Stone, clay, glass, and chemicals | 1,000 | 576 | 914 | 891 | 873 | 866 | 959 |
| Paper, printing, &c. | 1,000 | 637 | 890 | 863 | 857 | 884 | 950 |
| Skins, leather, &c. | 1,000 | 574 | 898 | 880 | 867 | 858 | 934 |
| Mines and quarries | 1,000 | 637 | 900 | 892 | 901 | 927 | 970 |
| The land (farming pursuits) | 1,000 | 675 | 716 | 672 | 687 | 705 | 903 |
| All groups combined | 1,000 | 623 | 864 | 833 | 839 | 858 | 950 |
Care must be exercised in drawing inferences from this table, for, while horizontal comparisons are quite valid, the vertical comparison between the various groups is valid only in so far as it shows in which groups the greater or the smaller increases have occurred since the base period. For example, the 1936 index for the “paper, printing, &c.,” group is 20 points below that for “mines and quarries,” the reason being that wages of workers in the former group have increased in a lesser degree than have those in the latter, although the actual rates of wages are considerably higher, as may be seen by reference to the previous table on the all-groups base.
Index numbers showing movements in the wage-rates paid to women workers are compiled, using the award rates of the Arbitration Court as representative of the ruling rates of wages. A much smaller list of occupations is used than is the case in computing index numbers of wage-movements for male workers. Although only fifteen occupations are taken into consideration in the case of women workers, however, these occupations cover a large proportion of the total women in industry — more than sufficient to be a representative sample for measuring movements in wages. The weights used have been computed from data as to occupations from the 1926 census results.
The table following shows index numbers for women divided into the principal industries in which women workers are engaged. It should be remembered that domestic servants (numerically a very important branch of women workers) are not represented in the compilation of these indexes.
The highest index numbers are recorded in the “accommodation, meals, and personal service” group. The comparatively high figure for this industry is, no doubt, accounted for by the fact that board and lodging is a usual perquisite of hotel workers, while meals are usually provided for restaurant employees. The value of these additions has been added to the money wage-rates in this industry. Women, in general, receive lower money wages than men, so that the addition of board and lodging has the effect of raising wage-rates for women in a much greater proportion than the addition of the same perquisite does in the case of men. Indeed, wages for men in this group are low as compared with most other industries.
In the table following the base is the Dominion “all groups” weighted average of wage-rates, 1926–30 = 1000.
NOMINAL WAGE-RATE INDEX NUMBERS (WOMEN).
| Industrial Group. | 1914. | 1932. | 1933. | 1934. | 1935. | 1936. |
|---|---|---|---|---|---|---|
| Provision of— | ||||||
| Food, drink, &c. | 390 | 767 | 767 | 767 | 767 | 809 |
| Clothing, footwear, and textiles | 534 | 838 | 835 | 835 | 851 | 893 |
| Accommodation, meals, and personal service | 836 | 1,103 | 1,053 | 1058 | 1,074 | 1,176 |
| Working in paper, printing, combined &c. | 487 | 945 | 874 | 872 | 892 | 979 |
| All groups | 602 | 905 | 887 | 887 | 903 | 961 |
The all-groups index for 1936 is still 4.9 per cent. below the peak level recorded in 1929 and 1930 (1010) each group having shared in this downward movement. The greatest decrease since 1930 (from 1055, or by 7.2 per cent.) is recorded in the case of the “working in paper, printing, &c.,” group, while the lowest decrease (from 932, or by 4.2 per cent.) is observed in the “clothing, footwear, and textiles” group.
A general order fixing basic rates of wages for adult male and female workers was issued by the Arbitration Court on 2nd November, 1936. The rates are fixed at £3 16s. for adult male workers and at £1 16s. for adult female workers. The basic wage applies to all workers twenty-one years of age or over (excepting casual workers and those working under apprenticeship contracts), the conditions of whose employment are fixed by any award or industrial agreement. The subject is treated in greater detail in the next section (Labour Laws and Allied Legislation).
The following table shows the unweighted averages of award rates for the four principal districts. In cases where awards have been allowed to lapse under the provisions of the Industrial Conciliation and Arbitration Amendment Act, 1932, the ruling rates of wages are quoted. The rates shown throughout this table are money rates, and do not include any allowance for the value of board and lodging, which is a usual perquisite of employment in some occupations—e.g., seamen and hotel workers.
AVERAGE MINIMUM WEEKLY ADULT WAGE-RATES.
| Occupation. | Average Wage-rate (Four Principal Districts). | |||||
|---|---|---|---|---|---|---|
| At 31st March, | ||||||
| 1914. | 1933. | 1934. | 1935. | 1936. | 1937. | |
| s. d. | s. d. | s. d. | s. d. | s. d. | s. d. | |
| Bakers—Journeymen | 55 0 | 86 10 | 89 4 | 88 9 | 88 2 | 107 6 |
| Labourers | 48 0 | 71 10 | 74 4 | 74 5 | 73 9 | 87 8 |
| Butchers—First shopmen | 72 6 | 105 2 | 104 1 | 104 1 | 105 8 | 116 11 |
| Second shopmen | 62 6 | 94 6 | 94 0 | 94 0 | 95 0 | 105 0 |
| Butter-factory employees— | ||||||
| Churning and buttermaking— | ||||||
| General hands | 52 6 | 72 9 | 72 7 | 72 7 | 70 5 | 81 0 |
| Flour-milling—Kilnmen | 48 0 | 86 5 | 86 5 | 86 5 | 86 5 | 96 0 |
| Assistant smuttermen | 48 0 | 79 2 | 79 2 | 79 2 | 79 2 | 88 0 |
| Rollermen | 56 0 | 90 0 | 90 0 | 90 0 | 90 0 | 100 0 |
| Meat-freezing— | ||||||
| Slaughtermen (per 100 sheep) | 27 6 | 30 0 | 30 6 | 33 6 | 35 0 | 40 0 |
| General hands | 54 0 | 79 9 | 79 9 | 79 9 | 87 1 | 102 8 |
| Meat-preserving— | ||||||
| Boners | 62 0 | 90 9 | 90 9 | 90 9 | 95 4 | 121 0 |
| Meat-preservers—Second men | 59 6 | 82 6 | 82 6 | 82 6 | 84 4 | 102 8 |
| Sausage - casing making — General hands | 58 8 | 82 6 | 82 6 | 82 6 | 89 10 | 106 4 |
| Aerated-waters and cordial making— | ||||||
| Cordial-makers | 58 9 | 83 9 | 83 9 | 83 9 | 83 9 | 92 9 |
| Bottle-washers | 45 0 | 74 8 | 74 8 | 74 8 | 74 8 | 82 9 |
| Brewing—Labourers | 47 7 | 74 11 | 74 11 | 75 8 | 82 0 | 85 0 |
| Tailors—Journeymen | 53 9 | 86 0 | 86 0 | 86 0 | 88 5 | 95 6 |
| Factory hands | 56 0 | 78 9 | 78 9 | 80 8 | 80 8 | 87 6 |
| Tailoresses (factory)—Journeywomen | 27 6 | 40 6 | 40 6 | 42 0 | 42 0 | 45 0 |
| Boot operatives— | ||||||
| Male | 52 6 | 79 9 | 79 9 | 79 9 | 79 9 | 88 11 |
| Female journeywomen | 27 6 | 44 0 | 44 0 | 44 0 | 44 0 | 50 0 |
| Woollen-mills— | ||||||
| Males—Spinners | 51 0 | 84 5 | 84 5 | 84 5 | 84 5 | 93 9 |
| General hands | 46 6 | 74 5 | 74 5 | 74 5 | 74 5 | 82 6 |
| Females—Adults | 26 3 | 40 6 | 40 6 | 40 6 | 40 6 | 45 0 |
| Building and construction— | ||||||
| Bricklayers | 68 5 | 93 1 | 93 1 | 93 1 | 94 1 | 104 6 |
| Carpenters | 64 3 | 88 0 | 88 0 | 88 0 | 91 8 | 101 8 |
| Joiners (outside work) | 64 3 | 88 0 | 88 0 | 88 0 | 91 8 | 101 8 |
| Plasterers | 67 9 | 92 7 | 92 7 | 91 3 | 90 8 | 104 4 |
| Plumbers (registered) | 66 0 | 89 3 | 89 3 | 89 3 | 91 3 | 99 1 |
| Builders' labourers | 52 6 | 74 3 | 74 3 | 74 3 | 77 1 | 82 6 |
| Shipping and cargo-working— | ||||||
| Assistant stewards, first class | 25 8 | 56 11 | 56 11 | 60 2 | 60 2 | 66 7 |
| Assistant stewards, second class | 18 8 | 54 10 | 54 10 | 57 11 | 57 11 | 64 3 |
| Chief cooks | 60 8 | 86 0 | 86 0 | 91 10 | 91 10 | 101 7 |
| Second cooks | 37 4 | 69 5 | 69 5 | 74 1 | 74 1 | 82 11 |
| A.B. seamen | 37 4 | 63 0 | 60 10 | 65 5 | 65 5 | 84 0 |
| Ordinary seamen, first class | 28 0 | 43 6 | 42 2 | 45 4 | 45 4 | 55 9 |
| Waterside workers—Ordinary cargo | 52 4 | 88 0 | 88 0 | 95 4 | 95 4 | 106 8 |
| Railways— | ||||||
| Engine-drivers (average grade 1 and grade 2) | 75 0 | 90 11 | 90 11 | 95 6 | 102 8 | 112 4 |
| Firemen (average grade 1 and grade 2) | 60 0 | 76 6 | 76 6 | 80 9 | 86 10 | 94 5 |
| Guards (average grade 1 and grade 2) | 63 0 | 89 2 | 89 2 | 93 7 | 100 8 110 | 0 |
| Tramways—Motormen | 53 6 | 86 0 | 87 4 | 90 1 | 92 4 | 96 9 |
| Conductors | 47 7 | 81 6 | 82 9 | 85 0 | 87 3 | 91 3 |
| Hotel workers—Chefs (male) | 90 0 | 87 0 | 87 0 | 87 0 | 94 6 | 102 0 |
| Waiters (male) | 31 1 | 48 9 | 48 9 | 48 9 | 52 6 | 57 0 |
| Cooks (female) | 29 5 | 42 3 | 42 3 | 42 3 | 46 0 | 49 6 |
| Housemaids | 17 2 | 27 9 | 27 9 | 27 9 | 30 0 | 32 6 |
| Waitresses | 22 5 | 27 9 | 27 9 | 27 9 | 30 0 | 32 6 |
| Sawmilling, bush— | ||||||
| Engine-drivers, first class | 54 0 | 82 2 | 82 2 | 86 8 | 86 8 | 103 5 |
| Sawyers | 53 0 | 84 11 | 84 11 | 86 5 | 88 3 | 106 3 |
| Tailers-out | 43 9 | 74 9 | 74 9 | 76 3 | 78 2 | 93 3 |
| Yardmen | 55 8 | 82 4 | 82 4 | 83 10 | 86 0 | 100 9 |
| General hands | 51 0 | 70 6 | 70 6 | 72 9 | 74 8 | 87 3 |
| Boatbuilding—Shipwrights | 62 8 | 88 0 | 88 0 | 88 0 | 93 6 | 104 6 |
| Metal-works, &c.— | ||||||
| Blacksmiths, floormen | 61 7 | 82 3 | 82 3 | 82 3 | 88 11 | 100 0 |
| Boilermaking—Journeymen | 62 8 | 82 3 | 82 3 | 82 3 | 85 9 | 99 2 |
| Iron and brass moulders | 64 7 | 82 3 | 82 3 | 82 3 | 88 11 | 100 0 |
| Tinsmiths—Journeymen | 62 8 | 89 1 | 85 6 | 85 6 | 86 2 | 99 0 |
| Engineering— | ||||||
| Fitters, &c. | 64 7 | 82 3 | 82 3 | 82 3 | 88 11 | 100 0 |
| Electrical workers | 61 10 | 85 2 | 85 2 | 84 3 | 88 0 | 99 4 |
| Motor mechanics | 64 11 | 80 8 | 80 8 | 84 4 | 84 4 | 100 0 |
| Mineral and stone workers— | ||||||
| Brickmakers | 53 11 | 93 9 | 93 9 | 91 3 | 92 3 | 104 6 |
| General hands | 46 9 | 78 7 | 78 7 | 77 3 | 78 3 | 89 10 |
| Skin and leather workers— | ||||||
| Curriers | 58 0 | 91 9 | 90 0 | 89 1 | 90 8 | 103 11 |
| General hands | 49 6 | 77 1 | 75 4 | 74 6 | 75 0 | 85 9 |
| Mining (coal)— | ||||||
| Surface—Tippers | 53 7 | 74 6 | 73 3 | 73 3 | 78 1 | 89 3 |
| Labourers | 54 3 | 75 6 | 73 3 | 73 3 | 75 11 | 86 4 |
| Engine-drivers, first class | 67 6 | 102 0 | 99 0 | 99 0 | 101 5 | 115 3 |
| Miners on day wages | 63 3 | 90 8 | 89 1 | 89 1 | 89 8 | 101 6 |
| Truckers | 55 11 | 81 6 | 80 2 | 80 2 | 85 1 | 95 8 |
| Mining (gold)— | ||||||
| Miners in rises or winzes with machines | 64 6 | 80 9 | 80 9 | 88 6 | 89 2 | 94 5 |
| Quarrymen | 52 8 | 76 9 | 76 11 | 76 11 | 80 11 | 88 5 |
| Agricultural and pastoral workers— | ||||||
| General farm hands (agricultural) | 26 4 | 17 6 | 19 5 | 20 11 | 26 3 | 41 0 |
| Threshing-mill hands | 60 0 | 84 0 | 84 0 | 84 0 | 88 0 | 114 0 |
| Ploughmen | 30 4 | 21 3 | 23 9 | 26 3 | 35 8 | 46 3 |
| Shearers (per 100 sheep shorn) | 20 0 | 18 0 | 18 0 | 22 6 | 19 6 | 27 0 |
| Shepherds | 31 2 | 23 9 | 26 3 | 29 5 | 37 6 | 52 6 |
| Wool-pressers | 30 0 | 44 0 | 45 0 | 55 0 | 46 0 | 80 0 |
| Dairy-farm hands | 23 0 | 17 6 | 19 5 | 21 3 | 26 3 | 42 6 |
| Miscellaneous— | ||||||
| Soft-goods assistants (male) | 55 0 | 85 6 | 85 2 | 85 2 | 86 3 | 95 0 |
| Grocers' assistants | 50 0 | 84 7 | 84 7 | 84 7 | 84 9 | 95 0 |
| Warehouse storemen | 48 9 | 72 9 | 72 9 | 72 9 | 78 6 | 85 0 |
The wage-rates published above are, with certain exceptions, minimum rates of pay as prescribed in awards of the Arbitration Court. The Agricultural Workers Act (September, 1936), inter alia, fixes minimum wage-rates of dairy-farm employees. The rates of pay for various classes of workers prescribed by the Act, together with subsequent amendments, are shown in the next section (pp. 780–782). The operation of the Act has since been extended to certain other classes of farm workers (see page 781). The rates of wages quoted for railway employees are also actual ruling rates, and not award minima.
Award rates of wages, which suffered a cut of 10 per cent. in June, 1931, were restored to the pre-existing level as from 1st July, 1936; and similar provision was made in respect of workers not covered by awards (see next section).
The following table shows index numbers of the number of hours constituting a full week's work in the various industrial groups for 1914 and for each year from 1932 to 1936. The material from which the index numbers have been compiled has been taken from the awards of the Arbitration Court in most cases; but where hours are not prescribed in the awards reference has been made to the Factories Act and the Shops and Offices Act. The agricultural and pastoral workers group has been omitted from the computations, which distinguish between male and female employees. For each sex, the base is the Dominion weighted average for all industrial groups combined, 1926–30 = 1000.
| Industrial Group. | 1914. | 1932. | 1933. | 1934. | 1935. | 1936. |
|---|---|---|---|---|---|---|
| NOTE.—The index numbers in each section of the above table are comparable both vertically and horizontally. | ||||||
| Males. | ||||||
| Provision of— | ||||||
| Food and drink | 1,135 | 1,006 | 1008 | 1009 | 1,011 | 988 |
| Clothing, footwear, and textiles | 1,000 | 978 | 978 | 978 | 978 | 948 |
| Building and construction | 988 | 977 | 977 | 977 | 977 | 923 |
| Power, heat, and light | 1,061 | 1,017 | 1,017 | 1,017 | 1,017 | 978 |
| Transport by water | 1093 | 1,075 | 1,075 | 1,075 | 1,075 | 1,045 |
| Transport by laud | 1,044 | 1028 | 1028 | 1028 | 1028 | 996 |
| Accommodation, meals, and personal service | 1,325 | 1039 | 1039 | 1039 | 1039 | 974 |
| Working in or on— | ||||||
| Wood, wicker, seagrass, &c. | 993 | 992 | 991 | 990 | 989 | 947 |
| Metal | 1008 | 953 | 953 | 953 | 953 | 924 |
| Stone, clay, glass, and chemicals | 1,026 | 1,017 | 1,017 | 1,017 | 1,017 | 969 |
| Paper, printing, &c. | 948 | 927 | 927 | 927 | 927 | 918 |
| Skins, leather, &c. | 1039 | 1,037 | 1,037 | 1,037 | 1,037 | 994 |
| Mines and quarries | 981 | 961 | 961 | 959 | 953 | 924 |
| All groups combined | 1,041 | 999 | 999 | 999 | 999 | 963 |
| Females. | ||||||
| Provision of— | ||||||
| Food and drink | 976 | 976 | 976 | 976 | 976 | 940 |
| Clothing, footwear, and textiles | 1,006 | 990 | 990 | 990 | 990 | 960 |
| Accommodation, meals, and personal service | 1,217 | 1,041 | 1,041 | 1,041 | 1,041 | 975 |
| Working in paper, printing, &c. | 976 | 954 | 954 | 954 | 954 | 941 |
| All groups combined | 1,054 | 1,000 | 1,000 | 1,000 | 1,000 | 962 |
The index numbers in the foregoing table being all on a common base, comparisons between movements in the different groups cannot be readily made. The following table brings out the movements in the various groups more clearly, a separate base being used for each group.
| Industrial Group. | 1926–30. | 1914. | 1932. | 1933. | 1934. | 1935. | 1936. |
|---|---|---|---|---|---|---|---|
| NOTE.—Vertical comparisons are indicative merely of the relative percentage changes in the length of the working week in the different industries since the base period, not of the actual respective number of hours of the different industrial groups. | |||||||
| Provision of— | |||||||
| Males. | |||||||
| Food and drink | 1,000 | 1128 | 1,000 | 1,002 | 1,003 | 1,005 | 982 |
| Clothing, footwear, and textiles | 1,000 | 1,023 | 1,000 | 1,000 | 1,000 | 1,000 | 969 |
| Building and construction | 1,000 | 1,011 | 1,000 | 1,000 | 1,000 | 1,000 | 944 |
| Power, heat, and light | 1,000 | 1,041 | 998 | 998 | 998 | 998 | 960 |
| Transport by water | 1,000 | 1,014 | 997 | 997 | 997 | 997 | 970 |
| Transport by land | 1,000 | 1,016 | 1,000 | 1,000 | 1,000 | 1,000 | 968 |
| Accommodation, meals, and personal service | 1,000 | 1,275 | 1,000 | 1,000 | 1,000 | 1,000 | 937 |
| Working in or on— | |||||||
| Wood, wicker, seagrass, &c. | 1,000 | 1,002 | 1,000 | 999 | 998 | 997 | 955 |
| Metal | 1,000 | 1058 | 1,000 | 1,000 | 1,000 | 1,000 | 970 |
| Stone, clay, glass, and chemicals | 1,000 | 1009 | 1,000 | 1,000 | 1,000 | 1,000 | 952 |
| Paper, printing, &c. | 1,000 | 1,021 | 998 | 998 | 998 | 998 | 989 |
| Skins, leather, &c. | 1,000 | 1,003 | 1,000 | 1,000 | 1,000 | 1,000 | 959 |
| Mines and quarries | 1,000 | 1,016 | 995 | 995 | 993 | 988 | 957 |
| All groups combined | 1,000 | 1,041 | 999 | 999 | 999 | 999 | 963 |
| Females. | |||||||
| Provision of— | |||||||
| Food and drink | 1,000 | 1,000 | 1,000 | 1,000 | 1,000 | 1,000 | 963 |
| Clothing, footwear, and textiles | 1,000 | 1,016 | 1,000 | 1,000 | 1,000 | 1,000 | 970 |
| Accommodation, meals, and personal service | 1,000 | 1169 | 1,000 | 1,000 | 1,000 | 1,000 | 937 |
| Working in paper, printing, &c. | 1,000 | 1,013 | 991 | 991 | 991 | 991 | 977 |
| All groups combined | 1,000 | 1,054 | 1,000 | 1,000 | 1,000 | 1,000 | 962 |
As indicated by the foregoing tables, changes in the length of the full working week were relatively few for a long period preceding 1936. The greatest number of hours in the normal working week was in the case of workers aboard ship, the hours prescribed by award for cooks and stewards while at sea being 9 hours per day for a seven-day working week. In butler and cheese factories also a seven-day week was usual until recently, the working week in butter-factories being 56 hours for six months of the year and 44 hours for the remainder of the year. In the case of cheese-factories some awards specified 60 hours per week at the height of the season, 48 hours for another portion of the year, and 38 hours in the slack season. The hours of labour prescribed by awards for hotel and restaurant workers and shop assistants were 48 per week, while in the engineering, building, and clothing trades a 44-hour week was normal. In coal-mines an 8-hour day was usual, with no work on alternate Saturdays.
The Industrial Conciliation and Arbitration Amendment Act, 1936 contains, inter alia, provisions aimed at the establishment of a 40-hour week, without reduction in the weekly wage-rate. New awards will contain a provision to this effect, except that the Court may fix longer hours; but in such cases the Court is required to state its reasons for so doing. Existing awards may be reviewed on application of the unions concerned with a view to the fixing of a 40-hour week. The Factories Amendment Act, 1936, requires the fixing of a 40-hour week in factories, applications for exemption from this provision being heard by the Arbitration Court. Among important industries where a 40-hour week has been brought into operation the following may be cited: Boot manufacture, biscuit and confectionery manufacture, woollen-milling, hotelkeeping (licensed), timber-milling, the building trades, clothing manufacture, coal and gold mining, electricity generation and supply, flour-milling, and rail and tramway operation.
The effect of the shorter working-week in many industries, dating as it does only from the latter portion of 1936, is not fully seen in the index-number for the year.
Table of Contents
SOCIAL and labour legislation was enacted early in New Zealand's history as a British country, and it is worthy of notice that, as in Britain it was the deplorable condition of apprentices that first excited popular support for labour legislation, so the first important New Zealand measures of this nature were the Master and Apprentices Act of 1865 and the apprentice-protection sections of the Offences against the Person Act of 1867. But in what was an essentially agricultural and pioneer country, conditions demanding labour legislation were not present, so that there was but little early progress in labour legislation. Initially, labour administration was interpreted in the light of English statutes, but such interpretations were largely ineffective, owing to the vast difference between English and New Zealand conditions.
The Trade-unions Act was passed in 1878, affording unions protection from prosecution for conspiracy by reason merely that they were in restraint of trade. A considerable portion of the Shipping and Seamen Act of 1877 regulated conditions of life aboard ship, payment of wages, &c. The Inspection of Machinery Act, 1882, provided for the inspection of machinery in factories, &c., and required that persons in charge of boilers be properly qualified. An Employers' Liability Act was passed in 1882, legislating in the matter of industrial accidents with the object of mitigating the consequences to the worker without recourse to expensive litigation at common law.
Legislation specifically governing the conditions of employment of females—particularly in respect of hours of labour—was introduced in 1873, there being several amendments to the Act in later years, while the legislation was amended and consolidated in 1881. Regulation of the hours of labour of children was also provided for. With the existence of slump conditions in the “eighties” allegations of “sweating” arose; and, since such complaints became increasingly numerous, a Commission was set up in 1889 to inquire into this evil. The Commission found that the Employment of Females Act was ineffective owing to the lack of the necessary powers of enforcement. The Commission declared that actual sweating conditions were not present, though a minority report differed from this view, and pointed out that with increasing industrialization such conditions would rapidly become prevalent if no attempt were made to check them. The Commission made recommendations for future labour legislation, and, as the result of its findings, the Factories Act of 1891 was passed.
Depression, discontent, and a growing labour force—despite depression, the number of hands employed in factories increased approximately 16 ½ per cent. between 1885 and 1890—formed an economic background favourable to social legislation. Meanwhile the maritime strike of 1890, which caused even further distress throughout the country, proved to the trade-unions that they were not sufficiently strong to obtain their demands by direct action, and diverted their activities to the political field. The strike also aroused public opinion to the necessity for preventing such industrial strife. Political opportunity was still further opened by Sir George Grey, who in 1889 obtained Parliamentary approval for the abolition of the last remnant of plural voting at the elections to the House of Representatives. The extension of the franchise to women followed four years later.
In January, 1891, the Liberal Government came into power under the leadership of Ballance, with Reeves (Labour) and Seddon (Public Works) in the portfolios directly concerned with labour matters. As indicated above, the economic and political back-ground demanded social change, and the change came to such a degree that New Zealand—still in the pioneer stage of economic development—acquired world fame as the land of advanced social legislation. The labour code enacted in the “nineties” was not so much socialistic as a correction of the more manifest injustices of an individualist system. There was not so much State control as an improved framework within which laissez faire could operate. This policy is most clearly seen in the realms of housing and farming, in which the Government aimed at making it easier for the worker to build or to settle on land, by the provision of finance through the State Advances Department (established in 1894). The Family Homes Protection Act, 1895, provided protection for homes from the legal processes resulting from bankruptcy proceedings, &c. The only encroachment on laissez faire principles was the fostering of co-operation on public works from 1891 onwards.
Working-conditions were improved by legislative regulation in four types of industry (factory work, shipping, shops and offices, and coal-mining), wages being also safeguarded though not directly increased.
The great achievement of this administration, however, was the evolution of machinery—the Conciliation Councils, the Arbitration Court, and the Labour Department, which not only administered the labour code efficiently, but could also modify it rapidly to suit the changing economic background. This dynamic machinery was far more effective than the all too soon antiquated improvements by the more normal procedure of static legislative enactment. An adjustable labour code was of special advantage to a primary-produce exporting country which is, of all countries, most open to the fluctuations of economic progress, and it is another example of the British empiricism that delights in suiting action to the conditions of the moment.
This code, and the resulting constant political intervention in labour conditions, profoundly modified labour organization. Since resort to judicial rather than militant action became the accepted means of settling industrial disputes, much of the bitterness usually associated with the struggle for improved wages and working-conditions was lost. Moreover, the close association with the Courts led to the growth of a strong political bias in the aims. of unionism. This was but natural, for, since the legislative code ensured to the workers many benefits for which they would otherwise have had to fight keenly, it was felt that the further amelioration of living-conditions would best be attained by legislation rather than by direct action.
Subsequent progress has been determined largely by this code, although the swing visible in the development of English labour legislation from Salisbury's Factory Acts to Lloyd George's pension schemes—from concrete intervention in working-conditions to attempts at equalizing the distribution of the national income —is also evident in New Zealand. For example, the rate of the old-age pension has been increased considerably—from £18 per annum (1898) to £45 10s. (1925), to £52 (July, 1936), and to £58 10s. (December, 1936). [There was a reduction to £40 19s. in 1932, and a restoration to £45 10s. in 1935.] Again, more favourable provisions exist in regard to loans under the State Advances legislation in respect of persons earning under £300 per annum than those that apply generally; while the present Government's housing plans include provision for the erection of homes of a good standard to be let to workers at a reasonable rental. Already several hundred homes have been built for this purpose (vide pages 524–525).
It must be admitted, however, that in respect of social legislation generally the initial pre-eminence of New Zealand has been largely lost. The National Provident Fund (established 1911) represents the only governmental provision towards sickness insurance. The scheme is a voluntary one, State aid being in the direction of administration, together with a subsidy. Compulsory health insurance has been in operation for many years past in several other countries—e.g., Germany (1883), Great Britain (1911). As yet legislation on these lines does not exist in New Zealand. The 1936 extension of the invalidity pensions provisions of the Pensions Act is a step in the direction of liberalizing the New Zealand legislation in regard to provision for sickness; while the Government is at present considering plans for a comprehensive scheme of universal health insurance, including provision for medical attention and sick-pay. Universal superannuation is yet another governmental plan under consideration. It has been recently announced (September, 1937) that legislation providing for national health insurance and national superannuation will be introduced by the Government in 1938.
The New Zealand Workers' Compensation Act, 1922 (as amended in 1926), in some respects falls considerably behind the law of several other countries, particularly in regard to payment of medical expenses; while, again, national provision for the relief of unemployment did not become law in this country until 1930, whereas in Great Britain legislation dealing with this subject has been in force since 1911, the years of initiation of unemployment insurance in certain other countries being as follows: Austria, 1920; Queensland, 1922; Italy, 1923; Germany, 1924. A Workers' Compensation Amendment Act was passed in October, 1936, liberalizing the scale of payments in respect of accidents, while changes in the administration of the unemployment legislation in the direction of granting greater benefits have been made.
Up to 1936 progress in other spheres was limited to technical improvements on the original Ballance-Seddon code, except perhaps in the case of the fluctuating fate of the Arbitration Court. During the twenty-six years of prosperity from 1895 to 1921 (there was but a slight setback in 1909–1910) the scope of the Court's awards was gradually expanded, the most important step being the power conferred in 1898 of prescribing minimum rates of wages. Whereas the Court was originally more concerned with conditions of work, and not at first with wages, there has been a gradual transformation, till in recent years the attention of the Court has been focused on the wages question. As the Court is progressive, or at least not static, its influence expanded at the cost of stationary measures, such as Factories Acts, which, in practice, became a dead-letter as affecting workers under the jurisdiction of the Court. During the depressed years from 1921 to 1927 wages were reduced, to the dissatisfaction of the workers, yet not fast enough for employers, so that the value of the Court was increasingly questioned till a National Industrial Conference was summoned in 1928 to discuss, inter alia, compulsory arbitration. In the boom years between 1927 and 1930 no action was taken; but in 1932, under stress of depressed conditions, amendments were made to the Act which in effect abolished the system of compulsory arbitration. The Arbitration Amendment Act, 1936, restored the full powers of the Court.
Though no great inroads have been made on the wages system, there has been definite governmental and legislative encouragement of co-operation. In 1891 much public-works construction, such as road and railway formation, was first organized on this principle. The plant, explosives, &c., were supplied to the men by the State at cost-price or on low hire terms. A modified form of the system then adopted is still followed, and the Minister of Public Works increased its scope in 1936. Similarly, the Companies Empowering Act of 1924 attempted to encourage the principle of profit-sharing among workers. Any company registered under the Companies Act was empowered to issue to its employees labour shares, which are not transferable, have no nominal value, and do not form part of the ordinary capital of the company. Except as otherwise provided, these shares entitle the holders to the same privileges as the ordinary shareholders. In the event of an employee leaving his employment or dying, the shares must be surrendered in cash or in capital shares to him or to his heirs. The Act of 1924 required the Arbitration Court to inquire into the merits of each scheme before such scheme could be validated, but this requirement was repealed in 1931. Another Act in the early “twenties” aimed at fostering co-operation among farmers, but it became, in practice, a dead-letter.
There was in the original labour code a definite policy of ensuring greater opportunities for the masses by financing farming and house-building projects, through the State Advances Department. This provision of easy credit to put workers on the land was the rural aspect of the labour code, for, apart from some provision for the inspection of housing, there were no other measures designed for the agricultural labourer. Even the Arbitration Court in 1908, 1919, and 1925 refused to make any award covering permanent farm labour. Full provision for the application of standard rates of wages, &c., to farm workers was made in 1936 (see Agricultural Workers Act, post). The policy of social lending survived the years of prosperity, and was employed to cope with part of the post - war demobilization; but the policy was reversed in the ensuing depression, and the Rural Advances Act of 1926 was a definite attempt to put State Advances loans on a more economic basis, eliminating much of the social background. This tendency was completed by the creation of the Mortgage Corporation in 1935, which definitely marked the subordination of social to economic ends. The agricultural bias and the workers' loans of up to 95 per cent. of their security were both eliminated, in theory at least. At the same time loans for housing were reintroduced for Maoris late in 1935, and further activity in this sphere was foreshadowed by the Housing Survey Act of 1935. The Government was also empowered to lend to farmers, through the Lands Department, by the Dairy Industry (Emergency Powers) Act of the same year.
The State Advances Corporation Act, 1936, marks a definite reversal of the previous Government's recent policy in regard to State Advances loans. The Mortgage Corporation is abolished, its powers being taken over by the State Advances Corporation (see Section XXIVD), while the general purpose of the 1936 Act is definitely in the direction of a liberalization of the lending policy of the State.
During the recent depression there was a cessation of the move towards better working-conditions; and on the grounds of economic circumstances and the danger of inconveniencing still further already bankrupt employers, the various inspection duties that usually preserve the labour code were curtailed. The rates of pensions and public servants' salaries and wages wen; reduced, while award rates of wages were also compulsorily reduced. At the same time heavy unemployment liabilities were undertaken and immigration control was made more rigid. Steps were also taken to reduce farmers' mortgage liabilities and to maintain farmers on their land.
In no case do the provisions laid down by any particular labour law cancel the worker's rights at common law; but since, naturally enough, better conditions are laid down by statute than the worker is entitled to at common law it is unusual to find in these days litigation under the common law affecting master and servant. It sometimes happens, however, notably in workers' compensation cases, that appeal is made at common law instead of under the Act, there being no statutory limits to the damages which may be obtained at common law. Since, with the exception of such of the labour statutes as are of general application, no labour legislation exists as yet affecting certain classes or workers—e.g., domestic servants—their relations with their employers are still governed mainly by the common law affecting master and servant.
New Zealand has been relatively backward in protection for permanent farm labour, for while seasonal labour is in general covered—awards existing both for shearers and shed hands and for threshing-mill workers—the Arbitration Court has made no awards in respect of permanent farm hands. In general, conditions of work on farms were not covered by any specific legislation—except as regards inspection of housing-accommodation—until, in 1936, the Agricultural Workers Act (described in some detail later) was passed, containing definite provision as to wages of dairy-farm workers and better provision for the housing of agricultural workers. Similar legislation has existed in many of the older countries for years past. In the following pages labour legislation, as it has developed in its principal provinces, is discussed in some detail.
Extensive amendments to pre-existing labour laws have been made by the Labour Government (elected in November, 1935) towards the formation of a more liberal code of social legislation. Legislative provisions novel to New Zealand have been made with the same object in view—e.g., the Agricultural Workers Act, the provision for the declaration of a basic wage contained in the Industrial Conciliation and Arbitration Amendment Act, &c. Following is a list of Acts dealing directly with labour questions, passed during the 1936 session of Parliament:—
Employment Promotion Act.
Industrial Conciliation and Arbitration Amendment Act.
Factories Amendment Act.
Shops and Offices Amendment Act.
Agricultural Workers Act.
Workers' Compensation Amendment Act.
Coal-mines Amendment Act.
A machinery measure (the Labour Department Amendment Act) brings certain functions of the Department under the control of the Minister of Labour, and defines more clearly the scope of the Department's activities. In addition to the Acts mentioned above, provisions in several other Acts of the 1936 session deal with matters which can be properly regarded as coming within the subject-matter of this section. The following Acts, or provisions in Acts, may be referred to in this connection. In some instances detailed reference is made later in this section, while in others reference is made in the sections indicated.
Certain provisions in the Finance Act dealing with restoration of wages and salaries.
The Distress and Replevin Amendment Act. Fair Rents Act.
Family Allowances Amendment Act. (See Section XXV.)
Pensions Amendment Act. (See Section XXV.)
Prevention of Profiteering Act. (See Section XXXVI.)
Mortgagors and Lessees Rehabilitation Act. (See Section XXXII.)
State Advances Corporation Act. (See Section XXIVD.)
Various enactments and amendments to previous Acts introduced in the 1936 session modifying the code of labour legislation and social legislation generally have been briefly referred to. More detailed reference is given in each instance under the appropriate heading in the following pages, where the legislation as it stands at present is discussed, with appropriate historical comment. A short resume of the Government's policy in relation to public works as it affects working-conditions, &c., on such works is also appended, as being highly relevant to the subject-matter of this section.
The 1937 session of Parliament is still in progress at the time of going to press for this section of the Year-Book (November, 1937). As yet the only legislative action having a bearing on the subjects discussed here is the extension of the period of operation of the Fair Rents Act. Government bills at present (November, 1937) before Parliament include amendments of a machinery nature to the Industrial Conciliation and Arbitration Act, including provision for the temporary appointment of a second Court of Arbitration. A Coal-mines Amendment Bill is also under consideration. This measure contains many provisions towards the improvement of working-conditions in coal-mines.
Working-conditions of females in factories were the subject of legislation as early as 1873; but the first legislation of this nature applying to all factory workers was the Inspection of Machinery Act of 1882, which provided for the inspection of machinery in factories, &c., and required that persons in charge of boilers should be properly qualified; while three years later an ineffective Factory Act was passed. But it was the Ballance and Seddon Governments which really initiated legislation in this sphere with four main Acts that have served as a basis for all subsequent legislation on this subject, and determined the lines along which progress was to be made—the Factories Act, 1891; the Shops and Shop-assistants Act, 1892; the Coal-mines Act, 1891; and the Shipping and Seamen Act, 1894. The Agricultural Workers Act, 1936, represents a definite extension of the scope of this legislation.
The original Factories Act, which was passed in 1891, provided for the registration as a factory of any office, building, or place in which three or more persons were engaged in working for hire or reward in any handicraft, or in preparing or manufacturing articles for trade or sale, and for the inspection of such factories. Other provisions dealt with sanitation in factories, the protection of women and children as regards hours of employment, and the notification of accidents in factories. No boy under thirteen years of age, or girl under fourteen, was permitted to be employed in any factory. This Act was repealed in 1894, the Act of that year containing several new features, notably provision for the labelling of work sent out from the factory and manufactured in private houses. A forty-eight-hour week was prescribed for women and boys, who were further protected by a provision that they were not to be employed between the hours of 6 p.m. and 7.45 a.m. without the written consent of an Inspector of Factories, who was empowered to permit a limited amount of overtime. The definition of a factory was widened to include establishments where two people were employed. In one respect the Act of 1894 compared unfavourably with the previous enactment. Under the 1891 Act women and youths had worked an eight-hour day, with a weekly half -holiday; but the 1894 Act, by merely prescribing a forty-eight-hour week, meant that they had by law to take a half-holiday at their own expense. Under the 1901 Act this fault was rectified; and, in addition, cognizance was taken of the working-hours of men—the hours being fixed at forty-eight hours per week for men, with a maximum of eight and three-quarter hours per day; and forty-five per week for women and youths, with a maximum of eight and one-quarter hours per day. Overtime was permitted with extra payment; but in the ease of women and girls the number of hours per day and the number of days per year were limited. Boys and girls could not be employed without payment or at a lower wage than 5s. per week. There were no major amendments between 1901 and 1936, although the law was consolidated in 1908 and in 1921–22. The statutory half-holiday for women and girls, which was fixed for Saturday, may be altered to any day other than Saturday fixed for the closing of shops and offices in the district. Before a boy or girl under sixteen may be employed in a factory a certificate of fitness must be obtained, which may be granted by the Inspector, having regard to age, standard of education, and general fitness for employment.
Important amendments to the law are contained in the Factories Amendment Act, 1936. The definition of a factory is widened to include all establishments where one person is employed (two persons being the minimum previously, with certain specified exceptions—viz., bakeries, laundries, all places where mechanical power is employed, gasworks, electric generating-plants, and places where Asiatics are employed in laundry-work, manufacture, or handicrafts).
A forty-hour week is prescribed as the legal maximum for an ordinary working-week in place of the pre-existing maximum of forty-eight hours (women and boys, forty-five hours). The number of hours per day is reduced to eight, while work may not be continued for more than four hours and one-quarter (previously five hours) without an intermission of at least three-quarters of an hour. Certain industries which were previously exempt from the forty-eight-hour maximum—meat-freezing works, dairy factories, fellmongery, fish-curing, jam-making, bacon-curing—are also exempted from the operation of these provisions. On application by any occupier of a factory, the Court of Arbitration may by order extend in respect of the factory for any specified period the limits on working - hours indicated above, but not to more than forty-four hours per week. Special provisions are made in the case of dairy factories, limiting, with certain exceptions, to six per week the number of days on which any worker may be employed.
The minimum rate of pay is raised from 10s. per week to 15s., rising by half-yearly increments of 4s. until the end of the third year, when the minimum rate of £2 per week operates. Overtime is permitted (as before) upon obtaining a permit from an Inspector of Factories; but Sunday work for women or boys is definitely prohibited.
Overtime rates of pay are raised to a minimum of 1s. 6d. per hour (preexisting minima 6d. and 9d., according to ordinary rate of pay), while the standard overtime rate is one and one-half times the ordinary rate (previously one and one-quarter times). The number of statutory holidays granted to workers has been increased from six to eight, while special provisions have been made requiring extra payment to be made for work on Sundays or holidays. Generally speaking, treble time is counted for work done on statutory whole holidays (where the worker would be paid ordinary time if not working), double time on Sundays or other holidays, and time and one-half on half-holidays.
No deduction from the pre-existing weekly wage is to be made on account of any reduction in working - hours made in consequence of the coming into force of the 1936 amending Act. The reduced hours came into operation on 1st September, 1936.
In addition to the provisions described in the previous paragraphs, there are, inter alia, sections extending the application of rules for the prevention of accidents in factories; while, where better conditions are prescribed in any respect by the amended Factories Act than exist in any award or agreement under the Industrial Conciliation and Arbitration Act, such award or agreement is to be read subject to the provisions of the Factories Act.
Provision was made in 1906 for protecting workers employed on any building work, and these provisions were later superseded by the Scaffolding and Excavation Act, 1922. This Act covers all persons engaged in erecting, demolishing, or altering any building, making the necessary excavations, or operating cranes and other gear. Notice of intention to commence building work that may involve a fall of 12 ft. or more, or to make an excavation, or to set up a crane, must be given to one of the Inspectors appointed by the Act. The Inspector is empowered to order work to cease, to brand or destroy unsafe gear, and generally to see that the life and health of workers are safeguarded.
Much legislation followed the original Shops and Shop-assistants Act of 1892, and the whole was consolidated in 1922 into the Shops and Offices Act, which is substantially amended by an Act passed in 1936.
The Act regulates the hours of assistants in shops and offices, and provides for the fixing of the hours of closing of shops and offices. Except in certain exempted trades and in small towns for which later hours are prescribed, work must cease at 0 p.m. on four nights of the week, at 9 p.m. on one night, and at noon on the day of the weekly half-holiday. The hours must not in any case exceed forty-four per week or eight per day, with the exception of eleven on one day in the week. Limited overtime (to be paid for) may, however, be worked for stocktaking and special occasions. A break of not less than one hour for a meal must be allowed after four and one-quarter hours' continuous work, except that an extension to five hours may be made if ten minutes' rest is allowed at the end of a working-period of three hours. Prior to the 1936 amendment the weekly minimum was forty-eight hours, and the closing-hour on the half-holiday was 1 p.m.
In regard to the closing of shops, a weekly half-holiday from noon is compulsory with a few exceptions—e.g., fishmongers and fruiterers. The closing-day is fixed in each district by the local authority, except where it is decided by a poll of the electors taken on petition of a certain number. Even in the exempted trades, a half-holiday must be given to each assistant on a day to be fixed by the occupier.
The closing-hours of shops in any district on the other days of the week have for many years been fixed pursuant to the Act by “requisition” of a majority of the shopkeepers if desired either in the whole of the local district or in any trade in the local district. The hours of closing have been thus determined in very many trades and districts.
In 1920 an amendment of the Act prescribed compulsory closing-hours at 6 p.m. on four days of the week and 9 p.m. on one day in the well-populated areas, except in certain exempted trades, thus incorporating by statute the closing-hours as already determined by “requisition” in many cases. The Court of Arbitration under the Industrial Conciliation and Arbitration Act is also now empowered, when making an award in any trade, to fix not only reduced hours of employment of assistants (which has been done in many trades), but also earlier closing-hours of all shops in that trade in the locality whether or not assistants are employed therein, with authority to make exemptions in cases of hardship, and this provision has also been acted upon.
Each trade in any district may also, by a majority vote, obtain an order of the Minister of Labour prohibiting the sale in such district, during the time the shops in such trade are required to be closed, of the goods the sale of which is comprised in such trade. This provision is inserted to meet those cases where the trades of various shopkeepers overlap one another, only some of whom are required to close at a certain hour. The provision enabling a majority of the shopkeepers in any trade to fix the closing-hours for that trade applies only to those who are principally engaged therein; if the latter are desirous that other shopkeepers carrying on the trade as a minor portion of their business should cease selling the same goods at the closing-hours fixed, they may apply to the Minister for an order prohibiting such sales.
The Act fixes a minimum wage of 15s. per week, with half-yearly increments of 4s. per week until the end of the third year, and thereafter a wage of not less than £2 per week. (Prior to the 1936 amendment, 10s. minimum; annual increases of 5s. until £1 10s. per week was reached.) As in the case of factories, higher rates of wages are, in the case of many shop-assistants, fixed by awards or industrial agreements under the Industrial Conciliation and Arbitration Act.
All assistants employed in hotels and restaurants are brought under special provisions as to holidays, hours (which must not exceed forty-four per week nor eight per day), overtime, &c. As in the case of shop-assistants, hotel and restaurant employees must be allowed an interval of an hour for a meal after four and one-quarter hours' continuous work.
The Act also makes provision for the comfort, health, and safety of assistants—viz., in regard to seating-accommodation, ventilation, heating, sanitation, and hygiene.
The hour of commencing work must not be earlier than 7 a.m., except in certain specified instances—e.g., bakers (4 a.m.), butchers (6 a.m.). Persons engaged in delivering milk may be required to start work at 3 a.m. or—in accordance with conditions approved by the Minister, but not otherwise—earlier than 3 a.m. The above exceptions do not apply in the case of boys or girls under sixteen years of age. The latest hour on which a male shop-assistant may be employed in any trade is 10.30 p.m., or 11 p.m. on one day in the week in certain instances; while boys under eighteen or females may be employed until 9.30 p.m., but there are exceptions on certain days—e.g., Christmas Eve. Extension to 10.30 p.m. is permissible in the case of women, girls, or boys under eighteen employed in restaurants. There is no limit under the Act to the time at which adult male hotel and restaurant employees may be required to commence or cease work.
No premium may be received by the occupier of any shop in respect of the employment of any shop-assistant or in respect of the teaching or training of any person in any trade or business carried on in the shop unless the shop is approved by the Chief Inspector appointed under the Factories Act, 1921–22, as a school for learners in a trade or business, and the payment is made pursuant to a written agreement that is approved by the Chief Inspector. The Chief Inspector cannot approve of any shop as a school for learners in any trade or business unless he is satisfied that reasonable facilities are provided for learning the trade or business, and he may at any time withdraw his approval if he ceases to be so satisfied. The Chief Inspector must not approve of any agreement under this section unless he is satisfied that the terms of the agreement are reasonable.
Offices are required to close at noon on the statutory half-holiday and at five o'clock on every other working-day, certain exceptions—e.g., shipping offices, railway offices, and newspaper offices—being allowed. The list of exemptions from this provision has been substantially amended by the 1936 Act, banks and insurance offices being important cases previously exempt. Limited employment after office-hours is permitted for such purposes as making up balances, &c., payment for overtime at the rate of time and a half (minimum 1s. 6d. per hour) and meal-allowance at the rate of 1s. 6d. per meal being mandatory in respect of such overtime.
The minimum wage-rates applying to shop-assistants set out in a preceding paragraph apply also to office assistants. Prior to the 1936 amendment office assistants did not come within the scope of the provisions for minimum wages. This particular provision also applies to solicitors' offices and mining offices, which do not come within the definition of the term “office” in respect of other provisions of the Act.
No person who was employed in any shop or office at the time the 1936 amendment came into operation may be dismissed, nor have his wages reduced, by reason merely of any reduction or alteration made in his working-hours pursuant to the amendment. Where any such person is dismissed or his wages are reduced after the commencement of the Act, the onus of proving that the dismissal or reduction, as the case may be, was not a breach of the provisions of that Act is on the employer.
Awards and industrial agreements covering shop and office workers are to be read subject to the provisions of the Shops and Offices Act—i.e., the conditions, &c., laid down in such awards and agreements must be at least equal to those prescribed in the Shops and Offices Act.
Provision is made for the keeping of a time-table of hours of duty of fruiterers' assistants; and, under certain conditions, shops which sell smoking-requisites in addition to carrying on other business may be compelled to close early in the evenings. Vendors of motor spirit or oil are not compelled to observe the limitations as to closing-hours, provided that this is the sole business conducted on the premises.
Since the passing of the original Coal-mines Act of 1891 legislation relating to coal-mines has always been set out separately from that regulating all other mines. The Mining Act of 1926, which consolidates no fewer than fifteen previous enactments on the subject, lays down in considerable detail regulations governing all mines except coal-mines. Inspectors of Mines are appointed with wide powers.
The Act requires that a person acting in the capacity of mine-manager of any mine where there are more than twelve men employed at any one time above ground, or more than six underground, must hold a certificate granted after examination by a Board of Examiners empowered under the Act to grant such certificates. Provision is made for proper ventilation in mines, special care is required to be taken in handling explosives, dangerous places must be properly timbered, special regulations are made as to hauling-machinery, &c. No female and no male person under the age of fourteen years may be employed in or about a mine, except in a clerical capacity. The employment of manual labour on Sundays without the previous written consent of an Inspector of Mines is prohibited. Overtime must be paid for any time worked in excess of eight hours a day, counting from the time the miner enters the underground workings until he leaves them. Time worked on Sundays and holidays must be paid for at time-and-a-half rates. All machinery used to supply motive power is subject to the provisions of the Inspection of Machinery Act, 1908, as far as these provisions apply. A sufficient supply of water must be supplied where it is necessary for the laying of dust in a mine. No youth may be employed in a mine for more than eight hours per day or forty-eight hours per week except in cases of emergency.
The Mining Amendment Act, 1927, provides, inter alia, that a mine where twenty men or over are employed on one shift must have two outlets.
Conditions of employment in coal-mines are dealt with in the Coal-mines Act, 1925. In general the provisions of this Act resemble those of the Mining Act, though, of course, to combat the special risks of coal-mining additional regulation is necessary. For every coal-mine there must be a duly qualified manager, who must be either the owner of the mine or some person appointed by the owner, and who is responsible for the control, management, and direction of the mine. Inspectors of Coal-mines are appointed, who must hold certificates as first-class mine-managers under the Act. Certain sections of the Act deal with the prevention of coal-dust, the use of safety-lamps, the prohibition of work in places where the presence of gas is suspected, and the inspection of the mine before the commencement of work, &c. Suitable housing-accommodation must be supplied for workers if required by notice of the Minister of Mines.
A levy of ½ d. per ton on every ton of marketable coal raised from mines is made under the terms of the Act, such moneys forming a fund for the relief of miners injured in the course of employment and of their dependants in the case of death. Information as to miners' pensions, provided for originally by the Miner's Phthisis Act of 1915, is contained in Section XXV of this book.
By an amending Act passed in 1927 wages for a period not exceeding six months, payable by the owner of a coal-mine in respect of mining operations, constitute an equitable charge on plant and machinery, with priority over mortgages, &c. Proceedings for the enforcement of the charge must be commenced within twelve months.
An amending Act passed in 1936 provided further measures for the safety of miners. Stricter precautions are to be taken to ensure that unlawful lights, &c., are not taken into mines. Additional safeguards are made to alleviate the danger to the health of miners from the presence of dust in mines, while the Minister may establish central rescue stations in coal-mining areas. A Coal-mines Amendment Bill, incorporating further provisions for the improvement of working-conditions, is at present (November, 1937) before the House of Representatives.
The first statute relating to this subject was passed in 1877, and the present law is embodied in the Shipping and Seamen Act, 1908, which, with subsequent amendments, contains many provisions designed for the safety of passengers and crew, and for the amelioration of working-conditions on board ship. A vast amount of regulation is contained in the Act dealing with matters which do not come under these headings, so that this résumé of its contents by no means covers the whole ground covered by the Act.
Adequate provision is made to ensure competence on the part of the controlling officers of ships. Home-trade steamships of 60 tons register and upwards and home-trade sailing-ships of 100 tons register must carry certificated mates, and such ships of 100 tons register and upwards trading more than three hundred miles between terminal ports must have second mates. A foreign-going ship is required to carry two certificated mates. Foreign-going certificated mates are entitled to ship as mates in the home trade. It is an offence for a master or owner to engage a certificated officer for the purpose only of enabling the ship to clear, and not for the purpose of making the voyage.
Provision is made for issuing certificates of competency to second mates of home-trade ships, and for recognizing as valid in the Dominion certificates of masters, mates, and engineers granted in any part of the British Dominions.
Any master or mate may, at any time, be required by the shipowner or the Minister of Marine to be examined in the sight tests by the Government Examiners.
Further sections dealing with the safety of the ship require the adjustment of compasses to be carried out under regulations; and power is given to the Minister to define restricted limits for steamers and for vessels propelled by oil, gas, &c. The Governor-General in Council is empowered to make regulations as to the loading and stowage of ballast and the loading of grain cargo in bulk. It is an offence to ship wool, flax, tow, or skins in such a condition as to be liable to spontaneous combustion.
Since 1909 there has been a gradual extension of the type of ship ordered by law to carry wireless. The regulations now define the nature of the installations and service and the number and grade of operators in different classes of vessels, and provide for inspection.
The provisions regarding working-conditions on vessels require, inter alia, proper sanitary, hospital, and lavatory accommodation, including bathrooms, to be provided for the crew, together with an adequate supply of hot water for those employed in connection with the engines, and a minimum of space to be provided in the seamen's quarters is laid down. Masters and officers who assault seamen on the high seas are liable to imprisonment or fine.
Intercolonial, in addition to home-trade, ships are made liable to pay the wages, maintenance, and medical expenses of seamen taken ill in the service of the ship for the remainder of the agreement, not exceeding three months; and, in the ease of intercolonial ships, if the agreement expires within one month from the commencement of the illness, payment is to be made for one month after the expiry. The illness which entitles a man to the benefits provided for is one which requires medical treatment for fourteen days.
The wage-rates on foreign-going ships trading between New Zealand ports are to equal the current rates of wages for such work paid in New Zealand at the same time. This does not apply to ships arriving from abroad with passengers or cargo but not trading in New Zealand further than to discharge passengers or cargo and shipping fresh passengers or cargo to be carried abroad.
The clearances of foreign-going ships which are required to pay the coastal rate of wages are to be withheld until such wages are paid.
Desertion is defined, and deserters who cannot be dealt with before their ship sails can afterwards be prosecuted by the owner or agent, and copies of the agreement and the entries in the log-book are to be accepted by Courts as evidence. Forfeited wages are to be paid into the Public Account.
It is unlawful for any person other than the owner, master, mate, or engineer of a ship, or a Superintendent of Mercantile Marine, to engage or supply seamen for ships, and only such seamen as have a knowledge of the English language are allowed to ship.
The law as to inquiries into shipping casualties is on the lines of the Imperial Merchant Shipping Act, and provision is made for rehearings, for Superintendents of Mercantile Marine to take part in such inquiries, and for Magistrates to order a change of venue. Inquiries are not to be held in Police Courts unless other suitable buildings are not available; and in cases where there has been loss of life, but no damage to the ship, the inquiries may be held by Coroners.
The purpose of this Act is to make better provision for the accommodation of agricultural workers, and to make special provisions for the remuneration of workers on dairy farms and for the conditions of their employment. The Act included provision for the extension of these special provisions to other classes of agricultural workers. As indicated in a later paragraph, Orders in Council have since been issued under this provision. The administration of the Act is in the hands of the Labour Department, which also administered the Agricultural Labourers' Accommodation Act, 1908 (repealed by the present Act).
The sections of the Act in relation to the accommodation of agricultural workers lay down definite requirements for the comfort of such workers. Inter alia, sleeping-quarters separate from the dining-quarters must be provided where two or more workers are accommodated; a sufficient supply of furniture and utensils must be provided by the employer; provision for the storing of perishable foodstuffs and for drying clothes must be available; while first-aid appliances must be provided. Inspectors of Factories have power to inspect the accommodation and to require that improvements be made where necessary. Inspectors have discretionary power in cases where special circumstances exist, provided that the accommodation conforms approximately to the requirements of the Act. The employer has a right of appeal to a Magistrate's Court against the decision of an Inspector. The provisions of the Act are not intended to apply to cases where workers can conveniently sleep in their own homes; but special provision may be made by regulations under the Act to cover cases where a married worker and his family are occupying a house owned or leased by his employer.
No child under the age of fifteen years may be employed for hire on a dairy-farm (excepting those in such employment at the date of the passing of the Act). The following minimum rates of pay of workers on dairy-farms operated between the commencement of the Act (September, 1936) and 31st July, 1937:—
For workers under the age of seventeen years, 17s. 6d. a week:
For workers of the age of seventeen years but under the age of eighteen years, £1 2s. 6d. a week:
For workers of the age of eighteen years but under the age of nineteen years, £1 7s. 6d. a week:
For workers of the age of nineteen years but under the age of twenty years, £1 12s. 6d. a week:
For workers of the age of twenty years but under the age of twenty-one years, £1 17s. 6d. a week:
For workers of the age of twenty-one years and upwards, £2 2s. 6d. a week.
After 31st July, 1937, the minimum rates of wages are to be fixed by Order in Council; and, in fixing such rates, the guaranteed prices fixed in respect of primary produce under the Primary Products Marketing Act, 1936 (see page 376), will be taken into account. Future rates must not, however, be lower than those specified above. An Order in Council gazetted on 11th November, 1937, prescribes the following rates of pay to apply for the period 1st November, 1937, to 31st July, 1938 (and thereafter until a further Order is made):—
| Per Week. | |
|---|---|
| £ s. d. | |
| (a) For workers under the age of seventeen years | 0 18 6 |
| (b) For workers of the age of seventeen years but under the age of eighteen years | 1 4 0 |
| (c) For workers of the age of eighteen years but under the age of nineteen years | 1 9 0 |
| (d) For workers of the age of nineteen years but under the age of twenty years | 1 14 6 |
| (e) For workers of the age of twenty years but under the age of twenty-one years | 1 19 6 |
| (f) For workers of the age of twenty-one years and upwards | 2 5 0 |
No charge may be made by an employer for board and lodging of his dairy-farm employees; and in the case of a worker not being supplied with board and lodging the rates of wages specified above must be increased by 17s. 6d. per week.
Every agricultural worker who is employed on a dairy-farm for not less than four weeks continuously is to be allowed a holiday on full pay plus an amount not less than one-half the lodging-allowance rate. The duration of the holiday is to be not less than seven days in the aggregate for every twelve weeks of employment, and a proportionate period for every broken period of employment. If a regular weekly half-holiday commencing at noon is allowed, a holiday of fourteen days a year (or proportionate duration for a lesser period of employment) will be regarded as sufficient compliance with the Act.
Among the miscellaneous provisions relating to dairy-farms are the following: Wages and allowances must be paid in full at least once a month; a wages and holiday book must be kept; an Inspector of Factories may take proceedings for the recovery of arrears of wages.
Provision exists for the employment of “under-rate” workers, with the consent of the Inspector of Factories. An amendment to the Act made by a section in the Statutes Revision Act, 1936, permits the Inspector to apply the under-rate provisions in respect both of money wages and of amount (if any) payable in lieu of board and lodging in cases of female workers employed on dairy-farms. This amendment is of considerable import; since the employment of women workers for short periods of the day—notably at milking-time—is common on dairy-farms.
Orders in Council have been issued since the passing of the Agricultural Workers Act extending the operation of the full provisions of the Act to (a) workers in orchards, (b) workers on farms or stations used for the commercial production of wool, meat, grain (including seed), whether exclusively or together with any other purpose. The Orders do not apply to workers covered by awards or agreements under the Industrial Conciliation and Arbitration Act. Following are the rates of pay prescribed for orchard workers:—
| Weekly Wage. | Amount to be deducted if Board is provided. | |
|---|---|---|
| Workers over twenty-one years of age— | £ s. d. | s. d. |
| Managers | 4 0 0 | 17 6 |
| Other workers | 3 16 0 | 17 6 |
| Wage Per Hour. | |
|---|---|
| Casual seasonal workers— | s. d. |
| Adult males | 1 8 |
| Adult females | 1 4 |
| Youths and girls eighteen years and under twenty-one years | 1 2 |
| Youths and girls under eighteen years of age | 1 0 |
There are eight compulsory holidays for which full pay must be paid, while after twelve months' continuous employment a worker is entitled to one week's holiday on full pay, to be taken at a time suitable to the convenience of the employer. Payment of wages is to made at fortnightly intervals. The Order in Council came into operation on 1st February, 1937, and is still (November, 1937) in force.
The rates of pay fixed in the Order in Council applying to full-time workers on farms or stations used for the commercial production of wool, meat, grain (including seed) are identical with those paid to dairy-farm workers (see previous page). The rates will be replaced by any new rates which may be fixed for dairy-farm workers, with the exception that the substituted rate for workers twenty-one years of age or upwards should not exceed £2 5s. per week. Rates payable under this Order to casual workers are as follows:—
| — | By the Hour. | By the Day. | ||
|---|---|---|---|---|
| Found. | Not Found. | Found. | Not Found. | |
| * Per hour with rations. | ||||
| s. d. | s. d. | s. d. | s. d. | |
| Harvesters | 2 0* | |||
| Other workers | 1 8 | 2 0 | 13 4 | 16 0 |
| Youths up to eighteen years | 1 0 | 1 3 | 8 0 | 10 0 |
Every worker must be allowed by his employer on the completion of twelve months' service a total of eighteen days' holiday (or full money wage paid), to be given at the convenience of the employer. Workers employed for three months but less than twelve months are to be allowed a proportionate number of days. Payment of wages is to be made in full at monthly intervals (or at such other period as may be mutually arranged between the employer and worker). The Order contains provision for the employment of under-rate workers, upon the issue of a permit by the Inspector of Factories. The Order continues in force from 1st May, 1937, to 31st July, 1938, and thereafter until a fresh Order is made.
The amounts of wage-rates generally have always been influenced largely by the rates specified for individual industries and occupations in awards and industrial agreements registered under the Arbitration Act. As mentioned previously, certain classes of workers have hitherto had no legal protection in the matter of wage-rates; while, again, until the passing of the Shops and Offices Amendment Act, 1936, many classes of office workers were in a similar position.
The New Zealand Arbitration Court functioned for many years before the question of a basic wage was specifically dealt with by the Court. Under the War Legislation and Statute Amendment Act, 1918, the Court was required to review on application existing awards and industrial agreements, taking into consideration, inter alia, changes in the cost of living. The Court in April, 1919, made a pronouncement fixing basic rates of wages for skilled, semi-skilled, and unskilled workers. [It is of interest at this point to mention that a basic wage was brought into operation by the Federal Arbitration Court in Australia in 1907.] No definite family unit was stated as the basis on which the basic rate was calculated, the minimum pre-war award rates for unskilled labour, with appropriate adjustment, being apparently used as a standard. A cost-of-living bonus, varied at half-yearly intervals in sympathy with movements in the cost of living, was added to the basic rates. In September, 1925, a further pronouncement on the basic wage was made by the Court, standard minimum rates being fixed as follows:—
| Unskilled workers | 1s. 10d. per hour. |
| Semi-skilled workers | 1s. 11d. to 2s. 1 ½d. per hour. |
| Skilled workers | 2s. 3d. per hour. |
The legislation by which the Court was empowered to make general orders having expired, the new rates—which represented an increase on those obtaining before—were brought into operation as individual awards expired. As in the 1919 pronouncement, no definite family unit was taken as the basis of assessment of the standard rates, which were in general stated to be somewhat in excess of 60 per cent. higher than the rates ruling in 1914. It is of interest to observe in the light of recent legislation that the standard rate of 1s. 10d. per hour works out at £4 0s. 8d. per week of forty-four hours, the ruling working-week at that time in many industries.
No further pronouncements directly relevant to the subject of the basic wage were made until 1931. The Finance Act of that year empowered the Arbitration Court to amend, by general order, awards or industrial agreements with respect to rates of remuneration. Rates of remuneration under awards or industrial agreements were reduced by 10 per cent. as from 1st June, 1931, with certain minor exceptions.
Full or partial restoration of this cut was effected in the case of several individual awards made in 1934 and 1935, while complete restoration was effected in respect of all awards by a section in the Finance Act, 1936. This Act went further; it required the restoration as from 1st July, 1936, of all cuts in wages and salaries imposed during the depression period, whether the workers concerned were working under an Arbitration Court award or not.
In September, 1937, the Arbitration Court made a pronouncement on standard wages. The following minimum rates are set out in the Court's pronouncement:—
| Per Hour. s. d. | |
|---|---|
| Skilled workers | 2 9 |
| Semi-skilled workers | 2 5 to 2 7 ½ |
| Unskilled workers | 2 4 |
These minimum rates are intended as general standard minima for casual labour, and are not necessarily applicable where employment is regular throughout the year.
The Industrial Conciliation and Arbitration Amendment Act, 1936, inter alia, requires the Arbitration Court to fix basic rates of wages for adult male and female workers. Orders of the Court made to this end may be amended at not less than six-monthly intervals by a subsequent general order. The basic rate of wages for adult male workers is required to be fixed at a rate which would, in the opinion of the Court, be sufficient to maintain a man, wife, and three children in a fair and reasonable standard of comfort. A general order fixing basic rates of wages for adult male and female workers was issued by the Arbitration Court on 2nd November, 1936. The weekly rates are fixed at £3 16s. for adult male workers and at £1 16s. for adult female workers. The basic wage applies to all workers twenty-one years of age or over (excepting casual workers and those working under apprenticeship contracts) the conditions of whose employment are fixed by any award or industrial agreement. The basic wage has not, up to the present time (November, 1937), come up for review by the Court.
Rates of salaries and wages of public servants have been adjusted from time to time by legislative action. Cost-of-living bonuses were granted in the late war years and in the immediate post-war years; while, at the general regrading of classified officers normally held every five years, the subject of salary scales comes up for review. Statutory reductions were made in 1922, 1931, and 1932, the two latter reductions having since been restored—partially in 1934 and 1935 and completely in 1936.
An interesting innovation made by the Arbitration Court in 1928 was the award of that year whereby the wages of shearers and other wool-shed hands were fixed at a rate fluctuating with the movement of wool prices as determined by the Government Statistician's index number for export prices of wool. The system did not operate between 1931 and 1933, workers and employers being unable to agree as to rates, though both parties expressed approval of the principle. The award of 1933 contained provision for the resumption of the sliding-scale system, which is still in operation.
In referring to the general question of wage rates it is relevant to draw attention to the provisions made under the Family Allowances Act for supplementing the incomes of necessitous families; while the Pensions Acts are of significance also in this connection (see Section XXV).
Workers' wages were first safeguarded by the Truck Act of 1891, which ensured them the payment of their wages in full, in coin of the realm. This was followed by a series of Acts—the Contractors' and Workmen's Lien Act, 1892; the Workmen's Wages Act, 1893; the Threshing-machine Owners' Lien Act, 1895; the Wages Attachment Act, 1895; and the Wages Protection Act, 1899—all aimed at making the payment of wages more certain and secure, and at limiting creditors' rights to attach future earnings.
This code was consolidated into the Wages Protection and Contractors' Liens Act of 1908, which aims principally at securing the regular payment of wages. In cases of contracts between employers and contractors who employ wages-men, or between contractors and sub-contractors who likewise employ wages-men, the Act permits the attachment of moneys in the hands of the employers for the payment of wages in arrear. The person for whom the contract is being performed is deemed to be the employer.
The attachment of a worker's wages for debt is prohibited, except in the case of any surplus exceeding £2 per week. (This, however, has been affected by section 20 of the Industrial Conciliation and Arbitration Amendment Act, 1908, under which, in the case of a penalty for a breach of that Act, the surplus above £1 per week earned by unmarried men may be attached by judgment in a Magistrate's Court.)
The Act prohibits payment for wages being made in goods (truck), or in any other way than in money or by approved cheque; and also prohibits any stipulation as to how the wages-money is to be expended. The truck provisions do not, however, apply where the employer supplies house-accommodation, board and lodging, fuel, medical assistance, materials, tools, and the like required for the work, nor to seamen or farm workers.
A contractor, sub-contractor, and any worker is entitled to obtain liens on the lands or chattels of the employer upon giving due notice, and the employer must then retain in his hands sufficient of the contract-moneys to satisfy and guarantee payment of the claimant's dues. This is subject to the limitations stated. For example, the worker's earnings are limited to thirty days' pay, and so long as the employer retains 25 per cent. of the contract-money for the purpose till the expiration of thirty-one days after the completion of the contract the employer is not liable for any further payment; but if any additional amount has not been paid by him to the contractor when a lien is lodged the employer must retain enough of such amount to meet the lien. When any part of the contract-money has been duly withheld by the employer pursuant to the Act the contractor has no claim on the employer for that money, except so far as that amount is not required for the purposes of the Act. Liens are given priority in the order of workers, sub-contractors, and contractors. There are exemptions made in favour of mortgages on the employer's land if registered prior to the lodging of the lien, unless the mortgagee is a party to the contract. In the case of the death of a lien-holder the right passes to his personal representative.
If wages in respect of threshing operations are not paid to the workers concerned the amount of such wages can be made a charge on the proceeds of the realization of the crop threshed.
No deduction from workers' wages may be made for purposes of insurance against compensation for accident.
Liens to be imposed as security for miners' wages or earnings are dealt with under the Mining Act, 1926, and the Coal-mines Act, 1925.
Wages are further safeguarded by certain sections of the Bankruptcy Act, which give priority of payment for wages or salaries of workers (with certain limitations as to amount and period) in preference to certain other debts, and since the Bankruptcy Amendment Act, 1927, wages take precedence over rents. Similarly under the Companies Act wages (with the same limitations as under the Bankruptcy Act) are a first claim on the assets of a company being wound up. Under the Workers' Compensation Amendment Act, 1936, compensation payments rank with wages as a first charge on the assets of a bankrupt.
Various individual labour laws contain provisions with the special intent of protecting the payment of wages of the workers to whom such legislation applies.
The first legal provision in connection with housing was contained in the Family Homes Protection Act, 1895, consolidated in the Family Protection Act, 1908. According to this provision it is possible, on certain conditions, to register any piece of land as a family home, so that the estate and interest of the settler and his family in it continue absolute and unaffected by any bankruptcy, assignment, judgment, &c. In 1898 inspection of shearers' accommodation was provided for and was subsequently carried out till the passing of the National Expenditure Adjustment Act in 1932, when it was temporarily discontinued. Inspection of the housing of agricultural labourers and of flax-mill and sawmill hands was established by the Agricultural Labourers' Accommodation Act of 1908, and is continued under the Agricultural Workers Act, 1936, which supersedes the former enactment.
A Workers' Dwellings Act was passed in 1905, authorizing the Minister of Labour to erect dwellings to be let to bona fide workers at a rental of 5 per cent. per annum of the capital value of such dwellings; and, in the following year, a system of advances to workers for the purpose of acquiring homes was instituted, through which they could borrow, after 1923, up to 95 per cent. of the value of their security. To cope with the post-war demobilization, the Housing Act of 1919 provided for the erection of dwellings not only by the State, but also by local authorities, employers, associations of public servants, and public-utility societies, the State advancing the money. The administration of this Act was later transferred to the State Advances Department, now State Advances Corporation. Local authorities are also empowered to obtain special loans from the State Advances Corporation to erect workers' dwellings for letting, and are granted certain concessions in carrying out this activity by the Municipal Corporations Act, 1933. There is much incidental legislation, as in the Coal-mines Act and the Government Railways Act, where provision is made for the suitable housing of employees.
Housing regulations are contained in the Municipal Corporations Act, where definite measurements are laid down to prevent overcrowding, and provision is made for the appointment of Inspectors to reduce fire-risk and other dangers. Similarly the Health Act of 1920, which replaced the Public Health Act of 1908, provides for medical inspection and for sanitation minima; an owner may be ordered to cleanse or demolish his building, or to close it till certain alterations are made. The Town Planning Acts of 1926 and 1929 aim to develop and reconstruct areas in such a way as to promote their healthfulness and convenience.
In 1935, as a preliminary to measures for remedying the existing position in regard to housing, a Housing Survey Act was passed, instructing local authorities to ascertain as far as possible the extent to which the existing housing-accommodation in their districts falls short of reasonable requirements. At the same time a Native Housing Act empowered the Board of Native Affairs to make advances to Maoris for the purchase, erection, or repair of dwellings. Advances must be secured upon first mortgages of land or other securities approved by the Board, and the rate of interest may not exceed that charged by the State Advances Corporation.
The provision of housing-facilities for workers is a very important part of the policy of the present Government. Apart from the facilities for the building of homes provided for in the State Advances Corporation Act (see Section XXIVD), the Government has launched a comprehensive housing plan whereby the legislative machinery provided in the Housing Act, 1919, is being used to build homes to be let to workers at a reasonable rental. An account of the Government's housing programme under this Act is included in Section XXIII, Building and Construction (vide pp. 524–525).
Reference should also be made to the provisions of the Mortgagors and Lessees Rehabilitation Act, 1936, which is designed to lighten the burden of excessive mortgage indebtedness (see Section XXXII).
Certain sections of the War Legislation Amendment Act of 1916 dealt with house-rents, the maximum rent being fixed at 8 per cent. per annum of the capital value of the dwelling. Material alterations in the law were made by the Rent Restriction Act, 1926. Rent-restriction provisions have since been kept in force by annual continuing statutes, the legislation expiring on 31st October, 1936.
Provisions for statutory reductions in rent and interest payments were contained in the National Expenditure Adjustment Act of 1932, continued by the Finance Act, 1934, and made permanent in 1936; while Courts were given power to reduce rents and mortgage interest by the mortgage-relief legislation of the depression that was consolidated in the Mortgagors and Tenants Relief Act, 1932. The Fair Rents Act, 1936, replacing various measures referred to above, is briefly described in the following paragraph.
The Fair Rents Act, 1936, makes temporary provision for the restriction of increases in the rent of certain classes of dwellinghouses, and for the determination of fair rents in respect of such houses. The Act applies, generally speaking, to dwellings actually let at the time the Act was passed (June, 1936) or let at any time between 27th November, 1935, and the date of the passing of the Act. It does not apply to other dwellings or to any dwelling let at a rent exceeding £156 per annum. The rent of a dwelling coming within the scope of the Act may not be raised beyond the rent payable on 1st May, 1936; or, in the case of dwellings not let on that date, the rent last payable before that date. On application of either the landlord or the tenant, a Stipendiary Magistrate may declare a fair rent in respect of any dwelling to which the Act applies, having regard to various specified conditions—e.g., the relative circumstances of landlord and tenant. The fair rent is not to exceed the rent payable on 1st May, 1936, or the rent (if any) payable on 27th November, 1935. The grounds for the recovery of possession are limited by the Act, while restrictions are imposed on the right of the landlord to distrain. The Act was to expire on 30th September, 1937, but its operation has been extended till 30th September, 1938.
The Distress and Replevin Amendment Act, 1936, protects personal effects, furniture, &c., to the value of £50 from seizure under a distress order for rent. The pre-existing legislation on this subject did not protect such effects from seizure.
Trade-unionists were early protected by the Trade-unions Act of 1878 from prosecution for conspiracy by reason merely that they were in restraint of trade. They were further protected by the Conspiracy Law Amendment Act of 1894, which laid down that any act by a union in furtherance of a trade dispute should not be deemed unlawful so as to render such persons liable to criminal prosecution for conspiracy if such act committed by one person would not be deemed unlawful. This removed a very serious handicap under which unionists up to that time had suffered.
The original Industrial Conciliation and Arbitration Act was placed on the New Zealand statute-book in 1894. Its object was to encourage the formation of industrial unions and associations, and to facilitate the settlement of industrial disputes by conciliation and arbitration. It provided for the registration as “industrial unions” of societies of workers or employers in the various industrial districts, and as “industrial associations” of any council or other body representing any number of such unions; for the making of industrial agreements pursuant to the Act, and the filing of such in the Supreme Court; for the formation of industrial districts, the election of Boards of Conciliation, and the setting-up of a Court of Arbitration.
In 1898 an amendment was passed empowering the Court in its awards to prescribe minimum rates of wages, with special provision for a lower rate being paid in the case of workers unable to earn the prescribed minimum. An important amendment was passed in 1903 prohibiting any employer, worker, union of workers, or union of employers from taking proceedings to defeat any of the provisions of an award during its currency. It forbade an employer to dismiss any employee merely because he happened to be entitled to the benefit of an award or merely because he was a member of a union.
In 1905 an amendment was passed providing for the punishment by fine of any worker or employer bound by an award or industrial agreement affecting an industry who takes part in a strike or lockout in that industry. In 1908 an additional penalty was added in the case of certain “public utility” industries, such as gas-manufacture, the supply of milk or meat, tramway services, &c. By this amendment the constitution of Conciliation Boards was altered to provide for the appointment of four Conciliation Commissioners, whose duty it is to call together representatives of employers and employees in the event of a dispute arising, and to sit with these representatives as a Conciliation Council to endeavour to effect a settlement. The decision of the Council is not binding, but disputes must be referred to a Council before they may be referred to the Arbitration Court.
A further amendment in 1911 empowered the Court to make an industrial agreement into an award, provided such agreement does not conflict with an existing award or is not contrary to the public interest. It also provided that recommendations of Conciliation Councils become in effect industrial agreements if none of the parties to a dispute disagrees with such recommendations.
Section 18 of the War Legislation and Statute Law Amendment Act, 1918, empowered the Court to amend during the term of an award or industrial agreement the provisions of the award or agreement, in so far as they related to rates of remuneration or hours of employment. In varying the conditions, the Court was to take into account the movement in the cost of living and any changes in the special conditions affecting the industry concerned. This measure, which was designed to meet the abnormal conditions caused by the Great War, remained in force till 1923.
The law as it existed in 1925 was consolidated in that year, previous consolidations having been effected in 1900, 1905, and 1908.
In 1927 a Bill was introduced into Parliament to exclude from the jurisdiction of the Arbitration Court the farming industry and certain associated industries. The Bill met with considerable opposition and was not proceeded with. An amending Act was, however, passed providing that no award relating to any agricultural, pastoral, or dairying operations, or to any other work effected on a farm, or to the manufacture or production of butter, cheese, or other milk products should be made before 1st September, 1928. In the meantime it was arranged that a National Industrial Conference, representative of all interests concerned, should be held to go fully into this and other questions affecting labour and the relationships between employers and employees.
The conference duly met during the parliamentary recess, and after full discussion came to unanimous agreement on a number of matters, others being left over for further consideration. The provisions of the amendment of 1927 were re-enacted in 1928, another amendment extending for twelve months the period during which awards in the industries mentioned were not to be made, and also providing that no awards in these industries were to be altered or amended in the meantime without the consent of all parties concerned. The provisions referred to lapsed on 1st September, 1929.
A second amendment passed in 1928 permits of industrial agreements and (with the consent of the parties concerned) awards being made for or extended to a term of five years. This amendment also allows of an award or industrial agreement, in lieu of prescribing minimum rates of wages, prescribing a method or basis for calculating minimum rates.
As a result of depression conditions the Court was empowered by the Finance Act, 1931, to amend by general order awards or industrial agreements in respect of rates of wages, though power was given for the exclusion of any class or section of workers from the operation of a general order. In the next year compulsory arbitration was abolished; conciliation was still compulsory, but disputes could be referred to the Court only by mutual consent. Provision was also made for the review of existing awards.
The Industrial Conciliation and Arbitration Amendment Act, 1936, restored the full jurisdiction of the Arbitration Court, and also made several other amendments, the more important of which are summarized below:—
The Court is required to fix basic wages for adult male workers based on the needs of a man, wife, and three children, and also a basic wage for adult female workers. It must make general orders prescribing the basic wages, which will apply to all awards, &c., in force. (See previous heading—Basic Wage, &c.)
Restrictions are imposed on the formation of new unions in districts where a union in respect of the same industry exists; in fact, no such new union may be registered unless with the concurrence of the Minister of Labour.
Provision is made for the registration of New Zealand unions covering all existing workers or employees, if all or the majority of district unions concur. In cases where no district union exists at present a New Zealand union may be formed, subject to compliance with the requirements of the principal Act in respect of registration of unions.
All workers who are subject to any award or industrial agreement registered under the Act must become members of a union. (This applies also in respect of awards or agreements in force at the time of the passing of the amending Act.) It is not lawful for an employer to employ or continue in employment in any position or employment subject to an award or industrial agreement any adult person who is not a member. Non-members may, however, be employed in cases where union membership is limited, and there are no union members available.
The Court may confer on union officials the right of entry on employers' premises.
Where it is deemed practicable the Court must fix the maximum hours of work per week (exclusive of overtime) at forty; while the Court may review existing awards to this end on application. The hours in such a review are to be fixed at forty, unless in the opinion of the Court such hours are impracticable. No reduction in weekly pay is to be made in consequence of reduced hours—i.e., the hourly rates are to be increased proportionately. The provisions stated in this paragraph came into operation on 1st September, 1936.
By the principal Act the maximum weekly union subscription was fixed at 1s. per week. This limitation is now removed.
The administration of the Industrial Conciliation and Arbitration Act is in the hands of the Labour Department and Inspectors of Factories are charged with the duty of seeing that the provisions of awards and agreements are carried out. The following paragraphs indicate the procedure followed in regard to industrial disputes under the Act:—
An industrial union (or association of unions) of workers registered under the Act may cite a union or association of unions of employers, or an employer, or a number of employers, before a Council of Conciliation for the hearing of an industrial dispute before a Commissioner and assessors appointed from either side.
An industrial union (or association of unions) of employers registered under the Act, or an individual employer, or employers, may cite a union of workers in a similar manner. The workers may compel any of their employers to come under the Act; but the employers cannot compel their workers to come under it, unless the latter have registered as an industrial union or association thereunder; registration is voluntary.
If a settlement of a dispute is arrived at by the parties in the course of an inquiry held before a Council of Conciliation, the terms of the settlement are set forth as an industrial agreement. Applications for exemption from the terms of the agreement must be made within one month after it has been filed. The Court is empowered to grant or refuse such applications. Where an agreement applies to the employers employing the majority of workers in the industry to which it relates, the agreement may be made binding on all employers, whether parties or not.
Every such agreement shall be executed on behalf of the parties by the assessors representing the parties. If settlement cannot be arrived at before the Conciliation Council the matter is referred to the Court. The Council may at the same time submit a recommendation for the settlement of the dispute; whereupon the parties are notified of such recommendation, and if acceptable to them, the recommendation is made an industrial agreement; failing agreement the matter is referred to the Court.
If a dispute comes before the Court, argument is heard upon the matters in debate, and the Court then makes its award, which becomes binding upon the employers specified in the award, upon any employers commencing business in the district subsequently to the date of the award, and upon all persons working for such employers. In all cases where an industrial agreement or accepted recommendation or award is filed, it becomes binding on all the parties. When an award or industrial agreement has been filed, a strike or lockout becomes unlawful.
In addition to the powers mentioned above, the administration of the Apprentices Act, 1923, is placed in the hands of the Court, which also deals with workers' compensation cases.
For all disputes to which the Industrial Conciliation and Arbitration Act does not relate, there was passed in 1913 the Labour Disputes Investigation Act.
Under this Act, if a dispute concerning wages or other conditions of employment arises between a society (or societies) of workers, whether registered or not, that is not bound by any award or industrial agreement, and its employers, the society must, before it may strike, give to the Minister of Labour formal notice of the dispute, setting forth the names of the parties to the dispute and the claims made by the society. The Minister then refers the dispute to a Conciliation Commissioner to call a conference, or to a “Labour Disputes Committee” for investigation and recommendation. Such a committee consists of from one to three members chosen from each side, with an independent chairman. In the event of no settlement being arrived at a secret ballot is taken by the Registrar of Industrial Unions among the members of the society as to whether, in the case of no recommendation having been made, a strike should eventuate; or, in the case of a recommendation having been made, as to whether the recommendation should be adopted. Seven days' notice must be given to the employers should a strike be decided upon.
Similar provisions apply with reference to the filing of a dispute and to a lockout by the employers.
In the event of an agreement being arrived at it may be filed with the Clerk of Awards. It is then enforceable in the same manner as an industrial agreement under the Industrial Conciliation and Arbitration Act.
By this Act the principle of settlement of industrial disputes by conciliation and arbitration is extended to workers outside the scope of the Arbitration Court, so that definite restrictions on the right to strike or to lockout exist over the whole field of industry in New Zealand. The powers under this Act are not, of course, as far-reaching as those under the Arbitration Act, its main object being that workers or employers should take time for consideration of the points at issue and not precipitate themselves into industrial strife.
This subject was the earliest one dealt with by labour legislation. Following the Master and Apprentices Act of 1865, came section 23 of the Offences against the Person Act, 1867, which protected servants and apprentices from ill-treatment by their employers. The original Master and Apprentices Act soon became out of date, and most of the conditions of employment of apprentices were for many years fixed by awards and industrial agreements under the Industrial Conciliation and Arbitration Act. As a result of the feeling that the fixing of the conditions of employment of apprentices should not be the subject of an industrial dispute between employers and unions of workers, and that the shortage of apprentices and skilled workers necessitated special attention, the Apprentices Act was passed in 1923. The employment of apprentices is accordingly now controlled by special orders of the Court of Arbitration, acting independently of its powers under the Industrial Conciliation and Arbitration Act, and by Apprenticeship Committees, the setting-up of which in the various industries and localities is provided for. The Court may delegate many of its powers to these Committees, but aggrieved persons have the right of appeal to the Court, whose decision is final. An amending Act in 1930, inter alia, authorizes an Apprenticeship Committee to refer to the Court for decision any matter on which the Committee cannot come to a decision. Also the Court may, in certain circumstances, authorize the District Registrars appointed under the principal Act to exercise the powers of Apprenticeship Committees.
Power is given by the Apprentices Act to compel employers to take and teach a minimum number of apprentices, in order to ensure as far as possible that the future requirements of the industries may be met. The Act of 1923 restricted employers to a maximum proportion of apprentices to journeymen, but this section of the Act was repealed in 1927.
Full power is given by the Apprentices Act to ensure that both the employers and the apprentices carry out their obligations. These powers include cancellation of apprenticeships, transfer, examination, and technical-school attendance of apprentices, also power to prohibit certain employers from taking apprentices. All contracts of apprenticeship and all voluntary transfers and cancellations of apprenticeships must now be registered, and it is the duty of the District Registrars to see before registering apprenticeships that the conditions are in accordance with the Act and orders thereunder, and are otherwise just to both parties. There is, however, a right of appeal from their decisions to the Court. The Registrar and District Registrars are also charged with the duty of seeing that the Act and decisions thereunder are generally complied with. By the 1930 amendment of the Act, the Court is empowered, on the bankruptcy of an employer, to order payment of an amount not exceeding three months' wages from the estate in respect of the period intervening between the time the apprentice is deprived of employment and the time when he receives other employment as an apprentice in the same industry.
Provision is made to enable employers in intermittent trades, such as building, who perhaps cannot continuously employ apprentices, to take them jointly, in which case the employers are jointly liable; also to enable adults and others already possessing a knowledge of an industry to enter into apprenticeship under such conditions other than those generally provided for apprentices, as the Committee or Court may approve.
In order to encourage young persons to enter the skilled trades and avoid “blind-alley” occupations, the Act provides for collaboration with the head teachers in the various schools, who are required to watch the progress of the children under their care, and to report to the District Registrars of Apprentices as to the character, aptitude, and attainments of the various children leaving the schools. On receipt of such reports it is the duty of the District Registrars to give such advice as may be in their power to assist the children or their parents or guardians to decide on the most suitable employments. Juvenile employment bureaux also operate free of charge to all parties concerned.
With a view to assisting the Director of Education in shaping the courses of education so that the labour requirements of the various industries of the Dominion may be met so far as possible the Act also provides that the Director shall be apprised from time to time of the number of persons employed in skilled industries, with information as to the prospects of future employment therein.
By the Finance Act, 1931, the Arbitration Court was empowered to amend by general order the rates of remuneration fixed by apprenticeship orders. A year later the Finance Act, 1932, made provision for the amendment, suspension, or cancellation of contracts of apprenticeship on application to a Stipendiary Magistrate, who was empowered to vary or cancel apprenticeship contracts if satisfied that the employer could not be reasonably expected to carry out the terms of the contract. This provision was repealed by a section in the Finance Act, 1936; the repeal does not, however, revive contracts already cancelled or apply to orders made before the passing of the Act. Rates of remuneration were restored to the 1931 level by the Finance Act, 1936.
Common law rights of the worker in this respect were early increased by the Employers Liability Act of 1882; while the Deaths by Accidents Compensation Act, 1908, gives a right of action which did not exist at common law to certain of the relatives of a person killed by a wrongful act.
The Law Reform Act of 1936 contains several provisions of particular relevance to the subject of workers' compensation. The Act, inter alia, creates a charge on all insurance-moneys payable as indemnity for compensation, and makes the charge apply immediately on the happening of the event giving rise to the claim. Similar provisions (now repealed) existed in the Workers' Compensation Act, but under that Act no charge was created unless the insured was insolvent or became bankrupt. Another provision of particular interest in the Law Reform Act is the abolition of the defence of “common employment”: which defence depended on a rule that damages could not be recovered from an employer in respect of the negligence of a fellow servant. A similar provision in the Workers' Compensation Act (but with a limit of £1,000 damages) is consequentially repealed.
The Workers' Compensation Act, 1922, with its amendments of 1922, 1926, and 1936, represents the existing law on workers' compensation—subject to the provisions briefly outlined in the preceding paragraph. The 1936 amendment, which came into force on 1st January, 1937, is briefly described at the end of the letterpress under this heading.
“Worker,” for purposes of the Workers' Compensation Act, means any person who has entered into, or works under, a contract of service or apprenticeship with an employer, whether by way of manual labour, clerical work, or otherwise, and whether remunerated by wages, salary, or otherwise; but does not include any person employed otherwise than by way of manual labour whose remuneration exceeds £400 per annum. The Act applies only to the employment of a worker under a contract of service or apprenticeship either in and for the purposes of any trade or business carried on by the employer, or in any of the following occupations, irrespective of whether or not carried on for purposes of the employer's trade: mining, quarrying, excavation, cutting of standing timber and scrub, clearing land, erection or demolition of buildings and other structures, manufacture and use of explosives, handling power machinery in motion, driving vehicles, domestic service (engagement for not less than three days), and any occupation in which a worker incurs a risk of falling any distance exceeding 12 ft., if the injury to, or death of, the worker results from such a fall. For purposes of this provision, an employer may have more than one trade or business. In general, persons working as independent contractors are not under contracts of service or apprenticeship, and are consequently not “workers.” But by way of exception persons who have contracted to perform any work in a gold- or a coal-mine, or to cut standing timber or scrub, or to clear land of stumps or logs, and who do not sublet the contract or employ labour (or who, if they do employ labour, actually perform part of the work themselves), though not “workers,” are yet covered by the Act.
The worker is not entitled to compensation unless he sustains by accident arising out of and in the course of his employment, and happening within New Zealand or on a New Zealand ship, personal injury incapacitating him from carrying on his occupation. No compensation is payable in respect of any accident as above defined which is attributable to the serious and wilful misconduct of the worker injured, unless the injury results in death or serious and permanent disablement. No compensation is payable in respect of the death of a worker following on, or incapacity resulting from, or aggravated by, unreasonable refusal to submit to medical or surgical treatment. Except under certain safeguarding restrictions, “contracting out” is forbidden.
Certain defined diseases are deemed to be personal injuries by accident if they arose within twelve months previous to the date of disablement and are due to the nature of the employment. There is power under the Act for the list of such diseases to be added to from time to time by regulation, as circumstances warrant the adoption of such a course.
Generally speaking, the employer is the person liable to pay compensation; and for this purpose “employer” includes any body of persons, corporate or unincorporate, the Crown (with certain minor exceptions), and the representatives of a deceased employer. Where a person (the principal), in the course of and for the purposes of his trade or business, contracts with another (the contractor) for the execution by the latter of work undertaken by the former, a workman employed by the contractor on meeting with an accident may claim compensation from either the principal or the contractor, except in certain cases. If the principal pays, he may, however (with certain minor exceptions), recover the amount from the contractor. The principal is not liable unless the accident occurs on or about his land, premises, or ship; or on or about land, premises, or ship on or in which the principal has contracted to do the work in connection with which the accident happens. Where the injury for which compensation is payable has resulted under circumstances creating a legal liability in some person other than the employer to pay damages in respect thereof, the person by whom the compensation is paid or payable is entitled to indemnification by the person so liable.
The Workers' Compensation Amendment Acts of 1926 and 1936 amended the Act of 1922 in the direction of raising the limits of compensation. The compensation payable is at present as follows:—
In case of death: Reasonable expenses of medical or surgical attendance, including first aid, and of funeral (maximum, £50), less any sums paid by way of compensation for the accident prior to the death of the person injured; but plus—
Where he leaves total dependants, a sum equal to 208 times his average weekly earnings, or the sum of £500, whichever is the larger, but not exceeding £1,000; or
Where he leaves partial dependants only, a sum reasonable and proportionate to the injury to those dependants, but not exceeding the sums specified in (a).
In case of injury: At the discretion of the Court, either—
During total incapacity, weekly payments amounting to 66 ⅔ per cent. of a full working week's earnings at the ordinary rate of pay for the work on which the worker was employed at the time of the accident, notwithstanding that he may not have actually worked or the employment may not have actually continued for a full week (maximum £4 10s. per week; minimum £2); during partial incapacity, weekly payments amounting to 66 ⅔ per cent. of the difference between the amount of the average weekly earnings before the accident and the average weekly amount which the worker is earning or able to earn in suitable employment or business after the accident, but not exceeding £4 10s. per week; or
A lump sum equal to the present value at 5 per cent. per annum compound interest of the aggregate weekly payments which, in the opinion of the Court, would probably become payable to the worker under (a).
Weekly payments are not to extend over a longer aggregate period than six years, and the aggregate amount is not to exceed £1,000. In the case of the temporary incapacity of an apprentice or a worker under twenty-one years of age, the weekly payment must not exceed an amount equal to a full week's earnings at the time of the accident.
In addition to 2 (a) and 2 (b) above, a sum not exceeding £1 is payable in respect of medical and surgical attendance and first aid to the worker in respect of his injury. No compensation is payable if incapacity lasts less than three days. In the case of certain injuries involving permanent disability (e.g., dismemberment or loss of use), compensation is assessed according to a special scheme representing a proportion (varying according to the nature of the dismemberment) of the compensation payable in the case of total incapacity. In the case of injury to workers whose earnings at the date of the accident are low by reason of their being at the time under twenty-one, or of their being apprenticed to a trade, &c., and in certain other specified cases, special provisions exist in order to prevent hardship.
Proceedings under the Act in respect of compensation for injuries are not maintainable by a worker unless written notice of the accident has been given to the employer as soon as possible after its occurrence: though the Court has power to excuse failure, due to reasonable causes, to give that notice, on the part of the person injured, or if it is clear that the absence of such notice has not prejudiced the employer's position. Except where the Court excuses delay resulting from mistake or other reasonable cause, proceedings must be taken within six months of the date of the accident or the date of the last payment of compensation in respect of injury, or the date of the death of the person injured, whichever is the later. Such proceedings are taken in the Arbitration Court; though in certain cases they will be heard in a Magistrates' Court. The Court may accept, admit, and call for such evidence as in equity and in good conscience it thinks fit, irrespective of whether strictly legal evidence or not. Costs lie in the discretion of the Court. There is no right of appeal; but for good cause orders or agreements in respect of compensation may be reviewed and even set aside by the Court at any time.
The right of a dependant who survives a worker to receive compensation for the death of that worker survives the dependant; and compensation can be recovered by the representative of that dependant.
The Workers' Compensation Amendment Act, 1936, which came into force on 1st January, 1937, contains several important amendments to the previous legislation. The definition of “worker” is extended to include share-farmers, and drivers of vehicles who receive a share in the takings as payment for their services, or who pay a fixed sum for the hire of the vehicle (other than under the terms of a hire-purchase agreement). While a share-farmer now comes within the provisions of the Act, he is still regarded as the employer in respect of persons employed by him.
The minimum amount of compensation payable in respect of the death of a worker is increased from £300 to £500, the maximum payment remaining at £1,000. The minimum weekly payment in respect of the incapacity of an adult worker is increased from £1 to £2; while the maximum weekly payment is raised from £4 to £4 10s. The special provisions in relation to workers under twenty-one years of age or indentured apprentices are broadened by the inclusion of a subsection covering cases of temporary incapacity.
The method of computing the basis of compensation has been changed. Previously the amount of compensation was based on the worker's average weekly earnings at the time of the accident; by the amending Act the term “weekly earnings” is defined as a full working-week's earnings at the ordinary rate of pay for the work in which the worker was employed at the time of the accident, notwithstanding that he may not have actually worked, or the employment may not have actually continued, for a full week.
The amending Act contains a provision whereby claims for compensation rank equally with wages in the distribution of the assets of a bankrupt.
Prior to the recent depression there was little permanent effective legislation to cope with the problem of unemployment. In 1895 a Servants Registry Act provided for the inspection of servants registry-offices and regulated the fees charged therein. The Labour Department was founded in 1891 and attempted, particularly through its Employment Bureaux, to cope with the problem. In 1928 a Committee was set up to examine this matter, which was becoming increasingly more serious; and, following on the presentation of its report, an Unemployment Act was placed on the statute-book during the 1930 session of Parliament.
An Unemployment Board was established to assist in the administration of the Act. The Board, as reconstituted in 1931, consisted of the Minister charged with the administration of the Act (Chairman), the Commissioner of Unemployment, and three members appointed by the Governor-General. The main functions of the Board as set out in the Act were: (1) To make arrangements with employers or prospective employers for the employment of unemployed persons; (2) to take such steps in accordance with the provisions of the Act as it considered necessary to promote the growth of primary and secondary industries in New Zealand, so that an increasing number of workers would be required for the efficient carrying-on of such industries; (3) to make recommendations for the payment of sustenance allowances out of the Unemployment Fund.
The Act of 1930 authorized the payment of sustenance allowances out of the Unemployment Fund, but the activities of the Board were directed towards the placing of men in employment in preference to the payment of sustenance, the funds being mainly devoted to the subsidizing (or refunding in full) of wages of men for whom work was provided under various relief schemes. A 1934 amendment to the Act, inter alia, repealed a subsection of the original Act, which, in effect, had limited to a maximum of thirteen weeks the unbroken period during which sustenance might be paid to any one individual.
The Employment Promotion Act, 1936, replaced the Unemployment Act, 1930, and other legislation relating to unemployment, the earlier legislation being consequentially repealed. The Unemployment Board is abolished, the new Act being administered by the Department of Labour. An Employment Promotion Fund is established (deemed to be the same fund as the Unemployment Fund established under the Unemployment Act, 1930), the revenue of the Fund being derived from the employment tax, fees and penalties under the Act, and any other moneys appropriated by Parliament for the purpose. The main purposes for which the moneys in the Fund are to be utilized are defined as follows:—
The development of primary and secondary industries in New Zealand, and the establishment of new industries, so that an increasing number of workers will be required for the efficient carrying-on of such industries:
The making of arrangements with employers or prospective employers for the employment of persons who are out of employment:
The assistance, in accordance with the provisions of the Act, of persons who are out of employment or are otherwise in need of assistance.
General power is conferred on the Minister to do such things as he considers necessary to carry out the purpose of the Act, the following being specifically mentioned:—
To take such steps as he deems necessary in relief of unemployment to ensure proper co-operation between Departments of State, local authorities, public bodies, and other persons and authorities engaged in carrying out public works or relief works:
To assist unskilled or other persons, by means of grants or loans, to pursue courses of vocational training or study; and to provide instructors, establish and equip classes or training-camps, and do any other things necessary to qualify any persons to undertake suitable employment:
Generally to do such things as he thinks fit for the benefit of unskilled or other workers:
To make grants or loans to any persons or authorities to enable them to under-take or to continue to carry on works calculated to relieve unemployment:
To make such inquiries as he thinks proper, for the purpose of obtaining information in relation to any of the purposes for which moneys may be expended from the Fund, into any matter whatsoever with reference to any industry which in the opinion of the Minister could under favourable conditions be profitably carried on in New Zealand, or to any industry—wherever carried on—which in the opinion of the Minister may affect the industries of New Zealand and the employment of workers therein:
To appoint such number of local committees as he thinks fit, and, subject to any regulations under the Act, to define the powers of such committees.
The taxation provisions of the Act are summarized in Section XXIVB, Taxation (p. 566); while a synopsis of the various employment schemes administered by the Labour Department under the provisions of the Employment Promotion Act is given in Section XL (Employment and Unemployment).
The Immigration Restriction Amendment Act of 1931, which empowered the Governor-General to make regulations restricting the number of immigrants entering the country aimed, inter alia, at preventing an unwanted inflow increasing the number of those unemployed. Its operation was extended in 1933 and 1935, and it expired on 31st December, 1936.
The development of New Zealand to its present stage in less than a century has involved the prosecution of a vigorous public-works policy. In the circumstances, public works afford an avenue of employment for a large body of wage-earners; and, consequently, a résumé of the conditions obtaining on such works forms an essential part of the subject-matter of this section. The Minister of Public Works in a statement of public-works policy laid before the House in May, 1936, outlined the Government's policy in relation to public works employees. A planned programme of public works was to be undertaken covering the next three years, and involving the expenditure of approximately £17,500,000 on such works as reading, bridging, irrigation, &c. An agreement with the workers was drawn up dating from 1st June, 1936, and to remain in force for three years. Following is a summary of the main provisions of the agreement:—
The hours of work are forty per week—five days of eight hours.
All works are standard works—i.e., no such works are classed as relief works, and the basic rate of pay is 16s. per day. A regulated scale of hourly rates is drawn up ranging from the basic rate of 2s. per hour to a maximum of 2s. 10d. according to the degree of skill and danger involved in the various occupations.
The system of co-operative works is adopted as a principle, the scales of piecework payment being designed so that a worker of average ability can earn the basic rates of wage.
Workers are paid for seven statutory holidays in the year; and, in addition, those with one year's service receive one week's annual leave on full pay; and after two years' service, two weeks' annual leave on full pay.
Improvements in accommodation on works are provided for in the agreement, with recreation facilities on large works.
Table of Contents
IN New Zealand dual provision for the registration and protection of unions of workers and employers exists in the Trade-unions Act and the Industrial Conciliation and Arbitration Act, and further provision has been made in the Industrial Conciliation and Arbitration Amendment Act, 1936, reference to which is made elsewhere in this volume (Section XXXVIII). The 1936 Amendment resulted in a considerable increase in membership of unions both of employers and of workers.
Provision was made under section 7, subsection (17), of the Industrial Conciliation and Arbitration Act, 1900 (now section 17 of the Industrial Conciliation and Arbitration Act, 1925), for the furnishing of an annual return showing the number and membership of unions registered under the Act. It is from this return (vide Parliamentary Paper H.-11) that the tables in this section have been compiled. Very little date are available as to registration of unions under the Trade-unions Act, which is now practically inoperative. Several of the few unions still registered under this Act are also registered under the Industrial Conciliation and Arbitration Act.
The numbers and membership of industrial unions of employers registered under the Industrial Conciliation and Arbitration Act as at the end of each of the last five years are shown in the following table.
| As at 31st December | Industrial District. | |||||||||||
|---|---|---|---|---|---|---|---|---|---|---|---|---|
| Northern. | Wellington. | Canterbury. | Otago and Southland. | Taranaki. | Marlborough. | Nelson. | Westland. | North Island. | South Island. | Dominion. | Totals. | |
| Number of Unions. | ||||||||||||
| 1932 | 28 | 31 | 29 | 27 | 7 | 2 | 2 | 1 | 127 | |||
| 1933 | 28 | 32 | 30 | 27 | 7 | 2 | 3 | 1 | 130 | |||
| 1934 | .. | 27 | 32 | 29 | 26 | 7 | 3 | 1 | 1 | 128 | ||
| 1935 | 29 | 35 | 29 | 24 | 7 | 3 | 3 | 1 | 131 | |||
| 1936 | 39 | 69 | 31 | 30 | 11 | 2 | 7 | 2 | 2 | 1 | 7 | 201 |
| Membership. | ||||||||||||
| 1932 | 967 | 941 | 1,239 | 840 | 172 | 80 | 12 | 3 | 4,254 | |||
| 1933 | 1,002 | 803 | 1,116 | 764 | 159 | 84 | 28 | 3 | 3,959 | |||
| 1934 | 985 | 864 | 1,140 | 854 | 156 | 77 | 28 | 3 | 4,107 | |||
| 1935 | 1,037 | 976 | 1,109 | 945 | 157 | 90 | 25 | 5 | 4,344 | |||
| 1936 | 1,171 | 1,597 | 919 | 849 | 314 | 29 | 100 | 19 | 19 | 12 | 1,413 | 6,442 |
The number of unions of employers and their membership rose gradually to 149 unions, with 5,819 members, in 1914, the year following that of the prolonged waterside workers' strike. Since that year there have been many slight variations, and considerable decreases in membership were recorded in 1931, 1932, and 1933. The effects of the 1936 Act are seen in the approximately 50-per-cent. increase in 1936. A good deal of duplication, however, exists in employers' union membership, many employers belonging to two or more unions.
Industrial unions of workers and their membership are shown in the following table as at the end of each of the last five years. It should be noted that the statistics cover only unions registered under the Industrial Conciliation and Arbitration Act, and that all unions are not so registered.
The membership of workers' unions rose year by year, without exception, from 17,989 in 1900 to 73,991 in 1914. It fell off during the war years, but a phenomenal rise was recorded in 1919, the year immediately following the cessation of hostilities. The total for 1928 (103,980) was the highest recorded up to and inclusive of 1935, but falls far below the figure for 1936.
| As at 31st December | Industrial District. | |||||||||
|---|---|---|---|---|---|---|---|---|---|---|
| Northern. | Wellington. | Canterbury. | Otago and Southland. | Taranaki. | Marlborough. | Nelson. | Westland. | Dominion. | Totals. | |
| Number of Unions. | ||||||||||
| 1932 | 97 | 77 | 67 | 96 | 20 | 7 | 18 | 15 | 3 | 400 |
| 1933 | 100 | 81 | 70 | 96 | 17 | 7 | 18 | 15 | 3 | 407 |
| 1934 | 100 | 80 | 68 | 95 | 17 | 8 | 18 | 15 | 3 | 404 |
| 1935 | 101 | 83 | 67 | 95 | 19 | 9 | 18 | 15 | 3 | 410 |
| 1936 | 114 | 95 | 67 | 111 | 30 | 13 | 27 | 21 | 9 | 487 |
| Membership. | ||||||||||
| 1932 | 19,800 | 19,068 | 13,247 | 11,989 | 1,684 | 467 | 624 | 1,627 | 10,777 | 79,283 |
| 1933 | 18,752 | 16,509 | 11,863 | 10,564 | 1,279 | 496 | 584 | 1,790 | 10,051 | 71,888 |
| 1934 | 19,434 | 16,738 | 12,140 | 10,851 | 1,240 | 522 | 615 | 1,897 | 10,954 | 74,391 |
| 1935 | 21,661 | 19,066 | 13,140 | 11,362 | 1,179 | 606 | 669 | 1,900 | 11,346 | 80,929 |
| 1936 | 55,283 | 38,5,38 | 22,468 | 20,852 | 4,293 | 637 | 1,819 | 3,522 | 38,115 | 185,527 |
In the following table industrial unions of workers are classified according to membership:—
| Year. | Under 50. | 50 and under 100. | 100 and under 200. | 200 and under 300. | 300 and under 500. | 500 and under 1,000. | 1,000 and under 2,000. | 2,000 and under 3,000. | 3,000 and over. | Totals. |
|---|---|---|---|---|---|---|---|---|---|---|
| Number of Unions. | ||||||||||
| 1901 | 99 | 43 | 30 | 19 | 5 | 4 | 1 | 1 | 202 | |
| 1932 | 169 | 74 | 58 | 31 | 29 | 25 | 11 | 2 | 1 | 400 |
| 1933 | 168 | 85 | 52 | 41 | 28 | 24 | 7 | 1 | 1 | 407 |
| 1934 | 168 | 80 | 56 | 37 | 28 | 23 | 10 | 1 | 1 | 404 |
| 1935 | 165 | 86 | 52 | 31 | 40 | 19 | 15 | 1 | 1 | 410 |
| 1936 | 138 | 85 | 95 | 45 | 43 | 36 | 33 | 5 | 7 | 487 |
| Membership. | ||||||||||
| 1901 | 2,759 | 3,018 | 4,032 | 4,815 | 2,073 | 2,520 | 1,651 | 2,900 | 23,768 | |
| 1932 | 4,264 | 5,210 | 7,749 | 7,622 | 11,143 | 16,848 | 14,287 | 4,660 | 7,500 | 79,283 |
| 1933 | 4,188 | 5,970 | 6,768 | 9,977 | 10,206 | 16,277 | 9,643 | 2,086 | 6,773 | 71,888 |
| 1934 | 4,250 | 5,538 | 7,625 | 8,900 | 10,483 | 15,942 | 12,864 | 2,200 | 6,589 | 74,391 |
| 1935 | 4,228 | 6,036 | 6,803 | 7,340 | 14,442 | 12,293 | 19,335 | 2,452 | 8,000 | 80,929 |
| 1936 | 3,984 | 5,882 | 13,693 | 10,880 | 16,256 | 26,280 | 47,283 | 11,671 | 49,598 | 185,527 |
| Percentage of Total Membership. | ||||||||||
| 1901 | 11.61 | 12.70 | 16.96 | 20.26 | 8.72 | 10.60 | 6.95 | 12.20 | 100.00 | |
| 1932 | 5.38 | 6.57 | 9.77 | 9.61 | 14.05 | 21.25 | 18.02 | 5.88 | 9.47 | 100.00 |
| 1933 | 5.83 | 8.30 | 9.41 | 13.88 | 14.20 | 22.64 | 13.41 | 2.90 | 9.43 | 100.00 |
| 1934 | 5.71 | 7.45 | 10.25 | 11.96 | 14.09 | 21.43 | 17.29 | 2.96 | 8.86 | 100.00 |
| 1935 | 5.22 | 7.46 | 8.41 | 9.07 | 17.84 | 15.19 | 23.89 | 3.03 | 9.89 | 100.00 |
| 1936 | 2.15 | 3.17 | 7.38 | 5.86 | 8.76 | 14.17 | 25.49 | 6.29 | 26.73 | 100.00 |
There has been a more or less steady growth in the average size of workers' unions, the trend being to a certain extent obscured (particularly between 1932 and 1933) by the cancellation of registration by some large unions, the members of which joined other newly created organizations restricted according to locality. The 1936 Act, providing for compulsory union membership on the part of workers subject to an award or industrial agreement, has, of course, been responsible for the great increase in 1936.
In the next table industrial unions of employers as at the end of 1936 are shown according to industry, and membership according to industry and district.
| Industrial Group. | Membership—Industrial Districts. | Number of Unions. | |||||||||||
|---|---|---|---|---|---|---|---|---|---|---|---|---|---|
| Northern. | Wellington. | Canterbury. | Otago and Southland. | Taranaki. | Marlborough. | Nelson. | Westland. | North Island. | South Island. | Dominion. | Totals. | ||
| Provision of— | |||||||||||||
| Food, drink, &c. | 330 | 436 | 205 | 378 | 147 | 55 | 20 | 1,571 | 41 | ||||
| Clothing, footwear, and textiles | 23 | 63 | 61 | 18 | 4 | 34 | 203 | 11 | |||||
| Building and construction | 216 | 250 | 226 | 236 | 13 | 941 | 30 | ||||||
| Power, heat, and light | 31 | 1 | 22 | 45 | 99 | 6 | |||||||
| Transport by water | 14 | 28 | 25 | 12 | 11 | 14 | 6 | 5 | 115 | 13 | |||
| Transport by land | 96 | 104 | 61 | 68 | 329 | 8 | |||||||
| Accommodation, meals, and personal service | 273 | 336 | 190 | 29 | 57 | 15 | 23 | 14 | 937 | 29 | |||
| Working in or on— | |||||||||||||
| Wood, wicker, seagrass, and fibre | 70 | 40 | 49 | 159 | 9 | ||||||||
| Metal | 41 | 28 | 28 | 35 | 132 | 8 | |||||||
| Stone, clay, glass, and chemicals | 47 | 13 | 12 | 72 | 5 | ||||||||
| Paper, printing, &c. | 88 | 77 | 27 | 46 | 8 | 6 | 252 | 19 | |||||
| Skins, leather, &c. | 4 | 22 | 26 | 3 | |||||||||
| Mines and quarries | 1 | 16 | 17 | 3 | |||||||||
| Land (farming pursuits) | 12 | 113 | 46 | 7 | 60 | 12 | 1,314 | 1,564 | 12 | ||||
| Miscellaneous | 3 | 22 | 25 | 4 | |||||||||
| Totals | 1,171 | 1,597 | 919 | 849 | 314 | 29 | 100 | 19 | 19 | 12 | 1,413 | 6,442 | 201 |
Prior to the year 1936 the membership of unions of agricultural and pastoral employers was remarkable, inasmuch as it was between one-fifth and one-sixth of that of similar unions of workers', the reason being that the greater part of the worker membership consisted of seasonal workers, such as shearers and threshing-mill employees, who are engaged by several employers during the season. The rural workers' union, however, now has more than twenty thousand members, and the disproportion referred to has been eliminated.
Similar information to that given for industrial unions of employers is now given for workers' unions, as at the end of 1936.
| Industrial Group. | Membership—Industrial Districts. | Number of Unions. | |||||||||
|---|---|---|---|---|---|---|---|---|---|---|---|
| Northern. | Wellington. | Canterbury. | Otago and Southland. | Taranaki. | Marlborough. | Nelson. | Westland. | Dominion. | Totals. | ||
| Provision of— | |||||||||||
| Food, drink, &c. | 7,889 | 3,010 | 4,059 | 3,080 | 1,184 | 81 | 364 | 48 | 19,715 | 81 | |
| Clothing, footwear, and textiles | 8,562 | 1,432 | 3,401 | 2,837 | 16,232 | 27 | |||||
| Building and construction | 7,771 | 7,121 | 3,729 | 3,036 | 820 | 141 | 357 | 346 | 23,321 | 76 | |
| Power, heat, and light | 1,533 | 967 | 125 | 200 | 141 | 13 | 2,979 | 12 | |||
| Transport by water | 1,172 | 2,140 | 107 | 433 | 1,065 | 4,917 | 19 | ||||
| Transport by land | 3,867 | 2,587 | 1,336 | 1,167 | 290 | 64 | 192 | 40 | 13,747 | 23,290 | 27 |
| Accommodation, meals, and personal service | 4,646 | 3,408 | 1,674 | 1,220 | 403 | 104 | 200 | 356 | 12,011 | 23 | |
| Working in or on— | |||||||||||
| Wood, wicker, seagrass, and fibre | 4,240 | 3,009 | 1,070 | 1,354 | 270 | 76 | 209 | 1,330 | 11,558 | 31 | |
| Metal | 2,401 | 2,371 | 2,281 | 1,666 | 145 | 59 | 155 | 150 | 9,228 | 27 | |
| Stone, clay, glass, and chemicals | 1,008 | 1,007 | 195 | 567 | 44 | 54 | 2,875 | 23 | |||
| Paper, printing, &c. | 992 | 1,280 | 560 | 705 | 58 | 24 | 33 | 3,652 | 14 | ||
| Skins, leather, &c. | 483 | 512 | 89 | 86 | 1,170 | 10 | |||||
| Mines and quarries | 2,205 | 27 | 500 | 31 | 32 | 732 | 3,527 | 26 | |||
| Land (farming pursuits) | 132 | 90 | 20,154 | 20,376 | 4 | ||||||
| Miscellaneous | 8,382 | 9,694 | 3,725 | 4,001 | 907 | 112 | 219 | 487 | 3,149 | 30,676 | 87 |
| Totals | 55,283 | 38,538 | 22,468 | 20,852 | 4,293 | 637 | 1,819 | 3,522 | 38,115 | 185,527 | 487 |
At 31st December, 1936, there were 16 industrial associations of employers and 38 of workers, the former having 102 affiliated unions and the latter 240. The following summary shows the number of industrial associations of employers and workers in each industrial group, with the number of affiliated unions in each case.
| Industrial Group. | Employers. | Workers. | ||||||
|---|---|---|---|---|---|---|---|---|
| Associations. | Affiliated Unions. | Associations. | Affilitated Unions. | |||||
| 1935. | 1936. | 1935. | 1936. | 1935. | 1936. | 1935. | 1936. | |
| Provision of— | ||||||||
| Food, drink, &c. | 1 | 3 | 2 | 16 | 3 | 6 | 19 | 36 |
| Clothing, footwear, and textiles | 1 | 1 | 3 | 3 | 3 | 4 | 16 | 18 |
| Building and construction | 3 | 3 | 25 | 24 | 4 | 6 | 42 | 61 |
| Transport by water | 1 | 1 | 10 | 10 | 5 | 4 | 42 | 11 |
| Transport by land | 1 | 5 | 1 | 1 | 9 | 12 | ||
| Accommodation, meals, and personal service | 1 | 20 | 1 | 1 | 9 | 9 | ||
| Working in or on— | ||||||||
| Wood, wicker, seagrass, and fibre | 1 | 1 | 4 | 3 | 2 | 4 | 10 | 18 |
| Metal | 1 | 1 | 4 | 4 | 3 | 3 | 15 | 18 |
| Stone, clay, glass, and chemicals | 2 | 1 | 7 | 4 | ||||
| Paper, printing, &c. | 2 | 2 | 12 | 12 | 2 | 1 | 12 | 7 |
| Mines and quarries | 1 | 1 | 2 | 2 | ||||
| Land (farming pursuits) | 1 | 1 | 3 | 3 | ||||
| Miscellaneous | 1 | 1 | 2 | 2 | 6 | 6 | 41 | 44 |
| Totals | 12 | 16 | 65 | 102 | 33 | 38 | 224 | 240 |
In the 1932 Year-Book appears an analysis of the proportion of workers belonging to unions registered under the Industrial Conciliation and Arbitration Act to the total number of wage-earners in the country (from Census returns). The percentages at five-yearly intervals 1900–25 were: 8, 11, 19, 24, 26, 24. Considering the proportions at the end of 1925, the lowest ratio of unionists was amongst agricultural and pastoral workers (6 per cent.), and the highest, water transport (67 per cent.), housing and construction (65 per cent.), and food and drink, &c. (61 per cent.).
Table of Contents
EXCEPT for occasional returns relating to State unemployment relief which were presented to Parliament from time to time, practically no direct statistical evidence as to the extent of unemployment in New Zealand prior to 1892 is available.
Unemployment was well known to have been acute in the middle and late “sixties,” owing to the paralysing effect of the Maori wars in the North Island and to the collapse of the alluvial-gold booms in Otago and Westland. At no time, however, during the depression of the late “sixties” does there appear to have been any unemployment among women. With the inauguration at the beginning of the “seventies” of the Vogel policy of public works and assisted immigration, employment was available for large numbers of new arrivals. At the beginning of the “eighties” scarcity of funds for the prosecution of public works necessitated, along with other considerations, the checking for a space of the stream of assisted immigrants. By 1883 the position had materially improved; but unemployment once more became serious in the late “eighties” and early “nineties,” mainly owing to the fall in the prices that New Zealand's products (notably wool) were fetching in the World's markets, and to a further slackening of the rate of prosecution of public works. During both of these periods the unemployment position was so acute as to be responsible for a considerable exodus of male population to Australia and elsewhere.
Direct statistical evidence as to the extent of unemployment in New Zealand is available from the census (since 1896) and from the records of the Labour Department (since 1892). In addition, statistics of unemployment among trade-unionists (from trade-union secretaries) were collected by the Census and Statistics Department from 1925 to 1930. Certain data as to employment are also available, and are referred to at the end of this section.
The great disadvantage of the Census inquiry as an indicator of the trend of unemployment is that it provides data at quinquennial intervals only.
| Census. | Number of Males Unemployed. | Proportion per Thousand Male Wage-earners. |
|---|---|---|
| 12 April, 1896 | 14,759 | 100 |
| 31 March, 1901 | 8,467 | 48 |
| 12 April, 1906 | 8,189 | 39 |
| 2 April, 1911 | 7,152 | 30 |
| 15 October, 1916 | 5,920 | 26 |
| 17 April, 1921 | 11,061 | 39 |
| 20 April, 1926 | 10,694 | 34 |
A more comprehensive survey of unemployment than had previously been attempted was made at the 1926 census: a concise presentation of the results is contained in the 1931 issue of the Year-Book (pp. 850–56), while full statistics are published in Volume X of the results of the 1926 census. Information on this subject was also obtained on the occasion of the census of 24th March, 1936 (the census was not taken in 1931), but the results are not yet available for publication.
The creation of the Labour Department in 1891 has not only assisted in dealing directly with the problem of unemployment, but has been the means of useful statistical data being obtained and recorded. The figures relating to the activities of the employment bureaux of the Department do not show the full volume of unemployment, but they may safely be regarded as roughly symptomatic of the general situation.
The following table shows the numbers of unemployed assisted to employment from year to year by the Labour Department. The figures exclude the operations of the Women's Employment Branch of the Department, which was twice created (not under identical names) on occasions when there was a dearth of employment for women, and twice discontinued as urgency passed:—
| Year ended 31st March, | Number assisted. |
|---|---|
* Excluding those engaged under Unemployment Board's No. 5 scheme. † Period ending 19th October, 1935, since when comparable information is not available. | |
| 1892 | 2,593 |
| 1893 | 3,874 |
| 1894 | 3,371 |
| 1895 | 3,030 |
| 1896 | 2,871 |
| 1897 | 1,718 |
| 1898 | 2,035 |
| 1899 | 2,115 |
| 1900 | 2,147 |
| 1901 | 3,124 |
| 1902 | 1,830 |
| 1903 | 3,704 |
| 1904 | 2,860 |
| 1905 | 3,130 |
| 1906 | 6,712 |
| 1907 | 7,393 |
| 1908 | 6,305 |
| 1909 | 10,391 |
| 1910 | 8,506 |
| 1911 | 7,102 |
| 1912 | 5,735 |
| 1913 | 5,848 |
| 1914 | 5,645 |
| 1915 | 7,515 |
| 1916 | 5,978 |
| 1917 | 2,966 |
| 1918 | 2,952 |
| 1919 | 3,199 |
| 1920 | 4,205 |
| 1921 | 3,364 |
| 1922 | 4,989 |
| 1923 | 3,987 |
| 1924 | 3,877 |
| 1925 | 3,890 |
| 1926 | 3,397 |
| 1927 | 10,268 |
| 1928 | 15,246 |
| 1929 | 16,363 |
| 1930 | 21,890 |
| 1931 | 30,223 |
| 1932 | *18,328 |
| 1933 | *29,942 |
| 1934 | *24,343 |
| 1935 | *16,256 |
| 1936† | *7,559 |
Commencing with 1926, unemployment, particularly during the winter months, assumed substantial proportions, in spite of steps taken by the Government, local authorities, and private organizations to provide work. In 1929 and 1930 matters reached a stage which led to the passing of the Unemployment Act., 1930, which has now been replaced by the Employment Promotion Act, 1936, to which reference is made in Section XXXVIII.
The slackness in industry and trade already evident when the Unemployment Act came into force intensified greatly during 1931, 1932, and the earlier portion of 1933. During 1931, indeed, the number of applicants on the registers totally unprovided for increased steadily, despite the fact that increasing numbers were being engaged under the various relief schemes which had been inaugurated. In 1932 and 1933 the placing of men on relief work more than offset the number of new registrations, so that the number of men unprovided for fell considerably. The improvement in business conditions commencing late in 1933 is reflected in the next table, showing the numbers of unemployed at quarterly intervals. The maximum for each year is indicated by heavy type. It should be noted that these figures are not comparable with those appearing in the 1936 and previous issues of the Year-Book, since they include men who have been placed in full-time employment with the aid of subsidies from the Employment Promotion Fund, and who do not, therefore, appear on the registers as unemployed.
It should be noted that men who receive relief under Scheme 5, including men on sustenance, still remain on the registers, and are included in the figures-shown.
In the compilation of the statistics care is taken to exclude from the figures of applications remaining on the books all cases of applicants for employment from whom the Department of Labour has not heard for fourteen days, on the assumption that such applicants have obtained employment through other means.
| Date. | Number of Unemployed (Males). |
|---|---|
| 1932. | |
| 26th November | 69,311 |
| 1933. | |
| 18th February | 65,782 |
| 13th May | 70,502 |
| 5th August | 78,091 |
| 28th October | 79,587 |
| 25th November | 76,137 |
| 1934. | |
| 20th January | 69,921 |
| 17th February | 68,618 |
| 12th May | 65,540 |
| 4th August | 66,291 |
| 24th November | 59,349 |
| 1935. | |
| 16th February | 53,321 |
| 11th May | 54,908 |
| 3rd August | 60,377 |
| 31st August | 60,806 |
| 23rd November | 57,246 |
| 1936. | |
| 18th January | 56,502 |
| 15th February | 54,654 |
| 9th May | 51,208 |
| 1st August | 54,003 |
| 21st November | 42,341 |
| 1937. | |
| 13th February | 35,722 |
| 8th May | 34,218 |
| 28th August | 37,316 |
The next table is illustrative of the seasonal fluctuations in unemployment, and shows (during the period in which strictly comparable figures are available) the relationship, on a percentage basis, existing between the monthly numbers remaining on employment registers and the average of the year 1933, this being the year in which the maximum was reached.
| Month. | 1932. | 1933. | 1934. | 1935. | 1936. | 1937. |
|---|---|---|---|---|---|---|
| January | 102 | 86 | 77 | 74 | 07 | |
| February | 96 | 81 | 74 | 69 | 61 | |
| March | 96 | 80 | 75 | 68 | 59 | |
| April | 98 | 80 | 78 | 71 | 59 | |
| May | 103 | 82 | 81 | 75 | 60 | |
| June | 105 | 83 | 83 | 83 | 62 | |
| July | 108 | 88 | 88 | 91 | 65 | |
| August | 106 | 89 | 90 | 95 | 58 | |
| September | 103 | 89 | 89 | 89 | ||
| October | 106 | 99 | 84 | 84 | 83 | |
| November | 102 | 90 | 80 | 76 | 75 | |
| December | 102 | 86 | 77 | 76 | 68 | |
| Average for year | 102 | 100 | 84 | 82 | 79 |
With the exception of 1937, when the peak occurred in January—a month always with comparatively high figures—the period of annual maximum unemployment has invariably been immediately following midwinter, while that of minimum intensity has varied from December to February. The annual average fell heavily between 1933 and 1934, since when it has maintained a consistent decline.
Considerable interest attaches to the relative extent of unemployment in the major centres of population. In view of the fact that the areas served by the city bureaux vary considerably as between the four chief centres, the next table has been compiled on an urban-area basis, the figures quoted representing in each case the numbers on the registers at all employment bureaux or post-offices within the boundaries of the urban area. Men working full-time in industry with assistance from the Employment Promotion Fund are not on the registers of the bureaux, and are accordingly omitted from this table.
On the basis of numbers on the registers, the peak level of unemployment was reached in Auckland on 30th September, 1933; in Wellington on 11th January, 1932; in Dunedin on 16th May, 1931; while Christchurch had two peaks approximately equal—viz., 5th August, 1933, and 6th October, 1934.
NUMBERS OF MALES ON REGISTERS.
| Date. | Urban Areas. | Remainder of' Dominion. | Total. | |||
|---|---|---|---|---|---|---|
| Auckland. | Wellington. | Christchurch. | Dunedin. | |||
| 1935. | ||||||
| 19th Jan. | 8,583 | 5,563 | 5,699 | 1,857 | 14,489 | 36,191 |
| 16th Feb. | 8,279 | 5,356 | 5,463 | 1,734 | 14,239 | 35,071 |
| 16th Mar. | 8,333 | 5,444 | 5,466 | 1,648 | 14,677 | 35,568 |
| 13th April | 8,346 | 5,742 | 5,439 | 1,778 | 15,487 | 36,792 |
| 11th May | 8,312 | 5,853 | 5,752 | 1,910 | 16,273 | 38,100 |
| 8th June | 8,414 | 5,759 | 6,079 | 2,030 | 17,048 | 39,330 |
| 6th July | 8,620 | 5,793 | 6,504 | 2,101 | 18,481 | 41,499 |
| 3rd Aug. | 9,010 | 5,809 | 6,583 | 2,238 | 18,991 | 42,631 |
| 31st Aug. | 8,875 | 5,792 | 6,515 | 2,308 | 19,255 | 42,745 |
| 28th Sept. | 8,833 | 5,685 | 6,478 | 2,399 | 18,805 | 42,200 |
| 26th Oct. | 8,440 | 5,202 | 6,295 | 2,259 | 17,485 | 39,681 |
| 23rd Nov. | 7,612 | 4,820 | 6,109 | 2,209 | 15,229 | 35,979 |
| 21st Dec. | 7,810 | 4,877 | 6,117 | 2,206 | 14,643 | 35,653 |
| 1936. | ||||||
| 18th Jan. | 8,068 | 4,718 | 5,812 | 2 222 | 13,957 | 34,777 |
| 15 th Feb. | 7,823 | 4,426 | 5,464 | 2,027 | 12,644 | 32,384 |
| 14th Mar. | 7,751 | 4,291 | 5,335 | 2,033 | 12,609 | 32,019 |
| 11th April | 8,225 | 4,095 | 5,497 | 2,047 | 13,413 | 33,277 |
| 9th May | 8,499 | 4,366 | 5,532 | 2,207 | 14,666 | 35,270 |
| 6th June | 8,791 | 4,791 | 5,989 | 2,368 | 17,099 | 39,038 |
| 4th July | 9,384 | 4,833 | 6,508 | 2,473 | 19,741 | 42,939 |
| 1st Aug. | 9,896 | 4,776 | 6,745 | 2,649 | 20,979 | 45,045 |
| 29th Aug. | 9,729 | 4,659 | 6,738 | 2,706 | 20,431 | 44,263 |
| 26th Sept. | 9,222 | 4,406 | 6,125 | 2,681 | 19,474 | 41,908 |
| 24th Oct. | 8,751 | 4,087 | 5,733 | 2 522 | 17,963 | 39,056 |
| 21st Nov. | 8,122 | 3,763 | 5,354 | 2,293 | 15,935 | 35,467 |
| 19th Dec | 7,597 | 3,554 | 4,884 | 2,178 | 14,073 | 32,286 |
| 1937. | ||||||
| 16th Jan. | 8,703 | 3,389 | 5,188 | 2,039 | 12,097 | 31,416 |
| 13th Feb. | 8,352 | 3,115 | 4,807 | 1,952 | 10,715 | 28,941 |
| 13th Mar. | 8,256 | 2,941 | 4,817 | 1,931 | 9,962 | 27,907 |
| 10th April | 8,155 | 2,800 | 4,956 | 1,897 | 10,145 | 27,953 |
| 8th May | 8,165 | 2,941 | 4,915 | 1,946 | 10,335 | 28,302 |
| 5th June | 8,125 | 2,955 | 5,196 | 1,955 | 11,095 | 29,326 |
| 3rd July | 8,290 | 3,040 | 5,289 | 2,402 | 11,800 | 30,821 |
| 31st July | 8,346 | 2,976 | 5,602 | 2,573 | 10,946 | 30,443 |
| 28th Aug. | 7,880 | 2,868 | 5,479 | 2,488 | 8,608 | 27,323 |
In making comparisons between individual centres, it is necessary to take cognizance of relative populations. The following table is of interest in this connection:—
| Urban Area. | Population, Census 1936. | Numbers on Registers of Employment Bureaux as at 31st, July, 1937. | |
|---|---|---|---|
| Number. | Per Thousand Inhabitants. | ||
| Auckland | 212,159 | 8,346 | 39 |
| Wellington | 149,971 | 2,976 | 20 |
| Christchurch | 132,559 | 5,602 | 42 |
| Dunedin | 81,961 | 2,573 | 31 |
It should be remembered that only males are registered at the Employment-Bureaux of the Labour Department, so that the figures quoted in this section do not take account of unemployment among women. Although no recent data are available as to the number of women and girls unemployed, this aspect of the unemployment problem was also serious during the depression period, and numerous grants were made from the Employment Promotion Fund for the relief of unemployment among women.
NUMBERS OF UNEMPLOYED MALES.
| Date. | Remaining on Registers but Unplaced or Ineligible for various Reasons. | In Receipt of Part-time Belief Work or Sustenance. | Working Full Time in Industry with Assistance from Employment Promotion Fund (not. registered as Unemployed). | Total wholly or partly a Charge on the Employment Promotion Fund, together with those unplaced. | |
|---|---|---|---|---|---|
| Scheme No. 5. (Rationed Work.) | Sustenance without Work. | ||||
| 1931. | |||||
| 30th June | 6,700 | 38,000 | 6,400 | 51,100 | |
| 30th September | 7,600 | 43,000 | 3,000 | 54,590 | |
| 31st December | 4,800 | 39,300 | 7,985 | 52,085 | |
| 1932. | |||||
| 31st March | 7,000 | 37,000 | 10,520 | 54,520 | |
| 30th June | 7,450 | 43,850 | 17,350 | 68,650 | |
| 30th September | 6,540 | 45,100 | 22,010 | 73,650 | |
| 24th December | 5,199 | 43,106 | 20,976 | 69,281 | |
| 1933. | |||||
| 18th Match | 5,585 | 39,874 | 21,193 | 66,652 | |
| 10th June | 5,802 | 43,837 | 23,279 | 72,918 | |
| 30th September | 4,301 | 44,743 | 30,391 | 79,435 | |
| 23rd December | 2,533 | 36,906 | 964 | 29,870 | 70,273 |
| 1934. | |||||
| 17th March | 3,273 | 32,555 | 1,793 | 27,766 | 65,387 |
| 9th June | 3,407 | 33,126 | 2,718 | 23,386 | 62,637 |
| 29th September | 3,272 | 32,731 | 5,569 | 23,189 | 64,761 |
| 22nd December | 2,131 | 28,303 | 5,923 | 20,481 | 56,838 |
| 1935. | |||||
| 19th January | 3,280 | 26,775 | 6,136 | 19,175 | 55,366 |
| 16th February | 3,187 | 24,936 | 6,948 | 18,250 | 53,321 |
| 16th March | 3,153 | 24,204 | 8,211 | 17,930 | 53,498 |
| 13th April | 3,292 | 24,634 | 8,866 | 17,243 | 54,035 |
| 11th May | 2,847 | 25,379 | 9,874 | 16,808 | 54,908 |
| 8th June | 3,025 | 25,043 | 11,262 | 16,936 | 56,266 |
| 6th July | 3,414 | 25,243 | 12,842 | 17,483 | 58,982 |
| 3rd August | 2,806 | 25,387 | 14,438 | 17,746 | 60,377 |
| 31st August | 2,581 | 24,817 | 15,347 | 18,061 | 60,806 |
| 28th September | 2,500 | 24,183 | 15,517 | 18,144 | 60,344 |
| 26th October | 2,043 | 22,260 | 15,378 | 18,800 | 58,481 |
| 23rd November | 1,825 | 19,610 | 14,544 | 21,267 | 57,246 |
| 21st December | 1,737 | 18,844 | 15,072 | 21,628 | 57,281 |
| 1936. | |||||
| 18th January | 2,233 | 17,365 | 15,179 | 21,725 | 56,502 |
| 15th February | 2,012 | 15,922 | 14,450 | 22,270 | 54,654 |
| 14th March | 1,872 | 15,704 | 14,443 | 22,510 | 54,529 |
| 11th April | 2,013 | 15,514 | 15,750 | 16,542 | 49,819 |
| 9th May | 2,642 | 15,528 | 17,100 | 15,938 | 51,208 |
| 6th June | 3,200 | 15,486 | 20,352 | 13,996 | 53,034 |
| 4th July | 3,189 | 15,280 | 24,470 | 11,299 | 54,238 |
| 1st August | 2,804 | 15,945 | 26,296 | 8,958 | 54,003 |
| 29th August | 2,700 | 15,569 | 25,994 | 6,584 | 50,847 |
| 26th September | 2,209 | 13,955 | 25,744 | 7,511 | 49,419 |
| 24th October | 2,173 | 12,582 | 24,301 | 7,084 | 46,140 |
| 21st November | 2,258 | 11,141 | 22,068 | 6,874 | 42,341 |
| 19th December | 2,037 | 10,085 | 20,164 | 6,786 | 39,072 |
| 1937. | |||||
| 16th January | 2,834 | 7,874 | 20,708 | 6,404 | 37,820 |
| 13th February | 2,526 | 7,058 | 19,357 | 6,781 | 35,722 |
| 13th March | 2,341 | 6,621 | 18,945 | 6,619 | 34,526 |
| 10th April | 2,268 | 6,242 | 19,443 | 6,296 | 34,249 |
| 8th May | 2,225 | 6,213 | 19,864 | 5,916 | 34,218 |
| 5th June | 2,500 | 6,136 | 20,690 | 6,513 | 35,839 |
| 3rd July | 2,901 | 6,075 | 21,845 | 6,725 | 37,546 |
| 31st July | 2,636 | 5,597 | 22,210 | 8,236 | 38,679 |
| 28th August | 2,371 | 4,749 | 19,973 | 9,993 | 37,316 |
The major form of relief was, in earlier years, the provision of part-time work by the payment of wages of men employed on relief works by local bodies (Scheme 5). Men provided with relief work under this scheme remain on the registers of the Labour Department, while men engaged in other employment subsidized from the Employment Promotion Fund are removed from the registers. Considerable attention has been devoted to the transfer of men from relatively unproductive part-time relief to more directly productive subsidized employment schemes.
The official statistics of the number of unemployed include, in addition to the registered unemployed, all those working in industry with the assistance of a subsidy from the Employment Promotion Fund. The latter class was excluded from the statistics published between October, 1935, and September, 1936, but is included in the totals given in the preceding table.
Immediately unemployment began to be seriously felt in the winter of 1926, steps were taken by the State and by local authorities to absorb as much labour as possible on ordinary public works and on relief works. One of the first enactments of the 1926 session of Parliament was the Local Authorities Empowering (Relief of Unemployment) Act (repealed in 1932) which empowered local authorities without taking a poll of the ratepayers, to borrow moneys for the purpose of providing relief works for unemployed men.
In addition to providing direct employment as far as possible, the Suite further assisted by subsidizing expenditure by local authorities. In spite of the efforts of the general and local governments, however, unemployment continued in evidence; and, with a vie v to remedying the situation, the Government undertook, in September, 1929, to find employment within a specified time for all genuinely unemployed men, provided that they registered at the Government labour bureaux and were willing and able to accept the work offered.
The question of providing some permanent solution of the problem received a good deal of attention; and in 1928, arising out of a recommendation of the National Industrial Conference of that year, a committee was set up to go fully into the matter. Following on the report of this committee, the Unemployment Act was passed in the 1930 session of Parliament. This Act and its subsequent amendments have now been repealed by the Employment Promotion Act, 1936, reference to which is also contained in Section XXXVIII.
For nearly three years after the passing of the Unemployment Act all applicants for relief were obliged to perform some kind of work in return for relief pay. While endeavours were made as far as possible to provide full-time employment for unemployed — on a subsidized basis, if necessary — there was a large residuum of applicants for relief for whom part-time employment had to be found, with the co-operation of local authorities. Towards the end of 1933 it became evident that local employing authorities, particularly in the main urban areas, where over 50 per cent. of relief workers on a rationed basis were domiciled, were reaching the end of their resources, both from a financial point of view in meeting supervision and other costs and by reason of difficulty in finding suitable work.
One of the main difficulties arose in the continued provision of appropriate work for those of the unemployed who were unfit for heavy manual labour. Many local bodies were also faced with the position that all their useful works of a nature suitable for the absorption of relief labour were rapidly nearing completion. From this state of affairs it was only a short step to the employment of relief workers on essential jobs in the nature of ordinary maintenance. These difficulties led to a modification of the former policy; and, although for obvious reasons sustenance payments could not be granted on the same scale as relief pay, those workers whom it was impossible to place on approved relief works were granted sustenance in proportion to the ration of relief they would have been eligible for, but on a slightly lower scale. Every effort was made to rotate work and sustenance so that the men would not be penalized by circumstances over which they had no control. In other words, the available work was distributed as evenly as possible amongst the eligible and most deserving applicants for relief.
Later on it became evident that the position was still not being met satisfactorily, mainly because of the high proportion of men who were not fitted by age, physique, or previous experience for the class of work offering.
In August, 1934, it was decided that the time had arrived for the application of the sustenance principle upon a revised and more permanent basis. This decision was impelled by increasing difficulties in the larger centres of population, where the provision of suitable and useful work under Scheme No. 5 was becoming a real problem. As will be seen from the statistics on page 804, men on sustenance now form a very considerable proportion of the reduced total number of unemployed males.
The weekly sustenance rates as from 30th November, 1936, are as follows:—
| Classification. | Weekly Rate. |
|---|---|
| £ s. d. | |
| Single man | 1 0 0 |
| Married man with wife only | 1 15 0 |
| Married man with wife and one child | 1 19 0 |
| Married man with wife and two children | 2 3 0 |
| Married man with wife and three children | 2 7 0 |
| Married man with wife and four children | 2 11 0 |
| Married man with wife and five children | 2 15 0 |
| Married man with wife and six children | 2 19 0 |
| Married man with wife and seven or more children | 3 3 0 |
The number of men in receipt of sustenance on 28th August, 1937, was 19,973.
Information as to the various schemes of subsidized employment which have been introduced is briefly set out below.
In previous issues of the Year-Book full information has been given regarding the various schemes of subsidized employment which have been in operation from time to time, but most of these have either now been discontinued or are carried on a very reduced scale. Those still in operation to an extent justifying particular reference are set out below.
Scheme No. 4B.—This provides for subsidies of up to 50 per cent. of labour-costs of co-operative contracts for work of a developmental character on farms, such as drainage, fencing, scrub-cutting, gorse-grubbing, eradication of noxious weeds, &c., in cases where, after inspection by its officers, the Lands Department is satisfied that the project is an economic proposition, and that it would not be carried out but for the inducement of a subsidy.
Scheme No. 5.—Under this scheme local bodies may engage registered unemployed men on a basis of rationed employment, for work other than that which would ordinarily be performed by the usual employees; the whole amount of wages not exceeding certain rates being refunded from the Employment Promotion Fund. Men placed under this scheme are allotted a weekly ration of work which is such as will enable them to earn, at a fixed rate per day, a certain specified amount, varying according to the number of their dependants. The rate or pay under the scheme has been amended from time to time, being 10s. 6d. per day up to 30th September, 1935; 12s. per day from 1st October, 1935, to 31st May, 1936; 16s. per day from 1st June to 24th October, 1936; and 18s. per day as a minimum subsequent to the last-mentioned date, higher award rates being paid where applicable. Following are the maximum weekly payments to the various classes of men, subject, however, to the foregoing and to the fact that local authorities operating under the scheme are encouraged to give additional work, at the cost of their own funds, sufficient to bring each man's weekly ration up to the nearesthalf-day above the time which he would require to work to earn the amount applicable to his classification.
| Classification. | Under Scheme No. 5. | Additional (Minimum) which Local Authorities are encouraged to provide. | Total | |||
|---|---|---|---|---|---|---|
| Hours. | Amount. | Hours. | Amount. | Hours. | Amount. | |
| £ s. d. | £ s. d. | £ s. d. | ||||
| Single man | 9 ⅓ | 1 1 0 | 2 ⅔ | 0 6 0 | 12 | 1 7 0 |
| Married man with— | ||||||
| Wife only | 17 1/9 | 1 18 6 | 2 8/9 | 0 6 6 | 20 | 2 5 0 |
| Wife and 1 child | 18 8/9 | 2 2 6 | 1 1/9 | 0 2 6 | 20 | 2 5 0 |
| Wife and 2 children | 20 ⅔ | 2 6 6 | 3 ⅓ | 0 7 6 | 24 | 2 14 0 |
| Wife and 3 children | 22 4/9 | 2 10 6 | 1 5/9 | 0 3 6 | 24 | 2 14 0 |
| Wife and 4 children | 24 2/9 | 2 14 6 | 3 7/9 | 0 8 6 | 28 | 3 3 0 |
| Wife and 5 children | 26 | 2 18 6 | 2 | 0 4 6 | 28 | 3 3 0 |
| Wife and 0 children | 27 7/9 | 3 2 6 | 2/9 | 0 0 6 | 28 | 3 3 0 |
| Wife and 7 or more children | 29 5/9 | 3 6 6 | 2 4/9 | 0 5 6 | 32 | 3 12 0 |
There is a further proviso regarding employment under Scheme No. 5 to the effect that if a local authority gives additional work in excess of the minimum shown above so that the total weekly payments would be greater than a certain fixed maximum (varying from £2 per week in the ease of single men to £3 18s. per week in the highest class), then the Scheme 5 employment must not be continued, but, instead, operations must be conducted under Scheme No. 13 (q.r.).
Prospecting and Development of Auriferous Areas (Schemes Nos. 15 and 8A).—Under the former scheme subsidies are granted to eligible unemployed men, in parties of two or more, to enable them to undertake gold-prospecting on approved areas, the rate depending on the circumstances of the men and the nature of the work performed, and varying from 15s. per week for youths under twenty years of age to £2, £2 10s., and—for certain classes of work—£4 per week for married men. Subsidies may be reduced if the value of gold won exceeds a certain figure.
The latter scheme provides for the subsidizing of wages of men engaged by a company or syndicate on developmental work in connection with gold-mining operations who are paid standard wages for full-time work. The minimum subsidy is at the rate of 15s. per week for single men and £1 10s. per week for married men. Stipulations are imposed to the effect that 10 per cent. of the value of gold won from the date the subsidy is granted must be refunded to the Employment Promotion Fund up to the full amount of the subsidy, that no dividends are to be paid or profits distributed until the full subsidy is repaid, and that the full subsidy must be repaid immediately in the event of the company or syndicate disposing of its rights either wholly or in part.
Scheme No. 13.—Certain works of either a national or local character put in hand by local authorities are, under this scheme, eligible for subsidy. Such works must be suitable for the employment of a considerable proportion of manual labour, and regard is had to the probability of a resultant increase in revenue or improved amenities. When the work is done by day-labour the rates of subsidy are generally £1 10s. per week for single men and £2 5s. per week for married men, and in the case of contract work 12 per cent. to 15 per cent. of the total contract price, provided that a certain proportion (generally 80 per cent., but in no case less than 50 per cent.) of the men employed are taken from the registers of the employment bureaux. Conditions precedent to approval of subsidy are—(1) Reasonable evidence must be forthcoming that the work would not proceed immediately without the aid of a subsidy; (2) labour must be paid at the rate of 16s. per day, or at award rate, if higher; and (3) a working week of five days of eight hours each must be maintained.
The destruction of rabbits may also be undertaken under this scheme by local authorities or Government Departments, but it is proposed to terminate all work of this nature by the end of the present year. A good deal of assistance was previously rendered under another scheme, but with improved economic conditions it is considered that Rabbit Boards should now make provision for sufficient rating to undertake necessary work without the help of subsidies.
Eradication of Noxious Weeds.—Two new schemes with this object were introduced as from 16th November, 1936, as follows:—
Scheme A, under which county councils may operate by arrangement with the Department of Agriculture. All labour must be drawn from labour bureaux (registered unemployed), and must be employed full time at 16s. per day, of which 14s. per day is refunded in the form of subsidy.
Scheme B, under which individual farmers may similarly engage labour, rates of subsidy in such cases being £1 10s. per week for single men and £2 5s. per week for married men (less 17s. 6d. per week in each case when food and accommodation is provided by the employing farmer).
Special Subsidies to Juvenile Labour.—A temporary scheme for the employment and training of youths in farm-work was brought into operation in March, 1937. The objects of the scheme were to assist in coping with the problem of juvenile unemployment and at the same time to assist farmers in obtaining labour. The duration of the subsidy is eight to nine weeks in each instance, after which period the farmer is required to retain the youth's services for at least four months.
A scheme of subsidizing the wages of apprentices of eighteen years of age or over was brought into operation in September, 1937. The subsidy applies to the carpentering and bricklaying trades only, and is intended to assist in absorbing youths in trades where age would otherwise debar them from the opportunity of becoming apprenticed.
The following analysis shows the numbers of men in receipt of relief under the various relief schemes at the dates specified:—
| Nature of Relief. | Dec., 1932. | March, 1933. | June, 1933. | Sept., 1933. | Dec., 1933. | March, 1934. | June, 1934. | Sept., 1934. | Dec., 1934. | Mar., 1935. | June, 1935. | Aug., 1935. | Nov., 1935. |
|---|---|---|---|---|---|---|---|---|---|---|---|---|---|
* Excluding men engaged in gold-prospecting. † Not available. ‡ Excluding men engaged on building schemes. | |||||||||||||
| Scheme 5* (see letterpress, ante) | 46,151 | 43,374 | 47,337 | 48,626 | 41,747 | 36,858 | 37,837 | 37,647 | 33,018 | 28,863 | 29,405 | 29,967 | 27, 694 |
| Sustenance without work | 5,569 | 5,923 | 8,211 | 11,262 | 15,347 | 14,544 | |||||||
| Farm schemes | 9,209 | 8,450 | 9,977 | 10,110 | 9,093 | 9,645 | 7,426 | 7,551 | 5,688 | 3,579 | 3,287 | 3,725 | 3,735 |
| Land improvement and development, &c. | 3,809 | 4,848 | 3,510 | 3,853 | 3,098 | 2,791 | 3,082 | 2,998 | 2,574 | 2,249 | 2,210 | 2,373 | 1,813 |
| Gold-prospecting | 1,506 | 2,217 | 3,595 | 3,908 | 3,760 | 3,572 | 3,608 | 3,671 | 3,404 | 3,310 | 3,342 | 3,253 | 2,879 |
| Building - subsidy schemes | 3,243 | 1,808 | 477 | 6,360 | 7,428 | 5,892 | 2,272 | 1,390 | 1,005 | 685 | 395 | 305 | † |
| Subsidized employment by Public Works Department | 2,125 | 2,063 | 2,870 | 3,440 | 2,937 | 2,524 | 2,922 | 3,285 | 3,184 | 3,086 | 4,604 | ||
| Miscellaneous | 164 | 370 | 95 | 97 | 147 | 70 | 72 | 139 | 173 | 163 | 158 | 169 | 152 |
| Totals | 64,082 | 61,067 | 67,116 | 75,017 | 68,743 | 62,268 | 57,234 | 61,489 | 54,707 | 50,345 | 53,241 | 58,225 | 55,421‡ |
Subsequent to the period covered by the above table, figures are available only on a somewhat modified basis, as follows:—
| — | March, 1936. | June, 1936. | Sept., 1936. | Dec., 1936. | March, 1937. | June, 1937. |
|---|---|---|---|---|---|---|
| Scheme 5 | 15,704 | 15,486 | 13,955 | 10,085 | 6,621 | 6,136 |
| Sustenance without work | 14,443 | 20,352 | 25,744 | 20,164 | 18,945 | 20,690 |
| In full-time subsidized employment— | ||||||
| At relief rates | 9,281 | 5,560 | 4,563 | 3,055 | 2,594 | 2,139 |
| At standard rates | 13,229 | 8,436 | 2,948 | 3,731 | 4,025 | 4,374 |
| Totals | 52,657 | 49,834 | 47,210 | 37,035 | 32,185 | 33,339 |
An analysis of the age-distribution of certain classes of unemployed workers—viz., those actually in receipt of sustenance or on rationed relief work, has been made by the Employment Division of the Labour Department. Following is a summary of the statistics, which relate to the position on 27th March, 1937:—
| Duration of Unemployment. | Age Groups. | Totals | |||||
|---|---|---|---|---|---|---|---|
| 22 Years and under. | 23 to 35 Years. | 36 to 45 Years. | 46 to 55 Years. | 56 to 64 Years. | 65 Years and over. | ||
| Over 5 years | 282 | 389 | 674 | 845 | 184 | 2,374 | |
| 4 years and under 5 years | 221 | 282 | 452 | 509 | 100 | 1,564 | |
| 3 years and under 4 years | 3 | 314 | 366 | 463 | 649 | 105 | 1,900 |
| 2 years and under 3 years | 32 | 451 | 431 | 618 | 034 | 130 | 2,296 |
| 1 years and under 2 years | 149 | 805 | 637 | 887 | 879 | 138 | 3,495 |
| 9 months and under 1 year | 146 | 513 | 403 | 454 | 441 | 66 | 2,023 |
| 6 months and under 9 months | 179 | 482 | 334 | 447 | 439 | 47 | 1,928 |
| 3 months and under 6 months | 163 | 571 | 437 | 455 | 435 | 46 | 2,107 |
| 2 months and under 3 months | 121 | 361 | 225 | 233 | 228 | 27 | 1,195 |
| 6 weeks and under 8 weeks | 81 | 202 | 178 | 139 | 157 | 14 | 831 |
| 4 months and under 6 weeks | 106 | 316 | 163 | 172 | 126 | 22 | 905 |
| Under 4 weeks | 203 | 621 | 353 | 350 | 257 | 17 | 1,801 |
| Seasonal applicants | 25 | 178 | 107 | 106 | 70 | 3 | 489 |
| Casually employed applicants | 120 | 773 | 594 | 606 | 508 | 35 | 2,636 |
| Grand totals | 1,328 | 6,150 | 4,899 | 6,056 | 6,177 | 934 | 25,544 |
The original Small-farms Scheme had for its object the placing of unemployed workers on small rural holdings of about 5 or 10 acres as a means of offering a partial livelihood, which would be supplemented by seasonal and other work obtained from farmers in the district. Up to the 31st March, 1933, 488 individual settlers had been placed, but, owing largely to the resumption of their former occupations by many of the men so placed, 130 of the placements were cancelled, in some cases the cancellation was due to the failure of the men to obtain employment in the district, and in some others the terms of the leases given by the landowners had expired.
In addition to the Small-farm settlers, 205 share milkers were installed in cottages, for the erection of which advances had been made out of the Employment Promotion Fund on condition that the landowners employed registered unemployed men as share milkers. The total expenditure to the 31st March, 1933, was £142,000.
In 1933–34 the administration was taken over by the Small-farms Board, constituted under the Small Farms (Relief of Unemployment) Act of March, 1933. The Small-farms Board operates through the Department of Lands and Survey. This Board initiated a wider policy of rural settlement, and confined its activities to the settlement of self-supporting farms and to the development of large blocks for subdivision. Where Crown land capable of economic development was not available, as was the case in many districts, private lands were purchased or leased.
During the year ended 31st March, 1937, an average of 1,007 men was engaged on development blocks, totalling 59,560 acres. Work on many of these blocks has been practically completed and the management of subdivisions handed over to individuals, but no titles have been issued, and in most cases the land will continue to be farmed by the Board, particularly in those districts where it is essential to retain full control of stock-movements, in order to prevent reversion to noxious-weed growths, such as ragwort.
Where the revenue is sufficient, the occupiers of the individual subdivisions are allowed to collect a proportion of the dairy cheques, but in other cases the men remain on a wage basis of £4 per week, less 10s. per week rent for cottage.
At the 31st March, 1937, the Small-farms Board had been in control of the scheme for approximately four years, and the gross capital expenditure (other than wages) was £958,160. Three hundred and sixty-five individual holdings had been established on an area of 24,522 acres; 594 sections were included in blocks under development, totalling 53,799 acres; while a further area of 5,761 acres was under development, but had not been sectionized.
Share milkers' cottage loans approved numbered sixty-six.
Until March, 1936, all wages paid to men engaged on development-work under the Small-farms Scheme were paid out of the Employment Promotion Fund, but after that date a subsidy of five-eighths of the total wages was paid out of the Consolidated Fund, the balance being treated as capital expenditure of the Small-farms Board.
The Employment Promotion Fund also provides a sustenance payment, not exceeding £1 per week, in the case of individual settlers during the period in which the revenue from their properties is not sufficient to provide a full living. Up to the 31st March, 1937, a total of 810 men had received sustenance at one time or another, but, as at that date, the number actually in receipt of sustenance was 101 only.
In twenty-five of the principal centres officers (known as Placement Officers) have been appointed, whose duty it is to investigate avenues for the reabsorption of unemployed workers in the trades or callings for which their training and experience best fits them. These officers obtain and verify particulars of each man's capabilities, and by keeping in touch with each other, with the various labour bureaux in the smaller centres, and with employers throughout the Dominion, have achieved a considerable measure of success. From the time the scheme was inaugurated (30th May, 1936) to the latest date available (4th September, 1937) 20,963 permanent, 12,880 temporary, and 15,299 casual placements have been effected by these means.
The importance of the unemployment question throughout the world in recent years has prompted in most countries statistical examination of the fluctuations or periodicity of employment. Until recent years the statistics available on this phenomenon in New Zealand have been somewhat scanty, being restricted to employment on public works. Data are now available on some of the avenues of industrial employment (including building and construction, but excluding transport and mining) as well as that contracted with local authorities.
In issues of the Year-Book prior to 1936 tables have been given illustrating the fluctuation of employment under this heading, month by month. Considerations of space preclude their reproduction, but full details may be found in successive issues of the Annual Statistical Report on Factory and Building Production. During 1935, of the twenty-three groups of factory industries which are of sufficient importance to justify consideration, seven had maximum employment in December, five in October, four in November, two each in January, February, and June, and one in April. In the case of fourteen groups, minimum employment occurred in January, while the balance were fairly evenly distributed throughout the remainder of the year. The principal group (animal food) had the maximum in January and the minimum in July, while for all industries in combination the maximum was in February and the minimum in July. In the building trade the maximum occurred in November and the minimum in February.
Seasonal unemployment has to a certain extent been coped with by the institution of relief works by the Public Works Department, which has tended to swell the numbers engaged on public works. This employment on public works may be classified according to the authority meeting the cost of the works:—
Public Works Department.
Public Works Department and local authorities.
Local authorities only.
Employment Promotion Fund.
Until recently, complete statistics covering all phases of this employment were not available. Those for past years relate to class (a), and part of class (b) to the extent to which the cost is met by the Public Works Department; furthermore, they do not include the employees of contractors. The following statistics are entirely exclusive of workmen engaged by local authorities, and are calculated by dividing the total amount paid as wages during each month by the sum which would represent the full-time earnings of one worker during each, particular period. They cover those workers who are employed on “time” as well as “piece” rates. Class (d) from 1932–33 to 1935–36 represents several thousand men, all of whom are also included in the figures relating to unemployment relief. As from 1st -April, 1936, however, all highways and road works being carried on at the instigation of the Employment Branch of the Labour Department were transferred to the Public Works Department.
The following figures show the yearly average number of men employed as indicated above:—
| Year ended 31st March, | Roads. | Other Works. | Total. |
|---|---|---|---|
| 1900 | 1,825 | 1,243 | 3,068 |
| 1905 | 1,407 | 2,119 | 3,526 |
| 1910 | 1,762 | 3,929 | 5,691 |
| 1915 | 2,494 | 2,234 | 4,728 |
| 1920 | 1,495 | 2,498 | 3,993 |
| 1925 | 1,614 | 5,151 | 6,765 |
| 1930 | 5,380 | 5,487 | 10,867 |
| 1931 | 6,365 | 6,057 | 12,422 |
| 1932 | 5,255 | 4,182 | 9,437 |
| 1933 | 3,213 | 3,520 | 6,733 |
| 1934 | 3,968 | 4,613 | 8,581 |
| 1935 | 4,094 | 4,821 | 8,915 |
| 1936 | 4,159 | 5,605 | 9,764 |
| 1937 | 9,247 | 8,064 | 17,311 |
There are now more comprehensive figures available, including, in addition to workers in the direct employ of the Public Works Department, those employed by contractors for public works and those employed by local authorities on (a) works which are financed wholly or partly by the Public Works Department, and (b) highway or road construction and maintenance. Such information is available only since the beginning of 1935, and is as follows, the figures quoted representing the averages of weekly returns:—
| Month. | 1935. | 1936. | 1937. |
|---|---|---|---|
| January | 11,179 | 13,791 | 19,307 |
| February | 11,715 | 14,942 | 20,063 |
| March | 12,127 | 15,831 | 20,102 |
| April | 12,199 | 16,026 | 20,003 |
| May | 12,212 | 15,946 | 19,692 |
| June | 11,840 | 15,551 | 19,392 |
| July | 11,569 | 15,542 | 19,016 |
| August | 11,553 | 15,905 | 18,976 |
| September | 11,560 | 16,884 | 19,082 |
| October | 12,067 | 18,257 | 19,407 |
| November | 13,234 | 18,878 | |
| December | 13,870 | 19,198 |
Figures are published in the Monthly Abstract of Statistics showing each month the numbers engaged on the various public works throughout the Dominion.
Employment by local authorities comprises principally the construction and maintenance of roads and streets, and the operation and maintenance of public-utility industries (gas, electric supply, and tramways) and social services.
Particulars relating to wage-earning employees engaged by the various classes of local authorities during the year ended March, 1936, are presented in the following table. The statistics do not cover Hospital Boards, Fire Boards, or Electric-power Boards. Employees of Electric-power Boards are included in the figures for manufacturing industries, published in the Annual Statistical Report on Factory and Building Production.
| Maximum for Year. | Minimum for Year. | ||||
|---|---|---|---|---|---|
| Class of Local District. | Number. | Month. | Number. | Month. | Average of Twelve Months. |
| Boroughs | 18,943 | July | 16,053 | March | 17,692 |
| Counties | 16,004 | Aug. | 13,079 | Jan. | 14,719 |
| Harbour districts | 2,873 | April | 2,379 | Feb. | 2,615 |
| Urban transport districts | 1,466 | Nov. | 1,444 | Aug. | 1,456 |
| Town districts | 1,120 | July | 822 | March | 957 |
| Urban drainage districts | 410 | Dec. | 337 | June | 363 |
| River districts | 1,149 | Sept. | 809 | April | 989 |
| Road districts | 545 | May | 237 | Feb. | 411 |
| Rabbit districts | 328 | Dec. | 217 | July | 263 |
| Land-drainage districts | 402 | April | 183 | Nov., Jan. | 261 |
| Gas-lighting district | 51 | Dec. | 39 | Feb. | 45 |
| Railway district | 15 | Aug. | 12 | Various | 13 |
| Water-supply districts | 64 | June | 17 | Feb., March | 39 |
| All districts | 42,705 | Aug. | 36,331 | Jan. | 39,823 |
The figures in the above table include, besides permanent, temporary, and casual employees, a large number of relief workers (vide earlier portion of this section). The inclusion of relief workers has somewhat obscured the normal characteristics of local-authority employment, as exemplified in this way.
Table of Contents
THE collection of information regarding industrial disputes was initiated by the Census and Statistics Department at the beginning of the year 1920. Information concerning disputes prior to that year was obtained by examination of the records of the Labour Department.
Under the system originated in 1920. returns furnished by Inspectors of factories from inquiries made in each district form the main source from which information is obtained. It is considered that the statistics based on these reports are less liable to bias than would be the case if parties to the dispute or other private persons were relied on to furnish the information. It is the duty of an Inspector, during the course of a dispute in his industrial district, to collect all available particulars relating to it. The Inspectors have power to demand information from the parties concerned in the dispute, and by exercising this power when necessary they can obtain complete information.
In these tabulations the term “industrial dispute” refers only to those disputes which result in a strike or a lockout, or where organized “go slow” or other passive resistance tactics are clearly manifested. Many disputes are, of course, settled without recourse to such measures; these are not recorded for statistical purposes.
It frequently occurs that there are strikes in different centres with the same or similar objects, and happening at or about the same time; in such cases the several disturbances have been treated as one if the available evidence is sufficient to justify such a course, while the duration has been taken as its maximum duration in any centre.
Reference to enactments framed to mitigate the severity of industrial disputes will be found in the section on labour laws and allied legislation.
Although for years prior to 1920 (in which the present system of reporting was instituted) it has been possible to extract from the records of the Labour Department certain information regarding industrial disputes, it is by no means complete, and has therefore been omitted from the following comparative table.
| Year. | Number of | Firms affected. | Workers Involved. | Working-days lost. | Estimated Loss in Wages. | ||
|---|---|---|---|---|---|---|---|
| Strikes. | Lockouts. | Total Disputes. | |||||
| 1920 | 77 | 77 | 15,138 | ||||
| 1921 | 77 | 77 | 112 | 10,433 | 119,208 | 90,477 | |
| 1922 | 58 | 58 | 67 | 6,414 | 93,456 | 60,782 | |
| 1923 | 49 | 49 | 79 | 7,162 | 201,812 | 114,074 | |
| 1924 | 34 | 34 | 58 | 14,815 | 89,105 | 62,732 | |
| 1925 | 81 | 2 | 83 | 93 | 9,905 | 74,552 | 49,149 |
| 1926 | 59 | 59 | 67 | 6,264 | 47,811 | 32,355 | |
| 1927 | 38 | 38 | 40 | 4,476 | 12,485 | 11,819 | |
| 1928 | 37 | 2 | 39 | 56 | 9,258 | 21,997 | 22,304 |
| 1929 | 46 | 1 | 47 | 60 | 7,151 | 25,889 | 26,940 |
| 1930 | 38 | 38 | 44 | 5,467 | 31,669 | 37,299 | |
| 1931 | 23 | 1 | 24 | 37 | 6,356 | 48,486 | 44,544 |
| 1932 | 23 | 23 | 67 | 9,355 | 108,605 | 105,715 | |
| 1933 | 15 | 15 | 43 | 3,558 | 65,099 | 59,334 | |
| 1934 | 24 | 24 | 37 | 3,773 | 10,393 | 7,121 | |
| 1935 | 12 | 12 | 65 | 2,323 | 18,563 | 15,266 | |
| 1936 | 43 | 43 | 128 | 7,354 | 10,980 | 12,886 | |
The total number of working - days lost is calculated by multiplying the number of workers involved in each dispute by the number of working - days lost. It is assumed that work would have been continuous if no dispute had taken place, and no allowance is made for loss of work from unemployment or other causes which might have occurred even if there had been no dispute. In some cases, such as shearing, there is a definite amount of work to be clone, and a stoppage of work does not decrease the total amount of it, but only postpones its completion. In those cases the figures are perhaps more or less fictitious, but in the great majority of cases they represent a real loss.
From the passing of the Industrial Conciliation and Arbitration Act in 1894 till the end of 1905 there were no industrial disputes between employers and workers coming within the scope of the Act; indeed, New Zealand may be said to have been almost entirely free from industrial disputes during that period. The greatest number of disputes in any one year since 1894 was recorded in 1925, when there were eighty-three disputes—mostly, however, of trivial importance. The number of workers concerned was greatest in 1920, when 15,138 workers were involved in industrial disputes, chiefly in the mining industry and in the railways. From the point of view of lost time the maximum was reached in 1923, when there were serious disputes in the coal-mining and shipping industries. Next in order come 1921 (marked by strikes of waterside workers) and 1932 (chiefly strikes of waterside workers and coal-miners).
Although both the number of disputes and the number of workers involved were greater in 1936 than in the previous year, owing to the fact that most of them were of comparatively short duration, the number of working-days lost was considerably less. During the year there were three disputes each involving more than five hundred workers: one of these was in the coal-mining industry in the Waikato and two were of waterside workers in Auckland.
The next table shows the nature of the disputes and the number of workers involved during the last ten years.
| Year. | Nature of Dispute. | Number of Workers involved. | ||||||||
|---|---|---|---|---|---|---|---|---|---|---|
| Direct Strike. | Sympathetic Strike. | Partial Strike.* | Lockout. | Total. | Direct Strike. | Sympathetic Strike. | Partial Strike.* | Lockout. | Total. | |
* I.e., where no actual cessation of work, but a “go slow” or other policy of protest adopted. | ||||||||||
| 1927 | 35 | 3 | 38 | 4,389 | 87 | 4,476 | ||||
| 1928 | 32 | 4 | 1 | 2 | 39 | 4,447 | 3,864 | 859 | 88 | 9,258 |
| 1929 | 40 | 2 | 4 | 1 | 47 | 5,114 | 1,837 | 185 | 15 | 7,151 |
| 1930 | 34 | 1 | 3 | 38 | 5,170 | 140 | 157 | 5,467 | ||
| 1931 | 19 | 3 | 1 | 1 | 24 | 5,429 | 350 | 572 | 5 | 6,356 |
| 1932 | 18 | 5 | 23 | 7,945 | 1,410 | 9,355 | ||||
| 1933 | 13 | 2 | 15 | 2,728 | 830 | 3,558 | ||||
| 1934 | 22 | 1 | 1 | 24 | 3,620 | 115 | 38 | 3,773 | ||
| 1935 | 12 | 12 | 2,323 | 2,323 | ||||||
| 1936 | 33 | 10 | 43 | 5,910 | 1,444 | 7,354 | ||||
The table following illustrates the duration of disputes during 1936:—
| Duration. | Number of Disputes. | Number of Workers involved. | Number of Working-days lost. | Estimated Loss in Wages. |
|---|---|---|---|---|
| £ | ||||
| 1 day and less | 17 | 4,007 | 3,252 | 2,784 |
| Over 1 day but not over 2 | 5 | 630 | 769 | 587 |
| Over 2 days but not over 3 | 7 | 1,601 | 4,708 | 3,084 |
| Over 3 days and less than 1 week | 5 | 575 | 2,767 | 2,483 |
| 1 week and less than 2 weeks | 4 | 99 | 657 | 597 |
| 2 weeks and less than 4 weeks | 5 | 442 | 4,827 | 3,351 |
| Totals | 43 | 7,354 | 16,980 | 12,886 |
It will be seen that the vast majority of disputes are in the nature of direct strikes, although in some years “sympathetic” strikes (when the workers go on strike in sympathy with the claims of other workers, and not on account of a grievance arising out of their own wages or conditions) attain serious proportions.
The following table shows the number of disputes in each industrial district for the last five years and also the number of workers involved: from this it will be seen that the Northern District in the last two years produced the greatest number both of strikes and of workers involved.
| Year. | Northern. | Taranaki. | Wellington. | Marlborough. | Nelson. | Westland. | Canterbury. | Otago and Southland. | Totals. |
|---|---|---|---|---|---|---|---|---|---|
* Include strikes which involved workers in more than one district. | |||||||||
| Number of Disputes. | |||||||||
| 1932 | 5 | 4 | 8 | 2 | 2 | 23* | |||
| 1933 | 4 | 1 | 4 | 2 | 1 | 2 | 15* | ||
| 1934 | 6 | 6 | 3 | 6 | 1 | 24* | |||
| 1935 | 7 | 1 | 4 | 12 | |||||
| 1936 | 19 | 3 | 5 | 11 | 3 | 2 | 43 | ||
| Number of Workers involved. | |||||||||
| 1932 | 1,708 | 78 | 855 | 5,815 | 304 | 595 | 9,355 | ||
| 1933 | 1,085 | 60 | 1,032 | 313 | 288 | 780 | 3,558 | ||
| 1934 | 856 | 21 | 828 | 633 | 1,351 | 84 | 3,773 | ||
| 1935 | 1,062 | 550 | 711 | 2,323 | |||||
| 1936 | 4,587 | 318 | 463 | 1,852 | 58 | 76 | 7,354 | ||
In the following table industrial disputes are classified according to the industries in which disputes took place. The classification into industrial groups is the same as that used in the compilation of wage and trade-union statistics. In four of the fourteen groups of the classification there were no disputes, and such groups have been omitted. The strike recorded in 1934 under the heading “Miscellaneous” was one of general labourers, and that in 1936 one of wool and grain store workers.
| Industrial Group. | 1932. | 1933. | 1934. | 1935. | 1936. |
|---|---|---|---|---|---|
| Number of Disputes. | |||||
| Provision of food, drink, &c. | 2 | 1 | 2 | ||
| ” building and construction | 2 | ||||
| ” power, heat, and light | 1 | ||||
| ” transport by water | 6 | 8 | 18 | 5 | 14 |
| ” transport by land | 1 | ||||
| Working in wood, &c. | 1 | 1 | 3 | ||
| ” metal | 2 | 1 | |||
| ” stone, glass chemicals, &c. | 3 | ||||
| ” paper, printing, &c. | 1 | ||||
| Working in mines and quarries— | |||||
| Coal-mines | 13 | 6 | 4 | 3 | 10 |
| Gold-mines | 2 | 4 | |||
| Quarries | 1 | ||||
| Miscellaneous | 1 | 1 | |||
| Totals | 23 | 15 | 24 | 12 | 43 |
| Industrial Group. | 1932. | 1933. | 1934. | 1935. | 1936. |
|---|---|---|---|---|---|
| Number of Workers involved. | |||||
| Provision of food, drink, &c. | 260 | 204 | 137 | ||
| Provision of building and construction | 122 | ||||
| Provision of power, heat, and light | 300 | ||||
| Provision of transport by water | 1,080 | 1,907 | 2,777 | 298 | 3,192 |
| Provision of transport by land | 10 | ||||
| Working in wood, &c. | 33 | 100 | 392 | ||
| Working in metal | 182 | 46 | |||
| Working in stone, glass, chemicals, &c. | 103 | ||||
| Working in paper, printing, &c. | 550 | ||||
| Working in mines and quarries— | |||||
| Coal-mines | 7,333 | 1,618 | 762 | 680 | 2,318 |
| Gold-mines | 695 | 294 | |||
| Quarries | 40 | ||||
| Miscellaneous | 30 | 400 | |||
| Totals | 9,355 | 3,558 | 3,773 | 2,323 | 7,354 |
Out of a total of 117 disputes during the five years, 53, involving 9,254 workers, occurred in the shipping industry; while in connection with mining and quarrying there were 43 disputes involving 14,240 workers. For a number of years prior to 1933, it was almost invariably the mining and quarrying industry in which both the greatest number of disputes occurred and the greatest number of workers was involved, but latterly the shipping industry has, in the former respect, assumed the lead. A more detailed analysis of disputes occurring during 1936 is given below.
| Industrial Group. | Number of Disputes. | Number of Firms affected. | Number of Workers involved. | Number of Working-days lost. | Estimated Loss in Wages. | ||
|---|---|---|---|---|---|---|---|
| Directly. | Indirectly. | Total. | |||||
| Provision of— | £ | ||||||
| Food, drink, &c. | 2 | 2 | 137 | 137 | 209 | 203 | |
| Building and construction | 2 | 2 | 81 | 41 | 122 | 1,342 | 665 |
| Power, heat, and light | 1 | 1 | 300 | 300 | 300 | 240 | |
| Transport by— | |||||||
| Water | 14 | 67 | 3,172 | 20 | 3,192 | 5,827 | 3,973 |
| Land | 1 | 1 | 10 | 10 | 30 | 21 | |
| Working in— | |||||||
| Wood, &c. | 3 | 8 | 392 | 392 | 2,112 | 1,082 | |
| Metal | 1 | 1 | 46 | 46 | 138 | 106 | |
| Stone, glass, chemicals, &c. | 3 | 3 | 103 | 103 | 125 | 20 | |
| Mines and quarries— | |||||||
| Coal-mines | 10 | 12 | 2,309 | 9 | 2,318 | 4,948 | 4,793 |
| Gold-mines | 4 | 4 | 294 | 294 | 1,469 | 1,463 | |
| Quarries | 1 | 2 | 40 | 40 | 80 | ||
| Miscellaneous | 1 | 25 | 400 | 400 | 400 | 320 | |
| Totals | 43 | 128 | 7,284 | 70 | 7,354 | 16,980 | 12,886 |
In the next table the causes of disputes occurring during the last five years are shown. Under the heading “Wages” are included disputes concerning wages, overtime, or rates for piecework.
Disputes concerning the employment or non-employment of certain classes of persons are included under the heading “Employment.” This question usually arises in connection with trade-union affairs—the employment of non-unionists, or the dismissal of men allegedly due solely or mainly to the fact that they are prominent in union activities.
“Other working conditions” are of diverse nature, but some may be mentioned as follows: Distribution of work in coal-mines and on wharves, reinstatement of individual workers after voluntary absence, conveyance to and from work, atmospheric conditions in coal-mines, accommodation on ships, numbers of men to be allocated to certain duties, supply of food, method of handling cargo.
Under the heading “Sympathy” are included all disputes caused by workers striking not on account of a grievance with their own particular employer, but in sympathy with the demands of other workers.
| Cause | 1932. | 1933. | 1934. | 1935. | 1936. |
|---|---|---|---|---|---|
| Number of Disputes. | |||||
| Wages | 10 | 5 | 7 | 4 | 13 |
| Hours | 2 | 1 | 12 | ||
| Employment | 2 | 5 | 4 | 4 | 11 |
| Other working-conditions | 5 | 1 | 9 | 1 | 6 |
| Sympathy | 5 | 2 | 1 | ||
| Other causes | 1 | 2 | 1 | 2 | 1 |
| Number of Workers involved. | |||||
| Wages | 6,130 | 1,833 | 1,274 | 1,345 | 1,786 |
| Hours | 400 | 9 | 1,577 | ||
| Employment | 406 | 372 | 637 | 401 | 2,764 |
| Other working-conditions | 1,393 | 86 | 1,297 | 320 | 1,196 |
| Sympathy | 1,410 | 830 | 115 | ||
| Other causes | 16 | 437 | 50 | 248 | 31 |
The following table gives further details for the year 1936:—
| Cause. | Number of disputes. | Number of Firms affected. | Number of Workers involved. | Number of Working-days lost. | Estimated Loss in Wages. |
|---|---|---|---|---|---|
| £ | |||||
| Wages | 13 | 67 | 1,786 | 6,238 | 5,340 |
| Hours | 12 | 40 | 1,577 | 2,240 | 1,260 |
| Employment | 11 | 11 | 2,764 | 5,461 | 3,579 |
| Other working-conditions | 6 | 9 | 1,196 | 3,041 | 2,707 |
| Other causes | 1 | 1 | 31 | ||
| Totals | 43 | 128 | 7,354 | 16,980 | 12,886 |
Following is a table showing the methods of settlement of disputes during the last five years. “Negotiations under Act” covers negotiations under both the Industrial Conciliation and Arbitration Act and the Labour Disputes Investigation Act.
| Method of Settlement. | 1932. | 1933. | 1934. | 1935. | 1936. |
|---|---|---|---|---|---|
| Number of Disputes. | |||||
| Negotiations under Act | 2 | 1 | 3 | 9 | |
| Private negotiations between parties | 12 | 7 | 15 | 5 | 23 |
| Substitution | 1 | 5 | 4 | ||
| Otherwise | 8 | 7 | 4 | 4 | 7 |
| Number of Workers involved. | |||||
| Negotiations under Act | 279 | 86 | 780 | 2,029 | |
| Private negotiations between parties | 7,030 | 2,043 | 3,196 | 1,008 | 2,224 |
| Substitution | 15 | 185 | 643 | ||
| Otherwise | 2,031 | 1,429 | 392 | 535 | 2,458 |
Further information for the year 1936 is given in the next table.
| Method of Settlement. | Number of Disputes. | Number of Workers involved. | Number of Working-days lost | Estimated Loss in Wages. |
|---|---|---|---|---|
| Negotiations under Act | 9 | 2,029 | 4,955 | 4,437 |
| Private negotiations between parties | 23 | 2,224 | 7,972 | 6,226 |
| Substitution | 4 | 643 | 1,095 | 359 |
| Otherwise | 7 | 2,458 | 2,958 | 1,864 |
| Totals | 43 | 7,354 | 16,980 | 12,886 |
In compiling the table which follows, no dispute has been included as ending in favour of either employers or workers unless the result has been beyond question. In cases where workers have made more than one demand, succeeding in one or more and failing in one or more, or where they have made one or more demands and in respect of each have been partially successful only, the result has been treated as a compromise. Where strikers have returned to work without any definite decision being arrived at regarding the demands made, or where (as in the case of a sympathetic strike) no definite demand has been made, or where a strike is merely by way of a protest, the result has been recorded as indeterminate.
| Result. | 1932. | 1933. | 1934. | 1935. | 1936. |
|---|---|---|---|---|---|
| Number of Disputes. | |||||
| In favour of workers | 4 | 1 | 3 | 3 | 15 |
| In favour of employers | 4 | 6 | 13 | 3 | 13 |
| Compromise | 9 | 2 | 2 | 2 | 3 |
| Indeterminate | 6 | 6 | 6 | 4 | 12 |
| Number of Workers involved. | |||||
| In favour of workers | 648 | 31 | 680 | 156 | 2,927 |
| In favour of employers | 898 | 896 | 1,778 | 910 | 857 |
| Compromise | 6,368 | 1,077 | 645 | 984 | 129 |
| Indeterminate | 1,441 | 1,554 | 670 | 273 | 3,441 |
| Number of Working-days lost. | |||||
| In favour of workers | 2,914 | 93 | 549 | 2,907 | 9,334 |
| In favour of employers | 46,930 | 45,548 | 2,987 | 8,791 | 2,116 |
| Compromise | 52,617 | 9,404 | 4,412 | 6,580 | 476 |
| Indeterminate | 6,144 | 10,054 | 2,445 | 285 | 5,054 |
Of disputes ending definitely in favour of one party or the other during the five years, workers won in twenty-six instances and employers in thirty-nine. In the previous five years (1927–31) workers were successful in fifty-four instances and employers in forty-seven.
In the following table the causes and results of disputes occurring during 1936 are shown in conjunction:—
| Result. | Cause. | |||||
|---|---|---|---|---|---|---|
| Wages. | Hours. | Employment. | Other Working-conditions. | Other Causes. | Total. | |
| Number of Disputes. | ||||||
| In favour of workers | 7 | 3 | 3 | 2 | 15 | |
| In favour of employers | 6 | 2 | 3 | 2 | 13 | |
| Compromise | 3 | 3 | ||||
| Indeterminate | 4 | 5 | 2 | 1 | 12 | |
| Number of Workers involved. | ||||||
| In favour of workers | 1,570 | 103 | 477 | 777 | 2,927 | |
| In favour of employers | 216 | 438 | 117 | 86 | 857 | |
| Compromise | 129 | 129 | ||||
| Indeterminate | 907 | 2,170 | 333 | 31 | 3,441 | |
| Number of Working-days lost. | ||||||
| In favour of workers | 5,392 | 125 | 1,672 | 2,145 | 9,334 | |
| In favour of employers | 846 | 410 | 549 | 311 | 2,116 | |
| Compromise | 476 | 476 | ||||
| Indeterminate | 1,229 | 3,240 | 585 | 5,054 | ||
Table of Contents
As a result of an international conference of official statisticians held at Geneva in 1923, under the auspices of the International Labour Office set up by the League of Nations, the collection and compilation of statistics of industrial accidents on substantially uniform lines is now being undertaken in virtually all of the principal countries. From the administrative standpoint, the principal types of industrial accidents occurring in New Zealand may be classified as follows:—
Factory Accidents.—Section 41 of the Factories Act requires the reporting to Inspectors of Factories of all accidents likely to incapacitate the injured person for at least forty-eight hours. Reports are compiled by Inspectors of Factories in connection with each such accident causing loss of work amounting to three days or upwards. These are ultimately forwarded to the Census and Statistics Department for statistical analysis.
Scaffolding Accidents.—The procedure adopted in connection with the compilation of statistics of scaffolding accidents is identical with that in connection with factory accidents.
Accidents to Railway, Public Works, and Post and Telegraph Employees.—Individual reports of all accidents involving loss of work for three days or upwards are supplied by the respective Departments to the Census and Statistics Department for detailed analysis and tabulation.
Accidents to Employees in Mines and Quarries.—Certain particulars of accidents to employees in metalliferous mines, in coal-mines, and in quarries and other places under the Stone-quarries Act, are given in successive numbers of the Mines Statement, parliamentary paper C.–2.
Other Industrial Accidents.—There are numerous types of industrial accidents for which it has not as yet been found practicable to collect and compile statistics. The principal classes of such accidents are those occurring to persons engaged in land transport (other than railway operation), in “watersiding,” in bushfelling, and in marine navigation. Accidents of the last-mentioned type are reportable to the Marine Department under the Shipping and Seamen Act.
The statistics of industrial accidents for the year 1931 do not include accidents caused by the Hawke's Ray earthquake to employees working at the time the earthquake took place. The total number of these accidents is not known; but in twenty-nine cases an appeal was made to the Court to decide whether there was any liability on the part of the employers to pay compensation in respect of such accidents. Ultimately, a decision of the Privy Council favoured the workers' claims, and compensation amounting to £2,902 was paid in respect of the twenty-nine cases cited. Of these twenty-nine accidents, twenty-seven were caused by the collapse of walls, two cases resulting in death and two cases in permanent partial disablement of the victims.
For the purpose of computing frequency rates in respect of industrial accidents in New Zealand, data as to the number of employees in establishments coming under the heading of various industries have been compiled in the Census and Statistics Department from returns furnished for the purpose by the Labour Department's Inspectors of Factories; while information as to the hours worked has been ascertained from awards, and supplemented by the statistics of short time and overtime compiled from data collected with the annual census of factory production. Similar data have been obtained from the records of the Post and Telegraph, Public Works, and Railways Departments. One hour's work performed by one man is taken as a unit. Data as to man-hours are not available in the case of scaffolding operations.
| Year. | Total Accidents. | Accidents per 100,000 Man-hours worked.* | Accidents where Particulars of Compensation available. | Total Compensation† or Damages paid in such Cases. | Compensation per Case where known. |
|---|---|---|---|---|---|
* Excluding scaffolding accidents. † Including medical expenses. | |||||
| £ | £ | ||||
| 1931 | 5,797 | 2.459 | 5,781 | 106,984 | 18.5 |
| 1932 | 4,730 | 2.195 | 4,715 | 80,453 | 17.1 |
| 1933 | 5,095 | 2.392 | 5,090 | 78,464 | 15.4 |
| 1934 | 4,911 | 2.021 | 4,907 | 80,837 | 16.5 |
| 1935 | 5,587 | 2.373 | 5,587 | 93,166 | 16.7 |
The average amount of compensation per case in respect of all accidents classified was lower in 1933 than in any other year during the quinquennium.
The distribution of industrial accidents in 1935 among the classes of industries covered by the statistics is indicated in the following table:—
| Class. | Total Accidents. | Accidents per 100,000 Man-hours worked. | Accidents where Particulars of Compensation available. | Total Compensation or Damages paid in such Cases. | Compensation per Case where known. |
|---|---|---|---|---|---|
* No information available. † Excluding scaffolding accidents. | |||||
| £ | £ | ||||
| Factory | 2,639 | 1.402 | 2,639 | 38,615 | 13.1 |
| Public Works | 1,132 | 5.370 | 1,132 | 17,784 | 15.7 |
| Scaffolding | 232 | * | 232 | 4,986 | 21.5 |
| Railways | 1,399 | 4.420 | 1,399 | 28,501 | 20.4 |
| Post and Telegraph | 185 | 1.132 | 185 | 3,280 | 17.7 |
| Grand totals | 5,587 | 2.373† | 5,587 | 93,166 | 16.7 |
It is usual for scaffolding accidents to involve the highest compensation per accident, owing to the proportionately greater number which terminate fatally, and although the rule holds good in respect of 1935, the difference is much less than is generally the case. There was only one fatality in this group during the year, while the group having the next highest average (railways) included eight fatalities.
The number of accidents per 100,000 man-hours worked was highest in the case of accidents to Public Works employees.
In the table following, industrial accidents during the year 1935 are classified into certain important industrial groups. Details for individual industries, under this and other headings, are published in an annual report (Statistical Report on Prices, Wage-rates, &c.) issued by the Census and Statistics Department.
| Industrial Group. | Total Accidents. | Accidents per 100,000 Man-hours worked. | Accidents where Particulars of Compensation available. | Total Compensation or Damages paid in such Cases. | Compensation per Case where known. |
|---|---|---|---|---|---|
* Data on which to compute not available. † Excluding scaffolding accidents. | |||||
| Provision of— | £ | £ | |||
| Food, drink, &c. | 1,730 | 3.630 | 1,730 | 18,194 | 10.5 |
| Clothing, footwear, and textiles | 101 | 0.219 | 101 | 1,139 | 11.3 |
| Building and construction—Public Works | 1,132 | 5.370 | 1,132 | 17,784 | 15.7 |
| Scaffolding | 232 | * | 232 | 4,985 | 21.5 |
| Power, heat, and light | 22 | 0.534 | 22 | 1,577 | 71.7 |
| Communication and land transport— | |||||
| Post and Telegraph | 185 | 1.132 | 185 | 3,280 | 17.7 |
| Railways | 1,399 | 4.420 | 1,399 | 28,501 | 20.4 |
| Personal services | 15 | 0.426 | 15 | 1,612 | 107.4 |
| Working in or on— | |||||
| Wood, seagrass, &c. Metal | 227 | 0.911 | 227 | 5,698 | 25.1 |
| Metal | 326 | 1.026 | 326 | 5,249 | 16.1 |
| Stone, clay, glass, &c. | 128 | 1.108 | 128 | 3,235 | 25.3 |
| Paper, printing, &c. Skins, leather, &c. | 62 | 0.482 | 62 | 1,504 | 24.3 |
| Quarries | |||||
| Miscellaneous | 10 | 0.633 | 10 | 137 | 13.7 |
| Totals | 5,587 | 2.373M* | 5,587 | 93,166 | 16.7 |
The average compensation paid in respect of industrial accidents naturally varies considerably in different industries and in different years according to the proportion of serious accidents occurring.
The following table shows for five years the average compensation paid, in conjunction with the extent of disability:—
| Year. | Temporary Disability. | Permanent Partial Disability. | Fatality. | Total. | ||||
|---|---|---|---|---|---|---|---|---|
| Number of Cases.* | Average Amount of Compensation. | Number of Cases.* | Average Amount of Compensation. | Number of Cases.* | Average Amount of Compensation. | Number of Cases.* | Average Amount of Compensation. | |
* Where amount of compensation known. | ||||||||
| £ | £ | £ | £ | |||||
| 1931 | 5,588 | 9.2 | 163 | 203.4 | 30 | 740.9 | 5,781 | 18.5 |
| 1932 | 4,564 | 9.3 | 128 | 161.5 | 23 | 752.4 | 4,715 | 17.1 |
| 1933 | 4,916 | 8.1 | 154 | 158.8 | 20 | 700.2 | 5,090 | 15.4 |
| 1934 | 4,736 | 8.1 | 143 | 174.8 | 28 | 629.5 | 4,907 | 16.5 |
| 1935 | 5,394 | 8.6 | 176 | 189.3 | 17 | 798.0 | 5,587 | 16.7 |
The average amount of compensation paid in respect of fatalities is normally considerably below the maximum amount which may be paid under the Workers' Compensation Act in respect of such accidents. This is due mainly to the fact that in cases where the deceased worker had no dependants only medical and funeral expenses are paid; and that in cases of partial dependency the amount paid as compensation may be considerably less than the maximum.
With regard to the extent and degree of the disability sustained, it is usual to distinguish fatal accidents, accidents causing temporary disability, accidents causing permanent partial disability, and accidents causing permanent total disability. In the actual compilation of the statistics difficulty occasionally arises as to whether a particular injury should be regarded as temporary or permanent; and in cases of doubt the conservative practice has been adopted of classifying the injury in the temporary-disability class. The following table relates to the five-years period, 1931–35.
| Cause. | Temporary Disability. | Permanent Partial Disability. | Fatality. | Total. | Percentage of Total Accidents |
|---|---|---|---|---|---|
| Machinery— | |||||
| Prime movers | 66 | 4 | 70 | 0.3 | |
| Transmission | 85 | 8 | 1 | 94 | 0.4 |
| Lifting-machinery | 514 | 23 | 7 | 544 | 2.1 |
| Power-working machines | 1,808 | 289 | 6 | 2,103 | 8.0 |
| Vehicles | 1,713 | 46 | 31 | 1,790 | 6.9 |
| Explosions and fires | 120 | 17 | 6 | 143 | 0.5 |
| Poisonous, hot, and corrosive substances | 648 | 2 | 3 | 653 | 2.5 |
| Electricity | 52 | 2 | 6 | 60 | 0.2 |
| Falls of persons— | |||||
| From elevations | 1,236 | 46 | 18 | 1,300 | 5.0 |
| Into excavations | 186 | 186 | 0.7 | ||
| Slipping and stumbling on the level | 2,149 | 14 | 1 | 2,164 | 8.3 |
| Stepping on or striking against fixed objects— | |||||
| Stepping on | 236 | 236 | 0.9 | ||
| Striking against | 1,004 | 4 | 2 | 1,010 | 3.9 |
| Falling objects, not being handled by the person injured | 668 | 19 | 9 | 696 | 2.7 |
| Falls of earth | 660 | 18 | 15 | 693 | 2.7 |
| Handling of objects— | |||||
| Heavy | 4,671 | 90 | 4 | 4,765 | 18.2 |
| Sharp | 1,709 | 28 | 1 | 1,738 | 6.6 |
| Hand-trucks, &c. | 410 | 4 | 414 | 1.6 | |
| Continual handling | 194 | 1 | 195 | 0.7 | |
| Hand-tools— | |||||
| In hands of person injured— | |||||
| Glancing of tool | 4,211 | 79 | 1 | 4,291 | 16.4 |
| Breaking of tool | 89 | 2 | 91 | 0.3 | |
| Flying particles | 487 | 30 | 517 | 2.0 | |
| Other | 698 | 12 | 710 | 2.7 | |
| In hands of other than person injured | 365 | 12 | 377 | 1.4 | |
| Animals | 203 | 4 | 1 | 208 | 0.8 |
| Miscellaneous— | |||||
| Strains, sprains, and septic wounds undefined as to cause (sustained while slaughtering) | 482 | 5 | 487 | 1.9 | |
| Doors, windows, covers, gates (excluding elevators) | 253 | 4 | 1 | 258 | 1.0 |
| Other | 311 | 9 | 7 | 327 | 1.3 |
| Summary. | |||||
| Factories | 11,752 | 443 | 24 | 12,219 | 46.8 |
| Public Works | 6,194 | 182 | 38 | 6,414 | 24.5 |
| Scaffolding | 791 | 32 | 15 | 838 | 3.2 |
| Railways | 5,725 | 110 | 38 | 5,873 | 22.5 |
| Post and Telegraph | 766 | 5 | 5 | 776 | 3.0 |
| Totals | 25,228 | 772 | 120 | 26,120 | 100.0 |
A classification of accidents according to the nature of the injuries sustained gives the following results for the last five years:—
| Nature of Injury. | 1931. | 1932. | 1933. | 1934. | 1935. | Totals, 1931–35. |
|---|---|---|---|---|---|---|
| Contusions and abrasions | 1,436 | 982 | 1,118 | 987 | 814 | 5,337 |
| Burns and scalds | 162 | 163 | 149 | 163 | 195 | 832 |
| Concussions | 36 | 27 | 27 | 29 | 24 | 143 |
| Cuts and lacerations | 1,903 | 1,648 | 1,818 | 1,727 | 2,163 | 9,259 |
| Punctures | 311 | 301 | 286 | 264 | 291 | 1,453 |
| Amputations | 91 | 75 | 103 | 82 | 104 | 455 |
| Dislocations | 27 | 28 | 25 | 23 | 26 | 129 |
| Fractures | 194 | 156 | 178 | 180 | 217 | 925 |
| Sprains and strains | 1,321 | 982 | 1,041 | 1,115 | 1,234 | 5,693 |
| Other and ill-defined | 316 | 368 | 350 | 341 | 519 | 1,894 |
| Totals | 5,797 | 4,730 | 5,095 | 4,911 | 5,587 | 26,120 |
| Number of cases where septic poisoning followed | 930 | 879 | 1,001 | 749 | 855 | 4,414 |
| Percentage of all accidents | 16.0 | 18.6 | 19.6 | 15.3 | 15.3 | 16.9 |
A feature of special interest brought out by this table is the relatively high percentage of accidents in which septic poisoning followed. It is gratifying to note, however, that this percentage has shown a considerable fall in the last two years.
Informative figures showing the number of cases in which the different parts of the body were affected by industrial accidents occurring in 1931–35 are given in the following table:—
| Part of Body affected. | 1931. | 1932. | 1933. | 1934. | 1935. | Totals, 1931–35. |
|---|---|---|---|---|---|---|
| Head | 127 | 82 | 99 | 104 | 91 | 503 |
| Eyes | 220 | 178 | 176 | 227 | 216 | 1,017 |
| Rest of face | 95 | 58 | 64 | 67 | 94 | 378 |
| Neck | 18 | 14 | 13 | 15 | 22 | 82 |
| Back | 524 | 366 | 420 | 421 | 513 | 2,244 |
| Thorax and contents | 247 | 183 | 196 | 223 | 222 | 1,071 |
| Abdomen and contents | 86 | 102 | 99 | 89 | 111 | 487 |
| External genitals | 20 | 8 | 10 | 12 | 11 | 61 |
| Upper limbs— | ||||||
| Collarbone and shoulder | 128 | 105 | 108 | 104 | 122 | 567 |
| Arm | 287 | 269 | 291 | 298 | 314 | 1,459 |
| Hand and wrist | 765 | 757 | 757 | 660 | 777 | 3,716 |
| Finger and thumb | 1,099 | 1,423 | 1,632 | 1,450 | 1,636 | 7,840 |
| Lower limbs— | ||||||
| Pelvis, hip, and thigh | 111 | 73 | 84 | 95 | 104 | 467 |
| Leg | 502 | 390 | 441 | 419 | 439 | 2,191 |
| Ankle and foot | 755 | 593 | 603 | 627 | 689 | 3,267 |
| Undefined or multiple | 213 | 129 | 102 | 100 | 226 | 770 |
| Totals | 5,797 | 4,730 | 5,095 | 4,911 | 5,587 | 26,120 |
Accidents to the fingers and hands form a large proportion of total accidents. Out of the total of 26,120 accidents classified during 1931 to 1935, 11,556 cases were recorded where fingers or hands were affected.
A tabulation made for 1935 correlating nature of injury with part of body affected showed that the most common type of accident was to the fingers and thumbs, resulting in cuts or lacerations; of the 5,587 accidents tabulated, 1,103 came under this category; of the 104 cases of amputations also, 93 resulted in loss of some part of the fingers or thumbs; contusions of the feet numbered 137, and cuts and lacerations of the hands 375; of the 1,234 sprains, 427 resulted in injury to the back; while sprained legs, ankles, &c., accounted for a further 335.
A further measure of the extent of disability is furnished in the cases of temporary disability by data as to duration of absence from work as the result of the accident. A summary of this aspect is given below.
| Duration. | 1931. | 1932. | 1933. | 1934. | 1935. | Totals, 1931 to 1935. | |||||
|---|---|---|---|---|---|---|---|---|---|---|---|
| No. | No. | Per Cent. | No. | Per Cent. | No. | Per Cent. | No. | Per Cent. | No. | Per Cent. | |
| 1 week or under | 1,262 | 983 | 20.8 | 1,067 | 20.9 | 986 | 20.1 | 1,123 | 20.1 | 5,421 | 20.8 |
| 1 week to 2 weeks | 1,811 | 1,442 | 30.5 | 1,597 | 31.4 | 1,540 | 31.4 | 1,719 | 30.7 | 8,109 | 31.1 |
| 2 weeks to 4 weeks | 1,490 | 1,231 | 26.0 | 1,339 | 26.3 | 1,354 | 27.6 | 1,518 | 27.21 | 6,932 | 26.5 |
| 4 weeks to 6 weeks | 511 | 395 | 8.4 | 427 | 8.4 | 405 | 8.2 | 461 | 8.2 | 2,199 | 8.4 |
| 6 weeks to 13 weeks | 390 | 375 | 7.9 | 354 | 7.0 | 339 | 6.9 | 428 | 7.7 | 1,886 | 7.2 |
| 13 weeks to 6 months | 104 | 117 | 2.5 | 104 | 2.0 | 86 | 1.7 | 112 | 2.0 | 523 | 2.0 |
| Over 6 months | 27 | 23 | 0.4 | 26 | 0.5 | 26 | 0.5 | 33 | 0.6 | 135 | 0.5 |
| Total specified cases of temporary disability | 5,595 | 4,560 | 96.5 | 4,914 | 96.5 | 4,736 | 96.4 | 5,394 | 96.5 | 25,205 | 96.5 |
| Cases where employee did not return or duration not stated | 7 | 10 | 0.2 | 6 | 0.1 | 23 | 0.1 | ||||
| Permanent partial disability | 164 | 130 | 2.8 | 155 | 3.0 | 147 | 3.0 | 176 | 3.2 | 772 | 2.9 |
| Fatality | 31 | 24 | 0.5 | 20 | 0.4 | 28 | 0.6 | 17 | 0.3 | 120 | 0.5 |
| Totals | 5,797 | 4,730 | 100.0 | 5,095 | 100.0 | 4,911 | 100.0 | 5,587 | 100.0 | 26,120 | 100.0 |
In many cases the injured employee did not cease work immediately, in some instances a considerable period intervening. The following table shows for such cases occurring during the year 1935 the length of time elapsing before the employee left work, and the final cause of cessation of work.
| — | Factories. | Public Works. | Scaffolding. | Railways. | Post and Telegraph. |
|---|---|---|---|---|---|
| Period elapsing. | |||||
| Under 1 week | 313 | 92 | 27 | 431 | 58 |
| Over 1 week and under 2 weeks | 54 | 13 | 4 | 46 | 6 |
| Over 2 weeks | 23 | 7 | 2 | 48 | 2 |
| Final Cause. | |||||
| Incipient septic poisoning | 252 | 36 | 18 | 129 | 7 |
| Strains | 50 | 39 | 4 | 156 | 29 |
| Other causes | 88 | 37 | 11 | 240 | 30 |
| Totals | 390 | 112 | 33 | 525 | 66 |
| Percentage of all accidents | 14.8 | 9.9 | 14.2 | 37.5 | 35.7 |
This table indicates that many employees suffering from minor injuries pay no Immediate attention, especially in the case of small cuts, strains, or abrasions.
The neglect may cause more severe pain (with abrasions, septic poisoning), and the absence then enforced is likely to be longer than if the first injury had received immediate attention. Lost time means lost wages, especially if the injury results in under three days' absence, in which case no compensation is payable. Further, in the case of apprentices, lost time has to be made up at the termination of the period of apprenticeship, and these two considerations are likely to militate against the worker ceasing work immediately on account of a minor injury.
In order to render the statistics of time lost and compensation paid as complete as possible, supplementary reports on cases outstanding at the 31st January are prepared by Inspectors of Factories for the Census and Statistics Department in the following June. By June most outstanding cases can be cleared up, although there remains a not altogether inconsiderable residuum of cases where employees fail to return to their former work—especially through having taken up other employment or through the seasonal closing-down of the industry (e.g., freezing) in connection with which the accident occurred, so that they cannot be traced. The cases still outstanding at the end of January must naturally be the severer cases, and, as the severest cases of all may still be outstanding in June, the toll of time lost as a result of factory accidents tends to be slightly understated in the statistics. The June clearing-up accounts for a few minor discrepancies between the statistics of factory accidents published in this volume and those published in the Annual Report of the Department of Labour.
In view of the fact that the age of the individual is not particularly relevant to the character of the hazard from which the injury has occurred, for the purpose of calculating accident-severity rates a constant loss of 60,000 working-hours is counted for each fatality irrespective of the age of the person at the time of death. In respect of permanent partial disablement an international scheme for the apportionment of loss of earning-power caused by this type of accident has been drawn up by the International Labour Office.
Under this scheme, which has been adopted with some slight modifications in the treatment of New Zealand statistics, time lost on account of permanent partial disability is assessed on the basis of a proportionate part of the time lost in connection with injuries resulting in death. For example, dismemberment or loss of use of hand is regarded as a 50-per-cent. disability—that is, the time lost on account of an injury of this type is assessed as 50 per cent. of 60,000 working-hours—i.e., 30,000 working-hours.
| — | 1931. | 1932. | 1933. | 1934. | 1935. |
|---|---|---|---|---|---|
* Excluding scaffolding accidents. | |||||
| Total cases resulting in— | |||||
| Temporary disability | 5,602 | 4,576 | 4,920 | 4,736 | 5,394 |
| Permanent partial disability | 164 | 130 | 155 | 147 | 176 |
| Fatality | 31 | 24 | 20 | 28 | 17 |
| Total | 5,797 | 4,730 | 5,095 | 4,911 | 5,587 |
| Calendar days lost per accident | 119 | 109 | 97 | 126 | 105 |
| Hours lost per 100,000 man-hours worked (i.e., severity rate)* | 1,683 | 1,413 | 1,378 | 1,532 | 1,556 |
A more detailed explanation of the method of compilation of accident severities is contained in the 1931 issue of the Year-Book.
The severity rate for all accidents during the period 1931–35 has varied between 1,378 (in 1933) and 1,683 (in 1931). The extent of the toll on industry exacted by industrial accidents is realized when it is considered that during the five years 1931–35 one hour was lost as a result of such accidents out of every sixty-six hours worked in the industries covered by these statistics.
Comparison of the severity rates as between different industrial groups is affected by the varying proportions of serious accidents and fatalities in different industries. In the main groups covered by the cumulative table for the five years 1931–35 shown below the effect of this factor is minimized by the relatively large number of accidents classified.
| Industrial Group. | Total Cases of Accidents resulting in | Calendar Days lost per Accident. | Hours lost per 100,000 Man - hours worked (Severity Rate), | |||
|---|---|---|---|---|---|---|
| Temporary Disability. | Permanent Partial Disability. | Fatality. | Total. | |||
* Data on which to compute not available. † Excluding scaffolding accidents. | ||||||
| Provision of— | ||||||
| Food, drink, &c. | 8,573 | 195 | 8 | 8,776 | 56 | 1,426 |
| Clothing, footwear, and textiles | 388 | 18 | 1 | 407 | 102 | 135 |
| Building and construction— | ||||||
| Public Works | 6,194 | 182 | 38 | 6,414 | 132 | 5,265 |
| Scaffolding | 791 | 32 | 15 | 838 | 277 | * |
| Power, heat, and light | 119 | 13 | 2 | 134 | 331 | 1,376 |
| Communication and land transport— | ||||||
| Post and Telegraph | 766 | 5 | 5 | 776 | 103 | 655 |
| Railways | 5,725 | 110 | 38 | 5,873 | 115 | 2,896 |
| Personal services | 24 | 7 | 31 | 793 | 916 | |
| Working in or on— | ||||||
| Wood, seagrass, &c. | 703 | 113 | 6 | 822 | 258 | 1,337 |
| Metal | 1,135 | 57 | 4 | 1,196 | 112 | 622 |
| Stone, clay, glass, &c. | 464 | 17 | 2 | 483 | 122 | 798 |
| Paper, printing, &c. | 243 | 13 | 256 | 93 | 260 | |
| Skins, leather, &c. | 61 | 7 | 1 | 69 | 333 | 905 |
| Quarries | 3 | 1 | 4 | 1,441 | 1,404 | |
| Miscellaneous | 39 | 2 | 41 | 40 | 147 | |
| Totals | 25,228 | 772 | 120 | 26,120 | 111 | 1,474† |
Provision is made in certain cases for the actual impairment of wage-earning capacity to be stated. Of the 176 cases of permanent partial incapacity in 1935, the question as to what wages the employee would earn on resumption was answered in 111 cases. In 88 cases it was reported that, though dismemberment or disablement had occurred, no diminution of earning-power had taken place. In 23 cases, however, definite impairment eventuated, in some cases to a serious extent.
The following tabulation of industrial accidents, according to the hour of occurrence, shows the effects of fatigue during the working-day:—
| Time of Occurrence, to nearest Hour. | Year. | Causes, 1931–35. | ||||||||
|---|---|---|---|---|---|---|---|---|---|---|
| 1931. | 1932. | 1933. | 1934. | 1935. | Machinery. | Falls of Persons. | Handling Objects. | Hand Tools. | Other. | |
| 8 a.m. | 227 | 204 | 232 | 216 | 241 | 102 | 142 | 288 | 268 | 320 |
| 9 a.m. | 550 | 407 | 470 | 469 | 504 | 282 | 310 | 609 | 685 | 514 |
| 10 a.m. | 820 | 661 | 739 | 728 | 809 | 381 | 496 | 1,065 | 958 | 857 |
| 11 a.m. | 828 | 639 | 693 | 709 | 846 | 447 | 506 | 1,070 | 882 | 810 |
| 12 noon | 462 | 423 | 400 | 433 | 463 | 251 | 319 | 557 | 552 | 502 |
| 1 p.m. | 172 | 123 | 138 | 166 | 192 | 119 | 121 | 173 | 172 | 206 |
| 2 p.m. | 473 | 372 | 448 | 450 | 476 | 227 | 311 | 647 | 507 | 527 |
| 3 p.m. | 667 | 546 | 612 | 524 | 606 | 338 | 410 | 824 | 699 | 684 |
| 4 p.m. | 596 | 472 | 460 | 484 | 599 | 288 | 393 | 690 | 602 | 638 |
| 5 p.m. | 321 | 386 | 308 | 254 | 272 | 122 | 206 | 414 | 363 | 436 |
| Other hours | 594 | 401 | 480 | 354 | 436 | 234 | 396 | 527 | 215 | 893 |
| Not stated | 57 | 87 | 107 | 46 | 98 | 15 | 38 | 160 | 70 | 120 |
| Not applicable | 26 | 9 | 7 | 75 | 45 | 5 | 2 | 88 | 12 | 55 |
| Totals | 5,793 | 4,730 | 5,094 | 4,908 | 5,587 | 2,811 | 3,650 | 7,112 | 5,985 | 6,562 |
This table shows the latter part of the morning—10 a.m. and 11 a.m. being almost equal in incidence—as the time when most accidents occur; but it is apparent that the Saturday half-holiday reduces materially the number of accidents occurring in the late afternoon, and this should be considered in its interpretation.
A more definite indication is given by considering the length of time the employee had worked when the accident occurred. The following table is exclusive of accidents to Post and Telegraph employees, the information not being available for this group.
| Number of Hours already worked. | 1931. | 1932. | 1933. | 1934. | 1935. | Totals, 1931–35. |
|---|---|---|---|---|---|---|
* Excluding accidents to Post and Telegraph employees. | ||||||
| Under 1 | 359 | 271 | 339 | 330 | 345 | 1,644 |
| 1 and under 2 | 640 | 518 | 555 | 524 | 608 | 2,845 |
| 2 and under 3 | 916 | 682 | 801 | 733 | 820 | 3,952 |
| 3 and under 4 | 905 | 052 | 732 | 705 | 867 | 3,861 |
| 4 and under 5 | 502 | 387 | 474 | 469 | 487 | 2,319 |
| 5 and under 6 | 482 | 419 | 432 | 439 | 482 | 2,254 |
| 6 and under 7 | 667 | 558 | 569 | 509 | 605 | 2,908 |
| 7 and under 8 | 639 | 570 | 468 | 501 | 623 | 2,801 |
| 8 or over | 343 | 323 | 363 | 288 | 337 | 1,654 |
| Not stated | 187 | 214 | 215 | 157 | 185 | 958 |
| Not applicable | 23 | 5 | 4 | 73 | 43 | 148 |
| Totals* | 5,663 | 4,599 | 4,952 | 4,728 | 5,402 | 25,344 |
The foregoing tabulation shows that the greatest number of accidents occurred during the third, and to a lesser extent during the fourth, hour worked in the day.
Table of Contents
PROBLEMS of consumption are of special interest in periods of rapid economic change, and, with a view to throwing some light on the changes in the consumption of commodities in New Zealand during the past few years, relevant statistics have been collated in a manner which illustrates some of the salient features of the economics of consumption in the Dominion in recent years. Statistics of consumption cannot be compiled with absolute accuracy, owing to the impossibility of obtaining exact comparability in component statistics of production, exports, and imports. Nevertheless, a sufficient degree of comparability can be attained to permit of the compilation of statistics of consumption with a reasonable approach to accuracy. There are several serious lacunæ in the available statistical data, the most serious deficiency being occasioned by the lack of statistics illustrating the distribution among individuals of the annual flow of commodities entering into consumption.
Statistics of the value of production, of exports, and of imports have been compiled regularly for many years past. From these statistics an estimate of the annual value of goods available for use can be made, the value of exports being deducted from that of production, and the value of imports added to the residuum. If all values were assessed on the same basis, the result of this computation would give a close approach to the value of all goods available for use in the Dominion. However, the bases of valuation do not exactly correspond, imports and exports being assessed at the value on shipboard in New Zealand ports, and New Zealand production at values at the place of production in most instances (although for some individual commodities wholesale market values or f.o.b. export values are used). Generally speaking, however, there is no serious lack of comparability between the bases of valuation of the three factors involved. The import and export statistics used in the computations which follow relate to a June year, while the production statistics are for the production year, which approximates closely, in most cases, to a June year. No adjustment is made to the estimates quoted in the table for held-over stocks of commodities exported or consumed in years subsequent to the year in which they are produced, so that the figures illustrate the value of goods available for use, but not necessarily the amount actually used during each year. Except on rare occasions, however, the influence of this factor would not appreciably affect the accuracy of the compilations as an indication of goods consumed in each year. In recent years exceptions may be found on occasions in the large stocks of wheat and wool held over, as compared with the total production. While these are important individual commodities, the influence of held-over stocks of these two commodities in an index of aggregate Dominion consumption is not sufficient to cause any material margin of error in the estimates shown.
| Year ended 30th June. | Production. | Exports. | Imports. | Goods available for Use. | |
|---|---|---|---|---|---|
| Total. | Per Head. | ||||
| VALUES (IN N.Z. CURRENCY). | |||||
| £m. | £m. | £m. | £m. | £ | |
| 1926 | 110.8 | 46.3 | 52.1 | 116.6 | 83.3 |
| 1927 | 111.5 | 46.4 | 47.3 | 112.4 | 78.7 |
| 1928 | 120.1 | 55.1 | 43.5 | 108.5 | 74.9 |
| 1929 | 126.6 | 56.1 | 46.5 | 117.0 | 79.9 |
| 1930 | 120.9 | 47.0 | 49.3 | 123.2 | 83.1 |
| 1931 | 97.6 | 36.9 | 35.1 | 95.8 | 63.7 |
| 1932 | 83.6 | 34.7 | 24.7 | 73.6 | 48.4 |
| 1933 | 83.8 | 37.5 | 25.3 | 71.6 | 46.7 |
| 1934 | 98.8 | 49.1 | 26.7 | 76.4 | 49.4 |
| 1935 | 97.0 | 43.0 | 34.3 | 88.3 | 56.7 |
| 1936 | 114.2 | 53.7 | 39.5 | 100.0 | 63.8 |
| INDEX NUMBERS (1926 = 100). | |||||
| 1926 | 100 | 100 | 100 | 100 | 100 |
| 1927 | 101 | 100 | 91 | 96 | 94 |
| 1928 | 108 | 119 | 83 | 93 | 90 |
| 1929 | 114 | 121 | 89 | 100 | 96 |
| 1930 | 109 | 102 | 95 | 106 | 100 |
| 1931 | 88 | 80 | 67 | 82 | 76 |
| 1932 | 75 | 75 | 47 | 63 | 58 |
| 1933 | 76 | 81 | 49 | 61 | 56 |
| 1934 | 89 | 106 | 51 | 66 | 59 |
| 1935 | 88 | 93 | 66 | 76 | 68 |
| 1936 | 103 | 116 | 76 | 86 | 77 |
Some interesting facts are illustrated by the foregoing table. It will be observed that between 1926 and 1929 the values of production and of exports increased steadily, imports declined in value, and there was but little change in value of goods available for use in the Dominion. During that period the terms of trade were favourable to New Zealand, prices received for exports increasing, while prices of commodities entering into New Zealand's import trade were falling. As will be shown in a later table, the quantum of imports and of goods available for use increased during those years, despite the fall in the value of imports. Between 1929 and 1932 all values fell sharply, the greatest fall being shown in the value of imports, while values of production and of exports fell less than the value of goods available for use. A sharp recovery in exports is revealed by the 1934 figures, while the value of imports and of goods available for use increased but slightly. The 1935 and 1936 statistics show sharp increases in the value of goods for New Zealand consumption.
Since the value of goods available for use in the Dominion is the main item entering into the aggregate income of the people, it is interesting to compare statistics for this item with such data as are available as to incomes. An estimate of the aggregate private income is available for 1925.26, a special compilation being made in that year as part of the census tabulations, while, from the taxation receipts of the Employment Promotion Fund, estimates are now made annually. It is not claimed that the results obtained by the two methods (census and taxation receipts) are exactly comparable; but, even allowing for differences in computation methods, a comparison of the figures affords undeniable evidence of an increase in the “spread” between aggregate private income and the value of goods available for use.
In 1925–26 the aggregate private income exceeded the value of goods available for use by approximately 15 per cent., corresponding figures for other years being—1931–32, 33 per cent.; 1932–33, 26 per cent.; 1933–34, 31 per cent.; 1934–35,17 per cent.; and 1935–36, 20 per cent. The explanation for the growth of this “spread” can best be arrived at by consideration of the principal factors making up the difference between aggregate private income and the valuations shown above of goods available for use. These are—
Transport charges, the services of retailers and other middlemen between the point of production (or importation) and the consumer.
The value of services other than those contributing directly to the production of material goods—e.g., professional services, Governmental administration, &c.
Payments by individuals in respect of obligations due outside New Zealand—e.g., interest on Government loans paid from taxation.
Accretions to savings other than those invested in material assets—e.g. abnormally high bank deposits.
The spread between aggregate private income and the value (at place of production or importation) of goods available for use was higher in 1931–32 than in any other year for which the figures are available. The probable causes are—(a) A lag between, retail prices in responding to the fall in producers' prices; (b) the relative stability of prices of services not entering into the production of commodities; (c) the higher proportion of income needed to pay overseas commitments. A closer adjustment is indicated by the 1932–33 figures, while the widening of the spread in 1933–34 is probably mainly symptomatic of the accumulation of liquid resources in the form of higher bank deposits in New Zealand and higher New Zealand banking funds overseas.
It is noteworthy that in 1934–35 the value of goods available for use increased at a much higher rate than the aggregate private income. Although the value of goods for use increased sharply in 1935–36, the increase in aggregate private income was even greater.
Index numbers of producers' prices, of export prices, and of import prices (the last mentioned on a calendar-year basis, and since 1926 only) are compiled regularly by the Census and Statistics Department. The index numbers of export prices and of producers' prices are available for June years; while in the case of import prices the mean between two calendar years has been taken as approximating to a June year basis. By the use of these index numbers in conjunction with the statistics of value quoted in the previous table it is possible to assess the value of goods available for use within the Dominion at prices ruling in any given year. By this means the influence of changing prices is eliminated from the statistics of value, the results indicating changes in volume. Figures for each year since 1926–27 are shown in the following table:—
| Year ended 30th June, | Produced in New Zealand. | Imported. | Total. | ||
|---|---|---|---|---|---|
| £m. | Percentage of Total. | £m. | Percentage of Total. | £m. | |
| 1927 | 65.1 | 58 | 47.3 | 42 | 112.4 |
| 1928 | 64.9 | 59 | 45.8 | 41 | 110.7 |
| 1929 | 70.1 | 58 | 51.1 | 42 | 121.2 |
| 1930 | 76.8 | 58 | 56.0 | 42 | 132.8 |
| 1931 | 69.3 | 62 | 41.8 | 38 | 111.1 |
| 1932 | 58.5 | 65 | 31.7 | 35 | 90.2 |
| 1933 | 55.6 | 63 | 32.0 | 37 | 87.6 |
| 1934 | 61.8 | 65 | 33.8 | 35 | 95.6 |
| 1935 | 63.0 | 59 | 44.0 | 41 | 107.0 |
| 1936 | 67.3 | 57 | 51.3 | 43 | 118.6 |
| Total for ten years | 652.4 | 60 | 434.8 | 40 | 1,087.2 |
An interesting feature brought out by the foregoing table is the assessment of the relative proportions of New-Zealand-produced goods and of imported goods in the total quantum of goods entering into consumption. Over the period of ten years covered by the table the proportions were approximately 60 per cent. of New-Zealand-produced goods and 40 per cent. of imported goods. While exact accuracy cannot be claimed for these figures—particularly in respect of single years—a definitely higher proportion of New-Zealand-produced goods in the total is observed from 1930–31 to 1933–34 than was the case in the earlier years covered and in 1934–35 and 1935–30. The falling-oil in the quantum of imports was considerably greater than that in the volume of locally produced goods consumed in the Dominion. The reversion of the proportions in 1934–35 to the figures for years preceding 1930–31 is attributable to—(1) The poor harvest season, some important crops—e.g., cereals and potatoes—being in short supply; (2) the marked recovery in imports. A continuation of the upward trend in imports in 1935–36 resulted in the percentage of New Zealand goods to total goods available for use again falling, despite a sharp increase indicated in the volume of consumption of New-Zealand-produced goods.
Movements in the volume of goods available for use in the Dominion are indicated in the following table of index numbers (on the base: 1926–27 = 100):—
| Year ended 30th June, | Produced in New Zealand. | Imported. | Total. | Average Volume per Head. |
|---|---|---|---|---|
| 1927 | 100 | 100 | 100 | 100 |
| 1928 | 100 | 97 | 98 | 97 |
| 1929 | 108 | 108 | 108 | 105 |
| 1930 | 118 | 118 | 118 | 114 |
| 1931 | 100 | 88 | 99 | 94 |
| 1932 | 90 | 67 | 80 | 75 |
| 1933 | 85 | 68 | 78 | 73 |
| 1934 | 95 | 71 | 85 | 79 |
| 1935 | 97 | 93 | 95 | 87 |
| 1936 | 103 | 108 | 106 | 96 |
The low point during the ton years covered by the table was reached in 1932–33. The figures for that year indicate a decrease by comparison with 1926–27 of 22 per cent. in the aggregate volume of goods available for use and of 27 per cent. in the volume per head, the decreases, as compared with 1929–30—the peak year in the period—being as much as 34 per cent. and 36 per cent. respectively. The 1934–35 aggregate volume is 5 per cent. below the 1926–27 figure—while the 1935–36 total is 6 per cent. above the 1920–27 figure, though, on a per head basis 4 per cent. below the level in that year.
While, in the ultimate analysis, the rate of growth of the population is probably the most significant basic factor underlying the long-term movement in the flow of goods entering into consumption, the standard of living of the people as a whole is another factor of paramount importance. In the absence of a marked ingress or egress through migration movements, short-term population changes are relatively small; while, in periods of rapid economic change such as have occurred during the period covered by the above table, substantial year-to-year changes in the standard of living of large sections of the community may and do occur. The marked movements in the index numbers of the aggregate volume of goods available for use shown in the above table are probably symptomatic of variations in the standard of living. A further factor of considerable importance is the fluctuation in the volume of consumption of capital goods, which, judging by the available statistics illustrating the volume of building activity, has been subject to very considerable movements during the past few years. Between 1930–31 and 1932–33 the fall in building activity was considerably greater than that in the total volume of production, or of imports. It was evident that normal replacements of capital goods were not being carried out—in short, the volume of production of goods (for export and home consumption) was being maintained only at the expense of some depreciation of capital assets. An indication of changes in the volume of consumption of the more immediately consumable types of goods is afforded by the next table, from which certain important classes of durable goods are omitted.
In periods of depression notable changes in the composition of goods produced or imported for use within the Dominion may be expected to occur. In particular, construction and other expenditure of a capital nature is severely restricted, despite governmental assistance towards the encouragement of building enterprise. With a view to throwing some light on the changes in the volume of consumption of immediately consumable goods, the products of certain industries and some of the more durable imports have been excluded from the statistics of value of goods available for use. The classes excluded are—(1) Building and construction (including expenditure by the Public Works Department and local authorities on construction and maintenance); (2) imports of machinery and machines; (3) value of products of general engineering works and agricultural and dairying machinery manufactories operating in the Dominion. The residuum approaches the total value of the less durable types of goods used in the Dominion. It has not been found possible to make a distinction between producers' goods and consumers' goods included in the remaining total. A difficulty exists in the fact that many commodities may be used either as material for further production or for final consumption.
| Year ended 30th June, | All Goods. | Goods other than Capital Goods. | ||||
|---|---|---|---|---|---|---|
| Volume. | Value. | Price Level. | Volume. | |||
| Total. | Per Head. | Total. | Per Head. | |||
| 1927 | 100 | 100 | 100 | 100 | 100 | 100 |
| 1928 | 98 | 97 | 97 | 98 | 99 | 98 |
| 1929 | 108 | 105 | 111 | 98 | 114 | 111 |
| 1930 | 118 | 114 | 116 | 97 | 120 | 115 |
| 1931 | 99 | 94 | 86 | 92 | 93 | 89 |
| 1932 | 80 | 76 | 69 | 87 | 79 | 74 |
| 1933 | 78 | 73 | 73 | 86 | 85 | 79 |
| 1934 | 85 | 79 | 77 | 86 | 90 | 83 |
| 1935 | 95 | 87 | 91 | 89 | 102 | 94 |
| 1936 | 106 | 96 | 101 | 90 | 112 | 102 |
In compiling the index numbers of volume (excluding capital goods) a special wholesale-prices index number was compiled to enable the values to be assessed on the assumption of unchanging prices. For the first four years covered there were only very slight differences between the index numbers of volume for all goods and for commodities other than capital goods. In 1930–31 and 1931–32 the figures for all goods were the higher, but, in 1932–33 and since, the index numbers for the less durable goods are the higher. An interesting point is that, despite the substantial increase in building and other capital construction in 1934–35 and 1935–36, the volume of goods available for immediate use increased during these two years at a slightly greater rate than that for all goods.
Statistics of the value of production are given in the Miscellaneous section of this Year-Book. From this basis it is possible to compute the ratio of local consumption to exports, a feature which is of peculiar significance to New Zealand in view of its high per caput overseas trade and debt.
It is first necessary to deduct from the production totals (miscellaneous group) the value represented by buildings and by road and railway construction, &c., for these items are not capable of being exported. In order to avoid such fluctuations as are caused by the unequal incidence of price-changes or by the holding of wool stocks, &c., the aggregate of five years has been adopted. For production, figures have been taken for the production years (terminating at varying dates for different commodities) 1931–32 to 1935–36; for exports, partly as naturally later in point of time, the calendar years 1932–36 have been adopted.
| Produce | Consumed Locally. | Exported. |
|---|---|---|
| Per Cent. | Per Cent. | |
| Agricultural and pastoral | 27 | 73 |
| Forest | 84 | 16 |
| Mining | 62 | 38 |
| Factory and other | 98 | 2 |
| Totals | 51 | 49 |
The term “Factory and other” includes fisheries, factory (added value), and other industrial production; but it should be noted that the output of butter and cheese factories and of meat-freezing works is treated herein under agricultural and pastoral, and not under factory production. Similarly, sawmill output is included with forestry.
An important qualification of the above figures lies in the fact that production values are computed as close to the point of production as possible, while export values are f.o.b. at the point of shipment, and consequently include transport and accessory charges. The effect is to understate local consumption, which may be taken as approximately 55 per cent. of the total production of commodities.
While the statistical data discussed in the foregoing pages afford an indication of movements in the value and volume of Dominion consumption of important classes of commodities in the aggregate, considerable interest attaches to the statistics for individual commodities of importance. Estimates of the consumption of a selection of individual commodities are given in the following paragraphs. No indication of the distribution of consumption of these commodities among individual classes of consumers is available; and, indeed, a family budget collection on a very extensive scale would be necessary to provide such information. The aggregate Dominion consumption of each commodity has been arrived at by combining statistics of production, of exports, and of imports, having regard also to changes in held-over stocks—where such data are available.
Figures showing for some of the more important food products of the Dominion in which an export trade is maintained, the proportions of the total production which are consumed locally and exported, are given in the following table:—
| Consumed Locally. | Exported. | |
|---|---|---|
| Per Cent. | Per Cent. | |
| Butter | 17 | 83 |
| Cheese | 4 | 96 |
| Beef | 71 | 29 |
| Mutton | 52 | 48 |
| Lamb | 10 | 90 |
| Pork | 13 | 87 |
| Potatoes (suitable for table use) | 97 | 3 |
| Onions | 90 | 10 |
The foregoing estimates are based on statistics of production, exports, imports, and stocks (where available) for the latest three-yearly period. In view of the very high proportion which exports bear to total production in some cases—e.g., cheese—the percentages must be regarded as approximate only.
Butter.—Available statistics indicate that the annual consumption of butter in the Dominion has increased from approximately 450,000 cwt. ten years ago to 550,000 cwt. at the present time, the latter figure representing an annual average consumption of 40 lb. per head and the former a little over 35 lb. per head.
Cheese.—Estimates of the quantum of New Zealand's consumption of cheese cannot be made with any close approach to accuracy. Approximately 96 per cent. of the average annual output of cheese is exported, so that the impossibility of obtaining exact correspondence in the periods covered by statistics of production, of exports, and of held-over stocks may involve a serious proportionate error in the estimate of the small residuum comprising New Zealand consumption. From a consideration of available statistics over a period of years it would appear that New Zealand consumption of cheese averages approximately 100,000 cwt. annually—equal to 7 lb. per head of population. Some increase in the quantity consumed is indicated by relevant statistics for the last three or four years.
Whole Milk.—Statistical data indicative of the consumption of whole milk point to an average consumption per head of approximately ⅝ pint per day. While the available data on which to base an estimate of milk-consumption are somewhat meagre, it would appear that some increase has occurred in recent years, earlier estimates giving a per head consumption of about ½ pint per day. Consumption of whole milk accounts for only 3 to 4 per cent. of total milk-production in the Dominion.
Beef.—From statistics of cattle slaughterings and exports of beef it is estimated that the amount of beef used in New Zealand is approximately 1,700,000 cwt. (inclusive of bone) annually, the average annual consumption per head being over 125 lb. Estimates of the consumption of beef cannot be made with any close degree of accuracy, since statistics of slaughterings do not indicate the weight of each carcass slaughtered and an appreciable margin of error is possible in the estimation of an average weight.
Mutton.—Consumption of mutton in the Dominion in recent years has been on a level considerably higher than that ruling in the previous decade. The average annual consumption during the three years ended in March, 1937, was slightly over 1,000,000 cwt. as compared with 750,000 cwt. during the three years ended in March, 1927. The latest figure represents an average of approximately 75 lb. per head as compared with 60 lb. ten years ago. Although the long term trend in mutton consumption has been upwards, the statistics for the last two periods point to some decline from an exceptionally high level recorded in 1932–34, in which years consumption averaged 85 lb. per head.
Lamb.—A marked increase in consumption accompanied the fall in prices of lamb in the depression period. The annual average consumption in the Dominion has increased from 150,000 cwt. in 1925–27 to over 300,000 cwt. during the last three years, the consumption per head increasing from 12 lb. to 22 lb. per annum during this decade. The latest figures indicate a slight falling off in consumption from the peak level two or three years ago.
Pork.—Consumption of pork has declined in recent years, statistics for the three years ending 1936 indicating a Dominion annual average consumption of 95,000 cwt., whereas corresponding statistics for 1924–26 pointed to an annual consumption of 190,000 cwt. The average consumption per head of population is now about 7 lb. per annum, as compared with 15 lb. ten years ago.
Bacon and Ham.—New Zealand's external trade in bacon and ham, both outward and inward, is negligible, so that the statistics of production of bacon-curing establishments in the Dominion afford a close guide to consumption. The output in 1925–26 and in each of the last five years was—
| Year. | Total. | Per Head of Population. |
|---|---|---|
| Tons. | Lb. | |
| 1925–26 | 10,054 | 16.2 |
| 1932–33 | 7,229 | 10.6 |
| 1933–34 | 7,356 | 10.7 |
| 1934–35 | 7,179 | 10.4 |
| 1935–36 | 7,830 | 11.2 |
| 1936–37 | 8,679 | 12.3 |
A substantial fall in consumption of bacon and ham is indicated by the above figures. The 1935–36 and 1936–37 figures, however, show a measure of recovery
Empire Comparison.—The following comparison of annual consumption per head of population of whole milk, butter, cheese, and meats in New Zealand, Great Britain, Australia, and Canada is of interest. In each instance the latest available data are quoted.
| Item. | Unit of Measure. | Annual Average Consumption per Head. | |||
|---|---|---|---|---|---|
| New Zealand. | Great Britain. | Australia. | Canada. | ||
*Veal not included. | |||||
| Whole milk | Gallons | 20–25 | 15–20 | 22 ½ | 60–65 |
| Butter | Lb. | 40 | 25 | 33 | 31 |
| Cheese | Lb. | 5–6 | 9 ½ | 3 ½ | 3 ¾ |
| Meats— | |||||
| Beef (including veal) | Lb. | 125* | 61 | 110 | 60 |
| Mutton and lamb | Lb. | 105 | 32 ½ | 84 | 6 |
| Pig meats | Lb. | 17 | 46 | 19 | 68 |
| Total meats | Lb. | 247 | 139 ½ | 213 | 134 |
Some interesting differences in habits of consumption are brought out by this comparison. New Zealand and Australia are considerably heavier meat-eating countries than either Canada or Great Britain. An interesting point is the predominance of pig meats in Canadian meat-consumption and the low position occupied by mutton and lamb. Incidentally, it should be noted that, while statistics of poultry consumption cannot be obtained for all four countries, data available in respect of Canada indicate that poultry occupies a much more important place in the dietary of that country than is the case in New Zealand. Pig meats have a very important place in the meat-consumption of Great Britain and Canada as contrasted with a comparatively minor position in both New Zealand and Australia. Raw-milk consumption is markedly higher in Canada than in either New Zealand or Great Britain, although it will be noted that butter-consumption is relatively high in New Zealand.
This brief table serves to illustrate the dangers of international comparisons of consumption of individual commodities, as, even in this short list of important foodstuffs, it is quite apparent that the differences for individual commodities represent in some instances differences in habits rather than a lower or higher standard of consumption. It would seem that the consumption of dairy-products and meats on the whole is considerably lower in Great Britain than in any of the other three countries, but that, while there are marked differences in respect of individual commodities in the case of the other three countries, such differences are—generally speaking—of a compensatory nature.
Flour.—The aggregate consumption of flour in the Dominion has remained remarkably constant during the past decade, never falling below 140,000 short tons per annum, and seldom reaching 145,000 short tons. The annual consumption per head has declined from 200 lb. some years ago to 185 lb. in the last three years. Statistics of bread-consumption are not available; but from a household budget survey conducted by the Census and Statistics Department in 1930 it would appear that the average consumption of bread per head is approximately ½ lb. per day. Flour used in bread-making is included in the estimate of flour-consumption quoted above.
Other Cereal Products.—Oatmeal and oaten products consumed in New Zealand are almost entirely of New Zealand manufacture. Approximately 4,500 tons of oatmeal are produced in New Zealand factories each year, only slight year to year variations being shown by the figures for the past decade. In addition, from 3,500 to 4,000 tons of other oaten products for human consumption are produced each year, representing an annual consumption per head of 6 ½ lb. of oatmeal and 5 ½ lb. of other oaten products. No data are available as to the consumption of wheaten products (other than flour) for human consumption.
Vegetables.—No data are available as to the consumption of vegetables, the quantities grown in home gardens being a matter of pure conjecture; while, even in respect of market gardens, only acreage statistics (for holdings 1 acre and upwards outside borough boundaries) are available. Statistics in respect of production of potatoes and onions grown on farm holdings are collected, however, from which the following estimates have been made, after taking into consideration external trade in these commodities.
| Year. | Potatoes. | Onions. | |||
|---|---|---|---|---|---|
| Total (including Seed and Pig Potatoes). | Table Potatoes. | Total. | Per Head. | ||
| Total Consumption. | Per Head. | ||||
| Tons(000). | Tons(000). | Lb. | Tons(000). | Lb. | |
| 1925–26 | 123 | 72 | 117 | 7 | 12 |
| 1931–32 | 116 | 74 | 109 | 7 | 11 |
| 1932–33 | 125 | 73 | 107 | 9 | 14 |
| 1933–34 | 130 | 86 | 125 | 8 | 12 |
| 1934–35 | 108 | 70 | 100 | 8 | 12 |
| 1935–36 | 116 | 78 | 112 | 9 | 12 |
Some marked variations are observed in the case of potatoes, the low years corresponding to seasons when there were crop shortages. The variations in human consumption are probably not as great as the figures would indicate, since in flush years (when prices are unprofitable) an appreciable proportion of the crop will be fed to animals or wasted in storage. Considerable year to year variations are also possible in the unknown quantities of potatoes and onions grown in home gardens.
The commodities dealt with under this and the previous headings comprise what may be described as basic foodstuffs. Data indicative of consumption of these commodities in recent years do not suggest any marked falling off during the depression years, although material changes are observed in the consumption of some of these commodities as compared with the position several years ago. In recent years an upward movement in consumption is observed in some instances —notably in butter-consumption. It should be noted, however, that, while statistical evidence points to increases in consumption during the depression period of some of the basically necessary foodstuffs (under the stimulus of lower prices), this does not necessarily preclude the possibility, or indeed the probability, of a considerable fall in consumption in the case of individual families suffering greatly diminished incomes at that time.
Marked movements have occurred in recent years in the aggregate consumption of many commodities included under this heading.
Eggs.—A census of poultry was taken in conjunction with the 1936 Census of Population; and by using the statistics made available from this inquiry, it is possible to estimate the annual production of eggs. The average annual production of eggs is estimated at 375,000,000 eggs, while exports of eggs and egg-pulp would account for approximately 5,000,000 eggs per annum. New Zealand consumption in all forms thus accounts for approximately 370,000,000 eggs in a year—a per caput consumption of 20 dozen.
Fresh Fruits.—Estimates of Dominion consumption of New-Zealand-produced fruits are particularly difficult in view of the fact that in rural localities—and even in some of the larger centres of population—homestead gardens contribute materially to the fruit-supplies of many individual families.
Statistics of production of certain classes of fruit on holdings of 1 acre and upwards outside borough boundaries during the 1935–36 season are published on page 400. From these statistics, in conjunction with the external-trade statistics, estimates of New Zealand consumption of the more important fruits have been compiled. The figures are shown in the following table; while for comparative purposes similar estimates based on the 1930 collection of orchard statistics are given:—
| Variety of Fruit. | 1930. | 1936. | ||
|---|---|---|---|---|
| Total. | Per Head. | Total. | Per Head | |
| Lb.(000). | Lb. | Lb.(000). | Lb. | |
| Apples | 47,643 | 31.9 | 81,366 | 51.7 |
| Pears | 12,980 | 8.7 | 13,658 | 8.7 |
| Peaches | 5,812 | 3.9 | 11,405 | 7.2 |
| Nectarines | 702 | 0.5 | 1,435 | 0.9 |
| Apricots | 2,079 | 1.4 | 2,461 | 1.6 |
| Plums | 2,879 | 2.0 | 3,865 | 2.5 |
| Oranges | 14,201 | 9.5 | 17,505 | 11.1 |
| Lemons | 2,679 | 1.8 | 5,804 | 3.7 |
| Bananas | 19,042 | 12.8 | 23,890 | 15.2 |
The figures in the above table indicate a substantial increase in consumption of fruits since 1930—probably the reflection of a more general recognition of the value of fruit in the dietary. The consumption of stone-fruits is, of course, variable, depending on the season, a fact which should be borne in mind in interpreting the figures shown for such fruits.
A further point of interest is the fact that the statistics of consumption of oranges and lemons quoted for 1936 include a much greater proportion of New Zealand fruits than is included in the corresponding figures for 1930. New Zealand production of lemons in 1930 totalled 1,502,000 lb., and in 1936 5,054,000 lb., imports in the former year totalling 1,272,000 lb. and in the latter year 752,000 lb. It will be seen that, while consumption has more than doubled between the two years, imports have fallen by over 40 per cent. A similar, though less striking, transition from imports to local production is observed in the case of oranges. In this instance, however, the increase in local production has been, to date, largely confined to bitter oranges, imports still accounting for practically the whole local consumption of sweet oranges. Imports from the Cook Islands are included.
Dried Fruits.—The following table, showing imports of dried fruits in 1926 and from 1932 to 1936, illustrates the changes in consumption of these commodities:—
| Commodity. | Unit of Quantity. | 1926. | 1932. | 1933. | 1934. | 1935. | 1936. |
|---|---|---|---|---|---|---|---|
| Raisins and sultanas | Tons | 4,037 | 4,640 | 3,765 | 3,778 | 4,698 | 4,730 |
| Per head | Lb. | 6.4 | 6.8 | 5.5 | 5.5 | 6.7 | 6.7 |
| Currants | Tons | 469 | 633 | 538 | 744 | 597 | 781 |
| Per head | Lb. | 0.7 | 0.9 | 0.8 | 1.1 | 0.9 | 11 |
| Dates | Tons | 1,238 | 2,417 | 1,722 | 2,374 | 1,984 | 1,498 |
| Per head | Lb. | 2.0 | 3.5 | 2.5 | 3.4 | 2.8 | 2.1 |
| Prunes | Tons | 874 | 640 | 808 | 804 | 930 | 1,047 |
| Per head | Lb. | 1.4 | 0.9 | 1.2 | 1.2 | 1.3 | 1.5 |
| Apricots | Tons | 217 | 357 | 223 | 348 | 405 | 569 |
| Per head | Lb. | 0.3 | 0.5 | 0.3 | 0.5 | 0.6 | 0.8 |
An interesting feature of this table is the falling-off in imports in 1933 in all classes of dried fruits except prunes.
Canned Fruits.—The production of canned fruits in New Zealand factories increased from 6,177 cwt. in 1926–27 to 26,951 cwt. in 1932–33, falling to 19,629 cwt. in 1934–35 (a poor fruit-production season) and increasing to 34,071 cwt. in 1935–36. The quantities of imports of the main types of canned fruits in 1927 and from 1932 to 1936 are indicated in the following table. Owing to variations in the size of the tins, the movements in the figures can be regarded only as an approximate indication of changes in imports of these commodities.
| Year. | Apricots. | Peaches. | Pineapples. |
|---|---|---|---|
| 1927 | 67 | 108 | 181 |
| 1932 | 32 | 62 | 205 |
| 1933 | 20 | 40 | 156 |
| 1934 | 44 | 58 | 240 |
| 1935 | 45 | 68 | 317 |
| 1936 | 46 | 83 | 296 |
A sharp falling-off is indicated in 1933 (as was observed in the case of dried fruits).
Miscellaneous Foods, Beverages, and Tobacco.—In the following table the estimated Dominion consumption of each of a selection of miscellaneous foodstuffs and beverages is shown for 1926, and for each year from 1931 to 1936.
| Commodity. | Unit of Quantity. | 1926. | 1931. | 1932. | 1933. | 1934. | 1935. | 1936. |
|---|---|---|---|---|---|---|---|---|
*1928 figures. † Figures not available. | ||||||||
| Dominion Totals. | ||||||||
| Fresh sea fish | Tons | 18,755 | 17,430 | 15,062 | 13,459 | 14,206 | 13,961 | 15,561 |
| Canned fish | Tons | 1,668 | 812 | 936 | 736 | 1,185 | 1,592 | 1,865 |
| Refined sugar | Tons | 76,138 | 72,599 | 77,274 | 69,620 | 67,687 | 76,825 | 78,759 |
| Salt | Tons | 29,813 | 30,167 | 31,280 | 34,449 | 34,529 | 33,946 | 35,064 |
| Maizena and cornflour | Tons | 1,159 | 1,269 | 1,409 | 1,502 | 1,540 | 1,633 | 1,853 |
| Sago and tapioca | Tons | 946 | 1,337 | 1,505 | 1,184 | 1,442 | 1,371 | 1,194 |
| Rice | Tons | 3,024 | 3,548 | 2,978 | 3,618 | 3,896 | 3,499 | 3,694 |
| Desiccated coconut | Tons | 365 | 570 | 513 | 662 | 655 | 621 | 802 |
| Mustard | Tons | 116 | 86 | 85 | 92 | 119 | 123 | 102 |
| Peel | Tons | 183 | 354 | 221 | 238 | 227 | 328 | 328 |
| Confectionery (includes chocolate) | Tons | 10,254* | 10,097 | 8,286 | 8,440 | 9,404 | 9,559 | 10,200 |
| Ice-cream (factory production) | Thousand gallons | 273* | 320 | 269 | 277 | 246 | 397 | 381 |
| Aerated waters | Ditto | † | 2,079 | 1,440 | 1,390 | 1,379 | 1,818 | 1,800 |
| Tea | Tons | 4,892 | 5,408 | 4,650 | 5,179 | 4,540 | 4,452 | 5,016 |
| Tobacco | Tons | 1,976 | 2,482 | 2,048 | 1,882 | 2,012 | 2,156 | 2,204 |
| Per Head of Population. | ||||||||
| Fresh sea fish | Lb. | 30 | 26 | 22 | 20 | 21 | 20 | 22 |
| Canned fish | Lb. | 2.6 | 1.2 | 1.4 | 1.1 | 1.7 | 2.3 | 2.7 |
| Refined sugar | Lb. | 121 | 107 | 113 | 101 | 98 | 111 | 112 |
| Salt | Lb. | 47 | 45 | 46 | 50 | 50 | 49 | 50 |
| Maizena and cornflour | Lb. | 1.8 | 1.9 | 2.1 | 2.2 | 2.2 | 2.3 | 2.6 |
| Sago and tapioca | Lb. | 1.5 | 2.0 | 2.2 | 1.7 | 2.1 | 2.0 | 1.7 |
| Rice | Lb. | 4.8 | 5.3 | 4.4 | 5.3 | 5.6 | 5.0 | 5.3 |
| Desiccated coconut | Lb. | 0.6 | 0.8 | 0.7 | 1.0 | 0.9 | 0.9 | 1.1 |
| Mustard | Oz. | 3.0 | 2.1 | 2.0 | 2.2 | 2.8 | 2.8 | 2.3 |
| Peel | Oz. | 4.7 | 8.5 | 5.2 | 5.6 | 5.3 | 7.6 | 7.5 |
| Confectionery (includes chocolate) | Lb. | 16* | 15 | 12 | 12 | 14 | 14 | 15 |
| Ice-cream (factory production) | Pints | 1.5* | 1.7 | 1.4 | 1.4 | 1.3 | 2.0 | 2.0 |
| Aerated waters | Gallons | † | 1.4 | 1.0 | 0.9 | 0.9 | 1.2 | 1.2 |
| Tea | Lb. | 7.8 | 8.0 | 6.8 | 7.5 | 6.6 | 6.4 | 7.1 |
| Tobacco | Lb. | 3.2 | 3.7 | 3.0 | 2.8 | 2.9 | 3.1 | 3.2 |
Alcoholic Liquors.—The following table shows estimates of the Dominion consumption of alcoholic liquors in each of the calendar years shown. The figures are based on the Customs returns, with an addition in respect of New-Zealand-produced wine, which is not included in such returns.
| Item. | 1926. | 1932. | 1933. | 1934. | 1935. | 1936. |
|---|---|---|---|---|---|---|
*Including locally produced cider. | ||||||
| Beer (ale and stout)— | ||||||
| Total (1,000 gallons) | 12,949 | 8,868 | 8,623 | 9,606 | 11,159 | 12,935 |
| Per head (gallons) | 9.2 | 5.8 | 5.7 | 6.2 | 7.2 | 8.2 |
| Potable spirits— | ||||||
| Total (1,000 gallons) | 658 | 323 | 317 | 325 | 338 | 385 |
| Per head (gallons) | 0.47 | 0.21 | 0.21 | 0.21 | 0.22 | 0.24 |
| Wine*— | ||||||
| Total (1,000 gallons) | 260 | 150 | 205 | 245 | 265 | 278 |
| Per head (gallons) | 0.18 | 0.10 | 0.13 | 0.16 | 0.17 | 0.18 |
An estimate of the Dominion's annual requirements of apparel is impossible of attainment in view of the heterogeneous nature of the items covered by this group. Some indication of changes in the consumption of clothing is, however, afforded by statistics of local production and imports of piece-goods, although, in the latter instance, values only are available. A rough estimate of the quantities of the main types of piece-goods imported has been made by applying import prices of a selection of standard lines of piece-goods to the statistics of value. Much more satisfactory data are available in respect of boots and shoes. In the following table these figures are shown for 1926 and 1931–36.
| Item. | Unit of Quantity. | 1926. | 1931. | 1932. | 1933. | 1934. | 1935. | 1936. |
|---|---|---|---|---|---|---|---|---|
*Local production, plus imports, minus exports. | ||||||||
| Woollen piece-goods— | ||||||||
| Estimated quantity imported | Million running yards | 1.4 | 1.0 | 1.1 | 1.3 | 1.5 | 1.4 | 1.9 |
| New Zealand production | Ditto | 2.1 | 1.6 | 1.8 | 2.1 | 2.2 | 2.3 | 2.3 |
| Total available for use | Ditto | 3.5 | 2.6 | 2.9 | 3.4 | 3.7 | 3.7 | 4.2 |
| Silk and artificial silk piece-goods— | ||||||||
| Estimated quantity imported | Million lb. | 1.1 | 1.6 | 2.2 | 1.8 | 2.4 | 2.5 | 3.0 |
| Cotton and linen piece-goods— | ||||||||
| Estimated quantity imported | Million running yards | 50.2 | 36.8 | 46.0 | 49.2 | 52.0 | 53.2 | 58.8 |
| Blankets (local production only) | Thousand pair | 128 | 121 | 117 | 111 | 116 | 127 | 157 |
| Boots and shoes* | Ditto | 3,902 | 4,480 | 3,389 | 4,298 | 4,884 | 4,835 | 5,162 |
The consumption of woollen piece-goods was low in 1931, 1932, and 1933, but increased in 1934. Imports of silk and artificial silk piece-goods have more than doubled since 1926—despite a recession in 1933—while imports of cotton piece-goods, after touching a low point in 1931, have increased substantially since that year. While statistics are not available as to the quantity of made-up apparel imported, the value of imports of miscellaneous made-up apparel has fallen from an average of over £2,000,000 during 1926–29 to £1,100,000 in 1933–36, figures for the calendar years 1926 and 1931–36 being as follows:—
| Year. | Value. £(N.Z.) |
|---|---|
| 1926 | 2,202,791 |
| 1931 | 1,285,243 |
| 1932 | 936,855 |
| 1933 | 947,033 |
| 1934 | 1,036,362 |
| 1935 | 1,107,622 |
| 1936 | 1,403,785 |
The relative buoyancy of imports and local production of piece-goods indicates that the proportion of the Dominion's clothing requirements made up in New Zealand factories, shops, and homes is considerably greater than was the case some years ago. Statistics of the output of clothing factories indicate a substantial increase in clothing manufacture since 1931–32, the value of products rising from £2,153,467 in that year to £3,090,027 in 1935–36. No data are available as to bespoke tailoring.
Trade statistics for recent years indicate that the bulk of imports of boots and shoes is now comprised of rubber-soled shoes for sports wear, &c. Imports of leather boots and shoes have declined from 101,138 dozen pairs in 1928 to 47,351 dozen pairs in 1936, while production in New Zealand factories has risen from 120,501 dozen pairs in 1927–28 to 166,789 dozen pairs in 1936–37. It will be observed that the increase in local production of leather footwear is considerably less than the fall in imports. A very substantial increase in usage of rubber-soled shoes is indicated by imports of this item, and this increase has apparently been accompanied by a material decrease in the case of leather footwear.
Fuel and Lighting.—Statistics indicative of the Dominion consumption of fuel and lighting are shown below. Consumption of gas and of electricity, both of which may be regarded as services rather than commodities, are included in the fuel and lighting group. No data are available as to consumption of firewood.
| Item. | Description. | Unit. | 1926. | 1931. | 1932. | 1933. | 1934. | 1935. | 1936. |
|---|---|---|---|---|---|---|---|---|---|
| Coal | Total consumption | Million tons | 2.4 | 2.3 | 1.9 | 1.9 | 2.1 | 2.1 | 2.1 |
| Coal | Domestic consumption | Million tons | 0.9 | 1.0 | 0.8 | 0.8 | 0.9 | 0.9 | 0.8 |
| Kerosene | Illuminating | Million gals | 2.3 | 1.7 | 2.6 | 1.8 | 1.7 | 1.8 | 2.6 |
| Candles | Million lb. | 3.7 | 2.6 | 2.4 | 2.5 | 2.4 | 2.5 | 2.3 | |
| Gas | Million cub. ft. | 3,372 | 3,594 | 3,438 | 3,338 | 3,282 | 3,263 | 3,324 | |
| Electricity | Million units | 288 | 591 | 615 | 635 | 667 | 710 | 775 |
Petrol.—The following table, taken from the Annual Report of the Transport Department, shows the consumption of petrol in each year since 1928. Data as to motor-vehicles licensed, &c., are included in a previous section (Section XIV: Roads and Road Transport).
| Calendar Year. | Consumption of Petrol. | ||
|---|---|---|---|
| By Motor-vehicles. | Other. | Total. | |
| Gals. (000). | Gals. (000). | Gals. (000). | |
| 1928 | 41,457 | 2,058 | 43,515 |
| 1929 | 56,576 | 3,650 | 60,226 |
| 1930 | 62,821 | 3,908 | 66,729 |
| 1931 | 55,203 | 5,286 | 60,489 |
| 1932 | 49,862 | 5,495 | 55,356 |
| 1933 | 51,294 | 5,400 | 56,694 |
| 1934 | 55,992 | 6,100 | 62,092 |
| 1935 | 62,807 | 6,484 | 68,291 |
| 1936 | 72,107 | 6,686 | 72,793 |
Miscellaneous Goods.—In the following table the values of imports of a number of miscellaneous consumers' goods are shown. In view of the heterogeneous nature of many of the items included—e.g., fancy goods—no indication is available as to the quantity of imports, nor, indeed, would such figures have much significance.
| Commodity. | 1926. | 1929. | 1932. | 1933. | 1934. | 1935. | 1936. |
|---|---|---|---|---|---|---|---|
*Not available. † Passenger vehicles other than buses. | |||||||
| £(000) | £(000) | £(000) | £(000) | £(000) | £(000) | £(000) | |
| Miscellaneous hardware and ironmongery | 1,147 | 917 | 346 | 356 | 489 | 660 | 818 |
| Sewing-machines | 99 | 133 | 57 | 72 | 84 | 130 | 164 |
| Vacuum cleaners | * | 68 | 29 | 36 | 54 | 72 | 81 |
| Plate and plated ware | 100 | 100 | 43 | 54 | 63 | 70 | 72 |
| Earthenware and chinaware | 292 | 344 | 137 | 153 | 182 | 241 | 278 |
| Miscellaneous glassware | 104 | 107 | 33 | 43 | 67 | 95 | 120 |
| Linoleum | 204 | 231 | 74 | 77 | 107 | 138 | 180 |
| Carpets and mats | 453 | 419 | 174 | 217 | 326 | 358 | 509 |
| Fancy goods and toys | 419 | 445 | 144 | 174 | 178 | 220 | 256 |
| Watches and clocks | 155 | 147 | 28 | 48 | 67 | 83 | 136 |
| Jewellery and precious stones | 133 | 96 | 40 | 40 | 47 | 60 | 82 |
| Perfumery and toilet preparations | 150 | 200 | 129 | 151 | 149 | 190 | 209 |
| Books, papers, and music | 488 | 514 | 334 | 380 | 409 | 438 | 518 |
| Miscellaneous sporting and athletic requisites | 121 | 144 | 102 | 118 | 132 | 132 | 150 |
| Motor-cycles and parts | 223 | 271 | 56 | 83 | 109 | 149 | 189 |
| Motor-cars and chassis° | 3,080 | 3,407 | 464 | 481 | 1,819 | 2,717 | 3,557 |
| Gramophones and records | 315 | 373 | 50 | 34 | 35 | 32 | 38 |
| Wireless apparatus | * | * | 264 | 288 | 365 | 319 | 440 |
The commodities for which import statistics are quoted above are, in general, particularly sensitive to economic changes, the aggregate import value of these items for each of the years shown being—
| Year. | Value. |
|---|---|
*Approximate. | |
| 1926 | 7,500,000* |
| 1929 | 8,000,000* |
| 1932 | 2,504,000 |
| 1933 | 2,805,000 |
| 1934 | 4,682,000 |
| 1935 | 6,104,000 |
| 1936 | 7,797,000 |
The fall from £8,000,000 in 1929 to only £2,504,000 in 1932 and £2,805,000 in 1933 in imports of these items is a significant indication of the effects of the depression on expenditure on goods other than immediate necessaries. The fall is oven more marked than the figures indicate, owing to the depreciation of New Zealand currency during the period. The figures for 1929 and 1933 on a sterling basis would be £8,000,000 and £2,244,000; and. on a gold basis, £8,000,000 and £1,526,000. A marked recovery in 1934, 1935, and 1936 is indicated by the figures for these years. An important point, however, which must not be lost sight of is the increasing part played by New Zealand factories in the provision of miscellaneous consumers' goods, local production of certain classes of these goods—e.g., radios—having made great advances in the last few years. Comparison of the statistics quoted above with corresponding figures in respect of local factory production (see particularly tables on-pages 497–498, 518) will illustrate this point.
Table of Contents
PRIOR to the year 1924 interest in radio-broadcasting was principally confined to a small section of the populace who were engaged in experimental transmission or reception of radio signals. As early as 1921, to meet the demands of this section of the public, a system of “provisional permits” was inaugurated by the Post and Telegraph Department, by which approved persons were permitted to erect and operate radio transmitting or receiving stations. (Approximately four hundred such permits were issued during that year.) The year 1922 saw further interest being taken; and, in January, 1923, regulations were gazetted under which provisions were laid down for the conduct of transmitting and receiving stations, including, inter alia, provision for the appointment of District Radio Inspectors. Licenses were issued under these regulations upon application being made and a reference as to personal character being certified to by a reputable citizen. The approval of the District Radio Inspector and of the Post and Telegraph Department was then required, and the payment of the prescribed annual license fee (in the case of an amateur receiving-station, 5s.).
This new avenue for experiment and entertainment developed to such an extent that on 31st March, 1924, there were 2,830 licensed amateur receiving-stations. A number of comparatively low-powered broadcasting-stations had been erected and operated by private enterprise with a measure of success, but the development of this class of station was retarded chiefly through lack of funds.
In consideration of the plight of these broadcasting-stations, and to ensure a reasonable standard of performance of such stations, regulations were gazetted by Order in Council providing that as from the 1st April, 1925, the annual license fees were to be increased (in the case of an amateur receiving-station to £1 10s.). The intention was that the additional amount of revenue obtained should be used by way of subsidizing broadcasting-stations. A fee was also made payable in respect of dealers in radio apparatus, 90 per cent. of the receipts from this being used for the conduct of a radio-broadcasting service.
The regulations empowered the Minister of Telegraphs to enter into a contract with a person or company with a view to providing a broadcasting-service, such service to be given by the operation of a broadcasting-station in each of the four main centres. Provisions were laid down as to the power of these stations, and the service to be given—a twelve-hour service per week (exclusive of Sunday) being specified as the minimum, with provision for one silent night per week.
The Radio-broadcasting Company of New Zealand, Ltd., undertook on 1st August, 1925, to provide a radio-broadcasting service on the conditions laid down in the Post and Telegraph Amendment Act, 1924, and the gazetted regulations of 1st April, 1925. The agreement entered into provided for the establishment and maintenance of an efficient broadcasting service for a term of five years, and the company was to provide any new apparatus that might be necessary in order to keep the stations and equipment up to date. The agreement also stated that two of the four stations (Auckland and Christchurch) mentioned in the regulations were to be in operation within six months of the date of the agreement, and also that a company with a capital of £20,000 was to be formed within one month to ratify the agreement. The company purchased existing stations in the four main centres, and commenced operations at its new Auckland station on 7th August, 1926. The new Christchurch station commenced operations on the 1st September, 1926; both stations were considered high-powered units (500 watts) as provided for in the regulations.
Following out the terms of the agreement, the company also opened up new stations at Wellington and Dunedin during the term of its contract. In the case of the new Wellington station, the company, in consideration of a loan from the Government of £15,000, erected a high-power station of 5,000 watts, this station being opened on the 16th July, 1927. The provision of this broadcasting service had the effect of increasing the number of licensed receiving-stations from approximately four thousand in 1926 to approximately seventy thousand at the end of 1931.
In January, 1932, the five-years' contract with the Radio-broadcasting Company of New Zealand, Ltd., having expired, the control of the broadcasting service was vested in the New Zealand Broadcasting Board (constituted by the Broadcasting Act, 1931), which took over the existing plant at the purchase-price of £58,646. The Post and Telegraph Department advanced this amount by way of loan, together with legal costs incidental to the valuation and transfer to the Board.
One of the first actions of the Broadcasting Board was to set up a Commission to go into the question of coverage, in order that the future policy of the Board could be decided with due consideration as to the most effective locations for its stations, and the most suitable equipment to be used in order to give the greatest service to listeners throughout the whole Dominion. Following on the recommendations of this Commission, and exhaustive tests carried out by the Board's staff, it was decided that the location of the four main stations should be altered to give better coverage, while, coupled with this, was the decision to make these four new stations high-powered units. The new locations of the “YA” stations are: Auckland, at Henderson; Wellington, at Titahi Bay; Christchurch, at Gebbie's Pass; and Dunedin, at Highcliff.
Under section 4 of the Broadcasting Act of 1931 an Advisory Council of eight members (“five of whom shall be ordinarily resident in the North Island, and three shall be ordinarily resident in the South Island”) was appointed by the Governor-General, on the recommendation of the Minister, to advise the Board in respect of its functions under the Act. This Advisory Council was abolished under section 5 of the Broadcasting Amendment Act of 1934–35.
The amending Act increased the numerical strength of the Board from three to seven, and charged it with the additional responsibility of supervising the programmes broadcast by private broadcasting-stations. Two of the seven members of the reconstituted Board were to be appointed from persons nominated in that behalf by organizations recognized by the Minister as being representative of the holders of receiving-licenses. Of the reconstituted Board, the Chairman was to hold office for a period not exceeding five years, while three of the remaining members were appointed for a period not exceeding four years, and the remaining three for a period not exceeding three years from the date of first appointment. Subsequent appointment of the chairman and members was to have been for a period not exceeding three years.
The Broadcasting Act of 1936 abolished the then existing Broadcasting Board as from the 1st July, 1936, and in its place vested the control of the National Broadcasting Service in a Minister of the Crown. All property, rights, liabilities, and engagements of the Board were transferred to the Crown.
The administration of the service is in the hands of the Director of Broadcasting, who was appointed by the Governor-General in Council to hold office for a period not exceeding three years. Permanent officers in the employ of the Broadcasting Board became officers of the Public Service as from the 1st July, 1936, and the Act contains other provisions relating to the appointment to the Public Service of any other persons who are possessed of any technical or other expert knowledge in relation to broadcasting.
Section 9 of the Act allows for the appointment of an advisory body, called the Broadcasting Advisory Council, to consist of not more than five members, to be appointed from time to time by the Governor-General on the recommendation of the Minister. Appointment to the Council is for a period of three years, except that members may be reappointed or removed from office by the Governor-General.
No advertisement for the pecuniary benefit of any person may be broadcast from any broadcasting-station, except commercial stations owned by the Crown. For every locality that is served by a commercial station an alternative service from at least one non-commercial station must be provided.
All programmes to be transmitted from private broadcasting-stations are supervised, and the Minister has authority to prohibit the broadcasting of any programme or part of a programme which in his opinion is unsuitable for broadcasting.
There are (October, 1937) fourteen national broadcasting-stations as follows:—
| Station. | Aerial Energy. | Frequency. | Wave-length. |
|---|---|---|---|
| Kilowatts. | Kilocycles. | Metres. | |
| 1YA, Auckland | 10.00 | 650 | 462 |
| 1YX, Auckland | 0.15 | 880 | 341 |
| 1ZB, Auckland | 0.10 | 1,010 | 275 |
| 2YA, Wellington | 60.00 | 507 | 526 |
| 2YC, Wellington | 5.00 | 849 | 357 |
| 2YD, Wellington | 0.20 | 990 | 303 |
| 2ZB, Wellington | 1.00 | 1,120 | 268 |
| 3YA, Christchurch | 10.00 | 720 | 416 |
| 3YL, Christchurch | 0.25 | 1,200 | 250 |
| 3ZB, Christchurch | 1.00 | 1,430 | 210 |
| 4YA, Dunedin | 10.00 | 790 | 380 |
| 4YO, Dunedin | 0.20 | 1,140 | 263 |
| 4ZB, Dunedin | 1.00 | 1,220 | 245 |
| 4YZ, Invercargill | 0.10 | 680 | 441 |
The four “YA” stations are the principal stations of the National Broadcasting Service, stations 1YX (Auckland), 2YC (Wellington), 3YL (Christchurch), and 4YO (Dunedin) ranking as alternate or auxiliary stations. The “ZB” stations, comprise the commercial chain of the National Commercial Broadcasting Service.
In order to give the best service possible for listeners throughout the entire Dominion, further services are provided by two other classes of stations: Government-owned stations operated under contract, and privately owned stations. These are—
| 1ZJ, Auckland. | 2ZP, Wairoa. |
|---|---|
| 1ZM, Manurewa. | 2ZR, Nelson. |
| 2YB, New Plymouth. | 3ZR, Greymouth. |
| 2ZH, Napier. | 4ZD, Dunedin. |
| 2ZJ, Gisborne. | 4ZC, Cromwell. |
| 2ZL, Hastings. | 4ZM, Dunedin. |
| 2ZM, Gisborne. |
The aggregate transmission-time in respect of the four principal and four auxiliary National Broadcasting Service stations in operation at 31st March, 1937, is 27,593 hours annually. During the fifteen months ended 31st March, 1937, transmission-time aggregated 34,932 hours, of which 36 ½ hours were lost owing to technical faults and power failures. The main stations transmit almost continuously on week-days from 7 a.m. to 11 p.m., and on Sundays from 9 a.m. to 12.15 p.m., 1 p.m. to 4.30 p.m., and 6 p.m. to 10 p.m.; while the alternative stations transmit from 5 p.m. to 6 p.m. and 7 p.m. to 10.30 p.m. on week-days, and 6 p.m. to 10 p.m. on Sundays.
The programme analysis in respect of the National Broadcasting Service stations for the year ended 31st March, 1937, shows that, of the total transmitting-time, 72.7 per cent. was devoted to music; 6.7 per cent. to news, reports, and announcements, &c.; 3.5 per cent. to educative and general talks; 4.7 per cent. to children's sessions; 5.3 per cent. to plays and sketches; 3.5 per cent. to church and devotional services; and 2.3 per cent. to sporting commentaries and sporting talks.
As occasion has permitted, many notable artists have been engaged, while many distinguished visitors from overseas have given performances, talks, &c. In order to supplement the relay lines available, and also to make it possible to broadcast descriptions of events and happenings at places not served by relay-lines, each of the four main stations is now equipped with a portable short-wave transmitter with a range of approximately ten miles.
Disk-recording equipment is now being used at the Wellington Station (2YA). Many important events occurring at times unsuitable for broadcasting are being recorded and transmitted at an hour suitable to the majority of listeners. A library of special recordings of noteworthy events and talks by prominent people is also being built up, not only with a view to future programmes but also with the object of preserving a permanent record for the Dominion. A number of recorded programmes have been purchased from the British Broadcasting Corporation, and these have given New Zealand listeners the opportunity of hearing some of the best British artists.
A recent innovation has been the broadcasting from station 2YA of proceedings in the House of Representatives in order to acquaint the public of the provisions contained in the various Bills, and the views of the various representatives.
Time signals from the Dominion Observatory are broadcast through the national stations at Wellington (2YA) and Christchurch (3YA) three times each day, with the exception of Sunday, when the afternoon signals are the only ones broadcast. The actual signals consist of a series of dashes of three seconds duration commencing at 10.30 a.m., 3.30 p.m., and 7.30 p.m. Fuller details of this time-service may be obtained from the article on mean time and time-service published in the Miscellaneous Section of this Year-Book.
Weather forecasts issued by the New Zealand Meteorological Office are broadcast from the four principal national stations each evening (see page 15), while the stations also broadcast reports for the benefit of aircraft and of farmers.
The Empire Short-wave Station in Daventry, England, broadcasts programmes for this part of the southern hemisphere, and a number of important events and speeches broadcast from this station are rebroadcast by the New Zealand national stations.
From the inception of radio-broadcasting in New Zealand, the Post and Telegraph Department has been very active in the detection and elimination where possible of all sources of interference. In the earlier years the Department endeavoured to attain this end by not allowing circuits to be used which would in any way cause undue interference with other radio receiving or transmitting apparatus.
The increasing use of electric power and appliances for commercial and domestic purposes also increased the number of potential sources of radio interference, while power leakages and irregularities due to faults on electric lines and apparatus kept the Department busy in applying remedial measures.
With the advent of the higher-powered broadcasting-stations and technical improvements in receiving-apparatus many of the causes of interference have been eliminated.
An indication of the growth in the number of radio-receiving licenses is apparent from the following table. The movement in the figures over the period shows very clearly the increases following the provision of better broadcasting services. The license fee for a receiving-station is (since April, 1935) £1 5s. per annum.
| As at 31st March, | Auckland. | Wellington. | Canterbury. | Otago. | Dominion. | Licenses per Hundred of Population. |
|---|---|---|---|---|---|---|
* Figures for individual districts not available. | ||||||
| 1924 | * | * | * | * | 2,830 | 0.21 |
| 1925 | * | * | * | * | 4,702 | 0.34 |
| 1926 | * | * | * | * | 3,588 | 0.25 |
| 1927 | * | * | * | * | 18,162 | 1.26 |
| 1928 | 13,931 | 15,113 | 7,931 | 2,340 | 39,315 | 2.70 |
| 1929 | 15,093 | 18,053 | 8,528 | 3,136 | 44,810 | 3.05 |
| 1930 | 17,201 | 21,968 | 9,371 | 4,867 | 53,407 | 3.59 |
| 1931 | 19,016 | 26,023 | 10,543 | 7,131 | 62,713 | 4.15 |
| 1932 | 22,475 | 31,055 | 11,963 | 9,487 | 74,980 | 4.92 |
| 1933 | 27,241 | 38,492 | 15,727 | 12,029 | 93,489 | 6.08 |
| 1934 | 35,054 | 46,354 | 21,028 | 15,650 | 118,086 | 7.62 |
| 1935 | 46,776 | 57,180 | 27,850 | 21,002 | 152,808 | 9.79 |
| 1936 | 60,378 | 71,155 | 34,541 | 26,191 | 192,265 | 12.22 |
| 1937 | 77,234 | 86,797 | 44,198 | 33,068 | 241,297 | 15.20 |
| (30th September, 1937) | 87,215 | 97,572 | 49,891 | 36,992 | 271,670 | 17.06 |
A summary of all radio licenses issued in New Zealand as at the 31st March, 1937, follows:—
| District. | Receiving-stations. | Transmitting Stations. | Radio-dealers. | Total Licenses. |
|---|---|---|---|---|
| Auckland | 77,234 | 269 | 472 | 77,975 |
| Wellington | 86,797 | 428 | 442 | 87,667 |
| Canterbury | 44,198 | 206 | 229 | 44,633 |
| Otago | 33,068 | 127 | 172 | 33,367 |
| Dominion | 241,297 | 1,030 | 1,315 | 243,642 |
Licenses are issued free of charge to institutions for the blind and also to any blind person who is the recognized head of a household. The number of free licenses as at the 31st March of the last five years was: 1933, 272; 1934, 302; 1935, 319; 1936, 411; 1937, 564.
In addition to the above, commencing on 1st September, 1936, public hospitals, benevolent and orphan institutions, and other charitable institutions were granted free license privileges, provided that the sets were being used for the benefit of patients or inmates. Free license privileges were also extended to the operation of receiving-sets in schools, where such sets are used for educational broadcast purposes.
Although a penalty is attached to the operating of unlicensed radio apparatus, each year sees a large number of persons convicted for this offence. Convictions during the last five years numbered: 1932, 782; 1933, 1,110; 1934, 1,047; 1935, 932; and 1936, 983.
The distribution of the total revenue derived from the issue of radio licenses during the four financial years ended 31st March, 1936, was as follows:—
| Year ended 31st March, | New Zealand Broadcasting Board. | Post and Telegraph Department. | Amalgamated Wireless (Australasia), Ltd. (Royalty). | Total. |
|---|---|---|---|---|
| £ | £ | £ | £ | |
| 1933 | 105,263 | 17,344 | 12,339 | 134,946 |
| 1934 | 132,948 | 20,154 | 15,817 | 168,919 |
| 1935 | 175,939 | 40,201 | 4,624 | 220,764 |
| 1936 | 202,840 | 27,374 | 230,214 |
On the 1st April, 1935, the amount of the radio-receiving-station license fee was reduced from £1 10s. to £1 5s. The reduction was made possible by the termination of the agreement under which 3s. out of every license fee was paid to Amalgamated Wireless (Australasia), Ltd., in respect of patent rights controlled by that company, and by the acceptance by the Broadcasting Board of £1 3s. instead of £1 5s. in respect of each license.
During the four calendar years 1932 to 1935 the income of the (now abolished) Broadcasting Board amounted to £98,129, £125,629, £166,535, and £197,135 respectively, and during the six months ended June, 1936, to £114,182. An analysis of expenditure during each of these years and during the six months ended June 1936, is given in the following table:—
| — | 1932. | 1933. | 1934. | 1935. | Six months ended June, 1936. |
|---|---|---|---|---|---|
* Not comparable, as no allocation is made to reserves until the end of the financial year. | |||||
| £ | £ | £ | £ | £ | |
| Programmes | 33,605 | 39,450 | 46,168 | 61,597 | 33,735 |
| Maintenance of plant, power, &c. | 6,894 | 7,797 | 11,798 | 14,025 | 8,450 |
| General expenses | 12,845 | 10,876 | 12,749 | 14,580 | 7,338 |
| Administration salaries and expenses | 5,315 | 6,037 | 6,017 | 7,463 | 3,925 |
| Subsidies to private “B” stations | 1,098 | 2,620 | 2,518 | 2,622 | 1,281 |
| Depreciation of assets | 20,714 | 17,889 | 23,348 | 19,345 | 11,820 |
| Appropriation to reserves, &c. | 14,000 | 38,000 | 60,000 | 75,000 | * |
| Other expenses | 1,301 | 567 | |||
| Total expenditure | 95,772 | 123,236 | 162,598 | 194,632 | 66,549 |
| Excess of income over expenditure | 2,357 | 2,393 | 3,937 | 2,503 | * |
The Broadcasting Board was abolished as from 1st July, 1936, and the following table shows the expenditure of the National Broadcasting Service for the nine months ended 31st March, 1937:—
| £ | |
|---|---|
| Programmes | 56,029 |
| Maintenance of plant | 15,785 |
| General administrative and running expenses | 17,427 |
| Subsidies to private “B” stations | 1,922 |
| Depreciation of assets | 14,945 |
| Other expenses | 641 |
| Total expenditure | £106,749 |
Income during the nine months ended 31st March, 1937, amounted to £201,268, the excess of income over expenditure being £94,519.
The Broadcasting Act, 1936, authorizes the Minister of Broadcasting to establish and operate commercial broadcasting-stations, from which advertising matter may be broadcast. For every locality that is served by a commercial station the Minister is required to provide an alternative service from at least one non-commercial station. Advertising over the air is forbidden except from the commercial stations authorized under the Act. Following the coming into operation of the Act the Crown purchased station 1ZB, Auckland, which had previously operated as a “B” station, and commenced the broadcasting of programmes which included advertising matter. More recently a chain of commercial stations has been established by the operation of new stations at Wellington (2ZB), Christchurch (3ZB), and Dunedin (4ZB). All these stations are now in operation.
The Broadcasting Amendment Act, 1937, makes legislative provision for the establishment of a National Commercial Broadcasting service and provides for the appointment of a Controller, who, under the direction of the Minister, shall be in charge of the commercial service.
Table of Contents
NEW ZEALAND is fortunately well served with a plentiful supply of water-power for the development of hydro-electricity, and since 1900 extensive use has been made of this agency in the generation of electrical energy. Prior to 1900 comparatively little development in the generation of hydro-power had taken place, but in 1903 water-power to the extent of 9,911 horse-power was actually available. During the next decade this amount rose to 34,956 horse-power, and by 1923 to 54,244 horsepower. Rapid advancement has taken place in recent years, and at 31st March, 1937, the available horse-power of hydro-electric schemes in operation totalled 386,263.
The Public Works Act vests the sole right to use the water-power of the Dominion in the Crown, subject to any existing rights, and gives the Government the right to develop such power, or to delegate it to any local authority, or, outside a mining district, to any person or company, subject to conditions.
The regulations covering the delegation of this right, which were amended in June, 1934, make it essential for persons desiring to obtain a license to generate power by this means to obtain permission from the Minister of Public Works. The regulations provide for an annual rental to be paid to the Crown by the licensee, such rental to be paid, except in special cases, at the rate of £1 per kv.a. of maximum demand per annum, and to be not less than £10. A number of local authorities and private concerns have taken advantage of this provision of the Act.
Persistent demands were made for some years that the Government should itself develop the power resources of the Dominion for the benefit of the people generally, and in 1910 the Aid to Water-power Works Act was passed, and the Lake Coleridge scheme for the supply of electricity to Christchurch City and Canterbury Provincial District was selected for development. Operations were commenced on these works in 1911 and completed in 1915, with a capacity of 5,300 kv.a., which was extended to 26,495 kv.a. in 1926, and further extended to 40,640 kv.a. in 1930. After the successful inauguration of the Lake Coleridge scheme a complete system was drawn up of interconnected power systems in both the North and South Islands.
The following table gives the present and ultimate installed capacity of each Government generating-station, together with the static head. The four stations in the North Island—viz., Arapuni, Horahora, Mangahao, and Waikaremoana—have now been linked up and are operated as one system.
| Name of Station. | Present Installed Capacity. | Ultimate Installed Capacity. | Static Head (feet). | ||
|---|---|---|---|---|---|
| K.W. | Kv. A. | K.W. | Kv. A. | ||
* Additional 16,000 kw., unit now on order. † Waikaremoana Scheme is being developed in three stages, the respective static heads being: Upper station, 440 ft.; middle (present) station, 675 ft.; lower station, 370 ft. | |||||
| Arapuni | 103,300 | 118,950 | 146,700 | 167,000 | 175 |
| Horahora | 10,300 | 12,860 | 10,300 | 12,860 | 27 |
| Mangahao | 19,200 | 24,000 | 19,200 | 24,000 | 896 |
| Tuai (Waikaremoana)* | 52,000* | 40,000 | 112,000 | 140,000 | 675° |
| Lake Coleridge | 34,500 | 40,640 | 34,300 | 40,640 | 480 |
| Waitaki | 30,000 | 33,332 | 75,000 | 83,330 | 70 |
| Lake Monowai | 6,000 | 7,050 | 6,000 | 7,050 | 154 |
As in the North Island, the two Government stations in the South Island, Lake Coleridge and Waitaki, have been interconnected, while the Dunedin City Council's station at Waipori has been linked up to Waitaki, and these three stations are operated as one system. It is proposed that the other station (Lake Monowai) will be linked up also, making a complete system covering the major portion of the South Island.
A commencement with the first of the major generating stations in the North Island was made at Mangahao in 1922, the full development of 24,000 kv.a. being undertaken. Mangahao was completed in 1925.
A start was made almost immediately with the first stage (40,000 kv.a) of the development of the Waikaremoana station, and power was turned on to full capacity in November, 1929.
In November, 1920, the Waihi Gold-mining Company's electric-power plant of 7,860 kv.a. at Horahora was acquired by the State. Considerable extension, to 12,860 kv.a., was made in 1925. The requirements of the whole of the Auckland District were in time to be supplied from Arapuni (60,000 kw.), and a commencement with this huge development was made in 1925. The first unit of 17,650 kv.a was brought into operation in June, 1929, and the station linked up with Horahora. Two further units were in use by March, 1930, and the fourth (18,000 kv.a.) went into commission in 1932, while in the latter months of 1937 another unit of 24,000 kv.a. commenced operating. Unfortunately, in June, 1930, an earth movement occurred, necessitating the temporary closing-down of the station. Remedial measures to recondition the headworks were made, and the station resumed operation in 1932.
The Waitaki River was selected as the next source of power for the South Island system, the scheme established there commencing operations at the end of 1934.
The following table for the last five years covers those State systems in actual operation in each year:—
| — | 1932–33. | 1933–34. | 1934–35. | 1935–36. | 1936–37. |
|---|---|---|---|---|---|
* Amount very small (see unite); precise data lacking. | |||||
| £ | £ | £ | £ | £ | |
| Capital outlay | 10,566,152 | 10,584,348 | 12,900,752 | 13,095,382 | 15,202,049 |
| Total revenue | 864,746 | 901,383 | 940,864 | 1,040,649 | 1,217,529 |
| Power purchased | 6,543 | * | * | 306 | |
| Working-costs | 229,249 | 137,995 | 151,518 | 197,968 | 225,305 |
| Interest | 512,872 | 537,861 | 511,834 | 585,268 | 629,799 |
| Sinking fund | 20,539 | 29,812 | 10,109 | ||
| Depreciation | 82,197 | 98,097 | 229,072 | 97,341 | 329,204 |
| Total costs | 851,400 | 869,591 | 930,111 | 918,725 | 1,194,477 |
| Number. | Number. | Number. | Number. | Number. | |
| Units generated | 652,858,396 | 683,128,000 | 729,266,587 | 792,864,909 | 946,928,851 |
| Units purchased | 6,544,567 | 34,000 | 62,712 | 236,134 | |
| Totals | 659,402,963 | 683,162,000 | 729,329,299 | 793,101,043 | 946,928,851 |
| Units sold | 583,963,603 | 615,887,000 | 656,465,321 | 713,371,996 | 856,018,126 |
The policy of the Government generally is to supply power in bulk, leaving the reticulation and retail supply in the hands of the local authorities. Formerly the only local authorities available were the cities, boroughs, counties, and town districts, but with the extension of electric supply into the country areas a wider organization became necessary, and this was first provided under the Electric-power Boards Act of 1918. This Act provides for several local districts to combine for the purpose of electric-power distribution, and to set up a special Electric-power Board to carry out the work, with rating-powers over the district concerned. The legislation was consolidated and amended in the Electric-power Boards Act, 1925, amendments to which were enacted in 1927 and 1928. An Act of 1930 established an Association of Electric-power Boards and municipal electric-lighting authorities.
So far only one of the four main cities—viz., Auckland—has been included in the inner area of a power district, but of the secondary centres the cities of Wanganui, Palmerston North, and Invercargill, and the boroughs of Gisborne, Napier, Hastings, Masterton, Lower Hutt, Petone, Blenheim, Greymouth, Timaru, and Oamaru are included.
Thirty Boards — viz., North Auckland, Waitemata, Auckland, Franklin, Cambridge, Central, Te Awamutu, Waitomo, Thames Valley, Bay of Plenty, Poverty Bay, Wairoa, Hawke's Bay, Central Hawke's Bay, Dannevirke, South Taranaki, Opunake, Wanganui-Rangitikei, Manawatu-Oroua, Horowhenua, Tararua, Wairarapa, Hutt Valley, North Canterbury, Malvern, Banks Peninsula, Springs-Ellesmere, Ashburton, South Canterbury, and Waitaki—have carried out fairly complete reticulation of their areas, and are distributing power taken in bulk from the systems of Horahora-Arapuni, Mangahao-Waikaremoana, and Lake Coleridge-Waitaki. Of the aforementioned Boards, six (South Taranaki, Opunake, Wairarapa, Banks Peninsula, South Canterbury, and Waitaki) have hydro-stations, which generate small quantities of power. Eight Boards—viz., Wairere, Taranaki, Marlborough, Waimea, Golden Bay, Grey, Teviot, and Otago Central — have local water - power stations in operation. The Southland station now operates under Government control (since 13th October, 1936). The Westland Board has delegated its license to a private company for a term of years. The Tauranga, Otago, and Central Boards have arranged to purchase power in bulk from other authorities. The other four—viz., Lake Wakatipu, Buller, Reefton, and Hurunui—were not actually functioning during 1936–37.
The following is a summary of actively functioning Electric-power Boards:—
| Year ended 31st March, | Capital Outlay as at End of Year. | Revenue. | Expenditure. | ||||
|---|---|---|---|---|---|---|---|
| Sale of Electricity (Gross). | Sale of Material (Profit). | Total.* | Capital Charges. | Power | Total.* | ||
* Includes other items. | |||||||
| £ | £ | £ | £ | £ | £ | £ | |
| 1928 | 11,078,670 | 1,553,627 | 15,387 | 1,628,191 | 720,388 | 609,003 | 1,520,489 |
| 1929 | 12,009,891 | 1,788,719 | 15,298 | 1,850,453 | 797,205 | 735,773 | 1,749,991 |
| 1930 | 12,920,150 | 2,030,239 | 12,150 | 2,092,169 | 859,262 | 786,147 | 1,887,500 |
| 1931 | 13,637,177 | 2,157,228 | 10,976 | 2,223,879 | 905,479 | 667,527 | 2,044,457 |
| 1932 | 13,847,760 | 2,129,192 | 4,555 | 2,203,485 | 944,868 | 908,116 | 2,076,822 |
| 1933 | 14,026,320 | 2,120,697 | 5,209 | 2,248,663 | 1,095,826 | 896,328 | 2,199,841 |
| 1934 | 14,226,259 | 2,098,088 | 4,562 | 2,154,188 | 981,196 | 884,460 | 2,066,683 |
| 1935 | 14,657,514 | 2,198,493 | 5,723 | 2,252,187 | 937,814 | 937,093 | 2,122,139 |
| 1936 | 14,319,420 | 2,281,487 | 7,834 | 2,338,221 | 1,003,660 | 1,018,272 | 2,275,941 |
| 1937 | 12,935,128 | 2,361,678 | 13,081 | 2,411,878 | 966,255 | 1,098,470 | 2,348,274 |
Revenue in the foregoing table is exclusive of moneys derived from rates. Rates, inclusive of arrears, brought in £13,414 in 1936–37. Capital charges are inclusive of interest, sinking-fund, and depreciation payments, while power charges include wages, stores, fuel, distribution, and street-lighting expenses.
In addition to the Government undertakings controlled by the Public Works Department, the Tourist Department's undertaking at Rotorua, and those undertakings operated by Electric-power Boards, there are fifty establishments which are operated by other organizations, six of which represent private enterprise, the rest being local bodies of various classes. A general summary covering all stations in operation for the last three years is given hereunder:—
| — | Year ended 31st March, | ||
|---|---|---|---|
| 1935. | 1936. | 1937. | |
| Stations No. | 98 | 99 | 98 |
| Persons engaged (both sexes) No. | 2,907 | 3,010 | 3,252 |
| Salaries and wages £ | 670,553 | 734,249 | 826,598 |
| Consumers No. | 342,413 | 356,048 | 371,096 |
| Number of— | |||
| Ranges | 39,730 | 44,449 | 53,402 |
| Milking-machines | 17,200 | 18,026 | 20,451 |
| Water-heaters | 53,635 | 58,864 | 67,049 |
| Generators (capacity)— | |||
| Main Kw. | 271,970 | 288,437 | 288,669 |
| Standby Kw. | 92,699 | 91,086 | 94,536 |
| Route-miles of lines Miles | 21,707 | 22,424 | 23,322 |
| Revenue— | |||
| Current— | |||
| Retail £ | 3,501,395 | 3,643,026 | 3,825,681 |
| Bulk £ | 988,828 | 1,083,944 | 1,197,222 |
| Other (including rates) £ | 150,239 | 141,190 | 115,533 |
| Total £ | 4,640,462 | 4,868,160 | 5,138,436 |
| Expenditure— | |||
| Working expenses £ | 2,051,725 | 2,199,814 | 2,380,097 |
| Capital charges £ | 2,075,617 | 2,153,631 | 2,287,192 |
| Total £ | 4,127,342 | 4,353,445 | 4,667,289 |
| Appropriations £ | 341,650 | 259,505 | 316,479 |
| Capital outlay— | |||
| Total expenditure £ | 33,495,186 | 34,036,936 | 35,347,417 |
| Depreciation £ | 4,332,940 | 4,796,665 | 4,996,409 |
| Net value at 31st March £ | 29,162,246 | 29,240,271 | 30,351,008 |
| Units— | |||
| Generated Thou'ds | 916,302 | 1,031,699 | 1,141,958 |
| Per head of mean population Units | 590 | 660 | 723 |
| Sold (retail) Thou'ds | 709,554 | 775,371 | 856,396 |
| Bulk sales Thou'ds | 681,423 | 773,585 | 871,033 |
The figures given in respect of employees and salaries and wages are those which are met out of revenue.
Prior to the 1935 issue of the Year-Book electric-supply stations were classified in two groups, one being termed generating stations and the other distributing stations. Stations which were solely engaged in generating or which generated more units than they purchased were classified as generating, while those which purchased all their energy or purchased more than they generated were classed as distributing stations.
The classification now adopted is a quadripartite one, as follows:—
Generating stations:—
(1) Generating solely.
(2) Generating and purchasing, but generating bulk of supplies of power.
Distributing stations:—
(3) Generating and purchasing, but purchasing bulk of supplies of power.
(4) Purchasing solely.
The following table sets out the main particulars of all stations classified in this manner for the year ended 31st March, 1937:—
| — | Generating only. | Both Generating and Purchasing. | Purchasing only. | Total. | |
|---|---|---|---|---|---|
| Mainly Generating. | Mainly Purchasing. | ||||
* 000 omitted. | |||||
| Stations No. | 28 | 9 | 18 | 43 | 98 |
| Capital outlay to date £ | 17,180,214 | 2,991,890 | 4,437,989 | 10,737,324 | 35,347,417 |
| Present net value £ | 15,101,989 | 2,508,171 | 4,002,037 | 8,738,811 | 30,351,008 |
| Revenue £ | 1,434,554 | 525,822 | 976,062 | 2,201,998 | 5,138,436 |
| Working-expenses £ | 317,547 | 177,840 | 583,191 | 1,301,519 | 2,380,097 |
| Capital charges and appropriations £ | 1,080,671 | 337,375 | 354,933 | 830,692 | 2,603,671 |
| Units generated* | 998,343 | 134,307 | 9,308 | 1,141,958 | |
| Units purchased* | 13,067 | 217,793 | 584,845 | 815,705 | |
| Units sold— | |||||
| Bulk sales* | 799,830 | 23,858 | 19,074 | 28,271 | 871,033 |
| Retail sales* | 98,699 | 98,322 | 177,999 | 481,376 | 856,396 |
The following summary, covering all stations, shows for 1936–37 the principal details for employees and for salaries and wages paid:—
| Class of Employment. | Persons engaged. | Salaries and Wages paid. | ||||
|---|---|---|---|---|---|---|
| Males. | Females. | Total. | To Males. | To Females. | Total. | |
| (a) Salaries or Wages paid out of Revenue from Sale of Energy. | ||||||
| £ | £ | £ | ||||
| Secretaries, managers, engineers | 280 | 280 | 122,795 | 122,795 | ||
| Clerical staff | 456 | 286 | 742 | 97,964 | 35,976 | 133,940 |
| Wage-earning employees | 2,213 | 17 | 2,230 | 568,156 | 1,707 | 569,863 |
| Totals | 2,949 | 303 | 3,252 | 788,915 | 37,683 | 826,598 |
| (b) Salaries or Wages not paid directly out of Revenue from Sale of Energy. | ||||||
| £ | £ | £ | ||||
| House-wiring | 121 | 121 | 24,537 | 24,537 | ||
| Trading departments | 53 | 3 | 56 | 13,325 | 357 | 13,682 |
| New construction-works | 821 | 821 | 215,305 | 215,305 | ||
| Totals | 995 | 3 | 998 | 253,167 | 357 | 253,524 |
| Grand totals | 3,944 | 306 | 4,250 | 1,042,082 | 38,040 | 1,080,122 |
The following is a summary of the data collected for 1936–37:—
| Class of Expenditure. | Expenditure during Year ended 31st March, 1937. | Total Expenditure to 31st March, 1937. |
|---|---|---|
| £ | £ | |
| Land in connection with power - house, headworks, cottages, &c. | 4,402 | 349,934 |
| Power-house buildings, cottages, &c. | 79,319 | 1,998,520 |
| Generating plant, headworks, &c. | 211,104 | 8,206,617 |
| Special standby plant | 110,481 | 1,581,129 |
| Main transmission-line and main substations | 264,447 | 5,879,547 |
| Distribution system, substations, land, cottages, &c. | 386,982 | 10,878,181 |
| Public (street) lighting | 14,901 | 445,965 |
| Office and store buildings, workshops, garages, houses, and service buildings | 17,149 | 757,340 |
| Loose tools, meters, instruments, furniture, and equipment | 74,927 | 984,618 |
| Interest during construction | Cr. 1,392 | 1,947,690 |
| Loan conversion premiums | Cr. 11,950 | 137,963 |
| Miscellaneous (cost of raising loans, law-costs, &c., and other capital expenditure) | 309,191 | 2,179,913 |
| Totals | 1,459,561 | 35,347,417 |
It will he seen that expenditure on capital account during the year 1936–37 approximated £1,500,000. Of the amount expended on generating plant, head-works, &c., additions to the Government station at Arapuni were responsible for £155,000. The expenditure on special standby plant may be attributed mainly to new installations by the Wellington City Council. Work on transmission-lines and main substations at Arapuni and Waitaki cost approximately £160,000.
It should be noted that the capital-outlay figures no longer include the outlay in stocks of materials and capital invested in trading departments.
The following statement of assets and liabilities summarizes the financial position of the industry, in addition to setting out fully the state of reserves and invested funds:—
| Assets. | |
| £ | |
| Capital expenditure | 35,347,417 |
| Less amounts written off, &c. | 1,169,246 |
| 34,178,171 | |
| Stocks, trading departments, and rolling-stock | 915,818 |
| Reserve funds accrued (invested outside the undertakings)— | |
| Sinking funds | 2,410,226 |
| Depreciation funds | 697,772 |
| Renewal and other funds | 671,710 |
| Cash in hand and bank, sundry debtors, &c. | 2,255,252 |
| £41,137,949 | |
| Liabilities, &c. | |
| £ | |
| Capital raised | 30,301,796 |
| Less repaid | 839,199 |
| Balance owing | 29,462,597 |
| Other liabilities (including sundry creditors) | 868,443 |
| Reserves— | |
| Sinking fund reserve | 2,745,063 |
| Depreciation reserve | 3,827,163 |
| Renewal fund reserve | 463,570 |
| Accident fund reserve | 48,790 |
| Other special reserves | 1,704,583 |
| General reserve | 1,119,422 |
| Credit balance, Revenue Account | 898,318 |
| £41, 137, 949 |
Particulars relating to the power plant in use during the year ended 31st March, 1937, are set out hereunder:—
| Source of Power. | Main Plant. | Standby Plant. | Total. | |||
|---|---|---|---|---|---|---|
| No. | B.H.P. | No. | B.H.P. | No. | B.H.P. | |
| Steam-engines | 1 | 1,250 | 32 | 84,102 | 33 | 85,352 |
| Water-turbines | 102 | 382,429 | 15 | 3,834 | 117 | 386,263 |
| Gas-engines | 11 | 2,214 | 11 | 2,214 | ||
| Oil-engines | 14 | 2,321 | 34 | 23,630 | 48 | 25,951 |
The following table sets out the number of units generated and their disposal. It should be noted that the figures are inclusive of bulk sales.
| Year ended 31st March, | UNITS (000 ommited). | ||||
|---|---|---|---|---|---|
| Generated. | Purchased. | Total. | Sold. | Lost in Transmission, &c. | |
| 1933 | 831,697 | 602,633 | 1,434,330 | 1,242,274 | 192,056 |
| 1934 | 857,806 | 630,715 | 1,488,521 | 1,301,191 | 187,330 |
| 1935 | 916,302 | 672,940 | 1,589,242 | 1,390,977 | 198,265 |
| 1936 | 1,031,699 | 731,602 | 1,763,301 | 1,548,956 | 214,345 |
| 1937 | 1,141,958 | 815,705 | 1,957,663 | 1,727,429 | 230,234 |
Revenue is derived chiefly from the sale of energy, and in 1936–37 this source was responsible for almost 98 per cent. of the total. Some local authorities supplement revenue by the levying of rates, and in 1936–37 this policy resulted in £16,134 being added to revenue. The following table sets out the revenue of all stations:—
| Year ended 31st March, | Sale of Energy. | Profits, Sale of Apparatus. | Miscellaneous. | Interest. | Rates. | Total. |
|---|---|---|---|---|---|---|
| £ | £ | £ | £ | £ | £ | |
| 1933 | 4,308,807 | 9,077 | 139,320 | 23,930 | 60,401 | 4,541,535 |
| 1934 | 4,319,230 | 9,128 | 67,258 | 19,752 | 69,915 | 4,485,283 |
| 1935 | 4,490,223 | 9,673 | 63,161 | 20,618 | 56,787 | 4,640,462 |
| 1936 | 4,726,970 | 12,536 | 66,300 | 17,721 | 44,633 | 4,868,160 |
| 1937 | 5,022,903 | 19,750 | 62,807 | 16,842 | 16,134 | 5,138,436 |
A study of the expenditure figures immediately reveals that overhead costs, comprising management expenses and capital charges, are considerably greater than prime costs, which may be taken as the operating-expenses. During the year ended 31st March, 1937, of the total expenditure recorded (£4,667,289), 58 per cent. represented overhead expenses, while operating-expenses or prime costs stood at 42 per cent.
The table following gives an analysis of expenditure:—
| Item. | Year ended 31st March, | ||||
|---|---|---|---|---|---|
| 1933. | 1934. | 1935. | 1936. | 1937. | |
| Operating Expenditure. | |||||
| £ | £ | £ | £ | £ | |
| Cost of power | 907,264 | 942,536 | 985,696 | 1,056,906 | 1,155,618 |
| Cost of generation | 77,788 | 85,496 | 90,325 | 80,949 | 85,664 |
| Fuel | 26,338 | 15,746 | 10,423 | 11,540 | 10,346 |
| Stores | 4,242 | 3,751 | 3,613 | 4,400 | 2,883 |
| Repairs | 55,252 | 31,485 | 32,544 | 43,983 | 34,599 |
| Standby plant | 131,646 | 21,497 | 19,354 | 37,933 | 50,320 |
| Cost of transmission | 57,756 | 67,491 | 74,626 | 81,618 | 72,924 |
| Cost of distribution | 388,389 | 369,057 | 402,047 | 463,316 | 521,787 |
| Public (street) lighting | 21,538 | 27,265 | 30,547 | 24,726 | 25,434 |
| Totals | 1,670,213 | 1,564,324 | 1,649,175 | 1,805,371 | 1,959,575 |
| Miscellaneous Expenditure. | |||||
| £ | £ | £ | £ | £ | |
| Cost of management | 250,500 | 253,479 | 271,124 | 308,640 | 331,276 |
| Insurance | 39,309 | 19,530 | 19,337 | 18,897 | 21,468 |
| Losses from trading | 3,655 | 3,086 | 1,568 | 5,290 | 2,850 |
| Other expenditure | 61,355 | 77,316 | 110,521 | 61,616 | 64,928 |
| Totals | 354,719 | 353,411 | 402,550 | 394,443 | 420,522 |
| Capital Charges. | |||||
| Interest | 1,456,257 | 1,366,825 | 1,325,223 | 1,372,115 | 1,357,095 |
| Sinking fund | 271,166 | 261,692 | 284,711 | 235,071 | 227,912 |
| Depreciation reserve | 322,591 | 289,229 | 401,359 | 411,413 | 521,900 |
| Loan repayment | 65,406 | 31,738 | 47,858 | 73,013 | 93,519 |
| Exchange | 37,302 | 58,890 | 16,466 | 62,019 | 86,766 |
| Totals | 2,152,722 | 2,008,374 | 2,075,617 | 2,153,631 | 2,287,192 |
| Grand totals | 4,177,654 | 3,926,109 | 4,127,342 | 4,353,445 | 4,667,289 |
The distribution of the expenditure per unit sold is given hereunder:—
| — | Year ended 31st March, | ||||
|---|---|---|---|---|---|
| 1933 | 1934 | 1935 | 1936 | 1937 | |
| d. | d. | d. | d. | d. | |
| Operating-expenses | 0.32 | 0.29 | 0.28 | 0.28 | 0.27 |
| Capital charges and miscellaneous expenses | 0.49 | 0.43 | 0.43 | 0.39 | 0.38 |
| Totals | 0.81 | 0.72 | 0.71 | 0.67 | 0.65 |
The following table shows the appropriations of net surplus for years ended 31st March:—
| — | 1933. | 1934. | 1935. | 1936. | 1937. |
|---|---|---|---|---|---|
| £ | £ | £ | £ | £ | |
| Renewal Fund | 59,488 | 75,113 | 48,195 | 18,782 | 44,254 |
| Reserve Fund | 56,510 | 101,689 | 90,059 | 15,099 | 12,902 |
| Other | 238,399 | 239,454 | 203,396 | 225,624 | 259,323 |
| Totals | 354,397 | 416,256 | 341,650 | 259,505 | 316,479 |
The following table shows the hydro-electric horse-power actually in use in the various districts at the 31st March in each of the last five years. The figures cover all hydro-plants, whether main or standby, exceeding one horse-power with the exception of plants not exceeding six horse-power used exclusively for farming purposes:—
| District. | 1933. | 1934. | 1935. | 1936. | 1937. |
|---|---|---|---|---|---|
| H.P. | H.P. | H.P. | H.P. | H.P. | |
| Auckland North | 2,839 | 3,188 | 3,188 | 3,126 | 3,126 |
| Auckland | 349 | ||||
| Auckland South | 118,452 | 118,445 | 118,445 | 118,445 | 118,445 |
| Gisborne | 46,331 | 46,306 | 46,279 | 56,279 | 56,279 |
| Hawke's Bay | |||||
| Taranaki North | 10,462 | 10,439 | 10,439 | 12,796 | 12,879 |
| Taranaki | 1,300 | 1,485 | 1,495 | 1,495 | 1,495 |
| Wellington North | 43,086 | 43,073 | 43,071 | 33,070 ½ | 33,037 ½ |
| Wellington | 1,547 | 1,540 | 1,540 | 1,530 | 4,563 |
| Nelson and Marlborough | 2,473 | 2,471 ½ | 2,827 | 2,777 | |
| Westland | 8,906 | 9,110 | 8,997 | 9,396 | 9,355 |
| Canterbury | 49,344 | ||||
| Canterbury South | 49,317 | 49,338 | 59,803 | 59,833 | |
| Otago | 31,169 ½ | 31,342 | 88,166 ½ | 81,766 ½ | 81,407 ½ |
| Southland | 12,450 | 12,457 ½ | 12,493 ½ | 13,401 ½ | 13,821 ½ |
| Totals | 328,708 ½ | 329,174 | 386,279 | 393,885 ½ | 394,241 ½ |
The following table gives an analysis of the purposes for which plants were generating power as at the 31st March, 1937:—
| District. | Mining. | Electric Supply. | Flax-mills. | Sawmills. | Flour-mills. | Dairying. | Construction Works. | Freezing-works. | Paper-mills. | Miscellaneous. | Totals. |
|---|---|---|---|---|---|---|---|---|---|---|---|
| H.P. | H.P. | H.P. | H.P. | H.P. | H.P. | H.P. | H.P. | H.P. | H.P. | H.P. | |
| Auckland N. | 149 | 2,920 | 15 | 4 | 38 | 3,126 | |||||
| Auckland | |||||||||||
| Auckland South | 1,013 | 117,403 | 17 | 12 | 118,445 | ||||||
| Gisborne | |||||||||||
| Hawke's Bay | 56,267 | 12 | 56,279 | ||||||||
| Taranaki North | 12,400 | 435 | 20 | 24 | 12,879 | ||||||
| Taranaki | 1,415 | 40 | 40 | 1,495 | |||||||
| Wellington N. | 33,020 | 8 | 9 ½ | 33,037 ½ | |||||||
| Wellington | |||||||||||
| Nelson | 4,434 | 69 | 30 | 30 | 4,563 | ||||||
| Marlborough | |||||||||||
| Westland | 500 | 8,339 | 36 | 450 | 18 | 12 | 9,355 | ||||
| Canterbury | |||||||||||
| Canterbury S. | 59,624 | 26 | 119 | 5 | 59 | 59,833 | |||||
| Otago | 1,300 | 78,610 | 7 | 79 | 1,411 ½ | 81,407 ½ | |||||
| Southland | 11,213 ½ | 8 | 1,200 | 1,400 | 13,821 ½ | ||||||
| Totals | 2,962 | 385,645 ½ | 70 | 598 | 198 | 496 | 1,224 | 1,400 | 1,648 | 394,241 ½ |
The figures shown in the above table do not, of course, indicate the purposes for which hydro-electric power was used, since by far the greatest proportion of the total horse-power used in industry would be drawn from the electric-supply stations and not generated in separate plants.
Table of Contents
THE Public Trust Office is designed mainly to afford, at low rates of commission, a secure and convenient recourse in any case where a person residing either in New-Zealand or abroad desires to draw a will, form a trust, or appoint an executor, trustee, agent, or attorney in the Dominion. The Office aims also to relieve those who for various reasons may be unable or unwilling to commence or continue the administration of trust property to which they may have been appointed.
The Public Trust Office commenced operations in 1873, at the end of which year 257 estates, of a total value of £17,500, were being administered by the Office. Since then there has been a practically continuous increase in both number and value of estates administered, the records at 31st March, 1937, showing 18,874 estates of a value of £60,770,814.
| At 31st March, | Total Value of Estates in Office, including Unrealized Assets. | Funds at Credit of Estates and Accounts. |
|---|---|---|
| £ | £ | |
| 1928 | 44,155,548 | 28,485,442 |
| 1929 | 48,334,790 | 31,043,172 |
| 1930 | 53,049,437 | 34,049,290 |
| 1931 | 57,527,263 | 36,488,434 |
| 1932 | 59,132,512 | 36,859,518 |
| 1933 | 59,757,449 | 36,815,941 |
| 1934 | 60,760,493 | 37,155,883 |
| 1935 | 60,706,016 | 36,666,196 |
| 1936 | 60,660,310 | 36,500,511 |
| 1937 | 60,770,814 | 36,553,648 |
New estates which came into the Office during the year ended 31st March, 1937, numbered 2,770, and represented a value of £5,968,109. The classification of these and of the estates under administration at 31st March, 1937, is as follows:—
| — | New Estates during 1936–37. | Estates under Administration at 31st March, 1937. | ||
|---|---|---|---|---|
| Number. | Value. | Number. | Value. | |
| £ | £ | |||
| Wills estates | 1,323 | 3,009,633 | 6,921 | 19,619,500 |
| Trust estates | 279 | 674,036 | 2,552 | 7,946,339 |
| Intestate estates | 455 | 351,417 | 2,443 | 1,665,918 |
| Mental patients' estates | 438 | 527,145 | 2,331 | 2,671,418 |
| Miscellaneous estates | 275 | 1,405,878 | 4,627 | 28,867,639 |
| Totals | 2,770 | 5,968,109 | 18,874 | 60,770,814 |
Testators and other clients appointing the Public Trustee their executor or trustee may direct investment of their funds either in the Common Fund of the Office or outside of the Common Fund. In the former case the investments are not ear-marked to the estate, but are guaranteed by the State. Interest, which is at such rate as is fixed from time to time by the Governor-General in Council, accrues from the date the moneys reach the Office, and is free of all commission and other charges.
In the case of special investment outside the Common Fund, the investments belong to the estate, but there is no State guarantee, and (subject to the Public Trustee's ordinary liability as a trustee) any loss falls on the estate. Commission is charged on the interest collected.
In general, investment in the Common Fund is preferred by clients, the safety of such investment being an important consideration. The Common Fund at 31st March, 1937, held moneys to the total of £24,044,359. The total amount invested by the Public Trust Office as at 31st March, 1937, on behalf of the estates and funds under administration was £36,211,293.
During the year ended 31st March, 1937, 4,408 wills were deposited with the Public Trustee, and 1,965 were withdrawn on account of the death of the testator or for other reasons, the net increase for the year being 2,443. The number of wills on deposit at the 31st March, 1917, was 19,565; by 1927 it had increased to 53,531; while at 31st March, 1937, it had risen to 88,321.
In addition to preparing wills in the first instance, the Office affords its clients special facilities for the revision of existing wills to provide for changes desired by them. During 1936–37 3,898 wills held on behalf of testators were so revised.
For thirty years following the enactment of the Companies Act of 1903, no comprehensive revision of statute law relating to companies was made in New Zealand, and the essential provisions of company law remained substantially unaltered. In 1930 the Attorney-General appointed an advisory committee, including representatives of the business community, and of the professions of law and accountancy, to act with the Law Draftsman in framing a new measure, which, in the form of the Companies Act, 1933, came into force on 1st April, 1934. In great part the measure is an adaptation of the Imperial Act of 1929 to suit the special conditions of New Zealand.
A noteworthy step in the history of company legislation was taken by the Companies (Bondholders Incorporation) Act, 1934–35, which provided machinery for the incorporation of the holders of bonds issued by certain afforestation and other companies.
The position of certain investment companies in 1934 led to the appointment of a Commission of Inquiry and the passing of a novel series of legislative enactments designed to investigate their affairs and to protect the investors. The Acts passed comprised the Companies (Special Investigations) Act, 1934; the Companies (Special Liquidations) Act, 1934–35; and the Companies (Temporary Receivership) Act, 1935.
During the year ended 31st December, 1936, 942 joint-stock companies were registered, with a total nominal capital of £9,934,903. In the following table these companies are classified according to the amount of their nominal capital.
| Amount. | Private Companies. | Public Companies. | Overseas Companies. | |||
|---|---|---|---|---|---|---|
| Number. | Aggregate Nominal Capital. | Number. | Aggregate Nominal Capital. | Number. | Aggregate Nominal Capital. | |
| £ | £ | £ | ||||
| Under £1,000 | 285 | 119,574 | 5 | 1,050 | 2 | 200 |
| £1,000 and under £2,000 | 228 | 269,075 | 3 | 4,200 | 1 | 1,000 |
| £2,000 and under £3,000 | 99 | 214,278 | 6 | 13,500 | ||
| £3,000 and under £4,000 | 50 | 157,900 | 6 | 19,250 | ||
| £4,000 and under £5,000 | 26 | 106,678 | 1 | 4,000 | ||
| £5,000 and under £6,000 | 34 | 171,100 | 8 | 40,500 | 3 | 15,000 |
| £6,000 and under £7,000 | 20 | 122,000 | 6 | 36,500 | ||
| £7,000 and under £8,000 | 9 | 65,250 | ||||
| £8,000 and under £9,000 | 7 | 57,300 | 3 | 24,500 | ||
| £9,000 and under £10,000 | 1 | 9,000 | ||||
| £10,000 and under £15,000 | 21 | 220,800 | 20 | 216,500 | 1 | 10,000 |
| £15,000 and under £20,000 | 6 | 95,100 | 9 | 139,500 | 1 | 15,000 |
| £20,000 and under £50,000 | 12 | 315,000 | 22 | 602,350 | 2 | 55,000 |
| £50,000 and over | 10 | 1,490,000 | 26 | 4,071,055 | 9 | 1,252,743 |
| Totals | 807 | 3,404,055 | 116 | 5,181,905 | 19 | 1,348,943 |
The next table gives figures of total registrations during each of the last three years, classified according to amount of nominal capital.
| Amount. | 1934. | 1935. | 1936. | |||
|---|---|---|---|---|---|---|
| Number. | Aggregate Nominal Capital. | Number. | Aggregate Nominal Capital. | Number. | Aggregate Nominal Capital. | |
| £ | £ | £ | ||||
| No fixed capital | 7 | |||||
| Under £1,000 | 280 | 110,117 | 285 | 122,745 | 292 | 120,824 |
| £1,000 and under £2,000 | 153 | 182,768 | 171 | 202,283 | 232 | 274,275 |
| £2,000 and under £3,000 | 85 | 185,710 | 103 | 220,642 | 105 | 227,778 |
| £3,000 and under £4,000 | 35 | 109,970 | 34 | 106,675 | 56 | 177,150 |
| £4,000 and under £5,000 | 17 | 70,799 | 24 | 99,100 | 27 | 110,678 |
| £6,000 and under £6,000 | 58 | 291,800 | 43 | 217,010 | 45 | 226,600 |
| £6,000 and under £7,000 | 15 | 91,981 | 10 | 60,500 | 26 | 158,500 |
| £7,000 and under £8,000 | 7 | 51,040 | 14 | 99,600 | 9 | 65,250 |
| £8,000 and under £9,000 | 6 | 49,416 | 5 | 40,750 | 10 | 81,800 |
| £9,000 and under £10,000 | 6 | 54,375 | 1 | 9,000 | 1 | 9,000 |
| £10,000 and under £15,000 | 45 | 480,500 | 47 | 504,500 | 42 | 447,300 |
| £15,000 and under £20,000 | 14 | 221,000 | 14 | 219,500 | 16 | 249,600 |
| £20,000 and under £50,000 | 41 | 1,145,000 | 29 | 769,872 | 36 | 972,350 |
| £50,000 and over | 164 | 197,694,663 | 30 | 21,565,841 | 45 | 6,813,798 |
| Totals | 933 | 200,739,139 | 810 | 24,238,018 | 942 | 9,934,903 |
In comparing one year with another, as in the following table, it should not be overlooked that re-registrations on account of reconstruction of companies or for other reasons are included. Such re-registrations may have a considerable effect on the year's total, when large companies are concerned.
| Year. | Number. | Aggregate Nominal Capital. |
|---|---|---|
* See letterpress. | ||
| £ | ||
| 1917 | 261 | 5,367,201 |
| 1918 | 200 | 3,055,351 |
| 1919 | 328 | 5,942,305 |
| 1920 | 501 | 9,562,933 |
| 1921 | 337 | 3,498,208 |
| 1922 | 417 | 13,125,494 |
| 1923 | 502 | 13,006,085 |
| 1924 | 565 | 21,367,310 |
| 1925 | 621 | 14,760,398 |
| 1926 | 655 | 10,748,231 |
| 1927 | 698 | 8,701,808 |
| 1928 | 736 | 10,984,907 |
| 1929 | 903 | 12,472,057 |
| 1930 | 893 | 6,702,675 |
| 1931 | 795 | 8,283,581 |
| 1932 | 812 | 6,865,769 |
| 1933 | 830 | 7,300,999 |
| 1934 | 933 | 200,739,139* |
| 1935 | 810 | 24,238,018 |
| 1936 | 942 | 9,934,903 |
The extraordinarily high figure for 1934 is due to the inclusion of all overseas companies (numbering 187 and with an aggregate nominal capital of £193,023,363) which had previous to 1934 established places of business in New Zealand and which were re-registered in 1934 under Part XII of the Companies Act, 1933.
The tables which follow, the result of a special compilation, show the number and capital of all companies on the register at 31st December, 1932. In the case of public companies, the information was obtained from the statutory returns furnished annually by each public company to the Registrar of Companies, and includes details of the nominal, subscribed, and paid-up capital, and also of the amount of mortgages registered under the Companies Act. As regards private companies, the information is less complete, there being no annual return as in the case of public companies. On the registration of a private company, however, it is necessary that all the capital be subscribed for in accordance with the Act, so that, except in cases where the capital has been subsequently increased by resolution, the subscribed capital is identical with the nominal capital. The paid-up and loan capital, as explained later, is capable of approximate estimation.
| Amount of Nominal Capital. | Number. | Nominal Capital. | Subscribed Capital. | Paid-up Capital. | Mortgages under Companies Act. |
|---|---|---|---|---|---|
| £ | £ | £ | £ | £ | |
| Under £1,000 | 86 | 39,867 | 30,869 | 27,217 | 36,484 |
| £1,000 and under £2,000 | 83 | 101,379 | 68,326 | 57,536 | 28,852 |
| £2,000 and under £3,000 | 127 | 271,351 | 192,028 | 163,188 | 63,969 |
| £3,000 and under £4,000 | 84 | 258,275 | 185,874 | 152,900 | 50,264 |
| £4,000 and under £5,000 | 45 | 185,521 | 133,652 | 108,714 | 67,605 |
| £5,000 and under £6,000 | 117 | 587,900 | 379,013 | 318,181 | 158,155 |
| £6,000 and under £7,000 | 40 | 241,777 | 172,595 | 141,466 | 166,265 |
| £7,000 and under £8,000 | 34 | 244,500 | 172,210 | 137,055 | 19,637 |
| £8,000 and under £9,000 | 42 | 339,450 | 263,677 | 216,253 | 101,250 |
| £9,000 and under £10,000 | 6 | 54,000 | 44,921 | 34,261 | 6,000 |
| £10,000 and under £15,000 | 196 | 2,094,321 | 1,445,713 | 1,174,715 | 472,406 |
| £15,000 and under £20,000 | 82 | 1,268,422 | 960,580 | 828,330 | 259,712 |
| £20,000 and under £50,000 | 359 | 9,916,312 | 7,280,037 | 6,117,071 | 2,238,446 |
| £50,000 and under £100,000 | 199 | 11,711,959 | 8,614,229 | 7,315,955 | 2,564,822 |
| £100,000 and over | 232 | 70,238,544 | 51,078,012 | 42,314,060 | 9,219,297 |
| Totals, 31st December, 1932 | 1,732 | 97,553,578 | 71,021,736 | 59,106,902 | 15,453,164 |
| Totals, 31st December, 1926 | 1,630 | 89,544,858 | 58,807,519 | 49,982,593 | 16,181,126 |
The total capital employed by the 1,732 public companies on the register at the 31st December, 1932, amounted to £74,560,066, as compared with £66,163,719 for 1,630 companies at the date of the previous tabulation (31st December, 1926). In regard to the mortgages included in the foregoing amounts, it should be noted that complete accuracy is impossible, owing to the fact that many of the mortgages are to secure current accounts which vary from time to time. Moreover, information regarding bank overdrafts and other accommodation not requiring registration is not available.
| Amount of Nominal Capital. | Number. | Aggregate Nominal Capital. |
|---|---|---|
| £ | ||
| Under £1,000 | 1,129 | 488,590 |
| £1,000 and under £2,000 | 1,021 | 1,250,409 |
| £2,000 and under £3,000 | 736 | 1,594,938 |
| £3,000 and under £4,000 | 495 | 1,556,926 |
| £4,000 and under £5,000 | 314 | 1,307,221 |
| £5,000 and under £6,000 | 459 | 2,319,577 |
| £6,000 and under £7,000 | 254 | 1,558,212 |
| £7,000 and under £8,000 | 150 | 1,081,421 |
| £8,000 and under £9,000 | 121 | 982,854 |
| £9,000 and under £10,000 | 71 | 647,080 |
| £10,000 and under £15,000 | 551 | 5,974,744 |
| £15,000 and under £20,000 | 201 | 3,194,469 |
| £20,000 and under £50,000 | 447 | 11,783,657 |
| £50,000 and under £100,000 | 84 | 5,074,298 |
| £100,000 and over | 50 | 9,548,710 |
| Totals, 31st December, 1932 | 6,083 | 48,363,106 |
| Totals, 31st December, 1926 | 3,439 | 36,060,343 |
Assuming that the subscribed capital of private companies is equivalent to the nominal capital, and that the ratio of subscribed capital to paid-up capital obtaining in the case of private companies engaged in manufacturing industries (this information being available from the annual returns of factory production) is similar for other private companies, the total paid-up capital of all private companies may be put down as approximately £44,800,000. Making a similar assumption in regard to the ratio of mortgages to paid-up capital, the mortgages of all private companies total about £9,800,000, which, added to the paid-up capital, gives a total working capital of £64,600,000, compared with £41,600,000 in 1926. For both public and private companies the total working capital is thus estimated at approximately £129,000,000, the corresponding figure for 1926 being £108,000,000.
The figures given above in respect of companies on the register in December, 1932, do not include foreign companies, regarding which information is extremely scanty, only the total nominal capital being recorded with the Registrar of Companies. At the end of 1932 there were 203 foreign companies on the register, with a total nominal capital of £143,800,000, this being a small decrease on the 1926 total of £145,300,000 (205 companies). The nominal capital of overseas companies in operation in New Zealand at the inception of the Companies Act, 1933, is shown above to have been £193,000,000. The figure quoted for overseas companies, however, gives no indication whatever as to the amount of overseas capital employed in the Dominion, which must be only a small proportion of the totals shown.
In addition to the foregoing there were at the end of 1932 41 companies limited by guarantee, 16 unlimited companies, 33 rural intermediate credit associations, and 11 companies of a miscellaneous character.
There were 1,836 applications for letters patent during 1936, 756 of these being filed with provisional specifications, and 1,080 with complete specifications. Patent fees for the year amounted to £13,276.
The total number of applications received up to the 31st December, 1936, was 77,238, and the patents in force in New Zealand at that date numbered 8,248. The number of patent agents on the register was 18.
In the following table are shown the countries of residence of persons who applied for patents in New Zealand during the last three years. Owing to applications being received from joint applicants resident in different countries, also from applicants giving two addresses, the figures usually total more than the actual number of applications received.
| Country. | 1934. | 1935. | 1936. |
|---|---|---|---|
| New Zealand | 921 | 888 | 781 |
| Great Britain | 367 | 351 | 440 |
| Australia | 207 | 205 | 216 |
| United States | 79 | 105 | 158 |
| Germany | 112 | 103 | 143 |
| Netherlands | 31 | 34 | 28 |
| France | 14 | 13 | 26 |
| Canada | 4 | 4 | 13 |
| Sweden | 10 | 8 | 4 |
| Denmark | 7 | 6 | 4 |
| Italy | 1 | 4 | |
| Austria | 1 | 4 | |
| Union of South Africa | 5 | 3 | |
| Switzerland | 8 | 1 | 2 |
| All other countries | 13 | 7 | 10 |
| Totals | 1,775 | 1,730 | 1,836 |
A large number of the applications for patents deal with telephony and telegraphy, the figures for 1936 and 1935 being 488 and 319 respectively. These show a considerable increase on the average yearly number for the quinquennium 1929–33 (236).
The total number of applications during 1936 in respect of trade-marks was 1,096, and the fees received totalled £3,483. Of the total applications (remarks above regarding joint applicants are applicable hero also), 424 were made by residents of New Zealand, 397 came from Great Britain, 134 from Australia, 72 from the United States, and 22 from Germany.
The number of applications for registration of designs totalled 124, and the fees received for the year were £98.
The following £table shows the number of applications for patents and for the registration of trade-marks and designs in each of the last ten years:—
| Year. | Patents. | Trademarks. | Designs. |
|---|---|---|---|
| 1927 | 2,052 | 1,325 | 145 |
| 1928 | 2,070 | 1,201 | 163 |
| 1929 | 2,251 | 1,359 | 125 |
| 1930 | 2,103 | 1,265 | 169 |
| 1931 | 2,065 | 999 | 151 |
| 1932 | 1,846 | 925 | 164 |
| 1933 | 1,762 | 814 | 143 |
| 1934 | 1,766 | 915 | 146 |
| 1935 | 1,730 | 943 | 185 |
| 1936 | 1,836 | 1,096 | 124 |
For the year 1936 the total receipts of the Patent Office were £13,276 and the payments £5,222, leaving a surplus of £8,054 compared with £8,392 in 1935.
The Inspection of Machinery Act makes provision for the inspection of steam boilers, digesters, other steam-pressure vessels, and air-receivers; of hydraulic, electric, and other lifts; of all types of power-driven cranes and power-driven machinery on land; and of machinery used on vessels afloat that are not self-propelled. Nothing in the Act applies to any machinery driven by manual or animal power, or to any machinery the motive power of which does not exceed one horse-power. Machinery which is used exclusively for farming purposes and does not exceed six horsepower is exempt from annual inspection.
Boilers, pressure-vessels, air-receivers, lifts, and cranes are required to be of approved design and workmanship, and the moving parts of machinery to be adequately guarded.
The Act provides that where loss of life or serious bodily injury to any person occurs by reason of the explosion of a boiler or as a result of an accident caused by machinery, the explosion or accident must be reported by the owner, and the cause investigated by an Inspector of Machinery. There were no boiler explosions during the year. The number of accidents reported as caused by machinery were: Fatal, 8; non-fatal, 129: total, 137.
The Act also provides for the issue of certificates to those who pass the prescribed examinations for land engineers and engine-drivers in charge of boilers and machinery, for winding-engine drivers for mining purposes, for drivers employed on locomotives working on railway-lines not under the control of the Government Working Railways Department, and for the drivers of traction-engines on roads. Certificates are also issued to electric-tram drivers as provided by the Tramways Amendment Act, 1910. The issue of these certificates is controlled by a Board of Examiners set up by the Act, the Chairman being the Chief Inspector of Machinery.
Inspections of boilers and machinery during the year ended 31st March, 1937, numbered 91,967, made up as follows:—
| Boiler inspections— | |
|---|---|
| Stationary, portable, and traction boilers | 4,834 |
| Steam-pressure vessels | 3,370 |
| Air-receivers | 775 |
| Total boilers | 8,979 |
| Machinery inspections— | |
|---|---|
| Lifts | 3,328 |
| Cranes | 336 |
| Hoists | 1,329 |
| Machines driven by steam power | 13,316 |
| Machines not driven by steam power | 64,214 |
| Electric-power supply station units | 154 |
| Tractors | 311 |
| Total machinery | 82,988 |
| Grand total | 91,967 |
In 1936–37 new boilers to the number of 560, representing an aggregate of 2,182 horse-power, were inspected and tested before being used. Of these, 294, of a total horse-power of 1,527, had been made in New Zealand, the others being imported.
During the year ended 31st March, 1937, 483 certificates were issued to land engineers, engine-drivers, and electric-tram drivers. At examinations during the year 565 candidates sat, 420 being successful.
Revenue and expenditure in connection with inspection of machinery for the last five years have been as follows:—
| — | 1932–33. | 1933–34. | 1934–35. | 1935–36. | 1930–37. |
|---|---|---|---|---|---|
| Revenue— | £ | £ | £ | £ | £ |
| Inspection fees, &c. | 18,981 | 19,530 | 19,332 | 19,566 | 20,082 |
| Examination fees, &c. | 401 | 313 | 359 | 423 | 593 |
| Totals | 19,382 | 19,843 | 19,691 | 19,989 | 20,675 |
| Expenditure | 17,144 | 16,933 | 17,565 | 18,349 | 20,892 |
Complete statistics covering all phases of production are not available; and, in compiling the following statistics of value of production, estimates of production have been made in several cases where direct data are not available. Since statistical information as to production in each of the major productive activities is collected by the Census and Statistics Department, the items for which estimates must be made are, with the exception of one group of commodities, relatively unimportant. Although the value of products made in the home—e.g., home-made clothing, jams, kitchen-garden products, &c.—must, in the aggregate, account for a considerable annual value, it is quite impossible to estimate with any reasonable degree of accuracy the value of such production; which is, on this account, omitted from the value of production statistics.
The general principle followed in assessing values has been to value products as near as possible to the actual point of production. For example, live-stock is valued at saleyard prices, while values at the factory are used in the case of factory products. In some cases, however, reliable data as to values at or near the point of production cannot be obtained; and in these cases export valuations or wholesale price quotations have been used in assessing values. Although absolute uniformity of treatment in the basis of valuation as between different commodities has not been possible, the method of valuation of each individual item has been the same for each year throughout the period covered. The statistics thus afford a fairly accurate measure of fluctuations in the value of production from year to year, although the absolute figures for any individual year must be regarded as approximate only.
Since the basis of valuation is (as far as possible) at the point of production, transport costs are only partly represented in the values shown, while the accretions to the value of commodities caused by the services of retailers and other distributors of finished products are not included in the statistics.
In classifying the value of production into the principal groups care has been taken to avoid duplication, products of one group which constitute the raw material of another group being excluded from the statistics. For example, the gross value of agricultural products in 1935–36 is estimated at £29.1 millions; but, as the major part of this was utilized for the purpose of adding value to live-stock, the net value only (£9.2 million) is classified under the heading “Agricultural”; since live-stock and live-stock products are included in the next two groups.
Products have been classified into the groups to which they most logically belong from a production point of view; butter and cheese, for example, being classified under “Dairying, Poultry, and Bees,” and not as factory products. The figure shown under the heading “Factory Production” is the aggregate value added to materials by the process of manufacture, excluding industries which are already included in other groups (e.g., butter and cheese-making, meat-freezing, fish-curing, and sawmilling). The total output of factory industries is included in cases where the materials are produced in New Zealand and are not already included as production in some other group.
The series of annual estimates of value of production have been revised back to the year 1900–01. It should be understood that all values are in terms of New Zealand currency, which since the latter portion of 1929–30 has depreciated in terms of sterling.
| Year. | Agricultural. | Pastoral. | Dairying, Poultry, and Bees. | Mining. | Fisheries. | Forestry. | Factory. | Building and Miscellaneous. | Total. |
|---|---|---|---|---|---|---|---|---|---|
| £m. | £m. | £m. | £m. | £m. | £m. | £m. | £m. | £m. | |
| 1900–01 | 4.1 | 12.2 | 3.7 | 2.9 | 0.1 | 2.0 | 5.4 | 3.5 | 33.9 |
| 1905–06 | 4.3 | 17.3 | 5.3 | 4.0 | 0.1 | 2.6 | 6.8 | 5.2 | 45.6 |
| 1910–11 | 4.0 | 20.5 | 7.4 | 4.0 | 0.2 | 2.8 | 8.1 | 5.8 | 52.8 |
| 1915–16 | 7.6 | 31.2 | 11.5 | 3.7 | 0.3 | 1.9 | 9.7 | 5.3 | 71.2 |
| 1916–17 | 6.3 | 31.4 | 12.7 | 3.3 | 0.2 | 2.4 | 10.6 | 5.2 | 72.1 |
| 1917–18 | 7.3 | 32.9 | 13.8 | 2.8 | 0.2 | 2.6 | 11.5 | 5.3 | 76.4 |
| 1918–19 | 8.0 | 37.6 | 14.8 | 3.8 | 0.3 | 2.6 | 12.6 | 5.9 | 85.6 |
| 1919–20 | 8.8 | 37.2 | 18.0 | 4.1 | 0.4 | 3.1 | 15.1 | 6.4 | 93.1 |
| 1920–21 | 8.8 | 30.2 | 26.2 | 3.0 | 0.4 | 4.6 | 18.6 | 7.6 | 99.4 |
| 1921–22 | 9.5 | 28.8 | 21.8 | 3.2 | 0.5 | 4.5 | 17.2 | 8.2 | 93.7 |
| 1922–23 | 8.1 | 31.4 | 25.2 | 3.1 | 0.4 | 4.5 | 18.0 | 9.7 | 100.4 |
| 1923–24 | 7.1 | 33.2 | 24.6 | 3.4 | 0.5 | 4.7 | 19.2 | 11.4 | 104.1 |
| 1924–25 | 8.1 | 44.1 | 26.2 | 3.5 | 0.5 | 4.8 | 20.8 | 11.9 | 119.9 |
| 1925–26 | 8.4 | 32.9 | 25.2 | 3.6 | 0.6 | 4.7 | 22.3 | 13.1 | 110.8 |
| 1926–27 | 8.8 | 32.7 | 24.7 | 3.9 | 0.5 | 4.0 | 23.0 | 13.9 | 111.5 |
| 1927–28 | 9.6 | 39.3 | 27.2 | 4.1 | 0.5 | 3.5 | 22.8 | 13.1 | 120.1 |
| 1928–29 | 9.9 | 43.1 | 29.3 | 4.0 | 0.5 | 3.4 | 24.0 | 12.4 | 126.6 |
| 1929–30 | 9.1 | 36.1 | 28.4 | 4.1 | 0.6 | 3.6 | 25.6 | 13.4 | 120.9 |
| 1930–31 | 8.8 | 24.6 | 22.2 | 4.0 | 0.5 | 2.9 | 23.3 | 11.3 | 97.6 |
| 1931–32 | 8.0 | 19.3 | 21.9 | 3.7 | 0.4 | 1.7 | 18.6 | 10.0 | 83.6 |
| 1932–33 | 8.9 | 20.4 | 21.2 | 3.5 | 0.4 | 1.7 | 17.7 | 10.0 | 83.8 |
| 1933–34 | 8.7 | 32.1 | 22.5 | 3.6 | 0.4 | 2.0 | 18.6 | 10.9 | 98.8 |
| 1934–35 | 7.9 | 28.3 | 23.0 | 3.8 | 0.4 | 2.6 | 20.7 | 10.3 | 97.0 |
| 1935–36 | 9.2 | 34.5 | 28.8 | 4.0 | 0.4 | 3.0 | 23.2 | 11.1 | 114.2 |
From the figures of total value of production it is possible, by taking into account the increase of population and the movement of prices, to compile a series of index numbers showing the relative volume of production. The index number of producers' prices used in this compilation is obtained by combining the index number of wholesale prices of locally produced commodities with the index number of export prices. The recent compilation of a series of export-prices index numbers for June years has made possible the construction of producers' prices index numbers on a more satisfactory basis than was formerly possible. The index numbers of the volume of production have accordingly been recomputed in the light of the improved data now available. The figures are given in detail in the next table.
| Year. | Mean Population, Year ended 30th June. | Value of Production. | Index Numbers of Value of Production (1928–29 = 1000). | Index Number of Producers' Prices (1928–29 = 1000). | Index Numbers of Volume of Production (1928–29 = 1000). | |||
|---|---|---|---|---|---|---|---|---|
| Total. | Per Head. | Total. | Per Head. | Total. | Per Head. | |||
| £m. | £ | |||||||
| 1900–01 | 812,010 | 33.9 | 41.7 | 268 | 483 | 465 | 576 | 1039 |
| 1905–06 | 929,066 | 45.6 | 49.1 | 360 | 568 | 602 | 598 | 944 |
| 1910–11 | 1,050,014 | 52.8 | 50.3 | 417 | 582 | 601 | 694 | 968 |
| 1915–16 | 1,150,372 | 71.2 | 61.9 | 562 | 716 | 823 | 683 | 870 |
| 1916–17 | 1,148,578 | 72.1 | 62.8 | 570 | 727 | 909 | 627 | 800 |
| 1917–18 | 1,151,235 | 76.4 | 66.4 | 603 | 769 | 979 | 616 | 786 |
| 1918–19 | 1,174,628 | 85.6 | 72.9 | 676 | 844 | 1,027 | 658 | 822 |
| 1919–20 | 1,217,150 | 93.1 | 76.5 | 735 | 885 | 1088 | 676 | 813 |
| 1920–21 | 1,258,313 | 99.4 | 79.0 | 785 | 914 | 1,105 | 710 | 827 |
| 1921–22 | 1,291,376 | 93.7 | 72.6 | 740 | 840 | 997 | 742 | 843 |
| 1922–23 | 1,317,154 | 100.4 | 76.2 | 793 | 882 | 948 | 836 | 930 |
| 1923–24 | 1,339,786 | 104.1 | 77.7 | 822 | 899 | 1029 | 799 | 874 |
| 1924–25 | 1,367,978 | 119.9 | 87.6 | 947 | 1,014 | 1,111 | 852 | 913 |
| 1925–26 | 1,399,583 | 110.8 | 79.2 | 875 | 917 | 1,016 | 861 | 903 |
| 1926–27 | 1,427,569 | 111.5 | 78.1 | 881 | 904 | 951 | 926 | 951 |
| 1927–28 | 1,447,657 | 120.1 | 83.0 | 949 | 961 | 987 | 961 | 974 |
| 1928–29 | 1,464,582 | 126.6 | 86.4 | 1,000 | 1,000 | 1,000 | 1,000 | 1,000 |
| 1929–30 | 1,482,805 | 120.9 | 81.5 | 955 | 943 | 907 | 1,053 | 1,040 |
| 1930–31 | 1,504,022 | 97.6 | 64.9 | 771 | 751 | 763 | 1,010 | 984 |
| 1931–32 | 1,521,228 | 83.6 | 55.0 | 660 | 637 | 690 | 957 | 923 |
| 1932–33 | 1,533,252 | 83.8 | 54.7 | 662 | 633 | 654 | 1,012 | 968 |
| 1933–34 | 1,545,628 | 98.8 | 63.9 | 780 | 746 | 726 | 1,074 | 1019 |
| 1934–35 | 1,556,923 | 97.0 | 62.3 | 766 | 721 | 739 | 1,037 | 976 |
| 1935–36 | 1,568,434 | 114.2 | 72.8 | 902 | 843 | 809 | 1,115 | 1,042 |
The total value of induction for 1935–36 is estimated to have amounted to £114,200,000. This figure is £17,200,000, or 17.7 per cent., higher than the value recorded in 1934–35 (£97,000,000). Due to a more favourable harvest of wheat, oats, and grass-seed crops than was the case during 1934–35, when an abnormally dry season materially affected the yield of field crops, agricultural production for 1935–36 has risen by £1,300,000, or by 10.5 per cent.
Pastoral production registered a sharp rise of £6,200,000, or 21.9 per cent., over the 1934–35 estimate. The increase in the quantum of wool-production from 265,000,000 lb. in 1934–35 to 304,300,000 lb. in 1935–36, together with a marked improvement in wool-prices, largely contributed to this increase. Another helpful factor was the advance in cattle-prices.
Dairy production, which comprises approximately 90 per cent. of the total shown under the heading “Dairying, Poultry, Bees,” recorded only a slight increase in the volume of produce as compared with the 1934–35 season. Prices, however, realized for the Dominion's butter and cheese in overseas and local markets were substantially higher than those obtaining during the previous season, with the result that the value of production in this group as a whole has increased by £5,800,000, or by 25.2 per cent.
The value of mining production was £200,000 greater than in 1934–35, gold-mining and (to a lesser extent) coal-mining activity both contributing to this result.
Forestry induction continues to advance, and now records its third successive increase, rising from £1,700,000 in 1932–33 to £3,000,000 in 1935–36. These increases may be attributed mainly to the revival of the building trade.
A notable increase of £2,500,000 is instanced in the value of factory production —i.e., the value added to materials by factory processes. This increase, following those recorded in the two previous years, has brought the value in 1935–36 to £23,200,000, signifying an almost complete recovery from the low levels that obtained in the depression years. It should be borne in mind that the amount shown as factory production in the value of production statistics does not include the value of production in the industries processing primary products. Production in such industries is credited to the appropriate primary-production groups (dairying, pastoral, forestry. &c.).
At the time of going to press, all data necessary for the computation of the value of production for the year 1936–37 have not been collated. Certain groups have, however, been completed and they are as follows: Agricultural production, £8,800,000, representing a decrease of £400,000 from the 1935–36 figure, due principally to a lower harvest for wheat and grass-seed crops; paral production, £47,100,000 recording a substantial increase of £12,600,000 over the previous year's result, and due in the main to the rise in wool and cattle prices; and mining production, £4,300,000, or £300,000 higher than in 1935–36. Though the dairying, poultry, and bees group is not yet completed, it may safely be assumed that this group will be appreciably higher than for 1935–36, judging by the value of dairy-produce exported during the year ended 30th June, 1937.
The 1935 general election of parliamentary representatives was held in November of that year—for Maori electorates on the 26th, and for European electorates on the 27th. Dealing with the latter only, it is found that out of a total roll number of 919,798 some 834,682 (90.75 per cent.) exercised their votes. A summary for the general elections of 1928, 1931, and 1935, is as follows:—
| 1928. | 1931. | 1935. | |
|---|---|---|---|
| Number of votes recorded for candidates elected | 365,116 | 382,562 | 442,716 |
| Number of votes recorded for candidates defeated | 370,275 | 310,510 | 385,079 |
| Number of informal votes | 8,300 | 4,955 | 6,887 |
| Total number of electors who voted at the election | 743,691 | 698,027 | 834,682 |
| Percentage of votes recorded for candidates elected to total valid votes recorded | 49.65 | 55.20 | 53.48 |
| Total number of electors on roll (where contest) | 844,633 | 838,344 | 919,798 |
| Number of districts where no contest | 4 | ||
| Percentage of electors on roll who voted | 88.05 | 83.26 | 90.75 |
| Percentage of votes recorded for candidates elected to total number of electors on roll | 43.22 | 45.63 | 48.13 |
| Number of seamen's rights exercised | 1,771 | 837 | 1,229 |
| Number of electors voting as absent voters | 38,887 | 31,160 | 38,776 |
| Number of electors exercising postal votes | 7,977 | 6,956 | 9,796 |
The relative interest in the poll evinced by men and women may be measured by the percentage of votes recorded to the number on the roll—viz., men 92.02 per cent. and women 89.46 per cent. in 1935, the 1931 figures being 84.51 and 81.99 respectively.
A statement of the voting in individual electorates in 1935 is given in the 1937 issue of the Year-Book (pp. 768–772).
The only by-election held since the General Election has been that for the Manukau seat, rendered vacant by the appointment of Mr. W. J. Jordan, M.P., as High Commissioner for New Zealand in London. At the by-election held on 30th September, 1936, Mr. A. G. Osborne was elected.
According to a return compiled by the Department of Justice, the following are the licenses for the sale of intoxicating liquors:—
| Publican's licenses | 1,032 |
| Accommodation licenses | 192 |
| Wholesale licenses | 145 |
| Packet licenses | 19 |
| New Zealand wine licenses | 4 |
| Total | 1,392 |
The date of the return is nominally 1st September, 1929, but the numbers quoted cannot be increased, and the figures may be accepted as correct at the present time. A further 412 conditional licenses (temporary licenses for race meetings, agricultural shows, &c.) were granted during 1929–30, the last year for which figures are available. In addition, there were (October, 1937) 46 club charters and (October, 1937) 166 wine-makers' licenses.
Due to the restriction in the number of licenses, the proportion of licensed houses to population is steadily declining. The average number of persons to each licensed (i.e., publican's or accommodation license) house at the present time may be taken as 1,301, as compared with 1,182 in 1925, 911 in 1915, and 583 in 1905.
The annual fees payable for licenses are,—
| (1) For a publican's license— | £ |
|---|---|
| (a) Within the limits of a borough or town district | 40 |
| (b) Outside the aforesaid limits | 25 |
| (2) For a New Zealand wine license | 1 |
| (3) For an accommodation license, a sum to be determined by the Licensing Committee, not exceeding | 20 |
| (4) For a packet license— | |
| (a) For a vessel exceeding 50 tons register | 10 |
| (b) For a vessel not exceeding 50 tons register | 5 |
| (5) For a wholesale license | 20 |
| (6) For a conditional license, according to duration of license, a sum not exceeding | 30 |
Fees form part of the revenue of the local authority of the district in which the license was issued.
The licensing poll of the 27th November, 1935, held in conjunction with the parliamentary elections, was the fourth at which the three issues—national continuance, State purchase and control, and national prohibition (without compensation)—were submitted to the electors. The votes recorded for the various issues at each of the four polls referred to are as follows:—
| 1922. | 1925. | 1928. | 1935. | |
|---|---|---|---|---|
| For national continuance | 282,669 | 299,590 | 373,692 | 521,167 |
| For State purchase and control | 35,727 | 56,037 | 64,276 | 57,499 |
| For national prohibition | 300,791 | 319,450 | 294,453 | 243,091 |
The voting in each licensing district in 1935 is given in the 1937 issue of the Year-Book (page 774).
In the no-license districts an additional issue is submitted—viz., local restoration—three-fifths of the valid votes cast being required for the carrying of the proposal. The voting figures for each of the twelve districts are shown for 1935.
| District. | That License be restored. | That License be not restored. |
|---|---|---|
| Auckland Suburbs | 5,746 | 5,317 |
| Clutha | 4,416 | 4,370 |
| Eden | 5,131 | 7,509 |
| Grey Lynn | 6,714 | 6,404 |
| Invercargill | 7,351 | 6,006 |
| Masterton | 5,238 | 4,089 |
| Mataura | 5,135 | 4,025 |
| Oamaru | 4,805 | 5,501 |
| Roskill | 5,321 | 9,014 |
| Wellington East | 6,228 | 8,756 |
| Wellington South | 5,938 | 5,887 |
| Wellington Suburbs | 6,509 | 9,061 |
| Totals | 68,532 | 75,939 |
Under section 42 of the Gaming Act, 1908, the Minister of Internal Affairs may grant permission (subject to such conditions as he thinks fit) for the disposing by raffle or chance of any painting, drawing, sculpture, or other work of art, or literature, or mineral specimens, or mechanical models. By the Stamp Duties Amendment Act, 1931, any such licenses granted for the raffling for mineral specimens in excess of £100 value are subject to a lottery duty of 10 per cent. of the nominal value of all tickets represented in the drawing of the lottery, whether such tickets have been disposed of by way of sale or otherwise. Information as to receipts from this source will be found in Section XXIVB—Taxation.
The Gaming Act permits sweepstakes and art-unions (as defined) under certain specified conditions.
During the year ended 31st March, 1937, 775 licenses were issued under the authority of section 42 (above), of which 482 were for works of art, 282 for small amounts of alluvial gold, and 11 for larger amounts of alluvial gold (£5,000 each).
The following is a summary of large alluvial-gold lotteries subject to lottery duty during the last five years:—
| — | 1931–32. | 1932–33. | 1933–34. | 1934–35. | 1935–36. | 1936–37. |
|---|---|---|---|---|---|---|
*Proceeds of sale of tickets, less commission, which was approximately 20 per cent. | ||||||
| Number of lotteries | 7 | 6 | 7 | 10 | 9 | 11 |
| Gross sales £ | 189,420* | 154,789 | 149,365 | 177,788 | 157,763 | 224,657 |
| Commission on sales £ | 23,218 | 22,405 | 26,362 | 23,664 | 33,699 | |
| Expenses £ | 53,829 | 18,467 | 19,964 | 28,763 | 26,076 | 32,537 |
| Prizes £ | 28,000 | 24,000 | 28,000 | 39,500 | 45,000 | 55,000 |
| Net proceeds £ | 107,591 | 89,104 | 78,996 | 83,163 | 63,022 | 103,421 |
| Lottery duty £ | 13,868 | 15,479 | 14,937 | 17,779 | 15,776 | 22,465 |
| Net profit £ | 93,723 | 73,625 | 64,059 | 65,384 | 47,246 | 80,956 |
Of the net profits, £66,850 was allocated for the relief of distress, of which £55,000 was distributed to the various mayoral or other recognized central funds established for the relief of distress.
The following article on the New Zealand service arrangements was prepared by Mr. R. C. Hayes, Acting Director of the Dominion Observatory.
One uniform time is kept throughout New Zealand, called “New Zealand Mean Time” (N.Z.M.T.).
The following extract from the New Zealand Gazette of 31st October, 1868, contains the Government announcement regarding the standardizing of mean time for New Zealand:—
“Colonial Secretary's Office,“Wellington, 30th October, 1868.
“In accordance with a resolution of the House of Representatives to the effect that New Zealand Mean Time be adopted throughout the colony, it is hereby notified for public information that the time corresponding to the longitude 172° 30' east of Greenwich—which is exactly 11 ½ hours in advance of Greenwich time—has been adopted as the mean time for the colony; and that from and after the second day of November the public offices of the General Government will be opened and closed in accordance therewith.
“E. W. STAFFORD.”
The meridian 172° 30' east is the approximate mean longitude of the Islands of New Zealand, and corresponds to a time 11 hours 30 minutes fast on Greenwich Mean Time (G.M.T.).
The use of Summer Time in New Zealand is governed by the Summer Time Act, 1929, and its amendment of 1933. For general purposes in New Zealand the clock is advanced thirty minutes during the period beginning at 2h., New Zealand Mean Time, on the last Sunday in September in any year, and ending at 2h., New Zealand Mean Time, on the last Sunday in April in the following year. Nothing in the Summer Time Act shall affect the use of New Zealand Mean Time for purposes of astronomy, meteorology, or navigation, or affect the construction of any document mentioning or referring to a point of time in connection with any of those purposes. The times stated in this article are N.Z.M.T., and are in accordance with the 24h. system; Oh. and 24h. = midnight; 12h. = noon.
The time throughout New Zealand is controlled by the Dominion Observatory, Wellington. The Observatory signal clock is kept as correct as possible by means of astronomical observations, and by comparison with radio time-signals from observatories in other parts of the world.
The Observatory provides the following time-service:—
These signals are transmitted at 10h. 30m., daily (including Sundays and holidays), in the following manner:—
At 10h. 28m. 0s. a dash of two seconds duration is sent, followed by the letters “ZMO” (the call sign of the Observatory). This signal is repeated at 28m. 15s. 28m. 30s., and 28m. 45s. At 10h. 29m. 10s., a series of G's is sent, ending at 10h. 29m. 50s. At 10h. 30m. 0s. the actual time-signal (a dash, of approximately three seconds duration) is sent direct from the Observatory signal clock—the beginning of the dash being the exact minute. The time-signal from the clock is repeated at 10h. 31m., 10h. 32m., 10h. 34m., and 10h. 35m.; there is no time-signal at 10h. 33m. Between each of the actual time-signals, series of one-second dashes are sent in groups of one, two, four, and five; according as they precede the time-signals at 10h. 31m., 10h. 32m., 10h. 34m., and 10h. 35m., respectively. The last of each set of intermediate dashes is sent on the 50th second. The intermediate signals are for tuning and identification purposes only, and must not be used as precise time-signals.
Special care is taken with all the signals transmitted through station ZLW, and their error seldom exceeds a quarter of a second. Corrections to these signals are afterwards determined, and may be obtained on application to the Dominion Observatory.
Time-signals are sent to station 2YA from the Observatory. On week-days these signals are usually broadcast by 2YA at 10h. 30m., 15h. 30m., and 19h. 30m. On Sundays, the only signal broadcast is that at 15h. 30m.
The time-signals at 10h. 30m. and 15h. 30m. consist of dashes of approximately three seconds duration, transmitted at 10h. 30m., 10h. 31m., 10h. 32m., and at 15h. 30m., 15h. 31m., 15h. 32m. Intermediate signals are also sent as described for ZLW in the preceding section. The intermediate signals are not sent at 15h. 30m. on Saturdays, Sundays, and Government holidays.
The time-signal at 19h. 30m. consists of a single dash of approximately three seconds duration.
Station 3YA re-broadcasts time-signals transmitted through station 2YA.
The above time-signals are sent regularly to station 2YA from the Observatory, but their actual broadcast is controlled by 2YA, and they are liable to be suppressed if special broadcasts are in progress, or if time-signals are deemed inadvisable on artistic grounds. The Observatory therefore cannot guarantee regularity in the time-service through the National Broadcasting Service stations.
The Observatory sends time-signals by telegraph to the General Post Office and the Railways Department, Wellington, at 9h. daily. This signal is transmitted to all telegraph-offices in New Zealand and to all railway-stations in the North Island.
The Government Buildings clock (Wellington) is checked at 9h. daily by means of a special circuit between the clock and the Observatory. The error of this clock is usually less than 15 seconds.
The Wellington General Post Office clock is also checked at 9h. by observing the first stroke of the hour as broadcast by station 2YA. The chimes of this clock are broadcast several times daily by the National Broadcasting Service stations in the various centres, and the first stroke of the hour may be used as a time-signal where high accuracy is not required. The clock is kept within a few seconds of the correct time.
An electric synchronous clock, installed at the Observatory, is checked twice daily, and the error reported to Mangahao Power-station. Observations show that the variation of the electric clocks running off the Mangahao power-supply amounts to a few seconds only.
The hot springs of the North Island form one of the most remarkable physical features of New Zealand. They are found over a large area, extending from Tongariro, south of hake Taupo, to Ohacawai, in the extreme north—a distance of some three hundred miles; but the principal seat of hydrothermal action appears to be in the neighbourhood of Lake Rotorua, about forty miles north-north-east from Lake Taupo. By the destruction of the famed Pink and White Terraces at Lake Rotomahana during the eruption of Mount Tarawera on the 10th June, 1886, the neighbourhood was deprived of attractions unique in character and of unrivalled beauty; but the numerous lakes, geysers, and hot springs still present numerous scenic attractions. The importance of conserving this region as a sanatorium has been recognized by the Government, and legislation has been enacted for that purpose.
There are also several small hot springs in the South Island, the best known being those at Hanmer. In addition to the major spas of Rotorua and Te Aroha, which are controlled by the Department of Industries and Commerce, Tourist, and Publicity, and of Hanmer, administered by the Department of Health, there are numerous smaller resorts which have been developed by private or municipal enterprise. In many other instances the springs are wholly or mainly undeveloped.
In his book “The Hot Springs of New Zealand,” Dr. A. S. Herbert, O.B.E., M.D., gives the following grouping of the better-known waters, corresponding roughly to their mineral-water classification:—
Sulphur waters: Rotorua, Hanmer, Taupo, Wairakei, Waiotapu.
Alkaline waters: Te Aroha.
Saline waters: Helensville, Waiwera, Tarawera.
Iodine waters: Morere, Te Puia.
Calcium carbonated waters: Kamo.
Simple thermal waters: Okoroire and the Waikato springs.
The following article, dealing with the waters at Rotorua and Te Aroha, is by the Government Balneologist, Dr. J. D. C. Duncan, M.B., Ch.B. (Edin.), Member of the International Society of Medical Hydrology, Fellow of the Royal Society of Medicine, and Fellow of the Royal Geographical Society:—
It has been acknowledged by the leading hydrologists in Europe that New Zealand possesses the most valuable mineral waters in existence. Not only are those mineral waters interesting from a tourist's point of view, but they are, because of their medicinal value, of great therapeutic importance, and, as a Dominion asset, worthy of the deepest scientific consideration.
From the spectacular aspect only a brief mention need be made in this article, as a full description of springs, geysers, and mud-pools has been given in Dr. Herbert's book, “The Hot Springs of New Zealand”—a book that presents a comprehensive and vivid picture of the main manifestations of thermal activity in New Zealand.
Since and as the result of experience gained during the war, the subject of hydrotherapy has been recreated on modern scientific lines, and the actions of thermal mineral waters have been investigated, both chemically and physiologically, in determining their therapeutic value in the treatment of disease.
The principal treatment establishments are the Main Bathhouse and the Ward Baths.
In the Main Bathhouse are a series of private bathrooms, slipper and step-down, each with its dressing-room attached, and a couch for packing purposes. The baths are arranged for either “Priest” or “Rachel” waters, with undercurrent douches and showers. There are, also, deep “Priest” pools at suitable temperatures for the treatment of chronic cases.
Off the main hall are treatment-rooms where massage and every variety of physiotherapeutic treatment can be given, and, in either wing of the building, a complete establishment for Aix-Vichy douche massage.
The Ward Bathhouse is a handsome new block of buildings which has replaced the old Pavilion Bathhouse. This building, divided into convenient sections for service and control, consists of a large main hall, swimming-pools, hot “Rachel” pools, “Old Priest” and “Radium” baths, and a block of private “Rachel” baths.
At the back of these buildings is an attractive sunken courtyard, with fountain and formal garden, surrounded on three sides by verandas, and on the fourth by an open pergola facing the lake. In this courtyard garden patients and visitors can bask in the sunshine, protected from prevailing winds.
The swimming-pools, open to the air, are spacious baths lined with white tiles and having douches, showers, and convenient dressing-cubicles. These provide recreational facilities for patients and visitors.
The “Radium” and “Priest” baths, built on the pumice bed of the soil, contain some of the most important therapeutic waters in existence, and are invaluable in the treatment of heart conditions and cases of nervous debility. In connection with these baths are comfortable rest-rooms and convenient massage establishments.
The private baths are of the porcelain, slipper variety, and step-down tiled baths—the latter designed for helpless or crippled patients.
The swimming-pools of the new Blue Bath afford one of the most attractive playgrounds for visitors to Rotorua. There are two pools, set in T form with a colonnade between. The larger pool, 100 ft. by 40 ft., with a depth of 4 ft. 6 in. to 9 ft., has unique diving-platforms. This pool is lighted under the water by twenty are lamps, which give a beautiful luminous effect to the water. The smaller pool, 70 ft. by 36 ft., is a safe and enjoyable playground for children of any age. Both pools are lined with white tiles. Convenient dressing and shower rooms surround the pools. At the entrance a luxurious lounge provides a resting-place for bathers, and above this an attractive tea-room serves refreshments to its patrons.
The mineral waters which have been harnessed for therapeutic use at the Rotorua Spa are of two main varieties — viz., the “Rachel,” which is an alkaline, sulphuretted water, emollient to the skin, and sedative in reaction; and the “Priest,” or free-acid water, which, due to the presence of free sulphuric acid, is mainly stimulating and tonic in reaction. There is, in addition to the foregoing, a valuable silicious mud similar to that found in Pistany, in Czechoslovakia, which, in its own sphere in hydrotherapy, exerts its influence as a curative agent.
However, it is in the “Priest” waters that one finds one's most valuable ally in the treatment of arthritis, fibrositis (the so-called rheumatic affections), and cases of nervous debility. The “Rachel” and mud baths are used mostly in those cases of fibrositis where the condition requires a softening effect; and in the types where pain is a manifest symptom those baths are invaluable as soothing and sedative agents.
In these natural acid baths the reactions are mainly stimulating, with increased hyperæmia in the parts submerged, and marked lessening of pain and swelling in the affected joints and tissues. Those waters containing free carbonic-acid gas are used for the cases of fibrositis in which the circulation requires the stimulating action of gaseous baths.
The “New Priest” waters, containing approximately 16.80 grains per gallon of free sulphuric acid, are utilized in the form of open pools, deep step-down baths, and slipper baths. They are prescribed at a suitable temperature for the individual case.
The “Old Priest” waters, containing a much lower degree of free acid (3.77 grains to the gallon), and of varying temperatures (from 84° F. to 102° F.), are used for treatment at their source. The waters, percolating through their pumice-bed, are confined in pools, and contain free carbonic-acid gas bubbling through the water.
The very strong “Postmaster” waters are also confined within pools on the natural pumice-bed, and, by a primitive arrangement of wooden sluice-valves, are maintained at three ranges of temperature—viz., 104°, 106°, and 108° F. They contain 22.29 grains of free sulphuric acid to the gallon, and are strongly counter-irritant in their reactions.
In such a brief account as this one can deal only in generalizations, and the forms of treatment mentioned must necessarily be subject to wide variations. In any form of hydro-therapeutic treatment the regime must be adapted to the individual manifestations of the disease, and no routine rules or regulations can be laid down in spa operations.
The “New Priest” waters are, for the most part, prescribed for patients suffering from subacute or chronic fibrositis, subacute or chronic gout, and the various forms of arthritis. Except in cases of marked debility, those patients are given graduated baths, at temperatures ranging from 102° to 104° F., from ten to fifteen minutes daily. Most of the baths are fitted with a subaqueous douche having a pressure of 25 lb. to the square inch, which is directed under water on the affected tissues. The bath is usually followed by a light or hot pack, according to the needs of the case.
The subthermal “Old Priest” waters (temperature 84° F.), containing a high degree of free carbonic-acid gas, are particularly valuable in the treatment of functional nervous disease, and the methods of administration are similar to those obtaining at Nauheim (Germany). The reactions are markedly stimulating through the sympathetic nervous system, and bring about, by reflex action, a tonic effect on the heart.
The “Postmaster” baths are used in the treatment of the more chronic forms of fibrositis, arthritis deformans, and gout, requiring a more or less heroic type of procedure. They are usually prescribed in combination—i.e., a certain time in each pool, commencing with the lowest temperature. The hyperæmic reaction is most marked, and in many of the cases where pain is a predominant symptom there is a temporary paralysis of the surface nerves, as well as a strong reflex excitation of the heart. For this reason these baths are not given to patients suffering from cardiac weakness.
The mud baths being highly impregnated with silica, which has a bland, sedative effect on the tissues, are particularly indicated in cases of acute or subacute neuritis, gout, and certain skin conditions. The action of these baths is to induce an active hypeæmia in the patient with an actual absorption of free sulphur, which is present in considerable quantity. Also the radio-activity of this medium (0.185 per c.c.) is possibly an active factor in the therapeutic action of these baths. In some of the cases undergoing mud-bath treatment the effect has been almost miraculous—instant relief from pain; reduction of swelling caused by inflammatory exudates—and such patients have been able to discard crutches or other adventitious aids and to walk with more or less normal comfort.
Perhaps, of more recent date, the most efficacious effects of mud treatments have been manifested in cases of skin conditions—notably psoriasis: cases which have resisted all forms of drug treatment have cleared up in an almost, magical manner; and so frequently have such cures been effected that one believes that the silicious mud of Rotorua has some markedly specific action as a therapeutic agent.
The treatment of gout depends entirely on the individual manifestations. In certain subacute and chronic types fairly high temperatures (104° to 106° F., with hot packs) of “Priest” water are employed, in order to hasten the absorption of exudates and the elimination of uric acid. In cases of acute gout more sedative measures are pursued, such as “Rachel” baths at neutral temperatures, local mud packs, and rest. As soon as the conditions permit, these patients are changed over to acid water baths. Cases of chronic gout exhibiting metabolic stagnation sometimes receive considerable benefit from the counter-irritant effects of the strongly acid “Postmaster” waters.
Separate establishments, containing the most modern apparatus of sprays, douches, hot steam, &c., are available for wet massage and treatments of the Aix-Vichy type.
The massage-rooms are fitted with the latest installations of electrical equipment—Bristowe tables, diathermy, high frequency, Bergonie chair, X-ray, Schnée baths, Greville hot air, and other apparatus for carrying out the most up-to-date methods of electrical-therapeutic treatments.
The baths are administered by a trained staff of attendants, and the massage, electrical-therapy, and douches carried out by a qualified staff of operators.
In every respect the hydrotherapy treatments aim at a restoration of function, and the measures employed are, for the most part, re-educative.
In connection with the Rotorua Spa is a sanatorium of seventy beds, where patients whoso finances are restricted can receive treatment at an exceedingly moderate cost. The institution consists of cubicles and open wards. Thermal baths and massage-rooms in the building provide for the more helpless type of invalid.
From sixty thousand to eighty thousand baths are given annually, and about thirty thousand special treatments—massage, electrical therapy, &c.—are administered each year at the Rotorua Spa. The usual course of treatment lasts from four to six weeks, and the high percentage of cures and improvements testifies to the value of the thermal mineral waters and the hydro-therapeutic treatments obtaining in this Dominion.
Te Aroha, which has over twenty springs of mineral waters, possesses absolutely unrivalled drinking-waters of the Vichy type. The springs vary in quantity, temperature, and chemical content, but are all, in their several spheres, valuable from a pharmacological point of view in treatment. The largest springs, No. 8 and No. 15, are of the true Vichy type, containing considerable quantities of sodium bicarbonate and sodium chloride. There are some cold springs, containing a fair amount of ferrous bicarbonate and free carbonic acid, and others containing magnesium bicarbonate, but not in any large quantity.
It is, however, the hot sodium bicarbonate waters from springs No. 8 and No. 15 which are chiefly used, and for which Te Aroha is justly celebrated.
An analysis of the more important springs is appended:—
Hot Sodium Bicarbonate Waters.
| Grains per Gallon. | ||
|---|---|---|
| Spring. No. 8. | Spring. No. 15. | |
| Sodium chloride | 59.1 | 59.5 |
| Sodium bicarbonate | 648.0 | 657.4 |
| Sodium sulphate | 39.2 | 40.1 |
| Potassium chloride | 10.0 | 11.0 |
| Calcium bicarbonate | 8.9 | 6.8 |
| Magnesium bicarbonate | 2.5 | 2.5 |
| Silica | 8.0 | 7.0 |
| Total solids | 775.7 | 784.3 |
| Carbonic acid (free) | 55.0 | 37.4 |
| Temperature (F.) 135°. | ||
OASES ARISING FROM THE SPRINGS.
| Per Cent. | |
|---|---|
| Carbonic acid | 96.00 |
| Methane | 1.63 |
| Nitrogen | 2.37 |
| 100.00 |
Cold Magnesium Waters.
| Grains per Gallon. Spring No. 21. | |
|---|---|
| Sodium chloride | 23.9 |
| Sodium bicarbonate | 258.1 |
| Sodium sulphate | 9.3 |
| Potassium chloride | 4.1 |
| Calcium bicarbonate | 31.5 |
| Magnesium bicarbonate | 13.3 |
| Ferrous bicarbonate | 0.7 |
| Lithium chloride | |
| Silica | 13.5 |
| Total solids | 354.4 |
| Free carbonic acid | 103.4 |
| Temperature, cold |
Cold Chalybeate Waters.
| Grains per Gallon. Spring No. 1. | |
|---|---|
| Sodium bicarbonate | 2.17 |
| Magnesium chloride | 1.33 |
| Magnesium sulphate | 2.31 |
| Calcium bicarbonate | 15.40 |
| Magnesium bicarbonate | 0.49 |
| Ferrous bicarbonate | 4.55 |
| Alumina | 1.89 |
| Sodium silicate | 5.11 |
| Total solids | 33.25 |
| Free carbonic acid | 76.93 |
Though it must be remembered that the Te Aroha Spa is important for its drinking-waters, there are certain cases which benefit considerably from taking the baths.
Gastric catarrh and hyperacidity.
Gout, in sthenic cases.
Gouty glycosuria.
Biliary calculus.
Uric acid calculus.
Chronic catarrh of the respiratory organs.
Mild cases of anæmia and general debility.
Because of the nature of the Te Aroha waters, they are more valuable from a pharmacological standpoint than as a bathing medium, and it is in “drinking the waters” that their most potent value is obtained.
The type of water, and the quantity to be taken, is a matter for the medical adviser's prescription, but there are certain rules which arc- essential in partaking of the waters:—
The waters must be taken “on an empty stomach”—i.e., two hours before or after a meal, or, preferably, in the morning, at least an hour before breakfasting.
To obtain the correct reactions and proper ingestion of the waters, they should be sipped quite slowly, with a five-minute pause between tumblers.
Not more than three tumblersful—i.e., a pint and a half—should be taken at one time.
These are in the form of pools, at their source, or in the Cadman Bath House, where the water is led into slipper baths, and arranged at suitable temperatures according to the needs of the case. In the pools the water is clear and sparkling, due to the presence of free carbonic acid gas.
The baths, suitably prescribed, are, in collaboration with drinking the waters, of potent value in treating the foregoing cases, but there are certain types of rheumatism and neuritis which benefit considerably from baths combined with massage and electrical treatment.
Electric Baths: By passing a controlled electrical current through the water, valuable tonic effects can be induced whereby the circulation and the nervous system are “toned” up.
Greville Hot Air: This form of apparatus arranged for dry heat or “baking” of the limbs is particularly valuable for treatment of synovitis, certain conditions of gout, and painful swellings around the joint. By this means high temperatures (200°–300° F.) can be brought about, intense sweating is induced, with consequent reduction of the swelling and relief of the pain.
Dry and Farado Massage: In conjunction with the bath treatment, massage is a valuable ally in the treatment of rheumatic diseases, subacute and chronic gout, and various forms of neuritis and nervous debility. The massage is prescribed according to the needs of the case, and, in some conditions, is augmented by a mild, faradic current which, passing through the operator's body, is conveyed to the patient in the form of a tonic stimulation.
Ionization: In rheumatic conditions, where fibrous tissue is often the cause of pain and stillness, ionization is used alternatively with massage. Using the various salts of sodium, lithium, iodine, &c., an electric current is used as a catalyser, and the ions of the salts are conveyed through the skin into the actual tissues of the body.
X-rays: The most up-to-date X-ray apparatus has been installed at the Cadman Bath House.
Acts passed: Public Acts, 59; Local Acts, 13; Private Acts, 7.
The following is a brief synopsis of the more important public and general Acts passed by the General Assembly during the session ended on the 3rd day of November, 1936:—
The Reserve Bank of New Zealand Amendment Act, 1936, amends the Reserve Bank of New Zealand Act, 1933, in several important respects. The share capital of the Bank is cancelled (with provision for the payment to shareholders of the value of the shares held and accrued dividends). The Board of Directors is reconstituted, and in future the Governor of the Bank is to be appointed by the Governor - General in Council. The authority of the Bank to discount bills is extended, and the Bank is authorized to grant accommodation by way of overdraft to the Government or to any Board with sufficient statutory authority for the purchase and marketing of New Zealand produce. The authority of the Bank is extended to buy and sell United Kingdom or New Zealand Government securities, while it may underwrite Government loans. The pre-existing limits on the authority of the Bank to grant accommodation to the Treasury are extended to allow the Bank to accept Treasury bills up to the total revenue or estimated revenue of the general Government for the year.
The Government Railways Amendment Act, 1936, amends the Government Railways Act, 1926. The main purpose of the Act is to abolish the Government Railways Board constituted by the Government Railways Amendment Act, 1931, and to vest the powers formerly exercised by that Board in the Minister of Railways. The Minister is authorized to undertake the carriage of passengers and goods otherwise than by railway, and whether by land, water, or air. Provision is made for the appointment of tribunals to inquire into conditions of employment in the Government Railways Department.
The Employment Promotion Act, 1936, is a consolidation of legislation passed since 1930 relating to the relief of unemployment. Section 5 of the Unemployment Amendment Act, 1931, which provided that amounts paid as unemployment-relief tax were exempt for income-tax purposes, is not reproduced in the 1936 Act. A description of the principal provisions of the Act is given on pages 794 and 795 of this Year-Book.
The Labour Department Amendment Act, 1936, defines the functions of the Department of Labour. It also provides for the appointment of a Secretary of Labour, who is charged with the administration (under the control of the Minister) of the several Acts (all of an industrial nature) specified in the Schedule.
The Primary Products Marketing Act, 1936, is expressed to be an Act to make better provision for the marketing of dairy-produce and other primary products. Part I relates to the administration and provides for the appointment of a Minister of Marketing and for the establishment of a Department of State to be known as the Primary Products Marketing Department. No contract for the carriage by sea of any primary products intended for export shall be made after the passing of the Act save by the Minister or in conformity with conditions approved by the Minister. Provision is made for the opening at the Reserve Bank of an account to be known as the Dairy Industry Account, while the Minister is authorized, on behalf of the Government, to enter into reciprocal trade agreements with other countries. Part II relates to the marketing of dairy-produce. All dairy-produce which is placed on board ship for export becomes the property of the Government. Provision is made for the price payable in respect of any such dairy-produce to be paid to the manufacturer immediately it becomes the property of the Government. The price payable for dairy-produce for the year ended 31st July, 1937, shall be determined on a basis of the average price obtained for similar produce during the last eight to ten years, while provision is made for the assessment of prices for future years, also for the fixation of the prices for and the marketing of dairy-produce intended for consumption in New Zealand. It is an offence to sell dairy-produce except at prices fixed under the Act.
The Industrial Conciliation and Arbitration Amendment Act, 1930, amends the Industrial Conciliation and Arbitration Act, 1925. Provision is made for the fixing of a basic wage for adult male and female workers employed in any industry to which any award or industrial agreement relates. The full powers of the Court in relation to the settlement of industrial disputes are restored. All workers who are subject to any award or industrial agreement are required to be members of a union. The Court is empowered to confer on union officials the right to enter upon the premises of employers for the purpose of interviewing workers. The Court is required to fix the maximum number of hours to be worked in one week in the industry to which an award relates, while it shall endeavour to fix the daily working-hours so that no part of the working-period falls on a Saturday. Section 143 of the principal Act is amended by removing the restriction on the maximum amount of weekly subscription payable by members of a union. Provision is made for an Inspector of Awards to take proceedings in respect of wages due to workers.
The Factories Amendment Act, 1936, amends the Factories Act, 1921–22. Provision is made for the limitation of the hours to be worked in factories, while the rate payable in respect of overtime worked is increased. Provision is made whereby wages are not to be reduced on account of reduction in working-hours, while the minimum wages payable to workers in factories are increased. The provisions of the principal Act as to holidays to be allowed to workers are extended, and provision is made for payment to be made to workers of wages for holidays and for overtime rates in respect of time worked on holidays.
The League of Nations Sanctions Regulations Confirmation Act, 1936, confirms regulations made under the authority of the League of Nations Sanctions (Enforcement in New Zealand) Act, 1935.
The Transport Licensing Amendment Act, 1936, amends the Transport Licensing Act, 1931, and the Transport Licensing (Commercial Aircraft Services) Act, 1934. Part I of the Act relates to road services, and the main purpose of that Part is to provide for the alteration of the constitution of the licensing authorities established by the principal Act. Section 3 provides that the Minister may appoint any qualified person to be the sole member of a district licensing authority. The central licensing authority is abolished, as is the Transport Co-ordination Board, the functions of the Board becoming the functions of the Minister. Section 12 makes provision for a right of appeal to the Minister against a licensing authority. It is provided that, except with the previous consent of the Minister of Railways, no license shall be granted to any person other than that Minister for a passenger-service similar to that already carried on by the said Minister. Part II relates to aircraft services, and the most important provision is that in section 22, which provides that the Minister shall be the sole licensing authority to grant aircraft-service licenses and to exercise jurisdiction in respect of such licenses. Section 24 makes provision for the revocation and suspension of licenses.
The Shops and Offices Amendment Act, 1936, amends the Shops and Offices Act, 1921–22, and its general purpose is to improve the working-conditions of shop-assistants in conformity with previous legislation passed during the session. It is provided that no shop-assistant shall be employed in any shop for more than a specified number of hours; but with the consent of an Inspector, extended hours may be worked by shop-assistants for the purposes of stocktaking or ether specified work. Minimum wages payable to shop-assistants are prescribed by the Act, while the payment of any premiums by or in respect of shop-assistants or learners, is prohibited. Increased payment for overtime worked in offices is provided for. No person employed in any shop or office shall be dismissed or have his wages reduced on account of reduction in working-hours.
The State Advances Corporation Act, 1936. —The main purpose of this Act is to change the identity of the Mortgage Corporation established under the Mortgage Corporation of New Zealand Act, 1934–35. The name of the Mortgage Corporation of New Zealand is changed to the State Advances Corporation of New Zealand, the shares in the Corporation being cancelled, with provision for payment to shareholders for the cancelled shares either in cash or in Government stock. Part II reconstitutes the Board of Management. Part III makes provision regarding the stall' of the Corporation. Part IV transfers to the Corporation the powers, duties, and the functions in relation to housing formerly exercised by the State Advances Superintendent. It is provided that securities issued by the Corporation shall he State-guaranteed, while certain restrictions as to the amount that may be borrowed by the Corporation are removed. The Corporation is authorized to make loans to local authorities for the purpose of providing funds for the erection of workers' dwellings, &c., and for the development of existing industries, or for the establishment of new industries. Loans may be granted to an amount exceeding two-thirds of the value of the security on condition that the Minister of Finance shall guarantee the Corporation against any loss attributable to the excess over the statutory lending margin (two-thirds of the value of the security). It is provided that a mortgagor may be required to effect a policy of insurance on his life as collateral security for any loan granted to him, while a mortgagor is prohibited from giving a subsequent mortgage over his security to the Corporation without the consent of the Corporation.
The Distress and Replevin Amendment Act, 1936, provides that the personal and family clothing, bedding, furniture, and tools of trade to a value of £50 belonging to a tenant are absolutely protected from seizure under distress for rent.
The Fair Rents Act, 1936. —The purpose of this Act is to restrict increases of rent of dwellings. The Act applies to dwellings let at any time before the passing of the Act at a rental of less than £156 per year. “Basic rent” is defined as the rent payable on the 1st May, 1936, or, in respect of a dwelling not let on that date, the rent last payable before that date. Any increase in the basic rent made since that date is irrecoverable. Provision is made whereby a Magistrate may determine the rent payable by a tenant. No premium shall be payable in respect of a tenancy or a renewal of a tenancy. The grounds on which a landlord may recover possession of a dwelling to which the Act applies are defined. Without the consent of a Magistrate no person shall be entitled to distrain for rent in respect of any dwelling to which the Act applies. No appeal shall lie from any determination of any Court made under the authority of the Act. The Governor-General is authorized to make regulations prescribing the method of determining fair rent. The earlier provisions of the Act relating to the fixing of fair rents are to be administered subject to the provisions of any regulations that may be made under the section. The duration of the Act is limited to the 30th September, 1937. [NOTE.—Extension to 30th September, 1938, is provided by the Fair Bents Amendment Act, 1937.]
The Broadcasting Act, 1936, is a consolidation of the legislation relating to broadcasting. Its main purposes are to vest the control of broadcasting in the Minister (instead of in a Broadcasting Board) and to permit, subject to control, the transmitting of advertising matter from broadcasting-stations. The New Zealand Broadcasting Board established under the Broadcasting Act, 1931, is abolished, and the property formerly belonging to the Board is vested in the Crown. Provision is made for the appointment of a Director of Broadcasting and of other officers, who shall be public servants. The Minister may from time to time establish and operate commercial broadcasting-stations, from which may be transmitted advertising matter. The revenue derived from these stations is to be paid into a Broadcasting Account to be opened at the Reserve Bank.
The Finance, Act, 1936.—The main purpose of this Act is to restore the rates of salaries and wages to the rates that were in force in March, 1931. Part I relates to salaries payable out of public money and provides that, as from the 1st July, 1930, such salaries shall be at the same rates as were payable immediately prior to 1st April, 1931. Part II provides that the rates of wages payable under any award, industrial agreement, or apprenticeship order in force on the 1st July, 1930, shall be increased to the rates payable under the award, agreement, or order immediately prior to the 29th May, 1931 (on which date a general order reducing wages was made by the Court of Arbitration). Similar provision is made in respect of awards, agreements, and orders not in force in May, 1931, so that a corresponding increase in the rates of wages payable thereunder shall be effected. Section 17 provides in effect that any person not already covered by the Act and working under a contract of service shall be paid at the same rate as would have been paid for the same service as at the 31st March, 1931.
The Motor-vehicles Amendment Act, 1936, imposes a speed-limit of thirty miles per hour in boroughs, town districts, or closely populated areas. Section 4, by adopting a provision contained in Imperial legislation, creates the offence of “careless driving.” The penalty to which motorists who fail to stop after being involved in an accident are liable is increased. The power conferred on the Governor-General to make regulations governing pedestrian and other traffic in its relation to motor traffic is extended.
The Prevention of Profiteering Act, 1936. —The purpose of this Act is to prevent profiteering by prohibiting unreasonable increases in the prices charged for goods and services. Every person who sells goods at a price which exceeds the basic price as defined in the Act by an unreasonable amount commits an offence. For the purpose of hearing cases under the Act provision is made for the establishment of special tribunals to be presided over by a Magistrate. The decisions of the tribunal shall be final. The provisions of the Act also apply to the charges for services rendered.
The Civil List Amendment Act, 1936, makes provision for the appointment of Parliamentary Under-Secretaries, whose functions shall be to exercise, under the direction of the Ministers, such functions of the Ministers as may be assigned to the Under-Secretaries. Provision is also made for the appointment of an extra Minister of the Crown without increase in the total amount of salaries payable to Ministers.
The Judicature Amendment Act, 1936, provides that, in an action where the only relief claimed is payment of a debt or damages, or the recovery of chattels, the action may be tried by a Judge and a jury of four or twelve, according to the amount of the claim or the value of the chattels. A jury of twelve is provided for where the amount involved exceeds £500. The provisions of the Act were formerly embodied in rules made under the principal Act, but these rules were amended in 1924 so as to restrict the rights of parties in civil actions to have the actions tried by juries. The amending rides are repealed by this Act.
The Political Disabilities Removal Act, 1936, authorizes public servants to stand for and become members of Parliament. This right was formerly denied to them. Provision is made for special leave without salary for a public servant who is a candidate for election to Parliament. Industrial unions and similar societies are authorized to apply their funds in the furtherance of political objects if a majority of the members of the society authorize such application.
The Pensions Amendment Act, 1936. —The main purpose of this Act is to effect an increase in the rates of pensions payable under the principal Act. The rate of old-age pensions is increased, other concessions to applicants for pensions also being provided for. The rate of widows' pensions is increased, while widows' pensions are also provided in respect of women who have been deserted by their husbands and women whose husbands are mentally defective. The rate of pension payable to the widow of a miner is increased, as is the rate of pension payable in respect of service in the Maori wars. Part II provides for invalidity pensions (a type of pension not previously granted except to blind persons). Subject to the provisions of the Act, every person aged sixteen years or upwards who is totally blind or is permanently incapacitated for work by reason of accident, illness, or congenital defect shall be entitled to a pension.
The War Pensions Amendment Act, 1930, increases the rates of pensions payable under the War Pensions Act, 1915.
The Family Allowances Amendment Act, 1930, provides that the allowances towards the maintenance of children prescribed by the Family Allowances Act, 1926, shall be allowed in all cases where the average weekly income of the family does not exceed £4 per week. The maximum income immediately prior to this amendment was £3 5s per week.
The Agricultural Workers Act, 1936. —The purpose of this Act is to provide for better wages and living-conditions for agricultural workers. A minimum standard of accommodation which must be provided by employers for agricultural workers is prescribed, with stated penalties where the standard accommodation is not provided. Employment on dairy-farms is specifically dealt with in the Act. No child under the age of fifteen years shall be employed as an agricultural worker on a dairy-farm. Rates of wages payable to workers on dairy-farms are set out in the Act, which also provides that every such worker shall be entitled to a holiday of seven days on full pay for every twelve weeks of employment. A wages and holiday book (subject to inspection) must be kept by the employer.
The Law Reform Act, 1936, is divided into seven unrelated parts. Part I, in effect, abrogates, subject to certain expressed provisions, the rule that the personal representative of a deceased person cannot sue or be sued in respect of a wrong committed against or by the deceased during his lifetime. Part II amends the Deaths by Accidents Compensation Act, 1908. The principal provision in this part is contained in section 7, which provides that in assessing damages under the principal Act any pecuniary benefit accruing to dependants by reason of the death of the person on whom the claimants depend shall not be taken into account. Part III creates a charge on all insurance-moneys payable as indemnity for liability to pay damages or compensation, and makes the charge apply immediately on the happening of the event giving rise to the claim. Part IV, in effect, provides that so far as the capacity to contract, to hold property, and to sue and be sued is concerned, a married woman shall be in exactly the same position as an unmarried woman. A married woman will also be subject to the law relating to the enforcement of judgments, and a husband will not be liable for his wife's torts and ante-nuptial debts. A husband will still be liable for necessaries supplied to his wife to the same extent as he was liable before the passing of the Act, and a husband and wife while living together will not be able to sue each other in tort except in order to protect their property. Section 13 prevents a restraint on the anticipation of property being imposed on a married woman if a similar restraint could not be imposed on a man. Part V relates to the liability of joint tort-feasors, and provides for contributions between such persons. Machinery is provided for assessing the amount of contributions. Part VI abolishes the rule that damages cannot be recovered from an employer in respect of the negligence of a fellow-servant. Part VII provides that, in all leases containing a covenant against assigning or subletting the demised premises without the consent of the landlord, there shall be deemed to be included a proviso that such consent shall not be unreasonably withheld.
The Fisheries Amendment Act, 1930, provides that acclimatization societies may be required to contribute, out of license fees received by them, towards the cost of research undertaken in relation to fresh-water fisheries.
The Mortgagors and Lessees Rehabilitation Act, 1936, repeals and replaces all former legislation relating to the relief of mortgagors and lessees. Its general purpose is to enable the Court of Review (a special Court established for the purpose) and Adjustment Commissions to make a final adjustment of the liability of mortgagors and lessees on the following lines: (a) Mortgages are reduced to the value of the security, and the surplus becomes an “adjustable debt”; (b) rents are reduced to the “fair rental value” of the property, and arrears of rent become an “adjustable debt”; (c) all adjustable debts are written off, except so far as the mortgagor or lessee can afford to pay them; (d) the terms of payment of moneys remaining owing on mortgage and adjustable debts (if not written off) are adjusted according to the financial position of the debtor.
“Adjustable debts” include (in addition to adjustable debts representing part of mortgage debts or arrears of rent) in the case of a farmer, all his unsecured liabilities; in the case of a home-mortgagor or home-lessee (not being a farmer), include all unsecured liabilities directly relating to the home property; and, in the case of other mortgagors or lessees, include all unsecured liabilities in relation to any mortgage or lease or any guarantee thereunder. Applications for adjustments must be made not later than 31st January, 1937, unless the time is extended by the Court to 28th February, 1937. The liabilities of guarantors in respect of mortgages and leases (including persons liable under a contract of indemnity) are to be written off automatically unless the mortgagor or lessee gives the guarantor a notice under the Act before the end of December, 1936. Mortgagors and lessees are protected from their creditors until 31st January, 1937, and so long thereafter as their applications are being dealt with. Mortgagors who do not desire a general adjustment may require their mortgagees to reduce the rate of interest or accept repayment.
Part II establishes a Court of Review, which is expressed to be the Court of Review of Mortgagors Liabilities constituted under the Rural Mortgagors Final Adjustment Act, 1934–35. The Court is presided over by a Judge, who must have the qualifications of a Judge of the Supreme Court. No appeal shall lie from any order made by the Court of Review. The appointment, by the Governor-General, of Adjustment Commissions is provided for; such Commissions are subject to the general supervision of the Court of Review. Part III prescribes the procedure in applications for relief. Applications are filed by the mortgagor or lessee (or by the mortgagee or lessor, if application is not made by the mortgagor or lessee) in the office of the Court nearest to the place where the property is situated. The application is to be accompanied by a statement of the applicant's assets and liabilities. Each application is referred to an Adjustment Commission, and a time and place is fixed for a hearing of the application. At the hearing the Adjustment Commission proceeds to adjust the liabilities of the applicant along the lines previously mentioned. Power is given to the Adjustment Commission to order, in appropriate cases, that the mortgagor or lessee shall not be permitted to remain in occupation of the property, and that the property shall be sold. From the decision of an Adjustment Commission there is an appeal to the Court, and the Court may on its own account review such a decision. It is provided that while an application under the Act is pending, any mortgagor, lessee, or guarantor who, without the consent of the Adjustment Commission, encumbers or parts with the possession of his property or, being a farmer, obtains credit to the extent of £20 or upwards without disclosing that he is an applicant, commits an offence and the transaction shall he void. At any time before 31st January, 1937, a mortgagor under a mortgage to which the Act applies may serve notice on the mortgagee requiring him to reduce the rate of interest payable under the mortgage to such rate as may be specified in the mortgage. If a reduction is not made to the rate specified, the mortgagor is entitled to repay the mortgage debt. Where an order adjusting liabilities has been made, the property in respect of which the order has been made shall not be sold without the leave of the Court, which, if it grants leave, may impose such conditions as it thinks fit. This provision shall cease to operate on 1st January, 1941.
The Land and Income Tax Amendment Act, 1936, provides that for the purposes of assessing income-tax there shall he deducted from all incomes subject to income-tax a sum of £210 by way of special exemption. A section is inserted excluding from the list of payments allowed to be deducted from assessable income moneys paid as unemployment-relief tax. It is provided that income-tax for any year may be made payable by instalments.
The Finance Act (No. 2), 1936.—This Act is divided into parts as follows: Part I, Public Revenues and Loans: Part II. Local Authorities: Part III, Miscellaneous. The Minister of Finance is empowered to borrow a sum not exceeding £6,000,000 for certain public works, an amount not exceeding £2,000,000 for the construction of main highways, and up to £5,000,000 for housing purposes. The powers of certain local authorities to borrow are extended. The powers of the Public Trustee as to investment of moneys in the common fund are extended so as to authorize him to invest such moneys in securities of the State Advances Corporation and in Government stock. The proportion of the value of securities on which the Public Trustee may advance moneys is increased. The Act also authorizes variation in the rates of interest payable on loans secured by Government Life Insurance policies.
The Main Highways Amendment Act, 1936, provides that works of construction of main highways shall not be commenced by the Main Highways Board without the prior consent of the Minister of Transport. The Act also makes provision for the classification of any main highway or portion thereof as a State highway, the cost of construction of State highways to be paid out of the Main Highways Account.
The Industrial Efficiency Act, 1930, aims at the promotion of new industries and the more efficient functioning of existing industries. A Bureau of Industry is set up under the provisions of the Act. The principal function of the bureau is to make inquiry and investigation into all matters relating to industry, and to make recommendations to the Minister in respect thereof. In addition to its functions as an advisory body, the bureau is authorized to prepare plans (in accordance with Part II of the Act) in relation to industry, and to act as a licensing authority under Part III of the Act. The Minister may direct the bureau to prepare an industrial plan for the organization of any industry or related industries, and the Minister may require the appointment of an industrial committee to carry out or assist in carrying out the provisions of any approved industrial plan. Provisions are included in the Act relating to the registration and licensing of industries. The compilation of registers in connection with any industry or industries for the time being carried on in New Zealand is provided for, and the Minister may, by public notice, declare that any industry specified in the notice shall, as from a specified date, be carried on only pursuant to a license issued under the Act. The bureau is constituted the licensing authority, and the matters to be considered on application for licenses are specified. A right of appeal to the Minister against the decisions of the bureau is allowed. No person shall, without the consent of the bureau, commence to carry on any industry unless he has given to the bureau notice of his intention to do so. This section is limited to industries specified by the Minister.
The Protection of British Shipping Act, 1936.—The purpose of this Act is to protect British shipping against foreign competition in the carriage of passengers and goods between New Zealand and Australia if such foreign shipping is protected in its own territorial waters against British shipping.
The Education Amendment Act, 1936.—The main purpose of this Act is to restore the age at which children may be admitted to State schools to five years, and to abolish the “proficiency” and “competency” examinations.
The Workers Compensation Amendment Act, 1936, amends the original Act in several important respects. The definition of the term “worker” is extended, while the provisions of the principal Act are extended to apply to casual and domestic workers. The minimum amount of compensation payable in respect of the death of a worker is increased, as are increases in the minimum weekly payments of compensation payable in respect of the incapacity of a worker. The method of computing the basis of compensation payable is changed so that lost time during the week of the accident shall not cause a deduction from compensation, which is now based on the weekly rate of pay, not actual earnings. In the event of the bankruptcy of an employer, compensation payable under the Act shall rank with wages in the distribution of the estate.
The Naval Defence Amendment Act, 1936, provides for the appointment of a Naval Secretary and the establishment of a Naval Board.
The Wool Industry Promotion Act, 1936.—The purpose of this Act is to increase the production and use of wool. To provide funds for that purpose authority is given to impose a levy on woolgrowers. A body to be known as the New Zealand Wool Publicity Committee is established. The functions of the Committee are to promote the use of New Zealand wool by methods of publicity or otherwise, to promote scientific or industrial research in relation to wool or sheep with a view to the improvement of New Zealand wool, and to act in association with overseas organizations of a similar nature. The imposition of a levy on wool produced in New Zealand is authorized for the purpose of providing funds for the Committee. The Act prescribes methods of collecting the levy and rules for its administration.
The Hospitals and Charitable Institutions Amendment Act, 1936, provides that a Hospital Board shall be liable for the negligence of the members of its professional stall (whether employed in an honorary capacity or not) in the same manner and to the same extent as if the damage had been caused by the negligence of a servant of the Board acting in the course of his employment. Hospital Boards are authorized to provide ambulance services for patients, and are empowered to make compassionate payments to nurses contracting pulmonary tuberculosis. The power conferred by the principal Act to make regulations for the benefit of nurses employed in public hospitals and in certain private hospitals is extended so as to include nurses employed in all kinds of private hospitals.
The Coal-mines Amendment Act, 1936, authorizes a mine-manager to search a person while employed in a mine for unlawful inflammable material, and to require such person to leave the mine in the event of his being found in possession of such unlawful material. The Act amends the principal Act in respect of the inspection of mines for possible accumulations of gas, and prescribes conditions under which rock-drills may be used in mines. The Minister of Mines is authorized to establish and maintain central rescue-stations in coal-mining areas.
The Native Land Amendment Ad, 1936.—The purpose of this Act is to promote the settlement and more effective utilization by Natives of Native land, and to encourage Natives to engage in farming and in other related industries. The Board of Native Affairs established by the Board of Native Affairs Act, 1934–35, is empowered to acquire land and to develop it for the benefit of and with the assistance of Natives. For that purpose the Board may establish base farms on which to breed stock or conduct experiments. The Board is also empowered to engage advisers for Native farmers, and to cut and remove timber from land acquired by it. Power is given to the Board to nominate Natives as occupiers of its land, and to render the Natives financial assistance in developing the land occupied. Authority is also given to lease land owned by the Board to Native lessees subject to conditions prescribed in the Act.
The Native Purposes Act, 1936, adjusts certain claims and disputes in relation to Native land, confers jurisdiction upon the Native Land Court and the Native Appellate Court, and deals with certain other matters relating to Native affairs.
The Dentists Act, 1936, is a consolidation of the law relating to dentistry. A Dental Council is established, consisting of eight persons representing bodies interested in the profession of dentistry. The qualifications of persons entitle to be registered as dentists are proscribed. It is laid down that, except as provided by the Act, any person who is not registered shall not practise dentistry or hold himself out as being entitled so to practise, while any dentist is prohibited from permitting an unregistered person to practise dentistry in the name of such dentist. The rights of companies to carry on the profession of dentistry are restricted. It is made an offence for any person not registered as a dentist to hold himself out as a dentist. Disciplinary powers over members of the profession are conferred on the Council.
The Statutes Amendment Act, 1930, is the first of a new series of Acts intended to cover miscellaneous amendments to various Acts which are not of sufficient importance to warrant a special Act. The 1936 Act contains eighty-two sections, covering a wide variety of subjects.
Table of Contents
ON page 1 of this book the islands comprising the Dominion of New Zealand are divided into three groups, viz.:—
Islands forming the Dominion proper.
Outlying islands included within the geographical boundaries of New Zealand as proclaimed in 1847.
Annexed islands.
Only the first of these groups has been covered by the preceding sections of the book. The present section deals briefly with the second and third groups, and also with the mandated territories of Western Samoa and Nauru, the Ross Dependency, and the Tokelau or Union Group.
Stewart Island and the Chatham Islands, although coming within the first group for general purposes, are given brief mention.
STEWART ISLAND, which, with its small adjacent islands, has an area of some 670 square miles, is separated from the South Island by Foveaux Strait. It was thought by Captain Cook in 1770 to be a peninsula, and not until 1808 was his error discovered. In that year Dugald Stewart, in the schooner “Prince of Denmark” sailed through the strait. Stewart Island has several good harbours, is well wooded, and mountainous, the highest peak being the extinct volcano, Mount Anglem (3,200 ft.). The principal industry is sea-fishing, and the island is also a noted holiday resort. Stewart Island is a county, and for broad comparisons is treated as part of the South Island. The population at the census date (24th March, 1936) was 617, including 119 Maoris.
The CHATHAM ISLANDS consist of two inhabited islands and several unimportant islets of a total area of some 372 square miles. The islands were discovered by Lieutenant Broughton on 28th November, 1700, and named after the Earl of Chatham. They contain no high country, and the larger island has a central lagoon of about 72 square miles. The chief industries are sheep-farming and sea-fishing. Although about 480 miles eastward of Banks Peninsula, the group was constituted a county in 1901, and is not classed with the outlying islands. Before 1927 the islands were not included in any electoral district, and thus had no parliamentary representation, but from 1927 have been included in the Lyttelton Electoral District, and in the Western Maori Electoral District for the election of Maori representatives. In view of the special circumstances of the Chathams, certain laws are modified in their case—e.g., the Employment Promotion Act does not apply to the Chatham Islands, nor do the provisions of the petrol-tax imposed for road purposes. The Chatham Islands are for most purposes grouped with the South Island, and are also treated for statistical purposes as part of Canterbury Provincial District, although the latter is not strictly correct in point of law. The islands are included within the Wellington Deeds, Land Transfer, and Land Districts, but within the North Canterbury Hospital District and the Canterbury-Kaikoura Sheep District. The population at the census of 24th March, 1936, was 702, including 303 Maoris.
The outlying islands (total area, 307 square miles) included within the geographical boundaries as proclaimed in 1847 are—
| Three Kings Islands. | Bounty Islands. |
| Auckland Islands. | Snares Islands. |
| Campbell Island. | Solander Island. |
| Antipodes Islands. |
The THREE KINGS ISLANDS (so named by Tasman on account of his having discovered them on the anniversary of the Feast of the Epiphany) are a group of uninhabited islets (area, about three square miles) extending about seven miles in an east-north-east direction, and situated about thirty-eight miles west-north-west of Cape Maria van Diemen, at the northern extremity of the North Island. It was here that the s.s. “Elingamite” was wrecked on the 9th November, 1902, with heavy loss of life.
The AUCKLAND ISLANDS were discovered on the 18th August, 1806, by Captain Abraham Bristow, in the ship “Ocean.” They lie about 200 miles south of Bluff Harbour, their accepted position being given as latitude 50° 32' south and longitude 166° 13' east. They have several good harbours. The largest of the islands is about twenty-seven miles by about fifteen miles, and is very mountainous, the highest part being about 2,000 ft. above the sea. The total area is about 234 square miles.
CAMPBELL ISLAND, which lies about 150 miles south-east of the Auckland Islands, was discovered in 1810 by Frederick Hazelburgh, master of the brig “Perseverance,” owned by Mr. Robert Campbell, of Sydney. It is mountainous, and of a circumference of about thirty miles. There are several good harbours. The area is approximately forty-four square miles.
The ANTIPODES ISLANDS are an isolated group, consisting of several detached rocky islands (aggregating about twenty-four square miles) lying nearly north and south over a space of four to five miles; accepted position, 49° 41' 15" south, and longitude 178° 43' cast.
The BOUNTY ISLANDS, a little cluster of islets, thirteen in number, and without verdure, were discovered in 1788 by Captain Bligh, R.N., of H.MS. “Bounty”; position verified by observation, 47° 43' south, longitude 179° 0 ½' east. The total area is probably less than one square mile.
The SNARES ISLANDS are situated about fifty-six miles to the south-west of Stewart Island, and comprise six islets of a total area of about 600 acres.
SOLANDER ISLAND, which lies about forty miles to the north-west of Stewart Island, was discovered by Captain Cook in 1770. It is a bare rock, one mile in length and approximately half a square mile in area.
None of the outlying islands is at present inhabited.
The KERMADEC ISLANDS, four in number, with some outlaying islets, rank as “annexed islands,” having been annexed to New Zealand by Proclamation dated the 21st July, 1887. The islands are situated between the parallels of 29° 10' and 31° 30' south latitude, and between the meridians of 177° 45' and 179° west longitude. The principal island, Sunday, is 600 miles distant from Auckland, and lies a little more than half-way to Tonga, but 100 miles to the eastward of the direct steam route to that place. It is 300 miles eastward of the steam route to Fiji, and 150 miles westward of that from Auckland to Rarotonga. Macaulay Island and Curtis Islands were discovered in May, 1788, by Lieutenant Watts in the “Penrhyn,” a transport ship. The remainder of the group was discovered in 1793 by Rear-Admiral de Bruni, Chevalier d'Entrecasteaux.
The islands are volcanic, and in two of them signs of activity are still to be seen. The rainfall is plentiful but not excessive. The climate is mild and equable, and slightly wanner than that of the north of New Zealand. The following are the areas of the islands and islets of the group: Sunday Island, 7,200 acres; Herald group of islets, 85 acres; Macaulay Island, 764 acres; Curtis Islands, 128 acres and 19 acres; L'Espérance, 12 acres: total, 8,208 acres. Sunday Island is twenty miles in circumference, roughly triangular in shape, and at the highest point 1,723 ft. above the sea-level. It is rugged and broken over a very large extent of its surface, and, except in a few places, covered with forest. The soil everywhere on the island is very rich, being formed by the decomposition of a dark-coloured pumiceous tuff and a black andesitic lava, with which is closely mixed a fine vegetable mould. The great luxuriance and richness of the vegetation bear witness to the excellence of the soil, which is everywhere—except where destroyed by eruptions and on the steep cliffs—the same rich loam. Want of water is one of the drawbacks. Three of the four lakes on the island are fresh, but are so difficult of approach as to be practically useless.
Several attempts have been made to settle on the islands, which are normally uninhabited, the latest being in 1935, when a small party took up residence on Sunday Island.
Under the provisions of the Colonial Boundaries Act, 1895, and by resolution of the New Zealand Parliament, the boundaries of New Zealand were extended to include the Cook Islands as from the 10th June, 1901. The provisions for the government of the Cook Islands are contained in the Cook Islands Act, 1915, and its various amendments. A member of the Executive Council (the Minister for the Cook Islands) is responsible to the Government for the administration of the Territory.
A Resident Commissioner is stationed at Rarotonga, with Resident Agents, answerable to the Resident Commissioner, in charge of the remaining islands of the Group. The only exception is Niue, which possesses no direct sea communication with the remainder of the Group (see letterpress post).
The local administration of each island is assisted by Island Councils, consisting of ex officio elected or nominated members. European officials and Arikis (Native chiefs) are councillors ex officio, and nominated members hold office during the pleasure of the Governor-General. The Cook Islands Amendment Act, 1921, provides for the election of a European member of the Island Council of Rarotonga as a representative of the European population.
Each Council is empowered to make laws for the good government of the island, with the proviso that such laws must not be repugnant to Acts of the New Zealand Parliament or regulations made thereunder. The maximum penalties imposed by the Ordinance of an Island Council must not exceed three months' imprisonment or a fine of £50. The Council has no power to deal with Customs duties, to borrow money, to establish Courts of Justice, or to appropriate expenditure of revenue other than that raised under authority of their Ordinance. No Ordinance has effect until it has received the assent of the Resident Commissioner or the Governor-General. The Governor-General may, by notice in the Gazette, disallow any Ordinance within one year after the Commissioner has given his assent.
Laws are enforced through the High Court, which has all jurisdiction, civil or criminal, necessary for the administration of justice. The Chief Judge resides at Rarotonga. A Commissioner may, with some exceptions, exercise the full powers and functions of a Judge. A judgment obtained in a civil proceeding in the High Court may be enforced in the Supreme Court of New Zealand. Prom any decision in the former Court an appeal lies to the Supreme Court in the Dominion.
A Native Land Court is constituted under the provisions of the Cook Islands Act, 1915, and consists of a Chief Judge at present stationed in Rarotonga.
Following is a brief description of the various islands of the Cook Group:—
RAROTONGA (1,638 miles from Auckland), the most fertile and valuable of the Cook Group, is a magnificent Island, rising to a height of 2,100 ft. It is clothed to the tops of the mountains with splendid vegetation, and has abundant streams, considerable tracts of sloping land, and rich alluvial valleys. The island is handicapped by the lack of a suitable harbour.
MANGAIA, the south-easternmost of the Cook Group, is of volcanic origin, and about eighteen miles in circumference. It produces large quantities of coconuts, bananas, oranges, limes, citrons, and other fruits.
ATIU resembles Mangaia in appearance and extent. It is a raised mass of coral, steep and rugged, except where there are small sandy beaches and some clefts, where the ascent is gradual. On the highest point of the central ridge coconuts, bananas, oranges, and coffee grow with the utmost luxuriance; and the kumara, one of the most valuable of South Sea vegetables, yields large crops.
MAUKE is a low circular island about two miles across, lying to the north-east of Rarotonga. Like Mangaia and Atiu, it is surrounded by an unbroken fringing reef. Mauke is very fertile.
MITIARO is a low-lying island, from three to four miles long and one mile wide.
MANUAE (Hervey Islands) is surrounded by a reef which is about 10 ½ miles in circumference.
TAKUTEA is a small coral island, about half a square mile in area, some 120 miles distant from Rarotonga.
AITUTAKI is probably the most fertile of all the islands forming the Lower Group. It is capable of exporting large quantities of tropical fruits and vegetables, but exports are restricted owing to irregular and infrequent shipping calls. The island is about eighteen miles in circuit.
NIUE was one of the islands annexed to New Zealand in 1901. By an Act of the New Zealand Legislature passed in 1932, its administration was transferred from the Minister for the Cook Islands to the Minister of External Affairs as from the 1st October, 1932. Separate reference to Niue appears later.
PALMERSTON is an atoll lying about 450 miles east of Niue and about 220 miles from the nearest island of the Cook Group (Aitutaki), and is remarkable as the “San Pablo” of Magellan, the first island discovered by Europeans in the South Sea.
SUWARROW lies 513 miles from Rarotonga. It is a coral atoll, of a triangular form, fifty miles in circumference, the reef having an average width of half a mile across, enclosing a land-locked lagoon eight miles by six, which is capable of being made into an excellent harbour. The island is at present uninhabited, although visited periodically; while part of it is a naval reserve.
PUKAPUKA (Danger Island): Next to the 10th parallel, bearing north-west of Suwarrow about 250 miles.
NASSAU is a fine island lying about 45 miles to the south-east of Pukapuka or Danger Island. The area under cultivation (well-planted coconuts) is about 300 acres.
RAKAHANGA is an atoll, three miles in length and of equal breadth.
MANIHIKI, lying about 400 miles eastward of Danger Island, is an atoll, about thirty miles in circumference, valuable from the extent of the coconut-groves.
PENRHYN (Tongareva) lies about 300 miles north-east of Manihiki. It is one of the most famous pearl-islands in the Pacific, and there is a lagoon with two entrances capable of holding a large number of vessels—the only island in the Group which affords land-locked shelter for craft other than the small local fleets of fishing-boats.
The areas of the islands included in this group are as follows:—
| Acres. | |
|---|---|
| Penrhyn | 4,000 |
| Rakahanga | 1,000 |
| Manihiki | 1,250 |
| Pukapuka | 1,250 |
| Suwarrow | 600 |
| Palmerston | 1,000 |
| Aitutaki | 3,900 |
| Manuae | 1,524 |
| Takutea | 302 |
| Atiu | 15,950 |
| Mitiaro | 2,500 |
| Mauke | 4,000 |
| Mangaia | 17,500 |
| Rarotonga | 10,500 |
| Nassau | 300 |
| Total | 63,176 |
| Niue | 64,028 |
| Grand total | 127,204 |
Revenues are derived principally from Customs duties, which, with minor exceptions, follow the New Zealand Customs tariff; from Court fees and fines, dog-tax, motor fees, road and water rates, stamp sales and duties, trading licenses, &c. The Rarotongan Treasury finds all revenue for ordinary expenditure, but the New Zealand Government subsidizes that Treasury for medical and educational purposes. Including grants from the New Zealand Government, the revenue of the Cook Islands for the year 1936–37 was £44,084 and the expenditure £42,713.
Under the provisions of the Cook Islands Act, 1915, all Natives are provided gratuitously with medicinal and surgical aid. As a result of this beneficent policy, the population is particularly free from the usual tropical diseases and is increasing steadily.
The manufacture or importation of intoxicating liquor is prohibited absolutely, excepting for medicinal, sacramental, or industrial purposes.
A census of the Cook Islands taken as for 30th April, 1936, showed an increase in population of 21.46 per cent. on the preceding census of 1926, The increase was restricted to the Native population, which numbered 11,991. (males 6,235, females 5,756) in 1936. The population other than Natives—255, comprising 141 males and 114 females—showed a decline of 26 in the ten years since 1926.
| Island. | Population, 1926 Census. | Population, 1936 Census. |
|---|---|---|
* Uninhabited at census. | ||
| Aitutaki | 1,431 | 1,719 |
| Atiu | 933 | 1,086 |
| Mangaia | 1,249 | 1,459 |
| Manihiki | 416 | 487 |
| Manuae | 23 | 8 |
| Mauke | 511 | 652 |
| Mitiaro | 238 | 265 |
| Palmerston | 97 | 90 |
| Penrhyn | 395 | 467 |
| Pukapuka | 526 | 651 |
| Rakahanga | 327 | 290 |
| Rarotonga | 3,936 | 5,054 |
| Suwarrow | * | * |
| Takutea | * | * |
| Nassau | * | 18 |
| Totals | 10,082 | 12,246 |
Each of the seven censuses taken since the annexation of the islands in 1901 has shown an increase of population. A system of compulsory registration of births, deaths, and marriages is in force in the islands; but in view of the irregularity and infrequency of communication with some of the islands it is' impossible to give precise figures for a given period. During the year ended 31st March, 1937, registered births for the island of Rarotonga numbered 159 (males 80, females 79); deaths, 82 (males 38, females 44); and marriages, 41.
Government schools are established on all the islands of the Lower Group, and the Administration subsidizes the London Missionary Society for its schools established in the Northern Cook Islands. In addition, Roman Catholic Mission schools are established on various islands throughout the Group.
The aim of the Administration is to educate the children up to the equivalent of Standard IV of the New Zealand school syllabus, with facilities at Rarotonga for advanced children to attain a level comparable to Standard VI in New Zealand. A limited number of scholarships are granted, which enable pupils of outstanding ability to enter Maori colleges in New Zealand in order to fit them for positions in the Cook Islands Public Service. During the year 1935, 2,979 children were being educated in the Cook Islands schools.
Radio stations are erected at Rarotonga, with substations at Aitutaki, Atiu, Mangaia, and Mauke. An extension of wireless services to the islands of the Northern Group is under consideration.
The figures of exports and imports for each of the last ten years are—
| Year. | Exports to New Zealand. | Total Exports. | Imports from New Zealand | Total Imports. |
|---|---|---|---|---|
| £ | £ | £ | £ | |
| 1927 | 99,206 | 138,357 | 87,773 | 116,606 |
| 1928 | 96,470 | 133,051 | 81,511 | 117,639 |
| 1929 | 93,066 | 124,486 | 73,565 | 106,835 |
| 1930 | 85,965 | 109,438 | 69,976 | 103,468 |
| 1931 | 66,932 | 79,945 | 49,223 | 69,260 |
| 1932 | 59,880 | 73,409 | 48,263 | 63,585 |
| 1933 | 59,262 | 73,983 | 54,022 | 76,716 |
| 1934 | 53,756 | 59,307 | 46,214 | 61,449 |
| 1935 | 40,472 | 53,599 | 43,566 | 61,676 |
| 1936 | 60,182 | 67,556 | 53,913 | 72,576 |
Apart from copra exports (£7,458 in 1936), the bulk of the trade is with New Zealand. In 1936 other countries to which exports were sent were the United States, £3,861; the United Kingdom, £3,509; and Tahiti, £4. Imports in 1936, exclusive of imports from New Zealand, came chiefly from the United Kingdom, £6,196; the United States, £4,176; and Australia, £5,519.
Exports of principal commodities during 1936 were—
| Quantity. | Value. | |
|---|---|---|
| £ | ||
| Copra | 689 tons | 7,458 |
| Oranges | 74,330 cases | 25,721 |
| Bananas | 49,431 cases | 19,092 |
| Tomatoes | 38,546 boxes | 13,000 |
| Orange-juice | 541 packages | 695 |
| Coconuts | 1,049 sacks | 348 |
| Pearls | 505 |
Niue (or Savage Island), lying about 300 miles to the cast of Tonga, is a coral island, thirty-six miles in circumference and 64,028 acres in area, rising to a height of 200 ft. It is fertile and has the usual tropical productions. Niue is included within the boundaries of the Cook and other islands annexed in 1901, but has a separate Administration.
By the Cook Islands Amendment Act, 1932, the control of Niue was transferred from the Minister for the Cook Islands to the Minister of External Affairs. The constitution and laws (vide observations under “Cook Islands Group,” immediately preceding) otherwise remain unaltered. A Resident Commissioner, who is also Judge, is stationed on the island.
Returns for the census taken on 30th April, 1936, disclose the population as 4,104. Totals for the six preceding censuses taken since the annexation of Niue by New Zealand (11th June 1901) are as follows:—
| 1902 | 4,079 |
| 1906 | 3,822 |
| 1911 | 3,943 |
| 1916 | 3,880 |
| 1921 | 3,750 |
| 1926 | 3,795 |
The following comparison with the census taken on 20th April, 1926, shows an increase of 309 (8.14 per cent.) in the ten years:—
| Native population— | Census, 1926. | Census, 1936. |
| Males | 1,763 | 1,980 |
| Females | 2,000 | 2,102 |
| European population— | ||
| Males | 18 | 12 |
| Females | 14 | 10 |
| Total population | 3,795 | 4,104 |
There are two Government schools, where agriculture, handicraft, domestic art, and woodwork form part of the curriculum. The average roll number of these two schools was 321 in 1936. In addition, there are ten schools under the control of the London Missionary Society, which are subsidized by the Administration. The average roll number for these schools during 1936 was 481.
A Government hospital is established in Niue, the staff consisting of a European matron and a number of Native nurses. The medical work of the island is under the control of a European medical officer, assisted by several Native trainees. Medical and surgical aid and attendance are given free of charge to all Natives.
During 1936 births registered in Nine numbered 140; deaths, 74.
Revenue of the Niue Island Administration for the year ended 31st March, 1937, was £18,339. No grants were received from the New Zealand Government. Customs duties brought in £2,634, copra export duty £418, stamp sales £1,538, and landing and shipping charges £1,496. Expenditure aggregated £20,806.
There is no intercommunication between the Cook Group and Niue, which lies 600 miles west of Rarotonga. Great difficulty was experienced in the past in providing a satisfactory subsidized service with New Zealand until the advent of the Government motor-vessel “Maui Pomare.” The “Maui Pomare” maintains a regular four-weekly service from Lyttelton, Wellington, and Apia to Niue, and this service adequately caters for the needs of the island.
Radio communication is maintained by regular services with New Zealand and Western Samoa.
Exports and imports for the last ten years are given below. The greater part of the trade is with New Zealand.
| Year. | Exports to New Zealand. | Total Exports. | Imports from New Zealand. | Total Imports. |
|---|---|---|---|---|
| £ | £ | £ | £ | |
| 1927 | 14,290 | 14,350 | 10,896 | 14,006 |
| 1928 | 16,347 | 20,938 | 14,403 | 18,637 |
| 1929 | 13,449 | 22,206 | 14,688 | 19,107 |
| 1930 | 13,323 | 15,877 | 14,863 | 18,630 |
| 1931 | 5,186 | 7,191 | 8,958 | 11,507 |
| 1932 | 10,820 | 13,987 | 11,568 | 14,756 |
| 1933 | 10,225 | 11,542 | 10,400 | 13,123 |
| 1934 | 11,342 | 12,341 | 11,888 | 13,372 |
| 1935 | 10,010 | 12,076 | 13,380 | 15,288 |
| 1936 | 15,915 | 22 992 | 22,280 | 24,662 |
The principal items of export are bananas and copra. Other items include fancy baskets, hats, and kumaras. With a view to improving the marketing of bananas in New Zealand, grading and packing for export are now done under the control and supervision of the Resident Commissioner and his inspectors. The export of fruit from Niue was hampered until 1925 by the difficulty and irregularity of communication with New Zealand, but with the maintenance of a regular service by a Government vessel these drawbacks have been removed.
Exports of principal commodities during 1936 were—
| Quantity. | Value. | |
|---|---|---|
| £ | ||
| Bananas | 35,701 cases | 13,744 |
| Copra | 662 tons | 7,077 |
| Hats | 880 dozen | 384 |
| Kumaras | 94 tons | 1,464 |
| Fancy baskets | 93 dozen | 80 |
The Native race inhabiting Samoa is of typical Polynesian character, with straight hair, brown colouring, good physique, and mild and hospitable disposition.
The first known visit of Europeans to the islands was that of a Dutch expedition, under Jacob Roggeveen, in its voyage around the world in 1721–22. In 1768 De Bougainville called at the islands, and in 1787 La Pérouse, who named them “Navigators Islands,” a name which the French retain. The first British vessel to pay a visit was H.M.S. “Pandora,” in 1790. Missionaries, who were to play an important part in the development of the country, made their advent in 1830, when two members of the London Missionary Society arrived at Savai'i.
The first formal recognition of “whites” took place some eight years later, when Captain Bethune, of the British Navy, concluded a commercial treaty with the Native chiefs, by which harbour dues were to be paid and security to European interests guaranteed in return. Next year (1839) Lieutenant Charles Wilkes, in command of a United States exploring expedition, completed a similar treaty.
Three great nations were to have control of the destinies of the Samoans. Great Britain appointed a Consular Agent in 1847, the United States a Commercial Agent in 1853, and Germany her first representative in 1861. In 1869 one of the frequent internecine wars of the Natives broke out—a war that was to have far-reaching consequences, for the foreign authorities took for the first time direct measures to ensure peace. The trouble arose over rival claimants to the Native chieftainship, and continued, despite several patched-up truces, for some years.
At a conference in Berlin in 1889, an Act was signed by the representatives of Great Britain, the United States, and Germany declaring the neutrality and independence of the islands, providing for equal rights therein of the nationals of the three signatory Powers and other matters affecting the government of the islands. This arrangement was never free from trouble, and when, on the death of King Malietoa Laupepa in 1898, disturbances again arose over the succession, the kingship was abolished, in accordance with the recommendation of a joint Commission. By the Anglo-German agreement of the 14th December, 1899, accepted by the United States in January, 1900, Great Britain renounced in favour of Germany all rights over Western Samoa, and similarly in favour of the United States all rights over Tutuila and the other islands of Eastern Samoa.
On the outbreak of war in 1914 between the United Kingdom and Germany a New Zealand Expeditionary Force took possession of Western Samoa, landing unopposed at Apia on the 29th August, and remained in occupation until the establishment of Civil Government under the ægis of the Dominion.
The islands have been administered since 1919 under mandate of the League of Nations, the Administrator being appointed by the Governor-General of New Zealand and responsible to the Minister of External Affairs. There is a Legislative Council, consisting of not less than four, nor more than six, official members appointed by the Governor-General, two members elected triennially by the European residents, and four Native Samoans, appointed by the Governor-General. The Administrator, acting with the advice and consent of this Council, is empowered to make Ordinances for the peace, order, and good government of the Territory, subject to disallowance by the Governor-General. A High Court is established, and the Supreme Court of New Zealand is given jurisdiction over Western Samoa—that is to say, there is the right of appeal from the High Court to the Supreme Court.
All matters concerning the Samoan people are placed before the Fono of Faipule, a body composed of chiefs elected by their districts, and no action regarding legislature or procedure affecting the Samoans is taken without its concurrence. Under the present system of administration the mandated territory has progressed steadily, particularly in the realms of health, public works, and education.
In June, 1936, a ministerial goodwill mission from New Zealand visited Samoa, and, during its stay of four weeks, heard representations from the Samoan people. On arrival it was announced that the declaration of the Mau (a political organization of Native Samoans) as a seditious organization, and regulations (which had been dormant) containing power for restricting movements within the territory, would be immediately repealed. In the course of the discussions with representatives of the Samoans the following changes were also made effective:—
Arrears of Native personal and medical taxes owing on 1st April, 1929, when the taxes were suspended, amounting to £28,786 19s. 9d., were written off, and the Ordinances empowering the levying of such taxes were listed for repeal, which became effective on 23rd December, 1936.
The Samoan Offenders Ordinance, 1922, under which the Administrator was empowered to banish individuals from their villages and to cancel family names (which power had not been used since 1927) was listed for repeal, which also was effected on 23rd December, 1936.
The Samoan membership of the Legislative Council was increased from two to four.
Tuimaleahifano, a leader of the Mau and a former Fautua, resumed that office.
Provision was made for a Finance Committee, consisting of three representatives of the Samoan race and one of the European community, to confer with the Administrator and two officials; for the Legislative Council to discuss the estimates of revenue and expenditure; and for the estimates to be published in the Samoan language.
A re-election of the Native Advisory Council of Faipule was held, being effective from 1st October, and thirty-nine Faipule were returned, of whom thirty-three were members of the Mau. Those of the previous Faipule who were not elected agreed to retire, and were paid their stipends for eighteen months, being the balance of their term of three years.
The appointment of a Samoan assistant or associate to sit with and advise Judges or Commissioners presiding in the High Court at Apia in all cases where Samoans are involved was approved.
Extension of health and education services was announced.
Western Samoa includes the Islands of Upolu, Savai'i, Apolima, and Manono, together with several small islets, lying between the 13th and 15th degrees of south latitude and the 171st and 173rd degrees of longitude west of Greenwich.
The principal islands are Savai'i and Upolu. Savai'i is the larger of the two with a length of 48 miles, a breadth of 25 miles, and a total area of 703 square miles. The island is mountainous, rising to a height of over 6,000 ft. Upolu, which extends some 45 miles in length and 13 in breadth, measures about 430 square miles in area, and rises to a height of over 3,000 ft. Of the two, Upolu is the more fertile and populous, and contains the port and capital of Apia. Rainfall is plentiful throughout the Group.
A census of population was taken by the Administration on the night of 4th November, 1930. The following table shows the summarized results, together with corresponding figures for the 1920 census:—
| — | 1926. | 1936. | Increase. | Decrease. |
|---|---|---|---|---|
| Native Samoans (including other Pacific-Islanders) | 36,688 | 52,266 | 15,578 | |
| Europeans | 446 | 367 | 79 | |
| Persons of part-Samoan blood | 2,052 | 2,708 | 656 | |
| Chinese | 890 | 522 | 368 | |
| Melanesian labourers | 155 | 83 | 72 | |
| Totals | 40,231 | 55,946 | 15,715 |
Following are statistics of the age-constitution of the Native Samoan population as disclosed by the census:—
| Matai (heads of families ranking as chiefs or orators, usually over thirty-five years of age) | 3,100 |
| Taulele'a (untitled men. of any age over fourteen years) | 10,149 |
| Tamaiti (boys, two to fourteen years) | 11,534 |
| Tama meamea (infant boys, under two years) | 1,685 |
| Total, males | 26,468 |
| Fafine (all women who have been married, and all other women over twenty-five years of age) | 11,273 |
| Teine muli (unmarried females, fifteen to twenty-five years) | 2,707 |
| Teineiti (girls, two to fourteen years) | 10,457 |
| Teine meamea (infant girls, under two years) | 1,361 |
| Total, females | 25,798 |
| Total of Samoan population, 4th November, 1936 | 52,266 |
Statistics of total population on 31st March, 1937, compiled by the Administration are as follows: Males, 28,876: females, 27,388: total, 56,264.
The Samoa Health Ordinance, 1921, is on the lines of the New Zealand Health Act, 1920, but remodelled to suit local conditions. A Government hospital is maintained at Apia, district hospitals have been established at Tuasivi (Savai'i) and Aleipata (Upolo), while there are five dispensaries in out-districts and at mission-stations.
Of the more important tropical diseases, only three are prevalent in Western Samoa—viz., ankylostomiasis (or hookworm), frambœsia (yaws), and filariasis (elephantiasis). Every effort has been made to stamp out these diseases, particularly hookworm and yaws, and systematic campaigns to this end have been in progress since 1923. These have resulted in a marked improvement in the general health of the Natives.
Of recent years the sanitation of Apia has been considerably improved, and the reticulation with a high-pressure water-supply system completed. Water has been piped into several villages from springs in the hills, while in other villages where this is not possible large reinforced-concrete tanks are erected to receive the rain-water from church buildings.
Until recent years education in Samoa had been almost entirely in the hands of the missions, and beyond the training of pastors (who also acted as teachers in the village mission schools) little higher education was attempted; latterly, however, more advanced instruction in the English language has been given not only in the Administration schools at Ifi Ifi, Malifa, Vaipouli, and Avele, but also by the London Missionary Society at Papauta, by the Methodist Mission at Faleula, and by the Marist Brothers and Sisters at Apia. All these schools are frequently inspected by one of the Senior Inspectors of the New Zealand Education Department.
A count taken in 1937 showed that 21,829 children were attending the various Government and mission schools. The majority of the pupils are at village mission schools, where the instruction is in the hands of Native pastors. In second-grade or district schools the Government and the missions co-operate, the teachers being paid by the Government. The number of such schools is sixty-four, having an aggregate roll number of 6,300 at 31st March, 1937. The Government schools, on the other hand, had an average attendance of 1,105 during the year ended 31st March, 1937.
The revenue for the financial year ended on 31st March, 1937, was £117,909, as compared with £111,857 in 1935–30. Following are the principal sources of revenue:—
| 1935–36. | 1936–37. | |
|---|---|---|
| £ | £ | |
| Import duties | 33,777 | 43,445 |
| Export duties (less refunds) | 24,401 | 22,903 |
| Taxes | 8,986 | 8,071 |
| Hospital fees, &c. | 8,715 | 9,899 |
| Postal and radio receipts | 7,824 | 6,994 |
| Public Works receipts | 4,504 | 4,798 |
| Other revenue | 23,660 | 21,799 |
| Total revenue | 111,807 | 117,909 |
The figures of revenue and expenditure for each of the last five years are—
| Year ended 31st March, | Revenue. | Expenditure. |
|---|---|---|
| £ | £ | |
| 1933 | 105,920 | 98,166 |
| 1934 | 90,613 | 89,955 |
| 1935 | 78,808 | 76,505 |
| 1936 | 111,867 | 100,736 |
| 1937 | 117,909 | 116,613 |
The public debt of the Territory at 31st March, 1937, was £121,940. The money has been provided by the New Zealand Government, a further £25,000 having been donated as a gift.
The exports and imports of Western Samoa for each of the last ten years are—
| Year. | Exports. | Imports. |
|---|---|---|
| £ | £ | |
| 1927 | 335,978 | 304,309 |
| 1928 | 422,175 | 326,553 |
| 1929 | 293,938 | 288,849 |
| 1930 | 284,515 | 275,355 |
| 1931 | 194,447 | 164,950 |
| 1932 | 183,028 | 150,902 |
| 1933 | 173,837 | 150,850 |
| 1934 | 128,117 | 92,784 |
| 1935 | 189,298 | 137,757 |
| 1936 | 203,255 | 107,020 |
The principal item of export is copra, exports of which in 1930 totalled 13,014 tons, of a value of £156,873. Cocoa-beans of a value of £46,607, representing 1,065 tons; bananas, £46,737 (4,573 tons), rubber, £3,408 (51 tons); constitute the only other items of any importance.
Of the exports in 1936, £254,791 was the produce of Western Samoa, the remaining £8,464 being re-exports. Total exports in 1936 included £56,809 to New Zealand, £64,570 to the United Kingdom, £9,836 to the United States, and £91,448 to the Continent of Europe (exact destination unknown). The imports in 1936 came principally from New Zealand (£53,218), the United Kingdom (£31,105), Australia (£27,530), Japan (£17,781), the United States (£11,636), Canada (£7,239), Dutch East Indies (£5,959), Fiji (£4,464), India (£4,114), and Hong Kong (£407).
The trade turnover for 1936 shows a total of £430,275, as compared with £327,055 for the previous calendar year, an increase of over 33 per cent. This satisfactory position is due mainly to increases in the prices of copra, cocoa, and rubber.
In addition to a scale of import duties, there are export duties, of which the chief are: Copra (£1 10s. per ton), cocoa-beans (£2 per ton), and bananas (2s. 6d. per case net). The net import duty collected in 1936 was £36,668, export duties collected totalling £23,691 (£38,140 gross, less refunds £14,449).
Vessels entered inwards at the Port of Apia during 1936 numbered eighty-four, and represented an aggregate tonnage of 112,139. The tonnage of cargo brought by these vessels was 11,378, while cargo entered outwards totalled 25,882 tons.
The latest addition to New Zealand's dependencies is the Tokelau or Union Group, which consists of three islands, or groups of islets (Atafu, Nukunono, and Fakaofo), of a total area of 2,550 acres. They are situated between 8° and 10° of south latitude and between 171° and 173° of west longitude, and are distant about 270 miles from Apia, Samoa, which has since 1923 been the port of entry for the group.
These islands were ceded to Great Britain in 1916, from which year up to 1925 they formed part of the Gilbert and Ellice Islands Colony. They were transferred to the jurisdiction of New Zealand as from the 11th February, 1926, and are now administered by the Administrator of Western Samoa on behalf of the New Zealand Government. The Secretary of Native Affairs in Western Samoa is District Officer for the Tokelau Islands, the latter having no local European officials or residents.
A census of population in the Group was taken by the Western Samoan Administration on the night of 4th November, 1936. The total population was 1,170, as compared with 1,033 at the 1926 census. Figures for the three islands are as follows (1926 totals in parentheses): Fakaofo, 508 (444); Atafu, 378 (360); Nukunono, 284 (229).
The Natives are Polynesians, with a language allied to that of the Samoans. Jurisdiction is exercised by the local chiefs with the assistance of Native Councils, while education is administered by the missions, which maintain Native teachers in the islands.
The only exportable product of the islands is copra. The total amount of copra available for export in a normal year is estimated to be 365 tons—viz., 65 from Atafu, 210 from Nukunono, and 90 from Fakaofo.
There is a wireless station on Fakaofo Island.
For much of the information contained in the following paragraphs the Census and Statistics Department is indebted to “Ocean Island and Nauru,” by A. F. Ellis, C.M.G., F.R.G.S.
Since 1899 the history of Nauru, or Pleasant Island, has been that of its rich phosphate deposits. Discovered by Captain Fern of the American whaling-ship “Hunter” in 1789, it was, until annexed by the Germans in 1888, the haunt of beachcombers. In 1899 an accidental discovery was made in Sydney, from a geological specimen, of the presence of phosphatic rock on the island. This discovery, made by an official of the Pacific Islands Company (later the Pacific Phosphate Company), led to a prospecting party being sent to Nauru in May of the following year, with the result that extensive deposits were discovered.
From 1900 to 1906 the company whilst working the deposits of the neighbouring Ocean Island, negotiated with German interests for the working of the Nauru deposits. In June, 1906, it was able to commence operations with a mixed staff of British and Germans. During 1907, 11,630 tons of phosphate were quarried and during the period 1909–13 the output was 630,656 tons, an average of 126,131 tons per annum.
With the outbreak of the 1914–18 war the island passed into British hands. It was surrendered to H.M.A.S. “Melbourne” on the 9th September, 1914, and was included with the German New Guinea possessions in the capitulation of Herbertshohe. The island was garrisoned with Australian troops on the 6th November, 1914, and a Civil administration was established on the 1st January, 1915. A mandate for the administration of the island was conferred by the Allied and Associated Powers upon the British Empire, to come into operation at the same date as the Treaty of Peace with Germany, and this mandate is held jointly by the Imperial Government, the Government of Australia, and the New Zealand Government. An agreement between the three parties to the mandate was drawn up and completed on the 2nd July, 1919. The administrative control of the island is vested in an Administrator, whose term of appointment is five years, the three successive administrators to date having been appointed by the Commonwealth Government.
Nauru Island is barely ⅓ of a degree below the equator and lies 166° 56' east of Greenwich. It is an elevated island about three miles and a half long and two miles and a half wide, with a circumference of twelve miles and an area of 5,396 acres. With the exception of a narrow coastal belt favourable for the growth of coconuts, and of a brackish lagoon, the island consists of phosphate deposits overlying a bed of coralliferous limestone. The island is completely surrounded by a coral reef, and beyond the reef the sea-bed slopes sharply at an angle of 45°. These two latter factors, together with the presence of the strong equatorial current of two knots, materially affect the shipping facilities of the island. The fact that the island lies in the latitude of the easterly trade winds, which blow from nine to ten months of the year, is also significant since it explains the comparative absence of rainfall, a condition necessary for the existence of phosphate deposits.
The origin of the deposits on Nauru Island, as well as those on Ocean Island, is a matter of conjecture. The deposits do not appear to be simple guano, while some authorities consider them to be of a marine sedimentary origin raised from the sea-bed and subjected to weathering.
From the point of view of phosphate manufacture the deposits are of a very high grade, exports averaging 85.4 per cent. tricalcic phosphate and 3.4 per cent. calcium carbonate. Owing to the uneven nature of the outcrops of coralliferous limestone the extent of the deposits cannot be measured accurately, but it is estimated as between fifty and ninety million tons.
For £3,500,000 the Governments of Great Britain, Australia, and New Zealand purchased from the Pacific Phosphate Company both the concession for working the Nauru deposits and the company's interests in Ocean Island. The rights under the concession, which had been obtained by the company from the German interests, were vested in the British Phosphate Commission, and in accordance with the Nauru agreement of 2nd July, 1919, the Commission succeeded the company on 30th June, 1920.
The agreement provides for the allocation of the annual output of phosphate among the three Governments in the following proportions, which coincide with the proportion of capital supplied by each towards the undertaking: Great Britain, 42 per cent.; Australia, 42 per cent.; and New Zealand, 16 per cent. Any portion of its share not required by any Government may be disposed of either to the other Governments pro rata, or (if they do not require it) to other countries. The partner countries receive interest at 6 per cent. on their capital invested, and redemption of capital within fifty years is provided for by a sinking fund. The Natives are paid £40 per acre (prior to 1st July, 1927, this was £20) for all phosphate-bearing lands, with an annual rental of £3 per acre for all non-phosphate lands leased, and are compensated for trees destroyed. A royalty of 7 ⅞d. (prior to 1st July, 1932, 7 ½d.) per ton of phosphate shipped is paid, 4 ⅜d. going to the Native landowner, 1 ½d. being used by the Administrator solely for the benefit of the Nauruan people, and the remaining 2d. held in trust by the Administrator for the benefit of the landowner.
Nauru, together with Ocean Island, presents a unique example of large-scale development in isolated tropical conditions. Complete mechanization of all stages of the productive process enables the phosphate to be handled with the maximum speed and minimum cost. From quarrying to loading, through the crushing and drying processes, it is carried by cableways, railways, and electric belt-conveyors. The method of loading vessels at Nauru is unique and has been evolved to suit the local conditions. Owing to the geophysical structure of the sea-bed the construction of either a harbour or dock was found impracticable; so, in 1930, a cantilever conveyor was built. On the outer edge of the coral reef massive pillars were constructed to which were fixed two large swinging cantilever arms. With a length of 172 ft. these arms are able to reach out to ships moored beyond the reef, and with electric belt-conveyors running out on both arms the plant is able to load both the fore and after holds of a vessel simultaneously at the rate of 1,000 tons per hour. Owing to the great depth of the sea-bed and the proximity of the reef the mooring system for vessels using the cantilever is both elaborate and expensive. Unfortunately the method of loading is only a fine weather one, and in uncertain weather conditions lightering has to be reverted to.
Besides controlling the extensive mechanized plant, comprising electric-power stations, refrigeration, water-condensers, reservoirs, foundries, electric dust-precipitators, &c., the Commission also owns and operates three vessels especially built for the carrying of phosphate, and fitted with special apparatus for the servicing of the mooring buoys and equipment. Shipment operations are also greatly expedited by a radio-telephone system enabling prompt consultations with Ocean Island as well as with the Commission's vessels. This service operates in addition to the radio-telegraph station under the control of the Administration.
The shipments from both Nauru and Ocean Islands, with deliveries to New Zealand, during each of the five years ended June, 1936, have been as follows:—
| Year ended 30th June, | Exports. | Shipments to New Zealand. | |||
|---|---|---|---|---|---|
| Nauru Island. | Ocean Island. | Total Shipments. | Quantity. | Per Cent. of Total. | |
| Tons. | Tons. | Tons. | Tons. | ||
| 1932 | 289,340 | 142,200 | 431,540 | 146,270 | 33.9 |
| 1933 | 436,100 | 224,200 | 660,300 | 177,770 | 26.9 |
| 1934 | 379,100 | 177,489 | 556,589 | 148,950 | 26.8 |
| 1935 | 457,900 | 237,982 | 695,882 | 214,621 | 30.8 |
| 1936 | 506,600 | 319,779 | 826,379 | 192,879 | 23.3 |
At the present time Australia and New Zealand absorb nearly the whole output, leaving very little for export to other countries. The distribution during 1935–36 was as follows: Australia, 561,200 tons; New Zealand, 192,879 tons; United Kingdom, 6,000 tons; and other countries, 66,300 tons.
The New Zealand Government receives from the British Phosphate Commission an annual contribution of £35,849 towards interest on and amortization of loan-money raised to meet the Dominion's share of the purchase-money of the Pacific Phosphate Company's rights. The indebtedness of the New Zealand Government on account of Nauru and Ocean Islands, originally £600,000, had been reduced to £410,915 at 31st March, 1936.
At the 1st April, 1937, there were 1,638 Native inhabitants, who speak a language akin to that of the Gilbert Islanders. In addition there were 4 Natives of other Pacific Islands, and 1,261 Chinese, who have been introduced for the working of the phosphate-deposits. Europeans numbered 194, the total population being thus 3,97.
Revenue and expenditure and trade of the Nauru Administration for each of the last five years were—
| Year. | Revenue. | Expenditure. | Exports. | Imports. |
|---|---|---|---|---|
| £ | £ | £ | £ | |
| 1932 | 20,235 | 15,435 | 466,423 | 95,739 |
| 1933 | 19,779 | 18,748 | 436,787 | 97,684 |
| 1934 | 19,798 | 19,758 | 470,872 | 98,085 |
| 1935 | 23,487 | 20,666 | 474,393 | 157,247 |
| 1936 | 24,906 | 23,989 | 469,607 | 154,940 |
Imports consist almost entirely of food-supplies, and of machinery for the working of the phosphate.
THE following article on the Ross Dependency was prepared by Mr. M. J. S. Nestor, of the Lands and Survey Department.
It is convenient when writing on the history of the Dependency to deal first with Antarctica as a whole.
Prior to the departure from Plymouth of Captain James Cook's South Polar Expedition (13th July, 1772) there existed a universal belief in a huge fertile southern continent, whose boundaries reached from the Pole to somewhere near the 30° S. latitude. This belief had been held in an even more exaggerated form centuries before by the ancient Greek philosophers, from whom, in fact, the name “Antarctica” is derived (“Anti-arktos”: opposite the Bear, the constellation containing the Polar Star). It was the object of Cook's voyage to discover the great southern continent if it existed, or to disprove its existence definitely. No man was better fitted for such a task, and on 17th January, 1773, the Antarctic Circle was crossed for the first time by human beings. Continuing south-east in high latitudes. Cook reached the 147° E. on 16th March, and as winter was approaching he bore up for New Zealand. In November, 1773, he sailed again for the south. On 30th January, 1774, the ship was blocked in 71° 10' S., and 106° 54' W., the farthest south of the cruise and of the century. Although Cook did not think it impossible to sail further to the south he considered that further attempts could only be classed as a dangerous and rash enterprise; added to which a diet of old and over-salted meat, and rotten biscuits half devoured by cockroaches, caused disease among the crew, and nearly caused the death of Cook himself. However, Cook's failure to discover the Antarctic continent did not disappoint him, since, to put it bluntly, he was of opinion that it was not worth discovering. “Countries condemned to everlasting rigidity by nature,” he wrote, “never to yield to the warm of the sun, for whose wild and desolate aspect I find no words; such are the countries (Isle of Georgia and Southern Thule) we have discovered; what then may those resemble which lie further to the south?” Milton may well have answered him:—
Beyond this flood, a frozen continent
Lies dark and wild, beat with perpetual storm
Of whirlwind and dire hail, which on firm land
Thaws not, but gathers heap, and ruin seems
Of ancient pile.
During the period following Cook's epochal cruise there are many accounts, some resting on doubtful evidence, of voyages far to the south by sealers, and others, notably Benjamin Morrell, Weddell (1823), Biscoe (who was the first to sight the Antarctic mainland, 1830), Kemp (1833), Balleny (1839), Wilkes (1839), and D'Urville (1839). Perhaps the most outstanding cruise of this period was that of the Russian, Bellinghausen (1819), who circumnavigated the globe in high southern latitudes, as part of a Czarist scheme of polar exploration on a truly imperial scale.
Controversy still rages concerning the alleged discoveries of the American navigator, Captain Wilkes (1839), but there is no doubt concerning those of the British navigator, Admiral Sir James Clark Ross, whose two specially equipped ships, “Erebus” and “Terror”—old bombing vessels of great strength—penetrated the Antarctic pack ice, for the first time in history, in January, 1841. We know of Ross that he was a determined man and absolutely fearless. The formidable ice-field was penetrated in five days, and the open sea beyond (since named the Ross Sea) attained. Presently there appeared to the south a mighty range of snow-clad mountains—the long-sought-for continent of Antarctica. The names of the two ships are immortalized in two volcanoes in the Prince Albert Range—Mount Erebus and Mount Terror; and of Ross, in the great segment of Antarctica which he discovered, now known as the Ross Dependency.
Ross entirely overshadows all previous southern explorers with the sole exception of Cook. He pioneered the route to Antarctica since followed by all successful explorers, and opened the gates to the Pole itself. The great polar expeditions of the present century led by Shackleton, Scott, Amundsen, and Byrd have all been based within the boundaries of the Ross Dependency.
In such a necessarily brief article it is impossible to do full justice to all the notable expeditions following that of Ross, but the salient points concerning the more outstanding of these are appended. The first discovery of fossils in Antarctica was made by the Norwegian whaler. Captain C. A. Larsen, well known in New Zealand through the visit to these coasts of his whaling-ships. The discovery is important since it revealed that at one time Antarctica enjoyed a warm climate. The later discovery of coal-seams confirmed scientific opinion on this point.
The first human beings to winter on Antarctica were the “Southern Cross” party of ten (1899) on Cape Adare under the leadership of C. E. Borchgrevinck. Although at the time the expedition set out from London it was feared that the whole party was doomed to certain death, it was found that climatic conditions were not nearly as terrible as was expected. There was only one death, and even this calamity was not attributable to the rigour of the climate.
Other scientific expeditions which may be mentioned were those of Kristensen (1894), Gerlache (1897), Drygalski (1901), Nordenskold (1902), the “Scotia” (1903), and Dr. Charcot (1904). None of these, however, attains the standard of the great “Discovery” expedition of 1902–4, when three of the foremost figures in Antarctic exploration—Captain Robert Falcon Scott, Dr. E. A. Wilson, and Sir Ernest Shackleton—were associated in a series of sledging journeys which did more to reveal the character of the mainland than any previous efforts. In addition to geographical discovery, scientific work of a high standard was performed and the unqualified success so attained undoubtedly did much to influence favourable opinion towards support for further exploration of a like nature.
The South Pole had not yet been reached, and such a spectacular achievement, which might also yield valuable scientific data, was aimed at by Shackleton, who later (1908–9) sledged to within ninety miles of this objective. The same goal was actually attained by a Norwegian expedition, led by Captain Roald Amundsen, and a British party under Captain Scott, simultaneously in 1911. They travelled by different routes and reached the Pole without mishap, but, on the return journey, Captain Scott and the remainder of his party—Dr. Wilson, Cates, Evans, and Bowers—perished on the Rose Barrier. Scott's chronicle of the return trip is considered to be one of the greatest of human documents ever written. The passing of this coterie—Scott, Amundsen, and Shackleton—marks the close of what has been termed the “heroic age,” the period characterized by spectacular achievement under trying conditions (hand sledges, and, above all, continuous isolation), as compared with the modern motor-tractor, aeroplanes, and wireless. A connecting link between those days and the present is provided by Sir Douglas Mawson, who has supplemented his original work (with Shackleton) by recent valuable charting and scientific discovery under modern conditions.
The Australasian Expedition (1911–14) marked the beginning of direct interest in the south by New Zealand and Australia. It was followed in 1929 by the “Banzare” expedition which, while fundamentally Australian, was supported strongly by the British Government, and by New Zealand and the Union of South Africa. The utility of the aeroplane as a permanent aid to polar reconnaissance was established conclusively when Sir G. H. Wilkins made a ten-hour flight (1928) from Deception Island over Graham Land to Hearst Land.
Other notable aeroplane flights were those of Byrd (1931) and Lincoln Ellsworth (1935). The importance of Mr. Ellsworth's epic flight from Dundee Island to the Bay of Whales can hardly be overestimated. The latest expedition is that of John Rymill, a South Australian explorer.
The physical character of Antarctica, and particularly of the Ross Dependency, has been established conclusively from the published results of the various scientific and other expeditions, although, of course, scientific study is yet far from complete.
The area of the continent, only a fraction of which has yet been seen by human beings, is computed by Sir Douglas Mawson and Dr. Bruce to be about 5 ½ million square miles, thus equalling the combined areas of Europe and Australia.
Of this huge area, the Ross Dependency occupies approximately 175,000 square miles. No part of the continent has ever been inhabited, probably because its most northerly point is separated by 500 miles of the stormiest ocean in the world from the nearest inhabited land mass (South America). Its mean altitude is probably no less than 6,500 ft., including the ice cap. There are no trees, flowers, land animals, or cultivable soil. It is unique in the ferocity of its winds, and the magnitude of its glaciers; its predominating features are essentially glacialogical. The bleakness and poverty of the life, combined with its changeless, and sombre beauty, almost transcend the imagination of man.
Coal-seams have been found, but the prospect of exploitation of this mineral, and any other which may be found in the future, is a distant one. As Dr. Priestley remarked to the writer, during his last visit to New Zealand, the problem of Antarctica is one of exploration, not exploitation.
The character of vegetation and terrestrial fauna may be summed up in the remark that the former is represented by a few mosses and lichens, and the latter by several small insects, none larger than a flea. The mainland is, however, visited by Emperor and Adelie penguins, petrels, skuas, gulls, terns, and true or hair seals (as distinct from the sub-Antarctic fur seals).
In the icy seas which beat against the coasts are found seven different kinds of whales, which, together with the seals (though these latter are not of great economic importance) constitute the sole material wealth so far taken from Antarctica. The blue whale (Balaenoptera sibbaldi) and the finner are the commonest type and the most profitable; but five others of both the toothed and baleen varieties have been reported. Thirteen years ago Captain C. A. Larsen, commanding a whaling fleet sent out by a Sandefjord company, the Hvalfangerselskap Rosshavet, pioneered the whaling industry in the Ross Sea. The mother ship was the “Sir James Clark Ross,” a steel single-screw steamer of 13,000 tons, built at Belfast in 1905; it was accompanied by five small steam catchers. On 17th December, 1923, the Antarctic Circle was crossed for the first time by a whaling fleet. Captain C. A. Larsen brought the ships safely through the pack ice, and, on the 27th December, the first whaling operations were put in train by the killing of four 100-ton blue whales. Captain Larsen lived to see confirmation of his confidence in the future of the Ross Sea fisheries, which should prove a valuable asset for generations to come providing that the industry is properly controlled. Grave fears have repeatedly been expressed as to Antarctic whaling generally, and the view is held that experience of the northern fisheries will be repeated if a “laissez-faire” policy is adopted. To date, no New Zealand capital has been attracted to this industry, although proposals to form a Ross Sea Whaling Company have been mooted from time to time. The arduous nature of the work, the isolation, the long hours, the perilous hurried trips in the small catchers, the working of machinery perpetually cased in ice, and the flensing of frozen carcases, is such that the fisheries are practically monopolized by Norwegians, and have been for many years.
It is impossible to forecast the future of the Ross Dependency. As mentioned before, the prospect of “making it pay” is remote. Settlement will depend on the value of precious minerals which may be discovered. Sir Douglas Mawson, however, looks far into the future when he writes: “Owing to the high velocity of the winds descending from the icy plateau of the hinterland, it would be possible, by the erection of only a limited installation of staunchly constructed wind generators, to harness a goodly amount of energy. In the present state of electrical science, such power could not be exported as current, but it might be converted to saleable commodities. Some day, therefore, there may thus be produced for export atmospheric-nitrogen products and like power-consuming manufactures.”
The same writer, who is one of the foremost authorities on south polar regions, sees possibilities in fur-farming, since the climate is favourable, and suitable food is available at no cost whatever. The shore stations established for this purpose would be linked with whaling operations. “The whaling craft, besides securing cargoes of whale products, would make it its business to visit the shore stations annually, bringing stores and transporting the trade to market.”
Regulations dated the 24th October, 1929, which supersede those of 1st November, 1926, prohibit the carrying-on of whaling operations within the boundaries of the Ross Dependency without a license, the annual fee payable for which is £200, in addition to which the Government requires a royalty of 2s. 6d. per barrel (40 gallons). The owner or master of a vessel engaged in whaling or used as a floating whale-factory is liable to a fine not exceeding £1,000 for each day on which operations are carried on without a license. A penalty not exceeding £100 per day is provided for in cases of non-compliance with the terms of the license granted in respect of any vessel used for whaling or as a floating factory and a similar penalty for failure to equip a floating factory in accordance with the requirements of the regulations or to convert a whale into commercial products within 48 hours after delivery at the factory. Provision is made for the 1st on warrant of any vessel in respect of which an offence against the regulations is committed.
The regulations apply, of course only to territorial waters, and operations are carried on outside territorial was by unlicensed expeditions. The great majority of whales are taken outside territorial waters.
Receipts from whaling-industry fees &c., have been as follows:—
| £ | |
|---|---|
| 1926–27 | 2,921 |
| 1927–28 | 7,177 |
| 1928–29 | 13,962 |
| 1929–30 | 7,871 |
| 1930–31 | Dr. 70 |
| 1931–32 | 614 |
| 1932–33 | |
| 1933–34 | 1,000 |
| 1934–35 | 600 |
| 1935–36 | 500 |
| 1936–37 | 100 |
The whale-oil taken by expeditions which have received New Zealand licenses in each of the seasons up to 1930–31 is as follows (later figures are not available):—
| Season. | Barrels.* |
|---|---|
* Of 40 imperial gallons. | |
| 1925–26 | 37,700 |
| 1926–27 | 70,300 |
| 1927–28 | 124,000 |
| 1928–29 | 122,000 |
| 1929–30 | 169,190 |
| 1930–31 | 272,500 |
The Whaling Industry Act, 1935, gives legislative effect, so far as New Zealand is concerned, to the International Whaling Convention signed at Geneva in 1931. The general principles of the Convention are in the direction of conservation of the species and regulation of the industry.
The ninth report on international Whaling Statistics—edited by the committee for whaling statistics appointed by the Norwegian Government—gives statistics of whaling in various geographical areas of the world.
The total catch of whales during the five years 1931–32 to 1935–36 was as follows:—
| Year. | Antarctic. | Arctic. | Africa. | North Pacific. | Japan. | Other Areas. | Total. |
|---|---|---|---|---|---|---|---|
| 1931–32 | 9,572 | 827 | 1,043 | 319 | 1,036 | 12,797 | |
| 1932–33 | 24,327 | 1,004 | 1,168 | 591 | 1,325 | 253 | 28,668 |
| 1933–34 | 26,087 | 583 | 2,392 | 1,019 | 1,775 | 311 | 32,167 |
| 1934–35 | 31,808 | 568 | 3,004 | 855 | 2,274 | 745 | 39,254 |
| 1935–36 | 30,991 | 705 | 3,768 | 857 | 2,341 | 6,120 | 44,782 |
The next table shows the production of oil in the last five years.
| Year. | Antarctic. | Arctic. | Africa. | Other Whaling Grounds. | Total. |
|---|---|---|---|---|---|
NOTE.—Six barrels of oil are equivalent to 1 ton. | |||||
| Barrels. | Barrels. | Barrels. | Barrels. | Barrels. | |
| 1931–32 | 808,560 | 28,590 | 44,112 | 34,580 | 915,842 |
| 1932–33 | 2,456,462 | 34,833 | 53,000 | 52,483 | 2,596,778 |
| 1933–34 | 2,395,544 | 16,038 | 82,359 | 79,214 | 2,573,155 |
| 1934–35 | 2,453,999 | 15,341 | 117,950 | 103,993 | 2,691,283 |
| 1935–36 | 2,436,338 | 14,384 | 135,081 | 285,314 | 2,871,117 |
Of the 44,782 whales caught in 1935–36, 18,108 were of the blue species, 12,138 were fin, 7,707 were humpback, 823 were sei, 4,853 were sperm, and 1,153 were of other or unspecified species.
The whaling expeditions operating during the year consisted of 36 shore stations, 33 floating factories, and 310 catchers.
Norwegian and British whaling operations are by far the most important. Records from 1919 onwards show that Norway led until 1931–32 At present the whaling output from these countries is approximately upon a level. Oil production during 1935–36 was—Norwegian, 1,162,742 barrels; British, 1,238,688 barrels; other countries, 469,687 barrels.
Table of Contents
| Year. | Population. | Mean Population. | Overseas Passenger Arrivals.* | Overseas Passenger Departures.* | ||
|---|---|---|---|---|---|---|
| At 31st December. | At 31st March. | Year ended 31st December. | Year ended 31st March. | |||
*Excluding “through” passengers, and tourists on cruising liners. | ||||||
| 1886 | 631,355 | 620,565 | 624,275 | 615,819 | 16,101 | 15,037 |
| 1887 | 645,330 | 635,347 | 638,343 | 627,956 | 13,689 | 12,712 |
| 1888 | 649,349 | 646,914 | 647,340 | 641,131 | 13,606 | 22,781 |
| 1889 | 658,02l | 652,128 | 653,685 | 649,521 | 15,392 | 15,178 |
| 1890 | 667,477 | 664,853 | 662,749 | 658,491 | 15,028 | 16,810 |
| 1891 | 676,051 | 668,594 | 671,776 | 666,724 | 14,431 | 17,629 |
| 1892 | 692,426 | 679,465 | 684,239 | 674,042 | 18,122 | 13,164 |
| 1893 | 714,258 | 698,182 | 703,342 | 688,824 | 26,135 | 15,723 |
| 1894 | 728,121 | 718,740 | 721,190 | 708,461 | 25,237 | 22,984 |
| 1895 | 740,699 | 731,468 | 734,410 | 725,104 | 21,862 | 20,967 |
| 1896 | 754,016 | 743,376 | 746,288 | 737,422 | 17,236 | 15,764 |
| 1897 | 768,910 | 757,503 | 761,463 | 749,370 | 18,592 | 15,840 |
| 1898 | 783,317 | 771,568 | 776,114 | 764,536 | 18,855 | 16,159 |
| 1899 | 796,359 | 786,530 | 789,838 | 779,049 | 18,506 | 16,619 |
| 1900 | 808,132 | 798,471 | 802,246 | 792,501 | 18,074 | 16,243 |
| 1901 | 830,800 | 815,862 | 821,111 | 808,811 | 25,086 | 18,564 |
| 1902 | 851,072 | 833,139 | 840,936 | 824,501 | 30,293 | 22,301 |
| 1903 | 875,648 | 857,993 | 863,360 | 845,566 | 30,883 | 19,608 |
| 1904 | 900,682 | 882,100 | 888,165 | 870,047 | 32,632 | 22,277 |
| 1905 | 925,605 | 908,116 | 913,144 | 895,108 | 32,685 | 23,383 |
| 1906 | 956,457 | 933,114 | 943,325 | 920,615 | 39,233 | 26,385 |
| 1907 | 977,215 | 961,598 | 966,836 | 949,650 | 36,108 | 30,378 |
| 1908 | 1,008,373 | 985,320 | 992,794 | 97,459 | 44,970 | 30,709 |
| 1909 | 1,030,657 | 1,016,063 | 1,019,515 | 1,000,692 | 38,650 | 33,931 |
| 1910 | 1,050,410 | 1,035,212 | 1,040,534 | 1,025,638 | 35,769 | 32,361 |
| 1911 | 1,075,250 | 1,056,199 | 1,063,887 | 1,045,706 | 41,389 | 37,189 |
| 1912 | 1,102,471 | 1,081,344 | 1,088,861 | 1,069,828 | 44,660 | 35,733 |
| 1913 | 1,134,506 | 1,111,589 | 1,118,488 | 1,096,467 | 44,588 | 30,369 |
| 1914 | 1,145,838 | 1,139,668 | 1,140,172 | 1,125,628 | 37,646 | 32,506 |
| 1915 | 1,152,638 | 1,150,386 | 1,149,238 | 1,145,027 | 25,551 | 22,476 |
| 1916 | 1,150,339 | 1,150,250 | 1,149,225 | 1,150,318 | 21,799 | 21,163 |
| 1917 | 1,147,448 | 1,150,938 | 1,148,893 | 1,149,225 | 15,649 | 13,869 |
| 1918 | 1,158,149 | 1,154,559 | 1,152,798 | 1,152,748 | 11,906 | 11,660 |
| 1919 | 1,227,181 | 1,178,406 | 1,192,665 | 1,166,482 | 20,931 | 19,877 |
| 1920 | 1,257,611 | 1,236,915 | 1,242,396 | 1,207,600 | 44,062 | 32,924 |
| 1921 | 1,292,892 | 1,267,498 | 1,276,652 | 1,252,206 | 41,882 | 28,559 |
| 1922 | 1,318,884 | 1,301,251 | 1,305,126 | 1,285,711 | 35,233 | 28,389 |
| 1923 | 1,343,021 | 1,325,301 | 1,328,193 | 1,311,381 | 36,488 | 29,668 |
| 1924 | 1,370,403 | 1,347,853 | 1,352,618 | 1,334,029 | 39,815 | 30,593 |
| 1925 | 1,401,230 | 1,379,487 | 1,384,428 | 1,359,995 | 41,846 | 29,172 |
| 1926 | 1,429,669 | 1,409,812 | 1,413,743 | 1,392,073 | 45,685 | 33,825 |
| 1927 | 1,450,356 | 1,438,132 | 1,439,004 | 1,420,838 | 38,676 | 36,248 |
| 1928 | 1,467,370 | 1,453,821 | 1,456,075 | 1,443,551 | 35,478 | 35,035 |
| 1929 | 1,486,134 | 1,471,110 | 1,473,419 | 1,460,363 | 34,439 | 31,643 |
| 1930 | 1,506,809 | 1,489,203 | 1,493,019 | 1,478,027 | 32,559 | 28,321 |
| 1931 | 1,522,762 | 1,511,700 | 1,514,215 | 1,498,416 | 20,225 | 21,634 |
| 1932 | 1,534,735 | 1,525,545 | 1,527,062 | 1,517,940 | 17,879 | 21,210 |
| 1933 | 1,547,124 | 1,538,028 | 1,539,590 | 1,530,119 | 18,826 | 21,217 |
| 1934 | 1,558,373 | 1,550,125 | 1,551,532 | 1,542,651 | 23,241 | 26,617 |
| 1935 | 1,569,689 | 1,560,992 | 1,562,233 | 1,554,297 | 26,157 | 27,397 |
| 1936 | 1,584,617 | 1,573,927 | 1,575,231 | 1,564,007 | 30,422 | 30,193 |
| 1937 | 1,587,211 | 1,578,757 | ||||
| Year. | Numbers. | Rates per 1,000 of Mean Population. | Deaths under 1 Year per 1,000 Live Births. | |||||
|---|---|---|---|---|---|---|---|---|
| Live Births. | Marriages. | Deaths. | Deaths. under 1 Year. | Live Births. | Marriages. | Deaths. | ||
| 1886 | 19,299 | 3,488 | 6,135 | 1,899 | 33.15 | 5.99 | 10.54 | 98.40 |
| 1887 | 19,135 | 3,563 | 6,137 | 1,795 | 32.09 | 5.97 | 0.29 | 93.81 |
| 1888 | 18,902 | 3,617 | 5,708 | 1,336 | 31.22 | 5.97 | 9.43 | 70.68 |
| 1889 | 18,457 | 3,632 | 5,772 | 1,456 | 30.17 | 5.94 | 9.44 | 78.89 |
| 1890 | 18,278 | 3,797 | 5,994 | 1,438 | 29.44 | 6.12 | 9.66 | 78.67 |
| 1891 | 18,273 | 3,805 | 6,518 | 1,667 | 29.01 | 604 | 10.35 | 91.23 |
| 1892 | 17,876 | 4,002 | 6,459 | 1,594 | 27.83 | 6.23 | 1,006 | 89.17 |
| 1893 | 18,187 | 4,115 | 6,767 | 1,600 | 27.50 | 6.22 | 10.23 | 87.97 |
| 1894 | 18,528 | 4,178 | 6,918 | 1,507 | 27.28 | 6.15 | 10 19 | 81.34 |
| 1895 | 18,546 | 4,110 | 6,863 | 1,637 | 26.78 | 5.94 | 9.91 | 88.27 |
| 1896 | 18,612 | 4,843 | 6,432 | 1,439 | 26.33 | 6.85 | 9.10 | 77.32 |
| 1897 | 18,737 | 4,928 | 6,595 | 1,354 | 25.96 | 6.83 | 9.14 | 72.26 |
| 1898 | 18,955 | 5,091 | 7,244 | 1,510 | 25.74 | 6.91 | 9.84 | 79.66 |
| 1899 | 18,835 | 5,461 | 7,680 | 1,806 | 25.12 | 7.28 | 10.24 | 95.89 |
| 1900 | 19,546 | 5,860 | 7,200 | 1,469 | 25.60 | 7.67 | 9.43 | 75.16 |
| 1901 | 20,491 | 6,095 | 7,634 | 1,463 | 26.34 | 7.83 | 9.81 | 71.40 |
| 1902 | 20,655 | 6,394 | 8,375 | 1,712 | 25.89 | 8.01 | 10.50 | 82.89 |
| 1903 | 21,829 | 6,748 | 8,528 | 1,770 | 26.61 | 8.23 | 10.40 | 81.08 |
| 1904 | 22,766 | 6,983 | 8,087 | 1,616 | 26.94 | 8.26 | 9.57 | 70.98 |
| 1905 | 23,682 | 7,200 | 8,061 | 1,599 | 27.22 | 8.28 | 9.27 | 67.52 |
| 1906 | 24,252 | 7,592 | 8,339 | 1,506 | 27.08 | 8.48 | 9.31 | 62.10 |
| 1907 | 25,094 | 8,192 | 10,066 | 2,228 | 27.30 | 8.91 | 10.95 | 88.79 |
| 1908 | 25,940 | 8,339 | 9,043 | 1,761 | 27.45 | 8.82 | 9.57 | 67.89 |
| 1909 | 26,524 | 8,094 | 8,959 | 1,634 | 27.29 | 8.33 | 9.22 | 61.60 |
| 1910 | 25,984 | 8,236 | 9,639 | 1,760 | 26.17 | 8.30 | 9.71 | 67.73 |
| 1911 | 26,354 | 8,825 | 9,534 | 1,484 | 25.97 | 8.70 | 9.39 | 56.31 |
| 1912 | 27,508 | 9,149 | 9,214 | 1,409 | 26.48 | 8.81 | 8.87 | 51.22 |
| 1913 | 27,935 | 8,813 | 10,119 | 1,653 | 26.14 | 8.25 | 9.47 | 59.17 |
| 1914 | 28,338 | 9,280 | 10,148 | 1,456 | 25.99 | 8.51 | 9.31 | 51.38 |
| 1915 | 27,850 | 10,028 | 9,965 | 1,394 | 25.33 | 9.12 | 9.06 | 50.05 |
| 1916 | 28,509 | 8,213 | 10,596 | 1,446 | 25.94 | 7.47 | 9.64 | 50.72 |
| 1917 | 28,239 | 6,417 | 10,528 | 1,360 | 25.69 | 5.84 | 9.58 | 48.16 |
| 1918 | 25,860 | 6,227 | 16,364 | 1,252 | 23.44 | 5.65 | 14.84 | 48.41 |
| 1919 | 24,483 | 9,519 | 10,808 | 1,108 | 21.42 | 8.33 | 9.46 | 45.26 |
| 1920 | 29,921 | 12,175 | 12,109 | 1,513 | 25.09 | 10.21 | 10.15 | 50.57 |
| 1921 | 28,567 | 10,635 | 10,682 | 1,366 | 23.34 | 8.69 | 8.73 | 47.82 |
| 1922 | 29,006 | 9,556 | 10,977 | 1,215 | 23.17 | 7.63 | 8.77 | 41.89 |
| 1923 | 27,967 | 10,070 | 11,511 | 1,225 | 21.94 | 7.90 | 9.03 | 43.80 |
| 1924 | 28,014 | 10,259 | 10,767 | 1,127 | 21.57 | 7.90 | 8.29 | 40.23 |
| 1925 | 28,153 | 10,419 | 11,026 | 1,125 | 21.17 | 7.84 | 8.29 | 39.96 |
| 1926 | 28,473 | 10,680 | 11,819 | 1,132 | 21.06 | 7.90 | 8.74 | 39.76 |
| 1927 | 27,881 | 10,478 | 11,613 | 1,080 | 20.29 | 7.63 | 8.45 | 38.74 |
| 1928 | 27,200 | 10,537 | 11,811 | 984 | 19.57 | 7.58 | 8.50 | 36.18 |
| 1929 | 26,747 | 10,967 | 12,314 | 912 | 19.03 | 7.80 | 8.76 | 34.10 |
| 1930 | 26,797 | 11,075 | 12,199 | 924 | 18.83 | 7.78 | 8.57 | 34.48 |
| 1931 | 26,622 | 9,817 | 12,047 | 856 | 18.45 | 6.81 | 8.35 | 32.15 |
| 1932 | 24,884 | 9,896 | 11,683 | 777 | 17.12 | 6.81 | 8.04 | 31.22 |
| 1933 | 24,334 | 10,510 | 11,701 | 770 | 16.63 | 7.18 | 7.99 | 31.64 |
| 1934 | 24,322 | 11,256 | 12,527 | 781 | 16.51 | 7.64 | 8.50 | 32.11 |
| 1935 | 23,965 | 12,187 | 12,217 | 773 | 16.17 | 8.23 | 8.25 | 32.26 |
| 1936 | 24,837 | 13,808 | 13,056 | 769 | 16.64 | 9.25 | 8.75 | 30.96 |
| Year. | Number of Scholars receiving | University Students (excluding affiliated Agricultural Colleges). | ||||||
|---|---|---|---|---|---|---|---|---|
| Primary Education at | Secondary Education at | |||||||
| Public Schools. | Registered Private Schools. | Native Village Schools. | Secondary* (including Endowed) Schools. | District High Schools. | Technical* Schools. | Registered Private Schools. | ||
* Combined secondary and technical high schools, Instituted in 1931, included with secondary schools. | ||||||||
| 1886 | 106,328 | 12,497 | 2,346 | 2,358 | 490 | |||
| 1887 | 110,919 | 13,417 | 2,631 | 2,242 | 588 | |||
| 1888 | 112,685 | 13,893 | 2,512 | 2,120 | 662 | |||
| 1889 | 115,456 | 13,516 | 2,462 | 2,147 | 588 | |||
| 1890 | 117,912 | 13,691 | 2,259 | 2,117 | 596 | |||
| 1891 | 119,523 | 14,176 | 2,231 | 2,205 | 705 | |||
| 1892 | 122,620 | 14,467 | 2,133 | 2,262 | 695 | |||
| 1893 | 124,690 | 14,931 | 2,134 | 2,251 | 680 | |||
| 1894 | 127,300 | 14,649 | 2,418 | 2,454 | 680 | |||
| 1895 | 129,856 | 14,704 | 2,675 | 2,525 | 742 | |||
| 1896 | 131,037 | 13,979 | 2,862 | 2,614 | 677 | |||
| 1897 | 132,197 | 14,524 | 2,864 | 2,709 | 653 | |||
| 1898 | 131,621 | 14,857 | 2,972 | 2,706 | 667 | |||
| 1899 | 131,315 | 15,380 | 3,065 | 2,723 | 766 | |||
| 1900 | 130,724 | 15,602 | 3,109 | 2,792 | 805 | |||
| 1901 | 131,351 | 15,397 | 3,273 | 2,899 | 662 | 783 | ||
| 1902 | 132,262 | 15,667 | 3,742 | 3,072 | 1,479 | 864 | ||
| 1903 | 133,568 | 15,687 | 3,693 | 3,722 | 2,096 | 862 | ||
| 1904 | 135,475 | 16,445 | 3,754 | 4,038 | 2,330 | 971 | ||
| 1905 | 137,623 | 16,738 | 3,863 | 4,060 | 2,872 | 1,153 | ||
| 1906 | 139,302 | 17,217 | 4,174 | 4,270 | 2,594 | 1,332 | ||
| 1907 | 141,216 | 18,174 | 4,183 | 4,196 | 2,452 | 1,325 | ||
| 1908 | 147,575 | 16,244 | 4,217 | 4,327 | 2,142 | 699 | 1,634 | |
| 1909 | 152,605 | 17,989 | 4,121 | 4,856 | 1,891 | 846 | 1,846 | |
| 1910 | 156,594 | 19,052 | 4,280 | 5,176 | 1,916 | 1,253 | 1,862 | |
| 1911 | 161,904 | 19,967 | 4,557 | 5,465 | 1,777 | 1,341 | 831 | 1,900 |
| 1912 | 166,553 | 20,350 | 4,694 | 5,831 | 1,815 | 1,526 | 883 | 2,228 |
| 1913 | 172,519 | 21,251 | 4,647 | 6,154 | 1,837 | 1,664 | 545 | 2,318 |
| 1914 | 178,871 | 22,247 | 5,072 | 6,418 | 1,896 | 1,839 | 850 | 2,257 |
| 1915 | 183,631 | 22,477 | 5,191 | 6,488 | 2,102 | 1,955 | 992 | 2,039 |
| 1916 | 186,350 | 23,635 | 5,132 | 7,052 | 2,115 | 2,105 | 1,004 | 1,985 |
| 1917 | 188,754 | 25,685 | 5,173 | 7,590 | 2,180 | 2,347 | 1,206 | 1,977 |
| 1918 | 193,345 | 26,371 | 5,064 | 8,384 | 2,283 | 2,747 | 1,366 | 2,226 |
| 1919 | 194,586 | 20,977 | 5,198 | 9,068 | 2,159 | 2,926 | 1,497 | 3,060 |
| 1920 | 198,460 | 22,193 | 5,508 | 9,196 | 2,157 | 2,766 | 1,439 | 3,822 |
| 1921 | 205,955 | 23,924 | 5,822 | 10,030 | 2,176 | 3,349 | 1,634 | 4,123 |
| 1922 | 211,081 | 24,861 | 6,161 | 10,736 | 2,606 | 4,202 | 1,998 | 3,958 |
| 1923 | 212,460 | 26,010 | 6,186 | 11,619 | 2,818 | 5,054 | 2,134 | 4,202 |
| 1924 | 213,768 | 26,302 | 6,310 | 12,010 | 2,900 | 5,369 | 2,473 | 4,236 |
| 1925 | 215,063 | 25,933 | 6,386 | 12,514 | 3,136 | 5,132 | 2,511 | 4,442 |
| 1926 | 219,017 | 26,778 | 6,591 | 13,651 | 3,299 | 5,700 | 2,794 | 4,653 |
| 1927 | 221,157 | 27,358 | 0,620 | 14,190 | 3,581 | 5,703 | 2,932 | 4,878 |
| 1928 | 219,950 | 26,596 | 6,671 | 15,038 | 3,880 | 6,061 | 3,430 | 4,802 |
| 1929 | 219,166 | 26,977 | 6,979 | 15,498 | 4,000 | 0,114 | 3,698 | 4,623 |
| 1930 | 219,235 | 26,451 | 7,070 | 16,149 | 4,240 | 6,953 | 3,825 | 4,801 |
| 1931 | 218,689 | 26,726 | 7,503 | 16,344 | 4,944 | 7,397 | 3,673 | 4,869 |
| 1932 | 207,489 | 26,410 | 7,313 | 15,948 | 4,486 | 7,106 | 3,526 | 4,912 |
| 1933 | 200,819 | 26,428 | 7,340 | 15,715 | 4,511 | 7,149 | 3,586 | 4,806 |
| 1934 | 199,913 | 26,636 | 7,587 | 15,901 | 4,365 | 7,183 | 3,651 | 4,721 |
| 1,335 | 197,526 | 26,869 | 7,876 | 16,162 | 4,593 | 7,323 | 3,968 | 4,818 |
| 1936 | 210,386 | 27,709 | 9,175 | 16,556 | 4,070 | 7,422 | 4,241 | 4,967 |
| Year. | Summary Convictions in Magistrates' Courts. | Total Convictions or Sentences in Superior Courts. | Total District Persons sentenced in Superior Courts. | Prisoners in Gaol at End of Year (undergoing Sentence). | ||||
|---|---|---|---|---|---|---|---|---|
| Number. | Rate per 1,000 of Mean Population. | Number. | Rate per 1,000 of Mean Population. | Number | Rate per 1,000 of Mean Population. | Number. | Rate per 10,000 of Population. | |
| 1886 | 16,705 | 26.76 | 306 | 0.49 | 286 | 0.46 | 558 | 8.84 |
| 1887 | 15,557 | 24.37 | 386 | 0.60 | 347 | 0.54 | 033 | 9.81 |
| 1888 | 14,472 | 22.36 | 308 | 0.48 | 265 | 0.41 | 005 | 9.32 |
| 1889 | 14,082 | 21.54 | 276 | 0.42 | 228 | 0.35 | 611 | 9.29 |
| 1890 | 14,128 | 21.32 | 270 | 0.41 | 227 | 0.34 | 517 | 7.75 |
| 1891 | 13,349 | 19.87 | 283 | 0.42 | 221 | 0.33 | 494 | 7.31 |
| 1892 | 13,583 | 19.85 | 241 | 0.35 | 195 | 0.29 | 433 | 6.25 |
| 1893 | 13,710 | 19.49 | 304 | 0.43 | 272 | 0.39 | 403 | 6.48 |
| 1894 | 12,934 | 17.93 | 371 | 0.51 | 324 | 0.45 | 483 | 6.63 |
| 1895 | 13,383 | 18.22 | 407 | 0.55 | 359 | 0.49 | 531 | 7.17 |
| 1896 | 14,481 | 19.40 | 355 | 0.48 | 311 | 0.42 | 493 | 6.54 |
| 1897 | 15,325 | 20.13 | 366 | 0.48 | 315 | 0.41 | 023 | 8.10 |
| 1898 | 16,991 | 21.89 | 391 | 0.50 | 386 | 0.50 | 533 | 6.80 |
| 1899 | 17,586 | 22.27 | 405 | 0.51 | 383 | 0.48 | 508 | 6.38 |
| 1900 | 19,242 | 23.99 | 427 | 0.53 | 391 | 0.49 | 527 | 6.52 |
| 1901 | 20,724 | 25.24 | 361 | 0.44 | 354 | 0.43 | 001 | 8.39 |
| 1902 | 22,455 | 26.70 | 349 | 0.42 | 339 | 0.40 | 002 | 7.45 |
| 1903 | 25,186 | 29.17 | 398 | 0.46 | 380 | 0.44 | 088 | 8.26 |
| 1901 | 25,672 | 28.90 | 527 | 0.59 | 519 | 0.58 | 701 | 7.78 |
| 1905 | 25,371 | 27.78 | 449 | 0.49 | 433 | 0.47 | 760 | 8.21 |
| 1906 | 27,670 | 29.33 | 445 | 0.47 | 433 | 0.46 | 833 | 8.71 |
| 1907 | 30,901 | 31.96 | 490 | 0.51 | 481 | 0.50 | 791 | 8.09 |
| 1908 | 30,852 | 31.08 | 543 | 0.55 | 532 | 0.54 | 815 | 8.08 |
| 1909 | 31,151 | 30.55 | 552 | 0.54 | 544 | 0.53 | 877 | 8.51 |
| 1910 | 32,435 | 31.17 | 495 | 0.48 | 494 | 0.47 | 843 | 8.01 |
| 1911 | 33,029 | 31.05 | 453 | 0.43 | 427 | 0.40 | 802 | 7.46 |
| 1912 | 36,191 | 33.24 | 480 | 0.44 | 428 | 0.39 | 821 | 7.45 |
| 1913 | 39,685 | 35.48 | 446 | 0.40 | 409 | 0.37 | 834 | 7.35 |
| 1914 | 41,723 | 36.59 | 522 | 0.46 | 483 | 0.42 | 981 | 8.56 |
| 1915 | 39,675 | 34.52 | 509 | 0.44 | 441 | 0.38 | 941 | 8.16 |
| 1916 | 35,459 | 30.85 | 448 | 0.39 | 401 | 0.35 | 834 | 7.25 |
| 1917 | 34,189 | 29.76 | 623 | 0.54 | 377 | 0.33 | 954 | 8.31 |
| 1918 | 29,252 | 25.37 | 632 | 0.55 | 355 | 0.31 | 1,005 | 8.68 |
| 1919 | 32,692 | 27.41 | 808 | 0.68 | 461 | 0.39 | 852 | 6.94 |
| 1920 | 35,517 | 28.59 | 1,011 | 0.81 | 459 | 0.37 | 990 | 7.92 |
| 1921 | 37,124 | 29.08 | 1,475 | 1.16 | 616 | 0.48 | 1,044 | 8.08 |
| 1922 | 34,513 | 26.44 | 1,417 | 1.09 | 601 | 0.46 | 1,052 | 8.32 |
| 1923 | 37,104 | 27.94 | 1,663 | 1.25 | 625 | 0.47 | 1,141 | 8.50 |
| 1924 | 39,594 | 29.27 | 1,388 | 1.03 | 555 | 0.41 | 1,197 | 8.73 |
| 1925 | 44,017 | 31.79 | 1,465 | 1.06 | 511 | 0.37 | 1,284 | 9.16 |
| 1926 | 46,205 | 32.68 | 1,562 | 1.10 | 509 | 0.40 | 1,388 | 9.71 |
| 1927 | 45,930 | 31.92 | 1,739 | 1.21 | 569 | 0.40 | 1,483 | 10.23 |
| 1928 | 45,139 | 31.00 | 1,368 | 0.94 | 478 | 0.33 | 1,435 | 9.78 |
| 1929 | 46,309 | 31.43 | 1,345 | 0.91 | 473 | 0.32 | 1,342 | 9.04 |
| 1930 | 47,247 | 31.65 | 1,524 | 1.02 | 538 | 0.36 | 1,523 | 10.11 |
| 1931 | 42,092 | 27.80 | 1,624 | 1.07 | 600 | 0.40 | 1,014 | 10.61 |
| 1932 | 42,366 | 27.74 | 1,710 | 1.12 | 036 | 0.42 | 1,522 | 9.92 |
| 1933 | 37,671 | 24.47 | 1,513 | 0.98 | 531 | 0.34 | 1,410 | 9.11 |
| 1934 | 37,704 | 24.30 | 1,213 | 0.78 | 490 | 0.32 | 1,199 | 7.69 |
| 1935 | 38,337 | 24.54 | 1,148 | 0.73 | 472 | 0.30 | 1,112 | 7.08 |
| 1936 | 41,890 | 26.59 | 1,178 | 0.75 | 460 | 0.29 | 915 | 5.77 |
| Season. | Wheat for Threshing. | Oats for Threshing. | ||||
|---|---|---|---|---|---|---|
| Area. | Yield. | Yield per Acre. | Area. | Yield. | Yield per Acre. | |
* Yield probably overstated for those four seasons, due to total being obtained by applying ascertained averages to areas returned by farmers as sown for threshing. Areas returned in these years as intended for threshing would appear, in many cases, to have been eventually utilized for other purposes. | ||||||
| Acres. | Bushels. | Bushels. | Acres. | Bushels. | Bushels. | |
| 1886–87 | 253,025 | 6,297,638 | 24.89 | 387,228 | 11,973,295 | 30.92 |
| 1887–88 | 357,359 | 9,424,059 | 26.37 | 336,474 | 10,512,119 | 31.24 |
| 1888–89 | 362,153 | 8,770,246 | 24.22 | 367,225 | 10,977,065 | 29.89 |
| 1889–90 | 335,861 | 8,448,506 | 25.15 | 426,071 | 13,673,584 | 32.10 |
| 1890–91 | 301,460 | 5,723,610 | 18.99 | 346,224 | 9,947,036 | 28.73 |
| 1891–92 | 402,273 | 10,257,738 | 25.50 | 323,508 | 11,009,020 | 34.03 |
| 1892–93 | 381,245 | 8,378,217 | 21.98 | 326,531 | 9,893,989 | 30.30 |
| 1893–94 | 242,737 | 4,891,695 | 20.15 | 376,646 | 12,153,068 | 32.27 |
| 1894–95 | 148,575 | 3,613,037 | 24.32 | 351,852 | 10,221,393 | 29.05 |
| 1895–96 | 245,441 | 6,843,768 | 27.88 | 364,788 | 12,263,540 | 33.62 |
| 1896–97 | 258,608 | 5,926,523 | 22.92 | 372,597 | 11,232,803 | 30.15 |
| 1897–98 | 315,801 | 5,670,017 | 17.95 | 354,819 | 9,738,391 | 27.44 |
| 1898–99 | 399,034 | 13,073,416 | 32.76 | 417,320 | 16,511,388 | 39.56 |
| 1899–1900 | 269,749 | 8,581,898 | 31.81 | 398,243 | 16,325,832 | 40.99 |
| 1900–1 | 206,465 | 6,527,154 | 31.61 | 449,534 | 19,085,837 | 42.45 |
| 1901–2 | 163,462 | 4,046,589 | 24.76 | 405,924 | 15,045,233 | 37.06 |
| 1902–3 | 194,355 | 7,457,915 | 38.37 | 483,659 | 21,766,708 | 45.00 |
| 1903–4 | 230,346 | 7,891,654 | 34.26 | 409,390 | 15,107,237 | 38.57 |
| 1904–5 | 258,015 | 0,123,673 | 35.36 | 342,189 | 14,553,611 | 42.53 |
| 1905–6 | 222,183 | 6,798,934 | 30.00 | 354,291 | 12,707,982 | 35.86 |
| 1906–7 | 206,185 | 5,605,252 | 27.18 | 351,929 | 11,201,789 | 31.83 |
| 1907–8 | 193,031 | 5,567,139 | 28.84 | 386,885 | 15,021,861 | 38.82 |
| 1908–9 | 252,391 | 8,772,790 | 34.75 | 406,908 | 18,906,788 | 46.46 |
| 1909–10 | 311,000 | 8,661,100 | 28.00 | 377,000 | 13,804,000 | 37.00 |
| 1910–11 | 322,167 | 8,290,221 | 25.73 | 302,827 | 10,118,917 | 33.41 |
| 1911–12 | 215,528 | 7,261,138 | 33.69 | 403,668 | 19,662,668* | 48.71 |
| 1912–13 | 189,869 | 5,179,626 | 27.28 | 386,786 | 13,583,924* | 35.12 |
| 1913–14 | 166,774 | 5,231,700 | 31.37 | 361,741 | 14,740,946* | 40.75 |
| 1914–15 | 229,600 | 6,644,336 | 28.94 | 287,561 | 11,436,301* | 39.77 |
| 1915–16 | 329,207 | 7,108,360 | 21.59 | 212,688 | 7,653,208 | 35.98 |
| 1916–17 | 217,743 | 5,051,227 | 23.19 | 177,524 | 5,371,436 | 30.29 |
| 1917–18 | 280,978 | 6,807,536 | 24.23 | 156,202 | 4,942,759 | 31.64 |
| 1918–19 | 208,030 | 6,567,629 | 31.57 | 172,686 | 6,884,609 | 39.87 |
| 1919–20 | 139,611 | 4,559,934 | 32.66 | 179,800 | 6,967,862 | 38.75 |
| 1920–21 | 219,985 | 6,872,202 | 31.24 | 147,559 | 5,225,115 | 35.41 |
| 1921–22 | 352,918 | 10,565,275 | 29.94 | 170,655 | 6,752,663 | 39.56 |
| 1922–23 | 275,775 | 8,395,023 | 30.44 | 143,090 | 5,688,157 | 39.75 |
| 1923–24 | 173,864 | 4,174,537 | 24.01 | 63,842 | 1,964,511 | 30.77 |
| 1924–25 | 166,964 | 5,447,758 | 32.62 | 147,387 | 5,707,174 | 38.72 |
| 1925–26 | 151,673 | 4,617,041 | 30.44 | 102,485 | 4,115,606 | 40–14 |
| 1926–27 | 220,083 | 7,952,442 | 36.13 | 117,326 | 4,997,535 | 42.58 |
| 1927–28 | 260,987 | 9,541,444 | 36.56 | 88,223 | 3,852,687 | 43.66 |
| 1928–29 | 255,312 | 8,832,864 | 34.60 | 73,101 | 3,065,113 | 41.93 |
| 1929–30 | 235,942 | 7,239,556 | 30.08 | 67,722 | 3,002,288 | 44.33 |
| 1930–31 | 249,014 | 7,579,153 | 30.44 | 87,152 | 3,376,609 | 38.74 |
| 1931–32 | 268,756 | 6,582,698 | 24.49 | 68,690 | 2,818,152 | 41.03 |
| 1932–33 | 302,531 | 11,054,972 | 36.54 | 116,206 | 5,132,183 | 44.10 |
| 1933–34 | 286,271 | 9,036,017 | 31.56 | 78,343 | 3,242,500 | 41.39 |
| 1934–35 | 225,389 | 5,933,245 | 26.32 | 52,516 | 1,890,145 | 35.99 |
| 1935–36 | 248,639 | 8,859,223 | 35.63 | 77,502 | 3,302,642 | 42.61 |
| 1936–37 | 221,790 | 7,168,963 | 32.32 | 74,772 | 3,525,430 | 47.15 |
| Year. | Horses. | Total Cattle. | Dairy Cows. | Sheep. | Figs. | Goats. |
|---|---|---|---|---|---|---|
* Not enumerated. | ||||||
| 1887 | * | * | * | 15,155,626 | * | * |
| 1888 | * | * | * | 15,042,198 | * | * |
| 1889 | * | * | * | 15,423,328 | * | * |
| 1890 | * | * | * | 16,116,113 | * | * |
| 1891 | 211,040 | 788,919 | * | 17,865,423 | 222,553 | 9,055 |
| 1892 | * | * | * | 18,570,752 | * | * |
| 1893 | * | * | * | 19,380,369 | * | * |
| 1894 | * | 885,305 | * | 20,230,829 | * | * |
| 1895 | * | 964,034 | 257,140 | 19,826,604 | * | * |
| 1896 | 237,418 | 1,047,901 | 276,217 | 19,138,493 | 239,778 | * |
| 1897 | 249,813 | 1,138,067 | 300,219 | 19,687,954 | 209,834 | * |
| 1898 | 252,834 | 1,209,165 | 324,485 | 19,673,725 | 186,027 | * |
| 1899 | 258,115 | 1,203,024 | 333,536 | 19,348,506 | 193,512 | * |
| 1900 | 261,931 | 1,222,139 | 355,256 | 19,355,195 | 249,751 | * |
| 1901 | 266,245 | 1,256,680 | 372,416 | 20,233,099 | 250,975 | * |
| 1902 | 279,672 | 1,361,784 | 381,492 | 20,342,727 | 224,024 | * |
| 1903 | 286,955 | 1,460,663 | 428,773 | 18,954,553 | 193,740 | * |
| 1904 | 298,714 | 1,593,547 | 468,125 | 18,280,806 | 226,591 | * |
| 1905 | 314,322 | 1,736,850 | 498,241 | 19,130,875 | 255,320 | * |
| 1906 | 326,537 | 1,810,936 | 517,720 | 20,108,471 | 249,727 | * |
| 1907 | 342,608 | 1,851,750 | 543,927 | 20,983,772 | 242,273 | * |
| 1908 | 352,832 | 1,816,299 | 541,363 | 22,449,053 | 241,128 | * |
| 1909 | 363,259 | 1,773,326 | 536,629 | 23,480,707 | 245,092 | * |
| 1910 | * | * | * | 24,269,620 | * | * |
| 1911 | 404,284 | 2,020,171 | 633,733 | 23,996,126 | 348,754 | * |
| 1912 | * | * | * | 23,750,153 | * | * |
| 1913 | * | * | * | 24,191,810 | * | * |
| 1914 | * | * | * | 24,798,763 | * | * |
| 1915 | * | * | * | 24,901,421 | * | * |
| 1916 | 371,331 | 2,417,491 | 750,323 | 24,788,150 | 297,501 | 17,601 |
| 1917 | 373,600 | 2,575,230 | 777,439 | 25,270,386 | 283,770 | 18,235 |
| 1918 | 378,050 | 2,869,465 | 793,212 | 26,538,302 | 258,694 | 17,730 |
| 1919 | 363,188 | 3,035,478 | 826,135 | 25,828,554 | 235,347 | 16,924 |
| 1920 | 346,407 | 3,101,945 | 893,454 | 23,919,970 | 266,829 | 14,534 |
| 1921 | 337,259 | 3,139,223 | 1,004,666 | 23,285,031 | 349,892 | 17,367 |
| 1922 | 332,105 | 3,323,223 | 1,137,055 | 22,222,259 | 384,333 | 17,480 |
| 1923 | 330,818 | 3,480,694 | 1,248,643 | 23,081,439 | 400,889 | 17,071 |
| 1924 | 330,430 | 3,563,497 | 1,312,588 | 23,775,776 | 414,271 | 18,196 |
| 1925 | 326,830 | 3,503,744 | 1,323,432 | 24,547,955 | 440,115 | 18,975 |
| 1926 | 314,867 | 3,452,486 | 1,303,856 | 24,904,993 | 472,534 | 21,761 |
| 1927 | 303,713 | 3,257,729 | 1,303,225 | 25,649,016 | 520,143 | 26,099 |
| 1928 | 307,160 | 3,273,769 | 1,352,398 | 27,133,810 | 586,898 | 24,251 |
| 1929 | 298,986 | 3,445,790 | 1,371,063 | 29,051,382 | 656,732 | 34,226 |
| 1930 | 297,195 | 3,770,223 | 1,441,410 | 30,841,287 | 487,793 | 39,127 |
| 1931 | 295,743 | 4,080,525 | 1,601,633 | 29,792,516 | 476,194 | * |
| 1932 | 280,994 | 4,072,383 | 1,702,070 | 28,691,788 | 513,416 | * |
| 1933 | 276,897 | 4,192,023 | 1,845,972 | 27,755,966 | 591,582 | * |
| 1934 | 273,906 | 4,301,128 | 1,932,511 | 28,649,038 | 660,393 | * |
| 1935 | 272,986 | 4,293,499 | 1,952,094 | 29,076,754 | 762,755 | * |
| 1936 | 276,170 | 4,254,078 | 1,951,507 | 30,113,704 | 808,463 | * |
| 1937 | 277,799 | 4,389,101 | 1,935,524 | 31,305,818 | 802,419 | * |
| Year. | Excluding Specie.* | Specie.† | ||||
|---|---|---|---|---|---|---|
| Exports. | Imports. | Exports. | Imports. | |||
| Total. | Per Head. | Total. | Per Head. | |||
* Figures are in terms of New Zealand currency, face value. † Specie exports and imports represent | ||||||
| £ | £ s. d. | £ | £ s. d. | £ | £ | |
| 1886 | 6,534,513 | 10 9 4 | 6,319,223 | 10 2 5 | 138,278 | 439,790 |
| 1887 | 6,680,772 | 10 9 4 | 6,064,281 | 9 10 0 | 185,397 | 181,234 |
| 1888 | 7,403,206 | 11 8 9 | 5,430,050 | 8 7 9 | 364,119 | 511,850 |
| 1889 | 9,183,954 | 14 1 0 | 5,980,583 | 9 3 0 | 157,910 | 328,280 |
| 1890 | 9,569,316 | 14 8 9 | 5,928,895 | 8 18 11 | 242,404 | 331,630 |
| 1891 | 9,560,859 | 14 4 8 | 6,431,101 | 9 11 6 | 5,538 | 72,748 |
| 1892 | 9,490,920 | 13 17 5 | 6,742,544 | 9 17 1 | 43,931 | 200,512 |
| 1893 | 8,680,845 | 12 6 10 | 6,494,279 | 9 4 8 | 304,519 | 417,236 |
| 1894 | 9,221,550 | 12 15 9 | 5,990,177 | 8 6 1 | 9,497 | 797,843 |
| 1895 | 8,518,119 | 11 12 0 | 6,115,953 | 8 6 7 | 32,105 | 284,176 |
| 1896 | 9,299,907 | 12 9 3 | 7,035,379 | 9 8 7 | 21,198 | 101,941 |
| 1897 | 9,741,222 | 12 15 10 | 7,994,201 | 10 10 0 | 275,771 | 61,022 |
| 1898 | 10,449,838 | 13 9 3 | 8,211,409 | 10 11 7 | 68,117 | 19,191 |
| 1899 | 11,923,422 | 15 1 11 | 8,613,656 | 10 18 1 | 14,913 | 125,977 |
| 1900 | 13,223,258 | 16 9 8 | 10,207,326 | 12 14 6 | 22,903 | 438,770 |
| 1901 | 12,869,810 | 15 13 6 | 11,353,416 | 13 16 6 | 11,614 | 464,499 |
| 1902 | 13,635,459 | 16 4 4 | 10,958,038 | 13 0 7 | 9,518 | 368,685 |
| 1903 | 14,971,926 | 17 6 10 | 12,075,959 | 13 19 9 | 38,452 | 712,716 |
| 1904 | 14,738,750 | 16 11 11 | 12,900,030 | 14 10 6 | 9,598 | 391,664 |
| 1905 | 15,642,069 | 17 2 7 | 12,481,178 | 13 13 4 | 13,878 | 347,679 |
| 1906 | 17,992,480 | 19 1 6 | 14,303,170 | 15 3 3 | 102,657 | 908,233 |
| 1907 | 20,061,641 | 20 15 0 | 16,539,707 | 17 2 2 | 7,316 | 763,154 |
| 1908 | 16,075,205 | 16 3 10 | 17,247,162 | 17 7 5 | 242,289 | 224,122 |
| 1909 | 19,636,151 | 19 5 2 | 14,817,462 | 14 10 8 | 25,845 | 857,257 |
| 1910 | 22,152,473 | 21 5 10 | 16,748,223 | 16 1 11 | 27,736 | 303,360 |
| 1911 | 18,980,185 | 17 16 10 | 18,782,608 | 17 13 1 | 48,305 | 763,271 |
| 1912 | 21,511,626 | 19 15 1 | 20,576,579 | 18 17 11 | 258,955 | 399,995 |
| 1913 | 22,810,363 | 20 7 11 | 21,653,632 | 19 7 2 | 176,359 | 634,670 |
| 1914 | 26,253,925 | 23 0 6 | 21,144,227 | 18 10 11 | 7,522 | 711,869 |
| 1915 | 31,430,822 | 27 7 0 | 20,658,720 | 17 19 6 | 318,090 | 1,070,114 |
| 1916 | 33,281,057 | 28 19 2 | 25,045,403 | 21 15 10 | 5,880 | 1,293,880 |
| 1917 | 31,517,072 | 27 8 8 | 20,742,130 | 18 1 1 | 70,475 | 177,135 |
| 1918 | 28,480,578 | 24 14 1 | 24,131,792 | 20 18 8 | 35,610 | 102,215 |
| 1919 | 53,907,925 | 45 4 0 | 30,309,167 | 25 8 3 | 62,150 | 362,531 |
| 1920 | 46,405,366 | 37 7 0 | 61,553,853 | 49 10 11 | 36,580 | 41,975 |
| 1921 | 44,828,460 | 35 2 3 | 42,744,122 | 33 9 8 | 367 | 198,321 |
| 1922 | 42,725,949 | 32 14 9 | 34,826,074 | 26 13 8 | 300 | 186,487 |
| 1923 | 45,939,793 | 34 11 9 | 43,363,983 | 32 13 0 | 27,372 | 14,510 |
| 1924 | 52,509,223 | 38 16 5 | 48,527,603 | 35 17 6 | 103,488 | |
| 1925 | 55,243,047 | 39 18 1 | 52,425,757 | 37 17 4 | 19,225 | 30,650 |
| 1926 | 45,268,924 | 32 0 6 | 49,811,763 | 35 4 8 | 6,651 | 77,800 |
| 1927 | 48,496,354 | 33 14 0 | 44,782,666 | 31 2 5 | 280 | |
| 1928 | 55,570,381 | 38 3 3 | 44,844,102 | 30 16 0 | 618,100 | 42,164 |
| 1929 | 54,930,063 | 37 5 7 | 48,734,472 | 33 1 6 | 649,000 | 63,505 |
| 1930 | 44,940,517 | 30 2 0 | 44,339,654 | 29 14 0 | 175 | 363,087 |
| 1931 | 34,950,698 | 23 1 8 | 26,498,151 | 17 10 0 | 202,330 | 56,155 |
| 1932 | 35,609,919 | 23 6 5 | 24,646,006 | 16 1 2 | 1,355,861 | 55,310 |
| 1933 | 41,005,919 | 26 12 8 | 25,581,366 | 16 12 4 | 296,032 | 424,704 |
| 1934 | 47,342,847 | 30 10 3 | 31,339,552 | 20 4 0 | 2,283,900 | 1,242,000 |
| 1935 | 46,538,381 | 29 15 9 | 36,317,267 | 23 4 11 | 521,000 | 381,821 |
| 1936 | 56,751,940 | 36 0 7 | 44,258,886 | 28 1 11 | 45,245 | 36,601 |
| Year. | Exports of New Zealand Produce. | |||||
|---|---|---|---|---|---|---|
| Wool. | Frozen Meat.* | Tallow. | ||||
| Quantity. | Value. | Quantity. | Value. | Quantity. | Value. | |
* Includes exports of chilled beef from 1933 onwards. | ||||||
| Lb. | £ | Cwt. | £ | Cwt. | £ | |
| 1886 | 90,853,744 | 3,072,971 | 346,055 | 427,193 | 129,700 | 119,619 |
| 1887 | 88,824,382 | 3,321,074 | 402,107 | 455,870 | 154,720 | 147,233 |
| 1888 | 83,225,733 | 3,115,008 | 552,298 | 628,800 | 136,460 | 124,950 |
| 1889 | 102,227,354 | 3,976,375 | 656,822 | 783,374 | 159,020 | 159,460 |
| 1890 | 102,817,077 | 4,150,599 | 898,894 | 1,087,617 | 173,300 | 102,471 |
| 1891 | 106,187,114 | 4,129,686 | 1,000,307 | 1,194,724 | 175,580 | 173,257 |
| 1892 | 118,180,912 | 4,313,307 | 809,600 | 1,033,377 | 165,220 | 165,513 |
| 1893 | 109,719,684 | 3,774,738 | 903,836 | 1,085,167 | 170,060 | 183,588 |
| 1894 | 144,295,154 | 4,827,016 | 1,025,243 | 1,194,545 | 199,400 | 204,499 |
| 1895 | 116,015,170 | 3,662,131 | 1,134,097 | 1,262,711 | 263,560 | 260,999 |
| 1896 | 129,151,624 | 4,391,848 | 1,103,362 | 1,251,993 | 222,540 | 208,821 |
| 1897 | 135,835,117 | 4,443,144 | 1,407,921 | 1,566,286 | 310,200 | 259,964 |
| 1898 | 149,385,815 | 4,645,804 | 1,551,773 | 1,698,750 | 347,160 | 302,141 |
| 1899 | 147,169,497 | 4,324,627 | 1,865,827 | 2,088,856 | 338,620 | 311,649 |
| 1900 | 140,706,486 | 4,749,196 | 1,844,831 | 2,123,881 | 367,780 | 368,473 |
| 1901 | 146,820,079 | 3,099,103 | 1,857,547 | 2,253,262 | 335,360 | 351,710 |
| 1962 | 160,419,023 | 3,354,563 | 2,138,557 | 2,718,763 | 424,060 | 550,131 |
| 1903 | 155,128,381 | 4,041,274 | 2,378,650 | 3,197,043 | 396,940 | 517,871 |
| 1904 | 144,647,376 | 4,673,826 | 1,912,979 | 2,793,599 | 322,480 | 357,974 |
| 1905 | 139,912,737 | 5,381,333 | 1,690,684 | 2,694,432 | 318,942 | 347,888 |
| 1906 | 154,384,568 | 6,765,655 | 2,025,507 | 2,877,031 | 378,400 | 455,026 |
| 1907 | 171,635,595 | 7,657,278 | 2,354,808 | 3,420,664 | 414,880 | 560,965 |
| 1908 | 162,518,481 | 5,332,781 | 2,120,303 | 3,188,515 | 372,520 | 481,335 |
| 1909 | 189,683,703 | 6,305,888 | 2,572,604 | 3,601,093 | 484,160 | 648,452 |
| 1910 | 204,368,957 | 8,308,410 | 2,654,196 | 3,850,777 | 520,180 | 756,841 |
| 1911 | 169,424,811 | 6,491,707 | 2,250,565 | 3,503,400 | 413,120 | 607,257 |
| 1912 | 188,361,790 | 7,105,483 | 2,573,238 | 3,909,569 | 470,900 | 684,739 |
| 1913 | 186,533,036 | 8,057,620 | 2,578,693 | 4,449,933 | 454,860 | 663,088 |
| 1914 | 220,472,898 | 9,318,114 | 3,229,969 | 5,863,062 | 490,300 | 694,348 |
| 1915 | 196,570,114 | 10,387,875 | 3,591,260 | 7,794,395 | 535,260 | 780,828 |
| 1916 | 185,506,859 | 12,386,074 | 3,326,045 | 7,271,318 | 449,440 | 785,339 |
| 1917 | 178,274,486 | 12,175,366 | 2,446,945 | 5,982,404 | 251,980 | 553,016 |
| 1918 | 108,724,575 | 7,527,266 | 2,036,904 | 4,957,576 | 328,420 | 847,618 |
| 1919 | 274,246,613 | 19,559,537 | 3,822,683 | 9,628,292 | 937,480 | 2,680,006 |
| 1920 | 162,327,176 | 11,863,827 | 4,629,282 | 11,673,696 | 540,820 | 1,748,773 |
| 1921 | 158,714,828 | 5,221,479 | 4,322,754 | 11,164,345 | 554,240 | 867,298 |
| 1922 | 321,525,562 | 11,882,463 | 3,518,004 | 8,387,461 | 529,900 | 750,574 |
| 1923 | 217,566,091 | 10,904,658 | 3,043,910 | 9,012,627 | 504,860 | 785,668 |
| 1924 | 206,189,911 | 15,267,544 | 3,213,574 | 9,499,877 | 479,760 | 799,230 |
| 1925 | 205,726,856 | 17,739,736 | 3,414,205 | 11,174,567 | 500,760 | 895,061 |
| 1926 | 213,154,399 | 11,830,190 | 3,034,356 | 8,656,213 | 422,560 | 741,045 |
| 1927 | 220,500,720 | 12,961,744 | 3,364,965 | 9,104,621 | 477,500 | 714,441 |
| 1928 | 226,804,544 | 16,679,098 | 3,793,828 | 10,309,662 | 514,960 | 864,271 |
| 1929 | 234,955,978 | 15,359,206 | 3,336,200 | 9,883,277 | 416,640 | 693,614 |
| 1930 | 197,239,614 | 7,664,362 | 4,036,639 | 10,937,382 | 492,560 | 683,571 |
| 1931 | 211,718,868 | 5,515,376 | 4,138,806 | 8,892,555 | 465,280 | 413,080 |
| 1932 | 238,179,062 | 5,742,821 | 4,645,480 | 8,436,306 | 507,540 | 462,081 |
| 1933 | 286,307,441 | 7,422,266 | 5,203,113 | 9,845,627 | 560,400 | 516,063 |
| 1934 | 255,796,783 | 12,516,425 | 4,969,447 | 11,886,955 | 553,240 | 480,354 |
| 1935 | 222,661,403 | 7,097, 133 | 5,206,514 | 12,768,968 | 505,540 | 630,638 |
| 1936 | 314,409,402 | 13,293,706 | 5,119,804 | 13,239,414 | 521,900 | 628,310 |
| Year. | Exports of New Zealand Produce. | |||||
|---|---|---|---|---|---|---|
| Butter. | Cheese. | Gold. | ||||
| Quantity. | Value. | Quantity. | Value. | Quantity. | Value. | |
| Cwt. | £ | Cwt. | £ | Oz. | £ | |
| 1886 | 23,175 | 105,537 | 16,429 | 45,657 | 235,578 | 939,648 |
| 1887 | 17,018 | 54,921 | 23,913 | 54,562 | 187,938 | 747,878 |
| 1888 | 29,995 | 118,252 | 36,682 | 78,918 | 229,608 | 914,309 |
| 1889 | 37,955 | 146,840 | 26,558 | 67,105 | 197,492 | 785,490 |
| 1890 | 34,816 | 122,701 | 40,451 | 84,986 | 187,641 | 751,360 |
| 1891 | 39,430 | 150,258 | 39,770 | 86,675 | 251,161 | 1,007,172 |
| 1892 | 53,930 | 227,162 | 41,493 | 91,042 | 237,393 | 951,963 |
| 1893 | 58,149 | 254,645 | 46,201 | 99,626 | 227,502 | 915,921 |
| 1894 | 60,771 | 251,280 | 55,655 | 115,203 | 221,614 | 887,865 |
| 1895 | 57,964 | 227,601 | 76,743 | 150,909 | 293,493 | 1,162,181 |
| 1896 | 71,353 | 281,716 | 71,372 | 130,166 | 263,694 | 1,041,428 |
| 1897 | 99,002 | 402,605 | 77,683 | 150,517 | 251,647 | 980,204 |
| 1898 | 96,801 | 403,690 | 68,711 | 135,776 | 280,175 | 1,080,691 |
| 1899 | 136,086 | 571,799 | 69,440 | 141,818 | 389,570 | 1,513,180 |
| 1900 | 172,583 | 740,620 | 102,849 | 229,111 | 373,614 | 1,439,602 |
| 1901 | 201,591 | 882,406 | 104,294 | 238,685 | 455,558 | 1,753,784 |
| 1902 | 253,998 | 1,205,802 | 74,746 | 163,539 | 507,852 | 1,951,426 |
| 1903 | 285,106 | 1,318,067 | 74,780 | 194,998 | 533,314 | 2,037,832 |
| 1904 | 314,360 | 1,380,460 | 84,526 | 185,486 | 520,323 | 1,987,501 |
| 1905 | 305,722 | 1,408,557 | 88,562 | 205,171 | 520,485 | 2,093,936 |
| 1906 | 320,225 | 1,560,235 | 131,206 | 341,002 | 563,843 | 2,270,904 |
| 1907 | 328,441 | 1,615,345 | 236,833 | 662,355 | 508,210 | 2,027,490 |
| 1908 | 229,971 | 1,171,182 | 280,798 | 783,419 | 506,381 | 2,004,799 |
| 1909 | 321,108 | 1,639,380 | 400,607 | 1,105,390 | 506,371 | 2,006,900 |
| 1910 | 356,535 | 1,811,975 | 451,915 | 1,195,373 | 478,286 | 1,896,318 |
| 1911 | 302,387 | 1,576,917 | 439,174 | 1,192,057 | 454,837 | 1,815,251 |
| 1912 | 378,117 | 2,088,809 | 577,070 | 1,680,393 | 343,163 | 1,345,131 |
| 1913 | 372,258 | 2,061,651 | 611,663 | 1,770,297 | 376,161 | 1,459,499 |
| 1914 | 434,067 | 2,338,576 | 863,776 | 2,564,125 | 227,954 | 895,367 |
| 1915 | 420,144 | 2,700,625 | 817,258 | 2,730,211 | 422,825 | 1,694,553 |
| 1916 | 358,632 | 2,632,293 | 949,416 | 3,514,310 | 292,620 | 1,199,212 |
| 1917 | 254,397 | 2,031,551 | 885,743 | 3,949,251 | 218,624 | 903,888 |
| 1918 | 431,023 | 3,402,223 | 883,430 | 4,087,278 | 11,987 | 42,391 |
| 1919 | 345,818 | 3,080,128 | 1,572,311 | 7,790,990 | 320,207 | 1,334,405 |
| 1920 | 312,009 | 3,022,335 | 1,222,050 | 6,160,840 | 212,973 | 883,748 |
| 1921 | 898,478 | 11,169,530 | 1,368,786 | 8,199,183 | 149,595 | 612,168 |
| 1922 | 1,120,200 | 9,041,554 | 1,161,196 | 4,686,850 | 131,848 | 540,182 |
| 1923 | 1,250,140 | 10,689,200 | 1,441,460 | 6,870,397 | 169,512 | 698,583 |
| 1924 | 1,269,455 | 11,641,668 | 1,594,486 | 7,023,297 | 133,631 | 551,788 |
| 1925 | 1,245,324 | 10,240,132 | 1,376,754 | 5,800,808 | 114,696 | 472,364 |
| 1926 | 1,168,040 | 8,695,188 | 1,461,548 | 5,939,359 | 125,777 | 516,207 |
| 1927 | 1,455,539 | 10,915,233 | 1,492,792 | 5,582,546 | 130,171 | 534,639 |
| 1928 | 1,449,570 | 11,302,667 | 1,567,272 | 6,693,951 | 118,722 | 489,584 |
| 1929 | 1,653,807 | 13,228,027 | 1,779,093 | 7,017,463 | 119,379 | 480,212 |
| 1930 | 1,884,237 | 11,854,056 | 1,812,981 | 6,438,438 | 133,749 | 550,678 |
| 1931 | 1,988,566 | 10,649,527 | 1,636,347 | 4,461,293 | 140,970 | 581,032 |
| 1932 | 2,185,545 | 10,639,053 | 1,790,431 | 4,951,268 | 200,648 | 1,092,288 |
| 1933 | 2,635,247 | 11,648,699 | 1,982,942 | 4,766,351 | 177,241 | 1,281,612 |
| 1934 | 2,614,519 | 10,042,776 | 1,984,496 | 4,694,459 | 162,490 | 1,320,690 |
| 1935 | 2,789,298 | 13,616,740 | 1,727,552 | 4,376,512 | 171,283 | 1,441,790 |
| 1936 | 2,796,145 | 15,317,576 | 1,658,206 | 5,122,438 | 168,073 | 1,398,656 |
| Year. | Exports of New Zealand Produce. | |||||
|---|---|---|---|---|---|---|
| Kauri-gum. | Pharmium Fibre. | Timber (sawn and hewn). | ||||
| Quantity. | Value. | Quantity. | Value. | Quantity. | Value. | |
| Tons. | £ | Tons. | £ | Sup. ft. | £ | |
| 1886 | 4,920 | 257,653 | 1,112 | 15,922 | 29,349,789 | 127,905 |
| 1887 | 6,790 | 362,434 | 1,578 | 25,094 | 30,919,464 | 127,108 |
| 1888 | 8,482 | 380,933 | 4,042 | 75,269 | 43,474,434 | 177,877 |
| 1889 | 7,519 | 329,590 | 17,084 | 361,182 | 42,568,600 | 176,608 |
| 1890 | 7,438 | 378,563 | 21,158 | 381,789 | 42,098,863 | 181,689 |
| 1891 | 8,388 | 437,056 | 15,809 | 281,514 | 42,824,365 | 182,431 |
| 1892 | 8,705 | 517,678 | 12,793 | 214,542 | 22,860,551 | 87,581 |
| 1893 | 8,317 | 510,775 | 12,587 | 219,375 | 26,718,046 | 101,082 |
| 1894 | 8,338 | 404,567 | 4,677 | 66,256 | 31,901,415 | 116,116 |
| 1895 | 7,425 | 418,766 | 1,806 | 21,040 | 38,297,905 | 141,892 |
| 1896 | 7,126 | 431,323 | 2,968 | 32,985 | 34,984,414 | 133,511 |
| 1897 | 6,641 | 398,010 | 2,769 | 30,674 | 39,326,396 | 154,169 |
| 1898 | 9,905 | 586,767 | 4,850 | 74,556 | 40,721,632 | 164,723 |
| 1899 | 11,116 | 607,919 | 10,371 | 184,411 | 50,425,741 | 196,749 |
| 1900 | 10,159 | 622,293 | 15,906 | 332,182 | 57,517,085 | 232,174 |
| 1901 | 7,541 | 446,114 | 10,171 | 195,728 | 71,822,369 | 294,699 |
| 1902 | 7,430 | 450,223 | 20,852 | 534,031 | 49,251,549 | 208,005 |
| 1903 | 9,357 | 631,102 | 22,652 | 595,684 | 57,097,990 | 240,713 |
| 1904 | 9,203 | 501,817 | 26,936 | 710,281 | 60,326,992 | 254,021 |
| 1905 | 10,883 | 561,444 | 27,877 | 696,467 | 75,370,136 | 318,895 |
| 1906 | 9,154 | 522,486 | 27,779 | 776,106 | 75,528,899 | 304,941 |
| 1907 | 8,708 | 579,888 | 28,547 | 832,068 | 72,154,417 | 311,862 |
| 1908 | 5,530 | 372,798 | 17,403 | 396,288 | 84,554,414 | 375,235 |
| 1909 | 8,250 | 552,698 | 14,318 | 306,973 | 71,599,318 | 337,740 |
| 1910 | 8,693 | 465,044 | 20,645 | 448,414 | 81,940,062 | 407,658 |
| 1911 | 7,587 | 395,707 | 17,366 | 300,209 | 86,309,570 | 439,353 |
| 1912 | 7,908 | 401,305 | 18,641 | 376,264 | 94,454,491 | 490,508 |
| 1913 | 8,780 | 549,106 | 28,092 | 721,924 | 63,469,105 | 319,055 |
| 1914 | 8,473 | 497,444 | 19,702 | 455,214 | 83,342,949 | 422,864 |
| 1915 | 4,575 | 279,133 | 23,220 | 571,621 | 76,797,161 | 383,883 |
| 1916 | 5,456 | 339,882 | 27,674 | 1,001,725 | 71,503,154 | 381,488 |
| 1917 | 4,594 | 291,917 | 23,516 | 1,197,396 | 71,338,174 | 408,121 |
| 1918 | 2,419 | 157,313 | 25,167 | 1,387,763 | 74,932,815 | 556,309 |
| 1919 | 4,128 | 255,812 | 22,347 | 866,930 | 49,726,670 | 439,935 |
| 1920 | 6,481 | 556,756 | 18,949 | 647,545 | 69,664,014 | 697,608 |
| 1921 | 3,901 | 367,197 | 9,643 | 293,775 | 45,902,627 | 503,785 |
| 1922 | 6,391 | 563,270 | 9,727 | 265,080 | 44,186,848 | 479,447 |
| 1923 | 6,598 | 596,222 | 10,612 | 284,897 | 47,570,490 | 473,752 |
| 1924 | 5,261 | 443,576 | 12,982 | 388,887 | 42,928,726 | 472,120 |
| 1925 | 5,370 | 414,901 | 16,408 | 516,466 | 49,204,676 | 573,882 |
| 1926 | 4,877 | 332,765 | 17,238 | 526,311 | 40,465,221 | 475,627 |
| 1927 | 4,674 | 278,632 | 16,189 | 473,221 | 37,147,798 | 425,453 |
| 1928 | 4,394 | 240,139 | 12,932 | 352,152 | 34,970,773 | 376,967 |
| 1929 | 4,937 | 267,610 | 12,317 | 340,588 | 39,102,831 | 439,342 |
| 1930 | 3,818 | 189,635 | 8,009 | 198,213 | 26,676,131 | 300,582 |
| 1931 | 3,058 | 128,095 | 1,784 | 30,930 | 17,532,304 | 172,633 |
| 1932 | 2,068 | 62,137 | 3,375 | 42,488 | 27,286,884 | 253,883 |
| 1933 | 3,089 | 77,973 | 3,828 | 42,770 | 25,829,404 | 237,528 |
| 1934 | 3,209 | 86,917 | 3,591 | 47,501 | 34,530,279 | 320,527 |
| 1935 | 2,872 | 79,113 | 3,661 | 53,968 | 39,585,198 | 364,359 |
| 1936 | 3,237 | 96,161 | 5,707 | 106,940 | 26,993,334 | 265,108 |
INDEBTEDNESS OF GENERAL GOVERNMENT.*
| As at 31st March, | Amount of Debentures and Stock in Circulation. | Gross Indebtedness per Head of Population. | Amount of Sinking Funds accrued. | Net Indebtedness. | Net Indebtedness per Head of Population. |
|---|---|---|---|---|---|
| £ | £ s. d. | £ | £ | £ s. d. | |
| 1887 | 35,741,653 | 56 5 1 | 1,427,199 | 34,314,454 | 54 0 2 |
| 1888 | 36,758,437 | 56 16 5 | 1,344,427 | 35,414,010 | 54 14 10 |
| 1889 | 38,375,050 | 58 16 11 | 1,390,915 | 36,984,135 | 56 14 3 |
| 1890 | 38,667,950 | 58 3 2 | 1,386,186 | 37,281,764 | 56 1 6 |
| 1891 | 38,830,350 | 58 1 7 | 1,487,042 | 37,343,308 | 55 17 1 |
| 1892 | 38,713,068 | 56 19 6 | 1,037,862 | 37,675,206 | 55 9 0 |
| 1893 | 39,257,840 | 56 4 7 | 1,113,770 | 38,144,070 | 54 12 8 |
| 1894 | 39,826,415 | 55 8 3 | 951,924 | 38,874,491 | 54 1 9 |
| 1895 | 40,386,964 | 55 4 3 | 751,932 | 39,635,032 | 54 3 9 |
| 1896 | 43,050,780 | 57 18 3 | 778,891 | 42,271,889 | 56 17 4 |
| 1897 | 44,366,618 | 58 11 5 | 814,294 | 43,552,324 | 57 9 11 |
| 1898 | 44,963,424 | 58 5 6 | 881,903 | 44,081,521 | 57 2 8 |
| 1899 | 46,938,006 | 59 13 7 | 857,279 | 46,080,727 | 58 11 9 |
| 1900 | 47,874,452 | 59 19 2 | 944,375 | 46,930,077 | 58 15 6 |
| 1901 | 49,591,245 | 60 15 8 | 1,033,494 | 48,557,751 | 59 10 4 |
| 1902 | 52,966,447 | 63 11 6 | 1,128,816 | 51,837,631 | 62 4 5 |
| 1903 | 55,899,019 | 65 3 0 | 1,357,739 | 54,541,280 | 63 11 4 |
| 1904 | 57,522,215 | 65 4 3 | 1,500,687 | 56,021,528 | 63 10 2 |
| 1905 | 59,912,000 | 65 19 7 | 1,650,718 | 58,261,282 | 64 3 3 |
| 1906 | 62,191,040 | 66 13 0 | 1,661,519 | 60,529,521 | 64 17 4 |
| 1907 | 64,179,040 | 66 14 10 | 2,042,068 | 62,136,972 | 64 12 4 |
| 1908 | 66,453,897 | 67 8 11 | 1,268,361 | 65,185,536 | 66 3 2 |
| 1909 | 70,938,534 | 69 16 4 | 1,479,224 | 69,459,310 | 68 7 3 |
| 1910 | 74,890,645 | 72 6 10 | 1,503,225 | 73,387,420 | 70 17 10 |
| 1911 | 81,078,122 | 76 15 3 | 1,754,486 | 79,323,636 | 75 2 0 |
| 1912 | 84,353,913 | 78 0 3 | 2,160,603 | 82,193,310 | 76 0 3 |
| 1913 | 90,060,763 | 81 0 5 | 2,603,642 | 87,457,121 | 78 13 7 |
| 1914 | 99,730,427 | 87 10 2 | 3,063,992 | 91,689,835 | 80 9 1 |
| 1915 | 100,059,910 | 86 19 7 | 3,178,055 | 96,644,455 | 84 0 3 |
| 1916 | 109,637,397 | 95 6 4 | 3,679,964 | 105,957,433 | 92 2 4 |
| 1917 | 129,836,105 | 112 16 2 | 4,263,590 | 125,572,515 | 109 2 1 |
| 1918 | 150,840,055 | 130 12 11 | 4,971,605 | 145,868,450 | 126 6 10 |
| 1919 | 176,076,260 | 149 8 5 | 5,951,056 | 170,125,204 | 144 7 5 |
| 1920 | 201,170,755 | 162 12 9 | 7,257,564 | 193,913,191 | 156 15 5 |
| 1921 | 206,324,319 | 162 15 7 | 8,763,072 | 197,561,222 | 155 17 4 |
| 1922 | 219,054,385 | 168 6 10 | 10,655,394 | 208,241,121 | 160 0 8 |
| 1923 | 218,953,324 | 165 4 2 | 11,879,256 | 207,024,048 | 156 4 2 |
| 1924 | 221,616,361 | 164 8 5 | 12,974,028 | 208,595,743 | 154 15 3 |
| 1925 | 227,814,647 | 165 2 11 | 13,462,839 | 214,287,128 | 155 6 9 |
| 1926 | 238,855,478 | 169 8 6 | 2,274,262† | 236,581,216 | 167 16 3 |
| 1927 | 245,850,889 | 170 19 0 | 2,443,540 | 243,407,349 | 169 5 1 |
| 1928 | 251,396,252 | 172 18 5 | 2,635,766 | 248,740,736 | 171 1 11 |
| 1929 | 264,191,983 | 179 11 9 | 2,156,561 | 256,652,371 | 174 9 3 |
| 1930 | 267,383,343 | 179 11 0 | 2,331,423 | 265,051,920 | 177 19 8 |
| 1931 | 276,033,358 | 182 12 0 | 2,313,673 | 273,715,710 | 181 1 4 |
| 1932 | 281,942,800 | 184 16 3 | 2,435,117 | 279,507,683 | 183 4 4 |
| 1933 | 282,622,958 | 183 15 2 | 2,509,545 | 280,113,413 | 182 2 6 |
| 1934 | 302,791,996‡ | 195 6 8 | 2,647,985 | 300,144,011‡ | 193 12 6 |
| 1935 | 280,581,217 | 179 14 11 | 2,657,832 | 277,923,385 | 178 0 10 |
| 1936 | 282,561,098 | 179 10 6 | 2,592,458 | 279,968,640 | 177 17 7 |
| 1937 | 287,670,200 | 181 4 10 | 2,715,960 | 284,952,179 | 179 10 7 |
*In the debt tables the whole debt is shown (in pounds) at its nominal amount, no adjustment having been made on account of the fact that New Zealand currency is at present at a discount on sterling and at a slight premium on Australian currency.
† In 1925–26 the sinking funds accrued were, with certain exceptions, transferred to the Public Debt Redemption Fund.
‡ Increase due mainly to floating debt under Banks Indemnity (Exchange) Act, 1932–33, which was paid off in 1934–35.
| Year ended 31st March, | Consolidated Fund. | Public Works Fund. | ||||
|---|---|---|---|---|---|---|
| Receipts. | Payments. | Receipts. | Payments. | |||
| Form Taxation. | From other Sources. | Total. | Total. | |||
| NOTE.—Commencing with 1925–26 railway revenue and expenditure, and with 1928–29 post and telegraph revenue and expenditure, were removed from the transactions of the Consolidated Fund Revenue of the Consolidated Fund, however, now includes interest in respect of railway and post and telegraph capital liability, while the expenditure for the years 1925–26 to 1928–29 covers payment to the Working Railways Account in respect of losses on non-paying branch lines and isolated sections. From 1931–32, also, post and telegraph net profits are paid into the Consolidated Fund. Employment promotion taxation receipts (commencing 1930–31) are not paid into the Consolidated Fund. | ||||||
| £ | £ | £ | £ | £ | £ | |
| 1887 | 1,882,050 | 1,946,412 | 3,828,462 | 4,310,875 | 1,499,500 | 1,333,484 |
| 1888 | 1,876,235 | 1,845,444 | 3,721,679 | 4,212,474 | 500,000 | 966,159 |
| 1889 | 2,031,658 | 2,341,357 | 4,373,015 | 4,226,112 | 1,503,000 | 613,939 |
| 1890 | 2,090,405 | 2,176,714 | 4,267,119 | 4,256,921 | 83,142 | 482,464 |
| 1891 | 2,173,985 | 2,322,043 | 4,496,028 | 4,369,566 | 4,262 | 334,756 |
| 1892 | 2,179,739 | 2,248,791 | 4,428,530 | 4,417,843 | 216,533 | 391,501 |
| 1893 | 2,339,511 | 2,330,040 | 4,669,551 | 4,324,990 | 215,765 | 462,506 |
| 1894 | 2,353,250 | 2,339,213 | 4,692,463 | 4,455,116 | 418,323 | 406,797 |
| 1895 | 2,300,350 | 2,147,549 | 4,447,899 | 4,352,185 | 353,000 | 504,486 |
| 1896 | 2,335,760 | 2,220,255 | 4,556,015 | 4,370,481 | 162,272 | 575,087 |
| 1897 | 2,521,911 | 2,276,797 | 4,798,708 | 4,509,981 | 540,275 | 601,343 |
| 1898 | 2,678,576 | 2,400,654 | 5,079,230 | 4,602,372 | 759,673 | 865,543 |
| 1899 | 2,707,099 | 2,551,129 | 5,258,228 | 4,858,511 | 935,691 | 916,327 |
| 1900 | 2,891,126 | 2,808,492 | 5,699,618 | 5,140,127 | 1,062,116 | 993,223 |
| 1901 | 3,042,890 | 2,864,026 | 5,906,916 | 5,479,704 | 1,401,788 | 1,309,021 |
| 1902 | 3,113,079 | 3,039,760 | 6,152,839 | 5,914,915 | 2,364,796 | 2,143,252 |
| 1903 | 3,277,964 | 3,169,471 | 6,447,435 | 6,214,019 | 1,398,950 | 1,514,445 |
| 1904 | 3,649,601 | 3,480,516 | 7,130,117 | 6,434,281 | 1,875,614 | 1,796,841 |
| 1905 | 3,754,379 | 3,592,818 | 7,347,197 | 6,635,902 | 1,908,683 | 1,354,158 |
| 1906 | 3,841,596 | 3,808,502 | 7,650,098 | 7,122,340 | 1,555,768 | 1,811,819 |
| 1907 | 4,264,555 | 4,214,401 | 8,478,956 | 7,774,926 | 1,918,081 | 2,168,894 |
| 1908 | 4,645,754 | 4,418,235 | 9,063,989 | 8,213,965 | 1,846,054 | 2,109,882 |
| 1909 | 4,377,761 | 4,623,424 | 9,001,185 | 8,785,513 | 3,628,270 | 3,363,895 |
| 1910 | 4,180,516 | 5,058,401 | 9,238,917 | 8,990,922 | 2,093,697 | 2,216,397 |
| 1911 | 4,837,322 | 5,459,951 | 10,297,273 | 9,343,106 | 3,396,648 | 2,058,691 |
| 1912 | 5,296,590 | 5,764,571 | 11,061,161 | 10,340,368 | 1,256,456 | 2,340,380 |
| 1913 | 5,606,829 | 6,127,442 | 11,734,271 | 11,082,038 | 3,300,729 | 2,548,918 |
| 1914 | 5,918,034 | 6,311,627 | 12,229,661 | 11,825,864 | 3,478,751 | 2,760,798 |
| 1915 | 5,880,811 | 6,571,134 | 12,451,945 | 12,379,803 | 2,224,491 | 2,737,364 |
| 1916 | 7,266,966 | 7,240,564 | 14,507,530 | 12,943,107 | 3,187,154 | 2,583,212 |
| 1917 | 10,549,654 | 7,805,540 | 18,355,194 | 14,058,770 | 1,105,837 | 1,775,513 |
| 1918 | 12,340,853 | 7,865,369 | 20,206,222 | 15,120,288 | 1,091,195 | 1,401,837 |
| 1919 | 13,801,643 | 8,550,729 | 22,352,372 | 18,673,599 | 1,240,680 | 1,387,661 |
| 1920 | 16,251,769 | 9,829,571 | 26,081,340 | 23,781,524 | 2,243,389 | 2,232,815 |
| 1921 | 22,184,414 | 12,076,547 | 34,260,961 | 28,068,730 | 5,012,156 | 3,658,240 |
| 1922 | 16,370,516 | 11,756,491 | 28,127,007 | 28,466,838 | 9,792,916 | 6,875,636 |
| 1923 | 15,594,288 | 11,985,155 | 27,579,443 | 26,263,760 | 3,968,565 | 4,729,679 |
| 1924 | 16,416,870 | 11,543,500 | 27,960,370 | 26,148,005 | 4,275,914 | 4,658,272 |
| 1925 | 16,172,306 | 12,470,694 | 28,643,000 | 27,399,200 | 4,833,280 | 5,482,069 |
| 1926 | 16,978,496 | 7,747,266 | 24,725,762 | 23,570,083 | 5,956,878 | 5,874,313 |
| 1927 | 16,899,556 | 8,043,551 | 24,943,107 | 24,355,965 | 5,931,170 | 5,505,897 |
| 1928 | 16,848,754 | 8,275,226 | 25,123,980 | 24,944,905 | 5,464,225 | 5,212,032 |
| 1929 | 17,832,033 | 5,767,643 | 23,599,676 | 24,176,928 | 9,028,994 | 5,696,161 |
| 1930 | 19,471,131 | 5,878,730 | 25,349,861 | 25,200,882 | 2,339,358 | 6,237,585 |
| 1931 | 18,597,456 | 4,471,475 | 23,068,931 | 24,708,042 | 7,356,050 | 6,547,883 |
| 1932 | 16,188,171 | 6,531,562 | 22,719,733 | 24,860,552 | 5,179,898 | 4,89.5,861 |
| 1933 | 15,604,041 | 6,964,480 | 22,568,521 | 22,528,379 | 1,958,386 | 2,2.7,336 |
| 1934 | 17,057,606 | 6,435,143 | 23,492,749 | 24,202,027 | 2,363,775 | 2,572,415 |
| 1935 | 20,176,345 | 5,949,749 | 26,126,094 | 24,499,595 | 3,000,372 | 2,714,210 |
| 1936 | 21,554,397 | 4,617,971 | 26,172,368 | 25,890,568 | 3,458,125 | 2,863,643 |
| 1937 | 26,939,338 | 4,207,849 | 31,147,187 | 30,675,158 | 6,743,040 | 6,601,091 |
| Year ended 31st March, | Receipts. | |||||
|---|---|---|---|---|---|---|
| Revenue. | Other Receipts. | Total. | Payments. | Total Gross Indebtedness. | ||
| From Rates. | From other Sources. | |||||
| £ | £ | £ | £ | £ | £ | |
| 1886 | 410,639 | 882,618 | 514,728 | 1,807,985 | 1,644,706 | 5,086,044 |
| 1887 | 434,237 | 790,063 | 992,633 | 2,216,933 | 1,885,001 | 5,825,683 |
| 1888 | 433,832 | 795,067 | 511,594 | 1,740,493 | 1,819,787 | 6,015,354 |
| 1889 | 445,929 | 676,428 | 316,139 | 1,438,496 | 1,560,605 | 6,164,901 |
| 1890 | 460,303 | 707,725 | 206,688 | 1,374,716 | 1,476,540 | 6,316,716 |
| 1891 | 463,581 | 662,765 | 236,902 | 1,363,248 | 1,381,320 | 6,427,473 |
| 1892 | 488,824 | 693,296 | 214,124 | 1,396,244 | 1,400,467 | 6,550,183 |
| 1893 | 508,157 | 709,676 | 340,538 | 1,558,371 | 1,482,548 | 6,750,698 |
| 1894 | 551,412 | 681,831 | 623,038 | 1,856,281 | 1,589,124 | 7,253,072 |
| 1895 | 581,868 | 683,857 | 328,798 | 1,594,523 | 1,584,518 | 7,422,306 |
| 1896 | 592,903 | 738,146 | 269,145 | 1,600,194 | 1,627,079 | 7,547,511 |
| 1897 | 598,526 | 765,047 | 246,919 | 1,610,492 | 1,636,716 | 7,675,814 |
| 1898 | 644,552 | 790,602 | 304,645 | 1,739,799 | 1,733,016 | 7,783,445 |
| 1899 | 685,769 | 820,727 | 385,368 | 1,891,864 | 1,778,574 | 7,995,400 |
| 1900 | 714,151 | 848,032 | 372,028 | 1,934,211 | 1,960,073 | 8,149,272 |
| 1901 | 734,023 | 919,831 | 825,039 | 2,478,893 | 2,250,572 | 8,785,303 |
| 1902 | 800,471 | 1,019,024 | 775,432 | 2,594,927 | 2,528,092 | 9,245,364 |
| 1903 | 846,716 | 1,053,582 | 966,087 | 2,866,385 | 2,867,506 | 9,886,676 |
| 1904 | 950,150 | 1,206,069 | 1,142,595 | 3,298,814 | 3,230,712 | 10,756,062 |
| 1905 | 1,019,431 | 1,255,222 | 1,350,631 | 3,625,284 | 3,497,321 | 12,056,736 |
| 1906 | 1,151,219 | 1,392,148 | 1,326,597 | 3,869,964 | 3,601,506 | 12,873,165 |
| 1907 | 1,233,049 | 1,579,391 | 1,227,473 | 4,039,913 | 3,897,515 | 13,903,153 |
| 1908 | 1,356,257 | 1,750,665 | 1,410,994 | 4,517,916 | 4,491,113 | 14,931,351 |
| 1909 | 1,390,698 | 1,934,122 | 1,440,746 | 4,765,566 | 4,800,711 | 15,920,757 |
| 1910 | 1,526,317 | 1,934,034 | 2,362,171 | 5,822,522 | 4,898,482 | 17,809,917 |
| 1911 | 1,592,601 | 2,171,725 | 1,776,958 | 5,541,284 | 5,360,261 | 19,104,571 |
| 1912 | 1,677,877 | 2,298,934 | 2,425,258 | 6,402,069 | 6,074,372 | 20,763,486 |
| 1913 | 1,799,299 | 2,531,686 | 2,383,123 | 6,714,108 | 6,537,769 | 22,183,427 |
| 1914 | 2,005,638 | 2,719,112 | 2,411,575 | 7,136,325 | 6,796,314 | 23,773,429 |
| 1915 | 2,140,086 | 2,861,297 | 2,595,706 | 7,597,089 | 6,806,567 | 24,538,721 |
| 1916 | 2,355,155 | 2,967,645 | 2,469,275 | 7,792,075 | 6,920,736 | 26,045,312 |
| 1917 | 2,534,539 | 3,243,942 | 1,411,422 | 7,189,903 | 6,758,593 | 26,799,586 |
| 1918 | 2,674,541 | 3,283,749 | 1,250,047 | 7,208,337 | 7,103,073 | 27,653,681 |
| 1919 | 2,939,606 | 3,452,071 | 942,780 | 7,334,457 | 7,320,277 | 28,074,950 |
| 1920 | 3,144,213 | 4,486,582 | 3,329,003 | 10,959,798 | 10,883,586 | 30,187,942 |
| 1921 | 3,549,590 | 5,336,374 | 3,429,662 | 12,315,626 | 12,761,690 | 32,104,957 |
| 1922 | 3,779,895 | 6,074,782 | 5,486,912 | 15,341,589 | 15,091,875 | 36,745,089 |
| 1923 | 4,277,781 | 6,243,951 | 7,399,674 | 17,921,406 | 15,695,507 | 43,191,184 |
| 1924 | 4,445,627 | 6,704,144 | 5,685,107 | 16,834,878 | 16,520,950 | 46,537,833 |
| 1925 | 4,668,884 | 7,512,080 | 7,613,399 | 19,794,363 | 19,422,833 | 53,353,466 |
| 1926 | 5,039,645 | 8,333,921 | 7,505,702 | 20,879,268 | 20,915,645 | 59,419,754 |
| 1927 | 5,311,260 | 8,954,685 | 6,680,176 | 20,946,121 | 21,747,557 | 64,012,247 |
| 1928 | 5,615,672 | 9,786,271 | 5,667,651 | 21,069,594 | 22,423,167 | 66,404,172 |
| 1929 | 5,844,495 | 9,583,576 | 6,042,007 | 21,470,078 | 21,300,024 | 69,294,619 |
| 1930 | 6,010,987 | 10,746,731 | 5,495,427 | 22,253,145 | 22,061,088 | 71,207,539 |
| 1931 | 5,637,254 | 10,627,391 | 4,432,956 | 20,697,601 | 22,174,524 | 72,686,036 |
| 1932 | 5,511,818 | 9,682,251 | 4,374,251 | 19,568,320 | 20,087,381 | 72,402,282 |
| 1933 | 5,237,688 | 8,913,285 | 4,433,294 | 18,584,267 | 18,885,173 | 72,476,056 |
| 1934 | 5,541,255 | 8,688,412 | 3,821,779 | 18,051,446 | 17,737,792 | 71,969,387 |
| 1935 | 5,511,442 | 9,167,287 | 3,943,488 | 18,622,217 | 18,744,891 | 71,245,458 |
| 1936 | 5,585,855 | 9,552,548 | 4,348,534 | 19,486,937 | 19,337,242 | 70,400,176 |
* Exclusive of Hospital Hoards.
(Exclusive of Inscribed Debt.)
| As at 31st March, | Counties. | Boroughs. | Harbour Boards. | Electric-power Districts. | Other. | Total. |
|---|---|---|---|---|---|---|
| £ | £ | £ | £ | £ | £ | |
| 1885 | 7,800 | 2,156,455 | 1,872,100 | 276,868 | 4,313,223 | |
| 1886 | 3,510 | 2,257,775 | 2,414,945 | 275,280 | 4,951,510 | |
| 1887 | 8,700 | 2,452,585 | 2,887,700 | 271,762 | 5,620,747 | |
| 1888 | 14,282 | 2,527,353 | 3,006,900 | 264,268 | 5,812,803 | |
| 1889 | 23,523 | 2,534,556 | 3,057,118 | 276,853 | 5,892,050 | |
| 1890 | 8,505 | 2,541,453 | 3,155,600 | 272,501 | 5,978,059 | |
| 1891 | 8,010 | 2,540,390 | 3,226,000 | 268,293 | 6,042,693 | |
| 1892 | 9,660 | 2,539,445 | 3,276,300 | 256,529 | 6,081,934 | |
| 1893 | 11,660 | 2,567,095 | 3,369,410 | 255,704 | 6,203,869 | |
| 1894 | 11,010 | 2,738,184 | 3,610,450 | 255,180 | 6,614,824 | |
| 1895 | 10,510 | 2,757,395 | 3,652,350 | 265,255 | 6,685,510 | |
| 1896 | 10,510 | 2,777,495 | 3,686,959 | 262,614 | 6,737,578 | |
| 1897 | 10,510 | 2,817,378 | 3,703,561 | 261,949 | 6,793,398 | |
| 1898 | 11,710 | 2,834,306 | 3,723,380 | 264,965 | 6,834,361 | |
| 1899 | 10,500 | 2,881,567 | 3,804,187 | 267,000 | 6,963,254 | |
| 1900 | 6,900 | 2,939,025 | 3,845,881 | 265,544 | 7,057,350 | |
| 1901 | 6,714 | 3,251,817 | 4,035,331 | 269,207 | 7,563,069 | |
| 1902 | 6,714 | 3,435,884 | 4,123,631 | 273,466 | 7,839,695 | |
| 1903 | 6,614 | 3,655,436 | 4,256,481 | 298,665 | 8,217,196 | |
| 1904 | 6,214 | 4,226,800 | 4,308,851 | 357,045 | 8,898,910 | |
| 1905 | 7,800 | 4,863,986 | 4,382,551 | 763,905 | 10,018,242 | |
| 1906 | 15,228 | 5,314,173 | 4,554,151 | 834,499 | 10,718,051 | |
| 1907 | 31,678 | 5,920,305 | 4,676,551 | 987,514 | 11,616,048 | |
| 1908 | 37,138 | 6,540,071 | 4,877,676 | 1,077,449 | 12,532,334 | |
| 1909 | 56,534 | 7,016,926 | 5,052,845 | 1,177,317 | 13,303,622 | |
| 1910 | 76,877 | 7,687,209 | 5,788,400 | 1,385,199 | 14,937,685 | |
| 1911 | 185,631 | 8,399,327 | 6,002,400 | 1,544,418 | 16,131,776 | |
| 1912 | 404,078 | 9,148,771 | 6,271,717 | 1,952,922 | 17,777,488 | |
| 1913 | 605,353 | 9,981,974 | 6,431,827 | 2,175,975 | 19,195,129 | |
| 1914 | 800,615 | 11,061,343 | 6,696,029 | 2,373,392 | 20,931,279 | |
| 1915 | 1,025,601 | 11,352,802 | 6,990,573 | 2,389,253 | 21,758,229 | |
| 1916 | 1,162,170 | 12,364,056 | 7,135,895 | 2,655,017 | 23,317,138 | |
| 1917 | 1,260,307 | 12,918,990 | 7,271,594 | 2,658,283 | 24,109,174 | |
| 1918 | 1,476,412 | 13,461,919 | 7,387,125 | 2,697,981 | 25,023,437 | |
| 1919 | 1,653,619 | 13,679,658 | 7,417,488 | 2,769,784 | 25,520,549 | |
| 1920 | 2,032,960 | 15,295,958 | 7,495,641 | 2,892,192 | 27,716,751 | |
| 1921 | 2,525,845 | 16,041,368 | 7,650,479 | 147,750 | 3,313,892 | 29,679,334 |
| 1922 | 3,006,582 | 18,060,322 | 8,250,272 | 1,480,000 | 3,566,123 | 34,363,299 |
| 1923 | 3,803,334 | 21,596,465 | 8,588,978 | 3,052,300 | 3,808,440 | 40,849,517 |
| 1924 | 3,997,009 | 22,075,003 | 9,173,484 | 4,740,865 | 4,237,168 | 44,223,529 |
| 1925 | 4,616,688 | 25,882,865 | 9,750,660 | 6,514,757 | 4,315,898 | 51,080,868 |
| 1926 | 5,390,003 | 28,025,700 | 9,993,259 | 8,745,755 | 5,025,420 | 57,180,137 |
| 1927 | 5,992,375 | 30,044,394 | 10,257,781 | 10,113,400 | 5,414,670 | 61,822,620 |
| 1928 | 6,205,468 | 31,599,324 | 10,476,883 | 10,175,364 | 5,817,390 | 64,274,429 |
| 1929 | 6,350,942 | 32,244,481 | 10,774,139 | 11,986,707 | 5,860,262 | 67,216,531 |
| 1930 | 6,533,322 | 31,521,149 | 10,460,692 | 12,636,351 | 8,028,555 | 69,180,069 |
| 1931 | 6,641,057 | 32,139,389 | 10,509,207 | 13,011,529 | 8,415,827 | 70,717,009 |
| 1932 | 6,685,905 | 31,683,238 | 10,549,493 | 13,121,960 | 8,437,121 | 70,477,717 |
| 1933 | 6,614,056 | 31,791,675 | 10,620,442 | 13,031,930 | 8,550,251 | 70,608,354 |
| 1934 | 6,557,849 | 31,358,647 | 10,496,533 | 13,213,079 | 8,522,069 | 70,148,177 |
| 1935 | 6,402,889 | 30,992,129 | 10,524,788 | 13,399,053 | 8,185,800 | 69,504,659 |
| 1936 | 6,228,614 | 30,773,342 | 10,218,672 | 13,484,988 | 8,040,463 | 68,746,079 |
* Exclusive of Hospital Boards.
| Year. | Assets. | Liabilities. | ||||
|---|---|---|---|---|---|---|
| Advances. | Coin and Bullion. | Total (all Assets). | Notes in Circulation. | Deposits. | Total (all Liabilities). | |
* Note-issuing functions taken over by Reserve Bank (August, 1934). † As at end of December. ‡ The Reserve Bank assumed the liability for the outstanding notes of the trading banks as from 1st August, 1936. Statistics of the note issue of the Reserve Bank and of net note-circulation will be found in the Banking and Currency section of the Year-Book. | ||||||
| £ | £ | £ | £ | £ | £ | |
| 1886 | 15,834,877 | 2,177,544 | 19,041,827 | 943,075 | 10,579,711 | 11,603,194 |
| 1887 | 15,310,050 | 2,342,052 | 18,799,847 | 896,517 | 11,031,614 | 11,995,495 |
| 1888 | 15,041,897 | 2,319,325 | 18,709,444 | 873,045 | 11,155,778 | 12,108,353 |
| 1889 | 14,272,481 | 2,217,833 | 17,652,915 | 879,440 | 11,528,424 | 12,486,717 |
| 1890 | 13,996,086 | 2,536,529 | 17,735,259 | 903,010 | 12,368,610 | 13,356,598 |
| 1891 | 11,448,745 | 2,405,099 | 16,814,518 | 937,309 | 12,796,098 | 13,820,458 |
| 1892 | 12,128,065 | 2,450,712 | 17,558,168 | 959,943 | 13,587,062 | 14,623,335 |
| 1893 | 12,688,303 | 2,627,367 | 18,255,534 | 973,894 | 14,433,777 | 15,489,633 |
| 1894 | 11,897,740 | 2,896,562 | 17,746,421 | 901,526 | 13,927,217 | 14,930,791 |
| 1895 | 11,600,080 | 3,310,943 | 18,159,781 | 897,919 | 13,544,415 | 14,491,627 |
| 1896 | 10,972,226 | 3,308,392 | 16,900,199 | 946,366 | 14,490,827 | 15,520,431 |
| 1897 | 10,020,640 | 3,093,295 | 17,276,771 | 1,009,038 | 14,290,512 | 15,380,248 |
| 1898 | 10,564,266 | 2,791,081 | 17,013,404 | 1,070,133 | 14,143,229 | 15,299,058 |
| 1899 | 10,954,435 | 2,675,361 | 17,190,433 | 1,163,759 | 14,591,223 | 15,834,858 |
| 1900 | 11,343,411 | 2,739,197 | 17,314,535 | 1,299,825 | 15,570,610 | 16,964,582 |
| 1901 | 12,148,335 | 2,996,345 | 18,422,274 | 1,361,355 | 16,034,848 | 17,490,035 |
| 1902 | 12,747,773 | 3,201,824 | 18,999,180 | 1,375,788 | 17,231,768 | 18,701,063 |
| 1903 | 13,435,993 | 3,608,941 | 19,913,546 | 1,450,267 | 19,011,114 | 20,563,879 |
| 1904 | 14,651,198 | 3,896,195 | 20,893,096 | 1,468,161 | 19,074,960 | 20,643,359 |
| 1905 | 15,496,395 | 4,006,108 | 21,770,525 | 1,468,977 | 20,545,601 | 22,144,166 |
| 1906 | 16,649,329 | 4,593,954 | 23,829,933 | 1,574,254 | 22,422,243 | 24,143,008 |
| 1907 | 18,514,045 | 4,836,718 | 26,584,239 | 1,644,645 | 23,517,111 | 25,334,348 |
| 1908 | 21,172,808 | 4,840,942 | 29,098,567 | 1,615,109 | 21,821,753 | 23,611,903 |
| 1909 | 19,078,032 | 4,947,096 | 26,937,265 | 1,577,558 | 21,996,621 | 23,728,326 |
| 1910 | 18,439,999 | 5,035,764 | 26,398,927 | 1,626,094 | 24,968,761 | 26,742,081 |
| 1911 | 21,259,727 | 5,195,333 | 29,433,614 | 1,677,842 | 26,765,122 | 28,625,803 |
| 1912 | 22,907,656 | 5,338,295 | 31,196,400 | 1,714,667 | 25,622,083 | 27,508,348 |
| 1913 | 22,902,298 | 5,204,266 | 30,708,932 | 1,674,333 | 25,733,187 | 27,591,099 |
| 1914 | 24,250,246 | 5,712,751 | 32,502,312 | 1,998,388 | 27,640,507 | 29,808,349 |
| 1915 | 23,638,970 | 6,781,006 | 33,209,483 | 2,846,275 | 31,433,653 | 34,448,270 |
| 1916 | 24,911,706 | 7,393,917 | 37,015,486 | 4,049,529 | 37,507,917 | 41,977,619 |
| 1917 | 28,847,749 | 8,072,279 | 44,979,615 | 5,410,957 | 42,930,713 | 48,541,961 |
| 1918 | 31,711,350 | 8,085,961 | 48,570,126 | 6,266,768 | 45,562,939 | 52,048,732 |
| 1919 | 31,717,720 | 8,017,159 | 48,615,209 | 7,087,545 | 50,489,444 | 57,861,393 |
| 1920 | 38,241,932 | 7,728,942 | 56,111,433 | 7,890,418 | 59,405,341 | 67,818,469 |
| 1921 | 50,607,541 | 7,660,532 | 68,701,282 | 7,569,319 | 49,397,411 | 58,808,439 |
| 1922 | 44,768,178 | 7,822,562 | 61,779,570 | 7,019,220 | 45,913,394 | 53,868,834 |
| 1923 | 43,322,242 | 7,900,594 | 59,641,235 | 6,593,068 | 49,039,482 | 56,204,292 |
| 1924 | 44,537,161 | 7,816,145 | 61,325,865 | 6,587,546 | 49,502,499 | 57,131,235 |
| 1925 | 45,298,955 | 7,722,917 | 62,128,808 | 6,775,470 | 52,207,202 | 60,219,697 |
| 1926 | 49,149,260 | 7,797,319 | 65,765,297 | 6,730,421 | 50,135,114 | 58,008,161 |
| 1927 | 50,032,203 | 7,874,971 | 66,626,676 | 6,510,018 | 48,294,096 | 56,321,397 |
| 1928 | 46,179,463 | 7,511,833 | 62,819,485 | 6,374,043 | 53,799,221 | 61,850,595 |
| 1929 | 49,278,194 | 7,051,391 | 65,475,529 | 6,433,911 | 57,609,746 | 65,232,866 |
| 1930 | 53,657,397 | 6,798,556 | 69,748,071 | 6,255,717 | 56,425,014 | 63,984,419 |
| 1931 | 52,419,527 | 6,917,897 | 68,557,120 | 5,782,354 | 53,645,018 | 61,463,034 |
| 1932 | 50,255,674 | 5,957,944 | 69,015,209 | 5,958,268 | 52,851,736 | 60,649,208 |
| 1933 | 45,705,044 | 5,105,846 | 69,656,700 | 6,205,429 | 57,620,233 | 65,281,375 |
| 1934 | 41,389,457 | 3,477,248* | 73,509,177 | 4,844,826* | 63,417,299 | 69,259,271 |
| 1935 | 44,666,541 | 767,589* | 83,008,626† | 765,343* | 61,474,511 | 65,981,411† |
| 1936 | 45,918,432 | 720,317* | 83,865,501† | ‡ | 65,153,972 | 65,939,649† |
| Year. | Number of Depositors at End of Year. | Total Amount of Deposits during Year. | Total Amount of Withdrawals. during Year. | Excess of Deposits over Withdrawals. | Interest Credited to Depositors. | Total Amount to Credit of Depositors at End of Year. |
|---|---|---|---|---|---|---|
*Fifteen months, 1st January, 1920, to 31st March, 1921. †Year ended 31st March following. ‡Excess of withdrawals over deposits. | ||||||
| £ | £ | £ | £ | £ | ||
| 1886 | 74,871 | 1,248,405 | 1,336,287 | - 87,882‡ | 65,825 | 1,615,979 |
| 1887 | 79,724 | 1,312,151 | 1,182,409 | 129,742 | 67,364 | 1,813,085 |
| 1888 | 84,488 | 1,544,747 | 1,387,471 | 157,276 | 78,080 | 2,048,442 |
| 1889 | 90,745 | 1,515,282 | 1,457,081 | 58,201 | 84,810 | 2,191,452 |
| 1890 | 97,208 | 1,658,543 | 1,500,437 | 158,106 | 92,319 | 2,441,876 |
| 1891 | 104,467 | 1,842,988 | 1,693,515 | 149,473 | 104,099 | 2,695,448 |
| 1892 | 112,528 | 1,878,270 | 1,821,349 | 56,921 | 111,302 | 2,863,671 |
| 1893 | 122,684 | 2,386,090 | 2,122,522 | 263,568 | 114,760 | 3,241,998 |
| 1894 | 129,423 | 2,252,862 | 2,268,624 | - 15,762‡ | 114,643 | 3,340,880 |
| 1895 | 137,683 | 2,794,507 | 2,369,333 | 425,174 | 129,490 | 3,895,543 |
| 1896 | 147,758 | 2,881,153 | 2,591,559 | 289,594 | 126,498 | 4,311,635 |
| 1897 | 159,331 | 3,187,219 | 2,891,169 | 296,050 | 137,240 | 4,744,925 |
| 1898 | 169,968 | 3,279,611 | 3,194,894 | 84,717 | 128,129 | 4,957,771 |
| 1899 | 183,046 | 3,644,980 | 3,417,299 | 227,681 | 134,918 | 5,320,371 |
| 1900 | 197,408 | 4,170,429 | 3,827,416 | 343,013 | 146,169 | 5,809,552 |
| 1901 | 212,436 | 4,611,456 | 4,230,193 | 381,263 | 159,198 | 6,350,013 |
| 1902 | 227,465 | 5,069,619 | 4,708,772 | 360,847 | 172,926 | 6,883,787 |
| 1903 | 243,675 | 5,661,593 | 5,343,828 | 317,765 | 187,130 | 7,388,682 |
| 1904 | 259,164 | 5,836,540 | 5,664,770 | 171,770 | 200,930 | 7,761,382 |
| 1905 | 276,066 | 6,625,744 | 5,984,185 | 641,559 | 259,081 | 8,662,023 |
| 1906 | 298,746 | 7,907,155 | 6,907,104 | 1,000,051 | 291,192 | 9,953,266 |
| 1907 | 319,773 | 9,351,664 | 8,125,123 | 1,226,541 | 343,424 | 11,523,231 |
| 1908 | 342,077 | 9,674,075 | 9,417,820 | 256,255 | 379,808 | 12,159,294 |
| 1909 | 359,714 | 9,611,120 | 9,499,320 | 111,800 | 395,804 | 12,666,898 |
| 1910 | 380,585 | 10,708,939 | 9,695,515 | 1,013,424 | 424,668 | 14,104,990 |
| 1911 | 405,566 | 11,627,368 | 10,662,046 | 965,322 | 472,875 | 15,543,187 |
| 1912 | 432,199 | 11,725,183 | 11,449,711 | 275,472 | 511,599 | 16,330,257 |
| 1913 | 458,594 | 11,286,702 | 11,041,454 | 245,248 | 555,908 | 17,131,414 |
| 1914 | 4,83,262 | 11,904,323 | 10,603,018 | 1,301,305 | 615,310 | 19,048,029 |
| 1915 | 509,085 | 13,706,057 | 11,294,973 | 2,411,084 | 707,252 | 22,166,365 |
| 1916 | 538,072 | 15,576,408 | 12,957,420 | 2,618,988 | 817,856 | 25,603,209 |
| 1917 | 566,351 | 17,106,529 | 14,461,169 | 2,645,360 | 947,821 | 29,196,390 |
| 1918 | 590,205 | 18,101,105 | 14,938,842 | 3,162,263 | 1,059,472 | 33,418,125 |
| 1919 | 630,783 | 29,758,447 | 25,962,377 | 3,796,070 | 1,178,935 | 38,393,130 |
| 1920* | 664,819 | 44,302,852 | 41,162,486 | 3,140,366 | 1,818,535 | 43,352,031 |
| 1921† | 678,930 | 29,125,997 | 30,236,231 | -1,110,234‡ | 1,599,907 | 43,841,704 |
| 1922† | 690,790 | 26,682,427 | 27,769,263 | -1,086,836‡ | 1,605,525 | 44,360,393 |
| 1923† | 710,157 | 29,598,372 | 29,510,321 | 88,051 | 1,649,976 | 46,098,421 |
| 1924† | 735,148 | 29,582,897 | 30,413,609 | - 830,712‡ | 1,680,920 | 46,948,628 |
| 1925† | 758,155 | 31,833,622 | 32,602,506 | - 768,884‡ | 1,731,578 | 47,911,322 |
| 1926† | 783,827 | 29,456,383 | 30,149,629 | - 693,246‡ | 1,767,426 | 48,985,502 |
| 1927† | 804,725 | 27,611,066 | 30,584,998 | -2,973,932‡ | 1,747,156 | 47,758,726 |
| 1928† | 828,296 | 27,252,381 | 28,111,940 | - 859,559‡ | 1,745,050 | 48,644,217 |
| 1929† | 852,757 | 28,561,854 | 29,575,994 | -1,014,140‡ | 1,806,414 | 49,436,491 |
| 1930† | 878,043 | 24,531,569 | 28,063,338 | -3,531,709‡ | 1,763,825 | 47,668,547 |
| 1931† | 877,090 | 19,463,985 | 25,488,081 | -6,024,096‡ | 1,611,048 | 43,255,499 |
| 1932† | 797,097 | 16,933,176 | 19,635,928 | -2,702,752‡ | 1,475,874 | 42,028,621 |
| 1933† | 798,262 | 19,428,853 | 17,818,172 | 1,610,681 | 1,231,089 | 44,870,391 |
| 1934† | 817,617 | 24,179,537 | 20,946,562 | 3,232,975 | 1,320,348 | 49,423,714 |
| 1935† | 840,671 | 25,619,775 | 23,533,596 | 2,086,179 | 1,406,459 | 52,916,352 |
| 1936† | 880,857 | 30,676,969 | 27,042,003 | 3,634,966 | 1,514,220 | 58,065,538 |
| Year. | Letters and Letter-cards posted and delivered. | Newspapers posted and delivered. | Money-orders issued. | Postal Notes issued.‡ | Postal Revenue.‡ | ||
|---|---|---|---|---|---|---|---|
| Number. | Amount. | Number. | Amount. | ||||
*Received and despatched. †Counted once only. ‡Year ended 31st March following. | |||||||
| £ | £ | £ | |||||
| 1886 | 38,084,592* | 14,324,047* | 155,680 | 547,755 | 92,546 | 37,019 | 206,029 |
| 1887 | 39,377,774* | 15,381,323* | 159,579 | 555,744 | 122,255 | 46,973 | 213,355 |
| 1888 | 40,398,020* | 16,202,849* | 162,387 | 555,996 | 149,879 | 55,785 | 212,247 |
| 1889 | 42,301,233* | 16,721,016* | 172,076 | 589,545 | 175,023 | 64,244 | 222,978 |
| 1890 | 43,917,200* | 17,912,734* | 176,427 | 602,077 | 189,915 | 68,395 | 229,867 |
| 1891 | 47,612,864* | 18,501,912* | 195,239 | 651,990 | 220,683 | 77,808 | 245,395 |
| 1892 | 50,610,742* | 18,557,565* | 199,438 | 694,847 | 247,902 | 86,176 | 252,494 |
| 1893 | 52,085,449* | 19,556,030* | 210,957 | 750,929 | 285,389 | 99,073 | 253,457 |
| 1894 | 52,168,336* | 19,271,590* | 222,678 | 776,783 | 319,368 | 110,142 | 254,800 |
| 1895 | 29,586,949† | 12,675,973† | 243,497 | 812,604 | 349,627 | 120,957 | 242,615 |
| 1896 | 30,442,053† | 13,216,521† | 269,566 | 902,160 | 376,796 | 126,448 | 262,482 |
| 1897 | 33,030,095† | 14,261,345† | 293,659 | 970,831 | 409,866 | 131,643 | 272,163 |
| 1898 | 35,654,947† | 15,095,487† | 318,370 | 1,029,241 | 431,449 | 137,085 | 304,947 |
| 1899 | 38,484,371† | 15,717,388† | 344,664 | 1,118,808 | 461,447 | 144,631 | 325,301 |
| 1900 | 39,898,479† | 17,045,715† | 369,834 | 1,214,853 | 490,506 | 151,180 | 316,858 |
| 1901 | 52,567,560† | 18,973,632† | 405,967 | 1,286,508 | 556,316 | 169,527 | 281,097 |
| 1902 | 57,714,631† | 18,517,276† | 367,207 | 1,277,059 | 616,264 | 187,709 | 302,604 |
| 1903 | 61,687,457† | 19,696,434† | 396,312 | 1,416,225 | 707,044 | 215,275 | 343,207 |
| 1904 | 66,501,434† | 21,500,744† | 407,783 | 1,476,887 | 785,347 | 244,719 | 383,243 |
| 1905 | 71,116,261† | 23,626,362† | 417,441 | 1,541,712 | 875,324 | 270,300 | 410,967 |
| 1906 | 79,084,566† | 23,716,431† | 439,020 | 1,686,231 | 981,642 | 307,323 | 438,729 |
| 1907 | 159,680,654 | 38,862,863 | 441,487 | 1,773,591 | 1,092,631 | 340,436 | 478,388 |
| 1908 | 175,440,111 | 41,358,913 | 488,084 | 2,050,684 | 1,222,280 | 383,472 | 544,642 |
| 1909 | 186,926,337 | 42,561,641 | 538,740 | 2,307,593 | 1,414,752 | 441,099 | 566,990 |
| 1910 | 196,768,968 | 42,305,554 | 569,657 | 2,457,523 | 1,666,959 | 517,315 | 603,150 |
| 1911 | 205,450,627 | 43,801,719 | 607,764 | 2,759,393 | 1,821,566 | 566,650 | 613,252 |
| 1912 | 214,184,119 | 43,460,016 | 666,425 | 3,231,350 | 1,970,643 | 627,443 | 644,637 |
| 1913 | 223,961,200 | 43,572,759 | 690,745 | 3,357,774 | 2,238,842 | 711,518 | 695,136 |
| 1914 | 233,901,320 | 43,779,983 | 691,518 | 3,427,505 | 2,314,327 | 714,683 | 698,898 |
| 1915 | 242,547,859 | 41,311,535 | 664,860 | 3,471,818 | 2,370,079 | 712,753 | 858,583 |
| 1916 | 242,121,361 | 41,807,999 | 669,355 | 3,607,087 | 2,286,463 | 685,708 | 964,793 |
| 1917 | 245,796,945 | 40,366,792 | 642,683 | 3,476,645 | 2,166,597 | 628,920 | 976,027 |
| 1918 | 242,527,369 | 35,476,212 | 638,500 | 3,649,371 | 2,091,051 | 610,591 | 983,585 |
| 1919 | 247,143,183 | 35,498,263 | 690,291 | 4,604,059 | 2,197,520 | 646,411 | 1,068,489 |
| 1920 | 259,743,234 | 37,859,247 | 699,674 | 5,276,776 | 2,280,219 | 691,201 | 1,352,677 |
| 1921 | 253,767,131 | 38,680,982 | 669,383 | 4,850,820 | 2,377,622 | 723,254 | 1,499,304 |
| 1922 | 239,997,081 | 35,635,219 | 659,943 | 4,278,529 | 2,434,506 | 730,232 | 1,378,421 |
| 1923 | 252,021,959 | 38,138,697 | 684,979 | 4,390,159 | 2,652,777 | 786,146 | 1,146,588 |
| 1924 | 272,311,925 | 41,602,497 | 731,511 | 4,692,929 | 2,846,333 | 840,559 | 1,257,942 |
| 1925 | 294,630,760 | 44,717,406 | 766,689 | 4,977,230 | 3,040,722 | 902,119 | 1,320,277 |
| 1926 | 298,617,089 | 45,364,274 | 793,110 | 5,033,127 | 3,329,638 | 965,270 | 1,400,886 |
| 1927 | 297,478,294 | 47,089,652 | 803,535 | 4,995,090 | 3,614,217 | 1,015,213 | 1,439,587 |
| 1928 | 298,548,364 | 48,257,194 | 807,885 | 4,977,522 | 3,575,984 | 1,057,624 | 1,441,794 |
| 1929 | 309,162,103 | 48,658,470 | 835,358 | 5,187,553 | 3,816,635 | 1,123,446 | 1,498,684 |
| 1930 | 313,148,058 | 47,644,098 | 833,505 | 5,069,629 | 3,907,288 | 1,128,807 | 1,582,550 |
| 1931 | 263,633,952 | 39,454,971 | 714,478 | 3,993,035 | 2,884,654 | 952,444 | 1,744,553 |
| 1932 | 246,395,130 | 33,410,372 | 648,951 | 3,335,552 | 2,686,648 | 958,373 | 1,393,655 |
| 1933 | 261,979,312 | 33,775,389 | 635,674 | 3,112,729 | 2,883,070 | 1,061,946 | 1,294,757 |
| 1934 | 275,063,943 | 33,485,832 | 654,621 | 3,209,713 | 3,325,561 | 1,140,695 | 1,384,264 |
| 1935 | 288,645,484 | 34,547,494 | 673,057 | 3,374,029 | 3,827,417 | 1,293,955 | 1,466,857 |
| 1936 | 292,098,761 | 33,341,059 | 733,966 | 3,794,648 | 3,833,288 | 1,378,387 | 1,628,868 |
| Year ended 31st March. | Miles Open for Traffic. | Capital Cost of Open Lines. | Train-mileage. | Passengers carried, excluding Season-ticket Holders. | Goods and Live-stock.* | Revenue.† | Expenditure.† |
|---|---|---|---|---|---|---|---|
*Equivalent tonnage of live-stock. † From 1925–26 figures relate to railway operation only. ‡Capital cost written down by £10,400,000. | |||||||
| £ | Tons. | £ | £ | ||||
| 1887 | 1,721 | 13,017,567 | 3,008,949 | 3,426,403 | 1,783,524 | 998,768 | 699,072 |
| 1888 | 1,753 | 13,352,978 | 2,944,786 | 3,451,850 | 1,770,638 | 994,843 | 687,328 |
| 1889 | 1,777 | 13,472,837 | 2,796,007 | 3,132,803 | 1,954,126 | 997,615 | 647,045 |
| 1890 | 1,809 | 13,899,955 | 2,868,203 | 3,376,459 | 2,112,734 | 1,095,569 | 682,787 |
| 1891 | 1,842 | 14,278,586 | 2,894,776 | 3,433,629 | 2,134,023 | 1,121,701 | 700,703 |
| 1892 | 1,869 | 14,656,691 | 3,010,489 | 3,555,764 | 2,122,987 | 1,115,432 | 706,517 |
| 1893 | 1,886 | 14,733,120 | 3,002,174 | 3,759,044 | 2,258,235 | 1,181,522 | 732,142 |
| 1894 | 1,948 | 15,137,036 | 3,113,231 | 3,972,701 | 2,128,709 | 1,172,792 | 735,359 |
| 1895 | 1,993 | 15,352,613 | 3,221,620 | 3,905,578 | 2,123,343 | 1,150,851 | 732,160 |
| 1896 | 2,014 | 15,425,532 | 3,307,226 | 4,162,426 | 2,175,943 | 1,183,041 | 751,368 |
| 1897 | 2,018 | 15,577,392 | 3,409,218 | 4,439,387 | 2,461,127 | 1,286,158 | 789,054 |
| 1898 | 2,055 | 15,993,903 | 3,666,483 | 4,672,264 | 2,628,746 | 1,376,008 | 857,191 |
| 1899 | 2,090 | 16,404,076 | 3,968,708 | 4,955,553 | 2,744,441 | 1,469,665 | 929,737 |
| 1900 | 2,104 | 16,703,887 | 4,187,893 | 5,468,284 | 3,251,716 | 1,623,891 | 1,052,358 |
| 1901 | 2,212 | 17,207,328 | 4,620,971 | 6,243,593 | 3,461,331 | 1,727,236 | 1,127,848 |
| 1902 | 2,235 | 18,170,722 | 5,066,360 | 7,356,136 | 3,667,039 | 1,874,586 | 1,252,237 |
| 1903 | 2,291 | 19,081,735 | 5,443,333 | 7,575,390 | 3,918,261 | 1,974,038 | 1,343,415 |
| 1904 | 2,328 | 20,692,911 | 5,685,399 | 8,306,383 | 4,259,217 | 2,180,641 | 1,438,724 |
| 1905 | 2,374 | 21,701,572 | 6,107,079 | 8,514,112 | 4,185,467 | 2,209,231 | 1,492,900 |
| 1906 | 2,407 | 22,498,972 | 6,413,573 | 8,826,382 | 4,415,166 | 2,349,704 | 1,621,239 |
| 1907 | 2,458 | 23,504,272 | 6,755,454 | 9,600,786 | 4,824,563 | 2,624,600 | 1,812,482 |
| 1908 | 2,474 | 24,365,647 | 7,051,274 | 9,756,716 | 5,070,176 | 2,761,938 | 1,949,759 |
| 1909 | 2,674 | 27,762,592 | 7,458,236 | 10,457,144 | 5,135,408 | 2,929,526 | 2,114,815 |
| 1910 | 2,717 | 28,513,476 | 7,889,166 | 11,141,142 | 5,490,018 | 3,249,790 | 2,169,474 |
| 1911 | 2,753 | 29,606,546 | 8,141,075 | 11,200,613 | 5,863,674 | 3,494,182 | 2,303,272 |
| 1912 | 2,798 | 30,506,089 | 8,371,687 | 11,891,134 | 5,887,908 | 3,676,509 | 2,465,896 |
| 1913 | 2,851 | 31,611,220 | 9,016,224 | 13,123,879 | 6,246,128 | 3,971,002 | 2,705,609 |
| 1914 | 2,854 | 32,355,087 | 9,319,268 | 13,355,893 | 6,019,633 | 4,043,328 | 2,880,323 |
| 1915 | 2,945 | 34,133,825 | 9,383,420 | 13,565,772 | 6,453,472 | 4,105,457 | 2,920,455 |
| 1916 | 2,960 | 34,857,882 | 9,356,522 | 14,201,506 | 6,370,945 | 4,548,356 | 2,910,883 |
| 1917 | 2,960 | 35,378,664 | 9,146,331 | 14,173,115 | 6,239,173 | 4,800,810 | 2,926,864 |
| 1918 | 2,983 | 36,001,432 | 7,468,646 | 11,408,156 | 5,742,968 | 4,687,700 | 3,042,907 |
| 1919 | 2,983 | 36,167,681 | 7,477,583 | 11,374,521 | 5,611,738 | 4,988,632 | 3,308,575 |
| 1920 | 2,996 | 36,390,115 | 7,408,608 | 12,760,814 | 6,000,279 | 5,752,487 | 4,105,067 |
| 1921 | 3,009 | 37,235,254 | 9,303,392 | 15,315,640 | 6,487,279 | 6,908,531 | 5,636,601 |
| 1922 | 3,021 | 39,309,097 | 8,717,265 | 14,262,440 | 6,321,351 | 6,643,591 | 6,237,727 |
| 1923 | 3,028 | 40,275,161 | 8,346,731 | 14,256,610 | 6,618,588 | 6,727,802 | 5,502,497 |
| 1924 | 3,053 | 41,399,427 | 9,024,503 | 13,817,378 | 6,918,349 | 6,984,211 | 5,403,766 |
| 1925 | 3,085 | 44,570,746 | 9,083,623 | 12,397,079 | 7,025,316 | 7,112,524 | 5,545,416 |
| 1926 | 3,138 | 47,608,676 | 10,319,407 | 11,787,723 | 7,246,692 | 7,589,274 | 6,164,570 |
| 1927 | 3,164 | 49,183,916 | 10,723,864 | 10,274,878 | 7,299,752 | 7,423,472 | 6,158,283 |
| 1928 | 3,180 | 51,187,376 | 10,838,594 | 9,272,547 | 7,358,388 | 7,343,845 | 6,302,119 |
| 1929 | 3,287 | 56,568,598 | 11,113,482 | 9,046,981 | 7,613,445 | 7,524,864 | 6,374,579 |
| 1930 | 3,287 | 57,787,671 | 12,022,043 | 8,466,779 | 7,788,973 | 7,473,993 | 6,848,026 |
| 1931 | 3,322 | 60,545,154 | 11,281,898 | 7,265,912 | 6,957,709 | 6,781,388 | 6,406,143 |
| 1932 | 3,315 | ‡51,424,883 | 10,168,720 | 6,503,566 | 5,824,811 | 5,788,965 | 5,301,653 |
| 1933 | 3,315 | 51,480,949 | 9,828,853 | 6,870,570 | 5,490,686 | 5,339,075 | 4,833,754 |
| 1934 | 3,320 | 53,909,347 | 10,163,474 | 7,511,346 | 5,642,199 | 5,628,835 | 4,877,146 |
| 1935 | 3,320 | 54,089,190 | 10,626,400 | 7,809,035 | 6,023,960 | 5,908,064 | 5,138,588 |
| 1936 | 3,320 | 54,253,059 | 11,050,376 | 7,963,824 | 6,188,805 | 6,243,519 | 5,523,193 |
| 1937 | 3,320 | 54,696,437 | 11,868,083 | 8,284,956 | 6,813,240 | 6,903,604 | 6,338,385 |
| Year. | Number of Bankruptcies. | Debtors' Statements of Assets, excluding Amounts secured to Creditors. | Amount realized by Official Assignees. | Amount of Debts proved. | Amount paid in Dividends and Preferential Claims. |
|---|---|---|---|---|---|
| £ | £ | £ | £ | ||
| 1886 | 1,089 | 415,953 | 128,370 | 566,291 | 102,966 |
| 1887 | 1,036 | 311,745 | 135,633 | 503,759 | 109,255 |
| 1888 | 881 | 252,322 | 98,213 | 571,741 | 79,843 |
| 1889 | 724 | 441,874 | 187,048 | 755,165 | 95,032 |
| 1890 | 652 | 262,733 | 112,951 | 381,124 | 122,276 |
| 1891 | 605 | 141,971 | 84,341 | 302,712 | 72,572 |
| 1892 | 507 | 122,050 | 66,497 | 238,953 | 43,662 |
| 1893 | 484 | 111,483 | 68,844 | 464,274 | 37,721 |
| 1894 | 626 | 187,785 | 85,538 | 310,078 | 70,889 |
| 1895 | 485 | 133,603 | 88,684 | 239,562 | 70,018 |
| 1896 | 412 | 115,455 | 71,712 | 256,870 | 37,492 |
| 1897 | 419 | 73,466 | 40,942 | 133,345 | 45,015 |
| 1898 | 407 | 90,068 | 45,474 | 285,155 | 30,994 |
| 1899 | 389 | 59,435 | 34,269 | 158,932 | 30,084 |
| 1900 | 304 | 77,689 | 53,415 | 141,800 | 37,411 |
| 1901 | 222 | 58,658 | 49,781 | 84,452 | 30,358 |
| 1902 | 205 | 61,604 | 39,386 | 110,995 | 29,406 |
| 1903 | 204 | 46,767 | 23,761 | 88,019 | 17,618 |
| 1904 | 257 | 86,094 | 43,514 | 125,392 | 28,103 |
| 1905 | 304 | 100,813 | 47,798 | 146,332 | 28,150 |
| 1906 | 347 | 106,376 | 50,761 | 192,927 | 35,448 |
| 1907 | 350 | 77,698 | 59,849 | 158,663 | 42,459 |
| 1908 | 406 | 200,447 | 67,018 | 199,069 | 47,800 |
| 1909 | 471 | 204,187 | 71,351 | 259,017 | 44,110 |
| 1910 | 393 | 127,634 | 79,100 | 176,001 | 47,796 |
| 1911 | 344 | 88,592 | 40,009 | 133,517 | 28,757 |
| 1912 | 312 | 64,398 | 39,965 | 120,325 | 26,825 |
| 1913 | 343 | 155,582 | 42,735 | 228,829 | 25,813 |
| 1914 | 391 | 174,410 | 64,153 | 199,251 | 33,910 |
| 1915 | 294 | 92,876 | 63,310 | 153,926 | 42,374 |
| 1916 | 304 | 123,441 | 56,416 | 172,774 | 29,223 |
| 1917 | 265 | 138,696 | 63,645 | 178,244 | 27,405 |
| 1918 | 164 | 50,356 | 67,729 | 88,607 | 33,176 |
| 1919 | 141 | 43,627 | 54,662 | 59,767 | 24,980 |
| 1920 | 145 | 44,026 | 47,897 | 77,752 | 45,227 |
| 1921 | 336 | 362,601 | 78,271 | 558,504 | 38,646 |
| 1922 | 690 | 344,861 | 126,145 | 834,356 | 63,009 |
| 1923 | 674 | 368,673 | 24,641 | 668,925 | 65,667 |
| 1924 | 670 | 279,602 | 118,641 | 703,995 | 74,878 |
| 1925 | 653 | 235,377 | 98,648 | 471,028 | 80,187 |
| 1926 | 752 | 236,915 | 102,899 | 585,687 | 71,515 |
| 1927 | 867 | 331,363 | 108,850 | 679,473 | 72,388 |
| 1928 | 806 | 236,264 | 116,613 | 767,327 | 68,763 |
| 1929 | 687 | 233,655 | 91,180 | 502,112 | 54,759 |
| 1930 | 780 | 471,502 | 83,308 | 827,345 | 68,611 |
| 1931 | 848 | 401,649 | 108,809 | 1,042,187 | 63,185 |
| 1932 | 661 | 252,348 | 75,657 | 624,892 | 55,940 |
| 1933 | 450 | 114,817 | 61,723 | 489,895 | 47,884 |
| 1934 | 326 | 72,572 | 44,533 | 258,920 | 33,788 |
| 1935 | 257 | 68,216 | 41,037 | 225,508 | 23,142 |
| 1936 | 260 | 40,557 | 32,983 | 169,866 | 21,520 |
Table of Contents
His Excellency the Right Honourable Viscount Galway, P.C., G.C.M.G., D.S.O., O.B.E.
Military Secretary—Major A. F. Purvis, M.C.
Official Secretary—D. E. Fouhy, Esq.
Aides-de-Camp—Lieut. Sir Standish O'G. Roche, Bart., R.N.; Captain R. F. H. P. Stnart French.
Assistant Secretary—J. H. L. James, Esq.
Honorary Aides-de-Camp—Naval: Captain I. G. Glennie, R.N.; Captain R. D. Oliver, D.S.C., R.N. Military: Colonel I. T. Standish, C.M.G., D.S.O., A.D.C. to the King; Colonel S. C. P. Nicholls C.B.E., D.S.O.; Colonel A. S. Wilder, D.S.O., M.C., V.D.; Colonel L. M. Inglis, M.C., V.D.; Colonel N. L. Macky, M.C.; Lieut.-Colonel S. G. Scoular. Air—Wing-Commander T. M. Wilkes, C.B.E., M.C.; Wing-Commander L. M. Isitt.
Honorary Physician—Colonel F. T. Bowerbank, O.B.E., M.D., F.R.C.P., Edin.
Honorary Surgeon—Lieut.-Colonel C. T. H. Newton, D.S.O., M.D., F.R.C.S., Edin.
His Excellency assumed office on the 12th April, 1935.
A complete list of vice-regal representatives will be found in the 1931 issue (pp. 59–60) of the Year-Book.
| Name of Ministry. | Name of Premier. | Assumed Office. | Retired. |
|---|---|---|---|
| 1. Bell-Sewell | Henry Sewell | 7 May, 1856 | 20 May, 1856. |
| 2. Fox | William Fox | 20 May, 1856 | 2 June, 1856. |
| 3. Stafford | Edward William Stafford | 2 June, 1856 | 12 July, 1861. |
| 4. Fox | William Fox | 12 July, 1861 | 6 Aug., 1862. |
| 5. Domett | Alfred Domett | 6 Aug., 1862 | 30 Oct., 1863. |
| 6. Whitaker-Fox | Frederick Whitaker | 30 Oct., 1863 | 24 Nov., 1864. |
| 7. Weld | Frederick Aloysius Weld | 24 Nov., 1864 | 16 Oct., 1865. |
| 8. Stafford | Edward William Stafford | 16 Oct., 1865 | 28 June, 1869. |
| 9. Fox | William Fox | 28 June, 1869 | 10 Sept., 1872. |
| 10. Stafford | Edward William Stafford | 10 Sept., 1872 | 11 Oct., 1872. |
| 11. Waterhouse | George Marsden Waterhouse | 11 Oct., 1872 | 3 Mar., 1873. |
| 12. Fox | William Fox | 3 Mar., 1873 | 8 April, 1873. |
| 13. Vogel | Julius Vogel, C.M.G. | 8 April, 1873 | 6 July, 1875. |
| 14. Pollen | Daniel Pollen, M.L.C. | 6 July, 1875 | 15 Feb., 1876. |
| 15. Vogel | Sir Julius Vogel, K.C.M.G. | 15 Feb., 1876 | 1 Sept., 1876. |
| 16. Atkinson | Harry Albert Atkinson | 1 Sept., 1876 | 13 Sept., 1876. |
| 17. Atkinson (reconstituted) | Harry Albert Atkinson | 13 Sept., 1876 | 13 Oct., 1877. |
| 18. Grey | Sir George Grey, K.C.B. | 15 Oct., 1877 | 8 Oct., 1879. |
| 19. Hall | John Hall | 8 Oct., 1879 | 21 April, 1882. |
| 20. Whitaker | Frederick Whitaker, M.L.C. | 21 April, 1882 | 25 Sept., 1883. |
| 21. Atkinson | Harry Albert Atkinson | 25 Sept., 1883 | 16 Aug., 1884. |
| 22. Stout-Vogel | Robert Stout | 16 Aug., 1884 | 28 Aug., 1884. |
| 23. Atkinson | Harry Albert Atkinson | 28 Aug., 1884 | 3 Sept., 1884. |
| 24. Stout-Vogel | Sir Robert Stout, K.C.M.G. | 3 Sept., 1884 | 8 Oct., 1887. |
| 25. Atkinson | Sir Harry Albert Atkinson, K.C.M.G. | 8 Oct., 1887 | 24 Jan., 1891. |
| 26. Ballance | John Ballance | 24 Jan., 1891 | 1 May, 1893. |
| 27. Seddon | Rt. Hon. Richard John Seddon, P.C. | 1 May, 1893 | 21 June, 1906. |
| 28. Hall-Jones | William Hall-Jones | 21 June, 1906 | 6 Aug., 1906. |
| 29. Ward | Rt. Hon. Sir Joseph George Ward, Bart., P.C., K.C.M.G. | 6 Aug., 1906 | 28 Mar., 1912. |
| 30. Mackenzie | Thomas Mackenzie | 28 Mar., 1912 | 10 July, 1912. |
| 31. Massey | Rt. Hon. William Ferguson Massey, P.C. | 10 July, 1912 | 12 Aug., 1915. |
| 32. National | Rt. Hon. William Ferguson Massey, P.C. | 12 Aug., 1915 | 25 Aug., 1919. |
| 33. Massey | Rt. Hon. William Ferguson Massey, P.C. | 25 Aug., 1919 | 14 May, 1925. |
| 34. Bell | Hon. Sir Francis Henry Dillon Bell, G.C.M.G., K.C. | 14 May, 1925 | 30 May, 1925. |
| 35. Coates | Rt. Hon. Joseph Gordon Coates, P.C., M.C. | 30 May, 1925 | 10 Dec., 1928. |
| 36. Ward | Rt. Hon. Sir Joseph George Ward, Bart., P.C., G.C.M.G. | 10 Dec., 1928 | 28 May, 1930. |
| 37. Forbes | Rt. Hon. George William Forbes, P.C. | 28 May, 1930 | 22 Sept., 1931. |
| 38. Coalition | Rt. Hon. George William Forbes, P.C. | 22 Sept., 1931 | 6 Dec., 1935. |
| 39. Labour | Rt. Hon. Michael Joseph Savage, P.C. | 8 Dec., 1935 |
Right Hon. M. J. SAVAGE, P.C., Prime Minister, Minister of External Affairs, Native Minister, Minister for the Cook Islands, and Minister in Charge of Broadcasting, Native Trust, Legislative, Electoral, Audit, and High Commissioner's Departments.
Hon. P. ERASER, Minister of Education, Minister of Health, Minister of Marine, and Minister in Charge of Mental Hospitals, and Police Departments, and Inspection of Machinery.
Hon. W. NASH, Minister of Finance, Minister of Customs, Minister of Marketing, Minister of Stamp Duties, and Minister in Charge of State Advances, Land and Income Tax, Public Service Superannuation, Public Trust, Government Life Insurance, State Fire Insurance, and Census and Statistics Departments.
Hon. D. G. SULLIVAN, Minister of Industries and Commerce, Minister of Railways, and Minister in Charge of Scientific and Industrial Research Department.
Hon. H. G. R. MASON, Attorney-General, Minister of Justice, and Minister in Charge of Prisons and Registrar-General's Departments, and Patents, Designs, Trade-marks, and Copyright Offices.
Hon. H. T. ARMSTRONG, Minister of Labour, and Minister of Immigration.
Hon. R. SEMPLE, Minister of Public Works, Minister of Transport, and Minister in Charge of Roads and Public Buildings.
Hon. W. E. PARRY, Minister of Internal Affairs, and Minister in Charge of Pensions, Dominion Museum, and Government Advertising.
Hon. P. C WEBB, Minister of Mines, and Minister in Charge of Printing and Stationery Department.
Hon. F. JONES, Postmaster-General, Minister of Telegraphs, Minister of Defence, and Minister in Charge of War Pensions.
Hon. W. LEE MARTIN, Minister of Agriculture, and Minister in Charge of Friendly Societies and National Provident Fund Departments.
Hon. F. LANGSTONE, Minister of Lands, Commissioner of State Forests, and Minister in Charge of Valuation Department. Land for Settlements, Scenery Preservation, Discharged Soldiers' Settlement, and Tourist and Health Resorts.
Hon. M. FAGAN, M.L.C., Member of the Executive Council without portfolio. Clerk of the Executive Council—C. A. Jeffery, C.M.G.
(Assumed Office, 6th December, 1935.)
| Name and Office. | From |
|---|---|
| Right Hon. Michael Joseph Savage, P.C.— | |
| Prime Minister | 6th December, 1935. |
| Minister of External Affairs | 6th December, 1935. |
| Native Minister | 6th December, 1935. |
| Minister for the Cook Islands | 6th December, 1935. |
| Peter Fraser— | |
| Minister of Education | 6th December, 1935. |
| Minister of Health | 6th December, 1935. |
| Minister of Marine | 6th December, 1935. |
| Walter Nash— | |
| Minister of Finance | 6th December, 1935. |
| Minister of Customs | 6th December, 1935. |
| Minister of Stamp Duties | 6th December, 1935. |
| Minister of Marketing | 25th May, 1936. |
| Daniel Giles Sullivan— | |
| Minister of Industries and Commerce | 6th December, 1935. |
| Minister of Railways | 6th December, 1935. |
| Henry Greathead Rex Mason— | |
| Attorney-General | 6th December, 1935. |
| Minister of Justice | 6th December, 1935. |
| Hubert Thomas Armstrong— | |
| Minister of Labour | 6th December, 1935. |
| Minister of Immigration | 6th December, 1935. |
| Robert Semple— | |
| Minister of Public Works | 6th December, 1935. |
| Minister of Transport | 6th December, 1935. |
| William Edward Parry— | |
| Minister of Internal Affairs | 6th December, 1935. |
| Patrick Charles Webb— | |
| Minister of Mines | 6th December, 1935. |
| Frederick Jones— | |
| Postmaster-General | 6th December, 1935. |
| Minister of Telegraphs | 6th December, 1935. |
| Minister of Defence | 6th December, 1935. |
| William Lee Martin— | |
| Minister of Agriculture | 6th December, 1935. |
| Frank Langstone— | |
| Minister of Lands | 6th December, 1935. |
| Commissioner of State Forests | 6th December, 1935. |
| Mark Fagan, M.L.C.— | |
| Member of Executive Council without portfolio | 6th December, 1935. |
(Appointed under Civil List Amendment Act, 1936.)
JOHN ALEXANDER LEE, M.P., Parliamentary Under-Secretary in relation to the office of the Minister of Finance. Appointed 2nd September, 1936.
Judges of the Supreme Court and Court of Appeal, December, 1937. — Chief Justice: Right Hon. Sir Michael Myers, P.O., G.C.M.G. Puisne Judges: Hon. Sir J. R. Reed, Kt., C.B.E.; Hon. H. H. Ostler; Hon. A. W. Blair; Hon. D. S. Smith; Hon. Robert Kennedy; Hon. A. Fair; Hon. E. H. Northcroft.
Judge of Court of Review (Mortgagors' and Lessees' Rehabilitation Act).—Hon. H. F. Johnston.
Judges of the Arbitration Court.—Hon. P. J. O'Regan, Hon. W. J. Hunter.
Since the preceding issue of the Year-Book the following honours have been conferred by His Majesty the King for services rendered in connection with New Zealand:—
[(a) Signifies conferred in February, 1937; (b) in May, 1937.]
Knight Grand Cross of St. Michael and St. George: Right Hon. Sir M. Myers, P.O., K.C.M.G. (b). Knight Commander of St. Michael and St. George: Professor A. P. W. Thomas (b). Knight Bachelor: E. Davis (b), G. Harper, O.B.E. (a), C. J. B. Norwood (b), G. A. Troup, C.M.G. (a). Companion of the Bath: Rear-Admiral the Hon. E. R. Drurnmond, M.V.O. (b), Major-General J. E. Duigan, D.S.O. (b). Companion of St. Michael and St. George: Dr. R. H. Hogg, O.B.E. (b), Professor H. Mackenzie (a), J. Rigg (b). Commander of the British Empire: J. W. A. Heenan (a), Princess To Puea Herangi (b), Captain L. V. Morgan, M.V.O., D.S.O. (a), H. E. Moston (b), Colonel S. G. P. Nicholls, D.S.O., A.D.C. (b), Wing-Commander T. M. Wilkes, M.C., A.D.C. (b). Companion of the Imperial Service Order: A. H. Cockayne (b), J. H. Jerram (b), N. T. Lambourne (b). W. Robertson (b). Officer of the British Empire: Miss E. M. Duggan (a), J. Higgins (b), Lieut.-Colonel H. B. Maunsell (b), C. F. Schadick (b), Miss A. E. J. Spencer (a), Mrs. E. B. Taylor (b), S. L. Thompson (b), Paymaster-Commander E. L. Tottenham (b), Mrs. A. M. Ward (b), Mrs. H. Wilson (b). Member of the British Empire: Miss M. Boyce (b), R. Brown (a), Miss A. H. Cookson (b), Battery Sergt.-Major W. D. Dean (b), Miss A. C. Ingles (b), Miss E. D. W. Leslie (b), Miss M. Mayze (b), Miss J. Morgan (b), Miss R. Muir (b), Mrs. C. E. McLaren (b), Staff Sergt.-Major C. T. R. McLean (b), Miss E. M. Nutsey (b), H. A. Sommerville (a), Miss E. P. Tennent (b), W. S. Wharton (a).
[For earlier Parliaments and sessions refer to pp. 59–60 of the 1930 edition of the Year-Book. On some occasions there have been long adjournments during sessions, without Parliament being prorogued.]
| Parliament. | Dates of Opening of Sessions. | Dates of Prorogation. | Dates of Dissolution. |
|---|---|---|---|
| Nineteenth | 24 June, 1915 9 May, 1916 28 June, 1917 9 April, 1918 24 Oct., 1918 28 Aug., 1919 | 15 Oct., 1915 9 Aug., 1916 2 Nov., 1917 17 April, 1918 12 Dec., 1918 7 Nov., 1919 | 27 Nov., 1919. |
| Twentieth | 24 June, 1920 10 Mar., 1921 22 Sept., 1921 28 June, 1922 | 12 Nov., 1920 24 Mar.,1921 13 Feb., 1922 1 Nov., 1922 | 15 Nov., 1922. |
| Twenty-first | 8 Feb., 1923 14 June, 1923 26 June, 1924 25 June, 1925 | 19 Feb., 1923 30 Aug., 1923 7 Nov., 1924 3 Oct., 1925 | 14 Oct., 1925. |
| Twenty-second | 16 June, 1926 23 June, 1927 28 June, 1928 | 14 Sept., 1926 7 Dec., 1927 11 Oct., 1928 | 18 Oct., 1928. |
| Twenty-third | 4 Dec., 1928 27 June, 1929 26 June, 1930 11 Mar., 1931 25 June, 1931 | 19 Dec., 1928 11 Nov., 1929 5 Nov., 1930 7 May, 1931 11 Nov., 1931 | 12 Nov., 1931. |
| Twenty-fourth | 23 Feb., 1932 22 Sept., 1932 21 Sept., 1933 28 June, 1934 29 Aug., 1935 | 11 May, 1932 21 Mar., 1933 22 Dec., 1933 16 April, 1935 29 Oct., 1935 | 1 Nov., 1935. |
| Twenty-fifth | 25 Mar., 1936 9 Sept., 1937 | 31 Oct., 1936 |
Speaker—Hon. Sir W. C. F. CARNCROSS, Kt. Chairman of Committees—Hon. J. A. HANAN. Clerk of the Legislative Council—C. M. BOTHAMLEY.
| Name. | Provincial District. | Date of Appointment. |
|---|---|---|
| Alexander, Hon. John, C.M.G. | Auckland | 22 June, 1934. |
| Allen, Colonel the Hon. Sir James, G.C.M.G., K.C.B. | Otago | 1 June, 1934. |
| Archer. Hon. John Kendrick | Canterbury | 22 Sept., 1937. |
| Bloodworth, Hon. Thomas | Auckland | 22 June, 1934. |
| Briggs, Hon. Mark | Wellington | 9 Mar., 1936. |
| Brindle, Hon. Thomas | Wellington | 9 Mar., 1936. |
| Burns, Hon. Archibald | Auckland | 22 June, 1934. |
| Carneross, Hon. Sir Walter Charles Frederick, Kt. | Taranaki | 17 Mar., 1931. |
| Carrington, Hon. Carey John | Auckland | 17 June, 1933. |
| Connelly, Hon. Michael | Otago | 9 Mar., 1936. |
| Cotter, Hon. James | Auckland | 9 Mar., 1936. |
| Davis, Hon. Eliot Rypinski | Auckland | 22 June, 1934. |
| Doyle, Hon. Thomas | Southland | 9 Mar., 1936. |
| Dunean, Hon. John Edward | Auckland | 22 Sept., 1937. |
| Dye, Hon. Edward | Auckland | 9 Mar., 1936. |
| Fagan, Hon. Mark | Wellington | 11 June, 1937. |
| Goodall, Hon. James | Westland | 9 Mar., 1936. |
| Hanan, Hon. Josiah Alfred | Otago | 17 June, 1933. |
| Hayward, Hon. William | Canterbury | 22 June, 1934. |
| Hunter, Hon. George Robert | Canterbury | 9 Mar., 1936. |
| Lark, Hon. Frank Edwin | Auckland | 9 Mar., 1936. |
| McCullough, Hon. John Alexander | Canterbury | 9 Mar., 1936. |
| McIntyre, Hon. William Henderson | Nelson | 3 Sept., 1935. |
| McLeod, Hon. James | Taranaki | 22 June, 1934. |
| Martin, Hon. Bernard | Auckland | 9 Mar., 1936. |
| Mawhete, Hon. Rangi | Wellington | 9 Mar., 1936. |
| O'Byrne, Hon. Thomas Francis | Southland | 22 June, 1934. |
| O'Flynn, Hon. Francis Edward | Canterbury | 22 Sept., 1937. |
| Perry, Hon. William | Wellington | 22 June, 1934. |
| Rhodes, Hon. Sir Robert Heaton, K.C.V.O., K.B.E. | Canterbury | 22 June, 1934. |
| Robbins, Hon. Benjamin Conrad | Auckland | 9 Mar., 1936. |
| Russell, Hon. Harold Arthur | Hawke's Bay | 22 June, 1934. |
| Snodgrass, Hon. William Wallace, M.B.E. | Nelson | 3 Sept., 1935. |
| Statham, Hon. Sir Charles Ernest, Kt. | Wellington | 9 Mar., 1936. |
| Trevethick, Hon. Jonathan | Auckland | 22 Sept., 1937. |
| Waite, Hon. Fred | Otago | 22 June, 1934. |
| Ward, Hon. Vincent Aubrey | Wellington | 22 June, 1934. |
| Wilson, Hon. David | Wellington | 22 Sept., 1937. |
ROLL OF MEMBERS OF THE HOUSE OF REPRESENTATIVES, DECEMBER, 1937. Speaker—Hon. W. E. BARNARD. Chairman of Committees—E. J. HOWARD.
Clerk of the House—T. D. H. HALL. LL.B.
| Name | Electoral District. |
|---|---|
| For European Electorates. | |
| Anderton, William Theophilus | Eden. |
| Armstrong, Hon. Hubert Thomas | Christchurch East. |
| Atmore, Harry | Nelson. |
| Barclay, James Gillispie | Marsden. |
| Barnard, Hon. William Edward | Napier. |
| Barnes, David | Waitaki. |
| Barrell, Charles Abraham | Hamilton. |
| Bodkin, William Alexander | Central Otago. |
| Broadfoot, Walter James | Waitomo. |
| Burnett, Charles Harris | Tauranga. |
| Burnett, Thomas David | Temuka. |
| Campbell, Archibald | Chalmers. |
| Carr, Rev. Clyde Leonard | Timaru. |
| Chapman, Charles Henry | Wellington North. |
| Christie, Hubert Maxwell | Waipawa. |
| Coates, Right Hon. Joseph Gordon, P.C., M.C. | Kaipara. |
| Cobbe, Hon. John George | Oroua. |
| Coleman, David William | Gisborne. |
| Cotterill, Joseph Bernard Francis | Wanganui. |
| Coulter, Robert | Waikato. |
| Cullen, Edward Lutterell | Hawke's Bay. |
| Denham, William Mortimer Clarence | Invercargill. |
| Dickie, Harold Galt | Patea. |
| Endean, William Phillips | Parnell. |
| Forbes, Right Hon. George William, P.C. | Hurunui. |
| Fraser, Hon. Peter | Wellington Central. |
| Hamilton, Hon. Adam | Wallace. |
| Hargest, James | Awarua. |
| Herring, Horace Edgar | Mid-Canter bury. |
| Hodgens, Joseph | Palmerston. |
| Holland, Sidney George | Christchurch North. |
| Holyoake, Keith Jacka | Motueka. |
| Howard, Edwin John | Christchurch South. |
| Hultquist, Axel Gordon | Bay of Plenty. |
| Hunter, Clifford Lorrie | Manawatu. |
| Jones, Hon. Frederick | Dunedin South. |
| Kyle, Herbert Seton Stewart | Riccarton. |
| Langstone, Hon. Frank | Waimarino. |
| Lee, John Alexander | Grey Lynn. |
| Lowry, Leonard George | Otaki. |
| Lyon, William John | Waitemata. |
| McCombs, Terence Henderson | Lyttelton. |
| McDougall, David | Mataura. |
| McKeen, Robert | Wellington South. |
| McMillan, Dr. David Gervan | Dunedin West. |
| Martin, Hon. William Lee | Raglan. |
| Mason, Hon. Henry Great-head Rex | Auckland Suburbs. |
| Meachen, Edwin Purcell | Wairau. |
| Moneur, Alexander Francis | Rotorua. |
| Munro, James Wright | Dunedin North. |
| Nash, Hon. Walter | Hutt. |
| Neilson, Peter | Dunedin Central. |
| Nordmeyer, Rev. Arnold Henry | Oamaru. |
| O'Brien. James | Westland. |
| Osborne, Arthur George | Manukau. |
| Parry, Hon. William Edward | Auckland Central. |
| Petrie, Charles Robert | Hauraki. |
| Poison, William John | Stratford. |
| Ransom, Hon. Sir Ethelbert Alfred, K.C.M.G. | Pahiatua. |
| Richards, Arthur Shapton | Roskill. |
| Roberts, Benjamin | Wairarapa. |
| Robertson, John | Masterton. |
| Roy, James Alexander McLean | Clutha. |
| Rushworth, Harold Montague | Bay of Islands. |
| Savage, Right Hon. Michael Joseph, P.C. | Auckland West. |
| Schramm, Frederick William | Auckland East. |
| Semple, Hon. Robert | Wellington East. |
| Sexton, Arthur Clifton Axford | Franklin. |
| Smith, Sydney George | New Plymouth. |
| Sullivan, Hon. Daniel Giles | Avon. |
| Thorn, James | Thames. |
| Webb, Hon. Patrick Charles | Buller. |
| Wilkinson, Charles Anderson | Egmont. |
| Williams, Charles Morgan | Kaiapoi. |
| Wilson, George Hamish Ormond | Rangitikei. |
| Wright, Robert Alexander | Wellington Suburbs. |
| For Maori Electorates, | |
| Henare, Tau | Northern Maori. |
| Ngata, Hon. Sir Apirana Turupa, Kt. | Eastern Maori. |
| Ratana, Haami Tokoura | Western Maori. |
| Tirikatene, Eruera Tihama | Southern Maori. |
GOVERNMENT DEPARTMENTS.
LIST OF DEPARTMENTS OF THE NEW ZEALAND GOVERNMENT, WITH TITLES AND NAMES OF PERMANENT HEADS, DECEMBER, 1937.
| Department. | Permanent Head. | |
|---|---|---|
| Title. | Name. | |
| Agriculture | Director-General | A. H. Cockayne, I.S.O. |
| Air | Chief of Air Staff | Group - Captain the Hon. R. A. Cochrane, A.F.C. |
| Secretary | T. A. Barrow. | |
| Audit | Controller and Auditor-General | J. H. Fowler. |
| Broadcasting | Director | J. Shelley, M.A. (Camb.). |
| Census and Statistics | Government Statistician | J. W. Butcher. |
| Commercial Broadcasting | Controller | C. G. Serimgeour. |
| Crown Law | Solicitor-General | H. H. Cornish, K.C., M.A., LL.M. |
| Customs | Comptroller | E. D. Good. |
| Defence | Commandant, N.Z. Military Forces | Major-General J. E. Duigan, C.B., D.S.O. |
| Under-Secretary | H. Turner. | |
| Education | Director | N. T. Lambourne, I.S.O., M.A. |
| Government Life Insurance | Commissioner | W. E. Arnold. |
| Health | Director-General | M. H. Watt, C.B.E., M.D., D.P.H. |
| Industries and Commerce, Tourist and Publicity | Secretary for Industries and Commerce, General Manager for Tourist and Health Resorts | L. J. Sohmitt. |
| Internal Affairs | Under-Secretary | J. W. A. Heenan, C.B.E., LL.B. |
| Dominion Museum | Director | W. R. B. Oliver, D.Sc. |
| Justice and Prisons | Under-Secretary of Justice, Controller-General of Prisons, and Registrar-General, Births, Deaths, and Marriages | B. L. Dallard. |
| Electoral | Chief Electoral Officer | G. G. Hodgkins. |
| Labour | Secretary | J. S. Hunter. |
| Land and Deeds and Stamp Duties | Secretary for Land and Deeds and Commissioner of Stamp Duties | P. G. Pearce. |
| Land and Income Tax | Commissioner of Taxes | J. M. Park. |
| Lands and Survey | Under-Secretary and Land Purchase Controller | W. Robertson, I.S.O. |
| Law Drafting | Law Draftsman | J. Christie, C.M.G., LL.M. |
| Legislative | Clerk of Parliaments and Clerk of the Legislative Council | C. M. Bothamley. |
| Clerk of House of Representatives | T. D. H. Hall, LL.B. | |
| Marine | Secretary | L. B. Campbell, A.M.I.C.E. |
| Mental Hospitals | Director-General | T. G. Gray, M.B., Ch.B. (Aberd.), M.P.C. |
| Mines | Under-Secretary | A. Tyndall, A.M.I.C.E. |
| National Provident, Friendly Societies, and Government Actuary's | Registrar and Superintendent (Acting) | R. Sinel. |
| Government Actuary (Acting) | S. Beckingsale, F.I.A. | |
| Native | Under-Secretary and Native Trustee | O. N. Campbell. |
| Naval | First Naval Member | Rear-Admiral the Hon. E. R. Drummond, C.B., M.V.O. |
| Naval Secretary | Paymaster-Captain E. L. Tottenham, O.B.E., R.N. | |
| Pensions | Commissioner | H. D. Smith. |
| Police | Commissioner | D. J. Cummings. |
| Post and Telegraph | Director-General | G. McNamara, C.B.E. |
| Primary Products Marketing | Director (Acting) | G.A.Duncan. |
| Internal Marketing Branch | Director | F. R. Picot. |
| Prime Minister's, Cook Islands, and External Affairs | Permanent Head | C. A. Berendsen, C.M.G., LL.M. |
| Printing and Stationery | Government Printer | E. V. Paul. |
| Public Service Superannuation | Secretary | R. S. Wogan. |
| Public Trust | Public Trustee | E.O. Hales. |
| Public Works | Under-Secretary and Engineer-in-Chief | J. Wood, M.I.C.E. |
| Railways | General Manager | G. H. Mackley. |
| Scientific and Industrial Research | Secretary | E. Marsden, C.B.E., D.Sc. |
| Dominion Laboratory | Dominion Analyst | W. Donovan, M.Sc., F.I.C. |
| Dominion Observatory | Dominion Astronomer and Seismologist | (Vacint). |
| Geological Survey | Director | J. Henderson, M.A., D.Sc., B.E., A.O.S.M. |
| Meteorological | Director | E. Kidson, O.B.E., M.A., D.Sc. |
| State Advances Corporation | Joint Managing Directors | A. D. Park, C.M.G. |
| T. N. Smallwood. | ||
| Manager | G. E. Miller. | |
| Housing Construction Branch | Director | A. Tyndall, A.M.I.C.E. |
| State Fire and Accident Insurance | General Manager | J. H. Jerram, I.S.O. |
| State Forest Service | Director | A. D. McGavock. |
| Transport | Commissioner | G. L. Lanrenson, A.M.I.C.E. |
| Treasury | Secretary | G. C. Rodda, M.B.E. |
| Valuation | Valuer-General | W. Stewart. |
By the Public Service Act, 1912, the Public Service of New Zealand was placed under the direct and sole control of a Commissioner and two Assistant Commissioners, who were appointed for a term of seven years. Section 41 of the Finance Act, 1936, provided for the appointment of two Public Service Commissioners to hold office jointly, the appointments to be for a term of three years. The Public Service Commissioners are responsible only to Parliament, and can be dismissed from office only for misbehaviour or incompetence.
The Public Service Act, which became operative on the 1st April, 1913, applies to all members of the Public Service with the exception of the Controller and Auditor-General, officers of the Railways Department, members of the Police and Defence Forces, Judges and Magistrates, officers of the House, certain officers of the Legislative Departments, and persons paid only by fees or commission, as well as any officer to whom the Governor-General in Council declares the Act shall not apply.
By the Post and Telegraph Department Act of 1918 the Post and Telegraph Department was exempted from the control of the Commissioners, with the exception that the Commissioners continued to make all appointments other than to positions carrying a salary of over £765 per annum. The Post and Telegraph Amendment Act, 1936, completely exempts the Post and Telegraph Department from the control of the Public Service Commissioners.
Public Service Commissioners: J. H. Boyes and T. Mark.
In Departments under the control of the Public Service Commissioners the number of permanent officers (excluding administrative officers and Native-school teachers) at 1st April, 1937, was 9,138, and the aggregate of annual salaries as at 1st April, 1936, was £2,178,679. The number of temporary employees, other than workmen, &c., in these Departments at 1st April, 1937, was 4,634, of whom 1,514 were shorthand-typists or machinists.
Stalls of the Railways, Post and Telegraph, Police, and Defence (military personnel; civil personnel are included above) Departments will be found in appropriate sections elsewhere in this volume, as will also the numbers of school-teachers. The number of workmen in the employ of the Public Works Department will be found in the section on Employment and Unemployment, and of miners, &c., in State coalmines in the Mining Section. While not exhaustive, the above covers substantially the whole of the employees of the State.
High Commissioner for New Zealand—W. J. Jordan.
Secretary, and Loan and Stock Agent—P. T. Sandford.
Economic Adviser—R. M. Campbell, M.A., LL.B., Ph.D.
Publicity and Exhibition Officer—H. T. B. Drew.
Stores, Indent, and Trade Officer—S. C. Manhire.
Finance Officer, Accountant, and Loan and Stock Agent—R. M. Sunley.
Audit Officer—J. P. Rutherford.
Customs Department Representative—F. W. Lawrence.
Dairy Produce Officer—F. H. Taylor.
Liaison Officer, Department of Scientific and Industrial Research—N. L. Wright, F.I.C., D.I.C.
Offices—New Zealand Government Offices, 415 Strand, London, W.C. 2. Code address—Deputy, Rand, London.
New Zealand Tourist and Trade Commissioner in Commonwealth of Australia—14 Martin Place (G.P.O. Box 395F), Sydney; code address—Zealandia, Sydney. District Manager—New Zealand Government Offices, Colonial Mutual Life Building, Collins and Elizabeth Streets (P.O. Box 2136), Melbourne: code address—Aotearoa, Melbourne.
Honorary New Zealand Tourist Agents, Brisbane—Messrs. Dewar and Jones, King's Building, 79 Queen Street, Brisbane.
Honorary New Zealand Tourist Agents, Adelaide—South Australian Intelligence and Tourist Bureau (P.O. Box 664G), Adelaide.
Honorary New Zealand Tourist Agents, Perth—Western Australian Government Tourist Bureau, 62 Barrack Street, Perth. Code address—Tourist.
New Zealand Trade and Tourist Commissioner in Europe—Shell Buildings, Cantersteen 47, Brussels, Belgium. Code address—Newzeal.
New Zealand Trade and Tourist Commissioner, Toronto—Canada. Permanent Building, 320 Bay Street, Toronto, 2. Code address—Maoriland.
New Zealand Trade and Tourist Commissioner, Los Angeles—Hollingsworth Buildings, 606 South Hill Street, Los Angeles, California. Code address—Newzeal.
New Zealand Government Agent, Vancouver, B.C.—E. E. Ackland, (P.O. Box 16), Vancouver, B.C.
Official Representative of Customs Department in Canada and United States—W. J. Stevenson, 44 Whitehall Street, New York. Code address—Depcustoms.
Honorary New Zealand Tourist Agent in India—New Zealand Insurance Co., Ltd., 26 Dalhousie Square West, Calcutta. Code address—Newzieo. Also at Rangoon and Bombay.
Honorary New Zealand Government Agent, Colombo—A. R. Hughes, Hong Kong Bank Buildings (P.O. Box 328), Colombo.
Acting Honorary New Zealand Government Agent, North China—C. G. Davis, care of Messrs. Hatch, Carter, and Co., 131 Devonport Road, Tientsin, North China.
Honorary New Zealand Government Agent, Shanghai—S. Hutchison, 384 Embankment Building, North Soochow Road (P.O. Box 355), Shanghai.
Honorary New Zealand Government Agent, Hong Kong—S. T. Williamson, P. and 0. Building (P.O. Box 615), Hong Kong. Code address—Williamson, Hong Kong.
Honorary New Zealand Tourist Agent, Singapore—American Express Company, Singapore.
Honorary New Zealand Government Agent, Johannesburg—H. J. Constable (P.O. Box 1909), Johannesburg.
New Zealand Tourist Agent in Africa—Parry, Leon, and Hayhoe, Johannesburg, and at all principal centres in South Africa and Portuguese East Africa.
Honorary New Zealand Government Agent, Durban—H. Middlebrook, 3 Natal Bank Buildings, West Street (P.O. Box 1822), Durban. Code address—Midstream.
Honorary New Zealand Tourist Agent, Hawaii: G. T. Armitago, Executive Secretary, Hawaii Tourist Bureau, Honolulu.
Honorary New Zealand Government Agents, Fiji—Messrs. Brown and Joske, Suva. Code address—Joske, Suva.
United Kingdom.—H.M. Trade Commissioner: R. Boulter, C.M.G., T. and G. Buildings, Grey Street (P.O. Box 369), Wellington.
Australia.—Trade Commissioner: C. E. Critchley, D.I.C. Building, Wellington.
Canada.—Trade Commissioner: C. M. Croft, Yorkshire House, Shortland Street, Auckland.
Argentine Republic.—Vice-Consuls: F. S. Battley, Aucklaud; E. S. Baldwin, Wellington.
Austria.—Honorary Consul (with jurisdiction in New Zealand): T. J. Parker, Sydney.
Belgium.—Consul (with jurisdiction over New Zealand): Armand Nihotte. Wellington. Consul: A. M. Ferguson, Auckland; M. G. C. McCaul, Wellington (acting). Hon. Consul: Sir C. R. J. Ward, Bart., Christchurch. Vice-Consuls: A. H. Allen (acting Hon. Consul), Dunedin; Sir R. A. Anderson, Kt., C.M.G., Invercargill.
Brazil.—Vice-Consul: C. A. L. Treadwell, O.B.E., Wellington.
Chile.—Consul-General for Australia and New Zealand: R. Dundas Smith, Sydney. Consuls: J. M. Wilson, Auckland; William Taylor, Dunedin.
China.—Consul: Feng Wang, Wellington. Vice-Consuls: Yue H. Jackson, Wellington; Cheng Fu Pan, Western Samoa.
Czechoslovakia.—Consul-General (with jurisdiction over New Zealand): F. Kveton, Sydney. Honorary Consuls: Professor R. M. Algie, Auckland; E. J. Hyams, Wellington. Honorary Vice-Consul: D. J. Shea, Christchurch.
Denmark.—Consul-General for Australia and New Zealand: Georg Lyngbye Host, Sydney. Consul for South Island: H. D. Acland, Christchurch. Honorary Consul: Stronach Paterson, Wellington. Vice-Consuls: S. P. Andersen, Auckland; W. Perry, Hokitika.
Ecuador.—Consul: William Birss, Auckland.
Finland.—Consul (with jurisdiction over New Zealand): Paavo Simelius, Sydney. Vice-Consuls (honorary): C. E. Tudehope, Auckland; H. J. Buck, Wellington; Vaino Sarelius, Christchurch.
France.—Acting Consul for New Zealand and Western Samoa: Edmond Meyer, Auckland. Consular Agents: R. St. J. Beere, D.S.O., Wellington; G. E. F. Kingscote, Christchurch; S. E. D. Neill, Dunedin.
Germany—Consul-General (with jurisdiction over New Zealand and Dependencies other than Western Samoa): Dr. Rudolf Asmis, Sydney. Consul (with jurisdiction over New Zealand and Dependencies, also Western and American Samoa): Dr. Walter Hellenthal, Wellington.
Greece.—Honorary Consul-General for New Zealand: J. F. Dyer, Wellington. Honorary Deputy Consul: G. T. Dawson, Wellington.
Italy.—Consul-General for Australia, New Zealand, Fiji, and New Guinea: Commendatore Nob. A. Grossardi, Melbourne. Consul: L. B. Vitali (acting), Wellington. Consular Agents: P. P. J. Amodeo (acting), Christchurch; J. A. Roberts, Dunedin; Adamo Vigna, Runanga (in charge).
Japan.—Consul-General (with jurisdiction over New Zealand and Dependencies, excluding Western Samoa): Torao Wakamatsu, Sydney. Honorary Consuls: N. S. Falla, C.M.G., D.S.O., Wellington; Hon. E. R. Davis, M.L.C., Auckland.
Latvia.—Consul-General (with jurisdiction over New Zealand—including Western Samoa—and its Dependencies): C. Zarine, London. Honorary Consul: N. E. Heath, Auckland.
Netherlands.—Consul-General for Australia and New Zealand: T. Elink Schuurman, Sydney. Honorary Consul: C. H. Weston, K.C., D.S.O., Wellington. Honorary Vice-Consuls: George Ritchie, Dunedin; H. H. F. Bauer, Auckland; N. Francis, C.M.G., Christchurch.
Nicaragua.—Consul-General (with jurisdiction in New Zealand): Senor Don Rafael Medina, Sydney.
Norway.—Consul-General for Australia and New Zealand: H. H. T. Fay, Sydney. Consul (with jurisdiction over Western Samoa also): J. Halligan, Wellington. Vice-Conouls: Robert Millar, Auckland; V. E. Hamilton, Christchurch (honorary); M. E. Wiig, Invercargill; J. H. Enright, Westport; W. F. Edmond, Dunedin (honorary).
Panama.—Honorary Consul: Simon Quiros y Quiros, Auckland.
Peru.—Consul-General for Australia and New Zealand: J. M. Paxton, Sydney. Consul: G. H. Baker, Auckland.
Poland.—Consul-General (with jurisdiction over New Zealand and Western Samoa): Dr. Karol Poznanski, London. Honorary Consul-General: W. Noskowski, Sydney.
Portugal.—Consul: David L. Nathan, Auckland. Honorary Vice-Consul: Alfred Nathan, Auckland. Vice-Consuls: A. D. S. Duncan, Wellington; C. W. Rattray, Dunedin.
Spain.—Honorary Vice-Consul: A. K. S. Maokenzie, Wellington.
Sweden.—Consul-General for Australia, New Zealand, and Fiji: C. O. D. von Dardel, Sydney. Consul: J. T. Martin, Wellington. Vice-Consuls: J. T. F. Mitchell, Auckland, W. Machin, Christchurch; J. S. Ross, C.M.G., Dunedin.
Switzerland.—Consul (with jurisdiction over New Zealand): M. Stahel, Sydney.
Turkey.—Consul-General for New Zealand and Dependencies and Western Samoa: Inayetullah Cemal Oskaya, London.
United States of America.—Consul-General: Lowell C. Pinkerton, Wellington. Consul: J. G. Groeninger, Auckland. Vice-Consuls: L. A. Bachelder (honorary), Auckland; Glion Curtis, jun., Wellington; G. B. Lane, Wellington. Consular Agents: H. P. Bridge, Christchurch; H. Reeves, Dunedin.
Uruguay.—Honorary Consul: David Allan, Wellington.
Yugoslavia.—Honorary Consul; John Totich, Dargaville.
Table of Contents
THE tabulation of the results of the population census taken for the night of 24th March, 1936, is proceeding steadily, and to date the following volumes of census results have been published:—
Volume I—Increase and Location of Population.
Volume II.—Dependencies (Cook Islands and Niue, Tokelau Islands, and Western Samoa [summary only]).
Appendix A.—Census of Poultry.
Census figures of geographic distribution of population were published in the 1937 number of the Year-Book (pp. 845–851), and in the Dependencies Section of this issue will be found 1936 population figures for the Cook Islands, Niue, Western Samoa, and the Tokelau Islands. Statistics of poultry are given on pp. 425–427 of this Year-Book.
Part of the data to be covered by further volumes of census results is available, and summarized figures, subject to revision in most instances, are here given.
The age-distribution of the population as disclosed at the censuses of 1926 and 1936 is as follows:—
| Age-group (Years). | European Population. | Maori Population. | ||
|---|---|---|---|---|
| 1926. | 1936. | 1926. | 1936. | |
| Under 5 | 134,431 | 116,738 | 10,380 | 14,024 |
| 5–9 | 132,796 | 128,389 | 8,829 | 12,605 |
| 10–14 | 133,949 | 135,325 | 8,028 | 10,322 |
| 15–19 | 124,314 | 132,237 | 6,763 | 7,984 |
| 20–24 | 112,812 | 133,539 | 5,631 | 7,801 |
| 25–29 | 103,650 | 124,988 | 4,724 | 6,352 |
| 30–34 | 94,879 | 109,509 | 3,283 | 4,297 |
| 35–39 | 98,651 | 101,804 | 3,152 | 4,197 |
| 40–44 | 95,557 | 91,049 | 2,672 | 3,130 |
| 45–49 | 87,464 | 92,954 | 2,373 | 2,788 |
| 50–54 | 66,287 | 89,323 | 1,891 | 2,230 |
| 55–59 | 51,160 | 78,539 | 1,450 | 1,726 |
| 60–64 | 37,370 | 57,813 | 1,387 | 1,553 |
| 65–69 | 27,655 | 42,833 | 1,040 | 1,340 |
| 70–74 | 19,355 | 26,837 | 820 | 778 |
| 75–79 | 11,483 | 16,004 | 405 | 435 |
| 80–84 | 6,023 | 8,078 | 284 | 282 |
| 86–89 | 2,552 | 3,033 | 117 | 135 |
| 90–94 | 606 | 729 | 53 | 77 |
| 95–99 | 114 | 139 | 34 | 36 |
| 100 or over | 12 | 8 | 28 | 30 |
| Not specified | 3,349 | 1,616 | 326 | 204 |
| Total | 1,344,469 | 1,491,484 | 63,670 | 82,326 |
These statistics fully confirm expectations of far-reaching changes in the population of European origin. Due mainly to the decline in the birth-rate, the population is moving to the higher age-groups.
Though the population as a whole (omitting Maoris from present consideration) increased by 147,015 in the ten years 1926 to 1936, children under 5 years of age actually decreased by 17,693, and children between 5 and 10 years of age decreased by 4,407. In 1936 children under 10 years of age formed only 16.45 per cent. of the population; in 1926 they formed 19.92 per cent.; in 1921 21.44 per cent.; and in 1874 31.85 per cent. At the other end of the scale the position is reversed. Persons of 60 years of age or over increased between 1926 and 1936 by 50,304; in 1936 such persons comprised 10.44 per cent. of the total population; in 1926 7.84 per cent.; in 1921 7.49 per cent.; and in 1874 only 2.33 per cent.
These changes impinge on the social economy in innumerable ways. The diminished number of children affects not only schools and school-teachers, but also all those concerned directly or indirectly with the needs of children. The needs of elderly people differ from those of children, and here the numbers are expanding. Of prime importance is the fact that (apart, of course, from migration gains or losses) there must inevitably be fewer workers of all classes available in years to come. For instance, in the group aged 20–24 years there were in 1936 133,539 persons. In twenty years' time their place will be taken by the group aged under 5 years in 1936, but this latter group numbered only 116,738, and deaths in the interim will have reduced its total by several thousand. In consequence, in twenty years' time there will be over 20,000 fewer persons aged 20–24 years available for employment than there wore of these ages in 1936. While one age-group is quoted as an example, others, of course, are affected as well. Furthermore, it will be obvious that the position thus outlined is definite and irremediable. A future recovery of the birth-rate would eventually re-establish numbers, but could not affect the position as regards persons already in existence.
As an index of the position in respect of future population (exclusive still of Maoris and of the effects of external migration) use may be made of the Kuezynski reproduction-rates. The Kuezynski method considers the female population only, since birth-giving is the point. There are two highly significant rates—viz., the gross and the net production rates, the difference being that the former takes fertility into account, while the latter considers both fertility and mortality. The gross reproduction-rate derives from the specific fertility-rates (ratio of female births to female population) of the individual years of age. It indicates the number of girls that would be born (assuming fertility remained constant) on the average, to a woman who lives through the child-bearing period. If this rate is less than unity the decline of population is inevitable, although there may be a considerable time-lag before the actual numbers of the population fall. A rate above unity does not necessarily entail a rising or even a stationary population.
The net reproduction-rate gives the better approximation of the probable replacement of the child-bearing female population. It is obtained by multiplying the specific fertility-rates (ratio of female births to female population) of the individual years of age by the proportions of female survivors at those ages according to the life table, the sum of these products being the net reproduction-rate. It gives approximately (assuming that fertility and mortality remain constant) the average number of girls who will eventually be born to each newly born girl. If it is above unity the rate means a growing population, if below unity the population is doomed to decline. The method, of course, does not take into account the question of gains or losses through migration.
Employing the 1936 census statistics of ages of females, and the records of female births during 1936, the gross reproduction-rate appears as 1.044. This rate, however, does not take into account the mortality which the succeeding generation must experience before it attains the ages of the generation it replaces. Using the survivorship figures from a New Zealand life table compiled for 1931, the net reproduction - rate appears as 0.967. A net reproduction - rate of unity means a stationary population; one below unity means a population which will decline after a short time - lag, providing conditions remain constant. Summed up, the position is that in 1936 the rate of reproduction in the New Zealand population was insufficient to maintain the population at its 1936 level. It is to be observed, however, that this is not to be taken as an actual forecast of a declining population. It is a statement of what must inevitably happen if the 1936 conditions remained constant. The mortality-rates of New Zealand are very favourable, and no great change can be anticipated therein. The birth-rate, however, is susceptible to changes of greater magnitude. If it fell to further low levels the decline would be intensified; on the other hand, a sufficient and maintained recovery would ultimately remedy matters. In this connection it is of interest to note that the birth-rate in 1936 was slightly higher than in the three years preceding. Returns for the first nine months of 1937 represent a further improvement on those for the corresponding period of 1936.
The position of the Maori division of the population is now in contrast to that of the European division. The natural increase (excess of births over deaths) of the Maoris in more recent years is sufficient to ensure a steadily rising population. The Maoris are a much younger community than are those of European origin.
The European population in 1936 may be divided into adults (21 years or over) 952,144, equal to 63.84 per cent., and minors (under 21 years) 539,340, or 36.16 per cent. In 1926 adults comprised 59.14 per cent. and minors 40.86 per cent.
Maori adults in 1936 numbered 35,736 (43.41 per cent.) and minors 46,590 (56.59 per cent.). Proportions in 1926 were—Adults, 44.54 per cent.; minors 55.46 per cent.
The marital status of persons aged sixteen years or over as returned at the census of 1936 is summarized in the following table. The figures, which are provisional, do not include Maoris. The status is that existing at the census date—e.g., a person who had been widowed or divorced but had remarried before the census is counted as married, not as widowed or divorced.
| Age (Years). | Never Married. | Married. | Legally separated. | Widowed. | Divorced. | Not specified. | Totals. |
|---|---|---|---|---|---|---|---|
| Males. | |||||||
| 16–19 | 52,601 | 229 | 2 | 3 | 34 | 52,869 | |
| 20 | 13,228 | 317 | 3 | 1 | 1 | 25 | 13,575 |
| 21–24 | 47,451 | 6,488 | 63 | 32 | 8 | 58 | 54,100 |
| 25–29 | 35,531 | 27,515 | 329 | 155 | 138 | 61 | 63,729 |
| 30–34 | 16,791 | 37,966 | 493 | 400 | 357 | 34 | 56,041 |
| 35–39 | 10,144 | 38,837 | 553 | 646 | 501 | 36 | 50,717 |
| 40–44 | 6,668 | 34,878 | 528 | 827 | 535 | 43 | 43,479 |
| 45–49 | 6,530 | 37,175 | 555 | 1,353 | 576 | 49 | 46,238 |
| 50–59 | 11,434 | 68,446 | 1,033 | 4,675 | 1,014 | 161 | 86,763 |
| 60–69 | 7,329 | 37,102 | 589 | 5,877 | 563 | 119 | 51,579 |
| 70–79 | 2,867 | 12,991 | 262 | 4,949 | 176 | 71 | 21,316 |
| 80 or over | 709 | 2,551 | 40 | 2,596 | 27 | 27 | 5,950 |
| Not specified (adults) | 293 | 439 | 22 | 57 | 16 | 45 | 872 |
| Totals, 1936 | 211,576 | 304,934 | 4,472 | 21,571 | 3,912 | 763 | 547,228 |
| Totals, 1926 | 183,139 | 258,251 | 2,426 | 18,295 | 2,073 | 4,571 | 468,755 |
| Females. | |||||||
| 16–19 | 49,556 | 1,664 | 12 | 5 | 3 | 46 | 51,286 |
| 20 | 11,338 | 1,626 | 16 | 2 | 1 | 15 | 12,998 |
| 21–24 | 35,939 | 16,587 | 189 | 70 | 45 | 36 | 52,866 |
| 25–29 | 23,197 | 36,954 | 518 | 280 | 269 | 41 | 61,259 |
| 30–34 | 12,126 | 39,684 | 593 | 641 | 403 | 21 | 53,468 |
| 35–39 | 8,717 | 39,893 | 650 | 1,284 | 519 | 24 | 51,087 |
| 40–44 | 7,097 | 37,149 | 607 | 2,177 | 522 | 18 | 47,570 |
| 45–49 | 6,317 | 35,634 | 659 | 3,554 | 511 | 41 | 46,716 |
| 50–59 | 10,924 | 57,537 | 1,032 | 10,763 | 754 | 89 | 81,099 |
| 60–69 | 7,016 | 26,822 | 512 | 14,279 | 360 | 78 | 49,067 |
| 70–79 | 2,382 | 7,056 | 125 | 11,814 | 79 | 69 | 21,525 |
| 80 or over | 440 | 846 | 14 | 4,701 | 14 | 22 | 6,037 |
| Not specified (adults) | 160 | 370 | 12 | 91 | 10 | 23 | 666 |
| Totals, 1936 | 175,209 | 301,822 | 4,939 | 49,661 | 3,490 | 523 | 535,644 |
| Totals, 1926 | 147,434 | 253,821 | 3,063 | 40,078 | 1,635 | 2,988 | 449,019 |
Taking only the adult population—i.e., aged twenty-one years or over—the proportional distribution was:—
| Marital Status. | Males. | Females. | ||
|---|---|---|---|---|
| 1926. | 1936. | 1926. | 1936. | |
| Per Cent. | Per Cent. | Per Cent. | Per Cent. | |
| Never married | 30.23 | 30.36 | 23.48 | 24.28 |
| Married | 64.10 | 63.40 | 64.94 | 63.40 |
| Legally separated | 0.60 | 0.93 | 0.79 | 1.04 |
| Widowed | 4.55 | 4.49 | 10.37 | 10.54 |
| Divorced | 0.52 | 0.82 | 0.42 | 0.74 |
| Totals | 100.00 | 100.00 | 100.00 | 100.00 |
In view of the present critical stage of the Dominion's population, the proportion of persons never married merits further examination. The majority of persons marry between the ages of twenty and thirty years. Comparison with the results of the preceding census in 1926 shows that between these ages there were definitely higher proportions (and higher numbers) unmarried than was the case ten years earlier. The percentages of never married to the total of the same ages are given:—
| Age (Years). | Males. | Females. | ||
|---|---|---|---|---|
| 1926. | 1936. | 1926. | 1936. | |
| Per Cent. | Per Cent. | Per Cent. | Per Cent. | |
| 20–24 | 87.92 | 89.77 | 70.20 | 71.84 |
| 25–29 | 52.61 | 55.81 | 35.11 | 37.89 |
| 30–34 | 29.07 | 29.98 | 22.01 | 22.69 |
| 35–30 | 20.19 | 20.02 | 17.22 | 17.07 |
It is definitely impossible to obtain from census data an accurate ethnological survey of the racial origins of the population. For example, such terms as “European” or “Indian” cover in reality a variety of races. Nevertheless, the general meaning of the terms employed will be clear and the data afforded are of distinct service. The following summary gives interim data (subject to revision) for the 1936 census and also for the preceding census:—
| Race. | Numbers. | |
|---|---|---|
| 1926. | 1936. | |
* Includes persons partly of European race. | ||
| European | 1,332,114 | 1,473,020 |
| European-Maori— | ||
| Three-quarter European | 6,053 | 11,508 |
| Half European | 11,306 | 14,891 |
| Quarter European | 6,632 | 11,397 |
| Not specified | 303 | 123 |
| Maori | 45,429 | 55,915 |
| Maori-Syrian | 26 | |
| Maori-Indian | 9 | 41 |
| Maori-Chinese | 38 | |
| Maori-Japanese | 9 | 9 |
| Maori-American Indian | 3 | |
| Maori-Polynesian (other) | 39 | 102 |
| Maltese* | 15 | |
| Abyssinian* | 10 | 16 |
| Negro* | 93 | 149 |
| Syrian | 816 | 952 |
| Syrian-European | 135 | 277 |
| Sinhalese* | 5 | 23 |
| Indian | 691 | 824 |
| Indian-European | 287 | 322 |
| Chinese | 3,086 | 2,579 |
| Chinese-European | 288 | 320 |
| Japanese* | 50 | 102 |
| American Indian* | 7 | 23 |
| West Indian* | 61 | 41 |
| Australian Aboriginal* | 10 | 12 |
| Polynesian (other) | 180 | 168 |
| Polynesian-European | 369 | 718 |
| Melanesian | 30 | 25 |
| Melanesian-European | 82 | 92 |
| Others* | 42 | 57 |
| Half-caste (undefined) | 3 | 22 |
| Totals | 1,408,139 | 1,573,810 |
Of the total population in 1936, Europeans comprised 1,484,528 (94.33 per cent.); Maoris, 82,326 (5.23 per cent.); and race aliens, 6,956 (0.44 per cent.). Corresponding figures for 1926 were—Europeans, 1,338,167 (95.03 per cent.). Maoris, 63,670 (4.52 per cent.); and race aliens, 6,302 (0.45 per cent.). The relative rate of increase between 1926 and 1936 was—Europeans, 10.9 per cent.; Maoris, 29.3 per cent.; and race aliens, 10.4 per cent.
For general statistical purposes European-Maoris of less than half Maori blood are classed with Europeans and Maori-race aliens with race aliens. It is interesting, however, to consider as a single community those wholly or partly of Maori origin.
| — | Full Maori. | Part Maori. | Total possessing Maori Blood. |
|---|---|---|---|
| Numbers— | |||
| 1926 | 45,429 | 24,351 | 69,780 |
| 1936 | 55,915 | 38,138 | 94,053 |
| Increase— | |||
| Numbers | 10,486 | 13,787 | 24,273 |
| Per cent. | 23.1 | 56.6 | 34.8 |
The relative net increase of those recorded as of pure Maori descent is more than double the rate of growth of the European population, although the former section can only lose by external migration while the latter gained considerably from this source. More striking, however, is the wide discrepancy between Maori and part Maori (mainly, of course, European-Maori). It would seem fairly definite that the most rapidly growing section of the population is that of part European and part Maori origin. Conclusions, however, should not be drawn too finely, as there is reason to believe that the proportion of pure Maori is somewhat overstated in census returns, and the higher growth of the “part Maoris” may be partly due to more correct statements in the latter census.
In the race-alien division there has been a fairly substantial decrease in the number of Chinese, but increases in most other cases, notably negroes, Syrians, Indians, and Polynesians (mainly Samoans).
The table following presents a summary (interim figures, subject to revision) of the religious professions of the population as recorded in 1936, together with comparative figures for 1926. Figures in this table are exclusive of Maoris.
| Religious Professions. | Adherents. | |
|---|---|---|
| 1926. | 1936. | |
| Church of England | 553,993 | 600,786 |
| Presbyterian | 330,731 | 367,855 |
| Roman Catholic (including Catholic undefined) | 173,364 | 195,261 |
| Methodist | 121,212 | 121,012 |
| Baptist | 21,955 | 24,703 |
| Brethren | 12,924 | 17,086 |
| Salvation Army | 12,241 | 12,608 |
| Church of Christ | 7,984 | 11,197 |
| Congregational | 7,282 | 7,179 |
| Protestant (undefined) | 3,725 | 5,178 |
| Christian Scientist | 1,382 | 4,617 |
| No religion | 2,838 | 4,292 |
| Seventh-day Adventist | 2,873 | 3,825 |
| Hebrew | 2,591 | 2,653 |
| Lutheran | 2,483 | 2,537 |
| Rationalist | 557 | 2,066 |
| Christian (undefined) | 1,030 | 1,689 |
| No denomination | 933 | 1,542 |
| Agnostic | 804 | 1,499 |
| Missions (undefined) | 273 | 1,346 |
| Christadelphian | 1,079 | 1,303 |
| Undenominational Christian | 1,365 | 1,289 |
| Spiritualist | 1,271 | 1,201 |
| Freethinker | 818 | 925 |
| Confucian | 1,194 | 778 |
| Latter-day Saints (Mormon) | 599 | 745 |
| British-Israelite | 4 | 704 |
| Unitarian | 1,024 | 669 |
| Atheist | 254 | 599 |
| Friendly Road | 598 | |
| Hindu | 338 | 591 |
| Society of Friends (Quaker) | 449 | 494 |
| Pentecostal | 726 | 490 |
| Ratana | 193 | 461 |
| Theosophist | 682 | 457 |
| Jehovah's Witness, Watch Tower Bible and Tract Society | 428 | |
| Assemblies of God | 389 | |
| Apostolic | 12 | 387 |
| Eastern Orthodox Catholic | 273 | 361 |
| Catholic Apostolic | 280 | 347 |
| Bible Students | 578 | 310 |
| Evangelical, United Evangelical | 416 | 301 |
| Nonconformist | 295 | |
| Liberal Catholic | 329 | 274 |
| Gospel Hall, Gospel Believer | 49 | 174 |
| Follower of Jesus | 49 | 147 |
| Church of God | 73 | 129 |
| Uncertain | 224 | 103 |
| All other professions | 1,457 | 1,597 |
| Object to state | 62,585 | 71,302 |
| Not specified | 6,973 | 14,705 |
| Totals | 1,344,469 | 1,491,484 |
The considerable group (4.8 per cent. of the population) recorded as “Object to state” represents those persons availing themselves of the special statutory right of objecting to answer a question on this subject. It may be added also that a considerable proportion of those returning no answer to this question may probably be considered as virtually objecting to give an answer.
A summary of the religious professions of Maoris is now given for the censuses of 1926 and 1936.
| Religious Professions. | Adherents. | |
|---|---|---|
| 1926. | 1936. | |
| Church of England | 21,738 | 24,832 |
| Ratana Church | 11,567 | 16,337 |
| Roman Catholic | 8,558 | 11,326 |
| Methodist | 4,066 | 5,743 |
| Ringatu | 3,837 | 5,091 |
| Hau Hau | 569 | 586 |
| Te Wairua Tapu | 134 | 25 |
| Latter-day Saints | 3,461 | 5,257 |
| Mission (so returned) | 3,804 | 5,047 |
| Presbyterian | 638 | 1,115 |
| No religion (so returned) | 379 | 362 |
| Followers of Te Whiti and Te Tohu (Raukura) | 375 | 217 |
| Brethren | 7 | 181 |
| Christian (so returned) | 80 | 159 |
| Protestant (so returned) | 64 | 118 |
| Maori Church | 90 | 75 |
| Seventh Day Adventist | 84 | 70 |
| Church of Christ | 27 | 52 |
| Undenominational | 36 | 40 |
| Salvation Army | 43 | 39 |
| Baptist | 24 | 32 |
| Seven Rules of Jehovah | 71 | 24 |
| Jehovah's Witness | 22 | |
| Other beliefs | 126 | 95 |
| Object to state | 3,193 | 4,235 |
| Not specified | 699 | 1,246 |
| Totals | 63,670 | 82,326 |
Among the Maoris the largest following is that of the Church of England, with 30.2 per cent. of the total Maori population. There are also considerable numbers returned simply as adherents of unspecified “missions.” There can be little doubt that the great majority of these are adherents of the various churches maintaining Maori missions. The percentage credited to the Church of England is therefore somewhat below the actual figure.
The second largest following is that of the Ratana Church, recording 19.8 per cent. of the total Maori population. It is interesting to note that, omitting those whose religious beliefs were not given, 29.1 per cent. of Maoris belonged to purely Maori churches; the corresponding percentage in 1926 was 27.8.
In view of problems connected with the treatment and care of war veterans the necessity became apparent of having accurate information regarding their numbers, ages, and other particulars. Accordingly an inquiry regarding war service was inserted in the questionnaire of the 1936 census. The following figures relate only to those serving with a New Zealand or other British Force. Veterans of more than one war have been counted once only; for example, those who served in the South African War and later in the Great War have been counted with the latter only.
The total number of persons (both men and women) recording war service with a British Force was 92,975, of whom 88,909 saw service in the Great War and 4,066 in other wars.
| Forces with which served. | Men. | Women. | |
|---|---|---|---|
| Great War. | Other Wars. | ||
| New Zealand | 70,457 | 2,540 | 563 |
| Australian | 1,590 | 253 | 51 |
| Imperial | 14,792 | 1,130 | 1,046 |
| Other British | 423 | 124 | 6 |
| Totals | 87,262 | 4,047 | 1,666 |
The great bulk of war veterans are naturally those who served with the New Zealand Forces in the Great War, and this section is covered in the table below.
| Age-group. | Never Married. | Married. | Widowed. | Divorced. | Legally separated. | Not specified. | Total. |
|---|---|---|---|---|---|---|---|
| NOTE.—In an additional 1,883 cases no information was given as to whether a war pension was being received. | |||||||
| (a) Those recorded as in Receipt of a War Pension. | |||||||
| Under 35 | 4 | 5 | 1 | 1 | 11 | ||
| 35–39 | 257 | 1,438 | 36 | 26 | 28 | 1 | 1,786 |
| 40–44 | 570 | 3,813 | 91 | 49 | 64 | 4,587 | |
| 45–49 | 542 | 2,539 | 81 | 43 | 39 | 3 | 3,247 |
| 50–54 | 441 | 1,367 | 66 | 38 | 28 | 4 | 1,944 |
| 55–59 | 382 | 771 | 71 | 26 | 26 | 1 | 1,277 |
| 60–64 | 214 | 301 | 55 | 16 | 12 | 1 | 599 |
| 65–69 | 67 | 108 | 44 | 4 | 7 | 230 | |
| 70 and over | 24 | 49 | 27 | 2 | 4 | 106 | |
| Not specified | 12 | 11 | 3 | 2 | 2 | 30 | |
| Totals | 2,513 | 10,402 | 474 | 204 | 211 | 13 | 13,817 |
| (b) Those recorded as not in Receipt of a War Pension. | |||||||
| Under 35 | 21 | 64 | 3 | 2 | 1 | 91 | |
| 35–39 | 1,331 | 8,326 | 159 | 116 | 130 | 5 | 10,067 |
| 40–44 | 2,276 | 15,154 | 297 | 224 | 191 | 3 | 18,145 |
| 45–19 | 2,061 | 10,007 | 317 | 144 | 125 | 3 | 12,657 |
| 50–54 | 1,687 | 5,227 | 297 | 97 | 99 | 5 | 7,412 |
| 55–59 | 1,186 | 2,546 | 208 | 89 | 49 | 5 | 4,083 |
| 60–64 | 579 | 803 | 130 | 23 | 25 | 1 | 1,561 |
| 65–69 | 114 | 242 | 53 | 14 | 12 | 1 | 436 |
| 70 and over | 38 | 101 | 45 | 8 | 5 | 197 | |
| Not specified | 31 | 63 | 4 | 7 | 1 | 2 | 108 |
| Totals | 9,324 | 42,533 | 1,513 | 724 | 638 | 25 | 54,757 |
Included among those who saw service with the New Zealand Forces in the Great War were 1,533 Maori men, of whom 243 were in receipt of a war pension, 1,273 were not receiving a war pension, and 17 failed to give this information. Three Maoris served with the Australian Forces, and 1 Maori with Imperial Forces in the Great War, while 8 served with New Zealand Forces in other wars.
The succeeding table includes 77 veterans of the Maori wars.
MEN WHO RECORDED SERVICE WITH NEW ZEALAND FORCES IN WARS OTHER THAN THE GREAT WAR.
| Age-group. | Never Married. | Married. | Widowed. | Divorced. | Legally separated. | Not specified. | Total. |
|---|---|---|---|---|---|---|---|
| Under 50 | 5 | 10 | 4 | 1 | 20 | ||
| 50–54 | 19 | 482 | 28 | 4 | 12 | 545 | |
| 55–59 | 46 | 1,026 | 88 | 8 | 18 | 2 | 1,188 |
| 60–64 | 43 | 396 | 46 | 11 | 6 | 1 | 503 |
| 65–69 | 35 | 135 | 24 | 4 | 4 | 202 | |
| 70 and over | 20 | 39 | 18 | 1 | 3 | 81 | |
| Not specified | 1 | 1 | |||||
| Totals | 168 | 2,089 | 208 | 29 | 43 | 3 | 2,540 |
| Force with which served. | In receipt of War Pension. | Not in receipt of War Pension. | No Information given. |
|---|---|---|---|
| Great War— | |||
| Australian | 238 | 1,292 | 60 |
| Imperial | 1,155 | 13,226 | 411 |
| Other British | 57 | 352 | 14 |
| Other wars— | |||
| Australian | 2 | 237 | 14 |
| Imperial | 53 | 1,025 | 52 |
| Other British | 118 | 6 | |
| Totals | 1,505 | 16,250 | 557 |
1642. Discovery of New Zealand by Tasman.
1769. Captain Cook's first visit to New Zealand.
1788. Discovery of Macaulay and Curtis Islands (Kermadec Group), and of Bounty Islands.
1791. Discovery of Snares and Chatham Islands.
1792. First sealing gang left on New Zealand coast.
1793. Discovery of Raoul or Sunday Island (Kermadec Group). Visit of Lieutenant-Governor King, of Norfolk Island, to Doubtless Bay.
1800. Discovery of Antipodes Islands.
1806. Discovery of Auckland Islands.
1807. Defeat of Hongi and the Ngapuhi Tribe.
1810. Discovery of Campbell Island.
1814. Arrival of Rev. Samuel Marsden, and introduction of Christianity. Horses, cattle, sheep, and poultry first brought to New Zealand.
1818. Hongi's and Te Morenga's great expedition to East Cape.
1819–20. Raid on Taranaki and Port Nicholson by Patuone, Nene, and Te Rauparaha.
1820. Hongi's visit to England: First vessel entered Auckland Harbour.
1821. Hongi's capture of Mauinaina and Te Totara Pas. Ngati-Toa migration from Kawhiu to Otaki.
1822. Fall of Matakitaki Pa, Waikato, to Hongi.
1823. Fall of Mokoia Pa, Rotorua, to Hongi.
1823–28. Jurisdiction of Courts of Justice in New South Wales extended to British subjects in New Zealand.
1824. Fall of Te Whetumatarau Pa to Pomare.
1825. First attempt at colonization, by an expedition under Captain Herd. Great defeat of Ngati-Whatau by Hongi.
1827. Hongi's forces destroyed mission station at Whangaroa.
1828. Death of Hongi.
1829. Brig “Hawes” captured by Maoris.
1830. Battles of Taumata-wiwi and Kororareka. Fall of Kaiapohia Pa, Canterbury, to Te Rauparaha.
1831. Tory Channel whaling-station established. Application of thirteen chiefs for the protection of King William IV. Capture of Pukerangiora Pa, Waitara, by Waikato.
1832. Repulse of Waikato at Nga-motu Pa.
1833. Mr. Busby appointed British Resident at Bay of Islands.
1834. Battle near Otaki. Waimate Pa shelled and captured by British—first occasion on which H.M. troops employed in New Zealand.
1835. Declaration of independence of the whole of New Zealand as one nation, with title of “United Tribes of New Zealand.” Ngati-Awa tribes migrated to and conquered Chatham Islands.
1836. Battles between Waikato and To Arawa.
1838. Pelorus Sound discovered. Arrival of Roman Catholic mission under Bishop Pompallier.
1839. Governor of New South Wales authorized to include within the limits of that colony any territory that might be acquired in sovereignty by Her Majesty in New Zealand. Preliminary expedition of New Zealand Company under Colonel Wakefield arrived at Port Nicholson.
1840. Arrival of New Zealand Company's settlers at Port Nicholson. Treaty of Waitangi signed. British sovereignty proclaimed. Captain Hobson appointed Lieutenant-Governor, with residence at Auckland. Settlements formed at Petre (Wanganui) and Akaroa.
1841. Issue of charter of incorporation of New Zealand Company. New Zealand proclaimed independent of New South Wales. Arrival of New Plymouth settlers.
1842. Settlement founded at Nelson.
1843. Affray with Natives at the Wairau, and massacre of persons who had surrendered.
1844. Royal flagstaff at Kororareka cut down by Heke.
1846. Destruction of Kororareka by Heke.
1846. Arrival of first steam vessel (H.M.S. “Driver”) in New Zealand waters. Capture of pa at Ruapekapeka and termination of Heke's war. Native hostilities near Wellington. Te Rauparaha captured and detained as a prisoner. New Zealand divided into two provinces, New Munster and New Ulster, and representative institutions conferred.
1847. Attack by Maoris on Wanganui.
1848. Suspension of that part of New Zealand Government Act which had conferred representative institutions. Severe earthquake at Wellington. Otago founded.
1850. Surrender of New Zealand Company's charter, all its interests reverting to the Imperial Government. Canterbury founded.
1852. Discovery of gold at Coromandel. Constitution Act passed, granting representative institutions to New Zealand, and dividing country into six provinces.
1854. Opening at Auckland of first session of the General Assembly.
1855. First members elected to the House of Representatives under system of responsible Government. Very severe earthquake on both sides of Cook Strait.
1856. Appointment of first Ministry under system of responsible Government.
1857. Goldfield opened at Collingwood.
1858. New Provinces Act passed. Hawke's Bay Province constituted.
1859. Establishment of Marlborough Province.
1860. Hostilities in Waitara district.
1861. Truce arranged with Waitara Maoris. Bank of New Zealand incorporated. Southland Province established. Gold discovered at Gabriel's Gully, Otago.
1862. Coromandel proclaimed a goldfield. Wreck of s.s. “White Swan,” with loss of many public records. First electric-telegraph line opened—Christchurch to Lyttelton.
1863. Wreck of H.M.S. “Orpheus” on Manukau bar, with loss of 181 lives. Control of Native affairs transferred to Colonial Government. Commencement of Waikato War. Defeat of Maoris at Rangiriri, and occupation of Ngaruawahia. First railway in New Zealand opened.
1864. Severe fighting in Waikato and elsewhere, including Battles of Rangiaohia, Orakau, Gate Pa, and Te Ranga. Gold discovered on west coast of South Island.
1865. Seat of Government transferred to Wellington. Further fighting, followed by proclamation of peace. Activities of Hauhau fanatics, including murders of Europeans. Rebel Natives defeated at Wairoa.
1866. Further defeats of rebel Natives. Commencement of Panama steam mail-service. Cook Strait submarine telegraph-cable laid.
1867. Opening of Thames Goldfield. Lyttelton Tunnel completed. Admission of four Maori members to House of Representatives as direct representatives of Maori people.
1868. Maori prisoners, under leadership of Te Kooti, seized schooner “Rifleman” and escaped from Chatham Islands to mainland, where they massacred Europeans. Considerable fighting with these and other rebel Natives.
1869. Continuation of fighting with rebels and of pursuit after Te Kooti. Termination of Panama mail-service. Visit of H.R.H. the Duke of Edinburgh. Government Life Insurance Office established.
1870. Further fighting with Te Kooti. Last of Imperial troops left New Zealand. Commencement of San Francisco mail-service. Bounty Island taken possession of. Inauguration of Vogel public-works policy. Act passed to establish the New Zealand University. Southland Province reunited with Otago.
1871. Commencement of railway-construction under public-works policy.
1872. Resumption of friendly relations with Waitara Maoris. Appointment of Maori chiefs (two) to Legislative Council. Public Trust Office created.
1873. Establishment of New Zealand Shipping Company.
1874. In pursuance of immigration and public-works policy, 31,774 assisted immigrants introduced. Westland Province established.
1875. Resumption of amicable relations with Maori King. Establishment of Union Steam Ship Company. Abolition of Provinces Act passed.
1876. New Zealand connected by cable with Australia. Abolition of Provinces Act came into operation, provincial institutions being abolished and the country divided into counties and boroughs.
1877. Education Act passed, providing for free and compulsory education.
1878. Completion of the Christchurch-Invercargill railway.
1879. Trouble with Parihaka Natives, under Te Whiti, and imprisonment of 180 of these. Triennial Parliaments Act passed. Adult male suffrage introduced. Kaitangata Coal-mine explosion, whereby thirty-four lives lost.
1880. Release of Parihaka prisoners.
1881. Wreck of s.s. “Tararua,” with loss of 130 lives. Severe earthquakes in Wellington. Arrest of Te Whiti and Tohu.
1882. First shipment of frozen meat from New Zealand.
1883. Amnesty to Maori political offenders proclaimed. Te Whiti and Tohu released. Direct steam communication inaugurated between New Zealand and England.
1885. New Zealand Industrial Exhibition at Wellington.
1886. Tarawera eruption, involving loss of 101 lives and destruction of Pink and White Terraces.
1887. Annexation of Kermadec Islands. Members of House of Representatives reduced to seventy-four, including four Maoris.
1888. British protectorate over Cook Islands proclaimed.
1889. South Seas Exhibition at Dunedin.
1890. Great maritime strike. First election of House of Representatives under one-man-one-vote principle.
1891. Inauguration of Liberal regime under Hon. John Ballance, succeeded on his death in 1893 by Mr. Seddon. This and following years marked by passage of industrial and social legislation.
1892. Introduction of lease-in-perpetuity system of land-tenure.
1893. Franchise extended to women. Special licensing poll introduced.
1894. Industrial Conciliation and Arbitration Act passed. Government Advances to Settlers Act passed. Wreck of s.s. “Wairarapa,” with loss of 135 lives.
1895. Government assumed management of Midland Railway.
1896. Brunner Mine explosion, causing sixty-seven deaths. Abolition of non-residential or property qualification to vote. Government Valuation of Land Act passed.
1898. Old-age Pensions Act passed.
1899. Labour Day instituted. New Zealand Contingent (the first of ten) sent to South Africa.
1900. Number of European representatives in Lower House increased to seventy-six.
1901. T.R.H. the Duke and Duchess of York visited New Zealand. Penny postage adopted by New Zealand. Cook and other Pacific islands annexed.
1902. Pacific cable opened. Wreck of s.s. “Elingamite” with loss of forty-three lives. Conference of colonial Premiers in London.
1903. Empire Day proclaimed. State Fire Insurance Act passed.
1905. Workers' Dwellings Act passed. Title of New Zealand's representative in London altered to “High Commissioner.”
1906. Death of Rt. Hon. R. J. Seddon, Premier since 1393. Advances to Workers Act passed. New Zealand International Exhibition at Christchurch.
1907. New Zealand constituted a Dominion. Lease-in-perpetuity system of land-tenure abolished. Parliament Buildings destroyed by fire.
1908. Through railway communication established between Wellington and Auckland. Wellington-Manawatu Railway purchased by Government. Second Ballot Act passed.
1909. S.s. “Penguin” wrecked in Cook Strait, with loss of seventy-five lives. Battle-cruiser presented by New Zealand to Imperial Government. System of compulsory military training introduced.
1910. Field-Marshal Lord Kitchener reported and advised on New Zealand defences. Public Debt Extinction Act and National Provident Fund Act passed.
1911. Wireless telegraphy installed in New Zealand. Widows' Pensions Act passed. First poll on national prohibition taken.
1912. Foundation-stone of new Parliament Buildings laid. Public Service placed under Commissioner control.
1913. Visit of Dominions Royal Commission. Visit of gift ship H.M.S. “New Zealand” to Dominion. Extensive strikes. Second Ballot Act repealed.
1914. Western Samoa occupied by New Zealand Advance Expeditionary Force. Main Expeditionary Force left for Egypt. Huntly coal-mine disaster, whereby forty-three lives lost.
1915. New Zealand Expeditionary Force engaged in operations on Gallipoli Peninsula. National Cabinet formed. National register of men compiled.
1916. New Zealand Division transferred to western front, Mounted Brigade being retained in Egypt. Compulsory enrolment of men for war service introduced. Lake Coleridge electric-supply scheme opened.
1918. S.s. “Wimmera” sunk by enemy mine off New Zealand coast. Otira Tunnel pierced. Great influenza epidemic, causing over five thousand deaths.
1919. Women made eligible for seats in Parliament. New Zealand represented at Peace Conference by Right Hon. W. F. Massey, P.C., Prime Minister.
1920. Visit of H.R.H. the Prince of Wales. Railway strike. First aeroplane flight over Cook Strait. League of Nations gave New Zealand mandate to administer Western Samoa. Anzac Day constituted.
1921. Samoa Act passed, making provision for government in terms of mandate. New Zealand represented at Disarmament Conference, Washington, by Hon. Sir John Salmond.
1922. Meat-export trade placed under control of a Board.
1923. Opening of Otira Tunnel. Ross Dependency proclaimed and placed under jurisdiction of Governor-General. Reintroduction of penny postage. Dairy-produce Export Control Act passed, and adopted by dairy producers.
1924. Railway strike. Direct two-way radio communication effected with England. Motor-vehicles Act provided for registration and annual licensing of motor-vehicles. Land Transfer (Compulsory Registration of Titles) Act passed.
1925. Repayment of the Public Debt Act passed. New Zealand and South Seas International Exhibition at Dunedin. Death of Right Hon. W. F. Massey.
1926. Administration of Tokelau (Union) Islands transferred to New Zealand. Absolute control adopted by Dairy-produce Control Board. Family Allowances Act passed.
1927. Visit of T.R.H. the Duke and Duchess of York. Summer Time Act passed. Limited control substituted for absolute control by Dairy-produce Control Board. Petrol-tax imposed.
1928. Kingsford Smith and party made first successful flight across Tasman. Compulsory insurance of motor-vehicles provided for by Motor-vehicles Insurance (Third-party Risks) Act.
1929. Severe earthquake in Murchison–Karamea district caused seventeen deaths. Daylight-saving (half-hour) permanently adopted for summer months. Fatal clash between police and Mau at Apia.
1930. Legislation providing for relief of unemployment first passed. Deaths of Sir Joseph Ward, Sir Robert Stout, and Sir Thomas Mackenzie, ex-Premiers.
1931. Worst earthquake in history of New Zealand occurred in Hawke's Bay, resulting in the loss of 255 lives. General reduction of 10 per cent. in wages and salaries. Parliament approved draft Statute of Westminster. Graduated land-tax replaced by income-tax. Mortgagors relief legislation passed.
1932. Industrial Conciliation and Arbitration Amendment Act made important changes in industrial legislation. National Expenditure Adjustment Act made reductions in old-age and other pensions, in salaries of State employees, and in rent, interest rates, and other fixed charges. The historic Waitangi Estate presented to the nation by Their Excellencies Lord and Lady Bledisloe. New Zealand represented at Ottawa Conference. Stratford–Main Trunk railway opened.
1933. Exchange raised at instance of Government to £125 N.Z. for £100 London (telegraphic transfers). Sales tax of 5 per cent. on wholesale sales instituted. New Zealand Debt Conversion Act passed reducing interest on internal public debt; a complementary Local Authorities Interest Reduction and Loans Conversion Act passed. Successful experimental shipments of chilled beef to England. Mr. H. E. Holland, Leader of Opposition, died. First New Zealand silver coins in circulation.
1934. First official trans-Tasman air-mail. Reserve Bank incorporated and commenced
business. Meat-export Restriction Order restricted export of frozen beef or veal. Dairy Board marketing regulations placed under control all butter and cheese exported to United Kingdom. H.R.H. the Duke of Gloucester arrived on an official visit. First licensed air-transport service commenced operations.
1935. Bank-notes of trading banks ceased to be legal tender. British silver coins ceased to be legal tender. Rural Mortgagors Final Adjustment Act passed and Court of Review established. Lieut.-Colonel the Right Hon. Viscount Galway, G.C.M.G., D.S.O., O.B.E., assumed office as Governor-General. War Veterans' Allowances Act passed. National Government defeated at general election, and Labour Government assumed office.
1936. Inauguration of inter-Island trunk air services. Death of King George V. Accession of King Edward VIII. Standard rates of pay announced for public works. Air-mail service inaugurated. Reserve Bank Amendment Act passed. Railways Amendment Act passed. State Advances Corporation Act passed. Death of Sir William Hall-Jones. Broadcasting Amendment Act passed. Committee set up to investigate problem of septic abortion. Final restoration of Public Service and pension “cuts.” Factories Amendment Act passed. Reintroduction of graduated land-tax. Guaranteed prices for dairy industry announced. Civil List Amendment Act passed, making provision for the appointment of Parliamentary Under-Secretaries. Forty-hour week became operative. Comprehensive Government housing scheme announced. Agricultural Workers Act passed. Rail-car services inaugurated. New Zealand elected to seat on League of Nations Council. Abdication of King Edward VIII. Accession of King George VI.
1937. Bureau of Industry established. Stay-in strike at Auckland Meat-freezing Works. New 2YA broadcasting-station at Titahi Bay opened. Government assumed control of Flock House. Death of Maori “prophet” Rua. Committee appointed to inquire into maternity services in New Zealand. Gift to New Zealand of £51,700 by Lord Nuffield. Departure of New Zealand Coronation Contingent for London. Prime Minister, Right Hon. M. J. Savage, represented New Zealand at Coronation, and, with Hon. W. Nash, at Imperial Conference. Pan-American Airways clipper-plane arrived at Auckland on survey flight. Visit of Australian naval squadron. Hon. H. T. Armstrong, Minister of Labour, attended International Labour Office Conference at Geneva. Avalanche at Homer Tunnel responsible for two fatalities. Admiralty survey-ship “Endeavour” arrived to commence charting the New Zealand coast-line. Opening of Wellington Railway-station and Tawa Flat deviation. Commencement of Auckland-Wellington air service. Arrival of H.M.S. “Leander” for service on New Zealand Station. Death of Hon. E. Page, Judge of the Arbitration Court. Hon. P. J. O'Regan appointed to succeed Hon. E. Page. Trans-Tasman record broken by s.s. “Awatea.” Trade agreement with Germany. Memorial to late H. E. Holland unveiled at Wellington. Death of Lord Rutherford of Nelson. Second Arbitration Court established.
The following list, compiled originally by Mr. Johannes C. Andersen, M.B.E., F.R.S.N.Z. (ex-Librarian of the Alexander Turnbull Library, Wellington), and revised for this issue by Mr. C. R. H. Taylor, M.A. (Librarian), contains the names of some of the principal works dealing with New Zealand, Samoa, and the Cook Islands.
Considerations of space preclude the inclusion of a complete list, and make it necessary in this issue to omit works which have not been published or republished since 1912. Earlier works are listed in the 1932 number of the Year-Book.
1912. The Geology of New Zealand. By P. Marshall, D.Sc., M.A., F.G.S., F.R.G.S., Wellington—Government Printer.
1913. New Zealand: its History, Commerce, and Industrial Resources. By S. Playne, London.
1913. Social Welfare in New Zealand. By H. H. Lusk. London.
1913. The Lore of the Whare Wananga. Third Volume of Memoirs of Polynesian Society. On Maori Religion, Myths, Cosmogony, &c. (Part 2, 1915.)
1914. The Constitutional History and Law of New Zealand. By J. Hight, Litt.D., and H. D. Bamford, LL.D. Christchurch—Whitcombe and Tombs, Ltd.
1914. Oxford Survey of the British Empire. Vol. 5. Australasian Territories. London.
1914. Early Rangitikei. By Sir James G. Wilson, Kt. Christchurch—Whitcombe and Tombs, Ltd.
1914. Mutton Birds and Other Birds. By H. Guthrie-Smith. Christchurch—Whitcombe and Tombs, Ltd.
1916. Jubilee History of South Canterbury. By Johannes C. Andersen. Christchurch—Whitcombe and Tombs, Ltd.
1916. The “Socialism” of New Zealand. By R. H. Hutchinson. New York—New Review Publishing Association.
1917. A Natural History of Australia, New Zealand, and the Adjacent Islands. By R. P. Thomson. London.
1917. A Dictionary of the Maori Language. By Herbert L. Williams. Wellington—Government Printer.
1921. Maori and Pakeha: a History of New Zealand. By A. W. Shrimpton, M.A., and A. E. Mulgan. Christchurch—Whitcombe and Tombs, Ltd. (second edition, 1930).
1921. Hawaiki: the Whence of the Maori. By S. Percy Smith. Christchurch—Whitcombe and Tombs. (Ed. 1, 1898; ed. 2, 1904; ed. 3, 1910.)
1921. The Hot Springs of New Zealand. By Arthur Stanley Herbert, M.D. London—H. K. Lewis and Co., Ltd.
1921. Tutira: the Story of a New Zealand Sheep-station. By H. Guthrie-Smith. London—Blackwood and Sons.
1922. The Naturalization of Animals and Plants in New Zealand. By Hon. George M. Thomson, F.L.S., F.N.Z.Inst., M.L.C. Cambridge University Press.
1922. The Geomorphology of New Zealand. By C. A. Cotton, D.Sc., F.G.S., F.N.Z.Inst. Wellington—Government Printer.
1922. Maori Myth and Religion. Spiritual and Mental Concepts of the Maori. Astronomical Knowledge of the Maori. Maori Division of Time. By Elsdon Best, F.N.Z.Inst. Dominion Museum Monographs 1–4. Wellington—Government Printer.
1922. The New Zealand Wars: a History of the Maori Campaigns and the Pioneering Period: Vol. 1, 1845–64. By James Cowan. Wellington—Government Printer. Vol. 2, 1864–72, issued 1923.
1922. Medical Practice in Otago and Southland in the Early Days. By Robert Valpy Fulton, M.D. Edin. Dunedin—Otago Daily Times.
1922. Phormium tenax. By E. H. Atkinson. Wellington—Government Printer.
1923. The Waikato War, together with some Account of Te Kooti Rikirangi. By John Featon (new edition revised by Captain Mair). Auckland—Brett Printing and Publishing Co.
1923. The Animals of New Zealand. Fourth edition. By Captain F. W. Hutton and James Drummond. Christchurch—Whitcombe and Tombs. (Ed. 1, 1904; ed. 2, 1905; ed. 3, 1909.)
1923. Polynesian Voyagers. Maori Schools of Learning. (Dominion Museum Bulletins Nos. 5 and 6.) By Elsdon Best. Wellington—Government Printer.
1923. Cultivation of New Zealand Plants. By L. Cockayne. Auckland—Whitcombe and Tombs, Ltd.
1924. Dominion Civics. By Miss N. E. Coad. Wellington—Whitcombe and Tombs, Ltd.
1924. The Maori. By Elsdon Best. Published by the Board of Maori Ethnological Research, 2 vols. Wellington—H. Tombs.
1924. Maori Religion and Mythology. (Dominion Museum Bulletin No. 10.) By Elsdon Best. Wellington—Government Printer.
1924. The Long White Cloud (Aotearoa). By W. P. Reeves. Third edition (to which is added a sketch of recent events in New Zealand by C. J. Wray). London—Allen and Unwin. (First edition in 1898.)
1924. White Wings (on early shipping). By H. Brett. (Vol. 2, 1928.) Auckland—Brett Co.
1925. The Maori as He Was. By Elsdon Best. Wellington—Government Printer.
1925. Bird Life on Island and Shore. By H. Guthrie - Smith. Edinburgh—Wm. Blackwood and Sons.
1925. Bibliography of Australasian Poetry and Verse. By P. Serle. Melbourne University Press.
1925. Fungous Diseases of Fruit-trees in New Zealand. By G. H. Cunningham. Auckland—New Zealand Fruitgrowers' Federation.
1925. The Maori Canoe. (Dominion Museum Bulletin No. 7.) By Elsdon Best. Published under the direction of the Board of Maori Ethnological Research. Wellington—Government Printer.
1925. Games and Pastimes of the Maori. (Dominion Museum Bulletin No. 8.) By Elsdon Best. Published under the direction of the Board of Maori Ethnological Research. Wellington—Whitcombe and Tombs, Ltd.
1925. Maori Agriculture. (Dominion Museum Bulletin No. 9.) By Elsdon Best. Published under the direction of the Board of Maori Ethnological Research. Wellington—Whitcombe and Tombs, Ltd.
1925. Land Legislation and Settlement in New Zealand. By W. R. Jourdain. Wellington—Lands and Survey Department.
1925. Manual of New Zealand Flora. Second edition. By T. F. Cheeseman, F.L.S., F.Z.S., F.N.Z.Inst. Edited by W. R. B. Oliver. Wellington—Government Printer. (First edition, 1906.)
1925. New Zealand Birds and how to Identify Them. By Mrs. P. Moncrieff. Auckland—Whitcombe and Tombs, Ltd.
1925. Short History of New Zealand. By J. B. Condliffe. Christchurch—L. M. Isitt.
1926. Geography of the Pacific. By Miss N. E. Coad. Wellington—New Zealand Book Depot.
1926. History of the Pacific. By Miss N. E. Coad. Wellington—New Zealand Book Depot.
1926. New Zealand: its Political Connection with Groat Britain. Vol. 1. By J. I. Hetherington. Vol. 2, 1927. Dunedin—Coulls, Somerville, Wilkie, Ltd.
1926. Treasury of New Zealand Verse: New Edition of New Zealand Verse. By W. F. Alexander and A. E. Currie. Auckland—Whitcombe and Tombs, Ltd.
1926. New Zealand's First War. By T. Lindsay Buick. Published under the direction of the Board of Maori Ethnological Research. Wellington—Government Printer.
1926. Bird-song and New Zealand Song-birds. By J. C. Andersen. Christchurch—Whitcombe and Tombs, Ltd.
1926. Travel in New Zealand, 2 vols. By James Cowan. Christchurch—Whitcombe and Tombs, Ltd.
1926. The Insects of Australia and New Zealand. By R. J. Tillyard. Sydney—Angus and Robertson.
1926. Tales of the Angler's Eldorado, New Zealand. By Zane Grey. London—Hodder and Stoughton.
1926. England and New Zealand. By A. J. Harrop. London—Methuen and Co., Ltd.
1927. The Pa Maori. (Dominion Museum Bulletin No. 6.) By Elsdon Best. Published under the direction of the Board of Maori Ethnological Research. Wellington—Whitcombe and Tombs, Ltd.
1927. Plants of New Zealand. By R. M. Laing and E. W. Blackwell. Third edition, revised and enlarged. Christchurch—Whitcombe and Tombs, Ltd. (First ed., 1906; second ed., 1907.)
1927. Colonization of New Zealand. By J. S. Marais. London—Oxford University Press.
1927. New Zealand. By W. P. Reeves. Illustrations by F. and W. Wright. Second edition, with thirty-two illustrations. London — A. and C. Black. (First edition, 1908.),
1927. Place Names of Banks Peninsula. By J. C. Andersen. Published by the Board of Science and Art. Wellington—Government Printer.
1927. Maori String Figures. By J. C. Andersen. Memoirs of the Board of Maori Ethnological Research, Vol. 2. Wellington—Ferguson and Osborn.
1927. The Evolution of Maori Clothing. By P. H. Buck. The Board of Maori Ethnological Research. New Plymouth—Avery and Sons, Ltd.
1927. Peoples and Problems of the Pacific. By J. Macmillan Brown. London—T. Fisher Unwin, Ltd., Bouverie House, Fleet Street, E.C.
1927. Earliest New Zealand. The Journals and Correspondence of the Rev. John Butler. Compiled by R. J. Barton Masterton—Palamontain and Petherick.
1927. Rod-fishing in New Zealand Waters. By T. E. Donne, C.M.G. With illustrations and map. London—Seeley, Service, and Co., Ltd.
1927. Natural History of Canterbury. Issued by the Philosophical Institute of Canterbury (R. Speight, Arnold Wall, and R. M. Laing, Honorary Editors). Christchurch—Simpson and Williams, Ltd.
1927. New Zealand Plants and their Story. Third edition. By L. Cockayne, Ph.D., F.L.S., F.R.S. Wellington—Government Printer. (First ed., 1910; second ed., 1913.)
1927. Trees from Other Lands for Shelter and Timber in New Zealand—Eucalypts. By J. H. Simmonds. Illustrated with seventy-six botanic plates and twenty, eight scenic plates. Auckland—The Brett Printing and Publishing Company.
1927. Supplement to Hocken's Bibliography of New Zealand Literature. By A. H. Johnstone. Christchurch—Whitcombe and Tombs.
1928. The Vegetation of New Zealand. Second edition. By Dr. L. Cockayne, F.R.S., F.N.Z.Inst. Leipzig—W. Engelmann. (First ed., 1921.)
1928. Cheerful Yesterdays. By the Hon. O. T. J. Alpors. With a Preface by the Earl of Birkenhead, P.C. London—John Murray.
1928. New Zealand Trees and Shrubs. By H. H. Allan, M.A., D.Sc., F.L.S., F.N.Z.Inst. Auckland—Whitcombe and Tombs, Ltd.
1928. A Pioneer Missionary among the Maoris, 1850–1879. Being Letters and Journals of Thomas Samuel Grace. Edited jointly by S. J. Brittan, G. F., C. W., and A. V. Grace. Palmerston North—G. H. Bennett and Co., Ltd.
1928. The Amazing Career of Edward Gibbon Wakefield. By A. J. Harrop, M.A. (N.Z.), Ph.D. (Cambridge). With extracts from “A Letter from Sydney” (1829). London—George Allen and Unwin, Ltd.
1928. Maori Artistry. By W. Page Rowe. Memoirs of the Board of Maori Ethnological Research. Vol. 3. New Plymouth—Thomas Avery and Sons, Ltd.
1928. The Changing Maori. By Felix M. Keesing, M.A. Memoirs of the Board of Maori Ethnological Research. Vol. 4. New Plymouth—Thomas Avery and Sons, Ltd.
1928. Captain Hobson and the New Zealand Company: A Study in Colonial Administration. By J. C. Beaglehole, M.A. Vol. 13, Nos. 1–3, October, 1927–April, 1928, Smith College Studies in History, Northampton, Mass.—Department of History of Smith College.
1928. Myths and Legends of the Polynesians. By J. C. Andersen. London—Harrap and Co., Ltd.
1928. The French at Akaroa. By T. Lindsay Buick, F.R.Hist.S. Wellington—Government Printer.
1928. Pioneering in Poverty Bay (N.Z.). By Philip T. Kenway. London—John Murray.
1928. The Butterflies and Moths of New Zealand. With fifty-two coloured plates. By G. V. Hudson, F.E.S., P.N.Z.Inst. Wellington—Ferguson and Osborn, Ltd.
1928. Pulping and Paper-making Properties of Selected New Zealand Woods. By C. E. Curran and others. Wellington—Government Printer.
1929. Primitive Economics of the New Zealand Maori. By Raymond Firth, M.A. (New Zealand), Ph.D. (London). London—George Routledge and Sons, Ltd.
1929. Young New Zealand. By A. G. Butchers, M.A., M.Ed. (Melb.), LL.B. (N.Z.)—Part 2, Education in New Zealand, 1930.
1929. Early Wellington. Compiled by Louis E. Ward. Wellington—Whitcombe and Tombs, Ltd.
1929. Te Hokenga. Early Days in Horowhenua. Being the Reminiscences of Mr. Rod McDonald. Compiled and written by E. O'Donnell. Palmerston North—G. H. Bennett and Co., Ltd.
1929. Edward Gibbon Wakefield. By Irma O'Connor. London—Selwyn and Blount.
1929. The New Zealand Nature Book. By W. Martin, B.Sc., F.R.G.S. Vol. 1, The Fauna; Vol. 2, The Flora. Christchurch—Whitcombe and Tombs, Ltd.
1929. The Pioneer Explorers of New Zealand. By J. R. Elder, M.A., D.Litt. (Abdn.). London and Glasgow—Blackie and Son, Ltd.
1929. A Great Colonizer: the Rev. Dr. Thomas Burns. By E. N. Merrington. Dunedin—The Otago Daily Times and Witness Newspapers Co., Ltd.
1929. Kohikohinga. Reminiscences and Reflections of “Ropata.” By Vernon Roberts. Wellington—Whitcombe and Tombs.
1930. New Zealand Birds. By W. R. B. Oliver, M.Sc., F.N.Z.Inst., C.F.A.O.U., R.A.O.U. Wellington—Fine Arts (N.Z.), Ltd.
1930. Pictures of Old New Zealand: the Partridge Collection of Maori Paintings by Gottfried Lindauer. Described by James Cowan. Whitcombe and Tombs, Ltd.
1930. New Zealand in the Making. By Professor J. B. Condliffe, D.Sc. London—Allen and Unwin.
1930. Yesterdays in Maoriland: New Zealand in the Eighties. By Andreas Reischek. Translated and edited by H. E. L. Priday. London—Jonathan Cape. (A German edition published in 1924.)
1930. Legends of the Maori. By Sir Maui Pomare, K.B.E., C.M.G., M.D., M.P., and James Cowan. Wellington—Fine Arts (N.Z.), Ltd. Vol. 2, Wellington—H. H. Tombs, 1934.
1930. The Maori Yesterday and To-day. By James Cowan. Christchurch—Whitcombe and Tombs.
1930. Old New Zealand. By F. Maning (Pakeha Maori). Christchurch—Whitcombe and Tombs. (Earlier editions: 1863, Auckland—Creighton and Scales; also London—Smith, Elder, and Co.; 1876, 1884, 1887, London—Bentley and Co.; 1900, London—Macmillan; 1906, 1912, 1922, Christchurch—Whitcombe and Tombs.)
1930. Early Days in Central Otago. By Robert Gilkison. Dunedin—Otago Daily Times and Witness Newspapers Co., Ltd.
1930. Tales of the Maori Coast. By James Cowan. New Plymouth—Thos. Avery and Sons.
1931. The Mystery of the Moa. By T. Lindsay Buick. New Plymouth—Thos. Avery and Sons.
1931. Maori and Education. By Patrick M. Jackson. Wellington—Ferguson and Osborn. (A collection of essays by various New Zealand writers, including Elsdon Best, Bishop Williams, Professor Sutherland, and others).
1931. Industrial Situation in New Zealand. By Fortescue W. Rowley, I.S.O. Wellington—H. H. Tombs.
1931. Songs from the Forests of Tane. By T. Chamberlin Chamberlin. Wellington—Fine Arts Co. (First ed., 1912.)
1931. Illustrated and Priced Catalogue of the Stamps of New Zealand. By Verne, Collins and Co. Christchurch—Simpson and Williams.
1931. Pictures of Old New Zealand. By James Cowan. Auckland—Whitcombe and Tombs.
1931. New Zealand Ferns. By H. B. Dobbie. Wellington—Third ed., Whitcombe and Tombs. (First ed., 1880; second ed., 1921.)
1931. Old Coaching Days in Otago and Southland. By E. M. Lovell-Smith. Christchurch—Lovell-Smith and Venner.
1931. Mining Laws of the British Empire, Vol. 10, New Zealand. London—Imperial Institute.
1931. The New Zealanders in England. By O. S. Hinz. London—Dent.
1932. Pasture Plants and Pastures of New Zealand. By F. W. Hilgendorf. Christchurch—Whitcombe and Tombs.
1932. Legends and Mysteries of the Maori. By Chas. A. Wilson. London—Harrap.
1932. Pioneering Days of Southern Maoriland. By M. A. Rugby Pratt. London—J. A. Sharp.
1932. Letters and Journals of Samuel Marsden. By J. R. Elder, M.A., D. Litt. (Abdn.) Dunedin—Coulls, Somerville, and Co.
1932. Samuel Marsden. By S. M. Johnstone. Sydney—Angus and Robertson.
1932. Who's Who in New Zealand. By G. H. Scholefield. Ed. 3. (First ed., 1908; second ed., 1924.) Wellington—Rangatira Press.
1932. The Provincial System of Government in New Zealand. By W. P. Morrell, London—Longmans.
1932. Price Fixing in New Zealand. By W. B. Sutch. New York—Columbia University Press.
1932. The Life Histories of New Zealand Birds. By Edgar F. Stead. London—Search Publishing Co.
1933. Cambridge History of the British Empire, Vol. 7, Part 2, New Zealand. Cambridge University Press.
1933. Report of the Hawke's Bay Earthquake. Published by the New Zealand Department of Scientific and Industrial Research. Bulletin No. 43. Wellington—Government Printer.
1933. Pages from the Past. By C. A. MacDonald. Blenheim—H. Duckworth (E. N. Penny and Co.).
1933. Pioneer Medical Men of Taranaki, 1834–1880. By W. H. Skinner and H. B. Leatham. New Plymouth—Thos. Avery and Sons.
1933. The New Zealand Dairy Industry. By G. A. Duncan. Palmerston North—H. L. Young.
1933. New Zealand Holiday. By Rosemary Rees. London—Chapman and Hall.
1934. New Zealand from Tasman to Massey. By Miss N. E. Coad. Wellington—H. H. Tombs.
1934. Samuel Marsden and his Lieutenants. By J. R. Elder. Dunedin—A. H. Reed.
1934. Beetles of New Zealand. By G. V. Hudson. Wellington—Ferguson and Osborn.
1934. Skyways of Maoriland. By Hugh Gardiner. Wellington—McKenzie, Thornton, and Cooper.
1934. Adventuring in Maoriland in the Seventies. By G. L. Meredith. Sydney—Angus and Robertson.
1934. Journalese. By Robin Hyde (Iris Wilkinson). Auckland—National Printing Co.
1934. Children of the Poor. Anonymous (J. A. Lee, M.P.). London—T. Werner Laurie.
1934. The Life of William Hobson. By G. H. Scholefield. Oxford University Press.
1934. Adventures in Geysorland. By Alfred Warbrick, with a preface by James Cowan. Dunedin—A. H. Reed.
1934. Maori Music with its Polynesian Background. By Johannes C. Andersen. Now Plymouth—Avery.
1934. The Elfin Dell. By Johannes C. Andersen. Wellington—A. H. Reed.
1934. Place Names in New Zealand. By Johannes C. Andersen. New Plymouth—Avery.
1934. Tales of the Maori Bush. By James Cowan. Wellington—A. H. Reed.
1934. Tales of the New Zealand Coast. By James Cowan. New Plymouth—Avery.
1934. Waitangi Ninety Years after. By T. Lindsay Buick. New Plymouth—Avery.
1934. Early History of Wellington College. By F. M. Leckie. Wellington—Whitcombe and Tombs.
1934. The Litany of Beauty. By C. Stuart Perry. Wellington—Ferguson and Osborn.
1934. Law relating to Companies in New Zealand. By H. E. Anderson and D. J. Dalgleish. Wellington—H. H. Tombs.
1935. Early Maoriland Adventures of J. W. Stack. Edited by A. H. Reed. Dunedin—A. H. and A. W. Reed.
1935. Exploration of the Pacific. By J. C. Beaglehole. A. and C. Black. Oxford University Press.
1935. The Genus Coprosma. By W. R. B. Oliver, D.Sc. Honolulu—Bernice P. Bishop Museum.
1935. The Silent Division. By 0. E. Burton. Sydney—Angus and Robertson.
1935. The Little Country. By John Guthrie. London—Nelson and Sons.
1935. Touring in New Zealand. By A. J. Harrop. London—Allen and Unwin.
1935. New Zealand. By W. P. Morrell. London—Benn.
1935. The Maori Situation. By I. L. G. Sutherland. Wellington—Harry H. Tombs.
1935. Vigil. By Jessie Mackay. Christchurch—Whitcombe and Tombs.
1935. The Confessions of a Journalist. By Pat Lawlor. Christchurch—Whitcombe and Tombs.
1935. Ideals of Nationhood. A selection of addresses delivered in New Zealand by the Right Hon. Lord Bledisloe. Arranged by T. Lindsay Buick. New Plymouth—Avery.
1935. A Pilgrim's Way in New Zealand. By Alan Mulgan. London—Oxford University Press.
1935. Hero Stories of New Zealand. By James Cowan. Wellington—H. H. Tombs.
1935. Wandering on the Islands of Wonders. By Bohumil Pospisil. Dunedin—Coulls, Somerville, Wilkie.
1935. The Gael Fares Forth. By N. R. Mackenzie. Wellington—Whitcombe and Tombs.
1935. The Greenstone Door. By W. B. Satchell (second edition). Wellington—Whitcombe and Tombs.
1935. Handbook of Arthur Pass National Park. By R. S. Odell. Wellington—Whitcombe and Tombs.
1936. New Zealand—A Short History. By J. C. Beaglehole. London—Allen and Unwin.
1936. The Discovery of Dinornis. By T. Lindsay Buick. New Plymouth—Avery.
1936. The Poor Scholar. By C. R. Allen. Dunedin—Reed.
1936. Notable New Zealand Trials. By C. A. L. Treadwell. New Plymouth—Avery.
1936. Recent Economic Changes in New Zealand. By Dr. W. B. South. Auckland—Whitcombe and Tombs.
1936. The Lure of New Zealand Book-collecting. By Johannes C. Andersen. Wellington—Whitcombe and Tombs.
1936. More Maoriland Adventures of J. W. Stack. Dunedin—Reed.
1936. Katherine Mansfield—A Critical Essay. By Arthur Sewell. Auckland—Unicorn Press.
1936. Land Problems of the Forties. By E. W. Wilson. Dunedin—Reed.
1936. Agricultural Organization in New Zealand. By H. Belshaw, Ph.D., and others (Institute of Pacific Relations). Melbourne—University Press.
1936. The Hunted. By J. A. Lee, M.P. London—T. Werner Laurie.
1936. So They Began. By John Guthrie. London—Nelson and Sons.
1936. Letters from Early New Zealand. By Charlotte Godley. (For private circulation only, but available in the Turnbull and other large libraries of New Zealand.)
1936. New Zealand Index of Every Place in New Zealand. Dunedin—H. Wise and Co.
1936. Sorrows and Joys of a New Zealand Naturalist. By H. Guthrie Smith. Dunedin—A. H. and A. W. Reed.
1936. Bibliography of New Zealand Education. By Mary Mules and A. G. Butchers. Wellington—New Zealand Council for Educational Research.
1936. The Treaty of Waitangi. By T. Lindsay Buick. Third edition (First edition, 1914; second edition, 1933). New Plymouth—Thos. Avery and Sons.
1936. Check to your King. By Robin Hyde (Iris Wilkinson). London—Hurst and Blackett. (A life of Charles, Baron de Thierry, in the form of a novel.)
1936. New Zealand Cricket, 1914–1933. By T. W. Reese. Christchurch—Whitcombe and Tombs.
1936. Memories of the Golden Road: A History of the Presbyterian Church in Central Otago. By Alexander Don. Dunedin—A. H. and A. W. Reed.
1936. The Marketing of Australian and New Zealand Primary Products. By W. Millar Smith, Ph.D. London—Pitman.
1937. New Zealand from Within. By Donald Cowie. Wellington—Whitcombe and Tombs.
1937. Civilian into Soldier. By John A. Lee, M.P. London—T. Werner Laurie.
1937. Sheep Kings. By Joyce M. West. Wellington—H. H. Tombs.
1937. George Rhodes of the Levels and his Brothers. By A. E. Woodhouse. Christ-church—Whitcombe and Tombs.
1937. A History of the New Zealand Dairy Industry. By H. G. Philpott, Dairy Division, Department of Agriculture. Wellington—Government Printer.
1937. The University of New Zealand: An Historical Study. By J C. Beaglehole. Wellington—Whitcombe and Tombs.
1918. History of Samoa. By R. M. Watson. Wellington—Whitcombe and Tombs, Ltd.
1918. Grammar and Vocabulary of the Samoan Language. By H. Neffgen. London—Kegan, Paul, Trench, Trubner, and Co.
1925. Handbook of Western Samoa. New Zealand External Affairs Department. Wellington—Government Printer.
1926. A New Samoan Grammar. By Spencer Churchward, M.A. Melbourne—Spectator Publishing Company Proprietary, Ltd.
1928. Coming of Age in Samoa. By Margaret Mead. New York—William Morrow (American Samoa).
1930. Samoa under the Sailing Gods. By N. A. Rowe. London—Putnam.
1931. Material Culture of Samoa. By Te Rangi Hiroa (Dr. P. H. Buck). Honolulu—Bishop Museum.
1934. The Origins of International Rivalry in Samoa, 1845–84. By Sylvia Masterman. London—Allen and Unwin.
1934. Modern Samoa: Its Government and Changing Life. By Felix M. Keesing. London—Allen and Unwin.
1935. Gods Who Die. By G. E. L. Westbrook. New York—Macmillan.
1937. Western Samoa, Mandate or German Colony? By the New Zealand Institute of International Affairs. Wellington—Tolan Print.
1916. Rarotongan Records. By Rev. W. W. Gill. (From the Journal of the Polynesian Society). New Plymouth.
1927. Material Culture of the Cook Islands. By Te Rangi Hiroa (Dr. P. H. Buck). Memoirs of the Board of Maori Ethnological Research. Vol. 2. New Ply mouth—Avery and Sons.
1935. Ocean Island and Nauru. By A. F. Ellis, C.M.G., F.R.G.S. Sydney—Angus and Robertson.
No book has been written dealing exclusively with the Ross Dependency, but a list of books dealing with this region incidentally may be found in the 1929 number of the Year-Book. A recent book containing a good deal of information regarding the area is “Antarctica—a Treatise on the Southern Continent,” by J. Gordon Hayes: London—The Richards Press, 1928.
| Article on | Appeared for the Last or Only Time in the Year-Book of | |
|---|---|---|
| Year. | Page. | |
| Acclimatization | 1894 | 430 |
| Agriculture in New Zealand (by M. Murphy, F.L.S.) | 1912 | 809 |
| “Britomart,” Mission of, at Akaroa in August, 1840 | 1927 | 1,012 |
| Building-stones | 1892 | 194 |
| Cancer in New Zealand—a statistical study | 1926 | 889 |
| Chatham Islands, the | 1900 | 531 |
| Cheviot Estate, the | 1895 | 264 |
| Christchurch to West Coast, journey from | 1899 | 548 |
| Coal-deposits of New Zealand, the | 1900 | 479 |
| Cook Islands, the laws of | 1902 | 573 |
| Co-operative system of constructing public works | 1894 | 234 |
| Education system of New Zealand, the | 1925 | 816 |
| Effect of nativity order on infant mortality | 1925 | 835 |
| Exotic trees in Canterbury | 1904 | 569 |
| External trade of New Zealand, the | 1915 | 858 |
| Forest-trees and the timber industry | 1899 | 470 |
| Frozen-meat trade, the | 1894 | 311 |
| Gold-dredging industry, the | 1899 | 509 |
| Government training-ship “Amokura” | 1913 | 942 |
| Hanmer Thermal Springs | 1905 | 631 |
| Hemp industry, the | 1900 | 477 |
| H.M.S. “New Zealand” | 1913 | 932 |
| Kauri-gum | 1900 | 489 |
| Labour in New Zealand | 1894 | 362 |
| Lakes of New Zealand | 1932 | 11 |
| Land and income tax assessment | 1913 | 884 |
| Laws of England and New Zealand, difference between | 1896 | 281 |
| Live-stock production—A review based on standard values and units | 1929 | 990 |
| Local Government in New Zealand | 1925 | 845 |
| Maori, ancient, his amusements, games, &c. | 1907 | 707 |
| Maori, ancient, his clothing | 1908 | 734 |
| Maori, chant (tangi) | 1907 | 711 |
| Maori, colour-sense of the | 1905 | 637 |
| Maori, marriage customs | 1906 | 638 |
| Maori, mythology | 1900 | 536 |
| Maori, neolithic, the | 1902 | 578 |
| Maori, place-names | 1919 | 936 |
| Maori, religion | 1901 | 530 |
| Maori, sociology | 1903 | 641 |
| Maori, songs | 1908 | 739 |
| Marlborough Sounds, the | 1901 | 517 |
| Midland Railway, the | 1894 | 386 |
| Mineral waters of New Zealand | 1913 | 896 |
| Moa, heir of the | 1899 | 517 |
| Mortality rates, New Zealand | 1927 | 995 |
| Mount Cook, a night on | 1900 | 525 |
| Mount Cook, district, the | 1899 | 554 |
| Mount Cook, its glaciers, and the Hermitage | 1898 | 552 |
| Mount Sefton, ascent of | 1900 | 519 |
| New Zealand Contingents for South Africa | 1900 | 449 |
| New Zealand International Exhibition | 1907 | 701 |
| Otago lakes, the | 1901 | 523 |
| Patents, designs, and trade-marks | 1893 | 350 |
| Pumice-stone deposits of New Zealand | 1900 | 486 |
| Railways in New Zealand, their history and progress | 1894 | 377 |
| Rivers of New Zealand | 1932 | 6 |
| Scenic wonderland, a | 1898 | 565 |
| Sheep, crossbreeding of | 1894 | 308 |
| Sheep-farming | 1894 | 302 |
| Shipping companies— | ||
| New Zealand Shipping Company | 1895 | 392 |
| Shaw, Savill, and Albion Company | 1895 | 393 |
| Union Steam Ship Company of New Zealand | 1895 | 389 |
| Southern Alps. the | 1894 | 474 |
| State farms | 1894 | 243 |
| Sydney Pageant, the | 1901 | 527 |
| Terman intelligence tests in New Zealand schools | 1925 | 823 |
| Thermal-springs district | 1905 | 614 |
| Timber-trees of the world | 1903 | 605 |
| Tokaanu to Raetihi | 1899 | 539 |
| Topographical nomenclature of the Maori | 1919 | 936 |
| Tree-planting | 1906 | 611 |
| Tuhoeland | 1899 | 546 |
| Varieties of soil | 1892 | 193 |
| Wages and working-hours in New Zealand | 1919 | 860 |
| Waihi Gold-mining Company | 1897 | 432 |
| Waikato district and through to Wanganui | 1899 | 520 |
| Waiouru to Mangaonoho | 1899 | 543 |
| Wanganui River, up the, to Tokaanu | 1900 | 509 |
| Wattle-growing in the Auckland Provincial District | 1897 | 430 |
| Wellington-Manawatu Railway, the | 1895 | 381 |
| West Coast Sounds, the | 1894 | 482 |
| White Island, a day on | 1906 | 637 |
A.
- Abattoirs, 364, 420–424.
- Aborigines (see Maoris).
- Accident Funds, 300, 303, 307, 485.
- Accident Insurance, 673–677.
- State, 676.
- Accidents—
- Aircraft, 334.
- Automobile, 131, 191, 324.
- Deaths from, 131, 134, 143, 188, 324, 334.
- Earthquake, 131, 820.
- Frequency Rates, 821.
- Industrial, 820–828.
- Mining, 478, 485.
- Railway, 131, 300, 820–828.
- Time lost through, 825.
- Traffic, 324.
- Tramway, 131.
- Treated in Hospitals, 143.
- Acclimatization of Animal Life, 33.
- Acclimatization of Fishes, 469–471.
- Accommodation Licenses, 868.
- Accounts, Public, 544–589.
- Acreage and Yield of Crops, 391–400, 909.
- Acreage of Holdings, 347.
- Acts passed in 1936, 877.
- Actuarial Valuation: Superannuation Funds, 603–605.
- Ad valorem Duties, 263.
- Added Value in Manufacturing, 498–499.
- Adjacent Islands, Population of, 52, 76.
- Adjustment of Farm Liabilities, 380.
- Adjustment of Mortgages, 585–587, 702.
- Administration, 38–43.
- Adopted Children, 93.
- Adult Suffrage, 39, 43.
- Adult Wage-rates, 760.
- Adulteration of Food, 151.
- Advances—
- Dank, 640, 645–647, 919.
- Building Societies, 692, 694.
- By State (see State Advances and State Aid).
- Advertising by Radio, 849.
- Aerated-water Factories, 517.
- Aero Clubs, 331.
- Aerodromes, 325, 326, 332.
- Afforestation, 459–463.
- Bondholders, 860.
- After-lifetime, Average, 110.
- Age-constitution, 935–937.
- Age, Mean—
- At Death, 108.
- At Marriage, 100.
- Agents Overseas, 932.
- Ages—
- Of Cancer Decedents, 128.
- Of Hospital Patients, 139.
- Of Industries, 502.
- Of Infants dying, 115–118, 134.
- Of Inmates of Charitable Institutions, 163.
- Of Inmates of Mental Hospitals, 166.
- Of Issue left, 112.
- Of Maoris dying, 133.
- Of Maoris in Prison, 197.
- Of Migrants, 60.
- Of Offenders probationed, 200.
- Of Parents, 84, 86–95.
- Of Persons dying, 108, 133.
- Of Persons married, 100.
- Of Population, 935–937.
- Of Prisoners, 197.
- Of Public-school Pupils, 173.
- Of Traffic Accident Victims, 324.
- Of Tubercular Decedents, 125.
- Of Unemployed, 809.
- Aggregate Private Income, 736–737, 830, 831.
- Aggregate Wealth, 722–723.
- Aggregation of Land, 344, 355.
- Tax against, 558.
- Agreement, Ottawa, 254, 263, 376.
- Agricultural and Pastoral Production, 362–448, 866, 909.
- Value of, 866.
- Agricultural Bursaries, 184.
- Agricultural Colleges, 182.
- Agricultural Machinery, 372, 521.
- Agricultural Policy, Recent Developments in, 372–388.
- Agricultural Produce—
- Consumed locally, 370, 371, 833–834.
- Exported, 226, 229, 834.
- Gross Farming Income, 366.
- Price Index Numbers, 750.
- Agricultural Workers Act, 780.
- Agriculture, 362–448, 909.
- Department of, 364.
- (Emergency Powers) Act, 383, 386.
- Executive Commission of, 387.
- Research in, 364, 387.
- Aides-de-Camp, 924.
- Air Force, 216, 325, 326.
- Air Mails, 334.
- Air Transport and Aviation, 325–336.
- Aircraft, 334.
- Aircraft Licensing and Control, 327–334.
- Aitutaki Island, 1, 889.
- Alcoholic Liquors—
- Consumption of, 840.
- Duty on, 265, 269.
- Sale of, 868.
- Ale brewed, 517.
- Alienation of Land, 346, 350, 355, 359.
- Aliens—
- Migrants, 61, 62.
- Naturalization, 64.
- Race Aliens, 61.
- All-groups Retail Price Index, 748, 749, 755, 756.
- Allowances, Family, 590, 600.
- Allowances, Sustenance, 554, 566, 805, 806.
- Alluvial-gold Mining, 474.
- Alps, 3, 4.
- Amalgamation of Local Bodies, 614.
- Amortization of Debt, 549, 551, 576, 624, 626, 628.
- Amusements-tax, 566.
- Analysis of Radio Programmes, 846.
- Anglers' Licenses, 471–472.
- Angling, 471–472.
- Animal Life, 33–36.
- Animals, Domestic, 403–428, 910.
- Annexed Islands, 1, 886–904.
- Annual Value Rating-system, 616.
- Annuities, 667, 671.
- Ante-natal Clinics, 162.
- Anthracite, 478.
- Anti-dumping Duty, 269.
- Antipodes Islands, 1, 887.
- Apia, 893.
- Apiaries, Registration of, 428.
- Apiculture, 428.
- Apolima Island, 894.
- Appeal Court (see Courts).
- Apples, 400–402.
- Exported, 240–245.
- Apprentices, 790–791.
- Appropriations, Expenditure under, 549.
- Arapuni Power Supply, 850.
- Arbitration Act, 760, 787.
- Unions registered under, 796–799.
- Arbitration Court, 40, 787.
- Award Wage-rates, 764–766.
- Area—
- Of Cook Islands, 1, 889.
- Of Indigenous Forests, 449.
- Of Lakes, 7.
- Of Land Holdings, 345, 724.
- Of New Zealand, 1, 344.
- Of Orchards, 400.
- Of Provincial Districts, 67.
- Under Crops, 390–397, 909.
- Under Cultivation, 390, 391–397.
- Army, 208–216.
- Arrivals, 58, 64, 905.
- Articles on Special Subjects in Previous Issues, 958.
- Artillery, Permanent, 210.
- Art-unions, 564, 870.
- Asiatics, 61, 62.
- Assembly, General, 39.
- Assessable Income, 725–737.
- Assessment Court, 631.
- Assessment of Income-tax, 561, 726.
- Assets—
- Of Afforestation Companies, 461.
- Of Bankrupts, 713, 716.
- Of Banks, 640, 644.
- Of Building Societies, 695.
- Of Electric-power Undertakings, 855.
- Of Fire-insurance Companies, 679.
- Of Friendly Societies, 689.
- Of Life-insurance Companies, 670.
- Of Local Bodies, 719.
- Of Manufacturing Industries, 500–501.
- Of Reserve Bank, 640.
- State, 718.
- Assigned Estates, 712–717.
- Assisted Immigration, 62.
- Associations, Industrial, 799.
- Assurance, Life, 664–672.
- Asylums, 165–168.
- Benevolent and Orphan, 162.
- Atafu Island, 2, 897.
- Atiu Island, 1, 888.
- Atlantic Salmon, 472.
- Auckland—
- Bankruptcies, 714.
- Broadcasting Stations, 845.
- Building Values, 531.
- Dwelling Construction Costs, 543.
- Fires, 683.
- Population, 72, 74.
- Rainfall, 16, 17, 24.
- Retail Prices, 741–747.
- Shipping, 284–290.
- Sunshine, 20, 24.
- Temperature, 18, 24.
- Trade of Port, 279–283.
- Tramways, 302, 305–307.
- Unemployment, 803.
- Valuation of Land, 635.
- Wind, 21.
- Auckland Islands, 1, 887.
- Audit of Expenditure, 544.
- Auriferous Mining, 474, 807.
- Australia—
- New Zealand Tourist and Trade Commissioner in, 932.
- Railway Revenue of, 296.
- Reciprocal Trade with New Zealand, 275, 276.
- Trade Commissioner in New Zealand, 933.
- Authority, Statistical, 45.
- Automatic Telephones, 340.
- Automobiles (see Motor-vehicles).
- Autonomy, Local (see Local Authorities).
- Aviation and Air Transport, 325–336.
- New Zealand Air Force, 216.
- Avifauna, 34.
- Award Rates of Wages, 764–766.
B.
- “Bachelor Tax,” 561.
- Bachelors marrying, 98.
- Backward Children, 182.
- Bacon produced, 516, 835.
- Balance of Overseas Payments, 222–224.
- Balance of Trade, 217–224.
- Balances of Public Accounts, 545.
- Balance-sheet, State, 718.
- Banking and Currency, 637–663, 919.
- Bank-notes, 640, 659.
- In Circulation, 649.
- Tax on, 564.
- Bankruptcy, 712–717, 923.
- Banks Indemnity (Exchange) Act, 570, 663.
- Banks, Overseas Funds of, 650.
- Banks, Savings—
- Post Office, 651, 920.
- Trustee, 652.
- Barley, 391, 392, 396.
- Barren Land, 345, 347.
- Basic Wage, 764, 782.
- Baths, Medicinal, 872–877.
- Beans, 391.
- Beds, Hospital, 160.
- Beef, Chilled, 384.
- Beef exported, 422.
- Beer, Consumption of, 835.
- Beer Duty, 265, 267.
- Beer produced, 517, 840.
- Bees, 428.
- Beet, Sugar, 385.
- Belgium, Trade Agreement with, 277.
- Benefit Societies, 688–691.
- Benevolent Asylums, 162.
- Bibliography—
- General, 950.
- New Zealand Flora, 24.
- Statistical, 44–51.
- Big-game Fishing, 468.
- Bills, Treasury, 570, 574, 647.
- Birds, Native, 34.
- Birthday Honours, 927.
- Birthplaces of Persons naturalized, 65.
- Births, 80–95, 906.
- In Cook Islands, 890.
- In Niue, 892.
- Biscuit-factories, 517.
- Bitumen-surfaced Roads, 309.
- Blind, Pensions for the, 590, 598–600.
- Blind, School for the, 182, 185.
- “Blue-books,” 44.
- Board of School-children, 174.
- Boat-building Works, 522.
- Boats, Fishing, 466.
- Boer War Pensions, 590, 598.
- Boilers, Inspection of, 864.
- Bond-issuing Companies, 461, 860.
- Bookstalls, Railway, 295.
- Boot and Shoe Factories, 514, 518.
- Boots and Shoes, Consumption of, 841.
- Boroughs, 610, 614–629.
- Capital and Unimproved Values, 634.
- Debts, 626, 918.
- Housing, 618.
- Mileage of Streets, 309.
- Population of, 70, 74.
- Borrowers from Building Societies, 694.
- Borrowing-powers of Local Bodies, 615.
- Borstal Institutions, 198.
- Boundaries of New Zealand, 1.
- Bounty Islands, 1, 887.
- Brass-foundries, 520.
- Bread Consumption, 836.
- Bread, Fixed Price for, 739.
- Bread, Law re Sale of, 151.
- Breeding-ewes, 404, 438.
- Breeds of Cattle, 411.
- Breeds of Sheep, 405.
- Breweries, 513, 517.
- Brickworks, 520.
- Brides and Grooms, 96–103.
- Bridges, 309.
- Bridle-tracks, 309.
- Brigades, Fire, 687.
- British Nationality, 64.
- British Preference, 254, 272–276.
- British Sovereignty, 2, 38.
- British Trade Representatives, 933.
- Broadcasting, 843–849.
- Commercial, 849.
- For Schools, 174.
- Time Signals, 871.
- Weather Forecast, 15.
- Budgets, Household, 740, 748.
- Building and Construction, 523–543.
- Building Costs, 542, 543.
- Building Materials, 526, 540.
- Building Permits, 529–534.
- Building Societies, 692–696.
- Buildings, 523–543.
- Building-stones, 481.
- Bullion, Exports of, 228, 475, 911.
- Bullion Production, 474.
- Bulls, 410.
- Bureau of industry, 487.
- Bursaries, 179, 184.
- Bush (see also Flora), 347, 453.
- Business Failures, 712–717, 923.
- Business Premises erected, 530–533, 541.
- Butter (see Dairy-produce).
- Butter-fat Production, 432–435.
- Butter-fat Yields, 414.
- Butterflies, 36.
- By-elections, 868.
C.
- Cabinet, 41.
- Members of, 925.
- Cabinetmaking, 522.
- Cable Tramways, 308.
- Cables, Ocean, 342.
- Cadets, Senior, 211.
- Calf-skins exported, 238, 241.
- Call, Deposits at, 637, 643, 645–647, 696.
- Campbell Island, 1, 887.
- Camps, Health, 154.
- Canada, Reciprocity with, 276.
- Canadian Trade Commissioner, 933.
- Cancer, 120–122, 126–128, 134, 140, 142.
- Candle-factories, 518.
- Capital—
- Expenditure of Government, 551.
- Invested in Electric-power Undertakings, 855.
- Invested in Factories, 501.
- Invested in Railways, 292, 922.
- Invested in Tramways, 303, 306.
- National, 723.
- Of Banks, 640, 642.
- Of Joint-stock Companies, 860, 861.
- Capital Punishment, 188, 194.
- Capital Value of Land, 631–636.
- Rating on, 616, 617.
- Cargo handled at Ports, 279–283.
- Car-miles run by Trams, 303.
- Carry-over of Wool, 407, 409.
- Cassiterite, 477.
- Casualties in the War, 212.
- Casualties, Shipping, 290.
- Cattle, 410–411, 910.
- Causes of Death, 120–135, 140–143.
- Causes of Fires, 685.
- Causes of Industrial Disputes, 816.
- Causes of Insanity, 166.
- Cement-concrete Roads, 309.
- Cement-works, 520.
- Cemeteries, 153.
- Census, 52, 53, 57, 66–78, 935–943.
- Income Statistics, 736.
- Ordinance, 44.
- Unemployment Statistics, 800.
- Central Reserve Bank, 637–640, 649–651, 660–663.
- Cereals, 391–394, 395.
- Consumption of, 836.
- Certificated Teachers, 170, 175.
- Certificates, Engine-drivers', 864.
- Certificates, Land Titles, 349.
- Certificates, Marine Officers', 289.
- Chaff, 393–394.
- Charges before Magistrates, 190.
- Charitable Aid, 158.
- Charitable Institutions, 155, 162.
- Chatham Islands, 1, 886.
- Flora, 26.
- Cheese (see Dairy-produce).
- Chemists, Registration of, 152.
- Cheque-paying Banks, 637–651.
- Chewings Fescue, 396.
- Chief Justice, 926.
- Child Welfare, 180, 185, 192, 200.
- Childbirth, Deaths in, 128, 143, 161.
- Children adopted, 93.
- Children born, Sexes of, 83.
- Children left by Parents dying, 112.
- Children, Offences by, 180, 200.
- Children under One, Deaths of, 114–120, 135, 906.
- Children's Courts, 180, 200.
- Children's Homes, 162, 181.
- Chilled Beef Exports, 384.
- Chinese, 61, 62.
- In Samoa, 894.
- Chou Moellier, 396.
- Christchurch—
- Bankruptcies, 714.
- Broadcasting Stations, 845.
- Building Values, 531.
- Dwelling Construction Costs, 543.
- Fires, 683.
- Population, 72, 75.
- Rainfall, 16, 17, 24.
- Retail Prices, 741–747.
- Sunshine, 20, 24.
- Temperature, 18, 19, 24.
- Tramways, 301, 302–308.
- Unemployment, 803.
- Valuation of Land, 635.
- Chronological List of Events, 944.
- Cinematograph Film-hire Tax, 566.
- Cinnabar, 477.
- Cities, Population of, 72.
- Citrus Fruits Industry, 385, 399–402.
- Civic Planning, 618.
- Civil Aviation, 327–336.
- Civil Law Cases, 187.
- Civil Marriages, 96, 102.
- Civil Service (see Public Service).
- Claims, Insurance, 664–687.
- Classification of Industries, 503, 504.
- Clearings, Bank, 647–648.
- Clergy of each Denomination, 102.
- Marriages by, 102.
- Climate, 15–24.
- Clinics, Ante-natal, 162.
- Clinics, School Dental, 154.
- Clothing, Consumption of, 840.
- Clothing-factories, 514, 518.
- Clothing-prices, 747, 748.
- Clover-seed (see Grass-seed).
- Club Charters, 869.
- Clubs, Aero, 331–333.
- Clubs, Rifle, 211.
- Clubs, Working-men's, 688.
- Coachbuilding-works, 521.
- Coal, Consumption of, 841.
- Coal exported, 229–230, 282, 474.
- Coal used in Factories, 496.
- Coal-miners' Relief Fund, 485.
- Coal-mining, 478–480.
- Coal-resources, 478.
- Coastal Shipping, 285.
- Coastal Trade, Tonnage, 281.
- Coastal Vessels registered, 288.
- Coast-line, 3.
- Cocksfoot, 396.
- Coin held by Banks, 639, 640, 641, 644, 919.
- Coin imported and exported, 224, 657, 911.
- Coinage, 656–659.
- Coin-in-slot Telephones, 340.
- Coleridge Power-supply, 850.
- College of Pharmacy, 152.
- Colleges, Training, 176.
- Colleges, University, 172, 182–184.
- Collieries, 478.
- Colonization, 38.
- Combined Schools, 171, 178.
- Commerce, Overseas, 217–290, 911.
- Commercial Afforestation, 461.
- Commercial Aircraft, Licensing and Control, 327–328.
- Commercial Broadcasting, 849.
- Commercial Failures, 712–717, 923.
- Commissions, Mortgagors' Liabilities Adjustment, 380, 698–703.
- Commodities, Consumption of, 829–842.
- Common Fund, 656.
- Companies (Bondholders Incorporation) Act, 860.
- Companies, Bond-issuing, 860.
- Companies, Co-operative Dairy, 386, 413.
- Companies, Income of, 726.
- Companies, Joint-stock, 860.
- In Manufacturing Industries, 501.
- Companies, Private, 862.
- Companies, Share Price Indexes, 757.
- Companies (Special Investigations) Act, 860.
- Companies (Special Liquidations) Act, 860.
- Companies, Taxation of, 561, 564.
- Comparisons with Other Countries—
- Birth-rates, 83.
- Dairy Produce, 413.
- Wool, 407, 408.
- Puerperal Septicæmia, 130.
- Septic Abortion, 130.
- Cancer Death-rates, 127.
- Dairy Produce, 413.
- Wool, 407, 408.
- Puerperal Septicæmia, 130.
- Septic Abortion, 130.
- Cattle, Number of, 410, 411.
- Dairy Produce, 413.
- Wool, 407, 408.
- Puerperal Septicæmia, 130.
- Septic Abortion, 130.
- Consumption of Primary Products, 833.
- Dairy Produce, 413.
- Wool, 407, 408.
- Puerperal Septicæmia, 130.
- Septic Abortion, 130.
- Dairy Cows, Number of, 420.
- Dairy Produce, 413.
- Wool, 407, 408.
- Puerperal Septicæmia, 130.
- Septic Abortion, 130.
- Dairy Produce, Production of, 416.
- Dairy Produce, 413.
- Wool, 407, 408.
- Puerperal Septicæmia, 130.
- Septic Abortion, 130.
- Death-rates, 110.
- Dairy Produce, 413.
- Wool, 407, 408.
- Puerperal Septicæmia, 130.
- Septic Abortion, 130.
- Friendly Societies, 691.
- Dairy Produce, 413.
- Wool, 407, 408.
- Puerperal Septicæmia, 130.
- Septic Abortion, 130.
- Health Insurance, 771.
- Dairy Produce, 413.
- Wool, 407, 408.
- Puerperal Septicæmia, 130.
- Septic Abortion, 130.
- Imports of British and Foreign Origin, 254.
- Dairy Produce, 413.
- Wool, 407, 408.
- Puerperal Septicæmia, 130.
- Septic Abortion, 130.
- Imports of United Kingdom Origin, 255.
- Dairy Produce, 413.
- Wool, 407, 408.
- Puerperal Septicæmia, 130.
- Septic Abortion, 130.
- Infantile Paralysis, 124.
- Dairy Produce, 413.
- Wool, 407, 408.
- Puerperal Septicæmia, 130.
- Septic Abortion, 130.
- Infant-mortality Rates, 114.
- Dairy Produce, 413.
- Wool, 407, 408.
- Puerperal Septicæmia, 130.
- Septic Abortion, 130.
- Life Insurance, 665.
- Dairy Produce, 413.
- Wool, 407, 408.
- Puerperal Septicæmia, 130.
- Septic Abortion, 130.
- Live-stock (see Cattle, Sheep, &c.).
- Dairy Produce, 413.
- Wool, 407, 408.
- Puerperal Septicæmia, 130.
- Septic Abortion, 130.
- Marriage-rates, 98.
- Dairy Produce, 413.
- Wool, 407, 408.
- Puerperal Septicæmia, 130.
- Septic Abortion, 130.
- Maternal Mortality (see Puerperal Death-rates).
- Dairy Produce, 413.
- Wool, 407, 408.
- Puerperal Septicæmia, 130.
- Septic Abortion, 130.
- Motor-vehicles to Population, 319.
- Dairy Produce, 413.
- Wool, 407, 408.
- Puerperal Septicæmia, 130.
- Septic Abortion, 130.
- Natural-increase Rates, 83.
- Dairy Produce, 413.
- Wool, 407, 408.
- Puerperal Septicæmia, 130.
- Septic Abortion, 130.
- Pigs, Number of, 420.
- Dairy Produce, 413.
- Wool, 407, 408.
- Puerperal Septicæmia, 130.
- Septic Abortion, 130.
- Population, 78.
- Dairy Produce, 413.
- Wool, 407, 408.
- Puerperal Septicæmia, 130.
- Septic Abortion, 130.
- Production—
- Dairy Produce, 413.
- Wool, 407, 408.
- Puerperal Septicæmia, 130.
- Septic Abortion, 130.
- Puerperal Death-rates, 130.
- Puerperal Septicæmia, 130.
- Septic Abortion, 130.
- Retail Food Prices, 744.
- Share Prices, 758, 759.
- Sheep, Number of, 406.
- Suicidal Death-rates, 132.
- Telephones to Population, 340.
- Tuberculosis Death-rates, 126.
- Vital Statistics (see Births, Deaths, &c.).
- Wool Production, 407, 408, 409.
- Compensation, Workers', 673, 791–793, 821.
- Conciliation Councils, 787–789.
- Concrete-surfaced Roads, 309.
- Condensed-milk Factories, 512, 516.
- Conditional Licenses, 869.
- Confectionery-factories, 517.
- Confinement—
- Deaths in, 128.
- Maternity Hospital Cases, 161.
- Conflagrations, 683.
- Conjugal Condition of Persons marrying, 98.
- Conjugal Rights, Restitution of, 104.
- Consent to Marriage, 96.
- Conservation of Forests, 449.
- Consolidated Fund, 547, 916.
- Constabulary, 188.
- Constitution, 39.
- Of Cook Islands, 888.
- Of Local Districts, 609.
- Of Western Samoa, 893.
- Construction and Building, 523–543.
- Construction of Railways, Cost of, 292, 922.
- Construction of Roads, 309–318.
- Consuls, Foreign, 933.
- Consumption of—
- Coal, 473, 478, 841.
- Commodities, 829–842.
- Electricity, 307, 494, 841.
- Farm-produce, 369–371, 834–838.
- Meat, 835–836.
- Timber, 456.
- Wheat and Flour, 393, 836.
- Wool, 406, 407, 522.
- Contagious Diseases, 136, 147.
- Conversion of Debt, 572, 573, 628.
- Conveyance of Children to School, 174.
- Conveyancing, 348.
- Convictions in Supreme Court, 193, 908.
- Convictions, Summary, 191, 908.
- For Drunkenness, 202.
- For Traffic Offences, 203.
- Of Juveniles, 200.
- Of Maoris, 202.
- Of Women, 201.
- Cook and other Pacific Islands, 1, 886–892.
- Bibliography, 957.
- Exports to, 246.
- Imports from, 262.
- Population, 52, 890, 891.
- Radio-stations, 890.
- Trade, 891, 892.
- Cook's Visits to New Zealand, 37.
- Co-operative Dairy Companies, 386, 413.
- Co-operative Pig Marketing, 384.
- Co-operative Public Works, 771, 795.
- Copper, 477.
- Cordial-factories, 517.
- Corn Crops, Acreage and Yield of, 391–394.
- Coroners' Inquests, 188.
- Correspondence Classes, 173, 178.
- Corriedale Sheep, 405.
- Cost of Living, 738–759.
- Cost of Railway Construction, 292, 922.
- Costs—
- Building, 540, 542–543.
- Dairy-farm, 447–448.
- Dwelling, 542–543.
- Farm, 380–383, 386, 387, 448.
- Roading, 316–317.
- Council, Executive, 39, 41.
- Members of, 925.
- Council, Legislative, 39, 41.
- Members of, 928.
- Counties, 609, 614–629.
- Capital and Unimproved Values, 634.
- Debt, 626, 918.
- Mileage of Roads, 309.
- Population of, 73.
- Country Lands, Mortgages on, 706, 710.
- Country Quota, 42.
- Courts—
- Appeal, 195.
- Arbitration, 40, 760, 771, 787.
- Assessment, 631.
- Bankruptcy, 712, 717.
- Children's, 180, 200.
- Divorce, 103.
- Judges of, 926.
- Magistrates', 190, 908.
- Native Appellate, 358.
- Native Land, 358.
- Of Review, 380.
- Supreme, 104, 190, 193, 703, 908.
- Cover, Fire, 683.
- Cow-testing, 364, 410.
- Crayfish, 467.
- Creameries, 412.
- Cream-separators on Farms, 372.
- Credit, Rural Intermediate, 587.
- Creditors' Petitions, 712.
- Credits-in-aid, 545–547.
- Crematoria, 153.
- Crime, Law and, 187–207, 908.
- Criminals, Habitual, 196–198.
- Crops, 347, 389–402, 909.
- Crown Lands, 345, 351–361.
- Crown Tenants, 354.
- Advances to, 353–356.
- Cultivation, Area in, 347, 390–402.
- Currency and Banking, 637–663.
- Curriculum, School, 169, 173, 174.
- Curtis Islands, 887.
- Customary Land, 357.
- “Customs Aerodromes,” 328.
- Customs Tariff and Revenue, 263–278.
- Customs Taxation, 263–278, 557.
- Cycle-works, 521.
D.
- Dairy Cows, 410, 910.
- Dairy-farm Survey, 429–448.
- Dairy Industry, 412, 429–448, 512, 516.
- Dairying Machinery, 372, 521.
- Dairy-produce, 412–420.
- Consumption of, 834–836.
- Export of, 226–245, 413–417, 913.
- Export Price Indexes, 752–754.
- Fixation of Prices, 378–379, 739.
- Grading of, 412.
- Gross Farming Income, 366.
- Guaranteed Prices of, 379.
- Imports into United Kingdom, 414.
- Local Consumption of, 834.
- Marketing of, 376–379, 414–415.
- Processing of, 512, 516.
- Production of, 413, 512, 516, 866.
- Retail Prices Index, 743, 746, 748.
- Danger Island (Pukapuka), 2, 889.
- Dangerous Drugs and Poisons, 152.
- Dates of Principal Events, 944.
- Daylight Saving, 870.
- Dead-births, 93–95.
- Deaf, School for the, 181, 182, 185.
- Dealing in Coin, Restriction on, 658.
- Death Duties, 562.
- Estates certified for, 721.
- Deaths, 81, 106–135, 906.
- Accidental (see Accidents).
- Due to Earthquakes, 12, 131.
- From Infantile Paralysis, 123, 141.
- From Puerperal Causes, 128, 161.
- From Violence, 131, 188.
- In Hospitals, 139–143.
- In Mental Hospitals, 167.
- Of Friendly Society Members, 689.
- Of Infants, 114–120, 134, 906.
- Of Maoris, 80, 95, 133.
- Debentures, General and Local Government, 569, 615, 624.
- Debenture-tax, 561.
- Debits, Bank, 647, 648.
- Debt, Conversion of, 572, 628.
- Debt of Local Authorities, 159, 580, 615, 624–633, 917, 918.
- Debt, Public, 569–580, 915.
- Debtors' Petitions, 712.
- Deceased, Estates of, 721.
- Decrees in Divorce, 104.
- Deeds Registration, 347.
- Defectives, Mental, 165–168.
- Defence, 208–216.
- Expenditure on, 216, 571, 572.
- Pensions, 598.
- Deferred-payment Lands, 352, 353, 354.
- Deficits, 548.
- Degrees, University, 149, 182, 185.
- Demography, 52–79.
- Denominational Schools, 171, 176.
- Density of Population, 77.
- Dental Nurses, 154.
- Dental Treatment of School-children, 154.
- Dentists, Registration of, 149.
- Departments, Government, 930.
- Reports of, 49–51.
- Departures, 58–61, 905.
- Dependencies, 1, 886–904.
- Dependent Children, Care of, 181, 185, 200.
- Deposits, 640, 645–647, 653, 919, 920.
- By Insurance Companies, 664, 678.
- Interest-rates, 654–656.
- With Building Societies, 653, 695.
- With Savings-banks, 651, 652.
- With Trading Companies, 653.
- Depreciation Allowance, 561.
- Depreciation of New Zealand Currency, 660–662.
- Designs, Registration of, 864.
- Destination—
- Of Emigrants, 61.
- Of Exports, 220, 231–240.
- Of Shipping, 286.
- Detention, Reformative, 182, 198.
- Development of Lands, 352, 360.
- Diagrams (see Graphs).
- Diamond Drills, 484.
- Diphtheria, 121, 122, 134, 136, 137, 141, 147.
- Diplomas, 149, 182, 185.
- Disabilities from Industrial Accidents, 823, 824, 826.
- Discharged Mortgages, 704, 707.
- Discharged Soldiers (see Soldiers).
- Discount Rates, 653, 654.
- Discovery of New Zealand, 37.
- Diseases, Notification of, 136, 147.
- Diseases, Principal, Deaths from, 121, 134–135, 140.
- Diseases treated in Hospitals, 140.
- Disputes, Industrial, 789–790, 813–819.
- Dissolution of Marriage, 103.
- Dissolution of Parliament, Dates of, 927.
- Distribution of Population, 66–77.
- District High Schools, 171, 178, 907.
- District Nurses, 162.
- Districts, Local, 608–614.
- Diversification of Farm Production, 383.
- Dividend (Totalizator) Duty, 565.
- Dividends, Bank, 642.
- Dividends, Bankrupts', 713, 714, 715, 923.
- Divorce, 103–105.
- Divorced Persons re-marrying, 98.
- Domains, Public, 347.
- Domestic-science Bursaries, 184.
- Domicile of Debt, 573, 627.
- Dominion of New Zealand, 1, 40, 782.
- Drainage Districts, 611, 617.
- Dredging, Gold, 474.
- Drilling for Oil, 480.
- Drills, Prospecting, 484.
- Drivers' Licenses, 317.
- Drowning Accidents, 131, 188.
- Drugs, 151, 152.
- Drunkenness, 202.
- Ducks, 425.
- Dumping Duty, 269.
- Dunedin—
- Bankruptcies, 714.
- Broadcasting Stations, 845.
- Building Values, 531.
- Dwelling Construction Costs, 543.
- Fires, 683.
- Population, 72, 75, 905.
- Rainfall, 16, 17, 24.
- Retail Prices, 741–747.
- Shipping, 284, 287–289.
- Sunshine, 20, 24.
- Temperature, 18, 19, 24.
- Trade of Port, 284–289.
- Tramways, 302, 304–308.
- Unemployment, 803.
- Valuation of Land, 636.
- Wind, 21.
- Duration of Marriage, 90, 91, 105.
- Duration of Unemployment, 809.
- Dutiable Imports, 263, 268.
- Duties—
- Customs and Excise, 263–278, 557.
- Death, 562.
- Excise, 266, 557.
- Export, 267, 556, 897.
- On Interest Receipts, 567.
- On Lottery Tickets, 564, 870.
- On Overseas Passenger-tickets, 564.
- Stamp, 564.
- Dwellings—
- Advances for, 581–589, 692–696.
- Costs, 542–543.
- Erected, 525, 530–534, 541–543.
- Private, 530, 541–543.
- Rents, 525, 703, 786.
- State, 524–525.
- Untenanted, 528.
- Workers', 525, 584, 589, 785.
E.
- Early History, 37.
- Earned, Income, 730.
- Of Factory Employees, 493, 494.
- Reduced Tax on, 559.
- Earthquakes, 10–14.
- Accidents due to, 820.
- Compensation to Injured Workers, 820.
- Deaths due to, 131.
- Economic Pensions, 597.
- Education, 169–186, 907.
- Education Endowments, 352.
- Education, Expenditure on, 185.
- Education Gazette, 174.
- Educational Associations, Workers', 184.
- Effective Wage-rates, 762.
- Eggs, 428, 837.
- Elections, General, 868.
- Electoral Districts, 42.
- Electoral Qualifications, 42.
- Electors, Compulsory Registration of, 43.
- Electric—
- Current, 495, 519, 850–858.
- Power Hoards, 612, 617, 851, 918.
- Power Districts, 612.
- Power in Factories, 495.
- Power on Farms, 372.
- Railways, 291.
- Telegraph, 339.
- Tramways, 302–308.
- Electricity, Consumption of, 841.
- Electricity Generation and Supply, 513, 519.
- Emergency Legislation, 40.
- Emergency Unemployment Charge, 554, 566.
- Emigration, 58–61, 905.
- Employees—
- Afforestation Companies, 462.
- Building and Construction, 529, 537.
- Electric-supply, 854.
- Factory, 489, 490–494.
- Fishing Industry, 466.
- Legislation affecting, 770–795.
- Local Authority, 812.
- Mining, 474, 478, 480, 482.
- On Dairy Farms, 441.
- Postal, 342.
- Public Service, 932.
- Public Works, 811.
- Railway, 299.
- Tramway, 303, 308.
- Unions of, 770, 796–799.
- Wage-rates of, 760–767.
- Employers' Liability, 791–793, 823.
- Insurance, 674–677.
- Employers' Unions, 796–797.
- Employment and Unemployment, 800–812.
- Employment Bureaux, 801.
- Employment Placement Scheme, 810.
- Employment Promotion, 800–810.
- Fund, 554.
- Taxation, 554, 566.
- Employment, Seasonal Fluctuations in, 810.
- Enactments affecting Labour, 770–795.
- Enactments of 1936, 877.
- Endowments, Education, 352.
- Endowments, National, 352, 449.
- Engine-drivers' Certificates, 864.
- Engineering-works, 520.
- Engines—
- Employed in Factories, 495.
- Employed on Farms, 372.
- Inspection of, 864.
- Railway, 294.
- Ensilage, 320, 390, 395, 397.
- Entertainments-tax, 564, 566.
- Entrepot Trade, 228, 231, 232, 242.
- Entry, Ports of, 279.
- Epicentres of Earthquakes, 14.
- Epidemic Pensions, 590, 598.
- Estate Duty, 562.
- Estates—
- Acquired for Settlement, 355.
- Administered by Public Trust Office, 859, 860.
- Assigned, 712–717.
- Passed for Probate, 721.
- Ewes, 404.
- Examinations—
- Education Department, 180, 185.
- Engine-drivers, 864.
- Marine Officers, 289.
- Medical, of School Children, 153.
- Medical Practitioners, 149.
- Mining, 485.
- Of Motor-vehicles, 318.
- University, 149, 185.
- Excess-profits Tax, 559.
- Exchange, Currency, 386, 638, 660.
- Banks Indemnity (Exchange) Act, 663.
- Effect on Trade Statistics, 217–222.
- Exchange Pool, 663.
- Expenditure on, 549, 663.
- New Zealand-London, 660.
- Reserve, 640.
- Exchanges, Telephone, 339.
- Excise Duties, 266.
- Taxation by Means of, 269, 557.
- Executions, 207.
- Executive Council, 39, 41.
- Members of, 925.
- Exemptions from Taxation—
- Income-tax, 558, 561, 731.
- Land-tax, 560, 711.
- Ex-nuptial Births, 90, 92.
- Exotic Trees, Planting of, 459–463.
- Expectation of Life, 110.
- Expeditionary Forces, 211.
- Expenditure, Broadcasting, 848.
- Expenditure, Local Authority, 157, 622, 917.
- Expenditure on Defence, 216, 571, 572.
- Expenditure on Education, 185.
- Expenditure on Naval Defence, 216.
- Expenditure, Public, 544–555, 916.
- Explorers, 37.
- Export Control—
- Dairy-produce, 375, 412.
- Export Licenses, 663.
- Fruit, 401.
- Honey, 428.
- Kauri-gum, 480.
- Meat, 423.
- Export Duties, 267, 474, 556, 897.
- Export Licenses, 663.
- Export Prices, 243, 752–754, 755, 756.
- Export Surplus, 218–223.
- Exports, 225–256, 911.
- Commandeering of, 40.
- Minerals, 228–231, 240, 473.
- Of Ports, 279–283.
- Specie, 224.
- Timber, 228–230, 240–242, 457, 914.
- Valuation of, 220, 225.
- Value in British Currency, 217, 218.
- Values, Gold Basis, Index Numbers, 219.
- Volume, Index Numbers, 219, 243.
- External Migration, 54, 58–64.
- External Trade, 217–262, 911.
- Extra-marital Conceptions, 90.
F.
- Factories, 486–522.
- Accidents in, 820–825.
- Act, 775.
- Classification of, 503, 504.
- Dairy, 386, 413, 512, 516.
- Employees, 489–494, 502, 504.
- Expenses of Operation, 492, 496, 499.
- Growth of Production, 489.
- Prices of Materials, 506–510.
- Prices of Products, 506–510.
- Promotion of, 486–487.
- Size of, 492.
- Fair Rents Act, 774, 786.
- Fakaofu Island, 2, 897.
- Fallow Land, 390.
- Family Allowances, 590, 600.
- Family Budgets, 740, 748.
- Farm Costs, Reduction of, 380, 382, 385.
- Farm Economy, Some Aspects of, 364–388.
- Farm Employees, Wages of, 766, 780–782.
- Farm Expenditure Indexes, 369, 756.
- Farm Finance, Provision of, 382.
- Farm Holdings, 345, 710, 723.
- Farm Implements, 372.
- Manufacture of, 521.
- Farm Liabilities, Adjustment of, 380.
- Farm Machinery, 372.
- Farm Management, 446.
- Farm Produce, Consumption of, 369–371.
- Farm Produce, Marketing of, 375–379.
- Farm Producers' Prices Indexes, 367, 369.
- Farmers—
- Advice for, 364.
- Financial Assistance to, 353, 356, 383.
- Mutual Fire Insurance, 686.
- Taxation of, 559, 561.
- Farming, 362–448.
- Farming Income, Gross, 364–371.
- Farming Industry, Subsidies to, 382–383.
- Farming Lands, Mortgages on, 710.
- Fathers—
- Ages of, 86, 112.
- Duration of Marriage of, 91.
- Occupations of, 88, 91.
- Fauna, 33–36.
- Feeble-minded, Schools for, 181.
- Fellmongering-works, 521.
- Female Suffrage, 39, 43.
- Fern Lands, 347.
- Fertilizer used, 398.
- Fertilizers, Prices of, 387, 739.
- Fibre, Phormium (see Phormium).
- Fidelity-guarantee Insurance, 673.
- Field Crops, 391–397.
- Film-hire Tax, 566.
- Finance, Farm, 382.
- Finance, Public, 544–589, 916.
- Finances of Local Authorities, 619–629.
- Hospital Boards, 157.
- Fire Brigades, 687.
- Fire Districts, 452, 613, 614–629.
- Fire Inquests, 188.
- Fire Insurance, 678–687.
- State, 686.
- Fire Losses, 680, 682.
- Fireblight, 401.
- Fire-prevention in Forests, 452.
- Fires on Vessels, 290.
- First Births, 84, 89–92.
- First Offenders' Probation, 199.
- Fish, 35, 464.
- Consumption of, 839.
- Exported, 228, 241, 466.
- Fisheries, 464–472.
- Fish-hatcheries, 468.
- Fishing, Big-game, 468.
- Fishing-boats, 466.
- Five-day Week on Public Works, 795.
- Fixation of Prices, 738–739.
- Fixed Deposits, 643–646.
- Flax (see Phormium).
- Floating Debt, 570.
- Flocks—
- Fowls, 426.
- Sheep, 405.
- Floods, 21.
- Flora, 24–33.
- Flotation of Loans, 569.
- Flour—
- Consumption of, 393, 836.
- Fixed Price for, 739.
- Importation of, 266.
- Flour-mills, 512, 516.
- Flying, 325–336.
- Fodder Crops, 391, 395.
- Fog, 21.
- Signals, 290.
- Food and Drugs, Sale of, 151.
- Food, Retail Prices of, 741–744, 748, 749.
- Foodstuffs, Consumption of, 833–839.
- Footwear, Consumption of, 841.
- Footwear Factories, 514, 518.
- Forecasts of Weather, 15.
- Foreign Consuls, 933.
- Foreign Immigrants, 62.
- Foreign Vessels entered and cleared, 285.
- Foreigners naturalized, 65.
- Forest Trees, 452–456, (See also Flora.)
- Forest Produce consumed locally, 456, 834.
- Forest Produce exported, 229–230, 240–241.
- Forestation Companies, 461–463.
- Forestry, 346, 449–463.
- Value of Production, 866.
- Forty-hour Week, 769, 775, 776.
- Forwarding Trade, 242.
- Foster-homes for Children, 182.
- Foundries, 520.
- Foveaux Strait Oysters, 466.
- Fowls, 425.
- Fowl-wheat, 393.
- Fractions, Totalizator, 565.
- Franchise, 43.
- Free and Dutiable Imports, 264, 270.
- Free Education, 170, 178, 179, 183.
- Freehold, Crown Land made, 353–354.
- Freehold Land, 345, 353.
- Freezing-works, 512, 515.
- Freight—
- Carried by Air-transport, 328–330.
- Carried by Motor-transport, 323.
- Carried by Shipping, 281–283.
- Carried by Trains, 297–299, 922.
- Train-mileage, 299.
- Frequency Rates of Accidents, 821.
- Fresh-water Fisheries, 468.
- Friendly Societies, 688–691.
- Frosts, 19, 20.
- Frozen Meat exported, 237, 241–242, 420, 912.
- Handled at Ports, 282.
- Fruit Industry, 385, 399.
- Fruit Marketing, 402.
- Fruit-export Control, 386, 401.
- Fruit-preserving Factories, 517.
- Fruits, Consumption of, 837–839.
- Fruits, Production of, 400.
- Fuel and Light, Retail Prices of, 747, 748.
- Funded Debt, 578.
- Funds of Public Account, 544.
- Funds, Sinking, 578.
- Funeral Funds, 689.
- Furniture-making Works, 522.
G.
- Gales, 21.
- Gaols, Prisoners in, 195–199, 908.
- Gardens, Acreage in, 398.
- Gas, Consumption of, 841.
- Gas-lighting District, 614–629.
- Gasworks, 519.
- Gauge, Railway, 292.
- Geese, 425.
- General Assembly, 39.
- General Elections, 868.
- Generating Stations, 850.
- Geographical Features, 3–7.
- Geological Survey, 7, 482.
- Geology, 7–10.
- Germany, Trade Agreement with, 277.
- Geysers, 3.
- Gift Duty, 564.
- Glaciers, 5.
- Goats, 403.
- Gold Coin, Export of, 224, 658, 911.
- Gold exported, 226–245, 474, 913.
- Duty on, 267.
- Gold Production, World's, 476.
- Gold Reserves, 640.
- Goldfields, Subsidized Roads on, 484.
- Gold-mining, 474.
- Gonorrhoea, 148.
- Goods carried on Railways, 297, 922.
- Goods, Consumption of, 829–842.
- Goods-service Licenses, 323.
- Government Agents abroad, 932.
- Government Departments, 930.
- Reports of, 49–51.
- Government insurance, 671, 676, 686.
- Government Railways, 291–301, 922.
- Superannuation Fund, 604.
- Government Roads, 311.
- Government, System of, 39.
- Government Valuations, 630–636.
- Governor-General, 924.
- Powers, Duties, &c., 41.
- Grading—
- Of Dairy-produce, 412, 414.
- Of Fruit, 401.
- Of Honey, 428.
- Of Phormium-fibre, 364.
- Of School-teachers, 170.
- Graduated Land-tax, 558, 560.
- Grain Crops, 391, 909.
- Grain-mills, 512, 516.
- Granite, 481.
- Grape-fruit, 385.
- Grapes, 390, 398, 401.
- Graphs—
- Births, Deaths, Natural Increase, and Marriages, 81.
- Cattle, Dairy-cows, and Pigs, 419.
- Exports as affected by Prices, 244.
- Imports, 253.
- Infant Death-rates, 117.
- Retail Price Indexes, 749.
- Sheep and Breeding-ewes, 405.
- Tuberculosis and Cancer Death-rates, 126.
- Value of Merchandise Imports, 253.
- Wholesale Price Indexes, 750.
- Grass Lands, 347, 390, 397.
- Grass-seed, 396–397.
- Certification of, 364.
- Exported, 229–230, 241–242.
- Green Fodder, 391, 395.
- Greenstone, 481.
- Greenwich Mean Time, 870.
- Groceries, Retail Prices of, 741, 742, 748.
- Gross Farming Income, 364–367, 369, 370.
- From Dairying, 443.
- Indexes, 367, 369.
- Gross Indebtedness, 569, 915.
- Mortgage Indebtedness, 710.
- Of Local Authorities, 624, 917.
- Grounds for Divorce, 103.
- Growth of Population, 53–56, 81, 82, 905.
- Guaranteed Prices, 378–379.
- Gum, Kauri, 480.
- Exported, 230, 240, 241, 242, 481, 914.
H.
- Habitual Criminals, 196.
- Habitual Drunkards, 202.
- Hail, 21.
- Half-castes, 53, 77.
- Ham and Bacon Curing, 516.
- Harbour Boards, 612, 614–629, 918.
- Harbours, 3 (see also Ports).
- Hardwood Trees, 455.
- Harvests, 391–397.
- Hatcheries, Fish, 468.
- Hawaiki, 37.
- Hay, 391, 395, 397.
- Heads of Government Departments, 930.
- Health Camps, 154.
- Health, Public, 147–168.
- Heavy-traffic Fees, 318, 320.
- Herald Islets, 887.
- Herd-book Societies, 410.
- Herd-testing, 446.
- Herds, Dairy, Size of, 431.
- Hides exported, 238, 241–242, 282.
- High Commissioner's Office, 932.
- High Schools, 171, 179, 907.
- Technical, 171, 179, 180.
- Higher Education, 182, 907.
- Highway Districts, 312.
- Highways, 311–318.
- Taxation, 317, 557.
- Hindus, 61.
- History, 37, 944.
- Hives of Bees, 428.
- Hobson's Proclamation, 38.
- Hogs, 418, 910.
- Holdings (see Land Holdings).
- Homes, Benevolent, 163.
- Homes, Children's, 163, 181.
- Home-science Bursaries, 184.
- Homicide, 131, 188, 193.
- Honey, 428.
- Export Control, 428.
- Honours conferred, 927.
- Hops, 398.
- Horahora Power Supply, 850.
- Horse-racing Taxation, 565.
- Horses, 403, 424–425, 910.
- Horticultural Station, 364.
- Horticulture, 399.
- Hosiery-factories, 518.
- Hospital Districts, 613.
- Hospitals and Charitable Institutions, 155–168.
- Maternity, 161.
- Mental, 165–168.
- Private, 160.
- Private Mental, 168.
- Public, 138–146, 159–160, 162.
- St. Helens, 161.
- Hot Springs, 3, 872–877.
- Hotels, Licensed, 868.
- Hours of Labour, 767–769.
- In Factories, 505.
- House of Representatives, 39, 42.
- Members of, 929.
- Household Budgets, 740, 748.
- Houses (see Dwellings).
- Housing, 524, 525, 532, 541–543, 584, 586, 589, 618, 785–786.
- State, 524–525, 785.
- Husbands' Petitions in Divorce, 104.
- Hydraulic Sluicing, 475.
- Hydro-electric Power, 5, 6, 850–858.
- Used for Industrial Purposes, 858.
- Hydrotherapeutical Treatment, 872.
- Hygiene, 147.
- Social, 148.
I.
- Ice-cream, 839.
- Igneous Rocks, 9.
- Illegitimate Infants—
- Births of, 90, 92.
- Deaths of, 115.
- In Benevolent Institutions, 164.
- Protection of, 181.
- Immigration, 54, 58–64, 905.
- Assisted, 62.
- Early, 38.
- Restriction on, 63, 795.
- Implements, Farm, 372.
- Manufacture of, 521.
- Import Price Indexes, 754.
- Imported Commodities, Price Indexes, 752.
- Imports, 217–224, 247–262, 279–283, 911.
- Diversion of, 250, 253–255.
- Excess of Exports over, 218.
- Free and Dutiable, 270–271.
- Of Ports, 279–283.
- Restrictions on, 266.
- Specie, 249.
- Value in British Currency, 217–218.
- Value on Gold Basis, Index Numbers, 219.
- Volume, Index Numbers, 219.
- Improved-farm Settlements, 352, 355.
- Improvements, Value of, 632–636.
- Incapacity from Industrial Accidents, 820–828.
- Income, Aggregate Private, 736–737, 830, 831.
- Income from Dairying, 443.
- Income, Gross Farming, 364–367, 369.
- Incomes, 725–737.
- Of Families granted Allowances, 600.
- Income-tax, 556, 558–560, 561, 562, 725–737.
- Increase in Population, 53, 81, 82, 905.
- Indebtedness, Mortgage, 709.
- Indebtedness of Local Bodies, 159, 580 624–629, 918.
- Indebtedness, Public, 569–580, 915.
- Index Numbers—
- Deaths, Sex-ratio, 107.
- Farm, 367, 369.
- Factory, Volume of, 510–512.
- Farm, Volume of, 367, 371.
- Export Prices, 752–754, 755.
- Farm, 367, 369.
- Factory, Volume of, 510–512.
- Farm, Volume of, 367, 371.
- Farm Expenditure, 367, 756.
- Farm, 367, 369.
- Factory, Volume of, 510–512.
- Farm, Volume of, 367, 371.
- Farm Producers' Prices, 367, 369.
- Farm, 367, 369.
- Factory, Volume of, 510–512.
- Farm, Volume of, 367, 371.
- Farm Production, Volume, 367, 371.
- Farm, 367, 369.
- Factory, Volume of, 510–512.
- Farm, Volume of, 367, 371.
- Goods Available for Consumption, 829–842.
- Farm, 367, 369.
- Factory, Volume of, 510–512.
- Farm, Volume of, 367, 371.
- Gross Farming Income, 367, 369.
- Farm, 367, 369.
- Factory, Volume of, 510–512.
- Farm, Volume of, 367, 371.
- Hours of Labour, 767–769.
- Farm, 367, 369.
- Factory, Volume of, 510–512.
- Farm, Volume of, 367, 371.
- House-rent, 744–746.
- Farm, 367, 369.
- Factory, Volume of, 510–512.
- Farm, Volume of, 367, 371.
- Import Prices, 754.
- Farm, 367, 369.
- Factory, Volume of, 510–512.
- Farm, Volume of, 367, 371.
- Population, 79.
- Farm, 367, 369.
- Factory, Volume of, 510–512.
- Farm, Volume of, 367, 371.
- Prices of Consumers' Goods, 752.
- Farm, 367, 369.
- Factory, Volume of, 510–512.
- Farm, Volume of, 367, 371.
- Prices of Factory Materials, 506–510.
- Farm, 367, 369.
- Factory, Volume of, 510–512.
- Farm, Volume of, 367, 371.
- Prices of Factory Products, 506–510.
- Farm, 367, 369.
- Factory, Volume of, 510–512.
- Farm, Volume of, 367, 371.
- Prices of Imported Commodities, 752.
- Farm, 367, 369.
- Factory, Volume of, 510–512.
- Farm, Volume of, 367, 371.
- Prices of Locally-produced Commodities, 752.
- Farm, 367, 369.
- Factory, Volume of, 510–512.
- Farm, Volume of, 367, 371.
- Producers' Prices, 867.
- Farm, 367, 369.
- Factory, Volume of, 510–512.
- Farm, Volume of, 367, 371.
- Production, 867.
- Factory, Volume of, 510–512.
- Farm, Volume of, 367, 371.
- Ratio of Customs Revenue to Imports, 270.
- Retail Prices, 369, 740–749, 755, 756.
- Share Prices, 757–759.
- Value of Exports, 219.
- Value of Imports, 219.
- Value of Production, 367, 371, 510–512.
- Volume of Exports, 219, 243.
- Volume of Factory Production, 510–512.
- Volume of Goods Available for Use, 832, 833.
- Volume of Imports, 219.
- Volume of Production, 371, 867.
- Volume of Total Trade, 219.
- Wage-rates, 760–764.
- Wholesale Prices, 749–752, 755, 756.
- Indians, 61.
- Indigenous Forest, 24–33, 449, 453–456.
- Individualization of Native Land, 357.
- Industrial Accidents, 820–828.
- Industrial Associations, 799.
- Industrial Conciliation and Arbitration, 769, 789, 878.
- Industrial Disputes, 789–790, 813–819.
- Industrial Efficiency Act, 487, 883.
- Industrial Life Insurance, 667.
- Industrial Unions, 770, 796–799.
- Industries, Important, 515–522.
- Industries, Manufacturing, 486–522.
- Industry, Bureau of, 487.
- Industry, Organization of, 502.
- Inebriates, 202.
- Infancy, Diseases of, 117, 134.
- Infant Mortality, 114–120, 906.
- Maori, 134.
- Infantile Paralysis, 122–125, 136, 137, 141, 143–146.
- Infant-life Protection, 114, 162, 180.
- Infectious Diseases—
- Control of, in Schools, 154.
- Hospital Cases, 140, 141.
- Notification of, 136, 147.
- Injuries (see Accidents).
- Inland Fisheries, 468.
- Inmates—
- Of Charitable Institutions, 163.
- Of Gaols, 195, 908.
- Of Hospitals, 138–146, 160.
- Of Mental Hospitals, 165.
- Inquests, 188.
- Insanity, 165–168.
- Insolvency, 712–717, 923.
- Inspection, Medical, of Schools, 153.
- Inspection of Dairies and Daily Factories, 412.
- Inspection of Machinery, 864.
- Instruments, Registration of, 348.
- Insurance, 664–687.
- State, 671, 676, 686.
- Intercensal Population, 53, 57, 58.
- Interest—
- Credited by Savings-banks, 651, 652, 920.
- On Local Authorities' Debt, 622, 627.
- On Mortgages, 708.
- On Public Debt, 575.
- Payments Overseas, 223, 628.
- Rates (see Rates of Interest).
- Recouped to Consolidated Fund, 548.
- Reduction of, 567, 628, 703.
- Tax on, 567, 573.
- Interference, Radio, 846.
- Inter-Island Passengers, 66.
- Intermediate Credit, 587.
- Intermediate Schools, 171, 177.
- Internal Migration, 66.
- International Comparisons (see Comparisons).
- International Payments, 222, 575, 627.
- Intestate Estates, 859.
- Intoxicating Liquor—
- Consumption of, 840.
- Sale of, 868.
- Invalidity Pensions, 590, 598–600.
- Investment Certificates, 569.
- Investment Societies, Deposits with, 695.
- Investments, State, 572, 718.
- Investments, Totalizator, 565.
- Invisible Imports and Exports, 223.
- Iron-foundries, 520.
- Iron-ores, 476.
- Islands—
- Adjacent, Population of, 52, 76.
- Administered on Mandate, 2, 893–904.
- Annexed, 1, 887–904.
- Outlying, 1, 886.
- Issue of Bank-notes, 640, 649, 659.
- Issue of Deceased Parents, 112.
- Issue, Previous, of Parents, 87–89.
J.
- Jam-factories, 517.
- Joint-stock Banks, 641–648.
- Joint-stock Companies, 860.
- In Manufacturing Industries, 501, 502.
- Journal of Agriculture, 364.
- Journal, School, 174.
- Judicial Separation, 104.
- Judiciary, Members of, 926.
- Junior High Schools, 171, 177.
- Justice, 187–207, 908.
- Juvenile Offenders, 182, 200.
K.
- Kauri-gum, 480.
- Exported, 240, 241, 242, 474, 914.
- Kermadec Islands, 1, 887.
- Kuczynski: Reproduction Rates, 936.
L.
- Labour Department Employment Bureaux, 801.
- Labour Disputes, 787–790, 813–819.
- Labour Disputes Investigation Act, 789.
- Labour, Hours of, 767.
- In Factories, 504.
- Labour Laws and Allied Legislation, 770–795.
- Labour Ministry, 926.
- Labour on Dairy Farms, 438–442.
- Labour Shares, 772.
- Lake Wakatipu Steamer Service, 293.
- Lakes, 6.
- Lamb—
- Consumption of, 835.
- Exported, 241, 242, 420.
- Lambs, 404.
- Land and Income Tax, 558–562, 725–737, 916.
- Land Boards, 351.
- Maori, 358.
- Land Development, 352, 360.
- Land Districts, 351.
- Land Drainage Districts, 611, 614–629.
- Land for Discharged Soldiers, 356.
- Land for Settlements, 355.
- Land, Government Valuation of, 630–636
- Land Holdings, 345.
- Mortgages on, 710.
- Value of, 710, 723.
- Land, Occupation of, 344, 347.
- Land Offices, 351.
- Land, Purchase of, 355, 356, 357.
- Land Tax, 558–560.
- Land Tonure and Settlement, 344–350
- Land Titles, Registration of, 348.
- Land Transfer System, 348.
- Land, Valuation of, 630–636.
- Landing-grounds, 325, 326, 332.
- Lands open for Selection, 353.
- Land-settlement Accounts, 552.
- Land-settlement Finance Associations, 356.
- Land-tax, 386, 556, 558, 560.
- Lapsed Insurance Policies, 666, 668.
- Latest Statistical Information [see Forefront of Book].
- Law and Crime, 187–207.
- Law, Mortgage, 697–698.
- Laws affecting Labour, 770–795.
- Laws enacted in 1936, 877.
- Lease, Renewable, 352, 354.
- Leasehold-landholdings, 345.
- Legacy Duty, 562, 563.
- Legal Education, 182.
- Legal-tender, 657, 658, 659.
- Legislation—
- Emergency, 40.
- Labour and Allied, 770–795.
- Passed in 1936, 877.
- Statistical, 44.
- Legislative Council, 39, 41.
- Members of, 928.
- Legitimation Act, 93.
- Legumes, 391.
- Letters of Naturalization, 64.
- Letters Patent, 863.
- Letters posted, 337, 921.
- Letter-telegrams, 339.
- Levies by Hospital Boards, 155–159, 622.
- Levy, Employment Promotion, 554, 566.
- Liabilities—
- Farm, Adjustment of, 380–382.
- Of Afforestation Companies, 461.
- Of Bankrupts, 713, 715, 716, 923.
- Of Banks, 640, 643, 650, 919.
- Of Building Societies, 695.
- Of Electric-power Undertakings, 855.
- Of Fire-insurance Companies, 679.
- Of Life-insurance Companies, 670.
- Of Local Authorities, 159, 623.
- Of Reserve Bank, 640.
- State, 718.
- Libraries, School, 173.
- Licensed Houses, 868.
- Licenses—
- Air Pilots, 331–333.
- Anglers, 472.
- By Local Authorities, 620, 869.
- Commercial Aircraft, 327.
- Export, 663.
- Ground Engineers, 333.
- Motor-vehicle, 318, 319, 322, 323.
- Radio, 847.
- Ross Sea Whaling, 902, 903.
- Sharebrokers, 564.
- Transport, 321.
- Licensing, 868, 869.
- Of Industries, 487.
- Poll, 869.
- Life, Expectation of, 110.
- Life Insurance, 664–672.
- State, 671.
- Life Table, 110.
- Lifts, Inspection of, 864.
- Light and Fuel, Retail Prices of, 747.
- Lighthouses, 290.
- Lignite, 478.
- Lime and Cement Works, 520.
- Lime for Top-dressing, 398.
- Limestone, 481.
- Limonite, 476.
- Lincoln Agricultural College, 171, 182, 388.
- Linseed, 391, 392.
- Liquidations of Companies, 860.
- Liquor, Consumption of, 840.
- Live-stock, 403–448, 910.
- Carried on Railways, 298, 922.
- Slaughtering of, 420–423.
- Loans—
- Allocation of, 572.
- By Building Societies, 694.
- Conversion of, 572, 628.
- Dates of Maturity of, 574, 629.
- Domicile of, 573, 627.
- Of Hospital Boards, 159.
- Of Local Authorities, 159, 580, 615, 624–633, 918.
- Receipts from, 572.
- Redemption of, 549, 551, 572, 576, 624, 628.
- Local Authorities, 608–629, 917.
- Advances to, 525.
- Assets of, 623, 719.
- Debt of, 159, 580, 615, 624–633, 918.
- Employees of, 811.
- Expenditure of, 622.
- History of, 608–614.
- Levies on, by Hospital Hoards, 157, 622.
- Receipts of, 619.
- Superannuation, 605.
- Taxation by, 568, 616, 619.
- Local Consumption of Produce, 829–842.
- Local Government (see Local Authorities).
- Local Option, 869.
- Local Railway District, 612, 614–629.
- Local Taxation, 568, 619, 620.
- Location of Debt, 573, 627.
- Location of New Zealand, 1.
- Lockouts, 789–790, 813–819.
- Locomotives, 294.
- Lodges, Friendly Societies, 688–691.
- London, Exchange on (see Exchange).
- London Prices of Gold, Average, 474.
- London Prices of New Zealand Stock, 575
- Losses from Fires, 680, 682.
- In Forests, 452.
- Lotteries, 870.
- Duty on, 564, 870.
- Lucerne, 391, 395.
- Lunacy, 165–168.
- Lupins, 392.
M.
- Macaulay Island, 887.
- Machinery—
- Accidents, 823.
- Factory, 501, 504.
- Farm, 372, 521.
- Inspection of, 804.
- Magistrates' Courts (see Courts).
- Magistrates, Superannuation of, 605.
- Mails, 337.
- Air, 334.
- Main Highways, 311–316.
- Account, 314, 554.
- Districts, 614.
- Taxation, 317, 555, 557.
- Maize, 391, 392, 396.
- Malnutrition of School-children, 153.
- Malthouses, 513, 517.
- Mammalia, 33.
- Mandated Territories, 2, 893–897.
- Mangahao Power Supply, 850.
- Mangaia Island, 1, 888.
- Manganese-ore, 477.
- Mangolds, 391, 395.
- Manihiki Island, 2, 889.
- Manono Island, 894.
- Manuae Island, 1, 889.
- Manual Education, 173.
- Manufacturing Production, 486–522.
- Manures used for Top-dressing, 398.
- Maori Dog, 33.
- Maori Land Boards, 358.
- Maori Secondary Schools, 178.
- Maori War Pensions, 590, 594.
- Maori Wars, 38, 39.
- Maoris, 37, 935–943.
- Ages of, 935.
- Births of, 80, 95.
- Children attending Schools, 171, 177, 178.
- Deaths of, 80, 95, 133–135.
- Half-castes, 53, 77.
- In Mental Hospitals, 168.
- In Prisons, 197.
- Infant Mortality of, 134.
- Lands, 357–361.
- Marriages of, 102.
- Members of Parliament, 42, 929.
- Offences by, 202.
- Population, 77.
- Schools for, 177.
- Map of New Zealand [End of Volume].
- Marble, New Zealand, 481.
- Marine Fish-hatchery, 468.
- Marine Officers' Certificates, 289.
- Marital Status, 937.
- Market Gardens, 346, 399.
- Marketing of Farm-produce, 375–379.
- Marriage, Duration of, 90, 91, 105.
- Marriages, 81, 96–105, 906.
- Masseurs, Registration of, 151.
- Massey Agricultural College, 171, 182.
- Maternal Mortality, 128, 161.
- Maternity Allowances, 605, 607.
- Maternity Hospitals, 161.
- Maternity Nurses, District, 162.
- Maternity Nurses, Registration of, 150.
- Maturity of Loans, Dates of, 574, 629.
- Mauke Island, 1, 889.
- Mean Population, 57, 58, 905.
- Mean Time, 870.
- Measures and Weights, 152, 344.
- Meat—
- Consumption of, 835–836.
- Export Control, 423.
- Export of, 226–245, 420–424, 912.
- Freezing-works, 512, 515.
- Retail Prices of, 743, 744, 748.
- Medical Inspection of Schools, 153.
- Medical Practitioners, 149.
- Medical Services in Samoa, 895.
- Medicinal Waters, 872.
- Members of Lodges, 688.
- Members of Parliament, 42, 929.
- Mental Hospitals, 165–168.
- Mercantile Marine, 284.
- Merchandise, Imports of, 247–262.
- Mercury Mines, 477.
- Merino Sheep, 405.
- Metal Reserves of Banks, 640, 644, 657, 660, 919.
- Meteorology, 15–24.
- Midwives, District, 162.
- Midwives, Registration of, 150.
- Migration, External, 54, 58–64, 905.
- Migration, Internal, 66.
- Mileage of—
- Main Highways, 311.
- Railways, 292, 301, 922.
- Roads, 309.
- Telegraph Lines and Wire, 339.
- Telephone Lines and Wire, 341.
- Tramway Routes, 302, 308.
- Mileage-tax, 314, 317, 558.
- Military Forces, 208–216.
- Military Pensions, 590, 596–598.
- Milk, Adulterated, 152.
- Milk, Consumption of, 835.
- Milk, Control of Prices of, 740.
- Milk for School-children, 154.
- Milk used in Dairy Factories, 516.
- Milking-machines, 346, 372.
- Milk-products (see Dairy-produce).
- Milk-testing, 364, 412.
- Milling-wheat, 393.
- Mills, 486–522.
- Mineral Waters, 872.
- Minerals, 473–485.
- Miners' Pensions, 485, 590, 594–595.
- Minimum Wage-rates, 760–769, 780–785, 787.
- Mining, 473–485.
- Accidents, 478, 485.
- Act, Examinations under, 485.
- Acts, 778.
- Advances, 483.
- Produce consumed locally, 834, 841.
- Produce exported, 225–246, 473.
- Subsidized Prospecting, 807.
- Value of Production, 473, 866.
- Ministers of each Denomination, 102.
- Marriages by, 102.
- Ministries, Successive, 924.
- Ministry, Labour, 926.
- Minors, Marriages of, 96, 101.
- Mission Schools, 169, 171, 890, 892, 895.
- Missionaries, Arrival of, 38.
- Mitiaro Island, 1, 889.
- Money-orders issued and paid, 338, 921.
- Morbidity, 136–146, 689.
- Mortality (see Deaths).
- Mortgage Corporation, 582, 703, 879.
- Mortgage Exemption, 560, 582, 711, 723.
- Mortgage Indebtedness, 709–711.
- Mortgagee, Rights of, 697.
- Mortgagees' Indemnity Insurance, 564, 675.
- Mortgages, 380–382, 697–711, 723.
- State Advances, 582–587.
- Mortgage-tax, 559.
- Mortgagors and Lessees Rehabilitation Act, 380, 698, 882.
- Mortgagors Liabilities Adjustment Commissions, 380, 698–703.
- Mortgagors Relief, 698–703.
- Mothers, Ages of, 84, 86–95.
- In Illegitimate Cases, 92.
- In Still-born Cases, 95.
- Moths, 36.
- Motion-picture Film-tax, 566.
- Motive-power in Factories, 494–495.
- Motor Traffic Offences, 204.
- Motor Transport, 308, 314, 317, 321–324.
- Motor-engineering Works, 521.
- Motor-omnibus Traffic, 308, 314, 317, 321–324.
- Motor-spirits, Consumption of, 841.
- Motor-spirits, Fixed Price for, 739.
- Motor-spirits Taxation, 266, 317, 320, 558.
- Motor-vehicles—
- Accidents, 131, 203–205, 324.
- Country of Manufacture, 320.
- Dormant Registrations, 319.
- Drivers' Licenses, 317, 318.
- Duty on, 265.
- Examination of, 318.
- Insurance, 675.
- Licensed for Goods-services, 322.
- Licensed for Passenger-services, 323.
- Operated by Tramway Authorities, 308.
- Registration of, 318.
- Speed Limit, 318.
- Taxation, 317, 558.
- Motor-vessels registered, 284.
- Motor-works, 521.
- Mountains, 3.
- Mud Baths, 873, 877.
- Multiple Births, 84, 85, 86.
- Municipal Tramways, 302–308.
- Municipalities (see Boroughs).
- Mutton Consumption of, 835.
- Mutual Fire Insurance, 686.
N.
- Nassau Island, 2, 889.
- National Broadcasting Services, 844.
- National Endowments, 352, 449.
- National Expenditure Adjustment Act, 386, 590, 628, 703, 746, 786.
- National Income, 737.
- National Parks, 347.
- National Prohibition, 869.
- National Provident Fund, 605–607.
- National Scholarships, 184.
- National Wealth, 722–723.
- Nationality, 64.
- Of Migrants, 61.
- Of Naturalized Persons, 65.
- Of Vessels, 285.
- Native (see Maori).
- Native Appellate Court, 358.
- Native Bush, 347, 453, (Sec also Flora.)
- Native Fresh-water Fishes, 468.
- Native Grasses, 347, 397.
- Native Land Court, 358.
- Native Lands, 344, 357–361.
- Purchase of, 358.
- Native Population, 77.
- Native Schools, 177, 907.
- Native Succession Duty, 563.
- Native Trust Office, 360.
- Native-land Purchase, 359.
- Nativity Order, 84, 95.
- Natural Increase of Population, 54, 82, 83.
- Naturalization, 64.
- Nauru Island, 897–900.
- Naval Board, 213.
- Naval Defence, 212.
- Expenditure on, 216.
- Naval Ratings, 215.
- Naval Reserve, 214, 216.
- Naval Station, 213.
- Navigators Islands (see Western Samoa)
- Navy, 212.
- Neo-natal Deaths, 116, 135.
- Nephrite, 481.
- Net State Indebtedness, 579, 915.
- New Year Honours, 927.
- New Zealand Coinage and Currency, 656–663.
- New Zealand Mean Time, 870.
- New Zealand Representatives Abroad, 932
- New Zealand University, 171, 182–184.
- Newspapers—
- Posted, 337, 921.
- Registered, 338.
- Night letter-telegrams, 339.
- Nisi Decrees in Divorce, 104.
- Niue Island, 2, 889, 891.
- No-license Issue, 869.
- Nomination of Assisted Immigrants, 62.
- Note-issue, 641, 643, 649, 659.
- Notes in Circulation, 649.
- Tax on, 564.
- Notification of Births, 80.
- Notification of Diseases, 136, 147.
- Nukunono Island, 2, 897.
- Nullity of Marriage, 104.
- Nurseries and Plantations, 347, 398, 459–463.
- State, 459.
- Nurses—
- Dental, 154.
- District, 162.
- Plunket, 162.
- Registration of, 150.
- Retiring-allowances to, 606.
- School, 153.
O.
- Oats, 391, 393–394, 909.
- Exported, 229, 230.
- Observatory, Time Signals from, 846, 871.
- Occupation of Land, 344, 347.
- Occupation with Right of Purchase, 352, 354.
- Occupations—
- Of Bankrupts, 715, 717.
- Of Fathers, 88, 91.
- Of Taxpayers, 727.
- Ocean Cables, 342.
- Ocean Island, 897–899.
- Offences, 190–207.
- Offenders Probation Act, 199.
- Offices Act, Shops and, 776.
- Official Assignees, 712–717.
- Official Representatives Abroad, 932.
- Officiating Ministers, 102.
- Oil-wells, 480.
- Old-age Pensions, 40, 590, 591–593.
- Old-peoples Homes, 162.
- Omnibus Traffic, 308, 314, 317, 321–324.
- Omnibuses licensed, 319, 322.
- Onakaka Iron-ore, 476.
- Onions, 391, 395.
- Consumption of, 837.
- Prices of, 739.
- Opium, Prohibition of, 152.
- Opossum-skins exported, 238.
- Opticians, Registration of, 150.
- Orchards, 390, 399–402.
- Orchard-tax, 401.
- Ordinance, Census, 44.
- Organization of Industry, 502.
- Organization, Statistical, 44–51.
- Origin of Immigrants, 60.
- Origin of Imports, 251–261.
- Origins, Racial, 939.
- Ornamental Stones, 481.
- Orphanages, 162.
- Orphanhood, 112.
- Otekaike Special School, 182.
- Ottawa Agreement, 263.
- Outlying Islands, 1, 886.
- Out-patients, 138, 160.
- Maternity Hospitals, 161.
- Output of Factories, 489.
- Overdraft Hates, 653, 654.
- Oversea Shipping, 285–289.
- Oversea Trade, 217–262, 911.
- Overseas Air Services, 331.
- Overseas Funds of Banks, 221, 650.
- Overseas Parcel-post, 338.
- Overseas Payments, 222–224.
- Overseas Representatives, 932.
- Overseas-passenger Duty, 564.
- Overtime in Factories, 504, 505.
- Oyster-beds, 466.
P.
- Pacific Cable, 342.
- Pacific Islands, Annexed, 1, 893–897.
- Packet Licenses, 868.
- Palmerston Island, 2, 889.
- Papers, Parliamentary, 49–51.
- Paralysis, Infantile, 122–125, 136, 137, 141, 143–146.
- Parapara Iron-ore Deposit, 476.
- Parcel-post, 337, 338.
- Parents—
- Ages of, 86–95.
- Duration of Marriage of, 90, 91.
- Issue left by, 112.
- Previous Issue of, 87, 89.
- Parks, National, 347.
- Parliament, 39.
- Members of, 929.
- Parliamentary Elections, 42, 868.
- Parliamentary Papers, 49–51.
- Parliamentary Under-Secretary, 926.
- Parliaments, Successive, 927.
- Party-line Telephones, 340.
- Passengers—
- Aero Club, 332.
- Commercial Aircraft, 328–330.
- Inter-Island, 66.
- Motor-vehicle, 320, 323.
- Overseas, 58, 60, 905.
- Railway, 297, 922.
- Tramway, 303, 308.
- Passenger-service Licenses, 322.
- Passenger-tickets, Duty on, 564.
- Passion-fruit, 385, 398.
- Passports, 62.
- Pastoral and Agricultural Production, 362–448.
- Value of, 866.
- Pastoral Produce—
- Consumed locally, 834.
- Export Price Indexes, 753, 754.
- Exported, 226–245.
- Gross Farming Income, 366.
- Price Indexes, 367.
- Pasture Grasses, 390, 397.
- Patents, Designs, and Trade-marks, 863.
- Patients in Mental Hospitals, 165.
- Patients in Public Hospitals, 138, 160.
- Payments by, 156, 159.
- Payments Overseas, Balance of, 222–224.
- Peaches, 400.
- Peaks, Altitude of, 3, 4.
- Pears, 400.
- Peas 391, 392.
- Export of, 229, 230, 239, 241–242.
- “Pelorus Jack” 34.
- Pelts, Export of, 238–239, 282.
- Penal Institutions, 195–199.
- Penrhyn Island, 2, 889.
- Pensions, 590–607, 941.
- Permanent Building Societies, 692, 693.
- Permanent Heads of Departments, 930.
- Permanent Military Forces, 209.
- Permits and Passports, 62.
- Permits, Building, 529–534.
- Petitions—
- Bankruptcy, 712.
- Divorce, 104.
- Petrol, Consumption of, 841
- Petrol Prices, 739.
- Petroleum, 480.
- Petrological Laboratory, 316.
- Petrol-tax, 314, 317, 558.
- Pharmacy, 152.
- College of, 153.
- Phormium, 346, 347, 402.
- Fibre exported, 240, 914.
- Grading of Fibre, 364.
- Mills, 519.
- Phosphate Rock, 481.
- From Nauru Island, 2, 899.
- Phthisis, 121, 122, 125, 136, 137, 141, 147.
- Maori Deaths from, 134.
- Miner's, 594, 595.
- Physical Education, 175, 185.
- Physicians, Registration of, 149.
- Physiography, 1–7.
- Pickle-factories, 517.
- Pig-iron Production, 473.
- Pig-recording, 384.
- Pigs, 418, 420, 436–438, 910.
- Pilots, Air, 326, 333.
- Pisciculture, 468, 469.
- Placement Scheme, 810.
- Plaints, 187.
- Plant Research, 364, 387, 451.
- Plantations, 390, 399.
- State, 459.
- Plants, New Zealand, 24–33.
- Platinum, 473, 477.
- Pleasant Island (Nauru), 897.
- Plumbers Registration, 151.
- Plunket System, 115, 162.
- Plural Births, 84, 85, 86.
- Poisons, 152.
- Police, 188.
- Offences Reported to, 206.
- Superannuation, 601.
- Policies, Insurance, 664–687.
- Poliomyelitis, 122–125, 136, 137, 141, 143–140.
- Polling—
- At By-elections, 868.
- At General Elections, 868.
- At Licensing Polls, 869.
- Population, 52–79, 905, 935–943.
- Of Cook Islands, 52, 890.
- Of Nauru Island, 905.
- Of Nine Island, 52, 891.
- Of Tokelau Islands, 52, 897.
- Of Various Countries, 79.
- Of Western Samoa, 52, 895.
- Of World, 78.
- Pork exported, 422.
- Portfolios of Ministers, 924, 925.
- Portobello Marine Fish-hatchery, 468.
- Ports—
- Finances of, 620–624.
- Of Entry, 279.
- Of Registry, 284.
- Shipping of, 287–288.
- Trade of, 279–283.
- Post Office Employees, 342.
- Accidents to, 820–828.
- Superannuation of, 601.
- Post Office Investment Certificates, 569.
- Post Office Savings-bank, 651, 920.
- Postal and Telegraphic, 337–343, 921.
- Postal Notes, 339, 921.
- Post-primary Education, 171, 178, 185.
- Post-war Changes, 40.
- Potatoes, 391, 394.
- Consumption of, 837.
- Pottery-works, 520.
- Poultry, 384, 425–428.
- Poultry-runs Registration, 428.
- Pounamu, 481.
- Power Boards, 612, 620–624, 851, 918.
- Power, Electric (Sec Electric).
- Power used in Factories, 495.
- Power used on Farms, 372.
- Preferential Tariff, 263, 272–278.
- Pregnancy, Diseases, &c., of, 128, 143, 161.
- Premiers, Successive, 924.
- Premium Income, 664–687.
- Prevention of Crime Act, 198.
- Prevention of Profiteering Act, 740.
- Previous Issue of Parents, 87–89.
- Price Fixation, 378–379, 738–739.
- Price Levels, the Spread in, 368–369.
- Prices, 738–759.
- Effect on Exports, 219, 243.
- Effect on Farm Expenditure, 369, 756.
- Effect on Imports, 219.
- Fixation of, 378, 738.
- Guaranteed, 379.
- Of Factory Materials, 506–510.
- Of Factory Products, 506–510.
- Of Fertilizers, 387.
- Of Stock, 575.
- Producers', 367, 867.
- Primage Duty, 264, 269.
- Primary Products—
- Consumption of, 833.
- Marketing of, 376–379, 414–415, 878.
- Primary Schools, 172–176, 907.
- Principal Events, 944.
- Printing Establishments, 514, 520.
- Prisons and Prisoners, 195–199, 908.
- Prisons Board, 199.
- Private Assignments, 715.
- Private Companies, 862.
- Private Dwellings, 527, 530, 541–543.
- Private Hospitals, 160.
- Private Income, Aggregate, 736, 737, 830, 831.
- Private Mental Hospital, 168.
- Private Radio-stations, 845.
- Private Railways, 301.
- Private Savings-banks, 652.
- Private Schools, 171, 176, 907.
- Private Wealth, 720–722.
- Probate, Estates passed for, 721.
- Probation, 199.
- Probationer Teachers, 175.
- Proclamation of British Sovereignty, 2, 38.
- Production—
- Agricultural and Pastoral, 362–448, 866.
- Dairy, 413–414, 512, 516.
- Diversification of Farm, 383.
- Factory, 486–522.
- Gold, World's, 476.
- Local Consumption of, 829–842.
- Mineral, 473–485.
- Timber, 457.
- Value of, 866.
- Volume of, 367, 510–512, 867.
- Wool, 407.
- Production Districts, Exports of, 279.
- Professors, University, 183.
- Profiteering, Prevention of, 740.
- Profit-sharing, 772.
- Programme Analysis, Radio, 846.
- Prohibited Immigrants, 63.
- Prohibited Imports, 266.
- Prohibition Issue, 869.
- Prohibition Orders, 202.
- Promotion of Industries, 487.
- Prorogation of Parliament, Dates of, 927.
- Prospecting, State Aid to, 483.
- Prospectine-drills, Government, 484.
- Provident Fund, National, 605.
- Provincial Districts, 608.
- Area and Population of, 67.
- Building and Construction in, 536.
- Fire Losses in, 684.
- Industrial Disputes in, 815.
- Industries in, 490.
- Provincial Governments, 39.
- Provisional State Forests, 449.
- Public Debt, 569–580, 915.
- Repayment of, 549, 551, 572, 576.
- Public Domains, 347.
- Public Finance, 544–589, 915–916.
- Public Health, 147–168.
- Public Hospitals (see Hospitals).
- Public Reserves, 345, 347, 348.
- Public Schools, 171–186, 907.
- Public Service, 929.
- Civil Service Act Pensions, 590, 601.
- Employees, 932.
- Superannuation, 601–602.
- Public Trust Office, 859.
- Public Wealth, 720.
- Public Works—
- Accidents, 820–828.
- Employees, 811.
- Five-day Week on, 795.
- Fund, 550, 916.
- Programme, 795.
- Road Construction, 310.
- Publicans' Licenses, 868.
- Publications—
- Census and Statistics Department [facing p. 1], 44–48.
- Education Department, 174.
- General Bibliography, 950.
- Statistical Bibliography, 44–51.
- Publishing Works, 514, 520.
- Puerperal Accidents, &c., 128, 143, 161.
- Puisne Judges, 926.
- Pukapuka Island, 2, 889.
- Pulmonary Tuberculosis (see Phthisis).
- Pulse Crops, 391.
- Pumpkins, 396.
- Punishments by Courts, 190–207.
- Pupils, School, 171–182, 907.
- Purchase of Land for Settlement, 353, 354.
- Pure Food Laws, 151.
Q.
- Quackery-prevention, 152.
- Quadrennial Parliaments, 42.
- Quadruplets born, 86.
- Quarries, 482.
- Quartz-mining, 474.
- Quicksilver-mining, 473, 474, 477.
- Quinnat Salmon, 470, 472.
- Quinquennial Census, 53, 67–77.
- Quorum—
- Executive Council, 41.
- House of Representatives, 43.
- Quota, Country, 42.
- Quotations, New Zealand Stock, 575.
R.
- Rabbit Districts, 613, 614–629.
- Rabbit-skins exported, 238, 241–242.
- Race Aliens, 61, 939.
- Racial Origins, 939.
- Racing, Tax on, 565.
- Radio Advertising, 849.
- Radio Licenses, 847.
- Radio Time-signals, 846, 870.
- Radio-beacons, 290, 341.
- Radio-broadcasting, 341, 843–849
- Weather Forecasts, 15, 846.
- Radio-telegraph, 341.
- Raffle-tickets, Duty on, 564, 870.
- Rail-cars, 294.
- Railway Accidents, 131, 300, 324, 820–828.
- Railway District, 612, 614–629.
- Railway Fares, School-children's, 174.
- Railways, 291–301, 877.
- Private, 301.
- Revenue and Expenditure, 294, 547, 553, 922.
- Superannuation Fund, 604, 605.
- Rain Forests, 453.
- Rainfall, 15–24.
- Rakahanga Island, 2, 889.
- Rams, 404.
- Rarotonga Island, 1, 888.
- Rateable Value of Land, 633.
- Rates collected by Local Bodies, 568, 619, 856, 917.
- Rates of Exchange, 386, 638, 660.
- Rates of Interest—
- On Building Societies' Deposits, 655, 696.
- On Fixed Deposits, 654.
- On Local Authorities' Debt, 616, 627.
- On Mortgages, 708–709.
- On Public Debt, 572, 575.
- Paid by Savings-banks, 654, 655.
- Reduction of, 567, 572, 628, 703.
- Rating by Local Authorities, 616.
- On Unimproved Value, 617.
- On Urban Farm Lands, 386, 616, 630.
- Ratings, Naval, 215.
- “Real” Wage-rates, 762.
- Rebate of Rates, 621.
- Receiving-homes, 162.
- Recent Developments in Agricultural Policy, 372–388.
- Reciprocal Tariff and Trade, 272–278.
- Records, Statistical, 44.
- Recruiting—
- Military, 208.
- Of Police, 189.
- Redemption of Loans, 549, 551, 572, 576, 624, 628.
- Redemption of Mortgages, 697.
- Reduction of Interest, 386, 567, 572, 628, 703.
- Reduction of Rent, 628, 703.
- Reduction of Wages, 761, 783.
- Re-exports, 231, 242.
- From United Kingdom, 233.
- Reformative Detention, 195, 198.
- Refuge Homes, 162.
- Refund of Rates, 621.
- Refunds to Racing Clubs, 565.
- Regional Planning, 618.
- Registered Articles posted, 337.
- Registered Companies, 860.
- Registered Mortgages, 704.
- Registered Vessels, 284.
- Registrars, Marriages before, 96, 102.
- Registration—
- Of Adopted Children, 93.
- Of Apiaries, 428.
- Of Applicants for Employment, 801.
- Of Births, 80.
- Of Chemists, 152.
- Of Companies, 860.
- Of Dairies, 412.
- Of Dairy Companies, 413.
- Of Deaths, 106.
- Of Deeds, 348.
- Of Dentists, 149.
- Of Designs, 862.
- Of Electors, 43.
- Of Friendly Societies, 688.
- Of Industrial Unions, 796.
- Of Land Titles, 348.
- Of Marriages, 96.
- Of Masseurs, 151.
- Of Maternity Nurses, 150.
- Of Medical Practitioners, 149.
- Of Midwives, 150.
- Of Mortgages, 704.
- Of Motor-vehicles, 318.
- Of Newspapers, 338.
- Of Nurses and Midwives, 150.
- Of Opticians, 150.
- Of Orchards, 401.
- Of Patents, 862.
- Of Pharmaceutical Chemists, 152.
- Of Physicians, 149.
- Of Plumbers, 151.
- Of Poultry-runs, 428.
- Of Private Schools, 176.
- Of Still-births, 80.
- Of Trade-marks, 862.
- Of Trade-unions, 796.
- Of Unemployed, 800–816.
- Of Vessels, 284.
- Registry, Ports of, 284.
- Regulation of Prices, 737–740.
- Relief, Charitable, 158.
- Relief Fund, Coal-miners', 485.
- Relief of Mortgagors, 698–703.
- Relief of Unemployed, 554, 805–810.
- Religions of Population, 940, 941.
- Religious Denominations, 940, 941.
- Marriages by Ministers of, 102.
- Officiating Ministers, 102.
- Renewable Leases, 352, 354.
- Rent Reduction, 703.
- Rent Restriction, 786.
- Renters, Film, Taxation of, 566.
- Rents, House, 525, 703, 744.
- Of State Houses, 525.
- Repatriation, 356.
- Repayment of Public Debt, 549, 551, 572, 576.
- Reports, Departmental, 49–51.
- Special, 50.
- Representatives abroad, 932.
- Representatives, House of, 39, 42.
- Members of, 929.
- Reproduction Pates, 936.
- Reptiles, 35.
- Research, Agricultural, 387.
- Research, Coal, 483.
- Research, Educational, 186.
- Research Institute, Wheat, 387, 393.
- Research Scholarships, 183.
- Research, Silvicultural, 451.
- Reserve Rank, 637–663, 877.
- Reserves of Banks, 642.
- Reserves, Public, 345, 347, 352.
- Restitution of Conjugal Rights, 104.
- Restorations, Salary and Wages, 783.
- Restriction Immigration, 63.
- Restrictions on Imports, 266.
- Retail Prices, 739–749, 756.
- Retardate Children, 180, 185.
- Revaluations, 631.
- Revenue, Customs, 268–270.
- Revenue, Local Authority, 157, 619, 917.
- Revenue, Public, 544–555, 916.
- Revenue, Railway, 294.
- Review, Court of, 380.
- Review of Legislation, 877–885.
- Rhodes Scholarships, 183.
- Richmond Special School, 182.
- Rifle Clubs, 211.
- River Districts, 611, 614–629.
- Rivers, 5.
- Road Districts, 611, 614–629.
- Mileage of Roads, 308.
- Road Transport, 308, 309–324.
- Roads, 309–324.
- On Goldfields, Subsidized, 484.
- Taxation, 317, 557, 558.
- Rock Oysters, 466.
- Rocks, Geological Account of, 7.
- Rolling-stock—
- Railway, 293.
- Tramway, 302, 308.
- Roman Catholic Schools, 176.
- Romney Sheep, 405.
- Root Crops, 391, 394, 395.
- Ross Dependency, 2, 900–903.
- Bibliography, 957.
- Whaling, 903, 904.
- Rotorua Nursery, 459.
- Rotorua Thermal Springs, 873.
- Rural Advances, 588.
- Rural Intermediate Credit, 587–588.
- Rural Mail Deliveries, 337.
- Rural Mortgages, 706, 711, 723.
- Rural Mortgagors Final Adjustment Act, 380.
- Rural Population, 68.
- Country Quota, 42.
- Rye-grass, 396.
S.
- Sailing-vessels registered, 284.
- St. Helens Hospitals, 161.
- Salary and Wage Cuts, 761, 783.
- Salary and Wage Restoration, 762, 783.
- Sale of Food and Drugs, 151.
- Sales of State Timber, 458.
- Sales Tax, 567.
- Salmon, Acclimatization of, 469.
- Samoa (see Western Samoa).
- San Pablo (Palmerston) Island, 2, 889.
- Sanatoria, 138, 160, 875.
- Sanitary Plumbing, 151.
- Sanitation, 147–154.
- Sauce-factories, 517.
- Sausage-casings, Export of, 229, 230, 239, 241–242.
- Savai'i Island, 894.
- Savings-banks, 651, 652, 920.
- Sawmills, 456, 513, 519.
- Scaffolding Accidents, 820–828.
- Scenic Reserves, 347.
- Scheelite, 477.
- Schemes, Unemployment Relief, 806–810.
- Scholarships, 179, 183, 184, 484.
- School Committees, 170.
- School Journal, 174.
- School-children, 171–182, 907.
- Conveyance of, 174.
- Dental Treatment of, 154.
- Medical Inspection of, 153.
- Schools, 171–184.
- Dental Clinics, 154.
- Of Mines, 182, 484.
- Private, 176.
- Special, 180.
- School-teachers, 170, 175–179.
- Superannuation, 604.
- Scrub Lands, 347.
- Sea-fisheries, 464.
- Seals, 34, 467.
- Seamen Act, Shipping and, 779.
- Season Tickets, Railway, 297.
- Secondary Education, 171, 178, 907.
- Second-growth Land, 347.
- Secular System of Education, 169.
- Securities, Mortgage, 706.
- Seed-gardens, 346, 398.
- Seeds, Grass and Clover, 396–397.
- Certification of, 364.
- Exported, 229, 230, 240.
- Seismology, 10–14.
- Selections of Lands, 353, 355.
- Senior Cadets, 208, 211.
- Sentences on Criminals, 190–207, 908.
- Separate Rates, 616.
- Separation, Judicial, 104.
- Separators, Cream, 372.
- Service, Public (see Public Service).
- Service, War, 941.
- Service-car Licenses, 319, 322.
- Services—
- Air, 326.
- Army and Navy, 208–216.
- Sessions, Parliamentary, Successive, 927.
- Settlement Accounts, 552.
- Settlement and Colonization, 38.
- Settlement Conditions, Selections under, 353.
- Settlement of Industrial Disputes, 787, 816.
- Settlement of Undeveloped bands, 353.
- Settlement, Small-farm, 809.
- Settlement Surveys, 344.
- Settlements, Land for, 355.
- Settlers, Advances to, 581–589.
- Sex Proportions, 56.
- Sexes of Children born, 83–85.
- Share Prices, Index Numbers, 757–759.
- Sharebrokers' Licenses, 564.
- Shares in Building Societies, 693.
- Shares, Labour, 772.
- Shearing-machines on Farms, 372.
- Sheep, 403–406, 910.
- Sheep-farms, 346.
- Sheep-skins and Pelts exported, 239, 241–242.
- Sheet-metal Works, 520.
- Shipbuilding-works, 522.
- Shipping, 284–290.
- Shipping and Seamen Act, 779.
- Ships (see Vessels).
- Shoe-factories, 514, 518.
- Shoes, Consumption of Boots and, 841.
- Shops and Offices Act, 776.
- Short-time in Factories, 504, 505.
- Shortwave Broadcasts, 846.
- Sick Funds, 300, 484, 554, 689.
- Sickness, 136–146, 598–600, 689.
- Signals, Time, 846.
- Silver, 476.
- Corns, New Zealand, 657.
- Exported, 474.
- Silviculture, 451–452, 459, 463.
- Singapore Naval Base, 213.
- Sinking Funds, State, 578, 915.
- Skins, Export of, 239, 241–242.
- Slaughter of Animals for Food, 420–423.
- Slaughterhouses 364, 420–423.
- Slot Telephones 40.
- Sluicing, 474.
- Small Farms for Unemployment Relief, 809.
- Snares Islands, 1, 887.
- Snowfall, 21.
- Soap-factories, 518.
- Social Hygiene Regulations, 148.
- Social Welfare, 158.
- Softwood Trees, 454.
- Soil Surveys, 387.
- Solander Island, 1, 887.
- Soldiers, 208–212.
- Acquisition of Land by, 356.
- Financial Assistance to, 314, 585.
- Pensions, 594, 596, 598.
- War Bursaries for Dependents, 179.
- Source of Income, 727.
- South Africa, Reciprocity with, 274.
- South African War Pensions, 590, 598.
- Southern Alps, 3, 4.
- Sown Grasses, Extent of, 347, 390, 397.
- Spas, 872.
- Special Articles in Previous Issues, 958.
- Special Rates, 616.
- Special Reports, 50.
- Specie, Movement of, 224, 911.
- Specific Customs Duties, 265.
- Speed Limit, 318.
- Spinsters Marrying, 98.
- Spirits, Consumption of, 840.
- Spread in Price Levels, 369.
- Springs, Hot, 872.
- Staff Corps, 210.
- Stakes, Tax on, 565.
- Stamp Duties, 564.
- Estates certified for, 721.
- Standardized Death-rates, 111.
- Cancer, 127.
- Standardized Marriage-rates, 97.
- Standards, Administration of—
- Length, 344.
- Weights and Measures, 152.
- State Accident Insurance, 676.
- State Advances, 571, 581–589.
- Corporation, 582.
- Mortgagors in Arrears, 586.
- Transfer to Corporation, 356.
- State Afforestation, 459, 552.
- State Aid to—
- Aero Clubs, 331.
- Afforestation, 460.
- Building, 524–525.
- Crown Tenants, 352–353.
- Discharged Soldiers, 356, 553.
- Farming Industry, 382–383.
- Fruit Industry, 400–401.
- Housing, 524, 525.
- Immigrants, 62.
- Kauri-gum Industry, 480.
- Local Authorities, 621.
- Manufacturing, 486–487.
- Mining, 482–485.
- Prospecting, 483.
- Purchasers of Private Land, 356.
- Settlers, 581–589.
- Unemployed, 800–810.
- Water-power Development, 850.
- Wheat Growing, 392.
- Workers, 581–589.
- State Assets and Liabilities, 718.
- State Coal-mines, 479, 553.
- State Finance, 544–589, 915–916.
- State Fire Insurance, 686.
- State Forests, 449.
- State Highways, 312.
- State Housing, 524–525.
- State Indebtedness, 569–580, 915.
- State Insurance—
- Accident, 676.
- Fire, 686.
- Life, 671.
- State Lands (see Crown Lands).
- State Maternity Hospitals, 161.
- State Railways, 291–301, 922.
- State Schools, 172–186, 907.
- State Water-power Supply, 850.
- Statistical Authority, 45.
- Statistical Information, Latest [see Forefront of Book].
- Statistical Legislation, 44.
- Statistical Organization, 44–51.
- Statistical Publications—
- Bibliography, 44–51.
- Census and Statistics Department [facing p. 1], 44–48.
- Statistical Records, 44.
- Statistical Summary, 905–923.
- Status of Aliens, 64.
- Statute of Westminster, 40.
- Statutes of 1936, 877.
- Steam-vessels registered, 284.
- Sterling Exchange—
- Holdings of, 650.
- Rates, 661.
- Standard, 660.
- Sterling Values of New Zealand Currency, 661.
- Sterling Values of Trade, 217–223.
- Stewart Island, 1, 886.
- Oysters, 466.
- Population, 74.
- Still-births, 93–95, 119.
- Stipendiary Magistrates' Courts (see Courts).
- Stock, Live (see Live-stock).
- Stock, Quotations for, 575.
- Stone-quarries, 482.
- Stones, Building and Ornamental, 481.
- Stranding of Vessels, 290.
- Stratigraphy, 7.
- Street-cars, 302–308.
- Street-lighting, 852, 856.
- Streets and Roads, Length of, 309.
- Strength of Timbers, 452.
- Strikes, 789–790, 813–819.
- Stud Sheep, 404.
- Students, University, 171, 183, 907.
- Subdivision of Land, 355.
- Submarine Cable, 342.
- Subsidies, Main Highways, 313, 555.
- Subsidies on Rates, 621.
- Subsidies to Aero Clubs, 331–333.
- Subsidies to Farming Industry, 383.
- Subsidies to Hospital Boards, 156–159.
- Subsidized Employment, 806.
- Subsidized Prospecting, 483.
- Subsidized Roads on Goldfields, 484.
- Succession Duty, 562.
- Suffrage, 39, 43.
- Sugar Beet, 385.
- Sugar, Consumption of, 839.
- Sugar, Duty on, 265, 269.
- Suicide, 132, 188.
- Sulphur, 478.
- Baths, 873–877.
- Summary Convictions, 192, 908.
- Summer Time (Daylight Saving), 870.
- Sumner School for Deaf, 181, 182, 185.
- Sunday Island, 887.
- Sunshine, 20.
- Superannuation, 601–607.
- Superphosphates, Fixed Price for, 387, 739.
- Supreme Court (see Courts).
- Surpluses, 548.
- Surrenders, Life Insurance, 666, 668.
- Surtax, 264, 269.
- Preferential, 264, 272.
- Surveys, 344.
- Geological, 482.
- Of Ships, 290.
- Of Traffic, 320.
- Sustenance Allowances, 554, 566, 805, 806.
- Suwarrow Island, 2, 889.
- “Sweating”, 770.
- Sweepstakes, 870.
- Swordfish, 468.
- Sympathetic Strikes, 813–819.
- Syphilis, 148.
- Syrians, 61.
T.
- Table Mortgages, 583, 701, 704, 709.
- Takutea Island, 1, 889.
- Tallow exported, 238, 241–242, 912.
- Tanneries, 521.
- Taranaki Scholarships, 183.
- Tariff Commission, 263.
- Tariff, Customs, 263–278.
- Tasman's Discovery of New Zealand, 37.
- Tax, Land and Income, 386, 558–562, 733.
- Taxation, 556–568, 916.
- Customs, 269, 557.
- Employment Promotion, 554, 566.
- Local, 568, 616–620.
- Motor-spirits, 266, 317, 558.
- Orchards, 401.
- Racing, 565.
- Sales, 567.
- Unemployment, 554, 566.
- Taxis, 319.
- Taxpayers, Land and Income, 725–737.
- Te Aroha Spa, 875.
- Tea, Consumption of, 839.
- Tea, Duty on, 265, 269.
- Teachers, Public-school, 170, 175–179.
- Superannuation Fund, 604.
- Technical Education, 171, 180, 907.
- Telegraph Services, 339, 341.
- Telephones, 339, 340.
- Temperature Records, 15–24.
- Tenants, Relief of, 698.
- Tenure of Occupied Land, 346.
- Tenures, Selection Lands, 352–356.
- Terminating Building Societies, 692, 693.
- Terraces, Pink and White, 872.
- Territorial Forces, 209, 210.
- Thermal Regions, 872.
- Third-party Risks, 675.
- Three Kings Islands, 1, 886.
- Thunder, 21.
- Tile-making, 520.
- Timber—
- Carried on Railways, 298.
- Export, 229, 230, 240, 241–242, 457, 914.
- Export Duty, 267.
- Import, 457.
- Import Duty on, 266.
- Output, 456.
- Plantations, 449, 459–463.
- Resources, 449.
- Sales, 457, 458.
- State Activities, 458–459.
- Trees, 453–456.
- Timbers, Strength of, 452.
- Time lost—
- In Factories, 504.
- Through Industrial Accidents, 825.
- Through Industrial Disputes, 813.
- Time Signals and Mean Time, 846, 870.
- Tin, 477.
- Tinware-works, 520.
- Tire-tax, 314, 317, 558.
- Title, Certificates of, issued, 349.
- Titles, Compulsory Registration of, 348.
- Tobacco, 385, 391, 402.
- Consumption of, 839.
- Duty on, 265, 266, 269.
- Excise Duty on, 266, 269.
- Imports of, 248, 256.
- Tokelau Islands, 2, 897.
- Toll Communications, 339.
- Ton-miles—
- Motor-vehicles, 320.
- Railway, 299.
- Tonnage handled at Ports, 279–283.
- Tonnage of Registered Vessels, 284.
- Tonnage of Shipping, 284–289.
- Top-dressing, 398.
- Total Income, 730.
- Totalizator Taxation, 565.
- Tourist Agents Abroad, 932.
- Tourists, 58, 60.
- Tourists' Rail Tickets issued, 298.
- Town Districts, 610, 614–629.
- Capital and Unimproved Values, 636.
- Debt, 626.
- Mileage of Streets, 309.
- Population, 71, 75, 76.
- Town Land, Mortgages on, 706, 710.
- Town-planning, 618.
- Tractors on Farms, 372.
- Trade, 217–283, 911.
- Agreements, 272–278.
- Balance of, 217–224.
- Cook Islands, 891.
- Niue Island, 892.
- Representatives, 933.
- Volume of, 219.
- Western Samoa, 896.
- Trade-marks, 862.
- Trade-unions, 770, 796–799.
- Trading Accounts, 553.
- Trading Banks, 641–648.
- Trading Companies' Deposits, 653.
- Traffic—
- Accidents, 131, 324.
- Motor, 320–324, 327.
- Offences, 203.
- Railway, 327.
- Survey, 320.
- Tramway, 304, 308.
- Training of Defence Forces, 208.
- Training of Police Recruits, 189.
- Training of Teachers, 176, 185.
- Training-farm, Reformative, 198.
- Train-miles run, 296, 922.
- Tramway District, 612, 614–629.
- Tramways, 302–308.
- Accidents, 131, 324.
- Cable, 308.
- Transfer, Land, 347.
- Transfers between Accounts, 546.
- Transhipments of Cargo, 282–283.
- Transit Trade, 242–243, 282, 283.
- Trans-Pacific Air Service, 331.
- Transport, 284–336.
- Co-ordination Board, 322.
- District, Urban, 612, 614–629.
- Licensing Act, 321.
- Trans-Tasman Air Service, 331.
- Trans-Tasman Flights, 327.
- Travelling Scholarships, 183.
- Trawlers, 466.
- Treasury Bills, 570, 574, 647.
- Treaty of Waitangi, 38, 357.
- Tree-planting, 459–463.
- Trees, Indigenous, 31, 453–456.
- Trend of Population, 55.
- Triennial Parliaments, 42.
- Triplets, 84, 85.
- Tropical Diseases in Samoa, 895.
- Trout, Acclimatization of, 469–471.
- Trustee, Native, 360.
- Trustee, Public, 859.
- Trustee Savings-banks, 652, 655.
- Tuberculosis, 119–122, 125–126, 136, 137, 141, 147.
- Maori Deaths from, 134.
- Tung-oil Industry, 385, 398.
- Tungsten-ore, 473, 474, 477.
- Turkeys, 425.
- Turnips, 391, 396.
- Tussock Land, 347, 397.
- Twins and Triplets born, 84, 85.
U.
- Unclaimed Moneys, 651, 664.
- Undergraduates, 171, 183.
- Undesirable Immigrants Exclusion, 63.
- Undeveloped Land, Settlement of, 353.
- Undischarged Bankrupts, 712.
- Unemployment, 794, 800–812.
- Convictions under Employment Promotion Act, 191.
- Fund, 554.
- Small Farms Scheme, 386, 809.
- Taxation, 554, 566.
- Unimproved Occupied Land, 347.
- Unimproved Value of Land, 631–636.
- Holdings, 723, 724.
- Land-tax assessed on, 556, 560.
- Rating on, 616.
- Union (Tokelau) Islands, 2, 897.
- Unions, Trade, 770, 796–799.
- University Education, 171, 182–184, 907.
- University Professors, 183.
- Unproductive Land, 345, 347.
- Upolu Island, 894.
- Urban Areas, 68–72.
- Fire Losses, 684.
- Population, 68, 70, 72.
- Unemployed registered in, 803.
- Urban Drainage Districts, 611, 614–629.
- Urban Drift, 69.
- Urban Farm Lands, Rating on, 386, 616, 630.
- Urban Population, 68, 70, 72.
- Urban Security, Mortgages on, 706, 710.
V.
- Valuation of Exports, 217, 225.
- Valuation of Land, 630–636.
- Value added in Manufacturing, 498, 499.
- Value, in Sterling, of Dominion Trade, 217–224.
- Value of Currency, 660–662.
- Value of Exports, Effect of Prices, 243.
- Value of Land Holdings, 711, 723.
- Value of Production, 866.
- Value of State Property, 719.
- Veal slaughtered and exported, 423.
- Vegetables, Consumption of, 837.
- Vegetation, 24–33.
- Vehicles—
- Motor (see Motor-vehicles).
- Railway, 293.
- Tramway, 302, 308.
- Venereal Diseases, Control of, 148.
- Vessels—
- Employed in Fishing Industry, 466.
- Entered and cleared, 286.
- Nationality of, 285.
- Registered, 284.
- Survey of, 290.
- War, 213, 214.
- Wrecked, 290.
- Veterans' Allowances, War, 590, 597.
- Village-settlements, Tenures, 351.
- Vinegar-factories, 517.
- Vineyards, 347, 400.
- Violent Deaths, 131, 188, (See also Accidents.)
- Virgin Bush, Area of, 347, 449.
- Visible Trade-balance, 217–224.
- Visitors to New Zealand, 58.
- Vital Statistics, 80–146, 906.
- Cook Islands, 890.
- Niue Island, 892.
- Western Samoa, 895.
- Viticulture, 401.
- Volcanoes, 3, 9.
- Volume of Exports, 219, 243.
- Volume of Factory Production, 510–512.
- Volume of Farm Production, 367.
- Volume of Trade, 219.
- Voluntary Contributions to Hospitals, 156.
- Voluntary Mental Patients, 166.
- Volunteer Territorial Force, 208, 210.
- Voting—
- At General Elections, 868.
- At Licensing Polls, 868, 869.
- Qualifications, 43.
- Vouchers, Audit of, 544.
W.
- Wage, Basic, 764.
- Wage-rates, 494, 760–767, 781–782.
- Legislative Changes in, 782.
- Wages—
- And Working Conditions, 774–785.
- Lost through Industrial Accidents, 827.
- Lost through Industrial Disputes, 813.
- Of Afforestation Employees, 462.
- Of Building Employees, 537, 538.
- Of Electric-supply Employees, 854.
- Of Factory Employees, 489, 492–494.
- Protection of, 784.
- Reduction of, 761, 762, 784.
- Restoration of Cuts in, 762, 784.
- Waikaremoana Power-supply, 850, 851.
- Waikato Power-supply, 850, 851.
- Waipori Power-supply, 850, 851.
- Waitaki Power-supply, 850, 851.
- Waitangi, Treaty of, 38, 357.
- Waitangi Treaty Site, Gift of, 348.
- Wakari Private Mental Hospital, 168.
- War, 208, 211.
- Bursaries for Soldiers' Dependants, 179.
- Expenditure, 571.
- Indebtedness, 571.
- Pensions, 590, 596–598, 942.
- Service, 941–943.
- Taxation, 558.
- Veterans' Allowances, 597, 598.
- Warships, 213, 214.
- Water-power, 850–858.
- Waters, Mineral, 872.
- Water-supply Districts, 611, 614–629.
- Wealth, 718–724.
- Weather, 15–24.
- Weights and Measures, 152, 344.
- Wellington—
- Bankruptcies, 714.
- Broadcasting Stations, 845.
- Building Values, 531.
- Dwelling Construction Costs, 543.
- Fires, 683.
- Population, 72, 74.
- Rainfall, 16, 17, 24.
- Retail Prices, 741–747.
- Shipping, 281, 284–289.
- Sunshine, 20, 24.
- Temperature, 19, 24.
- Trade of Port, 279–283.
- Tramways, 302, 305–308.
- Unemployment, 803.
- Valuation of Land, 635.
- Wind, 21.
- Weraroa Training-farm, 182.
- Western Samoa, 2, 893–897.
- Bibliography of, 957.
- Naturalization, 65.
- Population of, 895.
- Radio-communications, 341.
- Westminster, Statute of, 40.
- Wethers, 404.
- Whale-oil, 903.
- World Production, 904.
- Whales, 34, 467, 903.
- Whaling, 34, 902–904.
- International Statistics, 904.
- Wheat, 391–393, 909.
- Consumption of, 393.
- Duty on, 373.
- Export of, 229, 230.
- Fixed Price for, 739.
- Research Institute, 387, 392.
- Restriction on Imports, 266.
- Whey Butter, 413.
- White Island Sulphur, 478.
- Whitebait, 467.
- Whole Milk, Consumption of, 835.
- Wholesale Licenses, 868.
- Wholesale Prices, 749–752, 755, 756.
- Widows—
- And Orphans, 114.
- Pensions for, 590, 593–594.
- Re-marriages of, 98.
- Wills administered by Public Trust Office, 859.
- Wind, 15, 21.
- Wine, Consumption of, 840.
- Wine Licenses, 868, 869.
- Wine-makers' Licenses, 869.
- Wintering off, 446.
- Wire (Telegraph), Miles of, 339.
- Wireless (see Radio).
- Withdrawals from Savings-banks, 651, 652, 920.
- Wives' Petitions in Divorce, 104.
- Women—
- Deaths of, in Childbirth, 128, 161.
- Offences by, 201.
- Suffrage for, 39, 43.
- Wage-rates of, 764.
- Working-hours of, 767–769.
- Wool, 406–409.
- Export Price Index, 753, 754.
- Exported, 226–245, 406, 912.
- Purchases of, 407.
- Stocks of, 408.
- Used at Local Mills, 408, 522.
- Woollen-mills, 514, 522.
- Woolpacks, Fixed Price for, 739.
- Wool-scouring Works, 521.
- Workers, Advances to, 582–587.
- Workers' Compensation, 673, 791–793, 821.
- Insurance, 673–674.
- Workers' Dwellings, 525, 584, 589, 785.
- Workers' Educational Association, 184.
- Workers' Unions, 770, 796–799.
- Workers' Weekly Railway Tickets, 298.
- Working Conditions, Wages and, 774–785.
- Working Railways Account, 294, 553.
- Working-costs on Dairy-farms, 447.
- Working-days lost through Industrial Disputes, 813.
- Working-hours, 767–769.
- Working-men's Clubs, 688.
- World Comparisons (see Comparisons).
- World's Gold-production, 476.
- World's Population, 78.
- World's Whale-catch, 904.
- Wrecks, 290.
Y.
- Yaws in Samoa, 895.
- Yields of Crops, 392–402, 909.
Z.
- Zoology, 33–36.