
Table of Contents
THIS issue of the Year-book contains as a special article (pages 860 to 935) the thesis on wages and working-hours in New Zealand, 1897-1919, presented by Mr. G. W. Clinkard, B.Com., F.R.E.S., for his honours degree in economics. In another special article Mr. Elsdon Best has given useful information concerning the topographical nomenclature of the Maori, a subject on which Mr. Best is well known as a leading authority.
In other respects the book is mainly on the lines of its predecessors, but new matters to which attention might be drawn are the section on repatriation and the reference to Samoa and Nauru Island in Section XXXIII. Some new census figures are given and discussed in Section III, and statistics of the influenza epidemic in Section IV. The results of the special licensing poll of April, 1919, are contained in Section X, and the scale of gratuities to members of the Expeditionary Force in Section XXXII. Two new subsections have been added to the section dealing with mining, one containing an account by Mr. P. G. Morgan, M.A., of the Geological Survey of New Zealand, and the other epitomizing the report of the Board of Trade on the coal industry.
A number of new diagrams have been added, as well as a reproduction of the map prepared by the Railway Department showing the position New Zealand would occupy if placed in its corresponding latitude in the Northern Hemisphere, but with east longitude (instead of west), for comparison with Mediterranean countries.
The book is somewhat larger than recent issues, due to the inclusion of the articles referred to above, but it is gratifying to be able to report that the volume is not so late in publication as its immediate predecessors.
J. W. BUTCHER, Acting Government Statistician.
Census and Statistics Office, Wellington, N.Z., 27th January, 1920.
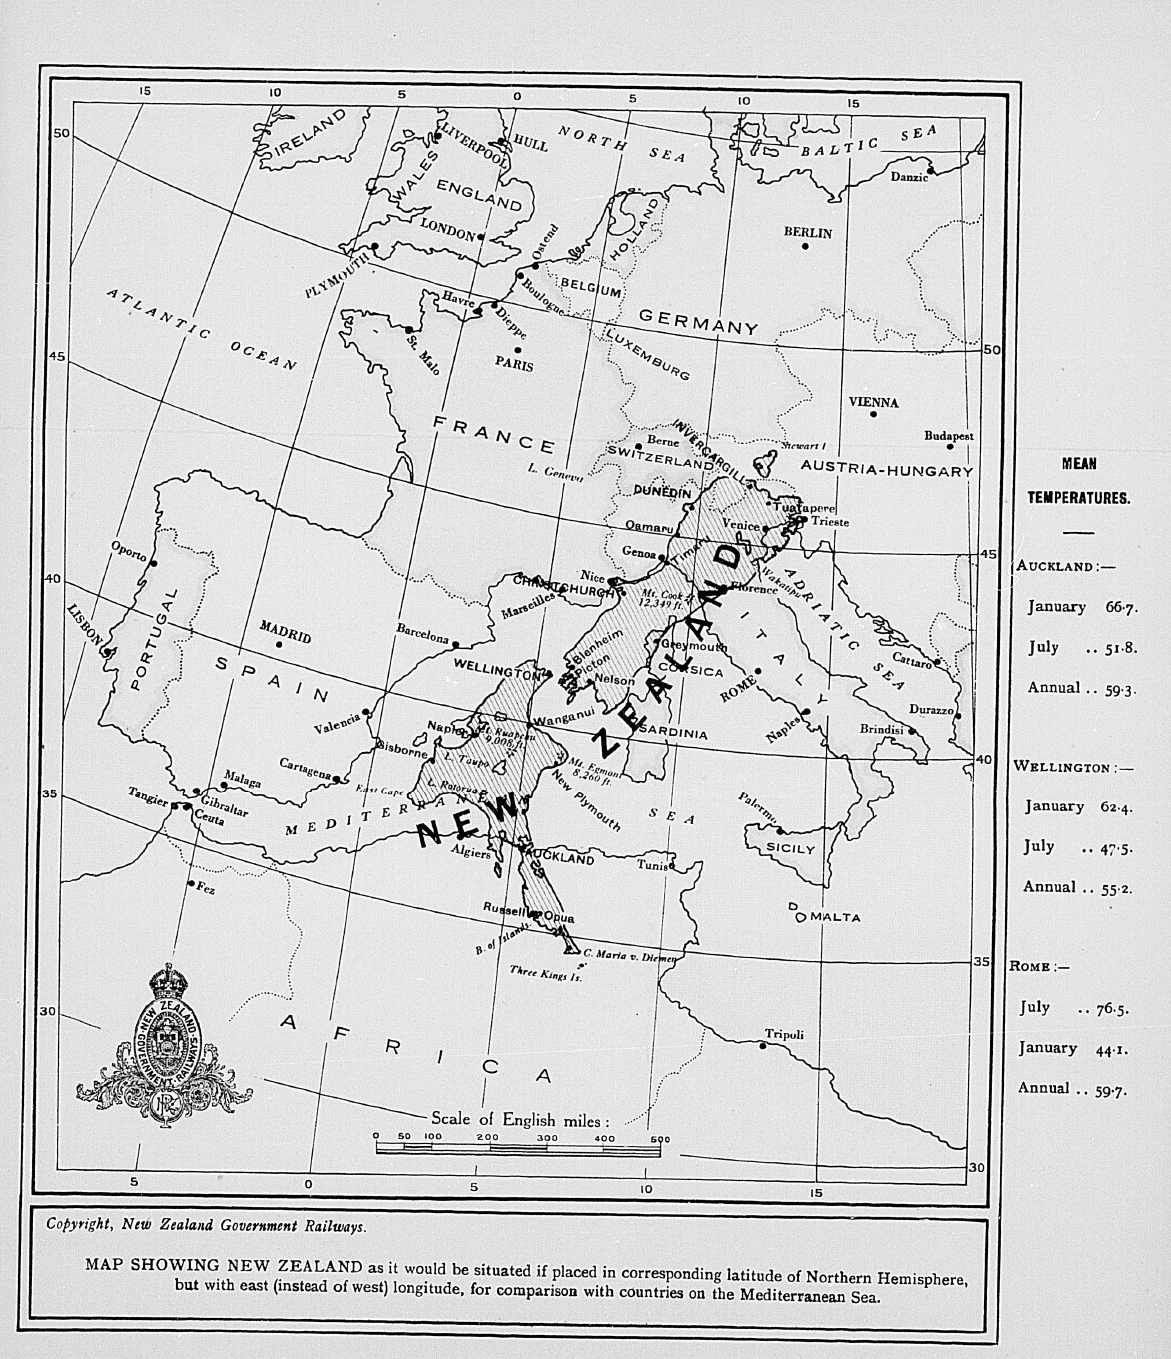
Table of Contents
THE Dominion of New Zealand consists of three main islands, with several groups of smaller islands lying at some distance from the principal group, The main islands, known as the North, the South, and Stewart Islands have a coast-line 4,330 miles in length: North Island, 2,200 miles; South Island, 2,000 miles; and Stewart Island, 130 miles. Other islands included within the Dominion are the Chatham, Auckland, Campbell, Snares, Antipodes, Bounty, and Kermadec Islands. The Cook Group of islands and certain neighbouring islands were included in the Dominion by Proclamation of the 10th June, 1901.
The total area of the Dominion proper (i.e., excluding the islands annexed in 1901) is 66292,232 acres, or 103,581 square miles. The land area of the Cook Group is about 150 square miles, and of the other islands annexed in 1901 about 130 square miles. Full information as to boundaries and area, together with descriptive matter relating to the physical features of the various portions of the Dominion, will be found in the 1913 issue of this book.
Facing this page is a map, reproduced by permission of the General Manager of the New Zealand Railways, showing the Dominion as it would be situated if placed in corresponding latitude of Northern Hemisphere, but with east instead of west longitude, for comparison with the principal European countries.
The geologic structure of New Zealand, so far as it has yet been determined is, owing to its complexity, difficult to summarize. For a fuller account than can be given here the reader is referred to the article in the 1914 Year-book, pages 943 to 947, and to the various works on geology mentioned therein.
The oldest fossiliferous rocks are the Ordovician argillites ("slates") of north-west Nelson and Preservation Inlet. At Baton River Silurian fossils, at Reefton Devonian fossils, and in the limestone near Nelson Carboniferous or Permo-Carboniferous fossils, show that these systems are all represented in the Palæozoic sequence. Included' in it are marble, sandstone, shale, greywacke, quartzite, schist, and gneiss. The auriferous lodes of the South Island are almost always found cutting through rocks of Palæozoic age.
Rocks belonging to the Mesozoic periods occur over a large area in both Islands. The Trias-Jura system of greywacke and argillite forms the main mountain-ranges, but contains few workable mineral deposits. It is fossiliferous in only a few localities, and cannot be easily subdivided.
While all these foregoing rocks were being deposited the New Zealand area was probably the foreshore of a great continent, but after the Trias-Jura sediments were deposited far-reaching changes, involving the breaking-up and disappearance of the continental land, took place. The New Zealand area was necessarily involved in these earth-movements, and as the result the existing strata were folded, broken, and raised above sea-level. After extensive denudation of its surface had taken place New Zealand was again, probably several times, depressed and elevated either in whole or in part. During the periods of subsidence Cretaceous and Tertiary strata were laid down. These contain all the workable coal-seams of the Dominion.
Pleistocene and Recent deposits are well represented by fluviatile, glacial, marine, and wind-blown material.
Plutonic rocks of various types, but mainly granitic, occupy a large area in the western parts of the South Island and occur also in North Auckland. Volcanic rocks, chiefly of Tertiary age, are found in scattered areas throughout the eastern part of the South Island, and occur extensively in the North Island, where volcanic activity still continues on a small scale.
The rivers of New Zealand were discussed in the 1914 issue of this book in an article (pages 948 to 956) supplied by R. Speight, Esq., M.Sc, F.G.S., Curator of the Canterbury Museum. Considerations of space in the present book prevent more than a list of the more important rivers being given. These are as follows, the lengths shown being in most cases only approximate. Very few of these rivers are navigable by vessels of any size.
NORTH ISLAND .
| Miles. | |
|---|---|
| Flowing into the Pacific Ocean— | |
| Piako | 60 |
| Waihou or Thames | 90 |
| Rangitaiki | 95 |
| Whakatane | 60 |
| Waiapu | 55 |
| Waipaoa | 50 |
| Wairoa | 50 |
| Mohaka | 80 |
| Ngaururoro | 85 |
| Tukituki | 65 |
| Flowing into Cook Strait— | |
| Ruamahanga | 70 |
| Hutt | 35 |
| Otaki | 30 |
| Manawatu (tributaries: Pohangina and Tiraumea) | 100 |
| Rangitikei | 115 |
| Turakina | 65 |
| Wangaehu | 85 |
| Wanganui (tributaries: Ohura, Tangarakau, and Maunganui-te-ao) | 140 |
| Waitotara | 50 |
| Patea | 65 |
| Flowing into Tasman Sea— | |
| Waitara (tributary: Maunganui) | 65 |
| Mokau | 75 |
| Waikato (tributary: Waipa) | 220 |
| Wairoa | 95 |
| Hokianga | 40 |
SOUTH ISLAND .
| Flowing into Cook Strait— | Miles. |
|---|---|
| Aorere | 45 |
| Takaka | 45 |
| Motueka | 75 |
| Wai-iti | 30 |
| Pelorus | 40 |
| Wairau (tributary: Waihopai) | 105 |
| Awatere | 70 |
| Flowing into the Pacific Ocean— | |
| Clarence (tributary: Acheron) | 125 |
| Conway | 30 |
| Waiau (tributary; Hope) | 110 |
| Hurunui | 90 |
| Waipara | 40 |
| Ashley | 55 |
| Waimakariri (tributaries: Bealey, Poulter, Esk, and Broken River) | 93 |
| Selwyn | 55 |
| Rakaia (tributaries: Mathias, Wilberforce, Acheron, and Cameron) | 95 |
| Ashburton | 67 |
| Rangitata | 75 |
| Opihi | 50 |
| Pareora | 35 |
| Waihao | 45 |
| Waitaki (tributaries: Tasman, Tekapo, Ohau, Ahuriri, and Hakataramea) | 135 |
| Kakanui | 40 |
| Shag | 45 |
| Taieri | 125 |
| Clutha (tributaries: Kawarau, Makarora, Hunter, Manuherikia, and Pomahaka) | 210 |
| Flowing South into Foveaux Miles. Strait— | |
| Mataura | 120 |
| Oreti | 105 |
| Aparima | 65 |
| Waiau (tributaries: Mararoa, Clinton, and Monowai) | 115 |
| Flowing into the Tasman Sea— | |
| Cleddau and Arthur | 20 |
| Hollyford | 50 |
| Cascade | 40 |
| Arawata | 45 |
| Haast (tributary: Lands-borough) | 60 |
| Karangarua | 30 |
| Fox | 25 |
| Waiho | 20 |
| Wataroa | 35 |
| Wanganui | 35 |
| Waitaha | 25 |
| Hokitika (tributary: Kokatabi) | 40 |
| Arahura | 35 |
| Taramakau (tributaries: Otira and Taipo) | 45 |
| Grey (tributaries: Ahaura, Arnold, and Mawhera-iti) | 75 |
| Buller (tributaries: Matakitaki, Maruia, and Inangahua) | 105 |
| Mokihinui | 30 |
| Karamea | 45 |
| Heaphy | 25 |
In a further article in the 1915 issue of the Year-book Mr. Speight dealt at length with the lakes of the Dominion. A summary of the statistics of the chief lakes of New Zealand is here given:—
| Lake. | Length, in Miles. | Greatest Breadth, in Miles. | Area, in Square Miles. | Drainage Area, in Square Miles. | Approximate Volume of Discharge, in Cubic Feet per Second. | Height above Sea-level, in Feet. | Greatest Depth, in Feet. |
|---|---|---|---|---|---|---|---|
| North Island. | |||||||
| Taupo | 25 | 17 | 238 | 995 | 5,000 | 1,211 | 534 |
| Rotorua | 7 1/2 | 6 | 32 | 158 | 420 | 915 | 84 |
| Rotoiti | 10 3/4 | 2 1/4 | 14 | 26 | 500 | 913 | 230 |
| Tarawera | 6 1/2 | 6 1/2 | 15 | 75 | .. | 1,032 | 285 |
| Waikaremoana | 12 | 6 1/4 | 21 | 128 | 772 | 2,015 | 846 |
| Wairarapa | 10 | 4 | 27 | 1,250 | .. | .. | .. |
| Lake. | Length, in Miles. | Greatest Breadth, in Miles. | Area, in Square Miles. | Drainage Area, in Square Miles. | Approximate Volume of Discharge, in Cubic Feet per Second. | Height above Sea-level, in Feet. | Greatest Depth, in Feet. |
|---|---|---|---|---|---|---|---|
| South Island. | |||||||
| Rotoiti | 5 | 2 | 2 3/4 | 86 | .. | 1,997 | 228 |
| Rotoroa | 7 | 2 1/2 | 8 | 146 | .. | 1,470 | .. |
| Brunner | 5 | 4 | 16 | 145 | .. | 280 | 357 |
| Kanieri | 5 | 1 3/4 | 8 | 11 | .. | 422 | 646 |
| Coleridge | 11 | 3 | 18 | 70 | .. | 1,667 | 680 |
| Tekapo | 12 | 4 | 32 | 580 | 5,000 | 2,323 | .. |
| Pukaki | 10 | 5 | 31 | 515 | 6,000 | 1,588 | .. |
| Ohau | 10 | 3 | 23 | 424 | 5,000 | 1,720 | .. |
| Hawea | 20 | 5 | 48 | 518 | 5,700 | 1,062 | .. |
| Wanaka | 30 | 4 | 75 | 960 | .. | 922 | .. |
| Wakatipu | 52 | 3 | 112 | 1,162 | 13,000 | 1,016 | 1,242 |
| Te Anau | 33 | 6 | 132 | 1,320 | 12,660 | 694 | 906 |
| Manapouri | 12 | 6 | 56 | 416 | .. | 596 | 1,458 |
| Monowai | 12 | 1 | 12 | 51 | 700 | 600 | .. |
| Hauroko | 20 | 3 | 25 | 195 | 1,800 | 611 | .. |
| Poteriteri | 17 | 2 | 17 | 162 | .. | 96 | .. |
| Waihola | 4 1/2 | 1 1/8 | 3 1/3 | 2,200 | .. | (Tidal) | .. |
| Ellesmere | 16 | 10 | 107 1/2 | 745 | .. | (Tidal) | .. |
In the 1913 issue of the Year-book (pages 32 to 34) appears a short account of the Flora of New Zealand, supplied by Dr. L. Cockayne, F.R.S. The article covers briefly the various points of interest in connection with the flora of the main Islands, and deals also with that of the outlying islands.
For information re the fauna of New Zealand the reader is referred to the article by James Drummond, Esq., F.L.S., F.Z.S., appearing on pages 957 to 961 of the Year-book for 1914. The article, though brief, contains a fairly comprehensive account of the Dominion's fauna.
The 1915 issue of this book contains considerable information concerning the history and Constitution of New Zealand, with lists of successive occupants of important offices. Particulars as to present occupants only (30th June. 1919) are given in the following pages.
GOVERNOR -GENERAL OF NEW ZEALAND .
The designation of "Governor," formerly borne by His Majesty's Representative in New Zealand, was altered in 1917 to "Governor-General." The Earl of Liverpool, who had held office as Governor since 19th December, 1912, was sworn in as the first Governor-General on 28th June, 1917.
Liverpool, His Excellency the Right Honourable Arthur William de Brito Savile, Fifth Earl of Liverpool. Born 27th May, 1870; succeeded 1907. Educated at Eton and the Royal Military College, Sandhurst. Formerly Major in the Rifle Brigade (the Prince Consort's Own), and subsequently Major of its 6th Battalion. Sometime an A.D.C. to the Lord Lieutenant of Ireland (Earl Cadogan, K.G.), and Staff Captain, Dublin District. Is a J.P. for Kesteven and Lindsey Divisions of Lincolnshire, and Lieut.-Colonel 8th Battalion London Regiment (the Post Office Rifles). Served in South Africa, 1901-2 (Queen's Medal with three clasps). Was State Steward and Chamberlain to the Lord Lieutenant of Ireland (the Earl of Aberdeen, K.T., G.C.M.G.), 1906-8. Comptroller of His Majesty's Household, 1909-12. Appointed Governor and Commander-in-Chief of the Dominion of New Zealand, 1912. Appointed Governor-General and Commander-in-Chief of New Zealand, 1917. M.V.O., 4th Class, 1900; K.C.M.G., 1912; G.C.M.G., 1914; P.C., 1917; G.B.E., 1918.
Seat: Hartsholme Hall, Lincoln.
London residence: 44 Grosvenor Gardens, S.W.
Residences: Government House, Wellington; Government House, Auckland.
Private Secretary: Gavin M. Hamilton, Esq.
Official Secretary: A. Cecil Day, Esq., C.B.E.
Aides-de-Camp: Captain A. T. G. Rhodes, Grenadier Guards; Honorary Lieutenant H. G. Helmore, M.B.E.; Lieutenant H. G. de P. Garland, M.C., Canterbury Yeomanry Cavalry; Lieutenant E. W. J. Millton, 13th North Canterbury and Westland Regiment.
Extra Aide-de-Camp: Lieut.-Colonel J. H. Boscawen.
Honorary Aides-de-Camp: Colonel R. J. Collins, C.M.G., I.S.O., V.D.; Major-General Sir A. H. Russell, K.C.B., K.C.M.G.,; Colonel R. Logan, C.B.; Colonel J. C. Nichols, C.B.E., V.D.; Colonel G. P. C. Campbell, C.M.G., V.D.; Colonel R. A. Chaffey, C.B.E., V.D.
EXECUTIVE COUNCIL , 1919.
The Executive Council now consists of:—
Right Hon. W. F. Massey, P.C., Prime Minister, Minister of Labour, Minister of Industries and Commerce, Minister in Charge of Imperial Government Supplies, Valuation, and Electoral Departments, and Chairman Repatriation Department.
Right Hon. Sir J. G. Ward, Bart., P.C., K.C.M.G., Minister of Finance, Postmaster-General and Minister of Telegraphs, Minister in Charge of Land and Income Tax, State Advances, Public Trust, and Government Life and Accident Insurance Departments.
Hon. Sir James Allen, K.C.B., Minister of Defence and Minister in Charge of War Pensions.
Hon. W. H. Herries, Minister of Railways and Native Minister.
Hon. Sir W. Fraser, Kt. Bach., Minister of Public Works and Minister in Charge of Roads Department.
Hon. G. W. Russell, Minister of Internal Affairs, Minister of Public Health, Minister in Charge of Hospitals and Charitable Aid, Mental Hospitals, Printing and Stationery, High Commissioner's, Audit, Museum, Registrar-General's, Census and Statistics, and Laboratory Departments.
Hon. A. M. Myers, Minister of Customs, and Minister in Charge of Munitions and Supplies, Pensions, Advertising, and National Provident Fund Departments.
Hon. Sir F. H. D. Bell, K.C.M.G., K.C., Attorney-General, Minister of Immigration, Commissioner of State Forests, and Leader of the Legislative Council.
Hon. W. D. S. MacDonald, Minister of Agriculture, Minister of Mines, Minister in Charge of Legislative, Public Buildings, State Fire Insurance, and Tourist and Health Resorts Departments.
Hon. J. A. Hanan, Minister of Education and Minister in Charge of Friendly Societies Department.
Hon. T. M. Wilford, Minister of Justice, Minister of Marine, Minister of Stamp Duties, Minister in Charge of Police, and Inspection of Machinery Departments.
Hon. D. H. Guthrie, Minister of Lands, Minister in Charge of Land for Settlements and Scenery Preservation Departments.
Hon. Dr. M. Pomare, Member of the Executive Council representing the Native Race, Minister of the Cook Islands, and in Charge of Maori Councils.
Clerk of the Executive Council—F. D. Thomson (acting).
Speaker—Hon. W. C. F. CARNCROSS .
Chairman of Committees—Hon. O. SAMUEL .
| Name. | Provincial District. | Date of Appointment. |
|---|---|---|
* Life member. †Since reappointed, July, 1919. | ||
| Aitken, Hon. John Guthrie Wood | Wellington | 14 July, 1914. |
| Alison, Hon. Ewen William | Auckland | 7 May, 1918. |
| Baillie, Hon. Colonel William Douglas Hall | Marlborough | 8 March, 1861.* |
| Barr, Hon. John | Canterbury | 22 January, 1914. |
| Bell, Hon. Sir Francis Henry Dillon, K.C.M.G., K.C. | Wellington | 10 July, 1912.‡ |
| Buchanan, Hon. Sir Walter, Kt. Bach. | Wellington | 23 June, 1915. |
| Carncross, Hon. Walter Charles Frederick | Taranaki | 17 March, 1917. |
| Carson, Hon. Gilbert | Wellington | 14 July, 1914. |
| Collins, Hon. Colonel William Edward, C.M.G. | Wellington | 14 July, 1914. |
| Earnshaw, Hon. William | Wellington | 26 June, 1913. |
| Fisher, Hon. John | Auckland | 14 July, 1914. |
| Fleming, Hon. David Thomas | Otago | 7 May, 1918. |
| Garland, Hon. George Joseph | Auckland | 7 May, 1918. |
| Geddis, Hon. William John | Wellington | 7 May, 1918. |
| Gow, Hon. James Burman | Auckland | 7 May, 1918. |
| Grimmond, Hon. Joseph | Westland | 7 May, 1918. |
| Hall-Jones, Hon. Sir William, K.C.M.G. | Wellington | 7 October, 1913. |
| Hardy, Hon. Charles Albert Creery | Canterbury | 26 June, 1913. |
| Harris, Hon. Major Benjamin | Auckland | 15 February, 1918. |
| Hawke, Hon. Archibald Fotheringham | Otago | 7 May, 1918. |
| Izard, Hon. Charles Hayward | Wellington | 7 May, 1918. |
| Jones, Hon. George | Otago | 7 May, 1918. |
| Louisson, Hon. Charles | Canterbury | 7 May, 1918. |
| MacGibbon, Hon. Thomas | Otago | 14 July, 1914. |
| MacGregor, Hon. John | Otago | 14 July, 1914. |
| Michel, Hon. Henry Leslie | Westland | 7 May, 1918. |
| Moore, Hon. Richard | Canterbury | 14 July, 1914. |
| Patuki, Hon. John Topi | Otago | 7 May, 1918. |
| Paul, Hon. John Thomas | Otago | 22 January, 1914. |
| Samuel, Hon. Oliver | Taranaki | 14 July, 1914. |
| Simpson, Hon. Robert Kirkpatrick | Wellington | 14 July, 1914. |
| Sinclair, Hon. Sir John Robert, Kt. Bach. | Otago | 7 May, 1918. |
| Stewart, Hon. William | Auckland | 7 May, 1918. |
| Thomson, Hon. George Malcolm | Otago | 7 May, 1918. |
| Triggs, Hon. William Henry | Canterbury | 7 May, 1918. |
| Tukino, Hon. Te Heuheu | Wellington | 7 May, 1918. |
| Wigram, Hon. Henry Francis | Canterbury | 7 May, 1918. |
Speaker—Hon. Sir FREDERIC WILLIAM LANG , Kt. Bach.
Chairman of Committees—ALEXANDER SCOTT MALCOLM .
| Name. | Electoral District. | Date of Election. |
|---|---|---|
| For European Electorates. | ||
| Allen, Hon. Sir James, K.C.B. | Bruce | 10 December, 1914. |
| Anderson, George James | Mataura | 10 December, 1914. |
| Anstey, John | Waitaki | 10 December, 1914. |
| Bollard, Richard Francis | Raglan | 10 December, 1914. |
| Brown, John Vigor | Napier | 10 December, 1914. |
| Buddo, Hon. David | Kaiapoi | 10 December, 1914. |
| Carroll, Hon. Sir James, K.C.M.G. | Gisborne | 10 December, 1914. |
| Coates, Joseph Gordon | Kaipara | 10 December, 1914. |
| Colvin, James | Buller | 10 December, 1914. |
| Craigie, James | Timaru | 10 December, 1914. |
| Dickie, William James | Selwyn | 10 December, 1914. |
| Dickson, James McColl | Chalmers | 10 December, 1914. |
| Dickson, James Samuel | Parnell | 10 December, 1914. |
| Ell, Henry George | Christchurch South | 10 December, 1914. |
| Field, Thomas Andrew Hemming | Nelson | 10 December, 1914. |
| Field, William Hughes | Otaki | 10 December, 1914. |
| Findlay, Hon. Sir John George, K.C.M.G. | Hawke's Bay | 8 March, 1917. |
| Forbes, George William | Hurunui | 10 December, 1914. |
| Eraser, Peter | Wellington Central | 3 October, 1918. |
| Fraser, Hon. Sir William, Kt. Bach. | Wakatipu | 10 December, 1914. |
| Glover, Albert Edward | Auckland Central | 10 December, 1914. |
| Guthrie, Hon. David Henry | Oroua | 10 December, 1914. |
| Hanan, Hon. Josiah Alfred | Invercargill | 10 December, 1914. |
| Harris, Alexander | Waitemata | 10 December, 1914. |
| Herries, Hon. William Herbert | Tauranga | 10 December, 1914. |
| Hine, John Bird | Stratford | 10 December, 1914. |
| Holland, Henry Edmund | Grey | 29 May, 1918. |
| Hornsby, John Thomas Marryat | Wairarapa | 10 December, 1914. |
| Hudson, Richard Phineas | Motueka | 10 December, 1914. |
| Hunter, George | Waipawa | 10 December, 1914. |
| Isitt, Leonard Monk | Christchurch North | 10 December, 1914. |
| Jennings, William Thomas | Taumarunui | 15 June, 1915. |
| Lang, Hon. Sir Frederic William, Kt. Bach. | Manukau | 10 December, 1914. |
| Lee, Ernest Page | Oamaru | 10 December, 1914. |
| Luke, John Pearce, C.M.G. | Wellington North | 28 February, 1918. |
| McCallum, Richard | Wairau | 10 December, 1914. |
| McCombs, James | Lyttelton | 10 December, 1914. |
| MacDonald, Hon. William Donald Stuart | Bay of Plenty | 10 December, 1914. |
| Malcolm; Alexander Scott | Clutha | 10 December, 1914. |
| Mander, Francis | Marsden | 10 December, 1914. |
| Massey, Right Hon. William Ferguson, P.C. | Franklin | 10 December, 1914. |
| Myers, Hon. Arthur Mielziner | Auckland East | 10 December, 1914. |
| Nash, James Alfred | Palmerston | 19 December, 1918. |
| Newman, Alfred Kingcome | Wellington East | 10 December, 1914. |
| Newman, Edward | Rangitikei | 10 December, 1914. |
| Nosworthy, William | Ashburton | 10 December, 1914. |
| Name. | Electoral District. | Date of Election. |
|---|---|---|
* Returned unopposed. Writs returnable 17th April, 1917. | ||
| Parr, Christopher James, C.M.G. | Eden | 10 December, 1914. |
| Payne, John | Grey Lynn | 10 December, 1914. |
| Pearce, George Vater | Patea | 10 December, 1914. |
| Poland, Hugh | Ohinemuri | 10 December, 1914. |
| Poole, Charles Henry | Auckland West | 10 December, 1914. |
| Reed, Vernon Herbert | Bay of Islands | 10 December, 1914. |
| Rhodes, Hon. Robert Heaton | Ellesmere | 10 December, 1914. |
| Rhodes, Thomas William | Thames | 10 December, 1914. |
| Russell, Hon. George Warren | Avon | 10 December, 1914. |
| Scott, Robert | Otago Central | 10 December, 1914. |
| Seddon, Thomas Edward Youd | Westland | 10 December, 1914. |
| Semple, Robert | Wellington South | 19 December, 1918. |
| Sidey, Thomas Kay | Dunedin South | 10 December, 1914. |
| Smith, George Harold | Pahiatua | 17 August, 1916. |
| Smith, Sydney George | Taranaki | 10 October, 1918. |
| Smith, Robert William | Waimarino | 10 December, 1914. |
| Statham, Charles Ernest | Dunedin Central | 3 February, 1915. |
| Stewart, William Downie | Dunedin West | 10 December, 1914. |
| Sykes, George Robert | Masterton | 10 December, 1914. |
| Talbot, Charles John | Temuka | 10 December, 1914. |
| Thacker, Henry Thomas Joynt | Christchurch East | 10 December, 1914. |
| Thomson, John Charles | Wallace | 10 December, 1914. |
| Veitch, William Andrew | Wanganui | 10 December, 1914. |
| Walker, Andrew | Dunedin North | 10 December, 1914. |
| Ward, Right Hon. Sir Joseph George, Bart., P.C., K.C.M.G. | Awarua | 10 December, 1914. |
| Wilford, Hon. Thomas Mason | Hutt | 10 December, 1914. |
| Wilkinson, Charles Anderson | Egmont | 10 December, 1914. |
| Witty, George | Riccarton | 10 December, 1914. |
| Wright, Robert Alexander | Wellington Suburbs and Country District | 10 December, 1914. |
| Young, James Alexander | Waikato | 10 December, 1914. |
| For Maori Electorates. | ||
| Tau Henare | Northern Maori | 11 December, 1914. |
| Ngata, Hon. Apirana Turupa | Eastern Maori | 11 December, 1914. |
| Pomare, Hon. Maui | Western Maori | 11 December, 1914. |
| Uru, John Hopere Wharewiti | Southern Maori | 21 February, 1918. |
Isaac Earl Featherston, Esq., appointed Agent-General under the Immigration and Public Works Act, 1870, by Warrant dated 5th April, 1871. Appointment to date from 25th March, 1871. (Gazette , 1871, page 155.)
(Note.—Sir W. Tyrone Power was appointed on 20th June, 1876, by the Crown Agents as temporary Agent-General on the death of Dr. Featherston.)
Sir Julius Vogel, K.C.M.G., appointed Agent-General under the Immigration and Public Works Act, 1870, by Warrant dated 19th September, 1876. Appointment to date from 9th September, 1876, vice I. E. Featherston, deceased. (Gazette , 1876, page 721.)
Sir Francis Dillon Bell, appointed Agent-General under the Public Revenues Act, 1878, by Warrant dated 7th December, 1880, vice Sir Julius Vogel, resigned. (Gazette , 1881, page 311.)
Westby Brook Perceval, Esq., appointed Agent-General under the Public Revenues Act, 1891, by Warrant dated 25th September, 1891, vice Sir F. D. Bell. (Gazette , 1891, page 1071.)
The Hon. William Pember Reeves, appointed Agent-General under the Public Revenues Act, 1891, by Warrant dated 23rd December, 1895, vice Sir W. B. Perceval. (Gazette , 1896, page 50.) Appointed High Commissioner under the High Commissioner Act, 1904, by Warrant dated 14th June, 1905. (Gazette , 1905, page 1509.) Reappointed High Commissioner as from 14th June, 1908. (Gazette , 1908, page 1921.)
The Hon. Sir William Hall-Jones, K.C.M.G., appointed High Commissioner from 1st December, 1908, vice Hon. W. P. Reeves. Assumed office 18th, January, 1909. (Gazette , 1909, page 27.) Appointment extended to 31st December, 1911. (Gazette , 1911, page 2720.) Appointment further extended to 31st March, 1912. (Gazette , 1912, page 45.) Appointment further extended to 31st May, 1912. (Gazette , 1912, page 1227.)
Charles Frederick Wray Palliser, appointed High Commissioner from 1st June, 1912, for one month. Reappointed from 1st July, 1912, and again reappointed from 1st August, 1912.
The Hon. Sir Thomas Mackenzie, K.C.M.G., LL.D., appointed High Commissioner from 23rd August, 1912, for a term of three years. (Gazette , 1912, page 2612.) Assumed office 9th October, 1912. Reappointed from 22nd August, 1915. (Gazette , 1915, page 2283.) Further reappointed for several short terms. Offices: Strand, London W.C.
(Downing Street, London S.W.)
Principal Secretary of State for the Colonies—The Viscount Milner, P.C., G.C.B., G.C.M.G.
Parliamentary Under-Secretary—L. C. M. S. Amery, M.P.
Permanent Under-Secretary—Sir George Vandeleur Fiddes, G.C.M.G., C.B.
Assistant Under-Secretaries—Sir H. J. Read, K.C.M.G., C.B., M.A.; H. C. M. Lambert, C.B., B.A. (acting); and G. E. A. Grindle, C.M.G., M.A. (acting).
CROWN AGENTS FOR THE COLONIES .
(City Office, Whitehall Gardens, S.W.; Stock Transfer Office, 1 Tokenhouse Buildings, E.C.; Shipping Office, 13 Great St. Helens, E.C.; Packing Store, Cole Abbey Chambers, Lambeth Hill, E.C.; Colonial Stamp Department, 8 Errol Street, Bunhill Row, E.C.)
Crown Agents — Major Sir Maurice Alexander Cameron, K.C.M.G., late R.E.; and Sir William Hepworth Mercer, K.C.M.G.
TRADE COMMISSIONERS .
H.M. Trade Commissioners.
New Zealand—R. W. Dalton, P.O. Box 369, 11 Grey Street, Wellington (telegraphic address, "Advantage"). Australia—S. W. B. McGregor, Commerce House, Flinders Street, Melbourne (telegraphic address, "Combrit"), and Major G. Fetherston, D.S.O., M.C., Royal Exchange, Sydney (telegraphic address, "Combritto"). Canada and Newfoundland—G. T. Milne, O.B.E., 367 Beaver Hall Square, Montreal (telegraphic address, "Britcom"); F. W. Field, 257-260 Confederation Life Buildings, Toronto (telegraphic address, "Toroncom"); L. B. Beale, care of W. J. Healy, Esq., Free Press Building, Winnipeg. South Africa—J. L. Wilson-Goode, P.O. Box 1346, Norwich Union Buildings, St. George's Street, Cape Town (telegraphic address, "Austere").; W. G. Wickham, P.O. Box 839, Johannesburg. India and Ceylon—T. M. Ainscough, O.B.E., McLeod House, 28 Dalhousie Square, Calcutta (telegraphic address, "Ainscough").
Imperial Trade Correspondents.
A. J. Denniston, Auckland; W. T. Monkman, Dunedin.
Trade Commissioner for the Dominion of Canada.
W. A. Beddoe, Auckland.
CONSULS OF FOREIGN COUNTRIES RESIDING IN , OR WITH JURISDICTION OVER , NEW ZEALAND , 30TH JUNE , 1919.
Argentine Republic.—Vice-Consul: H. H. Rayward, Wellington.
Belgium.—Hon. Consul (with jurisdiction over New Zealand): M. Balthazar (acting), Sydney. Vice-Consul: G. F. Johnston, Wellington. Consul (with jurisdiction over the Districts of Canterbury, Marlborough, Nelson, and Westland): Sir J. J. Kinsey, Kt. Bach., Christchurch. Consuls: A. M. Ferguson, Auckland; G. L. Denniston, Dunedin. Vice-Consul: C. R. J. Ward, Christchurch.
Brazil.—Vice-Consul: A. H. Miles, Wellington.
Chile.—Consul-General for Commonwealth of Australia and New Zealand: William Brown, Sydney. Consuls: E. A. Craig, Auckland; J. Montgomery, Christchurch. Honorary Consul: J. A. Roberts, Dunedin. Acting-Consul: H. L. Nathan, Wellington.
China.—Consul: Lin Shih Yuan, Wellington.
Denmark.—Consul-General for Australia and New Zealand: Otto Wadsted, San Francisco. Consul (for North Island): Hon. Sir F. H. D. Bell, K.C.M.G., Wellington (Principal Consulate). Consul (for South Island): H. B. Sorensen, Christchurch. Vice-Consuls: Robert Millar, Auckland (acting); W. E. Perry, Hokitika; O. H. Möller, Dunedin; Michael Myers, Wellington.
France.—Vice-Consul: Leon Hippeau, Auckland. Consular Agents: George Humphreys, Christchurch; James Macintosh, Wellington; S. E. D. Neill, Dunedin.
Greece.—Vice-Consul (for New Zealand): J. F. Dyer, Wellington.
Honduras.—Consul-General for Commonwealth of Australia and New Zealand: Frederic Walsh, Sydney.
Italy.—Consul-General for Commonwealth of Australia, New Zealand, and Fiji: E. Lauwers (acting), Melbourne. Consular Agents: Joseph Wallace, Christchurch; L. O. H. Tripp, Wellington; John Roberts, C.M.G., Dunedin; Geraldo Perotti, Greymouth; Giovanni (J. H.) Pagni, Auckland.
Japan.—Consul-General: S. Shimizu, Sydney. Consuls: H. D. Heather, Auckland; Thomas Young, Wellington.
Liberia.—Consul: Charles Louisson, Christchurch. Acting-Consul: T. N. Holmden, Wellington.
Mexico.—Consul: J. W. Hall, Auckland.
Netherlands.—Consul-General for Commonwealth of Australia, New Zealand, and Fiji: W. L. Bosschart, Melbourne. Vice-Consul de Carriere, attached to Consulate-General, P. A. van Buttingha Wichers, Melbourne. Consul with jurisdiction over New Zealand: W. G. Johnston, Wellington. Vice-Consuls: George Ritchie, Dunedin; M. Copeland, Auckland; G. Van der Velden, Christchurch.
Norway.—Consul-General for Commonwealth of Australia, New Zealand, and the adjacent islands: Finn Koren, Melbourne. Consul: A. W. Newton, Wellington. Vice-Consuls: Sigurd Bentzon, Melbourne; Robert Millar, Auckland; George Jameson, Christchurch; M. E. Wiig, Invercargill; J. H. Enright, Westport; John Scott, Timaru; W. F. Edmond, Dunedin (honorary).
Paraguay.—Consul: A. E. Kernot, Wellington.
Peru.—Consul-General (with jurisdiction over the Commonwealth of Australia and New Zealand): J. M. Paxton, Sydney. Consul: G. H. Baker, Auckland.
Portugal.—Consuls: John Duncan, Wellington; N. A. Nathan, Auckland Vice-Consuls; A. D. S. Duncan, Wellington; C. W. Rattray, Dunedin.
Spain.—Consul-in-Chief (with jurisdiction over Australia and New Zealand): Senor Don Jaime Montero y de Madrazo, Melbourne. Hon. Vice-Consul: A. K. S. Mackenzie, Wellington.
Sweden.—Acting - Consul: W. I. Nathan, Wellington. Vice-Consuls: Albert Kaye, Christchurch; C. I. Nathan, Auckland.
Switzerland.—Acting-Consul: N. A. Nathan, Auckland.
United States of America.—Consul-General (for New Zealand and its dependencies): A. A. Winslow, Auckland. Vice-Consul-General: L. A. Bachelder, Auckland. Consular Agents: J. H. Stringer, Christchurch; A. E. Whyte, Wellington; F. O. Bridgeman, Dunedin.
Uruguay.—Acting-Consul: W. J. Prouse, Wellington.
There is no State Church in the Dominion, nor is State aid given to any form of religion. Government in the early days set aside certain lands as endowments for various religious bodies, but nothing of the kind has been done for many years past.
The principal Churches, with the names, &c., of the present heads or officers, and the places and times of holding the annual or periodical assemblies or meetings, are as follows:—
Church of the Province of New Zealand, commonly called the Church of England.
For Church purposes, the Dominion is divided into six dioceses—viz., Auckland, Waiapu, Wellington, Nelson, Christchurch, and Dunedin. The General Synod meets every third year in each diocese in rotation. Representatives attend from each diocese, and also from the diocese of Melanesia. President, the Primate (Bishop of Dunedin). The Diocesan Synods meet once a year, under the presidency of the bishop of the diocese. There is also a standing committee of General Synod, called the Provincial Standing Committee, which meets in Wellington once a year.
The names, &c., of the bishops of the Church of England are as follows:—
The Most Rev. Samuel Tarratt Nevill, D.D., Dunedin; consecrated 1871 (Primate).
The Right Rev. Churchill Julius, D.D., Christchurch; consecrated 1890.
The Right Rev. Alfred Walter Averill, D.D., Auckland; consecrated 1910; translated 1914.
The Right Rev. Thomas Henry Sprott, D.D., O.B.E., Wellington; consecrated 1911.
The Right Rev. William Charles Sadlier, D.D., Nelson; consecrated 1912.
The Right Rev. William Walmsley Sedgwick, D.D., Waiapu; consecrated 1914.
Presbyterian Church of New Zealand.
This Church is composed of eighteen presbyteries, with 255 congregations and 120 home-mission stations. The adult church membership last year was 42,704, and the total revenue £177,774. Foreign mission work is carried on in the New Hebrides, China, and India, while the Maoris and local Chinese are also ministered to. Homes for orphan children are open in Auckland, Wellington, Christchurch, Timaru, Dunedin, and Invercargill. The General Assembly is the supreme court, the Rev. W. Gray Dixon, M.A., Roslyn, being the present Moderator; the Rev. J. A. Asher, B.A., the Moderator-Designate; the Rev. J. H. MacKenzie, Kelburn Parade, Wellington, the Clerk; and the Rev. W. J. Comrie, Presbyterian Church Offices, Wellington, the Treasurer. The Theological College is in Dunedin, with the Revs. M. Watt, M.A., D.D., W. Hewitson, B.A., and J. Dickie, M.A., D.D., as professors. The Rev. J. Gibb, D.D., Wellington, is Convener of Home Missions, the Rev. A. B. Todd, B.A., Wellington, Secretary of same, and the Rev. A. Don, Dunedin, Secretary for Foreign Missions. The Church's paper is The Outlook , Mr. A. H. Grinling, Dunedin, being editor. The next meeting of General Assembly is appointed for the 18th November, 1919, in First Church, Invercargill.
Roman Catholic Church.
The Diocese of Wellington, established in 1848, was in 1887 created an archdiocese and the metropolitan see. There are three suffragan dioceses—Auckland, Christchurch, and Dunedin. A retreat is held annually in each of the four dioceses, at the end of which a synod is held, presided over by the bishop or archbishop, and at which all his clergy attend.
In January, 1899, the first Provincial Council of New Zealand was held in Wellington, under the presidency of the metropolitan, and attended by all the suffragan bishops, and a number of priests elected specially in each diocese as representatives of the whole Catholic clergy in the Dominion The decrees of this Council were approved by Rome in April, 1900, were published on 1st January, 1901, and are now binding in every diocese in, the Dominion.
The Most Rev. Francis Redwood, S.M., D.D., consecrated in 1874, is Archbishop and Metropolitan of the Roman Catholic Church in New Zealand, and the Most Rev. Thomas O'Shea has been appointed Coadjutor Archbishop. The following arc the bishops:—
Auckland: The Right Rev. Henry W. Cleary, D.D., O.B.E.; consecrated 1910.
Christchurch: The Right Rev. Matthew Brodie; consecrated, 1910. Dunedin: (Vacant.)
Methodist Church of New Zealand.
The Officers of the Church for 1919 are as follows: President of the Conference, Rev. H. E. Bellhouse, Ponsonby; Vice-President, Mr. J. H. Blackwell, Kaiapoi; Secretary, Rev. E. Drake, Wellington; President-elect for 1920, Rev. E. Drake, Wellington; Connexional Secretary, Rev. Samuel Lawry, Christchurch; Secretary for Foreign Missions, Rev. W. A. Sinclair, Auckland; Secretary for Home Missions, Rev. T. G. Brook, Mount Eden.
The affairs of the Church are administered by ten District Synods, which meet annually. The Chairmen are appointed by Conference.
The next Conference will be held in Auckland, opening during the last, week in February, 1920.
Baptist Union of New Zealand.
President, Pastor M. W. P. Lascelles, Timaru; Vice-President, Rev. H. G. Herens, Hamilton; Secretary, Rev. R. S. Gray, Wellington; Treasurer, Mr. W. Lambourne, Ponsonby; Missionary Secretary, Rev. S. M. Jenkins, Wanganui; Financial Secretary, Rev. A. North, Warrington, Otago; Missionary Treasurer, Mr. C. Cathie, Wellington. The Union comprises fifty-six churches, forty-six preaching-stations, 6,000 members, and a constituency of 25,000. The denominational organ is the New Zealand Baptist; Editor, Rev. J. J. North, Christchurch. The Foreign Missionary Society, with an annual income of £3,625, has a thoroughly equipped hospital and dispensaries, employs a doctor, two missionaries, six zenana ladies, and forty-six Native helpers. The sphere of operations is in North Tipperah, East Bengal, with a population of 1,200,000.
Congregational Union of New Zealand.
The annual meetings are held during the month of March, at such place as may be determined by vote of Council. Chairman for 1919: Rev. J. Reed Glasson, Wellington; Secretary, Rev. Archibald E. Hunt, Wellington; Treasurer, Mr. Frank Meadowcroft, Wellington; Registrar, Rev. A. H. Wallace, Dunedin; headquarters and seat of executive, Wellington. In 1920 the meeting of the Council will be held in Dunedin. The Committee of the Union meets in Wellington on the last Monday in each month.
Hebrews.
Ministers: Rev. S. A. Goldstein and Rev. S. Katz, Auckland; Rev. H. Van Staveren and Rev. C. Pitkowsky, Wellington; Rev. A. Diamond, Dunedin. Annual meetings of the general congregations are usually held at these places during the month of Elul (about the end of August).
Church of Christ.
The next Conference of the Dominion Associated Churches of Christ will be held in Christchurch, at Easter of 1920. Statistics submitted to last Conference were as follows: Churches, 50; membership, 3,360; Bible-school scholars, 3,311; teachers, 339; ministers, 21.
Dominion Executive: President, Mr. Ralph Gebbie, B.A., 81 Williamson Avenue, Auckland; Vice-President, Mr. Herbert Langford, 19 London Street, Richmond, Christchurch; Secretary-Treasurer, Mr. Will J. Mason, 497 Madras Street, Christchurch.
A combined Conference of the Auckland and Middle Districts is held annually in Wellington and Auckland alternately. The Southern District has a separate Conference, meeting in various towns of the South Island. All the District Conferences meet at Easter.
Missionary stations are supported in Southern Rhodesia, where the Church has six missionaries and eight Native evangelists.
Unitarian Association of New Zealand.
President, Mr. G. Stevenson, Auckland; Treasurer, Mr. J. Godber, J.P., Wellington; Secretary, Rev. G. E. Hale, B.A., 153 Ghuznee Street, Wellington. Churches are established at Auckland, Wellington, Christchurch, and Timaru, and are linked with the British and Foreign Unitarian Association. The next Annual Conference will be held in November, 1919.
Salvation Army.
The annual congress of the Salvation Army is held in the month of April in each year.
The principal officers of the Salvation Army in New Zealand are: Territorial Commander, Commissioner H. C. Hodder; Chief Secretary, Colonel J. McInnes; Secretary for Field Affairs, Major H. B. Colledge; Property Secretary, Lieut.-Colonel J. H. Bray; Trade Secretary, Brigadier A. Kirk; National Young People's Secretary, Brigadier W. J. Hoare; Chief Accountant, Major W. P. Page; Divisional Commanders, Major E. Newby. Auckland, Brigadier J. Toomer, Palmerston North, Brigadier W. Gist, Wellington, Brigadier A. B. Carmichael, Christchurch, Major D. Gunn, Dunedin; Principal of Training College, Wellington, Brigadier W. Gist.
An officer engaged exclusively in repatriation work is stationed at Auckland and Wellington respectively, while in the chief centres of the South Island Salvation Army chaplains meet each returning draft and keep in touch with the needs of the men. A hostel has been opened in Wellington for the accommodation of soldiers, and at Rotorua the Soldiers' Institute caters for the social and moral welfare of the men under medical treatment there.
Among the social institutions maintained by the Salvation Army are: Rescue Homes at St. Albans, Caversham, Parnell, and South Wellington; Young Women's Industrial Home at Anderson's Bay; Maternity Homes at each of the four chief centres; Samaritan Homes at Gisborne and Napier; Boys' Training Farm at Putaruru; Boys' Homes at Island Bay, Eltham, Russell, and Temuka; Girls' Homes at Middlemarch, Auckland, and South Wellington; Prison Gate Brigade Homes at Epsom and Addington; Inebriates' Homes at Pakatoa and Rotoroa; and a Home for Aged Men and Women at Featherston.
A. HONOURS , NOT BEING ORDERS OR DECORATIONS .
Privy Councillors (P.C.).
Massey, Right Hon. William Ferguson, 1913.
Ward, Right Hon. Sir Joseph George, Bart., K.C.M.G., 1907
Baronet.
Ward, Right Hon. Sir Joseph George, P.C., K.C.M.G., 1911.
Knights Bachelor (Kt. Bach.).
Buchanan, Hon. Sir Walter, 1912.
Edwards, Hon. Sir Worley Bassett, 1919.
Fraser, Hon. Sir William, 1918.
Kennaway, Sir Walter, 1909.
Kinsey, Sir Joseph James, 1919.
Lang, Hon. Sir Frederic William, 1916.
Prendergast, Hon. Sir James, 1881.
Salmond, Sir John W., 1918.
Sinclair, Hon. Sir John Robert, 1918.
Wilson, Sir James G., 1915.
Persons allowed to retain the Title, of "Honourable" within His Majesty's Dominions.
By despatch from the Secretary of State for the Colonies dated 30th October, 1856, the Governor was apprised that the title of "Honourable" was conferred on members of the Legislative Council and on the Speaker of the House of Representatives of New Zealand.
By despatch from the Secretary of State for the Colonies dated 15th June, 1893, it was announced that the title of "Honourable" appertaining to Members of the Executive and Legislative Councils in colonies possessing Responsible Government, whether confined to duration of office or continued for life, was approved by Her late Majesty Queen Victoria, for use and recognition throughout her dominions, either during office or for life, as the case might be.
By further despatch of 10th March, 1894, the Secretary of State announced that ho was prepared in future to submit for the approval of the Sovereign the recommendation of the Governor of any colony having Responsible Government that the President of the Legislative Council or the Speaker of the Legislative Assembly may, on quitting office after three years' service in, their respective offices, be permitted to retain the title of "Honourable."
Besides the members of the Executive and Legislative Councils, the following ex-Ministers are allowed, as such, to retain the title of "Honourable": Buddo, David, 1912; Carroll, Sir James, K.C.M.G., 1912; Findlay, Sir John George, K.C., LL.D., K.C.M.G., 1911; Fowlds, G., 1911; Hall-Jones, Sir William, K.C.M.G., 1908; Herdman, Alexander Lawrence, 1918; Hislop, Thomas W., 1891; McKenzie, Roderick, 1912; Mackenzie, Sir Thomas, K.C.M.G., 1912; Mills, Charles H, 1906; Mitchelson, Edwin, 1891; Ngata, Apirana Turupa, 1912; Oliver, Richard, 1884; Reeves, William P., 1896; Rhodes, R. H., 1915; Stout, Hon. Sir Robert, K.C.M.G., 1887; Thompson, Thomas, 1900; Tole, Joseph A., 1888.
By another despatch of 14th November, 1896, the Secretary of State requested to be informed if the Government of New Zealand desired that members of the Legislative Council in this Dominion should on retirement or resignation, after a continuous service in such Council of not less than ten years, be eligible for recommendation by the Governor for Royal permission to retain the title of "Honourable."
By despatch of 29th August, 1877, it was announced that retired Judges of the Supreme Court may be allowed the privilege of bearing the title of "Honourable" for life, within the Dominion. This title is now held by Sir James Prendergast.
By despatch of 22nd December, 1911, it was announced that the title of "Honourable" was conferred on the Chief Justice and Judges of the Supreme Court of New Zealand.
The Most Honourable Order of the Bath.
KNIGHTS COMMANDERS (K.C.B.).
Allen, Hon. Sir James, 1917.
Godley, Lieut.-General Sir Alexander John, K.C.M.G., 1916.
Russell, Major-General Sir Andrew Hamilton, K.C.M.G., 1917.
COMPANIONS (C.B.).
Chaytor, Major-General Sir E. W. C, K.C.M.G., 1915.
Cradock, Lieut.-Colonel M., C.M.G., 1900.
Findlay, Lieut.-Colonel J., D.S.O., 1917.
Henderson, Surgeon-General R. S. F., 1917.
Logan, Colonel R.
Porter, Colonel T. W., 1902.
Richardson, Brigadier-General G. S., C.M.G., C.B.E., 1917.
Robin, Major-General Sir A. W., K.C.M.G., 1900.
The Most Distinguished Order of St. Michael and St. George.
KNIGHT GRAND CROSS (G.C.M.G.).
His Excellency the Right Hon. Arthur William de Brito Savile, Earl of Liverpool, P.C., G.B.E., M.V.O., Governor-General and Commander-in-Chief, 1914.
KNIGHTS COMMANDERS (K.C.M.G.).
Boll, Hon. Sir Francis Henry Dillon, 1915.
Carroll, Hon. Sir James, 1911.
Chaytor, Major-General Sir E. W. C., C.B., 1918.
Findlay, Hon. Sir John George, K.C., LL.D., 1911.
Godley, Lieut.-General Sir Alexander John, K.C.B., 1914.
Hall-Jones, Hon. Sir William, 1910.
Mackenzie, Hon. Sir Thomas, 1916.
Mills, Sir James, 1909.
Perceval, Sir Westby Brook, 1894.
Robin, Major-General Sir Alfred William, C.B., 1916.
Russell, Major-General Sir A. H., K.C.B. 1915.
Stout, Hon. Sir Robert, 1886.
Ward, Right Hon. Sir Joseph George, Bart., P.C., 1901.
COMPANIONS (C.M.G.).
Acland, Colonel H. T. D., C.B.E., 1917.
Adams, Colonel N. P., 1917.
Alderman, Lieut.-Colonel W. W., D.S.O., 1916.
Barnett, Lieut.-Colonel L. E., M.B., 1918.
Campbell, Colonel G. F. C., V.D., 1919.
Charters, Lieut.-Colonel A. B., D.S.O., 1916.
Chaytor, Lieut.-Colonel D'A., 1918.
Collins, Colonel R. J., I.S.O., V.D., 1911.
Collins, Colonel the Hon. W. E., M.B., 1917.
Dawson, Major T. H., 1917.
Esson, Lieut.-Colonel J. J., 1916.
Falla, Lieut.-Colonel N. S., D.S.O., 1917.
Fenwick, Lieut.-Colonel P. C., M.B., 1916.
Ferguson, Dr. Henry Lindo, 1918.
Fitchett, Frederick, M.A., LL.D., 1911.
Fitzherbert, Lieut.-Colonel N., 1917.
Francis, Major N., 1917.
Gudgeon, Lieut.-Colonel W. E., 1890.
Hall, Lieut.-Colonel G. T., 1917.
Hart, Brigadier-General H., D.S.O., 1918.
Hogben, George, M.A., F.G.S., 1915.
Hughes, Colonel J. G., D.S.O., 1916.
Hutchen, Lieut.-Colonel J. W., 1917.
Johnston, Brigadier-General G. N., D.S.O., 1918.
Jowsey, Colonel T., 1900.
King, Dr. F. Truby, 1917.
Luke, J. P., 1917.
Luxford, Rev. J. A., 1916.
Mackenzie, Lieut.-Colonel J. A., 1918.
Mackesy, Lieut.-Colonel C. E. R., D.S.O., 1917.
Meldrum, Brigadier-General W., D.S.O., 1916.
Melvill, Brigadier-General C. W., D.S.O, 1918.
Mill, Lieut.-Colonel T., M.B., 1917.
Morris, Colonel W. R., I.S.O., 1919.
Myers, Lieut.-Colonel B., M.D., 1917.
McGavin, Colonel D. J., D.S.O., M.B., 1918.
O'Neill, Colonel E. J., D.S.O., M.B., 1918.
Otterson, Henry, 1913.
Parkes, Colonel W. H., C.B.E., M.D., 1916.
Parr, C. J., 1914.
Plugge, Lieut.-Colonel A., 1915.
Potter, Colonel H. R., 1917.
Powles, Lieut.-Colonel C. G., D.S.O., 1918.
Richardson, Brigadier-General G. S., C.B., C.B.E., 1915.
Richardson, Josephus H., 1918.
Smith, Colonel G. S., D.S.O., 1917.
Standish, Lieut.-Colonel I. T., D.S.O., 1917.
Stowe, Leonard, 1912.
Symon, Lieut.-Colonel F., D.S.O., 1916.
Tewsley, Lieut.-Colonel C. H., D.S.O., M.D., 1918.
Wylie, Colonel D. S., M.B., 1917.
Young, Lieut.-Colonel R., D.S.O., 1916.
The Most Excellent Order of the. British Empire.
GRAND CROSS (G.B.E.).
Knight: Liverpool, His Excellency the Right Hon. Earl of, P.C., G.C.M.G., M.V.O., Governor-General.
Dame : Liverpool, Her Excellency the Countess of.
COMMANDERS (C.B.E.).
Acland, Colonel H. T. D., C.M.G.
Burnett, Miss Ethel.
Chaffey, Colonel R. A., V.D.
Christie, Colonel J. McN.
Clark, J. J.
Cooke, Colonel P. R.
Cooper, Colonel C. J., T.D.
Day, A. C.
Falconer, Lieut.-Colonel A. R.
Fowlds, Hon. George.
Gabites, Lieut.-Colonel G. E.
Gunson, J. H.
Hardwicke, Ellen, Countess of.
Hiley, Colonel E. H.
Holland, Henry.
Hume, Colonel J. E.
Hunter, Lieut.-Colonel T. A.
Leaky, Lieut.-Colonel J. P. D., M.B.
Luke, Mrs. Jacobina.
MacDonald, R. M.
MacDonald, Major W. M., M.D.
Mackenzie, Miss Helen.
McLean, Lieut.-Colonel H. J.
Major, Colonel C. T., D.S.O.
Massey, Mrs. Christina A.
Makgill, Lieut.-Colonel R. H.
Mill, Colonel Thomas, C.M.G.
Montgomery, W. H.
Nichols, Colonel J. C., V.D.
Nolan, R. H.
Parkes, Colonel W. H., C.M.G., M.D.
Pringle, Colonel David, T.D.
Purdy, Colonel J. R., V.D., M.B.
Reakes, Colonel C. J., M.R.C.V.S.
Reed, Colonel J. R., K.C.
Richardson, Brigadier-General G. S., C.B., C.M.G.
Roberts, Lieut.-Colonel A. F.
Robertson, Lieut.-Colonel J. H. G.
Rolleston, Mrs. Iris B.
Sleeman, Lieut.-Colonel J. L.
Smith, Colonel E. R., V.D.
Smith, Colonel Hon. G. J.
Strong, Colonel W. J., T.D.
Tate, Colonel R. W.
Valintine, Colonel T. H. A., M.R.C.S., L.R.C.P., D.P.H.
Ward, Colonel G. A.
Ward, Lady Theresa D.
Wilson, Mrs. A. E.
Wylie, Colonel D. S., C.M.G.
OFFICERS (O.B.E.).
Abraham, Mrs. Constance P.
Andrew, Lieut.-Colonel P.O.
Andrews, Lieut.-Colonel C. E.
Bankart, A. S.
Banks, Major G. B.
Bean, Mrs. Jane A.
Bernau, Lieut.-Colonel H. F., M.R.C.S.
Bethell, Mrs. Thyra T.
Bidwell, W. E.
Boden, Mrs. Annie S.
Bollard, Mrs. Louisa.
Boyle, Mrs. Fanny.
Brandon, Major P. de B.
Brewis, Major A. G., M.B.
Brodrick, T. N.
Brown. Paymaster Lieut.-Commander W. J. A.
Bruce, Major W., M.B.
Buckleton, Mrs. Alice A. G.
Burgess, F. J.
Burnett, James.
Burton, Rev. Canon H. D.
Carroll, Lady Heni M.
Chilton, Mrs. Elizabeth C.
Clark, D. G.
Cleary, Right Rev. H. W., D.D.
Closed Miss Etta.
Coates, Miss Lavinia.
Conn, Robert.
Cooper, D. G. A.
Corry, Mrs. Alice M.
Crooke, Mrs. Jane D.
Day, V. G.
Donaldson, Mrs. Ada M.
Duthie, D. W.
Earl, Frederick, K.C.
Elliott, George.
Empson, Mrs. Agnes D.
Evans, J. S.
Fache, G. C.
Fell, F. C. C.
Findlay, Mrs. Ellen K.
Findlay, James.
Flesher, J. A.
Fraser, Malcolm.
Galbraith, Mrs. Marion.
George, W. H. H.
Graham, Miss Helen.
Grimmond, Mrs. Margaret I.
Gunson, Mrs. Jessie.
Harper, George.
Herbert, Lieut.-Colonel A. S., M.B.
Hill, Mrs. Elizabeth A.
Hill, Mrs. Jessie.
Hindley, Captain F. L.
Hislop, James.
Hodder, H. C
Hogg, Lieut.-Colonel A. W.
Hogg, Captain R. H., M.B.
Holland, Mrs. Jane.
Home, Major G., M.D.
King, Rev. V. G. B.
Lawry, Major R. A. R.
Lee, Mrs. Jane W.
Little, Lieut.-Colonel W.
Lock, Mrs. Esther G.
Love, Mrs. Ripeka.
Lowry, Mrs. Helen.
McCristell, Major Thomas.
MacDonald, Rev. Angus.
Macfarlane, Mrs. Edith M.
MacGibbon, Miss Mabel J.
Mackay, Mrs. Isobelle M. A.
Mackenzie, Miss Jessie.
McKibbon, Major T.
McPherson, Captain J.
Maguire, Mrs. Emily H.
Mete, Mrs. Erina.
Miles, A. H.
Montgomery, W. B.
Moorhouse, Mrs. Jessie M.
Morris, Miss Cecilia M.
Moss, Thomas.
Mounsey, Major John.
Murphy, Mrs. Hannah.
Mutu, Mrs. Rahira M.
Myers, Mrs. Vera A.
Nathan, Miss Sybil C.
Newcombe, Major Neville.
Ostler, Major F. E.
Parker, Lieut.-Colonel P. W.
Peacock, Major H.
Petrie, Mrs. Helen Y.
Pomare, Mrs. Miria W.
Poynton, J. W.
Rattray, Miss Prances C.
Raymond, Mrs. Mary.
Rhodes, A. E. G.
Rhodes, Mrs. Ellen L. A.
Rhodes, G. E.
Reeve, Mrs. Joan L.
Richards, Captain H.
Robin, Miss Maggie.
Ronaldson, T. S.
Rutherford, Mrs. Eva L.
Scholefield, G. H.
Shallcrass, R. W.
Shera, Lieut.-Colonel L. M., M.C
Shirer, Rev. William.
Shirtcliffe, George.
Short, Lieut.-Colonel H., M.B.
Smith, C. B.
Smith, Mrs. Mary E. R.
Sprott, Right Rev. T. H., D.D.
Stewart, G. V.
Stewart, Mrs. Mary D.
Thompson, Mrs. Riria.
Topia, Kingi.
Tripe, W. A.
Tripp, L. O. H.
Ward, Mrs. Charlotte S.
Watson, Lieut.-Colonel J. J.
Webster, Miss Violet H.
Wigram, Miss Agnes V.
Wilkinson, H. K.
Williams, Miss Helen L.
Williams, Miss Hilda.
Wilson, Thomas.
Wood, Mrs. Grace A. M.
MEMBERS (M.B.E.).
Adams, A. M.
Atwell, Captain William.
Barton, Mrs. Rachel M.
Bell, Miss V. C.
Bissland, Mrs. Emma.
Blackwell, Mrs. Margaret B.
Bloomfield, Mrs. Hilda F.
Blundell, Mrs. Annie E.
Bosworth, Major J. T.
Bowie, Mrs. Janet.
Brocks, Captain A. W.
Brown, Mrs. Violet McC.
Browne, Major H. H.
Burgess, Mrs. Ann.
Burgess, C. H.
Burt, Alexander.
Burt, Miss Jean.
de Castro, Mrs. Edith.
Charles, Miss Esther.
Clark, Miss Lydia M.
Colclough, Captain W. C. S.
Cooper, Miss Ethel M.
Coradine, Mrs. Sarah Ann.
Corrigan, Major A. A.
Courage, Mrs. Zoe F.
Crawford, Mrs. Gertrude A.
Crawford, Mrs. Harriette S.
Crowther, Major Walter.
Cuff, Mrs. Ethel
Dalston, Captain N. H. M.
Dawson, Mrs. Hannah.
Dixon, G. F.
Dobson, Captain William.
Donaldson, G. L.
Eastgate, Captain H.
Ellis, J. W.
Ellison, Mrs. M. M. H.
Ewen, Lieutenant D. A.
Fenton, Miss Edith.
Forrester, Mrs. Elizabeth.
Forsythe, Captain G. H.
Gentry, Captain F. C.
Gerard, Harold.
Gibbons, Hope.
Goodchild, Mrs. A. V.
Greenslade, Mrs. Louisa G. C
Guinness, Mrs. Florence.
Gunnion, T. E.
Guthrie, Miss Agnes B. B.
Harcourt, Miss Eveline A. M.
Harding, Mrs. Margaret.
Harrington, H. W.
Harrison, Miss Kate C.
Hawke, Mrs. Leah L.
Helmore, H. G.
Herbert, Miss A. M.
Hill, Mrs. E. C.
Hislop, Mrs. Margaret M. A.
Hitchon, Mrs. Ann M.
Holdsworth, Mrs. Elizabeth A.
Holdsworth, W. G.
Hursthouse, Major W. R.
Jack, Douglas W.
Jolly, Major H.
Kelsey, Miss Lavinia J.
King, Miss Emma E. M. E.
King, Mrs. Sarah H.
Kirkpatrick, Mrs. M. H.
Larner, V. J.
Leaver, Mrs. Kate R.
Levien, Captain N. J.
Levinge, Dr. E. G.
Lovell, James B.
Macassey, Miss E. C. C.
McCurdy, Major D. A.
Macdonald, Miss Mina.
McDonnell, Miss Mysie.
McDougall, Mrs. A. M.
McGowan, Captain H. E.
McGregor, Mrs. Pura.
McLean, Miss Isobel.
Magnay, Captain C. R. A.
Maling, Miss Nesta G.
Manning, A. E.
Marris, Basil A.
Martin, A. A.
Matthews, F. G.
Matthews, Major R. S.
Mellows, Captain Samuel.
Millton, J. D.
Moeller, Mrs. Winifred.
Moller, Major O. H.
Moorhouse, Colonel W. H. S.
Murray, Miss Janet E.
Nash, Mrs. Elizabeth L.
Ngata, Mrs. Arihia K.
Northcote, Major J. A.
Nutsford, Major H. C.
O'Neill, L. P.
Oram, Captain M. H.
Page, Mrs. J. E.
Pearce, Miss A. I.
Perry, George Albert.
Pettit, Major W. H.
Philson, Mrs. Lucy.
Potter, Mrs. Mary A.
Pryor, Captain William.
Redmond, Captain H. J.
Ringland, Major T. H.
Rishworth, Major J. N.
Robertson, H. J. D.
Rodda, G. C.
Russell, W. A.
Scales, G. H.
Shand, Major D. B.
Sherratt, Mrs. Alice G.
Simpson, Mrs. Jean.
Smart, Mrs. Annie W.
Smedley, Captain C. F.
Smith, Mrs. Lilly M.
Snodgrass, W. W.
Spedding, Miss Bella.
Spencer, Mrs. Martha T.
Staples-Brown, Captain R. C.
Stead, William.
Stevenson, Mrs. Florence J.
Stewart, Mrs. E. W.
Stuckey, Miss E. E.
Thompson, Maurice.
Thomson, Miss Patricia C.
Treleaven, C. J.
Tripp, B. E. H.
Tunks, C. J.
Tweedy, Captain W.
Varney, Arthur.
Walker, Captain George.
Wallace. J. A.
Ward, Miss E. E. L.
Watson, Miss J. C.
Webster, Miss Georgina.
White, Charles.
Wray, Cecil J.
Wray, Miss Ellen.
Young, Mrs. F. R.
The Distinguished-service Order.
COMPANIONS, WITH BAR (D.S.O.).
Allen, Lieut.-Colonel R. C., 1919.
Allen, Lieut.-Colonel S. S., 1918.
Jardine, Lieut.-Colonel L. H., M.C., 1919.
McCarroll, Lieut.-Colonel J. N., 1918.
Stewart, Lieut.-Colonel H., M.C., 1917.
Whyte, Lieut.-Colonel J. H., D.C.M. 1917.
Wilding, Major H. G., 1918.
COMPANIONS (D.S.O.).
Acton-Adams, Major P. M., 1917.
Alderman, Lieut. - Colonel W. W., C.M.G., 1919.
Ardagh, Captain P. A., M.C., M.B., 1918.
Austin, Lieut.-Colonel W.S., 1916.
Avery, Lieut.-Colonel H. E., 1916.
Barrowclough, Captain H. E., M.C., 1918.
Bartlett, Major E., 1902.
Beck, Captain W. T., 1915.
Bell, Lieut.-Colonel P. H., 1918.
Bingay, Major H. L., 1919.
Blair. Lieut.-Colonel D. B., M.C., 1917.
Buck, Major P. H., M.D., 1917.
Cameron, Major F., M.B., 1917.
Charters, Lieut.-Colonel A. B., C.M.G., 1916.
Cockerell, Lieutenant A. R., 1917.
Colquhoun, Lieut.-Colonel D., 1917.
Craig, Lieut.-Colonel &., M.B., 1917.
Cunningham, Lieut.-Colonel W. H., 1916.
Daltry, Major H. J., 1917.
Duigan, Lieut.-Colonel J. E., 1917.
Duthie, Major N. A., 1918.
Ennis, Major W. O., 1917.
Evans, Lieut.-Colonel C H. D., 1917.
Falconer, Captain, A. S., M.C., 1918.
Falla, Lieut.-Colonel N. S., C.M.G., 1916.
Farr, Major T., M.C., 1918.
Findlay, Lieut.-Colonel J., C.B., 1916.
Finn, Major B. S., 1915.
Gardner, Major D. E., 1918.
Gard'ner. Lieut.-Colonel M. M., 1917.
Gibbs, Major D. J., 1917.
Glendining, Lieut.-Colonel H. C., 1917.
Grigor, Lieut.-Colonel R. R., 1916.
Hardie, Major R. D., 1917.
Hargest. Lieut.-Colonel J., M.C., 1918.
Harper, Captain R. P., M.C., D.C.M., 1918.
Hart, Brigadier-General H., C.M.G., 1918.
Herbert, Lieut.-Colonel A. H., 1917.
Hercus, Major C. E., M.B., 1918.
Herrold, Major J. H., 1918.
Hickey, Major D. A., 1902.
Holmes, Captain J. D., 1918.
Hughes, Colonel J. G., C.M.G., 1900.
Hulbert, Major E. J., 1917.
Hurst, Major H. C., 1916.
Jennings, Major W. I. K., 1918.
Johnston, Brigadier - General G. N., C.M.G., 1916.
Kennedy, Captain D., M.C., 1919.
Lampen, Major F. H., 1916.
Mackesy, Lieut.-Colonel C. E. R., C.M.G., 1916.
MacCormick, Major K., M.B., 1917.
McClelland, Major C. H., 1918.
McCrae, Major J., 1917.
McGavin, Brigadier - General D. J., C.M.G., M.D., 1917.
McKenzie, Major A. G., 1916.
Massey, Major F. G., M.C., 1918.
Meldrum, Brigadier-General W., C.M.G., 1916.
Melvill, Brigadier - General C. W., C.M.G., 1916.
Miles, Major R., M.C., 1918.
Milligan, Major R. G., 1918.
Mitchell, Lieut.-Colonel G., 1917.
Mitchell, Major G. R., 1919.
Murchison, Major D. S., 1917.
Murray, Colonel D. N. W., C.M.G., M.D., 1917.
Neil, Lieut.-Colonel J. H., M.B., 1918.
Newman, Major C. N., 1917.
Newton, Lieut.-Colonel C. T. H., M.D., 1917.
Nicholls, Major S. C. P., 1918.
O'Neill, Lieut.-Colonel E. J., C.M.G., M.B., 1915.
Orr, Major E. H., 1918.
Poison, Major D., 1900.
Pow, Lieut.-Colonel J., 1916.
Powles, Lieut.-Colonel C. G., C.M.G., 1916.
Puttick, Lieut.-Colonel E., 1917.
Roache, Lieut.-Colonel J. G., 1917.
Row, Lieut.-Colonel R. A., 1917.
Richardson, Major H. M. W., M.C., 1918.
Saunders, Major J. L., 1917.
Shephard, Lieut.-Colonel N. F., 1918.
Sinel, Major W. C., 1918.
Smith, Major A. D., 1917.
Smith, Colonel G. S., C.M.G., 1915.
Smythe, Major R. B., 1916.
Sommerville, Major C., 1918.
Sommerville, Major J. A., 1917.
Stafford, Major J., M.R.C.V.S., 1917.
Standish, Lieut.-Colonel J. T., C.M.G., 1915.
Starnes, Major F., 1916.
Stevenson, Captain R., 1902.
Stewart, Colonel A. E., 1916.
Stitt, Lieut.-Colonel A. D., M.C., 1917.
Stout, Major T. D. M., M.B., 1917.
Studholme, Major J., 1916.
Symon, Lieut.-Colonel F., C.M.G., 1917.
Thoms. Major N. W. B. B., M.C., 1917.
Todd, Captain T. J. M., 1900.
Turnbull. Lieut.-Colonel F. K., M.C., 1919.
Turnbull, Major W. McG., 1915.
Vercoe, Captain H. R., 1918.
Vickerman, Major H., 1917.
Waite, Major F., 1915.
Walker, Captain G. H., 1901.
Weston, Lieut.-Colonel C. H., 1917.
Whyte, Major J. B., 1918.
Wickens, Major R. C., 1917.
Widdowson, Major E. A., M.B., 1918.
Wilder, Major A. S., M.C., 1919
Wilson, Major N. R., M.C., 1918.
Wilson, Major R. A., 1918.
Wyman, Major R., 1910.
Young, Brigadier-General R., C.M.G., 1915.
The Imperial Service Order.
COMPANIONS (I.S.O.).
Andrews, James Frank, 1913.
Blow, Horatio John Hooper, 1911.
Collins, Colonel R. J., V.D., 1909.
Cullen, John, 1916.
Heywood, James B., 1905.
Holmes, Robert W., 1918.
Kensington, W. C., 1909.
Mackenzie, James, 1915.
Morris, W. R., C.M.G., 1917.
Robertson, Donald, 1912.
Ronayne, Thomas, 1914.
Short, W. S., 1919.
Strauchon, John, 1912.
Tregear, Edward, 1911.
Order of the Hospital of St. John of Jerusalem in England.
Knight of Justice: Liverpool, His Excellency the Right Hon. Earl of, P.C. G.C.M.G., C.B.E., M.V.O., 1919.
Knight of Grace: Parkes, Colonel W. H., C.M.G., C.B.E., 1918.
Lady of Grace: Moorhouse, Mrs. Jessie M., O.B.E., 1919.
C. DECORATIONS AND MEDALS .
Victoria Cross (V.C.).
Andrew, Sergeant L. W., 1917.
Bassett, 2nd Lieutenant C. R. G., 1915.
Crichton, 2nd Lieutenant J., 1918.
Frickleton, 2nd Lieutenant S., 1917.
Grant, 2nd Lieutenant J. G., 1918.
Hardham, Captain W. J., 1901.
Judson, 2nd Lieutenant R. S., D.C.M., M.M., 1918.
Laurent, 2nd Lieutenant H. J., 1918.
New Zealand Cross (N.Z.C.).
Biddle, Benjamin, 1869.
Hill, George, 1869.
Lingard, William, 1869.
Mace, Francis Joseph, 1869.
Mair, Gilbert, 1870.
Northcroft, Henry William, 1910.*
Preece, George Augustus, 1869.
Roberts, John Mackintosh, 1869.
Wrigg, Harry Charles William, 1898.†
Royal Red Cross, 1st Class (R.R.C.).
Brooke, Matron E., 1917.
Cameron, Matron M. M., 1917.
Maclean, Matron H., 1917.
Maclean, Matron V. M. K., A.R.R.C, 1918.
Nurse, Matron B., 1918.
Price, Matron F., 1916.
Thurston, Matron M., 1917.
Tombe, Matron A., 1916.
Bar to Military Cross (M.C.).
Ashby, Lieutenant F. E., 1918.
Burge, Lieutenant W. R., 1918.
Coates, Captain J. C, 1918.
Curtis, Lieutenant A. R., 1919.
Evans, Captain J., 1918.
Finlayson, Major A. C. M., 1919.
Gordon, Lieutenant A. W., 1918.
Gray, Captain W. P., 1918.
Greenish, Captain F. E., 1919.
Herbert, Lieutenant A. S., 1919.
Hollis, 2nd Lieutenant R. V., 1918.
Johnson, Lieutenant M. E., 1918.
Johnston, Captain H., 1919.
Melles, Captain A. G., 1917.
McClure, Lieutenant C. B., 1918.
McLeod, Lieutenant J. M. C., 1918.
McMinn, 2nd Lieutenant W. E., 1918.
Park, Lieutenant G. R., 1917.
Roy, 2nd Lieutenant J. A. McL., 1918
Saxon, Captain K. R. J., 1918.
Scott, Lieutenant K., 1917.
* For services rendered in 1866.
† For services rendered in 1867.
Military Cross (M.C).
Abbott, Major W. N., M.B.
Abernethy, 2nd Lieutenant R. C.
Acland, Major L. G. D.
Addison, Captain A. S., M.B.
Aitken, Major W.
Aitken, Lieutenant W. P.
Allen, 2nd Lieutenant J. E., M.M.
Anderson, Lieutenant E. J.
Anderson, Captain F. H.
Andrew, Lieutenant R. E.
Annabell, Major N.
Ardagh, Captain P. A., D.S.O., M.B.
Armstrong, Captain D. C.
Ashby, Lieutenant F. E., bar to M.C.
Ashby, Lieutenant P. C.
Atmore, Lieutenant C. F.
Averill, 2nd Lieutenant L. C. L.
Avery, Captain G. A.
Barrowclough, Captain H. E., D.S.O.
Barton, Lieutenant G. A. A.
Barton, Lieutenant J. M.
Bassett, Lieutenant L. W.
Baxter, Lieutenant E.
Baxter, Captain R. H., M.B.
Beasley, Lieutenant S. C.
Beetham, Lieutenant R. F.
Benham, Captain P. B., M.B.
Bennett, 2nd Lieutenant P. L.
Bennett, Lieutenant R. E.
Best, Captain C. C.
Bibby, Lieutenant R. E.
Bishop, Major W. G. A.
Black, Lieutenant E. R.
Black, Captain R. J.
Blackett, Major G. R.
Blair, Lieut.-Colonel D. B., D.S.O.
Blampied, Lieutenant M.
Blomfield, Lieutenant E. F.
Bongard, Lieutenant A.
Bongard, Lieutenant J. R.
Borrie, Captain W. G., M.B.
Boswell, Lieutenant C.
Bowron, 2nd Lieutenant F. L.
Brathwaite, Lieutenant J. L.
Bremner, Major D. E.
Brewster, Captain R. C., F.R.C.S.
Bristol, Lieutenant I. A.
Brooker, Captain S. W. B.
Brown, 2nd Lieutenant A. W., D.C.M.
Brown, 2nd Lieutenant J. L.
Brown, 2nd Lieutenant W. S., M.M.
Browne, 2nd Lieutenant L. H.
Bruce, Captain D.
Buchanan, Lieutenant R. H.
Burge, Lieutenant W. R., bar to M.C.
Burt, 2nd Lieutenant H. D.
Byrne, Lieutenant A. E.
Cade, Captain J. R.
Cameron, 2nd Lieutenant A. C.
Cameron, 2nd Lieutenant W. K.
Campbell, Captain H.
Campbell, Captain L. B.
Carmichael, Lieutenant L. S.
Carter, Lieutenant J. C.
Catchpole, Lieutenant J. H.
Caws, Captain R. B.
Chapman, Captain A. A.
Chapman, Captain W. W.
Charters, Lieutenant R. G.
Chaytor, Major L. C.
Chilcott, Lieutenant C. W.
Ciochetto, Lieutenant C. V., M.M.
Clark, Chaplain, 4th Class, Rev. H.
Clark, 2nd Lieutenant S. O.
Closey, Captain S. J. E.
Coates, Captain J. G., bar to M.C.
Cobb, Lieutenant W.
Cody, Lieutenant D. G.
Collins, Lieutenant H.
Collyns, Captain G. S.
Connor, Captain J.
Cooke, Captain P. B.
Cooke, 2nd Lieutenant W. B., M.M. and bar to M.M.
Cornwall, 2nd Lieutenant F. C.
Cory-Wright, Captain S.
Courtney, Lieutenant J.
Craven, Lieutenant L. A.
Crawford, Captain J. G.
Crawford, Lieutenant T. H.
Crosse, Captain H. E.
Curham, Lieutenant D. W.
Curtis, Lieutenant A. R., bar to M.C.
Dailey, Major G. C.
Daldy, Captain R. H.
Dallinger, Lieutenant J. T.
Dansey, Captain H. D.
Davidson, Captain C. J. H.
Dean, Captain A. G.
Dempster, Captain N. H., M.B.
Denniston, Lieutenant L. H.
Dittmer, Captain G.
Dixon, Lieutenant L. M.
Doake, Lieutenant D.
Dobson, Major D.
Dobson, Chaplain, 4th Class, Rev. J, H.
Doherty, Lieutenant P. G.
Domigan, Lieutenant H. R.
Douglass, Lieutenant R. D.
Dove, Captain W. W.
Drummond, 2nd Lieutenant E. C.
Duigan, Lieutenant D. F.
Duncan, 2nd Lieutenant J.
Dunn, Captain R. W.
Earl, Captain F. J. R.
Ebbitt, 2nd Lieutenant W. H.
Ellen, 2nd Lieutenant H., M.M.
Ellingham, Lieutenant H. A.
Ellis, 2nd Lieutenant J. W.
Ellis, Major P. J.
Emery, Captain L. A. J.
Esquilant, Lieutenant A. E.
Evans, Captain J., bar to M.C.
Falconer, Major A. S., D.S.O.
Farr, Major T., D.S.O.
Fawcett, Captain E. J.
Ferguson, Captain D.
Finlayson, Major A. C. M., bar to M.C.
Foley, Lieutenant W. R.
Forbes, Captain A. McR.
Foster, 2nd Lieutenant L. B.
Fowlds, Captain W. F.
Fowler, Lieutenant W. K.
Free, Captain C. W.
Fryer, Captain H.
Fyfe, Lieutenant R. E.
Gabites, Captain H. S.
Galloway, Lieutenant M. S.
Gardner, Captain J. E. L.
Garland, Captain H. G. de F.
Garroway, Lieutenant R.
Geddes, Major W. McK.
George, 2nd Lieutenant E. W.
Gibbs, Captain L. J.
Gillespie, Lieutenant C. T.
Gillies, Captain T. S.
Glasse, Lieutenant A. O.
Goldstein, Captain H. M., M.B.
Gordon, Lieutenant A. W., bar to M.C.
Gordon, Captain K. F., M.R.C.S.
Goulding, Lieutenant A. M.
Goulding, Lieutenant F.
Gow, Lieutenant G. V.
Grant, Captain R. J.
Gray, Lieutenant C. A.
Gray, Major G. H.
Gray, 2nd Lieutenant R. N., M.M.
Gray, Captain W. A.
Gray, Captain W. P., bar to M.C.
Greene, Chaplain, 4th Class, A. (Salvation Army).
Greenish, Captain F. E., bar to M.C.
Greenwood, Captain J.
Greenwood, Captain J. G.
Guthrie, Lieut.-Colonel R. N., M.B.
Guthrie, Lieutenant S. G.
Halliwell, Lieutenant R. S.
Harding, Captain E. A.
Hargest, Lieut.-Colonel J., D.S.O.
Harper, Captain R. P., D.S.O., D.C.M.
Harris, 2nd Lieutenant C. J.
Harrison, Lieutenant C.
Harrison, 2nd Lieutenant W. G.
Hartshorne, 2nd Lieutenant G.
Hayter, Major C.
Henderson, Major P. B.
Herbert, Lieutenant A. S., bar to M.C.
Herron, Chaplain, 4th Class, Rev. D. C.
Highet, Lieutenant H. A.
Hills, Captain H. S.
Hind, Lieutenant C. A. S.
Hines, Lieutenant J. H.
Hiroti, Captain Turu.
Holder, 2nd Lieutenant A. G.
Holderness, Captain H.
Hollis, 2nd Lieutenant R. V., bar to M.C.
Holmden, Captain T. N.
Holmes, Lieutenant C. H.
Hopkirk, Captain J. A. D.
Hubbard, Lieutenant F. C.
Houchen, Chaplain, 3rd Class, Rev. C.
Hume, Major G. H.
Hunter, Lieutenant A. C. C.
Hutton, Captain L. B.
Inglis, Major L. M.
Ingram, Captain C.
Iverach, 2nd Lieutenant J. A. D.
Jack, Lieutenant A. D.
Jardine, Lieut.-Colonel L. H., D.S.O. and bar.
Jeffrey, Major J. G.
Jennings, 2nd Lieutenant A. G.
Johnson, 2nd Lieutenant A. W.
Johnson, Lieutenant M. E., bar to M.C.
Johnson, Major W. H.
Johnston, Captain H., bar to M.C.
Johnstone, Lieutenant A. B.
Jones, 2nd Lieutenant J. A.
Jones, Captain L. F.
Jones, Major M. H. R.
Keesing, Captain H. M.
Kellaway, Lieutenant G. T.
Kemp, Captain F. W., M.D.
Kennedy, Captain D., D.S.O.
Kennedy, Captain H. W.
Kettle, Major D.
King, 2nd Lieutenant A. H.
King, 2nd Lieutenant H. L.
King, Lieutenant T. L. R.
King, Captain W. J.
Kirk, Lieutenant B. C.
Knight, Captain C. L.
Knox, 2nd Lieutenant R. J.
Knubley, Lieutenant H. C. J.
Lang, 2nd Lieutenant F. W.
Lang, Captain W. R.
Leaf, Lieutenant H.
Leeming, Major C.V.
Lepper, 2nd Lieutenant C. B., M.M.
Levien, Captain E.
Lewer, 2nd Lieutenant E. E.
Little, Lieutenant N. F.
Lumsden, Captain P. W., M.B.
Luxford, Lieutenant M. G.
Lyon, Captain G.
Macdonald, Lieutenant A.
Macdonald, Major A. C.
Mackay, Lieutenant J. C.
Mackenzie, Major H. C.
Mackenzie, Lieutenant R.
Macky, Captain N. L.
McAdam, 2nd Lieutenant H. M.
McAlister, Captain J. L.
McAuley, Lieutenant D.
McClathie, Lieutenant D. S.
McClure, Lieutenant C. B., bar to M.C.
McClurg, Captain D. W.
McCormick, 2nd Lieutenant A. L., D.C.M.
McDonald, 2nd Lieutenant M.
McDonald, Captain S. G.
McDowell, Captain A. L.
McFarland, Captain R. D.
McGhie, Captain J., M.B.
McGhie, Lieutenant J. G.
McGregor, Lieutenant E. J.
McHugh, Captain H. D.
McIntosh, Lieutenant F.
McIsaac, Lieutenant A. R.
McKenzie, Lieutenant C. R.
McKenzie, 2nd Lieutenant F. E.
McLean, Chaplain, 4th Class, Rev. W.
McLean, Major W. H.
McLeod, Captain B.
McLeod, Lieutenant J. M. C., bar to M.C.
McMinn, 2nd Lieutenant W. E., bar to M.C.
McPherson, Captain R.
McQuarrie, Lieut.-Colonel R. S.
McSavney, Lieutenant G.
Manson, Lieutenant A. J. M.
Marks, Captain J. D., M.B.
Marshall, 2nd Lieutenant H. T.
Martin. Captain A. L.
Massey, Captain F. G., D.S.O.
Mathias, Captain G.
Mawson, Lieutenant J. B.
Mayer, Lieutenant J.
Meikle, Captain H. C.
Melles, Captain A. G., bar to M.C.
Merton, Major J. L. C.
Metcalf, Captain L. W.
Mewett, Captain J. E. H.
Miles, Major R., D.S.O.
Miller, 2nd Lieutenant A. H.
Miller, Lieutenant J. A.
Miller, 2nd Lieutenant H. K.
Milne, Lieutenant M. C.
Mintrom, 2nd Lieutenant F. H., M.M.
Mitchell, Lieutenant F. M.
Mitchell, 2nd Lieutenant J.
Mitchell, Captain R. F.
Moncrief, Lieutenant E., G.
Morison, Captain B. H.
Moritzson, Lieutenant L., M.M.
Morpeth, Captain R. N.
Morrison, Lieutenant D. G. B.
Mullineux, Chaplain, 4th Class, Rev. M.
Murchison, Lieutenant D. B.
Murphy, Lieutenant W.
Murray, Lieutenant F. L.
Murray, 2nd Lieutenant T. T., M.M.
Napier, Captain W. E. L.
Natusch, Captain S.
Nelson, Captain A. D., M.B.
Nelson, 2nd Lieutenant R.
Newbould, Captain M. G. R.
Newman, Captain H. W.
Nimmo, Lieutenant A. J.
Nolan, 2nd Lieutenant H. C.
Norman, Captain E. G.
Oakey, Captain A. N.
O'Gorman, 2nd Lieutenant F. R
Olsen, Lieutenant O. R.
Orbell, Captain R. G. S.
Organ, Lieutenant W. J.
Oxenham, Lieutenant C.
Paisley, Lieutenant A. D.
Palmer, Squadron Sergeant-major W.
Palmes, Lieutenant B.
Park, Lieutenant G. R., bar to M.C.
Parks, Major L. B.
Parkinson, Lieutenant L.
Parr, Chaplain, 4th Class, Rev. S.
Pascoe, Lieutenant F. C.
Patrick, Lieutenant R. T. G.
Pattrick, Lieutenant H. B.
Pennefather, 2nd Lieutenant S. S., D.C.M.
Pettit, 2nd Lieutenant H.
Picot, Lieutenant E. H.
Pierce, Captain C. J.
Ponder, Lieutenant A. O.
Porritt, Lieutenant E. A.
Pott, 2nd Lieutenant G. F.
Potvine, Captain H. A.
Pratt, 2nd Lieutenant C. O.
Price, 2nd Lieutenant A. D., M.M.
Prior, Captain N. H., M.B.
Pulham, 2nd Lieutenant L. R.
Rauch, Captain J. N.
Rawlings, Captain C. R.
Reeves, Lieutenant E. F.
Reid, Lieutenant S. G.
Rhind Captain S. D., M.E.S.C.
Rhodes, Captain A. E. T.
Richards, Chaplain, 3rd Class, Rev. F. R.
Richardson, Major H. M. W., D.S.O.
Rickleton, Lieutenant J. G.
Robinson, Lieutenant C. G. H.
Robson, Chaplain, 4th Class, Rev. G. T.
Rodger, Lieutenant W. J., D.C.M.
Rogers, Captain S. D.
Rohloff, Major F. R.
Rose, Major J. M.
Rowe, Lieutenant L. J.
Roy, 2nd Lieutenant J. A. McL., bar to M.C.
Russell, Captain G. V.
Russell, Captain J.
Sandham, Captain G.
Saxon, Captain K. R. J., bar to M.C.
Scholes, 2nd Lieutenant E. E.
Scott, Lieutenant K., bar to M.C.
Scott, Major L. M.
Seaward, Lieutenant C. F.
Seddon, 2nd Lieutenant G. H.
Seddon, Lieutenant S. T.
Selby, Captain E. F.
Senior, Captain C. H. A.
Senior, Lieutenant S. E.
Sharp, Captain E. H.
Shera, Lieut.-Colonel L. M., O.B.E.
Sievers, Lieutenant W. N.
Sinclair, 2nd Lieutenant F. G.
Sim, Lieutenant T. M.
Simmonds, Captain H.
Slevin, Company Sergeant-major F. R.
Smith, Captain S. G.
Snelling, 2nd Lieutenant T. A.
Southey, 2nd Lieutenant C. C., M.M.
Spiers, Captain P. W. G.
Stainton, Captain W. H.
Stallard, Captain F. J. W.
Stedman, Lieutenant M. A.
Stewart, Lieutenant C. G.
Stewart, 2nd Lieutenant E. G.
Stewart, Lieutenant F.
Stewart, Captain J. G.
Stewart, Lieut.-Colonel H., D.S.O. and bar.
Stilwell, Lieutenant W. F.
Stitt, Lieut.-Colonel A. D., D.S.O.
Stocker, 2nd Lieutenant V.
Sutherland, 2nd Lieutenant R.
Swan, Lieutenant G.
Taylor, Lieutenant C. H.
Taylor, Captain L. J.
Thomas, Lieutenant A. W.
Thomas, Lieutenant J. T.
Thompson, Lieutenant H. J.
Thoms, Major N. W. B., D.S.O.
Thomson, Major A.
Tilsey, Lieutenant R., D.C.M.
Tingey, Captain E.
Todd, Captain B. A.
Tomline, 2nd Lieutenant G. H.
Tonkin, Captain J. F.
Tracey, Captain J. F.
Tremewan, Lieutenant W. B.
Tuck, Lieutenant G. A.
Turnbull, Lieut.-Colonel F. K., D.S.O.
Turner, Major F. M.
Tyson, 2nd Lieutenant E. F.
Urquhart, Major M.
Varnham, Captain F. S.
Vause, 2nd Lieutenant H.
Vickerman, 2nd Lieutenant K. L.
Wainscott, Lieutenant A. G.
Wales, Captain J. G. C.
Walker, Lieutenant D. J. B.
Walker, Captain M. R.
Walker, Captain W. H.
Wallingford, Major J. A.
Walls, Chaplain, 4th Class, C. (Salvation Army).
Ward, Captain T. L.
Watson, Chaplain, 4th Class, Rev. R. S.
Watson, Captain W.
Watt, Captain M. McP.
Webster, Company Sergeant - major G. F.
Wells, Lieutenant E. R.
White, Captain A. T.
White, Captain E.
Whitefield, 2nd Lieutenant R.
Whitmore, Captain F. N.
Whyte, Captain A. D. S., M.B.
Whyte, Captain H. H.
Widdowson, Captain W. H. S.
Wigley, Lieutenant A. J.
Wilder, Major A. S.
Wilkes, Captain T. M.
Williams, Captain E. G.
Williams, Major O. W.
Wilson, Lieutenant F. W.
Wilson, 2nd Lieutenant 'J. H., M.M.
Wilson, Major N. R.
Winchester, Captain E. A.
Winkler, Lieutenant E. R.
Wood, Major F. A.
Wood, Lieutenant R., M.M.
Woodward, 2nd Lieutenant W. J.
Worley, Lieutenant R.
Wray, Major W. G.
Wrightson, Captain R. W.
Wyllie, Captain E. M., M.B.
Yorke, 2nd Lieutenant W. H.
Young, 2nd Lieutenant R. A.
Zeisler, Captain E.
Royal Red Cross, 2nd Class (A.R.R.C.).
Anderson, Matron C. B., 1917.
Atkinson, Sister M. G., 1918.
Beswick, Sister M. B., 1917.
Bicknell, Matron J., 1917.
Bird, Sister L. M., 1917.
Brandon, Sister L., 1917.
Brooks, Sister B., 1917.
Buckley, Sister A., 1917.
Chalmers, Sister M., 1917.
Christmas, Sister M. L., 1918.
Davies, Staff Nurse K., 1917.
Dodds, Sub-Matron J. C., 1918.
Early, Staff Nurse M. A., 1917.
Fanning, Sister R. G., 1918.
Fricker, Sister N., 1918.
Gilmer, Sister J. M. R., 1917.
Grigor, Sister M., 1917.
Hodges, Staff Nurse E., 1917.
Huddleston, Sister B. M., 1918.
Ingles, Sister A. C., 1918.
Looney, Sister M. F., 1917.
Metherell, Sister G. M., 1917.
McBeth, Staff Nurse M., 1917.
McGann, Staff Nurse S. J., 1917.
McLean, Sister V., R.R.C., 1917
McNie, Acting-Matron L. A., 1917.
McRae, Acting-Matron I. M., 1917.
Nixon, Matron E., 1917.
Nutsey, Sister E. N., 1918.
Pengelly, Sister E., 1917.
Popplewell, Sister E., 1917.
Scott, Sister I., 1917.
Siddells. Sister F., 1918.
Speedy, Sister F. H., 1917.
Trumble, Staff Nurse L. M., 1917.
White, Sister W., 1917.
Wilkie, Sister M. H., 1917.
Wilkin, Sister E. L., 1917.
Wilson, Matron F., 1917.
Willis, Acting-Matron I. G., 1917.
Wright, Sister K. E., 1917.
Wright, Sister M., 1918.
Young, Sister C., 1918.
Bar to the Distinguished-conduct Medal (D.C.M.).
Anderson, Sergeant H.
Foot, Lance-Sergeant S. C.
Riddett, Sergeant-major J. J.
Distinguished-conduct Medal (D.C.M.).
(a.) Members of New Zealand Contingents in South Africa, 1899-02.
Baigent, Private I.
Black, Staff Sergeant-major G. C.
Burr, Sergeant-major W. T.
Cassidy, Sergeant W.
Fletcher, Major W. H.
Free, Private A.
Kent, Sergeant W.
Langham, Sergeant-major J.
Lockett, Sergeant-major E. B.
Pickett, Sergeant-major M.
Rouse, Farrier-Sergeant G.
Wade, Private H. B.
White, Sergeant-major H.
(b.) Members of the New Zealand Expeditionary Force, the War of 1914-19.
Abbey, Sergeant A. W.
Akroyd, Private A. G.
Alexander, Corporal S. C. S.
Anderson, Staff Sergeant-major A. G.
Armstrong, 2nd Lieutenant L. J.
Auld, Corporal J. A.
Bailey, Regimental Sergeant-major A.
Bain, Battery Sergeant-major G. R.
Baker, Sergeant F., M.M.
Baker, Company Sergeant-major G. B.
Barclay, Sergeant F.
Barker, Private C. R.
Barlow, Private H.
Barr, Sergeant J. A.
Barr, Private K. D.
Bates, Regimental Sergeant-major W.
Battersby, 2nd Lieutenant G. H.
Batty, Sergeant A. I.
Beauchamp, 2nd Lieutenant H. R. H
Beck, Private T. J.
Bellamy, Sergeant H.
Bennett, 2nd Lieutenant P. H. G.
Berry, Rifleman M.
Birch, Private C.
Black, Sergeant T.
Blundell, Sergeant E. K.
Boate, Sergeant-major P. C.
Board, Sergeant S.
Boles, 2nd Lieutenant G. H.
Boreham, Private H.
Bowers, Lance-Corporal W. G.
Bowman, Private N. D.
Boyd, Company Sergeant-major R. A.
Bradley, Corporal A.
Bremner, 2nd Lieutenant O. H.
Brewer, Sergeant J. H.
Brokenshire, Corporal A. T., M.M.
Brown. 2nd Lieutenant A. W.
Brown, Sergeant C.
Brown, Sergeant R. D.
Brown, Sergeant W. G.
Buckthought, Sergeant N. W.
Buckworth, Sergeant C. G.
Bunbury, 2nd Lieutenant T. A.
Burns, Lance-Corporal K. B.
Burrows, Sergeant L.
Butler, Sapper M.
Cameron, Sergeant-major E.
Cardno, Private J. F.
Carins, Corporal L. T.
Caselberg, Sapper A. L.
Cavenett, Private W. G.
Chadwick, Sergeant J.
Clark, Sergeant H. C. D.
Clark, Trooper J. P.
Clark, Fitter N.
Clifford, Sergeant F. H.
Coley, Sergeant A. K.
Conlon, Regimental Sergt.-major E. J.
Cooksley. Corporal W. E., M.M.
Comrie, Private J.
Coppell, Lance-Corporal M. H.
Corkill, Sergeant R.
Crawford-Watson, Private L.
Creed, Sergeant W. H. P.
Cruickshank, Sergeant V.
Cunneen, Sergeant W. C.
Cunningham, Sergeant A. J., M.M.
Cusack, Sergeant J.
Dallard, Private C. J.
Daniell, Company Sergeant-major L. T.
Davis, Sergeant-major D.
Davis, 2nd Lieutenant F. H.
Davy, Sergeant V. R.
de Latour, Lance-Corporal B. R.
de Lautour, Corporal A. G.
Deuchrass, Company Sergt-major W.
Devery, 2nd Lieutenant C. N.
Dibble, Corporal S. T.
Dickey, Rifleman A.
Dickinson, Sergeant L. R., M.M.
Dignan, Lieutenant B. L.
Dodds, Corporal F. M.
Donaldson, Sergeant T. D. S.
Douglas, Private W. T.
Draper, Lance-Corporal B.
Driver, Gunner A. S.
Du Flou, Company Sergt.-major L. L. J.
Dunlop, Corporal A.
Dunthorne, Private A.
Ecclesfield, Sergeant R. C.
Eisenhut, Squadron Sergeant-major H.
Ellery. Sergeant F.
Evans, Sergeant J. H.
Evans, Sergeant W. D.
Fairhall, Sergeant E. E.
Fergusson, Sergeant F. C.
Findlay, Private A. J.
Fisher, Sergeant G.
Fitzgerald, Sergeant R.
Fletcher, Sergeant D.
Ford, Lance-Corporal G. C.
Forde, Lance-Corporal M. J.
Fraser, Sergeant H. C.
Free, Sergeant W. L.
Friend, Lance-Corporal W.
Gair, 2nd Lieutenant C.
Gapes, Sergeant A.
Gilbert, Corporal H. P.
Gillam, Corporal A.
Goldingham, 2nd Lieutenant K. A.
Gordon, 2nd Lieutenant T. J.
Graham, Q.M.-Sergeant L. S. L. L.
Greenbank, Lance-Corporal L.
Greig, Sergeant F.
Griffiths, Corporal J. H.
Grubb, Company Q.M.-Sergeant J.
Gustafson, Regimental Sergeant-major W. A.
Guy, 2nd Lieutenant I. D.
Haddow, Regimental Sergeant-major R. W.
Halligan, Sergeant R. H.
Hansen, Private J.
Hardy. Corporal F. H.
Harper, Captain R. P., D.S.O., M.C.
Hatch, Sergeant G.
Hartley, Corporal S.
Hayton, Sergeant G., M.M.
Healey, Rifleman M.
Heaton, Sergeant F.
Henry, Corporal W. J.
Hewitt, Lance-Corporal G.
Hibbs, 2nd Lieutenant A. L.
Hill, Lance-Corporal C. T.
Hill, Sergeant J. F.
Hill, 2nd Lieutenant J. L.
Hodges, Sapper E. A.
Holder, Sergeant F. N.
Hooper, Sergeant A. G.
Hunter, Lance-Corporal G.
Hunter, 2nd Lieutenant V. G.
Ibbotson, Sergeant-major W.
Inglis, Bombardier D. C.
Jacobs, Sergeant E. C. H.
Jenkins, 2nd Lieutenant F.
Johnson, Private H. A.
Jordon, Sergeant E.
Joyce, Battery Sergeant-major J. P.
Judson. 2nd Lieutenant R. S., V.C., M.M.
Karika, Sergeant Pa G.
Keatley, Sergeant J.
Kelly, Corporal E.
Kenna, Company Sergeant-major T.
Kennedy, Sergeant-major E. J.
Kennerley, Sergeant T. R.
Kennet, Sergeant J. P.
Keogh, Private J. L.
Kerrigan, Rifleman M.
Lamb, Sergeant J. McG.
Lanauze, Private E.
Lang, Lance-Corporal F.
Langrish, Rifleman J. G.
Latimer, 2nd Lieutenant R. T.
Lee, Private J. A.
Lepper, Private R.
Lewis, Sergeant W. J.
Little, 2nd Lieutenant J.
Livingstone, Sergeant B. V., M.M.
Lloyd, Corporal D. P.
Lloyd, Sergeant L. J.
Macaskill, Sergeant M.
Macdonald, Private A.
Mackay, Company Sergt.-major D. M. G.
Macpherson, Lance-Corporal J.
McCall, 2nd Lieutenant J. J.
McCormick, 2nd Lieutenant A. L., M.C.
McFadyen, Company Sergeant-major A.
McGregor, Lance-Corporal M. T.
McGregor, Sergeant P.
McKean, 2nd Lieutenant W., M.M.
McKenzie, Corporal K.
McLean, Sapper K. B.
McLennan, Private A.
McLeod, Private R. C.
McNamara, Sergeant S. A.
McQueen, Bombardier W.
Magee, Sergeant L. P.
Mahoney, Corporal W. F.
Malone, Sergeant M. P.
Managh, Lance-Sergeant S. W.
Manderson, Rifleman P.
Manson, Sergeant R. V., M.M.
Marks, 2nd Lieutenant R.
Marshall, Sergeant S.
Martin, 2nd Lieutenant A.
Melville, Private H.
Menzies, 2nd Lieutenant C. E.
Mills, Sergeant A. C.
Mitchell, Captain F.
Moorhouse, Corporal W. C. S.
Morris, Sergeant W. P.
Morrison, Regimental Sergeant-major L. G.
Moss, Company Sergeant-major E. S.
Muir, Corporal H.
Muir, Sergeant T.
Mulligan, Captain A. S., M.M.
Mulvaney, Corporal M. J.
Munn, 2nd Lieutenant W. G.
Murphy, Private D.
Murray, Sergeant W.
Neilson, Corporal A.
Nesbit, Trooper D. D.
Nettleingham, Private P. J.
Nimmo, Corporal A.
Nimmo, Rifleman T.
Norrin, Lance-Corporal J. R.
Notton, Corporal A.
O'Brien, Sergeant J. H.
O'Connor, Trooper D. J.
O'Connor, Private F. O.
O'Connor, Private T. R.
Ohlson, 2nd Lieutenant A. W. M.
Olds, Private J.
O'Neill, Sergeant T.
Page, Sergeant H., M.M.
Paranihi, Private Tau.
Parson, Private T. W.
Paterson, 2nd Lieutenant A.
Pauling, Company Sergeant-major W. J.
Pennefather, 2nd Lieutenant S. S., M.C.
Pinkham, Lance-Corporal G. W. F.
Potter, 2nd Lieutenant R. C.
Price, 2nd Lieutenant H. W.
Proctor, Sergeant W. A.
Purves, Sergeant L. D.
Randall, Lance-Corporal A. J.
Randell 2nd Lieutenant W. E.
Reid, Lieutenant W. J.
Rhind, Corporal H.
Richmond, Staff Sergeant-major T. M. E.
Ricketts, Lieutenant W.
Ritchie, Lance-Corporal L. R.
Roberts, Staff Sergeant-major A., M.M.
Robertson, 2nd Lieutenant F.
Rodger, Lieutenant W. J., M.C.
Ryan, Private J. E.
Sail, Private H. L.
Salmon, 2nd Lieutenant C. W.
Saunders, Corporal C. W.
Scarfe, 2nd Lieutenant E. R.
Scrimshaw, Sapper E. G.
Shackleton, Private J. L.
Shannon, Private R. C.
Sharp, Corporal T. W.
Sheppard, .2nd Lieutenant F. W. H.
Sheriff, Private W.
Short, Lance-Sergeant I. G.
Skinner, Lance-Corporal H. D.
Smith, Private A.
Smith, 2nd Lieutenant W. E.
Speakman, Private J.
Spencer, Corporal H.
Stade, Private F. A.
Steedman, Lance-Corporal A. B.
Sterritt, Sergeant D.
Stichbury, 2nd Lieutenant W. S.
Stobie, Sergeant C. W.
Stockdill, 2nd Lieutenant F.
Stringer, 2nd Lieutenant J. M., M.M.
Struthers, Lance-Corporal H.
Sturmey, Rifleman A. L.
Tannahill, Sergeant J.
Taplin, Sergeant J. H.
Taylor, Sergeant J. A.
Tempany, Private G. A.
Thompson, Sergeant N. B.
Thomson, Bombardier J. P.
Thomson, Private R.
Tilsley, Lieutenant R., M.C.
Toms, Lance-Corporal S. W.
Tribe, Sergeant L.
Tucker, Rifleman C. A.
Tunley, 2nd Lieutenant F. C.
Turner, Corporal B. R.
Vesty, Private M.
Vial, Private W. G.
Vickery, Company Sergeant-major E. M.
Vincent, 2nd Lieutenant J., M.M.
Voyle, 2nd Lieutenant J. W., M.M.
Wade, Driver S.
Walker, Sergeant W. R.
Ward, Sergeant A.
Ward, Sergeant M.
Waterson, Sergeant D. C.
Watson, Sapper K. W.
Weaver, Sergeant J.
Weaver, Trooper P.
Webster, Sergeant A. S.
White, 2nd Lieutenant C. N.
White, Private F.
White, Corporal W.
Williams, Corporal C. J.
Williamson, Sergeant W. J.
Wilson, Sergeant C.
Wilson, 2nd Lieutenant C. M.
Wilson, Private J. H.
Wimms, Lance-Corporal J.
Winter, Trooper J. H.
Bar to Militant Medal (M.M.).
Alexander, Gunner J. P.
Anderson, Corporal A. D.
Baker, Lance-Corporal G. H.
Baty, Private J. A.
Beck, Lance-Sergeant M.
Bennie, Corporal-Fitter A. H.
Broughton, Lance-Corporal D. S.
Campbell, Private R.
Carr, Sergeant H. M.
Clark, Sergeant A. H.
Cochran, Bombardier J. I. Y.
Cole, Corporal A. W. E.
Cooke, 2nd Lieutenant W. B., M.C.
Dowsing, Sergeant C. E.
Foote, Sergeant R. B.
Forrester, Lance-Corporal S. C.
Fraser, Private J. Mel.
Gallagher, Private A.
Gilbert, Private G.
Gordon, Sapper J.
Gordon, Sergeant P. A.
Hammond, Corporal S. A.
Hopper, 2nd Lieutenant H. M.
Howie, Private W. D.
Kelsall, Private E.
Kennedy, Sergeant F.
Kidman, Sergeant C. A. H.
Law, Corporal N. H.
McLennan, Staff Sergeant A. D.
McLeod, 2nd Lieutenant J. D.
McManus, 2nd Lieutenant C.
Methven, Corporal W.
Muir, Sergeant A. H.
Nicolas, Lieutenant J. W.
Noble, 2nd Corporal L. A.
Papworth, Lance-Corporal G. A.
Parsons, Private T. W., D.C.M.
Pattie, Bombardier R. D.
Porter, Private C. W.
Quinn, Private C.
Rawhiti, Private H.
Rowe, Corporal H. C.
Sands, Corporal L. R.
Simmers, Lieutenant R.
Sinclair, Sergeant R. J.
Sly, Corporal R. H.
Stevenson, Lance-Corporal F. W.
Sutherland, Sergeant F. A.
Swainson, Corporal A.
Thom, Corporal W. N.
Thomas, Sergeant L.
Timmins, Sergeant W.
Ware, Private W. G. C.
Whalley, Corporal G.
Wilman, Lance-Corporal A.
Woods, 2nd Lieutenant W.
Military Medal (M.M.).
Abbott, Private R, M. V.
Adams, Rifleman J.
Adams, Corporal J. Q.
Adams, Sapper R. W.
Adams, Bombardier T.
Adams, Private W. C.
Adamson, Private W.
Adlam, Corporal V. J.
Adsett, Private G.
Aitken, Corporal H. D.
Alexander, Private J.
Alexander, Private R.
Allan, Bombardier E. F.
Allan, Rifleman J.
Allan, Sergeant H.
Allan, 2nd Lieutenant L. F.
Allason, Rifleman W. J.
Allen, Lance-Corporal A. L.
Allen, Private F. C.
Allen, Sergeant J. E., M.C.
Allen, Trooper W.
Alley, Private R.
Allison, Rifleman A. J.
Allom, Private W. H.
Allpress, Lance-Corporal A. E.
Anderson, Private A.
Anderson, Private A. D.
Anderson, Sergeant C.
Anderson, Private E. A.
Anderson, 2nd Lieutenant J. H.
Anderson, Corporal V. G.
Anderson, Lance-Corporal W. F.
Andrew, Private A.
Andrew, Sergeant J. J.
Andrew, Private W.
Andrews, Private B.
Andrews, Sergeant E. E.
Andrews. 2nd Lieutenant W. T.
Angel, 2nd Lieutenant R.
Angell, Private J.
Angus, Private J. N.
Angus, 2nd Lieutenant R.
Annand, Private D. B.
Ansin, Rifleman F. W.
Apa, Private J.
Apperley, Private H. W.
Archer, Private W.
Armour, Trooper H.
Armstrong, Corporal J. W.
Arthur, Private L. C.
Arthur-Worsop, Sergeant A. C.
Arundel, Corporal G.
Ashby, Sergeant A.
Ashwin, Private L. F.
Ashworth, Bombardier A.
Atherfold, Corporal L. J.
Atkinson, Private E. W.
Atkinson, Sergeant P. H.
Atkinson, Corporal T.
Atkinson, Lance-Corporal V.
Austin, Private A. T. W.
Austin, Lance-Corporal J. J.
Avis, Lance-Corporal G.
Baddeley, Private F. S.
Backholm, Rifleman F. J.
Bagley, Rifleman E.
Baigent, Lance-Corporal J. T.
Bailey, Rifleman G.
Baillie, Private P. W.
Bain, Corporal J. H.
Baker, Sergeant G. B., D.C.M.
Baker, Corporal F.
Baker, Sergeant H.
Baker, Lance-Corporal H.
Baker, Corporal J. F.
Ball, Lance-Corporal C. J.
Ball, Lance-Corporal W. E.
Ballantyne, Lance-Corporal J. M.
Balle, Sergeant J. T.
Balneaves, Private A. E.
Bannatyne, Private N.
Barber, Private F.
Barber, Private F. C.
Barclay, Sergeant W.
Bargh, Private C.
Bargh, Corporal W.
Barker, Private T. A.
Barker, Driver W. W.
Barlow, Private F.
Barnes, Private S.
Barnett, Private P. E.
Barnett, Sergeant R. T.
Barr, Sergeant J. P.
Barr, Corporal S. D.
Barrett, Trooper W.
Barrow, Sapper J. D.
Bartels, Lance-Corporal G.
Bartle, Private J. R.
Bath, Private A. F. F.
Bathurst, Sergeant H. C.
Batty, Rifleman C. W.
Baxter, 2nd Lieutenant J. N.
Beacock, Sergeant J. A.
Beaton, Rifleman A.
Beaton, Sergeant J.
Beaufort, Private F. E.
Beck, Bombardier S. L.
Beck, Corporal T. J.
Beckingham, Lance-Corporal J. E.
Beeby, Private C. W.
Begg, Private I. W. D.
Belbin, Private P. A.
Belk, Sapper R. W.
Bell, Sergeant A.
Bell, 2nd Lieutenant T.
Bell, Corporal W. D.
Bellamy, Private H.
Bellerby, Lance-Corporal M.
Belton, Gunner L. D.
Bennett, Sapper L. G.
Bennett, Sergeant W. R.
Bennetto, Sergeant T. J.
Berg, Corporal L. A.
Bergamini, Driver G.
Berghan, Rifleman A. J.
Berney, Sergeant R. B. B.
Berridge, Private F.
Biddick, Private J. H.
Biggar, Private T.
Bigham, Sergeant H.
Billing, Lance-Corporal E. A.
Bird, Corporal A. F.
Bird, Corporal-Fitter A. W.
Bird, Bombardier A. W.
Bird, Private J. R.
Birkett, Sergeant W. A.
Birnie, Sergeant W.
Birtles, Sergeant J. A.
Bishop, Private J.
Bishop, Sergeant T. A.
Bishoprick, Private A. E.
Black, Corporal C. A.
Black, Sergeant D. C.
Black, Private E. L.
Black, Sergeant M. C.
Black, Lance-Corporal H. M.
Black, Corporal R. I.
Blackburn, Sergeant J. J.
Blackburn, Private P.
Blackwell, Gunner C. M.
Blackwell, 2nd Lieutenant R. M.
Blake, Lance-Sergeant H. J.
Blake, Corporal J. R.
Blakemore, Private H.
Blakemore, Sergeant J. F.
Blenkinsopp, Rifleman J.
Blomkvist, Private H. H. A.
Blyth, Sergeant L. M.
Boag, Private G. H.
Boles, 2nd Lieutenant J. H.
Bond, Lance-Sergeant W. T. N.
Boniface, Private C. D.
Booth, 2nd Lieutenant G. R.
Borlase, Lance-Sergeant W.
Borrie, Private D.
Bourk, Driver A.
Bower, Sergeant F.
Bower, Private H. R.
Bowers, Lance-Corporal W. G.
Bowater, Sergeant A. G.
Bowie, Sergeant W.
Bowles, Sergeant W. B.
Boyce, 2nd Lieutenant T.
Boyd, Private E. F.
Boyle, Corporal J. McK.
Bradley, 2nd Lieutenant A.
Bradley, Sergeant J. H.
Bradshaw, Private J. W.
Brady, Sergeant A. T.
Brake, Bombardier R. I.
Brandt, Sergeant H. J.
Brash, Private A. D.
Bray, Lance-Corporal C.
Bray, Sergeant W.
Breslin, Lance-Sergeant J.
Brewer, Private J. H.
Briarley, Private E. S.
Brickell, Private R, R.
Brien, Sergeant W. S.
Brierley, Corporal W.
Bright, Private W. G.
Brightwell, Private F.
Brister, 2nd Lieutenant S. G.
Brokenshire, Sapper A. T., D.C.M.
Bromell, Lance-Corporal M. C.
Bromley, Rifleman J. H.
Brothers, Lieutenant W. F.
Brown, Private C.
Brown, Corporal C. D.
Brown, Sergeant E. B.
Brown, Sergeant F. E.
Brown, Private G. A.
Brown, Sergeant J.
Brown, Private J.
Brown, Private N. G.
Brown, Private T.
Brown, Private T.
Brown, Gunner W.
Brown, Sergeant W. J.
Brown, Gunner W. J.
Brown, Private W. G.
Brown, 2nd Lieutenant W. S.
Browne, Sergeant C. T.
Browning, Sapper C. A.
Bruce, Private F.
Brunton, Lance-Sergeant J. S.
Brunton, Sergeant N. T.
Bryant, Driver L. M.
Bryant, Private W. H.
Buchanan, Private G. H.
Buchanan, Bombardier L. H.
Buchanan, Corporal T.
Buckland, Private A. F.
Buckeridge, Private E.
Bullen. Private R. H.
Buller, Private R. C.
Bullick, Private T.
Bullock, Sapper L. E.
Burgess, Rifleman G.
Burgess, Corporal J. W.
Burke, Private A. F.
Burke, Private J. A.
Burnley, Corporal L. A. G.
Burnett, Private W. H. J.
Burns, Corporal H. A. K.
Burns, Private R. J.
Bums, Private S. B.
Burnside, Private R. J.
Burrowes, Private J. K. H.
Burt, Private J. M.
Burt, Sergeant O. C. H.
Burton, Lance-Corporal L. A.
Burton, Lance-Corporal O. E.
Bushill, Sapper A.
Butler, Lance-Corporal A. J.
Butler, Rifleman W. H.
Butler, Private W. J.
Butt, Private T. H.
Butterworth, Private J. S.
Butterworth, Trooper S.
Byrne, Lance-Corporal H. J.
Byrne, Private N.
Byron, Private A. J. W.
Cadman, Bombardier A.
Cain, Sergeant R. H.
Cairns, 2nd Corporal J. E.
Calame, Sergeant P. E.
Calder, Private E. H.
Calderwood, Corporal J. H.
Caldwell, Sergeant R. T.
Cameron. Sapper A.
Cameron, Private G.
Cameron, Private K.
Cameron, Lance-Sergeant J.
Cameron, Sergeant K. E.
Cameron, Corporal R. B.
Cameron, Private R.
Campbell, Lance-Corporal A. K.
Campbell, Rifleman E. H.
Campbell, Sergeant F.
Campbell, 2nd Corporal G.
Campbell, Private K.
Campbell, Corporal T. M.
Campbell, Rifleman W. C.
Canton, Private W.
Capper, Bombardier H.
Carr, Lance-Corporal C. H.
Carrington, Corporal A. H.
Carroll, Driver J. W.
Carson, Private J.
Carter, Sergeant F. D.
Carter, Sergeant F. J.
Carver, Private S. F.
Cashmore, Corporal F. R.
Castles, Gunner J. V.
Caulfield, Private J. P.
Cauty, Sergeant J. V.
Chalmers, Lance-Corporal C.
Chambers, Rifleman W. V.
Chandler, Private G.
Chapman, Lance-Corporal W. C.
Chappell, Private F. E.
Charteris, Sergeant R.
Cheeseman, Rifleman J. H.
Childs, Lance-Corporal R. A.
Chirnside, 2nd Lieutenant T.
Chisholm, Private J.
Chitty, Private T. W.
Chong, Private G. M.
Church, Private D. M.
Church, Private R. A.
Churchill, Private J. L.
Ciochetto, 2nd Lieutenant C. V. M.C.
Clague, Lance-Corporal J.
Clancy, 2nd Lieutenant W. S.
Clark, Corporal A. C.
Clark, Sergeant A. S.
Clark, Sapper H. G.
Clark, Private J. W.
Clarke, Rifleman P. A.
Clarke, 2nd Lieutenant M.
Clarke, Private N.
Clarke, Sergeant S. B.
Clearwater, 2nd Lieutenant J. T.
Cleland, Private T. B.
Clemance, Lance-Corporal C. W.
Clement, Corporal D. H.
Clifford, Sergeant W. J.
Clinker, Rifleman H. S.
Close, Private A. A.
Closey, Private F. W.
Clothier, Private W. A.
Coats, Sergeant H. E.
Cochran, Private H. R.
Cody, 2nd Lieutenant J. F.
Coe, 2nd Lieutenant A. H.
Cole, Lance-Corporal F. C.
Cole, Sergeant K. M.
Cole-Baker, Private D. P. G.
Coleman, Lance-Corporal E. J.
Coles, Private T.
Coley, Driver J. B.
Collin, Private B. A.
Collins, Lance-Corporal A. E.
Collins, 2nd Lieutenant W. J.
Collis, Sergeant F.
Columbus, Private L. H.
Connell, Private C. W.
Conway, Private A.
Conway, Private R. V.
Cook, Sergeant J. A.
Cook, Bombardier A. C.
Cooke, Private H.
Cooksley, Sergeant B. V.
Cooksley, Corporal W. E., D.C.M.
Coombes, Private A. N.
Coombes, Private J. A.
Coop, Rifleman N.
Cooper, Lance-Sergeant G. B.
Coote, 2nd Lieutenant J. C.
Coppell, Private W. R.
Corbett, Corporal A.
Corbett, Rifleman W. H.
Cordell, Corporal T. A.
Corrie, Trooper A.
Corry, Private W. A.
Cosbrook, Sergeant A. J.
Costar, Gunner W. R.
Coster, Sergeant A. H.
Cottingham, Artificer S. H.
Couch, Private C. A.
Coughey, Private J.
Coubrough, Driver D. W.
Coulam, Sergeant F.
Couling, 2nd Lieutenant J.
Cousins, Driver W. R.
Cowie, Lance-Corporal G. M.
Cowie, Sergeant R.
Cox, Sergeant A. B.
Cox, Lance-Corporal W. E. B.
Coxhead, Private S. M.
Craig, Sergeant P. G.
Craven, Rifleman W.
Crawford, 2nd Lieutenant E. H.
Crawford, Private T. H.
Crawley, Sergeant D. J.
Crawshay, Private V. G.
Cray, Private D.
Cree, Lance-Corporal J.
Creed, Private S. G.
Creighton, Private O.
Croker, 2nd Lieutenant B. W.
Cross, Bombardier N. E.
Cross, Corporal F. L.
Crossen, Private W. J.
Crowe, Private G. P.
Crowther, Private H.
Crutchley, Corporal L.
Cullen, Lance-Corporal E. L.
Cumming, Sergeant W.
Cunningham, Sergeant A. J., D.C.M.
Cupples, Private E. L.
Curran, 2nd Lieutenant T. M. J.
Currey, 2nd Lieutenant A. A.
Currie, Rifleman J.
Curry, Private A. W.
Curry, Private C. J. H.
Curry, Private D. W.
Cusack, Lance-Sergeant J. W.
Cuthbertson, Sergeant W. J.
Cuthill, Lance-Corporal R. J.
Cutts, Corporal T.
Dabner, Private H.
Dacre, Corporal L. M.
Dagnall, Sergeant W.
Dalzell, Rifleman A.
Danby, Lance-Corporal A. W.
Dass, Private C. E. H.
Dartnall, 2nd Lieutenant C. A.
Davey, Trooper A.
Davidson, Sergeant D.
Davis, Sergeant C. H.
Davis, Private J. S.
Davis, Private O. O.
Dawbin, Private H. J.
Dawson, Private C. R.
Dawson, Private J. R.
Day, Driver H.
Day, Lance-Corporal H. N.
Dean, Lance-Corporal E. J.
Dean, Private E. M.
Dean, Corporal H.
Dean, Corporal J.
De Luen, Corporal F.
Denize, Private H. V.
Denne, Corporal A. E.
Dent, Sergeant I.
Detteret, Sergeant A.
Dewar, Sergeant J. L.
Dewar, Lance-Corporal O. B.
Diack, Private A.
Diamanti, Trooper R. J.
Dibble, Private S. T.
Dickason, Rifleman A. E.
Dickinson, Private C. T.
Dickinson, Private L. R., D.C.M.
Dickson, Private N.
Dillon, Private A. H.
Dinnie, Sergeant C. H.
Dixon, Sergeant B. L.
Dixon, 2nd Lieutenant W. B.
Dobbyn, Sapper A. J.
Dobson, Bombardier T.
Dockery, Gunner A. E.
Dodds, Corporal J. T. K.
Dolman, Private W.
Donaldson, Lance-Sergeant G. A. H.
Donaldson, Sapper M.
Donghi, Private H. A.
Donovan, Private C. A.
Douglas, Private A. McF.
Douglas, Private K. W.
Downey, Private S. G.
Downie, Private H. C.
Downs, Corporal W.
Dowsing, Sergeant J.
Doyle, Private A. R.
Doyne, Private J. D.
Dredge, Sergeant G. M. L.
Dron, Private T.
Drury, Rifleman F. B.
Duff, Corporal A.
Duggan, Corporal J. W.
Duggan, Private L.
Duncan, Sergeant C. M.
Dunford, Lance-Corporal D. J.
Dunstall, Gunner F. A.
Durrant, Farrier C. G.
Duston, Sergeant H. McK.
Duthie, Corporal E. D.
Eagle, Sergeant F.
Eastgate, Lance-Corporal H. S.
Easton, Lance-Corporal M. G.
Easton, Sergeant W. B.
Ebert, Private G.
Edgecombe, Corporal F. C.
Edmonds, Driver A. E.
Edwards, Private E. E.
Edwards, Private C.
Edwards, Private S. H.
Edwards, Rifleman W. H.
Ellen, 2nd Lieutenant H., M.C.
Elliott, Sergeant A. C.
Elliott, Sergeant W. C. D.
Ellis, Private H. A.
Ellis, Lieutenant R. F.
Elsom, Sergeant C. H.
Emery, Private O.
Empson, Private O. C.
Entwhistle, Driver C.
Erikson, Lance-Corporal A.
Evans, Sergeant R. C.
Evans, Lance-Corporal O.
Everett, Private P.
Everett, Gunner R. E.
Eyles, Corporal H. P.
Fairbrother, Private R. E.
Fairweather, Private S.
Faithful, Private W. H.
Fake, Lance-Corporal H.
Falla, Private H. T.
Falls, Lance-Corporal D.
Fargie, Trooper W. G.
Farr, Sapper R. C.
Farrell, 2nd Lieutenant E.
Farrington, Driver M. C.
Fatt, Rifleman S.
Feather, Lance-Corporal T. E.
Fenemor, Sergeant R. C.
Ferguson, Rifleman C.
Ferguson, Trooper H.
Ferguson, Sergeant R. L.
Fernandez, Corporal J.
Ferrand, Sapper H. C.
Few, Corporal F.
Findlay, Lance-Corporal J. M.
Finlay, Lance-Corporal C. P.
Finlayson, Private W. J.
Finn, Private H. McL.
Finnerty, Private J.
Finucane, Sergeant E. M.
Fitzgerald, Sergeant N. E.
Fitzgerald, Lance-Sergeant W. M.
Fitzsimmons, Private A. J.
Fix, Sergeant W. J.
Flavell, Lance-Corporal R. H.
Fleming, Gunner R. I.
Fletcher, Corporal E. C.
Fletcher, Lance-Corporal F. N.
Flood, Private J.
Flowerday, Private H. N.
Flutey, Corporal R. H.
Fly, Lance-Corporal M. H.
Flynn, Private E. J.
Flynn, Sergeant M.
Fogarty, Lance-Sergeant R.
Fogelberg, Sapper C. E.
Foley, Private J.
Foley, Private P.
Foote, Private E.
Foote, 2nd Lieutenant H. A.
Ford, Private M.
Forrest, Private T. F.
Forsyth, Rifleman A. E.
Foster, Private G. A. W.
Foster, Private J.
Foster, Private R.
Fotheringham, Lance-Corporal G. B.
Fowler, Private S. J. E.
Fox, Sergeant E. V.
Fox, Corporal H.
Fraser, Company Sergeant-major A. H.
Fraser, Sergeant D.
Fraser, Private H. S.
Fraser, Corporal J. D.
Fraser, Private J. McI., bar to M.M.
Fraser, Sergeant J. R.
Fraser, Rifleman J. S.
Freshney, Corporal J. B.
Frew, Lance-Corporal J.
Fricker, Sergeant H. E.
Frost, Private E. W. J.
Frost, Lance-Corporal R. W. A.
Fruin, Rifleman J. L.
Fullarton, Lance-Corporal D. McT.
Fuller, Lance-Corporal E. G.
Gaffney, Lance-Corporal P. J.
Galbraith, Private J. A.
Gallagher, 2nd Lieutenant A. W.
Gallagher, Private M. C.
Galvin, Corporal F. G.
Galvin, Private M.
Gardner, Lance-Corporal G. W.
Garlick, Private R. T.
Garnett, Sapper J. W.
Garrett, Sergeant W. E.
Gates, Private F. G.
Gawler, Private S. R.
Geange, Private T.
George, Private B.
Gerken, Private G. L.
Gerrand, Private J. F.
Gibb, Corporal A. E.
Gibbs, Private L. L.
Gibbs, Sapper W. H.
Gibson, Gunner C.
Gibson, Private L. V.
Giffney, Sapper J. A.
Gilbert, Private G., bar to M.M.
Gilbert, Lance-Corporal J. R.
Gilbert, Corporal M.
Giles, Lance-Corporal S.
Gill, Lance-Sergeant A. M.
Gillespie, Private L. W.
Gillespie, 2nd Lieutenant A. O.
Gillon, Private J.
Gilmore, Sergeant W. B.
Gilmore, 2nd Lieutenant A. F.
Gilshman, 2nd Lieutenant S. E.
Girdlestone, Gunner G. S.
Girven, Lance-Corporal E.
Girven, Bombardier W. D.
Glassey, Private J.
Gledhill, Corporal G. L.
Gleeson, 2nd Corporal F. C.
Glentworth, Sergeant J. P.
Glogoski, Lance-Corporal E. W.
Going, Corporal L. R.
Golder, Sergeant A. G.
Goldfinch, Sergeant S.
Golding, Private S.
Goldsmith, Private F.
Goldstone, Lance-Corporal C.
Goodfellow, Sergeant T. A.
Goodhue, Sergeant A. C.
Goodin, Trooper S. L.
Gordon, Private A. W.
Gordon, Lance-Corporal C. J.
Gordon, 2nd Lieutenant J. McK.
Gordon, 2nd Lieutenant L. G.
Gorton, 2nd Lieutenant A. E.
Gould, Lance-Corporal J. R.
Goulden, Corporal H. H.
Gowers, Rifleman H.
Gradwell, Rifleman G. H.
Graham, Private A. C.
Graham, Corporal W. R.
Grainger, Bombardier A. R.
Grant, Lance-Corporal A.
Grant, Lance-Corporal C. O.
Grant, Lance-Corporal T. M.
Grant, Bombardier R. McP.
Gray, Rifleman C. A.
Gray, 2nd Lieutenant R. N., M.C.
Green, Corporal F. V.
Green, Private G. T. W.
Green, Corporal H. V.
Green, Corporal W. J.
Greenwood, 2nd Lieutenant J.
Gregson, Staff Sergeant J.
Gribble, Corporal W.
Grieve, Private E.
Griffin, Private A.
Griffiths, Corporal C. C.
Grundy, Private H. R.
Guise, Private H.
Gunn, Corporal A.
Gunn, Lance-Corporal D.
Gunn, 2nd Lieutenant F.
Gunn, Private W. G.
Guthrie, Bombardier A. H.
Guthrie, Private R. A.
Guthrie, Sergeant R. G.
Guthrie, Private W.
Guy, Private T. F.
Gwilliam, Gunner G. W. A.
Hadfield, Private R. H.
Hadley, Gunner P. R.
Hailes, Lance-Corporal W. J.
Haldane, Lance-Corporal W. J.
Hall, Private A.
Hall, Sergeant A. C.
Hall, Private A. M.
Hall, Corporal C. J.
Hall, Sergeant G.
Hallam, Rifleman W. E.
Hallett, Rifleman E. W.
Halligan, Lance-Corporal R. H.
Halpin, Lance-Corporal L. J.
Halvorsen, Private G.
Hamill, Lance-Corporal F. W.
Hamilton, Lance-Corporal L. R.
Hamlin, Private K. W.
Hammersley, Lance-Corporal J. M.
Hammond, Gunner I. E.
Hampton, Corporal H. R.
Hanger, Sergeant J. M.
Hannan, Lance-Corporal W. C.
Hansen, Private I. T.
Hansen, Driver G. H.
Hanson, Lance-Corporal F. M. H.
Hanson, Lance-Corporal S. F.
Haraki, Private W.
Harding, Corporal R. W.
Hardy, Corporal J. H.
Hardy, Sapper T. G.
Harper, Lance-Corporal L. A.
Harper, Private T. S.
Harrington, Lance-Corporal T. W.
Harris, Private C. A. J.
Harris, Private H.
Harris, Private J.
Hart, Private G. H.
Hart, Corporal J. G.
Hart, Sergeant R. G.
Hartigan, Rifleman H. H.
Hartman, 2nd Lieutenant B.
Hartman, Bombardier L.
Harty, Lieutenant L. P.
Harvey, Gunner C.
Harwood, Rifleman J. R. B.
Hastie, Sergeant G.
Hatfull, Lance-Corporal T.
Hatton, Sergeant R.
Havill, Lance-Corporal J.
Hawke, Corporal A. R.
Hawkes, Private C. J.
Hay, Private A. C.
Hayter, Rifleman R.
Hayton, Lance-Corporal G.
Hearn, Lance-Corporal F. W.
Heath, Rifleman H.
Heekin, Private T.
Heese, Lance-Sergeant B.
Helm, Private A. M.
Henderson, Gunner A. L. H.
Henderson, Private A. R.
Henderson, Sergeant C. L.
Henderson, Private E.
Henderson, Private R. A.
Henley, 2nd Lieutenant N. G.
Hennessy, Private W. G.
Henry, Company Sergeant-major C. C.
Henry, Driver G. E.
Henry, Corporal P.
Henson, Lance-Corporal J. H. H.
Hermiston, Private W.
Heron, Staff Sergeant D. H. H.
Heslop, Private J. W.
Hewitt, Private G.
Hewitt, Lance-Corporal J. E.
Hickey, Lance-Corporal M.
Hickey, Private W. J.
Hicks, Sergeant F. T.
Hicks, Lieutenant W. J.
Higginson, Corporal N. L.
Hill, Corporal E.
Hill, Lance-Corporal J
Hill, Corporal R. S.
Hilliard, Private J.
Hinchco, Private A.
Hinds, Private C.
Hine, Sergeant C. P.
Hine, Sergeant H. S.
Hinton, Corporal C. P. V.
Hodgson, Corporal F. J.
Hodgson, 2nd Lieutenant F. J
Hodgson, Sapper J. H.
Holder, Sergeant W. R.
Holgate, Private H. C.
Hollywood, Sapper J. E.
Holman, Private E.
Holmes, 2nd Lieutenant A. L.
Holmes, Private O. S.
Holmes, Sergeant P. D.
Holyoake, Rifleman F. T.
Hooker, Private A. C.
Hopkins, Private C.
Hopkins, Lance-Sergeant E.
Hopkins, Private L. G.
Hori, Private K.
Horn, Lance-Corporal J.
Horn, Corporal R. H.
Hornblow, Corporal J. A.
Hornell, Trooper W. J.
Hornwell, 2nd Lieutenant W. W.
Hough, Private R.
Hounsell, Private G. E.
Houston, Sapper J.
Howard, 2nd Corporal A. A.
Howatson, Private A. S.
Howden, Corporal J. A.
Howe, Private A.
Howe, Sergeant O. W.
Howie, Private W. D., bar to M.M.
Howie, Private W. J.
Howlett, Sergeant D.
Hudson, Private A.
Hudson, Private R.
Hughes, Lance-Corporal A.
Hughes, Lance-Corporal E. A.
Hughes, Trumpeter O.
Huggins, Private E. M.
Hull, Trooper J. K.
Hulton, Sergeant T. H.
Humphries, Corporal C. W.
Hunter, Corporal J.
Hunter, Private J. R.
Hunter, Private E. J.
Hunter, Private W. G.
Hurley, Corporal D.
Hutchings, Sergeant W.
Hutchins, Rifleman F. G.
Hutchins, Private G. T.
Hyde, Sapper M. C.
Hynes, Corporal H. W.
Idle, Private S.
Ilton. Private W. E.
Inch, Sergeant V. W.
Ingram, Lance-Corporal H.
Ingram, Private S.
Ingpen, Rifleman N. L.
Irvine, Sergeant G. W. McL.
Irvine, Rifleman J.
Irvine, Private R. F. B.
Irving, Rifleman W. C.
Jackson, Private A. D.
Jackson, Corporal C. W.
Jackson, Private F.
Jackson, Private H.
Jackson, 2nd Lieutenant J.
Jackson, Private R. M.
Jacques, Private W. H.
James, Private J. E.
Jamieson, Private R.
Jaques, Private P.
Jefferson, Corporal W. B.
Jeffs, Sergeant A. H.
Jeffrey, Private R.
Jeffreys, Sergeant H. D.
Jenkins, 2nd Lieutenant D. A.
Jenkins, Rifleman F.
Jenkins, Lance-Corporal H.
Jennens, Sergeant C. K.
Jensen, Lance-Sergeant A. R.
Jepson, Sergeant O.
Jesse, Rifleman P. W.
Jeune, Gunner D. J. F.
Joblin, Trooper P.
Johnsen, Company Sergeant-major F. W.
Johnson, Private A. R.
Johnson, Gunner F. W.
Johnson, Private H. A.
Johnson, Corporal H. R.
Johnson, Private J.
Johnson, Private J. A. W. B.
Johnson, Lance-Corporal H. H.
Johnson, Corporal T. O.
Johnston, Rifleman A.
Johnston, Gunner A. H.
Johnston, Sergeant W. A.
Johnstone, Staff Sergeant A. M.
Johnstone, Driver R.
Johnstone, Private R.
Joll, Private H. L.
Jonas, Sapper C. T.
Jones, Private D.
Jones, Private D. G.
Jones, Private E. J.
Jones, Rifleman J. A.
Jones, Corporal M. R.
Jones, Lance-Corporal S. W.
Jones, Gunner W. A.
Jowers, Rifleman W. H
Judd, Rifleman P. K.
Judson, 2nd Lieutenant R. S., V.C., D.C.M.
Juggins, Trooper J. F.
Jury, Corporal C. R.
Kasper, Sergeant A. C.
Kearney, Private J. J.
Keen, Private T. A.
Keesing, Sergeant H. W.
Keisenberg, Lance-Corporal O. A. von
Kelk, Company Sergeant-major G.
Kelland, Trooper C. R.
Kelliher, Lance-Corporal J.
Kelly, Lance-Sergeant J. J.
Kelly, Private W. R.
Kelsall, Private E., bar to M.M.
Kennedy, Corporal D. A.
Kennedy, Sergeant F., bar to M.M.
Kennedy, Driver F. W.
Kennedy, Corporal H.
Kennedy, Private T. O.
Kernick, Private J.
Keys, Rifleman J.
Keys, 2nd Lieutenant P. L.
Kidd, Gunner R.
Killoh, Sergeant L. W.
Kilroy, Sergeant R. J.
Kindberg, Private A.
King, Lance-Corporal E.
Kingham, Sapper W. J.
Kirkland, Corporal J. A.
Kirkwood, Private J.
Kirton, Corporal T.
Knight, 2nd Corporal R. A.
Knight, Private T. W.
Kuhtz, Bombardier J. R. H.
Kyle, Private L. A.
Lacey, Private W. T.
Lainchbury, Private T.
Laing, Private J. F.
Lamb, Private J. B.
Lamb, Private S. A.
Lambert, Private W. A.
Land, Private I. G.
Lane, Corporal T.
Lane, Private W. G.
Langford, Sapper E. H.
Lang, Private H. L.
Langvad, Private W.
Langwell, Sergeant H. J.
Lark, Private A.
Larkins, Private H.
Larsen, Private D. H.
Larsen, Corporal H.
Lauder, 2nd Lieutenant A.
Laurie, Trooper W. R. D.
Lauriston, Private D.
Law, Private A.
Lay, Corporal J. G.
Leary, Corporal L.
Le Comte, Lance-Corporal H E.
Lee, Lance-Sergeant A.
Lee, Private G. J.
Leef, Private H. T.
Lees, Private T. F.
Leigh, Lance-Corporal T. J.
Leighton, Corporal H. S.
Lepper, 2nd Lieutenant C. B.
Lepper, Lance-Corporal J.
Leshke, Private A.
Lessels, Sergeant D.
Lester, 2nd Lieutenant C. L.
Lewin, Private C
Lewis, Lance-Corporal A.
Lewis, Trooper E. D.
Lewis, Lance-Corporal T.
Lewis, Lance-Corporal W. J., D.C.M.
Lineham, Trooper C. A.
Linklater, Sapper H.
Linn, Corporal E. J.
Linton, Lance-Sergeant W.
Little, Signal Sergeant J. A.
Livesy, Private R.
Livingston, Sergeant B. V., D.C.M.
Lloyd, Gunner J. C. H.
Loader, Lance-Corporal C.
Lock, Sergeant S. G. S.
Lockwood, Driver T.
Lonergan, Corporal T.
London, Sergeant R. P.
Long, Sergeant W. E.
Longmuir, Private J.
Looker, Lance-Corporal W. L.
Lord, Private C. C.
Lorgelly, Driver W. J.
Loudon, Private R. H.
Loveday, Private L. G. V.
Lovelock, Private E.
Low, Rifleman J.
Low, Private J. C.
Lowe, Sergeant P. T.
Lowe, Rifleman W. E.
Luff, Private E. L.
Luff, Sergeant T. R.
Lund, Sergeant W.
Lyall, Private J. R.
Lyford, Rifleman L.
Lylian, Trooper H. D.
Lymer, Private E.
Lynch, Corporal F. G.
McAlinden, Private C. R. M.
McAndrew, Private J.
Macauley, Corporal G.
McAusland, Lance-Corporal J.
McBeath, Private A. D.
McBeath, Private C.
McBreen, Private E.
McBride, Sergeant M. D.
McCarthy, Private J.
McCarthy, Private J. P.
McCaw, 2nd Lieutenant W. T.
McClatchie, Corporal P. J.
McClenaghan, Private W. T.
McClintock, 2nd Lieutenant W. G.
McClure, Rifleman D. J.
McClure, Sergeant W.
McClymont, Lance-Corporal F. G.
McColgan, Private W.
McConnell, Gunner G.
McConnell, Corporal T. D.
McCorquodale, Corporal D. A.
McCoskie, Private C. O.
McCracken, Private J.
McCrostie, Lance-Corporal D. C.
McCullagh, Private A.
McCullagh, Private J. W.
McCully, Corporal A.
McDevitt, Driver F. J.
McDivitt, Private R.
McDonald, Corporal A.
McDonald, Private A. J.
McDonald, Private C. G.
McDonald, Gunner H.
McDonald, Gunner M.
McDonald, Gunner R. H.
McDougall, Corporal A. S.
McDougall, Lance-Corporal C. N.
McDowell, 2nd Lieutenant R.
McFarlane, Corporal H. M.
McGahan, Sergeant J.
MacGibbon, Corporal A. W.
McGibbon, 2nd Lieutenant D. A.
McGonagle, Private D. L.
McGowan, Private D. L.
McGowan, Sergeant E. A.
McGrath, Rifleman E.
McGregor, Private G.
McGuckin, Trooper H.
McGuire, Lance-Corporal T. F.
McIntyre, Lance-Sergeant C. E.
McIntyre, Private D. R.
McIntyre, Private H. P.
McIntyre, Lance-Corporal W.
McKane, Sergeant A. H.
McKay, Private B.
MacKay, Lance-Sergeant D.
McKay, Private G. A.
McKay, Sapper J. W.
McKay, Private R.
Mackay, Private W. J.
McKean, 2nd Lieutenant W. J.
McKechnie, Sergeant J.
McKeegan, Sergeant C.
McKendry, Private J.
McKenzie, Sergeant A. T.
McKenzie, Private D.
McKenzie, Private E. G.
McKenzie, Lance-Corporal J. W.
MacKenzie, Sergeant K.
McKenzie, Sergeant N. A.
McKenzie, Lance-Corporal N. H.
Mackie, Lance-Corporal A. P.
McKie, Rifleman D. A.
Mackinder, Rifleman W. A.
Macklam, Private A.
McKinley, Sergeant R. W.
Mackrell, 2nd Lieutenant H. H.
McLachlan, Private L. D.
McLaren, Sergeant D.
Maclean, Lance-Sergeant A.
McLean, Rifleman A.
McLean, Driver A. J.
McLean, Private C.
Maclean, Gunner J. R.
McLean, Private J. H.
McLean, Fitter L. D.
McLean, Corporal L. G.
McLean, Private T. A.
McLeely, Private J. W. J.
McLellan, Private A.
McLelland, Lance-Corporal J. F.
McLelland, Corporal W. H.
MacLennan, Lance-Corporal T.
McLeod, Sergeant D. S.
McLeod, 2nd Lieutenant J. D.
McMahon, Sergeant A. E.
McMahon, Corporal P. R.
McMaster, Sergeant A. A.
McMeeking, Private D. T.
McMillan, Sapper H.
McMillan, Lance-Corporal G. R.
McMillan, Corporal N.
MacMillan, Lance-Corporal W. H.
McMillan, Gunner W.
MacMurray, Bombardier K.
McNamara, Corporal G. P.
McOnie, Private G.
McPherson, Lance-Corporal B. D.
McQueen, Sergeant A. A.
McQuillan, Corporal J.
McQuillan, Sapper P.
McRae, Sergeant D.
Maindonald, Gunner F. W.
Mains, Bombardier C. E.
Mains, Corporal-Fitter J. H.
Mair, Sergeant A. D.
Malloch, Private R. T.
Malone, Gunner D.
Mander, Gunner L. J.
Manning, Lance-Corporal C. J.
Mano, Private H.
Manson, 2nd Corporal R. V., D.C.M.
Manson, Lance-Corporal W.
Marshall, Corporal G. L.
Marshall, Lance-Sergeant R. A.
Martelli, Rifleman C.
Martin, Private A.
Martin, Lance-Sergeant F. R.
Martin, Sergeant J.
Martindale, Sergeant J.
Mason, Sergeant A. J.
Mason, Corporal F. C.
Mason, Lance-Corporal J. R.
Mason, Driver S.
Masters, Sergeant F. H.
Mateer, Private F. E.
Matheson, Lance-Corporal H. A
Mathias, Lance-Corporal J. S.
Matthews, Private C.
Matthews, Private C. D.
Matthews, Sergeant F. C.
Maubon, Rifleman C. J.
Mawdsley, Bombardier W.
Maxwell, Private G.
May, Private W. H.
Mayall, Sergeant D.
Maynard, Corporal L.
Mead, Private A. D.
Meaney, Lance-Corporal A.
Melgren, Private R. F.
Mellor, Lance-Corporal E. E.
Melville, Private H., D.C.M.
Menzies, Private A. B.
Metcalfe, Private M.
Metge, Private D. D.
Meurant, Rifleman F. A.
Mexted, Lance-Corporal G. W.
Michael, Corporal H. W.
Michaels, Lieutenant L. G.
Michau, Lance-Corporal L. J.
Michell, 2nd Lieutenant H. J.
Middlemiss, Private W. P.
Midgley, Sergeant H. L.
Millar, Sergeant J.
Millar, Private O. McL.
Miller, Private D.
Miller. Lance-Corporal H. C.
Miller, Corporal J.
Miller, Private. L. P.
Miller, Private S. A.
Milligan, Sergeant P. G.
Millington, Private W.
Millis. Private E. A.
Mills, Gunner J. McA.
Mills, Sergeant M. F.
Mills. Lance-Sergeant S. R.
Millward, Corporal L. W. G.
Milne, Lance-Corporal R.
Milne, Lance-Corporal R.
Mintrom, 2nd Lieutenant P. H.
Mitchell, Private C. C. A.
Mitchell, 2nd Lieutenant G.
Mitchell, Corporal G. G.
Mitchell, Corporal T. G.
Moar, Lance-Corporal H.
Moffatt, Lance-Corporal L. P.
Moffet, Private G. A.
Moffit, Lance-Corporal P.
Moffitt, Corporal J. E.
Moffitt. Lance-Corporal W.
Moir, Corporal P. T., D.C.M.
Mole, Bombardier H. P.
Molesworth, Lance-Corporal C. E.
Molloy, Lance-Corporal J.
Moody, Lance-Corporal P. H.
Moon, Corporal W. H.
Mooney, Private T. A.
Moore, Bombardier E. W.
Moore, Private P. D.
Moore, Sergeant G. V. T.
Moore, Lieutenant J. J.
Moore, Corporal N. R.
Moore, 2nd Lieutenant W. A.
Moreland, Private R.
Morgan, Private C. M.
Morgan, Sergeant-Trumpeter J. W.
Morgan, Corporal L. O.
Morgan, Private T. T.
Moritzson, Lieutenant L., M.C.
Morrin, Sergeant W. P., D.C.M.
Morris, Private C. S.
Morris, Sergeant H. M.
Morris, Private J. H.
Morris, Private P.
Morris, Private S. W. E.
Morrison, Private K.
Morrow, Sergeant W. J. T.
Mortenson, Private L. G.
Moscroft, Lance-Sergeant H.
Moss, Sergeant J. C.
Motion, Sergeant W.
Mowbray, Bombardier E.
Moves, Lance-Corporal D.
Movie, Sergeant H. L.
Mulholland, Corporal G. R. O.
Mullen, Fitter E.
Mulligan, Captain A.S., D.C.M.
Mulligan, Private E. A.
Mulvaney, Corporal M. J.
Munro, Private C. T.
Munro, Rifleman J. M.
Munt, 2nd Lieutenant R. A.
Murray, Sergeant A. W.
Murray, Private A. W.
Murray, Lance-Corporal J.
Murray, Corporal J. W.
Murray, Rifleman R. N.
Murray, 2nd Lieutenant T. T., M.C.
Murray, Sergeant W. J.
Murrell, Corporal N. S.
Myers, Private G.
Naden, Private F.
Nainsmith, Rifleman R. C.
Nankivell, Sergeant L.
Napier, Lance-Sergeant G. S.
Neal, Private H. R.
Needham, Private D. G.
Needs, Private R. A.
Negus, Rifleman F.
Neilson, Private M.
Neilson, Private N. C.
Nelsen, Private M. L.
Neville, Rifleman P.
Newberry, Rifleman J.
Newcombe. Sergeant. A. C.
Newell, Private D. W.
Newman, Bombardier E. F.
Newrick, Private F.
Newton, Private A. W. H.
Ngapo, Private R.
Nichol, Private A. B.
Nicholas, Sergeant L. R.
Nicholls, Private J. C.
Nicholls, Corporal T. H.
Nicholson, Private M.
Nicholson, Rifleman N. A.
Nicol, Private R. S.
Nield, Corporal A. H.
Nielson, Private R. W. E.
Nilsson, Sergeant E. J.
Nimmo, Private T.
Nisbet, Sapper A. W.
Noble, Private S. A.
Noonan, Private D. P.
Noonan, Corporal W. S.
Norman. Bombardier W. C.
North, Corporal L. G.
Northe. Corporal R. P.
Nunn, Private J.
Oakley, Lance-Corporal W. G.
O'Brien, Private J.
O'Brien, Private J. W.
O'Brien, Corporal W. S.
O'Callaghan, Corporal J. W.
O'Connell, Private T.
O'Connor, Private R. J.
O'Connor. Corporal W. J.
Odell, Corporal L. M.
O'Donnell, Corporal H. D.
O'Donnell, Corporal J.
O'Halloran, Lance-Sergeant M. J.
Oldham, Lance-Corporal W. A.
Oliver, Lance-Corporal E. E.
Olliver, Private P.
Olliver, Gunner W. W.
O'Neill, Driver K.
O'Neill, Rifleman P.
O'Regan, Private P. J.
Orpwood, Rifleman H. F.
Orr, Private N.
Osborne, Corporal D.
Osborne, Lance-Corporal D. S.
Osborne, Lance-Corporal S.
Osmers, 2nd Lieutenant H. H.
Otene, Corporal Rangi.
Otto, Sapper A.
Otto, Private W. E.
Overden, Corporal W. B.
Overend, Corporal W.
Owen, Private J.
Oxenburg, Private E.
Oxley, Trooper O. V.
Paddy, Sergeant W. C.
Page, Private H., D.C.M.
Pain, 2nd Lieutenant J. C.
Paine, Private E. I.
Paine, Sergeant W.
Palmer, Private J.
Palmer, 2nd Corporal L. J.
Palmer, Lance-Corporal P. J. L
Panoho, Private J.
Park, Private A.
Park, Private J. W.
Parker, Lance-Corporal E. B.
Parker, 2nd Lieutenant H. R.
Parker, Private J. H.
Parker, Private L. J. K.
Parker, Private T. J.
Parmenter, Sapper H. E.
Parsons, Private J.
Parton, 2nd Lieutenant R.
Patching, Corporal W. J.
Paterson, Gunner A. J.
Paterson, Corporal D. T.
Patrick, Private V.
Patten, 2nd Lieutenant H. L
Pattison, Corporal H.J.
Patton, Lance-Corporal G. H.
Paulson, Corporal B.
Pavelka, Private M.
Payne, Private G. D.
Paynter, Lance-Corporal L. H.
Paynter, Private W. H.
Pearce, Sergeant E.
Pearce, Corporal P. G.
Pearcy, Private G. H.
Pearson, Private R. M.
Peart, Private P. W.
Peat, Rifleman A. G.
Pegg, Lance-Corporal H. A.
Pegler, Lance-Corporal S. P.
Penberthy, Sergeant P. J.
Penman, Corporal A. P.
Pepper, Sapper W. M.
Perkins, Lieutenant H. A.
Perry, Rifleman A. H.
Perry, Corporal W. C.
Perry, Sergeant W. J.
Peter, Corporal A. L.
Peters, Sergeant F. J. F.
Petersen, Lance-Corporal E. P.
Petherick, Private B. L.
Pethybridge, Corporal W. T.
Phaup, Lance-Corporal T. W.
Phillips, Private D. R.
Phillips, Lance-Corporal F. H.
Phillips, Sapper N.
Phillips, Corporal R.
Philpott, Gunner E. W.
Philson, Lance-Corporal G. H.
Pickford, Fitter J. L.
Pierce, Sergeant A. J. B.
Pilcher, Trooper D.
Pilkington, Sergeant U.
Pinching, Private E. L.
Pinkham, Sapper W. G. F.
Pirritt, Private D. A.
Pitcher, Private G. J.
Pledger, Lance-Corporal E. R. W.
Poff, 2nd Lieutenant L. J.
Pointon, Lance-Corporal A. E.
Pomana, Private H.
Poole, Lance-Corporal S. H.
Poots, Lance-Corporal R.
Pope, Corporal E. E.
Postlewaight, Private L. H.
Potter, Fitter-Sergeant J.
Potter, Private J.
Poultney, Lance-Corporal S.
Powers, Private A. T.
Pratt, Sapper R. J.
Pratt, Sergeant W.
Preston, Lance-Corporal W. E.
Price, 2nd Lieutenant A. D., M.C.
Price, Corporal H. G.
Price, Lance-Corporal W. V.
Priest, Private J. W.
Prime, 2nd Lieutenant E. J.
Prince, Private A. T.
Prince, Rifleman P.
Pringle, Driver A.
Pringle, Sapper D.
Pritchard, Trooper A.
Proctor, Private C.
Proud, Private G. O. D.
Purcell, Private A.
Purdie, Staff Sergeant C. L.
Pycroft, Driver E. J.
Pye-Smith, Private P. R.
Queenin, Lance-Corporal B. G.
Quin, Lance-Corporal R.
Quin, Private R. V.
Quinlan, Gunner A. J.
Quinn, Rifleman J. M.
Quinn, Rifleman J. P.
Quinn, Private P.
Radcliffe, Rifleman B.
Radcliffe, Private D. S.
Rae, Private E. R.
Raines, Private H. S.
Ralston. Private W.
Ramsay, Rifleman R. C.
Ramsay, Sergeant W. J.
Ramsey, Private W. E.
Randell, Private P. L.
Ratcliffe, Private F.
Ratcliffe, Sergeant J. T.
Ray, Private C. H.
Ray, Rifleman R.
Raynor, Private C. W.
Rees, 2nd Lieutenant E. T.
Rees, Private W. B.
Reeve, Private W. P.
Reid, Private A. E.
Renall, Trooper R. P.
Rendall, Private W. S.
Renner, Corporal C.
Rennie, Lance-Corporal D. D.
Rennie, Sapper C. H.
Rennie, Lance-Corporal J. W.
Rennie, Sergeant L.
Reston, Private R. A.
Revell, Lance-Corporal E. J.
Reynard, Private J.
Rice, 2nd Lieutenant S.
Richards, Lance-Corporal W.
Richardson, Private E. A.
Richardson, Private J. F.
Richardson, Private T.
Richter, Private O. G. C.
Richards, Private E.
Ricketts, Private J. E.
Riddell, Sergeant R.
Riddell, Lance-Corporal W. J.
Riddell, Corporal W.
Rigby, Sergeant J. H.
Rigby, 2nd Lieutenant K. R.
Ringham, Private H. J.
Riordan, Sapper E. B.
Riposio, Lance-Corporal P.
Risk, Trooper G. M.
Ritchie, Lance-Corporal L. R.
Roach, 2nd Lieutenant G. H.
Roache, Private M. V.
Roberts, Company Quartermaster-Sergeant A., D.C.M.
Roberts, Private C. P.
Roberts, Rifleman R. P.
Robertson, Sapper J. R.
Robertson, Sergeant L.
Robertson, Private J. F.
Robertson, Private W.
Robbins, Lance-Corporal J. I.
Robinson, Private F. M.
Robinson, Gunner F. V. H.
Robinson, Private G.
Robinson, Bombardier K. J.
Robinson, Lance-Corporal L.
Robinson, 2nd Lieutenant N. M.
Robson, Lance-Corporal J.
Robson, Private R.
Rodgerson, Private R.
Rogers, Sergeant A.
Rogers, Private H. F.
Rogers, Sergeant J. H.
Roper, Sergeant G. J.
Rosanowski, Corporal H.
Ross, Company Sergeant-major D.
Ross, Sergeant H. L.
Ross, Private J. D.
Ross, Private M.
Roselli, Bombardier P. J. T.
Rossiter, Sergeant C.
Rotoatara, 2nd Lieutenant T.
Rowe, Sergeant A. N.
Rowe, Corporal C. A.
Rowe, Private G. L.
Rowley, Lance-Corporal F. B.
Ruane, Private A. T.
Rudkin, Sergeant A. R.
Ruff, Sergeant J. A. P.
Rufford, Private A.
Rusbrudge, Private H. W.
Rusden, Sergeant G. C.
Russell, Private H. F.
Russell, Corporal R. D.
Rusterholz, Lance-Corporal P.
Rutherford, Private K. McK.
Rutherford, Private S. E.
Ryan, Private D.
Ryan, Private F. L.
Ryan, Private J. A.
Ryan, Lance-Sergeant R.
Ryder, Corporal C. A.
Ryland, Private H.
Sage, 2nd Lieutenant A. H.
Salter, Private M.
Samson, Corporal C. O.
Sandison, Gunner W.
Sapsford, Corporal S. J.
Saunders, Sergeant W.
Saunders-Loder, Private W.
Savingy, Gunner P.
Scothern, Private G. J.
Scott, Quartermaster-Sergeant D. C.
Scott, Corporal J.
Scott, Private J. D.
Scott, 2nd Lieutenant S.
Scott, Private T. C.
Scott, Private W. E.
Scrimgeour, Trooper A. R.
Scrimshaw, Driver J. R. A.
Sharp, Corporal S. R.
Sharpe, Private F. J.
Shaw, Private H.
Shaw, Lance-Corporal W. R.
Sheahan, Private J.
Sheat, Rifleman C. M.
Sheen, Lance-Corporal W.
Sheerin, Driver H.
Shelley, Lance-Corporal C. H.
Shelton, Sapper R. F.
Shewry, Private J. E.
Shirley, Lance-Corporal C. V.
Shirley, Corporal V. W.
Shove, 2nd Lieutenant S.
Sidney, Corporal T. P.
Sim, Lance-Corporal J.
Simon, Corporal J. H.
Simons, Private L. W.
Simpson, Lance-Corporal C. E.
Simpson, Sergeant F. W. P.
Sims, Private A. F.
Sims, Private C.
Sims, Private F. E.
Sinclair, Private F. S.
Sinton, Corporal W. A.
Skatt, Rifleman G.
Slade, Private H. R.
Slater, Corporal G.
Smaill, Sergeant W. D.
Smillie, Trooper J.
Smillie, Corporal J.
Smith, Rifleman A. G.
Smith, Private A. G. T.
Smith, Private A. J.
Smith, Private A. R.
Smith, Lance-Corporal B. T.
Smith, Sergeant E.
Smith, Private E. H.
Smith, Lance-Corporal E. M.
Smith, Rifleman F.
Smith, Corporal F.
Smith, Rifleman F.
Smith, Private G. T.
Smith, Corporal H. B.
Smith, Bombardier H. P.
Smith, Private J.
Smith, Private K. B.
Smith, Corporal R.
Smith, Private R. R.
Smith, Rifleman S.
Smith, Private S. H.
Smith, Private W.
Smith, Lance-Corporal W. A.
Smith, Private W. H.
Smith, Lance-Corporal W. A.
Smith, Rifleman W. K.
Smylie, Corporal A.
Smyth, Private J. F.
Smyth, Lance-Corporal T. J.
Snowden, Private A. S. C.
Soffe, Private G.
Southern, Trooper W.
Southey, 2nd Lieutenant C. C, M.C.
Sparks, Corporal A.
Sperry, Driver R. P.
Spittle, Private C.
Springall, Sapper A.
Squire, 2nd Lieutenant B. C.
Stacey, Private E. E.
Stainton, Private T.
Stainton, 2nd Lieutenant W. G.
Staite, Lance-Corporal O.
Stanley, Private G.
Stapley, Lance-Corporal R. H.
Stark, Sergeant G. H.
Stedman, Private A. J.
Steel, Corporal R. W.
Stevens, Corporal A. M.
Stevens, Rifleman C. T.
Stevenson, Rifleman D.
Steward, Sergeant A. de B. P.
Stewart, Sergeant A.
Stewart, Private A.
Stewart, Private A. D.
Stewart, Corporal A. T.
Stewart, Private N.
Stiles, Lance-Corporal R. W.
Still, Private A. E.
Stirling, Rifleman S. G.
Stirling, Private N. D.
Stockdale, Lance-Corporal W.
Stokes, Private A.
Stone, Corporal N. G.
Storry, Rifleman W.
Stow, Private J. C.
Strachan, Corporal D. H.
Strahan, Lance-Corporal T. A.
Stringer, 2nd Lieutenant J. M., D.C.M.
Strode, Private A.
Stronach, 2nd Lieutenant D. W.
Strong, Rifleman E. A.
Stuart, Private A.
Stuart, Corporal D. M.
Stuart, Sergeant J.
Stuart, Corporal J. B.
Stuart, Corporal R.
Stubbington, Private F. C.
Stunell, Corporal C. E.
Sullivan, Private J.
Sullivan, Lance-Corporal W.
Summerhayes, Lance-Corporal K. A.
Sutherland, Private A. J.
Sutherland, Private H.
Sutherland, Lance-Corporal H. J.
Sutherland, Private J. S.
Sutton, Gunner F. J.
Swan, Lance-Corporal V.
Sweetman, Private E. P. S.
Switalla, Lance-Corporal P.
Taaffe, Lance-Corporal J. T. B.
Taiapa, Private T.
Tait, Private G. A. G.
Tait, Trooper W. J.
Tallke, Lance-Corporal L. L.
Tangatake, Private W.
Tarbutt, Sergeant L. O. S.
Tatham, Private J.
Taua, Private M.
Tavendale, Private D.
Taylor, Corporal A.
Taylor, Private E.
Taylor, 2nd Corporal F. G.
Taylor, Corporal G. S.
Taylor, 2nd Lieutenant W. G.
Taylor, Private W. J.
Tchernegovski, Private J. I. L.
Templeton, Private T.
Tennant, Private W. J.
Tennent, Sergeant K. B.
Te Amo, Private P.
Te Patu, Private T.
Tepene, Sergeant C. W.
Tetley, Private C. A.
Thomas, Lance-Corporal H. A.
Thomas, Gunner H. J.
Thomas, Sergeant N. H.
Thomas, Corporal S. A.
Thomas, Private W. A.
Thomason, Sergeant H. H.
Thompson, Company Quartermaster-Sergeant A. C.
Thompson, Gunner H.
Thompson, Private H. C.
Thompson, Sergeant P. A.
Thompson, 2nd Lieutenant S. G.
Thomson, Private A. F.
Thomson, Sergeant D. M.
Thomson, Trooper D. W.
Thomson, Company Sergeant-major G. W. G.
Thomson, Corporal J.
Thomson, Rifleman M. A.
Thomson, Private N.
Thorpe, 2nd Corporal G. H.
Tilby, Private W. H.
Tillman, 2nd Lieutenant A. N.
Tindall, Sapper J.
Tod, 2nd Lieutenant A. N.
Tod, Private C.
Tod, Lance-Corporal G. D.
Todd, Lance-Corporal G. D.
Tomkins, Private W. E.
Tomes, Sergeant J.
Tomlinson, Sergeant C. G.
Tomlinson, Bombardier C. W.
Tomsett, Private H.
Torrance, Private J.
Torrens, Private W. J.
Tott, Corporal F. G.
Toy, Private W.
Trebes, Corporal W.
Treleaven, Lance-Corporal D. N.
Trembath, Lance-Corporal J.
Trembath, Bombardier W.
Tribe, Private L. R.
Tripp, Lance-Corporal J.
Tritt, Corporal L. F.
Trotter, Trooper J. R.
Trotter, 2nd Lieutenant W. J. R.
Troughear, Private A.
Trueman, Private F. L.
Tuck, Corporal H. J.
Tucker, Corporal L. E.
Tuke, 2nd Lieutenant E. A.
Turkington, Private J.
Turnbull, Private A.
Turnbull, Sergeant J. H.
Turnbull, Private L.
Turley, Sergeant C. E.
Turley, Private J. T., bar to M.M.
Turner, Private B.
Turner, Sergeant H.
Turner, Rifleman W. C.
Turner, Lance-Corporal W. F.
Turner, Bombardier W. H.
Tutty, Private S. R.
Tyne, Gunner P. W.
Tyson, Private J. H.
Underwood, Trooper H.
Underwood, Private H.
Ure, Private R. J.
Veitch, Private C. G. C.
Venning, Private S. J.
Verran, Private J. S.
Verity, Private S. N.
Vial, 2nd Lieutenant J. H.
Vickers, Lance-Corporal C. E.
Vincent, Sergeant G. A.
Vincent, 2nd Lieutenant J., D.C.M.
Vincent, Corporal R. W.
Vine, Sergeant S. J.
Voller, Private R. E.
Voss, Private H.
Voss, Private R. J.
Voss, Rifleman T. W.
Voyle, 2nd Lieutenant J. W., D.C.M.
Waddel, Sergeant G. R.
Wade, Private E.
Wade, Private W. M.
Wagg, Sergeant W. J. K.
Wake, Rifleman A. A.
Wakeling, Lance-Sergeant W.
Walders, Corporal W. H. T.
Walker, Sapper J.
Walker, Rifleman W. R.
Wallace, Private E. E.
Wallace, Private J.
Waller, Rifleman H. T.
Walles, Rifleman C. W.
Warburton, Bombardier A. E.
Ward, Private G. A.
Ward, Private R. J.
Ward, Lieutenant W.
Warder, Trooper H.
Warren, Rifleman N.
Wasley, Sergeant W. A.
Watkins, Private A.
Watkins, Lance-Corporal H. T.
Watkins, Private L.
Watson, Corporal E. G.
Watson, Private J. A.
Watson, 2nd Lieutenant J. W.
Watson, Sergeant S. V.
Watson, Private W. L.
Watt, Signal-Corporal G. S.
Wattie, Sapper A. J.
Watts, Lance-Corporal G. R.
Webb, Private M.
Webb, Private S. H.
Webley, Private K. G.
Weir, Private G. H.
Weir, Private R.
Welch, Sergeant J.
Wells, Private K. C.
Welsh, Lance-Corporal E. E.
West, Private I. G.
Westhead, Driver L.
Weston, Corporal I. W.
Wharton, Lance-Corporal J.
White, Rifleman A. E.
White, Lance-Corporal C. J.
White, Gunner E. A. T.
White, Rifleman E. J.
White, Gunner H. H.
White, Sergeant J. A.
White, Bombardier W. C.
Whitelaw, Private L. A.
Whitelaw, Sapper L. C.
Whiting, Private W. H.
Whittington, Sergeant W. C.
Whyte, Sergeant A. W.
Wildsmith, Private C. T.
Wiley, Private H. P.
Wilkie, Sergeant P.
Wilkie, Private R. A.
Wilkinson, Gunner A. E. B.
Wilkinson, 2nd Corporal P. S.
Wilkinson, Trooper J.
Wilkinson, Private S.
Willets, Lance-Corporal M. W.
Williams, Rifleman A. O.
Williams, Private E.
Williams, Private P. J.
Williams, Sergeant H.
Williams, Private L. T.
Williams, Private R. S.
Williams, Sergeant S. A.
Williams, Gunner T.
Williams, Sergeant W. E.
Williamson, Private A. G.
Williamson, Corporal D. G.
Williamson, Corporal G.
Williamson, Sapper J.
Willis, Sergeant A. L. M.
Willis, Private H. J.
Wilsher, Corporal J. F.
Wilson, Private A.
Wilson, Corporal A. G. K.
Wilson, Lance-Sergeant A. M. de L.
Wilson, Lance-Corporal C.
Wilson, Sergeant C. G.
Wilson, Sapper C. G.
Wilson, Corporal C. R.
Wilson, Sergeant H. F.
Wilson, 2nd Corporal H. G.
Wilson, 2nd Lieutenant J. H., M.C.
Wilson, Lance-Corporal J. H.
Wilson, Private J. J.
Wilson, Rifleman J. J. H.
Wilson, Private J. T.
Wilson, Sapper N. E.
Wilson, Lance-Corporal R.
Wilson, Private S.
Wilson, Corporal T.
Wilson, Rifleman W. A.
Wilson, Corporal W. A.
Wilton, Corporal W. K.
Winkley, Corporal J. R.
Winter, Private G. E.
Withell, Gunner R, P.
Witters, Private R.
Wood, Corporal E. W.
Wood, Lieutenant R., M.C.
Woodhall, Sergeant J.
Worth, Sergeant W. V.
Worthington, Private L. E. J.
Wotherspoon, Private P.
Wright, Lance-Corporal A.
Wright, Private F.
Wright, Private J. D.
Wright, Private L.
Wright, Lance-Corporal N.
Wright, Private R. F.
Yeoman, Lance-Corporal W. B.
Yorke, Private C. D.
Youle, 2nd Lieutenant H.
Young, Private A.
Young, Sapper J. H.
Young, Private J. W.
Young, Lance-Corporal O. F. T.
Young, Private W.
Zeinert, Lance-Corporal A.
Meritorious-service Medal (M.S.M.).
Adamson, Corporal A.
Aitken, Corporal A.
Alabaster, Corporal D. J.
Albiston, Staff Sergeant C.
Asher, Regimental Sergeant-major C.
Askenback, Corporal A.
Black, Sergeant T., D.C.M.
Boundy, Staff Sergeant H. H.
Brabant, Sergeant L. L. P.
Bray, Staff Sergeant B. R.
Briscoe, Lance-Corporal A.
Brundsden, Staff Sergeant C.
Burdekin, Staff Sergeant C. B.
Cameron, Sergeant D.
Cameron, Staff Sergeant J. C.
Carr, Sergeant J. T.
Carrig, Sergeant T.
Castle, Quartermaster-Sergeant S. J.
Child, Regimental Quartermaster-Sergeant C. H.
Choate, Sergeant S. S.
Clark, Staff Sergeant-major T. G.
Cochran, Gunner R. B
Colebrook, Regimental Quartermaster-Sergeant E. S.
Commons, Sergeant T. F.
Cooper, Staff Sergeant-major F. S.
Croft, Warrant Officer F.
Crook, Sergeant T. W.
Davis, Sergeant-major D., D.C.M.
Davies, Corporal H. M.
Dawson, Corporal A.
Dent, Gunner C.
Dewar, Private W.
Dewsnap, Corporal H. J.
Dumper, Sergeant A. J.
Dunstan, Sergeant E.
Eather, Corporal V. M.
Eaton, Sergeant H. F.
Eden, Quartermaster-Sergeant E. G. D.
Egley, Staff Quartermaster-Sergeant B.
Emerson, Sergeant-major A. L.
Evans, Sergeant-major G. R.
Fairbairn, Rifleman F.
Ferguson, Staff Sergeant R. A.
Findlay, Lance-Corporal E. A.
Flint, Private A.
Forrest, Lance-Corporal S. V.
Foster, Warrant Officer W. A.
Galbraith, Staff Sergeant D.
Glentworth, Sergeant J. P.
Godfrey, Sergeant J. D.
Goulding, Staff Sergeant R. T.
Goulding, Company Sergeant - major H. L.
Graham, Corporal J. A.
Grant, Company Sergeant-major G.
Gray, Staff Sergeant G. F.
Green, Staff Sergeant J. F.
Griffen, Sergeant G. H.
Guy, Company Sergeant-major A. H.
Hall, Sergeant A.
Hallett, Lance-Corporal F. J. P.
Hancock, Farrier-Sergeant R. J.
Harding; Corporal E. S.
Hart, Staff Sergeant C. D.
Harvey, Private L. J.
Hawthorne, Sergeant V. H.
Henty, Sergeant C. J.
Hickey, Private M.
Holland, Staff Sergeant-major J.
Holmes, Sergeant J.
Holz, Sergeant H. A.
Hooker, Corporal R. E.
Horne, Sergeant C. L.
Housden, Staff Sergeant V. G.
Hume, Private C. J.
Hunt, Sergeant R. E.
Iles, Company Quartermaster-Sergeant H. S. H.
Jeffries, Private H. T.
Jeffs, Sergeant E. C.
Jones, Sergeant T.
Keenan, Sergeant C.
Kenna, Company Sergeant-major T.
Kerei, Sergeant H.
Kingdom, Sergeant B.
Kivell, Company Quartermaster-Sergeant C. L.
Lakeman, Sergeant A.
Langrish, Private J. G.
Law, Private W. H. F.
Lemon, Bombardier J.
Lister, Armourer-Sergeant P. J.
Little, Sergeant G. C.
Logan, Company Quartermaster-Sergeant D. M.
Lovell, Staff Sergeant-major G. E.
Lynn, Lance-Corporal W.
Macdougall, Staff Sergeant A. H. B.
McCardell, Staff Sergeant J. R.
McDonald, Sergeant E. J.
McKenzie, Private D.
McKenzie, 2nd Lieutenant J. H.
McKibbin, Squadron Sergeant - major V. J.
McLaren, Quartermaster-Sergeant P. C.
McLean, Fitter L. D.
McNamara, Private V.
Manning, 2nd Lieutenant H. J.
Maynard, Company Quartermaster-Sergeant F. C.
Menzies, 2nd Lieutenant G. B.
Mercer, Lance-Corporal W. J.
Mailer, Company Quartermaster - Sergeant W.
Miller, Staff Sergeant W. E.
Mitchell, Drummer A.
Mitchell, Regimental Sergeant-major C.
Moles, Staff Sergeant W. T.
Morgan, Wheeler Staff Sergeant M.
Morison, Staff Sergeant H. B.
Morris, Sergeant B. J.
Morris, Lance-Corporal R.
Morton, Sergeant G. B.
Muir, Corporal T.
Muller, Private H. McQ.
Narborough, Private R. B.
Newman, Sergeant A. H.
Norman, Sergeant C.
O'Connor, Sergeant J. J.
O'Dowd, Warrant Officer T. E.
Oliver, Sergeant A. M.
Pahina, Private W.
Palmer, Private J., M.M.
Parsons, Staff Sergeant R. W. G.
Parsons, Sergeant T. C.
Pearse, 2nd Corporal W.
Pegler, Company Quartermaster-Sergeant J. A.
Perry, Private T. F.
Porteous, Regimental Sergeant-major J.
Porter, Sergeant W. L. F.
Power, Quartermaster-Sergeant S. A.
Prentice, Staff Sergeant A.
Pulsford, Staff Sergeant G. F.
Purdie, Quartermaster-Sergeant C. L., M.M.
Quintrell, Sergeant. S. B.
Quirk, Sergeant W. J.
Rafter, Sergeant M. E.
Rennie, Sergeant J.
Richards, Lance-Corporal W. H.
Rice, Private P. J.
Ricketts, Sergeant R. A.
Riley, Company Quartermaster - Sergeant W. H.
Ritchie, Gunner W. T.
Robb, Staff Sergeant C. C.
Robertson, Sergeant C. C.
Robinson, Staff Sergeant G. R.
Rowley. Staff Sergeant L. E.
Sammons, Private W. A.
Scott, Sergeant H.
Scott, Staff Sergeant W. A.
Seatter, Corporal J. I.
Selbie, Sergeant D. W.
Self, Regimental Quartermaster - Sergeant J. C.
Seymour, Sapper G.
Shaw, Corporal L.
Simmons, 2nd Lieutenant W. H.
Sleight, Sergeant G. H. B.
Slight, Gunner J.
Slingsby, Company Sergeant - major T. W.
Smith, Staff Sergeant J.
Smith, Staff Sergeant-major S. H.
Smith, Lance-Corporal T.
Smithers, Corporal H.
Spencer, Company Quartermaster-Sergeant N. B.
Spicer, Private A. T.
Spraggs, Sergeant E. O.
Steele, Sergeant J.
Stevenson, Company Quartermaster-Sergeant H. C.
Stewart, Sergeant-major C. B.
St. George, Sergeant G. L.
Taylor, Company Quartermaster W. P.
Te Au, Private G. D.
Thompson, Sergeant-major A. S.
Tonks, Lance-Corporal A. B.
Touhy, Sergeant J.
Tressider, Sergeant A. L.
Wagg, Armourer-Sergeant G. C. G.
Walden, Staff Sergeant H. L.
Watchman, Sergeant R.
Watkins, Sergeant W.
Ward, Sergeant A.
Waugh, Gunner H.
Weaver, Sergeant J.
Weir, Company Quartermaster - Sergeant A. J.
West, Regimental Sergeant-major T. S.
Wheeler, Sergeant E. A.
Wills, Staff Sergeant A. J.
Wilson, Bombardier J. A.
Wood, Quartermaster-Sergeant S.
Woodrow, Sergeant T. M.
Woods, Sergeant G. V.
Worgan, Private J. R.
Wylie, Sergeant L. T.
Youngman, Regimental Sergeant-major A. H.
Queen's Scarf.
(One of four knitted by Her late Majesty Queen Victoria for presentation to selected members of Colonial Contingents in South Africa.)
Coutts, Captain Henry Donald, 1900.
D. FOREIGN DECORATIONS AND MEDALS .
Legion d'Honneur (French).
CROIX DE COMMANDEUR.
Godley, Lieut.-General Sir A. J., K.C.B., K.C.M.G.
CROIX D'OFFICIER.
Godley, Lieut.-General Sir A. J., K.C.B., K.C.M.G.
Johnston, Brigadier-General G. N., C.M.G., D.S.O.
Russell, Major-General Sir A. H., K.C.B., K.C.M.G.
CROIX DE CHEVALIER.
Evans, Lieut.-Colonel C. H. D., D.S.O. Hargest, Lieut.-Colonel J., D.S.O., M.C.
Richardson, Brigadier-General G. S., C.B., C.M.G., C.B.E.
Young, Brigadier-General R., C.M.G., D.S.O.
Croix de Guerre (French).
Austin, Lieut.-Colonel W. S., D.S.O.
Barrowclough, Captain H. E., D.S.O., M.C.
Bell, Lieut.-Colonel P. H., D.S.O.
Chalmers, Sergeant C., M.M.
Cooper, Staff Sergeant-major F. S.
Cosbrook, Sergeant A. J.
Frost, Company Sergeant-major W. E.
Furby, Rifleman S. R.
Jamieson, Corporal W.
Jones, Sergeant T.
Karini, Private Toi.
Kettle, Major D.
Lamb, Sergeant J. McG.
Loughlin, Rifleman A.
Lylian, Trooper H. D., M.M.
McDonald, Rifleman T. C.
McLaren, Private C. D.
McNaught, Rifleman G.
Moore, Rifleman J.
Narbey, Major W. F.
Newman, Major C. N., D.S.O.
Powell, Sergeant J.
Richards, Private C. T.
Rillstone, Sergeant M. J.
Roache, Lieut.-Colonel J. G., D.S.O.
Rose, Major J. M., M.C.
Shearer, Sergeant A.
Shellam, Rifleman H.
Stanley, Lance-Corporal G.
Stewart, Colonel A. E., D.S.O.
Stewart, Lieut.-Colonel H., D.S.O. and Clasp, M.C.
Sturgess, Rifleman S. C.
Tamahana, Private Puia.
Teahan, Lance-Corporal J.
Tombs, 2nd Lieutenant H. G.
Warren, Rifleman C. H.
Wotten, Rifleman P. C.
In the following cases no definite information has yet been received whether the Croix de Guerre awards are French or Belgian.
Affleck, Company Quartermaster-Sergeant E.
Armitage, Driver H.
Blackburn, Sergeant J. J., M.M.
Boscawen, Captain S.
Bullick, Lance-Corporal T., M.M.
Carrington, Major A. H.
Cox, Lance-Sergeant A. R.
Dibble, Corporal J. C.
Dooley, Lance-Corporal J. J.
Farquhar, Private G. R.
Fishenden, Private W. T.
Floyd, Corporal P.
Gambirazzi, Lance-Corporal J.
Geary, Sergeant J. H.
Gothard, Company Sergeant-major K. B.
Gunnell, Sergeant A. J.
Hill, Corporal J.
Hodges, Sergeant A. J.
Hunter, Private E. McG.
Hyland, Sergeant F.
Karauti, Lieutenant H.
Lumley, Lieutenant J.
McMeeking, Trooper C.
Miller, Sergeant G. L.
Moulding, Sergeant J.
Nicholls, Lieutenant G. H.
Pegler, Lance-Corporal M. D.
Petherick, Corporal S. H.
Pomana, Sergeant H.
Ramsey, Corporal A. N.
Reeve, Company Sergeant-major E. J.
Robertson, Regimental Sergeant-major H.
Rooks, Sapper P. M.
Senn, Rifleman T. J.
Sinel, Corporal K.
Smith, Corporal F. R.
Stow, Corporal D.
Thackwell, Gunner R. G.
Varrell, Battery Sergeant-major G.
West, Major F. L. G.
Medaille Militaire (French).
Boate, Sergeant-major P. C.
Davies, Private J.
Dean, Private A. E.
Gutzell, Sergeant J.
Mascall, Lance-Corporal H. J.
McIntosh, Corporal A.
Salter, Corporal M.
Simkins, Sergeant J.
Stewart, Sergeant R.
Thompson, Sergeant P. A.
Trott, Lance-Corporal W. E.
Turner, Warrant Officer A.
Medaille d'Honneur avec Glaives en Vermeil (French).
MacKay, Sergeant-major J.
Medaille d'Honneur avec Glaives en Argent (French).
Burton, Sergeant O. E., M.M.
RUSSIAN.
Order of St. Stanislas, 3rd Class (with Swords).
Cunningham, Lieut.-Colonel W. H., D.S.O.
Cross of St. George, 3rd Class.
Martin, Lance-Corporal H. A.
Medal of St. George, 2nd Class.
Brister, 2nd Lieutenant S. G.
Simmers, Lieutenant R., M.M. and Clasp.
Medal of St. George, 3rd Class.
Carter, Trooper A.
Kennedy, Private A.
Medal of St. George, 4th Class.
Alexander, Trooper F. J.
ITALIAN.
Silver Medal.
Walker, Lieutenant M. R., M.C.
Bronze Medal.
Benny, Private H.
Martin, Corporal F. R.
Patterson, Private S. J.
Robinson, Sergeant F. C.
St. Leger, Sergeant R. W.
Wells, Sergeant C. M.
BELGIAN.
Ordre de la Couronne (Grand Officer).
Godley, Lieut.-General Sir A. J., K.C.B., K.C.M.G.
Ordre de la Couronne (Officer).
Mclvill, Brigadier-General C. W., C.M.G., D.S.O.
Commander de l'Ordre de Leopold.
Russell, Major-General Sir A. H., K.C.B., K.C.M.G.
Chevalier de l'Ordre de Leopold II.
Tempero, Corporal F. J.
Decoration Militaire.
O'Brien, Sergeant J. H.
Ordre de Merite Agricole (Chevalier).
McClure, Captain G. L.
Croix de Guerre.*
Andreassen, Sergeant T. A.
Barker, Sergeant A. C. M.
Beattie, Sergeant J. D.
Bickford, Company Quartermaster T. E.
Blake, Captain T. A.
Bolton, Rifleman G. M.
Carpell, Corporal J. M.
Conlon, Rifleman E. J.
Coupland, Company Quartermaster-Sergeant A. J.
Cox, Sergeant R. J.
Cruickshank, Private V.
Foulds, Private G. R.
Godley, Lieut.-General Sir A. J., K.C.B., K.C.M.G.
Grant, Sergeant P. L.
Greves, Bombardier A. K.
Harris, Private W. J.
Hoare, Sergeant V. H.
Hooper, Rifleman S. N.
Jackson, Sergeant J. G.
Kanari, Private H.
King, Corporal O.
Law, Sergeant A. E.
Loftus, Sergeant J.
McChesney, Lance-Corporal H. J.
McElligott, Private J.
McGregor, Lance-Sergeant J. L.
McLeod, Gunner A. W.
Mason, Quartermaster-Sergeant A.
Melvill, Brigadier-General C. W., D.S.O.
Moynihan, Private D.
Muir, Sergeant H.
Neil, Lieut.-Colonel J. H., D.S.O., M.B.
Rennie, Sergeant J.
Ross, Private J.
Russell, Brigadier-General Sir A. H., K.C.B., K.C.M.G.
Sloan, Company Sergeant-major G. C.
Sproat, Farrier Staff Sergeant J.
Thomas, Lance-Sergeant N. H.
Tott, Sergeant F. J.
Vincent, Sergeant J.
Ward, Sergeant A.
Watkins, Sergeant W.
Wheeler, Sergeant E. A.
Wixen, Sergeant A. E.
Woodrow, Sergeant T. M.
Woods, Sergeant G. V.
Wylie, Sergeant L. T.
* Vide also list and note at end of Croix de Guerre (French).
SERBIAN.
Order of the White Eagle, 2nd Class (with Swords).
Godley, Lieut.-General Sir A. J., K.C.B., K.C.M.G.
Order of the White Eagle, 5th Class (with Swords).
Mabin, Major F. B.
Wilder, Major A. S., D.S.O., M.C.
Wepiha, Chaplain, 4th Class, Rev. H. W.
Order of Karageorge, 4th Class (with Swords).
Mitchell, Lieut.-Colonel G., D.S.O.
Cross of Karageorge, 1st Class (with Swords).
Birkett, Lance-Corporal W. A.
Gardner, Private G.
Cross of Karageorge, 2nd Class (with Swords).
Conlan, Sergeant F. J.
Moore, Lieutenant J. J.
Gold Medal.
Duffill, Private G.
East, Private A.
Lovell-Smith, Sapper C.
Pederson, Private E.
Scrimgeour, Trooper A. R., M.M.
Soutar, Private W. J.
Silver Medal.
Boocock, Private J. M.
Champnay, Private N. D.
Edmonds, Trooper L. W.
Holmes, Private P. D.
Leese, Lance-Corporal A. E.
Noakes, Private E. L.
Reynolds, Sergeant P.
White, Private W. C.
MONTENEGRIN.
Order of Danilo, 2nd Class.
Russell, Major-General Sir A. H., K.C.B., K.C.M.G.
Order of Danilo, 4th Class.
Barclay, Major G.
Order of Danilo, 5th Class.
Urquhart, Captain M., M.C.
EGYPTIAN.
Order of the Nile, 2nd Glass.
Chaytor, Major-General Sir E. W. C., K.C.M.G., C.B.
Order of the Nile, 3rd Class.
Chaytor, Lieut.-Colonel D'A., C.M.G.
Findlay, Lieut.-Colonel J., C.B., D.S.O.
By an Act passed during the year 1912, and intituled the Public Service Act, 1912, the Public Service of New Zealand was placed under the direct and sole control of a Commissioner and two Assistant Commissioners, who were appointed in the first place for a term of seven years, are responsible only to Parliament, and can be dismissed from office only for misbehaviour or incompetence.
The Act became operative on the 1st April, 1913, and applies to all members of the Public Service with the exception of the Controller and Auditor-General, officers of the Railway Department, members of the Police and Defence Forces, Judges and Magistrates, officers of the House, certain officers of the Legislative Departments, and persons paid only by fees or commission, as well as any officer to whom the Governor in Council declares the Act shall not apply.
In accordance with the provisions of the Education Act, 1914, Inspectors appointed by Education Boards, and in office on the 1st January, 1915, are deemed Inspectors of the Education Department and are now under the jurisdiction of the Commissioner. Under the same Act the Commissioner is empowered to appoint to the Clerical Division of the Public Service any person who on the 1st January, 1915, was permanently employed by any Education Board for more than twenty hours a week in clerical work.
By the Post and Telegraph Act of 1918 the Post and Telegraph Department was exempted from the control of the Commissioner, with the exception that the Commissioner makes all appointments.
The powers vested in the Commissioner are very wide. They include the inspection of offices, the appointment, promotion, transfer, and dismissal of officers, and the framing of regulations.
An entrance examination is provided for youths desirous of entering the Service, and efficiency and educational tests for promotion have been established.
In accordance with the provisions of section 17 of the Act, a classification of all officers to whom the Act applied was immediately proceeded with by the Commissioner on his assuming control. The provisional list for Departments other than the Post and Telegraph Department was gazetted on the 20th August, 1913.
The Post and Telegraph Department had been working under a classification system for some years, and the list for this Department for 1913-14 was published separately on the 14th October, 1913.
Under the authority of section 22 of the Appropriation Act, 1918, a general regrading of the Service was made as from the 1st April, 1919. A new and increased salary schedule was adopted, and the system of war bonuses granted to assist in meeting the increase in the cost of living is now cancelled.
The classified staff on the following dates was,—
Departments other than Post and Telegraph.
| As at 1st April, | Number. | Salaries. £ |
|---|---|---|
| 1913 | 4,641 | 874,437 |
| 1914 | 5,095 | 953,343 |
| 1915 | 5,613 | 1,098,960 |
| 1916 | 5,985 | 1,158,949 |
| 1917 | 6,217 | 1,208,979 |
| 1918 | 6,282 | 1,231,433 |
Post and Telegraph Department.
| As at 1st April, | Number. | Salaries. £ |
|---|---|---|
| 1913 | 5,372 | 708,165 |
| 1914 | 5,633 | 761,365 |
| 1915 | 5,958 | 824,242 |
| 1916 | 6,441 | 885,927 |
| 1917 | 6,956 | 970,641 |
| 1918 | 6,965 | 1,008,186 |
The total increase in the number of officers in the Public Service (including the Post and Telegraph Department) between the 1st April, 1917, and the 1st April, 1918, was 74.
It was estimated that at the 1st April, 1918, the classified salaries would be underspent by approximately £385,000 for all Departments, including the Post and Telegraph, owing to the absence of officers at the war; it is necessary, however, to set against this an expenditure estimated at £235,000 for permanent and temporary assistance other than that supplied to the Defence Department for its special work.
An officer dissatisfied with any decision of the Commissioner with regard to (1) grade, (2) classification of the work performed by or assigned to him, or (3) salary or promotion, has the right of appeal, notice of which must be lodged with the Commissioner within thirty days. All appeals are dealt with by a Board consisting of three members, two of these appointed by the Governor, and the third elected by the officers of that branch of the Service, to which the appellant belongs. The decision of the Appeal Board on all matters brought before it is final. During the year ended 31st March, 1918, the Board dealt with a total of 121 appeals, 9 of these being allowed, 6 being by consent, while the remainder were either withdrawn or disallowed.
During the year 1918 there were two sessions of Parliament, one commencing on the 9th April and ending on the 15th of the same month, the second commencing on the 24th October and ending on the 12th December. The legislation passed was largely of an emergency nature, having reference principally to the war or to conditions arising out of the war.
The following is a brief summary of the most important provisions:—
1918, No. 1.—The Expiring Laws Continuance Act, 1918.—This Act continues in operation until the 31st August, 1919, the enactments mentioned in the schedule. Of these the most important are the Mortgages Extension Acts and the Regulation of Trade and Commerce Acts. By a subsequent enactment (section 20 of the War Legislation and Statute Law Amendment Act) the duration of the Regulation of Trade and Commerce Acts was extended until the expiration of two years after the termination of the war. Section 3 of the Expiring Laws Continuance Act revives Part I of the Monopoly Prevention Act, 1908 (relative to the price of agricultural implements), and continues that enactment in force until the 31st August, 1919.
1918, No. 2.—The Finance Act, 1918.—By Part. I of this Act the appropriations for the financial year ending on the 31st March, 1918, were extended until the 31st December of that year. By a later enactment (section 39 of the Appropriation Act, 1918) a further extension was made until 31st December,1919.
Part II fixes the rates of land-tax and income-tax (including the special war-tax) to be levied for the year commencing 10th April, 1918. The rates are the same in all respects as those levied for the immediately preceding year. Certain amendments of minor importance are made with reference to the incidence of the amusements-tax charged pursuant to Part III of the Finance Act, 1917.
Part III authorizes the raising of a "War Purposes Loan" of an amount not exceeding £20,000,000. Provision is made on the lines of the War Purposes Loans Act, 1917, for the issue of war-loan certificates, Post Office war-bonds (carrying interest at 5 per cent., free from income-tax), and securities available for payment of death duties. Provision is also made with a view to compelling subscription to the War Purposes Loans by persons who do not voluntarily subscribe in accordance with their means.
Part IV makes miscellaneous provisions, of which the following are the most important:—
By section 19 the duration of the present Parliament is extended until the 19th December, 1919.
By section 20 local authorities are afforded protection in respect of loans falling due during the continuance of the war and for twelve months thereafter.
Section 22 restricts the importation of immature spirits.
Section 24 amends the Mortgages Extension Acts, by—
Repealing the provisions allowing mortgagors to contract themselves out of the protection afforded by the principal Act; and
Excluding "trade mortgages," as defined, from the protection afforded by that Act.
Section 25 extends the authority of the Governor-General in Council to make War Regulations, and authorizes the making of such regulations to ensure the performance of national service.
1918, No. 3.—The Military Decorations and Distinctive Badges Act, 1918.—This Act prohibits the sale, pledging, or other disposal (except by way of testamentary disposition) of military decorations without the written permission of the Minister of Defence. It also makes provision for the recognition and protection of societies or organizations such as the Returned Soldiers' Association and the Boy Scouts' Association.
1918, No. 4.—The Finance Act, 1918 (No. 2).—This Act is divided into Parts as follows:—
Part I—Public Revenues Amendment.
Part II—Stamp Duties Amendment.
Part III—Land and Income Tax.
Part IV—War Purposes Loan.
Part V—Loans for Public Works and other Purposes.
Part VI—Miscellaneous.
Part I (Public Revenues Amendment).—This Part relates principally to the War Expenses Account established by section 8 of the Public Revenues Amendment Act, 1914. It repeals the former provisions and re-enacts them with substantial alteration. In particular it makes provision for payment out of the War Expenses Account of expenses incidental to the demobilization of the Expeditionary Forces.
Part II (Stamp Duties Amendment).—This Part of the Act makes various amendments of a technical nature in the law relating to the imposition of stamp duties.
Part III (Land and Income Tax).—This Part exempts the Government Life Insurance Department and all companies carrying on in New Zealand the business of life insurance from the payment of the special war-tax imposed by the Finance Act, 1918 (No. 1).
Part IV (War Purposes Loan).—This Part authorizes the raising of a War Purposes Loan of £10,000,000, on conditions similar to those attaching to the War Purposes Loan authorized to be raised by Part III of the Finance Act, 1918 (No. 1).
Part V authorizes the raising of loans for local purposes as follows:—
(l.) £2,500,000 for the erection of buildings for education purposes, for hydro-electrical works, for telegraph extension, and other public works (section 29).
An additional sum of £150,000 for the purpose of making advances for the provision of additional cold-storage accommodation (section 30).
An additional sum of £1,000,000 for the purposes of the Discharged Soldiers Settlement Act (section 31).
An additional sum of £200,000 for afforestation purposes.
Part VI (Miscellaneous).—In this Part provision is made for the following matters:—
(l.) The issue of bank-notes of a denomination of 5s.; and
The establishment of a Post Office Savings-bank Reserve Account.
1918, No. 5.—The Electric-power Boards Act, 1918.—This Act makes provision for the construction or purchase by specially constituted Electric-power Boards of works intended for the generation, transmission, and supply of electric power. The Act provides, inter alia , for the following matters:—
(l.) For the constitution of electric-power districts;
For the establishment of local governing bodies, known as Electric-power Boards, to be elected by the electors of the several local districts comprised in the several electric-power districts;
For the procedure of Electric-power Boards;
For the financial operations of the Boards, including provision for borrowing money to be secured on special rates, which the Boards are expressly authorized to make and levy;
For the construction or purchase by Electric-power Boards of electric works, subject to the controlling authority of the Government, as defined by the Public Works Act, 1908, and its amendments;
For the supply of electric power to consumers within the electric-power district, and also within the limits of a defined "outer area"; and
For the purchase by the Governor-General, on behalf of His Majesty, of the undertaking of any Board, at a price to be determined by arbitration.
1918, No. 6.—The Aviation Act, 1918.—This Act enables the Government to control the practice of aviation in New Zealand. It empowers the Governor-General by Order in Council to make regulations for the following purposes:—
(l.) The licensing of schools of instruction in aviation;
The issue of certificates of competency to aviators, and the recognition of certificates issued elsewhere than in New Zealand;
Prescribing standards of physical fitness for aviators and for candidates for certificates;
The issue of licenses authorising the use of aircraft, and prescribing conditions relative to the carriage of passengers and goods; and
Prescribing penalties, not exceeding £100 in any case, for the breach of any such regulation.
1918, No. 7.—The Post and Telegraph Department Act, 1918—This Act is an amendment of the Post and Telegraph Act, 1908, and relates exclusively to the internal administration of the Post and Telegraph Department.
The main provision of the Act is the exclusion of the Post and Telegraph Department from the operation of the Public Service Act, 1912. Provision is made for the appointment by the Governor-General of the four principal administrative and professional officers. The power of appointment of the remainder of the staff is, as heretofore, with the Public Service Commissioner, subject, however, to the provisions of the Act relative to the functions of the Post and Telegraph Promotion Board. Extensive powers are conferred on the Governor-General to make regulations with respect to the Department. Inter alia , regulations may be made for the following purposes:—
For the classification of the officers of the Department:
Determining the rates of salaries and allowances to be paid to officers of the Department:
Prescribing the duties of officers, and the modes of organization and discipline:
Providing for inquiries as to charges of inefficiency or misconduct against officers of the Department:
Prescribing examinations for candidates for appointment to the Department, and for officers of the Department, with a view to determine their fitness for promotion:
Regulating the conduct of appeals by officers of the Department to the Post and Telegraph Appeal Board.
A special Board to be called the Post and Telegraph Promotion Board is established. This Board considers in the first place all matters relative to the appointment or promotion of officers, and makes its recommendations to the Public Service Commissioner. In the event of a difference of opinion arising between the Commissioner and the Board with respect to any question the matter is to be determined by the Postmaster-General.
There is also established a Post and Telegraph Appeal Board, to which every officer of the Department has a right of appeal against any determination of his superior officers relative to his classification or salary.
1918, No. 8.—The Reformatory Institutions Act, 1918.—This Act provides for the establishment by the State of institutions intended for the care and treatment of drunkards and for the detention of women and girls requiring reformative treatment. The provisions of the Reformatory Institutions Act, 1909 (relative to institutions controlled by private philanthropic bodies), are made applicable to the State institutions proposed to be established pursuant to this Act.
1918, No. 9.—The Expeditionary Forces Amendment Act, 1918.—This Act amends the Expeditionary Forces Act, 1915. Its main provisions are the following:—
Section 2 extends until the expiration of twelve months after the end of the war the period of enlistment of members of the Expeditionary Forces. The object of the amendment is to allow adequate time for demobilization.
Section 5 provides for the establishment of military hospitals, in which all persons undergoing treatment (whether formally discharged from the Forces or not) are liable to military discipline and control.
Section 7 provides for the payment out of the War Expenses Account of a bonus to all officers, non-commissioned officers, and men of the Expeditionary Forces who have served beyond the seas in the present war. The amount of bonus payable in any case is to be determined in accordance with a scale to be prescribed by the Governor-General by Order in Council.
Sections 8 to 15 relate to military defaulters, and require the Minister of Defence to prepare a Military Defaulters List. Military defaulters out of New Zealand on the passing of the Act are prohibited from returning to New Zealand at any time within ten years. All military defaulters are deprived of civil rights for a period of ten years from the passing of the Act. Persons so deprived of civil rights are incapable—
Of being appointed to or of continuing to hold any office or employment in the service of the Crown, or of any local or other public authority;
Of being elected or appointed or of continuing to hold office as a member of either House of Parliament or as a member of any local or other public authority;
Of being enrolled as an elector or voting at any election of a member of either House of Parliament or of a member of any local or other public authority.
1918, No. 10.—The War Legislation and Statute Law Amendment Act, 1918.—This Act is divided into two Parts as follows:—
Part I.—War Legislation (sections 2 to 32).
Part II.—Statute Law Amendment (sections 33 to 41).
The most important provisions of the Act are the following:—
Acquisition of Land by Persons of Enemy Origin.—Sections 2 to 12 relate to the acquisition of land in New Zealand by persons of enemy origin (not being alien enemies within the proper meaning of that term). The statute law relative to alien enemies properly so called is contained in Part I of the War Legislation Act, 1917.
By section 5 the Governor-General in Council is empowered to grant licenses authorizing persons of enemy origin to acquire land in New Zealand. By section 6 a person of enemy origin is prohibited from acquiring land (other than a leasehold interest to expire within two years from the date of its acquisition) except pursuant to a license so issued by the Governor-General in Council. Land lawfully acquired by persons of enemy origin since the 4th August, 1914, and before the passing of the present Act may be taken by the Governor-General on payment of compensation assessed in the manner fixed by the Public Works Act, 1908. Land unlawfully acquired by persons of enemy origin after the passing of the Act may, by order of the Supreme Court in that behalf, be forfeited, and in such case shall be vested in the Public Trustee in trust for His Majesty.
By section 11 the operation of the Act is extended so as to apply, after the termination of the war, to persons who at the time of the passing of the Act were subject, as alien enemies, to the provisions of Part I of the War Legislation Act, 1917.
Restriction of Rent.—The object of section 13 is to afford further protection to tenants of dwellinghouses in cases where the tenant is a soldier, a discharged soldier, or the wife, widow, or other dependant of a soldier or discharged soldier.
Regulation of Trade and Commerce. — Sections 14 to 22 extend the provisions of the Regulation of Trade and Commerce Act, 1914.
Section 14 gives the necessary authority to enable the New Zealand Government to secure for the Imperial Government supplies of wool and other produce. Section 15 makes provision for the summary prosecution of offenders against the principal Act.
Section 18 enables the Court of Arbitration to amend any industrial award or industrial agreements in so far as they determine the hours of employment or the rates of remuneration of workers. The grounds on which any such alteration may be made are—
(l.) Any alteration since the date of the award or agreement in the conditions affecting the industry or industries to which it relates; or
Any increase since the date of the award or agreement in the cost of living.
Section 21 makes it an offence for any person to demand an excessive price for any goods "if the opportunity of obtaining such price in New Zealand arises by reason of the existence, present or past, of a war in which His Majesty is engaged, or by reason of a scarcity of such goods in New Zealand caused by war conditions, present or past." It is also made an offence for any person being in possession of goods for mercantile purposes to hoard or refuse to sell the same, or to make the same available for sale, if such hoarding or refusal raises or tends to raise the cost of other similar goods to the public.
Sections 20 and 22 (with the verbal amendments set out in the schedule) determine the duration and operation of the principal Act. Section 20 provides for the Act remaining in force during the war with Germany and for two years thereafter. Section 22 (and the schedule) repeal the words which expressly limit the exercise of the several powers to a period when " His Majesty is at war with any foreign Prince or State."
Soldiers' Wills.—Section 23 relates to the proper construction of section 11 of the Wills Act (Imperial), with respect to the wills of infant soldiers. It declares that the said section "authorizes and always has authorized any soldier being in actual military service, or any mariner or seaman being at sea, to dispose of his personal estate as he might have done before the passing of that Act though under the age of twenty-one years."
Termination of the War.—For the purposes of the various statutes which refer to the war, or to the duration of the war, or the termination of the war, the Governor-General is empowered to proclaim a date which shall be deemed to be the date of the termination of the war.
Protection of Soldiers.—Section 25 empowers the Attorney-General and the Minister of Justice, acting jointly, to cancel any warrant issued for the arrest of a person charged with an offence in cases where the person charged has, since the issue of the warrant, served with his Majesty's Forces beyond the seas.
Section 26 enables the Governor-General to make regulations for the protection of soldiers or discharged soldiers against the execution of civil judgments or process, proceedings in bankruptcy, forfeitures, the exercise of rights of distress or re-entry, the exercise of rights of sale or entry into possession, or the enforcement in any other manner of the civil obligations or liabilities of soldiers or discharged soldiers.
Unauthorized Consular Agents.—Section 28 makes it an offence, punishable by imprisonment for three months or a fine of £100, for any unauthorized person to purport or profess to be a diplomatic, consular, commercial, or other representative, agent, or officer in New Zealand of any foreign State or political community.
War Regulations.—Section 30 validates all regulations heretofore made or purporting to be made under the War Regulations Act. It is in the same terms as similar legislation passed in each session since the enactment of the War Regulations Act, 1914.
Public Service.—Section 32 repeals section 29 of the War Legislation Act, 1917 (which restricted the rights of retirement on superannuation of officers who had reached retiring age).
Harbour Regulations.—Section 33 repeals, and re-enacts with modifications and enlargement, section 205 of the Harbours Act, and enables the Governor-General to make General Harbour Regulations, to be in force in all harbours in New Zealand and overriding (in case of conflict) the by-laws of any Harbour Board.
State Forests.—Section 34 extends the authority of the Commissioner of State Forests; and authorizes—
The purchase or hire of sawmills and machinery and the sale of timber from State forests;
The purchase of private lands in addition to or in protection of State forests;
The setting-apart of any area of Crow land as a provisional State forest, which may subsequently be declared by the Governor-General to be available for settlement if so required, but which, pending such declaration, is regarded for all purposes as a State forest; and
The making of regulations for controlling the export of timber from New Zealand, and also the sale or cutting of timber either on public or private lands.
Education.—Sections 36 to 38 amend the Education Act, 1914. Provision is made for—
(l.) The appointment of organizing teachers;
The establishment of compulsory continuation classes (to be attended by young persons who have completed the primary school course of instruction); and
The admission of certain classes of children to Probationary Homes.
Apprentices.—Sections 39 and 40 relate to apprentices. Section 39 defines the status of Government apprentices; section 40 protects the interests of apprentices whose apprenticeship has been interrupted by reason of service with the Expeditionary Forces. It is in substitution for section 28 of the War Legislation Amendment Act, 1916.
1918, No. 11.—The Licensing Amendment Act, 1918.—This Act is divided into three Parts as follows:—
Part I.—Special Licensing Poll.
Part II.—Result if National Continuance is carried at the Special Licensing Poll.
Part III.—Result if the Determination at next General Licensing Poll is in favour of National Continuance.
Part I provided for the taking of a special licensing poll on the proposal of national prohibition with compensation. This poll was held on the 10th April, 1919, and the result in favour of national continuance was published in the New Zealand Gazette of 26th June, 1919, at page 1949.
By Part II provision is made for the submission to the electors of three proposals at the next general licensing poll, namely,—
(l.) The proposal of national continuance;
A proposal of national prohibition without compensation; and
A proposal of State purchase and control.
The proposals for national prohibition without compensation or of State purchase and control may be carried by a bare majority of all the votes recorded.
By Part III it is provided that in the event of national continuance being carried both at the special licensing poll and at the next ordinary licensing poll, then at any licensing poll thereafter the only proposals to be submitted are—
(l.) A proposal of national continuance; and
A proposal of national prohibition without compensation.
At any such poll the result is to be determined by a majority of the valid votes recorded.
1918, No. 12.—The Distillation Amendment. Act, 1918.—By this Act special provision is made enabling the Governor-General by regulation to authorize and control the distillation or manufacture of spirits for industrial or scientific purposes.
1918, No. 14.—The Repatriation Act, 1918.—This Act makes provision for the repatriation of soldiers. It provides for the establishment of a Department of State called the Repatriation Department, to be administered by the Repatriation Board, consisting of members of the Executive Council appointed in that behalf by the Governor-General. The chief administrative officer of the Department is to be known as the Director of Repatriation. For the purpose of decentralizing the work of the Department the Repatriation Board is empowered to establish local Boards or committees with such advisory or consultative functions as the Board may confer on them.
The function of the Repatriation Board is to make provision for the restoration of discharged soldiers to civil life, and for the establishment of discharged soldiers or soldiers' widows in civil employment or occupation. For these purposes the Board is empowered to establish schemes for educational, industrial, and vocational training, and is also empowered to grant financial assistance by way of loan to discharged soldiers and soldiers' widows.
1918, No. 15.—The Legislative Council Amendment Act, 1918.—This Act postpones the commencement of the Legislative Council Act, 1914 (providing for an elective Legislative Council). The date of commencement is to be fixed by the Governor-General by Proclamation.
1918, No. 16, The Orari and Waihi Rivers Act, 1918; 1918, No. 17, The Rangitata River Act, 1918.—These Acts make provision for the construction of certain river-protection works by the Public Works Department, at the cost of the controlling River Boards, such works to be handed over to these Boards on completion.
1918, No. 18.—The Slaughtering and Inspection Amendment Act, 1918.—The object of this Act is to enable the Government to control the business of the export of meat from New Zealand so as to prevent the development of any "combine" in the industry to the detriment of the public. Every person proposing to carry on such business is required before commencing business to obtain a license from the Minister of Agriculture, who is empowered in his absolute discretion to refuse or grant the same.
1918, No. 19.—The War Funds Act, 1918.—This Act is an amendment of the War Funds Act, 1915. The object of the Act is to protect war funds from improper administration. The Supreme Court is empowered to establish schemes for the administration of any fund where it is made to appear that the fund is being improperly administered or is no longer required for the purposes for which it was originally established. In the case of small funds (amounting to not more than £300), the Minister charged with the administration of the principal Act is empowered, subject to a right of appeal to a Stipendiary Magistrate, to direct the transfer of any such fund to the National War Funds Council, on the ground of improper administration.
1918, No. 20.—The Rabbit Nuisance Amendment Act, 1918.—This Act amends the Rabbit Nuisance Act, 1908, and requires the owners of private land to take such steps for the destruction of the rabbits thereon as may be considered necessary by Inspectors appointed under the principal Act.
1918, No. 21.—The Land Laws Amendment Act, 1918.—This Act remedies a defect of the law disclosed by a recent judgment of the Privy Council with respect to the renewal of leases of small grazing-runs. It also extends the provisions of section 28 of the Land Laws Amendment Act, 1912 (relative to the subdivision for the purposes of closer settlement of small grazing-runs under the Land Act, 1908), to such leases granted under the corresponding provisions of former Land Acts.
Section 8 amends the provisions of the Land Laws Amendment Act, 1913, relative to the assessment of compensation in respect of lands acquired by the Crown from owners who had acquired the same by way of aggregation. In any such case the maximum compensation payable is the capital value at the time of its acquisition by way of aggregation plus 10 per centum thereof. The Act makes other amendments of minor importance.
1918, No. 22.—The Public Health Amendment Act, 1918.—This Act establishes a Board of Public Health consisting of ten members, whose function is to advise the Minister of Public Health as to matters affecting the health of the community.
Section 6 empowers local authorities to establish and maintain lodging-houses in centres of population.
Section 7 empowers District Health Officers to order that insanitary buildings be either taken down or altered so as to make them fit for habitation. An appeal lies to a Stipendiary Magistrate from an order of a District Health Officer under this section.
By section 10, local authorities are required to appoint Inspectors of Buildings whose duty is to inspect buildings and to report thereon with special reference to the following matters:—
Area of land occupied and air-space;
Water-supply;
Baths;
Lavatories;
Sanitary and hygienic conditions;
The name of the owner;
The name and occupation of the occupier
The number and description of the rooms;
The number of persons living in the building
If rented, the rental payable; and
Such other information as may be ordered by the local authority.
Section 12 provides for the licensing of lodginghouses, and makes it an offence to conduct a lodginghouse (with more than five lodgers at a time) without a license.
Section 13 authorizes the appointment by local authorities of Sanitation Committees, with power to enter and inspect premises.
Section, 14 provides for the appointment by the Minister of Public Health, on application by a local authority, of resident medical practitioners. The remuneration of such practitioners is to be determined by the Minister and paid by the local authority concerned. Fees payable in respect of medical services rendered are to be paid to the district fund of the local authority.
Various other amendments of the law are made with a view to the preservation of the public health.
The Act is imperfect in many respects and requires further consideration with respect both to its form and substance at the earliest possible opportunity.
1918, No. 24.—The Appropriation Act, 1918.—This Act appropriates for the use of His Majesty the moneys required for the purposes of the current financial year. In addition the Act contains certain miscellaneous provisions, of which the most important are the following:—
Section 16 provides for the payment of a war bonus to persons employed in the service of the Government (including teachers in public schools, technical schools, and certain other educational institutions).
Section 18 empowers the Minister of Finance to advance moneys by way of loan for the purpose of developing the oil industry.
Section 22 provides for the regrading of officers employed in the Public Service, such regrading to be operative as from 1st April, 1919.
By section 25 the annual Government subsidy to the Teachers' Superannuation Fund is increased from £17,000 to £43,000. By section 26 the similar subsidy payable to the Public Service Superannuation Fund is increased from £48,000 to £86,000.
By section 37 provision is made for increased salaries to be paid to teachers. An annual sum of £118,000 is provided, which is to be distributed in accordance with regulations to be made in that behalf by the Governor-General in Council.
Section 48 contains an amendment of the Stamp Duties Act, relative to the assessment of stamp duty on transfers of property intended to be used for the purposes of the oil-mining industry.
Table of Contents
THE information given in this section deals only with the year 1918. For a fuller account of the climate and meteorology of New Zealand, giving records of past years, the reader is referred to the article in the 1915 issue of the Year-book, contributed by D. C. Bates, Esq., Dominion Meteorologist, by whom the matter here published has also been supplied.
The total year's rainfall was above the means of previous years in all districts with a westerly aspect and slightly below in the east coast districts.
Following arc brief monthly summaries of the weather and the principal atmospheric systems which were in evidence:—
January.—The aggregate month's rainfall was below the average in most parts of the South Island and in the extreme south and central regions of the North, while in the northern and east coast districts of the North Island it was considerably above normal. The cause of the excess in the two latter districts was the presence of an atmospheric depression northwards of the Dominion, which persisted between the 9th and the 16th. During this period frequent electrical disturbances were reported in the north, particularly about the 12th, 15th, and 19th, On New Year's Day boisterous and wet conditions were experienced generally, owing to the passage of the centre of a disturbance in the vicinity of Cook Strait. Several small westerly areas of low pressure were in evidence, passing in the south on the 17th, 24th, 28th, and 30th respectively. About these dates conditions were unsettled, with rainfall in many parts. The weather for the month as a whole was dull, warm, and humid.
February.—During the first week of February, and between the 11th and 13th and the 19th and 25th, anticyclonic conditions ruled, with fair, though at times dull and hazy, weather. Rainfall was experienced generally from the 14th to the 16th, while the centre of a cyclone passed down the western coast. On the 15th some very heavy downpours were recorded, particularly in the neighbourhood of Cook Strait, as the following totals will show:—
| Name of Station. | Rainfall on 15th (in Inches). |
|---|---|
| Wellington | 4.11 |
| Lower Hutt | 5.00 |
| Motueka | 4.50 |
| Cape Campbell | 4.40 |
| Picton | 4.30 |
| Endeavour Inlet | 8.93 (on 16th). |
| Seddon | 5.76 (on 16th). |
Stormy and wet conditions prevailed in the west coast and southernmost districts on the 25th and 26th, while a westerly low-pressure area passed in the south. A disturbance of a similar type to the latter, but of slighter gradient, brought rain in many parts on the 9th. Except in the Wanganui and Southland districts the total precipitation was everywhere well above the average.
March.—The outstanding meteorological feature of March was the intense cyclone which was responsible for very stormy conditions between the 18th and 20th. Of tropical origin, the centre apparently passed down from westward of Norfolk Island, and on the morning of the 19th was located off Farewell Spit. On the 20th it had passed to the south-east of the Dominion. The worst effects were experienced generally on the 19th, but stormy conditions also prevailed in the northern districts on the 18th and in the southern districts on the 20th. During the height of the storm on the 19th the heavy northerly gales caused bush fires to sweep over the district about Raetihi, resulting in most serious losses to the settlers. The rainfall accompanying the storm was generally not as much as might have been expected, but the southernmost districts on the 20th experienced some heavy precipitation, which caused floods in many of the rivers. Our observer at New Plymouth, Mr. W. W. Smith, referring to the storm, says: "After inquiries among the oldest settlers in New Plymouth there can be no doubt that the cyclonic storm on the 19th and 20th was the severest known, alike to Europeans and Maoris, in their lifetime." Many observers in different parts of New Zealand, also Mr. L. H. Steel, the observer at Chatham Islands, expressed a similar opinion. Two other disturbances were in evidence during the month, both passing in the north—one which ruled between the 3rd and 9th, and the other from the 29th to the end of the month. Some heavy rains were reported about these two periods, especially in the east coast districts of the North Island, and the former disturbance accounted for persistent south-east gales and very heavy seas between Capo Campbell and East Cape. Between the 8th and 16th, and the 21st and 27th, anticyclonic conditions ruled, and fair weather was experienced generally. Except in Westland, and at a few scattered places elsewhere, the total rainfall for the month was well above the average.
April.—In the east coast districts southwards of Napier the total rainfall for April was rather below the average, and in Canterbury it was considerably so. The remaining portion of the Dominion recorded an excessive rainfall, the greatest departure above the mean being in that portion of the North Island northwards of Wanganui and Gisborne. Both Hawke's Bay and Canterbury experienced fair and mild though somewhat dull weather, while generally elsewhere, as the records show, showery conditions were the rule. The most unsettled periods were between the 5th and 10th, and the 28th and 30th, both being due to intense areas of westerly low pressure. About the 9th and 10th some extremely heavy rains were experienced in the Bay of Plenty district, apparently the result of a secondary "low" which also accounted for severe thunderstorms. The Town of Opotiki reported a serious flood on the 9th, the rainfall on that date at Opotiki being 9.5 inches for the twenty-four hours.
May.—During the first half of May anticyclonic pressure ruled, with fair weather generally. From the 16th until the 29th an intense and extensive westerly area of low pressure held sway. The latter accounted for unsettled conditions and between the 20th and 26th high and boisterous north-west winds were experienced, with rain in most parts of the Dominion. On the 23rd and 24th thunderstorms occurred in the neighbourhood of Cook Strait, and at this time heavy rain fell in the Wairarapa district, causing floods in some of the low-lying country, especially about Masterton. During the 28th and 29th a depression passing off East Cape accounted for strong south-east winds and heavy showers along the east coast of the North Island. In nearly all parts of the Dominion the total rainfall for the month was considerably less than the average.
June.—Anticyclonic pressure prevailed from the 1st to the 10th, and accounted for fair and mild weather generally during this period. From the latter date until the end of the month westerly depressions were extremely persistent, and the weather proved very unsettled, with considerable rainfall. A notable meteorological feature was a remarkable tendency for the development of secondary "lows," and in consequence electrical disturbances frequently occurred in different parts of the country, more especially over the North Island. On the last day of the month a shallow depression was centred westward of Cook Strait, and was responsible for a serious snowstorm in the North Canterbury district. Except in the east coast districts of the North Island and the west coast of the South, the total rainfall for the month was everywhere above the average.
July.—The month of July proved one of the coldest and stormiest winter months experienced for many years. Rainfall, however, was not excessive, totals above the average only being recorded north of Auckland, and in the Wanganui, North Canterbury, and Otago districts. Atmospheric disturbances were so numerous that hardly a day passed without one either enveloping or being within effective distance of the Dominion. On the 1st of the month the shallow depression, mentioned in the June summary, was still in evidence, and further heavy snowfall occurred in North Canterbury. The most severe storm was one which ruled between the 15th and 24th, and which caused a widespread snowfall between the 19th and 22nd. Very stormy weather, with south-west gales, was experienced generally about this time, and snow was recorded at many places in the North Island where it had not occurred since August, 1904. A comparison of these two storms brings out some interesting facts. The one on the 1st was a shallow cyclone accounting for a heavy local snowstorm in North Canterbury, with south-east winds. The latter was an intense westerly area of low pressure which apparently remained stationary for several days, with its central area in the vicinity Of Chatham Islands. The winds were distinctly south-west, and the snowfall was more general. The stormiest weather is experienced with an intense and extensive depression, but, as in this instance, a small, shallow disturbance invariably proves the more dangerous when its effects are confined to a comparatively small area.
August.—During the first half of August cold, unsettled, and at times stormy weather prevailed, but afterwards conditions improved, and fair, mild, and spring-like weather was generally experienced. From the 1st until the 7th an extensive westerly area of low pressure held sway, and strong and squally westerly winds predominated. This was followed by a cyclone, the centre of which passed in the neighbourhood of Cook Strait on the night of the 8th. Heavy rain fell about this time, especially in and southward of Cook Strait, and many of the high-level stations reported considerable snowfall. On the 13th an intense westerly disturbance enveloped the Dominion, accounting for stormy weather on the 13th and 14th. By the 15th it had passed eastward of the Chatham Islands, and was followed by an anticyclone which brought a change to more settled conditions. From the latter date until the close of the month high atmospheric pressure ruled except on the 19th and 27th, when minor depressions passed in the south and north respectively.
September.—The changeable weather of September was typical of Spring, but, unfortunately, cold winds and sharp frosts were somewhat frequent, and, in consequence, the growth in vegetation was generally not as forward as is desired or expected at this time of the year. Rainfall was below the average in all except the Wanganui and Otago districts and in parts of Westland. Unsettled and boisterous conditions were experienced between the 5th and 8th and the 16th and 19th, when intense westerly areas of low pressure held sway. During the former period electrical disturbances were experienced in the northern districts, and on the 18th a severe thunderstorm, accompanied with heavy hail showers, occurred about Cook Strait. Small depressions passed in the south on the 22nd, 25th, and 31st, and these were responsible for frequent showers.
October.—October proved an extremely wet month over the North Island and in the north-west portion of the South. Elsewhere the total rainfall was below the average. High winds and stormy weather were frequently experienced, and, on account of the low temperatures, especially during the nights, the growth in vegetation was deficient in most parts of the Dominion. Atmospheric disturbances were numerous during the latter half of the month. The most intense were two westerly areas of low pressure, one ruling between the 13th and 20th, and the other between the 25th and 30th. On the 23rd and 24th a cyclone passed in the North, and on the latter date a cold south-east gale was responsible for some serious losses of shorn sheep in the east coast districts of the North Island. Although changeable, some fine days and mild conditions were experienced during the first fortnight.
November.—Anticyclonic conditions ruled between the 11th and 15th, and during this period fine weather was experienced generally. On various other days the weather was fair in different parts of the Dominion, but as a whole the remainder of the month was characterized by unsettled conditions, the result of numerous atmospheric depressions which passed over or within effective range of New Zealand. The worst storm was an intense westerly low-pressure area which was in evidence between the 5th and 9th. On the 7th the barometer at the Bluff fell as low as 28.77 in., and at this time heavy north-west gales were experienced in and southward of Cook Strait. The total month's rainfall was generally considerably above the average over the South Island, and also in the middle portion of the North. The northern and southernmost districts of the North Island recorded less than the average.
December.—The weather during December proved very changeable owing to the unusual number of westerly low-pressure areas which passed in the south. The only settled weather was experienced generally between the 14th and 20th, when anticyclonic conditions ruled. Some heavy rainfall accompanied electrical conditions in different parts of the North Island on the 8th and 28th, and on this account the middle districts of the North Island had a total rainfall above the average. Generally, however, the rainfall was of a showery nature, and the aggregate fall for the month was less than the mean.
The following table shows the difference, above or below the mean, for each month in the year:—
NORTH ISLAND RAINFALL , 1918.
Monthly Means compared with the Averages for Thirteen Previous Years.
| Jan. | Feb. | Mar. | April. | May. | June. | July. | Aug. | Sept. | Oct. | Nov. | Dec. | |
|---|---|---|---|---|---|---|---|---|---|---|---|---|
| + | 4.81 | 4.32 | 4.64 | 4.78 | 6.22 | .. | .. | .. | 7.56 | .. | 3.76 | |
| Av. | 3.08 | 2.87 | 4.47 | 3.98 | 4.94 | 4.34 | 5.42 | 4.34 | 3.86 | 4.25 | 3.75 | 3.32 |
| - | .. | .. | .. | .. | 3.26 | .. | 5.00 | 3.24 | 3.40 | .. | 3.20 | .. |
Mean Number of Days with Rain, compared with the Averages for Thirteen Previous Years.
| Jan. | Feb. | Mar. | April. | May. | June. | July. | Aug. | Sept. | Oct. | Nov. | Dec. | |
|---|---|---|---|---|---|---|---|---|---|---|---|---|
+ Above the average. - Below the average. | ||||||||||||
| + | 14.7 | 11.2 | 11.6 | 16.0 | .. | 19.3 | 20.1 | .. | .. | 19.6 | 15.5 | 11.8 |
| Av. | 9.5 | 8.5 | 11.3 | 12.9 | 14.9 | 15.3 | 16.9 | 14.8 | 14.8 | 15.2 | 13.6 | 11.2 |
| - | .. | .. | .. | .. | 12.7 | .. | .. | 14.0 | 13.2 | .. | .. | .. |
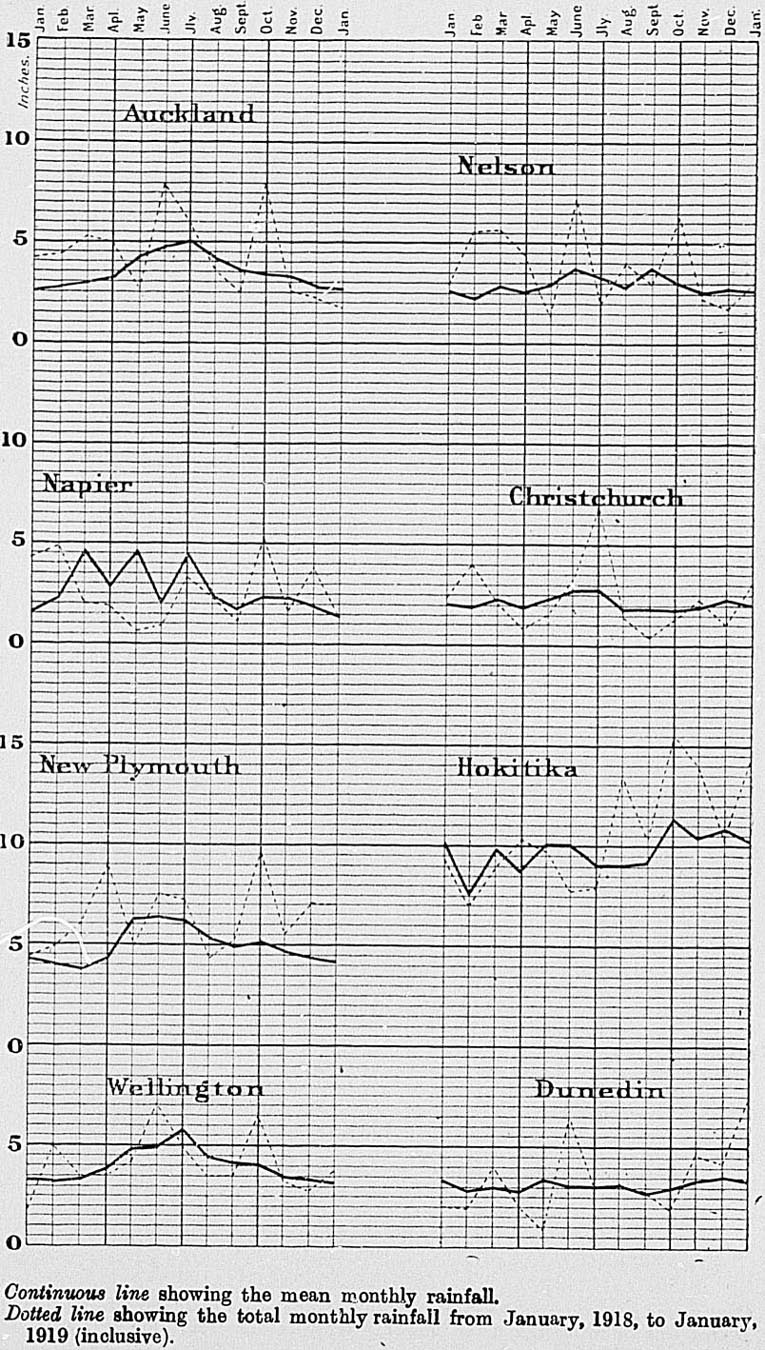
Continuous line showing the mean monthly rainfall.
Dotted line showing the total monthly rainfall from January, 1918, to January, 1919 (inclusive).
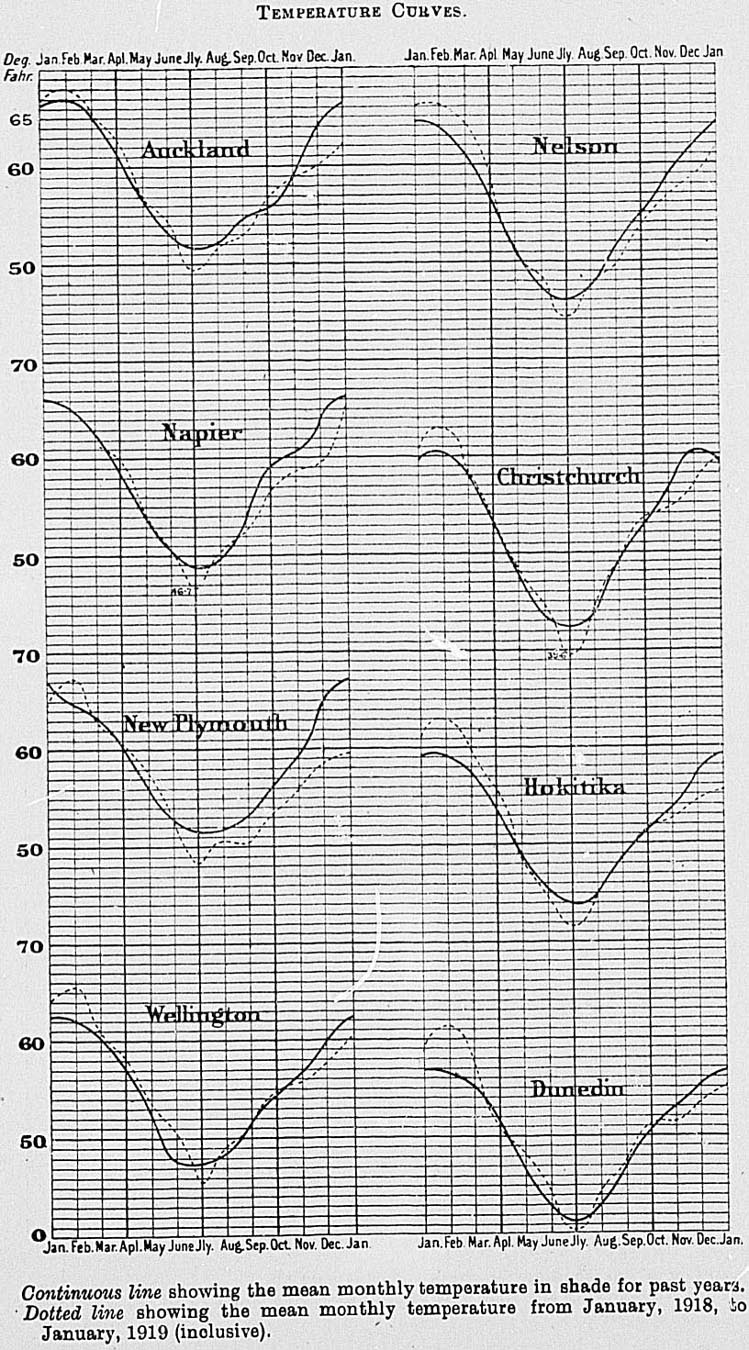
Continuous line showing the mean monthly rainfall.
Dotted line showing the total monthly rainfall from January, 1918, to January, 1919 (inclusive).
Continuous line showing the mean monthly temperature in shade for past years.
Dotted line showing the mean monthly temperature from January, 1918, to January, 1919 (inclusive).
Monthly Means compared with the Averages for Thirteen Previous Years .
| Jan. | Feb. | Mar. | April. | May. | June. | July. | Aug. | Sept. | Oct. | Nov. | Dec. | |
|---|---|---|---|---|---|---|---|---|---|---|---|---|
| + | .. | 3.33 | .. | 3.34 | .. | 4.90 | 3.95 | 3.91 | .. | .. | 4.49 | .. |
| Av. | 3.62 | 2.78 | 3.62 | 3.31 | 3.70 | 3.86 | 3.87 | 3.11 | 3.94 | 3.89 | 3.34 | 3.89 |
| - | 3.19 | .. | 3.56 | .. | 2.75 | .. | .. | .. | 3.02 | 3.87 | .. | 2.86 |
Mean Number of Days with Rain, compared with the Average for Thirteen Previous Years.
| Jan. | Feb. | Mar. | April. | May. | June. | July. | Aug. | Sept. | Oct. | Nov. | Dec. | |
|---|---|---|---|---|---|---|---|---|---|---|---|---|
+ Above the average. - Below the average. | ||||||||||||
| + | .. | 11.6 | .. | .. | .. | 13.5 | 13.5 | .. | .. | .. | 15.8 | .. |
| Av. | 12.1 | 9.2 | 11.9 | 12.1 | 12.4 | 13.5 | 13.5 | 12.5 | 13.8 | 14.4 | 13.7 | 13.1 |
| - | 11.9 | .. | 9.3 | 11.8 | 11.6 | .. | .. | 11.3 | 10.4 | 13.5 | .. | 11.4 |
TEMPERATURE , RAINFALL , ATMOSPHERIC PRESSURE , AND WIND THROUGHOUT NEW ZEALAND , AS OBSERVED AT TWELVE STATIONS , FOR THE YEAR 1918.
The observations were taken at 9 a.m.
| Stations. | Months. | Temperature in Shade. | Rainfall. | Mean Height of Barometer. | Prevailing Winds. | |||||
|---|---|---|---|---|---|---|---|---|---|---|
| Highest. | Lowest. | Mean Max. Temp. | Mean Min. Temp. | Mean Temp. for Month. | Wet Day. | Fall. | ||||
* No records taken. | ||||||||||
| Auckland (lat. 36° 50' S.; long. 174° 50' E.; alt. 125 ft.)— | °Fahr. | °Fahr. | °Fahr. | °Fahr. | °Fahr. | No. | Inches. | Inches. | ||
| January | 78.0 | 53.0 | 72.5 | 61.3 | 66.9 | 15 | 4.17 | 29.99 | NE, SW. | |
| February | 77.0 | 58.0 | 73.4 | 62.6 | 68.0 | 18 | 4.41 | 29.98 | NE, E. | |
| March | 78.0 | 54.0 | 72.0 | 59.4 | 65.7 | 17 | 5.38 | 29.99 | S, E. | |
| April | 73.5 | 52.5 | 68.3 | 57.4 | 62.8 | 18 | 4.90 | 30.00 | E. | |
| May | 67.0 | 44.0 | 62.9 | 51.0 | 56.9 | 20 | 2.57 | 30.02 | w, sw. | |
| June | 66.0 | 43.0 | 59.8 | 48.6 | 54.2 | 27 | 7.96 | 29.86 | w. | |
| July | 62.0 | 35.0 | 55.6 | 43.2 | 49.4 | 23 | 5.94 | 29.79 | w. | |
| August | 63.0 | 39.0 | 57.6 | 45.9 | 51.7 | 24 | 3.52 | 30.05 | w. | |
| September | 63.0 | 41.0 | 58.9 | 47.1 | 53.0 | 15 | 2.56 | 30.13 | w, sw. | |
| October | 67.0 | 42.5 | 62.6 | 51.4 | 57.0 | 23 | 8.08 | 29.92 | w. | |
| November | 71.0 | 47.0 | 64.7 | 53.1 | 58.9 | 18 | 2.56 | 29.94 | w. | |
| December | 73.0 | 48.0 | 66.5 | 54.0 | 60.3 | 11 | 2.25 | 29.90 | w, sw. | |
| Greenmeadows (Napier), (lat. 39° 32' S,; long. 176° 53' E.; alt. 70ft.)— | ||||||||||
| January | * | * | * | * | * | * | * | * | ||
| February | * | * | * | * | * | * | * | * | ||
| March | * | * | * | * | * | * | * | * | ||
| April | 76.5 | 41.5 | 67.7 | 51.9 | 59.8 | 9 | 1.86 | 30.008 | NW, W, N. | |
| May | 70.5 | 38.0 | 62.2 | 46.3 | 54.2 | 7 | 0.62 | 29.964 | N, S. | |
| June | 68.0 | 33.0 | 59.2 | 42.1 | 50.6 | 5 | 0.86 | 29.790 | N, NW. | |
| July | 65.5 | 30.5 | 54.4 | 39.0 | 46.7 | 7 | 3.32 | 29.686 | W. | |
| August | 66.5 | 28.0 | 59.0 | 41.3 | 50.2 | 9 | 2.36 | 29.951 | w. | |
| September | 70.0 | 34.0 | 61.3 | 44.0 | 52.6 | 7 | 1.17 | 30.079 | W NW. | |
| October | 74.5 | 36.0 | 64.8 | 48.4 | 56.6 | 11 | 5.30 | 29.865 | N, NW. | |
| November | 78.0 | 41.0 | 68.1 | 49.0 | 58.6 | 6 | 1.65 | 29.824 | N, W. | |
| December | 79.0 | 42.0 | 67.5 | 51.5 | 59.5 | 7 | 8.72 | 29.819 | W, S. | |
| Stations. | Months. | Temperature in Shade. | Rainfall. | Mean Height of Barometer. | Prevailing Winds. | |||||
|---|---|---|---|---|---|---|---|---|---|---|
| Highest. | Lowest. | Mean Max. Temp. | Mean Min. Temp. | Mean Temp. for Month. | Wet Day. | Fall. | ||||
| Palmerston North (last. 40° 21' S.; long. 175° 37' E.; alt. 103 ft.)— | °Fahr. | °Fahr. | °Fahr. | °Fahr. | °Fahr. | No. | Inches. | Indies. | ||
| January | 82.0 | 43.0 | 73.5 | 57.2 | 65.3 | 7 | 3.77 | .. | E, W. | |
| February | 82.0 | 49.0 | 73.9 | 57.6 | 65.7 | 10 | 2.01 | .. | W, E. | |
| March | 80.0 | 37.0 | 70.5 | 51.5 | 61.0 | 7 | 3.17 | .. | E. W. | |
| April | 72.5 | 38.0 | 65.2 | 48.4 | 56.8 | 13 | 3.58 | .. | W, E. | |
| May | 65.0 | 32.0 | 59.6 | 43.9 | 51.7 | 12 | 4.20 | .. | W, E. | |
| June | 62.0 | 32.0 | 55.7 | 42.8 | 49.2 | 21 | 3.58 | .. | W. E. | |
| July | 58.0 | 25.0 | 50.7 | 35.3 | 43.0 | 16 | 4.37 | .. | W, SW. | |
| August | 64.0 | 27.0 | 55.5 | 40.1 | 47.8 | 13 | 2.76 | .. | W, S. | |
| September | 63.0 | 32.5 | 57.1 | 42.6 | 49.8 | 11 | 3.47 | .. | W. | |
| October | 69.0 | 33.0 | 61.9 | 47.0 | 54.4 | 19 | 4.38 | .. | W, E. | |
| November | 72.0 | 37.0 | 61.4 | 47.3 | 54.3 | 19 | 3.84 | .. | W. | |
| December | 75.0 | 35.0 | 64.8 | 48.3 | 56.5 | 16 | 3.74 | .. | W, E. | |
| New Plymouth (lat 39° 3' 35" S.; long. 174° 4' 58" E.; alt. 160 ft.)— | January | 81.0 | 48.0 | 74.7 | 54.4 | 64.5 | 9 | 4.34 | .. | sw, s. |
| February | 85.0 | 53.0 | 77.3 | 57.2 | 67.2 | 12 | 4.80 | .. | NE, SW. | |
| March | 85.0 | 47.0 | 72.9 | 52.8 | 62.8 | 10 | 6.01 | .. | SE, S. | |
| April | 76.0 | 48.0 | 68.9 | 52.3 | 60.6 | 21 | 9.05 | .. | W, S. | |
| May | 71.0 | 43.0 | 64.4 | 50.8 | 57.6 | 19 | 4.95 | .. | S, SW. | |
| June | 65.0 | 34.0 | 59.7 | 45.2 | 52.4 | 20 | 7.57 | .. | S, SW. | |
| July | 59.0 | 31.0 | 54.8 | 41.8 | 48.3 | 24 | 7.28 | .. | SE, SW. | |
| August | 65.0 | 32.0 | 57.7 | 43.6 | 50.6 | 23 | 4.46 | .. | SW. S. | |
| September | 64.0 | 38.0 | 58.5 | 42.1 | 50.3 | 17 | 5.24 | .. | SW, SE. | |
| October | 68.0 | 40.0 | 61.4 | 45.3 | 53.3 | 26 | 9.65 | .. | SW. SE. | |
| November | 69.0 | 45.0 | 63.8 | 48.1 | 55.9 | 21 | 5.56 | .. | SW, S. | |
| December | 71.0 | 43.0 | 65.6 | 51.5 | 58.5 | 12 | 7.10 | .. | SW, S, W. | |
| Wellington (lat. 41° 16' S.; long. 174° 46' E.; alt. 8 ft.)— | ||||||||||
| January | 78.5 | 46.7 | 70.2 | 58.0 | 64.1 | 11 | 1.73 | 30.009 | N, S | |
| February | 79.3 | 51.0 | 71.8 | 59.5 | 65.6 | 8 | 5.04 | 30.024 | N, NW, S. | |
| March | 76.3 | 43.7 | 66.7 | 55.1 | 60.9 | 11 | 3.50 | 30.031 | S.N. | |
| April | 68.9 | 41.2 | 63.5 | 52.9 | 58.2 | 16 | 3.53 | 29.979 | N, NE, SE. | |
| May | 64.0 | 38.7 | 59.4 | 48.1 | 53.7 | 11 | 4.14 | 29.947 | NW, N. | |
| June | 61.9 | 32.9 | 56.1 | 44.8 | 50.4 | 16 | 7.08 | 29.758 | S, NW. | |
| July | 59.0 | 30.1 | 51.6 | 39.4 | 45.5 | 20 | 4.99 | 29.703 | S, NW. | |
| August | 62.7 | 30.5 | 54.9 | 43.3 | 49.1 | 13 | 3.51 | 29.929 | N, S, NW. | |
| September | 62.8 | 36.2 | 56.4 | 46.0 | 51.2 | 14 | 3.51 | 30.066 | NW, N, S. | |
| October | 69.6 | 38.2 | 60.3 | 49.4 | 54.8 | 17 | 6.48 | 29.804 | NW, N. | |
| November | 69.7 | 40.2 | 61.5 | 49.9 | 55.7 | 11 | 3.34 | 29.793 | NW, N. | |
| December | 74.6 | 42.9 | 63.9 | 51.4 | 57.6 | 11 | 2.73 | 29.801 | S, NW, N. | |
| Nelson (lat. 41° 16' 17" S.; long. 173° 18' 46" E.; alt. 34 ft.)— | ||||||||||
| January | 86.0 | 47.0 | 74.7 | 57.4 | 66.0 | 7 | 2.83 | .. | E, NE. | |
| February | 82.0 | 50.0 | 74.5 | 57.9 | 66.2 | 10 | 5.56 | .. | E, NE. | |
| March | 82.2 | 48.0 | 72.4 | 56.1 | 64.2 | 6 | 5.67 | .. | SE. | |
| April | 76.0 | 42.0 | 66.4 | 51.2 | 58.8 | 9 | 4.47 | .. | SE, SW. | |
| May | 69.0 | 32.0 | 59.6 | 42.0 | 50.8 | 10 | 1.44 | .. | E. | |
| June | 59.0 | 35.0 | 55.5 | 41.3 | 48.4 | 14 | 7.21 | .. | SE, NE. | |
| July | 58.0 | 29.0 | 51.1 | 37.3 | 44.2 | 10 | 1.99 | .. | NE, SW, SE. | |
| August | 61.0 | 30.0 | 56.0 | 39.7 | 47.8 | 8 | 4.03 | .. | NE, SE, SW. | |
| September | 65.5 | 30.0 | 59.4 | 40.0 | 49.7 | 10 | 2.89 | .. | SW. | |
| October | 69.0 | 34.5 | 62.6 | 45.0 | 53.8 | 16 | 6.33 | .. | NE. | |
| November | 76.0 | 34.0 | 66.2 | 47.3 | 56.7 | 12 | 2.23 | .. | NE. SW. | |
| December | 76.0 | 39.0 | 68.4 | 49.1 | 58.7 | 12 | 1.66 | .. | SW, NE. | |
| Hokitika (lat. 42° 41' 30" S.; long. 170° 49' E.; alt. 12ft.)— | ||||||||||
| January | 74.5 | 44.0 | 68.0 | 54.2 | 61.1 | 13 | 9.37 | 29.984 | SW. | |
| February | 73.0 | 46.5 | 69.2 | 56.9 | 63.0 | 15 | 6.95 | 29.986 | NE, SW. | |
| March | 77.0 | 43.5 | 67.8 | 51.9 | 59.8 | 9 | 8.86 | 30.010 | SW, SE. | |
| April | 69.5 | 42.0 | 61.7 | 49.3 | 55.5 | 21 | 10.26 | 29.983 | SE, E. | |
| May | 62.0 | 32.5 | 55.9 | 40.6 | 48.2 | 18 | 9.69 | 29.950 | SE, SW. | |
| June | 57.0 | 31.0 | 51.3 | 38.1 | 44.7 | 18 | 7.74 | 29.776 | E, SW. | |
| July | 54.5 | 26.0 | 49.9 | 33.0 | 41.4 | 18 | 7.99 | 29.766 | E, SE. | |
| August | 57.5 | 30.5 | 52.6 | 37.6 | 45.1 | 16 | 13.52 | 29.947 | SE, E. | |
| September | 59.0 | 29.5 | 55.6 | 41.9 | 48.7 | 20 | 10.33 | 30.078 | NE, E. | |
| October | 66.5 | 34.0 | 58.5 | 45.0 | 51.7 | 21 | 15.51 | 29.841 | SW, SE. | |
| November | 65.5 | 30.5 | 58.9 | 46.1 | 52.5 | 24 | 14.00 | 29.844 | N, SW. | |
| December | 65.5 | 36.0 | 61.8 | 47.1 | 54.4 | 16 | 10.28 | 29.843 | SW. | |
| Christchurch (lat. 43° 31' 50" S.; long. 172° 38' 50" E.; alt. 25 ft.)— | °Fahr. | °Fahr. | °Fahr. | °Fahr. | °Fahr. | No. | Inches. | Inches. | ||
| January | 83.9 | 42.0 | 67.4 | 54.5 | 60.9 | 12 | 2.37 | 29.970 | NE, SW. | |
| February | 83.7 | 43.2 | 69.9 | 56.1 | 63.0 | 13 | 4.03 | 29.970 | NE, SW. | |
| March | 81.3 | 39.2 | 65.1 | 51.5 | 58.3 | 11 | 2.12 | 30.016 | NE, SW. | |
| April | 74.5 | 32.0 | 61.7 | 45.0 | 53.4 | 10 | 0.87 | 29.922 | SW, NE. | |
| May | 62.1 | 29.0 | 56.2 | 40.0 | 48.1 | 17 | 1.59 | 29.876 | NE, SW. | |
| June | 64.9 | 28.0 | 52.6 | 36.4 | 44.5 | 13 | 3.26 | 29.733 | SW. | |
| July | 61.9 | 27.2 | 46.9 | 32.4 | 39.6 | 20 | 6.86 | 29.699 | SW. | |
| August | 65.3 | 27.2 | 53.5 | 35.8 | 44.6 | 11 | 1.43 | 29.855 | SW, NE. | |
| September | 73.2 | 31.5 | 59.3 | 38.9 | 49.1 | 9 | 0.93 | 29.994 | SW, NE. | |
| October | 74.3 | 35.0 | 63.1 | 44.3 | 53.7 | 12 | 1.31 | 29.752 | SW, NE. | |
| November | 80.0 | 30.8 | 63.7 | 45.0 | 54.4 | 16 | 2.30 | 29.722 | SW, NE. | |
| December | 81.2 | 38.0 | 66.4 | 47.8 | 57.1 | 11 | 1.09 | 29.724 | SW, NE. | |
| Lincoln (lat. 43° 32' 16" S.; long. 172° 38' 39" E.; alt. 42 ft.)— | ||||||||||
| January | 84.0 | 34.0 | 70.8 | 43.9 | 57.3 | 8 | 1.23 | 29.960 | NE, SW. | |
| February | 91.0 | 46.2 | 72.7 | 54.6 | 63.6 | 11 | 3.30 | 29.871 | NE, SW. | |
| March | 84.8 | 38.0 | 67.4 | 48.8 | 58.1 | 11 | 1.63 | 30.028 | NE. | |
| April | 71.0 | 32.0 | 64.3 | 43.5 | 53.9 | 7 | 0.79 | 29.897 | SW, NE. | |
| May | 64.5 | 26.6 | 58.2 | 40.7 | 49.5 | 12 | 1.49 | 29.893 | N.E. | |
| June | 66.0 | 26.0 | 53.5 | 34.9 | 44.2 | 12 | 2.17 | 29.761 | SW. | |
| July | 61.0 | 25.0 | 47.9 | 32.4 | 40.1 | 18 | 6.16 | 29.769 | SW. | |
| August | 64.8 | 27.4 | 54.8 | 35.6 | 45.2 | 10 | 1.63 | 29.857 | NE, SW. | |
| September | 71.6 | 30.0 | 57.3 | 37.9 | 47.6 | 9 | 1.31 | 29.992 | NE. | |
| October | 80.0 | 33.4 | 64.1 | 43.1 | 53.6 | 11 | 0.97 | 29.741 | SW, NE. | |
| November | 86.0 | 29.0 | 64.7 | 44.8 | 54.7 | 15 | 2.77 | 29.727 | NE, SW. | |
| December | 79.4 | 37.8 | 69.0 | 15.2 | 57.1 | 9 | 0.76 | 29.718 | NE, NW. | |
| Waimate (lat. 44° 44' S.; long. 171° E.; alt. 200 ft.)— | ||||||||||
| January | 81.0 | 43.0 | 67.2 | 51.5 | 59.3 | 13 | 2.91 | .. | NE. | |
| February | 80.0 | 42.0 | 67.7 | 53.0 | 60.3 | 11 | 1.98 | .. | NE. | |
| March | 81.0 | 39.0 | 64.7 | 49.3 | 57.0 | 9 | 3.17 | .. | NE. | |
| April | 70.0 | 33.0 | 60.4 | 43.7 | 52.0 | 10 | 0.55 | .. | NE, SW. | |
| May | 64.0 | 29.0 | 56.2 | 38.6 | 47.4 | 7 | 0.65 | .. | NE. | |
| June | 65.0 | 29.0 | 52.8 | 36.3 | 44.5 | 10 | 1.78 | .. | SW. | |
| July | 58.0 | 26.0 | 47.8 | 32.7 | 40.2 | 7 | 0.65 | .. | SW. | |
| August | 67.0 | 24.0 | 53.3 | 35.2 | 44.2 | 10 | 2.94 | .. | SW, NW. | |
| September | 70.0 | 31.0 | 57.2 | 37.5 | 47.3 | 7 | 1.97 | .. | NE, SW. | |
| October | 76.0 | 32.0 | 60.8 | 42.3 | 51.5 | 11 | 0.80 | .. | NE, SW. | |
| November | 81.0 | 36.0 | 60.2 | 43.6 | 51.9 | 17 | 3.87 | .. | NE, SE, SW. | |
| December | 80.0 | 36.0 | 64.2 | 44.8 | 54.5 | 8 | 2.05 | .. | NE, SE, SW. | |
| Dunedin (lat. 45° 52' S.; long. 170° 31' E.; alt. 300 ft.)— | ||||||||||
| January | 78.0 | 42.0 | 66.6 | 51.1 | 58.8 | 11 | 2.02 | 29.932 | NE, SW. | |
| February | 81.0 | 46.0 | 69.2 | 53.4 | 61.3 | 12 | 1.87 | 29.984 | NE, SW. | |
| March | 77.0 | 46.0 | 63.9 | 51.6 | 57.7 | 8 | 3.96 | 30.022 | NE, SW. | |
| April | 66.0 | 35.0 | 58.5 | 45.2 | 51.8 | 7 | 2.05 | 29.922 | SW, NE. | |
| May | 63.0 | 36.0 | 55.2 | 41.0 | 48.1 | 11 | 0.86 | 29.858 | SW, N. | |
| June | 57.0 | 31.0 | 49.1 | 39.8 | 44.4 | 21 | 6.48 | 29.759 | SW. | |
| July | 54.0 | 30.0 | 45.7 | 35.0 | 40.3 | 15 | 3.07 | 29.710 | SW. | |
| August | 62.0 | 28.0 | 50.8 | 38.4 | 44.6 | 13 | 3.12 | 29.858 | SW, N. | |
| September | 68.0 | 32.0 | 54.3 | 40.8 | 47.5 | 13 | 2.75 | 29.973 | SW. | |
| October | 72.0 | 34.0 | 59.5 | 43.0 | 51.2 | 15 | 1.88 | 29.741 | NE, SW. | |
| November | 78.0 | 34.0 | 59.2 | 43.7 | 51.4 | 16 | 4.69 | 29.754 | NE, SW. | |
| December | 72.0. | 39.0 | 61.3 | 45.6 | 53.4 | 17 | 4.15 | 29.710 | SW, NE. | |
| Invercargill (lat. 46° 25' S.; long. 168° 21' E.; alt. 18 ft.)— | ||||||||||
| January | 78.0 | 41.0 | 65.1 | 49.5 | 57.3 | 22 | 3.64 | .. | SW, SE. | |
| February | 82.0 | 35.0 | 71.5 | 49.1 | 60.3 | 15 | 1.58 | .. | SE, E. | |
| March | 79.0 | 38.0 | 65.6 | 47.4 | 56.5 | 11 | 2.94 | .. | SW, SE. | |
| April | 69.0 | 30.0 | 58.7 | 43.3 | 51.0 | 22 | 4.86 | .. | SE, SW, E. | |
| May | 61.0 | 28.5 | 53.4 | 37.9 | 45.6 | 20 | 5.77 | .. | E. | |
| June | 54.0 | 25.0 | 48.7 | 36.9 | 42.8 | 22 | 5.30 | .. | SE, E. | |
| July | 52.0 | 23.0 | 44.5 | 32.1 | 38.3 | 22 | 4.85 | .. | E, SW. | |
| August | 61.0 | 23.5 | 51.4 | 36.9 | 44.1 | 19 | 4.33 | .. | SE, E. | |
| September | 67.0 | 30.0 | 55.8 | 39.2 | 47.5 | 19 | 4.08 | .. | E, SW. | |
| October | 68.0 | 32.0 | 59.1 | 40.9 | 50.0 | 17 | 2.48 | .. | SW, E. | |
| November | 75.0 | 30.0 | 59.3 | 41.8 | 50.5 | 22 | 4.91 | .. | SW, E. | |
| December | 78.0 | 32.0 | 62.5 | 45.1 | 53.8 | 15 | 4.34 | .. | E, SW | |
| Stations. | Temperature in Shade. | Rainfall. | Mean Height of Barometer. | Prevailing Winds. | ||||||
|---|---|---|---|---|---|---|---|---|---|---|
| Highest, and Date. | Lowest, and Date. | Mean Max. Temp. for Year. | Mean Min. Temp. for Year. | Mean Temp. for Year. | Day on which Rain fell. | Total Fall. | ||||
| °Fahr. | °Fahr. | °Fahr. | °Fahr. | °Fahr. | No. | Inches. | Inches. | |||
| Auckland | 78.0 | 35.0 | 64.6 | 53.0 | 58.7 | 229 | 54.36 | 29.960 | W, SW. | |
| Jan. 13, Mar. 8 | July 26 | |||||||||
| Palmerston N | 82.0 | 25.0 | 62.5 | 46.8 | 54.6 | 164 | 42.87 | .. | W, E. | |
| Jan. 28, Feb. 15 | July 28 | |||||||||
| New Plymouth | 85.0 | 31.0 | 65.0 | 48.8 | 56.8 | 220 | 76.07 | .. | SW, S. | |
| Feb. 12,Mar. 7 | July 22 | |||||||||
| Wellington | 79.3 | 30.1 | 61.3 | 49.8 | 55.5 | 159 | 49.58 | 29.904 | N, NW, | S |
| Feb. 6 | July 27 | |||||||||
| Nelson | 86.0 | 29.0 | 63.9 | 47.0 | 55.4 | 124 | 46.33 | .. | NE, SE, | SW. |
| Jan. 26 | July 23, 24, 25 | |||||||||
| Hokitika | 77.0 | 26.0 | 59.2 | 45.1 | 52.2 | 209 | 124.50 | 29.917 | SW, | SE. |
| Mar. 7 | July 25 | |||||||||
| Christchurch | 83.9 | 27.2 | 60.5 | 44.0 | 52.2 | 155 | 28.16 | 29.853 | SW, | NE. |
| Jan. 18 | July 17, Aug. 16 | |||||||||
| Lincoln | 91.0 | 25.0 | 62.1 | 42.1 | 52.1 | 133 | 24.21 | 29.851 | NE, | SW. |
| Feb. 14 | July 27 | |||||||||
| Waimate | 81.0 | 24.0 | 59.3 | 42.3 | 50.8 | 120 | 23.32 | .. | NE, | SW. |
| Jan. 24, Mar. 27, Nov. 11 | Aug. 10 | |||||||||
| Dunedin | 81.0 | 28.0 | 57.8 | 44.1 | 50.9 | 159 | 36.90 | 29.852 | SW, | NE. |
| Feb. 13 | Aug. 9 | |||||||||
| Invercargill | 82.0 | 23.0 | 57.9 | 41.7 | 49.8 | 226 | 49.08 | .. | E, SW. | |
| Feb. 23 | July 4 | |||||||||
Table of Contents
THE estimated population of the Dominion on 31st December, 1918, was . 1,108,373 persons. This total does not include Maoris nor residents of the Cook and other Pacific islands annexed in 1901. The Maori population. at the census of 1916 was 49,776, while the annexed islands had at the same date a population of 12,797.
The details of the population as estimated on 31st December, 1918, are as follows:—
| — | Males. | Females. | Total. |
|---|---|---|---|
* Decrease; excess of emigration. | |||
| Estimated population (exclusive of Maoris and residents of Cook and other Pacific islands) at 31st December, 1917 | 537,360 | 560,312 | 1,097,672 |
| Increase during 1918— | |||
| By excess of births over deaths | 3,391 | 6,105 | 9,496 |
| By excess of immigration over emigration (including members of Expeditionary Forces) | 1,295 | -90* | 1,205 |
| Estimated population (exclusive of Maoris and residents of Cook and other Pacific islands) on 31st December, 1918 | 542,046 | 566,327 | 1,108,373 |
| Maori population, census 1916 | 25,933 | 23,843 | 49,776 |
| Population of Cook and other Pacific islands, census 1916 | 6,552 | 6,245 | 12,797 |
| Total estimated population of the Dominion on 31st December, 1918 | 574,531 | 596,415 | 1,170,946 |
The population, exclusive of Maoris and residents of the annexed islands, at each census since 1858 is given in the following statement, together with the numerical and centesimal increase between the successive enumerations:—
| Date of Enumeration. | Population | Numerical Increase. | Centesimal Increase. |
|---|---|---|---|
| December, 1858 | 59,413 | 39,608 | 66.67 |
| December, 1861 | 99,021 | 73,137 | 73.86 |
| December, 1864 | 172,158 | 46,510 | 27.01 |
| December, 1867 | 218,668 | 37,725 | 17.25 |
| February, 1871 | 256,393 | 43,121 | 16.82 |
| March, 1874 | 299,514 | 114,898 | 38.36 |
| March, 1878 | 414,412 | 75,521 | 18.22 |
| April, 1881 | 489,933 | 88,549 | 18.07 |
| March, 1886 | 578,482 | 48,176 | 8.33 |
| April, 1891 | 626,658 | 76,702 | 12.24 |
| April, 1896 | 703,360 | 69,359 | 9.86 |
| March, 1901 | 772,719 | 115,859 | 14.99 |
| April, 1906 | 888,578 | 119,890 | 13.49 |
| April, 1911 | 1,008,468 | 90,981 | 9.02 |
| October, 1916 | 1,099,449 |
Intercensal estimates of population are made from the records of births and deaths and the returns of migration. These estimates, especially of late years, are found to be remarkably near the truth, as will be seen from the following table showing the estimated population as at 30th September, 1916, and at 31st March in each of the preceding seven census years compared with the population as ascertained by the census in the same years. The comparatively large difference in 1916 is due in part to the difficulty experienced in keeping a reliable record of arrivals and departures since the outbreak of the war.
| Year. | Estimated Population, 31st March. | Census Population. | Difference. |
|---|---|---|---|
| 1881 | 488,649 | 489,933 | 1,284 |
| 1886 | 585,844 | 578,482 | 7,362 |
| 1891 | 631,898 | 626,658 | 5,240 |
| 1896 | 701,383 | 703,360 | 1,977 |
| 1901 | 775,123 | 772,719 | 2,404 |
| 1906 | 889,971 | 888,578 | 1,393 |
| 1911 | 1,006,761 | 1,008,468 | 1,707 |
| 1916 | 1,092,502 | 1,099,449 | 6,947 |
The Cook Islands are not included in any of the statistics of New Zealand quoted throughout this book. Figures re Maoris are included in the general details in a few cases—i.e., imports and exports, savings-bank deposits, &c.—but in other cases are either not taken into account or are shown separately. In cases where Maoris are included they swell totals to a much less extent per head than does the European population. The figures given below, therefore, do not include Maoris and residents of Cook Islands, information concerning whom is given at the end of this section.
| Year. | Estimated Population at End of Year. | Increase during Year. | Mean Population for Year. | |||
|---|---|---|---|---|---|---|
| Males. | Females. | Totals. | Numerical. | Per Cent. | ||
* Decrease. † Census population. | ||||||
| 1909 | 520,406 | 462,520 | 982,926 | 22,284 | 2.32 | 971,784 |
| 1910 | 529,998 | 474,388 | 1,004,386 | 21,460 | 2.18 | 992,802 |
| 1911 | 539,729 | 485,677 | 1,025,406 | 21,020 | 2.09 | 1,014,896 |
| 1912 | 553,212 | 499,415 | 1,052,627 | 27,221 | 2.65 | 1,039,016 |
| 1913 | 569,109 | 515,553 | 1,084,662 | 32,035 | 3.04 | 1,068,644 |
| 1914 | 568,161 | 527,833 | 1,095,994 | 11,332 | 1.04 | 1,090,328 |
| 1915 | 563,963 | 538,831 | 1,102,794 | 6,800 | 0.62 | 1,099,394 |
| 1916 | 549,895 | 550,668 | 1,100,563 | -2,231* | -0.19* | l,099,449† |
| 1917 | 537,360 | 560,312 | 1,097,672 | -2,891* | -0.27* | 1,099,117 |
| 1918 | 542,046 | 566,327 | 1,108,373 | 10,701 | 0.97 | 1,103,022 |
The smallness of the increases in 1914 and 1915, and the actual decreases in 1916 and 1917, are due in great part to the war, immigration being considerably restricted, while the emigration figures were swelled by the departure of troops for the front. In 1918 returning troops slightly exceeded those departing. The balance of civilian migration was also slightly in favour of immigration, thus allowing the effect of the natural increase—an abnormally low one—to record a small rise. Figures of emigration quoted later on in this section do not. include members of Expeditionary Forces.
With the exception of 1916 and 1917, the population of New Zealand has shown a continuous though not a regular increase in each year since 1855, the first year in which accurate records of births and deaths were obtained and used in conjunction with the returns of immigration and emigration. The greatest increase in any year was in 1874, when 32,118 assisted immigrants were brought into the country in accordance with the immigration and public-works policy of the Government. The next greatest increase of population was in 1863, following the discovery of gold in Otago. Latterly, however, direct gain from migration has been relegated to a place second to gain by natural increase. The accompanying logarithmic diagram gives a good indication of the progress of population in the Dominion, and is further interesting as showing the gradual tendency towards an equalization of the sexes. The loss of men, due to the departure of troops, actually brought the female population slightly ahead of the male at 31st December, 1916, a position which was maintained during the next two years. By the end of July, 1919, the male preponderance was again established.
Logarithmic Graphs of Population, 1855-1918.
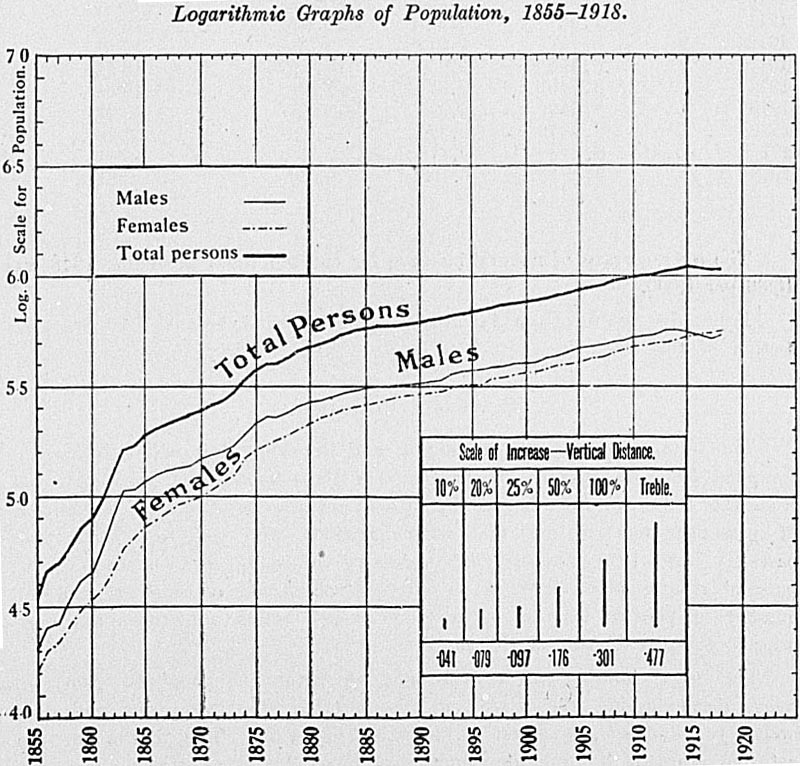
The increase of female population has been greater than that of males in each year since and including 1909. During the war period the departure of the Expeditionary Force caused each year to show decreases in male population. Apart from this, there has never been an actual decrease recorded, although in 1864 and again in 1888 the increase of males was less than 1,000, due in each case to an excess of emigration over immigration. The annual increase of female population has never fallen below 3,000 in any year since 1860.
The natural increase of population is shown in the following table:—
Natural Increase of Population, 1909-18.
| Year. | Excess of Births over Deaths. | Natural Increase per 1,000 of Mean Population. | ||
|---|---|---|---|---|
| Males. | Females. | Total. | ||
| 1909 | 8,256 | 9,309 | 17,565 | 18.07 |
| 1910 | 7,838 | 8,507 | 16,345 | 16.46 |
| 1911 | 7,937 | 8,883 | 16,820 | 16.58 |
| 1912 | 8,622 | 9,672 | 18,294 | 17.61 |
| 1913 | 8,566 | 9,250 | 17,816 | 16.67 |
| 1914 | 8,549 | 9,641 | 18,190 | 16.68 |
| 1915 | 8,649 | 9,236 | 17,885 | 16.27 |
| 1916 | 8,523 | 9,390 | 17,913 | 16.29 |
| 1917 | 8,298 | 9,413 | 17,711 | 16.11 |
| 1918 | 3,391 | 6,105 | 9,496 | 8.61 |
The average rate of natural increase for the ten years preceding 1918 was 16.86 per 1,000.
Fuller discussion of natural increase will be found in the Vital Statistics section of this book.
The number of persons arriving in and departing from New Zealand is compiled from the records of the Customs Department, and the departures from the Dominion are checked by special returns furnished by the pursers of passenger-steamers, so that where persons who did not book their passages have been omitted the necessary additions can be made. The parsers' returns also serve to prevent the occasional omission of the full number of persons leaving by any one vessel, which sometimes happened prior to the introduction of this check.
The total number of arrivals and departures during the past ten years, distinguishing the sexes and the number of those under and over twelve years of age, is given in the table following. The figures for the last five years do not include members of Expeditionary Forces.
Arrivals and Departures, 1909-18.
| Year. | Over 12 Years of Age. | Under 12 Years of Age. | Total. | ||
|---|---|---|---|---|---|
| Males. | Females. | Males. | Females. | ||
| ARRIVALS. | |||||
| 1909 | 21,763 | 12,480 | 2,302 | 2,105 | 38,650 |
| 1910 | 20,161 | 11,832 | 1,974 | 1,802 | 35,769 |
| 1911 | 22,881 | 13,953 | 2,452 | 2,103 | 41,389 |
| 1912 | 24,026 | 15,442 | 2,749 | 2,443 | 44,660 |
| 1913 | 22,872 | 15,801 | 3,019 | 2,896 | 44,588 |
| 1914 | 20,360 | 13,020 | 2,166 | 2,100 | 37,646 |
| 1915 | 12,993 | 9,589 | 1,494 | 1,475 | 25,551 |
| 1916 | 10,657 | 8,406 | 1,302 | 1,434 | 21,799 |
| 1917 | 8,334 | 5,583 | 825 | 907 | 15,649 |
| 1918 | 5,685 | 4,842 | 671 | 708 | 11,906 |
| DEPARTURES. | |||||
| 1909 | 20,772 | 10,373 | 1,472 | 1,314 | 33,931 |
| 1910 | 19,032 | 10,629 | 1,419 | 1,281 | 32,361 |
| 1911 | 21,730 | 12,190 | 1,809 | 1,460 | 37,189 |
| 1912 | 20,151 | 12,278 | 1,763 | 1,541 | 35,733 |
| 1913 | 17,188 | 10,516 | 1,372 | 1,291 | 30,369 |
| 1914 | 18,460 | 11,227 | 1,565 | 1,254 | 32,506 |
| 1915 | 12,228 | 8,251 | 1,090 | 907 | 22,476 |
| 1916 | 10,717 | 8,273 | 1,215 | 958 | 21,163 |
| 1917 | 6,896 | 5,672 | 701 | 600 | 13,869 |
| 1918 | 5,477 | 5,029 | 620 | 534 | 11,660 |
The monthly figures for 1918 are as follows:—
| Month. | Arrivals. | Departures. | Excess of Arrivals. | Excess of Departures. |
|---|---|---|---|---|
| January | 1,670 | 959 | 711 | .. |
| February | 1,145 | 1,181 | .. | 36 |
| March | 1,191 | 1,347 | .. | 156 |
| April | 1,208 | 1,379 | .. | 171 |
| May | 930 | 1,133 | .. | 203 |
| June | 960 | 1,069 | .. | 109 |
| July | 909 | 854 | 55 | .. |
| August | 844 | 931 | .. | 87 |
| September | 957 | 942 | 15 | .. |
| October | 1,257 | 1,094 | 163 | .. |
| November | 415 | 351 | 64 | .. |
| December | 420 | 420 | .. | .. |
| Totals | 11,906 | 11,660 | 246 | .. |
Some two-thirds of the oversea arrivals come from Australia, while five-sixths of the departures are booked for the Commonwealth. The numbers of departures for Australian ports are, however, inflated by the inclusion of many persons who sail from New Zealand for Australia to make that country a starting-point for further travel, and who may or may not return by the same route. The real destination and original place of departure when returning are not ascertained in these cases.
| Year. | Arrivals. | |||||
|---|---|---|---|---|---|---|
| From | Total Arrivals. | |||||
| United Kingdom. | Australian Commonwealth. | Fiji. | Other British Possessions. | Foreign Countries. | ||
| 1909 | 11,184 | 25,548 | 584 | 557 | 777 | 38,650 |
| 1910 | 9,367 | 24,502 | 581 | 351 | 968 | 35,769 |
| 1911 | 11,379 | 26,909 | 624 | 996 | 1,481 | 41,389 |
| 1912 | 12,912 | 28,522 | 767 | 1,305 | 1,154 | 44,660 |
| 1913 | 14,707 | 26,764 | 548 | 1,420 | 1,149 | 44,588 |
| 1914 | 8,579 | 25,967 | 648 | 1,267 | 1,185 | 37,646 |
| 1915 | 3,531 | 19,499 | 655 | 862 | 1,004 | 25,551 |
| 1916 | 3,394 | 15,321 | 697 | 626 | 1,761 | 21,799 |
| 1917 | 2,931 | 10,146 | 617 | 935 | 1,020 | 15,649 |
| 1918 | 1,176 | 8,282 | 574 | 1,130 | 744 | 11,906 |
| Year. | Departures. | |||||
|---|---|---|---|---|---|---|
| To | Total Departures. | |||||
| United Kingdom. | Australian Commonwealth. | Fiji. | Other British Possessions. | Foreign Countries. | ||
| 1909 | 2,676 | 28,995 | 663 | 663 | 934 | 33,931 |
| 1910 | 2,509 | 27,100 | 702 | 694 | 1,356 | 32,361 |
| 1911 | 2,755 | 30,918 | 696 | 844 | 1,976 | 37,189 |
| 1912 | 2,605 | 30,141 | 580 | 846 | 1,561 | 35,733 |
| 1913 | 2,649 | 24,961 | 479 | 1,017 | 1,263 | 30,369 |
| 1914 | 2,574 | 26,693 | 939 | 871 | 1,429 | 32,506 |
| 1915 | 2,063 | 17,793 | 659 | 821 | 1,140 | 22,476 |
| 1916 | 2,608 | 16,390 | 420 | 712 | 1,033 | 21,163 |
| 1917 | 1,501 | 10,499 | 503 | 588 | 778 | 13,869 |
| 1918 | 445 | 9,477 | 434 | 615 | 689 | 11,660 |
The War Regulations of the 15th November, 1915, as amended from time to time, prescribe that no person over the age of fifteen years shall leave New Zealand for any place beyond the seas save in pursuance of a written permit issued to him by the Minister or Under-Secretary of Internal Affairs, or some other authorized person.
The only persons exempted from the necessity for obtaining permits are those who—
Leave New Zealand on the King's Service:
Leave New Zealand as bona fide members of the crew of any ship:
Arrive in and leave New Zealand in the course of the same voyage of any ship other than a ship arriving from a port in the Commonwealth of Australia.
With regard to crews of ships, the regulations of the 24th July, 1916, as amended, provide that "No male person over the age of fifteen years shall be shipped as a member of the crew of an oversea vessel unless he produces to the Superintendent of Mercantile Marine—
"(a .) A certificate of discharge in New Zealand from an oversea vessel within the immediately preceding twelve months, or discharge for at least twelve months' service in vessels in the coasting trade of New Zealand, or such other discharges as the Superintendent of Mercantile Marine may deem satisfactory; or
"(b.) A permit to leave New Zealand issued under the War Regulations of the 15th day of November, 1915, and still in force."
Alien enemies desiring to leave New Zealand must, in addition to a permit under these regulations, obtain the consent of the Minister of Defence under clause 8 of the War Regulations of the 19th July, 1915.
The owner, charterer, or master of every ship is bound to take all reasonable care not to carry out of New Zealand any person whose departure from New Zealand would be a breach of the regulations.
There are permit agents of the Department of Internal Affairs (which administers the regulations) at various ports in New Zealand: At Auckland and Dunedin, Registrar of Births; Christchurch, Government Tourist Agent; Oamaru and Hokitika, Chief Postmaster; Dargaville, Postmaster; Bluff, Customs officer; Whangarei, Thames, Gisborne, Napier, Wanganui, New Plymouth, Blenheim, Timaru, Invercargill, Greymouth, Westport, and Nelson, the Collector of Customs. These officers are authorized to issue permits, but any doubtful cases are referred to the Head Office, Department of Internal Affairs, Wellington.
The amendments made in November, 1915, to the Defence of the Realm Regulations of the Imperial Government, providing that no person shall enter or leave the United Kingdom without a passport, have led to a greatly increased number being issued in New Zealand.
As far back as the 1st February, 1915, it was provided that no person should leave the United Kingdom for France or Belgium without a passport, and under the Aliens Restriction Amendment Orders aliens entering or leaving the United Kingdom were required to be in possession of passports granted by their own Governments.
Thus in the United Kingdom the passport fulfils a double function: In the first place it is practically a permit to enter the United Kingdom, and in the second place, as regards all aliens and British subjects going to France and Belgium, it is a permit to leave the United Kingdom. In this latter aspect it corresponds to the New Zealand permit issued under the War Regulations.
New Zealand is primarily concerned, however, with the first phase, and it is because passports are necessary to enable passengers to enter the United Kingdom that there has been such an overwhelming increase in the number issued in New Zealand during the past two years.
A person leaving New Zealand for the United Kingdom or other country (with the exception of British possessions in the Pacific, for which permits suffice) must therefore have in his possession (1) a permit under the War Regulations to enable him to depart from the Dominion. (2) a passport to enable him to land at the end of his journey. If foreign countries are being visited the passport must be víséd by the Consular representative of such country in New Zealand.
Applications for passports must be on the prescribed form, and accompanied by a fee of 10s. and two photographs, 3 in. by 2 in., of the applicant, certified to on the back thereof by some person of standing who recommends the issue of the passport.
Where separate passports are required for children under the age of sixteen years, application must be made on a special form. Forms of application are obtainable from the Department of Internal Affairs.
As inquiry is necessary in every case before His Excellency can be advised to sign a passport, applications must be received by the Department of Internal Affairs at least fourteen days before the passport is required.
Between the 1st November, 1915, and the 31st March, 1918, passports were issued to the number of 3,112, and for the year ended 31st March, 1919, 1,346.
Under the War Regulations of the 21st August, 1916, no person over the age of fifteen years may land in New Zealand unless in possession of a passport or some other document satisfactorily establishing his or her nationality or identity.
In the case of a person coming from a foreign country the passport must have been issued or viséd by the British Ambassador or a British Consul in that country, and in the case of a person coming from any part of the British dominions the issue or visé must have been by some public official duly authorized in that behalf.
Certain exceptions are made with respect to persons coming to New Zealand from Australia, the Cook Islands, and Samoa. In their case the only requirement is the possession of a permit to visit New Zealand granted by the Home and Territories Department of the Commonwealth, a Resident Commissioner of the Cook Islands, or the Administrator of Samoa, as the case may be. A person resident in New Zealand returning to the Dominion in possession of a New Zealand permit to visit Australia is also exempted. The regulations further do not apply to a British subject arriving in New Zealand as the master or a member of the crew of the vessel in which he arrives.
The Minister of Internal Affairs or any person authorized by him is given power to grant exemptions from the requirements of the regulation.
Special provision is made with regard to aliens being the masters or members of crows of ships arriving in New Zealand. They are prohibited from landing unless in the possession of passports or other documents establishing their nationality or identity, but the Collector of Customs may grant temporary permission to land for such purposes and subject to such conditions as the Collector thinks fit. The presence among the crew of an alien not possessing a passport, &c., must be notified to the Collector of Customs, and that alien must leave the Dominion with the vessel. Nothing in this particular regulation applies to any master or member of the crew whose home is in New Zealand.
The War Regulations of the 26th February, 1917, provide that no male over the age of fifteen years shall land in the Dominion without making a declaration in the specified form, setting forth particulars as to name, age, birthplace, nationality, occupation, &c. The following persons are exempted from making this declaration:—
Persons returning to New Zealand from Australia on permits issued in New Zealand;
Members of the naval or military forces of any of His Majesty's Allies or any part of the British dominions entering New Zealand on duty;
Any person arriving in New Zealand as the master or a member of the crew of the vessel in which he arrives.
A person who in his declaration states his intention of not becoming permanently resident in New Zealand cannot be granted a permit to leave the Dominion except within three months after the date of his arrival, or within such extended time as the Minister of Internal Affairs, on application in writing made before the expiry of the said period of three months, may allow.
In the 1915 issue of the Year-book particulars were given as to State assistance to desirable immigrants. Space is not available for the publication of this information in the present issue.
The restrictions caused by war conditions are responsible for the small number of assisted immigrants in the last three years.
The following table illustrates the proceedings of the last decade:—
| Year ended 31st March. | Immigrants assisted. | Capital possessed by Assisted Immigrants. £ | Net Government Expenditure on Immigration. £ |
|---|---|---|---|
* Not available. | |||
| 1910 | 2,672 | 34,688 | 17,002 |
| 1911 | 2,624 | 37,735 | 9,441 |
| 1912 | 3,300 | 24,088 | 11,681 |
| 1913 | 3,928 | 32,006 | 14,694 |
| 1914 | 5,064 | 39,701 | 33,914 |
| 1915 | 2,986 | 16,313 | 33,220 |
| 1916 | 1,103 | 2,564 | 10,010 |
| 1917 | 638 | 1,407 | 6,533 |
| 1918 | 171 | * | 3,877 |
| 1919 | 906 | * | 8,000 |
Under the immigration policy in force between 1871 and 1891 the following numbers were assisted:—
| Year. | Immigrants. |
|---|---|
No immigrants were assisted between 1892 and 1903 (inclusive). | |
| 1871 | 303 |
| 1872 | 4,736 |
| 1873 | 8,754 |
| 1874 | 32,118 |
| 1875 | 20,370 |
| 1876 | 9,677 |
| 1877 | 5,344 |
| 1878 | 6,618 |
| 1879 | 10,311 |
| 1880 | 2,689 |
| 1881 | 103 |
| 1882 | 726 |
| 1883 | 5,902 |
| 1884 | 3,888 |
| 1885 | 1,072 |
| 1886 | 917 |
| 1887 | 1,286 |
| 1888 | 485 |
| 1889 | 91 |
| 1890 | 144 |
| 1891 | 44 |
The Immigration Restriction Act prohibits the landing of lunatics or idiots, persons suffering from a dangerous or loathsome contagious disease, certain convicted criminals, and any person other than of British birth who fails to write out and sign in any European language a prescribed form of application. Shipwrecked persons are excepted. The Act does not apply to officers and crews of any mercantile vessels, provided they are not discharged in New Zealand, and are on board the vessel when she clears outward. There are other exemptions under the Act, including His Majesty's land and sea forces, and the officers and crew of any ship of war of any Government; and certain persons may be specially exempted by the Minister of Internal Affairs. Heavy penalties may be incurred for breaches of this law. Regulations under the Act were published in the New Zealand Gazette of the 26th November, 1908.
The law of the Commonwealth of Australia, with a view to the restriction of Asiatic immigration, prohibits the landing of any person who, when asked to do so by a public officer, fails to write out from dictation and sign a passage of fifty words in any prescribed language. An Act having a similar purpose was passed by the Parliament of New Zealand in 1907, requiring that any Chinese proposing to land in the Dominion shall be able to read a printed passage of not less than one hundred words of the English language. This measure became law on the 23rd October, 1908, and is now incorporated in the Immigration Restriction Act, 1908.
Persons of other than European descent are classified in the immigration returns as "race aliens." Immigrants of this class have since 1908 been required to pass an education test before admission to the Dominion.
| Birthplace. | Year. | |||||||||
|---|---|---|---|---|---|---|---|---|---|---|
| 1909. | 1910. | 1911. | 1912. | 1913. | 1914. | 1915. | 1916. | 1917. | 1918. | |
| British Possessions — | ||||||||||
| India | 157 | 80 | 190 | 325 | 133 | 257 | 13 | 92 | 92 | 138 |
| Pacific islands | 22 | 9 | 24 | 51 | 48 | 8 | 10 | 28 | 44 | 278 |
| Other | 30 | 43 | 1 | 4 | 34 | 7 | 8 | .. | .. | 1 |
| Total, British possessions | 209 | 132 | 215 | 380 | 215 | 272 | 31 | 120 | 136 | 417 |
| Foreign Countries — | ||||||||||
| China | 171 | 209 | 546 | 348 | 325 | 511 | 265 | 327 | 272 | 256 |
| Syria | 23 | 12 | 9 | 20 | 19 | 9 | 3 | 1 | 2 | 1 |
| Asia Minor | 12 | 4 | 4 | 8 | 2 | .. | .. | 2 | .. | 2 |
| Japan | 7 | 1 | 4 | 9 | 17 | 13 | 13 | 26 | 11 | 30 |
| Pacific islands | 18 | 7 | 25 | 24 | 4 | 6 | 6 | 537 | 295 | 211 |
| Other | 2 | 2 | 1 | 14 | 7 | 12 | 4 | .. | 8 | .. |
| Total, foreign countries | 233 | 235 | 589 | 423 | 374 | 551 | 291 | 893 | 588 | 500 |
| Total, "race aliens" | 442 | 367 | 804 | 803 | 589 | 823 | 322 | 1,013 | 724 | 917 |
Of the race aliens arriving in New Zealand a large proportion are Chinese, many of whom, however, have been formerly- resident in the Dominion. Hindus and other natives of India are also of late years arriving in considerable numbers. A number of soldiers from the French Pacific islands are included in the figures for the last three years.
Since July, 1914, records of departures of race aliens have been kept, and these show that a total of 414 race aliens left the Dominion during 1918, comprising natives of the following countries: China, 214; India, 19; Japan, 5; British Pacific islands, 24; foreign Pacific islands, 151; Syria, 1. There are indications that a large proportion of the Hindus arriving in the Dominion are coolies in transit to the Pacific islands.
The census returns of 1916 showed that there were 3,204 race aliens resident in the Dominion. They were as follows:—
| Race. | Full-blood. | Half-blood. | Totals. | ||||
|---|---|---|---|---|---|---|---|
| Males. | Females. | Males. | Females. | Males. | Females. | Total. | |
* Maori half-castes living as Europeans. | |||||||
| Chinese | 1,933 | 79 | 84 | 51 | 2,017 | 130 | 2,147 |
| Japanese | 52 | .. | 3 | 4 | 55 | 4 | 59 |
| Hindus | 160 | 5 | 7 | 9 | 167 | 14 | 181 |
| Cingalese | 6 | .. | 4 | 2 | 10 | 2 | 12 |
| Siamese | 1 | .. | .. | .. | 1 | .. | 1 |
| Afghans | 2 | .. | .. | .. | 2 | .. | 2 |
| Persians | 2 | .. | .. | .. | 2 | .. | 2 |
| Asiatic Turks | 1 | .. | .. | .. | 1 | 1 | |
| Asiatic Jews | 3 | 2 | .. | .. | 3 | 2 | 5 |
| Syrians | 262 | 186 | 5 | 6 | 267 | 192 | 459 |
| Arabs | 10 | .. | .. | .. | 10 | .. | 10 |
| Egyptians | 2 | .. | .. | .. | 2 | .. | 2 |
| Abyssinians | 1 | .. | 2 | 1 | 3 | 1 | 4 |
| Negroes | 49 | 2 | 30 | 14 | 79 | 16 | 95 |
| American Indians | 1 | .. | 1 | .. | 1 | ||
| Australian Aborigines | 1 | .. | 3 | 1 | 4 | 1 | 5 |
| Melanesians | 16 | .. | .. | 2 | 16 | 2 | 18 |
| Polynesians— | |||||||
| Maoris | 1,513 | 1,708 | 1,513 | 1,708 | *3,221 | ||
| Fijians | 15 | 8 | 14 | 12 | 29 | 20 | 49 |
| Other and undefined | 46 | 13 | 43 | 49 | 89 | 62 | 151 |
| Totals | 2,561 | 296 | 1,709 | 1,859 | 4,270 | 2,155 | 6,425 |
More than 45 per cent. of the race aliens reside in Auckland Province. Wellington, however, claims the largest share (over one-third) of the Chinese.
At the census of 1881, the year in which taxation was first imposed on Chinese landing in New Zealand, the Chinese population numbered 5,004 persons, which fell to 4,542 in 1884, and further to 3,711 in 1896. During the period 1881-96 the poll-tax was £10 per head, and this seemed sufficient for the purpose of preventing a large influx of the Chinese. During the years 1894 and 1895, however, the arrivals shown by the Customs returns were found to be somewhat greater than the departures, and in 1896 an Act was passed raising the poll-tax on Chinese immigrants to £100 per head, and limiting the number of Chinese passengers that may be carried by vessels to New Zealand to one for every 200 tons burthen. According to the census of 1901, the Chinese population was 2,857, in 1906 it was 2,570, in 1911, 2,630, and in 1916 2,147, of whom 135 were half-castes. The decrease still continues, deaths exceeding births, and the departures usually being more than the arrivals.
When any alien residing in New Zealand desires to be naturalized he may present to the Governor-General a memorial signed and verified by a statutory declaration setting forth—
His name, age, birthplace, residence, and occupation;
The length of his residence in New Zealand, and his desire to settle therein;
A request that letters of naturalization may be granted to him.
Every memorial must have written upon it or attached to it a certificate signed by some Magistrate or Justice to the effect that the applicant is known to the person certifying and is of good repute. On taking the oath of allegiance he shall enjoy within New Zealand all the rights and capacities that a natural-born subject of the United Kingdom can enjoy or transmit, excepting such rights (if any) as are specially excepted in the letters of naturalization granted to him.
Any person who has been previously naturalized in the United Kingdom or any British possession may obtain letters of naturalization in New Zealand upon presentation of his certificate or letters to the Governor-General, with satisfactory evidence of his bona fides.
An alien woman married to a natural-born or naturalized British subject shall be deemed to be herself naturalized. Where the father (or the mother, being a widow) has become naturalized in New Zealand, every child of such father or mother who during minority resides with such parent shall also be deemed to be naturalized.
No fee is payable for naturalization except in the case of Chinese, who arc charged £1.
Letters of naturalization were not granted during the war.
The Revocation of Naturalization Act of 1917 provided that the Governor-General may, by Order in Council, revoke the naturalization of any person when such revocation is considered desirable on grounds of public policy.
The number of natives of each country naturalized during the twenty years 1895-1914 is shown in the next table.
| Natives of— | Persons. |
|---|---|
| Austria-Hungary | 1,529 |
| Germany | 1,159 |
| Denmark | 676 |
| Sweden | 671 |
| Norway | 455 |
| Russia | 346 |
| Italy | 231 |
| Switzerland | 186 |
| France | 159 |
| Syria | 147 |
| China | 146 |
| United States of America | 144 |
| Netherlands | 61 |
| Greece | 61 |
| Portugal and possessions | 60 |
| Belgium | 40 |
| Spain | 16 |
| Japan | 11 |
| Turkey | 11 |
| Other countries | 52 |
| Total | 6,161 |
The Registration of Aliens Act passed in 1917 provided for the registration of all persons of the age of fifteen or over who are not British subjects either by birth or by naturalization in New Zealand. The Government Statistician is charged with the duty of compiling and keeping the register, but the actual registration is effected by Registration Officers (mostly police officers) throughout the Dominion. Every alien not less than fifteen years of age is required to make application for registration to a Registration Officer, and is required to supply the following particulars concerning himself or herself:—
Name in full:
(b .) Nationality (and if nationality is not the nationality of origin, nationality of origin):
(c .) Place of birth:
(d .) Age, and date of birth:
(e .) Whether married, single, widower, widow, or divorced:
(f .) If married, the name, age, nationality of origin, and place of abode of wife or husband:
(g .) If married, a widower, a widow, or divorced, number, names, and ages of children (if any):
(h .) Occupation:
(i .) Date of arrival in New Zealand:
(j .) Place of abode and postal address:
(k .) Whether permanently resident in New Zealand:
(l .) If not permanently resident in New Zealand, place of permanent residence, and date of projected departure from New Zealand:
(m .) Such other particulars as may from time to time be prescribed by regulations under the Act.
Upon receipt of an application for registration the Registration Officer issues a certificate of registration, and forwards the application in duplicate to the Superintendent of Police for the district, who files one copy and sends the other on to the Commissioner of Police for transmission to the Government Statistician. Registered aliens are required to notify change of address on pain of a penalty not exceeding £20. Failure to register involves a fine on conviction not exceeding £50.
The number of aliens on the Dominion register at the 1st July, 1919, was 8,335. The birthplaces of these are as follows:—
| Birthplace. | Males. | Females. | Total. |
|---|---|---|---|
| France | 87 | 44 | 131 |
| Spain | 19 | 4 | 23 |
| Portugal | 14 | 1 | 15 |
| Italy | 190 | 25 | 215 |
| Sardinia | 1 | .. | 1 |
| Sicily | 8 | .. | 8 |
| Switzerland | 208 | 72 | 280 |
| Holland | 63 | 3 | 66 |
| Belgium | 48 | 18 | 66 |
| Luxemburg | 3 | .. | 3 |
| Germany | 722 | 174 | 896 |
| Alsace | .. | 1 | 1 |
| Heligoland | 2 | .. | 2 |
| Denmark | 487 | 102 | 589 |
| Iceland | 1 | .. | 1 |
| Norway | 383 | 26 | 409 |
| Sweden | 453 | 28 | 481 |
| Russia | 264 | 64 | 328 |
| Finland | 172 | 8 | 180 |
| Siberia | 1 | .. | 1 |
| Poland | 72 | 25 | 97 |
| Austria | 236 | 9 | 245 |
| Hungary | 17 | 2 | 19 |
| Bohemia | 12 | 2 | 14 |
| Galicia | 5 | 1 | 6 |
| Croatia | 63 | .. | 63 |
| Slavonia | 2 | .. | 2 |
| Dalmatia | 782 | 18 | 800 |
| Istria | 1 | 1 | 2 |
| Bosnia | 6 | .. | 6 |
| Herzegovina | 3 | .. | 3 |
| Serbia | 15 | .. | 15 |
| Roumania | 12 | 1 | 13 |
| Bulgaria | 4 | .. | 4 |
| Montenegro | 3 | .. | 3 |
| Greece | 78 | .. | 83 |
| Macedonia | 2 | .. | 2 |
| Turkey | 12 | 1 | 13 |
| Palestine | 4 | .. | 4 |
| Syria | 89 | 49 | 138 |
| Mesopotamia | 1 | .. | 1 |
| China | 1,913 | 17 | 1,930 |
| Japan | 9 | .. | 9 |
| Egypt | 4 | 1 | 5 |
| United States | 381 | 81 | 462 |
| South Sea islands | 47 | 16 | 63 |
| Other countries | 26 | 3 | 29 |
| At sea | 8 | 3 | 11 |
| British - born, but aliens by naturalization, marriage, &c. | 25 | 572 | 597 |
| Totals | 6,958 | 1,377 | 8,335 |
A table published in Volume iv of "Statistics of New Zealand," 1918, gives fairly detailed information as to birthplaces in conjunction with ages. A summary giving information as to ages follows:—
| Age-group. | Males. | Females | Total. |
|---|---|---|---|
| 15 and under 20 | 93 | 27 | 120 |
| 20 and under 25 | 590 | 104 | 694 |
| 25 and under 30 | 901 | 153 | 1,054 |
| 30 and under 35 | 1,000 | 185 | 1,185 |
| 35 and under 40 | 897 | 157 | 1,054 |
| 40 and under 45 | 721 | 186 | 907 |
| 45 and under 50 | 632 | 134 | 766 |
| 50 and under 55 | 552 | 122 | 674 |
| 55 and under 60 | 467 | 107 | 574 |
| 60 and over | 1,105 | 202 | 1,307 |
| Totals | 6,958 | 1,377 | 8,335 |
The table following shows the birthplaces of the population, exclusive of Maoris, for 1916 and four preceding census years. The total number of British-born has increased during the period by 58 per cent., while the number of foreign-born has slightly decreased. Persons born in New Zealand have increased by 80 per cent. The Commonwealth of Australia is represented by 45,585 persons, a large increase since 1896. Against this there were 31,868 persons, natives of New Zealand, residing in the Commonwealth in 1911, as compared with 25,788 in 1901. Persons born in the United Kingdom numbered 218,834 in 1891 and 232,525 in 1916.
| Birthplace. | Number in each Census Year. | ||||
|---|---|---|---|---|---|
| 1896 | 1901 | 1906 | 1911 | 1916 | |
| Persons. | Persons. | Persons. | Persons. | Persons. | |
| New Zealand | 441,661 | 516,106 | 606,247 | 702,779 | 794,139 |
| Commonwealth of Australia | 21,631 | 26,991 | 47,256 | 50,029 | 45,585 |
| England | 116,541 | 111,964 | 116,560 | 133,811 | 140,997 |
| Wales | 2,148 | 1,765 | 2,144 | 2,206 | 2,197 |
| Scotland | 50,435 | 47,858 | 47,767 | 51,709 | 51,951 |
| Ireland | 46,037 | 43,524 | 42,460 | 40,958 | 37,380 |
| Other British possessions | 3,901 | 4,273 | 4,560 | 5,234 | 5,559 |
| Total British | 682,354 | 752,481 | 866,994 | 986,726 | 1,077,808 |
| Austria-Hungary | 881 | 1,874 | 2,212 | 2,131 | 2,365 |
| German Empire | 4,595 | 4,217 | 4,174 | 4,015 | 2,999 |
| Denmark | 2,125 | 2,120 | 2,277 | 2,262 | 2,244 |
| China | 3,719 | 2,902 | 2,602 | 2,611 | 2,041 |
| Other foreign countries | 7,760 | 7,480 | 8,602 | 8,552 | 9,007 |
| Total foreign | 19,080 | 18,593 | 19,867 | 19,571 | 18,656 |
| At sea | 41,322 | 1,203 | 1,245 | 1,392 | 1,377 |
| Not stated | 604 | 442 | 472 | 779 | 1,608 |
| Totals | 703,360 | 772,719 | 888,578 | 1,008,468 | 1,099,449 |
The next table shows the proportionate strength of the different nationalities represented in the Dominion:—
| Birthplace. | Proportion of each Nationality in— | ||||
|---|---|---|---|---|---|
| 1896 | 1901 | 1906 | 1911 | 1916 | |
| Per Cent. | Per Cent. | Per Cent. | Per Cent. | Per Cent. | |
| New Zealand | 62.85 | 66.83 | 68.26 | 69.74 | 72.34 |
| Commonwealth of Australia | 3.08 | 3.49 | 5.32 | 4.97 | 4.15 |
| England | 16.58 | 14.50 | 13.30 | 13.28 | 12.84 |
| Wales | 0.31 | 0.22 | 0.24 | 0.22 | 0.20 |
| Scotland | 7.18 | 6.20 | 5.38 | 5.13 | 4.73 |
| Ireland | 6.55 | 5.64 | 4.78 | 4.06 | 3.40 |
| Other British possessions | 0.55 | 0.55 | 0.51 | 0.52 | 0.51 |
| Total British | 97.10 | 97.43 | 97.62 | 97.92 | 98.17 |
| Austria-Hungary | 0.13 | 0.24 | 0.25 | 0.21 | 0.22 |
| German Empire | 0.65 | 0.55 | 0.47 | 0.40 | 0.27 |
| Denmark | 0.30 | 0.27 | 0.26 | 0.22 | 0.20 |
| China | 0.53 | 0.38 | 0.29 | 0.26 | 0.19 |
| Other foreign countries | 1.10 | 0.97 | 0.97 | 0.85 | 0.82 |
| Total foreign | 2.71 | 2.41 | 2.24 | 1.94 | 1.70 |
| At sea | 0.19 | 0.16 | 0.14 | 0.14 | 0.13 |
| 100.00 | 100.00 | 100.00 | 100.00 | 100.00 | |
The number of persons at each year of age is ascertained from the census household schedules. In the following tables these numbers have been condensed in customary groups, and the information disclosed at the census of 1916 is compared with that for two previous censuses. Maoris are not included.
| Age-groups. | Number. | |||||
|---|---|---|---|---|---|---|
| 1896 | 1906 | 1916 | ||||
| Males. | Females. | Males. | Females. | Males. | Females. | |
| Under 5 years | 42,448 | 41,211 | 52,499 | 50,246 | 67,320 | 64,735 |
| 5 years and under 10 years | 43,561 | 42,464 | 45,826 | 44,462 | 62,340 | 60,478 |
| 10 years and under 15 years | 43,044 | 42,423 | 43,834 | 42,924 | 55,532 | 53,693 |
| 15 years and under 20 years | 40,364 | 40,370 | 44,242 | 42,875 | 45,012 | 46,392 |
| 20 years and under 25 years | 34,264 | 34,452 | 49,370 | 45,238 | 30,419 | 46,759 |
| 25 years and under 30 years | 30,605 | 28,990 | 49,308 | 43,140 | 40,018 | 48,557 |
| 30 years and under 35 years | 23,747 | 21,466 | 37,798 | 32,621 | 46,166 | 47,415 |
| 35 years and under 40 years | 22,506 | 18,081 | 32,329 | 27,794 | 46,138 | 44,311 |
| 40 years and under 45 years | 19,999 | 14,855 | 24,451 | 20,930 | 36,758 | 33,866 |
| 45 years and under 50 years | 16,830 | 12,725 | 21,424 | 17,003 | 32,993 | 27,745 |
| 50 years and under 55 years | 16,203 | 11,523 | 18,336 | 13,563 | 24,027 | 21,083 |
| 65 years and under 60 years | 14,252 | 8,597 | 13,984 | 10,958 | 18,707 | 15,632 |
| 60 years and under 65 years | 10,504 | 6,278 | 12,452 | 9,442 | 16,115 | 12,576 |
| 65 years and under 70 years | 6,459 | 3,781 | 11,524 | 7,599 | 11,204 | 9,592 |
| 70 years and under 75 years | 3,219 | 2,205 | 7,567 | 4,616 | 8,319 | 6,855 |
| 75 years and under 80 years | 1,843 | 1,388 | 3,698 | 2,373 | 6,037 | 4,510 |
| 80 and over | 982 | 879 | 1,865 | 1,546 | 3,979 | 2,900 |
| Unspecified minors | 26 | 18 | 35 | 28 | 54 | 60 |
| Unspecified adults | 559 | 239 | 466 | 212 | 637 | 515 |
| All ages | 371,415 | 331,945 | 471,008 | 417,570 | 551,775 | 547,674 |
A calculation of the proportion per cent. at each age-group to the total of males and females shows the effect of a declining birth-rate on the ages under 15, the proportion of males at these ages being 30.19 per cent. in 1911 against 34.81 per cent. in 1896, and of females 32.58 per cent. against 38.02 per cent. respectively.
When the proportions for 1916 are considered, however, it will be seen that the figures in all age-groups for the male portion of the population have been materially affected by the withdrawal of men between the ages of 20 and 45 for service overseas.
The proportion of males under 15 to the total male population in 1916 was 33.61, an increase of 3.42 over the 1911 figures. The similar figures for females for 1913 were 32.70 per cent., an increase of only 0.12 over the percentage in 1911.
It must accordingly be pointed out that the following percentages for males in 1916 can be compared with figures in previous census years only after allowance has been made for the abnormal age-distribution resulting from the departure of troops.
Of the males, those 15-24 years formed 20.13 per cent. of the total in 1896, and only 13.69 per cent. in 1916. At the ages 15-64 the proportions were 61.82 per cent. and 61.03 per cent. in 1896 and 1916 respectively.
From 65 years upwards the proportions increased from 3.37 per cent. to 5.36 per cent. during the period under review.
Females at ages 15-44 increased in proportion to the total from 47.69 per cent. in 1896 to 48.87 per cent. in 1916. At 45 years and over there was 14.29 per cent. in 1896 and 18.43 per cent. in 1916 of the number of this sex.
| Age-groups: | Proportion per Cent. of Males. | Proportion per Cent. of Females. | ||||
|---|---|---|---|---|---|---|
| 1896 | 1906 | 1916 | 1896 | 1906 | 1916 | |
| Per Cent. | Per Cent. | Per Cent. | Per Cent. | Per Cent. | Per Cent. | |
| Under 5 years | 11.45 | 11.16 | 12.22 | 12.42 | 12.03 | 11.83 |
| 5 years and under 10 years | 11.75 | 9.74 | 11.31 | 12.80 | 10.65 | 11.06 |
| 10 years and under 15 years | 11.61 | 9.30 | 10.08 | 12.80 | 10.28 | 9.81 |
| 15 years and under 20 years | 10.88 | 9.41 | 8.17 | 12.17 | 10.28 | 8.48 |
| 20 years and under 25 years | 9.25 | 10.50 | 5.52 | 10.38 | 10.84 | 8.55 |
| 25 years and under 30 years | 8.25 | 10.48 | 7.26 | 8.74 | 10.34 | 8.88 |
| 30 years and under 35 years | 6.40 | 8.03 | 8.38 | 6.47 | 7.82 | 8.67 |
| 35 years and under 40 years | 6.07 | 6.87 | 8.37 | 5.45 | 6.66 | 8.10 |
| 40 years and under 45 years | 5.39 | 5.20 | 6.67 | 4.48 | 5.02 | 6.19 |
| 45 years and under 50 years | 4.54 | 4.55 | 5.99 | 3.84 | 4.07 | 5.07 |
| 50 years and under 55 years | 4.37 | 3.90 | 4.36 | 3.47 | 3.25 | 3.85 |
| 55 years and under 60 years | 3.84 | 2.97 | 3.39 | 2.59 | 2.63 | 2.30 |
| 60 years and under 65 years | 2.83 | 2.65 | 2.92 | 1.89 | 2.26 | 2.86 |
| 65 years and under 70 years | 1.74 | 2.45 | 2.03 | 1.14 | 1.82 | 1.75 |
| 70 years and under 75 years | 0.87 | 1.61 | 1.51 | 0.67 | 1.11 | 1.25 |
| 75 years and under 80 years | 0.50 | 0.79 | 1.10 | 0.42 | 0.57 | 0.82 |
| 80 and over | 0.26 | 0.39 | 0.72 | 0.27 | 0.37 | 0.53 |
| 100.00 | 100.00 | 100.00 | 100.00 | 100.00 | 100.00 | |
The declining proportions at the earlier ages 0-19 years may be ascribed to a falling birth-rate, while the increase at the higher ages is due to the advanced age of the then mostly adult immigrants introduced during the early stages of settlement. These form the greater portion of the groups 60 years and over, numbering 82,087 persons in 1916, only 7,583 of these being New-Zealand-born. The latter element in the population is assuming larger proportions each year, while the influence of the numbers recruited from abroad on the age-constitution is gradually waning.
The distribution of population at the census of 1916 (exclusive of Maoris) between the North and South Islands is shown according to age-groups in the following table:—
| Island. | Under 5 | 5 and under 20 | 20 and under 35 | 35 and under 50 | 50 and under 65 | 65 and over. | Unspecified. | Totals. |
|---|---|---|---|---|---|---|---|---|
| North | 79,218 | 189,781 | 159,614 | 132,424 | 62,110 | 27,143 | 782 | 651,072 |
| South | 52,837 | 133,666 | 99,720 | 99,387 | 46,030 | 26,253 | 484 | 448,377 |
| Totals | 132,055 | 323,447 | 259,334 | 221,811 | 108,140 | 53,396 | 1,266 | 1,099,449 |
It must be pointed out, however, that the figures for the North Island include 8,724 persons who on the night of the census were in military camps and internment camps, which are all situated in that Island.
The following table is interesting as showing the gradual equalization of the sexes, the number of females to 1,000 males having risen from 622 in 1861 to 903 in 1901. The proportion was slightly lower in 1906 and 1911, but has risen to 993 in 1916, mainly on account of the absence of so many men at the war.
| Census Year. | Males. | Females. | Females to 1,000 Males. |
|---|---|---|---|
| 1861 | 61,062 | 37,959 | 622 |
| 1871 | 150,356 | 106,037 | 705 |
| 1881 | 269,605 | 220,328 | 817 |
| 1891 | 332,877 | 293,781 | 883 |
| 1901 | 405,992 | 366,727 | 903 |
| 1906 | 471,008 | 417,570 | 887 |
| 1911 | 531,910 | 476,558 | 896 |
| 1916 | 551,775 | 547,674 | 993 |
While the male sex predominates in the country as a whole, that position does not obtain in every locality. Generally speaking, the females, following the natural course of events, prevail in the older-settled districts. In the wilder or newer-developed regions men regain their numerical superiority. Ten counties in which the distinction in each case is well marked are—
| County. | Females to 1,000 Males. |
|---|---|
| Halswell | 1,222 |
| Taieri | 1,198 |
| Heathcote | 1,197 |
| Eden | 1,158 |
| Levels | 1,138 |
| Makara | 1,187 |
| Waipukurau | 1,096 |
| Waimairi | 1,091 |
| Horowhenua | 1,086 |
| Oroua | 1,086 |
| County. | Females to 1,000 Males. |
|---|---|
| Awakino | 513 |
| Fiord | 545 |
| Waiapu | 566 |
| Chatham Islands | 598 |
| East Taupo | 604 |
| Castlepoint | 609 |
| Amuri | 620 |
| Murchison | 644 |
| Patangata | 677 |
| Ohura | 679 |
All the towns of any size were the fortunate possessors of more female inhabitants than male. Although in many cases this is an artificial state of affairs, due to the war; still, even in peace-times the majority of the larger centres—Nelson forming a classic example—are in this position.
At the census of 1906 and again in 1911 the number of females returned as married was less than that of males. In many instances married men coming to New Zealand from abroad leave their families behind until steady work has been obtained and a home prepared. This is the usual practice among aliens, the expense of transport in some cases preventing the union of families for a considerable length of time. At the 1916 census, however, the number of married females exceeded the number of married males by approximately 4,000. This, of course, is doubtless due to the departure with the Forces of a considerable number of married men.
The number of married persons in 1911 was slightly more than one-third of the total population, exclusive of Maoris. In 1916, however, the proportion of married people to the total population had increased to approximately 37 per cent., this again being partly due to the disturbance of the normal proportions through the enlistment and departure of large numbers of single men. Widowed and divorced are included among the unmarried over 20 and 15 years of age for males and females respectively, the number of the widowed in 1916 being 15,454 males and 30,423 females. Those returned as divorced at the last census—760 males and 613 females—are probably less than the actual fact, owing to the reluctance of some persons to state this condition. The following table shows the number of unmarried and married males and females for six successive census years:—
| Census. | Number of Unmarried. | Number of Married. | ||||
|---|---|---|---|---|---|---|
| Males. | Females. | Males. | Females. | |||
| Under Twenty Years of Age. | Twenty Years of Age and over. | Under Fifteen Years of Age. | Fifteen Years of Age and over. | |||
| 1891 | 159,000 | 77,955 | 123,852 | 78,776 | 90,371 | 90,765 |
| 1896 | 169,325 | 94,946 | 126,087 | 102,422 | 102,621 | 103,062 |
| 1901 | 173,096 | 110,485 | 127,017 | 121,297 | 118,401 | 117,746 |
| 1906 | 186,270 | 137,191 | 137,621 | 136,584 | 143,838 | 142,736 |
| 1911 | 204,883 | 150,484 | 155,047 | 149,274 | 171,936 | 170,989 |
| 1916 | 230,144 | 118,429 | 178,906 | 162,209 | 201,967 | 205,896 |
The proportions per cent. exhibit a steady increase in the case of married persons of either sex since 1891. Widowed males increased relatively to the total population, but not to the same extent as widowed females.
| Census. | Proportion of Males. | Proportion of Females. | ||||
|---|---|---|---|---|---|---|
| Unmarried. | Married. | Widowed. | Unmarried. | Married. | Widowed. | |
| Per Cent. | Per Cent. | Per Cent. | Per Cent. | Per Cent. | Per Cent. | |
| 1891 | 70.02 | 27.61 | 2.37 | 64.95 | 30.94 | 4.11 |
| 1896 | 69.48 | 27.97 | 2.55 | 64.37 | 31.10 | 4.53 |
| 1901 | 67.90 | 29.45 | 2.65 | 62.94 | 32.17 | 4.89 |
| 1906 | 66.52 | 30.78 | 2.70 | 60.57 | 34.24 | 5.19 |
| 1911 | 64.69 | 32.61 | 2.70 | 58.59 | 35.99 | 5.42 |
| 1916 | 60.51 | 36.69 | 2.80 | 56.80 | 37.64 | 5.56 |
The proportion of married women under 20 years of age is steadily diminishing, while between 35 and 45 years there is a tendency towards an increase.
Women in New Zealand are not now marrying at such early ages as they did formerly, as will be seen from the figures given below:—
| Age-groups. | Proportion of Married Women (under 45 Years of Age). | |||||
|---|---|---|---|---|---|---|
| 1891. | 1896. | 1901. | 1906. | 1911. | 1916. | |
| Per Cent. | Per Cent. | Per Cent. | Per Cent. | Per Cent. | Per Cent. | |
| Under 20 years | 1.19 | 1.12 | 0.98 | 0.94 | 0.81 | 0.75 |
| 20 and under 35 years | 60.12 | 59.57 | 59.94 | 60.29 | 59.98 | 56.00 |
| 35 and under 45 years | 38.69 | 39.31 | 39.08 | 38.77 | 39.21 | 43.25 |
| 100.00 | 100.00 | 100.00 | 100.00 | 100.00 | 100.00 | |
Excluding the widowed, but including persons divorced, the number of unmarried males 20 years of age and over was found at the census of 1916 to be 102,975, and the number of unmarried females 15 years of age and over was 131,786-78 bachelors to every 100 spinsters. The relative numbers in the last six census years were—
| Census. | Number of Bachelors to every 100 Spinsters. |
|---|---|
| 1891 | 105 |
| 1896 | 98 |
| 1901 | 97 |
| 1906 | 108 |
| 1911 | 110 |
| 1916 | 78 |
The substantial variation between the figures for 1911 and those for 1916 is, of course, another result of war conditions.
Reference to particulars of duration of marriage and number of children as disclosed by the census of 1916 will be found in the Marriage subsection of this issue.
There is no State Church in New Zealand, nor is financial assistance given by the State to any religious denomination. Among the first colonists settlements were formed composed entirely of the adherents of certain religious bodies, but as facilities for communication increased, this exclusiveness rapidly gave place to a spirit of tolerance, and no serious attempt was made to preserve the distinctive religious character of these communities. In Otago, where the Free Church of Scotland founded a settlement, adherents to the Presbyterian Church, mostly descendants of the original stock, form 47 per cent. of the population of that portion of the Dominion; while in Canterbury, which was originally settled by the United Church of England and Ireland, adherents to the Church of England constituted 46 per cent. of the population of the provincial district at the census of 1916.
The Church of England has the largest number of adherents, and, according to returns collected in 1916, had 645 churches, besides using 497 other buildings for Divine worship. The Presbyterian Church, the next in strength, had 519 churches, with the use of 551 buildings as temporary places of worship. Roman Catholics occupy third place in point of numbers, and possessed 336 churches and used 106 other buildings. Methodists had 416 churches, and used 274 other buildings wherein to hold service.
The total number of churches and chapels belonging to all denominations and sects was 2,091, besides which 870 schoolhouses and 886 dwellings or public buildings were made use of as places of worship or for meetings. These churches and buildings were sufficient for the accommodation of 493,260 persons, or 45 per cent. of the total number of adherents and members.
The number belonging to each of the principal denominations is shown, for five census periods, in the next table:—
| Denomination. | Number of Adherents. | ||||
|---|---|---|---|---|---|
| 1896. | 1901. | 1906. | 1911. | 1916. | |
| Church of England | 282,809 | 315,263 | 368,065 | 413,842 | 461,259 |
| Presbyterian 159,952 | 159,952 | 176,503 | 203,597 | 234,662 | 260,659 |
| Methodist 73,367 | 73,367 | 83,802 | 89,038 | 94,827 | 106,024 |
| Roman Catholic | 98,804 | 109,822 | 126,995 | 140,523 | 151,605 |
| Other Christian denominations | 55,137 | 53,739 | 58,619 | 65,735 | 68,932 |
| Non-Christian | 14,327 | 13,304 | 14,346 | 15,029 | 4,813 |
| Indefinite | 12,345 | ||||
| No religion | 1,875 | 1,109 | 1,709 | 5,529 | 4,311 |
| Object to state | 15,967 | 18,295 | 24,325 | 35,905 | 25,577 |
| Unspecified | 1,122 | 882 | 1,884 | 2,416 | 3,924 |
| Totals | 703,360 | 772,719 | 888,578 | 1,008,468 | 1,099,449 |
Members of Christian denominations formed 95.71 per cent. of those who made answer to the inquiry at the last census; non-Christian sects were 0.44 per cent., and those who described themselves as of no religion 0.39 per cent., whilst "indefinite" religions constituted 1.12 per cent. The Census Act provides that those persons who are unwilling to state what denomination, if any, they belong to may enter the word "Object" in the census schedule. In 1916 there were 25,577 persons, or 2.34 per cent. of the total, who took advantage of this permission.
| Denomination. | Proportion of Adherents. | ||||
|---|---|---|---|---|---|
| 1896. | 1901. | 1906. | 1911. | 1916. | |
| Per Cent. | Per Cent. | Per Cent. | Per Cent. | Per Cent. | |
| Church of England 40.27 | 40.27 | 40.85 | 41.51 | 41.14 | 42.10 |
| Presbyterian 22.78 | 22.78 | 22.87 | 22.96 | 23.32 | 23.79 |
| Methodist | 10.44 | 10.86 | 10.06 | 9.43 | 9.68 |
| Roman Catholic 14.07 | 14.07 | 14.23 | 14.32 | 13.97 | 13.84 |
| Other Christian denominations | 7.86 | 6.96 | 6.60 | 6.53 | 6.30 |
| Non-Christian | 2.04 | 1.72 | 1.61 | 1.49 | 0.44 |
| Indefinite | 1.12 | ||||
| No religion | 0.27 | 0.14 | 0.19 | 0.55 | 0.39 |
| Object to state | 2.27 | 2.37 | 2.75 | 3.57 | 2.34 |
| Totals | 100.00 | 100.00 | 100.00 | 100.00 | 100.00 |
Information in considerable detail in regard to the occupations of the people will be found in Part IX of the 1916 Census Results, and in the Government Statistician's Report on the census. Some explanation of the terms used post may be necessary:—
Professional: All those not otherwise classed engaged in Government, defence, law and order, or ministering to religion, health, education, art, science, or amusement.
Domestic: Persons supplying board and lodging or personal services for which payment is given. Commercial: Persons directly connected with the sale, storage, security, &c., of property and material. Transport and communication: Persons engaged in the transport of passengers and goods and in effecting communication.
Industrial: Persons employed in manufacture, &c.
Agricultural and other primary producers: Persons chiefly engaged in the cultivation or acquisition of food products and in obtaining other raw materials from natural sources.
Indefinite: Persons living on incomes earned in the past, or indefinitely described.
Dependants: All those, including wives and children, dependent on natural guardians, or upon charity, public or private.
| Class. | Males. | Females. | Total. | |||
|---|---|---|---|---|---|---|
| Number. | Per Cent. of Total. | Number. | Per Cent. of Total. | Number. | Per Cent. of Total. | |
| Breadwinners— | ||||||
| Professional | 24,797 | 4.50 | 17,304 | 3.16 | 42,101 | 3.83 |
| Domestic | 10,119 | 1.83 | 31,796 | 5.81 | 41,915 | 3.81 |
| Commercial | 49,490 | 8.97 | 16,714 | 3.05 | 66,204 | 6.02 |
| Transport and communication | 40,253 | 7.30 | 2,269 | 0.42 | 42,522 | 3.87 |
| Industrial | 97,045 | 17.59 | 19,874 | 3.62 | 116,919 | 10.64 |
| Agricultural, pastoral, mining, and other primary producers | 122,814 | 22.26 | 9,685 | 1.77 | 132,499 | 12.05 |
| Indefinite | 10,531 | 1.91 | 2,613 | 0.48 | 13,144 | 1.20 |
| Non-breadwinners— | ||||||
| Dependants | 196,600 | 35.64 | 447,415 | 81.69 | 644,015 | 58.58 |
| Not stated | 126 | .. | 4 | .. | 130 | .. |
| Total | 551,775 | 100.00 | 547,674 | 100.00 | 1,099,449 | 100.00 |
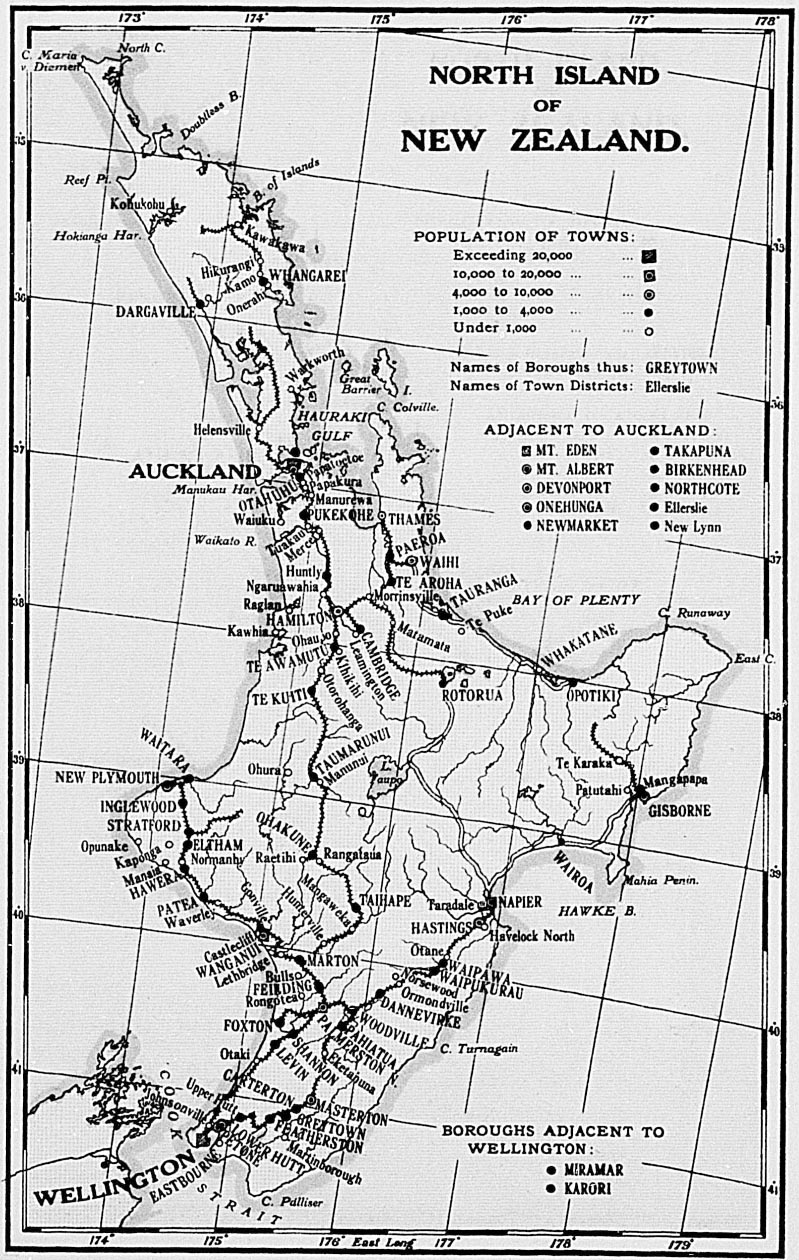
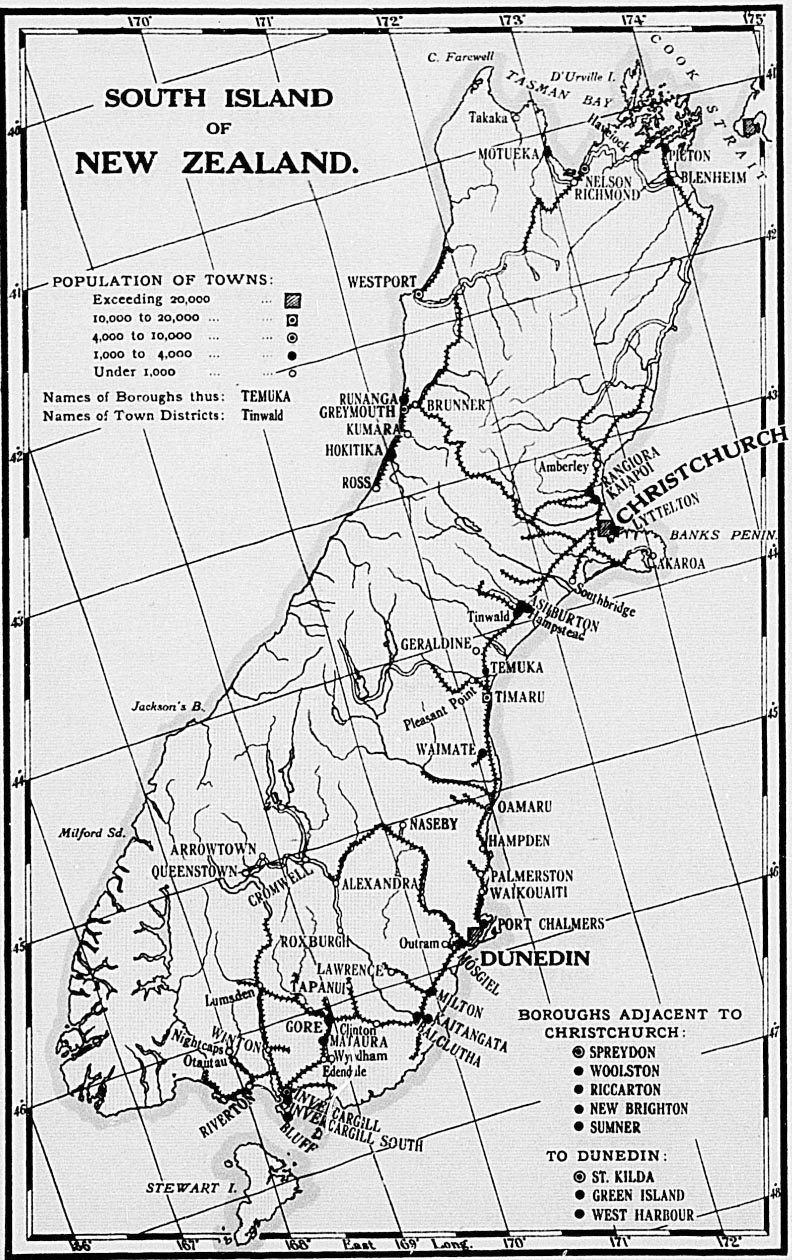
Comparisons with previous census returns would be scarcely just, by reason of the dislocation, largely temporary, effected by the war and circumstances arising directly out of it.
The next table needs a little explanation also. The abbreviations used are: E., employer of labour; O., in business on own account but not employing others; A., relative assisting but not receiving wages; W., working for wages or salary; W.N., wage-earner unemployed; N.A., classification not applicable (as in the case of a minister of religion); N.S., unspecified.
| Class. | E. | O. | A. | W. | W.N. | N.A. | N.S. | Total. |
|---|---|---|---|---|---|---|---|---|
| Breadwinners— | Males. | |||||||
| Professional | 5.21 | 3.85 | 0.34 | 8.65 | 5.17 | 5.11 | 7.24 | 6.98 |
| Domestic 3.84 | 2.40 | 1.03 | 3.03 | 4.85 | .. | 0.53 | 2.86 | |
| Commercial | 16.58 | 11.22 | 3.18 | 14.72 | 12.57 | 15.99 | 7.67 | 13.94 |
| Transport and communication | 2.63 | 4.24 | 0.60 | 16.27 | 10.52 | 0.37 | 2.29 | 11.33 |
| Industrial | 21.94 | 13.20 | 2.61 | 34.76 | 44.04 | 0.08 | 13.89 | 27.33 |
| Agricultural, pastoral, mining, and other primary producers | 49.80 | 65.09 | 92.24 | 22.57 | 22.85 | 0.04 | 68.38 | 34.59 |
| Indefinite | .. | .. | .. | .. | .. | 78.41 | .. | 2.97 |
| Total | 100.00 | 100.00 | 100.00 | 100.00 | 100.00 | 100.00 | 100.00 | 100.00 |
| Breadwinners— | Females. | |||||||
| Professional | 7.49 | 27.70 | 1.11 | 17.43 | 18.08 | 28.75 | 24.17 | 17.26 |
| Domestic 28.19 | 14.47 | 14.09 | 37.61 | 41.44 | 1.96 | 23.42 | 31.71 | |
| Commercial | 14.72 | 16.22 | 9.49 | 17.69 | 19.90 | 15.20 | 12.62 | 16.67 |
| Transport and communication | 0.53 | 0.05 | 0.41 | 2.96 | 1.21 | 0.11 | 2.26 | |
| Industrial | 18.07 | 25.10 | 2.05 | 22.62 | 19.20 | 0.24 | 21.71 | 19.83 |
| Agricultural, pastoral, mining, and other primary producers | 31.00 | 16.46 | 72.85 | 1.69 | 0.17 | 1.64 | 17.97 | 9.66 |
| Indefinite | .. | .. | .. | .. | .. | 52.21 | .. | 2.61 |
| Total | 100.00 | 100.00 | 100.00 | 100.00 | 100.00 | 100.00 | 100.00 | 100.00 |
The table next presented has the same facts from a different viewpoint. The grades of occupations as ascertained to exist in 1916 are very similar to those shown in 1911 and in 1906. The two sets of tables are sufficiently explicit and clear to require no comment.
| Class. | E. | O. | A. | W. | W.N. | N.A. | N.S. | Total. |
|---|---|---|---|---|---|---|---|---|
| Breadwinners— | Males. | |||||||
| Professional | 9.07 | 8.67 | 0.16 | 77.00 | 1.24 | 2.77 | 1.09 | 100.00 |
| Domestic | 16.42 | 13.19 | 1.24 | 66.11 | 2.84 | .. | 0.20 | 100.00 |
| Commercial | 14.48 | 12.64 | 0.79 | 65.67 | 1.50 | 4.34 | 0.58 | 100.00 |
| Transport | 2.82 | 5.87 | 0.18 | 89.24 | 1.55 | 0.13 | 0.21 | 100.00 |
| Industrial | 9.77 | 7.58 | 0.33 | 79.09 | 2.69 | 0.01 | 0.53 | 100.00 |
| Agricultural, pastoral, mining, and other primary producers | 17.55 | 29.56 | 9.16 | 40.57 | 1.10 | .. | 2.06 | 100.00 |
| Indefinite | .. | .. | .. | .. | .. | 100.00 | .. | 100.00 |
| Total | 12.18 | 15.71 | 3.43 | 62.18 | 1.67 | 3.78 | 1.05 | 100.00 |
| Breadwinners— | Females | |||||||
| Professional | 1.14 | 12.65 | 0.53 | 74.85 | 1.21 | 8.32 | 1.30 | 100.00 |
| Domestic | 2.33 | 3.59 | 3.68 | 87.86 | 1.56 | 0.30 | 0.68 | 100.00 |
| Commercial | 2.31 | 7.67 | 4.72 | 78.65 | 1.38 | 4.56 | 0.71 | 100.00 |
| Transport | 0.62 | 0.18 | 1.49 | 97.05 | 0.62 | .. | 0.04 | 100.00 |
| Industrial | 2.39 | 9.98 | 0.86 | 84.57 | 1.12 | 0.06 | 1.02 | 100.00 |
| Agricultural, pastoral, mining, and other primary producers | 8.41 | 13.44 | 62.61 | 12.94 | 0.02 | 0.84 | 1.74 | 100.00 |
| Indefinite | .. | .. | .. | .. | .. | 100.00 | .. | 100.00 |
| Total | 2.62 | 7.89 | 8.30 | 74.11 | 1.16 | 4.99 | 0.93 | 100.00 |
Unemployed males in October, 1916, numbered 5,919, or 1.67 per cent. of the male breadwinners, compared with 1.97 in April, 1911, and 2.53 in April, 1906.
Females out of employment totalled 1,156, or 1.16 per cent. of the female breadwinners.
| Length of Unemployment. | Under 20 Years. | 20 and under 25 Years. | 25 and under 35 Years. | 35 and under 45 Years. | 45 and under 55 Years. | 55 and under 65 Years. | 65 Years and over. | Not stated. | Total. |
|---|---|---|---|---|---|---|---|---|---|
| Under 2 weeks | 49 | 58 | 119 | 102 | 65 | 35 | 13 | 2 | 443 |
| 2 weeks and under 4 | 148 | 195 | 332 | 282 | 241 | 146 | 87 | 3 | 1,434 |
| 4 weeks and under 8 | 135 | 172 | 299 | 259 | 213 | 128 | 108 | .. | 1,314 |
| 8 weeks and under 16 | 78 | 121 | 229 | 205 | 163 | 160 | 138 | .. | 1,094 |
| 16 weeks and under 26 | 29 | 56 | 82 | 82 | 72 | 79 | 59 | .. | 459 |
| 26 weeks and under 52 | 22 | 53 | 102 | 77 | 89 | 109 | 109 | 1 | 562 |
| Over 1 year | 6 | 27 | 59 | 69 | 76 | 89 | 114 | .. | 440 |
| Not stated | 89 | 189 | 289 | 204 | 155 | 168 | 233 | 2 | 1,329 |
| Totals | 556 | 871 | 1,511 | 1,280 | 1,074 | 914 | 861 | 8 | 7,075 |
The vocations in which those out of employment were ordinarily engaged wore as under:—
| Persons engaged in— | No. |
|---|---|
| Government, defence, law, &c. | 139 |
| Religion, health, education, &c. | 377 |
| Supplying board and lodging | 255 |
| Domestic service and attendance | 511 |
| Dealing in textile fabrics, &c. | 160 |
| Dealing in food, drinks, &c. | 225 |
| General merchants and dealers | 331 |
| Traffic on seas and rivers | 408 |
| Art and mechanic productions | 432 |
| Persons engaged in— | No. |
| Working in food, drinks, &c. | 404 |
| Working in metals | 151 |
| Road and building construction | 741 |
| Agricultural pursuits | 470 |
| Pastoral pursuits | 492 |
| Mining and quarrying | 317 |
| Other occupations | 1,329 |
| 7,075 |
The tables following show the numbers and the proportions per 10,000 living at quinquennial age-periods of persons, males and females, stated to be deaf-and-dumb, blind, lunatics, and feeble-minded at the census taken on the 15th October, 1916. The total of these cases of infirmities numbered 6,359, or 57.84 in every 10,000 persons living. Of this total the deaf-and-dumb numbered 206, or 1.88 per 10,000; the blind contributed 566, or 5.15 per 10,000; the lunatics numbered 4,275, or 38.88 per 10,000; and the feebleminded 1,312, or 11.93 per 10,000.
DEAF -AND -DUMB AND BLIND .—CENSUS 1916.
| Ages, in Years. | Total Population. | Male Population. | Males. | Female Population. | Females. | ||
|---|---|---|---|---|---|---|---|
| Deaf-and-dumb. | Blind. | Deaf-and-dumb. | Blind. | ||||
| Under 5 | 132,055 | 67,320 | 1 | 4 | 64,735 | 6 | .. |
| 5 and under 10 | 122,818 | 62,340 | 7 | 7 | 60,478 | 7 | 8 |
| 10 and under 15 | 109,225 | 55,532 | 9 | 6 | 53,693 | 3 | 12 |
| 15 and under 20 | 91,404 | 45,012 | 8 | 12 | 46,392 | 7 | 8 |
| 20 and under 25 | 77,178 | 30,419 | 12 | 11 | 46,759 | 10 | 7 |
| 25 and under 30 | 88,575 | 40,018 | 18 | 16 | 48,557 | 12 | 6 |
| 30 and under 35 | 93,581 | 46,166 | 13 | 16 | 47,415 | 8 | 6 |
| 35 and under 40 | 90,449 | 46,138 | 14 | 18 | 44,311 | 8 | 10 |
| 40 and under 45 | 70,624 | 36,758 | 8 | 10 | 33,866 | 3 | 7 |
| 45 and under 50 | 60,738 | 32,993 | 8 | 13 | 27,745 | 6 | 7 |
| 50 and under 55 | 45,110 | 24,027 | 7 | 12 | 21,083 | 6 | 5 |
| 55 and under 60 | 34,339 | 18,707 | 4 | 27 | 15,632 | 5 | 16 |
| 60 and under 65 | 28,691 | 16,115 | 3 | 18 | 12,576 | 2 | 17 |
| 65 and under 70 | 20,796 | 11,204 | 1 | 13 | 9,592 | 2 | 20 |
| 70 and under 75 | 15,174 | 8,319 | 1 | 36 | 6,855 | 4 | 20 |
| 75 and under 80 | 10,547 | 6,037 | .. | 34 | 4,510 | 1 | 40 |
| 80 and over | 6,879 | 3,979 | 2 | 69 | 2,900 | .. | 52 |
| Totals—Specified ages | 1,098,183 | 551,084 | 116 | 322 | 547,099 | 90 | 241 |
| Unspecified | 1,266 | 691 | .. | 2 | 575 | .. | 1 |
| Grand totals | 1,099,449 | 551,775 | 116 | 324 | 547,674 | 90 | 242 |
INFIRMITY : PROPORTION PER 10,000 AT QUINQUENNIAL AGE -PERIODS .—CENSUS 1916.
| Ages, in Years. | Totals. | Deaf-and-dumb. | Blind. | Lunatics. | Feeble-minded. | ||||||||||
|---|---|---|---|---|---|---|---|---|---|---|---|---|---|---|---|
| Persons. | Males. | Females. | Persons. | Males. | Females. | Persons. | Males. | Females. | Persons. | Males. | Females. | Persons. | Males. | Females. | |
| Under 5 | 3.02 | 2.97 | 3.09 | 0.53 | 0.15 | 0.93 | 0.30 | 0.59 | .. | 0.15 | .. | 0.31 | 2.04 | 2.23 | 1.85 |
| 5 and under 10 | 11.72 | 12.67 | 10.74 | 1.14 | 1.12 | 1.16 | 1.22 | 1.12 | 1.32 | 0.73 | 0.64 | 0.82 | 8.63 | 9.79 | 7.44 |
| 10 and under 15 | 18.49 | 20.71 | 16.20 | 1.09 | 1.62 | 0.56 | 1.65 | 1.08 | 2.23 | 2.29 | 2.34 | 2.23 | 13.46 | 15.67 | 11.18 |
| 15 and under 20 | 30.74 | 36.87 | 24.78 | 1.64 | 1.77 | 1.51 | 2.19 | 2.66 | 1.72 | 5.80 | 6.00 | 5.60 | 21.11 | 26.44 | 15.95 |
| 20 and under 25 | 42.49 | 61.14 | 30.36 | 2.85 | 3.94 | 2.14 | 2.33 | 3.62 | 1.48 | 19.30 | 25.64 | 15.19 | 18.01 | 27.94 | 11.55 |
| 25 and under 30 | 48.88 | 64.72 | 35.83 | 3.39 | 4.50 | 2.47 | 2.48 | 4.00 | 1.23 | 28.45 | 36.48 | 21.83 | 14.56 | 19.74 | 10.30 |
| 30 and under 35 | 56.63 | 72.56 | 41.12 | 2.24 | 2.82 | 1.69 | 2.35 | 3.46 | 1.26 | 41.03 | 53.50 | 28.89 | 11.01 | 12.78 | 9.28 |
| 35 and under 40 | 70.97 | 83.66 | 57.77 | 2.43 | 3.03 | 1.80 | 3.20 | 4.12 | 2.26 | 55.06 | 65.67 | 44.01 | 10.28 | 10.84 | 9.70 |
| 40 and under 45 | 83.54 | 98.48 | 67.32 | 1.56 | 2.18 | 0.89 | 2.41 | 2.72 | 2.07 | 69.38 | 81.61 | 56.10 | 10.19 | 11.97 | 8.26 |
| 45 and under 50 | 96.80 | 104.26 | 87.94 | 2.30 | 2.42 | 2.16 | 3.29 | 3.94 | 2.52 | 83.31 | 88.81 | 76.77 | 7.90 | 9.09 | 6.49 |
| 50 and under 55 | 111.50 | 111.12 | 111.93 | 2.88 | 2.91 | 2.84 | 3.77 | 5.00 | 2.37 | 95.10 | 93.64 | 96.76 | 9.75 | 9.57 | 9.96 |
| 55 and under 60 | 142.40 | 147.53 | 136.25 | 2.62 | 2.14 | 3.19 | 12.23 | 13.89 | 10.23 | 120.27 | 124.02 | 115.79 | 7.28 | 7.48 | 7.04 |
| 60 and under 65 | 146.38 | 149.55 | 142.33 | 1.74 | 1.86 | 1.59 | 12.20 | 11.17 | 13.52 | 120.59 | 125.35 | 114.50 | 11.85 | 11.17 | 12.72 |
| 65 and under 70 | 155.79 | 170.47 | 138.65 | 1.44 | 0.89 | 2.09 | 15.86 | 11.60 | 20.85 | 123.58 | 141.02 | 103.20 | 14.91 | 16.96 | 12.51 |
| 70 and under 75 | 175.95 | 187.52 | 161.92 | 3.29 | 1.20 | 5.84 | 36.90 | 43.27 | 29.18 | 112.69 | 126.22 | 96.27 | 23.07 | 16.83 | 30.63 |
| 75 and under 80 | 241.77 | 230.24 | 257.20 | 0.95 | 2.22 | 70.16 | 56.32 | 88.69 | 142.22 | 152.39 | 128.60 | 28.44 | 21.53 | 37.69 | |
| 80 and upwards | 372.14 | 371.95 | 372.41 | 2.91 | 5.02 | 175.89 | 173.41 | 179.31 | 125.02 | 123.15 | 127.58 | 68.32 | 70.37 | 65.52 | |
| All specified ages | 57.29 | 66.59 | 47.92 | 1.88 | 2.11 | 1.65 | 5.12 | 5.84 | 4.40 | 38.43 | 44.89 | 31.91 | 11.86 | 13.75 | 9.96 |
| All ages | 57.84 | 67.29 | 48.31 | 1.88 | 2.10 | 1.64 | 5.15 | 5.87 | 4.42 | 38.88 | 45.51 | 32.21 | 11.93 | 13.81 | 10.04 |
| Ages, in Years. | Total Population. | Male Population. | Males. | Female Population. | Females. | ||
|---|---|---|---|---|---|---|---|
| Lunatics. | Feeble-minded. | Lunatics. | Feeble-minded. | ||||
| Under 5 | 132,055 | 67,320 | .. | 15 | 64,735 | 2 | 12 |
| 5 and under 10 | 122,818 | 62,340 | 4 | 61 | 60,478 | 5 | 45 |
| 10 and under 15 | 109,225 | 55,532 | 13 | 87 | 53,693 | 12 | 60 |
| 15 and under 20 | 91,404 | 45,012 | 27 | 119 | 46,392 | 26 | 74 |
| 20 and under 25 | 77,178 | 30,419 | 78 | 85 | 46,759 | 71 | 54 |
| 25 and under 30 | 88,575 | 40,018 | 146 | 79 | 48,557 | 106 | 50 |
| 30 and under 35 | 93,581 | 46,166 | 247 | 59 | 47,415 | 137 | 44 |
| 35 and under 40 | 90,449 | 46,138 | 303 | 50 | 44,311 | 195 | 43 |
| 40 and under 45 | 70,624 | 36,758 | 300 | 44 | 33,866 | 190 | 28 |
| 45 and under 50 | 60,738 | 32,993 | 293 | 30 | 27,745 | 213 | 18 |
| 50 and under 55 | 45,110 | 24,027 | 225 | 23 | 21,083 | 204 | 21 |
| 55 and under 60 | 34,339 | 18,707 | 232 | 14 | 15,632 | 181 | 11 |
| 60 and under 65 | 28,691 | 16,115 | 202 | 18 | 12,576 | 144 | 16 |
| 65 and under 70 | 20,796 | 11,204 | 158 | 19 | 9,592 | 99 | 12 |
| 70 and under 75 | 15,174 | 8,319 | 105 | 14 | 6,855 | 66 | 21 |
| 75 and under 80 | 10,547 | 6,037 | 92 | 13 | 4,510 | 58 | 17 |
| 80 and over | 6,879 | 3,979 | 49 | 28 | 2,900 | 37 | 19 |
| Totals—Specified ages | 098,183 | 551,084 | 2,474 | 758 | 547,099 | 1,746 | 545 |
| Unspecified | 1,266 | 691 | 37 | 4 | 575 | 18 | 5 |
| Grand totals | 1,099,449 | 551,775 | 2,511 | 762 | 547,674 | 1,764 | 550 |
That essential adjunct of a citizen—his habitation—next comes under review. Sundry statistics in this respect have been compiled from previous census collections, but never in the comprehensive wealth of detail of the 1916 census. These results will be found in Part XI of the Census volumes; further reference also in the Statistician's Report on the census. It should be noted in this connection that dwellings referred to hereunder do not include either those uninhabited or those occupied solely by Maoris. Nearly a quarter of a million habitations are necessary to house the Dominion's population. This means that the average dwelling—a wide term as here used—had in 1916 4.52 occupants, as compared with 4.68 in 1911. Allowing for the absent soldier element, this rate approximates very closely to that of 1911. The last five censuses have shown a successive decline in the average occupants of a dwelling. Dwellings to the square mile attain the sparse average of 2.35 only. The latest available data for Australia (census, 1911) places 4.78 as the average number of inmates of an occupied dwelling. Individual States are as follows: New South Wales, 4.94; Victoria, 4.80; Queensland, 4.76; South Australia, 4.81; Western Australia, 3.96; Tasmania, 4.76; Northern Territory, 2.36; Federal Territory, 3.86, per dwelling.
| Provincial District. | Private Dwellings. | Tenements in Private Swellings. | Hotels. | Boardinghouses. | Religious, Educational or Charitable Institutions. | Hospital, Mental Hospitals. | Prisons, Military Establishments. | Other. | Totals. |
|---|---|---|---|---|---|---|---|---|---|
| Auckland | 64,791 | 2,561 | 276 | 958 | 97 | 78 | 21 | 14 | 68,796 |
| Taranaki | 11,520 | 351 | 52 | 103 | 15 | 14 | 1 | 2 | 12,058 |
| Hawke's Bay | 11,218 | 294 | 69 | 123 | 21 | 10 | 1 | 3 | 11,739 |
| Wellington | 44,515 | 2,579 | 169 | 866 | 73 | 59 | 17 | 22 | 48,300 |
| Marlborough | 3,450 | 97 | 29 | 35 | 3 | 8 | 2 | .. | 3,624 |
| Nelson | 10,407 | 250 | 131 | 128 | 11 | 22 | 3 | 2 | 10,954 |
| Westland | 3,357 | 99 | 99 | 39 | 7 | 7 | 1 | 2 | 3,611 |
| Canterbury | 38,992 | 1,071 | 171 | 341 | 73 | 41 | 8 | 9 | 40,706 |
| Otago | 28,408 | 885 | 170 | 324 | 47 | 38 | 9 | 12 | 29,893 |
| Southland | 12,765 | 456 | 54 | 92 | 13 | 21 | 4 | .. | 13,405 |
| Totals | 229,423 | 8,643 | 1,220 | 3,009 | 360 | 298 | 67 | 66 | 243,086 |
While the various grades of dwelling are distributed in fairly even proportion, a few striking instances of the reverse are shown. Wellington, for example, has a larger share of tenements and boardinghouses, due principally to the number of that type of dwelling in Wellington City. Westland again possesses, as compared with other districts, rather an inordinate number of hotels, a state reminiscent of the old mining days.
Nearly one-half of the inhabited private dwellings and tenements are owned by the heads of the households occupying them.
| Nature of Occupancy. | Number. | Per Cent. |
|---|---|---|
| Renting | 108,916 | 45.75 |
| Buying on time payment | 11,963 | 5.03 |
| Owner, but paying interest on mortgage | 55,062 | 23.13 |
| Owner of freehold unencumbered | 56,860 | 23.88 |
| Not stated | 5,265 | 2.21 |
| Total | 238,066 | 100.00 |
Very interesting are the figures in the next table. These set out the mean rental values of the principal sizes of private dwellings in the four metropolitan areas. Metropolitan areas, which are of recent constitution, cannot be given for 1911; but the averages for the cities at that date afford reasonable comparison. It should be mentioned that a small number of houses were returned as being occupied either rent-free or at a nominal rental. The suggestion is that in most cases these houses were the property of the State or municipal or other bodies, and given to the tenants in lieu of a monetary allowance which would otherwise be payable.
| House of | Auckland. | Wellington. | Christchurch. | Dunedin. | ||||||||||||
|---|---|---|---|---|---|---|---|---|---|---|---|---|---|---|---|---|
| 1916.* | 1911.† | 1916.* | 1911.† | 1916.* | 1911.† | 1916.* | 1911.† | |||||||||
* Metropolitan areas. †City. | ||||||||||||||||
| s. | d. | s. | d. | s. | d. | s. | d. | s. | d. | s. | d. | s | d. | s. | d. | |
| 4 rooms | 12 | 10 | 10 | 10 | 16 | 1 | 14 | 4 | 12 | 5 | 10 | 6 | 11 | 6 | 10 | 6 |
| 5 rooms | 16 | 4 | 13 | 5 | 19 | 2 | 17 | 2 | 15 | 7 | 13 | 3 | 14 | 6 | 13 | 1 |
| 6 rooms | 18 | 8 | 16 | 3 | 22 | 9 | 22 | 0 | 18 | 0 | 15 | 5 | 16 | 5 | 15 | 11 |
| 7 rooms | 22 | 8 | 18 | 11 | 28 | 1 | 25 | 1 | 21 | 6 | 18 | 10 | 20 | 6 | 19 | 1 |
| All houses | 16 | 2 | .. | 19 | 7 | .. | 14 | 4 | .. | 13 | 6 | . | ||||
A general and very considerable rise is apparent, more especially in the northern cities. Many reasons are ascribed for this increase, amongst others the decreased purchasing-power of money and the higher (consequently more costly) standard of appearance and fittings required in the more recent house. The more rapid expansion of the North Island and the resulting demand for habitations explain partly the difference between North and South.
Naturally the great majority of New Zealand houses are of wooden construction, nor does the wooden house seem to be losing in public favour. Within the more closely settled parts of the larger cities wooden houses are not now permitted to be built on account of fire-risk, just as in older days the popular "raupo" erection was discriminated against.
| Material of which built. | Number of Houses. | Per Cent. of Total. |
|---|---|---|
| Wood | 219,511 | 92.21 |
| Brick | 7,057 | 2.97 |
| Concrete | 1,685 | 0.70 |
| Stone | 1,284 | 0.54 |
| Iron | 3,499 | 1.47 |
| Canvas | 2,391 | 1.00 |
| Other | 2,051 | 0.86 |
| Not stated | 588 | 0.25 |
| Total | 238,066 | 100.00 |
At the previous census the returns were grouped in a slightly dissimilar manner. The proportions were: Wood, iron, or lath and plaster, 90.99 per cent.; brick, stone, or concrete, 4.24 per cent.; canvas dwellings, 2.18 per cent.; huts, 1.54 per cent.; cob or sod, 0.32 per cent.; raupo, 0.01 per cent.; other materials, 0.72 per cent.
The average number of rooms in a private dwelling or tenement was ascertained to be 5.16 in 1916. The five-roomed house is the most favoured size, followed by the four-roomed and six-roomed, which rank almost equally.
A summary for the Dominion is as follows:—
INHABITED PRIVATE DWELLINGS AND TENEMENTS : ROOMS AND OCCUPANTS .
| Number of Rooms. | Dwellings and Tenements. | Total Occupants. | Average Number of Occupants. | |
|---|---|---|---|---|
| Number. | Per Cent. of Total. | |||
| 1 | 9,731 | 4.09 | 13,960 | 1.43 |
| 2 | 9,577 | 4.02 | 21,126 | 2.21 |
| 3 | 11,695 | 4.91 | 36,987 | 3.16 |
| 4 | 51,396 | 21.59 | 198,703 | 3.87 |
| 5 | 60,197 | 25.29 | 264,270 | 4.39 |
| 6 | 51,349 | 21.57 | 245,336 | 4.78 |
| 7 | 22,271 | 9.36 | 114,281 | 5.13 |
| 8 | 10,926 | 4.59 | 58,401 | 5.34 |
| 9 | 4,066 | 1.71 | 22,636 | 5.57 |
| 10 | 2,777 | 1.17 | 15,568 | 5.61 |
| 11 | 999 | 0.42 | 5,749 | 5.75 |
| 12 | 767 | 0.32 | 4,554 | 5.94 |
| 13 | 313 | 0.13 | 1,902 | 6.08 |
| 14 | 267 | 0.11 | 1,714 | 6.42 |
| 15 | 116 | 0.05 | 823 | 7.09 |
| 16 | 126 | 0.05 | 898 | 7.13 |
| 17 | 55 | 0.02 | 400 | 7.27 |
| 18 | 50 | 0.02 | 378 | 7.56 |
| 19 | 17 | 0.01 | 99 | 5.82 |
| 20 and over | 104 | 0.04 | 882 | 8.48 |
| Not stated | 1,267 | 0.53 | 4,027 | 3.18 |
| Totals | 238,066 | 100.00 | 1,012,694 | 4.25 |
Information concerning households was also collected at the last census, but compilation of the results is still proceeding.
The number of persons (excluding Maoris) to a square mile in each provincial district at the last eight censuses is as follows:—
| Provincial District. | Area in Square Miles. | Persons to a Square Mile. | |||||||
|---|---|---|---|---|---|---|---|---|---|
| 1881. | 1886. | 1891. | 1896. | 1901. | 1906. | 1911. | 1916. | ||
| Auckland | 25,364 | 3.92 | 5.14 | 5.25 | 6.05 | 6.94 | 8.33 | 10.43 | 12.17 |
| Taranaki | 3,732 | 3.98 | 4.82 | 5.91 | 8.35 | 10.14 | 11.63 | 13.82 | 14.99 |
| Hawke's Bay | 4,241 | 4.10 | 5.79 | 6.72 | 8.03 | 8.35 | 9.96 | 11.45 | 12.80 |
| Wellington | 10,807 | 5.68 | 7.17 | 9.04 | 11.28 | 13.08 | 16.64 | 18.42 | 21.48 |
| Marlborough | 4,225 | 2.20 | 2.63 | 3.02 | 2.95 | 3.15 | 3.40 | 3.78 | 3.93 |
| Nelson | 10,875 | 2.40 | 2.78 | 3.20 | 3.29 | 3.49 | 3.91 | 4.46 | 3.98 |
| Westland | 4,881 | 3.08 | 3.26 | 3.25 | 2.96 | 2.97 | 3.01 | 3.22 | 3.18 |
| Canterbury | 13,858 | 8.11 | 8.77 | 9.28 | 9.82 | 10.34 | 11.50 | 12.52 | 13.12 |
| Otago— | |||||||||
| Otago portion | 13,957 | 7.70 | 8.15 | 8.32 | 8.60 | 8.98 | 9.16 | 9.52 | 9.42 |
| Southland portion | 11,358 | 2.34 | 3.12 | 3.26 | 3.87 | 4.21 | 4.67 | 5.17 | 5.25 |
| Totals | 103,298 | 4.74 | 5.60 | 6.07 | 6.81 | 7.48 | 8.60 | 9.76 | 10.64 |
NOTE .—Certain uninhabited outlying islands (area, 283 square miles) are not included in this table.
The density of population in various countries is shown in a table in the 1915 issue of this hook. The figures relate in nearly every case to the year 1911, in which year a census was taken throughout the British Empire and in several other countries. Considerations of space prevent the table being repeated in this issue.
The principal natural divisions in New Zealand are the North, South, and Stewart Islands. These contain nearly the whole population of European descent, the Cook and other annexed islands being inhabited almost solely by coloured Natives.
In 1858 the North Island had a larger population than the South, this position being reversed at the succeeding enumerations until 1901, in which year the North Island was found to have slightly the larger total, a position which it has since considerably improved upon. The Maori war which broke out in 1860 retarded settlement in the North, while a large area of land reserved for the Maoris was until quite recently a serious hindrance to the development of this portion of the Dominion. The construction of railways, roads, and bridges is now giving access to larger areas of new lands, which are being offered for selection in blocks intended for close settlement, and are quickly occupied. The South Island was practically free from Maori troubles, and settlement was more rapid, though much of the land was disposed of in large areas. The discovery of gold in Otago in 1861 and on the West Coast in 1864 attracted to these localities considerable numbers of miners.
In 1870 a policy of vigorous construction of railways and other developmental public works and of assistance to immigrants was inaugurated, resulting in a large increase to the population, including nearly ninety thousand Government immigrants introduced between 1873 and 1879.
The population of the two Islands at successive censuses is given in the table following, together with the percentage that each Island bears to the total:—
Population of the North and South Islands. 1858-1916.
| Census Year. | Population (excluding Maoris). | Proportions per Cent. | |||
|---|---|---|---|---|---|
| North Island. | South Island.* | Total. | North Island. | South Island.* | |
* Including Stewart Island and Chatham Islands. | |||||
| 1858 | 34,094 | 25,319 | 59,413 | 57.38 | 42.62 |
| 1861 | 41,641 | 57,380 | 99,021 | 42.05 | 57.95 |
| 1864 | 65,263 | 106,895 | 172,158 | 37.91 | 62.09 |
| 1867 | 79,913 | 138,755 | 218,668 | 36.55 | 63.45 |
| 1871 | 96,875 | 159,518 | 256,393 | 37.78 | 62.22 |
| 1874 | 111,934 | 187,580 | 299,514 | 37.37 | 62.63 |
| 1878 | 158,208 | 256,204 | 414,412 | 38.18 | 61.82 |
| 1881 | 193,047 | 296,886 | 489,933 | 39.40 | 60.60 |
| 1886 | 250,482 | 328,000 | 578,482 | 43.30 | 56.70 |
| 1891 | 281,474 | 345,184 | 626,658 | 44.92 | 55.08 |
| 1896 | 340,638 | 362,722 | 703,360 | 48.43 | 51.57 |
| 1901 | 390,579 | 382,140 | 772,719 | 50.54 | 49.45 |
| 1906 | 476,737 | 411,841 | 888,578 | 53.65 | 46.35 |
| 1911 | 563,733 | 444,735 | 1,008,468 | 55.90 | 44.10 |
| 1916 | 651,072 | 448,377 | 1,099,449 | 59.22 | 40.78 |
The figures for 1916 are not quite fair to the South Island. All the military and internment camps are in the North Island, and many of the soldiers, &c., in these on census night belonged to the South Island. The presence of the camps in the North Island has had the further effect of temporarily attracting people from the other Island for business purposes, or to be near soldier friends and relatives. The troops abroad on census night (42,666 in number) may be regarded as having come from the two Islands in proportions approximately relative to population.
The populations of the various provincial districts as disclosed by the census of 15th October, 1916, are as follows:—
| Provincial District. | Males. | Females. | Totals. |
|---|---|---|---|
| Auckland | 155,298 | 153,468 | 308,766 |
| Taranaki | 28,775 | 27,150 | 55,925 |
| Hawke's Bay | 27,194 | 27,073 | 54,267 |
| Wellington | 119,572 | 11,542 | 232,114 |
| Marlborough | 8,506 | 8,102 | 16,608 |
| Nelson | 22,415 | 20,836 | 43,251 |
| Westland | 8,088 | 7,414 | 15,502 |
| Canterbury | 88,085 | 93,784 | 181,869 |
| Otago— | |||
| Otago portion | 63,546 | 67,972 | 131,518 |
| Southland portion | 30,296 | 29,333 | 59,629 |
| Totals for the Dominion | 551,775 | 547,674 | 1,099,449 |
The counties contain what is understood to be the rural population, but this is not strictly correct, as some of the towns not municipalized and forming part of counties have considerable populations. On the other hand, the population of a few of the smaller boroughs might be classed as rural, as will be noticed further on. A list is given below showing counties and their population (exclusive of interior boroughs) as at the census of 1916, with amendments where necessary on account of subsequent-alterations of boundaries.
Population of Counties.
| County. | Population. |
|---|---|
| Akaroa | 1,982 |
| Akitio | 1,416 |
| Amuri | 1,836 |
| Ashburton | 13,136 |
| Ashley | 728 |
| Awakino | 702 |
| Awatere | 1,542 |
| Bay of Islands | 3,589 |
| Bruce | 4,763 |
| Buller | 5,773 |
| Castlepoint | 621 |
| Chatham Islands | 219 |
| Cheviot | 1,224 |
| Clifton | 2,156 |
| Clutha | 6,901 |
| Collingwood | 1,253 |
| Cook | 6,846 |
| Coromandel | 2,256 |
| Dannevirke | 4,538 |
| East Taupo | 515 |
| Eden | 14,267 |
| Egmont | 3,264 |
| Eketahuna | 2,312 |
| Ellesmere | 3,441 |
| Eltham | 3,393 |
| Eyre | 1,806 |
| Featherston | 3,960 |
| Fiord | 17 |
| Franklin | 9,397 |
| Geraldine | 5,194 |
| Great Barrier | 245 |
| Grey | 5,510 |
| Halswell | 1,628 |
| Hawera | 4,599 |
| Hawke's Bay | 11,467 |
| Heathcote | 3,277 |
| Hobson | 4,728 |
| Hokianga | 2,792 |
| Horowhenua | 5,895 |
| Hutt | 6,397 |
| Inangahua | 4,130 |
| Kaikoura | 1,906 |
| Kairanga | 4,124 |
| Kaitieke | 3,597 |
| Kawhia | 991 |
| Kiwitea | 2,585 |
| Kowai | 1,914 |
| Lake | 1,749 |
| Levels | 5,100 |
| Mackenzie | 2,868 |
| Makara | 3,862 |
| Malvern | 2,757 |
| Manawatu | 4,521 |
| Maniototo | 2,527 |
| Manukau | 6,799 |
| Marlborough | 6,915 |
| Masterton | 3,746 |
| Matamata | 3,903 |
| Mauriceville | 771 |
| Mongonui | 3,739 |
| Mount Herbert | 405 |
| Murchison | 1,251 |
| Ohinemuri | 4,661 |
| Ohura | 2,382 |
| Opotiki | 1,881 |
| Oroua | 3,304 |
| Otamatea | 3,647 |
| Oxford | 1,756 |
| Pahiatua | 3,110 |
| Paparua | 4,716 |
| Patangata | 2,080 |
| Patea | 3,759 |
| Peninsula | 1,793 |
| Piako | 4,663 |
| Pohangina | 1,581 |
| Raglan | 4,027 |
| Rangiora | 2,747 |
| Rangitikei | 10,013 |
| Rodney | 4,043 |
| Rotorua | 4,245 |
| Selwyn | 1,423 |
| Sounds | 1,201 |
| Southland | 25,661 |
| Springs | 1,785 |
| Stewart Island | 349 |
| Stratford | 5,152 |
| Taieri | 5,599 |
| Takaka | 1,858 |
| Taranaki | 7,100 |
| Tauranga | 3,947 |
| Tawera | 847 |
| Thames | 2,665 |
| Tuapeka | 5,123 |
| Uawa | 819 |
| Vincent | 3,930 |
| Waiapu | 2,055 |
| Waihemo | 1,446 |
| Waikato | 8,099 |
| Waikohu | 3,033 |
| Waikouaiti | 4,094 |
| Waimairi | 11,914 |
| Waimarino | 3,502 |
| Waimate | 6,984 |
| Waimate West | 2,635 |
| Waimea | 9,284 |
| Waipa | 6,864 |
| Waipara | 2,058 |
| Waipawa | 3,084 |
| Waipukurau | 667 |
| Wairarapa South | 2,744 |
| Wairewa | 1,036 |
| Wairoa | 2,332 |
| Waitaki | 9,694 |
| Waitemata | 9,354 |
| Waitomo | 5,181 |
| Waitotara | 5,842 |
| Wallace | 9,432 |
| Wanganui | 2,337 |
| Weber | 420 |
| Westland | 4,087 |
| West Taupo | 2,351 |
| Whakatane | 2,054 |
| Whangamomona | 1,387 |
| Whangarei | 8,976 |
| Whangaroa | 797 |
| Woodville | 1,819 |
The next table shows the distribution of the population in counties and boroughs at each quinquennial census since 1881:—
| Census Year. | Counties. | Boroughs. | Percentage. | ||
|---|---|---|---|---|---|
| Counties. | Boroughs. | Shipboard, &c. | |||
| 1881 | 291,238 | 194,981 | 59.44 | 39.80 | 0.76 |
| 1886 | 327,328 | 245,612 | 56.58 | 42.46 | 0.96 |
| 1891 | 352,097 | 270,343 | 56.18 | 43.14 | 0.68 |
| 1896 | 391,735 | 307,294 | 55.69 | 43.69 | 0.62 |
| 1901 | 417,596 | 350,202 | 54.04 | 45.32 | 0.64 |
| 1906 | 458,797 | 424,614 | 51.63 | 47.79 | 0.58 |
| 1911 | 496,779 | 505,598 | 49.26 | 50.14 | 0.60 |
| 1916 | 501,259 | 585,306 | 45.59 | 53.24 | 1.17 |
Prior to the year 1900 there was no statutory limitation to the number of inhabitants necessary to constitute a borough, and consequently many small centres, the residents being mainly engaged in rural occupations, became municipalities. The Municipal Corporations Act now imposes a limit as to area, and provides that no new borough may be constituted unless the proposed area contains at least 1,000 inhabitants.
The following table shows the population of boroughs (excluding Maoris) as at the census of 1916, with amendments where necessary on account of subsequent alteration of boundaries:—
Population of Boroughs.
| Borough. | Population. |
|---|---|
* Town constituted under special Act. | |
| Akaroa | 540 |
| Alexandra | 679 |
| Arrowtown | 307 |
| Ashburton | 3,109 |
| Auckland (City) | 68,888 |
| Balclutha | 1,409 |
| Birkenhead | 2,116 |
| Blenheim | 3,822 |
| Bluff | 1,823 |
| Brunner | 598 |
| Cambridge | 1,507 |
| Carterton | 1,614 |
| Christchurch (City) | 55,860 |
| Cromwell | 549 |
| Dannevirke | 3,336 |
| Dargaville | 1,776 |
| Devonport | 7,613 |
| Dunedin (City) | 55,256 |
| Eastbourne | 952 |
| Eketahuna | 754 |
| Eltham | 1,711 |
| Featherston | 1,159 |
| Feilding | 3,438 |
| Foxton | 1,772 |
| Geraldine | 869 |
| Gisborne | 9,654 |
| Gore | 3,551 |
| Green Island | 1,904 |
| Greymouth | 4,863 |
| Greytown | 1,186 |
| Hamilton | 7,538 |
| Hampden | 364 |
| Hastings | 7,918 |
| Hawera | 3,375 |
| Hokitika | 2,091 |
| Inglewood | 1,199 |
| Invercargill | 14,154 |
| Invercargill South | 1,712 |
| Kaiapoi | 1,560 |
| Kaitangata | 1,681 |
| Karori | 1,647 |
| Kumara | 623 |
| Lawrence | 837 |
| Levin | 1,630 |
| Lower Hutt | 4,893 |
| Lyttelton | 3,766 |
| Marton | 1,650. |
| Masterton | 5,894 |
| Mataura | 1,129 |
| Milton | 1,317 |
| Miramar | 2,158 |
| Mosgiel | 1,719 |
| Motueka | 1,475 |
| Mount Albert | 9,654 |
| Mount Eden | 12,555 |
| Napier | 12,704 |
| Naseby | 276 |
| Nelson (City) | 8,774 |
| New Brighton | 2,310 |
| Newmarket | 2,863 |
| New Plymouth | 8,704 |
| Northcote | 1,651 |
| Oamaru | 5,140 |
| Ohakune | 1,371 |
| Onehunga | 5,913 |
| Opotiki | 1,073 |
| Otahuhu | 2,328 |
| Paeroa | 1,376 |
| Pahiatua | 1,300 |
| Palmerston | 752 |
| Palmerston North | 12,829 |
| Patea | 1,010 |
| Petone | 7,115 |
| Picton | 1,121 |
| Port Chalmers | 2,615 |
| Pukekohe | 1,533 |
| Queenstown | 657 |
| Rangiora | 1,808 |
| Riccarton | 2,890 |
| Richmond | 922 |
| Riverton | 837 |
| Ross | 491 |
| Rotorua* | 2,845 |
| Roxburgh | 449 |
| Runanga | 1,411 |
| Shannon | 1,031 |
| Spreydon | 4,289 |
| St. Kilda | 5,520 |
| Stratford | 2,713 |
| Sumner | 2,287 |
| Taihape | 1,927 |
| Takapuna | 2,756 |
| Tapanui | 322 |
| Taumarunui | 1,875 |
| Tauranga | 1,685 |
| Te Aroha | 1,802 |
| Te Awamutu | 1,064 |
| Te Kuiti | 1,982 |
| Temuka | 1,633 |
| Thames | 5,298 |
| Timaru | 12,238 |
| Waihi | 4,774 |
| Waikouaiti | 611 |
| Waimate | 1,867 |
| Waipawa | 1,100 |
| Waipukurau | 1,167 |
| Wairoa | 1,530 |
| Waitara | 1,422 |
| Wanganui | 14,380 |
| Wellington (City) | 75,496 |
| West Harbour | 1,631 |
| Westport | 4,067 |
| Whakatane | 900 |
| Whangarei | 3,294 |
| Win ton | 586 |
| Woodville | 1,078 |
| Woolston | 3,990 |
For various purposes (vital statistics, &c.) metropolitan areas have been created at each of the four chief centres, and suburban areas at nine of the more important secondary centres. Each area includes, in addition to the central borough and suburban boroughs, a considerable non-municipalized area adjacent to and contingent on the centre.
An objection to the old system of publishing statistics for the municipal areas only was that these were constantly being extended or otherwise altered, and no proper comparison could be made between one period and another, and no satisfactory record kept of the social condition and progress of the community. The creation of fairly extensive areas fixed for a long period will remove these disabilities.
Population figures as at the census of 1916, with necessary subsequent internal amendments due to alteration of boundaries, are as follows:—
Metropolitan Areas.
| Auckland. | Population. |
|---|---|
| Auckland City | 68,888 |
| Birkenhead Borough | 2,116 |
| Northcote Borough | 1,651 |
| Takapuna Borough | 2,756 |
| Devonport Borough | 7,613 |
| Newmarket Borough | 2,863 |
| Mount Eden Borough | 12,555 |
| Mount Albert Borough | 9,654 |
| Onehunga Borough | 5,913 |
| Otahuhu Borough | 2,328 |
| New Lynn Town District | 1,041 |
| Ellerslie Town District | 1,363 |
| Remainder of metropolitan area | 14,971 |
| Total | 133,712 |
| Wellington. | Population |
|---|---|
| Wellington City | 75,496 |
| Miramar Borough | 2,158 |
| Karori Borough | 1,647 |
| Petone Borough | 7,115 |
| Lower Hutt Borough | 4,893 |
| Eastbourne Borough | 952 |
| Johnsonville Town District | 886 |
| Remainder of metropolitan area | 2,088 |
| Total | 95,235 |
| Christchurch. | Population. |
|---|---|
| Christchurch City | 55,860 |
| Riccarton Borough | 2,890 |
| Spreydon Borough | 4,289 |
| Woolston Borough | 3,990 |
| New Brighton Borough | 2,310 |
| Sumner Borough | 2,287 |
| Lyttelton Borough | 3,766 |
| Remainder of metropolitan area | 17,341 |
| Total | 92,733 |
| Dunedin. | Population |
|---|---|
| Dunedin City | 55,256 |
| St. Kilda Borough | 5,520 |
| Green Island Borough | 1,904 |
| West Harbour Borough | 1,631 |
| Port Chalmers Borough | 2,615 |
| Remainder of metropolitan area | 1,790 |
| Total | 68,716 |
Suburban Areas.
| Gisborne. | Population. |
|---|---|
| Gisborne Borough | 9,654 |
| Mangapapa Town District | 1,140 |
| Remainder of suburban area | 1,866 |
| Total | 12,660 |
| Napier. | Population |
|---|---|
| Napier Borough | 12,704 |
| Taradale Town District | 1,012 |
| Remainder of suburban area | 1,415 |
| Total | 15,131 |
| New Plymouth. | Population. |
|---|---|
| New Plymouth Borough | 8,704 |
| Remainder of suburban area | 1,091 |
| Total | 9,795 |
| Wanganui. | Population |
|---|---|
| Wanganui Borough | 14,380 |
| Gonville Town District | 2,693 |
| Castlecliff Town District | 734 |
| Remainder of suburban area | 1,710 |
| Total | 19,517 |
| Palmerston North . | Population. |
|---|---|
| Palmerston North Borough.. | 12,829 |
| Remainder of suburban area | 1,177 |
| Total | 14,006 |
| Nelson. | Population |
|---|---|
| Nelson City | 8,774 |
| Remainder of suburban area | 1,188 |
| Total | 9,962 |
| Grey Valley Boroughs. | Population |
|---|---|
| Greymouth Borough | 4,863 |
| Runanga Borough | 1,411 |
| Brunner Borough | 598 |
| Remainder of suburban area | 1,501 |
| Total | 8,373 |
| Timaru. | Population. |
|---|---|
| Timaru Borough | 12,238 |
| Remainder of suburban area | 1,478 |
| Total | 13,716 |
| Invercargill. | Population |
|---|---|
| Invercargill Borough | 14,154 |
| South Invercargill Borough | 1,712 |
| Remainder of suburban area | 1,996 |
| Total | 17,862 |
The several stages in the growth of a New Zealand town may be marked thus: The village, taxed by the parent county, and dependent upon the latter for all public works; then the legally constituted town district, still subordinate to the county in some matters, its affairs administered by a Board presided over by a Chairman. When its population exceeds 500 the town district may become independent of the county and control the whole of its revenues. When the population reaches 1,000 full municipal powers may be obtained, with the dignity of a Council presided over by a Mayor; and finally, if the number of inhabitants should reach 20,000 or over, the title of "city" may be assumed, although the constitution remains unaltered. The name of each town district and its population at the census of 1916, as subsequently altered by variation of boundaries, are as fellows:—
(a.) Town Districts not forming Parts of Counties .
| Town District. | Population. |
|---|---|
| Bull's | 483 |
| Castlecliff | 760 |
| Ellerslie | 1,363 |
| Gonville | 2,693 |
| Hampstead | 1,278 |
| Havelock North | 870 |
| Helensville | 837 |
| Hikurangi | 775 |
| Hunterville | 555 |
| Huntly | 1,535 |
| Johnsonville | 886 |
| Lumsden | 530 |
| Manaia | 606 |
| Mangapapa | 1,140 |
| Mangaweka | 390 |
| Manunui | 813 |
| Martinborough | 725 |
| Matamata | 505 |
| Morrinsville | 934 |
| New Lynn | 1,041 |
| Ngaruawahia | 755 |
| Nightcaps | 600 |
| Otaki | 806 |
| Otautau | 696 |
| Papakura | 821 |
| Pleasant Point | 482 |
| Raetihi | 508 |
| Rangataua | 410 |
| Taradale | 1,012 |
| Te Puke | 565 |
| Tinwald | 1,075 |
| Tuakau | 390 |
| Upper Hutt | 1,399 |
| Waiuku | 641 |
| Warkworth | 624 |
| Waverley | 623 |
| Wyndham | 647 |
(b.) Town Districts forming Parts of Counties .
| Town District. | Population. |
|---|---|
| Amberley | 325 |
| Clinton | 413 |
| Edendale | 363 |
| Havelock | 290 |
| Kamo | 363 |
| Kaponga | 397 |
| Kawakawa | 327 |
| Kawhia | 169 |
| Kihikihi | 277 |
| Kohukohu | 403 |
| Leamington | 438 |
| Lethbridge | 234 |
| Manurewa | 430 |
| Mercer | 329 |
| Normanby | 368 |
| Norsewood | 213 |
| Ohaupo | 259 |
| Ohura | 205 |
| Onerahi | 325 |
| Opunake | 459 |
| Ormondville | 317 |
| Otane | 333 |
| Otorohanga | 367 |
| Outram | 348 |
| Papatoetoe | 750 |
| Patutahi | 292 |
| Raglan | 217 |
| Rongotea | 267 |
| Southbridge | 369 |
| Takaka | 370 |
| Te Karaka | 333 |
No fewer than nine of the "independent" town districts have sufficient population to enable them to be constituted boroughs, while on the other hand the census disclosed four as having fallen below the 500 mark. In addition, the town district of Tuakau, recently made independent, had a population, exclusive of Maoris, of only 390 at the census date. None of the town districts still under county jurisdiction have a population of over 500.
Adjacent to the main Islands are many smaller islands, some of which are of considerable area, and are under cultivation; others are but islets used as sites for lighthouses, while others again are barren and unfitted for human habitation. The Chatham Islands and Great Barrier Island have been constituted counties, and their populations are shown in the list of counties already given. The name and population of each of the other inhabited islands as at the census of 1916 are shown in the following table:—
| Islands. | Population. |
|---|---|
* Excluding internment camp. | |
| Mokohinau | 8 |
| Kawau | 23 |
| Motuketekete | 2 |
| Moturekareka | 1 |
| Little Barrier | 3 |
| Motuhora | 5 |
| Waiheke | 193 |
| Pakihi | 2 |
| Ponui | 21 |
| Rakino | 6 |
| Motutapu | 20 |
| Motuihi* | 6 |
| Rangitoto | 6 |
| Brown's | 5 |
| Rotoroa | 125 |
| Pakatoa | 43 |
| Tiritiri | 13 |
| Slipper | 2 |
| Cuvier | 7 |
| Mercury | 4 |
| Matakana | 7 |
| Motiti | 6 |
| Somes* | 7 |
| Mana | 1 |
| Kapiti | 3 |
| The Brothers | 3 |
| D'Urville | 87 |
| Stephen | 11 |
| Quarantine | 56 |
| Dog | 12 |
| Centre | 9 |
| Total | 697 |
Since 1901 the boundaries of New Zealand have been extended to include the Cook and certain other Pacific islands, the population of which is shown elsewhere in this section.
A census of the Maori population is taken every five years, the information being obtained by the collectors either directly or through the chief or head of the tribe or hapu. The name, sex, and age, so far as can be ascertained, of each Maori are entered; but, owing to the nomadic habits of the race and lack of definite knowledge in some particulars, it has been a difficult task in the past. The results of the past six enumerations are as follows:—
| Census Year. | Males. | Females. | Total. |
|---|---|---|---|
| 1891 | 22,861 | 19,132 | 41,993 |
| 1896 | 21,673 | 18,181 | 49,854 |
| 1901 | 23,112 | 20,031 | 43,143 |
| 1906 | 25,538 | 22,193 | 47,731 |
| 1911 | 26,475 | 23,369 | 49,844 |
| 1916 | 25,933 | 23,843 | 49,776 |
The slight decrease in 1916 as compared with 1911 is more than compensated for by the number of Maoris at the front.
The number of half-castes living as members of Maori tribes is given in the next table for six census periods. Those under the first heading are already included among Maoris in the preceding table, the others being classed among the European population. It is a matter of some difficulty to ascertain the number of half-castes living as Maoris. There has been no definite rule to guide collectors in deciding when a half-caste should be classified as living as a Maori—indeed, it might be said that all the half-castes and a large proportion of the Maoris in the South Island live in European fashion. They mostly have separate holdings of land and separate homes, and have adopted the habits of the Europeans. At the census of 1916 the old method of enumerating the South Island Maoris was discarded, the same methods and forms being utilized as for the European population.
Daring the year 1901 the boundaries of the Dominion were extended to include the Cook Group and certain other of the South Pacific islands. No record of the population of these islands was then obtainable, but at each subsequent census an account of the number and birthplaces of the inhabitants was taken. The figures for the censuses of 1906, 1911, and 1916 are as follows:—
| Census Year. | Males. | Females. | Total. |
|---|---|---|---|
| 1906 | 6,224 | 6,116 | 12,340 |
| 1911 | 6,449 | 6,149 | 12,598 |
| 1916 | 6,553 | 6,244 | 12,797 |
The Cook Islands have contributed a small native contingent for the front, and the increase in the population shown above is therefore all the more gratifying.
Table of Contents
REGISTRATION of births in New Zealand dates as far back as 1847, in which year was passed a Registration Ordinance which made provision for a record of births and deaths being kept by the State. Under this ordinance many registrations were effected, some of births as far back as 1840. Compulsory registration did not, however, come into force until 1865.
The earlier Registration Acts and their amendments provided for very little information being given in the case of births, the register containing merely date and place of birth, name and sex of child, names of father and mother, and occupation of father. In 1875, however, a new Registration Act was passed, under which information was recorded as to ages and birthplaces of parents. A recent amendment to the Act provides for the sexes and ages of previous issue of the marriage being given.
The law as to registration of births is now embodied in the Births and Deaths Registration Act, 1908, and the Births and Deaths Registration Amendment Acts, 1912 and 1915. The provisions generally as to registration are that a birth may be registered within sixty-two days without fee. After sixty-two days and within six months a birth is registrable only after solemn declaration made before the Registrar by. the parent or some person present at birth, and on payment of a late fee of 5s., which may, however, be remitted at the discretion of the Registrar-General. When six months have elapsed a birth cannot be registered except within a month after conviction of one of the responsible parties for neglect. But an information for such neglect must be laid within two years of date of birth. Registration of still-births was not compulsory until the 1st March, 1913, on which date the Amendment Act of 1912 came into force.
The Infant Life Protection Act of 1907 provided for notification of births in addition to registration, the time allowed for notification being seventy-two hours (since reduced to forty-eight hours) if in a city or borough, and twenty-one days in every other case. Further information concerning infant-life protection is given in the subsection dealing with deaths.
In the successive Registration Acts special provision was made for exemption from the necessity of registration in the case of births and deaths of Maoris, though registration could be effected if desired. Section 20 of the Births and Deaths Registration Amendment Act, 1912, however, empowered the Governor in Council to make regulations providing for the registration of births and deaths of Maoris either throughout the whole Dominion or in such districts as might be determined. Regulations were made accordingly, and were published in the New Zealand Gazette of the 27th March, 1913, page 946. The number of Registrars of Maori births and deaths in the Dominion is 207, most of these being in the North Island, where the great majority of the Maori population is located. Every Native settlement of any size is within easy reach of one of these Registrars. Maori registrations are entered in a separate register, and the numbers of births given below do not include those of Maoris, which are dealt with towards the end of this subsection.
Section 8 of the Births and Deaths Registration Amendment Act, 1915, contains provision for the registration of adopted children. The Clerk of the Court by which any adoption order is made is required to furnish to the Registrar-General particulars of the order, including the full name and place of birth of the child, as well as the full names and addresses of both the natural and the adopting parents. If the child's birth has been registered in New Zealand, a note of the adoption order is made on it. In any case a new entry is made on the prescribed form in the register of births.
The number of births registered during 1918 was 25,860, or 23.44 per 1,000 of mean population. The number is 2,379 below that for the year 1917, a decrease of 9.20 per cent., while the rate is lower by 2.25 per thousand. The births registered in a year numbered 19,846 in 1884, and, after falling to 17,876 in 1892, reached 28,509 in 1916, the highest number yet recorded in any year.
The number of male children born during 1918 was 13,124, and of female children 12,736.
The following table shows the number of births registered, the birthrate calculated on the total population, and comparison with the average rate for 1882-86 taken as 100.
| Year. | Total Number of Births registered. | Birth-rate. | |
|---|---|---|---|
| Per 1,000 of Population. | Compared with Kate in 1882-86, taken as 100. | ||
* Average of five years. | |||
| 1882-86 | 19,410* | 35.40 | 100 |
| 1887 | 19,135 | 32.09 | 91 |
| 1888 | 18,902 | 31.22 | 88 |
| 1889 | 18,457 | 30.07 | 85 |
| 1890 | 18,278 | 29.44 | 83 |
| 1891 | 18,273 | 29.01 | 82 |
| 1892 | 17,876 | 27.83 | 79 |
| 1893 | 18,187 | 27.50 | 78 |
| 1894 | 18,528 | 27.28 | 77 |
| 1895 | 18,546 | 26.78 | 76 |
| 1896 | 18,612 | 26.33 | 74 |
| 1897 | 18,737 | 25.96 | 73 |
| 1898 | 18,955 | 25.74 | 73 |
| 1899 | 18,835 | 25.12 | 71 |
| 1900 | 19,546 | 25.60 | 72 |
| 1901 | 20,491 | 26.34 | 74 |
| 1902 | 20,655 | 25.89 | 73 |
| 1903 | 21,829 | 26.61 | 75 |
| 1904 | 22,766 | 26.94 | 76 |
| 1905 | 23,682 | 27.22 | 77 |
| 1906 | 24,252 | 27.08 | 76 |
| 1907 | 25,094 | 27.30 | 77 |
| 1908 | 25,940 | 27.45 | 77 |
| 1909 | 26,524 | 27.29 | 77 |
| 1910 | 25,984 | 26.17 | 74 |
| 1911 | 26,354 | 25.97 | 73 |
| 1912 | 27,508 | 26.48 | 75 |
| 1913 | 27,935 | 26.14 | 74 |
| 1914 | 28,333 | 25.99 | 73 |
| 1915 | 27,850 | 25.33 | 72 |
| 1916 | 28,509 | 25.94 | 73 |
| 1917 | 28,239 | 25.69 | 73 |
| 1918 | 25,860 | 23.44 | 66 |
The decline of the birth-rate in New Zealand has been partially compensated for by a decrease in the death-rate. Nevertheless, the rate of natural increase of population has fallen from 31.19 per 1,000 of mean population in 1870 to 16.30 per 1,000 in 1916 and 16.11 in 1917. The heavy toll exacted by the epidemic of influenza is mainly responsible for the abnormally low figure of 8.60 in 1918. The following table shows the fall in all three rates:—
| Period. | Annual Rates per 1,000 living. | ||
|---|---|---|---|
| Births. | Deaths. | Natural Increase. | |
| 1871-1875 | 39.88 | 12.67 | 27.21 |
| 1876-1880 | 41.21 | 11.80 | 29.41 |
| 1881-1885 | 36.36 | 10.95 | 25.41 |
| 1886-1890 | 31.15 | 9.85 | 21.30 |
| 1891-1895 | 27.68 | 10.15 | 17.53 |
| 1896-1900 | 25.75 | 9.55 | 16.20 |
| 1901-1905 | 26.60 | 9.91 | 16.69 |
| 1906-1910 | 27.06 | 9.75 | 17.31 |
| 1911-1915 | 25.98 | 9.22 | 16.76 |
| 1916 | 25.94 | 9.64 | 16.30 |
| 1917 | 25.69 | 9.58 | 16.11 |
| 1918 | 23.44 | 14.84 | 8.60 |
In spite of the fact that the birth-rate in New Zealand is low compared with other countries, yet so low is the Dominion's death-rate that New Zealand has, so far as is known, the fourth highest rate of natural increase among countries keeping records of births and deaths. The rates of natural increase in various countries are as follows:—
| Country. | Quinquennium. | Rate per 1,000. |
|---|---|---|
| Bulgaria | 1907-11 | 17.7 |
| Roumania | 1910-14 | 17.4 |
| Australian Common-wealth | 1913-17 | 16.8 |
| New Zealand | 1913-17 | 16.4 |
| Russia (European) | 1905-09 | 16.1 |
| Hungary | 1908-12 | 15.8 |
| Jamaica | 1911-15 | 14.9 |
| The Netherlands | 1911-15 | 14.9 |
| Serbia | 1908-12 | 13.6 |
| Japan | 1909-13 | 13.1 |
| Denmark | 1911-16 | 12.9 |
| German Empire | 1909-13 | 12.8 |
| Italy | 1910-14 | 12.8 |
| Country. | Quinquennium. | Rate per 1,000. |
| Finland | 1910-14 | 12.3 |
| Norway | 14911-15 | 12.0 |
| Ontario | 1910-15 | 11.1 |
| Austria | 1908-12 | 10.7 |
| Scotland | 1911-15 | 9.7 |
| England and Wales | 1911-15 | 9.3 |
| Sweden | 1911-15 | 9.1 |
| Spain | 1910-14 | 8.9 |
| Switzerland | 1911-15 | 8.4 |
| Chile | 1910-14 | 8.4 |
| Belgium | 1908-12 | 7.8 |
| Ceylon | 1911-15 | 6.4 |
| Ireland | 1911-15 | 5. |
| France | 1910-14 | 0.0 |
Comparatively high as is the Dominion's rate of natural increase at the present time, it is still far below that of earlier days. The swift fall of the birth-rate was so pronounced as to override the effect of the slower falling death-rate and to reduce the rate of natural increase to little more than half its former height. A rough illustration of the result of this decline is shown in the next table. Here the actual population in each year is shown in contrast to what it would have attained had the average rate of natural increase (28.86 per 1,000) during the ten years 1865 to 1874 been maintained to the present day. It has been presumed for the purpose of the table that other factors, such as migration, influencing the growth of population would have remained unaffected.
| Year. | Population as at Standard Rate of Increase. | Actual Population recorded. |
|---|---|---|
| 1875 | 376,996 | 375,856 |
| 1876 | 399,831 | 399,075 |
| 1877 | 417,746 | 408,618 |
| 1878 | 440,304 | 432,519 |
| 1879 | 471,734 | 463,729 |
| 1880 | 492,579 | 484,864 |
| 1881 | 508,410 | 500,910 |
| 1882 | 526,571 | 517,707 |
| 1883 | 551,796 | 540,877 |
| 1884 | 577,041 | 564,304 |
| 1885 | 591;004 | 575,226 |
| 1886 | 609,046 | 589,386 |
| 1887 | 627,599 | 603,361 |
| 1888 | 636,536 | 607,380 |
| 1889 | 650,893 | 616,052 |
| 1890 | 666,849 | 625,508 |
| 1891 | 682,889 | 634,058 |
| 1892 | 707,554 | 650,433 |
| 1893 | 738,385 | 672,265 |
| 1894 | 761,947 | 686,128 |
| 1895 | 784,831 | 698,706 |
| 1896 | 808,952 | 714,162 |
| 1897 | 835,050 | 729,056 |
| 1898 | 861,845 | 743,463 |
| 1899 | 888,589 | 756,505 |
| 1900 | 916,064 | 768,278 |
| 1901 | 949,023 | 787,657 |
| 1902 | 984,403 | 807,929 |
| 1903 | 1,024,087 | 832,505 |
| 1904 | 1,063,996 | 857,539 |
| 1905 | 1,104,003 | 882,462 |
| 1906 | 1,148,711 | 908,726 |
| 1907 | 1,187,592 | 929,484 |
| 1908 | 1,236,126 | 960,642 |
| 1909 | 1,276,518 | 982,926 |
| 1910 | 1,316,765 | 1,002,679 |
| 1911 | 1,353,966 | 1,025,406 |
| 1911 | 1,353,966 | 1,025,406 |
| 1911 | 1,353,966 | 1,025,406 |
| 1913 | 1,461,938 | 1,084,662 |
| 1914 | 1,497,270 | 1,095,994 |
| 1915 | 1,529,395 | 1,102,794 |
| 1916 | 1,553,388 | 1,100,563 |
| 1917 | 1,577,615 | 1 ,097,672 |
| 1918 | 1,621,938 | 1,108,373 |
According to the table the Dominion would now have had over half a million more people than it actually possesses. Had the birth-rate remained the same, and the death-rate fallen as it has, this total would have been greatly augmented.
It is probable that the natural - increase rate — and it should be remembered that this is the most important factor in the growth of our population—will not rise. The death-rate in the last thirty years has remained fairly constant, and is always subject to the rising age-constitution and the effect of such epidemics as that of 1918. Conversely, the birthrate has always a falling tendency.
The diagram which follows shows the rates of births and deaths and of natural increase per 1,000 of mean population each year from 1855 to 1918. The marriage-rate is also shown.
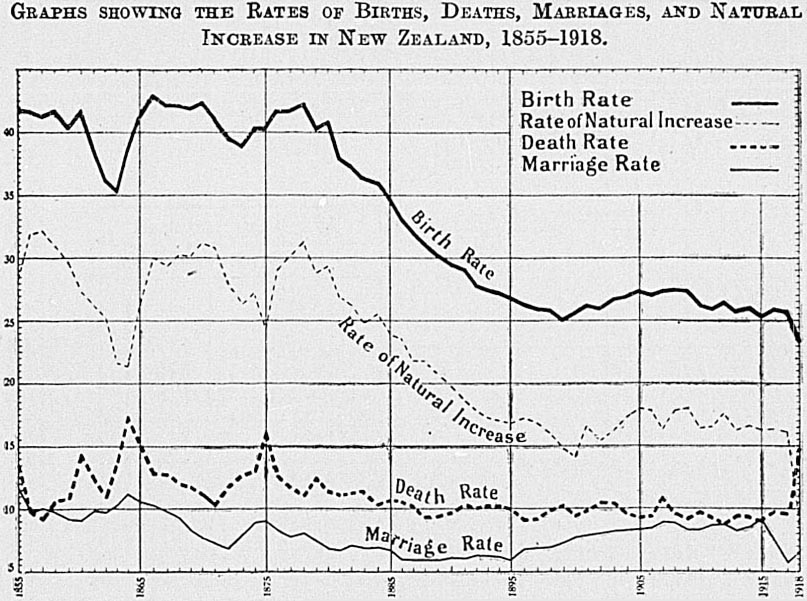
The birth-rate is seen to have fallen rapidly and continuously from 1880 to 1899. A similar decline is noticeable in the Australian birth-rate, but the period is later in point of time—viz., 1890-1903. The theory that the birth-rate is strongly influenced by economic factors finds some support in the position revealed by this graph. From 1880 to 1895 there was in general a period of economic depression, resulting largely from the subsequent collapse of the great land boom of 1874-76 and the slow growth of trade. During this period the birth-rate, as previously noted, fell rapidly and continuously. About 1895 the economic tide turned, and trade and consequent prosperity commenced to increase. Following this rise the birth-rate commenced in 1899 a period of slow but steady growth. Recent declines are, of course, largely, if not wholly, due to war influences. At the present time, however, birth-rates show a world-wide tendency to decline.
The above diagram is supplemented by another containing curves illustrative of the logarithmic increases in population and in the yearly number of births registered, which is instructive as showing how the latter has failed to keep pace with the former. The logarithmic graph, of course, shows a much smaller divergence between the two curves than would a diagram representative of the actual figures.
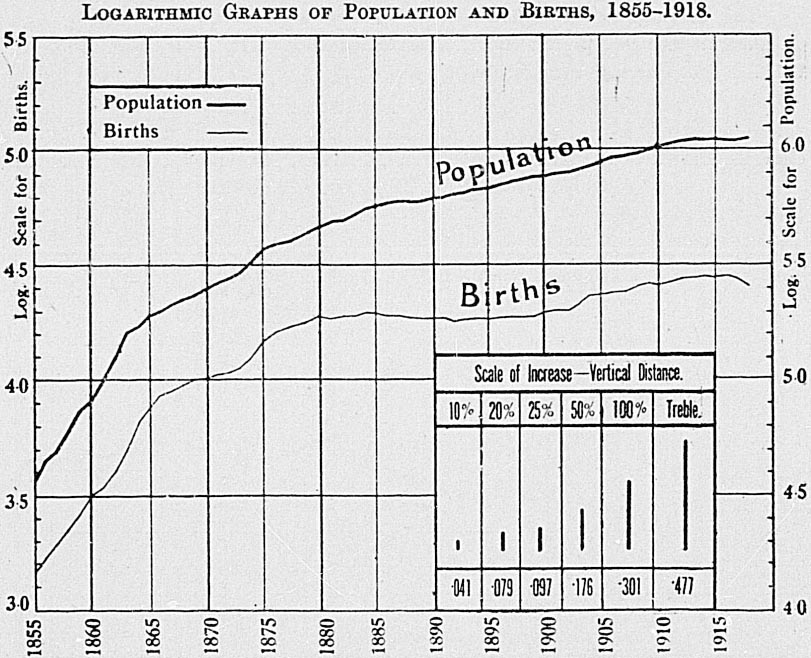
That fertility among women in New Zealand has decreased, from whatever causes, further facts will tend to show. Taking the number of married women in New Zealand at what may be considered the child-bearing ages (i.e., from 15 to 45 years, inclusive) as shown by each census since 1878, and for the same years the number of legitimate births (excluding plural) registered, the birth-rate per 1,000 married women of the above-stated ages is easily found, and is shown to be steadily declining. In 1878 the rate was 337 per 1,000, in 1896 it had fallen to 252, in 1901 to 244, in 1906 to 228, in 1911 to 209, and in 1916 to 189; or, in other words, in 1878 one in every three of the married women between the ages specified gave birth to a child, while in 1916 the rate was less than one in five. The figures for each census year are given below.
| Tear (Census). | Number of Married Women between 15 and 45 Years of Age. | Proportion per Cent. or Married Women in the Female Population aged 15 to 45 Years. | Number of Legitimate Births (Confinements). | Birth-rate per 1,000 Married Women of from 15 to 45 Years of Age. |
|---|---|---|---|---|
| 1878 | 50,995 | 63.50 | 17,196 | 337.2 |
| 1881 | 57,458 | 59.76 | 18,008 | 313.8 |
| 1886 | 62,704 | 53.19 | 18,532 | 295.5 |
| 1891 | 63,165 | 48.12 | 17,455 | 276.3 |
| 1896 | 69,807 | 44.12 | 17,596 | 252.1 |
| 1901 | 79,406 | 43.30 | 19,355 | 243.8 |
| 1906 | 98,211 | 46.15 | 22,352 | 227.6 |
| 1911 | 119,355 | 49.59 | 24,972 | 209.2 |
| 1916 | 141,322 | 52.97 | 26,786 | 189.5 |
Another table is given showing for a period of thirty years the numbers of married women at quinquennial groups of age belonging to the full term 15 to 45 years, with the proportions that those numbers bear to every 100 married women living at 15-45. These proportions are found to have diminished appreciably at the earlier ages 15-20 and 20-25, but the effect of this lesser number of wives at the earlier ages in reducing the birth-rate would not be serious. It is, however, undoubtedly a fact that to have a growing proportion of wives at the earlier productive ages is the best position, from the point of view of population-growth, but it is not the one which obtains at present in New Zealand.
| Age-groups. | Married Women under 45. | |||||||
|---|---|---|---|---|---|---|---|---|
| Numbers. | Proportions per Cent. | |||||||
| 1886. | 1896. | 1906. | 1916. | 1886. | 1896. | 1906. | 1916. | |
| 15-20 | 1,135 | 778 | 933 | 1,060 | 1.81 | 1.11 | 0.95 | 0.75 |
| 20-25 | 9,328 | 8,409 | 12,165 | 13,771 | 14.87 | 12.05 | 12.38 | 9.74 |
| 25-30 | 14,565 | 16,757 | 24,037 | 29,723 | 23.23 | 24.00 | 24.47 | 21.03 |
| 30-35 | 13,754 | 16,426 | 23,032 | 35,648 | 21.93 | 23.53 | 23.44 | 25.23 |
| 35-40 | 12,554 | 15,020 | 21,459 | 34,587 | 20.02 | 21.51 | 21.84 | 24.47 |
| 40-45 | 11,373 | 12,426 | 16,623 | 26,533 | 18.14 | 17.80 | 16.92 | 18.78 |
| Totals | 62,709 | 69,816 | 98,249 | 141,322 | 100.00 | 100.00 | 100.00 | 100.00 |
The effect of the declining birth-rate is shown in the following table, giving the numbers of children under one year of age, and the proportions which those numbers represent in the total population as recorded in past census years:—
| Total Population (all Ages). | Children under One Year. | Children under One Year per 1,000 of Population. | ||
|---|---|---|---|---|
| Census | 1886 | 578,482 | 18,355 | 31.73 |
| Census | 1891 | 626,658 | 16,443 | 26.24 |
| Census | 1896 | 703,360 | 17,070 | 24.27 |
| Census | 1901 | 772,719 | 18,381 | 23.79 |
| Census | 1906 | 888,578 | 22,289 | 25.08 |
| Census | 1911 | 1,008,468 | 24,340 | 24.14 |
| Census | 1916 | 1,099,449 | 27,021 | 24.57 |
Beginning with 1913 information as to domicile of parents has been obtained in the case of all births registered in the four chief centres, and the births allocated accordingly, the result being that many which in former years would have been included in the municipalized area were excluded, the rates being reduced accordingly. No proper comparison is therefore possible as between 1913 and previous years. From January, 1917, an alteration has been made in the areas constituting the chief centres. Metropolitan areas have been created at each of the four chief centres, and suburban areas at nine of the more important secondary centres. Each area includes, in addition to the central boroughs, a considerable non-municipalized area adjacent to and contingent on the centre. Notwithstanding this latter alteration, the figures for the years 1913-18 are reasonably comparable with one another.
The total number of births registered as belonging to the four metropolitan areas in 1918 was 8,275, as against a total of 9,064 for the previous year. The birth-rates last year were,—
| Birth-rates per 1,000 of Population. | |
|---|---|
| Auckland City | 24.71 |
| Auckland Metropolitan Area | 21.77 |
| Wellington City | 23.57 |
| Wellington Metropolitan Area | 23.15 |
| Christchurch City | 20.35 |
| Christchurch Metropolitan Area | 20.22 |
| Dunedin City | 18.51 |
| Dunedin Metropolitan Area | 18.69 |
Taking the whole of the four metropolitan areas into consideration the birth-rate becomes 21.20 per 1,000. Each individual metropolitan area has a lower rate than the Dominion as a whole (23.44 per 1,000), a position which always obtains.
The rates for five years, 1914 to 1918, are given below:—
| Births per 1,000 of Population. | |||||
|---|---|---|---|---|---|
| 1914. | 1915. | 1916. | 1917. | 1918. | |
*Metropolitan areas in 1917. | |||||
| Auckland (including suburbs)* | 24.78 | 23.13 | 23.35 | 22.33 | 21.77 |
| Wellington (including suburbs)* | 25.38 | 24.19 | 24.30 | 25.25 | 23.15 |
| Christchurch (including suburbs)* | 22.22 | 22.19 | 23.54 | 22.96 | 20.22 |
| Dunedin (including suburbs)* | 21.70 | 20.73 | 23.32 | 22.47 | 18.69 |
The fact is well illustrated above that, of the four centres, Wellington usually has the highest rate and Dunedin the lowest. Some explanation of this lies in the difference in age-constitution between the cities. In any year the ages of the parents of the great majority of children born in that year range from 25 to 50 years. Considering this group (i.e., married people of ages 25 to 49 inclusive) it is found that it forms to the total population a proportion of 41.48 per cent. in Auckland, in Wellington 46.19 per cent., in Christchurch 40.66 per cent., in Dunedin only 36.58 per cent. These proportions are clearly reflected in the birth-rates.
For twenty years prior to 1885 the New Zealand birth-rate was higher than that of the Australian Commonwealth. In 1885 the Commonwealth rate gained the ascendancy, and this position it held till 1903, in which year occurred the lowest rate in the history of the country. The New Zealand rate had already reached its then lowest level in 1899. These years marked the starting-point of a moderate rise in the birth-rate of each country. The prevailing decline recommenced in the Dominion in 1909, with the result that for 1909 and subsequent years the rate is lower than that of Australia.
The movement over the last ten years is as follows:—
| State. | 1909. | 1910. | 1911. | 1912. | 1913. | 1914. | 1915. | 1916. | 1917. | 1918. |
|---|---|---|---|---|---|---|---|---|---|---|
| Queensland | 27.29 | 27.33 | 27.65 | 29.67 | 30.24 | 29.46 | 29.35 | 27.91 | 29.09 | 28.37 |
| New South Wales | 27.40 | 27.83 | 28.75 | 29.86 | 28.86 | 28.96 | 28.33 | 27.89 | 28.06 | 26.53 |
| Victoria | 25.01 | 24.51 | 24.84 | 26.39 | 25.82 | 25.45 | 24.55 | 24.30 | 23.50 | 22.29 |
| South Australia | 25.91 | 26.50 | 26.89 | 28.65 | 29.08 | 29.33 | 26.8 | 27.37 | 26.21 | 25.80 |
| Western Australia | 28.87 | 27.99 | 28.21 | 28.83 | 29.36 | 28.45 | 27.97 | 27.21 | 25.54 | 22.84 |
| Tasmania | 28.91 | 29.25 | 28.57 | 30.53 | 30.03 | 30.33 | 29.32 | 28.47 | 27.03 | 25.91 |
| Aust. Commonwealth | 26.69 | 26.73 | 27.21 | 28.65 | 28.25 | 28.05 | 27.25 | 26.78 | 26.51 | 25.25 |
| New Zealand | 27.29 | 26.17 | 25.97 | 26.48 | 26.14 | 25.99 | 25.33 | 25.94 | 25.69 | 23.44 |
The next table shows the declining birth-rate and the marriage-rate in the United Kingdom:—
| Births. | Marriages. | |||
|---|---|---|---|---|
| Year. | Number. | Rate per 1,000 of Population. | Number. | Rate per 1,000 of Population. |
| 1886 | 1,145,577 | 31.5 | 241,180 | 6.6 |
| 1891 | 1,148,259 | 30.4 | 275,970 | 7.3 |
| 1896 | 1,152,144 | 29.0 | 296,089 | 7.5 |
| 1901 | 1,162,975 | 28.0 | 313,351 | 7.5 |
| 1906 | 1,170,622 | 27.0 | 325,842 | 7.5 |
| 1911 | 1,104,746 | 24.4 | 330,260 | 7.3 |
| 1916 | 986,899 | 21.1 | 333,574 | 7.1 |
| 1917 | 852,157 | 18.2 | 310,410 | 6.6 |
The birth-rates for ten years in Great Britain and Ireland and certain countries of the European Continent are also given. The decline is steady and continuous, except in the cases of Roumania and Hungary, where the rates are very high.
| Country. | Number of Births per 1,000 of Mean Population. | |||||||||
|---|---|---|---|---|---|---|---|---|---|---|
| 1905. | 1906. | 1907. | 1908. | 1909. | 1910. | 1911. | 1912. | 1913. | 1914. | |
| Roumania | 38.3 | 39.9 | 41.1 | 40.3 | 41.1 | 39.2 | 42.3 | 43.4 | 42.1 | 42.5 |
| Hungary | 36.3 | 36.5 | 36.7 | 36.9 | 37.7 | 35.7 | 35.0 | 36.3 | .. | .. |
| Spain | 35.2 | 34.0 | 33.6 | 34.0 | 33.5 | 33.1 | 31.2 | 32.6 | 30.4 | 29.8 |
| Italy | 32.7 | 32.1 | 31.7 | 33.7 | 32.7 | 33.3 | 31.5 | 32.4 | 31.7 | 31.1 |
| Austria | 33.9 | 35.0 | 34.0 | 33.7 | 33.4 | 32.5 | 31.4 | 31.3 | .. | .. |
| German Empire | 32.9 | 33.1 | 32.3 | 32.1 | 31.0 | 29.8 | 28.6 | 28.3 | 27.5 | .. |
| Netherlands | 30.8 | 30.4 | 30.0 | 29.7 | 29.1 | 28.6 | 27.8 | 28.1 | 28.1 | 28.2 |
| Denmark | 28.4 | 28.5 | 28.2 | 28.5 | 28.2 | 27.5 | 26.7 | 26.7 | 25.6 | 25.6 |
| Scotland | 28.6 | 28.6 | 27.7 | 28.1 | 27.3 | 26.2 | 25.6 | 25.9 | 25.5 | 26.1 |
| Norway | 27.4 | 26.7 | 26.4 | 26.3 | 26.3 | 25.1 | 25.9 | 25.6 | 25.3 | 25.2 |
| Switzerland | 26.9 | 26.9 | 26.2 | 26.4 | 25.5 | 25.0 | 24.2 | 24.1 | 23.1 | .. |
| England and Wales | 27.3 | 27.2 | 26.5 | 26.7 | 25.8 | 25.1 | 24.3 | 23.9 | 24.1 | 23.8 |
| Sweden | 25.7 | 25.7 | 25.5 | 25.7 | 25.6 | 24.7 | 24.0 | 23.8 | 23.1 | 22.9 |
| Ireland | 23.4 | 23.5 | 23.2 | 23.3 | 23.4 | 23.3 | 23.2 | 23.0 | 22.8 | 22.6 |
| Belgium | 26.1 | 25.7 | 25.3 | 24.9 | 23.7 | 23.7 | 22.9 | 22.6 | .. | .. |
| France | 20.6 | 20.6 | 19.7 | 20.1 | 19.5 | 19.6 | 18.7 | 19.0 | 19.0 | 18.0 |
An examination of the figures shows that, with the exception of one year, there has always been a preponderance of males in the number of children born in New Zealand. The proportions are usually shown by stating the number of births of male children to every 1,000 female births. This number has been as high as 1,113 (in 1859), and as low as 991 (in 1860).
But little significance can be attached to any figures prior to 1870, on account of the comparatively small number of births. The period preceding 1870 exhibits violent fluctuations in the proportion of males, which tend to disappear as the total of births grows larger. The extreme range since 1870 has been from 1,016 male to 1,000 female births in 1878, to 1,078 in 1875 and 1,073 in 1915.
The number of births and their sex-proportion for twenty years are given below.
| Year. | Number of Births | Proportion of Births of Males to every 1,000 Females. | |
|---|---|---|---|
| Males. | Females. | ||
| 1899 | 9,724 | 9,111 | 1,067 |
| 1900 | 10,107 | 9,439 | 1,071 |
| 1901 | 10,471 | 10,020 | 1,045 |
| 1902 | 10,653 | 10,002 | 1,065 |
| 1903 | 11,217 | 10,612 | 1,057 |
| 1904 | 11,762 | 11,004 | 1,069 |
| 1905 | 12,109 | 11,573 | 1,046 |
| 1906 | 12,337 | 11,855 | 1,046 |
| 1907 | 12,835 | 12,259 | 1,047 |
| 1908 | 13,369 | 12,571 | 1,063 |
| 1909 | 13,502 | 13,022 | 1,037 |
| 1910 | 13,442 | 12,542 | 1,072 |
| 1911 | 13,532 | 12,822 | 1,055 |
| 1912 | 13,996 | 13,512 | 1,036 |
| 1913 | 14,433 | 13,502 | 1,069 |
| 1914 | 14,535 | 13,803 | 1,053 |
| 1915 | 14,415 | 13,435 | 1,073 |
| 1916 | 14,669 | 13,840 | 1,060 |
| 1917 | 14,329 | 13,910 | 1,030 |
| 1918 | 13,124 | 12,736 | 1,030 |
The gradual increase in the proportion of males born is illustrated by taking the average ratios of the ten years in the decennial period indicated.
| Period. | Male Births to 1,000 Females. |
|---|---|
| 1856-1865 | 1,062 |
| 1866-1875 | 1,043 |
| 1876-1885 | 1,045 |
| 1886-1895 | 1,045 |
| 1896-1905 | 1,054 |
| 1906-1915 | 1,055 |
The English Registrar-General's reports for 1915 and 1916 contain some interesting figures as to the influence of the war on the sex-proportions in births, and it is seen that the proportion of male to female births in England and Wales is considerably higher in the period (commencing in the June quarter, 1915) affected by the war than in preceding years. In fact, the proportion of male to female births in England and Wales for the year 1916 is by far the highest recorded during the past fifty years. Curiously enough, the male preponderance in 1917, although still exceptionally high, shows a decrease from 1916. In New Zealand, where the numbers dealt with are much smaller and where there is considerable fluctuation in the sex-proportions, there is nothing in the figures for the war period, taken as a whole, to indicate Nature's supposed influence in restoring the sex-proportions of the population when disturbed by war. Indeed, the figures for 1917 and 1918 show an abnormally small excess of male over female births.
The sex-proportions of illegitimate births are generally supposed to be more nearly equal than those of legitimate births. Although little reliance can be placed on the figures for New Zealand by reason of the small numbers represented, such weight as they have is in favour of the theory. The average for the period 1909-18 was 1,030 males per 1,000 females—a rate considerably lower than that for all births (1,051) for the same period. The proportion in 1918 was 995 male births per 1,000 female.
There were 294 cases of twin births (588 children) and three cases of triplets registered in 1918. The number of children born was 25,860; the number of mothers was 25,560: thus, on an average, one mother in every 86 gave birth to twins (or triplets) against 89 in 1917, 87 in 1916, 91 in 1915, and 79 in 1914.
The number of cases of plural births and the proportion per 1,000 of the total cases of births during the past five years was,—
| Year. | Total Births. | Total Cases. | Cases of Twins. | Cases of Triplets. | Plural Cases per 1,000 of Total Cases. |
|---|---|---|---|---|---|
| 1914 | 28,338 | 27,976 | 350 | 6 | 12.73 |
| 1915 | 27,850 | 27,546 | 302 | 1 | 11.00 |
| 1916 | 28,509 | 28,134 | 323 | 1 | 11.50 |
| 1917 | 28,239 | 27,927 | 312 | .. | 11.17 |
| 1918 | 25,860 | 25,560 | 294 | 3 | 11.62 |
The following table shows the sexes in individual cases of twin births for the last seven years:—
| Year. | Total Cases. | Both Males. | Both Females. | Opposite Sexes. |
|---|---|---|---|---|
| 1912 | 329 | 114 | 106 | 109 |
| 1913 | 314 | 108 | 86 | 120 |
| 1914 | 350 | 105 | 116 | 129 |
| 1915 | 302 | 93 | 88 | 121 |
| 1916 | 323 | 99 | 98 | 126 |
| 1917 | 312 | 90 | 105 | 117 |
| 1918 | 294 | 87 | 95 | 112 |
During the seven years 1912-18 there were fifteen cases of triplets. In three cases all the children were males, in three cases all were females, in three cases there were two males and one female, and in each of the remaining six cases two of the three children were females.
Information as to the relative ages of parents of legitimate children whose births were registered in 1918 is shown in the following table:—
| Age of Mother, in Years. | Age of Father, in Years. | ||||||||||
|---|---|---|---|---|---|---|---|---|---|---|---|
| Under 21. | 21 and under 25. | 25 and under 30. | 30 and under 35. | 35 and under 40. | 40 and under 45. | 45 and under 50. | 50 and under 55. | 55 and under 65. | 65 and over. | Totals. | |
* Includes twenty-seven cases where plural births would have been registered had not one child been still-born. † Including two cases of triplets and one case where triplets would have been registered had not one child been still-born. | |||||||||||
| Single Births. | |||||||||||
| 15 and under 16 | 2 | .. | .. | .. | .. | .. | .. | .. | .. | .. | 2 |
| 16 and under 17 | 1 | .. | 3 | 3 | 1 | .. | .. | .. | 8 | ||
| 17 and under 18 | 14 | 14 | 12 | 6 | 1 | 2 | .. | .. | .. | .. | 47 |
| 18 and under 19 | 22 | 47 | 39 | 11 | 3 | 2 | 1 | .. | .. | .. | 125 |
| 19 and under 20 | 26 | 86 | 75 | 34 | 6 | 2 | .. | .. | .. | 229 | |
| 20 and under 21 | 30 | 140 | 153 | 58 | 10 | 5 | 2 | 1 | .. | .. | 399 |
| 21 and under 25 | 56 | 626 | 1,573 | 857 | 266 | 78 | 34 | 13 | 1 | 3,504 | |
| 25 and under 30 | 6 | 187 | 2,253 | 2,657 | 1,267 | 349 | 127 | 26 | 11 | 2 | 6,885 |
| 30 and under 35 | 3 | 21 | 509 | 2,513 | 2,275 | 898 | 301 | 89 | 28 | 5 | 6,642 |
| 35 and under 40 | .. | 6 | 69 | 476 | 1,865 | 1,328 | 618 | 148 | 60 | 9 | 4,579 |
| 40 and under 45 | .. | .. | 3 | 37 | 207 | 598 | 454 | 158 | 67 | 8 | 1,532 |
| 45 and under 46 | .. | .. | .. | .. | 3 | 12 | 33 | 19 | 11 | .. | 78 |
| 46 and under 47 | .. | .. | .. | .. | 1 | 4 | 19 | 12 | 4 | 1 | 41 |
| 47 and under 48 | .. | .. | .. | 1 | 2 | 1 | 7 | 6 | 6 | .. | 23 |
| 48 and under 49 | .. | .. | .. | .. | 1 | .. | .. | 3 | 2 | 1 | 7 |
| 49 and under 50 | .. | .. | .. | .. | .. | .. | .. | 2 | .. | .. | 2 |
| Totals | 160 | 1,127 | 4,689 | 6,653 | 5,908 | 3,277 | 1,596 | 477 | 190 | 26 | 24,103* |
| Plural Births. | |||||||||||
| 19 and under 20 | .. | 1 | .. | .. | .. | .. | .. | .. | .. | .. | 1 |
| 20 and under 21 | .. | .. | 3 | 1 | .. | .. | .. | .. | .. | .. | 4 |
| 21 and under 25 | 1 | 9 | 8 | 8 | 2 | 2 | .. | .. | .. | .. | 30 |
| 25 and under 30 | .. | .. | 15 | 26 | 15 | 2 | 2 | .. | .. | .. | 60 |
| 30 and under 35 | .. | .. | 5 | 51 | 25 | 11 | 2 | .. | .. | .. | 94 |
| 35 and under 40 | .. | .. | 2 | 9 | 33 | 21 | 10 | 4 | .. | .. | 79 |
| 40 and under 45 | .. | .. | .. | .. | 3 | 6 | 9 | 2 | .. | .. | 20 |
| Totals | 1 | 10 | 33 | 95 | 78 | 42 | 23 | 6 | .. | .. | |
| Grand totals | 161 | 1,137 | 4,722 | 6,749 | 5,986 | 3,319 | 1,619 | 483 | 190 | 26 | 24,392† |
Information as to the previous issue of the parents is now required in connection with the registration of births. Tables are given showing information as to number of previous issue in conjunction with (1) age of mother, and (2) duration of marriage.
(a.) Age of Mother and Number of previous Issue .
| Age of Mother. | Number of previous Issue. | Totals. | ||||||||
|---|---|---|---|---|---|---|---|---|---|---|
| 0 | 1 | 2 | 3 | 4 | 5 | 6 and under 10. | 10 and under 5 | 15 and over. | ||
| 15 and under 16 | 2 | .. | .. | .. | .. | .. | .. | .. | .. | 2 |
| 16 and under 17 | 8 | .. | .. | .. | .. | .. | .. | .. | .. | 8 |
| 17 and under 18 | 45 | 2 | .. | .. | .. | .. | .. | .. | .. | 47 |
| 18 and under 19 | 116 | 9 | .. | .. | .. | .. | .. | .. | .. | 125 |
| 19 and under 20 | 184 | 41 | 5 | .. | .. | .. | .. | .. | .. | 230 |
| 20 and under 21 | 282 | 98 | 17 | 5 | 1 | .. | .. | .. | .. | 403 |
| 21 and under 25 | 1,666 | 1,060 | 575 | 179 | 47 | 6 | 1 | .. | .. | 3,534 |
| 25 and under 30 | 1,681 | 1,999 | 1,608 | 888 | 473 | 186 | 108 | 2 | .. | 6,945 |
| 30 and under 35 | 861 | 1,386 | 11,490 | 1,107 | 828 | 506 | 533 | 25 | .. | 6,736 |
| 35 and under 40 | 373 | 563 | 837 | 772 | 647 | 475 | 906 | 84 | 1 | 4,658 |
| 40 and under 45 | 103 | 123 | 164 | 186 | 198 | 155 | 496 | 121 | 6 | 1,552 |
| 45 and under 46 | 3 | 4 | 4 | 5 | 7 | 9 | 35 | 10 | 1 | 78 |
| 46 and under 47 | 2 | 2 | 3 | 2 | 4 | 4 | 16 | 7 | 1 | 41 |
| 47 and under 48 | 1 | 2 | 3 | 2 | 2 | 3 | 4 | 5 | 1 | 23 |
| 48 and under 49 | 1 | .. | 1 | .. | .. | .. | 1 | 3 | 1 | 7 |
| 49 and under 50 | .. | .. | .. | .. | .. | .. | 2 | .. | .. | 2 |
| Totals | 5,328 | 5,289 | 4,704 | 3,146 | 2,207 | 1,344 | 2,102 | 257 | 11 | 24,391* |
(b.) Duration of Marriage and Number of previous Issue .
| Duration of Marriage, In Years. | Number of previous Issue. | Totals. | ||||||||
|---|---|---|---|---|---|---|---|---|---|---|
| 0 | 1 | 2 | 3 | 4 | 5 | 0 and under 10. | 10 and under 15. | 15 and over. | ||
* This number represents 24,104 single cases and 288 plural cases. | ||||||||||
| Under 1 | 2,413 | 6 | .. | .. | .. | .. | .. | .. | .. | 2,419 |
| 1 and under 2 | 1,376 | 560 | 8 | .. | .. | .. | .. | .. | .. | 1,944 |
| 2 and under 3 | 649 | 1,544 | 145 | 5 | 2 | .. | .. | .. | .. | 2,345 |
| 3 and under 4 | 3271,177 | 681 | 44 | 2 | 1 | .. | .. | .. | .. | 2,232 |
| 4 and under 5 | 178 | 699 | 942 | 218 | 24 | .. | .. | .. | .. | 2,061 |
| 5 and under 6 | 119 | 479 | 763 | 445 | 89 | 10 | 2 | .. | .. | 1,907 |
| 6 and under 7 | 66 | 301 | 587 | 455 | 187 | 27 | 3 | .. | .. | 1,626 |
| 7 and under 8 | 52 | 122 | 402 | 452 | 270 | 70 | 7 | .. | .. | 1,375 |
| 8 and under 9 | 28 | 121 | 294 | 332 | 288 | 102 | 46 | .. | .. | 1,211 |
| 9 and under 10 | 23 | 98 | 221 | 280 | 256 | 170 | 85 | .. | .. | 1,133 |
| 10 and under 15 | 77 | 159 | 551 | 731 | 805 | 707 | 914 | 28 | .. | 3,972 |
| 16 and under 20 | 19 | 21 | 104 | 164 | 242 | 221 | 816 | 112 | .. | 1,699 |
| 20 and under 25 | 1 | 2 | 9 | 19 | 42 | 35 | 211 | 95 | 4 | 418 |
| 25 and over | .. | .. | .. | 1 | .. | 1 | 18 | 22 | 7 | 49 |
| Totals | 5,328 | 5,289 | 4,707 | 3,146 | 2,207 | 1,344 | 2,102 | 257 | 11 | 24,391* |
In the two preceding tables plural births are included, twins counting as only one birth. Another table is appended giving in more detail the duration of the marriage in cases where less than one year had elapsed before the birth of the first child. Illegitimate births are also shown.
| Age of Mother, in Years. | Illegitimate Births. | Duration of Marriage, in Months. | Total Legitimate First Births within One Year after Marriage. | |||||||
|---|---|---|---|---|---|---|---|---|---|---|
| Under 3. | 3 and under 6. | 6 and under 7. | 7 and under 8. | 8 and under 9. | 9 and under 10. | 10 and under 11 | 11 and under 12. | |||
| Under 21 | 357 | 89 | 166 | 76 | 53 | 40 | 41 | 26 | 31 | 522 |
| 21 and under 25 | 369 | 61 | 213 | 112 | 96 | 85 | 167 | 97 | 109 | 940 |
| 25 and under 30 | 216 | 39 | 85 | 46 | 41 | 44 | 151 | 114 | 80 | 600 |
| 30 and under 35 | 117 | 13 | 26 | 19 | 15 | 27 | 67 | 45 | 37 | 249 |
| 35 and under 40 | 74 | 2 | 10 | 5 | 8 | 13 | 16 | 12 | 18 | 84 |
| 40 and under 45 | 32 | 1 | 4 | 1 | .. | 3 | 1 | 4 | 4 | 18 |
| 45 and over | 4 | .. | .. | .. | .. | .. | .. | .. | .. | |
| Totals | 1,169 | 205 | 504 | 259 | 213 | 212 | 443 | 298 | 279 | 2,413 |
The birth statistics for 1918 contain one feature which is by way of a novelty as far as New Zealand is concerned. This consists of a series of tables showing the period that elapsed between successive births in conjunction with the total number of children born. Details are published in Volume I of the Statistics, 1918. The first table only is quoted here as being perhaps the most interesting. In these tables those cases are excluded in which the number of previous issue was either none or not stated.
| Number of Children born. | Interval in Complete Years between First and Second Living Child. | |||||||||||
|---|---|---|---|---|---|---|---|---|---|---|---|---|
| 0.* | 1. | 2. | 3. | 4. | 5. | 6. | 7. | 8. | 9. | 10 and over. | Total. | |
* Presumably almost wholly cases of twins. | ||||||||||||
| 2 | 6 | 1,869 | 1,408 | 647 | 373 | 237 | 131 | 78 | 41 | 40 | 61 | 4,891 |
| 3 | 45 | 1,224 | 1,718 | 600 | 289 | 141 | 70 | 34 | 20 | 10 | 11 | 4,162 |
| 4 | 22 | 880 | 1,119 | 365 | 129 | 47 | 23 | 18 | 7 | 10 | 1 | 2,621 |
| 5 | 19 | 639 | 759 | 188 | 47 | 21 | 10 | 4 | 2 | .. | 1 | 1,690 |
| 6 | 11 | 365 | 443 | 70 | 29 | 10 | 3 | 1 | .. | .. | .. | 932 |
| 7 | 6 | 231 | 292 | 57 | 13 | 3 | 2 | 1 | .. | .. | .. | 605 |
| 8 | 5 | 115 | 157 | 25 | 6 | 1 | 1 | .. | .. | .. | .. | 310 |
| 9 | .. | 101 | 96 | 13 | 3 | .. | .. | 1 | .. | .. | .. | 214 |
| 10 | .. | 49 | 31 | 7 | 2 | 2 | .. | .. | .. | .. | .. | 91 |
| Over 10 | 1 | 48 | 37 | 5 | .. | .. | .. | .. | .. | .. | .. | 91 |
| Total | 115 | 5,521 | 6,060 | 1,977 | 891 | 462 | 240 | 137 | 70 | 60 | 74 | 15,607 |
This table indicates that in families of almost all sizes the general period intervening between the first birth and the second is from two to three years. The period next in importance is that from one to two years. One case is exceptional—that of a family where the previous issue was one only—in that for the greatest number of instances, the birth-interval was from one to two years. It is unfortunate that the ages of the previous issue are available in years only, and not more precisely. The period two to three years maintains supremacy during successive births as far as tabulated—i.e., up to the sixth birth. This is illustrated in the following table, which shows, for total families of all sizes, the percentage which the number in each period forms to the whole.
| Interval between | Percentage at each of the Complete Years indicated. | |||||||||||
|---|---|---|---|---|---|---|---|---|---|---|---|---|
| 0.* | 1. | 2. | 3. | 4. | 5. | 6. | 7. | 8. | 9. | 10 and over. | All Periods. | |
* Presumably almost wholly cases of twins. | ||||||||||||
| Per Cent. | Per Cent. | Per Cent. | Per Cent. | Per Cent. | Per Cent. | Per Cent. | Per Cent. | Per Cent. | Per Cent. | Per Cent. | Per Cent. | |
| First and second child | 0.74 | 35.38 | 38.83 | 12.67 | 5.70 | 2.96 | 1.54 | 0.88 | 0.45 | 0.38 | 0.47 | 100.00 |
| Second and third child | 1.22 | 28.27 | 39.63 | 14.07 | 6.68 | 4.11 | 2.04 | 1.46 | 0.91 | 0.58 | 1.03 | 100.00 |
| Third and fourth child | 1.60 | 25.21 | 40.74 | 15.59 | 6.67 | 4.18 | 2.27 | 1.36 | 0.82 | 0.55 | 1.01 | 100.00 |
| Fourth and fifth child | 1.75 | 23.70 | 41.88 | 15.89 | 7.09 | 4.12 | 2.03 | 1.32 | 0.92 | 0.56 | 0.74 | 100.00 |
| Fifth and sixth child | 2.23 | 23.99 | 42.93 | 15.25 | 6.87 | 4.06 | 2.27 | 0.62 | 0.67 | 0.58 | 0.53 | 100.00 |
One outstanding feature of the above tabulation is the increasing domination of the two-year interval as the number of children in the family grows larger, a position gained largely at the expense of the one-year interval.
The succeeding table gives the mean period, expressed in years, between successive births, according to the number of children in the family:—
| Average Interval (in Years) between | Cases in which the Number of Children in the Family was | ||||||||||
|---|---|---|---|---|---|---|---|---|---|---|---|
| 2. | 3. | 4. | 5. | 6. | 7. | 8 | 9. | 10. | Over 10. | All Families. | |
| First and second child | 2.96 | 2.75 | 2.55 | 2.35 | 2.27 | 2.27 | 2.24 | 2.14 | 2.15 | 2.01 | 2.67 |
| Second and third child | .. | 3.33 | 2.98 | 2.69 | 2.48 | 2.41 | 2.27 | 2.24 | 2.36 | 1.92 | 2.94 |
| Third and fourth child | .. | .. | 3.33 | 2.98 | 2.72 | 2.63 | 2.39 | 2.42 | 2.25 | 2.21 | 2.98 |
| Fourth and fifth child | .. | .. | .. | 3.30 | 2.92 | 2.65 | 2.61 | 2.50 | 2.49 | 2.27 | 2.97 |
| Fifth and sixth child | .. | .. | .. | .. | 3.20 | 2.80 | 2.65 | 2.54 | 2.43 | 2.19 | 2.88 |
It seems, then, that, on an average, the second birth takes place 2 years and 8 months after the first the third, 2 years and 11 months after the second; the fourth, 3 years after the third; the fifth, 3 years after the fourth ; and the sixth 2 years and 11 months after the fifth.
The increasing tendency for a greater period to elapse between children is measured to some extent above. Take, for example, the interval between the second child and the third. In the column headed "Over 10 Children the average period was under 2 years; in the column," 3 Children," it was 3 1/3 years. The time between these two columns would, on the figures above, represent about 25 years, so that in the space of a generation the birth-interval in that case was almost doubled.
Reading the columns downward, the lengthening period between successive births is shown clearly.
The births of 1,179 children (588 males, 591 females) were illegitimate: thus 46 in every 1,000 children registered were born out of wedlock, against 41 in 1917; 40 in 1916, 41 in 1915, and 46 in 1914.
The ages of the mothers of the illegitimate children registered during the year are as shown below. It will be seen that of the 1,169 mothers 357, or 30.54 per cent., were under 21 years of age; for the last five years the average in this respect being 35 per cent.
| Age. | Single Cases. | Plural Cases. |
|---|---|---|
| Years. | ||
| 13 | 1 | .. |
| 14 | 2 | .. |
| 15 | 5 | .. |
| 16 | 23 | .. |
| 17 | 47 | .. |
| 18 | 89 | .. |
| 19 | 93 | .. |
| 20 | 95 | 2 |
| 21 | 117 | 1 |
| 22 | 87 | .. |
| 23 | 95 | .. |
| 24 | 67 | 2 |
| 25 | 63 | 1 |
| 26 | 47 | .. |
| 27 | 40 | .. |
| 28 | 30 | .. |
| 29 | 34 | 1 |
| 30 | 33 | .. |
| 31 | 17 | 1 |
| 32 | 24 | 1 |
| 33 | 24 | .. |
| 34 | 17 | .. |
| 35 | 14 | .. |
| 36 | 19 | .. |
| 37 | 16 | .. |
| 38 | 8 | .. |
| 39 | 17 | .. |
| 40 | 13 | .. |
| 41 | 5 | .. |
| 42 | 5 | .. |
| 43 | 6 | .. |
| 44 | 3 | .. |
| 45 | 3 | .. |
| 46 | 1 | .. |
| Totals | 1,160 | 9 |
The proportion of illegitimate births per 1,000 unmarried women—i.e., spinsters and widows—at the reproductive ages, covering a period of twenty-five years, is shown in the following table.
| Year. | Unmarried Women aged 15-45 Years. | Illegitimate Births. | Illegitimate-birth Rate per 1,000 Unmarried Women. |
|---|---|---|---|
| 1891 | 68,990 | 638 | 9.25 |
| 1896 | 89,722 | 834 | 9.30 |
| 1901 | 105,420 | 937 | 8.89 |
| 1906 | 116,506 | 1,132 | 9.72 |
| 1911 | 116,726 | 1,078 | 9.24 |
| 1916 | 125,461 | 1,159 | 9.24 |
The rates of illegitimacy in Australasia are quoted. The average rate for New Zealand for the ten years (4.33 per 100 of all births) compares favourably with that of the Commonwealth (5.48 per 100).
| Year. | Queensland. | New South Wales. | Victoria. | South Australia. | Western Australia. | Tasmania. | Commonwealth. | New Zealand. |
|---|---|---|---|---|---|---|---|---|
| 1908 | 7.54 | 6.80 | 5.77 | 4.44 | 4.35 | 5.24 | 6.16 | 4.26 |
| 1909 | 7.05 | 6.44 | 5.94 | 4.18 | 3.95 | 5.45 | 6.01 | 4.61 |
| 1910 | 6.39 | 6.28 | 5.60 | 4.32 | 4.13 | 5.33 | 5.75 | 4.47 |
| 1911 | 6.22 | 6.14 | 5.96 | 4.21 | 4.47 | 5.33 | 5.79 | 4.09 |
| 1912 | 6.14 | 5.64 | 5.72 | 4.71 | 4.39 | 4.78 | 5.53 | 4.28 |
| 1913 | 6.22 | 5.35 | 6.03 | 4.18 | 4.40 | 5.18 | 5.48 | 4.23 |
| 1914 | 5.77 | 5.29 | 5.56 | 3.87 | 4.22 | 5.90 | 5.26 | 4.59 |
| 1915 | 5.36 | 4.97 | 5.74 | 4.00 | 4.24 | 5.32 | 5.12 | 4.14 |
| 1916 | 5.11 | 4.73 | 5.15 | 3.80 | 3.75 | 5.05 | 4.77 | 4.10 |
| 1917 | 5.01 | 4.74 | 5.53 | 3.96 | 4.15 | 5.28 | 4.91 | 4.56 |
These figures show the proportion of illegitimate births to every 100 births for New Zealand to be fairly steady during the period, while the rates for Queensland, New South Wales, and the Commonwealth show a considerable fall.
An important Act was passed in 1894 and re-enacted in 1908, intituled the Legitimation Act, which makes provision for the legitimation of children born before marriage on the subsequent intermarriage of their parents. Under this Act any child born out of wedlock, whose parents afterwards intermarry, is deemed to be legitimized by such marriage on the birth being registered in the manner prescribed by the Act. For legitimation purposes Registrars must register a birth when called upon to do so by any person claiming to be the father of an illegitimate child; but such person is required to make a solemn declaration that he is the father, and that at the time of the birth there existed no legal impediment to his marriage with the mother of the child. He has also to produce the evidence of his marriage. It will thus be seen that registration becomes the test of legitimacy. The following is the number of legitimations in each year, and. the total to 1918, since the Act came into force:—
| Number of Children legitimized. | |||
|---|---|---|---|
| Year. | Previously registered. | Not Previously registered. | Total. |
| 1894 | 9 | 2 | 11 |
| 1895 | 55 | 13 | 68 |
| 1896 | 45 | 11 | 56 |
| 1897 | 34 | 14 | 48 |
| 1898 | 32 | 27 | 59 |
| 1899 | 28 | 13 | 41 |
| 1900 | 30 | 32 | 62 |
| 1901 | 28 | 19 | 47 |
| 1902 | 55 | 41 | 96 |
| 1903 | 41 | 24 | 65 |
| 1904 | 44 | 43 | 87 |
| 1905 | 48 | 36 | 84 |
| 1906 | 73 | 52 | 125 |
| 1907 | 75 | 39 | 114 |
| 1908 | 84 | 35 | 119 |
| 1909 | 67 | 62 | 129 |
| 1910 | 75 | 46 | 121 |
| 1911 | 76 | 46 | 122 |
| 1912 | 86 | 51 | 137 |
| 1913 | 89 | 72 | 161 |
| 1914 | 99 | 66 | 165 |
| 1915 | 100 | 67 | 167 |
| 1916 | 190 | 91 | 281 |
| 1917 | 213 | 96 | 309 |
| 1918 | 128 | 76 | 204 |
| Totals | 1,804 | 1,074 | 2,878 |
The large increase in the number of legitimation entries in 1916, 1917, and 1918 as compared with preceding years is no doubt due almost entirely to the continued duration of the war and the passing of the Military Service. Act. The prospect of a prolonged absence abroad, and the uncertainty as to whether he would ever return, naturally caused many a Reservist to make proper provision for his illegitimate issue.
The registration of still-births has been made compulsory in New Zealand as from the 1st March, 1913. During the ten months ended the 31st December, 1913, 467 still-births were registered; the number for 1914 was 679; for 1915, 728; for 3916, 682 ; for 1917, 694; and for 1918, 692. Still-births are not included either as births or as deaths in the various numbers and rates shown in this subsection and in that relating to deaths.
In the 701 still-births registered in 1918 are included nine cases of twins, twenty-seven cases where one child of twins was still-born, and one case where one child of triplets was still-born.
| Age of Mother, in Years. | Age of Father, in Years. | Illegitimate Cases. | Totals. | ||||||||
|---|---|---|---|---|---|---|---|---|---|---|---|
| Under 21. | 21 and under 25. | 25 and under 30. | 30 and under 35. | 35 and under 40. | 40 and under 45. | 45 and under 50. | 50 and under 65. | 65 and over. | |||
*This number represents 683 single cases and nine plural cases. Total number of still-births was 701. | |||||||||||
| 15 and under 16 | .. | .. | .. | .. | .. | .. | .. | .. | .. | 1 | 1 |
| 16 and under 17 | .. | .. | .. | .. | .. | .. | .. | .. | .. | 2 | 2 |
| 17 and under 18 | .. | .. | .. | .. | .. | .. | .. | .. | .. | .. | .. |
| 18 and under 19 | .. | 5 | .. | .. | .. | .. | .. | .. | .. | 1 | 6 |
| 19 and under 20 | .. | 2 | 2 | .. | 1 | .. | .. | .. | .. | 3 | 8 |
| 20 and under 21 | .. | 7 | 3 | 1 | .. | .. | .. | .. | .. | 5 | 16 |
| 21 and under 25 | .. | 23 | 35 | 14 | 3 | 2 | .. | 1 | .. | 8 | 86 |
| 25 and under 30 | 1 | 7 | 51 | 41 | 26 | 9 | 3 | 2 | .. | 7 | 153 |
| 30 and under 35 | .. | 1 | 12 | 69 | 62 | 29 | 9 | 6 | .. | 6 | 194 |
| 35 and under 40 | .. | .. | 2 | 18 | 61 | 38 | 20 | 10 | .. | 3 | 152 |
| 40 and under 45 | .. | .. | .. | 2 | 7 | 37 | 15 | 8 | .. | .. | 69 |
| 45 and under 46 | .. | .. | .. | .. | .. | .. | .. | .. | .. | .. | .. |
| 46 and under 47 | .. | .. | .. | .. | 1 | 1 | .. | 2 | .. | .. | 4 |
| 47 and under 48 | .. | .. | .. | .. | .. | .. | 1 | .. | .. | .. | 1 |
| Totals | 1 | 45 | 105 | 151 | 161 | 116 | 48 | 29 | .. | 36 | 692* |
The sexes recorded in cases of still-births during each of the last five years are as follows:—
| Year. | Male. |
|---|---|
| 1914 | 421 |
| 1915 | 382 |
| 1916 | 383 |
| 1917 | 375 |
| 1918 | 396 |
| Female. | Not stated. | Total. |
|---|---|---|
| 244 | 14 | 679 |
| 340 | 6 | 728 |
| 295 | 4 | 682 |
| 305 | 14 | 694 |
| 300 | 5 | 701 |
The number of births of Maoris registered during 1918 under the provisions of section 20 of the Births and Deaths Registration Amendment Act, 1912, was 1,171 (573 males, 598 females). Only 8 Maori births were registered under the main Act.
Regulations under the Cook Islands Act, 1915, providing for compulsory registration of births and deaths in the Cook Islands and Niue from the 1st July, 1916, were gazetted on the 29th June, 1916.
In the case of a birth a month is allowed in which to furnish the following particulars to a Registrar: The place and date of birth; the Christian name and sex of the child; the names and residence of both father and mother, and also (if Natives) whether of full blood, or quarter-, half-, or three-quarter caste. A clause provides for the registering of any birth that took place between the 31st December, 1899, and the 1st July, 1916.
Particulars required of deaths are much the same as in New Zealand proper, but the onus of registering is thrown on the occupier of the house where the death took place, or on any person present at the time of death. If the deceased in his or her last illness was attended by a medical practitioner a medical certificate must be supplied to the Registrar. Any person conducting a burial or a religious service thereat must notify the nearest Registrar in writing within one week.
Duplicates of all entries are kept by the Registrars of the High Court at Rarotonga and Niue respectively. A fine not exceeding £5 is imposed on persons supplying false information. No fees are payable for registration.
According to information from the Cook Islands Department, the following are the figures of births which occurred during the year 1918:—
MARRIAGE may be solemnized in New Zealand only on the authority of a Registrar's certificate, wither by a person whose name is on the list of officiating ministers under the Marriage Act, or before a Registrar or Deputy Registrar of Marriages duly appointed. No marriage can be legally solemnized before 8 o'clock in the forenoon or after 4 o'clock in the afternoon.
Notice of intended marriage must be given to the Registrar of the district within which the marriage is to be solemnized, and the party giving notice must have resided for three full days in the district. If the parties dwell in different districts, notice must be given to and a certificate obtained from the Registrar of each district.* In the case of a person under twenty-one, not being a widow or widower, the consent of parent or guardian is necessary before the Registrar's certificate can be issued.
The system of notice and certificate has obtained in New Zealand since 1855. By this system it is ensured not only that marriages are in order, but that no legally solemnized marriage escapes registration. Officiating ministers and Registrars are required to send to the Registrar-General returns of all marriages solemnized, and as the returns come in they are checked off with the entries in the Registrars' lists of notices received and certificates issued. In case of the non-arrival of a marriage return corresponding to any entry in the list of notices, inquiries are made as to whether solemnization has been effected. Inquiries are made similarly in respect of any marriage for which return is received, but for which there is no corresponding return of notice and certificate.
The marriage of a man with his deceased wife's sister was legalized in New Zealand in the year 1881, and the marriage of a woman with her deceased's husband's brother in 1901. Both Acts are retrospective, including in their provisions marriages solemnized before as well as those contracted after the statutes were passed, and declaring all such marriages to be valid, and the issue born thereof to be deemed born in lawful wedlock.
In the following table are shown the numbers and rates in each year since 1887. A column is added showing the index number for each year as compared with the average of the five years 1882-86, taken as 100.
The marriage-rate for the period under review—war years 1915-18 excepted—shows a general upward tendency, having been above 8 per 1,000 in each year since and including 1902. Reference to the diagram on page 119 will show that the marriage-rate was at its lowest in the period 1885 to 1895, and that the rate in the early years of registration was considerably in excess of that in even the best of recent years.
| Year. | Total Number of Marriages registered. | Marriage-rate. | |
|---|---|---|---|
| Per 1,000 of Population. | Compared with Rate in 1882-86, taken as 100. | ||
* Average for five years. | |||
| 1882-86 | 3,663* | 6.68 | 100 |
| 1887 | 3,563 | 5.97 | 89 |
| 1888 | 3,617 | 5.97 | 89 |
| 1889 | 3,632 | 5.93 | 89 |
| 1890 | 3,797 | 6.12 | 92 |
| 1891 | 3,805 | 6.04 | 90 |
| 1892 | 4,002 | 6.23 | 93 |
| 1893 | 4,115 | 6.22 | 93 |
| 1894 | 4,178 | 6.15 | 92 |
| 1895 | 4,110 | 5.94 | 89 |
| 1896 | 4,843 | 6.85 | 103 |
| 1897 | 4,928 | 6.83 | 102 |
| 1898 | 5,091 | 6.91 | 103 |
| 1899 | 5,461 | 7.28 | 109 |
| 1900 | 5,860 | 7.67 | 115 |
| 1901 | 6,095 | 7.83 | 117 |
| 1902 | 6,394 | 8.01 | 120 |
| 1903 | 6,748 | 8.23 | 123 |
| 1904 | 6,983 | 8.26 | 124 |
| 1905 | 7,200 | 8.28 | 124 |
| 1906 | 7,592 | 8.48 | 127 |
| 1907 | 8,192 | 8.91 | 133 |
| 1908 | 8,339 | 8.82 | 132 |
| 1909 | 8,094 | 8.33 | 125 |
| 1910 | 8,236 | 8.30 | 124 |
| 1911 | 8,825 | 8.7 | 130 |
| 1912 | 9,149 | 8.81 | 132 |
| 1913 | 8,813 | 8.25 | 124 |
| 1914 | 9,280 | 8.51 | 127 |
| 1915 | 10,028 | 9.12 | 137 |
| 1916 | 8,213 | 7.47 | 112 |
| 1917 | 6,417 | 5.84 | 87 |
| 1918 | 6,227 | 5.65 | 85 |
The normal tendency towards a gradual increase in the marriage-rate was rudely upset by the war of 1914-19. Taking the years seriatim, 1914 is little affected, the influences being of a counter-balancing nature. The succeeding year, 1915, in spite of the increasing dimunition in the number of males of marriageable age, established a record in point of marriages and—for the last half century—of rate also: This may be regarded as resulting almost wholly from the passing of the National Registration Act in 1915, and the desire of many men to be shown in the register as married, with a view to obtaining certain advantages or escaping certain obligations. Many marriages which would ordinarily have taken place in later years were thus celebrated in 1915. The result was to adversely affect the marriage-rate in 1916. The Military Service Act of 1916, which took into account only marriages taking place before May, 1915, had a further depressing influence. The absence, in increasing proportion, of a large part of the men of marriageable age with the Expeditionary Forces was felt still more severely in 1917 and 1918. In 1917 the rate descended to a level never previously reached; a position accentuated in 1918.
| Year. | March Quarter. | June Quarter. | September Quarter. | December Quarter. |
|---|---|---|---|---|
| 1909 | 1,914 | 2,290 | 1,763 | 2,127 |
| 1910 | 2,158 | 2,118 | 1,842 | 2,118 |
| 1911 | 1,943 | 2,600 | 1,967 | 2,315 |
| 1912 | 1,930 | 2,705 | 2,078 | 2,436 |
| 1913 | 2,339 | 2,414 | 1,813 | 2,247 |
| 1914 | 2,219 | 2,625 | 2,181 | 2,255 |
| 1915 | 1,984 | 2,728 | 2,247 | 3,069 |
| 1916 | 2,214 | 2,393 | 1,773 | 1,833 |
| 1917 | 1,511 | 1,805 | 1,505 | 1,596 |
| 1918 | 1,457 | 1,756 | 1,593 | 1,421 |
| Decennial average | 1,967 | 2,343 | 1,876 | 2,142 |
It will be seen that June quarter is apparently considered the most, propitious for the solemnization of marriage. The two years exceptional in this respect are 1910 and 1915. In the former year Easter fell in March; in the latter, December quarter was swelled by the influence of the National Registration Act of October, 1915.
The marriage-rate, measured by the total population, does not show the true position when, as in the case of New Zealand, the age constitution of the people fluctuates considerably. A more satisfactory standard is found in the number of persons of marriageable age, defined as meaning the unmarried and widowed of males aged twenty years and upwards and of females aged fifteen years and upwards. The rates are given for seven census years in the following table:—
| Year of Census. | Proportion of Unmarried per 1,000 of Total. | Proportion of Marriages per 1,000 of the | ||||
|---|---|---|---|---|---|---|
| Males. | Females. | Marriageable Men. | Marriageable Women. | Marriageable Persons. | Total Population. | |
| 1886 | 235.0 | 238.2 | 47.32 | 54.56 | 25.36 | 5.99 |
| 1891 | 238.2 | 268.5 | 47.78 | 47.97 | 23.94 | 6.04 |
| 1896 | 258.8 | 308.9 | 50.14 | 47.00 | 24.26 | 6.85 |
| 1901 | 275.5 | 331.8 | 54.11 | 49.78 | 25.93 | 7.83 |
| 1906 | 294.3 | 328.2 | 54.36 | 54.93 | 27.72 | 8.48 |
| 1911 | 286.5 | 314.9 | 57.60 | 58.38 | 28.99 | 8.70 |
| 1916 | 215.1 | 296.5 | 69.35 | 50.63 | 29.27 | 7.47 |
It will be noted from the above figures for 1916 that the withdrawal from the population of large numbers of men of marriageable ages has materially affected the proportions shown in the table. The proportion of unmarried males in the total male population has fallen considerably, while the proportion of marriages to the number of marriageable men shows a largo increase, this increase, however, being offset by a decrease in the similar proportions as shown by the rates for females.
A comparison of the marriage-rate for each State of the Australian Commonwealth with New Zealand for the ten years 1909-18 is given. The Commonwealth rate has for some years been higher than that of this country.
| Year. | Queensland. | New South Wales. | Victoria. | South Australia (Proper). | Western Australia. | Tasmania. | Commonwealth. | New Zealand. |
|---|---|---|---|---|---|---|---|---|
| 1909 | 7.97 | 8.15 | 7.48 | 8.38 | 7.59 | 7.85 | 7.90 | 8.33 |
| 1910 | 8.06 | 8.76 | 7.98 | 9.17 | 7.77 | 7.82 | 8.37 | 8.30 |
| 1911 | 8.41 | 9.24 | 8.34 | 9.81 | 8.44 | 7.76 | 8.79 | 8.70 |
| 1912 | 8.91 | 9.60 | 8.65 | 9.62 | 8.37 | 7.86 | 9.07 | 8.81 |
| 1913 | 8.67 | 9.02 | 8.13 | 9.40 | 8.19 | 8.27 | 8.66 | 8.25 |
| 1914 | 8.73 | 9.37 | 8.31 | 9.11 | 8.22 | 7.78 | 8.80 | 8.51 |
| 1915 | 8.93 | 9.68 | 9.00 | 9.02 | 8.01 | 8.02 | 9.14 | 9.12 |
| 1916 | 7.69 | 8.74 | 8.05 | 8.31 | 7.51 | 7.23 | 8.21 | 7.47 |
| 1917 | 7.16 | 7.09 | 6.76 | 7.52 | 5.25 | 5.72 | 6.87 | 5.84 |
| 1918 | 6.99 | 6.90 | 6.46 | 7.25 | 5.18 | 5.55 | 6.65 | 5.65 |
The average rate for New Zealand in normal years is higher than the rate for most of the European countries given in the table following:—
| Country. | Quinquennial Period. | Rate. |
|---|---|---|
| Bulgaria | 1907-11 | 9.3 |
| Roumania | 1910-14 | 9.2 |
| Hungary | 1908-12 | 8.9 |
| Serbia | 1908-12 | 8.7 |
| Russia | 1905-09 | 8.4 |
| England and Wales | 911-15 | 8.2 |
| Belgium | 1908-12 | 7.9 |
| German Empire | 1908-12 | 7.8 |
| Italy | 1910-14 | 7.5 |
| Austria | 1908-12 | 7.5 |
| Prance | 1910-14 | 7.2 |
| Netherlands | 1911-15 | 7.1 |
| Denmark | 1911-15 | 7.1 |
| Scotland | 1911-15 | 7.1 |
| Spain | 1910-14 | 6.9 |
| Norway | 1911-15 | 6.3 |
| Finland | 1910-14 | 5.9 |
| Sweden | 1911-15 | 5.9 |
| Switzerland | 1911-15 | 5.4 |
| Ireland | 1911-15 | 5.3 |
The table which follows gives information as to the conjugal condition of persons married in each of the past ten years, divorced men and women being classed as bachelors and spinsters.
| Year. | Marriages contracted between | Number of Divorced Persons married (included previously). | Total Marriages registered. | |||
|---|---|---|---|---|---|---|
| Bachelors and Spinsters. | Bachelors and Widows. | Widowers and Spinsters. | Widowers and Widows. | |||
| 1909 | 7,375 | 230 | 357 | 132 | 152 | 8,094 |
| 1910 | 7,440 | 306 | 342 | 148 | 150 | 8,236 |
| 1911 | 8,036 | 258 | 365 | 166 | 165 | 8,825 |
| 1912 | 8,350 | 253 | 413 | 133 | 204 | 9,149 |
| 1913 | 8,034 | 274 | 370 | 135 | 218 | 8,813 |
| 1914 | 8,672 | 276 | 398 | 134 | 204 | 9,280 |
| 1915 | 9,124 | 337 | 394 | 173 | 227 | 10,028 |
| 1916 | 7,323 | 329 | 408 | 153 | 230 | 8,213 |
| 1917 | 5,613 | 284 | 369 | 151 | 218 | 6,417 |
| 1918 | 5,370 | 284 | 427 | 146 | 261 | 6,227 |
The figures for 1918 are given herewith in more detail as to conjugal condition of bride and bridegroom immediately prior to the marriage.
| Condition of Bridegrooms. | Condition of Brides. | |||
|---|---|---|---|---|
| Spinsters. | Divorced Women. | Widows. | Total. | |
| Bachelors | 5,157 | 86 | 268 | 5,511 |
| Divorced men | 118 | 9 | 16 | 143 |
| Widowers | 404 | 23 | 146 | 573 |
| Total | 5,679 | 118 | 430 | 6,227 |
Included amongst widows in 1918 are eleven married women, and amongst the widowers, three men, who elected to go through the form of marriage with other persons under the protection of the provisions of section 224, subsection (5), of the Crimes Act, which reads, " No one commits bigamy by going through a form of marriage if he or she has been continually absent from his or her wife or husband for seven years then last past, and is not proved to have known that his wife or her husband was alive at any time during those seven years."
The numbers of persons married under the protection of the above subsection during the past ten years are as shown in the following table:—
| Year. | Males. | Females. | Total. |
|---|---|---|---|
| 1909 | 3 | 13 | 16 |
| 1910 | 1 | 7 | 8 |
| 1911 | 3 | 15 | 18 |
| 1912 | 6 | 9 | 15 |
| 1913 | 4 | 5 | 9 |
| 1914 | 5 | 13 | 18 |
| 1915 | 5 | 7 | 12 |
| 1916 | 2 | 11 | 13 |
| 1917 | 8 | 21 | 29 |
| 1918 | 3 | 11 | 14 |
Of the persons married in 1918, 315 bridegrooms and 961 brides were under twenty-one years of age. Of the bridegrooms, six were between seventeen and eighteen, while thirty-four were between eighteen and nineteen. Of the brides, one was between fourteen and fifteen, three were between fifteen and sixteen, and twenty-eight between sixteen and seventeen years of age. A table is given showing relative ages of bridegrooms and brides in groups of years.
| Age of Bridegroom, in Years. | Age of Bride, in Years. | Total Bridegrooms. | ||||||
|---|---|---|---|---|---|---|---|---|
| Under 21. | 21 and under 25 | 25 and under 30 | 30 and under 35 | 35 and under 40 | 40 and under 45 | 45 and over. | ||
| Under 21 | 177 | 116 | 22 | .. | .. | .. | .. | 315 |
| 21 and under 25 | 366 | 658 | 167 | 18 | 4 | .. | 1 | 1,214 |
| 25 and under 30 | 257 | 834 | 626 | 143 | 39 | 8 | .. | 1,907 |
| 30 and under 35 | 108 | 358 | 383 | 225 | 73 | 20 | 6 | 1,173 |
| 35 and under 40 | 36 | 155 | 201 | 151 | 108 | 27 | 14 | 692 |
| 40 and under 45 | 11 | 48 | 74 | 81 | 75 | 41 | 32 | 362 |
| 45 and over | 6 | 26 | 49 | 76 | 111 | 108 | 188 | 564 |
| Total brides | 961 | 2,195 | 1,522 | 694 | 410 | 204 | 241 | 6,227 |
The following are the proportions of men and women married at each of certain age-periods to every 100 marriages in the years 1898, 1908, and 1918:—
| Age, in Years. | 1898. | 1908. | 1918. | |||
|---|---|---|---|---|---|---|
| Males. | Females. | Males. | Females. | Males. | Females. | |
| Under 21 | 1.57 | 18.13 | 2.12 | 16.05 | 5.06 | 15.43 |
| 21 and under 25 | 24.45 | 40.86 | 23.53 | 36.83 | 19.50 | 35.25 |
| 25 and under 30 | 39.29 | 27.32 | 38.67 | 28.59 | 30.62 | 24.44 |
| 30 and under 40 | 25.97 | 10.53 | 27.28 | 14.63 | 29.95 | 17.73 |
| 4 and under 50 | 5.60 | 2.12 | 5.31 | 2.84 | 9.94 | 5.47 |
| 50 and under 60 | 2.04 | 0.86 | 1.92 | 0.79 | 3.05 | 1.27 |
| 60 and under 70 | 0.90 | 0.18 | 0.88 | 0.26 | 1.54 | 0.35 |
| 70 and upwards | 0.18 | .. | 0.29 | 0.01 | 0.34 | 0.06 |
| 100.00 | 100.00 | 100.00 | 100.00 | 100.00 | 100.00 | |
The next table, showing similar information concerning bridegrooms during the past seven years, gives some indication of the effect of the war on the male population of the age-group twenty-five to thirty, which in recent years has contributed about three-eighths of the total bridegrooms. In each of the four years 1912-15, inclusive, this group remained fairly steady between the 37- and 38-per-cent. mark, but has fallen in each of the past three years to a level of 30.62 in 1918. The younger age-group of one to twenty-five exhibits a decrease in lesser degree.
| Age, in Years. | 1912. | 1913. | 1914. | 1915. | 1916. | 1917. | 1918. |
|---|---|---|---|---|---|---|---|
| Under 21 | 1.88 | 1.80 | 2.10 | 2.08 | 1.96 | 3.58 | 5.06 |
| 21 and under 25 | 22.63 | 22.04 | 22.04 | 23.33 | 23.07 | 21.63 | 19.50 |
| 25 and under 30 | 37.74 | 37.75 | 37.34 | 37.43 | 34.51 | 31.17 | 30.62 |
| 30 and under 40 | 29.54 | 29.63 | 28.99 | 28.22 | 29.39 | 30.25 | 29.95 |
| 40 and under 50 | 5.45 | 5.84 | 7.04 | 5.84 | 7.21 | 8.84 | 9.94 |
| 50 and under 60 | 1.86 | 1.84 | 1.61 | 1.95 | 2.41 | 2.96 | 3.05 |
| 60 and under 70 | 0.65 | 0.74 | 0.73 | 0.88 | 1.08 | 1.04 | 1.54 |
| 70 and upwards | 0.25 | 0.36 | 0.15 | 0.27 | 0.37 | 0.53 | 0.34 |
| 100.00 | 100.00 | 100.00 | 100.00 | 100.00 | 100.00 | 100.00 |
The decrease in the proportion of men at the ages at which marriages are usually solemnized is still further exemplified in the following statement giving average age of bridegrooms and brides over a series of years.
| Year. | Mean Age of Bridegrooms. | Mean Age of Brides. |
|---|---|---|
| 1899 | 29.86 | 25.48 |
| 1900 | 29.91 | 25.29 |
| 1901 | 29.72 | 25.54 |
| 1902 | 29.89 | 25.63 |
| 1903 | 29.89 | 25.84 |
| 1904 | 29.60 | 25.44 |
| 1905 | 29.65 | 25.75 |
| 1906 | 29.76 | 25.97 |
| 1907 | 29.83 | 26.07 |
| 1908 | 29.86 | 26.11 |
| 1909 | 30.11 | 26.40 |
| 1910 | 29.91 | 26.32 |
| 1911 | 30.12 | 26.48 |
| 1912 | 29.95 | 26.39 |
| 1913 | 30.15 | 26.42 |
| 1914 | 30.09 | 26.69 |
| 1915 | 30.03 | 26.56 |
| 1916 | 30.64 | 26.77 |
| 1917 | 31.19 | 27.07 |
| 1918 | 31.57 | 27.16 |
The average age of bridegrooms remained fairly constant during the earlier years of the period, with a gradual tendency to increase in latter years, but there is a fairly consistent increase in the average age of the brides. In England the mean age of those whose ages were stated was (average of the five years 1910-14) 29.02 years for men and 26.77 years for women. As in the case of New Zealand, ages of both bridegrooms and brides have risen swiftly during the war years, reaching in 1917, 30.04 years for bridegrooms and 27.27 for brides. Thus the average age at marriage in New Zealand would appear to be higher for men, but slightly lower for women, than in England. The average age of all spinsters married in New Zealand in 1918 was twenty-six years.
The foregoing figures give the average age at marriage, but these do not correspond with the popular age, if the age at which the most marriages are celebrated may be so termed.
In 1918 age twenty-eight holds pride of place for bridegrooms, and twenty-one in the case of brides. If the marriages of spinsters only be considered, age twenty-one is still the most popular for females.
Of every 1,000 men married in 1918, 51 were under twenty-one years of age, while 154 in every 1,000 brides were under twenty-one. The proportion of bridegrooms under twenty-one is in normal years 2 per cent. of the total number. The proportions for 1917 (3.6 per cent.) and 1918 (5.1 per cent.) therefore represent high increases in marriages of male minors. No corresponding rise occurs in the proportion of marriages of female minors. For comparison purposes the latest available figures (1917) of the Registrar-General of England are: males under twenty-one, 42 per 1,000 marriages; females, 134 per 1,000. It may be remarked that in England there has been no rise in the proportion of marriages of male minors similar to that experienced in New Zealand.
A table is given showing the number of bridegrooms and brides under and over the age of twenty-one during each of the past ten years, together with the percentages of minors included in the totals of grooms and brides.
| Year. | Bridegrooms. | Brides. | Minors, per 100 Marriages. | |||
|---|---|---|---|---|---|---|
| Adults. | Minors. | Adults. | Minors. | Bridegrooms. | Brides. | |
| 1909 | 7,951 | 143 | 6,785 | 1,309 | 1.76 | 16.17 |
| 1910 | 8,080 | 156 | 6,975 | 1,261 | 1.95 | 15.70 |
| 1911 | 8,653 | 172 | 7,499 | 1,326 | 1.95 | 15.02 |
| 1912 | 8,947 | 172 | 7,688 | 1,461 | 1.88 | 15.97 |
| 1913 | 8,654 | 159 | 7,419 | 1,394 | 1.80 | 15.82 |
| 1914 | 9,085 | 195 | 7,842 | 1,438 | 2.10 | 15.50 |
| 1915 | 9,819 | 209 | 8,516 | 1,512 | 2.08 | 15.07 |
| 1916 | 8,052 | 161 | 6,943 | 1,270 | 1.96 | 15.46 |
| 1917 | 6,187 | 230 | 5,343 | 1,074 | 3.58 | 16.74 |
| 1918 | 5,912 | 315 | 5,266 | 961 | 5.06 | 15.43 |
Registrars of Marriages are prohibited by law from issuing certificates for the marriage of minors without the consent of the parents or lawful guardians if there be any in New Zealand. If a declaration is made in any case that there is no such parent or lawful guardian resident in the Dominion, then a certificate may be issued after the expiration of fourteen days following the date on which the notice of intended marriage was given.
The ages at which persons may contract binding marriages are the same as in England—twelve years for females and fourteen for males. Marriage may be contracted at earlier ages than those stated, but would be voidable at the discretion of either of the parties upon reaching the age of twelve or fourteen, as the case may be, and without the necessity of proceedings in Court.
In connection with the fertility of marriages the succeeding table is of interest. The number of children born to the marriages in existence at the census in 1916 was over three. It should be kept in mind that this number does not represent the average children of a parent, but only the average children of the existing marriage, which is necessarily less than in the former case.
| Duration of existing Marriage. | Average of Issue born. | ||
|---|---|---|---|
| New Zealand, Census, 1916. | New Zealand, Census, 1911. | Australia, Census, 1911. | |
| Under 5 years | 0.88 | 1.21 | 0.89 |
| 5 to 9 years | 2.18 | 2.51 | 2.29 |
| 10 to 14 years | 3.05 | 3.54 | 3.34 |
| 15 to 19 years | 3.77 | 4.39 | 4.24 |
| 20 to 24 years | 4.35 | 5.23 | 5.05 |
| 25 to 29 years | 4.99 | 5.92 | 5.87 |
| 30 to 34 years | 5.65 | 6.78 | 6.67 |
| 35 to 39 years | 6.46 | 7.38 | 7.25 |
| 40 to 45 years | 7.16 | 7.81 | 7.74 |
| 45 and over | 7.76 | 8.34 | 8.37 |
| Unspecified | 3.05 | 3.61 | 4.53 |
| All periods | 3.24 | 3.94 | 3.78 |
The heavy decline from 1911 to 1916 may perhaps be discounted to some extent by the fact that in the prior year the proportion of cases where the number of issue was not stated formed nearly 12 per cent. of the total.
These cases were not included in computing the averages, and may have belonged in any proportion to any group. In 1916 the percentage of unstated cases was reduced to less than 1 per cent.
The continuous rise during ill periods of duration of marriage is at first glance rather curious, since additions to families after a marriage of thirty years' standing would be infinitesimal and would certainly not take place after forty years. It is, however, merely the effect of the steady decline in the once high birth-rate. Taking thirty years of marriage as the point marking the limit of fertility, then the average issue in respect of marriages of longer duration was 7.41 in 1911 and 6.52 in 1916.
Of the men married in 1918, five or 0.82 in every 1,000, and of the women nine or 1.44 per 1,000, signed the register by mark.
Although the figures with regard to this subject might be considered as an indication of the illiteracy of the people in past years, when the proportion of signatures by mark was relatively high, the figures have now fallen so low that fluctuations from year to year are mainly due to slight variations in the numbers of marriages of persons of foreign or Maori birth, and of persons under temporary or permanent physical disability.
The comparison over a period of twenty or thirty years, however, indicates an undoubted decrease in illiteracy. This is shown by the following table:—
| — | 1881. | 1891. | 1901. | 1914. | 1915. | 1916. | 1917. | 1918. |
|---|---|---|---|---|---|---|---|---|
| Male | 32.04 | 13.93 | 4.59 | 0.75 | 0.76 | 0.37 | 1.25; | 0.82 |
| Female | 57.98; | 16.82 | 6.23 | 1.51 | 1.00 | 0.24 | 2.02 | 1.44 |
Of the 6,227 marriages registered in 1918, Church of England clergymen officiated at 1,579, Presbyterians at 1,500, Methodists at 699, and Roman Catholics at 697, while 1,437 marriages wore celebrated before Registrars.
The following table shows the proportions of marriages by ministers of the principal denominations in the past five years:—
| Denomination. | Percentage of Marriages. | ||||
|---|---|---|---|---|---|
| 1914. | 1915. | 1916. | 1917. | 1918. | |
| Church of England | 26.28 | 26.76 | 25.73 | 24.54 | 25.36 |
| Presbyterians | 26.07 | 25.84 | 25.36 | 22.92 | 24.09 |
| Methodists | 12.30 | 11.83 | 10.47 | 10.44 | 11.22 |
| Roman Catholics | 11.07 | 11.18 | 12.02 | 11.94 | 11.19 |
| Other denominations | 5.51 | 5.83 | 5.37 | 5.39 | 5.06 |
| Before Registrars | 18.77 | 18.56 | 21.05 | 24.77 | 23.08 |
| 100.00 | 100.00 | 100.00 | 100.00 | 100.00 | |
The above figures must not be taken as a true indication of the religions of the parties married, as it does not necessarily follow that both parties are members of the Church whose officiating minister performed the ceremony, and persons married before Registrars may belong, in greater or lesser proportion, to any of the denominations. It will be noted that for the last three years the proportion of marriages by Registrars is decidedly high.
In cases where both parties to a marriage are of the Native race there is no necessity under the Marriage Act to comply with the provisions of that Act, though the parties are at liberty to take advantage thereof. Considerable inconvenience, however, has been found to exist on account of the non-registration of Maori marriages, and a section was inserted in the Native Land Act, 1909, whereby it was laid down that Maori marriages must be celebrated either under the provisions of the Marriage Act or in the presence of a registered officiating minister, but without complying with the other requirements of the Act. Ministers solemnizing the latter class of marriages must send returns to the Registrar-General.
Returns of 223 marriages in which both parties wore of the Native race were received during the year 1918. Of these, 26 were in accordance with the provisions of the Marriage Act. Maori marriages are not included in the numbers shown elsewhere in this subsection, nor are they taken into account in the computation of marriage-rates.
According to information received from the Cook Islands Department, the following are the figures of marriages solemnized in the Cook Islands during the year ending 31st March, 1918:—
| Island. | Number of Marriages. |
|---|---|
* Figures for year 1018. | |
| Rarotonga | 31 |
| Aitutaki | 11 |
| Mangaia | 3 |
| Palmerston (nine months) | .. |
| Manihiki (nine months) | .. |
| Mitiaro (nine months) | .. |
| Mauke (nine months) | .. |
| Island. | Number of Marriages. |
| Rakahanga (nine months) | 1 |
| Atiu | .. |
| Pukapuka (nine months) | 1 |
| Niue | 43* |
| Total | 90 |
The number of names on the list of officiating ministers under the Marriage Act is (June, 1919) 1,615, and the denominations to which they belong are shown hereunder:—
| Denomination. | Number. |
|---|---|
| Specified in statute— | |
| Church of England | 442 |
| Presbyterian Church of New Zealand | 346 |
| Methodist Church of New Zealand | 259 |
| Roman Catholic Church | 259 |
| Congregational Independents | 27 |
| Baptists | 54 |
| Lutheran Church | 7 |
| Hebrew Congregations | 5 |
| Not specified in statute— | |
| Church of Christ | 33 |
| Salvation Army | 107 |
| Catholic Apostolic Church | 4 |
| Old Catholic Church | 3 |
| Unitarians | 3 |
| Seventh-day Adventists | 16 |
| Latter-day Saints | 8 |
| Church of the Seven Rules of Jehovah | 17 |
| Ringatu Church | 12 |
| Others | 13 |
| Total | 1,615 |
The Ringatu Church and the Church of the Seven Rules of Jehovah are Maori denominations.
COMPULSORY registration of deaths was instituted in New Zealand in 1855. As in the case of births, a system of non-compulsory registration had obtained since 1848.
Until the year 1876 the only information provided for in the death-registration entry was as to date, place, and cause of death, and name, sex, age, and occupation of deceased. The Registration of Births and Deaths Act, 1875, required information to be recorded as regards parentage, conjugal condition, and issue of deceased. Particulars re burial had also to be entered, as well as more detailed information regarding cause of death. Subsequent amendments to the Act have made it requisite to give additional information concerning issue, and, in the case of married males, age of widow.
Every death occurring in New Zealand should be registered within three days after the day of the death if in a city or borough, or seven days in any other case. There is a penalty up to £10 for neglect, the undertaker in charge of the funeral being by the Amendment Act of 1912 made solely responsible for registration. Prior to 1913 the undertaker was primarily looked to for registration, but, in addition, the occupier of the house and every other person present at death were also responsible parties.
The law does not impose any limit of time after which a death may not be registered as it does in the case of a birth. It is not necessary to effect a death-registration entry in the case of a still-born child.
Any person burying or permitting or taking part in the burial of the body of any deceased person without a certificate of cause of death signed by a duly registered medical practitioner, a Coroner's order to bury the body, or a Registrar's certificate of registration of the death renders himself liable to a fine of £10.
The deaths registered in 1918 were 16,364, representing a rate of 14.84 per 1,000 of mean population. This total is easily a record for New Zealand. Only twice has the death-rate for 1918 ever been exceeded, viz., in 1864 and in 1875. On neither of these two occasions was the increase primarily due to an epidemic of any variety. Apart from the intervention of the world-wide epidemic of pneumonic influenza, the death-rate in 1918 remained normal.
The following table shows the number of deaths and the death-rate per 1,000 of the living population; also a comparison with the average rate for 1882-86:—
| Year. | Total Number of Deaths. | Death-rate. | |
|---|---|---|---|
| Per 1,000 of Population. | Compared with Rate in 1882-86, taken as 100. | ||
* Average for five years. | |||
| 1882-86 | 5,944* | 10.84 | 100 |
| 1887 | 6,137 | 10.29 | 95 |
| 1888 | 5,708 | 9.43 | 87 |
| 1889 | 5,772 | 9.44 | 87 |
| 1890 | 5,994 | 9.66 | 89 |
| 1891 | 6,518 | 10.35 | 95 |
| 1892 | 6,459 | 10.06 | 93 |
| 1893 | 6,767 | 10.23 | 94 |
| 1894 | 6,918 | 10.19 | 94 |
| 1895 | 6,863 | 9.91 | 91 |
| 1896 | 6,432 | 9.10 | 84 |
| 1897 | 6,595 | 9.14 | 84 |
| 1898 | 7,244 | 9.84 | 91 |
| 1899 | 7,680 | 10.24 | 94 |
| 1900 | 7,200 | 9.43 | 87 |
| 1901 | 7,634 | 9.81 | 90 |
| 1902 | 8,375 | 10.60 | 97 |
| 1903 | 8,528 | 10.40 | 96 |
| 1904 | 8,087 | 9.57 | 88 |
| 1905 | 8,061 | 9.27 | 86 |
| 1906 | 8,339 | 9.31 | 86 |
| 1907 | 10,066 | 10.95 | 101 |
| 1908 | 9,043 | 9.57 | 88 |
| 1909 | 8,959 | 9.22 | 85 |
| 1910 | 9,639 | 9.71 | 89 |
| 1911 | 9,534 | 9.39 | 87 |
| 1912 | 9,214 | 8.87 | 82 |
| 1913 | 10,119 | 9.47 | 87 |
| 1914 | 10,148 | 9.31 | 86 |
| 1915 | 9,965 | 9.06 | 84 |
| 1916 | 10,596 | 9.64 | 89 |
| 1917 | 10,528 | 9.58 | 88 |
| 1918 | 16,364 | 14.84 | 137 |
The death-rates of males and females for the last ten years are shown separately in the next table, also the number of male deaths to every 100 female deaths, and the death-rate of males expressed as an index number of the female rate, taking the latter as equal to 100.
| Year. | Deaths per 1,000 of the Total Population. | Male Deaths to every 100 Female Deaths. | Male Rate expressed as Index Number of Female Rate (= 100). | ||
|---|---|---|---|---|---|
| Males. | Females. | Total. | |||
| 1909 | 10.18 | 8.14 | 9.22 | 141 | 125 |
| 1910 | 10.67 | 8.63 | 9.71 | 139 | 124 |
| 1911 | 10.46 | 8.21 | 9.39 | 142 | 127 |
| 1912 | 9.83 | 7.79 | 8.87 | 140 | 126 |
| 1913 | 10.46 | 8.38 | 9.47 | 138 | 125 |
| 1914 | 10.53 | 7.98 | 9.31 | 144 | 132 |
| 1915 | 10.19 | 7.87 | 9.06 | 137 | 129 |
| 1916 | 11.14 | 8.13 | 9.64 | 138 | 138 |
| 1917 | 11.09 | 8.09 | 9.58 | 134 | 137 |
| 1918 | 18.03 | 11.77 | 14.84 | 147 | 153 |
Prior to the war period, the excess of male over female population had the effect of showing a smaller variation between death-rates for the two sexes than was indicated by a comparison of numbers of deaths.
The withdrawal of a large number of males between the ages of 20 and 45 for military service overseas, however, reduced the male population without proportionately reducing the total of male deaths. Consequently there has been a tendency towards an increase in the crude male death-rate. For 1917 and 1918 the excess of the female over the male population has resulted in higher figures in the last column (which shows the comparison between rates) than in the preceding column, which gives the comparison between the actual numbers of deaths.
For the purpose of considering the mortality in New Zealand more closely than can be done by means of crude death-rates, it is desirable to ascertain the rates at different age-periods of the population.
| Ages, in Years. | Averages, 1909-13. | 1914. | 1915. | 1916. | 1917. | 1918. | Increase 1909-13 to 1918. |
|---|---|---|---|---|---|---|---|
| Per Cent. | |||||||
| Under 5 | 17.21 | 15.01 | 14.27 | 15.49 | 14.02 | 14.12 | -18.54 |
| 5 and under 10 | 1.76 | 1.76 | 1.86 | 2.61 | 2.44 | 2.30 | +30.68 |
| 10 and under 15 | 1.35 | 1.19 | 1.47 | 1.59 | 1.39 | 1.98 | + 46.67 |
| 15 and under 20 | 2.15 | 1.95 | 1.83 | 2.35 | 2.05 | 5.16 | + 140.00 |
| 20 and under 25 | 2.89 | 2.78 | 3.19 | 3.16 | 3.40 | 10.03 | +247.06 |
| 25 and under 35 | 4.09 | 3.60 | 3.79 | 3.91 | 4.19 | 15.12 | + 209.68 |
| 35 and under 45 | 6.09 | 6.18 | 5.81 | 6.67 | 5.76 | 14.79 | + 142.86 |
| 45 and under 55 | 9.69 | 10.21 | 9.40 | 10.24 | 8.93 | 15.72 | + 62.23 |
| 55 and under 65 | 19.16 | 19.84 | 20.08 | 19.22 | 19.07 | 23.89 | + 24.69 |
| 65 and under 75 | 45.29 | 47.71 | 41.85 | 40.22 | 44.78 | 50.42 | + 11.33 |
| 75 and over | 136.80 | 138.31 | 134.83 | 142.75 | 128.55 | 145.94 | + 6.68 |
| All ages | 9.33 | 9.31 | 9.06 | 9.64 | 9.58 | 14.84 | + 59.06 |
Besides advantages of climate, New Zealand possesses a population younger in age constitution than that of most other countries—conditions favourable to a low rate of mortality. Another table is given comparing death-rates at twelve age-periods for 1917 with those of England and Wales. Here the extremely low rate of mortality in New Zealand among children under five years of age is remarkable, and the difference at some of the groups at the more advanced ages is considerable. The New Zealand rate for males is higher than that for females at all groups, while for England and Wales the male rate is less than that for females at 10-15 years, and is higher in every other instance. It may be noted that in only one instance is the Dominion rate higher than the corresponding rate in England and Wales. This occurs in the female death-rate for the age-period 25-35 years.
| Ages, in Years. | New Zealand. | England and Wales. | ||
|---|---|---|---|---|
| Males. | Females. | Males. | Females. | |
| Under 5 | 15.32 | 12.66 | 31.7 | 26.2 |
| 5 and under 10 | 2.66 | 2.21 | 3.2 | 3.0 |
| 10 and under 15 | 1.63 | 1.17 | 2.1 | 2.2 |
| 15 and under 20 | 2.08 | 2.02 | 8.5 | 3.1 |
| 20 and under 25 | 4.16 | 2.95 | 3.3 | |
| 25 and under 35 | 4.53 | 3.91 | 3.7 | |
| 35 and under 45 | 6.61 | 4.93 | 6.0 | |
| 45 and under 55 | 9.73 | 7.99 | 14.4 | 10.6 |
| 55 and under 65 | 20.23 | 17.63 | 29.4 | 22.2 |
| 65 and under 75 | 48.76 | 40.06 | 67.1 | 50.2 |
| 75 and under 85 | 118.09 | 100.20 | 157.5 | 126.8 |
| 85 and over | 286.23 | 244.88 | 302.1 | 280.6 |
| All ages | 11.09 | 8.10 | 17.8 | 12.1 |
The deaths occurring during 1918 are tabulated below in single ages up to five years, and thereafter in groups, showing males and females separately:—
| Ages. | Males. | Females. | Total. |
|---|---|---|---|
| Months. | |||
| Under 1 | 383 | 308 | 691 |
| 1-3 | 131 | 95 | 226 |
| 3-6 | 75 | 44 | 119 |
| 6-12 | 115 | 101 | 216 |
| Years. | |||
| 1-2 | 153 | 122 | 275 |
| 2-3 | 81 | 74 | 155 |
| 3-4 | 69 | 60 | 129 |
| 4-5 | 52 | 55 | 107 |
| 5-10 | 152 | 138 | 290 |
| 10-15 | 122 | 100 | 222 |
| 15-20 | 292 | 191 | 483 |
| 20-25 | 424 | 327 | 751 |
| 25-30 | 724 | 522 | 1,246 |
| 30-35 | 910 | 506 | 1,416 |
| 35-40 | 862 | 451 | 1,313 |
| Years. | |||
| 40-45 | 639 | 347 | 986 |
| 45-50 | 587 | 310 | 897 |
| 50-55 | 454 | 360 | 814 |
| 55-60 | 429 | 296 | 725 |
| 60-65 | 474 | 349 | 823 |
| 65-70 | 504 | 362 | 866 |
| 70-75 | 589 | 410 | 999 |
| 75-80 | 653 | 484 | 1,137 |
| 80-85 | 512 | 345 | 857 |
| 85-90 | 261 | 186 | 447 |
| 90-95 | 70 | 68 | 138 |
| 95-100 | 14 | 19 | 33 |
| 100 | 1 | .. | 1 |
| 104 | .. | 1 | 1 |
| 105 | 1 | .. | 1 |
| Totals | 9,733 | 6,631 | 16,364 |
The average age at death of persons of either sex in each of the ten years 1909-18 was as follows:—
| Males. | Females. | |
|---|---|---|
| 1909 | 42.76 years. | 38.78 years. |
| 1910 | 44.47 years. | 42.25 years. |
| 1911 | 46.17 years. | 42.37 years. |
| 1912 | 47.19 years. | 44.91 years. |
| 1913 | 46.26 years. | 43.04 years. |
| 1914 | 46.97 years. | 44.27 years. |
| 1915 | 47.24 years. | 44.71 years. |
| 1916 | 46.06 years. | 44.01 years. |
| 1917 | 48.33 years. | 45.51 years. |
| 1918 | 44.56 years. | 44.29 years. |
The drop in the average age at death in 1918 is the result of the influenza epidemic, the average age of those succumbing to influenza being, especially in the case of males, below the normal average age at death.
The 1915 issue of the Year-book contained results of a mortality investigation undertaken from the results of the five censuses 1891 to 1911, inclusive, in conjunction with the records of deaths. Considerations of space prevent the results being repeated in this volume, but a table follows showing the expectation of life in New Zealand, based on the experience of the quinquennium 1906-10.
| Age. | Males. | Females. |
|---|---|---|
| Years. | Years. | Years. |
| 0 | 59.165 | 61.764 |
| 1 | 63.125 | 64.816 |
| 2 | 62.836 | 64.503 |
| 3 | 62.168 | 63.843 |
| 4 | 61.407 | 63.053 |
| 5 | 60.581 | 62.211 |
| 6 | 59.724 | 61.350 |
| 7 | 58.849 | 60.465 |
| 8 | 57.959 | 59.576 |
| 9 | 57.057 | 58.672 |
| 10 | 56.144 | 57.754 |
| 11 | 55.225 | 56.834 |
| 12 | 54.306 | 55.913 |
| 13 | 53.388 | 54.994 |
| 14 | 52.474 | 54.079 |
| 15 | 51.570 | 53.172 |
| 16 | 50.677 | 52.273 |
| 17 | 49.795 | 51.385 |
| 18 | 48.923 | 50.505 |
| 19 | 48.058 | 49.634 |
| 20 | 47.200 | 48.770 |
| 21 | 46.348 | 47.914 |
| 22 | 45.502 | 47.067 |
| 23 | 44.659 | 46.226 |
| 24 | 43.819 | 45.391 |
| 25 | 42.979 | 44.562 |
| 26 | 42.137 | 43.740 |
| 27 | 41.296 | 42.922 |
| 28 | 40.454 | 42.107 |
| 29 | 39.614 | 41.292 |
| 30 | 38.775 | 40.477 |
| 31 | 37.937 | 39.659 |
| 32 | 37.101 | 38.841 |
| 33 | 36.268 | 38.023 |
| 34 | 35.439 | 37.207 |
| 35 | 34.614 | 36.396 |
| 36 | 33.794 | 35.588 |
| 37 | 32.978 | 34.784 |
| 38 | 32.166 | 33.981 |
| 39 | 31.353 | 33.177 |
| 40 | 30.540 | 32.368 |
| 41 | 29.726 | 31.555 |
| 42 | 28.913 | 30.739 |
| 43 | 28.103 | 29.923 |
| 44 | 27.300 | 29.107 |
| 45 | 26.507 | 28.294 |
| 46 | 25.725 | 27.485 |
| 47 | 24.952 | 26.680 |
| 48 | 24.188 | 25.880 |
| 49 | 23.429 | 25.085 |
| 50 | 22.672 | 24.295 |
| 51 | 21.919 | 23.511 |
| 52 | 21.170 | 22.734 |
| 53 | 20.428 | 21.963 |
| 54 | 19.695 | 21.200 |
| 55 | 18.972 | 20.443 |
| 56 | 18.262 | 19.694 |
| 57 | 17.562 | 18.953 |
| 58 | 16.872 | 18.220 |
| 59 | 16.188 | 17.494 |
| 60 | 15.508 | 16.774 |
| 61 | 14.831 | 16.061 |
| 62 | 14.161 | 15.357 |
| 63 | 13.502 | 14.666 |
| 64 | 12.857 | 13.990 |
| 65 | 12.229 | 13.331 |
| 66 | 11.618 | 12.689 |
| 67 | 11.026 | 12.067 |
| 68 | 10.455 | 11.463 |
| 69 | 9.907 | 10.878 |
| 70 | 9.383 | 10.311 |
| 71 | 8.884 | 9.762 |
| 72 | 8.407 | 9.231 |
| 73 | 7.953 | 8.722 |
| 74 | 7.519 | 8.237 |
| 75 | 7.102 | 7.777 |
| 76 | 6.703 | 7.341 |
| 77 | 6.321 | 6.929 |
| 78 | 5.958 | 6.539 |
| 79 | 5.615 | 6.168 |
| 80 | 5.294 | 5.815 |
| 81 | 4.995 | 5.478 |
| 82 | 4.716 | 5.156 |
| 83 | 4.453 | 4.848 |
| 84 | 4.201 | 4.552 |
| 85 | 3.954 | 4.262 |
| 86 | 3.709 | 3.976 |
| 87 | 3.467 | 3.697 |
| 88 | 3.233 | 3.428 |
| 89 | 3.001 | 3.165 |
| 90 | 2.765 | 2.900 |
| 91 | 2.523 | 2.632 |
| 92 | 2.280 | 2.366 |
| 93 | 2.046 | 2.113 |
| 94 | 1.825 | 1.876 |
| 95 | 1.613 | 1.650 |
| 96 | 1.409 | 1.436 |
| 97 | 1.214 | 1.232 |
| 98 | 1.030 | 1.042 |
| 99 | 0.864 | 0.871 |
| 100 | 0.720 | 0.723 |
| 101 | 0.599 | 0.600 |
It will be noted that while the expectation or average after-lifetime of males at age 0 is given as 59.165 years, the average age at death of males in 1918 is only 44.56 years. The reason for the difference in these figures is that the average age at death in 1918 is nothing more than the average of the ages of those dying in that year; and if the population be one with a preponderance of young people, as is the case in New Zealand, that preponderance of young ages must also be reflected among those dying in a particular year, who, after all, are largely a sample of the living.
The average ago at death in one particular year is therefore evidence of the age constitution of the population in that year rather than of the vitality of the people, though it is affected by both factors. In New Zealand it is on the whole constantly increasing, mainly because the population is gradually getting a due proportion of old people; but a largo immigration of young people or a sufficient increase in the birth-rate could send it down again by furnishing a greater number of deaths at low ages, oven without any change in the vitality.
The expectation of life is independent of these factors, being based upon the scientifically determined rates of mortality at every successive year of age, and could be said to represent the average age at death of, say, 100,000 people followed from birth to their final extinction by death. In the course of time, when the age constitution of the population of New Zealand approximates more closely to that existing in the older countries, the average age at death in a given year will tend to be in closer agreement with the actuarially ascertained expectation of life at ago 0.
A table is given showing the death-rates of the Australian States and Commonwealth, and of New Zealand, in each of the ten years 1909-18.
DEATH -RATES OF AUSTRALASIA PER 1,000 OF MEAN POPULATION , 1909-18.
| Country. | 1909. | 1910. | 1911. | 1912. | 1913. | 1914. | 1915. | 1916. | 1917. | 1918. |
|---|---|---|---|---|---|---|---|---|---|---|
| Queensland | 9.70 | 9.71 | 10.65 | 10.96 | 10.39 | 9.97 | 11.00 | 11.09 | 9.64 | 10.39 |
| New South Wales | 9.89 | 9.89 | 10.37 | 10.86 | 10.89 | 10.11 | 10.48 | 10.63 | 9.60 | 9.84 |
| Victoria | 11.45 | 11.49 | 11.45 | 12.23 | 11.11 | 11.59 | 11.10 | 11.70 | 10.36 | 10.70 |
| South Australia (proper) | 9.74 | 10.09 | 9.82 | 10.28 | 10.82 | 10.71 | 10.67 | 11.72 | 10.10 | 9.97 |
| Western Australia | 10.27 | 10.11 | 10.19 | 11.06 | 9.34 | 9.41 | 9.28 | 9.80 | 8.97 | 9.11 |
| Tasmania | 9.68 | 11.10 | 10.13 | 10.73 | 10.87 | 9.67 | 10.11 | 10.38 | 8.89 | 8.84 |
| Commonwealth | 10.33 | 10.43 | 10.66 | 11.23 | 10.87 | 10.51 | 10.66 | 11.04 | 9.80 | 10.09 |
| New Zealand | 9.22 | 9.71 | 9.39 | 8.87 | 9.47 | 3.31 | 9.06 | 9.64 | 9.58 | 14.84 |
New Zealand has ordinarily a lower death-rate than any of the Australian States, which, again, have considerably lower rates than other countries. The apparently disadvantageous position of New Zealand in the matter of the rate for 1918 is explained by the fact that the Dominion experienced the widespread influenza epidemic during 1918, while in the Commonwealth the outbreak did not occur till 1919, and will be reflected in the deaths for that year. A diagram is given on the following page showing the death-rates of England, Australia, and New Zealand in each year since 1887. The rates of England and Australia show a considerable fall throughout the period, but are in no year lower than the New Zealand rate.
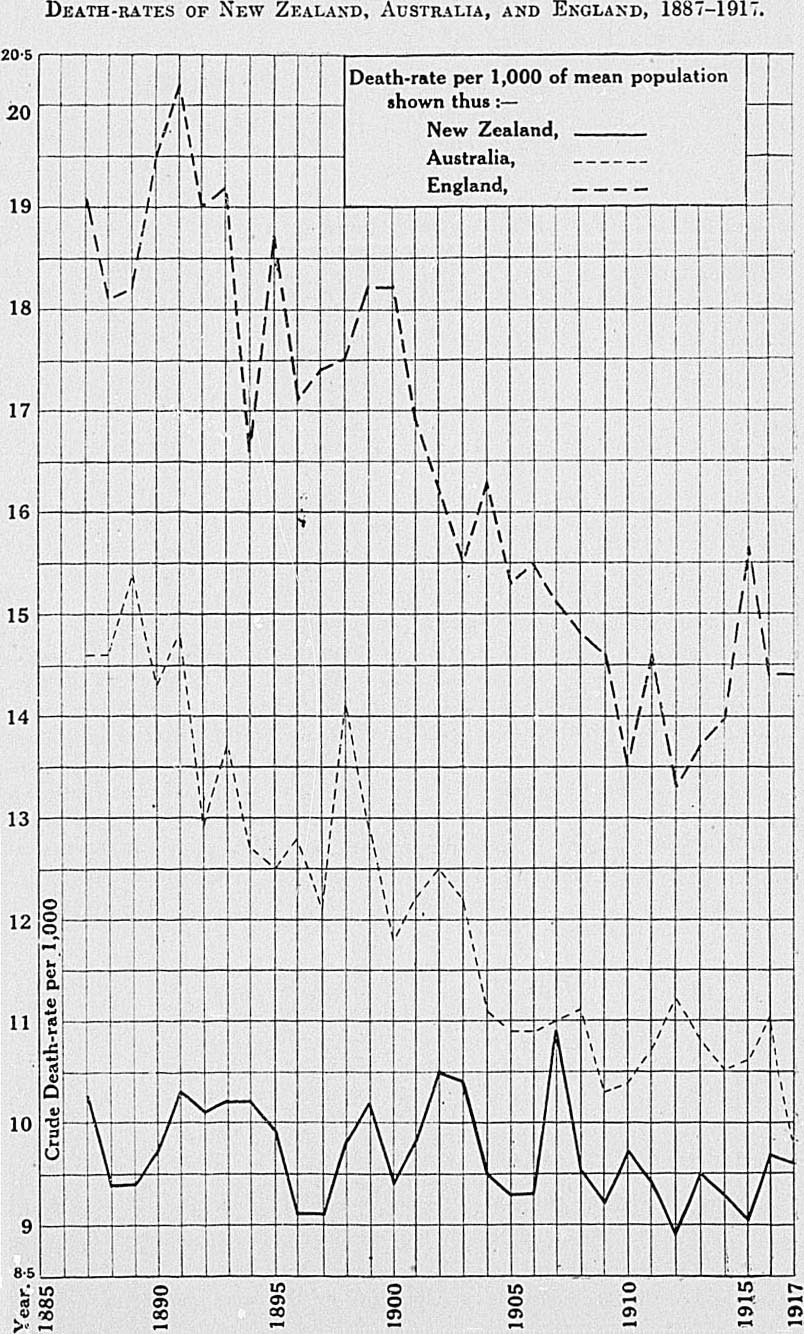
The death-rates of certain of the principal European and other countries are also given.
| Country. | Average of Five Years, 1909-13. | Year 1914. |
|---|---|---|
* Registration Area. † 1908-12. ‡ 1912. § 1913. | ||
| Denmark | 13.0 | 12.6 |
| Ontario | 13.1 | 11.8 |
| Netherlands | 13.3 | 12.4 |
| Norway | 13.4 | 13.5 |
| Sweden | 13.9 | 13.8 |
| England and Wales | 14.0 | 14.0 |
| United States* | 14.3 | 13.6 |
| Switzerland | 15.1 | 13.8 |
| Scotland | 15.4 | 15.5 |
| Belgium | 15.7† | 14.8‡ |
| German Empire | 16.3 | 15.0§ |
| Finland | 16.4 | 15.6 |
| Ireland | 16.9 | 16.3 |
| Prance | 18.3 | 19.6 |
| Italy | 20.0 | 17.9 |
| Austria | 21.8† | 20.5‡ |
| Jamaica | 22.7 | 21.4 |
| Spain | 22.9 | 22.1 |
| Serbia | 23.6† | 21.1‡ |
| Hungary | 24.6† | 23.3‡ |
| Roumania | 25.3 | 23.8 |
| Chile | 30.6 | 27.8 |
| Ceylon | 30.8 | 32.2 |
Perfect accuracy in comparing one country with another can be attained only by the use of what is termed an "index of mortality." The proportions of the living vary in regard to the different age-groups, and the ordinary death-rate-which is calculated on the population as a whole-does not afford a true means of judging of the relative healthiness of the places compared. But by taking a population like that of Sweden, and applying the percentage at each age-group to the death-rates, a standard of health or index of mortality can be arrived at. This has been done for New Zealand in accordance with a rsolution of the Statistical Conference held at Hobart in 1902, and the result is epressed in tabular form.
| Ages in Years. | Estimated Mean Population. | Number of Deaths. | Death-rate per 1,000. | Percentage of Population of Sweden, 1890 (Standard). | Index of Mortality in New Zealand per 1,000. |
|---|---|---|---|---|---|
| Under 1 | 25,860 | 1,252 | 48.41 | 2.55 | 1.23 |
| 1 and under 20 | 442,166 | 1,661 | 3.76 | 39.80 | 1.50 |
| 20 and under 40 | 338,242 | 4,726 | 13.97 | 26.96 | 3.77 |
| 40 and under 60 | 212,348 | 3,422 | 16.12 | 19.23 | 3.10 |
| 60 and upwards | 84,406 | 5,303 | 62.83 | 11.46 | 7.20 |
| Totals | 1,103,022 | 16,364 | 14.84 | 100.00 | 16.80 |
The New Zealand rates may be compared with those of the Australian States and of the Commonwealth standardized by the same system.
STANDARDIZED DEATH -RATES , 1908-17.
| Country. | 1908. | 1909. | 1910. | 1911. | 1912. | 1913. | 1914. | 1915. | 1916. | 1917. |
|---|---|---|---|---|---|---|---|---|---|---|
| New Zealand | 11.67 | 11.30 | 12.04 | 11.83 | 11.27 | 11.92 | 11.85 | 11.38 | 11.88 | 11.66 |
| Queensland | 14.56 | 13.80 | 12.44 | 13.57 | 1.91 | 13.25 | 12.70 | 14.30 | 14.37 | 12.64 |
| New South Wales | 13.88 | 13.44 | 12.36 | 13.23 | 13.63 | 13.61 | 12.72 | 13.24 | 13.48 | 12.45 |
| Victoria | 15.24 | 13.74 | 14.11 | 14.23 | 14.94 | 13.50 | 14.11 | 13.54 | 14.28 | 12.81 |
| South Australia | 13.15 | 12.57 | 12.39 | 12.18 | 12.76 | 13.25 | 13.03 | 13.09 | 14.45 | 12.65 |
| Western Australia | 15.80 | 15.07 | 13.31 | 13.47 | 14.55 | 12.58 | 12.56 | 12.79 | 14.15 | 12.93 |
| Tasmania | 15.34 | 13.14 | 13.59 | 12.97 | 13.69 | 13.54 | 12.11 | 13.04 | 13.43 | 11.78 |
| Commonwealth | 14.10 | 13.15 | 13.17 | 13.55 | 14.08 | 13.47 | 13.18 | 13.44 | 13.99 | 12.63 |
Where comparisons are restricted to the figures for different years in a country such as New Zealand, where the ago and sex constitution of the population is undergoing a gradual change, it is preferable to use as a standard the constitution of the population of the same country at some fixed date.
In the following table the rates have been standardized on the population as disclosed at the census of 1911.
The system of standardization adopted is similar to that used in arriving at the international index of mortality, but is more detailed. The population and deaths of each year of the period have been divided, each sex separately, into five-yearly groups of ages (with one group only for ages eighty and over), and the rates for the various groups ascertained and weighted according to the percentage which the respective age-groups bore to the total population at the census of 1911.
| Year. | Crude (Actual) Death-rate. | Standardized Rate. |
|---|---|---|
| 1872 | 11.39 | 12.36 |
| 1873 | 12.67 | 14.10 |
| 1874 | 12.98 | 13.79 |
| 1875 | 15.92 | 17.30 |
| 1876 | 12.66 | 14.09 |
| 1877 | 11.47 | 12.86 |
| 1878 | 10.96 | 12.76 |
| 1879 | 12.46 | 14.11 |
| 1880 | 11.46 | 12.70 |
| 1881 | 11.13 | 12.41 |
| 1882 | 11.19 | 13.06 |
| 1883 | 11.45 | 13.29 |
| 1884 | 10.39 | 11.88 |
| 1885 | 10.76 | 12.36 |
| 1886 | 10.54 | 12.17 |
| 1887 | 10.29 | 11.96 |
| 1888 | 9.43 | 11.72 |
| 1889 | 9.44 | 10.780 |
| 1890 | 9.66 | 11.25 |
| 1891 | 10.35 | 12.08 |
| 1892 | 10.06 | 11.75 |
| 1893 | 10.23 | 11.80 |
| 1894 | 10.19 | 11.56 |
| 1895 | 9.91 | 11.22 |
| 1896 | 9.10 | 10.35 |
| 1897 | 9.14 | 10.58 |
| 1898 | 9.84 | 11.50 |
| 1899 | 10.24 | 11.02 |
| 1900 | 9.43 | 10.21 |
| 1901 | 9.81 | 10.66 |
| 1902 | 10.50 | 11.41 |
| 1903 | 10.40 | 11.17 |
| 1904 | 9.57 | 9.87 |
| 1905 | 9.27 | 9.60 |
| 1906 | 9.31 | 9.66 |
| 1907 | 10.95 | 11.37 |
| 1908 | 9.57 | 9.94 |
| 1909 | 9.22 | 9.20 |
| 1910 | 9.71 | 9.63 |
| 1911 | 9.39 | 9.38 |
| 1912 | 8.87 | 8.87 |
| 1913 | 9.47 | 9.47 |
| 1914 | 9.31 | 9.31 |
| 1915 | 9.06 | 9.09 |
| 1916 | 9.64 | 9.22 |
| 1917 | 9.58 | 9.04 |
| 1918 | 14.84 | 14.66 |
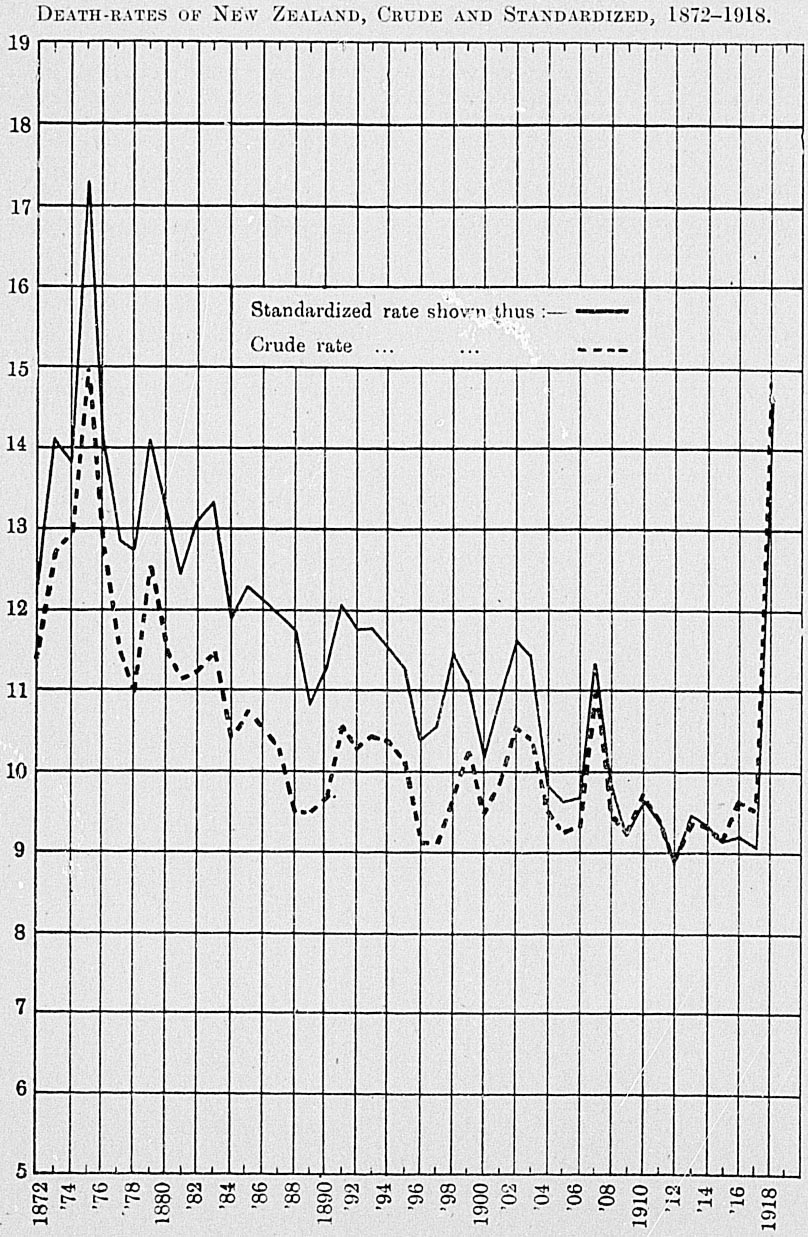
The occupations of males who died during 1918, arranged according to the census classification, are shown in the following table. Further details may be obtained from Volume 1 of "Statistics of the Dominion of New Zealand," 1918.
| Occupation. | Age, in Years. | Total. | ||||
|---|---|---|---|---|---|---|
| Under 20. | 20 and under 25. | 25 and under 45. | 45 and under 65. | 65 and over. | ||
| Professional | 18 | 135 | 485 | 143 | 136 | 917 |
| Domestic | 4 | 6 | 109 | 91 | 43 | 253 |
| Commercial | 25 | 48 | 430 | 260 | 200 | 963 |
| Engaged in transport and communication | 37 | 41 | 357 | 174 | 120 | 729 |
| Engaged in manufacturing | 25 | 39 | 354 | 191 | 222 | 831 |
| Engaged in building and construction | 3 | 8 | 186 | 87 | 156 | 440 |
| Other industrial workers | 51 | 50 | 458 | 396 | 489 | 1,444 |
| Agricultural and pastoral | 62 | 67 | 598 | 528 | 1,043 | 2,298 |
| Working in mines and quarries | .. | .. | 1 | 9 | 72 | 82 |
| Dependent relatives | 1,400 | 3 | 2 | .. | .. | 1,405 |
| Dependent on public or private support | .. | .. | 2 | 1 | 57 | 60 |
| Undefined or unknown | .. | 27 | 153 | 64 | 67 | 311 |
| 1,625 | 424 | 3,135 | 1,944 | 2,605 | 9,733 | |
As already explained in the subsection dealing with births, from January, 1917, an alteration has been made in the areas constituting the chief centres.
Metropolitan areas have been created at each of the four chief centres, and suburban areas at nine of the more important secondary centres. Each area includes, in addition to the central boroughs, a considerable non-municipalized area adjacent to and contingent on the centre.
Notwithstanding this alteration, however, the rates for 1917 and 1918 are reasonably comparable with those for past years.
The total number of deaths registered for the four metropolitan areas in the year 1918 was 6,460-viz., 4,554 in the cities and 1,906 in the suburban portions.
By including the suburban portions the death-rate for 1918 is lowered in the case of all four metropolitan areas. The rates for the year are,—
| Death-rates per 1,000 of Mean Population. | ||
|---|---|---|
| Auckland City | 21.40 | |
| Auckland Metropolitan Area | 18.07 | |
| Wellington City | 16.59 | |
| Wellington Metropolitan Area | 15.71 | |
| Christchurch City | 17.15 | |
| Christchurch Metropolitan Area | 15.47 | |
| Dunedin City | 16.40 | |
| Dunedin Metropolitan Area | 16.20 | |
The death-rates for the cities, including suburban boroughs, for live years are as below:—
| Deaths per 1,000 of Population. | |||||
|---|---|---|---|---|---|
| 1914. | 1915. | 1916. | 1917. | 1918. | |
*Metropolitan areas in 1917. | |||||
| Auckland (including suburbs)* | 9.42 | 9.05 | 9.58 | 10.45 | 18.07 |
| Wellington (including suburbs)* | 10.47 | 9.71 | 9.45 | 9.37 | 15.71 |
| Christchurch (including suburbs)* | 9.58 | 9.01 | 10.84 | 10.04 | 15.47 |
| Dunedin (including suburbs)* | 10.22 | 11.03 | 11.72 | 11.58 | 16.20 |
Wellington has proportionately fewer old people than the other three centres, and this explains largely its lower average death-rate. Dunedin, on the other hand, has a higher proportion of old people in its population than Auckland or Christchurch, and has consequently the highest death-rate of all four centres, notwithstanding its low rate of infantile mortality. In the five years, 1914-18, deaths of persons aged 65 or over in the four centres, including suburban boroughs, were,—
| 1914. | 1915. | 1916. | 1917. | 1918. | |
|---|---|---|---|---|---|
*Metropolitan areas in 1917. | |||||
| Auckland (including suburbs)* | 312 | 325 | 331 | 537 | 630 |
| Wellington (including suburbs)* | 214 | 192 | 220 | 261 | 303 |
| Christchurch (including suburbs)* | 245 | 269 | 296 | 412 | 472 |
| Dunedin (including suburbs)* | 288 | 308 | 320 | 358 | 417 |
The increase shown by the above figures since 1916 is, of course, largely due to the increased population covered by the now metropolitan areas.
If the number of deaths of infants under one year be excluded, the mortality among the rest of the population is found to have been for the years 1914-18 in the following ratio to the 1,000 living:—
| 1914. | 1915. | 1916. | 1917. | 1918. | |
|---|---|---|---|---|---|
* Metropolitan areas since 1916. | |||||
| Auckland (including suburbs)* | 8.19 | 7.39 | 8.39 | 9.29 | 16.81 |
| Wellington (including suburbs)* | 8.59 | 8.19 | 8.06 | 8.14 | 14.06 |
| Christchurch (including suburbs)* | 8.25 | 7.80 | 9.28 | 10.14 | 14.41 |
| Dunedin (including suburbs)* | 9.25 | 9.53 | 10.70 | 10.93 | 15.34 |
The infantile-mortality rates (deaths of children under one year of age to every 100 births) are as below. Caution must be exercised in comparing the last five years with previous years owing to alterations in system (vide subsection dealing with births). The rates per 100 births are,—
| 1914. | 1915. | 1916. | 1917. | 1913. | |
|---|---|---|---|---|---|
*Metropolitan areas since 1916. | |||||
| Auckland (including suburbs)* | 5.76 | 7.17 | 5.92 | 6.10 | 5.77 |
| Wellington (including suburbs)* | 8.26 | 6.28 | 6.51 | 5.65 | 7.12 |
| Christchurch (including suburbs)* | 6.82 | 5.42 | 6.67 | 4.93 | 5.28 |
| Dunedin (including suburbs)* | 5.43 | 7.23 | 5.47 | 4.02 | 4.60 |
Again, the percentage of deaths of children under five to the total number of deaths in 1918 was—in Auckland, 11.47; in Wellington, 15.11; in Christchurch, 10.73; in Dunedin, only 8.27.
Excluding suburbs, and dealing with the deaths at all ages in the four cities only, the rates for 1918 are found to be much higher than those for the previous year in all cases, especially that of Auckland. The figures for five years are given:—
| Deaths per 1,000 of Population. | |||||
|---|---|---|---|---|---|
| 1914. | 1915. | 1916. | 1917. | 1918. | |
| Auckland City | 10.43 | 9.99 | 11.10 | 12.36 | 21.40 |
| Wellington City | 10.73 | 10.02 | 9.73 | 10.05 | 16.59 |
| Christchurch City | 10.02 | 9.58 | 11.23 | 12.13 | 17.15 |
| Dunedin City | 11.00 | 11.58 | 12.36 | 12.23 | 16.40 |
Omitting the deaths of infants under one year, and calculating the rate on the population of one year of age and upwards, all four cities show higher rates in 1918 than in the previous year. The mean of the rates for five years are also given:—
| Deaths per 1,000 of Population, excluding Infants under One Year of Age. | ||||
|---|---|---|---|---|
| 1916. | 1917. | 1918. | Mean of Five Years. | |
| Auckland (excluding suburbs) | 9.60 | 11.02 | 20.07 | 11.64 |
| Wellington (excluding suburbs) | 8.26 | 8.73 | 14.90 | 9.87 |
| Christchurch (excluding suburbs) | 9.87 | 11.22 | 16.23 | 10.90 |
| Dunedin (excluding suburbs) | 11.29 | 11.58 | 15.54 | 11.73 |
The table following shows the number of living issue (male, female, and total) left by married men whose deaths were registered during the ten years 1909-18, the information being given according to age of father and of issue. It will be seen that during the period under review 22,068 fathers left issue to the number of 122,913, an average of 4.72. There were also 4,339 married men who died without leaving issue.
| Age of Issue, in Years. | Number of Issue left by Fathers dying within the Age-groups shown at Head of Column. | ||||||||
|---|---|---|---|---|---|---|---|---|---|
| 20 and under 30. | 30 and under 40. | 40 and under 50. | 50 and under 60. | 60 and under 65. | 65 and under 70. | 70 and under 80. | 80 and over. | Totals. | |
| Males. | |||||||||
| 0 | 70 | 193 | 67 | 34 | 5 | 1 | .. | .. | 376 |
| 1 | 76 | 241 | 142 | 28 | 7 | 0 | 1 | .. | 501 |
| 2 | 96 | 320 | 160 | 54 | 9 | 10 | 2 | .. | 651 |
| 3 | 70 | 328 | 198 | 79 | 13 | 3 | 4 | 2 | 697 |
| 4 | 50 | 291 | 208 | 78 | 13 | 10 | 6 | 1 | 657 |
| 5 | 31 | 317 | 243 | 77 | 15 | 15 | 11 | .. | 709 |
| 6 | 18 | 309 | 232 | 108 | 18 | 18 | 16 | 3 | 722 |
| 7 | 8 | 286 | 256 | 128 | 18 | 28 | 13 | 1 | 738 |
| 8 | 3 | 205 | 299 | 166 | 33 | 15 | 15 | 2 | 738 |
| 9 | 2 | 199 | 299 | 149 | 38 | 26 | 16 | 1 | 730 |
| 10 | 3 | 179 | 286 | 203 | 45 | 19 | 30 | 4 | 769 |
| 11 | .. | 131 | 295 | 227 | 51 | 37 | 29 | 2 | 772 |
| 12 | .. | 108 | 317 | 228 | 70 | 45 | 26 | 2 | 802 |
| 13 | .. | 71 | 290 | 261 | 70 | 52 | 44 | 8 | 802 |
| 14 | .. | 56 | 289 | 306 | 81 | 85 | 54 | 4 | 875 |
| 15 | .. | 32 | 259 | 301 | 94 | 62 | 62 | 9 | 820 |
| 16 | .. | 27 | 257 | 336 | 114 | 92 | 84 | 15 | 925 |
| 17 | .. | 6 | 233 | 354 | 153 | 104 | 96 | 10 | 956 |
| 18 | .. | 6 | 223 | 351 | 159 | 114 | 98 | 14 | 965 |
| 19 | .. | 3 | 164 | 410 | 182 | 146 | 145 | 27 | 1,077 |
| 20 | .. | 2 | 159 | 387 | 198 | 161 | 181 | 18 | 1,106 |
| 21 and over | .. | 5 | 417 | 4,026 | 4,600 | 6,566 | 18,426 | 10,597 | 44,637 |
| Unspecified | 9 | 51 | 101 | 169 | 118 | 156 | 316 | 25 | 945 |
| Total male issue | 442 | 3,366 | 5,400 | 8,460 | 6,110 | 7,772 | 19,075 | 10,745 | 61,970 |
| Age of Issue, in Tears. | Number of Issue left by Fathers dying within the Age-groups shown at Head of Column. | ||||||||
|---|---|---|---|---|---|---|---|---|---|
| 20 and under 30. | 30 and under 40. | 40 and under 50 | 50 and under 60. | 60 and under 65. | 65 and under 70. | 70 and under 80. | 80 and over. | Totals. | |
| Females. | |||||||||
| 0 | 86 | 181 | 92 | 25 | 4 | 1 | 1 | .. | 390 |
| 1 | 116 | 267 | 118 | 44 | 8 | 1 | 3 | .. | 557 |
| 2 | 78 | 299 | 175 | 72 | 14 | 4 | 4 | .. | 646 |
| 3 | 66 | 320 | 204 | 57 | 14 | 5 | 3 | 1 | 670 |
| 4 | 47 | 329 | 207 | 77 | 9 | 9 | 7 | 685 | |
| 5 | 33 | 293 | 253 | 88 | 12 | 9 | 9 | 2 | 699 |
| 6 | 29 | 268 | 249 | 110 | 17 | 10 | 7 | 4 | 694 |
| 7 | 9 | 269 | 253 | 143 | 27 | 20 | 12 | 1 | 734 |
| 8 | 4 | 210 | 266 | 148 | 29 | 17 | 20 | 2 | 696 |
| 9 | 7 | 202 | 301 | 174 | 38 | 27 | 18 | 3 | 770 |
| 10 | .. | 183 | 309 | 193 | 42 | 35 | 27 | 4 | 793 |
| 11 | 1 | 133 | 287 | 199 | 45 | 30 | 31 | 1 | 727 |
| 12 | .. | 109 | 292 | 254 | 06 | 53 | 40 | 6 | 820 |
| 18 | .. | 70 | 287 | 242 | 86 | 55 | 41 | 7 | 788 |
| 14 | .. | 44 | 266 | 277 | 79 | 56 | 55 | 5 | 782 |
| 15 | .. | 42 | 248 | 301 | 106 | 67 | 62 | 5 | 831 |
| 16 | .. | 20 | 250 | 321 | 115 | 91 | 75 | 9 | 881 |
| 17 | .. | 14 | 213 | 339 | 148 | 100 | 105 | 9 | 928 |
| 18 | .. | 6 | 197 | 331 | 160 | 115 | 123 | 13 | 945 |
| 19 | .. | 2 | 183 | 378 | 184 | 139 | 129 | 26 | 1,041 |
| 20 | 1 | 154 | 411 | 193 | 138 | 144 | 19 | 1,060 | |
| 21 and over | .. | 2 | 435 | 4,009 | 4,528 | 6,591 | 18,027 | 10,384 | 43,976 |
| Unspecified | 4 | 39 | 79 | 147 | 126 | 123 | 292 | 20 | 830 |
| Total female issue | 480 | 3,303 | 5,318 | 8,340 | 6,050 | 7,696 | 19,235 | 10,521 | 60,913 |
| Both Sexes. | |||||||||
| 0 | 62 | 374 | 159 | 59 | 9 | 2 | 1 | .. | 766 |
| 1 | 192 | 508 | 200 | 72 | 15 | 7 | 4 | .. | 1,058 |
| 2 | 174 | 619 | 335 | 126 | 23 | 14 | 6 | .. | 1,297 |
| 3 | 136 | 648 | 402 | 136 | 27 | 8 | 7 | 3 | 1,367 |
| 4 | 97 | 620 | 415 | 155 | 22 | 19 | 13 | 1 | 1,342 |
| 5 | 64 | 610 | 496 | 165 | 27 | 24 | 20 | 2 | 1,408 |
| 6 | 47 | 577 | 481 | 218 | 35 | 28 | 23 | 7 | 1,416 |
| 7 | 17 | 555 | 509 | 271 | 45 | 48 | 25 | 2 | 1,472 |
| 8 | 7 | 415 | 505 | 314 | 62 | 32 | 35 | 4 | 1,434 |
| 9 | 9 | 401 | 600 | 323 | 76 | 53 | 34 | 4 | 1,500 |
| 10 | 3 | 362 | 595 | 396 | 87 | 54 | 57 | 8 | 1,562 |
| 11 | 1 | 264 | 582 | 426 | 96 | 67 | 60 | 3 | 1,499 |
| 12 | .. | 217 | 609 | 482 | 142 | 98 | 66 | 8 | 1,022 |
| 13 | .. | 141 | 583 | 503 | 156 | 107 | 85 | 15 | 1,590 |
| 14 | .. | 100 | 555 | 583 | 160 | 141 | 109 | 9 | 1,657 |
| 15 | .. | 74 | 507 | 602 | 200 | 130 | 124 | 14 | 1,651 |
| 16 | .. | 47 | 507 | 657 | 229 | 183 | 159 | 24 | 1,806 |
| 17 | .. | 20 | 446 | 693 | 301 | 204 | 201 | 19 | 1,884 |
| 18 | .. | 12 | 420 | 682 | 319 | 229 | 221 | 27 | 1,910 |
| 19 | .. | 5 | 347 | 788 | 366 | 285 | 274 | 53 | 2,118 |
| 20 | .. | 3 | 313 | 798 | 391 | 299 | 325 | 37 | 2,166 |
| 21 and over | .. | 7 | 852 | 8,035 | 9,128 | 13,157 | 36,453 | 20,981 | 88,613 |
| Unspecified | 13 | 90 | 180 | 316 | 244 | 279 | 608 | 45 | 1,775 |
| Grand totals | 922 | 6,669 | 10,718 | 16,800 | 12,160 | 15,468 | 38,910 | 21,266 | 122,913 |
| Total male deathsMarried men who died— | 4,141 | 5,927 | 5,434 | 6,045 | 3,644 | 4,478 | 10,999 | 6,259 | 46,927 |
| (a ) Without leaving issue | 258 | 620 | 590 | 602 | 307 | 415 | 975 | 572 | 4,339 |
| (b ) Leaving issue | 545 | 2,574 | 2,965 | 3,649 | 2,332 | 2,820 | 7,088 | 4,095 | 26,068 |
Several tables dealing with orphanhood are given in full in the annual volume of "Statistics of the Dominion of New Zealand." Three of these, showing the number of issue under 14, under 16, and under 21 years of age left by married men whose deaths were registered during 1917, are summarized and given below:—
| Age at Death, in Years. | Married Men who died leaving Number of Issue under 14 Years of Age shown at Head of Column. | Total Number of Married Men who died leaving Issue under Age 14. | ||||||
|---|---|---|---|---|---|---|---|---|
| 1 | 2 | 3 | 4 | 5 | 6 | 7 and over. | ||
| 20 and under 25 | 12 | 3 | 3 | 1 | .. | .. | .. | 19 |
| 25 and under 30 | 89 | 52 | 27 | 9 | 3 | .. | .. | 180 |
| 30 and under 35 | 131 | 118 | 93 | 32 | 11 | 4 | 2 | 391 |
| 35 and under 40 | 108 | 134 | 106 | 62 | 21 | 21 | 13 | 465 |
| 40 and under 45 | 84 | 95 | 76 | 43 | 22 | 18 | 10 | 348 |
| 45 and under 50 | 76 | 63 | 48 | 33 | 10 | 6 | 7 | 243 |
| 50 and under 55 | 63 | 34 | 29 | 18 | 4 | 2 | 2 | 152 |
| 55 and under 60 | 51 | 27 | 13 | 5 | 3 | 1 | 3 | 103 |
| 60 and under 65 | 40 | 13 | 4 | 2 | 3 | 1 | 63 | |
| 65 and under 70 | 20 | 11 | 4 | .. | .. | 1 | .. | 36 |
| 70 and under 75 | 11 | 4 | 5 | 3 | .. | .. | .. | 23 |
| 75 and under 80 | 2 | 1 | 1 | 1 | .. | 1 | .. | 6 |
| 80 and over | 2 | 1 | .. | 1 | .. | .. | 4 | |
| Totals | 689 | 556 | 409 | 210 | 77 | 54 | 38 | 2,033 |
| Age at Death, in Years. | Married Men who died leaving Number of Issue under 16 Years of Age shown at Head of Column. | Total Number of Married Men who died leaving Issue under Age 16. | ||||||
|---|---|---|---|---|---|---|---|---|
| 1 | 2 | 3 | 4 | 5 | 6 | 7 and over. | ||
| 20 and under 25 | 12 | 3 | 3 | 1 | .. | .. | .. | 19 |
| 25 and under 30 | 89 | 52 | 27 | 9 | 3 | .. | .. | 180 |
| 30 and under 35 | 129 | 119 | 94 | 32 | 11 | 3 | 3 | 391 |
| 35 and under 40 | 111 | 130 | 107 | 65 | 27 | 17 | 18 | 475 |
| 40 and under 45 | 72 | 100 | 80 | 48 | 26 | 20 | 19 | 365 |
| 45 and under 50 | 75 | 61 | 52 | 40 | 18 | 9 | 11 | 266 |
| 50 and under 55 | 67 | 49 | 29 | 25 | 6 | 4 | 4 | 184 |
| 55 and under 60 | 66 | 28 | 22 | 9 | 6 | 2 | 3 | 136 |
| 60 and under 65 | 51 | 16 | 9 | 2 | 2 | 3 | 1 | 84 |
| 65 and under 70 | 29 | 10 | 9 | .. | .. | .. | 1 | 49 |
| 70 and under 75 | 16 | 8 | 4 | 3 | 3 | .. | .. | 34 |
| 75 and under 80 | 4 | 2 | 1 | 1 | .. | .. | .. | 9 |
| 80 and over | 2 | 1 | .. | .. | 1 | .. | 4 | |
| Totals | 723 | 579 | 437 | 235 | 103 | 58 | 61 | 2,196 |
| Age at Death, in Years. | Married Men who died leaving Number of Issue under 21 Years of Age, shown at Head of Column. | Total Number of Married Men who died leaving Issue under Age 21. | ||||||
|---|---|---|---|---|---|---|---|---|
| 1 | 2 | 3 | 4 | 5 | 6 | 7 and over. | ||
| 20 and under 25 | 12 | 3 | 3 | 1 | .. | .. | .. | 19 |
| 25 and under 30 | 89 | 52 | 27 | 9 | 3 | .. | .. | 180 |
| 30 and under 35 | 129 | 119 | 94 | 32 | 11 | 3 | 3 | 391 |
| 35 and under 40 | 106 | 132 | 106 | 69 | 23 | 21 | 18 | 475 |
| 40 and under 45 | 51 | 97 | 88 | 45 | 35 | 26 | 34 | 376 |
| 45 and under 50 | 63 | 65 | 48 | 54 | 36 | 14 | 28 | 308 |
| 50 and under 55 | 46 | 58 | 42 | 36 | 15 | 16 | 12 | 225 |
| 55 and under 60 | 63 | 42 | 37 | 23 | 19 | 6 | 7 | 197 |
| 60 and under 65 | 60 | 50 | 23 | 5 | 9 | 3 | 6 | 156 |
| 65 and under 70 | 48 | 25 | 19 | 4 | 5 | 2 | 2 | 105 |
| 70 and under 75 | 37 | 16 | 11 | 4 | 6 | 2 | 4 | 80 |
| 75 and under 80 | 16 | 3 | 5 | 3 | .. | .. | 1 | 28 |
| 80 and over | 13 | 3 | 1 | 1 | .. | 21 | ||
| Totals | 733 | 665 | 506 | 286 | 163 | 93 | 115 | 2,561 |
Of the 5,186 married men or widowers whose deaths were registered in 1918, 848 were shown to have been widowers, and 4,255 to have left widows; while in the remaining 83 cases there was no information given as to whether the deceased left a widow. Of the married men leaving widows, 3,589 had living issue also at time of death, and 666 had no living issue. In 729 cases widowers left issue, and in 119 cases no issue. In 43 of the 83 cases where no information was given as to whether a widow was left, there was living issue, in 39 cases no living issue, and in 1 case no information as to issue was given.
A table is given showing the relative ages of married men who died in 1918, and of their widows :—
| Age of Widow, in Years. | Age of Deceased, in Years. | ||||||||
|---|---|---|---|---|---|---|---|---|---|
| 20 and under 30. | 30 and under 40. | 40 and under 50. | 50 and under 60. | 60 and under 70. | 70 and under 80. | 80 and under 90. | 90 and upwards | Totals. | |
| 17 | 1 | .. | .. | .. | .. | .. | .. | .. | 1 |
| 18 | 3 | 1 | .. | .. | .. | .. | .. | .. | 4 |
| 19 | 3 | 2 | .. | .. | .. | .. | .. | .. | 5 |
| 20 and under 25 | 89 | 47 | 2 | 1 | 1 | .. | .. | .. | 140 |
| 25 and under 30 | 138 | 218 | 32 | 4 | 1 | .. | .. | .. | 393 |
| 30 and under 35 | 23 | 374 | 85 | 15 | 2 | 1 | .. | .. | 500 |
| 35 and under 40 | 3 | 224 | 193 | 46 | 4 | 3 | .. | .. | 473 |
| 40 and under 45 | 2 | 53 | 263 | 72 | 14 | 7 | 2 | .. | 413 |
| 45 and under 50 | .. | 9 | 134 | 162 | 43 | 23 | 3 | .. | 374 |
| 50 and under 55 | .. | 2 | 15 | 156 | 103 | 25 | 5 | .. | 306 |
| 55 and under 60 | .. | .. | 8 | 82 | 151 | 57 | 15 | 1 | 314 |
| 60 and under 65 | .. | .. | 2 | 17 | 145 | 116 | 29 | .. | 309 |
| 65 and under 70 | .. | .. | 1 | 6 | 72 | 132 | 33 | 1 | 245 |
| 70 and under 75 | .. | .. | .. | 2 | 14 | 145 | 46 | 4 | 211 |
| 75 and under 80 | .. | .. | .. | .. | 4 | 60 | 64 | 4 | 132 |
| 80 and under 85 | .. | .. | .. | .. | .. | 12 | 35 | 3 | 50 |
| 85 and under 90 | .. | .. | .. | .. | .. | 2 | 9 | 1 | 12 |
| 90 and upwards | .. | .. | .. | .. | .. | .. | .. | 2 | 2 |
| Ages not specified | 39 | 92 | 50 | 26 | 35 | 64 | 59 | 6 | 371 |
| Totals.. | 301 | 1,022 | 785 | 589 | 589 | 647 | 300 | 22 | 4,255 |
Subjoined is a classified statement of the deaths of infants under one year during 1918, with the ratio of the deaths in each class to the 1,000 births during the year:—
| Sex. | Under 1 Month. | 1 and under 3 Months. | 3 and under 6 Months. | 6 and under 12 Months. | Total under 12 Months. |
|---|---|---|---|---|---|
| NUMBER OF DEATHS . | |||||
| Male | 383 | 131 | 75 | 115 | 704 |
| Female | 308 | 95 | 44 | 101 | 548 |
| DEATHS PER 1,000 BIRTHS . | |||||
| Male | 29.18 | 9.98 | 5.72 | 8.76 | 53.64 |
| Female | 24.18 | 7.46 | 3.46 | 7.93 | 43.03 |
Fifty-four out of every thousand male children born, and forty-three of every thousand females, are found to have died before attaining the age of one year. The mortality was thus one in nineteen of male children, and one in twenty-three of females.
It will be seen from the figures that the chances of living during the first year of age are greater for female than for male infants. Thus, in proportion to the number of children of each sex born in 1918. there were during the year—
100 deaths of males to 83 deaths of females under 1 month of age;
100 deaths of males to 75 deaths of females from 1 to 3 months of age;
100 deaths of males to 60 deaths of females from 3 to 6 months of age;
100 deaths of males to 91 deaths of females from 6 to 12 months of age;
100 deaths of males to 80 deaths of females under 12 months of age.
Dealing with the results for ten years, the deaths of infants under one year are in the large proportion of 75 per cent. of the total deaths under five.
For 1918, the low proportion of deaths under five years to the total deaths at all ages (17.85 per cent.) constituted a record for the Dominion. Although the proportion was only 11.72 per cent. in 1918, the comparison is not a just one. Deaths of children were not less in number in 1918 than in 1917, but the total deaths were enhanced by the huge number of deaths due to the influenza epidemic, from which children experienced comparative immunity.
| Year. | Deaths of Children under 5 Years of Age. | Total Deaths at all Ages. | Deaths under 5 Years: Per Cent. of Mortality at all Ages. | |||||
|---|---|---|---|---|---|---|---|---|
| Under 1 Year. | 1 Year and under 2 Years. | 2 Years and under 3 Years. | 3 Years and under 4 Years. | 4 Year and under 5 Years. | Total under 5 Years. | |||
| 1909 | 1,634 | 242 | 115 | 75 | 44 | 2,110 | 8,959 | 23.55 |
| 1910 | 1,760 | 253 | 95 | 76 | 54 | 2,238 | 9,639 | 23.22 |
| 1911 | 1,484 | 206 | 122 | 99 | 69 | 1,980 | 9,534 | 20.77 |
| 1912 | 1,409 | 157 | 93 | 45 | 46 | 1,750 | 9,214 | 18.99 |
| 1913 | 1,653 | 223 | 104 | 65 | 54 | 2,099 | 10,119 | 20.74 |
| 1914 | 1,456 | 199 | 118 | 80 | 63 | 1,916 | 10,148 | 18.88 |
| 1915 | 1,394 | 204 | 125 | 65 | 80 | 1,868 | 9,965 | 18.75 |
| 1916 | 1,446 | 261 | 139 | 132 | 84 | 2,062 | 10,596 | 19.46 |
| 1917 | 1,360 | 196 | 132 | 102 | 89 | 1,879 | 10,528 | 17.85 |
| 1918 | 1,252 | 275 | 155 | 129 | 107 | 1,918 | 16,364 | 11.72 |
| Average of ten years | 1,485 | 222 | 120 | 87 | 69 | 1,982 | 10,507 | 18.86 |
| Year. | Deaths of Infants under 1 Year of Age. | Total Births registered. | Proportion of Deaths of Infants under 1 Year to every 1,000 Births. | ||||
|---|---|---|---|---|---|---|---|
| Under 1 Month | 1 Month and under 3 Months. | 3 Months and under 6 Months. | 6 Months and under 12 Months. | Total under 12 Months. | |||
| 1909 | 794 | 285 | 258 | 297 | 1,634 | 26,524 | 61.60 |
| 1910 | 786 | 298 | 333 | 343 | 1,760 | 25,984 | 67.73 |
| 1911 | 751 | 217 | 234 | 282 | 1,484 | 26,354 | 56.31 |
| 1912 | 827 | 188 | 192 | 202 | 1,409 | 27,508 | 51.22 |
| 1913 | 830 | 283 | 238 | 302 | 1,653 | 27,935 | 59.17 |
| 1914 | 818 | 241 | 192 | 205 | 1,456 | 28,338 | 51.38 |
| 1915 | 815 | 195 | 175 | 209 | 1,394 | 27,850 | 50.05 |
| 1916 | 770 | 212 | 228 | 236 | 1,446 | 28,509 | 50.70 |
| 1917 | 787 | 186 | 171 | 216 | 1,360 | 28,239 | 48.16 |
| 1918 | 691 | 226 | 119 | 216 | 1,252 | 25,860 | 48.41 |
| Average of ten years | 787 | 233 | 214 | 251 | 1,485 | 27,310 | 54.38 |
The figures regarding deaths of infants under one year of ago, as given for 1918 in the preceding table, show a decrease, compared with 1917. The infantile-mortality rates during the last two years are the most satisfactory ever experienced in New Zealand.
| Year. | New Zealand. | Auckland and Suburban Boroughs.* | Wellington and Suburban Boroughs.* | Christchurch and Suburban Boroughs.* | Dunedin and Suburban Boroughs.* |
|---|---|---|---|---|---|
* Metropolitan areas subsequent to 1916. | |||||
| 1909 | 61.60 | 61.85 | 84.21 | 62.78 | 48.52 |
| 1910 | 67.73 | 79.02 | 84.59 | 69.40 | 79.08 |
| 1911 | 56.31 | 63.02 | 73.36 | 62.90 | 43.42 |
| 1912 | 51.22 | 56.95 | 61.32 | 60.03 | 38.11 |
| 1913 | 59.17 | 80.81 | 60.23 | 63.49 | 73.42 |
| 1914 | 51.38 | 57.62 | 82.57 | 68.15 | 54.28 |
| 1915 | 50.05 | 71.67 | 57.17 | 54.24 | 72.26 |
| 1916 | 50.70 | 59.21 | 65.13 | 66.71 | 54.74 |
| 1917 | 48.16 | 60.96 | 56.55 | 49.32 | 40.16 |
| 1918 | 48.41 | 57.71 | 71.20 | 52.80 | 45.95 |
Although 14,848 infants under one year were lost to the Dominion by death during the ten years 1909-18, and, including these, 19,820 children under five, the next table shows more satisfactory results for New Zealand than for the Australian Commonwealth and its principal States in the matter of the preservation of infant life:—
| Year. | New Zealand. | Queensland. | New South Wales. | Victoria. | South Australia. | Australian Commonwealth. |
|---|---|---|---|---|---|---|
| 1913 | 59.17 | 63.35 | 77.78 | 70.53 | 69.83 | 72.21 |
| 1914 | 51.38 | 63.93 | 69.29 | 78.27 | 75.79 | 71.47 |
| 1915 | 50.05 | 64.33 | 67.67 | 68.78 | 67.04 | 67.52 |
| 1916 | 50.70 | 70.27 | 67.15 | 74.63 | 73.21 | 70.33 |
| 1917 | 48.16 | 53.87 | 56.93 | 56.82 | 53.06 | 55.91 |
| Means of five years | 51.89 | 63.15 | 67.76 | 69.81 | 67.79 | 67.49 |
Graphs follow showing the rates of infantile mortality (male and female) since 1870. The male and female birth-rates are also shown. The tendency for variations in the rates of the two sexes to occur simultaneously is very noticeable.
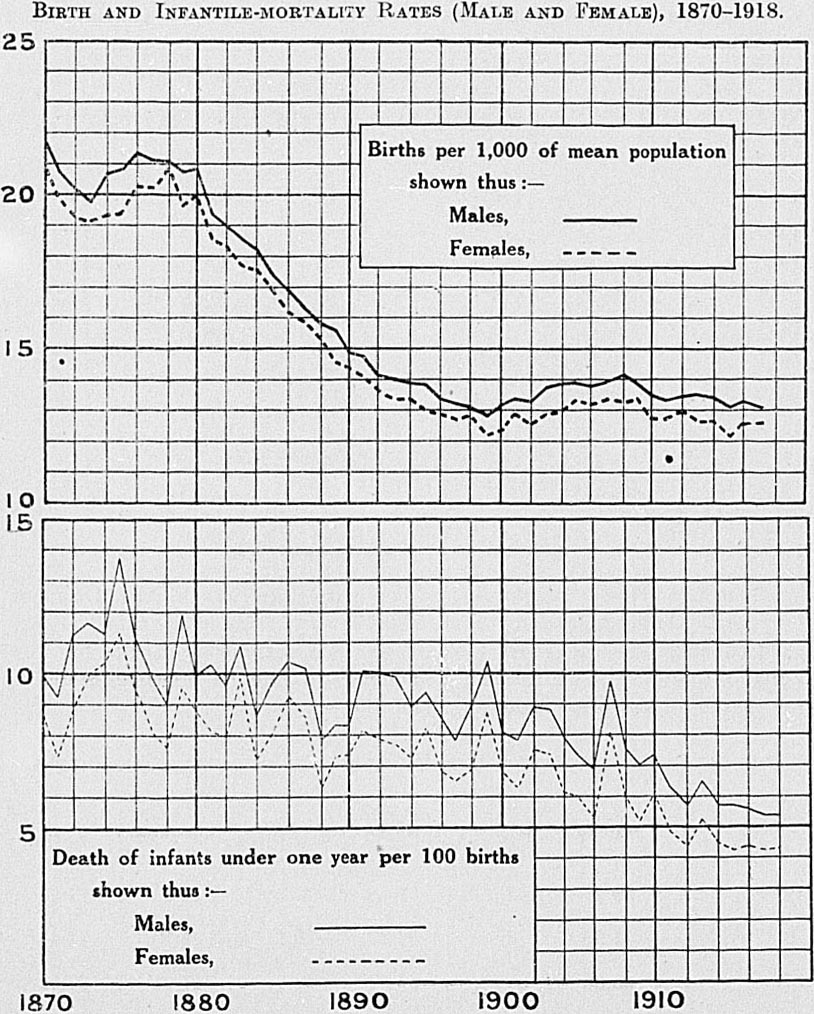
The principal causes of mortality in children under one year of age, together with the numbers of deaths in New Zealand from such causes during the five years 1914-18, are given below.
According to the medical certificates of death, premature birth stands first in importance, congenital debility next, followed by diarrhœa and enteritis.
| Causes. | Number of Deaths from each Cause. | Percentage of Total. | ||||||||
|---|---|---|---|---|---|---|---|---|---|---|
| 1914. | 1915. | 1916. | 1917. | 1918. | 1914. | 1915. | 1916. | 1917. | 1918. | |
| Whooping-cough | 53 | 50 | 63 | 29 | 20 | 3.64 | 3.58 | 4.36 | 2.13 | 1.60 |
| Convulsions | 51 | 55 | 74 | 56 | 53 | 3.50 | 3.95 | 5.12 | 4.12 | 4.23 |
| Bronchitis and pneumonia | 115 | 127 | 123 | 96 | 102 | 7.90 | 9.11 | 8.50 | 7.06 | 8.15 |
| Diarrhœa and enteritis | 163 | 115 | 164 | 146 | 50 | 11.19 | 8.25 | 11.34 | 10.74 | 3.99 |
| Malformations | 98 | 132 | 108 | 120 | 82 | 6.73 | 9.47 | 7.47 | 8.82 | 6.55 |
| Premature birth | 420 | 397 | 381 | 380 | 373 | 28.85 | 28.48 | 26.35 | 27.94 | 29.79 |
| Congenital debility | 246 | 211 | 215 | 208 | 239 | 16.90 | 15.14 | 14.87 | 15.29 | 19.09 |
| Other causes | 310 | 307 | 318 | 325 | 333 | 21.29 | 22.02 | 21.99 | 23.90 | 26.60 |
| Totals | 1,456 | 1,394 | 1,446 | 1,360 | 1,252 | 100.00 | 100.00 | 100.00 | 100.00 | 100.00 |
It is unlawful for any person to take charge of an infant under the age of six years, for the purpose of nursing or maintaining it apart from its parents or guardians, for a longer period than seven consecutive days, unless such person is licensed as a foster-parent.
Provision is made by law for the granting and revocation of licenses, and for the method of payment of maintenance-money. No payment is to be made to or received by a foster-parent except in pursuance of an agreement approved by the Secretary of Education, and if default be made in payment under the agreement the amount due, or part thereof may be paid by the Secretary, and shall be recoverable as a debt due to the Crown. When and so long as any money so recoverable remains unpaid the Secretary shall have and may exercise the powers of a guardian until the child attains the age of fifteen years. Provision is also made for the inspection of foster-homes, and the procedure in the case of the removal or death of foster-children is specified. The Act applies to any adopted infant in the same manner and to the same extent as if no such adoption had taken place. The Department of Education is the authority by whom the Act is administered.
The New Zealand Legislature in 1907 introduced provisions for early notification of birth, allowing seventy-two hours after birth if in a city or borough, or twenty-one days in any other case. The time allowed for notification in the case of a birth in a city or borough has now been reduced to forty-eight hours.
The classification of causes of death was made in 1908 for the first time in New Zealand according to the Bertillon Index of Diseases. This system has been adopted by the Commonwealth of Australia and the principal European and American countries. It is highly desirable for comparative purposes that uniformity of statistical method should obtain when possible.
The Bertillon system differs materially from that formerly in use, and comparisons of certain causes of mortality between years prior and subsequent to 1908 are impossible owing to changes in, the classification. This applies more particularly to diseases of the digestive, nervous, respiratory, and circulatory systems. There are, however, certain principal causes of death which are unaffected and retain their comparative value, such as cancer, tubercular diseases, typhoid fever, whooping-cough, measles, influenza, scarlet fever, diabetes, appendicitis, liver and puerperal diseases, suicide, and old age.
A comparison of the causes of deaths in 1918 and 1917 arranged according to an abridged classification, the percentage of each group to the total deaths, and the proportion per 10,000 persons living is given in the following table:—
| Class. | Number of Deaths. | Proportion to Total Deaths. | Proportion per 10,000 living. | |||
|---|---|---|---|---|---|---|
| 1918. | 1917. | 1918. | 1917. | 1918. | 1917. | |
| Per Cent. | Per Cent. | |||||
| I. General diseases | 8,141 | 2,719 | 49.75 | 25.83 | 73.81 | 24.73 |
| II. Diseases of the nervous system and of the organs of special sense | 1,150 | 1,105 | 7.03 | 10.50 | 10.43 | 10.05 |
| III. Diseases of the circulatory system | 1,795 | 1,688 | 10.97 | 16.03 | 16.27 | 15.35 |
| IV. Diseases of the respiratory system | 1,172 | 822 | 7.16 | 7.81 | 10.63 | 7.48 |
| V. Diseases of the digestive system | 649 | 824 | 3.96 | 7.83 | 5.88 | 7.50 |
| VI. Diseases of the genitourinary system and annexa | 453 | 475 | 2.77 | 4.51 | 4.11 | 4.32 |
| VII. Puerperal condition | 134 | 169 | 0.82 | 1.60 | 1.21 | 1.54 |
| VIII. Diseases of the skin and of the cellular tissue | 47 | 51 | 0.29 | 0.48 | 0.43 | 0.46 |
| IX. Diseases of the organs of locomotion | 24 | 18 | 0.15 | 0.17 | 0.22 | 0.16 |
| X. Malformations | 112 | 133 | 0.68 | 1.25 | 1.02 | 1.21 |
| XI. Infancy | 704 | 695 | 4.30 | 6.60 | 6.38 | 6.32 |
| XII. Old age | 1,229 | 1,001 | 7.51 | 9.51 | 11..14 | 9.12 |
| XIII. Violence | 661 | 685 | 4.04 | 6.61 | 5.99 | 6.23 |
| XIV. Ill-defined causes | 93 | 143 | 0.57 | 1.36 | 5.84 | 1.30 |
| Totals | 16,364 | 10,528 | 100.00 | 100.00 | 148.36 | 95.77 |
The next table shows the number of deaths from certain principal causes for the five years 1914-18, and the proportion per 10,000 of the population:—
| Cause. | Number of Deaths. | Proportion per 10,000 of Mean Population. | ||||||||
|---|---|---|---|---|---|---|---|---|---|---|
| 1914. | 1915. | 1916. | 1917. | 1918. | 1914. | 1915. | 1916. | 1917. | 1918. | |
| Typhoid fever | 48 | 52 | 37 | 41 | 33 | 0.44 | 0.47 | 0.34 | 0.37 | 0.30 |
| Measles | 33 | 64 | 93 | 17 | 15 | 0.30 | 0.58 | 0.85 | 0.15 | 0.14 |
| Scarlet fever | 22 | 44 | 52 | 30 | 30 | 0.20 | 0.40 | 0.47 | 0.27 | 0.27 |
| Whooping-cough | 74 | 80 | 98 | 44 | 27 | 0.08 | 0.73 | 0.89 | 0.40 | 0.24 |
| Diphtheria | 78 | 99 | 163 | 237 | 189 | 0.72 | 0.90 | 1.48 | 2.16 | 1.71 |
| Influenza | 63 | 110 | 73 | 38 | 5,516 | 0.58 | 1.00 | 0.66 | 0.35 | 50.01 |
| Pulmonary tuberculosis | 576 | 562 | 591 | 597 | 664 | 5.28 | 5.11 | 5.38 | 5.43 | 6.02 |
| Other forms of tuberculosis | 152 | 131 | 141 | 158 | 168 | 1.39 | 1.19 | 1.28 | 1.44 | 1.52 |
| Cancer | 904 | 900 | 909 | 957 | 936 | 8.29 | 8.19 | 8.27 | 8.71 | 8.49 |
| Diabetes | 152 | 148 | 154 | 144 | 195 | 1.40 | 1.35 | 1.40 | 1.31 | 1.77 |
| Exophthalmic goitre | 31 | 31 | 27 | 37 | 42 | 0.28 | 0.28 | 0.25 | 0.34 | 0.38 |
| Anæmia, chlorosis | 76 | 69 | 99 | 104 | 82 | 0.70 | 0.63 | 0.90 | 0.95 | 0.74 |
| Meningitis | 140 | 138 | 169 | 166 | 182 | 1.28 | 1.26 | 1.54 | 1.51 | 1.65 |
| Infantile paralysis | 9 | 3 | 123 | 10 | 4 | 0.08 | 0.03 | 1.12 | 0.09 | 0.04 |
| Apoplexy, cerebral hemorrhage | 441 | 403 | 478 | 472 | 470 | 4.05 | 3.68 | 4.35 | 4.29 | 4.26 |
| Epilepsy | 51 | 49 | 51 | 56 | 61 | 0.47 | 0.45 | 0.46 | 0.51 | 0.55 |
| Convulsions of children under 5 years of age | 62 | 77 | 105 | 62 | 70 | 0.57 | 0.70 | 0.95 | 0.50 | 0.63 |
| Organic heart-disease | 1,301 | 1,144 | 1,269 | 1,390 | 1,369 | 11.93 | 10.41 | 11.54 | 12.65 | 12.41 |
| Arterio-sclerosis | 106 | 87 | 71 | 83 | 0.97 | 0.72 | 0.79 | 0.65 | 0.75 | |
| Embolism, thrombosis | 101 | 52 | 75 | 62 | 53 | 0.93 | 0.47 | 0.68 | 0.50 | 0.48 |
| Bronchitis | 262 | 283 | 240 | 225 | 304 | 2.40 | 2.57 | 2.18 | 2.05 | 2.76 |
| Broncho-pneumonia | 139 | 136 | 127 | 121 | 200 | 1.28 | 1.24 | 1.15 | 1.10 | 1.81 |
| Pneumonia | 321 | 300 | 320 | 262 | 449 | 2.94 | 2.73 | 2.91 | 2.38 | 4.07 |
| Gastritis | 47 | 37 | 37 | 51 | 38 | 0.43 | 0.34 | 0.34 | 0.46 | 0.34 |
| Diarrhœea and enteritis.. | 265 | 244 | 302 | 306 | 147 | 2.43 | 2.22 | 2.75 | 2.78 | 1.33 |
| Appendicitis and typhlitis | 86 | 94 | 90 | 101 | 92 | 0.79 | 0.80 | 0.82 | 0.92 | 0.83 |
| Hernia, intestinal obstruction | 111 | 86 | 116 | 46 | 96 | 1.02 | 0.78 | 1.05 | 0.42 | 0.87 |
| Cirrhosis of liver | 41 | 51 | 53 | 33 | 41 | 0.40 | 0.46 | 0.48 | 0.30 | 0.37 |
| Simple peritonitis | 53 | 42 | 37 | 46 | 45 | 0.49 | 0.38 | 0.34 | 0.42 | 0.41 |
| Nephritis, Bright's disease | 261 | 207 | 304 | 271 | 287 | 2.39 | 2.43 | 2.76 | 2.46 | 2.69 |
| Cystitis | 45 | 28 | 51 | 49 | 26 | 0.41 | 0.25 | 0.46 | 0.45 | 0.24 |
| Diseases and accidents of puerperal condition | 118 | 131 | 167 | 109 | 134 | 1.08 | 1.19 | 1.52 | 1.54 | 1.21 |
| Malformations | 113 | 153 | 127 | 133 | 112 | 1.04 | 1.39 | 1.15 | 1.21 | 1.02 |
| Congenital debility | 252 | 217 | 222 | 208 | 239 | 2.31 | 1.97 | 2.02 | 1.89 | 2.17 |
| Premature birth | 420 | 397 | 381 | 381 | 373 | 3.85 | 3.61 | 3.47 | 3.47 | 3.38 |
| Senility | 812 | 793 | 883 | 1,001 | 1,229 | 7.45 | 7.21 | 8.03 | 9.11 | 11.14 |
| Violence (1) suicide | 137 | 113 | 147 | 124 | 113 | 1.26 | 1.03 | 1.34 | 1.18 | 1.02 |
| (2) accident, &c. | 647 | 623 | 595 | 561 | 548 | 5.93 | 5.67 | 5.41 | 5.10 | 4.97 |
| Other causes | 1,595 | 1,735 | 1,003 | 1,747 | 1,702 | 14.63 | 15.70 | 14.59 | 15.89 | 15.43 |
| Totals | 10,148 | 9,905 | 10,596 | 10,528 | 16,364 | 93.07 | 90.64 | 90.37 | 95.77 | 148.36 |
During the latter part of 1918 the Dominion was visited by a most virulent epidemic of influenza of a character similar to that experienced in most countries of the world in 1918 or 1919. The disease was more properly pneumonic influenza, and many deaths in the earlier stages of the outbreak were registered as caused by pneumonia, broncho-pneumonia, &c., which in the light of later knowledge would probably have been ascribed to influenza.
The deaths from influenza alone during 1918 reached a total of 5,516. This figure does not include Maori deaths—approximately 1,200—due to this disease.
While unprecedented in extent and virulence, the epidemic of 1918 had as its precursors at least two milder epidemics of influenza, one in 1852-53, and one in 1890-94. Some reference to them in passing may be of interest.
Of the first, few details remain. The following extract is taken from some "Observations on the Climate of the North Island of New Zealand," published in the New Zealand Gazette of 23rd December, 1853.
"Notice of the Epidemic Influenza.
"During the latter part of the year 1852, and the beginning of 1853, an Epidemic Influenza of singular severity prevailed all over New Zealand. .... it will be seen that forty-five soldiers were admitted into hospital with this disease, but many more were ill who managed to do their duty. On the old and the young it bore most heavily, and several of both classes died. This remark refers to the Anglo-Saxon and New Zealand races. There was nothing very peculiar about the elements of the climate when the disease prevailed, if I except an unequal distribution of electricity, and a large amount of rain and moisture in the air. Epidemic Influenza was prevalent in every part of the Southern Hemisphere I have heard from, during the years 1852 and 1853."
The effect of the outbreak on the civilian population is unknown, but it would be worse probably than on the troops, who would include few of the "old and young" whom it seemed to effect more severely. Twenty-eight of the 65th Regiment which, about 350 strong, was stationed at Wellington were admitted into hospital with "epedemic influenzia." The second outbreak, also of a mild type, commenced in 1889. Deaths from influenza, which had for the previous five years numbered less than nine per year, increased twentyfold, and the death-rate from this cause remained high for some years.
It would appear to have been more widespread than the number of deaths indicate. In the quinquennium 1891-5, some 1,198 cases of influenza were treated in hospitals, and of these only twenty-two died. It is interesting to note that the number of deaths from bronchitis and pneumonia increased somewhat suddenly at the same time.
| Year. | Deaths. |
|---|---|
| 1872 | 8 |
| 1873 | 6 |
| 1874 | 17 |
| 1875 | 15 |
| 1876 | 17 |
| 1877 | 9 |
| 1878 | 3 |
| 1879 | 15 |
| 1880 | 11 |
| 1881 | 10 |
| 1882 | 13 |
| 1883 | 11 |
| 1884 | 6 |
| 1885 | 5 |
| 1886 | 11 |
| 1887 | 9 |
| 1888 | 9 |
| 1889 | 9 |
| 1890 | 70 |
| 1891 | 210 |
| 1892 | 144 |
| 1893 | 106 |
| 1894 | 233 |
| 1895 | 125 |
| 1896 | 89 |
| 1897 | 120 |
| 1898 | 219 |
| 1899 | 135 |
| 1900 | 181 |
| 1901 | 219 |
| 1902 | 117 |
| 1903 | 56 |
| 1904 | 113 |
| 1905 | 70 |
| 1906 | 132 |
| 1907 | 223 |
| 1908 | 64 |
| 1909 | 47 |
| 1910 | 141 |
| 1911 | 63 |
| 1912 | 65 |
| 1913 | 56 |
| 1914 | 63 |
| 1915 | 110 |
| 1916 | 73 |
| 1917 | 38 |
| 1918 | 5,516 |
In 1918 influenza caused very many more deaths than in the whole period since 1872, the year in which statistics of death-causation were first compiled.
The accompanying graph shows the remarkable rapidity with which the virulence of the epidemic both waxed and waned. Although cases had occurred at least two months before, it was not until the first week of November that the death-roll became large, and in little more than a month later the rate was again comparatively low. In the North Island, the death-rate reached its culminating point on November 23rd. In the South Island where the effect was slightly less severely felt, the rising wave of deaths kept pace with the North Island rate at the interval of five or six days, reaching its greatest height also on 23rd November. The decline was simultaneous in both Islands.
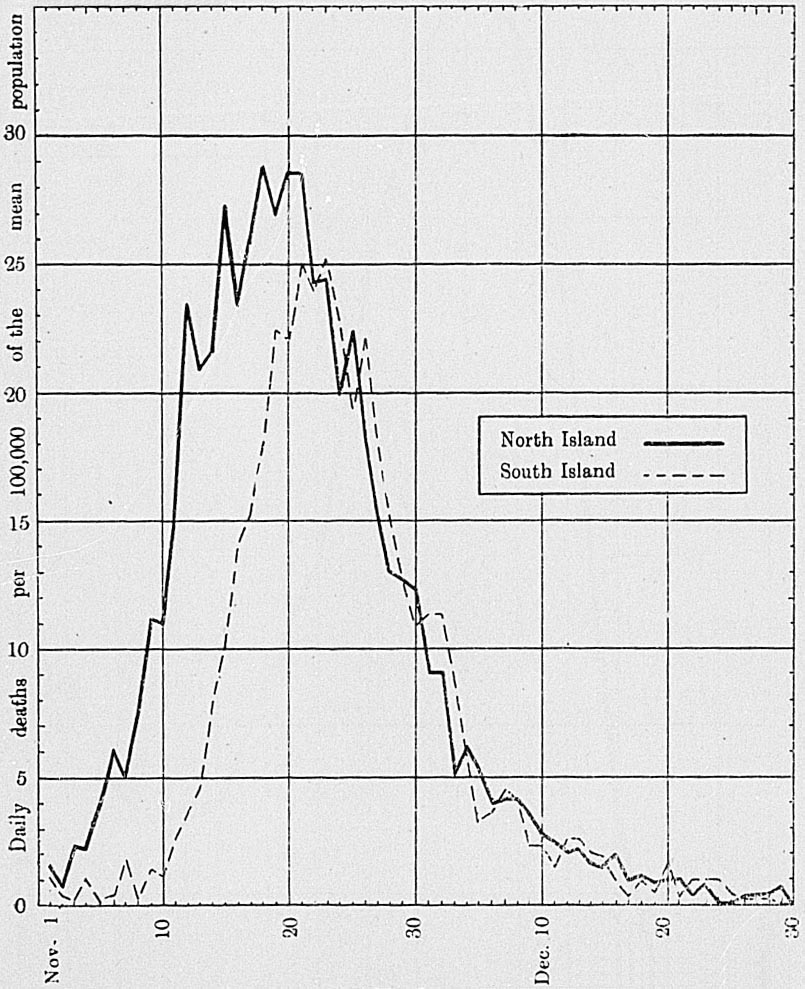
Of the four chief centres, Auckland, where the outbreak first assumed importance, suffered most severely.
| Death-rate per 1,000 Inhabitants. | |
|---|---|
| Auckland | 6.71 |
| Wellington | 5.94 |
| Christchurch | 4.25 |
| Dunedin | 3.70 |
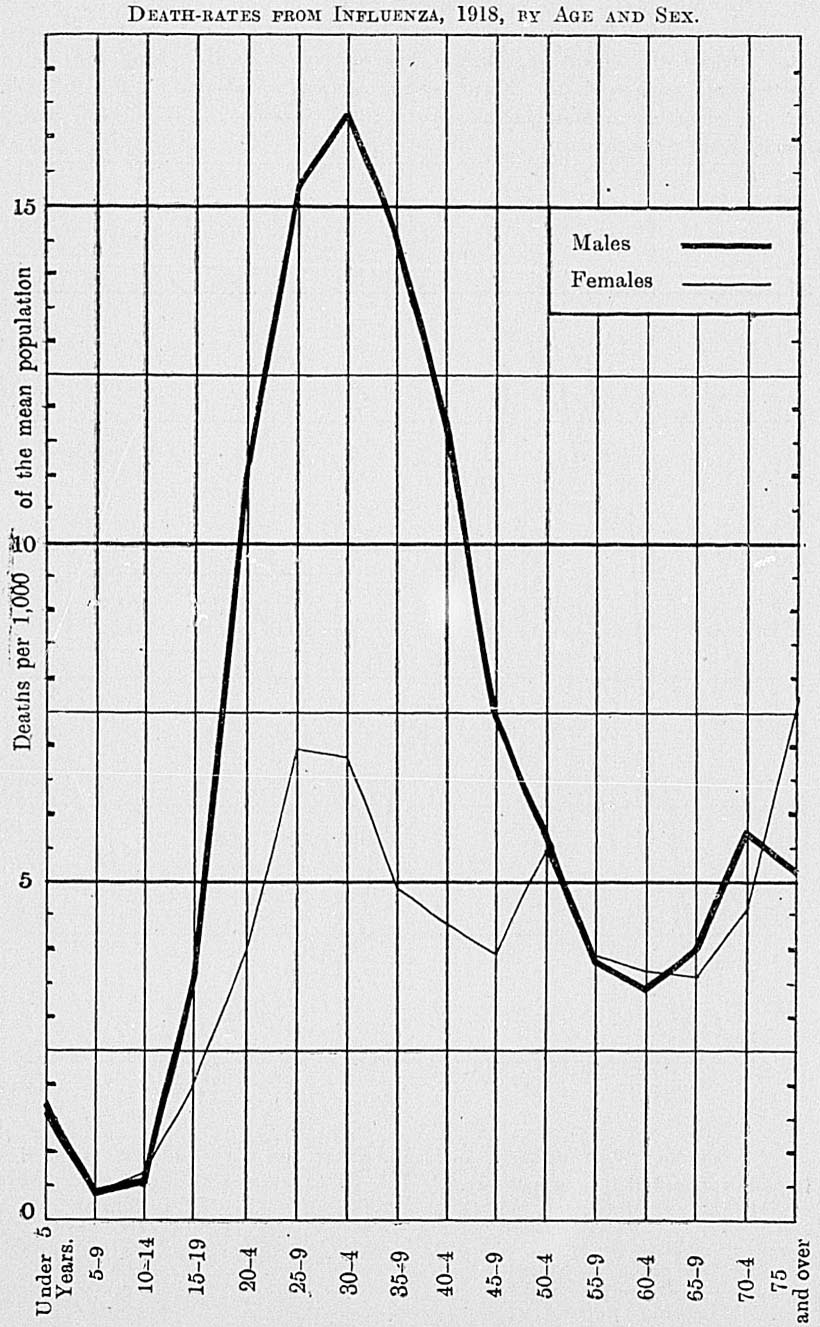
Of the 5,516 victims of influenza during 1918, 3,529 were males and 1,987 were females. The number of male deaths equals 6.54 per 1,000 of the male population, and the female deaths were 3.68 per 1,000 of the female population. Males, therefore, suffered almost twice as severely as females. Reference to the subsection on Morbidity will show that males not only contracted the disease in higher proportion than females, but that of those influenza patients admitted to hospitals males recovered in less proportion than females. The graph given in illustration shows the great disparity in mortality rates of the sexes. Under the age of fifteen the rates for both sexes are low and comparatively equal. Over the age of fifty-four the same is true, except that both rates are fairly high. But between those two groups lies the great bulk of the population, varying from youth to middle age, and with normally a comparatively low death-rate. Yet in this instance the death-rate soars very high, particularly so in the case of males. In the age-group 35-39 years inclusive, the male death-rate is more than three times the female rate. Possibly the fact that many thousands of males of good health and physique were temporarily absent from the country is an influencing factor.
In this the contrast between the latest and the earliest recorded visits of an influenza epidemic is conspicuous. In 1853 it was the old and the young who suffered most heavily; in 1918 they were comparatively immune.
The total of deaths from influenza given previously includes a certain number due to the more ordinary type. In general, it was not possible to distinguish from the death entries whether the death was caused by pneumonic influenza or by the common variety Influenza caused a yearly average of sixty-eight deaths during 1913-17.
There were also many hundreds of deaths in which some other disease was registered as the cause but which are directly attributable to the effects of the epidemic. Most of these are included under the headings of Bronchitis, Broncho-pneumonia, and Pneumonia.
| Deaths registered in 1918. | Average of Three Years previous. | |
|---|---|---|
| Bronchitis | 304 | 249 |
| Broncho-pneumonia | 200 | 128 |
| Pneumonia | 449 | 294 |
| 953 | 671 |
It would seem therefore that the epidemic caused, during 1918 alone approximately 6,000 deaths. No authoritative statistics are yet available of its ravages in other countries so that a comparison is not yet possible.
Pulmonary tuberculosis takes fifth place in point of the number of deaths resulting therefrom during 1918, ranking after influenza, heart-disease, senility, and cancer, in that order. Acute miliary tuberculosis is included with pulmonary. The average for the past ten years was 600, or 5.68 per 10,000. The last three years, contrary to the general tendency, have shown successive increases in rate.
| Year. | Deaths from Pulmonary Tuberculosis. | Rate per 10,000. |
|---|---|---|
| 1909 | 624 | 6.42 |
| 1910 | 582 | 5.86 |
| 1911 | 584 | 5.75 |
| 1912 | 567 | 5.46 |
| 1913 | 656 | 6.14 |
| Year. | Deaths from Pulmonary Tuberculosis. | Rate per 10,000. |
|---|---|---|
| 1914 | 576 | 5.28 |
| 1915 | 562 | 5.11 |
| 1916 | 591 | 5.38 |
| 1917 | 597 | 5.43 |
| 1918 | 664 | 6.02 |
Reference to the table will show that 530 persons known to have been born in the Dominion died during 1918 from phthisis, and 97 persons born elsewhere but resident in New Zealand for fifteen years or over succumbed to the disease.
| Length of Residence in the Dominion. | Age at Death, in Years. | ||||||||||
|---|---|---|---|---|---|---|---|---|---|---|---|
| Under 5 | 5 and under 10. | 10 and under 15. | 15 and under 25. | 25 and under 35. | 35 and under 45. | 45 and under 55. | 55 and under 65. | 65 and under 75. | 75 and upwards. | Total. | |
| Males. | |||||||||||
| Under 1 month | ... | ... | ... | ... | ... | 2 | ... | ... | ... | 2 | |
| 1 month and under 6 | ... | ... | ... | ... | ... | ... | ... | ... | ... | ... | ... |
| 6 months and under 12 | ... | ... | ... | ... | ... | ... | ... | ... | ... | ... | ... |
| 1 year and under 2 | ... | ... | ... | ... | ... | ... | ... | 1 | ... | ... | 1 |
| 2 years and under 3 | ... | ... | ... | ... | 1 | ... | 1 | ... | ... | ... | 2 |
| 3 years and under 4 | ... | ... | ... | 1 | 1 | 1 | ... | ... | 1 | ... | 4 |
| 4 years and under 5 | ... | ... | ... | ... | ... | 1 | ... | 1 | ... | ... | 2 |
| 5 years and under 10 | ... | ... | ... | 2 | 5 | 5 | 7 | 2 | ... | ... | 21 |
| 10 years and under 15 | ... | ... | ... | .. | 3 | 11 | 6 | ... | ... | ... | 20 |
| 15 years and under 20 | ... | ... | ... | 1 | 3 | 5 | ... | 1 | ... | ... | 10 |
| 20 years and under 25 | ... | ... | ... | ... | ... | ... | 1 | 3 | ... | ... | 4 |
| 25 years and upwards | ... | ... | ... | ... | 1 | 8 | 9 | 18 | 8 | ... | 47 |
| Not known or not stated | ... | ... | ... | 1 | 1 | 2 | 2 | 1 | 2 | ... | 9 |
| Birthplace unknown | ... | ... | ... | ... | 1 | 6 | 0 | 2 | 1 | ... | 12 |
| Born in Dominion | ... | 3 | 3 | 55 | 79 | 47 | 26 | 3 | 1 | 220 | |
| Totals | 3 | 3 | 3 | 61 | 100 | 84 | 54 | 31 | 12 | ... | 354 |
| Females. | ... | ... | ... | ... | ... | ... | ... | ... | ... | ... | |
| Under 1 month | ... | ... | ... | ... | ... | ... | ... | ... | ... | ... | |
| 1 month and under 6 | ... | ... | ... | ... | ... | ... | ... | ... | ... | ... | ... |
| 6 months and under 12 | ... | ... | ... | ... | ... | ... | ... | ... | ... | ... | ... |
| 1 year and under 2 | ... | ... | ... | ... | ... | ... | ... | ... | ... | ... | ... |
| 2 years and under 3 | ... | ... | ... | 1 | 1 | ... | ... | ... | ... | ... | 2 |
| 3 years and under 4 | ... | ... | ... | 1 | 2 | ... | ... | ... | ... | ... | 3 |
| 4 years and under 5 | ... | ... | ... | ... | 1 | 1 | ... | ... | ... | ... | 2 |
| 5 years and under 10 | ... | ... | 1 | 1 | 10 | 4 | 3 | ... | ... | ... | 19 |
| 10 years and under 15 | ... | ... | ... | 2 | 4 | 3 | 1 | 1 | ... | ... | 11 |
| 15 years and under 20 | ... | ... | ... | ... | 1 | 3 | ... | 1 | ... | ... | 5 |
| 20 years and under 25 | ... | ... | ... | ... | 2 | 1 | 1 | ... | 1 | ... | 5 |
| 25 years and upwards | ... | ... | ... | ... | ... | 5 | 8 | 16 | 3 | 1 | 27 |
| Not known or not stated | ... | ... | ... | ... | ... | ... | ... | ... | ... | ... | ... |
| Birthplace unknown | ... | ... | ... | ... | ... | 1 | 1 | 1 | 2 | ... | 5 |
| Born in Dominion | 5 | ... | ... | 81 | 74 | 54 | 14 | 3 | ... | 231 | |
| Totals | 5 | ... | 1 | 86 | 96 | 72 | 28 | 17 | 4 | 1 | 310 |
| Totals of both sexes | 8 | 3 | 4 | 147 | 196 | 156 | 82 | 48 | 16 | 4 | 664 |
The mortality-rate from all forms of tuberculosis has exhibited a very satisfactory decline for many years (vide graph on page 174). Ten years' figures are quoted.
| Year. | Mean Population. | Number of Deaths from Tubercular Diseases. | Rate per 10,000. | Percentage of Total Deaths from all Causes. |
|---|---|---|---|---|
(a ) All deaths; (b ) excluding deaths from influenza October-December, 1918. | ||||
| 1909 | 971,784 | 800 | 8.23 | 8.93 |
| 1910 | 992,02 | 731 | 7.36 | 7.58 |
| 1911 | 1,014,896 | 738 | 7.27 | 7.74 |
| 1912 | 1,039,016 | 716 | 6.89 | 7.77 |
| 1913 | 1,068,644 | 812 | 7.60 | 8.02 |
| 1914 | 1,090,328 | 728 | 6.67 | 7.17 |
| 1915 | 1,099,394 | 693 | 6.30 | 6.95 |
| 1916 | 1,099,49 | 742 | 6.74 | 7.00 |
| 1917 | 1,099,117 | 755 | 6.87 | 7.17 |
| 1918 | 1,103,022 | 832 | 7.54 | 5.08 (a ) |
| 7.64 (b ) | ||||
| Ages. | Males. | Females. | Total. |
|---|---|---|---|
| Under 5 years | 29 | 21 | 50 |
| 5 years and under 10 | 9 | 3 | 12 |
| 10 years and under 15 | 5 | 8 | 13 |
| 15 years and under 20 | 32 | 42 | 74 |
| 20 years and under 25 | 49 | 62 | 111 |
| 25 years and under 30 | 53 | 62 | 115 |
| 30 years and under 35 | 64 | 47 | 111 |
| 35 years and under 40 | 51 | 51 | 102 |
| 40 years and under 45 | 44 | 30 | 74 |
| 45 years and under 50 | 45 | 15 | 60 |
| 50 years and under 55 | 15 | 17 | 32 |
| 55 years and under 60 | 20 | 14 | 34 |
| 60 years and under 65 | 14 | 7 | 21 |
| 65 years and under 70 | 6 | 3 | 9 |
| 70 years and under 75 | 7 | 2 | 9 |
| 75 years and under 80 | 1 | 2 | 3 |
| 80 and upwards | 2 | .. | 2 |
| Total deaths | 446 | 386 | 832 |
Tuberculosis claims its victims at comparatively early age (vide graph on page 177). Of those dying from this cause in 1918, persons under the age of twenty years formed 18 per cent. and those under forty years, 70 per cent.
The New Zealand rate of deaths from tubercular diseases, as well as those of the Australian States, compares very favourably with those of England, Scotland, and Ireland, which have, however, also decreased considerably of late years.
| Death-rates (per 1,000) from Tuberculosis. | Percentage of Total Deaths. | |
|---|---|---|
* Civilians only. † Year 1915. | ||
| England and Wales* | 1.62 | 11.21 |
| Scotland † | 1.63 | 9.58 |
| Ireland † | 2.20 | 12.50 |
| Queensland | 0.50 | 5.20 |
| New South Wales | 0.61 | 6.36 |
| Victoria | 0.79 | 7.63 |
| South Australia | 0.95 | 9.37 |
| Western Australia | 0.77 | 8.63 |
| Tasmania | 0.59 | 6.67 |
| Commonwealth | 0.69 | 7.00 |
| New Zealand | 0.69 | 7.17 |
This disease is annually responsible for more deaths in New Zealand than can be assigned to any cause other than organic disease of the heart. The increasing prevalence of cancer is, in fact, causing no little concern throughout the civilized world.
A much more complete presentation of data than can be given here was published in a special article on cancer mortality in the Year-book for 1917 (pages 776-809).
In 1918 there were 936 deaths from cancer in the Dominion, a proportion of 8.49 per 10,000 persons. This number, although below that of the preceding year, is otherwise the highest recorded, an unenviable distinction which almost every year in succession attains.
Rates for war years are inflated to some extent by the absence of a large number of young men who are comparatively immune from cancer.
The average number of cancer deaths and the average cancer death-rate for the years 1913-17 were 905 and 8.29 respectively. Deaths of males during 1918 numbered 471, and of females 465.
The following diagram illustrates on the one hand the increase in the cancer death-rate, and on the other the decrease in the rate of deaths from tuberculosis:—
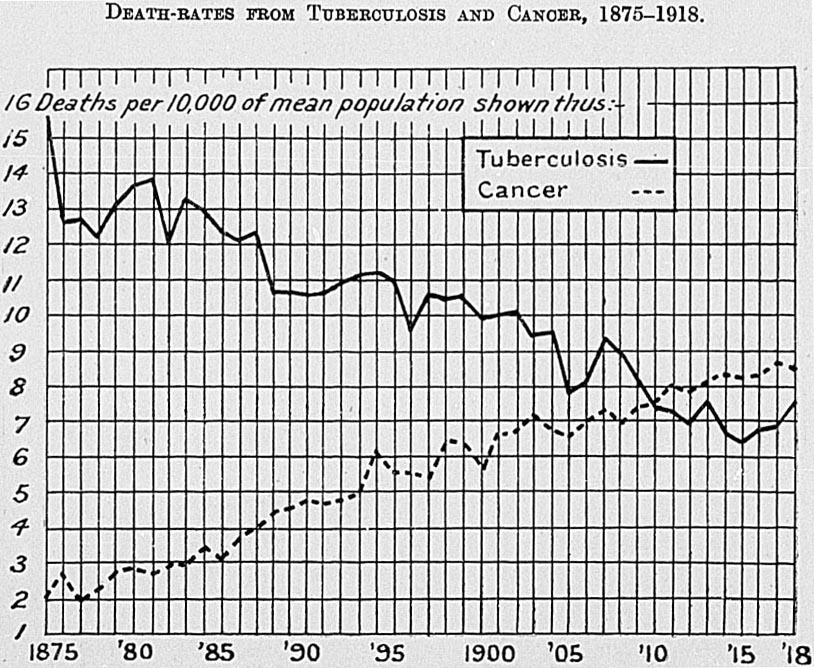
| Year. | Deaths from Cancer. | Total Deaths, all Causes. | Deaths from Cancer per 10,000 of Living Persons. | Deaths from Cancer per 100 of All Deaths. |
|---|---|---|---|---|
(a ) All deaths; (b ) Excluding deaths from influenza October-December, 1918. | ||||
| 1909 | 711 | 8,959 | 7.32 | 7.94 |
| 1910 | 742 | 9,639 | 7.47 | 7.70 |
| 1911 | 809 | 9,534 | 7-97 | 8-49 |
| 1912 | 812 | 9,214 | 7-82 | 8-81 |
| 1913 | 856 | 10,119 | 8-01 | 8-46 |
| 1914 | 904 | 10,148 | 829 | 8-91 |
| 1915 | 900 | 9,965 | 8-19 | 9-03 |
| 1916 | 909 | 10,596 | 8-27 | 8-50 |
| 1917 | 957 | 10,528 | 8-71 | 9-09 |
| 1918 | 936 | 16,364 | 8-49 | (5-72 (a ) |
| 18-59 (b ) | ||||
The proportion of deaths from cancer to the 1,000 persons living in some of the principal countries of the world, as shown below, leads to the conclusion that there is a general tendency to increase. The rate for England and Wales for 1917 (1.21 per 1,000) is the highest yet recorded in that country.
| Country. | Average of 5 Years, 1896-1900. | Average of 5 Years, 1906-10. | Increase per Cent. during 10 Years. | Rate for Last Year ascertainable | |
|---|---|---|---|---|---|
* Decrease. | |||||
| Year. | Rate. | ||||
| New Zealand | 0.59 | 0.72 | 22.03 | 1918 | 0.85 |
| Commonwealth of Australia | 0.58 | 0.70 | 20.69 | 1917 | 0.82 |
| England and Wales | 0.80 | 0.94 | 17.50 | 1917 | 1.21 |
| Scotland | 0.77 | 1.00 | 29.87 | 1916 | 1.12 |
| Ireland | 0.58 | 0.79 | 36.21 | 1916 | 0.91 |
| German Empire | 0.66 | 0.84 | 27.27 | 1913 | 0.91 |
| Austria | 0.69 | 0.78 | 13.04 | 1912 | 0.81 |
| Italy | 0.51 | 0.64 | 25.49 | 1914 | 0.67 |
| Norway | 0.86 | 0.97 | 12.79 | 1914 | 1.02 |
| Denmark | 0.45 | 0.54 | 20.00 | 1914 | 0.58 |
| Netherlands | 0.92 | 1.03 | 11.96 | 1915 | 1.09 |
| Switzerland | 1.27 | 1.26 | 0.79* | 1915 | 1.28 |
The parts of the body most commonly affected are the stomach and liver. Among females the generative and mammary organs are frequently the seat of the disease. Full details of location are published in Volume 1 of the "Statistics of the Dominion of New Zealand," 1918.
| Seat of Disease. | Males. | Females. | Total. |
|---|---|---|---|
| Buccal cavity | 52 | 12 | 64 |
| Stomach and liver | 186 | 143 | 329 |
| Peritoneum, intestines, rectum | 70 | 64 | 134 |
| Female genital organs | .. | 85 | 85 |
| Breast | .. | 73 | 73 |
| Skin | 18 | 3 | 21 |
| Other organs or organs not specified | 145 | 85 | 230 |
| Totals | 471 | 465 | 936 |
It will be observed that in three instances the rates for the two sexes show considerable disparity, to the disadvantage of the male sex—viz., cancer of the buccal cavity, stomach and liver, and skin. The discrepancy in the former instance is, perhaps, due largely to two circumstances: first, that smoking is confined more or less exclusively to the males, and, secondly, that, generally speaking, more attention is paid to the teeth, &c., by females. In the second instance it appears that another predominantly male habit—drinking—is partially responsible. Alcohol is known to detrimentally affect the stomach, &c., by producing ulceration and cirrhosis, often forerunners to cancer. The difference in cases of skin-cancer is, perhaps, mainly due to the better care of the skin by women.
It would almost be safe to speak of cancer as an "old man's disease."
Ninety per cent. of the deaths from cancer during 1918 were at the ages 45 years and upwards, and 58 per cent. at the ages 60 years and upwards.
Exhaustive statistical inquiry for the period 1872-1918 has shown that in New Zealand death from cancer is, on the average, now occurring later in life than formerly. It would seem that this is the case even if allowance be made for the fact that the age-constitution of the Dominion is increasing—i.e., that the average citizen of New Zealand is now older than the average citizen of ten, twenty, or fifty years ago.
| Ages. | M. | F. | Total. |
|---|---|---|---|
| Under 5 years | 1 | .. | 1 |
| 5 years and under 10 | 1 | .. | 1 |
| 10 years and under 15 | 1 | .. | 1 |
| 15 years and under 20 | 2 | 3 | 5 |
| 20 years and under 25 | 1 | 2 | 3 |
| 25 years and under 30 | 3 | 6 | 9 |
| 30 years and under 35 | 3 | 7 | 10 |
| 35 years and under 40 | 7 | 17 | 24 |
| 40 years and under 45 | 14 | 27 | 41 |
| 45 years and under 50 | 35 | 57 | 92 |
| 50 years and under 55 | 49 | 51 | 100 |
| 55 years and under 60 | 54 | 50 | 104 |
| 60 years and under 65 | 62 | 72 | 134 |
| 65 years and under 70 | 71 | 51 | 122 |
| 70 years and under 75 | 72 | 49 | 121 |
| 75 years and under 80 | 50 | 49 | 99 |
| 80 years and upwards | 45 | 24 | 69 |
| Totals | 471 | 465 | 936 |
The succeeding diagram shows very clearly how cancer is practically confined to the period of life after age 45. On the other hand, tuberculosis appears to be fairly evenly divided among the various age-groups. The diagram is based on the statistics of the ten years 1906-15.
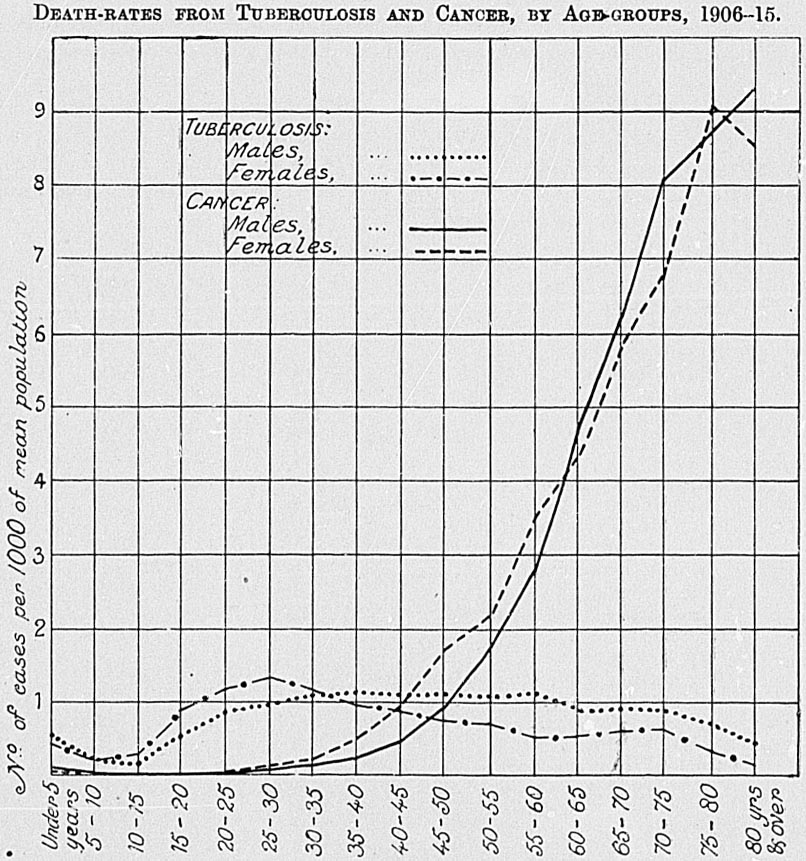
The deaths certified to these causes in 1918 numbered 134, as against 169 in 1917. Included in the number in 1918 were: Accidents of pregnancy 15; puerperal hæmorrhage, 11; other accidents of labour, 19: puerperal septicæmia, 48; puerperal albuminuria, 30; puerperal embolism, 8 ; puerperal phlebitis, 2; puerperal insanity, 1. The number of deaths to every 1,000 confinements (where children were born alive) for each ten years is shown.
| Year. | Deaths of Mothers to every 1,000 Confinements. |
|---|---|
| 1909 | 5.14 |
| 1910 | 4.55 |
| 1911 | 4.38 |
| 1912 | 3.73 |
| 1913 | 3.62 |
| 1914 | 4.22 |
| 1915 | 4.76 |
| 1916 | 5.93 |
| 1917 | 6.05 |
| 1918 | 5.24 |
The higher rate of puerperal accidents and diseases shown since 1915 as compared with preceding years is largely, perhaps wholly, accounted for by the fact that during the past three years in all cases possible where a woman of child-bearing age was shown as having died of septicæmia, peritonitis, convulsions, &c., steps wore taken to ascertain whether the disease was puerperal.
Deaths from violence are steadily decreasing in numbers. The rate per 10,000 living was 5.93 in 1914, 5.67 in 1915, 5.41 in 1916, 5.10 in 1917, and 4.97 in 1918. The various forms of violent deaths (excluding suicides) in 1918 are shown in the following table:—
| Cause of Death. | M. | F. | Total. |
|---|---|---|---|
| Accidents— | |||
| Poisoning | 8 | 1 | 9 |
| Conflagration | 9 | 2 | 11 |
| Burns, scalds | 24 | 18 | 42 |
| Asphyxia | 4 | 6 | 10 |
| Drowning | 102 | 28 | 130 |
| Shot | 18 | .. | 18 |
| Falls | 41 | 7 | 48 |
| Mines and quarries | 8 | .. | 8 |
| Machinery | 4 | 1 | 5 |
| Crushing, vehicles, railways, landslides, &c. | 145 | 13 | 158 |
| Injuries by animals | 8 | 1 | 9 |
| Electrocuted | 1 | .. | 1 |
| Fractures (cause not shown) | 26 | 13 | 39 |
| Homicide— | |||
| By firearms | 1 | .. | 1 |
| By cutting or piercing instruments | .. | 1 | 1 |
| By other means | 1 | 1 | 2 |
| Starvation | 2 | .. | 2 |
| Excessive cold | 4 | .. | 4 |
| Other external violence | 47 | 3 | 50 |
| Totals | 453 | 95 | 548 |
The suicidal deaths in 1918 Were 113—males 98 and females 15. The rate per 10,000 living was males 1.82, females 0.27, both sexes 1.02. The average of the preceding five years was 1.23 per 10,000 living. The New Zealand suicide-rate, 1914-17, approximates that of the Commonwealth (0.12 per 1,000 living) but compares unfavourably with that of England and Wales (0.82 per 10,000 living). The following table shows the means of self-destruction employed:—
| Mode of Death. | M. | F. | Total. |
|---|---|---|---|
| Hanging or strangulation | 30 | 5 | 35 |
| Firearms | 18 | .. | 18 |
| Cutting or piercing instruments | 17 | .. | 17 |
| Poison | 5 | 1 | 6 |
| Drowning | 9 | 5 | 14 |
| Asphyxia | 2 | 1 | 3 |
| Jumping from high places | 3 | 1 | 4 |
| Other modes | 14 | 2 | 16 |
| Total suicides | 98 | 15 | 113 |
The following table shows the numbers of Maoris registered under section 20 of the Births and Deaths Registration Amendment Act, 1912, since its coming into force. The numbers registered under the main Act are also given.
| Year. | Under Section 20 of Births and Deaths Registration Amendment Act, 1912. | Under Main Act. | ||
|---|---|---|---|---|
| Males. | Females. | Totals. | Totals. | |
* Not shown separately. | ||||
| 1913 | * | * | 412 | 61 |
| 1914 | 382 | 341 | 723 | 42 |
| 1915 | 424 | 362 | 786 | 31 |
| 1916 | 432 | 329 | 761 | 47 |
| 1917 | 382 | 347 | 729 | 44 |
| 1918 | 1,000 | 937 | 1,937 | 99 |
Maoris suffered exceedingly severe losses during the influenza epidemic of 1918. As statistics of causes of deaths are not compiled in their case, the exact totals cannot be ascertained. By taking December quarters' huge total of deaths, and subtracting the approximate number in normal times, it seems that the death-toll of the epidemic was in the neighbourhood of 25 per 1,000 of the Maori population.
These deaths are not included in the numbers quoted elsewhere in this subsection.
As explained in the Births subsection of this book, a system of compulsory registration of deaths is now ruling in the Cook Islands.
The following figures of deaths during the year ended 31st March, 1919, are supplied by the Cook Islands Department.
DEATH -RATES are of great value as indicating the relative healthiness of different countries, or for different years. The statistics of causes of registered deaths are of further use as showing the incidence of fatal diseases or accidents, and as indicating in a general way the relative rise or fall of diseases over a series of years. For instance, the fall in the incidence of tuberculosis and the increase in cancer (discussed in Subsection C of this section) can be readily traced from the records of deaths attributed to these causes in different years.
In comparisons of healthiness based on death-rates, however, the effect of the advance of medical science in recent years is not taken into account. It is common knowledge that many diseases regarded a few decades ago as incurable now give a fair percentage of recoveries. Similarly the death-rates in epidemics are now much lower than formerly, owing partly to the steps taken to prevent the spread of the disease, partly to the necessity of early notification in most countries, and partly to increased medical knowledge. Again, many diseases seldom or never result fatally.
Of recent years much attention has been devoted in different countries to the possibility or otherwise of obtaining reliable statistics of sickness. In certain of the American States an attempt has been made to obtain from medical men returns of all patients dealt with, giving the nature and duration of illness, and similar systems have been inaugurated or proposed in other countries.
In New Zealand curtain infectious diseases are notifiable, but beyond this the only record other than that of fatality is the information ascertainable from the returns of discharges from public hospitals. In the absence of full statistics of sickness, however, information from the two previously mentioned sources is of considerable value, and gives a fair indication of the prevalence of the more important diseases. The following diseases are infectious diseases notifiable within New Zealand:—
1. Infectious diseases declared under interpretation clause of the Act—
| Typhus fever. | Smallpox. |
| Enteric fever. | Diphtheria. |
| Scarlet fever. | Bubonic plague. |
2. Infectious diseases declared by Gazette notice:—
| Date declared notifiable. | |
| Tuberculosis | 18th April, 1901. |
| Leprosy | 16th January, 1902. |
| Cholera | 16th February, 1902. |
| Yellow fever | 16th February, 1902. |
| Beriberi | 2nd August, 1906. |
| Date declared notifiable. | |
| Puerperal fever (including milk-fever, sapræmia, acute sepsis, septicæmia) | 20th December, 1906. |
| Cerebro-spinal meningitis (including cerebrospinal fever, cerebral typhus, spotted fever, petechial fever, malignant purpuric fever) | 18th April, 1907. |
| Hydatids | 9th May, 1907. |
| Actinomycosis | 27th June, 1907. |
| Poliomyelitis | 26th February, 1914. |
| Ophthalmia neonatorum | 10th August, 1916. |
| Trachoma (or granular conjunctivitis, or granular ophthalmia, or granular eyelids) | 8th February, 1917. |
| Bilharziosis (or blood-fluke infection, or Egyptian hæmaturia, or endemic hæmaturia, or bilharzia hæmatobia disease) | 16th August, 1917. |
| Influenza | 6th November, 1918. |
| Measles | 25th November, 1918. |
| Lethargic encephalitis | 23rd May, 1919. |
| Acute primary pneumonia | 30th May, 1919. |
| Pneumonic influenza | 30th May, 1919. |
| Septicæmic influenza | 30th May, 1919. |
| Fulminant influenza | 30th May, 1919. |
3. Dangerous infectious diseases declared by Gazette notice:—
| Date declared notifiable. | |
| Leprosy | 16th January, 1902. |
| Bubonic plague | 16th January, 1902. |
| Smallpox | 16th January, 1902. |
| Cholera | 7th July, 1904. |
| Influenza | 6th November, 1918. |
| Pneumonic influenza | 9th June, 1919. |
| Septicæmic influenza | 9th June, 1919. |
| Fulminant influenza | 9th June, 1919. |
Chicken-pox has been declared an infectious disease, but the declaration has been subsequently revoked. During the year 1918 a total of 14,176 cases of infectious diseases were notified, diphtheria taking the first place with 5,539 notifications, as against 5,458 in 1917. During the years 1917 and 1918 diphtheria has been more prevalent than in any previous years since notification was first introduced. With the reorganization and the strengthening of the bacteriological side of the Public Health Department it is hoped that this disease will be much more effectively coped with in the future. From the table below, showing the ordinary incidence of the various notifiable diseases, it will be seen that diphtheria is much more prevalent during the months of April, May, June, July, and August than at any other time during the year. It occurred in 1918 mainly in localized epidemics, Auckland Hospital District and Wellington Hospital District in the North Island recording the largest numbers of cases, and North Canterbury and Southland in the South Island similarly recording the largest numbers of cases.
While diphtheria showed a slight increase for 1918 on the 1917 figures, and a comparatively large increase when compared with the years prior thereto, it is interesting to note that the notifications for scarlet fever were in 1918 lower than in the previous year. For the last three years the notifications have been—
| 1918 | 1,654 |
| 1917 | 2,755 |
| 1916 | 4,287 |
During the months of October, November, and December New Zealand was visited by a serious epidemic of influenza. Though the statistics of notifications in reference thereto are incomplete and of little value, the statistics of death, to which reference is made in another part of this book, are of great importance. As a result of the epidemic the diseases influenza, pneumonic influenza, septicæmic influenza, and fulminant influenza have been declared to be dangerous infectious diseases, and each of these has been declared to be an infectious disease. Further, measles, lethargic encephalitis, and acute primary pneumonia have been declared to be infectious diseases.
Reference to the notifications of cerebro-spinal meningitis shows that little or no cerebro-spinal meningitis was existent prior to the month of August. It is, however, known that cerebro-spinal meningitis is closely associated with influenza, and the notifications during the latter months of the year have been affected on this account.
| Month. | Scarlet Fever. | Diphtheria. | Tuberculosis. | Enteric Fever. | Cerebro-spinal Meningitis. | Poliomyelitis. | Puerperal Septicemia. | Influenza. | Hydatids. | Ophthalmia Neonatorum. | Erysipelas. | Trachoma. | Tetanus. | Septicæmia (unclassified). | Measles. | Actinomycosis. | Totals. |
|---|---|---|---|---|---|---|---|---|---|---|---|---|---|---|---|---|---|
| Jan. | 137 | 348 | 102 | 64 | .. | 1 | 7 | .. | .. | .. | 3 | 1 | 1 | .. | .. | .. | 664 |
| Feb. | 97 | 349 | 87 | 65 | 2 | 1 | 4 | .. | 6 | 3 | 4 | .. | .. | .. | .. | .. | 618 |
| March | 134 | 419 | 79 | 51 | 3 | 1 | 4 | .. | 4 | 3 | 3 | .. | .. | .. | .. | .. | 702 |
| April | 184 | 626 | 64 | 56 | 1 | 1 | 5 | .. | 4 | 4 | 15 | 2 | .. | 3 | .. | .. | 965 |
| May | 229 | 770 | 96 | 46 | 3 | 5 | .. | 2 | .. | 4 | .. | .. | 1 | .. | .. | 1,157 | |
| June | 175 | 687 | 108 | 27 | 3 | 1 | 6 | .. | 4 | 2 | 8 | 1 | .. | 2 | .. | .. | 1,024 |
| July | 185 | 740 | 109 | 29 | 6 | 1 | 1 | 11 | .. | 4 | 2 | 6 | .. | 1 | .. | .. | 1,094 |
| Aug. | 149 | 851 | 110 | 15 | 27 | .. | 15 | .. | 9 | 1 | 10 | .. | .. | 1 | .. | .. | 918 |
| Sept. | 129 | 423 | 88 | 24 | 20 | .. | 6 | .. | .. | 3 | 9 | 1 | .. | 1 | .. | .. | 704 |
| Oct. | 129 | 316 | 117 | 22 | 27 | .. | 8 | .. | .. | 2 | 6 | 1 | .. | .. | .. | .. | 629 |
| Nov. | 52 | 137 | 40 | 12 | 32 | .. | 5 | 2,510 | .. | 2 | 1 | 1 | .. | 1 | .. | .. | 2,793 |
| Dec. | 54 | 143 | 72 | 12 | 35 | .. | .. | 2,363 | .. | 1 | 3 | 1 | .. | .. | 224 | .. | 2,908 |
| Totals | 1,654 | 5,539 | 1,072 | 423 | 159 | 6 | 76 | 4,873 | 33 | 23 | 72 | 8 | 2 | 10 | 224 | 2 | 14,176 |
| Hospital District. | Population (excluding Maoris), Census 1916. | Maori Population, Census 1910. | Scarlet Fever. | Diphtheria. | Enteric Fever. | Tuberculosis. | Cerebro-spinal Meningitis. | Poliomyelitis. | Puerperal Septicæmia | Influenza. | Hydatids. | Ophthalmia Neonatorum. | Erysipelas. | Trachoma. | j Tetanus. | Scpticæmia (unclassified). | Measles. | Actinomycosis. | Totals. |
|---|---|---|---|---|---|---|---|---|---|---|---|---|---|---|---|---|---|---|---|
| Auckland Health District. | |||||||||||||||||||
| Bay of Islands | 11,534 | 9,636 | 2 | 1 | 41 | 27 | .. | .. | 1 | .. | .. | 1 | 1 | 1 | .. | .. | .. | .. | 75 |
| Kaipara | 9,640 | 1,274 | 3 | 53 | 5 | 2 | .. | .. | .. | 2 | .. | .. | .. | .. | .. | .. | 4 | .. | 69 |
| Whangarei | 12,164 | 1,087 | 8 | 39 | 14 | 21 | 3 | .. | 1 | 13 | .. | .. | 2 | .. | .. | .. | .. | .. | 103 |
| Auckland | 161,975 | 1,703 | 55 | 563 | 97 | 172 | 8 | 2 | 17 | 30 | 4 | 5 | 18 | 3 | 2 | 5 | 73 | .. | 1,053 |
| Waikato | 54,613 | 8,076 | 33 | 208 | 38 | 47 | 6 | 1 | 2 | 10 | 1 | 1 | .. | 2 | .. | .. | 9 | .. | 357 |
| Thames | 14,000 | 1,355 | 10 | 48 | 16 | 15 | 3 | .. | 1 | 55 | 1 | .. | 2 | .. | .. | 1 | .. | .. | 152 |
| Waihi | 4,774 | .. | 5 | 14 | 1 | 2 | 1 | .. | .. | .. | .. | .. | .. | .. | .. | .. | .. | .. | 23 |
| Coromandel | 2,256 | 298 | .. | 2 | .. | .. | .. | .. | .. | .. | .. | 1 | .. | .. | .. | .. | .. | .. | 3 |
| Tauranga | 5,632 | 1,703 | .. | .. | 10 | 3 | .. | .. | .. | 28 | .. | .. | .. | .. | .. | .. | .. | .. | 41 |
| Bay of Plenty | 5,908 | 4,169 | 1 | 21 | 26 | 3 | .. | .. | .. | 20 | .. | .. | 3 | .. | .. | 1 | .. | .. | 75 |
| Taumarunui | 8,675 | 1,073 | .. | 11 | 8 | 7 | .. | .. | .. | .. | .. | .. | .. | .. | .. | .. | .. | .. | 26 |
| Wellington Health District. | |||||||||||||||||||
| Waiapu | 2,075 | 2,693 | 4 | 1 | 33 | 1 | .. | .. | .. | 1 | .. | .. | .. | .. | .. | .. | .. | .. | 40 |
| Cook | 20,332 | 1,742 | 23 | 135 | 22 | 16 | 2 | .. | 2 | 202 | .. | .. | .. | .. | .. | .. | .. | .. | 402 |
| Wairoa | 3,862 | 2,536 | 4 | 16 | 6 | 21 | .. | .. | .. | 140 | 1 | .. | .. | .. | .. | .. | .. | .. | 188 |
| Hawke's Bay | 32,089 | 1,194 | 34 | 306 | 5 | 37 | 11 | .. | 6 | 221 | .. | .. | .. | .. | .. | .. | .. | .. | 620 |
| Waipawa | 19,289 | 721 | 15 | 194 | 3 | 12 | 1 | 1 | 1 | 169 | 5 | 1 | 1 | .. | .. | .. | .. | .. | 403 |
| Taranaki | 23,845 | 1,739 | 7 | 266 | 17 | 15 | 1 | .. | 3 | 160 | 3 | .. | .. | .. | .. | .. | .. | .. | 476 |
| Stratford | 9,252 | 19 | 7 | 56 | .. | 4 | 1 | .. | 1 | 191 | .. | .. | .. | .. | .. | .. | .. | .. | 260 |
| Hawera | 15,713 | 826 | 6 | 313 | 1 | 9 | 4 | .. | 1 | 102 | 1 | 1 | .. | .. | .. | .. | 1 | .. | 439 |
| Patea | 4,769 | 274 | 1 | 27 | .. | 1 | 1 | .. | .. | 4 | 1 | .. | .. | .. | .. | .. | 1 | 1 | 37 |
| Wanganui | 41,022 | 2,334 | 26 | 292 | 6 | 25 | .. | .. | 1 | 166 | .. | 2 | 1 | 1 | .. | .. | .. | .. | 520 |
| Palmerston North | 42,710 | 1,764 | 15 | 339 | 3 | 22 | 7 | .. | 2 | 74 | 2 | 1 | .. | 1 | .. | .. | .. | .. | 466 |
| Wellington | 102,520 | 455 | 91 | 509 | 8 | 100 | 32 | 1 | 5 | 454 | 1 | 3 | 2 | .. | .. | .. | 1 | .. | 1,207 |
| Wairarapa | 30,587 | 874 | 14 | 164 | 3 | 21 | 44 | 1 | 192 | .. | 1 | 1 | .. | .. | .. | .. | .. | .. | 441 |
| Wairau | 11,146 | 85 | 2 | 50 | 1 | 5 | 2 | .. | .. | .. | .. | .. | .. | .. | .. | .. | .. | .. | 60 |
| Picton | 3,155 | 285 | .. | 7 | .. | 4 | .. | .. | .. | 4 | .. | .. | .. | .. | .. | .. | .. | .. | 15 |
| Nelson | 24,817 | 137 | 58 | 233 | 2 | 6 | .. | 1 | 1 | 71 | .. | 1 | .. | .. | .. | .. | .. | .. | 373 |
| Canterbury Heath District. | |||||||||||||||||||
| Westland | 7,292 | 56 | .. | 8 | 1 | 3 | .. | .. | 1 | 8 | .. | .. | .. | .. | .. | .. | .. | .. | 21 |
| Buller | 9,840 | 25 | 1 | 20 | .. | 3 | .. | .. | .. | 21 | .. | 2 | 1 | .. | .. | .. | 1 | .. | 49 |
| Inangahua | 4,130 | .. | .. | 7 | 8 | 4 | .. | .. | .. | 12 | .. | .. | .. | .. | .. | .. | .. | .. | 31 |
| Grey | 12,382 | .. | 8 | 45 | 1 | 18 | 4 | .. | 1 | 15 | .. | .. | .. | .. | .. | .. | .. | .. | 92 |
| North Canterbury | 130,705 | 734 | 303 | 690 | 14 | 185 | 9 | .. | 10 | 1,061 | 6 | .. | 14 | .. | .. | 2 | 121 | 1 | 2,416 |
| Ashburton | 15,944 | 17 | 108 | 29 | .. | 9 | .. | .. | 2 | 82 | 1 | .. | .. | .. | .. | .. | 5 | .. | 236 |
| South Canterbury | 36,753 | 215 | 66 | 79 | 12 | 32 | 2 | .. | 7 | 107 | 2 | 1 | 4 | .. | .. | .. | 2 | .. | 314 |
| Otago Health District. | |||||||||||||||||||
| Waitaki | 15,198 | 37 | 63 | 80 | 1 | 26 | 1 | .. | 1 | 106 | 1 | .. | 6 | .. | .. | .. | .. | .. | 285 |
| Otago | 105,742 | 122 | 512 | 199 | 19 | 153 | 9 | .. | 5 | 808 | 3 | 2 | 10 | .. | .. | .. | 1 | .. | 1,721 |
| Vincent | 5,158 | .. | 14 | 5 | .. | 7 | .. | .. | 1 | 16 | .. | .. | 2 | .. | .. | 1 | .. | .. | 46 |
| Maniototo | 2,803 | .. | 1 | .. | 1 | 4 | .. | .. | 1 | 3 | .. | .. | .. | .. | .. | .. | .. | .. | 10 |
| Southland | 51,678 | 47 | 144 | 469 | .. | 29 | 7 | .. | 1 | 310 | .. | .. | 3 | .. | .. | .. | 5 | .. | 968 |
| Wallace and Fiord | 10,286 | 92 | 10 | 40 | .. | 1 | .. | .. | .. | 11 | .. | .. | 1 | .. | .. | .. | .. | .. | 63 |
| Totals | 1,086,505 | 49,397 | 1,654 | 5,539 | 423 | 1,072 | 159 | 6 | 76 | 4,873 | 33 | 23 | 72 | 8 | 2 | 10 | 224 | 2 | 14,176 |
A quinquennial summary is as follows:—
PRINCIPAL INFECTIOUS DISEASES nOTIFIED DURING THE PAST FIVE YEARS .
| Disease. | 1914. | 1915. | 1916. | 1917. | 1918. |
|---|---|---|---|---|---|
* Not notifiable. | |||||
| Scarlet fever | 1,506 | 2,312 | 4,278 | 2,755 | 1,654 |
| Diphtheria | 1,094 | 1,420 | 2,376 | 5,458 | 5,539 |
| Enteric fever | 859 | 825 | 806 | 653 | 423 |
| Tuberculosis | 957 | 1,019 | 950 | 1,521 | 1,072 |
| Cerebro-spinal meningitis | * | 85 | 135 | 42 | 159 |
| Poliomyelitis | * | 10 | 1,018 | 54 | 6 |
| Totals | 4,417 | 5,671 | 9,563 | 10,483 | 8,853 |
The total admissions to public hospitals in New Zealand during 1918 numbered 46,226. There were 3,164 patients in hospital at the beginning of the year, the total cases dealt with during the year being thus 49,390, equal to 428 per 10,000 of mean population, including Maoris. The total number of persons treated is somewhat less than the number of cases, each admission being counted a separate case. The large increase in cases in 1918 is accounted for by the 7,399 influenza patients.
Of the 49,390 cases, 31,253 were discharged as recovered, including a number of tuberculosis cases in which the patient was described as able to work or as having had the disease arrested. In 9,409 cases the patient was discharged relieved, and in 1,366 cases as unrelieved. Deaths in hospital numbered 4,468, or 9.05 per cent. of cases dealt with. The figures of admissions, discharges, and deaths for each of the public hospitals of the Dominion, other than St. Helens Maternity Homes, are given in the table following, together with the numbers of patients in hospital at the beginning and end of the year. There are 65 public general hospitals, 4 fever or infectious-diseases hospitals, and 5 sanatoria for consumptives.
PUBLIC HOSPITALS .—ADMISSIONS , DISCHARGES , ETC ., 1918.
| Hospital. | Patients remaining on 1st January, 1918. | Admissions during 1918. | Discharges during 1918. | Deaths in Hospital during 1918. | Patients remaining on 31st December, 1918. | ||
|---|---|---|---|---|---|---|---|
| Recovered. | Relieved. | Unrelieved. | |||||
| Mangonui | 11 | 117 | 87 | 17 | 7 | 11 | 6 |
| Bay of Islands | 9 | 240 | 184 | 37 | 4 | 23 | 1 |
| Hokianga | 21 | 246 | 206 | 32 | .. | 9 | 20 |
| Northern Wairoa | 12 | 286 | 209 | 45 | 8 | 28 | 8 |
| Otamatea | 1 | 30 | 20 | 5 | 2 | 4 | |
| Whangarei | 22 | 762 | 547 | 135 | 6 | 67 | 29 |
| Auckland | 397 | 5,531 | 3,141 | 1,691 | 109 | 579 | 408 |
| Waikato | 103 | 2,102 | 1,532 | 294 | 67 | 168 | 144 |
| Cambridge Sanatorium | 64 | 251 | .. | 206 | 40 | 7 | 62 |
| Taumarunui | 23 | 392 | 315 | 37 | 4 | 46 | 13 |
| Waihi | 33 | 420 | 301 | 83 | 7 | 38 | 24 |
| Thames | 46 | 879 | 649 | 155 | 4 | 88 | 29 |
| Coromandel | 6 | 70 | 46 | 17 | 1 | 6 | 6 |
| Mercury Bay | 1 | 39 | 32 | 1 | 1 | 5 | 1 |
| Tauranga | 6 | 147 | 114 | 16 | 3 | 12 | 8 |
| Te Puke | .. | 74 | 64 | 4 | 1 | 3 | 2 |
| Opotiki | 6 | 164 | 128 | 22 | 3 | 9 | 8 |
| Waiapu | 4 | 55 | 50 | 3 | .. | 2 | 4 |
| Cook | 96 | 1,301 | 931 | 291 | 17 | 92 | 66 |
| Wairoa | 19 | 312 | 247 | 28 | 1 | 31 | 24 |
| Napier | 158 | 1,356 | 949 | 241 | 50 | 131 | 143 |
| Waipawa | 27 | 517 | 394 | 78 | 9 | 44 | 19 |
| Dannevirke | 33 | 556 | 430 | 54 | 8 | 61 | 36 |
| Taranaki | 72 | 1,688 | 1,316 | 184 | 30 | 164 | 66 |
| Stratford | 21 | 350 | 276 | 48 | 1 | 35 | 11 |
| Hawera | 33 | 695 | 542 | 101 | 1 | 54 | 30 |
| Patea | 6 | 351 | 267 | 30 | 8 | 32 | 20 |
| Wanganui | 114 | 1,668 | 1,296 | 205 | 50 | 126 | 105 |
| Taihape | 8 | 203 | 157 | 21 | 3 | 21 | 9 |
| Palmerston North | 62 | 1,527 | 1,242 | 66 | 78 | 129 | 74 |
| Pahiatua | 12 | 185 | 125 | 43 | 6 | 13 | 10 |
| Masterton | 27 | 668 | 432 | 132 | 12 | 74 | 45 |
| Greytown | 10 | 243 | 164 | 57 | 10 | 22 | |
| Wellington | 357 | 4,638 | 3,607 | 586 | 87 | 379 | 336 |
| Otaki | 12 | 191 | 139 | 19 | 11 | 32 | 2 |
| Otaki Sanatorium | 26 | 46 | 22 | 18 | 17 | 2 | 13 |
| Wairau | 23 | 582 | 490 | 33 | 16 | 48 | 18 |
| Havelock | .. | 85 | 76 | 7 | .. | 2 | .. |
| Picton | 8 | 240 | 202 | 22 | 1 | 11 | 12 |
| Nelson | 62 | 855 | 677 | 93 | 33 | 67 | 47 |
| Westport | 36 | 320 | 278 | 35 | 1 | 25 | 17 |
| Reefton | 36 | 247 | 164 | 52 | 24 | 43 | |
| Waiuta Nurses' Home | 1 | 62 | 59 | 3 | 1 | .. | |
| Denniston | .. | 67 | 28 | 14 | 1 | 13 | 11 |
| Grey River | 70 | 555 | 357 | 68 | 62 | 83 | 55 |
| Westland | 37 | 259 | 175 | 44 | .. | 53 | 24 |
| Otira | .. | 31 | 15 | 16 | .. | .. | .. |
| Kaikoura | 7 | 149 | 96 | 43 | 7 | 7 | 3 |
| Christchurch | 228 | 4,439 | 2,493 | 1,208 | 262 | 521 | 183 |
| Lyttelton Casualty Ward .. | 99 | 58 | 23 | 1 | 17 | .. | |
| Burwood Fever Hospital | 28 | 261 | 265 | .. | .. | 4 | 20 |
| Cashmere Hills Sanatorium | 65 | 46 | 34 | 4 | 3 | 5 | 65 |
| Coronation Hospital for Consumptives | 50 | 44 | .. | .. | .. | .. | 44 |
| Akaroa | 1 | 52 | 41 | 4 | 8 | ||
| Ashburton | 14 | 363 | 289 | 34 | 4 | 34 | 16 |
| Timaru | 63 | 934 | 568 | 282 | 15 | 80 | 52 |
| Timaru Infectious Diseases | 1 | 39 | 32 | .. | .. | .. | 8 |
| Waimate | 23 | 328 | 222 | 64 | 5 | 30 | 30 |
| Oamaru | 33 | 467 | 347 | 57 | 10 | 63 | 23 |
| Palmerston Sanatorium | 46 | 102 | 55 | 49 | 12 | 3 | 29 |
| Port Chalmers | .. | 36 | 24 | 5 | 2 | 3 | 2 |
| Logan Point Fever Hospital | 10 | 124 | 115 | 4 | 9 | 1 | 5 |
| Dunedin | 256 | 3,933 | 1,488 | 1,808 | 190 | 497 | 206 |
| Tuapeka | 7 | 87 | 49 | 29 | 6 | 6 | 4 |
| Kaitangata | .. | 29 | 24 | 4 | .. | 1 | .. |
| Tapanui | 3 | 87 | 28 | 44 | 3 | 11 | 4 |
| Maniototo | 6 | 115 | 73 | 28 | 1 | 11 | 8 |
| Dunstan | 7 | 74 | 40 | 21 | 2 | 15 | 3 |
| Cromwell | 2 | 132 | 85 | 35 | 2 | 5 | 7 |
| Wakatipu | 6 | 65 | 37 | 12 | 10 | 6 | 6 |
| Seddon Memorial | 16 | 210 | 150 | 28 | 4 | 25 | 19 |
| Southland | 96 | 1,673 | 1,317 | 159 | 35 | 180 | 78 |
| Kew Infectious Diseases | 46 | 305 | 323 | 4 | 1 | 3 | 20 |
| Wallace and Fiord | 19 | 430 | 314 | 55 | 3 | 49 | 28 |
| Totals | 3,164 | 46,226 | 31,253 | 9,409 | 1,366 | 4,468 | 2,894 |
The ages of patients discharged from or dying in public hospitals during 1917 and 1918 are as shown in the following summary:—
PUBLIC HOSPITALS .—AGES OF PATIENTS DISCHARGED OR DYING .
| Ages of Patients, in Years. | 1917. | 1918. | ||||
|---|---|---|---|---|---|---|
| Males. | Females. | Total. | Males. | Females. | Total. | |
| Under 5 | 2,275 | 1,622 | 3,897 | 2,208 | 1,775 | 3,983 |
| 5 and under 10 | 2,550 | 2,206 | 4,756 | 2,571 | 2,199 | 4,770 |
| 10 and under 15 | 1,766 | 1,436 | 3,202 | 1,851 | 1,508 | 3,359 |
| 15 and under 25 | 3,523 | 3,196 | 6,719 | 4,793 | 4,125 | 8,918 |
| 25 and under 35 | 3,658 | 3,404 | 7,062 | 5,405 | 4,483 | 9,888 |
| 35 and under 45 | 2,941 | 2,284 | 5,225 | 3,992 | 2,657 | 6,649 |
| 45 and under 55 | 1,972 | 1,082 | 3,054 | 2,539 | 1,259 | 3,798 |
| 55 and under 65 | 1,413 | 590 | 2,003 | 1,513 | 648 | 2,161 |
| 65 and over | 2,074 | 631 | 2,705 | 2,166 | 648 | 2,814 |
| Unspecified | 67 | 41 | 108 | 81 | 75 | 156 |
| Totals | 22,239 | 16,492 | 38,731 | 27,119 | 19,377 | 46,496 |
The Bertillon system of classification of diseases and causes of death divides such into fourteen well-defined classes, which are further subdivided into 189 orders. The table following shows that Class I, " General diseases," is first on the list as regards both discharges and deaths. Diseases of the digestive system come next in point of numbers, but the death-rate is low. External causes come third on the list, and here again the death-rate is low, owing to the preponderance of simple fractures, cuts, bruises, &c.
PUBLIC HOSPITALS .—CLASSIFICATION OF DISEASES , 1918.
| Class. | Discharges. | Deaths. | Total Discharges and Deaths. | ||||
|---|---|---|---|---|---|---|---|
| Recovered. | Relieved. | Unrelieved. | Males. | Females. | Males. | Females. | |
| I. General diseases | 12,665 | 2,356 | 463 | 1,637 | 900 | 10,142 | 7,879 |
| II. Diseases of the nervous system and of the organs of special sense | 746 | 1,044 | 207 | 160 | 106 | 1,352 | 911 |
| III. Diseases of the circulatory system | 712 | 668 | 51 | 239 | 89 | 1,165 | 594 |
| IV. Diseases of the respiratory system | 3,256 | 644 | 71 | 268 | 111 | 2,585 | 1,765 |
| V. Diseases of the digestive system | 4,767 | 1,009 | 141 | 184 | 104 | 3,335 | 2,870 |
| VI. Diseases of the genitourinary system and annexa | 2,049 | 770 | 111 | 118 | 51 | 973 | 2,126 |
| VII. Puerperal condition | 1,019 | 88 | 17 | .. | 38 | .. | 1,162 |
| VIII. Diseases of the skin and of the cellular tissue | 1,192 | 340 | 11 | 20 | 9 | 1,076 | 496 |
| IX. Diseases of the organs of locomotion | 673 | 492 | 18 | 10 | 8 | 856 | 345 |
| X. Malformations | 215 | 65 | 12 | 1 | 7 | 234 | 66 |
| XI. Diseases of early infancy | 42 | 12 | 5 | 32 | 15 | 59 | 47 |
| XII. Old age | 15 | 103 | 76 | 113 | 37 | 272 | 72 |
| XIII. External causes | 3,444 | 1,586 | 115 | 161 | 26 | 4,630 | 702 |
| XIV. Ill-defined causes | 458 | 232 | 68 | 12 | 12 | 440 | 342 |
| Totals | 31,253 | 9,409 | 1,366 | 2,955 | 1,513 | 27,119 | 19,377 |
More detailed information concerning certain of the principal diseases and groups of diseases is given in the following pages. The "Statistics of the Dominion of New Zealand" (Volume 1) contain detailed information for each hospital.
The first diseases in the Bertillon classification are the "General diseases," the first nineteen orders of which cover epidemic diseases. The principal epidemic general diseases dealt with in public hospitals are scarlet fever and diphtheria. In 1918 influenza has an enormous priority in numbers, owing to the epidemic which swept New Zealand in the latter part of the year. There are four special hospitals for the treatment of these and similar infectious diseases, all situated in the South Island. Several hospitals have fever wings attached.
A table of the epidemic general diseases dealt with in public hospitals during 1918 is given. The figures in this and following tables throughout this subsection deal with the discharges and deaths only, and not with patients remaining in hospital at the end of the year, who will be included in the figures for 1919 or such other year of discharge or death.
EPIDEMIC GENERAL DISEASES , 1918.
| Disease. | Discharges. | Deaths. | Total Discharges and Deaths. | ||||
|---|---|---|---|---|---|---|---|
| Recovered. | Relieved. | Unrelieved. | Males. | Females. | Males. | Females. | |
| Typhoid fever | 203 | 13 | .. | 14 | 10 | 143 | 97 |
| Malta fever | .. | 1 | .. | .. | .. | 1 | .. |
| Malaria | 12 | 11 | .. | .. | .. | 23 | .. |
| Measles | 68 | .. | 1 | 1 | 1 | 45 | 26 |
| Scarlet fever | 852 | 24 | 18 | 4 | 9 | 328 | 579 |
| Whooping-cough | 14 | 1 | 1 | .. | .. | 7 | 9 |
| Diphtheria | 4,220 | 62 | 2 | 70 | 76 | 2,016 | 2,414 |
| Croup | 12 | 2 | 1 | .. | 1 | 10 | 6 |
| Influenza | 5,580 | 206 | 9 | 1,093 | 511 | 4,424 | 2,975 |
| Dysentery | 23 | 11 | .. | 1 | 1 | 27 | 9 |
| Erysipelas | 70 | 6 | .. | .. | 3 | 31 | 48 |
| Chicken-pox | 16 | 6 | .. | .. | .. | 12 | 10 |
| Mumps | 14 | .. | .. | .. | .. | 6 | 8 |
| Dengue | .. | 1 | .. | .. | .. | 1 | .. |
| German measles | .. | 2 | .. | .. | .. | .. | 2 |
| Totals | 11,084 | 346 | 32 | 1,183 | 612 | 7,074 | 6,183 |
The rate of mortality of this group is normally very low, between 2 and 3 per cent. In 1918 the number of cases is more than doubled as a result of the influenza epidemic, the mortality rate being 13.54 per cent. Omitting influenza cases the rate falls to 3.26 per cent.
Discharges from and deaths in public hospitals of influenza patients during 1918 reached the huge total of 7,399. This, of course, does not include the enormous numbers dealt with in private hospitals and the emergency hospitals extemporized in the crisis of the epidemic.
INFLUENZA IN HOSPITALS , 1918.
| Males. | Females. | |||
|---|---|---|---|---|
| Cases. | Per Cent. | Cases. | Per Cent. | |
| Recovered | 3,183 | 71.94 | 2,397 | 80.57 |
| Relieved | 143 | 3.24 | 63 | 2.12 |
| Unrelieved | 5 | 0.11 | 4 | 0.13 |
| Died | 1,093 | 24.71 | 511 | 17.18 |
| Total, discharges and deaths | 4,424 | 100.00 | 2,975 | 100.00 |
A clear indication is shown in the above table of the severity of the epidemic. The male sex felt the effect more heavily than the female. Not only did males contract the disease in higher proportion than females, but, having contracted it, they had less chance of recovery. Of males in hospitals with influenza, one in four died; of females, one in six.
Further information relating to influenza will be found in the Deaths subsection.
Tuberculosis occupies eight orders in the classification of diseases, but is usually divided into two groups—viz., pulmonary tuberculosis and other forms of tuberculosis. In the following table an attempt has been made to show in detail the part of the body affected. Pulmonary tuberculosis, with which is included tuberculosis (undefined) and acute miliary tuberculosis, comprises 68 per cent. of the total of 1,806 cases of tubercular diseases, and 73 per cent. of the deaths.
TUBERCULOSIS CASES IN HOSPITALS , 1918.
| Form of Tuberculosis. | Discharges. | Deaths. | Total Discharges and Deaths. | ||||
|---|---|---|---|---|---|---|---|
| Recovered. | Relieved. | Unrelieved. | Males. | Females | Males. | Females | |
| Pulmonary tuberculosis | 147 | 669 | 176 | 146 | 92 | 873 | 357 |
| Acute miliary tuberculosis | .. | .. | 1 | 1 | 3 | 1 | 4 |
| Tuberculous meningitis | .. | .. | 2 | 19 | 18 | 20 | 19 |
| Abdominal tuberculosis | 13 | 37 | 6 | 5 | 10 | 36 | 35 |
| Tuberculosis of spine | 6 | 21 | 2 | 5 | 4 | 23 | 15 |
| Spinal caries | 1 | 11 | 2 | 2 | .. | 11 | 5 |
| Pott's disease | 7 | 8 | 3 | 1 | .. | 8 | 11 |
| Spinal abscess | .. | 3 | 1 | .. | .. | 4 | 1 |
| Psoas abscess | 2 | 8 | .. | 1 | .. | 6 | 5 |
| Tuberculosis of hip | 6 | 52 | 9 | 1 | 4 | 49 | 23 |
| Tuberculosis of knee | 5 | 26 | 1 | 1 | 1 | 19 | 15 |
| Tuberculosis of ankle | .. | 6 | .. | .. | .. | 6 | .. |
| Tuberculosis of elbow | 1 | 4 | .. | .. | .. | 3 | 2 |
| Tuberculosis of wrist | 1 | .. | .. | .. | .. | .. | 1 |
| Tuberculosis of neck | .. | 1 | .. | .. | .. | .. | 1 |
| Tuberculosis of foot | 2 | .. | 1 | .. | .. | 1 | .. |
| Tuberculosis of shoulder | .. | 1 | .. | .. | .. | .. | 1 |
| Tuberculosis of eye | .. | 1 | .. | .. | .. | .. | 1 |
| Tuberculosis of nose | .. | 1 | .. | .. | .. | .. | 1 |
| Tuberculous arthritis | 1 | 4 | .. | .. | .. | 4 | 1 |
| Tuberculosis of synovitis | .. | 3 | .. | .. | .. | 2 | 1 |
| Tuberculosis of bones | 7 | 25 | 1 | .. | .. | 27 | 6 |
| Tuberculosis of kidney | 3 | 13 | 3 | 5 | 2 | 18 | 8 |
| Tuberculous nephritis | .. | 1 | .. | .. | 1 | .. | 2 |
| Tuberculosis of glands | 42 | 33 | 1 | .. | .. | 40 | 36 |
| Tuberculous adenitis | 10 | 7 | .. | .. | .. | 8 | 9 |
| Tuberculosis of bladder | 1 | 2 | 1 | .. | .. | 4 | .. |
| Tuberculous cystitis | .. | 1 | .. | .. | .. | 1 | .. |
| Tuberculosis of genital organs | 12 | 18 | 1 | 1 | .. | 25 | 7 |
| Tuberculosis of breast | .. | 1 | .. | .. | .. | .. | 1 |
| Tuberculous abscess | 5 | 16 | 2 | .. | .. | 17 | 6 |
| Tuberculous sinus | .. | 9 | 3 | 1 | .. | 4 | 9 |
| Lupus | 1 | 9 | .. | 1 | .. | 5 | 6 |
| Totals | 273 | 991 | 216 | 191 | 135 | 1,215 | 591 |
Five sanatoria for the treatment of tuberculosis cases are situated in suitable districts throughout the Dominion. The classification in use at these institutions is somewhat different to that of general hospitals as regards condition of patients on discharge. The actual classifications in use at the various sanatoria are,—
Cambridge: Much improved; improved; stationary.
Otaki: Able to work; relieved; unrelieved.
Cashmere Hills and Coronation Hospital, Christchurch: Disease arrested; much improved; improved; not improved.
Palmerston: Apparently cured; disease arrested; improved; unimproved.
The figures of recoveries given above include the first-mentioned class in each case the first two for Palmerston). The last-mentioned corresponds to "unrelieved" in each case, and all other classifications rank as "relieved."
The total number of discharges and deaths in which the disease was definitely shown to be venereal was 292, including 16 deaths. Syphilis was the disease assigned in 156 cases, and various forms of gonococcic infection in the remaining 136 cases. There is reason to believe that the totals given do not include all such cases dealt with in the public hospitals, incomplete classification on the return cards being probably responsible for a number of venereal cases being placed elsewhere in the tabulation. Again, the Medical Superintendent of a hospital, in stating the disease for which a patient is treated, is concerned not with the cause of the complaint, but rather with the actual facts of the case as they appear before him, so that most cases of diseases of syphilitic origin in which, for the time being at least, the venereal disease has ceased to be of primary importance are returned under the heading of the disease for which the patient is treated.
Of recent years cancer has come into great prominence amongst causes of death, now ranking in New Zealand second only to heart-disease in point of number of deaths. Information as to deaths and death-rates from cancer is given in Subsection C of this section.
A special article on cancer in New Zealand was published in the Official Year-book for 1917.
The total number of deaths in public hospitals in 1918 where cancer was assigned as the cause was 255 (males 168, females 87). In addition 136 patients treated for cancer were discharged as recovered, 186 as relieved, and 121 as unrelieved. Very few of the recoveries were in cases of internal cancer, and but a small proportion of the deaths in cases of surface cancer. It is noticeable that with but four exceptions cancer of the mouth and its annexa was confined to males. A table is given showing the seat of the disease in all cases of discharge or death during 1918. In 35 cases the location cannot be given on account of the disease being returned merely as "cancer." In a number of other similar cases the nature of the operation was the only means of enabling the seat of the disease to be allocated.
CANCER CASES .—DISCHARGES FROM AND DEATHS IN PUBLIC HOSPITALS , 1918.
| Seat of Disease. | Discharges. | Deaths. | ||||||
|---|---|---|---|---|---|---|---|---|
| Recovered. | Relieved. | Unrelieved. | Males. | Females. | ||||
| Males. | Females. | Males. | Females. | Males. | Females. | |||
| Mouth | 3 | .. | 2 | .. | 1 | .. | 1 | .. |
| Jaw | .. | 1 | 3 | 1 | .. | .. | 4 | .. |
| Lip | 20 | 1 | 19 | .. | 2 | .. | 4 | .. |
| Tongue | 2 | .. | 6 | .. | 6 | .. | 12 | .. |
| Tonsils | .. | .. | 2 | .. | 1 | .. | 2 | 1 |
| Œsophagus | .. | .. | 2 | 1 | 1 | 1 | 5 | 2 |
| Stomach | 4 | 1 | 14 | 5 | 20 | 6 | 32 | 6 |
| Pylorus | .. | .. | 4 | .. | 2 | .. | 4 | .. |
| Liver | 1 | .. | 3 | 3 | 4 | 2 | 15 | 7 |
| Gall-bladder | .. | .. | .. | .. | .. | .. | .. | 3 |
| Stomach and liver | .. | .. | .. | .. | .. | .. | 2 | .. |
| Peritonæum | .. | .. | .. | .. | .. | .. | 1 | .. |
| Omentum | .. | .. | .. | .. | .. | 1 | .. | .. |
| Bowels | 1 | .. | 1 | 1 | 1 | .. | 3 | 3 |
| Intestines | .. | .. | 2 | .. | 1 | .. | 1 | 1 |
| Cæcum | .. | .. | 1 | .. | .. | .. | .. | 2 |
| Colon | .. | .. | 3 | .. | .. | 3 | 2 | .. |
| Sigmoid | 1 | 1 | .. | 2 | 1 | 1 | .. | 2 |
| Rectum | 2 | 2 | 4 | 3 | 4 | .. | 12 | 6 |
| Anus | .. | .. | .. | .. | 1 | .. | .. | .. |
| Mesentery | .. | .. | .. | .. | .. | .. | .. | 1 |
| Ileum | .. | .. | .. | .. | .. | .. | 1 | .. |
| Uterus | .. | 16 | .. | 9 | .. | 13 | .. | 17 |
| Neck of uterus | .. | 3 | .. | 7 | .. | 7 | .. | 4 |
| Ovary | .. | 3 | .. | 1 | .. | 1 | .. | .. |
| Vulva, vagina | .. | 1 | .. | 3 | .. | 2 | .. | 2 |
| Breast | .. | 22 | .. | 24 | .. | 7 | .. | 14 |
| Ear | 2 | .. | 4 | .. | 2 | .. | .. | .. |
| Nose | .. | .. | .. | .. | .. | .. | 1 | .. |
| Cheek | .. | .. | 1 | 1 | .. | .. | .. | .. |
| Face | 1 | 4 | 1 | 1 | .. | 3 | 1 | |
| Rodent* ulcer (undefined) | 11 | 6 | 6 | 1 | 1 | 2 | .. | 1 |
| Epithelioma (undefined) | 1 | .. | 3 | .. | .. | .. | .. | .. |
| Eye (cancer) | .. | .. | .. | .. | .. | 1 | .. | .. |
| Antrum | .. | .. | .. | .. | .. | .. | 1 | .. |
| Parotid | .. | .. | 2 | .. | 1 | .. | .. | .. |
| Neck | 2 | .. | 3 | .. | 1 | .. | 6 | .. |
| Glands of neck | 3 | .. | 2 | .. | .. | 1 | 3 | .. |
| Throat | .. | 1 | .. | .. | .. | .. | .. | 1 |
| Sacrum | .. | .. | .. | .. | .. | .. | 1 | .. |
| Lung | .. | .. | 1 | .. | 1 | .. | 1 | 1 |
| Ribs | .. | .. | .. | 1 | .. | .. | .. | .. |
| Shoulder | .. | .. | .. | .. | .. | .. | .. | 1 |
| Axilla | .. | .. | .. | .. | .. | .. | 1 | .. |
| Arm | .. | 1 | .. | .. | .. | .. | .. | .. |
| Hand | 3 | .. | .. | .. | 1 | .. | 1 | .. |
| Back | .. | .. | 1 | .. | .. | .. | .. | .. |
| Spine | .. | .. | .. | .. | .. | .. | .. | 1 |
| Thyroid | .. | 1 | .. | .. | .. | .. | .. | .. |
| Larynx | .. | .. | 1 | 1 | 4 | .. | 5 | .. |
| Abdomen | .. | 2 | 1 | .. | .. | 1 | 4 | 1 |
| Pancreas | .. | 1 | 1 | 1 | .. | .. | 2 | 3 |
| Kidney | .. | .. | 2 | 1 | .. | 2 | 2 | 1 |
| Spleen | .. | .. | .. | .. | .. | .. | 1 | .. |
| Bladder | .. | .. | .. | 2 | 1 | .. | 6 | .. |
| Prostate | .. | .. | 4 | .. | .. | .. | 16 | .. |
| Male genital organs | 2 | .. | .. | .. | 1 | .. | 3 | .. |
| Thigh | .. | .. | .. | .. | .. | 1 | .. | .. |
| Hip | .. | .. | .. | 1 | .. | .. | .. | .. |
| Femur | .. | 1 | .. | .. | .. | .. | .. | .. |
| Tibia | .. | 1 | .. | .. | .. | .. | .. | .. |
| Sternum | .. | .. | 2 | 1 | .. | .. | .. | .. |
| Muscle | 1 | .. | .. | .. | .. | .. | .. | .. |
| Foot | 2 | .. | 1 | 1 | .. | .. | .. | .. |
| Buttock | .. | .. | 1 | .. | .. | .. | .. | .. |
| Glands (other than neck) | 1 | 1 | 1 | .. | 1 | .. | 1 | .. |
| Not specified | 3 | 2 | 3 | 4 | 6 | 3 | 9 | 5 |
| Totals | 66 | 69 | 110 | 76 | 66 | 55 | 168 | 87 |
Of the 255 patients who died in hospitals from cancer during 1918, 140, or more than half, had been in hospital less than one month, and of these 39 died within one week of admission.
Tables published in Volume I of Statistics give detailed information as to condition on discharge and part of body affected, in conjunction with age of patient, and also with period in hospital.
The principal of the remaining general diseases are as follows:—
| Disease. | Discharges. | Deaths. | Total Discharges and Deaths. | |||
|---|---|---|---|---|---|---|
| Recovered. | Relieved. | Unrelieved. | Males. | Females. | ||
| Non-puerperal septicæmia | 365 | 112 | 4 | 26 | 345 | 162 |
| Tetanus | 3 | 2 | .. | 9 | 13 | 1 |
| Non-malignant tumours | 126 | 39 | 10 | 4 | 105 | 74 |
| Acute rheumatism | 282 | 107 | 2 | 6 | 240 | 157 |
| Chronic rheumatism and gout | 32 | 135 | 20 | 6 | 120 | 73 |
| Diabetes | 7 | 46 | 16 | 39 | 64 | 44 |
| Exophthalmic goitre | 27 | 63 | 6 | 12 | 19 | 89 |
| Leucæmia | .. | 7 | 1 | 3 | 10 | 1 |
| Anæmia and chlorosis | 33 | 38 | 6 | 20 | 35 | 62 |
| Alcoholism | 147 | 70 | 6 | 10 | 211 | 22 |
Diabetes, exophthalmic goitre, leucæmia, and pernicious anæmia are usually fatal, and if occurring in conjunction with practically any other disease must take precedence as the cause of death. Only two recoveries are recorded in the case of pernicious anæmia, the remaining 31 mentioned being due to other forms of anæmia. Fourteen of the 20 deaths from anæmia are due to the pernicious type of the disease.
The diseases of the nervous system, following the Bertillon classification, are as follows:—
| Disease. | Discharges. | Deaths. | Total Discharges and Deaths. | |||
|---|---|---|---|---|---|---|
| Recovered. | Relieved. | Unrelieved. | Males. | females. | ||
| Abscess of brain | .. | .. | .. | 8 | 4 | 4 |
| Meningitis | 27 | 9 | 7 | 87 | 79 | 51 |
| Locomotor ataxia | 3 | 12 | 12 | 2 | 28 | 1 |
| Other diseases of the spinal cord | 7 | 57 | 9 | 9 | 44 | 38 |
| Apoplexy, cerebral hæmorrhage | 11 | 33 | 9 | 75 | 79 | 49 |
| Softening of the brain | .. | 1 | .. | 2 | 2 | 1 |
| Paralysis without specified cause | 27 | 81 | 17 | 45 | 98 | 72 |
| Genera] paralysis of the insane | 1 | 5 | 5 | .. | 8 | 3 |
| Other forms of mental alienation | 13 | 20 | 67 | .. | 58 | 42 |
| Epilepsy | 29 | 94 | 20 | 5 | 106 | 42 |
| Convulsions | 11 | 3 | .. | 1 | 8 | 7 |
| Convulsions of infants | 24 | 5 | 1 | 2 | 21 | 11 |
| Chorea | 20 | 15 | 1 | .. | 12 | 24 |
| Neuralgia, neuritis | 131 | 134 | 7 | 3 | 150 | 125 |
| Other nervous diseases | 124 | 239 | 31 | 25 | 261 | 158 |
| Totals | 428 | 708 | 186 | 264 | 958 | 628 |
This class shows a fairly high death-rate over the whole group, the rate, however, being greatly reduced by the inclusion of such minor complaints as neuralgia and neurasthenia, which represent a fair proportion of the total cases dealt with. Among the discharges it is noticed that the number of cases returned as recovered is considerably less than those classified as relieved or unrelieved.
The diseases included under "Other diseases of the spinal cord" are as follows:—
| Discharges. | Deaths. | |
|---|---|---|
| Myelitis | 4 | 2 |
| Poliomyelitis | 5 | 1 |
| Infantile paralysis | 47 | .. |
| Paralysis agitans | 2 | 2 |
| Bulbar paralysis | 1 | 1 |
| Disseminated sclerosis | 4 | 1 |
| Lateral scleross | 6 | .. |
| Spastic paralysis | 1 | .. |
| Spinal diplegia | 2 | .. |
| Insular sclerosis | 1 | .. |
| Spinal hæmorrhage | .. | 1 |
| Creeping paralysis | .. | 1 |
| Totals | 73 | 9 |
The large percentage of mental cases shown as unrelieved is due to the inclusion of a number of such cases being admitted to hospital for observation. It is not usual for mental patients to be treated in hospital for any length of time. Many mental patients are transferred from the public general hospitals to the mental hospitals.
Neurasthenia was the complaint in 239 of the 419 cases shown above for "Other nervous diseases," this number including a large proportion of returned soldiers. Cerebral tumours accounted for 21 of the 25 deaths.
Eye troubles were responsible for admission to hospital in no fewer than 503 of the cases discharged from hospital during 1918. There were only 2 deaths from these causes. A summary of the various diseases of the eyes dealt with may be of interest.
DISEASES OF THE EYES .—DISCHARGES FROM HOSPITAL , 1918.
| Disease. | Recovered. | Relieved. | Unrelieved. | Deaths. | Total. | |||||
|---|---|---|---|---|---|---|---|---|---|---|
| Males. | Females. | Males. | Females. | Males. | Females. | Males. | Females. | Males. | Females. | |
| Foreign body in eye | 8 | 1 | 3 | .. | 2 | .. | .. | .. | 13 | 1 |
| Strabismus | 1 | 3 | 7 | 9 | .. | .. | .. | .. | 8 | 12 |
| Keratitis | 4 | 3 | 10 | 8 | 1 | .. | .. | .. | 15 | 11 |
| Glaucoma | 5 | 3 | 8 | 2 | .. | .. | .. | .. | 13 | 5 |
| Iritis | 12 | 8 | 21 | 12 | .. | .. | .. | .. | 33 | 20 |
| Corneal ulcer | 25 | 6 | 23 | 4 | 1 | 1 | .. | .. | 49 | 11 |
| Cataract | 32 | 19 | 31 | 33 | 1 | 2 | .. | .. | 64 | 54 |
| Conjunctivitis | 14 | 5 | 8 | 4 | .. | .. | .. | .. | 22 | 9 |
| Pterygium | 2 | .. | 2 | .. | .. | .. | .. | .. | 4 | .. |
| Dacryocystitis | .. | 4 | 2 | 4 | .. | .. | .. | .. | 2 | 8 |
| Other diseases (including undefined) | 26 | 47 | 31 | 36 | 4 | 3 | 1 | 1 | 62 | 87 |
| Totals | 129 | 99 | 146 | 112 | 9 | 6 | 1 | 1 | 285 | 218 |
Injuries to the eyes, other than those due to the presence of some foreign body, are included in the "accident" class. There were 105 cases of injury to the eyes in 1918.
Diseases of the ears dealt with in hospital appear to be much fewer than eye-diseases. The total number in 1918 was 174, including otitis media 103 and otorrhœa 12. No deaths were recorded.
Organic diseases of the heart are the most important in this class. The deaths of 215 males and 70 females in hospital were due to heart-disease, while the returns show that 66 patients treated for various forms of organic heart-disease were discharged as recovered, 431 as relieved, and 30 as unrelieved. One hundred and three patients were treated for varicose veins, 148 for varicose ulcers, 24 for varicocele, 189 for hæmorrhoids, and 21 for phlebitis, only 3 deaths resulting. Diseases of the glands and other diseases of the lymphatic system were returned in 282 cases, of which 2 were fatal.
Diseases of the circulatory system do not occupy a very prominent position in the statistics of hospital cases. Evidently, in a high proportion of the large number of deaths registered in which heart-disease is assigned as the cause, the general state of health has not been such as to cause admission to hospital.
In the classification of diseases adenoids rank as a disease of the respiratory system, while treatment of the tonsils is included under the digestive system. As, however, many children are admitted to hospital for the removal of tonsils and adenoids at the same time, it is well to discuss these two complaints together.
During 1918, adenoids alone was the cause shown in 199 cases, tonsils alone in 619 cases, while in 1,224 cases the treatment was for both tonsils and adenoids. Only 3 deaths were recorded. The medical inspection of schoolchildren is responsible for the admission of a large proportion of these cases to public hospitals.
Bronchitis, broncho-pneumonia, and pneumonia represent a big proportion of the non-tuberculous diseases of the respiratory system. The figures for hospitals for 1918 are,—
| — | Discharges. | Deaths. | Totals. | |||
|---|---|---|---|---|---|---|
| Recovered. | Recovered. | Unrelieved. | Males. | Females. | ||
| Acute bronchitis | 221 | 28 | .. | 10 | 170 | 89 |
| Chronic bronchitis | 79 | 116 | 8 | 23 | 163 | 63 |
| Broncho-pneumonia | 115 | 13 | 3 | 72 | 124 | 79 |
| Pneumonia | 615 | 46 | 3 | 216 | 572 | 308 |
| Totals | 1,030 | 203 | 14 | 321 | 1,029 | 539 |
Diseases of the respiratory system, not already enumerated, include,—
| Disease. | Cases. |
|---|---|
Other than adenoids. | |
| Pleurisy | 321 |
| Empyema | 82 |
| Goitre | 138 |
| Thyroid disease | 54 |
| Diseases of larynx | 72 |
| Diseases of nose and nasal fossæ* | 370 |
| Asthma | 173 |
| Hæmoptysis | 27 |
| Hydatids of lungs | 20 |
| Pneumoconiosis | 14 |
| Other diseases | 88 |
| Total | 1,359 |
The principal diseases of the stomach were as follows:—
| Disease. | Cases. |
|---|---|
| Ulcer of stomach | 199 |
| Gastritis | 395 |
| Dyspepsia | 70 |
| Hæmatemesis | 27 |
| Gastric catarrh | 14 |
| Other diseases | 97 |
| Total | 802 |
Diseases of the oesophagus, numbering 21, are not included.
Ulcer of the stomach was fatal in 23 cases, gastritis in 5, and other diseases in 10.
The total cases of diarrhœa and enteritis included in the returns were 412, including 36 deaths. Nineteen of the deaths were of children under two years of age.
Appendicitis ranks high among hospital cases, but the death-rate is exceedingly low. During 1918 only 58 deaths occurred out of a total of 2,040 cases dealt with, representing a percentage of 2.35. Of the discharges, 1,750 were returned as recoveries, 217 as relieved, and 15 as unrelieved. The males dealt with numbered 1,010, and females 1,030.
Hernia cases included in the returns of discharges and deaths for 1918 numbered 751, including 34 deaths. Included in the total are 372 shown as inguinal hernia, 15 as umbilical hernia, 31 as femoral hernia, 68 as ventral hernia, and 265 as hernia undefined. Intussusception cases numbered 14, and intestinal obstruction (so defined) 108 cases, of which 30 were fatal.
Non-cancerous diseases of the liver were responsible for 42 deaths in hospital during 1918. Discharges of patients treated for liver-diseases numbered 346. Of the total discharges and deaths, 167 cases were attributed to biliary calculi (including 134 females), 23 to cirrhosis, 56 to jaundice, 52 to cholecystitis, and 59 to hydatids.
Diseases of the kidneys and other portions of the urinary system numbered. 1,165; details are given in the following table:—
| Disease. | Discharges | Deaths. | Total Discharges and Deaths. | |||
|---|---|---|---|---|---|---|
| Recovered. | Relieved. | Unrelieved. | Males. | Females. | ||
| Acute nephritis | 90 | 52 | 1 | 18 | 104 | 57 |
| Bright's disease | 6 | 17 | 6 | 17 | 28 | 18 |
| Chronic nephritis | 5 | 48 | 2 | 27 | 59 | 23 |
| Uræmia | 4 | 1 | .. | 10 | 8 | 7 |
| Albuminuria | 11 | 9 | 1 | .. | 10 | 11 |
| Pyelitis | 47 | 29 | 1 | 4 | 15 | 66 |
| Hæmaturia | 12 | 12 | 1 | 2 | 18 | 9 |
| Movable kidney | 14 | 13 | 3 | .. | 6 | 24 |
| Pyelonephritis | 6 | 1 | .. | 2 | 6 | 3 |
| Pyonephrosis | 2 | 1 | .. | 2 | 4 | 1 |
| Hydronephrosis | 1 | .. | 9 | .. | 1 | 2 |
| Abscess of kidney | 4 | .. | 1 | .. | 2 | 3 |
| Other kidney-diseases | 17 | 8 | .. | 5 | 15 | 15 |
| Renal colic | 15 | 17 | .. | .. | 24 | 8 |
| Renal stone | 15 | 20 | 2 | 2 | 34 | 5 |
| Stone in bladder or urethra | 11 | 3 | 1 | .. | 14 | 1 |
| Nephrolithiasis | .. | 2 | 1 | .. | 2 | 1 |
| Retention of urine | 29 | 15 | 2 | 3 | 45 | 4 |
| Cystitis | 69 | 66 | 8 | 10 | 80 | 73 |
| Cystocele | 13 | 2 | .. | .. | .. | 15 |
| Other diseases of bladder | 21 | 23 | 13 | 3 | 42 | 18 |
| Stricture of urethra | 78 | 52 | 5 | 8 | 127 | 16 |
| Enlargement of prostate | 45 | 51 | 10 | 35 | 141 | .. |
| Totals | 515 | 442 | 60 | 148 | 785 | 380 |
Non-venereal diseases of the male genital organs numbered 188, including orchitis 39 and hydrocele 51.
Diseases of the female genital organs, other than cancer or those diseases shown to be venereal or puerperal, are an important group in hospital cases, though the death-rate is exceedingly low. The total cases passing through public hospitals in 1918 were 1,601, including only 20 deaths. The list is shown on the next page.
DISEASES OF FEMALE GENITAL ORGANS .
| Disease. | Discharges. | Deaths. | Total Discharges and Deaths. | ||
|---|---|---|---|---|---|
| Recovered. | Relieved. | Unrelieved. | |||
| Uterine hæmorrhage | 101 | 27 | 2 | 2 | 132 |
| Uterine tumour | 123 | 20 | 4 | 3 | 150 |
| Prolapse of uterus | 94 | 14 | 1 | 2 | 111 |
| Retroflexion of uterus | 24 | 1 | .. | .. | 25 |
| Retroversion of uterus | 234 | 36 | 10 | 4 | 284 |
| Anteflexion of uterus | 4 | 1 | .. | .. | 5 |
| Endometritis | 153 | 22 | 5 | .. | 180 |
| Metritis | 54 | 3 | .. | .. | 57 |
| Endocervitis | 4 | 1 | 1 | .. | 6 |
| Dysmenorrhœa | 40 | 21 | 2 | .. | 63 |
| Leucorrhœa | 14 | 11 | 1 | .. | 26 |
| Amenorrhœa | .. | 2 | .. | .. | 2 |
| Pelvic cellulitis | 32 | 12 | 1 | 1 | 46 |
| Pelvic abscess | 9 | 3 | .. | 2 | 14 |
| Pelvic inflammation | 20 | 4 | 1 | .. | 25 |
| Other diseases of uterus | 72 | 24 | 3 | 1 | 100 |
| Ovarian cysts | 70 | 7 | 4 | 2 | 83 |
| Salpingitis | 126 | 27 | 5 | 3 | 161 |
| Other diseases | 96 | 32 | 3 | .. | 131 |
| Totals | 1,270 | 268 | 43 | 20 | 1,601 |
The above figures do not include 145 cases of diseases of the female breast (mastitis 44, tumour 45, abscess 53, and other diseases 3).
A total of 1,162 cases come under the heading of puerperal. This number includes 321 cases of normal childbirth dealt with at public general hospitals, but does not cover maternity cases in St. Helens Hospitals.
PUERPERAL ACCIDENTS , ETC .
| Disease. | Discharges | Deaths. | Total Discharges and Deaths. | ||
|---|---|---|---|---|---|
| Recovered. | Relieved. | Unrelieved. | |||
| Miscarriage | 230 | 28 | 1 | 7 | 266 |
| Abortion | 284 | 11 | 1 | .. | 296 |
| Ectopic gestation | 39 | 4 | .. | 2 | 45 |
| Other accidents of pregnancy | 46 | 12 | 1 | 3 | 62 |
| Normal labour | 298 | 13 | 10 | .. | 321 |
| Puerperal hæmorrhage | 19 | 3 | 1 | .. | 23 |
| Ruptured perinæum | 24 | 1 | 1 | .. | 26 |
| Other accidents of labour | 38 | 4 | .. | 1 | 43 |
| Puerperal septicæmia | 23 | 3 | .. | 17 | 43 |
| Puerperal albuminuria. | 14 | 4 | .. | 6 | 24 |
| Puerperal phlebitis and phlegmasia | 2 | 1 | .. | 1 | 4 |
| Puerperal mania | 2 | 4 | 2 | 1 | 9 |
| Totals | 1,019 | 88 | 17 | 38 | 1,162 |
The principal diseases of the skin and annexa were as follows:—
| Disease. | Cases. |
|---|---|
| Abscess | 461 |
| Ulcers | 223 |
| Eczema | 164 |
| Cellulitis | 160 |
| Sinus | 83 |
| Ingrown nail | 44 |
| Gangrene | 36 |
| Erythema | 38 |
| Carbuncle | 44 |
| Scabies | 24 |
| Herpes | 22 |
| Whitlow | 39 |
| Dermatitis | 32 |
| Furuncle | 28 |
| Psoriasis | 12 |
| Impetigo | 47 |
| Rash (undefined) | 9 |
| Boils | 23 |
| Corns and warts | 10 |
| Other | 73 |
| Total | 1,572 |
Deaths numbered 29, including 4 from cellulitis, 5 from abscess, and 15 from gangrene.
Non-tuberculous diseases of the bones and of the organs of locomotion numbered 1,201, including 18 deaths. Thirteen of the deaths were due to osteomyelitis. The principal diseases in this class, following the order of the classification, were.—
| Disease. | Cases. |
|---|---|
| Caries | 6 |
| Necrosis | 95 |
| Osteomyelitis | 149 |
| Periostitis | 51 |
| Ostitis | 15 |
| Mastoiditis | 66 |
| Sinusitis | 40 |
| Abscess of bone | 11 |
| Exostosis | 2 |
| Antrum-disease | 35 |
| Ununited fracture | 24 |
| Other diseases of bones | 48 |
| Arthritis | 53 |
| Synovitis | 97 |
| Ankylosis | 22 |
| Other diseases of joints | 62 |
| Amputations (cause not shown) | 33 |
| Bursitis | 92 |
| Talipes | 38 |
| Tenosynovitis | 14 |
| Lumbago | 59 |
| Muscular rheumatism | 35 |
| Hammer-toe | 9 |
| Ganglion | 14 |
| Bunion | 12 |
| Abscess of joint | 19 |
| Other diseases of organs of locomotion | 100 |
| Total | 1,201 |
Male infants to the number of 178 were discharged from hospital after treatment for phimosis. Other malformations were,—
| Cases. | |
|---|---|
| Cleft palate | 21 |
| Nævus | 32 |
| Hare-lip | 10 |
| Hydrocephalus | 7 |
| Spina bifida | 5 |
| Congenital dislocation | 8 |
| Hypospadias | 1 |
| Club-foot | 8 |
| Others | 30 |
| Total | 300 |
Light deaths were recorded, 2 from spina bifida, 1 from cleft palate, 2 from hydrocephalus, and 3 from "others."
Forty-seven deaths are recorded as having been due to diseases of early infancy. The chief items in this class are marasmus (27 deaths) and premature birth (12 deaths). The total discharges and deaths amounted to only 106, thus the deaths amounted to the very high percentage of 44.34 to the total cases treated.
Hospital returns show a total of 113 male deaths and 37 female deaths from old age during 1918. In addition, 15 old people treated for senility were discharged recovered, 103 relieved, and 76 unrelieved. These totals include the returns of three hospitals which are also old people's homes.
The principal headings included in this class in hospital cases are fractures and injuries in regard to which no specified cause is shown. In death-registrations the cause of death is asked for, and in cases of deaths resulting from fractures and Other injuries the actual cause is obtained, and the death classified under one or other of the thirty definite headings provided. The Medical Superintendents are, however, concerned not. with causes but with natures of injuries, and the returns in the great majority of cases are classed under the headings "fractures" and "injuries." which in death statistics would be regarded as somewhat indefinite, but which in morbidity statistics are invaluable on account of the fact that the part of the body affected is given in most of the cases. Fractures and injuries are dealt with in detail further on.
Seven suicidal deaths in hospital were returned in 1918, and 28 of the patients discharged were admitted for treatment for self-inflicted injuries.
Accidental poisoning, including cases not shown to be suicidal, was returned in 81 cases, including 14 of ptomaine poisoning. One hundred and ninety-six cases of burns, 55 of accidental shooting, 271 of injuries by cutting or piercing instruments, 11 by fall, and 84 by crushing are also shown. Six persons were treated for effects of heat, 5 for effects of excessive cold, 1 for starvation, 1 for suffocation, 2 for electrocution, 7 for injuries inflicted by animals, 6 for effects of immersion in water, and 2 for homicide by firearms. The total deaths in hospitals during the year from "External Causes" were 187 out of a total of 5,332 cases.
The part of the body affected in the 1,635 cases of fractures referred to above is shown in full in the next table:—
| Fractures. | Cases. |
|---|---|
| Fracture of skull | 106 |
| Fracture of jaw | 45 |
| Fractured malar | 4 |
| Fracture of nose | 16 |
| Fracture of tracheal cartilage | 1 |
| Fracture of clavicle | 81 |
| Dislocation of shoulder | 61 |
| Fracture of sternum | 1 |
| Fracture of scapula | 5 |
| Fracture of humerus | 140 |
| Dislocation of elbow | 54 |
| Fracture of radius | 33 |
| Fracture of ulna | 55 |
| Fracture of arm | 38 |
| Dislocation of wrist | 12 |
| Colles fracture | 21 |
| Dislocation of fingers | 32 |
| Fracture of spine | 17 |
| Fracture of ribs | 74 |
| Fracture of pelvis | 15 |
| Dislocation of hip | 12 |
| Fracture of coccyx | 1 |
| Fracture of thigh | 28 |
| Fracture of femur | 191 |
| Fracture of patella | 15 |
| Dislocation of knee | 27 |
| Dislocation of semi-lunar cartilage | 18 |
| Fracture of tibia | 221 |
| Fracture of fibula | 49 |
| Fracture of leg | 105 |
| Pott's fracture | 50 |
| Sprained ankle | 64 |
| Dislocation of foot | 7 |
| Dislocation of toe | 13 |
| Fractured toe | 1 |
| Greenstick-fracture | 2 |
| Fracture (undefined) | 20 |
| Total | 1,635 |
The total shown includes 88 deaths, 43 of which were due to fracture of the skull.
The heading "Other External Violence," which covers a large list of miscellaneous and undefined injuries, accounted for a total of 2,928 cases, including 41 deaths, 9 of which were due to injuries to the head or brain. The total number of cases was swelled by the inclusion of 1,184 returned soldiers treated for wounds received in battle.
| Location. | Cases. |
|---|---|
| Head and brain | 270 |
| Scalp | 85 |
| Eye | 105 |
| Face | 110 |
| Neck, &c. | 20 |
| Shoulder | 38 |
| Arm | 62 |
| Elbow | 37 |
| Wrist | 9 |
| Hand | 112 |
| Fingers | 143 |
| Spine | 16 |
| Back | 77 |
| Side | 11 |
| Bibs and chest | 42 |
| Kidneys | 4 |
| Loin | 4 |
| Abdomen | 28 |
| Urethra | 1 |
| Groin | 3 |
| Hip | 38 |
| Thigh | 38 |
| Knee | 91 |
| Leg | 132 |
| Pelvis | 7 |
| Buttock | 4 |
| Ankle | 32 |
| Foot | 102 |
| Toes | 29 |
| Tendon | 10 |
| Injury in battle | 1,184 |
| Undefined | 84 |
| Total | 2,928 |
Table of Contents
THE Public Health Act, 1900, repealed eight amending and allied Acts dating from 1876 to 1900. The Public Health Act, 1900, with amendments in 1901, 1902, 1903, 1904, and 1907, in the general consolidation of the New Zealand Statutes, now forms the Public Health Act, 1908. This principal Act consists of four parts, and has been further amended in 1910 and 1918.
Part I of the principal Act provides for the constitution of a Department of Public Health under the control of a Minister of the Crown, called the Minister of Public Health, and also enables the Dominion to be divided up into health districts, each health district being placed under a District Health Officer, who must possess special knowledge of sanitary and bacteriological science. These officers, and such Inspectors and other officers who may be appointed by the Governor-General, are under the control of and responsible to the Chief Health Officer.
Part II deals with sanitation and the prevention of infectious diseases. The initial clauses under this part are more particularly designed to be made use of in the case of an outbreak of any dangerous infectious disease. These diseases have been declared to be plague, smallpox, leprosy, and cholera. The subsequent sections of this part deal with the notification and prevention of the spread of infectious diseases. By the Hospitals and Charitable Institutions Amendment Act, 1910, the Hospital Boards throughout the Dominion are made the local authorities under this Act for all matters relating to infectious diseases. Notification of the latter is required to be made to the Hospital Board and the District Health Officer.
Under "Sanitation," the abatement of nuisances, the prevention of pollution of watercourses, the control of offensive trades, the removal or repairing of insanitary buildings, and other similar matters are dealt with; and the functions of the District Health Officer and the Inspectors in regard thereto are laid down. Generally speaking, in addition to his duties under the Public Health Act, the District Health Officer acts in the advisory capacity of a medical officer of health to the several municipalities and other local governing bodies in his district.
Part III deals with quarantine, and Part IV with vaccination.
The 1918 amendment was passed largely as the result of experience gained during the influenza epidemic which visited New Zealand in the last three months of the year 1918. Its principal object was the provision of necessary powers to enable the Public Health Department to take more vigorous action in combating an epidemic. It also provided for the creation of a Board of Public Health, consisting of ten members, whose duty it is to report to the Minister of Health on matters concerning developments in national health, medical service, instruction in health questions, and desirable legislative reforms. Further power is given to the Minister of Health to create District Advisory Committees in any health district when required. Provision is also made for any local authority to establish lodginghouses within the area of its jurisdiction, or contiguous thereto, the money for the purchase of the necessary land and buildings being obtainable by loan under the Local Bodies' Loans Act. In regard to buildings in a condition unfit for occupation or dangerous to public health, the local authority may, upon the certificate of the District Health Officer, require the owner to have the premises pulled down, or, as an alternative, the District Health Officer may require structural alterations or additions made to the buildings or improvements to the sanitary conditions. The owner is given the right of appeal to a Magistrate. If he fails to pull down the building within the time prescribed the local authority has power to take action and recover the cost therefor from the owner. If, in turn, the local authority fails to do so the District Health Officer can proceed to exercise all the powers conferred on the local authority in this behalf. Dwelling-houses deemed unfit for occupation may also be dealt with by the local authority, which has power to make by-laws providing for the inspection of any building before being occupied, and also to appoint Inspectors to carry out such work and report to the local authority, particular attention being paid to the area of land occupied, air-space, and the sanitary arrangements. Insanitary areas may also be reported upon by the District Health Officer to the Board of Health, which has power, if it deems fit, to require the work to be carried out, failing which the Minister may authorize the work to be done at the expense of the local authority. In order to prevent overcrowding in lodginghouses and tenements, no person is allowed to accommodate more than five lodgers at any time, for either temporary or permanent board and residence, unless the premises have been licensed by the local authority; nor can the owner let any house or tenement in which more than one family is to reside, or any room for the occupation of more than two persons, without the previous approval of the local authority. The setting-up of a Sanitation Committee by the local authority is also provided for. Such Committee may report on the sanitation of the district, and furnish recommendations upon any matters connected therewith. To secure adequate medical services in the outlying districts power is given to the Minister, on receiving an application from a local authority, to provide a resident medical practitioner, whose salary and emoluments shall be fixed, and who will not be debarred from holding Government appointments connected with matters of public health in his district. The Act also provides various amendments to the principal Act, chief among which are sections providing for the restriction of the hour of performances in picture-theatres, and enabling grants to be made to societies and organizations engaged in the teaching of public-health matters.
The New Zealand University Amendment Act, 1912, confers on the Senate of the New Zealand University the power to grant diplomas in public health, and to make regulations for the examination of candidates for such diplomas.
The quarantine laws are administered by the officers of the Department of Public Health, under authority of the Public Health Act, 1908. The Act provides for the proclamation of infected places in or beyond the Dominion, and every ship arriving at a New Zealand port from or after having touched at an infected place is liable to quarantine, and this liability extends to every person on board such ship. No persons or goods are allowed to be landed from an infected ship except at the appointed quarantine-ground, and any restrictions that may be deemed necessary to prevent the spread of infection may be enforced by the Health Officers. Heavy fines may be inflicted for any breach of these laws.
A medical practitioner may be appointed to take charge of passengers and crew of a ship liable to quarantine, and the owners or agents of the ship are liable for the cost of such attendance. It is the duty of the owners or agents of the ship to supply the passengers with such whole-some provisions and medicines as the medical man in charge directs or requires. All expenses incurred in connection with the disinfection or destruction of infected goods are a charge against the ship.
Regulations under the Act direct the manner in which the ship and the quarantine quarters must be disinfected, and the precautions to be taken by those on board the ship. Suspected ships are liable to the same precautions as those infected, and healthy ships—i.e., those on board which there has been no case of infectious disease though they have sailed from or touched at an infected port, or have communicated with an infected ship—are liable to fumigation if directed by the Health Officer, and the method of mooring is set out.
No vessel may be admitted to pratique between the hours of sunset and sunrise, unless under exceptional circumstances.
The procedure under the law as to vaccination is as follows: The Registrar of Births issues a notice when a birth is registered, with forms for certificate as to the result of vaccination attached. Vaccination is compulsory, if exemption is not secured in four months from date of birth. But everything is subject to the provisions of the "exemption clause," which is the main feature, and governs the rest. Any parent or custodian who has conscientious objections — believing that vaccination would be injurious to the child's health—can apply for a certificate of exemption to a Magistrate or to a Registrar of Births; and when the child's parent or guardian is resident outside of a borough the application may be made to and certificate granted by a Justice of the Peace.
When no exemption certificate is obtained, the law allows the parent twelve months from date of birth in which to vaccinate, and a similar period from date of taking charge of child in case of a custodian. There are penalties for not vaccinating, but one conviction for neglecting to vaccinate a child removes liability until the child is four years of age.
Under the Medical Practitioners Act, 1914, is constituted the Medical Board of New Zealand, consisting of the Inspector-General of Hospitals and six other registered medical practitioners, who are appointed to the Board by the Governor-General, the term of appointment being a three-yearly one. The Board elects its own Chairman annually, the Inspector-General of Hospitals at present occupying the position.
The Board deals with all applications for registration under the Act, which enacts that every person shall be entitled to registration who satisfies the Board that he is a graduate in medicine and surgery of the University of New Zealand; or registered on the register kept in accordance with the provisions of the Acts regulating the registration of medical practitioners in the United Kingdom, or eligible for registration on such last-mentioned register; or the holder of a foreign diploma approved by the Board, and granted by any university or institution other than the University of New Zealand or a university or institution situated in the United. Kingdom, after a course of not less than five years' study of the subjects pertaining to a medical and surgical degree or license. The Board may, however, refuse to approve any diploma unless it appears that New Zealand graduates are, without further examination, entitled to registration in the country granting the diploma.
No person is entitled to be registered if he has been at any time convicted of any offence punishable by imprisonment with hard labour for a term of two years or upwards, or is otherwise not of good fame or character. Applicants who are refused registration have the right of appeal to the Supreme Court.
Application for registration should be made in the first place to the Registrar of Births and Deaths at Auckland, Wellington, Christchurch, or Dunedin. One month's notice of intended application must be given, and such notice advertised once in the New Zealand Gazette and also in a newspaper circulating near the residence of the applicant. Residence in New Zealand is therefore essential before notice can be given.
The fee for registration is £3 3s., payable on deposit of evidence of qualification.
A table is appended showing the additions to and removals from the Medical Register during the last four years, with the numbers on the register on the 1st January and 31st December of each year.
MEDICAL REGISTER ,—ADDITIONS AND REMOVALS .
| — | 1915. | 1916. | 1917. | 1918. |
|---|---|---|---|---|
| Number on register on 1st January | 1,268 | 948 | 962 | 969 |
| Number added during year by registration | 28 | 37 | 27 | 30 |
| Number added during year by restoration | .. | 5 | 1 | 3 |
| Number removed during year on evidence of death | 8 | 10 | 21 | 17 |
| Number removed during year by direction of Medical Board— | ||||
| Letter not delivered and returned to Registrar-General | 309 | 18 | .. | .. |
| Ceased to practise | 20 | .. | .. | .. |
| Reported dead | 11 | .. | .. | .. |
| Number on register on 31st December | 948 | 962 | 969 | 985 |
Application for registration as a dentist should be made to the Registrar-General, Wellington, accompanied by a fee of £1.
Every adult person is entitled to be registered as a dentist in New Zealand who is the holder of a degree in dental surgery of the University of New Zealand, or a certificate of proficiency in dentistry obtained from the Senate of the University, or is registered or entitled to be registered as a dentist in the United Kingdom, or is the holder of such degree in dentistry granted in a British possession or a foreign country as may be recognized by the Senate of the New Zealand University. Evidence of good character is required in every case.
A table is appended showing the additions to and removals from the Dentists' Register during the last four years, with the numbers on the register on the 1st January and 31st December of each year.
DENTISTS ' REGISTER .—ADDITIONS AND REMOVALS .
| — | 1915. | 1916. | 1917. | 1918. |
|---|---|---|---|---|
| Number on register on 1st January | 769 | 767 | 764 | 759 |
| Number added during year by registration | 2 | 3 | 1 | .. |
| Number removed during year on evidence of death | 4 | 6 | 6 | 6 |
| Number on register on 31st December | 767 | 764 | 759 | 753 |
In order to make better provision for the sale of food and drugs in a pure state, the Sale of Food and Drugs Act was passed by the Legislature, and came into operation on the 1st January, 1908. This Act forms part of and is to be read together with the Public Health Act, 1908.
The Act is administered by the officers of the Public Health Department, and provides for the analysis, by public analysts, of any article of food or drink, or of any drug, which may be sold, offered for sale, or exposed for sale, and for the inspection of any place where there is any food or drug intended for sale. If any such article be proved to be unfit for human consumption, or likely to cause injury to health if consumed, heavy penalties may be inflicted on the person or persons responsible.
Stringent measures are provided for the prevention of adulteration of food, drink, or drugs, and for the inspection of places where such things are manufactured or packed. The selling of light-weight bread is an offence under the Act, as is also the taking back of bread after it has been in the possession of the purchaser for more than an hour.
Any person may, on payment of the prescribed fee, together with the cost of the sample, require any authorized officer to purchase a sample of any food or drug and submit the same for analysis.
Regulations under the Act defining standards for the control of the purity of foodstuffs and of drugs were published in the New Zealand Gazette of the 6th March, 1913, 2nd March, 1916, 15th June, 1916, 18th May, 1916, 8th November, 1917, 21st March, 1918, and 18th April, 1918. In general, the New Zealand standards are on the lines recommended by the Australian Inter-State Conference.
During the year 1918, 247 charges under the Sale of Food and Drugs Act were dealt with in the Magistrates' Courts, resulting in 196 convictions. Fines wore imposed in 168 cases, in three cases the convicted persons were imprisoned, in twenty-four cases the defendant was convicted and discharged, and in one case ordered to come up for sentence. One hundred of the convictions were for selling adulterated milk, ten for other offences in connection with the sale of milk, twenty-two for selling fight-weight bread, and eight for selling fight-weight or over-watered butter.
During the year 1917, 2,655 analyses were made by the Department's analysts, 2,456 being milk-samples. Samples of bread to the number of 3,925 were weighed, and 160 of these were found to be short-weighted. The total fines and costs where legal proceedings resulted from sampling or weighing amounted to £1,413 for the year.
Section 2 of this Act enacts that every person commits an offence who publishes or causes to be published any statement which is intended by the defendant or any other person to promote the sale of any article as a medicine, preparation, or appliance for the prevention, alleviation, or cure of any human ailment or physical defect, and which is false in any material particular relating to the ingredients, composition, structure, nature, or operation of that article, or to the effects which have followed or may follow the use thereof.
The penalty inflicted is a fine not exceeding £100 in the case of first conviction, and not exceeding £200 for every subsequent conviction. The object of the Act is to provide the means of effectually stopping the exploitation of the public by means of medicines or treatment alleged to cure all and sundry complaints and ailments.
The Plumbers Registration Act, passed during the session of 1912, provided for the setting-up of a Board, to be called the Plumbers' Board of New Zealand. This Board consists of five members—viz., the Chief Health Officer or his deputy, who shall be Chairman; the Director of Education; a city or borough engineer nominated by the cities and boroughs which have a population of over 5,000 inhabitants, and appointed by the Governor-General; a master plumber and a journeyman plumber elected by their respective associations.
The functions of the Board are to decide what persons may be registered under the Act, in what districts sanitary plumbing shall be performed only by registered plumbers, and what shall be the scope of the examinations to be held in the future as a part of the process of securing registration.
The main principle underlying the Act is that of securing trained and certificated sanitary plumbers, and that such registered plumbers shall not be required to pay any license fee or pass any examination under any local authorities controlling sanitary-plumbing works.
At the examination held under the Act in July, 1918, thirty-one candidates presented themselves, the results being as follows: Six qualified in the theoretical part, eight in the practical part, and ten qualified or completed in both parts of the examination and were duly granted registration. At the examination held under the Act in December, 1918, twenty-six candidates presented themselves, the results being as follows: Ten qualified in the theoretical part, six in the practical part, and eight qualified or completed in both parts of the examination and were duly granted registration. In addition, one plumber was admitted to registration during the year under other provisions of the Act. The total of names entered in the register to date is 1,267.
EXPENDITURE ON HOSPITALS AND CHARITABLE AID .
For the year 1916-17 the official statistics of Hospital and Charitable Aid Boards were for the first time prepared on the basis of an Income and Expenditure Account and Balance-sheet; and the year ended 31st March, 1918, being the second year for which such complete statistics are available, comparisons can now be drawn which are more definite, and the results obtained by such comparisons enable conclusions to be drawn when comparing the figures of this country with other parts of the British Empire and with American hospitals. On account of the alteration in the system that took place for the year 1916-17, the accounts are in some points not absolutely comparable with the figures shown under the system followed in past years.
The total income of Hospital Boards, separate institutions, and Government institutions for the year ended 31st March, 1918, on account of hospitals and charitable aid and public health was £953,108, and for Hospital Boards alone was £893,334. The main sources of income for the year are as follows:—
| £ | |
|---|---|
*Exclusive of fees paid by Hospital and Charitable Aid Boards or separate institutions. | |
| Contributable by Government | 245,209 |
| Levies on local authorities | 214,020 |
| Voluntary contributions | 19,976 |
| Pees payable by those assisted | 202,966* |
| Fees payable on account of patients by Hospital and Charitable Aid Boards, separate institutions, and Government (inter se ) | 7,864 |
| Charitable-aid recoveries | 28,875 |
The total expenditure of Hospital Boards, separate institutions, and Government institutions amounted during the year to £953,108, including an excess of income over expenditure amounting to £237,057. The total expenditure of Hospital Boards alone was £893,334, including an excess of income over expenditure of £223,898. The following are the main items of. expenditure by all authorities:—
| £ | |
| Hospital maintenance | 456,483 |
| Charitable aid | 135,098 |
| Public health | 12,511 |
| Administration | 30,173 |
The average annual cost of maintenance per occupied bed for the last five years is set out below:—
| Year. | Provisions. | Surgery and Dispensary. | Domestic and Establishment. | Salaries and Wages. | Total Maintenance. |
|---|---|---|---|---|---|
| £ | £ | £ | £ | £ | |
| 1913-14 | 24.9 | 9.8 | 27.4 | 43.0 | 105.1 |
| 1914-15 | 25.0 | 10.7 | 27.0 | 43.5 | 106.2 |
| 1915-16 | 27.4 | 10.4 | 31.1 | 42.5 | 111.3 |
| 1916-17 | 28.7 | 10.3 | 27.1 | 43.7 | 109.6 |
| 1917-18 | 37.3 | 12.3 | 25.6 | 41.5 | 116.7 |
The charitable-aid expenditure for the last five years has been as follows:—
| Year. | Indoor Relief. | Outdoor Relief. | Total. |
|---|---|---|---|
| £ | £ | £ | |
| 1913-14 | 68,510 | 34,541 | 103,051 |
| 1914-15 | 74,081 | 37,413 | 111,494 |
| 1915-16 | 84,269 | 40,349 | 124,618 |
| 1916-17 | 72,524 | 41,119 | 113,643 |
| 1917-18 | 91,092 | 44,006 | 135,098 |
HOSPITAL AND CHARITABLE -AID EXPENDITURE , 1898-99 TO 1917-18.
| Year ended 31st March. | Mean Population. | Hospital and Charitable Aid and other Expenditure. | Expenditure per Head of Mean Population. |
|---|---|---|---|
| £ | s. d. | ||
| 1899 | 739,193 | 198,823 | 5 4 1/2 |
| 1900 | 752,644 | 185,860 | 4 11 1/4 |
| 1901 | 765,668 | 197,408 | 5 1 3/4 |
| 1902 | 781,356 | 212,215 | 5 5 |
| 1903 | 802,419 | 231,185 | 5 9 |
| 1904 | 826,902 | 243,000 | 5 10 1/2 |
| 1905 | 851,964 | 259,616 | 6 1 |
| 1906 | 877,469 | 270,710 | 6 2 |
| 1907 | 901,920 | 288,808 | 6 4 1/2 |
| 1908 | 925,727 | 315,197 | 6 10 |
| 1909 | 945,063 | 359,941 | 7 7 1/4 |
| 1910 | 977,906 | 375,075 | 7 8 |
| 1911 | 997,974 | 416,384 | 8 4 1/4 |
| 1912 | 1,019,984 | 482,645 | 9 5 1/2 |
| 1913 | 1,046,624 | 500,442 | 9 6 3/4 |
| 1914 | 1,075,788 | 579,606 | 10 9 1/4 |
| 1915 | 1,095,206 | 578,838 | 10 6 3/4 |
| 1916 | 1,100,496 | 631,504 | 11 5 3/4 |
| 1917 | 1,099,449 | 603,081 | 10 11 3/4 |
| 1918 | 1,114,706 | 716,059 | 12 10 1/4 |
The above figures for the last six years include infectious-diseases hospitals and consumptive sanatoria under Boards' control, also public-health expenditure and subsidies to medical associations and district nurses. The 1916-17 and 1917-18 figures are statements of expenditure incurred, not of actual payments made as in previous years. The number of persons availing themselves of treatment in the general hospitals for the last ten years has been as follows:—
| Year. | Total Number of Persons under Treatment. | Mean Population. | Proportion under Treatment per 1,000 of Population. | Average Number of Occupied Beds per Diem. | Proportion per 1,000 of Population. |
|---|---|---|---|---|---|
| 1908-9 | 18,653 | 945,063 | 20.8 | 1,566 | 1.66 |
| 1909-10 | 21,108 | 977,906 | 21.6 | 1,709 | 1.75 |
| 1910-11 | 23,584 | 997,974 | 23.6 | 1,839 | 1.81 |
| 1911-12 | 24,681 | 1,019,984 | 24.1 | 1,900 | 1.83 |
| 1912-13 | 26,979 | 1,046,624 | 25.8 | 2,131 | 2.04 |
| 1913-14 | 28,885 | 1,075,787 | 26.8 | 2,234 | 2.08 |
| 1914-15 | 31,366 | 1,095,206 | 28.6 | 2,364 | 2.16 |
| 1915-16 | 36,477 | 1,100,496 | 33.1 | 2,617 | 2.38 |
| 1916-17 | 39,029 | 1,099,449 | 35.5 | 2,972 | 2.73 |
| 1917-18 | 40,232 | 1,114,706 | 36.1 | 3,190 | 2.86 |
The general hospitals, numbering sixty-four in 1917-18, covered by the above table include five hospitals which are also old people's homes, as well as two institutions—the Mercury Bay and Oamaru Hospitals—which are not under the control of Hospital Boards. The figures given do not cover maternity hospitals or special hospitals for infectious diseases or tuberculosis.
The number of public general hospitals at 31st March, 1918, was 64. In addition there were four infectious-diseases hospitals and five sanatoria for consumptives.
Information as to the number of public general hospitals and their staff and accommodation is given for each of the past five years.
| Number of | Year ended 31st March. | ||||
|---|---|---|---|---|---|
| 1914. | 1915. | 1916. | 1917. | 1918. | |
| Institutions | 63 | 65 | 65 | 65 | 64 |
| Medical staff (stipendiary) | 88 | 100 | 115 | 112 | 114 |
| Nursing staff— | |||||
| Trained nurses | 300 | 281 | 260 | 248 | 293 |
| Probationers | 578 | 647 | 764 | 833 | 864 |
| Domestic staff | 576 | 623 | 675 | 600 | .. |
| Beds | 3,292 | 3,531 | 3,832 | 4,075 | 4,191 |
Further particulars concerning the public general hospitals of the Dominion for the years ended the 31st March, 1917 and 1918, are given in the next table:—
| Year ended 31st March. | ||
|---|---|---|
| 1917. | 1918. | |
| Average number of patients per diem | 2,972 | 3,190 |
| Number of patients under treatment | 39,029 | 40,232 |
| Deaths | 2,631 | 2,607 |
| Average annual cost of maintenance per occupied bed apart from administration, &c., charged | £109.6 | £116.7 |
| Number of oat-patients attended during year | 18,116 | 28,091 |
State charitable institutions are administered by combined Hospital and Charitable Aid Boards, who also distribute outdoor relief. Most of the aged needy are provided with old-age pensions, but many of these old people prefer to enter a public home, where they are probably cared for better and at less cost than could be possible with individuals. In these cases the pension is received by the officers of the Board as payment for the maintenance of the pensioner, but a proportion is handed over to the latter to be expended as he or she may choose.
* For particulars as to institutions covered see previous page.
The Private Hospitals Act, which came into force on the 1st January, 1907, is now embodied in the Hospitals and Charitable Institutions Act, 1909, which provides for the licensing, management, and inspection of private hospitals. All such institutions must be licensed, and every application for a license must be accompanied by a statement giving full description of the house proposed to be used, number of patients, and class of cases proposed to be received. The licensee shall state whether it is in respect of a lying-in private hospital or a surgical and medical private hospital, or if for both classes of cases; and no private hospital may be used for any purpose other than that in respect of which the license is granted and purposes reasonably incidental thereto.
For every private hospital there must be a resident manager, either the licensee or some person appointed by the licensee, and in every case the manager must be a legally qualified medical practitioner or a registered nurse in the case of a surgical and medical hospital, or a registered midwife in the case of a lying-in hospital, or a registered nurse and midwife, or a registered nurse having as resident assistant a registered midwife, in the case of a hospital licensed for both purposes. No license shall be granted in respect of a house not previously licensed until such house and annexed buildings have been approved by the Inspector-General of Hospitals, and no addition shall be made to any private hospital until it has been so approved. No license shall be granted until the character and fitness of the applicant have been proved satisfactory, and the license must be renewed on the 1st January of each year.
In every private hospital there must be kept a register of patients showing particulars as to name, age, abode, and date of reception of each patient, date when such patient left, or in the event of death the date thereof, name of medical practitioner attending, and such other details as may be prescribed. Inquiry may be made at any time as to the management and conduct of any such private hospital, and if such inquiry prove unsatisfactory the license may be revoked, and, for a period of five years, no new license shall be granted to the person whose license is so revoked.
Provision is made for the visitation and inspection of private hospitals in the same manner as for public institutions of the like nature.
The Governor-General may from time to time make such regulations as are necessary for carrying the Act into effect, and substantial penalties are provided for breaches of its provisions.
There are six State maternity hospitals now open for the use of the public. The St. Helens Hospital at Wellington was opened in June, 1905, and a new and up-to-date building in July, 1912; that at Dunedin was opened in October, 1905; that at Auckland in June, 1906; that at Christchurch in April, 1907; and that at Gisborne in November, 1915. The most recently acquired of these institutions is the St. Helens Hospital at Invercargill, which was opened on the 22nd March, 1918.
These institutions are a development of the policy begun by legislation in 1901, when the Nurses Registration Act was passed, and followed in 1904 by the Midwives Act. The latter provided that after a certain date only those midwives who were duly registered would be qualified to practise on their own account. During the year ended 31st March, 1919, a total of 1,123 confinements took place in the six hospitals mentioned, and 521 confinements were attended by the institution nurses outside these hospitals, as compared with 1,248 and 521 confinements respectively during the previous twelve months.
Tables are given showing information as to births and deaths in each of these institutions during the year ended 31st March, 1919, and the totals for each of the past five years. Births in cases dealt with outside St. Helens Hospitals by nurses attached to institutional staffs are also shown.
ST . HELENS HOSPITALS , 1918-19.
| Town. | Confinements in Institution. | Confinements attended outside. | ||
|---|---|---|---|---|
| Births. | Deaths of Mothers. | Deaths of Infants. | ||
| Auckland | 269 | 5 | 7 | 183 |
| Gisborne | 94 | 1 | 3 | .. |
| Wellington | 310 | 5 | 6 | 94 |
| Christchurch | 216 | 2 | 8 | 181 |
| Dunedin | 121 | 2 | 2 | 61 |
| Invercargill | 113 | 3 | .. | 2 |
| Totals | 1,123 | 18 | 26 | 521 |
ST . HELENS HOSPITALS , 1914-15 TO 1918-19.
| Year ended 31st March. | Confinements in Institution. | Confinements attended outside. | ||
|---|---|---|---|---|
| Births. | Deaths of Mothers. | Deaths of Infants. | ||
| 1915 | 794 | 6 | 20 | 410 |
| 1916 | 798 | 2 | 6 | 563 |
| 1917 | 1,071 | 8 | 28 | 523 |
| 1918 | 1,248 | 7 | 27 | 530 |
| 1919 | 1,123 | 18 | 26 | 521 |
There is a maternity hospital attached to the Medical School at Dunedin, which also serves as a training-school for medical students and midwives.
Charitable maternity homes are established at Auckland, Otahuhu, Napier, Wellington, Christchurch, and Invercargill for the reception of unfortunate girls. The Salvation Army have similar institutions at Auckland, Wellington, Christchurch, and Dunedin.
The Nurses Registration Act provides that every person who has attained the age of twenty-three years and is certified as having had three years' training as a nurse in a recognized general hospital, together with systematic instruction in theoretical and practical nursing from the medical officer and the matron of that hospital, and who passes the prescribed examination, is entitled to registration. During the year ended 3lst March, 1919, there were 288 candidates for the final examination in medical and surgical nursing, and 222 passed. There are now 2,433 nurses on the register.
The number of registered midwives on 31st March, 1919, was 2,508. Of these latter, 989 were trained and certificated, the remainder having satisfied the Registrar that at the date of the passing of the Act they had been for at least three years in bona fide practice as midwives, and that they bear a good character.
Exclusive of industrial schools, there are so far as is known some thirty-five institutions that may be described as orphanages or children's homes. The Education Act provides for the inspection of all orphanages and cognate institutions by Inspectors of the Education Department, with a view to securing that as regards education of the children and general management these organizations are acting consistently with the laws governing the education, care, and upbringing of children who are maintained in kindred institutions.
Under the control of the Education Department come also the various institutions for deaf and dumb, blind, or mentally defective children. These are dealt with in the section of this book dealing with Education.
There are seven public mental hospitals in the Dominion, maintained wholly or in part out of the public revenue. There is also one private hospital, licensed by the Governor-General for the reception of the mentally afflicted.
Information concerning the law dealing with the treatment of mental defectives is given in the 1914 issue of this book.
The number of patients at the end of 1918 was 4,546, consisting of 2,603 males and 1,943 females. These numbers include Maoris, of whom there are 39 male and 22 female patients.
The patients on the register at the end of the year 1918 were distributed as shown below (Maoris are included):—
| Mental Hospital. | Males. | Females. | Total. |
|---|---|---|---|
| Auckland | 648 | 393 | 1,041 |
| Tokanui | 115 | 44 | 159 |
| Porirua | 567 | 436 | 1,003 |
| Nelson | 93 | 106 | 199 |
| Hokitika | 195 | 72 | 267 |
| Christchurch | 326 | 377 | 703 |
| Dunedin (Seacliff and Waitati) | 615 | 437 | 1,052 |
| Ashburn Hall (private mental hospital) | 21 | 24 | 45 |
| Absent on probation | 23 | 54 | 77 |
| Totals | 2,603 | 1,943 | 4,546 |
The number of patients remaining at the close of each of the past five years, and the proportion per 10,000 of the population (excluding Maoris), are shown in the following table:—
NUMBER REMAINING (EXCLUDING MAORIS ), 1914-18.
| Year. | Number remaining at Close of Year. | Proportion per 10,000 of Population. | ||||
|---|---|---|---|---|---|---|
| Males. | Females. | Total. | Males. | Females. | Total. | |
| 1914 | 2,389 | 1,695 | 4,084 | 42.05 | 32.60 | 37.26 |
| 1915 | 2,428 | 1,740 | 4,168 | 43.05 | 31.50 | 37.79 |
| 1916 | 2,533 | 1,804 | 4,337 | 46.06 | 32.76 | 39.41 |
| 1917 | 2,577 | 1,884 | 4,461 | 47.96 | 33.62 | 40.64 |
| 1918 | 2,564 | 1,921 | 4,485 | 47.30 | 33.92 | 40.46 |
| Means of five years | 2,498 | 1,809 | 4,307 | 45.23 | 32.96 | 39.12 |
The total number of patients under oversight, care, or control during 1918 was 5,408 (males 3,093, females 2,315), as against 5,260 in 1917. The average number resident in mental hospitals was 4,368 in 1917 and 4,501 in 1918.
The total admissions to mental hospitals during the year 1918 were 839 (437 males and 402 females), this number not including 54 transfers from one institution to another. A reflection of the epidemic at the end of 1918 is the entry of influenza as an important factor in insanity causation.
The causes of insanity as assigned on admission are given below, distinguishing each hospital:—
| Causes. | Auckland. | Christchurch. | Dunedin. | Hokitika. | Nelson. | Porirua. | Tokanui. | Ashburn Hall. | Total. |
|---|---|---|---|---|---|---|---|---|---|
| Heredity | 24 | 8 | 37 | 4 | 5 | .. | .. | .. | 78 |
| Congenital | 29 | 4 | 19 | 3 | 2 | 37 | .. | .. | 94 |
| Previous attack | 16 | 21 | 12 | .. | 2 | 28 | .. | .. | 79 |
| Puberty and adolescence | 4 | 2 | 8 | .. | 1 | 13 | .. | .. | 28 |
| Climacteric | 6 | 2 | 8 | .. | .. | 4 | .. | 1 | 21 |
| Senility | 32 | 11 | 24 | .. | 3 | 21 | .. | 2 | 98 |
| Pregnancy | .. | .. | .. | .. | .. | 1 | .. | .. | 1 |
| Puerperal state | 2 | 1 | 6 | .. | .. | 8 | .. | 1 | 18 |
| Lactation | .. | 1 | 1 | .. | .. | .. | .. | .. | 2 |
| Mental stress, sudden | 1 | .. | .. | .. | .. | .. | .. | .. | 1 |
| Mental stress, prolonged | 28 | 3 | 16 | .. | .. | 35 | .. | 2 | 88 |
| Privation | .. | .. | .. | .. | .. | 1 | .. | .. | 1 |
| Solitude | 1 | .. | .. | .. | .. | 1 | .. | .. | 2 |
| Sexual excess | 3 | .. | .. | .. | .. | .. | .. | .. | 3 |
| Masturbation | 1 | .. | .. | .. | .. | .. | .. | .. | 1 |
| Insomnia | 1 | .. | .. | .. | .. | .. | .. | .. | 1 |
| Alcohol | 12 | .. | 6 | 2 | .. | 21 | .. | 1 | 52 |
| Drug habit | .. | .. | .. | .. | .. | 2 | .. | .. | 2 |
| Syphilis | 14 | 2 | 10 | .. | .. | 20 | .. | 1 | 47 |
| Traumatic | 4 | .. | 1 | 1 | .. | 1 | .. | .. | 7 |
| Organic brain-disease | .. | .. | .. | 1 | .. | 1 | .. | .. | 2 |
| Epilepsy | 5 | 8 | 9 | 4 | 1 | 9 | .. | .. | 36 |
| Apoplexy | .. | .. | .. | .. | .. | 1 | .. | 2 | 3 |
| Arterio-sclerosis | 3 | .. | .. | .. | .. | 3 | .. | .. | 9 |
| Chorea | .. | .. | .. | .. | .. | 1 | .. | .. | 1 |
| Graves' disease | 1 | .. | .. | .. | .. | .. | .. | .. | 1 |
| Ill health | 2 | .. | 5 | .. | .. | 5 | .. | 1 | 13 |
| Toxæmia | 2 | .. | .. | .. | .. | .. | .. | .. | 2 |
| Post operative | 2 | .. | .. | .. | .. | .. | .. | .. | 2 |
| Sunstroke | .. | .. | .. | .. | .. | 1 | .. | .. | 1 |
| Cancer | .. | .. | .. | .. | .. | 1 | .. | .. | 1 |
| Phthisis | 1 | .. | .. | .. | .. | 1 | .. | .. | 2 |
| Influenza | 24 | .. | 2 | 2 | .. | 10 | .. | .. | 38 |
| Cerebral hæmorrhage | 2 | .. | .. | .. | .. | .. | .. | .. | 2 |
| Overstudy | 3 | .. | 1 | .. | .. | .. | .. | .. | 4 |
| Unknown | 19 | 45 | 5 | 3 | 1 | 25 | .. | .. | 98 |
| Totals, excluding transfers | 242 | 121 | 170 | 28 | 16 | 251 | .. | 11 | 839 |
| Transfers | 3 | 3 | 22 | 20 | 1 | 5 | .. | .. | 54 |
| Grand totals | 245 | 124 | 192 | 48 | 17 | 256 | .. | 11 | 893 |
Of the 839 persons admitted to mental hospitals during 1918, those admitted for the first time to any mental hospital in New Zealand numbered 704 (males 381, females 323), and those readmitted 135 (males 56, females 79).
Excluding the Native race, the number of first admissions and the rate per 10,000 of population for each of the past five years were as follows:—
FIRST ADMISSIONS AND RATE PER 10,000 OF MEAN POPULATION , 1914-18.
| Year. | Number of First Admissions. | Proportion per 10,000 of Population. | ||||
|---|---|---|---|---|---|---|
| Males. | Females. | Total. | Males. | Females. | Total. | |
| 1914 | 430 | 293 | 723 | 7.56 | 5.62 | 6.63 |
| 1915 | 376 | 269 | 645 | 6.87 | 5.10 | 6.01 |
| 1916 | 436 | 283 | 719 | 7.90 | 5.17 | 6.54 |
| 1917 | 406 | 294 | 700 | 7.47 | 5.29 | 6.37 |
| 1918 | 367 | 320 | 687 | 6.80 | 5.68 | 6.23 |
| Means of five years | 403 | 292 | 695 | 7.27 | 5.36 | 6.33 |
The figures for 1918 represent one first admission for every 1,606 persons in the Dominion.
Persons labouring under mental defect, but capable of understanding the meaning of the procedure, may seek admission to a mental hospital as voluntary boarders. At the beginning of 1918 there were 29 boarders in residence (10 males, 19 females), and during the year 75 (28 males, 47 females) were admitted. If a voluntary boarder should after admission show mental defect sufficiently pronounced and sustained to render it improper to classify him any longer as such, application for a reception order is made to a Magistrate. During the year 1918, 5 (1 male, 4 females) were transferred from the voluntary to the ordinary register, and 4 died, while 44 (15 males, 29 females) were discharged, leaving 51 resident at the end of the year (20 males, 31 females).
A summary is attached showing the ages of patients in mental hospitals at the close of 1918:—
AGES OF INMATES , 31ST DECEMBER , 1918.
| Age, in Years. | Males. | Females. | Total. |
|---|---|---|---|
| 1 to 5 | 2 | 3 | 5 |
| 5 to 10 | 7 | 8 | 15 |
| 10 to 15 | 24 | 30 | 54 |
| 15 to 20 | 49 | 47 | 96 |
| 20 to 30 | 280 | 205 | 485 |
| 30 to 40 | 587 | 391 | 978 |
| 40 to 50 | 593 | 457 | 1,050 |
| 50 to 60 | 483 | 386 | 869 |
| 60 to 70 | 340 | 236 | 576 |
| 70 to 80 | 149 | 123 | 272 |
| 80 to 90 | 43 | 29 | 72 |
| 90 and over | 3 | 0 | 3 |
| Unknown | 43 | 28 | 71 |
| Totals | 2,603 | 1,943 | 4,546 |
The number of Maoris admitted as patients to the mental hospitals is small. Twenty-six (20 males, 6 females) were admitted during the year, and 61 (39 males, 22 females) remained at the end of the year.
Dealing with patients of all races, the next table gives the average number resident, those who were discharged as recovered, and those who died during the period 1914-18:—
| Year. | Average Number Resident. | Discharged as recovered. | Died. | ||
|---|---|---|---|---|---|
| Number. | Per Cent. of Average Number Resident. | Number. | Per Cent. of Average Number Resident. | ||
| 1914 | 3,950 | 369 | 9.34 | 281 | 7.11 |
| 1915 | 4,094 | 359 | 8.77 | 284 | 6.94 |
| 1916 | 4,251 | 331 | 7.79 | 289 | 6.80 |
| 1917 | 4,368 | 323 | 7.39 | 318 | 7.28 |
| 1918 | 4,501 | 283 | 6.29 | 448 | 9.95 |
| Means of five years | 4,333 | 333 | 7.62 | 324 | 7.48 |
The year 1918 is characterized by an abnormally high death-rate for mental patients. The principal causes of death occur in about their usual proportions: Old age, 28 per cent. of the total deaths; tuberculosis, 9 per cent.; general paralysis of the insane, 9 per cent.; organic brain-disease, 8 per cent. Influenza, although it obtained a virulent footing in only two of the institutions, was responsible for 9.6 per cent. of the total deaths. Influenza ravages do not alone explain the high death-rate, which is due largely to heavier mortality in all causes.
DEATHS IN MENTAL HOSPITALS , 1918.
| Cause of Death. | Auckland. | Christchurch. | Dunedin. | Hokitika. | Nelson. | Porirua. | Tokanui. | Ashburn Hall. | Total. |
|---|---|---|---|---|---|---|---|---|---|
| Influenza | 1 | .. | 18 | .. | .. | 22 | 2 | .. | 43 |
| Tuberculosis | 20 | 4 | 5 | .. | 3 | 7 | 1 | .. | 40 |
| Cancer | .. | .. | 4 | .. | 1 | 1 | .. | .. | 6 |
| Other general diseases | 5 | 1 | 2 | 1 | .. | .. | .. | .. | 9 |
| General paralysis of the insane | 14 | 2 | 5 | .. | .. | 20 | .. | .. | 41 |
| Organic brain-disease | 28 | 5 | 1 | 1 | .. | .. | .. | .. | 35 |
| Epilepsy | 8 | 3 | 7 | 1 | .. | 7 | .. | 1 | 27 |
| Other diseases of the nervous system | 15 | 5 | 9 | .. | 1 | 3 | .. | 3 | 36 |
| Diseases of the respiratory system | 3 | 3 | .. | 2 | 1 | 6 | 2 | 1 | 18 |
| Diseases of the circulatory system | 8 | 10 | 3 | 5 | 2 | 10 | 3 | .. | 41 |
| Diseases of the digestive system | 3 | .. | .. | 3 | 1 | .. | .. | .. | 7 |
| Diseases of the genito-urinary system | .. | 1 | .. | .. | .. | 2 | 1 | .. | 4 |
| Malformation | 1 | .. | .. | .. | .. | .. | .. | .. | 1 |
| Old age | 28 | 24 | 40 | 5 | 5 | 21 | 1 | .. | 124 |
| External causes | 2 | .. | 1 | .. | 1 | .. | .. | 1 | 5 |
| Ill-defined causes | 3 | .. | 2 | 4 | .. | 1 | .. | 1 | 11 |
| Totals | 139 | 58 | 97 | 22 | 15 | 100 | 10 | 7 | 44 |
A table is added showing for all admissions since 1876 the percentages of patients discharged (as recovered, relieved, and not improved, separately), dying, and remaining.
| — | Males. | Females. | Both Sexes. |
|---|---|---|---|
| Discharged— | |||
| Recovered | 36.92 | 42.97 | 39.38 |
| Relieved | 7.28 | 9.10 | 8.02 |
| Not improved | 9.43 | 9.33 | 9.39 |
| Died | 32.24 | 22.19 | 28.15 |
| Remaining at end of 1918 | 14.13 | 16.41 | 15.06 |
| 100.00 | 100.00 | 100.00 | |
A license may be granted to enable a private mental hospital to receive patients for treatment. Stringent conditions are attached to the issue of such licenses, which may be revoked at any time. The Inspector-General has wide powers in the regulation and control of private institutions, which are placed practically on the same footing as public mental hospitals in regard to inspection and other matters.
There is only one licensed private institution in the Dominion, that at Wakari, near Dunedin, established in 1882. Particulars of admissions, discharges, deaths, and patients remaining, for the past five years are as follows. These figures are included in the tables given above.
PRIVATE MENTAL HOSPITAL (included in previous figures).
| Year. | Admissions. | Discharges. | Deaths. | Patients remaining at End of Year. |
|---|---|---|---|---|
| 1914 | 13 | 10 | 2 | 45 |
| 1915 | 8 | 12 | 1 | 40 |
| 1916 | 15 | 5 | 4 | 46 |
| 1917 | 20 | 11 | 3 | 52 |
| 1918 | 11 | 11 | 7 | 45 |
At the end of the year 1918 the mental hospitals of the Dominion had accommodation for 4,281 patients, the cubic content of the dormitories and sleeping-rooms being well over three millions of cubic feet. Details of accommodation are as follows:—
| Institution. | Number of Patients for whom there is Accommodation. | |||||
|---|---|---|---|---|---|---|
| Single Rooms. | Dormitories. | Totals. | ||||
| Males. | Females. | Males. | Females. | Males. | Females. | |
| Auckland | 161 | 94 | 462 | 245 | 623 | 339 |
| Christchurch | 52 | 62 | 278 | 323 | 330 | 385 |
| Seacliff | 170 | 123 | 325 | 271 | 495 | 394 |
| Hokitika | 40 | 17 | 165 | 45 | 205 | 62 |
| Nelson | 11 | 15 | 74 | 106 | 85 | 121 |
| Porirua | 106 | 90 | 474 | 313 | 580 | 403 |
| Tokanui | 29 | 9 | 120 | 40 | 149 | 49 |
| Totals, State institutions | 569 | 410 | 1,898 | 1,343 | 2,467 | 1,753 |
| Ashburn Hall Private Mental Hospital | 28 | 33 | .. | .. | 28 | 33 |
| Totals, all institutions | 597 | 443 | 1,898 | 1,343 | 2,495 | 1,786 |
The total expenditure on maintenance of mental hospitals (not including the cost of new buildings and additions), and receipts from patients and for sale of produce, &c., during the past five years were as follows:—
| Year. | Total Expenditure. | Receipts from Patients, Sale of Produce, &c. | Not Expenditure. |
|---|---|---|---|
| £ | £ | £ | |
| 1914 | 165,095 | 46,787 | 118,308 |
| 1915 | 178,373 | 51,786 | 126,587 |
| 1916 | 197,663 | 60,745 | 136,918 |
| 1917 | 220,777 | 68,446 | 152,331 |
| 1918 | 248,609 | 69,195 | 179,414 |
The total net expenditure out of the Public Works Fund for buildings and equipment from 1st July, 1877, to 31st March, 1919, was £873,263.
Farms are conducted in connection with the various mental hospitals, the inmates themselves doing most of the labour. During 1918, sales of produce brought in £10,588, while the value of produce grown on the farms and consumed in. the institutions was estimated at £19,734. Expenses in connection with the farms amounted to £20,227, so that the year's working shows a credit balance of £10,095.
Table of Contents
As a result of the census taken in October, 1916, it is found that 83.53 per cent. of the persons in New Zealand at that date were able to read and write, 0.68 per cent. could read only, while 15.79 per cent. could neither read nor write.
The proportion able to read and write has fallen slightly as compared with figures compiled from the 1911 census returns. This small decrease is probably due to the disturbance of the normal proportions of the population brought about by the absence with the Forces of a number of men between twenty and forty years of age.
Over a longer period, however, there has been a considerable increase in the proportion of the population able to both read and write. This improvement, however, is not entirely due to improved educational facilities, but has to some extent been caused by the decreased birth-rate and the consequent decreased proportion of the population comprised of children under five years of age. The figures for six census years since 1874 are as follows:—
| Read and Write. | Read only. | Cannot Read. | |
|---|---|---|---|
| Census, 1874 | 68.15 | 8.09 | 23.76 |
| Census, 1886 | 74.01 | 4.80 | 21.19 |
| Census, 1896 | 80.60 | 2.89 | 16.51 |
| Census, 1906 | 83.50 | 1.60 | 14.90 |
| Census, 1911 | 83.78 | 0.86 | 15.36 |
| Census, 1916 | 83.53 | 0.68 | 15.79 |
The following table shows for various age-groups in 1916 the percentages under the three headings:—
| Age-group (in Years). | Read and Write. | Read only. | Cannot Read. |
|---|---|---|---|
| Under 5 | .. | .. | 100.00 |
| 5 and under 10 | 71.32 | 2.62 | 26.06 |
| 10 and under 15 | 99.57 | 0.09 | 0.34 |
| 15 and under 20 | 99.63 | 0.07 | 0.30 |
| 20 and under 25 | 99.47 | 0.16 | 0.37 |
| 25 and under 30 | 99.42 | 0.18 | 0.40 |
| 30 and under 35 | 99.38 | 0.18 | 0.44 |
| 35 and under 40 | 99.16 | 0.20 | 0.64 |
| 40 and under 45 | 98.99 | 0.28 | 0.73 |
| 46 and under 50 | 98.66 | 0.33 | 1.01 |
| 50 and under 55 | 97.91 | 0.64 | 1.45 |
| 55 and under 60 | 96.53 | 1.13 | 2.34 |
| 60 and under 65 | 94.99 | 1.83 | 3.18 |
| 65 and under 70 | 93.11 | 2.70 | 4.19 |
| 70 and under 75 | 91.38 | 3.54 | 5.08 |
| 75 and under 80 | 90.45 | 4.22 | 5.33 |
| 80 and upwards | 86.26 | 6.00 | 7.74 |
Even after allowance is made for the infirmities of old people, it will be seen from the above figures that the persons of the younger generations are much less illiterate than persons of advanced ages.
In the following tables an attempt has been made to analyse the public expenditure on the various branches of education. The first table shows the total amount expended both from the Public Account and out of income from endowments during the years ended 31st March, 1918 and 1919. The figures are given to the nearest £1,000.
ANALYSI s OF EXPENDITURE ON EDUCATION IN NEW ZEALAND FOR THE YEARS
1917-18 AND 1918-19.
(Figures given in every case to the nearest £1,000.)
| Branch of Education. | 1917-18. | 1918-19. | ||||
|---|---|---|---|---|---|---|
| Out of Public Funds.* | Secondary and University Reserves Revenue. | Total for all Items from all Public Sources. | Out of Public Funds.* | Secondary and University Reserves Revenue. | Total for all Items from all Public Sources. | |
Including expenditure out of income from primary-education reserves. | ||||||
| £ | £ | £ | £ | £ | £ | |
| Primary (including Native schools and training colleges) | 1,416,000 | ... | 1,416,000 | 1,555,000 | .. | 1,555,000 |
| Secondary (including secondary schools, technical high schools, and secondary departments of district high schools) | 180,000 | 55,000 | 235,000 | 185,000 | 58,000 | 243,000 |
| Continuation and technical | 70,000 | .. | 70,000 | 54,000 | .. | 54,000 |
| Higher | 56,000 | 26,000 | 82,000 | 51,000 | 23,000 | 79,000 |
| 1,722,000 | 81,000 | 1,808,000 | 1,845,000 | 86,000 | 1,931,000 | |
| Industrial schools | 49,000 | .. | 49,000 | 68,000 | .. | 68,000 |
| Special schools (deaf, blind, and backward children) | 15,000 | .. | 15,000 | 12,000 | .. | 12,000 |
| Superannuation and miscellaneous | 28,000 | .. | 28,000 | 61,000 | .. | 61,000 |
| Totals | 1,814,000 | 81,000 | 1,895,000 | 1,986,000 | 86,000 | 2,072,000 |
The amounts expended per head of population, including Maoris, but excluding residents of the Cook and other Pacific islands, were as follows:—
| Branch of Education. | 1917-18. | 1918-19. | ||||
|---|---|---|---|---|---|---|
| Out of Public Funds.* | Secondary and University Reserves Revenue. | Total. | Out of Public Funds.* | Secondary and University Reserves Revenue. | Total. | |
* Including expenditure out of income from primary-education reserves. | ||||||
| s. d. | s. d. | s. d. | s. d. | s. d. | s. d. | |
| Primary (including Native schools and training colleges) | 24 7 | .. | 24 7 | 26 10 | .. | 26 10 |
| Secondary (including secondary departments of district high schools) | 3 2 | 0 11 | 4 1 | 3 3 | 1 0 | 4 3 |
| Continuation and technical | 1 3 | .. | 1 3 | 0 11 | .. | 0 11 |
| Higher | 1 0 | 0 5 | 1 5 | 0 11 | 0 6 | 1 5 |
| 30 0 | 1 4 | 31 4 | 31 11 | 1 6 | 33 5 | |
| Industrial schools | 0 10 1/2 | .. | 0 10 1/2 | 1 2 | .. | 1 2 |
| Special schools (deaf, blind, &c.) | 0 3 1/2 | .. | 0 3 1/2 | 0 3 | .. | 0 3 |
| Superannuation and miscellaneous | 0 6 | .. | 0 6 | 1 0 | .. | 1 0 |
| Totals | 31 8 | 1 4 | 33 0 | 34 4 | 1 6 | 35 10 |
The following table shows the total amount expended on education a of the public funds only, and the amount per head of population for 1898-99 and 1903-4, and for the last eight years:—
| Year. | Amount expended out of Public Funds. | Expenditure per Head of Population out of Public Funds. |
|---|---|---|
Income from primary-education reserves included. | ||
| £ | s. d. | |
| 1898-99 | 519,000 | 13 4 |
| 1903-4 | 679,000 | 15 6 |
| 1911-12 | 1,133,000 | 21 5 |
| 1912-13 | 1,237,000 | 22 5 |
| 1913-14 | 1,301,000 | 23 0 |
| 1914-15 | 1,378,000 | 24 1 |
| 1915-16 | 1,493,000 | 25 8 |
| 1916-17 | 1,694,000* | 29 5* |
| 1917-18 | 1,814,000* | 31 7* |
| 1918-19 | 1,986,000* | 34 4* |
The central Department of Education, with a Cabinet Minister at its head, manages directly the Native schools and special schools, and administers the Education Act. For the purposes of primary education the Dominion is divided into nine education districts, each of which is presided over by an Education Board, and these in turn are divided into smaller districts, in each of which a School Committee elected by the householders has authority. The School Committees of each education district elect the Education Board, and are subject to its general control. The Board receives from the Department and disburses the money voted by the General Assembly for the purposes of instruction, and appoints the teachers, subject to the condition of consultation with the Committee of the school district.
Regulations governing the examination, classification, and grading of teachers, prescribing the accounts to be kept by Boards and Committees and by Managers of Technical Schools, defining standards and examination subjects, and covering other matters set forth in clause 161 of the Education Act, 1914, may be made by the Governor-General in Council. A General Council of Education created by the Act reports to the Minister upon educational methods or developments deemed worthy of introduction into the Dominion and upon such matters as bear upon the provision of further facilities for education, whether local or general.
Education at the public schools is free and purely secular. Attendance at a registered school is obligatory upon all children between the ages of seven and fourteen, except when special exemptions are granted. The Inspectors who visit the schools are officers of the Education Department.
The programme of primary instruction provided by the Act includes English, arithmetic, geography, history and civics, drawing and handwork (including needlework), nature-study and elementary science, physical instruction, moral instruction and health, and singing.
The number of scholars and students as in 1918 is shown in the following summary. Pupils of private schools not inspected by the Education Department are excluded.
NUMBER OF SCHOLARS AND STUDENTS IN ATTENDANCE DURING 1918.
| Primary education— | |
|---|---|
| Public schools | 188,932 |
| Native village and Native mission schools | 5,223 |
| Registered private primary schools | 20,076 |
| Lower departments of secondary schools | 665 |
| Special schools | 252 |
| 215,148 | |
| Secondary education— | |
| Secondary schools | 8,384 |
| Secondary departments of district high schools | 2,283 |
| Technical high schools | 2,747 |
| Maori secondary schools | 471 |
| Registered private secondary schools | 1,366 |
| 15,251 | |
| Technical and continuation (excluding technical high schools) | 16,910 |
| Higher education— | |
| University colleges (including training-college students) | 2,226 |
| Lincoln Agricultural College | 54 |
| 2,280 | |
| Total under instruction | 249,589 |
This is an increase of 4,494 on the number under instruction during the previous year.
The public primary schools numbered 2,365 in 1918, against 2,368 in 1917. The number of registered private primary schools was 210. The number of aided or endowed colleges, grammar and high schools in operation was 34, and the number of technical schools 8. The number of University colleges was 4. The number of private schools from which returns were received in 1917 by the Government Statistician was 320, an increase of 15 on the figures for the previous year. There were also 12 industrial schools, State and private, as well as State schools for the deaf and for backward children, and a school for the blind, subsidized by the State.
The number of primary and secondary schools established for the education of the Native or Maori race was 133.
Compared with 1917, there was in 1918 an increase of 4,580 in the number of pupils belonging to the public schools at the end of the year, and the average attendance shows an increase of 3,428 for the whole year.
SCHOOLS AND SCHOLARS , 1878 TO 1918.
| Year. | Number of Schools. | Pupils at End of Year. | Mean of Average Weekly Roll. | Average Attendance, Whole Year. | Average Attendance as Percentage of Weekly Roll. |
|---|---|---|---|---|---|
| 1878 | 748 | 65,040 | .. | 48,773 | .. |
| 1883 | 971 | 92,476 | 90,859 | 69,838 | 76.9 |
| 1888 | 1,158 | 112,685 | 113,626 | 90,108 | 79.3 |
| 1893 | 1,375 | 124,686 | 125,692 | 100,321 | 79.8 |
| 1898 | 1,655 | 131,621 | 133,782 | 111,636 | 83.4 |
| 1903 | 1,786 | 133,568 | 134,748 | 113,047 | 83.9 |
| 1908 | 1,998 | 147,428 | 145,974 | 127,160 | 87.1 |
| 1913 | 2,255 | 172,168 | 169,530 | 151,242 | 89.2 |
| 1914 | 2,301 | 178,509 | 175,570 | 158,134 | 90.1 |
| 1915 | 2,338 | 183,214 | 181,229 | 163,092 | 90.0 |
| 1916 | 2,355 | 185,884 | 184,056 | 163,156 | 88.6 |
| 1917 | 2,368 | 190,364 | 187,954 | 168,711 | 89.8 |
| 1918 | 2,365 | 194,934 | 191,382 | 169,836 | 88.7 |
The increase in average attendance was much smaller in 1918 than in the previous year; what would have been a good record being largely spoiled by the sickness that prevailed in the last quarter of the year. The increase in average attendance during the last five years has been: 1914, 3.6 per cent.; 1915, 3.1 per cent.; 1916, 0.04 per cent.; 1917, 3.4 per cent.; 1918, 0.07 per cent. The average attendance taken as a percentage of the average weekly roll was 88.7 in 1918, as compared with 89.8 in the previous year and 90.1 in 1914—the highest record yet reached.
The following table shows the age and sex of the pupils on the rolls of the public schools of the Dominion at the end of 1918, and the percentage of the roll for each age:—
| Age, in Years. | 1918. | Percentages for Five Years. | ||||||
|---|---|---|---|---|---|---|---|---|
| Boys. | Girls. | Total. | 1914. | 1915. | 1916. | 1917. | 1918. | |
| 5 and under 6 | 7,416 | 6,767 | 14,183 | 8.0 | 7.8 | 7.9 | 8.0 | 7.4 |
| 6 and under 7 | 10,653 | 9,875 | 20,528 | 10.9 | 10.8 | 10.6 | 10.6 | 10.7 |
| 7 and under 8 | 11,511 | 10,523 | 22,034 | 11.5 | 11.7 | 11.6 | 11.5 | 11.4 |
| 8 and under 9 | 11,277 | 10,543 | 21,820 | 11.7 | 11.4 | 11.7 | 11.7 | 11.3 |
| 9 and under 10 | 11,307 | 10,545 | 21,852 | 11.4 | 11.4 | 11.2 | 11.6 | 11.4 |
| 10 and under 11 | 11,473 | 10,701 | 22,174 | 11.3 | 11.2 | 11.1 | 11.1 | 11.5 |
| 11 and under 12 | 10,723 | 9,930 | 20,653 | 10.5 | 10.9 | 10.8 | 10.9 | 10.7 |
| 12 and under 13 | 10,403 | 9,746 | 20,149 | 9.9 | 10.0 | 10.5 | 10.4 | 10.5 |
| 13 and under 14 | 9,014 | 8,227 | 17,241 | 8.6 | 8.5 | 8.5 | 8.8 | 8.9 |
| 14 and under 15 | 4,816 | 4,322 | 9,138 | 4.4 | 4.5 | 4.3 | 4.2 | 4.7 |
| 15 and over | 1,623 | 1,285 | 2,908 | 1.8 | 1.8 | 1.8 | 1.2 | 1.5 |
| Totals | 100,216 | 92,464 | 192,680 | 100.0 | 100.0 | 100.0 | 100.0 | 100.0 |
Physical exercises based on the syllabus of the Board of Education, England, are practised in all public schools under the supervision of a staff of physical instructors. Corrective classes for children with physical deformities are also held with good results.
A staff of Medical Inspectors and School Nurses medically examine public-school children, notifying parents when medical or dental treatment is required. In from 60 to 75 per cent. of the cases reported by the Medical Inspectors parents have obtained for the children the necessary medical or dental treatment. Lectures to parents and teachers on matters pertaining to the health of children are freely given by Medical Inspectors, and circulars giving valuable hints to parents on health topics are widely distributed. A scheme for the dental treatment of school-children, especially in country districts, will shortly be in operation.
Free passes on the railway to the nearest public or private school are granted to children living near to the railway-line but out of reach of a primary school; and the same privilege is enjoyed by pupils having to travel to attend secondary schools, district high schools, and technical schools, and also by free-place holders travelling to attend technical schools or classes other than technical high schools.
Education Boards are also authorized to make provision when necessary for the conveyance of pupils to primary schools by road or water. In the case of a child being compelled to live away from home to attend school, provision is made for a boarding-allowance of 5s. a week.
The following shows expenditure for 1918 on the above-named services:—
| Railway Fares. | Conveyance by Road or Water. | Boarding-allowance. | Total. | |
|---|---|---|---|---|
| £ | £ | £ | £ | |
| Primary | 10,974 | 8,869 | 1,218 | 21,061 |
| Secondary | 4,948 | .. | .. | 4,948 |
| Technical | 3,138 | .. | .. | 3,138 |
| Totals | 19,060 | 8,869 | 1,218 | 29,144 |
Classes for elementary handwork exist in 2,135 primary schools, and in 1,532 schools other branches of manual instruction are taught. The capitation payments made by the Department on account of manual instruction for the year 1918-19 amounted to £44,223.
In the lower standards hand-and-eye training is given through the media of constructive work in paper and cardboard, modelling in plasticine, and design and colour work with crayons or water-colours. In the higher standards these are supplemented whore practicable by various forms of manual training, such as woodwork, ironwork, cookery, laundry-work, dressmaking, and various branches of elementary science, including agriculture and dairy-work. Woodwork and cookery are taught mainly on the centre system, there being now ninety well-equipped buildings for instruction in these subjects. In the larger centres these take the form of special manual-training schools; elsewhere suitable accommodation is provided in the local technical school, secondary school, or district high school, as the case may be. The number of schools providing instruction in woodwork and ironwork for boys now stands at 494, and 500 schools made provision for girls in instruction in cookery, dressmaking, and laundry-work. Increased attention continues to be given to subjects bearing on the home, and the teaching staff now includes a number of well-qualified teachers, many of whom as holders of home-science bursaries have completed their course for the diploma or the degree of home science at the Otago University.
At 1,390 schools elementary agriculture (combined in some districts with elementary dairy-work), and supervised by qualified itinerant instructors, formed part of the regular school course. This instruction may have only an indirect bearing on the primary industries, but as it includes observational and experimental work in connection with school gardens and plots, its value as an educational factor appears to lie in the opportunity given to introduce the children to elementary scientific methods.
A more or less complete course bearing on rural pursuits with a domestic trend in the case of girls was carried on in the secondary department of forty-seven district high schools.
A capitation grant at the rate of 3d. per head on the average attendance is paid to Boards for the purpose of supplying schools with supplementary continuous readers in sufficient numbers for class-reading, and also for the free supply of class-books in necessitous cases or in cases where a newly entered pupil has already purchased elsewhere class-books different from those in use in the school. After provision has been made for the supply of such books, the balance of the grant, if any, is spent on approved books suitable for individual reading in school or at home.
Further, to encourage school libraries, provision has been made for the payment of subsidies of £1 for £1 on moneys raised by voluntary contributions for the purpose of establishing, maintaining, or increasing the utility of school libraries that contain books suitable for individual reading in school or at home. In addition to this departmental subsidy, a subsidy is payable by the Education Board under section 37 of the Education Act, but in this case the Board is not required to pay a sum exceeding 3d. for each child in average attendance at a school, or exceeding £5 for any one school.
The books purchased are to be suitable for individual reading in school or at home, and are to be approved by the Senior Inspector.
An illustrated paper, called the School Journal , is published monthly by the Education Department for free circulation among pupils attending public primary schools and for sale at moderate prices to private schools. The Journal is issued in three parts, each part being adapted to the educational attainments of pupils in two of the classes S1 to S6. In addition to reading-matter of a general character there have appeared in the School Journal during the past year special articles dealing with national events, scientific discoveries, and the industries of the Dominion, while special numbers have been largely devoted to topics suitable for Empire Day and Arbor Day. Of the November issue of 1918 the number of copies printed was—Part I, 63,000; Part II, 58,900; Part III, 49,000: total, 170,900.
The number of teachers in the public schools, exclusive of those employed in the secondary departments of district high schools, is shown for a number of years. The figures are as in December of the years given.
| Year. | Adults. | Pupil-teachers. | ||||
|---|---|---|---|---|---|---|
| Males. | Females. | Total. | Males. | Females. | Total. | |
Excluding probationers. | ||||||
| 1878 | 707 | 454 | 1,161 | 181 | 332 | 450 |
| 1883 | 905 | 656 | 1,561 | 159 | 571 | 730 |
| 1888 | 1,039 | 887 | 1,926 | 219 | 694 | 913 |
| 1893 | 1,107 | 1,096 | 2,203 | 238 | 825 | 1,063 |
| 1898 | 1,234 | 1,370 | 2,604 | 229 | 831 | 1,060 |
| 1903 | 1,270 | 1,726 | 2,996 | 147 | 552 | 699 |
| 1908 | 1,331 | 2,021 | 3,352 | 161 | 476 | 637 |
| 1913 | 1,603 | 2,659 | 4,262 | 142* | 474* | 616* |
| 1914 | 1,628 | 2,820 | 4,448 | 139* | 470* | 609* |
| 1915 | 1,591 | 3,077 | 4,668 | 141* | 485* | 626* |
| 1916 | 1,501 | 3,209 | 4,710 | 137* | 519* | 656* |
| 1917 | 1,383 | 3,324 | 4,707 | 132* | 517* | 649* |
| 1918 | 1,366 | 3,452 | 4,818 | 123* | 523* | 646* |
The total number of teachers employed in primary schools, excluding probationers and including pupil-teachers, in 1918 was 5,464 (1,489 males, 3,975 females). The number of probationers was 378 (48 males and 330 females). Taking all schools with two or more teachers, the average number of pupils per teacher was 38, and in schools with six or more teachers the average number was 42.
Omitting schools with less than 21 pupils the ratio of adult men teachers to adult women teachers in 1918 was 100 to 227. The proportion of men to women in charge of schools with 1 to 20 scholars was 100 to 523. If all public schools and all teachers are included, it is found that the ratio of men teachers to women teachers was 100 to 254 in 1917. and 100 to 267 in 1918.
The ratio of male pupil-teachers to female pupil-teachers was 100 to 391 in 1917. and 100 to 425 in 1918.
The average salaries paid to teachers in 1918, including house allowance or value of residence and excluding war bonus, were—Male head teachers, £319; female head teachers, £251; male assistants, £257; female assistants, £150; sole male teachers, £174; sole female teachers, £143.
Information as to the Teachers' Superannuation Fund will be found in the section of this book dealing with Pensions, Superannuation, &c.
Training colleges are situated in the four principal centres of the Dominion, and are open to four classes of students, as follows: Division A, ex-pupil-teachers, ex-probationers, or ex-trainees of recognized kindergarten schools who have obtained the necessary educational qualification; Division B, other students who have passed Matriculation or obtained a higher leaving-certificate; Division C, University graduates admitted for one year; and Division D, teachers entering on short-period studentships. The numbers of students in attendance during the last quarter of 1918 under the various divisions were—Division A, 452; Division B, 33; Division C, 4; and Division D, 11: the total being 500, as compared with 451 for the previous year. The figures do not include male students absent with the Expeditionary Forces. The total provision is for 150 students at each centre. Towards this number, out of the total reported, Auckland contributed in the year 1918, 138; Wellington, 136; Christchurch, 117; and Dunedin, 109.
The management of the training colleges is entrusted to the local Education Boards, subject to general regulations which include certain reservations for the approval of the Minister of Education. All students are required to attend lectures in at least one subject other than education at the University college, to which the principal of the training college is in each case also attached as the University college lecturer on education.
The ordinary course of training is for two years, so that when the training colleges have their full complement of students (150 in each case) the number of students annually completing their training and passing into the schools will be about 300. There is also provision for a one-year course which, under certain conditions, may be taken by University students or matriculated students who have completed a two-years course at an agricultural college or a school of home science recognized by the University of New Zealand. In addition, there are short-period studentships, of not less than three months' or more than one year's duration, for the benefit of teachers who have already been employed in teaching and are deemed worthy of further training in professional work, the allowances payable to such students being the same as those payable to students under Division B.
For students in training allowances are provided which have recently been increased in value. A student who has completed a pupil-teacher's course now receives an allowance of £65 a year, with a further allowance of £25 if obliged to live away from home to attend a training college. Those who have not been pupil-teachers receive an allowance of £45 a year, together with a boarding-allowance of £25 where necessary. In all cases free instruction at the University college classes approved by the principal is also given.
For the teaching practice of students the normal practising schools forming part of the training college in each case are available, and opportunities of observation are now extended so as to embrace specially selected teachers and classes in neighbouring schools. Provision is made for the inclusion in each normal school of—(a) a main school, organized as a "mixed school"'; and (b ) such "model schools" as may be approved by the Minister, each model school being of one of the following types: (i) A rural public school under a sole teacher; (ii) a junior school under one teacher with not more than 45 children of classes P to S2 on the roll; (iii) a class representing the secondary department of a district high school; (iv) a class for backward children; (v) a junior kindergarten.
The amount paid to Education Boards during 1918-19 for the training of teachers was £59,921, made up as follows:—
| Training college— | |
|---|---|
| £ | |
| Salaries of staff (two-fifths charged to public-school salaries) | 16,741 |
| War bonus to staff and students | 4,164 |
| Students' allowances and University fees | 32,110 |
| Special instruction | 1,437 |
| Buildings, sites, and equipment | 140 |
| Total | 54,592 |
| Other training— | |
| Grants for special instruction in certificate subjects of teachers other than training-college students | 1,800 |
| Railway fares of teachers and instructors | 3,529 |
| Total | 5,329 |
| Grand total | £59,921 |
The total receipts of the various Education Boards for the year 1918 were £1,499,983, including £32,103 from local sources and £1,467,880 by way of Government grants. The latter amount includes in the case of each education district a sum sufficient to pay the salaries of teachers and pupil-teachers, a capitation grant to cover the cost of administration, grants for the incidental expenses of schools, school and class libraries, manual and technical instruction, maintenance of training colleges, scholarships, and maintenance and rebuilding of school buildings, and new school buildings, sites, and furniture.
The receipts and payments of the Education Boards, numbering nine altogether in 1918, are tabulated below, with further particulars:—
| RECEIPTS AND PAYMENTS OF EDUCATION BOARDS , 1918. | ||||||
|---|---|---|---|---|---|---|
| Receipts. | ||||||
| From Government,— | £ | s. | d. | £ | s. | d. |
| General fund | 42,917 | 17 | 10 | |||
| Teachers' salaries and allowances | 981,560 | 10 | 3 | |||
| School and class libraries | 648 | 14 | 3 | |||
| Conveyance and board of school-children | 11,631 | 6 | 4 | |||
| Incidental expenses of schools | 53,002 | 11 | 8 | |||
| Training of teachers | 49,302 | 15 | 2 | |||
| Teachers' house allowance | 26,157 | 4 | 7 | |||
| Manual instruction | 46,766 | 4 | 0 | |||
| Technical instruction | 72,739 | 11 | 10 | |||
| Buildings, sites, furniture, &c. | 160,795 | 10 | 1 | |||
| Scholarships, subsidies, and miscellaneous | 19,357 | 8 | 6 | |||
| 1,467,879 | 14 | 6 | ||||
| From local sources | 32,103 | 2 | 6 | |||
| Total | £1,499,982 | 17 | 0 | |||
| Expenditure. | £ | s. | d. | £ | s. | d |
| Staff salaries, office expenses, &c. | 33,178 | 7 | 0 | |||
| Teachers' salaries and allowances | 983,294 | 16 | 8 | |||
| School and class libraries | 2,260 | 6 | 0 | |||
| Conveyance and board of school-children | 12,368 | 17 | 1 | |||
| Incidental expenses of schools | 66,170 | 14 | 0 | |||
| Training of teachers | 51,113 | 8 | 3 | |||
| Teachers' house allowance | 26,237 | 14 | 3 | |||
| Manual instruction | 55,790 | 7 | 6 | |||
| Technical instruction | 87,524 | 11 | 8 | |||
| Buildings, sites, house allowance | 167,886 | 2 | 5 | |||
| Scholarships, refunds, and sundries | 25,260 | 11 | 1 | |||
| Total | £1,511,085 | 15 | 11 | |||
| Bank balance at beginning of year 1918 | 150,217 | 2 | 7 | |||
| Bank balance at end of year 1918 | 139,114 | 3 | 8 | |||
| Total credit balance (including monetary assets and liabilities at end of 1918) | 200,292 | 19 | 6 | |||
There were 320 private schools at the end of 1917, an increase of 15 on the number in 1916: 32 were for boys, 67 for girls, and 221 for children of both sexes. The number of pupils attending them was 25,491—namely, 10,749 boys and 14,742 girls, not counting 194 Maoris (90 boys and 104 girls). The number of European pupils at these schools was greater than in 1916 by 2,079. Of the private schools, 171 were Roman Catholic, with an attendance of 18,257 pupils, a decrease of 1 school, but an increase of 991 pupils, as compared with 1916.
The following table gives, for the past ten years, the number of private schools and of European scholars attending them, the number of Roman Catholic schools and pupils being also shown separately:—
| Year. | Number of Private Schools. | Pupils. | Included in previous Numbers. | |||
|---|---|---|---|---|---|---|
| Boys. | Girls. | Totals. | Roman Catholic Schools. | Pupils at Roman Catholic Schools. | ||
| 1908 | 307 | 7,653 | 10,714 | 18,367 | 149 | 12,538 |
| 1909 | 306 | 7,597 | 10,333 | 17,930 | 150 | 12,611 |
| 1910 | 318 | 8,036 | 10,945 | 18,981 | 156 | 13,161 |
| 1911 | 326 | 8,310 | 11,558 | 19,868 | 158 | 13,941 |
| 1912 | 310 | 8,801 | 11,437 | 20,238 | 156 | 14,476 |
| 1913 | 304 | 9,146 | 11,969 | 21,115 | 155 | 14,837 |
| 1914 | 321 | 9,641 | 12,439 | 22,080 | 180 | 16,471 |
| 1915 | 310 | 9,555 | 12,784 | 22,339 | 172 | 15,892 |
| 1916 | 305 | 9,791 | 13,621 | 23,412 | 170 | 17,266 |
| 1917 | 320 | 10,749 | 14,742 | 25,491 | 171 | 18,257 |
The distribution of the private schools in the various provincial districts is shown on the next page.
PRIVATE SCHOOLS . 1917.—SUMMARY BY PROVINCIAL DISTRICTS .
| Provincial Districts. | Number of Schools. | Number of Teachers. | Number of Scholars (exclusive of Maoris). | Daily Average Attendance. | |||||||||
|---|---|---|---|---|---|---|---|---|---|---|---|---|---|
| Boys. | Girls. | Mixed. | Total. | Male. | Female. | Total. | Male. | Female. | Total. | Male. | Female. | Total. | |
Exclusive of 194 Maoris (90 boys, 104 girls). | |||||||||||||
| Auckland | 5 | 10 | 50 | 65 | 32 | 231 | 263 | 2,586 | 3,804 | 6,390 | 2,345 | 3,464 | 5,809 |
| Taranaki | 1 | 4 | 12 | 17 | 2 | 50 | 52 | 640 | 844 | 1,384 | 482 | 752 | 1,234 |
| Hawke's Bay | 2 | 5 | 13 | 20 | 7 | 78 | 85 | 571 | 915 | 1,486 | 500 | 816 | 1,316 |
| Wellington | 10 | 17 | 52 | 79 | 53 | 222 | 275 | 2,829 | 3,372 | 6,201 | 2,527 | 3,040 | 5,567 |
| Marlborough | 1 | .. | 5 | 6 | ... | 16 | 16 | 192 | 213 | 405 | 166 | 191 | 357 |
| Nelson | ... | 3 | 10 | 13 | ... | 36 | 36 | 392 | 483 | 875 | 354 | 427 | 781 |
| Westland | 1 | 2 | 9 | 12 | 3 | 29 | 32 | 451 | 496 | 947 | 415 | 464 | 879 |
| Canterbury | 7 | 15 | 41 | 63 | 23 | 171 | 194 | 1,770 | 2,586 | 4,355 | 1,534 | 2,301 | 3,835 |
| Otago {Otago portion | 3 | 8 | 22 | 33 | 13 | 120 | 133 | 1,088 | 1,567 | 2,655 | 954 | 1,387 | 2,341 |
| Southland portion | 2 | 3 | 7 | 12 | 3 | 31 | 34 | 330 | 462 | 792 | 269 | 382 | 651 |
| Totals | 32 | 67 | 221 | 820 | 136 | 984 | 1,120 | 10,749 | 14,742 | 25,491* | 9,546 | 13,224 | 22,770 |
Denominational schools such as Roman Catholic and Anglican, are included in the above as private schools. Particulars for the Roman Catholic schools in December, 1917, are as under:—
SUMMARY OF ROMAN CATHOLIC SCHOOLS .
| Provincial Districts. | Number of Schools. | Number of Teachers. | Number of Scholars (exclusive of Maoris). | Daily Average Attendance. | |||||||||
|---|---|---|---|---|---|---|---|---|---|---|---|---|---|
| Boys. | Girls. | Mixed. | Total. | Male. | Female. | Total. | Male. | Female. | Total. | Male. | Female. | Total. | |
| Auckland | 2 | 2 | 29 | 33 | 18 | 126 | 144 | 1,912 | 2,570 | 4,482 | 1,750 | 2,343 | 4,093 |
| Taranaki | ... | 2 | 8 | 10 | ... | 30 | 30 | 442 | 552 | 994 | 398 | 491 | 889 |
| Hawke's Bay | 1 | 2 | 7 | 10 | 3 | 27 | 30 | 429 | 546 | 975 | 372 | 472 | 844 |
| Wellington | 5 | 7 | 23 | 35 | 21 | 113 | 134 | 1,887 | 2,331 | 4,218 | 1,675 | 2,073 | 3,748 |
| Marlborough | 1 | ... | 4 | 5 | ... | 15 | 15 | 188 | 204 | 392 | 163 | 182 | 345 |
| Nelson | ... | 3 | 6 | 9 | ... | 27 | 27 | 346 | 406 | 752 | 313 | 362 | 675 |
| Westland | 1 | 2 | 9 | 12 | 3 | 29 | 32 | 451 | 496 | 947 | 415 | 464 | 879 |
| Canterbury | 3 | 6 | 19 | 28 | 10 | 86 | 96 | 1,255 | 1,619 | 2,874 | 1,097 | 1,445 | 2,542 |
| Otago {Otago portion | 3 | 3 | 14 | 20 | 11 | 65 | 76 | 943 | 942 | 1,885 | 860 | 856 | 1,716 |
| Southland portion | 1 | 2 | 6 | 9 | 3 | 25 | 28 | 320 | 418 | 738 | 262 | 342 | 604 |
| Totals | 17 | 29 | 125 | 171 | 69 | 543 | 612 | 8,173 | 10,084 | 18,257 | 7,305 | 9,030 | 16,335 |
Any private school may apply to be registered under the Education Act, 1914. At the end of 1918 the number of registered private primary schools was 210. The total roll number was 20,076, and the average attendance 17,441.
The roll number of the eighteen registered private secondary schools in 1918 was 1,366.
The number of Native village schools in operation at the end of 1918 was 119. In addition, there were thirteen private schools at which education for Maori boys and girls is provided. Of these, ten are maintained from the incomes arising out of lands held in trust for educational purposes by various denominational bodies; the others are supported by private resources.
As required by law, instruction in all Native schools is given through the medium of the English language only. The subjects of the school course are English, arithmetic, drawing and handwork, nature-study and geography, health and moral instruction, and civics, singing, and physical drill.
In a number of schools instruction in woodwork and in elementary agriculture is given, and the girls are taught practical dressmaking and plain cookery. In the majority of schools some form or other of elementary handwork is taken with success.
At one or other of the ten boarding-schools—Otaki, St. Stephen's (Auckland), Te Aute, Waerengaahika, and Hikurangi for boys, and Hukarere, St. Joseph's (Napier), Queen Victoria (Auckland), Turakina, and Te Waipounamu Schools for girls—the Government provides a number of free places, tenable for two years, for children of predominantly Maori race who pass the higher standards at the Maori village schools. At the end of the year the number of pupils on the rolls of these schools was 471. Of the pupils in attendance 45 boys and 58 girls were holders of free places.
Senior free places are provided for boys in the form of industrial scholarships, which enable the holders to be apprenticed to suitable trades. These scholarships have not of late been eagerly sought after, the boys finding that they can secure higher wages in other ways. Senior free places for girls take the form of nursing-scholarships. At the end of 1918 three girls were in training as day-pupils, and one as a probationer on the staff of two different hospitals.
On the rolls of the 119 village schools at the 31st December, 1918, there were 5,064 children (including 592 Europeans). The average attendance for the year was 4,338, the percentage of regularity being 86.0, and the average weekly roll number 5,044. The total number of pupils on the rolls of the Native mission schools was 175, and on those of the secondary schools 471. At the end of the year, therefore, the total roll number of all the Native schools inspected by officers of the Education Department was 5,710, the average weekly roll being 5,694, and the total average attendance 4,927.
Besides the children of the Maori race who are receiving instruction in the Native schools there is a still larger number attending public schools, so that the total number of primary pupils of Maori race (including those in the mission schools) is 9,501, made up as follows:—
| Attending Government Native schools | 4,472 |
| Attending public schools | 4,854 |
| Attending mission schools | 175 |
| 9,501 |
Of the children on the rolls of the Native schools in December, 1918, 85.2 per cent. were Maoris speaking Maori in their homes, 3.1 per cent. were Maoris speaking English, and 11.7 per cent. were Europeans.
The total net expenditure on Native schools during the year ended the 31st March, 1919, was £48,500. Included in this is the sum of £37,285 expended on teachers' salaries (including war bonus), £2,646 expended on new buildings and additions, £3,112 on maintenance of buildings, repairs, &c., and £2,303 on secondary education.
The staffs of the village schools included seventy-three male and forty-three female head or sole teachers, and 127 assistants. The average salary of the head or sole teachers was £194 6s. 3d., of the 119 female assistants £89 11s. 1d., and of the eight male assistants £81 17s. 6d.
Secondary education is carried on at secondary schools, district high schools, technical high schools, Maori secondary schools, and private secondary schools.
The number of secondary schools in operation during 1918 was thirty four.
The number of district high schools was sixty-two, technical high schools eight, and Maori secondary schools ten. In addition there were eighteen private secondary schools registered under the Education Act, 1914.
The total numbers of pupils attending the thirty-four secondary schools for the last terms of 1917 and 1918 respectively were as follows:—
| 1917 | 1918 | |||||
|---|---|---|---|---|---|---|
| Boys. | Girls. | Total. | Boys. | Girls. | Total. | |
| Roll (exclusive of lower departments) | 4,203 | 3,387 | 7,590 | 4,621 | 3,763 | 8,384 |
| Number in lower departments | 365 | 215 | 580 | 397 | 268 | 665 |
| Totals | 4,568 | 3,602 | 8,170 | 5,018 | 4,031 | 9,049 |
In the same years these schools were staffed as follows:—
| 1917 | 1918 | |||||
|---|---|---|---|---|---|---|
| M. | F. | Total. | M. | F. | Total. | |
| Regular staff | 174 | 175 | 349 | 175 | 195 | 370 |
| Part-time teachers | 37 | 43 | 80 | 42 | 43 | 85 |
The average number of pupils per teacher (excluding part-time teachers) was thus 22.
The number on the roll of the secondary departments of district high schools at the end of the year 1918 was 2,283.
Besides the head teachers, who generally take some part in the secondary instruction, there were employed in 1918 in the secondary departments of district high schools 93 special assistants—21 men and 72 women. The average number of pupils per teacher was 24.
The total numbers on the roll of technical high schools at any time during the years 1917 and 1918 were as follows:—
| 1917. | 1918. | |
|---|---|---|
| Boys | 1,110 | 1,265 |
| Girls | 1,237 | 1,482 |
| Totals | 2,347 | 2,747 |
The number on the roll of secondary schools for Maoris (all of whom were boarders) at the end of 1918 was 471.
The number of children on the rolls of registered private secondary schools at the end of the year was 1,366, being 357 boys and 1,009 girls.
Summarizing all these figures, and excluding pupils in the lower departments of secondary schools, we obtain the following statement of the numbers receiving some form or other of secondary instruction during the years 1917 and 1918 (as nearly as can be ascertained):—
| 1917. | 1918. | |
|---|---|---|
| Secondary schools | 7,590 | 8,384 |
| District high schools | 2,405 | 2,283 |
| Technical high schools | 2,347 | 2,747 |
| Maori secondary schools | 487 | 471 |
| Private secondary schools | 1,206 | 1,366 |
| Totals | 14,035 | 15,251 |
The figure shows an increase of 10.4 per cent. over the corresponding figure for the previous year, and an increase of nearly 50 per cent. over the figure of five years ago.
Free places are divided into two classes—junior and senior—both being tenable at secondary schools and districts high schools, or, under somewhat different conditions, at technical schools.
Generally speaking, junior free places are tenable for two years, with a possible extension in certain cases to three years. In the case of their being held at district high schools they are tenable to the age of seventeen. The means of qualification are—
For entrance to secondary schools and district high schools—(a ) Special examinations for Junior National Scholarships, (b) the certificate of proficiency.
For entrance to technical high schools the means of qualification named in (1), or the certificate of competency in S6, with a special endorsement of merit in handwork and elementary science, which for the purposes of technical schools is deemed to be equivalent to a certificate of proficiency.
For entrance to technical classes other than technical high schools the means of qualification named in (1) or (2), or, under special conditions applicable to industrial courses only, a recommendation by the Inspector of Schools if a pupil is over fourteen years and has been in regular attendance at a public school up to a date not more than six months prior to the date of admission to the technical classes.
Senior free places are tenable at secondary schools, district high schools, and technical high schools up to the age of nineteen, and at technical classes other than technical high schools for three or in some cases four years. The means of qualification for senior free places are the Intermediate or other equivalent examinations, or the recommendation of the Principal or Director of the school or classes attended based on the school records and examination results, or the recommendation of an Inspector of Secondary Schools, or in the case of district high schools of the senior Inspector of the district, or in part on such a recommendation and in part on the results of a special examination.
The following are some of the figures for 1917 and 1918 in regard to free places in secondary schools:—
| 1917. | 1918. | |
|---|---|---|
| Number of secondary schools giving free tuition | 32 | 32 |
| Roll number of these schools | 7,106 | 7,871 |
| Number of free-place holders at end of year | 6,231 | 6,966 |
| Average number of free-place holders during year | 6,468 | 7,177 |
| Free-place holders as a percentage of roll number | 91 per cent. | 91 per cent. |
| Total annual payment by Government for free places | £78,567 | £85,422 |
| Cost to Government per free pupil | £12 2s. 11d. | £11 18s. |
In order to arrive at the total number of pupils in New Zealand receiving free secondary instruction it will be necessary, however, to include also eighty-seven holders of scholarships or exhibitions carrying free instruction not otherwise enumerated, which are granted by the secondary schools included above or by endowed secondary schools not coming under the conditions for free places, 2,123 free-place holders at district high schools, 103 Maori pupils receiving free education in Maori secondary schools, and 2,504 holders of free places in technical high schools. Consequently, there were approximately 11,783 pupils receiving free secondary education in the Dominion, exclusive of those holders of free places in technical schools (mostly evening students), who, while not taking full-day courses, were nevertheless receiving free education of secondary grade.
The following table gives a summary of the various secondary free places at the end of the year for which payment was made by Government:—
| Free Places in December, 1917 and 1918. | ||||||
|---|---|---|---|---|---|---|
| 1917 | 1918 | |||||
| (i.) Secondary schools— | Boys. | Girls. | Total. | Boys. | Girls. | Total. |
| (a .) Junior free pupils | 2,327 | 2,257 | 4,584 | 2,503 | 2,405 | 4,908 |
| (b .) Senior free pupils | 910 | 737 | 1,647 | 1,081 | 977 | 2,058 |
| Totals | 3,237 | 2,994 | 6,231 | 3,584 | 3,382 | 6,966 |
| (ii.) District high schools— | ||||||
| (a .) Junior free pupils | 836 | 971 | 1,807 | 876 | 977 | 1,853 |
| (b .) Senior free pupils | 103 | 134 | 237 | 103 | 167 | 270 |
| Totals | 939 | 1,105 | 2,044 | 979 | 1,144 | 2,123 |
| (iii.) Maori secondary schools | 41 | 55 | 96 | 45 | 58 | 103 |
| (iv.) Technical high schools— | ||||||
| (a .) Junior free pupils | 906 | 1,005 | 1,911 | 1,053 | 1,160 | 2,213 |
| (b.) Senior free pupils | 102 | 137 | 239 | 109 | 182 | 291 |
| Totals | 1,003 | 1,142 | 2,150 | 1,162 | 1,342 | 2,504 |
| Grand totals | 5,225 | 5,296 | 10,521 | 5,770 | 5,926 | 11,696 |
These scholarships are of three kinds,—
National Scholarships:
Foundation (or Governors') Scholarships, given by the governing bodies of secondary schools;
Private scholarships, endowed by private owners.
Junior and Senior National Scholarships in the proportion of 9 to 5 are awarded on the results of annual examinations, the junior examination being of a standard somewhat higher than that of the certificate of proficiency, and the senior examination being of a standard comparable with the standard of the Public Service Entrance Examination. Scholarships are awarded to all candidates reaching a certain standard, the standard of award being determined so as approximately to provide one scholarship for every 500 children in attendance in all public schools. In the case of pupils from sole-teacher schools—i.e., schools with an average attendance of under 36—the standard of award is made 10 per cent. lower than in the case of pupils from larger schools.
At the examinations held in 1918 214 candidates qualified for Junior National Scholarships, of which number 9 were pupils of sole-teacher schools, and 67 were pupils of secondary schools. The number of candidates qualifying for Senior National Scholarships was 120, of which number 5 qualified on the alternative programme provided specially to suit the needs of those taking a rural or domestic course.
Junior and Senior National Scholarships are tenable at secondary schools and district high schools, each for three years, provided that the total tenure of the two scholarships in the case of one person must not exceed five years. In addition to tuition fees the holder receives £5 per annum if a junior scholar, or £10 per annum if a senior scholar, with a further sum of £35 per annum in each case if obliged to live away from home.
The following figures indicate the number and the value of scholarships current in 1917 and 1918, respectively:—
| Number of scholarship-holders— | 1917. | 1918. |
|---|---|---|
| Boys | 403 | 486 |
| Girls | 235 | 310 |
| Totals | 638 | 796 |
| Number receiving boarding-allowance (included in the above total) | 211 | 239 |
| Number receiving travelling-allowance (similarly included) | 29 | 47 |
| Number held at secondary schools | 542 | 687 |
| Number held at district high schools | 77 | 86 |
| Number held at other registered secondary schools | 19 | 23 |
| Total annual rate of payment | £11,677 | £13,130 |
These are of two kinds, those afforded by the Governors of secondary schools not granting free places under the Act, and those offered as additional scholarships by the Governors of schools providing free places.
These are derived from funds provided by private donors at certain schools, by bequest or otherwise. The number of foundation and private scholarships in the last term of 1918 was 152. Of the holders, sixty-five were also Government free pupils under the regulations. The total annual value of the scholarships in cash was £1,851. In addition, free tuition was given by the schools to holders of foundation and private scholarships to the value of £473, the value of the Government free places already mentioned not being included in this amount.
Regulations which came into force in January, 1918, provided for the award of bursaries to dependants of killed or disabled members of the New Zealand Expeditionary Force. To qualify for a war bursary a child must be eligible for—
Free education at technical classes; or
A free place at a secondary school, district high school, or technical high school; or
A University or educational bursary at a University college.
A bursary entitles the holder to an allowance, in addition to free tuition, of £1 10s. or £3 per annum in the case of those qualified under (a ), £5 for those under (b ), or £10 for those under (c ). Lodging-allowance is also payable to bursars who are obliged to live away from home to attend school, at the rate of £15 per annum under (a ) and £30 under (b ) and (c ); travelling-allowances varying from £5 to £10 per annum are also made when travelling is necessary. During 1918 the number of bursaries held at secondary schools was twenty-seven, the expenditure thereon being £327 10s.
Three classes of certificates may be issued to free-place holders taking a secondary course of instruction. The intermediate certificate may be granted to junior-free-place holders who have satisfactorily completed under certain conditions a two-years course at a secondary school, district high school, or technical high school, and who in general are qualified in attainment to receive a senior free place. The lower leaving-certificate may be issued to pupils who have satisfactorily completed a three-years course of secondary instruction, including not less than one year of a senior course in which the standard of work is sufficiently advanced in character to meet the requirements of the examination for a teacher's certificate of Class D, or of the Matriculation Examination. Likewise the higher leaving-certificate may be granted to pupils having satisfactorily completed at least a four-years course of secondary instruction and having satisfied the requirements of the lower leaving-certificate, and, in addition, having completed to good advantage and under certain conditions a further secondary course of not less than one year.
The income of secondary schools is derived from the following sources:—
Bents from the special reserves allocated to them by statute:
Statutory grants, given in lieu of special reserves:
Interest upon moneys derived from the sale of reserves, and invested in accordance with the Education Reserves Act:
Income from the secondary-school reserves controlled by the Land Boards, divided among the secondary schools in the several land districts in proportion to the number of pupils in average attendance, lower departments excluded:
Government payments—(a ) Statutory capitation upon free pupils under the Act; (b) subsidies on voluntary contributions; (c ) capitation for manual-instruction classes:
Special Government grants for buildings and apparatus:
Tuition fees of pupils:
Boarding fees of pupils:
Miscellaneous sources, such as interest on moneys (other than those obtained by the sale of reserves), donations, and special endowments (for scholarships, prizes, &c.), rent of premises, loans raised, &c.
The revenue derived from the sources (i) to (iv) is the income derived from endowments, and the "net annual income derived from endowments" is the average of this revenue for the three preceding years, less the expenditure upon the endowments and investments, upon buildings approved by the Minister, and less mortgage and other charges.
The following is a summary of the receipts and payments of all secondary schools (excluding Wanganui Collegiate and Christ's College Grammar Schools) for the year 1918:—
| Receipts. | £ |
|---|---|
| Endowments— | |
| Sales and mortgage-money repaid | 799 |
| Lands vested in High School Boards | 41,746 |
| Secondary-education reserves | 9,753 |
| Interest on moneys invested | 890 |
| Government grants— | |
| Grants for buildings, sites, rent, apparatus, &c., and subsidies | 3,784 |
| Capitation for free places | 82,517 |
| Capitation for manual instruction | 2,082 |
| School fees | 10,745 |
| Lower Department Account | 4,625 |
| Boarding-school Account | 34,689 |
| Loans, transfers from Capital Account, interest, &c. | 461 |
| Technical Classes Account | 2,102 |
| Voluntary contributions, income from property not reserves, refunds, and sundries | 10,584 |
| £204,777 | |
| Expenditure. | £ |
| Endowments (including proportion of office expenses) | 6,024 |
| Teachers' salaries and allowances | 99,482 |
| Incidental expenses of secondary departments— | |
| Office expenses and salaries (excluding endowments) | 3,358 |
| Printing, stationery, and advertising | 2,666 |
| Cleaning, heating, lighting, and care of school-grounds | 8,010 |
| Material, examinations, prizes, games, and other incidentals | 2,030 |
| Manual instruction (excluding buildings, &c.) | 1,458 |
| Sites, buildings, furniture, apparatus, taxes, &c. | 29,747 |
| Lower Department Account | 4,658 |
| Boarding-school Account | 32,363 |
| Loans repaid and interest | 8,336 |
| Technical Classes Account | 2,404 |
| Scholarships, advances to pupils, and miscellaneous | 5,828 |
| £206,364 | |
Taking into account all the monetary assets and liabilities of the various Boards, it appears that the total debit balance at the end of 1918 was £37,239, ton Boards having debit and twelve having credit balances. The debit balances are for the most part due to loans required for the erection of necessary buildings. The following is a summary of the monetary assets and liabilities at the end of the year:—
| Monetary Assets. | £ |
|---|---|
| Bank balances | 42,055 |
| Other assets | 22,229 |
| Total | £64,284 |
| Liabilities. | £ |
| Overdrafts | 65,626 |
| Other liabilities | 35,897 |
| Total | £101,523 |
| Debit balance | £37,239 |
The Education Act provides that pupils who have not obtained a certificate of competency in the subjects of Standard V or a higher standard of the public-school syllabus may be admitted to a lower department of a secondary school if they are taught in a separate building or class-room, and if no part of the actual cost of their instruction is met out of the endowments of the secondary school or out of any moneys granted by the Government. There were lower departments in fourteen secondary schools during 1918; the total number of pupils in those departments was 665; the total expenditure on salaries of teachers and incidental expenses was £4,658; the total receipts from fees, &c., was £4,626.
The Education Act provides for public instruction in such subjects of art, science, and technology as are set forth in regulations. Classes recognized under the Act are eligible for grants in aid of necessary buildings, equipment, and material, for capitation, and for subsidies of £1 for £1 on voluntary contributions. Free technical education is also provided for. Persons complying with the conditions prescribed by the regulations are entitled to hold junior free places at technical schools or classes. These free places are tenable for two years, and may be continued under certain conditions for three years more as senior free places. Holders of senior free places are required to take up definite courses of technical instruction.
The controlling authorities of classes for technical instruction are Education Boards, governing bodies of secondary schools and University colleges, and, in the case of certain classes in existence prior to 1904, the managers of those classes.
The Auckland University College and the Otago University have each established a School of Mines, providing for courses for the University degree of B.Sc. or for the associateship in mining and metallurgy. The Canterbury College has an endowed School of Engineering and Technical Science, providing for courses for the University degree of B.Sc. in mechanical, electrical, or civil engineering, or for the associateship in engineering.
There are also several Schools of Mines located in districts in which mining is actively carried on. Particulars relating to these will be found in the Mining section of this book.
The Otago University has a home-science department, at which sixty-one students were in attendance in 1918.
The Canterbury Agricultural College has an endowment of about 77,800 acres of land, of the rental value of about £2,800 per annum, and possesses extensive buildings and an experimental farm of a very complete character. The institution offers an opportunity to acquire a thorough knowledge of the science and practice of agriculture. Two years' residence at the college is accepted by the University of New Zealand as part of the curriculum qualifying for the degree of B.Sc. in agriculture. The college accommodated fifty-four students in 1918.
Recognized classes for commercial subjects, subsidized by the Government, are held at three of the four University colleges.
The total number of classes held in 1918 was 1,965, and the total number of students in attendance 16,910. The following figures show the number of classes at which the various subjects indicated were taken:—
| Mathematics and science | 135 |
| Engineering | 220 |
| Wood and lead working, and other trade subjects | 204 |
| Agriculture, dairy-work, &c. | 98 |
| Art and art crafts | 235 |
| Domestic subjects | 367 |
| Commercial subjects | 369 |
| Subjects of general education | 337 |
| Total | 1,965 |
Regulations requiring the attendance of young persons between the ages of fourteen and seventeen who are not otherwise receiving a suitable education or who are not specially exempted from attendance were in operation in 1918 in certain school districts in the Auckland, Wanganui, Taranaki, and Hawke's Bay education districts. The classes established under these regulations were attended by 1,324 students.
The number of discharged soldiers who received free education at technical schools in 1918 was 353.
The number of pupils receiving free education under the regulations for free places at technical high schools and other technical schools and classes was 4,211-2,209 males and 2,002 females; the number for the previous year was 3,977.
These schools (eight in number) are of secondary grade, and provide industrial, domestic, agricultural, commercial, and art courses. The number of pupils in attendance was as follows: Auckland, 595; Wanganui, 258; Wellington, 414; Napier, 203; Westport, 26; Christchurch, 532; Dunedin, 422; and Invercargill, 297. The total roll number was 2,747, an increase of 400 over that of the preceding year. The schools appear to meet the needs of a number of young people who would not otherwise proceed to secondary schools. The courses of instruction taken up by pupils were as follows :—
| Males. | Females. | Total. | |
|---|---|---|---|
| Industrial | 698 | .. | 698 |
| Commercial and general | 390 | 1,092 | 1,482 |
| Domestic | .. | 385 | 385 |
| Agricultural | 177 | .. | 177 |
| Art | .. | 5 | 5 |
| Totals | 1,265 | 1,482 | 2,747 |
Capitation earned on account of technical high schools during 1918 totalled £32,474.
The following table classifies the free pupils at technical high schools in 1917 and 1918:—
| 1917. | 1918. | |||||
|---|---|---|---|---|---|---|
| Boys. | Girls. | Total. | Boys. | Girls. | Total. | |
| Junior free pupils | 906 | 1,005 | 1,911 | 1,053 | 1,160 | 2,213 |
| Senior free pupils | 102 | 137 | 239 | 109 | 182 | 291 |
| Totals | 1,008 | 1,142 | 2,150 | 1,162 | 1,342 | 2,504 |
The following is a summary of the expenditure by the State on technical instruction during the year ended the 31st March, 1919:—
| £ | |
|---|---|
| Capitation | 66,269 |
| Subsidies on voluntary contributions | 1,673 |
| Scholarships and bursaries | 2,166 |
| Grants in aid of material for class use | 1,885 |
| Grants for buildings and equipment | 5,773 |
| Rents | 369 |
| Conveyance of instructors, students, and free pupils | 3,776 |
| Examinations (less recoveries) | 16 |
| Inspectors' salaries and travelling-expenses | 1,108 |
| War bonus to teachers | 2,224 |
| £85,259 |
The Special Schools Branch of the Education Department deals with an extensive field of social work which is of vital importance to the community. The functions of the branch include provision (1) for all destitute, uncontrollable, or delinquent children and juvenile offenders committed by the Courts or admitted by private arrangement under the provisions of the Industrial Schools Act to receiving-homes, probation homes, training-farms, and industrial schools; (2) for the maintenance and supervision of all children who have lost both parents or the surviving parent as a result of the recent influenza epidemic; (3) for investigation regarding the conduct, characteristics, and home conditions generally of delinquent and uncontrollable children and juvenile offenders who are brought before the Courts in each of the four centres of population, and for supervision of children admitted to probation; (4) for the supervision of all infants under the age of six years who are maintained for payment apart from their parents or guardians, or adopted with premium; and (5) for the education and care of deaf, blind, or feeble-minded children over the age of six years.
The following figures show the number of children under the control of the branch at the 31st December, 1918:—
| Industrial schools | 3,140 |
|---|---|
| Juvenile probation | 249 |
| Infant-life protection | 860 |
| Special schools— | |
| Deaf | 104 |
| Feeble-minded | 144 |
| Total | 4,497 |
The policy of the Department is now in the direction of supervising young delinquents and uncontrollable children in their own homes, provided that the conditions are favourable and that the conduct and characteristics of the children are not considered of such a nature as should debar their attendance at a public school. To provide for children who, while requiring stricter disciplinary treatment than is generally found in the ordinary home, are quite fit to attend an ordinary public school, there is accommodation at the various receiving-homes and probation homes now fully established in each of the centres of population.
The total roll of children belonging to industrial schools and receiving- homes at the 31st December, 1918, was 3,140, of which number 1,851 were boys and 1,289 girls.
The children are classified as follows:—
| In residences— | |
|---|---|
| In Government industrial schools | 249 |
| In private industrial schools | 267 |
| Total | 516 |
| Boarded out— | |
| From Government schools (including receiving-homes) | 1,264 |
| From private industrial schools | 7 |
| Total | 1,271 |
| Placed out in situations | 643 |
| With friends on probation | 438 |
| In private institutions, hospitals, absent without leave, in prison, &c. | 272 |
| Total | 1,353 |
| Grand total | 3,140 |
The net expenditure for the year 1918-19 on Government industrial schools, receiving-homes, and the probation system, but exclusive of capital charges for additional buildings, works, &c., was £46,508. The contributions from parents under orders of Court, agreements, &c., amounted to £12,907.
Included in the total sum recovered (£24,879) is an amount of £11,972 paid by Hospital and Charitable Aid Boards for the maintenance of 1,009 children committed to industrial schools on account of indigency. In addition 134 inmates of private industrial schools were maintained at the expense of Hospital and Charitable Aid Boards. As these latter schools make their claims direct against the Boards, the figures are not included in the totals given above.
The purpose of this system is to provide supervision and protection for infants boarded out by their parents or guardians in circumstances that might lead to their neglect or ill-treatment. Unless licensed as a foster-parent, no person in consideration of any payment or reward may receive or take charge of an infant for the purpose of nursing or maintaining it apart from its parents or guardians for longer than seven consecutive days. "Infant" means a child under six years of age. Besides the district agents, duly appointed officers who are qualified nurses have full power to inspect the licensed homes. If necessary the Education Department may take over the maintenance of a. child, recovering the cost from the parents or guardians, and the foster-parent's license may be revoked, the children in the home being otherwise provided for as the Minister may direct. Payment of a premium on the adoption of a child brings the case within the provisions of the Act.
The number of homes licensed at the end of 1918 was 1,060, and the total number of children in them during the year was 1,349. Of this total, the number of infants under one year was 293. Six children died, being 0.44 per cent. of those in the homes.
The expenditure in connection with infant-life protection for the year ended 31st March, 1919, was £1,194; for the preceding year the amount was £1,219.
The Education Department maintains a school for deaf children at Sumner, the number belonging to the institution at the end of 1918 being 117.
The following classes of deaf children are admitted to the institution, mental soundness being in all cases a necessity:—
Children born deaf or who have lost their hearing before learning to speak.
Children who can hear a little, but are too deaf to be taught in an ordinary school.
Children who have lost their hearing after having learned to speak.
The method of instruction used is the oral method, in favour of which there is a vast predominance of expert opinion.
The necessity for sending deaf children to be properly treated at as early an age as possible is imperative, since the process of educating the deaf must be slower and more arduous than in the case of normal children. In addition to the ordinary school-work the girl pupils receive instruction in general domestic work, cooking, laundry-work, dressmaking, and dancing; while the boys are taught woodwork and gardening.
The gross expenditure on the school for the financial year 1918-19 was £7,055, and the recoveries were £3,082, leaving a net expenditure of £3,973.
This institution is governed by a Board of Trustees, four of whom are appointed by the Government, and the remaining five elected by the subscribers to the funds of the institute. As the institute comes within the scope of the Hospitals and Charitable Institutions Act, subsidy at the rate of 24s. in the pound is payable by the State on voluntary subscriptions received by the Board, and 10s. in the pound on the value of bequests. The State contributed £759 towards the cost of training 29 pupils. The amount recovered from parents and Hospital and Charitable Aid Boards was £933.
Provision is made at the institute for the education and training of adults as well as children, although the Education Department is chiefly interested in the latter. In addition to the ordinary school subjects kindergarten classes are held, and instruction is also given in music, swimming, typewriting and shorthand, sewing, knitting, beadwork, &c. Technical work and manual training forms an important part of the curriculum. The boys and men receive instruction in woodwork and in several trades, such as piano-tuning, mat and basket making, &c., while the girls are taught household duties, which will be of great benefit to them when they return to their homes after completing their education in the day school.
The need for controlling and in the majority of cases for segregating all feeble-minded children is of the utmost importance if the physical and mental standard of the race is to be preserved. Of the cases already examined a great many are unfitted, on account of their low mentality, for admission to special schools, although in certain urgent cases admission has been arranged in the absence of any other means of dealing with them.
The inmates of schools for feeble-minded children are given a very simple course of instruction suited to their limited intelligence. Instruction is largely of a manual character, since these children are able to advance very slightly in the arts of reading, writing, and counting. The object of the instruction is to quicken the intelligence and dexterity of the children, so that later on they may be able to take part in some simple occupation and help to some extent in supporting themselves.
The special school at Richmond for the reception of feeble-minded girls has now been fully established. The school has two teachers, and the number of children in December, 1918, was fifty-three. The net expenditure on the school for the year 1918-19 was £1,092.
At the special school for boys at Otekaike a scheme providing instruction in carpentry, bootmaking, and mat and basket making is in operation. The younger boys receive instruction by means of kindergarten and Montessori methods. Many of the elder boys assist either in the garden or orchard or on the farm. The number of boys belonging to the school in December, 1918, was ninety - one, and the net expenditure on the school for the year 1918-19 was £5,323.
The following table gives particulars of the number, attendance, staff, salaries, &c., at district high schools in 1918:—
| Education Board. | Number of Secondary Departments grouped according to Average Attendance. | ||||||||
|---|---|---|---|---|---|---|---|---|---|
| Average, 12-20. | Average, 21-30. | Average, 31-70. | Average, 71-105. | Average, 106-140. | Average, 141-175 | Average, 176-210. | Average, over 210. | Total. | |
| Auckland | 5 | 4 | 4 | .. | .. | .. | .. | .. | 13 |
| Taranaki | .. | 1 | .. | .. | .. | 1 | .. | .. | 2 |
| Wanganui | 4 | 1 | 1 | .. | .. | .. | .. | .. | 6 |
| Hawke's Bay | .. | .. | 3 | .. | .. | .. | .. | .. | 3 |
| Wellington | 2 | 1 | 4 | 1 | 1 | .. | .. | .. | 9 |
| Nelson | 1 | 1 | 1 | 1 | .. | .. | .. | .. | 4 |
| Canterbury | 7 | 3 | 4 | 1 | .. | .. | .. | 1 | 16 |
| Otago | 1 | 4 | 4 | .. | .. | .. | .. | .. | 9 |
| Totals, 1918 | 20 | 15 | 21 | 3 | 1 | 1 | .. | 1 | 62 |
| Education Board. | Average attendance, 1918. | Number of Assistant Teachers. | Average Number of Pupils per Assistant Teacher. | Statutory Annual Rate of Salary as in December, 1918. | ||||
|---|---|---|---|---|---|---|---|---|
| M. | F. | Total. | ||||||
| £ | s. | d. | ||||||
| Auckland | 381 | 5 | 12 | 17 | 22 | 4,200 | 10 | 0 |
| Taranaki | 187 | 2 | 3 | 5 | 35 | 1,100 | 0 | 0 |
| Wanganui | 145 | 3 | 4 | 7 | 20 | 1,710 | 0 | 0 |
| Hawke's Bay | 130 | .. | 4 | 4 | 33 | 960 | 0 | 0 |
| Wellington | 377 | 3 | 12 | 15 | 25 | 3,750 | 0 | 0 |
| Nelson | 165 | .. | 6 | 6 | 28 | 1,420 | 0 | 0 |
| Canterbury | 631 | 6 | 21 | 27 | 23 | 6,727 | 0 | 0 |
| Otago | 307 | 2 | 10 | 12 | 26 | 3,170 | 0 | 0 |
| Totals, 1918 | 2,323 | 21 | 72 | 93 | 26 | 23,037 | 10 | 0 |
Courses bearing more or less on rural pursuits are taken in many district high schools, 70 per cent. of the boys and 39 per cent. of the girls studying agricultural science, 32 per cent. of the pupils taking dairy-work, 29 per cent. of the boys learning woodwork, and 58 per cent. of the girls cookery or needlework. Latin is taken by only 34 per cent. of the pupils, and French by 46 per cent.
Rural courses were, in 1918, in operation at forty-seven district high schools, and were taken by 1,413 pupils. The course for boys is not intended to fit them for carrying on agricultural and pastoral pursuits, but is intended to give them a knowledge of the scientific principles upon which the successful practice of these pursuits depends. Similarly, the course for girls is intended to fit them for the work which they, as members of families engaged in such pursuits, may have to perform or superintend. In most instances it has been found possible not only to provide reasonably full courses with a distinct bias towards rural and domestic pursuits, but also to secure adequate opportunities for pupils preparing for the various public examinations. A special payment of £5 10s. per annum is paid to the Education Boards on account of each pupil in the secondary department of a district high school taking an approved rural course.
The affairs of the University of New Zealand are controlled by three Courts—the Senate, the Board of Studies, and the General Court of Convocation. The Senate has the entire management of and superintendence over the affairs, concerns, and property of the University, and, subject to certain provisions relating to the Board of Studies, has power to alter all statutes and regulations. The Board of Studios has power to make recommendations to the Senate as to the appointment of examiners, and as to degrees, diplomas, scholarships, prizes, courses of study, and examinations. The chief function of the General Court of Convocation is to discuss matters relating to the University, and to declare its opinion on any such matters.
The University of New Zealand has power to confer degrees, but is not itself a teaching body, undergraduates for the most part keeping their terms at one or other of the four affiliated institutions—Otago University. Canterbury College, Auckland University College, and Victoria University College.
The revenue of the University is derived mainly from a statutory Government grant of £3,000 per annum, from fees, and from interest on investments.
Auckland. University College and Victoria University College each receive an annual statutory grant of £9,000, while Canterbury College receives £2,000 and Otago University £5,000. The two latter institutions are endowed with reserves of land. In addition a certain proportion of the income from the National Endowment Fund for the purposes of education is paid directly to the four affiliated institutions. In 1918 the sum paid to each out of the fund amounted to £1,814. There is also now provision for the payment under regulations of a Government subsidy on voluntary contributions to the funds of the institutions affiliated to the University of New Zealand.
The total amount paid by the Government on account of the University of New Zealand and the affiliated colleges for the year 1918-19 was £51,110.
There were in 1918 2,140 students actually in attendance at the four University colleges. Of these, 68 were graduates, 1,271 undergraduates, and 801 unmatriculated students. In addition to the students mentioned above, there were 86 students attached to the various University colleges, but exempt from lectures. There were also 54 students taking an agricultural course of University grade at the Lincoln Agricultural College.
University scholarships may be divided into three broad classes— (1) Entrance scholarships, (2) scholarships awarded during the degree course, (3) post-graduate scholarships.
University entrance scholarships are awarded annually on the results of the University Junior Scholarship Examination, which is held at the same time as the Matriculation Examination. They are known as (a ) University Junior Scholarships, (b ) University National Scholarships, (c ) Taranaki Scholarships (open only to residents in Taranaki).
The University Junior Scholarships (eleven of which were gained in 1918) are of the value of £20 per annum plus tuition fees, and are tenable for three years. In the case of holders living away from home a further sum of £30 per annum is allowed. The University National Scholarships are of equal monetary value, the number gained in 1918 being twenty-two. Taranaki Scholarships are of the annual value of £60, and the Senate may at discretion extend the tenure from three to four years. There are also some thirty or forty local and privately endowed scholarships awarded on the results of the same entrance examination.
Scholarships awarded during the degree course are the Senior University and John Tinline Scholarships. These are tenable by candidates sitting for their final examination for B.A. or B.Sc., and may therefore be regarded in a sense as post-graduate. The various colleges have also private scholarships for which their own students may compete.
The chief scholarships awarded at the end of the University course are the Rhodes Scholarship, the 1851 Exhibition Scholarship, the Medical Travelling Scholarship, and the National Research Scholarships. The first three are all tenable abroad. The Research Scholarships are each of the value of £100 per annum, with laboratory fees and expenses.
So far fifteen Rhodes Scholarships have been granted, of which five have been gained by students of Auckland University College, four by students of Otago University, four by students of Victoria University College, and two by students of Canterbury College. Owing to the war all further election to these scholarships has been postponed for the present.
Of the eighteen Research Scholarships awarded up to the present one was in active operation in 1918.
University bursaries are awarded under the University Amendment Act, 1914, on the credit pass in the University Junior Scholarship Examination or on a higher leaving-certificate qualification, and entitle the holders to the payment of tuition and examination fees (not exceeding £20 per annum) during a three (or possibly four) years' course at a University college or school of agriculture recognized by the University. The number of University bursaries held in 1918 was 291.
Educational bursaries are awarded under the Education Act, 1914, and any matriculated student is entitled to one who—
Has within the six months immediately preceding completed his term of service as a pupil-teacher or probationer in some education district in accordance with regulations and to the satisfaction of the Education Board and of the Senior Inspector of that district, and declares his intention of entering a recognized training college on the completion of the tenure of his bursary; or
Has satisfactorily completed his course of training at a recognized training college and gained a trained-teacher's certificate; or
Has otherwise gained a teacher's certificate of a class not lower than Class C.
These bursaries are tenable for three years, with possibly two yearly extensions, at a University college or recognized school of agriculture. The classes taken must be such as to form part of a course in arts, science, or agriculture, and proof of satisfactory progress must be given.
The number of educational bursaries held in 1918 was forty-two, of which number seven completed the three-years tenure of their bursaries. In addition sixteen holders of bursaries were absent on military service.
Domestic-science bursaries tenable at the Otago University may be awarded under the regulations for technical instruction. Applicants for the bursaries must have been resident in the Dominion for not less than twelve months, and must have—
Passed the Matriculation Examination or some other examination approved for the purpose; or
Obtained at least a partial pass in the examination for the Class D teachers' certificate; or
Gained a higher leaving-certificate or, in the case of pupil-teachers or probationers, a lower leaving-certificate.
Applicants are required to make a declaration that they will, on completion of their course, engage in teaching for not less than three years. The term of a bursary is two (or possibly three) years. The bursar receives £20 per annum, together with the fees for the course for the degree or the diploma in home science and domestic arts, and, if obliged to live away from home, an allowance of £30 per annum. Bursaries of this kind were awarded to nineteen students in 1918.
In the distribution to University colleges of the moneys received by the University from the National Endowment Fund in 1918, £300 was allocated in each case for the establishment and maintenance of the Workers' Educational Association tutorial or University extension classes. Branches of this association have been established in several of the larger towns, and tutorial classes in such subjects as economics, history, industrial law, English, electricity, debating, and chairmanship, conducted in some cases by University-college professors or lecturers, are in operation for the better education of working men and women.
Agricultural bursaries may be awarded to qualified candidates in order to enable them to obtain the necessary practical training for positions as teachers or agricultural instructors, as officers of the Department of Agriculture, or as farmers. After completion of their training the bursars are under a legal obligation to serve for a term of three years in one or other of these capacities. The qualification for a bursary is Matriculation or a higher or lower leaving-certificate, and candidates are preferred who have received agricultural instruction during their secondary-school course. In addition, ex-students of teachers' training colleges who desire to specialize in the teaching of agriculture may obtain bursaries to enable them to receive the necessary training in agriculture. Agricultural bursaries are tenable at an experimental farm, an agricultural college, or other approved institution for two years, with a possible extension to a third year. Bursars receive an allowance of £20 per annum, with free tuition and, if obliged to live away from home, a lodging-allowance of £30 per annum.
Six bursaries were awarded in 1918, which are being held at Lincoln Agricultural College, Canterbury. The available accommodation for bursars being limited, a selection has to be made each year from the number of candidates desiring bursaries.
Annual examinations are conducted by the Education Department for the various purposes of Junior and Senior National Scholarships, junior and senior free places in secondary schools, district high schools, and technical schools, and teachers' certificates. Also, by arrangement with the Public Service Commissioner, examinations are held for admission to and promotion in the Public Service.
The following table shows collectively, in comparison with the preceding year, the number who entered for the various examinations above enumerated, the number present, and the number of absentees:—
| 1917-18. | 1918-19. | |
|---|---|---|
| Number who entered | 9,908 | 9,054 |
| Number who actually sat for examination | 8,829 | 6,515 |
| Number of absentees | 1,079 | 2,539 |
The number of candidates for the various examinations in 1918-19 who actually presented themselves in the examination-room is given below:—
| Junior National and junior free places | 1,917 |
| Public Service Entrance, Senior National Scholarships, and Intermediate | 2,422 |
| Teachers' D and C | 1,912 |
| Public Service Senior | 78 |
| Typists' Examination | 46 |
| Kindergarten Certificate Examination | 5 |
| London University Examinations | 2 |
| Special Public Service Entrance Examination in June | 133 |
| Total | 6,515 |
All eligible candidates from public or registered private schools who reached the respective standards of qualification fixed in accordance with the Act—62 1/2 per cent. for juniors and 60 1/2 per cent. for seniors—received National Scholarships from the Education Boards of their districts. In the case of junior - scholarship candidates from one-teacher schools the standard of qualification was fixed at its lowest limit allowable by regulation—viz., 10 per cent. below the ordinary standard. 214 candidates qualified for junior and 120 for senior scholarships in 1918.
The cost of conducting the examinations was as follows:—
| £ | |||
|---|---|---|---|
| Total expenses, including cost of additional temporary clerical services, but omitting other salaries | 5,519 | ||
| Less recoveries— | |||
| £ | |||
| Fees paid by candidates for teachers' certificates and others | 2,200 | ||
| Paid by Public Service Commissioner for expense of conducting Public Service examinations, the fees for which were credited to him— | |||
| £ | |||
| Public Service Entrance (two examinations) | 1,386 | ||
| Public Service Senior and Typists' Examinations | 105 | ||
| 1,491 | |||
| 3,691 | |||
| Net expenditure | £1,828 |
Table of Contents
THE remodelling of the New Zealand defence system, outlined in the 1915 and preceding issues of the Year-book, placed the Defence Forces of the Dominion in such a position that on the outbreak of war in August, 1914, it was possible to take immediate and decisive steps to assist the other Forces of the Empire.
Before the end of August, 1914, the New Zealand Force, acting in conjunction with the warships of the British and Australian Navies, had taken possession of German Samoa.
An Expeditionary Force consisting of a brigade of mounted rifles, a brigade of infantry, a brigade of artillery, and certain departmental units, amounting in all to 360 officers and 8,000 other ranks, was despatched in October, 1914, to take part in the war in Europe.
After some months' training in Egypt, during which a part of the New Zealand Force assisted to repel the Turkish attack on the Suez Canal, the New Zealand Expeditionary Force sailed for Gallipoli in April, 1915, taking part in the desperate fighting at the landing and in subsequent occasions on the Gallipoli Peninsula throughout 1915.
After the withdrawal of the Allied Forces from Gallipoli the New Zealand Expeditionary Force returned to Egypt, and early in 1916, having been augmented by reinforcements, was reorganized as a complete division, consisting of headquarters, three brigades (twelve battalions) of infantry, three brigades of artillery, three field companies of engineers, one battalion of pioneers (Maoris), complete with the usual technical and medical units.
The New Zealand Division so constituted was transferred to the western front in April, 1916, and played a prominent and distinguished part in the subsequent operations culminating in the defeat of the enemy.
The Mounted Rifles Brigade, consisting of the Auckland, Wellington, and Canterbury Regiments of Mounted Rifles, remained on the Egyptian front and formed part of the Anzac Mounted Division, taking part in the subsequent operations in Sinai and Palestine.
The Otago Mounted Rifles accompanied the New Zealand Division to the western front, and were employed as corps mounted troops, together with the Cyclist Battalion, which was formed in France in 1916, one company having been sent from New Zealand intact in May, 1916.
A tunnelling company, composed of practical miners from the mines in New Zealand, was formed in 1916, and was employed as a general headquarters unit on the western front, principally in connection with important subterranean works in the vicinity of Arras. The company also rendered valuable service in the final advance by assisting to replace the bridges destroyed by the enemy in the course of his retirement.
In addition to the forementioned units a troop of wireless telegraphists was placed at the disposal of the Imperial Government in 1915. This troop was employed in Mesopotamia.
When the New Zealand troops arrived in Egypt in 1914 it became apparent that the arrangements for the treatment of the sick and wounded in Egypt were inadequate, and early in 1915 a New Zealand hospital unit was formed and accepted by the Imperial Government. Finally, New Zealand supplied and maintained in a high state of efficiency two hospital ships, three general hospitals, one stationary hospital, and a number of auxiliary hospitals.
The total number attested into the New Zealand Expeditionary Force who left for service overseas was 3,085 officers, 550 nurses, and 96,809 other ranks. Given below is a summary of the various reinforcement drafts:—
| Unit. | Strength. |
|---|---|
| Main Body and 1st Reinforcements | 8,499 |
| 2nd Reinforcements | 1,974 |
| 3rd Reinforcements | 1,712 |
| 4th Reinforcements | 2,261 |
| No. 1 Stationary Hospital | 93 |
| 5th Reinforcements | 2,411 |
| No. 1 Hospital Ship ("Maheno") | 71 |
| Extra Ambulance Reinforcements | 32 |
| 6th Reinforcements | 2,364 |
| Remainder of 6th. Ambulance, &c. | 211 |
| Rifle Brigade (1st and 2nd Battalions) | 2,250 |
| 7th Reinforcements | 2,450 |
| 8th Reinforcements | 2,576 |
| No. 2 Hospital Ship ("Marama") | 170 |
| 9th Reinforcements | 3,123 |
| Horse Transport "Dalmore" | 156 |
| No. 1 Hospital Ship (second commission) | 82 |
| Rifle Brigade (3rd and 4th Battalions) | 2,111 |
| Horse Transport "Waitemata" | 157 |
| Horse Transport " Waihora" | 154 |
| Horse Transport "Aparima" | 193 |
| 10th Reinforcements | 1,762 |
| 11th Reinforcements | 2,399 |
| 12th Reinforcements | 2,469 |
| 13th Reinforcements | 2,107 |
| 14th Reinforcements | 2,108 |
| 14th Reinforcements (Mounted Rifles) | 107 |
| 15th Reinforcements (Mounted Rifles) | 97 |
| 15th Reinforcements | 1,875 |
| 16th Reinforcements (Mounted Rifles) | 105 |
| Unit. | Strength |
| 16th Reinforcements | 1,994 |
| 17th Reinforcements | 2,101 |
| 17th Reinforcements (Mounted Rifles) | 111 |
| 18th Reinforcements (Mounted Rifles) | 93 |
| 18th Reinforcements | 1,945 |
| No. 2 Hospital Ship (second commission) | 82 |
| 19th Reinforcements | 1,808 |
| 19th and 20th Mounted Reinforcements | 245 |
| 20th Reinforcements (part) | 692 |
| 20th Reinforcements (part) | 1,135 |
| 21st Reinforcements | 1,991 |
| No. 1 Hospital Ship (third commission) | 77 |
| 21st Reinforcements (Mounted Rifles) | 124 |
| 22nd Reinforcements (Mounted Rifles) | 122 |
| 22nd Reinforcements | 1,965 |
| 23rd Reinforcements (part) | 924 |
| 23rd Reinforcements (remainder) | 1,123 |
| 24th Reinforcements (part) | 954 |
| 23rd and 24th Reinforcements (Mounted Rifles) | 257 |
| 24th Reinforcements (remainder) | 1,151 |
| 25th Reinforcements | 2,052 |
| No. 1 Hospital Ship (third commission) | 8 |
| 25th to 28th Reinforcements (Mounted Rifles) | 511 |
| 26th Reinforcements (part) | 1,220 |
| Remainder 26th and part 27th Reinforcements | 2,134 |
| 28th Reinforcements (part) | 1,121 |
| 27th Reinforcements (remainder) | 776 |
| 28th Reinforcements (remainder) | 939 |
| 29th Reinforcements (part) | 1,572 |
| Remainder 29th and part 30th Reinforcements | 1,666 |
| No. 1 Hospital Ship (fourth commission) | 41 |
| 29th to 34th Reinforcements (Mounted Rifles) | 801 |
| 31st and 32nd Reinforcements | 2,661 |
| 33rd Reinforcements | 1,106 |
| No. 2 Hospital Ship (third commission) | 18 |
| 34th Reinforcements | 974 |
| 35th and 36th Reinforcements (Mounted Rifles) | 266 |
| No. 1 Hospital Ship (fourth commission, second voyage) | 17 |
| 35th Reinforcements | 923 |
| 36th Reinforcements and 37th (Mounted Rifles) and 38th (Field Artillery) Reinforcements | 1,566 |
| 37th Reinforcements (part) | 952 |
| 37th Reinforcements (remainder) | 251 |
| Unit. | Strength. |
| No. 2 Hospital Ship (fourth commission) | 51 |
| 38th Reinforcements | 753 |
| 38th Reinforcements (Mounted Rifles) | 145 |
| 39th Reinforcements | 759 |
| No. 1 Hospital Ship (fifth commission) | 34 |
| 40th Reinforcements | 1,091 |
| 41st Reinforcements | 988 |
| 42nd Reinforcements | 844 |
| 39th Reinforcements (Mounted Rifles) | 134 |
| 43rd Reinforcements (part) | 442 |
| 43rd Reinforcements (remainder) | 552 |
| 40th to 43rd Reinforcements (Mounted Rifles) | 455 |
| No. 2 Hospital Ship (fourth commission, second voyage) | 29 |
| Details and others not included above | 35 |
| Total number of troops sailed to the front from outbreak of war to 12th November, 1918 | 92,860 |
The following are additional bodies, not included in the previous table:—
| Unit. | Strength. |
|---|---|
| Samoan "Advance Party" | 1,423 |
| Samoan Relief Force | 358 |
| Reinforcements | 298 |
| Maori Expeditionary Force— | |
| First draft | 518 |
| Second draft | 311 |
| Reinforcements | 1,398 |
| Rarotongan drafts | 461 |
| Tunnelling Company | 318 |
| Reinforcements | 587 |
| Wireless Troop | 56 |
| Reinforcements | 122 |
| Imperial Reservists | 211 |
| Naval ranks and ratings | 190 |
| H.M.S. "Philomel" | 159 |
| Royal Naval Auxiliary Patrol | 190 |
| Royal Flying Corps | 192 |
| New Zealand Nursing Service | 550 |
| Others | 242 |
| 7,584 | |
A total of 9,924 troops were in training at the date of the Armistice. The complete number of troops and nurses provided for foreign service up to the cessation of hostilities was therefore 110,368—more than 10 per cent. of the Dominion's total mean population in 1914. A further total of 3,370 are known to have left New Zealand to serve in British and Australian Forces.
The great majority of these troops were volunteers. Of 124,211 men provided from the commencement of the war to the 12th November, 1918, 91,941 were volunteers, and 32,270 were conscripted under the Military Service Act, 1916.
"Wastage" whilst undergoing training accounted for a loss to the Force of 11,333.
Casualties in the Expeditionary Force were, unfortunately, very high. The following is a summary as on the 4th August, 1919:—
| — | officers. | Other Ranks. | Totals. |
|---|---|---|---|
| Killed in action | 489 | 9,751 | 10,240 |
| Died of wounds | 200 | 3,763 | 3,963 |
| Died of disease | 64 | 1,535 | 1,599 |
| Died, cause unknown | 12 | 806 | 818 |
| Drowned | 10 | 58 | 68 |
| Total dead | 775 | 15,913 | 16,688 |
| Missing | Nil | 1 | 1 |
| Prisoners of war | Nil | Nil | Nil. |
| Wounded | 1,721 | 39,594 | 41,315 |
| Grand total | 2,496 | 55,508 | 58,004 |
On the declaration of the Armistice in November, 1918, the following New Zealand troops were overseas:—
| In France | 24,115 |
|---|---|
| In England | 23,467 |
| In Egypt | 4,541 |
| Total | 52,123 |
In deciding the order of return to New Zealand it was arranged that as a general principle those who had been longest on service were to be returned first, but that all invalids and convalescents were to be got away as rapidly as suitable transport was available and their condition permitted.
An average of 4,500 men per month from the United Kingdom and France, and 500 men per month from Egypt, were returned to New Zealand from the date of the Armistice.
Approximately 3,000 wives and 600 children of New Zealand soldiers who were married abroad were brought to New Zealand in the troopships during the period of demobilization.
Men demobilized in New Zealand after active service abroad have been given four weeks' leave on full pay, together with a privilege railway pass entitling them to travel free on the New Zealand railways for that period.
Sufficient officers, warrant officers, non-commissioned officers, and men are permanently employed for the staffs of general headquarters and military districts, and to furnish cadres of regular troops as a nucleus of the Territorial personnel and fixed defences and field artillery. These comprise—
The New Zealand Staff Corps—consisting of officers employed on staff duties and as adjutants to mounted rifle regiments and infantry battalions of the Territorial Force.
The Royal New Zealand Artillery—consisting of officers, warrant officers, non-commissioned officers, and men employed as instructors to and cadres or nuclei for Territorial field and garrison artillery.
The New Zealand Permanent Staff—consisting of warrant officers and non-commissioned officers employed as instructors to the Territorial Force and the Senior Cadets. The New Zealand Permanent Staff is recruited from suitable non-commissioned officers of the New Zealand military forces, the engagement being for five years.
The New Zealand Army Ordnance Department—consisting of officers, warrant officers, non-commissioned officers, and men whose duties comprise the purchase and care of war material.
The New Zealand Army Pay Department—consisting of officers, warrant officers, non-commissioned officers, and men whose duties comprise all financial matters connected with the New Zealand military forces.
The New Zealand Army Medical Department—consisting of officers, warrant officers, non-commissioned officers, and men who are employed chiefly in the various military hospitals in the Dominion.
Most of the officers and other ranks of the New Zealand Permanent Forces left for active service with the Expeditionary Force, but in order that the reinforcements might be properly trained and the efficiency of the division maintained at full strength it was necessary that a certain number of officers and instructors should be retained in New Zealand. So far as possible only those unfit for active service were retained, and the New Zealand Staff Corps, the Royal New Zealand Artillery, and the New Zealand Permanent Staff have rendered valuable services and established a magnificent record.
Officers for the New Zealand Staff Corps and Royal New Zealand Artillery are admitted from the Royal Military College at Duntroon, to which cadets are admitted as is explained in the following paragraph.
Under an arrangement with the Australian Government, New Zealand may send ten cadets every year to the Royal Military College of Australia at Duntroon. This college, erected in pursuance of the recommendations of the late Lord Kitchener, was opened in 1911, the first examination being held in February of that year.
The college has a staff of twenty-two, and contains barracks for 150 cadets. It is equipped with class-rooms, physical and chemical laboratories, library, riding-school, gymnasium, &c. The total number of cadets in training on the 31st March, 1918, was 128. The number of New Zealand cadets at the college at present is thirty-six, eight having joined this year.
Entrance to. the college is by competitive examination, the requirements being set out fully below. No fees are charged the cadets for maintenance and instruction, the expenses of the New Zealand representatives (£200 each per annum) being borne by the New Zealand Government, Each cadet receives 5s. 6d. per diem to cover expenses of uniform, books, instruments, messing, washing, &c. The course is a four-years one, and in the normal course of events is followed by a tour of duty in England or India, the New Zealand officers subsequently returning to take up positions in a permanent capacity in the Dominion's Defence Forces.
To be eligible for admission to the college as a cadet a candidate must—
Be free from any disease or from any physical defect likely to render him unfit for military service;
Be unmarried;
Be a natural-born British subject who has resided in New Zealand, or whose parents or guardians have resided in New Zealand for one year immediately preceding the date of the entrance examination;
Be substantially of European origin or descent;
Be not less than sixteen nor more than nineteen years of age at the 1st March of the year in which he would join the college.
Any youth eligible as above is entitled to apply to the officer commanding the district wherein he resides to have his name entered on the list of candidates for the examination. The application is to be accompanied by a certificate of age and character, and by a promise on the part of a candidate that if appointed a cadet he will engage to serve in the permanent military forces of the Dominion for twelve years unless previously discharged or released. A signed statement by the parent or guardian of the candidate must also be furnished signifying his consent and his intention that the candidate shall adopt the military service as his profession in life.
Under new conditions commencing in 1919, candidates to the number of five may sit for entrance to the college under the University Entrance Scholarships Examination, and at least half of the cadetships are open under the old conditions. Scholarship candidates must pass in English, mathematics, French (or German), chemistry (or heat, or magnetism and electricity) on the scholarship papers, and in history and geography on the matriculation papers, unless they take these subjects or either of them for scholarships; also in general knowledge. A candidate may sit at any centre at which the Matriculation Examination is held, the entrance fee being £3 3s.
Under the old conditions a pass must be obtained in six compulsory and two optional subjects, the compulsory subjects being English, elementary mathematics, history, geography, general knowledge, and French or German, and the optional ones mathematics, chemistry, and physics.
The college year consists of two terms, the autumn term lasting from about the 12th March to the 15th July, and the spring term from the 21st July to the 10th December. Before the commencement of the autumn term a four-weeks camp is held.
The subjects forming the course of studies at the college are: Military departments—Strategy; military history and geography; tactics; military engineering and mechanical drawing; map-reading and surveying; artillery; military law and administration; drills of all arms; musketry; physical training; signalling; riding and driving. Civil departments—Mathematics; physics; chemistry; English; French and German; geometrical drawing and solid geometry; sanitation, hygiene, and first aid; manual training.
Liability for service: All male inhabitants of New Zealand who have resided therein for six months and are British subjects are liable to be trained as follows:—
In the Senior Cadets: From fourteen years of age, or the date of leaving school, as the case may be, to eighteen years of age (or, in the case of those who on the age of eighteen are attending a secondary school, then to the date of their leaving school).
In the Territorial Force: From eighteen years, or from any later date on which they cease to attend a secondary school as aforesaid, to twenty-five.
Although the principal efforts of the Dominion's military organization were directed during the five years of war towards the training, equipping, and despatching of reinforcements for the Expeditionary Force abroad, the Territorial Force and Senior Cadets were not neglected, training on normal lines being carried out excepting in the more remote parts of the country.
The strengths of the Territorial Force, Senior Cadets, and rifle clubs from the inception of the system in 1910 to date have been as under:—
| Year. | Territorial Force. | Senior Cadets. | General Training Section. | Rifle Clubs. |
|---|---|---|---|---|
| 1911-12 | 22,614 | .. | .. | .. |
| 1912-13 | 23,919 | 24,770 | 1,370 | 4,003 |
| 1913-14 | 25,902 | 25,332 | 3,729 | 2,577 |
| 1914-15 | 29,447 | 26,446 | 2,075 | 8,770 |
| 1915-16 | 26,839 | 27,063 | 3,437 | 7,928 |
| 1916-17 | 22,174 | 29,832 | .. | 7,975 |
| 1917-18 | 22,933 | 30,668 | .. | 7,252 |
| 1918-19 | 25,626 | 31,109 | .. | 6,354 |
NOTE .—The total strength of the Volunteer Forces at the end of the year 1909-10 was 14,249.
The Dominion Rifle Association was formed to encourage the members of the New Zealand Defence Forces to become efficient in the use of the rifle, and to promote rifle shooting generally as a necessary element for the defence of the Empire. It was established in 1879, the annual rifle meetings prior to that date having been conducted and controlled by the military authorities. For some years after its formation its movements from year to year were peripatetic, but it is now definitely fixed at Trentham, near Wellington, where a range accommodation of seventy-five targets with all necessary equipment and suitable buildings has been made available for the rifle championship meetings, which until 1914 were conducted annually under the control of the Dominion Rifle Association. The following is a statement of entries and prize-money (exclusive of trophies) for the five years 1910 to 1914.
No meetings were held during the war period, but no time was lost in renewing these valuable competitions after the Armistice was signed.
The first post-war meeting, held in March, 1919, was largely attended and a great success.
| Number of Competitors. | Entry Fees. £ | Prize-money. £ | |
|---|---|---|---|
| 1910 | 568 | 1,704 | 1,702 |
| 1911 | 583 | 1,927 | 1,931 |
| 1912 | 310 | 1,154 | 1,524 |
| 1913 | 351 | 1,269 | 1,609 |
| 1914 | 347 | 1,220 | 1,520 |
The association receives an annual grant from the State.
Railway passes are granted to Territorials and members of rifle clubs up to a distance of 100 miles to attend rifle-shooting competitions.
By the Australian Defence Act, 1887, provision was made for the payment by New Zealand of a proportional part of the cost of the establishment and maintenance of a British Naval Force to be employed for the protection of trade in Australasian waters. Under this Act a sum of approximately £20,000 per annum was paid by New Zealand to the Imperial Government.
In 1903, consequent on the passing of the Australian and New Zealand Naval Defence Act, the annual contribution payable by New Zealand was raised to "a sum not exceeding £40,000."
By the Naval Subsidy Act, 1908, the contribution of the Dominion was again increased, this time to a sum of £100,000 payable annually for ten years from the 12th May, 1909.
The year 1909 was an important one in the history of the Dominion. At what was generally regarded as a critical period for the whole Empire New Zealand presented a battle-cruiser to the Home Government. Full information concerning this vessel and her visit to New Zealand in 1913 appears in the 1913 issue of this book (pages 932-941).
The Naval Defence Act, 1913, provides for the establishment of a New Zealand Naval Force, to be raised and maintained by voluntary enlistment only, enlistment being for a prescribed period of not less than two years. In time of war the Naval Force (including vessels acquired for defence purposes) is to be at the disposal of the British Government. The establishment of a New Zealand Royal Naval Reserve is also provided for under the Act. The third-class cruiser "Philomel" was lent by the English Admiralty to the New Zealand Government to serve as a training-ship for the forming of a nucleus of the Naval Force. A vessel of the light-cruiser type has recently been presented to New Zealand by the Imperial Government.
On the 20th August the battle-cruiser "New Zealand," bringing Admiral of the Fleet Viscount Jellicoe of Scapa, G.C.B., O.M., G.C.V.O., entered Wellington Harbour on her second visit to New Zealand. Before leaving, Admiral Lord Jellicoe presented a report on the naval defence of the Dominion, and the policy and suggestions contained therein will probably become the foundation of an enlarged naval policy for New Zealand.
The "Amokura," formerly H.M.S. "Sparrow," is maintained by the New Zealand Marine Department as a training-ship for fitting boys for service in either the Navy or the mercantile marine.
Besides making voyages on the coast for training purposes, the vessel visits the Auckland, Campbell, Antipodes, Bounty, and Kermadec Islands to search for castaways, and to examine and, when necessary, to replenish the provision-depots which are maintained on those islands.
Boys who are taken on board must be between the ages of thirteen and a half and fifteen years, and when applying for admission they are required to produce a certificate of birth, a medical certificate, a certificate of having passed the Fourth Standard of education, and two certificates of character, one of which must be from either a Justice of the Peace or a minister of religion. After they join the ship they are on probation for one week, and if found suitable are then finally enrolled. They are required to remain on the shin for two years, or such less period as is found necessary for their proper training, on completion of which they are required to serve at least six months on another vessel conditional on the Department being able to make suitable arrangements. So far there has been no difficulty in getting employment for the boys on other vessels. Most of them have taken employment in the merchant service, but some have joined the Navy.
The training given on board is primarily to fit the boys to be seamen, but it and the instruction which is given to them at technical-school classes, which they attend when the vessel is in Wellington Harbour during the winter months, enable those who desire to do so to qualify themselves to become officers, and some of them have, since leaving the "Amokura," passed the necessary examinations for officers' certificates. Their service on the "Amokura" is allowed to count as half-time up to twelve months as qualifying service for examination for second officers' certificates.
An arrangement made with the Union Steamship Company provided for four of the best boys being taken each year on the company's steamer "Aparima" to be trained as officers without any premium charge. The recent loss of the "Aparima" has necessitated the suspension of this arrangement.
Whilst the boys are on the "Amokura" they receive a small payment, and are allowed five weeks' holidays during the year, three weeks in the summer and two weeks in the winter. The Department pays their passages and fares to and from their homes when they go on holiday leave, and also when they first join the ship.
The vessel has accommodation for sixty boys, and, since she started as a training-ship in 1907, 381 boys have been trained on her, exclusive of those now on board.
Of the boys who have served on the vessel, 105 are known to have joined the Forces for the front since the war began—a very large percentage, considering that many of the other boys are not of military age.
The "Amokura" has proved to be not particularly well adapted for the purposes of a training-ship, and it is the intention of the Government to purchase a more suitable vessel. The captain of the "Amokura" has proceeded to England to assist in its selection.
Table of Contents
THE ordinary civil jurisdiction of Magistrates' Courts is limited generally to claims not exceeding £200. Justices of the Peace may hear and decide certain civil cases when the sum in dispute does not exceed £20. The number of plaints issued, cases tried, amount sued for, and amount for which judgment was recorded in the lower Courts during the ten years 1909-18 is shown in the following table:—
| Year. | Cases entered. | Cases tried. | |||
|---|---|---|---|---|---|
| Number. | Total Amount claimed. | Number. | Total Amount sued for. | Total Amount for which Judgment entered. | |
* Information not available. | |||||
| £ | £ | £ | |||
| 1909 | 452,456 | 597,831 | 29,782 | * | 326,040 |
| 1910 | 55,225 | 562,115 | 29,698 | * | 293,326 |
| 1911 | 53,394 | 557,158 | 34,627 | * | 296,629 |
| 1912 | 57,079 | 592,943 | 36,815 | 420,073 | 331,020 |
| 1913 | 61,759 | 670,925 | 39,086 | 427,484 | 366,981 |
| 1914 | 62,471 | 706,953 | 39,233 | 455,197 | 398,760 |
| 1915 | 60,170 | 695,625 | 37,632 | 446,979 | 383,532 |
| 1916 | 49,806 | 639,922 | 31,064 | 395,779 | 339,847 |
| 1917 | 46,004 | 624,693 | 29,412 | 401,568 | 340,958 |
| 1918 | 39,176 | 563,358 | 25,594 | 378,025 | 308,429 |
Until the year 1915 these figures showed a marked tendency towards increase in both the number of litigants and the amount sued for. It would appear that the practice of using the Courts as media for the collection of small debts is growing. For instance, the number of cases tried in Magistrates' Courts in 1900 was 19,816, the aggregate sum sued for being £286,719. Although the population of the Dominion has increased from 1900 to 1915 by little more than 25 per cent., the number of cases tried represents an increase of nearly 100 per cent. in the fifteen years. War causes probably occasion the successive declines of the past four years. Last year's total (25,594) is the lowest since 1907.
The number of actions commenced, cases tried, and judgments entered, together with the total amount for which judgments were recorded, in the Supreme Court of New Zealand during each of the ten years 1909-18 wore as follows:—
SUPREME COURT : CIVIL JURISDICTION .
| Year. | Number of Actions commenced. | Cases tried. | Judgments recorded. | ||
|---|---|---|---|---|---|
| With Jury. | Without Jury. | Number. | Amount. | ||
* Including also District Courts, now abolished. | |||||
| £ | |||||
| 1909* | 870 | 67 | 222 | 267 | 91,038 |
| 1910 | 569 | 52 | 211 | 193 | 83,427 |
| 1911 | 729 | 76 | 170 | 211 | 84,822 |
| 1912 | 755 | 64 | 233 | 235 | 102,657 |
| 1913 | 788 | 75 | 243 | 284 | 79,610 |
| 1914 | 792 | 95 | 251 | 281 | 91,286 |
| 1915 | 697 | 50 | 253 | 241 | 68,555 |
| 1916 | 673 | 48 | 193 | 254 | 78,877 |
| 1917 | 581 | 70 | 172 | 234 | 100,447 |
| 1918 | 611 | 47 | 188 | 226 | 104,927 |
Under the provisions of the Judicature Amendment Act, 1913, the Court of Appeal now consists of two divisions, each composed of five Judges of the Supreme Court, the Chief Justice and the two senior Judges being members of both divisions. The two divisions sit separately, but the Governor-General in Council may authorize them to sit together for the purpose of determining any appeal deemed to be of special difficulty or importance.
The Chief Justice or, in his absence, the senior Judge presides. The decision of the Court must be in accordance with the opinion of a majority of the Judges present. Certain proceedings may by order of the Supreme Court be removed to the Court of Appeal. The decision of the Court of Appeal is final as regards the tribunals of New Zealand, but the Court may, in civil proceedings, give leave to either party to appeal to the Privy Council. In criminal cases any party aggrieved by the judgment of the Supreme Court, or any conviction or order removed into such Court, or on appeal against any such order, may appeal to the Court of Appeal. The number of cases brought before this Court and the judgments thereon for the past ten years will be seen in the following table:—
| Year. | Crown Criminal Cases. | Civil. | |||||
|---|---|---|---|---|---|---|---|
| Number. | Convictions affirmed. | Appeals. | Cases removed. | ||||
| Number. | Allowed. | Number, | Judgments for Plaintiffs. | Judgments for Defendants. | |||
| 1909 | 7 | 4 | 16 | 7 | 15 | 9 | 6 |
| 1910 | 8 | 8 | 17 | 10 | 11 | 6 | 5 |
| 1911 | 11 | 5 | 24 | 8 | 17 | 11 | 5 |
| 1912 | 6 | 4 | 20 | 4 | 20 | 11 | 8 |
| 1913 | 8 | 5 | 18 | 4 | 20 | 13 | 6 |
| 1914 | 4 | 4 | 13 | 5 | 16 | 13 | 2 |
| 1915 | 4 | 3 | 14 | 7 | 14 | 11 | 3 |
| 1916 | 4 | 1 | 16 | 6 | 6 | 3 | 3 |
| 1917 | 4 | 4 | 11 | 4 | 12 | 8 | 4 |
| 1918 | 5 | 3 | 11 | 5 | 7 | 5 | 2 |
Under the Bankruptcy Act, 1908—a consolidation of the then existing laws—a person may seek the protection of the Court by filing a petition with a declaration of insolvency, or one or more creditors may petition the Court to have a debtor declared insolvent. The Dominion is divided into four districts for administrative purposes, each district being in charge of a State officer styled the Official Assignee, who is assisted by deputies stationed at the principal business centres.
The number of transactions in bankruptcy during the past ten years was as follows:—
| Year. | Petitions by Debtors. | Adjudications on Petitions by Creditors. | Cases in which Composition accepted. | Orders of Immediate Discharge granted. | Cases in which Orders of Discharge were suspended. |
|---|---|---|---|---|---|
| 1909 | 412 | 59 | 1 | 122 | 24 |
| 1910 | 329 | 64 | 4 | 135 | 14 |
| 1911 | 281 | 63 | 1 | 123 | 14 |
| 1912 | 278 | 34 | 2 | 88 | 13 |
| 1913 | 296 | 47 | 1 | 108 | 12 |
| 1914 | 322 | 69 | .. | 61 | 11 |
| 1915 | 250 | 44 | .. | 55 | 18 |
| 1916 | 267 | 37 | .. | 63 | 21 |
| 1917 | 221 | 44 | 1 | 60 | 10 |
| 1918 | 133 | 31 | 1 | 53 | 9 |
Private assignments and compositions are not registered, and particular respecting this class of insolvency are not procurable.
The following table shows the total number of petitions, the amount of the unsecured assets, the amount of debts proved, and the amount paid in dividends and preferential claims for the years 1909-18:—
| Year. | Number of Bankruptcies. | Debtors' Statements of Assets, excluding Amounts secured to Creditors. | Amounts realized by Official Assignees. | Amount of Debts proved. | Amounts paid in Dividends and Preferential Claims. |
|---|---|---|---|---|---|
| £ | £ | £ | £ | ||
| 1909 | 471 | 204,187 | 71,351 | 259,017 | 44,110 |
| 1910 | 393 | 127,634 | 79,100 | 176,001 | 47,796 |
| 1911 | 344 | 88,592 | 40,009 | 133,517 | 28,757 |
| 1912 | 312 | 64,398 | 39,965 | 120,325 | 26,825 |
| 1913 | 343 | 155,582 | 42,735 | 228,829 | 25,812 |
| 1914 | 391 | 174,410 | 64,153 | 199,251 | 33,910 |
| 1915 | 294 | 92,876 | 63,310 | 153,926 | 42,374 |
| 1916 | 304 | 123,441 | 56,416 | 172,774 | 29,223 |
| 1917 | 265 | 138,696 | 63,645 | 178,244 | 27,405 |
| 1918 | 164 | 50,356 | 67,729 | 88,607 | 33,176 |
Of the bankruptcies in 1918: in 5 cases the liabilities were under £50; in 25, from £50 to £100; in 39, from £100 to £250; in 46, from £250 to £500; in 29, from £500 to £1,000; in 9, from £1,000 to £2,000; in 8, from £2,000 to £5,000; and in 1, from £5,000 upwards. In two cases of absconding debtors no statements were filed.
A table showing the occupations of the bankrupts in 1918 is published in full in the volume of "Statistics of the Dominion of New Zealand," and is summarized here.
OCCUPATIONS OF BANKRUPTS , 1918.
| Class. | Employers. | Working on Own Account. | Working for Wages. | Totals. |
|---|---|---|---|---|
| Professional | 1 | 3 | 3 | 7 |
| Domestic | 7 | 3 | 5 | 15 |
| Commercial | 11 | 11 | 11 | 33 |
| Transport and communication | 2 | 6 | 3 | 11 |
| Industrial | 17 | 13 | 30 | 60 |
| Agricultural, pastoral, and mining | 8 | 21 | 6 | 35 |
| Indefinite | .. | 2 | 1 | 3 |
| Totals | 46 | 59 | 59 | 164 |
During the year 1918 an abnormally large number—viz., 380—of petitions for dissolution of marriage were filed, this number including 2 petitions for nullity of marriage. In 219 of these cases a decree nisi was granted, 78 of these being made absolute during the year. In addition, decrees nisi were granted in respect of 60 petitions filed in previous years, 39 of these being made absolute before the end of the year, and 82 decrees nisi of previous years became absolute. The total number of decrees nisi for the year was thus 279, which includes 1 decree for nullity of marriage.
In addition, 4 petitions for judicial separation were filed, and 4 decrees granted.
Two applications for restitution of conjugal rights were made, both of which are still pending.
The subject of the next table is the duration of the marriage for dissolution of which petitions were filed in the past four years,
| Duration of Marriage, in Years. | Husbands' Petitions. | Wives' Petitions. | ||||||
|---|---|---|---|---|---|---|---|---|
| 1918. | 1917. | 1916. | 1915. | 1918. | 1917. | 1916. | 1915. | |
| Under 1 | 1 | 1 | 2 | 2 | 2 | 1 | 2 | 3 |
| 1 and under 2 | 3 | 6 | 2 | 1 | 3 | 3 | .. | |
| 2 and under 3 | 7 | 3 | 3 | 3 | 2 | 2 | 3 | 1 |
| 3 and under 4 | 7 | 7 | 5 | 3 | 3 | 4 | 3 | 6 |
| 4 and under 5 | 10 | 5 | 7 | 7 | 5 | 5 | 1 | 4 |
| 5 and under 10 | 46 | 35 | 47 | 36 | 42 | 39 | 48 | 46 |
| 10 and under 15 | 61 | 25 | 27 | 19 | 56 | 36 | 34 | 39 |
| 15 and under 20 | 30 | 28 | 24 | 18 | 39 | 29 | 34 | 27 |
| 20 and under 30 | 14 | 11 | 13 | 9 | 35 | 30 | 22 | 20 |
| 30 and under 40 | 6 | 2 | 4 | 4 | 7 | 8 | 4 | 4 |
| 40 and over | .. | 2 | 1 | 1 | 1 | .. | 3 | 3 |
| Totals | 185 | 125 | 135 | 103 | 195 | 157 | 154 | 153 |
A table is also given showing the grounds of petitions, in combination with particulars as to number of living issue. Columns are added showing for the various grounds the sex of the petitioner.
| Grounds. | Petitioner. | Number of Cases in which Number of Living Issue was | Total Number of Cases. | |||||||
|---|---|---|---|---|---|---|---|---|---|---|
| Husband. | Wife. | 0 | 1 | 2 | 3 | 4 | 5 | 6 or over. | ||
* "Nullity" cases. | ||||||||||
| Adultery (alone) | 122 | 72 | 64 | 50 | 35 | 21 | 8 | 5 | 11 | 194 |
| Adultery and bigamy | 1 | 1 | 2 | .. | .. | .. | .. | .. | .. | 2 |
| Adultery and cruelty | .. | 1 | .. | .. | .. | .. | .. | .. | .. | 1 |
| Adultery and desertion | 3 | 1 | 1 | .. | 1 | 1 | 1 | .. | .. | 4 |
| Adultery and drunkenness | 1 | .. | 1 | .. | .. | .. | .. | .. | .. | 1 |
| Attempt to murder child of petitioner | .. | 1 | .. | .. | .. | .. | .. | .. | 1 | 1 |
| Bigamy* | 1 | .. | .. | 1 | .. | .. | .. | .. | .. | 1 |
| Cruelty | .. | 3 | .. | 1 | .. | .. | .. | .. | 2 | 3 |
| Desertion (alone) | 52 | 94 | 42 | 40 | 28 | 12 | 12 | 6 | 6 | 146 |
| Desertion and drunkenness | .. | 1 | .. | .. | .. | .. | .. | .. | 1 | 1 |
| Drunkenness (alone) | .. | 5 | 1 | 1 | 1 | 1 | .. | .. | .. | 5 |
| Drunkenness and cruelty | .. | 13 | 1 | 3 | 3 | 2 | 1 | 3 | .. | 13 |
| Drunkenness, cruelty, and neglect of household duties | 1 | .. | 1 | .. | .. | .. | .. | .. | .. | 1 |
| Drunkenness and failure to maintain | .. | 1 | 1 | .. | .. | .. | .. | .. | .. | 1 |
| Insanity | 2 | 1 | .. | .. | 1 | 1 | 1 | .. | .. | 3 |
| Physical defect* | 1 | .. | 1 | .. | .. | .. | .. | .. | .. | 1 |
| Not stated | 1 | 1 | 2 | .. | .. | .. | .. | .. | .. | 2 |
| Totals | 185 | 195 | 117 | 96 | 70 | 38 | 23 | 14 | 22 | 380 |
In eight cases the number of living issue was 6, in seven cases 7, in two eases 8, in three cases 9, and in two cases 10 or over.
It is found that in 344 of the cases the parties were married in New Zealand, and that in 231 cases the marriage had been solemnized by a clergyman, and in the remaining 149 cases (39 per cent.) by a Registrar of Marriages or other civil official. Civil marriages constituted 23 per cent. of those solemnized in New Zealand in 1918.
Figures showing the operations of the Supreme Court in its divorce jurisdiction during each of the past ten years are as follows:—
| Year. | Divorce. | Judicial Separation granted. | Nullity of Marriage. | Restitution of Conjugal Rights. | |||
|---|---|---|---|---|---|---|---|
| Petitions. | Decrees. | Petitions. | Decrees. | Petitions. | Decrees. | ||
| 1909 | 219 | 163 | .. | 3 | 2 | 2 | 1 |
| 1910 | 200 | 154 | 2 | 7 | 6 | .. | .. |
| 1911 | 226 | 161 | .. | 2 | 1 | .. | .. |
| 1912 | 274 | 222 | 2 | 4 | 4 | .. | .. |
| 1913 | 260 | 223 | .. | 5 | 3 | .. | .. |
| 1914 | 290 | 234 | .. | 1 | 1 | .. | .. |
| 1915 | 249 | 221 | .. | 7 | 3 | .. | .. |
| 1916 | 280 | 246 | .. | 9 | 1 | .. | .. |
| 1917 | 282 | 221 | .. | 6 | 3 | .. | .. |
| 1918 | 380 | 279 | 4 | 6 | 1 | 2 | .. |
The divorces in New South Wales, Victoria, and New Zealand during each of the twenty years ending with 1917 are as under. The figures for New South Wales and Victoria appearing in the table are taken from official publications of those States.
| Year. | New South Wales. | Victoria. | New Zealand. |
|---|---|---|---|
| 1898 | 229 | 87 | 31 |
| 1899 | 205 | 105 | 46 |
| 1900 | 217 | 93 | 85 |
| 1901 | 208 | 83 | 101 |
| 1902 | 239 | 109 | 90 |
| 1903 | 183 | 101 | 124 |
| 1904 | 216 | 140 | 99 |
| 1905 | 182 | 136 | 114 |
| 1906 | 157 | 123 | 125 |
| 1907 | 148 | 134 | 147 |
| 1908 | 206 | 151 | 171 |
| 1909 | 287 | 138 | 163 |
| 1910 | 257 | 140 | 154 |
| 1911 | 206 | 211 | 161 |
| 1912 | 343 | 247 | 222 |
| 1913 | 313 | 234 | 223 |
| 1914 | 295 | 241 | 234 |
| 1915 | 346 | 215 | 221 |
| 1916 | 347 | 205 | 246 |
| 1917 | .. | 201 | 221 |
On the 31st March, 1919, the number of permanent members of the Police Force in New Zealand was 791 of all ranks, being a decrease of 54 during the year. The total is made up as follows: 4 superintendents, 8 inspectors, 8 sub-inspectors, 27 senior sergeants, 85 sergeants, 618 constables, 4 chief detectives, 21 detective-sergeants, and 16 detectives. There were also 4 police surgeons, 6 matrons, 9 district constables, and 5 Native constables.
To fill vacancies due to the loss of permanent members, temporary constables have been appointed under section 32 of the War legislation Amendment Act, 1916. There were 87 temporary constables employed on 31st March, 1919.
The following table shows the number of stations and of police in each police district:—
| Police District. | No. of Stations. | No. of Police. |
|---|---|---|
| Auckland | 53 | 171 |
| Hamilton | 36 | 67 |
| Napier | 28 | 65 |
| Wanganui | 28 | 54 |
| Palmerston North | 17 | 38 |
| Wellington | 35 | 155 |
| Greymouth | 23 | 40 |
| Christchurch | 46 | 136 |
| Dunedin | 39 | 103 |
| Invercargill | 22 | 41 |
In addition to the above, 7 are attached to headquarters, and 1 has been lent to the Cook Islands Administration.
The proportion of police to population is 1 to every 1,319 persons, and the expenditure (exclusive of the cost of buildings) on the whole Police Force for the year ended the 31st March, 1919, was 5s. 2 1/2d. per head of population.
The following table shows the growth of the Police Force since 1878, prior to which each province had its own Police Force, and reliable data are not available:—
| Year ended 31st March. | Officers. | Non-commissioned Offices. | Detectives. | Constables. | Total. | Police to Population (including Maoris). | Cost per Inhabitant. | |
|---|---|---|---|---|---|---|---|---|
| 1878 | 25 | 90 | 14 | 329 | 458 | 1 to 944 | s | d. |
| 1885 | 20 | 65 | 17 | 372 | 474 | 1 to 1,293 | 3 | 0 3/4 |
| 1890 | 12 | 66 | 13 | 403 | 494 | 1 to 1,346 | 2 | 10 3/4 |
| 1895 | 7 | 51 | 13 | 416 | 487 | 1 to 1,495 | 2 | 6 3/4 |
| 1900 | 11 | 56 | 20 | 499 | 586 | 1 to 1,359 | 2 | 10 3/4 |
| 1905 | 12 | 65 | 25 | 553 | 655 | 1 to 1,375 | 2 | 10 1/4 |
| 1910 | 16 | 86 | 34 | 639 | 775 | 1 to 1,330 | 3 | 3 1/2 |
| 1916 | 19 | 104 | 36 | 757 | 916 | 1 to 1,258 | 4 | 2 3/4 |
| 1917 | 20 | 108 | 36 | 734 | 898 | 1 to 1,280 | 4 | 3 |
| 1918 | 20 | 111 | 38 | 732 | 901 | 1 to 1,274 | 4 | 6 1/2 |
| 1919 | 20 | 112 | 41 | 705 | 878 | 1 to 1,319 | 5 | 2 1/2 |
The proportion of police to population is much lower in New Zealand than in any of the Australian States, and the cost of police per inhabitant is, as might be expected, also lower in New Zealand than in the Commonwealth. If, however, the proportion of police to population were the same in each of the Australian States as in New Zealand, the cost per inhabitant would be higher in the Dominion than in any of the States.
| State. | Proportion of Police to Population. | Cost of Police per Inhabitant. | Index Number.* | |
|---|---|---|---|---|
* Showing relative cost per inhabitant were proportions of police to population the same in each State. New Zealand = 100. | ||||
| s. | d. | |||
| New Zealand | 1 to 1,319 | 5 | 2 1/2 | 100 |
| Queensland | 1 to 638 | 8 | 10 1/2 | 82 |
| New South Wales | 1 to 744 | 6 | 4 1/2 | 69 |
| Victoria | 1 to 825 | 4 | 11 | 59 |
| South Australia | 1 to 792 | 5 | 10 1/2 | 68 |
| Western Australia | 1 to 660 | 8 | 11 | 78 |
| Tasmania | 1 to 893 | 5 | 3 3/4 | 69 |
The total number of charges brought before Magistrates in 1918, and number of convictions obtained, are shown in the following table:—
| How brought before Magistrate. | Arrested or summoned. | Convicted. | ||
|---|---|---|---|---|
| Total Offences, including Multiple Charges. | Distinct Arrests or Summonses, excluding Multiple Charges. | Total Summary Convictions, including Multiple Charges. | Distinct Summary Convictions, excluding Multiple Charges. | |
| By arrest | 12,846 | 10,070 | 11,344 | 9,238 |
| By summons | 23,553 | 20,162 | 17,903 | 15,687 |
| Totals | 36,399 | 30,232 | 29,252 | 24,925 |
If the Maoris be excluded the number of charges in 1918 is found to have been 34,682, a decrease of 5,104 upon the number for 1917; and the proportion per 1,000 of population 31.44, as against 36.20.
Persons charged with lunacy and committed to mental hospitals have been excluded from the calculations for this and previous years shown.
The figures, both numerical and proportional, covering the last three decades are subjoined:—
Charges before Magistrates.
| Year. | Number. | Proportion per 1,000 of Mean Population. |
|---|---|---|
| 1885 | 22,297 | 38.89 |
| 1888 | 18,370 | 30.35 |
| 1891 | 16,714 | 26.54 |
| 1894 | 16,820 | 24.76 |
| 1897 | 19,390 | 26.87 |
| 1900 | 24,084 | 31.54 |
| 1902 | 28,076 | 35.19 |
| 1904 | 30,934 | 36.60 |
| 1905 | 30,741 | 35.33 |
| 1906 | 32,866 | 36.70 |
| 1907 | 36,852 | 40.09 |
| 1908 | 36,286 | 38.40 |
| 1909 | 36,902 | 37.97 |
| 1910 | 38,207 | 38.48 |
| 1911 | 38,095 | 37.54 |
| 1912 | 42,394 | 40.80 |
| 1913 | 46,847 | 43.84 |
| 1914 | 49,371 | 45.28 |
| 1915 | 45,505 | 41.39 |
| 1916 | 41,060 | 37.35 |
| 1917 | 39,786 | 36.20 |
| 1918 | 34,682 | 31.44 |
The summary convictions in 1918 numbered 29,252, including 1,418 recorded against Maoris. In respect of 346 charges (23 of which were against Maoris) the accused were committed for sentence. Commitments for trial at the Supreme Courts numbered 467 (including 90 charges against Maoris). The total commitments (813) for 1918 represent a net decrease of 76 on the numbers for 1917.
Dealing with the summary convictions for all offences, the figures for 1909 and onward (excluding the Maoris) are,—
| Year. | Offences against the Person. | Offences against Property. | Other Offences. | Totals. | ||||
|---|---|---|---|---|---|---|---|---|
| Total Number. | Per 1,000 Mean Population. | Total Number. | Per 1,000 Mean Population. | Total Number | Per 1,000 Mean Population. | Number. | Per 1,000 Mean Population. | |
| 1909 | 772 | 0.79 | 2,228 | 2.30 | 27,697 | 28.50 | 30,697 | 31.59 |
| 1910 | 655 | 0.66 | 2,080 | 2.09 | 29,245 | 29.47 | 31,980 | 32.22 |
| 1911 | 654 | 0.64 | 2,146 | 2.11 | 29,239 | 28.81 | 32,039 | 31.56 |
| 1912 | 595 | 0.57 | 2,407 | 2.32 | 31,984 | 30.78 | 34,986 | 33.67 |
| 1913 | 646 | 0.60 | 2,852 | 2.67 | 35,250 | 32.99 | 38,748 | 36.26 |
| 1914 | 726 | 0.67 | 2,740 | 2.51 | 36,944 | 33.88 | 40,410 | 37.06 |
| 1915 | 628 | 0.57 | 2,579 | 2.35 | 35,012 | 31.85 | 38,219 | 34.76 |
| 1916 | 618 | 0.56 | 2,360 | 2.15 | 31,218 | 28.39 | 34,196 i | 31.10 |
| 1917 | 588 | 0.54 | 2,315 | 2.11 | 29,868 | 27.17 | 32,771 | 29.82 |
| 1918 | 525 | .. | 2,321 | .. | 24,958 | .. | 27,834 | .. |
In dealing with the summary convictions in the Magistrates' Courts in the above table each offence is reckoned as a distinct person. It will be noted that the rates for the last three years are generally lower than those for the other years given. This decline appears to be largely due to the decrease in the number of convictions for drunkenness. In each of the years 1916, 1917, and 1918 a fall of some 2000 convictions from this offence was recorded. The total number is from time to time swelled by the inclusion of breaches of statutes, the provisions of which give rise to fresh offences against the public welfare not strictly criminal, so that comparisons with past years are adversely affected. As a case in point may be mentioned the fact that the convictions in 1913, 1914, 1915, 1916, 1917, and 1918 include 4,819, 4,071, 1,954, 1,724,1,717, and 1,097 respectively for breaches of the Defence Act, as against 1,924 in 1912 and only 12 in 1911. The numbers of prosecutions under this Act were 28 in 1911, 3,187 in 1912, 7,030 in 1913, 6,321 in 1914, 3,136 in 1915, 2,478 in 1916, 2,342 in 1917, and 1,501 in 1918.
The total number of summary convictions for offences against the person (excluding Maoris) was 525 for the year 1918, which is 63 less than that for 1917. Of the 525 summary convictions in 1918 the greater number were on account of common (477) and aggravated (8) assaults. There were also 34 convictions for attempt to commit suicide.
Of offences against property, theft (not otherwise described) is the most common, showing 1,547 summary convictions during 1918. There were, besides, 9 for specific lands of theft and 63 for housebreaking. Obtaining money and goods under false pretences caused 161 summary convictions, and wilful damage to property 499. These are the principal items only.
Under the heading "Other Offences" (those relating to good order included) drunkenness comes first with 6,999 summary convictions, of which 532 were in respect of females. These figures cover, besides drunkenness only, drunkenness with disorderly conduct and habitual drunkenness. Prohibition orders numbered 1,618, including 140 made against women. The subject of drunkenness is specially dealt with under a separate heading.
Further offences against good order include 3,508 summary convictions simply defined as for "breach of by-laws"; 532 for obscene, threatening, or abusive language; 454 for indecent, riotous, or offensive conduct; and 173 for assaulting or resisting the police. Under "Vagrancy" there were 297 summary convictions, including 71 against women. The chief items only are referred to above.
Information in connection with charges brought before Magistrates is now obtained on cards, and it is possible to give particulars in regard to the ages and birthplaces of persons arrested. Ages and birthplaces in summons cases are not obtainable.
From the following table it will be seen that of the total convictions in 1918 of persons arrested (10,898) the distinct arrests amounted to 8,886, the difference being accounted for by multiple charges against the same person. If distinct persons only are taken this total is further reduced to 6,390, representing 5.79 for every 1,000 of the mean population. Convictions of Maoris are not included.
Convictions on Arrests only, 1918.
| Offences against | Total Convictions, including Multiple Charges. | Distinct Convictions, excluding Multiple Charges. | Distinct Persons convicted, most Serious Offence recorded. | Proportion of Distinct Persons convicted per 1,000 of Mean Population. |
|---|---|---|---|---|
| The person | 263 | 233 | 204 | 0.19 |
| Property | 1,419 | 892 | 784 | 0.71 |
| Good order | 8,280 | 7,000 | 5,100 | 4.62 |
| Other offences | 936 | 761 | 302 | 0.27 |
| Total | 10,898 | 8,886 | 6,390 | 5.79 |
Of the 6,390 distinct persons arrested and convicted during 1918, no fewer than 5,100 were convicted for offences against good order, and of these 4,203 were for drunkenness (including 89 drunk and disorderly, and 11 habituals). In addition, 16 were convicted in respect of prohibition orders; 252 for indecent, riotous, or offensive conduct; 267 for using obscene, threatening, or abusive language; 178 for vagrancy; 57 for assaulting, resisting, or obstructing the police; 21 for soliciting prostitution; 20 for keeping brothels; 67 for offences relating to gambling; and 19 for other offences against good order.
Of the 204 distinct persons arrested and convicted during 1918 of offences against the person, 168 convictions were for common assault; and of the 784 distinct persons arrested and convicted of offences against property, 618 were for theft of various classes, 47 for fraud and false pretences, and 106 for wilful damage.
The next three tables give the offences and ages, offences and birthplaces, and birthplaces and ages of the distinct persons (excluding Maoris) arrested and convicted during 1918.
Offences and Ages.
| Offences against | Under 20. | 20 and under 25. | 25 and under 30. | 30 and under 40. | 40 and over.* | Totals. |
|---|---|---|---|---|---|---|
| The person | 12 | 23 | 33 | 67 | 69 | 204 |
| Property | 204 | 98 | 74 | 196 | 212 | 784 |
| Good order | 67 | 235 | 406 | 1,252 | 3,140 | 5,100 |
| Other offences | 16 | 39 | 58 | 89 | 100 | 302 |
| Totals | 299 | 395 | 571 | 1,604 | 3,521 | 6,390 |
Offences and Birthplaces.
| Offences against | new Zealand. | England and Wales. | Scotland. | Ireland. | Australia. | Elsewhere.* | Totals. |
|---|---|---|---|---|---|---|---|
| The person | 94 | 42 | 13 | 18 | 22 | 15 | 204 |
| Property | 464 | 112 | 32 | 40 | 55 | 81 | 784 |
| Good order | 1,864 | 1,094 | 561 | 668 | 343 | 570 | 5,100 |
| Other offences | 112 | 54 | 12 | 21 | 28 | 75 | 302 |
| Totals | 2,534 | 1,302 | 618 | 747 | 448 | 741 | 6,390 |
Birthplaces and Ages.
| Birthplace. | Under 20. | 20 and under 25. | 25 and under 30. | 30 and under 40. | 40 and over.* | Totals. |
|---|---|---|---|---|---|---|
| New Zealand | 244 | 259 | 298 | 796 | 937 | 2,534 |
| England and Wales | 19 | 57 | 99 | 285 | 842 | 1,302 |
| Scotland | 4 | 11 | 26 | 111 | 460 | 618 |
| Ireland | 3 | 11 | 28 | 126 | 579 | 747 |
| Australia | 9 | 28 | 45 | 140 | 226 | 448 |
| Elsewhere* | 20 | 29 | 75 | 146 | 471 | 741 |
| Totals | 299 | 395 | 571 | 1,604 | 3,521 | 6,390 |
Offences and Ages.—New-Zealand-born only (excluding Maoris).
| Offences against | Under 20 | 20 and under 25. | 25 and under | 30 and under 40. | 40 and over.* | Totals. |
|---|---|---|---|---|---|---|
* Including unspecified. | ||||||
| The person | 12 | 13 | 16 | 36 | 17 | 94 |
| Property | 173 | 77 | 43 | 107 | 64 | 464 |
| Good order | 51 | 149 | 213 | 615 | 836 | 1,864 |
| Other offences | 8 | 20 | 26 | 38 | 20 | 112 |
| Totals | 244 | 259 | 298 | 796 | 937 | 2,534 |
The offences and sentences for convictions in arrest and summons cases (including multiple charges) are shown below. Cases concerning Maoris are not included.
| Offences against | Convicted and discharged or ordered to come up for Sentence | Fined. | Imprisoned. | Other. | Total Convictions. |
|---|---|---|---|---|---|
* Including 166 released under the First Offenders' Probation Act, 453 committed to industrial schools, 29 whipped, 60 bound over, and 3,402 against whom an order was made. | |||||
| The person | 120 | 326 | 56 | 23 | 525 |
| Property | 1,055 | 521 | 347 | 398 | 2,321 |
| Good order | 2,690 | 8,737 | 926 | 1,842 | 14,195 |
| Other offences | 1,583 | 6,653 | 710 | 1,847 | 10,793 |
| Totals | 5,448 | 16,237 | 2,039 | 4,110* | 27,834 |
Included in the figures of total charges and convictions for the year 1918 are a number dealing with offences committed by juvenile offenders—i.e., persons under or apparently under the age of sixteen. A summary of these cases is given showing for the various classes of offences the number of charges, dismissals, committals to Supreme Court, and summary convictions.
JUVENILE OFFENDERS , 1918.
| Class of Offence. | Charges. | Dismissed or discharged. | Committed for Sentence or Trial. | Summary Convictions. |
|---|---|---|---|---|
| Against the person | 21 | 11 | 1 | 9 |
| Against property | 1,119 | 611 | 2 | 506 |
| Against good order | 97 | 46 | 51 | |
| Other | 315 | 50 | 265 | |
| Totals | 1,552 | 718 | 3 | 831 |
Another table is given showing the punishments meted out in cases where a summary conviction was recorded in 1918. Of the 831 convictions, in 138 cases the offender was discharged, and in 186 ordered to come up for sentence. Magistrates are adopting the latter course in an increasing number of cases, the intention being that it rests largely with the offender himself whether any further steps will be taken. In very few cases does the future conduct of the convicted person render it necessary for him to be brought before the Magistrate again for sentence. In other words, the recording of a conviction and the ordering of the prisoner to come up for sentence when called upon has usually the effect of deterring him from further crime, and is probably more efficacious than a definite punishment would be.
Glass of Offence and Punishment .
| Punishment. | Against the Person. | Against Property. | Against Good Order. | Other. | Totals. |
|---|---|---|---|---|---|
| Released on probation | .. | 32 | .. | .. | 32 |
| Convicted and discharged | 3 | 89 | 26 | 20 | 138 |
| Convicted and ordered to come up for sentence | 4 | 179 | .. | 3 | 186 |
| Committed to industrial school | .. | 116 | 6 | 229 | 351 |
| Fined | 1 | 30 | 19 | 13 | 63 |
| Imprisoned | .. | 6 | .. | .. | 6 |
| Whipped | .. | 24 | .. | .. | 24 |
| Bound over | .. | 1 | .. | .. | 1 |
| Order made | .. | 30 | .. | .. | 30 |
| Total summary convictions | 9 | 506 | 51 | 265 | 831 |
Where a Magistrate, after the preliminary hearing of an information, proposes to commit any accused person for trial for an indictable offence not punishable by death, the accused may plead guilty and be then sent to the Supreme Court for sentence without further trial. Such cases represent a considerable proportion of the total cases dealt with in Supreme Courts. In 1918 the total was 802, and this included 341 cases sent from Magistrates' Courts for sentence. Maoris are included in these numbers.
Of 417 indictments and informations (excluding Maoris), 254 resulted in convictions being recorded. The figures are given in the next table:—
INDICTMENTS , ETC ., IN SUPREME COURTS , 1918.
| Class of Offence. | Indictments and Informations. | How disposed of. | |||
|---|---|---|---|---|---|
| Awaiting Trial. | Not prosecuted or no Bill. | Acquittals. | Convictions. | ||
| Against the person | 178 | 10 | 5 | 72 | 91 |
| Against property | 167 | 7 | 2 | 56 | 102 |
| Forgery and against the currency | 33 | .. | .. | 1 | 32 |
| Other | 39 | 1 | 1 | 8 | 29 |
| Totals | 417 | 18 | 8 | 137 | 254 |
The total indictments and informations against Maoris (not included in the above figures were 44, resulting in 38 convictions.
Dealing now with distinct persons, it is found that the total indicted during the year was 258, including 31 Maoris; of these, 155 were convicted, including 28 Maoris. The distinct persons sent up from Magistrates' Courts for sentence numbered 200, inclusive of 17 Maoris.
A summary is given showing the distinct persons indicted and convicted during the year 1918, classified according to offence. Those sentenced during the year after committal from a Magistrate's Court for sentence are also given.
SUPREME COURTS , 1918.—DISTINCT PERSONS (EXCLUDING MAORIS ).
| Class of Offence. | Number indicted. | Number convicted. | Number sent from Magistrates' Courts for Sentence.* |
|---|---|---|---|
Not included in preceding columns. | |||
| Against the person | 108 | 50 | 24 |
| Against property | 90 | 54 | 121 |
| Forgery and against the currency | 13 | 11 | 29 |
| Other | 16 | 12 | 9 |
| Totals | 227 | 127 | 183 |
First, dealing with distinct persons actually convicted in Supreme Courts, it is found that all but 3 of the 50 persons (excluding Maoris) convicted for offences against the person were males. Assault, with or without robbery, caused the conviction of 17 persons, robbery with violence being the offence in 5 cases; 14 persons were convicted for indecent assault on females, 6 for rape and carnal knowledge of young girls (including attempts), and 3 for indecent assault on males. For murder 1 person, and for manslaughter 1 person, were convicted.
Persons convicted for offences against the person were 4 less than those found guilty in respect of offences against property, the convictions for offences against property amounting to 54, of whom 3 were females. Theft of various forms, including robbery and burglary, was responsible for the conviction of 34 of the 54 persons, while 3 of the remainder were convicted for receiving stolen property, 8 for fraud and false pretences, and 1 for arson.
Under the heading "Forgery and. Offences against the Currency" 11 persons were convicted (4 for forgery alone, and 7 for forgery and uttering).
The offences committed by the 183 persons who were sentenced in the Supreme Court during the year 1918, after committal from a Magistrate's Court for sentence, included 24 against the person, made up as follows: Assault, 1; concealment of birth, 2; attempted rape, 2; indecent assault, 4; bigamy, 8; attempted murder, 1; attempted unnatural offence, 2; indecent assault on a male, 2; attempt to procure miscarriage, 1; negligent act causing actual bodily harm, 1. Dealing with the 121 persons sent for sentence on account of offences against property it is found that in 90 cases the offence was theft of some description.
During the ten years 1909-18 the number of persons (excluding Maoris) convicted and sentenced in the Supreme and District Courts, and of those who, on pleading guilty in the lower Courts, were committed to the Supreme Court for sentence, were as follows:—
SUPREME COURTS .—PERSONS CONVICTED , ETC ., 1909-18.
| Year. | Offences against the Person. | Offences against Property. | Forgery and Offences against the Currency. | Other Offences. | Total Convictions. | Number committed for Sentence included in previous Columns. |
|---|---|---|---|---|---|---|
Including also District Courts, now abolished. | ||||||
| 1909* | 117 | 270 | 82 | 45 | 514 | 256 |
| 1910 | 89 | 301 | 54 | 34 | 478 | 243 |
| 1911 | 88 | 245 | 34 | 36 | 403 | 185 |
| 1912 | 105 | 225 | 44 | 21 | 395 | 185 |
| 1913 | 123 | 194 | 44 | 21 | 382 | 171 |
| 1914 | 90 | 258 | 57 | 47 | 452 | 192 |
| 1915 | 95 | 233 | 52 | 32 | 412 | 212 |
| 1916 | 101 | 204 | 47 | 21 | 373 | 190 |
| 1917 | 116 | 181 | 37 | 28 | 362 | 178 |
| 1918 | 74 | 175 | 40 | 21 | 310 | 183 |
The distinct persons convicted in the Supreme Court in 1918 numbered 155, including 28 Maoris. To this number should be added the 200 persons (including 17 Maoris) sent from Magistrates' Courts for sentence, thus bringing the total to 355. Particulars of sentences are appended.
SENTENCES OF CRIMINALS IN SUPREME COURTS , 1918.
| Sentence. | Excluding Maoris. | Including Maoris. |
|---|---|---|
| Death | 1 | 1 |
| Imprisonment (only) with or without hard labour | 88 | 107 |
| Imprisonment and declared habitual criminal | 6 | 6 |
| Declared an habitual criminal (only) | 1 | 1 |
| Committed to institutions | 3 | 3 |
| Imprisonment and reformative detention | 13 | 13 |
| Reformative detention (only) | 73 | 82 |
| Fined | 10 | 10 |
| Released on probation | 78 | 90 |
| Ordered to come up for sentence | 37 | 42 |
| 310 | 355 |
The number of convictions for breaches of the licensing laws by publicans and for selling liquor without a license during the past five years was as shown in the following statement. Offences by Maoris are not included.
| Year. | Convictions for | |
|---|---|---|
| Breaches of Licensing Laws by Publicans. | Selling Liquor without a License. | |
| 1914 | 78 | 108 |
| 1915 | 171 | 142 |
| 1916 | 223 | 102 |
| 1917 | 452 | 132 |
| 1918 | 360 | 73 |
The charges against publicans include selling liquor after hours or on Sundays, failing to admit the police promptly, allowing drunkenness on premises, supplying prohibited or intoxicated persons, failing to keep light burning in front of premises, &c.
The number of convictions for drunkenness and drunkenness with disorderly conduct during 1918 (exclusive of convictions against Maoris) totalled 6,467 against males and 532 against females. In addition there were 297 convictions against Maoris—294 against males and 3 against females. The following table shows the number of convictions for drunkenness recorded and the proportion per 1,000 of the mean population of each sex, excluding Maoris, during the past ten years:—
CONVICTIONS FOR DRUNKENNESS (EXCLUSIVE OF MAORIS ). 1909-18.
| Year. | Convictions recorded against. | Per 1,000 of Mean Population. | ||||
|---|---|---|---|---|---|---|
| Males. | Females. | Total. | Males. | Females. | Total. | |
| 1909 | 9,942 | 755 | 10,697 | 19.29 | 1.68 | 11.01 |
| 1910 | 10,808 | 805 | 11,613 | 20.58 | 1.72 | 11.70 |
| 1911 | 10,559 | 841 | 11,400 | 19.74 | 1.75 | 11.23 |
| 1912 | 10,688 | 843 | 11,531 | 19.56 | 1.71 | 11.10 |
| 1913 | 10,815 | 783 | 11,598 | 19.27 | 1.54 | 10.85 |
| 1914 | 12,133 | 1,012 | 13,145 | 21.34 | 1.94 | 12.06 |
| 1915 | 12,010 | 952 | 12,962 | 21.22 | 1.78 | 11.79 |
| 1916 | 9,937 | 765 | 10,702 | 18.01 | 1.40 | 9.73 |
| 1917 | 7,971 | 606 | 8,577 | 14.66 | 1.09 | 7.83 |
| 1918 | 6,467 | 532 | 6,999 | 11.98 | 0.94 | 6.35 |
If the Maoris are included, the total convictions for drunkenness during 1918 will amount to 7,296 (6,761 against males and 535 against females). Of these, 6,918 (6,403 males and 515 females) were arrest cases, while 378 (358 males and 20 females) were cases brought before the Magistrate by summons. The following table shows the birthplaces and ages of all persons (including Maoris) arrested and convicted for drunkenness during the year. Birthplaces and ages in summons cases are not obtainable.
BIRTHPLACES AND AGES OF PERSONS CONVICTED FOR DRUNKENNESS (ARRESTS ONLY ), 1918.
| Birthplace. | Under 20. | 20 and under 25. | 25 and under 30. | 30 and under 40. | 40 and under 60. | 60 and over, and Unspecified. | Totals. |
|---|---|---|---|---|---|---|---|
| New Zealand— | |||||||
| Maoris | 1 | 23 | 30 | 52 | 89 | 36 | 231 |
| Others | 29 | 129 | 219 | 800 | 1,080 | 77 | 2,334 |
| Australia | 2 | 11 | 36 | 132 | 221 | 40 | 442 |
| England and Wales | 4 | 34 | 63 | 315 | 781 | 262 | 1,459 |
| Scotland | 1 | 8 | 22 | 137 | 419 | 179 | 766 |
| Ireland | 1 | 7 | 25 | 147 | 535 | 255 | 970 |
| Other European | 2 | 7 | 25 | 71 | 172 | 46 | 323 |
| Asia | .. | 2 | 3 | 2 | 8 | 3 | 18 |
| Africa | 1 | 2 | 4 | 7 | 8 | 3 | 25 |
| America | 1 | 4 | 4 | 15 | 48 | 19 | 91 |
| Other (including unspecified) | .. | 3 | 4 | 6 | .. | 237 | 259 |
| Totals | 42 | 230 | 435 | 1,684 | 3,370 | 1,157 | 6,918 |
Among the New-Zealand-born population of European descent there is evidence of less drunkenness than among persons who have come from abroad. At the census of 1916, out of the total population of New Zealand of 20 years of age or over, 57.28 per cent. were found to have been born in the Dominion; while of the convictions for drunkenness of all persons over 20 years of age (excluding Maoris) New-Zealand-born Europeans comprised in 1913 only 34.90 per cent.
The following table gives a comparison between convictions for drunkenness of New-Zealand-born and other males, and shows also the proportion which each class bears to the male population. It will be seen that in all the age-groups given the percentage of convictions of New-Zealand-born males is lower than the corresponding percentage of population, while the reverse is, of course, true in respect of males born outside the Dominion.
PERCENTAGES OF MALE POPULATION BY AGE -GROUPS , AND CONVICTIONS FOR DRUNKENNESS AS BETWEEN NEW - ZEALAND - BORN AND OTHER MALES (MAORIS EXCLUDED ).
| Age, in Years. | Percentage of Male Population.* | Percentage of Convictions for Drunkenness.† | ||
|---|---|---|---|---|
| New-Zealand-born. | Others. | New-Zealand-born. | Others. | |
As at census, 1916. † Arrest cases only. | ||||
| 20 and under 25 | 80.16 | 19.84 | 62.32 | 37.68 |
| 25 and under 30 | 71.19 | 28.81 | 54.07 | 45.93 |
| 30 and under 40 | 65.58 | 34.42 | 49.02 | 49.98 |
| 40 and under 50 | 59.61 | 40.39 | 40.37 | 59.63 |
| 50 and under 60 | 36.12 | 63.88 | 21.37 | 78.63 |
| 60 and under 70 | 14.27 | 85.73 | 8.93 | 91.07 |
| 70 and under 80 | 5.70 | 94.30 | 7.22 | 92.78 |
Repeated charges against the same person are included in the totals shown in the tables on the previous page. Dealing with arrests only (males, 6,174; females, 513: total 6,687), but excluding Maoris, it is found that the number of distinct persons convicted of this offence was 4,203 (3,860 males and 343 females), or 65.78 per cent. of the total "arrest" convictions (excluding Maoris) for drunkenness.
The total convictions (exclusive of those of Maoris) for all offences (arrests only) in 1918 were 10,898, but the distinct convictions amounted to only 8,886, the former total including 2,012 convictions for multiple charges against the same person. Of the latter, 976 were in conjunction with arrests for drunkenness. Details of the offences are given in the following table:—
OFFENCES FOR WHICH CONVICTIONS WERE ENTERED AGAINST PERSONS ARRESTED (AND CONVICTED ) AT THE SAME TIME FOR DRUNKENNESS .
| Convicted of Drunkenness and | Number of Maoris. | Number, excluding Maoris. | Total. | ||
|---|---|---|---|---|---|
| M. | F. | M. | F. | ||
| Offences against the person— | |||||
| Assault aggravated | .. | .. | 1 | .. | 1 |
| Assault (common) | .. | .. | 29 | 5 | 34 |
| Offences against property— | |||||
| Theft and attempts at | .. | .. | 19 | 4 | 23 |
| Wilful damage | .. | .. | 50 | 6 | 56 |
| Fraud and false pretences .. | .. | .. | 1 | .. | 1 |
| Offences against good order— | |||||
| Assaulting, resisting, or obstructing police | .. | .. | 72 | .. | 72 |
| Indecent, riotous, or offensive conduct | 5 | .. | 88 | .. | 93 |
| Obscene, threatening, or abusive language | 4 | 1 | 185 | 6 | 196 |
| Cruelty to animals | .. | .. | 1 | .. | 1 |
| Soliciting prostitution | .. | .. | .. | 4 | 4 |
| Vagrancy | .. | .. | 21 | 3 | 24 |
| Begging | .. .. | .. .. | 3 | .. | 3 |
| Breaches of by-laws | .. | .. | 16 | .. | 16 |
| Other offences against good order | 1 | .. | 1 | .. | 2 |
| Offences not included above— | |||||
| Breach of Licensing Act (by others than publicans) | 9 | .. | 299 | 36 | 344 |
| Under Shipping and Seamen Act | .. | .. | 2 | .. | 2 |
| Under Military Service Act | .. | .. | 4 | .. | 4 |
| Under War Regulations | .. | .. | 4 | .. | 4 |
| Other offences | 1 | .. | 8 | 1 | 10 |
| Total convictions for other offences against persons arrested (and convicted) at the same time for drunkenness | 20 | 1 | 804 | 65 | 890 |
| Number of prohibition orders against persons convicted at the same time for drunkenness | 2 | 1 | 94 | 13 | 110 |
| Total | 22 | 2 | 898 | 78 | 1,000 |
| Number of convictions for drunkenness (alone) of persons arrested | 229 | 2 | 6,174 | 513 | 6,918 |
| Total convictions for drunkenness of persons arrested | 251 | 4 | 7,072 | 591 | 7,918 |
| Number of distinct persons arrested (and convicted) for drunkenness | 184 | 2 | 4,044 | 345 | 4,575 |
| Number of convictions for drunkenness in summons cases (not included above) | 65 | 1 | 293 | 19 | 378 |
Any person who has been three times convicted for drunkenness within the nine months immediately preceding any conviction for drunkenness may be declared an habitual drunkard. A Magistrate may, in addition to or in lieu of a penalty, commit an habitual drunkard to any institution authorized by the Governor-General to receive and detain such persons for any period not being less than twelve months. The law makes provision in respect of the discharge of inmates, their good conduct, discipline, and punishment for offences during detention, and for the proper inspection of such institutions.
A calculation of the amount of alcoholic liquor consumed per head of mean population during the past five years is given below:—
CONSUMPTION OF BEER , WINE , AND SPIRITS PER HEAD OF MEAN POPULATION .
| Including Maoris. | Excluding Maoris. | |||||
|---|---|---|---|---|---|---|
| Beer. Gal. | Wine. Gal. | Spirits. Gal. | Beer. Gal. | Wine. Gal. | Spirits Gal. | |
| 1914 | 9.340 | 0.137 | 0.778 | 9.767 | 0.144 | 0.814 |
| 1915 | 9.455 | 0.142 | 0.818 | 9.883 | 0.148 | 0.856 |
| 1916 | 9.987 | 0.121 | 0.678 | 10.439 | 0.126 | 0.709 |
| 1917 | 9.937 | 0.124 | 0.661 | 10.387 | 0.130 | 0.691 |
| 1918 | 9.213 | 0.109 | 0.502 | 9.629 | 0.114 | 0.524 |
The quantity of each kind of alcoholic liquor used in the Dominion during the same period was as follows:—
| Beer for Consumption. Gal. | Wine for Consumption. Gal. | Spirits for Consumption. Gal. | |
|---|---|---|---|
| 1914 | 10,649,090 | 156,513 | 887,116 |
| 1915 | 10,865,764 | 163,244 | 940,611 |
| 1916 | 11,477,041 | 138,757 | 779,698 |
| 1917 | 11,416,475 | 142,859 | 759,118 |
| 1918 | 10,621,229 | 126,122 | 578,177 |
The average annual consumption per head of population during the years 1908-12 is given in the following table for New Zealand (excluding Maoris) and curtain other countries. The figures for the other countries are from returns prepared by the British Board of Trade.
TABLE SHOWING AVERAGE ANNUAL CONSUMPTION OF BEER , WINE , AND SPIRITS IN CERTAIN COUNTRIES , 1908-12. (GALLONS PER HEAD OF POPULATION .)
| Country. | Beer. | Wine | Spirits. |
|---|---|---|---|
| New Zealand | 9.8 | 0.15 | 0.78 |
| Australia | 11.1 | 0.97 | 0.80 |
| United Kingdom | 26.7 | 0.26 | 0.71 |
| Canada | 6.4 | 0.11 | 1.00 |
| United States | 16.6 | 0.52 | 1.03 |
| Germany | 22.4 | 1.10 | 1.29 |
| France | 8.7 | 30.94 | 1.42 |
The number of convictions of Maoris brought before Magistrates' Courts for the past ten years is shown in the following table: —
SUMMARY CONVICTIONS OF MAORIS (MAGISTRATES ' COURTS ), 1909-18.
| Year. | Offences. | |||||
|---|---|---|---|---|---|---|
| Against the Person. | Against Property. | Against Good Order. | Other Offences. | Total. | ||
| Drunkenness.* | Other. | |||||
Including drunkenness with disorderly conduct. | ||||||
| 1909 | 34 | 81 | 140 | 118 | 81 | 454 |
| 1910 | 28 | 67 | 167 | 136 | 57 | 455 |
| 1911 | 42 | 123 | 322 | 314 | 189 | 990 |
| 1912 | 44 | 126 | 320 | 351 | 364 | 1,205 |
| 1913 | 45 | 23 | 294 | 332 | 243 | 937 |
| 1914 | 51 | 191 | 335 | 330 | 406 | 1,313 |
| 1915 | 69 | 187 | 422 | 405 | 373 | 1,456 |
| 1916 | 44 | 152 | 296 | 393 | 378 | 1,263 |
| 1917 | 50 | 185 | 320 | 373 | 490 | 1,418 |
| 1918 | 66 | 190 | 297 | 407 | 458 | 1,418 |
These numbers apply only to the Maoris residing in the main Islands of the Dominion. Prior to 1911 statistics of crime were compiled from returns of criminal business brought before Magistrates furnished by Clerks of Courts, on which the numbers of offences by Maoris included in the return were to be marked, but since 1911 a card for each offence has been obtained. The figures for the past six years can be relied on as correct, and from the number of convictions in those years it would appear that the figures for previous years are understated. Clerks of Courts would probably have omitted to mark on the returns the Maori cases in some instances. There has also been an increase in the police stationed in Maori districts.
Distinct Maoris convicted after arrest in 1918 numbered 327. The ages of these are given in the following table in combination with information as to class of offence:—
AGES AND OFFENCES OF DISTINCT MAORIS CONVICTED (ARRESTS ONLY ), 1918.
| Offences against | Under 20. | 20 and under 25. | 25 and under 30. | 30 and under 40. | 40 and over. | Unspecified. | Totals. |
|---|---|---|---|---|---|---|---|
| The person | 1 | 6 | 4 | 3 | 3 | .. | 17 |
| Property | 20 | 15 | 7 | 16 | 5 | 2 | 65 |
| Good order | 6 | 34 | 37 | 51 | 91 | 17 | 236 |
| Other offences | .. | 5 | .. | 2 | 2 | .. | 9 |
| Totals | 27 | 60 | 48 | 72 | 101 | 19 | 327 |
The number of Maoris convicted in the higher Courts exhibits the extent of serious crime amongst the Native race. Those who were sentenced in the Supreme Court after pleading guilty in the lower Court have been included.
| Year. | Maoris convicted or sentenced in Supreme Court for | Total. | |||
|---|---|---|---|---|---|
| Offences against the Person. | Offences against Property. | Forgery and Offences against the Currency. | Miscellaneous Offences. | ||
| 1914 | 4 | 15 | 9 | 3 | 31 |
| 1915 | 10 | 17 | 1 | .. | 28 |
| 1916 | 6 | 13 | 6 | 3 | 28 |
| 1917 | 3 | 7 | 4 | 1 | 15 |
| 1918 | 4 | 17 | 6 | 18 | 45 |
Seventeen of the number for 1918 had been sent up from the Magistrates' Courts for sentence.
The following table gives for the year 1918 the prison accommodation, the number of prisoners received, the number in prison at end of year, and the daily average number in confinement:—
| Name of Prison. | Number for whom there is Accommodation. | Number received during Year. | Number in Confinement at End of Year. | Daily Average Number in Confinement. |
|---|---|---|---|---|
| Auckland | 311 | 876 | 245 | 230.41 |
| Kaingaroa | 62 | 30 | 58 | 56.34 |
| Waikeria | 128 | 95 | 121 | 109.2 |
| New Plymouth | 58 | 91 | 42 | 40.73 |
| Roto-aira | 45 | 24 | 45 | 40.26 |
| Napier | 74 | 141 | 14 | 14.6 |
| Wellington | 225 | 1,028 | 144 | 150.48 |
| Addington | 35 | 53 | 50 | 49.16 |
| Lyttelton | 111 | 326 | 35 | 38.28 |
| Paparua | 112 | 138 | 117 | 95.5 |
| Invercargill | 157 | 150 | 154 | 129.9 |
| Minor prisons | 165 | 855 | 27 | 27.09 |
| Totals | 1,483 | 3,807 | 1,047 | 981.95 |
The total number of prisoners received in the different gaols during the year 1918 was 3,807 (males 3,517, females 290), as compared with 4,839 (males 4,364, females 475) in 1917, counting each admission as a distinct person.
The number of receptions into gaols during 1918 is exceptionally small, much the lowest recorded for many years.
Omitting those received by transfer from another prison, 657 (males 633, females 24), the debtors and lunatics received, 74 (males 73, females 1), the duplicate receptions of the same prisoner on the same charge, 131 (males 119, females 12), and 11 prisoners of war (males), it is found that the total receptions for criminal offences during 1918 were 2,971 (males 2,715, females 256). In this total are included 37 persons (males 34, females 3) on remand or awaiting sentence from the previous year. The following table shows how the prisoners received were disposed of, classified according to ages, the number of distinct convicted prisoners being 1,783, including 82 Maoris:—
| Age, in Years. | Total Receptions (excluding Duplicates) for Criminal Offences. | Handed to Police for Trial elsewhere, and not returned to Prison. | Acquitted or discharged. | On Remand, awaiting Trial or Sentence at End of Year. | Number of Prisoners convicted and sentenced for Criminal Offences. | Number of Distinct Convicted Prisoners received during Year 1918. | ||
|---|---|---|---|---|---|---|---|---|
| Summary | Indictments. | Excluding Maoris. | Maoris. | |||||
Includes 37 on remand or awaiting trial from previous year. | ||||||||
| Under 21 | 257 | 80 | 45 | 3 | 80 | 49 | 107 | 17 |
| 21 and under 25 | 232 | 41 | 24 | 4 | 136 | 27 | 136 | 17 |
| 25 and under 30 | 370 | 63 | 50 | 4 | 219 | 34 | 216 | 14 |
| 30 and under 35 | 469 | 83 | 41 | 5 | 295 | 45 | 272 | 13 |
| 35 and under 40 | 437 | 66 | 38 | 11 | 277 | 45 | 264 | 9 |
| 40 and under 45 | 330 | 52 | 32 | 3 | 222 | 21 | 197 | 3 |
| 45 and under 50 | 279 | 44 | 17 | 2 | 199 | 17 | 157 | 2 |
| 50 and under 55 | 223 | 23 | 12 | 4 | 172 | 12 | 134 | 3 |
| 55 and under 60 | 145 | 18 | 7 | 4 | 197 | 9 | 92 | 3 |
| 60 and under 65 | 117 | 20 | 3 | .. | 86 | 8 | 62 | 1 |
| 65 and over | 108 | 15 | 15 | .. | 66 | 12 | 61 | .. |
| Not stated | 4 | .. | .. | .. | 3 | 1 | 3 | .. |
| Totals | 2,971* | 505 | 284 | 40 | 1,862 | 280 | 1,701 | 82 |
The number of persons in gaol (including Maoris) at the end of each of the past ten years, and the proportion per 10,000 of population as at the 31st December, is given in the next table:—
PRISONERS IN GAOL (31ST DECEMBER ).
| Year. | Number of Prisoners. | Proportion per 10,000 of Population. | |||
|---|---|---|---|---|---|
| Undergoing Sentence. | On Remand and awaiting Trial, &c. | Total. | Undergoing Sentence. | Total in Confinement | |
| 1909 | 877 | 72 | 949 | 8.51 | 9.21 |
| 1910 | 843 | 38 | 881 | 8.01 | 8.38 |
| 1911 | 802 | 71 | 873 | 7.46 | 8.12 |
| 1912 | 821 | 45 | 866 | 7.45 | 7.86 |
| 1913 | 834 | 85 | 919 | 7.35 | 8.10 |
| 1914 | 981 | 64 | 1,045 | 8.56 | 9.12 |
| 1915 | 941 | 57 | 998 | 8.53 | 9.05 |
| 1916 | 836 | 54 | 890 | 7.60 | 8.09 |
| 1917 | 954 | 53 | 1,007 | 8.68 | 9.16 |
| 1918 | 1,005 | 42 | 1,047 | 9.07 | 9.45 |
A separate card for each admission is furnished for every gaol. Such cards as show convictions are arranged alphabetically according to name of prisoner, and where several are found referring to the same person all but one are thrown out; then the number of cards retained equals the actual number of distinct convicted prisoners received in the various gaols during the year. In 1918 this number (excluding Maoris) was 1,701, a decrease of 698 on the number in 1917. These figures do not include children committed to the industrial schools simply on the ground that they are neglected or destitute.
In classifying the offences a prisoner convicted of more than one offence during the year is reckoned once only, under the heading of the principal offence—e.g., a prisoner convicted three times of drunkenness, twice of vagrancy, and once of theft is counted only once, under the heading "Offences against Property," theft being the principal offence. Debtors and lunatics received into gaol are omitted.
The following tables show the number of distinct persons (exclusive of Maoris) received into prison after conviction during 1918, classified according to birthplaces and offences, ages and offences, and ages and previous convictions:—
BIRTHPLACES AND OFFENCES OF DISTINCT CONVICTED PRISONERS (EXCLUDING MAORIS ) RECEIVED INTO GAOL DURING 1918.
| Birthplace. | Nature of Offence. | Totals. | |||
|---|---|---|---|---|---|
| Against the Person. | Against Property. | Drunkenness. | Other Offences. | ||
| New Zealand | 48 | 196 | 86 | 411 | 741 |
| Australia | 11 | 36 | 22 | 68 | 137 |
| England and Wales | 18 | 62 | 90 | 195 | 365 |
| Scotland | 7 | 19 | 38 | 64 | 128 |
| Ireland | 7 | 22 | 53 | 87 | 169 |
| Other British possessions | 3 | 5 | 5 | 7 | 20 |
| China | 1 | .. | 1 | 9 | 11 |
| Other countries | 8 | 19 | 28 | 70 | 125 |
| Not stated | 1 | .. | 1 | 3 | 5 |
| Totals | 104 | 359 | 324 | 914 | 1,701 |
AGES AND OFFENCES OF DISTINCT CONVICTED PRISONERS (EXCLUDING MAORIS ) RECEIVED INTO PRISON DURING 1918.
| Age, in Years. | Offences against the Person. | Theft and other Offences against Property. | Offences not included previously. | Totals. | ||||
|---|---|---|---|---|---|---|---|---|
| Sexual Offences. | Assaults. | Other. | Vagrancy. | Drunkenness. | Other. | |||
| Under 21 | 3 | 3 | .. | 65 | 3 | 1 | 32 | 107 |
| 21 and under 25 | 4 | 6 | .. | 26 | 4 | 7 | 89 | 136 |
| 25 and under 30 | 3 | 12 | 4 | 36 | 6 | 9 | 146 | 216 |
| 30 and under 35 | 5 | 8 | 3 | 56 | 25 | 31 | 144 | 272 |
| 35 and under 40 | 4 | 17 | 2 | 52 | 9 | 49 | 131 | 264 |
| 40 and under 45 | 1 | 9 | .. | 36 | 19 | 39 | 93 | 197 |
| 45 and under 50 | 1 | 3 | .. | 32 | 11 | 45 | 65 | 157 |
| 50 and under 55 | 4 | 3 | .. | 14 | 18 | 48 | 47 | 134 |
| 55 and under 60 | 1 | 1 | .. | 7 | 12 | 35 | 36 | 92 |
| 60 and under 65 | 2 | .. | .. | 9 | 8 | 28 | 15 | 62 |
| 65 and over | 2 | 3 | .. | 6 | 18 | 19 | 13 | 61 |
| Not stated | .. | .. | .. | 1 | .. | 1 | 1 | 3 |
| Totals | 30 | 65 | 9 | 340 | 133 | 312 | 812 | 1,701 |
AGES AND PREVIOUS CONVICTIONS OF DISTINCT CONVICTED PRISONERS (EXCLUDING MAORIS ) RECEIVED INTO PRISON DURING 1918.
| Age, in Years. | Not previously convicted. | Previous Convictions. | Total Distinct Convicted Prisoners. | |||||
|---|---|---|---|---|---|---|---|---|
| Once. | Twice. | Three Times. | Four Times. | Over Four Times. | Total. | |||
| Under 21 | 67 | 19 | 7 | 3 | 7 | 40 | 107 | |
| 21 and under 25 | 94 | 23 | 7 | 2 | 1 | 9 | 42 | 136 |
| 25 and under 30 | 131 | 37 | 4 | 9 | 4 | 31 | 85 | 216 |
| 30 and under 35 | 121 | 44 | 22 | 14 | 10 | 61 | 151 | 272 |
| 35 and under 40 | 115 | 40 | 17 | 12 | 7 | 73 | 149 | 264 |
| 40 and under 45 | 65 | 26 | 17 | 10 | 9 | 70 | 132 | 197 |
| 45 and under 50 | 55 | 22 | 13 | 9 | 5 | 53 | 102 | 157 |
| 50 and under 55 | 39 | 15 | 4 | 6 | 5 | 65 | 95 | 134 |
| 55 and under 60 | 22 | 10 | 13 | 4 | 3 | 40 | 70 | 92 |
| 60 and under 65 | 18 | 9 | 1 | 3 | 3 | 28 | 44 | 62 |
| 65 and over | 20 | 8 | 3 | 1 | 1 | 28 | 41 | 61 |
| Not stated .. | .. | 1 | 1 | .. | .. | 1 | 3 | 3 |
| Totals | 747 | 254 | 109 | 74 | 51 | 466 | 954 | 1,701 |
The next table gives the offences and gravest previous offences of the distinct persons received into prison after conviction during 1918:—
OFFENCES AND GRAVEST PREVIOUS OFFENCES OF DISTINCT CONVICTED PRISONERS , 1918.
| Offences. | Gravest Previous Offences. | |||||||
|---|---|---|---|---|---|---|---|---|
| Against the Person. | Theft and other Offences against Property. | Offences not included previously. | Total. | |||||
| Sexual Offences. | Assaults. | Other | Vagrancy. | Drunkenness. | Other. | |||
| Against the person— | ||||||||
| Sexual offences | 5 | .. | 3 | 1 | 3 | 2 | 14 | |
| Assaults | 6 | 1 | 7 | 4 | 1 | 7 | 26 | |
| Other | .. | .. | 1 | 2 | .. | .. | .. | 3 |
| Against property | 3 | 11 | .. | 170 | 15 | 9 | 28 | 236 |
| Offences not included above— | ||||||||
| Vagrancy | 1 | 7 | .. | 38 | 37 | 7 | 14 | 104 |
| Drunkenness | 1 | 7 | 2 | 36 | 26 | 118 | 46 | 236 |
| Other | .. | 29 | 3 | 77 | 32 | 44 | 158 | 343 |
| Totals | 5 | 65 | 7 | 333 | 115 | 182 | 255 | 962 |
The number of distinct persons (exclusive of Maoris) imprisoned after conviction in each of the past twenty years, counting one offence only when the same person was imprisoned more than once, with the proportion per 10,000 persons living, is added.
DISTINCT PERSONS IMPRISONED AFTER CONVICTION .
| Year. | Prisoners | Proportion per 10,000 of Mean Population. |
|---|---|---|
| 1899 | 2,125 | 28.33 |
| 1900 | 2,116 | 27.71 |
| 1901 | 2,345 | 30.14 |
| 1902 | 2,396 | 30.03 |
| 1903 | 2,842 | 34.65 |
| 1904 | 2,896 | 34.27 |
| 1905 | 2,796 | 32.14 |
| 1906 | 2,966 | 33.12 |
| 1907 | 3,091 | 33.63 |
| 1908 | 3,009 | 31.84 |
| 1909 | 3,159 | 32.51 |
| 1910 | 3,242 | 32.66 |
| 1911 | 2,877 | 28.35 |
| 1912 | 3,023 | 29.09 |
| 1913 | 3,229 | 30.22 |
| 1914 | 3,386 | 31.05 |
| 1915 | 2,924 | 26.51 |
| 1916 | 2,404 | 21.87 |
| 1917 | 2,399 | 21.83 |
| 1918 | 1,701 | 15.42 |
It must be understood that the actual number of imprisonments was much in excess of the figures given, as many persons were several times imprisoned either for offences differing in kind or for repetitions of the same offence. Thus, persons returned as imprisoned for larceny underwent other imprisonments for drunkenness, &c. Some returned as convicted of drunkenness were several times in gaol during the year for the same offence or for another, such as assault, riotous or indecent conduct, &c. Often there were several charges preferred against the same person at the one time, of which the most serious followed by conviction has been selected.
While the New-Zealand-born formed, at the census of 1916, 72 per cent. of the whole population (excluding Maoris), they contributed in 1918 only 43.56 per cent of the prisoners received in gaol. Of the New-Zealand-born population, however, a large number are under fifteen years of age, a period of life at which there are very few prisoners, and therefore another comparison is necessary. It is found that the New-Zealand-born over fifteen years formed 60 per cent of the total population above that age; but, as before stated, New-Zealanders constituted only 43.56 per cent. of the total number received in gaols.
The number of New-Zealand-born distinct prisoners (excluding Maoris) received for the year 1918—741 persons—is a decrease of 24 per cent. from the previous year's total. Those born outside the Dominion, however, showed a still heavier decline of 32.58 per cent. As before stated, the plan adopted in preparing the foregoing tables is to count each prisoner once only, and to exclude all who are not convicted prisoners, besides dealing only with the number received during the year instead of with the full number in gaol, which would, of course, include those brought forward from the previous year. The comparative results for a series of years given by this method are held to be more valuable than those brought out by one which includes prisoners merely awaiting trial, and continual repetitions of the same individuals.
The ages of New-Zealand-born distinct convicted prisoners (excluding Maoris) are given in the following table showing figures for the past ten years:—
DISTINCT NEW -ZEALAND -BORN CONVICTED PRISONERS RECEIVED INTO PRISON , 1909-18.
| Year. | Under 15. | 15 and under 20. | 20 and under 25. | 25 and under 30. | 30 and under 40. | 40 and over. | Totals. |
|---|---|---|---|---|---|---|---|
| 1909 | 2 | 70 | 189 | 264 | 351 | 220 | 1,096 |
| 1910 | 2 | 78 | 208 | 284 | 382 | 210 | 1,164 |
| 1911 | 4 | 62 | 171 | 206 | 377 | 203 | 1,023 |
| 1912 | 2 | 96 | 204 | 222 | 402 | 208 | 1,134 |
| 1913 | 2 | 88 | 182 | 203 | 449 | 230 | 1,154 |
| 1914 | 2 | 79 | 163 | 247 | 474 | 315 | 1,280 |
| 1915 | .. | 63 | 137 | 206 | 455 | 310 | 1,171 |
| 1916 | .. | 69 | 98 | 140 | 333 | 286 | 926 |
| 1917 | 3 | 70 | 136 | 135 | 338 | 293 | 975 |
| 1918. | .. | 62 | 100 | 122 | 265 | 192 | 741 |
One hundred and ninety-two persons were placed on probation in the year 1918, as against 127 in 1917 and 125 in 1916.
The following table gives the ages and terms of probation of offenders dealt with under the provisions of the Act during the year 1918:—
| Age. | Term of Probation. | Totals. | |||
|---|---|---|---|---|---|
| Under One Year. | One Year and under Two Years. | Two Years and under Three Years. | Three Years and over. | ||
| 10 and under 15 | 3 | .. | 2 | 5 | |
| 15 and under 20 | 5 | 25 | 28 | 15 | 73 |
| 20 and under 25 | 2 | 13 | 15 | 7 | 37 |
| 25 and under 30 | 1 | 4 | 14 | 2 | 21 |
| 30 and under 40 | 3 | 16 | 8 | 6 | 33 |
| 40 and under 50 | .. | 8 | 6 | 3 | 17 |
| 50 and under 70 | .. | 4 | 2 | .. | 6 |
| Totals | 11 | 73 | 73 | 35 | 192 |
The following table shows the distinct convicted prisoners (excluding Maoris) received in prison during 1918 after being sentenced to reformative treatment or having been declared habitual criminals, classified according to sentences:—
| Original Sentence. | Sentenced to Reformative Treatment for a Period of | Declared Habitual Criminals. | Totals. | ||
|---|---|---|---|---|---|
| Under Two Years. | Two and under Five Years. | Five Years and over. | |||
| Reformative treatment only | 15 | 74 | 10 | .. | 99 |
| Declared habitual criminal | .. | .. | .. | 2 | 2 |
| Under 1 year | 3 | 11 | .. | 7 | 21 |
| 1 year and under 2 | 1 | 6 | .. | 2 | 9 |
| 2 years and under 3 | .. | 2 | 3 | 3 | 8 |
| 3 years and under 4 | .. | .. | 1 | 2 | 3 |
| 4 years and under 5 | .. | .. | .. | 2 | 2 |
| 5 years and under 7 | .. | .. | .. | 6 | 6 |
| 7 years and under 10 | .. | .. | .. | .. | .. |
| Totals | 19 | 93 | 14 | 24 | 150 |
Afforestation by prison labour is now carried on at one camp only— viz., at Kaingaroa, which is situated about 33 miles from Rotorua, on the Kaingaroa Plains.
During the past year the camp has been largely used as a place of detention for military court-martialled prisoners, the greater part of the tree-planting work for the year having been carried out by them.
The number of trees planted in the neighbourhood of Kaingaroa for the year ended 31st March, 1919, was 1,418,975, while the total number of trees planted throughout the Dominion by prison labour since the inception of the afforestation scheme in 1901 is 39,797,475.
The total labour value of the prisoners' work during the period since 1901 to March, 1919, as estimated by the Forestry Department, is £63,753.
For the purposes of the Crimes Amendment Act of 1910 there is constituted a Prisons Board, the members of which are appointed by the Governor-General in Council for a period of three years, and may be reappointed. As at present constituted, the Board consists of the Chief Justice as President, and six other members. The Board meets at such times as the President determines, and, subject to the provisions of the Act and regulations, may determine its own procedure.
It is the duty of the Board to make inquiry from time to time whether there is reasonable cause for belief that any habitual criminal undergoing sentence or reformative detention is sufficiently reformed to be released on probation or discharged, or for granting discharge to any person who has been released on probation; and to make recommendations as to the release or discharge of any habitual criminal, habitual offender, or person under sentence of reformative detention, and as to the conditions which may be imposed on any such release or probation. The Board is required to take into consideration the case of every habitual criminal, &c., at least once a year, and to make a report to the Minister of Justice annually as to the operations of the Board, numbers dealt with, and the operation and effect of the Act.
Under the provisions of section 14 of the Statute Law Amendment Act, 1917, the Board was empowered to consider, at the request of the Minister of Justice, the cases of prisoners who had been sentenced to imprisonment with or without hard labour for periods exceeding two years, after half of the full term of imprisonment had expired, and to make recommendations to the Governor-General as to the release on probation of any such prisoner.
The total number of cases considered during 1918 was 380, of which 87 concerned habitual criminals, 201 prisoners undergoing reformative detention, and 92 prisoners serving sentences of hard labour. Several of the cases were those of persons who came more than once before the Board, the total number of distinct cases being 289, of which 59 wore habitual criminals, 151 reformative-detention prisoners, and 79 hard-labour prisoners.
Thirty-four habitual criminals were recommended for release on probation, of which number 27 wore actually released during the year. The number of prisoners undergoing reformative detention who were recommended for release on probation was 65, of whom 62 were released during the year. Twenty-nine persons who had been recommended for release in the previous year were also released, making a total of 91 for the twelve months. Two prisoners serving sentences of reformative detention were discharged from prison during the year. Three habitual criminals who had been released on probation were recommended for discharge, and 2 persons with sentences of reformative detention who had been released on probation were recommended for discharge, and were so discharged.
Of those reformative-detention prisoners released on probation, 2 were returned to prison for fresh offences or for breaches of their licenses; 1 female was sent to Mount Magdala Home, and another to the Tokanui Mental Hospital; 23 joined the Expeditionary Forces, of whom 12 left the Dominion with Reinforcements; 1 deserted from Trentham Camp; 2 were discharged from camp medically unfit for active service, and 8 were demobilized after the signing of the Armistice; 3 left the Dominion for their former domiciles; 24 (exclusive of Expeditionary Force men) completed their terms of probation; leaving 37 still reporting at the end of the year.
Of habitual criminals released on probation, 1 left New Zealand with the Reinforcements, 4 were returned to prison for fresh offences or for breaches of their licenses, 3 left the Dominion for their former domiciles, leaving 19 reporting to the Probation Officers at the end of the year.
In the eight years that the Board has been in existence no fewer than 1,102 persons have been sentenced to reformative detention. Seventy-four per cent. of these were released on the Board's recommendation, while of those released some 82 per cent are not known to have again offended.
Much less favourable are the statistics of habitual criminals, of whom there were 234 declared in the period dealt with. Eighty-one per cent were released, but more than half (57 per cent.) of these relapsed into criminal ways.
The number of bodies on which inquests were held in 1918 was 1,404, including 45 Maoris. In 1,023 cases the bodies were of males, and in 381 of females.
The verdicts given at the inquests held in 1918 may be classified as under:—
| Nature of Verdict. | Inquests on Persons. | ||
|---|---|---|---|
| Males. | Females. | Totals. | |
| Disease and natural causes | 556 | 287 | 843 |
| Accident | 363 | 72 | 435 |
| Homicide | 5 | .. | 5 |
| Suicide | 99 | 22 | 121 |
| 1,023 | 381 | 1,404 | |
Of the accidental deaths drowning is the most common form. The verdicts show that 110 deaths were due to this cause, giving a percentage of 25.29 of the accidental deaths from all causes.
The inquests on suicidal deaths in 1918 show a decrease on the number for the previous year. The figures for each of the past ten years were,—
| Year. | Inquests on Suicides. | ||
|---|---|---|---|
| Males. | Females. | Totals. | |
| 1909 | 94 | 22 | 116 |
| 1910 | 90 | 16 | 106 |
| 1911 | 109 | 25 | 134 |
| 1912 | 111 | 15 | 126 |
| 1913 | 118 | 33 | 151 |
| 1914 | 116 | 27 | 143 |
| 1915 | 112 | 12 | 124 |
| 1916 | 122 | 28 | 150 |
| 1917 | 104 | 30 | 134 |
| 1918 | 99 | 22 | 121 |
In case of fire causing the destruction of any building, ship, or merchandise, or any stack of grain, pulse, or hay, or any growing crop, a Coroner may hold an inquiry into the cause of such fire, the procedure being similar to that of inquests into cause of death.
The inquests on fires held during 1918 numbered six. In four cases the verdict was arson, and in the remaining two cases no evidence was forthcoming.
A short summary of the provisions of the Gaming Act appears on pages 328 and 329 of the 1915 Year-book.
The number of charges laid in the Magistrates' Courts for breaches of the gaming laws, and the manner in which such charges were disposed of, are shown for five years in the table following. Maoris are not included.
| Year. | Number of Charges. | Discharged or dismissed. | Convictions recorded. |
|---|---|---|---|
| 1914 | 346 | 91 | 255 |
| 1915 | 217 | 54 | 163 |
| 1916 | 286 | 60 | 226 |
| 1917 | 336 | 117 | 219 |
| 1918 | 278 | 73 | 205 |
Table of Contents
FULL information concerning the system of representation in New Zealand and of the electoral law is given in the 1915 issue of the Year-book, together with details of the voting at the general election of 1914.
The Parliamentary Elections Postponement Act, 1916, prolonged the duration of the present Parliament to four years, unless the General Assembly should be sooner dissolved by the Governor-General pursuant to section 44 of the Constitution Act. The duration was further extended till the 19th December, 1919, by a provision in the Finance Act, 1918. The Parliamentary Elections Postponement Act, 1916, also directed that in computing population for the rearrangement of the boundaries of electoral districts Representation Commissioners were to take into account the number of members of the Expeditionary Force absent from New Zealand on census night.
The Legislative Council Amendment Act, 1916, postponed for four years (until the 1st January, 1920) the operation of the Legislative Council Act, 1914. Persons appointed to the Council between the 5th November, 1914, and the 1st January, 1920, will vacate their seats on the latter date.
The electoral districts have been again defined on the basis of the population as shown by the census taken in 1916, with the result that the North Island will now return forty-five members as against thirty-one for the South Island.
Fourteen by-elections have been held since the general election of December, 1914—viz., in the Electorates of Dunedin Central, Bay of Islands (2), Taumarunui, Pahiatua, Hawke's Bay, Grey (2), Wellington North, Southern Maori, Wellington Central, Taranaki, Wellington South, and Palmerston.
The first of these by-elections was that held on the 3rd February, 1915, in the Electoral District of Dunedin Central. The voting was as follows:—
| Statham, Charles Ernest | 4,033 |
| Munro, James Wright | 3,926 |
| Total number of valid votes polled | 7,959 |
| Votes rejected as informal | 11 |
| Number of electors on the roll | 9,413 |
On the 8th June, 1915, a by-election was held in the above electoral district. The votes polled were as follows:—
| Stewart, William | 3,264 |
| Menzies, George Gardiner | 2,221 |
| Total number of valid votes polled | 5,485 |
| Votes rejected as informal | 6 |
| Number of electors on the roll | 6,790 |
A by-election in the above district was held on the 15th June, 1915. The voting was as follows:—
| Jennings, William Thomas | 3,899 |
| Wilson, Charles Kendall | 3,741 |
| Total number of valid votes polled | 7,640 |
| Votes rejected as informal | 15 |
| Number of electors on the roll | 9,418 |
A by-election was held in the Pahiatua Electoral District on the 17th August, 1916, to fill the vacancy caused by the death of Mr. J. H. Escott on the 28th July, 1916. Three candidates were nominated, and the voting resulted in the election of Mr. G. H. Smith. The votes polled were as follows:—
| Smith, George Harold | 1,519 |
| Ross, Robert Beatson | 1,440 |
| McFarlane, George Dickson | 238 |
| Total number of valid votes polled | 3,197 |
| Votes rejected as informal | 23 |
| Number of electors on the roll | 5,227 |
The Bay of Islands seat became vacant early in 1917 by the resignation of the sitting member, Mr. W. Stewart.
Writs for a by-election were issued, returnable on the 17th March, but polling was rendered unnecessary through Mr. V. H. Reed being returned unopposed.
A by-election was held in the Hawke's Bay Electoral District on the 8th March, 1917, to fill the vacancy caused by the death of the Hon. Dr. McNab on the 3rd February, 1917.
Three candidates were nominated, and the voting resulted in the election of Sir John Findlay. The votes polled were as follows:—
| Findlay, John George | 2,641 |
| Simson, Horace Ian | 2,175 |
| Fraser, Alfred Levavasour Durell | 11 |
| Total number of valid votes polled | 4,827 |
| Votes rejected as informal | 40 |
| Number of electors on the roll | 8,194 |
Through the resignation on the 20th November, 1917, of the sitting member, Mr. P. C. Webb, the seat for the Grey Electoral District became vacant, and a writ for a by-election was issued on the 24th November, 1917. No poll was necessary as Mr. P. C. Webb was returned unopposed.
Through, the resignation on the 4th February, 1918, of the Hon. A. L. Herdman, the Wellington North seat became vacant, and a writ for a by-election was issued on the 12th February, 1918.
Three candidates were nominated, and the voting resulted in the election of Mr. John P. Luke, C.M.G. The votes polled were as follows:—
| Brandon, Alfred de Bathe | 823 |
| Holland, Henry Edmund | 2,578 |
| Luke, John Pearce | 2,992 |
| Poison, Angus James Neville | 722 |
| Total number of valid votes polled | 7,115 |
| Votes rejected as informal | 30 |
| Number of electors on the roll | 11,188 |
On the 20th April, 1918, the Grey seat became vacant owing to the sitting member, Mr. P. C. Webb, failing to attend the sittings of the House of Representatives for the whole session of 1918 without the permission of the House (section 30, Legislature Act, 1908).
A by-election to fill the vacancy was held on the 29th May, 1918.
Two candidates were nominated, and the voting resulted in the election of Mr. H. E. Holland. The votes polled were as follows:—
| Coates, Thomas Eldon | 2,717 |
| Holland, Henry Edmund | 2,865 |
| Total number of valid votes polled | 5,582 |
| Votes rejected as informal | 46 |
| Number of electors on the roll | 9,249 |
A by-election was held in the Southern Maori Electoral District on the 21st February, 1918, to fill the vacancy caused by the death of Mr. Taare Parata on the 8th January, 1918.
In the Legislature Amendment Act, 1914, provision was made requiring Maoris to register as electors in like manner to Europeans, as provided in Part II of the Legislature Act, 1908. The provision came into operation after the completion of the 1914 general election, and for the by-election a roll of Maori electors was used for the first time.
There were three candidates nominated, and the voting resulted in the election of Mr. John Hopere Wharewiti Uru. The votes polled were as follows:—
| John Hopere Wharewiti Uru | 237 |
| Henare Parata | 223 |
| Teone Matapura Erihana | 158 |
| Total number of votes polled | 618 |
| Number of electors on the roll | 997 |
A by-election was held in, the Wellington Central Electoral District on the 3rd October, 1918, to fill the vacancy caused by the death of Mr. Robert Fletcher on the 4th September, 1918.
Six candidates were nominated, but the polling was tight. Mr. Peter Fraser was elected. The votes polled were as follows:—
| Fraser, Peter | 2,660 |
| Mack, Matthew Joseph | 1,046 |
| Hildreth, William Thomas | 783 |
| Atmore, Harry | 185 |
| Garmston, Lindsay John Frederick | 29 |
| Tanner, Cyril William | 8 |
| Total number of valid votes polled | 4,711 |
| Votes rejected us informal | 39 |
| Number of electors on the roll | 9,180 |
Owing to the death of Mr. Henry James Hobbs Okey on the 13th September, 1918, the Taranaki seat became vacant, and a by-election was held on the 10th October, 1918.
Two candidates were nominated, and the voting was as follows:—
| Smith, Sydney George | 2,832 |
| Connett. John Snell | 2,672 |
| Total number of valid votes polled | 5,504 |
| Votes rejected as informal | 59 |
| Number of electors on the roll | 7,561 |
A vacancy was caused in the Wellington South Electoral District through the death on the 18th November, 1918, of Mr. Alfred Humphrey Hindmarsh, the sitting member. A by-election was held on the 19th December, 1918, and resulted in the return of Mr. Robert Semple. The voting was as follows:—
| Semple, Robert | 2,411 |
| Frost, George | 1,286 |
| Castle, John | 398 |
| Total number of valid votes polled | 4,095 |
| Votes rejected as informal | 17 |
| Number of electors on the roll | 8,721 |
The sitting member for Palmerston, Mr. David Buick, died on the 19th November, 1918, and the by-election to fill the vacancy was held on the 19th December, 1918. Four candidates were nominated, Mr. J. A. Nash being elected. The voting was as follows:—
| Nash, James Alfred | 2,230 |
| Galbraith, Alexander | 1,931 |
| Crabb, Ernest Hugh | 1,130 |
| Buchanan, Andrew | 101 |
| Total number of valid votes polled | 5,392 |
| Votes rejected as informal | 27 |
| Number of electors on the roll | 8,990 |
Table of Contents
DURING the year ended the 31st March, 1918, 1,698 licenses for the sale of intoxicating liquors were granted. Of these, 1,184 were publicans' and accommodation licenses, 28 New Zealand wine, 53 packet, 146 wholesale, and 287 conditional licenses. The fees paid amounted to .41,208, and formed part of the revenue of the local governing bodies of the districts in which the licenses were issued. Particulars are given in the following table:—
NUMBER OF LICENSES GRANTED DURING THE YEAR 1917-18, AND THE AMOUNT OF FEES PAID TO LOCAL BODIES THEREFOR .
| Licenses. | In Counties. | In Boroughs. | In Town Districts. | Total. |
|---|---|---|---|---|
| Publicans' licenses | 367 | 598 | 45 | 1,010 |
| Accommodation licenses | 173 | .. | 1 | 174 |
| Total licensed houses | 540 | 598 | 46 | 1,184 |
| New Zealand wine licenses | 18 | 10 | .. | 28 |
| Packet licenses | 13 | 40 | .. | 53 |
| Wholesale licenses | 6 | 138 | 2 | 146 |
| Conditional licenses | 160 | 127 | .. | 287 |
| Total licenses granted | 737 | 913 | 48 | 1,698 |
| Amount of license fees paid to local bodies | £11,869 | £27,490 | £1,849 | £41,208 |
The number of publicans' and accommodation licenses granted in counties, boroughs, and independent town districts during each of the past ten years is here given, together with the total amount of fees paid for all licenses for the sale of intoxicating liquor:—
| Year ended 31st March. | Counties. | Boroughs. | Town Districts. | Total. | Total Fees. |
|---|---|---|---|---|---|
| £ | |||||
| 1909 | 695 | 635 | 34 | 1,364 | 49,017 |
| 1910 | 643 | 580 | 34 | 1,257 | 44,900 |
| 1911 | 630 | 582 | 36 | 1,248 | 43,843 |
| 1912 | 617 | 590 | 28 | 1,235 | 42,572 |
| 1913 | 594 | 592 | 32 | 1,218 | 42,456 |
| 1914 | 578 | 598 | 42 | 1,218 | 42,283 |
| 1915 | 564 | 596 | 47 | 1,207 | 41,769 |
| 1916 | 557 | 598 | 44 | 1,199 | 42,978 |
| 1917 | 536 | 598 | 49 | 1,183 | 46,164 |
| 1918 | 540 | 598 | 46 | 1,184 | 41,208 |
The average number of persons to each licensed house in counties, boroughs, and independent town districts respectively for 1917-18 is next shown:—
| Number of Licensed Houses.* | Estimated Population. | Number of Persons to each Licensed House. | |
|---|---|---|---|
* I.e., houses holding publicans' or accommodation licenses. | |||
| Counties | 540 | 496,839 | 920 |
| Boroughs | 598 | 594,512 | 994 |
| Town districts | 46 | 29,072 | 632 |
| Totals | 1,184 | 1,120,423 | 946 |
There has been a consistent decline in the proportion of licensed houses to population in the last decade.
| Year ended 31st March. | Average Persons to a Licensed House. |
|---|---|
| 1909 | 687 |
| 1910 | 732 |
| 1911 | 803 |
| 1912 | 824 |
| 1913 | 852 |
| 1914 | 895 |
| 1915 | 911 |
| 1916 | 920 |
| 1917 | 918 |
| 1918 | 946 |
The annual fees payable for licenses are,—
| (1.) For a publican's license— | £ |
| (a.) Within the limits of a borough or town district | 40 |
| (b.) Outside the aforesaid limits | 25 |
| (2.) For a New Zealand wine license | 1 |
| (3.) For an accommodation license, a sum to be determined by the Licensing Committee, not exceeding | 20 |
| (4.) For a packet license— | |
| (a.) For a vessel exceeding 50 tons register | 10 |
| (b.) For a vessel not exceeding 50 tons register | 5 |
| (5.) For a wholesale license | 20 |
| (6.) For a conditional license, according to duration of license, a sum not exceeding | 30 |
The approximate capital value of the licensed houses in the counties for the year ended 31st March, 1918, was stated at £719,673, in certain of the boroughs at £1,675,897, and in the town districts at £133,373. There was, besides, an annual value of £127,175 for other licensed houses in the boroughs, which, capitalized at 6 per cent., would represent £2,119,583. The capital value of all licensed houses may therefore be put down at £4,648,526.
During 1918 there were 360 convictions (320 of males, 40 of females) against publicans and 2,020 convictions (1,896 of males and 124 of females) against others for breaches of the licensing laws. These figures include convictions against Maoris.
There were 128 charges (including charges against Maoris) of selling liquor without a license (including storing liquor for sale) investigated in 1918 in the Magistrates' Courts with the following results: 24 were discharged for want of prosecution or want of evidence, 26 dismissed on the merits, and 78 convicted.
The fines imposed on sly-grog sellers during 1918 amounted to £1,396, as against £1,632 in 1917.
Full information concerning the licensing law of New Zealand, with details of the local option and national prohibition polls of 1914, is given in the 1915 issue of this book.
With a view to preventing the excessive consumption of liquor during the war, regulations under the War Regulations Act were made by Order in Council of 21st August, 1916, and came into force on the 28th of the same month.
Under these regulations, commonly referred to as the "Anti-shouting" regulations, treating is made an offence. The term "treating" includes the following acts:—
The act of any person who directly or indirectly—
Pays, or undertakes or offers to pay; or
Gives or lends, or offers or undertakes to give or lend, money with which to pay—
for any intoxicating liquor sold or to be sold on licensed premises for consumption on or about those premises by any person other than the person first mentioned:
The act of any person who purchases intoxicating liquor on licensed premises, and invites or permits any other person to consume that liquor on or about those premises:
The act of any person who on licensed premises purchases or offers to purchase intoxicating liquor with intent that it shall be consumed on or about those premises by any other person:
Any other act done by any person with intent that any other person shall consume on or about licensed premises any intoxicating liquor other than liquor purchased and paid for by the consumer with his own money. (Money lent or given to him elsewhere with intent that it shall be spent in the purchase of intoxicating liquor is, for the purposes of these regulations, deemed not to be his own money.)
It is not only the person who treats another who commits an offence; the person treated and the licensee, or his servant, who knowingly permits treating are also offenders under the regulations. A bar attendant, other than a member of the licensee's family, who is convicted of an offence of this nature is disqualified for six months from employment on licensed premises, but the convicting Magistrate may, in the case of a first offence against the regulations, order that such disqualification shall not be imposed or that the term of disqualification shall be reduced.
The regulations do not apply to liquor consumed as part of a substantial meal after mid-day, nor to treating by boarders or other persons bona fide resident on the premises. Constables have full powers of entry and search under the regulations.
To prevent the congregation of undesirable women on licensed premises during the evening hours it is made an offence for women other than the licensee, a member of the licensee's family, or a servant of the licensee, to be or remain in the bar of any licensed premises or to loiter about the entrance thereof after 6 p.m.
Further regulations affecting the liquor trade came into operation on the 9th October, 1916. Under these a license may be cancelled by the Licensing Committee for any of the following shortcomings on the part of the licensee: —
A breach of the Licensing Act or of any regulations (including those referred to above) made under section 3 of the War Regulations Act relating to the sale of intoxicating liquor, or for a breach of the conditions of the license.
Permitting the premises to be frequented by disorderly or disreputable persons.
Failure to conduct the premises in an orderly manner.
Not being a fit and proper person to hold a license.
The Sale of Liquor Restriction Act, 1917, which came into force on the 1st December, 1917, makes it illegal for licensed premises to be open for the sale of liquor between the hours of 6 in the evening and 9 in the morning. This Act, originally a war measure only, has since the coming into operation of the Licensing Amendment Act, 1918, become permanent.
During the 1918 session of Parliament an amendment to the Licensing Act was passed whereby authority was given for taking a special licensing poll on the question of national prohibition of liquor with compensation to all those engaged in the industry, or national continuance of the sale of liquor.
In addition to the taking of civilian votes the Act made provision for taking the votes of soldiers who were members of any Expeditionary Force under the New Zealand Expeditionary Forces Act, 1915, located in New Zealand or abroad, and also those of soldiers who on the day of the poll were returning on troopships to the Dominion.
The poll was taken on the 10th April, 1919, and resulted in national continuance being carried by a majority of 10,362. Complete returns for each licensing district and the votes recorded by members of the Expeditionary Force are given below:—
RESULTS OF SPECIAL LICENSING POLL , 1919.
| District. | Number of Electors on Roll. | For National Continuance. | For National Prohibition with Compensation. | Number of Valid Votes recorded. |
|---|---|---|---|---|
| Bay of Islands | 7,339 | 2,334 | 2,605 | 4,939 |
| Marsden | 7,248 | 2,128 | 3,158 | 5,286 |
| Kaipara | 6,318 | 2,238 | 2,545 | 4,783 |
| Waitemata | 10,710 | 3,626 | 4,930 | 8,556 |
| Eden | 15,255 | 3,817 | 6,622 | 10,439 |
| Auckland East | 9,195 | 3,754 | 2,861 | 6,615 |
| Auckland Central | 8,623 | 3,713 | 2,134 | 5,847 |
| Auckland West | 11,070 | 3,798 | 3,955 | 7,753 |
| Grey Lynn | 10,314 | 3,781 | 4,937 | 8,718 |
| Parnell | 12,125 | 3,852 | 4,764 | 8,616 |
| Manukau | 12,056 | 4,132 | 5,696 | 9,828 |
| Franklin | 9,909 | 2,695 | 4,081 | 6,776 |
| Raglan | 8,770 | 2,760 | 3,806 | 6,566 |
| Thames | 6,473 | 2,301 | 2,633 | 4,934 |
| Ohinemuri | 5,735 | 2,339 | 2,074 | 4,413 |
| Tauranga | 9,593 | 3,185 | 3,664 | 6,849 |
| Waikato | 9,774 | 3,309 | 4,418 | 7,727 |
| Bay of Plenty | 9,303 | 3,348 | 3,070 | 6,418 |
| Taumarunui | 9,731 | 3,352 | 2,877 | 6,229 |
| Gisborne | 10,918 | 3,776 | 3,830 | 7,606 |
| Hawke's Bay | 10,805 | 3,978 | 3,953 | 7,931 |
| Napier | 9,720 | 3,868 | 3,820 | 7,688 |
| Waipawa | 7,231 | 3,010 | 2,819 | 5,829 |
| Pahiatua | 5,872 | 2,307 | 2,278 | 4,585 |
| Masterton | 7,583 | 2,781 | 2,780 | 5,561 |
| Wairarapa | 7,086 | 2,846 | 2,421 | 5,267 |
| Stratford | 5,508 | 1,954 | 2,774 | 4,728 |
| Taranaki | 8,249 | 2,668 | 3,912 | 6,580 |
| Egmont | 6,198 | 2,265 | 2,691 | 4,956 |
| Patea | 8,510 | 2,845 | 3,739 | 6,584 |
| Wanganui | 10,765 | 4,011 | 4,421 | 8,432 |
| Waimarino | 6,915 | 2,954 | 2,009 | 4,963 |
| Oroua | 6,512 | 2,319 | 2,860 | 5,179 |
| Rangitikei | 7,611 | 2,508 | 2,495 | 5,003 |
| Palmerston | 10,060 | 3,537 | 4,296 | 7,833 |
| Otaki | 6,329 | 2,375 | 2,529 | 4,904 |
| Hutt | 9,262 | 3,875 | 3,617 | 7,492 |
| Wellington North | 10,632 | 4,951 | 3,500 | 8,451 |
| Wellington Central | 9,099 | 4,556 | 2,629 | 7,185 |
| Wellington East | 10,078 | 4,189 | 4,110 | 8,299 |
| Wellington South | 9,375 | 3,879 | 3,745 | 7,624 |
| Wellington Suburbs | 8,750 | 3,282 | 3,445 | 6,727 |
| Nelson | 7,492 | 3,168 | 3,021 | 6,189 |
| Motueka | 5,639 | 2,643 | 1,925 | 4,568 |
| Buller | 5,446 | 2,413 | 1,937 | 4,350 |
| Grey | 6,783 | 3,324 | 1,878 | 5,202 |
| Westland | 5,791 | 3,101 | 1,454 | 4,555 |
| Wairau | 7,324 | 3,072 | 2,799 | 5,871 |
| Hurunui | 6,046 | 2,604 | 1,795 | 4,399 |
| Kaiapoi | 6,417 | 2,759 | 2,598 | 5,357 |
| Christchurch North | 11,023 | 4,363 | 4,696 | 9,059 |
| Christchurch East | 8,291 | 4,096 | 2,828 | 6,924 |
| Christchurch South | 8,829 | 3,515 | 3,780 | 7,295 |
| Riccarton | 9,018 | 3,456 | 3,461 | 6,917 |
| Avon | 9,950 | 3,786 | 4,436 | 8,222 |
| Lyttelton | 8,329 | 3,097 | 3,183 | 6,280 |
| Ellesmere | 5,432 | 2,536 | 2,089 | 4,625 |
| Selwyn | 7,315 | 2,817 | 2,192 | 5,009 |
| Ashburton | 6,939 | 3,008 | 2,562 | 5,570 |
| Timaru | 9,297 | 3,061 | 4,174 | 7,235 |
| Temuka | 6,610 | 2,724 | 2,489 | 5,213 |
| Waitaki | 6,372 | 2,325 | 2,656 | 4,981 |
| Oamaru | 8,115 | 2,566 | 3,191 | 5,757 |
| Otago Central | 6,263 | 2,196 | 2,345 | 4,541 |
| Dunedin North | 9,438 | 2,770 | 4,469 | 7,239 |
| Dunedin West | 9,773 | 3,085 | 3,986 | 7,071 |
| Dunedin Central | 9,526 | 3,035 | 3,829 | 6,864 |
| Dunedin South | 10,116 | 3,457 | 4,708 | 8,165 |
| Chalmers | 7,422 | 2,053 | 3,792 | 5,845 |
| Bruce | 6,232 | 2,073 | 2,454 | 4,527 |
| Clutha | 5,526 | 1,770 | 2,465 | 4,235 |
| Wakatipu | 5,314 | 2,187 | 1,930 | 4,117 |
| Mataura | 6,541 | 2,233 | 2,772 | 5,005 |
| Wallace | 5,341 | 2,252 | 2,011 | 4,263 |
| Invercargill | 9,331 | 3,280 | 4,307 | 7,587 |
| Awarua | 5,742 | 2,187 | 2,389 | 4,576 |
| Totals | 626,632 | 232,208 | 246,104 | 478,312 |
| Number of Valid Votes recorded by Members of Expeditionary Force. | ||||
| United Kingdom | 15,875 | 3,955 | 19,830 | |
| France | 442 | 49 | 491 | |
| Egypt | 1,853 | 444 | 2,297 | |
| Samoa | 100 | 35 | 135 | |
| New Zealand | 3,886 | 1,482 | 5,368 | |
| On board troopships | 9,825 | 1,758 | 11,583 | |
| Totals | 31,981 | 7,723 | 39,704 | |
| Grand totals | 264,189 | 253,827 | 518,016 | |
In accordance with the Amendment Act of 1918 three issues are to be submitted for decision in December, 1919—viz., (1) Continuance, (2) national prohibition without compensation, and (3) State purchase and control.
Table of Contents
FOR purposes of local government New Zealand is divided into counties and boroughs, the counties being, for administrative purposes, in some cases subdivided into road and town districts. Certain of the latter, having a population of over five hunched, possess powers independent of county control.
Counties are constituted by special Act, but two or more existing counties may, by Proclamation, be united to form one county. Boroughs were formerly constituted only by Proclamation, and required to possess a population of not less than one thousand. They might not exceed in area more than nine square miles, nor might any point be distant farther than six miles from another. An alternative mode of creating a borough is, however, now provided, under which the Governor-General may, on the petition of 10 per cent of the ratepayers within an area, cause inquiry to be made as to the suitableness for municipal control of such area, and may direct a poll to be taken on the proposal to constitute such area as a borough. In every case the petition to the Governor-General must be signed by at least one-fifth of the residents qualified to vote, and must be favourably reported on by an official Commission. A borough containing a population of 20,000 or upwards may be designated a city, although the Corporation remains unaltered. Contiguous boroughs may be amalgamated or adjacent town or road districts may be added to a borough, notwithstanding that the amalgamated borough may exceed the area or distance between points above mentioned. Conversely, any portion of a borough may be merged in another district. Any locality not exceeding two square miles in area, outside a borough, and wherein there are not less than fifty householders, may be proclaimed a town district. A road district may comprise any portion of the area of the county within which it lies, and may be created by special order of the Council of such county. Harbour districts are constituted by special Act, and in some cases possess rating-powers over areas already included within counties and boroughs. Special districts, with limited powers, may be constituted for specific purposes such as river-protection, drainage, water-supply, &c., within the areas wherein such services are required.
Although the boroughs, of which there were 118 on the 31st March, 1918, lie geographically within the counties, yet by the law they are not considered as part of them. On the 31st March, 1918, the counties numbered 125. The number is increased from time to time as need is found, by the subdivision of existing districts. In the year 1878 there were only 63 counties. There were, moreover, 104 road districts (including two without Boards) in existence at the close of March, 1918, and 34 independent and 33 non-independent town districts. Besides the above there were 41 river-protective districts, 3 city and suburban drainage districts (Christchurch, Dunedin, and Auckland), 9 water-supply districts (4 without Boards), 48 land-drainage districts under the Land Drainage Act, 2 tramway districts, and 1 local railway district. The Harbour Boards numbered 36, excluding Coromandel, Kawhia, Tokomaru Bay, Port Robinson, Kaikoura, Fortrose, and Half-moon Bay, for which the County Councils of Coromandel, Kawhia, Waiapu, Cheviot, Kaikoura, Southland, and Stewart Island, respectively, act as the Harbour Boards; also New River and Port Molyneux, for which the Invercargill Borough Council and the Clutha River Board act as the respective Harbour Boards.
Local governing bodies levied rates in the financial year 1917-18 to the amount of £2,674,541, of which £1,791,028 consisted of general rates and £883,513 special and separate rates. The sum of £89,358 was raised by licenses, and £103,124 by other taxes, making £2,867,023 altogether, which sum is equivalent to £2 12s. per head of the mean European population. In the year 1916-17 the local taxation was £2 9s. 6d. per head, or 2s. 6d. less than in 1917-18.
Revenue derived from rates increased from £1,390,698 in 1908-9 to £2,674,541 in 1917-18. Revenue from Government has increased in the same period from £223,410 to £248,855. Receipts other than "revenue" were £1,440,746 in 1908-9, and £1,250,047 in 1917-18; but these figures vary from year to year according to circumstances, such as large operations by way of construction of works, for which money has to be specially raised.
The receipts of local governing bodies, divided into the various groups shown above, are given for each of the past ten years.
| Financial Year. | Revenue from | Receipts not Revenue. | Total Receipts. | |||
|---|---|---|---|---|---|---|
| Rates. | Licenses, Fees, Rents, and other Sources. | Government. | Total Revenue. | |||
| £ | £ | £ | £ | £ | £ | |
| 1908-9 | 1,390,698 | 1,710,712 | 223,410 | 3,324,820 | 1,440,746 | 4,765,566 |
| 1909-10 | 1,526,307 | 1,738,410 | 195,624 | 3,460,341 | 2,362,171 | 5,822,512 |
| 1910-11 | 1,592,601 | 1,941,655 | 230,070 | 3,764,326 | 1,776,958 | 5,541,284 |
| 1911-12 | 1,677,877 | 2,075,126 | 223,808 | 3,976,811 | 2,425,258 | 6,402,069 |
| 1912-13 | 1,799,299 | 2,306,424 | 225,262 | 4,330,985 | 2,383,123 | 6,714,108 |
| 1913-14 | 2,005,638 | 2,484,893 | 234,219 | 4,724,750 | 2,411,575 | 7,136,325 |
| 1914-15 | 2,140,086 | 2,622,221 | 239,076 | 5,001,383 | 2,595,706 | 7,597,089 |
| 1915-16 | 2,355,155 | 2,705,562 | 262,083 | 5,322,800 | 2,469,275 | 7,792,075 |
| 1916-17 | 2,534,539 | 3,001,324 | 242,618 | 5,778,481 | 1,411,422 | 7,189,903 |
| 1917-18 | 2,674,541 | 3,034,894 | 248,855 | 5,958,290 | 1,250,047 | 7,208,337 |
The figures given in this and following tables are for the year ended 31st March, except in the case of certain Harbour Boards whose own financial year is taken in each case. The financial year of the Wellington Harbour Board ends on the 30th September (six months before the usual financial year); for the Coromandel, Fortrose, Greymouth, Half-moon Bay and Horseshoe Bay, Kaikoura, Kawhia, Mangonui, New River, Port Molyneux, Riverton, Tokomaru Bay, Westport, and Whangateau-Omaha Harbour Boards the year ends on the 31st March, but in all other cases the Harbour Board year ends on the 31st December, or three months prior to the usual financial year.
A summary of receipts for the year 1917-18 is given below. The total revenue of the local bodies for the financial year was £5,958,290, and they further received a sum of £1,250,047 which could not properly be termed "revenue," making altogether a grand total of receipts amounting to £7,208,337. The rates formed 44.89 per cent of the revenue proper; licenses, rents, and other sources yielded 50.93 per cent.; and 4.18 per cent was granted by the General-Government.
While the revenue proper of the counties amounted to £1,311,197, of which £1,007,885, was raised by way of rates, the Road Boards' revenue was only £125,296, of which £98,655 represented the result of their rating. The boroughs had the very much larger revenue of £3,169,338, including £1,286,929 yielded by rates, and their receipts under the heading of licenses, rents, and other sources amounted to the considerable sum of £1,837,439.
LOCAL GOVERNING BODIES :—RECEIPTS , 1917-18.
| Local Districts. | Revenue from | Receipts not Revenue. | Total Receipts. | |||
|---|---|---|---|---|---|---|
| Rates. | Licenses, Rents, &c. | Government. | County. | |||
| £ | £ | £ | £ | £ | £ | |
| Counties | 1,007,885 | 119,483 | 183,829 | ... | 286,026 | 1,597,223 |
| Boroughs | 1,286,929 | 1,837,439 | 44,970 | ... | 514,139 | 3,683,477 |
| Town districts | 51,100 | 26,084 | 4,087 | ... | 23,762 | 105,033 |
| Road districts | 98,655 | 8,443 | 15,651 | 2,547 | 13,703 | 138,999 |
| River districts | 14,234 | 12,694 | 168 | ... | 8,938 | 36,034 |
| Land-drainage districts | 22,432 | 1,068 | ... | ... | 26,312 | 49,812 |
| Water-supply districts | 5,335 | 554 | ... | ... | 128 | 6,017 |
| Tramway districts | 3,618 | 167,574 | ... | ... | ... | 171,192 |
| City and suburban drainage districts | 94,314 | 5,126 | 150 | ... | 12,434 | 112,024 |
| Railway district | ... | 6,134 | ... | ... | 1,000 | 7,134 |
| Harbour districts | 90,039 | 847,748 | ... | ... | 363,605 | 1,301,392 |
| Totals | 2,674,541 | 3,032,347 | 248,855 | 2,547 | 1,250,047 | 7,208,337 |
As stated above, rates contributed in 1917-18 the sum of £2,674,541 to the revenue of local governing bodies. General rates levied brought in £1,791,028, and special and separate rates £883,513. Of the latter, £662,810 was received by boroughs, and £130,326 by counties. The whole of the rates in harbour districts were general rates, while all those collected by Tramway Boards came under the heading of "special and separate."
General rates bring in a little more than two-thirds of the total revenue from rates.
RATES LEVIED BY LOCAL GOVERNING BODIES , 1908-9 TO 1917-18.
| Financial Year. | General. | Special and Separate. | Total. |
|---|---|---|---|
| £ | £ | £ | |
| 1908-9 | 970,225 | 420,473 | 1,390,698 |
| 1909-10 | 1,058,447 | 467,860 | 1,526,307 |
| 1910-11 | 1,118,112 | 474,489 | 1,592,601 |
| 1911-12 | 1,156,718 | 521,159 | 1,677,877 |
| 1912-13 | 1,252,717 | 546,582 | 1,799,299 |
| 1913-14 | 1,359,776 | 645,862 | 2,005,638 |
| 1914-15 | 1,484,591 | 655,495 | 2,140,086 |
| 1915-16 | 1,607,764 | 747,391 | 2,355,155 |
| 1916-17 | 1,695,572 | 838,967 | 2,534,539 |
| 1917-18 | 1,791,028 | 883,513 | 2,674,541 |
Separate rates are of two classes—"general" and "particular." General separate rates are levied for the construction, maintenance, &c., of any public work, for the acquisition of land or buildings, or for engaging in any undertaking for the benefit of whole or part of a local district. Particular separate rates are levied in respect of water-supply, lighting, sanitation, and of libraries. Special rates are those levied as security for the repayment of loans.
Full particulars concerning the rating-powers of local bodies is given in the 1914 issue of the Year-book, together with information concerning the system of rating on unimproved value. Local districts in which a poll on the question of rating on unimproved value has been taken since the 31st March, 1914, are as shown below. The result of all polls to that date are given on pages 876-79 of the Year-book for 1914.
| Local District. | Date of Poll. | Result of Poll. | Votes recorded. | ||
|---|---|---|---|---|---|
| For. | Against | Informal. | |||
* For rescission. | |||||
| Avondale Road District | 1 June, 1918 | Rejected | 231 | 300 | 1 |
| Christchurch City* | 4 Mar., 1915 | Rating on U.V. remains | 1,914 | 2,086 | .. |
| Ellerslie Town District | 8 Mar., 1916 | Carried | 175 | 25 | 1 |
| Featherston County | 16 Feb., 1915 | Rejected | 315 | 164 | 2 |
| Huntly Town District | 20 Oct., 1915 | Rejected | 30 | 1 | .. |
| Manawatu County | 29 Jan., 1919 | Rejected | 677 | 193 | 3 |
| Mangaorongo Road District | 13 Mar., 1918 | Rejected | 45 | 1 | .. |
| Mangapapa Town District | 13 Oct., 1915 | Rejected | 109 | 164 | 14 |
| Mataura Borough* | 3 Nov., 1915 | Rescission carried | 136 | 129 | 2 |
| Moa Road District | 26 Mar., 1919 | Carried | 205 | 32 | 1 |
| Mosgiel Borough* | 28 Mar., 1916 | Rating on U.V. remains | 115 | 240 | .. |
| New Plymouth Borough | 30 Apr., 1919 | Rating on U.V. remains .. | 781 | 595 | .. |
| Normanby Town District | .. | Rating on U.V. remains | 33 | 44 | 1 |
| Local District. | Date of Poll. | Result of Poll. | Votes recorded | ||
|---|---|---|---|---|---|
| For. | Against | Informal. | |||
* For rescission. | |||||
| Northcote Borough | 30 Apr., 1919 | Rejected | 123 | 140 | .. |
| Onehunga Borough | 9 Mar., 1915 | Carried | 563 | 391 | 7 |
| Otaki Town District | 4 Mar., 1919 | Carried | 132 | 44 | 1 |
| Otautau Town District* | 8 Mar., 1916 | Rescission carried | 40 | 33 | 1 |
| Otorohanga Native Township | 30 Oct., 1914 | Carried | 43 | 5 | .. |
| Paeroa Borough | 30 Apr., 1919 | Carried | 155 | 71 | .. |
| Raglan Town District | 15 Nov., 1916 | Carried | 54 | 19 | .. |
| Taihape Borough | 26 Mar., 1919 | Carried | 141 | 21 | .. |
| Waiatarua Drainage Board | 24 Dec., 1918 | Carried | 19 | 1 | .. |
| Westport Borough | 25 Apr., 1917 | Carried | 467 | 345 | 30 |
| Whakatane Borough | 30 Apr., 1919 | Carried | 163 | 92 | 10 |
| Whakatane Town District | 21 Sept., 1915 | Rejected | 70 | 105 | 1 |
| Whangarei County | 11 Nov., 1914 | Carried | 736 | 236 | 22 |
Rates are not the only form of local taxation. Local authorities derive a certain amount of revenue from publicans' licenses, auctioneers' and hawkers' licenses, abattoir fees, dog-taxes, pound-taxes, tolls, &c. Sources of revenue not classed as taxation are—Rents; fines and penalties; market dues; sales of material; sale of light and power from gasworks and electric-supply works; tramway receipts; interest on deposits; wharf dues, &c.
Revenue received from the Government comprise—Rates on Crown and Native lands; timber and flax royalties; goldfields revenue and gold duty; fees and fines; subsidy on rates; one-third of receipts from lands sold on deferred payment and from perpetual leases; one-fourth of rents from small grazing-runs; other. In addition there are special grants from the General Government for various local works of a public or semi-public character. These are not considered revenue, and are included with "Receipts not revenue."
A further class of receipts from the Government is provided by loans under the various Loans to Local Bodies Acts and from the New Zealand State Advances Office.
A statement of all receipts by controlling bodies of local districts from the Government during the financial year 1917-18 is given in the next table.
LOCAL GOVERNING BODIES .—RECEIPTS FROM GOVERNMENT .—TABLE SHOWING UNDER SEPARATE HEADS THE AMOUNTS RECEIVED FROM THE GOVERNMENT BY THE LOCAL GOVERNING BODIES IN THE DOMINION DURING THE FINANCIAL YEAR 1917-18.
| — | Counties. | Boroughs. | Town Boards. | Road Boards. | River Boards (excluding Inch-Clutha, also Road Board). | Land Drainage Boards. | Harbour Boards. | City and Suburban Drainage | Totals. |
|---|---|---|---|---|---|---|---|---|---|
| £ | £ | £ | £ | £ | £ | £ | £ | £ | |
| Rates on Crown and Native lands | 21 | 81 | 94 | 6 | .. | .. | .. | .. | 202 |
| One-third receipts from land sold on deferred payment and from perpetual leases | 32,611 | 189 | .. | 2,931 | .. | .. | .. | 35,731 | |
| One-fourth of rents from small grazing-runs | 5,222 | .. | .. | 169 | .. | .. | .. | .. | 5,391 |
| Timber and flax royalties | 4,288 | .. | .. | .. | .. | .. | .. | .. | 4,288 |
| Goldfields revenue and gold duty | 18,270 | 15,879 | 1 | 190 | .. | .. | .. | .. | 34,340 |
| Subsidies on rates | 120,157 | 23,951 | 3,917 | 12,007 | .. | .. | .. | .. | 160,032 |
| Fees and fines | 665 | 1,569 | 86 | 39 | .. | .. | .. | .. | 2,359 |
| Other receipts | 2,595 | 3,300 | .. | 309 | 168 | .. | 33 | 150 | 6,555 |
| Total Revenue Account | 183,829 | 44,969 | 4,098 | 15,651 | 168 | .. | 33 | 150 | 248,898 |
| Loans from Government under Loans to Local Bodies Acts and from New Zealand State Advances Office | 77,648 | 21,318 | 5,400 | 1,725 | 992 | 11,290 | .. | .. | 118,373 |
| Grants for special works, &c. | 75,030 | 2,877 | 388 | 2,072 | 3,077 | 3,918 | .. | .. | 87,362 |
| Total receipts from Government | 336,507 | 69,164 | 9,886 | 19,448 | 4,237 | 15,208 | 33 | 150 | 454,633 |
The expenditure of local governing bodies during each of the past twenty years is as follows:—
| Financial Year. | Expenditure. |
|---|---|
| £ | |
| 1898-99 | 1,778,574 |
| 1899-1900 | 1,960,073 |
| 1900-1 | 2,250,572 |
| 1901-2 | 2,528,092 |
| 1902-3 | 2,867,506 |
| 1903-4 | 3,230,712 |
| 1904-5 | 3,497,321 |
| 1905-6 | 3,601,506 |
| 1906-7 | 3,897,515 |
| 1907-8 | 4,491,113 |
| 1908-9 | 4,800,711 |
| 1909-10 | 4,898,482 |
| 1910-11 | 5,360,261 |
| 1911-12 | 6,074,372 |
| 1912-13 | 6,537,769 |
| 1913-14 | 6,796,314 |
| 1914-15 | 6,806,567 |
| 1915-16 | 6,920,736 |
| 1916-17 | 6,758,593 |
| 1917-18 | 7,103,073 |
The expenditure of the various classes of local governing bodies during 1917-18 is shown below in more detail.
LOCAL GOVERNING BODIES .—EXPENDITURE , 1917-18.
| — | Public Works. | Hospitals and Charitable Aid. | Management. | Interest on Loans and Overdraft. | Other. | Total Expenditure. |
|---|---|---|---|---|---|---|
* Included in public works. | ||||||
| £ | £ | £ | £ | £ | £ | |
| Counties | 1,156,461 | 137,400 | 150,797 | 142,932 | 61,882 | 1,649,472 |
| Boroughs | 2,492,282 | 98,343 | 179,425 | 655,842 | 82,775 | 3,508,667 |
| Town districts | 72,299 | 3,052 | 11,742 | 18,074 | 3,155 | 108,322 |
| Road districts | 95,997 | 7,113 | 14,448 | 14,727 | 7,482 | 139,767 |
| River districts | 20,361 | .. | 4,900 | 5,753 | 600 | 31,620 |
| Land-drainage districts | 30,235 | .. | 3,774 | 8,974 | 57 | 43,040 |
| Water-supply districts | 3,422 | .. | 1,442 | 381 | 51 | 5,296 |
| Tramway districts | 100,714 | .. | * | 29,354 | 33,216 | 163,284 |
| City and suburban drainage districts | 42,060 | .. | 8,465 | 70,704 | 1,055 | 122,284 |
| Railway district | 25,999 | .. | .. | 879 | .. | 26,878 |
| Harbour districts | 611,097 | .. | 123,163 | 335,455 | 234,728 | 1,304,443 |
| Totals | 4,650,927 | 245,908 | 498,156 | 1,283,075 | 425,007 | 7,103,073 |
It is seen that during the year the total expenditure was £7,103,073, of which £4,650,927 was expended on public works and £1,283,075 on debt charges. The item "management expenses" does not rank very high in the aggregate, though the table following shows that in some classes of local bodies the expenses of management account for a fair percentage of the revenue:—
| Local Districts. | Management Expenses as Percentage of | ||
|---|---|---|---|
| Revenue. | Total Receipts. | Expenditure. | |
| £ | £ | £ | |
| Counties | 11.50 | 9.44 | 9.14 |
| Boroughs | 5.66 | 4.87 | 5.11 |
| Town districts | 14.45 | 11.18 | 10.84 |
| Road districts | 11.53 | 10.31 | 10.34 |
| River districts | 18.08 | 13.59 | 15.50 |
| Land-drainage districts | 16.06 | 7.46 | 8.77 |
| Water-supply districts | 24.49 | 23.97 | 27.23 |
| City and suburban drainage districts | 8.50 | 7.56 | 6.92 |
| Harbour districts | 20.50 | 9.46 | 9.44 |
| All districts | 8.36 | 6.91 | 7.01 |
The table following gives, in respect of boroughs only, the expenditure out of loan-money during the past ten years, classified under various heads:—
EXPENDITURE OUT OF LOANS.—BOROUGHS ONLY , 1908-9 TO 1917-18.
| Year ended 31st March. | Streets, Footways, and Bridges. | Drainage and Sanitation. | Waterworks. | Tramways. | Abattoirs, Slaughterhouses and Pounds. | Lighting and Power Services. | Other Public Works. | Management, Interest, and Sundries. | Total. |
|---|---|---|---|---|---|---|---|---|---|
| £ | £ | £ | £ | £ | £ | £ | £ | £ | |
| 1909 | 111,295 | 111,336 | 150,592 | 43,336 | 23,671 | 139,502 | 16,686 | 17,849 | 614,267 |
| 1910 | 87,819 | 129,994 | 160,662 | 81 | 15,120 | 106,452 | 44,786 | 10,098 | 555,012 |
| 1911 | 113,216 | 132,037 | 143,717 | 52,195 | 1,922 | 139,409 | 53,153 | 22,841 | 658,490 |
| 1912 | 149,057 | 206,393 | 246,485 | 114,653 | 3,626 | 137,599 | 98,176 | 14,651 | 970,640 |
| 1913 | 182,251 | 205,373 | 169,447 | 61,224 | 15,596 | 134,873 | 103,985 | 16,433 | 889,182 |
| 1914 | 244,619 | 131,547 | 129,601 | 47,427 | 3,074 | 199,757 | 58,368 | 20,491 | 834,884 |
| 1915 | 153,209 | 68,061 | 70,306 | 28,889 | 5,463 | 201,651 | 58,982 | 25,098 | 611,659 |
| 1916 | 175,248 | 98,366 | 86,864 | 45,390 | 3,860 | 235,071 | 78,398 | 17,818 | 741,015 |
| 1917 | 98,595 | 92,677 | 84,012 | 21,497 | 14,970 | 130,489 | 60,902 | 16,794 | 519,936 |
| 1918 | 72,290 | 86,346 | 45,917 | 6,880 | .. | 104,359 | 57,086 | 12,571 | 385,449 |
The assets and liabilities of local governing bodies at the end of the financial year 1917-18 are as shown in the table following. The figures shown in the column "other assets" are taken from the respective balance-sheets, but are far from complete. In quite a number of cases no assets whatever are shown, while in the majority of the others nothing is included for the reserves held. These totals can only be taken as a very approximate indication of the property held in addition to the actual cash assets.
| Assets. | Liabilities. | ||||
|---|---|---|---|---|---|
| Cash Assets. | Other Assets (as estimated in Published Balance-sheets). | Loans (excluding Government Loans and those from the State Advances Office). | Loans from State Advances Office. (Net indebtedness on 31st March, 1918.) | Liabilities other than the Loans included in preceding Columns (Bank Overdrafts, Outstanding Accounts, &c.). | |
| £ | £ | £ | £ | £ | |
| Counties | 562,950 | 563,172 | 421,214 | 1,055,198 | 380,425 |
| Boroughs | 2,507,028 | 14,077,746 | 12,150,384 | 1,311,535 | 1,075,965 |
| Town districts | 35,773 | 225,937 | 252,520 | 79,176 | 24,624 |
| Road districts | 59,869 | 79,180 | 71,886 | 87,913 | 30,374 |
| River districts | 24,052 | 67,230 | 44,620 | 3,269 | 16,911 |
| Land-drainage districts | 23,955 | 12,602 | 23,270 | 107,500 | 4,255 |
| City and suburban drainage districts | 216,406 | 573,697 | 1,400,000 | 177 | 2,913 |
| Tramway districts | 16,814 | 686,529 | 613,650 | .. | 134,085 |
| Water-supply districts | 4,740 | 27,706 | 13,000 | .. | 2,002 |
| Railway districts | 5,809 | 21,776 | 1,000 | .. | 24,809 |
| Harbour districts | 626,658 | 8,844,066 | 7,268,993 | 118,132 | 170,602 |
| Totals | 4,084,054 | 25,179,641 | 22,260,537 | 2,762,900 | 1,866,965 |
In addition to the above liabilities there was outstanding at the 1st February, 1918, an amount of £1,088,957, being the inscribed debt of local bodies under the Loans to Local Bodies Act (including inscribed stock exchanged for debentures under the Roads and Bridges Construction Act, 1882).
The indebtedness of local governing bodies on account of outstanding loans has increased in the twenty years 1898-99 to 1917-18 from £7,753,219 to £22,260,537, exclusive of moneys borrowed from the Government, which represented a further indebtedness of £3,851,857 at the end of March, 1918 (Roads and Bridges Construction Act, the Government Loans to Local Bodies Act, and the Loans to Local Bodies Act, £1,088,957, and loans from the New Zealand State Advances Office, £2,762,900).
The outstanding loans of local bodies at the end of each of the past twenty years are as shown in the following table:—
LOANS OF LOCAL BODIES , 1898-99 TO 1917-18.
| Financial Year. | Outstanding Loans (excluding Government Loans). | Government Loans to Local Bodies. | Total Gross Indebtedness at End of Year. | ||
|---|---|---|---|---|---|
| Outstanding Debentures under the Roads and Bridges Construction Act. | Loans from New Zealand State Advances Office outstanding on 31st March. | Net Indebtedness in February of each Year under the Local Bodies' Loans Acts (including Debentures under the Roads and Bridges Construction Act converted). | |||
| £ | £ | £ | £ | £ | |
| 1898-99 | 6,963,254 | 347 | .. | 789,618 | 7,753,219 |
| 1899-1900 | 7,057,350 | .. | .. | 810,192 | 7,867,542 |
| 1900-1 | 7,563,069 | .. | .. | 902,769 | 8,465,838 |
| 1901-2 | 7,839,695 | .. | .. | 1,046,645 | 8,886,340 |
| 1902-3 | 8,217,196 | .. | .. | 1,266,002 | 9,483,198 |
| 1903-4 | 8,898,910 | .. | .. | 1,401,752 | 10,300,662 |
| 1904-5 | 10,018,242 | .. | .. | 1,526,353 | 10,644,595 |
| 1905-6 | 10,718,051 | .. | .. | 1,580,494 | 12,298,545 |
| 1906-7 | 11,616,048 | .. | .. | 1,647,273 | 13,263,321 |
| 1907-8 | 12,532,334 | .. | .. | 1,691,083 | 14,223,417 |
| 1908-9 | 13,303,622 | .. | .. | 1,839,017 | 15,142,639 |
| 1909-10 | 14,937,685 | .. | .. | 1,925,606 | 16,863,291 |
| 1910-11 | 15,727,613 | .. | 404,163 | 2,025,663 | 17,157,439 |
| 1911-12 | 16,590,877 | .. | 1,186,611 | 1,948,852 | 19,726,340 |
| 1912-13 | 17,483,332 | .. | 1,711,797 | 1,761,409 | 20,956,538 |
| 1913-14 | 18,923,482 | .. | 2,007,797 | 1,631,965 | 22,563,244 |
| 1914-15 | 19,454,475 | .. | 2,312,754 | 1,482,212 | 23,249,441 |
| 1915-16 | 20,754,168 | .. | 2,680,245 | 1,349,916 | 24,784,329 |
| 1916-17 | 21,432,767 | .. | 2,676,407 | 1,229,468 | 25,338,642 |
| 1917-18 | 22,260,537 | .. | 2,762,900 | 1,088,957 | 26,112,394 |
A further table is given showing the amount of the debt raised in New Zealand and elsewhere, other than loans from the General Government. Columns are added showing the interest payable and the average rate of interest per cent. It will be noticed that the amount of outstanding loans shown to have been raised in New Zealand was only a small percentage of the total at the end of the first of the twenty financial years shown, but increased gradually at first, and rapidly later, till at the end of the year 1912-13 it was nearly £3,000,000 in excess of the amount raised abroad. During 1913-14, however, the New Zealand amount decreased slightly, while the loans raised abroad showed a large increase. During the war period there have been decreases in the amounts raised abroad and increases in the amounts raised in New Zealand, making a difference between the two amounts of nearly £6,000,000 at the 31st March, 1918.
INDEBTEDNESS AND INTEREST CHARGES .
| Financial Year. | Raised in New Zealand. | Raised Abroad. | Total Indebtedness. | Interest. | Average Rate per Cent. |
|---|---|---|---|---|---|
| £ | £ | £ | £ | £ | |
| 1898-99 | 1,478,154 | 5,485,100 | 6,963,254 | 363,915 | 5.23 |
| 1899-1900 | 1,579,050 | 5,478,300 | 7,057,350 | 367,019 | 5.20 |
| 1900-1 | 2,052,269 | 5,510,800 | 7,563,069 | 385,959 | 5.10 |
| 1901-2 | 2,287,595 | 5,552,100 | 7,839,695 | 396,460 | 5.06 |
| 1902-3 | 2,880,596 | 5,336,600 | 8,217,196 | 409,238 | 4.91 |
| 1903-4 | 3,369,410 | 5,529,500 | 8,898,910 | 439,879 | 4.94 |
| 1904-5 | 3,479,642 | 5,638,600 | 10,018,242 | 487,145 | 4.86 |
| 1905-6 | 5,250,551 | 5,467,500 | 10,718,051 | 515,188 | 4.81 |
| 1906-7 | 6,145,548 | 5,470,500 | 11,616,048 | 548,387 | 4.72 |
| 1907-8 | 7,246,834 | 5,285,500 | 12,532,334 | 587,564 | 4.69 |
| 1908-9 | 7,785,922 | 5,517,700 | 13,303,622 | 616,330 | 4.63 |
| 1909-10 | 7,967,385 | 6,970,300 | 14,937,685 | 684,630 | 4.58 |
| 1910-11 | 8,254,313 | 7,473,300 | 15,727,613 | 715,289 | 4.55 |
| 1911-12 | 9,574,527 | 7,016,350 | 16,590,877 | 748,805 | 4.51 |
| 1912-13 | 10,134,782 | 7,348,550 | 17,483,332 | 787,827 | 4.51 |
| 1913-14 | 10,106,082 | 8,817,400 | 18,923,482 | 855,063 | 4.52 |
| 1914-15 | 10,998,775 | 8,455,700 | 19,454,475 | 870,992 | 4.48 |
| 1915-16 | 12,793,543 | 7,960,625 | 20,754,168 | 948,511 | 4.57 |
| 1916-17 | 13,218,617 | 8,214,150 | 21,432,767 | 983,408 | 4.59 |
| 1917-18 | 14,096,187 | 8,164,350 | 22,260,537 | 1,034,272 | 4.64 |
The average rate of interest shows a steady fall throughout the twenty years shown, with, however, a check in the last three years of the period. The loans outstanding, other than Government loans, at the end of the financial year 1917-18 are shown below, classified according to various rates of interest:—
| Rate of Interest: Per Cent. | Raised in New Zealand. | Raised Abroad. | Total. |
|---|---|---|---|
| £ | £ | £ | |
| Under 4 per cent. | 96,217 | .. | 96,217 |
| 4 per cent. | 3,082,560 | 2,519,900 | 5,602,460 |
| 4 1/4 per cent | 1,615,280 | 237,000 | 1,852,280 |
| 4 3/8 per cent | 37,000 | .. | 37,000 |
| 4 1/2 per cent | 4,005,613 | 2,296,675 | 6,302,288 |
| 4 3/4 per cent | 533,790 | .. | 533,790 |
| 4 7/8 per cent | 15,163 | .. | 15,163 |
| 5 per cent | 3,136,016 | 2,175,900 | 5,311,916 |
| 5 1/8 per cent | 112,800 | .. | 112,800 |
| 5 1/4 per cent | 1,106,529 | 8,175 | 1,114,704 |
| 5 1/2 per cent | 194,648 | 1,000 | 195,748 |
| 6 per cent | 154,827 | 925,600 | 1,080,427 |
| 6 1/4 per cent | 5,744 | .. | 5,744 |
| Totals | 14,096,187 | 8,164,350 | 22,260,537 |
The total indebtedness at the end of 1917-18, excluding loans from the State Advances Office and the inscribed debt under the Loans to Local Bodies Acts (the latter including stock exchanged for debentures under the Roads and Bridges Construction Act), was £22,260,537, as shown above. Against this were sinking funds amounting to £2,477,692, leaving the net indebtedness, other than to the State, £19,782,845. The annual charge for interest was £1,034,272, and for sinking fund £170,723. The net indebtedness to the State Advances Office was £2,762,900, representing loans originally amounting to £2,962,190. The instalments of principal and interest on this amounted to an annual charge of £154,003.
The debt under the Loans to Local Bodies Acts, including inscribed stock exchanged for debentures under the Roads and Bridges Construction Act, 1882, was £1,088,957 at the end of the year. This debt is decreasing yearly, and will be extinguished in course of time. The amount outstanding is repayable by annual instalments of £100,606, representing 4 1/2 per cent. on £802,489, 4 per cent. on £104,444, and 3 1/2 per cent. on £1,723,311, the amount inscribed to the 1st February, 1918. Repayments on the amount inscribed would be £3,545,552, including interest. The actual repayments have been £2,003,673, leaving £1,541,879 still to be paid by way of interest and sinking fund on a present indebtedness of £1,088,957.
Full information concerning the law governing local bodies' loans is given in the 1914 issue of this book. The section of this book dealing with State aid to settlors and workers contains information regarding State advances to local authorities.
Detailed tables showing the statistics of individual local bodies will be found in Volume iv of "Statistics of New Zealand," also as regards boroughs, town districts, and Harbour Boards in the "Municipal Handbook," published biennially.
Table of Contents
THE system of separately assessing the value of the land itself and the value of the buildings and improvements effected thereon was first put into practice in New Zealand for the purposes of State taxation on the passing of the Land-tax Act, 1878, under which a tax was levied on land-values, the impost being 1/2d. in the pound on the capital value of real estate, less the assessed value of the improvements.
The Land-tax Act, 1878, was superseded by the Property-tax Act, 1879, which provided for the levy of a uniform tax of 1d. in the pound on the capital value of all property—real and personal—above the amount of £500 in value.
The Property-tax Act, 1879, was in its turn superseded by the Land and Income Assessment Act, 1891. Under this enactment a land-tax was imposed on land and mortgages of land, with an exemption of improvements on land up to £3,000. An exemption from income-tax was also allowed on all incomes derived from land and mortgages of land.
Two years later, under the provisions of the Land and Income Assessment Acts Amendment Act, 1893, all improvements on land were entirely exempted.
An endeavour to extend the principle of general exclusion of improvements to local taxation resulted in the passing of the Rating on Unimproved Value Act, 1896, which gave local authorities the option of deciding that equivalent rates on the unimproved values of lands in their jurisdiction should be substituted for the rates levied on the full capital values or on the annual values.
The valuing of land up to the year 1896 was not conducted on a uniform basis. Each State Department and each local authority worked quite independently, and employed as valuers whom it thought fit. The Land-tax Department periodically employed a small army of temporary valuers when it required a new valuation of lands for taxation purposes, and each local authority had its own particular method of making up its roll for the levying of rates. Estimates of values arrived at by various authorities varied to a dangerous degree. Some values were very high, being based on speculative prices, while many were extremely low. Frequently the same property had several values assigned to it.
In order to overcome as far as possible the obvious defects of the old system, it was decided to establish a new system of valuation, by which all valuations required by State Departments—whether for loan, taxation, or other purposes—and by local authorities that rate on the capital or unimproved value, should be made by valuers employed by the State at fixed salaries and responsible to the Government alone.
The Government Valuation of Land Act, 1896, was in due course introduced and passed. This Act provided for the setting-up of a separate Department of State charged with the duty of estimating the values of real estate in the Dominion for taxation and other purposes of the General Government and for local rating purposes.
The whole of the existing law relating to the valuation of land in New Zealand is contained in the Valuation of Land Act, 1908 (which is a consolidation of the Government Valuation of Land Act, 1896, and the Acts amending the same), the Valuation of Land Amendment Act, 1908, and the Valuation of Land Amendment Act, 1912, and the regulations made under these Acts.
General valuations of land for the whole of New Zealand were made periodically up to the year 1897-98. Since that year no general valuations for the whole Dominion have been made, but portions have been revalued from time to time. The figures in the following table showing valuations over a number of years therefore represent general valuations up to 1897 only, while for subsequent years the figures have been revised to include the latest valuations of small divisions.
CAPITAL AND UNIMPROVED VALUES , 1878-1918.
| Year. | Capital Value (Land and Improvements). | Unimproved Value of Land (included in previous Column). | Year. | Capital Value (Land and Improvements). | Unimproved Value of Land (included in previous Column). |
|---|---|---|---|---|---|
| £ | £ | £ | £ | ||
| 1878.. | 99,566,679 | 62,573,868 | 1908.. | 253,440,172 | 161,324,763 |
| 1882.. | 101,000,000 | .. | 1909.. | 271,516,022 | 172,759,948 |
| 1885.. | 113,270,649 | .. | 1910.. | 277,630,083 | 175,289,861 |
| 1888.. | 111,137,714 | 75,497,379 | 1911.. | 293,117,065 | 184,062,798 |
| 1891.. | 122,225,029 | 75,832,465 | 1912.. | 315,503,213 | 199,184,261 |
| 1897.. | 138,591,347 | 84,401,244 | 1913.. | 340,559,728 | 212,963,468 |
| 1902.. | 154,816,132 | 94,847,727 | 1914.. | 365,342,237 | 228,493,376 |
| 1904.. | 182,796,241 | 112,629,412 | 1915 | 371,076,683 | 230,705,147 |
| 1905 | 197,684,475 | 122,937,126 | 1916.. | 389,164,729 | 241,322,255 |
| 1906.. | 218,422,552 | 137,168,548 | 1917.. | 405,466,071 | 251,087,708 |
| 1907 | 236,644,536 | 149,682,689 | 1918.. | 421,383,373 | 260,921,812 |
In the nineteen years from 1878 to 1897 the value, both of unimproved land and of improvements, increased roughly by one-third. In the twenty-one years from 1897 to 1918, as the effect of a long period of prosperity, values were more than trebled, so that for the last twenty years values of land rose on an average at many times the rate of the previous two decades.
No accurate statement can be given, as the total shown for 1918 and preceding years is not ascertained by general revaluations in each year. Revaluations are made, district by district, as circumstances permit. Some of the valuations which form component parts of the total capital value of £421,383,373 shown for 1918 date as far back even as 1897, although such are exceptional cases. It will be seen, therefore, that if all lands were revalued in 1918 the total would be much larger, since land-values almost invariably rise. Probably the figure would be in the neighbourhood of £500,000,000.
The unimproved value of land is the basis on which some 41 per cent. of the local authorities (boroughs, town districts, and counties only) assess their rates.
| A comparison is— | System of Rating. | ||||
|---|---|---|---|---|---|
| Unimproved Value. | Capital Value. | Annual Value. | Nil. | Total. | |
| Counties | ..38 | 79 | .. | 8 | 125 |
| Boroughs | ..61 | 25 | 34 | .. | 120 |
| Town districts (independent) | 15 | 18 | 3 | .. | 36 |
| Totals | 114 | 122 | 37 | 8 | 281 |
Information covering the past ten years as to capital and unimproved values in the North and South Islands is given in the following table, which also shows the separate totals for counties, boroughs, and town districts (independent of county jurisdiction). Summarized totals are also given.
CAPITAL AND UNIMPROVED VALUES IN THE NORTH AND SOUTH ISLANDS AND FOR THE WHOLE DOMINION .
| Year. | North Island. | South Island.* | New Zealand. | |||
|---|---|---|---|---|---|---|
| Capital Value (Land and Improvements). | Unimproved Value of Land (included in previous Column). | Capital Value (Land and Improvements). | Unimproved Value of Land (included in previous Column). | Capital Value (Land and Improvements). | Unimproved Value of Land (included in previous Column). | |
Including Stewart Island and Chatham Islands. | ||||||
| COUNTIES . | ||||||
| £ | £ | £ | £ | £ | £ | |
| 1909 | 100,434,677 | 68,121,211 | 75,166,586 | 55,218,139 | 175,601,263 | 123,339,350 |
| 1910 | 102,947,079. | 69,161,564 | 74,754,540 | 55,399,156 | 177,701,619 | 124,560,720 |
| 1911 | 107,638,954 | 72,319,273 | 77,403,383 | 57,671,320 | 185,042,337 | 129,990,593 |
| 1912 | 117,099,194 | 78,574,769 | 81,014,944 | 60,239,117 | 198,114,138 | 138,813,886 |
| 1913 | 130,946,882 | 87,361,655 | 87,335,156 | 64,912,274 | 218,282,038 | 152,273,929 |
| 1914 | 136,142,912 | 90,361,877 | 93,708,093 | 69,484,292 | 229,851,005 | 159,846,169 |
| 1915 | 137,669,168 | 91,079,543 | 94,296,275 | 69,841,015 | 231,965,443 | 160,920,558 |
| 1916 | 146,242,118 | 97,379,015 | 96,811,084 | 71,199,250 | 243,053,202 | 168,578,265 |
| 1917 | 154,477,641 | 102,981,689 | 100,636,688 | 74,108,106 | 255,114,329 | 177,089,795 |
| 1918 | 164,928,221 | 109,611,569 | 103,714,879 | 76,670,835 | 268,643,100 | 186,282,404 |
| BOROUGHS . | ||||||
| 1909 | 57,227,864 | 32,334,028 | 35,795,030 | 15,405,830 | 93,022,894 | 47,739,858 |
| 1910 | 59,726,326 | 33,245,235 | 37,329,437 | 15,807,220 | 97,055,763 | 49,112,455 |
| 1911 | 65,159,196 | 35,551,071 | 39,649,805 | 16,766,347 | 104,809,001 | 52,317,418 |
| 1912 | 73,385,468 | 41,506,154 | 40,295,801 | 16,856,865 | 113,681,269 | 58,363,019 |
| 1913 | 76,763,293 | 41,734,848 | 42,207,280 | 17,354,970 | 118,970,578 | 59,089,818 |
| 1914 | 84,945,582 | 47,017,463 | 45,875,023 | 19,367,115 | 130,820,605 | 66,384,578 |
| 1915 | 87,671,609 | 48,150,309 | 46,638,663 | 19,396,948 | 134,310,272 | 67,547,257 |
| 1916 | 92,902,160 | 50,443,309 | 48,313,999 | 20,050,324 | 141,216,159 | 70,493,733 |
| 1917 | 96,207,345 | 51,510,819 | 48,770,852 | 20,018,500 | 144,978,197 | 71,529,319 |
| 1918 | 97,648,139 | 51,772,269 | 49,660,419 | 20,358,456 | 147,308,558 | 72,130,725 |
| TOWN DISTRICTS . | ||||||
| 1909 | 2,286,857 | 1,396,478 | 605,008 | 284,262 | 2,891,865 | 1,680,740 |
| 1910 | 2,245,074 | 1,328,297 | 627,627 | 288,389 | 2,872,701 | 1,616,686 |
| 1911 | 2,591,833 | 1,439,866 | 673,894 | 314,921 | 3,265,727 | 1,754,787 |
| 1912 | 2,925,871 | 1,639,588 | 781,935 | 367,768 | 3,707,806 | 2,007,356 |
| 1913 | 2,487,087 | 1,228,438 | 820,025 | 371,283 | 3,307,112 | 1,599,721 |
| 1914 | 3,808,368 | 1,880,433 | 862,259 | 382,196 | 4,670,627 | 2,262,629 |
| 1915 | 3,916,101 | 1,854,576 | 884,867 | 382,756 | 4,800,968 | 2,237,332 |
| 1916 | 4,273,975 | 1,989,761 | 621,393 | 260,496 | 4,895,368 | 2,250,257 |
| 1917 | 4,732,948 | 2,207,633 | 640,597 | 260,961 | 5,373,545 | 2,468,594 |
| 1918 | 4,820,083 | 2,255,646 | 611,632 | 253,037 | 5,431,715 | 2,508,683 |
| GRAND TOTAL | ||||||
| 1909 | 159,949,398 | 101,851,717 | 111,566,624 | 70,908,231 | 271,516,022 | 172,759,968 |
| 1910 | 164,918,479 | 103,785,096 | 112,711,604 | 71,554,765 | 277,630,083 | 175,289 861 |
| 1911 | 175,389,983 | 109,310,210 | 117,727,082 | 74,752,588 | 293,117,065 | 184,062,798 |
| 1912 | 193,410,533 | 121,720,511 | 122,092,680 | 77,463,750 | 315,503,213 | 199,184,261 |
| 1913 | 210,197,267 | 130,324,941 | 130,362,461 | 82,638,527 | 340,559,728 | 212,963,468 |
| 1914 | 224,896,862 | 139,259,773 | 140,445,375 | 89,233,603 | 365,342,237 | 228,493,376 |
| 1915 | 229,256,878 | 141,084,428 | 141,819,805 | 89,620,719 | 371,076,683 | 230,705,147 |
| 1916 | 243,418,253 | 149,812,085 | 145,746,476 | 91,510,170 | 389,164,729 | 241,322,255 |
| 1917 | 255,417,934 | 156,700,141 | 150,048,137 | 94,387,567 | 405,466,071 | 251,087,708 |
| 1918 | 267,396,443 | 163,639,484 | 153,986,930 | 97,282,328 | 421,383,373 | 260,921,812 |
The total valuations are given for counties and boroughs, and for town districts not forming parts of counties. The particulars for component parts of counties, being road districts, town districts forming parts of counties and portions of outlying country, will be found in Volume iv of "Statistics of New Zealand."
TABLE SHOWING CAPITAL VALUE OF LAND WITH IMPROVEMENTS (AND DISTINGUISHING THE UNIMPROVED VALUE OF LAND ) FOR ALL LANDS AND FOR RATEABLE PROPERTIES IN EACH COUNTY IN NEW ZEALAND AS AT THE 1ST APRIL , 1918, WITH THE AREA , POPULATION , NUMBER OF ASSESSMENTS ON VALUATION ROLL , AND THE YEAR IN WHICH THE VALUES WERE LAST REVISED .
| County. | Area in Square Miles (including Interior Boroughs, &c.) | Population, Census, 1916 (excluding Interior Boroughs, &c). | Number of Assessments on Valuation Roll. | Gross Values. | System of Rating. | Rateable Values. | Values last revised as at 1st April, in* | ||
|---|---|---|---|---|---|---|---|---|---|
| Capital Value (Land and Improvements). | Unimproved Value of Land (included in previous Column). | Capital Value (Land and Improvements). | Unimproved Value of Land (included in previous Column). | ||||||
* In cases where more than one year is shown in this column the revision of the county was carried out in sections, certain ridings, road districts, or town districts being revised in the years stated. † The values shown for these counties have been adjusted as at 17th May, 1918, the data of alteration of boundaries. | |||||||||
| £ | £ | £ | £ | ||||||
| Mongonui† | 875 | 3,739 | 2,243 | 936,986 | 557,970 | U.V. | 828,085 | 473,282 | 1916 |
| Whangaroa† | 200 | 797 | 959 | 296,189 | 190,052 | C.V. | 257,914 | 154,746 | 1918 |
| Bay of Islands† | 818 | 3,589 | 3,491 | 1,575,450 | 1,001,254 | C.V. | 1,465,163 | 914,013 | 1918 |
| Hokianga† | 933 | 2,792 | 2,900 | 1,267,564 | 768,241 | U.V. | 1,048,717 | 566,862 | 1918 |
| Whangarei† | 894 | 8,976 | 4,348 | 2,491,833 | 1,408,558 | U.V. | 2,355,214 | 1,301,196 | 1914, 1917 |
| Hobson† | 626 | 4,728 | 1,901 | 2,113,006 | 1,261,718 | U.V. | 2,012,726 | 1,178,483 | 1918 |
| Otamatea | 443 | 3,647 | 1,805 | 1,006,412 | 621,898 | C.V. | 951,010 | 576,401 | 1912 |
| Rodney | 493 | 4,043 | 1,886 | 1,020,951 | 612,586 | C.V. | 983,151 | 584,119 | 1912 |
| Waitemata | 630 | 9,354 | 3,720 | 2,604,664 | 1,791,771 | C.V. | 2,495,723 | 1,705,475 | 1912, '13, '14, '16 |
| Eden | 30 | 14,267 | 4,793 | 4,224,097 | 2,640,145 | ‡ | 3,800,402 | 2,410,094 | 1911, '13, '16, '17 |
| Manukau | 197 | 6,799 | 2,124 | 3,085,059 | 2,108,257 | C.V. | 3,005,314 | 2,065,604 | 1911,'12,'13,'14,'18 |
| Franklin | 620 | 9,397 | 3,853 | 3,677,467 | 2,391,994 | C.V. | 3,625,244 | 2,364,890 | 1912,'13,'14,'16,'17 |
| Great Barrier | 108 | 245 | 201 | 133,758 | 108,440 | U.V. | 129,131 | 104,043 | 1914 |
| Islands— | |||||||||
| Little Barrier, Waiheke, &c. | .. | .. | 264 | 327,038 | 212,080 | Nil | 265,273 | 172,700 | 1913 |
| Waikato | 613 | 8,099 | 2,206 | 4,648,036 | 3,316,557 | C.V. | 4,464,334 | 3,175,860 | 1918 |
| Raglan | 855 | 4,027 | 2,346 | 3,164,152 | 2,071,200 | U.V. | 3,115,618 | 2,037,192 | 1916 |
| Waipa | 284 | 6,864 | 2,188 | 3,058,218 | 2,040,020 | C.V. | 2,987,883 | 2,013,210 | 1913 |
| Kawhia | 351 | 991 | 826 | 574,939 | 369,689 | U.V. | 525,522 | 323,215 | 1913 |
| Awakino | 416 | 702 | 522 | 954,226 | 553,666 | U.V. | 900,009 | 502,834 | 1916 |
| Waitomo | 1,115 | 5,181 | 2,770 | 2,249,531 | 1,492,457 | C.V. | 2,149,001 | 1,404,878 | 1913, 1916, 1917 |
| Ohura | 527 | 2,382 | 986 | 1,046,111 | 675,058 | U.V. | 970,374 | 604,079 | 1913 |
| Coromandel | 440 | 2,256 | 1,585 | 433,995 | 282,367 | C.V. | 367,169 | 232,113 | 1913 |
| Thames | 498 | 4,690 | 2,242 | 1,512,098 | 1,096,926 | U.V. | 1,410,389 | 1,005,310 | 1913, 1916, 1917 |
| Ohinemuri | 507 | 4,661 | 2,508 | 1,742,624 | 1,251,171 | C.V. | 1,582,252 | 1,120,224 | 1913, 1917 |
| Tauranga | 651 | 3,947 | 2,342 | 1,242,277 | 809,718 | U.V. | 1,133,338 | 712, 570 | 1912 |
| Piako | 431 | 4,663 | 1,203 | 3,330,320 | 2,279,010 | U.V. | 3,192,988 | 2,160,473 | 1917 |
| Matamata | 942 | 3,963 | 1,397 | 3,095,760 | 1,947,602 | C.V. | 2,929,624 | 1,795,371 | 1918 |
| Rotorua | 995 | 4,245 | 1,095 | 611,830 | 475,823 | C.V. | 482,450 | 378,828 | 1912 |
| Whakatane | 1,550 | 2,054 | 1,476 | 1,340,396 | 933,090 | C.V. | 1,189,549 | 796,481 | 1913, 1916 |
| Opotiki | 1,509 | 1,881 | 1,173 | 1,320,102 | 847,191 | U.V. | 1,198,929 | 731,147 | 1913 |
| East Taupo | 2,470 | 515 | 1,020 | 549,315 | 351,563 | Nil | 401,266 | 210,666 | 1914 |
| West Taupo | 1,438 | 2,351 | 1,216 | 1,975,215 | 1,432,473 | † | 1,630,635 | 1,155,078 | 1916 |
| Islands— | |||||||||
| Mayor and Motiti | .. | .. | 41 | 19,415 | 12,141 | Nil | 18,820 | 12,121 | 1917 |
| Waiapu | 1,102 | 2,075 | 971 | 2,734,253 | 1,672,792 | C.V. | 2,542,418 | 1,535,157 | 1913 |
| Waikohu | 896 | 3,013 | 940 | 2,698,288 | 1,568,686 | U.V. | 2,607,327 | 1,484,644 | 1912 |
| Cook | 1,074 | 7,665 | 3,512 | 8,050,030 | 5,456,923 | C.V. | 7,971,459 | 5,413,371 | 1916, 1918 |
| Wairoa | 1,362 | 2,332 | 2,341 | 2,462,053 | 1,532,630 | C.V. | 2,346,867 | 1,431,840 | 1913 |
| Hawke's Bay | 2,022 | 11,467 | 4,321 | 9,993,937 | 7,496,562 | C.V. | 9,862,863 | 7,429,429 | 1913, 1914, 1918 |
| Waipawa | 440 | 3,084 | 1,271 | 2,954,245 | 2,095,820 | U.V. | 2,922,359 | 2,076,174 | 1916 |
| Waipukurau | 88 | 667 | 284 | 907,745 | 678,269 | U.V. | 904,162 | 676,121 | 1916, 1917 |
| Dannevirke | 414 | 4,538 | 1,594 | 3,315,579 | 2,179,603 | U.V. | 3,284,378 | 2,160,394 | 1916 |
| Woodville | 154 | 1,819 | 817 | 1,380,883 | 962,428 | U.V. | 1,368,786 | 955,125 | 1914 |
| Patangata | 707 | 2,080 | 976 | 4,596,704 | 3,578,927 | C.V. | 4,572,412 | 3,565,336 | 1912, 1917 |
| Weber | 108 | 420 | 180 | 719,621 | 475,510 | U.V. | 716,475 | 474,423 | 1917 |
| Clifton | 615 | 2,156 | 1,349 | 998,131 | 564,518 | C.V. | 963,276 | 533,447 | 1911 |
| Taranaki | 386 | 7,100 | 3,012 | 2,262,252 | 1,266,634 | C.V. | 2,223,992 | 1,249,154 | 1912, 1913 |
| Egmont | 197 | 3,264 | 1,644 | 1,931,891 | 1,038,292 | C.V. | 1,876,442 | 1,004,754 | 1914 |
| Stratford | 368 | 5,152 | 1,653 | 2,083,283 | 1,218,373 | U.V. | 2,032,752 | 1,182,481 | 1909 |
| Whangamomona | 378 | 1,387 | 621 | 564,929 | 326,259 | U.V. | 519,632 | 282,620 | 1909 |
| Waimate West | 75 | 2,635 | 499 | 1,414,629 | 1,119,250 | C.V. | 1,410,742 | 1,118,218 | 1913 |
| Hawera | 195 | 4,599 | 1,580 | 2,575,885 | 1,929,414 | C.V. | 2,550,034 | 1,914,418 | 1910, 1913 |
| Eltham | 201 | 3,393 | 887 | 1,998,206 | 1,356,860 | C.V. | 1,960,985 | 1,332,885 | 1914 |
| Patea | 626 | 3,759 | 1,534 | 3,612,437 | 2,394,798 | C.V. | 3,529,240 | 2,328,914 | 1915 |
| Waitotara | 447 | 5,842 | 981 | 2,679,002 | 1,825,744 | C.V. | 2,618,952 | 1,772,347 | 1914, 1916 |
| Waimarino | 930 | 3,502 | 1,519 | 1,400,029 | 969,919 | U.V. | 1,248,285 | 821,449 | 1913 |
| Wanganui | 420 | 3,397 | 1,440 | 2,752,192 | 1,743,745 | C.V. | 2,704,432 | 1,706,300 | 1913, 1916 |
| Rangitikei | 1,374 | 8,953 | 3,167 | 6,591,605 | 4,312,351 | C.V. | 6,533,768 | 4,272,474 | 1908, '12, '14, '17 |
| Kiwitea | 336 | 2,585 | 1,496 | 2,014,048 | 1,350,823 | C.V. | 1,988,417 | 1,333,812 | 1910, 1911 |
| Pohangina | 295 | 1,581 | 986 | 1,224,285 | 813,670 | C.V. | 1,192,711 | 787,273 | 1911 |
| Kaitieke | 600 | 2,784 | 787 | 1,484,853 | 978,144 | U.V. | 1,174,156 | 677,573 | 1917 |
| Manawatu | 267 | 4,521 | 1,575 | 3,622,601 | 2,583,965 | C.V. | 3,596,764 | 2,570,573 | 1918 |
| Oroua | 213 | 3,304 | 1,491 | 2,940,519 | 2,100,125 | C.V. | 2,926,904 | 2,096,079 | 1913, 1917 |
| Kairanga | 190 | 4,124 | 1,145 | 2,986,963 | 2,189,442 | U.V. | 2,958,519 | 2,177,565 | 1912 |
| Horowhenua | 534 | 5,895 | 2,442 | 3,477,597 | 2,505,613 | C.V. | 3,318,170 | 2,406,211 | 1913, 1914 |
| Islands— | |||||||||
| Kapiti, Mana, and Somes | .. | .. | 17 | 17,984 | 13,378 | Nil | 10,454 | 9,378 | 1898 |
| Chatham Islands | 375 | 219 | 201 | 286,373 | 195,957 | Nil | 281,017 | 195,393 | 1915 |
| Pahiatua | 301 | 3,110 | 2,241 | 1,737,662 | 1,042,559 | U.V. | 1,707,559 | 1,021,516 | 1907 |
| Akitio | 326 | 1,416 | 691 | 1,187,549 | 608,945 | U.V. | 1,171,883 | 600,522 | 1914 |
| Castlepoint | 239 | 621 | 167 | 831,608 | 536,660 | C.V. | 828,563 | 536,158 | 1913 |
| Eketahuna | 276 | 2,312 | 1,174 | 1,250,292 | 708,358 | U.V. | 1,224,543 | 694,177 | 1908, 1910 |
| Mauriceville | 122 | 771 | 441 | 541,787 | 303,960 | C.V. | 523,787 | 289,821 | 1914 |
| Masterton | 583 | 3,746 | 1,298 | 2,850,733 | 1,876,432 | C.V. | 2,818,710 | 1,865,053 | 1909, 1910 |
| Wairarapa South | 452 | 2,744 | 1,032 | 2,280,536 | 1,358,000 | U.V. | 2,244,906 | 1,338,249 | 1913 |
| Featherston | 961 | 3,960 | 1,007 | 4,666,155 | 2,982,575 | U.V. | 4,582,625 | 2,918,615 | 1917, 1918 |
| Hutt | 461 | 6,397 | 2,526 | 2,176,524 | 1,285,810 | C.V. | 1,929,528 | 1,180,742 | 1913,1914 |
| Makara | 101 | 3,862 | 967 | 1,043,309 | 499,760 | C.V. | 912,944 | 477,360 | 1916 |
| Collingwood | 719 | 1,253 | 878 | 253,977 | 153,057 | U.V. | 210,038 | 116,535 | 1909 |
| Takaka | 454 | 1,858 | 878 | 688,630 | 383,062 | U.V. | 650,540 | 352,758 | 1917, 1918 |
| Waimea | 1,662 | 9,284 | 3,853 | 3,180,333 | 1,783,908 | C.V. | 3,072,826 | 1,725,515 | 1916, 1917 |
| Sounds | 473 | 1,201 | 867 | 793,716 | 478,708 | Nil | 756,857 | 444,975 | 1914 |
| Marlborough | 1,931 | 6,915 | 2,615 | 3,220,359 | 2,437,636 | † | 3,126,544 | 2,368,099 | 1909, 1911, 1912, 1913, 1914 |
| Awatere | 1,267 | 1,542 | 518 | 1,610,461 | 1,254,434 | U.V. | 1,581,267 | 1,233,466 | 1913 |
| Kaikoura | 703 | 1,906 | 749 | 1,229,039 | 903,387 | C.V. | 1,198,897 | 897,916 | 1913 |
| Buller | 1,818 | 5,773 | 3,062 | 1,412,955 | 730,724 | U.V. | 1,000,452 | 406,233 | 1913, 1916 |
| Murchison | 1,640 | 1,251 | 862 | 778,620 | 471,732 | U.V. | 471,129 | 174,332 | 1916 |
| Inangahua | 741 | 4,130 | 1,718 | 588,406 | 296,047 | U.V. | 390,246 | 120,842 | 1912 |
| Grey | 1,452 | 5,510 | 2,450 | 998,819 | 652,756 | C.V. | 587,261 | 299,286 | 1912 |
| Westland | 4,420 | 4,087 | 3,217 | 1,046,349 | 756,246 | C.V. | 594,674 | 331,798 | 1914 |
| Cheviot | 322 | 1,224 | 661 | 1,473,379 | 1,183,956 | U.V. | 1,454,057 | 1,170,624 | 1913 |
| Amuri | 2,362 | 1,836 | 615 | 2,013,023 | 1,647,796 | C.V. | 1,976,405 | 1,619,526 | 1911, 1912 |
| Waipara | 901 | 2,058 | 713 | 3,165,529 | 2,701,129 | C.V. | 3,137,834 | 2,682,569 | 1914 |
| Ashley | 311 | 728 | 348 | 850,317 | 700,610 | C.V. | 830,182 | 682,535 | 1916 |
| Kowai | 165 | 1,914 | 911 | 1,188,874 | 937,277 | C.V. | 1,173,849 | 933,621 | 1914 |
| Oxford | 332 | 1,756 | 827 | 1,149,535 | 952,064 | C.V. | 1,108,900 | 919,919 | 1918 |
| Rangiora | 100 | 2,747 | 1,168 | 1,382,679 | 1,065,278 | C.V. | 1,366,910 | 1,059,118 | 1913, 1914 |
| Eyre | 175 | 1,806 | 713 | 1,202,541 | 961,224 | C.V. | 1,196,729 | 959,237 | 1914 |
| Waimairi | 74 | 11,914 | 3,838 | 3,711,089 | 2,278,556 | C.V. | 3,026,686 | 1,835,918 | 1918 |
| Paparua | 140 | 4,716 | 1,608 | 2,114,282 | 1,567,503 | C.V. | 2,051,501 | 1,532,237 | 1917 |
| Malvern | 232 | 2,757 | 1,286 | 1,953,035 | 1,539,577 | C.V. | 1,898,928 | 1,521,143 | 1914 |
| Tawera | 932 | 847 | 317 | 580,039 | 483,549 | C.V. | 569,721 | 477,189 | 1918 |
| Heathcote | 21 | 3,277 | 1,507 | 951,795 | 550,310 | C.V. | 887,080 | 529,995 | 1916, 1917 |
| Halswell | 42 | 1,628 | 437 | 855,994 | 684,184 | C.V. | 820,625 | 670,860 | 1918 |
| Selwyn | 977 | 1,423 | 603 | 1,726,182 | 1,395,782 | C.V. | 1,654,530 | 1,381,279 | 1917 |
| Springs | 89 | 1,785 | 616 | 1,052,560 | 827,800 | C.V. | 1,011,172 | 824,802 | 1913 |
| Ellesmere | 183 | 3,441 | 1,198 | 2,232,784 | 1,818,726 | C.V. | 2,167,458 | 1,778,416 | 1906, 1911 |
| Mount Herbert | 59 | 405 | 194 | 571,734 | 469,784 | C.V. | 533,029 | 437,614 | 1917 |
| Wairewa | 165 | 1,036 | 647 | 1,281,693 | 1,058,898 | C.V. | 1,264,208 | 1,045,453 | 1917 |
| Akaroa | 163 | 1,982 | 667 | 2,285,656 | 1,915,952 | C.V. | 2,269,391 | 1,909,527 | 1918 |
| Ashburton | 2,542 | 13,136 | 4,046 | 9,471,141 | 7,832,281 | C.V. | 9,368,117 | 7,778,018 | 1911, '12, '14, '17 |
| Geraldine | 949 | 5,194 | 2,443 | 3,524,708 | 2,871,627 | C.V. | 3,493,517 | 2,853,581 | 1917, 1918 |
| Levels | 273 | 5,100 | 2,040 | 3,061,972 | 2,434,943 | C.V. | 3,039,456 | 2,426,033 | 1914 |
| Mackenzie | 2,537 | 2,868 | 1,096 | 2,136,743 | 1,675,241 | C.V. | 2,084,995 | 1,657,403 | 1911, 1912, 1913 |
| Waimate | 1,313 | 6,984 | 2,500 | 5,398,646 | 4,395,954 | U.V. | 5,342,911 | 4,367,252 | 1913, 1914 |
| Waitaki | 2,333 | 9,694 | 3,913 | 4,134,719 | 3,176,245 | C.V. | 4,064,745 | 3,156,403 | 1909 |
| Maniototo | 1,239 | 2,527 | 1,863 | 927,653 | 640,442 | C.V. | 902,706 | 630,471 | 1912, 1913 |
| Waihemo | 336 | 1,446 | 698 | 799,805 | 598,881 | C.V. | 792,727 | 597,378 | 1918 |
| Waikouaiti | 318 | 4,094 | 2,028 | 894,327 | 511,567 | C.V. | 769,357 | 493,448 | 1908 |
| Peninsula | 37 | 1,793 | 1,475 | 517,066 | 290,648 | † | 482,883 | 286,334 | 1908, 1911 |
| Taieri | 957 | 5,599 | 2,602 | 2,083,036 | 1,493,087 | C.V. | 2,044,063 | 1,481,527 | 1907, 1917, 1918 |
| Tuapeka | 1,365 | 5,123 | 2,619 | 1,919,345 | 1,356,943 | C.V. | 1,786,278 | 1,282,714 | 1911, 1912 |
| Bruce | 503 | 4,763 | 2,161 | 1,660,315 | 1,105,235 | C.V. | 1,637,095 | 1,099,357 | 1907,'09,'17,'18 |
| Clutha | 946 | 6,901 | 3,274 | 2,688,927 | 1,699,753 | C.V. | 2,587,531 | 1,642,204 | 1913,'14,'16 '17 |
| Islands— | |||||||||
| Quarantine and Goat | .. | .. | .. | 3,454 | 900 | Nil | .. | .. | .. |
| Vincent | 2,684 | 3,930 | 1,896 | 976,410 | 645,289 | C.V. | 945,724 | 632,941 | 1914 |
| Lake | 3,712 | 1,749 | 1,389 | 551,815 | 405,274 | C.V. | 508,979 | 371,801 | 1914, 1916 |
| Fiord | 3,059 | 17 | 90 | 144,293 | 137,513 | Nil | 15,851 | 15,071 | 1897 |
| Wallace | 3,696 | 9,432 | 3,900 | 3,739,013 | 2,561,446 | C.V | 3,544,836 | 2,396,155 | 1913, 1914, 1917 |
| Southland | 3,756 | 25,661 | 10,145 | 11,356,121 | 7,452,285 | U.V. | 11,160,995 | 7,545,297 | 1911,'13,'14,'16,'17 |
| Stewart Island | 665 | 349 | 295 | 167,105 | 129,749 | C.V. | 40,553 | 17,526 | 1904 |
| Islands— | |||||||||
| Antipodes, &c. | .. | .. | 7 | 13,880 | 13,880 | Nil | 12,005 | 12,005 | 1897 |
TABLE SHOWING CAPITAL VALUE OF LAND WITH IMPROVEMENTS (AND DISTINGUISHING THE UNIMPROVED VALUE OF LAND ) FOR ALL LANDS AND FOR RATEABLE PROPERTIES IN EACH BOROUGH IN NEW ZEALAND AS AT THE 1ST APRIL , 1918, WITH THE AREA , POPULATION , NUMBER OF ASSESSMENTS ON VALUATION ROLL , AND THE YEAR IN WHICH THE VALUES WERE LAST REVISED .
| Roll No. | Borough. | Area, in Acres. | population (census 1916.) | Number of Assessments on Valuation Roll. | Gross Values. | System of Rating. | Rateable Values. | Values last revised as at 1st April in | ||
|---|---|---|---|---|---|---|---|---|---|---|
| Capital Value (Land and Improvements). | Unimproved Value of Land (included in previous Column). | Capital Value (Land and Improvements). | Unimproved Value of Land (included in previous Column). | |||||||
| £ | £ | £ | £ | |||||||
| 1/1 | Whangarei | 2,038 | 3,294 | 869 | 660,444 | 348,226 | U.V. | 614,859 | 325,816 | 1911 |
| 41c | Dargaville | 2,788 | 1,776 | 893 | 425,570 | 231,235 | U.V. | 406,450 | 224,580 | 1915 |
| 55 | Birkenhead | 3,114 | 2,116 | 724 | 608,640 | 320,835 | U.V. | 591,815 | 310,290 | 1914 |
| 56 | Devonport | 745 | 7,613 | 1,934 | 1,572,798 | 655,950 | U.V. | 1,274,740 | 526,439 | 1911 |
| 57, 63, 65, 93, 94, 100, 102 | Auckland | 7,142 | 68,888 | 17,389 | 24,663,452 | 14,245,984 | A.V. | 21,739,202 | 12,319,479 | 1912 1913 1914 |
| 64 | Newmarket | 180 | 2,863 | 774 | 685,469 | 369,379 | A.V. | 658,084 | 350,384 | 1914 |
| 66 | Onehunga | 1,349 | 5,913 | 1,808 | 1,071,225 | 510,165 | U.V. | 1,007,025 | 477,370 | 1918 |
| 88a | Takapuna | 2,775 | 2,756 | 2,254 | 1,168,176 | 763,559 | C.V. | 1,137,191 | 750,104 | 1914 |
| 90 | Northcote | 1,200 | 1,651 | 532 | 335,778 | 184,153 | A.V. | 324,663 | 176,703 | 1913 |
| 96 | Mount Albert | 2,437 | 9,654 | 3,453 | 1,679,993 | 804,165 | C.V. | 1,628,623 | 776,650 | 1914 |
| 99 | Mount Eden | 1,422 | 12,555 | 3,187 | 2,459,035 | 1,018,635 | A.V. | 2,284,400 | 976,055 | 1916 |
| 117 | Otahuhu | 1,408 | 2,328 | 726 | 502,560 | 272,660 | C.V. | 470,990 | 255,320 | 1916 |
| 129A | Pukekohe | 3,510 | 1,533 | 533 | 391,286 | 216,401 | C.V. | 371,749 | 208,624 | 1912 |
| 140, 158A | Hamilton | 3,202 | 7,538 | 2,309 | 2,279,376 | 1,374,620 | U.V. | 2,086,329 | 1,230,413 | 1912, 1914 |
| 141 | Cambridge | 1,083 | 1,507 | 623 | 445,870 | 257,530 | A.V. | 394,190 | 229,765 | 1914 |
| 163 | Te Awamutu | 1,520 | 1,064 | 314 | 301,525 | 173,346 | C.V. | 282,320 | 161,966 | 1913 |
| 166 | Thames | 2,680 | 3,273 | 954 | 443,630 | 183,510 | A.V. | 373,015 | 158,900 | 1914 |
| 167 | Tauranga | 875 | 1,685 | 687 | 291,481 | 143,527 | A.V. | 263,913 | 129,444 | 1912 |
| 176B | Paeroa | 2,780 | 1,376 | 650 | 193,276 | 84,843 | A.V. | 174,853 | 75,815 | 1913 |
| 177B | Waihi | 3,130 | 4,774 | 1,691 | 422,468 | 149,258 | A.V. | 388,925 | 139,380 | 1908 |
| 187 | Te Aroha | 2,965 | 1,802 | 600 | 224,880 | 123,992 | C.V. | 205,385 | 111,542 | 1911 |
| 192 | Rotorua (Town) | 4,140 | 2,845 | 725 | 350,620 | 161,985 | C.V. | 304,360 | 136,690 | 1916 |
| 195 | Whakatane | 1,460 | 900 | 416 | 780,690 | 467,987 | C.V. | 534,032 | 286,142 | 1918 |
| 199 | Opotiki | 770 | 1,073 | 438 | 273,267 | 153,086 | C.V. | 250,219 | 139,256 | 1913 |
| 201A | Taumarunui | 1,925 | 1,875 | 579 | 375,208 | 196,878 | U.V. | 340,525 | 178,525 | 1917 |
| 230 | Te Kuiti | 2,143 | 1,982 | 738 | 561,660 | 333,923 | U.V. | 525,662 | 310,945 | 1917 |
| 2/1 | Gisborne | 2,632 | 9,654 | 2,250 | 2,941,251 | 1,492,516 | U.V. | 2,728,041 | 1,370,114 | 1912 |
| 22 | Wairoa | 1,562 | 1,530 | 752 | 420,272 | 237,368 | U.V. | 386,840 | 224,983 | 1916 |
| 25, 33A | Napier | 1,160 | 12,704 | 2,781 | 3,432,149 | 1,669,785 | U.V. | 3,121,263 | 1,535,596 | 1916, 1917 |
| 26 | Hastings | 2,601 | 7,918 | 3,855 | 2,643,303 | 1,521,008 | U.V. | 2,554,215 | 1,470,762 | 1916 |
| 27 | Dannevirke | 1,270 | 3,336 | 1,192 | 810,381 | 381,489 | U.V. | 752,682 | 361,342 | 1911 |
| 28 | Woodville | 1,240 | 1,078 | 1,041 | 164,176 | 60,368 | U.V. | 140,604 | 53,819 | 1913 |
| 41 | Waipawa | 4,810 | 1,100 | 534 | 262,113 | 141,796 | U.V. | 248,006 | 135,069 | 1914 |
| 44A | Waipukurau | 1,046 | 1,167 | 471 | 245,337 | 133,198 | U.V. | 231,693 | 128,580 | 1908 |
| 61 | New Plymouth | 4,088 | 8,704 | 3,170 | 2,255,177 | 1,333,051 | A.V. | 2,031,523 | 1,193,818 | 1914 |
| 62 | Hawera | 750 | 3,375 | 71 | 860,989 | 420,184 | U.V. | 811,819 | 399,470 | 1917 |
| 63 | Patea | 1,430 | 1,010 | 390 | 149,197 | 57,406 | A.V. | 133,939 | 53,568 | 1914 |
| 70 | Waitara | 1,540 | 1,422 | 748 | 231,424 | 84,546 | U.V. | 221,646 | 81,081 | 1910 |
| 74 | Inglewood | 703 | 1,199 | 514 | 198,873 | 87,302 | U.V. | 180,062 | 76,178 | 1914 |
| 91 | Stratford | 1,920 | 2,713 | 1,882 | 571,374 | 241,718 | U.V. | 535,361 | 221,320 | 1912 |
| 97A | Eltham | 1,590 | 1,711 | 641 | 413,593 | 193, 542 | C.V. | 396,112 | 186,022 | 1914 |
| 116, 120A | Wanganui | 4,944 | 14,380 | 3,845 | 3,186,012 | 1,920,790 | A.V. | 2,912,368 | 1,749,215 | 1911 |
| 117 | Marton | 1,160 | 1,650 | 815 | 350,262 | 139,767 | U.V. | 331,400 | 131,720 | 1913 |
| 118H | Ohakune | 3,134 | 1,371 | 491 | 117,428 | 42,890 | U.V. | 104,718 | 35,246 | 1912 |
| 125A | Taihape | 1,230 | 1,927 | 584 | 344,683 | 173,702 | C.V. | 298,552 | 148,050 | 1914 |
| 3/1 | Feilding | 2,450 | 3,438 | 1,251 | 870,393 | 431,846 | U.V. | 812,482 | 395,000 | 1916 |
| 2 | Palmerston North | 4,595 | 12,829 | 3,809 | 3,151,292 | 1,661,763 | U.V. | 2,928,425 | 1,551,455 | 1914 |
| 3 | Foxton | 1,240 | 1,772 | 604 | 273,670 | 115,902 | U.V. | 247,319 | 101,150 | 1916 |
| 4 | Onslow | 2,000 | 2,191 | 1,199 | 550,625 | 267,703 | U.V. | 525,572 | 256,229 | 1914 |
| 5 | Karori | 2,240 | 1,647 | 1,332 | 532,664 | 315,856 | U.V. | 491,681 | 287,351 | 1913 |
| WELLINGTON — | ||||||||||
| 4A | Onslow portion | 9,650 | 73,305 | 486 | 390,659 | 206,292 | U.V. | 365,509 | 185,343 | 1913 |
| 5A | Karori portion | 872 | 527,778 | 215,054 | U.V. | 459,408 | 199,779 | 1913 | ||
| 7 | City portion | 11,585 | 18,059,983 | 9,709,683 | U.V. | 16,414,929 | 9,570,356 | 1914 | ||
| 8 | Kilbirnie portion | 7,549 | 3,687,582 | 1,494,862 | U.V. | 3,569,397 | 1,434,223 | 1913 | ||
| 9 | Island Bay portion | |||||||||
| 10 | Ohiro portion | |||||||||
| 23A | Shannon | 827 | 1,031 | .. | 124,625 | 54,050 | C.V. | 117,840 | 51,469 | 1918 |
| 24A | Levin | 1,330 | 1,630 | 1,024 | 309,968 | 148,014 | C.V. | 286,091 | 133,776 | 1914 |
| 29 | Pahiatua | 720 | 1,300 | 570 | 241,683 | 101,486 | U.V. | 231,147 | 98,824 | 1906 |
| 30 | Masterton | 2,350 | 5,894 | 1,840 | 1,365,394 | 574,160 | U.V. | 1,230,833 | 536,678 | 1907 |
| 31 | Carterton | 1,920 | 1,614 | 762 | 294,746 | 118,650 | C.V. | 273,781 | 111,978 | 1908 |
| 32 | Greytown | 3,907 | 1,186 | 464 | 205,068 | 85,953 | A.V. | 189,895 | 84,214 | 1911 |
| 33 | Lower Hutt | 3,255 | 4,893 | 3,124 | 1,460,560 | 832,582 | U.V. | 1,379,876 | 773,671 | 1911 |
| 34 | Petone | 1,060 | 7,115 | 2,099 | 1,461,824 | 676,225 | U.V. | 1,336,274 | 595,332 | 1911 |
| 42 | Eketahuna | 960 | 754 | 448 | 151,737 | 66,624 | U.V. | 139,239 | 61,934 | 1912 |
| 54 | Featherston | 876 | 1,159 | .. | 131,703 | 32,525 | U.V. | 122,849 | 31,075 | 1918 |
| 64A | Eastbourne | 1,380 | 952 | 786 | 222,589 | 102,042 | U.V. | 213,140 | 95,915 | 1914 |
| 66 | Miramar | 2,254 | 2,158 | 1,822 | 867,225 | 482,739 | U.V. | 783,520 | 425,261 | 1914 |
| 67 | Richmond | 2,300 | 922 | 247 | 220,473 | 117,515 | C.V. | 207,168 | 114,705 | 1917 |
| 68 | Nelson | 4,966 | 8,774 | 2,541 | 1,776,149 | 848,781 | A.V. | 1,647,319 | 791,550 | 1914 |
| 69 | Picton | 920 | 1,121 | 825 | 295,873 | 154,235 | C.V. | 262,603 | 132,424 | 1909 |
| 70 | Blenheim | 1,613 | 3,822 | 1,628 | 980,026 | 476,992 | U.V. | 913,707 | 444,333 | 1914 |
| 77 | Motueka | 5,960 | 1,475 | 426 | 200,162 | 89,661 | C.V. | 192,320 | 87,655 | 1909 |
| 98 | Westport | 760 | 4,067 | 1,340 | 744,958 | 374,211 | U.V. | 625,787 | 296,350 | 1910 |
| 99 | Greymouth | 2,130 | 4,863 | 1,590 | 847,169 | 270,611 | U.V. | 724,406 | 227,494 | 1911 |
| 100 | Brunner | 5,670 | 598 | 524 | 71,310 | 12,229 | A.V. | 20,774 | 9,362 | 1898 |
| 101 | Kumara | 842 | 623 | 459 | 33,812 | 6,072 | C.V. | 23,669 | 4,007 | 1904 |
| 102 | Hokitika | 2,000 | 2,091 | 1,110 | 262,374 | 77,213 | U.V. | 201,752 | 60,483 | 1907 |
| 103 | Ross | 3,955 | 491 | 340 | 23,619 | 5,843 | C.V. | 18,548 | 4,609 | 1909 |
| 115A | Runanga | 1,101 | 1,411 | 410 | 58,799 | 19,025 | U.V. | 46,606 | 10,925 | 1912 |
| 4/1 | Rangiora | 1,040 | 1,808 | 682 | 327,617 | 130,287 | U.V. | 304,202 | 123,672 | 1914 |
| 2 | Kaiapoi | 1,020 | 1,560 | 602 | 189,331 | 58,731 | A.V. | 174,696 | 56,711 | 1907 |
| Christchurch— | ||||||||||
| 25 | St. Albans portion | 5,923 | 55,860 | 4,364 | 2,621,865 | 925,130 | U.V. | 2,568,455 | 906,945 | 1914 |
| 26-30 | Central portion | 3,984 | 7,891,378 | 4,036,420 | U.V. | 6,963,949 | 3,687,177' | 1914 | ||
| 31 | Sydenham portion | 3,624 | 2,103,773 | 746,938 | U.V. | 1,887,111 | 616,037 | 1914 | ||
| 32, 32A | Linwood portion | 2,670 | 1,290,141 | 435,919 | U.V. | 1,256,696 | 424,874 | 1914 | ||
| 31A | Opawa portion | 361 | 152,365 | 67,430 | U.V. | 150,435 | 67,055 | 1917 | ||
| 31B | St. Martin's portion | 150 | 68,625 | 36,760 | U.V. | 68,370 | 36,595 | 1917 | ||
| 32B | Avonside portion | 232 | 121,375 | 52,355 | U.V. | 118,020 | 51,455 | 1917 | ||
| 33 | Woolston | 1,276 | 3,990 | 1,180 | 520,171 | 172,296 | U.V. | 491,776 | 164,306 | 1908 |
| 34 | New Brighton | 1,500 | 2,310 | 1,829 | 426,982 | 170,682 | U.V. | 412,682 | 164,712 | 1913 |
| 35 | Sumner | 4,876 | 2,287 | 1,301 | 582,362 | 272,450 | U.V. | 548,912 | 259,085 | 1913 |
| 36 | Lyttelton | 2,014 | 3,766 | 921 | 988,107 | 272,707 | A.V. | 435,087 | 172,367 | 1908 |
| 37 | Akaroa | 228 | 540 | 190 | 115,436 | 44,349 | C.V. | 94,802 | 37,138 | 1911 |
| 39E | Riccarton | 566 | 2,890 | 891 | 574,339 | 196,935 | U.V. | 560,969 | 193,890 | 1918 |
| 48, 48A | Spreydon | 1,295 | 4,289 | 1,616 | 623,200 | 235,360 | U.V. | 607,550 | 229,995 | 1914 |
| 63 | Ashburton | 680 | 3,109 | 964 | 544,501 | 213,569 | A.V. | 493,400 | 185,753 | 1905 |
| 64 | Timaru | 2,330 | 12,238 | 3,304 | 2,398,785 | 1,145,936 | A.V. | 2,248,275 | 1,072,571 | 1908 |
| 78 | Geraldine. | 718 | 869 | 384 | 136,140 | 43,660 | C.V. | 120,460 | 38,584 | 1912 |
| 80, 80A | Temuka | 945 | 1,633 | 741 | 251,668 | 67,581 | C.V. | 215,104 | 57,404 | 1909 |
| 5/1 | Waimate | 649 | 1,867 | 696 | 392,125 | 129,510 | U.V. | 355,223 | 119,730 | 1918 |
| 2 | Oamaru | 1,111 | 5,140 | 1,538 | 880,923 | 290,416 | A.V. | 786,195 | 259,664 | 1910 |
| 3 | Hampden | 640 | 364 | 393 | 29,086 | 9,682 | C.V. | 24,821 | 8,113 | 1907 |
| 23 | Naseby | 113 | 276 | 184 | 20,863 | 2,583 | A.V. | 13,733 | 1,908 | 1912 |
| 24 | Palmerston | 900 | 752 | 462 | 91,534 | 24,376 | C.V. | 79,587 | 22,492 | 1913 |
| 25 | Waikouaiti | 1,952 | 611 | 602 | 77,457 | 28,112 | C.V. | 69,537 | 26,845 | 1908 |
| 44 | Port Chalmers | 485 | 2,615 | 529 | 362,741 | 117,892 | A.V. | 286,551 | 101,687 | 1907 |
| 45 | West Harbour | 1,670 | 1,631 | 864 | 214,158 | 74,363 | U.V. | 202,913 | 71,038 | 1907 |
| Dunedin— | ||||||||||
| 46 | Valley Portion | 14,570 | 55,256 | 13,903 | 640,736 | 210,552 | A.V. | 612,984 | 203,090 | 1907 |
| 47 | Maori Hill portion | 447,247 | 186,700 | A.V. | 376,797 | 155,350 | 1914 | |||
| 48 | Roslyn portion | 1,037,417 | 346,391 | A.V. | 997,902 | 335,941 | 1908 | |||
| 49 | Mornington Portion | 550,291 | 191,021 | A.V. | 529,506 | 184,881 | 1907 | |||
| 50, 51 | Leith portion | 3,410,775 | 1,473,165 | A.V. | 2,833,030 | 1,239,930 | 1909 | |||
| 52, 53 | Central portion | 4,102,676 | 1,766,195 | A.V. | 3,553,441 | 1,511,560 | 1909 | |||
| 54, 55 | Caversham portion | 1,622,789 | 454,553 | A.V. | 1,427,883 | 398,478 | 1907 | |||
| 64A | Bay portion | 396,721 | 161,633 | A.V. | 388,111 | 159,148 | 1911 | |||
| 56 | St. Kilda | 463 | 5,520 | 1,647 | 947,955 | 313,060 | U.V. | 901,135 | 297,695 | 1913 |
| 65 | Green Island | 804 | 1,904 | 676 | 284,251 | 65,775 | A.V. | 271,221 | 63,130 | 1909 |
| 66 | Mosgiel | 967 | 1,719 | 668 | 267,030 | 95,660 | U.V. | 243,530 | 90,900 | 1916 |
| 67 | Roxburgh | 400 | 449 | 220 | 37,725 | 5,959 | A.V. | 32,670 | 4,829 | 1912 |
| 68 | Lawrence | 640 | 837 | 553 | 112,864 | 30,344 | A.V. | 92,950 | 25,330 | 1905 |
| 69 | Tapanui | 124 | 322 | 145 | 33,225 | 9,075 | A.V. | 29,955 | 8,535 | 1909 |
| 70 | Milton | 297 | 1,317 | 431 | 184,248 | 55,856 | A.V. | 167,588 | 52,856 | 1907 |
| 71 | Balclutha | 568 | 1,409 | 501 | 223,943 | 82,708 | U.V. | 206,403 | 76,073 | 1911 |
| 72 | Kaitangata | 1,158 | 1,681 | 736 | 109,756 | 31,528 | A.V. | 98,885 | 29,093 | 1905 |
| 114 | Cromwell | 640 | 549 | 499 | 46,487 | 10,060 | A.V. | 40,813 | 8,799 | 1906 |
| 115 | Alexandra | 860 | 679 | 461 | 57,239 | 11,548 | A.V. | 50,565 | 10,003 | 1906 |
| 6/1 | Arrowtown | 390 | 307 | 180 | 21,519 | 3,375 | A.V. | 15,377 | 2,850 | 1905 |
| 2 | Queenstown | 923 | 657 | 267 | 65,595 | 14,564 | A.V. | 52,481 | 12,264 | 1905 |
| 20 | Gore | 1,353 | 3,551 | 1,448 | 692,306 | 275,712 | U.V. | 635,612 | 247,677 | 1911,1913 |
| 21 | Mataura | 1,530 | 1,129 | 447 | 207,064 | 74,808 | A.V. | 195,628 | 70,213 | 1912 |
| 22 | Winton | 160 | 586 | 232 | 114,517 | 38,745 | U.V. | 102,503 | 35,370 | 1916 |
| 27 | Invercargill | 2,583 | 14,154 | 4,719 | 3,820,998 | 1,712,322 | U.V. | 3,378,553 | 1,486,772 | 1916 |
| 28 | Invercargill South | 2,280 | 1,712 | 788 | 278,462 | 136,355 | U.V. | 268,107 | 132,825 | 1914 |
| 29 | Riverton | 718 | 837 | 521 | 139,197 | 44,885 | U.V. | 120,051 | 42,063 | 1913 |
| 30 | Bluff | 2,006 | 1,823 | 680 | 295,614 | 101,090 | U.V. | 264,704 | 91,560 | 1909 |
TABLE SHOWING CAPITAL VALUE OF LAND WITH IMPROVEMENTS (AND DISTINGUISHING THE UNIMPROVED VALUE OF LAND ) FOR ALL LANDS AND FOR RATEABLE PROPERTIES IN EACH TOWN DISTRICT (OUTSIDE THE JURISDICTION OF ANY COUNTY ) IN NEW ZEALAND AS AT THE 1ST APRIL , 1918, WITH THE POPULATION , NUMBER OF ASSESSMENTS ON VALUATION ROLL , AND THE YEAR IN WHICH THE VALUES WERE LAST REVISED .
| Roll No. | Town District, independent of County (outside County Jurisdiction). | Population (Census 1916). | Number of Assessments on Valuation Roll. | Gross Values. | System of Rating. | Rateable Values. | Values last revised as at 1st April in | ||
|---|---|---|---|---|---|---|---|---|---|
| Capital Value (Land and Improvements). | Unimproved Value of Land (included in previous Column). | Capital Value (Land and Improvements). | Unimproved Value of Land (included in previous Column). | ||||||
| £ | £ | £ | £ | ||||||
| 1/24A | Hikurangi | 775 | 291 | 66,015 | 31,415 | U.V. | 62,665 | 29,875 | 1913 |
| 79B | Warkworth | 624 | 211 | 82,237 | 26,670 | C.V. | 75,717 | 25,090 | 1912 |
| 84 | Helensville | 837 | 261 | 111,740 | 36,430 | C.V. | 102,020 | 33,505 | 1911 |
| 92B | New Lynn | 1,041 | 268 | 200,160 | 104,970 | C.V. | 194,680 | 103,070 | 1917 |
| 105A | Ellerslie | 1,363 | 422 | 287,950 | 138,450 | U.V. | 265,085 | 127,665 | 1916 |
| 109A | Waiuku | 641 | 202 | 136,933 | 67,165 | C.V. | 129,993 | 65,045 | 1914 |
| 125 | Papakura | 641 | 288 | 154,665 | 90,965 | U.V. | 143,285 | 82,655 | 1918 |
| 130A | Tuakau | 390 | 203 | 103,712 | 59,022 | C.V. | 102,370 | 58,405 | 1918 |
| 143A | Huntly | 1,535 | 290 | 150,880 | 71,910 | U.V. | 143,585 | 69,315 | 1911 |
| 157 | Ngaruawahia | 755 | 301 | 132,788 | 64,238 | U.V. | 112,204 | 50,854 | 1913 |
| 184B | Te Puke | 565 | 127 | 102,974 | 45,500 | U.V. | 93,334 | 42,745 | 1915 |
| 186A | Morrinsville | 934 | 260 | 237,670 | 125,815 | U.V. | 222,700 | 120,175 | 1917 |
| 189A | Matamata | 505 | 319 | 133,735 | 66,685 | C.V. | 119,370 | 57,130 | 1918 |
| 2/16 | Mangapapa | 1,140 | 555 | 271,117 | 122,846 | C.V. | 211,054 | 114,761 | 1913 |
| 32 | Taradale | 1,012 | 436 | 226,819 | 135,101 | C.V. | 220,434 | 133,751 | 1918 |
| 38A | Havelock North | 870 | 323 | 261,507 | 136,473 | C.V. | 233,672 | 130,598 | 1918 |
| 94 | Manaia | 606 | 402 | 115,992 | 51,258 | C.V. | 103,964 | 47,008 | 1916 |
| 111 | Waverley | 623 | 257 | 100,717 | 42,341 | U.V. | 90,672 | 38,936 | 1912 |
| 115A | Gonville | 2,693 | 789 | 574,717 | 221,307 | U.V. | 540,670 | 208,057 | 1912 |
| 115B | Castlecliff | 734 | 464 | 172,594 | 61,144 | C.V. | 166,814 | 57,124 | 1913 |
| 154 | Manunui | 813 | 149 | 71,386 | 25,871 | A.V. | 64,513 | 22,148 | 1917 |
| 118F | Raetihi | 508 | 296 | 81,437 | 42,027 | U.V. | 71,856 | 34,312 | 1913 |
| 118J | Rangataua | 410 | 171 | 34,701 | 10,557 | U.V. | 28,497 | 7,087 | 1913 |
| 125B | Mangaweka | 390 | 259 | 57,252 | 22,055 | C.V. | 50,173 | 18,975 | 1914 |
| 126 | Hunterville | 555 | 273 | 96,144 | 37,325 | C.V. | 86,061 | 33,258 | 1914 |
| 136 | Bull's | 483 | 177 | 57,761 | 23,788 | A.V. | 53,139 | 22,588 | 1908 |
| 3/25A | Otaki | 806 | 515 | 198,100 | 111,034 | C.V. | 189,773 | 107,620 | 1913 |
| 52B | Martinborough | 725 | 451 | 159,783 | 53,549 | U.V. | 146,202 | 51,899 | 1914 |
| 59 | Johnsonville | 886 | 677 | 191,798 | 100,835 | U.V. | 181,756 | 95,760 | 1914 |
| 62A | Upper Hutt, | 1,399 | 1,160 | 246,799 | 128,900 | U.V. | 229,279 | 124,165 | 1914 |
| 4/71 | Hampstead | 1,278 | 472 | 142,616 | 58,230 | C.V. | 131,456 | 57,290 | 1908 |
| 75 | Tinwald | 1,075 | 247 | 88,991 | 45,405 | C.V. | 84,157 | 43,195 | 1905 |
| 83 | Pleasant Point | 482 | 235 | 80,497 | 36,582 | C.V. | 71,307 | 33,517 | 1914 |
| 6/35 | Otautau | 696 | 327 | 128,839 | 50,197 | C.V. | 119,071 | 47,210 | 1912 |
| 39A | Lumsden | 530 | 380 | 47,185 | 12,043 | U.V. | 44,082 | 11,079 | 1914 |
| 52 | Wyndham | 647 | 275 | 123,504 | 50,580 | A.V. | 110,311 | 44,640 | 1912 |
Table of Contents
FROM the very earliest times New Zealand has inevitably been dependent upon foreign intercourse for its development and progress. The first European residents in New Zealand seem to have been the small party of sealers from Sydney who settled at Dusky Sound for ten months in 1792-93, and built there the first vessel made from local timber. The seals and whales of the South Seas seem to have attracted the first attention to the Islands as a convenient depot, and by 1800 there were established many little settlements where the blubber was tried out. In 1794 the timber trade was inaugurated by the visit of the "Fancy," and the export of timber, mainly kahikatea (white-pine), rapidly grew to goodly proportions. The native flax (Phormium tenax ) was also early recognized as a source of wealth, and a considerable export arose.
Thus, irregularly, the settlement of New Zealand went hand-in-hand with external trade, and was, indeed, promoted by the hope of commercial gain. The small community which grew up mainly in the northern peninsula was adventurous and lawless in the extreme. The early exports were all local products as enumerated above, with the gruesome addition of the tattooed Maori heads, while the imports were mainly muskets and powder.
The arrival of the New Zealand Company's expedition in 1840 stimulated the development of a more stable trade—wool had been exported to Hobart in 1839—and gradually the exports and imports of New Zealand took on their modern form. In 1852 the young colony was granted representative government, and from that date there is an accurate record of the external trade of the country. By 1856 full responsible or cabinet government was established.
By 1853 the export of flax had been practically ruined owing to increased competition from other sources, and the amount exported in that year was negligible. Timber, however, retained its place as a principal export, supplying 31 per cent. (£93,000) of the total exports; while wool had increased to 22 per cent. (£66,507); the value of grain exported was small, only £19,000 (6 per cent.); oil amounted to £22,000, and potatoes to £30,000. The total exports in 1853 were £303,282, and the total imports £597,827.
The following table shows the increase in the total trade since the year 1853:—
TOTAL TRADE , IMPORTS , AND EXPORTS OF NEW ZEALAND , 1853-1918.
| Year. | Total Value. | Value per Head. | ||||||||||
|---|---|---|---|---|---|---|---|---|---|---|---|---|
| Total Trade. | Imports. | Exports. | Total Trade. | Imports. | Exports. | |||||||
* Excluding gold (specie and bullion). | ||||||||||||
| £ | £ | £ | £ | s. | d. | £ | s. | d. | £ | s. | d. | |
| 1853 | 901,110 | 597,828 | 303,282 | 30 | 0 | 9 | 19 | 18 | 7 | 10 | 2 | 2 |
| 1863. | 10,510,079 | 7,024,674 | 3,485,405 | 72 | 10 | 5 | 48 | 9 | 5 | 24 | 1 | 0 |
| 1873 | 12,075,058 | 6,464,687 | 5,610,371 | 41 | 19 | 3 | 22 | 9 | 4 | 19 | 9 | 11 |
| 1883 | 15,070,037 | 7,974,038 | 7,095,999 | 28 | 9 | 5 | 15 | 1 | 3 | 13 | 8 | 2 |
| 1893 | 15,896,879 | 6,911,515 | 8,985,364 | 24 | 0 | 9 | 10 | 9 | 0 | 13 | 11 | 9 |
| 1903 | 27,799,053 | 12,788,675 | 15,010,378 | 33 | 17 | 10 | 15 | 11 | 10 | 18 | 6 | 0 |
| 1904 | 28,040,042 | 13,291,694 | 14,748,348 | 33 | 3 | 8 | 15 | 14 | 7 | 17 | 9 | 1 |
| 1905 | 28,484,804 | 12,828,857 | 15,655,947 | 32 | 14 | 10 | 14 | 14 | 11 | 17 | 19 | 11 |
| 1906 | 33,306,540 | 15,211,403 | 18,095,137 | 37 | 3 | 9 | 16 | 19 | 8 | 20 | 4 | 1 |
| 1907 | 37,371,818 | 17,302,861 | 20,068,957 | 40 | 13 | 3 | 18 | 16 | 6 | 21 | 16 | 9 |
| 1908 | 33,788,778 | 17,471,284 | 16,317,494 | 35 | 15 | 1 | 18 | 9 | 9 | 17 | 5 | 4 |
| 1909 | 35,336,715 | 15,674,719 | 19,661,996 | 36 | 7 | 3 | 16 | 2 | 7 | 20 | 4 | 8 |
| 1910 | 39,231,792 | 17,051,583 | 22,180,209 | 39 | 10 | 4 | 17 | 3 | 6 | 22 | 6 | 10 |
| 1911 | 38,574,369 | 19,545,879 | 19,028,490 | 38 | 0 | 2 | 19 | 5 | 2 | 18 | 15 | 0 |
| 1912 | 42,747,155 | 20,976,574 | 21,770,581 | 41 | 2 | 10 | 20 | 3 | 9 | 20 | 19 | 1 |
| 1913 | 45,275,024 | 22,288,302 | 22,986,722 | 42 | 7 | 3 | 20 | 17 | 1 | 21 | 10 | 2 |
| 1914 | 48,117,543 | 21,856,096 | 26,261,447 | 44 | 2 | 8 | 20 | 0 | 11 | 24 | 1 | 9 |
| 1915 | 53,477,746 | 21,728,834 | 31,748,912 | 48 | 12 | 10 | 19 | 15 | 2 | 28 | 17 | 8 |
| 1916 | 59,626,220 | 26,339,283 | 33,286,937 | 54 | 4 | 8 | 23 | 19 | 2 | 30 | 5 | 6 |
| 1917* | 51,602,418 | 20,919,259 | 30,683,159 | 46 | 19 | 0 | 19 | 0 | 8 | 27 | 18 | 4 |
| 1918* | 52,707,441 | 24,233,944 | 28,473,497 | 47 | 15 | 8 | 21 | 19 | 5 | 25 | 16 | 3 |
A diagram showing the increase in the total external trade and in the population of the Dominion during the period 1853 to 1918 is given below. This diagram is constructed on what is known as the "ratio" method —that is, it shows each yearly movement as a percentage or ratio of the previous figure, and therefore gives a more correct view of the "speed" of progress than if the actual numerical increases from year to year were plotted.
Unfortunately, figures relating to gold imports and exports for 1917 and 1918 are not available for publication. Accordingly the expedient has been adopted of assuming the gold figures for these two years to be equal to the average for the years 1912-14, the last normal years for which such figures are available.
A low and fluctuating level of trade was turned in 1860-63 into a rapidly increasing volume by the effect of the gold-discoveries which occurred in the early sixties." Both imports and exports were stimulated, the former to feed and clothe an ever-increasing population, the latter by the export of gold.
DIAGRAM SHOWING THE MOVEMENT OF EXTERNAL TRADE AND OF POPULATION OF NEW ZEALAND , 1853-1918.
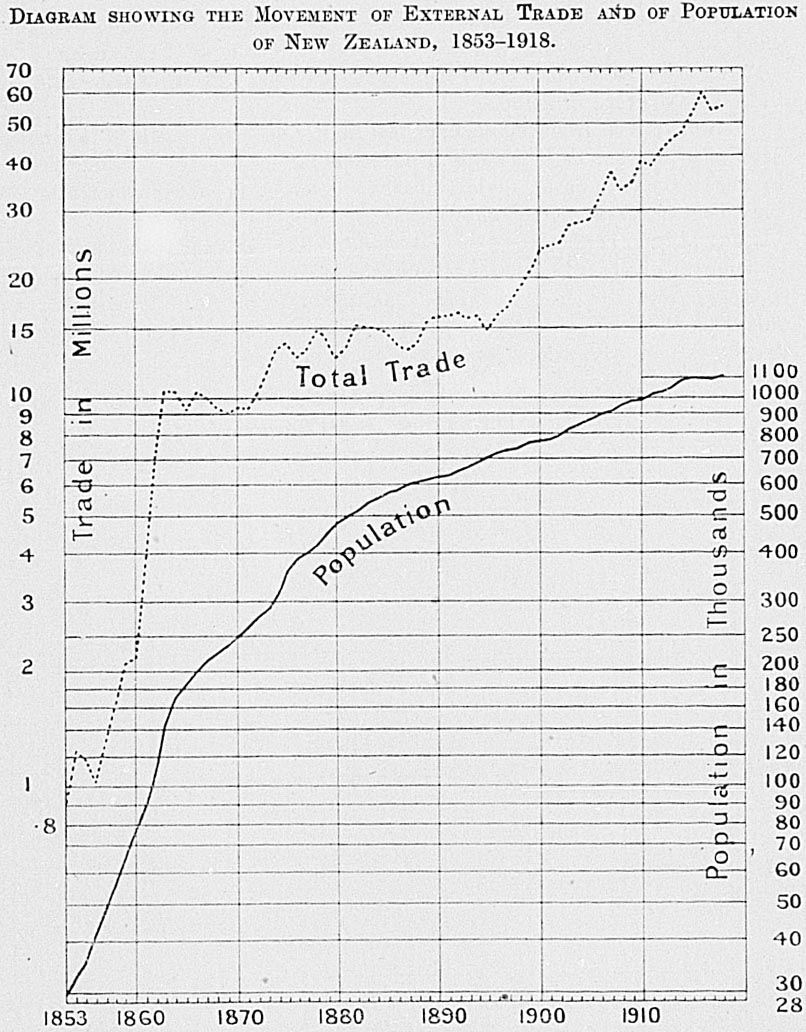
Trade remained stationary till the expenditure of borrowed money brought the land-boom of the early "seventies." A great temporary increase of trade was succeeded by violent fluctuations and but slowly increasing trade, as the effects of the bubble were slowly worked off. It is significant that from 1873 till 1895 the world level of prices was falling continuously, and this factor contributed not a little to the depression of New Zealand. Little headway could be made against a falling price of wool and a decreasing production of gold, which were the main features of those twenty years.
But in 1895 world prices began to rise, and the effect is seen immediately in the upward shoot of the external trade. On only three occasions has this upward tendency been checked—in 1908, when the commercial crisis which was felt in the Old World a year previously affected New Zealand; in 1913, on the occasion of another depression of trade; and again since 1916, as a result of shortage of shipping.
It will be seen from the diagram that since 1895 trade has increased much faster than has population. This is doubtless largely due to increasing prices. To some extent, however, it is probably a result of greater productivity and consequent increased purchasing-power.
For a long period, the external trade, while increasing absolutely, was declining relatively to population, and therefore attention has been directed to the per capita trade of the Dominion, as shown in the following diagram, which has been drawn up on the same assumption as regards movements of gold as that adopted for the preceding diagram:—
DIAGRAM SHOWING TOTAL TRADE , IMPORTS , AND EXPORTS PER HEAD OF MEAN POPULATION , 1853-1918.
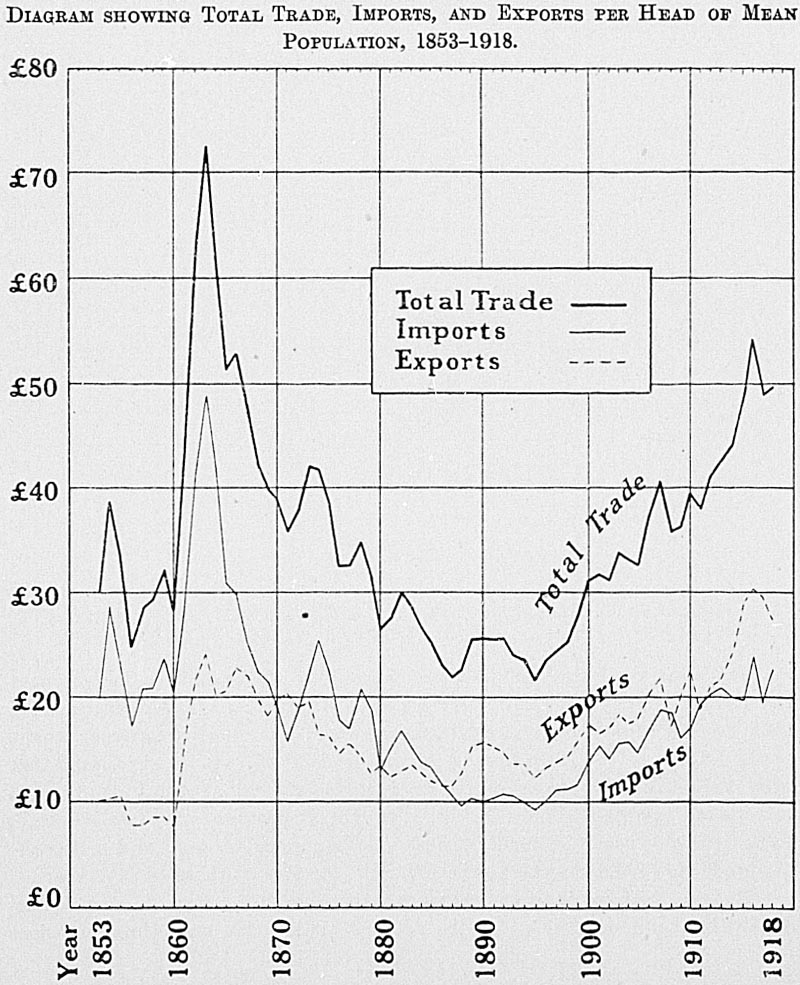
The trade per head was fairly great in the early years, after 1853; but the amount was swelled by the relatively large imports which were necessary for the development of the young colony. The gold-discoveries raised the level both of imports and exports, and after 1870 the borrowing policy which was inaugurated greatly inflated trade, and especially imports. The highest level, apart from the abnormal years of the early "sixties," was reached in 1874, and the consequent reaction saw an almost continuous decrease in the per capita trade both in imports and exports till 1895.
It is significant that the turning-point should have come in 1895, the year in which prices turned to rise all over the world. Since 1895 there has been an almost constant increase. Since the outbreak of war the total trade until 1917 increased to a very considerable extent, with the result that the figures for 1916 constituted a record for the Dominion. This, of course, was largely if not entirely due to increased market values of both imports and exports. The decline since 1916 is no doubt due to the shortage of shipping. For 1919 a large increase in the volume of trade, consequent on the relief of this shortage, may be prophesied.
The following comparison between trade in 1916, 1917, and in 1918 gives the figures exclusive of gold specie and bullion.
TOTAL TRADE , 1916, 1917, AND 1918.
| £ | £ | £ | |
|---|---|---|---|
| 1916. | 1917. | 1918. | |
| Total trade | 57,402,398 | 51,602,418 | 52,707,441 |
| Imports | 25,315,483 | 20,919,259 | 24,233,944 |
| Exports | 32,086,915 | 30,683,159 | 28,473,497 |
The relation between imports and exports is of the greatest importance to a young country like New Zealand. In the very earliest years of occupation by Europeans the exports of phormium, timber, and skins were greatly in excess of the few imports, mainly muskets and gunpowder, a fact which is explained partly by the temporary residence of the traders and more by the weaker bargaining-power of the Maori. With the settlement of the regular colony in 1840 there was evident an inflation of imports occasioned by the amount of capital the new colonists brought in for the development of the country. From 1853 to 1870 there was an excess of imports, which, however, was tending to decrease.
A temporary excess of exports was changed in the early "seventies" by another great increase of imports, due to the borrowing policy inaugurated in that period. Except for a big decrease in 1880, imports continued to be greater than exports until 1886.
From that year onward there is a continued excess of exports, except for two bad years, 1908 and 1913. The divergence from 1886 to 1895 is most marked. Since 1895 the lines of imports and exports run almost parallel, as a reference to the smoothed curves given below will show; but fluctuations in exports always precede by a year similar fluctuations in imports.
GRAPH OF THE QUINQUENNIAL MOVING AVERAGE IMPORTS AND EXPORTS OF NEW ZEALAND FROM 1853 TO 1918.
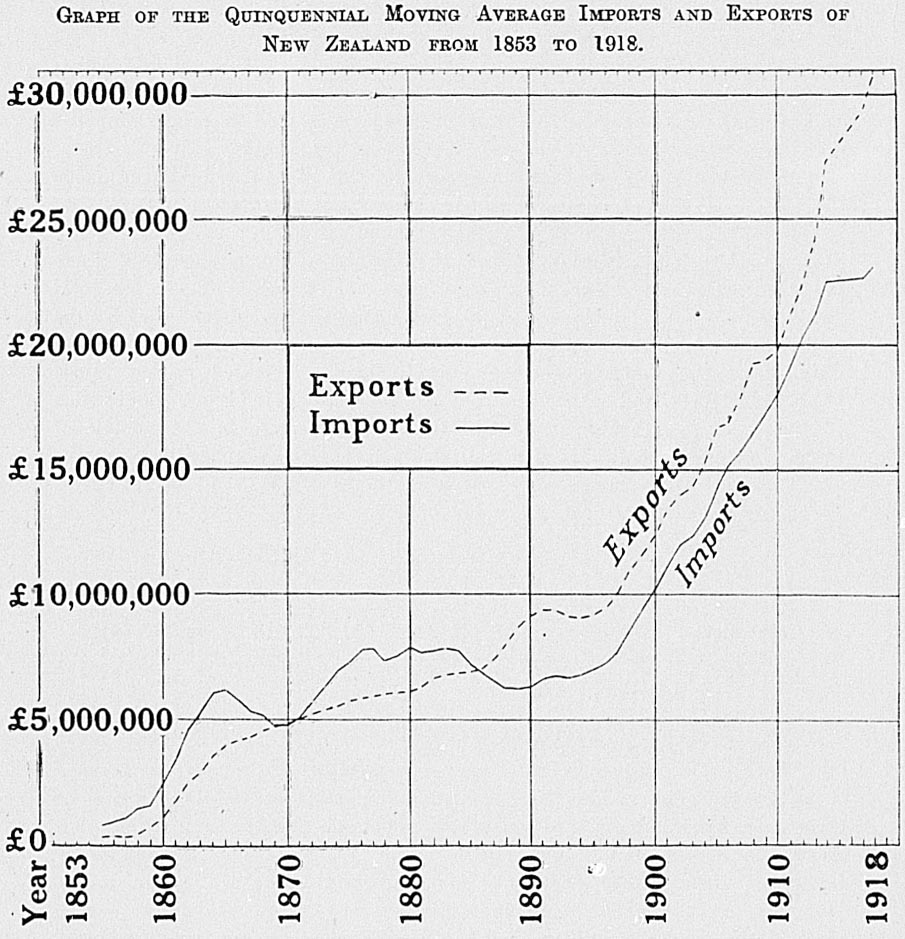
The balance of trade is intimately bound up, in later years especially, with the large imports of capital which have been brought in to assist in the development of the country. This has already been made evident in discussing the balance of trade in early years. The excess of imports from 1853 to 1870, and again from 1872 to 1886, can definitely be traced to the importation of capital in those periods.
The excess of exports in later years consists mainly of profits, interest, and other charges on the debt of New Zealand, public, local, and private. Other items, such as remittances abroad and subsidies, also swell the balance of exports. The amount necessary in each year to pay the interest on the debt of New Zealand cannot be definitely stated, owing to the lack of data concerning the private investments in the Dominion.
The amount of interest payable on the public debt at the 31st March, 1918, was £6,141,590, but of this amount roughly two-fifths must be deducted for stock held in the Dominion (see section on "Public Finance"). Added to this there is the interest on local bodies' debts of approximately twenty-six millions (of which, however, only eight millions were raised abroad), and on the private debts of the Dominion, for which no statistics are available. It is evident that some five millions are needed each year to defray the charges on the various debts owing abroad.
Against this outgoing must be set the amount of new importations of capital in the shape of loans. While the expenditure on interest is fairly constant from year to year, the amount raised by new loans varies, and these variations are a big factor in the fluctuations of the balance of trade. The following table shows the comparison of this balance with the increase in the public debt since 1866:—
COMPARISON OF BALANCE OF TRADE AND INCREASE OF PUBLIC DEBT .
| Period. | Annual Average. | ||||
|---|---|---|---|---|---|
| Imports.* | Exports.* | Excess of Imports.* | Excess of Exports.* | Increase of Net Debt.* | |
* In millions of pounds. | |||||
| £ | £ | £ | £ | £ | |
| 1866-70 | 5.01 | 4.53 | 0.48 | 0.69 | |
| 1871-75 | 6.37 | 5.43 | 0.94 | 1.91 | |
| 1876-80 | 7.43 | 6.02 | 1.41 | 2.24 | |
| 1881-85 | 7.84 | 6.75 | 1.09 | 1.03 | |
| 1886-90 | 6.30 | 8.09 | .. | 1.79 | 1.02 |
| 1891-95 | 6.71 | 9.17 | .. | 2.46 | 0.99 |
| 1896-1900 | 8.56 | 11.01 | .. | 2.45 | 1.26 |
| 1901-5 | 12.41 | 14.39 | .. | 1.98 | 2.22 |
| 1906-10 | 16.54 | 19.26 | .. | 2.72 | 1.62 |
| 1911-15 | 21.28 | 24.36 | .. | 3.08 | 5.33 |
There is no Mint in New Zealand, while there is a fairly considerable production of gold bullion. Gold therefore ranks as an ordinary export of the Dominion, along with wool, frozen meat, and dairy-produce. In earlier days this export of gold was much more important than now, amounting in 1863 to 70 per cent of the total exports, from which figure it shrank steadily to 6 per cent in 1913. The outbreak of hostilities in 1914 restricted export, and the percentage dropped to 3 1/2 for that year, but rose to 5 1/3 in 1915, when large parcels were sent to the United States.
As all coin necessary for the commerce of the Dominion must be imported from abroad—silver from the United Kingdom and gold from Australia—the movement of specie affords a ready index of the state of trade. A bad year is reflected in an export of specie, while prosperous years show a steady inflow. A table is given showing imports and exports of specie during the ten years 1907-16. Figures relating to exports and imports of gold bullion and specie in 1917-18 are not available for publication.
VALUE OF SPECIE IMPORTED AND EXPORTED , 1907-16.
| Year. | Total Specie. | Balance. | ||
|---|---|---|---|---|
| Imported. | Exported. | In. | Out. | |
| £ | £ | £ | £ | |
| 1907 | 763,154 | 7,316 | 755,838 | .. |
| 1908 | 224,122 | 242,289 | .. | 18,167 |
| 1909 | 857,257 | 25,845 | 831,412 | .. |
| 1910 | 303,360 | 27,736 | 275,624 | .. |
| 1911 | 763,271 | 48,305 | 714,966 | .. |
| 1912 | 399,995 | 258,955 | 141,040 | .. |
| 1913 | 634,670 | 176,359 | 458,311 | .. |
| 1914 | 711,869 | 7,522 | 704,347 | .. |
| 1915 | 1,070,114 | 318,090 | 752,024 | .. |
| 1916 | 1,293,880 | 5,880 | 1,288,000 | .. |
The amount of gold bullion exported is shown in the following table:—
EXPORTS OF GOLD FROM NEW ZEALAND , 1907-16.
| Year. | Exports. | Percentage of Total Exports. | |||
|---|---|---|---|---|---|
| To United Kingdom. | To Australia. | To other Countries. | Total. | ||
| £ | £ | £ | £ | ||
| 1907 | 899,977 | 1,127,513 | .. | 2,027,490 | 10.10 |
| 1908 | 1,067,427 | 937,372 | .. | 2,004,799 | 12.29 |
| 1909 | 1,124,525 | 882,375 | .. | 2,006,900 | 10.21 |
| 1910 | 996,081 | 900,237 | .. | 1,896,318 | 8.55 |
| 1911 | 379,596 | 1,435,655 | .. | 1,815,251 | 9.54 |
| 1912 | 394,425 | 950,706 | .. | 1,345,131 | 6.18 |
| 1913 | 353,763 | 1,105,720 | 16 | 1,459,499 | 6.35 |
| 1914 | 159,499 | 735,811 | 57 | 895,367 | 3.41 |
| 1915 | 5,060 | 507,659 | 1,181,834 | 1,694,553 | 5.34 |
| 1916 | 134,827 | 510,499 | 553,886 | 1,199,212 | 6.01 |
It is customary to classify the trade of a country as "special" and "entrepôt," according as it represents the exchange of domestic productions for imports for home consumption, or a mere transit trade. In many countries, such as Belgium, France, and the United Kingdom, the transit trade attains considerable importance, but New Zealand, owing to its geographical position, is precluded from developing in that direction. Her imports, except for a small forwarding trade to the Pacific islands, are for her own consumption, and the great bulk of her exports are commodities of domestic production.
The following table gives the proportion of special trade for the last ten years:—
"SPECIAL " AND "ENTREPOT " TRADE OF NEW ZEALAND .
| Year. | Trade (excluding Specie). | Re-exports (included in two preceding columns). | Percentage Re-exports. | |||
|---|---|---|---|---|---|---|
| Imports. | Exports. | Total. | To Imports | To Exports | ||
* Excluding gold. | ||||||
| £ | £ | £ | £ | |||
| 1909 | 14,817,462 | 19,636,151 | 34,453,613 | 173,215 | 1.17 | 0.88 |
| 1910 | 16,748,223 | 22,152,473 | 38,900,696 | 208,310 | 1.24 | 0.94 |
| 1911 | 18,782,608 | 18,980,185 | 37,762,793 | 198,287 | 1.06 | 1.04 |
| 1912 | 20,576,579 | 21,511,626 | 42,088,205 | 239,221 | 1.16 | 1.11 |
| 1913 | 21,653,632 | 22,810,363 | 44,463,995 | 232,473 | 1.07 | 1.02 |
| 1914 | 21,144,227 | 26,253,925 | 47,398,152 | 269,208 | 1.27 | 1.03 |
| 1915 | 20,658,720 | 31,430,822 | 52,089,542 | 392,690 | 1.90 | 1.25 |
| 1916 | 25,045,403 | 33,281,057 | 58,326,460 | 311,030 | 1.24 | 0.93 |
| 1917* | 20,742,124 | 30,613,184 | 51,355,308 | 499,090 | 2.41 | 1.63 |
| 1918* | 24,131,729 | 28,438,187 | 52,569,916 | 578,878 | 2.39 | 2.03 |
Before comparisons may properly be made with the trade of other countries care must be taken to ensure that the statistics are comparable in their methods of compilation and definition.
The value of imports into New Zealand has, since 1916, been reckoned at the fair market value in the country of export at the time of exportation, plus 10 per cent. (see subsection C of this section); exports are valued f.o.b. In the United States and Canada, however, the value of imports also are calculated f.o.b., and the difference representing freight, insurance, and charges amounts to about 10 per cent. of the total value.
Again, in the United Kingdom the values both of imports and exports are obtained by assessment at current market prices in the United Kingdom.
A comparison of the "special" trade of various countries is shown in the table given below, which is reproduced from the Commonwealth Official Yearbook, 1916, page 568. Such a comparison (which covers in most cases the latest available year before the outbreak of the war) necessarily ignores many of the elements considered above, but gives a sufficiently accurate idea of the relative trade of the various countries. The figures for New Zealand relate to the calendar year 1915, those for the United Kingdom to the calendar year 1916, for Canada to the year ended 31st March, 1916, for the United States to the twelve months ended 30th June, 1915, for Australia to the year ended 30th June, 1916, and for Uruguay to the calendar year 1911; in all other cases the figures refer to the calendar year 1912.
TRADE OF VARIOUS COUNTRIES —IMPORTS FOR HOME CONSUMPTION AND EXPORTS OF DOMESTIC PRODUCE , INCLUDING BULLION AND SPECIE .
| Country. | Trade. | Trade per Inhabitant. | ||||||||||
|---|---|---|---|---|---|---|---|---|---|---|---|---|
| Imports.* | Exports.* | Total.* | Imports. | Exports. | Total. | |||||||
* In thousands of pounds. | ||||||||||||
| £ | £ | £ | £ | s. | d. | £ | s. | d. | £ | s. | d. | |
| New Zealand | 21,023 | 31,043 | 52,066 | 19 | 2 | 5 | 28 | 4 | 10 | 47 | 7 | 3 |
| United Kingdom | 851,544 | 506,546 | 1,358,090 | 19 | 2 | 10 | 11 | 7 | 10 | 30 | 10 | 8 |
| Australia | 75,784 | 71,793 | 147,577 | 15 | 7 | 5 | 14 | 11 | 3 | 29 | 18 | 8 |
| Canada | 105,795 | 154,502 | 260,297 | 12 | 3 | 5 | 17 | 15 | 3 | 29 | 18 | 8 |
| United States of America | 344,146 | 605,289 | 949,435 | 3 | 8 | 7 | 6 | 0 | 7 | 9 | 9 | 2 |
| Argentine Republic | 84,187 | 96,195 | 180,382 | 11 | 9 | 2 | 13 | 1 | 8 | 24 | 10 | 10 |
| Austria - Hungary | 149,026 | 121,345 | 270,371 | 2 | 19 | 4 | 2 | 8 | 4 | 5 | 7 | 8 |
| Belgium | 210,211 | 160,054 | 370,265 | 27 | 15 | 3 | 21 | 2 | 10 | 48 | 18 | 1 |
| Brazil | 63,425 | 74,649 | 138,074 | 2 | 12 | 1 | 3 | 1 | 2 | 5 | 13 | 3 |
| Denmark | 41,954 | 33,940 | 75,894 | 14 | 19 | 8 | 14 | 2 | 5 | 27 | 2 | 1 |
| France | 350,482 | 281,495 | 631,977 | 8 | 16 | 9 | 7 | 1 | 11 | 15 | 18 | 8 |
| German Empire | 541,675 | 447,392 | 989,067 | 8 | 3 | 9 | 6 | 15 | 3 | 14 | 19 | 0 |
| Italy | 149,113 | 97,536 | 246,649 | 4 | 5 | 2 | 2 | 15 | 8 | 7 | 0 | 10 |
| Japan | 66,007 | 57,972 | 123,979 | 1 | 5 | 3 | 1 | 2 | 2 | 2 | 7 | 5 |
| Norway | 28,756 | 18,147 | 46,903 | 11 | 15 | 9 | 7 | 8 | 10 | 19 | 4 | 7 |
| Portugal | 17,035 | 7,867 | 24,902 | 3 | 0 | 10 | 1 | 8 | 2 | 4 | 9 | 0 |
| Spain | 42,089 | 41,826 | 83,915 | 2 | 2 | 9 | 2 | 2 | 6 | 4 | 5 | 3 |
| Sweden | 44,095 | 42,257 | 86,352 | 7 | 17 | 4 | 7 | 10 | 10 | 15 | 8 | 2 |
| Switzerland | 81,577 | 55,629 | 137,206 | 21 | 6 | 7 | 14 | 10 | 11 | 35 | 17 | 6 |
| Uruguay | 9,333 | 8,840 | 18,173 | 7 | 18 | 6 | 7 | 10 | 1 | 15 | 8 | 7 |
New Zealand is seen to head the list as regards exports of domestic produce, Belgium taking second place. For imports of articles entered for consumption in the country itself, which in the case of such countries as the United Kingdom, Belgium, &c., includes raw material imported for manufacturing purposes, New Zealand is led only by Belgium, Switzerland, and the United Kingdom.
By themselves statistics of foreign trade are not a sure test of a country's prosperity, and they must always be interpreted with a knowledge of local conditions. An increase of imports may not be the result of increased purchasing-power, but may merely represent loans from another country, or even a failure of the home supply of certain commodities. Similarly, increased exports may mean greater productivity and increased purchasing-power, but they may also denote the payments on greatly increased liabilities.
In all countries the home trade is greatly in excess of the external trade, and in larger countries which are more self-contained a decrease in foreign trade may be due to development within the country itself. But New Zealand is far from self-contained, and from her position must attach a great importance to external trade. Under present conditions, only by export can a sufficient market be obtained for her rich resources, and only from abroad can be obtained the manufactures which are needed for common use. The development of the external trade since 1895 has been accompanied by increasing prosperity, and every advance in exports, followed in the next year by larger imports, represents an increase in the wealth of the Dominion.
IN New Zealand the Department of H.M. Customs requires for every package exported a declared statement of the contents, value, and destination. Since 1914 the statistics have been compiled in the Head Office of the Customs Department at Wellington instead of at the branch offices, and this centralization has given greater opportunity for a more complete system of checking.
In all cases exports are valued "free on board at the port of shipment." In many cases, however, the goods are not sold till arrival at their destination, and therefore values must be assessed in New Zealand with reference to current prices. It is possible, therefore, that an interim change in the markets overseas may to some extent falsify the values given to exports.
No account is taken in the export values of "ships' stores" except where they are shipped "ex warehouse"—that is, from a bonded store under Customs control. The exports of New Zealand produce are separated from re-exports of foreign goods.
The ultimate destination of the goods is distinguished as far as is practicable, but it is impossible to discover what proportion of the exports is intended for home consumption in the country of destination. Goods for transhipment on a through bill of lading are, however, credited to the ultimate destination shown.
The following table gives a summary of the main exports from New Zealand during the last twenty years. the main commodities are shown separately, and the progress of the Dominion during the last two decades is strikingly illustrated.
The main feature of the table is the prominence given to the primary products of the soil. The extractive industries of New Zealand have always supplied the overwhelming bulk of the exports, and, though the proportion of the different classes has varied from time to time, there has never been any considerable or even noticeable export of manufactured goods.
Until 1914 the statistical tables included a heading "Manufactures," which showed a considerable total value in each year, reaching £987,072 in 1913. Included in this group, however, was phormium, the value of which (excluding tow) was in 1913 £721,924; and, though the phormium is stripped and prepared in New Zealand, it leaves the Dominion as a raw fibre, which can hardly be termed a "manufacture." Similarly, leather in 1913 amounted to £31,945, and copra was also included in this heading. There are some genuine manufactures exported, such as ale and beer, cordage, soap, and woollens, but their value is insignificant compared with the primary products.
Practically every item considered shows a great increase over the twenty years, and the total exports show a threefold increase in the period. This increase is practically continuous: there are two slight checks in 1901 and 1904, and more serious decreases in 1908 and 1911. the figures for both 1917 and 1918 are considerably below the record figures of 1916.
Throughout this subsection figures relating to the export of gold (specie and bullion) during 1917 and 1918 have, at the request of the Imperial Government, been withheld from publication.
| Year. | Wool. | Frozen Meat. | Butter. | Cheese. | Tallow. | Skins, Hides, and Pelts. | Other Pastoral Produce.* |
|---|---|---|---|---|---|---|---|
* The main items in this heading are bacon and hams, beef and pork (salted), live-stock, preserved meats, sausage-skins, and preserved milk. | |||||||
| £ | £ | £ | £ | £ | £ | £ | |
| 1899 | 4,324,627 | 2,088,856 | 571,799 | 141,818 | 311,649 | 386,606 | 184,381 |
| 1900 | 4,749,196 | 2,123,881 | 740,620 | 229,111 | 368,473 | 363,787 | 211,790 |
| 1901 | 3,699,103 | 2,253,262 | 822,406 | 238,685 | 351,710 | 364,701 | 238,550 |
| 1902 | 3,354,563 | 2,718,763 | 1,205,802 | 163,539 | 550,131 | 473,699 | 338,371 |
| 1903 | 4,041,274 | 3,197,043 | 1,318,067 | 194,998 | 517,871 | 566,178 | 239,532 |
| 1904 | 4,673,826 | 2,793,599 | 1,380,460 | 185,486 | 357,974 | 498,121 | 189,942 |
| 1905 | 5,381,333 | 2,694,432 | 1,408,557 | 205,171 | 347,888 | 675,201 | 208,939 |
| 1906 | 6,765,655 | 2,877,031 | 1,560,235 | 341,002 | 455,026, | 894,518 | 257,313 |
| 1907 | 7,657,278 | 3,420,664 | 1,615,345 | 662,355 | 560,965 | 1,055,650 | 273,447 |
| 1908 | 5,332,781 | 3,188,515 | 1,171,182 | 783,419 | 481,335 | 767,692 | 231,142 |
| 1909 | 6,305,888 | 3,601,093 | 1,639,380 | 1,105,390 | 648,452 | 1,018,103 | 316,959 |
| 1910 | 8,308,410 | 3,850,777 | 1,811,975 | 1,195,373 | 756,841 | 1,129,041 | 468,298 |
| 1911 | 6,491,707 | 3,503,406 | 1,576,917 | 1,192,057 | 607,257 | 911,519 | 467,695 |
| 1912 | 7,105,483 | 3,909,569 | 2,088,809 | 1,680,393 | 684,739 | 1,091,871 | 370,616 |
| 1913 | 8,057,620, | 4,449,933 | 2,051,651 | 1,770,297 | 663,088 | 1,199,375 | 317,181 |
| 1914 | 9,318,114 | 5,863,062 | 2,338,576 | 2,564,125 | 694,348 | 1,317,593 | 433,331 |
| 1915 | 10,387,875 | 7,794,395 | 2,700,625 | 2,730,211 | 780,828 | 1,450,276 | 690,398 |
| 1916 | 12,386,074 | 7,271,318 | 2,632,293 | 3,514,310 | 785,339 | 1,667,679 | 637,409 |
| 1917 | 12,175,366 | 5,982,404 | 2,031,551 | 3,949,251 | 553,016 | 1,861,817 | 776,194 |
| 1918 | 7,527,266 | 4,957,576 | 3,402,223 | 4,087,278 | 847,618 | 2,645,864 | 1,170,011 |
EXPORTS OF NEW ZEALAND PRODUCE .—MINING AND AGRICULTURAL PRODUCE.
| Year. | Wheat. | Oats. | Other Agricultural Produce.* | Gold. | Coal. | Kauri-gum. | Phormium Fibre and Tow. | Timber. |
|---|---|---|---|---|---|---|---|---|
* The main items in this heading are bran and sharps, chaff, flour, barley, beans and peas, maize, malt, hops, oatmeal, potatoes, and seeds. † Not available for publication. | ||||||||
| £ | £ | £ | £ | £ | £ | £ | £ | |
| 1899 | 338,476 | 286,102 | 289,100 | 1,513,180 | 83,085 | 607,919 | 185,561 | 196,749 |
| 1900 | 351,494 | 552,270 | 326,801 | 1,439,602 | 98,136 | 622,293 | 333,802 | 232,174 |
| 1901 | 276,111 | 922,301 | 333,974 | 1,753,784 | 142,176 | 446,114 | 196,868 | 294,699 |
| 1902 | 31,074 | 666,664 | 348,248 | 1,951,426 | 154,747 | 450,223 | 539,390 | 208,005 |
| 1903 | 14,068 | 453,702 | 277,075 | 2,037,832 | 128,927 | 631,102 | 603,411 | 240,713 |
| 1904 | 126,035 | 212,724 | 220,484 | 1,987,501 | 139,898 | 501,817 | 714,147 | 254,021 |
| 1905 | 144,374 | 99,664 | 184,242 | 2,093,936 | 107,062 | 561,444 | 711,940 | 318,895 |
| 1906 | 9,915 | 76,981 | 183,646 | 2,270,904 | 122,614 | 522,486 | 812,712 | 304,941 |
| 1907 | 326 | 4,656 | 157,985 | 2,027,490 | 114,737 | 579,888 | 897,718 | 311,862 |
| 1908 | 344 | 108,997 | 156,389 | 2,004,799 | 85,846 | 372,798 | 420,520 | 375,235 |
| 1909 | 305,902 | 453,314 | 216,954 | 2,006,900 | 183,961 | 552,698 | 324,458 | 337,740 |
| 1910 | 216,657 | 44,299 | 220,566 | 1,896,318 | 259,562 | 465,044 | 480,519 | 407,658 |
| 1911 | 219,196 | 9,211 | 184,408 | 1,815,251 | 204,379 | 395,707 | 325,130 | 439,353 |
| 1912 | 95,702 | 483,756 | 431,147 | 1,345,131 | 216,170 | 401,305 | 407,903 | 490,508 |
| 1913 | 11,816 | 29,252 | 238,908 | 1,459,499 | 205,010 | 549,106 | 797,062 | 319,055 |
| 1914 | 3,580 | 165,930 | 278,894 | 895,367 | 282,163 | 497,444 | 492,230 | 422,864 |
| 1915 | 128 | 132,827 | 541,318 | 1,694,553 | 329,731 | 279,133 | 610,059 | 383,883 |
| 1916 | 17,835 | 30,200 | 135,680 | 1,199,212 | 326,553 | 339,882 | 1,078,632 | 381,488 |
| 1917 | 509 | 1,306 | 178,087 | † | 236,063 | 291,917 | 1,232,608 | 408,121 |
| 1918 | 460 | 872 | 194,422 | † | 227,228 | 157,313 | 1,408,147 | 556,309 |
In the past twenty years the proportions of the principal exports have changed a good deal. Wool, which reached its maximum percentage (47.9) in 1897, showed a tendency to decline till 1902, then partially regained its position, once more showing a marked fall in 1918. Frozen meat had in recent years supplied approximately 20 per cent of the total exports, but the figures for 1915, owing to war demands, constituted a record. Both wool and frozen meat show a continuous decline since 1916.
The main feature of the period has been the great advance, relatively and absolutely, of dairy-produce, which has increased over tenfold—viz., from £713,617 to £7,489,501. This advance has been shared by all classes of pastoral produce and by phormium. Agricultural produce shows a fluctuating export, reaching its highest percentage in 1899-1901, the period of the South African War. Striking features of 1918 have been the sudden increases in the values of exports of skins, hides, and other pastoral produce, and the falling-off in that of kauri-gum.
The relative importance of the main commodities is shown on the graph given below, plotted on a uniform basis.
GRAPH OF THE VALUES OF MAIN EXPORTS , 1898-1918.
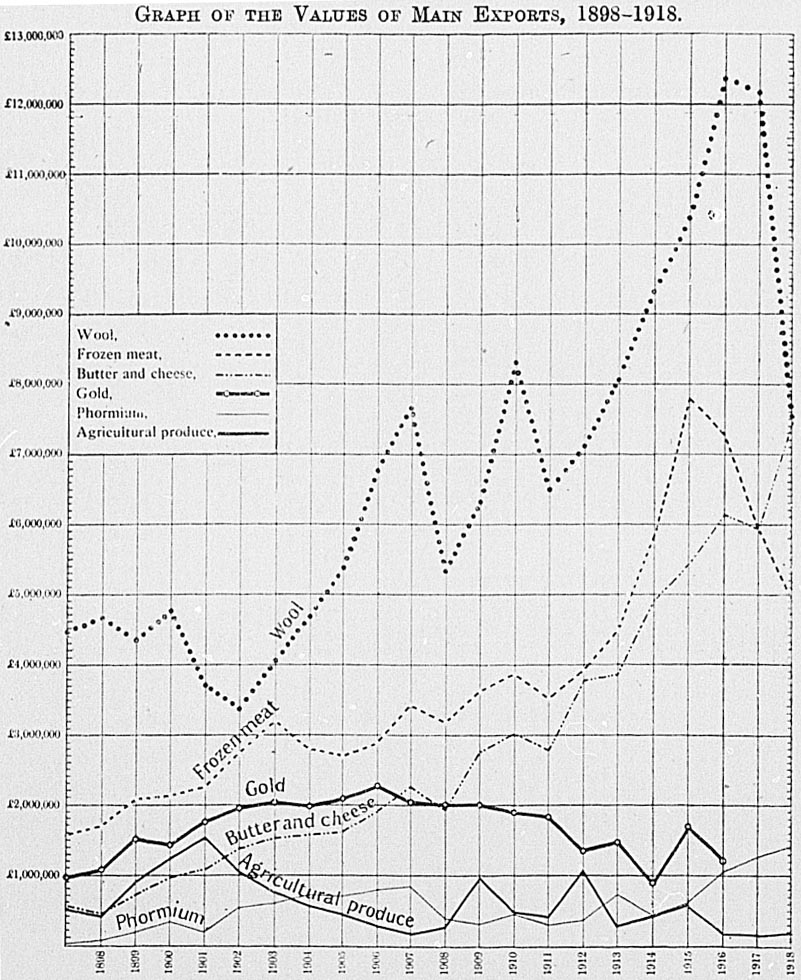
In the following table the exports are classified under the main industries, according to a broad division, to illustrate the relative importance of the pastoral, agricultural, mining, forest, and other industries as far as the export trade is concerned. It must be remembered that in a particular industry the home trade may be relatively more important than the external trade.
The table indicates a tendency for the Dominion to rely more and more upon the pastoral industry for her main exports. The four main products of that industry—wool, frozen meat, butter, and cheese—provide an ever-increasing proportion of the total quantity of goods shipped overseas. On the other hand, the proportion of minerals has tended to fall, through decreasing exports of gold, and agricultural exports fluctuate with a downward tendency. It would seem that New Zealand is restricting her agriculture to a level barely sufficient to provide for her own needs in the matter of foodstuffs, and only in exceptionally good years is there a surplus available for export.
TABLE SHOWING PROPORTIONS OF EXPORTS SUPPLIED BY THE MAIN INDUSTRIES , 1899-1918.
| — | Exports. | Percentage of Total Exports. | ||||||||
|---|---|---|---|---|---|---|---|---|---|---|
| Pastoral. | Mining. | Agricultural. | Forest. | Other. | Pastoral. | Mining. | Agricultural. | Forest. | Other. | |
* Cannot be supplied, as figures in respect of gold are not available. | ||||||||||
| £ | £ | £ | £ | £ | Per Cent. | Per Cent. | Per Cent. | Per Cent. | Per Cent. | |
| 1899 | 8,009,736 | 1,644,101 | 913,678 | 817,743 | 553,077 | 67.1 | 13.8 | 7.7 | 6.8 | 4.6 |
| 1900 | 8,786,858 | 1,590,212 | 1,230,565 | 863,144 | 775,382 | 66.3 | 12.0 | 9.3 | 6.5 | 5.9 |
| 1901 | 7,969,197 | 1,969,963 | 1,532,386 | 754,457 | 655,421 | 61.9 | 15.3 | 11.9 | 5.9 | 5.0 |
| 1902 | 8,804,868 | 2,183,211 | 1,045,986 | 670,962 | 939,950 | 64.5 | 16.0 | 7.7 | 4.9 | 6.9 |
| 1903 | 10,074,963 | 2,265,604 | 744,845 | 885,257 | 1,039,709 | 67.1 | 15.1 | 5.0 | 5.9 | 6.9 |
| 1904 | 10,079,408 | 2,251,108 | 559,243 | 769,188 | 1,089,401 | 68.3 | 15.3 | 3.8 | 5.2 | 7.4 |
| 1905 | 10,921,521 | 2,329,858 | 428,280 | 891,410 | 1,084,878 | 69.8 | 14.9 | 2.7 | 5.7 | 6.9 |
| 1906 | 13,150,780 | 2,555,551 | 270,542 | 841,166 | 1,277,098 | 72.6 | 14.1 | 1.5 | 4.6 | 7.2 |
| 1907 | 15,245,704 | 2,344,903 | 162,967 | 904,486 | 1,410,897 | 76.0 | 11.7 | 0.8 | 4.5 | 7.0 |
| 1908 | 11,956,066 | 2,279,520 | 265,730 | 758,115 | 1,058,063 | 73.3 | 14.0 | 1.6 | 4.6 | 6.5 |
| 1909 | 14,635,265 | 2,378,775 | 976,170 | 905,930 | 765,856 | 74.4 | 12.1 | 5.0 | 4.6 | 3.9 |
| 1910 | 17,520,715 | 2,344,348 | 481,522 | 889,603 | 944,021 | 79.0 | 10.6 | 2.2 | 4.0 | 4.2 |
| 1911 | 14,750,558 | 2,165,137 | 412,815 | 843,310 | 856,670 | 77.5 | 11.4 | 2.2 | 4.4 | 4.5 |
| 1912 | 16,931,480 | 1,660,280 | 1,060,605 | 900,671 | 1,217,545 | 77.8 | 7.6 | 4.9 | 4.1 | 5.6 |
| 1913 | 18,519,145 | 1,791,777 | 279,976 | 874,110 | 1,521,714 | 80.6 | 7.8 | 1.2 | 3.8 | 6.6 |
| 1914 | 22,529,149 | 1,263,553 | 448,404 | 927,482 | 1,092,859 | 85.8 | 4.8 | 1.7 | 3.5 | 4.2 |
| 1915 | 26,534,608 | 2,149,217 | 674,273 | 674,533 | 1,716,281 | 83.6 | 6.8 | 2.1 | 2.1 | 5.4 |
| 1916 | 28,894,422 | 1,661,650 | 183,797 | 734,034 | 1,502,004 | 87.6 | 5.0 | 0.6 | 2.2 | 4.6 |
| 1917 | 27,829,599 | * | 179,902 | 711,188 | 1,593,046 | * | * | 0 | * | * |
| 1918 | 24,638,531 | * | 196,291 | 719,538 | 1,903,633 | * | * | * | * | * |
DIAGRAM SHOWING PROPORTIONS OF EXPORTS SUPPLIED BY THE MAIN INDUSTRIES , 1898-1918.
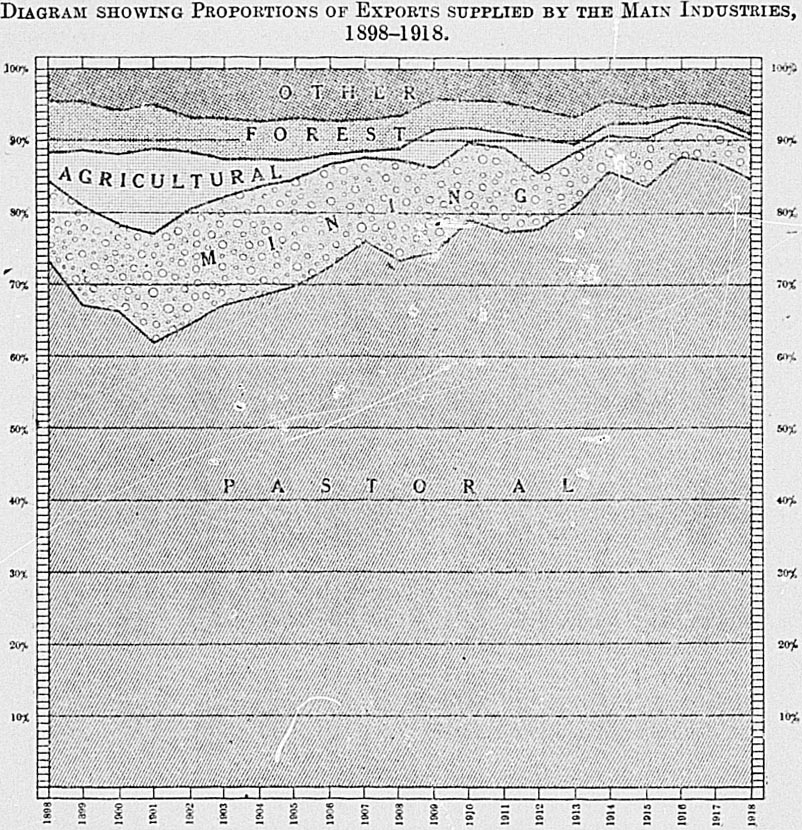
The diagram given above shows clearly the relative importance in the external trade of the main classes of exports. In its construction it has been assumed that the exports of gold for 1917 and for 1918 equalled in each case the average for the years 1912-14. The actual figures relating to gold-exports during 1917 and 1918 are not available. The most noticeable feature is the extremely high proportion of the exports supplied by the pastoral industries. The percentage supplied by this group was high in the late "nineties," but in the early years of the new century fell relatively, owing mainly to increased exports of agricultural and mining produce. Since 1901, however, the percentage increased almost continuously till 1914, when it reached more than 85 per cent of the total. Yet another record was attained in 1916, when the exports of pastoral products amounted to over 87 per cent of the total.
On the whole, mining products are growing less important to New Zealand, mainly because of the overwhelming increase of the pastoral products. In later years especially this tendency to diminish is noticeable.
Agricultural exports showed an abnormal increase from 1899 to 1903, the period which covers the South African War, but since then their importance has steadily declined. Their lowest level (0.6 per cent of total exports) was reached in 1916 and 1917. Forest products, too, though steady, showed a relative downward tendency, and therefore the strip representing them tapers toward the latter years.
Measured by their value in money the exports of 1916 constituted a record, the total being nearly 5 per cent in advance of the previous year's, and more than double that of 1906. Wool retained its leading position, and with £12,386,074 to its credit accounted for 37 per cent of the Dominion's total sales abroad. Frozen meat stood at £7,271,318, a decrease of slightly over £500,000 when compared with the figure for the previous year.
It should be mentioned, however, that an increased value is not in all cases an indication of increased output, being in many cases accountable for (especially during the war period) solely by enhanced prices. Thus, while the actual amount of wool exported in 1916 was 6 per cent less than the quantity shipped in 1915, the value of this commodity exported showed an increase of, roughly, £2,000,000. A fuller reference to the effect of price-changes upon most of the main items will be found further on in this subsection.
It will be noted that while the accompanying table shows that there has been an increase in the value of exports during 1918 over that during 1917 in the case of butter, cheese, tallow, skins, hides and pelts, phormium, and timber, the actual quantity exported does not show an increase in all of these cases, but in the case of cheese actually shows a fall. Moreover, where an increase in the quantity exported actually exists, the proportion of the increase in the quantity exported is usually small in comparison with that of the value of such exports.
INCREASES OR DECREASES IN THE MAIN EXPORTS IN 1918.
| Article. | Value. | Amount of | Percentage. | |||
|---|---|---|---|---|---|---|
| 1918. | 1917. | Increase. | Decrease. | Increase. | Decrease. | |
* Figures for gold not available. | ||||||
| £ | £ | £ | £ | Per Cent. | Per Cent. | |
| Wool | 7,527,266 | 12,175,366 | .. | 4,648,100 | .. | 38.18 |
| Frozen meat | 4,957,576 | 5,982,404 | .. | 1,024,828 | .. | 17.13 |
| Butter | 3,402,223 | 2,031,551 | 1,370,672 | .. | 67.47 | .. |
| Cheese | 4,087,278 | 3,949,251 | 138,027 | .. | 3.50 | .. |
| Tallow | 847,618 | 553,016 | 294,602 | .. | 53.27 | .. |
| Skins, hides, and pelts | 2,645,864 | 1,861,817 | 784,047 | .. | 42.11 | .. |
| Wheat | 460 | 509 | .. | 49 | .. | 9.63 |
| Oats | 872 | 1,306 | .. | 434 | .. | 33.23 |
| Gold | * | * | * | * | * | * |
| Coal | 227,228 | 236,063 | .. | 8,835 | .. | 3.74 |
| Kauri-gum | 157,313 | 291,917 | .. | 134,604 | .. | 46.11 |
| Phormium | 1,408,147 | 1,232,608 | 175,539 | .. | 14.24 | .. |
| Timber | 556,309 | 408,121 | 148,188 | .. | 36.31 | .. |
In 1914 a new method of classification was adopted, and both imports and exports were divided into classes, which will in the future be adhered to in all statistical comparisons. The total exports of each class in 1918 are shown in the following table:—
| No. | Class. | Domestic Produce. | Foreign Produce. |
|---|---|---|---|
* Excluding gold (specie and bullion). | |||
| £ | £ | ||
| I | Foodstuffs of animal origin (excluding live animals) | 13,561,825 | 19,143 |
| II | Foodstuffs of vegetable origin and common salt | 172,040 | 28,921 |
| III | Beverages (non-alcoholic), and substances used in making up the same | 1,168 | 16,982 |
| IV | Spirits and alcoholic liquors | 1,547 | 34,498 |
| V | Tobacco and preparations thereof | 9 | 22,566 |
| VI | Live animals | 68,603 | 420 |
| VII | Animal substances (mainly unmanufactured), not being foodstuffs | 10,176,849 | 193 |
| VIII | Vegetable substances and non-manufactured fibres | 1,486,009 | 21,891 |
| IXA | Apparel | 109,065 | 79,838 |
| IXB | Textiles | 11,133 | 76,951 |
| IXC | Manufactured fibres | 27,705 | 4,465 |
| X | Oils, fats, and waxes | 875,596 | 10,573 |
| XI | Paints and varnishes | 150 | 6,301 |
| XII | Stones and minerals used industrially | 390,394 | 3,907 |
| XIII | Specie | .. | 35,310 |
| XIVA | Metal (unmanufactured and partly manufactured) and ores | 223,260 | 3,367 |
| XIVB | Metal manufactures, other than machinery and machines | 6,192 | 23,915 |
| XV | Machinery and machines | 8,197 | 21,754 |
| XVIA | Indiarubber and manufactures thereof (not including tires) | 1,375 | 1,389 |
| XVIB | Leather and manufactures thereof, including substitutes | 30,146 | 5,199 |
| XVIIA | Timber | 556,309 | 67 |
| XVIIB | Wood, cane, and wicker manufactures | 2,636 | 1,311 |
| XVIII | Earthenware, china, glass, stoneware, cement, and cement materials | 9,774 | 2,002 |
| XIXA | Paper | 2,196 | 3,923 |
| XIXB | Stationery | 3,978 | 6,705 |
| XX | Jewellery, timepieces, and fancy goods | 85 | 52,334 |
| XXI | Optical, surgical, and scientific instruments | 3,002 | 16,105 |
| XXIIA | Drugs, chemicals, and druggists' wares | 24,918 | 7,931 |
| XXIIB | Manures | 335 | 31 |
| XXIII | Miscellaneous | 19,687 | 70,886 |
| Parcels-post | 120,436 | .. | |
| Total* | 27,894,619 | 578,878 | |
It will be seen that the great bulk of the exports fall into two classes— I, which includes butter and cheese, frozen meat, and fish; and VII, which includes wool, hides, skins, pelts, and hair. Mineral products fall under XII and XIVA , and timber under XVIIA ; tallow is the main item in X, phormium, seeds, and fungus in VIII, while the main agricultural products are included in II.
The re-exports are clearly shown to be spread over various manufactured items, and, indeed, are mainly returned imports, since the genuine entrepôt trade is very small.
The principal items of export may conveniently be grouped under six definite heads, and for over forty years a decennial table has been published in the "Statistics of the Dominion of New Zealand" using this method of summary. A comparative statement is given below for the past five years, following the classification therein adopted.
Practically all the main commodities are homogeneous articles, and it is therefore possible to give the quantities exported' For some purposes quantities are preferable to values, since the latter contain the variable element of price.
| Articles. | 1914. | 1915. | 1916. | 1917. | 1918. | |
|---|---|---|---|---|---|---|
* Figures for gold since 1916 are not available for publication. | ||||||
| The mine— | ||||||
| Coal | (tons) | 302,908 | 323,992 | 328,183 | 221,125 | 182,603 |
| Gold | (oz.) | 227,954 | 422,825 | 292,620 | * | * |
| Silver | (oz.) | 599,162 | 957,541 | 787,053 | 787,152 | 879,383 |
| Other minerals | (tons) | 337 | 244 | 304 | 161 | 171 |
| The fisheries— | ||||||
| Fish | (cwt.) | 14,601 | 17,698 | 19,372 | 12,370 | 8,633 |
| Oysters | (doz.) | 302,163 | 283,735 | 178,354 | 30,900 | 142,800 |
| Whalebone | (lb.) | 3,024 | 896 | 896 | .. | .. |
| Whale-oil | (gal.) | 44,616 | 40,397 | 22,740 | 46,151 | 64,940 |
| The forest- | ||||||
| Fungus | (cwt.) | 2,455 | 2,881 | 3,829 | 3,610 | 2,054 |
| Kauri-gum | (tons) | 8,473 | 4,575 | 5,456 | 4,594 | 2,419 |
| Timber, sawn and hewn | (sup. ft.) | 83,342,949 | 76,797,161 | 71,503,154 | 71,338,174 | 74,932,815 |
| Pastoral products— | ||||||
| Bacon and hams | (cwt.) | 1,389 | 3,469 | 2,646 | 1,359 | 3,475 |
| Beef and pork, salted | (cwt.) | 6,201 | 3,823 | 2,794 | 4,416 | 4,904 |
| Butter | (cwt.) | 434,067 | 420,144 | 358,632 | 254,397 | 431,023 |
| Cheese | (cwt.) | 863,776 | 817,258 | 949,416 | 885,743 | 883,430 |
| Hides and skins | (number) | 412,822 | 516,799 | 510,936 | 237,906 | 320,832 |
| Live-stock— | ||||||
| Cattle | (number) | 401 | 386 | 297 | 357 | 402 |
| Horses | (number) | 2,914 | 5,738 | 2,453 | 283 | 316 |
| Sheep | (number) | 8,066 | 8,396 | 7,241 | 5,158 | 3,251 |
| Pigs | (number) | 293 | 528 | 367 | 714 | 626 |
| Preserved meats | (cwt.) | 36,338 | 61,851 | 65,582 | 55,008 | 74,903 |
| Frozen meats | (cwt.) | 3,229,970 | 3,591,260 | 3,326,045 | 2,446,945 | 2,036,904 |
| Sausage-skins | (cwt.) | 40,322 | 44,707 | 22,612 | 18,132 | 19,899 |
| Rabbit-skins | (number) | 4,512,171 | 6,090,872 | 5,896,410 | 4,944,607 | 7,854,152 |
| Sheep skins and pelts | (number) | 8,525,611 | 9,093,850 | 8,335,570 | 6,528,053 | 8,741,538 |
| Tallow | (cwt.) | 490,300 | 535,260 | 449,440 | 251,980 | 328,420 |
| Wool | (lb.) | 220,472,898 | 196,570,114 | 185,506,859 | 178,274,486 | 108,724,575 |
| Agricultural products— | ||||||
| Bran and sharps | (tons) | 4,758 | 6,629 | 619 | 340 | 275 |
| Chaff | (tons) | 1,471 | 27,032 | 386 | 354 | 249 |
| Flour | (tons) | 62 | 173 | 131 | 744 | 1,541 |
| Grain— | ||||||
| Barley | (centals) | 27,317 | 11,153 | 429 | 911 | 412 |
| Beans and peas | (centals) | 183,032 | 121,165 | 50,501 | 66,705 | 54,297 |
| Oats | (centals) | 529,345 | 273,061 | 88,106 | 2,307 | 1,300 |
| Wheat | (centals) | 10,248 | 216 | 41,287 | 902 | 674 |
| Hops | (cwt.) | 3,476 | 4,336 | 4,358 | 2,805 | 2,010 |
| Oatmeal | (tons) | 30 | 18 | 11 | 16 | 87 |
| Potatoes | (tons) | 1,744 | 19,572 | 1,724 | 727 | 440 |
| Seeds (grass and (cwt) clover) | 39,572 | 13,980 | 9,841 | 16,484 | 15,995 | |
| Miscellaneous— | ||||||
| Ale and beer | (gal.) | 15,774 | 23,025 | 11,948 | 11,989 | 12,782 |
| Cordage( | (cwt.) | 2,945 | 10,654 | 6,508 | 7,872 | 7,359 |
| Leather | (cwt.) | 5,138 | 6,678 | 3,499 | 845 | 2,228 |
| Phormium fibre and tow | (tons) | 23,928 | 26,685 | 32,252 | 26,016 | 26,982 |
| Soap | (cwt.) | 6,470 | 6,973 | 9,748 | 9,287 | 7,361 |
The values of these principal commodities are tabulated in the following pages, and the statement of exports is rendered complete by the addition of miscellaneous groups and the provision of totals for each group and for all combined.
VALUE OF PRINCIPAL ARTICLES EXPORTED , 1914-18.
| Articles. | 1914. | 1915. | 1916. | 1917. | 1918. |
|---|---|---|---|---|---|
* Figures for gold not available. | |||||
| The mine— | £ | £ | £ | £ | £ |
| Coal | 282,163 | 329,731 | 326,553 | 236,063 | 227,228 |
| Gold | 895,367 | 1,694,553 | 1,199,212 | * | * |
| Silver | 62,085 | 93,583 | 85,111 | 105,299 | 171,456 |
| Other minerals | 23,938 | 29,350 | 50,774 | 28,972 | 37,942 |
| Totals | 1,263,553 | 2,149,217 | 1,661,650 | 370,334 | 436,626 |
| The fisheries— | |||||
| Fish | 34,778 | 37,166 | 37,475 | 23,818 | 19,202 |
| Oysters | 2,396 | 2,057 | 1,340 | 244 | 1,114 |
| Whalebone | 1,243 | 250 | 280 | .. | .. |
| Whale-oil | 2,910 | 3,011 | 1,647 | 5,511 | 12,618 |
| Other | 3,337 | 2,412 | 1,751 | 201 | 25 |
| Totals | 44,664 | 44,896 | 42,493 | 29,774 | 32,959 |
| The forest— | |||||
| Fungus | 6,706 | 9,709 | 12,227 | 10,688 | 5,784 |
| Kauri-gum | 497,444 | 279,133 | 339,882 | 291,917 | 157,313 |
| Timber | 422,864 | 383,883 | 381,488 | 408,121 | 556,309 |
| Other | 468 | 1,808 | 437 | 462 | 132 |
| Totals | 927,482 | 674,533 | 734,034 | 711,188 | 719,538 |
| Pastoral products— | |||||
| Bacon and hams | 6,597 | 15,717 | 13,329 | 7,974 | 21,901 |
| Beef and pork, salted | 10,318 | 7,227 | 5,647 | 11,310 | 13,862 |
| Butter | 2,338,574 | 2,700,625 | 2,632,293 | 2,031,551 | 3,402,223 |
| Cheese | 2,564,126 | 2,730,211 | 3,514,310 | 3,949,251 | 4,087,278 |
| Hides and skins | 412,373 | 573,765 | 673,641 | 456,308 | 532,510 |
VALUE OF PRINCIPAL ARTICLES EXPORTED , 1914-18—continued.
| Articles. | 1914. | 1915. | 1916. | 1917. | 1918. |
|---|---|---|---|---|---|
* Figures for 1917 and 1918 are exclusive of gold (specie and bullion). | |||||
| Pastoral products—continued. | |||||
| Live-stock— | £ | £ | £ | £ | £ |
| Cattle | 6,056 | 7,357 | 5,612 | 11,381 | 16,743 |
| Horses | 84,481 | 154,488 | 79,720 | 20,447 | 29,544 |
| Sheep | 30,708 | 26,594 | 23,089 | 19,096 | 16,933 |
| Pigs | 726 | 1,954 | 1,453 | 3,122 | 4,350 |
| Other | 929 | 2,160 | 453 | 485 | 1,033 |
| Preserved milk and cream | 791 | 20,388 | 23,780 | 153,538 | 341,797 |
| Preserved meats | 111,217 | 223,666 | 249,519 | 278,753 | 420,179 |
| Frozen meats | 5,863,062 | 7,794,395 | 7,271,318 | 5,982,404 | 4,957,576 |
| Sausage-skins | 139,452 | 192,028 | 196,785 | 227,431 | 257,871 |
| Rabbit-skins | 48,388 | 59,004 | 76,405 | 105,321 | 299,765 |
| Sheep skins and pelts | 856,832 | 826,507 | 917,633 | 1,300,188 | 1,813,589 |
| Tallow | 694,348 | 780,828 | 785,339 | 553,016 | 847,618 |
| Wool | 9,318,114 | 10,387,875 | 12,386,074 | 12,175,366 | 7,527,266 |
| Other | 42,060 | 38,819 | 38,022 | 42,657 | 46,493 |
| Totals | 22,529,149 | 26,534,608 | 28,894,422 | 27,329,599 | 24,638,531 |
| Agricultural products— | |||||
| Bran and sharps | 19,582 | 52,051 | 3,702 | 2,111 | 1,827 |
| Chaff | 7,609 | 154,552 | 2,727 | 2,917 | 3,155 |
| Flour | 701 | 2,678 | 2,154 | 13,595 | 29,341 |
| Fruits | 23,031 | 21,603 | 7,493 | 722 | 307 |
| Grain and pulse— | |||||
| Barley | 9,090 | 5,318 | 218 | 513 | 307 |
| Beans and peas | 91,078 | 77,022 | 38,545 | 72,077 | 71,282 |
| Oats | 165,930 | 132,827 | 30,200 | 1,306 | 872 |
| Wheat | 3,580 | 128 | 17,835 | 509 | 460 |
| Other | 333 | 168 | 723 | 889 | 1,240 |
| Hops | 21,811 | 18,536 | 17,632 | 12,038 | 11,234 |
| Oatmeal | 219 | 336 | 271 | 340 | 2,083 |
| Onions | 6,419 | 7,475 | 3,778 | 9,814 | 2,099 |
| Potatoes | 7,014 | 135,552 | 14,941 | 5,816 | 4,279 |
| Seeds (grass and clover) | 73,551 | 42,314 | 34,266 | 48,635 | 42,215 |
| Seeds (various) | 3,785 | 7,459 | 7,622 | 6,937 | 24,372 |
| Other | 14,671 | 16,254 | 1,690 | 1,683 | 1,218 |
| Totals | 448,404 | 674,273 | 183,797 | 179,902 | 196,291 |
| Miscellaneous (including manufactures)— | |||||
| Ale and beer | 1,743 | 3,223 | 1,661 | 1,456 | 1,442 |
| Apparel | 11,875 | 37,606 | 36,589 | 55,808 | 92,814 |
| Cement | 10,669 | 28,503 | 18,711 | 5,506 | 7,651 |
| Cordage | 5,332 | 2,571 | 17,553 | 22,781 | 26,630 |
| Foods, infants' and invalids' | 39,099 | 45,297 | 37,890 | 31 | 6 |
| Leather | 40,965 | 61,795 | 35,143 | 10,458 | 28,095 |
| Phormium fibre and tow | 492,230 | 610,059 | 1,078,632 | 1,232,608 | 1,408,147 |
| Soap | 7,935 | 9,260 | 12,393 | 14,846 | 14,724 |
| Sugar | 8,347 | 24,663 | 48,183 | 62,102 | 19,238 |
| Woollen manufactures | 13,755 | 18,592 | 19,504 | 8,780 | 10,632 |
| Other* | 139,226 | 115,515 | 153,252 | 148,896 | 261,295 |
| Totals* | 771,465 | 965,335 | 1,459,511 | 1,563,272 | 1,870,674 |
| Total exports (domestic produce)* | 25,984,717 | 31,042,862 | 32,975,907 | 30,184,069 | 27,894,619 |
| Specie* | 7,522 | 318,090 | 5,880 | 69,975 | 35,310 |
| Re-exports | 269,208 | 387,960 | 305,150 | 429,115 | 543,568 |
| Total exports* | 26,261,447 | 31,748,912 | 33,286,937 | 30,683,159 | 28,473,497 |
The first exports from New Zealand went naturally to the earlier-developed sister colony, and for a considerable time Australia had a monopoly of our trade. In 1865 70 per cent., and even in 1871 44 per cent., of the total exports went to Australia. But since the establishment of direct shipping lines with the United Kingdom the Mother-land has absorbed the bulk of New Zealand exports, and four-fifths of the total exports up till the end of 1917 went to the United Kingdom. This proportion had prevailed with but slight variations for forty years. During 1918, however, the proportion showed a sudden drop, less than two-thirds of the total exports for the year being destined for that country. The total amount sent to Australia fluctuates considerably from year to year, rising if the products of the Commonwealth are reduced by drought. On the whole it tends to rise, but not in the same ratio as the total exports from New Zealand, of which it constituted 6.19 per cent in 1918.
In 1918, as in 1917, exports to the United States exceeded those to Australia, being in 1918, 14.21 per cent of the total. The increase of exports to the United States, from £1,894,317 in 1917 to £4,045,648 in 1918, is particularly noteworthy. This increase is mainly confined to raw materials, the items concerned being fairly uniformly distributed throughout this group. It is notable that exports to Canada in 1918 for the first time on record exceeded in value those to Australia.
The total for other countries was swollen in 1899-1902 by the abnormal diversion of trade caused by the South African War, but, apart from this period, shows a steady increase, as New Zealand's trade with outside countries naturally develops. Ceylon, the South African Union, and Hong Kong within the Empire, and France, Belgium, and Uruguay among foreign countries, are regular customers, though the war has dislocated their trade temporarily and given to Egypt an importance hitherto unknown An interesting recent development is the growth of exports to Japan, which have risen from a modest £377 in 1911, £1,460 in 1912, and £2,901 in 1913, to £59,508 in 1914 and £137,464 in 1915. A slight check was, however, experienced in 1916, when the exports to Japan fell to £110,045. In 1917 the exports to Japan totalled only £4,388, and in 1918 £5,415. This decrease was due to a complete cessation of exports of wool to that country.
| — | United Kingdom. | Australia. | Canada. | Pacific Islands.* | United States. | Germany. | Other Countries.† | Total. |
|---|---|---|---|---|---|---|---|---|
* Includes Cook Islands prior to 1902. † The principal other countries are Hong Kong, India, France, Egypt, and Japan. ‡ Excluding gold (specie and bullion). | ||||||||
| £ | £ | £ | £ | £ | £ | £ | £ | |
| 1897 | 8,168,123 | 1,323,784 | 1,026 | 117,365 | 375,096 | 5,468 | 26,131 | 10,016,993 |
| 1898 | 8,265,499 | 1,475,157 | 3,716 | 108,315 | 623,133 | 17,244 | 24,891 | 10,517,955 |
| 1899 | 9,427,515 | 1,708,036 | 6,363 | 133,896 | 433,499 | 28,027 | 200,999 | 11,938,335 |
| 1900 | 10,259,342 | 1,858,582 | 287 | 183,641 | 458,796 | 24,186 | 461,327 | 13,246,161 |
| 1901 | 9,295,375 | 1,993,831 | 2,118 | 157,594 | 519,079 | 10,470 | 902,957 | 12,881,424 |
| 1902 | 9,450,648 | 2,684,350 | 7,366 | 159,214 | 489,964 | 9,389 | 844,046 | 13,644,977 |
| 1903 | 11,345,075 | 2,233,996 | 2,421 | 160,133 | 669,649 | 17,584 | 581,520 | 15,010,378 |
| 1904 | 11,876,273 | 1,817,622 | 15,961 | 166,767 | 598,921 | 23,931 | 248,873 | 14,748,348 |
| 1905 | 12,087,818 | 2,294,971 | 51,329 | 170,210 | 716,301 | 38,958 | 296,360 | 15,655,947 |
| 1906 | 14,047,176 | 2,882,522 | 29,815 | 188,755 | 642,792 | 54,952 | 249,125 | 18,095,137 |
| 1907 | 16,533,493 | 2,221,260 | 78,015 | 186,839 | 714,063 | 66,489 | 268,798 | 20,068,957 |
| 1908 | 13,143,780 | 2,103,161 | 24,051 | 203,581 | 326,415 | 40,191 | 476,315 | 16,317,494 |
| 1909 | 16,193,188 | 1,918,115 | 180,975 | 258,164 | 684,810 | 77,969 | 348,775 | 19,661,996 |
| 1910 | 18,633,118 | 2,010,751 | 160,842 | 296,244 | 553,603 | 205,931 | 319,720 | 22,180,209 |
| 1911 | 15,134,743 | 2,515,168 | 199,587 | 324,306 | 434,586 | 170,493 | 249,607 | 19,028,490 |
| 1912 | 16,861,256 | 2,848,664 | 542,271 | 338,621 | 620,988 | 254,703 | 304,078 | 21,770,581 |
| 1913 | 18,130,160 | 2,315,747 | 606,662 | 295,032 | 912,051 | 337,448 | 389,622 | 22,986,722 |
| 1914 | 21,383,891 | 1,928,410 | 595,611 | 326,025 | 1,028,054 | 456,163 | 543,293 | 26,261,447 |
| 1915 | 25,389,030 | 2,548,605 | 925,813 | 499,063 | 2,006,507 | 4 | 379,890 | 31,748,912 |
| 1916 | 26,869,988 | 2,191,545 | 691,986 | 368,069 | 2,493,987 | 5 | 671,357 | 33,286,937 |
| 1917 ‡ | 25,333,371 | 1,247,117 | 961,653 | 539,880 | 1,894,317 | 6 | 672,091 | 30,683,159 |
| 1918 ‡ | 18,243,975 | 1,761,623 | 1,793,576 | 511,542 | 4,045,648 | .. | 2,117,133 | 28,473,497 |
Included in the exports to the United Kingdom, however, are considerable quantities of wool and similar commodities which are shipped to London merely as a convenient depot, and which are retransferred to the Continent or America. the following figures, taken from the Board of Trade statement Cd. 9136, will show the extent to which the United Kingdom serves as a distributing centre for our exports:—
IMPORTS INTO AND RE -EXPORTS FROM THE UNITED KINGDOM OF NEW ZEALAND PRODUCE .
| Article. | Imports from New Zealand. | Re-exports. | ||||||||
|---|---|---|---|---|---|---|---|---|---|---|
| 1913. | 1914. | 1915. | 1916. | 1917. | 1913. | 1914. | 1915. | 1916. | 1917. | |
* Re-exports greater than imports. | ||||||||||
| £ | £ | £ | £ | £ | £ | £ | £ | £ | £ | |
| Butter | 1,351,285 | 2,100,958 | 2,693,808 | 2,727,645 | 3,195,608 | 206,465 | 193,273 | 81,469 | 83,322 | 11,986 |
| Cheese | 1,685,472 | 2,432,117 | 3,081,465 | 3,352,195 | 4,000,665 | 3,861 | 11,462 | 25,773 | 32,758 | 13,917 |
| Wheat | 23,210 | 3,726 | .. | 26,501 | 3,134 | 85 | 37 | .. | .. | |
| Oats | 41,818 | 123,216 | 39,133 | 31,450 | 20,951 | 313 | 130 | 151 | 23 | .. |
| Beef (fresh and frozen) | 393,429 | 944,459 | 2,176,621 | 2,824,664 | 2,709,385 | 185 | 26,280 | 33,550 | 83,160 | 543 |
| Mutton (fresh and frozen) | 4,965,310 | 5,435,128 | 7,669,945 | 8,416,301 | 4,793,705 | 4,482 | 85,502 | 14,603 | 74,294 | 5,612 |
| Sausage skins, casings, and bladders | 167,565 | 189,641 | 129,686 | 39,161 | 150 | 131,189 | 169,879 | 112,656 | 8,814 | .. |
| Kauri-gum | 593,729 | 474,624 | 292,257 | 233,443 | 108,098 | 482,850 | 333,633 | 262,775 | 179,594 | 73,772 |
| Hemp (dressed, undressed) and tow | 718,959 | 437,807 | 428,471 | 630,816 | 597,097 | 553,480 | 324,891 | 262,297 | 341,758 | 258,908 |
| Copra | 161,183 | 42,701 | 96,506 | 43,949 | 18,609 | 81,321 | 22,690 | 7,215 | .. | .. |
| Sheep-skins (undressed) | 641,853 | 657,800 | 825,202 | 557,286 | 522,213 | 464,500 | 475,380 | 605,431 | 613,413* | 305,169 |
| Rabbit-skins (undressed) | 92,149 | 51,827 | 41,259 | 50,119 | 25,519 | 15,299 | 13,425 | 4,516 | 13,588 | 25,171 |
| Tallow | 717,264 | 774,124 | 826,437 | 922,853 | 549,996 | 78,645 | 111,239 | 31,528 | 25,950 | 27,645 |
| Wool | 8,165,408 | 8,628,368 | 11,075,927 | 10,927,874 | 11,125,380 | 1,829,105 | 2,548,965 | 845,098 | 376,068 | 263,168 |
| Totals | 20,338,057 | 22,994,319 | 30,407,581 | 30,784,257 | 27,670,510 | 4,066,815 | 4,442,729 | 2,408,737 | 1,832,742 | 985,891 |
From this table it may be seen that the bulk of the re-exports consists of wool, which, to the value of nearly £2,000,000 annually, was redistributed in pre-war years from London to the manufacturing centres of Belgium, northern France, and Germany. This amounted to a big proportion of the Dominion's wool exports, averaging about 25 per cent.
Practically all the foodstuffs are usually consumed in the United Kingdom itself.
The bulk of the kauri-gum, more than one-half of the phormium, and three-fourths of the sheep-skins are usually re-exported.
The re-exports of butter, copra, and tallow, all of which were relatively heavy in the earlier years, show a distinct tendency to decrease. The total reexports in normal years amounted to about £4,000,000 annually, but the amount has fallen, under war conditions, to less than a quarter of its former value.
It would seem, then, that on the average only about four-fifths of the exports from New Zealand to the United Kingdom are normally retained in that country, and the remaining fifth is distributed to Europe and America. Even deducting this re-export trade, the Mother-country may be said to retain two-thirds of the total exports from the Dominion. The following table must be read subject to the remarks made above:—
DESTINATION OF EXPORTS , 1898-1918.
| Year. | United Kingdom. | British Colonies and Possessions. | Foreign Countries. | Total. |
|---|---|---|---|---|
* Excluding gold (specie and bullion). | ||||
| £ | £ | £ | £ | |
| 1898 | 8,265,499 | 1,532,511 | 719,945 | 10,517,955 |
| 1899 | 9,427,515 | 1,850,239 | 660,581 | 11,938,335 |
| 1900 | 10,259,342 | 2,332,780 | 654,039 | 13,246,161 |
| 1901 | 9,295,375 | 2,907,412 | 678,637 | 12,881,424 |
| 1902 | 9,450,648 | 3,577,815 | 616,514 | 13,644,977 |
| 1903 | 11,345,075 | 2,821,608 | 843,695 | 15,010,378 |
| 1904 | 11,876,273 | 2,088,691 | 783,384 | 14,748,348 |
| 1905 | 12,087,818 | 2,591,802 | 976,327 | 15,655,947 |
| 1906 | 14,047,176 | 3,141,327 | 906,634 | 18,095,137 |
| 1907 | 16,533,493 | 2,559,631 | 975,833 | 20,068,957 |
| 1908 | 13,143,780 | 2,414,521 | 759,193 | 16,317,494 |
| 1909 | 16,193,188 | 2,449,691 | 1,019,117 | 19,661,996 |
| 1910 | 18,633,118 | 2,468,119 | 1,078,972 | 22,180,209 |
| 1911 | 15,134,743 | 2,966,952 | 926,795 | 19,028,490 |
| 1912 | 16,861,256 | 3,641,276 | 1,268,049 | 21,770,581 |
| 1913 | 18,130,160 | 3,135,957 | 1,720,605 | 22,986,722 |
| 1914 | 21,383,891 | 2,724,965 | 2,152,591 | 26,261,447 |
| 1915 | 25,389,030 | 3,694,453 | 2,665,429 | 31,748,912 |
| 1916 | 26,869,988 | 3,122,187 | 3,294,762 | 33,286,937 |
| 1917* | 25,333,371 | 2,420,639 | 2,929,149 | 30,683,159 |
| 1918* | 18,243,975 | 3,763,476 | 6,466,046 | 28,473,497 |
The following table shows in more detail the exports for the five years ending with 1918, according to the countries of destination. the British possessions are stated first, according to geographical order, followed by foreign countries in the same order.
DESTINATION OF EXPORTS FROM NEW ZEALAND , 1914-18.
| Country. | 1914. | 1915. | 1916. | 1917.* | 1918.* |
|---|---|---|---|---|---|
* Excluding gold (specie and bullion). | |||||
| £ | £ | £ | £ | £ | |
| United Kingdom | 21,383,891 | 25,389,030 | 26,869,988 | 25,333,371 | 18,243,975 |
| British Possessions. | |||||
| Europe— | |||||
| Gibraltar | 16,431 | 1 | .. | 2 | 3 |
| Malta | .. | 13 | 4 | 8 | 47 |
| 16,431 | 14 | 4 | 10 | 50 | |
| Asia— | |||||
| Burma | 11 | 73 | 72 | .. | .. |
| Ceylon | 41,877 | 57,406 | 20,912 | 2,172 | 992 |
| Hong Kong | 7,151 | 9,442 | 12,329 | 10,727 | 5,052 |
| India | 1,512 | 1,000 | 32,203 | 14,385 | 57,293 |
| Straits Settlements | 769 | 1,401 | 42,057 | 5,833 | 1,124 |
| Other Asiatic possessions | 37 | 34 | 22 | .. | 17 |
| 51,357 | 69,356 | 107,595 | 33,117 | 64,478 | |
| Africa— | |||||
| Mauritius | 3 | 4 | 1 | .. | .. |
| South African Union | 60,826 | 11,350 | 6,681 | 1,588 | 718 |
| Other African possessions | 48 | 14 | 19 | 4 | 175 |
| 60,877 | 11,368 | 6,701 | 1,592 | 893 | |
| America— | |||||
| British West Indies | 6 | .. | 5 | 3 | 1 |
| Canada | 595,611 | 925,823 | 691,986 | 961,653 | 1,793,576 |
| Other American possessions | 4 | 5 | 23 | 2 | 111 |
| 595,621 | 925,828 | 692,014 | 961,658 | 1,793,688 | |
| Pacific islands- | |||||
| Australia | 1,928,410 | 2,548,605 | 2,191,545 | 1,247,117 | 1,761,623 |
| Fiji | 67,557 | 131,821 | 116,496 | 167,024 | 136,076 |
| Other Pacific islands | 4,712 | 7,461 | 7,832 | 10,121 | 6,668 |
| 2,000,679 | 2,687,887 | 2,315,873 | 1,424,262 | 1,904,367 | |
| Foreign Countries and Possessions. | |||||
| Europe— | |||||
| Austria | 1,260 | .. | .. | .. | .. |
| Belgium | 33,484 | 1 | 1 | .. | 1 |
| France | 227,027 | 2,160 | 303,288 | 481,792 | 810,007 |
| Germany | 456,163 | 4 | 5 | 6 | .. |
| Hungary | 46 | .. | .. | .. | .. |
| Italy | 907 | 40 | 33 | 78 | 46 |
| Netherlands | 749 | 3 | 1 | .. | .. |
| Norway | 35 | 9 | 2 | 2 | 9,958 |
| Sweden | 599 | 2 | 9 | 21 | 1 |
| Other European countries | 1,232 | 2,796 | 3,906 | 25,682 | 8,398 |
| 721,502 | 5,015 | 307,245 | 507,581 | 828,411 | |
| China | 167 | 204 | 167 | 180 | 335 |
| Japan | 59,508 | 137,464 | 110,045 | 4,388 | 5,415 |
| Other Asiatic countries | 198 | 173 | 227 | 734 | 3,104 |
| 59,873 | 137,841 | 110,439 | 5,302 | 8,854 | |
| Africa— | |||||
| Egypt | 51,786 | 120,415 | 125,936 | 157,358 | 1,211,722 |
| Other African countries | 66 | 13 | 1 | 4 | 4 |
| 51,852 | 120,428 | 125,937 | 157,362 | 1,211,726 | |
| America— | |||||
| Argentina | 8,413 | 8,260 | 4,012 | 86 | 11 |
| Brazil | 4,969 | 6,521 | 3,385 | .. | .. |
| United States of America | 1,028,054 | 2,006,507 | 2,493,987 | 1,894,317 | 4,045,648 |
| Uruguay | 23,838 | 16,871 | 3,390 | .. | 1 |
| Other American countries | 334 | 4,153 | 2,338 | 1,766 | 2,597 |
| 1,065,608 | 2,042,312 | 2,507,112 | 1,896,169 | 4,048,257 | |
| Pacific islands— | |||||
| German Samoa | 59,938 | 113,143 | 71,781 | 119,049 | 84,241 |
| Hawaii | 12,262 | 17,702 | 12,617 | 3,634 | 766 |
| Society Islands | 72,039 | 59,537 | 54,652 | 74,613 | 118,865 |
| Tonga | 36,393 | 54,933 | 24,981 | 79,250 | 107,310 |
| Tutuila | 1,025 | 300 | 424 | 2,075 | 4,360 |
| Other foreign Pacific islands | 72,099 | 114,166 | 79,574 | 84,114 | 53,256 |
| 253,756 | 359,781 | 244,029 | 362,735 | 368,798 | |
In the following table exports have been grouped in accordance with the classification adopted by the British Board of Trade in many of its tables. As might be expected, the classification shows that raw material (other than foodstuffs) is the largest of the five divisions, food, drink, and tobacco coining next. Many of the most important items in this latter class are raw materials also, and the table is a further illustration of the fact that New Zealand is essentially a primary-producing country. Exports of manufactures in 1918 constituted only 5.37 per cent of the total. A similar table given in the Imports subsection of this book shows that the reverse is the case in respect of imports—namely, a preponderance of manufactured goods received into the Dominion.
| Countries. | Food, Drink, and Tobacco. | Raw Materials and Articles mainly unmanufactured. | Articles wholly or mainly manufactured. | Miscellaneous and Unclassified (including Parcels-post). | Bullion and Specie.* | Total.* |
|---|---|---|---|---|---|---|
* Excluding gold. | ||||||
| £ | £ | £ | £ | £ | £ | |
| United Kingdom | 11,635,430 | 6,105,058 | 398,600 | 104,887 | .. | 18,243,975 |
| British Possessions. | ||||||
| Europe— | ||||||
| Gibraltar | .. | .. | .. | 3 | .. | 3 |
| Malta | .. | .. | 42 | 5 | .. | 47 |
| Asia— | ||||||
| British North Borneo Protectorate | 2 | .. | 1 | 12 | .. | 15 |
| Ceylon | 360 | .. | 593 | 39 | .. | 992 |
| Hong Kong | 378 | 4,559 | 56 | 59 | .. | 5,052 |
| India | 2,812 | 420 | 5 | 562 | 53,494 | 57,293 |
| Straits Settlements | 1,040 | .. | 2 | 82 | .. | 1,124 |
| Weihaiwei | .. | .. | .. | 2 | .. | 2 |
| Africa— | ||||||
| British East Africa Protectorate | .. | .. | 9 | .. | 9 | 15 |
| British Somaliland Protectorate | .. | .. | .. | .. | 15 | .. |
| Nyasaland Protectorate | .. | .. | .. | 5 | 5 | |
| St. Helena | .. | .. | 142 | .. | .. | 142 |
| South African Union | .. | .. | 489 | 229 | .. | 718 |
| Southern Rhodesia | .. | .. | .. | 4 | .. | 4 |
| America— | ||||||
| British Guiana | .. | .. | .. | 1 | .. | 1 |
| British West Indies | .. | .. | .. | 1 | .. | 1 |
| Canada | 349,316 | 1,163,660 | 278,295 | 2,305 | .. | 1,793,576 |
| Falkland Island | .. | .. | .. | 1 | .. | 1 |
| Newfoundland | .. | .. | 52 | 57 | .. | 109 |
| Pacific islands— | ||||||
| Australia | 209,436 | 1,035,581 | 274,641 | 126,254 | 115,711 | 1,761,623 |
| British Solomon Islands Protectorate | 2,621 | 236 | 1,408 | 11 | .. | 4,276 |
| Fanning Island | 847 | .. | 184 | 2 | 200 | 1,233 |
| Fiji | 47,070 | 26,162 | 47,709 | 6,115 | 9,020 | 136,076 |
| Gilbert and Ellice Islands | 2 | .. | .. | .. | .. | 2 |
| Maiden Island | 210 | .. | .. | .. | .. | 210 |
| Norfolk Island | 368 | 34 | 421 | 17 | .. | 840 |
| Papua | 81 | .. | 15 | 1 | .. | 97 |
| Pitcairn Island | .. | .. | 4 | 6 | .. | 10 |
| Foreign Countries and Possessions. | ||||||
| Europe— | ||||||
| Belgium | .. | .. | .. | 1 | .. | 1 |
| Denmark | .. | .. | .. | 6 | .. | 6 |
| France | 6,110 | 776,876 | 26,723 | 298 | .. | 810,007 |
| Greece | .. | .. | .. | 9 | .. | 9 |
| Italy | .. | .. | .. | 46 | .. | 46 |
| Norway | .. | 9,957 | .. | 1 | .. | 9,958 |
| Russia | .. | .. | 8,381 | .. | .. | 8,381 |
| Spain | .. | .. | .. | 1 | .. | 1 |
| Sweden | .. | .. | .. | 1 | .. | 1 |
| Switzerland | .. | .. | .. | 1 | .. | 1 |
| Asia— | ||||||
| Asiatic Turkey | 35 | .. | .. | .. | .. | 35 |
| China | .. | .. | 81 | 254 | .. | 335 |
| Japan | 162 | 654 | 4,516 | 83 | .. | 5,415 |
| Java | .. | .. | 3,023 | 4 | .. | 3,027 |
| Malay States | .. | .. | .. | 35 | .. | 35 |
| Philippine Islands | 2 | .. | .. | .. | .. | 2 |
| Sarawak | .. | .. | .. | 1 | .. | 1 |
| Siam | .. | .. | .. | 4 | .. | 4 |
| Countries. | Food, Drink, and Tobacco. | Law Materials and Articles mainly unmanufactured. | Articles wholly or mainly manufactured. | Miscellaneous and Unclassified (including Parcels-post). | Bullion and Specie.* | Total.* |
|---|---|---|---|---|---|---|
* Excluding gold. † The nominal destination only of practically all the total shown. In accordance with an ancient custom, where the real destination may not advisedly be shown, it is credited to "Guam." | ||||||
| Foreign Countries and Possessions —continued. | ||||||
| Africa— | £ | £ | £ | £ | £ | £ |
| Cape Verde Islands | .. | .. | .. | 1 | .. | 1 |
| Egypt | 1,196,274 | 3,569 | 11,710 | 169 | .. | 1,211,722 |
| Togoland | .. | .. | .. | 3 | .. | 3 |
| America— | ||||||
| Argentina | .. | .. | .. | 11 | .. | 11 |
| Chile | 27 | 1,664 | .. | 6 | .. | 1,697 |
| Cuba | 900 | .. | .. | .. | .. | 900 |
| United States of America | 221,375 | 3,430,852 | 370,445 | 22,976 | .. | 4,045,618 |
| Uruguay | .. | .. | .. | 1 | .. | 1 |
| Pacific Islands— | ||||||
| German New Guinea | .. | .. | .. | 1 | .. | 1 |
| German Samoa | 48,598 | 4,241 | 30,862 | 420 | 120 | 84,241 |
| Guam† | 13,342 | 28,853 | 4,266 | .. | .. | 46,461 |
| Hawaii | 456 | 31 | 16 | 263 | .. | 766 |
| New Caledonia | 2,954 | .. | 976 | 2 | .. | 3,932 |
| New Hebrides | 768 | .. | 442 | 8 | .. | 1,218 |
| Society Islands | 77,421 | 6,209 | 25,796 | 9,319 | 120 | 118,865 |
| Tonga | 36,529 | 6,716 | 37,269 | 946 | 25,850 | 107,310 |
| Tuamotu Archipelago | 476 | 370 | 748 | 50 | .. | 1,644 |
| Tutuila | 3,297 | 316 | 747 | .. | .. | 4,360 |
| Totals | 13,858,699 | 12,606,018 | 1,528,660 | 275,605 | 204,515 | 28,473,497 |
Throughout the following tables figures in respect of exports of gold during 1917 and 1918 have been omitted.
| Class. | Item. | Article. | 1914. | 1915. | 1916. | 1917. | 1918. |
|---|---|---|---|---|---|---|---|
* Not available for publication. | |||||||
| £ | £ | £ | £ | £ | |||
| I | 1 | Butter | 1,925,222 | 2,356,051 | 2,464,709 | 2,000,161 | 3,266,296 |
| 3 | Casein | 1,091 | 3,577 | 10,214 | 12,564 | 4,937 | |
| 4 | Cheese | 2,551,758 | 2,676,396 | 3,488,222 | 3,851,915 | 3,902,487 | |
| 14 | Honey | 4,993 | 5,976 | 2,723 | 5,342 | 5,814 | |
| 16 | Bacon | 211 | 15 | 1 | 1,178 | 17,403 | |
| Meats, poultry and game— | |||||||
| 19 | Beef, frozen | 979,614 | 1,623,380 | 2,118,906 | 1,981,140 | 923,001 | |
| 20 | Beef, salted | 2,018 | 27 | .. | 16 | .. | |
| 24 | Kidneys, frozen | 19,738 | 23,595 | 18,175 | 30,072 | 21,394 | |
| 25 | Lamb, whole carcases, frozen | 2,482,272 | 3,001,691 | 2,437,097 | 1,366,511 | 1,168,221 | |
| 27 | Meat-extract | 8,216 | 8,111 | 9,412 | 2,902 | 2,593 | |
| 28 | Mutton, whole carcases, frozen | 2,107,068 | 2,890,467 | 2,529,905 | 2,424,765 | 1,566,837 | |
| 29 | Mutton, joints, frozen | 33,202 | 73,936 | 22,523 | 8,616 | 30,644 | |
| 30 | Pork, frozen | 1,833 | 8,576 | 2,229 | 36,757 | ||
| 32 | Potted and preserved | 42,064 | 166,506 | 166,502 | 192,964 | 284,113 | |
| 34 | Rabbits, frozen in skins | 68,270 | 91,848 | 55,696 | 24,891 | 52,785 | |
| 36 | Sausage casings and skins | 125,546 | 95,888 | 22,794 | 25 | ||
| 37 | Veal, frozen | 8,703 | 32,034 | 25,974 | 5,786 | 9,011 | |
| 38 | Other kinds, frozen | 12,745 | 24,154 | 39,452 | 33,660 | 30,525 | |
| Milk and cream— | |||||||
| 40 | Preserved, condensed, &c. | 131 | 4,157 | 13,090 | 101,328 | 248,468 | |
| 41 | Provisions n.o.e. | 99 | 139 | 73 | 6,341 | 1,376 | |
| II | 59 | Bottled and preserved in syrup | 314 | 222 | 491 | 2,134 | .. |
| Grain and pulse— | |||||||
| Unprepared— | |||||||
| 78 | Barley | 5,165 | 428 | 11 | 213 | .. | |
| 79 | Beans and peas | 78,095 | 49,099 | 20,405 | 62,763 | 58,182 | |
| 81 | Oats | 141,590 | 4,008 | .. | .. | .. | |
| 83 | Wheat Prepared or manufactured— | 2,910 | .. | 17,486 | .. | .. | |
| 86 | Bran | 6,041 | 5 | .. | .. | .. | |
| 87 | Flour, wheaten | 68 | .. | .. | 480 | 2,311 | |
| 101 | Hops | 2,089 | 8,688 | 11,321 | .. | .. | |
| 102 | Infants' and invalids' foods n.o.e. | 12,332 | 9 | 38 | 6 | .. | |
| 103 | Jams, jellies, and preserves | 100 | 297 | 1,431 | 4,485 | 11,668 | |
| III | 139 | Cocoa-beans, uncrushed | .. | 2,192 | 4,242 | 874 | .. |
| V | 168 | Cigarettes | 2,797 | 274 | 575 | 5,455 | .. |
| 171 | Tobacco, manufactured, cut | 2,639 | 1,252 | 925 | 2,746 | 3,403 | |
| VII | 192 | Hair, not made up Hides, pelts and skins, undressed— | 5,126 | 6,128 | 5,278 | 1,747 | 436 |
| 193 | Calf | 5,681 | 4,882 | 8,327 | 2,295 | .. | |
| 194 | Cattle | 52,856 | 134,473 | 70,154 | 235,195 | 121,606 | |
| 196 | Rabbit | 46,140 | 40,416 | 55,261 | 15,161 | 11,204 | |
| 198 | Sheep, with wool | 179,408 | 77,365 | 46,002 | 610 | .. | |
| 199 | Sheep, without wool | 432,596 | 652,901 | 381,143 | 364,750 | 17,661 | |
| Wool— | |||||||
| 204 | Greasy | 6,612,226 | 6,829,868 | 7,983,784 | 8,671,533 | 3,811,136 | |
| 205 | Scoured | 740,148 | 1,100,790 | 1,193,789 | 1,316,604 | 855,116 | |
| 206 | Sliped | 947,623 | 1,582,516 | 1,622,683 | 1,384,681 | 856,308 | |
| 207 | Washed | 25,030 | 36,592 | 63,623 | 20,520 | 73,623 | |
| VIII | 208 | Copra | 13,254 | 81,457 | 14,527 | 3,178 | .. |
| 216 | Phormium tenax | 291,701 | 369,872 | 527,298 | 374,592 | 178,829 | |
| 217 | Rags | 2,637 | 2,052 | 1,407 | 2,042 | 2,751 | |
| 218 | Tow | 26,224 | 26,409 | 60,594 | 2,857 | .. | |
| 223 | Seeds, grass and clover | 20,635 | 19,370 | 24,052 | 20,869 | 3,034 | |
| 225 | Seeds, other | 535 | 1,387 | 705 | 4,398 | 1,081 | |
| IXA | 234 | Apparel and ready-made clothing n.o.e. | 10,709 | 19,461 | 35,066 | 54,793 | 78,659 |
| 244 | Boots and shoes, other | .. | 20 | .. | .. | 14,650 | |
| X | 310 | Glycerine, unrefined | 1,656 | 1,443 | 3,302 | 2,165 | .. |
| 313 | Lard and refined animal fats n.o.e. | 3,061 | 2,787 | 1,795 | 5,098 | 2,899 | |
| Tallow— | |||||||
| 340 | Mutton-stock and oleomargarine | 96,050 | 113,123 | 99,084 | 118,020 | 92,243 | |
| 341 | Unrefined | 595,826 | 662,931 | 681,616 | 296,190 | 106,729 | |
| XII | Coal— | ||||||
| 357 | Bunker | 149,239 | 196,249 | 121,734 | 117414, | 121,182 | |
| 358 | Cargo | .. | .. | .. | .. | .. | |
| 360 | Kauri-gum | 148,370 | 48,585 | 68,347 | 24,881 | 4,198 | |
| XIVA | Gold— | ||||||
| 384 | Bar, dust, ingot, and sheet | 150,519 | 1,031 | 131,906 | * | * | |
| 385 | Concentrates, slimes, tailings, &c. | 10,483 | 2,412 | 3,017 | * | * | |
| 397 | Metals, scrap (except iron and steel), not being precious | 7,605 | 9,485 | 20,452 | 15,122 | 8,842 | |
| XIV | 398 | Platinum—Bars, blocks, rods, &c. | .. | .. | 12 | 5,720 | .. |
| 400 | Scheelite | 4,344 | 25,140 | 49,070 | 28,972 | 37,922 | |
| 401 | Silver | 16,472 | 693 | 1,507 | 17,120 | .. | |
| XVIA | 574 | Indiarubber, old | 1,786 | 275 | 4,639 | 216 | 2 |
| XVIA | .. | Leather— | £ | £ | £ | £ | £ |
| 587 | Hide-leathers, crust or rough tanned, but undressed | 5,823 | 6,142 | 198 | .. | .. | |
| 588 | Dressed | 668 | 3,851 | 4,623 | .. | .. | |
| 591 | Sheep-skins and lambskins n.o.e. | 4,740 | 10,466 | 64 | .. | .. | |
| 592 | Sole, pump, and skirt leather | 25,450 | 37,139 | 27,490 | 5,344 | .. | |
| XVIIA | .. | Timber— | |||||
| 605 | Flitches, other Sawn, n.o.e., rough— | 16,635 | 10,693 | 390 | 2 | .. | |
| 635 | Kauri | 5,430 | 3,835 | 3,037 | 1,599 | 732 | |
| 636 | New Zealand white-pine and kahikatea | 5,159 | 828 | 362 | .. | .. | |
| XXI | 733 | Surgical and dental instruments | 56 | 1,712 | 7,789 | 2,745 | 2,634 |
| XXII | 788 | Sugar-of-milk | .. | 840 | 3,831 | 9,990 | 18,596 |
| 790 | Vanilla-beans | .. | 1,588 | 2,072 | 3,087 | .. | |
| XXIII | .. | Vehicles: Motors for road traffic, and materials therefor— | |||||
| 895 | Materials and parts, viz., rubber tires, covers, and tubes | 268 | 872 | 2,669 | 117 | .. | |
| 902 | Miscellaneous — Manufactured | 3,658 | 2,385 | 2,692 | 679 | 154 | |
| .. | Parcels-post | 26,449 | 19,577 | 20,380 | 13,237 | 97,015 | |
PRINCIPAL ARTICLES EXPORTED TO OTHER COUNTRIES , 1914-18.
| Class. | Item. | Article. | 1914. | 1915. | 1916. | 1917. | 1918. |
|---|---|---|---|---|---|---|---|
* Not available for publication. † Not Including gold. | |||||||
| Gibraltar. | |||||||
| £ | £ | £ | £ | £ | |||
| I | 19 | Beef, frozen | 6,626 | .. | .. | .. | .. |
| 28 | Mutton, frozen | 3,839 | .. | .. | .. | .. | |
| India. | |||||||
| I | 40 | Milk and cream, preserved, condensed, &c. | .. | .. | 26 | 7,060 | 1,621 |
| XIVA | 384 | Gold—Bar, dust, ingot, and sheet. | .. | .. | 16,926 | * | * |
| 401 | Silver—Bar, ingot, and sheet | .. | .. | 13,543 | 5,260 | 53,494 | |
| Ceylon. | |||||||
| I | 40 | Milk and cream, preserved, condensed, &c. | . | .. | .. | 2,058 | 360 |
| II | 81 | Grain and pulse—Oats | 2,488 | 781 | 845 | .. | .. |
| XIVA | 401 | Silver | 39,263 | 56,492 | 19,892 | .. | .. |
| Straits Settlements. | |||||||
| Coal— | |||||||
| XII | 357 | Bunker | 654 | 1,299 | 4,577 | 3,439 | .. |
| 358 | Cargo | .. | .. | 37,111 | 400 | .. | |
| Hong Kong. | |||||||
| VIII | 220 | Fungus | 6,343 | 9,140 | 11,572 | 10,214 | 4,559 |
| South African Union. | |||||||
| I | 1 | Butter | 51,356 | 1,206 | .. | .. | .. |
| 4 | Cheese | 5,952 | 6,648 | 5,433 | .. | .. | |
| VIII | 223 | Seeds, grass and clover | 627 | .. | .. | .. | .. |
| Canada. | |||||||
| £ | £ | £ | £ | ||||
| I | Butter | 291,849 | 114,266 | 25,186 | 2,640 | 102,907 | |
| Meats— | |||||||
| 19 | Beef, frozen | 8,108 | 3 | .. | .. | 52,611 | |
| 25 | Lamb, frozen | 699 | .. | .. | .. | .. | |
| 28 | Mutton | 1,010 | 441 | .. | 9,188 | 118,471 | |
| 30 | Pork, frozen | .. | .. | .. | .. | 2,112 | |
| 32 | Potted frozen and preserved meats | 277 | .. | .. | 160 | 13,759 | |
| 36 | Sausage casings and skins | 370 | 4,647 | 21,690 | 32,430 | 50,462 | |
| II | 134 | Vegetables—Onions | 2,312 | 1,200 | 2,289 | 7,412 | .. |
| Hides, pelts and skins— | |||||||
| Undressed— | |||||||
| VII | 193 | Calf | 30,018 | 46,708 | 35,162 | 11,481 | 10,775 |
| 194 | Cattle | 150,787 | 279,361 | 227,377 | 190,000 | 224,984 | |
| 196 | Rabbit | 332 | 332 | .. | 30,968 | 96,410 | |
| 198 | Sheep, with wool | 31,994 | 52,233 | 75,650 | .. | .. | |
| 199 | Sheep, without wool | 7,666 | 12,251 | 25,647 | 12,957 | 79,358 | |
| Wool— | |||||||
| 204 | Greasy | 8,872 | 78,860 | 87,181 | 161,168 | 382,314 | |
| 205 | Scoured | 6,622 | 15,913 | 5,826 | .. | 19,661 | |
| 200 | Sliped | 31,981 | 98,888 | 93,492 | 149,369 | 170,515 | |
| VIII | 216 | Phormium tenax | 4,677 | 5,635 | 61,925 | 196,557 | 89,876 |
| X | 341 | Tallow, unrefined | 27 | 126 | .. | 59,918 | 275,513 |
| XII | 357 | Coal, bunker | 2,599 | 3,350 | 5,198 | 5,532 | 8,266 |
| 360 | Kauri-gum | 2,114 | 4,550 | 14,591 | 79,412 | 81,497 | |
| Australia. | |||||||
| I | 1 | Butter | 3,262 | 200,125 | 116,550 | 11,557 | 3,791 |
| 4 | Cheese | 5,086 | 44,573 | 18,733 | 2,343 | 1,704 | |
| 9 | Fresh oysters | 2,396 | 2,032 | 1,340 | 244 | 1,114 | |
| 10 | Fish, fresh or preserved by cold process (other than oysters) | 21,741 | 27,653 | 29,623 | 19,549 | 13,643 | |
| 11 | Fish, preserved in tins or other airtight vessels | 13,177 | 12,200 | 8,566 | 4,744 | 4,180 | |
| 13 | Gelatine | .. | 116 | 2,849 | 8,655 | 16,525 | |
| 16 | Bacon | 141 | 4,195 | 2,524 | 74 | .. | |
| 21 | Hams | 1,080 | 5,877 | 5,558 | 405 | .. | |
| 30 | Pork, frozen | 2,364 | 9,001 | 17,047 | .. | 37,076 | |
| 32 | Meats, potted and preserved | 18,015 | 12,033 | 37,791 | 28,816 | .. | |
| 36 | Sausage casings and skins | 4,791 | 8,025 | 7,463 | 1,817 | 2,593 | |
| 40 | Milk and cream, preserved, condensed, &c. | 356 | 13,800 | 4,015 | 26,821 | 59,452 | |
| II | 54 | Foods for animals—Chaff Grain and pulse— | 3,742 | 152,030 | .. | 3 | |
| Unprepared— | |||||||
| 78 | Barley | 3,527 | 4,333 | 1 | .. | .. | |
| 79 | Beans and peas | 9,066 | 21,831 | 15,960 | 9,005 | 12,565 | |
| 81 | Oats | 18,885 | 125,104 | 1,081 | 207 | 76 | |
| Prepared or manufactured— | |||||||
| 86 | Bran | 19,594 | 29,553 | .. | 1 | .. | |
| 101 | Hops | 19,522 | 9,661 | 6,016 | 11,649 | 10,664 | |
| 102 | Infants' and invalids' foods n.o.e. | 26,949 | 45,870 | 37,502 | 85 | .. | |
| 130 | Sugar, refined Vegetables— | .. | 2,564 | 7,924 | 25,421 | 222 | |
| 134 | Onions | 2,662 | 4,491 | 24 | .. | 404 | |
| 135 | Potatoes | 3,104 | 125,567 | 8,884 | .. | 18 | |
| Spirits (beverages)— | |||||||
| IV | 154 | Brandy | 428 | 153 | 3,144 | 980 | .. |
| 158 | Whisky | 592 | 158 | 1,583 | 4,080 | .. | |
| VI | 175 | Cattle for stud purposes | 1,654 | 2,827 | 1,500 | 6,129 | 11,854 |
| Horses— | |||||||
| 176 | Ordinary | 25,284 | 20,914 | 19,853 | 15,965 | 20,620 | |
| For stud purposes— | |||||||
| 177 | Entires | 7,186 | 3,125 | 3,050 | 2,932 | 5,072 | |
| 178 | Mares | 3,483 | 2,614 | 4,555 | 578 | 2,435 | |
| 183 | Sheep for breeding purposes | 20,145 | 16,997 | 16,531 | 13,439 | 9,610 | |
| VII | 192 | Hair, not made up, other Hides, pelts and skins— | 2,528 | 2,668 | 2,071 | 1,248 | 1,163 |
| Undressed— | |||||||
| 193 | Calf | 10,096 | 11,426 | 23,047 | 6,073 | 31,117 | |
| 194 | Cattle | 107,766 | 90,560 | 309,668 | 8,893 | 125,335 | |
| 196 | Rabbit | 822 | 4,046 | 6,397 | 3,842 | 1,074 | |
| 198 | Sheep, with wool | 3,668 | 2,133 | 571 | .. | .. | |
| 199 | Sheep, without wool | 16,487 | 19,513 | 31,766 | 32,511 | 14,696 | |
| 201 | Horns, hoofs, and glue pieces | 1,754 | 1,373 | 1,577 | 1,074 | 436 | |
| Wool— | |||||||
| 204 | Greasy | 8,612 | 88,902 | 33,730 | .. | 8,272 | |
| 206 | Sliped | 1,619 | 3,151 | 1,136 | .. | 30,585 | |
| VIII | 216 | Phormium tenax | 96,672 | 139,411 | 163,402 | 146,893 | 218,507 |
| 218 | Tow | 9,771 | 11,912 | 13,304 | 30,243 | 19,730 | |
| 223 | Seeds, grass and clover | 54,832 | 24,223 | 7,199 | 24,824 | 22,289 | |
| 224 | Linseed | 4,672 | 1,034 | 18 | .. | 14,690 | |
| 225 | Seeds, other | 4,536 | 11,714 | 8,590 | 6,233 | 8,525 | |
| IXA | 253 | Apparel—Hosiery | 1,760 | 10,278 | 7,113 | 174 | 49 |
| Textiles— | |||||||
| IXB | 264 | Blankets | 785 | 165 | 2,889 | 539 | 814 |
| 278 | Piece-goods n.o.e. | 446 | 772 | 691 | 3,224 | 2,656 | |
| 283 | Silks, satins, velvets, &c. | 1,464 | 508 | 1,029 | 4,914 | .. | |
| 286 | Woollen, n.o.e., of pure or mixed wool | 1,995 | 3,007 | 1,792 | 15,909 | 5 | |
| 288 | Rugs, woollen | 6,795 | 5,508 | 7,753 | 5,289 | 4,336 | |
| Bags and sacks— | |||||||
| IXC | 294 | Corn | 170 | 2,823 | 2,367 | 2,442 | .. |
| 295 | Jute and hessian, n.o.e. | 7 | 4,126 | 2,818 | 5,757 | .. | |
| 302 | Twine, binder | 1,531 | 18,921 | 15,154 | 18,494 | 21,241 | |
| 310 | Glycerine | 415 | 2,618 | 929 | 971 | 4,097 | |
| X | 318 | Oil, whale | 2,910 | 3,000 | 1,647 | 5,511 | 12,614 |
| 341 | Tallow, unrefined | 35 | 2,594 | 391 | 21,355 | 3,998 | |
| Coal— | |||||||
| XII | 357 | Bunker | 25,868 | 34,222 | 41,661 | 30,091 | 28,092 |
| 358 | Cargo | 18,546 | 30 | 6,848 | 3,472 | 3,411 | |
| 360 | Kauri-gum | 1,720 | 594 | 2,129 | 1,130 | 4,895 | |
| 367 | Pumice-sand | 5,251 | 4,790 | 11,805 | 5,660 | 5,238 | |
| XIVA | 379 | Bronze—Blocks, bars, &c. | 2,995 | .. | .. | .. | .. |
| Gold— | |||||||
| 384 | Bar, dust, ingot, and sheet | 708,659 | 489,904 | 476,415 | * | * | |
| 385 | Concentrates, slimes, tailings, &c. | 27,757 | 17,735 | 36,292 | 2,688† | 2,158† | |
| XIV | 397 | Metals, scrap (except iron and steel), not being precious | 2,545 | 687 | 1,245 | 879 | 1,018 |
| 401 | Silver | 3,171 | 36,297 | 46,925 | 80,205 | 115,711 | |
| XIVB | 495 | Metals, manufactures, &c., n.o.e. | 1,969 | 5,152 | 953 | 2,326 | 390 |
| Machinery and machines— | |||||||
| XV | 522 | Dairying, other | 1,113 | 1,362 | 1,594 | 2,939 | 1,805 |
| 560 | Sewing-machines | 542 | 1,669 | 1,474 | 5,747 | .. | |
| 570 | N.o.e. | 3,533 | 6,208 | 2,362 | 5,298 | 3,105 | |
| XVIA | 574 | Indiarubber, old | 1,907 | 825 | 579 | 616 | .. |
| XVIB | 591 | Leather—Sheep-skins and lamb-skins n.o.e. | 2,314 | 1,259 | 2,427 | 15 | .. |
| Timber— | |||||||
| XVIIA | 605 | Flitches, other | 7,712 | 12,734 | 6,383 | 4,168 | 18,314 |
| Sawn, n.o.e., dressed— | |||||||
| 628 | Kauri | 470 | 1,651 | 966 | 2,308 | 1,859 | |
| Sawn, n.o.e., rough— | |||||||
| 632 | Beechwood | 4,058 | 969 | 2,686 | 2,514 | 11,040 | |
| 635 | Kauri | 89,230 | 56,254 | 78,958 | 77,200 | 55,777 | |
| 636 | New Zealand white-pine and kahikatea | 224,934 | 223,435 | 203,053 | 182,885 | 231,358 | |
| 638 | Rimu or red-pine | 53,915 | 60,944 | 69,748 | 109,587 | 196,499 | |
| 639 | Timber, other | 192 | 133 | 176 | 1,691 | 14,912 | |
| XVIII | 666 | Cement, building, Portland, and other structural | 7,542 | 23,937 | 14,767 | .. | .. |
| XIXB | 698 | Books, papers, music, printed, n.o.e. | 7,411 | 4,575 | 2,551 | 3,085 | 2,003 |
| XX | 714 | Jewellery — Precious stones, unmounted | .. | 63 | 17,634 | 23,746 | .. |
| XXI | 725 | Cinematographs, n.o.e.— Kinetoscopes | 8,648 | 4,260 | 1,648 | 3,716 | .. |
| XXIIA | 751 | Cream of tartar | 722 | 1,730 | .. | 2,175 | .. |
| 765 | Medicinal preparations— Drugs and druggists' sundries n.o.e. | 1,782 | 3,232 | 5,467 | 3,427 | 747 | |
| 788 | Sugar-of-milk | 375 | 221 | 2,300 | 1,902 | 1,228 | |
| XXIII | 870 | Blacking and boot-polish Vehicles, motor, for road traffic, and materials therefor— | 28 | 11 | 2,714 | 222 | .. |
| 893 | Cars, motor | 2,277 | 1,912 | 4,763 | 5,019 | .. | |
| 895 | Rubber tires, covers, and tubes | 4,176 | 3,637 | 4,898 | 20,024 | .. | |
| 902 | Miscellaneous, manufactured | 16,878 | 24,303 | 32,185 | 27,549 | 62 | |
| .. | Parcels-post | 10,703 | 7,822 | 9,203 | 10,848 | 13,871 | |
| Papua. | |||||||
| I | 32 | Meats, potted and preserved | 273 | 1,428 | 2,160 | 358 | 63 |
| Fiji. | |||||||
| I | 1 | Butter | 4,631 | 7,156 | 7,238 | 7,008 | 3,966 |
| 16&21 | Bacon and hams | 2,719 | 2,797 | 2,529 | 2,750 | 1,841 | |
| 32 | Meats, potted and preserved | 8,056 | 10,321 | 11,734 | 14,399 | 17,493 | |
| II | 86 | Bran | 2,495 | 4,868 | 1,852 | 860 | 926 |
| 87 | Flour, wheaten | 141 | 445 | 1,185 | 5,066 | 161 | |
| 130 | Sugar, refined | 120 | 3,354 | 4,719 | 5,151 | 4,364 | |
| 135 | Potatoes | 2,204 | 2,895 | 4,350 | 3,813 | 2,196 | |
| VI | 176 | Horses, ordinary | 1,869 | 1,886 | 1,099 | 1,627 | 1,995 |
| 182 | Sheep, ordinary | 1,158 | 2,431 | 2,330 | 2,283 | 1,986 | |
| IXA | 234 | Apparel and ready-made clothing | 1,109 | 922 | 186 | 1,038 | 861 |
| IXB | 278 | Piece-goods n.o.e. | 250 | 133 | 944 | 3,933 | .. |
| Bags and sacks— | |||||||
| IXC | 295 | Jute and hessian, n.o.e. | .. | 1,624 | 1,944 | 2,873 | .. |
| X | 341 | Tallow, unrefined | 840 | 2,048 | 4,235 | 5,095 | 4,037 |
| Coal— | |||||||
| XII | 357 | Bunker | 2,470 | 6,773 | 14,054 | 6,279 | 6,934 |
| 358 | Cargo | 5,464 | 3,353 | 1,943 | 5,592 | 130 | |
| XIII | 375 | Silver (specie) | .. | 38,680 | 5,000 | 28,300 | .. |
| Timber— | |||||||
| Sawn, n.o.e., dressed — | |||||||
| XVIIA | 628 | Kauri | 2,032 | 2,151 | 2,215 | 2,034 | 4,169 |
| Sawn, n.o.e., rough— | |||||||
| 635 | Kauri | 4,548 | 5,786 | 10,197 | 15,840 | 11,628 | |
| XVIII | 666 | Cement, building, Portland, and other structural | 2,827 | 3,263 | 12,895 | 3,893 | 4,199 |
| XXI | 725 | Cinematograph, bioscope, and kinetoscope films | .. | 1,500 | 2,663 | 1,415 | .. |
| Austria. | |||||||
| XII | 360 | Kauri-gum | 329 | .. | .. | .. | .. |
| Belgium. | |||||||
| VII | 204 | Wool, greasy | 27,637 | .. | .. | .. | .. |
| XII | 360 | Kauri-gum | 1,519 | .. | .. | .. | .. |
| France. | |||||||
| Wool— | £ | £ | £ | £ | £ | ||
| VII | 204 | Greasy | 218,252 | .. | 298,962 | 467,899 | 767,237 |
| 205 | Scoured | .. | .. | 148 | 3,592 | .. | |
| 206 | Sliped | .. | .. | .. | .. | 9,639 | |
| X | 341 | Tallow, unrefined | .. | .. | .. | 8,898 | 26,597 |
| XII | 360 | Kauri-gum | 3,599 | 430 | .. | .. | .. |
| XIVA | 400 | Scheelite | 3,562 | 1,550 | .. | .. | .. |
| Germany. | |||||||
| I | 3 | Casein | 6,703 | .. | .. | .. | .. |
| 36 | Sausage-skins | 7,619 | .. | .. | .. | .. | |
| VII | 198 | Skins, sheep, with wool | 2,736 | .. | .. | .. | .. |
| 204 | Wool, greasy | 396,793 | .. | .. | .. | .. | |
| VIII | 223 | Seeds, grass and clover | 1,821 | .. | .. | .. | .. |
| XII | 360 | Kauri-gum | 21,193 | .. | .. | .. | .. |
| XIVA | 400 | Scheelite | 13,007 | .. | .. | .. | .. |
| Norway. | |||||||
| VIII | 216 | Phormium tenax | .. | .. | .. | .. | 9,957 |
| Russia. | |||||||
| X | 341 | Tallow, unrefined | .. | .. | .. | 22,417 | 8,381 |
| Japan. | |||||||
| VII | 204 | Wool, greasy | 59,222 | 135,108 | 108,617 | .. | .. |
| X | 341 | Tallow, unrefined | .. | .. | .. | .. | 3,744 |
| Java. | |||||||
| XIV | 495 | Metal manufactures n.o.e. | .. | .. | .. | .. | 3,023 |
| Switzerland. | |||||||
| .. | .. | Parcels-post | 210 | 23 | 2,398 | 65 | 1 |
| Egypt. | |||||||
| I | 1 | Butter | .. | .. | .. | 2 | 14,021 |
| 4 | Cheese | .. | .. | .. | 93,257 | 180,718 | |
| Meats— | |||||||
| 19 | Beer, frozen | .. | .. | .. | 25,128 | 736,534 | |
| 28 | Mutton, whole carcases, frozen | .. | .. | .. | 33,404 | 237,633 | |
| 40 | Milk and cream, preserved, condensed, &c. | 106 | 1,158 | 35 | 5,250 | 24,358 | |
| 41 | Provisions n.o.e. | .. | 32 | 3,465 | .. | 100 | |
| II | 81 | Oats | 1,383 | .. | 27,466 | .. | .. |
| V | 171 | Tobacco, manufactured | .. | 1,828 | 4,343 | 11 | .. |
| VI | 176 | Horses, ordinary | 46,246 | 75,548 | 51,100 | .. | .. |
| XII | 357 | Coal, bunker | .. | 31,355 | 26,307 | 226 | 3,569 |
| United States. | |||||||
| I | 1 | Butter | 44,773 | 500 | 26 | 8 | .. |
| 19 | Beef, frozen | 29,478 | 90 | 1 | .. | .. | |
| 25 | Lamb, whole carcases, frozen | 71,214 | 1,757 | .. | .. | .. | |
| 28 | Mutton, whole carcases, frozen | 3,038 | 179 | .. | .. | .. | |
| 32 | Meats, potted and preserved | 2,416 | 130 | 3 | .. | 10,223 | |
| 36 | Sausage casings and skins | 699 | 83,468 | 144,838 | 193,675 | 204,783 | |
| 37 | Veal, frozen | 8,143 | 654 | .. | .. | .. | |
| II | 79 | Beans and peas | 2,686 | 5,751 | 685 | 496 | 413 |
| III | 139 | Cocoa-beans, uncrushed | .. | .. | 1,876 | 6,381 | .. |
| VI | 183 | Sheep for breeding purposes | 1,073 | 1,351 | 1,723 | 2,338 | 4,043 |
| Hides, pelts and skins— | |||||||
| Undressed— | £ | £ | £ | £ | £ | ||
| VII | 193 | Calf | 4,523 | 3,171 | 462 | .. | .. |
| 194 | Cattle | 43,169 | 1,280 | .. | .. | 16,614 | |
| 196 | Rabbit | 1,044 | 4,687 | 14,745 | 55,350 | 191,077 | |
| 198 | Sheep, with wool | 11,277 | 7,934 | 33,958 | .. | .. | |
| 199 | Sheep, without wool | 168,448 | 2,177 | 322,891 | 889,360 | 1,701,874 | |
| Wool— | |||||||
| 204 | Greasy | 203,914 | 388,562 | 831,668 | .. | 542,772 | |
| 205 | Scoured | 4,291 | 14,880 | 52,078 | .. | .. | |
| 206 | Sliped | 15,216 | 11,038 | 7,121 | .. | 88 | |
| VIII | 208 | Copra | 721 | .. | .. | 8,049 | .. |
| 216 | Phormium tenax | 62,154 | 56,703 | 249,065 | 479,343 | 890,594 | |
| 218 | Tow | 1,021 | 66 | 1,432 | 2,067 | .. | |
| 223 | Seeds, grass and clover | 1,945 | 505 | 4,954 | 16,968 | 16,547 | |
| X | 337 | Oils n.o.e. | .. | .. | .. | .. | 2,574 |
| 340 | Oleomargarine | .. | .. | .. | 390 | 66,824 | |
| 341 | Tallow, unrefined | 617 | .. | .. | 20,726 | 259,540 | |
| XII | 357 | Coal, bunker | 10,404 | 4,963 | 19,612 | 16,106 | 16,413 |
| 360 | Kauri-gum | 316,200 | 222,856 | 253,316 | 183,508 | 66,723 | |
| XIVA | 384 | Gold—Bar, dust, ingot, and sheet | .. | 1,181,834 | 536,960 | .. | .. |
| 587 | Hide leathers, undressed | .. | .. | .. | .. | 27,265 | |
| XVIB | 588 | Leather—Hide leather other than East India kip, dressed | .. | .. | .. | 2,649 | .. |
| Vehicles, motor, for road traffic, and materials therefor— | |||||||
| XXIII | 895 | Rubber tires, covers, and tubes | 152 | 315 | 2,512 | 2,536 | .. |
| .. | .. | Parcels-post | 2,881 | 2,622 | 3,167 | 2,544 | 2,377 |
| Brazil. | |||||||
| II | 67 | Apples, fresh | 4,549 | 5,891 | 3,378 | .. | .. |
| Argentina. | |||||||
| II | 67 | Apples | 7,872 | 5,352 | 1,882 | .. | .. |
| 73 | Pears | 180 | .. | .. | .. | .. | |
| VI | 183 | Sheep for breeding | .. | .. | .. | .. | .. |
| Uruguay. | |||||||
| II | 67 | Apples | 8,994 | 6,733 | 1,956 | .. | .. |
| 73 | Pears | 62 | .. | .. | .. | .. | |
| VI | 183 | Sheep for bleeding | 6,366 | 3,911 | 914 | .. | .. |
| VIII | 221 | Plants, trees, and shrubs | 4,182 | 515 | .. | .. | .. |
| Chile. | |||||||
| XII | 357 | Coal, bunker | 265 | 4,031 | 2,293 | 1,390 | 1,664 |
| Bismarck Archipelago. | |||||||
| XII | 358 | Coal cargo | 2,594 | .. | .. | .. | .. |
| German Samoa. | |||||||
| I | 1 | Butter | 3,611 | 4,335 | 4,090 | 4,556 | 3,788 |
| 20 | Beef, salted | 5,406 | 5,637 | 4,052 | 5,848 | 7,433 | |
| 32 | Meats, potted and preserved | 12,568 | 12,557 | 13,699 | 16,686 | 17,186 | |
| II | 54 | Food for animals—Chaff | 446 | 1,179 | 2,369 | 2,570 | 2,544 |
| 130 | Sugar, refined | 2,876 | 3,549 | 4,475 | 6,214 | 1,540 | |
| IXB | 278 | Textile piece-goods n.o.e. | 1,495 | 2,223 | 2,700 | 6,257 | .. |
| XIII | 375 | Silver (specie) | .. | 25,350 | .. | 19,700 | .. |
| XXIII | 816 | Arms, ammunition, and explosives—Cartridges n.o.e. | 6 | .. | 2 | 8,005 | .. |
| 875 | Soap, common bar (yellow and blue mottled) | 1,916 | 2,140 | 4,226 | 4,317 | 1,884 | |
| Guam. | |||||||
| £ | £ | £ | £ | £ | |||
| V | 168 | Cigarettes | 833 | 235 | 451 | 3,023 | .. |
| Coal— | |||||||
| XII | 357 | Bunker | 3,449 | 31,014 | 31,023 | 25,627 | 10,422 |
| 358 | Cargo | 55,312 | 2,065 | 10,149 | 17,465 | 18,431 | |
| Hawaii (Sandwich Islands). | |||||||
| I | 1 | Butter | 5,889 | 9,536 | 8,140 | 60 | 24 |
| 19 | Beef, frozen | 5,349 | 2,206 | .. | 68 | .. | |
| 40 | Milk and cream, preserved, condensed, &c. | 8 | 589 | 2,026 | 2,622 | .. | |
| New Caledonia. | |||||||
| I | 40 | Milk and cream, preserved, condensed, &c. | .. | .. | 3 | 2,719 | 30 |
| II | 130 | Sugar, refined | .. | 8,099 | 22,953 | 15,522 | 2,042 |
| Society Islands. | |||||||
| I | 1 | Butter | 6,606 | 5,754 | 4,805 | 3,492 | 4,686 |
| 32 | Meats, potted and preserved | 14,620 | 7,521 | 11,813 | 11,947 | 18,587 | |
| 40 | Milk and cream, preserved, condensed, &c. | 4,209 | 3,371 | 5,186 | 3,605 | 1,181 | |
| II | 43 | Biscuits | 1,960 | 998 | 504 | 1,700 | 3,849 |
| 87 | Flour, wheaten | 29 | 114 | 96 | 9,388 | 26,108 | |
| Sugar— | |||||||
| 129 | Raw | 1,539 | 1,345 | 2,872 | 3,137 | .. | |
| 130 | Refined | 3,526 | 2,249 | 2,964 | 3,312 | 4,109 | |
| VI | 174 | Cattle, ordinary | 3,451 | 3,024 | 2,228 | 3,987 | 4,172 |
| 179 | Pigs, ordinary | 252 | 1,143 | 914 | 2,120 | 3,127 | |
| XII | 357 | Coal, bunker | 1,543 | 3,214 | 2,202 | 2,080 | 3,153 |
| XXI | 725 | Cinematograph, bioscope, and kinetoscope films | 3,813 | 4,808 | 490 | 3,097 | 20 |
| XXIII | 875 | Soap, common bar (yellow and blue mottled) | 5,162 | 5,291 | 7,010 | 8,663 | 9,396 |
| Tonga (Friendly Islands). | |||||||
| I | 1 | Butter | 1,057 | 1,530 | 1,290 | 1,538 | 2,243 |
| 20 | Beef, salted | 1,082 | 537 | 474 | 2,462 | 3,753 | |
| 32 | Meats, potted and preserved | 8,839 | 9,356 | 3,602 | 10,499 | 17,565 | |
| II | 43 | Biscuits, ships' plain | 2,148 | 3,066 | .. | 1,765 | 1,533 |
| 130 | Sugar, refined | 1,708 | 3,758 | .. | 3,557 | 1,913 | |
| IXB | 278 | Cotton piece-goods n.o.e. | 1,293 | 1,215 | 1,934 | 6,897 | .. |
| X | 324 | Oil, kerosene | 1,728 | 1,843 | 2,164 | 2,602 | .. |
| XI | 357 | Coal, bunker | 969 | 1,898 | .. | 1,343 | 2,614 |
| XIII | 375 | Silver (specie) | .. | 900 | .. | 21,100 | .. |
| Tutuila. | |||||||
| I | 32 | Meats, potted and preserved | 629 | 203 | 332 | 1,011 | 2,048 |
In order to give further detail concerning the destination of the main exports a number of tables are appended showing the details for five years for each of the principal articles.
| Country to which exported. | 1914 | 1915. | 1916. | 1917. | 1918. |
|---|---|---|---|---|---|
* Not available for publication. | |||||
| lb. | WOOL . lb. | lb. | lb. | lb. | |
| United Kingdom | 195,612,290 | 183,011,230 | 162,452,392 | 168,062,049 | 80,502,867 |
| Canada | 906,829 | 2,881,566 | 2,508,349 | 3,620,449 | 8,191,769 |
| Australia | 272,269 | 1,579,063 | 555,881 | .. | 523,057 |
| Belgium | 695,850 | .. | .. | .. | .. |
| France | 5,686,732 | .. | 4,369,748 | 6,591,988 | 11,328,194 |
| Germany | 10,305,579 | .. | .. | .. | |
| Japan | 1,821,999 | 2,998,791 | 2,182,035 | .. | .. |
| United States of America | 5,014,714 | 6,113,073 | 13,438,854 | .. | 8,178,688 |
| Other countries | 154,636 | .. | .. | .. | .. |
| Totals | 220,472,898 | 196,583,723 | 185,507,259 | 178,274,486 | 108,724,575 |
| FROZEN MEAT | |||||
| Cwt. | Cwt. | Cwt. | Cwt. | Cwt. | |
| United Kingdom | 3,149,624 | 3,582,602 | 3,319,911 | 2,438,456 | 1,537,671 |
| Canada | 8,663 | 221 | .. | 2,584 | 70,671 |
| Pacific islands | 3,726 | 2,805 | 467 | 547 | 603 |
| Australia | 869 | 4,603 | 5,667 | 11 | 275 |
| Gibraltar | 7,088 | .. | .. | .. | .. |
| United States of America | 59,918 | 1,025 | .. | .. | 638 |
| Egypt | .. | .. | .. | 25,334 | 427,034 |
| Other countries | 85 | 4 | .. | .. | .. |
| Totals | 3,229,973 | 3,591,260 | 3,326,045 | 2,466,932 | 2,036,892 |
| BUTTER . | |||||
| United Kingdom | 361,381 | 371,959 | 336,412 | 250,721 | 415,250 |
| South African Union | 8,941 | 200 | .. | .. | .. |
| Canada | 51,599 | 18,838 | 3,557 | 304 | 11,893 |
| Pacific islands | 3,607 | 3,791 | 3,094 | 1,872 | 1,495 |
| Australia | 560 | 25,269 | 15,566 | 1,499 | 436 |
| United States of America | 7,917 | 87 | 3 | 1 | .. |
| Other countries | 62 | .. | .. | .. | 1,949 |
| Totals | 434,067 | 420,144 | 358,632 | 254,397 | 431,023 |
| CHEESE . | |||||
| United Kingdom | 859,986 | 803,917 | 942,773 | 865,152 | 844,198 |
| South African Union | 1,917 | 1,971 | 1,574 | .. | .. |
| Pacific islands | 286 | 278 | 239 | 279 | 233 |
| Australia | 1,483 | 10,729 | 4,682 | 314 | 256 |
| Egypt | .. | .. | .. | 19,975 | 38,646 |
| Other countries | 104 | 363 | 148 | 23 | 112 |
| Totals | 863,776 | 817,258 | 949,416 | 885,743 | 883,445 |
| tALLOW . | |||||
| Tons. | Tons. | Tons. | Tons. | Tons. | |
| United Kingdom | 24,437 | 26,599 | 22,333 | 9,672 | 3,529 |
| Pacific islands | 30 | 68 | 127 | 143 | 109 |
| Australia | 2 | 92 | 12 | 464 | 96 |
| Canada | 1 | 4 | .. | 1,256 | 5,872 |
| United States of America | 12 | .. | .. | 375 | 6,018 |
| Other countries | 33 | .. | .. | 689 | 797 |
| Totals | 24,515 | 26,763 | 22,472 | 12,599 | 16,421 |
| HIDES (HORSE AND CATTLE ). | |||||
| Number. | Number. | Number. | Number. | Number. | |
| United Kingdom | 31,689 | 69,013 | 32,084 | 98,142 | 53,848 |
| Canada | 82,034 | 150,758 | 114,488 | 72,633 | 82,942 |
| Australia | 70,633 | 49,703 | 151,624 | 7,551 | 65,736 |
| United States of America | 28,709 | 889 | .. | .. | 6,434 |
| Other countries | 2,336 | .. | .. | .. | .. |
| Totals | 215,401 | 270,363 | 298,196 | 178,326 | 208,960 |
| RABBIT -SKINS . | |||||
| Number. | Number. | Number. | Number. | Number. | |
| United Kingdom | 4,278,542 | 5,323,176 | 4,819,597 | 879,483 | 254,868 |
| Canada | 43,431 | 98,400 | .. | 1,611,089 | 2,871,980 |
| Australia | 45,842 | 255,241 | 225,551 | 201,822 | 52,917 |
| United States of America | 140,006 | 412,555 | 851,132 | 2,252,213 | 4,674,387 |
| Other countries | 4,350 | 1,500 | 130 | .. | .. |
| Totals | 4,512,171 | 6,090,872 | 5,896,410 | 4,944,607 | 7,854,152 |
| SHEEP SKINS AND PELTS . | |||||
| United Kingdom | 5,870,438 | 8,375,638 | 4,141,630 | 1,786,153 | 65,163 |
| Canada | 183,105 | 301,075 | 440,138 | 49,327 | 340,620 |
| Australia | 300,661 | 374,333 | 433,370 | 205,809 | 123,370 |
| United States of America | 2,139,614 | 42,804 | 3,320,394 | 4,486,764 | 8,212,385 |
| Other countries | 31,793 | .. | 38 | .. | .. |
| Totals | 8,525,611 | 9,093,850 | 8,335,570 | 6,528,053 | 8,741,538 |
| SAUSAGE -SKINS . | |||||
| Cwt. | Cwt. | Cwt. | Cwt. | Cwt. | |
| United Kingdom | 35,374 | 34,120 | 6,511 | .. | 4 |
| Canada | 45 | 322 | 2,295 | 2,390 | 3,527 |
| Australia | 1,938 | 1,662 | 1,635 | 650 | 1,767 |
| Germany | 2,394 | .. | .. | .. | .. |
| Russia | 408 | .. | .. | .. | .. |
| United States of America | 153 | 8,604 | 12,171 | 15,091 | 14,600 |
| Other countries | 10 | .. | 1 | 1 | 1 |
| Totals | 40,322 | 44,708 | 22,613 | 18,132 | 19,899 |
| WHEAT . | |||||
| Centals. | Centals. | Centals. | Centals. | Centals. | |
| United Kingdom | 8,569 | .. | 40,570 | .. | .. |
| Pacific islands | 1,658 | 206 | 93 | 890 | 660 |
| Australia | .. | 10 | 624 | 12 | 14 |
| Other countries | 21 | .. | .. | .. | .. |
| Totals | 10,248 | 216 | 41,287 | 902 | 674 |
| OATS . | |||||
| United Kingdom | 450,146 | 8,257 | .. | .. | .. |
| Ceylon | 8,101 | 1,629. | 1,514 | .. | .. |
| Pacific islands (other than Fiji) | 2,497 | 2,844 | 1,371 | 1,555 | 1,009 |
| Australia | 63,358 | 258,202 | 2,393 | 398 | 170 |
| Fiji | 330 | 279 | 278 | 419 | 121 |
| Brazil | 442 | .. | .. | .. | .. |
| Uruguay | 890 | 713 | .. | .. | .. |
| Other countries | 3,581 | 1,137 | 82,550 | .. | .. |
| Totals | 529,345 | 273,061 | 88,106 | 2,372 | 1,300 |
| BEANS AND PEAS . | |||||
| United Kingdom | 159,851 | 79,912 | 23,454 | 56,070 | 43,517 |
| Canada | 1,174 | 60 | 1,961 | 2,684 | 45 |
| South African Union | 390 | .. | 1 | .. | .. |
| Australia | 15,728 | 34,888 | 24,042 | 7,258 | 10,251 |
| Fiji | 70 | 2 | 2 | 16 | 10 |
| France | .. | .. | 98 | 176 | .. |
| United States of America | 5,114 | 6,018 | 711 | 476 | 444 |
| Other countries | 705 | 285 | 202 | 25 | 30 |
| Totals | 183,032 | 121,165 | 50,871 | 66,705 | 54,297 |
| POTATOES . | |||||
| Tons. | Tons. | Tons. | Tons. | Tons. | |
| Pacific islands (other than Fiji) | 212 | 262 | 190 | 197 | 176 |
| Australia | 958 | 18,145 | 1,029 | .. | 1 |
| Fiji | 485 | 418 | 517 | 532 | 26 |
| Argentine Republic | .. | .. | .. | .. | .. |
| Brazil | 45 | 95 | .. | .. | .. |
| Other countries | 44 | 655 | 2 | 10 | 1 |
| Totals | 1,744 | 19,575 | 1,738 | 739 | 440 |
| SEEDS (GRASS AND CLOVER ). | |||||
| Cwt. | Cwt. | Cwt. | Cwt. | Cwt. | |
| United Kingdom | 10,392 | 6,579 | 6,669 | 5,230 | 778 |
| Canada | 257 | 424 | 60 | 351 | 140 |
| Pacific islands (other than Fiji) | 1 | 26 | 5 | 1 | 3 |
| South African Union | 198 | .. | .. | .. | .. |
| Australia | 26,702 | 7,809 | 2,212 | 8,398 | 10,659 |
| Fiji | .. | .. | 3 | 1 | .. |
| Germany | 901 | .. | .. | .. | .. |
| United States of America | 1,121 | 242 | 1,475 | 5,111 | 4,415 |
| Uruguay | .. | 1 | .. | .. | .. |
| Other countries | .. | .. | 2 | .. | .. |
| Totals | 39,572 | 15,081 | 10,426 | 19,092 | 15,995 |
| GOLD . | |||||
| Oz. | Oz. | Oz. | Oz. | Oz. | |
| United Kingdom | 45,044 | 1,417 | 32,866 | * | * |
| Australia | 182,896 | 126,922 | 127,345 | * | * |
| Other countries | 14 | 294,498 | 132,409 | * | * |
| Totals | 227,954 | 422,837 | 292,620 | * | * |
| COAL . | |||||
| Tons. | Tons. | Tons. | Tons. | Tons. | |
| United Kingdom | 139,943 | 185,616 | 115,682 | 102,970 | 90,010 |
| Canada | 2,050 | 3,350 | 5,330 | 5,532 | 4,959 |
| Pacific islands (other than Fiji) | 14,009 | 12,900 | 5,724 | 9,166 | 6,085 |
| Austrlia | 50,330 | 36,444 | 51,972 | 32,073 | 26,773 |
| FIJI | 9,988 | 12,915 | 17,391 | 12,672 | 4,871 |
| Egypt | .. | 29,621 | 25,246 | 206 | 2,506 |
| Argentine Repulic | .. | 1,400 | .. | .. | .. |
| Chile | 250 | 4,140 | 1,815 | 994 | 1,100 |
| United States of America | 9,556 | 5,072 | 17,999 | 15,643 | 16,527 |
| Guam | 75,334 | 32,817 | 40,705 | 46,087 | 29,372 |
| Other countries | 1,448 | 1,993 | 49,811 | 3,500 | 400 |
| Totals | 302,908 | 326,268 | 331,675 | 228,843 | 182,603 |
| KAURI -GUM . | |||||
| United Kingdom | 3,335 | 1,172 | 1,516 | 620 | 69 |
| Canada | 70 | 56 | 237 | 1,229 | 1,167 |
| Austrlia | 19 | 9 | 31 | 11 | 56 |
| Belgium | 34 | .. | .. | .. | .. |
| Austria-Hungary | 14 | .. | .. | .. | .. |
| France | 42 | 5 | .. | .. | .. |
| Germany | 373 | .. | .. | .. | .. |
| Italy | 23 | .. | .. | .. | .. |
| Netherlands | 8 | .. | .. | .. | .. |
| Russia | 3 | 21 | 15 | 35 | .. |
| Sweden | 20 | .. | .. | .. | .. |
| United States of America | 4,531 | 3,312 | 3,649 | 2,689 | 1,127 |
| Other countries | 1 | .. | 8 | 10 | .. |
| Totals | 8,473 | 4,575 | 5,456 | 4,594 | 2,419 |
| PHORMIUM FIBRE . | |||||
| Tons. | Tons. | Tons. | Tons. | Tons. | |
| United Kingdom | 12,784 | 15,369 | 15,288 | 7,669 | 3,286 |
| Canada | 255 | 237 | 1,444 | 3,538 | 1,572 |
| Australia | 3,948 | 5,538 | 4,722 | 3,249 | 4,556 |
| United States of America | 2,715 | 2,076 | 6,219 | 9,059 | 15,568 |
| Other countries | .. | .. | 1 | 1 | 185 |
| Totals | 19,702 | 23,220 | 27,674 | 23,516 | 25,167 |
| TIMBER (SAWN AND HEWN ). | |||||
| Sup. ft. | Sup. ft. | Sup. ft. | Sup. ft. | Sup. ft. | |
| United Kingdom | 2,851,070 | 1,438,249 | 340,490 | 163,988 | 45,800 |
| Pacific islands (other than Fiji) | 632,402 | 408,451 | 309,054 | 665,975 | 619,708 |
| Australia | 78,874,633 | 73,811,328 | 69,168,629 | 68,725,732 | 72,965,071 |
| Fiji | 961,080 | 1,173,899 | 1,692,821 | 1,801,860 | 1,301,936 |
| Other countries | 23,763 | 360 | .. | .. | 300 |
| Totals | 83,342,948 | 76,832,287 | 71,510,994 | 71,357,555 | 74,932,815 |
The forwarding trade of New Zealand has never at any time been of great significance, and the amount has on only six occasions (in 1907, 1914, 1915, 1916, 1917, and 1918) exceeded a quarter of a million sterling. The proportion fluctuates slightly, but has usually been about l per cent of the total exports (excluding specie). Of recent years, however, this proportion has shown a somewhat marked tendency to increase. Items of re-exports consist partly of goods returned from New Zealand either as unsuitable or as finished with, though the bulk of the total amount is made up by various classes of machinery, hardware, metal manufactures, motor-cars, and also items such as apparel, books, tobacco, and spirits.
There is, however, a genuine entrepôt trade with the islands of the Pacific, the amount of which is still comparatively small. Exports to Cook Islands, which are treated as part of the Dominion, are not included in the figures of either exports or re-exports.
The amounts for the last twenty years of the re-exports of New Zealand are shown in the table below:—
RE -EXPORTS OF BRITISH , FOREIGN , AND OTHER COLONIAL PRODUCE (EXCLUDING SPECIE ).
| £ | £ | £ | |||
|---|---|---|---|---|---|
| 1898 | 124,850 | 1905 | 138,539 | 1912 | 239,221 |
| 1899 | 123,682 | 1906 | 152,134 | 1913 | 232,473 |
| 1900 | 168,009 | 1907 | 278,503 | 1914 | 269,208 |
| 1901 | 179,350 | 1908 | 180,675 | 1915 | 387,960 |
| 1902 | 136,860 | 1909 | 173,215 | 1916 | 305,150 |
| 1903 | 133,734 | 1910 | 208,310 | 1917 | 429,115 |
| 1904 | 136,963 | 1911 | 198,287 | 1918 | 578,878 |
The destination of this re-export trade is shown in the following table for 1914-18:—
| Country. | 1914. | 1915. | 1916. | 1917. | 1918. |
|---|---|---|---|---|---|
| £ | £ | £ | £ | £ | |
| United Kingdom | 50,481 | 122,379 | 40,577 | 50,245 | 103,580 |
| Australia | 136,308 | 144,104 | 144,406 | 217,168 | 261,814 |
| Fiji | 11,546 | 18,991 | 24,480 | 36,434 | 45,947 |
| Canada | 3,260 | 2,371 | 5,828 | 6,670 | 7,009 |
| Germany | 753 | .. | .. | .. | .. |
| United States of America | 8,284 | 4,481 | 11,926 | 24,697 | 17,008 |
| Tonga or Friendly Islands | 11,066 | 18,242 | 10,364 | 23,881 | 58,901 |
| Samoa or Navigator Islands | 16,673 | 26,055 | 22,355 | 26,201 | 25,470 |
| Tahiti or Society Islands | 22,779 | 19,523 | 14,665 | 18,019 | 27,303 |
| Other countries | 8,058 | 31,814 | 30,549 | 25,800 | 31,846 |
| Totals | 269,208 | 387,960 | 305,150 | 429,115 | 578,878 |
It is widely recognized that the price of wool and of the other principal exports has a vital bearing on the prosperity of New Zealand, and the following pages are an attempt to analyse the influence exerted upon the exports by these changes of prices. New Zealand has always been peculiarly dependent for her prosperity upon her external trade, and the early vicissitudes of the several settlements were caused in great part by the difficulty of finding an assured market for their products. After the gold-discoveries of the "sixties," there was always a steady export of that metal; but the great development of sheep-farming caused the export of wool to outstrip and finally to overshadow gold. Before refrigeration these two commodities comprised the overwhelming bulk of New Zealand's exports—on the average from 90 to 95 per cent.
This was the position when, in the early "seventies," the world level of prices began to fall, which it continued to do steadily till 1895. About this time the first alluvial deposits of gold began to work out, and exports constantly decreased. At the same time the price of wool fell lower and lower, so that the colony found both its great sources of wealth shrinking fast. An ambitious borrowing policy, followed by a period of land speculation, precipitated the country into the severest crisis it has yet experienced, and economic conditions became rapidly worse, till a long period of depression ended in the early "nineties" in a banking crisis.
All through this period the quantities of goods exported constantly increased. Refrigeration came in 1882, and frozen meat and dairy-produce added to the country's wealth. But the depressing influence of falling prices continually minimized the effect of the strenuous efforts at increased production, and the condition of the country remained unpromising.
The years 1895-96 saw a complete change, which can be ascribed only to two facts: the world level of prices began to rise, and the beneficial effects of refrigeration began to make themselves felt; so that from this period dates the prosperity of New Zealand. Under the stimulus of rising prices, which always benefit debtors and producers, exports have increased by leaps and bounds, as will be seen by a reference to the charts in the subsection on "Total Trade." Following the increase of exports, there has been a great development of imports and of the home trade.
It is an economic axiom that rising prices tend to benefit producers, for the reason that all prices do not rise equally, and the main prices which lag behind the general level are the prices of the two biggest expenses of production — labour and capital. Hence the producer gets the benefit of rising prices for his produce, while his wages-bill and the interest on his borrowed capital do not increase so fast. It is the latter fact which is of value to New Zealand. The amount of interest which must be paid by New Zealand in each year (sec subsection on "Total Trade") is paid by the export of domestic produce, and is represented by a continued excess of exports over imports. In times of rising prices fewer bales of wool and carcases of mutton need be shipped each year to discharge this obligation.
At the same time New Zealand derives an extra benefit from the fact that her exports are rising faster than the average level of prices. Investigations into prices, not only in New Zealand but also in the older countries, show that raw materials and foodstuffs rise much faster than other commodities, and this feature is especially marked in animal products. In New Zealand Dr. McIlraith has demonstrated that prices of exports constantly rise faster than prices of imports.
All these influences, which are the principal effects of rising prices, tend to stimulate and increase production; but their exact extent can never be separated from the other causes of increased productivity: all that may be measured is the apparent effect upon the exports as disclosed by changing values. From these data it is possible to ascertain with some accuracy what extra value has been added by the element of prices; but the important influences increasing productivity are not touched by this method.
Practically all the main exports of New Zealand are primary products, either raw materials or foodstuffs. From their nature it is possible in nearly every case to obtain the quantities exported as well as the values.
It is then an easy matter of computation to find what the value would have been, assessing the quantities for each year at the prices of a selected base year or period, and by comparison with the actual values recorded to estimate the effect of price-changes.
This method is used by the Board of Trade and by the Commonwealth Statistician, and it is very suitable for application to New Zealand. Of the total exports of New Zealand produce, 99 per cent can, for the purpose of the present inquiry, be treated in this fashion, leaving only l per cent to be calculated pro rata. In all the following computations gold is necessarily treated separately, since its price is fixed and cannot change. Figures in respect of gold for the years 1917 and 1918 are, however, not available for publication.
The first table given is based on the year 1901, and is useful for comparison with the similar figures published for Australia.
EXPORTS OF NEW ZEALAND PRODUCE , SHOWING VALUES AS ACTUALLY RECORDED AND AS ASSESSED AT THE PRICES OF 1901.
| Year. | Exports (excluding Gold). | Gold Bullion exported. | Total Exports (Domestic Produce). | Index Number of Export Values. | |||
|---|---|---|---|---|---|---|---|
| Recorded Value. | Value at 1901 Prices. | Recorded Value. | Value at 1901 Prices. | Excluding Gold. | Total (Domestic Produce). | ||
* Not available for publication. | |||||||
| £ | £ | £ | £ | £ | |||
| 1901 | 10,936,676 | 10,936,676 | 1,753,784 | 12,690,460 | 12,690,460 | 1000 | 1000 |
| 1902 | 11,547,173 | 11,649,294 | 1,951,426 | 13,498,599 | 13,600,720 | 991 | 992 |
| 1903 | 12,800,360 | 11,805,815 | 2,037,832 | 14,838,192 | 13,843,647 | 1084 | 1072 |
| 1904 | 12,614,286 | 10,797,317 | 1,987,501 | 14,601,787 | 12,784,818 | 1168 | 1142 |
| 1905 | 13,409,594 | 10,471,132 | 2,093,936 | 15,503,530 | 12,565,068 | 1281 | 1234 |
| 1906 | 15,569,442 | 11,384,110 | 2,270,904 | 17,840,346 | 13,655,014 | 1368 | 1306 |
| 1907 | 17,755,648 | 12,508,957 | 2,027,490 | 19,783,138 | 14,536,447 | 1419 | 1361 |
| 1908 | 13,889,731 | 11,366,102 | 2,004,799 | 15,894,530 | 13,370,901 | 1222 | 1189 |
| 1909 | 17,456,036 | 14,356,499 | 2,006,900 | 19,462,936 | 16,363,399 | 1216 | 1189 |
| 1910 | 20,047,845 | 15,043,367 | 1,896,318 | 21,944,163 | 16,939,685 | 1333 | 1295 |
| 1911 | 16,966,647 | 12,968,508 | 1,815,251 | 18,781,898 | 14,783,759 | 1308 | 1270 |
| 1912 | 19,927,274 | 14,821,997 | 1,345,131 | 21,272,405 | 16,167,128 | 1344 | 1316 |
| 1913 | 21,118,391 | 14,483,211 | 1,459,499 | 22,577,890 | 15,942,710 | 1458 | 1416 |
| 1914 | 25,089,350 | 17,072,531 | 895,367 | 25,984,717 | 17,967,898 | 1470 | 1446 |
| 1915 | 29,348,309 | 16,905,593 | 1,694,553 | 31,042,862 | 18,597,421 | 1736 | 1669 |
| 1916 | 31,776,695 | 15,831,875 | 1,199,212 | 32,975,907 | 17,031,087 | 2007 | 1936 |
| 1917 | 30,184,069 | 13,294,083 | * | * | * | 2270 | * |
| 1918 | 27,894,619 | 11,173,730 | * | * | * | 2497 | * |
In this table the base used is the same as that used in Australia; similar information is given in the "New Zealand Official Year-book" for 1914. pages 349-354, based on the year 1900, the base used by the Board of Trade (England).
The feature of the table is the constant rising tendency shown by the index number of export values, especially in recent years. This upward tendency is always retarded by the influence of gold, which does not change in price. In recent years, however, the influence of gold is becoming less, not only because the export is decreasing, but also because other exports are increasing very greatly. The comparison of the recorded value with that assessed at the prices of 1901 shows how much New Zealand benefits from this factor of rising prices.
In order to show the effect of changes in price from year to year, and particularly in the latter years, it is interesting to construct a series of index numbers basing the figures for each year upon the prices of the previous year. In this way it is possible to compare succeeding years directly, instead of comparing each year with a given base. The method used is the same, except that the base is changed.
EXPORTS OF NEW ZEALAND PRODUCE FOR EACH YEAR , 1901-18, SHOWING ACTUAL VALUES AND VALUES ASSESSED AT PRICES OF THE PREVIOUS YEAR .
| Year. | Exports (excluding Gold). | Gold Bullion exported. | Total Exports (Domestic Produce). | Effect of Price-changes. | Index Number of Export Values. | ||||
|---|---|---|---|---|---|---|---|---|---|
| Recorded Value. | Value at Prices of Previous Year. | Recorded Value. | Value at Prices of Previous Year. | Gain. | Loss. | Excluding Gold. | Total (Domestic Produce). | ||
* Not available for publication. | |||||||||
| £ | £ | £ | £ | £ | £ | £ | |||
| 1901 | 10,936,676 | .. | 1,753,784 | 12,690,460 | .. | .. | .. | 1000 | 1000 |
| 1902 | 11,547,173 | 11,649,294 | 1,951,426 | 13,498,599 | 13,600,720 | .. | 102,121 | 991 | 992 |
| 1903 | 12,800,360 | 11,702,322 | 2,037,832 | 14,838,192 | 13,740,154 | 1,098,038 | .. | 1094 | 1080 |
| 1904 | 12,614,286 | 11,706,904 | 1,987,501 | 14,601,787 | 13,694,405 | 907,382 | .. | 1078 | 1066 |
| 1905 | 13,409,594 | 12,233,211 | 2,093,936 | 15,503,530 | 14,327,147 | 1,176,383 | .. | 1096 | 1082 |
| 1906 | 15,569,442 | 14,578,776 | 2,270,904 | 17,840,346 | 16,849,680 | 990,666 | .. | 1068 | 1059 |
| 1907 | 17,755,648 | 17,107,835 | 2,027,490 | 19,783,133 | 19,135,325 | 647,813 | .. | 1038 | 1034 |
| 1908 | 13,889,731 | 16,133,439 | 2,004,799 | 15,894,530 | 18,138,238 | .. | 2,243,708 | 861 | 876 |
| 1909 | 17,456,036 | 17,544,090 | 2,006,900 | 19,462,936 | 19,550,990 | .. | 88,054 | 995 | 995 |
| 1910 | 20,047,845 | 18,291,198 | 1,896,318 | 21,944,163 | 20,187,516 | 1,756,647 | .. | 1096 | 1087 |
| 1911 | 16,966,647 | 17,282,741 | 1,815,251 | 18,781,898 | 19,097,992 | .. | 316,094 | 982 | 983 |
| 1912 | 19,927,274 | 19,391,560 | 1,345,131 | 21,272,405 | 20,736,691 | 535,714 | .. | 1028 | 1026 |
| 1913 | 21,118,391 | 19,471,797 | 1,459,499 | 22,577,890 | 20,931,296 | 1,646,594 | .. | 1085 | 1079 |
| 1914 | 25,089,350 | 24,893,953 | 895,367 | 25,984,717 | 25,789,320 | 195,397 | .. | 1008 | 1008 |
| 1915 | 29,348,309 | 24,838,018 | 1,694,353 | 31,042,662 | 26,532,371 | 4,510,291 | .. | 1181 | 1170 |
| 1916 | 31,776,695 | 27,484,322 | 1,199,212 | 32,975,907 | 28,683,534 | 4,292,373 | .. | 1156 | 1149 |
| 1917 | 31,084,069 | 26,683,006 | * | * | * | 4,401,063 | .. | 1165 | * |
| 1918 | 27,894,619 | 25,354,739 | * | * | * | 2,539,880 | .. | 1100 | * |
The comparison of each year with the preceding year brings out the advantage gained by a rise in prices. The gain shown represents the surplus value added by rising prices to the exports of any year, and, similarly, the loss shows how falling prices penalize New Zealand. The figures for the crisis years 1908-9, and for 1911, are eloquent of what failing prices would mean for the Dominion. The gain due to the rise of prices in 1915 amounted to upwards of £4,500,000—an unprecedented figure—and, taking this into account, the further increases of £4,300,000 in 1916, £4,400,000 in 1917, and in a lesser degree that of £2,500,000 in 1918, are remarkable.
It has been noticed repeatedly that the calendar year is a bad period for which to calculate exports of New Zealand produce. These exports consist almost wholly of seasonal products, and the calendar year often splits the seasons. The largest export, wool, is sheared from the sheep in the early summer, and the wool-sales are held in December and January. Exports of any season's wool-clip are therefore divided between one year and the next in varying proportion. A favourable season or, as in 1914, a sudden demand may cause a great increase of exports in the December quarter, with the result that the March quarter of the next year shows low figures. The wool trade invariably bases its calculations on each season's clip, not on calendar years.
The same argument holds good in the case of butter and cheese, which are almost wholly exported in December and March quarters. It is desirable, therefore, to tabulate New Zealand exports for years ending in June instead of December, since this division does not split the seasonal production of any main commodity, and more truly shows the results of each season as compared with previous seasons. The following table gives this information for the principal items of export during each of the last nine "June" years.
PRINCIPAL EXPORTS OF DOMESTIC PRODUCE FROM NEW ZEALAND FOR YEARS ENDING 30TH JUNE , 1911 TO 1919 (INCLUS
| Article. | 1910-11. | 1911-12. | 1912-13. | 1913-14. | 1914-15. | 1915-16. | 1916-17. | 1917-18. | 1918-19. |
|---|---|---|---|---|---|---|---|---|---|
* Not available for publication. † Excluding gold (specie and bullion). | |||||||||
| The mine— | £ | £ | £ | £ | £ | £ | £ | £ | £ |
| Coal | 185,578 | 208,011 | 252,790 | 173,475 | 380,170 | 292,447 | 249,106 | 270,028 | 195,573 |
| Gold | 1,898,910 | 1,710,021 | 1,232,725 | 1,485,920 | 438,234 | 2,134,256 | * | * | * |
| Silver | 144,288 | 122,725 | 82,013 | 89,643 | 57,311 | 107,851 | 89,651 | 139,214 | 128,464 |
| Fisheries— | |||||||||
| Fish | 25,170 | 27,555 | 35,090 | 29,575 | 32,454 | 41,914 | 30,785 | 24,057 | 17,374 |
| The forest— | |||||||||
| Kauri-gum | 456,353 | 358,336 | 462,604 | 590,341 | 315,038 | 332,308 | 330,433 | 220,085 | 193,902 |
| Timber (sawn and hewn) | 435,485 | 474,483 | 427,517 | 372,380 | 377,184 | 387,370 | 422,281 | 457,317 | 517,182 |
| Pastoral products— | |||||||||
| Beef, salted | 17,176 | 14,250 | 12,100 | 12,488 | 7,197 | 5,331 | 7,912 | 14,198 | 10,821 |
| Butter | 1,685,033 | 1,891,235 | 2,027,822 | 2,197,662 | 2,336,862 | 2,805,152 | 2,767,150 | 3,232,788 | 3,592,875 |
| Cheese | 1,093,715 | 1,496,730 | 1,914,238 | 2,317,970 | 2,277,509 | 3,345,314 | 3,982,089 | 4,010,842 | 5,501,452 |
| Hides | 194,602 | 160,614 | 253,334 | 323,359 | 412,236 | 626,834 | 343,858 | 558,560 | 707,057 |
| Live-stock | 236,030 | 145,490 | 81,086 | 83,310 | 235,265 | 119,245 | 54,265 | 66,239 | 40,920 |
| Meat, preserved | 146,223 | 134,220 | 112,413 | 122,096 | 134,567 | 231,113 | 268,323 | 534,256 | 924,934 |
| Meat, frozen | 3,875,379 | 3,671,948 | 4,315,444 | 5,079,228 | 5,737,657 | 7,523,788 | 6,953,944 | 6,414,471 | 4,911,582 |
| Sausage-skins | 73,105 | 80,491 | 93,343 | 132,039 | 165,527 | 217,709 | 212,110 | 243,745 | 262,288 |
| Skins, rabbit | 123,547 | 72,911 | 118,482 | 90,350 | 32,981 | 56,078 | 79,182 | 258,246 | 209,702 |
| Skins, sheep | 698,568 | 648,600 | 765,926 | 880,660 | 821,536 | 887,014 | 1,136,923 | 1,002,476 | 1,937,242 |
| Tallow | 658,962 | 640,451 | 660,224 | 711,858 | 704,797 | 698,605 | 767,313 | 615,464 | 1,613,250 |
| Wool | 7,164,844 | 6,965,416 | 8,217,644 | 8,262,153 | 9,907,670 | 12,127,697 | 10,628,359 | 9,519,199 | 15,378,923 |
| Agricultural products— | |||||||||
| Beans and peas | 74,348 | 68,222 | 116,815 | 80,704 | 72,609 | 66,172 | 40,804 | 97,902 | 170,012 |
| Oats | 26,948 | 254,779 | 253,414 | 36,129 | 258,083 | 15,922 | 28,839 | 1,228 | 4,758 |
| Wheat | 294,515 | 90,965 | 76,780 | 14,253 | 801 | 211 | 17,940 | 491 | 401 |
| Hops | 12,276 | 28,040 | 14,293 | 24,106 | 15,249 | 18,474 | 18,792 | 6,129 | 18,409 |
| Potatoes | 5,059 | 13,152 | 143,548 | 6,052 | 22,129 | 130,399 | 6,199 | 5,036 | 7,722 |
| Seeds, grass and clover | 78,388 | 57,067 | 64,045 | 77,092 | 47,805 | 42,043 | 43,331 | 44,912 | 98,066 |
| Miscellaneous— | |||||||||
| Leather | 25,773 | 30,824 | 32,032 | 40,474 | 45,232 | 57,608 | 23,894 | 29,360 | 47,133 |
| Phormium | 349,610 | 320,637 | 630,089 | 600,048 | 428,364 | 778,966 | 1,221,184 | 1,553,791 | 1,059,316 |
| Other New Zealand produce | 326,867 | 461,460 | 528,004 | 483,533 | 642,790 | 712,192 | 646,821 | 794,428 | 1,523,115 |
| Totals | 20,306,752 | 20,148,633 | 22,923,815 | 24,316,898 | 25,907,263 | 33,762,013 | †30,371,488 | †30,114,372 | †39,072,473 |
It was stated earlier in this subsection that the present period of price-movements began in 1895. Since that time the level of prices and exports has risen continuously, and this period is quite a distinct epoch in the economic history of New Zealand. A series of tables has accordingly been compiled to illustrate more definitely the effect of prices upon the exports, and therefore upon the prosperity of the Dominion, since 1890. The tables have been compiled throughout for Juno years.
The period 1890-99 has been chosen as the base in preference to any single year, since by obtaining the average of a period of years the effect of any temporary fluctuations cannot vitiate the results. The base has been chosen at the beginning of the period to be considered in order that the benefit New Zealand has received from a constantly rising price-level might more easily be seen. The decade 1890-99 is a good base, showing as it does both falling and rising prices, and is a fair level from which to begin comparisons.
The rise in prices is reflected by the following table of index numbers of export values for the principal commodities and all exports:—
INDEX NUMBERS OF EXPORT VALUES OF THE PRINCIPAL EXPORTS FOR YEARS ENDING 30TH JUNE .
(Base: Average annual value, 1890-99 = 1000.)
| Year. | Wool. | Frozen Meat. | Butter. | Cheese. | Total Exports. | |
|---|---|---|---|---|---|---|
| Excluding Gold. | All (Domestic) Produce. | |||||
* Export figures for gold are not available. | ||||||
| 1890-91 | 1158 | 1046 | 892 | 1023 | 1089 | 1081 |
| 1891-92 | 1132 | 1034 | 961 | 1097 | 1077 | 1069 |
| 1892-93 | 1018 | 1048 | 1100 | 1040 | 1031 | 1028 |
| 1893-94 | 1018 | 1031 | 1015 | 1055 | 1019 | 1017 |
| 1894-95 | 930 | 989 | 956 | 980 | 937 | 943 |
| 1895-96 | 1011 | 1027 | 979 | 889 | 1007 | 1006 |
| 1896-97 | 979 | 997 | 974 | 946 | 983 | 985 |
| 1897-98 | 940 | 924 | 1000 | 956 | 947 | 952 |
| 1898-99 | 875 | 985 | 998 | 1002 | 928 | 937 |
| 1899-1900 | 1006 | 993 | 1041 | 1065 | 1011 | 1010 |
| 1900-1 | 814 | 1033 | 1044 | 1136 | 930 | 938 |
| 1901-2 | 604 | 1067 | 1102 | 1055 | 893 | 907 |
| 1902-3 | 737 | 1165 | 1159 | 1272 | 990 | 991 |
| 1903-4 | 902 | 1227 | 1074 | 1108 | 1051 | 1044 |
| 1904-5 | 1110 | 1354 | 1075 | 1088 | 1158 | 1135 |
| 1905-6 | 1284 | 1301 | 1167 | 1233 | 1253 | 1215 |
| 1906-7 | 1351 | 1100 | 1195 | 1377 | 1293 | 1253 |
| 1907-8 | 1063 | 1290 | 1203 | 1370 | 1194 | 1165 |
| 1908-9 | 932 | 1275 | 1245 | 1371 | 1112 | 1099 |
| 1909-10 | 1208 | 1230 | 1229 | 1303 | 1235 | 1209 |
| 1910-11 | 1155 | 1330 | 1222 | 1303 | 1232 | 1206 |
| 1911-12 | 1101 | 1338 | 1317 | 1401 | 1224 | 1201 |
| 1912-13 | 1264 | 1493 | 1348 | 1427 | 1350 | 1325 |
| 1913-14 | 1238 | 1528 | 1307 | 1454 | 1349 | 1321 |
| 1914-15 | 1437 | 1810 | 1372 | 1526 | 1512 | 1499 |
| 1915-16 | 1941 | 1891 | 1682 | 1742 | 1808 | 1725 |
| 1916-17 | 1989 | 1974 | 1917 | 2116 | 1985 | * |
| 1917-18 | 2116 | 2146 | 1919 | 2244 | 2201 | * |
| 1918-19 | 2095 | 2686 | 2094 | 2372 | 2303 | * |
GRAPH OF INDEX NUMBERS OF EXPORT VALUES .
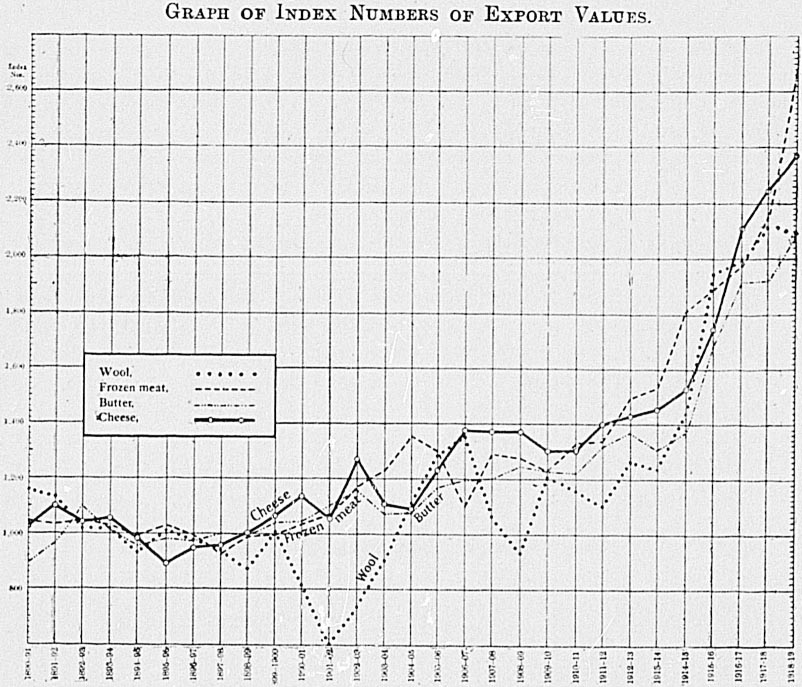
The values of the main exports were higher in 1890-91 than in the middle of the decade 1890-99, and for five or six years the fall is well marked. It is hard from a scrutiny of the index numbers for each item to fix on the turning-point, but the average for all exports puts it in 1894-95, thus corroborating other investigations into this subject.
Since this time, though there have been a good many fluctuations, particularly in wool, the general tendency has been very decidedly upward. The index number for all exports shows that in 1914 the immediate gain from rising prices was as much as 50 per cent., exports being worth half as much again as they would have been at the average prices of 1890-99.
The year ending June, 1916, shows still steeper curves, which continued until the year ending June, 1919, which latter showed a falling-off in the steepness of the curve. The most serious set-back was in 1907-8 and 1908-9.
The course of wool-values has shown remarkable fluctuations. The seasons 1900-1, 1901-2, and 1902-3 show exceptionally low prices; and again in 1908-9 wool is responsible for lowering the value of exports. Wool has shown very much higher values during the three seasons preceding 1918-19, only to fall slightly again for that year.
Index numbers for cheese, frozen meat, and wool, and also for the total exports are all well over 2000, indicating clearly that the export values per unit of quantity have more than doubled since the base period.
Perhaps a bettor illustration of the effect of increased value will be found in the table given below, where the recorded values of exports are contrasted with values assessed on the basis of 1890-99 prices. Gold, which does not change in price, is necessarily calculated separately from the other commodities.
NEW ZEALAND EXPORTS FOR YEARS ENDING 30TH JUNE , SHOWING VALUES AS ACTUALLY RECORDED AND ASSESSED AT THE AVERAGE PRICES OF 1890-99.
| Year. | Exports (excluding Gold). | Gold Bullion exported. | Total Exports (Domestic Produce). | Index Number of Export Values. | |||
|---|---|---|---|---|---|---|---|
| Recorded Value. | Value at Prices of 1890-99. | Recorded Value. | Value at Prices of 1890-99. | Excluding Gold. | Total (Domestic Produce). | ||
* Figures in connection with the export of gold are not available for publication. | |||||||
| £ | £ | £ | £ | £ | |||
| 1890-91 | 8,601,525 | 7,891,864 | 897,918 | 9,499,443 | 8,789,782 | 1089 | 1081 |
| 1891-92 | 8,504,738 | 7,894,711 | 923,663 | 9,428,401 | 8,818,374 | 1077 | 1069 |
| 1892-93 | 8,065,782 | 7,821,133 | 926,556 | 8,992,338 | 8,747,689 | 1031 | 1028 |
| 1893-94 | 7,839,783 | 7,690,658 | 950,946 | 8,790,729 | 8,641,604 | 1019 | 1017 |
| 1894-95 | 7,612,430 | 8,128,360 | 923,931 | 8,536,361 | 9,052,291 | 937 | 943 |
| 1895-96 | 8,062,459 | 8,007,754 | 1,117,918 | 9,180,377 | 9,125,672 | 1007 | 1006 |
| 1896-97 | 8,265,455 | 8,406,001 | 1,076,504 | 9,341,959 | 9,482,505 | 983 | 985 |
| 1897-98 | 9,156,551 | 9,664,411 | 997,978 | 10,154,529 | 10,662,389 | 947 | 952 |
| 1898-99 | 9,248,433 | 9,961,865 | 1,303,672 | 10,552,105 | 11,265,537 | 928 | 937 |
| 1899-1900 | 11,759,063 | 11,631,573 | 1,457,540 | 13,216,603 | 13,089,113 | 1011 | 1010 |
| 1900-1 | 10,853,168 | 11,671,369 | 1,589,632 | 12,442,800 | 13,261,001 | 930 | 938 |
| 1901-2 | 10,952,806 | 12,261,296 | 1,798,345 | 12,751,151 | 14,059,641 | 893 | 907 |
| 1902-3 | 12,863,848 | 12,993,919 | 2,039,797 | 14,903,645 | 15,033,716 | 990 | 991 |
| 1903-4 | 12,604,740 | 11,991,834 | 2,084,095 | 14,688,835 | 14,075,929 | 1051 | 1044 |
| 1904-5 | 13,252,055 | 11,440,392 | 1,974,739 | 15,226,794 | 13,415,131 | 1158 | 1135 |
| 1905-6 | 15,388,595 | 12,280,611 | 2,153,047 | 17,541,642 | 14,433,658 | 1253 | 1215 |
| 1906-7 | 17,134,134 | 13,251,715 | 2,106,889 | 19,241,023 | 15,358,604 | 1293 | 1253 |
| 1907-8 | 14,321,316 | 11,996,945 | 2,129,042 | 16,450,358 | 14,125,987 | 1194 | 1165 |
| 1908-9 | 16,196,819 | 14,568,412 | 1,944,652 | 18,141,471 | 16,513,064 | 1112 | 1099 |
| 1909-10 | 19,780,063 | 16,022,222 | 1,948,212 | 21,728,275 | 17,970,434 | 1235 | 1209 |
| 1910-11 | 18,407,842 | 14,938,728 | 1,898,910 | 20,306,752 | 16,837,638 | 1232 | 1206 |
| 1911-12 | 18,438,612 | 15,068,559 | 1,710,021 | 20,148,633 | 16,778,580 | 1224 | 1201 |
| 1912-13 | 21,691,090 | 16,066,627 | 1,232,725 | 22,923,815 | 17,299,352 | 1350 | 1325 |
| 1913-14 | 22,830,978 | 16,927,383 | 1,485,920 | 24,316,898 | 18,413,303 | 1349 | 1321 |
| 1914-15 | 25,469,029 | 16,842,014 | 438,234 | 25,907,263 | 17,280,248 | 1512 | 1499 |
| 1915-16 | 31,627,757 | 17,495,330 | 2,134,256 | 33,762,013 | 19,629,586 | 1808 | 1725 |
| 1916-17 | 30,371,488 | 15,303,688 | * | * | * | 1985 | * |
| 1917-18 | 30,114,372 | 13,682,199 | * | * | * | 2201 | * |
| 1918-19 | 39,072,473 | 16,964,252 | * | * | * | 2303 | * |
GRAPH SHOWING DOMESTIC EXPORTS (EXCLUDING GOLD ) AS ACTUALLY RECORDED AND AS ASSESSED AT PRICES OF 1890-99.
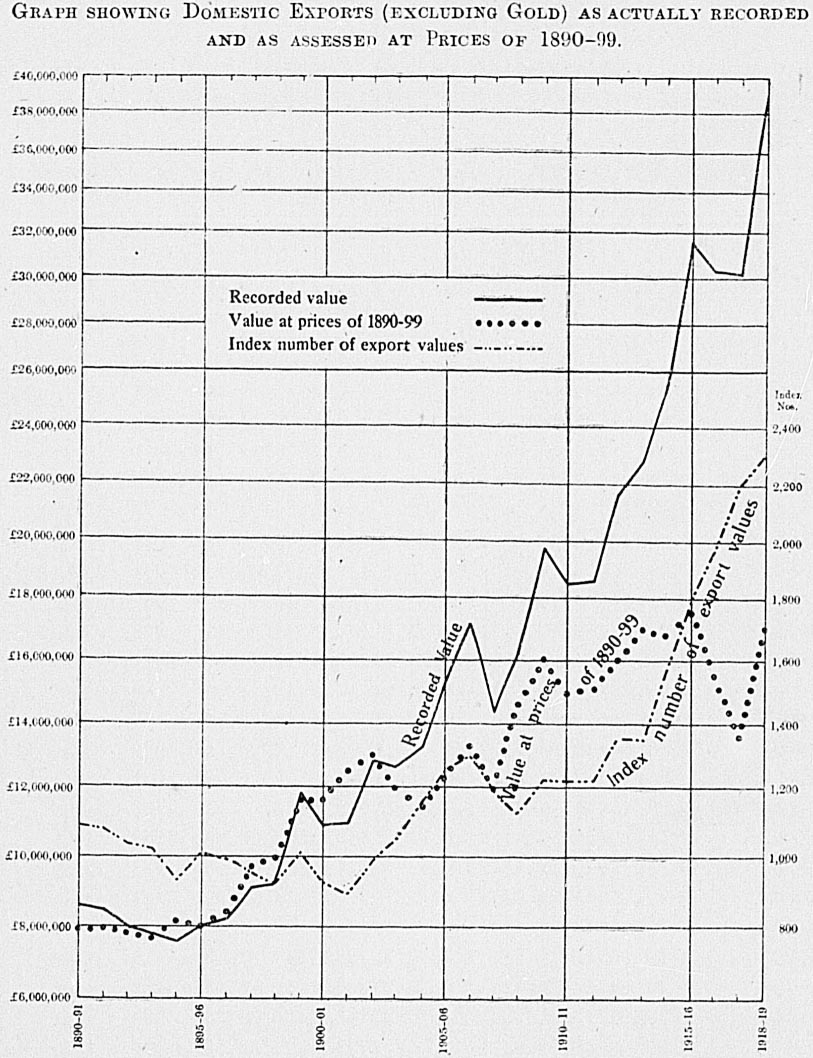
The graph, which illustrates the effect of prices on export values, is very illuminating in its course. Since the period 1890-99 is the base, and during those years the relative levels have been equated, the lines naturally run together. It will be noticeable, however, that for the first years, while the quantity exported remained about stationary, the value fell owing to falling prices.
The rate of increase in the last twenty years is very high, though broken in 1907-8 and 1911-12. Both the quantity exported and its value show great increases. the dotted line which shows the quantities assessed at the uniform values of 1890-99 varies in the same direction as the recorded value, and it is significant that the greatest fluctuations are apparently due to variations in the quantity exported.
The effect of rising prices is measured by the constantly increasing divergence of the two lines: war has so greatly accelerated the divergence that, whereas in 1914 (i.e., fifteen years after the base period) our exports were worth half as much again, by 1917 they had risen to more than double what they would have been at the prices of 1890-99.
This divergence has been plotted separately by a curve showing the index numbers of export values, the scale for which is charted on the right-hand side of the graph. The index number for 1918-19 (excluding gold) was 2303, as against 2201 for 1917-18 and 1985 for 1916-17. The slackening in the rate of rise of the index number for the most recent June year is entirely due to a fall in the price of wool, tallow, and phormium.
Similarly, the following table and the graphs attached show the divergence for the four main exports—wool, frozen meat, butter, and cheese:—
EXPORTS OF WOOL , FROZEN MEAT , BUTTER , AND CHEESE FOR YEARS ENDING 30TH JUNE , SHOWING VALUES AS ACTUALLY RECORDED AND AS ASSESSED AT THE AVERAGE PRICES OF 1890-99.
| Year. | Wool. | Frozen Meat. | Butter. | Cheese. | ||||
|---|---|---|---|---|---|---|---|---|
| Recorded Value. | Value at Average Prices, 1890-99. | Recorded Value. | Value at Average Prices, 1890-99. | Recorded Value. | Value at Average Prices, 1890-99. | Recorded Value. | Value at Average Prices, 1890-99. | |
| £ | £ | £ | £ | £ | £ | £ | £ | |
| 1890-91 | 4,216,419 | 3,641,768 | 1,188,620 | 1,136,432 | 128,306 | 143,796 | 95,866 | 93,699 |
| 1891-92 | 4,229,683 | 3,735,461 | 1,140,571 | 1,103,579 | 198,363 | 206,478 | 91,670 | 83,578 |
| 1892-93 | 4,072,342 | 3,999,329 | 1,067,780 | 1,018,744 | 208,909 | 189,978 | 95,903 | 92,232 |
| 1893-94 | 4,353,415 | 4,274,711 | 1,054,537 | 1,022,559 | 303,951 | 299,575 | 106,280 | 100,779 |
| 1894-95 | 4,028,651 | 4,329,769 | 1,322,810 | 1,337,768 | 231,700 | 242,471 | 160,061 | 163,260 |
| 1895-96 | 4,393,574 | 4,345,449 | 1,276,232 | 1,243,269 | 250,885 | 256,159 | 121,993 | 137,210 |
| 1896-97 | 4,357,244 | 4,449,230 | 1,340,169 | 1,344,449 | 357,187 | 366,728 | 151,298 | 159,899 |
| 1897-98 | 4,732,542 | 5,032,162 | 1,691,546 | 1,831,138 | 404,049 | 404,127 | 136,146 | 142,455 |
| 1898-99 | 4,241,984 | 4,847,271 | 1,776,843 | 1,804,212 | 451,269 | 452,348 | 127,209 | 126,913 |
| 1899-1900 | 4,889,101 | 4,859,806 | 2,298,140 | 2,315,097 | 693,666 | 666,625 | 224,238 | 210,638 |
| 1900-1 | 3,890,573 | 4,781,059 | 2,193,494 | 2,122,519 | 858,543 | 822,599 | 239,325 | 210,630 |
| 1901-2 | 3,079,271 | 5,094,446 | 2,526,661 | 2,367,931 | 1,044,317 | 947,782 | 171,886 | 162,912 |
| 1902-3 | 4,034,712 | 5,475,277 | 3,310,073 | 2,840,937 | 1,211,223 | 1,045,407 | 186,412 | 146,500 |
| 1903-4 | 4,313,018 | 4,779,745 | 2,846,082 | 2,318,958 | 1,445,814 | 1,345,834 | 194,779 | 175,808 |
| 1904-5 | 5,468,566 | 4,927,285 | 2,714,026 | 2,003,709 | 1,417,984 | 1,319,133 | 180,215 | 165,619 |
| 1905-6 | 6,605,790 | 5,144,559 | 2,882,387 | 2,215,618 | 1,540,327 | 1,319,385 | 300,056 | 243,318 |
| 1906-7 | 7,415,486 | 5,487,427 | 3,143,764 | 2,858,903 | 1,631,174 | 1,365,022 | 568,058 | 412,533 |
| 1907-8 | 5,649,636 | 5,314,779 | 3,165,048 | 2,453,043 | 1,133,665 | 942,588 | 761,100 | 555,439 |
| 1908-9 | 5,965,283 | 6,397,453 | 3,775,990 | 2,961,113 | 1,491,837 | 1,198,433 | 977,353 | 712,921 |
| 1909-10 | 7,962,669 | 6,594,295 | 3,631,122 | 2,952,041 | 1,712,659 | 1,393,613 | 1,275,148 | 978,653 |
| 1910-11 | 7,164,844 | 6,202,335 | 3,875,379 | 2,914,507 | 1,685,033 | 1,378,474 | 1,093,715 | 839,158 |
| 1911-12 | 6,965,416 | 6,328,167 | 3,671,948 | 2,743,477 | 1,891,235 | 1,435,884 | 1,496,730 | 1,068,174 |
| 1912-13 | 8,217,644 | 6,503,545 | 4,315,444 | 2,890,424 | 2,027,822 | 1,504,318 | 1,914,238 | 1,341,035 |
| 1913-14 | 8,262,153 | 6,673,803 | 5,079,228 | 3,323,433 | 2,197,662 | 1,681,915 | 2,317,970 | 1,594,670 |
| 1914-15 | 9,907,670 | 6,893,420 | 5,737,657 | 3,169,706 | 2,336,862 | 1,702,856 | 2,277,509 | 1,492,725 |
| 1915-16 | 12,127,697 | 6,247,718 | 7,476,637 | 3,954,744 | 2,805,152 | 1,668,157 | 3,345,314 | 1,919,876 |
| 1916-17 | 10,628,359 | 5,342,668 | 6,953,944 | 3,481,347 | 2,767,150 | 1,443,410 | 3,982,089 | 1,881,560 |
| 1917-18 | 9,519,199 | 4,497,983 | 6,414,471 | 2,943,970 | 3,232,788 | 1,684,537 | 4,010,842 | 1,787,735 |
| 1918-19 | 15,378,923 | 7,340,775 | 4,578,144 | 1,704,447 | 3,592,875 | 1,715,795 | 5,501,452 | 2,319,330 |
GRAPH SHOWING EXPORTS OF WOOL AS ACTUALLY RECORDED AND AS ASSESSED AT PRICES OF 1890-99.
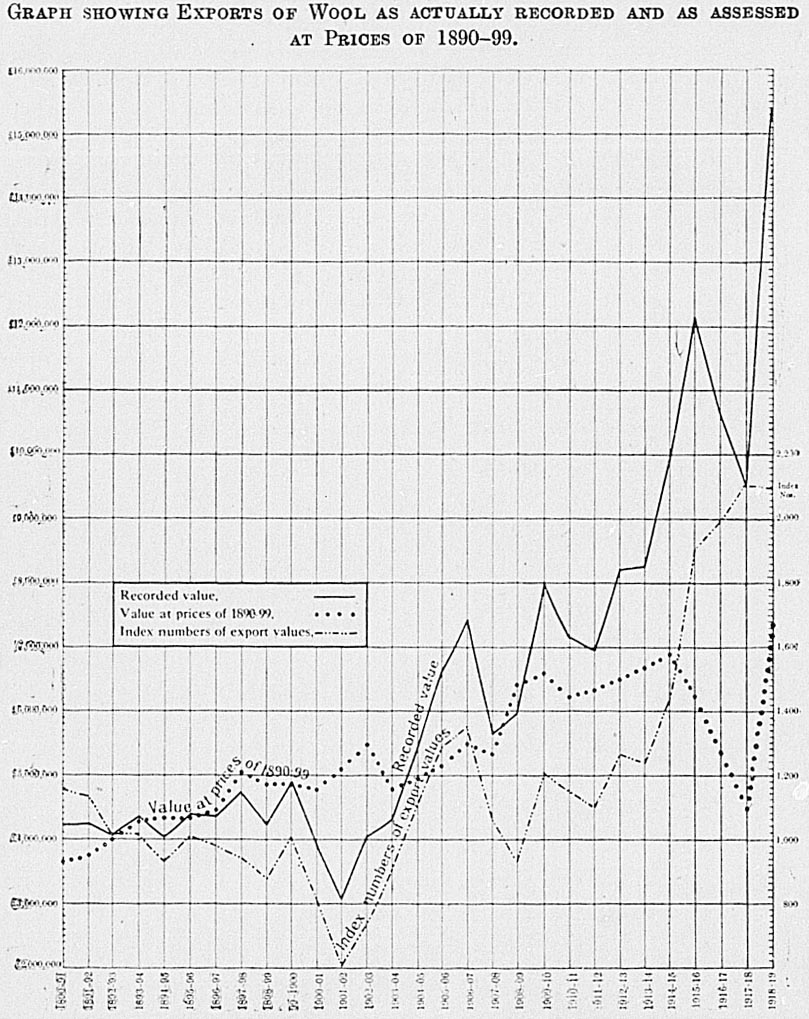
GRAPH SHOWING EXPORTS OF FROZEN MEAT AS ACTUALLY RECORDED AND AS ASSESSED AT PRICES OF 1890-99.
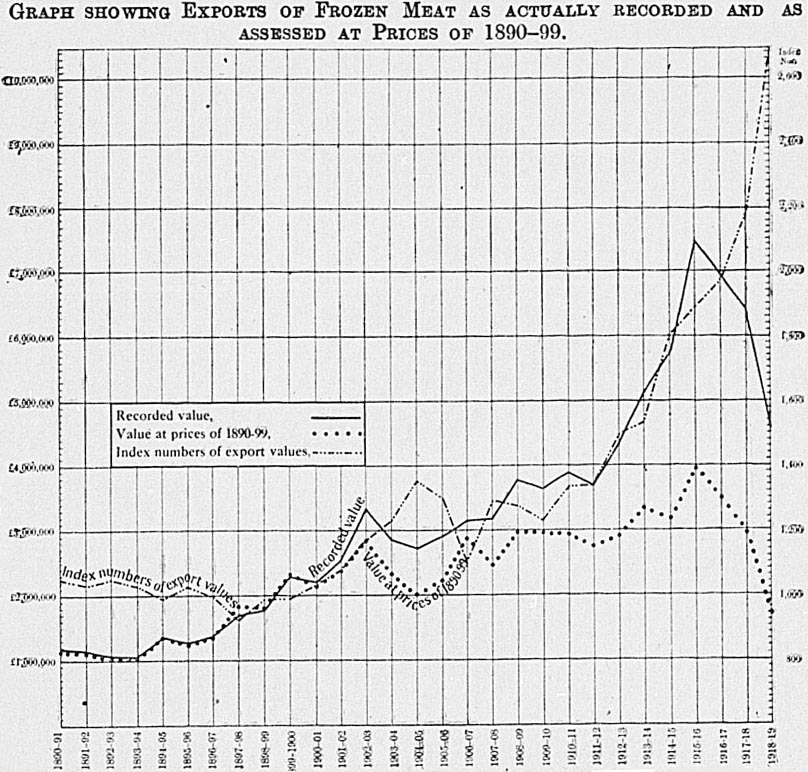
GRAPH SHOWING EXPORTS OF BUTTER AS ACTUALLY RECORDED AND AS ASSESSED AT PRICES OF 1890-99.
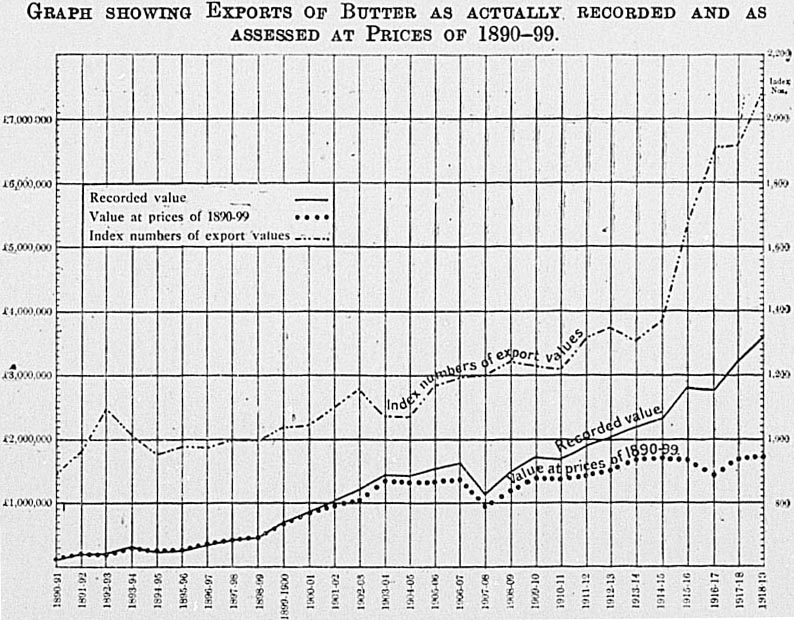
GRAPH SHOWING EXPORTS OF CHEESE AS ACTUALLY RECORDED AND AS ASSESSED AT PRICES OF 1890-99.
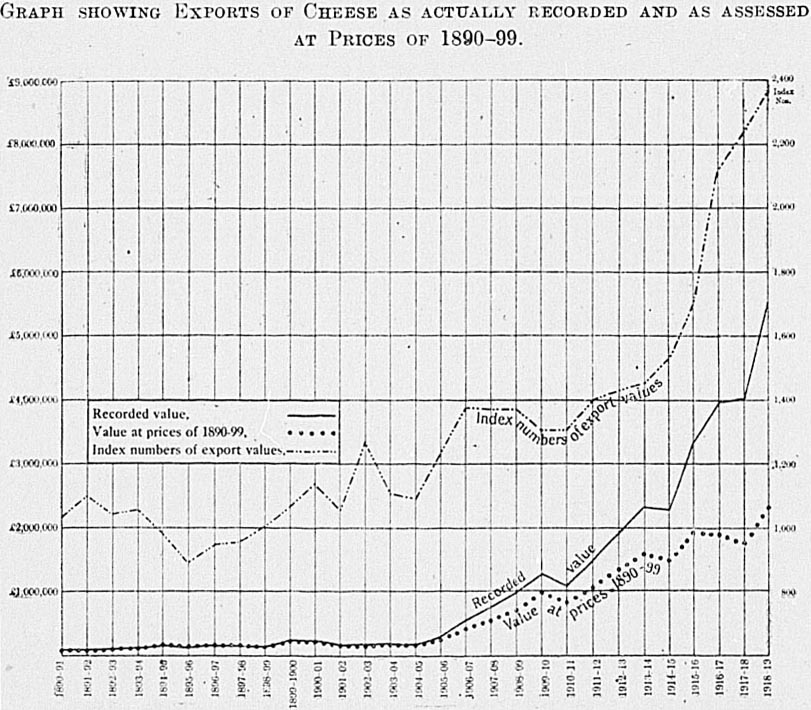
The following tables show the effect upon the principal exports of New Zealand produce (as shown by the declared export values), firstly of the increases in prices in 1918 as compared with 1917, and, secondly, during the first half of 1919 as compared with the first half of 1918. The seven commodities selected account for well over 80 per cent of the total exports (in 1917, £27,000,000 out of £30,000,000, and in 1918, £24,000,000 out of £28,000,000). The yearly totals mentioned do not include gold.
In all of the main items quoted below with the exception of wool, frozen meat, and cheese, the actual quantity exported shows an increase in the figure for the previous year. Yet wool and frozen meat alone show an actual decrease in export values, the falling-off in the quantity of cheese exported being more than counteracted by the increase in its price. Although the quantity of cheese exported in 1917 was 6.7 per cent less than in 1916, its value increased by 16.1 per cent., and constituted a record. This record was again broken in 1918, which year, however, again saw a falling-off in the actual quantity exported.
It is worth noting that in 1917 the total increase in value attributable to enhanced prices as compared with those prevailing in the previous year was for the seven selected items £2,625,202. In 1918 the corresponding increase was but £709,016, pointing to a check on the rate of the upward movements of prices. In the first half of 1919 sheep-skins without wool, tallow, and phormium fibre showed an actual fall in price as did also butter temporarily during 1918.
| Item. | 1917. | 1918. | ||||
|---|---|---|---|---|---|---|
| Quantity. | Value as recorded. | Quantity. | Value as recorded. | Value at 1917 Prices. | Increase. | |
| £ | £ | £ | £ | |||
| Wool (lb.) | 178,274,486 | 12,175,366 | 108,724,575 | 7,527,266 | 7,425,888 | 101,378 |
| Frozen meat (cwt.) | 2,446,945 | 5,982,404 | 2,024,577 | 4,957,576 | 4,949,767 | 7,809 |
| Butter (cwt.) | 254,397 | 2,031,551 | 431,023 | 3,402,223 | 3,442,055 | -39,832 |
| Cheese (cwt.) | 885,743 | 3,949,251 | 883,430 | 4,087,278 | 3,938,941 | 148,337 |
| Skins (sheep, without wool) (lb.) | 18,921,286 | 1,299,578 | 27,335,577 | 1,813,589 | 1,675,407 | 138,182 |
| Tallow (ton) | 12,599 | 553,016 | 16,421 | 847,618 | 600,777 | 246,841 |
| Phormium fibre (ton) | 23,516 | 1,197,396 | 25,167 | 1,387,763 | 1,281,462 | 106,301 |
| 27,188,562 | 139,440,770 | 24,023,313 | 23,314,297 | 709,016 | ||
A comparison of the first half-year of 1919 with the corresponding period of 1918 follows:—
| Item. | First Six Months, 1918. | First Six Months, 1919. | ||||
|---|---|---|---|---|---|---|
| Quantity. | Value as declared: | Quantity. | Value as declared. | Value on 1918 Basis. | Increase. | |
| £ | £ | £ | £ | |||
| Wool .. (lb.) | 70,898,704 | 4,874,873 | 180,671,534 | 12,726,530 | 12,422,649 | 303,881 |
| Frozen meat (cwt.) | 1,511,499 | 3,700,408 | 1,428,577 | 3,583,917 | 3,497,399 | 86,518 |
| Butter .. (cwt.) | 339,352 | 2,685,255 | 323,196 | 2,875,907 | 2,557,411 | 318,496 |
| Cheese .. (cwt.) | 599,156 | 2,767,287 | 852,761 | 4,181,461 | 3,938,596 | 242,865 |
| Skins (sheep, with wool) (lb.) | .. | .. | .. | .. | .. | .. |
| Skins (sheep, without wool) (lb.) | 7,610,628 | 508,673 | 10,843,430 | 632,326 | 724,775 | -92,449 |
| Tallow .. (ton) | 8,699 | 466,154 | 24,464 | 1,231,786 | 1,310,954 | -77,168 |
| Phormium fibre (ton) | 14,932 | 906,900 | 14,642 | 578,453 | 889,287 | -310,834 |
| 15,909,550 | 194,158,604 | 24,810,380 | 24,341,071 | 469,309 | ||
The following tables further illustrate the effect of prices on the New Zealand exports. These tables have been compiled with various twelve-monthly periods as bases. The gain to New Zealand on the eleven principal items quoted amounts to over 19 1/2 millions for the two years ended 31st March, 1918 and 1919, when assessed on the values for the same items in the calendar year 1913.
TEN PRINCIPAL EXPORTS OF NEW ZEALAND FOR THE TWELVE - MONTHLY PERIODS ENDED 31ST MARCH , 1918 AND 1919, SHOWING ACTUAL VALUES AND VALUES WHEN ASSESSED ON PRICES RULING IN THE CALENDAR YEAR 1913.
| Item. | Calendar Year 1913. | Year ended 31st March, 1918. | Year ended 31st March, 1919. | Difference for Two Years. | ||
|---|---|---|---|---|---|---|
| Actual Value. | Value at 1913 Prices. | Actual Value. | Value at 1913 Prices. | |||
| £ | £ | £ | £ | £ | £ | |
| Wool | 8,057,620 | 9,948,736 | 6,076,885 | 10,047,295 | 6,283,757 | 7,635,389 |
| Mutton (frozen) | 1,630,332 | 2,618,499 | 1,660,155 | 1,579,288 | 1,000,907 | 1,536,725 |
| Lamb (frozen) | 2,332,372 | 1,817,770 | 1,335,027 | 801,907 | 595,323 | 689,047 |
| Beef (frozen) | 347,383 | 1,993,858 | 1,139,183 | 1,837,460 | 1,037,941 | 1,654,194 |
| Butter | 2,061,651 | 2,507,546 | 1,752,607 | 3,543,724 | 2,379,369 | 1,919,294 |
| Cheese | 1,770,297 | 4,461,957 | 2,851,314 | 4,666,944 | 2,867,246 | 3,410,341 |
| Hides | 261,744 | 523,812 | 334,806 | 531,858 | 346,666 | 323,879 |
| Tallow | 663,088 | 473,723 | 297,563 | 1,305,366 | 763,680 | 717,846 |
| Phormium | 721,924 | 1,298,872 | 614,196 | 1,324,827 | 664,538 | 1,344,965 |
| Timber, sawn and hewn | 318,767 | 418,966 | 355,533 | 551,905 | 345,307 | 270,031 |
| 18,165,178 | 26,063,739 | 16,417,269 | 26,190,574 | 16,284,734 | 19,501,711 | |
TEN PRINCIPAL EXPORTS OF NEW ZEALAND FOR THE CALENDAR YEARS 1917 AND 1918, SHOWING ACTUAL VALUES AND VALUES WHEN ASSESSED AT PRICES RULING IN THE CALENDAR YEAR 1914.
| Item. | 1914. | 1917. | 1918. | Difference for Two Years. | ||
|---|---|---|---|---|---|---|
| Actual Value. | Value at 1914 Prices. | Actual Value. | Value at 1914 Prices. | |||
| £ | £ | £ | £ | £ | £ | |
| Wool | 9,318,114 | 12,175,366 | 7,534,631 | 7,527,266 | 4,588,938 | 7,579,063 |
| Mutton (frozen) | 2,115,080 | 2,458,172 | 1,652,329 | 1,922,941 | 1,293,400 | 1,435,384 |
| Lamb (frozen) | 2,554,517 | 1,366,514 | 1,044,627 | 1,220,832 | 930,634 | 612,085 |
| Beef (frozen) | 1,029,529 | 2,007,393 | 1,495,586 | 1,661,187 | 1,221,980 | 951,014 |
| Butter | 2,338,576 | 2,031,551 | 1,370,587 | 3,402,223 | 2,322,175 | 1,741,012 |
| Cheese | 2,564,125 | 3,949,251 | 2,629,334 | 4,087,278 | 2,622,471 | 2,784,724 |
| Hides | 358,618 | 435,579 | 296,892 | 490,150 | 347,894 | 280,943 |
| Tallow | 694,348 | 553,016 | 356,846 | 847,618 | 465,100 | 578,688 |
| Phormium | 455,214 | 1,197,396 | 543,336 | 1,387,763 | 581,908 | 1,459,915 |
| Timber, sawn and hewn | 422,545 | 408,064 | 361,681 | 556,270 | 380,039 | 222,614 |
| 21,850,666 | 26,582,302 | 17,285,849 | 23,103,528 | 14,754,539 | 17,645,442 | |
TEN PRINCIPAL EXPORTS OF NEW ZEALAND FOR THE TWELVE -MONTHLY PERIODS ENDED 31ST MARCH , 1918 AND 1919, SHOWING ACTUAL VALUES AND VALUES WHEN ASSESSED ON PRICES RULING IN THE CALENDAR YEAR 1914.
| Item. | Calendar Year 1914. | Year ended 31st March, 1918. | Year ended 31st March, 1919. | Difference for Two Years. | ||
|---|---|---|---|---|---|---|
| Actual Value. | Value at 1914 Prices. | Actual Value. | Value at 1914 Prices. | |||
| £ | £ | £ | £ | £ | £ | |
| Wool | 9,318,114 | 9,948,736 | 5,945,698 | 10,047,295 | 6,149,033 | 7,901,300 |
| Mutton (frozen) | 2,115,080 | 2,618,499 | 1,760,301 | 1,579,288 | 1,061,291 | 1,376,195 |
| Lamb (frozen) | 2,554,517 | 1,817,770 | 1,384,671 | 801,907 | 617,479 | 617,527 |
| Beef (frozen) | 1,029,529 | 1,993,858 | 1,482,916 | 1,837,460 | 1,351,122 | 997,280 |
| Butter | 2,338,576 | 2,507,546 | 1,704,936 | 3,543,724 | 2,314,654 | 2,031,680 |
| Cheese | 2,564,125 | 4,461,957 | 2,924,484 | 4,666,944 | 2,940,924 | 3,263,493 |
| Hides | 358,618 | 523,812 | 360,614 | 531,858 | 384,161 | 310,895 |
| Tallow | 694,348 | 473,723 | 289,069 | 1,305,366 | 741,931 | 748,089 |
| Phormium | 455,214 | 1,298,872 | 552,209 | 1,324,827 | 531,954 | 1,539,536 |
| Timber, sawn and hewn | 422,545 | 418,966 | 358,576 | 551,905 | 348,399 | 263,896 |
| 21,850,666 | 26,063,739 | 16,763,474 | 26,190,574 | 16,440,948 | 19,049,891 | |
The following table shows the total values of the exports from each port of New Zealand, arranged in order of magnitude, in 1918. In order to eliminate any temporary fluctuation an annual average has been taken over five-yearly periods since 1896 and contrasted with the figures for 1918.
The majority of the ports show decreases as compared with the previous year, the only exceptions being Auckland, Dunedin, New Plymouth, Patea, Oamaru, Greymouth, Tauranga, and Hokitika, and the largest increases being those of Auckland (£878,053), and Patea (£352,178). Wellington shows the remarkable decrease of £1,107,776.
Several differences have been made in the order of importance for 1918. Of these the most notable is that Wellington yields pride of place to Auckland.
It should be remembered that the totals shown for 1918 do not include gold exported, and, further, that as the gold-export is confined to some seven or eight ports, all are not equally affected by gold-exclusion. Gold bullion is most largely exported from Auckland, Greymouth, and Dunedin.
EXPORTS FROM VARIOUS PORTS .
| Port. | Yearly Average of Quinquennial Periods. | Year 1918. | |||
|---|---|---|---|---|---|
| 1895-1900. | 1901-5. | 1906-10. | 1911-15. | ||
* Excluding exports of gold, both bullion and specie. † Included in New Plymouth. | |||||
| £ | £ | £ | £ | £ | |
| Auckland | l,649,238 | 2,334,369 | 3,374,789 | 4,031,432 | 6,022,514 |
| Wellington | 1,825,895 | 2,612,896 | 3,692,669 | 5,684,827 | 5,845,622 |
| Lyttelton | 2,107,449 | 2,431,547 | 2,704,521 | 3,153,723 | 3,225,428 |
| Napier | 950,614 | 944,293 | 1,674,638 | 2,000,657 | 2,364,734 |
| Wanganui | 337,319 | 350,039 | 409,526 | 673,035 | 1,900,467 |
| Dunedin | 1,155,387 | 1,488,901 | 1,500,952 | 1,619,348 | 1,759,045 |
| Patea | 43,361 | 230,195 | 510,504 | 738,668 | 1,329,100 |
| Invercargill | 700,580 | 888,637 | 1,173,801 | 1,442,996 | 1,281,596 |
| Gisborne | 347,603 | 512,749 | 992,554 | 1,373,145 | 1,228,449 |
| New Plymouth | 351,452 | 400,357 | 554,135 | 591,212 | 1,113,557 |
| Timaru | 645,843 | 876,514 | 1,142,524 | 1,273,164 | 831,764 |
| Oamaru | 247,180 | 239,419 | 225,308 | 259,294 | 351,713 |
| Wairau (including Picton) | 133,786 | 186,196 | 285,991 | 311,187 | 287,399 |
| Waitara | † | 99,329 | 292,503 | 366,326 | 214,097 |
| Greymouth | 239,553 | 419,547 | 376,185 | 403,297 | 185,497 |
| Nelson | 60,168 | 88,601 | 94,608 | 173,964 | 165,255 |
| Kaipara | 112,311 | 150,817 | 138,023 | 124,830 | 93,463 |
| Tauranga | 137 | .. | .. | 5,648 | 74,722 |
| Hokitika | 52,147 | 39,113 | 32,133 | 28,277 | 39,807 |
| Westport | 38,501 | 75,769 | 58,533 | 59,070 | 38,832 |
In 1901 a group of Pacific islands was annexed to New Zealand, and has since been administered by the Dominion. The islands are fertile and rich in tropical products, so that there is a growing trade between them and the Dominion proper. This trade is not regarded as external to New Zealand, but merely as interchange between different parts of the Dominion, and it is therefore not included in the account of the external trade. Separate returns are made of the transactions between the Dominion and its dependent islands, and these are summarized below.
TOTAL VALUE OF EXPORTS FROM NEW ZEALAND TO COOK AND OTHER ANNEXED ISLANDS SINCE 1901.
| Year. | Exports. | Year. | Exports. |
|---|---|---|---|
| £ | £ | ||
| 1901 | 21,849 | 1910 | 60,647 |
| 1902 | 22,973 | 1911 | 56,131 |
| 1903 | 27,965 | 1912 | 75,774 |
| 1904 | 28,644 | 1913 | 72,046 |
| 1905 | 29,098 | 1914 | 59,056 |
| 1906 | 35,452 | 1915 | 55,459 |
| 1907 | 38,288 | 1916 | 52,831 |
| 1908 | 39,284 | 1917 | 53,449 |
| 1909 | 40,204 | 1918 | 79,309 |
The principal items of export to the islands in 1918 are next shown.
EXPORTS TO COOK ISLANDS , 1918.
| Class. | Item. | Article. | Quantity. | Value. | ||
|---|---|---|---|---|---|---|
| Produce of New Zealand. | Other. | Total. | ||||
| £ | £ | £ | ||||
| I | 1 | Butter | 95 cwt. | 1,072 | 1,072 | |
| 4 | Preserved fish in tins | 29,699 lb. | 238 | 1,341 | 1,579 | |
| 32 | Meats, potted and preserved | 1,459 cwt. | 9,794 | 5 | 9,799 | |
| 41 | Provisions n.o.e. | .. | 743 | 311 | 1,054 | |
| II | 43 | Biscuits, ships' plain | 1,774 cwt. | 4,075 | .. | 4,075 |
| 87 | Flour, wheaten | 3,991 centals | 2,645 | 681 | 3,326 | |
| 96 | Dressed rice | 1,028 lb. | .. | 1,269 | 1,269 | |
| 130 | Sugar, refined | 2,276 cwt. | 2,367 | 21 | 2,388 | |
| V | 171 | Cut tobacco, manufactured | 3,239 lb. | .. | 1,010 | 1,010 |
| IXA | 234 | Apparel and ready-made clothing n.o.e. | .. | 1,667 | 412 | 2,079 |
| 267 | Drapery n.o.e. | .. | 126 | 2,556 | 2,682 | |
| IXB | 278 | Cotton piece-goods n.o.e. | .. | .. | 4,908 | 4,908 |
| XII | 357 | Coal, bunker | 2,036 tons | 2,903 | .. | 2,903 |
| XV | 529 | Electrical machinery n.o.e. | .. | .. | 2,543 | 2,543 |
| XVIIA | 635 | Timber, sawn, n.o.e., rough, kauri | 863,461 sup. ft. | 9,471 | .. | 9,471 |
| 638 | Rimu | 143,260 sup. ft. | 1,657 | .. | 1,657 | |
| 639 | Other | 197,113 sup. ft. | 2,474 | .. | 562,530 | |
| XXIIA | 765 | Medicinal preparations, drugs, &c., n.o.e. | .. | 227 | 815 | 1,042 |
| XXIII | 875 | Soap, common bar | 900 cwt. | 1,823 | 14 | 1,837 |
Further particulars regarding the trade of the Cook Islands will be found in the section of this book dealing with "Outlying Islands of New Zealand."
The occupation of German Samoa by New Zealand troops in August, 1914, has led to an expansion of the Dominion's trade with those islands. This development arose in the first place from the necessity for sending stores, &c., from New Zealand for the troops, but there is evidence now of considerable interchange of commodities between New Zealand and the settlers in the Group. Exports from the Dominion to German Samoa in 1918 were valued at £84,241, spread over the various classes as indicated below:—
| Class. | Value. |
|---|---|
| £ | |
| I | 34,263 |
| II | 11,197 |
| III | 1,306 |
| IV | 311 |
| V | 1,521 |
| VI | 360 |
| VII | 1 |
| VIII | 192 |
| IX | 13,255 |
| X | 1,475 |
| XI | 401 |
| XII | 2,099 |
| XIII | .. |
| XIV | 4,114 |
| XV | 1,116 |
| XVI | 497 |
| XVII | 2,497 |
| XVIII | 1,808 |
| XIX | 722 |
| XX | 247 |
| XXI | 261 |
| XXII | 1,495 |
| XXIII | 5,086 |
| Total | £84,241 |
The principal commodities comprised in the foregoing are,—
| Item. | Quantity. | Value. |
|---|---|---|
| £ | ||
| Butter | 358 cwt. | 3,788 |
| Beef, salted | 2,593 cwt. | 7,433 |
| Potted and preserved meat | 2,566 cwt. | 17,187 |
| Milk and cream (preserved, &c.) | 40,111 lb. | 1,216 |
| Chaff | 213 tons | 2,614 |
| Sugar, refined | 1,452 cwt. | 1,568 |
| Cotton (textile piece-goods) | .. | 7,523 |
| Apparel n.o.e. | .. | 1,597 |
| Hardware n.o.e. | .. | 1,097 |
| Sawn timber, dressed | 101,257 sup. ft. | 1,854 |
| Coal | 1,282 tons | 1,739 |
| Common bar soap | 945 cwt | 1,897 |
AN exact and detailed account is kept of all imports of merchandise into New Zealand from overseas, and the Customs Department insists on full and accurate descriptions of all goods passing under its control. Entries must be passed and invoices presented for every package imported, and the quantities and values stated on the entries must be supported by declaration. The detailed nature of the tariff makes it essential that all goods should be described minutely under the tariff headings, and care is also taken to furnish statistical information concerning quantities. In the case of goods chargeable with specific duties the quantities are ascertained by examination in support of the invoices, but where no duty is involved the invoiced quantities are accepted.
Prior to 1916 the import value taken was the c.i.f. or landed value in New Zealand, thus including freight into the Dominion. For free goods and goods liable to specific duties this landed value in New Zealand was insisted upon. But the landed value for ad valorem goods was defined as the fair market value of the goods when sold for home consumption in the principal markets of the country whence imported, and at the time when imported, plus 10 per cent.— i.e., the f.o.b. invoice value, plus a uniform 10 per cent. to cover the cost of freight, &c. From and including the year 1916, however, the value shown for all merchandise imported is the fair market value in the country of export at the time of exportation, plus 10 per cent. Fair market value is accepted as the wholesale value, less all the usual trade discounts, but including all special discounts. Since 1914 the ordinary cash discount has been allowed, and the value of casing or packing may also be deducted if shown separately.
Passengers' baggage is omitted from the total of imports in each year, except whore dutiable items are included. Personal luggage is exempt from duty upon declaration that the goods are personal property, not intended for sale, have been in use for twelve months, and do not exceed £100 in value.
The earliest trade in New Zealand, as of most colonies, consisted more of exploitation and appropriation by visiting traders than of regular exchange. The whalers and sealers brought with them sufficient provisions to last their season, and they were never more than passing visitors to the Islands. The first genuine import trade sprang up when the Maoris became sensible of the great wealth to be won by bartering their flax for iron and other treasures of the white man. A new element was introduced when the Maori adopted the musket in preference to the old hand weapons, for the possession of firearms became a necessary precaution against the danger of extermination. Intertribal warfare was conducted on an ever-increasing scale, and muskets were the most prized of all possessions, so that when the chief Hongi returned from his visit to England in 1821 he changed all his valuable presents into firearms as soon as he reached Sydney.
In 1830 the imports into New Zealand from Sydney, according to a return quoted by the late Dr. McNab ("Historical Records of New Zealand," Vol. i), were made up of the following items:—
TOTAL QUANTITIES , DESCRIPTION , AND VALUE OF GOODS EXPORTED FROM SYDNEY TO NEW ZEALAND FROM 1ST JANUARY TO 14TH AUGUST , 1830.
| Description. | Quantity. | Value. | ||
|---|---|---|---|---|
| £ | s. | d. | ||
| Bread | 203 1/2 cwt. | 260 | 0 | 0 |
| Bricks | 7,000 | 10 | 5 | 0 |
| Beer | 730 gallons | 75 | 0 | 0 |
| Cedar | 1,793 ft. | 33 | 0 | 0 |
| Cheese | 335 lb. | 14 | 0 | 0 |
| Flour | 87,992 lb. | 787 | 0 | 0 |
| Shingles | 24,970 | 25 | 0 | 0 |
| Cartouche boxes | 142 | 39 | 0 | 0 |
| Corks | 30 gross | 7 | 0 | 0 |
| Earthen and glass ware | Sundry packs | 75 | 0 | 0 |
| Flints | 12,000 | 18 | 0 | 0 |
| Groceries | Sundry packs | 44 | 0 | 0 |
| Gunpowder | 11,052 lb. | 862 | 0 | 0 |
| Hardware | Sundry packs | 639 | 0 | 0 |
| Muskets | 2,120 | 2,938 | 0 | 0 |
| Rope | 80 cwt. | 220 | 0 | 0 |
| Salt | 249 cwt. | 51 | 10 | 0 |
| Tobacco-pipes | 65 gross | 26 | 0 | 0 |
| Salt provisions | 87 cwt. | 200 | 0 | 0 |
| Shot | 836 lb. | 8 | 0 | 0 |
| Water-casks | 260 tons | 235 | 0 | 0 |
| Slops | Sundry packs | 458 | 0 | 0 |
| Staves | 3,400 | 300 | 0 | 0 |
| Woollens | 1,426 yards | 104 | 0 | 0 |
| Rice | 2,540 lb. | 21 | 0 | 0 |
| Rum and whisky | 2,429 gallons | 424 | 0 | 0 |
| Brandy and gin | 1,607 gallons | 300 | 0 | 0 |
| Sugar | 7,149 lb. | 138 | 0 | 0 |
| Tea | 1,696 lb. | 115 | 0 | 0 |
| Tobacco | 5,062 lb. | 310 | 0 | 0 |
| Horned cattle | 2 | 10 | 0 | 0 |
| Blankets | 78 pairs | 76 | 0 | 0 |
| Iron | 8 tons | 152 | 0 | 0 |
| Linen | 2,700 yards | 220 | 0 | 0 |
| Cutlasses | 50 | 15 | 0 | 0 |
| Leather, manufactured | Sundry packs | 67 | 0 | 0 |
| Wine | 120 gallons | 18 | 0 | 0 |
| Sundries not enumerated above | .. | 297 | 0 | 0 |
| Total | .. | £9,591 | 15 | 0 |
However, with the incoming of the regular colonists, trade assumed its more modern form, and the import of firearms was quickly overshadowed by the more peaceful requirements of the settlers. It was not for many years that the Maori finally gave up the appeal to force in order to sustain his claims or his rights; but since the second Maori War in the "sixties" the Natives have settled more and more into European habits.
Permanent settlement in 1840 rendered necessary the continued and increasing import of clothing, metals, and manufactures to sustain the colonists and to develop the colony. For many years after the first landing imports were greatly in excess of exports, and this excess represents the import of capital which was necessary to put the young colony on a firm footing. Especially in the early years, New Zealand, while supplying foodstuffs from her own resources, has been dependent upon the outside world for a great proportion of the manufactures necessary for development, and also of the luxuries and amenities of modern life.
The gold rushes brought a huge increase of population and also of imports, and reference to the subsection on "Total trade" will show the effect of the stimulus given by the gold discoveries. In the later "sixties" imports were declining; but the borrowing policy pursued in the "seventies" resulted once more in an increase of imports for a time. Violent fluctuations succeed, with a general tendency to diminish until, in sympathy with the increased exports, the value o£ imports rapidly increases from 1895. The worst check was received in 1909, following the bad year of exports in 1908. The figures for 1917 also showed a substantial fall, largely due to shortage of shipping and restriction of exports from Europe.
The nature of the imports has changed little from the time of the first settlement in New Zealand, though now commodities have naturally been introduced, the principal groups of commodities being clothing and textiles, metals and machinery, sugar, tea, alcoholic liquors, tobacco, paper and stationery, and motor vehicles. The proportions of these imports have changed little for many years, except that motor vehicles have increased very rapidly during the last decade.
The following table shows the total imports for New Zealand during the last decade:—
| Year. | Value. | Value per Head. | ||||||
|---|---|---|---|---|---|---|---|---|
| Including Specie. | Excluding Specie. | Including Specie. | Excluding Specie. | |||||
*Excluding gold. | ||||||||
| £ | £ | £ | s. | d. | £ | s. | d. | |
| 1909 | 15,674,719 | 14,817,462 | 16 | 2 | 7 | 15 | 4 | 11 |
| 1910 | 17,051,583 | 16,748,223 | 17 | 3 | 6 | 16 | 17 | 5 |
| 1911 | 19,545,879 | 18,782,608 | 19 | 5 | 2 | 18 | 10 | 2 |
| 1912 | 20,976,574 | 20,576,579 | 20 | 3 | 9 | 19 | 16 | 1 |
| 1913 | 22,288,302 | 21,653,632 | 20 | 17 | 1 | 20 | 5 | 3 |
| 1914 | 21,856,096 | 21,144,227 | 20 | 0 | 11 | 19 | 7 | 10 |
| 1915 | 21,728,834 | 20,658,720 | 19 | 15 | 2 | 18 | 15 | 10 |
| 1916 | 26,339,283 | 25,045,403 | 23 | 19 | 2 | 22 | 15 | 7 |
| 1917* | 20,919,259 | 20,742,124 | 19 | 0 | 8 | 18 | 17 | 5 |
| 1918* | 24,233,944 | 24,131,729 | 21 | 19 | 5 | 21 | 17 | 7 |
Throughout the following pages figures relating to the years 1917 and 1918 are in all cases exclusive of gold. Particulars regarding both imports and exports of gold (specie and bullion) for these years have been, at the request of the Imperial Government, withheld from publication.
The main groups of imports according to the classification followed in the "Statistics of the Dominion of New Zealand," Volume ii, are given below for the five years 1914-18. Owing to the very varied nature of the import trade it is not possible to summarize it as satisfactorily as is possible with exports, and the classification is necessarily rough. The big totals for the general headings, such as "Other metals and manufactures." indicate the difficulty of summarizing such varied articles.
MAIN GROUPS OF IMPORTS , 1914-18.
| Group of Principal Articles imported. | 1914. | 1915. | 1916. | 1917. | 1918. |
|---|---|---|---|---|---|
*Includes methylated and perfumed spirits, and spirits of wine. Excluding gold (specie and bullion). | |||||
| £ | £ | £ | £ | £ | |
| Apparel (including hats and caps) | 1,438,838 | 1,172,998 | 1,675,782 | 1,346,505 | 1,558,385 |
| Boots and shoes | 396,576 | 409,987 | 505,114 | 493,109 | 589,642 |
| Drapery, haberdashery, linens, woollens, and other textiles | 2,382,911 | 2,470,036 | 3,703,338 | 2,783,291 | 3,715,045 |
| Hosiery | 200,561 | 211,962 | 367,096 | 209,741 | 311,356 |
| Silks | 140,261 | 201,854 | 293,101 | 277,962 | 468,629 |
| Totals | 4,559,147 | 4,466,837 | 6,544,431 | 5,110,608 | 6,643,057 |
| Iron and steel (pig, wrought, wire, &c., and galvanized) | 1,261,159 | 1,206,655 | 1,313,584 | 681,546 | 613,709 |
| Railway and tramway plant | 164,198 | 288,536 | 94,842 | 44,007 | 52,214 |
| Machinery | 967,568 | 893,383 | 948,858 | 777,353 | 702,044 |
| Sewing and knitting machines | 43,948 | 47,013 | 50,789 | 62,946 | 65,782 |
| Hardware and ironmongery | 408,654 | 309,754 | 390,840 | 294,951 | 208,158 |
| Tools and implements (including agricultural) | 373,215 | 256,098 | 318,355 | 274,654 | 219,074 |
| Nails | 58,592 | 61,829 | 101,740 | 66,092 | 58,130 |
| Other metals and metal manufactures | 834,710 | 734,769 | 947,421 | 708,078 | 753,966 |
| Totals | 4,112,044 | 3,798,037 | 4,166,429 | 2,909,627 | 2,673,077 |
| Sugar | 699,307 | 1,069,096 | 986,766 | 1,136,722 | 904,957 |
| Tea | 430,001 | 455,240 | 386,316 | 428,912 | 415,244 |
| Totals | 1,129,308 | 1,524,336 | 1,373,082 | 1,565,634 | 1,320,201 |
| Beer | 62,292 | 53,668 | 44,775 | 17,535 | 10,920 |
| Spirits* | 413,427 | 405,628 | 743,510 | 528,797 | 868,645 |
| Wine | 79,326 | 83,817 | 85,183 | 73,336 | 68,908 |
| Tobacco | 614,029 | 533,876 | 717,822 | 446,308 | 690,924 |
| Totals | 1,169,074 | 1,076,989 | 1,591,290 | 1,065,976 | 1,639,397 |
| Group of Principal Articles imported. | 1914. | 1915. | 1916. | 1917. | 1918. |
| £ | £ | £ | £ | £ | |
| Paper | 378,535 | 386,996 | 590,530 | 485,300 | 472,050 |
| Printed books | 252,160 | 233,058 | 258,125 | 236,267 | 288,070 |
| Stationery | 224,099 | 198,590 | 269,308 | 207,789 | 210,047 |
| Totals | 854,794 | 818,644 | 1,117,963 | 929,356 | 970,167 |
| Miscellaneous (specified articles)— | |||||
| Arms, ammunition, and explosives and explosives | 173,994 | 173,140 | 149,267 | 163,140 | 156,017 |
| Automobiles, motorcars, and motorcycles, and materials for | 1,158,143 | 1,037,079 | 1,668,895 | 1,254,608 | 1,323,488 |
| Bags and sacks | 222,122 | 254,174 | 235,139 | 219,955 | 254,518 |
| Bicycles and tricycles | 14,304 | 11,900 | 21,895 | 11,755 | 14,695 |
| Bicycle and tricycle fittings | 41,048 | 96,369 | 105,431 | 80,204 | 90,192 |
| Candles | 40,217 | 37,440 | 36,009 | 9,064 | 26,237 |
| Canvas | 91,384 | 71,745 | 91,047 | 94,692 | 130,177 |
| Carpeting and druggeting | 101,442 | 78,327 | 128,214 | 82,703 | 59,307 |
| Carts, carriages, and materials for | 92,782 | 68,525 | 47,273 | 41,573 | 40,214 |
| Cement | 19,773 | 5,667 | 1,374 | 788 | 527 |
| China, porcelain, earthenware, and Parian ware | 167,874 | 109,135 | 188,552 | 114,261 | 103,513 |
| Coal | 558,564 | 344,495 | 189,526 | 214,152 | 202,102 |
| Drugs, chemicals and druggists' wares | 639,038 | 680,122 | 890,980 | 741,776 | 994,173 |
| Fancy goods and toys | 264,198 | 212,840 | 320,996 | 284,781 | 292,539 |
| Fish, potted and preserved | 92,058 | 87,736 | 92,821 | 104,819 | 133,321 |
| Floorcloth and oilcloth | 92,165 | 81,079 | 101,337 | 54,482 | 29,540 |
| Fruits (including fresh, preserved, bottled, and dried) | 375,358 | 410,842 | 458,417 | 493,733 | 519,166 |
| Furniture, cabinet-ware, and upholstery | 49,914 | 31,152 | 41,012 | 32,072 | 75,417 |
| Glass and glassware | 178,895 | 181,873 | 218,664 | 134,256 | 134,921 |
| Leather and leather manufactures | 211,102 | 218,464 | 295,697 | 372,051 | 344,454 |
| Manures | 512,193 | 476,584 | 342,580 | 328,762 | 267,323 |
| Musical instruments and materials for | 150,453 | 124,025 | 157,188 | 116,062 | 99,692 |
| Seeds | 157,815 | 327,290 | 219,502 | 294,520 | 262,973 |
| Oil | 772,303 | 793,663 | 1,001,924 | 943,460 | 1,448,318 |
| Group of Principal Articles imported. | 1914. | 1915. | 1916. | 1917. | 1918. |
| Miscellaneous—cont'd. | £ | £ | £ | £ | £ |
| Timber | 404,582 | 305,685 | 166,817 | 160,914 | 152,525 |
| Woolpacks and wool-pockets | 77,056 | 82,798 | 101,909 | 113,926 | 119,955 |
| Total miscellaneous (specified articles) | |||||
| 6,658,777 | 6,302,149 | 7,272,466 | 6,462,509 | 7,275,304 | |
| Other imports (excluding specie) | |||||
| 2,661,083 | 2,671,728 | 2,979,742 | 2,698,414 | 3,610,526 | |
| Total imports (excluding specie) | |||||
| 21,144,227 | 20,658,720 | 25,045,403 | 20,742,124 | 24,131,729 | |
| Specie imported | 711,869 | 1,070,114 | 1,293,880 | 177,135 | 102,215 |
| Total imports | |||||
| 21,856,096 | 21,728,834 | 26,339,283 | *20,919,259 | *24,233,944 | |
As stated above, it is not possible to classify imports so completely as exports. There are two big groups of items, however, which are of dominating importance, and are, moreover, fairly homogeneous. The first, "Clothing and textiles," comprises practically all woven articles; but the second, "Metals and machinery," is not altogether complete, since there are many items in the "Miscellaneous" group which are metal manufactures. The other three groups are well defined, and the value imported in each is, on the whole, steady.
In the miscellaneous items the most noteworthy advance is that made by motor-cars and accessories; whereas prior to 1911 their value never exceeded £300,000 per annum, two years later it rose to over a million, and in 1916 amounted to £1,668,895.
The grand total of £24,233,944 shown for 1918 (over £3,300,000 more than in 1917) is very satisfactory, but it must be remembered that most if not all of this increase was attributable to higher prices ruling. No systematic investigation into the effects of higher prices on imports is possible, but a consideration of a few items would serve to show the trend of price-levels during the war period. For instance, if the 107,947 dozen pairs of boots (valued at £480,193) imported in 1918 were valued on 1915 prices, the sum would amount to only £296,766, a clear gain for 1918 of £183,427. Similar remarks apply in greater or less degree to all commodities. The decrease of over £5,400,000 in values of imports in 1917 as compared with 1916 accordingly indicates a greater reduction in quantity of imports than is shown by the figures given, and likewise the increase in value for 1918 as compared with 1917 probably represents no increase in quantity at all. As previously mentioned, this reduction is, of course, due to war conditions, and more particularly to the shortage of available shipping.
The increase in the last decade is shown by the following table, which, for each of the groups treated above, contrasts 1918 with 1908. A great increase will be evident in all the main items.
| — | Years. | Annual Imports from | |||||
|---|---|---|---|---|---|---|---|
| United Kingdom. | British Possessions. | Foreign Countries. | Totals. | ||||
| United States. | Germany. | Others. | |||||
*Excluding gold. | |||||||
| £ | £ | £ | £ | £ | £ | ||
| Textiles, boots and shoes, drapery and clothing | 1908 | 3,397,679 | 268,963 | 100,032 | 25,247 | 75,572 | 3,867,493 |
| 1918 | 4,448,615 | 468,971 | 505,041 | 12 | 1,220,418 | 6,643,057 | |
| Iron and steel, machinery, hardware, tools, and other manufactures of iron and steel | 1908 | 2,643,759 | 347,413 | 556,408 | 71,877 | 51,680 | 3,671,138 |
| 1918 | 956,278 | 519,712 | 1,056,976 | 22 | 140,089 | 2,673,077 | |
| Sugar and tea | 1908 | 1,111 | 774,630 | 5,323 | .. | 64,130 | 845,194 |
| 1918 | 212 | 1,246,311 | 3,946 | .. | 69,732 | 1,320,201 | |
| Beer, wine, spirits, and tobacco | 1908 | 468,015 | 169,756 | 126,536 | 8,783 | 35,977 | 809,061 |
| 1918 | 947,718 | 484,806 | 103,621 | 4 | 103,248 | 1,639,397 | |
| Paper, books, and stationery | 1908 | 489,528 | 152,920 | 39,704 | 23,824 | 13,007 | 718,983 |
| 1918 | 451,057 | 293,005 | 191,162 | 17 | 34,926 | 970,167 | |
| Miscellaneous articles | 1908 | 3,441,720 | 2,401,649 | 828,878 | 259,800 | 403,246 | 7,335,293 |
| 1918 | 1,800,036 | 4,298,556 | 3,611,376 | 625 | 1,175,237 | 10,885,830 | |
| Specie | 1908 | 25 | 223,114 | .. | .. | 983 | 224,122 |
| 1918 | 102,215 | .. | .. | .. | .. | 102,215 | |
| Total imports* | 1908 | 10,441,837 | 4,338,439 | 1,656,882 | 389,531 | 644,595 | 17,471,284 |
| 1918 | 8,703,480 | 7,314,011 | 5,472,122 | 684 | 2,743,647 | 24,233,944 | |
Note.—In the above table import figures for 1908 are as for countries of shipment; those for 1918 are as for countries of origin.
The subjoined table exhibits the value of the imports received at each port in New Zealand during 1918, together with average annual values for the four preceding quinquennial periods. The general increase in the value of imports in 1918 as compared with the previous year is principally confined to the larger ports of the Dominion, the only lesser ports which show increases being Napier, Wanganui, Timaru, New Plymouth, Westport, Patea. Hokitika, and Kaipara.
In several cases the figures for 1918 have altered the relative positions of the ports. Napier displaces Invercargill for the position of fifth port, while Timaru is now slightly ahead of Wanganui. Greymouth shows a lead over Oamaru, and Hokitika over Tauranga.
It will be observed that the number of ports participating in the direct importing trade of the Dominion is large. The four chief ports are far in advance of the rest, and amongst them the North shows a more rapid progress, so that now Lyttelton and Dunedin combined do not receive so much as either Wellington or Auckland.
The imports credited to each port consist of the goods actually landed over the wharf at that port, not, as in the case of exports, of the goods credited to the district in which they are produced. The figures given in the following table therefore represent the actual shipping import trade of each port, though from the central ports the goods are afterwards distributed over the country either by rail or by coastal shipping:—
IMPORTS BY PORTS .
| Port. | Yearly Average of Quinquennial Periods. | 1918. | |||
|---|---|---|---|---|---|
| 1897-1901. | 1902-6. | 1907-11. | 1912-16. | ||
*Parcels-post now included under the headings of the various ports | |||||
| £ | £ | £ | £ | £ | |
| Wellington | 2,353,678 | 3,897,314 | 4,979,747 | 6,881,216 | 8,378,557 |
| Auckland | 2,434,444 | 3,250,124 | 4,786,242 | 6,683,080 | 7,217,732 |
| Lyttelton | 1,600,056 | 2,154,373 | 2,670,757 | 3,418,749 | 3,781,115 |
| Dunedin | 1,914,319 | 2,112,128 | 2,467,786 | 2,783,086 | 2,842,083 |
| Napier | 201,157 | 261,940 | 417,597 | 570,557 | 414,158 |
| Invercargill | 251,633 | 349,532 | 501,344 | 577,029 | 401,854 |
| Timaru | 133,732 | 196,022 | 303,622 | 376,691 | 298,863 |
| Wanganui | 123,017 | 167,188 | 233,082 | 281,545 | 250,721 |
| New Plymouth | 60,939 | 89,975 | 132,056 | 192,901 | 219,654 |
| Gisborne | 40,054 | 70,519 | 143,521 | 201,660 | 141,334 |
| Nelson | 133,467 | 133,812 | 126,836 | 147,835 | 87,771 |
| Greymouth | 52,640 | 74,203 | 108,370 | 101,552 | 50,183 |
| Oamaru | 45,251 | 59,896 | 68,750 | 89,783 | 45,192 |
| Westport | 28,815 | 34,562 | 53,801 | 43,718 | 32,934 |
| Wairau (including Picton) | 14,016 | 25,028 | 38,297 | 54,825 | 31,101 |
| Patea | 14,037 | 20,411 | 27,520 | 30,072 | 30,369 |
| Hokitika | 14,696 | 13,989 | 17,126 | 10,768 | 5,741 |
| Tauranga | 3,146 | 2,704 | 3,628 | 5,494 | 3,195 |
| Kaipara | 5,419 | 6,002 | 10,188 | 5,509 | 1,387 |
| Parcels-post | 73,377 | 169,748 | 318,995 | * | * |
| Totals | 9,497,893 | 13,089,470 | 17,409,265 | 22,637,817 | 24,233,944 |
Information as to the amount of certain principal articles of food and drink entered for home consumption on importation and ex warehouse is given in the tables which follow. The figures shown for beer include also beer manufactured in the Dominion on which excise duty was paid. In all other cases the articles specified are not produced (in the raw) in the Dominion, or, if so, only in very small quantities, so that the figures shown in the second of the tables practically represent the per capita consumption of the various commodities. Coffee-essence, of which £6,153 worth was entered for home consumption in 1918, is not included in the figures given for coffee.
TOTAL AMOUNTS ENTERED FOR HOME CONSUMPTION .
| Article. | Unit of Quantity. | 1914. | 1915. | 1916. | 1917. | 1918. |
|---|---|---|---|---|---|---|
| Tea | lb. | 9,937,248 | 9,148,578 | 7,977,963 | 8,793,057 | 9,403,207 |
| Coffee, raw and roasted | lb. | 338,042 | 343,501 | 375,408 | 365,351 | 539,591 |
| Cocoa and chocolate* | lb. | 555,292 | 774,880 | 685,639 | 235,213 | 554,585 |
| Cocoa-beans | lb. | 669,211 | 574,965 | 1,124,373 | 1,011,811 | 978,090 |
| Rice | lb. | 9,808,400 | 9,171,232 | 8,042,944 | 10,261,328 | 8,235,696 |
| Sago and tapioca | lb. | 3,487,456 | 2,715,104 | 2,928,800 | 3,558,016 | 3,065,888 |
| Currants, dried | lb. | 3,366,514 | 2,455,674 | 1,571,232 | 1,808,475 | 1,177,500 |
| Raisins | lb. | 4,913,674 | 6,535,863 | 6,253,293 | 5,479,282 | 6,361,968 |
| Figs, dates, and prunes | lb. | 3,166,768 | 3,851,558 | 2,758,546 | 2,415,312 | 1,610,799 |
| Sugar | Cwt. | 1,012,899 | 1,333,649 | 1,246,457 | 1,368,056 | 1,041,537 |
| Salt | Cwt. | 422,740 | 437,620 | 637,160 | 319,820 | 843,600 |
| Spices | lb. | 757,216 | 705,530 | 717,584 | 892,798 | 780,335 |
| Mustard | lb. | 239,500 | 236,618 | 332,365 | 154,640 | 177,007 |
| Tobacco | lb. | 3,147,515 | 3,173,152 | 3,075,756 | 3,092,929 | 3,107,248 |
| Beer | Gal. | 10,649,090 | 10,865,764 | 11,477,046 | 11,416,475 | 10,621,229 |
| Wine | Gal. | 156,513 | 163,248 | 138,806 | 142,893 | 126,138 |
| Spirits | Gal. | 877,173 | 932,547 | 769,964 | 750,729 | 568,868 |
AMOUNTS PER HEAD ENTERED FOR HOME CONSUMPTION .
| Article. | Unit of Quantity | 1914. | 1915. | 1916. | 1917. | 1918. | Average of Five Years. |
|---|---|---|---|---|---|---|---|
*Not including chocolate confectionery. | |||||||
| (a) Including Maoris. | |||||||
| Tea | lb. | 8.72 | 7.96 | 6.94 | 7.65 | 8.16 | 7.85 |
| Coffee, raw and roasted | lb. | 0.30 | 0.30 | 0.33 | 0.32 | 0.47 | 0.32 |
| Cocoa and chocolate* | lb. | 0.49 | 0.67 | 0.60 | 0.20 | 0.48 | 0.41 |
| Cocoa-beans | lb. | 0.59 | 0.50 | 0.98 | 0.88 | 0.85 | 0.76 |
| Rice | lb. | 8.60 | 6.98 | 7.00 | 8.93 | 7.14 | 7.89 |
| Sago and tapioca | lb. | 3.06 | 2.36 | 2.55 | 3.10 | 2.66 | 2.73 |
| Currants, dried | lb. | 2.95 | 2.14 | 1.37 | 1.57 | 1.02 | 1.81 |
| Raisins | lb. | 4.31 | 5.69 | 5.44 | 4.77 | 5.52 | 5.13 |
| Pigs, dates, and prunes | lb. | 2.78 | 3.35 | 2.40 | 2.10 | 1.40 | 2.63 |
| Sugar | lb. | 99.68 | 129.92 | 120.96 | 133.48 | 101.19 | 116.64 |
| Salt | lb. | 41.44 | 42.56 | 61.60 | 31.36 | 81.96 | 51.52 |
| Spices | lb. | 0.66 | 0.61 | 0.62 | 0.78 | 0.68 | 0.67 |
| Mustard | lb. | 0.21 | 0.21 | 0.29 | 0.13 | 0.15 | 0.19 |
| Tobacco | lb. | 2.76 | 2.76 | 2.68 | 2.68 | 2.69 | 2.71 |
| Beer | Gal. | 9.34 | 9.46 | 9.99 | 9.94 | 9.21 | 9.55 |
| Wine | Gal. | 0.14 | 0.14 | 0.12 | 0.12 | 0.11 | 0.13 |
| Spirits | Gal. | 0.77 | 0.81 | 0.67 | 0.65 | 0.49 | 0.68 |
| (b.) Excluding Maoris. | |||||||
| Tea | lb. | 9.11 | 8.32 | 7.26 | 8.00 | 8.52 | 8.21 |
| Coffee, raw and roasted | lb. | 0.31 | 0.31 | 0.34 | 0.33 | 0.49 | 0.36 |
| Cocoa and chocolate* | lb. | 0.51 | 0.70 | 0.62 | 0.21 | 0.50 | 0.51 |
| Cocoa-beans | lb. | 0.61 | 0.52 | 1.02 | 0.92 | 0.89 | 0.79 |
| Rice | lb. | 9.00 | 8.32 | 7.32 | 9.34 | 7.47 | 8.25 |
| Sago and tapioca | lb. | 3.20 | 2.47 | 2.66 | 3.24 | 2.78 | 2.86 |
| Currants, dried | lb. | 3.09 | 2.23 | 1.43 | 1.65 | 1.07 | 1.88 |
| Raisins | lb. | 4.51 | 5.94 | 5.69 | 4.99 | 5.77 | 5.36 |
| Figs, dates, and prunes | lb. | 2.90 | 3.50 | 2.51 | 2.20 | 1.46 | 2.50 |
| Sugar | lb. | 104.16 | 135.52 | 126.56 | 138.88 | 105.75 | 122.08 |
| Salt | lb. | 43.68 | 44.80 | 64.96 | 32.48 | 85.66 | 54.04 |
| Spices | lb. | 0.69 | 0.64 | 0.65 | 0.81 | 0.71 | 0.70 |
| Mustard | lb. | 0.22 | 0.22 | 0.30 | 0.14 | 0.16 | 0.21 |
| Tobacco | lb. | 2.89 | 2.89 | 2.80 | 2.82 | 2.82 | 2.83 |
| Beer | Gal. | 9.77 | 9.88 | 10.44 | 10.39 | 9.63 | 9.98 |
| Wine | Gal. | 0.14 | 0.15 | 0.13 | 0.13 | 0.11 | 0.13 |
| Spirits | Gal. | 0.80 | 0.85 | 0.70 | 0.68 | 0.52 | 0.71 |
Whilst the average consumption of the main items of food and drink is naturally very steady from year to year, no items show an uninterrupted increase. Coffee, however, appears on the whole to be advancing in popular favour. Salt also shows a marked increase for 1918. The fluctuations in dried fruits are due to repeated wars in the part of the world from which they mainly come. The fluctuations in sugar are probably due in the main to the success or otherwise from year to year of the crops in Fiji.
In 1914 the statistics, both of imports and exports, were collected for the first time upon a new plan, a statistical classification being adopted, which assembles the items in well-defined classes, so that all similar commodities are grouped as far as may be. The advantages of a stereotyped classification of this kind over an alphabetical arrangement of items are obvious. In the preparation of the classes adopted, a good deal of weight has been attached to the recommendations of the Dominions Royal Commission which toured New Zealand in 1913. In a memorandum prepared for the Commission, Professor A. L. Bowley submitted a scheme for uniformity of statistical work within the Empire, and suggested that New Zealand statistics should follow as closely as possible the lines laid down by Australia. The advantages of similarity of treatment in Australia and New Zealand are apparent, and in the classification of imports and exports, as in other matters, the statistics of New Zealand are being made comparable with those of Australia as far as possible.
The main classes of imports in 1918 are presented below:—
IMPORTS BY CLASSES , 1918.
| No. | Class. | Value in 1918. |
|---|---|---|
*Not including chocolate confectionery. | ||
| £ | ||
| I | Foodstuffs of animal origin (excluding live animals) | 270,113 |
| II | Foodstuffs of vegetable origin, and common salt | 2,775,992 |
| III | Beverages (non-alcoholic) and substances used in making up the same | 536,578 |
| IV | Spirits and alcoholic liquors | 948,473 |
| V | Tobacco and preparations thereof | 690,924 |
| VI | Live animals | 16,897 |
| VII | Animal substances (mainly unmanufactured) not being foodstuffs | 30,750 |
| VIII | Vegetable substances and non-manufactured fibres | 559,796 |
| IXA | Apparel | 2,842,817 |
| IXB | Textiles | 4,025,490 |
| IXC | Manufactured fibres | 458,156 |
| X | Oils, fats, and waxes | 1,587,365 |
| XI | Paints and varnishes | 229,377 |
| XII | Stones and minerals used industrially | 228,560 |
| XIII | Specie | 102,215 |
| XIVA | Metal unmanufactured, partially manufactured, and ores | 184,273 |
| XIVB | Metal manufactures, other than machinery and machines | 1,566,718 |
| XV | Machinery and machines | 901,153 |
| XVIA | Indiarubber and manufactures thereof (not including tires) | 65,695 |
| XVIB | Leather and manufactures thereof, including substitutes | 354,257 |
| XVIIA | Timber | 152,525 |
| XVIIB | Wood, cane, and wicker manufactures | 71,183 |
| XVIII | Earthenware, china, glass, stoneware, cements, and cement materials | 238,961 |
| XIXA | Paper | 547,138 |
| XIXB | Stationery | 488,052 |
| XX | Jewellery, timepieces, and fancy goods | 473,448 |
| XXI | Optical, surgical, and scientific instruments | 311,936 |
| XXIIA | Drugs, chemicals, and druggists' wares | 994,173 |
| XXIIB | Manures | 267,323 |
| XXIII | Miscellaneous | 2,313,606 |
| Total* | 24,233,944 | |
From the above table it can be seen that New Zealand's largest group of imports in 1918 was that containing textiles (Class IXB ). This group shows an increase, as compared with 1917, of over £1,000,000. The total for Group IX amounted in 1918 to £6,868,307, or 27 per cent. of all imports.
Class IV shows an increase of over £320,000 when compared with the figure for the previous year, and Class X an increase of over £540,000.
This increase is shared but to a lesser degree by all classes except live animals, stones and minerals used industrially, specie, metals, machinery, leather goods, timber, earthenware, and manures.
The import trade of the Dominion, though spread over more countries than the export trade, is yet confined mainly to the United Kingdom, Australia, and the United States. In the days of the first settlement Australia was the source from which the young colony drew most of its supplies, and for a long period imports from Australia overshadowed imports from the United Kingdom. The proportion of imports from Australia, however, tended to decrease steadily till from 60 per cent. in 1862 it had fallen to about 15 per cent. In 1918, however, imports from Australia were nearly 22 per cent. of the total imports.
Most of the goods brought to New Zealand from overseas come from the United Kingdom, which in normal times supplies about 60 per cent. of the total imports. The proportion has fallen a good deal of recent years—in the "eighties" and "nineties" the figure was, on the average, nearer 70 per cent. than 60 per cent.
The cause of this decline is to be found in the development of trade with other countries in quite recent years, particularly with Germany, the United States, Japan, and in a less degree with France, Belgium, Holland, and other European countries. The United States was sending goods to New Zealand practically from the foundation of the colony, and the share of the imports received from that country steadily increased, till in the first decade of the present century it was 11 or 12 per cent. The adoption of Imperial preference seems to have caused a temporary drop in the figure to about 7 per cent., though the proportion has now for some years been steadily climbing again, and has indeed actually surpassed its old level. In 1918 more than 20 per cent. of the imports came from the United States. Trade with Germany developed steadily during the decade preceding the outbreak of war.
India captured the New Zealand jute-market in the early "eighties," and since then there has been a regular import of corn-sacks, woolpacks, &c. In former times the colony imported its sugar from Mauritius, but after 1890 Fiji supplanted Mauritius, so that the imports from the Pacific islands are swelled to 4 per cent., while Mauritius practically disappears from the list of countries. Similarly the import of tea from China gave way about the same time to imports from Ceylon.
The present position is illustrated by the tables which follow. It will be seen that, while imports of goods from Germany have practically ceased, and imports from the United Kingdom are less than in any year except 1917, since 1905 the remaining six countries, with the exception of Fiji, have maintained a high level. The figures for India, United States, and Canada are the highest ever recorded.
| Year. | United Kingdom. | Australia. | Canada. | India. | Ceylon. | Fiji. | United States. | Germany |
|---|---|---|---|---|---|---|---|---|
| £ | £ | £ | £ | £ | £ | £ | £ | |
| 1898 | 5,148,833 | 1,158,865 | 71,491 | 202,295 | 113,813 | 320,886 | 800,411 | 153,102 |
| 1899 | 5,526,645 | 1,336,828 | 63,250 | 213,041 | 116,833 | 250,706 | 775,309 | 160,605 |
| 1990 | 6,504,484 | 1,776,978 | 41,165 | 256,779 | 123,333 | 364,510 | 1,061,873 | 182,074 |
| 1901 | 6,885,831 | 1,979,320 | 42,178 | 332,747 | 134,742 | 349,706 | 1,415,267 | 198,521 |
| 1902 | 6,851,452 | 1,715,295 | 53,374 | 286,061 | 125,891 | 327,972 | 1,318,937 | 210,560 |
| 1903 | 7,512,668 | 2,154,966 | 68,329 | 252,570 | 138,959 | 461,988 | 1,441,358 | 274,297 |
| 1904 | 7,982,340 | 1,893,036 | 113,485 | 276,106 | 172,759 | 516,539 | 1,527,915 | 308,804 |
| 1905 | 7,795,284 | 1,815,717 | 96,119 | 297,128 | 179,809 | 456,629 | 1,438,501 | 277,467 |
| 1906 | 9,003,229 | 2,775,312 | 157,088 | 290,725 | 189,288 | 378,050 | 1,405,781 | 336,960 |
| 1907 | 10,278,019 | 3,127,553 | 215,232 | 370,655 | 220,102 | 625,644 | 1,425,596 | 351,634 |
| 1908 | 10,441,837 | 2,841,426 | 268,259 | 345,180 | 210,675 | 557,709 | 1,643,937 | 389,531 |
| 1909 | 9,287,786 | 2,764,210 | 198,384 | 367,999 | 230,499 | 590,214 | 1,166,063 | 327,847 |
| 1910 | 10,498,771 | 2,359,393 | 261,402 | 399,991 | 248,476 | 580,084 | 1,399,737 | 391,795 |
| 1911 | 11,787,300 | 2,944,991 | 283,410 | 326,360 | 275,672 | 728,806 | 1,682,129 | 480,617 |
| 1912 | 12,499,787 | 2,583,887 | 394,249 | 395,298 | 289,008 | 764,790 | 2,049,618 | 653,230 |
| 1913 | 13,312,193 | 2,914,848 | 452,519 | 421,209 | 275,350 | 846,493 | 2,107,990 | 687,935 |
| 1914 | 11,985,946 | 3,376,371 | 479,140 | 486,978 | 394,444 | 738,751 | 2,282,966 | 620,400 |
| 1915 | 11,141,067 | 3,554,535 | 797,816 | 527,942 | 408,697 | 1,128,959 | 2,600,248 | 7,790 |
| 1916 | 13,869,455 | 4,002,171 | 757,286 | 572,257 | 366,753 | 1,053,754 | 3,969,925 | 4,287 |
| 1917 | 8,817,513 | 3,660,931 | 757,041 | 612,063 | 353,613 | 1,203,372 | 3,900,658 | 733 |
| 1918 | 8,977,725 | 5,133,349 | 930,964 | 712,633 | 319,498 | 939,341 | 4,980,748 | 393 |
The next table gives greater detail, and shows all the main countries which shipped goods to New Zealand, arranged in geographical order. A quinquennial comparison is made so as to eliminate any temporary fluctuations.
IMPORTS FROM MAIN COUNTRIES , 1914-18.
| Country. | 1914. | 1915. | 1916. | 1917. | 1918. |
|---|---|---|---|---|---|
*Excluding gold. | |||||
| £ | £ | £ | £ | £ | |
| United Kingdom | 11,985,946 | 11,141,067 | 13,869,455 | 8,817,513 | 8,977,725 |
| British Possessions. | |||||
| Europe— | |||||
| Gibraltar | 1 | 21 | 1 | 1 | 5 |
| Malta | 74 | 270 | 98 | 15 | 92 |
| 75 | 291 | 99 | 16 | 97 | |
| Asia— | |||||
| Burma | 29,026 | 30,944 | 44,916 | 38,553 | 92,566 |
| Ceylon | 394,444 | 408,697 | 366,753 | 353,613 | 319,498 |
| Hong Kong | 32,472 | 27,809 | 29,041 | 20,677 | 22,461 |
| India | 486,978 | 527,942 | 572,257 | 612,063 | 712,633 |
| Straits Settlements | 57,499 | 43,323 | 51,418 | 62,678 | 83,693 |
| Other Asiatic possessions | 452 | 36 | 189 | 1,509 | 150 |
| 1,000,871 | 1,038,756 | 1,064,575 | 1,089,093 | 1,231,001 | |
| Africa— | |||||
| South African Union | 33,229 | 42,654 | 71,300 | 56,392 | 43,856 |
| Other African possessions | 13,513 | 14,119 | 685 | 4 | 295 |
| 46,742 | 56,773 | 71,985 | 56,396 | 44,151 | |
| Country. | 1914. | 1915. | 1916. | 1917. | 1918. |
| America— | £ | £ | £ | £ | £ |
| British West Indies | 6,511 | 4,069 | 6,192 | 4,293 | 4,408 |
| Canada via East Coast | 380,340 | 545,885 | 440,171 | 438,563 | 225,993 |
| Canada via West Coast | 98,800 | 251,931 | 317,115 | 318,478 | 704,971 |
| Newfoundland | .. | 69 | 2,029 | 2,473 | 4,688 |
| 485,651 | 801,954 | 765,507 | 763,827 | 940,060 | |
| Pacific Islands— | |||||
| Australia | 3,376,371 | 3,554,535 | 4,002,171 | 3,660,931 | 5,133,349 |
| Fiji | 738,751 | 1,128,959 | 1,053,754 | 1,203,372 | 939,341 |
| Other Pacific islands | 15,377 | 4,802 | 5,915 | 154 | 161 |
| 4,130,499 | 4,688,296 | 5,061,840 | 4,864,457 | 6,072,851 | |
| Foreign Countries. | |||||
| Europe— | |||||
| Austria | 11,228 | 458 | 259 | 8 | |
| Belgium | 110,391 | 3,551 | 4,330 | 414 | 2 |
| Denmark | 9,804 | 36,175 | 41,671 | 66,801 | 30,724 |
| France | 147,877 | 132,201 | 113,352 | 33,731 | 33,783 |
| Germany | 620,400 | 7,790 | 4,287 | 733 | 393 |
| Greece | 25,043 | 20,793 | 31 | 2 | .. |
| Hungary | 551 | .. | .. | .. | .. |
| Italy | 55,315 | 94,839 | 103,486 | 79,414 | 57,530 |
| Netherlands | 127,038 | 84,205 | 70,860 | 20,873 | 23,274 |
| Norway | 67,771 | 76,291 | 62,467 | 43,343 | 22,632 |
| Portugal | 6,008 | 4,806 | 6,165 | 771 | 2,468 |
| Russia | 6,198 | 1,211 | 1,017 | 501 | 89 |
| Spain | 14,518 | 9,951 | 14,456 | 3,751 | 9,507 |
| Sweden | 79,817 | 94,916 | 102,760 | 99,299 | 69,858 |
| Switzerland | 67,827 | 49,071 | 72,160 | 48,972 | 42,482 |
| Turkey | 13,974 | 2,846 | .. | .. | .. |
| Other European countries | .. | .. | 9 | .. | .. |
| 1,363,760 | 619,104 | 597,310 | 398,605 | 292,750 | |
| Asia— | |||||
| Asiatic Turkey | 32,805 | 5,953 | 6,110 | 7,359 | 5,228 |
| China | 32,847 | 35,539 | 69,124 | 70,711 | 115,356 |
| Japan | 187,501 | 304,322 | 562,974 | 628,822 | 1,214,865 |
| Java | 57,412 | 32,660 | 40,622 | 34,490 | 146,780 |
| Philippine Islands | 20,012 | 24,187 | 31,270 | 26,389 | 35,550 |
| Sumatra | 135,843 | 183,450 | 109,240 | 87,967 | 52,169 |
| Other Asiatic countries | 4,062 | 1,669 | 4,203 | 15,141 | 19,936 |
| 470,480 | 587,780 | 823,543 | 870,879 | 1,589,884 | |
| Africa— | |||||
| Egypt | 1,741 | 5,724 | 43,634 | 48,449 | 4,399 |
| Other African countries | 39,004 | 11,620 | 23 | 3,144 | 627 |
| 40,745 | 17,344 | 43,657 | 51,593 | 5,026 | |
| America— | |||||
| Argentina | |||||
| 23 | 1,452 | 81 | 209 | 80 | |
| Brazil | 165 | 145 | 170 | .. | 1,439 |
| Chile | 1 | 1,258 | 521 | 8,360 | 3,758 |
| Cuba | 7,780 | 4,327 | 3,550 | 6,605 | 1,632 |
| United States of America— | |||||
| Via East Coast | 1,851,046 | 1,693,325 | 2,577,449 | 2,672,640 | 1,766,131 |
| Via West Coast | 431,920 | 906,923 | 1,392,476 | 1,228,018 | 3,214,617 |
| Other American countries | 314 | 133 | 3,372 | 1,088 | 3,636 |
| 2,291,249 | 2,607,563 | 3,977,619 | 3,916,920 | 4,993,293 | |
| Pacific Islands— | |||||
| German Samoa | 8,049 | 52,045 | 19,317 | 16,301 | 20,359 |
| Hawaii | 367 | 1,015 | 2,545 | 3,757 | 2,073 |
| New Caledonia | 3 | 12,173 | 4,042 | 11,067 | 10,179 |
| Society Islands | 19,423 | 29,189 | 10,950 | 16,137 | 13,381 |
| Tonga | 12,122 | 29,853 | 4,145 | 1,409 | 3,150 |
| Tuamotu Archipelago | 100 | 45,578 | 22,664 | 41,271 | 37,945 |
| Other Pacific islands | 14 | 53 | 30 | 8 | 19 |
| 40,078 | 169,906 | 63,693 | 89,950 | 87,106 | |
| Antarctica | .. | .. | .. | 10 | .. |
| Grand total | 21,856,096 | 21,728,834 | 26,339,283 | 20,919,259* | 24,233,944 |
In 1914 a change was made in the system of compilation of trade statistics, and for the first time statistics of imports were obtained for countries of origin as well as countries of shipment. Before 1914 it was the practice to credit imports to the country from which the goods were shipped to the Dominion, and considerable care was taken to ensure that the original port of shipment was ascertained. But there was no means of discovering where the goods were actually made, and this was felt to be a great gap in the statistics. Arrangements were made accordingly, so that importers are now required to declare the country of origin as well as the country of shipment of all goods imported. The following table permits the study of imports under both headings:—
IMPORTS FROM VARIOUS COUNTRIES IN 1918.
| Country. | Imports according to | |||
|---|---|---|---|---|
| Country of Shipment. | Country of Origin. | |||
| Value. | Per Cent. of Total. | Value. | Per Cent. of Total. | |
| £ | £ | |||
| United Kingdom | 8,977,725 | 37.04 | 8,703,480 | 35.46 |
| British Possessions. | ||||
| Europe— | ||||
| Gibraltar | 5 | .. | 5 | .. |
| Malta | 92 | .. | 624 | .. |
| 97 | .. | 629 | .. | |
| Asia— | ||||
| Burma | 92,566 | 0.38 | 99,099 | 0.41 |
| Ceylon | 319,498 | 1.32 | 323,213 | 1.33 |
| Hong Kong | 22,461 | 0.09 | 18,573 | 0.08 |
| India | 712,633 | 2.94 | 729,419 | 3.01 |
| Straits Settlements | 83,693 | 3.45 | 77,524 | 0.32 |
| Other Asiatic possessions | 150 | .. | 55 | .. |
| 1,231,001 | 5.08 | 1,247,883 | .. | |
| Africa— | ||||
| British West Africa | 295 | .. | 549 | .. |
| Mauritius | .. | .. | .. | .. |
| South African Union | 43,856 | 0.18 | 110,645 | 0.46 |
| Other African possessions | 30 | .. | ||
| 44,151 | 0.18 | 111,224 | 0.46 | |
| America— | ||||
| British West Indies | 4,408 | 0.02 | 9,989 | 0.04 |
| Canada via East Coast | 225,993 | 0.93 | 950,588 | 3.92 |
| Canada via West Coast | 704,971 | 2.91 | ||
| Newfoundland | 4,688 | 0.02 | 4,727 | 0.02 |
| Other American possessions | ||||
| 940,060 | 3.88 | 965,304 | 3.98 | |
| Pacific Islands— | £ | £ | ||
| Australia | 5,133,349 | 21.18 | 4,043,320 | 16.68 |
| Fiji | 939,341 | 3.88 | 935,885 | 3.85 |
| Gilbert and Ellice Islands | .. | .. | .. | .. |
| Other Pacific possessions | 161 | .. | 9,766 | 0.04 |
| 6,072,851 | 25.06 | 4,988,971 | 20.59 | |
| Foreign Countries. | ||||
| Europe— | ||||
| Austria | 8 | .. | 8 | .. |
| Belgium | 2 | .. | 1,470 | 0.01 |
| Denmark | 30,724 | 0.13 | 31,281 | 0.13 |
| France | 33,783 | 0.14 | 333,118 | 1.37 |
| Germany | 393 | .. | 684 | .. |
| Greece | .. | .. | 844 | .. |
| Italy | 57,530 | 0.23 | 119,513 | 0.49 |
| Luxemburg | .. | .. | .. | .. |
| Netherlands | 23,274 | 0.10 | 65,060 | 0.27 |
| Norway | 22,632 | 0.09 | 33,565 | 0.14 |
| Portugal | 2,468 | 0.01 | 8,721 | 0.04 |
| Russia | 89 | .. | 8,501 | 0.04 |
| Spain | 9,507 | 0.04 | 19,401 | 0.08 |
| Sweden | 69,858 | 0.30 | 80,361 | 0.33 |
| Switzerland | 42,482 | 0.18 | 257,726 | 1.06 |
| Turkey | .. | .. | 216 | .. |
| Other European countries | .. | .. | .. | .. |
| 292,750 | 1.28 | 960,469 | 3.96 | |
| Asia— | ||||
| Asiatic Turkey | 5,228 | 0.02 | 8,055 | 0.03 |
| China | 115,356 | 0.48 | 128,015 | 0.53 |
| Dutch Borneo | 18,480 | 0.07 | 21,858 | 0.10 |
| Japan | 1,214,865 | 5.01 | 1,266,416 | 5.23 |
| Java | 146,780 | 0.61 | 153,895 | 0.63 |
| Persia | 13 | .. | 237 | .. |
| Philippine Islands | 35,550 | 0.15 | 38,849 | 0.16 |
| Sarawak and Brunei | 357 | .. | 357 | .. |
| Sumatra | 52,169 | 0.22 | 52,195 | 0.22 |
| Other Asiatic countries | 1,086 | .. | 2,122 | 0.01 |
| 1,589,884 | 6.56 | 1,671,999 | 6.89 | |
| Africa— | ||||
| Egypt | 4,899 | 0.02 | 8,563 | 0.04 |
| Madagascar | 8 | .. | 8 | .. |
| Morocco | .. | .. | 660 | .. |
| Zanzibar | 211 | .. | 1,382 | 0.01 |
| Other African countries | 408 | .. | 848 | .. |
| 5,026 | 0.02 | 11,461 | 0.05 | |
| America— | £ | £ | ||
| Alaska | 344 | .. | 344 | .. |
| Brazil | 1,439 | 0.01 | 1,555 | 0.01 |
| Chile | 3,758 | 0.02 | 3,891 | 0.02 |
| Cuba | 1,632 | 0.01 | 1,681 | 0.01 |
| Guatemala | .. | 362 | .. | |
| United States of America— | ||||
| Via East Coast | 1,766,131 | 7.29 | 5,472,122 | |
| Via West Coast | 3,214,617 | 13.26 | 22.58 | |
| Other American countries | 5,372 | 0.02 | 7,882 | 0.03 |
| 4,993,293 | 20.60 | 5,487,837 | 22.65 | |
| Pacific Islands— | ||||
| German Samoa | 20,359 | 0.08 | 18,779 | 0.08 |
| Hawaii | 2,073 | 0.01 | 2,059 | 0.01 |
| New Caledonia | 10,179 | 0.04 | 10,180 | 0.04 |
| Society Islands | 13,381 | 0.06 | 12,902 | 0.05 |
| Tonga | 3,150 | 0.01 | 2,689 | 001 |
| Tuamotu Archipelago | 37,945 | 0.16 | 37,945 | 0.16 |
| Other Pacific islands | 19 | .. | 133 | .. |
| 87,106 | 0.36 | 84,687 | 0.35 | |
| Antarctica | .. | .. | .. | .. |
| Grand total | 24,233,944 | .. | 24,233,944 | .. |
Direct shipments from the United Kingdom, it will be seen, exceeded by nearly £300,000 the imports of goods manufactured in that country. In view, however, of the considerable quantity of British goods that enter New Zealand by way of Australia it would not be correct to take that figure as measuring the re-export trade done by Great Britain in goods from abroad intended for the Dominion.
Australia acts as a re-exporting centre for a certain proportion of goods received from Ceylon and India, just as Hong Kong does for Chinese goods. The British West Indies still produce considerably more of the imports than they ship direct. The 1918 figures for Canada are practically level. In the case of the United States, goods to the value of, roughly £500,000, were imported indirectly in 1918.
The goods produced in European countries are often shipped via United Kingdom, and, as was expected, the total produce of these countries in every instance greatly exceeds the value shipped direct from their ports. The most important country, France, affords a good illustration of the position. Asiatic countries generally show similar results. Hong Kong and Australia take part of the Eastern entrepôt trade. United States seems to ship to New Zealand a considerable quantity of goods made in Canada.
In the exports subsection of this book it has been shown that New Zealand is a primary-producing country—i.e., her exports consist principally of raw materials. It was also pointed out that the largest proportion of imports was of manufactures. The following table, grouped in the same manner as the export table referred to, illustrates this statement. Of the total (£24,233,944), the United Kingdom supplied £8,703,480, or 35.91 per cent. Manufactured articles imported amounted to £17,630,511, of which the Mother-country supplied £7,325,174, or 41.55 per cent. The figures given refer to countries of origin.
| Countries. | Food, Drink, and Tobacco. | Raw Materials and Articles mainly unmanufactured. | Articles wholly or mainly manufactured. | Miscellaneous and Unclassified. | Bullion and Specie.* | Total.* |
|---|---|---|---|---|---|---|
*Excluding gold. | ||||||
| £ | £ | £ | £ | £ | £ | |
| United Kingdom | 1,070,227 | 83,957 | 7,325,174 | 121,907 | 102,215 | 8,703,480 |
| British Possessions. | ||||||
| Europe— | ||||||
| Gibraltar | .. | .. | 5 | .. | .. | 5 |
| Malta | 2 | .. | 622 | .. | .. | 624 |
| Asia— | ||||||
| British North Borneo Protectorate | .. | .. | 55 | .. | .. | 55 |
| Burma | 25,278 | 340 | 73,481 | .. | .. | 99,099 |
| Ceylon | 318,415 | 1,258 | 3,540 | .. | .. | 323,213 |
| Hong Kong | 14,085 | 1,105 | 3,383 | .. | .. | 18,573 |
| India | 80,130 | 4,791 | 632,690 | 5,808 | .. | 729,419 |
| Straits Settlements | 71,532 | 4,544 | 1,396 | 52 | .. | 77,524 |
| Africa— | ||||||
| British East Africa Protectorate | 24 | .. | .. | .. | .. | 24 |
| British West Africa | 549 | .. | .. | .. | .. | 549 |
| Nyasaland Protectorate.. | 6 | .. | .. | .. | .. | |
| South African Union | 28,417 | 16,955 | 65,273 | .. | .. | 110,645 |
| America— | ||||||
| British West Indies | 7,654 | 558 | 1,777 | .. | .. | 9,989 |
| Canada | 197,255 | 20,859 | 718,999 | 13,475 | .. | 950,588 |
| Newfoundland | .. | .. | 4,727 | .. | .. | 4,727 |
| Pacific Islands— | ||||||
| Australia | 1,621,095 | 498,968 | 1,880,220 | 42,714 | 323 | 4,043,320 |
| British Solomon Islands | .. | .. | 6 | .. | .. | 6 |
| Protectorate | ||||||
| Fiji | 935,762 | .. | 116 | 7 | .. | 935,885 |
| New Zealand | 303 | 463 | 1,815 | 6,886 | .. | 9,467 |
| Norfolk Island | 71 | 40 | 1 | .. | 112 | |
| Papua | .. | 179 | .. | .. | .. | 179 |
| Pitcairn Island | .. | .. | 2 | .. | .. | 2 |
| Foreign Countries and Possessions. | ||||||
| Europe— | ||||||
| Austria | .. | .. | 8 | .. | .. | 8 |
| Belgium | .. | .. | 1,470 | .. | .. | 1,470 |
| Denmark | 557 | .. | 4,906 | 25,818 | .. | 31,281 |
| France | 60,607 | 697 | 270,399 | 1,415 | .. | 333,118 |
| Germany | 30 | .. | 654 | .. | .. | 684 |
| Greece | .. | .. | 844 | .. | .. | 844 |
| Italy | 14,312 | 13 | 101,725 | 3,463 | .. | 119,513 |
| Netherlands | 33,975 | 20 | 30,925 | 140 | .. | 65,060 |
| Norway | 13,242 | 6 | 18,925 | 1,392 | .. | 33,565 |
| Portugal | 5,297 | 3,424 | .. | .. | .. | 8,721 |
| Russia | 21 | 169 | 7,995 | 316 | .. | 8,501 |
| Spain | 6,713 | 12,006 | 682 | .. | .. | 19,401 |
| Sweden | .. | 7,591 | 57,231 | 15,539 | .. | 80,361 |
| Switzerland | 8,835 | 6 | 248,367 | 518 | .. | 257,726 |
| Turkey | .. | .. | 216 | .. | .. | 216 |
| Countries. | Food, Drink, and Tobacco. | Raw Materials and Articles mainly unmanufactured. | Articles wholly or mainly manufactured. | Miscellaneous and Unclassified. | Bullion and Specie.* | Total.* |
|---|---|---|---|---|---|---|
** Excluding gold. | ||||||
| Asia— | £ | £ | £ | £ | £ | £ |
| Asiatic Turkey | 7,761 | .. | 294 | .. | .. | 8,055 |
| China | 35,345 | 704 | 91,909 | 57 | .. | 123,015 |
| Cochin-China | .. | .. | 216 | .. | .. | 216 |
| Dutch Borneo | .. | .. | 21,858 | .. | .. | 21,858 |
| French Indo-Chinese Protectorates | .. | .. | 382 | .. | .. | 382 |
| Japan | 12,857 | 28,166 | 1,220,267 | 5,126 | .. | 1,266,416 |
| Java | 79,324 | 69,166 | 5,405 | .. | .. | 153,895 |
| Malay States | .. | .. | .. | 17 | .. | 17 |
| Minor Dutch East Indies | 165 | 443 | 436 | .. | .. | 1,044 |
| Persia | .. | .. | 237 | .. | .. | 237 |
| Philippine Islands | 2,667 | 35,777 | 405 | .. | .. | 38,849 |
| Sarawak and Brunei | 357 | .. | .. | .. | .. | 357 |
| Siam | 463 | .. | .. | .. | .. | 463 |
| Sumatra | 572 | .. | 53,623 | .. | .. | 52,195 |
| Africa— | ||||||
| Abyssinia | 19 | .. | .. | .. | .. | 19 |
| Algeria | .. | .. | 11 | .. | .. | 11 |
| Anglo-Egyptian Sudan | .. | .. | 15 | .. | .. | 15 |
| Canary Islands | .. | .. | 12 | .. | .. | 12 |
| Egypt | 2,026 | .. | 6,537 | .. | .. | 8,563 |
| French West Africa | .. | .. | 18 | .. | .. | 18 |
| Madagascar | .. | .. | 8 | .. | .. | 8 |
| Madeira | .. | .. | 326 | .. | .. | 326 |
| Morocco | 445 | .. | 209 | .. | .. | 660 |
| Portuguese East Africa | .. | .. | 3 | .. | .. | 3 |
| Portuguese West Africa | 408 | .. | .. | .. | .. | 408 |
| Tripoli | .. | .. | 36 | .. | .. | 36 |
| Zanzibar | 1,375 | .. | 7 | .. | .. | 1,382 |
| America— | ||||||
| Alaska | 344 | .. | .. | .. | .. | 344 |
| Argentina | .. | 80 | .. | .. | .. | 80 |
| Brazil | 1,434 | .. | 121 | .. | .. | 1,555 |
| Chile | .. | .. | 3,831 | 60 | .. | 3,891 |
| Colombia | .. | .. | 1,604 | .. | .. | 1,604 |
| Cuba | 1,663 | .. | 18 | .. | .. | 1,681 |
| Dutch West Indies | .. | .. | 36 | .. | .. | 36 |
| Ecuador | 4,023 | .. | 791 | .. | .. | 4,814 |
| Guatemala | 362 | .. | .. | .. | .. | 362 |
| Mexico | 111 | .. | 55 | .. | .. | 166 |
| Panama | .. | .. | 14 | .. | .. | 14 |
| Panama Canal Zone | .. | .. | 1 | .. | .. | 1 |
| Peru | .. | 12 | 96 | .. | .. | 108 |
| Santo Domingo | 684 | 18 | .. | .. | .. | 702 |
| Surinam | 357 | .. | .. | .. | .. | 357 |
| United States of America | 521,415 | 91,505 | 4,713,340 | 145,862 | .. | 5,472,152 |
| Pacific Islands— | ||||||
| German New Guinea | .. | .. | 2 | .. | .. | 2 |
| German Samoa | .. | 17,527 | 155 | 1,097 | .. | 18,779 |
| Hawaii | .. | 1,904 | 155 | .. | .. | 2,059 |
| New Caledonia | 2 | .. | 10,171 | 7 | .. | 10,180 |
| New Hebrides | 131 | .. | .. | .. | .. | 131 |
| Society Islands | 8,024 | 551 | 4,327 | .. | .. | 12,902 |
| Tonga | .. | 2,683 | 6 | .. | .. | 2,689 |
| Tuamotu Archipelago | .. | .. | 37,945 | .. | .. | 37,945 |
| Totals | 5,202,728 | 906,485 | 17,630,511 | 391,682 | 102,538 | 24,233,944 |
In order to give more detailed information concerning the trade of New Zealand with other countries the following tables have been compiled, giving the main items of import from all the principal countries with which New Zealand trades. The tables give a five-yearly comparison, and in order to do this it was necessary to take the value of goods shipped from each country, a value which does not necessarily agree with the amount produced in that country.
Account has been taken only of those items of a value of £5,000 or more, so that the tables are not made too complicated by the additions of great numbers of small items. The full details will be found in the "Statistics of New Zealand," Volume ii.
PRINCIPAL IMPORTS .
| Class. | Item. | Article. | 1914. | 1915. | 1916. | 1917. | 1918. |
|---|---|---|---|---|---|---|---|
*Not available for publication. † Including antifriction metal, now Item 377A . * Heading altered in 1916. * Heading altered in 1916. * Heading altered in 1916. * Not available for publication † Heading altered in 1916. * Heading altered in 1916. * Heading altered in 1916. * Heading altered in 1916. * Heading altered in 1916. | |||||||
| United Kingdom. | |||||||
| £ | £ | £ | £ | £ | |||
| I | 11 | Fish, preserved, in tins, &c. | 21,773 | 11,129 | 18,343 | 5,179 | 32 |
| 40 | Milk and cream, preserved &c. | 21,283 | 7,042 | 6,448 | 448 | .. | |
| 41 | Provisions n.o.e. | 19,815 | 17,802 | 22,298 | 5,139 | 1,126 | |
| II | 44 | Biscuits, other | 6,120 | 3,517 | 4,166 | 628 | 25 |
| 46 | Cocoa-butter, &c. | 16,015 | 19,355 | 35,469 | 33,200 | 21,345 | |
| Chocolate confectionery— | |||||||
| 48 | In fancy packages | 43,866 | 60,599 | 90,295 | 13,402 | 534 | |
| 49 | In plain trade packages | 12,071 | 12,958 | 10,464 | 2,306 | 55 | |
| 52 | Confectionery n.o.e. | 37,910 | 29,893 | 38,151 | 7,525 | 2,217 | |
| 58 | Foods for animals, n.o.e. | 3,297 | 6,096 | 3,643 | 916 | 371 | |
| 61 | Currants | 1,864 | 11,427 | 2,467 | .. | .. | |
| 62 | Dates | 4,560 | 18,052 | 12,321 | 57 | .. | |
| Grain and pulse, prepared— | |||||||
| 88 | Maizena and cornflour | 16,830 | 21,291 | 29,470 | 6,684 | .. | |
| 100 | Unenumerated | 5,704 | 5,925 | 5,111 | 1,552 | 11 | |
| 102 | Infants' and invalids' foods n.o.e. | 9,609 | 9,883 | 12,201 | 3,587 | 834 | |
| 103 | Jams, jellies, and preserves | 6,546 | 4,110 | 4,243 | 384 | 83 | |
| 107 | Mustard | 13,620 | 13,223 | 21,312 | 10,966 | 13,446 | |
| 108 | Nuts, edible—Almonds | 4,059 | 16,956 | 10,932 | 5,081 | 80 | |
| 112 | Oilmen's stores n.o.e. | 15,056 | 12,746 | 15,856 | 4,729 | 2,911 | |
| 117 | Sauces and chutneys | 10,892 | 9,015 | 11,692 | 5,398 | 9,803 | |
| Salt— | |||||||
| 122 | Other than table preparations and rock | 39,543 | 35,137 | 26,475 | 25,419 | 55,658 | |
| 137 | Vinegar | 8,701 | 8,051 | 7,146 | 4,799 | 1,950 | |
| III | 140 | Cocoa and chocolate | 30,626 | 64,133 | 59,793 | 10,835 | 265 |
| 142 | Coffee-essence | 16,947 | 11,404 | 18,875 | 7,070 | 16 | |
| IV | 151 | Ale and beer, &c. | 59,500 | 50,691 | 42,756 | 16,633 | 10,174 |
| Spirits, beverages— | |||||||
| 154 | Brandy | 16,470 | 12,074 | 24,866 | 19,552 | 637 | |
| 155 | Gin, geneva, and schnapps | 10,035 | 13,889 | 31,800 | 18,116 | 12,036 | |
| 156 | Rum | 3,656 | 4,215 | 5,973 | 4,914 | 1,031 | |
| 158 | Whisky | 283,239 | 246,144 | 495,425 | 388,941 | 490,639 | |
| Spirits other than beverages— | |||||||
| 160 | Flavouring-essences .. | 10,796 | 9,165 | 16,125 | 10,984 | 17,400 | |
| 163 | Spirits, perfumed | 5,651 | 5,924 | 6,176 | 5,891 | 5,476 | |
| Wine, fermented— | |||||||
| 166 | Sparkling | 5,920 | 5,602 | 6,873 | 12,108 | 115 | |
| 167 | Still | 10,040 | 9,444 | 12,568 | 9,691 | 3,220 | |
| V | 168 | Cigarettes | 221,809 | 183,108 | 313,380 | 143,396 | 284,688 |
| 169 | Cigars | 7,817 | 7,376 | 8,5481 | 6,173 | 3,984 | |
| Tobacco, manufactured— | |||||||
| 171 | 95,148 | Cut | 91,457 | 126,103 | 75,715 | 113,010 | |
| VI | 177 | Horses—Entires | 5,015 | 10,950 | 275 | 1,436 | 500 |
| VIII | 209 | Cork, cut | 9,778 | 13,781 | 18,865 | 10,710 | 6,254 |
| 211 | Engineers' cotton-waste | 7,784 | 9,211 | 6,348 | 6,021 | 9,601 | |
| 222 | Rosin | 1,595 | 3,905 | 5,706 | 88 | 18 | |
| Seeds— | |||||||
| 223 | Grass and clover | 35,444 | 194,810 | 89,301 | 93,184 | 10,481 | |
| 225 | Other | 50,779 | 70,201 | 69,558 | 58,376 | 91,286 | |
| 227 | Starch | 9,197 | 7,484 | 13,303 | 2,165 | ||
| VIII | 230 | Tanning-materials, crude, other | 5,119 | 8,671 | 32,945 | 5,356 | 6,638 |
| 233 | Yarns, other | 22,941 | 34,114 | 51,430 | 38,704 | 14,607 | |
| IXA | 234 | Apparel and ready-made clothing n.o.e. | 1,092,539 | 862,811 | 1,097,550 | 834,978 | 761,153 |
| 235 | Apparel made to order | 6,417 | 3,637 | 3,535 | 2,607 | 2,161 | |
| Boots and shoes— | |||||||
| 236 | Children's 0-6 | 20,257 | 18,202 | 32,086 | 41,378 | 20,644 | |
| 239 | Goloshes, slippers, &c. | 18,665 | 17,899 | 18,196 | 13,300 | 15,119 | |
| 240 | Grindery | 30,803 | 25,898 | 47,836 | 27,043 | 33,861 | |
| 243 | Vamps, uppers, lace | 11,030 | 6,812 | 14,187 | 8,910 | 6,787 | |
| 244 | Other | 310,102 | 279,646 | 275,861 | 215,970 | 161,732 | |
| 245 | Corsets | 11,145 | 16,056 | 21,897 | 21,531 | 21,698 | |
| 246 | Furs and fur trimmings | 20,864 | 16,269 | 15,708 | 18,103 | 17,438 | |
| 247 | Gloves n.o.e. | 46,356 | 51,430 | 70,557 | 46,056 | 25,915 | |
| Haberdashery— | |||||||
| 248 | Brace-elastic & brace-mounting | 3,366 | 3,321 | 5,829 | 3,865 | 2,950 | |
| 249 | Buttons, tapes, &c. | 46,951 | 38,562 | 51,435 | 34,613 | 26,636 | |
| 250 | Unenumerated | 16,931 | 18,401 | 26,373 | 20,750 | 24,991 | |
| 251 | Hats and caps | 119,916 | 101,496 | 101,012 | 83,507 | 78,600 | |
| 252 | Hatmakers' materials | 15,837 | 20,900 | 27,254 | 43,839 | 47,478 | |
| 253 | Hosiery | 192,990 | 197,277 | 296,513 | 162,202 | 219,195 | |
| 254 | Lace and laces n.o.e. | 44,598 | 35,627 | 37,650 | 32,550 | 37,321 | |
| Millinery— | |||||||
| 256 | Other ornamental feathers | 12,653 | 8,674 | 6,486 | 3,339 | 2,166 | |
| 257 | Unenumerated | 89,526 | 77,861 | 83,076 | 63,258 | 65,849 | |
| 258 | Minor articles n.o.e. for making up apparel, &c. | 8,863 | 12,839 | 21,212 | 14,942 | 16,106 | |
| 259 | Ribbon and crape | 71,444 | 72,996 | 65,896 | 52,268 | 2,912 | |
| 260 | Tailors' trimmings | 69,353 | 64,236 | 82,544 | 43,349 | 118,924 | |
| 261 | Umbrellas, parasols, and sunshades | 5,807 | 4,186 | 4,492 | 5,388 | 4,875 | |
| 262 | Umbrellas, parasols, &c., materials for making | 6,206 | 7,042 | 8,723 | 9,631 | 7,396 | |
| IXB | 263 | Articles n.o.e., partly or wholly made up from textiles | 30,438 | 34,314 | 45,136 | 27,235 | 43,769 |
| 266 | Carpets, druggets, &c. | 95,810 | 71,273 | 119,089 | 75,647 | 46,095 | |
| 267 | Drapery n.o.e. | 251,412 | 210,229 | 273,911 | 163,874 | 119,989 | |
| 268 | Felt, sheathing | 6,187 | 11,850 | 8,380 | 1,037 | 1,071 | |
| 270 | Matting n.o.e. and mats | 7,990 | 6,729 | 9,225 | 3,354 | 2,374 | |
| 271 | Oilcloths, linoleum, and stair and oil baize | 89,189 | 80,506 | 99,038 | 50,275 | 25,637 | |
| 274 | Canvas, sailcloth, and unbleached double-warped duck | 82,911 | 56,418 | 68,754 | 68,154 | 107,812 | |
| 275 | Butter and cheese cloth | 7,603 | 12,844 | 18,047 | 14,577 | 30,846 | |
| 276 | Candle-wick | 6,325 | 6,105 | 9,492 | 10,422 | 24,447 | |
| 277 | Tubular woven cotton-cloth, for meat-wraps | 49,634 | 57,953 | 78,570 | 73,341 | 83,254 | |
| 278 | Cotton piece-goods n.o.e. | 736,062 | 870,838 | 1,381,350 | 1,044,319 | 1,744,232 | |
| 279 | Hessians n.o.e. and scrim | 45,917 | 23,509 | 42,571 | 31,641 | 17,261 | |
| 280 | Leather-cloth | 7,202 | 6,390 | 9,145 | 6,428 | 6,535 | |
| 281 | Linen piece-goods | 41,800 | 37,649 | 37,140 | 19,775 | 29,009 | |
| 283 | Silks, satins, velvets, and plushes | 55,673 | 79,635 | 107,221 | 67,227 | 31,169 | |
| 285 | Waterproof cloth | 5,850 | 4,860 | 5,886 | 3,598 | 6,309 | |
| 286 | Woollen piece-goods n.o.e. | 345,091 | 325,786 | 826,278 | 519,305 | 374,054 | |
| 287 | Textile piece-goods n.o.e. | 139,452 | 106,725 | 38,780 | 16,938 | 13,422 | |
| Rugs- | |||||||
| 288 | Woollen | 11,424 | 8,461 | 6,455 | 2,633 | ||
| 289 | Other | 10,880 | 13,077 | 17,641 | 7,355 | 3,105 | |
| 290 | Sewing threads, silks, cotton, &c. | 67,147 | 81,156 | 109,547 | 131,174 | 161,873 | |
| 291 | Tents, tarpaulins, sails, &c. | 7,477 | 302 | 5,783 | 65 | 13 | |
| Cordage and rope— | |||||||
| IX | 300 | Iron and steel | 34,047 | 25,018 | 32,351 | 18,784 | 16,711 |
| 301 | Unenumerated | 11,924 | 11,975 | 17,007 | 12,295 | 11,889 | |
| 309 | Twine n.o.e. | 28,307 | 31,601 | 49,289 | 51,713 | 26,971 | |
| Oils | |||||||
| X | 325 | Mineral, lubricating | 15,554 | 15,428 | 19,744 | 7,733 | 2,808 |
| 332 | Vegetable, linseed | 39,200 | 44,434 | 45,752 | 9,358 | 787 | |
| 338 | Oils (not essential) in vessels containing less than 1 gallon | 6,060 | 6,052 | 5,778 | 3,848 | 1,018 | |
| 343 | Paraffin-wax | 3,957 | 3,853 | 6,821 | 5,924 | 2,869 | |
| Paints and colours— | |||||||
| XI | 348 | Ground in oil or turpentine | 83,215 | 69,473 | 82,848 | 57,080 | 7,899 |
| 349 | Ships' antifouling composition | 2,082 | 2,414 | 8,786 | 4,664 | 2,966 | |
| 350 | Other | 32,641 | 30,823 | 42,132 | 26,766 | 15,820 | |
| 351 | Unenumerated | 12,461 | 12,355 | 16,727 | 9,352 | 7,788 | |
| 354 | Varnishes, lacquers, and gold-size | 15,234 | 13,951 | 15,721 | 10,759 | 2,937 | |
| XII | 371 | Stone, other, dressed or polished | 8,403 | 5,739 | 9,271 | 7,182 | 2,822 |
| Specie— | |||||||
| XIII | 374 | Gold | 21,000 | .. | .. | * | * |
| 375 | Silver | 6,900 | 211,111 | 264,445 | 165,170 | 100,570 | |
| Iron and steel— | |||||||
| XIVA | 388 | Bar, bolt, and rod | 172,196 | 135,499 | 172,173 | 62,567 | 32,064 |
| 391 | Pig | 38,675 | 26,448 | 17,648 | 6,491 | 4,887 | |
| 402 | Tin—ingots, pigs, bars, &c. | 15,489 | 6,757 | 4,594 | 2,789 | 2,636 | |
| 405 | Metal, unmanufactured, n.o.e. | 5,558† | 6,260† | 6,985† | 1,366 | 1,580 | |
| XIVB | 408 | Bolts and nuts | 44,155 | 34,768 | 41,946 | 23,251 | 12,156 |
| 410 | Brass, plate and sheet, plain | 3,598 | 11,234 | 17,682 | 974 | 783 | |
| 414 | Chains and chain cables | 13,256 | 12,964 | 15,880 | 12,868 | 9,383 | |
| 416 | Copper, plate and sheet, plain | 19,629 | 20,821 | 20,903 | 6,578 | 3,308 | |
| 417 | Cutlery | 35,298 | 35,592 | 26,965 | 32,920 | 27,069 | |
| 422 | Hardware, hollow-ware, and ironmongery n.o.e. | 273,709 | 206,157 | 247,540 | 146,044 | 81,998 | |
| Iron and steel— | |||||||
| 423 | Angle and tee | 8,816 | 12,737 | 11,677 | 1,784 | 440 | |
| 424 | Channel and girders | 37,769 | 31,604 | 8,172 | 1,429 | 2,052 | |
| 426 | Hoop, black, n.o.e. | 20,833 | 22,718 | 45,793 | 21,081 | 44,842 | |
| Plate and sheet— | |||||||
| 430 | Corrugated, galvanized | 249,101 | 268,430 | 180,451 | 22,731 | 31,618 | |
| 431 | Plain black | 47,186 | 50,633 | 51,304 | 7,716 | 4,368 | |
| 432 | Plain galvanized | 53,430 | 53,510 | 92,251 | 10,418 | 3,630 | |
| Tubes, pipes, &c.— | |||||||
| 433 | Cast over 9 in. diam. | 12,301 | 2,957 | 492 | 130 | 874 | |
| 434 | Cast under 9in.dlam. | 27,916 | 15,086 | 21,149 | 3,603 | 2,898 | |
| 435 | Wrought over 6 in. diam. | 8,235 | 7,250 | 560 | 408 | 326 | |
| 436 | Wrought under 6 in. diam. | 162,804 | 161,164 | 153,626 | 66,039 | 84,231 | |
| Lamps, &c.— | |||||||
| 439 | Gas-mantles | 6,131 | 6,774 | 16,819 | 9,880 | 12,747 | |
| 441 | Other | 25,075 | 20,247 | 17,366 | 12,953 | 12,273 | |
| 443 | Lead, sheet | 10,182 | 2,031 | 2,395 | 199 | 180 | |
| Meters— | |||||||
| 447 | Electricity, household supply | 9,691 | 8,883 | 11,564 | 5,469 | 6,959 | |
| 448 | Gas, household supply | 17,920 | 19,882 | 13,689 | 9,279 | 917 | |
| 450 | Water | 6,244 | 8,920 | 2,670 | 187 | 789 | |
| 455 | Nails, other | 20,936 | 19,657 | 15,135 | 6,491 | 2,941 | |
| XIVB | 456 | Plate and plated ware | 87,749 | 41,694 | 71,402 | 42,392 | 24,350 |
| 458 | Printing-materials—Type and materials n.o.e. | 7,927 | 6,128 | 5,629 | 3,239 | 2,248 | |
| Railway and tramway plant— | |||||||
| 461 | Rails, &c. | 104,156 | 183,789 | 18,910 | 3,153 | 6,403 | |
| 462 | Wagons, cars, &c. | 8,943 | 2,691 | 1,527 | 550 | 536 | |
| 463 | Other | 34,707 | 56,096 | 51,663 | 8,901 | 6,680 | |
| 464 | Refrigerating-apparatus | 4,726 | 5,978 | 17,374 | 3,872 | 4,623 | |
| 465 | Rivets and washers | 10,176 | 10,485 | 15,927 | 6,848 | 5,893 | |
| 469 | Stoves and ranges, gas | 5,588 | 2,803 | 4,679 | 4,233 | 3,723 | |
| 472 | Tanks and cisterns | 17,089 | 13,589 | 16,592 | 7,970 | 3,894 | |
| 473 | Telephones and accessories | 11,793 | 26,412 | 16,391 | 6,850 | 7,466 | |
| 474 | Tinned sheets and plates, plain | 75,536 | 81,907 | 151,097 | 98,226 | 139,507 | |
| 476 | Tinware, other | 18,074 | 21,531 | 22,879 | 23,779 | 16,191 | |
| 481 | Spades, shovels, and forks | 11,794 | 6,563 | 9,415 | 6,260 | 4,106 | |
| 482 | Tools and implements, other | 54,846 | 38,296 | 43,389 | 32,056 | 19,032 | |
| Wire— | |||||||
| 484 | Bare copper | 21,495 | 23,530 | 14,308 | 2,003 | 1,870 | |
| Iron— | |||||||
| 485 | Fencing, barbed | 22,707 | 13,153 | .. | 48 | .. | |
| 486 | Fencing, plain | 66,704 | 40,167 | 42,511 | 7,029 | 93 | |
| 487 | Telegraphic and telephonic | 4,747 | 8,554 | 1,368 | .. | 272 | |
| 488 | N.o.e. | 5,482 | 4,105 | 6,392 | 2,332 | 887 | |
| 489 | Netting | 56,182 | 27,148 | 13,212 | 810 | 72 | |
| 490 | Wove, &c. | 3,557 | 6,485 | 4,407 | 1,752 | 741 | |
| 491 | Other, plain | 9,929 | 7,908 | 4,976 | 3,137 | 613 | |
| Metal manufactures, other— | |||||||
| 494 | Free | 15,929 | 16,879 | 31,816 | 11,377 | 7,406 | |
| 495 | 20 per cent. | 115,141 | 73,130 | 94,167 | 47,375 | 46,441 | |
| Machinery— | |||||||
| XV | 511 | Agricultural, other | 37,898 | 30,719 | 39,315 | 26,416 | 23,268 |
| 517 | Dairying—Cream-separators | 8,139 | 7,124 | 3,443 | 384 | 710 | |
| Electrical— | |||||||
| 524 | Electric batteries and cells | 3,937 | 4,516 | 9,955 | 8,180 | 1,019 | |
| 525 | Generators, motors, and transformers, &c. | 59,122 | 43,428 | 44,253 | 35,931 | 19,998 | |
| 526 | Insulated cable and wire | 111,045 | 90,032 | 139,606 | 51,065 | 12,045 | |
| 527 | Lamps, &c. | 22,021 | 23,769 | 32,060 | 24,894 | 15,827 | |
| 528 | Materials, &c. | 6,080 | 4,802 | 7,083 | 2,055 | 2,222 | |
| 529 | N.o.e. | 65,077 | 66,107 | 76,168 | 51,627 | 20,005 | |
| Engines— | |||||||
| 531 | Gas, &c., for motorcars | 63,012 | 34,814 | 95 | 1,956 | 404 | |
| 532 | Gas, &c., other | 67,755 | 41,089 | 40,076 | 30,179 | 12,941 | |
| 533 | Portable and traction | 15,804 | 2,160 | 1,449 | .. | .. | |
| 535 | Steam n.o.e., 1,000 i.h.p. and under | 10,809 | 8,244 | 10,456 | 4,928 | 8,030 | |
| 536 | Boilers for, over 500 i.h.p. | 5,725 | .. | .. | .. | 4,991 | |
| 537 | Boilers for, 500 i.h.p. and under | 3,416 | 13,389 | 9,698 | 4,183 | 4,147 | |
| 553 | Mining, unenumerated | 16,187 | 9,170 | 9,484 | 5,749 | 3,834 | |
| 557 | Printing — Printing machines and presses | 18,750 | 18,147 | 10,744 | 854 | 1,988 | |
| 559 | Road rollers and graders | 7,157 | 5,697 | 5,641 | 628 | .. | |
| XV | 560 | Sewing-machines | 6,597 | 13,160 | 30,362 | 30,061 | 17,989 |
| 561 | Tools — Engineers', machine and hand | 32,724 | 16,827 | 11,262 | 6,502 | 6,400 | |
| 562 | Typewriters | 5,504 | 4,397 | 3,645 | 950 | 29 | |
| 567 | Woollen-mill, unenumerated | 7,876 | 3,306 | 6,095 | 6,035 | 6,556 | |
| 569 | Unenumerated (5 per cent.) | 5,493 | 3,741 | 1,569 | 2,244 | 1,118 | |
| 570 | N.o.e. (20 per cent.) | 67,370 | 58,222 | 50,854 | 28,807 | 32,629 | |
| 571 | Materials for and parts of (dutiable)* | 4,869 | 2,666 | 24,018 | 9,111 | 7,917 | |
| 572 | Materials for parts of (free)* | 27,151 | 19,919 | 7,366 | 5,514 | 4,157 | |
| XVIA | 573 | Indiarubber hose, tubing, and piping | 11,344 | 11,481 | 10,436 | 9,839 | 7,555 |
| XVIB | 579 | Belting, other than leather | 26,862 | 22,091 | 38,153 | 38,554 | 47,296 |
| Leather— | |||||||
| 585 | Goat and kid skins | 7,669 | 9,328 | 18,556 | 9,444 | 909 | |
| 592 | Sole, pump, and skirt leather | 38,259 | 3,903 | 5,411 | 644 | 797 | |
| 597 | Portmanteaux, trunks, and carpet-bags | 9,840 | 4,082 | 5,403 | 2,968 | 1,320 | |
| Saddlery and harness— | |||||||
| 598 | Collar-check | 13,652 | 12,561 | 19,285 | 17,107 | 9,581 | |
| 600 | Saddlers' ironmongery | 15,634 | 11,437 | 18,232 | 16,531 | 15,541 | |
| 602 | N.o.e. (including whips) | 18,889 | 7,594 | 12,495 | 9,487 | 9,518 | |
| 603 | Unenumerated manufactures of leather | 4,798 | 6,312 | 7,506 | 5,986 | 4,146 | |
| Furniture— | |||||||
| XVIIB | 651 | Materials for — Blind webbing and tape, &c. | 7,840 | 5,950 | 10,747 | 8,661 | 8,119 |
| 653 | Unenumerated | 10,382 | 5,125 | 4,123 | 1,557 | 646 | |
| 661 | Woodenware and turnery n.o.e. | 11,807 | 12,302 | 6,749 | 6,080 | 1,608 | |
| XVIII | 666 | Cement, building, Portland, and other structural | 19,252 | 5,407 | 1,183 | 763 | 379 |
| 667 | China, porcelain, and Parian ware | 28,957 | 21,981 | 39,604 | 17,271 | 14,141 | |
| 669 | Earthenware n.o.e. | 75,275 | 63,662 | 93,672 | 60,890 | 36,412 | |
| Glass— | |||||||
| 671 | Bottles, plain, empty | 25,391 | 21,354 | 12,029 | 7,252 | 4,404 | |
| 673 | Crown, sheet and common window | 13,476 | 24,462 | 22,810 | 14,802 | 9,348 | |
| 674 | Glassware n.o.e. | 12,034 | 10,832 | 12,489 | 6,553 | 3,786 | |
| 676 | Mirrors and looking-glasses | 5,971 | 3,909 | 5,448 | 3,425 | 1,492 | |
| 678 | Plate, other | 12,625 | 16,253 | 14,969 | 9,869 | 11,861 | |
| 679 | Unenumerated | 6,430 | 5,601 | 5,605 | 3,984 | 4,254 | |
| 682 | Tiles n.o.e.—Flooring, wall, hearth, and garden | 10,771 | 7,129 | 13,360 | 5,925 | 9,252 | |
| XIXA | 685 | Paper bags n.o.e. | 8,934 | 6,304 | 8,215 | 5,348 | 2,254 |
| 686 | Bookbinders' materials | 7,948 | 6,626 | 8,512 | 3,539 | 4,900 | |
| 689 | Cardboard boxes, materials for, other | 9,877 | 13,388 | 20,174 | 8,242 | 9,186 | |
| 692 | Paperhangings | 34,750 | 22,411 | 34,814 | 20,004 | 19,469 | |
| Paper— | |||||||
| 693 | Printing | 99,995 | 92,990 | 165,334 | 78,036 | 58,634 | |
| 694 | Wrapping | 5,934 | 4,576 | 5,465 | 2,220 | 1,665 | |
| 695 | Writing | 49,331 | 51,154 | 110,432 | 39,666 | 34,923 | |
| XIXB | 697 | Artists' materials | 5,887 | 6,201 | 6,156 | 5,024 | 6,209 |
| 698 | Books, papers, and music, printed, n.o.e. | 179,957 | 162,824 | 176,723 | 152,244 | 218,421 | |
| 699 | Calendars and showcards | 10,710 | 8,624 | 7,982 | 4,867 | 3,278 | |
| 703 | Handbills, circulars, &c. | 14,303 | 11,302 | 11,968 | 8,755 | 6,664 | |
| 704 | Inks, printing | 5,548 | 4,847 | 8,545 | 3,332 | 2,007 | |
| 706 | Stationery, manufactured | 50,049 | 42,349 | 49,089 | 26,766 | 43,744 | |
| XIXB | 709 | Pictures, paintings, &c., n.o.e. | 6,705 | 3,303 | 4,690 | 4,053 | 2,766 |
| XX | 711 | Stationery n.o.e. | 58,262 | 53,647 | 89,792 | 51,175 | 38,661 |
| 712 | Fancy goods and toys | 118,000 | 86,203 | 112,222 | 69,932 | 47,641 | |
| 714 | Jewellery — Precious stones, cut, unmounted | 14,435 | 15,654 | 22,850 | 12,377 | 11,409 | |
| 715 | Jewellery, other | 52,318 | 37,501 | 50,511 | 38,794 | 28,061 | |
| 716 | Sporting, gaming, and athletic requisites n.o.e. | 31,655 | 26,963 | 12,993 | 10,885 | 12,209 | |
| Timepieces— | |||||||
| 717 | Clocks | 6,254 | 1,677 | 2,430 | 230 | 1,114 | |
| 719 | Watches | 45,337 | 52,941 | 18,320 | 9,732 | 697 | |
| 721 | Tobacco-pipes, cigarette-cases, &c. | 29,366 | 29,207 | 31,664 | 32,639 | 13,164 | |
| 725 | Cinematograph, &c., films | 13,465 | 15,759 | 24,050 | 7,489 | 4,271 | |
| XXI | 728 | Microscopes and telescopes | 9,171 | 4,369 | 4,214 | 2,546 | 1,456 |
| Photographic materials and goods— | |||||||
| 729 | Cameras and lenses | 8,390 | 4,783 | 4,305 | 2,355 | 1,369 | |
| 730 | Sensitized surfaces, &c. | 19,771 | 14,147 | 26,102 | 17,747 | 21,095 | |
| Instruments— | |||||||
| 732 | Scientific n.o.e. | 5,989 | 4,207 | 5,250 | 2,677 | 3,163 | |
| 733 | Surgical and dental | 24,358 | 21,084 | 30,261 | 18,918 | 33,063 | |
| XXII | 736 | Acid, boracic | 3,156 | 2,394 | 4,115 | 5,436 | 5,442 |
| XXIIA | 741 | Tartaric acid | 3,774 | 10,653 | 18,665 | 8,816 | 8,227 |
| 747 | Borax | 4,646 | 3,221 | 6,349 | 5,240 | 6,354 | |
| 750 | Chemicals and chemical preparations n.o.e. | 4,822 | 6,947 | 9,967 | 6,635 | 8,049 | |
| 751 | Cream of tartar | 1,685 | 19,506 | 14,543 | 16,709 | 3,917 | |
| 752 | Cyanide of potassium and sodium | 40,270 | 42,503 | 44,152 | 34,462 | 33,150 | |
| 753 | Dyes | 3,955 | 10,591 | 28,380 | 19,512 | 28,299 | |
| 757 | Disinfectants | 14,568 | 16,491 | 25,327 | 15,508 | 15,840 | |
| 759 | Insecticides and tree-washes n.o.e. | 6,434 | 4,486 | 8,053 | 2,883 | 2,678 | |
| 761 | Sheep-dip | 43,270 | 31,074 | 59,426 | 54,541 | 65,562 | |
| 765 | Medicinal preparations n.o.e. | 100,222 | 83,080 | 129,289 | 94,807 | 117,140 | |
| 768 | Oils, essential, other | 6,298 | 7,255 | 7,851 | 5,996 | 3,970 | |
| 772 | Perfumery — Toilet preparations | 20,638 | 23,885 | 24,796 | 18,265 | 16,119 | |
| Soda— | |||||||
| 780 | Ash | 6,676 | 6,746 | 8,239 | 8,827 | 18,861 | |
| 781 | Bicarbonate and carbonate | 7,083 | 5,569 | 11,848 | 2,284 | 11,446 | |
| 782 | Caustic | 13,219 | 9,855 | 18,221 | 7,364 | 22,705 | |
| XXII | 785 | Silicate | 2,838 | 3,348 | 2,612 | 3,145 | 6,208 |
| 791 | Drugs, other (free) | 4,283 | 7,054 | 7,753 | 4,155 | 6,481 | |
| XXIIB | 798 | Basic slag and Thomas's phosphate | 67,817 | 40,113 | 21,359 | 195 | .. |
| 803 | Superphosphates | 48,954 | 20,580 | 1,444 | .. | 16 | |
| Arms, &c.— | |||||||
| XXIII | 811 | Accoutrements | 3,460 | 9,168 | 2,504 | 2,288 | |
| 815 | Cartridges, shot, 10-24 bore | 24,926 | 18,290 | 19,450 | 7,895 | 220 | |
| 816 | Cartridges n.o.e. | 1,034 | 489 | 240 | 23,188 | 31 | |
| 818 | Detonators | 1,707 | 6,873 | 3,929 | 4,424 | 4,676 | |
| 822 | Firearms for New Zealand Government (not ordnance stores) | 9,164 | 375 | .. | .. | .. | |
| XXIII | 824 | Firearms, other | 8,609 | 4,327 | 3,041 | 27,011 | 2,249 |
| 831 | Gelignite | 46,412 | 37,996 | 36,589 | 18,244 | 36,004 | |
| 833 | Lithofracteur, cordite, &c. | 1,470 | 5,831 | 3,381 | 3,150 | 212 | |
| 834 | Ordnance stores | 13,653 | 635 | 11,762 | 15,287 | 9,303 | |
| 835 | Powder, blasting | 17,049 | 19,114 | 13,042 | 13,549 | 23,819 | |
| 838 | A. and M.S. | 19,608 | 22,328 | 23,824 | 26,440 | 16,403 | |
| XXIII | 839 | Asbestos sheets, slates, and tiles | 19,658 | 24,477 | 19,450 | 16,652 | 6,028 |
| 842 | Blue, laundry | 8,999 | 9,855 | 11,400 | 10,462 | 8,984 | |
| 847 | Brushes, brushware, and brooms | 36,948 | 23,207 | 27,864 | 23,477 | 12,571 | |
| 848 | Brushmakers' materials | 10,804 | 7,298 | 11,347 | 7,475 | 5,582 | |
| 849 | Candles | 23,806 | 19,129 | 24,138 | 5,802 | 5,798 | |
| 850 | Combs, hair and toilet | 2,110 | 2,950 | 5,550 | 3,380 | 1,165 | |
| 853 | Educational apparatus | 5,661 | 4,078 | 6,648 | 4,696 | 2,394 | |
| Instruments, musical— | |||||||
| 859 | Pianos | 61,325 | 77,948 | 90,747 | 55,688 | 32,035 | |
| 860 | Pianolas, phonographs, &c. | 9,456 | 5,320 | 8,004 | 4,742 | 3,733 | |
| 861 | Records (pianolas, &c.) | 7,966 | 5,527 | 11,921 | 8,641 | 13,292 | |
| 862 | Other | 8,980 | 9,638 | 9,071 | 5,046 | 3,286 | |
| Matches and vestas— | |||||||
| 863 | Wax | 22,257 | 13,735 | 16,150 | 12,915 | 5,169 | |
| 864 | Wooden | 7,013 | 7,368 | 8,141 | 446 | .. | |
| 867 | Engine-packing | 11,587 | 11,657 | 15,478 | 10,020 | 11,753 | |
| Polishes- | |||||||
| 870 | Blacking | 5,723 | 3,014 | 6,143 | 702 | 395 | |
| 871 | Blacklead | 5,343 | 10,275 | 8,946 | 7,161 | 5,461 | |
| 872 | Metal-polishes | 5,169 | 4,389 | 6,741 | 3,811 | 463 | |
| 873 | Furniture, knife, and plate powder and polish | 3,980 | 3,000 | 8,779 | 2,748 | 3,417 | |
| Soap— | |||||||
| 876 | Powder, &c. | 15,689 | 16,999 | 13,581 | 9,887 | 5,232 | |
| 877 | Unenumerated | 23,704 | 19,125 | 33,399 | 22,930 | 23,484 | |
| 882 | Bicycles and tricycles | 13,760 | 11,690 | 20,827 | 9,199 | 9,139 | |
| 883 | Rubber tires for | 14,327 | 21,360 | 22,786 | 16,389 | 17,006 | |
| 884 | Other materials (free)* | 4,912 | 12,202 | 2,812 | 1,393 | 1,287 | |
| 885 | N.o.e.* | 4,190 | 13,688 | 35,217 | 16,674 | 14,743 | |
| 886 | Motor bicycles and tricycles | 40,565 | 33,841 | 55,984 | 17,785 | 6,757 | |
| 887 | Rubber tires, covers for | 28,900 | 20,291 | 19,988 | 10,438 | 7,702 | |
| 888 | Other materials (free)* | 21,465 | 1,662 | 24 | 45 | .. | |
| 889 | Other* | 18,569 | 1,084 | 7,824 | 4,228 | 2,463 | |
| Motor vehicles— | |||||||
| 893 | Bodies for | 66,613 | 44,364 | 70,237 | 22,947 | 7,686 | |
| 894 | Chassis for | 281,551 | 163,048 | 102 | .. | .. | |
| 895 | Materials for* | 108,846 | 144,234 | 225,519 | 115,407 | 84,196 | |
| Vehicles— | |||||||
| 899 | Axles, axle-arms, &c. | 9,500 | 6,631 | 7,683 | 4,834 | 5,243 | |
| 900 | Springs, &c. | 21,628 | 21,559 | 9,910 | 7,133 | 4,618 | |
| 902 | Miscellaneous (manufactured) | 11,126 | 14,950 | 20,663 | 14,208 | 13,218 | |
| 903 | Miscellaneous (unmanufactured) | 4,083 | 5,812 | 2,413 | 1,079 | 373 | |
| Burma. | |||||||
| II | 96 | Rice, dressed | 1,831 | 954 | 4,922 | 5,144 | 14,774 |
| Wax— | |||||||
| X | 343 | Paraffin | 9,468 | 8,137 | 24,947 | 28,318 | 61,218 |
| XXIII | 849 | Candles | 16,297 | 18,182 | 10,596 | 2,819 | 11,506 |
| Ceylon. | |||||||
| II | 47 | Coconut, desiccated | 9,347 | 7,113 | 8,968 | 7,890 | 7,300 |
| III | 139 | Cocoa-beans, uncrushed | 6,571 | 6,810 | 12,755 | 7,751 | 8,864 |
| 149 | Tea, in bulk | 372,795 | 388,742 | 338,515 | 333,950 | 297,947 | |
| Hong Kong. | |||||||
| II | 103 | Jams, jellies, and preserves | 7,516 | 4,324 | 7,277 | 8,277 | 12,654 |
| IXB | 283 | Other silks, satins, &c. | 3,272 | 6,357 | 9,948 | 2,767 | 3 |
| India. | |||||||
| £ | £ | £ | £ | £ | |||
| III | 143 | Coffee, raw | 3,246 | 5,394 | 5,084 | 4,567 | 8,588 |
| 149 | Tea, in bulk | 24,679 | 38,952 | 28,739 | 39,144 | 48,100 | |
| IXB | 266 | Carpets and carpeting, &c. | 1,747 | 4,110 | 6,344 | 3,812 | 4,438 |
| Bagging and sacking— | |||||||
| 272 | Hessian and jute | 43,307 | 43,076 | 45,292 | 36,634 | 9,606 | |
| 279 | Hessians and scrim | 11,080 | 18,606 | 33,719 | 56,994 | 55,026 | |
| Bags and sacks— | |||||||
| IXC | 294 | Corn-sacks | 183,170 | 189,164 | 177,366 | 164,602 | 204,972 |
| 295 | Jute and hessian n.o.e. | 30,595 | 46,817 | 49,740 | 48,767 | 48,026 | |
| 296 | Woolpacks | 75,691 | 81,444 | 101,640 | 112,648 | 119,880 | |
| 309 | Other | .. | .. | 234 | 3,602 | 7,605 | |
| Oils, vegetable— | |||||||
| X | 329 | Castor | 21,183 | 27,864 | 21,781 | 16,937 | 23,020 |
| 332 | Linseed | 7,088 | 6,749 | 16,759 | 11,051 | 113,886 | |
| XII | 358 | Coal, cargo | 39,184 | .. | .. | 13,196 | .. |
| 391 | Pig iron | 2,749 | 7,166 | 9,336 | 30,590 | .. | |
| XXIIB | 800 | Manures—Bonedust | 16,140 | 29,046 | 47,601 | 43,383 | 12,789 |
| Straits Settlements. | |||||||
| II | 59 | Fruits, bottled and preserved | 7,323 | 9,964 | 11,110 | 11,175 | 15,096 |
| 119 | Sago and tapioca | 17,422 | 16,525 | 22,474 | 29,434 | 32,530 | |
| 124 | Spices n.o.e., unground | 14,266 | 12,067 | 15,067 | 15,401 | 20,131 | |
| XXIIB | 802 | Manures — Guano and rock phosphates | 13,257 | 1,260 | .. | .. | .. |
| Seychelles. | |||||||
| XXIIB | 802 | Manures — Guano and rock phosphates | 13,298 | 13,730 | .. | .. | .. |
| South African Union. | |||||||
| II | 80 | Maize | 723 | 7,158 | 973 | .. | .. |
| IV | 154 | Spirits — Beverages: brandy | 4 | .. | 34,627 | 1,997 | 7,706 |
| 167 | Wine—Still | 5,324 | 6,589 | 11,015 | 8,054 | 10,214 | |
| V | 171 | Tobacco, cut, manufactured | 2,192 | 5,436 | 5,459 | 748 | 813 |
| VIII | 229 | Tanning-bark | 264 | 5,375 | 5,936 | 12,139 | 15,146 |
| XII | 358 | Coal, cargo | 23,018 | .. | .. | 2,809 | .. |
| XX | 714 | Jewellery, precious stones, unmounted | .. | 329 | 4,765 | 15,157 | 60,395 |
| XXIII | 831 | Gelignite | .. | 13,200 | 6,600 | .. | .. |
| Canada. | |||||||
| I | 11 | Fish, preserved | 36,546 | 40,267 | 43,742 | 56,118 | 98,535 |
| II | 67 | Fruits, fresh—Apples | 6,875 | 8,946 | 11,963 | 17,750 | 4,029 |
| 83 | Wheat | 1 | 139,153 | .. | .. | .. | |
| 87 | Flour, wheaten | 359 | 31,539 | 2,223 | .. | .. | |
| IV | 158 | Whisky | 753 | 733 | 3,004 | 7,322 | 84,894 |
| VIII | 209 | Cork, cut | .. | .. | 1 | .. | 9,777 |
| 223 | Seeds, grass and clover | 9,694 | 11,637 | 6,657 | 44,109 | 11,814 | |
| 231 | Wood-pulp | .. | 95 | .. | .. | 6,484 | |
| IXA | 234 | Apparel and ready-made clothing n.o.e. | 6,754 | 8,605 | 8,898 | 28,421 | 21,667 |
| 239 | Goloshes and overshoes, &c. | 4,674 | 3,636 | 3,988 | 5,128 | 11,406 | |
| 241 | Gum boots | 2,402 | 1,799 | 1,794 | 5,693 | 11,598 | |
| 245 | Corsets | 7,123 | 4,571 | 12,357 | 13,294 | 22,099 | |
| 249 | Haberdashery | .. | 489 | 1,963 | 1,871 | 6,807 | |
| IXB | 278 | Cotton piece-goods n.o.e. | 397 | 1,037 | 2,084 | 472 | 8,769 |
| Paints and colours— | |||||||
| XI | 348 | Ground in oil | .. | 2 | 29 | 1,485 | 12,042 |
| 350 | Other | 190 | 320 | 1,424 | 2,335 | 6,105 | |
| XIVA | 388 | Iron and steel—Bar, bolt, and rod | .. | 16,594 | 55,878 | 19,260 | 4,281 |
| 418 | Fencing-staples | 2,566 | 2,584 | 5,822 | 5,052 | 3,005 | |
| 422 | Hardware, &c. | 3,632 | 2,880 | 6,115 | 8,566 | 5,638 | |
| XIVB | 431 | Iron and steel, plain, black | .. | .. | 39 | 1,547 | 12,135 |
| 436 | Iron pipes, wrought, under 6 in. diam. | 20,063 | 80,233 | 49,257 | 14,286 | 24,992 | |
| Nails— | |||||||
| 452 | Horse-shoe | .. | .. | .. | 235 | 5,505 | |
| 455 | Other | 4,411 | 13,442 | 48,943 | 30,192 | 16,242 | |
| Iron wire, fencing— | |||||||
| 485 | Barbed | 5,257 | 1,687 | 3,853 | 5,946 | 2,646 | |
| 486 | Plain | 13,264 | 1,948 | 28,710 | 26,503 | 15,253 | |
| 487 | Telegraphic, &c. | .. | .. | .. | 8,318 | 10,781 | |
| 488 | N.o.e. | .. | 2,338 | 6,874 | 2,771 | 1,760 | |
| Machinery, agricultural— | |||||||
| XV | 499 | Drills and sowers | 15,097 | 2,962 | 2,019 | 4,957 | 3,172 |
| 507 | Reapers and binders | 2,103 | 8,097 | 13,324 | 7,888 | 9,422 | |
| 511 | Parts of | 7,504 | 5,701 | 5,248 | 6,743 | 6,613 | |
| 587 | Hide-leathers, undressed | 2,431 | 9,036 | 2,388 | 2,037 | .. | |
| XVIB | 589 | Leather, japanned, &c. | 39 | 351 | 2,831 | 18,875 | 10,144 |
| 592 | Sole leather, &c. | 2,799 | 9,618 | 9,146 | 11,984 | 8,056 | |
| 653 | Furniture, &c., n.o.e. | 4,444 | 6,638 | 4,982 | 3,117 | 50 | |
| XIXA | 692 | Paperhangings | 5,443 | 5,050 | 7,792 | 5,386 | 6,793 |
| Paper— | |||||||
| 693 | Printing | 122,889 | 149,238 | 119,046 | 174,596 | 190,810 | |
| 694 | Wrapping, unprinted | 4,606 | 12,522 | 9,447 | 10,420 | 10,479 | |
| 695 | Writing | 22 | ... | 582 | 1,514 | 5,002 | |
| Motor vehicles— | |||||||
| XXIII | 893 | Bodies for | 27,886 | 38,375 | 139,391 | 79,353 | 98,493 |
| 894 | Chassis for | 78,346 | 98,306 | .. | .. | .. | |
| 895 | Motor-car materials and parts* | 917 | 11,905 | 58,265 | 42,315 | 68,367 | |
| 900 | Vehicles—Springs, &c. | 7,413 | 2,632 | 828 | 524 | 623 | |
| 902 | Miscellaneous (manufactured) | .. | 71 | 114 | 4,469 | 7,262 | |
| Australia. | |||||||
| I | 4 | Cheese | .. | 648 | 3,764 | 5,672 | 5,782 |
| 11 | Fish, preserved, in tins | 954 | 514 | 1,337 | 10,859 | 95 | |
| 16 | Bacon | 13 | .. | .. | .. | 31,896 | |
| 40 | Milk and cream, preserved, &c. | 267 | 7,866 | 2,248 | 18,479 | 24,309 | |
| 41 | Provisions n.o.e. | 2,602 | 3,358 | 4,378 | 7,945 | 15,769 | |
| II | 44 | Biscuits, other | 762 | 497 | 966 | 2,445 | 5,102 |
| 46 | Cocoa-butter | 969 | 2,473 | 3,118 | 9,839 | 14,122 | |
| 48 | Chocolate confectionery | 25 | 2 | 2 | 232 | 6,690 | |
| 52 | Confectionery, unenumerated | 2,537 | 2,761 | 9,104 | 10,502 | 17,923 | |
| Foods for animals— | |||||||
| 54 | Chaff | 114 | 80 | 77 | 6,206 | 3,052 | |
| 58 | N.o.e. | 1,307 | 2,493 | 1,746 | 5,433 | 18,940 | |
| 59 | Fruits, bottled and preserved in syrup | 1,537 | 1,650 | 711 | 16,360 | 25,999 | |
| Fruits, dried— | |||||||
| 61 | Currants | 13,826 | 468 | 32,200 | 50,724 | 38,171 | |
| 62 | Dates | 862 | 125 | 664 | 5,081 | .. | |
| 65 | Raisins | 17,929 | 14,955 | 51,989 | 46,758 | 39,817 | |
| Fruits, fresh— | |||||||
| 67 | Apples | 7,821 | 572 | 4,161 | 96 | 2 | |
| 71 | Lemons | 6,458 | 5,040 | 3,319 | 2,744 | 5,597 | |
| 72 | Oranges | 10,546 | 12,740 | 11,624 | 17,196 | 19,848 | |
| 75 | Other | 14,909 | 20,532 | 23,089 | 16,934 | 28,226 | |
| Grain and pulse, unprepared— | |||||||
| 78 | Barley | .. | 9 | 26,434 | 28,028 | 38,649 | |
| 79 | Beans and peas | 1,105 | 1,692 | 2,315 | 8,304 | 14,974 | |
| 80 | Maize | 3,153 | 8,638 | 1,925 | 7,722 | 31,184 | |
| 81 | Oats | 3,383 | 3,151 | 43,023 | 84,099 | 30,103 | |
| 83 | Wheat | 24,841 | 23,288 | 15,357 | 213,638 | 404,535 | |
| 84 | Other | 3,046 | 1,300 | 2,261 | 6,869 | 2,854 | |
| Grain and pulse—contd. | £ | £ | £ | £ | £ | ||
| Prepared— | |||||||
| II | 87 | Flour, wheaten | 97,498 | 8,246 | 60,051 | 132,847 | 39,418 |
| 88 | Maizena and cornflour | 80 | 27 | 664 | 18,466 | 30,396 | |
| 95 | Pollard and sharps | 4,419 | .. | 9,058 | 218 | 1,992 | |
| 96 | Rice, dressed | 44,695 | 43,312 | 32,754 | 45,278 | 18,634 | |
| 98 | Rice-meal refuse | 7,645 | 11,700 | 9,263 | 9,709 | 12,147 | |
| 100 | N.o.e. | 1,128 | 651 | 1,252 | 1,855 | 5,304 | |
| 102 | Infants' and invalids' foods n.o.e. | 8,834 | 8,007 | 9,746 | 8,268 | 1,116 | |
| 105 | Macaroni and vermicelli | 3,588 | 4,910 | 4,406 | 5,886 | 8,023 | |
| 113 | Peel, candied, &c. | .. | .. | .. | 320 | 5,259 | |
| 119 | Sago and tapioca | 235 | 172 | 655 | 5,982 | 228 | |
| 122 | Salt, other | 8,487 | 25,561 | 45,641 | 19,928 | 146,976 | |
| 124 | Spices n.o.e., unground | 1,480 | 1,386 | 3,130 | 5,925 | 92 | |
| 125A | Sugar—Glucose | 466 | 1,404 | 2,470 | 9,003 | 31,260 | |
| 130 | Sugar, refined | 16,697 | 8,395 | 8,928 | 9,384 | 10,191 | |
| 134 | Onions | 12,043 | 10,578 | 17,009 | 23,884 | 17,869 | |
| 135 | Potatoes | 65 | 38 | 15,698 | 234 | 42,232 | |
| III | 140 | Cocoa fond chocolate | 770 | 509 | 1,696 | 6,838 | 11,644 |
| 142 | Coffee-essence | 11 | 7 | 2,451 | 2,381 | 5,709 | |
| 143 | Coffee, raw | 3,594 | 2,467 | 4,637 | 5,794 | 164 | |
| 149 | Tea, in bulk | 29,225 | 24,456 | 15,821 | 51,492 | .. | |
| Spirits —Beverages: | |||||||
| IV | 154 | Brandy | 2,060 | 1,085 | 3,133 | 2,351 | 10,389 |
| 156 | Rum | 243 | 364 | 1,876 | 2,680 | 25,059 | |
| 158 | Whisky | 7,310 | 20,158 | 16,750 | 25,759 | 109,204 | |
| 164 | Spirits of wine | 10,357 | 10,890 | 11,135 | 12,123 | 11,960 | |
| 167 | Wine, still | 32,856 | 32,289 | 32,792 | 37,775 | 26,179 | |
| Tobacco, manufactured— | |||||||
| V | 171 | Cut | 96,333 | 91,687 | 98,607 | 109,420 | 128,901 |
| 172 | Other | 63,572 | 55,619 | 55,467 | 46,833 | 53,402 | |
| VI | 176 | Horses, ordinary | 7,012 | 9,834 | 7,628 | 9,953 | 3,094 |
| 194 | Hides, cattle, undressed | 1,936 | 20,537 | 23,805 | 494 | 10,794 | |
| 198 | Hides, sheep, with wool | 4,958 | 17,124 | 434 | 17 | .. | |
| VII | 201 | Horns, hoofs, glue pieces | 55 | 1,739 | 7,919 | 4,913 | 7,747 |
| 204 | Wool, greasy | 20,650 | 7,987 | .. | .. | .. | |
| VIII | 209 | Cork, cut | 2,188 | 2,617 | 5,731 | 6,432 | 2,050 |
| 221 | Plants, trees, and shrubs | 10,472 | 12,439 | 10,971 | 6,338 | 2,364 | |
| Seeds— | |||||||
| 223 | Grass and clover | 3,325 | 6,100 | 15,733 | 12,169 | 16,926 | |
| 225 | Other | 2,629 | 1,639 | 3,516 | 5,697 | 5,929 | |
| Tanning-material, crude— | |||||||
| 229 | Bark | 27,195 | 28,020 | 27,863 | 28,852 | 31,421 | |
| 230 | Other | 3,829 | 4,817 | 10,899 | 4,883 | 3,943 | |
| IXA | 234 | Apparel and ready-made clothing n.o.e. | 15,889 | 19,238 | 15,859 | 21,998 | 23,000 |
| Boots and shoes— | |||||||
| 236 | Children's | 3 | 1 | 1,529 | 4,826 | 15,160 | |
| 240 | Grindery | 13,881 | 12,795 | 17,743 | 22,954 | 28,107 | |
| 244 | Other | 2,147 | 7,219 | 21,184 | 61,302 | 182,977 | |
| 251 | Hats and caps | .. | .. | 5,029 | 5,642 | 10,766 | |
| 252 | Hatmakers' materials | 137 | 187 | 131 | 575 | 5,473 | |
| 257 | Millinery—Feathers | 446 | 229 | 640 | 1,803 | 6,449 | |
| 258 | Minor articles n.o.e, for making up apparel | 117 | 1,103 | 6,153 | 1,969 | 1,470 | |
| 263 | Articles n.o.e. partly or wholly made up from textiles | 580 | 2,670 | 8,336 | 6,461 | 219 | |
| 267 | Drapery n.o.e. | 4,682 | 8,108 | 6,526 | 6,281 | 1,733 | |
| 277 | Tubular woven cotton-cloth, for meat-wraps | 4,138 | 5,770 | 9,635 | 572 | .. | |
| IXB | 278 | Cotton piece-goods n.o.e. | 19,037 | 30,185 | 30,656 | 32,186 | 8,450 |
| 281 | Linen piece-goods | 1,574 | 3,284 | 5,356 | 1,921 | .. | |
| 283 | Other silks, satins, &c. | 4,401 | 4,638 | 6,403 | 17,151 | 115 | |
| 286 | Woollen piece-goods n.o.e. | 11,215 | 15,553 | 11,423 | 12,043 | 739 | |
| 295 | Bags and sacks, jute and hessian | 4,276 | 13,121 | 5,094 | 2,517 | 296 | |
| 300 | Cordage and rope—Iron and steel | 2,832 | 4,166 | 7,514 | 903 | 223 | |
| X | 321 | Petroleum, crude, &c. | 3,567 | 5,632 | 2,819 | 2,840 | 7,644 |
| Oils— | |||||||
| 325 | Mineral, lubricating | 11,169 | 10,063 | 23,596 | 26,603 | 9,911 | |
| 332 | Vegetable, linseed | 9 | 931 | 7,015 | 13,556 | 12,055 | |
| 339 | Stearine | 3,167 | 13,673 | 16,567 | 18,140 | 16,932 | |
| Paints, &c.— | |||||||
| XI | 348 | Ground in oil | .. | .. | 54 | 12,858 | 22,341 |
| 350 | Other | 197 | 352 | 412 | 1,824 | 33,181 | |
| 351 | Unenumerated | 397 | 318 | 352 | 1,892 | 6,600 | |
| 354 | Varnishes, &c. | 367 | 582 | 1,412 | 1,748 | 10,238 | |
| XII | 356 | Charcoal | 4,288 | 2,255 | 1,102 | 1,149 | 8,882 |
| 358 | Coal, cargo | 459,243 | 338,131 | 189,526 | 189,798 | 202,102 | |
| Specie— | |||||||
| XIII | 374 | Gold | 653,000 | 797,000 | 1,023,000 | * | * |
| 375 | Silver | 27,100 | 10,000 | .. | 2,983 | .. | |
| XIVA | 381 | Copper—Angle, strip, tee, &c. | 13,266 | 14,462 | 5,632 | 1,542 | 2,880 |
| 388 | Iron and steel—Bar, bolt, and rod | 5,987 | 8,622 | 20,291 | 13,839 | 12,746 | |
| 391 | Pig iron | 4,363 | 14,035 | 6,494 | 7,889 | 8,145 | |
| 393 | Lead—Pig and bar | 21,458 | 16,033 | 19,690 | 14,929 | 15,013 | |
| 402 | Tin—Ingot, pig, bar, &c. | 27,896 | 22,622 | 27,850 | 34,909 | 74,995 | |
| XIVB | 408 | Bolts and nuts | 115 | 262 | 342 | 4,129 | 7,934 |
| 410 | Brass—Plate and sheet, plain | 1,140 | 4,934 | 12,633 | 35,025 | 22,761 | |
| 422 | Hardware, hollow-ware, and ironmongery | 10,975 | 9,373 | 14,766 | 12,235 | 15,463 | |
| Tubes, pipes, and fittings— | |||||||
| 434 | Cast, 9in. and under in internal diameter | 880 | 1,564 | 5,428 | 8,498 | 5,547 | |
| 436 | Wrought, under 6 in. | 5,392 | 11,289 | 15,081 | 7,167 | 1,730 | |
| 443 | Sheet lead | 17,693 | 14,054 | 14,933 | 13,732 | 12,370 | |
| 455 | Nails, other | 244 | 414 | 7,061 | 1,878 | 1,064 | |
| Railway and tramway plant, n.o.e.— | |||||||
| 461 | Rails | 2,429 | 3,355 | 5,917 | 5,646 | 5,604 | |
| 463 | Other | 3,804 | 4,479 | 8,082 | 11,545 | 18,171 | |
| Tinned sheets and plates— | |||||||
| 474 | Plain | 1,050 | 9,452 | 15,864 | 7,984 | 654 | |
| 475 | Tinsmiths' furniture | 138 | 367 | 8,055 | 56 | 274 | |
| Wire— | |||||||
| 486 | Fencing, plain | 55 | 1,258 | 6,596 | 2,807 | .. | |
| 489 | Netting | 351 | 9,874 | 8,568 | 3,596 | 926 | |
| Metal manufactures, other— | |||||||
| 494 | Free | 7,806 | 8,306 | 5,053 | 8,798 | 2,739 | |
| 495 | 20 per cent. | 14,517 | 14,979 | 26,806 | 27,370 | 34,392 | |
| Machinery: Agricultural- | |||||||
| 511 | Other, and parts of | 4,850 | 6,843 | 5,522 | 8,053 | 11,267 | |
| Machines— | |||||||
| XV | 522 | Dairying, other | 12,838 | 11,939 | 22,046 | 19,288 | 25,628 |
| Electrical— | |||||||
| 525 | Generators, motors, and transformers | 4,352 | 4,801 | 7,144 | 9,814 | 1,086 | |
| 526 | Insulated cable and wire | 9,180 | 13,341 | 17,277 | 8,592 | 572 | |
| 529 | N.o.e. | 10,471 | 7,708 | 9,233 | 10,591 | 3,520 | |
| 532 | Engines—Gas, oil, and hot-air, other | 2,725 | 2,648 | 5,132 | 3,418 | 6,106 | |
| 560 | Sewing-machines | 4,619 | 9,363 | 9,294 | 18,495 | 4,578 | |
| 561 | Tools, engineers', &c., machine and hand | 7,608 | 10,859 | 11,124 | 7,062 | 6,455 | |
| 562 | Typewriters | 6,842 | 3,748 | 5,076 | 2,557 | 153 | |
| 570 | Machines n.o.e. (20 per cent.) | 14,065 | 8,795 | 21,276 | 13,600 | 10,767 | |
| 572 | Materials for and parts of (free)* | 5,536 | 4,600 | 4,962 | 7,918 | 1,589 | |
| Indiarubber— | |||||||
| XVIA | 573 | Hose, tubing, &c. | 19,997 | 19,724 | 18,261 | 19,536 | 30,053 |
| 575 | Other (free) | 7,045 | 8,594 | 8,700 | 7,129 | 14,544 | |
| XVIB | 577 | Leather, and manufactures of | 1,148 | 2,027 | 2,362 | 5,013 | 5,902 |
| Leather— | |||||||
| 579 | Belting, other | 1,046 | 993 | 1,887 | 2,759 | 6,188 | |
| 580 | Belt, harness, &c. | 5,195 | 6,560 | 4,493 | 4,817 | 6,545 | |
| 581 | Calf-skins, whole | 2,993 | 9,830 | 12,350 | 11,972 | 8,046 | |
| 585 | Goat and kid skins | 15,188 | 15,837 | 36,268 | 63,859 | 43,458 | |
| 587 | Hide, undressed | 801 | 6,146 | 899 | 708 | 2,999 | |
| 588 | Hide, dressed | 3,610 | 6,732 | 7,223 | 5,570 | 7,895 | |
| 589 | Japanned and enamelled | 3,264 | 7,728 | 8,578 | 13,469 | 3,678 | |
| 591 | Sheep-skins, lamb-skins | 1,346 | 2,571 | 2,179 | 11,221 | 11,343 | |
| 592 | Sole | 1,397 | 8,542 | 993 | 3,794 | 18,056 | |
| 603 | Unenumerated | 1,478 | 990 | 1,342 | 3,377 | 8,074 | |
| Timber— | |||||||
| Logs, hewn— | |||||||
| XVIIA | 613 | Ironbark | 57,532 | 56,380 | 22,386 | 27,863 | 18,505 |
| 614 | Jarrah | 34,588 | 21,310 | 137 | 2,049 | 5,904 | |
| 617 | Other | 16,525 | 32,893 | 13,850 | 25,142 | 13,821 | |
| 618 | Logs, round—Ironbark | 20,337 | 13,721 | 9,455 | 7,528 | 5,624 | |
| 625 | Palings, split | 5,113 | 3,593 | 3,191 | 1,867 | 1,192 | |
| Sawn, n.o.e., rough— | |||||||
| 633 | Ironbark | 19,445 | 15,275 | 5,779 | 4,782 | 5,776 | |
| 634 | Jarrah | 108,170 | 61,028 | 10,514 | 31,781 | 8,206 | |
| 639 | Other | 46,163 | 41,810 | 41,714 | 17,739 | 20,049 | |
| XVIIB | 646 | Carriage materials—Shafts &c., in the rough | 9,182 | 5,421 | 3,782 | 3,623 | 2,942 |
| 661 | Woodenware and turnery n.o.e. | 3,476 | 3,578 | 9,185 | 5,536 | 4,063 | |
| 671 | Glass and glassware — Bottles, plain, empty | 5,626 | 19,883 | 38,541 | 17,279 | 12,514 | |
| XIXA | 689 | Cardboard boxes, other | 378 | 372 | 2,229 | 3,539 | 7,661 |
| 698 | Books, papers, and music, printed, n.o.e. | 60,076 | 59,257 | 65,359 | 62,664 | 38,095 | |
| XIXB | 703 | Handbills, circulars, programmes, &c. | 7,482 | 7,359 | 9,735 | 13,100 | 6,880 |
| 706 | Stationery, manufactured, n.o.e. | 9,601 | 7,886 | 7,446 | 8,798 | 9,025 | |
| XX | 712 | Fancy goods and toys | 7,945 | 5,027 | 9,696 | 13,623 | 18,923 |
| 714 | Jewellery — Precious stones, unmounted | 42,578 | 22,851 | 35,044 | 57,513 | 10,871 | |
| 715 | Jewellery, other | 1,633 | 1,082 | 887 | 1,181 | 32,053 | |
| XXI | 725 | Cinematograph, &c., films | 22,321 | 28,158 | 57,606 | 66,863 | 3,119 |
| 730 | Sensitized surfaces, &c. | 7,519 | 9,200 | 11,453 | 12,972 | 35,008 | |
| 733 | Instruments, surgical and dental | 6,853 | 14,411 | 7,414 | 7,085 | 1,824 | |
| XXIIA | 740 | Acid, sulphuric | 8,776 | 6,472 | 6,645 | 5,383 | 5,466 |
| 753 | Dyes | 4,401 | 5,953 | 12,189 | 17,679 | 5,744 | |
| 755 | Glycerine, refined | 3,180 | 994 | 4,138 | 7,694 | 8,659 | |
| 757 | Disinfectants | 580 | 1,178 | 1,707 | 2,910 | 6,331 | |
| 758 | Insecticides and tree-washes — Denatured red oils | 2,769 | 3,183 | 5,243 | 6,979 | 6,767 | |
| 759 | Disinfectants | 1,082 | 1,574 | 3,308 | 3,212 | 7,879 | |
| 761 | Sheep-dip | 170 | 223 | 506 | 575 | 5,697 | |
| Liquefied and compressed gases— | |||||||
| 762 | Anhydrous ammonia | 10,302 | 11,229 | 19,783 | 26,760 | 17,663 | |
| 763 | Other | 8,102 | 9,799 | 11,706 | 14,248 | 21,794 | |
| 765 | Medicinal preparations n.o.e. | 79,008 | 77,079 | 85,772 | 92,444 | 54,383 | |
| 772 | Perfumery—Toilet preparations | 8,078 | 9,653 | 11,143 | 12,851 | 12,816 | |
| XXIIB | 792 | Ammonia, sulphate of | 7,315 | 10,328 | 5,423 | 2,994 | 4 |
| 795 | Gypsum | 10,203 | 13,712 | 8,037 | 3,681 | 857 | |
| 799 | Blood and bone | 7,512 | 5,207 | 4,966 | 1,485 | 1,313 | |
| 800 | Bonedust | 38,307 | 31,856 | 12,512 | 10,900 | 13,962 | |
| 802 | Guano and rock phosphates | 5,877 | 16,019 | 21,289 | 17,937 | 6,010 | |
| 803 | Superphosphates | 25,428 | 136,507 | 121,229 | 120,355 | 174,328 | |
| XXIII | 833 | Lithofracteur, cordite, &c. | .. | .. | 924 | 7,206 | 15,492 |
| 838 | Articles and materials suited only for and to be used only in the fabrication or repair of goods within the Dominion | 1,969 | 3,727 | 3,491 | 7,265 | 11,332 | |
| 839 | Sheets, slates, tiles | .. | 105 | 62 | 5,160 | 7,639 | |
| 848 | Brushmakers materials | 4,009 | 3,578 | 6,502 | 5,753 | 9,276 | |
| 849 | Candles, | 10 | 8 | 494 | 33 | 5,822 | |
| 860 | Pianolas, phonographs, &c. | 5,927 | 4,844 | 5,384 | 6,133 | 3,014 | |
| 861 | Records for pianolas, &c. | 8,486 | 7,823 | 7,673 | 5,845 | 417 | |
| 863 | Matches and vestas, wax | .. | .. | 9,457 | 12,291 | 30,059 | |
| 870 | Blacking and boot-polish | 1,656 | 1,835 | 2,685 | 2,142 | 5,109 | |
| 876 | Soap-powder, dry, &c. | 3,549 | 6,772 | 7,046 | 9,010 | 11,147 | |
| 877 | Soap n.o.e. | 37,565 | 37,481 | 39,732 | 49,498 | 62,329 | |
| 880 | Tar | 1,251 | 1,667 | 2,107 | 3,877 | 6,584 | |
| 883 | Bicycles, rubber tires for | 14,059 | 44,625 | 38,363 | 39,690 | 41,421 | |
| 887 | Motor bicycles, rubber tires for | 27,069 | 5,742 | 10,290 | 12,483 | 17,076 | |
| Motor vehicles— | |||||||
| 893 | Bodies for | 2,069 | 3,431 | 6,136 | 11,687 | 771 | |
| 894 | Chassis for | 7,368 | 10,759 | 1,165 | .. | .. | |
| 895 | Materials and parts for* | 61,367 | 76,233 | 74,561 | 102,540 | 149,723 | |
| 902 | Miscellaneous manufactures | 6,356 | 9,377 | 8,935 | 12,448 | 10,415 | |
| Fiji. | |||||||
| II | 68 | Fruits, fresh—Bananas | 81,038 | 64,925 | 86,796 | 93,128 | 78,990 |
| 129 | Sugar, raw | 650,630 | 1,043,486 | 959,455 | 1,102,951 | 854,688 | |
| Malden Island. | |||||||
| XXIIB | 802 | Manures — Guano and rock phosphates | 15,174 | 4,664 | .. | .. | .. |
| Belgium. | |||||||
| II | 48 | Chocolate confectionery, in fancy packages | 6,998 | .. | .. | .. | .. |
| XV | 526 | Machinery, electric—Insulated cable and wire | 5,971 | .. | .. | .. | .. |
| Glass— | |||||||
| XVIII | 673 | Crown, sheet, and common window | 16,688 | .. | 2,025 | .. | .. |
| 678 | Plate, other | 8,168 | .. | .. | .. | .. | |
| France. | |||||||
| IV | 154 | Spirits—Brandy | 23,752 | 33,284 | 35,647 | 5,381 | 36,177 |
| 166 | Wine, sparkling | 13,290 | 18,551 | 10,612 | 2,399 | 16,271 | |
| VIII | 222 | Rosin | 3,814 | 3,387 | 5,419 | 1 | 202 |
| 223 | Grass and clover seeds | 892 | 8,571 | 977 | 1,840 | 255 | |
| IXA | 234 | Apparel, &c. | 14,506 | 13,814 | 14,128 | 8,827 | 13,091 |
| 247 | Gloves n.o.e. | 8,978 | 18,874 | 27,500 | 18,022 | 17,532 | |
| 254 | Lace and laces, &c. | 4,498 | 4,090 | 4,220 | 4,004 | 7,001 | |
| 257 | Millinery, unenumerated | 6,558 | 8,017 | 9,865 | 8,384 | 9,082 | |
| 258 | Minor articles, &c. | 154 | 2,346 | 2,533 | 2,096 | 8,827 | |
| 259 | Ribbons and crape | 20,422 | 14,608 | 18,673 | 10,924 | 20,479 | |
| 267 | Drapery n.o.e. | 10,529 | 10,542 | 11,771 | 6,814 | 8,315 | |
| IXB | 283 | Silk, satins, &c. | 10,100 | 224 | 403 | 128 | 46,084 |
| X | 339 | Stearine | 6,864 | .. | .. | .. | .. |
| XVIII | 683 | Tiles—Glass or earthen, roofing | 17,420 | .. | 3,902 | .. | .. |
| XX | 712 | Fancy goods | 6,962 | 9,061 | 13,447 | 7,433 | 7,518 |
| 721 | Tobacco-pipes, &c. | 13,967 | 17,138 | 17,077 | 18,974 | 32,769 | |
| XXIIA | 751 | Cream of tartar | 18,987 | 41,244 | 31,702 | 7,435 | 7,781 |
| XXIII | 894 | Motor vehicles, chassis for | 10,403 | 2,746 | .. | .. | .. |
| 895 | Materials for vehicles | 14,149 | 13,068 | 14,841 | 16,295 | 49,950 | |
| Germany. | |||||||
| £ | £ | £ | £ | £ | |||
| VIII | 223 | Seeds—Grass and clover | 20,265 | .. | .. | .. | .. |
| IXA | 234 | Apparel and ready-made clothing n.o.e. | 8,515 | 238 | 46 | 18 | 10 |
| IXB | 267 | Drapery n.o.e. | 5,956 | 272 | 219 | .. | 2 |
| XIVB | 422 | Hardware, hollow - ware, and ironmongery | 15,043 | 147 | 31 | .. | 15 |
| 486 | Iron wire, fencing, plain | 8,332 | 1,604 | .. | .. | .. | |
| XV | 526 | Machinery, electric—Insulated cable and wire | 15,040 | .. | .. | .. | .. |
| XVIII | 667 | China, porcelain, and Parian ware | 6,958 | 68 | 33 | .. | .. |
| Glass and glassware— | |||||||
| 671 | Bottles, plain, empty | 17,887 | .. | 1,591 | .. | .. | |
| 674 | Glassware n.o.e. | 10,699 | 52 | .. | 2 | 1 | |
| XIXA | 687 | Butter - paper, waxed paper, &c. | 5,341 | 181 | 144 | 42 | .. |
| XX | 712 | Fancy goods and toys | 27,471 | 843 | 379 | 88 | 5 |
| XXIIA | 751 | Cream of tartar | 21,351 | .. | .. | .. | |
| 753 | Dyes | 5,322 | 25 | .. | 216 | .. | |
| XXIIB | 798 | Basic slag and Thomas's phosphate | 46,532 | 225 | .. | .. | .. |
| 803 | Superphosphates | 62,267 | 885 | .. | .. | .. | |
| 805 | Kainit | 7,996 | .. | .. | .. | .. | |
| 807 | Sulphate of potash | 16,936 | .. | .. | .. | .. | |
| 808 | Manures, other | 6,336 | .. | .. | .. | .. | |
| XXIII | 839 | Asbestos—Sheets, plates, and tiles | 6,304 | .. | 53 | .. | .. |
| 859 | Pianos | 31,661 | 332 | .. | .. | 141 | |
| Motor-cars— | |||||||
| 894 | Chassis for | 5,413 | 362 | .. | .. | .. | |
| 895 | Materials for | 59,222 | .. | .. | .. | .. | |
| Greece. | |||||||
| II | 61 | Fruits, dried—Currants | 21,669 | 20,539 | 31 | .. | .. |
| Italy. | |||||||
| II | 108 | Nuts—Almonds, shelled or unshelled | 13,359 | 7,459 | 5,104 | 10,456 | 11,213 |
| IXA | 251 | Hats and caps | 7,105 | 11,405 | 11,908 | 11,939 | 6,058 |
| 247 | Gloves n.o.e. | 3,351 | 9,448 | 14,786 | 6,478 | 12,739 | |
| IXB | 283 | Other silks, satins, &c. | 2,950 | 7,497 | 14,122 | 8,718 | 21,825 |
| XII | 364 | Marble, dressed | 3,977 | 4,199 | 5,188 | 2,779 | 2,551 |
| XXIIA | 751 | Cream of tartar | .. | 19,033 | 25,022 | 13,327 | 9,025 |
| XXIII | 839 | Asbestos | 122 | 5,658 | 5,959 | .. | .. |
| 863 | Matches and vestas (wax) | 1,003 | 1,498 | 2,970 | 14,623 | 4,396 | |
| 895 | Vehicles, motor—Materials for * | 2,669 | 6,376 | 14,300 | 727 | 12,934 | |
| Netherlands. | |||||||
| II | 46 | Cocoa-butter | 8,192 | 723 | 643 | 364 | .. |
| III | 140 | Cocoa and chocolate | 25,269 | 16,007 | 11,893 | 790 | 6,062 |
| IV | 155 | Spirits—Geneva, gin, and schnapps | 17,339 | 30,810 | 35,546 | 6,752 | 27,444 |
| XV | 527 | Electrical lamps | 1,491 | 6,731 | 5,153 | 4,883 | 26,195 |
| XXIIB | 803 | Manures — Superphosphates | 37,925 | 8,322 | .. | .. | .. |
| Norway. | |||||||
| I | 11 | Fish, preserved | 24,771 | 28,098 | 20,792 | 17,926 | 13,242 |
| VIII | 231 | Wood-pulp | 4,309 | 5,078 | 1,463 | .. | .. |
| XIXA | 695 | Writing-paper, &c. | 1,127 | 2,654 | 2,397 | 10,810 | 8,553 |
| XXIIA | 748 | Calcium carbide | 29,198 | 25,784 | 24,870 | 2,144 | |
| Spain. | |||||||
| VIII | 209 | Cork, cut | 6,594 | 4,757 | 9,611 | 3,490 | 12,005 |
| Sweden. | |||||||
| £ | £ | £ | £ | £ | |||
| VIII | 231 | Wood-pulp | 2,934 | 4,829 | 9,726 | 6,957 | 7,384 |
| XIVB | 422 | Hardware, hollow-ware, &c. | 1,853 | 2,362 | 5,909 | 3,710 | 189 |
| 473 | Telephones and accessories | 16,904 | 12,540 | 1,127 | 9,343 | 4,669 | |
| XV | 517 | Machinery, dairying — Cream-separators | 20,304 | 30,944 | 37,806 | 43,316 | 19,557 |
| XXIIA | 748 | Carbide of calcium | 7,357 | 4,027 | 4,398 | 1,697 | 83 |
| XXIII | 838 | A. and M.S. | 766 | 2,472 | 8,677 | 8,180 | 15,539 |
| 864 | Matches, wooden | 1,291 | 1,757 | 3,896 | 5,266 | 15,053 | |
| Switzerland. | |||||||
| II | 48 | Chocolate confectionery in fancy packages | 50,440 | 40,271 | 16,126 | 387 | 8,811 |
| IXA | 234 | Apparel, &c. | 6,226 | 10,470 | 20,364 | 17,059 | 13,854 |
| 254 | Lace and laces n.o.e. | 9,683 | 11,356 | 13,692 | 11,636 | 23,124 | |
| 259 | Ribbons and crape | 28,590 | 53,165 | 42,947 | 39,758 | 71,540 | |
| IXB | 267 | Drapery n.o.e. | 4,538 | 615 | 7,001 | 3,573 | 50,159 |
| 283 | Silks, satins, velvets, &c. | 14,969 | 21,720 | 26,825 | 13,214 | 13,020 | |
| XX | 719 | Watches | 1,262 | 3,512 | 39,863 | 36,541 | 51,463 |
| Asiatic Turkey. | |||||||
| Fruits, dried— | |||||||
| II | 62 | Dates | 6,660 | 3,363 | 4,862 | 7,346 | 7,577 |
| 65 | Raisins | 17,414 | 1,588 | .. | .. | .. | |
| China. | |||||||
| II | 96 | Rice, dressed | 7,683 | 5,718 | 5,071 | 5,761 | 9,225 |
| 110 | Walnuts | 341 | 1,016 | 1,964 | 2,306 | 5,839 | |
| IXA | 254 | Lace and laces n.o.e. | 1,000 | 1,335 | 6,487 | 14,575 | 34,863 |
| IXB | 283 | Silk piece-goods n.o.e. | 12,421 | 19,572 | 38,539 | 23,628 | 35,042 |
| XXIII | 848 | Brushmakers' materials | 1,225 | 1,707 | 2,499 | 1,921 | 5,128 |
| Japan. | |||||||
| IXA | 234 | Apparel and ready-made clothing n.o.e. | 13,410 | 15,671 | 55,910 | 50,478 | 68,986 |
| 240 | Grindery n.o.e. | 394 | 1 | 2,811 | 3,496 | 7,015 | |
| 247 | Gloves n.o.e. | .. | .. | 1,405 | 4,699 | 16,666 | |
| 249 | Haberdashery—Buttons, tapes, &c. | 6,620 | 7,829 | 12,594 | 9,369 | 12,513 | |
| 251 | Hats and caps | 2,982 | 3,985 | 17,535 | 33,343 | 38,129 | |
| 252 | Hatmakers' materials | 1,087 | 1,752 | 2,141 | 6,766 | 14,737 | |
| 253 | Hosiery | 541 | 1,032 | 11,286 | 4,027 | 5,655 | |
| IXB | 263 | Articles n.o.e. | 1,990 | 2,089 | 2,776 | 4,114 | 6,237 |
| 267 | Drapery n.o.e. | 11,294 | 9,757 | 15,322 | 13,846 | 15,217 | |
| 270 | Matting n.o.e., and mats | 2,315 | 3,203 | 5,199 | 5,486 | 12,381 | |
| 274 | Canvas, sailcloth, &c. | .. | .. | 6,435 | 11,736 | 14,278 | |
| 277 | Tubular woven cotton-cloth | .. | .. | 11 | .. | 15,131 | |
| 278 | Cotton piece-goods n.o.e. | 12,828 | 16,104 | 63,494 | 55,999 | 219,275 | |
| 283 | Silks, satins, and velvets | 52,352 | 90,062 | 126,185 | 162,312 | 301,746 | |
| 289 | Rugs, other | 1,465 | 3,279 | 12,473 | 6,775 | 572 | |
| X | 336 | Oils—Vegetable, other | 371 | 2,170 | 3,010 | 2,107 | 16,597 |
| XII | 358 | Coal, cargo | 7,875 | .. | .. | 5,303 | .. |
| XIVB | 422 | Hardware, hollow-ware, &c. | 532 | 524 | 5,878 | 3,185 | 8,030 |
| 484 | Bare copper | .. | 112 | 2,275 | 3,041 | 5,767 | |
| XV | 526 | Electrical—Insulated cable and wire | .. | .. | 8,853 | 10,048 | 24,725 |
| 529 | Electrical materials n.o.e. | 46 | 859 | 3,461 | 3,972 | 9,073 | |
| XVIIA | 639 | Timber, rough - sawn, n.o.e. | 2,369 | 8,907 | 16,870 | 14,789 | 15,913 |
| XVIII | 667 | China, porcelain, and Parian ware | 1,521 | 2,487 | 11,148 | 5,359 | 14,793 |
| 669 | Earthenware n.o.e. | 1,381 | 1,254 | 7,569 | 8,527 | 13,665 | |
| 671 | Bottles, plain, empty | 1,914 | 11,298 | 10,795 | 14,170 | 23,081 | |
| 674 | Glassware n.o.e. | 110 | 3,232 | 21,513 | 9,004 | 17,231 | |
| 689 | Cardboard boxes—Materials for, other | 1,552 | 2,590 | 6,006 | 5,969 | 27,001 | |
| XX | 712 | Fancy goods and toys | 11,956 | 19,092 | 38,410 | 39,688 | 61,219 |
| XXIIA | 748 | Calcium carbide | .. | .. | .. | 4,592 | 36,064 |
| 765 | Drugs, &c. | 2,269 | 2,662 | 5,628 | 3,131 | 10,723 | |
| XXIIB | 789 | Sulphur | .. | 7,057 | 8,756 | 14,141 | 21,278 |
| 803 | Manures — Superphosphates | 24,526 | 51,956 | 17,417 | 19,088 | 1,035 | |
| XXIII | 847 | Brushes, brushware, and brooms | 4,030 | 4,835 | 9,411 | 8,930 | 22,206 |
| 864 | Matches, wooden | .. | 5,275 | 4,839 | 1,982 | 40,424 | |
| Java. | |||||||
| II | 84 | Grain and pulse, unprepared, other | 38 | 246 | .. | 3,238 | 5,272 |
| 130 | Sugar, refined | 10,581 | 105 | .. | .. | .. | |
| III | 143 | Coffee, raw | 3,043 | 1,557 | 520 | 2,440 | 6,028 |
| 149 | Tea, in bulk | .. | .. | .. | 7,089 | 61,638 | |
| VIII | 214 | Kapok | 42,785 | 27,859 | 37,437 | 29,370 | 69,075 |
| Philippine Islands. | |||||||
| VIII | 213 | Hemp | 13,842 | 19,903 | 27,476 | 22,765 | 35,777 |
| Sumatra. | |||||||
| X | 319 | Oils, mineral—Benzine | 135,120 | 173,740 | 105,625 | 84,742 | 39,595 |
| 324 | Kerosene | .. | 8,310 | 2,349 | .. | .. | |
| 326 | Motor-spirit n.o.e. | 70 | .. | 434 | .. | 9,943 | |
| Madagascar. | |||||||
| XXIIB | 802 | Manures — Guano and rock phosphates | 9,255 | 11,458 | .. | .. | .. |
| Portuguese East Africa. | |||||||
| XII | 358 | Coal, cargo | 29,240 | .. | .. | 3,046 | .. |
| Cuba. | |||||||
| V | 169 | Cigars | 7,780 | 4,327 | 3,516 | 6,604 | 1,663 |
| United States of America. | |||||||
| I | 11 | Fish, preserved, in tins | 1,610 | 4,163 | ,304 | 12,821 | 17,620 |
| 36 | Sausage casings and skins | 20,766 | 16,612 | 19,531 | 25,758 | 30,888 | |
| II | 46 | Cocoa-butter, &c. | 1,199 | 3,805 | 10,548 | 7,507 | 16,525 |
| 48 | Confectionery, chocolate | 1,880 | 1,002 | 3,886 | 2,920 | 12,812 | |
| 52 | Confectionery n.o.e. | 5,780 | 8,583 | 5,998 | 3,065 | 2,836 | |
| 59 | Fruits, bottled and preserved in syrup | 19,275 | 27,177 | 33,600 | 22,567 | 36,868 | |
| Fruits, dried— | |||||||
| 60 | Apples and apricots | 8,983 | 10,372 | 10,560 | 14,211 | 19,851 | |
| 63 | Figs | 823 | 4,015 | 4,516 | 6,217 | 6,907 | |
| 64 | Prunes | 11,648 | 18,590 | 10,726 | 21,763 | 23,145 | |
| 65 | Raisins | 25,290 | 89,640 | 90,102 | 95,524 | 122,075 | |
| 66 | Other | 4,547 | 3,087 | 3,323 | 4,631 | 5,549 | |
| Fruits, fresh— | |||||||
| 67 | Apples | 14,626 | 10,339 | 9,369 | 2,500 | 1,603 | |
| 71 | Lemons | 667 | 4,439 | 5,166 | 3,792 | 5,441 | |
| 72 | Oranges | 9,307 | 13,11 | 14,602 | 10,198 | 7,691 | |
| Grain and pulse, unprepared— | |||||||
| 78 | Barley | .. | 7,235 | 1 | .. | .. | |
| 81 | Oats | .. | 11,080 | 16 | .. | .. | |
| Grain and pulse, prepared or manufactured— | |||||||
| 87 | Flour, wheaten | .. | 58,292 | 121 | .. | .. | |
| 88 | Maizena and cornflour | 8,234 | 7,911 | 6,022 | 6,802 | 434 | |
| 102 | Infants' and invalids' foods n.o.e. | 441 | 443 | 561 | 4,589 | 5,594 | |
| 122 | Salt, other | 8,977 | 5,925 | 4,062 | 1,491 | 36,626 | |
| 125 | Sugar—Glucose | 9,752 | 10,270 | 13,402 | 13,926 | 3,946 | |
| III | 139 | Cocoa-beans, uncrushed | 956 | 1,433 | 3,320 | 5,269 | 3,512 |
| 140 | Cocoa and chocolate | 1 | 59 | 25 | 2,830 | 36,968 | |
| V | 168 | Cigarettes | 6,805 | 4,629 | 2,971 | 1,410 | 4,065 |
| Tobacco, manufactured— | |||||||
| 171 | Cut | 46,199 | 34,725 | 38,301 | 22,404 | 31,089 | |
| 172 | Other | 40,361 | 42,149 | 49,062 | 19,680 | 44,403 | |
| 173 | Tobacco, unmanufactured | 913 | 1,043 | 2,372 | 2,374 | 16,507 | |
| VIII | 222 | Resin | 5,354 | 5,486 | 3,377 | 9,282 | 21,346 |
| Seeds— | |||||||
| 223 | Grass and clover | 24,197 | 7,961 | 15,947 | 55,453 | 101,853 | |
| 225 | Other | 1,490 | 3,519 | 2,267 | 4,025 | 11,414 | |
| 230 | Tanning-materials, other | 333 | 1,508 | 6,525 | 5,671 | 7,512 | |
| IXA | 234 | Apparel and ready-made clothing n.o.e. | 28,239 | 22,089 | 39,711 | 29,962 | 42,980 |
| 240 | Grindery n.o.e. | 8,676 | 9,869 | 18,060 | 16,695 | 17,666 | |
| 241 | Gum boots | 8,595 | 9,292 | 7,779 | 10,380 | 7,759 | |
| 244 | Boots, other | 8,023 | 7,618 | 26,219 | 32,572 | 44,829 | |
| 245 | Corsets | 17,201 | 24,962 | 27,987 | 16,544 | 19,549 | |
| 247 | Gloves n.o.e. | 648 | 574 | 2,306 | 2,004 | 5,253 | |
| 249 | Buttons, tapes, &c. | 1,140 | 3,322 | 5,945 | 5,946 | 9,237 | |
| 251 | Hats and caps | 896 | 2,329 | 2,520 | 7,254 | 18,413 | |
| 253 | Hosiery | 2,340 | 12,160 | 54,440 | 36,394 | 82,067 | |
| 258 | Minor articles for apparel | 323 | 719 | 3,600 | 2,227 | 5,174 | |
| 259 | Ribbons and crape | 46 | 53 | 164 | 87 | 18,416 | |
| IXB | 266 | Carpets, carpeting, &c. | 93 | 134 | 413 | 715 | 5,205 |
| 274 | Canvas, sail-cloth, &c. | 4,888 | 12,761 | 12,699 | 7,555 | 6,430 | |
| 275 | Butter and cheese cloth | 4,635 | 3,099 | 6,094 | 2,293 | 24,957 | |
| 278 | Cotton piece-goods n.o.e. | 31,716 | 66,683 | 98,574 | 93,206 | 151,253 | |
| 283 | Other silks, satins, velvets | 831 | 740 | 3,208 | 4,440 | 19,305 | |
| 290 | Sewing silks and cottons n.o.e. | 4,396 | 3,228 | 7,636 | 5,537 | 16,792 | |
| 311 | Axle-greases and other solid lubricants | 4,151 | 2,996 | 6,252 | 4,237 | 9,485 | |
| Oils— | |||||||
| Mineral— | |||||||
| X | 319 | Benzine | 156,878 | 158,027 | 264,427 | 269,447 | 424,870 |
| 320 | Benzoline | 3,860 | 2,195 | 6,964 | 4,621 | 2,388 | |
| 323 | Gasolene | 3,243 | 12,335 | 14,158 | 57,232 | 147,982 | |
| 324 | Kerosene | 159,339 | 175,802 | 155,387 | 133,842 | 167,202 | |
| 325 | Lubricating | 41,014 | 31,949 | 72,573 | 62,142 | 172,043 | |
| 326 | Motor-spirit n.o.e. | 114,909 | 51,729 | 152,553 | 168,153 | 203,684 | |
| Vegetable— | |||||||
| 332 | Linseed | .. | .. | 93 | 2,209 | 6,710 | |
| 334 | Turpentine | 6,438 | 13,489 | 15,706 | 10,598 | 13,691 | |
| 336 | Other | 5,664 | 6,381 | 10,562 | 10,182 | 7,227 | |
| 337 | Other n.o.e. | 3,031 | 4,244 | 1,561 | 4,723 | 5,830 | |
| 338 | Not essential, in vessels less than 1 gallon | 3,234 | 4,164 | 8,647 | 5,836 | 4,428 | |
| 343 | Wax, paraffin | 12,840 | 12,681 | 13,723 | 10,081 | 10,140 | |
| Paints and colours- | |||||||
| XI | 348 | Ground in oil or turpentine | 5,718 | 10,005 | 22,107 | 21,091 | 45,188 |
| 350 | Mixed ready for use | 12,213 | 10,420 | 17,530 | 13,157 | 32,231 | |
| 351 | Unenumerated | 1,487 | 1,249 | 2,470 | 2,222 | 6,151 | |
| 354 | Varnishes, lacquers, &c. | 4,206 | 3,118 | 5,509 | 4,903 | 5,698 | |
| XIVA | 388 | Iron and steel, bar, bolt, and rod | 355 | 1,126 | 5,578 | 10,233 | 9,387 |
| 408 | Bolts and nuts | 3,437 | 1,960 | 4,897 | 9,514 | 9,480 | |
| XIVB | 410 | Brass, plate and sheet, plain | 2,100 | 10,644 | 888 | 11,136 | 21,751 |
| 416 | Copper, plate and sheet, plain | 878 | 1,654 | 2,102 | 4,787 | 13,442 | |
| 417 | Cutlery—Table forks and spoons | 2,064 | 3,138 | 1,448 | 2,133 | 5,679 | |
| 418 | Fencing-staples | 10,420 | 7,124 | 10,076 | 8,786 | 9,805 | |
| 422 | Hardware, hollow-ware, &c. | 61,655 | 48,760 | 80,951 | 82,446 | 59,831 | |
| 428 | Iron for pipes, spiral | .. | 11,846 | 2,774 | 4,598 | .. | |
| 430 | Corrugated iron | 3,653 | 7,399 | 13,113 | 12,012 | 19,306 | |
| 431 | Iron and steel, plain, black | 312 | 441 | 932 | 13,458 | 15,404 | |
| 432 | Plain galvanized iron | 2,678 | 7,399 | 7,082 | 13,508 | 34,444 | |
| XIVB | 436 | Iron and steel pipes— | 6,434 | 2,389 | 6,711 | 15,382 | 16,716 |
| Wrought, 6 in. and under | |||||||
| 441 | Lamps, other | 8,937 | 7,443 | 13,195 | 14,579 | 19,414 | |
| 447 | Meters, electricity | 174 | 530 | 2,375 | 1,446 | 11,827 | |
| 455 | Nails, other | 22,731 | 19,268 | 14,282 | 14,958 | 18,893 | |
| 459 | Pumps, spraying | 2,263 | 2,091 | 2,194 | 2,483 | 5,302 | |
| 463 | Railway, &c., plant, other | 1,846 | 419 | 3,608 | 8,555 | 13,871 | |
| 473 | Telephones and accessories therefor | 2,267 | 3,857 | 6,642 | 15,591 | 29,310 | |
| Tinware— | |||||||
| 474 | Tinned sheets and plates, plain | 344 | 3,483 | 14,772 | 23,962 | 2,635 | |
| Tools and implements— | |||||||
| 477 | Axes and hatchets | 10,816 | 6,805 | 3,906 | 4,070 | 2,889 | |
| 482 | Other | 56,100 | 42,216 | 63,548 | 66,654 | 49,897 | |
| Wire— | |||||||
| 484 | Copper, bare | 3,348 | 4,158 | 5,828 | 1,918 | 7,083 | |
| 485 | Fencing, barbed | 27,543 | 18,904 | 18,261 | 23,844 | 22,958 | |
| 486 | Fencing, plain | 46,816 | 47,213 | 53,579 | 45,665 | 51,620 | |
| 488 | N.o.e. | 488 | 2,935 | 10,574 | 8,770 | 5,871 | |
| 490 | Wire-wove, expanded-metal lathing, &c. | 5,120 | 3,145 | 4,376 | 1,968 | 2,591 | |
| 493 | Zinc, plain, sheet | 660 | 6,166 | 16,892 | 10,168 | 4,268 | |
| Metal manufactures— | |||||||
| 494 | Other, free—Bellows, nails | 7,591 | 8,193 | 7,065 | 8,762 | 9,502 | |
| 495 | Other (20 per cent.) | 41,606 | 28,174 | 39,627 | 45,275 | 56,603 | |
| Machinery— | |||||||
| Agricultural implements— | |||||||
| XV | 499 | Drills, &c. | 8,920 | 5,805 | 4,370 | 4,186 | 1,049 |
| 505 | Ploughs | 5,927 | 4,658 | 7,944 | 6,344 | 3,866 | |
| 507 | Reapers, &c. | 8,522 | 7,776 | 11,321 | 4,908 | .. | |
| 511 | Other | 19,020 | 10,017 | 19,709 | 18,911 | 19,667 | |
| 513 | Calculating-machines | 2,459 | 1,919 | 2,658 | 7,478 | 5,675 | |
| 514 | Cash-registers | 11,565 | 12,044 | 6,826 | 4,897 | 8,841 | |
| 517 | Cream-separating machines | 2,027 | 3,596 | 4,774 | 9,246 | 10,068 | |
| Electrical— | |||||||
| 524 | Electric batteries and cells | 2,563 | 1,581 | 6,468 | 17,485 | 27,994 | |
| 525 | Generators, motors, &c. | 17,020 | 24,275 | 32,898 | 25,244 | 38,796 | |
| 526 | Insulated cable-wire | 1,045 | 3,408 | 6,088 | 7,054 | 1,515 | |
| 527 | Lamps | 5,894 | 6,370 | 6,938 | 16,116 | 20,099 | |
| 528 | Materials — Carbon, in block | 856 | 1,058 | 3,256 | 4,662 | 7,801 | |
| 529 | N.o.e. | 22,003 | 26,686 | 49,135 | 31,840 | 102,179 | |
| 531 | Gas, oil, and hot-air engines | 2,509 | 9,996 | .. | 533 | 850 | |
| 532 | Engines, gas, &c., other | 16,719 | 13,891 | 20,547 | 22,341 | 25,955 | |
| 533 | Portable and traction engines | 867 | 1,179 | 9,524 | 18,285 | 18,868 | |
| 546 | Locomotives | 2,907 | 34,000 | .. | 1,253 | .. | |
| 553 | Mining, unenumerated | 3,390 | 14,299 | 4,817 | 4,231 | 1,319 | |
| 558 | Printing—Typesetting and casting | 11,414 | 4,151 | 1,207 | 3,130 | 2,176 | |
| 560 | Sewing-machines | 24,135 | 21,931 | 8,661 | 10,082 | 41,889 | |
| 561 | Tools—Engineers', &c., machine and hand | 14,785 | 12,136 | 24,292 | 24,401 | 23,748 | |
| 562 | Typewriters | 10,821 | 7,711 | 17,083 | 19,105 | 26,240 | |
| 570 | N.o.e. (20 per cent.) | 16,569 | 24,628 | 26,047 | 34,681 | 19,716 | |
| 571 | Materials for, &c., (dutiable)* | 1,300 | 2,317 | 12,677 | 18,460 | 21,146 | |
| 572 | Materials for, &c. (free)* | 7,678 | 7,081 | 3,817 | 4,343 | 13,232 | |
| Leather— | £ | £ | £ | £ | £ | ||
| XVIB | 579 | Belting, other | 2,790 | 1,755 | 2,805 | 5,509 | 9,472 |
| 581 | Calf-skins, whole | 221 | 566 | 8,235 | 6,416 | 11,961 | |
| 585 | Goat and kid skins | 6,474 | 8,744 | 18,112 | 11,132 | 47,642 | |
| 589 | Japanned and enamelled | 3,790 | 3,081 | 10,258 | 9,914 | 13,782 | |
| 592 | Sole, pump, and skirt | 984 | 29,904 | 30,661 | 38,906 | 8,549 | |
| Timber, sawn, n.o.e., rough— | |||||||
| XVIIA | 637 | Oregon pine | 45,199 | 20,574 | 18,544 | 8,011 | 30,735 |
| 639 | Other | 26,784 | 14,919 | 13,382 | 10,871 | 11,093 | |
| XVIIB | 653 | Furniture n.o.e. | 6,362 | 4,056 | 4,420 | 2,315 | 1,021 |
| 655 | Handles for tools, other | 9,970 | 7,334 | 10,174 | 5,509 | 3,763 | |
| 657 | Mouldings and panels for picture-frames, &c. | 6,527 | 1,925 | 2,594 | 2,200 | 871 | |
| 661 | Woodenware n.o.e. | 10,136 | 7,734 | 7,535 | 3,945 | 4,227 | |
| Glass and glassware— | |||||||
| XVIII | 671 | Bottles, plain, empty | 3,538 | 10,160 | 13,846 | 9,506 | 19,510 |
| 673 | Glass, Crown, sheet, and common | 1 | 14,181 | 20,154 | 12,436 | 8,857 | |
| 674 | Glassware n.o.e. | 5,930 | 7,204 | 7,209 | 4,799 | 4,189 | |
| 675 | Glass jars, plain | 6,780 | 5,835 | 4,449 | 593 | 339 | |
| 678 | Glass, plate, other | .. | 11,658 | 8,392 | 10,083 | 7,090 | |
| XIXA | 687 | Butter-paper | 38 | 9,527 | 9,914 | 14,147 | 24,929 |
| 689 | Cardboard boxes, materials for, other | 5,534 | 13,010 | 17,376 | 12,440 | 9,093 | |
| 692 | Paperhangings | 3,831 | 1,910 | 2,607 | 3,688 | 6,911 | |
| 693 | Paper, printing | 206 | 625 | 4,943 | 21,047 | 26,197 | |
| 695 | Writing-paper, not less than "Demy" | 2,473 | 1,358 | 20,573 | 16,557 | 39,523 | |
| XIXB | 698 | Books, papers, and music, printed, n.o.e. | 11,416 | 10,558 | 15,487 | 6,907 | 7,971 |
| 703 | Handbills, circulars, &c. | 2,662 | 3,384 | 6,936 | 20,945 | 30,839 | |
| 709 | Pictures, &c., n.o.e. | 3,970 | 4,908 | 5,846 | 3,795 | 4,054 | |
| 711 | Stationery n.o.e. | 5,618 | 4,596 | 13,510 | 18,147 | 26,958 | |
| XX | 712 | Fancy goods and toys | 6,291 | 10,458 | 21,529 | 24,007 | 23,323 |
| Timepieces— | |||||||
| 717 | Clocks | 9,641 | 11,416 | 15,131 | 9,117 | 12,829 | |
| 719 | Watches | 4,676 | 4,216 | 8,859 | 7,146 | 13,411 | |
| 721 | Tobacco- pipes and smokers' requisites | 73 | 106 | 294 | 4,704 | 10,347 | |
| XXI | 725 | Cinematograph, &c., films | 695 | 2,772 | 15,191 | 19,929 | 79,485 |
| 728 | Microscopes and telescopes | 1,260 | 2,684 | 10,383 | 15,021 | 19,045 | |
| Photographic materials, &c.— | |||||||
| 729 | Cameras | 2,399 | 4,710 | 10,310 | 21,204 | 29,052 | |
| 730 | Sensitized surfaces | 1,248 | 2,501 | 14,981 | 17,367 | 14,179 | |
| 731 | Cameras n.o.e. | 1,547 | 1,259 | 3,220 | 3,532 | 5,104 | |
| 733 | Instruments, surgical and dental | 22,089 | 22,740 | 30,799 | 12,883 | 40,421 | |
| XXIIA | 750 | Chemicals and preparations | 800 | 1,820 | 4,649 | 2,905 | 6,839 |
| 751 | Cream of tartar | 1,934 | 17,019 | 9,463 | 29,081 | 85,578 | |
| 753 | Dyes | 950 | 2,153 | 1,443 | 3,096 | 10,025 | |
| 759 | Insecticides, &c., n.o.e. | 1,455 | 1,214 | 1,881 | 3,036 | 9,924 | |
| 765 | Medicinal preparations, &c., n.o.e. | 22,057 | 15,709 | 27,453 | 22,393 | 50,840 | |
| 772 | Perfumery — Toilet preparations | 8,861 | 8,325 | 25,988 | 13,038 | 33,481 | |
| XXII | 782 | Soda, caustic | 172 | 2,175 | 2,865 | 11,023 | 4,085 |
| XXIII | 814 | Cartridges, 25 calibre and under | 6,889 | 9,759 | 10,490 | 6,658 | 10,008 |
| 815 | Cartridges, shot (10 to 24 bore) | 49 | 2 | 549 | 8,767 | 27,810 | |
| 824 | Firearms, other | 7,016 | 9,423 | 11,655 | 5,431 | 5,989 | |
| 838 | A. and M.S. | 1,504 | 2,046 | 6,991 | 19,430 | 31,848 | |
| 859 | Pianos | 819 | 1,931 | 3,843 | 6,123 | 6,419 | |
| 860 | Pianolas, &c. | 1,205 | 390 | 4,170 | 5,823 | 11,061 | |
| 867 | Packing, engine | 3,510 | 4,450 | 6,558 | 7,623 | 8,384 | |
| XXIII | 873 | Furniture, knife, and plate powder and polish | 2,869 | 2,186 | 4,682 | 3,920 | 6,028 |
| 876 | Soap-powder, dry, &c. | 6,455 | 7,418 | 7,942 | 85 | 3,031 | |
| 877 | Soap n.o.e. | 14,711 | 10,359 | 20,006 | 1,964 | 207 | |
| 886 | Motor bicycles and tricycles | 2,103 | 14,523 | 44,483 | 40,005 | 46,687 | |
| 887 | Rubber tires and tubes for | 364 | 1,994 | 6,796 | 7,251 | 12,031 | |
| Motor vehicles— | |||||||
| 893 | Bodies for | 68,204 | 56,665 | 588,379 | 525,357 | 343,965 | |
| 894 | Chassis for | 192,015 | 186,876 | 1,849 | 127 | .. | |
| 893 | Materials for* | 24,697 | 98,088 | 327,145 | 245,242 | 407,023 | |
| 900 | Vehicles — Springs and other materials | 7,484 | 10,349 | 3,294 | 5,832 | 7,468 | |
| 902 | Miscellaneous manufactures | 10,461 | 17,927 | 27,766 | 20,734 | 45,716 | |
| Society Islands. | |||||||
| II | 72 | Fresh fruit—Oranges | 8,407 | 6,362 | 2,842 | 7,978 | 7,806 |
| VIII | 208 | Copra | 2,744 | 15,358 | 2,482 | 416 | .. |
| XXIIA | 790 | Vanilla-beans | 6,352 | 5,219 | 3,117 | 4,780 | 3,635 |
| Tonga (Friendly Islands). | |||||||
| VIII | 208 | Copra | 10,422 | 29,168 | 1,232 | 390 | 2,530 |
| German Samoa. | |||||||
| III | 139 | Cocoa-beans, uncrushed | 3,653 | 2,273 | 16,061 | 13,172 | 16,187 |
| Gilbert and Ellice Islands. | |||||||
| XXIIB | 802 | Guano and rock phosphates | .. | 5,720 | .. | .. | .. |
| Tuamotu Archipelago. | |||||||
| XXIIB | 802 | Guano and rock phosphates | .. | 45,578 | 22,664 | 41,271 | 37,945 |
| Egypt. | |||||||
| XXIIB | 804 | Phosphates, other | .. | .. | 39,032 | 43,217 | .. |
| Denmark. | |||||||
| XXIII | 838 | A. and M.S. | 1,894 | 6,374 | 24,227 | 48,898 | 22,621 |
A small group of Pacific islands was annexed to the Dominion on the 11th June, 1901, and has since been administered as the "Cook and other annexed islands." The following table shows the growth of the import trade from this group—previous figures are included with those for the other Pacific islands:—
| Year. | Imports. |
|---|---|
| £ | |
| 1902 | 32,163 |
| 1903 | 38,708 |
| 1904 | 45,517 |
| 1905 | 44,179 |
| 1906 | 63,477 |
| 1907 | 61,922 |
| 1908 | 67,483 |
| 1909 | 73,469 |
| 1910 | 90,039 |
| 1911 | 92,382 |
| 1912 | 105,943 |
| 1913 | 109,095 |
| 1914 | 94,620 |
| 1915 | 87,890 |
| 1916 | 63,702 |
| 1917 | 72,470 |
| 1918 | 70,374 |
The principal articles imported for the past five years are as follows:—
| Class. | Item. | Article. | 1914. | 1915. | 1916. | 1917. | 1918. |
|---|---|---|---|---|---|---|---|
| Fruits, fresh— | £ | £ | £ | £ | £ | ||
| II | 68 | Bananas | 37,443 | 24,770 | 15,049 | 29,376 | 24,998 |
| 72 | Oranges | 34,005 | 28,321 | 26,033 | 21,155 | 28,060 | |
| 74 | Tomatoes, plums, &c. | 568 | 4,359 | 7,541 | 3,632 | 2,136 | |
| 75 | Other | 1,328 | 6,040 | 1,114 | 1,934 | .. | |
| 109 | Nuts—Coconuts | 1,502 | 804 | 565 | 676 | 774 | |
| 135 | Potatoes | 224 | 143 | 821 | 290 | .. | |
| III | 143 | Coffee, raw | 500 | 870 | 1,337 | 120 | 396 |
| VII | 202 | Pearlshell | 566 | .. | .. | .. | .. |
| VIII | 208 | Copra | 13,149 | 17,051 | 7,560 | 11,704 | 10,918 |
| 220 | Fungus | 157 | 61 | 1,259 | 315 | 51 | |
| IXA | 251 | Hats and caps | 1,979 | 2,073 | 979 | 773 | 1,914 |
| XIII | 374 | Specie—Gold | 500 | .. | .. | .. | .. |
| XXI | 725 | Cinematograph-films | 1,524 | 2,418 | 825 | 1,705 | 400 |
IT was natural that the tariff should early promise a means of obtaining a sure revenue for the colony, and the first Customs Ordinance was proclaimed in 1841 by the Governor, Captain Hobson, with the advice of the Legislative Council. This Ordinance, which repealed the New South Wales Ordinance then in force in these Islands, was the first of two long series of enactments dealing with Customs law and the tariff of Customs duties. The Customs law has been constantly revised and extended, Acts being passed in 1858, 1868, 1882, 1892, 1908, and revised, extended, and consolidated by the Customs Duties Act of 1914, and further extended by the Finance Acts of 1915 and 1917.
The first tariff, contained in the Ordinance of 1841, covered only a few items, and may be given in full as a type of all the early tariffs. It is noteworthy that, following the old mercantilist policy of colonial administration, preference was given to certain products of the Motherland. The full schedule of duties was as follows:—
| Spirits or strong waters, not being the produce of the United Kingdom, of any British possession in America, or of New South Wales, or of Van Diemen's Land, per proof gallon | £ | s. | d. |
| 0 | 5 | 0 | |
| Spirits or strong waters, the produce of United Kingdom, of any British possession in America, or of New South Wales, or of Van Diemen's Land, per proof gallon | 0 | 4 | 0 |
| Wine, for every hundred pounds' value | 15 | 0 | 0 |
| Tobacco, unmanufactured, per pound | 0 | 0 | 9 |
| Tobacco, manufactured, except cigars and snuff, per pound | 0 | 1 | 0 |
| Cigars and snuff, per pound | 0 | 2 | 0 |
| Tea, sugar, flour, meal, wheat, rice, and other grain and pulse, for every hundred pounds' value | 5 | 0 | 0 |
| On all other goods (except goods the produce and manufacture of the United Kingdom, or of New South Wales, or of Van Diemen's Land), for every hundred pounds' value | 10 | 0 | 0 |
In 1844 alterations wore made in the direction of increasing most of the duties, while the preference to the United Kingdom was dropped. A very interesting item was the duty of 30 per cent. imposed "On all guns or weapons of any description, or gunpowder, or any munition of war," evidently imposed to check the growing import of firearms for the Maoris. The rate of duty on all unspecified goods, except personal baggage, living animals, and specie, was 5 per cent.
In 1846 again preference was introduced by the imposition of a duty of 12 1/2 per cent. on all foreign unspecified goods, while similar British goods paid only 10 per cent. At the same time there appears the germ of the later free list, five items—glass bottles, bullion, live animals, books, and seeds and bulbs—being proclaimed free of duty.
The tariff of 1851 was the first elaborate scale of duties, and is noticeable for the liberal use of ad valorem duties, mainly at the rate of 10 per cent., though cottons, woollens, &c., were charged by the yard, calico by the bolt, and trousers by the pair.
The first tariffs seem to have been purely for revenue purposes, and there is little protective design in them. The number of commodities chargeable with duty was few, and as time went on successive Governments continually raised the rates on these revenue-producing articles. There is a constant succession of increases in the duty levied on spirits, from the 4s. per gallon of the first tariff to the 18s. per gallon of 1917, and there are similar increases in tobacco, wines, beer, &c.-indeed, in all the high-duty goods. On the other hand, sugar and tea, which at first paid a duty of 5 per cent., by 1856 were paying much higher rates at 1/2d. per pound and 3d. per pound respectively. Two years later the duties had been raised to 1d. per pound and 4d. per pound, and in 1864 tea was charged 6d. per pound. These rates remained till in 1878 sugar was reduced again to 1/2d. per pound, and in 1907 made free, while the tariff of 1895 reduced the duty on tea to 4d., and that of 1900 to 2d., British tea being eventually placed on the free list by the tariff of 1903.
In 1856 the first Gold Duty Act was passed, empowering the Governor to collect an export duty on gold at the rate of 2s. 6d. per ounce. This rate was amended by various Acts; but in 1890 the Gold Duty Abolition Act was passed, and a system of rating in mining districts substituted for the export duty as far as the South Island was concerned. The Gold Duty Act, 1908, consolidated and repealed all previous enactments. An export duty was also imposed on timber by Acts of 1901 and 1903.
Excise duties were levied in 1881 on the manufacture of tobacco and perfumery in bond, and the amount of revenue derived from this source, though still small, has constantly increased. While sugar was liable to duty, excise was collected from the warehouses where sugar was refined; but since 1907 this revenue has disappeared. A duty was imposed on New Zealand beer in 1880, and this duty, though charged at a low rate, yields a considerable sum each year. There are no distilleries in the Dominion.
The first definite attempt at reciprocity was made in 1870, when the Colonial Reciprocity Act gave power to the Government to make reciprocal agreements with the Australian States, including Tasmania; but this Act failed to receive the Royal assent and consequently lapsed.
In 1895, however, the Customs Duties Reciprocity Act received the Royal assent, and ratified an agreement which had been tentatively proposed with South Australia, besides giving power to the Government to make further agreements with the other Australian States. In 1907 the New Zealand and South African Customs Treaty was negotiated, and there is a steady interchange of products under this agreement.
Imperial preference proper was introduced in New Zealand by the Preferential and Reciprocal Trade Act, 1903, which followed the lead given by Canada. At first only a few items were covered by the extra duties levied upon goods of foreign origin; but the Tariff Act of 1907 extended this additional preferential duty to a great number of items.
The general tariff of 1864 comprised many items, but the duties were levied for revenue primarily; the rates were low, and were mostly specific duties, even drapery being charged at per cubic foot. Amendments of the tariff, mostly small and affecting only a few items, followed rapidly in 1866, 1867, 1871, 1873; but in 1878 some sweeping changes were made, particularly the reduction of sugar from 1d. per pound to 1/2d., and similar reductions on many foodstuffs, while tools were also made free of duty. Another Act in 1879 added a few dutiable articles—in this case, however, chargeable with ad valorem duty; and the Act of 1881 was similar. All these changes were revised and consolidated in the Customs Duties Consolidation Act, 1882, which also extended the range of the tariff a good deal. The tariff of 1888 was distinguished by a more liberal use of ad valorem duties, the most usual rate being 20 per cent., as against 10 per cent. in the earliest years, while a primage duty was also levied.
With the year 1895 the tariff takes on its distinctive modern form, marked by the preponderance of ad valorem duties and a definitely protective intention. The scope of the tariff was greatly widened so as to enumerate in detail a number of new items, and there were many reductions, principally of the duties on foodstuffs such as dried fruits and cocoa.
The process of subdivision and protection then begun was continued in 1900, when further steps were taken in the direction of a free breakfast-table; and another notable remission was made, the duty on kerosene being abolished.
In 1907 the Customs tariff was completely revised and some important alterations made. Among articles placed upon the free list were: Sugar, molasses and treacle, currants, raisins, figs, dates, prunes, unground spices, mustard, maizena, cornflour, almonds and nuts (excepting walnuts), carbonate and bicarbonate of soda, tartaric acid, infants' foods, forfar, dowlas and flax-sheeting, vegetable oils, fencing staples and standards, shoot lead; gas, electricity, and water meters; rubber and pneumatic tires for carriages. Children's boots Nos. 0-6 and tea in bulk were admitted free if of British manufacture or growth.
Increased rates of ordinary duty were imposed on certain articles, among which were: Flavouring essences n.o.e., medicinal preparations, drugs and druggists' sundries, candles, paraffin-wax, hosiery, cash-registers, cartridges (shot) 10-24 bore, cartridge-cases, certain sizes of iron and fibre pipes, mouldings and panels.
Tea, the produce of British dominions, if in packages of 5 lb. in weight or over was admitted free: when put up in packages under 5 lb. there was a duty of 2d. per pound. the preferential duty on tea of foreign growth was 2d. per pound if in packages of 5 lb. in weight or over, and £d. per pound if in packages of a less weight than 5 lb.
The Customs Duties Amendment Act, 1909, imposed a surtax of 1 per cent. on the amount of duty payable on tobacco, cigars, and cigarettes, and of 2 1/2 per cent. on the amount of duty payable on all other dutiable goods. This surtax remained in operation until the 31st March, 1911.
The Customs revenue for 1916 was increased by the sum of £197,466 in consequence of the preferential tariff, but the exemption in favour of British-grown tea has resulted in a considerable loss of revenue. the duty collected on all tea imported in 1903 was £43,606, while in 1916 only £623 was received. In 1917, however, as a result of the increased rates imposed in that year, the amount rose to £36,651. Sugar and molasses, from which the duty has been removed, yielded an average annual revenue of £194,000 during the years 1903-7.
In 1915 again changes were made in the rates of duty levied on certain articles, in order to meet the extraordinary expenses of the war. The principal changes were: the duty was raised on spirits from 16s. to 17s. per gallon; gas and oil engines were made subject to 10 per cent., plus an additional preferential 10 per cent. if foreign, instead of being free and 20 per cent. preferential as before; electric motors, transformers, and lamps were charged 10 per cent. plus 10 per cent., instead of 10 per cent. plus 5 per cent.; and motor-cars were charged 10 per cent. plus 10 per cent. preferential surtax, whereas before the chassis was free and the body was liable to 20 per cent. duty. On the other hand, the 20 per cent. on bicycles was reduced to 10 per cent.
At the same time a primage duty of 1 per cent. was levied on all goods imported, with the exception of a few small classes of exempted articles. In addition, power was taken to gazette at any time an extra surtax of 50 per cent. on any goods which may be specified, when they are the produce or manufacture of any country now at war with His Majesty. Power was also taken to impose an excise duty on aerated waters, cordials, and other beverages, subject to a report by an officer of Customs to be appointed as a Commission to inquire into the advisability of controlling and regulating this manufacture.
The excise duties on spirituous tinctures, which formerly paid 12s. per gallon, were raised to 13s. per gallon, and finally (on 2nd August, 1917) to 14s. per gallon. The beer duty was altered so as to increase according to the specific gravity of the worts used, the rate being 3 3/4d. per gallon when the specific gravity does not exceed 1,047, and increasing by 1/16d. per gallon for every unit of specific gravity up to 1,055, and by 1/8d. thereafter. The specific gravity of distilled water at 60° F. is taken as 1,000, and the specific gravity of the worts determined in relation thereto. On 2nd August, 1917, the minimum rate of duty for beer was increased from 3 3/4d. to 4 3/4d. per gallon, and further (on 15th September, 1917) to 5 3/4d. with a maximum of 6d. per gallon
On 2nd August, also, as part of the scheme of additional war taxation, further increases were made in the rates of duties to be levied on certain items of import. These increases were somewhat more accentuated in some cases by the Finance Act, 1917, which received the assent of the Governor-General on the 15th September of that year. The new scale of duties for these items is shown in the following table:—
| Tariff Heading. | Rate of Duty. | |
|---|---|---|
| General. | Preferential. | |
| Fruits, preserved in juice or syrup | 25 per cent. ad valorem | 12 1/2 per cent. ad valorem. |
| Fruits, preserved in juice or syrup, fortified with alcohol to any extent exceeding 33 per cent. of proof spirit | 25 per cent. ad valorem, with an additional duty of 18s. the proof gallon of juice or syrup | 12 1/2 per cent. ad valorem. |
| Cordials, bitters, and liqueurs, when exceeding the strength of 33 per cent. of proof spirit, but not exceeding the strength of proof | 18s. the liquid gallon. | |
| Cordials, bitters, and liqueurs, when exceeding the strength of proof | 18s. the proof gallon. | |
| Spirits and spirituous mixtures, the strength of which can be ascertained by Sykes's hydrometer or other instrument | 18s. the proof gallon. | |
| (No allowance beyond 16.5 underproof shall be made for spirits or spirituous mixtures of a less strength than 16.5 underproof.) | ||
| Spirits and spirituous mixtures, sweetened, not otherwise enumerated, when not exceeding the strength of proof | 18s. the liquid gallon. | |
| Spirits and spirituous mixtures, sweetened, not otherwise enumerated, when exceeding the strength of proof (Spirits and spirituous mixtures, in bottles, or jars in cases, shall be charged as follows:—viz., two gallons and under as two gallons; over two gallons and not exceeding three as three gallons; over three gallons and not exceeding four as four gallons; and so on for any greater quantity contained in any case: provided that with the sanction of the Collector the foregoing restriction need not be applied to absolute alcohol, spirits of wine, spirits for scientific, medicinal, perfumery, or toilet purposes, or to trade samples.) | 18s. the proof gallon. | |
| Spirits and spirituous mixtures, containing, more then 33per cent. of proof spirit, in combination with other ingredients, and although thereby coming under any other designation excepting medicinal preparations otherwise enumerated | 18s. the proof gallon. | |
| Wine of any kind containing more than 40 per cent. of proof spirit | 18s. the liquid gallon. | |
| Wine, sparkling, containing not more than 40 per cent of proof spirit; the gallon, or for six reputed quart bottles, or the equivalent in bottles of a larger or smaller reputed quantity | 15s. the gallon. | |
| Essences, flavouring, containing more than 33 per cent. of proof spirit | 18s. the liquid gallon. | |
| Cigars, including the weight of every band, wrapper, or attachment to any cigar | 12s. the pound. | |
| Snuff | 12s. the pound. | |
| Cigarettes, not exceeding in weight 2 1/2 lb. per 1,000 | 25s. 6d. the 1,000. | |
| Cigarettes not otherwise enumerated | 10s. 6d. the pound. | |
| Tea not otherwise enumerated | 5d. the pound | 2d. the pound. |
| Tea, in bulk—viz., in packages of 5lb. or over net weight of tea | 3d. the pound | 2d. the pound. |
| All articles not otherwise enumerated, made of textile, felt, or other piece-goods, or of any combination of the same, wholly or partly made up or manufactured, and not being apparel or clothing either wholly or partly made up | 20 per cent. ad valorem | 10 per cent. ad valorem. |
| Drapery not otherwise enumerated | 20 per cent. ad valorem | 10 per cent. ad valorem. |
| Flags | 20 per cent. ad valorem | 10 per cent. ad valorem. |
| Haberdashery not otherwise enumerated | 20 per cent. ad valorem | 10 per cent. ad valorem. |
| Lace, and laces not otherwise enumerated | 20 per cent. ad valorem | 10 per cent. ad valorem. |
| Ribbons and crape, all kinds | 20 per cent. ad valorem | 10 per cent. ad valorem. |
| Rugs, woollen, cotton, opossum, or other | 20 per cent. ad valorem | 10 per cent. ad valorem. |
| Textile piece-goods not otherwise enumerated, including silks, satins, velvets, plushes, not otherwise enumerated, composed of pure silk, or of silk mixed with any other material, in the piece, and including also imitation silks composed of any material or substance whatsoever | 20 per cent. ad valorem | 10 per cent. ad valorem. |
| Umbrellas, parasols, and sunshades | 20 per cent. ad valorem | 10 per cent ad valorem |
| Yarns not otherwise enumerated | 20 per cent. ad valorem | 10 per cent. ad valorem |
| Apparel, and ready-made clothing, not otherwise enumerated | 25 per cent. ad valorem | 12 1/2 per cent. ad valorem. |
| Feathers, ornamental (including ostrich); artificial flowers, leaves, and sprays | 25 per cent. ad valorem | 12 1/2 per cent. ad valorem. |
| Furs, and fur trimmings | 25 per cent. ad valorem | 12 1/2 per cent. ad valorem. |
| Hats of all kinds (including straw hats), also caps | 25 per cent. ad valorem | 12 1/2 per cent. ad valorem. |
| Hosiery not otherwise enumerated | 25 per cent. ad valorem | 12 1/2 per cent. ad valorem. |
| Millinery of all kinds, including trimmed hats, caps, and bonnets | 25 per cent. ad valorem | 12 1/2 per cent. ad valorem. |
| Apparel made to the order or measurement of residents in New Zealand and intended for the individual use of such residents, whether imported by the residents themselves or otherwise | 40 per cent. ad valorem | 20 per cent. ad valorem. |
| Apparel—viz, Volunteer clothing made to measurements sent from New Zealand | 40 per cent. ad valorem | 20 per cent. ad valorem. |
Of the above items, that which most nearly concerns the people as a whole is tea. The previous rate for tea was (in bulk) free from British possessions, with a preferential surtax of 2d. per pound on the produce of foreign countries. Tea in packages of under 5 lb. was previously 2d. per pound with a preferential rate of a further 2/5d.
The rates of duty levied by the tariff now in force are divided into two classes, specific and ad valorem. The specific class includes 18s. per gallon on spirits; 30s. per gallon on perfumed spirits; 12s. per pound on cigars and snuff; 25s. 6d. per 1,000, of 2 1/2 lb. and under, on cigarettes; also 3s. 6d. per pound on manufactured and 2s. on unmanufactured tobacco. Sparkling vine is charged 15s. a gallon; Australian, 5s; other kinds, 6s; ale and beer, 2s. The duty on cocoa, chocolate, chicory, and roasted coffee is 3d. per pound. Opium is charged 40s. per pound; but this article, in a form suitable for smoking, cannot now be legally imported. Ad valorem duties range from 5 to 40 per cent. on the value of the goods, 20 per cent. being the commonest rate.
In addition to the beer duty referred to above there are also excise duties of 1s. per pound on tobacco; 4s. per pound on cigars and snuff; 9d. per pound on medicinal preparations (with exceptions) containing more than 50 per cent. of proof spirit, which, if less than 50 per cent., would be free. Toilet preparations subject to 18s. per liquid gallon on importation are charged 14s. the liquid gallon, or when subject to 25 per cent. duty, 6s. per gallon. Other excise duties are 14s. per gallon on culinary and flavouring essences, and 20s. on perfumed spirits. The excise duty on cigarettes made in New Zealand is now (from the 15th September, 1917) 5s. 6d. per pound on machine-made and 4s. per pound on hand-made cigarettes. All packages of manufactured tobacco must be labelled before leaving the manufactory, and it is necessary to obtain warrants to use cutting-machines for cutting duty-paid manufactured tobacco for sale (or to be used in the manufacture of cigarettes by hand), and to manufacture cigarettes by hand, under certain conditions. .
In the earlier years of New Zealand's history the revenue derived from Customs and excise duties produced a greater proportion of the revenue than it does to-day. There has been a constant tendency for this proportion to decrease, and the table given below will show that, even in the last twenty years, this tendency has been very noticeable.
AMOUNT OF CUSTOMS AND EXCISE REVENUE , EXPRESSED AS A PERCENTAGE OF THE TOTAL TAXATION AND TOTAL REVENUE OF NEW ZEALAND .
| Year ending 31st March. | Total Taxation. | Total Revenue. | Customs and Excise Duties. | ||
|---|---|---|---|---|---|
| Amount. | Percentage of Total Revenue. | Percentage of Total Taxation. | |||
| £ | £ | £' | Per Cent. | Per Cent. | |
| 1900 | 5,699,618 | 2,891,126 | 2,187,859 | 38.39 | 75.67 |
| 1901 | 5,906,916 | 3,042,890 | 2,266,032 | 38.36 | 74.47 |
| 1902 | 6,152,839 | 3,113,079 | 2,291,349 | 37.24 | 73.61 |
| 1903 | 6,447,435 | 3,277,964 | 2,426,043 | 37.63 | 74.01 |
| 1904 | 7,130,117 | 3,649,601 | 2,698,046 | 37.84 | 73.93 |
| 1905 | 7,347,197 | 3,754,379 | 2,728,193 | 37.13 | 72.67 |
| 1906 | 7,650,098 | 3,841,596 | 2,795,546 | 36.54 | 72.77 |
| 1907 | 8,478,957 | 4,264,555 | 3,048,622 | 35.96 | 71.49 |
| 1908 | 9,063,989 | 4,645,754 | 3,217,538 | 35.50 | 69.26 |
| 1909 | 9,001,185 | 4,377,761 | 2,917,462 | 32.41 | 66.64 |
| 1910 | 9,238,917 | 4,180,516 | 2,786,490 | 30.16 | 65.63 |
| 1911 | 10,297,273 | 4,837,322 | 3,145,929 | 30.55 | 65.03 |
| 1912 | 11,061,161 | 5,296,590 | 3,398,143 | 30.72 | 64.16 |
| 1913 | 11,734,276 | 5,606,829 | 3,531,761 | 30.10 | 62.99 |
| 1914 | 12,229,661 | 5,918,034 | 3,553,785 | 29.06 | 60.05 |
| 1915 | 12,451,945 | 5,880,811 | 3,294,943 | 26.46 | 56.03 |
| 1916 | 14,507,530 | 7,266,966 | 3,524,063 | 24.29 | 48.49 |
| 1917 | 18,355,194 | 10,549,654 | 4,037,628 | 22.00 | 38.27 |
| 1918 | 20,206,222 | 12,340,853 | 3,601,383 | 17.82 | 29.18 |
| 1919 | 22,352,372 | 13,801,643 | 4,104,749 | 18.37 | 29.74 |
Though the Customs revenue has increased greatly, the table shows that other forms of taxation and other sources of revenue have increased still faster, so that the proportion of taxation and of revenue furnished by the Customs duties constantly decreases. This relative decrease has been due in part to the extension of the governmental services in the Dominion increasing the revenue apart from taxation, to the greater use of direct taxation, and to the remissions and reductions of duty which have been made from time to time. These reductions have been mainly in foodstuffs, so that the tariff has tended towards the ideal of a free breakfast-table. War conditions necessitated in 1917 a partial reversal of this principle whereby non-alcoholic beverages again became the subject of taxation. The increase in the revenue received during 1918 over that received during 1917, a difference amounting to £104,509, is the direct outcome of this.
The tables hereunder show the amounts and percentages collected at intervals of five years, 1891-1911, and in each year since 1911, in respect of (1) foods and non-alcoholic drinks, (2) clothing and textiles, (3) alcoholic drinks and tobacco, and (4) all other articles. Excise duties on alcoholic liquors, tobacco, &c., are not included.
| Year. | Amount of Duty derived from | Total. | |||
|---|---|---|---|---|---|
| Foods and Non-alcoholic Drinks. | Clothing and Textiles. | Alcoholic Drinks and Tobacco. | All other Articles. | ||
| £ | £ | £ | £ | £ | |
| 1891 | 312,809 | 276,072 | 651,680 | 320,141 | 1,560,702 |
| 1896 | 329,622 | 322,947 | 715,019 | 400,264 | 1,767,852 |
| 1901 | 321,625 | 434,112 | 928,176 | 512,853 | 2,196,766 |
| 1906 | 369,964 | 610,873 | 1,130,837 | 787,429 | 2,899,103 |
| 1911 | 147,456 | 682,710 | 1,286,601 | 1,048,890 | 3,165,657 |
| 1912 | 158,077 | 708,853 | 1,395,837 | 1,072,952 | 3,335,719 |
| 1913 | 146,938 | 790,862 | 1,408,977 | 1,078,649 | 3,425,426 |
| 1914 | 165,998 | 822,373 | 1,459,464 | 906,780 | 3,354,615 |
| 1915 | 155,292 | 727,869 | 1,515,903 | 745,264 | 3,144,328 |
| 1916 | 170,009 | 985,335 | 1,390,322 | 1,036,227 | 3,581,893 |
| 1917 | 174,430 | 794,443 | 1,397,267 | 805,400 | 3,171,540 |
| 1918 | 278,939 | 935,203 | 1,342,443 | 801,953 | 3,358,538 |
| PERCENTAGE OF EACH CLASS TO THE TOTAL DUTY COLLECTED . | ||||
|---|---|---|---|---|
| Year. | Percentage of Total Duty collected on | |||
| Foods and Non-alcoholic Drinks. | Clothing and Textiles. | Alcoholic Drinks and Tobacco. | All other Articles. | |
| Per Cent. | Per Cent. | Per Cent. | Per Cent. | |
| 1891 | 20.05 | 17.69 | 41.75 | 20.51 |
| 1896 | 18.64 | 18.27 | 40.45 | 22.64 |
| 1901 | 14.64 | 19.76 | 42.25 | 23.35 |
| 1906 | 12.76 | 21.07 | 39.01 | 27.16 |
| 1911 | 4.66 | 21.57 | 40.64 | 33.13 |
| 1912 | 4.74 | 21.25 | 41.84 | 32.17 |
| 1913 | 4.29 | 23.09 | 41.13 | 31.49 |
| 1914 | 4.95 | 24.51 | 43.51 | 27.03 |
| 1915 | 4.94 | 23.15 | 48.21 | 23.70 |
| 1916 | 4.75 | 27.51 | 38.81 | 28.93 |
| 1917 | 5.50 | 25.05 | 44.06 | 25.39 |
| 1918 | 8.31 | 27.84 | 39.97 | 23.88 |
The total taxation on imports in 1917 was £454,608 less than in 1916. Most of the items showed decreases when compared with 1916, the only items showing increases being wine, cigars, cigarettes and snuff, tobacco, opium, and tea.
In the 1918 figures relating to the revenue received from imports the effects of the new tariff reveal themselves in the general increase over the preceding year of £217,761, the principal items affected being non-alcoholic beverages.
The Customs and excise duties received during the last five years are shown in detail in the table given below, which also shows the rate of revenue per head of mean population, inclusive and exclusive of Maoris, for each year considered.
| CUSTOMS AND EXCISE REVENUE , 1914-18. | |||||
|---|---|---|---|---|---|
| — | 1914. | 1915. | 1916. | 1917. | 1918. |
* Minus quantity. † Parcels-post included under respective heads for these years. | |||||
| Customs Duties. | £ | £ | £ | £ | £ |
| Spirits | 712,446 | 762,694 | 665,182 | 659,477 | 522,401 |
| Wine | 41,796 | 42,258 | 34,950 | 35,812 | 31,698 |
| Ale, beer, &c.. | 29,285 | 26,005 | 22,932 | 8,063 | 3,237 |
| Cigars, cigarettes, and snuff | 247,144 | 258,494 | 262,695 | 287,777 | 369,817 |
| Tobacco | 425,455 | 423,435 | 401,598 | 403,591 | 413,226 |
| Coffee, cocoa, &c.. | 7,636 | 10,214 | 9,062 | 3,261 | 8,012 |
| Tea | 796 | 574 | 623 | 36,651 | 129,145 |
| Opium | 18 | 22 | 17 | 21 | 29 |
| Other goods by weight | 217,655 | 190,121 | 195,351 | 141,089 | 144,356 |
| Other goods ad valorem | 1,526,774 | 1,315,611 | 1,854,262 | 1,498,805 | 1,613,908 |
| Other duties | 145,610 | 114,901 | 135,221 | 96,993 | 122,709 |
| Parcels-post | † | † | † | † | † |
| Primage | .. | 46,576 | 241,118 | 196,863 | 227,626 |
| Surtax | 1 | *22 | .. | .. | |
| Totals, Customs duties | 3,354,616 | 3,190,883 | 3,823,011 | 3,368,403 | 3,586,164 |
| Excise Duties. | |||||
| Tinctures—New Zealand | 7,504 | 7,815 | 8,557 | 9,892 | 12,078 |
| Cigars, cigarettes, and snuff —New-Zealand-manufactured | |||||
| 298 | 331 | 399 | 543 | 866 | |
| Tobacco — New - Zealand manufactured | |||||
| 488 | 583 | 1,452 | 3,478 | 1,745 | |
| Beer—New Zealand | 129,453 | 137,225 | 189,671 | 219,594 | 261,536 |
| Totals, excise duties | 137,743 | 145,954 | 200,079 | 233,507 | 276,225 |
| Revenue from Customs duties per head of mean population (excluding Maoris) | £ s. d. | £ s. d. | £ s. d. | £ s. d. | £ s. d. |
| 3 1 6 | 2 18 1 | 3 9 6 | 3 1 4 | 3 5 0 | |
| Ditto (including Maoris) | 2 18 10 | 2 15 6 | 3 6 6 | 2 18 8 | 3 2 3 |
| Revenue from excise duties per head of mean population (excluding Maoris) | |||||
| 0 2 6.3 | 0 2 7.9 | 0 3 7.7 | 0 4 2.9 | 0 5 0.1 | |
| Ditto (including Maoris) | 0 2 5.0 | 0 2 6.5 | 0 3 5.8 | 0 4 0.8 | 0 4 9.5 |
The increasing Customs revenue shown in the pre-war years suffered, a check in 1914, followed by further diminution in 1915. Since then the tendency has been a fluctuating one, owing to the modifications in the tariff, but with a general tendency to rise.
The following table furnishes a general view of the ratio of Customs revenue to imports since 1895, which is taken as the base year:—
| Year. | Imports. | Revenue. | Percentage of Revenue on Total Imports. | Index Numbers of Customs Revenue compared with Imports. | |||
|---|---|---|---|---|---|---|---|
| Value. | Value per Head. | Amount. | Actual Value per Head. | Value per Head at 1895 Ratio. | |||
| * Imports are given exclusive of gold. | |||||||
| £ | £ s. d. | £ | £ s. d. | £ s. d. | Per Cent. | ||
| 1895 | 6,400,129 | 9 4 10 | 1,619,970 | 2 6 9 | 2 6 9 | 25.31 | 1000 |
| 1896 | 7,137,320 | 10 1 11 | 1,765,073 | 2 9 11 | 2 11 1 | 24.73 | 977 |
| 1897 | 8,055,223 | 11 3 3 | 1,912,161 | 2 13 0 | 2 16 6 | 23.74 | 938 |
| 1898 | 8,230,600 | 11 3 7 | 1,961,726 | 2 13 3 | 2 16 7 | 23.83 | 942 |
| 1899 | 8,739,633 | 11 13 1 | 2,042,002 | 2 14 5 | 2 19 0 | 23.36 | 923 |
| 1900 | 10,646,096 | 13 18 10 | 2,170,354 | 2 16 10 | 3 6 4 | 20.39 | 805 |
| 1901 | 11,817,915 | 15 3 10 | 2,191,798 | 2 16 4 | 3 16 11 | 18.55 | 733 |
| 1902 | 11,326,723 | 14 3 11 | 2,285,043 | 2 17 3 | 3 11 10 | 20.17 | 797 |
| 1903 | 12,788,675 | 15 11 10 | 2,501,896 | 3 1 0 | 3 18 11 | 19.56 | 773 |
| 1904 | 13,291,694 | 15 14 7 | 2,650,189 | 3 0 9 | 3 19 8 | 19.94 | 788 |
| 1905 | 12,828,857 | 14 14 11 | 2,652,666 | 3 1 0 | 3 14 8 | 20.68 | 817 |
| 1906 | 15,211,403 | 16 19 8 | 2,899,103 | 3 4 9 | 4 6 0 | 19.06 | 753 |
| 1907 | 17,302,861 | 18 16 6 | 3,079,422 | 3 7 0 | 4 15 4 | 17.80 | 703 |
| 1908 | 17,471,284 | 18 9 9 | 2,903,086 | 3 1 5 | 4 13 7 | 16.62 | 656 |
| 1909 | 15,674,719 | 16 2 7 | 2,653,617 | 2 14 7 | 4 1 8 | 16.93 | 669 |
| 1910 | 17,051,583 | 17 3 6 | 2,954,989 | 2 19 6 | 4 6 11 | 17.33 | 685 |
| 1911 | 19,545,879 | 19 5 2 | 3,165,657 | 8 2 5 | 4 9 2 | 16.20 | 640 |
| 1912 | 20,976,574 | 20 3 9 | 3,335,719 | 3 4 3 | 5 2 2 | 15.90 | 628 |
| 1913 | 22,288,302 | 20 17 1 | 3,425,426 | 3 4 1 | 5 5 7 | 15.37 | 607 |
| 1914 | 21,856,096 | 20 0 11 | 3,354,616 | 3 1 6 | 5 1 6 | 15.35 | 606 |
| 1915 | 21,728,834 | 19 15 2 | 3,190,883 | 2 18 1 | 5 0 1 | 14.68 | 580 |
| 1916 | 26,339,283 | 23 19 2 | 3,823,011 | 3 9 6 | 6 1 4 | 14.51 | 573 |
| 1917* | 20,919,259 | 19 0 8 | 3,368,403 | 3 1 3 | 4 16 4 | 16.10 | 636 |
| 1918* | 24,233,944 | 21 19 5 | 3,586,164 | 3 5 0 | 5 11 2 | 14.80 | 585 |
With regard to the above table, it may be explained that the figures-given in the column "Value per head at 1895 ratio "indicate the amount of revenue per head of population which would have been obtained had the same high ratio of Customs taxation been levied as prevailed in 1895. The last two columns in the table show clearly the substantial decline in the proportion which the Customs revenue bears to the value of the imports.
With slight interruptions in 1902, 1905, 1909, 1910, 1914, 1915, and 1917 the imports increased annually in both total and per capita values, until in 1918 the total was roughly four times as much as that of 1895.
In the same period the Customs revenue has considerably more than doubled, whilst the advance in population was only about 60 per cent. It is plain, therefore, that the Customs taxation per head has been increasing steadily in sympathy with the greater imports, and in spite of a steady movement towards diminishing the relative duty payable.
In 1895 the proportion of revenue to the total imports was one-fourth; in 1918 it had fallen to nearly one-seventh. The tariff of 1903 and the further changes made in 1907, together with the financial circumstances of 1908, may account for such interruptions as are noticeable in this generally steady diminution. As will be seen later in this subsection, duty-free goods are, in recent years, being imported more rapidly than those on which duty is levied.
| Class. | Items. | Articles. | Revenue collected. | ||
|---|---|---|---|---|---|
| General. | Additional Preferential. | Total. | |||
| £ | £ | £ | |||
| I | 1-41 | Foodstuffs of animal origin (excluding live animals) | 42,586 | 2,980 | 45,566 |
| II | 42-137 | Foodstuffs of vegetable origin, and common salt | 88,589 | 5,686 | 94,275 |
| III | 138-150 | Beverages (non-alcoholic) and substances used in making up the same | 126,438 | 12,660 | 139,098 |
| IV | 151-167 | Spirits and alcoholic liquors | 559,392 | 8 | 559,400 |
| V | 168-173 | Tobacco and preparations thereof | 783,043 | .. | 783,043 |
| VI | 174-186 | Live animals | 28 | .. | 28 |
| VII | 187-207 | Animal substances (mainly unmanufactured), not being foodstuffs | 256 | 13 | 269 |
| VIII | 208-233 | Vegetable substances and non-manufactured fibres | 3,261 | 1,902 | 5,163 |
| IXA | 234-262 | Apparel | 545,764 | 72,954 | 618,718 |
| IXB | 263-291 | Textiles | 243,558 | 60,708 | 304,266 |
| IXC | 292-309 | Manufactured fibres | 10,969 | 1,250 | 12,219 |
| X | 310-344 | Oils, fats, and waxes | 60,286 | 8,040 | 68,326 |
| XI | 345-355 | Paints and varnishes | 12,163 | 1,494 | 13,657 |
| XII | 356-372 | Stones and minerals used industrially | 1,573 | .. | 1,573 |
| XIII | 373-375 | Specie | .. | .. | .. |
| XIVA | 376-405 | Metal, unmanufactured, partially manufactured, and ores | .. | 1,317 | 1,317 |
| XIVB | 406-495 | Metal manufactures, other than machinery and machines | 95,992 | 24,258 | 120,250 |
| XV | 496-572 | Machinery and machines | 56,425 | 25,123 | 81,548 |
| XVIA | 573-576 | Indiarubber and manufactures thereof (not including tires) | 74 | 885 | 959 |
| XVIB | 577-603 | Leather and manufactures thereof (including substitutes) | 12,430 | 1,604 | 14,034 |
| XVIIA | 604-641 | Timber | 6,511 | .. | 6,511 |
| XVIIB | 642-661 | Wood, cane, and wicker manufactures | 8,069 | 1,512 | 9,581 |
| XVIII | 662-683 | Earthenware, china, glass, stoneware, cements, and cement materials | 24,275 | 5,380 | 29,655 |
| XIXA | 684-696 | Paper | 3,447 | 5,703 | 9,150 |
| XIXB | 697-711 | Stationery | 34,612 | 4,294 | 38,906 |
| XX | 712-722 | Jewellery, timepieces, and fancy goods | 75,273 | 15,321 | 90,594 |
| XXI | 723-734 | Optical, surgical, and scientific instruments | 2,031 | 5,085 | 7,116 |
| XXIIA | 735-791 | Drugs, chemicals, and druggists' wares | 71,611 | 12,402 | 84,013 |
| XXIIB | 792-810 | Manures | .. | .. | .. |
| XXIII | 811-903 | Miscellaneous | 156,334 | 62,969 | 219,303 |
| Totals | 3,024,990 | 333,548 | 3,358,538 | ||
Rather less than one-fifth of the Customs revenue collected during 1918 was furnished by spirits and alcoholic liquors (£559,400). Although in previous years this class has furnished more of the Customs revenue than any other item, it has been surpassed in 1918 by both tobacco (£783,043) and apparel (£618,718).
Two classes (manures and specie) are entirely duty-free, and a good number contribute very little to the revenue. The additional surtax on foreign goods by which New Zealand extends preference to British imports produces most revenue from the items comprised in Classes IXA , IXB , XIVB , and XV, and to a. less degree from those in the miscellaneous class, and from fancy goods, non-alcoholic beverages, and drugs. The total surtax, however, compared with the revenue derived from the general tariff, does not amount to a very large sum, and in 1918 was less than 10 per cent. of the total duties.
The main item from which excise revenue is derived is beer, which, however, pays only a few pence per gallon, as against the import duty of 2s. per gallon, so that the quantity of beer brewed in New Zealand is very much greater than the quantity imported. There are, besides, small but growing manufactures of tinctures and of tobacco which yield a certain amount of excise revenue. The following table shows the amounts of duty collected in respect of these manufactures during the past five years:—
| EXCISE DUTIES , 1914-18 | |||||
|---|---|---|---|---|---|
| Item. | 1914. | 1915. | 1916. | 1917. | 1918. |
| £ | £ | £ | £ | £ | |
| Beer | 129,453 | 137,225 | 189,671 | 219,594 | 261,536 |
| Culinary and flavouring essences, spirituous | 3,514 | 3,402 | 4,167 | 4,096 | 4,552 |
| Medicinal preparations over 50 per cent. proof spirit | 2,946 | 3,097 | 2,915 | 3,181 | 4,907 |
| Perfumed spirits | 924 | 1,117 | 1,439 | 2,430 | 2,331 |
| Toilet preparations | .. | .. | .. | .. | .. |
| Toilet preparations spirituous | 120 | 199 | 36 | 185 | 288 |
| Cigarettes made by hand | 23 | .. | .. | .. | .. |
| Cigarettes manufactured by machinery | .. | .. | .. | .. | .. |
| Cigars and snuff | 275 | 331 | 399 | 543 | 866 |
| Tobacco, manufactured | 488 | 583 | 1,452 | 3,478 | 1,745 |
| Totals | 137,743 | 145,954 | 200,079 | 233,507 | 276,225 |
The next table gives the imports of free and dutiable goods arranged according to the statistical classification. The main features of the table are the overwhelming proportion of dutiable goods in the classes containing beverages (both alcoholic and non-alcoholic), tobacco, animal products, paints and varnishes, and apparel, and the high proportion of free goods in stones and minerals (mainly coal), specie, raw metals, paper, and manures.
| FREE AND DUTIABLE GOODS BY CLASSES , 1918. | ||||||
|---|---|---|---|---|---|---|
| No. | Class. | Value of Imports. | Duty collected. | Percentage of Total. | ||
| Free. | Dutiable. | Free. | Dutiable. | |||
| * Exclusive of gold. | ||||||
| £ | £ | £ | Per Cent. | Per Cent. | ||
| I | Foodstuffs of animal origin (excluding live animals) | 15 | 270,098 | 45,566 | 0.01 | 99.99 |
| II | Foodstuffs of vegetable origin, and common salt | 2,170,474 | 605,518 | 94,275 | 78.19 | 21.81 |
| III | Beverages (non-alcoholic) and substances used in making the same | 55,854 | 480,724 | 139,098 | 10.41 | 89.59 |
| IV | Spirits and alcoholic liquors | 644 | 947,829 | 559,400 | 0.07 | 99.93 |
| V | Tobacco and preparations thereof | 8 | 690,916 | 783,043 | 0.001 | 99.999 |
| VI | Live animals | 4,402 | 12,495 | 28 | 26.05 | 73.95 |
| VII | Animal substances (mainly manufactured) not being foodstuffs | 28,224 | 2,526 | 269 | 91.79 | 8.21 |
| VIII | Vegetable substances and non-manufactured fibres | 526,228 | 33,568 | 5,163 | 94.00 | 6.00 |
| IXA | Apparel | 466,843 | 2,375,974 | 618,718 | 16.43 | 83.57 |
| IXB | Textiles | 2,736,875 | 1,288,615 | 304,266 | 67.99 | 32.01 |
| IXC | Manufactured fibres | 399,906 | 58,250 | 12,219 | 87.29 | 12.71 |
| X | Oils, fats, and waxes | 1,250,554 | 336,811 | 68,326 | 78.78 | 21.22 |
| XI | Paints and varnishes | 28,363 | 201,014 | 13,657 | 12.36 | 87.64 |
| XII | Stones and minerals used Industrially | 222,261 | 6,299 | 1,573 | 97.25 | 2.75 |
| XIII | Specie* | 102,215 | .. | .. | 100.00 | .. |
| XIVA | Metal, unmanufactured, partially manufactured, and ores* | 177,885 | 6,388 | 1,317 | 96.54 | 3.46 |
| XIVB | Metal manufactures, other than machines and machinery | 927,359 | 639,359 | 120,250 | 59.19 | 40.81 |
| XV | Machinery and machines | 472,265 | 428,888 | 81,548 | 52.41 | 47.59 |
| XVIA | Indiarubber and manufactures thereof (not including tires) | 60,808 | 4,887 | 959 | 92.56 | 7.44 |
| XVIB | Leather and manufactures thereof (including substitutes) | 205,928 | 148,329 | 14,034 | 58.13 | 41.87 |
| XVIIA | Timber | 70,522 | 82,003 | 6,511 | 46.24 | 53.76 |
| XVIIB | Wood, cane, and wicker manufactures | 31,414 | 39,769 | 9,581 | 44.13 | 55.87 |
| XVIII | Earthenware, china, glass, stoneware, cements, and cement materials | 117,379 | 121,582 | 29,655 | 49.12 | 50.88 |
| XIXA | Paper | 494,088 | 53,050 | 9,150 | 90.33 | 9.67 |
| XIXB | Stationery | 326,706 | 161,346 | 38,906 | 66.94 | 33.06 |
| XX | Jewellery, timepieces, and fancy goods | 90,579 | 382,869 | 90,594 | 19.13 | 80.87 |
| XXI | Optical, surgical, and scientific instruments | 257,979 | 53,957 | 7,116 | 82.70 | 17.30 |
| XXIIA | Drugs, chemicals, and druggists' wares | 646,031 | 348,142 | 84,013 | 64.98 | 35.02 |
| XXIIB | Manures | 267,323 | .. | .. | 100.00 | .. |
| XXIII | Miscellaneous | 1,227,580 | 1,086,026 | 219,303 | 53.06 | 46.94 |
| Totals | 13,366,712 | 10,867,232 | 3,358,538 | 55.15 | 44.85 | |
By classifying the different rates of duty as is done in the following table it will be found that even if specie is excluded, on the average rather over half the imports into New Zealand are duty-free, while the value of goods which are liable to specific duties is about one-seventh. The most usual ad valorem rates are 20 per cent. and 25 per cent. the 15-per-cent. figures are composed mainly of the imports of boots, while the 30-per-cent. figures consist of the value of goods which are liable to 20 per cent. general duty plus an additional preferential duty of 10 per cent.
| Rate of Duty. | 1914. | 1915. | 1916. | 1917. | 1918. |
|---|---|---|---|---|---|
| £ | £ | £ | £ | £ | |
| Free (excluding specie) | 11,356,092 | 11,819,569 | 12,789,639 | 11,301,521 | 13,264,496 |
| Specific duties | 3,208,506 | 3,007,981 | 3,742,150 | 2,995,395 | 4,243,319 |
| Ad valorem duties— | |||||
| 5 per cent. | 69,380 | 58,321 | 57,683 | 28,524 | 29,255 |
| 10 per cent. | 126,793 | 321,028 | 583,390 | 387,617 | 353,163 |
| 14 11/20 per cent. | .. | .. | 4 | .. | .. |
| 15 per cent. | 360,722 | 316,684 | 303,043 | 282,475 | 350,902 |
| 19 2/5 per cent. | 123 | 81 | 173 | 271 | 516 |
| 20 per cent. | 3,422,382 | 3,035,260 | 4,713,363 | 3,042,690 | 2,673,710 |
| 22 1/2 per cent. | 51,059 | 41,291 | 69,854 | 69,137 | 85,123 |
| 24 per cent. | 71,173 | 63,240 | 51,875 | 9,883 | 21,623 |
| 24 1/4 per cent. | 79 | 52 | 269 | 173 | 50 |
| 25 per cent. | 2,012,502 | 1,730,835 | 2,262,780 | 1,478,009 | 1,561,701 |
| 30 per cent. | 664,592 | 459,082 | 649,149 | 1,062,883 | 1,412,273 |
| 33 3/4 per cent. | 4,467 | 3,958 | 7,772 | 12,787 | 8,630 |
| 37 1/2 per cent. | 110,903 | 93,102 | 135,303 | 380,824 | 515,354 |
| 40 per cent. | 6,668 | 4,119 | 3,862 | 2,788 | 2,292 |
| 60 per cent. | .. | .. | .. | 62 | 104 |
| 6,900,843 | 6,116,044 | 8,838,520 | 6,758,113 | 7,014,696 | |
| Specie | 711,869 | 1,070,114 | 1,293,880 | 177,135 | 102,215 |
| Totals | 21,856,096 | 21,728,834 | 26,339,283 | 20,919,259 | 24,233,944 |
The value of boots imported is included under both specific and ad valorem duties: 1914, £321,214; 1915, £295,883; 1916, £324,906; 1917, £312,905; 1918, £390,782.
As already stated, general tariff revisions were made in 1895 and 1907. The table following shows for the years immediately preceding and following these changes, and for 1918, the value of free and dutiable imports, the percentage admitted free of duty, and the duty per cent. on dutiable imports and on all merchandise imported:—
| — | 1894. | 1896. | 1906. | 1908. | 1918. |
|---|---|---|---|---|---|
| * Including excise duties levied on certain imports manufactured in bond. | |||||
| Merchandise— | £ | £ | £ | £ | £ |
| Free | 1,871,772 | 2,263,091 | 5,476,949 | 8,658,111 | 13,264,496 |
| Dutiable | 4,118,405 | 4,772,288 | 8,826,221 | 8,589,051 | 10,867,233 |
| Imports (less specie) | 5,990,177 | 7,035,379 | 14,303,170 | 17,247,162 | 24,131,729 |
| Percentage of free merchandise | Per Cent. | Per Cent. | Per Cent. | Per Cent. | Per Cent. |
| 31.25 | 32.17 | 38.29 | 50.20 | 54.97 | |
| £ | £ | £ | £ | £ | |
| Total net duty received* | 1,572,467 | 1,767,852 | 2,903,131 | 2,907,151 | 3,600,853 |
| Duty, per cent. of imports— | Per Cent. | Per Cent. | Per Cent. | Per Cent. | Per Cent. |
| (a.) On dutiable imports | 38.18 | 37.04 | 32.89 | 33.85 | 33.13 |
| (b.) On all merchandise | 26.25 | 25.13 | 20.30 | 16.86 | 14.92 |
The average rate levied on dutiable goods in 1918 was thus very slightly higher than before the tariff revision of 1907, although the average on all merchandise shows a decrease of roughly 25 per cent. The proportion of imported merchandise free of duty amounted to 54.97 per cent. in 1918, the corresponding figure for 1917 being 54.49 per cent., and for 1906, 38.29 per cent.
There has been a reciprocal arrangement with British South Africa since 1907, by which New Zealand admits certain goods, mainly wine and tobacco, at reduced rates of duty, in return for similar concessions granted by the South African Union. The following table shows the growth of trade since 1907:—
| Year. | Imports. | Exports. | |
|---|---|---|---|
| According to Country of Shipment. | According to Country of Origin. | ||
| * Not available. | |||
| £ | £ | £ | |
| 1907 | 1,067 | * | 63,717 |
| 1908 | 5,494 | * | 86,465 |
| 1909 | 6,221 | * | 121,931 |
| 1910 | 7,443 | * | 45,555 |
| 1911 | 9,936 | * | 43,755 |
| 1912 | 13,733 | * | 83,229 |
| 1913 | 7,796 | * | 61,651 |
| 1914 | 33,229 | 98,437 | 60,826 |
| 1915 | 42,654 | 55,826 | 11,279 |
| 1916 | 71,300 | 105,000 | 6,681 |
| 1917 | 56,392 | 98,538 | 1,588 |
| 1918 | 43,856 | 110,645 | 718 |
Prior to 1914 the figures for imports represent only the value of goods shipped from South Africa. In 1918 the value of imports produced there was £110,645. As a rule, very little of this trade, however, comes within the scope of the reciprocal treaty, as the following table showing imports from British South Africa (as country of origin) will reveal:—
| IMPORTS INTO NEW ZEALAND UNDER THE BRITISH SOUTH AFRICAN RECIPROCAL TARIFF . | |||||||
|---|---|---|---|---|---|---|---|
| Class. | Item. | Article. | 1914. | 1915. | 1916. | 1917. | 1918. |
| £ | £ | £ | £ | £ | £ | ||
| I | 11 | Fish, in airtight vessels | 232 | 162 | .. | .. | .. |
| II | 80 | Maize | 723 | 8,376 | 973 | .. | .. |
| IV | 166 | Wine, sparkling | .. | .. | 14 | 86 | 876 |
| 167 | Wine, still | 5,445 | 6,594 | 11,015 | 8,082 | 10,214 | |
| V | 168 | Cigarettes | 481 | 166 | 61 | 1 | .. |
| 169 | Cigars | .. | .. | .. | 1 | .. | |
| 171 | Tobacco, cut | 2,341 | 5,436 | 5,459 | 748 | 813 | |
| 172 | Tobacco, other | 102 | 18 | .. | .. | .. | |
| IXA | 234 | Apparel and ready-made clothing | 43 | 52 | 265 | 65 | 14 |
| 246 | Furs and fur trimmings | .. | .. | .. | 107 | 20 | |
| 253 | Hosiery | .. | .. | .. | .. | 3 | |
| 256 | Ornamental feathers— Ostrich n.o.e. | 462 | 711 | 687 | 282 | 62 | |
| 257 | Millinery, unenumerated | .. | .. | .. | .. | 3 | |
| IXB | 263 | Articles n.o.e., partly or wholly made up from textiles | .. | 1 | 4 | 3 | .. |
| 267 | Drapery n.o.e. | 9 | 22 | 37 | 46 | 22 | |
| 270 | Matting n.o.e. and mats | 1 | .. | 5 | 85 | 2 | |
| 283 | Piece-goods—Silks, &c.. | 1 | 2 | 3 | 3 | 3 | |
| 288 | Rugs, woollen | .. | 7 | 4 | .. | .. | |
| 289 | Rugs, other | 2 | 20 | 12 | 47 | .. | |
| XIVB | 422 | Hardware, hollow - ware, &c.. | .. | .. | 1 | .. | 122 |
| 456 | Plate and plated ware | .. | 1 | 21 | .. | 3 | |
| XVIB | 602 | Saddlery and harness n.o.e. | .. | .. | 6 | .. | .. |
| XVIII | 667 | China, porcelain, and Parian ware | .. | .. | .. | 1 | .. |
| XIXB | 698 | Books, papers, and music—Printed, n.o.e. | .. | .. | .. | .. | 14 |
| 699 | Calendars and show-cards | .. | .. | .. | .. | 10 | |
| 703 | Handbills, circulars, &c.. | 2 | 1 | 6 | 5 | 4 | |
| 709 | Pictures, paintings, and photographs n.o.e. | .. | .. | .. | 1 | 362 | |
| XX | 712 | Fancy goods and toys | 87 | 7 | 60 | 74 | 4 |
| 714 | Precious stones, unmounted | .. | .. | .. | .. | 60,395 | |
| 715 | Jewellery, other | 4 | 10 | 3 | 3 | .. | |
| 721 | Tobacco - pipes, cases, cigarette-papers, &c.. | .. | .. | .. | 8 | 1 | |
| XXII | 773 | Perfumery n.o.e | .. | .. | .. | 1 | .. |
| XXIII | 847 | Brushes, brushware, and brooms | .. | 2 | 4 | .. | 5 |
| 849 | Candles | .. | .. | .. | .. | 2,455 | |
Though the preferential tariff of New Zealand covers a considerable number of items, the amount of revenue obtained from it has only recently attained any importance. The following table shows the extent of the imports which are affected by preference, by giving the percentage of the total imports and of foreign imports so affected. It will be seen that the proportions have increased after the tariff changes of 1903, 1907, and 1917.
| IMPORTS AFFECTED BY PREFERENTIAL SURTAX . | ||||||
|---|---|---|---|---|---|---|
| Year. | Value of Imports. | Imports on which Surtax was paid. | Percentage of | |||
| Total. | British Empire. | Foreign Countries. | Total Imports. | Foreign Imports. | ||
| £ | £ | £ | £ | Per Cent. | Per Cent. | |
| 1903 | 12,788,675 | 10,648,142 | 2,140,533 | 1,752 | 0.01 | 00.08 |
| 1904 | 13,291,694 | 11,029,694 | 2,262,000 | 487,867 | 3.67 | 21.57 |
| 1905 | 12,828,857 | 10,709,642 | 2,119,215 | 599,764 | 4.68 | 28.30 |
| 1906 | 15,211,403 | 12,890,016 | 2,321,387 | 620,600 | 4.08 | 26.73 |
| 1907 | 17,302,861 | 14,942,183 | 2,360,678 | 658,027 | 3.98 | 27.87 |
| 1908 | 17,471,284 | 14,780,276 | 2,691,008 | 895,007 | 5.12 | 33.26 |
| 1909 | 15,674,719 | 13,554,962 | 2,119,757 | 842,407 | 5.37 | 39.74 |
| 1910 | 17,051,583 | 14,465,824 | 2,585,759 | 1,000,267 | 5.87 | 38.68 |
| 1911 | 19,545,879 | 16,497,340 | 3,048,539 | 1,159,342 | 5.93 | 38.03 |
| 1912 | 20,976,574 | 17,073,272 | 3,903,302 | 1,337,182 | 6.37 | 34.26 |
| 1913 | 22,288,302 | 18,348,249 | 3,940,053 | 1,325,057 | 5.95 | 33.63 |
| 1914 | 21,856,096 | 17,649,784 | 4,206,312 | 1,228,207 | 5.62 | 29.20 |
| 1915 | 21,728,834 | 17,727,137 | 4,001,697 | 1,321,853 | 6.08 | 33.03 |
| 1916 | 26,339,283 | 20,833,461 | 5,506,822 | 2,071,175 | 7.86 | 37.61 |
| 1917 | 20,919,259 | 15,591,302 | 5,327,957 | 2,251,428 | 10.77 | 42.26 |
| 1918 | 24,233,944 | 16,017,491 | 8,216,453 | 3,457,004 | 14.27 | 42.07 |
The system of recording imports was changed in 1914, and for that and subsequent years statistics are given of the countries of origin as well as the countries of shipment, so that it is now possible to got better comparisons of the value of goods produced each year in the various countries with which New Zealand trades. Previously the imports credited to any country were those shipped to New Zealand from that country, and it is evident that more foreign goods come into New Zealand than are shipped direct.
A list is attached of the principal items of import which are subject to the additional preferential tariff. Only the bigger items are included, and these are arranged in the statistical order followed elsewhere in this volume.
| PRINCIPAL ITEMS PAYING PREFERENTIAL SURTAX , 1918. | ||||||
|---|---|---|---|---|---|---|
| Class. | Item No. | Item. | Imports from | Surtax. | ||
| British Empire. | Foreign Countries. | Rate. | Amount. | |||
| £ | £ | £ | ||||
| I | 6 | Eggs, desiccated, white and yolk | .. | 3,455 | 10% | 346 |
| 7 | Eggs, liquid, white and yolk | 1,297 | 4,754 | 10% | 477 | |
| 11 | Fish, preserved in tins, &c.. | 98,968 | 32,821 | Various | 1,737 | |
| II | 41 | Provisions n.o.e. | 17,647 | 3,076 | 10% | 305 |
| Confectionery— | ||||||
| 48 | Chocolate, in fancy packages | 8,380 | 21,623 | 4% | 857 | |
| 52 | Unenumerated | 30,230 | 4,434 | 2/5d. lb. | 112 | |
| 58 | Foods for animals, n.o.e. | 19,332 | 2,181 | 10% | 221 | |
| 59 | Fruits, bottled and preserved in syrup | 41,139 | 39,303 | 12 1/2% | 3,930 | |
| 133 | Vegetables, dried and preserved | 424 | 2,247 | 10% | 121 | |
| III | 140 | Cocoa and chocolate | 13,619 | 43,030 | 3/5d. lb. | 1,044 |
| 149A | Tea in bulk | 344,800 | 65,333 | 2d. lb. | 11,318 | |
| VIII | 209 | Cork, cut | 180,081 | 18,633 | 10% | 1,886 |
| IXA | 234 | Apparel and ready-made clothing n.o.e. | 805,132 | 144,094 | 12 1/2% | 17,924 |
| Boots and shoes— | ||||||
| 239 | Goloshes and overshoes of rubber—Gymnasium, &c.. | 27,094 | 3,478 | 11 1/4% | 385 | |
| 244 | Other | 344,379 | 45,700 | Various | 4,810 | |
| 245 | Corsets | 43,812 | 19,560 | 12 1/2 % | 2,498 | |
| 246 | Furs and fur trimmings | 18,876 | 2,288 | 12% | 290 | |
| 247 | Gloves n.o.e. | 26,185 | 52,700 | 12% | 6,521 | |
| 250 | Haberdashery | 25,420 | 3,110 | 10% | 311 | |
| 251 | Hats and caps | 89,649 | 65,748 | 12 1/2% | 8,068 | |
| 253 | Hosiery | 222,174 | 89,182 | 12 1/2% | 10,777 | |
| 254 | Lace and laces n.o.e. | 41,104 | 70,601 | 10% | 7,054 | |
| 257 | Millinery, unenumerated | 72,255 | 18,662 | 12 1/2% | 2,378 | |
| 259 | Ribbons and crape | 3,039 | 111,063 | 10% | 10,879 | |
| IXB | 263 | Articles n.o.e., partly or wholly made up from textiles | 43,595 | 12,392 | 10% | 1,237 |
| 267 | Drapery n.o.e. | 121,023 | 82,670 | 10% | 7,954 | |
| 268 | Felt sheathing | 1,071 | 2,003 | 10% | 200 | |
| Piece-goods, cotton— | ||||||
| 275 | Butter and cheese cloth | 30,846 | 25,240 | 20% | 5,048 | |
| 277 | Tubular woven for meat-wraps | 83,254 | 15,131 | 20% | 3,026 | |
| 283 | Other silks, satins, velvets, &c.. | 31,547 | 436,717 | 10% | 42,120 | |
| 286 | Woollen, n.o.e., of pure or mixed wool | 374,487 | 4,997 | 10% | 649 | |
| 287 | Piece goods n.o.e. | 12,430 | 3,606 | 10% | 399 | |
| X | 311 | Axle-greases and other solid lubricants | 2,025 | 9,387 | 10% | 943 |
| 312 | Petroleum greases and mixtures with other substances n.o.e. | 3,022 | 2,845 | 10% | 283 | |
| Oils— | ||||||
| 325 | Mineral, lubricating | 9,383 | 159,946 | 1 1/8d. gal. | 6,678 | |
| 337 | Vegetable, other | 3,995 | 4,180 | 1 1/2d. gal. | 108 | |
| 339 | Stearine | 16,935 | 2,439 | 3/20d. lb. | 28 | |
| Paints and colours— | £ | £ | £ | |||
| XI | 348 | Ground in oil | 41,427 | 44,086 | 6d. cwt. | 349 |
| 350 | Other | 51,496 | 32,261 | 1s. cwt. | 421 | |
| 351 | Unenumerated | 14,628 | 5,187 | 10% | 518 | |
| 354 | Varnishes, lacquers, and goldsize, &c.. | 10,923 | 5,716 | 4 4/5d. gal. | 192 | |
| XIVA | 388 | Iron and steel | 47,135 | 6,388 | 20% | 1,317 |
| XIVB | 417 | Cutlery (including table forks and spoons) | 27,211 | 7,596 | 10% | 767 |
| 420 | Fire appliances | 1,212 | 3,226 | 10% | 323 | |
| 422 | Hardware, hollow - ware, ironmongery, n.o.e. | 98,407 | 68,194 | 10% | 6,651 | |
| Iron and steel— | ||||||
| 430 | Plate, sheet | 31,618 | 16,907 | 4 4/5d cwt. | 138 | |
| 431 | Plain, black | 16,242 | 14,326 | 20% | 2,425 | |
| 432 | Plain, galvanized | 5,920 | 34,444 | 3 3/5d. cwt. | 245 | |
| 436 | 6 in. and under in internal diameter | 110,208 | 12,244 | 20% | 2,466 | |
| 439 | lamps (not electric), lanterns, and lamp-wick | 12,930 | 21,139 | 10% | 2,073 | |
| Nails— | ||||||
| 452 | Horse-shoe | 6,209 | 4,656 | 1s. cwt. | 46 | |
| 455 | Other, including dog-spikes | 19,388 | 19,299 | 1s. cwt. | 682 | |
| 464 | Refrigerating-apparatus | 7,217 | 2,179 | 10% | 231 | |
| 472 | Tanks and cisterns | 4,767 | 3,117 | 6d. per 100 gals. | 11 | |
| 490 | Wove-wire, expanded-metal fencing, electric-welded fencing | 1,317 | 2,597 | 10% | 266 | |
| 495 | Metal manufactures, &c.. (20% ad val.) | 80,950 | 51,675 | 10% | 5,247 | |
| Electrical— | ||||||
| XV | 524 | Electric batteries and cells | 362 | 22,683 | 10% | 2,271 |
| 525 | Generators, motors, and transformers | 20,452 | 38,390 | 10% | 3,803 | |
| 527 | Lamps | 15,700 | 48,124 | 10% | 4,821 | |
| 529 | N.o.e. | 16,867 | 39,727 | 10% | 3,938 | |
| 532 | Engines, other | 17,813 | 26,392 | 10% | 2,432 | |
| 533 | Engines, portable and traction | .. | 18,518 | 10% | 1,852 | |
| 540 | Flying-machines | 602 | 2,359 | 10% | .. | |
| Machinery— | ||||||
| 569 | Unenumerated (5% ad val.)—viz., rope and twine making, &c.. | 2,804 | 2,750 | 10% | 275 | |
| 570 | N.o.e. (20% ad val.) | 41,846 | 22,972 | 10% | 2,666 | |
| 571C | Materials for, and parts of (dutiable), Nos. 531 and 532 | 7,978 | 18,213 | 10% | 1,810 | |
| XVIA | 573 | Rubber hose, tubing, and piping | 38,550 | 4,516 | 20% | 875 |
| XVIB | 579 | Belting, other (including canvas and rubber) | 53,492 | 10,941 | 10% | 1,067 |
| 597 | Portmanteaux, trunks, and carpet bags | 2,824 | 2,301 | 12 1/2% | 287 | |
| XVIIB | 643 | Basketware and wickerware | 388 | 4,630 | 10% | 407 |
| 652 | Picture and photograph frames and mounts | 3,346 | 2,282 | 10% | 230 | |
| 661 | Wooden ware and turnery n.o.e. | 9,251 | 5,268 | 10% | 548 | |
| XVIII | 667 | China, porcelain, and Parian ware | 14,200 | 14,895 | 10% | 1,444 |
| 669 | Earthenware n.o.e. | 35,892 | 14,018 | 10% | 1,453 | |
| 674 | Glassware n.o.e. | 5,273 | 21,567 | 10% | 2,180 | |
| 676 | Mirrors and looking-glasses | 1,336 | 2,264 | 12 1/2% | 284 | |
| XIXA | 693 | Printing | 204,997 | 25,089 | 20% | 5,007 |
| 694 | Wrapping, unprinted | 12,791 | 8,779 | 2s. 6d.cwt. | 394 | |
| XIXB | 699 | Calendars and show-cards | 4,734 | 2,289 | 12 1/2% | 289 |
| 703 | Handbills, circulars, and programmes; printed advertising-matter n.o.e., &c.. | 12,817 | 8,229 | 3/5d. lb. | 205 | |
| 704 | Inks, printing | 4,232 | 2,866 | 10% | 289 | |
| 706 | Stationery, manufactured, n.o.e. | 44,921 | 5,080 | 12 1/2% | 640 | |
| 711 | Stationery, n.o.e. | 37,236 | 27,854 | 10% | 2,728 | |
| XX | 712 | Fancy goods | 73,946 | 94,653 | 10% | 9,301 |
| 715 | Jewellery, other | 60,485 | 3,173 | 10% | 319 | |
| 717 | Timepieces—Clocks | 1,181 | 13,266 | 10% | 1,337 | |
| 721 | Tobacco - pipes and cases, and cigarette-papers, &c.. | 13,217 | 43,592 | 10% | 4,075 | |
| XXI | 724 | Cinematographs n.o.e., and kinetoscopes, &c.. | 80 | 2,303 | 10% | 220 |
| 729 | Photographic materials and goods | 1,867 | 29,054 | 10% | 2,905 | |
| 730 | Sensitized surfaces and albumenized paper | 56,753 | 14,192 | 10% | 1,380 | |
| 731 | Photographic materials and goods n.o.e. | 2,309 | 5,133 | 10% | 497 | |
| XXIIA | 750 | Chemicals and chemical preparations n.o.e. | 10,932 | 7,476 | 10% | 728 |
| 765 | Medicinal preparations, drugs, and druggists' sundries n.o.e., &c.. | 166,793 | 68,146 | 10% | 6,802 | |
| 772 | Perfumery—Toilet preparations | 28,993 | 37,091 | 12 1/2% | 4,669 | |
| XXIII | 814 | Cartridges—25 calibre and under | 51 | 10,008 | 10% | 1,001 |
| 815 | Cartridges— shot (10-24 bore) | 4,860 | 27,810 | 1s. 3d. per 100 | 2,601 | |
| 816 | Arms, ammunition, and explosives n.o.e. | 129 | 2,270 | 10% | 225 | |
| 824 | Firearms, other | 385 | 5,991 | 10% | 593 | |
| 847 | Brushes, brushware, and brooms | 13,529 | 26,701 | 12 1/2% | 3,343 | |
| 859 | Pianos | 32,839 | 6,859 | 10% | 718 | |
| 860 | Pianolas, phonographs, and other instruments (mechanical) | 7,469 | 12,052 | 10% | 1,182 | |
| 861 | Records for pianolas, graphophones, &c.. | 13,709 | 7,606 | 10% | 508 | |
| 862 | Instruments, musical, other | 3,841 | 5,693 | 10% | 581 | |
| Matches and vestas— | ||||||
| 863 | Wax | 35,228 | 4,396 | Various | 464 | |
| 864 | Wooden | 1,144 | 55,780 | Various | 4,571 | |
| 871 | Blacklead (including stove-polish) | 5,599 | 3,279 | 10% | 328 | |
| 873 | Furniture, knife, and plate powder and polish | 5,746 | 6,028 | 10% | 610 | |
| 885 | Vehicles—Bicycles, &c., n.o.e. | 16,587 | 3,711 | 10% | 381 | |
| 886 | Motor bicycles and tricycles | 6,757 | 46,555 | 10% | 4,542 | |
| 889 | Materials and parts n.o.e. | 2,699 | 3,767 | 10% | 382 | |
| 890 | Side-cars for motor-cycles | 616 | 2,059 | 10% | 206 | |
| 893 | Cars, buses, carriages, and vehicles, motor | 105,350 | 341,690 | 10% | 34,387 | |
| 895A | Materials and parts, other | 20,163 | 50,125 | 10% | 4,889 | |
THE purchase and control of produce requisitioned on behalf of the Imperial Government is in the hands of the Department of Imperial Government Supplies. This Department, which commenced its operations on the 3rd March, 1915, was primarily constituted for the purpose of controlling the purchase of frozen meat on behalf of the Imperial Government. Later its operations in this connection were extended to include many other items of New Zealand produce, notably wool, butter, cheese, and hides. In addition a considerable amount of business has been undertaken on behalf of the New Zealand Government, such as the purchase of butter and cheese for use in camps and on transports, the butter-fat levy, and the internal arrangements in connection with the sale and shipment of kauri-gum.
The requisition of frozen meat on behalf of the Imperial Government commenced on the 3rd March, 1915, and has since then comprised all beef, mutton, and lamb in store or produced at freezing-works available for shipment.
The preliminary arrangements in connection with this requisition were made at conferences convened by the Prime Minister and attended by representatives of the industry, and the schedule of prices and general arrangements necessary in connection with the requisition were agreed upon and subscribed to by all parties interested.
The rates are quoted hereunder:—
| Description. | Prices operating from 3rd March, 1915, to 19th October, 1916. | Prices operating from 20th October, 1916. |
| d. | d. | |
| Wethers, first quality, 72 lb. and under | 4 1/2 | 5 3/8 |
| Wethers, first quality, over 72 lb. and up to 85 lb. | 4 1/4 | 5 1/8 |
| Wethers, first quality, over 85 lb. and up to 98 lb. (subject to special approval by Inspector) | 4 | 4 7/8 |
| Wethers, second quality | 4 1/4 | 5 1/8 |
| Ewes, first quality, 72 lb. and under | 4 | 4 7/8 |
| Ewes, first quality, over 72 lb. and up to 85 lb. | 3 3/4 | 4 5/8 |
| Ewes, second quality | 3 3/4 | 4 5/8 |
| Lamb, specially prime and Canterbury quality, 42 lb. and under | 5 5/8 | 6 1/2 |
| Lamb, first quality, 42 lb. and under | 5 1/2 | 6 3/8 |
| Lamb, first quality, over 42 lb. | 5 1/4 | 6 1/8 |
| Lamb, second quality | 5 1/4 | 6 1/8 |
| Beef, prime ox | 4 3/4 | 5 |
| Beef, second and heifer | 4 1/2 | 4 3/4 |
| Beef, boning in quarters | 4 | 4 1/4 |
| Beef, cow, prime | 4 1/2 | 4 3/4 |
| Beef, cow, second | 4 | 4 1/4 |
| Beef, boneless | 5 | 5 1/4 |
| Mutton, legs | 5 1/2 | 6 3/8 |
| Mutton, shoulders | 4 1/2 | 5 3/8 |
| Mutton, loins | 4 1/2 | 5 3/8 |
| Mutton, haunches | 5 | .. |
A condition applying to the prices fixed on the 20th October, 1916, was that they should operate for at least three months after the termination of the war, and that the storage rate previously paid should be reduced by 25 per cent. as from the 1st November, 1916. Important amendments with regard to storage charges, insurance, delivery, and transfer of ownership were embodied in an agreement completed in December, 1917. Provision was also made in this agreement for the withdrawal from storage of meat required for local consumption.
In January, 1919, the Imperial Government agreed to an extension of the contract for the purchase of meat to the 30th June, 1920. This amendment has, with one exception, been accepted by all the freezing companies in the Dominion.
Payment for meat up to June, 1918, was made only when shipment had been effected. Now, however, advances are made to the extent of 75 per cent. of the value after the meat has been in store six weeks. Outstanding advances at the 31st March, 1919, amounted to £4,772,033.
Between the 3rd March, 1915, and the 31st March, 1919, 2,452,259 quarters of beef, 8,392,329 carcases of mutton, 9,864,344 carcases of lamb, and 254,549 carcases (60 lb.) of other meat had been shipped under the Government-purchase scheme, the quantities shipped from the various ports being as shown in the table following. the total payments to the 31st March, 1919, in respect of meat-purchases amounted to £32,869,318.
| SHIPMENTS OF MEAT UNDER IMPERIAL -PURCHASE SCHEME , 3RD MARCH , 1915, TO 31ST MARCH , 1919. | |||
|---|---|---|---|
| Port of Shipment. | Quarters Beef. | Carcases Mutton. | Carcases Lamb. |
| Whangarei | 140,979 | 25,585 | 7,456 |
| Auckland | 494,081 | 141,358 | 233,523 |
| Whakatane | 14,301 | .. | .. |
| Tokomaru Bay | 34,873 | 273,191 | 153,181 |
| Gisborne | 186,691 | 924,120 | 414,115 |
| Napier | 187,030 | 1,197,871 | 830,937 |
| Waitara | 233,873 | 158,837 | 130,287 |
| New Plymouth | 36,253 | 25,978 | 19,485 |
| Wanganui | 184,025 | 458,941 | 286,278 |
| Wellington | 487,766 | 2,395,360 | 2,001,687 |
| Totals, North Island | 1,999,872 | 5,601,241 | 4,076,949 |
| Nelson | 15,867 | 37,132 | 54,120 |
| Picton | 1,583 | 99,506 | 157,140 |
| Lyttelton | 138,544 | 1,103,439 | 2,575,174 |
| Timaru | 32,787 | 545,423 | 1,605,178 |
| Oamaru | 111,143 | 161,467 | |
| Dunedin | 72,826 | 384,610 | 579,509 |
| Bluff | 190,780 | 509,835 | 654,807 |
| Totals, South Island | 452,387 | 2,791,088 | 5,787,395 |
| Grand totals | 2,452,259 | 8,392,329 | 9,864,344 |
The quantity of meat in store on the 31st March, 1919, was 6,567,871 freight carcases.
The following is a brief summary of the conditions of the contracts which have governed this purchase since the inception of the requisition in October, 1915:—
During the 1915-16 season one-third of the first-grade factory cheese produced in New Zealand was purchased by the Imperial Government on the basis of 71/4d. per pound f.o.b.
During the 1916-17 season the whole of the output of first- and second-grade factory cheese was purchased at the rates of 9 1/2d. and 9 1/4d. per pound f.o.b. respectively.
During the 1917-18 season the prices were fixed at 10d. and 9 3/4d. per pound for first- and second-grade factory cheese respectively, and, in addition, dairy cheese was purchased at 8 1/2d. and 8d. per pound for first and second grades.
Arrangements were also completed to enable the shipment of third-grade factory cheese on the condition that it would be valued on arrival in the United Kingdom and purchased at a price not exceeding 9 1/4d. per pound. This condition was accepted, and the subsequent valuation of the cheese in London enabled the Imperial Government to authorize the payment of 9 1/2d. per pound instead of the maximum of 9 1/4d. previously fixed in the negotiations.
During the present (1918-19) season the whole output has again been purchased, and the prices fixed at 10 3/4d., 10 1/2d., and 10d. for first-, second-, and third-grade factory cheese respectively.
Dairy cheese also has been purchased at 9 1/4d. and 8 3/4d. respectively for first- and second-grade quality.
The following table shows the number of crates and the value of all cheese purchased to the 31st March, 1919, during the several seasons mentioned above—
| Season. | Number of Crates. | Amount. £ |
| 1915-16 | 189,502 | 917,748 |
| 1916-17 | 518,326 | 3,295,557 |
| 1917-18 | 751,863 | 4,948,367 |
| 1918-19 | 679,296 | 3,576,380 |
| 2,138,987 | £12,738,052 |
The figures for the 1918-19 season include 461,359 crates awaiting shipment on the 31st March, a portion of which had been advanced against in accordance with the conditions of purchase.
Of this total quantity of cheese purchased and shipped it is interesting to note that only two shipments have failed to arrive at their destination as a result of enemy action and that the total quantity carried by the two steamers was 62,846 crates.
The conditions of purchase for the 1918-19 season apply also to all cheese manufactured up to and including the 1st July, 1920, and provide for the payment on delivery of the cheese f.o.b. ocean steamer, subject, however, to an advance of 90 per cent. in the event of the cheese remaining in store for a period of fourteen days prior to shipment.
For the first time since the commencement of the present war the Dominion's output of butter was requisitioned by the Imperial Government as from the 20th November, 1917. The prices paid for the 1918-19 output were as follows: Creamery butter, first grade, 181s. per hundredweight; second grade, 1s. per hundredweight less for each grade-point by which the butter falls below first grade. Whey butter and dairy butter, 162s. 4d. per hundredweight; second grade, 1/2d. per pound less. Milled butter, 148s. 4d. per hundredweight; second grade, £d. per pound less. It was also arranged that 50 per cent. of any profit arising from the sale of the butter in the United Kingdom should be distributed to producers through the New Zealand Government.
The total quantity of butter "purchased and shipped during each season to the 31st March, 1919, was as follows:—
| Season. | Number of Boxes. | Value.£ |
|---|---|---|
| 1917-18 | 724,699 | 2,931,529 |
| 1918-19 | 647,139 | 2,720,090 |
| 1,371,838 | £5,651,619 |
The value shown against the 1918-19 season includes the amount advanced against a portion of the 93,729 boxes which were awaiting shipment on the 31st March.
During the past year many of the factories which had been supplying butter for local requirements were attracted by the higher prices prevailing in the United Kingdom, and, withdrawing from the local markets, exported their produce.
This action on the part of factories necessitated action by the New Zealand Government, and steps were accordingly taken to release a portion of the butter purchased on Imperial Government account for sale to local retailers.
When the 50-per-cent. profits, amounting to £307,997 1s. 6d., were subsequently received from the Imperial Government the Dominion Butter Committee met and discussed the position, and decided to approach all butter-factories with a view to obtaining their consent to credit the amount to an Equalization Fund, and apply the fund towards the equalization of prices as between factories which exported and those which supplied local requirements.
This proposal of the Dominion Butter Committee was agreed to by all butter-factories throughout the Dominion with the exception of three, and at the request of the Committee arrangements were accordingly undertaken by the Department to administer the fund in accordance with the proposals of the Committee.
The equalization scheme applies to creamery butter only.
During the year ended the 31st March, 1919, 7,509 cases of condensed milk were purchased on behalf of the Imperial Government by the New Zealand Munitions and Supplies Department, and payment arranged for on behalf of the Imperial Government by the Department of Imperial Government Supplies.
The value of these purchases amounted to £7,884 9s., and the total shipments and payments to the 31st March, 1919, were 66,666 cases, valued at £70,955 2s. 4d.
In October, 1917, arrangements were completed by the Imperial Government for the purchase of considerable quantities of "Glaxo" (dried milk) from the manufacturers in the Dominion.
Up to the 31st March, 1919, some 163,923 tins, valued at £660,769, were purchased for the Imperial Government.
The demand for tungstic acid occasioned by the war drew the attention of the Imperial Government to New Zealand's small but useful supplies of scheelite, most of the output of which in years prior to the war had been forwarded to Germany. Accordingly on the 6th September, 1915, notice was given that all supplies were to be requisitioned by the Imperial Government. The price fixed was £2 15s. per unit—i.e., per 1-per-cent. tungstic trioxide in respect of ore assaying at least 65 per cent., with a reduction in cases where the assay fell below that point down to 50 units per ton.
From the 1st January, 1917, an additional allowance was made to shippers to cover increased freight and insurance charges. On the 1st January, 1918, the price was increased to £3 per unit for ore assaying 65-per-cent. tungstic acid, together with an allowance of 3s. 10d. per unit to cover increased charges since the requisition commenced. From the 1st May, 1918, the price was again increased to £3 8s. per unit—this, however, to cover the allowance previously given.
Shipments and payments to date (31st March, 1919) were 690 tons and £135,213 respectively.
The scheelite requisition is now at an end.
The contract for the purchase of rabbits of the 1917 pack was completed in 1918-19, and the total shipments have amounted to 91,480 crates, of an f.o.b. value of £85,762.
The contract price for the purchase of rabbits was fixed at 19s. per crate f.o.b., all storage and insurance charges being borne by the seller.
To the 31st March, 1919, 34,639 cases of canned rabbits have also been purchased and shipped on behalf of the Imperial Government, the value, including freight, amounting to £67,332.
In addition, 18,601 cases of corned beef and mutton have been purchased on behalf of the War Office, London, and shipped to the Director of Supplies, Egypt; and the total payments in respect of these purchases, including freight, amount to £82,390.
At the request of the Imperial Government, the Dominion Government made arrangements for the purchase of the 1916-17 wool-clip for war purposes.
The prices paid for the wool-clip were fixed at a 55-per-cent. advance on those ruling in 1913-14. The scale of qualities and values (to which 55 per cent. must be added) is as follows:—
| Description of Wool. | Ranges of Values per Pound according to Quality. |
| Superior merino combings | From 12d. to 14 1/2d. |
| Medium to good merino | From 9 3/4d. to 11 1/2d. |
| Inferior merino | From 8 1/2d. to 9 1/2d. |
| Superior half-bred | From 12d. to 14d. |
| Medium to good half-bred | From 9 3/4d. to 12d. |
| Inferior half-bred | From 9d. to 10d. |
| Superior crossbred | From 10 1/2d. to 12d. |
| Medium to good crossbred | From 9d. to 11d. |
| Inferior crossbred | From 7 3/4d. to 9d. |
| Lincoln and Leicester | From 8 3/4d. to 10 1/2d. |
| Lambs, good | From 11d. to 13d. |
| Lambs, medium | From 9d. to 10 3/4d. |
The 1917-18, 1918-19, and 1919-20 wool-clips have also been accepted on the same terms. In addition the Imperial Government undertook to return to New Zealand wool-growers half the profits on wool sold for other than military purposes.
Since the commencement of the requisition the following quantities of wool have been disposed of as under:—
| Total number of bales valued (as per valuation certificates received) | 1,531,473 | |
| Number of bales lost in transit | 9,668 | |
| Number of bales arrived at destination (in 116 steamers) | 566,502 | |
| Number of bales en route to Great Britain (in 20 steamers) | 128,997 | |
| Number of bales shipped on account of other Governments | 115,318 | |
| Number of bales of greasy wool available for shipment, or scouring, or delivered to scourers | 710,988 | |
| 1,531,473 | ||
| Number of bales of greasy wool delivered to scourers for treatment | 233,451 | |
| Number of bales of scoured wool shipped | 121,994 | |
| Number of bales of scoured wool available for shipment | 84,306 | |
| Total number of bales paid for | 1,518,591 |
For the 1,518,591 bales of wool paid for as mentioned above, the sum of £36,814,755 has been disbursed.
Acting under instructions from the Imperial Government the following quantities of wool were purchased and shipped for other Governments during the past year:—
| France | 49,207 bales. |
| United States of America | 44,373 bales |
| Canada | 21,738 bales |
Wool required for local mills is supplied at Imperial Government schedule rates, plus the cost of valuation.
The representatives of New Zealand woollen-mills are required to make their selections prior to valuation, and in the case of any dispute arising as between two mills preference is given to the one which has first intimated its requirements to the broker concerned.
To the 31st March, 1919, 68,959 bales had been purchased subject to valuation in the United Kingdom under regulations ruling to the 31st March, 1918, and of this quantity 65,130 bales had been shipped to the United Kingdom and 1,795 bales to other Governments; 63,201 bales have been valued and purchased in New Zealand, and of this number 18,440 bales have been shipped to the United Kingdom and 7,604 bales to other Governments. The total payments for freezing companies' slipe wool were £3,660,957.
The Imperial Government, in accordance with the wishes of the owners, having agreed to extend the purchase of slipe wool on the same basis to be conterminous with the purchase of greasy wool, the necessary action was taken, and a Proclamation issued by Gazette notice on the 25th January, 1919, extending the purchase of freezing companies' slipe wool up to the 30th June, 1920.
The purchase of sheep-skins by the New Zealand Government on behalf of the Imperial Government commenced on the 5th February, 1917. The scale of prices on which purchases are made is as follows:—
| Skins. | Merino. | Half-bred. | Fine Crossbred. | Coarse Crossbred. |
|---|---|---|---|---|
| d. | d. | d | d. | |
| Three-quarter to full-woolled, sound | 10 1/2-11 1/2 | 13-14 | 12-13 | 11 1/2-12 1/2 |
| Half-woolled, sound | 8 3/4 9 3/4 | 11-12 | 10 1/2-11 1/2 | 10-11 1/2 |
| Short to quarter-woolled, sound | 7 1/2-8 1/2 | 9 1/4-10 3/4 | 9 1/4-10 3/4 | 8 1/2-10 3/4 |
| Shorn, sound | 5 3/4-6 3/4 | 8-9 | 8 1/2-9 1/2 | 8-10 |
| Lamb-skins, sound | 11-12 1/2 | |||
All skins with damaged or faulty pelts are valued at prices proportionate to those shown above. After purchase, the skins are allocated to fellmongers for treatment, the resultant slipe wool and pelts being shipped to the United Kingdom.
The payment to fellmongers for their services was increased as from the 1st November, 1917, to the following rates:—
| Fellmongering | 2 1/4d. per pound on the weight of wool. |
| Curing pelts | 3s. 9d. per dozen pelts (casks extra). |
At the 31st March, 1919, the number of skins purchased and distributed to fellmongers was 4,082,415. The total payments to that date amounted to £1,581,413.
More than double the quantity of wool has been annually sorted and scoured in the Dominion than in any year prior to Government control.
The purchase of hides and calf-skins on behalf of the Imperial Government ceased at the 28th March, 1918; only those hides and calf-skins produced from stock slaughtered on or before that date have been purchased in the current year. The total purchases of hides and calf-skins were 370,508, for which £725,339 was paid.
At the 31st March, 1919, 43,941 were still held at the disposal of the Imperial Government.
Table of Contents
THE number and tonnage of the registered vessels belonging to the several ports of registry in the Dominion on the 31st December, 1918 distinguishing sailing-vessels and steamers), were as under:—
| Ports. | Sailing-vessels. | Steam-vessels. | ||||
|---|---|---|---|---|---|---|
| Vessels. | Gross Tonnage. | Net Tonnage. | Vessels. | Gross Tonnage. | Net Tonnage. | |
| Auckland | 119 | 8,387 | 7,172 | 201 | 23,128 | 11,833 |
| Napier | 4 | 266 | 253 | 30 | 3,887 | 2,273 |
| Wellington | 13 | 3,173 | 2,886 | 37 | 11,061 | 5,620 |
| Nelson | 7 | 189 | 152 | 14 | 2,769 | 1,291 |
| Lyttelton | 12 | 3,713 | 3,615 | 18 | 6,183 | 3,002 |
| Timaru | 1 | 733 | 690 | 1 | 942 | 488 |
| Dunedin | 20 | 8,367 | 8,046 | 66 | 67,318 | 40,280 |
| Invercargill | 2 | 372 | 344 | 12 | 1,263 | 601 |
| Totals | 178 | 25,200 | 23,158 | 379 | 116,551 | 65,388 |
Auckland is the port of registry of the majority of the vessels forming New Zealand's "mosquito" fleet, the average net tonnage of the 320 vessels on the Auckland register being under 60 tons. At Dunedin most of the vessels of the Union Steamship Company of New Zealand are registered. Shortly after the outbreak of war, however, many of the principal vessels of this company were transferred to the London register, the large decrease in 1914 as compared with 1913, shown in the next table, being due to this cause.
| Year. | Sailing-vessels. | Steam-vessels. | ||||
|---|---|---|---|---|---|---|
| Vessels. | Gross Tonnage. | Net Tonnage. | Vessels. | Gross Tonnage. | Net Tonnage. | |
| 1909 | 262 | 42,384 | 40,163 | 327 | 188,230 | 110,677 |
| 1910 | 254 | 40,894 | 38,631 | 352 | 192,637 | 112,475 |
| 1911 | 244 | 37,710 | 35,651 | 361 | 196,374 | 114,973 |
| 1912 | 242 | 36,558 | 34,308 | 374 | 208,887 | 121,772 |
| 1913 | 225 | 33,931 | 31,619 | 391 | 220,186 | 127,691 |
| 1914 | 197 | 22,714 | 20,984 | 384 | 135,838 | 77,901 |
| 1915 | 196 | 23,546 | 21,762 | 385 | 126,549 | 71,695 |
| 1916 | 190 | 23,664 | 21,853 | 390 | 124,833 | 70,442 |
| 1917 | 184 | 24,356 | 22,404 | 376 | 115,683 | 65,092 |
| 1918 | 178 | 25,200 | 23,158 | 379 | 116,551 | 65,388 |
The tonnage of sailing-vessels on the register has decreased rapidly during recent years, though a slight improvement has been effected since 1914, due probably to the demand for vessels to replace those used for war purposes.
During the year 1918 a total of 469 vessels direct from oversea ports were entered inwards in the Dominion: this number is 74 less than the corresponding figure for 1917. The year 1912 saw a total entry of 677 vessels, but the strike of the following year and the subsequent outbreak of the war have told against subsequent progress. Vessels entered outwards numbered 666 in 1912, 635 in 1913, 657 in 1914, 649 in 1915, 574 in 1916, 547 in 1917, and 411 in 1918. It will be noticed that the total arrivals in the two years 1913 and 1914 were 1,291, and the departures 1,292, the figures of departures for 1914 being swelled by the inclusion of a number of vessels detained at ports of the Dominion at the end of 1913 on account of the strike and the consequent delay in loading.
The actual effects of the two disturbances on oversea shipping, however, cannot be accurately gauged. Of late years the number of vessels engaged in the oversea trade has not increased to any great extent; the tendency is rather for vessels of a larger size to be employed in the New Zealand trade, in order to cope with the growing imports and exports of the Dominion, and for the purposes of the passenger traffic. The number of vessels entered inwards and cleared outwards in 1908 was 1,314, of an aggregate tonnage of 2,692,352 tons—an average of 2,048 tons. The 1,087 vessels in 1918 aggregated 2,590,175 tons, the average being 2,382 tons. Dealing with steamships only (938 in 1908 and 922 in 1918), the average tonnage is found to be 2,665 and 2,917 tons respectively. The number of sailing-vessels arriving and departing decreased from 376 in 1908 to 119 in 1918, the aggregate tonnage falling in the same time from 192,115 to 55,007 tons.
The number and tonnage of vessels entered and cleared during each of the last ten years, separating steam from sailing, are as shown in the following table:—
| OVERSEA SHIPPING , 1909-18. | ||||||||
|---|---|---|---|---|---|---|---|---|
| Year. | Entered. | Cleared. | ||||||
| Vessels. | Tonnage. | Vessels. | Tonnage. | |||||
| Steam. | Sailing. | Steam. | Sailing. | Steam. | Sailing. | Steam. | Sailing. | |
| 1909 | 445 | 160 | 1,186,393 | 77,542 | 437 | 159 | 1,172,478 | 81,400 |
| 1910 | 475 | 134 | 1,317,284 | 71,747 | 464 | 124 | 1,299,082 | 68,125 |
| 1911 | 499 | 122 | 1,417,943 | 64,435 | 498 | 126 | 1,402,103 | 65,299 |
| 1912 | 582 | 95 | 1,619,411 | 52,681 | 572 | 94 | 1,620,057 | 48,573 |
| 1913 | 563 | 82 | 1,692,929 | 46,056 | 559 | 76 | 1,658,457 | 41,350 |
| 1914 | 567 | 79 | 1,676,840 | 48,009 | 582 | 75 | 1,735,601 | 46,380 |
| 1915 | 581 | 57 | 1,613,679 | 27,746 | 585 | 64 | 1,604,050 | 31,883 |
| 1916 | 520 | 54 | 1,418,991 | 29,526 | 534 | 56 | 1,461,597 | 29,996 |
| 1917 | 485 | 58 | 1,378,676 | 27,100 | 486 | 61 | 1,353,975 | 27,907 |
| 1918 | 385 | 84 | 867,729 | 53,443 | 354 | 57 | 930,427 | 27,282 |
Tables are given showing the number and tonnage of British, colonial, and foreign vessels entered and cleared in each of the ten years 1909 to 1918.
| Year. | British. | Colonial. | Foreign. | Total. | ||||
|---|---|---|---|---|---|---|---|---|
| Vessels. | Tons. | Vessels. | Tons. | Vessels. | Tons. | Vessels. | Tons. | |
| Entered. | ||||||||
| 1909 | 155 | 587,235 | 407 | 633,813 | 43 | 42,887 | 605 | 1,263,935 |
| 1910 | 186 | 703,244 | 385 | 643,128 | 38 | 42,659 | 609 | 1,389,031 |
| 1911 | 169 | 707,573 | 409 | 727,969 | 43 | 46,836 | 621 | 1,482,378 |
| 1912 | 153 | 672,289 | 462 | 931,811 | 62 | 67,992 | 677 | 1,672,092 |
| 1913 | 171 | 765,943 | 430 | 905,034 | 44 | 68,008 | 645 | 1,738,985 |
| 1914 | 191 | 791,529 | 398 | 847,910 | 57 | 85,410 | 646 | 1,724,849 |
| 1915 | 314 | 1,145,609 | 290 | 439,292 | 34 | 56,524 | 638 | 1,641,425 |
| 1916 | 255 | 998,388 | 283 | 388,961 | 36 | 61,168 | 574 | 1,448,517 |
| 1917 | 249 | 1,008,759 | 262 | 336,027 | 32 | 60,990 | 543 | 1,405,776 |
| 1918 | 193 | 838,198 | 289 | 374,130 | 61 | 67,220 | 543 | 1,279,548 |
| Cleared. | ||||||||
| 1909 | 152 | 572,384 | 406 | 641,055 | 38 | 40,439 | 596 | 1,253,878 |
| 1910 | 181 | 688,143 | 371 | 637,513 | 36 | 41,551 | 588 | 1,367,207 |
| 1911 | 169 | 693,665 | 412 | 726,655 | 43 | 47,082 | 624 | 1,467,402 |
| 1912 | 152 | 680,774 | 459 | 930,627 | 55 | 57,229 | 666 | 1,668,630 |
| 1913 | 171 | 748,769 | 420 | 886,440 | 44 | 64,598 | 635 | 1,699,807 |
| 1914 | 194 | 826,358 | 407 | 867,184 | 56 | 88,439 | 657 | 1,781,981 |
| 1915 | 317 | 1,138,873 | 293 | 437,388 | 39 | 59,672 | 649 | 1,635,933 |
| 1916 | 259 | 1,027,088 | 294 | 400,646 | 37 | 63,859 | 590 | 1,491,593 |
| 1917 | 253 | 995,346 | 261 | 327,822 | 33 | 58,714 | 547 | 1,381,882 |
| 1918 | 203 | 872,204 | 289 | 377,383 | 52 | 61,040 | 544 | 1,310,627 |
British and colonial vessels have shown a net increase in tonnage ever the period under review, and the tonnage of foreign vessels has also risen in the past few years. This tendency to increase has, of course, been checked during the prevalence of war conditions.
The nationality of the foreign-owned vessels entered inwards and cleared outwards in 1908 and 1918 is as follows:—
| FOREIGN VESSELS , 1908 AND 1918. | ||||||||
|---|---|---|---|---|---|---|---|---|
| Nationality. | 1908. | 1918. | ||||||
| Entered. | Cleared. | Entered. | Cleared. | |||||
| Vessels. | Tons. | Vessels. | Tons. | Vessels. | Tons. | Vessels. | Tons. | |
| American | 2 | 1,665 | 2 | 1,665 | 43 | 36,536 | 37 | 33,224 |
| Danish | .. | .. | .. | .. | 1 | 2,675 | 1 | 2,675 |
| French | 3 | 4,606 | 3 | 4,606 | 4 | 4,283 | 1 | 333 |
| German | 4 | 6,150 | 4 | 6,150 | .. | .. | .. | .. |
| Italian | 2 | 2,552 | 2 | 2,056 | .. | .. | .. | .. |
| Japanese | .. | .. | .. | .. | 4 | 5,393 | 4 | 5,393 |
| Norwegian | 32 | 24,980 | 40 | 32,107 | 6 | 11,558 | 6 | 11,558 |
| Swedish | .. | .. | .. | .. | 3 | 6,775 | 3 | 7,857 |
| Totals | 43 | 39,953 | 51 | 46,584 | 61 | 67,220 | 52 | 61,040 |
Particulars of the number and net tonnage of vessels entered and cleared between New Zealand and various countries during the years 1908 and 1918 are given below:—
| Country. | 1908. | 1918. | ||||||
|---|---|---|---|---|---|---|---|---|
| Entered. | Cleared. | Entered. | Cleared. | |||||
| No. | Tonnage. | No. | Tonnage. | No. | Tonnage. | No. | Tonnage. | |
| United Kingdom | 90 | 396,513 | 93 | 387,899 | 35 | 190,758 | 78 | 417,945 |
| India | 5 | 16,469 | 1 | 3,684 | 4 | 11,424 | .. | .. |
| South African Union | 1 | 874 | .. | .. | .. | .. | .. | .. |
| Canada | 5 | 16,051 | 1 | 3,116 | 17 | 83,312 | 14 | 74,430 |
| Australia | 437 | 689,518 | 487 | 815,257 | 333 | 778,416 | 314 | 577,504 |
| Fiji | 30 | 62,554 | 25 | 41,732 | 27 | 47,038 | 34 | 38,027 |
| Maiden Island | 5 | 3,083 | 4 | 1,818 | .. | .. | .. | .. |
| Norfolk Island | 2 | 806 | 2 | 806 | 2 | 987 | 2 | 806 |
| France | 2 | 2,552 | .. | .. | .. | .. | .. | .. |
| Asiatic Turkey | .. | .. | .. | .. | .. | .. | 1 | 5,835 |
| China | .. | .. | .. | .. | .. | .. | 1 | 2,342 |
| Japan | .. | .. | .. | .. | 4 | 5,393 | 1 | 2,344 |
| Philippine Islands | .. | .. | 2 | 5,443 | .. | .. | .. | .. |
| Dutch Borneo | .. | .. | .. | .. | 1 | 1,201 | .. | .. |
| Egypt | .. | .. | .. | .. | .. | .. | 9 | 48,953 |
| Chile | .. | .. | 9 | 21,021 | .. | .. | 5 | 16,782 |
| Panama Canal Zone | .. | .. | .. | .. | .. | .. | 1 | 2,476 |
| United States of America | 49 | 137,105 | 3 | 8,988 | 94 | 123,605 | 46 | 62,816 |
| Uruguay | .. | .. | 1 | 2,185 | .. | .. | .. | .. |
| "Guam" | .. | .. | .. | .. | 3 | 16,418 | 15 | 43,118 |
| German Samoa | .. | .. | .. | .. | .. | .. | 2 | 404 |
| New Caledonia | .. | .. | .. | .. | 6 | 4,685 | .. | .. |
| Hawaii | .. | .. | .. | .. | .. | .. | 1 | 624 |
| Society Islands | .. | .. | .. | .. | 10 | 8,180 | 13 | 13,883 |
| Tonga | .. | .. | .. | .. | 2 | 194 | 7 | 2,338 |
| Tuamotu Archipelago | .. | .. | .. | .. | 5 | 7,937 | .. | .. |
| Totals | 626 | 1,315,525 | 62 | 1,291,949 | 543 | 1,237,548 | 544 | 1,310,027 |
The net tonnage of oversea shipping entered and cleared at the various ports during the years 1908 and 1918 is given in the next table. Vessels arriving from abroad are recorded at the first port of call, and those departing oversea are cleared at the port from which they finally sail.
| Port. | 1908. | 1918. | ||
|---|---|---|---|---|
| Entered. | Cleared. | Entered. | Cleared. | |
| Tons. | Tons. | Tons. | Tons. | |
| Auckland | 597,707 | 363,436 | 541,124 | 389,637 |
| Kaipara | 6,870 | 40,373 | .. | 16,236 |
| Tauranga | .. | .. | 185 | 370 |
| Gisborne | 3,415 | 12,022 | 13,759 | 139 |
| New Plymouth | 8,140 | 3,934 | 3,439 | 2,016 |
| Waitara | .. | .. | 24,680 | .. |
| Wanganui | 2,854 | 6,797 | 8,308 | 7,977 |
| Wellington | 439,867 | 469,226 | 529,947 | 713,349 |
| Napier | 3,849 | 8,616 | 18,346 | 9,851 |
| Wairau (including Picton) | 11,762 | 9,620 | .. | .. |
| Nelson | 1,070 | .. | 4,548 | .. |
| Westport | 9,188 | 32,079 | 1,049 | 10,798 |
| Greymouth | 2,271 | 19,835 | 327 | 29,566 |
| Lyttelton | 37,745 | 77,359 | 66,352 | 28,695 |
| Timaru | 2,304 | 5,729 | 8,329 | 1,840 |
| Oamaru | 7,991 | 598 | .. | .. |
| Dunedin | 66,057 | 108,941 | 35,259 | 70,317 |
| Bluff | 159,957 | 172,740 | 23,896 | 29,836 |
| Totals | 1,361,047 | 1,331,305 | 1,279,548 | 1,310,627 |
The extensive coast-line and numerous harbours of New Zealand facilitate travelling and the distribution of goods by sea. The total tonnage of coastwise shipping, as shown below, includes that of oversea vessels which, after entry at the first port of arrival, proceed to other ports within the Dominion for the purpose of delivering and loading cargo, each movement, until the final sailing, being recorded as coastwise shipping.
| COASTWISE SHIPPING , 1909-18. | ||||
|---|---|---|---|---|
| Year. | Entered. | |||
| Vessels. | Tonnage. | |||
| Steam. | Sailing. | Steam. | Sailing. | |
| 1909 | 20,924 | 4,467 | 11,706,700 | 241,974 |
| 1910 | 22,272 | 4,500 | 11,839,244 | 242,652 |
| 1911 | 23,092 | 4,024 | 12,060,227 | 206,427 |
| 1912 | 23,654 | 3,843 | 12,451,499 | 180,698 |
| 1913 | 21,937 | 3,764 | 11,332,143 | 173,494 |
| 1914 | 23,019 | 3,880 | 12,217,206 | 175,757 |
| 1915 | 21,890 | 3,204 | 10,918,580 | 133,102 |
| 1916 | 21,228 | 3,092 | 9,919,576 | 129,253 |
| 1917 | 18,503 | 2,283 | 8,172,124 | 93,845 |
| 1918 | 17,492 | 1,967 | 6,942,341 | 113,124 |
| Cleared. | |||
|---|---|---|---|
| Vessels. | Tonnage. | ||
| Steam. | Sailing. | Steam. | Sailing. |
| 20,956 | 4,425 | 11,730,052 | 244,554 |
| 22,217 | 4,478 | 11,848,680 | 241,302 |
| 23,064 | 4,033 | 2,026,951 | 208,820 |
| 23,622 | 3,870 | 12,457,316 | 181,718 |
| 21,922 | 3,733 | 11,330,078 | 172,715 |
| 23,026 | 3,846 | 12,154,108 | 179,761 |
| 21,927 | 3,202 | 10,899,058 | 133,519 |
| 21,156 | 3,131 | 9,713,698 | 127,182 |
| 18,403 | 2,295 | 8,164,407 | 95,808 |
| 17,493 | 1,923 | 7,041,489 | 103,059 |
The decrease in 1913 as compared with 1912 is largely accounted for by the strike during the latter part of the year. Many coastal vessels were laid up for several weeks during the strike period. Coastwise shipping naturally reflects on a larger scale the effects of the war noticeable in overseas shipping. That this is so will be more readily understood if it be observed that the normal rate of progress from year to year is much greater in the overseas shipping. Despite the difference of ten years (during which there might be expected to be a large increase in shipping commensurate with the Dominion's developments in other directions), there is a big drop shown in the coastwise shipping handled in 1918 as compared with 1908. Whangarei shows an increase of about 25 per cent. over 1908. All other ports of any importance indicate decreases when compared with 1908.
In the next table is given information showing tonnage of vessels entered and cleared coastwise at each port in the years 1908 and 1918:—
| TONNAGE ENTERED AND CLEARED AT VARIOUS PORTS , 1908 AND 1918. | ||||
|---|---|---|---|---|
| Ports. | 1908. | 1918. | ||
| Tonnage entered. | Tonnage cleared. | Tonnage entered. | Tonnage cleared. | |
| Auckland | 996,718 | 1,229,621 | 734,879 | 863,229 |
| Onehunga | 210,317 | 207,192 | 93,068 | 93,441 |
| Thames | 117,863 | 114,599 | 84,435 | 84,240 |
| Coromandel | 33,432 | 33,083 | 11,562 | 11,562 |
| Whitianga | .. | .. | 9,815 | 9,815 |
| Whangaparapara | .. | .. | 5,606 | 5,606 |
| Whangarei | 150,101 | 146,397 | 187,540 | 190,916 |
| Russell | 58,599 | 59,112 | 47,853 | 49,715 |
| Whangaroa | 51,708 | 51,674 | 45,996 | 45,996 |
| Mangonui | 30,713 | 30,387 | 28,566 | 28,566 |
| Hokianga | 28,190 | 17,180 | 15,263 | 8,606 |
| Whangape | .. | .. | 419 | 219 |
| Kaipara | 41,340 | 11,768 | 20,354 | 5,070 |
| Tauranga | 44,096 | 43,872 | 49,781 | 49,596 |
| Gisborne | 679,944 | 670,847 | 279,619 | 286,764 |
| New Plymouth | 267,336 | 267,336 | 104,307 | 103,493 |
| Waitara | 99,283 | 99,164 | 12,215 | 36,879 |
| Patea | 18,256 | 18,284 | 15,328 | 15,328 |
| Wanganui | 128,979 | 128,510 | 108,010 | 113,710 |
| Foxton | 27,464 | 27,464 | 9,557 | 9,557 |
| Wellington | 2,469,089 | 2,421,132 | 2,138,752 | 2,127,252 |
| Napier | 815,765 | 799,996 | 311,072 | 313,559 |
| Wairau | 23,561 | 23,561 | 9,245 | 9,304 |
| Picton | 447,984 | 453,153 | 216,605 | 216,523 |
| Nelson | 400,610 | 401,013 | 197,493 | 201,676 |
| Westport | 581,688 | 557,459 | 288,749 | 279,000 |
| Greymouth | 345,201 | 328,364 | 217,549 | 188,084 |
| Hokitika | 3,673 | 3,673 | 1,902 | 1,902 |
| Lyttelton | 2,041,794 | 2,002,221 | 1,135,921 | 1,160,859 |
| Timaru | 431,958 | 425,023 | 161,915 | 167,780 |
| Oamaru | 185,016 | 192,513 | 69,245 | 69,245 |
| Dunedin | 975,373 | 917,559 | 364,961 | 325,212 |
| Bluff | 399,253 | 397,047 | 77,883 | 71,844 |
| Totals | 12,105,304 | 12,079,204 | 7,055,465 | 7,144,548 |
Viewed from the standpoint of shipping handled in 1918, Wellington is the principal port of the Dominion, followed by Auckland and Lyttelton. Wellington and Lyttelton are the termini of the daily inter-Island ferry service, and to this fact is due a large part of the coastwise shipping entered and cleared from these two ports. The table which follows summarizes the shipping of the principal ports of the Dominion for the year 1918. A comparison with the figures for 1917 brings out the fact that there was a decrease in the total tonnage handled in the majority of the ports mentioned.
| Port. | Oversea. | Coastwise. | Total. | ||
|---|---|---|---|---|---|
| Entered. | Cleared. | Entered. | Cleared. | ||
| Tons. | Tons. | Tons. | Tons. | Tons. | |
| Wellington | 529,947 | 713,349 | 2,138,752 | 2,127,252 | 5,509,300 |
| Auckland | 541,124 | 389,637 | 734,879 | 863,229 | 2,528,869 |
| Lyttelton | 66,352 | 28,695 | 1,135,921 | 1,160,859 | 2,391,827 |
| Dunedin | 35,259 | 70,317 | 364,961 | 325,212 | 795,749 |
| Napier | 18,346 | 9,851 | 311,072 | 313,559 | 652,828 |
| Gisborne | 13,759 | 139 | 279,619 | 286,764 | 580,281 |
| Westport | 1,049 | 10,798 | 288,749 | 279,000 | 579,596 |
| Greymouth | 327 | 29,566 | 217,549 | 188,084 | 435,526 |
| Nelson | 4,548 | .. | 197,493 | 201,676 | 403,717 |
| Wairau (including Picton) | .. | .. | 225,850 | 225,827 | 451,677 |
| Bluff | 23,896 | 29,836 | 77,883 | 71,844 | 203,459 |
| Timaru | 8,329 | 1,840 | 161,915 | 167,780 | 339,864 |
Information as to pilotage, port charges, wharfage rates, &c., at these and certain other ports of the Dominion is given in the 1914 issue of this book. Particulars concerning the graving-docks at Auckland, Lyttelton, and Port Chalmers (2), and the patent slips at Wellington and Lyttelton, will be found in the same issue.
The examinations for masters, mates, engineers, &c., of vessels are controlled by the Marine Department. New regulations have been made, and the new methods came into vogue from October, 1918. During 1918-19 some 391 candidates sat for examinations. Of the 307 who passed, 139 were masters, mates, and engineers of sea-going ships, and 24 of ships plying within restricted limits; 38 were engineers of sea-going motor-propelled boats, and 99 engineers of such boats plying within restricted limits.
The Shipping and Seamen Act of 1908, and its amendment of 1909, provide for an annual survey by Government surveyors of all vessels, with a view to ensuring their seaworthiness. Certificates of survey were issued in 1918-19 to 286 steamers, 476 oil-engine vessels, and 61 sailing-vessels.
The long coast-line of the Dominion is marred in many places by hidden rocks or reefs and other perils to navigation. This has compelled the erection of some sixty-five lighthouses of various types. No fewer than fifteen of these are situated in the stormy area of Cook Strait and the bays opening therefrom, reaching from where the red and white rays of Cape Farewell light give warning of the seven-mile-long sandspit at the northern extremity of the South Island to the bluff shore marked by the Cape Palliser light at the southern point of the North Island.
The buildings are of varying kinds, as necessitated by their respective situations. In some thirty-three cases the light apparatus is classed as of the dioptric order—i.e., a central lamp sending its rays through a combination of surrounding lenses. The Aga light is used in seventeen lighthouses, while the remainder have the Pintsch-gas system, port lights, or Wigham beacon-lamps.
The most powerful light is that of Stephen Island, which, placed some 70 ft. above high water, is visible at a distance of 32 1/2 miles. Next in order come the Cape Brett light (altitude 510 ft.), visible at 30 1/2 miles; Godley Head (altitude 450 ft.), visibility 29 miles; Cuvier Island light (altitude 390 ft.), Manukau (altitude 385 ft.), and Mokohinau (altitude 385 ft.), all of which have a visibility of 27 miles. Seventeen other lights have a range of 20 miles or over.
The majority of lighthouses are equipped with flags and lamps, the keepers being competent to receive or transmit messages. Lights outside the bounds of the various harbour authorities are maintained by the Marine Department. The Government steamer "Hinemoa" is largely used in connection with the supply of stores, &c., to the more inaccessible lights.
The average cost of erection and equipment of the coastal lighthouses was about £6,000 per light. The two most costly were Cape Brett Lighthouse (£11,237) on the Auckland Peninsula, and Dog Island Lighthouse (£10,481) in Foveaux Strait. The average cost of maintenance for 1918-19 was: Salaries, £299; oil and stores, &c., £212: total, £511. Light dues collected at the various ports in 1918-19 were as follows: Auckland, £9,619; Wellington, £8,047; Lyttelton, £1,926; Dunedin, £767; other ports, £4,362: making a total of £24,721.
In the case of any wreck or shipping casualty in or near the coast of New Zealand a Collector of Customs, or other person empowered by the Minister of Marine, institutes an inquiry into the cause and circumstances of such casualty. If necessary a formal investigation is held by a Magistrate, who has power to cancel or suspend the certificate of any officer where the damage has resulted from his wrongful act or default.
Should any wreck occur on the coast the Receiver of Wrecks for that district, usually an officer of the Customs, has the necessary authority to be used in the preservation of life and property.
During 1918-19 sixty inquiries were held, seven of which were Magisterial. Ships concerned had a total tonnage of 34,509 tons register. Lives lost numbered thirty-six, as compared with one in the previous year. Twenty-six of the deaths were caused by the destruction of the "Wimmera," which struck a German mine off the North Cape on the 26th June, 1918. A summary of shipping casualties is as follows:—
| Strandings— | No. | Tonnage. |
| Total wrecks | 3 | 178 |
| Partial loss | 3 | 73 |
| Slight damage | 3 | 158 |
| No damage | 5 | 6,466 |
| Foundered— | ||
| Total loss | 1 | 1,872 |
| Collisions— | ||
| Partial loss | 2 | 135 |
| Slight damage | 13 | 677 |
| No damage | 3 | 1,519 |
| Fires— | ||
| Total loss | 3 | 3,865 |
| Partial loss | 1 | 83 |
| Slight damage | 2 | 552 |
| No damage | 2 | 6,980 |
| Miscellaneous | 19 | 11,951 |
| Totals | 60 | 34,509 |
Table of Contents
RAILWAY history in New Zealand dates from the year 1860 only. In that year a contract was let for the construction of a line from Christchurch to Lyttelton. The first portion of this line was opened on the 1st December, 1863, so that to Canterbury Province belongs the honour of first having railway communication within its borders. Four years later the Lyttelton tunnel (1 1/2 miles long) had been pierced and the line completed. Meanwhile other lines were being proceeded with inland towards the Canterbury Plains. Following the lead of Canterbury Province, the Provincial Council of Southland commenced in 1863 a line from Invercargill to Bluff Harbour which was opened on the 5th February, 1867. Driven by the necessity for efficient military transport, the Provincial Council of Auckland in 1863 began the construction of a line from Auckland to Drury.
The effect of the various short railways being constructed by different authorities is apparent in the divers gauges adopted. The General Government recommended the adoption of a 5 ft. 6 in. gauge; nevertheless the Canterbury lines were using a 5 ft. 3 in. gauge, while the Auckland and Otago lines had the standard English gauge of 4 ft. 8 in.
Happily, these troubles were solved by the historic Railways Act of 1870. At this date only forty-six miles of railway were in operation. This Act, which was part of the public-works policy of the late Sir Julius Vogel, provided a general railway policy for the colony. Six years later, when the abolition of provinces placed the earlier-constructed lines in the hands of the General Government, railway mileage had risen to 718 miles.
Although practically all the railways are State-owned, some were built by private enterprise. Of these the more important were constructed by the Midland and Wellington-Manawatu Railway Companies. The former line, of which some 87 miles were in use, was taken over by the Government on the 27th May, 1895. As yet the work on this route is still incomplete owing to the engineering difficulties obtaining. Through rail communication between Canterbury and the "Coast" will be effected shortly. The second line of consequence ran from Wellington to Longburn, a distance of some 84 miles. It was acquired for the State by purchase in December, 1908.
At the present time there are some 3,012 miles of railway open for traffic of which 2,983 are State-owned. State railways are divided into nine distinct sections, as follows:—
| Section. | Length. Miles. |
|---|---|
| North Island main lines and branches | 1,126 |
| Whangarei | 74 |
| Kaihu | 20 |
| Gisborne | 49 |
| Total, North Island | 1,269 |
| Section. | Length. Miles. |
| South Island main lines and branches | 1,404 |
| Westland | 157 |
| Westport | 36 |
| Nelson | 61 |
| Picton | 56 |
| Total, South Island | 1,714 |
Government railways are constructed by the Public Works Department, and are transferred to the Railways Department when completed.
The gauge is 3 ft. 6 in., and a steel rail of 70 lb. weight per lineal yard is the standard for the permanent-way, and is in use on some 1,299 miles of line. Some 1,515 miles are still in 53 lb., 55 lb., and 56 lb. steel rails, and most of the remainder is of lighter material. Sleepers, which are laid down to the number of 2,100 to the mile, are principally Australian hardwoods or New Zealand silver-pine or totara.
Since 1901 all carriages and wagons required for use on the State railways have been manufactured in the railway workshops of the Dominion. The locomotives also are now all built in the Dominion, mostly in the railway workshops. A new passenger locomotive, Class AB , was brought into operation during 1915, and has been adopted as a standard type. This is a simple superheated tender-engine of the "Pacific" type — weight in working trim, 79 tons; tractive power, 20,000 lb. The AB locomotive is of sufficient power to be also easily adapted for use as a goods engine. The standard goods locomotive used is of the four-cylinder balanced compound type, weighs 94 tons, and has a tractive power of 29,840 lb. Standard carriages are 50 ft. in length, fitted with chair seats to accommodate forty-four passengers, and lighted by the Pintsch-gas system. All rolling-stock is fitted with the Westinghouse brake.
Information as to the rolling-stock in use on the State railways of Australia and New Zealand is given in the following table:—
| ROLLING -STOCK , STATE RAILWAYS OF AUSTRALASIA . | ||||
|---|---|---|---|---|
| State. | Miles open for Traffic. | Locomotives. | Passenger Vehicles. | Wagons and Brake-vans. |
| Number. | Number. | Number. | ||
| Victoria | 4,152 | 817 | 1,641 | 20,292 |
| New South Wales | 4,679 | 1,282 | 1,659 | 22,859 |
| Queensland | 5,295 | 658 | 817 | 14,371 |
| South Australia | 2,235 | 489 | 636 | 9,483 |
| Western Australia | 3,463 | 424 | 409 | 10,069 |
| Tasmania | 591 | 80 | 175 | 1,813 |
| New Zealand | 2,983 | 620 | 1,489 | 22,658 |
NOTE .—The Australian figures are for the year ended 30th June, 1918; the New Zealand figures for the year ended 31st March, 1919.
New Zealand railways, it is apparent, carry more rolling-stock in proportion to mileage open than do the Australian lines.
The following statement shows the number of miles of Government railways open in the Dominion, the number of train-miles travelled and of passengers carried, and the tonnage of goods traffic for the past twenty years.
| Year ended 31st March. | Length open (Miles). | Train-mileage. | Passengers. | Season Tickets issued. | Goods and Live-stock.* |
|---|---|---|---|---|---|
| * The equivalent tonnage for live-stock has been given. | |||||
| Tons. | |||||
| 1900 | 2,104 | 4,187,893 | 5,468,284 | 63,335 | 3,251,716 |
| 1901 | 2,212 | 4,620,971 | 6,243,593 | 82,921 | 3,461,331 |
| 1902 | 2,235 | 5,066,360 | 7,356,136 | 100,778 | 3,667,039 |
| 1903 | 2,291 | 5,443,333 | 7,575,390 | 118,431 | 3,918,261 |
| 1904 | 2,328 | 5,685,399 | 8,306,383 | 129,919 | 4,259,217 |
| 1905 | 2,374 | 6,107,079 | 8,514,112 | 140,453 | 4,185,468 |
| 1906 | 2,407 | 6,413,573 | 8,826,382 | 147,989 | 4,415,166 |
| 1907 | 2,458 | 6,755,454 | 9,600,786 | 165,504 | 4,824,563 |
| 1908 | 2,474 | 7,051,274 | 9,756,716 | 185,174 | 5,070,176 |
| 1909 | 2,674 | 7,458,236 | 10,457,144 | 192,547 | 5,135,408 |
| 1910 | 2,717 | 7,889,166 | 11,141,142 | 199,371 | 5,490,018 |
| 1911 | 2,753 | 8,141,075 | 11,200,613 | 222,104 | 5,863,674 |
| 1912 | 2,798 | 8,371,687 | 11,891,134 | 236,957 | 5,887,908 |
| 1913 | 2,851 | 9,016,224 | 13,123,879 | 265,259 | 6,246,128 |
| 1914 | 2,854 | 9,319,268 | 13,355,893 | 287,037 | 6,019,633 |
| 1915 | 2,945 | 9,383,420 | 13,565,772 | 302,912 | 6,453,472 |
| 1916 | 2,960 | 9,356,522 | 14,201,506 | 330,622 | 6,370,945 |
| 1917 | 2,960 | 9,146,331 | 14,173,115 | 355,832 | 6,239,172 |
| 1918 | 2,983 | 7,468,646 | 11,408,156 | 322,487 | 5,742,968 |
| 1919 | 2,983 | 7,477,583 | 11,374,521 | 351,124 | 5,613,739 |
The principal commodities carried on the State railways during each of the past twenty years were,—
| Year ended 31st March. | Wool. | Timber. | Grain. | Minerals. | Cattle. | Sheep and Pigs. |
|---|---|---|---|---|---|---|
| *Information not available. | ||||||
| Tons. | Tons. | Tons. | Tons. | Number. | Number. | |
| 1900 | 104,621 | 334,677 | 764,033 | 1,218,698 | 65,063 | 2,559,836 |
| 1901 | 96,519 | 380,803 | 772,571 | 1,366,241 | 72,868 | 2,463,250 |
| 1902 | 101,878 | 427,153 | 813,345 | 1,443,792 | 83,458 | 2,780,019 |
| 1903 | 116,309 | 436,008 | 718,376 | 1,604,426 | 102,461 | 3,883,177 |
| 1904 | 101,316 | 509,712 | 820,453 | 1,744,323 | 107,435 | 3,826,646 |
| 1905 | 107,625 | 493,327 | 732,480 | 1,806,360 | 110,924 | 3,490,752 |
| 1906 | 116,086 | 534,533 | 772,258 | 1,938,548 | 119,311 | 3,441,387 |
| 1907 | 128,161 | 567,835 | 770,706 | 2,135,446 | 133,031 | 4,776,223 |
| 1908 | 120,593 | 616,892 | 739,568 | 2,319,913 | 150,751 | 4,719,087 |
| 1909 | 137,916 | 582,860 | 793,793 | 2,342,048 | 159,884 | 5,329,115 |
| 1910 | 151,051 | 523,845 | 1,044,468 | 2,486,121 | 176,412 | 5,253,692 |
| 1911 | 143,247 | 627,107 | 1,013,298 | 2,655,250 | 210,848 | 6,071,670 |
| 1912 | 141,607 | 718,414 | 949,556 | 2,676,783 | 207,546 | 5,601,711 |
| 1913 | 147,735 | 695,060 | 1,181,899 | 2,760,983 | 221,595 | 5,524,935 |
| 1914 | 155,709 | 676,858 | 1,050,395 | 2,551,614 | 254,291 | 7,006,268 |
| 1915 | 162,002 | 621,963 | 1,103,352 | 2,988,028 | 314,219 | 7,086,461 |
| 1916 | 154,633 | 625,866 | 1,061,987 | 2,831,959 | 371,529 | 7,387,269 |
| 1917 | * | 579,428 | * | 2,787,523 | 402,769 | 7,269,544 |
| 1918 | * | 523,784 | * | 2,572,576 | 362,134 | 6,502,090 |
| 1919 | * | 487,729 | * | 2,444,007 | 346,544 | 6,691,760 |
The total cost of construction of open lines up to the 31st March, 1919, was £36,167,681. The amount spent on lines in course of construction and not handed over to the Working Railways Department for traffic purposes was £3,093,201, making the total capital invested in State railways £39,260,882. The figures for each of the past five years are given.
| — | 1914-15. | 1915-16. | 1916-17. | 1917-18. | 1918-19. |
|---|---|---|---|---|---|
| £ | £ | £ | £ | £ | |
| Lines open for traffic | 34,133,825 | 34,857,882 | 35,378,664 | 36,001,432 | 36,167,681 |
| Lines under construction | 1,999,330 | 2,477,198 | 2,808,509 | 2,796,731 | 3,093,201 |
| Totals | 36,133,155 | 37,335,080 | 38,187,173 | 38,798,163 | 39,260,882 |
So varied are the geographical features of the Dominion that a great disparity exists in the cost of constructing the individual sections of lines. The numerous mountain-chains and the innumerable rivers fed by the heavy rainfall make railway construction in general both difficult and expensive, as the next statement shows.
| COMPARISON OF COST AND REVENUE OF EACH SECTION , 1918-19. | |||
|---|---|---|---|
| Section. | Capital Cost of Open Lines, 31st March, 1919. | Capital Cost per Mile (Open Lines). | Net Revenue per Mile of Open Line, 1918-19. |
| * Loss. | |||
| North Island— | £ | £ | £ |
| Whangarei | 767,510 | 10,372 | 141.74 |
| Kaihu | 99,962 | 4,998 | -119.76* |
| Gisborne | 682,157 | 13,921 | -14.95* |
| Main line and branches | 16,006,227 | 14,215 | 994.77 |
| Total | 17,555,856 | 13,834 | 888.48 |
| South Island— | |||
| Westland | 2,099,420 | 13,372 | 236.82 |
| Westport | 606,225 | 16,840 | 1,255.56 |
| Nelson | 542,534 | 8,894 | 19.56 |
| Picton | 683,683 | 12,209 | -4.70* |
| Main line and branches | 14,616,816 | 10,411 | 334.45 |
| Total | 18,548,678 | 10,822 | 322.39 |
| Lake Wakatipu steamer service | 43,708 | .. | .. |
| W.R.D. stock of A.O.L. stores | 19,439 | .. | .. |
| Grand total | 36,167,681 | 12,125 | 563.21 |
The Westport Section is both the most expensive line constructed and the most lucrative owing to the huge quantity of coal transported.
The railways of New Zealand have been looked upon more as adjuncts to the settlement of the country and the development of its natural resources than as an investment from which large profits should directly accrue. For many years a profit of 3 per cent. was regarded as sufficient, and any excess over this rate was followed by reductions in passenger charges or in freights. Consequent on the extension of settlement and the soundness of the Dominion's industries, a higher rate than 3 per cent. has been aimed at in recent years. The rate looked for in 1909-10 was 3 3/4 per cent., in 1910-11 4 per cent., followed in 1911-12 by a return to 3 3/4 per cent. These rates were obtained, as will be seen from the table following. The rates for 1913-14 and 1914-15 fell below expectations, a result due in the earlier year to the extended strike which obtained during nearly three months of the year and to the outbreak of smallpox in the North Island, and in the later year to the outbreak of the European War. In 1915-16 and 1916-17, however, there were considerable increases, bringing the revenue up to 4 3/4 per cent. and 5 1/4 per cent. respectively. These increases are largely due to the increased scale of fares, &c., now ruling.
The paralysing effect of the influenza epidemic at the close of 1918 prevented last year's revenue from reaching a higher total.
The gross revenue from lines open for traffic during the financial year ended the 31st March, 1919, was £4,988,632, a decrease of £113,110 on the amount realized for the previous year. The net revenue amounted to £1,680,057, equivalent to a return of 4.65 per cent. on the capital invested in lines open for traffic.
Information as to the revenue of the railways during each of the past twenty years is given in the following table:—
| RAILWAY REVENUE , 1899-1900 TO 1918-19. | |||||||
|---|---|---|---|---|---|---|---|
| Year ended 31st March. | Gross Revenue from | Total Gross Revenue. | Net Revenue. | Percentages of Net Revenue to Capital Cost. | |||
| Passenger-fares. | Parcels, Luggage, and Mails. | Goods and Livestock. | Rents and Miscellaneous. | ||||
| £ | £ | £ | £ | £ s. d. | |||
| 1900 | 515,020 | 68,488 | 985,723 | 54,660 | 1,623,891 | 571,533 | 3 8 5 |
| 1901 | 544,976 | 72,712 | 1,051,694 | 57,854 | 1,727,236 | 599,389 | 3 9 8 |
| 1902 | 621,019 | 79,561 | 1,110,575 | 63,431 | 1,874,586 | 622,349 | 3 8 6 |
| 1903 | 625,698 | 87,273 | 1,189,101 | 71,966 | 1,974,038 | 630,623 | 3 6 1 |
| 1904 | 704,660 | 110,151 | 1,293,169 | 72,661 | 2,180,641 | 741,917 | 3 118 |
| 1905 | 738,158 | 115,051 | 1,277,976 | 78,046 | 2,209,231 | 716,331 | 3 6 0 |
| 1906 | 786,873 | 142,642 | 1,346,038 | 74,151 | 2,349,704 | 728,465 | 3 4 9 |
| 1907 | 892,053 | 151,913 | 1,498,686 | 81,948 | 2,624,600 | 812,118 | 3 9 1 |
| 1908 | 912,978 | 176,876 | 1,582,328 | 89,756 | 2,761,938 | 812,179 | 3 6 8 |
| 1909 | 1,011,658 | 187,040 | 1,630,704 | 100,124 | 2,929,526 | 814,711 | 3 2 7 |
| 1910 | 1,171,040 | 192,585 | 1,772,547 | 113,618 | 3,249,790 | 1,080,316 | 3 160 |
| 1911 | 1,223,412 | 193,789 | 1,961,078 | 115,903 | 3,494,182 | 1,190,910 | 413 |
| 1912 | 1,319,114 | 203,334 | 2,032,785 | 121,276 | 3,676,509 | 1,210,613 | 3 197 |
| 1913 | 1,461,873 | 215,209 | 2,157,686 | 136,234 | 3,971,002 | 1,265,393 | 4 0 9 |
| 1914 | 1,450,480 | 236,761 | 2,209,398 | 146,689 | 4,043,328 | 1,163,005 | 3 123 |
| 1915 | 1,482,382 | 227,521 | 2,249,399 | 146,155 | 4,105,457 | 1,185,002 | 3 107 |
| 1916 | 1,722,702 | 236,705 | 2,423,493 | 165,456 | 4,548,356 | 1,637,473 | 41 4 4 |
| 1917 | 1,873,048 | 243,832 | 2,498,862 | 185,068 | 4,800,810 | 1,873,946 | 5 5 11 |
| 1918 | 1,802,597 | 254,110 | 2,465,241 | 165,752 | 4,687,700 | 1,644,793 | 4 11 11 |
| 1919 | 1,950,281 | 258,525 | 2,608,336 | 171,490 | 4,988,632 | 1,680,057 | 4 12 11 |
The revenue from passenger-fares during the year 1918-19 represented an expenditure on railway travel of £1 13s. 10d. per head of mean population, including Maoris. The total revenue was equal to £4 6s. 7d. per capita.
A table is added showing information as to railway revenue in each of the Australian States for the year ended the 30th June, 1918. Figures for New Zealand for the year 1918-19 are also given.
| REVENUE OF STATE RAILWAYS IN AUSTRALASIA , 1917-18. | ||||||
|---|---|---|---|---|---|---|
| State. | Average Miles of Line worked. | Train-miles run (,000 omitted). | Gross Revenue (,000 omitted). | Net Revenue. | ||
| Amount (,000 omitted) | Per Train-mile. | Per Cent. of Capital. | ||||
| * Year ended 31st March, 1919. | ||||||
| £ | £ | s. d. | ||||
| Queensland | 5,295 | 10,320 | 4,024 | 613 | 1 2 | 1.55 |
| New South Wales | 4,679 | 18,143 | 8,955 | 3,014 | 1 4 | 4.10 |
| Victoria | 4,152 | 13,626 | 6,562 | 2,374 | 3 6 | 4.19 |
| South Australia | 2,235 | 5,441 | 2,332 | 584 | 2 2 | 3.18 |
| Western Australia | 3,463 | 4,095 | 1,816 | 365 | 1 9 | 2.05 |
| Tasmania | 591 | 1,056 | 357 | 79 | 1 6 | 1.58 |
| New Zealand* | 2,983 | 7,478 | 4,989 | 1,680 | 46 | 4.65 |
Expenditure on State railways open for traffic dining the year ended the 31st March, 1919, amounted to £3,308,575, or 66.32 per cent. of the gross revenue. The figures for each of the past twenty years are as follows:—
| Year ended 31st March. | Expenditure. | |
|---|---|---|
| Amount. | Per Cent. of Revenue. | |
| 1900 | 1,052,358 | 64.80 |
| 1901 | 1,127,847 | 65.30 |
| 1902 | 1,252,237 | 66.80 |
| 1903 | 1,343,415 | 68.05 |
| 1904 | 1,438,724 | 65.98 |
| 1905 | 1,492,900 | 67.58 |
| 1906 | 1,621,239 | 69.00 |
| 1907 | 1,812,482 | 69.06 |
| 1908 | 1,949,759 | 70.59 |
| 1909 | 2,114,815 | 72.19 |
| 1910 | 2,169,474 | 66.76 |
| 1911 | 2,303,272 | 65.92 |
| 1912 | 2,465,896 | 67.07 |
| 1913 | 2,705,609 | 68.13 |
| 1914 | 2,880,323 | 71.24 |
| 1915 | 2,920,455 | 71.14 |
| 1916 | 2,910,883 | 64.00 |
| 1917 | 2,926,864 | 60.97 |
| 1918 | 3,042,907 | 64.91 |
| 1919 | 3,308,575 | 66.32 |
The expenditure under various heads for each of the past ten years has been as follows:—
| Year ended 31st March. | Maintenance of Way. | Locomotive Power. | Carriages and Wagons. | Traffic. | Lake Wakatipu Steamers. | Head and Departmental Offices. | Total. |
|---|---|---|---|---|---|---|---|
| £ | £ | £ | £ | £ | £ | £ | |
| 1910 | 620,008 | 669,559 | 163,833 | 615,033 | 5,139 | 95,902 | 2,169,474 |
| 1911 | 693,445 | 695,062 | 180,221 | 631,380 | 5,029 | 98,135 | 2,303,272 |
| 1912 | 735,546 | 743,443 | 209,039 | 670,631 | 5,997 | 101,240 | 2,465,896 |
| 1913 | 765,860 | 833,146 | 226,146 | 768,936 | 6,619 | 104,902 | 2,705,609 |
| 1914 | 763,207 | 921,564 | 232,745 | 838,222 | 7,046 | 117,539 | 2,880,323 |
| 1915 | 738,550 | 954,868 | 228,145 | 870,392 | 6,085 | 122,415 | 2,920,455 |
| 1916 | 740,349 | 934,737 | 225,968 | 889,991 | 6,377 | 113,461 | 2,910,883 |
| 1917 | 720,840 | 937,780 | 238,868 | 904,318 | 6,602 | 118,456 | 2,926,864 |
| 1918 | 710,655 | 962,222 | 283,248 | 954,142 | 7,664 | 124,976 | 3,042,907 |
| 1919 | 752,558 | 1,075,489 | 306,308 | 1,032,609 | 6,985 | 134,626 | 3,308,575 |
The number of men employed in operating the State railways at the 31st March, 1919, was 12,391. The staff is divided into two divisions— namely, the first or clerical division and the second or out-of-door division— and is further classed in four branches, as shown in the following table, which gives the number of employees in March of each of the past ten years:—
| RAILWAY EMPLOYEES , 1909-10 TO 1918-19. | |||||
|---|---|---|---|---|---|
| As at 31st March. | General. | Traffic. | Maintenance. | Locomotive. | Totals. |
| 1910 | 648 | 3,758 | 3,847 | 3,971 | 12,224 |
| 1911 | 671 | 3,848 | 4,228 | 4,134 | 12,881 |
| 1912 | 673 | 4,064 | 4,308 | 4,478 | 13,523 |
| 1913 | 718 | 4,469 | 4,240 | 4,786 | 14,213 |
| 1914 | 600 | 4,676 | 3,952 | 4,948 | 14,176 |
| 1915 | 632 | 4,753 | 4,065 | 5,164 | 14,614 |
| 1916 | 693 | 5,041 | 3,931 | 5,303 | 14,968 |
| 1917 | 675 | 4,798 | 3,586 | 4,649 | 13,708 |
| 1918 | 660 | 4,612 | 3,410 | 4,320 | 13,002 |
| 1919 | 661 | 4,505 | 3,347 | 3,878 | 12,391 |
Railway employees are under a system of classification, first introduced in 1896, and revised at various times since then.
Appeal Boards (one in each Island) have been constituted to hear and redress grievances of men dissatisfied with decisions respecting the withholding of annual increments, promotion, loss of status, or breaches of discipline involving fines in excess of £2. Each Board consists of a Magistrate and two members of the Railway service elected by the members thereof. The Minister of Railways has the power of veto in respect of any decision of the Board.
A superannuation fund in connection with the Railway service was established in 1903. Full information concerning this is given in the section dealing with Pensions and Superannuation Funds.
The history of railways in New Zealand has been one of comparative freedom from accidents of a serious nature. One of the most serious was the Rakaia accident of 1899, wherein four persons were killed and several injured. The Whangamarino accident of the 27th May, 1914, resulted in three persons being killed and others injured. As the result of a large slip on the line at Mataroa on 8th November, 1918, an accident occurred, resulting in the deaths of four persons and serious injuries to three others. A table is given dealing with railway accidents during each of the past ten years.
| RAILWAY ACCIDENTS , 1909-10 TO 1918-19. | |||||||
|---|---|---|---|---|---|---|---|
| Year ended 31st March. | To Passengers. | To Employees. | To Others. | Fatal. | Serious. | Minor. | Totals. |
| 1910 | 14 | 708 | 19 | 25 | 11 | 705 | 741 |
| 1911 | 28 | 722 | 36 | 35 | 3 | 748 | 786 |
| 1912 | 18 | 806 | 22 | 23 | 6 | 817 | 846 |
| 1913 | 8 | 868 | 39 | 22 | 5 | 888 | 915 |
| 1914 | 18 | 1,008 | 25 | 27 | 4 | 1,020 | 1,051 |
| 1915 | 15 | 973 | 28 | 28 | 7 | 981 | 1,016 |
| 1916 | 28 | 919 | 27 | 33 | 6 | 935 | 974 |
| 1917 | 25 | 852 | 22 | 24 | 8 | 867 | 899 |
| 1918 | 11 | 765 | 29 | 22 | 13 | 770 | 805 |
| 1919 | 33 | 715 | 29 | 23 | 22 | 732 | 777 |
Of the persons meeting with fatal accidents in 1918-19, 8 were passengers, 5 employees, and 10 neither passengers nor employees. Of the non-fatal accidents, 61 were classified as train accidents, 285 as accidents on line (other than train-running), 65 as shunting accidents, 125 as accidents on wharves and in sheds, and 218 as accidents in railway workshops.
Private railways have a total mileage of 136 miles. A complete list is as follows:—
| Railway. | Location. | Length of Railway. |
|---|---|---|
| M. C. L. | ||
| Waipa Railway and Collieries (Limited) | Ngaruawahia | 5 50 0 |
| Taupo Totara Timber Company (Limited) | Putaruru | 50 40 0 |
| Waihi Gold-mining Company (Limited) | Waikino | 5 72 0 |
| Sanson Tramway | Sanson-Himatangi | 17 0 0 |
| Castlecliff Railway | Wanganui-Castlecliff | 3 40 0 |
| Napier Harbour Board's line | Port Ahuriri | 1 24 50 |
| Homebush Coal Company | Coalgate | 3 37 0 |
| Waronui Coal Company | Milton | 5 33 0 |
| Taratu Coal Company | Lovell's Flat | 7 47 0 |
| Kaitangata Coal Company | Stirling | 5 45 0 |
| Dunedin City Corporation Ocean Beach Railway | Dunedin (about) | 3 14 0 |
| Nightcaps Coal Company | Wairio-Nightcaps | 2 33 63 |
| Ohai Railway | From Wairio | 5 60 0 |
| Westport Harbour Board | Westport-Cape Foulwind and Quarries | 16 14 0 |
| Denniston Incline (Westport Coal Company's line) | Waimangaroa - Conn's Creek | 1 20 0 |
| Paparoa Company's Railway | (Worked by N.Z.R.) | 1 68 21 |
| Total mileage | 136 38 34 |
Table of Contents
THE Post and Telegraph Department is really a "Service" rather than a "Department." By reason of its ramifications it has probably greater potentialities for usefulness to the public than any other organization, and in New Zealand very full use is made of it.
Around the money-order and savings-bank accounts as a nucleus there has been built up a system of accounting which receives from all the departments of the Post and Telegraph service various revenues which are due to the Treasury, and, in addition to this, includes a vast amount of work for other Departments of the State.
In connection with the Post Office Savings-bank, information concerning which is given in the portion of this book dealing with banking, the Department receives interest-bearing deposits from the public, and invests the money received in liquid securities, not dealing in any way with land or actively participating in commercial ventures. In its money-order and postal-note business it issues drafts on places both within and beyond New Zealand, and pays drafts drawn on New Zealand either by its own agencies or by the agencies of foreign countries with which it has relations.
It receives amounts for credit of almost every Department in the Government service, and clears them from its central office in Wellington. In fact, it performs for the general public and the State various duties which, in quite another sphere of activity, are usually performed by a commercial bank. On account of the smallness of the majority of its transactions, the business, which bulks very large even from the "£ s. d." point of view, is very much larger from the standpoint of the number of transactions involved, which run into millions in each of the main divisions of the business.
A very large business is done both for the Public Trust Office and the State Advances Office in connection with the receipt and payment of moneys throughout the Dominion, amounting (in 1918) in the case of the former Office to £2,728,274, and in that of the latter to £2,709,678. Payments of all kinds, including advances on mortgages, are made upon vouchers prepared and certified in the Head Offices of these Departments, and transmitted to the Accountant's Office, General Post Office, for payment. On the other hand, lodgments are received at any money-order office in the Dominion of any moneys whatever that may be due to the Public Trustee or to the State Advances Office. A very large number of vouchers is paid on behalf of the Treasury. Last year these amounted in value to £7,342,587. This system has been extended by making provision for the prompt payment through the Post Office of all claims against the General Government of sums of £5 and under, without pre-audit and without reference to the central authority. This is very much appreciated by small creditors, enabling them, as it does, to receive payment immediately after completion of the service.
In addition to the items mentioned where the Post Office acts as the agent or intermediary, there is a very considerable number of others, including such diverse matters as the collection of fees under the Arms Act, sale of fishing and game licenses, collection of Customs duty on parcels received from abroad, collection of goldfields revenue, collection of premiums for the Government Insurance Department, the payment of old-age, widows', and military pensions, Imperial pensions, and Public Servants' superannuation allowances, the collection of machinery fees, of amounts for the National Provident Fund, of fees in connection with the registration of births, deaths, and marriages, of valuation revenue, of land and income tax, orchard-tax, beer duty, workers' dwellings instalments, and industrial-schools receipts. All these entail special knowledge on the part of the officers dealing with them, and special classes of accounts. This is particularly the case in connection with the payment of both Imperial and old-age pensions, where the rules governing the payments are elaborate and intricate.
The Post Office pays the allotments of members of the Expeditionary Forces, war pensions, and separation allowances to dependants, and also arranges the payment of wages to wounded and sick soldiers not in camp. The number of payments for the year 1918 was 855,148, for £4,495,715. Soldiers who did not wish to allot to dependants were also afforded facilities to deposit their deferred pay with the Post Office Savings-bank, special accounts being opened for each man taking advantage of this privilege.
When the New Zealand Government decided to float the £2,000,000 public-works loan in 1915 the Postal Department acted as the agent of the Treasury, and received applications and lodgments at all the 800 money-order offices throughout the Dominion. the debentures were subsequently delivered to investors through the same channel.
In connection with the flotation of the war loans in 1916, 1917, 1918. and 1919 the Postal Department again aided the Treasury in the same manner as was done in 1915, and in addition undertook at the very shortest notice an entirely new scheme—viz., the sale of short-dated scrip designated war-loan certificates. This paper was disposed of in two denominations—viz., £1 and £10 for 16s. and £8 respectively in the case of loans for five years, and for 13s. and £6 10s. in respect of investments for a period of ten years, the difference between the sale price and maturity value representing compound interest at 4 1/2 per cent. for five years. Considering the fact that the flotation was an entirely new departure, the sales may be regarded as highly satisfactory, a sum in the vicinity of £4,000,000 having been raised in this manner to date. In order to provide a repository for the safe keeping of war-loan certificates purchased by persons having no suitable accommodation, the Post Office further set up a system whereby it took custody, without charge, of all certificates tendered until the date of maturity. A very large proportion of the purchasers of the war-loan certificates took advantage of the facilities offered.
The Post Office has also set up a system of safe deposits at the principal money-order offices in the Dominion. For a nominal fee debentures, wills, insurance policies, or any paper or parchment documents may be deposited for safe custody.
A further extension of the activities of the Postal Department was made in connection with the population census of October, 1916, the distribution and collection of the householders' schedules being undertaken by the Department on behalf of the Census and Statistics Office. In addition special periodic censuses of stocks of coal, oil, tinplates, &c., have been collected by the Post and Telegraph Department on behalf of the Census and Statistics Office.
Apart from the advantages which are enjoyed by the public under the Post Office system of the collection and disbursement of public moneys, there is a very distinct benefit to the State, as the work is performed at a fractional part of the cost which would be incurred under other conditions.
An idea of the volume of business transacted for the other branches of the Public Service may be formed from the following figures in connection with the work performed for some of the principal Departments for the year ended 31st December, 1918:—
| Receipts. | £ |
| Advances to settlers | 1,366,858 |
| Public Trust | 1,389,158 |
| Beer duty | 19,414 |
| Customs duty | 185,797 |
| Government Life Insurance | 262,941 |
| Income-tax | 3,293,678 |
| Land-tax | 1,122,182 |
| Machinery inspection | 10,868 |
| National Provident Fund | 28,470 |
| Public Service superannuation | 189,477 |
| Registration of births | 2,852 |
| Valuation revenue | 7,162 |
| Fishing licenses | 1,164 |
| Game licenses | 3,943 |
| Industrial schools | 14,209 |
| Teachers' superannuation | 59,837 |
| Payments. | |
| Advances to settlers | 1,342,820 |
| Public Trust | 1,339,116 |
| Pensions paid— | |
| Imperial | 36,659 |
| Military | 51,285 |
| Miners' | 13,672 |
| Old age | 736,853 |
| Widows' | 72,712 |
| War | 1,017,313 |
| Public Service superannuation | 183,305 |
| National Provident Fund | 26,996 |
| Teachers' superannuation | 59,837 |
The total amount received by the Post Office from all sources was £64,443,219, and the total paid out £64,599,297.
The huge volume and multifarious business of the Post and Telegraph Department entails the employment of a numerous staff. the Secretary, under the Ministerial control of the Postmaster-General, is the administrative head.
Since the passing of the Post and Telegraph Department Act, 1918, the jurisdiction of the Public Service Commissioner is to some extent limited. The four senior officers of the Department are now appointed directly by the Governor-General. All other appointments are recommended in the first instance by a Promotion Board, consisting of the Secretary, Chief Telegraph Engineer, the Chief Inspector, the Superintendent of Staff, and an officer elected by his fellow-officers of the Department. The Public Service Commissioner, if satisfied that the recommendations are in accordance with the Act, makes the appointments accordingly.
A return of the staff as at 31st March, 1918 and 1919, is as follows:—
| 31st March, | 31st March. | |
| 1918. | 1919. | |
| Postmaster-General | 1 | 1 |
| Classified staff,— | ||
| Permanent— | ||
| Administrative Division | 3 | 4 |
| Professional Division | 38 | 33 |
| Clerical Division | 3,463 | 3,601 |
| General Division | 3,464 | 3,722 |
| Temporary— | ||
| Night-watchmen | 2 | 2 |
| Postmistresses and assistants | 164 | 188 |
| Switchboard attendants | 520 | 313 |
| Note-sorters, distributors, &c.. | 146 | 66 |
| Postmen, messengers, and chauffeurs | 306 | 331 |
| Night telephonists | 50 | 65 |
| Total, classified staff | 8,157 | 8,325 |
| Employees not on classified staff,— | ||
| Country Postmasters and Postmistresses | 2,303 | 2,280 |
| Postmasters and telegraphists or telephonists who are Railway officers | 140 | 143 |
| Grand total | 10,600 | 10,748 |
The receipts and payments of the Post and Telegraph Department for the financial year 1918-19 are shown in the following table:—
| RECEIPTS . | |||
|---|---|---|---|
| Item. | Postal. | Telegraph | Total. |
| £ s. d. | £ s. d. | £ s. d. | |
| Postages | 935,548 10 2 | .. | 935,548 10 2 |
| Money-order and postal-note commission | 26,912 0 11 | .. | 26,912 0 11 |
| Money-order commission received from foreign offices | 775 7 11 | .. | 775 7 11 |
| Private box and bag fees | 18,369 167 | .. | 18,369 167 |
| Miscellaneous receipts | 1,979 7 4 | 130,131 12 9 1/2 | 132,111 0 1 1/2 |
| Paid telegrams | 485,654 1 11 | .. | 485,654 1 11 |
| Telephone exchanges | .. | 373,168 167 1/2 | 373,168 167 1/2 |
| Totals | 983,585 2 11 | 988,954 114 | 1,972,539 143 |
| PAYMENTS . | |||
|---|---|---|---|
| Item. | Postal. | Telegraph. | Total. |
| £ s. d. | £ s. d. | £ s. d. | |
| Salaries (classified officers) | 288,024 15 5 | 429,474 0 0 | 717,498 155 |
| Salaries (country Postmasters and telephonists, and contributions to Railway Department) | 21,391 0 0 | 37,607 0 0 | 58,998 0 0 |
| Conveyance of mails by sea | 59,238 0 7 | .. | 59,238 0 7 |
| Conveyance of inland mails | 122,019 9 2 | .. | 122,019 9 2 |
| Conveyance of mails by railway | 80,179 119 | .. | 80,179 119 |
| Money-order commission credited to foreign offices | 2,346 198 | .. | 2,346 198 |
| Maintenance of telegraph and telephone lines | .. | 134,616 9 10 | 134,616 9 10 |
| Miscellaneous | 249,351 5 11 | 277,799 1211 | 527,150 1810 |
| Totals | 822,551 2 6 | 879,497 2 9 | 1,702,048 5 3 |
| Balance of receipts over payments | 161,034 0 5 | 109,457 8 7 | 270,491 9 0 |
| Totals | 983,585 2 11 | 988,954 114 | 1,972,539 143 |
There were 2,344 post-offices in New Zealand at the end of 1918, a decrease of two during the year.
The table following gives information covering the past five years as to number of post-offices and numbers of articles posted and delivered: —
| POSTAL BUSINESS , 1914-18. | ||||||
|---|---|---|---|---|---|---|
| Year. | Post-offices open at End of Year. | Articles posted and delivered. | ||||
| Letters and Letter-cards. | Post-cards. | Books and Pattern-packets. | Parcels. | Newspapers | ||
| 1914 | 2,396 | 233,901,320 | 10,585,042 | 65,709,908 | 5,055,147 | 43,779,983 |
| 1915 | 2,402 | 242,547,859 | 9,242,792 | 57,693,130 | 5,724,576 | 41,311,535 |
| 1916 | 2,379 | 242,121,361 | 8,133,697 | 48,868,537 | 6,085,103 | 41,807,999 |
| 1917 | 2,346 | 245,796,945 | 7,549,867 | 44,934,218 | 6,314,875 | 40,366,792 |
| 1918 | 2,344 | 242,527,369 | 7,145,606 | 42,301,230 | 6,376,469 | 35,476,212 |
The average number of letters, &c., posted in the Dominion per head of the mean population in the past ten years is as shown in the next table:—
| ARTICLES POSTED PER HEAD OF MEAN POPULATION , 1909-18. | |||||
|---|---|---|---|---|---|
| Year. | Letters and Letter-cards. | Post-cards. | Books and Parcels. | Newspapers. | Totals. |
| 1909 | 95.98 | 6.32 | 26.29 | 20.48 | 149.07 |
| 1910 | 97.14 | 5.83 | 30.04 | 18.51 | 151.52 |
| 1911 | 97.85 | 5.35 | 31.28 | 18.66 | 153.14 |
| 1912 | 102.06 | 5.00 | 31.52 | 18.89 | 157.47 |
| 1913 | 101.91 | 4.36 | 28.14 | 17.81 | 152.22 |
| 1914 | 105.01 | 4.51 | 33.37 | 18.15 | 161.04 |
| 1915 | 111.53 | 3.77 | 31.40 | 16.94 | 163.64 |
| 1916 | 109.54 | 3.20 | 25.80 | 17.20 | 155.74 |
| 1917 | 110.27 | 3.00 | 24.47 | 16.60 | 154.34 |
| 1918 | 112.57 | 2.94 | 23.57 | 15.14 | 154.22 |
During recent years the Post Office has made very substantial extensions in the establishment of rural-mail deliveries. Many of these are performed by officers mounted on motor-cycles. By means of such deliveries it has been possible to give settlers living in the back country an efficient service.
The facilities afforded for the transmission of parcels through the Post Office to places within and without the Dominion have proved of much convenience to the public. The regulations admit of parcels up to 11 lb. in weight being sent to almost all the important countries of the world, and up to 28 lb. in weight for inland parcels for or from places served the whole way by railway or steamer.
The following table shows the number of parcels exchanged with the United Kingdom, the Australian States, &c., in 1917 and 1918:—
| Country. | Number of Parcels. | |||
|---|---|---|---|---|
| Received. | Despatched. | |||
| * Including parcels for His Majesty's ships. | ||||
| 1917. | 1918. | 1917. | 1918. | |
| United Kingdom and foreign countries, via London | 105,368 | 140,453 | 33,810 | 84,583 |
| United States of America | 32,904 | 60,852 | 1,793 | 1,832 |
| N.Z. Expeditionary Force | 891 | 1,415 | 392,235 | 442,318 |
| Canada | 1,836 | 2,654 | 593 | 1,116 |
| Victoria | 9,609 | 12,303 | 3,613 | 3,253 |
| New South Wales | 16,087 | 20,869 | 11,593 | 6,010 |
| South Australia | 550 | 570 | 557 | 456 |
| Queensland | 913 | 1,061 | 956 | 874 |
| Tasmania | 217 | 235 | 697 | 511 |
| Western Australia | 362 | 317 | 452 | 399 |
| Fiji | 406 | 423 | 1,143 | 1,145 |
| Ceylon | 237 | 336 | 83 | 177* |
| Cape of Good Hope | 1,375 | 714 | 113 | 69 |
| Natal | .. | .. | 283 | 251 |
| India | 1,293 | 1,375 | 697 | 675* |
| Tonga | 43 | 48 | 425 | 507 |
| Tahiti | 7 | 7 | 337 | 977 |
| Hong Kong | 1,241 | 2,682 | 164 | 207 |
| Straits Settlements | 103 | 119 | 101 | 130 |
| Totals | 173,442 | 246,433 | 449,645 | 545,490 |
In normal years parcels despatched average less than one-fourth the number of parcels received. The huge volume of parcels sent to soldiers abroad has gone far towards reversing this proportion.
The declared value of the parcels received from places outside the Dominion during 1918 was £945,113, on which the Customs duty amounted to £162,166.
The number and weight of parcels dealt with—i.e., the total posted plus the foreign received—from 1909 to 1918 are given below:—
| Year. | Number. | Weight. |
|---|---|---|
| lb. | ||
| 1909 | 1,148,471 | 3,903,227 |
| 1910 | 1,306,932 | 4,533,770 |
| 1911 | 1,741,736 | 6,037,050 |
| 1912 | 1,764,534 | 5,998,602 |
| 1913 | 2,231,733 | 7,783,252 |
| Year. | Number. | Weight. |
| lb. | ||
| 1914 | 2,619,995 | 9,561,599 |
| 1915 | 3,002,788 | 11,792,760 |
| 1916 | 3,282,564 | 13,521,485 |
| 1917 | 3,468,981 | 15,077,460 |
| 1918 | 3,584,196 | 15,800,924 |
Special house-to-house deliveries of parcels axe in force in many of the principal towns.
There are (January, 1919) 240 publications on the register of newspapers for New Zealand. Of these, 62 are published daily, 25 three times a week, 30 twice a week, 62 once a week, 8 fortnightly, 1 four-weekly, and 52 monthly. The figures for each postal district are as follows:—
| Postal District | Daily. | Three Times per Week. | Twice per Week. | Weekly. | Fortnightly. | Monthly. | Total. |
|---|---|---|---|---|---|---|---|
| * Including 1 four-weekly. | |||||||
| Auckland | 8 | 2 | 6 | 25 | 2 | 15 | 58 |
| Thames | 4 | 3 | 2 | .. | .. | 1 | 10 |
| Gisborne | 2 | .. | .. | .. | .. | 1 | 3 |
| Napier | 4 | 3 | .. | 3 | .. | 1 | 11 |
| New Plymouth | 5 | 2 | 2 | 1 | .. | .. | 10 |
| Wanganui | 4 | 2 | 3 | .. | .. | .. | 9 |
| Wellington | 10 | 8 | 1 | 9 | 3 | 20* | 51 |
| Blenheim | 1 | 1 | 1 | .. | .. | .. | 3 |
| Nelson | 2 | .. | 1 | 2 | .. | 1 | 6 |
| Westport | 2 | .. | .. | 1 | .. | .. | 3 |
| Greymouth | 4 | .. | .. | .. | .. | .. | 4 |
| Hokitika | 1 | .. | .. | .. | .. | 1 | 2 |
| Christchurch | 5 | 1 | 5 | 3 | 2 | 8 | 24 |
| Timaru | 3 | 3 | .. | .. | .. | .. | 6 |
| Oamaru | 2 | .. | .. | .. | .. | .. | 2 |
| Dunedin | 2 | .. | 4 | 9 | 1 | 5 | 21 |
| Invercargill | 3 | .. | 5 | 9 | .. | .. | 17 |
| Totals | 62 | 25 | 30 | 62 | 8 | 53 | 240 |
The number of offices open for the transaction of money-order business at the end of 1918 was 803.
During 1918, 638,500 money-orders, for a total sum of £3,649,371, were issued at the various post-offices. The money-orders from places beyond New Zealand and payable in the Dominion numbered 42,951, for the amount of £167,072.
The number of offices open for the sale of postal notes at the end of 1918 was 1,020: 2,091,051 postal notes were sold, value £619,605. The notes paid numbered 2,071,995, value £606,276.
British postal orders issued in the Dominion during the year numbered 83,162, of a value amounting to £50,351. Those paid numbered 25,564, and represented £14,884.
The first Government telegraph-lines in New Zealand were constructed by the provincial authorities.
The Canterbury Provincial Government opened a line between Christchurch and Lyttelton in the beginning of the year 1863. On the 12th February, 1864, the Southland Provincial Government opened a line between Invercargill and the Bluff. The General Government subsequently acquired both the above-named lines, and further established communication by wire between Dunedin and Invercargill, also Dunedin and Christchurch, on the 25th May, 1865.
Messrs. Driver and McLean, merchants, of Dunedin, erected a private line between Dunedin and Port Chalmers, which was opened to the public in 1861, and acquired by the General Government some time after the opening of through communication between Lyttelton, Christchurch, Dunedin, and Bluff referred to above.
There were 13,813 miles of telegraph and interurban telephone line open at the end of March, 1919, carrying 50,742 miles of wire. There were 12,091,017 telegrams transmitted during the year: of these, the private and Press messages numbered 11,989,882, which, together with telephone-exchange and other telegraph receipts, yielded a revenue of £988,955.
There were 62 central telephone exchanges and 225 sub-exchanges on the 31st March, 1919. The number of telephone connections, including extensions, increased from 67,763 in March, 1918, to 72,561 in March, 1919. The subscriptions to these exchanges during the financial year amounted to £373,169.
The capital expended on the equipment, &c., of the several telephone exchanges up to the 31st March, 1919, was £2,194,238.
At the 31st March, 1919, the direct connections to exchanges had reached 61,298, with a gross revenue of £373,169.
The telephone, moreover, has been largely availed of in extending rapid communication to outlying places which could not economically have been served by telegraph.
With the growth of the system there arose a demand for telephone facilities between centres of population, and that class of business in this Dominion, as in other countries, has necessitated the provision of a large number of circuits at considerable expenditure to meet requirements. By the end of March, 1919. the number of bureau communications—i.e., public conversations by telephone paid by fees had risen to 5,520,768 for the year then ended, and were of a value of £169,553.
The telephone-exchange system included on the 31st March, 1919, 4,789 miles of pole line and 165,962 miles of wire.
Originally the system was worked by single aerial wires, but these were replaced some years ago at the more important exchanges by aerial and subterranean lead-covered cables. The system of subterranean cables and metallic telephone circuits is being largely extended.
The telephone-exchange system in use is generally of the magneto type, branching multiple switchboards being installed in the principal exchanges. In three installations the common battery system is in operation. Automatic telephones have been introduced to some extent, and contracts are being executed for the installation of automatic exchanges at four of the principal cities and at six less important places.
By the "party" line system of telephone-exchange service several persons may share a common line. This has, on account of the considerable reduction in rental charges, been largely availed of, particularly by those whoso premises are situated at a distance from the exchange.
The first coin-in-slot telephones erected in the Dominion were installed at Wellington on the 17th August, 1910. There are now 275 such instruments in use in the Dominion, 14 of these having been installed during the past year.
The percentage of telephones to the population of the Dominion and of the four principal centres on the 31st March, 1919, was as follows:—
| Dominion | 6.5 |
| Auckland | 6.4 |
| Wellington | 9.0 |
| Christchurch | 7.1 |
| Dunedin | 7.7 |
The first wireless installation in New Zealand was placed in the tower of the General Post Office at Wellington in June, 1910, and experiments were carried out with different systems. Later on a Telefunken 2 1/2 k.w. set was installed, and a wireless-telegraph office opened for commercial work on the 26th July, 1911.
On the 14th October, 1912, the G.P.O. station was replaced by one of 2 1/2 k.w. upon Mount Wakefield, immediately behind the City of Wellington. Full details concerning this and other radio-telegraph stations, and of the history of radio-telegraphy in New Zealand, are given in the 1915 issue of the Year-book.
The New Zealand wireless system includes stations at Chatham Islands and Rarotonga (Cook Islands).
The radio business transacted by the New Zealand coast stations during the past seven years was as follows:—
| Year ended 31st March. | Forwarded. | Received. | ||||
|---|---|---|---|---|---|---|
| Messages. | Words. | Value. | Messages. | Words. | Value. | |
| * Calendar year ended 31st December preceding. | ||||||
| £ | £ | |||||
| 1913* | 909 | 8,803 | 355 | 1,665 | 14,705 | 596 |
| 1914* | 1,405 | 16,818 | 565 | 2,776 | 27,867 | 1,048 |
| 1915 | 2,418 | 47,998 | 1,077 | 4,656 | 64,284 | 2,067 |
| 1916 | 3,076 | 61,759 | 2,296 | 4,666 | 71,291 | 2,763 |
| 1917 | 3,018 | 63,872 | 3,023 | 4,651 | 73,149 | 3,032 |
| 1918 | 2,851 | 60,393 | 3,082 | 4,338 | 73,050 | 3,330 |
| 1919 | 4,482 | 93,507 | 5,245 | 6,570 | 235,889 | 6,227 |
The above table does not include free (service) messages.
The New Zealand coast stations are all reliably connected with the land-line systems. Complete arrangements exist for the prompt transmission of wireless telegrams over them, and for ensuring that distress-signals shall be immediately communicated to the proper authorities.
The cable opened for traffic between New Zealand and Australia and Fiji on the 9th April, 1902, was completed to Bamfield, Vancouver Island, on the 31st October following, and opened for international business on the 8th December, 1902.
The route is from Auckland to Vancouver, via Norfolk Island, Fiji, and Fanning Island. The Australian connection is at Norfolk Island. The deep-sea portion of the Vancouver - Fanning Island cable is stated to be the longest in the world. Following the opening of the cable a much faster service with America and Europe has resulted.
Direct communication between Auckland and Sydney was established on the 31st December, 1912, thus giving the Pacific Cable Board an alternative route to Australia.
During the year 1918-19 the Pacific route took 59 per cent. of the outward business, and the Eastern route 41 per cent.
Table of Contents
THE Crown lands are administered under the authority of the Land Act, 1908, by the Minister of Lands at Wellington, his executive officer being the Under-Secretary of Lands, who is the permanent head of the Department of Lands and Survey. New Zealand is divided into eleven land districts, each being under the local direction of a Commissioner of Crown Lands and a Land Board. The Commissioner's office is known as the principal land office, and in some of the larger districts there are one or more local land offices. It is with these land offices the selector has to transact all business, from the first consultation of the maps to the final receipt of the Crown title.
The names of the land districts and of the towns where the principal office of each is situated are as under:—
| Land District. | Principal Land Office situated at |
| Auckland North | Auckland. |
| Auckland | Auckland |
| Taranaki | New Plymouth. |
| Hawke's Bay | Napier. |
| Wellington | Wellington. |
| Nelson | Nelson. |
| Land District. | Principal Land Office situated at |
| Marlborough | Blenheim. |
| Westland | Hokitika. |
| Canterbury | Christchurch |
| Otago | Dunedin. |
| Southland | Invercargill. |
Commissioners of Crown Lands are executive officers of the land districts, having large discretionary powers under the Act. Each is the Chairman of the Land Board of his district, and transacts all its routine business in the sale, letting, and occupation of Crown lands. The Commissioners deal with trespassers and intruders (persons and cattle), removing the former and prosecuting the owners of the latter; they recover all penalties, ascertain the boundaries of Crown lands, enforce all contracts for the disposition of Crown lands, recover rents and other moneys, deal with determinable contracts, prosecute and defend suits, and do whatever is necessary in the course of their duties. They are also Conservators of State Forests for their respective land districts.
A Land Board consists of five members—viz., the Commissioner of Crown Lands for the district (who is ex officio Chairman), three members nominated by the Governor-General, and one member elected by the Crown tenants of the district.
The Boards transact all business connected with the sale, letting, disposal, and occupation of Crown lands, and all matters connected with the management and control of the public lands in their hands. They are the sole judges of the fulfilment of conditions in leases and licenses, and they can declare them forfeit. All meetings are open to the Press and public, with certain limitations.
A selector may purchase for cash, or may select for occupation with right of purchase or for renewable lease. Every applicant must be of the age of seventeen years or upwards, and must apply for Crown land solely for his own use and benefit, and not directly or indirectly for the use or benefit of any other person, whilst, including the land he applies for, he is not to be the owner, holder, or occupier under any tenure of more than one year's duration, either severally or jointly or in common with any other person or persons, of any land anywhere in New Zealand exceeding in the whole 5,000 acres of land, computed as follows:—
Every acre of first-class land is reckoned as 7 1/2 acres;
Every acre of second-class land is reckoned as 2 1/2 acres;
Every acre of third-class land is reckoned as 1 acre.
The annual rental payable for occupation-with-right-of-purchase selections is 5 per cent. on the cash price of the land, and for lands selected for renewable lease the annual rental is 4 per cent. on the cash price of the land.
Applications for unsurveyed lands are received up to the maximum area for contiguous lands only. Such applications must conform to a general scheme approved by the Land Board, and extend in every instance to the back lines, unless otherwise approved; and approval of all applications is subject to the right of the Crown to make reserves for public purposes and to lay off roads. The cost of survey must be deposited with the application, but the Minister may, on the recommendation of the Land Board, dispense with such deposit.
Crown lands are divided into the following classes:—
Town and village lands the upset prices of which are, respectively, not less than £20 and £3 per acre. Such lands are sold by auction, or leased for any term up to ten years, or disposed of on a renewable lease for a thirty-three years term at a rent of 5 per cent. on the value of the land.
Suburban lands the upset price of which may not be less than £2 an acre. These lands are also sold by auction or leased as aforesaid.
Rural lands, which may be disposed of at not less than £1 per acre for first-class, 10s. an acre for second-class, and 5s. per acre for third-class lands. Such lands may be sold or leased by auction, or sold or leased on application. No rural section may be larger than 666 acres in extent if first-class land, 2,000 acres if second-class land, or 5,000 acres if third-class land, whether offered by auction or application.
Crown land may be selected and occupied under the following tenures and systems:—
Town, suburban, and village lands—
For cash, by public auction;
By lease for terms up to ten years;
By renewable lease for thirty-three years.
Rural land (unimproved), (under optional system)—
For cash, by application;
Occupation with right of purchase for twenty-five years;
Renewable lease for sixty-six years.
Village settlements—
Under the three foregoing tenures of optional system.
Improved-farm settlements (rural land)—
Under special conditions, and either (a ) on occupation-with-right-of-purchase license or (b ) on renewable lease.
(5.) Special settlements (rural land)—
On renewable lease for sixty-six years and under special regulations.
(6.) Land-for-settlement estates (improved rural and pastoral land)—
Under renewable lease for thirty-three years, with limited right to acquire freehold.
(7.) Pastoral land—
By small-grazing-run lease for twenty-one years, with right of renewal (maximum area, 20,000 acres);
By pastoral license on terms up to twenty-one years, as follows: (a ) Pastoral lands suitable exclusively for pasturage, and not capable of being used with profit in areas of a carrying-capacity of less than 5,000 sheep; and (b ) pastoral agricultural lands, with areas not exceeding 5,000 acres.
(8.) Land within mining districts—
On pastoral licenses under special regulations, with right to acquire the freehold or exchange to a renewable lease;
On occupation leases under special regulations, with similar rights as to purchase of freehold and exchange.
(9.) Miscellaneous—
Temporary occupation on terms up to five years;
Sale, or occupation, for special purposes;
Outlying land.
Full particulars are given in the Crown Lands Guide, issued periodically and obtainable at any Land Office, as to the conditions of lease and occupation. A certain amount of improvements is required to be effected on rural land purchased for cash, or held under occupation-with-right-of-purchase or renewable-lease tenures, and residence is compulsory for certain periods on many Crown leaseholds. Rebate of rent is given in many cases when the half-yearly instalment of rent is paid within thirty days of its becoming due. Applications for mortgage, transfer, and sublease of a Crown leasehold have to be approved by the Land Board of the district in most cases.
National Endowments may be disposed of under renewable lease, small-grazing-run lease, or pastoral license. The freehold of the land cannot be acquired, but in other respects they are subject to the conditions of the Land Act.
Education Endowments are available for leasing under the Education Reserves Amendment Act, 1910, modifying the Education Reserves Act, 1908, which permits of a lease being granted under the Public Bodies' Leases Act, 1908, as well as under the Land Act, 1908. The freehold of the land cannot be acquired.
Public Reserves not vested in trustees or a local authority may be leased under the Public Reserves and Domains Amendment Act, 1911, for any term not exceeding twenty-one years, with right of renewal for a further term. The freehold of the land cannot be acquired.
During the year ended 31st March, 1919, an area of 66,892 acres of land was offered for selection under the various tenures provided by the Land Act, Land for Settlements Act, and Education Reserves Acts.
Under the optional system an area of 3,465 acres was advertised.
Under renewable lease an area of 1,720 acres was offered, 630 acres being settlement land of which the lessees have the right to acquire the freehold, and 1,090 acres national endowment. The pastoral-run area comprised 52,000 acres.
In addition to the above a total area of 113,671 acres of Crown, settlement, and national-endowment lands was set apart for selection by discharged soldiers under the ordinary tenures of the Land Act and the Land for Settlements Act, and the special tenures of the Discharged Soldiers Settlement Act. Fuller particulars regarding these lands will be found at the end of this subsection.
The total selections during the year covered an area of 802,097 acres by 1,283 selectors. These figures include, however, 127 purchases of small town, suburban, and rural lands, aggregating 2,224 acres, offered for sale at auction. The ordinary Crown lands holdings represented 339,697 acres, land for settlements and Cheviot Estate 44,581 acres, national endowment 397,841 acres, and educational 19,966 acres. Selections by discharged soldiers are included in the foregoing totals.
Of the lands selected in 1918-19, 142,143 acres were selected on settlement conditions, representing 745 of the total of 1,283 selections referred to above. The area mentioned includes all lands sold for cash or selected on the deferred-payment system, small grazing-runs, and leases under the following tenures: Renewable lease, occupation with right of purchase, mining districts land occupation leases, education-endowment leases, and pastoral licenses in mining districts under special regulations.
The number of selections under settlement conditions during the past ten years is as follows:—
| Year ended 31st March. | Sold for Cash. | Deferred-payment Licenses. | Leases and Licenses (Ordinary Settlement). | Small Grazing-runs. | Totals. |
|---|---|---|---|---|---|
| 1910 | 381 | .. | 1,357 | 45 | 1,783 |
| 1911 | 274 | .. | 1,304 | 22 | 1,600 |
| 1912 | 409 | .. | 1,281 | 23 | 1,713 |
| 1913 | 358 | .. | 1,240 | 10 | 1,608 |
| 1914 | 312 | .. | 1,293 | 4 | 1,609 |
| 1915 | 289 | 18 | 997 | 6 | 1,310 |
| 1916 | 319 | 11 | 884 | 12 | 1,226 |
| 1917 | 313 | 37 | 868 | 16 | 1,234 |
| 1918 | 180 | 14 | 708 | 5 | 907 |
| 1919 | 127 | 44 | 573 | 1 | 745 |
The acreage represented by the selections included in the foregoing table is as follows:—
| Year ended 31st March. | Sold for Cash. | Deferred-payment Licenses. | Leases and Licenses (Ordinary Settlement). | Small Grazing-runs. | Totals. |
|---|---|---|---|---|---|
| Acres. | Acres. | Acres. | Acres. | Acres. | |
| 1910 | 8,886 | .. | 341,686 | 298,494 | 649,066 |
| 1911 | 9,547 | .. | 292,260 | 128,764 | 430,571 |
| 1912 | 6,096 | .. | 379,552 | 144,617 | 530,265 |
| 1913 | 4,640 | .. | 348,752 | 37,749 | 391,141 |
| 1914 | 5,948 | .. | 364,543 | 14,691 | 385,182 |
| 1915 | 5,743 | 27 | 258,312 | 14,803 | 278,885 |
| 1916 | 7,097 | 486 | 251,822 | 150,514 | 409,919 |
| 1917 | 5,414 | 680 | 231,477 | 135,691 | 373,262 |
| 1918 | 4,696 | 992 | 151,854 | 31,093 | 188,635 |
| 1919 | 2,225 | 632 | 136,754 | 2,532 | 142,143 |
The following table shows in a condensed form the area of Crown land held at 31st March, 1919, the yearly rental payable, and the area made freehold:—
| Tenure. | Total Number of Selectors. | Total Area held. | Total Yearly Rental or Instalment Payable. | Total Area made Freehold. | |
|---|---|---|---|---|---|
| Number of Purchasers. | Area. | ||||
| Acres. | £ | Acres. | |||
| Cash lands | .. | .. | .. | .. | 13,191,285 |
| Deferred payment | 1,152 | 240,072 | 43,693 | 9,834 | 1,154,974 |
| Perpetual lease | 366 | 32,035 | 1,715 | 2,964 | 840,865 |
| Occupation with right of purchase | 5,339 | 1,601,548 | 121,680 | 3,175 | 862,123 |
| Lease in perpetuity | 8,385 | 1,802,172 | 206,623 | 2,282 | 423,699 |
| Renewable lease | 5,104 | 1,549,901 | 251,799 | 270 | 60,264 |
| Agricultural lease | 12 | 319 | 14 | 1,475 | 140,896 |
| Mining districts land occupation leases | 706 | 22,803 | 1,548 | 43 | 1,499 |
| Pastoral licenses in mining districts under special regulations | 917 | 218,812 | 5,549 | 35 | 7,333 |
| Small grazing-runs | 871 | 2,642,605 | 93,498 | 29 | 35,076 |
| Pastoral runs | 659 | 10,232,291 | 82,233 | .. | .. |
| Miscellaneous leases and licenses | 6,371 | 1,369,260 | 41,736 | .. | .. |
| Totals | 29,882 | 19,711,818 | 850,358 | .. | 16,717,014 |
| Thermal - spring leases (Rotorua) | 328 | 3,650 | 2,135 | .. | .. |
| Education endowments— | |||||
| Primary | 3,208 | 764,991 | 87,325 | .. | .. |
| Secondary | 420 | 38,993 | 9,142 | .. | .. |
| Totals | 3,628 | 803,984 | 96,467 | .. | .. |
| Grand Totals | 33,838 | 20,519,452 | 948,690 | .. | 16,717,014 |
| Other endowment lands | 741 | 351,179 | 16,091 | .. | .. |
A statement of land open for selection or available for future settlement as at the 31st March, 1919, is next given. The greater part of the area shown as remaining for future disposal comprises rugged and mountainous country suitable only for pastoral purposes in large areas.
LANDS AVAILABLE FOR FUTURE SETTLEMENT .
| District. | Total Area open for Selection. | Total Area remaining for Future Disposal, exclusive of Land shown in Preceding Column. |
|---|---|---|
| Acres. | Acres. | |
| Auckland | 209,864 | 1,148,066 |
| Hawke's Bay | 20,150 | 121,724 |
| Taranaki | 21,370 | 185,384 |
| Wellington | 13,831 | 213,156 |
| Nelson | 39,460 | 1,152,490 |
| Marlborough | 8,554 | 105,446 |
| Westland | 361,175 | 345,451 |
| Canterbury | 434 | 76,089 |
| Otago | 8,336 | 115,680 |
| Southland | 21,004 | 296,870 |
| Totals | 704,178 | 3,760,356 |
Much of the land legislation of recent years has been in the direction of preventing large areas of good land from being acquired or retained by a single individual. The land-for-settlements system of New Zealand, whereby the State purchases properties from private individuals for subdivision into small farms, has been fully dealt with in the 1915 and previous issues of the Year-book, and some statistics of the system are given a little farther on in this subsection. The Land Laws Amendment Acts of 1912 and 1913 went further in the direction of encouraging or compelling subdivision of land held in large areas.
Part III of the Land Laws Amendment Act, 1912, makes provision for agreements between the Minister of Lands and the owner in fee-simple of any land for the subdivision of that land, and for the disposal by public tender of the allotments by way of sale or by way of lease with right of purchase. On the execution of any such agreement the Minister may advance the moneys required for rendering the land available for settlement, including the cost of subdivision and survey and the cost of the construction of roads and bridges. In the case of a sale, the agreement may provide for the payment of the purchase-money by annual instalments extending over a period of from ten to twenty years, with interest on the amount for the time being unpaid not exceeding 5 per cent. per annum. In the case of a lease, the term shall be for twenty-one years, and the lessee shall have the right at any time during the currency of the lease to purchase the allotment at a price to be named in the tender. The rent payable under the lease must not exceed 5 per cent. per annum of the price so named in the tender.
Section 49 provides for similar agreements between the Minister and the owners of Native freehold land in respect of the disposition by sale or lease of that land. In pursuance of such agreement a proportion (not exceeding one-third) of the proceeds may be paid over to the Native owners, and the balance is payable into a Native Land Trust Account to be invested upon trust for such Native owners.
In Part VI of the Land Laws Amendment Act, 1913, provision is made whereby the Minister of Lands may at any time in writing notify an owner of land that such land or a portion thereof is required for purposes of settlement. The owner is thereupon required, within six months after such notice has been gazetted, to notify the Minister whether he elects (a ) to himself subdivide and offer the land for sale in subdivisions, or (b ) to enter into an agreement with the Minister under the provisions of Part III of the Land Laws Amendment Act, 1912 (as described in the preceding paragraph), or (c ) that the land shall be taken compulsorily under the Land for Settlements Act.
If the owner himself elects to subdivide the land he is required within three years to subdivide, road, and offer the land for sale by public auction or private contract at reasonable upset prices and upon reasonable terms and conditions. If, on the other hand, he elects to enter into an agreement with the Minister he must do so within six months of such election.
If the owner does not elect to do either of the above things the land may at any time within five years be taken compulsorily on payment of compensation.
In Part VII of the Land Laws Amendment Act, 1913, provision is made for compulsorily taking private land (not within a borough or town district) in cases where in the opinion of the Board of Land Purchase Commissioners such land has been acquired by way of aggregation, and where such aggregation is contrary to the public interest. Compensation is payable for all land so taken.
The land taken in this manner is offered to the public under renewable lease (thirty-three years) at reasonable rentals and in suitable areas.
The following is extracted from the report of the Land for Settlements Department:—
Purchases, as in the previous year, have been entirely for discharged soldiers. The number of properties considered during the year was 708, of an area of 714,531 acres. The properties were widely distributed, and none were of any great extent. As usual, many were found to be quite unsuitable, and the prices asked were in most instances far in excess of the taxable value.
There has been a considerable number of single farms purchased for discharged soldiers, under section 3, Discharged Soldiers Settlement Amendment Act, 1917.
The area purchased for selection during 1918-19 was 37,263 acres, at a cost of £556,810, and for individual soldiers 4,916 acres, at a cost of £88,577.
Generally the prices now ruling are such that it is found next to impossible to secure land at a price, even without the addition of the necessary charges, that will leave any great margin for working, consequently only the most experienced and energetic soldiers can look for the success they deserve.
A table is given showing for each land district the number and area of estates purchased to the 31st March, 1919, together with information as to purchase-money and incidental expenses.
SUMMARY OF ESTATES ACQUIRED UP TO THE 31ST MARCH , 1919.
| Land District. | Number. | Area. | Purchase-money. | Incidental Expenses, Improvements, Roads, &c. |
|---|---|---|---|---|
| Acres. | £ | £ | ||
| Auckland | 63 | 329,091 | 964,510 | 108,804 |
| Hawke's Bay | 42 | 248,034 | 1,639,377 | 113,007 |
| Taranaki | 11 | 9,781 | 152,097 | 11,799 |
| Wellington | 70 | 97,609 | 1,035,333 | 88,797 |
| Marlborough | 14 | 216,331 | 646,909 | 59,519 |
| Nelson | 7 | 28,111 | 39,880 | 5,142 |
| Westland | 2 | 5,125 | 8,343 | 2,971 |
| Canterbury | 129 | 410,626 | 2,799,147 | 133,868 |
| Otago | 55 | 257,989 | 1,403,378 | 115,550 |
| Southland | 19 | 86,417 | 392,629 | 28,853 |
| Totals | 412 | 1,689,114 | 9,081,603 | 668,310 |
The transfer of certain areas from Crown to settlement lands, and the adjustment of areas to account for ascertained surpluses or deficiencies, brings the total area to 1,839,602 acres at the 31st March, 1919. Of this, 137,957 acres have been sold for cash or made freehold, the total purchase-money being £489,518; and 22,014 acres are occupied by roads or by reserves unlet. At the 31st March, 1919, 5,741 selectors were holding a total of 1,574,161 acres, the annual rental for which amounts to £411,565; and the remaining 105,282 acres, of a yearly value of £15,102, were unlet. The figures for each land district are as follows:—
POSITION OF LAND FOR SETTLEMENTS AT THE 31ST MARCH , 1919.
| Land District. | Net Area acquired. | Area occupied by Roads, &c. | Area unlet. | Area purchased for Cash or made Freehold. | Lands occupied on Leasehold. | |
|---|---|---|---|---|---|---|
| Area. | Number of Selectors. | |||||
| Acres. | Acres. | Acres. | Acres. | Acres. | Number. | |
| Auckland | 318,557 | 7,067 | 76,816 | 89,199 | 145,476 | 901 |
| Hawke's Bay | 244,438 | 2,591 | 4 | 14,818 | 227,023 | 699 |
| Taranaki | 8,895 | 72 | 1,715 | 1,029 | 6,079 | 86 |
| Wellington | 94,554 | 886 | 1,755 | 5,036 | 86,877 | 539 |
| Nelson | 35,019 | 766 | 4,679 | 966 | 28,608 | 42 |
| Marlborough | 228,358 | 2,682 | 1,492 | 4,556 | 219,441 | 474 |
| Westland | 5,125 | 99 | .. | 192 | 4,834 | 30 |
| Canterbury | 567,361 | 4,052 | 886 | 10,412 | 552,011 | 1,704 |
| Otago | 245,189 | 2,846 | 9,724 | 4,248 | 228,371 | 957 |
| Southland | 92,106 | 953 | 8,211 | 7,501 | 75,441 | 309 |
| Totals | 1,839,602 | 22,014 | 105,282 | 137,957 | 1,574,161 | 5,741 |
The Land for Settlements Account at the 31st March, 1919, stands as under:—
| Dr. | £ |
|---|---|
| Loans current | 8,406,487 |
| Rents, &c., received | 4,855,287 |
| Sales of settlement lands | 625,356 |
| Sales of workers' dwellings | 35,669 |
| Receipts under Land Act, section 191 | 8,037 |
| Receipts under Land Act, section 177 | 59,701 |
| Sale of Crown lands | 863,569 |
| Interest on investments | 26,227 |
| Recoveries | 27,127 |
| Premium on loan | 117 |
| Four-per-cent. stock created to cover expenses of raising loan | 349 |
| £14,907,926 |
| Cr. | £ |
|---|---|
| Purchase-money | 9,081,603 |
| Incidental expenses | 757,235 |
| Interest | 3,985,686 |
| Sinking fund | 637,096 |
| Land Laws Amendment Act, section 63 | 220,171 |
| Unauthorized expenditure | 25,873 |
| Balance | 200,262 |
| £14,907,926 |
On the 1st January, 1910, the Land Settlement Finance Act, which is described fully in the 1915 issue of this book, came into force. The associations incorporated now number forty-six.
Under the provisions of the Discharged Soldiers Settlement Act, 1915, and amendments, any person is entitled to the benefits of the Act who has been a member of a New Zealand Naval or Expeditionary Force, has served beyond New Zealand in connection with the present war, has returned to New Zealand, and has received an honourable discharge, together with any person who immediately prior to the commencement of the present war was a bona fide resident of New Zealand, and has also served during the present war with some portion of His Majesty's Naval or Military Forces (not being Forces raised in New Zealand), and has received an honourable discharge therefrom. In addition, all discharged members of an Expeditionary Force who, having been classed as medically fit for service beyond the seas, have served as members of that Force in a camp of military training and remained attached to that camp on the 12th November, 1918 (being the date of the cessation of hostilities with Germany), are entitled to apply for advances or private land under sections 2 or 3 of the Discharged Soldiers Settlement Amendment Act, 1917. (See paragraphs headed "Private Land" and "Financial Assistance.")
Any discharged soldier wishing to take up land should obtain a provisional application form, answer the questions thereon, and forward it to the Commissioner of Crown Lands for the land district in which he desires to settle. Provisional application forms may be obtained at any land office or from the Discharged Soldiers' Information Department, Wellington. On receipt of a provisional application the Commissioner will supply the applicant with information regarding all available Crown lands in his land district, and the Land Board will endeavour to place the applicant on a suitable holding.
There is power to dispose of land under the ordinary tenures of the Land Act, 1908, and the Land for Settlements Act, 1908—i.e., for cash, or occupation with right of purchase, or on renewable lease under the former Act, and renewable lease under the latter Act, also under the "special tenures" of the Discharged Soldiers Settlement Act, 1915, which are cash, deferred payment, or a renewable lease with a purchasing clause. The various tenures mentioned may be explained as under, and are given under two headings—viz., "Ordinary Tenures "and "Special Tenures."
(A.) Ordinary Tenures.
Cash.—In all cases of purchase of land for cash the applicant is required to pay one-fifth of the purchase-money at the date of the sale, and the balance, with the Crown-grant fee, within thirty days from the date of the approval of the application.
Occupation with Right of Purchase.—Term, twenty-five years; rental, 5 per cent. on the capital value of the land; right of purchase after the license has been held six years, provided the residence and improvement conditions have been complied with. If the licensee does not acquire the freehold prior to the expiration of the term of twenty-five years he has a prior right to a renewable lease.
Renewable Lease under the Land Act.—Term, sixty-six years, with a perpetual right of renewal; rental, 4 per cent. on the capital value of the land. Land selected under this tenure immediately becomes national endowment, and there is no right to the freehold.
Renewable Lease under the Land for Settlements Act.—Term, thirty-three years, with perpetual right of renewal; rental, 4 1/2 per cent. on the capital value of the land. Right of purchase at any time during the currency of the lease. Purchase of the freehold may be made on the deferred-payment system if desired.
(B.) Special Tenures.
Cash.—The remarks already made under "Cash" heading apply to cash selections under "Special Tenures."
Deferred Payment under Special Tenures.—Term, twenty years; licensee to deposit 5 per cent. of the purchase-money, and thereafter pay the balance of 95 per cent. by equal annual payments, together with interest at 5 per cent., payable half-yearly, on all outstanding balances. The licensee has the right to pay off the whole or any part of the outstanding money at any time during the currency of the license.
Renewable Lease with Purchasing Clause under Special Tenures.—Term may be for any period not exceeding thirty-three years in the case of settlement land, and sixty-six years in the case of Crown land, with perpetual rights of renewal for thirty-three years or sixty-six years as the case may be. Freehold may be acquired any time during the currency of the lease. Purchase of the freehold may be made on the deferred-payment system if desired.
Under section 3 of the Discharged Soldiers Settlement Amendment Act, 1917, one or more discharged soldiers may apply to the Land Board with, a view to the acquisition by the Crown on their behalf of any private land, The Land Board, however, cannot deal with such application until an offer in writing to sell the land to the Crown has been submitted to the Board by the owner of the land. It can then consider the application and offer, and forward them to the Minister of Lands with such recommendations as it thinks proper. The Minister may thereupon refer the offer to the Land Purchase Board for consideration, and if the land or any part thereof is acquired by the Crown, it may then be disposed of under the Discharged Soldiers Settlement Act to the applicant. (See also under heading of "Financial Assistance.")
The Minister may set land apart for the purpose of soldiers' dwellings, and may erect suitable buildings thereon. The land and dwellings may then be disposed of to discharged soldiers in the same manner generally as in the case of workers by the Workers' Dwellings Act, 1910.
No transfer of land selected under the Discharged Soldiers Settlement Act will be permitted for a period of ten years, except with the approval of the Land Board and the Minister of Lands.
Section 2 of the Discharged Soldiers Settlement Amendment Act, 1917, provides that financial assistance may be given to discharged soldiers for the following purposes: (a ) The purchase of private or Native land; (b ) the acquisition by assignment or transfer of the lease of any land administered by a Land Board; and (c ) the discharge of any mortgage affecting any land owned by a discharged soldier or held by him under license or lease from a Land Board. The maximum amount for any of these purposed that may be advanced to any one person is £2,500, with a further advance of £750 for improvements, stock, &c., where necessary. Repayment of advances may be secured by flat mortgage for ten years, with interest at 5 per cent., or by instalment mortgage extending over a period of thirty-six years and a half, with an annual charge of 6 per cent., which includes interest and sinking fund.
If assistance is required for the purchase of a residential site with dwelling thereon, an advance not exceeding £1,000 may be made, or, in the event of the site being owned by the applicant, an advance not exceeding £750 may be made towards the erection of a dwelling thereon. Repayment of advances may be secured by flat mortgage for ten years, with interest at 5 per cent., or by instalment mortgage extending over a period of twenty-five years and a half, with an annual charge of 7 per cent., which includes interest and sinking fund.
Valuation fees are payable with applications.
In addition, financial assistance may be given to discharged soldiers who own freehold land or are the lessees or licensees of any land administered by a Land Board, for any of the following purposes: The clearing, fencing, draining, and general improvement (including erection of buildings) of the land, and the purchase of plant, stock, implements, seeds, trees, &c. Except in the case of a house to be built on other than rural land, the maximum total amount that may be advanced for all the foregoing purposes is £500 (not more than £250 of this being for a dwelling and other buildings) unless there be special circumstances in which the amount would be inadequate, when the Minister may authorize an additional advance not exceeding £250.
Advances are secured by a first mortgage over the land, with the addition, at the option of the Minister, of a bill of sale over the stock, implements, &c. The rate of interest is 5 per cent.
Advances for improvements or buildings may be made by progress-payments up to 75 per cent. of the value of any work done.
Applications for assistance, giving full particulars, must be made to the Land Board for the district in which the land affected is situated. Before making its recommendation the Board will require the applicant to appear personally before it, or before such person as it may appoint. No application for an advance to assist in the purchase of land can be considered unless accompanied by an option to purchase the fee-simple, or lease, or license, as the case may be.
At the 31st March, 1919, advances amounting to £1,150,172, to 1,692 settlers, had been authorized. Advances actually made to the same date reached a total of £757,554, of which £35,130 has already been repaid.
In special cases, where circumstances warrant it, remission or postponement of rent may be made.
Postponements of rental amounting to £9,610 were granted to 119 settlers during the year ended the 31st March, 1918.
The total amount remaining postponed at the close of the year was £10,024.
The following table shows the total area proclaimed under the Discharged Soldiers Settlement Act, 1915. Of the total area proclaimed, ordinary Crown lands amounted to 301,288 acres, Cheviot Estate to 3,453 acres, land for settlements to 123,474 acres, and national-endowment land to 79,675 acres.
| District. | Under Section 3 of the Act. (Ordinary Tenures.) | Under Section 4 of the Act. (Special Tenures.) | Total Area proclaimed. | |||
|---|---|---|---|---|---|---|
| For the Year ended 31st March, 1919. | Total to 31st March, 1919. | For the Year ended 31st March, 1919. | Total to 31st March, 1919. | For the Year ended 31st March, 1919. | Total to 31st March, 1919. | |
| Acres. | Acres. | Acres. | Acres. | Acres. | Acres. | |
| Auckland | 2,163 | 33,973 | 11,105 | 61,974 | 13,268 | 95,947 |
| Hawke's Bay | .. | 13,812 | 6,442 | 69,935 | 6,442 | 83,747 |
| Taranaki | 2,625 | 10,965 | 6,570 | 7,696 | 9,195 | 18,661 |
| Wellington | .. | 1,591 | 2,416 | 75,019 | 2,416 | 76,610 |
| Nelson | 10,880 | 23,230 | .. | 3,786 | 10,880 | 27,016 |
| Marlborough | .. | .. | 2,338 | 11,020 | 2,338 | 11,020 |
| Westland | 2,694 | 11,186 | 331 | 480 | 3,025 | 11,666 |
| Canterbury | 18,870 | 80,398 | 5,691 | 8,032 | 24,561 | 88,430 |
| Otago | 33,008 | 52,484 | 878 | 27,408 | 33,886 | 79,892 |
| Southland | 5,461 | 7,304 | 2,199 | 7,597 | 7,660 | 14,901 |
| Totals | 75,701 | 234,943 | 37,970 | 272,947 | 113,671 | 507,890 |
During the year ended 31st March, 1919, 1,379 applications were made under the provisions of the Discharged Soldiers Settlement Act, and allotments were made in the case of 348 applicants. The following table shows the number of applications for land in each of the several land districts of the Dominion, and also the number of applications granted, together with the area of such grants:—
| District. | Applications. | Allotments. | |
|---|---|---|---|
| Number. | Area. | ||
| Acres. | |||
| Auckland | 315 | 108 | 14,061 |
| Hawke's Bay | 164 | 23 | 14,425 |
| Taranaki | 85 | 18 | 3,215 |
| Wellington | 98 | 78 | 22,152 |
| Nelson | 25 | 11 | 5,747 |
| Marlborough | 18 | 8 | 3,439 |
| Westland | 10 | 8 | 3,358 |
| Canterbury | 329 | 47 | 8,305 |
| Otago | 278 | 26 | 38,966 |
| Southland | 57 | 21 | 3,350 |
| Totals | 1,379 | 348 | 117,018 |
An aggregate area of 703 acres (representing eleven allotments) was sold. The remaining 116,315 acres (337 allotments) were let under leases and licenses.
By section 24 of the Land Laws Amendment Act, 1915, it is provided that any duly authorized agent of a member of a New Zealand Expeditionary Force may apply on behalf of that member for any land that may be open for application under either the Land Act, 1908, or the Land for Settlements Act, 1908, at any time while the said member is absent from New Zealand on military service. Such applicants, and also applicants who have at any time been members of a New Zealand Expeditionary Force, shall at any ballot be entitled to the same preference as that accorded to married men who have families dependent on them or single men who have been twice unsuccessful at a ballot, and the age-limit of 21 years is abolished in the case of soldier applicants who have been engaged on military service beyond New Zealand.
By sections 23 and 24 of the Land Laws Amendment Act, 1915, and Part II of the War Legislation Amendment Act, 1916, the Minister of Lands is empowered to grant exemption from rent to Crown tenants during their term of service and until six months after discharge. The Minister is also empowered to grant remission or postpone date of payment of interest falling due on account of balance of purchase-money due under licenses to acquire land on deferred payment from the Crown, and to postpone the due dates of instalments of principal, and extend the terms of such licenses for a period not exceeding three years. Applications under both of these provisions are considered by the Land Board, which recommends what concession should be granted in each case, and the Minister then decides.
NATIVE lands and Native affairs generally are administered by the Native Department, with several subsidiary branches, the duties of each being as indicated below.
The Head Office controls the general administration of the Department, while the purchase of lands by the Native Land Purchase Board is also conducted through the Head Office.
The Native Land Court is the Court of Record of Titles, and deals, inter alia , with the partition and exchange of Native lands, succession, probate and letters of administration, consolidation of interests, incorporation of owners, and alienation.
The work of the Native Land Court is divided into seven Court districts, as follows :—
| District. | Location. |
|---|---|
| Tokerau | North Auckland. |
| Waikato-Maniapoto | South Auckland. |
| Waiariki | Bay of Plenty. |
| Tairawhiti | Gisborne. |
| Ikaroa | Wellington and Hawke's Bay. |
| Aotea | Wanganui and Taranaki. |
| South Island | South Island (office at Wellington). |
Maori Land Boards, of which there are seven, all located in the North Island, are concerned with the confirmation and approval of alienations, the administration of Native lands by way of sale or lease, and the administration of estates as farms. The Boards also act as agents for beneficial owners, and receive and pay out rents and purchase-moneys.
The Registrars of the Native Land Courts are also the administrative officers of the Maori Land Boards of the various districts.
The boundaries of the Court and Maori Land Board Districts are conterminous.
Maori Councils elected for defined districts, and composed of Natives, supervise matters generally affecting the Maori settlements and kaingas, more particularly as regards sanitary arrangements.
The terms "partition" and "individualization" as applied to Native Land Court dealings are often confused. To individualize is to partition in severalty, and not merely to define relative interests, which may be done without further partition. To partition is to cut out certain interests in a block of land, and may not necessarily be for an individual. The term "customary land," which is also sometimes misunderstood, is applied to land not yet clothed with a Native Land Court title. Customary land was formerly known as papatupu land.
All dealings with Native land are now determined by the provisions of the Native Land Act, 1909, which consolidated and repealed most of the numerous previous Acts, and came into force on the 31st March, 1910, and by the provisions of amending Acts passed in subsequent years. Full information concerning the Act and its amendments is given in the 1915 and previous issues of this book.
Particulars of the business dealt with by the Native Land Court during the twelve months ended 31st March, 1919, are as follows:—
| Number of sittings | 107 |
|---|---|
| Number of cases notified | 18,744 |
| Number of cases for which orders were made | 6,102 |
| Number of cases dismissed | 2,609 |
| Number of cases adjourned sine die | 10,033 |
| Number of partitions made | 1,119 |
| Area affected (acres) | 321,534 |
| Number of investigations of title | 33 |
| Area affected (acres) | 23,595 |
| Number of succession orders made | 4,649 |
| Number of other orders made | 2,772 |
During the year 1,024 acres of vested land were disposed of by lease and 4,733 acres by sale, as against 862 acres by lease and 862 acres by sale in the previous year.
With regard to Native freehold land, the Boards during the year approved of 407 leases, comprising 43,978 acres, and confirmed 921 transfers (apart from sales to the Crown) affecting 92,572 acres of freehold land. The figures disclose a decrease of 107 leases and 90,241 acres from the previous year's totals in respect of land leased, and a decrease of 218 transfers and 26,664 acres with regard to land sold. Much of this decrease is due to the operation of the influenza epidemic.
During the year some 63 blocks, comprising 125,769 acres, were proclaimed Crown land. The actual purchases made during the year totalled an area of 145,389 acres, as compared with 43,445 acres acquired during the previous period. In the Urewera Reserve an area of 42,693 acres was secured, making the Crown purchases in the Urewera total 290,602 acres as at the 31st March last.
During the nine years which have elapsed since the coming into operation of the Native Land Act, 1909, the total sum expended upon the purchase of Native lands through the Native Land Purchase Board has amounted to £1,713,817. The total area of Native land alienated by way of sale during the nine years is approximately 2,258,738 acres, and of this total an area of some 955,394 acres has been acquired on behalf of the Crown.
PRIOR to 1870 conveyancing in New Zealand was based upon the English laws of real property as existing at the date of the constitution of the colony, varied in some important particulars by the Conveyancing Ordinance of 1842 and other colonial legislation, now embodied in the Property Law Act, 1908. Considerable areas of land in all parts of the Dominion are still held and dealt with under this system. Although provision is made for the registration of deeds affecting such land, registration is no guarantee of their validity, and a purchaser has to rely for the security of his title upon the skill and care of his legal adviser.
By the Land Transfer Act, 1870, the system of title by registration was introduced. This principle had long been in vogue in parts of central Europe, but was unknown in the British dominions until its introduction into the Australasian Colonies in 1856 by Sir Robert Torrens, after whom it is popularly known as the Torrens system. It was first introduced by him into South Australia, and was afterwards adopted by the other colonies. The title to land under this system is not affected by the execution of documents. Registration is the fundamental principle, and it is only on registration that any interest passes. The Land Transfer Department assumes all responsibility for the registration, and any person named in the register as taking an interest under a registered instrument acquires a practically indefeasible title.
Provision has existed since 1841 and is now contained in the Deeds Registration Act, 1908, for the registration of deeds and instruments affecting land which is not subject to the provisions of the Land Transfer Act. Registration is not essential to the validity of the instrument, but it is highly important as a record and to secure priority. The Act provides that every deed shall be void as against any person claiming for valuable consideration under any subsequent deed duly registered unless the earlier deed was registered before the subsequent one.
The Department is not responsible for the form or matter of the instruments registered beyond seeing that they are duly stamped and contain a sufficient description of the land to identify it.
Instruments are registered by being first entered in the "Book of Primary Entry," from which the registration number is taken. Particulars are then inserted in the "Index Book" under the heading of the land affected, and they are then copied in extenso into the "Record Books."
Provision is also made for the deposit of instruments in the Deeds Registry Office for safe custody and reference, and such deposit operates as a release from any covenant for production.
The Deeds Index and all recorded and deposited instruments are open to public inspection, and certified copies may be obtained on payment of the prescribed fees, which are given in full in the Year-book for 1914.
A table is given containing information concerning the registration of deeds during the year ended 31st March, 1919.
DEEDS REGISTRATION , 1918-19.
| District. | Deeds | Fees. | |||
|---|---|---|---|---|---|
| Unrecorded on 31st March, 1918. | Received for Registration during the Year ended 31st March, 1919. | Recorded during the same Period. | Unrecorded on 31st March, 1919. | ||
| Number. | Number. | Number. | Number. | £ | |
| Auckland | 237 | 5,744 | 5,293 | 688 | 5,646 |
| Taranaki | 21 | 623 | 583 | 61 | 578 |
| Wellington | 288 | 2,019 | 1,741 | 566 | 1,850 |
| Hawke's Bay | 92 | 1,009 | 955 | 146 | 1,047 |
| Poverty Bay | 3 | 41 | 44 | .. | 40 |
| Nelson | 3 | 831 | 793 | 41 | 722 |
| Marlborough | 6 | 246 | 248 | 4 | 242 |
| Canterbury | 50 | 993 | 1,012 | 31 | 891 |
| Otago | 37 | 1,724 | 1,654 | 107 | 1,627 |
| Southland | 49 | 462 | 420 | 91 | 449 |
| Westland | .. | 55 | 55 | .. | 56 |
| Totals | 786 | 13,747 | 12,798 | 1,735 | 13,148 |
The land-transfer system in New Zealand originated, as stated above, with the Land Transfer Act, 1870. This was re-enacted with amendments as the Land Transfer Act, 1885, and this again gave place to the consolidated Land Transfer Act, 1908. Some amendments were effected by the Land Transfer Amendment Act, 1913, and the Act as amended has been re-enacted under the Statutes Compilation Act as the Land Transfer Act, 1915.
The land subject to the Land Transfer Act comprises all land alienated from the Crown since 1870, all land included in any order under the Native Land Acts vesting such land in any person in freehold tenure, and all land vested in any person in fee-simple by virtue of any Act of the General Assembly, besides land which has been brought under the Act on the application of the proprietors after investigation and acceptance of the title by the Department.
Full information concerning the land-transfer system is given in the 1914 and preceding issues of this book, together with the scale of fees payable under the Land Transfer Act.
The first of the tables which follow shows for the year 1918-19 the applications to bring land under the Land Transfer Act.
APPLICATIONS UNDER LAND TRANSFER ACT , 1918-19.
| District. | Town and Suburban. | Country. | ||||
|---|---|---|---|---|---|---|
| Number. | Area. | Value. | Number. | Area. | Value. | |
| Acres. | £ | Acres. | £ | |||
| Auckland | 30 | 27 | 48,939 | 63 | 12,246 | 159,382 |
| Taranaki | 11 | 5 | 14,217 | 5 | 604 | 18,839 |
| Wellington | 14 | 5 | 28,825 | 13 | 4,205 | 105,731 |
| Hawke's Bay | 4 | 3 | 9,695 | .. | .. | .. |
| Poverty Bay | .. | .. | .. | 1 | 53 | 2,540 |
| Nelson | 3 | 49 | 1,091 | 6 | 1,526 | 9,846 |
| Marlborough | 4 | 5 | 4,786 | 3 | 14,871 | 85,720 |
| Canterbury | 47 | 18 | 19,820 | 28 | 4,464 | 54,322 |
| Otago | 27 | 10 | 57,663 | 12 | 725 | 7,366 |
| Southland | 2 | 1 | 895 | 18 | 37,747 | 146,710 |
| Westland | 1 | .. | 16 | .. | .. | .. |
| Totals | 143 | 133 | 185,947 | 149 | 76,441 | 590,456 |
Information as to applications during each of the past ten years is given in the next table.
APPLICATIONS UNDER LAND TRANSFER ACT , 1909-10 TO 1918-19.
| Year ended 31st March. | Applications. | |||
|---|---|---|---|---|
| Number. | Area. | Value. | ||
| Town and Suburban. | Country. | |||
| Acres. | Acres. | £ | ||
| 1910 | 565 | 376 | 64,697 | 821,306 |
| 1911 | 705 | 324 | 3,054 | 1,229,990 |
| 1912 | 571 | 330 | 65,028 | 1,078,124 |
| 1913 | 656 | 398 | 108,945 | 1,561,589 |
| 1914 | 563 | 156 | 123,712 | 1,361,042 |
| 1915 | 478 | 159 | 105,180 | 1,247,905 |
| 1916 | 428 | 185 | 64,914 | 1,215,552 |
| 1917 | 409 | 133 | 37,447 | 1,029,143 |
| 1918 | 316 | 99 | 89,388 | 965,089 |
| 1919 | 292 | 133 | 76,441 | 776,403 |
The following table shows the number of certificates issued for the past ten years. Included in the totals are those certificates issued in lieu of Crown grants, 1,370 being the number for 1918-19.
CERTIFICATES ISSUED , 1909-10 TO 1918-19.
| Year ended 31st March. | Number. |
|---|---|
| 1910 | 9,525 |
| 1911 | 11,645 |
| 1912 | 12,907 |
| 1913 | 13,075 |
| 1914 | 12,867 |
| 1915 | 11,074 |
| 1916 | 10,525 |
| 1917 | 10,350 |
| 1918 | 10,230 |
| 1919 | 7,988 |
Tables next follow showing transfers registered under the Land Transfer Act in each district during the year ended 31st March last, and in the whole Dominion for each of the past ten years.
TRANSFERS REGISTERED , 1918-19.
| District. | Town and Suburban. | Country. | ||||
|---|---|---|---|---|---|---|
| Number. | Area | Consideration-money. | Number. | Area. | Consideration-money. | |
| Acres. | £ | Acres. | £ | |||
| Auckland | 3,510 | 2,357 | 2,065,964 | 3,174 | 688,123 | 5,309,041 |
| Taranaki | 734 | 294 | 330,429 | 822 | 143,846 | 1,605,250 |
| Wellington | 2,544 | 16,193 | 2,145,184 | 2,462 | 270,124 | 4,486,231 |
| Hawke's Bay | 651 | 469 | 356,823 | 442 | 134,302 | 1,478,146 |
| Poverty Bay | 276 | 121 | 180,028 | 325 | 145,373 | 1,048,150 |
| Nelson | 231 | 108 | 60,967 | 274 | 65,493 | 235,037 |
| Marlborough | 101 | 81 | 27,323 | 90 | 39,350 | 242,586 |
| Canterbury | 2,834 | 609 | 1,114,237 | 838 | 190,705 | 2,033,140 |
| Otago | 1,418 | 385 | 589,822 | 526 | 158,820 | 762,719 |
| Southland | 569 | 510 | 236,148 | 538 | 137,577 | 809,701 |
| Westland | 69 | 29 | 11,261 | 68 | 18,599 | 69,197 |
| Totals | 12,937 | 21,156 | 7,118,186 | 9,559 | 1,992,312 | 18,079,198 |
TRANSFERS REGISTERED , 1909-10 TO 1918-19.
| Year ended 31st March. | Number. | Area. | Consideration-money. | |
|---|---|---|---|---|
| Town and Suburban. | Country. | |||
| Acres. | Acres. | £ | ||
| 1910 | 17,277 | 5,623 | 1,457,395 | 9,820,261 |
| 1911 | 22,157 | 7,394 | 1,958,709 | 14,285,759 |
| 1912 | 24,297 | 7,298 | 2,391,004 | 17,405,278 |
| 1913 | 24,495 | 7,471 | 2,516,821 | 17,325,730 |
| 1914 | 23,983 | 7,333 | 2,206,268 | 16,307,637 |
| 1915 | 21,381 | 6,206 | 2,129,973 | 17,206,248 |
| 1916 | 22,394 | 7,073 | 2,414,007 | 22,264,623 |
| 1917 | 22,187 | 79,316 | 2,676,691 | 34,288,831 |
| 1918 | 19,949 | 6,156 | 2,008,370 | 18,083,634 |
| 1919 | 22,496 | 21,156 | 1,992,312 | 25,197,384 |
One of the most notable differences between the present system of land-transfer and the former is in respect of the form of a mortgage. Under the old system the mortgagor convoyed the land to the mortgagee subject to a right to a reconveyance or "equity of redemption" on repayment of the money. Under the Act no transfer of the property takes place, but a charge only is created, the mortgagee being specially empowered to sell the land in the event of default being made in payment. A simple receipt by the mortgagee for the amount secured releases the land from the encumbrance. Provision is made, similar to that contained in the Property Law Act, for sale through the Registrar of the Supreme Court in the event of the mortgagee desiring to buy in the mortgaged land.
During the year ended 31st March, 1919, mortgages to the number of 16,508, and representing an amount of £11,040,897, were registered under the Land Transfer Act. The figures for each land-registration district were as follows:—
MORTGAGES REGISTERED UNDER LAND TRANSFER ACT , 1918-19.
| District. | Town and Suburban. | Country. | ||||
|---|---|---|---|---|---|---|
| Number. | Area. | Amount secured. | Number. | Area. | Amount secured. | |
| Acres. | £ | Acres. | £ | |||
| Auckland | 2,161 | 1,146 | 904,097 | 2,631 | 543,386 | 3,406,098 |
| Taranaki | 388 | 176 | 144,525 | 863 | 219,261 | 1,151,674 |
| Wellington | 1,821 | 16,106 | 1,049,591 | 1,886 | 467,286 | 2,896,204 |
| Hawke's Bay | 364 | 263 | 174,952 | 508 | 282,087 | 1,266,148 |
| Poverty Bay | 260 | 101 | 106,040 | 251 | 297,093 | 902,884 |
| Nelson | 156 | 84 | 76,944 | 272 | 94,240 | 200,081 |
| Marlborough | 37 | 37 | 9,994 | 79 | 52,594 | 143,348 |
| Canterbury | 1,328 | 331 | 489,401 | 933 | 388,044 | 1,452,324 |
| Otago | 679 | 195 | 247,655 | 519 | 249,938 | 451,144 |
| Southland | 309 | 298 | 141,408 | 536 | 215,516 | 594,193 |
| Westland | 28 | 5 | 6,986 | 60 | 20,815 | 75,586 |
| Totals | 7,531 | 18,742 | 3,351,593 | 8,538 | 2,830,260 | 12,539,684 |
A table showing information for each of the past ten years is also given.
MORTGAGES REGISTERED UNDER LAND TRANSFER ACT , 1909-10 TO 1918-19.
| Year ended 31st March. | Number. | Area. | Amount secured. | |
|---|---|---|---|---|
| Town and Suburban. | Country. | |||
| Acres. | Acres. | £ | ||
| 1910 | 19,955 | 5,379 | 3,734,962 | 13,611,123 |
| 1911 | 23,397 | 6,069 | 4,485,402 | 16,896,484 |
| 1912 | 25,127 | 8,033 | 4,784,883 | 19,128,732 |
| 1913 | 23,883 | 10,965 | 5,549,385 | 18,643,708 |
| 1914 | 23,988 | 5,642 | 4,862,163 | 18,080,701 |
| 1915 | 21,795 | 5,393 | 4,036,464 | 16,378,727 |
| 1916 | 20,545 | 4,872 | 4,608,014 | 18,428,772 |
| 1917 | 18,803 | 4,342 | 3,714,395 | 17,604,524 |
| 1918 | 15,899 | 4,118 | 3,559,517 | 14,879,640 |
| 1919 | 16,069 | 18,742 | 2,830,260 | 15,891,277 |
In regard to mortgages under the Land Transfer Act, a table is added showing the total amount remaining secured by such mortgages on the 31st March, 1919.
LAND TRANSFER ACT .—MORTGAGES REMAINING ON 31ST MARCH , 1919.
| District. | Amount. |
|---|---|
| £ | |
| Auckland | 27,334,788 |
| Taranaki | 11,570,948 |
| Wellington | 34,729,839 |
| Hawke's Bay | 14,116,974 |
| Poverty Bay | 5,155,859 |
| Nelson | 2,410,345 |
| Marlborough | 2,209,012 |
| Canterbury | 25,522,395 |
| Otago | 7,543,827 |
| Southland | 8,653,508 |
| Westland | 499,671 |
| Total | 139,747,166 |
The total, £139,747,166, represents a net increase of £6,871,444 during the year, the amount of mortgages paid off since 1st April, 1918, being £9,019,833 as against mortgages registered amounting to £15,891,277, shown above.
In addition to the mortgages under the Land Transfer Act, a considerable number are registered under the Deeds Registration Act. During the year ended the 31st March, 1919, the total mortgages registered were 19,489, representing £19,007,286, so that the registrations of mortgages under the Deeds Registration Act numbered 3,420, for an amount of £3,116,009.
The total amount represented by the mortgages on the register under the Land Transfer and Deeds Registration Acts on the 1st April, 1918, was £138,784,247. Those added during the year were for an amount of £19,007,286, and those discharged (16,508 in number), for £11,040,897, leaving the total at the 31st March, 1919, at £146,750,636, a net increase of £7,966,389 during the year.
It should be explained that the amounts quoted in respect of mortgages do not represent the true amounts of advances secured by deed. In cases where the property mortgaged is situated in more than one registration district the deed is registered for the full amount in each district, and thus there is some degree of duplication. On the other hand, mortgages are not all registered, those given in security for temporary loans, stock and crop liens, bills of sale, and chattels—transfers not being included in the figures.
The total amounts represented in the mortgages registered and paid off in each registration district during 1917-18 and 1918-19 were.—
| District. | 1917-18. | 1918-19. | ||
|---|---|---|---|---|
| Mortgages registered. | Mortgages discharged. | Mortgages registered. | Mortgages discharged. | |
| £ | £ | £ | £ | |
| Auckland | 4,992,441 | 2,244,128 | 5,595,211 | 2,589,624 |
| Poverty Bay | 931,708 | 561,229 | 1,009,360 | 383,024 |
| Hawke's Bay | 1,663,271 | 1,015,267 | 1,798,061 | 1,006,708 |
| Taranaki | 1,397,686 | 828,785 | 1,414,543 | 678,240 |
| Wellington | 4,043,099 | 3,035,738 | 4,570,238 | 2,918,360 |
| Nelson | 283,438 | 198,149 | 414,946 | 232,890 |
| Marlborough | 283,180 | 294,404 | 233,575 | 130,687 |
| Canterbury | 2,842,575 | 1,967,321 | 2,052,731 | 1,659,766 |
| Otago | 868,400 | 819,624 | 927,186 | 817,726 |
| Southland | 791,461 | 623,162 | 868,593 | 587,506 |
| Westland | 29,665 | 26,710 | 92,842 | 36,366 |
| Totals | 18,126,924 | 11,614,517 | 19,007,286 | 11,040,897 |
A comparison of the monthly totals of mortgages registered for the years ended the 31st March, 1918 and 1919, is next given.
MORTGAGES REGISTERED EACH MONTH , 1917-18 AND 1918-19.
| Month. | Number. | Amount. | ||
|---|---|---|---|---|
| 1917-18. | 1918-19. | 1917-18. | 1918-19. | |
| £ | £ | |||
| April | 1,342 | 1,282 | 1,483,872 | 1,256,464 |
| May | 1,866 | 1,826 | 1,762,008 | 1,625,210 |
| June | 1,763 | 1,496 | 1,737,254 | 1,279,341 |
| July | 1,903 | 1,835 | 1,929,282 | 1,737,424 |
| August | 1,952 | 1,995 | 2,140,923 | 1,990,506 |
| September | 1,693 | 1,796 | 1,473,854 | 1,898,262 |
| October | 1,741 | 1,928 | 1,449,670 | 2,005,450 |
| November | 1,640 | 906 | 1,390,868 | 989,334 |
| December | 1,357 | 1,561 | 1,282,997 | 1,508,355 |
| January | 1,176 | 1,180 | 1,016,206 | 1,103,108 |
| February | 1,384 | 1,760 | 1,074,009 | 1,558,372 |
| March | 1,529 | 1,924 | 1,385,981 | 2,055,460 |
| Totals | 19,346 | 19,489 | 18,126,924 | 19,007,286 |
Classified according to the various rates of interest, the amounts in the mortgage-deeds registered during 1917-18 and 1918-19 were,—
| Rate per Cent. | 1917-18. | 1918-19. |
|---|---|---|
| £ | £ | |
| 0 | 4,420 | 1,000 |
| 3/4 | .. | .. |
| 1 | 390 | .. |
| 1 1/2 | 250 | .. |
| 2 | 300 | .. |
| 2 1/10 | 75 | .. |
| 2 1/2 | 1,825 | .. |
| 3 | 925 | 12,000 |
| 3 1/2 | 9,700 | 1,000 |
| 3 3/5 | 652 | .. |
| 3 3/4 | 8,000 | 50 |
| 4 | 27,641 | 52,564 |
| 4 1/4 | .. | .. |
| 4 1/6 | 2,607 | .. |
| 4 1/2 | 105,798 | 56,452 |
| 4 3/4 | 568 | 15,654 |
| 5 | 2,498,079 | 2,584,734 |
| 5 1/4 | 107,929 | 191,943 |
| 5 3/10 | 3,700 | .. |
| 5 1/2 | 5,652,310 | 5,232,243 |
| 5 3/5 | .. | .. |
| 5 3/4 | 348,108 | 216,243 |
| 5 5/6 | .. | .. |
| 6 | .. | 5,777,932 |
| 6 1/8 | 3,620 | 5,650 |
| 6 1/5 | 8,895 | .. |
| 6 1/4 | 71,300 | 46,460 |
| 6 3/8 | 263 | .. |
| 6 1/2 | 971,453 | 1,080,927 |
| 6 3/4 | 3,170 | 5,700 |
| 6 4/5 | 4,000 | .. |
| 7 | 718,298 | 674,261 |
| 7 1/4 | 3,000 | .. |
| 7 5/16 | 1,500 | .. |
| 7 1/2 | 155,585 | 93,722 |
| 7 3/4 | 7,000 | 7,000 |
| 7 4/5 | 1,315 | .. |
| 8 | 471,586 | 493,224 |
| 8 1/4 | 1,500 | .. |
| 8 1/2 | 13,130 | 10,557 |
| 9 | 37,677 | 36,801 |
| 9 1/4 | .. | 100 |
| 9 1/2 | .. | .. |
| 9 3/4 | .. | 125 |
| 10 | 106,471 | 74,252 |
| 12 | 165 | 965 |
| 12 1/2 | 324 | 35 |
| 13 1/2 | .. | 500 |
| 15 | 150 | 121 |
| 20 | 75 | 492 |
| 30 | .. | 900 |
| 33 1/3 | .. | .. |
| 40 | .. | .. |
| Unspecified | 995,348 | 981,686 |
| Totals | 18,126,924 | 19,007,286 |
Comparison of the foregoing with the amounts at the various rates of interest in the mortgages registered during 1895-96 shows the lowering of the rates that has taken place:—
| Year 1895-96. | |
|---|---|
| £ | |
| 26,285 | in small sums at less than 5 per cent. |
| 833,226 | at from 5 per cent. to 5 1/4 per cent. |
| 732,764 | at 5 1/2 per cent. |
| 116,600 | at 5 3/4 per cent. |
| 1,372,261 | at from 6 per cent. to 6 1/4 per cent. |
| 371,896 | at from 6 1/2 per cent. to 6 3/4 per cent. |
| 599,542 | at from 7 per cent. to 7 1/4 per cent. |
| 111,651 | at 7 1/2 per cent. |
| 382,348 | at 8 per cent. |
| 173,416 | in small sums at rates above 8 per cent. |
| 853,801 | at rates not specified. |
| £5,573,790 |
THE total area of the Dominion, excluding Cook and other Pacific islands annexed in 1901, is 66,292,232 acres. Of this total, 43,342,706 acres were returned in 1919 as being in occupation, including reserves and Native lands leased, but excluding areas within borough boundaries and holdings of less than 1 acre in extent, which are not dealt with in the annual collection of agricultural and pastoral statistics. Of the balance, it is estimated that 3,831,526 acres are barren and worthless, and 2,241,016 acres are occupied by lakes, rivers, and roads.
The numbers of holdings and percentages of total holdings in occupation in groups of sizes, as returned at the past five collections, are given below:—
OCCUPIED LANDS .—HOLDINGS .
| Area, in Acres. | Number of Holdings. | Percentages of Total. | ||||||||
|---|---|---|---|---|---|---|---|---|---|---|
| 1911.* | 1916. | 1917. | 1918. | 1919. | 1911.* | 1916. | 1917. | 1918. | 1919. | |
* Inclusive of holdings within borough boundaries. | ||||||||||
| (Inclusive) | ||||||||||
| 1 to 10 | 18,075 | 15,454 | 15,832 | 15,735 | 15,674 | 24.47 | 20.01 | 19.91 | 19.63 | 19.48 |
| 11 to 50 | 12,151 | 12,748 | 13,097 | 13,232 | 13,291 | 16.45 | 16.51 | 16.45 | 16.51 | 16.52 |
| 51 to 100 | 7,948 | 9,122 | 9,399 | 9,479 | 9,524 | 10.76 | 11.81 | 11.82 | 11.83 | 11.84 |
| 101 to 200 | 10,746 | 12,159 | 12,609 | 12,698 | 12,745 | 14.54 | 15.75 | 15.85 | 15.84 | 15.84 |
| 201 to 320 | 7,083 | 7,972 | 8,157 | 8,217 | 8,277 | 9.59 | 10.32 | 10.26 | 10.25 | 10.28 |
| 321 to 640 | 8,466 | 9,572 | 9,800 | 9,940 | 10,031 | 11.46 | 12.39 | 12.32 | 12.40 | 12.46 |
| 641 to 1,000 | 3,611 | 3,895 | 4,022 | 4,120 | 4,133 | 4.89 | 5.04 | 5.06 | 5.14 | 5.13 |
| 1,001 to 5,000 | 4,780 | 5,284 | 5,540 | 5,623 | 5,699 | 6.47 | 6.84 | 6.97 | 7.02 | 7.08 |
| 5,001 to 10,000 | 526 | 517 | 562 | 565 | 562 | 0.71 | 0.67 | 0.71 | 0.71 | 0.70 |
| 10,001 to 20,000 | 264 | 277 | 281 | 291 | 287 | 0.36 | 0.36 | 0.35 | 0.36 | 0.33 |
| 20,001 to 50,000 | 136 | 165 | 173 | 185 | 183 | 0.18 | 0.21 | 0.22 | 0.23 | 0.23 |
| Over 50,000 acres | 90 | 64 | 64 | 61 | 62 | 0.12 | 0.09 | 0.08 | 0.08 | 0.08 |
| Totals | 73,876 | 77,229 | 79,536 | 80,146 | 80,408 | 100.00 | 100.00 | 100.00 | 100.00 | 100.00 |
The areas of holdings in occupation by size-groups, and the percentage each group represents of the total area in occupation, are now given.
OCCUPIED LANDS .—AREAS .
| Sizes of Holdings, in Acres. | Aggregate Area of Group. | Percentage of Total Area occupied. | ||||||||
|---|---|---|---|---|---|---|---|---|---|---|
| 1911.* | 1916. | 1917. | 1918. | 1919. | 1911.* | 1916. | 1917. | 1918. | 1919. | |
* Inclusive of holdings within borough boundaries. | ||||||||||
| (Inclusive) | ||||||||||
| 1 to 10 | 81,397 | 69,390 | 72,071 | 72,413 | 72,524 | 0.20 | 0.17 | 0.16 | 0.17 | 0.17 |
| 11 to 50 | 335,056 | 358,726 | 368,068 | 372,509 | 373,737 | 0.83 | 0.87 | 0.86 | 0.86 | 0.86 |
| 51 to 100 | 618,980 | 708,228 | 730,703 | 737,054 | 741,469 | 1.54 | 1.72 | 1.71 | 1.71 | 1.71 |
| 101 to 200 | 1,628,608 | 1,812,196 | 1,873,968 | 1,890,152 | 1,895,119 | 4.05 | 4.39 | 4.38 | 4.37 | 4.37 |
| 201 to 320 | 1,818,087 | 2,054,917 | 2,096,827 | 2,114,802 | 2,129,449 | 4.52 | 4.98 | 4.91 | 4.89 | 4.91 |
| 321 to 640 | 3,872,809 | 4,355,985 | 4,465,009 | 4,525,386 | 4,576,782 | 9.62 | 10.56 | 10.45 | 10.47 | 10.56 |
| 641 to 1,000 | 2,931,721 | 3,149,598 | 3,242,427 | 3,330,364 | 3,365,145 | 7.28 | 7.63 | 7.59 | 7.71 | 7.76 |
| 1,001 to 5,000 | 9,388,126 | 10,366,504 | 10,911,716 | 11,015,761 | 11,199,385 | 23.33 | 25.12 | 25.53 | 25.49 | 25.84 |
| 5,001 to 10,000 | 3,525,514 | 3,593,266 | 3,929,618 | 3,949,500 | 3,905,073 | 8.76 | 8.71 | 9.19 | 9.14 | 9.01 |
| 10,001 to 20,000 | 3,751,346 | 3,880,927 | 3,975,105 | 4,091,022 | 4,033,038 | 9.34 | 9.41 | 9.30 | 9.47 | 9.31 |
| 20,001 to 50,000 | 4,157,740 | 5,126,470 | 5,442,567 | 5,727,399 | 5,654,073 | 10.33 | 12.42 | 12.73 | 13.26 | 13.05 |
| Over 50,000 acres | 8,128,742 | 5,785,986 | 5,636,640 | 5,385,717 | 5,396,912 | 20.20 | 14.02 | 13.19 | 12.46 | 12.45 |
| Totals | 40,238,126 | 41,262,193 | 42,744,719 | 43,212,079 | 43,342,706 | 100.00 | 100.00 | 100.00 | 100.00 | 100.00 |
Taking the years 1916, 1917, 1918, and 1919, which are directly comparable, as they do not include holdings in boroughs, it is now possible to show the increase or decrease per cent. of numbers and areas of holdings according to size-groups.
OCCUPIED LANDS .—PERCENTAGES OF INCREASE OR DECREASE OF NUMBERS AND AREAS OF HOLDINGS BY SIZE -GROUPS .
| Sizes of Holdings, in Acres. | 1916. | 1917. | 1918. | 1919. | ||||||||
|---|---|---|---|---|---|---|---|---|---|---|---|---|
| Per Cent. of Total. | Per Cent. Increase or Decrease compared with 1916. | Per Cent. Increase or Decrease compared with 1917. | Per Cent. Increase or Decrease compared with 1916. | Per Cent. Increase or Decrease compared with 1918. | Per Cent. Increase or Decrease compared with 1916. | |||||||
| No. | Area. | No. | Area. | No. | Area. | No. | Area. | No. | Area. | No. | Area. | |
| (Inclusive) | ||||||||||||
| 1 to 10 | 20.01 | 0.17 | -0.10 | -0.01 | -0.28 | +0.01 | -0.38 | .. | -0.15 | .. | -0.53 | .. |
| 11 to 50 | 16.51 | 0.87 | -0.06 | -0.01 | +0.06 | .. | .. | -0.01 | +0.01 | .. | +0.01 | -0.01 |
| 51 to 100 | 11.81 | 1.72 | +0.01 | -0.01 | +0.01 | .. | +0.02 | -0.01 | +0.01 | .. | +0.03 | -0.01 |
| 101 to 200 | 15.75 | 4.39 | +0.10 | -0.01 | -0.01 | -0.01 | +0.09 | -0.02 | .. | .. | +0.09 | -0.02 |
| 201 to 320 | 10.32 | 4.98 | -0.06 | -0.07 | -0.01 | -0.02 | -0.07 | -0.09 | +0.03 | +0.02 | -0.04 | -0.07 |
| 321 to 640 | 12.39 | 10.56 | -0.07 | -0.11 | +0.08 | +0.02 | +0.01 | -0.09 | +0.06 | +0.09 | +0.07 | .. |
| 641 to 1,000 | 5.04 | 7.63 | +0.02 | -0.04 | +0.08 | +0.12 | +0.10 | +0.08 | -0.01 | +0.05 | +0.09 | +0.13 |
| 1,001 to 5,000 | 6.84 | 25.12 | +0.13 | +0.41 | +0.05 | -0.04 | +0.18 | +0.37 | +0.06 | +0.35 | +0.24 | +0.72 |
| 5,001 to 10,000 | 0.67 | 8.71 | +0.04 | +0.48 | .. | -0.05 | +0.04 | +0.43 | -0.01 | -0.13 | +0.03 | +0.30 |
| 10,001 to 20,000 | 0.36 | 9.41 | -0.01 | -0.11 | +0.01 | +0.17 | .. | +0.06 | .. | -0.16 | .. | -0.10 |
| 20,001 to 50,000 | 0.21 | 12.42 | +0.01 | +0.31 | +0.01 | +0.53 | +0.02 | +0.84 | .. | -0.21 | +0.02 | +0.63 |
| Over 50,000 acres | 0.09 | 14.02 | -0.01 | -0.83 | .. | -0.73 | -0.01 | -1.56 | .. | -0.01 | -0.01 | -1.57 |
The following table gives the numbers and average areas of holdings for each county in the Dominion as ascertained at the 1919 collection of agricultural and pastoral statistics.
Eden County is the most closely settled, the average area of holdings being 15.51 acres, while Fiord County shows the largest average—viz., 9,013.50 acres. There are no counties in the North Island having an average in excess of 2,500 acres, but in the South Island there are no fewer than seven—viz., Awatere, Amuri, Tawera, Mackenzie, Vincent. Lake, and Fiord.
The average area for the Dominion is 538.63 acres, and twenty-one counties out of seventy-three in the North Island exceed this, and twenty-seven out of fifty-two in the South Island. The average area for the North Island is 393.18 acres, and for the South 741.70 acres.
TABLE SHOWING THE NUMBERS AND AVERAGE AREAS OF HOLDINGS FOR EACH COUNTY IN THE DOMINION .
| County. | Number of Holdings. | Total Area occupied. | Average Area of Holdings. |
|---|---|---|---|
| Land District of North Auckland. | |||
| Acres. | Acres. | ||
| Mongonui | 572 | 320,874 | 560.97 |
| Whangaroa | 204 | 75,891 | 372.01 |
| Bay of Islands | 927 | 294,631 | 317.83 |
| Hokianga | 567 | 218,893 | 386.05 |
| Whangarei | 1,544 | 454,606 | 294.43 |
| Hobson | 628 | 317,434 | 505.47 |
| Otamatea | 665 | 234,706 | 352.94 |
| Rodney | 913 | 263,568 | 288.68 |
| Waitemata | 2,284 | 282,780 | 123.81 |
| Eden | 1,197 | 18,569 | 15.51 |
| Great Barrier | 88 | 43,998 | 499.98 |
| Manukau | 1,367 | 160,251 | 117.23 |
| Franklin | 1,809 | 282,208 | 156.00 |
| Totals, North Auckland | 12,765 | 2,968,409 | 232.54 |
| Land District of Auckland. | |||
| Waikato | 1,167 | 278,143 | 238.34 |
| Raglan | 877 | 430,412 | 490.78 |
| Waipa | 1,090 | 162,408 | 149.00 |
| Kawhia | 225 | 107,736 | 478.83 |
| Awakino | 150 | 162,700 | 1,084.67 |
| Waitomo | 1,057 | 515,719 | 487.91 |
| Coromandel | 509 | 214,539 | 421.49 |
| Thames | 866 | 161,609 | 186.62 |
| Ohinemuri | 855 | 154,308 | 180.48 |
| Tauranga | 813 | 233,168 | 286.80 |
| Piako | 943 | 211,446 | 224.23 |
| Matamata | 791 | 408,077 | 515.90 |
| Rotorua | 287 | 198,639 | 692.12 |
| Acres. | Acres. | ||
| Whakatane | 391 | 162,949 | 416.75 |
| Opotiki | 216 | 256,188 | 1,186.06 |
| East Taupo | 132 | 327,966 | 2,484.59 |
| West Taupo | 463 | 293,955 | 634.89 |
| Totals, Auckland | 10,832 | 4,279,962 | 395.12 |
| Land District of Hawke's Bay. | |||
| Waiapu | 413 | 534,927 | 1,295.22 |
| Waikohu | 372 | 522,095 | 1,403.48 |
| Uawa | 1,123 | 632,093 | 562.86 |
| Cook | |||
| Wairoa | 405 | 714,471 | 1,764.13 |
| Hawke's Bay | 1,675 | 1,104,301 | 659.28 |
| Waipukurau | 130 | 62,940 | 484.15 |
| Waipawa | 559 | 271,164 | 485.09 |
| Woodville | 335 | 84,073 | 250.96 |
| Dannevirke | 770 | 244,779 | 317.89 |
| Patangata | 365 | 434,094 | 1,189.30 |
| Weber | 74 | 66,464 | 898.16 |
| Totals, Hawke's Bay | 6,221 | 4,671,401 | 750.91 |
| Land District of Taranaki. | |||
| Okura | 499 | 261,965 | 524.98 |
| Clifton | 400 | 241,459 | 603.65 |
| Taranaki | 1,399 | 187,675 | 134.15 |
| Egmont | 650 | 127,060 | 195.48 |
| Stratford | 861 | 185,243 | 215.15 |
| Whangamomona | 216 | 152,403 | 705.57 |
| Waimate West | 389 | 45,117 | 115.98 |
| Hawera | 736 | 110,233 | 149.77 |
| Eltham | 513 | 115,244 | 224.65 |
| Patea | 570 | 277,464 | 486.78 |
| Totals, Taranaki | 6,233 | 1,703,863 | 273.36 |
| Land District of Wellington. | |||
| Waitotara | 518 | 201,301 | 388.61 |
| Wanganui | 635 | 314,589 | 495.42 |
| Waimarino | 392 | 444,397 | 1,133.67 |
| Kaitieke | 419 | 173,105 | 413.14 |
| Rangitikei | 1,280 | 613,901 | 479.61 |
| Kiwitea | 422 | 188,348 | 446.32 |
| Pohangina | 248 | 108,412 | 437.15 |
| Kairanga | 794 | 104,376 | 131.46 |
| Oroua | 548 | 115,613 | 210.98 |
| Manawatu | 615 | 127,683 | 207.61 |
| Horowhenua | 1,000 | 227,875 | 227.87 |
| Pahiatua | 604 | 166,482 | 275.63 |
| Akitio | 197 | 203,960 | 1,035.33 |
| Castlepoint | 76 | 157,434 | 2,071.50 |
| Eketahuna | 400 | 182,818 | 457.05 |
| Mauriceville | 116 | 41,322 | 356.22 |
| Masterton | 567 | 317,638 | 560.21 |
| Wairarapa South | 468 | 221,924 | 474.20 |
| Featherston | 428 | 464,336 | 1,084.90 |
| Hutt | 781 | 195,040 | 249.73 |
| Makara | 243 | 58,803 | 241.99 |
| Chatham Islands | 83 | 181,064 | 2,181.49 |
| Totals, Wellington | 10,834 | 4,810,421 | 444.01 |
| Land District of Nelson. | |||
| Collingwood | 233 | 145,785 | 625.69 |
| Takaka | 349 | 105,747 | 303.00 |
| Waimea | 2,045 | 639,387 | 312.66 |
| Buller | 615 | 114,114 | 185.55 |
| Murchison | 376 | 241,136 | 641.32 |
| Inangahua | 245 | 69,476 | 283.57 |
| Totals, Nelson | 3,863 | 1,315,645 | 340.58 |
| Land District of Marlborough. | |||
| Sounds | 316 | 243,208 | 769.65 |
| Marlborough | 1,079 | 866,849 | 803.38 |
| Awatere | 247 | 950,214 | 3,847.02 |
| Kaikoura | 299 | 409,418 | 1,369.29 |
| Totals, Marlborough | 1,941 | 2,469,689 | 1,272.38 |
| Land District of Westland. | |||
| Grey | 529 | 472,328 | 892.87 |
| Westland | 940 | 1,264,213 | 1,344.91 |
| Totals, Westland | 1,469 | 1,736,541 | 1,182.12 |
| Land District of Canterbury. | |||
| Cheviot | 216 | 187,752 | 869.22 |
| Amuri | 285 | 1,246,201 | 4,372.64 |
| Waipara | 345 | 508,336 | 1,473.44 |
| Ashley | 164 | 352,155 | 2,147.29 |
| Oxford | 324 | 162,813 | 502.51 |
| Kowai | 283 | 99,580 | 351.87 |
| Rangiora | 496 | 56,385 | 113.68 |
| Eyre | 305 | 89,653 | 293.94 |
| Waimairi | 1,384 | 27,654 | 19.98 |
| Paparua | 734 | 69,791 | 95.08 |
| Malvern | 334 | 212,434 | 636.03 |
| Tawera | 83 | 303,070 | 3,651.45 |
| Heathcote | 336 | 10,414 | 30.99 |
| Halswell | 242 | 23,794 | 98.32 |
| Selwyn | 225 | 452,438 | 2,010.84 |
| Springs | 308 | 49,589 | 161.00 |
| Ellesmere | 519 | 114,376 | 220.38 |
| Mount Herbert | 88 | 37,043 | 420.94 |
| Wairewa | 197 | 84,778 | 430.35 |
| Akaroa | 417 | 102,755 | 246.41 |
| Ashburton | 1,929 | 1,229,531 | 637.39 |
| Geraldine | 965 | 403,378 | 418.01 |
| Levels | 842 | 157,973 | 187.62 |
| Mackenzie | 420 | 1,404,500 | 3,344.05 |
| Waimate | 1,320 | 904,505 | 685.23 |
| Totals, Canterbury | 12,761 | 8.290,898 | 649.71 |
| Land District of Otago. | |||
| Waitaki | 1,611 | 1,408,396 | 874.24 |
| Maniototo | 537 | 827,755 | 1,541.44 |
| Waihemo | 267 | 229,904 | 861.06 |
| Waikouaiti | 472 | 168,862 | 357.76 |
| Peninsula | 250 | 20,509 | 82.04 |
| Taieri | 862 | 573,241 | 665.01 |
| Tuapeka | 849 | 784,648 | 924.20 |
| Bruce | 814 | 317,565 | 390.13 |
| Clutha | 1,158 | 498,278 | 430.29 |
| Vincent | 623 | 1,657,458 | 2,660.45 |
| Lake | 415 | 1,423,483 | 3,430.08 |
| Totals, Otago | 7,858 | 7,910,099 | 1,006.63 |
| Land District of Southland. | |||
| Fiord | 2 | 18,027 | 9,013.50 |
| Wallace | 1,489 | 1,165,552 | 782.78 |
| Southland | 4,062 | 1,962,336 | 483.10 |
| Stewart Island | 138 | 39,863 | 288.86 |
| Totals, Southland | 5,691 | 3,185,778 | 559.79 |
| Totals, Dominion | 80,468 | 43,342,706 | 538.63 |
Land in occupation in each land district tabulated according to tenure is given below. The acreage in the fifth column is slightly in excess of that appearing in the report of the Lands and Survey Department, but this is accounted for by the fact that it is inclusive of Crown reserves leased.
OCCUPIED LANDS .—TENURE , 1919.
| Land District. | Total of Holdings. | Freehold (occupied by Owner). | Leased from private Individuals or Public Bodies. | Leased from Natives. | Held from Crown under Different Tenures | Tenure not specified. |
|---|---|---|---|---|---|---|
| Acres. | Acres. | Acres. | Acres. | Acres. | Acres. | |
| North Auckland | 2,968,409 | 2,235,413 | 188,046 | 82,904 | 462,046 | .. |
| Auckland | 4,279,962 | 2,386,869 | 226,147 | 458,739 | 1,208,153 | 54 |
| Hawke's Bay | 4,671,401 | 2,658,014 | 414,127 | 729,884 | 869,376 | .. |
| Taranaki | 1,703,863 | 855,461 | 221,066 | 129,866 | 497,470 | .. |
| Wellington | 4,810,421 | 3,081,777 | 543,259 | 406,770 | 778,557 | 58 |
| Nelson | 1,315,645 | 616,327 | 75,464 | 14,404 | 609,365 | 85 |
| Marlborough | 2,469,689 | 799,902 | 53,381 | 31,235 | 1,585,171 | .. |
| Westland | 1,736,541 | 152,197 | 34,358 | 4,927 | 1,545,059 | .. |
| Canterbury | 8,290,898 | 3,138,638 | 725,483 | 10,414 | 4,408,443 | 7,920 |
| Otago | 7,910,099 | 1,586,368 | 303,830 | 7,142 | 6,012,759 | .. |
| Southland | 3,185,778 | 1,452,140 | 273,505 | 4,509 | 1,455,624 | .. |
| Totals | 43,342,706 | 18,963,106 | 3,058,666 | 1,880,794 | 19,432,023 | 8,117 |
In point of area the most important Crown-lands tenure is "pastoral run," the area for 1919 being 10,232,291 acres. Considerable areas are also held under the following tenures: Small grazing-runs, 2,642,605 acres; lease in perpetuity, 1,802,172 acres; occupation with right of purchase, 1,601,548 acres; renewable lease, 1,549,901 acres.
Further details of tenure, &c., of Crown lands will be found in Section XVII, Subsection A, of this volume.
Lands in occupation are, however, not strictly comparable with Crown lands alienated or in process of alienation, for certain lands have passed into the hands of Europeans which were never made waste lands of the Crown. It must also be remembered that of the freehold land in the Dominion a considerable area is unoccupied and unused.
Table of Contents
DURING the past four years complete collections of agricultural and pastoral statistics have been made annually by the Census and Statistics Office through the agency of officers of the Police Department, who were appointed sub-enumerators for the purpose. About 275 officers are so employed every year, and practically every holding of 1 acre or over (with the exception of those within borough boundaries) is canvassed personally. As soon as sufficient information is available interim returns of principal crops and live-stock are published in the New Zealand Gazette , and when the collection is completed the full statistics are gazetted, and are also included in Volume iii of "Statistics of the Dominion of New Zealand."
In the years previous to and inclusive of 1908-9 complete statistics were collected annually by sub-enumerators appointed by the Department of Agriculture; in 1909-10 full statistics were not collected, but the areas under the principal grain and root crops were ascertained and an estimate made of the yields; for 1910-11 complete information was obtained in connection with the 1911 census. In the four succeeding years returns were collected by post regarding the acreage and yield of the principal crops; but this method of collection was found to be less satisfactory than the personal visit, and the figures for these years are probably not quite accurate. The yield of oats in grain is probably overstated (see note to table on p. 517), while other yields and all areas may be slightly below actual facts.
In addition to the main collection of agricultural and pastoral statistics the following supplementary inquiries are undertaken: Areas sown or intended to be sown in wheat and oats (taken at the end of September); stocks of flour, wheat, and oats in the hands of millers, merchants, storekeepers, and farmers (at the end of November); estimated yields of wheat and oats (early in February); and returns of wheat and oats threshed (throughout the threshing season). The results of these first three inquiries are gazetted, and they are also, together with the threshing, published from time to time in the Monthly Abstract of Statistics.
Of the total area in occupation in 1918-19 (43,342,706 acres) 17,613,337 acres were in cultivation. Land in cultivation expressed as a percentage of land in occupation for the past four years, together with the area in cultivation per inhabitant (inclusive of Maoris) is given below:—
| Year. | Total Area in Occupation. | Total Area in Cultivation. | Cultivated Land per Cent. of Occupied Land. | Cultivated Land per Inhabitant. |
|---|---|---|---|---|
| Acres. | Acres. | Acres. | ||
| 1915-16 | 41,262,193 | 16,895,590 | 40.95 | 14.69 |
| 1916-17 | 42,744,719 | 17,061,675 | 39.92 | 14.85 |
| 1917-18 | 43,212,079 | 17,386,160 | 40.23 | 15.15 |
| 1918-19 | 43,342,706 | 17,613,337 | 40.64 | 15.21 |
The following table gives details of cultivation and total area occupied for each land district in the Dominion for the season, 1918-19.
| Land District. | In Grain and Pulse Crops. | In Grasses and Clovers (for Hay or Seed), and Green and Root Crops. | In Fallow. | In Grasses and Clovers not cut for Hay or Seed. | In Vineyards and Orchards. | In Market Gardens, Nurseries, and Seed-gardens. | In Private Gardens and Pleasure-grounds. | In Plantations (not Native Bush). | Total Area in Cultivation. | Unimproved Land. | Total Area in Occupation. |
|---|---|---|---|---|---|---|---|---|---|---|---|
| Acres. | Acres. | Acres. | Acres. | Acres. | Acres. | Acres. | Acres. | Acres. | Acres. | Acres. | |
| North Auckland | 8,812 | 29,188 | 9,070 | 1,350,797 | 7,645 | 706 | 5,408 | 1,642 | 1,413,268 | 1,555,141 | 2,968,409 |
| Auckland | 21,657 | . 89,898 | 12,401 | 1,900,940 | 2,531 | 123 | 5,207 | 4,391 | 2,037,148 | 2,242,814 | 4,279,962 |
| Hawke's Bay | 21,992 | 36,136 | 640 | 2,953,228 | 2,726 | 253 | 5,036 | 4,514 | 3,024,525 | 1,646,876 | 4,671,401 |
| Taranaki | 9,525 | 59,553 | 390 | 1,222,835 | 291 | 56 | 2,531 | 897 | 1,296,078 | 407,785 | 1,703,863 |
| Wellington | 30,472 | 74,680 | 761 | 3,344,748 | 1,443 | 605 | 7,795 | 5,801 | 3,466,305 | 1,344,116 | 4,810,421 |
| Nelson | 13,257 | 9,951 | 673 | 289,217 | 11,004 | 256 | 999 | 1,117 | 326,474 | 989,171 | 1,315,645 |
| Marlborough | 30,950 | 12,171 | 963 | 364,349 | 1,025 | 49 | 1,630 | 3,529 | 414,666 | 2,055,023 | 2,469,689 |
| Westland | 396 | 1,243 | 75 | 138,730 | 67 | 6 | 495 | 670 | 141,682 | 1,594,859 | 1,736,541 |
| Canterbury | 397,439 | 245,027 | 23,153 | 2,112,390 | 2,974 | 764 | 14,860 | 21,790 | 2,818,387 | 5,472,511 | 8,290,898 |
| Otago | 135,825 | 134,060 | 16,472 | 1,065,238 | 4,946 | 124 | 6,136 | 3,476 | 1,366,277 | 6,543,822 | 7,910,099 |
| Southland | 80,639 | 128,128 | 4,021 | 1,089,132 | 283 | 41 | 5,129 | 1,154 | 1,308,527 | 1,877,251 | 3,185,778 |
| Totals | 750,964 | 820,035 | 68,619 | 15,831,604 | 34,935 | 2,973 | 55,226 | 48,981 | 17,613,337 | 25,729,369 | 43,342,706 |
Further details of the various crops are given under their respective headings on the following pages, but as unimproved lands are not again referred to, a table is appended showing condition by land districts:—
UNIMPROVED OCCUPIED LAND , 1918-19.
| Land District. | Phormium Tenax. | Tussock and other Native Grasses. | Fern, Scrub, and Second Growth. | Standing Virgin Bush. | Barren and Unproductive Land. | Total Unimproved Occupied Land. |
|---|---|---|---|---|---|---|
| Acres. | Acres. | Acres. | Acres. | Acres. | Acres. | |
| North Auckland | 5,201 | 210,721 | 810,029 | 407,360 | 121,830 | 1,555,141 |
| Auckland | 11,194 | 435,049 | 1,001,829 | 731,545 | 63,197 | 2,242,814 |
| Hawke's Bay | 243 | 860,917 | 346,766 | 334,414 | 104,536 | 1,646,876 |
| Taranaki | 50 | 10,653 | 65,698 | 325,900 | 5,484 | 407,785 |
| Wellington | 19,249 | 502,302 | 282,345 | 448,560 | 91,660 | 1,344,116 |
| Nelson | 3,401 | 303,910 | 151,552 | 480,436 | 49,872 | 989,171 |
| Marlborough | 1,265 | 1,242,318 | 209,599 | 200,816 | 401,025 | 2,055,023 |
| Westland | 6,669 | 226,661 | 65,995 | 995,846 | 299,688 | 1,594,859 |
| Canterbury | 1,947 | 4,445,331 | 104,105 | 239,000 | 682,128 | 5,472,511 |
| Otago | 1,734 | 6,003,478 | 207,522 | 123,709 | 207,379 | 6,543,822 |
| Southland | 4,668 | 1,384,128 | 148,495 | 211,631 | 128,329 | 1,877,251 |
| Totals | 55,621 | 15,625,468 | 3,393,935 | 4,499,217 | 2,155,128 | 25,729,369 |
The areas, yields, and average yields per acre of the principal crops during the past ten seasons are shown in the following tables:—
GRAIN AND PULSE CROPS , 1909-10 TO 1918-19.
Areas.
| Season. | Wheat. | Oats. | Barley. | Maize. | Peas and Beans. |
|---|---|---|---|---|---|
| Acres. | Acres. | Acres. | Acres. | Acres. | |
| 1909-10 | 311,000 | 377,000 | 41,500 | .. | .. |
| 1910-11 | 322,167 | 302,827 | 33,491 | 13,057 | 16,627 |
| 1911-12 | 215,528 | 403,668 | 31,644 | 6,094 | .. |
| 1912-13 | 189,869 | 386,786 | 37,486 | 4,683 | .. |
| 1913-14 | 166,774 | 361,741 | 32,022 | 5,942 | .. |
| 1914-15 | 229,600 | 287,561 | 18,347 | 5,477 | .. |
| 1915-16 | 329,207 | 212,688 | 30,204 | 8,086 | 9,209 |
| 1916-17 | 218,942 | 177,332 | 29,648 | 6,359 | 11,905 |
| 1917-18 | 280,978 | 156,202 | 18,860 | 8,151 | 11,685 |
| 1918-19 | 200,030 | 172,686 | 18,753 | 9,792 | 17,929 |
Yields.
| Season. | Wheat. | Oats. | Barley. | Maize. | Peas and Beans. | |||||
|---|---|---|---|---|---|---|---|---|---|---|
| Total. | Average per Acre. | Total. | Average per Acre. | Total. | Average per Acre. | Total. | Average per Acre. | Total. | Average per Acre. | |
* The figures for 1911-12 to 1911-15 (inclusive) do not represent actual results, but were obtained by applying to ascertained average yields per acre the areas stated by growers to be intended for threshing. It would appear, however, that in many cases farmers Included under the heading "Oats for Threshing" areas which were intended or used for chaffing or other purposes. The yields given are therefore probably overstated. | ||||||||||
| Bushels. | Bushels. | Bushels. | Bushels. | Bushels. | Bushels. | Bushels. | Bushels. | Bushels. | Bushels. | |
| 1909-10 | 8,661,100 | 28.00 | 13,804,000 | 37.00 | 1,304,000 | 31.00 | .. | .. | .. | .. |
| 1910-11 | 8,290,221 | 25.73 | 10,118,917 | 33.41 | 927,112 | 27.68 | 569,807 | 43.64 | 583,750 | 35.11 |
| 1911-12 | 7,261,138 | 33.69 | 19,662,668* | 48.71 | 1,254,648 | 39.65 | 278,252 | 45.66 | .. | .. |
| 1912-13 | 5,179,626 | 27.28 | 13,583,924* | 35.12 | 1,377,610 | 36.75 | 222,115 | 47.43 | .. | .. |
| 1913-14 | 5,231,700 | 31.37 | 14,740,946* | 40.75 | 1,205,628 | 37.65 | 307,736 | 51.79 | .. | .. |
| 1914-15 | 6,644,336 | 28.94 | 11,436,301* | 39.77 | 596,828 | 32.53 | 275,274 | 50.26 | .. | .. |
| 1915-16 | 7,108,360 | 21.59 | 7,653,208 | 35.98 | 820,174 | 27.15 | 340,372 | 42.09 | 163,273 | 17.73 |
| 1916-17 | 5,083,277 | 23.22 | 5,371,249 | 30.29 | 758,935 | 25.60 | 274,332 | 43.14 | 243,297 | 20.43 |
| 1917-18 | 6,807,536 | 24.23 | 4,942,759 | 31.64 | 568,702 | 30.15 | 367,761 | 45.09 | 312,582 | 26.73 |
| 1918-19 | 6,567,629 | 31.57 | 6,884,609 | 39.88 | 710,932 | 37.91 | 413,595 | 42.17 | 505,950 | 28.16 |
CEREALS AND GRASSES FOR CHAFF , HAY , OR ENSILAGE , AND FOR GREEN FODDER .
Areas.
| — | Wheat for Chaff, &c. | Oats for Chaff, &c. | Barley for Chaff, &c. | Maize for Ensilage, &c. | Grasses and Clovers for Hay. | Green Fodder. |
|---|---|---|---|---|---|---|
* Including green fodder. | ||||||
| Acres. | Acres. | Acres. | Acres. | Acres. | Acres. | |
| 1909-10 | .. | .. | .. | .. | .. | .. |
| 1910-11 | 14,222* | 290,569* | 4.640* | 5,800* | 62,600 | .. |
| 1911-12 | .. | .. | .. | .. | .. | .. |
| 1912-13 | .. | .. | .. | .. | .. | .. |
| 1913-14 | .. | .. | .. | .. | .. | .. |
| 1914-15 | .. | .. | .. | .. | .. | .. |
| 1915-16 | 6,215 | 429,437 | 2,040 | 624 | 94,330 | 229,496 |
| 1916-17 | 3,738 | 354,550 | 1,240 | 711 | 106,723 | 218,452 |
| 1917-18 | 2,258 | 311,316 | 634 | 613 | 111,181 | 186,867 |
| 1918-19 | 1,646 | 301,724 | 530 | 272 | 131,557 | 149,622 |
Yields.
| — | Wheat. | Oats. | Barley. | Maize. | Hay. |
|---|---|---|---|---|---|
| Tons. | Tons. | Tons. | Tons. | Tons. | |
| 1909-10 | .. | .. | .. | .. | .. |
| 1910-11 | .. | .. | .. | .. | .. |
| 1911-12 | .. | .. | .. | .. | .. |
| 1912-13 | .. | .. | .. | .. | .. |
| 1913-14 | .. | .. | .. | .. | .. |
| 1914-15 | .. | .. | .. | .. | .. |
| 1915-16 | 7,440 | 572,435 | 3,387 | 3,493 | 177,165 |
| 1916-17 | 5,186 | 432,878 | 2,151 | 5,107 | 179,505 |
| 1917-18 | 3,549 | 419,434 | 1,240 | 3,335 | 180,436 |
| 1918-19 | 2,554 | 461,739 | 938 | 1,378 | 225,549 |
SEED AND ROOT CROPS .
Areas.
| — | Rye-grass. | Cocksfoot. | Chewings Fescue. | Red Clover and Cow-grass. | White Clover. | Potatoes. | Turnips. | Mangolds. |
|---|---|---|---|---|---|---|---|---|
| Acres. | Acres. | Acres. | Acres. | Acres. | Acres. | Acres. | Acres. | |
| 1909-10 | 56,550 | 29,500 | .. | .. | .. | 30,500 | .. | .. |
| 1910-11 | 46,706 | 41,918 | .. | .. | .. | 29,023 | 450,959 | 14,082 |
| 1911-12 | 77,535 | 38,297 | .. | .. | .. | 28,248 | .. | .. |
| 1912-13 | 63,031 | 34,007 | .. | .. | .. | 23,480 | .. | .. |
| 1913-14 | 55,936 | 25,935 | .. | .. | .. | 29,164 | .. | .. |
| 1914-15 | .. | .. | .. | .. | .. | .. | .. | .. |
| 1915-16 | 43,095 | 13,293 | 5,787 | 1,643 | 888 | 29,809 | 572,137 | 13,046 |
| 1916-17 | 79,135 | 16,134 | 5,514 | 2,978 | 1,330 | 26,156 | 526,283 | 9,073 |
| 1917-18 | 70,220 | 16,595 | 4,372 | 6,907 | 3,722 | 22,854 | 450,819 | 8,712 |
| 1918-19 | 31,250 | 19,318 | 2,329 | 6,682 | 6,798 | 19,169 | 438,045 | 8,233 |
Yields.
| — | Rye-grass. | Cocksfoot. | Chewings Fescue. | Red Clover and Cow-grass. | White Clover. | Potatoes. |
|---|---|---|---|---|---|---|
| Bushels. | lb. | lb. | lb. | lb. | Tons. | |
| 1909-10 | 1,894,650 | 4,451,000 | .. | .. | .. | 180,500 |
| 1910-11 | 1,167,650 | 5,868,520 | .. | .. | .. | 141,510 |
| 1911-12 | 2,198,893 | 6,974,650 | .. | .. | .. | 144,912 |
| 1912-13 | 1,458,947 | 5,285,708 | .. | .. | .. | 147,689 |
| 1913-14 | 1,098,835 | 4,956,438 | .. | .. | .. | 157,194 |
| 1914-15 | .. | .. | .. | .. | .. | .. |
| 1915-16 | 795,416 | 1,577,285 | 1,230,219 | 385,638 | 14,469 | 128,807 |
| 1916-17 | 1,152,487 | 1,907,043 | 1,247,545 | 443,861 | 143,465 | 133,642 |
| 1917-18 | 1,355,612 | 2,410,557 | 1,013,042 | 1,076,360 | 461,853 | 100,596 |
| 1918-19 | 646,194 | 3,761,814 | 551,588 | 1,255,478 | 958,360 | 105,483 |
Wheat is principally grown in the central and southern portions of the South Island. About 80 per cent. of the grain produced conies from Canterbury, Otago and Southland together produce about 15 per cent., while the remainder of the South Island and the whole of the North Island contribute the remaining 5 per cent. The area under wheat for threshing in each season since 1874-75 is given below:—
| Year. | Area. |
|---|---|
| Acres. | |
| 1874-75 | 105,673 |
| 1875-76 | 90,804 |
| 1876-77 | 141,614 |
| 1877-78 | 243,406 |
| 1878-79 | 264,861 |
| 1879-80 | 270,198 |
| 1880-81 | 324,949 |
| 1881-82 | 305,715 |
| 1882-83 | 390,818 |
| 1883-84 | 377,706 |
| 1884-85 | 2,700,431 |
| 1885-80 | 173,891 |
| 1886-87 | 253,025 |
| 1887-88 | 357,359 |
| 1888-89 | 362,153 |
| 1889-90 | 335,861 |
| 1890-91 | 301,460 |
| 1891-92 | 402,273 |
| 1892-93 | 381,245 |
| 1893-94 | 242,737 |
| 1894-95 | 148,575 |
| 1895-96 | 245,441 |
| 1896-97 | 258,608 |
| 1897-98 | 315,801 |
| 1898-99 | 399,034 |
| 1899-1900 | 269,749 |
| 1900-1 | 208,084 |
| 1901-2 | 167,474 |
| 1902-3 | 195,255 |
| 1903-4 | 230,959 |
| 1904-5 | 258,896 |
| 1905-6 | 222,183 |
| 1906-7 | 206,185 |
| 1907-8 | 193,031 |
| 1908-9 | 252,391 |
| 1909-10 | 311,000 |
| 1910-11 | 322,167 |
| 1911-12 | 215,528 |
| 1912-13 | 189,869 |
| 1913-14 | 166,774 |
| 1914-15 | 229,600 |
| 1915-16 | 329,207 |
| 1916-17 | 218,942 |
| 1917-18 | 280,978 |
| 1918-19 | 208,030 |
The area (for threshing) and the production of wheat per head of population for the last ten years are now given:—
| Year. | Per Head of Population. | |
|---|---|---|
| Area. | Production. | |
| Acres. | Bushels. | |
| 1909-10 | 0.32 | 8.91 |
| 1910-11 | 0.32 | 8.35 |
| 1911-12 | 0.21 | 7.15 |
| 1912-13 | 0.18 | 4.98 |
| 1913-14 | 0.16 | 4.90 |
| 1914-15 | 0.21 | 6.09 |
| 1915-16 | 0.30 | 6.47 |
| 1916-17 | 0.19 | 4.62 |
| 1917-18 | 0.26 | 6.19 |
| 1918-19 | 0.18 | 5.67 |
Unless there is a considerable carry-over from the previous season, importation of wheat requires to be made when the production nears or falls below 6 bushels per head of population. The carry-over from 1911-12 made up the deficiency of the 1913 harvest; but in 1914, 121,737 bushels were imported; in 1915, 522,617 bushels; in 1916, 51,512 bushels; in 1917, 719,977 bushels; and in 1918, 1,370,542 bushels.
Wheat grown for purposes other than threshing is insignificant. Information regarding areas and yields of chaff, &c., is given under "Fodder Crops" (ante ).
Wheat-production in Australasia, 1917-18.
The area and yield of wheat in 1917-18 for each State in the Commonwealth of Australia and in New Zealand were as follows:—
| State. | Wheat Crop. | ||
|---|---|---|---|
| Area. | Total Yield. | Average Yield per Acre. | |
| Acres. | Bushels. | Bushels. | |
| Queensland | 127,815 | 1,035,268 | 8.10 |
| New South Wales (including Federal Territory) | 3,329,371 | 37,712,000 | 11.21 |
| Victoria | 2,690,216 | 37,737,552 | 14.03 |
| South Australia | 2,355,682 | 28,692,594 | 12.18 |
| Western Australia | 1,249,672 | 9,303,787 | 7.44 |
| Tasmania | 21,812 | 252,383 | 11.57 |
| Totals for Commonwealth | 9,774,658 | 114,733,584 | 11.74 |
| New Zealand | 280,978 | 6,807,536 | 24.23 |
| Grand Totals | 10,055,636 | 121,541,120 | 12.09 |
The average production per acre for the last ten seasons is—for New Zealand, 27.44 bushels per acre; and for Australia, 11.13 bushels per acre.
It may be said that although from twenty to thirty countries in the world generally produce more wheat than does New Zealand, only three or four European countries have a better record of production per acre. This says much for the fertility of the soil of the Dominion, for cultivation here is naturally less intensive than it is in the closely settled continental countries.
In point of area oats is the most important grain crop of the Dominion. Canterbury, Otago, and Southland produce about 80 per cent. of the total, the remainder of the South Island 5 per cent., and the North Island 15 per cent. The greater portion of the oat crop is usually converted into chaff without threshing, but the proportion so dealt with depends on market conditions. In 1915-16, 33.12 per cent. of the crop harvested was threshed; in 1916-17, 33.36 per cent.; in 1917-18, 33.41 per cent.; and in 1918-19, 36.40 per cent.
The total and average yields per acre of grain and of chaff, hay, or ensilage for the past four seasons were as follows:—
| Season. | Grain. | Chaff, Hay, or Ensilage. | ||
|---|---|---|---|---|
| Total Yield. | Average per Acre. | Total Yield. | Average per Acre. | |
| Bushels. | Bushels. | Tons. | Tons. | |
| 1915-16 | 7,653,208 | 35.98 | 572,435 | 1.33 |
| 1916-17 | 5,371,436 | 30.26 | 432,878 | 1.22 |
| 1917-18 | 4,942,759 | 31.64 | 419,434 | 1.35 |
| 1918-19 | 6,884,609 | 39.87 | 461,739 | 1.53 |
EXPORT OF OATS .
New Zealand has no regular export of oats, and in some years has practically no surplus available for export. The quantity exported in 1891 and succeeding years was as follows:—
| Year. | Export of Oats. Bushels. |
|---|---|
| 1891 | 4,052,414 |
| 1892 | 3,830,444 |
| 1894 | 1,963,288 |
| 1896 | 2,247,053 |
| 1898 | 816,210 |
| 1900 | 5,818,648 |
| 1901 | 10,514,924 |
| 1903 | 4,956,330 |
| 1904 | 2,693,417 |
| 1905 | 1,076,916 |
| 1906 | 734,997 |
| 1907 | 36,693 |
| 1908 | 972,896 |
| 1909 | 5,133,473 |
| 1910 | 444,586 |
| 1911 | 72,826 |
| 1912 | 4,123,920 |
| 1913 | 239,268 |
| 1914 | 1,323,362 |
| 1915 | 682,652 |
| 1916 | 220,265 |
| 1917 | 5,767 |
| 1918 | 3,250 |
OAT CROP OF AUSTRALIA , 1916-17.
The oat crop for 1916-17 in the States of the Commonwealth of Australia was as follows:—
| Acres. | Bushels. | Average per Acre Bushels. | |
|---|---|---|---|
| Queensland | 6,564 | 108,664 | 16.55 |
| New South Wales | 67,003 | 1,083,030 | 16.16 |
| Federal Capital Territory | 108 | 1,950 | 18.06 |
| Victoria | 441,598 | 8,289,289 | 18.77 |
| South Australia | 151,609 | 1,839,541 | 12.13 |
| Western Australia | 122,220 | 1,689,352 | 13.82 |
| Tasmania | 55,028 | 1,006,183 | 18.28 |
| Totals for Commonwealth | 844,130 | 14,018,009 | 16.61 |
The area under barley for threshing for the season 1918-19 was 18,753 acres, the crop amounting to 710,932 bushels, an average of 37.91 bushels per acre. In 1917-18 the area under barley was 18,869 acres, and the yield 568,702 bushels, or 30.15 bushels per acre.
The returns for 1918-19 show that there were 9,792 acres sown for grain, being an increase of 1,641 acres from the area for the previous season (8,151 acres). The yield in 1919 was 413,595 bushels of corn, an average of 42.17 bushels per acre, and in 1918 367,761 bushels, an average of 45.09 bushels per acre. With the exception of a few acres in the South, maize is grown only in the North Island. In 1918-19 the Land District of North Auckland had 477 acres; Auckland, 5,818 acres; Hawke's Bay, 3,437 acres; Taranaki, 1 acre; Wellington, 58 acres; and Otago, 1 acre.
The area under peas and beans for threshing in the season 1918-19 was 17,969 acres, yielding 505,950 bushels. The area under these crops in 1917-18 was 11,685 acres.
New Zealand has a considerable export of peas and beans, the figures for the past ten years being,—
EXPORT OF PEAS AND BEANS , 1909-18.
| Year. | Bushels. |
|---|---|
| 1909 | 181,517 |
| 1910 | 198,527 |
| 1911 | 332,227 |
| 1912 | 464,609 |
| 1913 | 339,998 |
| 1914 | 305,053 |
| 1915 | 201,942 |
| 1916 | 84,168 |
| 1917 | 111,175 |
| 1918 | 90,495 |
The area under potatoes in 1918-19 was 19,116 acres, yielding a return of 105,483 tons, or at a rate of 5.50 tons per acre, against 22,854 acres in 1917-18 and 100,596 tons (or 4.38 tons per acre).
These figures do not include areas of less than a quarter of an acre, so that a considerable quantity of potatoes grown for private use has not been taken into account.
The following table shows the average yield per acre of potatoes in each of the Australian States and in New Zealand from 1912-13 to 1916-17, Later figures for Australia are not available.
AVERAGE YIELD PER ACRE OF POTATOES , 1912-13 TO 1916-17.
| State. | 1912-13. | 1913-14. | 1914-15. | 1915-16 | 1916-17. |
|---|---|---|---|---|---|
| Tons. | Tons. | Tons. | Tons. | Tons. | |
| Queensland | 1.86 | 1.64 | 1.91 | 1.28 | 2.18 |
| New South Wales | 2.69 | 2.76 | 1.34 | 2.27 | 2.02 |
| Victoria | 4.02 | 2.37 | 2.89 | 3.05 | 2.55 |
| South Australia | 3.85 | 3.05 | 2.36 | 2.99 | 4.29 |
| Western Australia | 2.62 | 3.40 | 3.08 | 2.90 | 2.88 |
| Tasmania | 2.95 | 2.61 | 2.50 | 2.71 | 1.95 |
| Federal Territory | 1.35 | 1.47 | 1.88 | 3.57 | 2.92 |
| Commonwealth | 3.25 | 2.53 | 2.41 | 2.75 | 2.38 |
| New Zealand | 6.29 | 5.39 | 6.06 | 4.33 | 5.11 |
Turnips form a most important crop in a sheep-breeding country such as New Zealand, and in 1918-19 the area under this crop was 438,045 acres, while there were 8,233 acres of mangolds.
The figures for these crops for 1917-18 were 450,819 acres and 8,712 acres respectively.
There were 450 acres under hops in 1918-19, 446 acres of this area being in the Nelson Land District. The total produce amounted to 649,556 lb.
Previous to 1916 the official statistics of the growing of tobacco were not collected since 1895. In 1889, 34 acres were being cultivated; in 1890, 25 acres; in 1891, 16 acres; in 1892, 6 acres; in 1893, 4 acres; in 1894, 4 acres; in 1895, 5 acres. In 1916, and again in 1917, the New Zealand Tobacco Company (Limited), Napier, returned 100 acres as under this crop. No tobacco was grown by this company in 1918, as the abundant crops obtained during the previous seasons were sufficient to fill manufacturing requirements up to 1919. Eight acres were grown in Nelson in 1918-19.
Certain localities which are free from frosts are eminently suited for this crop, which can be grown to advantage in young orchards, between the rows of fruit-trees.
Large areas (55,621 acres in 1918-19) in various parts of New Zealand are covered with Phormium tenax , the fibre of which is largely used for rope-making, &c. At the census of 1916 there were seventy-six mills in operation, employing 1,257 hands. The export of fibre and tow during each of the past ten years was as follows:—
PHORMIUM EXPORTED , 1909-18.
| Year. | Fibre. Tons. | Tow. Tons. |
|---|---|---|
| 1909 | 14,318 | 2,974 |
| 1910 | 20,645 | 4,501 |
| 1911 | 17,366 | 3,283 |
| 1912 | 18,641 | 3,388 |
| 1913 | 28,092 | 6,299 |
| 1914 | 19,702 | 4,226 |
| 1915 | 23,220 | 3,465 |
| 1916 | 27,674 | 4,578 |
| 1917 | 23,516 | 2,500 |
| 1918 | 25,167 | 1,815 |
In 1918-19 there were 2,472 acres in market gardens, 501 acres in nurseries and seed-gardens, and 55,226 acres in private gardens and pleasure-grounds. The area in plantations (not virgin bush) was 48,981 acres.
The area in orchard in 1918-19 (exclusive of that within borough boundaries) was 34,722 acres; in 1917-18 there were 34,452 acres exclusive of boroughs. Orchards within boroughs aggregated 2,443 acres in 1916, these being the latest figures available.
The following table gives particulars, by land districts, of areas for private use and for commercial purposes:—
AREA IN ORCHARD , 1918-19
| Land District. | For Private Use only. | For Commercial Purposes. | Total Area in Orchard. | |
|---|---|---|---|---|
| Not bearing. | Bearing. | |||
| Acres. | Acres. | Acres. | Acres. | |
| North Auckland | 2,049 | 2,579 | 2,907 | 7,535 |
| Auckland | 1,406 | 361 | 725 | 2,492 |
| Hawke's Bay | 461 | 836 | 1,373 | 2,670 |
| Taranaki | 235 | 11 | 45 | 291 |
| Wellington | 779 | 124 | 540 | 1,443 |
| Nelson | 359 | 5,566 | 5,077 | 11,002 |
| Marlborough | 269 | 518 | 238 | 1,025 |
| Westland | 28 | 2 | 37 | 67 |
| Canterbury | 1,140 | 882 | 951 | 2,973 |
| Otago | 585 | 2,081 | 2,275 | 4,941 |
| Southland | 261 | 8 | 14 | 283 |
| Dominion | 7,572 | 12,968 | 14,182 | 34,722 |
Commercial orchards are defined as "those producing fruit for sale to the value of £50 and upwards annually, or, if not yet in full bearing, that are calculated to produce fruit for sale to that value when in full bearing." Private orchards consist chiefly of small areas the produce of which is consumed principally on the holding, or, if sold, does not aggregate an annual value of £50. Larger areas winch, through age, disease, or other cause, are incapable of producing a yearly revenue of the stipulated amount are also included in private orchards.
Largo areas are continually being planted in fruit-trees, especially in the Nelson Land District, where tracts of land which until recently bore nothing but stunted manuka, and were looked upon as practically useless, have now been proved to be eminently suitable for growing fruit, particularly apples. A good market exists locally for choice clean fruit, but as the large areas recently planted come into bearing, growers will have to look to outside markets to take the surplus, and it is hoped that the export of fruit will become in time one of the largest in the Dominion.
The Agricultural Department assists orchardists by supplying information on fruitgrowing generally, and as to the most up-to-date methods to adopt for the control of diseases and insect pests, pruning, &c. Practical demonstrations of pruning, spraying, and the grading and packing of fruit are given regularly by the Orchard Instructors attached to the Department.
Co-operative fruit-testing plots are established in various parts of the Dominion. These plots are for the purpose of—
Ascertaining which varieties of fruit are best adapted to particular districts:
Demonstrating various methods of pruning:
Conducting modified manurial experiments.
Extensive experiments have been carried out in the growing of tomatoes and the control of diseases affecting them, many thousands of pounds having been lost through failure of the tomato crops grown under glass during the last few years. The results of these experiments have proved of great value, and have enabled growers to adopt successful methods for the production of large and profitable crops.
The total acreage in vineyards outside of borough boundaries is 253 acres. The growing of outdoor grapes is chiefly confined to the districts situated between the North Cape and Hawke's Bay. The greater portion of the crop is used for wine making, but a considerable quantity of outdoor-grown grapes is sold for table use.
Copies of full plans and specifications of a cool store capable of holding 4,000 cases of fruit have been prepared by the Department of Agriculture, and are supplied free on application.
The canning of fruit is also another important feature of the fruit industry. Plans and specifications for the building and equipment of a factory capable of turning out 4,000 cans per day are also available, free of charge, for those contemplating the erection of a factory.
State aid to the fruit-preserving industry is provided for by the Fruit-preserving Industry Act, 1913, whereby not more than £25,000 may be raised in any year for the purpose of making advances for the establishment of cold stores for fruit and of fruit-canning works, and otherwise for the assistance of the fruitgrowing industry. The advances during the financial year 1914-15 totalled £10,000.
The Orchard-tax Act, 1916, provides for the levying of a tax of 1s. per acre on commercial orchards (with a minimum of 2s. 6d.), the proceeds to be paid over to the New Zealand Fruitgrowers' Federation (Limited), and to be expended in aid of the fruitgrowing industry. This Act is to remain in force until 1921.
The area under rye-grass for seed in the season 1918-19 was 31,250 acres, yielding 646,194 bushels of 20 lb., or a rate of 20.18 bushels per acre.
In cocksfoot there were 19,318 acres, which yielded 3,761,814 lb., or an average of 194.70 lb. per acre. The area in the previous season was 16,595 acres, and the total yield 2,410,557 lb., the average yield per acre being 138.73 lb. The area returned by farmers as being under cocksfoot is decreasing steadily, having been 41,918 acres in 1910-11. Much of the waste land of the Dominion is laid down in cocksfoot, including a large proportion of the land enclosed with the State railway lines. Much of this is harvested, but no record of the. amount obtained from this source is kept.
New Zealand is essentially suited for grazing purposes. Wherever there is light and moisture English grasses thrive when the natural bush and fern are cleared off—in fact, the white clover gradually overcomes the fern; and, from the mildness of the winter season, there are few places where there is not some growth even in the coldest months of the year. In all parts of the Dominion stock live, although in varying condition, without other food than such as they can pick up. Sown-grass land, as might be expected, heads the list of cultivations.
At the beginning of the year 1919 there were 15,831,604 acres under artificial grasses, an increase of 383,470 acres over the area in 1918.
Seeds for sowing pasture lands are used much as in Great Britain, the following being a common mixture: Perennial rye-grass. 25 lb. to 30 lb. per acre; cocksfoot, 2 lb.; alsike, 2 lb.; timothy, 3 lb.; cow-grass, 2 lb.; red clover, 2 lb.; white clover, 2 lb.; rape, 1 lb.: total, 39 lb. to 44 lb. per acre. Pastures are renewed at intervals of from four to eight years, according to the nature of the land.
The following shows the acreage in sown grasses in each State of Australia and in New Zealand for the 1916-17 season:—
| Acres. | |
|---|---|
| Queensland | 363,876 |
| New South Wales | 1,357,087 |
| Victoria | 1,292,817 |
| South Australia | 29,644 |
| Western Australia | 8,327 |
| Tasmania | 654,072 |
| Federal Territory | 70 |
| New Zealand | 14,971,725 |
It will be observed that the acreage of land under sown grasses is far greater in New Zealand than in the whole of Australia and Tasmania. When compared in size with the States of Australia, New Zealand is not large—about one-thirtieth of their total area—but in respect of grazing capabilities the relative importance of this country is much greater. Australia is generally unsuitable, owing to conditions of climate, for the growth of English grasses, and the amount of feed produced by the natural grasses throughout the year is very much less per acre than is obtained from the sown-grass lands in New Zealand; indeed, it may be said that the average productiveness of grass land is about nine times as great here as in Australia, or, in other words, that land in New Zealand covered with English grasses may be considered equal for grazing purposes to an area of Australian land about nine times as great.
In addition to the artificially sown pastures, the returns for 1918-19 show that 15,625,468 acres in tussock or native grass belonged to the occupied holdings, and were available for stock-feeding by the sheep and cattle farmers.
A COMPARATIVE table is presented showing the increase in live-stock since the year 1858. The figures are taken from the census as far as 1891 and for 1911, but for 1895-96 and following years up to 1910 the results of the enumeration made annually by the Department of Agriculture have been made use of. No enumeration was taken from 1911 to 1915, except as regards sheep.
| Year. | Horses. | Asses and Mules. | Cattle. | Sheep. | Goats. | Pigs. | Poultry. |
|---|---|---|---|---|---|---|---|
* Not enumerated. | |||||||
| 1858 | 14,912 | 122 | 137,204 | 1,523,324 | 11,797 | 40,734 | * |
| 1861 | 28,275 | 153 | 193,285 | 2,761,383 | 12,191 | 43,270 | 236,098 |
| 1864 | 49,409 | 339 | 249,760 | 4,937,273 | 12,005 | 61,276 | 378,414 |
| 1867 | 65,715 | 323 | 312,835 | 8,418,579 | 11,964 | 115,104 | 676,065 |
| 1871 | 81,028 | 397 | 436,592 | 9,700,629 | 12,434 | 151,460 | 872,174 |
| 1874 | 99,859 | 267 | 494,917 | 11,704,853 | 14,276 | 123,921 | 1,058,198 |
| 1878 | 137,768 | 241 | 578,430 | 13,069,338 | 14,243 | 207,337 | 1,323,542 |
| 1881 | 161,736 | 362 | 698,637 | 12,190,215 | 11,223 | 200,083 | 1,566,114 |
| 1886 | 187,382 | 297 | 853,358 | 15,174,263 | 10,220 | 277,901 | 1,679,021 |
| 1891 | 211,040 | 348 | 831,831 | 16,753,752 | 9,055 | 308,812 | 1,790,070 |
| 1895-96 | 237,418 | 426 | 1,047,901 | 19,826,604 | * | 239,778 | * |
| 1896-97 | 249,813 | 434 | 1,138,067 | 19,138,493 | * | 209,834 | * |
| 1897-98 | 252,834 | 393 | 1,209,165 | 19,687,954 | * | 186,027 | * |
| 1898-99 | 258,115 | 534 | 1,203,024 | 19,673,725 | * | 193,512 | * |
| 1899-00 | 261,931 | 459 | 1,222,139 | 19,348,506 | * | 249,751 | * |
| 1900-1 | 266,245 | 480 | 1,256,680 | 19,355,195 | * | 250,975 | * |
| 1901-2 | 279,672 | 406 | 1,361,784 | 20,233,099 | * | 224,024 | * |
| 1902-3 | 286,955 | 464 | 1,460,663 | 20,342,727 | * | 193,740 | * |
| 1903-4 | 298,714 | 468 | 1,593,547 | 18,954,553 | * | 226,591 | * |
| 1904-5 | 314,322 | 448 | 1,736,850 | 18,280,806 | * | 255,320 | * |
| 1905-6 | 326,537 | 429 | 1,810,936 | 19,130,875 | * | 249,727 | * |
| 1906-7 | 342,608 | 451 | 1,851,750 | 20,108,471 | * | 242,273 | 3,191,604 |
| 1907-8 | 352,832 | 425 | 1,816,299 | 20,983,772 | * | 241,128 | * |
| 1908-9 | 363,259 | 519 | 1,773,326 | 22,449,053 | * | 245,092 | * |
| 1909 | * | * | * | 23,480,707 | * | * | * |
| 1910 | * | * | * | 24,269,620 | * | * | * |
| 1911 | 404,284 | 404 | 2,020,171 | 23,996,126 | * | 348,754 | 3,693,137 |
| 1912 | * | * | * | 23,750,153 | * | * | * |
| 1913 | * | * | * | 24,191,810 | * | * | * |
| 1914 | * | * | * | 24,798,763 | * | * | * |
| 1915 | * | * | * | 24,901,421 | * | * | * |
| 1916 | 371,331 | 246 | 2,417,491 | 24,788,150 | 17,601 | 297,501 | 3,465,638 |
| 1917 | 373,600 | 320 | 2,575,230 | 25,270,386 | 18,235 | 283,770 | * |
| 1918 | 378,050 | 253 | 2,869,465 | 26,538,302 | 17,730 | 258,694 | * |
| 1919 | 363,188 | 296 | 3,035,478 | 25,828,554 | 16,924 | 235,347 | * |
The following diagram will give an idea of the large increase in the number of horses, cattle, sheep, and pigs since 1858:—
NUMBER OF SHEEP , CATTLE , HORSES , AND PIGS , 1858-1919.
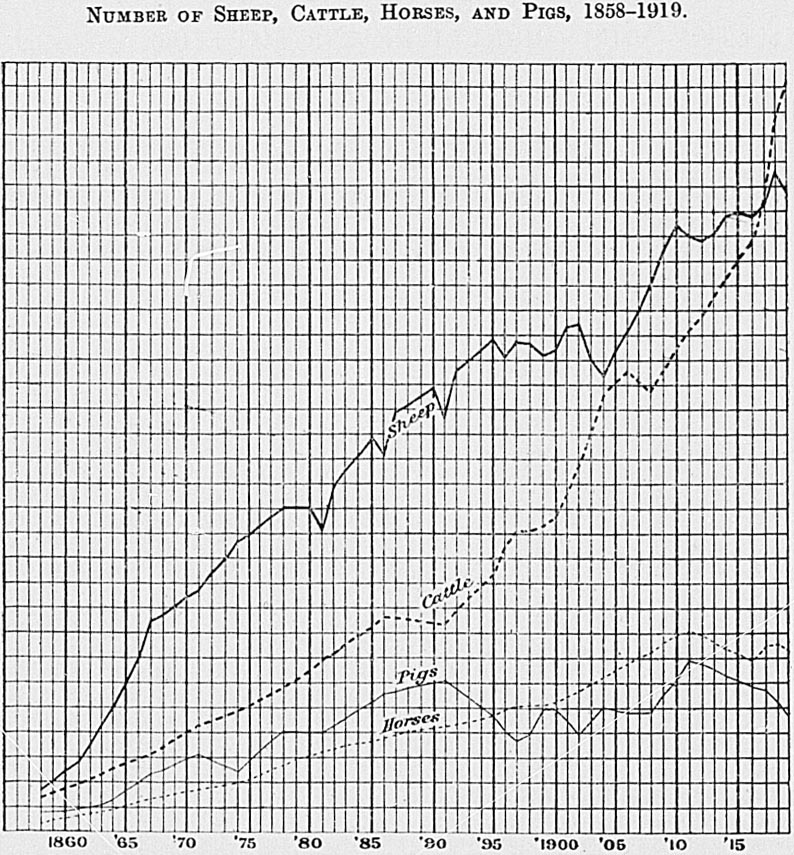
Explanation of Graph.—The base of each small rectangle represents an interval of one. year, and the vertical height the number of animals, as follows: Sheep, one million; cattle, one hundred thousand; horses and pigs, each fifty thousand.
The table on the following pages gives for each county and land district in the Dominion the totals of the principal varieties of live-stock. Further details as to sex, age, breed, &c., will be found under the respective headings later in this volume.
TABLE SHOWING FOR EACH COUNTY IN THE DOMINION THE NUMBER OF LIVE -STOCK AS AT 31ST JANUARY , 1919.
| County (including Interior Boroughs). | Horses. | Asses, and Mules. | Dairy Cows. | Cattle (including Dairy Cows). | Number of Sheep shorn, 1918-19. | Number of Lambs tailed, 1918-19. | Sheep (including Lambs) as at 30th April, 1919. | Pigs. | Goats. | |
|---|---|---|---|---|---|---|---|---|---|---|
| Angora. | Other. | |||||||||
| Land District of North Auckland. | ||||||||||
| Mongonui | 2,244 | 1 | 6,280 | 23,351 | 37,563 | 17,125 | 46,345 | 1,597 | 55 | 134 |
| Whangaroa | 554 | .. | 1,408 | 6,237 | 14,270 | 5,532 | 16,948 | 355 | 31 | 220 |
| Bay of Islands | 3,754 | 5 | 8,025 | 38,726 | 82,699 | 34,667 | 91,680 | 2,161 | 328 | 78 |
| Hokianga | 2,463 | 8 | 7,539 | 37,485 | 59,380 | 23,236 | 40,030 | 1,976 | .. | .. |
| Whangarei | 5,385 | 6 | 18,896 | 75,131 | 123,231 | 41,171 | 114,814 | 3,784 | 564 | 114 |
| Hobson | 2,618 | 2 | 9,566 | 42,813 | 88,811 | 36,358 | 105,558 | 1,434 | 2 | .. |
| Otamatea | 2,522 | 1 | 8,775 | 39,296 | 75,217 | 31,090 | 62,328 | 2,287 | 20 | .. |
| Rodney | 2,075 | 3 | 6,847 | 32,826 | 89,417 | 27,114 | 80,427 | 1,231 | 99 | 311 |
| Waitemata | 3,909 | 4 | 9,281 | 29,286 | 49,117 | 17,113 | 53,577 | 2,213 | 435 | 365 |
| Eden | 4,769 | 8 | 4,197 | 8,126 | 2,391 | 474 | 2,761 | 2,052 | 14 | 36 |
| Great Barrier | 90 | .. | 312 | 800 | 7,854 | 2,871 | 9,461 | 51 | 5 | .. |
| Manukau | 3,352 | 50 | 13,370 | 31,239 | 70,843 | 28,220 | 54,596 | 2,200 | 71 | 254 |
| Franklin | 6,392 | 8 | 27,034 | 63,059 | 53,964 | 25,495 | 50,390 | 8,716 | 82 | 219 |
| Totals | 41,027 | 96 | 121,530 | 428,375 | 754,757 | 290,460 | 728,915 | 30,057 | 1,706 | 1,731 |
| Land District of Auckland. | ||||||||||
| Waikato | 6,121 | 2 | 27,226 | 63,372 | 59,741 | 27,650 | 52,521 | 5,054 | 61 | 64 |
| Raglan | 4,473 | 1 | 7,734 | 59,379 | 231,520 | 98,396 | 191,142 | 2,445 | 99 | 909 |
| Waipa | 4,944 | 1 | 22,720 | 54,568 | 30,817 | 18,763 | 32,452 | 5,380 | 138 | 104 |
| Kawhia | 592 | .. | 2,016 | 6,756 | 50,678 | 22,516 | 50,806 | 805 | 31 | 58 |
| Awakino | 937 | 4 | 1,030 | 12,382 | 86,313 | 26,220 | 102,387 | 492 | 6 | 6 |
| Waitomo | 5,825 | 1 | 14,002 | 59,881 | 181,743 | 78,586 | 158,636 | 3,850 | .. | .. |
| Coromandel | 958 | .. | 2,272 | 9,499 | 36,851 | 14,400 | 42,255 | 464 | 2 | 3 |
| Thames | 1,857 | .. | 10,562 | 26,475 | 8,442 | 3,634 | 4,019 | 2,537 | .. | 7 |
| Ohinemuri | 2,845 | 2 | 13,183 | 33,978 | 12,232 | 6,342 | 5,212 | 2,503 | 116 | 57 |
| Tauranga | 4,483 | .. | 11,588 | 44,807 | 14,919 | 4,291 | 8,153 | 3,409 | 3 | 27 |
| Piako | 4,412 | 3 | 26,835 | 59,375 | 33,963 | 18,434 | 32,117 | 3,472 | 26 | 30 |
| Matamata | 4,629 | .. | 21,578 | 56,673 | 46,605 | 18,063 | 21,535 | 3,155 | 1 | 13 |
| Rotorua | 1,650 | 2 | 2,411 | 11,013 | 13,479 | 7,208 | 8,005 | 849 | .. | 2 |
| Whakatane | 2,589 | .. | 7,600 | 30,327 | 37,191 | 12,806 | 48,247 | 1,847 | 8 | 53 |
| Opotiki | 1,439 | .. | 2,551 | 1,983 | 121,923 | 39,065 | 157,199 | 1,159 | .. | .. |
| East Taupo | 1,249 | 3 | 509 | 5,250 | 33,024 | 11,787 | 16,594 | 1,072 | 5 | |
| West Taupo | 2,693 | 1 | 7,319 | 29,371 | 39,566 | 11,578 | 35,097 | 2,686 | .. | 1 |
| Totals | 51,696 | 20 | 181,136 | 575,089 | 1,039,007 | 419,745 | 966,377 | 41,179 | 496 | 1,334 |
| Land District of Hawke's Bay. | ||||||||||
| Waipu | 5,590 | 66 | 3,172 | 48,486 | 666,015 | 288,496 | 716,539 | 3,030 | 110 | 38 |
| Waikohu | 3,298 | .. | 1,242 | 56,486 | 616,199 | 293,403 | 656,246 | 719 | 50 | 1 |
| Uawa | ||||||||||
| Cook | 7,753 | 7 | 6,487 | 85,769 | 985,888 | 393,864 | 1,012,594 | 2,274 | 3 | .. |
| Wairoa | 4,812 | 2 | 1,347 | 44,398 | 628,239 | 209,852 | 743,824 | 984 | 40 | 1 |
| Hawke's Bay | 7,908 | 9 | 7,988 | 75,130 | 1,135,116 | 387,535 | 1,108,253 | 3,140 | 261 | 333 |
| Waipukurau | 751 | .. | 809 | 8,005 | 105,245 | 45,245 | 118,463 | 260 | .. | .. |
| Waipawa | 2,940 | 3 | 4,943 | 34,694 | 391,472 | 160,302 | 440,947 | 1,235 | 6 | 30 |
| Woodville | 1,180 | .. | 6,058 | 17,950 | 99,495 | 47,261 | 96,851 | 1,548 | 12 | 4 |
| Dannevirke | 2,723 | 1 | 11,566 | 40,678 | 319,046 | 174,950 | 312,175 | 2,048 | 4 | .. |
| Patangata | 2,712 | 4 | 2,058 | 58,600 | 712,125 | 299,005 | 643,479 | 317 | 26 | 307 |
| Weber | 410 | .. | 332 | 8,816 | 109,795 | 40,677 | 128,434 | 49 | .. | .. |
| Totals | 40,077 | 92 | 46,002 | 479,012 | 5,768,635 | 2,340,590 | 5,977,805 | 15,604 | 512 | 714 |
| Land District of Taranaki. | ||||||||||
| Ohura | 1,902 | .. | 2,7321 | 24,868 | 182,055 | 65,415 | 165,406 | 645 | 130 | .. |
| Clifton | 1,929 | .. | 7,4911 | 27,828 | 106,894 | 37,399 | 94,943 | 1,599 | 88 | 418 |
| Taranaki | 5,111 | 1 | 27,638 | 61,700 | 51,899 | 24,989 | 46,086 | 5,345 | 109 | 2,355 |
| Egmont | 2,385 | 1 | 17,443 | 40,985 | 12,684 | 5,116 | 11,869 | 2,620 | 22 | 23 |
| Stratford | 3,165 | .. | 23,076 | 46,251 | 102,745 | 32,421 | 96,045 | 4,563 | 310 | 169 |
| Whangamomona | 803 | .. | 1,513 | 10,165 | 99,400 | 29,010 | 96,754 | 169 | 82 | 230 |
| Waimate West | 1,481 | .. | 15,754 | 25,217 | 2,828 | 1,231 | 4,742 | 4,045 | 1 | 20 |
| Hawera | 2,544 | .. | 19,697 | 40,030 | 74,168 | 27,730 | 81,076 | 5,547 | 1 | 6 |
| Eltham | 1,992 | .. | 18,117 | 34,273 | 66,043 | 23,663 | 64,175 | 3,895 | 28 | 4 |
| Patea | 3,273 | 1 | 11,348 | 38,507 | 281,290 | 88,861 | 276,131 | 2,503 | 7 | 1 |
| Totals | 24,585 | 3 | 144,809 | 349,824 | 980,006 | 335,835 | 937,227 | 30,931 | 778 | 3,226 |
| Land District of Wellington. | ||||||||||
| Waitotara | 2,580 | .. | 6,494 | 23,782 | 220,220 | 79,089 | 240,485 | 1,181 | 15 | 2 |
| Wanganui | 3,028 | 1 | 4,767 | 36,793 | 513,691 | 181,966 | 542,108 | 740 | 38 | 31 |
| Waimarino | 2,011 | .. | 2,312 | 18,185 | 286,830 | 110,751 | 312,694 | 825 | 2 | .. |
| Kaitieke | 1,213 | .. | 2,412 | 13,251 | 137,419 | 53,057 | 141,205 | 988 | 1 | 1 |
| Rangitikei | 7,277 | 3 | 12,150 | 69,851 | 859,220 | 387,631 | 974,640 | 3,536 | 147 | 25 |
| Kiwitea | 2,148 | 2 | 4,802 | 23,844 | 287,547 | 144,121 | 320,651 | 1,472 | 1 | 35 |
| Pohangina | 1,215 | 1 | 2,849 | 13,886 | 157,625 | 88,679 | 159,737 | 628 | 14 | 38 |
| Kairanga | 3,141 | .. | 13,025 | 31,657 | 134,898 | 63,320 | 131,711 | 2,213 | 2 | 55 |
| Oroua | 2,420 | .. | 6,760 | 20,263 | 178,573 | 114,859 | 167,379 | 1,376 | .. | 4 |
| Manawatu | 2,830 | .. | 14,424 | 33,916 | 93,523 | 48,563 | 125,038 | 3,946 | 1 | 10 |
| Horowhenua | 3,117 | .. | 13,477 | 39,685 | 139,259 | 62,978 | 135,235 | 4,706 | 5 | 70 |
| Pahiatua | 1,836 | 1 | 9,820 | 32,756 | 190,150 | 91,957 | 218,615 | 2,146 | 7 | 14 |
| Akitio | 1,239 | .. | 857 | 25,623 | 276,013 | 110,749 | 288,866 | 155 | .. | 1 |
| Castlepoint | 795 | .. | 318 | 16,275 | 183,900 | 75,155 | 183,033 | 37 | 12 | 7 |
| Eketahuna | 1,667 | .. | 6,696 | 25,558 | 211,148 | 105,369 | 109,495 | 1,150 | 11 | 9 |
| Mauriceville | 275 | .. | 1,189 | 5,376 | 59,193 | 33,643 | 69,661 | 196 | 7 | 4 |
| Masterton | 3,285 | 4 | 3,493 | 37,874 | 399,443 | 181,385 | 541,776 | 717 | .. | 6 |
| Wairarapa South | 2,363 | .. | 8,184 | 30,915 | 221,105 | 111,150 | 215,860 | 2,440 | 11 | 10 |
| Featherston | 3,465 | 2 | 7,940 | 54,084 | 461,385 | 191,984 | 485,490 | 2,721 | 1 | 2 |
| Hutt | 2,012 | 1 | 5,393 | 15,493 | 147,555 | 61,148 | 152,277 | 1,739 | 122 | 30 |
| Makara | 1,609 | 3 | 2,902 | 6,604 | 64,329 | 24,646 | 85,664 | 1,267 | 1 | 11 |
| Chatham Islands | 836 | 1 | 177 | 1,243 | 6,35 | 25,738 | 81,921 | 106 | 443 | .. |
| Totals | 50,362 | 19 | 130,441 | 576,914 | 5,292,411 | 2,347,938 | 5,683,541 | 34,288 | 841 | 365 |
| Land District of Nelson. | ||||||||||
| Collingwood | 408 | .. | 1,920 | 6,883 | 16,716 | 7,078 | 19,254 | 863 | .. | 20 |
| Takaka | 721 | .. | 2,655 | 6,388 | 53,548 | 24,401 | 58,999 | 1,419 | 65 | 130 |
| Waimea | 5,391 | .. | 6,702 | 19,971 | 299,917 | 110,081 | 327,803 | 2,899 | 890 | 818 |
| Buller | 927 | .. | 4,684 | 11,626 | 5,798 | 2,856 | 4,802 | 1,586 | 11 | 42 |
| Murchison | 690 | .. | 2,036 | 9,173 | 47,126 | 20,297 | 55,522 | 1,037 | 8 | 26 |
| Inangahua | 452 | 2 | 1,837 | 4,747 | 9,567 | 5,228 | 11,899 | 573 | 25 | 218 |
| Totals | 8,589 | 2 | 19,834 | 58,788 | 432,672 | 169,941 | 478,279 | 8,377 | 999 | 1,254 |
| Land District of Marlborough. | ||||||||||
| Sounds | 527 | .. | 1,844 | 5,888 | 167,789 | 75,714 | 173,856 | 1,879 | 3 | 113 |
| Marlborough | 3,895 | .. | 6,716 | 17,005 | 305,498 | 109,966 | 368,701 | 3,076 | 625 | 1,192 |
| Awatere | 1,713 | .. | 818 | 8,189 | 295,610 | 114,899 | 293,387 | 390 | 51 | .. |
| Kaikoura | 1,255 | .. | 2,209 | 7,217 | 173,202 | 79,537 | 208,363 | 876 | 8 | 72 |
| Totals | 7,390 | .. | 11,587 | 38,299 | 942,099 | 380,116 | 1,044,307 | 6,221 | 687 | 1,377 |
| Land District of Westland. | ||||||||||
| Grey | 1,177 | .. | 4,828 | 15,530 | 24,908 | 13,039 | 30,222 | 1,525 | 19 | 78 |
| Westland | 1,718 | .. | 5,026 | 26,512 | 38,895 | 17,944 | 41,425 | 1,571 | 24 | 20 |
| Totals | 2,895 | .. | 9,854 | 42,042 | 63,803 | 30,983 | 71,647 | 3,096 | 43 | 98 |
| Land District of Canterbury , | ||||||||||
| Cheviot | 1,246 | .. | 1,071 | 5,485 | 174,318 | 92,357 | 188,506 | 461 | .. | .. |
| Amuri | 2,416 | 1 | 917 | 9,402 | 301,709 | 129,553 | 398,982 | 451 | .. | 5 |
| Waipara | 2,637 | .. | 1,248 | 5,778 | 365,154 | 200,683 | 386,804 | 400 | .. | .. |
| Ashley | 1,078 | .. | 411 | 2,538 | 95,096 | 45,409 | 120,198 | 184 | .. | 11 |
| Oxford | 1,549 | .. | 1,320 | 3,939 | 95,035 | 53,760 | 115,909 | 600 | .. | 1 |
| Kowai | 1,631 | .. | 1,789 | 4,578 | 85,037 | 47,810 | 93,024 | 1,040 | .. | 2 |
| Rangiora | 2,205 | .. | 2,989 | 7,243 | 42,633 | 26,203 | 48,317 | 1,934 | 7 | 11 |
| Eyre | 1,661 | 1 | 1,996 | 4,298 | 61,308 | 44,658 | 60,700 | 1,946 | .. | 5 |
| Waimairi | 2,182 | .. | 3,871 | 6,455 | 5,660 | 3,551 | 8,566 | 2,850 | 3 | 11 |
| Paparua | 2,456 | .. | 2,617 | 5,299 | 42,078 | 17,963 | 44,380 | 2,309 | 6 | 4 |
| Malvern | 2,313 | .. | 1,375 | 3,578 | 133,159 | 66,567 | 148,393 | 1,283 | .. | .. |
| Tawera | 620 | .. | 460 | 1,709 | 82,790 | 32,991 | 97,109 | 327 | .. | .. |
| Heathcote | 1,959 | .. | 1,370 | 2,333 | 9,382 | 3,426 | 11,007 | 887 | 1 | 13 |
| Halswell | 924 | 2 | 2,356 | 4,470 | 17,030 | 7,974 | 16,779 | 959 | .. | 12 |
| Selwyn | 1,667 | 1 | 885 | 2,879 | 184,104 | 89,372 | 231,677 | 644 | .. | .. |
| Springs | 1,336 | .. | 2,404 | 5,246 | 33,902 | 28,700 | 34,922 | 1,580 | 2 | 1 |
| Ellesmere | 2,956 | .. | 4,218 | 10,109 | 80,658 | 56,782 | 97,936 | 4,863 | 12 | 14 |
| Mount Herbert | 320 | .. | 931 | 3,450 | 45,441 | 28,609 | 48,179 | 166 | .. | .. |
| Wairewa | 660 | 1 | 1,878 | 7,777 | 76,940 | 54,866 | 88,399 | 744 | .. | .. |
| Akaroa | 1,111 | .. | 6,195 | 23,727 | 90,565 | 57,005 | 109,672 | 1,250 | 18 | 41 |
| Ashburton | 12,203 | 3 | 7,893 | 19,687 | 817,079 | 459,608 | 1,021,348 | 5,464 | 14 | 3 |
| Geraldine | 5,107 | 14 | 5,514 | 14,768 | 277,258 | 175,815 | 354,811 | 3,635 | .. | 1 |
| Levels | 4,712 | .. | 3,709 | 10,512 | 173,836 | 107,783 | 216,781 | 2,195 | .. | 3 |
| Mackenzie | 3,121 | 10 | 1,399 | 6,331 | 418,831 | 205,419 | 539,912 | 727 | .. | .. |
| Waimate | 8,015 | 3 | 5,106 | 17,626 | 535,310 | 301,961 | 665,366 | 3,825 | .. | 1 |
| Totals | 66,085 | 36 | 63,922 | 189,217 | 4,244,313 | 2,338,825 | 5,147,677 | 40,724 | 63 | 139 |
| Land District of Otago. | ||||||||||
| Waitaki | 7,633 | 3 | 9,166 | 23,865 | 544,189 | 272,993 | 651,677 | 3,435 | .. | .. |
| Maniototo | 2,604 | 9 | 1,492 | 5,169 | 280,924 | 106,893 | 312,786 | 227 | .. | .. |
| Waihemo | 1,317 | .. | 1,316 | 3,275 | 109,767 | 51,016 | 147,772 | 363 | .. | .. |
| Waikouaiti | 1,717 | 1 | 4,505 | 10,791 | 75,452 | 38,622 | 87,451 | 1,667 | .. | .. |
| Peninsula | 706 | .. | 2,904 | 5,534 | 6,254 | 5,315 | 8,718 | 435 | .. | .. |
| Taieri | 5,986 | 4 | 8,156 | 23,746 | 202,566 | 76,620 | 221,112 | 2,760 | 1 | 4 |
| Tuapeka | 4,323 | .. | 2,899 | 10,754 | 405,801 | 157,678 | 458,969 | 1,253 | .. | 2 |
| Bruce | 4,902 | 2 | 4,879 | 13,790 | 203,090 | 99,158 | 246,762 | 1,708 | 3 | 2 |
| Clutha | 6,283 | 6 | 7,357 | 24,212 | 326,416 | 160,784 | 380,067 | 2,075 | .. | .. |
| Vincent | 2,923 | .. | 1,607 | 5,564 | 294,683 | 99,778 | 315,757 | 1,153 | .. | 3 |
| Lake | 1,683 | 3 | 1,275 | 5,919 | 194,347 | 53,146 | 213,432 | 553 | .. | 6 |
| Totals | 40,077 | 28 | 45,556 | 132,619 | 2,643,489 | 1,122,003 | 3,044,503 | 15,629 | 4 | 17 |
| Land District of Southland. | ||||||||||
| Fiord | 2 | 10 | .. | .. | .. | 2 | .. | .. | ||
| Wallace | 7,119 | .. | 10,402 | 38,987 | 427,398 | 190,403 | 519,228 | 2,246 | .. | .. |
| Southland | 23,217 | .. | 40,974 | 125,982 | 1,129,260 | 517,347 | 1,225,300 | 6,977 | 317 | 210 |
| Stewart Island | 69 | .. | 86 | 320 | 2,968 | 1,159 | 3,748 | 16 | .. | 13 |
| Totals | 30,405 | .. | 51,464 | 165,299 | 1,559,626 | 708,909 | 1,748,276 | 9,241 | 317 | 223 |
| Totals for Dominion | 363,188 | 296 | 826,135 | 3,035,478 | 23,720,818 | 10,485,351 | 25,828,554 | 235,347 | 6,446 | 10,478 |
TABLE SHOWING THE AVERAGE NUMBERS OF HORSES AND CATTLE , AND OF SHEEP SHORN , PER 1,000 ACRES IN EACH COUNTY IN THE DOMINION .
| County (exclusive of Interior Boroughs). | Total Area occupied (Acres). | Horses (as at 31st January, 1919). | Cattle (as at 31st January, 1919). | Dairy Cows (as at 31st January, 1919), (included in "Cattle" in previous Columns). | Sheep shorn, Season 1918-19. | ||||
|---|---|---|---|---|---|---|---|---|---|
| Total Number. | Average Number per 1,000 Acres. | Total Number. | Average Number per 1,000 Acres. | Total Number. | Average Number per 1,000 Acres. | Total Number. | Average Number per 1,000 Acres. | ||
| Land District of North Auckland. | |||||||||
| Mongonui | 320,874 | 2,231 | 6.95 | 23,347 | 72.76 | 6,278 | 19.57 | 37,563 | 117.06 |
| Whangaroa | 75,891 | 538 | 7.09 | 6,232 | 82.12 | 1,405 | 18.51 | 14,270 | 188.03 |
| Day of Islands | 294,631 | 3,710 | 12.59 | 38,645 | 131.16 | 7,978 | 27.08 | 82,699 | 280.69 |
| Hokianga | 218,893 | 2,463 | 11.25 | 37,485 | 171.25 | 7,539 | 34.44 | 59,380 | 271.27 |
| Whangarei | 454,606 | 5,045 | 11.10 | 74,648 | 164.20 | 18,664 | 41.06 | 122,836 | 270.20 |
| Hobson | 317,434 | 2,566 | 8.08 | 42,486 | 133.84 | 9,542 | 30.06 | 88,631 | 279.21 |
| Otamatea | 234,706 | 2,522 | 10.75 | 39,296 | 167.43 | 8,775 | 37.39 | 75,217 | 320.47 |
| Rodney | 263,568 | 2,962 | 11.24 | 32,794 | 124.42 | 6,838 | 25.94 | 89,417 | 339.26 |
| Waitemata | 282,780 | 3,463 | 12.25 | 28,583 | 101.08 | 8,879 | 31.40 | 49,111 | 173.67 |
| Eden | 18,569 | 1,543 | 83.10 | 6,754 | 363.72 | 3,472 | 186.98 | 2,268 | 122.14 |
| Great Barrier | 43,998 | 89 | 2.02 | 800 | 18.18 | 312 | 7.09 | 7,854 | 178.51 |
| Manukau | 160,251 | 3,180 | 19.84 | 31,002 | 193.46 | 13,240 | 82.62 | 70,842 | 442.07 |
| Franklin | 282,208 | 6,022 | 21.34 | 61,471 | 217.82 | 26,162 | 92.70 | 53,316 | 188.92 |
| Totals | 2,968,409 | 36,334 | 12.24 | 423,543 | 142.68 | 119,084 | 40.12 | 753,404 | 253.81 |
| Land District of Auckland. | |||||||||
| Waikato | 278,143 | 5,776 | 20.77 | 63,033 | 226.62 | 27,017 | 97.13 | 59,723 | 214.72 |
| Raglan | 430,412 | 4,442 | 10.32 | 59,379 | 137.96 | 7,734 | 17.97 | 231,520 | 537.90 |
| Waipa | 162,408 | 4,661 | 28.70 | 54,151 | 333.43 | 22,530 | 138.72 | 29,911 | 184.17 |
| Kawhia | 107,736 | 592 | 5.49 | 6,756 | 62.71 | 2,016 | 18.71 | 50,678 | 470.39 |
| Awakino | 162,700 | 932 | 5.73 | 12,377 | 76.07 | 1,027 | 6.31 | 86,313 | 530.50 |
| Waitomo | 515,719 | 5,571 | 10.80 | 59,632 | 115.73 | 13,913 | 26.98 | 180,869 | 350.71 |
| Land District of Auckland. | |||||||||
| Coromandel | 214,539 | 943 | 4.40 | 9,494 | 44.25 | 2,269 | 10.58 | 36,851 | 171.77 |
| Thames | 161,609 | 1,669 | 10.33 | 26,425 | 163.51 | 10,531 | 65.16 | 8,442 | 52.24 |
| Ohinemuri | 154,308 | 2,352 | 15.24 | 33,178 | 215.01 | 12,772 | 82.77 | 12,060 | 78.16 |
| Tauranga | 233,168 | 4,168 | 17.88 | 44,539 | 191.02 | 11,411 | 48.94 | 14,918 | 63.98 |
| Piako | 211,446 | 4,197 | 19.85 | 58,944 | 278.77 | 26,627 | 125.93 | 33,832 | 160.00 |
| Matamata | 408,077 | 4,616 | 11.31 | 56,654 | 138.83 | 21,567 | 52.85 | 46,605 | 114.21 |
| Rotorua | 198,639 | 1,328 | 6.69 | 10,879 | 54.77 | 2,325 | 11.70 | 13,394 | 67.43 |
| Whakatane | 162,949 | 2,589 | 15.89 | 30,327 | 186.11 | 7,600 | 46.64 | 37,191 | 228.24 |
| Opotiki | 256,188 | 1,263 | 4.93 | 11,817 | 46.13 | 2,452 | 9.57 | 121,923 | 475.91 |
| East Taupo | 327,966 | 1,219 | 3.72 | 5,207 | 15.88 | 482 | 1.47 | 33,024 | 100.69 |
| West Taupo | 293,955 | 2,551 | 8.68 | 28,923 | 98.39 | 7,213 | 24.54 | 39,194 | 133.33 |
| Totals | 4,279,962 | 48,869 | 11.42 | 571,765 | 133.59 | 179,486 | 41.94 | 1,036,448 | 242.16 |
| Land District of Hawke's Bay. | |||||||||
| Waiapu | 534,927 | 5,581 | 10.43 | 48,470 | 90.61 | 3,158 | 5.90 | 666,015 | 1,245.06 |
| Waikohu | 522,095 | 3,294 | 6.31 | 56,485 | 108.19 | 1,241 | 2.38 | 616,199 | 1,180.24 |
| Uawa | 632,093 | 7,239 | 11.45 | 85,639 | 135.48 | 6,406 | 10.13 | 985,874 | 1,559.70 |
| Cook | |||||||||
| Wairoa | 714,471 | 4,508 | 6.31 | 44,071 | 61.68 | 1,115 | 1.56 | 627,577 | 878.38 |
| Hawke's Bay | 1,104,301 | 7,071 | 6.40 | 74,647 | 67.60 | 7,711 | 6.98 | 1,134,772 | 1,027.59 |
| Waipukurau | 62,940 | 631 | 10.03 | 7,818 | 124.21 | 714 | 11.34 | 105,009 | 1,668.40 |
| Waipawa | 271,164 | 2,670 | 9.85 | 34,175 | 126.03 | 4,776 | 17.61 | 387,060 | 1,427.40 |
| Woodville | 84,073 | 1,085 | 12.91 | 17,730 | 20.89 | 5,907 | 70.26 | 99,487 | 1,183.34 |
| Dannevirke | 244,779 | 2,546 | 10.40 | 40,490 | 165.40 | 11,439 | 46.73 | 319,007 | 1,303.24 |
| Patangata | 434,094 | 2,670 | 6.15 | 58,454 | 134.66 | 2,003 | 4.61 | 712,125 | 1,640.49 |
| Weber | 66,464 | 410 | 6.17 | 8,816 | 132.64 | 332 | 5.00 | 109,795 | 1,651.95 |
| Totals | 4,671,401 | 37,705 | 8.07 | 476,795 | 102.07 | 44,802 | 9.59 | 5,762,920 | 1,233.66 |
| Land District of Taranaki. | |||||||||
| Ohura | 261,965 | 1,829 | 6.98 | 24,842 | 94.83 | 2,715 | 10.36 | 182,055 | 694.96 |
| Clifton | 241,459 | 1,929 | 7.99 | 27,828 | 115.25 | 7,491 | 31.02 | 106,894 | 442.70 |
| Taranaki | 187,675 | 4,432 | 23.62 | 60,549 | 322.63 | 26,937 | 143.53 | 51,436 | 274.07 |
| Egmont | 127,060 | 2,383 | 18.75 | 40,984 | 322.56 | 17,442 | 137.27 | 12,684 | 99.83 |
| Stratford | 185,243 | 2,882 | 15.56 | 45,900 | 247.78 | 22,836 | 123.28 | 102,623 | 553.99 |
| Whangamomona | 152,403 | 778 | 5.10 | 10,117 | 66.38 | 1,480 | 9.71 | 99,400 | 652.22 |
| Waimate West | 45,117 | 1,475 | 32.69 | 25,186 | 558.24 | 15,730 | 348.65 | 2,828 | 62.68 |
| Hawera | 110,233 | 2,417 | 21.93 | 39,822 | 361.25 | 19,554 | 177.39 | 74,138 | 672.56 |
| Eltham | 115,244 | 1,830 | 15.88 | 33,582 | 291.40 | 17,655 | 153.20 | 65,851 | 571.41 |
| Patea | 277,464 | 3,095 | 11.15 | 38,308 | 138.06 | 11,266 | 40.60 | 281,050 | 1,012.92 |
| Totals | 1,703,863 | 23,050 | 13.53 | 347,118 | 203.72 | 143,106 | 83.99 | 978,959 | 574.55 |
| Land District of Wellington. | |||||||||
| Waitotara | 201,301 | 1,986 | 9.87 | 21,888 | 108.73 | 5,683 | 28.23 | 215,646 | 1,071.26 |
| Wanganui | 314,589 | 3,028 | 9.63 | 36,793 | 116.96 | 4,767 | 15.15 | 513,691 | 1,632.90 |
| Waimarino | 444,397 | 1,880 | 4.23 | 17,604 | 39.61 | 2,017 | 4.54 | 286,564 | 644.84 |
| Kaitieke | 173,105 | 1,213 | 7.01 | 13,251 | 76.55 | 2,412 | 13.93 | 137,419 | 793.85 |
| Rangitikei | 613,901 | 6,955 | 11.33 | 69,554 | 113.30 | 11,960 | 19.48 | 857,670 | 1,397.08 |
| Kiwitea | 188,348 | 2,148 | 11.40 | 23,844 | 126.60 | 4,802 | 25.50 | 287,547 | 1,526.68 |
| Pohangina | 108,412 | 1,210 | 11.16 | 13,886 | 128.09 | 2,849 | 26.28 | 157,625 | 1,453.94 |
| Kairanga | 104,376 | 2,414 | 23.13 | 30,585 | 293.03 | 12,298 | 117.82 | 134,369 | 1,287.36 |
| Oroua | 115,613 | 2,098 | 18.15 | 19,785 | 171.13 | 6,417 | 55.50 | 178,235 | 1,541.65 |
| Manawatu | 127,683 | 2,758 | 21.60 | 33,624 | 263.34 | 14,260 | 111.68 | 93,507 | 732.34 |
| Horowhenua | 227,875 | 2,879 | 12.63 | 39,096 | 171.57 | 13,112 | 57.54 | 139,225 | 610.97 |
| Pahiatua | 166,482 | 1,749 | 10.51 | 32,676 | 196.27 | 9,777 | 58.73 | 190,134 | 1,142.07 |
| Akitio | 203,960 | 1,239 | 6.07 | 25,623 | 125.63 | 857 | 4.20 | 276,013 | 1,353.27 |
| Castlepoint | 157,434 | 795 | 5.05 | 16,275 | 103.38 | 318 | 2.02 | 183,900 | 1,168.11 |
| Eketahuna | 182,818 | 1,566 | 8.57 | 25,370 | 138.77 | 6,585 | 36.02 | 210,231 | 1,149.95 |
| Mauriceville | 41,322 | 275 | 6.66 | 5,376 | 130.10 | 1,189 | 28.77 | 59,193 | 1,432.48 |
| Masterton | 317,638 | 2,921 | 9.20 | 37,573 | 118.29 | 3,298 | 10.38 | 399,189 | 1,256.74 |
| Wairarapa South | 221,924 | 2,167 | 9.76 | 30,519 | 137.52 | 7,900 | 35.60 | 220,907 | 995.42 |
| Featherston | 464,336 | 3,287 | 7.08 | 53,439 | 115.09 | 7,481 | 16.11 | 459,197 | 988.93 |
| Hutt | 195,040 | 1,540 | 7.90 | 14,815 | 75.96 | 4,930 | 25.28 | 146,952 | 753.45 |
| Makara | 58,803 | 582 | 9.90 | 5,505 | 93.62 | 2,048 | 34.83 | 61,826 | 1,051.41 |
| Chatham Islands | 181,064 | 836 | 4.62 | 1,243 | 6.86 | 177 | 0.98 | 69,385 | 383.21 |
| Totals | 4,810,421 | 45,526 | 9.46 | 568,324 | 118.14 | 125,137 | 26.01 | 5,278,425 | 1,097.29 |
| Land District of Nelson. | |||||||||
| Collingwood | 145,785 | 401 | 2.75 | 6,877 | 47.17 | 1,915 | 13.14 | 16,716 | 114.66 |
| Takaka | 105,747 | 713 | 6.74 | 6,383 | 60.36 | 2,651 | 25.07 | 53,548 | 506.38 |
| Waimea | 639,387 | 4,388 | 0.86 | 18,467 | 28.88 | 5,768 | 9.02 | 294,792 | 461.05 |
| Buller | 114,114 | 814 | 7.13 | 11,446 | 100.30 | 4,623 | 40.51 | 5,655 | 49.56 |
| Murchison | 241,136 | 688 | 2.85 | 9,170 | 38.03 | 2,034 | 8.44 | 47,126 | 195.43 |
| Inangahua | 69,476 | 435 | 6.26 | 4,726 | 68.02 | 1,824 | 26.25 | 9,567 | 137.70 |
| Totals | 1,315,645 | 7,439 | 5.65 | 57,069 | 43.38 | 18,815 | 14.30 | 427,404 | 324.86 |
| Land District of Marlborough. | |||||||||
| Sounds | 243,208 | 486 | 2.00 | 5,787 | 23.79 | 1,797 | 7.39 | 167,364 | 688.15 |
| Marlborough | 866,849 | 3,596 | 4.15 | 16,618 | 19.17 | 6,458 | 7.45 | 305,454 | 352.37 |
| Awatere | 950,214 | 1,694 | 1.79 | 8,171 | 8.60 | 806 | 0.85 | 295,610 | 311.10 |
| Kaikoura | 409,418 | 1,255 | 3.07 | 7,217 | 17.63 | 2,209 | 5.40 | 173,202 | 423.04 |
| Totals | 2,469,689 | 7,031 | 2.85 | 37,793 | 15.30 | 11,270 | 4.50 | 941,630 | 381.27 |
| Land District of Westland. | |||||||||
| Grey | 472,328 | 871 | 1.84 | 15,062 | 31.89 | 4,597 | 9.73 | 24,645 | 52.18 |
| Westland | 1,264,213 | 1,494 | 1.18 | 25,959 | 20.53 | 4,756 | 3.76 | 38,160 | 30.18 |
| Totals | 1,736,541 | 2,365 | 1.36 | 41,021 | 23.62 | 9,353 | 5.39 | 62,805 | 36.17 |
| Land District of Canterbury. | |||||||||
| Cheviot | 187,752 | 1,239 | 6.60 | 5,478 | 29.18 | 1,065 | 5.67 | 174,318 | 928.45 |
| Amuri | 1,246,201 | 2,372 | 1.90 | 9,368 | 7.52 | 890 | 0.71 | 301,709 | 242.10 |
| Waipara | 508,336 | 2,595 | 5.10 | 5,752 | 11.32 | 1,227 | 2.41 | 365,154 | 718.33 |
| Ashley | 352,155 | 1,068 | 3.03 | 2,535 | 7.20 | 410 | 1.16 | 95,096 | 270.04 |
| Oxford | 162,813 | 1,542 | 9.47 | 3,939 | 24.19 | 1,320 | 8.11 | 95,035 | 583.71 |
| Kowai | 99,580 | 1,617 | 16.24 | 4,558 | 45.77 | 1,774 | 17.81 | 85,037 | 853.96 |
| Rangiora | 56,385 | 1,973 | 34.99 | 7,066 | 125.32 | 2,856 | 50.65 | 42,580 | 755.17 |
| Eyre | 89,653 | 1,543 | 17.21 | 4,198 | 46.82 | 1,940 | 21.64 | 61,308 | 683.84 |
| Waimairi | 27,654 | 2,063 | 74.60 | 6,363 | 230.09 | 3,819 | 138.10 | 5,660 | 204.67 |
| Paparua | 69,791 | 2,421 | 34.69 | 5,228 | 74.91 | 2,561 | 36.70 | 42,078 | 602.91 |
| Malvern | 212,434 | 2,313 | 10.89 | 3,578 | 16.84 | 1,375 | 6.47 | 133,159 | 626.83 |
| Tawera | 303,070 | 612 | 2.02 | 1,707 | 5.63 | 458 | 1.51 | 82,790 | 273.17 |
| Heathcote | 10,414 | 532 | 51.09 | 1,587 | 152.39 | 892 | 85.65 | 6,791 | 652.10 |
| Halswell | 23,794 | 759 | 31.90 | 4,325 | 181.77 | 2,259 | 94.94 | 16,598 | 697.57 |
| Selwyn | 452,438 | 1,667 | 3.68 | 2,879 | 6.36 | 885 | 1.96 | 184,104 | 406.92 |
| Springs | 49,589 | 1,336 | 26.94 | 5,246 | 105.79 | 2,404 | 48.48 | 33,902 | 683.66 |
| Ellesmere | 114,376 | 2,955 | 25.84 | 9,997 | 87.40 | 4,218 | 36.88 | 80,658 | 705.20 |
| Mount Herbert | 37,043 | 314 | 8.48 | 3,447 | 93.05 | 928 | 25.05 | 45,441 | 1,226.71 |
| Wairewa | 84,778 | 626 | 7.38 | 7,761 | 91.54 | 1,867 | 22.02 | 76,940 | 907.55 |
| Akaroa | 102,755 | 1,063 | 10.34 | 23,666 | 230.31 | 6,147 | 59.82 | 90,545 | 881.17 |
| Ashburton | 1,229,531 | 11,915 | 9.69 | 19,535 | 15.89 | 7,791 | 6.34 | 817,078 | 664.54 |
| Geraldine | 403,378 | 4,844 | 12.01 | 14,583 | 36.15 | 5,409 | 13.41 | 277,181 | 687.15 |
| Levels | 157,973 | 4,248 | 26.89 | 10,321 | 65.33 | 3,570 | 22.60 | 173,835 | 1,100.41 |
| Mackenzie | 1,404,500 | 3,121 | 2.22 | 6,331 | 4.51 | 1,399 | 1.00 | 418,831 | 298.21 |
| Waimate | 904,505 | 7,899 | 8.73 | 17,509 | 19.36 | 5,033 | 5.56 | 535,310 | 591.83 |
| Totals | 8,290,898 | 62,637 | 7.55 | 186,957 | 22.55 | 62,497 | 7.54 | 4,241,138 | 511.54 |
| Land District of Otago. | |||||||||
| Waitakio | 1,408,396 | 7,326 | 5.20 | 23,452 | 16.65 | 8,917 | 6.33 | 544,189 | 386.39 |
| Maniotot | 827,755 | 2,548 | 3.08 | 5,115 | 6.18 | 1,465 | 1.77 | 280,924 | 339.38 |
| Waihemo | 229,904 | 1,220 | 5.31 | 3,164 | 13.76 | 1,244 | 5.41 | 109,540 | 476.46 |
| Waikouaiti | 168,862 | 1,538 | 9.11 | 10,362 | 61.36 | 4,246 | 25.14 | 75,449 | 446.81 |
| Peninsula | 20,509 | 702 | 34.23 | 5,526 | 269.44 | 2,898 | 141.30 | 6,254 | 304.94 |
| Taieri | 573,241 | 3,912 | 6.82 | 21,431 | 37.39 | 6,725 | 11.73 | 202,032 | 352.44 |
| Tuapeka | 784,648 | 4,079 | 5.20 | 10,446 | 13.31 | 2,739 | 3.49 | 405,681 | 517.02 |
| Bruce | 317,565 | 4,483 | 14.12 | 13,228 | 41.65 | 4,572 | 14.40 | 203,000 | 639.24 |
| Clutha | 498,278 | 6,084 | 12.21 | 24,041 | 48.25 | 7,248 | 14.55 | 326,416 | 655.09 |
| Vincent | 1,657,458 | 2,737 | 1.65 | 5,522 | 3.33 | 1,570 | 0.95 | 294,683 | 177.79 |
| Lake | 1,423,483 | 1,577 | 1.11 | 5,834 | 4.10 | 1,228 | 0.86 | 194,345 | 136.53 |
| Totals | 7,910,099 | 36,206 | 4.58 | 128,121 | 16.20 | 42,852 | 5.42 | 2,642,513 | 334.07 |
| Land District of Southland. | |||||||||
| Fiord | 18,027 | .. | .. | 10 | 0.55 | 2 | 0.11 | .. | .. |
| Wallace | 1,165,552 | 7,031 | 6.03 | 38,816 | 33.30 | 10,310 | 8.84 | 427,395 | 366.69 |
| Southland | 1,962,336 | 22,330 | 11.38 | 124,450 | 63.42 | 40,127 | 20.45 | 1,128,449 | 575.05 |
| Stewart Island | 39,863 | 68 | 1.71 | 314 | 7.88 | 85 | 2.13 | 2,968 | 74.46 |
| Totals | 3,185,778 | 29,429 | 9.24 | 163,590 | 51.35 | 50,524 | 15.86 | 1,558,812 | 489.30 |
| Totals for Dominion | 43,342,706 | 336,601 | 7.77 | 3,002,123 | 6.93 | 806,929 | 18.62 | 23,684,458 | 546.45 |
The following table gives the number of the principal kinds of livestock in Australasia for the year 1917 (preliminary figures):—
| State. | Sheep. | Cattle. | Horses. | Pigs. |
|---|---|---|---|---|
*Final figures. | ||||
| New South Wales | 36,086,241 | 2,757,713 | 732,334 | 359,504 |
| Victoria | 14,760,013 | 1,371,049 | 514,061 | 323,159 |
| Queensland | 17,204,268 | 5,316,558 | 733,014 | 172,699 |
| South Australia | 5,091,282 | 288,887 | 257,422 | 118,542 |
| Western Australia | 6,384,191 | 957,086 | 178,151 | 111,844 |
| Tasmania | 1,711,116 | 197,938 | 42,396 | 54,653 |
| Northern Territory | 47,520 | 420,362 | 21,674 | 500 |
| Federal Territory | 110,142 | 8,230 | 1,457 | 259 |
| Totals for Commonwealth | 81,394,773 | 11,317,823 | 2,480,509 | 1,141,160 |
| New Zealand* | 25,270,386 | 2,575,230 | 373,600 | 283,770 |
The Dominion is eminently suited for sheep-breeding, practically every description of sheep finding a favourable local habitat. In the hilly and down country of the South Island the merino has been bred for very many years, and was the original sheep depastured. In fact, the merino ewe furnished the foundation of the crossbred stock which has made Canterbury mutton famous on British meat-markets. In the early days of the Canterbury meat trade the English Leicester of the original type was the favourite ram for putting to the merino ewe. Of later years the Lincoln has been largely employed to cross with the merino, and black-faced rams have been further employed to put to the crossbred ewes. In the North Island the Romney sheep, which suits the rather moist climate of this portion of the Dominion, has become the most popular sheep; it is also increasing in numbers in the South Island. The Lincoln and Border Leicester are also favoured in both Islands, while the Southdown is displacing other breeds for fat-lamb production throughout the Dominion.
A table appears on p. 546 giving the predominating breed of sheep in each county in the Dominion, together with the average weight of fleece obtained in the past three years.
From the table following it will be seen that the flocks of the North Island increased from 5,285,907 sheep in the year 1886 to 10,009,731 in 1906 and 13,880,799 in 1916, or at the rate of 89.37 per cent. in the first twenty years of the period, and of 38.67 per cent. between 1906 and 1916; 1919 shows a decrease of 1.39 per cent. from the previous year.
The number of sheep in the South Island has fluctuated considerably, decreases from previous years having occurred in 1911, 1912, 1913, 1915, 1916, 1917, and 1919.
| Year. | North Island. | South Island. | Total. |
|---|---|---|---|
| 1886 | 5,285,907 | 9,888,356 | 15,174,263 |
| 1910 | 12,917,662 | 11,351,958 | 24,269,620 |
| 1911 | 12,814,353 | 11,181,773 | 23,996,126 |
| 1912 | 12,618,089 | 11,132,064 | 23,750,153 |
| 1913 | 13,145,445 | 11,046,365 | 24,191,810 |
| 1914 | 13,155,958 | 11,642,805 | 24,798,763 |
| 1915 | 13,315,916 | 11,585,505 | 24,901,421 |
| 1916 | 13,880,799 | 10,907,351 | 24,788,150 |
| 1917 | 14,567,128 | 10,703,258 | 25,270,386 |
| 1918 | 14,758,278 | 11,780,024 | 26,538,302 |
| 1919 | 14,211,944 | 11,616,610 | 25,828,554 |
There was an increase of 2,347,847 in the total number of sheep between 1909 and 1919, representing a rate of 10 per cent. in the ton years.
In the table given above the Chatham Islands are included in the South Island, as they form portion of the Canterbury-Kaikoura Sheep District. In dealing with land districts, however, they are included with Wellington.
Of the land districts, Hawke's Bay had most sheep in 1919, Wellington came next, and Canterbury occupied the third place.
| Land District. | No. of Sheep in 1918. | No. of Sheep in 1919. | Increase. | Decrease. |
|---|---|---|---|---|
| North Auckland | 1,844,666 | 728,915 | .. | 149,374 |
| Auckland | 966,377 | |||
| Hawke's Bay | 6,308,338 | 5,977,805 | .. | 330,533 |
| Taranaki | 960,219 | 937,227 | .. | 22,992 |
| Wellington | 5,724,165 | 5,683,541 | .. | 40,624 |
| Nelson | 473,270 | 478,279 | 5,009 | .. |
| Marlborough | 1,037,660 | 1,044,307 | 6,647 | .. |
| Westland | 66,907 | 71,647 | 4,740 | .. |
| Canterbury | 5,135,942 | 5,147,677 | 11,735 | .. |
| Otago | 3,097,291 | 3,044,503 | .. | 52,788 |
| Southland | 1,889,844 | 1,748,276 | .. | 141,568 |
| Total | 26,538,302 | 25,828,554 | .. | 709,748 |
The number of breeding-ewes and the total number of sheep in each county on the 30th April, 1919, are detailed in the next table.
TABLE SHOWING FOR EACH COUNTY THE NUMBER OF BREEDING -EWES AND THE TOTAL NUMBER OF SHEEP ON THE 30TH APRIL , 1919.
| Sheep, April, 1919. | ||
|---|---|---|
| County. | Total (including Lambs). | Breeding-ewes (included in previous Column). |
| Mongonui | 46,345 | 21,130 |
| Whangaroa | 16,948 | 8,237 |
| Bay of Islands | 91,680 | 41,943 |
| Hokianga | 40,030 | 17,202 |
| Whangarei | 114,814 | 44,518 |
| Hobson | 105,558 | 44,453 |
| Otamatea | 62,328 | 26,608 |
| Rodney | 80,427 | 31,532 |
| Waitemata | 53,577 | 23,289 |
| Eden | 2,761 | 40 |
| Great Barrier | 9,461 | 4,963 |
| Manukau | 54,596 | 22,776 |
| Franklin | 50,390 | 23,159 |
| Totals, North Auckland L.D. | 728,915 | 309,850 |
| Waikato | 52,521 | 27,367 |
| Raglan | 191,142 | 93,396 |
| Waipa | 32,452 | 18,310 |
| Kawhia | 50,806 | 28,749 |
| Awakino | 102,387 | 40,921 |
| Waitomo | 158,636 | 77,054 |
| Coromandel | 42,255 | 19,251 |
| Thames | 4,019 | 2,496 |
| Ohinemuri | 5,212 | 2,277 |
| Tauranga | 8,153 | 1,980 |
| Piako | 32,117 | 14,930 |
| Matamata | 21,535 | 8,197 |
| Rotorua | 8,005 | 4,242 |
| Whakatane | 48,247 | 21,009 |
| Opotiki | 157,199 | 59,888 |
| East Taupo | 16,594 | 4,495 |
| West Taupo | 35,097 | 13,699 |
| Totals, Auckland L.D. | 966,377 | 438,261 |
| Waiapu | 716,539 | 338,481 |
| Waikohu | 656,248 | 309,709 |
| Uawa | 1,012,594 | 466,407 |
| Cook | ||
| Wairoa | 743,824 | 306,001 |
| Hawke's Bay | 1,108,253 | 453,745 |
| Waipukurau | 118,463 | 49,064 |
| Waipawa | 440,947 | 181,900 |
| Woodville | 90,851 | 40,704 |
| Dannevirke | 312,175 | 139,909 |
| Patangata | 643,479 | 297,558 |
| Weber | 128,434 | 48,708 |
| Totals, Hawke's Bay L.D. | 5,977,805 | 2,632,186 |
| Ohura | 165,406 | 68,909 |
| Clifton | 94,943 | 39,074 |
| Taranaki | 46,086 | 22,662 |
| Egmont | 11,869 | 4,740 |
| Stratford | 96,045 | 40,263 |
| Whangamomona | 96,754 | 41,852 |
| Waimate West | 4,742 | 2,571 |
| Hawera | 81,076 | 32,865 |
| Eltham | 64,175 | 27,659 |
| Patea | 276,131 | 99,307 |
| Totals, Taranaki L.D. | 937,227 | 379,902 |
| Waitotara | 240,485 | 99,355 |
| Wanganui | 542,108 | 217,657 |
| Waimarino | 312,694 | 126,339 |
| Kaitieke | 141,205 | 61,908 |
| Rangitikei | 974,640 | 420,439 |
| Kiwitea | 320,651 | 159,732 |
| Pohangina | 159,737 | 83,396 |
| Kairanga | 131,711 | 61,823 |
| Oroua | 167,379 | 88,716 |
| Manawatu | 125,038 | 52,462 |
| Horowhenua | 135,235 | 62,326 |
| Pahiatua | 218,615 | 102,866 |
| Akitio | 288,866 | 128,366 |
| Castlepoint | 183,033 | 86,053 |
| Eketahuna | 109,495 | 61,482 |
| Mauriceville | 69,661 | 39,277 |
| Masterton | 541,776 | 260,995 |
| Wairarapa South | 215,860 | 104,563 |
| Featherston | 485,490 | 215,243 |
| Hutt | 152,277 | 73,562 |
| Makara | 85,664 | 45,038 |
| Chatham Islands | 81,921 | 33,394 |
| Totals, Wellington L.D. | 5,683,541 | 2,584,992 |
| Collingwood | 19,254 | 8,906 |
| Takaka | 58,999 | 34,149 |
| Waimea | 327,803 | 178,961 |
| Buller | 4,802 | 2,700 |
| Murchison | 55,522 | 27,268 |
| Inangahua | 11,899 | 6,099 |
| Totals, Nelson L.D. | 478,279 | 258,083 |
| Sounds | 173,856 | 98,442 |
| Marlborough | 368,701 | 168,943 |
| Awatere | 293,387 | 148,162 |
| Kaikoura | 208,303 | 112,994 |
| Totals, Marlborough L.D. | 1,044,307 | 528,541 |
| Grey | 30,222 | 16,231 |
| Westland | 41,425 | 20,240 |
| Totals, Westland L.D. | 71,647 | 36,471 |
| Cheviot | 188,506 | 118,886 |
| Amuri | 398,982 | 212,051 |
| Waipara | 386,804 | 242,052 |
| Ashley | 120,198 | 66,295 |
| Oxford | 115,909 | 64,821 |
| Kowai | 98,024 | 51,309 |
| Rangiora | 48,317 | 27,368 |
| Eyre | 60,700 | 37,347 |
| Waimairi | 8,566 | 5,161 |
| Paparua | 44,380 | 22,393 |
| Malvern | 148,393 | 73,034 |
| Tawera | 97,109 | 49,386 |
| Heathcote | 11,007 | 6,392 |
| Halswell | 16,779 | 8,703 |
| Selwyn | 231,677 | 125,470 |
| Springs | 34,922 | 19,739 |
| Ellesmere | 97,936 | 56,538 |
| Mount Herbert | 48,179 | 29,030 |
| Wairewa | 88,399 | 61,557 |
| Akaroa | 109,672 | 62,317 |
| Ashburton | 1,021,348 | 551,645 |
| Geraldine | 354,811 | 198,013 |
| Levels | 216,781 | 114,017 |
| Mackenzie | 539,912 | 296,584 |
| Waimate | 665,366 | 344,138 |
| Totals, Canterbury L.D. | 5,147,677 | 2,844,246 |
| Waitaki | 651,677 | 352,280 |
| Maniototo | 312,786 | 152,768 |
| Waihemo | 147,772 | 79,024 |
| Waikouaiti | 87,451 | 50,272 |
| Peninsula | 8,718 | 5,076 |
| Taieri | 221,112 | 105,484 |
| Tuapeka | 458,969 | 193,553 |
| Bruce | 246,762 | 116,420 |
| Clutha | 380,067 | 183,558 |
| Vincent | 315,757 | 162,318 |
| Lake | 213,432 | 96,315 |
| Totals, Otago L.D. | 3,044,503 | 1,497,068 |
| Fiord | .. | .. |
| Wallace | 519,228 | 248,950 |
| Southland | 1,225,300 | 581,528 |
| Stewart Island | 3,748 | 1,822 |
| Totals, Southland L.D. | 1,748,276 | 832,300 |
| Totals for Dominion | 25,828,554 | 12,341,900 |
NUMBER OF FLOCKS , 1911, 1916, 1917, 1918, AND 1919.
| Size of Flocks. | 1911. | 1916. | 1917. | 1918. | 1919. |
|---|---|---|---|---|---|
| Under 500 | 11,463 | 11,818 | 11,812 | 11,562 | 11,719 |
| 500 and under 1,000 | 4,366 | 4,911 | 5,071 | 5,603 | 5,466 |
| 1,000 and under 2,500 | 3,703 | 4,344 | 4,279 | 4,747 | 4,637 |
| 2,500 and under 5,000 | 1,130 | 1,299 | 1,375 | 1,407 | 1,440 |
| 5,000 and under 10,000 | 540 | 566 | 629 | 622 | 611 |
| 10,000 and under 20,000 | 216 | 202 | 176 | 187 | 162 |
| 20,000 and upwards | 75 | 41 | 38 | 40 | 30 |
| Totals | 21,493 | 23,181 | 23,380 | 24,168 | 24,065 |
The average size of the flocks is found to have been 1,116 sheep in 1911, 1,069 in 1918, 1,081 in 1917, 1,098 in 1918, and 1,073 in 1919.
The number of the different classes composing the flocks in April, 1919, was as follows:—
| — | North Island. | South Island. | Total in Dominion. |
|---|---|---|---|
| Stud sheep (entered in Flock-book)— | |||
| Merino | .. | 15,545 | 15,545 |
| Lincoln | 36,060 | 6,420 | 42,480 |
| Romney | 96,350 | 53,133 | 149,483 |
| Border Leicester | 1,276 | 28,599 | 29,875 |
| English Leicester | 1,083 | 27,967 | 29,050 |
| Shropshire | 536 | 2,752 | 3,288 |
| Southdown | 13,553 | 6,578 | 20,131 |
| Corriedale | 196 | 27,205 | 27,401 |
| Other breeds | 463 | 847 | 1,310 |
| Totals | 149,517 | 169,046 | 318,563 |
| Sheep of a distinctive breed, but not entered in Flock-book— | |||
| Merino | 56,361 | 836,176 | 892,537 |
| Lincoln | 304,071 | 26,274 | 330,345 |
| Romney | 2,164,899 | 561,169 | 2,726,068 |
| Border Leicester | 11,329 | 158,528 | 169,857 |
| English Leicester | 6,325 | 100,074 | 106,399 |
| Shropshire | 6,624 | 4,322 | 10,946 |
| Southdown | 21,778 | 7,567 | 29,345 |
| Corriedale | 34,649 | 370,260 | 404,909 |
| Half-bred | 42 | 1,098,603 | 1,098,645 |
| Other breeds | 2,985 | 2,890 | 5,875 |
| Totals | 2,609,063 | 3,165,863 | 5,774,926 |
| Flock sheep— | |||
| Crossbreds and others not otherwise enumerated | 11,453,364 | 8,281,701 | 19,735,065 |
| Grand Totals | 14,211,944 | 11,616,610 | 25,828,554 |
The following table gives the predominating breed of sheep and the average weight of fleece for each county in the Dominion in 1916, 1917, 1918, and 1919.
TABLE SHOWING THE PREDOMINATING BREED OF SHEEP (EXCLUSIVE OF CROSSBREDS , EXCEPTING IN COUNTIES WHERE THERE ARE NO OTHERS ) AND THE AVERAGE WEIGHT OF FLEECE FOR EACH COUNTY IN THE DOMINION FOR THE YEARS 1916, 1917, 1918, AND 1919.
Reference.—M., Merino. L., Lincoln. R., Romney. B.L., Border Leicester. E.L., English Leicester. Shp., Shropshire. Sd., Southdown. C., Corriedale. Hb., Half-bred. O., Other breeds.
| County. | 1915-16.* | 1916-17.* | 1917-18. | 1918-19. | ||||
|---|---|---|---|---|---|---|---|---|
| Predominating Breed of Sheep. | Average Weight of Fleece. | Predominating Breed of Sheep. | Average Weight of Fleece. | Predominating Breed of Sheep. | Average Weight of Fleece. | Predominating Breed of Sheep. | Average Weight of Fleece. | |
* See note at end of table. | ||||||||
| Land District of North Auckland. | ||||||||
| lb. | lb. | lb. | lb. | |||||
| Mongonui | R. | 7.41 | R. | 6.96 | R. | 6.29 | R. | 6.26 |
| Whangaroa | R. | 6.79 | R. | 5.31 | R. | 5.36 | R. | 5.86 |
| Bay of Islands | R. | 7.93 | R. | 6.22 | R. | 6.14 | R. | 6.20 |
| Hokianga | R. | 6.34 | R. | 6.29 | R. | 6.42 | R. | 5.89 |
| Whangarei | R. | 6.63 | R. | 6.78 | R. | 6.57 | R. | 6.26 |
| Hobson | R. | 7.92 | R. | 7.59 | R. | 6.45 | R. | 6.68 |
| Otamatea | Shp. | 7.71 | R. | 7.24 | R. | 6.82 | R. | 6.82 |
| Rodney | R. | 7.03 | R. | 7.05 | R. | 7.05 | R. | 7.12 |
| Waitemata | R. | 6.79 | R. | 7.00 | R. | 6.71 | R. | 6.80 |
| Eden | R. | 6.78 | R. | 6.38 | R. | 6.63 | R. | 6.72 |
| Great Barrier | R. | 6.51 | R. | 5.98 | R. | 6.19 | R. | 6.24 |
| Manukau | R. | 5.46 | R. | 6.78 | R. | 6.86 | R. | 6.81 |
| Franklin | L. | 6.80 | R.L. | 7.30 | R. | 7.01 | R. | 7.41 |
| Totals | R. | 7.04 | R. | 6.92 | R. | 6.61 | R. | 6.60 |
| Land District of Auckland. | ||||||||
| Waikato | R. | 7.06 | R. | 7.10 | R. | 6.83 | R. | 7.13 |
| Raglan | R. | 7.24 | R. | 7.02 | R. | 7.01 | R. | 7.26 |
| Waipa | R. | 7.44 | R. | 7.47 | R. | 7.14 | R. | 7.85 |
| Kawhia | R. | 6.64 | R. | 5.54 | R. | 6.07 | R. | 6.93 |
| Awakino | R. | 7.01 | R. | 6.32 | R. | 6.41 | R. | 6.91 |
| Waitomo | R. | 5.32 | R. | 6.48 | R. | 6.66 | R. | 6.88 |
| Coromandel | R. | 6.08 | R. | 5.41 | R. | 5.95 | R. | 5.67 |
| Thames | R. | 6.28 | R. | 6.34 | R. | 6.63 | R. | 7.17 |
| Ohinemuri | R. | 7.02 | R. | 6.68 | R. | 6.91 | R. | 6.82 |
| Tauranga | R. | 5.77 | R. | 6.54 | R. | 6.73 | R. | 7.08 |
| Piako | R. | 8.02 | R. | 7.10 | R. | 7.28 | R. | 7.46 |
| Matamata | E.L., R. | 7.61 | R. | 6.69 | E.L., R. | 7.10 | R. | 7.62 |
| Rotorua | R. | 6.10 | R. | 6.49 | R. | 5.65 | R. | 6.33 |
| Whakatane | R. | 6.60 | R. | 7.77 | R. | 6.84 | R. | 7.25 |
| Opotiki | R. | 6.25 | R. | 6.06 | R. | 6.80 | R. | 6.92 |
| East Taupo | R. | 5.80 | R. | 6.62 | R. | 5.85 | R. | 6.08 |
| West Taupo | M. | 6.54 | R. | 6.06 | L. | 5.85 | M. | 6.28 |
| Totals | R. | 6.74 | R. | 6.62 | R. | 6.72 | R. | 6.99 |
| Land District of Hawke's Bay. | ||||||||
| Waiapu | R. | 7.57 | R. | 7.73 | R. | 6.98 | R. | 7.25 |
| Waikohu | R. | 8.28 | R. | 8.42 | R. | 7.72 | R. | 7.69 |
| Uawa | R. | 8.02 | R. | 8.26 | R. | 7.70 | R. | 8.02 |
| Cook | ||||||||
| Wairoa | R. | 7.74 | R. | 7.50 | R. | 7.23 | R. | 7.34 |
| Hawke's Bay | R. | 7.28 | R. | 8.71 | R. | 7.95 | R. | 7.81 |
| Waipukurau | R. | 8.58 | R. | 8.31 | R. | 7.81 | R. | 8.36 |
| Waipawa | R. | 6.86 | R. | 8.06 | R. | 7.50 | R. | 7.82 |
| Woodville | L., R. | 8.41 | R., L. | 8.76 | R., L. | 8.36 | R. | 8.77 |
| Dannevirke | R. | 8.96 | R. | 8.65 | R. | 8.02 | R. | 8.38 |
| Patangata | R. | 7.55 | R. | 9.25 | R. | 8.27 | R. | 8.47 |
| Weber | L., R. | 6.71 | R. | 9.88 | R. | 8.98 | R. | 9.30 |
| Totals | R. | 7.73 | R. | 8.39 | R. | 7.63 | R. | 7.89 |
| Land District of Taranaki. | ||||||||
| Ohura | R. | 7.13 | R. | 6.71 | R. | 6.56 | R. | 7.22 |
| Clifton | R. | 6.68 | R. | 6.45 | R. | 6.00 | R. | 6.71 |
| Taranaki | R. | 6.99 | R. | 6.67 | R. | 6.03 | L. | 7.09 |
| Egmont | R. | 7.12 | R. | 6.46 | R. | 6.91 | C. | 6.99 |
| Stratford | R. | 6.44 | R. | 6.68 | R. | 6.38 | R. | 6.90 |
| Whangamomona | R. | 6.38 | R. | 5.95 | R. | 5.83 | R. | 6.47 |
| Waimate West | Crossbred | 7.91 | R. | 7.53 | Sd. | 6.79 | L. | 8.46 |
| Hawera | L., R. | 4.87 | L., R. | 7.92 | R. | 7.46 | R. | 8.37 |
| Eltham | L., R. | 6.31 | R. | 7.12 | R. | 6.59 | R. | 7.14 |
| Patea | L. | 7.68 | L. | 7.27 | R. | 7.53 | R., L. | 7.48 |
| Totals | L. | 6.83 | R. | 6.88 | R. | 6.72 | R. | 7.20 |
| Land District of Wellington. | ||||||||
| Waitotara | R., L. | 7.00 | R. | 7.37 | R. | 7.47 | R. | 7.57 |
| Wanganui | L., R. | 7.65 | R. | 7.86 | R. | 7.40 | R. | 7.69 |
| Waimarino | R. | 7.10 | R. | 6.88 | R. | 6.69 | R. | 6.96 |
| Kaitieke | R. | 6.12 | R. | 6.37 | R. | 6.08 | R. | 6.79 |
| Rangitikei | R. | 7.06 | R. | 7.85 | R. | 7.36 | R. | 7.97 |
| Kiwitea | R. | 7.78 | R. | 7.79 | R. | 7.48 | R. | 7.74 |
| Pohangina | R. | 7.60 | R. | 8.41 | R. | 7.58 | R. | 7.72 |
| Kairanga | R. | 8.97 | R. | 8.18 | R. | 8.35 | R. | 8.63 |
| Oroua | R. | 8.07 | R. | 8.30 | R. | 8.22 | R. | 8.15 |
| Manawatu | Sd., R. | 8.08 | R. | 7.64 | R. | 8.01 | R. | 7.85 |
| Horowhenua | R. | 6.52 | R. | 6.98 | R. | 6.96 | R. | 7.11 |
| Pahiatua | R., L. | 8.23 | R. | 8.78 | L., R. | 8.17 | R. | 8.50 |
| Akitio | R. | 8.72 | R. | 8.82 | R. | 8.71 | R. | 8.89 |
| Castlepoint | R. | 8.66 | R. | 9.78 | R. | 8.83 | R. | 9.30 |
| Eketahuna | R. | 8.80 | R. | 8.22 | R. | 8.25 | R. | 8.07 |
| Mauriceville | R., L. | 8.70 | L., R. | 8.81 | L., R. | 8.48 | L., R. | 8.40 |
| Masterton | R. | 8.10 | R. | 9.21 | R. | 8.72 | R. | 8.91 |
| Wairarapa South | R. | 8.71 | R. | 8.76 | R. | 8.47 | R. | 8.91 |
| Featherston | R. | 9.11 | R. | 9.19 | R. | 9.21 | R. | 9.09 |
| Hutt | R. | 7.97 | R. | 7.19 | R. | 6.73 | R. | 7.37 |
| Makara | R. | 7.71 | R. | 7.56 | R. | 8.51 | R. | 7.94 |
| Chatham Islands | R. | 6.86 | R. | 7.03 | R. | 7.03 | R. | 7.22 |
| Totals | R. | 7.98 | R. | 8.14 | R. | 7.85 | R. | 8.12 |
| Land District of Nelson. | ||||||||
| Collingwood | R. | 6.85 | R. | 6.87 | R. | 6.22 | R. | 7.04 |
| Takaka | R. | 6.03 | R. | 5.75 | R. | 5.94 | R. | 6.06 |
| Waimea | R. | 5.70 | R. | 5.49 | R. | 5.60 | R. | 5.80 |
| Buller | R. | 5.05 | R. | 4.92 | R. | 5.72 | R. | 6.00 |
| Murchison | R. | 5.62 | R. | 5.18 | R. | 5.77 | R. | 5.80 |
| Inangahua | R. | 5.61 | R. | 5.41 | R. | 5.45 | R. | 5.86 |
| Totals | R. | 5.77 | R. | 5.61 | R. | 5.69 | R. | 5.89 |
| Land District of Marlborough. | ||||||||
| Sounds | R. | 6.10 | R. | 6.41 | R. | 6.68 | R. | 6.53 |
| Marlborough | M. | 6.86 | M. | 6.64 | M. | 7.06 | M., Hb. | 7.26 |
| Awatere | M. | 7.13 | M. | 8.31 | M. | 7.84 | Hb., M. | 8.09 |
| Kaikoura | R., E.L. | 6.05 | M. | 7.14 | Hb. | 6.46 | M., Hb. | 6.73 |
| Totals | M. | 6.60 | M. | 7.21 | Hb. | 7.12 | Hb. | 7.29 |
| Land District of Westland. | ||||||||
| Grey | R. | 5.01 | R. | 5.41 | R. | 5.81 | R. | 5.85 |
| Westland | R. | 5.90 | R. | 6.03 | R. | 6.07 | R. | 5.96 |
| Totals | R. | 5.46 | R. | 5.75 | R. | 5.94 | R. | 5.92 |
| Land District of Canterbury. | ||||||||
| Cheviot | M., O. | 5.96 | O., M. | 7.71 | Hb. | 7.05 | Hb., C. | 7.14 |
| Amuri | M. | 7.09 | M. | 7.46 | M. | 7.01 | M., Hb. | 6.89 |
| Waipara | O. | 6.66 | O. | 7.40 | Hb., C. | 7.55 | Hb., C. | 7.47 |
| Ashley | O. | 6.31 | O. | 6.48 | C. | 6.93 | Hb., C. | 6.77 |
| Oxford | E.L., Sd., O. | 6.01 | O., M., B.L. | 6.97 | Hb., M. | 6.43 | Hb., M. | 6.35 |
| Kowai | Sd., E.L., B.L. | 6.41 | O. | 7.28 | Hb. | 7.34 | Hb., C. | 7.39 |
| Rangiora | E.L., Sd., B.L.. Shp. | 6.65 | Shp., E.L., B.L. | 7.22 | Hb. | 7.42 | Hb. | 7.17 |
| Eyre | Sd. | 7.02 | M. | 7.49 | Hb. | 7.26 | Hb. | 7.06 |
| Waimairi | B.L., E.L. | 6.91 | E.L., Sd. | 7.93 | Hb. | 7.90 | Shp., M., E.L. | 6.93 |
| Paparua | E.L., Sd., Shp. | 5.99 | O., M. | 7.38 | Hb., M. | 8.04 | Hb. | 7.75 |
| Malvern | E.L., Sd. | 7.81 | M., O. | 7.67 | E.L., M. | 7.14 | Hb. | 7.40 |
| Tawera | E.L., M. | 6.40 | M., O. | 6.83 | M., Hb. | 7.23 | Hb., M. | 7.23 |
| Heathcote | E.L. | 6.88 | E.L. | 7.66 | E.L. | 8.11 | Hb. | 6.63 |
| Halswell | E.L. | 7.53 | E.L. | 7.35 | E.L. | 8.21 | E.L. | 7.43 |
| Selwyn | E.L., M. | 8.77 | M., E.L. | 8.17 | M. | 7.70 | M., Hb. | 7.89 |
| Springs | E.L., Sd. | 6.99 | E.L., Sd. | 7.43 | Hb. | 7.78 | Hb. | 8.00 |
| Ellesmere | Sd., E.L. | 7.01 | M. | 7.44 | Hb., M. | 7.74 | Hb. | 7.60 |
| Mount Herbert | E.L. | 6.99 | E.L. | 8.28 | B.L. | 8.03 | M. | 7.88 |
| Wairewa | E.L. | 6.64 | E.L. | 7.28 | E.L. | 7.19 | E.L. | 7.36 |
| Akaroa | E.L. | 7.40 | E.L. | 8.08 | E.L. | 8.03 | E.L. | 7.76 |
| Ashburton | M. | 6.42 | M. | 7.24 | Hb. | 7.34 | Hb., M. | 7.37 |
| Geraldine | E.L. | 5.97 | E.L. | 6.94 | E.L. | 6.86 | E.L., M., Hb. | 6.86 |
| Levels | B.L. | 6.82 | B.L., E.L. | 7.66 | B.L. | 7.38 | B.L. | 7.57 |
| Mackenzie | R., M. | 6.60 | M. | 6.63 | M. | 7.38 | M., Hb. | 7.11 |
| Waimate | B.L., O. | 6.96 | O. | 7.25 | C. | 7.29 | Hb., C. | 7.36 |
| Totals | M. | 6.99 | O. | 7.28 | Hb. | 7.31 | Hb. | 7.29 |
| Land District of Otago. | ||||||||
| Waitaki | B.L. | 6.78 | M. | 7.16 | M. | 6.78 | M. | 6.83 |
| Maniototo | M., R. | 6.72 | B.L., R., M. | 7.19 | R., M. | 7.03 | R., Hb. | 6.67 |
| Waihemo | B.L., O., E.L., R. | 5.82 | R. | 5.98 | R. | 6.34 | B.L., R. | 6.46 |
| Waikouaiti | O. | 6.12 | O. | 6.37 | C. | 6.30 | C. | 6.26 |
| Peninsula | B.L. | 6.29 | B.L. | 7.17 | B.L. | 6.83 | B.L. | 6.56 |
| Taieri | R. | 6.22 | R. | 6.12 | R. | 6.07 | R. | 6.17 |
| Tuapeka | R., O. | 6.94 | O., R. | 7.35 | C., R. | 7.35 | C., R. | 6.95 |
| Bruce | B.L., R. | 6.31 | B.L., R. | 6.66 | R. | 7.05 | B.L., R. | 6.79 |
| Clutha | R. | 6.69 | R. | 7.19 | R. | 7.22 | R. | 7.03 |
| Vincent | M. | 6.63 | M. | 7.45 | M. | 7.04 | M., Hb. | 6.71 |
| Lake | R., M. | 5.98 | M. | 6.47 | M: | 6.33 | M., Hb. | 6.25 |
| Totals | M. | 6.90 | M. | 6.98 | M. | 6.87 | M. | 6.71 |
| Land District of Southland. | ||||||||
| Fiord | .. | .. | .. | .. | .. | .. | .. | .. |
| Wallace | R. | 5.91 | R. | 6.32 | R. | 6.81 | R. | 6.30 |
| Southland | R. | 7.84 | R. | 6.98 | R. | 6.94 | R. | 6.79 |
| Stewart Island | O., R. | 4.62 | R. | 6.27 | R. | 5.53 | R. | 5.72 |
| Totals | R. | 7.27 | R. | 6.79 | R. | 6.90 | R. | 6.65 |
| Dominion totals | R. | 7.31 | R. | 7.58 | R. | 7.32 | R. | 7.45 |
Figures showing sheep and lambs slaughtered for food purposes during each of the last ten years, together with the exports of frozen mutton and lamb, are given in the tables following:—
SHEEP .
| Year ended 31st March. | Sheep slaughtered for Food Purposes. | Frozen Mutton exported. | ||
|---|---|---|---|---|
| Number. | Weight. | Number of Carcases, including Pieces at 60 lb. to a Sheep. | Weight. | |
| Cwt. | Cwt. | |||
| 1910 | 2,793,878 | 1,496,720 | 1,775,090 | 883,361 |
| 1911 | 3,372,150 | 1,806,509 | 2,193,665 | 1,068,881 |
| 1912 | 3,189,527 | 1,708,675 | 1,867,828 | 912,926 |
| 1913 | 3,306,588 | 1,771,386 | 2,208,330 | 1,092,692 |
| 1914 | 4,019,831 | 2,153,570 | 2,557,639 | 1,271,935 |
| 1915 | 3,999,460 | 2,139,889 | 2,522,448 | 1,244,399 |
| 1916 | 4,018,578 | 2,152,809 | 2,939,611 | 1,498,843 |
| 1917 | 3,601,284 | 1,929,259 | 2,409,899 | 1,228,696 |
| 1918 | 3,631,344 | 1,945,363 | 2,150,505 | 1,118,014 |
| 1919 | 4,381,005 | 2,346,967 | 1,300,047 | 680,732 |
| Total for 10 years | 36,313,645 | 19,451,147 | 21,925,063 | 11,000,479 |
LAMBS .
| Year ended 31st March. | Lambs slaughtered for Food Purposes. | Frozen Lamb exported. | ||
|---|---|---|---|---|
| Number. | Weight. | Number of Carcases. | Weight. | |
| Cwt. | Cwt. | |||
| 1910 | 3,675,676 | 1,181,467 | 3,356,702 | 1,049,113 |
| 1911 | 4,044,953 | 1,301,056 | 3,839,922 | 1,167,980 |
| 1912 | 3,192,108 | 1,026,034 | 3,093,091 | 932,835 |
| 1913 | 3,505,986 | 1,126,924 | 2,956,249 | 901,146 |
| 1914 | 4,338,180 | 1,394,415 | 3,854,348 | 1,186,638 |
| 1915 | 4,471,861 | 1,597,093 | 3,692,003 | 1,120,682 |
| 1916 | 4,091,085 | 1,314,991 | 3,750,590 | 1,152,736 |
| 1917 | 3,431,943 | 1,103,125 | 2,797,290 | 838,569 |
| 1918 | 2,695,443 | 866,392 | 2,048,612 | 623,022 |
| 1919 | 2,950,316 | 948,315 | 916,914 | 277,822 |
| Totals for 10 years | 36,397,551 | 11,859,812 | 30,305,721 | 9,250,543 |
In addition to the figures of slaughterings given above there are the killings by farmers for their own use. During the 1918-19 season farmers killed 617,147 sheep and 56,090 lambs for food, and on the basis of these figures it is estimated that about 5,500,000 sheep, representing a weight of 330,000,000 lb., and 500,000 lambs, of a weight of 18,000,000 lb., were killed by farmers for local consumption during the ten years shown. This gives a total of approximately 1,350,000,000 lb., equal to an average annual consumption per head of population, including Maoris, of over 120 lb.
The number of sheep in the Australian States and in New Zealand for the years 1900, 1905, 1910, 1915, and 1917 was as follows:—
| 1900. | 1905. | 1910. | 1915. | 1917. | |
|---|---|---|---|---|---|
* Including Northern Territory. † Figures for April following. | |||||
| Queensland | 10,339,185 | 12,535,231 | 20,331,838 | 15,950,154 | 17,204,268 |
| Now South Wales | 40,020,506 | 39,506,764 | 45,560,969 | 32,874,359 | 36,086,241 |
| Victoria | 10,841,790 | 11,455,115 | 12,882,665 | 10,545,632 | 14,760,013 |
| South Australia* | 5,283,247 | 6,339,542 | 6,324,717 | 3,744,747 | 5,145,991 |
| Western Australia | 2,434,311 | 3,120,703 | 5,158,516 | 4,831,727 | 6,384,191 |
| Tasmania | 1,683,956 | 1,583,561 | 1,788,310 | 1,624,450 | 1,711,116 |
| Federal Territory | .. | .. | .. | 134,679 | 110,142 |
| New Zealand† | 19,355,195 | 19,130,875 | 23,996,126 | 24,788,150 | 26,538,302 |
| Total, Australasia | 89,958,190 | 93,671,791 | 116,043,141 | 94,493,898 | 107,940,264 |
According to the Year-book of the International Institute of Agriculture at Rome, the following figures represented the latest information (1916) available as to the number of sheep in the various countries concerned at the time of the publication of the volume. The figure shown for France does not include the number of sheep in territory occupied by the enemy at the time of the enumeration, while that for Turkey covers both Turkey in Europe and Turkey in Asia.
| Country. | Number of Sheep. |
|---|---|
| Argentina | 81,485,149 |
| Russia | 76,404,792 |
| Australia | 69,244,603 |
| United States of America | 48,483,000 |
| South African Union | 35,710,843 |
| British India | 31,443,727 |
| United Kingdom | 28,770,692 |
| Turkey | 27,094,678 |
| New Zealand | 24,788,150 |
| Spain | 16,012,277 |
| Italy | 13,824,000 |
| Uruguay | 11,482,251 |
| France | 10,845,280 |
| Austria-Hungary | 8,987,959 |
| Algeria | 8,810,739 |
| Bulgaria | 8,632,388 |
| Brazil | 7,204,920 |
| British East Africa Protectorate | 6,555,000 |
| Roumania | 5,269,493 |
| Germany | 5,073,478 |
| French Morocco | 4,715,371 |
| Chile | 4,557,800 |
| Serbia | 3,818,997 |
| Portugal | 3,072,988 |
| Canada | 1,965,101 |
Wool is the most important product of New Zealand. In normal years the value of the export is over a third of the value of the total exports of the Dominion, the figures for 1917 and 1918 being,—
| 1917. | 1918. | |
|---|---|---|
| £ | £ | |
* Exclusive of gold (specie and bullion). | ||
| Wool | 12,175,366 | 7,527,266 |
| Total exports of New Zealand produce | 30,184,069* | 27,894,619 |
The quantity of wool exported in 1918 was 108,724,575 lb., a decrease of 69,549,911 lb. as compared with the quantity exported in the previous year. The annual production of wool for the past twenty years, taking the exports for the twelve months immediately preceding the commencement of shearing, and adding thereto the quantity used in the Dominion for manufacturing purposes, is shown in the next table, but no addition has been made for wool on sheep-skins exported, nor for loss in scouring and washing.
| Year ended 30th September. | Quantity exported. | Quantity purchased by Local Mills. | Total. |
|---|---|---|---|
| lb. | lb. | lb. | |
| 1899 | 143,644,203 | 4,258,505 | 147,902,708 |
| 1900 | 144,829,515 | 3,223,392 | 148,052,907 |
| 1901 | 143,064,789 | 4,629,924 | 147,694,713 |
| 1902 | 155,652,563 | 4,203,312 | 159,855,875 |
| 1903 | 160,919,693 | 5,294,652 | 166,214,345 |
| 1904 | 141,031,699 | 5,191,451 | 146,223,150 |
| 1905 | 146,889,767 | 3,651,343 | 150,541,110 |
| 1906 | 152,765,232 | 4,372,472 | 157,137,704 |
| 1907 | 164,006,579 | 4,116,722 | 168,123,301 |
| 1908 | 163,930,722 | 4,779,198 | 168,709,920 |
| 1909 | 187,619,181 | 5,202,821 | 192,822,002 |
| 1910 | 194,472,934 | 5,642,113 | 200,115,047 |
| 1911 | 184,854,149 | 6,048,164 | 190,902,313 |
| 1912 | 189,553,723 | 6,284,114 | 195,837,837 |
| 1913 | 195,353,533 | 6,823,545 | 202,177,078 |
| 1914 | 196,499,896 | 6,846,960 | 203,346,856 |
| 1915 | 208,908,118 | 6,628,019 | 215,536,137 |
| 1916 | 200,119,016 | 8,772,467 | 208,891,483 |
| 1917 | 162,043,634 | 7,590,445 | 169,634,079 |
| 1918 | 110,054,315 | 7,488,932 | 117,543,247 |
The following summary is interesting as showing the various classes of wool purchased by the New Zealand mills. For 1917-18 greasy wool represents over 98 per cent. of the total. Nearly half of the wool used at mills is shown to be half-bred, slightly less than one-third crossbred, and slightly more than one-fifth merino.
CLASS OF WOOL PURCHASED BY WOOLLEN -MILLS , 1917-18.
| — | Merino. | Half-bred. | Crossbred. | Totals. |
|---|---|---|---|---|
| lb. | lb. | lb. | lb. | |
| Greasy | 1,618,667 | 3,574,021 | 2,162,810 | 7,355,498 |
| Scoured | 4,750 | 26,566 | 7,890 | 39,206 |
| Sliped | .. | 53,327 | 40,901 | 94,228 |
| Totals, 1917-18 | 1,623,417 | 3,653,914 | 2,211,601 | 7,488,932 |
| Totals, 1916-17 | 1,417,169 | 3,022,073 | 3,151,203 | 7,590,445 |
The percentages of greasy, scoured, and washed wool to the total quantities exported during the last ten years are,—
| Year. | Greasy. | Scoured and sliped. | Washed. |
|---|---|---|---|
| Per Cent. | Per Cent. | Per Cent. | |
| 1909 | 82.40 | 17.09 | 0.51 |
| 1910 | 83.48 | 16.27 | 0.25 |
| 1911 | 80.63 | 19.16 | 0.21 |
| 1912 | 80.96 | 18.77 | 0.27 |
| 1913 | 83.28 | 16.43 | 0.29 |
| 1914 | 83.45 | 16.28 | 0.27 |
| 1915 | 78.62 | 21.09 | 0.29 |
| 1916 | 79.27 | 20.24 | 0.49 |
| 1917 | 81.77 | 18.07 | 0.16 |
| 1918 | 77.92 | 21.21 | 0.87 |
The following diagram shows the increase in the weight of wool exported since 1882, also the great expansion of the frozen-meat trade in the same period. The decrease during the war period is attributable to lack of shipping facilities.
EXPORTS OF WOOL AND FROZEN MEAT , 1882-1918.
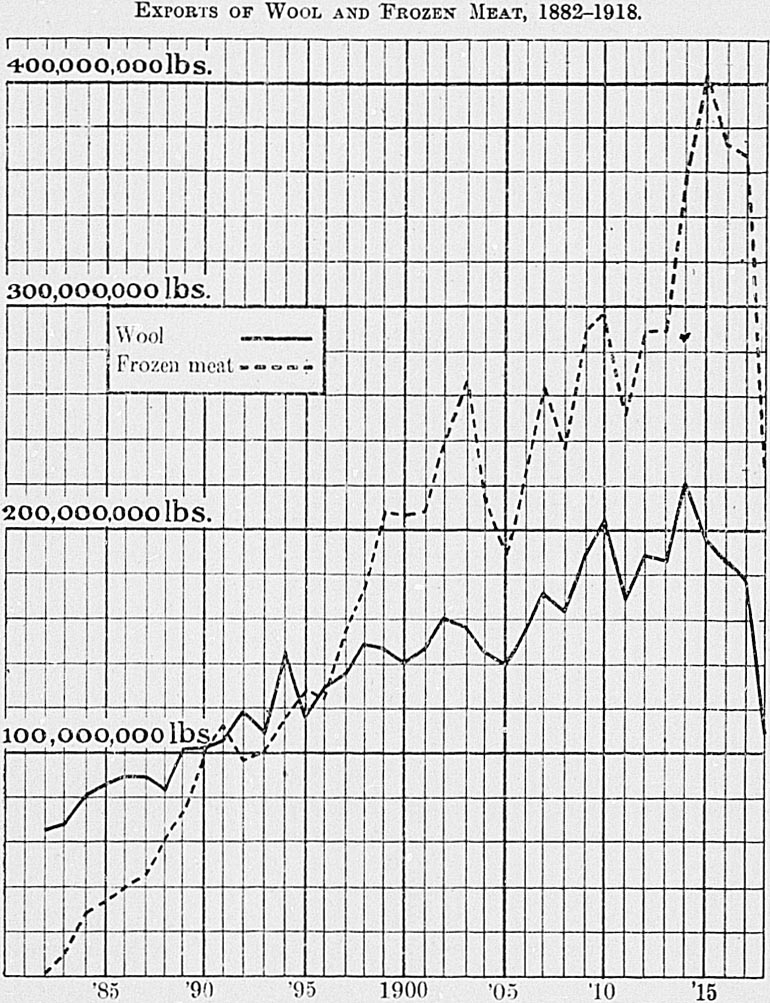
Most of the leading breeds of the cattle of Great Britain are represented in the Dominion by herds bred on sound lines, though the beef-breeds of later years are not making much headway owing to the advance taking place in dairying operations. There are still very many fine Short-horn herds of the beef type, while Aberdeen-Angus and Hereford cattle are also bred. There are herd-books for each of these breeds.
The breeding of dairy cattle has made considerable progress in recent years. A special Jersey herd-book has been in existence for some time, and herd-book societies are now well established for the Holstein, Ayrshire, and milking Shorthorn breeds as well. The various societies have heartily co-operated in a scheme for establishing registers of merit in connection with purebred dairy cattle, giving a great fillip to the breeding of purebred dairy stock. The ordinary dairy-farmer is encouraged to use purebred bulls and thereby to assist materially in raising the standard of the dairy stock of the country. He is now coming to appreciate the value of herd-testing work, and thus, knowing the really profitable cows in his herd, will be anxious to secure a bull which will enable them to perpetuate their good qualities.
An important factor responsible for the improved position of dairy cattle in New Zealand is the milking-machine, which is making the farmer more independent of hired labour. The farms generally are on a fairly large scale, but with the increasing price of land there is a gradual tendency towards smaller farms and the keeping of fewer but better cows. Also, there is a growing realization of the necessity of a more liberal system of feeding, particularly in the direction of growing special fodder crops to maintain the milk-flow at all seasons of the year. Generally, dairy-farming in New Zealand is being conducted on a sound and profitable basis, and the outlook for the industry is most encouraging.
A policy which has been partly responsible for placing the breeding of dairy cattle on up-to-date principles has been the establishment of purebred herds at three of the State experimental farms, and there breeding them according to an exact record of performance. High-priced stock have been imported in order that the foundation herds at the farms may be of the best quality. The milk of all the cattle is daily weighed and periodically tested, official check tests being conducted by experts of the Dairy Division of the Agriculture Department. The yearling bulls from these State milk-record herds command high values. The appreciation of the farming community for this officially tested stock has been chiefly responsible for the gratifying manner in which private breeders of pedigree stock have participated in the official register - of - merit scheme of the Department and the herd-book societies. In the season of 1910-11 the Department established a model herd-testing association in the Wairarapa district, carrying out the work of testing and of recording results free of all charge to the farmers taking part. This had the effect of creating at once wide interest in the important herd-testing movement, and the following season model associations were established in several leading dairying districts. This was intended not only to demonstrate the value of herd-testing when properly conducted and with full comparative records published at the end of the season, but also to encourage farmers to establish co-operative testing associations on their own account. The object was achieved, and many associations are now in operation.
Details for 1919 for each land district are given in the next table.
TABLE SHOWING DETAILS OF CATTLE FOR EACH LAND DISTRICT IN THE DOMINION AS AT 31ST JANUARY , 1919.
| Land District (including Interior Boroughs). | Dairy Cattle. | Other Cattle. | Total Cattle. | ||||||||
|---|---|---|---|---|---|---|---|---|---|---|---|
| Bulls of all Ages. | Cows and Heifers over Two Years Old. | Total Dairy Cattle. | Bulls of all Ages. | Cows and Heifers over Two Years Old. | Heifers under Two Years Old. | Steers over Two Years Old. | Steers under Two Years Old. | Total other Cattle. | |||
| In Milk. | Dry. | ||||||||||
| North Auckland | 5,862 | 106,854 | 14,676 | 127,392 | 1,902 | 58,428 | 96,159 | 59,771 | 84,723 | 300,983 | 428,375 |
| Auckland | 8,160 | 159,714 | 21,422 | 189,296 | 1,848 | 64,752 | 120,565 | 86,790 | 111,838 | 385,793 | 575,089 |
| Hawke's Bay | 1,763 | 39,362 | 6,640 | 47,765 | 5,984 | 161,768 | 89,640 | 91,986 | 81,869 | 431,247 | 479,012 |
| Taranaki | 6,569 | 135,568 | 9,241 | 151,378 | 1,255 | 30,634 | 82,450 | 31,505 | 52,602 | 198,446 | 349,824 |
| Wellington | 5,736 | 116,319 | 14,122 | 136,177 | 5,893 | 127,324 | 110,370 | 106,567 | 90,583 | 440,737 | 576,914 |
| Totals, North Island | 28,090 | 557,817 | 66,101 | 652,008 | 16,882 | 442,906 | 499,184 | 376,619 | 421,615 | 1,757,206 | 2,409,214 |
| Nelson | 890 | 16,906 | 2,928 | 20,724 | 233 | 6,812 | 13,421 | 6,451 | 11,147 | 38,064 | 58,788 |
| Marlborough | 635 | 10,083 | 1,504 | 12,222 | 161 | 5,343 | 8,923 | 4,000 | 7,650 | 26,077 | 38,299 |
| Westland | 405 | 7,953 | 1,901 | 10,259 | 262 | 7,802 | 8,623 | 6,937 | 8,159 | 31,783 | 42,042 |
| Canterbury | 2,905 | 56,193 | 7,729 | 66,827 | 429 | 20,265 | 39,549 | 28,198 | 33,949 | 122,390 | 189,217 |
| Otago | 2,173 | 38,951 | 6,605 | 47,729 | 538 | 14,537 | 30,164 | 15,862 | 23,789 | 84,890 | 132,619 |
| Southland | 2,355 | 44,350 | 7,114 | 53,819 | 748 | 22,696 | 34,686 | 21,119 | 32,231 | 111,480 | 165,299 |
| Totals, South Island | 9,363 | 174,436 | 27,781 | 211,580 | 2,371 | 77,455 | 135,366 | 82,567 | 116,925 | 414,684 | 626,264 |
| Totals, Dominion | 37,453 | 732,253 | 93,882 | 863,588 | 19,253 | 520,361 | 634,550 | 459,186 | 538,540 | 2,171,890 | 3,035,478 |
The total number of cattle in the Dominion at the enumeration of 1919 was 3,035,478, as against 2,869,465 in 1918. The comparative figures for the two years, according to the classification in use, are as follows:—
| Dairy cattle— | 1918. | 1919. |
|---|---|---|
| Bulls of all ages | 34,432 | 37,453 |
| Cows and heifers two years old and over | 793,215 | 826,135 |
| Other cattle— | ||
| Bulls of all ages | 17,503 | 19,253 |
| Cows and heifers two years old and over | 469,504 | 520,361 |
| Heifers under two years old | 616,464 | 634,550 |
| Steers two years old and over | 429,331 | 459,186 |
| Steers under two years old | 509,016 | 538,540 |
| Totals | 2,869,465 | 3,035,478 |
The greater proportion of the large increase in cattle appears in the Auckland (including North Auckland), Hawke's Bay, and Wellington Land Districts. Taranaki is the only land district showing a decrease on the previous year's figures. The figures for each district are as follows:—
| Laud District. | Increase. | Decrease. |
|---|---|---|
| Auckland (incl. Nth. Auckland) | 55,700 | .. |
| Hawke's Bay | 49,197 | .. |
| Taranaki | .. | 4,259 |
| Wellington | 20,338 | .. |
| Nelson | 3,803 | .. |
| Marlborough | 2,261 | .. |
| Westland | 4,415 | .. |
| Canterbury | 12,659 | .. |
| Otago | 5,613 | .. |
| Southland | 16,286 | .. |
| Total increase | 166,013 | .. |
Out of a total of 3,035,478 cattle, the North Island is shown to have had 2,409,214, or 79.37 per cent., while the South Island had 626,264, or 20.63 per cent. The dairy cows and heifers intended for dairying in the North Island numbered 623,918, or 75.52 per cent., and in the South Island 202,217, or 24.48 per cent.
The following table shows the number and weight of cattle slaughtered for food purposes in each of the past ten years, together with the weight of beef exported:—
| Year ended 31st March. | Cattle slaughtered for Food Purposes. | Weight of Frozen Beef exported. | |
|---|---|---|---|
| Number. | Weight. | ||
| Cwt. | Cwt. | ||
| 1910 | 300,800 | 2,148,571 | 478,930 |
| 1911 | 286,256 | 2,044,686 | 500,022 |
| 1912 | 237,696 | 1,697,829 | 210,629 |
| 1913 | 259,935 | 1,856,679 | 260,880 |
| 1914 | 299,409 | 2,139,529 | 325,593 |
| 1915 | 347,353 | 2,481,093 | 716,289 |
| 1916 | 369,647 | 2,640,336 | 750,938 |
| 1917 | 385,129 | 2,750,921 | 1,008,689 |
| 1918 | 341,300 | 2,437,857 | 882,982 |
| 1919 | 355,357 | 2,538,264 | 804,512 |
| Totals for 10 years | 3,182,882 | 22,735,765 | 5,939,464 |
In addition to these figures there were 2,961 bullocks and cows and 1,966 calves slaughtered by farmers for local consumption during the year ended the 31st January, 1919.
In connection with the enumeration of live-stock in 1918 information was collected as to breeds of cattle, horses, and pigs in addition to the usual details of age, sex, &c. A summary of the results of this enumeration as regards cattle is given below. More detailed information giving particulars according to land districts will be found in the 1918 issue of this book.
TABLE SHOWING DETAILS OF CATTLE IN THE DOMINION ON 31ST JANUARY , 1918, CLASSIFIED ACCORDING TO BREED , SEX , AND AGE .
| Breed. | Bulls of All Ages for Stud. | Cows and Heifers over Two Years Old. | Heifers under Two Years Old. | Steers over Two Years Old. | Steers under Two Years Old. | Total Cattle. |
|---|---|---|---|---|---|---|
| Purebred— | ||||||
| Jersey | 2,048 | 2,774 | 1,337 | 14 | 55 | 6,228 |
| Alderney | 2 | 3 | .. | .. | .. | 5 |
| Friesian (Holstein) | 1,082 | 1,939 | 920 | 16 | 76 | 4,033 |
| Ayrshire | 318 | 659 | 339 | .. | 3 | 1,319 |
| Shorthorn | 1,550 | 2,624 | 903 | 63 | 100 | 5,240 |
| Hereford | 1,455 | 2,575 | 913 | 47 | 3 | 4,993 |
| Polled Angus | 538 | 846 | 304 | 325 | 92 | 2,105 |
| Devon | 22 | 10 | .. | .. | .. | 32 |
| Other breeds | 21 | 41 | 25 | .. | .. | 87 |
| Crossbred with predominating strain of— | ||||||
| Jersey and other Channel Island breeds | 5,823 | 214,144 | 98,146 | 6,629 | 30,505 | 355,247 |
| Friesian (Holstein) | 5,542 | 90,168 | 54,470 | 10,752 | 37,110 | 198,042 |
| Ayrshire | 1,053 | 29,677 | 12,201 | 1,349 | 5,536 | 49,816 |
| Shorthorn | 23,068 | 675,057 | 335,131 | 296,282 | 330,736 | 1,660,274 |
| Hereford | 188 | 109,139 | 55,244 | 64,191 | 55,700 | 289,462 |
| Polled Angus | 2,669 | 58,817 | 26,757 | 30,062 | 26,873 | 145,178 |
| Other (dairy cattle) | 315 | 39,238 | 14,826 | 3,084 | 9,314 | 66,777 |
| Other (beef cattle) | 193 | 14,809 | 8,277 | 15,448 | 11,062 | 49,789 |
| Totals | 50,887 | 1,242,520 | 609,793 | 428,262 | 507,165 | 2,838,627 |
| Boroughs | 1,048 | 20,199 | 6,671 | 1,069 | 1,851 | 30,838 |
| Grand Totals | 51,935 | 1,262,719 | 616,464 | 429,331 | 509,016 | 2,869,465 |
The Dairy Industry Act, 1908, a consolidation of previous legislation, provides for the appointment of inspectors of dairy stock and factories or other places used for the manufacture of dairy-produce, and power is given to condemn or forbid their use, if necessary. The sale of unwholesome milk or other dairy-produce is prohibited, and provision is made for the inspection, grading, and shipping of all such produce exported. Provision is made for the framing of regulations for the registration of dairies, licensing of persons carrying on the manufacture or sale of the produce, registration of trade-marks or brands, and for inspection and grading. A fine not exceeding £50 may be inflicted for any offence under this part of the Act.
Authority is given for State advances to dairy companies, on the security of their assets, for the purposes of acquiring land or of erecting buildings and machinery for carrying on the manufacture of dairy-produce. Loans are repayable by equal half-yearly instalments within fifteen years, and bear interest at the rate of 5 per cent. per annum.
The Act also provides for the registration of co-operative dairy companies, and shareholders are protected in the event of certain contingencies.
A short amending Act was passed in 1915, but does not affect the main points of the measure as summarized.
The census of industrial manufacture showed that during the year ended 31st March, 1916, 603,470 cwt. of butter was produced by butter-factories in the Dominion. The quantity exported during this period amounted to 398,440 cwt., which leaves for local consumption 205,030 cwt. This figure, without taking into consideration the small quantity of butter made privately on farms, approximates very nearly to a consumption of 20 lb. per head of population (including Maoris), which has formerly been used in computing the estimated local consumption.
Returns from cheese-factories give the quantity manufactured during the twelve months ended 31st March, 1916, as 805,103 cwt.
The number of butter and cheese factories in each district as in April, 1919, with the previous season's output for export, is next shown. The districts shown do not in all cases correspond exactly with the land districts of the same name.
| District. | Number of Factories. | Skimming-stations. | Forwarded for Export, 1918-19. | Number of Suppliers. | |||
|---|---|---|---|---|---|---|---|
| Butter. | Cheese. | Butter. | Cheese. | Butter. | Cheese. | ||
| Tons. | Tons. | ||||||
| Auckland | 57 | 51 | 40 | 12,278 | 9,467 | 10,877 | 1,199 |
| Hawke's Bay | 14 | 23 | 5 | 686 | 3,163 | 1,699 | 639 |
| Taranaki | 57 | 111 | 70 | 2,833 3/4 | 23,952 | 1,628 | 2,823 |
| Wellington | 31 | 71 | 24 | 1,820 1/2 | 9,964 | 2,505 | 1,807 |
| Nelson | 7 | 4 | 2 | 428 | 363 | 573 | 127 |
| Marlborough | 4 | 7 | 1 | 164 | 949 | 390 | 213 |
| Westland | 8 | 5 | 3 | 268 | 180 | 443 | 78 |
| Canterbury | 15 | 16 | 15 | 1,193 | 1,556 | 3,490 | 525 |
| Otago and Southland | 21 | 96 | 8 | 631 1/4 | 7,795 | 3,284 | 2,715 |
| Totals, 1919 | 214 | 384 | 168 | 20,302 1/2 | 57,389 | 24,789 | 10,026 |
| Totals, 1918 | 162 | 402 | 180 | .. | .. | .. | .. |
| Totals, 1917 | 164 | 392 | 234 | .. | .. | .. | .. |
| Totals, 1916 | 173 | 381 | 332 | .. | .. | .. | .. |
| Totals, 1915 | 167 | 330 | 345 | .. | .. | .. | .. |
| Totals, 1914 | 181 | 293 | 374 | .. | .. | .. | .. |
| Totals, 1913 | 174 | 276 | 409 | .. | .. | .. | .. |
| Totals, 1912 | 172 | 224 | 427 | .. | .. | .. | .. |
| Totals, 1911 | 185 | 218 | 431 | .. | .. | .. | .. |
| Totals, 1910 | 189 | 194 | 417 | .. | .. | .. | .. |
| Totals, 1909 | 193 | 152 | 419 | .. | .. | .. | .. |
In addition to the above, in April, 1919, there were 24 private dairies for butter and 18 for cheese, also 29 packing-houses.
The total export of butter and cheese in the past twenty years, and the total quantity of each commodity sent to the United Kingdom, are tabulated below:—
| Year. | Total Export of Butter. | Butter exported to the United Kingdom. | Total Export of Cheese. | Cheese exported to the United Kingdom. |
|---|---|---|---|---|
| Cwt. | Cwt. | Cwt. | Cwt. | |
| 1899 | 136,086 | 121,502 | 69,440 | 40,901 |
| 1900 | 172,583 | 165,871 | 102,849 | 81,908 |
| 1901 | 201,591 | 170,903 | 104,294 | 74,510 |
| 1902 | 253,998 | 170,207 | 74,746 | 50,325 |
| 1903 | 285,106 | 249,016 | 74,780 | 64,661 |
| 1904 | 314,360 | 299,171 | 84,526 | 82,046 |
| 1905 | 305,722 | 282,275 | 88,562 | 85,653 |
| 1906 | 320,225 | 306,739 | 131,206 | 129,321 |
| 1907 | 328,441 | 314,081 | 236,833 | 234,517 |
| 1908 | 229,971 | 211,242 | 280,798 | 276,212 |
| 1909 | 321,108 | 301,693 | 400,607 | 398,619 |
| 1910 | 356,535 | 345,400 | 451,915 | 449,167 |
| 1911 | 302,387 | 283,505 | 439,174 | 435,616 |
| 1912 | 378,117 | 316,857 | 577,070 | 572,562 |
| 1913 | 372,258 | 288,224 | 611,663 | 608,933 |
| 1914 | 434,067 | 361,381 | 863,776 | 859,986 |
| 1915 | 420,144 | 371,959 | 817,258 | 803,917 |
| 1916 | 358,632 | 336,412 | 949,416 | 942,773 |
| 1917 | 254,397 | 250,721 | 885,751 | 865,152 |
| 1918 | 431,023 | 415,250 | 883,445 | 844,198 |
Exports of butter to countries other than the United Kingdom in 1918 include 11,893 cwt. to Canada, and 38,646 cwt. of cheese to Egypt.
The quantities of butter and cheese exported continued about equal till the close of the year 1895. During the period 1896-1907 butter assumed the lead, reaching its maximum of comparative importance in 1903, in which year the export was nearly four times that of cheese. A remarkable rise then took place in the cheese - exports, and the increase in the exports continued so rapidly that 1917 saw the quantity of cheese more than treble that of butter.
The number of horses is shown for seven census years,—
| Census Years. | Number of Horses. | Numerical Increase. | Increase per Cent. |
|---|---|---|---|
* Decrease. | |||
| 1886 | 187,382 | .. | .. |
| 1891 | 211,040 | 23,658 | 12.63 |
| 1896 | 237,418 | 26,378 | 12.50 |
| 1901 | 266,245 | 28,827 | 12.14 |
| 1906 | 326,537 | 60,292 | 22.65 |
| 1911 | 404,284 | 77,747 | 23.81 |
| 1916 | 371,331 | -32,953* | -8.15* |
As previously stated, particulars as to breeds of horses were obtained at the enumeration of 1918, and detailed tables giving particulars by land districts were published in last year's issue of this volume. A summarized table is subjoined.
TABLE SHOWING DETAILS OF HORSES IN THE DOMINION ON 31ST JANUARY , 1918, CLASSIFIED ACCORDING TO BREED , SEX , AND AGE .
| Breed. | Stallions for Stud. | Geldings Two Years Old and Over. | Dry Mares Two Years Old and Over. | Mares with Foal at Foot or to foal this Season. | Fillies under Two Years Old. | Colts or Geldings under Two Years Old. | Other Horses, and Horses unspecified. | Total Horses. |
|---|---|---|---|---|---|---|---|---|
| Thoroughbred | 407 | 1,772 | 1,895 | 928 | 637 | 511 | 177 | 6,327 |
| Draught | 922 | 72,299 | 64,116 | 6,905 | 7,971 | 6,452 | 1,022 | 159,687 |
| Other (harness and saddle) | 408 | 76,707 | 71,144 | 8,281 | 8,701 | 7,083 | 5,897 | 178,221 |
| Ponies under fourteen hands | 123 | 3,753 | 4,083 | 505 | 459 | 413 | 568 | 9,904 |
| Totals | 1,860 | 154,531 | 141,238 | 16,619 | 17,768 | 14,459 | 7,664 | 354,139 |
| Boroughs | 158 | 11,080 | 6,875 | 622 | 406 | 3,022 | 1,748 | 23,911 |
| Grand Totals | 2,018 | 165,611 | 148,113 | 17,241 | 18,174 | 17,481 | 9,412 | 378,050 |
In addition there were 253 asses and mules in the Dominion, classified as follows:—
| Stallions for stud | 17 |
| Geldings over two years old | 124 |
| Dry mares over two years old | 63 |
| Mares with foal at foot or to foal this season | 7 |
| Fillies under two years old | 5 |
| Colts or geldings under two years old | 8 |
| Other asses and mules, and asses and mules unspecified | 13 |
| Total | 237 |
| Boroughs | 16 |
| Grand total | 253 |
There were 363,188 horses in the Dominion on 31st January, 1919, being a decrease of 14,862 on the total for the previous year. The following table gives details by land districts:—
| Land District (including Interior Boroughs). | Stallions for Stud. | Geldings Two Years Old and Over. | Dry Mares Two Years Old and Over. | Mares with Foal at Foot or to foal this Season. | Fillies under Two Years Old. | Colts or Geldings under Two Years Old. | Other Horses, and Horses unspecified. | Total Horses. |
|---|---|---|---|---|---|---|---|---|
| North Auckland | 215 | 19,748 | 16,016 | 1,228 | 1,167 | 1,377 | 1,276 | 41,027 |
| Auckland | 343 | 22,526 | 19,727 | 2,331 | 2,440 | 2,322 | 2,007 | 51,696 |
| Hawke's Bay | 230 | 17,243 | 14,737 | 2,718 | 1,955 | 2,016 | 1,178 | 40,077 |
| Taranaki | 113 | 11,095 | 10,979 | 615 | 730 | 764 | 289 | 24,585 |
| Wellington | 270 | 21,502 | 20,528 | 2,183 | 1,882 | 2,228 | 1,769 | 50,362 |
| Nelson | 42 | 3,752 | 3,811 | 292 | 283 | 301 | 108 | 8,589 |
| Marlborough | 43 | 3,214 | 3,157 | 289 | 286 | 281 | 120 | 7,390 |
| Westland | 18 | 1,195 | 1,085 | 126 | 81 | 140 | 250 | 2,895 |
| Canterbury | 271 | 29,764 | 26,376 | 2,167 | 2,356 | 2,221 | 2,930 | 66,085 |
| Otago | 163 | 17,336 | 16,394 | 1,334 | 1,454 | 1,585 | 1,811 | 40,077 |
| Southland | 61 | 13,435 | 13,153 | 930 | 1,170 | 1,131 | 525 | 30,405 |
| Totals | 1,769 | 160,810 | 145,963 | 14,213 | 13,804 | 14,366 | 12,263 | 363,188 |
Additional information in regard to horses over two years old was collected for the first time in 1919. Horses over two years old were classified in three classes—(1) Draught; (2) spring-cart or light artillery; and (3) light (including thoroughbred and trotting). This information is available only in respect of holdings that are over one acre in extent and that are not situated within borough boundaries. The number of horses included in this classification at the 31st January, 1919, was 310,581, of which 127,150 were draught, and 102,162 light, whilst spring-cart or light artillery horses numbered 81,277.
The following table gives details by land districts:—
HORSES OVER TWO YEARS OLD , 31ST JANUARY , 1919.
| Land District (excluding Interior Boroughs). | Draught. | Spring-cart or Light Artillery. | Light (including Thoroughbred and Trotting). | Total Horses over Two Years Old. |
|---|---|---|---|---|
| North Auckland | 6,249 | 12,123 | 15,803 | 34,175 |
| Auckland | 13,819 | 14,726 | 15,332 | 43,877 |
| Hawke's Bay | 8,880 | 8,362 | 16,916 | 34,158 |
| Taranaki | 5,544 | 9,640 | 6,502 | 21,686 |
| Wellington | 11,968 | 13,073 | 16,903 | 41,944 |
| Nelson | 2,797 | 2,174 | 2,024 | 6,995 |
| Marlborough | 3,329 | 1,657 | 1,489 | 6,475 |
| Westland | 519 | 1,057 | 629 | 2,205 |
| Canterbury | 35,352 | 8,201 | 14,608 | 58,161 |
| Otago | 20,383 | 6,514 | 6,754 | 33,651 |
| Southland | 18,310 | 3,742 | 5,202 | 27,254 |
| Totals | 127,150 | 81,269 | 102,162 | 310,581 |
Asses and mules numbered 296 as at the 31st January, 1919, being an increase of 43 on the figures for 1918.
There were 258,694 pigs in the Dominion on the 31st January, 1918.
The following table shows the classification by breeds:—
| Breed. | Boars of All Ages for Stud. | Sows of All Ages used or intended for Breeding. | Other Pigs. | Total Pigs. |
|---|---|---|---|---|
| Pure Berkshire | 3,990 | 13,137 | 49,483 | 66,610 |
| Pure Yorkshire | 552 | 2,064 | 4,600 | 7,216 |
| Other purebred pigs | 219 | 1,115 | 3,066 | 4,400 |
| Crossbred pigs | 1,838 | 16,692 | 156,508 | 175,038 |
| Totals | 6,599 | 33,008 | 213,657 | 253,264 |
| Boroughs | 116 | 632 | 4,682 | 5,430 |
| Grand Totals | 6,715 | 33,640 | 218,339 | 258,694 |
A further decrease of 23,347 was recorded in 1919, the figures for that year being 235,347. Details by land districts are as follows:—
| Land District (including Interior Boroughs). | Boars of All Ages for Stud. | Sows of All Ages used or intended for Breeding. | Other Pigs. | Total Pigs. |
|---|---|---|---|---|
| North Auckland | 848 | 4,261 | 24,948 | 30,057 |
| Auckland | 1,303 | 6,037 | 33,839 | 41,179 |
| Hawke's Bay | 455 | 2,207 | 12,942 | 15,604 |
| Taranaki | 1,004 | 4,128 | 25,799 | 30,931 |
| Wellington | 967 | 4,671 | 28,650 | 34,288 |
| Nelson | 209 | 1,041 | 7,127 | 8,377 |
| Marlborough | 139 | 842 | 5,240 | 6,221 |
| Westland | 88 | 411 | 2,597 | 3,096 |
| Canterbury | 819 | 5,157 | 34,748 | 40,724 |
| Otago | 356 | 1,680 | 13,593 | 15,629 |
| Southland | 216 | 949 | 8,076 | 9,241 |
| Totals | 6,404 | 31,384 | 197,559 | 235,347 |
During the ten years ended the 31st March, 1919, 1,892,151 pigs were slaughtered in New Zealand for food purposes, the weight of pork, bacons and hams being 2,196,247 cwt. Little of this was exported, and it is estimated that 96.5 per cent. was consumed in the Dominion. Figures showing the slaughter for each of the ten years are given below:—
| Year ended 31st March. | Number of Pigs. | Weight of Pork, Bacon, and Hams. |
|---|---|---|
| Cwt. | ||
| 1910 | 113,491 | 131,731 |
| 1911 | 163,307 | 189,553 |
| 1912 | 232,091 | 269,391 |
| 1913 | 192,407 | 223,330 |
| 1914 | 191,797 | 222,622 |
| 1915 | 241,683 | 280,525 |
| 1916 | 219,041 | 254,244 |
| 1917 | 202,834 | 235,432 |
| 1918 | 179,540 | 208,395 |
| 1919 | 155,960 | 181,024 |
The number of Angora goats in the Dominion on the 31st January, 1919, was 6,446, an increase of 515 since 1918. Other goats decreased by 1,321 during the period, the number in 1919 being 10,478.
The number of poultry in New Zealand at the taking of the 1916 census was ascertained to be 3,468,000, a decrease of 225,137 from the number for the year 1911 (3,693,137).
Details as to kind, age, and sex, and a comparison with previous years, are given below:—
| — | 1916. | Total, 1916. | Total, 1911. | Total, 1906. | ||
|---|---|---|---|---|---|---|
| Reared in a Previous Season. | Reared in Current Season. | |||||
| Male Birds. | Female Birds. | |||||
| Fowls | 198,056 | 2,308,928 | 634,370 | 3,141,354 | 3,215,031 | 2,784,269 |
| Ducks | 32,907 | 145,399 | 42,502 | 220,808 | 329,230 | 281,999 |
| Turkeys | 13,268 | 37,315 | 5,938 | 56,521 | 97,933 | 77,101 |
| Geese | 9,231 | 20,791 | 16,933 | 46,955 | 45,389 | 44,300 |
| Other poultry | .. | .. | .. | 2,362 | 5,554 | 3,935 |
In the North Island 74,848 householders owned 1,866,608 poultry, in the South Island (including Stewart Island and Chatham Islands) the numbers were 59,313 and 1,596,024 respectively, and in other adjacent islands 73 and 3,006. These figures are exclusive of poultry other than fowls, ducks, turkeys, and geese.
Bees were first introduced into New Zealand in 1839, and after early vicissitudes bee-farming has steadily increased. The census returns of 1916 show that there were 8,244 households keeping bees in the Dominion, the number of colonies being 57,540. During 1918 the amount of honey exported was 172,014 lb., valued at £5,964.
The Department of Agriculture maintains four apiary instructors and inspectors who give practical instruction in management, preparation of products for market, &c. The grading of honey for export is now compulsory.
Regulations have recently been gazetted under the Apiaries Amendment Act, 1913, requiring all beekeepers to make application to the Director of the Horticulture Division, Department of Agriculture, for registration of their apiaries. Re-registration is to be effected in 1920, and every third year thereafter. In the case of apiaries being established or transferred from one beekeeper to another, application for registration of such establishment or transfer must be made within twenty-one days of such establishment or transfer.
Table of Contents
NEW ZEALAND possesses a large variety of trees in its native forests, there being no fewer than eighty-six different species known to botanists. The majority of these are, unfortunately, through various causes, of little use for commercial purposes to any great extent, and, as a matter of fact, the following trees are practically the staple supply of the timber trade: Kauri, totara, rimu (red-pine), kahikatea (white-pine), matai (black-pine). The puriri, miro, silver-pine, and the various birches (or beeches, as they should be properly designated) are the only other trees which are used to any extent for general purposes.
Most of the indigenous trees suitable for conversion into marketable timber are slow of growth, and the steps that have been taken in regard to New Zealand forests have been in the direction of conserving the existing supply as far as practicable, while allowing sawmilling to proceed under conditions that ensure the greatest possible use being made of the timber.
Future requirements are also being provided for by planting annually about 2,500 acres of the most suitable exotic timber-yielding trees.
One of the earlier methods of inducing the planting of suitable trees was by means of "land grants"—a settler being given a free grant of Crown land if he planted a certain portion of his freehold land in suitable trees. In Canterbury, whore the system came into force in the early "seventies," as much as 2 acres of Crown lands for 1 acre put down in plantation was sometimes granted, and every inducement was offered to the settlers to put down part of their farms in plantations. Several large plantations may be seen in North Canterbury that were established by means of this method, and settlers are now, in many instances, getting good returns for their timber, the Pinus insignis trees being cut down for their timber, which is used extensively for fruit-cases, for outbuildings, and even in a few cases for the construction of dwellings. As, however, the system referred to did not meet the growing needs of the country, it was discontinued, and it came to pass that the methods of State afforestation that had proved so successful in older countries eventually came to be adopted in New Zealand.
As a first step, three experimental plantations of various trees, aggregating about 15 acres, wore started by the Government on the Kaingaroa Plains, between Taupo and Rotorua. Another plantation of 15 acres was started at Tarukenga, on the Rotorua Railway line, and another of 6 acres at Mamaku, not far away. These latter plantations were for the purpose of providing timber for railway requirements. Part of the Rotorua Town Bolt was also planted.
Encouraged by the success of these preliminary experiments, a Forestry Branch of the Department of Lands was started in 1896, and three nurseries were established—two at Tapanui and Ranfurly, in the Otago District of the South Island, and the other at Whakarewarewa, near Rotorua, in the North Island. Later on another nursery was formed at Hanmer, in the Canterbury District (South Island). The establishment of nurseries in certain other localities was also undertaken, but from various causes these nurseries have been discontinued.
In 1919 the urgent needs of the rapidly dwindling forest resources of the Dominion impelled the creation of a separate Department of Forestry. This Department will be under the control of a Director of Forests, who will have the assistance of research officers, Forest Inspectors, and such other staff as may be necessary.
Section 34 of the War Legislation and Statute Law Amendment Act, 1918, confers power upon the Commissioner of State Forests to purchase and hire sawmills and machinery, to cut and sell timber in State forests, and to purchase private lands for addition to or production of State forests. The Governor-General in Council is empowered to set aside by Proclamation any Crown lands as and for "provisional forests."
As the dairy, fruit, and other industries, which use a large quantity of white-pine, were finding it impossible to secure adequate supplies, measures have been taken through the Board of Trade to limit export to 40 per cent. of the total production. Additional authority was also taken last year to allow control of the sale or cutting of standing timber on public or private land.
Up to and including the financial year 1915-16 the expenditure on State afforestation was provided out of the rents and royalties received from State-forest reserves, supplemented latterly by an annual contribution from the Consolidated Fund. A new departure was made in 1916-17, when provision was made in the Finance Act (section 50) enabling the Minister of Finance to borrow £50,000 for forestry purposes, and during that year £10,000 was raised and placed to the credit of the State Forests Account. A further £28,100 was borrowed in 1917-18. Section 32 of the Finance Act, 1918, authorized the raising of a further loan of £200,000 for forestry purposes.
A statement showing receipts and expenditure during the year 1918-19 is appended.
STATE FORESTS ACCOUNT .
| Receipts. | ||||||
| £ | s. | d. | ||||
| Cash in hand, 1st April, 1918 | 1,174 | 16 | 10 | |||
| Loan Account — Debentures issued | 20,900 | 0 | 0 | |||
| Consolidated Fund — Contributions towards forest-tree growing and planting | 10,000 | 0 | 0 | |||
| Revenue from State forests— | ||||||
| Rents, royalties, fees, &c. | 5,294 | 2 | 8 | |||
| Revenue from nurseries and plantations— | £ | s. | d. | |||
| Trees | 608 | 12 | 10 | |||
| Seeds | 84 | 19 | 5 | |||
| Firewood | 408 | 15 | 0 | |||
| Poles | 67 | 19 | 0 | |||
| Grain | 536 | 12 | 10 | |||
| Sheep | 88 | 14 | 6 | |||
| Wool | 194 | 7 | 4 | |||
| Grazing | 231 | 19 | 2 | |||
| Rent of cottages | 13 | 6 | 11 | |||
| 2,235 | 7 | 0 | ||||
| £45,604 | 6 | 6 | ||||
| Expenditure. | ||||||
| £ | s. | d. | £ | s. | d. | |
| Nurseries and plantations— | ||||||
| Salaries | 5,163 | 15 | 5 | |||
| Buildings, planting, material, &c. | 29,785 | 10 | 10 | |||
| Travelling - expenses | 698 | 7 | 0 | |||
| Books, stationery, postages, &c. | 204 | 9 | 7 | |||
| War bonus | 3,309 | 4 | 7 | |||
| 39,161 | 13 | 5 | ||||
| State forests— | ||||||
| Management expenses | 1,434 | 7 | 11 | |||
| Timber Control Committee | 274 | 18 | 7 | |||
| Bridges, &c. | 372 | 10 | 2 | |||
| Report by D. E. Hutchins | 100 | 0 | 0 | |||
| 2,181 | 16 | 8 | ||||
| Interest on debentures | 1,861 | 10 | 11 | |||
| Cash in hand, 31st March, 1919 | 2,399 | 5 | 6 | |||
| £45,604 | 6 | 6 | ||||
Owing to the youth of the plantations and the immaturity of the timber therein, but little return has yet been derived from them, but it is hoped that in a few years time a revenue may be received, which will increase as larger thinnings are available for disposal. A fair market has been found for thinnings from the larch plantations at Rotorua, and small thinnings from the South Island plantations have been satisfactorily disposed of. These thinnings are utilized partly as mine-props and partly as firewood, as well as for fencing purposes.
On the 31st March, 1919, there were over ten million trees in the four nurseries of the Forestry Department, and nearly five million trees had been sent out during the preceding twelve months. A total area of 35,444 acres had been planted with seventy-five million trees in State plantations, the addition for the year being 2,799 acres. The expenditure for the year 1918-19 included £9,749 on the nurseries and £25,056 on the plantations.
Summaries of the operations in nurseries and plantations to the 31st March, 1919, are given.
SUMMARY OF OPERATIONS IN NURSERIES FROM 1896 TO 1919.
| Name of Nursery. | Total Expenditure. | Estimated Number of Trees raised | Output of Trees. | ||||
|---|---|---|---|---|---|---|---|
| Tree-growing. | Maintenance. | Buildings, &c. | Total. | To Plantations. | To Outside Places. | ||
* Nursery now closed. | |||||||
| £ | £ | £ | £ | ||||
| Rotorua | 56,071 | 6,966 | 12,090 | 75,127 | 62,948,319 | 57,522,574 | 1,798,670 |
| Tapanui | 30,309 | 1,904 | 5,327 | 37,540 | 25,719,039 | 15,538,943 | 1,295,628 |
| Ranfurly | 16,463 | 894 | 3,404 | 20,761 | 8,536,737 | 5,762,738 | 397,757 |
| Hanmer Springs | 15,607 | 1,212 | 3,312 | 20,131 | 19,063,142 | 10,661,705 | 607,304 |
| Starborough* | 6,399 | .. | 2,857 | 9,256 | 3,059,610 | 1,965,095 | 1,094,515 |
| Kurow* | 960 | .. | 2,110 | 3,070 | 172,460 | .. | 172,460 |
| Totals | 125,809 | 10,976 | 29,100 | 165,885 | 119,499,307 | 91,451,055 | 5,366,334 |
SUMMARY OF OPERATIONS IN PLANTATIONS FROM 1896 TO 1918.
| Name of Plantation. | Trees. | Total Expenditure. | Total Area planted. | Average Cost per Acre planted. | |||||
|---|---|---|---|---|---|---|---|---|---|
| Number received from Nursery. | Number raised from Seed sown in situ. | Number used to replace Losses. | Total Number in Plantations. | ||||||
* Data not available. † Experimental. | |||||||||
| North Inland. | £ | Acres. | £ | s. | d. | ||||
| Whakarewarewa | 20,579,980 | 109,725 | 3,957,294 | 16,732,411 | 70,368 | 7,966 | 4 | 18 | 9 |
| Waiotapu | 25,062,369 | 83,121 | 4,905,959 | 20,239,531 | 59,882 | 8,454 | 4 | 9 | 0 |
| Kaingaroa | 11,106,503 | .. | 1,630,000 | 9,476,503 | 22,681 | 6,007 | 2 | 11 | 8 |
| Puhipuhi | 3,060,764 | .. | 2,060,764 | 1,000,000 | 13,696 | 1,200 | 4 | 7 | 9 |
| South Inland. | |||||||||
| Conical Hills | 10,725,376 | .. | 1,439,080 | 9,286,296 | 33,802 | 3,533 1/2 | 4 | 17 | 0 |
| Pukerau | 833,860 | .. | 20,300 | 813,560 | 3,705 | 573 | 3 | 0 | 3 |
| Dusky Hill | 3,043,897 | .. | 863,060 | 2,180,837 | 15,283 | 74 3/4 | 11 | 17 | 4 |
| Greenvale | 1,191,795 | .. | 10,000 | 1,181,795 | 7,049 | 737 | 4 | 4 | 10 |
| Waitahuna | 42,025 | .. | 11,500 | 30,525 | 248 | 11 | 8 | 0 | 8 |
| Gimmerburn | 936,235 | .. | 783,339 | 152,896 | 3,349 | 88 | 12 | 17 | 8 |
| Naseby | 4,776,528 | .. | 566,355 | 4,210,173 | 13,621 | 1,776 | 4 | 6 | 4 |
| Hanmer Springs | 9,372,133 | .. | 1,639,949 | 7,732,184 | 27,628 | 2,886 1/2 | 5 | 11 | 7 |
| Balmoral | 1,267,547 | .. | 147,100 | 1,120,447 | 10,726 | 732 | 6 | 19 | 5 |
| Tekapo | 48,000 | .. | .. | 48,000 | 177 | 29 | 5 | 2 | 0 |
| Dumgree | 1,679,765 | .. | 1,110,125 | 569,640 | 12,479 | 209 | * | ||
| Galloway† | 6,930 | .. | 3,050 | 3,880 | 69 | 2 | .. | ||
| Omarama† | 4,390 | .. | .. | 4,390 | 70 | 2 | .. | ||
| Raincliff | .. | .. | .. | 50,000 | 1,105 | 206 | .. | ||
| Totals | 93,838,097 | 192,846 | 19,147,875 | 74,833,068 | 295,937 | 35,157 3/4 | .. | ||
The Commissioner of State Forests, who is the Ministerial head of the Forestry Department, has control only over State forests proclaimed under the State Forests Acts, and certain forest reserves made under the Land Act prior to 1885. The total area is some 1,654,214 acres, of which approximately 1,464,214 acres are under forest, but only 364,000 carry kauri, rimu, white-pine, matai, totara, or miro in sufficient quantity to be of any commercial value at the present time.
The. area of forest on Crown lands not under the control of the Forestry Department is approximately 3,899,832 acres: but of this again only 494,000 has a commercial value for milling purposes.
National-endowment lands are forest-clad to the extent of 2,205,575 acres, about 417,500 acres of this area being milling forest. Reserves under the Land Act, Public Works and other Acts carry 371,269 acres of forest. Only 37,200 acres of this is classed as milling forest. Scenic reserves of an area of 389,065 acres carry much valuable-timber, but, of course, it is highly desirable to preserve this in its natural state. National parks occupy 2,817,389 acres, of which over 2,000,000 acres are under forest, mostly of poor milling quality.
The total area of forest now owned by the State is about 10,478,247 acres, but of this area the total area of forest at present of milling value is approximately only 1,371,000 acres, and a portion of this is already subject to milling licenses. As the area of the whole Dominion is sixty-six million acres, it will be seen that the total area of forest still owned by the State is less than 16 per cent. of the total, whilst the area of milling forest owned by the State is only 2.08 per cent. It may be concluded that most of the forest on private and Native lands (of which there is no information as regards the forest area) will be cut down in a few years' time. When, therefore, it is borne in mind that such highly developed countries as France and Germany (and even these countries import together about 30 per cent. of their total consumption of timber) have respectively 17 per cent. and 26 per cent. of their total area under commercial forests, it will be seen how necessary it is that our remaining forests should be subjected to such management as will prevent their wasteful use and the exhaustion of our timber-supplies.
The Government's proposal to assist farmers in tree-planting was authorized by section 69 of the Reserves and other Lands Disposal and Public Bodies Empowering Act, 1915, and the sum of £1,000 was voted by Parliament to cover expenses in connection with raising and supplying the trees. Price-lists, application forms, and regulations governing the matter have been issued for general information. As the advantages of the scheme become better known it is expected that a very large number of farmers will apply for trees. In addition to the great value on farms of shelter plantations, the increasing scarcity and enhanced prices of fencing and firewood timber are. every year making it more necessary for farmers to plant trees to produce these requisites.
It is not, of course, expected that the planting of trees by farmers for farm purposes will add appreciably to the supply of timber that will be required for building and construction purposes. This supply, if we are not to be dependent on foreign countries, must be provided by the State, and possibly to some extent by public bodies, who may find it an advantage to grow timber-trees on water-catchment areas.
The total number of trees disposed of to farmers and local bodies during the year was 431,045, which were valued at £608 12s. 10d.
Returns collected in 1919 show that the total area of plantations belonging to farmers was 48,981 acres.
The following extract from the Annual Report of the Forestry Branch of the Lands Department for the year 1916-17 shows how rapidly the indigenous timber forests of New Zealand are disappearing:—
Without a survey it is impossible to give the area of land carrying commercial forest, nor, except in the case of kauri, can more than a guess be made of the amount of the various milling-timbers that our forests contain. Kauri is our most valuable milling-timber, but if the present annual rate (52,000,000 ft.) of cutting is continued our supply will not last more than seven years.
The largest output of timber is from the Auckland Land District, but it is estimated that at the past rate of conversion the present stand of all timbers in that district will not last twenty years. In the Taranaki and Hawke's Bay Districts there are only a few small areas of milling forests left, whilst in the Wellington Land District the milling forest, which is confined to the Waimarino, will last a little more than a decade.
In the South Island there is no milling forest left in the Canterbury Land District; in Nelson and Marlborough the area is very small; in the Otago District the milling forest produces scarcely enough timber for the present local consumption; in Southland there is still a fair area of milling forest, but the Commissioner of Crown Lands estimates that the rod-pine will be exhausted in about twenty-eight years, and the white-pine in about sixteen years. This estimate does not, however, allow for the largely increased demands on Southland forests that will be the result of the exhaustion of the supplies in other districts. Black-pine and totara are not plentiful, but occur sporadically in the forest. Beech is plentiful, but, being what is technically termed a hard wood, it cannot fully take the place of soft woods. The largest forest of commercial timber is now in Westland, but the Commissioner for that district estimates that the milling-timbers (rimu and white-pine) will at the present rate of cutting last only about twenty years.
The great expansion that has occurred in recent years in the dairy and fruit industries, together with the great demand that there has been in Australia for our white-pine, has caused heavy cuttings to be made of this timber. The forests of pure white-pine that used to exist on the extensive swamp lands of the Auckland District have almost gone, and the time is close at hand when the white-pine scattered in our mixed-limber forests will be insufficient to supply the demand.
Puriri and silver-pine, both so valuable for railway-sleepers, have almost gone, and their place is now being taken by imported Australian hardwoods, or ferro-concrete. Except in the case of hardwoods, the exhaustion of the supply of one kind of timber usually results in an increased use of other supplies of an inferior timber, or in the importation of a foreign timber technically as useful but generally more expensive.
During the year ended 31st March, 1916, New Zealand timber-mills handled logs containing an aggregate of 308,568,278 superficial feet. The various timbers represented were,—
| Sup. ft. | |
|---|---|
* Not indigenous. | |
| Kauri | 40,707,738 |
| Rimu (red-pine) | 134,462,145 |
| Kahikatea (white-pine) | 85,353,955 |
| Matai (black-pine) | 11,609,669 |
| Totara | 10,983,352 |
| Beech | 5,710,060 |
| Tawa | 623,342 |
| Taraire | 490,077 |
| Puriri | 50,000 |
| Rata | 31,300 |
| Silver-pine | 18,000 |
| Pukatea | 3,300 |
| Yellow-pine | 2,400 |
| Pinus insignis * | 25,000 |
| Undefined | 9,497,940 |
| Total | 308,568,278 |
The figures given in the next table show that the mills of the Auckland Provincial District dealt with almost exactly half of the total:—
| Provincial District. | Sup. ft. |
|---|---|
| Auckland | 153,519,599 |
| Taranaki | 5,756,073 |
| Hawke's Bay | 5,197,800 |
| Wellington | 44,023,020 |
| Marlborough | 2,498,715 |
| Nelson | 5,768,111 |
| Westland | 62,532,986 |
| Canterbury | .. |
| Otago | 4,455,499 |
| Southland | 24,816,475 |
| Total | 308,568,278 |
Output of Sawn Timber.
Information supplied by the Board of Trade shows that the total output of all timbers during the year 1918-19 was, in superficial feet, as follows: Rimu; 111,318,579; white-pine, 63,136,665; kauri, 21,835,023; totara, 13,387,038; matai, 11,930,040; beech, 4,466,116; taraire, 228,377; Pinus radiata , 1,501,274: or a total of all kinds of 227,803,112 superficial feet.
The output is 20,000,000 superficial feet below that for the year ended 31st March, 1918, as obtained from the reports which were sent in for that year by the Conservators of State Forests.
The Dominion's timber-production is at present more than sufficient for home requirements. A considerable quantity of Oregon pine and Australian hardwoods is imported, but is more than balanced by a much larger export, principally of white-pine, rimu, and kauri. During the year ended 31st March, 1919, some 11,750,818 superficial feet of timber, valued at £152,500, was imported. The chief varieties were: Oregon pine (sawn, rough), 2,694,052 superficial feet, value £25,400; ironbark (logs and sawn timber), 2,606,442 superficial feet, value £40,474; and jarrah (logs and sawn timber), 668,362 superficial feet, value £7,473. Exports amounted to 68,697,103 superficial feet, of a value of £551,973, including white-pine, 28,385,105 superficial feet (£233,680); rimu, 27,977,703 superficial feet (£194,282); kauri, 9,280,213 superficial feet (£97,084); and beech, 1,254,091 superficial feet (£10,670).
Table of Contents
UP to the present time New Zealand's fisheries can scarcely be said to have attained to national importance. With a few exceptions, the fishing-grounds so far worked have been those within easy reach of the principal centres. Beyond them is an immense extent of grounds, a few sections of which have been partly prospected, but of the greater part practically nothing is known regarding the value and extent of its fish-supply.
The 1914 issue of this book contains a short summary of the various fishing-grounds worked, giving information as to the kinds of fish caught in the different sections. A short résumé of experimental trawling operations, which show that the waters round the coast of the Dominion are well stocked with fish, is also given, and in the 1915 and 1916 issues reference is made to the visit of the Canadian Commissioner of Fisheries and his recommendations for the better utilization of New Zealand's fish-supplies.
A site for a marine fish-hatchery was selected at Purakanui, Otago, in 1900, but this being found unsuitable for its intended purpose, another site was chosen at Portobello, in Otago Harbour. The erection of the hatchery was carried out by a Board set up to superintend the work of the hatchery, funds being provided by the State, and grants being made by the Otago Institute, the Australasian Association for the Advancement of Science, and a number of acclimatization societies. The State makes an annual grant towards the maintenance of the hatchery, the buildings and equipment of which have also been added to from time to time.
Experiments have been carried out with a view to introducing English food-fishes to New Zealand waters, and these have been fairly successful as regards the three species dealt with so far—viz., lobsters, edible crabs, and turbot. Much valuable work has also been done in the direction of hatching the spawn of various indigenous fishes and in making a study of their life habits.
The principal oyster-beds round the coast of New Zealand are those situated in Foveaux Strait, between South and Stewart Islands, and the rock-oyster beds on the east and west coasts of the Auckland peninsula. The Foveaux Strait beds are very extensive, and are considered to be inexhaustible. An official prospecting cruise was carried out in respect of these beds in 1904, resulting in a number of new beds being discovered and reliable information being ascertained concerning the areas and qualities of the various beds.
During the 1918 season 25,007 sacks of oysters, valued at £12,503, were picked from the Foveaux Strait beds. Of these, 2,180 sacks, containing 142,800 dozen oysters, valued at £1,114, were exported to Australia.
The rock-oyster beds of Auckland were worked for many years under a variety of systems, including the leasing of the beds to individuals and the licensing of pickers to take oysters on payment of a fee, but owing to stripping of the beds close seasons had frequently to be proclaimed. For some years an export duty of 6d. per hundredweight was payable on all North Island oysters exported, and in 1899 the export of rock-oysters and also of mangrove-oysters was absolutely prohibited. A further step towards conserving the beds was taken in 1908, when the picking of rock-oysters from the North Island beds was undertaken by the State, private picking being prohibited. A table is given showing the. quantity and value of oysters picked and sold by the State during each of the last five years; also the cost of picking and selling, this item including interest and depreciation on the cost of the oil-launches used by the Inspectors. It will be seen that a profit accrues to the State, and the scheme has, moreover, resulted in the conservation of the beds.
| Season. | Oysters sold. | Prices realized. | Cost of picking and selling. |
|---|---|---|---|
| Sacks. | £ | £ | |
| 1914 | 8,361 | 5,752 | 4,087 |
| 1915 | 9,396 | 6,715 | 5,475 |
| 1916 | 8,172 | 5,693 | 4,282 |
| 1917 | 10,357 | 6,890 | 5,819 |
| 1918 | 10,422 | 7,517 | 6,822 |
Most of the rock-oysters are marketed in Auckland, the price per sack charged there last season being 13s. 6d. Parcels of four and one-half dozen are sold at 1s., and parcels of sixteen dozen at 3s. 6d.
Mangrove-oysters grow on the roots of the mangrove-trees in the northern part of Auckland, but there is no market for them in New Zealand. As stated above, the export of mangrove and rock oysters has been prohibited for some years past. An inspection of the beds during 1915 showed that the quantities of these oysters were not nearly so great as was thought.
Various attempts were made about fifteen years ago to form artificial oyster-beds, but none of these met with success. A further attempt to plant rook-oysters in the Marlborough Sounds has been made recently, and, so far as can be seen at present, this has resulted successfully. During the past year eighty sacks of Foveaux Strait oysters were planted in a suitable place in Cook Strait.
In the earlier part of the nineteenth century New Zealand was the centre of an important whale-fishery, many whaling-stations being established in the North of Auckland and in Cook and Foveaux Straits. The industry gradually declined in importance until at present only two or three stations remain. The whales caught are mostly of the hump-back variety. At Whangamumu, North Auckland, a whaling-steamer, fitted with the most modern appliances for killing and handling whales, has been placed in commission, and a very serviceable whaling plant has been established. Forty-one were taken last season in this locality, yielding 224 tons of oil and 38 tons of bonedust, of a total value of £7,176. Whaling operations are also carried on from Kaikoura and Tory Channel, in Marlborough. The value of the product of the Marlborough, whale-fisheries in 1918 (290 tons of oil) was £8,700, the number of whales caught being forty-nine.
An attempt to revive the whaling industry on a large scale was made some few years ago, and a fleet of vessels was sent out from Norway, but their operations did not meet with the success anticipated.
A close season for seals existed in New Zealand from the end of August, 1894, until 1913, but owing to poaching, which it was found impossible to atop, the seals did not increase to any great extent. It was proposed a few years ago to grant licenses for the right to take seals, one of the conditions of which was that a royalty should be paid on each skin. Tenders were invited for the licenses, but none were received. At present the taking of seals is prohibited.
As early as 1807 attempts wore made to introduce English brown trout into New Zealand. The first attempt was not successful, but from ova imported in the two following years and hatched at Opoho the bulk of the trout now inhabiting the streams and lakes of the Dominion have descended. In later years Loch Leven and Scottish brown trout were introduced, as also rainbow trout, perch, carp, and tench.
Beginning in 1874, various attempts were made to introduce salmon into New Zealand. Up to 1889, ova of Atlantic salmon to the number of 474,000 had been imported and the fry liberated in the Aparima and other rivers considered suitable in the South Island, but no salmon have been caught in those rivers. Similarly, quinnat-salmon fry were liberated in the Waitaki and a few other rivers from 1875 to 1880, but up to 1900 none of the fish had been caught. Beginning with 1901., several more shipments of quinnat-ova were imported by the Government, and at length, in 1905, several specimens of this fish were taken in the Waitaki River, as well as in Oamaru Bay. Every season since 1905 the quinnat salmon have returned to the Waitaki in increasing numbers, and they are now firmly established as an adjunct to the Dominion's freshwater fisheries. Last year which was an exceptionally poor one in this respect, only 77,000 quinnat-ova were collected, the localities being the Hakataramea and Dobson Rivers. The fish have now extended along the east coast as far as the Waiau-ua River in the north and the Taieri in the south.
Ova of the sockeye or blue-back salmon were imported in 1902, and specimens of this fish were caught in 1907. Further efforts to introduce the Atlantic salmon in the Waiau River (Southland) have also been made in recent years, but at present it is impossible to say whether or not these attempts have met with success.
Several shipments of whitefish-ova have been made since 1898, the fry being liberated in Lakes Kanieri and Tekapo. Reports as to the fish having been seen, are received from time to time, but so far as is known none have yet been caught.
Trout from Lakes Taupo and Rotorua are now marketed, principally in Auckland, by the Government. During the 1917-18 season 38,217 trout, of a total weight of over 46 tons and a value of £1,727, were sold to the public.
Municipal fish-markets have been established at Wellington and Auckland with a view to bringing the fisherman and the public into closer contact, and enabling the former to dispose of his catch at a figure which ensures a good return to himself and is reasonable from the point of view of the public.
The market is under the management of a Markets Committee appointed by the City Council. The office and premises are situate at Hobson Street Wharf, where the two Municipal trawlers discharge their loads of fish. Two motor-lorries are engaged delivering the fish to the various hotels and fish-shops in Auckland City and suburbs, while an increasing trade is also being done with country districts. At the market facilities are provided for handling and treating fish, and for the performance of necessary work in connection with the industry. The premises comprise a trawling-shed (where nets are repaired and new nets made), store-rooms, receiving and cleaning sheds, boiler-house, seven smoke-houses, refrigerating-chamber, and a shed for treating rabbit-skins.
The staff at the wholesale market consists of a manager, book-keeper, and office staff; two smokers, eighteen cleaners, oysterman, and two motor-drivers.
The market is open from 6 a.m. to 5 p.m. daily, and a night staff is provided for receiving, cleaning, and smoking fish for the next day's business. The sales at the wholesale market for the year ending 31st March, 1919, totalled £15,364. In addition, at the retail premises in Queen Street, conducted by a manager, four salesmen, cashier, and oyster-opener, the turnover was £10,125.
The following statement shows the quantity and variety of fish handled during the twelve months ended 31st March, 1919:—
The s.t. "Cowan." as a result of twelve months' trawling, brought in 9,189 baskets of about 100 lb. each of mixed fish (chiefly snapper): total, 410 tons 11 cwt. 1 qr. 5 lb., at a cost of from £9 to £16 per ton.
The s.t. "Phantom," under contract for the Municipal market, caught 3,790 baskets of about 100 lb. each—total, 164 tons 14 cwt. 1 qr.
The largest trawler was mine-sweeping the whole of the year 1918-19, which decreased the supply about 60 per cent.
Additional supplies from co-operative societies, fishermen, and others are as follows.
| — | Bundles. | Purchasing Price. | Selling Price. | |||||||||
|---|---|---|---|---|---|---|---|---|---|---|---|---|
| s. | d. | s. | d. | s. | d. | s. | d. | |||||
| Snapper (24 lb. bundles) | 13,119 | bundles | 2 | 3 | to | 4 | 6 | 2 | 6 | to | 5 | 0 |
| Flounder (large) | 8,599 | dozen | 3 | 6 | to | 5 | 6 | 3 | 9 | to | 6 | 0 |
| Flounder (small) | 9,044 | dozen | 1 | 6 | to | 2 | 3 | 1 | 9 | to | 2 | 6 |
| Mullet (Auckland) | 3,656 | dozen | 5 | 0 | to | 8 | 0 | 6 | 0 | to | 10 | 0 |
| Mullet (Onehunga) | 1,209 | dozen | 2 | 6 | to | 3 | 6 | 3 | 0 | to | 4 | 0 |
| Mullet (Kaipara) | 5,549 | dozen | 1 | 0 | to | 3 | 1 | 1 | 3 | to | 4 | 0 |
| Crayfish | 295 | dozen | 18 | 0 | to | 20 | 0 | 22 | 0 | to | 25 | 0 |
| Piper | 1,043 | dozen | 0 | 4 | 0 | 5 | ||||||
| Trevally | 73 | dozen | 1 | 6 | 2 | 0 | ||||||
| Gurnard | 518 | dozen | 1 | 0 | to | 1 | 6 | 0 | 6 | to | 1 | 6 |
| Trout | 6,142 | lb. | 0 | 3 1/2 | to | 0 | 4 | 0 | 5 | to | 0 | 6 |
| Shrimps | 353 | lb. | 1 | 0 | 1 | 6 | ||||||
| Hapuku and kingfish | 14,811 | lb. | 0 | 2 | to | 0 | 3 1/2 | 0 | 3 | to | 0 | 4 1/2 |
| Whitebait | 4,808 | lb. | 1 | 0 | to | 2 | 0 | 1 | 3 | to | 2 | 6 |
| Oysters | 423 | sacks | 14 | 0 | 14 | 6 | ||||||
| Mussels | 32 | sacks | 6 | 0 | 6 | 6 | ||||||
| Mixed fish: dogfish, bream, butterfish, tarakihi, dabs | 1,920 | dozen | 1 | 0 | to | 2 | 0 | 1 | 6 | to | 2 | 6 |
| Rabbits | 13,961 | pairs | 1 | 1 | 1 | 3 | ||||||
The registration and licensing of fishing-boats and of boats engaged in taking oysters was made compulsory in July, 1904. A table is appended showing the number licensed at the various ports of the Dominion in each of the past five years:—
| Port. | 1914. | 1915. | 1916. | 1917. | 1918. |
|---|---|---|---|---|---|
| Auckland | 389 | 216 | 284 | 136 | 195 |
| Blenheim | 6 | 12 | 7 | 12 | 7 |
| Bluff | 81 | 70 | 66 | 57 | 54 |
| Chatham Islands | .. | 14 | 20 | 14 | 15 |
| Dunedin | 91 | 94 | 92 | 73 | 75 |
| Gisborne | 28 | 17 | 17 | 23 | 21 |
| Greymouth | 9 | 6 | 8 | 12 | 10 |
| Hokianga | 15 | 26 | 27 | 15 | 21 |
| Hokitika | .. | 1 | 2 | 1 | 1 |
| Invercargill | 42 | 44 | 42 | 23 | 20 |
| Kaiapoi | .. | 40 | .. | 36 | .. |
| Kaipara | 42 | 54 | 35 | 22 | 100 |
| Karamea | .. | 3 | .. | .. | .. |
| Kawhia | .. | 5 | .. | .. | .. |
| Lyttelton | 261 | 174 | 58 | 48 | 68 |
| Mangonui | .. | 3 | .. | .. | .. |
| Napier | 51 | 65 | 68 | 53 | 59 |
| Nelson | 83 | 72 | 69 | 60 | 65 |
| New Plymouth | 20 | 21 | 23 | 20 | 31 |
| Oamaru | 28 | 34 | 32 | 29 | 31 |
| Picton | 32 | 26 | 22 | 20 | 18 |
| Rangiora | .. | 14 | .. | 10 | .. |
| Russell | 67 | 75 | 47 | 35 | 30 |
| Southbridge | .. | 11 | .. | 19 | .. |
| Tauranga | 32 | 41 | 13 | 20 | 30 |
| Thames | 57 | 60 | 48 | 30 | 45 |
| Timaru | 26 | 27 | 23 | 22 | 22 |
| Wanganui | 13 | 17 | 15 | 8 | 9 |
| Wellington | 70 | 73 | 84 | 77 | 52 |
| Westport | 16 | 18 | 8 | 10 | 16 |
| Totals | 1,459 | 1,330 | 1,220 | 885 | 998 |
Provision exists in the Fisheries Act, 1908, whereby owners of boats and fish-curers may be required to make returns to the Marino Department in such form and in such manner as may be prescribed by the Governor-General in Council, but advantage of this provision has not yet been taken to enable information to be collected as to quantity of fish caught.
A table has been compiled by the Chief Inspector of Fisheries showing the various kinds of fish caught and the approximate quantity and value of fish landed at the different fishing-ports for the year ended the 31st March, 1919. The figures are as follows:—
| Port. | Kinds of Fish caught. | Total Weight. | Total Value. |
|---|---|---|---|
* Also 330 sacks crayfish and 400 sacks pipi. | |||
| Cwt. | £ | ||
| Hokianga | Mullet, snapper, flounder, and kahawai | Not supplied. | |
| Russell | Mullet, snapper, flounder, hapuku, kingfish, tarakihi, and kahawai | 2,400 | 12,200 |
| Whangarei | Snapper, mullet, flounder, hapuku, and gurnard | 2,470 | 3,458 |
| Kaipara | Mullet, flounder, snapper, and kahawai | 5,620 | 5,152 |
| Auckland | Snapper, mullet, trevally, flounder, john dory, hapuku, gurnard, kahawai, tarakihi, kingfish, barracouta, and garfish | 74,232 | 70,096 |
| Thames | Snapper, flounder, sole, kahawai, and garfish | 27,700 | 15,246 |
| Tauranga | Snapper, hapuku, trevally, kahawai, moki, kingfish, and flounder | Not supplied. | |
| Gisborne | Snapper, tarakihi, gurnard, flounder, sole, and crayfish | 3,125 | 4,130 |
| Wanganui | Flounder, snapper, hapuku, blue cod, mullet, and kahawai | 103 | 198 |
| Napier | Flounder, sole, snapper, gurnard, blue cod, butterfish, hapuku, moki, trumpeter, ling, barracouta, kingfish, trevally, warehou, and crayfish | 11,557* | 16,070 |
| Port. | Kinds of Fish caught. | Total Weight. | Total Value. |
|---|---|---|---|
* Also 120 dozen crayfish. † Also 70 sacks crayfish. | |||
| Foxton | Whitebait, flounder, snapper, and kahawai | 100 | 1,120 |
| Wellington | Snapper, hapuku, kingfish, warehou, butterfish, blue cod, flounder, sole; and kahawai | 16,400 | 20,160 |
| Picton | Blue cod, hapuku, herring, butterfish, and flounder | 91 | 1,700 |
| Blenheim | Flounder, sole, tarakihi, moki, butterfish, ling, snapper, garfish, and crayfish | 540 | 850 |
| Nelson | Snapper, flounder, gurnard, kahawai, moki, garfish, hapuku, herring, blue cod, butterfish, barracouta, and crayfish | 908* | 823 |
| Westport | Hapuku, snapper, blue cod, kahawai, herring, flounder, sole, crayfish, and whitebait | 1,165† | 2,567 |
| Greymouth | Hapuku, snapper, herring, red cod, sole, flounder, and whitebait | 76 | 180 |
| Hokitika | Flounder, herring, kahawai, snapper, hapuku, and whitebait | 447 | 2,347 |
| Kaikoura | Groper, ling, kingfish, flounder, trumpeter, and blue cod | 2,860 | 8,500 |
| Rangiora | Flounder, herring, and whitebait | 91 | 677 |
| Kaiapoi | Flounder, kahawai, whitebait, and herring | 573 | 2,510 |
| Southbridge | Flounder, herring, and red cod | 200 | 1,060 |
| Lyttelton | Groper, ling, red cod, herring, flounder, garfish, butterfish, moki, and trevally | 6,000 | 12,000 |
| Akaroa | Groper, blue cod, red cod, trevally, moki, butterfish, flounder, sole, ling, tarakihi, and crayfish | 1,550† | 1,664 |
| Timaru | Groper, sole, flounder, brill, ling, red cod, gurnard, barracouta, and elephant-fish | 5,000 | 8,000 |
| Oamaru | Groper, red cod, blue cod, moki, warehou, barracouta, and ling | 3,548 | 2,189 |
| Moeraki | Groper, blue cod, red cod, moki, warehou, barracouta, and ling | 2,556 | 2,186 |
| Dunedin and Port Chalmers | Groper, kingfish, ling, barracouta, blue cod, red cod, moki, trumpeter, bream, tarakihi, trevally. herring, garfish, elephant-fish, flounder, sole, and brill | 34,180 | 35,889 |
| Invercargill | Blue cod, red cod, groper, and flounder | 645 | 733 |
| Bluff | Blue cod, groper, flounder, trevally, trumpeter, and sole | 5,202 | 6,841 |
| Stewart Island | Blue cod, red cod, groper, butterfish, and moki | 3,568 | 5,981 |
| Chatham Islands | Blue cod. and groper | 3,624 | 3,750 |
| Totals | 216,531 | 248,277 | |
In addition, the produce of the oyster-fisheries was valued at £20,019, and of the whale-fisheries at £15,876.
A further table is given below showing the number of steam trawlers, oil engine trawlers, and other vessels employed in line and net fishing, with the number of fishermen employed, and approximately the total number of persons engaged in the fishing industry at each port for the year ended the 31st March, 1919.
| Name of Port. | Steam Trawlers. | Oil-engine Trawlers. | Line- and Net-fishing Vessels. | Number of Fishermen employed. | Persons employed in various Ways in connection with the Industry. | Total Number of Persons employed. |
|---|---|---|---|---|---|---|
* Principally whitebait-fishing. | ||||||
| Hokianga | .. | .. | 9 | 17 | .. | 17 |
| Russell | .. | .. | 30 | 60 | .. | 60 |
| Whangarei | .. | .. | 15 | 20 | 10 | 30 |
| Kaipara | .. | .. | 25 | 30 | 15 | 45 |
| Auckland | 5 | .. | 65 | 157 | 44 | 201 |
| Thames | .. | .. | 36 | 108 | 22 | 130 |
| Tauranga | .. | .. | 39 | 30 | .. | 30 |
| Gisborne | 2 | .. | 23 | 59 | .. | 59 |
| Napier | 9 | .. | 54 | 110 | 18 | 128 |
| Wanganui | .. | 2 | 10 | 7 | 4 | 11 |
| Foxton | .. | .. | 19 | 24 | .. | 24 |
| Wellington | 1 | .. | 92 | 230 | 140 | 370 |
| Picton | .. | .. | 18 | 25 | 10 | 35 |
| Blenheim | .. | 3 | 5 | 14 | 2 | 16 |
| Nelson | 2 | .. | 58 | 20 | 10 | 30 |
| Westport | 1 | 8 | 14 | 20 | .. | 20 |
| Greymouth | .. | 2 | 10 | 12 | .. | 12 |
| Hokitika | .. | .. | 1 | 90* | .. | 100 |
| Kaikoura | .. | .. | 10 | 22 | .. | 22 |
| Lyttelton and Sumner | .. | 5 | 36 | 63 | .. | 63 |
| Akaroa | .. | .. | 12 | 17 | .. | 17 |
| Southbridge | .. | .. | 11 | 18 | .. | 18 |
| Kaiapoi and Styx | .. | .. | 44 | 45 | .. | 45 |
| Rangiora | .. | .. | 15 | 15 | .. | 15 |
| New Brighton | .. | .. | 5 | .. | .. | 5 |
| Timaru | 1 | 8 | 16 | 40 | 8 | 48 |
| Oamaru and Moeraki | .. | .. | 29 | 41 | .. | 41 |
| Dunedin and Port Chalmers | 2 | 4 | 60 | 111 | 89 | 200 |
| Invercargill | .. | .. | 13 | 15 | .. | 15 |
| Bluff | 3 | .. | 50 | 107 | .. | 107 |
| Stewart Island | .. | .. | 28 | 58 | 8 | 66 |
| Chatham Islands | .. | .. | 13 | 30 | 11 | 41 |
| Grand totals | 26 | 32 | 865 | 1,620 | 401 | 2,021 |
Included in New Zealand produce exported during the past fire years were,—
| Item. | 1914. | 1915. | 1916. | 1917. | 1918. |
|---|---|---|---|---|---|
| £ | £ | £ | £ | £ | |
| Fish | 34,778 | 37,166 | 37,475 | 23,818 | 19,202 |
| Oysters | 2,396 | 2,057 | 1,340 | 244 | 1,114 |
| Whalebone | 1,243 | 250 | 280 | .. | .. |
| Whale-oil | 2,910 | 3,011 | 1,647 | 5,511 | 12,618 |
| Ambergris | 920 | .. | .. | .. | .. |
| Other products of fisheries | 2,417 | 2,412 | 1,751 | 201 | 25 |
| Totals | 44,664 | 44,896 | 42,493 | 29,774 | 32,959 |
The value of fish imported in 1918 was £133,321.
Table of Contents
NEW ZEALAND has been described by an eminent geologist as a mineralized rather than a mineral country, for although in no other country of equal size are indications of a greater number of economic minerals to be found, yet, with the exception perhaps of iron-ore, the known mineral reserves are not great in comparison with those in many other countries, and the value of our mineral production is incomparable with that of our pastoral products. The life of our coalfields has been estimated by the Director of Geological Survey at under one hundred years, but this is not of supreme importance, as coal in abundance occurs in New South Wales, of which a large quantity is imported into this Dominion. Likewise, in the almost unrivalled resources of water-power from our mountain rivers and streams suitable for the production of hydro-electric power New Zealand possesses an inexhaustible resource of continuously increasing value, which will be still available when the coalfields of the world are exhausted.
The gold-mining industry, which in its early stages contributed greatly to the progress and settlement of New Zealand, has for a number of years continued to decline in importance, in common with most other gold-producing countries. The causes of such decline are found in the approaching exhaustion of the most accessible known alluvial-gold deposits, the exhaustion of ore from the zones of secondary enrichment, and the increased cost of material and labour, whereas the value of gold has remained stationary.
The quantities and values of metals and minerals entered for exportation, also the coal output during the years 1917 and 1918, and the total value since 1853, are —
| 1917. | 1918. | Total Value since 1853. | |||
|---|---|---|---|---|---|
| Oz. | £ | Oz. | £ | £ | |
| Silver | 787,152 | 105,299 | 879,383 | 171,456 | 2,458,248 |
| Tons. | Tons. | ||||
| Quicksilver | .. | .. | 4 1/2 | 2,122 | 2,122 |
| Copper-ore | 6 | 163 | .. | 6 | 19,378 |
| Chrome-ore | .. | .. | .. | .. | 38,002 |
| Antimony-ore | .. | .. | 13 | 104 | 55,045 |
| Manganese-ore | .. | .. | .. | .. | 61,905 |
| Hæmatite ore | .. | .. | .. | .. | 469 |
| Tungsten-ore | 161 | 28,972 | 169 13/20 | 37,922 | 268,444 |
| Sulphur (crude) | 1/10 | 2 | .. | .. | 13,241 |
| Mixed minerals | 2,351 | 6,679 | 2,286 3/4 | 5,772 | 237,328 |
| Coal | 2,068,419 | 1,186,710 | 2,034,250 | 2,530,677 | 27,591,483 |
| Kauri-gum | 4,594 | 291,917 | 2,419 | 157,313 | 18,325,252 |
| Shale | .. | .. | .. | .. | 7,236 |
| Coke | 119 | 240 | 70 | 146 | 25,512 |
[Note.—Publication of the gold export from New Zealand during 1917 and 1918 is prohibited as a war measure.]
The total value of the mineral production of Australia and New Zealand to the end of the year 1916 is shown in the following table:—
| State. | Gold. | Silver and Lead. | Copper. | Tin. | Coal. | Other Minerals. | Totals. |
|---|---|---|---|---|---|---|---|
* Inclusive of kauri-gum, £17,876,022. | |||||||
| £ | £ | £ | £ | £ | £ | £ | |
| New S'th Wales | 61,649,740 | 75,412,860 | 13,478,070 | 10,589,308 | 83,356,873 | 24,659,026 | 269,145,877 |
| Victoria | 297,794,151 | 226,038 | 218,590 | 816,996 | 3,518,647 | 617,532 | 303,191,954 |
| Queensland | 79,380,926 | 2,503,615 | 17,421,440 | 8,995,443 | 6,995,984 | 2,781,594 | 118,079,002 |
| South Australia | 1,007,888 | 342,199 | 30,036,799 | ... | ... | 2,450,007 | 33,836,893 |
| W'st'n Australia | 129,766,685 | 1,036,558 | 1,449,041 | 1,261,568 | 1,657,415 | 108,390 | 135,279,663 |
| Tasmania | 7,806,489 | 6,920,455 | 12,724,674 | 13,407,043 | 684,337 | 296,144 | 41,839,142 |
| N'th'n Territory | 2,147,803 | 78,940 | 350,975 | 409,989 | ... | 77,149 | 3,064,856 |
| Commonwealth | 579,553,682 | 86,520,665 | 75,679,589 | 35,480,347 | 96,213,256 | 30,989,848 | 904,437,387 |
| Mew Zealand | 85,847,675 | 2,181,493 | 19,209 | ... | 23,901,096 | 18,478,241* | 130,427,714 |
| Totals | 665,401,357 | 88,702,158 | 75,698,798 | 35,480,347 | 120,114,352 | 49,468,089* | 1034,865,101 |
The value of minerals (excluding gold) entered for exportation, and of the coal-output during 1918, was £2,905,518, and their total value to the end of 1918 was £49,103,665.
Gold-mining operations in New Zealand are divided into three branches, viz.: (1) Quartz-mining, (2) Alluvial mining, and (3) Dredging.
The statement following shows for the years 1917 and 1918 the value of the bullion production and dividends declared by gold-mines; also the number of persons ordinarily employed, and the number of mines and dredges being worked:—
| - | Production of Bullion (all Mines). | Dividends paid (by Registered Companies only). | Number of Persons ordinarily employed. | Number of productive Mines and Dredges. | ||
|---|---|---|---|---|---|---|
| 1918. | 1917. | 1918. | 1917. | 1918. | 1918. | |
| £ | £ | £ | £ | |||
| Quartz-mining | 743,731 | 911,799 | 193,519 | 203,069 | 1,751 | 50 |
| Dredges | 63,691 | 91,666 | 4,925 | 4,800 | 187 | 28 |
| Alluvial mining | 78,895 | 89,941 | 4,953 | 5,710 | 520 | 153 |
| Totals | 886,317 | 1,093,406 | 203,397 | 213,579 | 2,458 | 231 |
As regards dredges and alluvial mining, the bullion-production is from all dredges and claims, whereas the dividends paid are only obtainable from those few which are owned by registered companies.
The most important gold-mining operations in New Zealand consist in the working of quartz lodes and the extraction of the precious metals therefrom, Quartz-mining is conducted in the North Island in the Ohinemuri County, and to a less extent in the Thames and Coromandel Counties. The mountain ranges and hills of andesite and other volcanic rocks which form the Hauraki Goldfields are intersected by lodes containing gold and silver. In the South Island quartz-mining operations are carried on in the Reefton and Blackwater districts, also to a small extent in the Wakamarina Valley (Marlborough). In Otago the only quartz-mining operations of importance are in connection with the working of quartz-mines in which scheelite is associated with gold.
Alluvial gold is found chiefly on the west coast of the South Island and in Otago, where mining operations have been conducted over an area of 17,000 square miles. On the West Coast the auriferous alluvium originated from the weathering and denudation of the gold-bearing lodes during countless ages. The rich leads or defined placers of auriferous wash are the result of concentration. The first transportation of auriferous gravel from the mountains was by streams, and following this the glaciers carried much material from the interior seawards. During the advance and retreat of these glaciers immense masses of drift were deposited all over the low lands and even high up on the lower hills. Since glacial times the rivers have continued the movement of auriferous gravel from the interior to the sea. In Otago the conditions are different—the alluvial gold rests in the hollows of the denuded surface of the schistose rocks, from which it has most probably been derived.
The method of working these deposits depends on the depth of the superincumbent strata and the elevation at which they occur; for if there is ample fall and a good supply of water hydraulic sluicing has been generally adopted; but where the material is mainly or partly below water-level, and is comparatively free from hard boulders or hard matrix, hydraulic sluicing and elevating or dredging is employed.
This system of gold - mining, which originated in New Zealand, is generally employed upon rivers and streams and at places where the sluicing method may not be advantageously applied owing to the absence of water-supply or to excessive water in the deposits. Gold-dredging is rapidly declining in importance, the number of productive dredges having decreased from 167 during 1906 to twenty-eight during 1918.
The greatest weekly output by a New Zealand gold-dredge was attained by the "Lady Ranfurly" during six days ended the 4th November, 1904, when operating on the River Molyneux (Clutha), 1,273 oz. of gold being obtained. This dredge was owned by the Electric Gold-dredging Company, which at the end of 1917 had produced by dredging, gold to the value of £240,681, of which £132,593 was distributed as dividends.
The following table shows the result of dredge-mining operations in New Zealand from 1909 to 1918 inclusive:—
| Year. | Total Number of Dredges working. | Value of Production. | Average Production per Dredge. | Dividend-paying Dredges owned by Registered Companies. | Number of Persons employed. | |
|---|---|---|---|---|---|---|
| Number. | Dividends. | |||||
| £ | £ | £ | ||||
| 1909 | 111 | 327,676 | 2,952 | 37 | 56,788 | 893 |
| 1910 | 104 | 315,237 | 3,031 | 35 | 51,918 | 838 |
| 1911 | 93 | 297,900 | 3,203 | 31 | 45,318 | 775 |
| 1912 | 87 | 257,333 | 2,958 | 28 | 38,841 | 694 |
| 1913 | 74 | 195,848 | 2,646 | 11 | 18,750 | 621 |
| 1914 | 64 | 191,112 | 2,986 | 16 | 23,080 | 491 |
| 1915 | 52 | 164,605 | 3,165 | 21 | 26,333 | 427 |
| 1916 | 45 | 125,317 | 2,785 | 10 | 9,915 | 392 |
| 1917 | 35 | 91,666 | 2,619 | 6 | 4,800 | 260 |
| 1918 | 28 | 63,691 | 2,274 | 5 | 4,925 | 187 |
The gold-yield of Australia and New Zealand (in fine ounces) during the years 1901, 1906, 1911, and 1916 was as follows:—
| 1901. | 1906. | 1911. | 1916. | |
|---|---|---|---|---|
| Fine Ounces. | Fine Ounces. | Fine Ounces. | Fine Ounces. | |
* Including Northern Territory. | ||||
| New South Wales | 173,543 | 253,987 | 181,121 | 108,145 |
| Victoria | 730,450 | 772,291 | 504,000 | 256,653 |
| Queensland | 598,382 | 544,636 | 386,165 | 215,162 |
| South Australia* | 21,946 | 19,122 | 9,817 | 8,370 |
| Western Australia | 1,703,417 | 1,794,548 | 1,370,868 | 1,061,399 |
| Tasmania | 69,490 | 60,023 | 31,101 | 15,790 |
| New Zealand | 412,876 | 534,616 | 427,346 | 282,319 |
| Totals | 3,710,104 | 3,997,223 | 2,910,418 | 1,947,838 |
The value is as follows: 1901, £15,759,515; 1900, £16,902,649; 1911, £12,362,667; 1916, £8,273,885.
Even allowing for the effects of the war, it is evident that the annual output for Australia and New Zealand is decreasing to a very considerable extent. The output for each of the ten years 1907-16 was,—
| Year. | Fine Ounces. |
|---|---|
| 1907 | 3,659,039 |
| 1908 | 3,546,285 |
| 1909 | 3,439,818 |
| 1910 | 3,166,437 |
| 1911 | 2,911,409 |
| 1912 | 2,642,604 |
| 1913 | 2,551,028 |
| 1914 | 2,265,990 |
| 1915 | 2,345,934 |
| 1916 | 1,947,838 |
The following figures showing the world's gold-production are taken from the Statistical Abstract of the United States:—
World's Gold-production, 1896-1916.
| Year. | Fine Ounces. |
|---|---|
* Subject to revision. | |
| 1896 | 9,783,914 |
| 1897 | 11,420,068 |
| 1898 | 13,877,806 |
| 1899 | 14,837,775 |
| 1900 | 12,315,135 |
| 1901 | 12,625,527 |
| 1902 | 14,354,680 |
| 1903 | 15,852,620 |
| 1904 | 16,804,372 |
| 1905 | 18,396,451 |
| 1906 | 19,471,080 |
| 1907 | 19,977,260 |
| 1908 | 21,422,244 |
| 1909 | 21,965,111 |
| 1910 | 22,022,180 |
| 1911 | 22,348,313 |
| 1912 | 22,549,335 |
| 1913 | 22,249,596 |
| 1914 | 21,240,416 |
| 1915 | 22,674,568 |
| 1916 | 22,107,669* |
Nearly the whole of the silver-production of New Zealand, amounting in value at the end of 1918 to £2,458,248, was obtained from the refinement of bullion from the quartz-mines, principally from those of the Hauraki Goldfield, where the two precious metals are found alloyed as an electrum, the ratio of the two metals in the alloy varying greatly. No other silver-mining operations have been carried out profitably in this country.
Iron-ore occurs in New Zealand at Parapara, Golden Bay; on the seashore in Taranaki; at Kerr Point and Waitangi River, North Auckland; in the Raglan-Kawhia district; on Mount Peel, Nelson; on Mount Royal, near Palmerston North; on Table Hill, near Milton; in the Lake Wakatipu district; and in the Mount Cook district, Westland.
The most extensive iron-ore deposits occur at Parapara, Golden Bay, in the Nelson Province, where it is estimated that the amount of limonite-ore on the surface exceeds 63,000,000 tons; but in the absence of any thorough system of prospecting this estimate must be regarded as inconclusive.
Samples of outcrop ore taken from the Parapara deposit some years ago were found to contain 51.38 per cent. of metallic iron. By means of prospecting-drives during 1913 more definite information concerning the ore was obtained, and the samples analysed showed the percentage of metallic iron to be 45.02. A comparison of the surface ore and ore taken from the drives is given—
| Outcrop Ore: | Ore from Drives: | |
|---|---|---|
| Average of 28 Samples. Per Cent. | Average of 15 Samples. Per Cent. | |
| Silica | 9.56 | 16.42 |
| Alumina | 3.36 | 5.39 |
| Ferric oxide | 71.25 | 64.32 |
| Ferrous oxide | 1.94 | .. |
| Manganous oxide | 0.65 | 0.71 |
| Lime | 0.51 | .. |
| Magnesia | 0.10 | 0.16 |
| Titanium-oxide | 0.63 | 0.49 |
| Phosphoric anhydride | 0.35 | 0.31 |
| Sulphuric anhydride | 0.21 | 0.18 |
| Carbon-dioxide | 0.10 | 0.46 |
| Alkalies | 0.08 | |
| Water, and loss on ignition | 11.84 | 11.56 |
| 100.58 | 100.00 | |
| Equivalents. | ||
| Metallic iron | 51.38 | 45.02 |
| Phosphorus | 0.15 | 0.13 |
| Sulphur | 0.08 | 0.75 |
Along the seashore from Patea to New Plymouth occur large quantities of magnetic ironsand more or less titaniferous. This has originated through the disintegration of hornblende-andesites and their tufas, which occur very extensively near New Plymouth around the volcanic cone of Mount Egmont. It is quite impossible to give any definite idea of the quantity of this ironsand; undoubtedly, however, it exists in immense quantities, and is measurable in millions of tons.
The most extensive deposit of ironsand occurs near Patea, the quantity of which has been estimated to be at least 5,374,000 tons of high-grade ore in addition to a great quantity of low-grade ironsand.
Between the years 1869 and 1918 there have been several attempts made to smelt Taranaki ironsand.
Near the Breakwater, New Plymouth, the New Zealand Iron-ore Smelting Company (Limited), which was formed for working the beach ironsand, commenced smelting during the latter part of 1917, and after several trials, pig iron was obtained in grades varying from white to grey.
The following is an analysis of the ironsand which, after magnetic concentration, was used in the blast furnace charge.—
* Equivalent to phosphorus, 0.30 per cent. † Equivalent to metallic iron, 56.36 per cent. | |
|---|---|
| Silica (SiO2) | 5.40 |
| Alumina (AlO3) | 1.53 |
| Lime (CaO) | 1.81 |
| Magnesia (MgO) | 2.80 |
| Phosphoric anhydride* | 0.69 |
| Titanium-dioxide (TiO2) | 10.45 |
| Ferrous oxide (FeO) | 28.71 |
| † Ferric oxide (Fe2O3) | 48.61 |
| 100.00 | |
At Kerr Point the deposit of iron-ore consists of limonite, but does not probably exceed 100,000 tons. The iron-ore near the head of the Waitangi River is also limonite of excellent quality, but does not exceed 100,000 tons. The limonite deposits in the Kawhia-Raglan district and on Table Hill, so far as known, are not large. Little authentic information exists concerning the iron-ore deposits at Mount Peel or at Mount Royal. In the Lake Wakatipu district from Moke Creek, through Benmore in the direction of Mount Gilbert, a band of hæmatite has been reported to occur also at Maori Point, Shotover River. On the Westland side of Mount Cook large quantities of magnetite are disseminated through chlorite schist.
Scheelite, one of the principal ores of tungsten, is mined at the gold-scheelite-quartz mines near Glenorchy, Paradise, Macrae's, Stoneburn, Hyde, and Barewood, Otago; also at Wakamarina Valley, Marlborough; at which places milling and concentrating plants have been installed.
The quantity of tungsten-ore exported during 1918 amounted to 169 1/2 tons, valued at £37,922, as compared with 161 tons, valued at £28,972, in 1917.
The following statement shows the quantity and value of scheelite exported since the year 1899:—
| Year. | Quantity exported. | Value. |
|---|---|---|
| Tons. | £ | |
| 1899 | 32 | 2,788 |
| 1900 | 54 | 2,635 |
| 1901 | 2 | 83 |
| 1902 | 39 | 1,200 |
| 1903 | 42 | 1,439 |
| 1904 | 17 | 791 |
| 1905 | 28 | 1,848 |
| 1906 | 55 | 3,407 |
| 1907 | 137 | 15,486 |
| 1908 | 68 | 6,055 |
| 1909 | 58 | 4,263 |
| 1910 | 143 | 15,070 |
| 1911 | 138 | 11,853 |
| 1912 | 135 | 13,347 |
| 1913 | 221 | 22,933 |
| 1914 | 204 | 21,498 |
| 1915 | 194 | 27,784 |
| 1916 | 266 | 49,070 |
| 1917 | 161 | 28,972 |
| 1918 | 169 1/2 | 37,922 |
| Totals | 2,163 1/2 | 268,444 |
The quantity of tungsten-ore concentrate produced during 1918 was 143 3/10 tons (value £31,279).
The principal operations have been carried out in the locality of Glenorchy, where the lodes occur in the mica-schist of Mount Judah, in the Richardson Range, which flanks the lake to the eastward. The area over which these lodes occur and mining operations are in progress is considerable, extending from the Junction Mine, a few miles to the east of Glenorchy, at an altitude of about 3,500 ft. above Lake Wakatipu, northward about twelve miles to Mount Albert Mine, near Paradise, on the Dart River. At numerous points in this distance scheelite-quartz lodes have been found at altitudes varying up to 5,000 ft. above the lake. All the lodes developed belong to the class of replacement fissure lodes in which a zone of country rock lying between two more or less parallel fissures has become crushed and contorted by wall-movement, and more or less silicified and partially replaced by quartz and calcite containing scheelite and a little gold.
During the war period the price of scheelite concentrates which had been commandeered by the British Government was raised from £2 15s. per unit (per ton) of tungsten acid to £3 8s. Prior to 1914 the market price was about half the latter amount. The decline in production is due to depletion of known deposits, and retarded development at the productive mines. During 1919 the Imperial Government has terminated its agreement to purchase all tungsten-ore.
Ores of copper are found in New Zealand in no fewer than thirty-two localities, but during the past fifty years attempts at their successful exploitation have been unprofitable, the total recorded copper-production at the end of 1918 amounting in value to only £19,378. Prior to the inauguration of systematic records there was a considerable production from mines on Great Barrier and Kawau Islands.
Copper-mines have been worked on Kawau and Great Barrier Islands in the Hauraki Gulf, and on the Dun Mountain, near Nelson. Underground prospecting has been carried on near Kaeo, Whangaroa; at Maharahara, near Woodville; and at Mount Radiant, near Karamea; but no conclusive results have been obtained.
Manganese-ore has been found at Otau, Wairoa, Bay of Islands, Purua Bay, Mangapai, Otonga, Waiheke Island, and Taieri Mouth. Many years ago a considerable amount of manganese-ore was mined at Tikiora, near Bay of Islands. At a later period operations were carried on at Waiheke Island, distant about twelve miles from Auckland. On that island manganese-ore may be traced for several miles, where it occurs in massive but bunchy form and of excellent quality, bulk analyses returning 56.5 per cent. metallic manganese. Some thousands of tons have been exported, but it is supposed that fluctuating prices prevented expansion of this industry. The total quantity of manganese-ore exported to the end of 1918 amounted to 19,364 tons, value £61,905.
After several unsuccessful attempts, extending over a number of years, to work our cinnabar-deposits in the Auckland Province, satisfactory and profitable results have been obtained by the New Zealand Quicksilver-mines (Limited), whose mine and furnace are situated at Puhipuhi, about twenty-eight miles by road from Whangarei.
This company, having installed a furnace at its mine, has successfully treated two trial parcels of ore with the following results: 1917-68 tons of ore yielded 1,500 lb. of mercury; 1918—582 tons of ore yielded 11,296 lb. of mercury. This mercury sold at 5s. per pound f.o.b. Auckland. Cinnabar-prospecting operations have also been carried out in the locality by two other small parties. The number of persons employed at the North Auckland cinnabar-mines is thirteen.
For the purpose of encouraging the cinnabar-mining industry the Government on the 1st August, 1917, published in the New Zealand Gazette a notice that a bonus of 4d. per pound would be paid on the production of the first 100,000 lb. of good marketable retorted quicksilver, free from impurities, from any mine in New Zealand on the following conditions:—
That at least one-half of the quantity is produced on or before the 31st March, 1920, and the remaining half on or before the 31st March, 1921.
The first instalment of the bonus will be paid when 50,000 lb. of quicksilver has been produced as stipulated to the satisfaction of an officer to be appointed by the Minister of Mines, and on whose certificate alone the bonus will be paid.
In the event of more than one person producing the required quantities of quicksilver before the dates named, inquiry will be made by the officer above referred to, when, if it is found that each applicant is equally entitled to a bonus, the amount will be divided in proportion to the quantities produced by each applicant, but in no case shall any bonus be paid until at least 50,000 lb. of quicksilver has been produced in the aggregate.
Cassiterite in the form of "stream-tin" occurs near Port Pegasus, Stewart Island, where it has been worked to some extent. "Lode-tin" has been found in the same locality, and is now being prospected. Small quantities of cassiterite have also been detected in the stream-gravels of the Reefton, Greymouth, and Westport districts. Among other localities in which traces of tin occur are Wet Jacket Arm (Otago) and Campbell Island.
In the published lists of minerals of New Zealand platinum is stated to occur in several places associated generally with gold in gravel. It is only from Southland, however, that platinum has been mined and exported.
The Customs Department has not kept any separate record of the quantity and value of platinum entered for exportation, the value of this metal exported being included in a general total of exports by parcel-post, by which means platinum has generally been despatched from the Dominion.
In Southland native platinum occurs in auriferous wash, and is distributed on the beaches and coastal terraces from Blue Cliffs, west of Invercargill, to Longbeach, Waikawa River, east of Invercargill, over a distance of about ninety-two miles. It is probable that the platiniferous sands of Southland have been derived from serpentine or other oh vine-bearing rocks, which are known to occur in Fiordland. In Russia and in Lapland platinum has been found in a matrix of serpentine (altered peridotite).
Native platinum has been obtained in payable quantities from claims at Cameron Creek, Groveburn, Orepuki, Pahi, Round Hill, Steel Head, Bushy Point, Waipapa, Otara Beach, Twelve-mile Beach, and Waikawa. The coarsest and heaviest samples have been obtained from west of the Waiau River, that obtained east of Otara being extremely fine. Direct from the gold-saving mats at the alluvial workings at the Waikoau River, Rowallen, as high a proportion as 1 oz. platinum to 3 oz. gold has been obtained.
The platinum is collected by miners as a residue, after amalgamation, of alluvial gold, and is reduced by further washing to about a 50-per-cent. concentrate, the remainder of the concentrate being chiefly iridosmine (osmiridium).
During the earlier and more prosperous era of gold-mining alluvial miners did not save the platinum, as the banks would not give more than a few shillings per ounce for mat concentrates of platinum and osmium-iridium; consequently by far the greater proportion collected on the gold-saving matting at alluvial claims was thrown away. As years passed the price increased; about 1907 it reached £6 per ounce for new refined platinum; during 1917 it was quoted on the London metal-market at £14 10s. per ounce.
The following are the results of assays of concentrates taken direct from the gold-saving mats of Smith's Claim, Round Hill: No. 1 sample—Gold per ton of concentrate, 55 oz.; platinum per ton of concentrate, 72 oz. No. 2 sample—Gold per ton of concentrate, 15 oz.; platinum per ton of concentrate, 51.5 oz.
The following is the result of an assay of a sample of concentrate from rich wash from the Otara Claim: Osmiridium, 15 dwt. 7 gr. per ton; platinum. 7 dwt. 14 gr. per ton; gold, 4 dwt. 22 gr. per ton; monazite. 2.07 per cent.; thoria, 0.67 per cent.
Native sulphur in sufficient quantity to be profitably worked is known to occur only in the thermal districts of the North Island, near Rotorua and Lake Taupo, and at White Island. With the exception of the small lake deposit on White Island, all the known native sulphur in payable quantity occurs in the form of pockets in pumice, or sinter around fumaroles or thermal springs (from which it has been sublimed in crystalline form), and as black sulphur. The fumarolic deposits, although of high grade generally, are inextensive when compared with those of massive form in seams or in veins as extensively worked in Japan, Sicily, and North America.
The only recent operations in connection with the sulphur-deposits were carried out at Rotorua. near the Postmaster Bath at the southern shore of the lake, by the New Zealand Drug Company, who obtained during 1917 1,120 tons from pockets in the sinter. To the end of that year 4,841 tons of crude sulphur were obtained from the same locality. During 1916 the company was granted a three-years lease of Section 3 of the Sanatorium Reserve for sulphur-mining purposes at a royalty of 15s. per ton. The sulphur is used at the chemical-works of the company.
Prior to 1898 there was no separate record kept of the quantity of native sulphur exported, this being included under the heading of "mixed minerals" in the official statistics, but the quantity was not large. The following quantities have since been exported:—
| Tons. | Value. £ | |
|---|---|---|
| 1898 | 1,765 | 4,097 |
| 1899 | 1,227 | 3,483 |
| 1900 | 1,692 | 4,824 |
| 1901 | 143 | 360 |
| 1902 | 100 | 475 |
Since 1902 the small quantity of sulphur produced has been used at chemical-works in the Dominion. Owing to the nature of the deposits and to transport difficulties it is unlikely that sulphur can be exported at a price to compete with the supplies of the above-mentioned countries.
Coal, varying in grade from anthracite to lignite, occurs in many parts of New Zealand. In proportion to the present yearly consumption of somewhat under 2,500,000 tons (10 to 15 per cent. of which is in normal times imported), the supply may be considered relatively large, but in comparison with probable future needs it is decidedly small. It is likely, indeed, that the proved coal resources of the Dominion will be practically exhausted within a hundred years.
The following is an estimate of the proved and probable coal in New Zealand by the Director of the Geological Survey of New Zealand.
| Class of Coal. | Proved. | Probable. | Possible. |
|---|---|---|---|
| Imperial Tons. | Imperial Tons. | ||
| Anthracite | Very little | Very little | Small. |
| Bituminous | 187,000,000 | 477,000,000 | Moderate. |
| Semi-bituminous | 68,000,000 | 196,000,000 | Moderate. |
| Brown | 194,000,000 | 728,000,000 | Large. |
| Lignite | 161,000,000 | 420,000,000 | Large. |
| Totals | 610,000,000 | 1,821,000,000 | Large. |
No individual coal-seam has yet been traced for more than a few miles in any direction. The variations in thickness are extraordinary. There are many instances of seams 10 ft. to 20 ft. thick thinning to 1 ft. or 2 ft. in distances of a quarter of a mile or less. The following instances of thick seams may be mentioned: In the Waikato district (Auckland), 50 ft. to 60 ft. of brown coal; in the Buller-Mokihinui district (Nelson), 53 ft. of bituminous coal; in the Kaitangata district (Otago), 30 ft. or more of brown coal; at Coal Creek, near Roxburgh, Central Otago, 80 ft. (or, according to Professor Park, 100 ft.) of lignite; at Nightcaps (Southland), 36 ft. of brown coal.
In New Zealand the difficulties in settling the relative ages of the principal coalfields are such that for many years the subject has been a controversial one. The known facts may be summarized as follows: In south-east Otago (Waikawa, Catlin's River) and in Southland (Hokonui Hills) small seams of coal occur in Jurassic rocks, but in no case is a workable seam known to be present. The chief coal-bearing rocks are probably of early Tertiary age, but late Cretaceous coal-seams almost certainly occur. There are also considerable quantities of lignite of Miocene, Pliocene, and possibly even Pleistocene age.
The following table shows the output of coal from each coalfield:—
| Name of Coalfield. | Output during 1918. | Approximate Total Output up to 31st December, 1918. |
|---|---|---|
| Tons. | Tons. | |
| North Auckland | 125,349 | 3,739,303 |
| Waikato (including Mokau) | 424,429 | 5,354,412 |
| Nelson | 13,954 | 342,241 |
| Buller | 580,796 | 15,634,050 |
| Inangahua | 16,237 | 295,612 |
| Grey | 386,102 | 9,566,773 |
| Canterbury | 20,475 | 757,135 |
| Otago | 316,449 | 9,443,892 |
| Southland | 150,459 | 3,069,522 |
| Totals | 2,034,250 | 48,192,840 |
The following statement shows the tons of coal and shale raised, persons employed, lives lost by accidents in or about coal-mines, &c., from 1899 to 1918:—
| Year. | Output. | Persons employed above and below Ground. | Tons raised per each Person employed Under-ground. | Lives lost. | ||
|---|---|---|---|---|---|---|
| Per Million Tons raised. | Per Thousand Persons employed. | Number by Accident. | ||||
* All the principal collieries were rendered idle by the strike during November and December. † Year of Ralph's (Huntly) explosion. | ||||||
| 1899 | 975,234 | 2,153 | 609 | 3.07 | 1.39 | 3 |
| 1900 | 1,093,990 | 2,460 | 593 | 3.65 | 1.62 | 4 |
| 1901 | 1,239,686 | 2,754 | 600 | 2.42 | 1.09 | 3 |
| 1902 | 1,365,040 | 2,885 | 655 | 1.46 | 0.69 | 2 |
| 1903 | 1,420,229 | 2,852 | 665 | 2.81 | 1.40 | 4 |
| 1904 | 1,537,838 | 3,288 | 609 | 2.60 | 1.21 | 4 |
| 1905 | 1,585,756 | 3,269 | 651 | 3.78 | 1.83 | 6 |
| 1906 | 1,729,536 | 3,692 | 687 | 3.46 | 1.62 | 6 |
| 1907 | 1,831,009 | 3,910 | 662 | 8.55 | 3.07 | 12 |
| 1908 | 1,860,975 | 3,894 | 641 | 2.68 | 1.28 | 5 |
| 1909 | 1,911,247 | 4,191 | 633 | 3.65 | 1.79 | 7 |
| 1910 | 2,197,362 | 4,599 | 634 | 7.28 | 3.55 | 16 |
| 1911 | 2,066,073 | 4,290 | 706 | 6.77 | 3.26 | 14 |
| 1912 | 2,177,615 | 4,328 | 681 | 4.13 | 2.08 | 9 |
| 1913* | 1,888,005 | 4,250 | 590 | 3.18 | 1.38 | 6 |
| 1914 | 2,275,614 | 4,734 | 639 | 21.53 | 10.35 | 49† |
| 1915 | 2,208,624 | 4,156 | 711 | 4.07 | 2.16 | 9 |
| 1916 | 2,257,135 | 3,988 | 750 | 2.65 | 1.50 | 6 |
| 1917 | 2,068,419 | 3,983 | 715 | 1.93 | 1.00 | 4 |
| 1918 | 2,034,250 | 3,994 | 703 | 2.95 | 1.50 | 6 |
| Totals to date | 48,207,283 | .. | .. | .. | .. | 335 |
The decline in the annual output for 1918 amounts to 2 per cent.; a similar decline occurred in the output per person employed underground.
Had it not been for the influenza epidemic, to which sixty-six coal-miners succumbed, and which caused most of the collieries to be idle for two or three weeks, an increased output would have been produced. The considerable decline in bituminous-coal production was principally due to scarcity of miners on the West Coast.
The State Coal-mines Act of 1901 provided for the acquisition and working of State coal-mines in New Zealand under the direct control of the Minister of Mines.
The gross capital expenditure on the State coal-mines up to the 31st March, 1919, amounted to £374,775, and no less than £210,868 of this amount has now been written off out of profits for depreciation, &c., being nearly 59 per cent. of the total capital embarked. The present book value of the assets is £148,718, but the actual value is largely in excess of that sum.
Owing to the approaching exhaustion of the present Point Elizabeth State Mine it has become necessary to secure another suitable colliery to take its place.
An area of coal-bearing land at Waikokowai, in the Waikato district, has recently been purchased by the Government for the establishment of a State colliery, which it is proposed to develop forthwith.
A valuable extension of the Point Elizabeth coal-measure has recently been proved in the low coastal hills to the north of the Point Elizabeth Colliery towards Nine-mile Creek. This area also is now being developed for a State colliery. The coal-seam has been proved by boring to cover an area of at least 250 acres, and averages 8ft. in thickness, and is probably identical with that mined at Point Elizabeth.
The output from the Point Elizabeth and Liverpool State collieries during 1918 was 208,119 tons, of which 95,106 tons was produced from the Point Elizabeth Colliery, and 113,013 tons from the Liverpool Colliery. The State coal business during the year ended the 31st March, 1919, resulted in a profit of £30,607, as compared with a profit of £24,467 during the previous year.
According to the figures published in the Statistical Abstract of the United States the world's coal-production in the five years 1910 to 1914 was as shown below. The quantity is stated in short tons (of 2,000 lb.).
| Short Tons. | |
|---|---|
| 1910 | 1,141,600,000 |
| 1911 | 1,309,600,000 |
| 1912 | 1,377,000,000 |
| 1913 | 1,478,000,000 |
| 1914 | 1,346,000,000 |
A table in the Statistical Abstract issued by the United Kingdom Board of Trade places the total production in 1912 at 1,244,700,000 metric tons (of 2,204 lb.). The principal contributors to this total are,—
| 1,000 Metric Tons. | |
|---|---|
* 1911 figures. † Estimated. | |
| United States | 484,997 |
| United Kingdom | 264,670 |
| Germany | 255,810 |
| Austria-Hungary | 52,522 |
| France | 41,308 |
| Russia | 26,423* |
| Belgium | 22,972 |
| Japan | 19,640 |
| India | 14,947 |
| China | 13,190† |
| Canada | 13,170 |
| Australia | 11,921 |
Included in the totals for Germany and Austria-Hungary are 80,935,000 and 35,422,000 tons of lignite respectively. The figures for United States and France also include a small proportion of lignite.
Drilling for petroleum has been carried on in Taranaki, Hawke's Bay, Canterbury, and Westland. Throughout the Dominion twenty-five deep boreholes in search of petroleum have been drilled or are in progress, the deepest being that of the Blenheim Oil Company at Moturoa, near New Plymouth, which has attained a depth of 5,300 ft., drilling being still in progress. Petroleum of good quality but in limited quantity has been proved at Moturoa, but up to the present time boring for petroleum in the Dominion has only attained a small and intermittent flow.
Oil-prospecting operations throughout the Dominion have received very liberal financial assistance from the Government in the forms of bonus, subsidies, and loans.
The kauri-gum industry is under the administration of a separate Department controlled by a Superintendent.
During 1918 2,419 tons of kauri-gum, valued at £157,313, was exported, the total quantity and value of gum exported to the end of 1918 being respectively 356,292 tons, valued at £18,325,252.
During the past five years attempts have been made to raise kauri-gum from swamp land by means of gold-dredges, but up to the present time the profits therefrom, if any, have been small.
Since 1917 progress has been made in the development of the kauri-peat oil-extraction. Plants are being installed by two companies—viz., the New Zealand Peat-oils Company (Limited), who propose to operate on 3,000 acres at Kaimaumau, north of Mangonui, and by the Parenga Gumfields (Limited), who will shortly commence operations at Redhill, Northern Wairoa, upon 0,000 acres. It is proposed to refine from the crude oil motor-spirit (benzine), paint-oil, and varnish-oils, with the residuum pitch.
The following is the result of analyses by the Dominion Analyst of samples of peat from Kaimaumau taken from a depth of 12 ft.:—
| Sample No. 1. | Sample No. 2. | Sample No. 3. | Sample No. 4. | Sample No. 5. | |
|---|---|---|---|---|---|
| Total crude oil, in gallons per ton | 29.8 | 17.3 | 20.2 | 40.9 | 29.0 |
| Gas (cubic feet per ton) | .. | .. | .. | .. | 4,300 |
| Ammonia sulphate, in pounds per ton | 11.9 | 13.2 | 11.2 | 10.5 | 14.1 |
| Charcoal (hundredweights per ton) | .. | .. | .. | .. | 7.2 |
| Acetic acid (pounds per ton) | .. | .. | .. | .. | 8.0 |
By a new process, known as the "salt vacuum process," the gum-containing dirt is agitated in a conical tank containing a strong solution of common salt, the air being removed by a pump. Upon stopping the agitation the gum and dirt separate by gravity, the gum rising to the top of the tank, while the dirt sinks to the bottom, where it is drawn off.
The European market for this fossil resin—used in the manufacture of varnish and linoleum—being greatly restricted by the present war, new but smaller markets have been obtained. The Kauri-gum Industry Act, 1914, providing for State purchase of gum from diggers and the disposal of the gum, has served a useful purpose in enabling the industry to keep going in spite of the disorganization occasioned by the war.
At Clarendon and Milburn, Otago, considerable deposits of phosphate rock were discovered in 1902, and have since been actively worked. A thin bed of phosphatic rock has recently been identified at Kaikoura and Amuri Bluff, in Marlborough. A similar bed occurs near Port Robinson. Phosphatic nodules are found in the Kaikorai Valley (near Dunedin), at Weka Pass (North Canterbury), and elsewhere. A limestone containing 10.6 per cent. of tricalcic phosphate occurs in the neighbourhood of Onewhero, Waikato district. Other districts where phosphatic material of good quality, though, so far as known, not in commercial quantity, is found are Amberley, Dipton, Oamaru, Waimate, Wangapeka, Clarence Valley, Tutira Block (Mangaharuru Survey District, Hawke's Bay), and Whangarei.
Phosphatic minerals, the most common of which is the hydrous iron phosphate, vivianite, have been discovered in numerous other localities besides those mentioned above, but commercially these occurrences are of little importance.
The only operations during 1918 in connection with the quarrying of phosphates were those of the Ewing Phosphate Company at Clarendon, Otago, which produced about 5,000 tons.
The mineral nephrite, the "pounamu" of the Maori, more popularly known as one of the varieties of "greenstone," whenever observed in situ , occurs as rounded segregations in talc or talc-serpentine rocks. These segregations vary up to 2 ft. or even more in lateral dimension. As a rule they average less than 1 ft. in width. So far as known, the mineral has only been found in its original locus in the Griffin Range, Turiwhate Survey District; North Westland.
Pounamu is a deep-green semi-transparent mineral with dark opaque patches. With the wearing-away of the enclosing matrix the segregations are freed as rounded masses, and were once transported by the Arahura, Taramakau, and other glaciers, and are now found as boulders in the glacial debris along the lower streams of the Arahura and Taramakau Valleys. From boulders all greenstone ornaments have hitherto been manufactured.
New Zealand possesses a great variety of handsome and durable building-stones scattered throughout both Islands. In Auckland there is basalt, andesite, porphyrite, and quartz biotite-diorite, known in the building trade as Coromandel "granite," a hard, coarsely crystalline rock capable of taking a fine polish. Besides these rocks are the Whangarei limestone and Raglan stone, the former an excellent building-stone, the latter a good freestone. Taranaki has the hornblende andesites of New Plymouth and Mount Egmont, and Wellington the andesites of Ruapehu.
In Nelson there is the granite of Tata Island and Tonga Bay and the marble and crystalline limestones of the Pikikiruna (Riwaka) Range. Marble of fine quality from a quarry on the last-named range is now being used for the new Parliamentary Buildings at Wellington. West Nelson and Westland are well provided with granites and limestones of good quality, well adapted for building purposes; and in the Griffin Range, North Westland, there is found an abundance of finely coloured serpentine, unsurpassed as a decorative stone. Building-stone is scarce in Marlborough, but Canterbury is well supplied, having an abundance of Lyttelton bluestone (andesite) and Mount Somers stone, a limestone of exceptional quality. In Otago there is an abundance of excellent building-stone, ranging from the well-known Oamaru stone to the granite, gneiss, and limestones of Fiordland, all close to deep water. In Southland there is the so-called Ruapuke "granite," the norite of the Bluff, and the granites of Stewart Island.
Many of the principal buildings in New Zealand have been constructed in stone from local quarries.
The following is a table containing the number of quarries, the number of persons employed, also the output during 1918 from stone-quarries arid places which come under the operations of the Stone-quarries Act. The production of 247 stone quarries which are under the operation of the Act amounted to 840,426 tons.
| District. | Number of Working Quarries under the Act. | Number of Persons ordinarily employed. | Output of Crude Stone during 1918. | |||||||
|---|---|---|---|---|---|---|---|---|---|---|
| Stone or Gravel for Macadamizing or Ballast. | Stone for Harbour-works. | Building-stone. | Limestone for Agriculture. | Limestone for Cement or Mortar. | Phosphate for Agriculture. | Fireclay for Bricks or Tiles. | Sand for Building or Asphalting. | |||
| Tons. | Tons. | Tons. | Tons. | Tons. | Tons. | Tons. | Tons. | |||
| Auckland | 100 | 651 | 322,921 | 8,505 | 2,578 | 250 | 115,420 | .. | .. | .. |
| Auckland | 11 | 71 | 39,904 | .. | 735 | .. | .. | .. | .. | .. |
| Hawke's Bay | 11 | 65 | 18,215 | .. | .. | 16,000 | .. | .. | .. | .. |
| Taranaki | 15 | 60 | 38,237 | .. | .. | .. | .. | .. | .. | .. |
| Wellington | 60 | 147 | 59,773 | 12,605 | .. | 4,001 | .. | .. | .. | .. |
| Greymouth and Westport | 2 | 15 | .. | 15,369 | .. | .. | .. | .. | .. | .. |
| Nelson | 4 | 112 | 400 | .. | 653 | .. | 23,494 | .. | .. | .. |
| Westland | 1 | 15 | .. | .. | .. | 400 | .. | .. | .. | .. |
| Canterbury | 16 | 98 | 65,993 | 33,602 | .. | 4,428 | 1,642 | .. | .. | 437 |
| Otago | 20 | 161 | 56,430 | 7,980 | 231 | 56,748 | 11,371 | 5,000 | 2,500 | 5,749 |
| Southland | 7 | 48 | 9,296 | 12,000 | .. | 4,980 | .. | .. | .. | .. |
| Totals 1918 | 247 | 1,443 | 611,169 | 90,061 | 4,197 | 86,807 | 151,927 | 5,000 | 2,500 | 6,186 |
| Totals 1917 | 151 | 1,000 | 620,261 | 180,161 | 6,409 | 69,861 | 154,717 | 5,050 | .. | 3,124 |
The number of fatal accidents in or about the mines and quarries of the Dominion is low, and compares favourably with Great Britain and other European countries, where the proportion of fatal accidents is lower than in America and Africa. This satisfactory result is due greatly to the enforcement of the strict legal provision for the safety of persons employed.
The following is a table showing the number and proportion of persons killed at coal-mines, metal-mines, and at quarries and places under the Stone quarries Act for ten years past:—
| Year. | Coal-mines. | Metal-mines. | Stone-quarries. | |||
|---|---|---|---|---|---|---|
| Number of Deaths. | Proportion per 1,000 Persons employed. | Number of Deaths. | Proportion per 1,000 Persons employed. | Number of Deaths. | Proportion per 1,000 Persons employed | |
* Year of the explosion at Ralph's Colliery, Huntly. | ||||||
| 1909 | 7 | 1.79 | 14 | 1.83 | .. | .. |
| 1910 | 16 | 3.55 | 15 | 1.84 | .. | .. |
| 1911 | 14 | 3.26 | 5 | 0.67 | 4 | Unknown. |
| 1912 | 9 | 2.08 | 5 | 0.95 | 2 | 1.00 |
| 1913 | 6 | 1.38 | 10 | 2.02 | 2 | 1.90 |
| 1914 | 49* | 10.35 | 6 | 1.34 | 2 | 1.00 |
| 1915 | 9 | 2.16 | 10 | 2.38 | 2 | 1.27 |
| 1916 | 6 | 1.50 | 9 | 2.42 | 2 | 1.23 |
| 1917 | 4 | 1.00 | 7 | 2.03 | 2 | 2.00 |
| 1918 | 6 | 1.50 | 2 | 0.77 | 2 | 1.40 |
| — | 1917. | 1918. | Increase or Decrease. |
|---|---|---|---|
| Metalliferous mines | 3,012 | 2,582 | 430 (Decrease). |
| Coal-mines | 3,983 | 3,994 | 11 (Increase). |
| Stone-quarries | 1,000 | 1,453 | 453 (Increase). |
| Totals | 7,995 | 8,029 | 34 (Increase). |
During the year ended 31st March, 1919, nine approved prospecting parties were granted subsidies amounting to £1,440, of which £1,206 was expended during the year. In addition to this, £9,943 granted during previous years was expended by fifteen other parties. Upon these operations eighty-six persons were engaged intermittently during the year. The results disclosed were unimportant.
As an aid towards the development of the mining industry the Government offers varied and liberal assistance to prospectors in the form of subsidies, loans, expert and technical advice, use of plant, &c. Subject to the provisions of the Mining Act, the holder of a valid miner's right is entitled to prospect for gold and any other metal or mineral (except coal) on any Crown land. He may also obtain authority from the Governor-General to prospect on Native land, and he may also prospect on private land with the consent of the owner.
Assistance is offered to prospectors as under:—
Subsidies for prospecting (vide Regulation 127 under the Mining Act):—
For prospecting new ground by parties of not less than two men, a subsidy not exceeding £1 10s. per week per man.
For sinking in dry ground by parties of not less than two men: From surface to 15 ft., 1s. 6d. per foot; from 15 ft. to 30 ft., 2s. 6d. per foot; from 30 ft. to 60 ft., 3s. per foot; over 60 ft., 4s. per foot.
For sinking in wet ground where slabbing is necessary, double the foregoing rate.
For sinking in solid rock by blasting, 7s. 6d. per foot, but if the cost exceeds £1 10s. per foot then 10s. per foot may be paid.
For tunnelling or driving through drift or blue-reef: Up to 400 ft., 1s. 6d. per foot; 400 ft. to 700 ft., 2s. 6d. per foot; 700 ft. to 1,000 ft., 3s. per foot; over 1,000 ft., 4s. per foot.
For tunnelling or driving through hard rock by blasting, a subsidy of 5s. per foot; but if the cost exceeds £1 per foot then 6s. 8d. per foot may be paid.
When timbering by sets is necessary, then a subsidy not exceeding 2s., per foot of driving, or one-half the cost of the timber, may be paid.
Subsidies for prospecting deep levels for gold-quartz lodes down to a depth of not less than 1,000 ft., and for alluvial drift not less than 250 ft. (vide Regulation 125 under the Mining Act) to half the estimated cost of the work, but not to exceed £10,000.
Advances by way of loan of a sum not to exceed £10,000 for the development of mining operations having a reasonable probability of proving to be of a remunerative character.
The loan to prospectors free of charge except that of upkeep and maintenance of prospecting-drills of diamond or placer type, accompanied by a skilled drill superintendent.
The identification and assaying free of charge of samples from bona fide prospectors, at the Dominion Laboratory, Wellington, or at the goldfields schools of mines.
Wardens in mining districts and Commissioners of Crown Lands in other districts, may, with the consent of the Minister of Mines, grant licenses to prospect for coal, but no subsidies are payable on coal-prospecting.
Any prospector desiring information regarding favourable localities, or the most suitable method of prospecting, or any other matter connected with mining, may receive free advice upon application to the Mines Department. Wellington. All inquiries to be addressed to the Under Secretary, Mines Department, Wellington.
The attention of prospectors is directed to the localities herein recommended by the Government Inspectors of Mines, who themselves are practical miners and prospectors.
North Island .—Gold-silver Quartz Lodes.
Coromandel County.—Between Cabbage Bay and Tokatea, also from Mahakirau to Gumtown. In different parts of these localities loose specimen ore has been found. Numerous lodes varying in size have been discovered, some of which by assay contain payable values; but the source of the rich specimen ore referred to has not hitherto been located. At Mahakirau there is a small Government battery.
Thames County.—A large area of unprospected country occurs on the main range between Waikawau and Whangamata. The locality which offers the best prospects lies between Tararu and Tapu Greeks. Some rich pockets have been found, but in most cases this ore is accompanied by lead and zinc, and the treatment plants installed, with the exception of that at the New Sylvia Mine, have failed to reduce this class of ore.
Thames Borough.—All the auriferous ground within this borough has been well prospected. Numerous shoots of exceedingly rich ore have been found above the 500 ft. level, but these invariably gave out at depth. The total value of bullion obtained within the borough exceeds £5,000,000. Prospecting by driving at the 1,000 ft. level proved nothing of value, and operations were stopped on account of large quantities of carbon-dioxide gas being given off in the workings, rendering mining dangerous. By cessation of pumping the mine-water has been allowed to rise to sea-level.
Ohinemuri County.—A large area of promising unprospected country exists behind the Talisman Mine and Te Aroha Mountain. Large lodes are known to exist, and it is possible that rich ore may be found. The Talisman Consolidated to the end of 1918 had paid in dividends £1,133,722.
Piako County.—The low levels of Hardy's Mine, Waiorongomai, expose a large highly mineralized lode which for 100 ft. assayed up to £3 per ton.
Tauranga County.—No attempt has yet been made to prospect the country surrounding the recently opened mine of Muir's Gold Reefs (Limited), near Te Puke. Quartz lodes outcrop on the main range two miles from that mire, the country there being similar to that at the mine.
South Island.—Gold-quartz and other Lodes.
Buller and Waimea Counties.—Between Karamea and Wangapeka, embracing all the country up to Collingwood. In the far north of this area a number of quartz lodes have been worked more or less in past years, and a variety of minerals have been found; this region has not been systematically prospected, it being difficult to convey supplies to this somewhat inaccessible country.
Westland County.—The locality of the upper Arahura River, including the Wilberforce River country. Auriferous quartz lodes have been found in this locality. The country is difficult of access, and owing to its altitude can not be prospected during winter. The Bald Hill Range, in Totara Survey District, due east from Mount Greenland, deserves attention, as lodes are in evidence. At the head of Donnelly's Creek small quartz lodes have been worked. In the ranges eastward of Okarito, which are rough and difficult of access, some quartz lodes have been found, but owing to difficulty of access but little prospecting has been done, although there are reasonable prospects of the discovery of gold-quartz lodes.
Otago and Southland—-Gold-silver and Scheelite Lodes.
Payable returns were obtained from quartz-mines in the following localities in the early days of mining, and there are possibilities of new lodes or new lenses of known lodes being found at lower levels than hitherto developed.
Taieri County.—Hindon and Barewood.
Tuapeka County.—Waipori.
Vincent County.—Bendigo, Carrick Range, and Old Man Range.
Lake County.—Macetown, Upper Shotover, and head of Lake Wakatipu.
Alluvial-gold Deposits.
Deep leads of auriferous-quartz drifts are known to occur in Central Otago, in the Maniototo County at St. Bathan's, Matakanui, Block No. 3, Hamilton, and Hyde. These leads may best be prospected by Keystone drills, which are lent free of charge by the Government to bona fide prospecting-parties. The conditions on which they may be had are obtainable from the Mines Department, Wellington.
Since 1905, when statutory provision was made for advances by way of loans for mining development, six companies have been assisted by grants of loans aggregating £35,225.
The opening-up by roads of remote or inaccessible mining fields still continues; and when the rugged character of many of these fields is taken into consideration it will be found that the mining industry is now well served as regards roads and bridges. Mining being generally the pioneer for agriculture, the roads constructed in some of the older mining fields are more used by farmers than by miners.
The expenditure on roads and tracks by subsidies and direct grants during the financial year ended the 31st March, 1919, amounted to £4,185.
The Waimea-Kumara and Mount Ida water-races, which render possible hydraulic mining in the Kumara district, Westland, and the Naseby district, Central Otago, supplied thirty-five miners with water for sluicing during 1918, by which gold to the value of about £8,481 was obtained. The average earnings per miner for the past year, after deducting the sum paid for Government water, amounted to £197, and from this must be deducted all expenditure on plant, rent, &c.
For the year ended 31st March, 1919, the sum received for water sold amounted to £1,583, and the expenditure on the upkeep of the races amounted to £3,350.
The capital expenditure upon these races exceeds £250,000, and, as the expenditure in maintenance has for some years exceeded the cash received for water sold, no interest on capital or depreciation has been provided.
Prospecting-drills of various types suitable for the conditions existing in the Dominion are lent to bona fide prospectors free of all charge except that of maintenance in good order and condition; as security for which a deposit of £50 is required. The Government will pay the salary of the expert drill superintendent who has charge of the drill, and when diamond drills are used will bear half the cost of diamonds (carbons) used. The hirer is required to furnish to the Mines Department weekly journals of boring-results.
For boring in rock for coal and oil-shale seams or for mineral lodes (reefs) the following drills are available: Three Schram-Harker steam-power-driven diamond drills, of 2,500 ft., 1,500 ft., and 600 ft. capacity respectively; one Sullivan C.N. steam-power-driven diamond drill of 900 ft. capacity: these drills produce cores of the rocks penetrated. One oil-engine-driven percussion drill of 300 ft. capacity: this drill produces samples in the form of debris. For boring in gravel or other alluvium for alluvial gold: three Keystone percussion traction drills, driven by steam-power, of 150 ft. capacity in favourable ground.
Cost of Drilling.—The cost of drilling depends upon the following conditions—viz., the depths to be bored, the character of the strata, and the accessibility or otherwise of the boring-site.
Diamond drilling in rock by Government drills to moderate depths has varied greatly in total cost, including transport, wages, repairs, and materials, between 3s. 5d. and £2 3s. per foot. Percussion drilling is somewhat cheaper. Keystone drilling in alluvium has varied in total cost between 2s. 3d. and 18s. 4d. per foot.
General Remarks.—The most favourable country for diamond drilling is compact but not very hard rock, such as the North Island coal-measures—viz., limestone, sandstone, claystone (fireclay), and coal-seams. The most unfavourable country for diamond drilling is coarse quartz grit and conglomerate, as on the Reefton coalfield; also any disturbed and fractured rock or thick gravel deposits which will not core, and which require the use of boring-tubes (easing). For Keystone drilling the light auriferous gravel of Central Otago is most favourable, and the heavy and sometimes cemented gravels in the ancient river-beds of Westland are the most difficult, but these can be drilled.
The advantages of boring as against shaft-sinking for prospecting are that the former is generally cheaper, consequently more tests may be made for an equal expenditure; also, boring is more expeditious, and wet ground and depth are no obstacles. In favour of shaft-sinking is the fact that the mineral deposit is exposed to view and is available for more reliable sampling than is possible from the cores by diamond drills or the rock debris by Keystone and other percussion drills; likewise, from a shaft the mineral deposit may be driven on and further tested, or even developed for subsequent mining. A prospecting-shaft may later on be used for mining operations at an established mine. Prospecting-shafts limited to comparatively dry ground and to moderate depths.
After ten years' experience of Government drills as an aid to the mining industry it may be positively stated that no other class of State aid to mining has been so satisfactory. During 1918 an aggregate of 246 holes were drilled and a total depth amounting to 12,366 ft. attained by Government drills, with the following results:—
| Number of Holes drilled. | Mineral, &c., searched for. | Type of Drill used. | Cost per Foot, including Transport. | Aggregate depth attained. | Results. |
|---|---|---|---|---|---|
| s.d | |||||
| 11 | Coal | Diamond | 4 3 to 5 11 | Ft.3,105 | Very good; workable area Waikato coalfield. |
| 11 | Coal | Percussive | .. | 1,377 | Very good; workable area, State Colliery Reserve, Point Elizabeth. |
| 1 | Water | Diamond | 13 4 | 350 | Negative. |
| 17 | Oil-shale | Keystone | 3 11 to 7 3 | 1,238 | Partially successful, Wakaia. |
| 206 | Alluvial gold | Keystone | 5 6 | 6,296 | One of the three localities bored proved profitable ground. |
| 246 | 12,366 |
Further information regarding these drills may be obtained upon application to the Under-Secretary, Mines Department, Wellington.
There are Government subsidized schools of mines at Coromandel, Thames, Waihi, Karangahake, Huntly, Westport, and Reefton.
For the year ended 31st March, 1919, the expenditure by the Mines Department on schools of mines amounted to £4,299.
Examinations are held by the Board of Examiners annually of candidates for certificates as first-class and second-class mine-managers, battery-superintendents, and dredgemasters under the Mining Act, 1908, and for certificates as first-class and second-class mine-managers, underviewers, and firemen and deputies under the Coal-mines Act, 1908. No candidate is permitted to present himself for examination unless ho holds an authority from the Secretary to the Board of Examiners stating that his certificates of service comply with the Acts and regulations, and have been accepted by the Board.
As required by the Coal-mines Act, 1908, the owner of every coal-mine contributes Ad. per ton on all coal sold, for the relief of coal-miners who may be injured whilst working, and for the relief of families of coal-miners who may be killed or injured. The proceeds of this levy are administered partly by the Public Trustee, under the above title, and partly by miners' medical associations, under the title of "Sick and Accident Fund."
The following is a statement of the accounts of that part of the fund administered by the Public Trustee during the last two financial, years:—
| Year ended 31st March, 1917. | Year ended 31st March, 1918. | |
|---|---|---|
| £ | £ | |
| Contributions | 1,980 | 1,655 |
| Allowances on account or accidents, &c. | 1,427 | 1,193 |
| Cash balance | 8,172 | 8,980 |
By the passing of the Miner's Phthisis Act, 1915, the Gold-minors' Relief Fund was abolished; and provision is now made in the new Act for a pension of £1 per week being paid to a married man or a widower with young children, and 15s. per week to a single man, who is or becomes totally incapacitated for work owing to minor's phthisis contracted while working as a miner in New Zealand. In addition to this, the widow of any pensioner under the Act who dies from that disease is entitled to a pension of 12s. 6d. per week for two years. Funeral expenses to the extent of £20 are also provided for. A duty of 3d. per ounce on all gold exported is reserved for these pensions, and the Act is administered by the Commissioner under the Pensions Act, 1913.
THE following brief résumé of the work of the New Zealand Geological Survey has been prepared by P. G. Morgan, Esq., M.A., the present Director:—
As early as 1835 the Bay of Islands district was visited by Charles Darwin, who there made some geological observations which are recorded in "Journal of Researches during the Voyage of H.M.S.; Beagle.'" A few years later the American geologist J. D. Dana also made a visit to the same locality. Shortly afterwards Dr. E. Dieffenbach visited various portions of the North Island, and in 1848 the Hon. Walter Mantell traversed a great part of the east coast of the South Island. His notes and collections formed the basis of a paper published two years later by his father, Dr. Gideon Algernon Mantell, the well-known author of several geological and other scientific works, in the Quarterly Journal of the Geological Society of London.
The first record of geological survey being undertaken under the auspices of the New Zealand Government is in the correspondence between Governor T. Gore Browne and Commodore von Wuellerstorf-Urbair, of the Austrian frigate "Novara." Towards the end of December, 1858, the "Novara," on a scientific expedition, reached Auckland, and the commodore was requested to permit his geologist, Dr. F. von Hochstetter, to make a geological survey of the coalfield near Drury. This request was readily granted, and Hochstetter's conclusions are embodied in a special report entitled “On the Coalfield in the Drury and Hunua Districts in the Province of Auckland,” which appeared in the New Zealand Government Gazette of the 14th January, 1858.
After this report had been supplied it was arranged that von Hochstetter should be allowed to remain in New Zealand for six months in order to make a geological survey of the Auckland Provincial District on behalf of the New Zealand Government. In July he went by special request to Nelson, where he made a survey of portions of the Nelson Provincial District. The results of his work were made known to English readers by means of a volume entitled "New Zealand," published in 1867.
About 1861 Dr. W. Lauder Lindsay did a considerable amount of geological work in Otago, and, as a result, made several important generalizations.
In 1862 Dr. James Hector (afterwards Sir James Hector) was appointed Geologist to the Otago Provincial Government. He held the position until 1865, when he was appointed Director of the Geological Survey of New Zealand. It is interesting to note that from early in 1861 Canterbury also employed a Provincial Geologist, Dr. J. von Haast. About the same time Mr. J. C. Crawford was acting as Geologist to the Wellington Government, and geological work was also being done in Hawke's Bay by Mr. A. D. Triphook.
From 1865 to 1903 Hector remained in charge of the New Zealand Geological Survey, and the reports of the investigations made throughout New Zealand are contained in the twenty-two volumes of the New Zealand Geological Survey Reports published between the years 1866 and 1894. The surveys, generally being of a reconnaissance character, were not carried out with the same attention to detail as has been given to the more recent work. This applies more especially to the published maps, with the exception, however, of the Buller Coalfield maps, which were the result of a topographical survey made by W. M. Cooper between 1873 and 1876. During the years of Sir James Hector's directorship the staff included at different times such men as F. W. Hutton, S. Herbert Cox, J. Park, and A. McKay.
From 1894 to 1904—the latter date being the year after Hector's retirement—geological explorations were carried out chiefly by Mr. Alexander McKay, whose reports are included in the annual "Papers and Reports relating to Minerals and Mining" for those years, and are concerned chiefly with various mining districts.
The want of good roads and, hence, of facility for surveying areas geologically in detail greatly hampered the early geologists. Dense forest at one time concealed many outcrops that have since been made visible. Great praise is due to these geological pioneers for the work they performed in the face of great difficulties.
Besides the twenty-two reports already mentioned as published between 1866 and 1894, the old Geological Survey issued numerous other scientific publications, together with several geological maps of New Zealand, and various other maps showing the distribution of mineral deposits. These are enumerated more or less completely in various bibliographic lists—for example, that published in Colonial Museum Bulletin No. 1, 1906, by A. Hamilton.
The close relationship between the Colonial Museum and the Geological Survey initiated by a parliamentary Act in 1867 was maintained until the retirement of Sir James Hector in 1903 from the position of Director of each institution. After that date the Museum became a separate Department under the control of the Colonial Secretary, although the Geological Survey remained a branch of the Mines Department. Many of the rock-specimens, minerals, and fossils that have been collected from various parts of New Zealand have been stored in boxes in the Museum, and in a few instances have been displayed in the show-cases.
Consequent on the retirement of Sir James Hector in 1803 was the appointment of Dr. J. M. Bell in 1904. The new Director immediately after his arrival early in 1905 began to reorganize the Survey, and henceforward more attention was given to detail and topography than had previously been given. The permanent staff was much increased, and outside assistance was utilized in the geological survey of certain districts.
One of the first schemes was the preparation of a detailed topographical and geological map of New Zealand. For this purpose the North Island has been divided into twelve divisions of varying shapes and sizes. In the South Island are seventeen divisions. Each division has some distinguishing deposits or geologic features common throughout its area. A division is composed of survey districts as bounded by the Lands and Survey Department, and several of these districts having some similarity of formation may be grouped together to form a subdivision. The different creeks, ridges, roads, and railway-cuttings are examined, the positions of the outcrops are mapped, and all information suitable to the framing of a report is noted. Items to be noted may concern palæontology, petrography, structure, topography, and economic geology. The report or bulletin on a subdivision is written in the winter months and after the examination has been completed.
In addition to the information given in the bulletins there are published with them carefully prepared geological maps of the subdivision described. These maps prove of use to miners, prospectors, settlers, and others who desire later to re-examine portions of the area mapped. No claim is made that every outcrop of economic importance is shown on them, but in every case definite horizons are shown in which minerals or mineral-bearing deposits are likely to occur. Since New Zealand is a country practically dependent on agriculture, it is necessary for the geologist to devote some attention to the soil and subsoil of a subdivision, and to make comment on the nature of soil or soils common to the area. This is being done, and the opinions of the geologists are given in the various bulletins.
With the advent of Dr. Bell to the position of Director the geological reports were given a regular method of presentation of subject-matter, so that parts are readily understood by the non-scientific as well as by the scientific reader. Dr. Bell retained the position of Director until early in 1911, when he resigned, and was succeeded by Mr. P. G. Morgan, the present Director.
Since the reorganization of the Survey in 1905, areas in different parts of New Zealand aggregating about 11,000 square miles have been examined in detail. These include the principal lode-mining and coal-bearing districts of the West Coast and the North Island, as well as areas of economic importance in Taranaki, East Auckland, and Otago. In addition to the usual detail surveys, many visits have been paid by the Director and other members of the staff to different localities to examine and report on matters of economic as well as geologic interest. The conclusions arrived at from these visits are to be found in parliamentary papers, in the annual reports presented by the Director to the Hon. the Minister of Mines, and in the Journal of Science and Technology.
During the past few years considerable attention has been given to areas containing limestone and phosphate deposits. A lengthy report on limestone occurrences has lately been published, and another dealing with treatment plants and phosphate deposits is in preparation.
The following are the short titles of the bulletins dealing with general and economic geology issued since 1905: Hokitika Sheet (No. 1), Alexandra Sheet (No. 2), Parapara Subdivision (No. 3), Coromandel Subdivision (No. 4), Cromwell Subdivision (No. 5), Mikonui Subdivision (No. 6), Queenstown Subdivision (No. 7), Whangaroa Subdivision (No. 8), Whatatutu Subdivision (No. 9), Thames Subdivision (No. 10), Mount Radiant Subdivision (No. 11), Dun Mountain Subdivision (No. 12), Greymouth Subdivision (No. 13), New Plymouth Subdivision (No. 14), Waihi-Tairua Subdivision (No. 15), Aroha Subdivision (No. 16), Buller-Mokihinui Subdivision (No. 17), Reefton Subdivision (No. 18), Tuapeka District (No. 19), Oamaru District (No. 20), and Part I of Limestone Resources (No. 22). In addition reports in varying stages of preparation are in hand for the Gisborne, Huntly, Egmont, and Mokau districts. Seven palæontological bulletins have also, been issued, as well as thirteen annual reports. Other publications are "A Geographical Report on Franz Josef Glacier," and a "List of the Minerals of New Zealand." Copies of most of the Geological Survey publications are obtainable at nominal or moderate prices from the Government Printer, Wellington.
On the 10th September, 1918, the appointed members Of the Board of Trade, together with James Hight, Esquire, M.A., Litt. D., of Christchurch, were authorized and empowered, by Warrant issued by His Excellency the Governor-General under section 6 of the Cost of Living Act, 1915, to inquire into and report upon the following matters:—
The present cost of the production and distribution of coal in New Zealand.
Any increases in the cost of such production or distribution since the commencement of the present war, and the causes of such increases.
Whether the profits made in the production and distribution of coal are fair and reasonable.
Whether the selling-prices of coal are fair and reasonable.
Whether increased economy or efficiency can be obtained in the production and distribution of coal, and, if so, in what respects and in what manner.
All other matters affecting the supply or price of coal.
The increases since the commencement of the present war in the cost of living so far as such increases affect men engaged in the production of coal, distinguishing between increases, if any, prior to and subsequent to the industrial agreements made in the coal industry in the year 1917.
The increases since the commencement of the present war in the earnings of men engaged in the production of coal, distinguishing between increases, if any, prior to and subsequent to the said industrial agreements.
The report of the Board contains a vast amount of detail, and deals with the coal industry from many standpoints. This entails considerable difficulty in presenting a necessarily summarized and curtailed version. In the following account each chapter is treated seriatim, omitting mention of any points already dealt with elsewhere in this volume. This account is necessarily somewhat inadequate in character.
THE CHIEF COALFIELDS .
The North Auckland Field.—The chief mines producing at present are those of the Hikurangi Coal Company (Limited) and the Northern Coal Company (Limited), near Whangarei. The coal is of good quality, and is largely used for steam-raising purposes, for which it is well adapted. The coal from this field is usually classed as pitch, glance, or semi-bituminous.
The Waikato Field.—The chief mines are those of the Taupiri Coalmines (Limited), the Pukemiro Collieries (Limited), and the Waipa Railway and Collieries (Limited), producing brown coal, near Huntly and Ngaruawahia.
The West Coast Fields.— These fields are developed mainly in the Grey Valley, the Paparoa Range, and the districts between Westport, Mokihinui, and Karamea. The coals are chiefly bituminous, though there are also valuable seams of semi-anthracite in the Paparoa Range. The chief mines now worked are those of the Westport Coal Company (Limited), the Blackball Coal Company (Limited), the Westport-Stockton Coal Company (Limited), the Tyneside Proprietary (Limited), the Paparoa Coal-mining Company (Limited), (in liquidation), and the State Mines near Greymouth. On the Inangahua Coalfield, extending from the Buller River to Reefton, there are a few minor collieries producing a superior pitch-coal.
Canterbury.—There are a few comparatively small mines producing brown coal in the western foothills, the chief being that of the Homebush Brick and Coal Company (Limited), and the newly opened mine of the Mount Torlesse Collieries (Limited) at Avoca on the Midland line. Isolated deposits of anthracite are found in the Malvern Hills.
The Kaitangata Field.—This field contains a superior type of brown coal, as well as lignites, the chief mines being those of the New Zealand Coal and Oil Company (Limited) and the Taratu Coal-mines (Limited).
Nightcaps , about forty-five miles from Invercargill, producing a superior brown coal and lignites. The chief mine is that of the Nightcaps Coal Company (Limited).
Central Otago and Southland , where there are numerous small mines producing lignites.
The mines in the Mokau, North-west Nelson, and North-east Otago districts are as yet comparatively unimportant or present no features of peculiar interest.
New Zealand coals vary extremely in quality and character. There are five principal classes:—
Anthracite , an anhydrous non-coking coal with a very high percentage of fixed carbon. The supply of this is very limited.
Bituminous , an anhydrous coal forming very good steam fuel.
Semi-bituminous , or pitch-coal, friable and forming a soft coke.
Brown coal , which forms no coke during combustion, and desiccates rapidly on exposure to the air.
Lignite , an inferior coal with a high percentage of water and a pronounced woody structure.
| Description of Coal. | Locality. | Analysis. | Calorific Value. | Evaporative Power as determined by Calorimeter. | Evaporative Power. | |||||
|---|---|---|---|---|---|---|---|---|---|---|
| Fixed Carbon. | Volatile Matter. | Water. | Ash. | Total Sulphur. | Percentage of Coke. | |||||
* These samples were taken from coal that had been in store several months, and anthracite is said to deteriorate on keeping. | ||||||||||
| Anthracite | Paparoa Coal Company (No. 1 seam) | 78.90 | 16.93 | 0.40 | 3.77 | 0.37 | 82.67 | 8439 | 15.74 | 9.44 |
| Bituminous | Paparoa (best) | 62.90 | 33.53 | 0.67 | 2.90 | 0.33 | 65.80 | 8443 | 15.75 | 9.45 |
| Bituminous | Mine Creek, Millerton Colliery (east) | 57.67 | 41.14 | 0.91 | 0.28 | 4.62 | 57.95 | 8227 | 15.35 | 9.21 |
| Bituminous | Coalbrookdale, Munsie's Section | 55.73 | 40.08 | 2.37 | 1.82 | 0.55 | 57.55 | 7923 | 14.78 | 8.87 |
| Bituminous | State Coal-mines, Point Elizabeth (best) | 56.07 | 40.58 | 0.60 | 2.75 | 0.49 | 58.82 | 8213 | 15.32 | 9.19 |
| Bituminous | State Coal-mines, Point Elizabeth (household) | 48.70 | 41.52 | 8.36 | 1.42 | 0.82 | 50.12 | 7143 | 13.33 | 8.00 |
| Bituminous | Tyneside Mine, Brunnerton | 56.57 | 37.22 | 0.46 | 5.75 | 2.67 | 62.32 | 8064 | 15.05 | 9.03 |
| Bituminous | Blackball Mine (lower seam) | 46.67 | 48.66 | 3.52 | 1.15 | 4.70 | 47.82 | 7541 | 14.07 | 8.44 |
| Glance | Puponga (west workings) | 49.28 | 41.51 | 4.94 | 4.27 | 0.42 | 53.55 | 6921 | 12.91 | 7.75 |
| Glance | Hikurangi Coal Company | 44.56 | 47.17 | 4.06 | 4.21 | 5.81 | 48.77 | 6810 | 12.71 | 7.63 |
| Glance | Northern Collieries, Kiripaka (Ngunguru) | 43.08 | 44.79 | 4.65 | 7.48 | 1.03 | 50.56 | 6581 | 12.28 | 7.37 |
| Brown | Taupiri, Taupiri Extended | 43.73 | 42.12 | 11.72 | 2.43 | 0.32 | .. | 6129 | 11.44 | 6.86 |
| Brown | Nightcaps, Southland (new workings) | 41.20 | 38.72 | 17.56 | 2.52 | 0.28 | .. | 5737 | 10.70 | 6.42 |
| Brown | Kaitangata | 38.00 | 39.96 | 18.22 | 3.82 | 0.40 | .. | 5553 | 10.36 | 6.22 |
| Brown | Homebush, Canterbury | 31.83 | 41.82 | 23.15 | 3.20 | 0.41 | .. | 4953 | 9.24 | 5.54 |
| Lignite | Bannockburn, Cromwell, Central Otago | 23.75 | 43.83 | 26.12 | 6.30 | 0.32 | .. | 4291 | 8.00 | 4.80 |
| Lignite | Mataura, Southland | 19.01 | 40.77 | 35.65 | 4.57 | 0.31 | .. | 3789 | 7.07 | 4.24 |
| For Comparison. | ||||||||||
| Anthracite* | Wales | 89.07 | 6.51 | 2.27 | 2.15 | 0.86 | .. | 8220 | 15.34 | 9.20 |
| Bituminous | Sydney; Nova Scotia, Canada | 60.70 | 34.93 | 2.62 | 1.75 | 0.41 | 62.45 | 8120 | 15.15 | 9.09 |
| Bituminous | Aberdare Collieries | 52.55 | 41.59 | 2.46 | 3.40 | 0.55 | 55.95 | 7900 | 14.74 | 8.84 |
Coal resources proved are estimated at 1,000 million tons, while the coal probable is considered to exceed 2,800 million tons. The supply, it seems, will suffice for an extreme limit of 150 years only. Further data on coal resources and production will be found in Subsection A of this section, and need not be duplicated here. It will suffice to say that the normal output of coal is over 2,000,000 tons annually, imports 350,000 tons, and exports 275,000 tons.
The following table shows the actual cost of production per ton, 1913-18:—
| Mine. | Mining-cost of Production per Ton. | Increase per Cent. | Increase. | ||||||||||||
|---|---|---|---|---|---|---|---|---|---|---|---|---|---|---|---|
| 1913. | 1914. | 1915. | 1916. | 1917. | 1918. | ||||||||||
* Of the mines giving returns for six years. | |||||||||||||||
| s. | d. | s. | d. | s. | d. | s. | d. | s. | d. | s. | d. | s. | d. | ||
| Highest (to nearest penny)* | 15 | 6 | 16 | 3 | 16 | 11 | 18 | 0 | 20 | 10 | 23 | 4 | 50.5 | 7 | 10 |
| Lowest (to nearest penny)* | 6 | 6 | 7 | 0 | 6 | 10 | 6 | 8 | 8 | 5 | 10 | 6 | 61.6 | 4 | 0 |
| Mean (to nearest penny)* | 12 | 6 | 11 | 5 | 11 | 8 | 12 | 6 | 14 | 5 | 16 | 2 | 29.3 | 3 | 8 |
The above table does not purport to measure the increase in the cost of mining for the industry as a whole. By weighting the average cost at each mine by the mine's annual output it appears that the cost of production has risen during the period 1913 to 1918 over 37 per cent. Making allowances for other circumstances, the Board comes to the conclusion that the total average cost of production has increased about 40 per cent. since 1913. Brown coal shows a rate of increase in mining-costs much above the average.
Of the total cost a considerable percentage is represented by wages paid to underground and surface workers about the mine. This cost may be referred to as the direct labour-cost, and is illustrated by the next table.
| Kind of Coal. | Cost of Production per Ton. | Amount paid to Mine Employees. | Percentage of Total. | ||
|---|---|---|---|---|---|
| s. | d. | s. | d. | ||
| Bituminous | 17 | 0 | 7 | 3 | 42 |
| Semi-bituminous | 14 | 5 | 8 | 2 | 57 |
| Brown | 13 | 1 | 8 | 0 | 60 |
| Dominion average | 15 | 4 | 7 | 1 | 46 |
In no fewer than nine of the fifteen mines quoted below, the labour-cost increased to a less extent than the total costs.
| Mine. | Increase in Labour-cost. | Increase in other Costs. | Increase in Total Cost. | |||||
|---|---|---|---|---|---|---|---|---|
| Amount. | Per Cent. | Amount. | Per Cent. | |||||
| s. | d. | s. | d. | s. | d. | |||
| A | 1 | 11.98 | 38.8 | 1 | 8.03 | 3 | 8.01 | 29.25 |
| B | 3 | 3 | 56 | 0 | 1.26 | 3 | 1.74 | 31.66 |
| (decrease) | ||||||||
| C | 0 | 7.34 | 10 | 1 | 7.35 | 2 | 2.69 | 20 |
| (decrease).. | (decrease) | (decrease) | ||||||
| D | 3 | 9.24 | 78.1 | 4 | 5.55 | 8 | 2.79 | 57.2 |
| E | 2 | 4 | 40 | 0 | 0.25 | 2 | 3.75 | 18.7 |
| (decrease) | ||||||||
| F (5 years) | 1 | 6.25 | 26.7 | 0 | 0.85 | 1 | 7.1 | 18 |
| G (3 years) | 1 | 0.05 | 19 | .. | .. | .. | .. | |
| H (5 years) | 1 | 4.6 | 33.6 | 0 | 9.2 | 2 | 2.8 | 26.7 |
| I (5 years) | 5 | 6.26 | 55 | 3 | 11.54 | 9 | 5.8 | 59 |
| J | 3 | 2.78 | 38.5 | 4 | 3.28 | 7 | 6.06 | 56 |
| K | 2 | 7.25 | 51.25 | 1 | 5.5 | 4 | 0.75 | 63 |
| L | 1 | 2.65 | 24.8 | .. | 7 | 9.54 | 50.2 | |
| M (3 years) | 0 | 3 | 4 | 0 | 10.6 | 1 | 1.6 | 6.6 |
| N (4 years) | 0 | 1.61 | 3 | 0 | 0.14 | 1 | 1.75 | 7.5 |
| O | 1 | 11.6 | 31.8 | .. | 7 | 9.54 | 50.2 | |
| P | 1 | 7.4 | 28.2 | 5 | 3.86 | 6 | 11.26 | 63.6 |
With the exception of the Point Elizabeth Mine, which is approaching exhaustion and consequently is working under peculiar conditions, direct labour-costs increased in all instances, varying in different mines from 3 per cent. to 78.1 per cent. during the quinquennium. The percentage which labour-cost is of the total cost has in most mines also increased considerably.
It would appear that of the average increase in the total mining-cost of all the mines giving data, from and including 1913 to September, 1918, nearly 39 per cent. is due to increased direct labour-cost and a little more than 60 per cent. to increases in other costs than that of wage-labour employed at the mines.
When account is taken of all coal concerning which exact particulars of mining-cost could be obtained, both from mines giving returns or operating over the whole period and from those which could provide such data for part only of the period, we find that the labour-cost in 1918 compared with that in 1913 shows an increase of about 20 per cent. The average labour-cost for 1914 was 4 per cent. less than for 1913; for 1916, about 4 per cent. more; for 1917, 14 per cent.; and for 1918, about 20 per cent. The labour-cost of bituminous coals from these mines increased on the average by about 28 per cent., or 1s. 7d. a ton. It was lower in 1914 than in 1913; in 1916 it was 8 per cent. higher than in 1913; in 1917, 16 per cent.; and in 1918 (September), 28 per cent. Semi-bituminous coal increased in labour-cost from about 6s. to 8s. 2d., or 36 per cent., and brown coals about 13 per cent. The labour-cost of brown coal in 1918 was nearly 30 per cent. higher than the recorded 1914 cost. The comparatively low increase in brown coals between 1913 and 1918 is due to the fact that in 1913 no account was taken of those mines which were in an abnormal condition, and that in the subsequent years collieries have been opened up which contribute a fair proportion of the supply at a comparatively low cost.
On the average the increase in the labour-cost of all coals forming the subject of inquiry in any year, whether from mines operating throughout the period or not, is about 1s. 2d., or almost one-third of the increase in the total mining-costs.
In all these cases the averages are true averages obtained with due regard to the relative outputs of the respective collieries.
Administration-costs cover the cost of management, and include office and clerical charges. This particular charge shows only a small average increase, despite the falling-off in output, which would tend to increase the cost per ton of administration in common with all standing charges. In 1913 the highest charge formed about 11 per cent. of the total mining-cost of the coal in question; the corresponding figure for 1918 is about 10 per cent.; the corresponding percentages for the mines with the lowest cost are under 1 per cent. for 1913 and 1 1/2 per cent. for 1918. The wide range between highest and lowest cost in the above table is due in part to difference of custom as to the contents of administration charges among some of the companies. The high administration charges of State mines are due partly to the inclusion of hulk-costs in this item.
As an indication of the effect of "lost time," the experience of one of the largest mines is quoted:—
| Period. | Percentage of Possible Shifts worked. | Percentage lost. | Lost by Accident. | Lost otherwise. | Remarks. |
|---|---|---|---|---|---|
| Year 1913-14 | 93.38 | 6.61 | 4.47 | 2.13 | Omitting strike-time. |
| Year 1917-18 | 90.45 | 9.54 | 5.36 | 4.17 | .. |
| To 31st March, 1918 | 90.07 | 9.91 | 4.41 | 5.49 | .. |
| April to August, 1918 | 87.69 | 12.30 | 4.38 | 7.87 | Equal to about 7,000 tons of coal. |
The time during which mines have been idle has in several cases formed a serious proportion of the total time they could have worked. A valuable analysis has been prepared of the number of days that the State mines at Point Elizabeth and Rewanui could have worked, the number of days worked, and the causes of the cessation of work. The return covers the period April, 1913, to September, 1918, for Point Elizabeth, and April, 1915, to September, 1918, for the Liverpool Mine. The time lost through pay-Saturdays, holidays, and the cavilling-time has not been included in the possible working-time as defined in the return. The Point Elizabeth Mine stood idle during 13.3 per cent. of its possible working-time, the Liverpool Mine 17.3 per cent. The following shows the number of days the mines stood idle owing to each particular cause:—
| Cause. | Number of Days idle, 1913-18. | |
|---|---|---|
| Point Elizabeth. | Both Mines. | |
| Strikes | 109 | 146 |
| Lack of shipping | 48 | 108 |
| Harbour unworkable | 34 | 59 |
| Slips | 3 | 38 1/2 |
| Floods | 1 | 4 |
| Miscellaneous | 2 1/2 | 5 1/2 |
| Total | 197 1/2 | 361 |
| Point Elizabeth | Liverpool. | Both Mines. | |
|---|---|---|---|
| Number of days mine could have worked, excluding union holidays, pay-Saturdays, and cavils | 1,488 1/2 | 944 | 2,432 1/2 |
| Percentage of time lost by mine | 13.3 | 17.3 | 14.9 |
The number of holidays at both mines during the period was 125, of pay-Saturdays 235, and of days lost through cavils 11 1/2, totalling 371 1/2 days.
The number of days worked each year by the mines is as follows:—
| Year. | Point Elizabeth. | Liverpool. |
|---|---|---|
| 1913-14 (31st March) | 216 | .. |
| 1914-15 | 246 | .. |
| 1915-16 | 237 | 222 |
| 1916-17 | 256 | 262 1/2 |
| 1917-18 | 219 | 197 1/2 |
| Annual average | 235 | 227 |
| Half-year to 30th September, 1918 | 117 | 98 1/2 |
The Board obtained particulars of the number of days annually worked by several important mines from 1908 inclusive. Some mines have been open for work for 10 per cent. more time per year over the war period than for the six years preceding 1914, and others have had a shorter working-year than before the war. There has been an increase on the whole, but it would not average more than 5 per cent. for the Dominion.
The next table illuminates the relation between cost of transport by rail or sea and the net retail price of certain household coals:—
| Freight between | Percentage added to Mine-cost by Freight. | Percentage which Freight is of Net Retail Price. |
|---|---|---|
| Newcastle and Lyttelton | 110 | 29 (Christchurch price). |
| Newcastle and Christchurch | 147 | 39 |
| Newcastle and Wellington | 110 | 32 |
| Taupiri and Auckland | 40 | 23 |
| Taupiri and Wellington | 77 | 29 |
| Westport and Lyttelton | 46 | 19 (Christchurch price). |
| Westport and Christchurch | 65 | 27 1/4 |
| Kaitangata and Dunedin | 22 3/4 | 15 |
| Kaitangata and Christchurch | 24 1/2 | |
| Nightcaps and Invercargill | 35 1/3 | 18 1/2 |
| Greymouth (other than State) and Lyttelton | 39 | 19 (Christchurch price). |
| Greymouth (other than State) and Christchurch | 56 | 27 1/4 |
Rail freights have increased 21 per cent. since 1913. Steamer freights show more diversity, as under:—
Newcastle coal, increase, 1914-19, 73 per cent.
Westport coal, increase. 1913-18, 55 1/2 per cent.
Westport-Stockton, 53 1/4 per cent.
State coal, 42 per cent.
Profits in the transport of coal appear to be higher than in mining or retail distribution. For the period 1914-17 the profit earned on the carriage of coal in certain typical parts of the New Zealand coastal trade appears to have ranged from 1s. to 1s. 3d. a ton, from which depreciation, sinking fund, and periodical overhaul charges have to be deducted. Higher margins of profit were undoubtedly earned by foreign-owned shipping carrying coal to the Dominion.
The costs incidental to the distribution of coal (over and above cost of production) were as follows for Auckland, Wellington, Christchurch, and Dunedin in 1918:—
| — | Railage or Freight. | Wholesalers' Gross Profit. | Retailers' Profit. | |||
|---|---|---|---|---|---|---|
| s. | d. | s. | d. | s. | d. | |
| Auckland | 7 | 11 | 6 | 9 | 7 | 9 |
| Wellington | 9 | 7 | 2 | 5 | 15 | 0 |
| Christchurch (i) | 15 | 0 | 4 | 6 | 12 | 6 |
| Christchurch (ii) | 13 | 6 | 3 | 0 | 11 | 0 |
| Christchurch (iii) | 5 | 9 | 5 | 3 | 9 | 0 |
| Dunedin | 6 | 7 | .. | .. | 9 | 0 |
If the increase in the average selling-price for the industry as a whole be calculated from the available data in the same manner as the increase in the cost of production (see above, p. 609), it is found that the selling-price of those mines for which data are available over the whole period of 1913-18 increased, when due allowance has been made for relative outputs, by 36 per cent.—i.e., from about 14s. 3d. to 19s. 5d. per ton. This figure is to be compared with that showing the increase in total cost of production—viz., 37 per cent.
When the selling-prices of all coals for which exact details were available in each year, whether from collieries working over the whole period or not, are compared, the increase in selling-price is 22 per cent. This figure, however, as in the case of cost of production, does not give a true measure of the change of the price of all coal, since the selling-prices and cost of the mines for which exact particulars were not available for 1913 were on the average lower than those of the mines providing data for that year.
This figure was lower during 1914-15-16 than in 1913. In 1916-17 it rose 11 per cent. above the 1913 level, and in 1917-18 22 per cent. The selling-price of bituminous coal increased 35 per cent. (3s. 2d.) during the period, though the cost rose 40 per cent.; that of semi-bituminous coal rose 34 per cent. (5s. 7d.), or slightly more than its cost; that of brown coal 22 per cent. (2s. 7d.), as against a rise of 25 per cent. in cost. The increase in the price of brown coal for 1917-18 when compared with 1913-14 (a better basis of comparison in view of the incomplete data for brown-coal mines for 1913) is 30 per cent. (3s. 1d.), the corresponding increase in cost of production being 31 per cent.
Generally speaking, the decreases in the mine-profit per ton are more significant and typical of the whole output of the period than the increases. The average annual profit per ton shows a range from 1s. 10d. gain to 1s. 11d. loss.
If the properly weighted average selling-price be compared with the corresponding average cost of production for the mines giving returns for the years 1913-18 the margins between cost and price are 9d. and 10d. a ton for 1913 and 1918 respectively, or 5.6 and 4.5 per cent. of the cost of production. A comparison of the similar margins for all mines giving data, whether over the whole period or not, shows a reduction from 9d. to 5d. a ton, the latter representing 2.2 per cent. of the average cost.
| — | Coal from Mines giving Exact Data for each Year of the Period 1913-18. | All Coal to which Data related, 1913-18, whether from Mines over the Whole or Part of Period. | ||||||||||||
|---|---|---|---|---|---|---|---|---|---|---|---|---|---|---|
| 1913. | 1918. | Increase, 1913-18. | Increase per Cent., 1913-18. | 1913. | 1918. | Increase, 1913-18. | Increase per Cent., 1913-18. | |||||||
| s. | d. | s. | d. | s. | d. | s. | d. | s. | d. | s. | d. | |||
| Average selling-price | 14 | 3 | 19 | 5 | 5 | 2 | 36 | 14 | 3 | 17 | 5 | 3 | 2 | 22 |
| Average cost of production | 13 | 6 | 18 | 7 | 5 | 1 | 37 | 13 | 6 | 17 | 0 | 3 | 6 | 26 |
| Average profit | 0 | 9 | 0 | 10 | 0 | 1 | 11 | 0 | 9 | 0 | 5 | 0 | 4 (dec.) | 44 (dec.) |
| Rate of profit per cent. of cost of production | 0 | 5 1/2 | 0 | 4 1/2 | .. | .. | .. | 0 | 5 1/2 | 0 | 2 1/2 | .. | .. | .. |
This summary shows clearly that the mining companies have not increased their gains from the industry during the war period relatively to their costs.
The average profit of mining companies, weighted according to the capital in each company, is a rate of just over 5 per cent., out of which the industry has to make provision for return to the shareholders by way of interest and a large part of the insurance against the risks associated with the industry, as well as providing a considerable part of the depreciation and sinking-fund charges. It is clear that, judged by the current rates in finance during the period, this return does not constitute a fund sufficient for these purposes.
As regards all those engaged in "dealing" with coal, the general conclusion is that, except in the case of those dealers who are engaged in the retail trade on a large scale, the difference between the cost of coal to the dealers and the price received by them affords but a mere living to those engaged in it. The profits of the retail dealers cannot be assessed as exactly as those of the mining companies, because of the mixed nature of the business conducted by them, but the balance of evidence does not suggest that they are not "fair and reasonable" as the industry is organized at the present time.
The rates for hewing in 1914 wore: Buller—Pillars, 1s. 11d.; solid, 2s. 4d. per ton. Grey—Pillars, 2s. 2d.; solid, 2s. 4d. per ton. North—Pillars, 2s.; solid, 2s. per ton. South—Pillars, 2s. 3d.; solid, 2s. 5d. per ton. There were some variations—e.g., in a northern mine 1s. 8d. was the rate in 1914, rising to 1s. 10d. in 1916 and 2s. in 1917. In another northern mine the rate was increased by 2d.
These rates have remained as the minimum or standard; but in the first half of 1916 an increase of 10 per cent. was granted as a war bonus. The date on which the payment of this first war bonus began varied from mine to mine. The second war bonus of 7 1/2 per cent. was paid from about the middle of 1917, and the third, also of 7 1/2 per cent., from September-October, 1918. There has therefore been an increase in the rates paid to miners of at least 17 1/2 per cent. between the outbreak of the war and September - October, 1918, and 25 per cent. after the latter date. The increases granted at the same times to all other workers, those on day-wages at the mine were 10 per cent. in each case, making a total increase of at least 30 per cent. in their rates of pay.
Since, however, a lowering of the value of the money unit in relation to the necessaries and comforts of life has been effected to the extent of at least 35 per cent. since 1913, the effective wages of the miner have not increased, but rather fallen.
| Total Expenditure on | 1913-14. | 1918. | Increase per Cent. |
|---|---|---|---|
| Food | 34 | 51 | 50 |
| Rent | 20 | 21 | 5 |
| Fuel and light | 5 | 6 | 20 |
| Boots and clothing | 13 | 22 | 65 |
| Miscellaneous | 28 | 35 | 25 |
| "Living" | 100 | 135 | 35 |
Much of the industrial unrest and dissatisfaction of the miners may be attributed to the sordidness of their housing-conditions and monotony of their home life. Early in the inquiry the representatives of the workers asked the Board to give special attention to housing-conditions; and the inspections which the Board made of the mining villages at Huntly, Pukemiro, Rotowaro, Glen Massey, Nightcaps, Kaitangata, Runanga, Blackball, Denniston, Burnett's Face, Millerton, and Ngakawau showed that in many cases the general conditions were exceedingly bad. "Few of the houses in these townships reach the standard of comfort seen in the average workers' homes in our cities. There is no proper water-supply or drainage, and only in isolated instances are there bathrooms. The conditions generally are insanitary, and in certain fields the surroundings are dreary in the extreme. In spite of the disadvantages under which the occupants labour, some of the houses are kept in an excellent manner, and there are not a few well-cultivated gardens, tended with the greatest care and pride. But these stand out as isolated examples on these fields among the general mass of inconvenient, unhealthy, and crowded homes."
The causes which have led to the present conditions of housing in the mining settlements are bound up with the haphazard way in which the villages have grown up, a method far too common in respect of all New Zealand towns. The towns were not pre-planned by a competent authority, nor was due consideration given to local conditions.
No thought has been spent on the aspect or prospect of the houses. Had proper consideration been given to the contour and steepness of the land and the possibility of erecting healthy homes on the sites selected, much of the present inconvenience and insanitary conditions would not have arisen.
Generally there has been little thought for the health, convenience, or comfort of the workers who are called upon to live on the sites marked out. The hopelessness of the attempt to make comfortable homes under the conditions provided tends to create callousness and an utter disregard for the amenities of life, and to acceptance of conditions of housing similar to those found in the Old World only as the result of extreme poverty.
In regard to general social welfare, miners are at present suffering under several further handicaps—the lack of proper medical attention and maternity homes, the high cost of medical attention, and the lack of higher educational facilities for their children.
The Board, after carefully considering all relevant arguments, is of opinion that some form of nationalization is urgently needed as an essential step towards removing shortcomings of long standing, effecting needed improvements of a positive kind, and avoiding evils that threaten to turn the industry out of the course of healthy and sane development.
The chief aims to be achieved by reorganization of the industry appear to be these:—
The introduction of economies in the cost of producing the output of coal.
The conservation of the coal resources of the Dominion, with due regard to the most equitable distribution of the available supplies as between present and future needs; the systematic and easy development and expansion of the industry to satisfy the growing requirements of the community.
The concentration of the industry at any given time in the most profitable fields.
The removal of the causes of labour unrest. Sudsidiary to this is the institution of proper housing for mine workers.
The inauguration of an efficient system of distribution.
The regulation of coal-prices in the interests of consumers.
This should not be interpreted as meaning State purchase and direct management of the mines.
The Board is strongly in favour of the immediate institution of a Dominion Coal Board (for development and conservation).
The Dominion Coal Board should consist of representatives of—(1) The existing coal-mining companies, (2) the employees of these companies, and (3) the Crown.
It is suggested that the Board comprise five members at most—the companies to appoint two members, the coal-workers two, and the Crown one, who shall be president. If the Board took over the function of distribution the employees engaged in that branch would exercise a voice in the selection of the representatives of labour on the Board. The nominee of the Crown should be appointed for a definite term. The representatives of coal companies should be elected by the shareholders voting by a method similar to that prescribed for the election of the directors of a company under the Companies Act. The representatives of the coal-workers should be elected annually according to a system to be determined after consultation with the workers. In order to establish some continuity in policy the members of the Board should retire from office not as a whole, but one representative of each of the two interests of capital and labour at a time; this would involve a two-years term of office for each representative, but he should be eligible for re-election.
The Dominion Coal Board should be in a position to achieve effectively the objects detailed above and similar aims. To these ends the Board should be empowered to take over the existing coal companies with their assets and liabilities at valuation, and to issue stock to the existing shareholders in exchange for the shares held by them at the average market value of such shares for the period of the three years immediately preceding such exchange; such average market value to be calculated and determined by a specially appointed Commission.
Among the improvements which this Board might effect would be the following:—
Modernizing the methods of mining.
Provision of suitable housing-accommodation on the coalfields.
Improvement in the transport of miners to their work.
Establishment, where necessitated, of dispensaries, motor ambulances, and maternity hospitals.
Transfer to the control of the Board of certain coal-carrying railway-lines. It is suggested that this would avoid any friction.
Modification of parts of the Coal-mines Act.
Improvement of the coal ports.
Thorough prospecting of coalfields.
Introduction of the mine workers to a voice in the control of the industry.
Improvement in the system of distribution by the abolition of overlapping in deliveries, the concentration of depots, and the ownership by the mine of the means of transport to the main distributing centres.
Several suggestions are put forward with a view to eliminating waste in the use of coal. It is believed that a reduction in the price of coal can be effected.
Table of Contents
ALTHOUGH abundant water-power is available throughout New Zealand, comparatively little use had been made of it before 1900, but since then the development has been extensive, and promises to be still more extensive in the early future. The Public Works Act of 1908 vests the sole right to use the water-power of the Dominion in His Majesty, subject to any existing rights, and gives the Government the right to develop such power, or to delegate such power to any local authority, or, outside a mining district, to any person or company, subject to conditions. Advantage has been taken of this in several eases, the right in the case of local authorities being issued free of royalty, and in the case of private individuals developing water-power for electrical distribution, subject to a royalty of 1/20d. per unit generated.
The following table shows the actual horse-power in use in the various districts at the 31st March, 1915, 1916, 1917, 1918, and 1919:—
| 1915. | 1916. | 1917. | 1918. | 1919. | |
|---|---|---|---|---|---|
* Including Nelson North. † Excluding Nelson North, now included in Marlborough. | |||||
| Auckland | 12,933 | 12,153 | 15,206 | 15,113 | 15,473 |
| Hawke's Bay | 9 | 35 | 55 1/2 | 90 | 94 |
| Taranaki | 2,853 | 2,968 | 3,122 | 3,255 | 3,374 |
| Wellington | 663 | 711 | 713 | 749 | 844 |
| Marlborough | 174 | 291* | 127 1/4* | 88* | 120* |
| Nelson | 640 | 583† | 554 1/2† | 548† | 546† |
| Westland | 3,595 | 3,579 | 3,609 | 3,611 | 3,611 |
| Canterbury | 9,682 | 9,642 | 9,040 1/2 | 12,468 | 12,455 |
| Otago | 10,555 | 10,735 | 10,789 | 10,625 | 10,504 |
| Southland | 1,912 | 1,921 | 1,925 | 1,939 | 1,949 |
| Totals | 43,016 | 42,618 | 45,141 3/4 | 48,487 | 48,970 |
The following table gives the analysis of the purposes for which this water-power was employed as on the 31st March, 1919:—
WATER -POWER IN USE ON THE 31ST MARCH , 1919.
| District. | Mining. | Electric Supply. | Flax-mills. | Sawmills. | Flour-mills. | Dairying. | Construction-works. | Freezing-works. | Paper-mills. | Miscellaneous. | Totals. |
|---|---|---|---|---|---|---|---|---|---|---|---|
| Auckland North | .. | 2,680 | .. | .. | .. | 20 | .. | .. | .. | 5 | 2,705 |
| Auckland | 2,340 | 730 | .. | .. | .. | 16 | 100 | 10 | .. | 90 | 3,286 |
| Auckland South | .. | 9,410 | 60 | .. | .. | 3 | .. | .. | .. | 9 | 9,482 |
| Hawke's Bay | .. | 34 | .. | 15 | .. | 12 | .. | .. | .. | 33 | 94 |
| Taranaki | .. | 2,053 1/2 | 30 | 30 | 30 | 995 | .. | 24 | .. | 211 | 3,373 1/2 |
| Wellington Nth. | 3 | 552 | 50 | .. | .. | .. | .. | .. | .. | .. | 605 |
| Wellington | .. | 45 1/2 | .. | 45 | .. | 62 1/2 | .. | .. | .. | 86 | 239 |
| Marlborough | |||||||||||
| Nelson North | 19 1/2 | 26 | 24 | 8 | 8 | .. | .. | .. | .. | 34 1/2 | 120 |
| Nelson South | 269 1/2 | 158 | 6 | 52 | .. | 12 | .. | .. | .. | 48 1/2 | 546 |
| Westland | 1,175 | 1,745 | 27 | 37 | .. | .. | 600 | .. | .. | 27 | 3,611 |
| Canterbury | .. | 12,028 1/2 | 82 | .. | 127 | 15 | .. | .. | .. | 90 | 12,342 1/2 |
| Canterbury Sth. | .. | 22 | 30 | .. | 54 | .. | .. | .. | .. | 7 | 113 |
| Otago | 75 1/2 | 10,027 1/2 | 37 | .. | 68 1/2 | 20 | .. | .. | .. | 275 | 10,503 1/2 |
| Southland | 115 | 29 1/2 | 46 | 29 | 45 | 2 | .. | 1,200 | 450 | 33 | 1,949 1/2 |
| Totals | 3,997 1/2 | 39,541 | 392 | 217 | 332 1/2 | 1,157 1/2 | 700 | 1,234 | 450 | 949 | 48,970 |
The following table gives details of the chief installations from which power is distributed for public supply. Of the twenty-one stations mentioned, fourteen are operated by local authorities, two by the State, and five by private companies.
| Locality. | Supply Authority. | Power installed. | Distance transmitted: Miles. | Voltage of Transmission. | |
|---|---|---|---|---|---|
| H.P. | K.W. | ||||
* Lake Coleridge works. † Waipori works. | |||||
| Canterbury* | State | 8,000 | 6,000 | 65 | 66,000 |
| Dunedin† | City Council | 8,000 | 6,000 | 32 | 35,000 |
| Horahora | Waihi Gold-mining Company | 8,000 | 6,000 | 45 | 50,000 |
| Rotorua | State | 380 | 200 | 13 | 6,600 |
| Hawera | Electric Light Company | 400 | 250 | 12 | 5,000 |
| Wairua Falls | Dominion Cement Company | 3,300 | 2,460 | 22 | 33,000 |
| Stratford | Borough Council | 150 | 90 | 2 | 2,200 |
| New Plymouth | Borough Council | 1,150 | 785 | 5 | 6,600 |
| Inglewood | Borough Council | 200 | 120 | 3 | 3,200 |
| Patea | Borough Council | 67 | 45 | 4 | 3,000 |
| Te Aroha | Borough Council | 255 | 150 | 3 | 3,000 |
| Ohakune | Borough Council | 160 | 120 | 1 | 2,400 |
| Tauranga | Borough Council | 213 | 160 | 18 | 11,000 |
| Akaroa | Borough Council | 50 | 30 | 1 | 220 |
| Taihape | Borough Council | 133 | 100 | 2 | 460 |
| Mangaweka | Town Board | 47 | 35 | 3 | 2,400 |
| Brightwater | Waimea Electric Company | 53 | 40 | 4 | 2,500 |
| Reefton | Electric Supply Company | 80 | 60 | 1 | 230 |
| Oamaru | Borough Council | 150 | 112 | .. | 3,300 |
| Kaponga | Borough Council | 60 | 45 | .. | 230 |
| Raetihi | Borough Council | 80 | 60 | 4 | 3,000 |
The Lake Coleridge works are referred to below. Of the others, the only one of any size is the power-station of the Dunedin City Council on the Waipori River, thirty-two miles from the city. This plant was started in 1907 with two units of 1,000 kilowatts (1,340 h.p.) each. Two more similar units were added in 1910, and two more were installed in 1913, which brings the total capacity up to 6,000 kilowatts (8,000 h.p.). The retail rates charged range from 5d. to 1d. per unit for lighting, and from 2d. to 1/2d. per unit for power purposes.
The output for the year 1918-19 was as follows:—
| Units sold: | Average Price per Unit. | |
|---|---|---|
| Number. | d. | |
| Private lighting | 2,382,579 | 3.46 |
| Public lighting | 380,154 | 3.01 |
| Power and heating | 7,652,992 | 0.81 |
| Tramways | 2,575,898 | .. |
| Total supply | 12,991,623 | 1.38 |
The total outlay to the 31st March, 1919, was £508,353, including distribution, stand-by plant, and public lighting; the total revenue for the year ended the 31st March, 1919, £76,378; and the total expenditure, including interest, sinking fund, depreciation, and renewal funds, £60,681, leaving a net profit of £15,697. The number of consumers supplied was 7,858, and the total capacity of all connections to the mains at the 31st March, 1919, was 17,770 kilowatts.
The Aid to Water-power Works Act of 1910 empowered the State to establish hydro-electric-supply installations, and the first is now in operation at Lake Coleridge, in the Southern Alps, sixty-five miles west of Christchurch. This plant has been designed for a total capacity of 12,000 kilowatts (16,000 h.p.), but natural features of the lake and adjacent rivers allow of a very large extension of the supply up to 58,000 h.p. The transmission-fine is constructed in duplicate by separate routes to Christchurch, thus ensuring continuity of supply, each line having a capacity of 5,000 kw. The present plant capacity is 8,000 h.p., but further plant of 4,000 h.p. capacity is now on order for extensions. The population to be served is over 110,000, and a large demand for power is being made. Contracts have already been made for the bulk supply to the Christchurch City Council and some fifteen other local bodies for retail distribution, the Christchurch Tramway Board, and the power-supply to the large meat-freezing works and dairy factories, tanneries, flour-mills, woollen-mills, and other factories and industries of Canterbury. The contract entered into with the Christchurch City Council provides for a charge for the first 300 kilowatts (400 h.p.) of £8 13s. 4d. per annum per kilowatt of maximum load (equivalent to £6 10s. per horse-power), and all over 300 kilowatts at £5 per annum per kilowatt of maximum load (equivalent to £3 15s. per horse-power). This enables the Council to retail it to the public for lighting at 5d. per unit, flat rate, or 6d. per unit for forty hours of maximum demand and 1d. per unit thereafter, and at 1 1/2d. per unit for power in small units, and special rates ranging from 1/2d. to 1/3d. per unit for special contracts. The standard rate of sale by the Public Works Department is based on £12 per kilowatt year (£9 per horse-power year).
The growth of the supply and the general financial results are as follows:—
| Results of Operation for | First Year, ending March, 1916. | Second Year, ending March, 1917. | Third Year, ending March, 1918. | Fourth Year, ending March, 1919. |
|---|---|---|---|---|
| Capital outlay | £320,330 | £366,984 | £389,754 | £403,157 |
| Working costs | £9,383 | £12,889 | £14,449 | £17,138 |
| Interest 4 per cent. | £11,398 | £13,743 | £14,871 | £15,692 |
| Depreciation 2 per cent. | £5,386 | £6,078 | £7,013 | £7,329 |
| Total costs | £26,167 | £32,710 | £36,333 | £40,159 |
| Total revenue | £8,518 | £20,754 | £32,092 | £37,324 |
| Maximum load, kw.— | ||||
| Power-house | 1,372 | 4,366 | 5,438 | 5,900 |
| Substation | 1,220 | 3,900 | 4,800 | 5,340 |
| Results of Operation for | First Year, ending March, 1916. | Second Year, ending March, 1917. | Third Year, ending March, 1918. | Fourth Year, ending March, 1919. |
|---|---|---|---|---|
| Units output— | ||||
| Power-house | 4,860,260 | 14,774,960 | 22,403,660 | 27,495,720 |
| Substation | 4,128,232 | 12,934,230 | 20,539,430 | 24,548,554 |
| Total units sold | 3,994,767 | 11,664,961 | 19,844,676 | 23,387,546 |
| Average weekly load factor per cent.— | ||||
| Power-house | 44.3 | 52.9 | 58.0 | 59.1 |
| Substation | 43.3 | 53.1 | 58.4 | 58.4 |
| Working cost per unit sold | 0.56d. | 0.265d. | 0.175d. | 0.176d. |
| Capital charge per unit sold | 1.01d. | 0.41d. | 0.265d. | 0.236d. |
| Total cost per unit sold | 1.57d. | 0.675d. | 0.44d. | 0.412d. |
| Revenue per unit sold | 0.51d. | 0.45d. | 0.388d. | 0.383d. |
| Total cost per kw., substation maximum | £21.4 | £8.4 | £7.57 | £7.52 |
To the above costs must be added the cost of retailing by the various local authorities, and the gross results of distribution in the district for the year ending 31st March, 1919, are given in the attached table.
Gross Financial Results of the Distribution of Lake Coleridge Power in Canterbury.
| Authority. | Number of Consumers. | Capital Outlay. | Revenue from Consumers. | Paid for Electricity. | Management and Working Expenses. | Interest. | Sinking Fund. | Depreciation. | Net Profit or Loss. |
|---|---|---|---|---|---|---|---|---|---|
* Paid to Public Works Department. † Paid to Christchurch City Council. | |||||||||
| £ | £ | £ | £ | £ | £ | £ | £ | ||
| Public Works Department | 448 | 389,754 | 18,811 | .. | 14,449 | 14,871 | .. | 7,013 | -4,241 |
| City Council | 4,906 | 264,758 | 49,020 | 11,338* | 16,749 | 7,580 | 641 | 12,425 | +2,277 |
| Waimairi County (approx.) | 687 | 28,875 | 3,416 | 1,269† | 700 | 1,400 | .. | .. | +47 |
| Heathcote County | 307 | 9,500 | 1,418 | 724* | 84 | 430 | .. | .. | +180 |
| Lyttelton Borough | 59 | 3,191 | 134 | 69* | .. | .. | .. | +56 | |
| Sumner Borough | 140 | 3,315 | 624 | 275* | 89 | 101 | .. | 66 | +93 |
| Woolston Borough | 120 | 7,315 | 950 | 371* | 169 | 347 | 50 | .. | +13 |
| Riccarton Borough | 170 | 3,817 | 836 | 371† | 230 | 170 | .. | .. | +65 |
| Spreydon Borough | 185 | 6,002 | 392 | 350† | 22 | 180 | .. | .. | -160 |
| Tai Tapu Company (approx.) | 80 | 4,600 | 1,205 | 504* | 381 | 230 | .. | 90 | .. |
| 7,102 | 721,127 | 76,806 | 15,271 | 32,882 | 25,309 | 691 | 19,594 | -1,670 | |
The column "Revenue from Consumers" omits, in the cases of the Public Works Department and Christchurch City Council, the revenue from the sale of energy to other local authorities for distribution, as this is resold and the actual revenue from the consumers is included in the revenue of the distributing local authority. The amounts thus paid for power in bulk for resale are shown in the column "Paid for Electricity."
Practically all the local authorities were carrying out construction during the year, and in the case of Lyttelton Borough the Council only took over the supply for the last three months of the year. As interest during construction is paid in all cases out of capital, the period on which the amount of interest included in the columns "Interest" and "Sinking Fund" is based does not in many cases cover the whole year.
A large and comprehensive scheme is now under consideration for the supply of electrical energy in the North Island, with the object of making it generally available, as far as possible, to all the towns and districts throughout the Island, and it is anticipated that advantage will be taken of the facilities offered to work the railways by electricity, and to promote a system of light railways throughout the country districts now suffering from lack of communication because of the difficulty of obtaining stone for surfacing the roads.
A complete scheme was outlined in a report dated October, 1918, by Mr. Evan Parry, B.Sc. M.I.C.E., recently Chief Electrical Engineer of the Public Works Department. He estimates the demand at 0.2 h.p. per head of population exclusive of large blocks of power required for electro chemical and metallurgical industries, and allowing for losses in transmission and distribution the power required on this basis for the North Island is 160,000 h.p. This it is proposed to obtain from three sources—the Mangahao River, near Shannon (24,000 h.p.), Lake Waikaremoana (40,000 h.p.), and the Arapuni Rapids, on the Waikato, near Putaruru (96,000 h.p.). Of these the Waikaremoana scheme is capable of further development up to a total of 100,000 h.p.
Capital Expenditure.
The complete estimate to provide for the general scheme of electricity-supply is—
| — | Amount. | Per Horsepower. |
|---|---|---|
| Generating-stations (total plant capacity 160,000 h.p.)— | £ | £ |
| H.P. Cost. Per H.P. | ||
| Mangahao 24,000 £438,654 18.30 | ||
| Waikaremoana 40,000 544,369 13.16 | ||
| Arapuni 96,000 1,078,700 10.80 | ||
| 160,000 | 2,061,723 | 12.88 |
| Main transmission-lines | 1,553,880} | 11.22 |
| Extra branch transmission-lines at lower voltage to main substations not on main lines | 241,360} | |
| Main substations | 838,808 | 5.24 |
| Distribution-lines and secondary substations | 2,086,000 | 13.04 |
| 6,781,771 | 42.38 | |
| Interest during construction | 271,271 | 1.69 |
| Assistance to local authorities and power-users | 100,000 | 0.62 |
| Working capital | 150,000 | 0.94 |
| Total | 7,303,042 | 45.63 |
The capital charges for interest, depreciation, and sinking fund at 7 1/2 per cent. will amount to £547,728 per annum. The working-expenses should not exceed £220,000 per annum, making a total annual expenditure of £767,728, requiring an average return of £5.9 per horse-power per annum of maximum load—i.e., about £8 per kilowatt.
Water-power is extensively used for hydraulic mining in New Zealand, and to a smaller extent for hydro-electric transmissions and for water-motors installed to drive mining machinery.
During 1918 water was used for sluicing auriferous alluvium at 153 claims, employing 520 persons, in Otago and Southland and on the West Coast. The quantity of water utilized per claim ranges up to about 40 cubic feet per second. Most of the sources of water-supply are privately owned, but on the West Coast and in Central Otago the Government has constructed, and now maintains, very extensive water-races for the use of miners.
On the West Coast the Waimea-Kumara Government water-races, in length about forty-five miles, have a capacity of 220 cubic feet per second. The cost of construction has been approximately £250,000, and the value of the gold obtained by use of the water is about £1,400,000. In Central Otago the Mount Ida Government water-races, in length about twenty-two miles, have a capacity of 51 cubic feet per second; the cost of these races to the Government has been about £80,000. The water is generally sold from Government races at a charge per hour of 2 1/2d. per "sluice head," which is equivalent to a flow of 1 cubic foot per second. Of recent years the cash received for water sold has been less than the cost of upkeep of the races. Power from water-motors is used in the Reefton district at the Progress Mine for milling and ore-reduction, and in Central Otago on three gold-dredges.
There are three hydro-electric ruining transmissions. On the Waikato River the Waihi Gold-mining Company has installed a 9,000 h.p. plant at Horahora Falls, near Cambridge, a distance of fifty miles from the mines and reduction-works at Waihi and Waikino. The transmission pressure is 50,000 volts. The company has the right to supply local authorities en route with power for public distribution.
At Kanieri Forks, near Hokitika, there is a hydro-electric-power station, formerly the property of Ross Goldfields (Limited), but recently purchased by the Kanieri Forks Power Company. The water-supply is carried by races from Lake Kanieri, and from the Pelton wheels at the power-house 675 h.p. is obtainable. It is proposed to distribute generally in the district.
From the Fraser River, near Alexandra, Otago, water is taken by the Earnscleugh Gold-mining Company for hydro-electric power for its two gold dredges, 300 electrical horse-power being utilized.
In addition to the developed power in New Zealand there is a practically unlimited amount of undeveloped power. A table in the 1914 issue of this book gave particulars concerning the more important available water-powers over 1,000 horse-power, showing also the nearest market consisting of a city or an actual or potential port. A considerable number of these are suitable for general industrial development, but the largest ones, as a rule being in the unsettled portions of the South Island and near the deep-water sounds, are particularly suitable for utilization in connection with electro-chemical or electro-metallurgical industries.
Table of Contents
PRIOR to 1919 particulars of manufactories and works were ascertained only in census years. This year, however, a system of annual collections was inaugurated, and in the next and subsequent issues up-to-date figures in this connection will be available. Meanwhile the following data is reprinted from the 1918 Year-book:—
As on previous occasions, a census of manufactories and works was taken in conjunction with the population census of 1916, and the summarized results are given in the following pages with comparative figures for previous censuses. It should be mentioned, to avoid misunderstanding, that the statistics do not purport to include all "factories" registered under the Factories Act, the figures showing the results of returns collected only from manufactories and works employing over two hands. In a number of cases where work was carried on by the same manufacturer in separate buildings a considerable distance from one another, each building would be registered as a distinct "factory," but only one census return might be furnished. For instance, in the case of a butter-factory with, say, a dozen or more creameries separating and supplying cream, each creamery would be registered as a separate "factory," but the particulars for all might be included in one census return. Certain industries also which are registered as factories (bakers, blacksmiths, &c.) do not furnish returns for census purposes. The collection of 1916 followed as closely as possible the lines of previous census collections.
The first statement given shows at a glance the principal points of comparison between the 1916 and 1911 censuses. The operations of the Government Printing Office and the Railway Workshops are excluded.
| 1910-11. Number. | 1915-16. Number. | Increase. Number. | |
|---|---|---|---|
* Decrease. | |||
| Number of establishments | 4,402 | 4,670 | 268 |
| Hands employed— | |||
| Males | 42,267 | 43,970 | 1,703 |
| Females | 13,967 | 13,853 | -114* |
| Totals | 56,234 | 57,823 | 1,589 |
| Wages paid— | £ | £ | £ |
| To males | 4,865,426 | 5,868,788 | 1,003,362 |
| To females | 706,844 | 785,716 | 78,872 |
| Totals | £5,572,270 | £6,654,504 | £1,082,234 |
| H.p. | H.p. | H.p. | |
| Horse-power | 100,587 | 146,051 | 45,464 |
| £ | £ | £ | |
| Cost of materials used or operated on | 20,810,211 | 31,317,969 | 10,507,758 |
| Value of all manufactures or produce (including repairs).. | 31,729,002 | 45,454,184 | 13,725,182 |
| Total approximate value of— | |||
| Land | 3,890,921 | 4,536,614 | 645,693 |
| Buildings | 5,174,890 | 6,814,141 | 1,639,251 |
| Machinery and plant | 7,665,548 | 10,600,821 | 2,935,273 |
| Totals | £16,731,359 | £21,951,576 | £5,220,217 |
The number of establishments continues to show an increase, in keeping with the growing population of the Dominion. The figures for each of the last five censuses are as follows:—
| 1896 | 2,459 |
| 1901 | 3,680 |
| 1906 | 4,186 |
| 1911 | 4,402 |
| 1916 | 4,670 |
In reference to the large increase shown between 1896 and 1901 it should be explained that in 1901 a number of industries not included at previous censuses were enumerated for the first time: these were tailoring, dressmaking and millinery, shirtmaking, and monumental masonry. These industries had in 1901 a total of 517 establishments, employing 5,121 hands and giving an aggregate output valued at £711,984. New industries have been added from time to time at later enumerations, notably electric tramways, electric-current supply, and electrical engineering.
Of the 4,670 establishments returned in 1916, 2,691 were situated in the North Island, 1,236 of these being in the Auckland Provincial District. Reference to the following summary will show that while the total increase for the Dominion between 1911 and 1916 was 268, Auckland alone showed an increase of 302. Five of the ten provincial districts are seen to have decreased as regards number of establishments in operation.
| Provincial District. | 1896. | 1901. | 1906. | 1911. | 1916. |
|---|---|---|---|---|---|
| Auckland | 573 | 752 | 885 | 934 | 1,236 |
| Taranaki | 128 | 267 | 247 | 253 | 246 |
| Hawke's Bay | 147 | 160 | 214 | 251 | 256 |
| Wellington | 396 | 707 | 846 | 982 | 953 |
| Marlborough | 50 | 61 | 61 | 95 | 57 |
| Nelson | 154 | 198 | 236 | 214 | 156 |
| Westland | 47 | 78 | 112 | 107 | 105 |
| Canterbury | 448 | 648 | 696 | 724 | 776 |
| Otago | 516 | 809 | 889 | 549 | 579 |
| Southland | 293 | 306 | |||
| Totals | 2,459 | 3,680 | 4,186 | 4,402 | 4,670 |
Details of the number of establishments connected with the various industries are next given for each provincial district for 1916.
| Class. | Number of Industries in Provincial Districts. | Total Number of Industries. | |||||||||
|---|---|---|---|---|---|---|---|---|---|---|---|
| Auckland. | Taranaki. | Hawke's Bay | Wellington. | Marlborough. | Nelson. | Westland. | Canterbury. | Otago. | Southland. | ||
| Animal food— | |||||||||||
| Meat freezing and preserving works | 11 | 2 | 4 | 7 | 1 | 1 | 1 | 5 | 9 | 4 | 45 |
| Ham- and bacon-curing establishments | 4 | 3 | 2 | 3 | .. | .. | .. | 5 | 10 | 1 | 28 |
| Fish curing and preserving works | ? | .. | 2 | .. | .. | .. | 2 | 1 | 1 | .. | 14 |
| Butter and cheese factories | 64 | 61 | 21 | 69 | 7 | 10 | 5 | 32 | 29 | 50 | 348 |
| Condensed-milk factories | .. | .. | .. | 1 | .. | .. | .. | .. | 1 | 2 | 4 |
| Vegetable food— | |||||||||||
| Grain-mills | 4 | 1 | .. | 5 | 2 | 2 | .. | 22 | 15 | 2 | 53 |
| Biscuit-factories | 5 | .. | .. | 1 | .. | 1 | .. | 2 | 2 | 1 | 12 |
| Fruit-preserving and jam-making works | 7 | .. | 1 | 1 | .. | 3 | .. | 1 | 2 | 1 | 16 |
| Sugar - boiling and confectionery works | 8 | .. | 1 | 5 | .. | .. | .. | 3 | 4 | 1 | 22 |
| Sugar-refining works | 1 | .. | .. | .. | .. | .. | .. | .. | .. | .. | 1 |
| Baking-powder factories | 5 | .. | .. | 1 | .. | .. | .. | 1 | .. | .. | 7 |
| Drinks, narcotics, and stimulants— | |||||||||||
| Breweries | 5 | 2 | 5 | 11 | 2 | 4 | 6 | 9 | 7 | 4 | 55 |
| Malthouses | 3 | .. | 1 | 2 | .. | 2 | 1 | 3 | 6 | .. | 18 |
| Colonial-wine making | .. | .. | 1 | .. | .. | .. | .. | .. | 1 | .. | 2 |
| Aerated-water factories | 37 | 10 | 9 | 32 | .. | 7 | 7 | 23 | 11 | 7 | 143 |
| Coffee and spice works | .. | .. | .. | 2 | .. | 1 | .. | 3 | 4 | 1 | 11 |
| Tobacco and cigarette works | .. | .. | .. | 2 | .. | .. | .. | .. | .. | .. | 2 |
| Sauce, pickle, and vinegar factories | 5 | .. | 1 | 5 | .. | 1 | 1 | 4 | 3 | .. | 20 |
| Animal matters (not otherwise classed)— | |||||||||||
| Soap and candle works | 4 | .. | 1 | 5 | .. | .. | .. | 5 | 3 | .. | 18 |
| Glue-factories | 1 | .. | .. | .. | .. | .. | .. | 1 | .. | .. | 2 |
| Sausage-casing factories | 3 | .. | 1 | 5 | .. | .. | .. | 4 | 3 | .. | 16 |
| Boiling-down and manure works | 8 | 1 | 3 | 6 | .. | 1 | .. | 10 | 5 | .. | 34 |
| Working in wood— | |||||||||||
| Cooperages and packing-case factories | 5 | 4 | 2 | 5 | .. | 1 | .. | 1 | 2 | 1 | 21 |
| Sawmills, sash and door factories | 74 | 12 | 19 | 49 | 6 | 32 | 31 | 20 | 18 | 31 | 292 |
| Woodware and turnery factories | 26 | 4 | 3 | 25 | .. | 1 | .. | 9 | 2 | 3 | 73 |
| Vegetable produce for fodder— | |||||||||||
| Grain-crushing establishments | 3 | .. | 1 | 4 | .. | .. | .. | 1 | 2 | .. | 11 |
| Seed-dressing establishments | .. | .. | 1 | .. | 2 | .. | .. | 5 | 8 | 6 | 22 |
| Paper-manufacture— | |||||||||||
| Paper-mills | 1 | .. | .. | .. | .. | .. | .. | .. | 1 | 1 | 3 |
| Paper-bag and box factories | 6 | .. | .. | 1 | .. | .. | .. | .. | 4 | 1 | 12 |
| Gasworks | 12 | 3 | 7 | 12 | 2 | 3 | 2 | 9 | 4 | 2 | 56 |
| Electric light and supply works | 11 | 6 | 5 | 5 | .. | 3 | .. | 7 | 1 | 5 | 42 |
| Electric tramways | 2 | .. | 1 | 2 | .. | .. | .. | 1 | 2 | 1 | 9 |
| Processes relating to stone, clay, glass, &c— | |||||||||||
| Lime and cement works | 5 | .. | 1 | 1 | .. | 2 | .. | .. | 7 | .. | 16 |
| Stone crushing and cutting | 12 | .. | .. | .. | .. | .. | 1 | .. | 7 | .. | 20 |
| Asphalt-works | 2 | .. | .. | 1 | .. | .. | .. | .. | .. | 3 | |
| Brick, tile, and pottery works | 17 | 21 | 8 | 16 | 1 | 3 | 1 | 13 | 8 | 5 | 74 |
| Monumental masonry | 4 | 1 | .. | 4 | .. | 2 | .. | 6 | 2 | 2 | 21 |
| Glass-bevelling and leadlights | 6 | .. | .. | 3 | .. | .. | .. | 3 | .. | 1 | 13 |
| Electroplating-works | 2 | .. | .. | 5 | .. | .. | .. | 1 | .. | .. | 8 |
| Pumice-works | 1 | .. | .. | .. | .. | .. | .. | .. | .. | .. | 1 |
| Concrete-block and fibrous-plaster works | 12 | .. | 1 | 2 | .. | .. | .. | 5 | 2 | .. | 22 |
| Metals, other than gold or silver— | |||||||||||
| Tinned - plate and sheet - metal works | 35 | 4 | 9 | 30 | .. | 2 | 3 | 11 | 12 | 9 | 115 |
| Iron and brass foundries, boiler-making, machinists, &c. | 8 | .. | .. | 5 | .. | .. | .. | 2 | 5 | 2 | 22 |
| Engineering-works | 45 | 3 | 6 | 33 | 2 | 5 | 3 | 22 | 19 | 4 | 142 |
| Electrical-engineering works | 6 | .. | .. | 3 | .. | .. | .. | 2 | 1 | 2 | 14 |
| Rangemaking-works | 3 | .. | .. | 1 | .. | .. | .. | 3 | 3 | .. | 10 |
| Wirework-factories | 2 | .. | .. | 3 | .. | .. | .. | 3 | 2 | 1 | 11 |
| Fencing-standard making | .. | .. | .. | .. | 2 | .. | .. | 1 | 1 | 1 | 5 |
| Precious metals— | |||||||||||
| Jewellery-making and watch-repairing | 13 | .. | 6 | 20 | .. | 3 | 2 | 18 | 9 | 2 | 73 |
| Books and publications— | |||||||||||
| Printing and bookbinding offices | 80 | 13 | 13 | 58 | 3 | 9 | 5 | 36 | 33 | 16 | 266 |
| Musical instruments— | |||||||||||
| Musical-instrument factories | 1 | .. | .. | 1 | .. | .. | .. | 1 | 1 | .. | 4 |
| Ornaments, minor art products— | |||||||||||
| Picture-frame makers | 6 | .. | 2 | 8 | .. | .. | .. | 11 | .. | 1 | 28 |
| Basket and perambulator factories | 4 | .. | 1 | 10 | .. | .. | .. | 2 | 5 | .. | 22 |
| Equipment for sports and games— | |||||||||||
| Billiard-table works | 1 | .. | .. | 2 | .. | .. | .. | 1 | .. | .. | 4 |
| Designs, medals, type, and dies— | |||||||||||
| Engraving and stamp-making | 3 | .. | .. | 2 | .. | .. | .. | 1 | .. | .. | 6 |
| Ammunition and explosives— | |||||||||||
| Ammunition, explosives, and fireworks makers | 3 | .. | .. | .. | .. | 1 | .. | 1 | .. | .. | 5 |
| Machines, tools, and implements— | |||||||||||
| Agricultural-machinery works | 2 | .. | 1 | 2 | .. | 1 | .. | 5 | 3 | 3 | 16 |
| Brush and broom factories | 7 | 1 | .. | 1 | .. | .. | .. | 1 | 2 | .. | 12 |
| Carriages and vehicles— | |||||||||||
| Coachbuilding-works | 86 | 24 | 16 | 46 | 1 | 10 | 3 | 57 | 49 | 21 | 313 |
| Motor and cycle works | 12 | 3 | 8 | 44 | 2 | 2 | 6 | 61 | 23 | 11 | 172 |
| Harness, saddlery, and leather-ware— | |||||||||||
| Saddlery and harness factories | 48 | 12 | 10 | 22 | 3 | 3 | 1 | 31 | 10 | 11 | 151 |
| Leather-goods makers | 2 | .. | .. | 4 | .. | .. | .. | 3 | 3 | .. | 12 |
| Tanning, fellmongery, and wool-scouring establishments | 10 | 5 | 6 | 7 | .. | 3 | .. | 19 | 5 | 4 | 59 |
| Ships, boats, and their equipment— | |||||||||||
| Ship- and boat-building yards | 21 | .. | 1 | 2 | 1 | .. | .. | 3 | 3 | .. | 31 |
| Sail, tent, and oilskin factories | 11 | 2 | 3 | 7 | 1 | 2 | 1 | 9 | 4 | 1 | 41 |
| Furniture— | |||||||||||
| Furniture and cabinetmaking | 87 | 20 | 10 | 60 | 2 | 5 | 7 | 35 | 21 | 10 | 257 |
| Blindmaking | 3 | .. | .. | .. | .. | .. | .. | 1 | 1 | .. | 5 |
| Mattress-factories | 7 | .. | .. | 9 | .. | .. | .. | 2 | 1 | .. | 19 |
| Rug and mat making | 1 | .. | .. | 3 | .. | .. | .. | 2 | 1 | .. | 7 |
| Chemicals and by-products— | |||||||||||
| Varnish and paint factories | 3 | .. | .. | .. | .. | .. | .. | .. | 1 | .. | 4 |
| Ink-factories | 1 | .. | .. | .. | .. | .. | .. | .. | .. | .. | 1 |
| Starch-factories | 1 | .. | 1 | .. | .. | .. | .. | 1 | 2 | .. | 5 |
| Chemical-works | 6 | 1 | 1 | 4 | .. | .. | .. | 5 | 7 | .. | 24 |
| Sheep-dip works | .. | .. | 1 | .. | .. | .. | .. | 1 | .. | .. | 2 |
| Match-factories | .. | .. | .. | 1 | .. | .. | .. | .. | 1 | .. | 2 |
| Boot-polish factories | 3 | .. | .. | 1 | .. | .. | .. | .. | .. | .. | 4 |
| Textile fabrics— | |||||||||||
| Woollen-mills | 1 | .. | 1 | 1 | .. | .. | .. | 3 | 4 | .. | 10 |
| Flock-mills | 1 | .. | .. | 1 | .. | .. | .. | 1 | 1 | .. | 4 |
| Dress— | |||||||||||
| Tailoring establishments | 145 | 32 | 25 | 98 | 10 | 16 | 10 | 72 | 64 | 24 | 496 |
| Dressmaking and millinery establishments | 66 | 6 | 22 | 79 | 3 | 6 | 3 | 74 | 52 | 28 | 339 |
| Boot and shoe factories | 61 | 4 | 11 | 37 | .. | 3 | .. | 28 | 14 | 8 | 166 |
| Clothing and waterproof factories | 20 | 1 | .. | 24 | .. | .. | .. | 20 | 16 | 2 | 83 |
| Hosiery-factories | 1 | .. | .. | 2 | .. | .. | .. | 3 | 3 | 1 | 10 |
| Umbrella-factories | 2 | .. | 1 | 1 | .. | .. | 1 | .. | .. | .. | 5 |
| Fibrous materials— | |||||||||||
| Rope and twine works | 1 | .. | .. | 2 | .. | .. | .. | 3 | 2 | 2 | 10 |
| Bag and sack works | .. | .. | .. | .. | .. | .. | .. | 3 | 1 | .. | 4 |
| Flax-mills | 27 | 2 | .. | 16 | 4 | 6 | 2 | 2 | 8 | 9 | 76 |
| Returns not included in above | 6 | 1 | .. | 5 | .. | .. | .. | 1 | .. | .. | 13 |
| Totals | 1236 | 246 | 256 | 953 | 57 | 156 | 105 | 776 | 579 | 306 | 4670 |
The next table shows, according to industries, the number of works established during each of the last six years and for various periods of years prior to 1910:—
| Industry. | Number established in | Total. | |||||||||||||
|---|---|---|---|---|---|---|---|---|---|---|---|---|---|---|---|
| Prior to 1860. | 1860-9. | 1870-9. | 1880-9. | 1890-9. | 1900-4. | 1905-9. | 1910. | 1911. | 1912. | 1913. | 1914. | 1915. | Not stated. | ||
| Meat-freezing | 1 | 2 | 1 | 8 | 11 | 6 | 6 | 2 | 1 | 1 | .. | 1 | 4 | 1 | 45 |
| Bacon-curing | .. | 3 | .. | 2 | 7 | 7 | 1 | 1 | 2 | .. | 1 | 2 | .. | 2 | 28 |
| Fish-curing | .. | 1 | .. | .. | 1 | 5 | 2 | .. | .. | 2 | 1 | 1 | .. | 1 | 14 |
| Butter and cheese | .. | 1 | 4 | 20 | 78 | 48 | 58 | 19 | 21 | 26 | 18 | 8 | 22 | 25 | 348 |
| Condensed milk | .. | .. | .. | .. | 1 | .. | 1 | .. | .. | .. | 1 | .. | .. | 1 | 4 |
| Grain-mills | 6 | 5 | 13 | 7 | 5 | 4 | .. | .. | .. | .. | .. | 1 | 1 | 11 | 53 |
| Biscuits | 4 | 4 | 1 | .. | .. | 1 | 1 | 1 | .. | .. | .. | .. | .. | .. | 12 |
| Fruit-preserving | 1 | 1 | .. | 2 | 2 | 1 | 3 | 1 | .. | 1 | .. | 3 | .. | 1 | 16 |
| Confectionery | 1 | 1 | .. | 4 | 3 | 3 | 3 | 1 | .. | .. | .. | 3 | .. | 3 | 22 |
| Sugar-refining | .. | .. | .. | 1 | .. | .. | .. | .. | .. | .. | .. | .. | .. | .. | 1 |
| Baking-powder | .. | 1 | 1 | 3 | 1 | .. | .. | .. | .. | .. | .. | 1 | .. | .. | 7 |
| Brewing | 4 | 11 | 10 | 8 | 7 | 3 | 3 | 1 | .. | .. | 2 | .. | .. | 6 | 55 |
| Malting | 3 | 2 | 5 | .. | 1 | 1 | 1 | .. | .. | .. | .. | .. | .. | 5 | 18 |
| Colonial wine | .. | .. | .. | .. | 1 | .. | .. | .. | .. | .. | .. | 1 | .. | .. | 2 |
| Aerated water | 2 | 10 | 12 | 15 | 12 | 27 | 20 | 1 | 3 | 4 | 4 | 3 | 3 | 27 | 143 |
| Coffee and spice | .. | 4 | 1 | 3 | 2 | .. | .. | .. | .. | .. | .. | .. | .. | 1 | 11 |
| Tobacco and cigarettes | .. | .. | 1 | .. | .. | .. | 1 | .. | .. | .. | .. | .. | .. | .. | 2 |
| Sauce, pickle, and vinegar | 1 | .. | 1 | 4 | 4 | 2 | .. | .. | .. | .. | 4 | 1 | 1 | 2 | 20 |
| Soap and candle | .. | 2 | 2 | 4 | 5 | .. | .. | 2 | .. | .. | .. | 1 | .. | 2 | 18 |
| Glue | .. | .. | .. | 2 | .. | .. | .. | .. | .. | .. | .. | .. | .. | .. | 2 |
| Sausage-casings | .. | .. | .. | 1 | 8 | 2 | .. | 1 | .. | 2 | .. | .. | .. | 2 | 16 |
| Boiling-down and manures | .. | 6 | 4 | 3 | 1 | 7 | 3 | 1 | 1 | .. | 2 | 1 | .. | 5 | 34 |
| Cooperages and packing-cases | .. | 1 | 2 | 6 | 4 | .. | 4 | .. | 1 | .. | 1 | .. | .. | 2 | 21 |
| Sawmills | 3 | 5 | 22 | 27 | 35 | 39 | 53 | 14 | 11 | 18 | 16 | 10 | 12 | 27 | 292 |
| Woodware and turnery | .. | 2 | 3 | 6 | 3 | 9 | 17 | 6 | 7 | 5 | 3 | 3 | 1 | 8 | 73 |
| Grain-crushing | .. | .. | 1 | 3 | .. | 3 | .. | .. | 1 | .. | .. | .. | .. | 3 | 11 |
| Grass-seed dressing | .. | .. | 2 | 3 | 2 | 5 | 3 | .. | .. | 1 | .. | .. | .. | 6 | 22 |
| Paper-mills | .. | .. | 3 | .. | .. | .. | .. | .. | .. | .. | .. | .. | .. | .. | 3 |
| Paper bag and box | 1 | .. | 2 | 2 | .. | 2 | 2 | .. | .. | 1 | .. | .. | .. | 2 | 12 |
| Gasworks | .. | 5 | 15 | 3 | 5 | 6 | 11 | 2 | 2 | 3 | 1 | .. | .. | 3 | 56 |
| Electric light and supply | .. | .. | .. | 4 | 2 | 5 | 8 | 3 | 2 | 1 | 6 | 8 | 2 | 1 | 42 |
| Electric tramways | .. | .. | 1 | 1 | .. | .. | 1 | .. | .. | 1 | 2 | .. | .. | 3 | 9 |
| Stone-crushing | .. | .. | 1 | 4 | 1 | 2 | 2 | .. | .. | 3 | 2 | .. | 2 | 3 | 20 |
| Lime and cement | .. | .. | 3 | 1 | 1 | 2 | 2 | .. | .. | .. | .. | .. | .. | 7 | 16 |
| Asphalt | .. | .. | .. | .. | .. | 1 | .. | .. | .. | .. | 1 | 1 | .. | .. | 3 |
| Brick, tile, and pottery | 2 | 5 | 10 | 10 | 12 | 11 | 10 | .. | .. | .. | .. | 1 | 2 | 11 | 74 |
| Monumental masonry | .. | 2 | 4 | 4 | 1 | 5 | 4 | .. | 1 | .. | .. | .. | .. | .. | 21 |
| Glass-works | 1 | .. | .. | .. | 2 | 2 | 4 | 1 | .. | 1 | 2 | .. | .. | .. | 13 |
| Electroplating | .. | .. | .. | 1 | .. | 2 | 2 | .. | 1 | .. | .. | .. | 1 | 1 | 8 |
| Pumice-works | .. | .. | .. | .. | 1 | .. | .. | .. | .. | .. | .. | .. | .. | .. | 1 |
| Concrete and fibrous plaster | .. | .. | 1 | .. | 1 | 3 | 7 | 2 | 2 | .. | 2 | 2 | 2 | .. | 22 |
| Tinned-plate and sheet-metal works | 3 | 5 | 7 | 17 | 16 | 18 | 22 | 1 | 2 | 5 | 3 | .. | 4 | 12 | 115 |
| Iron and brass | .. | .. | 1 | 2 | 4 | 2 | 4 | 5 | 1 | 1 | 2 | .. | .. | .. | 22 |
| Engineering-works | 3 | 11 | 17 | 11 | 17 | 17 | 19 | 7 | 6 | 7 | 9 | 1 | 3 | 14 | 142 |
| Electrical engineering | .. | .. | .. | .. | 1 | 1 | 6 | 1 | .. | 2 | 1 | 1 | 1 | .. | 14 |
| Rangemaking | 1 | .. | 2 | 2 | 2 | 1 | .. | .. | .. | .. | .. | .. | 1 | 1 | 10 |
| Wireworking | .. | .. | .. | .. | 2 | 2 | 5 | .. | .. | .. | .. | .. | 1 | 1 | 11 |
| Printing | 7 | 29 | 42 | 27 | 48 | 20 | 30 | 9 | 8 | 7 | 9 | 7 | 4 | 19 | 266 |
| Musical instruments | .. | .. | .. | 1 | 1 | 1 | .. | .. | .. | .. | .. | .. | 1 | .. | 4 |
| Picture-frames | 1 | 1 | 3 | 4 | 3 | 3 | 6 | 4 | 2 | 1 | .. | .. | .. | .. | 28 |
| Baskets and perambulators | .. | .. | 2 | 2 | 10 | 2 | 1 | 2 | .. | .. | .. | 1 | .. | 2 | 22 |
| Billiard-tables | .. | 1 | .. | .. | 1 | 1 | .. | 1 | .. | .. | .. | .. | .. | .. | 4 |
| Engraving and stamp-making | .. | .. | .. | 1 | 2 | .. | 1 | .. | .. | .. | 1 | .. | .. | 1 | 6 |
| Ammunition and explosives | .. | 1 | .. | 2 | 1 | .. | .. | .. | .. | .. | 1 | .. | .. | .. | 5 |
| Agricultural machinery | .. | 1 | 2 | 1 | 2 | 5 | 1 | 1 | .. | 1 | .. | .. | .. | 2 | 16 |
| Brush and broom | .. | .. | 2 | 1 | 4 | .. | 3 | 1 | .. | .. | .. | 1 | .. | .. | 12 |
| Coachbuilding | 5 | 16 | 27 | 51 | 53 | 29 | 28 | 15 | 8 | 8 | 11 | 3 | 2 | 57 | 313 |
| Motor and cycle works | .. | 1 | .. | 5 | 28 | 11 | 38 | 6 | 6 | 21 | 12 | 10 | 22 | 12 | 172 |
| Saddlery and harness | 1 | 4 | 11 | 28 | 25 | 14 | 28 | 6 | 3 | 1 | 3 | 2 | 2 | 23 | 151 |
| Leather | .. | .. | .. | 1 | 1 | .. | 6 | 1 | .. | 1 | 1 | .. | .. | 1 | 12 |
| Industry. | Number established in | Total. | |||||||||||||
|---|---|---|---|---|---|---|---|---|---|---|---|---|---|---|---|
| Prior to 1860. | 1860-9. | 1870-9. | 1880-9. | 1890-9. | 1900-4. | 1905-9. | 1910. | 1911. | 1912. | 1913. | 1914. | 1915. | Not stated. | ||
| Tanning and fellmongery | .. | 5 | 5 | 18 | 14 | 2 | 8 | .. | .. | .. | 1 | 3 | .. | 3 | 59 |
| Ship and boat building | 2 | 1 | 5 | 3 | 3 | 4 | 4 | .. | 2 | 2 | .. | 1 | 1 | 3 | 31 |
| Sail, tent, and oilskin | 2 | 5 | 5 | 3 | 9 | 5 | 1 | .. | 1 | .. | .. | 2 | 3 | 5 | 41 |
| Furniture and cabinetmaking | 3 | 8 | 15 | 22 | 36 | 26 | 46 | 11 | 10 | 16 | 15 | 12 | 11 | 26 | 257 |
| Blinds | .. | .. | .. | 3 | .. | .. | 2 | .. | .. | .. | .. | .. | .. | .. | 5 |
| Mattress-factories | .. | .. | .. | 2 | 5 | 4 | 4 | 1 | .. | .. | 1 | 1 | .. | 1 | 19 |
| Bug and mat | .. | .. | .. | 3 | 2 | 1 | 1 | .. | .. | .. | .. | .. | .. | .. | 7 |
| Paint and varnish | .. | .. | .. | 1 | 2 | .. | 1 | .. | .. | .. | .. | .. | .. | .. | 4 |
| Ink-factories | .. | .. | .. | 1 | .. | .. | .. | .. | .. | .. | .. | .. | .. | .. | 1 |
| Starch | .. | 2 | .. | 1 | 1 | 1 | .. | .. | .. | .. | .. | .. | .. | .. | 5 |
| Chemical-works | 1 | 2 | 2 | 1 | 5 | 4 | 3 | .. | .. | 1 | .. | 1 | 2 | 2 | 24 |
| Sheep-dip | .. | .. | .. | 1 | .. | .. | .. | .. | .. | .. | .. | .. | 1 | .. | 2 |
| Match-factories | .. | .. | .. | .. | 2 | .. | .. | .. | .. | .. | .. | .. | .. | .. | 2 |
| Polishes | .. | .. | .. | .. | 2 | 1 | 1 | .. | .. | .. | .. | .. | .. | .. | 4 |
| Woollen-mills | .. | .. | 3 | 5 | 1 | 1 | .. | .. | .. | .. | .. | .. | .. | .. | 10 |
| Flock-mills | .. | .. | 2 | .. | 2 | .. | .. | .. | .. | .. | .. | .. | .. | .. | 4 |
| Tailoring | 4 | 12 | 18 | 37 | 64 | 61 | 102 | 26 | 16 | 25 | 36 | 27 | 21 | 47 | 496 |
| Dressmaking | 5 | 16 | 18 | 42 | 32 | 24 | 59 | 21 | 17 | 14 | 16 | 18 | 26 | 31 | 339 |
| Boot and shoe | 2 | 5 | 19 | 20 | 22 | 19 | 26 | 2 | 6 | 4 | 8 | 6 | 6 | 21 | 166 |
| Hosiery-factories | .. | .. | .. | 3 | 2 | 1 | 2 | .. | .. | .. | .. | .. | .. | 2 | 10 |
| Umbrella-factories | .. | .. | .. | 1 | 1 | .. | 2 | 1 | .. | .. | .. | .. | .. | .. | 5 |
| Clothing | 3 | 1 | 2 | 7 | 12 | 8 | 15 | 3 | 1 | 3 | 5 | 6 | 6 | 11 | 83 |
| Rope and twine | .. | .. | 3 | .. | 3 | .. | 1 | .. | 1 | .. | .. | 2 | .. | .. | 10 |
| Bag and sack | .. | .. | .. | .. | 1 | .. | 3 | .. | .. | .. | .. | .. | .. | .. | 4 |
| Flax-mills | .. | .. | 2 | 3 | 61 | 12 | 22 | 1 | 1 | 2 | 8 | 1 | 9 | 9 | 76 |
| Jewellery | .. | 2 | 6 | 14 | 12 | 8 | 12 | 1 | 1 | 4 | 1 | 1 | 2 | 9 | 73 |
| Miscellaneous | .. | 1 | 2 | 1 | 3 | 1 | 2 | .. | 2 | 1 | 2 | .. | .. | 3 | 18 |
| Totals | 73 | 204 | 349 | 510 | 683 | 524 | 748 | 186 | 150 | 197 | 215 | 159 | 182 | 490 | 4,670 |
Of the total number of industries (4,670) in operation at the census of 1916, 2,222 were under individual ownership. Public registered companies owned 445 of these works, or 9.50 per cent. of the whole, while the value of the manufactures or products of these 445 amounted to £21,623,870, or 47.57 per cent. of the total output. A summary is given showing figures for the various works as classified according to character of organization.
TABLE SHOWING CHARACTER OF ORGANIZATION OF MANUFACTORIES AND WORKS .
| Character of Organization. | Number of Works. | Hands employed. | Power. | Cost of Materials used or operated upon. | Value of Manufactures or Products. | ||
|---|---|---|---|---|---|---|---|
| Number. | Wages. | Number using. | Horse-Power. | ||||
| £ | £ | £ | |||||
| Individual | 2,222 | 11,670 | 1,220,103 | 1,230 | 12,413 | 3,135,221 | 5,371,479 |
| Firm or limited partnership | 1,042 | 8,728 | 954,771 | 1,022 | 11,976 | 2,054,222 | 3,881,718 |
| Public registered company | 445 | 20,081 | 2,356,475 | 2,070 | 58,260 | 16,332,219 | 21,623,870 |
| Private registered company | 595 | 13,752 | 1,609,930 | 1,038 | 18,775 | 3,884,061 | 6,833,220 |
| Co-operative and miscellaneous | 366 | 3,592 | 513,225 | 681 | 44,617 | 5,912,246 | 7,743,897 |
| Total | 4,670 | 57,823 | 6,654,504 | 6,041 | 146,041 | 31,317,969 | 45,454,184 |
The two following tables give information as to capital of (1) private registered companies and (2) public registered companies:—
TABLE SHOWING CAPITAL OF PRIVATE REGISTERED COMPANIES .
| Industry. | Number of Private Companies. | (a.) Amount of Subscribed Capital, including all Classes of Shares. | (b.) Amount of Paid-up Capital. | (c.) Amount of Loan Capital—i.e., Debentures and Fixed Loan. | (d.) Amount of Paid-up Shares issued to Vendors, included in (b ). |
|---|---|---|---|---|---|
| £ | £ | £ | £ | ||
| Ham and bacon curing | 5 | 85,000 | 83,051 | 26,750 | 45,900 |
| Butter and cheese factories | 14 | 50,726 | 40,878 | 10,850 | 5,000 |
| Grain-mills | 8 | 131,500 | 116,500 | 7,217 | 55,000 |
| Breweries | 9 | 387,006 | 381,106 | 100,000 | 58,330 |
| Malthouses | 5 | 40,000 | 40,000 | 8,176 | 9,500 |
| Aerated-water factories | 9 | 61,550 | 56,000 | 9,039 | 25,000 |
| Sauce, pickle, and vinegar works | 8 | 50,750 | 50,100 | 3,352 | 9,250 |
| Soap and candle works | 6 | 47,500 | 37,925 | 4,500 | 22,050 |
| Boiling-down works | 4 | 144,850 | 124,850 | 1,000 | 350 |
| Cooperages | 6 | 167,913 | 157,504 | 34,000 | 27,338 |
| Sawmilling | 72 | 859,616 | 764,830 | 92,564 | 233,555 |
| Woodware and joinery | 12 | 189,692 | 174,245 | 16,875 | 24,189 |
| Grass-seed dressing | 4 | 24,000 | 24,000 | .. | 6,000 |
| Brick, tile, and pottery works | 8 | 86,625 | 77,975 | 19,115 | 18,000 |
| Glass-bevelling and leadlights | 5 | 13,695 | 12,695 | .. | 3,050 |
| Iron and brass foundries | 6 | 27,724 | 26,124 | 1,081 | 14,650 |
| Tinned - plate and sheet-metal works | 13 | 91,829 | 90,829 | 8,500 | 40,619 |
| Engineering-works | 40 | 419,008 | 400,594 | 19,731 | 81,925 |
| Electrical engineering | 4 | 21,150 | 20,950 | 200 | 20,000 |
| Printing-offices | 66 | 660,292 | 562,299 | 46,933 | 203,258 |
| Agricultural machinery | 7 | 152,590 | 105,074 | 44,000 | .. |
| Coachbuilding | 12 | 44,100 | 41,380 | .. | 9,000 |
| Motor and cycle works | 20 | 95,500 | 87,083 | 6,134 | 51,750 |
| Saddlery and harness works | 9 | 72,267 | 63,237 | 2,763 | 19,829 |
| Tanneries and fellmongery-works | 13 | 116,352 | 92,071 | 11,419 | 52,003 |
| Furniture-factories | 27 | 106,100 | 91,450 | 20,270 | 24,325 |
| Woollen-mills | 4 | 266,666 | 209,999 | 6,700 | 100,000 |
| Tailoring establishments | 22 | 87,219 | 75,844 | 11,035 | 15,819 |
| Dressmaking and millinery | 44 | 43,050 | 42,750 | 1,032 | 6,500 |
| Boot and shoe factories | 16 | 152,713 | 111,543 | 9,409 | 56,900 |
| Clothing and waterproof factories | 18 | 103,560 | 96,890 | 1,124 | 23,000 |
| Flax-milling | 8 | 143,000 | 121,000 | 10,860 | 11,600 |
| Rope and twine works | 4 | 27,055 | 26,555 | 11,420 | 11,600 |
| Industries not included above | 74 | 606,545 | 570,222 | 53,975 | 237,961 |
| Industries less than four of one kind | 13 | 173,930 | 137,492 | 99,035 | 38,540 |
| Totals | 595 | 5,751,073 | 5,115,045 | 699,059 | 1,561,841 |
TABLE SHOWING CAPITAL OF PUBLIC REGISTERED COMPANIES .
| Industry. | Number of Public Companies. | (a.) Amount of Subscribed Capital, including all Classes of Shares. | (b.) Amount of Paid-up Capital. | (c.) Amount of Loan Capital—i.e., Debentures and Fixed Loan. | (d .) Amount of Paid-up Shares issued to Vendors, included in (b ). |
|---|---|---|---|---|---|
| £ | £ | £ | £ | ||
| Meat-freezing | 34 | 2,392,780 | 1,887,977 | 385,847 | 190,150 |
| Ham and bacon curing | 4 | 125,119 | 95,975 | .. | 10,000 |
| Butter and cheese factories | 27 | 176,965 | 143,021 | 3,905 | 3,369 |
| Grain-mills | 10 | 252,190 | 228,006 | 17,750 | 57,500 |
| Biscuit-factories | 7 | 105,234 | 103,162 | 40,802 | 20,007 |
| Fruit-preserving | 5 | 66,900 | 62,895 | 5,300 | 21,560 |
| Breweries | 9 | 697,656 | 107,451 | 5,000 | 66,801 |
| Malthouses | 5 | 123,000 | 122,000 | .. | 12,750 |
| Aerated-water factories | 9 | 48,701 | 36,112 | 5,000 | 8,796 |
| Coffee and spice works | 4 | 31,000 | 27,000 | .. | 11,000 |
| Boiling-down works | 14 | 365,066 | 292,701 | 17,830 | 40,200 |
| Sawmilling | 29 | 1,421,331 | 978,00 | 125,585 | 171,120 |
| Woodware and joinery | 7 | 73,674 | 43,869 | 4,939 | 11,935 |
| Grass-seed dressing | 8 | 38,000 | 34,000 | 3,000 | .. |
| Gasworks | 24 | 1,564,186 | 1,362,996 | 260,550 | 23,856 |
| Electric light and supply | 7 | 151,965 | 147,37 | 33,650 | 4,337 |
| Lime and cement works | 7 | 349,240 | 317,740 | 41,000 | 32,900 |
| Brick, tile, and pottery works | 11 | 148,129 | 143,753 | 27,849 | 25,500 |
| Tinned - plate and sheet-metal works | 7 | 51,007 | 48,757 | .. | 18,000 |
| Engineering-works | 10 | 340 676 | 325,781 | 67,345 | 63,130 |
| Printing-offices | 27 | 768,810 | 654,308 | 109,592 | 109,960 |
| Agricultural machinery | 4 | 66,358 | 61,850 | 1,300 | 24,000 |
| Saddlery and harness works | 4 | 84,000 | 82,000 | 12,000 | 16,000 |
| Tanneries and fellmongery works | 5 | 86,222 | 56,222 | 85,000 | .. |
| Sail, tent, and oilskin making | 5 | 11,450 | 10,025 | .. | .. |
| Furniture-factories | 12 | 57,795 | 53,045 | 9,529 | 29,786 |
| Mattress-making | 5 | 11,481 | 10,596 | 1,000 | 9,248 |
| Woollen-mills | 6 | 652,777 | 560,748 | 63,087 | 80,000 |
| Tailoring establishments | 5 | 29,000 | 27,000 | 4,500 | 16,000 |
| Dressmaking and millinery | 31 | 66,670 | 61,139 | 6,100 | 32,250 |
| Boot and shoe factories | 9 | 188,341 | 174,476 | 4,277 | 20,819 |
| Clothing and waterproof factories | 7 | 28,000 | 28,000 | .. | 10,000 |
| Rope and twine works | 4 | 42,835 | 42,695 | 8,000 | 35,250 |
| Industries not Included above | 65 | 4,620,455 | 3,923,576 | 558,899 | 181,495 |
| Industries, less than four of one kind | 18 | 205,469 | 178,135 | 12,103 | 29,622 |
| Totals | 445 | 15,442,482 | 12,432,852 | 1,920,739 | 1,387,341 |
The approximate value of the land utilized as factory premises shows a further satisfactory rise for the quinquennium. The value of the buildings and of the machinery and plant shows a much greater rate of increase, the increased utilization of machinery being a gratifying feature of the returns.
The figures for each of the past five censuses are,—
| Year. | Land. | Buildings. | Machinery. | Total. |
|---|---|---|---|---|
| £ | £ | £ | £ | |
| 1896 | 1,063,989 | 1,743,073 | 2,988,955 | 5,796,017 |
| 1901 | 1,980,428 | 2,575,679 | 3,852,457 | 8,408,564 |
| 1906 | 3,264,862 | 3,851,902 | 5,392,522 | 12,509,286 |
| 1911 | 3,980,921 | 5,174,890 | 7,665,548 | 16,731,359 |
| 1916 | 4,536,614 | 6,814,141 | 10,600,821 | 21,951,576 |
The most remarkable feature of the statistics of employees for 1916 is the fact that at the 31st March, 1916, eighteen months after the outbreak of war and only eight months before the taking of the first ballot under the Military Service Act, the number of female employees was actually less than at the corresponding date in 1911. It is evident that women and girls, the utilization of whose services in ever-increasing proportion has been necessitated by the war, have been drawn to the clerical branches of employment rather than to the industrial. Probably this trend towards clerical work had been going on for some years previously.
While male hands decreased from 44,946 in 1906 to 42,267 in 1911, female hands increased in the same time from 11,413 to 13,967. Between 1911 and 1916, however, male hands increased by 1,703, while female hands decreased by 114, the net increase being 1,589, representing a rate of 2.83 per cent., as against a corresponding rate of increase of 6.09 per cent. in the number of establishments.
The number of hands employed in the principal industries at each of the last five censuses is as shown below. The industries are ranged in the order of their importance as reckoned by the number of employees in 1916.
| Industry. | 1895-96. | 1900-1. | 1905-6. | 1910-11. | 1915-16. |
|---|---|---|---|---|---|
| Meat freezing and preserving works | 2,037 | 2,282 | 3,260 | 4,095 | 5,982 |
| Sawmills, sash and door factories | 4,059 | 6,812 | 9,111 | 6,877 | 5,870 |
| Clothing and boot and shoe factories | .. | .. | .. | .. | 5,831 |
| Printing and bookbinding establishments (excluding Government Printing Office) | 2,351 | 3,134 | 3,898 | 4,222 | 4,202 |
| Dressmaking and millinery | .. | 2,888 | 3,039 | 4,128 | 3,645 |
| Tailoring establishments | .. | 1,621 | 2,997 | 4,225 | 3,132 |
| Iron and brass foundries, machinists, engineering (excluding Government Railway Workshops) | 1,642 | 3,397 | 3,706 | 3,747 | 2,783 |
| Electric tramways | .. | .. | .. | .. | 1,954 |
| Woollen-mills | 1,416 | 1,693 | 1,549 | 1,410 | 1,897 |
| Furniture and cabinetmaking works | 496 | 1,310 | 1,528 | 1,689 | 1,821 |
| Butter and cheese factories | 576 | 1,188 | 1,484 | 1,504 | 1,814 |
| Coachbuilding | 807 | 1,185 | 1,465 | 1,439 | 1,393 |
| Flax-mills | 647 | 1,698 | 4,076 | 1,244 | 1,257 |
| Tanning, fellmongering, and wool-scouring establishments | 1,629 | 1,963 | 1,336 | 1,372 | 1,187 |
| Biscuit-factories | 425 | 667 | 587 | 381 | 920 |
| Brick, tile, and pottery works | 455 | 838 | 1,254 | 966 | 855 |
| Breweries and malthouses | 560 | 827 | 821 | 848 | 822 |
| Woodware and turnery factories | 81 | 156 | 304 | 30 | 781 |
| Agricultural-machinery factories | 581 | 586 | 793 | 646 | 756 |
| Motor and cycle works | 125 | 395 | 452 | 315 | 649 |
| Gasworks | 295 | 572 | 954 | 757 | 598 |
| Saddlery and harness factories | 266 | 652 | 544 | 594 | 587 |
| Lime and cement works | 79 | 184 | 280 | 456 | 550 |
| Aerated-water factories | 347 | 452 | 586 | 570 | 505 |
| Tinned-plate and sheet-metal works | 289 | 337 | 473 | 414 | 475 |
| Sugar-boiling and confectionery | 69 | 305 | 571 | 729 | 463 |
| Industry. | 1895-96. | 1900-1. | 1905-6. | 1910-11. | 1915-16. |
|---|---|---|---|---|---|
| Ship- and boat-building yards | 108 | 211 | 237 | 589 | 402 |
| Cooperages and packing-cases | 76 | 138 | 116 | 171 | 390 |
| Grain-mills | 419 | 515 | 540 | 424 | 388 |
| Boiling-down works | .. | .. | .. | .. | 351 |
| Sugar-refining | 160 | 256 | 228 | 338 | 297 |
| Fruit-preserving and jam-making works | 193 | 172 | 311 | 289 | 278 |
| Jewellery | .. | .. | .. | .. | 247 |
| Soap and candle works | 190 | 232 | 238 | 252 | 244 |
| Sausage-casing factories | 56 | 98 | 151 | 174 | 239 |
| Sail, tent, and oilskin factories | 143 | 231 | 163 | 224 | 236 |
| Rangemaking-works | .. | 193 | 230 | 271 | 235 |
| Rope and twine works | 150 | 192 | 195 | 190 | 235 |
| Electric light and supply | .. | 52 | 118 | 170 | 223 |
| Chemical-works | 114 | 95 | 178 | 98 | 213 |
| Ham and bacon curing | 123 | 196 | 224 | 201 | 199 |
| Sauce, pickle, and vinegar factories | 74 | 151 | 219 | 143 | 168 |
| Brush and broom factories | 92 | 128 | 154 | 133 | 165 |
| Ammunition and explosives | 90 | 105 | 130 | 85 | 162 |
| Paper-bag and box factories | 86 | 81 | 100 | 240 | 152 |
| Paper-mills | 84 | 98 | 116 | 100 | 146 |
| Match-factories | 121 | 183 | 206 | 188 | 136 |
| Hosiery-factories | 133 | 282 | 374 | 527 | 127 |
| Mattress-factories | 15 | 55 | 53 | 128 | 123 |
| Basket and perambulator factories | 76 | 118 | 148 | 157 | 114 |
| Glass-bevelling and leadlights | 6 | 9 | 14 | 84 | 100 |
| Condensed-milk factories | 10 | 33 | 58 | 56 | 94 |
| Concrete and fibrous-plaster works | .. | .. | .. | 66 | 86 |
| Fish curing and preserving works | 75 | 137 | 106 | 59 | 79 |
| Bag and sack factories | 22 | 6 | 36 | 45 | 74 |
| Baking-powder factories | 19 | 29 | 25 | 68 | 68 |
| Coffee and spice works | 119 | 78 | 120 | 66 | 62 |
| Leather-goods makers | 13 | 22 | 4 | 39 | 61 |
| Pumice-works | 20 | 28 | 12 | 20 | 55 |
| Wirework-factories | .. | .. | .. | 64 | 53 |
| Glue-factories | .. | .. | .. | .. | 52 |
| Picture-frame makers | .. | 22 | 34 | 37 | 48 |
| Seed-dressing establishments | 7 | 60 | 92 | 110 | 46 |
| Billiard-table works | 2 | 7 | 25 | 35 | 41 |
| Umbrella-factories | .. | .. | .. | 61 | 37 |
| Grain-crushing establishments | 212. | 266 | 197 | 37 | 35 |
| Electroplate-works | .. | .. | .. | .. | 29 |
| Starch-factories | 27 | 32 | 25 | 24 | 25 |
| Blindmaking | 45 | 51 | 35 | 34 | 22 |
| Flock-mills | .. | .. | .. | .. | 21 |
| Wool rug and mat making | .. | .. | .. | .. | 21 |
| Boot-polish factories | .. | .. | .. | .. | 19 |
| Varnish and paint | .. | .. | .. | .. | 19 |
| Engraving and stamp-making | .. | .. | .. | .. | 15 |
| Musical-instrument factories | .. | .. | .. | .. | 12 |
As might be expected in a time of increasing prosperity, with the resultant increases in prices and wages, the total and average wages paid to employees in 1915-16 were considerably higher than in 1910-11. The figures for each of the past five census years are as given in the following statement. In connection with these it should be noted that the wages are not entirely those of adults, but cover all employees, including boys and girls, the averages being lowered considerably on this account.
| Census Year. | Males. | Females. | ||||||||
|---|---|---|---|---|---|---|---|---|---|---|
| Number. | Total Wages. | Average Yearly Earnings. | Number. | Total Wages. | Average Yearly Earnings. | |||||
| £ | £ | s. | d. | £ | £ | s. | d. | |||
| 1896 | 22,986 | 1,776,076 | 77 | 5 | 4 | 4,403 | 131,516 | 29 | 17 | 5 |
| 1901 | 36,292 | 2,972,193 | 81 | 17 | 11 | 10,555 | 330,454 | 31 | 6 | 2 |
| 1906 | 44,946 | 3,979,593 | 88 | 10 | 10 | 11,413 | 478,026 | 41 | 17 | 8 |
| 1911 | 42,267 | 4,865,426 | 115 | 1 | 3 | 13,967 | 706,844 | 50 | 12 | 2 |
| 1916 | 43,970 | 5,868,788 | 133 | 9 | 6 | 13,853 | 785,716 | 56 | 14 | 4 |
The following table, showing for provincial districts the number of engines, &c., driven by the various kinds of motive power, will be of interest. When compared with the census of 1911 a large increase is apparent in the figures for electricity, as well as in the total number of engines and the amount of horse-power.
TABLE SHOWING MOTIVE POWER EMPLOYED IN PROVINCIAL DISTRICTS .
| Provincial District. | Number of Works. | Motive Power employed; Number of Engines, &c., driven by | Amount of Horse-power. | |||||||
|---|---|---|---|---|---|---|---|---|---|---|
| Steam. | Water. | Gas. | Oil. | Horse. | Hand. | Electricity. | Total. | |||
| Auckland | 1,236 | 553 | 37 | 243 | 80 | .. | 2 | 712 | 1,627 | 54,237 |
| Taranaki | 246 | 339 | 86 | 17 | 18 | .. | .. | 99 | 559 | 5,326 |
| Hawke's Bay | 256 | 126 | 3 | 54 | 16 | 3 | 1 | 76 | 279 | 5,668 |
| Wellington | 953 | 355 | 11 | 222 | 41 | .. | 1 | 589 | 1,219 | 31,587 |
| Marlborough | 57 | 31 | 1 | 8 | 3 | .. | .. | 14 | 57 | 1,400 |
| Nelson | 156 | 93 | 9 | 31 | 12 | .. | .. | 35 | 180 | 4,135 |
| Westland | 105 | 112 | 8 | 18 | 1 | .. | .. | 3 | 142 | 2,649 |
| Canterbury | 776 | 229 | 22 | 123 | 27 | .. | .. | 471 | 872 | 19,949 |
| Otago | 579 | 206 | 52 | 59 | 21 | .. | 3 | 444 | 785 | 12,372 |
| Southland | 306 | 187 | 7 | 34 | 20 | .. | .. | 73 | 321 | 8,718 |
| Totals, 1915-16 | 4,670 | 2,231 | 236 | 809 | 239 | 3 | 7 | 2,516 | 6,041 | 146,041 |
| Totals, 1910-11 | 4,402 | 2,221 | 230 | 872 | 231 | 4 | 61 | 1,163 | 4,782 | 100,587 |
The value of output for the year 1915-16 was returned at £45,454,184, being an increase of £13,725,182 on the total for 1910-11 (£31,729,002). Reference to the individual tables for principal industries given at the end of this section will show that this enormous increase is due almost entirely to higher prices now ruling, quantities of the various articles produced by different industries showing in the main but little advance on the results for 1910-11.
As pointed out on previous occasions, a certain amount of duplication is unavoidable in arriving at the total value of output of the manufacturing industries of a country. To take timber as an example, it will be seen that the rough sawn timber is treated as the output of the bush sawmill, and on being sent to the resawing and planing mill becomes included in the value of materials used, the prepared timber being again included at its full value in the output totals. Leather is valued in the tanning returns, and some part of it again in the boot and saddlery returns, while the value of cloth produced by woollen-mills and utilized by clothing-factories is also necessarily twice included.
For comparison between one census and another, however, the figures are quite correct. And in cases such as those mentioned, where values are twice counted, the cost of materials used is similarly overstated, so that it is quite proper to deduct the cost of materials from the value of output to arrive at what may be called the net value of the manufacture (£14,136,215 for 1915-16). To arrive at an approximate estimate as to profits it is necessary to deduct from this the amount expended on wages (£6,654,504), as well as interest and depreciation on £21,951,576 invested in land, buildings, machinery, and plant, together with taxes, insurance, and other incidental expenses.
The succeeding statement shows the most important industries in operation in 1915-16, ranged in order of the values of their output for 1915-16, and compared with the results obtained for the years 1910-11, 1905-6, 1900-1, and 1895-96.
TOTAL VALUE OF ALL MANUFACTURES OR PRODUCE , INCLUDING REPAIRS .
| Industry. | 1895-96. | 1900-1. | 1905-6. | 1910-11. | 1915-16. |
|---|---|---|---|---|---|
| £ | £ | £ | £ | £ | |
| Meat freezing and preserving works | 1,652,275 | 3,834,891 | 4,928,545 | 7,422,187 | 12,613,571 |
| Butter and cheese factories | 501,274 | 1,535,150 | 2,581,639 | 3,919,184 | 7,524,904 |
| Tanning, fellmongering, and wool-scouring establishments | 1,237,252 | 1,888,107 | 1,836,310 | 2,036,770 | 2,755,283 |
| Grain-mills | 874,656 | 682,884 | 1,058,686 | 1,248,001 | 1,98,914 |
| Sawmills, sash and door factories | 898,807 | 1,268,689 | 2,128,766 | 2,699,888 | 1,898,526 |
| Clothing and boot and shoe factories | 649,414 | 897,299 | 848,377 | 1,126,998 | 1,709,689 |
| Industry. | 1895-96. | 1900-1. | 1905-6. | 1910-11. | 1915-16. |
|---|---|---|---|---|---|
| £ | £ | £ | £ | £ | |
| Printing establishments (not including Government Printing Office) | 389,124 | 704,285 | 1,067,827 | 1,377,926 | 1,697,381 |
| Iron and brass foundries, boilermaking, machinists, &c., (not including Government Railway Workshops) | 302,815 | 870,864 | 813,563 | 1,125,640 | 1,008,367 |
| Tailoring establishments | .. | 301,356 | 578,416 | 936,237 | 828,840 |
| Breweries and malthouses | 418,830 | 659,298 | 645,637 | 787,532 | 807,631 |
| Gasworks | 199,025 | 290,567 | 386,920 | 623,209 | 804,414 |
| Electric tramways | .. | .. | .. | 548,842 | 750,893 |
| Woollen-mills | 302,423 | 359,382 | 397,348 | 377,713 | 717,638 |
| Furniture and cabinetmaking factories | 85,327 | 241,024 | 328,185 | 497,681 | 578,560 |
| Dressmaking and millinery establishments | .. | 312,436 | 331,268 | 575,059 | 568,472 |
| Ham- and bacon-curing establishments | 86,022 | 159,564 | 253,937 | 371,621 | 524,929 |
| Coachbuilding-works | 148,969 | 216,077 | 294,818 | 396,012 | 487,824 |
| Flax-mills | 32,546 | 203,492 | 557,808 | 284,399 | 470,774 |
| Biscuit-factories | 118,979 | 197,989 | 225,476 | 168,122 | 445,747 |
| Boiling-down works | .. | .. | .. | .. | 423,988 |
| Electric light and supply works | .. | 23,234 | 82,030 | 124,951 | 305,875 |
| Tinned-plate and sheet-metal works | 63,723 | 98,587 | 127,150 | 160,584 | 300,387 |
| Soap and candle works | 152,298 | 158,649 | 178,556 | 268,635 | 277,053 |
| Agricultural-machinery factories | 102,054 | 138,094 | 199,741 | 222,040 | 266,256 |
| Lime and cement works | 15,881 | 45,142 | 107,675 | 184,686 | 264,667 |
| Saddlery and harness factories | 63,735 | 147,626 | 140,813 | 220,364 | 259,507 |
| Aerated-water factories | 98,609 | 151,811 | 189,561 | 250,571 | 256,957 |
| Woodware and turnery factories | IS,276 | 37,552 | 110,225 | 12,602 | 243,652 |
| Brick, tile, and pottery factories | 66,140 | 122,230 | 216,550 | 235,220 | 233,904 |
| Cooperages | 19,233 | 37,521 | 38,124 | 73,807 | 193,090 |
| Motor and cycle works | 18,817 | 65,047 | 75,991 | 92,141 | 189,482 |
| Sugar-boiling and confectionery works | 33,235 | 88,580 | 138,635 | 259,498 | 169,478 |
| Rope and twine works | 52,400 | 87,863 | 100,753 | 104,325 | 161,447 |
| Grass-seed-dressing establishments | .. | 241,239 | 270,028 | 275,693 | 153,926 |
| Fruit-preserving and jam-making factories | 36,108 | 53,092 | 98,032 | 135,506 | 152,888 |
| Condensed-milk factories | .. | .. | .. | .. | 145,348 |
| Sausage-casing factories | 13,472 | 30,674 | 37,045 | 65,278 | 135,833 |
| Ship- and boat-building yards | 25,233 | 45,811 | 66,572 | 143,019 | 130,870 |
| Chemical-works | 75,320 | 64,834 | 95,390 | 49,866 | 127,010 |
| Baking-powder factories | 10,153 | 18,163 | 16,352 | 46,954 | 122,593 |
| Industry. | 1895-96. | 1900-1. | 1905-6. | 1910-11. | 1915-16. |
|---|---|---|---|---|---|
| £ | £ | £ | £ | £ | |
| Jewellery and watch repairing | .. | .. | .. | .. | 98,078 |
| Sail, tent, and oilskin factories | 30,166 | 44,854 | 45,321 | 92,249 | 97,990 |
| Ammunition and explosives | ... | ... | .. | .. | 97,409 |
| Bag and sack factories | .. | ... | .. | 50,871 | 92,901 |
| Rangemaking-works | .. | 53,307 | 64,271 | 82,600 | 85,776 |
| Sauce, pickle, and vinegar factories | 13,417 | 38,082 | 56,326 | 62,726 | 78,527 |
| Mattress-factories | 1,850 | 16,296 | 17,892 | 46,915 | 69,496 |
| Brush and broom factories | 23,363 | 21,131 | 36,345 | 33,303 | 64,538 |
| Hosiery-factories | 9,357 | 31,265 | 67,588 | 140,442 | 62,828 |
| Fish curing and preserving works | 10,292 | 25,173 | 28,109 | 29,002 | 62,530 |
| Paper-bag and box factories | 7,698 | 14,217 | 11,941 | 62,051 | 46,944 |
| Coffee and spice works | 74,339 | 45,628 | 60,758 | 32,261 | 45,095 |
| Grain-crushing establishments | 78,497 | 169,313 | 139,060 | 48,398 | 42,543 |
| Glass-bevelling and lead-lights | .. | .. | 5,123 | 26,327 | 41,441 |
| Leather-goods makers | .. | 5,483 | 12,064 | 16,585 | 30,759 |
| Basket and perambulator factories | 11,920 | 17,942 | 34,103 | 40,025 | 30,040 |
| Concrete and fibrous-plaster works | .. | .. | .. | 16,907 | 28,751 |
| Wirework-factories | .. | .. | .. | 31,991 | 28,095 |
| Picture-frame making | .. | 5,771 | 16,296 | 14,135 | 21,635 |
| Billiard-table factories | .. | .. | 10,417 | 20,165 | 20,155 |
| Flock-mills | .. | .. | .. | .. | 19,430 |
| Starch-factories | .. | .. | .. | .. | 18,749 |
| Umbrella-factories | .. | .. | .. | 22,885 | 17,248 |
| Boot-polish factories | .. | .. | .. | .. | 16,891 |
| Varnish and paint factories | .. | 6,732 | .. | 16,260 | 13,187 |
Certain particulars relating to the various industries for the year 1915-16 are given in the following table, which shows the industries arranged in classes according to their nature. Where there are fewer than four establishments in any industry the amount of wages, cost of materials operated on, and value of output, property, and plant, is omitted so as not to allow of details of individual establishments being identified.
Fuller details of the principal industries are given after this table.
DETAILS OF THE PRINCIPAL INDUSTRIES .
| Nature of Industries. | Total Number of Industries. | Number of Hands employed. | Wages paid. | Amount of Power employed (Horsepower). | Coat of all Materials used or operated upon during 1915-16. | Value of all Manufactures or Produce for the Year 1915-16.* | Approximate Value of Land (excluding Crown), Buildings, Machinery, and Plant. | ||||
|---|---|---|---|---|---|---|---|---|---|---|---|
| Males. | Females | Total. | Males. | Females. | Total. | ||||||
* For fuller particulars respecting the industries see special tables in this section and in census volume. † Value of output, wages, &c., not shown where the number of establishments is so small that particulars might be identified. * For fuller particulars respecting the industries see special tables in this section and in census volume. † Value of output, wages, &c., not shown where the number of establishments is so small that particulars might be identified. ‡ Particulars in reference to the Government Printing Office and the Government Railway Workshops are not included in the table. | |||||||||||
| Animal food— | £ | £ | £ | £ | £ | £ | |||||
| Meat freezing and preserving works | 45 | 5,932 | 50 | 5,982 | 767,369 | 2,954 | 770,323 | 28,767 | 10,554,905 | 12,613,571 | 2,631,142 |
| Ham- and bacon-curing works | 28 | 198 | 1 | 199 | 32,364 | 90 | 32,454 | 974 | 405,799 | 524,929 | 130,005 |
| Fish curing and preserving works | 14 | 76 | 3 | 79 | 11,342 | 37 | 11,379 | 124 | 8,967 | 62,530 | 28,991 |
| Butter and cheese factories | 348 | 1,744 | 70 | 1,814 | 252,473 | 3,487 | 255,960 | 12,794 | 6,168,907 | 7,524,904 | 1,175,671 |
| Condensed-milk factories | 4 | 80 | 14 | 94 | 10,178 | 1,031 | 11,209 | 96 | 95,064 | 145,848 | 49,937 |
| Vegetable food— | |||||||||||
| Grain-mills | 53 | 372 | 16 | 388 | 58,842 | 802 | 59,644 | 3,750 | 1,833,249 | 1,985,914 | 397,720 |
| Biscuit-factories | 12 | 497 | 423 | 920 | 54,188 | 20,310 | 74,498 | 553 | 259,417 | 445,747 | 182,087 |
| Fruit-preserving and jam-making works | 16 | 175 | 103 | 278 | 15,910 | 4,684 | 20,594 | 284 | 115,761 | 152,888 | 67,318 |
| Sugar-boiling and confectionery works | 22 | 185 | 278 | 463 | 18,175 | 13,455 | 31,630 | 298 | 109,954 | 169,478 | 73,148 |
| Sugar-refining works† | 1 | 297 | .. | 297 | .. | .. | .. | 1,517 | .. | .. | .. |
| Baking-powder factories | 7 | 49 | 19 | 68 | 4,209 | 943 | 5,152 | 54 | 92,768 | 122,593 | 18,457 |
| Drinks, narcotics, and stimulants— | |||||||||||
| Breweries | 55 | 730 | 5 | 735 | 119,202 | 548 | 119,750 | 1,810 | 325,804 | 635,488 | 523,776 |
| Malthouses | 18 | 87 | .. | 87 | 14,102 | .. | 14,102 | 109 | 146,627 | 172,143 | 75,009 |
| Colonial-wine making | 2 | 8 | .. | 8 | .. | .. | 3 | .. | .. | .. | |
| Aerated-water factories | 143 | 492 | 13 | 505 | 62,544 | 730 | 63,274 | 554 | 69,165 | 256,957 | 229,470 |
| Coffee and spice works | 11 | 36 | 26 | 62 | 3,765 | 1,524 | 5,289 | 122 | 34,919 | 45,095 | 28,266 |
| Tobacco and cigarette works† | 2 | 3 | 3 | 6 | .. | .. | .. | 7 | .. | .. | .. |
| Sauce, pickle, and vinegar making | 20 | 104 | 64 | 168 | 12,258 | 3,499 | 15,757 | 249 | 51,341 | 78,527 | 63,646 |
| Animal matters (not otherwise classed)— | £ | £ | £ | £ | £ | £ | |||||
| Soap and candle works | 18 | 216 | 28 | 244 | 29,601 | 1,479 | 31,080 | 404 | 191,832 | 277,053 | 73,598 |
| Glue-factories† | 2 | 36 | 16 | 52 | .. | .. | 225 | .. | .. | .. | |
| Sausage-casing factories | 16 | 239 | .. | 239 | 28,985 | .. | 28,985 | 11 | 86,065 | 135,833 | 16,974 |
| Boiling-down and manure works | 34 | 350 | 1 | 351 | 35,769 | 39 | 35,808 | 1,154 | 273,096 | 423,988 | 251,939 |
| Working in wood— | |||||||||||
| Cooperages and packing-case factories | 21 | 388 | 2 | 390 | 50,080 | 208 | 50,288 | 963 | 107,612 | 193,090 | 346,951 |
| Sawmills, sash and door factories | 292 | 5,870 | .. | 5,870 | 678,028 | .. | 678,028 | 16,816 | 996,484 | 1,898,526 | 2,329,454 |
| Woodware and turnery factories | 73 | 781 | .. | 781 | 79,446 | .. | 79,446 | 1,567 | 122,094 | 243,652 | 170,731 |
| Vegetable produce for fodder— | |||||||||||
| Grain-crushing establishments | 11 | 35 | .. | 35 | 3,477 | .. | 3,477 | 174 | 33,128 | 42,543 | 15,660 |
| Seed-dressing establishments | 22 | 46 | .. | 46 | 4,543 | .. | 4,543 | 297 | 123,241 | 153,926 | 59,135 |
| Paper-manufacture— | |||||||||||
| Paper-mills† | 3 | 107 | 39 | 146 | .. | .. | .. | 1,041 | .. | .. | .. |
| Paper-bag and box factories | 12 | 54 | 98 | 152 | 6,860 | 4,851 | 11,711 | 101 | 21,447 | 46,944 | 31,843 |
| Gasworks | 56 | 592 | 6 | 598 | 95,672 | 741 | 96,413 | .. | 244,346 | 804,414 | 1,382,077 |
| Electric light and supply works | 42 | 219 | 4 | 223 | 30,727 | 257 | 30,984 | 33,459 | 256,124 | 305,875 | 852,475 |
| Electric tramways | 9 | 1,954 | .. | 1,954 | 315,946 | .. | 315,946 | .. | 363,853 | 750,893 | 1,775,241 |
| Processes relating to stone, clay, glass, &c.— | |||||||||||
| Stone crushing and cutting plants | 20 | 172 | .. | 172 | 24,514 | .. | 24,514 | 697 | .. | 44,014 | 61,491 |
| Lime and cement works | 16 | 550 | .. | 550 | 65,558 | .. | 65,558 | 6,854 | 113,276 | 264,667 | 327,753 |
| Brick, tile, and pottery works | 74 | 855 | .. | 855 | 109,449 | .. | 109,449 | 3,263 | .. | 233,904 | 350,206 |
| Asphalt-works† | 3 | 28 | .. | 28 | .. | .. | .. | 39 | .. | .. | .. |
| Monumental-masonry works | 21 | 94 | .. | 94 | 13,656 | .. | 13,656 | 149 | 14,012 | 44,849 | 26,775 |
| Leadlight-making and glass-bevelling | 13 | 98 | 2 | 100 | 11,903 | 114 | 12,017 | 77 | 18,279 | 41,441 | 21,022 |
| Electroplating-works | 8 | 27 | 2 | 29 | 2,896 | 141 | 3,037 | 38 | 1,875 | 9,014 | 13,167 |
| Pumice-works† | 1 | 55 | .. | 55 | .. | .. | .. | 280 | .. | .. | |
| Concrete and fibrous - plaster works | 22 | 86 | .. | 86 | 11,895 | .. | 11,895 | 19 | 12,627 | 28,751 | 23,542 |
| Metals, other than gold or silver— | |||||||||||
| Tinned-plate and sheet-metal works | 115 | 475 | .. | 475 | 78,995 | .. | 78,995 | 458 | 157,853 | 300,387 | 193,186 |
| Iron and brass foundries, boiler-making, machinists, &c. | 22 | 270 | .. | 270 | 40,586 | .. | 40,586 | 684 | 53,608 | 124,871 | 65,607 |
| Engineering-works‡ | 142 | 2,478 | 35 | 2,513 | 311,152 | 2,652 | 313,804 | 3,322 | 361,480 | 883,496 | 668,431 |
| Electrical-engineering works | 14 | 89 | 2 | 91 | 8,045 | 82 | 8,127 | 244 | 11,951 | 25,745 | 14,257 |
| Rangemaking-works | 10 | 235 | .. | 235 | 29,985 | .. | 29,985 | 306 | 29,309 | 83,776 | 74,493 |
| Wirework-factories | 11 | 53 | .. | 53 | 6,251 | .. | 6,251 | 49 | 13,482 | 28,095 | 17,055 |
| Fencing-standard making | 5 | 8 | .. | 8 | 520 | .. | 520 | 18 | 4,579 | 5,424 | 4,315 |
| Precious metals— | |||||||||||
| Jewellery-making and watch-repairing | 73 | 235 | 12 | 247 | 30,905 | 710 | 31,615 | 53 | 41,466 | 98,079 | 84,608 |
| Books and publications— | |||||||||||
| Printing and bookbinding offices‡ | 266 | 3,292 | 910 | 4,202 | 544,627 | 47,855 | 592,482 | 4,240 | 432,712 | 1,697,831 | 1,601,078 |
| Musical-instrument factories | 4 | 12 | .. | 12 | 1,328 | .. | 1,328 | 14 | 654 | 2,666 | 4,086 |
| Ornaments, minor art products— | |||||||||||
| Picture-frame makers | 28 | 41 | 7 | 48 | 4,942 | 313 | 5,255 | 12 | 10,558 | 21,635 | 21,367 |
| Basket and perambulator factories | 22 | 95 | 19 | 114 | 10,352 | 1,048 | 11,400 | .. | 12,530 | 30,040 | 17,588 |
| Equipment for sports and games— | |||||||||||
| Billiard-table works | 4 | 41 | 41 | 6,547 | .. | 6,547 | 61 | 9,937 | 20,155 | 14,444 | |
| Designs, medals, type, and dies— | |||||||||||
| Engraving and stampmaking | 6 | 14 | 1 | 15 | 1,720 | 52 | 1,772 | 63 | 876 | 5,523 | 7,133 |
| Ammunition and explosives— | |||||||||||
| Ammunition, explosives, and fireworks makers | 5 | 43 | 119 | 162 | 8,736 | 7,985 | 16,721 | 110 | 45,073 | - 97,409 | 35,114 |
| Nature of Industries. | Total Number of Industries. | Number of Hands employed. | Wages paid. | Amount of Power employed (Horsepower). | Cost of all Materials used or operated upon during 1915-16. | Value of all Manufactures or Produce for the Year 1915-16.* | Approximate Value of Land (excluding Crown), Buildings, Machinery, and Plant. | ||||
|---|---|---|---|---|---|---|---|---|---|---|---|
| Males. | Females | Total. | Males. | Females. | Total. | ||||||
* For fuller particulars respecting the industries see special tables in tills section and In census volume. † Value of output, wages, &c., not shown where the number of establishments is so small that particulars might he identified. | |||||||||||
| Machines, tools, and implements— | £ | £ | £ | £ | £ | £ | |||||
| Agricultural machinery works | 16 | 756 | .. | 756 | 99,491 | .. | 99,491 | 629 | 108,307 | 266,256 | 140,866 |
| Brush and broom factories | 12 | 116 | 49 | 165 | 11,582 | 2,389 | 13,971 | 236 | 29,310 | 64,538 | 31,081 |
| Carriages and vehicles— | |||||||||||
| Coachbuilding-works | 313 | 1,389 | 4 | 1,393 | 163,856 | 156 | 164,012 | 1,018 | 186,249 | 487,824 | 371,358 |
| Motor and cycle works | 172 | 632 | 17 | 649 | 55,219 | 945 | 56,164 | 562 | 65,742 | 189,482 | 284,225 |
| Harness, saddlery, and leather-ware— | |||||||||||
| Saddlery and harness factories | 151 | 519 | 68 | 587 | 66,689 | 4,245 | 70,934 | 56 | 141,455 | 259,507 | 156,690 |
| Leather-goods makers | 12 | 39 | 22 | 61 | 5,211 | 1,424 | 6,635 | 6 | 18,193 | 30,759 | 13,160 |
| Tanneries, fellmongery, and wool-scouring | 59 | 1,187 | .. | 1,187 | 146,532 | .. | 146,532 | 1,890 | 2,215,417 | 2,755,283 | 470,549 |
| Ships, boats, and their equipment— | |||||||||||
| Ship- and boat-building yards | 31 | 402 | .. | 402 | 56,514 | .. | 56,514 | 362 | 47,308 | 130,870 | 90,022 |
| Sail, tent, and oilskin factories | 41 | 107 | 129 | 236 | 13,578 | 7,218 | 20,796 | 62 | 60,611 | 97,990 | 44,083 |
| Furniture— | |||||||||||
| Furniture and cabinetmaking | 257 | 1,727 | 94 | 1,821 | 267,672 | 5,386 | 273,058 | 1,853 | 253,054 | 578,560 | 403,853 |
| Blindmaking | 5 | 11 | 11 | 22 | 945 | 1,236 | 2,181 | 17 | 3,319 | 7,696 | 6,461 |
| Mattress-factories | 19 | 87 | 36 | 123 | 9,490 | 1,668 | 11,158 | 143 | 45,577 | 69,496 | 31,650 |
| Rug and mat making | 7 | 13 | 8 | 21 | 1,296 | 586 | 1,882 | 14 | 4,546 | 8,611 | 5,602 |
| Chemicals and by-products— | |||||||||||
| Ink-factories† | 1 | 5 | .. | 5 | .. | .. | .. | .. | .. | .. | .. |
| Starch-factories | 5 | 19 | 6 | 25 | 2,464 | 269 | 2,733 | 80 | 9,525 | 18,749 | 6,116 |
| Chemical-works | 24 | 108 | 105 | 213 | 12,789 | 4,672 | 17,461 | 166 | 69,903 | 127,010 | 72,276 |
| Paint and varnish works | 4 | 15 | 4 | 19 | 2,622 | 165 | 2,787 | 89 | 7,824 | 13,187 | 10,845 |
| Sheep-dip works | 2 | 4 | 1 | 5 | .. | .. | .. | 10 | .. | .. | .. |
| Match-factories | 2 | 13 | 123 | 136 | .. | .. | .. | 143 | .. | .. | .. |
| Boot-polish factories | 4 | 5 | 14 | 19 | 652 | 574 | 1,226 | 8 | 10,051 | 16,891 | 4,541 |
| Textile fabrics— | |||||||||||
| Woollen-mills | 10 | 751 | 1,146 | 1,897 | 107,753 | 79,983 | 187,736 | 3,080 | 411,632 | 717,638 | 427,984 |
| Flock-mills | 4 | 16 | 5 | 21 | 1,938 | 278 | 2,216 | 140 | 10,082 | 19,430 | 3,326 |
| Dress— | |||||||||||
| Tailoring establishments | 496 | 1,123 | 2,009 | 3,132 | 167,538 | 126,621 | 294,159 | 58 | 333,446 | 828,840 | 564,744 |
| Dressmaking and millinery | 339 | 91 | 3,554 | 3,645 | 13,519 | 191,986 | 205,505 | 136 | 267,855 | 568,472 | 363,060 |
| Boot and shoe factories | 166 | 1,455 | 802 | 2,257 | 192,382 | 46,449 | 238,831 | 831 | 441,292 | 801,572 | 295,024 |
| Hosiery-factories | 10 | 11 | 116 | 127 | 2,106 | 6,773 | 8,879 | 43 | 40,938 | 62,828 | 16,916 |
| Umbrella-factories | 5 | 13 | 24 | 37 | 2,169 | 1,223 | 3,392 | 4 | 11,073 | 17,248 | 6,385 |
| Clothing and waterproof factories | 83 | 534 | 3,040 | 3,574 | 72,491 | 163,811 | 236,302 | 488 | 560,380 | 908,117 | 218,917 |
| Fibrous materials— | |||||||||||
| Rope and twine factories | 10 | 226 | 9 | 235 | 26,186 | 370 | 26,556 | 1,084 | 99,620 | 161,447 | 73,258 |
| Bag and sack works | 4 | 17 | 57 | 74 | 2,070 | 2,078 | 4,148 | 104 | 68,339 | 92,901 | 7,450 |
| Flax-mills | 76 | 1,253 | 4 | 1,257 | 164,081 | 179 | 164,260 | 3,316 | 174,573 | 470,774 | 442,164 |
| Value of industries of which less than four of any one sort are shown in the returns | .. | .. | .. | .. | 75,839 | 12,093 | 87,932 | .. | 1,163,149 | 1,348,269 | 704,060 |
| Returns not included in the above | 13 | 28 | 5 | 33 | 3,497 | 318 | 3,815 | 86 | 21,093 | 28,718 | 57,471 |
| Totals, census 1915-16 | 4,670 | 43,970 | 13,853 | 57,823 | 5,868,788 | 785,716 | 6,654,504 | 146,041 | 31,317,969 | 45,454,184 | 21,951,576 |
| Totals, census 1910-11 | 4,402 | 42,267 | 13,967 | 56,234 | 4,865,426 | 706,844 | 5,572,270 | 100,587 | 20,810,211 | 31,729,002 | 16,731,359 |
| Totals, census 1905-06 | 4,186 | 44,946 | 11,413 | 56,359 | 3,979,593 | 478,026 | 4,457,619 | 60,335 | 13,163,692 | 23,444,235 | 12,509,286 |
The war has given a greatly increased fillip to this growing industry, which has for many years past held the premier position as regards value of output. The figures given below speak for themselves, but attention may be drawn to (1) the enormous increase in the value of output, £13,037,559 in 1915-16 as against £5,884,939 in 1910-11; (2) the greatly enhanced values of all classes of frozen meat; (3) the expansion of the beef killing and freezing branch of the industry; and (4) the increase in the utilization of all parts of the animal, as evidenced by a comparison of the quantity of manures produced in 1915-16 compared with previous years.
| Number of— | 1905-6. | 1910-11. | 1915-16 | |
|---|---|---|---|---|
| Works | 56 | 64 | 79 | |
| Hands employed | 3,260 | 4,095 | 6,333 | |
| Amount of— | ||||
| Wages paid | £ | 283,916 | 459,650 | 806,131 |
| Horse-power | Hp. | 9,625 | 16,897 | ' 29,921 |
| Approximate value of— | ||||
| Land | £ | 126,174 | 196,327 | 253,225 |
| Buildings | £ | 732,802 | 845,159 | 1,583,642 |
| Machinery and plant | £ | 644,631 | 774,944 | 1,046,214 |
| Frozen sheep— | ||||
| Carcases | No. | 1,355,934 | 2,000,131 | 2,854,424 |
| Value | £ | 1,023,385 | 1,337,407 | 2,983,561 |
| Frozen lambs— | ||||
| Carcases | No. | 2,258,211 | 3,858,003 | 4,147,421 |
| Value | £ | 1,407,761 | 2,260,844 | 3,271,278 |
| Frozen mutton and lamb pieces— | ||||
| Quantity | Cwt. | 15,598 | 41,452 | 22,442 |
| Value | £ | 23,210 | 49,807 | 52,205 |
| Frozen beef— | ||||
| Quantity | Cwt. | 160,133 | 461,852 | l,027,03o |
| Value | £ | 154,988 | 520,734 | 2,229,171 |
| Frozen rabbits— | ||||
| Quantity | No. | 2,632,874 | 2,830,076 | 2,716,211 |
| Value | £ | 60,329 | 60,523 | 80,164 |
| Preserved meats— | ||||
| Quantity | Cwt. | 44,453 | 52,527 | 96,054 |
| Value | £ | 88,719 | 140,610 | 270,736 |
| Tallow— | ||||
| Quantity | Tons | 13,910 | 19,267 | 24,967 |
| Value | £ | 316,532 | 561,261 | 848,407 |
| Bonedust— | ||||
| Quantity | Tons | 5,870 | 6,356 | 6,121 |
| Value | £ | 28,859 | 39,174 | 41,672 |
| Other manures— | ||||
| Quantity | Tons | 6,410 | 4,845 | 74,576 |
| Value | £ | 28,349 | 31,473 | 321,472 |
| Neatsfoot and trotter oil— | ||||
| Quantity | Gal. | 32,938 | 44,804 | 85,026 |
| Value | £ | 3,879 | 4,420 | 22,858 |
| Bones, horns, hoofs, &c.— | ||||
| Quantity | Tons | 240 | 44 | 154 |
| Value | £ | 1,276 | 1,277 | 1,753 |
| Other products—Value | £ | 62,790 | 877,729 | 2,914,282 |
| Total value of output | £ | 3,200,077 | 5,884,939 | 13,037,559 |
This is one of several industries which show a decrease in the number of works but a considerable increase in value of output and in other respects. There. appears to have been for some reason a falling-off in the quantity of bacon and hams in 1915 as compared with 1910, though more pigs were dealt with. The output of lard, however, shows a substantial increase.
| Number of— | 1905-6. | 1910-11. | 1915-16. | |
|---|---|---|---|---|
* Not shown separately. | ||||
| Works | 52 | 42 | 28 | |
| Hands employed | 224 | 201 | 199 | |
| Amount of— | ||||
| Wages paid | £ | 22,222 | 27,055 | 32,454 |
| Horse-power | H.p. | 532 | 678 | 974 |
| Approximate value of— | ||||
| Land | £ | 21,098 | 18,342 | 27,884 |
| Buildings | £ | 35,130 | 51,814 | 66,058 |
| Machinery and plant | £ | 22,738 | 33,110 | 36,063 |
| Pigs dealt with— | ||||
| Number | * | 109,423 | 122,006 | |
| Value | £ | 186,375 | 274,060 | 372,793 |
| Value of other material used | £ | * | 11,294 | 33,006 |
| Hams and bacon—Quantity | Cwt. | 67,822 | 132,007 | 101,580 |
| Lard—Quantity | lb. | 364,896 | 370,533 | 787,001 |
| Total value of output | £ | 253,937 | 371,621 | 524,929 |
Only fourteen fish curing and preserving works were returned in 1916, as against twenty in 1911, but there was a considerable increase in the value of fish cured and tinned. The figures for 1915 were £34,541 for fish cured, and £27,483 for fish canned, the corresponding totals for 1910 being £22,599 and £5,929 respectively. The total value of all products of the establishments rose from £29,002 to £62,530. The fish-canning industry is apparently beginning to make some headway.
| Number of— | 1905-6. | 1910-11. | 1915-16. | |
|---|---|---|---|---|
| Works | 21 | 20 | 14 | |
| Hands employed | 106 | 59 | 79 | |
| Approximate value of— | ||||
| Land | £ | 5,555 | 6,017 | 6,308 |
| Buildings | £ | 7,155 | 7,069 | 8,598 |
| Machinery and plant | £ | 7,662 | 7,638 | 14,085 |
| Fish cured—Value | £ | 11,859 | 22,599 | 34,541 |
| Fish canned—Value | £ | 2,736 | 5,929 | 27,483 |
| Value of other products | £ | 13,514 | 474 | 506 |
| Total value of output | £ | 28,109 | 29,002 | 62,530 |
Comparison of the. results shown by the returns collected at the census of 1906 with that of 1901 showed great development, and a similar development between 1905 and 1910, was shown by the census of 1911. Enormous further expansion of the industry is shown by the results of the last census. The number of factories increased by only ten during the five years, but the value of the output in 1915 rose to £3,605,720 over the amount for 1910. The figures are £7,524,904 for 1915 and £3,919,184 for 1910.
The produce of factory-made butter for 1910 was set down at 541,851 cwt., and for 1915 at 603,470 cwt., while cheese made increased from 474,111 cwt. to 603,470 cwt. in the same period. While butter shows an increase of nearly one-third during the ten years 1905-15, the output of cheese was more than five times as great in 1915 as in 1905.
By far the greater number of butter and cheese factories are in the North Island. Taranaki, formerly the "butter" province of New Zealand, now goes in mainly for cheese-production. Auckland turned out in 1915 more than half the total output of butter for the Dominion, but as a cheese-producer was exceeded by Taranaki, Wellington, and Otago. Wellington is the second largest producer both of butter and of cheese.
The money invested for purposes of this industry in land, buildings, machinery, and plant has largely increased. Full particulars are given n the subjoined table:—
| Number of— | 1905-6. | 1910-11. | 1915-16. | |
|---|---|---|---|---|
| Factories | 264 | 338 | 348 | |
| Hands employed | 1,484 | 1,504 | 1,814 | |
| Amount of— | ||||
| Wages paid | £ | 131,123 | 170,065 | 255,960 |
| Horse-power | H.p. | 3,759 | 5,995 | 12,794 |
| Approximate value of— | ||||
| Land | £ | 56,008 | 110,360 | 101,930 |
| Buildings | £ | 215,178 | 381,308 | 525,003 |
| Machinery and plant | £ | 345,080 | 462,454 | 548,738 |
| Value of materials used | £ | 2,062,215 | 3,304,993 | 6,168,907 |
| Butter produced— | ||||
| Quantity | Cwt. | 462,666 | 541,851 | 603,470 |
| Value | £ | 2,195,681 | 2,685,103 | 4,344,372 |
| Cheese produced— | ||||
| Quantity | Cwt. | 150,061 | 474,111 | 805,103 |
| Value | £ | 362,684 | 1,199,677 | 3,088,949 |
| Value of other produce | £ | 23,274 | 34,404 | 91,583 |
| Total value of all produce | £ | 2,581,639 | 3,919,184 | 7,524,904 |
Some further interesting details collected in 1911 and 1916 are as follows:—
| Number of separators— | 1910-11. | 1915-16. | |
|---|---|---|---|
| At home | 2,418 | 11,079 | |
| At butter-factories | 850 | 770 | |
| Butter-fat separated— | |||
| At home | lb. | 5,643,260 | 24,521,298 |
| At butter-factories | lb. | 44,054,558 | 29,706,410 |
| Milk received by cheese-factories | lb. | 523,321,631 | 886,373,030 |
| Fat received | lb. | 20,824,440 | 30,927,108 |
Home separating is seen to have made enormous strides during the five years.
The result of the inquiry regarding this industry is to show that so far as it relates to number of mills and hands employed there has been a decrease during the past five years. There has, however, been an increase as regards value of materials operated on, and of output. The flour produced in 1915 was given as 107,242 tons, as against 105,939 tons in 1910, an increase of only 1,303 tons, but the value of flour in 1915 was nearly two-thirds greater than in 1910. The value of the output of all kinds, which includes meal, was returned for 1915 as £1,976,914, and for 1910 as £1,248,001.
| Number of— | 1905-6. | 1910-11. | 1915-16. | |
|---|---|---|---|---|
| Mills | 77 | 66 | 53 | |
| Hands employed | 540 | 424 | 382 | |
| Amount of— | ||||
| Wages paid | £ | 57,335 | 50,984 | 58,885 |
| Horse-power | Hp. | 3,188 | 3,624 | 3,638 |
| Approximate value of— | ||||
| Land | £ | 71,870 | 81,513 | 68,014 |
| Buildings | £ | 160,799 | 153,668 | 146,199 |
| Machinery and plant | £ | 178,889 | 172,539 | 177,107 |
| Wheat used—Quantity | Bush. | 4,352,544 | 5,165,763 | 5,101,102 |
| Total grain—Value | £ | 835,477 | 1,040,762 | 1,826,009 |
| Flour produced | Tons | 95,528 | 105,939 | 107,242 |
| Oatmeal produced | Tons | 7,247 | 6,758 | 5,602 |
| Other products—Value | £ | 144,188 | 192,502 | 287,380 |
| Total value of output | £ | 1,058,686 | 1,248,001 | 1,976,914 |
This industry shows a decided advance on the figures of five years ago in all respects. Biscuit-factories are still few in number, but they employ a comparatively large number of hands, and their output is not insignificant. Included in the output for 1915, however, is a considerable amount of confectionery, probably as much in value as the output shown further on for confectionery-works.
| Number of— | 1905-6. | 1910-11. | 1915-16. | |
|---|---|---|---|---|
| Works | 12 | 9 | 12 | |
| Hands employed | 587 | 381 | 920 | |
| Amount of— | ||||
| Wages paid | £ | 33,881 | 30,092 | 74,498 |
| Horse-power | H.p. | 389 | 448 | 553 |
| Approximate value of | ||||
| Land | £ | 26,131 | 14,000 | 29,981 |
| Buildings | £ | 42,440 | 29,780 | 57,371 |
| Machinery and plant | £ | 52,795 | 46,194 | 94,735 |
| Value of materials used | £ | 110,396 | 98,460 | 259,417 |
| Biscuits made— | ||||
| Quantity | Tons | 4,133 | 5,667 | 5,863 |
| Value | £ | 178,646 | 158,253 | 223,957 |
| Other products—Value | £ | 46,830 | 9,869 | 221,790 |
| Total value of all manufactures | £ | 225,476 | 168,122 | 445,747 |
This industry appears to have declined considerably during the five years 1910 to 1915. There were 33 works in the former year, and only 22 in the latter, a decrease of 11. The value of the manufactured articles, which for the year 1905 reached the sum of £138,635, was returned for 1910 as £259,498, but for 1915 as only £169,478. Besides the output included in these returns, a certain amount of confectionery is included in "other products" in the biscuit-factory table. The confectionery and sugar-boiling works used 3,836 tons of sugar, valued at £55,488, during the year 1910, together with other materials valued at £88,343, but in 1915 only 2,023 tons of sugar (£39,426) and £70,528 worth of other materials.
| Number of— | 1905-6. | 1910-11. | 1915-16. | |
|---|---|---|---|---|
| Works | 36 | 33 | 22 | |
| Hands employed | 571 | 729 | 463 | |
| Amount of wages paid | £ | 29,410 | 47,722 | 41,630 |
| Approximate value of— | ||||
| Land | £ | 22,840 | 27,300 | 14,262 |
| Buildings | £ | 26,654 | 51,311 | 23,851 |
| Machinery and plant | £ | 34,258 | 62,463 | 35,035 |
| Sugar used— | ||||
| Quantity | Tons | 2,350 | 3,836 | 2,023 |
| Value | £ | 44,703 | 55,488 | 39,426 |
| Other materials used—Value | £ | 44,252 | 88,343 | 70,528 |
| Total value of output | £ | 138,635 | 259,498 | 169,478 |
Only 16 factories were returned in 1916, as against 22 in 1911 and 24 in 1906, but the value of the works has increased considerably, as have also the output and the wages-bill. It is noticeable that while jam-making shows a substantial rise in volume, fruit-preserving has fallen away.
| Number of— | 1905-6. | 1910-11. | 1915-16. | |
|---|---|---|---|---|
* Not shown separately. | ||||
| Works | 24 | 22 | 16 | |
| Hands employed | 311 | 289 | 278 | |
| Amount of wages paid | £ | 12,203 | 16,727 | 20,594 |
| Approximate value of— | ||||
| Land | £ | 10,828 | 11,179 | 12,410 |
| Buildings | £ | 20,021 | 23,297 | 30,504 |
| Machinery and plant | £ | 11,468 | 20,985 | 24,404 |
| Fruit used | Tons | * | 2,173 | 1,572 |
| Value of— | ||||
| Fruit used | £ | * | 32,828 | 46,577 |
| Sugar and other ingredients | £ | * | 57,420 | 69,184 |
| Fruit bottled or preserved | £ | 9,537 | 22,871 | 8,843 |
| Jams and jellies made— | ||||
| Quantity | Cwt. | 46,396 | 49,661 | 63,101 |
| Value | £ | 83,520 | 88,281 | 126,720 |
| Other preserves—Value | £ | 4,975 | 24,354 | 17,325 |
| Total value of output | £ | 98,032 | 135,506 | 152,888 |
The number of breweries in the Dominion shown in the census returns for 1916 was somewhat fewer than that returned five years previously, but the quantity of beer manufactured was considerably greater.
While in the year 1910, 9,582,790 gallons of ale were brewed, the output for 1915 amounted to 10,493,129 gallons, being an increase of nearly 1,000,000 gallons in the five-year period. In addition, 489,972 gallons of stout, valued at £29,058, and other products of the value of £6,608 were produced in 1910, and 756,219 gallons of stout (£42,880) and other products valued at £6,407 in 1915. The value of the total output in 1910 amounted to £634,759, and in 1915 to £635,488.
The quantities of beer on which excise duty was paid were—for 1915, 10,605,714 gallons, and for 1910 9,399,440 gallons. These quantities are in close agreement with those returned at the corresponding censuses as manufactured.
The imported beer entered at the Customs for home consumption increased in quantity only from 218,270 gallons in 1905 to 271,590 gallons in 1910, and decreased again to 260,050 gallons in 1915, which shows that the colonial-made beer has practically displaced the beer brought from abroad.
| Number of— | 1905-6. | 1910-11. | 1915-16. | |
|---|---|---|---|---|
* Apparently understated. †Not shown separately. ‡Included in total brewings. | ||||
| Breweries | 72 | 60 | 55 | |
| Hands employed | 731 | 741 | 735 | |
| Amount of— | ||||
| Wages paid | £ | 92,308 | 109,544 | 119,750 |
| Horse-power | Hp. | 703 | 1,378 | 1,810 |
| Approximate value of— | ||||
| Land | £ | 82,590 | 130,932 | 104,454 |
| Buildings | £ | 156,541 | 208,543 | 218,237 |
| Machinery and plant | £ | 95,800 | 159,882 | 201,085 |
| Malt used | Bush. | 447,065 | 547,139 | 554,092 |
| Hops used | Cwt. | 5,155 | 5,992 | 5,621 |
| Sugar used | Cwt. | 15,518* | 32,759 | 32,343 |
| Ale brewed | Gal. | 7,634,362 | 9,582,790 | 10,493,129 |
| Stout brewed | Gal. | † | 489,972 | 756,219 |
| Ale bottled‡ | Doz. qts. | † | 588,955 | 626,325 |
| Stout bottled‡ | Doz. qts | † | 168,035 | 235,532 |
| Value of output | £ | 572,579 | 634,759 | 635,488 |
The number of malthouses returned in 1916 was 18, as against 28 in 1911 and 22 in 1906. The output more than doubled between 1905 and 1910, the figures for the respective years being £73,058 and £152,773, while in 1915 a further increase to £172,143 was recorded, in spite of the decrease in the number of malthouses. The increase in value of output between 1910 and 1915. however, is due entirely to a rise in price, the malt produced in 1915 amounting to 489,574 bushels, as against 509,391 bushels in 1910.
| Number of— | 1905-6. | 1910-11. | 1915-16. | |
|---|---|---|---|---|
* Not available. | ||||
| Malthouses | 22 | 28 | 18 | |
| Hands employed | 90 | 107 | 87 | |
| Amount of— | ||||
| Wages paid | £ | 8,673 | 13,777 | 14,102 |
| Horse-power | Hp. | 59 | 114 | 109 |
| Approximate value of— | ||||
| Land | £ | 15,618 | 21,715 | 19,421 |
| Buildings | £ | 49,050 | 67,513 | 44,106 |
| Machinery and plant | £ | 10,139 | 24,942 | 11,488 |
| Barley used | Bush. | * | 519,815 | 503,773 |
| Malt produced | Bush. | * | 509,391 | 489,574 |
| Value of output | £ | 73,058 | 152,773 | 172,143 |
This industry appears to be unique in that the value of output has increased between the years 1910-11 and 1915-16 at a much lower rate than the quantity. There is, however, reason to believe that the quantities were understated at the earlier census. The value of manufactures increased from £250,571 in 1910 to only £256,957 in 1915, while, on the other hand, large increases in quantity of output returned are recorded. In 1915, 2,564,074 dozen of aerated waters, 90,306 dozen of cordials, and 296,603 dozen of hop-beer were produced, the corresponding figures for 1910 being 1,780,163 dozen, 36,399 dozen, and 95,400 dozen respectively.
| Number of— | 1905-6. | 1910-11. | 1915-16. | |
|---|---|---|---|---|
| Works | 123 | 124 | 143 | |
| Hands employed | 586 | 570 | 505 | |
| Amount of wages paid | £ | 49,617 | 62,937 | 63,274 |
| Approximate value of— | ||||
| Land | £ | 57,083 | 71,737 | 59,791 |
| Buildings | £ | 52,128 | 62,904 | 71,245 |
| Machinery and plant | £ | 57,259 | 66,324 | 98,434 |
| Aerated waters—Quantity | Doz. | 2,220,174 | 1,780,163 | 2,564,074 |
| Cordials—Quantity | Doz. | 37,945 | 36,399 | 90,306 |
| Hop-beer—Quantity | Doz. | 106,607 | 95,400 | 296,613 |
| Total value of all manufactures | £ | 189,561 | 250,571 | 256,957 |
This industry employed 104 males and 64 females in 1906, the numbers for 1911 being 80 and 63 respectively. Sauces and pickles with other condiments and vinegar were manufactured to the value of £78,527 in 1915, an increase of £15,801 over the amount made five years before.
| Number of— | 1905-6. | 1910-11. | 1915-16. | |
|---|---|---|---|---|
| Works | 27 | 23 | 20 | |
| Hands employed | 219 | 143 | 168 | |
| Amount of wages paid | £ | 11,163 | 10,084 | 15,757 |
| Approximate value of— | ||||
| Land | £ | 14,483 | 11,176 | 16,979 |
| Buildings | £ | 22,842 | 16,995 | 29,653 |
| Machinery and plant | £ | 7,657 | 6,580 | 17,004 |
| Value of materials used | £ | 31,466 | 38,846 | 51,341 |
| Total value of all manufactures | £ | 56,326 | 62,726 | 78,527 |
The output in 1915-16 included 53,868 dozen pints of pickles (valued at £18,209), 152,004 dozen pints of sauces (£32,772), and 471,500 gallons of vinegar (£19,146). Vegetables used totalled 2,344,503 lb., valued at £12,510, and, in addition, 384,938 lb. of spices, valued at £6,731, and acid, of a value of £8,706, were used.
The value of manufactures of all kinds at these works reached the sum of £268,635 in 1910 and £277,053 in 1915. The soap made in 1915 was 8,240 tons, or 631 tons more than that produced five years previously. The making of candles, however, decreased, according to the returns, the output for 1910 being 3,520,205 lb., valued at £75,047, and for 1915 3,111,462 lb., valued at £65,689. The industry appears to be just holding its own.
| Number of— | 1905-6. | 1910-11. | 1915-16. | |
|---|---|---|---|---|
| Works | 19 | 20 | 18 | |
| Hands employed | 238 | 252 | 244 | |
| Amount of wages paid | £ | 21,853 | 28,390 | 31,080 |
| Approximate value of— | ||||
| Land | £ | 9,447 | 16,459 | 18,977 |
| Buildings | £ | 27,533 | 44,562 | 21,458 |
| Machinery and plant | £ | 31,586 | 31,588 | 33,163 |
| Soap manufactured— | ||||
| Quantity | Tons | 5,791 | 7,609 | 8,240 |
| Value | £ | 107,012 | 149,970 | 186,177 |
| Candles manufactured— | ||||
| Quantity | lb. | 1,930,544 | 3,520,205 | 3,111,462 |
| Value | £ | 48,385 | 75,047 | 65,689 |
| Other manufactures—Value | £ | 23,159 | 51,802 | 25,187 |
| Total value of all manufactures | £ | 178,556 | 268,635 | 277,053 |
Included in "Other manufactures" in 1915 were soda crystals (1,872 tons, valued at £9,636) and glycerine (65 tons, £2,781).
These numbered 21 in 1916, as against 20 in 1911 and 22 in 1906. The manufacture of casks would appear to have doubled somewhat during the last five years, judging from the comparison given below. Kegs went up by nearly 200 per cent. between 1905 and 1910, but relapsed badly in the next five years. Butter-boxes also show a decided increase, while cheese cases and crates manufactured in 1915 numbered 463,789, as against 184,343 in 1910 and only 10,645 in 1905.
The total value of the manufacture of all kinds increased by well over 100 per cent. during the last five years. This industry appears to cater almost entirely for the dairy factories.
| Number of— | 1905-6. | 1910-11. | 1915-16. | |
|---|---|---|---|---|
| Works | 22 | 20 | 21 | |
| Hands employed | 116 | 171 | 390 | |
| Amount of wages paid | £ | 9,503 | 14,991 | 50,288 |
| Approximate value of— | ||||
| Land | £ | 10,283 | 9,915 | 43,718 |
| Buildings | £ | 7,200 | 9,104 | 139,409 |
| Machinery and plant | £ | 9,253 | 14,862 | 163,824 |
| Manufactures— | ||||
| Kegs | No. | 11,297 | 32,028 | 2,104 |
| Casks | No. | 37,936 | 36,859 | 72,243 |
| Butter-boxes | No. | 212,776 | 512,414 | 719,378 |
| Cheese cases and crates | No. | 10,645 | 184,343 | 463,789 |
| Total value of all manufactures | £ | 3S.124 | 73,807 | 193,090 |
The great development of this industry between 1901 and 1906 was not maintained at a similar rate during the five years preceding the census of 1911, though the value of the total output showed an increase of £571,122, the figures for 1910 being £2,699,888, as against £2,128,766 for 1905. Most of this increase, however, was due to higher prices, as there were decreases in the quantities of sawn timber and of mouldings in 1910, which were not compensated for by an increase in the quantity of flooring and skirting.
As might have been expected, the census of 1916 showed an all-round decrease in the activities of the sawmilling industry, but it is impossible to say whether this is due entirely to war conditions, or whether the industry is declining on account of the approaching exhaustion of the Dominion's timber reserves. The value of the output for the mills is far greater in the Auckland Provincial District than in any other, the order being as follows:—
| Value of Output of Sawmills. | ||
|---|---|---|
| 1910. | 1915. | |
* Including Southland, £159,044 in 1910 and £146,850 in 1915. | ||
| £ | £ | |
| Auckland | 1,194,953 | 838,701 |
| Wellington | 558,573 | 343,612 |
| Westland | 173,670 | 210,407 |
| Otago* | 230,594 | 199,945 |
| Canterbury | 127,761 | 105,327 |
| Hawke's Bay | 122,041 | 81,816 |
| Nelson | 103,691 | 56,296 |
| Taranaki | 94,613 | 46,904 |
| Marlborough | 93,992 | 15,518 |
| Totals | £2,699,888 | £1,898,526 |
Some further comparative figures for the last three censuses are given below. The details obtained in 1916 in respect of employees and wages were in somewhat different form to those ascertained at preceding inquiries, and cannot be properly compared with them. The number of employees in the mills themselves in 1916 was 3,473, with an annual wages-sheet of £465,013. In addition, 2,397 men were employed in the bush on contract work and otherwise, their wages totalling £213,015. A further £253,958 over and above wages was also expended on contracts.
| Number of— | 1905-6. | 1910-11. | 1915-16. | |
|---|---|---|---|---|
* Not comparable (see letterpress). † Not shown separately. | ||||
| Mills | 444 | 534 | 292 | |
| Hands employed | 9,111 | 6,877 | * | |
| Amount of— | ||||
| Wages paid | £ | 834,927 | 774,402 | * |
| Horse-power | H.p | 13,278 | 19,484 | 16,816 |
| Approximate value of— | ||||
| Land | £ | 373,313 | 340,968 | 311,427 |
| Buildings | £ | 181,899 | 283,122 | 190,453 |
| Machinery and plant | £ | 649,631 | 826,436 | 1,458,468 |
| Tramways | £ | † | 356,102 | 369,106 |
| Sawn timber— | ||||
| Quantity | Ft. | 336,470,930 | 296,033,017 | 251,097,312 |
| Value | £ | 1,442,950 | 1,725,827 | 1,330,831 |
| Posts, rails, &c.—Value | £ | 12,297 | 56,778 | 12,659 |
| Resawing, planed, flooring, skirting, &c.— | ||||
| Quantity | Ft. | 51,588,812 | 56,770,537 | 41,752,156 |
| Value | £ | 517,954 | 435,986 | 397,313 |
| Moulding— | ||||
| Quantity | Ft. | 12,148,474 | 10,896,134 | 4,057,358 |
| Value | £ | 56,027 | 80,056 | 22,890 |
| Doors and sashes—Value | £ | 99,538 | 150,302 | 49,599 |
| Joinery, undescribed | £ | † | 250,939 | 85,234 |
| Total value of all manufactures | £ | 2,128,766 | 2,699,888 | 1,898,526 |
The operations of the gasworks in the Dominion for the year 1915 still show such expansion as must be considered highly satisfactory, and this notwithstanding the increased use of electricity in substitution for gas.
There were 56 gasworks at the time of the census of 1916, employing 598 hands, as against 48 with 757 hands in 1911. The quantity of gas generated in 1915 shows a big increase on the figures for 1910, being 2,776,461,583 cubic feet, as compared with 2,074,566,794 cubic feet. The output of coke and tar also increased considerably during the five years.
| Number of— | 1905-6. | 1910-11. | 1915-16. | |
|---|---|---|---|---|
* Not shown. | ||||
| Works | 38 | 48 | 56 | |
| Hands employed | 954 | 757 | 598 | |
| Amount of wages paid | £ | 113,785 | 93,150 | 96,413 |
| Approximate value of— | ||||
| Land | £ | 132,188 | 151,101 | 157,127 |
| Buildings | £ | 135,919 | 174,858 | 194,046 |
| Machinery and plant | £ | 1,107,134 | 753,428 | 1,030,904 |
| Quantity of coal used | Tons | * | 161,162 | 214,425 |
| Value of coal used | £ | 134,474 | 176,306 | 244,346 |
Some further particulars ascertained in 1911 and 1916 are as follows:—
| 1910-11. | 1915-16. | ||
|---|---|---|---|
| Gas made—Quantity | C. ft. | 2,074,566,794 | 2,776,461,583 |
| Gas sold— | |||
| Quantity | C. ft. | 1,881,867,919 | 2,424,909,290 |
| Value | £ | 500,299 | 644,558 |
| Coke sold— | |||
| Quantity | Tons | 58,960 | 65,723 |
| Value | £ | 60,718 | 76,412 |
| Tar sold— | |||
| Quantity | Gal. | 1,643,765 | 1,957,142 |
| Value | £ | 30,575 | 43,711 |
| Other receipts | £ | 31,617 | 39,733 |
| Total receipts | £ | 623,200 | 804,414 |
| Total expenditure | £ | 494,297 | 642,358 |
The following figures showing the purposes for which the gas was utilized may also be of interest, in spite of the large proportion included in the "undefined" class:—
| 1910-11. | 1915-16. | |
|---|---|---|
| Cubic Feet. | Cubic Feet. | |
| Street lighting | 67,288,559 | 85,529,879 |
| General lighting | 228,348,935 | 636,941,925 |
| Heating and cooking | 126,380,810 | 182,974,070 |
| Motive power | 62,296,500 | 55,446,725 |
| Undefined | 1,397,553,115 | 1,464,016,691 |
| Total | 1,881,867,919 | 2,424,909,290 |
Under the heading "general lighting" in 1915 there were 41,171 consumers, and a further 60,028 in the "undefined" section, making a total of 101,199 consumers of gas for lighting purposes. Street lamps to the number of 7,701 were served. Gas-stoves numbered 24,027, gas-fires 6,320, and gas-engines 954. The horse-power of the latter aggregated 4,030 h.p.
The number of works returned at the census of 1916 was 42, as against only 14 in 1911. The hands employed increased from 170 to 223, and the amount of wages paid from £23,969 to £30,984. The units generated during 1910 aggregated 18,392,733, and the units sold 12,419,940. The corresponding figures for 1915 were—units generated, 37,456,763; units sold, 26,779,314. The total revenue for 1910 amounted to £124,951, and for 1915 £305,875. The alternating-current system was in operation in 12 cases, and the direct system in 30.
| Number of— | 1905-6. | 1910-11. | 1915-16 | |
|---|---|---|---|---|
| Works | 13 | 14 | 42 | |
| Hands employed | 118 | 170 | 223 | |
| Amount of— | ||||
| Wages paid | £ | 17,627 | 23,969 | 30,984 |
| Horse-power | H.p. | 6,029 | 16,780 | 33,459 |
| Approximate value of— | ||||
| Land | £ | 48,245 | 83,032 | 130,378 |
| Buildings | £ | 51,222 | 86,983 | 151,792 |
| Machinery and plant | £ | 223,961 | 234,666 | 570,305 |
Full details concerning this industry are not available for 1905-6, but comparisons between 1910-11 and 1915-16 in respect of the items given below show the increasing use that is being made of electricity in the Dominion for various purposes.
| 1910-11. | 1915-16. | |||
|---|---|---|---|---|
| Units sold. | Revenue. £ | Units sold. | Revenue. £ | |
* Figures for 1910-11 incomplete. The total units sold were returned at 12,419,940. | ||||
| Street lighting | 808,167 | 11,481 | 1,574,827 | 22,966 |
| General lighting | 2,963,967 | 88,383 | 8,257,608 | 174,162 |
| Heating and cooking | 46,903 | 554 | 632,964 | 6,878 |
| Motive power | 6,294,568 | 16,529 | 16,313,915 | 89,354 |
| Totals | 10,113,605* | £116,947 | 26,779,314 | £293,360 |
In 1915-16, 61 are lamps and 8,384 incandescent lamps were in use; consumers under the "general lighting" heading numbered 22,031, with a total of 654,941 incandescent lamps and 30 are lamps. "Heating and cooking" consumers numbered 4,485, and 1,490 electric motors of a total of 19,733 h.p. were served.
In 1916 the number of electric tramways in operation was 9, 7 of these being municipally owned. These employed 1,954 hands, and had 432 motorcars and 74 trailers in use. The car-miles run during the year were 10,797,384, and the passengers carried totalled 109,538,171. The lines open consisted of 142 miles of single track and 55 miles of double track.
During the year 25,412,079 units were generated, 1,607,965 units being sold for other purposes. The revenue for the year was £750,893, and the expenditure £679,799, including sinking-fund payments, depreciation, interest, &c. Capital outlay to the end of the year amounted to £1,972,424.
Although fewer works were in operation in 1916 than in 1906 or 1911, a decided increase in number of hands and in value of output is recorded. This industry, though not yet of large dimensions, shows steady progress.
| Number of— | 1905-6. | 1910-11. | 1915-16. | |
|---|---|---|---|---|
| Works | 20 | 17 | 16 | |
| Hands employed | 280 | 456 | 550 | |
| Amount of— | ||||
| Wages paid | £ | 34,249. | 53,934 | 65,558 |
| Horse-power | H.p. | 1,175 | 3,586 | 6,854 |
| Approximate value of— | ||||
| Land | £ | 17,565 | 45,289 | 32,242 |
| Buildings | £ | 23,539 | 43,650 | 54,274 |
| Machinery and plant | £ | 75,642 | 166,675 | 241,237 |
| Value of materials used | £ | 36,251 | 80,882 | 113,276 |
| Total value of manufactures | £ | 107,675 | 184,686 | 264,667 |
These works employed 855 hands in 1916, as against 966 in 1911, and the number of building-bricks made decreased from 62,735,239 to 48,383,234 in the quinquennium. There were also firebricks made to the number of 998,090 in 1915, and 877,028 in 1910. The value of bricks of all kinds made in 1910 was £131,594, and in 1915 £118,778. The value of pottery made, including drainpipes, rose from £92,125 to £115,126, while the total value of all the manufactures fell from £235,220 to £233,904. This industry appears to be on the decline.
| Number of— | 1905-6. | 1910-11. | 1915-16. | |
|---|---|---|---|---|
| Works | 125 | 94 | 74 | |
| Hands employed | 1,254 | 966 | 855 | |
| Amount of— | ||||
| Wages paid | £ | 99,246 | 112,328 | 109,449 |
| Horse-power | H.p. | 1,496 | 3,039 | 3,263 |
| Approximate value of— | ||||
| Land | £ | 96,001 | 97,890 | 107,815 |
| Buildings | £ | 83,367 | 103,501 | 127,286 |
| Machinery and plant | £ | 94,463 | 124,899 | 115,105 |
| Bricks manufactured— | ||||
| Common | No. | 69,785,911 | 62,735,239 | 48,383,234 |
| Fire | No. | 774,281 | 877,028 | 998,090 |
| Total value | £ | 150,200 | 131,594 | 118,778 |
| Value of pottery manufactured | £ | 52,193 | 92,125 | 115,126 |
| Total value of all manufactures | £ | 216,550 | 235,220 | 233,904 |
Considerable development is observed in respect of this industry. The value of the manufacture rose from £98,587 in 1900 to £127,150 in 1905, to £160,584 in 1910, and to £300,387 in 1915. In 1895 the value of the goods was only £63,723. The number of hands increased from 414 to 475 between 1910 and 1915.
| Number of— | 1905-6. | 1910-11. | 1915-16. | |
|---|---|---|---|---|
| Works | 54 | 65 | 115 | |
| Hands employed | 473 | 414 | 475 | |
| Amount of wages paid | £ | 36,467 | 40,493 | 78,995 |
| Approximate value of— | ||||
| Land | £ | 36,792 | 39,072 | 77,568 |
| Buildings | £ | 23,657 | 38,564 | 62,729 |
| Machinery and plant | £ | 19,821 | 20,953 | 52,889 |
| Value of materials used | £ | 6S,802 | 76,942 | 157,853 |
| Total value of manufactures and repairs | £ | 127,150 | 160,584 | 300,387 |
Twenty-two works were in operation in 1916, employing 270 hands. No comparison with former years is possible, owing to boilermaking-works having been included in this class up to and including 1911. Figures for the 1916 census are as follows:—
| Number of— | ||
|---|---|---|
| Works | 22 | |
| Hands employed | 270 | |
| Amount of— | ||
| Wages paid | £ | 40,586 |
| Horse-power | H.p. | 684 |
| Approximate value of— | ||
| Land | 25,190 | |
| Buildings | £ | 16,699 |
| Machinery and plant | £ | 23,718 |
| Value of materials used or operated on | £ | 53,608 |
| Total value of manufactures (including repairs) | £ | 124,871 |
Here again no proper comparison can be made with preceding census years, on account of an alteration in the classification.
| Number of— | ||
|---|---|---|
| Works | 142 | |
| Hands employed | 2,513 | |
| Amount of— | ||
| Wages paid | £ | 313,804 |
| Horse-power | H.p. | 3,322 |
| Approximate value of— | ||
| Land | £ | 228,808 |
| Buildings | £ | 158,932 |
| Machinery and plant | £ | 280,691 |
| Value of materials used | £ | 361,480 |
| Total value of manufactures (including repairs) | £ | 883,496 |
Particulars in reference to the Government Railway Workshops are not included, figures for 1915-16 not being obtainable.
It is necessary to remark previously to considering the figures given that, for the sake of obtaining true comparisons, particulars relating to the Government Printing Office have been omitted. To arrive at the full measure of the printing and bookbinding industry as in 1915-16, 565 hands should be added, with £110,653 value of output.
The number of establishments (other than the Government Printing Office) increased from 241 in 1911 to 266 in 1916, but the number of hands employed decreased from 4,222 to 4,202. Female hands increased from 660 in 1906 to 789 in 1911 and 910 in 1916. The linotypes used in 1911 numbered 216, and the monolines in operation were 26, while in 1916 the number of linotypes returned was 292, and of monolines 13. The value of output increased in the five years from £1,377,926 to £1,697,831.
| 1905-6. | 1910-11. | 1915-16. | ||
|---|---|---|---|---|
| Number of works | 239 | 241 | 266 | |
| Hands employed— | ||||
| Males | No. | 3,238 | 3,433 | 3,292 |
| Females | No. | 660 | 789 | 910 |
| Wages paid— | ||||
| Males | £ | 374,872 | 454,812 | 544,627 |
| Females | £ | 25,940 | 35,434 | 47,855 |
| Approximate value of land, buildings, machinery, and plant | £ | 920,022 | 1,302,497 | 1,601,078 |
| Value of all manufactures | £ | 1,067,827 | 1,377,926 | 1,697,831 |
| Value of materials used | £ | 272,857 | 314,763 | 432,712 |
During 1915, 23,615,551 lb. of paper for newspapers and 4,411,368 lb. for job-printing were used, these quantities being nearly double the corresponding totals for 1910 (12,280,789 lb. and 2,331,341 lb. respectively).
The total value of all manufactures, including repairs, increased from £222,040 in 1910 to £266,256 in 1915. The number of works decreased from 19 to 16, but the hands employed increased by 110.
| Number of— | 1905-6. | 1910-11. | 1915-16. | |
|---|---|---|---|---|
| Works | 29 | 19 | 16 | |
| Hands employed | 793 | 646 | 756 | |
| Amount of— | ||||
| Wages paid | £ | 79,042 | 81,026 | 99,491 |
| Horse-power | H.p. | 419 | 426 | 629 |
| Approximate value of— | ||||
| Land | £ | 27,878 | 42,914 | 43,173 |
| Buildings | £ | 30,791 | 30,006 | 36,993 |
| Machinery and plant | £ | 36,798 | 45,711 | 60,700 |
| Value of all materials used | £ | 91,043 | 81,237 | 108,307 |
| Total value of manufactures (including repairs) .. .. | £ | 199,741 | 222,040 | 266,256 |
Repairs in 1915 represented only £22,075 of the total shown for value of manufactures, including repairs.
The value of the manufactures and repairs rose from £396,012 in 1910 to £487,824 in 1915, an increase of £91,812, or at a rate of 23 per cent. The number of works returned in 1916 was 313, as against only 180 in 1911, but it would appear that a large proportion of the factories in 1916 were only small establishments. The number of hands employed actually shows a decrease.
| Number of — | 1905-6. | 1910-11. | 1915-16. | |
|---|---|---|---|---|
| Works | 183 | 180 | 313 | |
| Hands employed | 1,465 | 1,439 | 1,393 | |
| Amount of— | ||||
| Wages paid | £ | 116,204 | 149,806 | 164,012 |
| Horse-power | H.p. | 395 | 657 | 1,018 |
| Approximate value of— | ||||
| Land | £ | 116,916 | 142,414 | 184,485 |
| Buildings | £ | 97,238 | 127,754 | 132,888 |
| Machinery and plant | £ | 37,563 | 50,806 | 53,985 |
| Value of materials used | £ | 122,384 | 156,829 | 186,249 |
| Total value of manufactures (including repairs) .. .. | £ | 294,818 | 396,012 | 487,824 |
The number of motor and cycle works returned in 1916 was 172, as against only 71 in 1911, the increase being due to the rapid spread of repairing-garages throughout the country. The value of manufactures, including repairs, rose from £92,141 for the year 1910 to £189,482 for 1915, or at a rate of 106 per cent. The value of land, buildings, machinery, and plant was also much higher in 1916 than in 1911.
| Number of— | 1905-6. | 1910-11. | 1915-16. | |
|---|---|---|---|---|
| Works | 97 | 71 | 172 | |
| Hands employed | 452 | 315 | 649 | |
| Amount of wages paid | £ | 30,831 | 30,366 | 56,164 |
| Approximate value of— | ||||
| Land | £ | 38,020 | 71,266 | 133,464 |
| Buildings | £ | 33,664 | 58,244 | 118,323 |
| Machinery and plant | £ | 11,982 | 15,367 | 32,438 |
| Total value of manufactures (including repairs) .. .. | £ | 75,991 | 92,141 | 189,482 |
This industry continues to show steady expansion, though the value of output is still insignificant.
| Number of— | 1905-6. | 1910-11. | 1915-16. | |
|---|---|---|---|---|
| Works | 106 | 117 | 151 | |
| Hands employed | 544 | 594 | 587 | |
| Amount of wages paid | £ | 42,213 | 62,482 | 70,934 |
| Approximate value of— | ||||
| Land | £ | 65,038 | 76,913 | 84,431 |
| Buildings | £ | 36,554 | 54,995 | 59,459 |
| Machinery and plant | £ | 7,082 | 11,066 | 12,800 |
| Value of materials used | £ | 72,662 | 114,993 | 141,455 |
| Total value of manufactures (including repairs) | £ | 140,813 | 220,364 | 259,507 |
The value of output for 1915-16 was made up as follows: Harness, £81,792; saddles, £44,147; horse-collars, £14,469; other products (including repairs), £119,099.
Although the number of works decreased from 79 to 59 during the five years 1906-11, the value of manufactures and products was £718,513 more in 1915 than in 1910. Hands employed decreased by 185.
| Number of— | 1905-6. | 1910-11. | 1915-16. | |
|---|---|---|---|---|
| Works | 99 | 79 | 59 | |
| Hands employed | 1,336 | 1,372 | 1,187 | |
| Amount of— | ||||
| Wages paid | £ | 102,506 | 136,875 | 146,532 |
| Horse-power | H.p. | 980 | 1,927 | 1,890 |
| Approximate value of— | ||||
| Land | £ | 48,386 | 46,305 | 64,118 |
| Buildings | £ | 80,380 | 124,894 | 226,526 |
| Machinery and plant | £ | 53,916 | 90,257 | 179,905 |
| Value of materials used | £ | 1,261,026 | 1,788,772 | 2,215,417 |
| Total value of manufactures and produce | £ | 1,836,310 | 2,036,770 | 2,755,283 |
Further particulars ascertained in 1911 and 1916 are as follows:—
| 1910-11. | 1915-16. | ||||
|---|---|---|---|---|---|
| Materials operated on— | Quantity. | Value. £ | Quantity. | Value. £ | |
| Sheep-skins | No. | 4,440,392 | 683,170 | 4,340,811 | 1,080,349 |
| Greasy wool | lb. | 19,386,969 | 609,945 | 13,112,883 | 608,272 |
| Hides, pelts, &c. .. | No. | 2,835,289 | 398,173 | 1,021,786 | 426,428 |
| Bark used— | |||||
| New Zealand | Tons | 626 | 4,383 | 415 | 2,214 |
| Other | Tons | 2,544 | 25,697 | 3,308 | 34,334 |
| Other materials used | .. | 67,404 | .. | 63,820 | |
| Output— | |||||
| Scoured and sliped wool | lb. | 25,281,998 | 1,159,820 | 25,084,466 | 1,747,946 |
| Pelts | No. | 1,155,488 | 105,305 | 1,789,237 | 162,607 |
| Leather | lb. | 4,762,803 | 326,471 | 5,681,228 | 503,890 |
| Basils | lb. | 236,825 | 14,285 | 371,602 | 32,094 |
| Pickled pelts | No. | 2,944,360 | 204,394 | 1,298,377 | 135,797 |
| Other products | .. | 226,495 | .. | 172,949 | |
This industry is small but useful, catering mainly for the fishing industry, most of the output being boats, launches, &c. Only four vessels of over 50 tons were built during 1915-16, as against eight in 1910-11.
| Number of— | 1905-6. | 1910-11. | 1915-16. | |
|---|---|---|---|---|
| Establishments | 30 | 29 | 31 | |
| Hands employed | 237 | 589 | 402 | |
| Amount of wages paid | £ | 20,889 | 69,415 | 56,514 |
| Total value of manufactures, &c. | £ | 66,572 | 143,019 | 130,870 |
| Number of vessels built | 334 | 310 | 237 |
In 1911 there were 34 establishments employing 224 hands, and in 1916 41 establishments and 236 hands. The annual production is still less than £100,000 in value.
| Number of— | 1905-6. | 1910-11. | 1915-16. | |
|---|---|---|---|---|
| Works | 29 | 34 | 41 | |
| Hands employed | 163 | 224 | 236 | |
| Amount of wages paid | £ | 11,205 | 18,287 | 20,796 |
| Sails manufactured | No. | 489 | 1,505 | 369 |
| Tents and flies manufactured | No. | 6,048 | 15,921 | 15,119 |
| Oilskins manufactured | No. | 15,920 | 31,773 | 29,779 |
| Horse and cow covers manufactured | No. | 11,345 | 15,292 | 21,574 |
| Total value of all manufactures | £ | 45,321 | 92,249 | 97,990 |
In this branch of industrial work a substantial increase took place during the five years' operations. The value of the output, which was £497,681 in 1910, rose to £578,560 in 1915. There were 1,821 hands employed in 1916, being an increase of 132 on the number for 1911.
| Number of— | 1905-6. | 1910-11. | 1915-16. | |
|---|---|---|---|---|
| Factories | 172 | 207 | 257 | |
| Hands employed | 1,528 | 1,689 | 1,821 | |
| Amount of wages paid | £ | 134,584 | 178,042 | 273,058 |
| Approximate value of— | ||||
| Land | £ | 98,966 | 134,279 | 170,313 |
| Buildings | £ | 99,373 | 138,039 | 154,522 |
| Machinery and plant | £ | 41,036 | 55,364 | 79,018 |
| Value of materials used | £ | 157,484 | 215,031 | 253,054 |
| Total value of manufactures | £ | 328,185 | 497,681 | 578,560 |
There were 10 woollen-mills in operation in the Dominion in 1915-16, employing 1,897 persons—751 males and 1,146 females. These factories therefore provide more occupation for women and girls than for the male sex.
The value of manufactures shown for 1915 is nearly double that for 1910. The increase in value, however, was not accompanied by a correspondingly great increase in quantity, being mainly due to the higher prices ruling.
| Number of— | 1905-6. | 1910-11. | 1915-16. | |
|---|---|---|---|---|
| Works | 10 | 10 | 10 | |
| Hands employed | 1,549 | 1,410 | 1,897 | |
| Amount of— | ||||
| Wages paid | £ | 105,036 | 137,161 | 187,736 |
| Horse-power | H.p. | 1,945 | 2,641 | 3,080 |
| Approximate value of— | ||||
| Land | £ | 9,003 | 7,694 | 10,549 |
| Buildings | £ | 110,297 | 100,941 | 161,205 |
| Machinery and plant | £ | 188,459 | 180,454 | 256,230 |
| Scoured wool used— | ||||
| Quantity | lb. | 3,835,064 | 3,092,777 | 4,096,048 |
| Value | £ | 167,291 | 214,387 | 354,688 |
| Output— | ||||
| Tweed | Yards | 1,300,471 | 1,160,686 | 1,256,847 |
| Flannel | Yards | 1,368,268 | 1,140,794 | 1,353,088 |
| Blankets | Pairs | 59,572 | 67,201 | 111,452 |
| Rugs and shawls | No. | 23,780 | 49,073 | 25,467 |
| Yarn | lb. | 259,067 | 260,397 | 183,125 |
| Total value | £ | 397,348 | 377,713 | 717,638 |
This industry employs 3,574 hands, and is therefore of considerable importance in the matter of labour, especially that of the female sex, of whom 3,040 are employed.
The value of all manufactures for the year 1915 was returned at £908,117, and for 1910 £507,125, the increase for the quinquennium being £400,992, or at the rate of 80 per cent. This industry owes part at least of its present prosperity to the demand for uniforms, &c., for troops.
| 1905-6. | 1910-11. | 1915-16. | ||
|---|---|---|---|---|
| Number of works | 23 | 69 | 83 | |
| Number of hands employed— | ||||
| Males | 375 | 477 | 534 | |
| Females | 1,539 | 2,470 | 3,040 | |
| Amount of wages paid— | ||||
| Males | £ | 38,045 | 52,957 | 72,491 |
| Females | £ | 67,516 | 116,695 | 163,811 |
| Approximate value of— | ||||
| Land | £ | 32,985 | 63,036 | 73,241 |
| Buildings | £ | 42,493 | 92,285 | 110,122 |
| Machinery and plant | £ | 15,163 | 39,160 | 35,554 |
| Output— | ||||
| Suits | No. | 101,113 | 196,825 | 608,570 |
| Shirts | Doz. | 45,239 | 94,249 | 127,426 |
| Caps and hats | Doz. | 5,895 | 23,861 | 65,885 |
| Other garments | No. | 35,265 | 356,190 | 106,236 |
| Total value | £ | 308,943 | 507,125 | 908,117 |
At the census of 1916 returns were obtained from 10 hosiery-factories, employing 11 males and 116 females, as against 14 factories and 49 male and 478 female hands in 1911. The value of the output amounted to only £62,828, as against £140,442 in 1910.
| Number of— | 1905-6. | 1910-11. | 1915-16. | |
|---|---|---|---|---|
| Works | 10 | 14 | 10 | |
| Hands employed | 374 | 527 | 127 | |
| Amount of wages paid | £ | 21,960 | 36,702 | 8,879 |
| Approximate value of— | ||||
| Land | £ | 4,248 | 4,077 | 3,615 |
| Buildings | £ | 5,513 | 32,067 | 5,455 |
| Machinery and plant | £ | 26,936 | 56,015 | 7,846 |
| Total value of all manufactures | £ | 67,588 | 140,442 | 62,828 |
The total value of all manufactures as brought out is £801,572 for 1915, an increase of £181,699. The volume of output, however, shows a slight decrease during the five years on the figures for 1910. The number of factories in 1916 was considerably more than double that for 1911, due to the inclusion of many small shops employing only two or three hands and not greatly affecting the total value of output.
| Number of— | 1905-6. | 1910-11. | 1915-16. | |
|---|---|---|---|---|
| Works | 72 | 74 | 166 | |
| Number of hands employed— | ||||
| Males | 1,518 | 1,359 | 1,455 | |
| Females | 688 | 713 | 802 | |
| Amount of wages paid— | ||||
| Males | £ | 142,826 | 154,244 | 192,382 |
| Females | £ | 28,669 | 43,549 | 46,449 |
| Approximate value of— | ||||
| Land | £ | 46,409 | 61,602 | 99,614 |
| Buildings | £ | 50,170 | 74,751 | 98,642 |
| Machinery and plant | £ | 57,412 | 90,704 | 96,768 |
| Manufactures— | 1905-6. | 1910-11. | 1915-16. | |
|---|---|---|---|---|
| Boots and shoes | Pair | 1,081,644 | 1,324,477 | 1,332,929 |
| Slippers | Pair | 89,378 | 68,040 | 58,560 |
| Shoe-ettes | Pair | 20,000 | 98,644 | 79,997 |
| Uppers | Pair | 38,410 | 17,464 | 7,400 |
| Leggings | Pair | 1,468 | 2,279 | 425 |
| Total value | £ | 501,065 | 619,873 | 801,572 |
A gratifying feature of the figures for 1915-16 is the increased use that is being made of New Zealand leather, as indicated by the following comparative statement:—
| New Zealand leather— | 1910-11. | 1915-16. | |
|---|---|---|---|
| Purchased by measurement | Ft. | 1,331,274 | 1,636,882 |
| Purchased by weight | lb. | 2,267,060 | 2,587,382 |
| Total value | £ | 190,336 | 309,282 |
| Imported leather— | |||
| Purchased by measurement | Ft. | 1,771,193 | 1,015,869 |
| Purchased by weight | lb. | 135,298 | 172,354 |
| Total value | £ | 86,854 | 75,456 |
This industry is one of ups and downs. It was in the lowest depths of depression at the time of the census of 1896, only 52 mills being in operation, and the hands employed numbering only 484 men and 163 boys. Returns for 1901 showed a revival in the mills to 101 in operation, with 1,519 men and 179 boys; while in 1906 there were 240 mills, with a total of 4,076 employees. The census returns for 1911, however, showed only 81 mills in operation during April of that year, with 1,244 persons employed thereat. In 1916 the industry was in a comparatively good condition again, as, although only 76 mills were in operation, the output, thanks mainly to the higher prices ruling, was valued at £470,774, against £284,399 in 1910-11.
The most important particulars given in the returns are tabulated below:—
| Number of— | 1905-6. | 1910-11. | 1915-16. | |
|---|---|---|---|---|
| Works | 240 | 81 | 76 | |
| Hands employed | 4,076 | 1,244 | 1,257 | |
| Amount of— | ||||
| Wages paid | £ | 227,646 | 143,895 | 164,260 |
| Horse-power | H.p. | 3,087 | 2,516 | 3,316 |
| Approximate value of— | ||||
| Land | £ | 192,471 | 236,306 | 307,669 |
| Buildings | £ | 43,751 | 31,197 | 48,426 |
| Machinery and plant | £ | 119,618 | 75,135 | 86,069 |
| Raw material used— | ||||
| Quantity | Tons | 199,171 | 126,034 | 155,629 |
| Value | £ | 185,894 | 73,835 | 174,573 |
| Fibre dressed— | ||||
| Quantity | Tons | 22,128 | 15,130 | 17,696 |
| Value | £ | 544,070 | 270,530 | 447,909 |
| Tow produced— | ||||
| Quantity | Tons | 2,439 | 2,396 | 2,423 |
| Value | £ | 13,738 | 13,869 | 22,865 |
| Total value of output | £ | 557,808 | 284,399 | 470,774 |
The number of these works increased from 8 in 1911 to 10 in 1916, and the number of hands employed also increased somewhat. The output shows a considerable increase as regards both quantity and value. As to materials used, phormium comes by far the first, 5,215 tons being utilized in 1915, against only 215 tons of manila.
| Number of— | 1905-6. | 1910-11. | 1915-16. | |
|---|---|---|---|---|
| Works | 10 | 8 | 10 | |
| Hands employed | 195 | 190 | 235 | |
| Materials used— | ||||
| Phormium— | ||||
| Quantity | Tons | 1,568 | 5,267 | 5,215 |
| Value | £ | 35,165 | 44,040 | 75,074 |
| Manila— | ||||
| Quantity | Tons | 363 | 558 | 215 |
| Value | £ | 16,524 | 14,469 | 11,642 |
| Total value of all manufactures | £ | 100,753 | 104,325 | 161,647 |
The manufactures in 1915 included 1,749 tons of rope, 1,601 tons of twine, and 248 tons of other products.
Table of Contents
ISSUES of this book for some few years prior to 1915 contain a schedule of the Acts in force coming within the definition of "labour laws," together with those statutes now repealed and incorporated in existing laws. Detailed references to the principal labour laws are also given.
The business dealt with by the Arbitration Court and Conciliation Councils during the year ended the 31st March, 1919, may be summarized as follows:—
| Number of Cases | |
|---|---|
| Industrial agreements | 31 |
| Recommendations of Conciliation Councils | 137 |
| Awards of Arbitration Court | 130 |
The number of cases brought before Magistrates during the year ended the 31st March, 1919, in regard to enforcement of awards or breaches of the Industrial Conciliation and Arbitration Act was 178. The awards and agreements in force as at the 31st March, 1919, totalled 519.
The table following shows the work performed by Commissioners and Councils of Conciliation during the year ended the 31st March, 1919:—
| — | Industrial District. | Total. | ||
|---|---|---|---|---|
| Northern and Taranaki. | Wellington, Marlborough, Nelson, and Westland. | Canterbury, and Otago and Southland. | ||
| Industrial agreements arrived at and filed under section 26:— | ||||
| By parties through the Commissioner alone | 1 | 4 | 2 | 7 |
| Disputes under section 30, Industrial Conciliation and Arbitration Amendment Act, 1908, and dealt with by Conciliation Councils:— | ||||
| Where industrial agreements were filed (under section 26) or accepted recommendations were made (under section 7, Industrial Conciliation and Arbitration Amendment Act, 1911.) | .. | 4 | .. | 4 |
| Where recommendations were fully accepted and forwarded to the Court to be made into awards | 39 | 16 | 40 | 95 |
| Where recommendations were substantially accepted and referred to Court to make awards | 8 | 9 | 15 | 32 |
| Where only minor recommendation or no recommendation was made | 2 | .. | 8 | 10 |
| Totals | 50 | 33 | 65 | 148 |
The above table shows that out of 14S disputes dealt with by them 138 (or 94 per cent.) were settled or substantially settled by the Commissioners and Councils of Conciliation.
In the action Registrar of Industrial Unions v. Canterbury Slaughtermen's Industrial Union of Workers the question for decision was whether an industrial union consisting of workers engaged in one industry may amalgamate with an industrial union of workers engaged in another industry if those industries are "related" within the meaning of section 24 of the Act. The answer was given in the negative by their Honours Sir Robert Stout. Mr. Justice Chapman, and Mr. Justice Stringer, as the section that provides for amalgamation restricts such action to unions in "the same industry" only.
The Denniston Coal-miners' industrial Union of Workers claimed from each of its members 2s. 6d. for a levy to make good a deficiency in the union's funds. It was held that the use of the funds of an industrial union must be limited to the purposes of the Act (e.g., the settlement of industrial disputes), and that as the money thus claimed was to be used to pay wages to a member imprisoned for sedition, and to pay travelling-expenses to another member charged with sedition, the defendant was justified in refusing payment. This judgment was upheld in the Supreme Court.
During last session an important amendment of the Industrial Conciliation and Arbitration Act was passed—and included in the War Legislation and Statute Law Amendment Act—providing that on an application being made, the Arbitration Court should have power to amend any award or industrial agreement in regard to wages or hours to meet any alteration in the conditions of employment or the cost of living that may have taken place since the award or agreement was made. This legislation came into operation on the 10th December last, and between that date and the 31st March. 1919, a large number of applications have already been made to the Court. In. seventeen instances the Court has made amendments in accordance with the provision referred to. A considerable number has also been made since the 31st March.
In regard to proposals for the amendment of the law relating to the settlement of industrial disputes, considerable interest attaches to the Carton memoranda and the Whitley reports in England. Already Industrial Councils in accordance with the reports of the Whitley Committee have been set up in England in a large number of industries. Proposals for amendment of the Industrial Conciliation and Arbitration Act of New Zealand are now under the consideration of the Government.
Returns of the number and membership. of industrial unions of employers and workers are compiled for the calendar year, and the following table shows the numbers of industrial unions, together with the numbers of members, in the various industrial districts of the Dominion on the 31st December, 1918:—
| Industrial District. | Employers. | Workers. | ||
|---|---|---|---|---|
| Unions. | Membership. | Unions. | Membership. | |
| Northern (Auckland) | 42 | 1,230 | 96 | 20,239 |
| Taranaki | 6 | 123 | 13 | 605 |
| Wellington | 35 | 866 | 85 | 26,931 |
| Marlborough | 1 | 49 | 5 | 214 |
| Nelson | 2 | 15 | 8 | 288 |
| Westland | 2 | 23 | 19 | 3,086 |
| Canterbury | 25 | 2,157 | 59 | 9,449 |
| Otago and Southland | 34 | 883 | 85 | 10,635 |
| Totals | 147 | 5,346 | 370 | 71,447 |
The number and membership of employers' unions increased by two and decreased by 44 respectively as compared with last year, while the number of workers' unions registered has decreased by twelve, and the total membership by 1,426. The number under each heading on the 31st December of each year from 1909 to 1918 inclusive is shown in the following table:—
| Year. | Employers. | Workers. | ||
|---|---|---|---|---|
| Unions. | Membership. | Unions. | Membership. | |
| 1909 | 120 | 3,702 | 308 | 54,519 |
| 1910 | 118 | 4,262 | 308 | 57,091 |
| 1911 | 118 | 4,251 | 307 | 55,629 |
| 1912 | 123 | 4,410 | 322 | 60,622 |
| 1913 | 134 | 4,700 | 372 | 71,544 |
| 1914 | 149 | 5,819 | 403 | 73,991 |
| 1915 | 141 | 5,718 | 389 | 67,661 |
| 1916 | 141 | 5,554 | 378 | 71,388 |
| 1917 | 145 | 5,390 | 382 | 72,873 |
| 1918 | 147 | 5,346 | 370 | 71,447 |
The number of registered factories in the Dominion on the 31st March, 1919, was 12,444, employees thereat numbering 82,783. These figures show an increase on those for the previous year amounting to 45 in the number of factories and 3,130 in the number of workers. The following table shows the number of factories and employees for the past five years:—
| Year. | Number of Factories. | Number of Workers. |
|---|---|---|
| 1914-15 | 13,937 | 88,812 |
| 1915-16 | 13,214 | 83,011 |
| 1916-17 | 12,455 | 78,188 |
| 1917-18 | 12,485 | 79,653 |
| 1918-19 | 12,444 | 82,783 |
A table is given showing the number of accidents in factories during the past five years.
The chief industrial disturbances during the year were those in coal-mines, but strikes of importance also took place at the Tokomaru and Foxton flaxmills, at the Ohinemuri gold-mines (engineers), at the Roslyn Woollen-mills, on the s.s. "Pateena" (stokers), and in the tramways industry. Brief particulars in regard to these disturbances are given below. In addition there were stoppages lasting from a day to six days at the Westfield and Gear Meat Companies' works (chambermen), at the Westfield Chemical-manure Works, by the Gisborne tailors, and by the Wellington waterside workers. In the last-mentioned case the men refused to work the s.s. "Westland" for six days, believing that the engineer had influenza. Work was resumed when the men wore assured to the contrary.
Operations in the coal-mining industry in the Dominion have been marked this year by a large number of stoppages of work of varying duration and for various reasons. In addition to these stoppages the policy of "going slow" has been introduced into the mines. Towards the end of last year a series of strikes were declared in the principal Westland coal-mines for the purpose of compelling a number of workers to pay a levy struck for the benefit of Australian miners who were at that time on strike. The levy was paid by a number of the men, and work was resumed at the request of the Government. Perhaps the principal strike in this industry during the year, however, was that of the Paparoa miners. In this case it was alleged that the mine was badly ventilated, and the men went on strike and remained idle for thirteen weeks. Work was eventually resumed by mutual consent. The strikers were prosecuted and fined under the Industrial Conciliation and Arbitration Act.
Objection was taken by the men to an amendment to the award of the Arbitration Court governing their employment. They refused to work overtime or to perform Sunday work or shift work, and subsequently went on strike. A conference of the parties to the dispute was arranged, over which the Conciliation Commissioner for the district presided, and an agreement was entered into operating retrospectively from the date of the coming into operation of the amendment complained of. Work was resumed after the mine had been idle seven days.
The s.s. "Pateena" was held up for twelve days on account of the stokers going on strike in sympathy with a dismissed worker. The men were prosecuted under the War Regulations, two being sentenced to a month's imprisonment and another to fourteen days.
Two disturbances took place in the flax-milling industry, one at Foxton and the other at Tokomaru. In the former case eleven cutters were dismissed, and thereupon thirty-three other employees went on strike as a protest. A conference was called, and a settlement of the dispute was effected, the employer agreeing to reinstate the dismissed men. The mill was idle for ten days.
At Tokomaru a demand for increased wages was refused, and about thirty men ceased work. As the season was drawing to a close, the employers decided to close down the mill.
At intervals during the year demands for increased wages were made by the employees in this industry in Auckland, New Plymouth, Wellington, Christchurch, and Dunedin. The "go slow" policy was adopted in varying degree in each case, and subsequently the increases demanded were either wholly or partially conceded. A dispute at Invercargill was settled by a conference of the parties.
It was alleged in this dispute that a worker had been disrated in consequence of an appointment to the staff of the company. Fourteen employees (twelve men and two boys) ceased work, and remained on strike for ten days. Proceedings were instituted against the twelve men, who were each fined.
A detailed reference to the Shops and Offices Act was made in the 1914 and previous issues of this book. During the year 1918-19 there were 168 prosecutions under the Act. Convictions were obtained in 163 of these.
Six hundred and sixty-six notices of intention to erect scaffolding were received by the Department of Labour during the year ended the 31st March, 1919. Fifty-two accidents were reported under the Act. Of this number one was fatal; the remaining fifty-one were of minor character, and were not due to faulty scaffolding or gear. Eight prosecutions were made under the provisions of the Act, resulting in convictions in each case.
During the year ended the 31st March, 1919, twenty-nine cases were dealt with under this Act, as compared with forty-two during the previous year.
The Footwear Regulation Act, 1913, provides that—
No person shall manufacture for sale, or sell, offer, or expose for sale, or have in his possession for sale, any boots or shoes the soles of which consist wholly or partly of leather, or any imitation of leather, or of any material having the appearance of leather, unless—
The soles thereof are of leather without admixture or addition other than of materials used for filling spaces, shanks, or rubber outsoles, or, in the case of ladies' fancy or evening footwear, of heels of wood or celluloid; or
A statement of the material or materials composing the soles thereof is conspicuously and legibly stamped upon or impressed into the outer surface of the sole of each boot or shoe.
During 1918-19 Court proceedings were instituted in one case for a breach of the above Act, and a fine of £5 was imposed. Several warnings had to be administered for minor breaches of the Act.
During the year the Munitions and Supplies Department has been assisted by Inspectors of Footwear, who have supervised the manufacture of military boots, and have also co-operated with the Customs Department in the inspection of basils and other leathers not required for military purposes.
The War Legislation Amendment Acts of 1916, 1917, and 1918 contain provisions calculated to prevent undue increases of rent and other hardships in connection with housing. Under these Acts 234 applications were received for reduction of rents charged for dwellinghouses. No fewer than 148 of these were from Wellington. Action was taken in 208 cases, and in some 108 instances the increase was decided to be unjustified and rents reduced accordingly. The following comment on the operations of the Act is from the report of the Labour Department:—
This Act has continued to be of considerable benefit to tenants, especially in Wellington. The provision requiring that, in certain cases, the rent shall not exceed 8 per cent. of the capital value has undoubtedly, however, had the effect of discouraging the building of houses, thereby accentuating the very difficulty that the rent-restriction law was designed to overcome; 8 per cent. is, in fact, hardly sufficient to allow the owner 6 per cent. interest on his outlay. Besides interest, repayment of principal, rates, fire insurance, and maintenance, a builder needs to allow in his rents sufficient to provide for the house being empty occasionally, for bad debts, and also for the fact that, as the house ages, its rent-producing value diminishes. It is true that the value of property in the locality may increase as time goes on, but this latter prospect cannot, of course, always be depended on.
The co-operative system of carrying out public works as applied to railway and road formation was adopted by the Government in 1891, and is still continued. During the period 1891 to 1912 the principal works of this class undertaken by the State were carried out almost entirely by this means. The system worked very well, but latterly altered conditions and the attitude of a section of the workmen rendered it advisable to reintroduce to some extent the direct-contract system, and both systems of carrying out work are now in force.
The co-operative contract system is somewhat as follows: When a length of railway or road is to be constructed on the co-operative principle the formation-work is divided into sections the size of which depends upon the difficulty of the work. Plans and a simple specification of the work are prepared, also an estimate of the cost based on the rate of wages ruling in the district for similar work. The work, at a price reckoned at so-much per unit of quantity or measurement, is offered to a party of men, who, if they accept, become the contractors. The work done by the men is measured periodically, and full payment made to the party, who divide the money amongst themselves according to the time worked by each workman. The engineer in charge of the work has a certain amount of discretion and control in respect of the character of the men employed, the progress of the work, hours of labour, &c.
The constitution of the party is left very much to the men themselves, and they have power, subject to approval of the engineer, to ballot out any member who proves himself undesirable or inefficient. The Department supplies the men with materials, explosives, &c., at cost price.
When the work is let by direct contract, tenders are publicly invited, but the sections of work included in each contract are more extensive than under the co-operative system, yet not too large to enable parties of working contractors to tender.
The number of labourers and artisans employed under the co-operative system during each month of the year ended the 31st March, 1919. was as follows:—
| Month. | Roads. | Railways. | Other Works. | Total. |
|---|---|---|---|---|
| April, 1918 | 939 | 926 | 364 | 2,229 |
| May, 1918 | 897 | 1,040. | 382 | 2,319 |
| June, 1918 | 959 | 1,228 | 364 | 2,551 |
| July, 1918 | 913 | 1,203 | 372 | 2,4SS |
| August, 1918 | 894 | 1,190 | 467 | 2,551 |
| September, 1918 | 914 | 1,247 | 424 | 2,585 |
| October, 1918 | 975 | 1,267 | 402 | 2,644 |
| November, 1918 | 911 | 1,250 | 409 | 2,570 |
| December, 1918 | 756 | 1,316 | 422 | 2,494 |
| January, 1919 | 1,390 | 1,886 | 741 | 4,017 |
| February, 1919 | 1,498 | 1,953 | 715 | 4,166 |
| March. 1919 | 1,463 | 1,749 | 780 | 3,992 |
The (monthly) average number of men employed in each year since 1891-92 was as follows:—
| Year ended 31st March. | Roads. | Railways, Buildings, &c. | Total. |
|---|---|---|---|
| 1892 | 261 | 527 | 788 |
| 1893 | 280 | 842 | 1,122 |
| 1894 | 933 | 1,015 | 1,948 |
| 1895 | 1,103 | 962 | 2,065 |
| 1896 | 1,572 | 764 | 2,336 |
| 1897 | 1,459 | 854 | 2,313 |
| 1898 | 1,552 | 890 | 2,442 |
| 1899 | 1,613 | 1,194 | 2,807 |
| 1900 | 1,825 | 1,243 | 3,068 |
| 1901 | 1,820 | 2,090 | 3,910 |
| 1902 | 1,894 | 2,673 | 4,567 |
| 1903 | 1,319 | 1,733 | 3,052 |
| 1904 | 1,493 | 2,305 | 3,798 |
| 1905 | 1,407 | 2,119 | 3,526 |
| 1906 | 3,440 | 2,345 | 5,785 |
| 1907 | 2,393 | 4,614 | 7,007 |
| 1908 | 2,132 | 3,000 | 5,132 |
| 1909 | 3,482 | 4,031 | 7,513 |
| 1910 | 1,762 | 3,929 | 5,691 |
| 1911 | 1,920 | 3,450 | 5,370 |
| 1912 | 3,128 | 3,418 | 6,546 |
| 1913 | 2,730 | 3,098 | 5,828 |
| 1914 | 1,964 | 1,944 | 3,908 |
| 1915 | 2,494 | 2,234 | 4,728 |
| 1916 | 1,863 | 3,345 | 5,208 |
| 1917 | 965 | 1,875 | 2,840 |
| 1918 | 788 | 1,444 | 2,232 |
| 1919 | 1,042 | 1,841 | 2,883 |
The total number of men for whom employment has been found by the Department of Labour up to the end of March, 1919, is as given in the following statement, which also shows the number of persons dependent upon the men assisted:—
| Year ended 31st March. | Men. | Dependants. |
|---|---|---|
* Ten months only. | ||
| 1892* | 2,593 | 4,729 |
| 1893 | 3,874 | 7,802 |
| 1894 | 3,341 | 7,942 |
| 1895 | 3,030 | 8,883 |
| 1896 | 2,871 | 8,424 |
| 1897 | 1,718 | 4,719 |
| 1898 | 2,035 | 4,928 |
| 1899 | 2,115 | 4,759 |
| 1900 | 2,147 | 4,471 |
| 1901 | 3,124 | 5,432 |
| 1902 | 1,830 | 2,747 |
| 1903 | 3,704 | 5,934 |
| 1904 | 2,860 | 3,085 |
| 1905 | 3,130 | 3,425 |
| 1906 | 6,712 | 7,351 |
| 1907 | 7,393 | 4,187 |
| 1908 | 6,305 | 4,408 |
| 1909 | 10,391 | 7,510 |
| 1910 | 8,506 | 10,164 |
| 1911 | 7,102 | 8,454 |
| 1912 | 5,735 | 4,233 |
| 1913 | 5,848 | 5,122 |
| 1914 | 5,645 | 4,295 |
| 1915 | 7,515 | 8,342 |
| 1916 | 5,978 | 8,097 |
| 1917 | 2,966 | 3,518 |
| 1918 | 2,952 | 3,675 |
| 1919 | 3,199 | 3,005 |
| 124,619 | 159,641 | |
Of the 124,619 men assisted to 31st March, 1919, 43,753 were married men and 80,866 single men or widowers. Private employment was found for 58,072, while the remaining 66,547 went to works of various kinds for the General Government.
In each of the four chief centres of population—Auckland, Wellington, Christchurch, and Dunedin—women's employment branches of the Labour Department were established in June, 1908. In January, 1909, a branch was opened at Nelson. Each branch is in charge of an experienced female officer, and every assistance is given, free of charge, to women seeking employment. During the year ended the 31st March, 1919, work was found for 1,552 women, making a total of 23,449 women assisted since the initiation of the system. In most cases the employment is domestic service.
Table of Contents
THE Advances to Settlers Office was established by an Act passed in 1894. An administrative officer called the Superintendent was appointed early in the following year, and a Board set up to advise and co-operate with the Superintendent. Advances can be granted only with the consent of the Board.
The capital fund was limited to £3,000,000, which was to be raised within two years after the passing of the Act at an annual rate of interest not higher than 4 per cent. The first issue of £1,500,000 realized £94 8s. 9d. per £100 stock. The minimum advance was fixed at £25, and the maximum at £2,500, repayable in thirty-six years and a half by half-yearly instalments of 3 per cent. on the amount borrowed.
The legislation has been amended at different times, and is now embodied in the State Advances Act, 1913. It authorizes the borrowing of moneys for the purpose of lending to settlers, workers, and local authorities. Each year there may be borrowed for advances to settlers £1,500,000, to workers £750,000, and to local authorities £1,000,000.
From the inception of the scheme of advances to settlers in 1894, applications have been received to the number of 63,651 for loans totalling £26,004,047. The Advances Board authorized loans of £18,076,170 to 48,924 applicants, the total actual payments to 31st March, 1919, being £17,957,600, of which £9,972,323 has been repaid in respect of principal. A table is given showing the business to date and for each of the past ten years.
| Year ended 31st March. | Applications received. | Loans authorized. | Amount advanced. | Amount repaid. | ||
|---|---|---|---|---|---|---|
| Number. | Amount. | Number. | Amount. | |||
| £ | £ | £ | £ | |||
| 1910 | 4,131 | 1,539,150 | 3,201 | 1,038,340 | 1,095,120 | 545,528 |
| 1911 | 4,957 | 2,122,749 | 3,571 | 1,282,880 | 1,204,310 | 726,714 |
| 1912 | 5,355 | 2,593,084 | 4,610 | 2,191,300 | 2,235,495 | 1,018,286 |
| 1913 | 3,187 | 1,164,225 | 2,114 | 749,590 | 937,435 | 698,938 |
| 1914 | 3,604 | 1,400,248 | 2,390 | 878,855 | 978,395 | 710,590 |
| 1915 | 3,870 | 1,826,265 | 2,100 | 749,040 | 1,136,475 | 754,810 |
| 1916 | 2,507 | 982,800 | 2,022 | 746,630 | 814,555 | 713,177 |
| 1917 | 1,619 | 660,975 | 1,412 | 515,270 | 589,975 | 643,751 |
| 1918 | 1,228 | 511,532 | 984 | 353,465 | 367,160 | 501,009 |
| 1919 | 1,326 | 579,022 | 986 | 363,875 | 350,140 | 529,023 |
| Totals to 31st March, 1919 | 63,651 | 26,004,047 | 48,924 | 18,076,170 | 17,957,600 | 9,972,323 |
Not all the advances to settlers are made by the Advances to Settlers Branch of the State Advances Office. Part of the business shown in the above table relates to the Public Debt Sinking Funds Branch and the Advances Office Sinking Fund Branch. The advances to settlers authorized by these three branches during 1918-19 are as follows.
| Advances authorized. | ||
|---|---|---|
| Branch. | Number. | Amount. £ |
| Advances to Settlers | 904 | 314,835 |
| Public Debt Sinking Funds | 4 | 1,670 |
| Advances Office Sinking Fund | 78 | 47,370 |
| Totals | 986 | £363,875 |
The advances authorized in each provincial district during the year, and the total to 31st March, 1919, are next shown.
| Provincial District. | Advances authorized, 1918-19. | Total Advances authorized to 31st March, 1919. | ||
|---|---|---|---|---|
| Number. | Amount. | Number. | Amount. | |
| £ | £ | |||
| Auckland | 433 | 153,045 | 16,465 | 5,632,208 |
| Taranaki | 36 | 19,110 | 5,276 | 2,447,039 |
| Hawke's Bay | 35 | 13,730 | 2,346 | 772,845 |
| Wellington | 273 | 106,910 | 11,499 | 4,511,123 |
| Marlborough | 13 | 6,160 | 1,252 | 523,265 |
| Nelson | 21 | 5,725 | 891 | 276,320 |
| Westland | 15 | 5,400 | 911 | 239,265 |
| Canterbury | 113 | 37,255 | 4,639 | 1,560,805 |
| Otago— | ||||
| Otago portion | 33 | 11,365 | 2,505 | 962,660 |
| Southland portion | 14 | 5,175 | 3,140 | 1,150,640 |
| Totals | 986 | 363,875 | 48,924 | 18,076,170 |
Dealing now only with the operations of the Advances to Settlers Branch, it is seen that during the year 1918-19 the advances authorized numbered 904, representing a total amount of £314,835. The number of borrowers and the sums actually advanced during the year, classified according to amount, were,—
| Category. | Number of Advances. | Amount advanced. |
|---|---|---|
| £ | ||
| Not exceeding £500 | 685 | 222,870 |
| Exceeding £500, but not exceeding £1,000 | 80 | 56,200 |
| Exceeding £1,000, but not exceeding £2,000 | 14 | 20,285 |
| Totals | 779 | £299,355 |
The nature of the security upon which these advances were made was as follows:—
| Security. | Number of Advances. | Amount advanced. |
|---|---|---|
| Freehold | 589 | 215,990 |
| Leasehold | 181 | 79,285 |
| Freehold and leasehold combined | 9 | 4,080 |
| Totals | 779 | £299,355 |
The advances outstanding, classified according to amount, are as follows:—
| Category. | Number of Advances. | Amount outstanding. £ |
|---|---|---|
| Not exceeding £500 | 15,399 | 3,287,526 |
| Exceeding £500, but not exceeding £1,000 | 3,166 | 2,203,206 |
| Exceeding $1,000 but not exceeding £2,000 | 1,116 | 1,574,268 |
| Exceeding $2,000 but not exceeding £3,000 | 130 | 325,142 |
| Totals | 19,811 | £7,390,142 |
The nature of the security for the total amount of advances outstanding on the 31st March, 1919, was,—
| Security. | Number of Advances. | Amount outstanding. £ |
|---|---|---|
| Freehold | 12,165 | 5,344,865 |
| Leasehold | 7,412 | 1,911,007 |
| Freehold and leasehold combined | 234 | 134,270 |
| Totals | 19,811 | £7,390,142 |
The average freehold advance is £439, the average leasehold advance £258, and the average of advances secured on both freehold and leasehold combined £574. Corresponding figures for the year ended the 31st March, 1918, are freehold, £453; leasehold, £272; and combined freehold and leasehold, £599.
The number and amounts of current advances on rural and urban and suburban land are,—
| Number. | Amount. £ | |
|---|---|---|
| On rural land | 12,506 | 4,824,374 |
| On urban and suburban land | 7,305 | 2,565,768 |
| Totals | 19,811 | £7,390,142 |
The average rural advance is £386, and the average urban and suburban advance is £351.
The gross profits for the year ended the 31st March, 1919, were £67,047, and the cost of management £9,725, being 0.105 per cent., or 2s. 1d. per £100 on the capital employed. The net profits amounted to £55,765.
The liabilities and assets at the 31st March, 1919, of the Settlers Branch of the State Advances Office were,—
| Liabilities. | £ | s. | d. |
|---|---|---|---|
| Sundry loans | 9,283,193 | 1 | 10 |
| Temporary advances from Public Debt Sinking Fund Branch | 461,962 | 0 | 0 |
| Temporary advances from Advances Office Sinking Fund Account | 320,000 | 0 | 0 |
| Advances Suspense Account | 9,420 | 0 | 0 |
| Fire Loss Suspense Account | 2,987 | 14 | 3 |
| Suspense Account | 4,765 | 17 | 3 |
| Reserve Fund | 50,000 | 0 | 0 |
| Interest payable on loans, accrued but not due | 74,810 | 9 | 11 |
| Interest payable on deposits, accrued but not due | 3 | 7 | 2 |
| Profit and Loss Account | 471,275 | 16 | 2 |
| £10,678,418 | 6 | 7 |
| Assets. | £ | s. | d. |
|---|---|---|---|
| Investment Account— | |||
| Less total repayments | 7,372,507 | 8 | 10 |
| Plus mortgage instalments overdue—principal | 17,633 | 19 | 3 |
| Total principal owing by mortgagors at 31st March, 1919 | 7,390,141 | 8 | 1 |
| Mortgage instalments overdue—interest | 35,855 | 5 | 8 |
| Interest on mortgages, accrued but not due | 82,136 | 13 | 8 |
| Temporary advances to Workers Branch | 250,000 | 0 | 0 |
| Temporary investments | 1,816,773 | 7 | 9 |
| Interest on temporary investments, accrued but not due | 25,764 | 4 | 4 |
| Insurance Premiums Account | 688 | 17 | 1 |
| Office Furniture and Equipment Account | 1,357 | 8 | 2 |
| Sinking Funds— | |||
| Public Trustee | 302,904 | 13 | 9 |
| Advances Office Sinking Fund Account | 535,160 | 18 | 5 |
| Public Debt Sinking Fund Branch | 6,802 | 4 | 8 |
| Cash in bank at 31st March, 1919 | 230,833 | 5 | 0 |
| £10,678,418 | 6 | 7 |
The total of the advances to workers up to the 31st March, 1919 (including moneys repaid and again advanced), was £3,560,840.
The applications received for loans during the year ended the 31st March, 1919, numbered 562, the aggregate amount required being £214,415. Advances authorized during 1918-19 numbered 372, representing a total amount of £119,555. The advances actually paid during the year numbered 260, for an aggregate of £87,590. The tenures upon which these loans were made were,—
| Tenure. | Number of Loans. | Aggregate Amount. £ |
|---|---|---|
| Freehold | 256 | 86,150 |
| Leasehold | 4 | 1,440 |
| Totals | 260 | £87,590 |
The total number of loans and the aggregate amount authorized in each provincial district from the inception of the system to the 31st March, 1919, are as follows:—
| Provincial District. | Number of Applications. | Amount of Advances authorized. |
|---|---|---|
| £ | ||
| Auckland | 3,887 | 1,134,560 |
| Taranaki | 405 | 111,085 |
| Hawke's Bay | 823 | 236,350 |
| Wellington | 3,316 | 999,590 |
| Marlborough | 403 | 116,130 |
| Nelson | 227 | 56,360 |
| Westland | 194 | 42,030 |
| Canterbury | 3,028 | 920,830 |
| Otago— | ||
| Otago portion | 938 | 263,050 |
| Southland portion | 430 | 112,635 |
| Totals | 13,651 | 3,992,620 |
The net amount outstanding at the end of the financial year was £2,576,578, secured upon the following tenures:—
| Tenure. | Number of Loans outstanding. | Aggregate Amount outstanding. £ |
|---|---|---|
| Freehold | 9,093 | 2,474,766 |
| Leasehold | 582 | 101,812 |
| Totals | 9,675 | £2,576,578 |
The following table gives particulars of the transactions for each of the past ten years, and the total transactions since the passing of the Government Advances to Workers Act on the 29th October, 1906.
ADVANCES TO WORKERS , 1909-10 to 1918-19.
| Year ended 31st March. | Applications received. | Loans authorized. | Amount advanced. | Amount repaid. | ||
|---|---|---|---|---|---|---|
| Number. | Amount. | Number. | Amount. | |||
| £ | £ | £ | £ | |||
| 1910 | 2,028 | 550,651 | 1,854 | 470,425 | 362,353 | 26,295 |
| 1911 | 2,125 | 660,892 | 1,521 | 473,530 | 407,760 | 47,925 |
| 1912 | 2,223 | 750,772 | 1,900 | 612,910 | 543,840 | 78,853 |
| 1913 | 1,805 | 574,493 | 1,254 | 397,175 | 449,260 | 84,771 |
| 1914 | 1,599 | 528,240 | 1,200 | 339,200 | 272,860 | 80,933 |
| 1915 | 1,492 | 462,065 | 1,129 | 337,690 | 313,025 | 110,110 |
| 1916 | 1,079 | 383,365 | 953 | 297,630 | 275,680 | 115,535 |
| 1917 | 734 | 266,740 | 658 | 210,995 | 214,965 | 127,450 |
| 1918 | 555 | 197,738 | 411 | 129,710 | 125,855 | 139,485 |
| 1919 | 562 | 214,415 | 372 | 119,555 | 87,590 | 147,791 |
| Totals from inception to 31/3/1919 | 17,296 | 5,413,970 | 13,651 | 3,992,620 | 3,560,840 | 984,251 |
The financial position of the Advances to Workers Branch of the State Advances Office as on the 31st March, 1919, is shown in the following table:—
| Liabilities. | £ | s. | d. |
|---|---|---|---|
| Sundry loans | 2,419,346 | 14 | 1 |
| Temporary loans from Settlers Branch | 250,000 | 0 | 0 |
| Interest payable on loans, accrued but not due | 24,922 | 11 | 8 |
| Advances Suspense Account | 1,984 | 12 | 6 |
| Fire Loss Suspense Account | 722 | 16 | 7 |
| Suspense Account | 120 | 0 | 8 |
| Reserve Fund | 20,838 | 7 | 0 |
| £2,717,935 | 2 | 6 |
| Assets . | £ | s. | d. |
|---|---|---|---|
| Investment Account— | |||
| Less total repayments | 2,566,949 | 0 | 3 |
| Plus mortgage instalments overdue—principal | 9,629 | 11 | 9 |
| Total principal owing by mortgagors at 31st March, 1919 | 2,576,578 | 12 | 0 |
| Mortgage instalments overdue—interest | 12,944 | 16 | 5 |
| Interest on mortgages, accrued but not due | 29,981 | 15 | 11 |
| Loan Charges Account | 22,000 | 0 | 0 |
| Insurance Premiums Account | 330 | 4 | 7 |
| Sinking Funds— | |||
| Public Trustee | 2,7,15 | 17 | 9 |
| Advances Office Sinking Fund Account | 43,658 | 8 | 10 |
| Public Debt Sinking Fund Branch | 2,882 | 4 | 10 |
| Cash in bank at 31st March, 1919 | 26,843 | 2 | 2 |
| £2,717,935 | 2 | 6 |
During the nine years which have elapsed since the system of State advances to local authorities was initiated, 1,546 applications under this head have been received for loans totalling £6,096,447. Loans authorized, 1,122 in number, have aggregated £3,254,909, of which £3,099,865 has been actually advanced. Repayments to 31st March, 1919, have totalled £253,029, leaving an indebtedness of £2,846,836 in respect of principal moneys. Figures for each of the nine years and to date are as follows:—
| Year ended 31st March. | Applications received. | Loans authorized. | Amount advanced. | Amount repaid. | ||
|---|---|---|---|---|---|---|
| Number. | Amount. | Number. | Amount. | |||
| £ | £ | £ | £ | |||
| 1811 | 429 | 3,572,585 | 193 | 947,770 | 405,195 | 1,172 |
| 1912 | 257 | 1,184,133 | 227 | 1,047,484 | 790,485 | 8,010 |
| 1913 | 93 | 136,513 | 87 | 181,795 | 494,135 | 20,781 |
| 1914 | 167 | 166,165 | 72 | 84,970 | 259,430 | 29,600 |
| 1915 | 77 | 222,070 | 48 | 254,430 | 237,285 | 29,800 |
| 1916 | 170 | 263,858 | 164 | 238,970 | 285,410 | 35,192 |
| 1917 | 118 | 154,025 | 103 | 127,135 | 152,310 | 38,874 |
| 1918 | 110 | 171,110 | 109 | 158,055 | 128,150 | 41,681 |
| 1919 | 125 | 225,988 | 119 | 214,300 | 130,575 | 46,615 |
| Totals to 31/3/19 | 1,546 | 6,096,447 | 1,122 | 3,254,909 | 3,099,865 | 253,029 |
As in the case of advances to settlers, advances to local authorities are made from three distinct sources—viz., the funds of the Advances to Local Authorities Branch of the State Advances Office, the Public Debt Sinking Funds, and the Advances Office Sinking Fund. Of the £130,575 advanced in 1918-19 as shown above, only £4,795 came from the Local Authorities Branch, the Advances Office Sinking Fund contributing £26,040, and the Public Debt Sinking Funds £99,740. Of the amount outstanding at 31st March, the Public Debt Sinking Funds claimed £651,757, and the Advances Office Sinking Fund £85,437.
A statement of the liabilities and assets of the Local Authorities Branch as at the 31st March, 1919, is appended.
| Liabilities. | £ | s. | d. |
|---|---|---|---|
| Sundry loans | 2,775,529 | 0 | 0 |
| Money received from Treasury in accordance with section 72, Local Bodies' Loans Act, 1913 | 3,987 | 12 | 10 |
| Temporary loans from Public Debt Sinking Funds | 155,038 | 0 | 0 |
| Suspense Account | 89 | 6 | 8 |
| Interest on loan-moneys, accrued but not due | 36,385 | 6 | 7 |
| £2,971,029 | 6 | 1 |
| Assets . | £ | s. | d. |
|---|---|---|---|
| Investment Account, less total repayments— | |||
| Local bodies | 2,062,410 | 16 | 9 |
| Section 70, Local Bodies' Loans Act, 1913 | 44,233 | 19 | 1 |
| Plus mortgage instalments overdue—principal— | |||
| Local bodies | 2,863 | 5 | 5 |
| Section 70, Local Bodies' Loans Act, 1913 | 133 | 11 | 6 |
| Total balance of principal owing on mortgages | 2,109,641 | 12 | 9 |
| Interest on mortgages— | |||
| Local bodies—Overdue at 31st March, 1919 | 6,302 | 18 | 7 |
| Accrued but not due at 31st March, 1919 | 17,849 | 15 | 7 |
| Section 70—Overdue at 31st March, 1919 | 338 | 2 | 6 |
| Accrued but not due at 31st March, 1919 | 387 | 17 | 11 |
| Loan Charges Account | 39,113 | 5 | 0 |
| Temporary investments | 545,226 | 12 | 3 |
| Interest accrued but not due on temporary investments | 9,351 | 3 | 5 |
| Sinking Funds— | |||
| Public Trustee | 48,461 | 0 | 5 |
| Advances Office Sinking Fund Account | 125,422 | 3 | 0 |
| Public Debt Staking Funds Branch | 6,513 | 6 | 7 |
| Profit and Loss Account | 58,836 | 17 | 7 |
| Cash in hand and in bank at 31st March, 1919 | 3,584 | 10 | 6 |
| £2,971,029 | 6 | 1 |
The Workers' Dwellings Acts of 1905 and 1910 made provision for the erection by the State of workers' dwellings on Crown lands purchased for that purpose. Purchase of houses already erected was also provided for.
By the Act of 1910 the maximum salary of a worker entitled to take advantage of the provisions of the Act was £175 per annum. As amended in 1914 the Act stipulated that the maximum capital value of a workers' dwelling should be £750. Dwellings could be leased or purchased on the instalment principle by the worker.
The number of dwellings erected and purchased during the year ended 31st March, 1919, was only fourteen, the high cost of materials and scarcity of labour making it impossible to accept tenders for the erection of a larger number. The total number of dwellings provided under the Act to 31st March was 654, while three others were in course of erection at that date.
The enormous rise in building-costs, and other circumstances arising out of the war have created a somewhat serious shortage of houses. To assist in meeting this difficulty the Housing Act, 1919, was passed in the last session. An outline of its provisions is as follows:—
Part I, which deals with workers' dwellings, repealed the existing legislation thereon. A Housing Board takes the place of the Workers' Dwellings Board. Crown land may be set apart for dwellings under this part of the Act. Houses may be erected or purchased and disposed of by way of sale or lease, with provisions as to time payment. The maximum price for a dwelling disposed of under this part of the Act is £750 if of wooden construction, and £850 in any other case.
No person can acquire one of these houses if his ordinary annual income exceeds (a ) £275 in the case of a person with not more than two children or other dependants; (b ) £275 increased by £20 in respect of each child or other dependant in excess of two, with a limit set at £355.
The Minister of Finance is authorized to borrow £750,000 annually for the purposes of this section of the Act.
Part II provides means whereby financial assistance may be given to any association of public servants to establish village settlements or garden suburbs. For this end the Minister of Finance may borrow £250,000 annually.
Part III authorizes the raising of £250,000 yearly in order that loans may be granted to employers for the purpose of providing workers' dwellings.
Part IV gives power to any Harbour Board to purchase land and erect dwellings for their employees.
Part V authorizes other local authorities to borrow for this purpose without taking a poll. The Minister of Finance may in any financial year raise the further sum of £1,000,000 for the Advances to Local Authorities Branch of the State Advances Office.
Part VI amends the definition of "worker" under the State Advances Act, 1913. The new definition is that described in Part I, supra. The amount of loan that may be granted to workers under Part III of the State Advances Act, 1913, is increased from £450 to £750.
Part VII deals with restrictions on the increase of rents, and enacts that the Court may refuse any order for ejectment if satisfied that the making of such an order would cause undue hardship to the tenant.
Table of Contents
THE law relating to old-age, military, and widows' pensions is contained in the Pensions Act, 1913, a consolidation of previous enactments, and in the Pensions Amendment Act, 1914. The history of legislation dealing with old-age pensions is given in previous issues of this book.
The qualifications for the old-age pension are briefly as follows:—
(l.) The applicant, if a male, must have reached the age of sixty-five, or, if a female, must have reached the age of sixty.
NOTE .—The pension age has been reduced to fifty-five for women and to sixty for men where the applicant is the parent of two or more children under fourteen years of age for the maintenance of whom he (or she) is responsible. The pension payable in such cases may be any sum up to £13 per annum, in addition to the ordinary pension payable as set out hereunder.
The applicant must have resided continuously in New Zealand for the past twenty-five years.
NOTE .—Continuous residence is not interrupted by absences not exceeding two years. An additional six months' period of absence is allowed for every additional year's residence in excess of the twenty-five years immediately preceding the date of application, provided that the applicant has resided in New Zealand during the twelve months immediately preceding the said date of application. In the case of a seaman continuous residence is not interrupted by absences on board a ship registered in New Zealand, provided the applicant establishes the fact that his home is in New Zealand.
(3) The applicant must not during the past twelve years have been imprisoned for four months or on four occasions for an offence punishable by twelve months' imprisonment.
The applicant must not during the past twenty-five years have been imprisoned for five years for any offence.
The applicant must not during the past twelve years have deserted his wife (or husband, as the case may be) and children.
The applicant must have led a sober, reputable life during the past year.
The yearly income of the applicant, if single, must not reach £60, and, if married, £100.
The net value of accumulated property must not be £260 or over.
The applicant must not have deprived himself or herself of property or income to qualify for a pension.
All residents of New Zealand who fulfil the necessary conditions are eligible for the old-age pension, with the exception of—
(l.) Maoris who receive votes other than pensions out of the grant appropriated by the Civil List Act, 1908.
Aliens.
Naturalized subjects who have not been naturalized one year.
Chinese or other Asiatics, whether naturalized or not, and whether British subjects by birth or not.
The term "alien" is deemed not to include a woman who ceased to be a British subject by reason of marriage with an alien who is since deceased, or from whom she is legally separated.
All applications for pensions are referred to a Stipendiary Magistrate for determination. The Magistrate, who is required to hear each case in chambers, has power to dispense with the personal attendance of the applicant if he is satisfied that the documentary evidence in support of the claim is sufficient to establish it.
The Magistrate intimates his decision to the Commissioner of Pensions, who, if the pension is allowed, issues a pension-certificate for the amount granted, without which no payment can be made.
The term of a pension is for twelve months only, and an application for renewal is required to be made each year. The first of twelve monthly instalments is due on the 1st day of the month following the granting of the pension by the Magistrate. Payment is made through the Post Office.
Though the due date of each instalment falls on the 1st of the month, payment may be made on any day between the 23rd of the preceding month and the 1st day of the following month.
The original Act of 1898 provided for a pension of £18 per annum, or 6s. 11d. per week. This amount was, however, increased to £26 per annum (i.e., 10s. a week or £2 3s. 4d. a month) by the Amendment Act of 1905.
(NOTE .—Under the Finance Act, 1917, every person in receipt of an old-age pension is paid an additional 5s. a week, or £13 per annum. This provision operates until twelve months after the present war with Germany has ceased.)
The full pension of £26 is reducible by—
(l.) £1 for every complete £1 of income over £34.
£1 for every complete £10 of not accumulated property.
£1 for every year or part of a year by which the ago of the applicant is less than sixty-five years.
The income of a married applicant for pension purposes is considered to be half of the joint incomes of husband and wife. The joint incomes of a married couple must not exceed, with pension added, the sum of £100.
Income includes free board and lodging up to £26 per annum, but does not include—
Sick allowance or funeral benefits paid by a friendly society.
Relief by way of charity, or gifts from relatives, up to £52 in any year.
Pensions granted under the War Pensions Act, 1915.
Capital expended for the benefit of the applicant, or the wife or husband of the applicant.
Property received on the intestacy or under the will of a deceased husband or wife.
The income chargeable is that received during the twelve months preceding the date of application, the Magistrate having power to exempt all personal earnings earned at a rate not exceeding £2 a week, provided it is shown to his satisfaction that owing to loss of employment or any other cause such earnings have ceased. Income being received when an application is lodged at the rate of the qualifying amount—i.e., £60 for a single person and £100 for a married person—is a bar to the granting of a pension.
Net accumulated property is the capital value of all real and personal property owned by an applicant, other than life-assurance policies and annuities, or other life interests in the capital sum of which the applicant has no interest beyond the income derived therefrom, less the following deductions:—
The amount of mortgage existing on the property.
£340 from the home, including furniture and personal effects.
£50 from any other property.
The net accumulated property of a husband or wife for pension purposes is half of the total net accumulated properties of both.
The pension is not affected by any increase in the value of property used exclusively as a home, which is taken at the valuation obtaining at the date of the original grant of the pension.
Provision is made for including transferred property, or property disposed of by will by the husband or wife of an applicant, in the computation of the pension.
To ascertain whether a pensioner is entitled to a renewal of his pension he is required each year, shortly before the expiry of the certificate held by him, to furnish a statement of his income during the past year and also of his property. On receipt of this statement the Registrar proceeds to verify the contents, and then submits it to the Magistrate, who investigates it in the same manner as an original claim, the pensioner being required to attend at the discretion of the Magistrate. The decision of the Magistrate is notified to the Commissioner, who issues a fresh pension-certificate for the amount for which the pension is renewed, and authorizes payment for another twelve months.
If a person is physically unfit to draw his pension in person he may apply to the Commissioner to have an agent appointed to collect instalments. Any authority issued to such an agent holds good only for the pension-certificate for any one year, but it may be renewed each year when the pension itself is renewed.
A pension granted to a person maintained in a charitable institution is paid to the governing body of the institution on production of an authority signed by the local Registrar. A fresh authority is required each month in cases of this nature.
When any person to whom a pension has already been granted is committed to a mental hospital, the instalments of such pension are payable to the Mental Hospitals Department. An inmate of a mental hospital, however, cannot lodge an original claim for a pension.
The pension, being for the personal support of the pensioner, is absolutely inalienable, whether by way of assignment, charge, execution, bankruptcy, or otherwise howsoever.
An old-age pension is not payable in addition to a widow's pension or a military pension for Maori War veterans.
No payment is made of an instalment which falls due while a pensioner is in gaol or out of New Zealand.
On the death of a pensioner the portion of the instalment accruing to date of death, together with any unpaid instalment then payable, may be paid if applied to defray funeral expenses, or, in the case of a pensioner in a charitable institution, towards cost of maintenance.
If the Commissioner has reason to believe that any pension has been improperly obtained he may suspend payment and cause an inquiry to be held before a Magistrate, who has full power to act.
If during the currency of a pension-certificate a pensioner, or the wife or husband of a pensioner, becomes possessed of property or income in excess of the amount allowed by law, the Commissioner may apply to the Magistrate to have the pension cancelled or varied. A Magistrate has power on his own initiative to review any previous decision and to cancel or amend any pension-certificate.
Any person who by a wilfully false statement obtains or attempts to obtain a pension to which he is not entitled is liable to six months' imprisonment or to a fine of £50, as also is any person who aids or abets such person.
It is an offence to receive money in consideration of the procuring of a pension for any person; and it is also an offence to refuse to answer any question concerning an applicant or any statement contained in an application, the penalty being a fine not exceeding £10 in each case.
Where it has been found that a pensioner has been overpaid, and the Magistrate is of opinion that such overpayment was obtained by fraud, the pensioner is liable, in addition to imprisonment, to a penalty of double the amount paid in excess.
If on the death of a pensioner, or the wife or husband of a pensioner, it is found that either of them was possessed of property in excess of the amount allowed by law in respect to the amount of pension granted, double the amount of pension so overpaid may be recovered from the estate.
If a pensioner is convicted of drunkenness or of any offence punishable by imprisonment for one month or more, or misspends, wastes, or lessens his estate, the Commissioner is empowered to pay the instalments of pension to an agent for the benefit of the pensioner, or to suspend the pension for such period as he deems fit.
Any person otherwise qualified to receive a pension who owns property on which he resides, and which does not permit of the granting of a full pension, may qualify for the full pension by transferring the said property to the Public Trustee. The pensioner is permitted to reside on the property rent-free during his lifetime, but he must pay all rates and charges thereon. If a husband and wife, both being pensioners, are living together, and one dies, the survivor is permitted to continue to reside on the property. On the death of both pensioner and survivor, or where the pensioner is no longer entitled to a pension, the Public Trustee shall sell the property, and, after deducting from the proceeds of the sale the amount of pension paid as a consequence of the transfer of the property, together with his commission and interest at the rate of 4 per cent., shall pay the balance to the person or persons entitled thereto. Provision is made for a pensioner, or survivor, or next-of-kin paying such amounts as aforesaid at any time, with a view to obtaining a retransfer of the property and obviating a sale.
The number of old-age pensions in force on the 31st March, 1919, was 19,872, a decrease of 88 on the figures for the previous year. The annual liability was £731,910, being an average of £36 per pension. The total payment in respect of old-age pensions during the year was £743,063. The number in force at the end of each year since the institution of the system, the total amount paid during each year, and the annual cost per head of population are as follows:—
| At 31st March, | Pensioners. | Amount. | Cost per Head of Population | |
|---|---|---|---|---|
| £ | s. | d. | ||
* Including allowance under Finance Act, 1917. | ||||
| 1899 | 7,443 | 3,124 | 0 | 1 |
| 1900 | 11,285 | 157,342 | 4 | 1 |
| 1901 | 12,405 | 197,292 | 5 | 1 |
| 1902 | 12,776 | 207,468 | 5 | 3 |
| 1903 | 12,481 | 210,140 | 5 | 2 |
| 1904 | 11,926 | 203,164 | 4 | 10 |
| 1905 | 11,770 | 195,475 | 4 | 6 |
| 1906 | 12,582 | 254,367 | 5 | 8 |
| 1907 | 13,257 | 314,184 | 6 | 10 |
| 1908 | 13,569 | 325,199 | 6 | 11 |
| 1909 | 14,396 | 336,760 | 6 | 11 |
| 1910 | 15,320 | 362,496 | 7 | 4 |
| 1911 | 16,020 | 383,393 | 7 | 7 |
| 1912 | 16,649 | 406,256 | 7 | 10 |
| 1913 | 16,509 | 415,761 | 7 | 10 |
| 1914 | 18,050 | 416,776 | 7 | 7 |
| 1915 | 19,352 | 460,814 | 8 | 5 |
| 1916 | 19,804 | 479,339 | 8 | 9 |
| 1917 | 19,697 | 480,230 | 8 | 9 |
| 1918 | 19,960 | 643,177 | 11 | 8* |
| 1919 | 19,872 | 743,063 | 13 | 4 |
The total payments to the 31st March, 1919, aggregated £7,195,820.
The Widows' Pensions Act, 1911, came into operation on the 1st January, 1912. The scope of this Act was widened by an Amendment Act passed in 1912, further amendments being embodied in the Act of 1913 consolidating the law relating to old-age, widows', and military pensions and in the Finance Act, 1919.
Applicants for widows' pensions must be British subjects of good character, and applications require to be lodged with the local Registrar of Pensions, and to be investigated by a Magistrate, who alone has power to grant pensions. The term "widow" includes a woman whose husband is detained in a mental hospital.
The maximum pension payable is 7s. 6d. weekly to a widow with one child under fourteen years of age, with 7s. 6d. weekly added for each additional child under fourteen. The term "child" includes a stepchild or a child legally adopted during the lifetime of the husband of the applicant.
Section 10 of the Finance Act, 1919, provides that a pension is not to be granted of such an amount that the aggregate income of a widow will exceed £1 5s. a week, together with 10s. a week in respect of each child. It is provided, however, that no one shall be entitled to a less pension than if the Act of 1919 had not been passed.
The Act does not apply to aliens, or to Chinese or other Asiatics. Similarly to old-age pensions, all payments are made through the Post Office. In practically every other respect the same conditions as apply to an old-age pension apply to a widow's pension.
The pension ceases on remarriage, and is not payable outside of New Zealand.
Provision is also made for continuance of the pension, after the death of a widow, to the guardian of her children.
The receipt of a war pension does not debar a widow from receiving this class of pension.
The influenza epidemic, which worked havoc in New Zealand at the close of 1918, is responsible for a heavy increase in this class of pension.
The number of widows' pensions in force on the 31st March, 1919, was 3,211, the annual value of these being £112,618. The gross payments during the year were £80,773.
The figures for each year since the institution of the system of widows' pensions are as follows:—
| Year ended 31st March. | Number at End of Year. | Annual Value. | Annual Payments. |
|---|---|---|---|
* Two months. † Including allowance under Finance Act, 1917. | |||
| £ | £ | ||
| 1912 | 788 | 14,863 | 1,963* |
| 1913 | 1,313 | 24,768 | 22,114 |
| 1914 | 1,540 | 29,320 | 27,077 |
| 1915 | 1,788 | 34,975 | 31,619 |
| 1916 | 1,890 | 37,042 | 36,357 |
| 1917 | 2,024 | 39,386 | 38,016 |
| 1918 | 2,192 | 73,872† | 57,952† |
| 1919 | 3,211 | 112,618† | 80,773† |
The Military Pensions Act, 1912, was enacted to provide for payment of an annual pension of £36 to veterans of the Maori War who have been awarded the New Zealand War Medal for active service in such war. This Act is now embodied in the Pensions Act of 1913 above referred to, which consolidates the law relating to old-age, widows', and military pensions.
The qualifications of an applicant for this pension are as follows:—
Ho must have resided in New Zealand for the ten years immediately preceding the date of his application.
Ho must not have been imprisoned during the same period for any offence punishable by imprisonment for two years.
He must not during the same period have deserted or failed to provide for his wife and children.
He must be of good character and sober habits.
Unlike the old-age and widows' pensions, which require to be determined by a Stipendiary Magistrate, the military pension is obtained by applying direct to the Commissioner of Pensions at Wellington.
The number of pensions in force on the 31st March, 1919, was 1,040, representing an annual value of £47,814. The payments on account of military pensions during the year aggregated £50,488. The figures for each year since the Act of 1912 came into force are,—
| Year ended 31st March. | Number at End of Year. | Annual Value. | Annual Payments. |
|---|---|---|---|
* Including allowance under Finance Act, 1917. | |||
| £ | £ | ||
| 1913 | 568 | 19,026 | 3,681 |
| 1914 | 1,240 | 44,640 | 29,447 |
| 1915 | 1,388 | 49,968 | 47,616 |
| 1916 | 1,323 | 47,623 | 48,273 |
| 1917 | 1,232 | 44,352 | 45,674 |
| 1918 | 1,153 | 53,208* | 50,734* |
| 1919 | 1,040 | 47,814* | 50,488* |
The Miner's Phthisis Act, 1915, as amended by sections 7-9 of the Finance Act, 1919, provides for a pension to any miner who is totally incapacitated for work owing to miner's phthisis (pneumoconiosis) contracted while working as a miner in New Zealand.
The rates of pension payable are—
To a single man or widower without children under 14, £1 a week.
To a married man or widower with children under 14, £1 10s. a week.
The qualifications for this class of pension are—
The applicant must have been a British subject for one year.
The applicant must have resided in New Zealand for five years immediately prior to application.
The applicant must have been employed as a miner in New Zealand for two years and a half.
The applicant must not have deserted wife or children, nor have been convicted for any offence punishable by imprisonment for two years.
The applicant must be of sober habits and good moral character.
The widow of any miner, who is entitled to a pension under this Act and dies of miner's phthisis, is entitled to claim a pension of 12s. 6d. a week during her widowhood. The reasonable cost of the burial of a miner dying of miner's phthisis is also payable under this Act.
All applications are determined by the Commissioner of Pensions at Wellington.
Instalments of pensions are not payable outside of New Zealand.
(NOTE .—Under the Finance Act, 1917, every person in receipt of a miner's pension is paid an additional 5s. a week, or £13 per annum. The Finance Act, 1919, which raised the pension scale (except for widows), repealed this allowance, with the proviso that no one should receive a lesser pension than if it (Finance Act, 1919) had not been passed.
The War Pensions Act, 1915, amended in 1916 and 1917, provides for the payment of pensions on the conditions hereinafter set out:—
To disabled members of the New Zealand Forces.
To dependants of disabled, deceased, or missing members of the New Zealand Forces.
"Member of the Forces" may include—
A member of any New Zealand Expeditionary Force raised for service beyond New Zealand in the present war.
A member of any New Zealand Naval Force raised for service beyond New Zealand in the present war.
A member of the New Zealand Army Nursing Service who, while domiciled in New Zealand, has served beyond New Zealand in the present war and was in the pay of the New Zealand Government.
A member of the New Zealand Defence or Naval Forces temporarily attached to any other portion of His Majesty's Forces who has served beyond New Zealand in the present war and was in receipt of pay from the Imperial Government.
Any person, not being a member of any New Zealand Expeditionary or Naval Force, who, while domiciled in New Zealand, has served beyond New Zealand in the present war and was in receipt of pay from the New Zealand Government.
Any person, not being a member of any New Zealand Expeditionary Force, who has been engaged on active military service in any capacity in New Zealand in connection with the present war.
A "dependant" may be wife, child, father, mother, grandfather, grandmother, stepfather, stepmother, grandchild, brother, sister, or mother-in-law, and, except wife or child, must have been wholly or in part dependent upon a member of the Forces at any time during the twelve months immediately preceding the date on which the said member joined the Forces.
A "dependant" may, however, include a father or mother who was not actually dependent during the said twelve months, but is without adequate means of support.
A "child" means a person under the age of sixteen years, being a son, daughter, stepson, stepdaughter, or illegitimate child of a member of the Forces, or a child legally adopted by such member before he became a member of the Forces.
The death or disablement of any member of the Forces must occur in the course of his military service in connection with the present war.
Death or disablement may have taken place in New Zealand or after departure from New Zealand.
The pension may, however, be refused to a disabled applicant if any wilful misconduct contributed to the disablement.
Forms of application, which may be obtained direct from the Commissioner of Pensions at Wellington, or from any Registrar of Pensions, must be lodged, when completed, with the Registrar of Pensions in the district in which the applicant resides.
There are three forms of application—one for a disabled member, one for the wife of a disabled soldier or the widow of a deceased soldier, and one for any other dependant.
Claims should be lodged by disabled members of the Forces and their wives within six months after the termination of appointment or date of discharge, and, in the case of death, by any dependant within six months after the date of the notification of such death.
All claims are forwarded to the Commissioner of Pensions at Wellington and recorded by him.
Where the applicant is the wife of a Native member of the Forces, married according to Maori custom, a certificate relating to such marriage must be supplied by a Judge, Commissioner, or Registrar of the Native Land Court. This should, if possible, be sent in with the application.
The amount of pension payable is determined by the War Pensions Board, located in Wellington.
In deciding any claim by a disabled soldier the Board is required to take into account only the extent to which the applicant is incapacitated. The receipt of income or the possession of any property is not a test of eligibility for a disability pension.
The Board may, when satisfied that a disabled member requires the services of an attendant, increase the pension by £1 a week.
In regard to claims by dependants other than by widows of soldiers and their children, the Board is required to inquire into the property and income from all sources of the applicant.
In the case of disablement the pension dates from the termination of the appointment or from the date of discharge, or, if the claim is not lodged within the time allowed by law, from such date as the Board may decide.
In the case of death the pension dates from the date of death, and, where a member is missing, from the date on which he was so reported, unless the claim has not been lodged in accordance with law, when the Board may decide upon any other date. Where an allotment of pay has been continued to the applicant after date of casualty, the payments made are treated as instalments of the pension granted.
Should a missing member eventually be reported as living, power is given to withdraw the pension, and, if necessary, to adjust matters by deduction from the accumulated pay of the member.
Should the circumstances of any pensioner or applicant for pension alter, the Board may review its determination, except that the permanent pension granted to a soldier for disablement cannot be reduced on account of any change in earning-capacity.
Any pension may be cancelled by the Board on the conviction of the pensioner for any offence punishable by imprisonment for three months or upwards. The Act provides for a fine of £100 or twelve months' imprisonment for attempted fraud.
Pensions are absolutely inalienable by law, whether by way of sale, assignment, charge, execution, or insolvency.
The applicant is informed of the Board's decision by the Commissioner of Pensions.
Where the wife or children are receiving pensions, any other dependant (such as father or mother) may not receive more than three-fourths of the amount payable to the wife.
Where there is no wife or child, any other dependant may receive the full amount payable to a wife, but not more than the actual amount received during the year preceding the date on which the disabled, deceased, or missing member joined the Forces.
The pension payable to a widowed mother of a deceased or disabled soldier who was her sole support is the same as that payable to the widow or wife of the soldier without children.
Power is given to the Board to grant a pension to any person, not necessarily a relative, who satisfies the Board that material loss has been sustained by the death or disablement of a soldier, and who has not adequate means of support.
To a disabled member of the Forces the maximum amount of pension payable ranges from £2 a week for a private to £3 5s. a week for a general; to the wife of a disabled member of the Forces, from £1 a week for the wife of a private to £1 12s. 6d. a week for the wife of a general; to the widow of a deceased or missing member, from £1 10s. a week in the case of a private to £3 10s. a week in the case of a general, with an additional 10s. a week if there are children in receipt of a pension.
The maximum for any child under sixteen years of age, whether in respect of death or disablement, is 10s. a week. The Board may continue the pension to a female child until the age of seventeen years, and to any infirm child for a longer period. Any orphan or motherless child may be granted a pension of 15s. a week.
A pension granted to the widow of a soldier ceases on her remarriage, as also does the pension of any female dependant; but the Board may grant to the widow in that event any amount up to two years' pension as a gratuity.
Capitalized sums in lieu of pensions may be granted at the discretion of the Board.
Power is given under the Act to the Minister to continue voluntary allotments of pay after the date on which the member of the Forces dies, or is reported missing, until such time as the Board determines the rights of the person receiving such pay to a pension, but not for a longer period than thirteen weeks.
The wife and children may receive a pension payable in respect of the death of a member of the Forces at any time within seven years of the receipt of any wounds or injury, or the commencement of disease responsible for death and contracted in the service.
When a pension is granted, a pension-certificate is issued to the applicant, which must be produced before payment can be made by the paying-officer
Pensions are paid by monthly instalments at the post-office nearest to the residence of the pensioner.
Instalments, which fall due on the 1st of the month, may be collected on any day between the 23rd of the month preceding due date and the 1st of the month following due date. If not so collected, and the authority has been returned by the Post Office, application may be made for the amount to the local Registrar of Pensions or Postmaster, or to the Commissioner at Wellington.
If a pensioner is unable to collect the instalments in person on account of disablement, age, or infirmity, an agent may be appointed on application being made direct to the Commissioner or through the local Registrar or Postmaster.
Pensions may be granted and paid to a member of the Forces, or to the father, mother, wife, or children of any such member, but not to any other dependant, while resident out of New Zealand.
In Australia, Canada, and South Africa payment is made by the Pensions authorities on behalf of the New Zealand Government; in Great Britain all payments are made through the High Commissioner in London; and in outlying places of the world payment is made by money-order.
Special provisions embodied in the Amendment Act of 1917 are as follows:—
If the War Pensions Board is satisfied that the amount of pension paid to a disabled member of the Forces, together with any pension paid to his wife, children, or other dependants and the average amount of which he is deemed to be capable of earning, is not sufficient to enable the member to live according to the standard of comfort enjoyed before the war, the Board may grant a supplementary pension up to £1 a week, provided that the total pension payable in respect of his disablement shall not exceed £5 a week.
If for the purpose of undergoing medical treatment a partially disabled soldier in receipt of pension is required to live away from home, the War Pensions Board may increase the pensions payable to himself and his dependants to the maximum pensions payable for total disablement or to the amount which would be payable under the preceding paragraph, whichever is the greater.
Where a disabled member of the Forces in receipt of a pension is, under authority from the Director-General of Medical Services, an inmate of a hospital or other institution, the maximum amount that shall be paid to him by way of pension either directly or by arrangement with the authorities of the institution shall be 10s. a week, and any balance shall be retained and paid to him on his discharge from the institution, or paid, at the discretion of the War Pensions Board, to the wife or such other dependant as may be determined.
If a partially disabled soldier in receipt of pension is in regular employment, and it is necessary that he should continue to receive medical treatment, the War Pensions Board may grant him a special allowance not exceeding £1 a week in consideration of any loss of wages and any expense that he may be put to in connection with such treatment.
If the War Pensions Board is satisfied that the amount receivable by the widow of a member of the Forces and her children is not sufficient to enable them to maintain themselves in accordance with the standard of comfort enjoyed before the war, the Board may grant a supplementary pension not exceeding 15s. a week, provided that the total amount payable does not exceed £4 a week.
Where a bona fide resident of New Zealand, who was a member of His Majesty's Naval or Military Reserve Forces or enlisted in New Zealand for service in the Imperial Forces, is in receipt of a war pension from the Imperial Government which is not equal to the pension payable under the New Zealand Acts, the War Pensions Board may increase such pension to the amount that would be payable if the said resident was a member of the
New Zealand Forces. Similarly, the pension payable to any dependant of such soldier may be increased up to the level of the New Zealand rates.
The wife of a soldier married in New Zealand after her husband's discharge from the Forces is entitled, if the Board consider the circumstances warrant it, to claim a pension in the case of total disablement or of partial disablement where the soldier is incapacitated for full employment. Marriages outside of New Zealand after disablement are not recognized without proof of engagement before the husband's departure from New Zealand.
The pensions payable are set out in detail in the following schedules:—
RATES OF PENSION IN CASE OF DEATH .
| Rank or Rating. | Weekly Pension. | ||||||
|---|---|---|---|---|---|---|---|
| To the Wife without a Child. | To Wife with a Child or Children. | To each Child. | |||||
| £ | s. | d. | £ | s. | d. | s. | |
| Private, bombardier, lance-corporal, trooper, gunner, driver, sapper, trumpeter, bugler | 1 | 10 | 0 | 2 | 0 | 0 | 10 |
| Able seaman and equivalent ratings | |||||||
| Corporal | 1 | 11 | 0 | 2 | 1 | 0 | 10 |
| Farrier, shoeing-smith, saddler, or fitter (If bombardier, lance-corporal, gunner, or private) | |||||||
| Lance-sergeant (not paid as such) | |||||||
| Leading seaman and equivalent ratings | |||||||
| Sergeant, farrier-corporal, shoeing-smith corporal, saddler-corporal, corporal-fitter, farrier-sergeant, saddler-sergeant, armourer-sergeant, sergeant-fitter | 1 | 12 | 0 | 2 | 2 | 0 | 10 |
| Lance-sergeant (paid as such) | |||||||
| Petty officer and equivalent ratings | |||||||
| Squadron, battery, or company sergeant-major, quartermaster-sergeant, colour-sergeant, staff sergeant, pay-clerk | 1 | 14 | 0 | 2 | 4 | 0 | 10 |
| Chief petty officer and equivalent ratings | |||||||
| Regimental sergeant-major, regimental quartermaster-sergeant | 1 | 15 | 0 | 2 | 5 | 0 | 10 |
| Warrant officer and equivalent ranks (Navy) | |||||||
| 2nd lieutenant, lieutenant (Army) | |||||||
| Commissioned warrant officer and equivalent ranks; sub-lieutenant and equivalent ranks (Navy) | 2 | 5 | 0 | 2 | 15 | 0 | 10 |
| Captain (Army) | 2 | 10 | 0 | 3 | 0 | 0 | 10 |
| Lieutenant under eight years' seniority and equivalent ranks (Navy) | |||||||
| Major | 2 | 17 | 0 | 3 | 7 | 0 | 10 |
| Lieutenant of eight years' seniority and equivalent ranks (Navy) | |||||||
| Lieutenant-colonel | 3 | 6 | 0 | 3 | 16 | 0 | 10 |
| Captain under three years' seniority and equivalent ranks; commanders and equivalent ranks (Navy) | |||||||
| Colonel | 3 | 8 | 0 | 3 | 18 | 0 | 10 |
| Captain of three years' seniority and equivalent ranks (Navy) | |||||||
| Brigadier-general, major-general | 3 | 10 | 0 | 4 | 0 | 0 | 10 |
| Commodores, first and second class; rear-admiral and other equivalent ranks | |||||||
RATES OF PENSION IN CASE OF DISABLEMENT .
| Rank or Rating. | Maximum Weekly Pension. | ||||||
|---|---|---|---|---|---|---|---|
| To the Member. | To the Wife. | To each Child. | |||||
| £ | s. | d. | £ | s. | d. | s. | |
| Private, bombardier, lance - corporal, trooper, gunner, driver, sapper, trumpeter, bugler | 2 | 0 | 0 | 1 | 0 | 0 | 10 |
| Able seaman and equivalent ratings | |||||||
| Corporal | 2 | 0 | 0 | 1 | 0 | 0 | 10 |
| Farrier, shoeing-smith, saddler, or fitter (If bombardier, lance-corporal, gunner, or private) | |||||||
| Lance-sergeant (not paid as such) | |||||||
| Leading seaman and equivalent ratings.. | |||||||
| Sergeant, farrier-corporal, shoeing-smith corporal, saddler-corporal, corporal-fitter, farrier-sergeant, saddler-sergeant, armourer-sergeant, sergeant-fitter | 2 | 0 | 0 | 1 | 0 | 0 | 10 |
| Lance-sergeant (paid as such) | |||||||
| Petty officer and equivalent ratings | |||||||
| Squadron, battery, or company sergeant-major, quartermaster-sergeant, colour-sergeant, staff sergeant, pay-clerk | 2 | 0 | 0 | 1 | 0 | 0 | 10 |
| Chief petty officer and equivalent ratings | |||||||
| Regimental sergeant-major, regimental quartermaster-sergeant | 2 | 0 | 0 | 1 | 0 | 0 | 10 |
| Warrant officer and equivalent ranks (Navy) | |||||||
| 2nd lieutenant, lieutenant (Army) | 2 | 2 | 6 | 1 | 1 | 3 | 10 |
| Commissioned warrant officer and equivalent ranks; sub-lieutenant and equivalent ranks (Navy) | |||||||
| Captain (Army) | 2 | 5 | 0 | 1 | 2 | 6 | 10 |
| Lieutenant under eight years' seniority and equivalent ranks (Navy) | |||||||
| Major | 2 | 12 | 0 | 1 | 6 | 0 | 10 |
| Lieutenant of eight years' seniority and equivalent ranks (Navy) | |||||||
| Lieutenant-colonel | 3 | 1 | 0 | 1 | 10 | 6 | 10 |
| Captain under throe years' seniority and equivalent ranks; superiors (Navy) | |||||||
| Colonel | 3 | 3 | 0 | 1 | 11 | 6 | 10 |
| Captain of three years' seniority and equivalent ranks (Navy) | |||||||
| Brigadier-general, major-general | 3 | 5 | 0 | 1 | 12 | 6 | 10 |
| Commodores, first and second class; rear-admiral and other equivalent ranks | |||||||
The gross annual value of war pensions in force at 31st March, 1919, amounted to £1,615,827, representing an average annual pension of £59. Of the total annual value, temporary pensions to soldiers amounted to £1,097,303. Permanent soldiers' pensions represented an annual value of £69,669.
Details regarding the war pensions in force at the 31st March, 1919, are given in the following table:—
| Class of Pension. | In Force at 31st March, 1919. | ||
|---|---|---|---|
| Number. | Annual Value. | Average Pension. | |
* Including the pensions of 1,240 children. † Including the pensions of 2,209 children. | |||
| £ | £ | ||
| Soldiers (permanent) | 1,316 | 69,669 | 52 |
| Soldiers (temporary) | 18,329 | 1,097,303 | 59 |
| Dependants (temporary) | 1,076 | 55,940* | 51 |
| Widows of soldiers | 1,970 | 233,451† | 118 |
| Other dependants of disabled soldiers | 4,736 | 159,464 | 33 |
| Totals | 27,427 | 1,615,827 | 59 |
Including the 3,449 children, the average of the grand total of 30,876 pensions in force on the 31st March, 1919, is £52 per annum.
Information as to number and rate of war pensions in force at 31st March, 1919, is given in the following table:—
TABLE SHOWING THE NUMBER OF WAR PENSIONS IN FORCE AT EACH RATE ON 31ST MARCH , 1919.
| Rate (nearest £1). | Soldiers (Permanent and upwards of Twelve Months). | Soldiers (Temporary). | Wives and Parents on Account of Disablement. | On Account of Death. | |
|---|---|---|---|---|---|
| Widows (including Children's Pensions). | Parents and other Dependants. | ||||
| £ £ | |||||
| 301-312 | .. | .. | .. | 3 | .. |
| 278-300 | .. | .. | .. | 9 | .. |
| 251-275 | .. | .. | .. | 14 | .. |
| 241-250 | .. | .. | .. | 7 | .. |
| 231-240 | .. | .. | .. | 21 | .. |
| 221-230 | .. | .. | .. | 18 | .. |
| 211-220 | .. | 1 | .. | 4 | .. |
| 201-210 | .. | 1 | 1 | 59 | .. |
| 191-200 | .. | 1 | .. | 24 | .. |
| 181-190 | .. | 3 | 3 | 110 | .. |
| 171-180 | .. | .. | .. | 8 | .. |
| 161-170 | .. | 2 | .. | 75 | .. |
| 151-160 | 6 | 8 | 10 | 205 | .. |
| 141-150 | 2 | 1 | 1 | 14 | .. |
| 131-140 | .. | 1 | 1 | 66 | .. |
| 121-130 | 1 | 7 | 16 | 437 | .. |
| 111-120 | .. | 12 | 12 | 62 | 2 |
| 101-110 | 14 | 997 | 38 | 13 | 3 |
| 96-100 | 1 | 4 | 14 | 2 | 5 |
| 90-95 | 19 | 175 | 19 | 7 | 2 |
| 88 | 9 | .. | .. | 8 | .. |
| 84 | 4 | 1 | 3 | .. | 1 |
| 83 | 139 | .. | .. | 34 | 4 |
| 82 | 2 | .. | .. | .. | .. |
| 81 | .. | .. | 4 | .. | .. |
| Rate (nearest £1). | Soldiers (Permanent and upwards of Twelve Months). | Soldiers (Temporary). | Wives and Parents on Account of Disablement. | On Account of Death. | |
|---|---|---|---|---|---|
| Widows (including Children's Pensions). | Parents and other Dependants. | ||||
| £ | |||||
| 80 | .. | .. | .. | 40 | 6 |
| 78 | 130 | 7,110 | 117 | 529 | 122 |
| 72 | 16 | .. | .. | .. | .. |
| 71 | 12 | .. | 2 | .. | .. |
| 68 | .. | .. | 3 | .. | .. |
| 67 | 5 | 1 | 2 | .. | 1 |
| 65 | 65 | 555 | 33 | 7 | 49 |
| 58 | 19 | 6 | 89 | .. | 20 |
| 55 | 1 | 1 | 6 | .. | 1 |
| 52 | 345 | 3,787 | 149 | .. | 342 |
| 48 | .. | .. | 11 | .. | 1 |
| 45 | 22 | 3 | 15 | .. | 4 |
| 44 | .. | .. | .. | .. | 5 |
| 41 | 1 | .. | 1 | .. | 30 |
| 40 | .. | .. | .. | .. | 35 |
| 39 | 179 | 2,830 | 216 | .. | 1,282 |
| 32 | 25 | 2 | 18 | .. | 8 |
| 31 | 4 | 1 | .. | .. | 1 |
| 29 | .. | .. | 9 | .. | .. |
| 26 | 261 | 2,799 | 205 | 137 | 2,717 |
| 20 | 7 | 1 | .. | .. | 8 |
| 19 | 15 | 10 | 46 | .. | 33 |
| 18 | .. | .. | .. | .. | 6 |
| 15 | .. | .. | .. | .. | 7 |
| 13 | 9 | 8 | 32 | 1 | 29 |
| 12 and under | 3 | 1 | .. | .. | 12 |
| Totals | 1,316 | 18,329 | 1,076 | 1,970 | 4,736 |
Section 13 of the Finance Act, 1919, provides that every person permanently resident in New Zealand who on the passing of this Act was in receipt of a pension or allowance under Part IX of the Defence Act, 1909, in respect of military service in South Africa, shall be entitled to a pension under the War Pensions Act, 1915 in the same manner as if he had been a member of the Forces within the meaning of that Act. Any pension under this section shall not be of such amount that the total amount receivable (including any Imperial pension) would be more than the pension payable if he had been a member of the Forces within the War Pensions Act, 1915.
Section 14 of the Finance Act, 1919, makes provision that, in the event of the death of any Police officer by misadventure suffered in the exercise of his duties, an allowance is payable to or on behalf of his widow and children at rates not exceeding those payable if he were a member of an Expeditionary Force under the Expeditionary Force Act, 1915. This Act is retrospective, but in this case any compensation already paid is taken into account. The scale for disablement is also similar to the war-pensions scale.
Applications are made to the same authorities, and the procedure is the same as in the case of war-pensions.
The question of providing pensions for the public and semi-public servants of the Dominion on their retirement has received a good deal of attention in recent years. The schemes now in force embrace the State Railways (1903), Public Service (1908) including Police (1899), and Teachers (1906), while the various local bodies are empowered to establish schemes under the Local Authorities Superannuation Act, 1908.
The Public Service Superannuation Act, 1907, now embodied in the Public Service Classification and Superannuation Act, 1908, which with its amendments includes all branches of the Public Service except the Railway Department and so much of the Education Department as is included in Part IX of the Education Act, 1908 (mainly Inspectors and teachers of public schools), came into force on the 1st January, 1908. The scheme, although optional on the part of public servants permanently employed at that date, is compulsory on all persons appointed thereafter.
The principal benefits are—
A pension for every year of service equal to one-sixtieth of the average annual salary for the last three years, payable (a ) after forty years' service, or (b ) at age sixty-five, or (c ) on retirement owing to ill health. The maximum pension is not to exceed two-thirds of the salary, or, in the case of entrants after the 24th December, 1909, £300 per annum.
A pension of £18 per annum to the widow of a contributor or pensioner during widowhood, and £13 per annum for each child under the age of fourteen.
Females may retire after thirty years' service or at the age of fifty-five, while the retiring age may be reduced in certain cases for both males and females. Special pensions may be given in the case of a member of the Police Force for injuries received on duty.
The contributions vary with the age on joining the fund: For ages under thirty they are 5 per cent. of the salary; ages thirty and under thirty-five, 6 per cent.; thirty-five and under forty, 7 per cent.; forty and under forty-five, 8 per cent.; forty-five and under fifty, 9 per cent.; fifty and over, 10 per cent.
On the 31st December, 1918, there were 14,071 contributors paying £152,792 per annum into the fund. The pensioners at the same date numbered 1,584, and were entitled to £110,166 per annum, made up as follows:—
| Number. | Pension. | |
|---|---|---|
| £ | ||
| Retired for age or length of service | 663 | 88,081 |
| Retired for ill health | 126 | 9,384 |
| Police injured on duty | 6 | 614 |
| Widows | 366 | 6,588 |
| Children | 423 | 5,499 |
| 1,584 | £110,166 |
The following table contains particulars of the public servants who were contributing to the fund at the end of the year 1918, grouped according to their respective rates of contribution:—
| Rate per Cent. of Contribution as provided by the Act. | Number. | Annual Salary. | Annual Contributions. | ||
|---|---|---|---|---|---|
| Male. | Female. | Total. | |||
| £ | £ | ||||
| 5 | 7,977 | 1,805 | 9,782 | 1,432,536 | 71,627 |
| 6 | 1,316 | 164 | 1,480 | 343,973 | 20,638 |
| 7 | 995 | 107 | 1,102 | 273,147 | 19,120 |
| 8 | 712 | 84 | 796 | 212,128 | 16,970 |
| 9 | 505 | 36 | 541 | 1,54,782 | 13,931 |
| 10 | 357 | 13 | 370 | 105,056 | 10,506 |
| Totals | 11,862 | 2,209 | 14,071 | 2,521,622 | 152,792 |
The revenue and expenditure for the year ended 31st December, 1918, were as follows:—
| Revenue. | £ |
|---|---|
| Amount of fund at beginning of year | 1,015,603 |
| Members' contributions— | |
| Under section 29 (ordinary) | 150,806 |
| Transfers from other superannuation funds | 93 |
| Government contribution | 48,000 |
| Interest | 55,703 |
| Fines, &c. | 258 |
| £1,270,463 |
| Expenditure. | £ |
|---|---|
| Retiring-allowances— | |
| To members | 92,921 |
| To widows and children | 9,978 |
| Contributions returned— | |
| Under section 46, Amendment Act (left service) | 21,051 |
| Under section 42 or 43 (death) | 10,734 |
| Under section 32 (ee ) | 1,294 |
| Under section 32 (e ) | 792 |
| Under section 32 (f ) | 4,303 |
| Under section 38 (retirement) | 946 |
| Transfers to other superannuation funds (section 48) | 196 |
| Expenses— | |
| Salaries | 763 |
| Office expenses | 281 |
| Public Trustee's charges | 1,393 |
| Investment expenses | 2 |
| Election expenses | 2 |
| Medical fees | 46 |
| Board members' travelling-expenses | 5 |
| Post Office charges | 50 |
| Amount of fund at end of year | 1,125,706 |
| £1,270,463 |
The assets and liabilities of the fund as at 31st December last are set out in the following statement:—
BALANCE -SHEET AS AT THE 31ST DECEMBER , 1918.
| Liabilities. | £ |
|---|---|
| Fund as per Revenue Account | 1,125,706 |
| Retiring and other allowances due, in course of payment— | |
| Members | 1,884 |
| Widows and children | 387 |
| Refunds of contributions due, in course of payment— | |
| Under section 46, Amendment Act (left service) | 2,063 |
| Under section 42 or 43 (death) | 5,418 |
| Under section 32 (ee ) | 850 |
| Under section 38 | 257 |
| Transfers to other funds due, in course of payment (section 48) | 38 |
| Expenses due, in course of payment— | |
| Salaries | 397 |
| Office expenses | 29 |
| Post Office charges | 50 |
| Public Trustee's charges | 503 |
| Medical fees | 7 |
| Valuation fees due to Valuation Department | 24 |
| Unclaimed Account (contributions, &c.) | 989 |
| Contributions paid in advance or in error | 2,721 |
| £1,141,323 |
| Assets. | £ |
|---|---|
| Amount invested by the Board | 1,068,631 |
| Contributions due, in course of transmission | |
| 4,795 | |
| Recoveries due | 50 |
| Interest due and accrued | 20,116 |
| Bank balance | 18,401 |
| Balance in hands of Postal Department | 13,569 |
| Balance in hands of Public Trustee | 15,761 |
| £1,141,323 |
The Government Actuary, in his report on the actuarial examination of the fund for the first triennium, recommended that the State subsidy be increased from £23,000 to £48,000 per annum during the succeeding triennium. By the amending Act mentioned above parliamentary sanction was given to the increased payment as from the 1st January, 1913. The increase in the subsidy was necessitated through officers retiring with service for which they had paid no contributions, the basis of the scheme being that the State should pay for these pensions except in so far as they were provided for by the members' contributions.
The Actuary's report on the second triennium, covering the period from the 1st January, 1911, to the 31st December, 1913, sets out the position of the fund at the end of 1913, and gives an estimate of the pensions falling due during 1914, 1915, and 1916. The estimated amounts of the pensions for the three years are set down as £66,664, £74,665, and £83,058 respectively. If the amounts provided by contributions are deducted, the State subsidies required on this basis would be £60,163, £66,286, and £72,516. The Actuary advised that, in addition to the annual subsidy of £48,000 hitherto paid, further subsidies of £12,000, £18,000, and £25,000 would be necessary in 1914, 1915, and 1916, or an average of £18,000 for the three years. The subsidies paid to the fund so far have in reality been old payments in a new guise, taking the place of compensation for loss of office and gratuities; for, while the State's total contribution to the fund for the six years ended the 31st December, 1913, was £156,500, the compensation the pensioners would have been entitled to if they had not accepted pensions was £149,554. This sum is computed only to the date these pensioners joined the fund, whereas if there had been no fund there would have been further compensation from that date to the date of retirement, bringing the sum in excess of the actual subsidy.
The report of the Superannuation Board for the year 1918 shows that up to the end of that year the total amount saved to the Consolidated Fund since the initiation of the superannuation scheme has been £341,130, the State subsidies to the fund aggregating £396,500, or £55,370 in excess of the actual saving referred to, which is reckoned only to the date the contributors joined the fund.
There has also been a great saving in gratuities to widows and children of public servants, for while these amounted to £37,091 for the eight years prior to the establishment of the fund, for the next succeeding eight years they amounted to only £6,065, or a decrease of over £31,000.
The Police Provident Fund, which was established on the 1st December, 1899, under the Police Provident Act, 1899, was merged in the Public Service Superannuation Fund on the 1st April, 1910, and members of the Police Force contributing at that date now pay the same contributions and receive the same benefits (plus the special allowance if injured on duty) as other members of the Public Service.
Since the passing of the Public Service Classification and Superannuation Amendment Act, 1908, the benefits from the Teachers' Superannuation Fund have been brought into line with those of the Public Service Superannuation Fund. Existing contributors had, however, the right of electing to remain subject to the provisions formerly in force.
By the amending Act of 1912 the definition of "Education service" was extended so as to admit of the members of the staffs of universities joining the fund. Any person in the employ of the University of New Zealand, the Auckland University College, Victoria University College, Canterbury College, the University of Otago, or the Canterbury Agricultural College at the date of the passing of the Act (7th November, 1912) had the option of joining, this option to be exercised before the 1st July, 1913. Any person first permanently employed on the staff of any of those institutions after the passing of the Act is compelled to become a contributor. The basis of calculation of the retiring-allowance in the case of persons appointed under the provision in respect of universities differs from that of contributors under the Act of 1908. The retiring-allowance is one-sixtieth of the average rate of salary for the three years next preceding retirement, for each year or part of a year of contribution to the fund, together with a one-hundred-and-twentieth part of such salary for each complete year of service between the 1st January, 1878, and the date of the passing of the Act (7th November, 1912). These allowances are subject to the limitation of a maximum of £300 prescribed by the amending Act of 1909.
With the extension of the benefits to employees of universities, Education service to which the fund applies now includes service in any capacity for not less than 20 hours per week—
Under an Education Board; or
Under the governing body of a secondary school; or
Under the managers of associated classes under Part VII of the Education Act, 1908; or
Under the Education Department in the case of Inspectors of Schools or of Inspectors, managers, or visiting officers of industrial schools, or of teachers of any schools under the control of that Department; or
Under the University of New Zealand, or under the Auckland University College, Victoria. College, the University of Otago, Canterbury College, or the Canterbury Agricultural College.
There are a few slight differences between the Public Service and the Teachers' Funds, the chief being that (1) the service of the teachers need not be continuous; (2) no pensions are payable on retirement for ill health unless the service exceeds fifteen years; and (3) in the case of reduction of status owing to age or infirmity, there is no provision that the pension must be computed on the higher salary as in the Public Service Fund.
The Government subsidy to the fund is £17,000 per annum. The total subsidies paid to the fund by the Government amounted on 31st December, 1918, to £135,000.
On the 31st December, 1918, there were 4,894 contributors, the annual contributions amounting to £59,199.
The retiring and other allowances were 698, representing a charge of £51,033 per annum, made up of—
| Amount of Pension. | ||
|---|---|---|
| Number. | £ | |
| Retired for age or length of service | 407 | 40,610 |
| Retired for ill health | 81 | 7,125 |
| Widows | 111 | 2,011 |
| Children | 99 | 1,287 |
| 698 | £51,033 | |
The income and expenditure for the year ended the 31st December, 1918, were as follows:—
| Income. | £ |
|---|---|
| To Balance 31st Dec., 1917 | 420,225 |
| Contributions of members | 60,160 |
| Government subsidy | 17,000 |
| Interest— | |
| Ordinary—Public Trustee | 22,514 |
| On arrears of contributions | 152 |
| Contributions transferred from other funds | 150 |
| £520,201 |
| Expenditure. | £ |
|---|---|
| By Retiring and other allowances | 48,354 |
| Contributions refunded— | |
| On voluntary retirement | 6,560 |
| On death of contributor | 5,436 |
| On lapse of membership | 1,091 |
| Contributions transferred to other funds | 27 |
| Administration expenses— | |
| Commission, G.P.O. | 154 |
| Commission, Public Trustee | 105 |
| Office expenses | 49 |
| Travelling - expenses of Board members | 82 |
| Clerical assistance | 250 |
| Medical fees | 37 |
| Balance 31st Dec, 1918 | 458,056 |
| £520,201 |
The balance-sheet of the Teachers' Superannuation Fund as at the 31st December, 1918, reads as follows:—
| Liabilities. | £ |
|---|---|
| Fund as per Revenue Account | 458,056 |
| Retiring and other allowances due and unpaid | 628 |
| Refunds of contributions on death of contributor due and unpaid | 3,261 |
| Administration expenses due and unpaid— | |
| Clerical assistance | 250 |
| Medical fees | 19 |
| Commission, G.P.O. | 82 |
| Commission, Public Trustee | 81 |
| Travelling-expenses of Board members | 10 |
| Office expenses | 26 |
| Unclaimed contributions | 1,161 |
| Contributions overpaid and paid in error | 233 |
| £463,807 |
| Assets. | £ |
|---|---|
| Cash in hands of G.P.O. | 5,393 |
| Less vouchers in course of payment | 3,274 |
| 2,119 | |
| Cash in hand for payment of travelling-expenses of Board members | 12 |
| Amount held by Public Trustee— | |
| Invested | 446,421 |
| Uninvested | 2,003 |
| 448,424 | |
| Contributions of members— | |
| In transit | 2,435 |
| Due and outstanding | 2,338 |
| 4,773 | |
| Interest on investments— | |
| Due and outstanding | 1,931 |
| Accrued, but not due | 5,641 |
| 7,572 | |
| Interest on arrears of contributions due and outstanding | 907 |
| £463,807 |
The Government Actuary, in his report containing the results of an actuarial examination of the fund for the triennium 1914-16, estimated that the amounts required for pensions during the next three years would be— 1917, £47,229; 1918, £52,155; 1919, £57,066. Contributions paid by those benefiting would provide only a small proportion of the cost, leaving the State to contribute balances of £39,954, £43,423, and £46,837 in the respective years. The Actuary reported that, in addition to the annual subsidy of £17,000 at present being paid, further subsidies of £23,000 in 1917, £26,000 in 1918, and £30,000 in 1919 would be required. As in the case of the Public Service scheme, the amount of pension purchased by the contributions is very small, but the proportion to the total is already increasing. Most of the pensions in either scheme are for long periods of service, with, of course, only short periods of contribution.
The Government Railways Superannuation Fund was established on the 1st January, 1903, by the Government Railways Superannuation Fund Act, 1902, now embodied in the Government Railways Act, 1908.
The pension is here also one-sixtieth of the annual rate of pay for every year of service, but the retiring age is sixty for both males and females, instead of ages sixty-five and fifty-five respectively as in the Public Service. The only other differences of importance are that the annual allowances to widows and children are paid only on the death of contributors before retiring on a pension, and that the pension is computed on the last salary except where the contributor has served in a lower grade within the previous five years, in which case the average for seven years is taken.
The contributions originally were: For ages not exceeding thirty when the first contribution became payable, 3 per cent.; ages thirty and under thirty-five, 4 per cent.; thirty-five and under forty, 5 per cent.; forty and under forty-five, 6 per cent.; forty-five and under fifty, 7 per cent.; fifty and over, 10 per cent.
These contributions are still payable by members who joined the scheme prior to the 1st January, 1908, but for those who joined subsequently the contributions are the same as are payable under the Public Service scheme.
The number of contributors on the 31st March, 1919, was 10,733, and at that date there were 1,872 persons on the fund, drawing annual allowances amounting to £101,864.
The revenue and expenditure for the year ended 31st March, 1919, were—
| Revenue. | |
|---|---|
| £ | |
| Balance brought forward on 1st April, 1918 | 373,098 |
| Members' contributions | 78,610 |
| Fines | 215 |
| Government contribution | 25,000 |
| Interest received (with bonus) | 17,016 |
| Donation, H.E. the Governor-General | 10 |
| £493,949 |
| Expenditure. | |
|---|---|
| Retiring-allowances to— | £ |
| Members | 88,738 |
| Widows and children | 11,102 |
| Payments under section 86 (c ) | 108 |
| Payments under section 82 (6) | 1,201 |
| Contributions refunded | 28,581 |
| Fines refunded | 2 |
| Travelling-expenses of members of Board | 49 |
| Contributions transferred to Public Service Superannuation Fund | 74 |
| Public Trust Office charges | 290 |
| Amount of Fund at close of year | 363,804 |
| £493,949 |
The balance-sheet of the fund as at the 31st March, 1919, was—
| Liabilities. | £ |
|---|---|
| Fund as per Revenue Account above | 363,804 |
| Life allowances not paid | 789 |
| Widows' allowances not paid Contributions due to be refunded not paid | 94 871 |
| £365,558 | |
| Assets. | £ |
| In hands of Public Trustee | 352,056 |
| Contributions and fines in transit | 7,883 |
| Arrears of contributions due by members in respect to casual service | 5,619 |
| £365,558 |
The Local Authorities Superannuation Act, 1908, which came into force on the 10th October, 1908, applies to Borough Councils, County Councils, Town Boards, Road Boards, Harbour Boards, Charitable Aid Boards, tramway companies, or any body possessing rating powers over any district.
The benefits and contributions are the same as in the Public Service Fund. Under the Act of 1908 a contributor's service prior to joining the fund was not counted for pension purposes. By an amendment passed in 1912, however, local authorities were empowered, when establishing superannuation funds, to grant in respect of prior service an additional retiring allowance not exceeding th of the annual salary for each year of such prior service.
So far as can be ascertained, only three local authorities have so far initiated superannuation schemes under the authority of the statute—namely, Wellington Harbour Board, Auckland Harbour Board, and Buller County Council. The subsidies payable by the respective local authorities are as follows:—
Wellington Harbour Board: 65 per cent. of the members' contributions, equivalent to 5 per cent. of the salaries.
Auckland Harbour Board: 60 per cent. of the members' contributions, equivalent to 4 per cent. of the salaries.
Buller County Council: 80 per cent. of the members' contributions, equivalent to 7 per cent. of the salaries.
Payments to the various funds during each of the six years ended 1918 are as follows:—
| Local Authority. | Year. | Payment to Fund by | |||||
|---|---|---|---|---|---|---|---|
| Employees. | Local Authority. | ||||||
| £ | s. | d. | £ | s. | d. | ||
| Wellington Harbour Board | 1913 | 2,450 | 15 | 9 | 1,592 | 19 | 6 |
| 1914 | 3,623 | 17 | 11 | 2,353 | 11 | 2 | |
| 1915 | 3,595 | 9 | 9 | 2,337 | 1 | 6 | |
| 1916 | 3,805 | 8 | 10 | 2,475 | 10 | 5 | |
| 1917 | .. | .. | .. | .. | .. | .. | |
| 1918 | .. | .. | .. | .. | .. | .. | |
| Auckland Harbour Board | 1913 | 319 | 11 | 9 | 191 | 15 | 0 |
| 1914 | 694 | 13 | 2 | 416 | 15 | 11 | |
| 1915 | 713 | 16 | 7 | 428 | 5 | 11 | |
| 1916 | 707 | 6 | 4 | 424 | 7 | 10 | |
| 1917 | .. | .. | .. | .. | .. | .. | |
| 1918 | 715 | 10 | 2 | 429 | 6 | 1 | |
| Buller County Council | 1913 | 8 | 1 | 2 | 23 | 2 | 3 |
| 1914 | 166 | 10 | 5 | 124 | 14 | 2 | |
| 1915 | 172 | 18 | 4 | 149 | 16 | 9 | |
| 1916 | 225 | 18 | 5 | 161 | 1 | 5 | |
| 1917 | .. | .. | .. | .. | .. | .. | |
| 1918 | .. | .. | .. | .. | .. | .. | |
The National Provident Fund was established by Act in 1910, and came into operation on the 1st March, 1911. The fund is administered by a Board composed of the Hon. the Minister of Finance as Chairman and four members appointed by the Governor-General, one of whom is the Superintendent of the fund.
The main object of the scheme is to provide for annuities in old age. This is supplemented by benefits for the protection of the family from birth to old age.
The system is open to any person between the ages of sixteen and forty-five years residing in New Zealand, and whose average income during the three years prior to joining has not exceeded £250 per annum. There is no medical examination on entry, and the method of joining is extremely simple, the applicant having merely to fill in a form at a postal money-order office or local office of the Fund, and pay a first weekly contribution.
The following benefits are payable:—
After contributing for twelve months, a payment not exceeding £6 for medical attendance and nursing on the birth of a contributor's child or children.
After contributing for five years, an allowance, after three months' incapacity to work, of 7s. 6d. per week for each child of a contributor under fourteen years of age. Payable independent of any allowances due from friendly societies. No contributions payable while in receipt of incapacity allowance.
After contributing for five years, an allowance, on the death of a contributor, of 7s. 6d. per week for each child until fourteen years of age,. and 7s. 6d. for the widow so long as any child is under fourteen years of age.
On reaching age sixty, a pension of 10s., 20s., 30s., or 40s. per week, according to the scale of contributions. The payment of this pension will not affect any rights under the Old-age Pensions Act.
The maternity allowance is payable only if the combined income of a contributor and wife or husband does not exceed £200 per annum at the time of claim, but this limitation does not debar from the other benefits. The incapacity allowance is not to exceed the pecuniary loss which, in the opinion of the Board, the contributor has probably suffered during incapacity, and the income of a contributor during incapacity, independent of the fund, is not to exceed the rate of £4 per week.
The contributions range from 9d. per week at age sixteen last birthday, 1s. 1d. at age twenty-two, 1s. 4d. at twenty-five, and so on to age forty-five, for the 10s. pension, the rate being two, three, or four times as much if a higher pension is applied for. A contributor may decrease his pension after entry, or he may increase it at any time whilst he is under the age of forty-five years.
The contributions are payable in weekly sums at any postal money-order office or local office of the Fund; but, as any number of contributions may be paid at one time, contributors have the choice of paying weekly, monthly, quarterly, half-yearly, yearly, or at irregular intervals.
In the event of a contributor leaving the fund or dying, all contributions (less any benefits received) are returnable. If a contributor dies before the first five years are completed his representatives receive the contributions he has paid, less anything he received during lifetime. Should he die after age sixty, before receiving in benefits a sum equal to the contributions paid in during his lifetime, the difference is returnable to his representatives; and, further, if the allowances paid for widow and children do not exhaust the contributions, his representatives are entitled to the residue. If a contributor dies before sixty, leaving a widow and no children, all the contributions are returnable, less benefits paid out.
The latitude allowed for arrears is very wide, and covers a period of eighteen months, but after six months a fine equal to one-eighth of the contributions is to be paid.
Moneys payable out of the fund cannot be assigned in any way, nor, on the death of a contributor, be used as assets for purposes of payment of his debts or liabilities.
The benefits under the Act are guaranteed by the State, which subsidizes the contributions to the extent of one-fourth of the amount paid into the fund.
An important extension of the fund was authorized by the amending Act of 1914 whereby the employees of local authorities, &c., could be enrolled in the fund for superannuation purposes.
A further amendment was incorporated in the Finance Act, 1916, whereby approved friendly societies were granted a maternity allowance and offered annuities on reduced terms and under special tables.
The result of the fund's operations up to the end of the eighth year is indicated in the following table:—
| At End of— | Number of Contributors. | Annual Rate of Contribution payable. | Amount of Fund. |
|---|---|---|---|
| £ | £ | ||
| 1911 | 550 | 3,172 | 1,826 |
| 1912 | 2,660 | 11,727 | 10,038 |
| 1913 | 5,791 | 22,719 | 29,327 |
| 1914 | 6,858 | 26,520 | 53,718 |
| 1915 | 8,101 | 31,875 | 83,000 |
| 1916 | 9,847 | 38,664 | 122,361 |
| 1917 | 12,124 | 56,707 | 176,210 |
| 1918 | 13,410 | 69,486 | 246,901 |
A total amount of £17,809 was paid out through the fund for the year ended the 31st December, 1918, in respect of maternity grants, the amount to contributors being £4,001, and to the members of approved friendly societies, £13,808.
The Revenue Account of the fund for the year ended 31st December, 1918, is as follows:—
REVENUE ACCOUNT FOR THE YEAR 1918.
| Revenue. | £ |
|---|---|
| Amount of fund at beginning of year | |
| 176,210 | |
| Contributions | 57,237 |
| Interest | 8,439 |
| Fines | 371 |
| Benefits refunded by deduction | 535 |
| Government contribution under Act | 13,812 |
| Refund of maternity claims by the State | 17,809 |
| Refunds unclaimed | 441 |
| Miscellaneous receipts | 1 |
| £274,855 |
| Expenditure. | £ |
|---|---|
| Maternity claims (section 18) | 4,001 |
| Maternity claims (approved friendly societies) | 13,808 |
| Refund of contributions on lapse, reduction, and withdrawal | 5,666 |
| Death: Refund of contributions | 3,639 |
| Allowances | 526 |
| Pensions | 314 |
| Amount of fund at end of year | 246,901 |
| £274,855 |
The balance-sheet of the fund as at the end of the year 1918 is also given:—
BALANCE -SHEET AS AT 31ST DECEMBER , 1918.
| Liabilities. | £ |
|---|---|
| Fund as per Revenue Account | 246,901 |
| Claims due and in course of payment*— | |
| Maternity | 2,167 |
| Death | 2,171 |
| Allowances | 186 |
| Refunds in suspense | 4,727 |
| Deposits on incomplete applications to join fund | 1 |
| Suspense account | 28 |
| Contributions prepaid | 1,588 |
| £257,769 |
| Assets. | £ |
|---|---|
* Included in Revenue Account. | |
| Invested with Public Trustee | 224,972 |
| Balance with Post Office | 1,903 |
| Balances in transit | 721 |
| Contributions outstanding or in course of transmission*— | |
| (a.) Contributions in course of transmission | 3,533 |
| (b .) Contributions due but not overdue | 6,630 |
| (c .) Contributions overdue | 2,024 |
| Government subsidy due under Act | 13,813 |
| Refund due in respect of maternity claims* | 2,701 |
| Fines due | 253 |
| One-half contributions of members of Expeditionary Forces due by the State* | 1,219 |
| £257,769 | |
Table of Contents
THE Banking Act, 1908, consolidates the law of New Zealand relating to the general business of banking in the Dominion. The Act provides that the incorporation of banks by Royal Charter shall be as effectual within New Zealand as Acts of the General Assembly. The number of directors is prescribed, and authority given to any bank to increase its capital on a resolution of the shareholders. Transfers of shares on which there is any liability must be approved by the directors or their duly appointed attorney or attorneys. Every bank trading in the Dominion is required to furnish quarterly statements of its business, for publication in the Gazette. A sworn copy of an entry in the books of a bank shall in all legal proceedings be evidence of such entry, and a bank is not required in any legal proceedings to which it is not a party to produce its books before a Court, unless ordered by a Judge for special cause. Provision is made for bank holidays, and for the destruction of cheques, drafts, bills of exchange, or promissory notes after the expiration of ten years from the date or due date of such documents.
Part II of the Bills of Exchange Act, 1908, consolidates the law relating to cheques on a bank.
The Companies Act, 1908, with the exception of Part IX (re companies incorporated outside New Zealand), and also of the provisions relating to branch registers, does not apply to banking companies formed within and operating only within the Dominion.
There are six banks of issue trading in New Zealand, two of these institutions, the Bank of New Zealand and the National Bank of New Zealand, being incorporated by special Acts of the General Assembly of the Dominion. The Bank of New Zealand has branches in London, Australia, Fiji, and Samoa, while its branches and agencies within the Dominion number 196. The other five banks have between them 207 establishments within the Dominion, making a total of 403, or an average of one bank to every 2,737 inhabitants, excluding Maoris.
The paid-up capital of the above banks, their reserve funds, and the rate and amount of their last dividend as on the 31st December, 1918, were as follows.
| Bank. | Paid-up Capital. | Rate per Cent. per Annum of Last Dividend and Bonus. | Amount of Last Half-yearly Dividend and Bonus. | Reserve Fund. |
|---|---|---|---|---|
* Dividend for full year. | ||||
| £ | Per Cent | £ | £ | |
| Bank of New Zealand— 4-per-cent. stock guaranteed by New Zealand Government | 529,988 | .. | .. | .. |
| "A" preference shares issued to the Crown (Act of 1903) | 500,000 | 10 | 237,500* | 2,345,702 |
| "B" preference shares issued to the Crown (Act of 1913) | 250,000 | 12 and bonus of 3 per cent. | ||
| Ordinary shares | 1,000,000 | 12 and bonus of 3 per cent. | ||
| Union Bank of Australia (Limited) | 2,000,000 | 10 and bonus of 2 per cent. for half-year | 140,000 | 2,239,293 |
| Bank of New South Wales | 3,904,860 | 10 | 195,243 | 3,025,000 |
| Bank of Australasia | 2,000,000 | 14 and bonus of 12s. per share | 170,000 | 3,071,100 |
| National Bank of New Zealand (Limited) | 750,000 | 12 per cent. per annum for half-year, and bonus of 1 per cent. | 52,500 | 833,150 |
| Commercial Bank of Australia (Limited)— Ordinary | 95,659 | .. | .. | .. |
| Preference | 2,117,350 | 4 (preference only) | 42,347 | 10,486 |
The development of banking in New Zealand since the year 1857 has been very great. Taking for each year the average of the four quarters' returns made up by the banks of issue, the figures for 1857, 1870, 1880, 1890, 1900, 1910, and each of the past five years are,—
| Year. | Deposits. | Advances. | Assets. | Liabilities. |
|---|---|---|---|---|
| £ | £ | £ | £ | |
| 1857 | 343,316 | .. | 419,860 | 432,494 |
| 1870 | 3,127,769 | 4,547,217 | 6,315,354 | 3,819,670 |
| 1880 | 8,538,935 | 11,300,404 | 14,220,275 | 9,550,177 |
| 1890 | 12,368,610 | 14,096,446 | 17,735,259 | 13,356,598 |
| 1900 | 15,570,610 | 12,084,744 | 17,314,535 | 16,964,582 |
| 1910 | 24,968,761 | 19,772,656 | 26,398,927 | 26,742,081 |
| 1914 | 27,640,507 | 25,222,127 | 32,502,312 | 29,808,349 |
| 1915 | 31,433,653 | 24,590,171 | 33,209,484 | 34,448,272 |
| 1916 | 37,757,917 | 26,989,644 | 37,015,486 | 41,977,619 |
| 1917 | 42,930,713 | 33,808,309 | 44,979,615 | 48,541,961 |
| 1918 | 45,562,939 | 37,396,623 | 48,570,126 | 52,048,732 |
In 1880 the deposits of these banks were £18 per head of the mean population; in 1890, £19.92; in 1900, £20.39; in 1910, £25.15; and in 1911, £26.37. In 1912, however, the average fell to £24.66, and in 1913 (the strike year) a further fall is recorded, the rate per head being £24.08. The years 1914 and 1915 show a recovery, the rates being £25.35 and £28.59 respectively, while for 1916 the rate has jumped to £34.34. In 1917 it rose to the high level of £39.06, this record being in turn beaten in 1918, when the rate was £41.11. The ratio of advances to deposits, which was 132.34 per cent. in 1880, reached its maximum in 1883, when it stood at 173.35 per cent. The proportion since that year fell, till in 1903 it was only 75.96 per cent. The 1916 rate (71.48) was the lowest ever recorded. The rate for 1917 (78.75), though still very low, showed a substantial increase on the figure for 1916, while the 1918 figure was as high as 82.08.
In 1886 the average amount of advances made by the banks was £15,853,420, equal to £27.23 per head of the mean population. The advances gradually declined in amount and proportion to population until 1891, when they were in value £11,549,145, or £18.34 per head. In 1897 advances stood at £10,892,111, or £15.09 per head, which is the lowest average since the year 1872. There was then a continuous rise both in amounts of advances and in rates per head of population until 1908, for which year the figures were £22,495,576, or £23.80 per head. After 1908 the amounts fluctuated, but the tendency was still to rise. The total amount for 1918 (£37,396,623) is by far the highest yet reached. The rate per head for 1918 (£33.90) also constitutes a record, the next highest rate being that of 1917 (£30.76) and that of 1878 (£30.53). The largest amount of discounts in any year was £6,061,959 in 1879, a rate of £13.53 per head. In the previous year had occurred the highest rate—£14.22 per head. From 1879 there was a fall, year by year, until 1896, when the sum was £1,756,791, or £2.49 per head, since when the ratio has fluctuated between £2.45 and £1.29 per head, the last ten years showing the lowest figures, the rate per head being less than £2 in each of those years. Both amount and rate for 1918 are lower than in any previous year. This inflation of deposits and advances during recent years is, of course, a direct result of war conditions.
The liabilities of the banks of issue for the last ten years are shown in the table following, the figures given referring to New Zealand business only. The liabilities shown represent the average of the four quarters of the year, with the exception that in the figures for 1912 only the last quarter is taken in respect of the Commercial Bank of Australia, as this institution did not commence operations in the Dominion until fairly late in that year
| Year. | Notes in Circulation. | Bills in Circulation. | Balances due to other Banks. | Deposits. | Total Liabilities. |
|---|---|---|---|---|---|
| £ | £ | £ | £ | £ | |
| 1909 | 1,577,558 | 93,582 | 60,565 | 21,996,621 | 23,728,326 |
| 1910 | 1,626,094 | 93,603 | 53,622 | 24,968,761 | 26,742,080 |
| 1911 | 1,677,842 | 113,582 | 69,257 | 26,765,122 | 28,625,803 |
| 1912 | 1,714,667 | 111,877 | 59,721 | 25,622,083 | 27,508,348 |
| 1913 | 1,674,333 | 108,518 | 75,061 | 25,733,187 | 27,591,099 |
| 1914 | 1,998,386 | 96,012 | 73,444 | 27,640,507 | 29,808,349 |
| 1915 | 2,846,277 | 105,759 | 62,580 | 31,433,653 | 34,448,272 |
| 1916 | 4,049,527 | 96,468 | 73,707 | 37,757,917 | 41,977,619 |
| 1917 | 5,410,957 | 105,895 | 94,396 | 42,930,713 | 48,541,961 |
| 1918 | 6,266,768 | 123,344 | 95,681 | 45,562,939 | 52,048,732 |
The average assets, as shown below, include Colonial Government securities, which in 1918 amounted to £5,685,273.
| Year. | Coin and Bullion. | Notes and Bills discounted. | Debts due, exclusive of Bad Debts. | All other Assets. | Total Assets. |
|---|---|---|---|---|---|
| £ | £ | £ | £ | £ | |
| 1909 | 4,947,096 | 1,928,178 | 17,149,854 | 2,912,137 | 26,937,265 |
| 1910 | 5,035,764 | 1,741,984 | 16,698,015 | 2,923,164 | 26,398,927 |
| 1911 | 5,195,333 | 1,792,261 | 19,467,467 | 2,978,553 | 29,433,614 |
| 1912 | 5,338,295 | 1,847,016 | 21,062,101 | 2,948,983 | 31,196,400 |
| 1913 | 5,204,266 | 1,951,665 | 20,950,633 | 2,602,368 | 30,708,932 |
| 1914 | 5,712,751 | 1,843,217 | 22,407,029 | 2,539,315 | 32,502,312 |
| 1915 | 6,781,006 | 1,471,808 | 22,167,162 | 2,789,506 | 33,209,483 |
| 1916 | 7,393,917 | 1,484,356 | 23,427,562 | 4,709,651 | 37,015,486 |
| 1917 | 8,072,279 | 1,414,585 | 27,433,164 | 8,059,587 | 44,979,615 |
| 1918 | 8,085,961 | 1,261,203 | 30,450,147 | 8,772,815 | 48,570,126 |
The total amount of deposits, the amount per head of population, the total advances, and the ratio of advances to deposits, taking the average of the four quarters for each of the past ten years, are as follows:—
| Year. | Deposits. | Advances. | ||||
|---|---|---|---|---|---|---|
| Total Amount. | Per Head of Population. | Total Amount. | Ratio to Deposits. | |||
| £ | £ | s. | d. | £ | Per Cent. | |
| 1909 | 21,996,621 | 22 | 10 | 2 | 20,386,367 | 92.68 |
| 1910 | 24,968,761 | 25 | 3 | 0 | 19,772,656 | 79.19 |
| 1911 | 26,765,122 | 26 | 7 | 5 | 22,601,863 | 84.45 |
| 1912 | 25,622,083 | 24 | 13 | 2 | 24,268,634 | 94.72 |
| 1913 | 25,733,187 | 24 | 1 | 7 | 24,005,038 | 93.28 |
| 1914 | 27,640,507 | 25 | 7 | 0 | 25,222,127 | 91.25 |
| 1915 | 31,43,653 | 25 | 11 | 10 | 24,590,171 | 78.23 |
| 1916 | 37,757,917 | 34 | 6 | 10 | 26,989,644 | 71.48 |
| 1917 | 42,930,713 | 39 | 1 | 2 | 33,808,309 | 78.75 |
| 1918 | 45,562,939 | 41 | 6 | 1 | 37,396,623 | 82.08 |
Deposits per head of population in banks of issue in each of the Australian States during 1918 and the four preceding years are shown. Figures for New Zealand are also given by way of comparison.
DEPOSITS PER HEAD IN BANKS OF ISSUE IN AUSTRALASIA , 1914-18.
| State. | 1914. | 1915. | 1916. | 1917. | 1918. | ||||||||||
|---|---|---|---|---|---|---|---|---|---|---|---|---|---|---|---|
| £ | s. | d. | £ | s. | d. | £ | s. | d. | £ | s. | d. | £ | s. | d. | |
| Queensland | 36 | 14 | 11 | 39 | 16 | 2 | 37 | 9 | 1 | 43 | 2 | 2 | 49 | 13 | 3 |
| New South Wales | 34 | 18 | 10 | 36 | 8 | 10 | 42 | 19 | 0 | 44 | 19 | 9 | 45 | 7 | 2 |
| Victoria | 37 | 5 | 4 | 37 | 18 | 6 | 42 | 0 | 6 | 46 | 9 | 9 | 48 | 10 | 5 |
| South Australia | 28 | 17 | 2 | 26 | 19 | 0 | 31 | 6 | 3 | 36 | 14 | 7 | 42 | 6 | 11 |
| Western Australia | 22 | 12 | 6 | 23 | 7 | 2 | 25 | 11 | 8 | 27 | 12 | 9 | 31 | 9 | 8 |
| Tasmania | 28 | 0 | 0 | 28 | 12 | 5 | 30 | 9 | 7 | 30 | 2 | 5 | 33 | 4 | 0 |
| Northern Territory | 36 | 7 | 8 | 41 | 9 | 1 | 45 | 10 | 9 | 64 | 12 | 10 | 71 | 4 | 6 |
| Total Commonwealth New Zealand | 34 | 4 | 7 | 35 | 6 | 8 | 39 | 5 | 5 | 42 | 15 | 1 | 45 | 5 | 1 |
| 25 | 7 | 0 | 25 | 11 | 10 | 34 | 6 | 10 | 39 | 1 | 2 | 41 | 6 | 1 | |
The graphs in the following diagram show the amounts of liabilities, assets, and deposits of banks of issue in New Zealand each year from 1857 to 1918:—
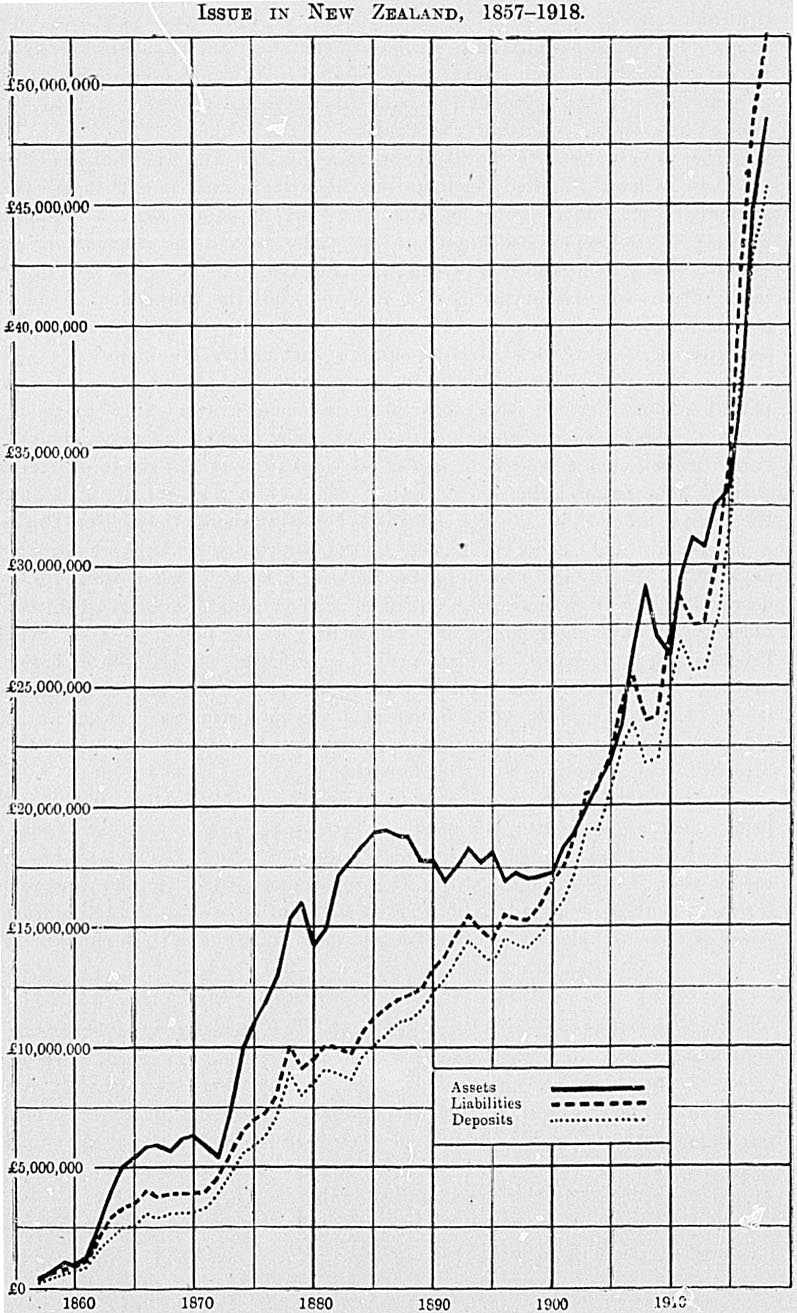
The Banking Act, 1908, deals with the issue of notes generally. The Governor-General may empower any bank to issue and circulate notes, subject to the provisions and restrictions contained in the charter or letters patent under which such bank is incorporated; all such notes to be payable in gold only at the office of the bank at the place of issue, and to be a first charge on all assets of the bank.
The private Acts of the Bank of New Zealand and the National Bank of New Zealand (Limited) contain the following clause: "That the total amount of promissory notes payable on demand, issued and in circulation within the Dominion, shall not at any time exceed the amount of coin, bullion, and public securities which shall for the time being be held by the same corporation within the Dominion; nor shall the proportion of coin be less than one-third part of the amount of the coin, bullion, and public securities so held by the said corporation within the Dominion."
On the 5th August, 1914, an amendment to the Banking Act was passed empowering the Governor-General in Council, from time to time, to make a Proclamation declaring "that the notes payable on demand by any bank therein named, and then issued or thereafter to be issued or reissued within New Zealand under any lawful authority in that behalf, shall during the period limited by the Proclamation be everywhere within New Zealand a good and legal tender of money to the amount therein expressed to be payable." Conditions governing the issue of such Proclamation are laid down, and the bank may be required to give adequate security that it will redeem the notes in gold on the expiration of the period covered by the Proclamation. Provision is also made for payment by the State Treasury in case of default by the bank. During the period any such Proclamation is in force, gold must not be exported except with the consent of the Minister of Finance, and any gold exported or attempted to be exported in breach of this provision is to be forfeited.
Immediately on the passing of the amendment referred to, Great Britain being then at war with Germany, a Proclamation was gazetted declaring notes of all six banks of issue doing business in New Zealand to be legal tender from the 6th August to the 6th September, 1914. Further extensions for short periods were made from time to time until the end of 1917, when the notes of the six banks were declared legal tender until the 31st December, 1922.
In connection with the Post Office in New Zealand a savings-bank is conducted. The minimum deposit receivable, except in certain specified cases, is 1s., and no interest is given on any sum less than £1 or in excess of £1,000. Prior to the 1st January, 1914, the maximum amount on which interest was payable was £600. Interest on sums up to £300 must not exceed 5 per cent. per annum, and on sums between £300 and £1,000 4 per cent. is the maximum allowable.
The number of post-offices open for the transaction of savings-bank business at the end of 1918 was 786.
There were 76,869 new accounts opened in 1918, and 53,015 accounts were closed during the year. The total number of open accounts at the end of 1918 was 590,205, or one in every 1.96 of the population, excluding Maoris.
The deposits received during the year amounted to £18,101,105, and the withdrawals to £14,938,842, the excess of deposits over withdrawals having thus been £3,162,263. The total sum standing at credit of all accounts on the 31st December, 1918, was £33,418,125, which gave an average of £56 12s. 5d. to the credit of each open account. Information for each of the past ten years is given below.
POST OFFICE SAVINGS -BANK .
| Year. | Number of Depositors at End of Year. | Total Amount of Deposits during Year. | Total Amount of Withdrawals during Year. | Excess of Deposits over Withdrawals. | Total Amount to Credit of Depositors at End of Year. |
|---|---|---|---|---|---|
| £ | £ | £ | £ | ||
| 1909 | 359,714 | 9,611,120 | 9,499,320 | 111,800 | 12,666,898 |
| 1910 | 380,585 | 10,708,939 | 9,695,515 | 1,013,424 | 14,104,990 |
| 1911 | 405,566 | 11,627,368 | 10,662,046 | 965,322 | 15,543,187 |
| 1912 | 432,199 | 11,725,183 | 11,449,711 | 275,472 | 16,330,257 |
| 1913 | 458,594 | 11,286,702 | 11,041,454 | 245,248 | 17,131,414 |
| 1914 | 483,262 | 11,904,323 | 10,603,018 | 1,301,305 | 19,048,029 |
| 1915 | 509,085 | 13,706,057 | 11,294,974 | 2,411,083 | 22,166,338 |
| 1916 | 538,072 | 15,576,408 | 12,957,420 | 2,618,988 | 25,603,209 |
| 1917 | 566,351 | 17,106,529 | 14,461,169 | 2,645,360 | 29,196,390 |
| 1918 | 590,205 | 13,101,105 | 14,938,842 | 3,162,263 | 33,418,125 |
The Post Office Savings-bank commenced operations on the 1st February, 1867, and the progress of. the establishment since that date is shown on the next page in graphical representation, the curves representing number of open accounts, total amount to credit, and average amount to credit respectively.
This diagram shows clearly the large increase in the business of the Post Office Savings-bank during recent years.
During the past 30-odd years (since 1887) the total amount standing to the credit of depositors at the end of each year has in no case shown a decrease, while the total increase over that period in the amount standing to credit of depositors is no less than £31,605,040—from £1,813,085 in 1887 to £33,418,125 in 1918.
Another pleasing feature of the diagram is the substantial and fairly steady increase in the average amount standing to the credit of each depositor.
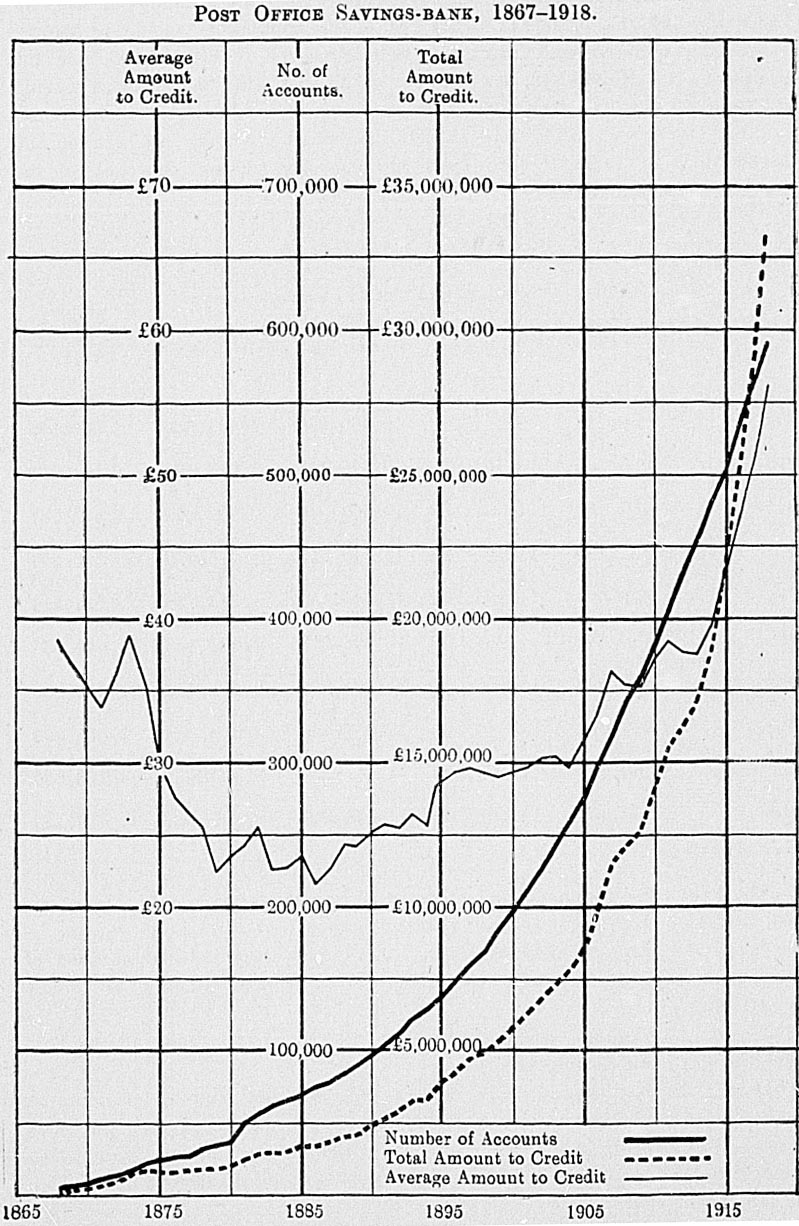
The number of open accounts (as on the 31st December) for five years, classified according to amounts at credit, is as follows:—
| Amount. | 1914. | 1915. | 1916. | 1917. | 1918. |
|---|---|---|---|---|---|
| Not exceeding £20 | 347,464 | 356,968 | 369,769 | 382,689 | 385,812 |
| Exceeding £20 and up to £50 | 47,722 | 55,186 | 57,216 | 59,680 | 61,466 |
| Exceeding £50 and up to £100 | 33,354 | 36,047 | 39,715 | 43,392 | 48,178 |
| Exceeding £100 and up to £200 | 27,499 | 29,759 | 34,498 | 39,813 | 45,258 |
| Exceeding £200 and up to £300 | 12,011 | 13,555 | 15,443 | 17,243 | 20,985 |
| Exceeding £300 and up to £400 | 6,707 | 7,346 | 8,690 | 9,330 | 11,518 |
| Exceeding £400 and up to £500 | 3,534 | 3,891 | 4,775 | 5,152 | 6,255 |
| Exceeding £500 and up to £600 | 2,239 | 2,638 | 3,149 | 3,628 | 4,180 |
| Exceeding £600 | 2,732 | 3,695 | 4,817 | 5,424 | 6,553 |
| Totals | 483,262 | 509,085 | 538,072 | 566,351 | 590,205 |
Accounts above the £600 mark in 1918 included 2,438 between £600 and £700, 1,367 between £700 and £800, 872 between £800 and £900, 744 between £900 and £1,000, and 1,132 over £1,000.
The securities standing in the name of the Postmaster-General on account of the Post Office Savings-bank Fund on the 31st December, 1918, represented a nominal value of £31,900,937. Most of this fund is invested in Government securities. A summary of the investments is as follows:—
| £ | s. | d. | |
|---|---|---|---|
| In New Zealand Government securities | 30,781,612 | 11 | 1 |
| In local bodies' securities | 1,074,926 | 0 | 0 |
| In other securities | 44,398 | 4 | 9 |
| Total | £31,900,936 | 15 | 10 |
There are five savings-banks not connected with the Post Office. The total amount deposited in them during the year ended the 31st March, 1919, was £2,058,360, of which the deposits by Maoris comprised £407. The withdrawals reached the sum of £1,775,531, or £282,829 less than the deposits. The total amount to the credit of the depositors at the 31st March, 1919, was £3,111,529; of which sum £382 belonged to Maoris. Figures for ten years are as follows:—
| Year ended 31st March. | Number of Depositors at End of Year. | Total Amount of Deposits during Year. | Total Amount of Withdrawals during Year. | Excess of Deposits over Withdrawals. | Total Amount to Credit of Depositors at End of Year. |
|---|---|---|---|---|---|
The minus sign (-) represents excess of withdrawals over deposits. * Year ended 31st December. † Fifteen months ended 31st March. | |||||
| £ | £ | £ | £ | ||
| 1909* | 49,056 | 1,168,735 | 1,169,654 | -919 | 1,398,512 |
| 1910* | 51,534 | 1,338,336 | 1,269,973 | 68,363 | 1,515,525 |
| 1911* | 54,036 | 1,420,321 | 1,337,586 | 82,735 | 1,651,275 |
| 1913† | 71,728 | 1,824,606 | 1,833,390 | -8,784 | 1,713,283 |
| 1914 | 74,120 | 1,478,309 | 1,461,510 | 16,799 | 1,792,108 |
| 1915 | 75,941 | 1,358,876 | 1,340,760 | 18,116 | 1,876,725 |
| 1916 | 78,024 | 1,449,938 | 1,327,364 | 122,574 | 2,072,602 |
| 1917 | 81,900 | 1,631,065 | 1,374,114 | 256,951 | 2,412,465 |
| 1918 | 85,191 | 1,764,723 | 1,551,836 | 212,887 | 2,720,709 |
| 1919 | 89,203 | 2,058,360 | 1,775,531 | 282,829 | 3,111,529 |
The deposits in the savings-banks of the Commonwealth on the 31st March, 1918, and of New Zealand on the 31st December, 1917 (Post Office), and on the 31st March, 1918 (private), are shown in the table following. The Australian figures are taken from the Quarterly Summary of Australian Statistics issued by the Commonwealth Statistician. In calculating the deposits per head of population in New Zealand Maoris were omitted from the population, although the total amount on deposit includes deposits by them. The amount deposited by Maoris is very small in proportion to the number of Maoris in the Dominion. Their inclusion would lower the rate per head to £27 13s. 8d.
| State. | Number of Depositors. | Amount on Deposit at End of Year. | Average Amount per Depositor at End of Year. | Deposits to Credit per Head of Population. | ||||
|---|---|---|---|---|---|---|---|---|
| £ | £ | s. | d. | £ | s. | d. | ||
| New South Wales | 908,203 | 41,976,008 | 46 | 3 | 3 | 22 | 2 | 7 |
| Victoria | 903,813 | 33,267,158 | 36 | 16 | 2 | 23 | 16 | 6 |
| Queensland | 302,945 | 16,077,837 | 53 | 1 | 4 | 23 | 4 | 4 |
| South Australia | 333,429 | 12,348,146 | 37 | 0 | 8 | 28 | 2 | 11 |
| Western Australia | 177,703 | 6,108,727 | 34 | 7 | 6 | 19 | 14 | 8 |
| Tasmania | 93,914 | 2,887,306 | 30 | 14 | 11 | 14 | 3 | 3 |
| Total, Commonwealth | 2,720,007 | 112,665,182 | 41 | 8 | 5 | 22 | 14 | 11 |
| New Zealand | 651,542 | 31,917,099 | 48 | 19 | 9 | 28 | 18 | 9 |
If the total deposits in the banks of issue at the end of the year be assumed to be equal to the average deposits for the four quarters of the year, then it may be affirmed that, exclusive of Government moneys, the deposits in the said banks of issue and in the two classes of savings-banks amounted at the end of 1918 to £77,480,038, representing an average of £70 4s. 10d. per head of population, or, including Maoris, £67 4s. 2d. per head. In addition there are the deposits with the building societies, referred to further on in this book, and it is known that there were also deposits with financial companies of which no particulars have been collected.
Table of Contents
AT the close of the year 1918 the following life-assurance offices were represented in New Zealand:—
The Australian Temperance and General Mutual Life Assurance Society (Limited).
The Australian Mutual Provident Society.
The Colonial Mutual Life Assurance Society (Limited).
The Equitable Life Assurance Society of the United States.
The Mutual Life and Citizens' Assurance Company (Limited).
The National Mutual Life Association of Australasia (Limited).
The New York Life Insurance Company.
The Norwich Union Life Insurance Company.
The Provident Life Assurance Company.
The Yorkshire Insurance Company.
The Life Insurance Department of the New Zealand Government.
The New Zealand Government and the Provident are the only purely New Zealand institutions, five of the societies having their head offices in Australia, two in England, and two in the United States of America.
The Provident Life Assurance Company and four of the Australian offices transact both ordinary life and industrial business. Several of the companies, including the New Zealand Government Office, have branches for assurance against accident.
The following table shows the total ordinary life-assurance business in force in the Dominion at the end of each of the ten years from 1908 to 1917:—
ORDINARY LIFE ASSURANCE . —NEW ZEALAND BUSINESS , 1908-17.
| Year. | Number of Policies in Force, including Annuities. | Amount insured. | Annuities per Annum. | Annual Premium Income, including Annuities. |
|---|---|---|---|---|
| £ | £ | £ | ||
| 1908 | 127,721 | 31,447,101 | 32,759 | 1,005,984 |
| 1909 | 133,558 | 32,629,734 | 34,369 | 1,040,303 |
| 1910 | 137,514 | 33,816,736 | 34,686 | 1,073,010 |
| 1911 | 143,652 | 35,323,742 | 37,009 | 1,116,772 |
| 1912 | 150,079 | 37,162,918 | 45,975 | 1,164,699 |
| 1913 | 153,654 | 38,566,688 | 44,636 | 1,199,047 |
| 1914 | 156,218 | 39,654,784 | 46,939 | 1,229,398 |
| 1915 | 160,568 | 40,967,147 | 39,112 | 1,274,667 |
| 1916 | 164,245 | 42,153,414 | 38,279 | 1,330,855 |
| 1917 | 164,145 | 42,885,433 | 37,856 | 1,372,278 |
Similar information to the above is given respecting the industrial business of the companies operating in New Zealand.
INDUSTRIAL ASSURANCE .—NEW ZEALAND BUSINESS , 1908-17.
| Year. | Number of Policies in Force, including Annuities. | Amount insured. | Annuities per Annum. | Annual Premium Income, including Annuities. |
|---|---|---|---|---|
| £ | £ | £ | ||
| 1908 | 49,435 | 1,188,920 | 888 | 69,822 |
| 1909 | 56,269 | 1,366,985 | .. | 81,999 |
| 1910 | 64,119 | 1,608,793 | 16 | 96,394 |
| 1911 | 72,194 | 1,887,111 | 16 | 113,421 |
| 1912 | 80,419 | 2,158,273 | .. | 130,691 |
| 1913 | 87,603 | 2,422,161 | .. | 148,928 |
| 1914 | 93,488 | 2,598,905 | .. | 163,164 |
| 1915 | 99,740 | 2,811,255 | .. | 181,533 |
| 1916 | 109,667 | 3,180,011 | .. | 206,495 |
| 1917 | 118,823 | 3,532,075 | .. | 233,620 |
The number of ordinary life policies in force in 1907 was 122,924, so that the increase in number during the ten years was 33.53 per cent., while in the industrial business the number of policies increased by 170.74 per cent. in the period, the number in force in 1907 having been 43,889. Taking both classes of life assurance together, the policies increased in number by 69.63 per cent. in the decennium, as compared with an increase in the total population of 18.09 per cent. during the same period. A statement of the income and outgo of all the companies operating in the Dominion, so far as ordinary business only is concerned, further illustrates the large increase in the business for the ten years.
ORDINARY LIFE ASSURANCE .—NEW ZEALAND BUSINESS .—INCOME AND OUTGO .
| Year. | Receipts and Expenditure. | Expenses of Management. | ||||
|---|---|---|---|---|---|---|
| Total Receipts, excluding Transfers. | Total Expenditure, excluding Transfers | Excess of Receipts. | Total. | Proportion to Premium Receipts | Proportion to Total Receipts | |
| £ | £ | £ | £ | Per Cent. | Per Cent. | |
| 1908 | 1,488,975 | 933,066 | 555,909 | 167,188 | 16.77 | 11.23 |
| 1909 | 1,556,282 | 970,808 | 585,474 | 172,325 | 16.83 | 11.07 |
| 1910 | 1,717,820 | 961,198 | 756,622 | 166,367 | 15.78 | 9.68 |
| 1911 | 1,679,576 | 1,100,297 | 579,279 | 177,078 | 16.06 | 10.54 |
| 1912 | 1,756,183 | 1,127,743 | 628,440 | 184,108 | 15.90 | 10.48 |
| 1913 | 1,794,353 | 1,101,013 | 693,340 | 182,666 | 15.41 | 10.18 |
| 1914 | 1,911,446 | 1,311,661 | 599,785 | 179,261 | 14.80 | 9.38 |
| 1915 | 1,922,485 | 1,397,434 | 525,051 | 176,715 | 14.05 | 9.19 |
| 1916 | 2,016,607 | 1,558,320 | 458,287 | 174,683 | 13.20 | 8.66 |
| 1917 | 2,091,512 | 1,804,647 | 286,865 | 173,407 | 12.63 | 8.29 |
The general expense rate, which in 1910 fell for the first time below 10 per cent., shows throughout the ten years the general decrease which might be expected to accompany the growing volume of the business; and in the premium-expense rate there is even a more marked decline, the rate having decreased from 16.84 per cent. in the year 1907 to 12.63 per cent. in 1917.
Results under similar headings are given in the next table for industrial assurance:—
INDUSTRIAL ASSURANCE .—NEW ZEALAND BUSINESS .—INCOME AND OUTGO .
| Year. | Receipts and Expenditure. | Expenses of Management. | ||||
|---|---|---|---|---|---|---|
| Total Receipts, excluding Transfers. | Total Expenditure, excluding Transfers. | Excess of Receipts. | Total. | Proportion to Premium Receipts. | Proportion to Total Receipts. | |
| £ | £ | £ | £ | Per Cent. | Per Cent. | |
| 1908 | 77,894 | 46,734 | 31,160 | 34,455 | 56.28 | 44.23 |
| 1909 | 76,763 | 55,185 | 21,578 | 40,121 | 55.57 | 52.26 |
| 1910 | 93,971 | 60,871 | 33,100 | 43,554 | 51.62 | 46.35 |
| 1911 | 107,238 | 70,224 | 37,014 | 52,508 | 51.88 | 48.96 |
| 1912 | 126,897 | 79,505 | 47,392 | 59,357 | 49.42 | 46.78 |
| 1913 | 145,283 | 103,587 | 41,696 | 62,277 | 45.22 | 42.87 |
| 1914 | 158,974 | 94,553 | 64,421 | 65,513 | 43.05 | 41.21 |
| 1915 | 177,319 | 93,973 | 83,346 | 66,041 | 39.22 | 37.24 |
| 1916 | 200,903 | 109,452 | 91,451 | 71,778 | 37.79 | 35.72 |
| 1917 | 232,895 | 128,468 | 104,427 | 77,921 | 35.49 | 33.46 |
This class of business has only recently attained any magnitude in the Dominion. The expense rate is exceedingly high, as is common with industrial assurance.
The New Zealand liabilities of all the institutions in respect of their ordinary life business at the end of 1917 were as follows:—
| £ | |
|---|---|
| Life assurance and annuity funds | 14,599,838 |
| Depreciation, reserve, and other special funds | 313,379 |
| Other liabilities | 548,067 |
| Total | £15,461,284 |
At the same date the liabilities of the industrial branch of the Provident Life Assurance Company and the Colonial Mutual Life Assurance Society were,—
| £ | |
|---|---|
| Capital | 21,000 |
| Funds | 138,262 |
| Other liabilities | 5,611 |
| Total | £164,873 |
The three other companies transacting both ordinary life and industrial assurance business did not show separate returns for their industrial branches.
The assets balance the liabilities in every case, and are stated as follows:—
| Ordinary Assurance. | Industrial Assurance.* | |
|---|---|---|
| £ | £ | |
* Two companies only; figures tor other companies included under "ordinary assurance." | ||
| Mortgages on property | 7,460,749 | 22,911 |
| Loans on policies | 2,165,467 | 1,951 |
| Government securities | 2,695,037 | 10,517 |
| Other investments | 1,415,841 | 68,435 |
| Cash | 254,272 | 4,586 |
| Other assets | 1,469,918 | 56,473 |
| Totals | £15,461,284 | £164,873 |
The Life Insurance Department of the New Zealand Government had at the end of 1918 policies in force to the number of 53,803, including 417 annuities. The total sum assured is £13,257,682, to which should be added reversionary bonuses amounting to £1,512,861, making the total business £14,770,543. The policies in force represent an annual premium income of £404,965.
The total income for 1918 was £654,316, of which £399,673 was premium income, £11,406 annuity purchase-money, and £243,237 interest (less land and income tax).
During the year 1,291 policies became claims by the deaths of policy-holders, the amounts payable totalling £337,767; and 711 policies matured for £177,199. The total sum which has been paid in respect of claims by death and survival since the foundation of the Department forty-nine years ago has amounted to £7,054,732.
The total assurance, annuity, and endowment funds, apart from a special investment reserve of £288,825, now stand at £5,191,745.
On the 31st December, 1918, the total assets amounted to £5,672,981, and were invested as shown in the following statement, which also gives the distribution of the assets at the end of the previous year for purposes of comparison: —
| Class of Investment. | At 31st December, 1917. | At 31st December, 1918. | ||
|---|---|---|---|---|
| Amount. | Percentage of Total Assets. | Amount. | Percentage of Total Assets. | |
| £ | £ | |||
| Mortgages on freehold property | 3,141,294 | 56.1 | 3,038,552 | 53.6 |
| Loans on policies | 780,976 | 13.9 | 738,018 | 13.0 |
| Government securities | 1,055,900 | 18.9 | 1,250,900 | 22.0 |
| Local bodies' debentures | 209,277 | 3.7 | 211,711 | 3.7 |
| Landed and house property | 134,898 | 2.4 | 134,864 | 2.4 |
| Miscellaneous assets | 130,064 | 2.3 | 128,593 | 2.3 |
| Cash in hand and on current account | 150,462 | 2.7 | 170,343 | 3.0 |
| Totals | 5,602,871 | 100.0 | 5,672,981 | 100.0 |
A detailed statement of the liabilities and assets as at the 31st December, 1918, is also given.
BALANCE -SHEET OF THE GOVERNMENT LIFE INSURANCE DEPARTMENT ON THE 31st DECEMBER , 1918.
| Liabilities. | |
|---|---|
| Total assurance, annuity, and endowment funds (as per Revenue Account) | £ |
| 5,191,745 | |
| Claims admitted (proofs not yet completed) | |
| 182,543 | |
| Annuities | 358 |
| Commission | 1,360 |
| Medical fees | 458 |
| Premium and other deposits | 5,407 |
| Fire-insurance moneys in suspense | 1,450 |
| Sundry accounts owing | 834 |
| Investment Fluctuation Reserve | 288,826 |
| £5,672,981 |
| Assets. | £ |
|---|---|
| Loans on policies | 738,017 |
| Government securities— £ | |
| Consolidated stock | 625,900 |
| Debentures issued under the District | |
| Railways Purchasing Act 1885 Extension and Amendment Act, 1886 | 40,000 |
| Debentures issued under the authority of the Finance Act, 1915 | 40,000 |
| New Zealand Inscribed Stock— War | |
| Loans | 545,000 |
| 1,250,900 | |
| Municipal Corporation debentures | 117,045 |
| County securities | 8,372 |
| Harbour Board debentures | 36,300 |
| Town Board debentures | 26,450 |
| Road Board debentures | 21,500 |
| Drainage Board debentures | 2,044 |
| Landed and house property | 133,121 |
| Landed and house property (leasehold) | 1,744 |
| Mortgages on property | 3,038,552 |
| Properties acquired by foreclosure | 3,000 |
| Overdue premiums on policies in force | 4,564 |
| Outstanding premiums due but not overdue | 41,354 |
| 45,918 | |
| Overdue interest | 2,941 |
| Outstanding interest due but not overdue | 7,554 |
| Interest accrued but not due | 66,992 |
| 77,487 | |
| Agents' balances | 2,188 |
| Cash in hand and on current account | 170,343 |
| £5,672,981 |
The triennial valuation of the liabilities was again made as at the 31st December, 1917. After adding a further sum of £99,704 to the Investment Fluctuation Reserve, there remained a surplus of £216,712, of which £205,291 was divided among the policyholders by way of bonus, and the balance of £11,421 carried forward. As on former occasions, the surplus divided was allotted as a compound reversionary bonus on the sum assured and bonuses in force, thus giving bonuses increasing with the duration of the policies to those policyholders who had not surrendered their previous bonuses. The bonuses allotted range from 20s. to 34s. per cent. per annum on the sum assured.
The cash surplus divided, £205,291, represents additions to the policies payable at death or on maturity of £322,090. Since the inception of the Department in 1870, £2,016,676 in cash has been distributed by way of bonus, the corresponding addition to the sums assured being £3,568,310.
The progress of the Department during the last three years, when compared with the four previous trienniums in respect of total business in force, is as follows:—
| Triennium. | Number of Policies. | Sums assured. | Reversionary Bonuses. | Annual Premiums. |
|---|---|---|---|---|
| £ | £ | £ | ||
| 1903-05 | 45,137 | 10,468,316 | 954,751 | 319,221 |
| 1906-08 | 47,033 | 10,955,749 | 1,068,950 | 331,830 |
| 1909-11 | 49,376 | 11,514,657 | 1,168,620 | 348,285 |
| 1912-14 | 52,273 | 12,550,465 | 1,246,610 | 370,882 |
| 1915-17 | 53,058 | 12,884,531 | 1,304,243 | 387,377 |
The new business undertaken during the same periods also shows an increase in each succeeding triennium.
NEW BUSINESS OF TRIENNIUM .
| Triennium. | Number of Policies. | Sums assured. | Annual Premiums. |
|---|---|---|---|
| £ | £ | ||
| 1903-05 | 9,526 | 2,112,927 | 70,428 |
| 1906-08 | 9,739 | 2,261,767 | 72,803 |
| 1909-11 | 10,476 | 2,487,472 | 77,477 |
| 1912-14 | 11,721 | 3,197,694 | 89,715 |
| 1915-17 | 10,129 | 2,709,163 | 90,017 |
At the close of the year 1917 there were thirty-three insurance offices doing accident business in the Dominion. Returns of receipts and expenditure have been submitted by all but two of these offices, and the figures are given in the next table. The table relates only to the accident business transacted by the various offices within the Dominion.
ACCIDENT INSURANCE IN NEW ZEALAND .—RECEIPTS AND EXPENDITURE , 1917.
| Office. | Receipts. | Expenditure. | ||||||||||||||||
|---|---|---|---|---|---|---|---|---|---|---|---|---|---|---|---|---|---|---|
| Premiums. | Other Receipts. | Total. | Claims paid. | Other Payments. | Total. | |||||||||||||
* Figures not available. | ||||||||||||||||||
| £ | s. | d. | £ | s. | d. | £ | s. | d. | £ | s. | d. | £ | s. | d. | £ | s. | d. | |
| Alliance | 5,388 | 14 | 5 | .. | .. | .. | 5,388 | 14 | 5 | 1,006 | 4 | 9 | 2,931 | 8 | 11 | 3,937 | 13 | 8 |
| Atlas | 4,591 | 0 | 11 | .. | .. | .. | 4,591 | 0 | 11 | 2,531 | 18 | 10 | 2,157 | 0 | 11 | 4,688 | 19 | 9 |
| British Traders | * | * | * | * | * | * | * | * | * | * | * | * | * | * | * | * | * | * |
| Colonial Mutual | 3,145 | 12 | 3 | 1,137 | 5 | 11 | 4,282 | 18 | 2 | 1,214 | 13 | 0 | 1,571 | 19 | 0 | 2,786 | 12 | 0 |
| Commercial Union | 15,997 | 9 | 8 | .. | .. | .. | 15,997 | 9 | 8 | 6,495 | 4 | 10 | 8,555 | 8 | 10 | 15,050 | 13 | 8 |
| Eagle, Star, and British Dominions | 915 | 9 | 11 | .. | .. | .. | 915 | 9 | 11 | .. | .. | .. | 620 | 13 | 4 | 620 | 13 | 4 |
| Farmers' Co-operative | 1,259 | 2 | 11 | .. | .. | .. | 1,259 | 2 | 11 | 522 | 2 | 2 | 600 | 4 | 5 | 1,122 | 6 | 7 |
| Guardian | 5,45 | 11 | 11 | .. | .. | .. | 5,145 | 11 | 11 | 2,219 | 12 | 7 | 2,972 | 13 | 6 | 5,102 | 6 | 1 |
| Liverpool and London and Globe | 7,670 | 14 | 6 | .. | .. | .. | 7,670 | 14 | 6 | 2,557 | 12 | 10 | 3,244 | 10 | 8 | 5,802 | 3 | 6 |
| London and Lancashire | 8,611 | 2 | 7 | 258 | 15 | 0 | 8,869 | 17 | 7 | 3,270 | 0 | 2 | 3,770 | 10 | 8 | 7,040 | 10 | 10 |
| Mutual Life and Citizens | 14,627 | 11 | 3 | .. | .. | .. | 14,627 | 11 | 3 | 6,387 | 4 | 1 | 6,881 | 15 | 0 | 13,268 | 19 | 1 |
| National | 17,422 | 18 | 8 | .. | .. | .. | 17,422 | 18 | 8 | 7,751 | 8 | 4 | 6,620 | 14 | 9 | 14,372 | 3 | 1 |
| New Zealand | 64,575 | 8 | 4 | .. | .. | .. | 64,575 | 8 | 4 | 39,586 | 4 | 6 | 23,537 | 2 | 8 | 63,123 | 7 | 2 |
| North British and Mercantile | 1,833 | 11 | 8 | .. | .. | .. | 1,833 | 11 | 8 | 763 | 13 | 4 | 777 | 9 | 2 | 1,541 | 2 | 6 |
| Northern | 4,960 | 10 | 0 | 408 | 0 | 0 | 5,368 | 10 | 0 | 1,464 | 17 | 8 | 2,220 | 8 | 9 | 3,685 | 6 | 5 |
| Norwich and London | 13,846 | 13 | 8 | 190 | 0 | 0 | 14,036 | 13 | 8 | 8,740 | 10 | 3 | 5,655 | 5 | 8 | 14,395 | 15 | 11 |
| Ocean | 25,386 | 12 | 3 | .. | .. | .. | 25,386 | 12 | 3 | 13,924 | 19 | 9 | 10,644 | 3 | 11 | 24,569 | 3 | 8 |
| Phoenix | 2,891 | 10 | 7 | .. | .. | .. | 2,891 | 10 | 7 | 607 | 6 | 8 | 1,477 | 14 | 3 | 2,085 | 0 | 11 |
| Provident Life | 570 | 15 | 11 | 18 | 2 | 0 | 588 | 17 | 11 | 238 | 7 | 6 | 180 | 4 | 9 | 418 | 12 | 3 |
| Queensland | 8,533 | 12 | 1 | 400 | 0 | 0 | 8,933 | 12 | 1 | 3,899 | 19 | 5 | 3,094 | 0 | 6 | 6,993 | 19 | 11 |
| Royal | 11,550 | 17 | 8 | .. | .. | .. | 11,550 | 17 | 8 | 7,329 | 12 | 8 | 4,845 | 14 | 3 | 12,175 | 6 | 11 |
| Royal Exchange | 12,145 | 12 | 5 | .. | .. | .. | 12,145 | 12 | 5 | 5,391 | 7 | 2 | 5,115 | 9 | 2 | 10,506 | 16 | 4 |
| Sawmillers' Mutual | 2,962 | 6 | 6 | 514 | 5 | 11 | 3,476 | 12 | 5 | 1,739 | 12 | 7 | 847 | 16 | 2 | 2,587 | 8 | 9 |
| South British | 48,818 | 10 | 10 | .. | .. | .. | 48,818 | 10 | 10 | 30,929 | 17 | 2 | 16,941 | 4 | 7 | 47,871 | 1 | 9 |
| Standard | 23,229 | 8 | 2 | .. | .. | .. | 23,229 | 8 | 2 | 11,931 | 9 | 11 | 10,727 | 13 | 7 | 22,659 | 3 | 6 |
| Sun | 1,640 | 2 | 8 | .. | .. | .. | 1,640 | 2 | 8 | 281 | 10 | 1 | 599 | 6 | 2 | 880 | 16 | 3 |
| Taranaki Farmers | 228 | 18 | 0 | .. | .. | .. | 228 | 18 | 0 | 35 | 0 | 10 | 156 | 7 | 0 | 191 | 7 | 10 |
| Union | 4,340 | 6 | 8 | .. | .. | .. | 4,340 | 6 | 8 | 2,870 | 9 | 6 | 1,053 | 16 | 11 | 3,924 | 6 | 5 |
| Union Insurance Society of Canton | * | * | * | * | * | * | * | * | * | * | * | * | * | * | * | * | * | * |
| United | 3,083 | 18 | 9 | 3,083 | 18 | 9 | 1,770 | 2 | 10 | 1,815 | 8 | 4 | 3,585 | 11 | 2 | |||
| Victoria | 10,480 | 9 | 0 | .. | .. | .. | 10,480 | 9 | 0 | 3,843 | 5 | 2 | 4,927 | 16 | 0 | 8,771 | 1 | 2 |
| Yorkshire | 3,190 | 6 | 5 | .. | .. | .. | 3,190 | 6 | 5 | 939 | 10 | 5 | 953 | 12 | 10 | 1,893 | 3 | 3 |
| Insurance Department of New Zealand Government | 22,058 | 3 | 7 | 2,450 | 5 | 11 | 24,508 | 9 | 6 | 9,269 | 14 | 9 | 6,015 | 12 | 6 | 15,285 | 7 | 3 |
| Totals | 351,103 | 4 | 2 | 5,376 | 14 | 9 | 356,479 | 18 | 11 | 179,513 | 13 | 9 | 141,513 | 7 | 2 | 321,027 | 0 | 11 |
The Accident Branch of the Government Insurance Department was opened in 1901. General accident business is undertaken, but the branch was opened more especially with a view to relieve employers of labour of the liability imposed upon them by the Workers' Compensation for Accidents Act, 1900, particulars of which are given in the 1915 issue of this book.
The Department's policies cover the full liability of an employer to his workmen under the Workers' Compensation Act, and the liability under common law to the extent of £500 per man.
Personal-accident policies are also issued securing amounts for accidental death and permanent total or partial disablement, and weekly allowances during temporary disablement.
The premium income and claims of the Accident Branch since the commencement of business have been as follows:—
| Year. | Gross Premium Income. | Claims. |
|---|---|---|
* From 7th June to 31st December. | ||
| £ | £ | |
| 1901* | 11,856 | 2,428 |
| 1902 | 14,100 | 7,364 |
| 1903 | 24,381 | 13,230 |
| 1904 | 23,768 | 12,105 |
| 1905 | 23,970 | 11,242 |
| 1906 | 20,815 | 13,720 |
| 1907 | 21,477 | 11,288 |
| 1908 | 20,898 | 11,926 |
| 1909 | 26,337 | 12,805 |
| 1910 | 21,364 | 12,522 |
| 1911 | 20,756 | 10,497 |
| 1912 | 23,513 | 12,016 |
| 1913 | 23,677 | 11,492 |
| 1914 | 22,284 | 9,633 |
| 1915 | 23,466 | 9,092 |
| 1916 | 22,378 | 10,698 |
| 1917 | 22,115 | 9,270 |
| 1918 | 21,823 | 10,830 |
The funds, assets, and liabilities of the Government Insurance Department belonging to its Accident Insurance Branch are kept separate and distinct from the main life-insurance business, and powers are vested in the Governor-General to make regulations in regard to tables fixing rates of premium and other details for the conduct of the Accident Insurance Branch.
The funds at the end of 1917 amounted to £29,212, which amount has been transferred to the Reserve Fund. The funds at the end of 1918—viz., £6,329— consequently represent the excess for the year of income over outgo. The Reserve Fund, which was constituted under section 20 of the Government Accident Insurance Act, 1908, now stands at £91,808. The total assets at the end of the year amounted to £119,748.
The assets and liabilities on the 31st December, 1918, were as follows:—
| Liabilities. | |
|---|---|
| £ | |
| Accident funds as per Revenue Account | 6,329 |
| Claims admitted (proofs not yet completed) | 8,500 |
| Commission | 341 |
| Premium and other deposits | 36 |
| Reserve for unearned premiums | 9,734 |
| Investment Fluctuation Reserve | 3,000 |
| Reserve Fund constituted under section 20 of the Government Accident Insurance Act, 1908 | 91,808 |
| £119,748 |
| Assets. | ||
|---|---|---|
| £ | ||
| Debentures issued under authority of the Finance Act, 1915 | 10,000 | |
| New Zealand Inscribed Stock— War loans | 26,000 | |
| Mortgages on property | 65,020 | |
| Overdue interest | £41 | |
| Outstanding interest due but not overdue | 47 | |
| Interest accrued but not due | 1,039 | |
| 1,127 | ||
| Agents' balances | 158 | |
| Sundry accounts owing | 599 | |
| Cash in hand and on current account | 16,844 | |
| £119,748 |
On the 1st April, 1919, thirty companies and four associations, besides the New Zealand State Fire Insurance Office, were carrying on the business of fire insurance in the Dominion, seven of the companies, as well as all four of the associations, being New Zealand institutions. The full list is as follows:—
Alliance Assurance Company (Limited).
Atlas Assurance Company (Limited).
Australian Alliance Assurance Company.
British Traders Insurance Company (Limited).
Commercial Union Assurance Company (Limited).
Eagle, Star, and British Dominions General Insurance Company (Limited) of London.
Excess Insurance Company (Limited).
Farmers' Co-operative Fire and Marine Insurance Association of New Zealand (Limited).
Guardian Assurance Company (Limited).
Home Insurance Company.
Liverpool and London and Globe Insurance Company (Limited).
London and Lancashire Fire Insurance Company (Limited).
National Insurance Company of New Zealand (Limited).
New Zealand Insurance Company (Limited).
North British and Mercantile Insurance Company.
Northern Assurance Company (Limited).
Norwich Union Fire Insurance Society (Limited).
Ocean Accident and Guarantee Corporation (Limited).
Phœnix Assurance Company (Limited).
Queensland Insurance Company (Limited).
Royal Exchange Assurance Corporation of London.
Royal Insurance Company (Limited).
South British Insurance Company (Limited).
Standard Fire and Marine Insurance Company of New Zealand (Limited).
State Fire Insurance Office.
Sun Insurance Office.
Union Assurance Society (Limited).
Union Insurance Society of Canton (Limited).
United Insurance Company (Limited).
Victoria Assurance Company (Limited).
Yorkshire Insurance Company (Limited).
Hawke's Bay Farmers' Mutual Fire Insurance Association.
Otago "Farmers' Union Mutual Fire Insurance Association.
Taranaki Farmers' Mutual Fire Insurance Association.
Wellington Farmers' Union Mutual Fire Insurance Association.
By an Order in Council gazetted 31st July, 1919, the Government Statistician was authorized to collect statistics relating to offices doing fire business in the Dominion, the principal heads of inquiry being as to the stability of companies, revenue account, and fire losses. Information has already been collected for the year 1918, but the tabulation of the figures supplied has not yet reached a stage which will permit of the inclusion of the results in this volume.
In the year 1903 an Act was passed "to establish a State Fire Insurance Office and to make other provisions for the insurance and protection of insurable property in New Zealand against loss or damage by fire." This Act came into operation on the 4th January, 1905, when the State Fire Insurance Office opened for public business.
As a consequence of the operations of the State Fire Office, the rates on trade risks and the like have been reduced by 10 per cent., and those on dwellings, offices, and similar risks by 33 1/3 per cent.
The premium income, after deducting premiums on reinsurances during the ten years 1909-18, has been as follows:—
| Year. | Amount of Net Premium Income. |
|---|---|
| £ | |
| 1909 | 33,281 |
| 1910 | 40,552 |
| 1911 | 47,745 |
| 1912 | 54,380 |
| 1913 | 59,418 |
| 1914 | 64,646 |
| 1915 | 71,166 |
| 1916 | 77,609 |
| 1917 | 85,321 |
| 1918 | 90,077 |
The premium rates have remained unaltered during the above years. Debentures to the amount of £2,000 were raised under the authority of the Act governing the Office, but have now been redeemed. The Office has the sum of £68,196 invested in Government debentures and Consols, exclusive of war bonds mentioned below. The accumulated funds amount to £214,020, an increase of £31,375 over the figures for 1917.
The net profits for the year 1918, after deducting a sum of £13,793 payable as income-tax, and after appropriating a sum of £1,902 to reserve for unearned premiums and £1,000 to a special Investments Fluctuation Reserve, were £28,472, as against £22,601 for 1917. The total accumulated profit at the 31st December, 1918, amounted to £172,989.
The loss-ratio of 33.2 per cent. for the year, as compared with 32.0 per cent. for 1917, is still remarkably low, and is considerably less than the average loss-ratio for the whole fire-insurance business of the Dominion.
The total cover (new and renewals) issued during the year amounted to the large sum of over £24,000,000.
The total assets of the Office at the close of 1918 amounted to £244,927, the increase for the year being £36,707.
Investments at the 31st December, 1918, amounted to £199,480. Of this sum £45,000 was invested during the year in New Zealand Government war bonds.
In view of the present strong financial position of the Office the State Fire Insurance Board has determined, under the provisions of the State Fire Insurance Amendment Act, 1912, to grant as early as possible a bonus to policyholders on premiums paid. The sum of £8,000 out of the profits for 1916 has been set aside for this purpose and to cover costs of making the assessment.
The balance-sheet of the State Fire Insurance Office as at the 31st December, 1918, is appended.
| Liabilities. | £ | £ |
|---|---|---|
| Capital authorized by £ the State Fire Insurance Act, 1908 | 100,000 | |
| Less not raised | 100,000 | |
| — | Nil | |
| Reserve Fund | 136,517 | |
| Reserve for bonus to policyholders | 8,000 | |
| Investment Fluctuation Reserve Fund | 5,000 | |
| Reserve for unearned premiums | 36,031 | |
| Premiums and other deposits | 486 | |
| Outstanding fire losses | 2,390 | |
| Government taxes | 13,793 | |
| Other amounts owing by the Office— | ||
| Reinsurance premiums due | £ | |
| 12,329 | ||
| Commission | 1,375 | |
| Rent | 40 | |
| Printing, stationery, and advertising | 17 | |
| Postages and sundry charges | 478 | |
| 14,239 | ||
| Fire-insurance funds, as per Revenue Account | 28,472 | |
| £244,928 |
| Assets. | ||
|---|---|---|
| £ | ||
| Government war bonds and stock | 100,000 | |
| Government debentures and Consols | 68,196 | |
| Municipal Corporation loans | 500 | |
| Mortgages on property | 2,850 | |
| Freehold land and buildings | 27,934 | |
| Outstanding premiums | 7,172 | |
| Interest accrued but not due | 1,470 | |
| Rent accrued but not due | 80 | |
| Cash in Bank of New Zealand at Wellington or in transit to Wellington | 36,437 | |
| Imprest Account balances— | ||
| £ | ||
| Head Office | 16 | |
| Auckland | 64 | |
| Christchurch | 87 | |
| Dunedin | 90 | |
| Palmerston North | 30 | |
| New Plymouth | 2 | |
| 289 | ||
| £244,928 |
Every foreign company—i.e., a company registered or established out of New Zealand, and including a local company whose chief office is situated out of the Dominion—which proposes to commence in New Zealand the business of life insurance, whether conjointly or not with any other class of business, must deposit with the Public Trustee a sum of not less than £5,000 nor more than £50,000 in cash or approved securities. The amount of deposit is calculated on the total amount assured by current policies at the rate of £5,000 deposit for every £100,000 assured until the maximum deposit is reached.
A foreign company proposing to carry on fire- and marine-insurance business in the Dominion must first obtain from the Public Trustee a certificate in the form prescribed authorizing the company to transact its business for a period of twelve months from the date of the certificate. The certificate is renewable annually, provided the Public Trustee is satisfied that the company is financially sound.
Accident insurance or insurance business of any class not previously mentioned may be transacted in New Zealand by a foreign company, provided the company deposit with the Public Trustee the sum of £10,000 in cash or approved securities. If the company carries on a life-assurance business as well as accident insurance the last-mentioned deposit must be made in addition to that described in the first paragraph.
All cash deposited with the Public Trustee as deposit shall bear interest, which is payable to the company making the deposit.
Table of Contents
THE various Acts relating to the custody and administration of the public moneys and securities are now consolidated in the Public Revenues Act, 1908. All public moneys, excepting those payable to or received by the Post Office, the Government Insurance Office, the Public Trust Office, the Commissioners of the Public Debt Sinking Funds, the New Zealand State Advances Office, the State Fire Insurance Office, and the deposits under the New Zealand Consols Act, are paid into one account at the bank called the "Public Account," and are carried to one or other of the following accounts or funds in the books of the Treasury:—
The Consolidated Fund.
The Public Works Fund.
Separate accounts or funds created under any special Act.
The main Consolidated Fund Account records the ordinary public revenue and expenditure. There are certain subsidiary accounts to this fund which come under the third head in the above category. The Public Works Fund Account contains receipts from loans or aids from the Consolidated Fund and the expenditure on public works, immigration, or special services legally chargeable to that account.
The financial year commences on the 1st day of April and ends on the 31st day of March. The revenue of any financial year is the money received into the Public Account at the bank at Wellington within the year; the expenditure is the money paid at the Treasury within the year, and the money paid by imprestees of which accounts are received at the Treasury within the year. Imprests not accounted for at the end of a financial year are included in the accounts of the following year.
At the end of each financial year the Appropriation Acts lapse, but the Minister of Finance is authorized for a period of three months from the commencement of the next financial year to pay money in respect of any service, provided the amount does not exceed the unexpended balance voted for that purpose in the previous year, together with an amount equal to one-fourth of such vote.
The usual practice is for Parliament to meet at the end of June in each year, and vote supplies from month to month until the estimated expenditure for the year has been approved and the annual Appropriation Act is passed.
In the audit of expenditure both the pre-audit and post-audit systems are in operation. Pro-audit is applied to vouchers in respect of payments on account of salaries of new appointees, temporary officers, and officers claiming more than one month's salary at any time; interest, loan transactions, and return of deposits; on account of unauthorized expenditure; or chargeable against the accounts of local bodies. Post-audit is applied to all other payments.
Vouchers must be certified as correct by the proper officer, and forwarded by him to the Head of his Department for approval. Vouchers subject to pre-audit are then forwarded to the Audit Office, and on being found correct are sent on to the Treasury to be entered on requisitions for payment. Vouchers subject to post-audit are transmitted by the Head of the Department direct to the Treasury. Payment is made by the Treasury, and the claim is afterwards submitted for audit.
The total revenue and expenditure of the Consolidated Fund Account for the financial years ended the 31st March, 1910 to 1919, is shown in the following table, together with the excess of revenue for each year and the amount of such excess transferred to the Public Works Fund in the succeeding year:—
| Year ended 31st March. | Revenue. | Expenditure. | Excess of Revenue over Expenditure. | Amount of Excess transferred to the Public Works Fund. |
|---|---|---|---|---|
| £ | £ | £ | £ | |
| 1910 | 9,238,917 | 8,990,922 | 247,995 | .. |
| 1911 | 10,297,273 | 9,343,106 | 954,167 | 800,000 |
| 1912 | 11,061,161 | 10,340,368 | 720,793 | 500,000 |
| 1913 | 11,734,271 | 11,082,038 | 652,233 | 750,000 |
| 1914 | 12,229,661 | 11,825,864 | 403,797 | 675,000 |
| 1915 | 12,451,945 | 12,379,803 | 72,142 | 350,000 |
| 1916 | 14,507,530 | 12,493,107 | 2,014,423 | .. |
| 1917 | 18,355,194 | 14,058,770 | 4,296,424 | .. |
| 1918 | 20,206,222 | 15,120,288 | 5,085,934 | .. |
| 1919 | 22,352,372 | 18,673,599 | 3,678,773 | .. |
| Totals, 10 years | 142,434,546 | 124,307,865 | 18,126,681 | 3,075,000 |
To the amount of excess revenue for the ten years must be added the sum of £184,320 brought forward from the financial year ended the 31st March, 1909, and an amount of £14,960, representing sinking funds set free (£2,607 in 1915-16 and £12,353 in 1916-17), making a total of £18,325,961. Deducting the total amount transferred to the Public Works Fund, and a sum of £11,400 for redemption of debentures (in 1913-14), there remains a balance of £15,239,561 which has been carried forward to the current year's account. Of this large balance £12,021,529 is invested in London in Imperial Government securities as a special reserve to meet any possible sudden demands resulting from the war.
The total amount of excess revenue transferred to the Public Works Fund during the twenty-eight financial years ended the 31st March, 1919, was £10,305,000.
An analysis of the revenue received during each of the past ten financial years is made in the next table.
CONSOLIDATED FUND .—REVENUE . 1909-10 TO 1918-19.
| Year ended 31st March. | Revenue derived from | Total Revenue. | |||
|---|---|---|---|---|---|
| Taxation. | Services. | Crown Lands. | Other Sources. | ||
| £ | £ | £ | £ | £ | |
| 1910 | 4,180,516 | 4,420,096 | 269,730 | 368,575 | 9,238,917 |
| 1911 | 4,837,322 | 4,743,056 | 310,894 | 406,001 | 10,297,273 |
| 1912 | 5,296,590 | 4,987,088 | 311,156 | 466,327 | 11,061,161 |
| 1913 | 5,606,829 | 5,379,966 | 313,923 | 433,553 | 11,734,271 |
| 1914 | 5,918,034 | 5,551,913 | 262,846 | 496,868 | 12,229,661 |
| 1915 | 5,880,811 | 5,706,929 | 318,393 | 545,812 | 12,451,945 |
| 1916 | 7,266,966 | 6,423,452 | 311,969 | 505,143 | 14,507,530 |
| 1917 | 10,549,654 | 6,885,422 | 301,758 | 618,360 | 18,355,194 |
| 1918 | 12,340,853 | 6,729,524 | 306,136 | 829,709 | 20,206,222 |
| 1919 | 13,801,643 | 7,162,530 | 311,558 | 1,076,641 | 22,352,372 |
| Totals, 10 years | 75,679,218 | 57,989,976 | 3,018,363 | 5,746,989 | 142,434,546 |
Revenue under the head of "Taxation" includes Customs and excise duties, land-tax, income-tax, death duties, a tax on bank-note issue, and totalizator-taxes. Revenue from "Services" consists of Railway, Post, Telegraph, and Telephone receipts, and certain fees paid in return for special services. Revenue from "Crown Lands" includes proceeds of sales up to and including 1912-13, but not for subsequent years. The other items in Crown-lands revenue are rents and national-endowment net revenue. The amounts shown under "Other Sources" include miscellaneous revenue and sundry amounts recovered in respect of expenditure of previous years.
During the war period the total revenue shows in each year very large increases—that for 1915-16 being over two millions, for 1916-17 nearly four millions, for 1917-18 nearly two millions, and for 1918-19 over two millions. These increases are due in great part to increased taxation as set out in the next subsection, but partly also to increased charges for certain public services, notably railway fares and postal and telegraphic charges.
The total revenue per head of population, and the amounts per head derived from taxation and from other sources, during the past ten years are shown in the following table:—
REVENUE PER HEAD OF POPULATION . 1909-10 TO 1918-19.
| Year ended 31st March. | Revenue per Head derived from | Total Revenue per Head. | |||||||
|---|---|---|---|---|---|---|---|---|---|
| Taxation. | Other Sources. | ||||||||
| £ | s. | d. | £ | s. | d. | £ | s. | d. | |
| 1910 | 4 | 5 | 6 | 5 | 3 | 5 | 9 | 8 | 11 |
| 1911 | 4 | 16 | 11 | 5 | 9 | 5 | 10 | 6 | 4 |
| 1912 | 5 | 3 | 10 | 5 | 13 | 1 | 10 | 16 | 11 |
| 1913 | 5 | 7 | 2 | 5 | 17 | 1 | 11 | 4 | 3 |
| 1914 | 5 | 10 | 0 | 5 | 17 | 4 | 11 | 7 | 4 |
| 1915 | 5 | 7 | 5 | 6 | 0 | 0 | 11 | 7 | 5 |
| 1916 | 6 | 12 | 1 | 6 | 11 | 7 | 13 | 3 | 8 |
| 1917 | 9 | 11 | 11 | 7 | 2 | 0 | 16 | 13 | 11 |
| 1918 | 11 | 3 | 9 | 7 | 2 | 7 | 18 | 6 | 4 |
| 1919 | 12 | 7 | 8 | 7 | 13 | 5 | 20 | 1 | 1 |
Expenditure out of the Consolidated Fund is grouped under two main headings by the Treasury, "Permanent" and "Annual." Permanent appropriations, as the name implies, are those fixed by special Acts of the Legislature. Annual appropriations are voted each year by resolution of Parliament, and include the cost of the business undertakings of the State. In the following table this grouping has not been adopted, as it is considered more desirable to show the growth of the main items of expenditure during the last ten financial years:—
| Year ended 31st March. | Amount expended on | Total Expenditure. | ||||
|---|---|---|---|---|---|---|
| Working Railways. | Post and Telegraph. | Education. | Interest, &c., on Public Debt. | Other Expenses. | ||
| £ | £ | £ | £ | £ | £ | |
| 1910 | 2,168,189 | 855,862 | 936,875 | 2,397,462 | 2,632,534 | 8,990,922 |
| 1911 | 2,270,851 | 911,529 | 984,854 | 2,458,452 | 2,717,420 | 9,343,106 |
| 1912 | 2,467,718 | 986,527 | 1,072,992 | 2,656,344 | 3,156,787 | 10,340,368 |
| 1913 | 2,817,141 | 1,066,922 | 1,148,897 | 2,717,013 | 3,332,065 | 11,082,038 |
| 1914 | 3,004,181 | 1,170,883 | 1,206,678 | 2,887,981 | 3,556,141 | 11,825,864 |
| 1915 | 2,881,087 | 1,245,224 | 1,288,795 | 3,071,448 | 3,893,249 | 12,379,803 |
| 1916 | 2,964,006 | 1,294,712 | 1,441,398 | 3,190,798 | 3,602,193 | 12,493,107 |
| 1917 | 2,871,977 | 1,368,490 | 1,525,106 | 4,032,885 | 4,260,312 | 14,058,770 |
| 1918 | 3,067,658 | 1,487,145 | 1,640,988 | 4,430,779 | 4,493,718 | 15,120,288 |
| 1919 | 3,415,595 | 1,699,701 | 1,737,036 | 6,086,769 | 5,734,498 | 18,673,599 |
The "Other Expenses" group includes old-age pensions, which amounted to £362,195 in 1909-10 and to £741,983 in 1918-19. The charges of the public debt are found to have absorbed 30.01 per cent. of the revenue in 1909-10 (excluding amounts received by alienation of Crown lands) and 27.23 per cent. in 1918-19.
The total receipts of the Consolidated Fund for the financial year 1918-19, including a balance of £11,560,788 brought forward from the previous year were £33,913,160, and the total expenditure for the same period was £18,673,599, leaving the large balance of £15,239,561 to carry forward.
CONSOLIDATED FUND .—RECEIPTS , 1918-19.
| From taxation— | £ | £ |
|---|---|---|
| Customs | 3,830,682 | |
| Excise | 273,334 | |
| Land-tax | 1,512,693 | |
| Income-tax | 6,219,336 | |
| Death duties | 869,371 | |
| Bank-note-issue tax | 188,003 | |
| Totalizator-tax | 229,273 | |
| Other taxes | 678,951 | |
| 13,801,643 | ||
| From services— | £ | £ |
| Railways | 4,975,445 | |
| Postal | 993,584 | |
| Telegraph | 615,786 | |
| Telephone | 373,169 | |
| Other services | 222,274 | |
| 7,180,258 | ||
| Land revenue— | ||
| Rents, Crown lands | 202,734 | |
| Net revenue from national-endowment lands (1916-17) | 108,824 | |
| 311,558 | ||
| Miscellaneous | 1,058,913 | |
| Total | £22,352,372 |
Taxation represented 61.74 per cent. of the total revenue for the year 1918-19, and services contributed 32.12 per cent. For the last financial year preceding the war (1913-14) the proportions were 48.39 per cent. and 45.40 per cent. respectively.
The amount shown as net revenue from national-endowment lands represents the money received from that source during the previous financial year. The method adopted is to place the amount received under this head each year to a separate account, and, after deducting necessary expenses, to transfer the balance to the Consolidated Fund Account. Of this balance 70 per cent. is expended on education and 30 per cent. on old-age pensions
CONSOLIDATED FUND .—EXPENDITURE , 1918-19.
| £ | £ | |
|---|---|---|
| Charges of the public debt (excluding interest and sinking fund charges paid out of separate accounts) | 6,086,769 | |
| Pensions and allowances— | ||
| Old-age pensions | 741,983 | |
| Widows' pensions | 80,670 | |
| Military pensions | 1,253,486 | |
| Miners' pensions | 8,852 | |
| Civil pensions and allowances | 36,850 | |
| Civil Service, Railway, and Teachers' Superannuation Funds | 154,000 | |
| 2,275,841 | ||
| Payment to local bodies— | ||
| Subsidies | 163,524 | |
| Endowments revenue | 41,595 | |
| Under the Land Act | 46,576 | |
| Other payments | 559 | |
| 252,254 | ||
| Public instruction— | ||
| Elementary | 1,023,402 | |
| Secondary and higher | 162,530 | |
| Manual and technical | 72,894 | |
| Training of teachers | 53,467 | |
| Native schools | 38,345 | |
| Industrial schools | 42,185 | |
| School buildings | 147,895 | |
| Departmental and miscellaneous | 120,141 | |
| National-endowment revenue not included above | 76,177 | |
| 1,737,036 | ||
| Judicial and legal— | £ | £ |
| Administration of Justice | 139,624 | |
| Police | 302,775 | |
| Prisons | 73,670 | |
| 516,069 | ||
| Railways working-expense | 3,415,595 | |
| Postal and Telegraph services | 1,699,701 | |
| Defence (including naval defence) | 448,553 | |
| Other expenditure— | ||
| Departmental | 2,226,227 | |
| Miscellaneous | 15,554 | |
| 2,241,781 | ||
| Total | £18,673,599 |
A comparison of the revenue of the Consolidated Fund for the year 1918-19 with that of the previous year, together with the percentage which each item bears to the totals, and the increase or decrease, as the case may be, is given in the table following:—
CONSOLIDATED FUND .—REVENUE FOR 1918-19 COMPARED WITH 1917-18.
| Head of Revenue. | Revenue of Consolidated Fund. | Increase for 1918-19. | ||||
|---|---|---|---|---|---|---|
| 1917-18. | Per Cent. of Total. | 1918-19. | Per Cent. of Total. | Numerical. | Per Cent. | |
* Decrease. | ||||||
| Taxation— | £ | £ | £ | |||
| Customs and excise | 3,601,383 | 17.82 | 4,104,016 | 18.36 | 502,633 | 13.96 |
| Land | 1,385,708 | 6.86 | 1,512,693 | 6.77 | 126,985 | 9.16 |
| Income | 5,619,561 | 27.81 | 6,219,336 | 27.82 | 599,775 | 10.67 |
| Death duties | 805,511 | 3.99 | 869,371 | 3.89 | 63,860 | 7.93 |
| Other taxes | 928,690 | 4.60 | 1,096,227 | 4.90 | 167,537 | 18.04 |
| Services— | ||||||
| Railways | 4,668,273 | 23.10 | 4,975,445 | 22.26 | 307,172 | 6.58 |
| Postal | 976,027 | 4.83 | 993,584 | 4.45 | 17,557 | 1.80 |
| Telegraph | 516,865 | 2.56 | 615,786 | 2.75 | 98,921 | 19.14 |
| Telephone | 344,368 | 1.70 | 373,169 | 1.67 | 28,801 | 8.36 |
| Other services | 223,991 | 1.11 | 222,274 | 1.00 | -1,717* | 0.77* |
| Land revenue | 306,136 | 1.51 | 311,558 | 1.39 | 5,422 | 1.77 |
| Miscellaneous | 829,709 | 4.11 | 1,058,913 | 4.74 | 229,204 | 27.62 |
| Totals | 20,206,222 | 100.00 | 22,352,372 | 100.00 | 2,146,150 | 10.62 |
The expenditure of the Consolidated Fund Account for the last two financial years is presented in the next table in similar form to the above.
CONSOLIDATED FUND .—EXPENDITURE FOR 1918-19 COMPARED WITH 1917-18.
| Head of Expenditure. | Expenditure of Consolidated Fund | Increase for 1918-19. | ||||
|---|---|---|---|---|---|---|
| 1917-18. | Per Cent. of Total. | 1918-19. | Per Cent of Total. | Numerical. | Per Cent. | |
* Decrease. | ||||||
| £ | £ | £ | ||||
| Charges of the public debt | 4,430,779 | 29.30 | 6,086,769 | 32.60 | 1,655,990 | 37.37 |
| Pensions and allowances | 1,398,746 | 9.25 | 2,275,841 | 12.19 | 877,095 | 62.71 |
| Payment to local bodies | 276,885 | 1.83 | 252,254 | 1.35 | -24,631* | 8.90* |
| Public instruction | 1,640,987 | 10.85 | 1,737,036 | 9.30 | 96,049 | 5.85 |
| Judicial and legal | 463,747 | 3.07 | 516,069 | 2.76 | 52,322 | 11.28 |
| Railways working-expenses | 3,069,255 | 20.30 | 3,415,595 | 18.29 | 346,340 | 11.28 |
| Postal and Telegraph services | 1,487,145 | 9.84 | 1,699,701 | 9.10 | 212,556 | 14.29 |
| Defence (including naval) | 470,337 | 3.11 | 448,553 | 2.40 | -21,784* | 4.63* |
| Other expenditure | 1,882,407 | 12.45 | 2,241,781 | 12.01 | 359,374 | 19.09 |
| Totals | 15,120,288 | 100.00 | 18,673,599 | 100.00 | 3,553,311 | 23.50 |
The receipts of this account consist mainly of the proceeds of loans raised for the construction of public works. From time to time the fund has been aided by substantial transfers of surplus revenue from the Consolidated Fund Account. The receipts for the last ten years are shown in the next table.
PUBLIC WORKS FUND .—RECEIPTS , TEN YEARS .
| Year ended 31st March. | Amounts received. | Total Receipts. | ||
|---|---|---|---|---|
| From Loans. | Transfers from Consolidated Fund. | Other Sources. | ||
| £ | £ | £ | £ | |
| 1910 | 2,091,090 | .. | 2,607 | 2,093,697 |
| 1911 | 2,590,140 | 800,000 | 6,508 | 3,396,648 |
| 1912 | 744,307 | 500,000 | 12,149 | 1,256,456 |
| 1913 | 2,420,685 | 750,000 | 130,044 | 3,300,729 |
| 1914 | 2,763,884 | 675,000 | 39,867 | 3,478,751 |
| 1915 | 1,857,742 | 350,000 | 16,749 | 2,224,491 |
| 1916 | 3,166,830 | .. | 20,324 | 3,187,154 |
| 1917 | 1,095,000 | .. | 10,837 | 1,105,837 |
| 1918 | 1,025,100 | .. | 66,095 | 1,091,195 |
| 1919 | 1,180,000 | .. | 60,680 | 1,240,680 |
Included in amounts received from "Other Sources" in 1912-13 is the sum of £25,000 which was formerly held in the Deposit Account for the purchase of permanent-way material; also £86,970, receipts under section 16 of the Reserves and other Lands Disposal and Public Bodies Empowering Act, 1912. This column for 1913-14 includes a further amount of £21,890, receipts under the Act mentioned.
In addition to the amounts shown above, the sum of £6,430,000 was transferred during the years 1891-92 to 1907-8 from the Consolidated Fund Account to the Public Works Fund. The next table shows the expenditure at intervals of five years from 1884-85 to 1904-5 and for each of the last ten financial years upon services which are charged to the fund. As will be seen further on the whole of what may be termed public works are not included in this account.
EXPENDITURE ON SERVICES PROVIDED FOR BY THE PUBLIC WORKS FUND .
| Year ended 31st March. | Immigration. | Railways. | Roads. | Development of mining. | Telegraph extension. | Public Buildings. | Lighthouses, &c. | Other Services. | Totals. |
|---|---|---|---|---|---|---|---|---|---|
| £ | £ | £ | £ | £ | £ | £ | £ | £ | |
| 1885 | 57,148 | 663,063 | 317,043 | 8,029 | 25,799 | 117,361 | 34,033 | 114.251 | 1,336,727 |
| 1890 | 867 | 289,572 | 84,126 | 284 | 16,346 | 35,473 | 9,434 | 46,362 | 482,464 |
| 1895 | 101 | 247,545 | 164,833 | 5,865 | 19,229 | 54,190 | 3,145 | 9,578 | 504,486 |
| 1900 | 385 | 417,937 | 285,532 | 21,815 | 26,771 | 115,427 | 9,026 | 116,330 | 993,223 |
| 1905 | 6,482 | 811,994 | 230,012 | 6,258 | 79,298 | 116,678 | 5,990 | 97,446 | 1,354,158 |
| 1910 | 17,002 | 1,279,807 | 367,230 | 18,598 | 123,422 | 276,949 | 16,683 | 116,706 | 2,216,397 |
| 1911 | 9,441 | 1,184,083 | 270,648 | 10,845 | 111,868 | 325,613 | 8,427 | 137,766 | 2,058,691 |
| 1912 | 11,681 | 1,178,969 | 430,647 | 21,245 | 147,692 | 349,655 | 12,576 | 187,915 | 2,340,380 |
| 1913 | 14,694 | 1,179,554 | 376,078 | 10,644 | 251,375 | 445,142 | 16,785 | 254,646 | 2,548,918 |
| 1914 | 33,914 | 1,144,756 | 382,097 | 4,889 | 392,648 | 369,600 | 9,059 | 423,835 | 2,760,798 |
| 1915 | 33,219 | 1,156,073 | 514,798 | 2,384 | 288,395 | 417,000 | 17,131 | 308,364 | 2,737,364 |
| 1916 | 10,010 | 1,205,287 | 424,637 | 8,602 | 249,554 | 335,774 | 13,673 | 337,675 | 2,583,212 |
| 1917 | 6,533 | 846,983 | 219,794 | 4,592 | 203,311 | 251,431 | 3,768 | 239,101 | 1,775,513 |
| 1918 | 3,856 | 607,931 | 135,642 | 27 | 213,955 | 229,288 | 2,976 | 208,162 | 1,401,837 |
| 1919 | Cr. 12,018 | 467,737 | 226,073 | 518 | 198,611 | 235,846 | 5,392 | 265,502 | 1,387,661 |
The receipts and expenditure of the fund during the financial year ended 31st March, 1919, were as under:—
PUBLIC WORKS FUND .—RECEIPTS AND EXPENDITURE , 1918-19.
| Receipts— | £ | £ |
|---|---|---|
| Balance, 31st March, 1918 | .. | 386,470 |
| Debentures issued under the Finance Act, 1917 and 1918 (No. 2) | 1,085,000 | |
| Debentures issued under the Railways Improvement Authorization Act, 1914 | 70,000 | |
| Debentures issued under the Aid to Water-power Works Act, 1910 | 25,000 | |
| 1,180,000 | ||
| Recoveries on account of expenditure of previous years | 20,176 | |
| Receipts under the Waihou and Ohinemuri Rivers Improvement Act, 1910 | 2,680 | |
| Receipts in connection with the Ellesmere and Forsyth Reclamation and Akaroa Railway Trust, Account | 1,587 | |
| Receipts under State Supply of Electrical Energy Act, 1917 | 36,236 | |
| 60,679 | ||
| Total | £1,627,149 | |
| Expenditure— | £ | £ |
| Railways | 467,737 | |
| Roads | 226,073 | |
| Public buildings | 235,846 | |
| Telegraph extension | 198,611 | |
| Contingent defence | 8,809 | |
| Immigration | Cr. 12,018 | |
| Development of mining | 518 | |
| Lighthouses, harbour-works, and harbour-defences | 5,392 | |
| Tourist and health resorts | 1,620 | |
| Lands improvement | Cr. 4,268 | |
| Development of water-power | 69,214 | |
| Irrigation and water-supply | 13,664 | |
| Waihou and Ohinemuri Rivers improvement | 31,151 | |
| Plant, material, and stores | 20,638 | |
| Departmental | 115,419 | |
| Electric Supply | 9,254 | |
| 1,287,666 | ||
| Balance, 31st March, 1919 | 239,483 | |
| Total | £1,627,149 |
The expenditure on roads out of the Public Works Fund does not comprise all of the moneys spent under that head by the General Government. Between 1896-97 and 1910-11 the sum of £469,236 was expended on construction of roads to open up Crown lands out of the moneys raised for loans to local bodies.
Further expenditure on the construction of roads to open up Crown lands includes amounts of £45,690 in 1910-11, £49,739 in 1911-12, £47,951 in 1912-13, £63,245 in 1913-14, £92,975 in 1914-15, £47,974 in 1915-16, £24,730 in 1916-17, £43,996 in 1917-18, and £51,355 in 1918-19. During the four years 1910-11 to 1913-14 these payments were made from a separate account entitled the Opening up Crown Lands for Settlement Account. This account was abolished during 1914-15, and the balance transferred to the Land for Settlements Account, out of which the amounts shown above for 1914-15 and succeeding years were paid.
Roads to open national-endowment lands are paid for out of the National Endowment Account, the amount paid in 1916-17 being £6,787. There was no expenditure in 1917-18 or 1918-19 under this heading.
The roading of lands purchased for closer settlement is made a charge upon the Land for Settlements Account, and is included in the value upon which the rentals of those lands are based. The reclamation by drainage and opening up by means of roads of an area of the Hauraki Plains is provided for out of moneys borrowed for that purpose and shown in a separate account.
The accounts included under this heading in some cases comprise revenue of different kinds mixed up with loan-money, while others are merely records of transactions which of their nature cannot be considered as properly belonging to the Public Account. Among the former may be counted the State Forests and State Coal-mines Accounts, and among the latter the accounts of local bodies, which consist of revenue collected on behalf of and paid over to local authorities, and the Deposit Accounts, consisting partly of moneys held in trust and partly of moneys held in suspense for various reasons. The transactions of these accounts or funds are shown in the tables following:—
STATE FORESTS ACCOUNT .
| Receipts. | £ |
|---|---|
| Rents from lands set apart | 7,529 |
| Debentures issued | 26,900 |
| Contribution from Consolidated Fund | 10,000 |
| Total | £44,429 |
| Expenditure. | £ |
|---|---|
| Expenses of nurseries, tree-planting, and forest conservation | 41,343 |
| Interest on debentures | 1,862 |
| Total | £43,205 |
STATE COAL -MINES ACCOUNT .
| Receipts. | £ |
|---|---|
| Proceeds of sale of coal | 275,837 |
| Total | £275,837 |
| Expenditure. | £ |
|---|---|
| Working-expenses and development | 259,960 |
| Interest on debentures | 8,739 |
| Total | £268,699 |
SCENERY PRESERVATION ACCOUNT .
| Receipts. | £ |
|---|---|
| Rents | 132 |
| Land-sales | 700 |
| Total | £832 |
| Expenditure. | £ |
|---|---|
| Scenery-preservation | 3,589 |
| Total | £3,589 |
LOCAL BODIES ACCOUNT .
| Receipts. | £ |
|---|---|
| Revenue received on account of local bodies— | |
| Fees, fines, &c. | 6,321 |
| Endowments of land, &c. | 391 |
| Goldfields revenue | 13,515 |
| Gold duty | 14,790 |
| Counties separate account | 156 |
| Advance Account— | |
| Amounts repaid by local bodies | 20,379 |
| Total | £55,552 |
| Expenditure. | £ |
|---|---|
| Revenue paid over to local bodies— | |
| Fees, fines, &c. | 6,289 |
| Endowments of land, &c. | 608 |
| Goldfields revenue | 15,077 |
| Gold duty | 15,079 |
| Counties separate account | 172 |
| Advance Account— | |
| Sundry payments made on behalf of local bodies | 20,235 |
| Total | £57,460 |
This account deals with revenue collected for and paid over to local authorities, also sundry payments made on behalf of such authorities and refunded by them.
DEPOSIT ACCOUNTS .
| Receipts. | £ |
|---|---|
| Lodgments | 36,759,410 |
| Total | £36,759,410 |
| Expenditure. | £ |
|---|---|
| Withdrawals | 37,806,190 |
| Total | £37,806,190 |
This account consists of moneys to be applied to specific purposes under various Acts, collections on behalf of local institutions, and miscellaneous items in suspense. The purchase of supplies by the Imperial Government was responsible for the greater portion of the receipts and expenditure of the account in 1918-19, as is evidenced by the following figures:—
| Item. | Receipts. | Expenditure. |
|---|---|---|
| £ | £ | |
| Wool-supply | 15,445,000 | 16,315,215 |
| Wool-supply (pelts) | 1,505 | 1,867 |
| Meat-supply | 10,210,000 | 10,019,067 |
| Butter-supply | 3,559,770 | 3,531,497 |
| Cheese-supply | 5,200,427 | 5,499,449 |
| Canned-rabbits supply | 29,650 | 29,385 |
| Frozen-rabbits supply | 67,800 | 81,845 |
| Scheelite-supply | 33,000 | 35,346 |
| Condensed-milk supply | 7,884 | 7,884 |
| Glaxo-supply | 390,016 | 412,384 |
| Jam-supply | 2,929 | .. |
| Hides-supply | 138,681 | 115,445 |
| Corned-meats supply | 82,390 | 82,390 |
| Totals | £35,169,052 | £36,131,774 |
CHEVIOT ESTATE ACCOUNT .
| Receipts. | £ |
|---|---|
| Bents from land | 17,711 |
| Interest on securities | 3,655 |
| Total | £21,366 |
| Expenditure. | £ |
| Interest on loans | 8,866 |
| Total | £8,866 |
The operations of this account during each of the five financial years ended 31st March, 1915-19, and the total transactions to the latter date, are shown in the table following:—
| Head. | Year ended 31st March. | Total to 31st March, 1919. | ||||
|---|---|---|---|---|---|---|
| 1915. | 1916. | 1917. | 1918. | 1919. | ||
| Receipts— | £ | £ | £ | £ | £ | £ |
| Loans raised | 136,078 | 60,000 | 300,000 | 140,000 | 550,000 | 7,404,578 |
| Advances made by State Advances Office | .. | .. | .. | .. | .. | 1,003,875 |
| Sale of lands | 293,867 | 345,598 | 267,714 | 218,877 | 269,307 | 1,541,572 |
| Rents, &c. | 312,827 | 337,288 | 340,077 | 353,172 | 358,302 | 4,937,603 |
| Total receipts | 742,772 | 742,886 | 907,791 | 712,049 | 1,177,609 | 14,887,628 |
| Expenditure— | ||||||
| Land-purchases | 356,686 | 100,506 | 595,419 | 445,579 | 645,387 | 9,081,607 |
| Transfer to Opening up Crown Lands for Settlement Account | 51,000 | 45,000 | .. | 40,000 | 50,000 | 220,171 |
| Interest on loans | 287,225 | 288,728 | 267,073 | 322,925 | 313,469 | 3,985,687 |
| Payment to sinking fund | 41,937 | 41,871 | 38,153 | 28,216 | 27,547 | 637,096 |
| Incidental expenses | 36,142 | 26,514 | 24,924 | 26,424 | 46,418 | 787,055 |
| Total expenditure | 772,990 | 502,619 | 925,569 | 863,144 | 1,082,821 | 14,711,616 |
The whole of the annual contributions to the sinking fund were formerly paid to the Public Trustee for investment. By section 26 of the State Advances Act, 1913, however, it was provided that future contributions should be paid to the Public Trustee only in respect of loans not obtained from any Department of the Public Service. For loans from the State Advances and other Departments the sinking-fund contributions are to be paid to the Consolidated Fund in terms of the Public Debt Extinction Act, 1910.
For some years there was a special account for the opening-up of Crown lands for settlement. This has now been abolished, and the money in the account transferred to the Land for Settlements Account. The money is still to be devoted to the same purposes, and is kept in a separate subsidiary account. The operations of this account for the year 1918-19 are,—
| Receipts. | £ |
|---|---|
| Amount set aside under section 63 of the Land Laws Amendment Act, 1913 | 50,000 |
| Revenue under section 63 of the Land Laws Amendment Act, 1913 | 16,586 |
| Total | £66,586 |
| Expenditure. | £ |
|---|---|
| Roads to open up lands for settlement | 51,355 |
| Interest | 7,981 |
| Total | £59,336 |
WAIMARINO BUSH -FIRE RELIEF ACCOUNT
| Receipts. | £ |
|---|---|
| Debentures issued | 75,000 |
| Total | £75,000 |
| Expenditure. | £ |
|---|---|
| Expenditure under section 33 of the Appropriation Act, 1918 | 51,950 |
| Total | £51,950 |
NATIVE LAND SETTLEMENT ACCOUNT .
| Receipts. | £ |
|---|---|
| Debentures issued | 225,000 |
| Amount received for surveys | 16,477 |
| Land-sales | 9,319 |
| Rents, &c. | 33,438 |
| Repayment of advances by Maori Land Boards | 2,296 |
| Total | £286,530 |
| Expenditure. | £ |
|---|---|
| Expenditure under the Act | 164,891 |
| Native - land - purchase expanses | 2,201 |
| Interest | 73,887 |
| Total | £240,979 |
CONVERSION ACCOUNT .
| Receipts. | £ |
|---|---|
| Nil. | |
| Total | Nil. |
| Expenditure. | £ |
|---|---|
| Rent and office expenses | 503 |
| Total | £503 |
This account, called into existence by the war, has now assumed immense proportions, the expenditure from it for the financial year ended. 31st March, 1919, being greater than that of the Consolidated Fund. Apart from voluntary contributions to the fund in the early months of the war, the expenditure has been met entirely by loans aggregating over 68 millions of pounds, much of which has been raised in the Dominion.
The account was made the medium for remittances between soldiers and their relatives, but these have not greatly affected the totals on either side of the ledger. The operations of the account for the last three financial years and the total since its creation in 1914-15 are given in the following statement. There was a credit balance of £7,979,826 at 31st March, 1919.
| Head. | Year ended 31st March, | Total to 31st March, 1919. | ||
|---|---|---|---|---|
| 1917. | 1918. | 1919. | ||
| Receipts— | £ | £ | £ | £ |
| Loans raised | 17,812,890 | 19,459,700 | 22,274,806 | 68,506,902 |
| Contributions towards War Expenses Fund | 5,405 | 1,157 | 1,669 | 174,148 |
| Remittances to and from soldiers | 84,248 | 139,503 | 145,646 | 385,611 |
| Pay-warrants Account | .. | .. | .. | 19,400 |
| Totals | 17,902,543 | 19,600,360 | 22,422,121 | 69,086,061 |
| Expenditure— | ||||
| War expenditure | 14,139,956 | 16,803,799 | 20,997,054 | 59,805,537 |
| Relief expenditure | 129,245 | 11,493 | 35,201 | 268,439 |
| Repatriation expenditure | .. | .. | 8,641 | 8,641 |
| Remittances to and from soldiers | 46,889 | 124,813 | 119,882 | 294,906 |
| Pay-warrants Account | 5 | 3 | 2 | 19,354 |
| Expenses of raising loans | 75,323 | 73,612 | 430,917 | 709,358 |
| Totals | 14,391,418 | 17,013,720 | 21,591,697 | 61,106,235 |
An Act of the General Assembly, passed in 1908, authorizes the construction of works necessary for the drainage, reclamation, and opening up for settlement of a block of swampy land, part of the Hauraki Plains. The Act provides for borrowing the funds required to carry out the work, and lays down that the future revenues of the land recovered shall be applied to the repayment of the moneys so raised. The transactions for each of the last five years and the total to date are given in the following table:—
| Head. | Year ended 31st March, | Total to 31st March, 1919. | ||||
|---|---|---|---|---|---|---|
| 1915. | 1916. | 1917. | 1918. | 1919. | ||
| Receipts— | £ | £ | £ | £ | £ | £ |
| Land sales, leases, &c. | 10,449 | 11,540 | 19,631 | 18,255 | 15,474 | 101,023 |
| Transfers from Local Bodies Account | .. | .. | .. | .. | .. | 31,000 |
| Advances made by New Zealand State Advances Office | .. | .. | .. | .. | .. | 95,000 |
| Transfer from State Advances Office | 771 | .. | .. | .. | .. | 771 |
| Debentures issued | 9,000 | 11,000 | .. | .. | 25,000 | 50,000 |
| Totals | 20,220 | 22,540 | 19,631 | 18,255 | 40,474 | 277,794 |
| Expenditure— | ||||||
| Reclamation, drainage, and road-construction | 16,609 | 14,334 | 13,937 | 22,151 | 26,395 | 235,770 |
| Payment of principal and interest | 3,791 | 3,997 | 4,469 | 4,438 | 4,855 | 31,434 |
| Totals | 20,400 | 18,331 | 18,406 | 26,589 | 31,250 | 267,204 |
Under the Land Act, 1908, the net revenues from certain areas of Crown lands are applied to educational purposes and to payment of old-age pensions in the proportion of 70 per cent. and 30 per cent. respectively. Prom the gross revenue is deducted any expenditure which may be incurred in the construction of roads, and also any sums which by law have been appropriated to local authorities out of the rents. The transactions during the year ended 31st March, 1919, were,—
| Receipts. | £ |
|---|---|
| Rents, &c. | 119,079 |
| Total | £119,079 |
| Expenditure. | £ |
|---|---|
| Payments under the Act | 115,063 |
| Total | £115,063 |
WORKERS ' DWELLINGS ACCOUNT .
| Receipts. | £ |
|---|---|
| Sale of dwellings under section 16 of Act | 20,384 |
| Total | £20,384 |
| Expenditure. | £ |
|---|---|
| Nil. | |
| Total | Nil. |
This account has now been separated from the State Advances Account proper (section 4 of the Mining Amendment Act, 1913). The operations of the account for the year 1918-19 are shown.
| Receipts. | £ |
|---|---|
| Interest on advances | 24 |
| Repayments of principal | 550 |
| Total | £574 |
| Expenditure. | £ |
| Interest | 1,098 |
| Total | £1,098 |
RANGITAIKI LAND DRAINAGE ACCOUNT .
| Receipts. | |
|---|---|
| Receipts under the Rangitaiki Land Drainage Act, 1910 | 10 |
| Receipts under the Rangitaiki Land Drainage Act, 1913 | 4,123 |
| Debentures issued | 25,000 |
| Total | £29,133 |
| Expenditure. | £ |
|---|---|
| Land-drainage | 28,843 |
| Compensation | 181 |
| Total | £29,024 |
BANK OF NEW ZEALAND ACTS 1903 AND 1913 ACCOUNT .
| Dr. | £ |
|---|---|
| Investment Account | 875,000 |
| Total | £875,000 |
| Cr . | £ |
|---|---|
| Preference shares of the Bank of New Zealand | 375,000 |
| Total | £875,000 |
RESERVE FUND ACCOUNT .
| Dr. | £ |
|---|---|
| Investment Account | 800,000 |
| Total | £800,000 |
| Cr. | £ |
|---|---|
| Securities | 800,000 |
| Total | £800,000 |
NEW ZEALAND CONSOLS ACCOUNT .
| Dr. | £ |
|---|---|
| Cash in Deposit Account | 7 |
| Investment Account | 475,985 |
| Total | £475,992 |
| Cr. | £ |
|---|---|
| Cash in Deposit Account | 7 |
| Investment Account | 475,985 |
| Total | £475,992 |
The Kauri-gum Industry Amendment Act, 1914, authorizes the Minister of Lands to act as agent for the disposal of kauri-gum on behalf of the gum-diggers, thus affording a measure of relief for the industry during the war period. The Minister may advance to diggers up to one-half of the estimated value of the gum, the balance, less deductions for insurance, storage, &c., being paid over when the Minister sells the gum.
| Receipts. | £ |
|---|---|
| Sale of gum | 16,804 |
| Total | £16,804 |
| Expenditure. | £ |
|---|---|
| Expenditure under the Act | 28,667 |
| Interest | 5,679 |
| Total | £34,346 |
SWAMP LAND DRAINAGE ACCOUNT .
| Receipts. | £ |
|---|---|
| Debentures issued | 25,000 |
| Total | £25,000 |
| Expenditure. | £ |
|---|---|
| Drainage of swamp lands | 24,125 |
| Total | £24,125 |
FRUIT -PRESERVING INDUSTRY ADVANCES ACCOUNT .
| Receipts. | £ |
|---|---|
| Debentures issued | 9,500 |
| Repayment of principal and interest | 2,815 |
| Total | £12,315 |
| Expenditure. | £ |
|---|---|
| Advances | 14,490 |
| Total | £14,490 |
DISCHARGED SOLDIERS SETTLEMENT ACCOUNT .
| Receipts. | £ |
|---|---|
| Debentures issued | 740,000 |
| Repayment of principal and interest | 31,444 |
| Total | £771,444 |
| Expenditure. | £ |
|---|---|
| Advances | 572,803 |
| Expenditure under section 9 of Act | 10,308 |
| Total | £583,111 |
Section 22 of the Appropriation Act, 1917, authorizes the Minister of finance to raise sums not exceeding £120,000 for the purpose of providing additional cold storage in New Zealand.
| Receipts. | £ |
|---|---|
| Debentures issued | 80,000 |
| Total | £80,000 |
| Expenditure. | £ |
| Advances | 82,500 |
| Total | £82,500 |
The cash balances and investments of the foregoing accounts as on 31st March, 1919, are shown in the following table:—
| Account. | Cash. | Investments. | Total. |
|---|---|---|---|
| Cr. | £ | £ | £ |
| Consolidated Fund (ordinary revenue) | 3,218,031 | 12,021,529 | 15,239,560 |
| State Forests | 2,399 | .. | 2,399 |
| State Coal-mines | 120,356 | .. | 120,356 |
| Scenery Preservation | 433 | .. | 433 |
| Local Bodies | 10,858 | .. | 10,858 |
| Deposit Accounts | 1,595,773 | 1,471,338 | 3,067,111 |
| Public Works Fund (proper) | 186,199 | .. | 186,199 |
| Railways Improvement Authorization Act, 1914 | 3,788 | .. | 3,788 |
| Waihou and Ohinemuri Rivers Improvement | 7,814 | 5,000 | 12,814 |
| Electric Supply | 36,688 | .. | 36,688 |
| Cheviot Estate | 9,343 | 123,000 | 132,343 |
| Land for Settlements | 200,262 | .. | 200,262 |
| Land for Settlements (opening up Crown lands for settlement) | 10,848 | .. | 10,848 |
| Native Land Settlement | 88,578 | .. | 88,578 |
| Conversion Account | 7,235 | .. | 7,235 |
| War Expenses | 2,634,608 | 5,345,218 | 7,979,826 |
| Hauraki Plains Settlement | 10,589 | .. | 10,589 |
| National Endowment | 112,840 | .. | 112,840 |
| Workers' Dwellings | 29,918 | 55,000 | 84,918 |
| Mining Advances | 5,275 | .. | 5,275 |
| Rangitaiki Land Drainage | 4,379 | .. | 4,379 |
| Bank of New Zealand (preference shares) | .. | 875,000 | 875,000 |
| Reserve Fund | .. | 800,000 | 800,000 |
| New Zealand Consols | 7 | 475,985 | 475,992 |
| Kauri-gum Industry | 3,388 | .. | 3,388 |
| Swamp Drainage | 6,264 | .. | 6,264 |
| Fruit-preserving Industry Advances | 4,083 | .. | 4,083 |
| Cold-storage Advances | .. | .. | .. |
| Discharged Soldiers Settlement | 219,767 | .. | 219,767 |
| Waimarino Bush-fire Relief | 23,050 | .. | 23,050 |
| Totals | 8,552,773 | 21,172,070 | 29,724,843 |
The State Advances Account, which is administered directly by the Advances Board, is not included in the above statement, nor is the Loans Redemption Account. In addition there are the funds of the Government Life Insurance Department, the State Fire Insurance Department, and the Public Trust Office, which are administered by the Departments concerned. Reference to the working of these Departments will be found elsewhere in this book.
ALL revenue collected by means of taxation is applied to general purposes Customs duties on imported goods, excise duties on beer and also on a few minor items, constitute the indirect taxation, land and income taxes, death duties, a tax on bank-note issues, duty on cheques and receipts for payments being the main source of revenue by direct taxation. Particulars of the collections during the past ten years, under the main headings, are shown in the following table:—
| Year ended 31st March. | Amount of Taxation derived from | Total. | ||||
|---|---|---|---|---|---|---|
| Customs and Excise Duties. | Land-tax. | Income-tax. | Death Duties. | Other Taxes. | ||
| £ | £ | £ | £ | £ | £ | |
| 1910 | 2,786,490 | 642,270 | 316,835 | 192,014 | 242,907 | 4,180,516 |
| 1911 | 3,145,929 | 628,723 | 407,235 | 323,783 | 331,652 | 4,837,322 |
| 1912 | 3,398,143 | 647,015 | 448,935 | 361,186 | 441,311 | 5,296,590 |
| 1913 | 3,531,761 | 728,636 | 462,994 | 458,265 | 425,173 | 5,606,829 |
| 1914 | 3,553,785 | 767,451 | 554,271 | 613,751 | 428,776 | 5,918,034 |
| 1915 | 3,294,943 | 799,641 | 540,318 | 796,232 | 449,677 | 5,880,811 |
| 1916 | 3,524,063 | 1,048,356 | 1,392,119 | 610,350 | 692,078 | 7,266,966 |
| 1917 | 4,037,628 | 713,118 | 4,262,126 | 570,040 | 966,742 | 10,549,654 |
| 1918 | 3,601,383 | 1,385,708 | 5,619,561 | 805,511 | 928,690 | 12,340,853 |
| 1919 | 4,104,016 | 1,512,693 | 6,219,336 | 869,371 | 1,096,227 | 13,801,643 |
The percentage under each heading to the total amount collected for each year is as under:—
| Year ended 31st March. | Proportion per Cent. derived from | ||||
|---|---|---|---|---|---|
| Customs and Excise Duties. | Land-tax. | Income-tax. | Death Duties. | Other Direct Taxes. | |
| Per Cent. | Per Cent. | Per Cent. | Per Cent. | Per Cent. | |
| 1910 | 65.63 | 15.13 | 7.46 | 4.52 | 7.26 |
| 1911 | 65.03 | 13.00 | 8.42 | 6.69 | 6.86 |
| 1912 | 64.16 | 12.21 | 8.48 | 6.82 | 8.33 |
| 1913 | 62.99 | 13.00 | 8.26 | 8.17 | 7.58 |
| 1914 | 60.05 | 12.97 | 9.37 | 10.37 | 7.24 |
| 1915 | 56.03 | 13.60 | 9.19 | 13.54 | 7.64 |
| 1916 | 48.49 | 14.43 | 19.16 | 8.40 | 9.52 |
| 1917 | 38.27 | 6.76 | 40.40 | 5.40 | 9.17 |
| 1918 | 29.18 | 11.23 | 45.54 | 6.53 | 7.52 |
| 1919 | 29.74 | 10.96 | 45.06 | 6.30 | 7.94 |
Some remarkable alterations in percentages are noticed during the last few years, due to the war taxation referred to in detail below.
The revenue from taxation per head of mean population during the past ten years is shown in the next table:—
REVENUE FROM .TAXATION PER HEAD OF MEAN POPULATION , 1909-10 TO 1918-19.
| Year ended 31st March. | Including Maoris. | Excluding Maoris. | ||||
|---|---|---|---|---|---|---|
| £ | s. | d. | £ | s. | d. | |
| 1910 | 4 | 1 | 6 | 4 | 5 | 6 |
| 1911 | 4 | 12 | 4 | 4 | 16 | 11 |
| 1912 | 4 | 19 | 0 | 5 | 3 | 10 |
| 1913 | 5 | 2 | 3 | 5 | 7 | 2 |
| 1914 | 5 | 5 | 2 | 5 | 10 | 0 |
| 1915 | 5 | 2 | 9 | 5 | 7 | 5 |
| 1916 | 6 | 6 | 4 | 6 | 12 | 1 |
| 1917 | 9 | 3 | 7 | 9 | 11 | 11 |
| 1918 | 10 | 14 | 1 | 11 | 3 | 9 |
| 1919 | 11 | 17 | 1 | 12 | 7 | 8 |
As was inevitable with a war of the magnitude of that in which New Zealand was engaged, additional taxation had to be imposed to meet deficiencies and to provide interest and sinking-fund payments on the new and rapidly mounting indebtedness incurred on account of the extraordinary expenditure of the war.
During the session of 1914 no war taxation was imposed, but in each of the three succeeding sessions legislation has been passed providing for heavier taxation. Apart also from increases, the incidence of the war taxation was modified in the sessions of 1916 and 1917 in accordance with the dictates of experience, the aim of the Legislature having been to place the taxation in such a way as to make the direct effect as little oppressive as possible on those least able to bear additional burdens, and to remove inequalities and anomalies as these were seen to exist.
Naturally income has borne the brunt of the increased taxation, as being best able to do so on account of the higher profits made during the war period, and also because of the case of collection, and of the existence of the necessary machinery. It should be noted that, in contradistinction to the policy adopted in Great Britain, no reduction has been made in the minimum income (£300) subject to income-tax.
The war taxation imposed in 1915 covered a fairly wide range. An additional 33 1/3 per cent. was added to the former rates of income-tax, and the incidence of this branch of taxation was extended to cover incomes derived from land and mortgages of land, which were formerly assessed for land-tax but not for income-tax. Under the new rates land-tax was still payable on mortgages, but whatever was paid as land-tax was to be deducted from the amount of income-tax payable. The intention was that the increased taxation would fall on those making increased profits from the sale of wool, meat, and dairy-produce. The land-tax on mortgages was increased from 3/4d. to 1d. in the pound on the capital value, and the graduated land-tax was increased by 50 per cent.
Additional Customs duties were placed on a number of items of import, including spirits, wines, and flavouring-essences; bicycles, motorcycles, carriages, &c., and their fittings; and electric machinery, gas-, oil-, and hot-air engines, &c. A primage duty of 1 per cent. of the value of goods imported (with certain exceptions) was also imposed.
In place of the former system of assessing and collecting beer duty a new system was brought in, with a new scale of fees. The duty was to be calculated according to the specific gravity of the worts used in the production of the beer. For a specific gravity not exceeding 1,047 (reckoned in relation to water at 60° Fahrenheit, taken as 1,000) the duty was fixed at 3 3/4d. per gallon; the rate was increased by 1/16d. for every unit above 1,047 but not exceeding 1,055, and by 1/8d. for every unit above 1,055. The graduated scale was introduced partly with a view to encouraging the brewing of light beer. The former duty was a uniform one of 3d. per gallon.
Numerous new and additional stamp duties were also imposed. Contracts for the sale of land were made chargeable with the same duty as if they were actual conveyances. Mortgages and transfers of mortgages, formerly exempt from stamp duty, were made dutiable to the extent of 5s. for every £100 or part of £100, and 10s. became payable on the discharge of a mortgage. The duty on a deed of assignment became £3 instead of £2 10s. as formerly; the duty on receipts, cheques, bills of exchange, and promissory notes was increased from 1d. to 2d.; and the general schedule of stamp duties was revised, and many duties were increased by amounts representing 3d. in the shilling, 6d. in the half-crown, 1s. in 5s., and 2s. 6d. in 10s. on the former rates. The tax on the bank-note issue was increased from 10s. to 15s. per £100. One per cent. of stakes won in respect of horse-racing was made payable to the Commissioner of Stamps, and a tax of 6d. was imposed on totalizator dividends in addition to the former percentage payable on totalizator investments and gate receipts.
Various amendments were made to the Death Duties Act, not, however, in the direction of imposing extra taxation in the aggregate, but involving only alterations in respect of exemptions.
In addition to the war taxation referred to, the charges for certain public services were increased with a view to counteracting the effect of anticipated deficiencies in revenue. The scale of ordinary passenger-fares on the railways was increased by 1d. in the shilling, and second-class excursion fares were raised to approximately 1 1/3d. per mile return, as against 1d. under the former scale. An additional charge of 2d. was placed on every ticket for excursion fares, whether first or second class. An increase of 10s. was made in all rates chargeable on goods, parcels, luggage, horses, &c., and on charges in respect of railway wharves and Lake Wakatipu steamers. Postage charges were increased by 1/2d. on all articles posted, with the exception of newspapers and of letters, &c., addressed to countries the rates of postage to which are the maximum rates chargeable under the International Postal Convention. The minimum charge for telegrams was fixed at 8d. (formerly 6d.), and an extra 2d. was made payable on all telegrams, and as an additional inland charge on cablegrams.
The principal item in the additional war taxation of the 1916 session was the imposition of an excess-profits duty of 45 per cent. on excess income in the year 1915-16 as compared with the "standard" income, this tax being additional to the ordinary and special income-tax payable. Standard income might be taken at the option of the taxpayer as—
The average income of the three years ended 31st March, 1914, 1913, and 1912:
The average income of any two of these three years:
The income of any one of the three years:
Seven-and-a-half per cent. of the capital employed at 1st April, 1915, in the production of income, plus such additional amount, not exceeding £600, as the Commissioner of Taxes deems just and reasonable as remuneration of the personal exertion of the taxpayer.
It was laid down that where, in the opinion of the Commissioner of Taxes, standard income could not be arrived at in any of the first three ways mentioned it must be ascertained in the fourth way. Increases and deductions equal to 7 1/2 per cent. of the difference were provided for in cases where the capital for the income year was greater or less than that employed in the production of the standard income. Losses in the three years ended 31st March, 1915, and cases of hardship of certain specified classes, were to be taken into account. The excess-profits duty was not payable on salaries and wages, nor on incomes of less than £300. The tax charged was not to be more than the amount by which the assessable income exceeded £300.
In addition to the excess-profits duty all incomes (with the usual exemptions) were subjected to further taxation, an extra 6d. in the pound over and above the rates imposed in 1915 being placed on assessable incomes up to £900, and an extra 1s. on incomes above £900.
The tax on mortgages of land was definitely converted from land-tax to income-tax.
Further slight increases in certain stamp duties were also made in 1916.
The excess-profits duty levied in 1916 was not reimposed in 1917, experience having brought to light almost insuperable difficulties in ascertaining exactly the actual profits resulting from the war. The tax was also found to be inequitable in its operation, and in its place was substituted a comprehensive system of progressive land and income tax, with a special war-tax on incomes. Details of the new system, with the rates of duty payable, are given farther on in this subsection.
Customs duties were again increased in 1917 in respect of certain items, which are given in detail in the section of this book dealing with trade. The general rate of beer duty imposed in 1915 was increased from 3 3/4d. to 5 3/4d. in cases where the specific gravity does not exceed 1,047, with an additional 1/16d for every extra unit up to and including 1,051. Additional rates of excise duty were also imposed on tobacco manufactured in New Zealand. Gold held by banks on behalf of the Imperial Government was made chargeable with the usual gold duty on receipt of the purchase-money instead of on export, perhaps many months afterwards, as had been the case. This alteration in respect to gold duty is to remain in force only until six months after the end of the war.
A new form of tax imposed in 1917 is the amusements-tax, payable on payments for admission to entertainments, with certain specified exceptions. "Entertainment" is defined as "any exhibition, performance, amusement, game, or sport to which persons are admitted for payment." No duty is payable where the charge for admission is not more than 6d. The rates of duty are as follow:—
| Payment for Admission (exclusive of Amount of Tax). | Tax payable. |
|---|---|
| Exceeding 6d. but not exceeding 2s. 6d. | d. |
| Exceeding 2s. 6d. but not exceeding 5s. | 2 |
| Exceeding 5s. but not exceeding 7s. 6d. | 3 |
| Exceeding 7s. 6d. but not exceeding 12s. 6d. | 6 |
| Exceeding 12s. 6d.— | |
| For the first 12s. 6d. | 12 |
| For every additional 10s. or part of 10s. | 12 |
No alterations in the laws relating to taxation were made during the year 1918.
During the year ended 31st March, 1918, the sum of £3,364,308 was collected, after deduction of drawbacks, for duty on imported goods, and £237,075 for excise duties, a total of £3,601,383. The amount of revenue derived from these sources for each of the past ten years is shown below.
| Year ended 31st March. | Customs Duties. | Excise Duties. | Total. |
|---|---|---|---|
| £ | £ | £ | |
| 1910 | 2,671,121 | 115,369 | 2,786,490 |
| 1911 | 3,027,829 | 118,100 | 3,145,929 |
| 1912 | 3,279,012 | 119,131 | 3,398,143 |
| 1913 | 3,407,538 | 124,223 | 3,531,761 |
| 1914 | 3,426,744 | 127,041 | 3,553,785 |
| 1915 | 3,167,283 | 127,660 | 3,294,943 |
| 1916 | 3,366,171 | 157,892 | 3,524,063 |
| 1917 | 3,849,675 | 187,953 | 4,037,628 |
| 1918 | 3,364,308 | 237,075 | 3,601,383 |
| 1919 | 3,830,682 | 273,334 | 4,104,016 |
The revenue from Customs and excise duties in 1908-9 was £2,917,462, and the increase for the ten years is £1,186,554, or roughly 40 per cent. In the ten calendar years corresponding to the same period the value of imports (excluding specie) increased from £14,817,462 to £24,131,729, or at the rate of approximately 63 per cent. Generally speaking, in spite of slight increases in Customs and excise duties referred to above as part of the war taxation, the average rate of duty has not increased greatly during the ten years. The increase in the total duties collected is thus almost entirely due to the increased prosperity of the country as reflected by its trade. The decrease in imports in 1914 as compared with 1913, it will be seen, brought a corresponding decrease in Customs duties collected, but the additional imposts referred to above have made their impression on the Customs taxation figures of 1915-16, in spite of a further fall in the total value of imports for 1915.
The Customs duties collected in 1916-17 showed a substantial increase as a result of increased imports, but with the fall in imports during the following year the duties collected fell back to approximately the figure of 1915-16, only to return again to approximately the 1916-17 level with the increased imports of 1918.
For a fuller discussion of Customs taxation than can be given here the reader is referred to the section of this book dealing with Commerce.
Except in regard to minor details, the system of land and income taxation in force in 1915 had remained unaltered for many years. Probably the only noteworthy point was the gradual hardening-up of the graduated land-tax, designed to prevent aggregation of land and to compel the cutting-up of large estates rather than to secure additional revenue.
The war taxation of 1915, however, not only included increased rates of 33 1/3 per cent. in the case of income-tax, 1/4d. in the pound in the case of land-tax payable on mortgages, and 50 per cent. in the case of graduated land-tax, but also involved an important change of principle. Among the incomes formerly exempt from income-tax are those derived directly from land, but income-tax is now payable on such incomes, including those derived from mortgages of land. In the case of mortgages, however, the income-tax is reduced by such amount as has been paid for land-tax, provided such amount does not exceed the total amount of income-tax.
With the exception of the abolition of the land-tax on mortgages and the substitution of an income-tax in its place, the principles of land-tax assessment were not altered in 1916, nor were the rates increased, but an entirely new scheme, the excess-profits tax (described above), was brought into operation in respect of income-tax, the 1915 system remaining also, with increased rates, for ordinary income-tax.
The excess-profits tax being found inequitable and otherwise unsatisfactory, a system of progressive land and income tax, with a special war tax on incomes, was adopted in 1917, and was continued in 1918.
Land-tax is assessed on the unimproved value of the land after allowing certain exemptions as set out below. As the law now stands an owner of land the unimproved value of which does not exceed £1,500 is allowed an exemption of £500, and where the unimproved value lies between £1,500 and £2,500 there is a similar exemption, diminished, however, by £1 for every £2 over the £1,500 mark, so that no exemption is allowable when the £2,500 is reached. Where the land is subject to a registered mortgage an alternate scale of deductions is provided—viz., £1,500 in cases where the unimproved value does not exceed £3,000 and the same amount diminished by £1 for every £2 above £3,000 when the unimproved value lies between £3,000 and £6,000. Where the capital value of the mortgage is less than the amount of deduction provided, such capital value is to be deducted instead. In lieu of the exemptions mentioned, the Commissioner of Taxes has discretionary powers to grant relief in certain specified cases of hardship. Subject to deductions provided, lessees and life tenants are liable to tax, and joint owners are to be assessed jointly as regards the land held in conjunction, and also severally in respect of each owner's interest in such land and any other land. This also applies to the shareholders in a company owning land.
The progressive land-tax, now substituted for the former double system of ordinary and graduated tax, ranges from 1d. to 7d. in the pound. The 1d. rate applies in cases where the unimproved value on which tax is payable does not exceed £1,000, and the rate is increased by 1/32,000 of a penny for every pound in excess of £1,000, up to the maximum of 7d. These rates were virtually increased for the years 1917-18 and 1918-19 by the imposition of a super-tax of 50 per cent., the minimum rate for the year being thus 1 1/2d. and the maximum 10 1/2d, A further 50-per-cent. increase on the total rates is imposed in the case of absentees, including shareholders in companies, but not in the case of the companies themselves.
Income-tax is payable on the full incomes of registered companies and of absentees, and in other cases on incomes in excess of £300 per annum. Formerly a deduction of £300 was made from the income in all cases (except for companies and absentees) when computing the amount of tax payable, but the full deduction is now made only when the income does not exceed £600. Between £600 and £900 the exemption is reduced by £1 for every £1 above £600, and no exemption at all is allowed for incomes above £900. Certain specified incomes are wholly exempt from taxation, and a further £25 is deductible from assessable income for each child under sixteen years of age. Sundry other deductions are also provided.
The rates of progressive income-tax for the years 1917-18 and 1918-19 range from 6d. to 3s. in the case of persons and firms, and from 1s to 3s. for companies. The 6d. rate for persons and firms applies where the taxable income is not more than £400, and the 1s. rate for companies where the taxable income does not exceed £1,600, the rates being increased by 1/200 part of a penny for every additional pound until the maximum tax of 3s. in the pound is reached. Income derived by holders of company debentures from such debentures bears a uniform tax of 1s., plus a special war tax of 1s. 6d.
The special war tax also applies to assessable income in excess of £300 of all other income-tax payers. For incomes up to £400 the rate of special war tax is 9d. in the pound, and this is increased by 3/400 of a penny for every additional pound of income, but so as not to exceed 4s. 6d. in the pound. The maximum total rate of income-tax is thus 7s. 6d. in the pound.
A new feature of the land and income taxation laws of the Dominion was the provision in the Finance Act, 1917, for an additional penal tax in cases where the taxpayer had not contributed to the war loan in proportion to his income. The Act made it the duty of every taxpayer whose taxable income for the year ended 31st March, 1916, exceeded £700 to subscribe to the war loan of 1917-18, on notice being served by the Commissioner of Taxes, an amount equal to three times the amount of land and income tax payable for the year 1916-17. This provision was renewed for the following year by the Finance Act (No. 2) of 1918.
The income-tax for the year ended the 31st March, 1919, amounted to £6,219,336 and the land-tax to £1,512,693. The number of income-tax payers was 43,280, as against only 37,949 in the preceding year. Land-tax payers numbered 53,484, as against. 51,275 in 1917-18.
The total number of land- and income-tax payers for each of the past ten years was,—
NUMBER OF TAXPAYERS .
| Year ended 31st March. | Land-tax. | Income-tax. |
|---|---|---|
| 1910 | 33,162 | 11,175 |
| 1911 | 33,516 | 11,303 |
| 1912 | 35,273 | 12,207 |
| 1913 | 38,232 | 13,167 |
| 1914 | 40,889 | 14,277 |
| 1915 | 44,270 | 13,967 |
| 1916 | 45,409 | 20,072 |
| 1917 | 35,859 | 30,230 |
| 1918 | 51,275 | 37,949 |
| 1919 | 53,484 | 43,280 |
The revenue derived from land-tax and income-tax during each of the past ten years is as shown below.
LAND AND INCOME TAX , 1909-10 TO 1918-19.
| Year ended 31st March. | Land-tax. | Income-tax. |
|---|---|---|
| £ | £ | |
| 1910 | 642,270 | 316,835 |
| 1911 | 628,723 | 407,235 |
| 1912 | 647,015 | 448,935 |
| 1913 | 728,636 | 462,994 |
| 1914 | 767,451 | 554,271 |
| 1915 | 799,641 | 540,318 |
| 1916 | 1,048,356 | 1,392,119 |
| 1917 | 713,118 | 4,262,125 |
| 1918 | 1,385,708 | 5,619,561 |
| 1919 | 1,512,693 | 6,219,336 |
In 1917 the dual system of land taxation (ordinary and graduated) was superseded by a single graduated tax, which in 1918-19 yielded the sum of £1,512,693.
Particulars of the amounts collected under the three classes (ordinary, graduated, and absentee) during the ten years 1908-9 to 1917-18 are as given in the following table:—
LAND -TAX , 1908-9 TO 1917-18.
| Year ended 31st March. | Land-tax. | ||
|---|---|---|---|
| Ordinary. | Graduated. | Absentee. | |
* Included in preceding column. | |||
| £ | £ | £ | |
| 1909 | 389,844 | 209,248 | 5,809 |
| 1910 | 417,668 | 220,044 | 4,558 |
| 1911 | 416,426 | 209,493 | 2,804 |
| 1912 | 439,398 | 205,114 | 2,503 |
| 1913 | 475,281 | 251,275 | 2,080 |
| 1914 | 506,407 | 258,135 | 2,909 |
| 1915 | 547,959 | 249,193 | 2,489 |
| 1916 | 696,930 | 351,426 | * |
| 1917 | 347,913 | 365,205 | * |
The effect of the increased rates during and since the 1915-16 financial year is clearly shown by the table of revenue from land and income tax given above. Land-tax collected during 1915-16 was 30 per cent. above that of 1914-15, while income-tax was £300,000 more than the combined totals of 1913-14 and 1914-15. The fall in the amount of land-tax in 1916-17 was due to the alteration in system referred to above, whereby income derived from mortgages of land now bears income-tax instead of land-tax as formerly. The increase in land-tax collected in 1917-18 and the following year was a result of the increased rates levied under the provisions of the Finance Act, 1917.
Under the Death Duties Act, 1909, an estate duty is levied upon the final balance of all property of a deceased person which is situated in New Zealand at his death in excess of the value of £500. In the case of any estate the final balance of which does not exceed £10,000, any interest acquired by the wife of the deceased up to the value of £5,000 is exempt from estate duty, but the rate of duty on the whole estate must be determined before the deduction is made. The following is the scale of duties:—
| Net Value of Estate. | Rate of Duty. |
|---|---|
| £ £ | Per Cent. |
| 500 to 1,000 | 1 |
| 1,000 to 2,000 | 2 |
| 2,000 to 3,000 | 2 1/2 |
| 3,000 to 4,000 | 3 |
| 4,000 to 5,000 | 3 1/3 |
| 5,000 to 6,000 | 3 2/3 |
| 6,000 to 7,000 | 4 |
| 7,000 to 8,000 | 4 1/3 |
| Net Value of Estate. | Rate of Duty. |
| ££ | Per Cent. |
| 8,000 to 9,000 | 4 2/3 |
| 9,000 to 10,000 | 5 |
| 10,000 to 12,000 | 5 1/3 |
| 12,000 to 14,000 | 5 2/3 |
| 14,000 to 16,000 | 6 |
| 16,000 to 18,000 | 6 1/3 |
| 18,000 to 20,000 | 6 2/3 |
| 20,000 to 25,000 | 7 |
On states exceeding £25,000 the rate of duty progresses by one-third of 1 per cent. for each successive £5,000, but the maximum rate must not exceed 15 per cent.
Succession duty is payable by any person who acquires a beneficial interest in the estate of a deceased person either by will or by intestacy, according to the following scale:—
| Per Cent. | |
|---|---|
| Wife of deceased | 2 |
| Husband | 2 |
| Child, grandchild, or other descendant | 2 |
| Relatives in degree not more remote than fourth | 5 |
| Others | 10 |
No duty is payable by the wife of deceased where the succession does not exceed £20,000, nor by a child, grandchild, or other descendant where the amount is not more than £5,000. Where duty is payable it is levied on the full amount of the succession, but must not be greater than the amount by which the succession exceeds £20,000 or £5,000, as the case may be.
In all other cases duty is not payable in respect of any succession the value of which does not exceed £200, and the duty payable on any succession in excess of that sum is not to be greater than the amount by which the succession exceeds £200.
Excepting in the case of wife, or of children, grandchildren, or other descendants, if the value of the succession exceeds £20,000 any such excess is charged with double the rate of the ordinary duty. Charitable trusts are exempt from succession duty.
The wife or lineal descendant of a soldier who has met his death on account of the war is allowed an exemption to the extent of £5,000 in addition to the exemptions mentioned above, duty to be payable on the residue only. A lineal ancestor is also exempt up to £5,000, but in this case, where the succession exceeds £5,000, the duty is payable on the full amount, but must not be more than the amount by which the succession exceeds £5,000.
A gift means any disposition of property which is made otherwise than by will, whether with or without an instrument in writing, without fully adequate consideration in money or its equivalent. The duty payable is as follows:—
On a gift which together with the value of all other gifts made at the same time, or within twelve months previously or subsequently by the same donor to the same or any other beneficiary, otherwise than by way of a charitable trust, does not exceed the value of £1,000, no duty shall be charged.
On gifts exceeding the value of £1,000, 5 per cent. Antenuptial marriage settlements and charitable gifts are exempt from duty.
Death duties are due and payable to the Commissioner of Stamps within six months from the death of the deceased, and gift duties at the time the gift is made.
The revenue received from death duties during each of the past ten years was.—
| Year ended 31st March. | Amount. |
|---|---|
| £ | |
| 1910 | 192,014 |
| 1911 | 323,783 |
| 1912 | 361,186 |
| 1913 | 458,265 |
| 1914 | 613,751 |
| 1915 | 796,283 |
| 1916 | 610,350 |
| 1917 | 570,040 |
| 1918 | 805,511 |
| 1919 | 869,371 |
Full information concerning the law as to the use of the totalizator in New Zealand is given in Section XXXII of this book (Miscellaneous). The Government tax on totalizator investments is 2 1/2 per cent. of the gross amount passed through the machines. Prior to the 1st March, 1910, the percentage was 1 1/2.
A tax of 1 per cent. has from the 1st November, 1915, been imposed on the total value of all stakes, and 6d. in the pound or part of a pound on totalizator dividends, in addition to the tax on totalizator investments.
The following table shows for each of the last twenty years the number of totalizator licenses issued, the amount of investments by the public, and the amount paid to the Treasury as a percentage of such investments. The amounts shown as "Percentage paid to Treasury" represent the amounts paid in respect of the race meetings held during the year as shown, but do not in all cases coincide with the amount of totalizator revenue received during the financial year, for the reason that the percentage in respect of race meetings held late in March may not be paid to the Treasury until after the end of the financial year.
| Financial Year. | Number of Totalizator Licenses issued for Meetings held during Financial Year. | Days. | Percentage paid to Treasury. | Total Amount invested by the Public. |
|---|---|---|---|---|
| £ | £ | |||
| 1899-1900 | 154 | 278 | 15,983 | 1,065,580 |
| 1900-1 | 153 | 278 | 17,541 | 1,168,732 |
| 1901-2 | 165 | 309 | 19,040 | 1,275,813 |
| 1902-3 | 148 | 276 | 19,734 | 1,274,102 |
| 1903-4 | 151 | 282 | 20,486 | 1,357,263 |
| 1904-5 | 156 | 294 | 21,571 | 1,437,431 |
| 1905-6 | 158 | 298 | 22,898 | 1,555,638 |
| 1906-7 | 159 | 303 | 27,651 | 1,837,095 |
| 1907-8 | 152 | 292 | 29,996 | 1,999,757 |
| 1908-9 | 157 | 307 | 27,964 | 1,834,333 |
| 1909-10 | 167 | 323 | 29,645 | 2,030,426 |
| 1910-11 | 144 | 287 | 48,338 | 1,933,534 |
| 1911-12 | 142 | 264 | 72,184 | 2,887,371 |
| 1912-13 | 148 | 265 | 86,095 | 3,600,465 |
| 1913-14 | 126 | 231 | 92,260 | 3,690,390 |
| 1914-15 | 141 | 255 | 110,733 | 4,429,320 |
| 1915-16 | 180 | 285 | 119,379 | 4,775,120 |
| 1916-17 | 171 | 279 | 127,387 | 5,095,480 |
| 1917-18 | 135 | 205 | 110,845 | 4,433,816 |
| 1918-19 | 134 | 201 | 122,154 | 4,886,156 |
In addition to the amount shown above as percentage paid to the Treasury in 1918-19, the sum of £109,935 was received as dividend duty and £3,242 as tax on stakes.
The racing year ends on the 31st July, and the position as regards the last seven years is better shown in the next table, which gives figures for July years. Information as to gate-money, licenses, &c., is also given. Figures for racing prior to 1911-12 are not obtainable.
| Racing Year. | Number of Totalizator Licenses issued. | Days. | Amount invested on Totalizator by the Public. | Amount of Gate-money, Licenses, &c. | Amounts paid to Treasury. | |
|---|---|---|---|---|---|---|
| As Tax on Investments. | From Gate-money, Licenses, &c. | |||||
| £ | £ | £ | £ | |||
| 1911-12 | 138 | 250 | 2,898,596 | 90,921 | 72,465 | 2,273 |
| 1912-13 | 138 | 250 | 3,538,188 | 102,686 | 88,455 | 2,567 |
| 1913-14 | 138 | 250 | 4,188,594 | 123,932 | 104,714 | 3,099 |
| 1914-15 | 151 | 262 | 4,450,331 | 129,388 | 111,258 | 3,235 |
| 1915-16 | 175 | 281 | 4,796,515 | 133,700 | 119,913 | 3,343 |
| 1916-17 | 163 | 280 | 5,040,594 | 128,868 | 126,015 | 3,222 |
| 1917-18 | 131 | 189 | 4,421,175 | 108,444 | 110,529 | 2,711 |
| 1918-19 | 152 | 239 | 5,721,649 | 137,572 | 143,041 | 3,439 |
Local governing authorities have power under various Acts of the Legislature to impose taxes for general or special purposes as set out in another section of this book. The amount of revenue collected for local purposes during ten years is shown below.
| Year ended 31st March. | Local Revenue derived from | Total. | ||
|---|---|---|---|---|
| General Rates. | Special and Separate Rates. | Licenses and other Taxes. | ||
| £ | £ | £ | £ | |
| 1909 | 970,225 | 420,473 | 111,195 | 1,501,893 |
| 1910 | 1,058,447 | 467,860 | 108,470 | 1,634,777 |
| 1911 | 1,118,112 | 474,489 | 108,234 | 1,700,835 |
| 1912 | 1,156,718 | 521,159 | 113,106 | 1,790,983 |
| 1913 | 1,252,717 | 546,582 | 169,468 | 1,968,767 |
| 1914 | 1,359,776 | 645,862 | 181,896 | 2,187,534 |
| 1915 | 1,484,430 | 655,495 | 185,569 | 2,325,494 |
| 1916 | 1,607,764 | 747,391 | 187,065 | 2,542,220 |
| 1917 | 1,695,572 | 838,967 | 185,611 | 2,720,150 |
| 1918 | 1,791,028 | 883,513 | 192,482 | 2,867,023 |
Of recent years there has been great activity in local enterprise, the necessary funds being provided partly out of general rates, but mainly by borrowing, interest on loans and payments to sinking funds being secured in most cases by special rates. The increase in the amount of general rates collected during the ten years 1907-8 to 1917-18 was £841,889, or 89 per cent.; special and separate rates increased by £476,394, or 117 per cent.; and total rates by £1,318,283, or 97 per cent. Licenses and other taxes show an increase for the ten years of £82,142, or 75 per cent.
A table is given setting out in greater detail the taxation by local authorities during the year ended the 31st March, 1918.
REVENUE FROM LOCAL TAXATION , 1917-18.
| Local Bodies. | Rates. | Licenses. | Other Taxes. | Total. | |
|---|---|---|---|---|---|
| Special and Separate. | General. | ||||
| £ | £ | £ | £ | £ | |
| Counties | 877,559 | 130,326 | 19,315 | 24,927 | 1,052,127 |
| Boroughs | 624,119 | 662,810 | 64,858 | 75,639 | 1,427,426 |
| Town Boards | 30,455 | 20,645 | 4,319 | 1,582 | 57,001 |
| Road Boards | 85,284 | 13,371 | 863 | 976 | 100,494 |
| River Boards | 11,190 | 3,044 | .. | .. | 14,234 |
| Land Drainage Boards | 15,263 | 7,169 | .. | .. | 22,432 |
| Harbour Boards | 90,039 | .. | .. | .. | 90,039 |
| City and Suburban | 56,727 | 37,587 | .. | .. | 94,314 |
| Drainage Boards | |||||
| Tramway Boards | .. | 3,618 | .. | .. | 3,618 |
| Water-supply Boards | 392 | 4,943 | 3 | .. | 2,745 |
| Totals | 1,791,028 | 883,513 | 89,358 | 103,124 | 2,867,023 |
The figures quoted above are exclusive of wharfage dues, charges, fees, and tolls received by Harbour Boards.
EARLY in the history of the settlement of New Zealand the necessity for financial assistance to open up the forest-clad rugged country was made apparent. In the year 1856 the first Loan Act was passed by the General Assembly, and under that authority £500,000 was raised. In addition to the requirements for necessary initial public works, the opposition to settlement by the Maoris, resulting in active hostilities, compelled considerable borrowing. At the conclusion of the Maori War the work of road and railway construction was mainly carried on under the administration of Provincial Councils, who exercised control over expenditure within their respective districts, the General Government being responsible for undertakings of a national character. Under this system of divided responsibility no general and comprehensive scheme of public works could be carried out.
Up to the end of the year 1870 the General Government had borrowed £4,543,316, while the debt of the Provincial Councils amounted to £3,298,575. In that year the General Government brought forward a public-works and immigration policy, by which it was proposed to raise a loan of ten millions for the construction of main trunk railways, roads, and other public works of importance to the country as a whole, as well as for the promotion of settlement on a large scale, the expenditure to be spread over a period of ten years. This policy was accepted by the Legislature, and embodied in the Immigration and Public Works Act, 1870. The necessity for local railways and other works soon caused the original proposals to be exceeded, and to a far greater amount than was at first contemplated. Broadly stated, the system of opening up the lands in advance of settlement was adopted, the State retaining the ownership and control of facilities for transport and communication.
In 1892 the General Government began the repurchase of lands already alienated. The money required for this purpose has been borrowed, but the rentals obtained by the leasing of the lands are sufficient for the payment of interest and sinking fund on the amount raised. In 1894 the Advances to Settlers Act was passed, authorizing the raising of loans for advances on the security of real estate. This was followed by the Advances to Workers Act in 1906. A considerable amount has been borrowed for these purposes, but both interest and sinking funds are derived from the special revenues, and thus are not a charge upon the Consolidated Fund. In order to assist local governing bodies to obtain money at low rates of interest the General Government has borrowed over six millions. Under this scheme the advances are repaid to the State by instalments.
The money composing the debt has been borrowed on the security of the public revenues. No portion of the public estate is pledged for payment of either principal or interest.
The Minister of Finance may raise loans when authorized by Parliament so to do, by the issue of debentures, or scrip; or stock, in New Zealand or elsewhere at his discretion, and may prescribe the mode and conditions of repayment of loans, the rates of interest (not exceeding the maximum rate fixed by the authorizing Act), and the times and places of the payment of principal and interest respectively. Power is given to convert debentures or scrip into consolidated stock, and the Minister may specify the terms of conversion at the time when a loan is raised, or arrange that terms shall be subsequently agreed upon. For the purpose of paying off or renewing at maturity any debenture, scrip, or other security, new debentures or other securities may be issued and disposed of if necessary. Authority also exists for the conversion of loan-money which has not yet matured.
The gross and net indebtedness of the General Government, the amount of sinking fund accrued, and the rate of indebtedness per head of population, for each of the past twenty years, is given in the following table:—
| As at 31st March. | Estimated or Census Population. | Amount of Debentures and Stock in Circulation. | Gross Indebtedness per Head of European Population. | Amount of Sinking Fund accrued. | Net Indebtedness. | Net Indebtedness per Head of European Population. | ||||
|---|---|---|---|---|---|---|---|---|---|---|
| £ | £ | s. | d. | £ | £ | £ | s. | d. | ||
| 1900 | 758,616 | 47,874,452 | 63 | 2 | 2 | 944,375 | 46,930,077 | 61 | 17 | 3 |
| 1901 | 772,719 | 49,591,245 | 64 | 3 | 7 | 1,033,494 | 48,557,751 | 62 | 16 | 10 |
| 1902 | 789,994 | 52,966,447 | 67 | 0 | 11 | 1,128,816 | 51,837,631 | 65 | 12 | 4 |
| 1903 | 814,842 | 55,899,019 | 68 | 12 | 0 | 1,357,739 | 54,541,280 | 66 | 18 | 8 |
| 1904 | 838,954 | 57,522,215 | 68 | 11 | 4 | 1,500,687 | 56,021,528 | 66 | 15 | 6 |
| 1905 | 864,971 | 59,912,000 | 69 | 5 | 4 | 1,650,718 | 58,261,282 | 67 | 7 | 2 |
| 1906 | 889,968 | 62,191,040 | 69 | 17 | 7 | 1,661,519 | 60,529,521 | 68 | 0 | 3 |
| 1907 | 913,873 | 64,179,040 | 70 | 4 | 7 | 2,042,068 | 62,136,972 | 67 | 19 | 10 |
| 1908 | 937,587 | 66,453,897 | 70 | 17 | 6 | 1,268,361 | 65,185,536 | 69 | 10 | 6 |
| 1909 | 968,313 | 70,938,534 | 73 | 5 | 2 | 1,479,224 | 69,459,310 | 71 | 14 | 8 |
| 1910 | 987,481 | 74,890,645 | 75 | 16 | 10 | 1,503,225 | 73,387,420 | 74 | 6 | 4 |
| 1911 | 1,008,468 | 81,078,122 | 80 | 7 | 11 | 1,754,486 | 79,323,636 | 78 | 13 | 2 |
| 1912 | 1,031,500 | 84,353,913 | 81 | 15 | 7 | 2,160,603 | 82,193,310 | 79 | 13 | 8 |
| 1913 | 1,061,748 | 90,060,763 | 84 | 16 | 5 | 2,603,642 | 87,457,121 | 82 | 7 | 5 |
| 1914 | 1,089,827 | 99,730,427 | 91 | 10 | 2 | 3,063,992 | 91,689,835 | 84 | 2 | 8 |
| 1915 | 1,100,586 | 100,059,910 | 90 | 18 | 4 | 3,178,055 | 96,644,455 | 87 | 16 | 3 |
| 1916 | 1,100,406 | 109,637,397 | 99 | 12 | 8 | 3,679,964 | 105,957,433 | 96 | 5 | 9 |
| 1917 | 1,101,166 | 129,836,105 | 117 | 18 | 2 | 4,263,590 | 125,572,515 | 114 | 0 | 9 |
| 1918 | 1,104,783 | 150,840,055 | 136 | 10 | 8 | 4,971,605 | 145,868,450 | 132 | 0 | 8 |
| 1919 | 1,124,630 | 176,076,260 | 156 | 11 | 4 | 5,951,056 | 170,125,204 | 151 | 5 | 6 |
The gross indebtedness at the 31st March, 1914, includes the sum of £4,976,600 raised at the end of the year 1913-14 for redemption of debentures falling due early in 1914-15; and the sum of £237,400 raised on the 30th March, 1915, for redemptions on the 1st April, 1915, is included in the figure for 1914-15. The net indebtedness does not include these amounts.
In issues of the Year-book prior to 1912, in addition to the customary deduction made for sinking funds accrued, the gross debt was further reduced for the years 1903 to 1911 by taking off the amount of Government securities in which the New Zealand Consols deposits are invested, as well as the value of the preference shares held by the Government in the Bank of New Zealand, which was £500,000 up to 1914, but has now been increased by the sum of £375,000, representing 4-per-cent. inscribed stock created and issued to the bank under the authority of section 6 of the Bank of New Zealand Act, 1913. For the years 1908 to 1911 the cost price of securities (£800,000) purchased for a reserve to meet any unexpected financial contingency was also similarly deducted from the gross debt. In 1912, however, the Government decided that as these items are not strictly sinking funds proper they should not be included in official statements of the Dominion's sinking funds, and they are now accordingly omitted. In order that the above table may show a proper comparison of the growth of the accrued sinking fund, the total net indebtedness, and the net indebtedness per head of population, the last three columns have been recast for the years 1903 to 1911, the figures for all the years shown being thus put on the same basis.
In regard to the investments of New Zealand Consols deposits in Government securities, it may be stated that the amounts so invested during the ten years 1909-10 to 1918-19 were as follows:—
| Year ended 31st March, | Amount. |
|---|---|
| £ | |
| 1910 | 308,840 |
| 1911 | 335,240 |
| 1912 | 347,180 |
| 1913 | 348,960 |
| 1914 | 348,960 |
| 1915 | 425,485 |
| 1916 | 475,885 |
| 1917 | 475,885 |
| 1918 | 475,985 |
| 1919 | 475,985 |
These sums represent the amount of the public debt held by the New Zealand Government itself for those years.
In considering the indebtedness of a country it is important to know whether the money borrowed has been utilized for productive or for unproductive purposes. New Zealand's public debt expenditure is usually divided into four classes, as follows:—
Directly reproductive undertakings.
Investments.
Indirectly productive public utilities.
Unproductive.
Much of the money borrowed is obtained for specific purposes and can be accurately placed in one or other of the four classes shown. On the other hand, however, general public-works loans are obtained to cover the cost of a number of undertakings ranging from railways (directly productive) to public buildings (unproductive). As the Public Works Fund receives from time to time transfers from the Consolidated Fund, and as no distinction is made between expenditure out of revenue and expenditure out of loan, it is necessary to allocate the loan-money over the various items according to the total expenditure on each. The result is accurate enough for practical purposes.
The indebtedness as at 31st March, 1919, allocated to its various items in the four classes referred to, is shown in the following statement. The figures for the last financial year are also given.
ALLOCATION OF LOANS .
| Increase during 1918-19. | Total Indebtedness at 31st March, 1919. | |
|---|---|---|
* Decrease. | ||
| (a.) Directly reproductive undertakings,— | £ | £ |
| Railways | 392,838 | 32,034,024 |
| Railways improvement | 70,000 | |
| Telegraphs and telephones | 201,127 | 3,299,976 |
| Lighthouses and harbours | 5,460 | 650,219 |
| Tourist and health resorts | 1,641 | 183,413 |
| State forests | 26,900 | 65,000 |
| State coal-mines | .. | 227,601 |
| Water-power development and electric supply | 34,371 | 462,291 |
| Totals (class a) | 732,337 | 36,992,524 |
| (b.) Investments,— | ||
| Advances to settlers | .. | 9,283,196 |
| Advances to workers | .. | 2,419,347 |
| Advances to local authorities | .. | 2,775,528 |
| Mining advances | .. | 26,500 |
| Kauri-gum industry advances | .. | 47,000 |
| Fruit-preserving industry advances | 9,500 | 56,200 |
| Cold-storage advances | 80,000 | 103,250 |
| Land for settlements | 550,000 | 8,319,523 |
| Discharged soldiers settlement | 740,000 | 900,000 |
| Native-land settlement | 225,000 | 2,130,031 |
| Opening up Crown lands | .. | 347,911 |
| Hauraki Plains settlement | 25,000 | 145,000 |
| Rangitaiki drainage | 25,000 | 145,000 |
| Purchase of Native lands | .. | 2,715,217 |
| Loans to local bodies | .. | 3,507,000 |
| Investment of New Zealand Consols | .. | 475,992 |
| Bank of New Zealand shares | .. | 875,000 |
| Reserve Fund securities | .. | 800,000 |
| Totals (class b) | 1,654,500 | 35,071,695 |
| (c .) Indirectly productive,— | ||
| Roads and bridges | 228,937 | 9,518,177 |
| Lands improvement | -4,321* | |
| Irrigation and water-supply | 13,837 | |
| Swamp drainage | 25,000 | |
| Waihou and Ohinemuri Rivers improvement | .. | |
| Development of mining | 525 | 909,242 |
| Immigration | -12,170* | 2,548,726 |
| Totals (class c) | 251,808 | 12,976,145 |
| (d.)Unproductive,— | £ | £ |
| Public buildings | 238,834 | 7,673,229 |
| Scenery-preservation | .. | 89,000 |
| Maori War | .. | 2,357,000 |
| Contingent defence | 8,921 | 3,756,852 |
| Naval defence | .. | |
| European War | 22,274,806 | 68,460,040 |
| Waimarino bush-fire relief | 75,000 | 75,000 |
| Deficiencies in revenue, charges and expenses of raising loans, provincial liabilities, &c. | .. | 8,624,776 |
| Totals (class d) | 22,597,561 | 91,035,897 |
| Grand totals | £25,236,206 | £176,076,261 |
In considering the increase of the public debt, the position at the end of the financial year 1890-91 has been selected as the basis of comparison, because that date marks the beginning of a period during which the functions of the State have been widely extended, most notably as regards financial assistance to settlers, workers, and local bodies, the repurchase of alienated lands, the working of coal-mines, and the establishment of State fire- and accident-insurance offices. In every department these nwe activities, as well as the old, have been directly successful, while the indirect benefits, though admittedly great, are incapable of measurement. A considerable portion of the annual interest on the debt, although paid out of the Consolidated Fund, does not fall upon the whole of the taxpaying community, the revenue derived from several of the more important undertakings being sufficient to meet the interest on the money borrowed in respect of them.
The increase of the gross public debt since the 31st March, 1891, amounts to £137,245,911. Excluding war expenditure, referred to later, the largest item in the increase is £9,283,196 raised for advances to settlers, with which should be classed advances to workers (£2,419,347), and to local authorities (£2,775,528). In addition to this latter amount £3,507,000 was raised for loans to local bodies prior to the inauguration of the present system of making such loans through the State Advances Office. These four items, as well as a number of smaller ones, represent investments by the Government bearing interest and lent on continually improving security, the principal being repaid by instalments. Other considerable items which may be considered as interest-bearing investments are those under the heads "Land for settlements," "Native-land purchases," "Lands improvement," "New Zealand Consols," "Bank of New Zealand shares," and "Reserve Fund securities."
The advent of the war has created a second point of demarcation in the Dominion's loan expenditure. The great demands for money for war purposes have compelled a postponement of all but urgently necessary public works and the temporary cessation of borrowings for advances to settlers, workers, and local authorities The following statement sets out the indebtedness for the various purposes, (1) as at 31st March, 1891, (2) between 31st March, 1891, and 31st March, 1914, and (3) since 31st March, 1914.
EXPENDITURE OF PUBLIC DEBT .
| — | Up to 31st March, 1891. | From 31st March, 1891, to 31st March, 1914. | Since 31st March, 1914. |
|---|---|---|---|
* Decrease | |||
| (a.) Directly reproductive undertakings,— | £ | £ | £ |
| Railways | 14,580,000 | 13,841,304 | 3,682,720 |
| Telegraphs and telephones | 769,000 | 1,439,884 | 1,091,092 |
| Lighthouses and harbours | 484,000 | 128,971 | 37,248 |
| Tourist and health resorts | .. | 168,995 | 14,418 |
| State coal-mines | .. | 225,000 | 2,601 |
| State forests | .. | .. | 65,000 |
| Development of water-power | .. | 218,920 | 243,371 |
| Totals | 15,833,000 | 16,023,074 | 5,136,450 |
| (b.) Investments,— | |||
| Advances to settlers | .. | 8,677,325 | 605,871 |
| Advances to workers | .. | 2,536,927 | *117,580 |
| Advances to local authorities | .. | 2,568,067 | 207,461 |
| Land for settlements | .. | 7,230,093 | 539,430 |
| Discharged soldiers settlement | .. | .. | 900,000 |
| Opening up lands for settlement | .. | 251,911 | 646,000 |
| Native-land settlement | .. | 929,600 | 1,200,431 |
| Guaranteed mining advances | .. | 15,000 | 11,500 |
| Kauri-gum industry advances | .. | .. | 47,000 |
| Fruit preserving industry advances | .. | .. | 56,200 |
| Cold-storage advances | .. | .. | 103,250 |
| Hauraki Plains settlement | .. | 100,000 | 45,000 |
| Rangitaiki drainage | .. | 45,000 | 100,000 |
| Purchase of Native lands | 1,546,000 | 1,169,217 | .. |
| Loans to local bodies | 325,000 | 3,182,000 | .. |
| Investment of New Zealand Consols | .. | 475,992 | .. |
| Bank of New Zealand shares | .. | 500,000 | 375,000 |
| Reserve Fund securities | .. | 800,000 | .. |
| Totals | 1,871,000 | 28,481,132 | 4,719,563 |
| (c .) Indirectly productive,— | |||
| Roads, bridges, and land-improvement | 5,106,000 | 2,869,334 | 1,372,919 |
| Waihou and Ohinemuri Rivers improvement | .. | 100,000 | .. |
| Swamp drainage | .. | .. | 46,000 |
| Irrigation and water-supply | .. | .. | 23,924 |
| Immigration | 2,459,000 | 62,878 | 26,848 |
| Development of mining | 571,000 | 325,992 | 12,250 |
| Totals | 8,136,000 | 3,358,204 | 1,481,941 |
| (d.) Unproductive,— | |||
| Public buildings | 1,800,000 | 4,643,556 | 1,229,673 |
| Maori War | 2,357,000 | .. | .. |
| European War | .. | .. | 68,460,040 |
| Defence | 1,638,000 | 2,082,011 | 36,841 |
| Scenery-preservation | .. | 74,000 | 15,000 |
| Waimarino bush-fire relief | .. | .. | 75,000 |
| Deficiencies in revenue, charges and expenses of raising loans, provincial liabilities, and miscellaneous | 7,195,350 | 1,261,500 | 167,926 |
| Totals | 12,990,350 | 8,061,067 | 69,984,480 |
| Grand totals | 38,830,350 | 55,923,477 | 81,322,434 |
The tremendous, though necessary, increase in unproductive expenditure during the five war years is more clearly illustrated in the following table, showing the percentages of the various classes to the total for each of the three periods:—
| Class. | Percentage of Indebtedness. | ||||
|---|---|---|---|---|---|
| Prior to 31st March, 1891. | Between 31st March, 1891 and 1914. | As at 31st March, 1914. | Since 31st March, 1914. | As at 31st March, 1919. | |
| (a.) Reproductive expenditure | 40.78 | 28.65 | 33.62 | 6.32 | 21.01 |
| (b.) Investments | 4.82 | 50.93 | 32.03 | 5.80 | 19.92 |
| (c.) Indirectly productive expenditure | 20.95 | 6.01 | 12.13 | 1.82 | 7.37 |
| (d.) Unproductive expenditure | 33.45 | 14.41 | 22.22 | 86.06 | 51.70 |
| Totals | 100.00 | 100.00 | 100.00 | 100.00 | 100.00 |
The directly interest-earning portion of the debt amounts to 40.93 per cent. of the total debt, and is represented by assets which are of much greater value than the amount of borrowed money spent upon them, a considerable amount of surplus ordinary revenue having been expended from time to time on railways and other public services, as well as other moneys of the nature of special receipts. The small proportion represented by unproductive loan-money raised during the period 1891 to 1914 (14.41 per cent.) is in strong contrast to the similar proportion for the period 1914 to 1918 (86.06 per cent.).
The whole of the public debt as stated in the foregoing tables comprises inscribed stocks and debentures with varying periods of currency. Treasury bills issued in anticipation of revenue have not been included in the total. The following table shows the relative increase of the different classes of securities during the past ten financial years:—
| Year ended 31st March. | Inscribed Stock. | Debentures. | Total. | Treasury Bills outstanding (not included in preceding Columns). |
|---|---|---|---|---|
| £ | £ | £ | £ | |
| 1910 | 51,364,868 | 23,525,777 | 74,890,645 | 100,000 |
| 1911 | 54,832,570 | 26,245,552 | 81,078,122 | .. |
| 1912 | 55,626,235 | 28,727,678 | 84,353,913 | .. |
| 1913 | 59,960,105 | 30,100,658 | 90,060,763 | .. |
| 1914 | 66,076,250 | 33,654,177 | 99,730,427 | .. |
| 1915 | 68,008,389 | 32,051,521 | 100,059,910 | .. |
| 1916 | 68,689,630 | 40,947,767 | 109,637,397 | .. |
| 1917 | 68,689,935 | 61,146,170 | 129,836,105 | .. |
| 1918 | 77,760,485 | 73,079,570 | 150,840,055 | .. |
| 1919 | 87,373,480 | 88,702,780 | 176,076,260 | .. |
Until comparatively recent years the large proportion of the productive power of the Dominion diverted to the construction of railways, roads, &c., and engaged in the preparation of land for farming, necessitated the borrowing of capital from abroad; but of late the accumulation of savings, chiefly of small sums deposited in the savings-banks, has enabled the Government to raise considerable amounts from time to time locally. With the exception of advances from the Imperial Government, the large war loans of 1916 and 1917 were raised entirely in the Dominion.
Between the 31st March, 1909, and the corresponding date in 1919 the amount raised (and remaining outstanding) in London increased from 64 3/4 to 95 3/4 millions, while that raised in New Zealand increased from 12 1/2 to 77 millions. The amount raised in Australia is negligible. The following table shows, of the total amount outstanding in each of the past ten years, the amount raised in London, Australia, and New Zealand:—
PUBLIC DEBT , WHERE RAISED .
| Year ended 31st March. | Inscribed Stock. | Debentures. | Total. | |||
|---|---|---|---|---|---|---|
| London. | New Zealand. | London. | Australia. | New Zealand. | ||
| £ | £ | £ | £ | £ | £ | |
| 1910 | 50,954,744 | 410,124 | 6,778,914 | 4,113,985 | 12,632,878 | 74,890,645 |
| 1911 | 54,370,404 | 462,166 | 7,851,414 | 4,213,985 | 14,180,153 | 81,078,122 |
| 1912 | 55,152,124 | 474,111 | 8,852,750 | 4,213,985 | 15,660,943 | 84,353,913 |
| 1913 | 59,484,214 | 475,891 | 9,445,250 | 4,213,985 | 16,441,423 | 90,060,763 |
| 1914 | 65,600,259 | 475,991 | 13,024,050 | 4,286,800 | 16,343,327 | 99,730,427 |
| 1915 | 67,532,398 | 475,991 | 8,877,603 | 3,979,000 | 19,194,918 | 100,059,910 |
| 1916 | 68,213,639 | 475,991 | 13,251,109 | 3,520,650 | 24,176,008 | 109,637,397 |
| 1917 | 68,213,943 | 475,992 | 15,663,875 | 3,385,650 | 42,096,645 | 129,836,105 |
| 1918 | 68,213,943 | 9,546,542 | 20,493,875 | 3,385,650 | 49,200,045 | 150,840,055 |
| 1919 | 68,213,943 | 19,159,537 | 27,494,385 | 3,385,650 | 57,822,745 | 176,076,260 |
The percentage of the total debt raised in each of the markets and outstanding in 1908-9 and 1918-19 was,—
| 1908-9. | 1918-19. | |
|---|---|---|
| Market. | Per Cent. | Per Cent. |
| London | 77.01 | 54.35 |
| New Zealand | 17.53 | 43.72 |
| Australia | 5.46 | 1.93 |
| 100.00 | 100.00 |
A summary of the loans outstanding on the 31st March, 1919, showing the amounts falling due in each financial year is given.
| Due Date: Year ending 31st March. | Amount. |
|---|---|
* Overdue. | |
| £ | |
| 1915 | 2,500* |
| 1918 | 1,000* |
| 1919 | 600* |
| 1920 | 3,767,945 |
| 1921 | 10,005,457 |
| 1922 | 6,217,090 |
| 1923 | 9,083,356 |
| 1924 | 8,509,265 |
| 1925 | 1,131,492 |
| 1926 | 383,410 |
| 1927 | 56,400 |
| 1928 | 2,338,160 |
| 1930 | 30,100,402 |
| 1931 | 5,680,640 |
| 1936 | 17,730 |
| Due Date: Year ending 31st March. | Amount. |
| £ | |
| 1937 | 1,000 |
| 1938 | 3,000 |
| 1939 | 24,067,335 |
| 1940 | 17,568,932 |
| 1941 | 781,815 |
| 1942 | 2,765,950 |
| 1946 | 17,074,121 |
| 1948 | 895,000 |
| 1949 | 1,423,600 |
| 1950 | 1,106,500 |
| 1963 | 10,884,628 |
| Unspecified | 22,208,932 |
| Total | £176,076,260 |
The amounts that have matured or will mature during the current financial year, with their due dates, are as follows:—
| Due Date. | £ |
|---|---|
* Overdue. | |
| 1914, July 15 | 2,500* |
| 1918, January 1 | 1,000* |
| 1919, January 1 | 600* |
| 1919, April 1 | 414,000 |
| 1919, May 1 | 144,300 |
| 1919, June 1 | 823,200 |
| 1919, July 1 | 40,000 |
| 1919, September 1 | 262,300 |
| 1919, October 1 | 40,100 |
| 1919, November 1 | 704,000 |
| 1919, November 28 | 54,700 |
| 1919, December 1 | 30,400 |
| 1919, December 31 | 385,500 |
| 1920, January 1 | 262,430 |
| 1920, February 1 | 231,015 |
| 1920, March 1 | 266,000 |
| 1920, March 31 | 110,000 |
| Total | £3,772,045 |
Of the total amount of public debt outstanding at the end of March, 1919, over twenty-three millions bore interest at the rate of 5 per cent., nearly forty-seven millions at 4 1/2 per cent., and nearly seventy-two millions at 4 per cent. Only £33,660,588, or 19.12 per cent. of the total, bore interest at a lower rate than 4 per cent., as against 48.39 per cent. of the total at 31st March, 1914. The following are the rates of interest payable on the whole public debt:—
| Rates of Interest. | Amount at each Rate. |
|---|---|
| 5 per cent. | 23,398,671 |
| 4 1/2 per cent. | 46,991,821 |
| 4 1/4 per cent. | 55,100 |
| 4 per cent. | 71,965,980 |
| 3 3/4 per cent. | 1,461,000 |
| 3 1/2 per cent. | 22,536,798 |
| 3 per cent. | 9,662,790 |
| Overdue | 4,100 |
| Total | £176,076,260 |
The total amount of interest payable to bondholders on the full amount of the public debt (excluding interest on £4,100 shown as overdue) is £7,299,006, which gives an average rate of £4 2s. 11d. per £100. On the total public debt outstanding on the 31st March, 1891, the average interest charge was £4 10s. 3d. per £100. During the period 1890-91 to 1918-19, therefore, the average rate is found to have declined by 7s. 4d. per £100. There was, however, an increase of 8s. 6d. per £100 in 1918-19 as compared with 1913-14.
The foregoing refers to interest payable to bondholders only, and has nothing to do with sinking-fund requirements, which are included in the whole annual charge of the public debt.
The actual payments during the past twenty years for interest and sinking fund out of the Consolidated Fund are shown in the following table, together with the rate per head of population and the percentage of ordinary and territorial revenue absorbed by the public-debt charges:—
| Year ended 31st March. | Amounts actually paid for Interest and Sinking Fund out of the Consolidated Fund. | Rate per Head of Mean Population. | Percentage of Revenue absorbed by Public-debt Charges. | ||||||
|---|---|---|---|---|---|---|---|---|---|
| Public Debt. | Treasury Bills. | Total. | |||||||
| Interest. | Sinking Fund. | Total. | Interest. | ||||||
| £ | £ | £ | £ | £ | £ | s. | d. | ||
| 1900 | 1,674,618 | 46,073 | 1,720,691 | 28,703 | 1,749,394 | 2 | 6 | 6 | 31.07 |
| 1901 | 1,671,552 | 46,364 | 1,717,916 | 27,700 | 1,745,616 | 2 | 5 | 6 | 29.83 |
| 1902 | 1,722,819 | 47,724 | 1,770,543 | 33,396 | 1,803,939 | 2 | 6 | 2 | 29.80 |
| 1903 | 1,817,701 | 50,464 | 1,868,165 | 32,814 | 1,900,979 | 2 | 7 | 5 | 29.77 |
| 1904 | 1,875,376 | 53,408 | 1,928,784 | 29,179 | 1,957,963 | 2 | 7 | 4 | 27.89 |
| 1905 | 1,914,296 | 54,933 | 1,969,229 | 24,500 | 1,993,729 | 2 | 6 | 10 | 27.38 |
| 1906 | 2,006,537 | 56,167 | 2,062,704 | 24,500 | 2,087,204 | 2 | 7 | 7 | 27.52 |
| 1907 | 2,048,990 | 97,351 | 2,146,341 | 25,751 | 2,172,092 | 2 | 8 | 2 | 25.86 |
| 1908 | 2,085,018 | 81,842 | 2,166,860 | 20,559 | 2,187,419 | 2 | 7 | 3 | 24.15 |
| 1909 | 2,149,739 | 91,438 | 2,241,177 | 17,188 | 2,258,365 | 2 | 7 | 5 | 25.09 |
| 1910 | 2,282,182 | 95,124 | 2,377,306 | 20,156 | 2,397,462 | 2 | 9 | 0 | 25.95 |
| 1911 | 2,381,000 | 54,104 | 2,435,104 | 23,348 | 2,458,452 | 2 | 9 | 3 | 23.87 |
| 1912 | 2,446,493 | 198,388 | 2,644,881 | 11,459 | 2,656,340 | 2 | 12 | 1 | 24.02 |
| 1913 | 2,506,025 | 202,757 | 2,708,782 | 8,231 | 2,717,013 | 2 | 11 | 11 | 23.15 |
| 1914 | 2,649,796 | 221,726 | 2,871,512 | 16,468 | 2,887,980 | 2 | 13 | 8 | 23.61 |
| 1915 | 2,788,513 | 247,570 | 3,036,083 | 35,365 | 3,071,448 | 2 | 16 | 1 | 24.67 |
| 1916 | 2,888,533 | 257,036 | 3,145,569 | 45,229 | 3,190,798 | 2 | 18 | 0 | 21.99 |
| 1917 | 3,701,040 | 326,924 | 4,027,964 | 4,921 | 4,032,885 | 3 | 13 | 4 | 21.97 |
| 1918 | 3,935,118 | 494,699 | 4,429,817 | 962 | 4,430,779 | 4 | 0 | 4 | 21.93 |
| 1919 | 5,409,210 | 677,559 | 6,086,769 | .. | 6,086,769 | 5 | 9 | 2 | 27.23 |
The above amounts shown as interest and sinking fund do not comprise the whole of the interest and sinking fund paid in respect of moneys raised by way of loans. For loans raised for the purposes of State advances to settlers, workers, local authorities, &c., and under the Land for Settlements Acts, the interest, although made a charge upon the Consolidated Fund, is recovered from the receipts derived from the leasing of the lands or from instalments paid by borrowers. Other loan-money coming within the same category is that raised for State coal-mines, Native-land settlement, the purchase of the Cheviot Estate, the Rangitaiki land drainage, the Hauraki Plains settlement, the Waihou and Ohinemuri Rivers improvement, and a number of other purposes.
The amount of interest charged and recovered during last year in respect of the loan-money raised for such purposes was £998,463. The details are as follows:—
| Land for settlements (including opening up Crown lands for settlement) | £ |
|---|---|
| 321,440 | |
| Advances to settlers | 345,239 |
| Advances to workers | 94,829 |
| Advances to local authorities | 103,196 |
| Mining advances | 1,098 |
| State coal-mines | 8,739 |
| Kauri-gum industry | 5,679 |
| Native-land settlement | 73,887 |
| Cheviot Estate | 8,866 |
| Waihou and Ohinemuri Rivers improvement | 3,750 |
| Hauraki Plains settlement | 4,855 |
| State forests | 1,862 |
| Electric supply | 25,023 |
| £998,463 |
Such interest does not become a burden upon the taxpayer, and consequently is not included in the figures upon which the rate per head of mean population is calculated.
The amount actually paid for interest and sinking fund out of the Consolidated Fund during 1918-19 was £1,655,990 more than that for the previous year, and the rate of charge per head of population shows an increase of £1 8s. 10d.
From time to time in the earlier financial history of the Dominion sinking funds were created in respect of various loans. These loans have now all been paid off, with the exception of an item of £2,500 which matured on the 15th July, 1914, as part of a loan of £266,300 raised under the New Zealand Loan Act, 1863, but which has not yet been paid off. A sinking fund of £2,607, which covered this loan, was credited to the Consolidated Fund during 1915-16, and is held to meet the debentures when presented.
More recently provision was made for sinking funds for the repayment of loans raised for local bodies and for war and defence loans. A sinking fund was also provided for in the case of the loans raised under the Naval Defence Act, 1909. All of these funds are invested with the Public Trustee.
Another class of sinking fund which has come into existence in later years may more correctly be termed an "internal reserve fund," because the accumulations are immediately converted into capital, although kept apart in the accounts. Part of the surplus revenue of the various accounts of the State Advances Department, equal to 1 per cent. of the loan liabilities at the end of each financial year, is set apart as a sinking fund.
The whole of the public debt for which no special sinking fund exists has now been provided for by the Public Debt Extinction Act, 1910, referred to in detail below.
On the 31st March, 1919, the accrued sinking funds amounted to £5,951,056, made up as follows:—
| New Zealand Loan Act, 1863 | 2,500 |
|---|---|
| Government loans to local bodies | 799,601 |
| War and defence loans | 192,691 |
| War loans (1914-18) | 863,511 |
| Naval Defence Act, 1909 | 614,521 |
| State-advances loans | 1,224,354 |
| Land for settlements | 788,590 |
| Native-land settlement | 11,977 |
| Guaranteed mining advances | 696 |
| Hauraki Plains settlement | 2,176 |
| Opening up Crown lands for settlement | 3,417 |
| Rangitaiki land drainage | 904 |
| Public Debt Extinction Act, 1910 | 1,446,118 |
| £5,951,056 |
A scheme making provision to repay the existing public debt, with application to future borrowings, was embodied in the Public Debt Extinction Act, 1910. This Act provides for the setting-apart each year, on the certificate of the Controller and Auditor-General, out of the Consolidated Fund an amount equal to the sum which, if invested at compound interest at 4 per cent. per annum for seventy-five years, would repay the whole of the public debt as at the preceding 31st March. In this manner, for every loan raised in the future an additional proportional amount will be contributed to the fund to enable such new loan to be extinguished at the expiry of seventy-five years from the date of issue.
After the 31st March, 1915, the interest, instead of being calculated at 4 per cent., is to be the actual average net interest earned by the funds invested under the Act during the previous three years.
The annual payment will be increased—(a ) for every new loan, by an amount needed to extinguish it in seventy-five years; (b ) in case the fund at any time fails to earn 4 per cent., by an amount which will supply the deficiency.
The fund is administered by a Board constituted under the Act, and must be invested in loans to settlers, to workers, and to local authorities. It is expressly forbidden to invest any of the moneys in New Zealand Government securities. If at any time the funds cannot be invested as above stated the Board may purchase at or below par, and cancel, any New Zealand Government stock or debentures charged upon the consolidated revenue. In order to preserve the continuity of the fund it is provided that in the event of any stock or debentures being redeemed before the expiry of the seventy-five years there shall be paid annually out of the Consolidated Fund into the Sinking Fund Account a sum sufficient to compensate for the loss of earnings of the money so expended. There is also a provision that if the earnings of the fund should fall below 4 per cent. any deficiency must be made good out of the Consolidated Fund Account
The most prominent features of the scheme are—(1) the mode of investment, which is intended to prevent any improper use being made of the accumulations, (2) the provision for preserving the continuity of the fund by the adjustment of the annual contributions, and (3) the automatic action of the fund whereby the total debt existing at any given date will be extinguished in seventy-five years from such date.
No further payments are to be made to the Public Trustee on account of the sinking funds of the war and defence and local bodies' loans, but the accumulated capital of these funds remains invested with him as at the date of the passing of the Act, the interest being paid by him to the Consolidated Fund each year.
The contributions to the fund to the 31st March, 1919, amounted to £1,246,714, interest, &c., bringing the amount to the credit of the fund to £1,446,118. The payments to the fund in each of the eight years which have elapsed since the coming into operation of the Act have been,—
| Year ended 31st March, | £ |
|---|---|
| 1912 | 144,885 |
| 1913 | 149,343 |
| 1914 | 151,572 |
| 1915 | 169,404 |
| 1916 | 161,870 |
| 1917 | 171,301 |
| 1918 | 155,038 |
| 1919 | 143,301 |
The amount required to be set aside during the financial year 1919-20 is £140,076.
The decrease in the amount set aside in 1915-16, as compared with 1914-15, is due to the fact that in terms of section 10 of the Act the interest used in the calculation for 1915-16 was taken as the actual average net rate of interest earned during the preceding three years (£4 4s. 3d. per cent.), as against 4 per cent. in previous years. The decreases in the amount set aside in 1917-18 and 1918-19 respectively, as compared with the amount set aside in 1916-17, have resulted from the increasing rates of interest ruling. The average net rate for the three years ended the 31st March, 1919, has been ascertained to be £4 14s. 3d., as against £4 12s. 1 1/3d. per cent. for the triennium ending with the preceding year. The former rate was used in the computation of the amount due to be set aside in 1919-20.
The sum of £148,814 was at the 31st March, 1919, invested in mortgages to settlers, and £651,757 to local authorities. The former amount bears interest at 5 per cent., reducible to 4 1/2 per cent. if instalments are paid within fourteen days of due date. Of the amount advanced to local authorities, part bears interest at 4 1/8 per cent., and the balance at 4 1/2 per cent.
The highest and lowest London prices for the New Zealand 4-, 3 1/2-, and 3 per-cent. stock, taken over a range of twenty years, are quoted.
QUOTATIONS , NEW ZEALAND STOCK .
| 4-per-cents. (1943-63.) | 4-per-cents. (1929.) | 3 1/2-per-cents. (1940.) | 3-per-cents. (1945.) | |||||
|---|---|---|---|---|---|---|---|---|
| Year. | Highest. | Lowest. | Highest. | Lowest. | Highest. | Lowest. | Highest. | Lowest. |
| 1899 | .. | .. | 116 1/2 | 105 1/2 | 109 | 102 | 99 1/4 | 94 1/4 |
| 1900 | .. | .. | 113 1/4 | 109 | 106 3/4 | 103 3/8 | 98 1/2 | 95 1/4 |
| 1901 | .. | .. | 115 3/8 | 110 3/4 | 109 3/4 | 104 1/8 | 99 1/2 | 93 1/8 |
| 1902 | .. | .. | 113 1/4 | 109 | 109 1/2 | 102 1/8 | 97 | 93 5/8 |
| 1903 | .. | .. | 110 1/8 | 105 | 104 3/4 | 99 1/2 | 96 | 88 |
| 1904 | .. | .. | 107 1/2 | 104 1/2 | 101 1/2 | 96 3/4 | 90 | 86 1/4 |
| 1905 | .. | .. | 110 1/4 | 105 1/4 | 100 1/8 | 97 5/8 | 89 7/8 | 89 1/2 |
| 1906 | .. | .. | 110 3/4 | 104 5/8 | 102 1/2 | 98 3/8 | 91 1/4 | 87 1/4 |
| 1907 | .. | .. | 108 3/4 | 103 1/4 | 101 | 98 | 89 3/4 | 84 |
| 1908 | .. | .. | 109 5/8 | 105 1/8 | 101 | 98 1/4 | 90 1/2 | 85 3/4 |
| 1909 | .. | .. | 108 3/8 | 104 3/4 | 99 3/4 | 97 3/8 | 88 3/8 | 85 5/8 |
| 1910 | .. | .. | 106 3/4 | 103 | 99 | 94 1/4 | 88 3/8 | 84 3/4 |
| 1911 | .. | .. | 106 3/4 | 102 1/8 | 98 1/ | 95 1/4 | 87 3/8 | 85 |
| 1912 | .. | .. | 105 | 100 | 97 3/4 | 90 3/8 | 87 3/4 | 79 1/2 |
| 1913 | 101 | 96 3/8 | 102 1/2 | 95 1/2 | 91 7/8 | 87 3/4 | 80 3/4 | 76 1/4 |
| 1914 | 100 3/8 | 96 1/4 | 103 1/8 | 98 | 92 3/4 | 87 | 83 1/2 | 77 |
| 1915 | 97 1/2 | 95 | 99 1/8 | 95 | 87 1/2 | 83 1/4 | 77 3/4 | 76 |
| 1916 | 95 1/8 | 77 | 95 | 83 3/4 | 83 3/8 | 69 | 76 | 62 |
| 1917 | 82 5/8 | 76 | 86 1/2 | 81 1/4 | 74 1/2 | 69 | 64 3/8 | 60 |
| 1918 | 85 1/2 | 78 1/4 | 90 7/8 | 84 | 79 | 71 3/4 | 68 3/4 | 61 3/4 |
The following figures show the gross and net public debt of each State of the Australian Commonwealth, and of the Commonwealth itself, on the 30th June, 1918, and of New Zealand on the 31st March, 1918:—
| State. | Gross Indebtedness. | Accrued Sinking Funds. | Net Indebtedness. | Indebtedness per Head. | |||||
|---|---|---|---|---|---|---|---|---|---|
| Gross. | Net. | ||||||||
* Information not available. † Excluding £12,000,000 borrowed by the Commonwealth on behalf of the States. | |||||||||
| £ | £ | £ | £ | s. | d. | £ | s. | d. | |
| Now South Wales | 152,584,693 | 494,163 | 152,090,530 | 79 | 17 | 4 | 79 | 12 | 2 |
| Victoria | 79,595,646 | 2,186,078 | 77,409,568 | 56 | 3 | 5 | 54 | 12 | 7 |
| Queensland | 62,296,986 | 369,522 | 61,927,464 | 89 | 19 | 11 | 89 | 9 | 3 |
| South Australia | 40,621,480 | 1,533,973 | 39,087,507 | 92 | 9 | 6 | 88 | 19 | 8 |
| Western Australia | 42,304,001 | 5,570,851 | 36,733,150 | 135 | 19 | 6 | 118 | 1 | 4 |
| Tasmania | 15,137,355 | 878,737 | 14,258,618 | 74 | 12 | 6 | 70 | 5 | 11 |
| Total, Australian States | 392,540,161 | 11,033,324 | 381,506,837 | 78 | 16 | 3 | 76 | 12 | 0 |
| Commonwealth | †260,852,954 | * | * | 52 | 7 | 7 | * | ||
| Total Common-wealth and States | 653,393,115 | * | * | 131 | 3 | 10 | * | ||
| New Zealand | 150,840,055 | 4,971,605 | 145,868,450 | 136 | 10 | 8 | 132 | 0 | 8 |
New Zealand has now a greater per capita debt than any of the Australian States. The gross indebtedness of the Dominion is rather more than £5 per head greater than that of Australia, but if full information as to the net indebtedness of the Commonwealth were available it would probably be found that the net debt per head in New Zealand approximates a little more closely to that of Australia than is indicated by the figures of gross indebtedness.
Table of Contents
THE investigation of price-changes was undertaken by the Statistical Office of New Zealand early in 1914. Retail prices were collected and tabulated for each year since 1891, and the results of the inquiry, together with a full discussion of the method adopted, were published in the "Report on the Cost of Laving in New Zealand, 1891-1914." A summary of this publication was given in the Year-book for 1915.
The following pages on the subject of retail prices are divided into three divisions, the first dealing with average prices during 1918, the second with index numbers of prices for that year, and the third division covering a general survey of price movements from 1891 to 1918.
The following tables give the average retail prices of the commodities considered in the following pages, for the year 1918:—
AVERAGE RETAIL PRICES IN 1918.
| Town. | Bread. | Flour. | Oatmeal. | Rice. | Sago. | Tapioca. | Tea. |
|---|---|---|---|---|---|---|---|
| Per 2 lb. loaf. | Per 25lb. bag. | Per lb. | Per lb. | Per lb. | Per lb. | Per lb. | |
| d. | d. | d. | d. | d. | d. | d. | |
| Auckland | 5.38 | 61.05 | 4.21 | 3.34 | 5.22 | 5.26 | 21.90 |
| Wellington | 5.50 | 60.12 | 3.93 | 3.23 | 4.29 | 4.43 | 23.21 |
| Christchurch | 4.85 | 53.47 | 3.80 | 3.08 | 4.45 | 4.49 | 23.17 |
| Dunedin | 4.92 | 55.62 | 3.56 | 2.97 | 4.94 | 4.94 | 23.28 |
| Whangarei | 5.42 | 62.90 | 4.15 | 3.72 | 5.60 | 5.60 | 24.00 |
| Hamilton | 4.96 | 59.83 | 4.04 | 4.28 | 5.33 | 5.56 | 21.28 |
| Rotorua | 5.38 | 63.75 | 4.16 | 3.88 | 5.27 | 5.42 | 24.40 |
| Waihi | 5.21 | 59.75 | 3.95 | 3.53 | 5.33 | 5.36 | 23.78 |
| Gisborne | 5.96 | 61.44 | 3.98 | 3.64 | 5.62 | 5.66 | 23.94 |
| Napier | 5.13 | 64.10 | 4.01 | 3.89 | 5.61 | 5.67 | 24.47 |
| Dannevirke | 5.00 | 50.17 | 3.61 | 3.50 | 4.81 | 4.77 | 25.63 |
| New Plymouth | 5.04 | 57.50 | 3.78 | 3.12 | 4.25 | 4.25 | 21.78 |
| Wanganui | 5.00 | 56.83 | 3.51 | 3.21 | 4.72 | 4.76 | 22.75 |
| Taihape | 5.42 | 63.00 | 3.33 | 3.50 | 4.83 | 4.83 | 20.66 |
| Palmerston North | 4.92 | 56.08 | 3.62 | 3.36 | 3.97 | 4.22 | 21.66 |
| Masterton | 5.00 | 63.20 | 3.82 | 3.43 | 4.13 | 4.13 | 24.25 |
| Blenheim | 4.83 | 62.96 | 4.27 | 3.90 | 4.46 | 4.50 | 27.75 |
| Nelson | 5.00 | 58.63 | 3.67 | 3.22 | 4.00 | 4.00 | 27.80 |
| Greymouth | 4.50 | 60.80 | 3.75 | 3.75 | 4.58 | 4.57 | 23.50 |
| Ashburton | 4.71 | 56.50 | 3.78 | 3.47 | 4.86 | 4.91 | 22.00 |
| Timaru | 5.04 | 57.63 | 3.57 | 3.35 | 4.75 | 4.75 | 23.29 |
| Oamaru | 5.00 | 58.88 | 3.66 | 3.38 | 5.29 | 5.29 | 22.92 |
| Alexandra | 5.00 | 59.38 | 3.97 | 3.80 | 5.46 | 5.46 | 25.67 |
| Gore | 4.88 | 60.94 | 4.16 | 4.00 | 5.94 | 5.99 | 22.48 |
| Invercargill | 5.00 | 58.88 | 3.76 | 3.25 | 5.29 | 5.46 | 24.42 |
| Town. | Coffee. | Cocoa. | Sugar. | Salt. | Pepper. | Jam. | Honey. |
|---|---|---|---|---|---|---|---|
| Per lb. | Per 1/4 lb. tin. | Per 56lb. bag. | Per lb. | Per 1/4 lb. | Per lb. | Per lb. | |
| d. | d. | d. | d. | d. | d. | d | |
| Auckland | 20.64 | 11.46 | 146.23 | 2.42 | 6.10 | 7.28 | 11.64 |
| Wellington | 20.10 | 14.69 | 164.93 | 2.79 | 6.31 | 7.68 | 12.29 |
| Christchurch | 20.99 | 12.99 | 157.03 | 2.29 | 6.02 | 7.43 | 11.31 |
| Dunedin | 19.82 | 13.13 | 164.40 | 2.55 | 5.20 | 7.42 | 10.31 |
| Whangarei | 20.78 | 13.56 | 153.25 | 2.91 | 6.62 | 8.21 | 12.27 |
| Hamilton | 18.17 | 13.33 | 151.07 | 2.85 | 6.67 | 8.33 | 11.77 |
| Rotorua | 21.37 | 13.98 | 169.90 | 2.82 | 6.28 | 8.46 | 12.64 |
| Waihi | 20.89 | 13.28 | 150.32 | 2.56 | 6.11 | 6.95 | 11.93 |
| Gisborne | 22.35 | 13.71 | 152.77 | 2.88 | 6.11 | 7.90 | 11.52 |
| Napier | 22.81 | 13.44 | 160.60 | 2.92 | 6.92 | 7.64 | 11.47 |
| Dannevirke | 20.92 | 15.92 | 171.40 | 2.67 | 5.44 | 6.67 | 10.96 |
| New Plymouth | 20.45 | 11.90 | 148.63 | 2.61 | 4.93 | 6.48 | 10.97 |
| Wanganui | 22.03 | 11.86 | 151.80 | 2.69 | 6.03 | 6.92 | 11.34 |
| Taihape | 24.50 | 12.00 | 170.40 | 2.83 | 6.00 | 8.00 | 13.54 |
| Palmerston North | 22.50 | 10.51 | 166.12 | 2.49 | 5.95 | 7.67 | 12.11 |
| Masterton | 20.80 | 13.76 | 169.35 | 2.79 | 6.55 | 8.78 | 11.12 |
| Blenheim | 23.54 | 18.13 | 167.88 | 2.94 | 6.17 | 8.00 | 10.40 |
| Nelson | 20.83 | 12.80 | 161.80 | 2.83 | 5.87 | 7.87 | 10.88 |
| Greymouth | 21.54 | 14.56 | 161.48 | 2.73 | 5.98 | 7.58 | 9.04 |
| Ashburton | 22.28 | 13.08 | 166.93 | 2.51 | 5.47 | 7.18 | 9.89 |
| Timaru | 20.88 | 14.50 | 157.10 | 2.60 | 5.69 | 7.25 | 10.71 |
| Oamaru | 20.00 | 11.04 | 165.60 | 2.70 | 6.33 | 7.00 | 9.63 |
| Alexandra | 24.38 | 15.67 | 178.40 | 2.98 | 6.67 | 7.21 | 9.82 |
| Gore | 21.94 | 16.65 | 165.31 | 3.00 | 6.64 | 7.49 | 10.79 |
| Invercargill | 21.79 | 12.00 | 164.90 | 3.00 | 6.68 | 8.42 | 9.94 |
| Town. | Golden Syrup. | Treacle. | Raisins. | Currants. | Apricots. | Peaches. | Pears. |
| Per 2 lb. tin. | Per 2 lb. tin. | Per lb. | Per lb. | Per 2 1/2 lb. tin. | Per 2 1/2 lb. tin. | Per 2 1/2 lb. tin. | |
| d. | d. | d. | d. | d. | d. | d. | |
| Auckland | 6.49 | 5.58 | 8.24 | 9.75 | 16.60 | 17.00 | 16.83 |
| Wellington | 7.15 | 6.58 | 8.70 | 9.89 | 16.45 | 16.44 | 17.11 |
| Christchurch | 7.02 | 6.91 | 7.77 | 9.45 | 15.84 | 15.82 | 16.87 |
| Dunedin | 6.70 | 5.78 | 8.00 | 9.58 | 16.40 | 16.72 | 17.33 |
| Whangarei | 7.02 | 6.06 | 9.23 | 10.60 | 17.40 | 17.40 | 18.19 |
| Hamilton | 7.57 | 6.90 | 9.33 | 10.11 | 17.54 | 16.63 | 16.58 |
| Rotorua | 7.50 | 6.97 | 10.22 | 11.18 | 18.08 | 18.40 | 18.79 |
| Waihi | 6.31 | 6.12 | 8.67 | 10.00 | 16.44 | 16.78 | 17.25 |
| Gisborne | 7.49 | 6.71 | 8.93 | 10.10 | 17.27 | 17.23 | 17.86 |
| Napier | 8.00 | 7.00 | 9.61 | 10.72 | 15.72 | 15.72 | 16.22 |
| Dannevirke | 8.00 | 7.00 | 8.65 | 10.41 | 15.46 | 15.33 | 15.46 |
| New Plymouth | 6.33 | 5.98 | 8.13 | 9.42 | 14.75 | 14.97 | 15.31 |
| Wanganui | 6.44 | 6.44 | 8.36 | 9.83 | 16.17 | 16.17 | 16.69 |
| Taihape | 8.00 | 7.00 | 9.00 | 10.58 | 20.00 | 20.00 | 20.00 |
| Palmerston North | 7.56 | 6.70 | 8.44 | 9.36 | 17.07 | 17.11 | 17.42 |
| Masterton | 7.53 | 6.93 | 8.93 | 9.87 | 17.48 | 17.45 | 18.45 |
| Blenheim | 8.63 | 7.71 | 9.50 | 9.71 | 16.75 | 16.75 | 17.66 |
| Nelson | 7.62 | 6.87 | 8.42 | 9.46 | 16.50 | 16.50 | 17.42 |
| Greymouth | 8.04 | 7.04 | 9.38 | 10.29 | 16.27 | 16.25 | 16.35 |
| Ashburton | 7.76 | 7.07 | 8.43 | 9.78 | 17.00 | 17.00 | 17.44 |
| Timaru | 7.25 | 6.21 | 7.29 | 9.65 | 16.17 | 16.21 | 16.92 |
| Oamaru | 7.00 | 6.00 | 9.08 | 10.21 | 16.67 | 16.67 | 17.75 |
| Alexandra | 9.50 | 8.50 | 10.29 | 11.38 | 16.42 | 16.17 | 14.92 |
| Gore | 8.34 | 8.08 | 9.39 | 10.47 | 17.42 | 17.42 | 18.54 |
| Invercargill | 7.57 | 7.08 | 8.00 | 10.00 | 16.46 | 16.46 | 18.00 |
| Town. | Prunes (dried). | Apricots (dried). | Potatoes. | Onions. | Salmon. | Herrings. | Starch. |
| Per lb. | Per lb. | Per 14 lb. | Per lb. | Per 1 lb. tin. | Per 1 lb. tin. | Per lb. | |
| d. | d. | d. | d. | d. | d. | d. | |
| Auckland | 9.15 | 16.20 | 20.00 | 3.15 | 17.39 | 13.98 | 8.77 |
| Wellington | 8.73 | 17.14 | 23.57 | 3.40 | 20.15 | 15.93 | 8.57 |
| Christchurch | 8.73 | 14.83 | 18.02 | 2.52 | 18.43 | 14.35 | 8.49 |
| Dunedin | 8.92 | 14.80 | 21.67 | 2.99 | 21.32 | 14.89 | 8.36 |
| Whangarei | 8.88 | 16.19 | 23.65 | 3.27 | 18.98 | 15.46 | 9.10 |
| Hamilton | 9.03 | 16.71 | 21.03 | 3.30 | 16.74 | 15.42 | 8.30 |
| Rotorua | 9.75 | 17.95 | 21.65 | 3.72 | 18.54 | 16.51 | 9.08 |
| Waihi | 8.75 | 16.10 | 19.35 | 3.09 | 16.83 | 15.72 | 7.86 |
| Gisborne | 8.87 | 16.85 | 22.10 | 3.91 | 18.13 | 16.01 | 8.75 |
| Napier | 9.11 | 17.83 | 22.39 | 4.65 | 19.92 | 16.45 | 8.97 |
| Dannevirke | 8.95 | 15.77 | 19.31 | 3.38 | 18.00 | 13.83 | 8.79 |
| New Plymouth | 8.69 | 15.84 | 19.99 | 2.94 | 15.28 | 14.33 | 7.59 |
| Wanganui | 9.11 | 16.83 | 17.73 | 2.95 | 16.36 | 16.19 | 8.64 |
| Taihape | 9.00 | 18.00 | 23.00 | 3.41 | 17.16 | 17.92 | 9.00 |
| Palmerston North | 8.36 | 16.00 | 19.22 | 3.46 | 17.00 | 15.41 | 8.81 |
| Masterton | 9.43 | 17.03 | 22.05 | 3.73 | 16.35 | 16.35 | 9.28 |
| Blenheim | 9.75 | 14.50 | 17.63 | 3.10 | 18.33 | 13.04 | 9.50 |
| Nelson | 8.63 | 17.59 | 20.88 | 3.15 | 17.71 | 14.50 | 8.50 |
| Greymouth | 9.94 | 16.31 | 20.94 | 3.56 | 16.72 | 16.02 | 8.96 |
| Ashburton | 8.81 | 14.69 | 14.38 | 2.33 | 19.00 | 14.67 | 8.97 |
| Timaru | 7.88 | 13.17 | 19.04 | 2.66 | 20.04 | 16.08 | 8.50 |
| Oamaru | 9.54 | 14.96 | 19.81 | 2.94 | 20.25 | 15.67 | 8.04 |
| Alexandra | 9.00 | 14.00 | 23.04 | 2.85 | 20.08 | 17.08 | 9.71 |
| Gore | 9.63 | 16.39 | 19.33 | 3.41 | 22.15 | 17.75 | 9.73 |
| Invercargill | 9.83 | 15.08 | 22.58 | 2.73 | 19.25 | 16.75 | 8.71 |
| Town. | Blue. | Soap. | Tobacco. | Milk. | Butter (Factory) | Cheese. | Eggs. |
| Per lb. | Per bar (36 to cwt) | Per quart. | Per lb. | Per lb. | Per lb. | Per doz. | |
| d. | d. | d. | d. | d. | d. | d. | |
| Auckland | 13.48 | 11.89 | 86.80 | 5.38 | 19.70 | 13.67 | 20.00 |
| Wellington | 15.54 | 15.88 | 86.43 | 5.50 | 19.83 | 13.43 | 26.91 |
| Christchurch | 13.25 | 13.04 | 84.56 | 4.58 | 19.11 | 13.00 | 21.38 |
| Dunedin | 13.93 | 15.79 | 88.03 | 5.00 | 19.97 | 13.06 | 23.67 |
| Whangarei | 13.90 | 13.29 | 89.11 | 4.50 | 20.00 | 14.00 | 21.63 |
| Hamilton | 14.08 | 14.72 | 86.40 | 5.29 | 19.30 | 13.75 | 24.30 |
| Rotorua | 15.08 | 12.53 | 90.38 | 4.75 | 19.70 | 14.05 | 28.39 |
| Waihi | 13.86 | 11.99 | 86.75 | 5.00 | 19.75 | 14.03 | 23.03 |
| Gisborne | 14.51 | 14.43 | 36.38 | 5.00 | 18.99 | 14.29 | 24.56 |
| Napier | 15.22 | 13.64 | 89.09 | 5.00 | 19.93 | 14.97 | 26.39 |
| Dannevirke | 13.21 | 13.46 | 79.59 | 5.00 | 18.96 | 13.09 | 23.67 |
| New Plymouth | 12.63 | 13.46 | 76.25 | 5.42 | 19.00 | 11.83 | 23.11 |
| Wanganui | 14.92 | 13.50 | 82.17 | 5.00 | 19.08 | 13.17 | 24.53 |
| Taihape | 15.83 | 15.16 | 91.25 | 5.83 | 19.00 | 14.00 | 26.33 |
| Palmerston North | 15.75 | 13.70 | 84.05 | 4.92 | 19.78 | 12.;30 | 23.56 |
| Masterton | 14.67 | 14.12 | 88.52 | 5.00 | 20.00 | 12.35 | 25.95 |
| Blenheim | 14.54 | 15.83 | 91.83 | 4.96 | 19.00 | 13.42 | 20.38 |
| Nelson | 14.37 | 14.17 | 88.80 | 5.00 | 19.60 | 13.54 | 22.29 |
| Greymouth | 15.96 | 12.23 | 86.98 | 5.25 | 19.37 | 13.51 | 27.48 |
| Ashburton | 14.81 | 14.61 | 84.75 | 5.42 | 20.00 | 13.33 | 16.50 |
| Timaru | 12.29 | 14.00 | 86.08 | 4.42 | 19.50 | 12.08 | 19.92 |
| Oamaru | 14.25 | 15.71 | 85.25 | 5.00 | 19.92 | 14.00 | 18.79 |
| Alexandra | 14.46 | 19.93 | 89.00 | 5.00 | 20.08 | 14.96 | 22.54 |
| Gore | 15.50 | 13.45 | 90.88 | 5.25 | 20.00 | 13.63 | 19.42 |
| Invercargill | 13.71 | 13.51 | 88.79 | 4.63 | 20.00 | 13.58 | 21.33 |
| Town. | Bacon (Sh'ld'r | Bacon (Middle Cut). | Ham. | Beef (Sirloin) | Beef (Brisket | Beef (Prime Ribs). | Beef (Rump Steak). | Beef (Top Side). |
|---|---|---|---|---|---|---|---|---|
| Per lb. | Per lb. | Per lb. | Per lb. | Per lb. | Per lb | Per lb. | Per lb. | |
| d. | d. | d. | d. | d. | d. | d. | d. | |
| Auckland | 10.86 | 17.27 | 16.68 | 9.33 | 5.10 | 8.03 | 11.67 | 8.33 |
| Wellington | 11.35 | 18.01 | 16.57 | 8.88 | 6.12 | 7.75 | 11.50 | 7.50 |
| Christchurch | 11.49 | 16.93 | 15.54 | 9.02 | 6.67 | 8.11 | 11.20 | 8.18 |
| Dunedin | 16.77 | 17.29 | 17.81 | 8.56 | 6.32 | 7.56 | 10.90 | 8.85 |
| Whangarei | 11.96 | 17.06 | 16.04 | 10.00 | 5.83 | 9.00 | 12.00 | 9.00 |
| Hamilton | 10.32 | 16.50 | 17.36 | 8.58 | 5.58 | 7.58 | 10.42 | 7.71 |
| Rotorua | 13.98 | 16.98 | 16.80 | 10.00 | 6.50 | 8.00 | 12.00 | 8.00 |
| Waihi | 12.47 | 16.45 | 16.57 | 9.63 | 6.10 | 8.50 | 12.25 | 9.00 |
| Gisborne | 13.81 | 18.43 | 17.41 | 9.19 | 8.13 | 8.19 | 12.42 | 8.38 |
| Napier | 13.78 | 18.44 | 19.00 | 9.00 | 7.87 | 8.00 | 12.00 | 8.87 |
| Dannevirke | 13.79 | 17.60 | 15.85 | 9.00 | 7.00 | 8.23 | 10.00 | 8.54 |
| New Plymouth | 11.69 | 15.68 | 15.10 | 9.00 | 6.00 | 8.00 | 12.00 | 8.00 |
| Wanganui | 11.93 | 15.67 | 15.28 | 9.00 | 8.00 | 8.03 | 12.00 | 8.30 |
| Taihape | 15.00 | 18.14 | 18.00 | 8.66 | 7.58 | 7.66 | 10.66 | 7.92 |
| Palmerston North | 17.69 | 16.38 | 9.00 | 6.93 | 8.00 | 12.00 | 8.78 | 11.98 |
| Masterton | 13.10 | 17.85 | 17.19 | 8.75 | 6.48 | 8.00 | 11.00 | 8.00 |
| Blenheim | 10.58 | 18.75 | 18.75 | 8.06 | 8.06 | 8.06 | 9.42 | 8.00 |
| Nelson | 12.46 | 18.13 | 18.38 | 9.00 | 7.29 | 8.00 | 10.04 | 8.50 |
| Greymouth | 15.08 | 17.15 | 16.64 | 9.33 | 7.13 | 8.17 | 10.33 | 8.67 |
| Ashburton | 16.61 | 17.56 | 16.72 | 9.00 | 7.75 | 8.00 | 12.00 | 9.75 |
| Timaru | 14.54 | 16.79 | 16.17 | 9.33 | 7.67 | 8.33 | 11.33 | 9.33 |
| Oamaru | 18.00 | 17.96 | 17.33 | 9.54 | 6.71 | 8.54 | 11.71 | 9.71 |
| Alexandra | 17.06 | 18.00 | 17.75 | 8.00 | 7.00 | 8.00 | 10.00 | 9.00 |
| Gore | 17.53 | 17.43 | 17.40 | 9.14 | 7.14 | 8.06 | 12.00 | 10.00 |
| Invercargill | 17.21 | 16.94 | 16.42 | 9.00 | 7.96 | 7.67 | 12.00 | 10.00 |
| Town. | Beef (Stewing (Steak). | Beef Corned Round). | Beef (Corned Roll). | Beef (Corned Brisket) | Mutton (Leg). | Mutton (Sh'ld'r) | Mutton (Loin). | Mutton (Neck). |
| Per lb. | Per lb. | Per lb. | Per lb. | Per lb. | Per lb. | Per lb. | Per lb. | |
| d. | d. | d. | d. | d. | d. | d. | d. | |
| Auckland | 8.33 | 8.67 | 7.83 | 5.28 | 8.33 | 6.83 | 8.36 | 6.28 |
| Wellington | 7.96 | 8.15 | 6.98 | 6.06 | 7.88 | 6.72 | 7.63 | 5.37 |
| Christchurch | 7.80 | 8.87 | 7.95 | 8.01 | 8.18 | 7.07 | 7.59 | 5.66 |
| Dunedin | 7.87 | 8.78 | 7.78 | 6.27 | 7.89 | 6.48 | 7.72 | 6.50 |
| Whangarei | 7.33 | 9.00 | 8.00 | 6.00 | 9.50 | 8.17 | 9.00 | 7.00 |
| Hamilton | 6.25 | 7.72 | 7.08 | 6.67 | 8.08 | 7.58 | 7.58 | 7.50 |
| Rotorua | 7.58 | 8.00 | 8.00 | 6.50 | 10.00 | 9.00 | 9.00 | 8.50 |
| Waihi | 8.00 | 9.00 | 8.00 | 6.50 | 9.25 | 7.54 | 9.00 | 7.00 |
| Gisborne | 9.25 | 8.42 | 8.00 | 8.00 | 7.50 | 6.71 | 7.50 | 4.69 |
| Napier | 8.00 | 8.08 | 8.00 | 8.00 | 8.00 | 6.00 | 7.08 | 5.00 |
| Dannevirke | 6.50 | 8.23 | 8.29 | 6.92 | 8.25 | 7.17 | 8.00 | 6.92 |
| New Plymouth | 8.37 | 8.00 | 7.92 | 7.92 | 9.00 | 8.00 | 8.00 | 6.00 |
| Wanganui | 8.39 | 8.00 | 8.00 | 8.00 | 8.19 | 7.33 | 8.33 | 7.30 |
| Taihape | 8.33 | 7.66 | 7.66 | 7.58 | 7.66 | 6.58 | 7.66 | 6.16 |
| Palmerston North | 8.27 | 8.00 | 8.00 | 7.87 | 8.03 | 7.03 | 8.03 | 6.12 |
| Masterton | 8.50 | 8.00 | 7.17 | 6.67 | 8.00 | 7.00 | 7.75 | 5.96 |
| Blenheim | 8.00 | 8.00 | 8.00 | 8.00 | 8.00 | 7.08 | 8.00 | 7.00 |
| Nelson | 7.25 | 8.50 | 8.35 | 7.48 | 8.50 | 7.50 | 7.92 | 6.60 |
| Greymouth | 7.83 | 8.54 | 8.46 | 6.83 | 9.71 | 8.88 | 8.88 | 8.04 |
| Ashburton | 8.92 | 9.00 | 8.75 | 7.00 | 8.50 | 8.00 | 8.00 | 6.00 |
| Timaru | 8.08 | 9.33 | 9.00 | 8.06 | 8.01 | 7.51 | 7.67 | 6.33 |
| Oamaru | 8.71 | 9.71 | 8.71 | 6.71 | 8.00 | 7.00 | 7.00 | 6.50 |
| Alexandra | 8.00 | 8.75 | 7.75 | 7.00 | 8.33 | 7.33 | 7.92 | 7.33 |
| Gore | 9.28 | 9.00 | 8.00 | 7.00 | 8.67 | 7.75 | 8.00 | 7.50 |
| Invercargill | 9.00 | 9.00 | 8.00 | 7.67 | 8.50 | 8.00 | 8.00 | 7.50 |
| Town. | Mutton (Chops). | Pork (Leg). | Pork (Loin). | Pork (Belly). | Pork (Chops). | Tripe. | Saus'ges (Pork). | Saus'ges (Beef). |
| Per lb. | Per lb. | Per lb. | Per lb. | Per lb. | Per lb. | Per lb. | Per lb. | |
| d. | d. | d. | d. | d. | d. | d. | d. | |
| Auckland | 9.01 | 10.68 | 11.22 | 11.20 | 11.89 | 7.67 | 7.22 | 6.11 |
| Wellington | 8.08 | 10.70 | 11.10 | 10.92 | 11.50 | 6.19 | 7.90 | 5.35 |
| Christchurch | 8.37 | 11.68 | 12.12 | 12.13 | 12.53 | 7.18 | 8.27 | 5.17 |
| Dunedin | 8.02 | 11.71 | 11.95 | 11.92 | 12.55 | 7.93 | 6.38 | 4.67 |
| Whangarei | 10.00 | 9.83 | 10.83 | 10.75 | 11.41 | 8.00 | 8.00 | 6.00 |
| Hamilton | 8.00 | 10.17 | 10.25 | 9.25 | 11.42 | 7.08 | 8.00 | 6.25 |
| Rotorua | 10.00 | 9.38 | 9.58 | 9.38 | 9.96 | 8.00 | 9.00 | 6.00 |
| Waihi | 9.00 | 10.25 | 10.25 | 10.25 | 11.25 | 7.25 | 9.75 | 8.04 |
| Gisborne | 9.00 | 9.42 | 9.42 | 9.42 | 10.42 | 7.42 | 8.00 | 6.42 |
| Napier | 8.04 | 11.00 | 11.00 | 11.00 | 12.00 | 7.13 | 8.00 | 6.08 |
| Dannevirke | 8.92 | 9.54 | 9.54 | 9.54 | 10.33 | 6.21 | 8.00 | 6.42 |
| New Plymouth | 9.00 | 10.00 | 10.00 | 10.00 | 10.04 | 7.17 | 8.67 | 5.92 |
| Wanganui | 9.00 | 9.78 | 9.78 | 9.78 | 10.06 | 6.47 | 9.00 | 6.55 |
| Taihape | 9.66 | 9.50 | 9.50 | 9.50 | 9.92 | 6.75 | 9.16 | 7.33 |
| Palmerston North | 9.00 | 9.39 | 9.69 | 9.92 | 10.69 | 7.00 | 8.31 | 6.00 |
| Masterton | 8.50 | 9.62 | 9.62 | 9.62 | 10.12 | 6.00 | 8.00 | 6.00 |
| Blenheim | 8.00 | 9.42 | 9.42 | 9.42 | 10.29 | 7.71 | 8.00 | 6.00 |
| Nelson | 8.50 | 9.54 | 9.54 | 9.54 | 9.54 | 6.75 | 8.17 | 6.37 |
| Greymouth | 9.04 | 9.54 | 9.54 | 9.54 | 10.38 | 7.42 | 8.83 | 6.73 |
| Ashburton | 9.00 | 10.75 | 10.75 | 10.92 | 11.25 | 7.92 | 8.00 | 6.00 |
| Timaru | 8.07 | 10.56 | 10.50 | 9.94 | 10.53 | 8.00 | 8.00 | 6.00 |
| Oamaru | 8.00 | 11.08 | 11.08 | 11.08 | 11.08 | 8.13 | 12.00 | 6.25 |
| Alexandra | 8.00 | .. | .. | .. | .. | .. | 7.00 | 7.00 |
| Gore | 9.00 | 10.44 | 10.44 | 10.44 | 11.89 | 8.11 | 8.38 | 6.64 |
| Invercargill | 9.00 | 10.00 | 10.00 | 9.33 | 11.94 | 8.11 | 8.75 | 6.83 |
| Town. | 3 Rooms or under. | 4 Rooms. | 5 Rooms. | 6 Rooms. | 7 Rooms. | 8 Rooms. | 9 Rooms and over. |
|---|---|---|---|---|---|---|---|
| d. | d. | d. | d. | d. | d. | d. | |
| Auckland | 96.18 | 135.22 | 182.03 | 213.37 | 266.79 | 288.69 | 424.87 |
| Wellington | 133.59 | 176.65 | 219.09 | 284.78 | 358.60 | 449.33 | 691.36 |
| Christchurch | 87.77 | 128.59 | 182.41 | 216.44 | 268.87 | 293.99 | 407.37 |
| Dunedin | 90.14 | 132.47 | 171.06 | 218.83 | 259.54 | 289.06 | 399.89 |
| Whangarei | 61.89 | 136.72 | 171.94 | 173.25 | 226.50 | 300.00 | 484.00 |
| Hamilton | 108.65 | 137.52 | 209.88 | 254.27 | 271.31 | 329.70 | 282.00 |
| Rotorua | 102.63 | 145.40 | 181.57 | 215.50 | 210.00 | 480.00 | 360.00 |
| Waihi | 54.07 | 80.28 | 98.99 | 121.15 | 163.50 | 150.00 | 240.00 |
| Gisborne | 118.70 | 158.00 | 199.03 | 230.26 | 252.30 | 322.06 | 330.00 |
| Napier | 104.15 | 145.36 | 186.01 | 224.67 | 289.82 | 291.86 | 284.15 |
| Dannevirke | 80.20 | 94.42 | 116.37 | 166.98 | 214.90 | 233.14 | 330.00 |
| New Plymouth | 94.64 | 131.48 | 186.65 | 223.86 | 264.63 | 289.43 | 319.17 |
| Wanganui | 100.08 | 143.10 | 175.79 | 223.30 | 273.40 | 279.72 | 387.60 |
| Taihape | 111.43 | 197.22 | 207.97 | 247.50 | 255.00 | 318.00 | .. |
| Palmerston North | 96.49 | 134.29 | 179.74 | 214.57 | 244.77 | 294.75 | 361.07 |
| Masterton | 88.94 | 121.03 | 145.07 | 188.19 | 224.50 | 352.50 | 381.00 |
| Blenheim | 64.00 | 108.57 | 139.87 | 179.19 | 184.49 | 197.70 | 248.00 |
| Nelson | 86.29 | 135.23 | 180.57 | 187.35 | 199.09 | 261.60 | 258.75 |
| Greymouth | 63.66 | 95.53 | 121.29 | 154.07 | 196.00 | 246.25 | 280.00 |
| Ashburton | 59.06 | 113.84 | 156.02 | 185.70 | 240.00 | 216.00 | .. |
| Timaru | 67.80 | 118.00 | 160.30 | 210.92 | 194.92 | 370.00 | 343.40 |
| Oamaru | 59.79 | 94.70 | 149.04 | 179.19 | 234.00 | 232.50 | 345.00 |
| Alexandra | 60.00 | 95.25 | 120.00 | 150.00 | 168.00 | .. | .. |
| Gore | 66.18 | 106.74 | 143.78 | 172.92 | 224.50 | 300.00 | 270.00 |
| Invercargill | 63.09 | 113.51 | 151.16 | 180.31 | 192.88 | 208.88 | 332.23 |
The price quotations on which the preceding figures are based, and upon which index numbers are regularly calculated, are collected each month in twenty-five towns of the Dominion, which were selected as being representative of New Zealand as a whole. These twenty-five towns are distributed over both Islands, from Whangarei in the North to Invercargill in the South, and represent coastal and inland districts and large and small centres. Returns of prices are collected by the local Inspector of Factories from representative retailers, and index numbers are computed in the Census and Statistics Office. Wellington. The average prices for each town, together with index numbers, are published each month in the "Monthly Abstract of Statistics."
It will be noted that the commodities considered are almost exclusively articles of food, divided into three groups—groceries, dairy-produce, and meat. Figures regarding house-rents and fuel and lighting are also given.
The exclusion of various items of expenditure is of less importance than is popularly believed. The prices of those commodities which for various reasons have not been covered by the retail-price inquiry tend generally to move in the same direction, and in a substantial degree to the same extent, as those included in the food groups for which index numbers have been compiled.
Many articles of common consumption vary in quality from time to time to such an extent as to make it impossible to measure the true price-movement of those articles. This is particularly true in relation to clothing-prices, for which no fully reliable and comparable data can be collected. While it is evident that clothing-prices have advanced during recent years to a very considerable extent, the relative importance of clothing as one item in household budgets is not very great in comparison with expenditure on food and housing.
In the course of various inquiries which have been made in the Dominion and in Australia it has been ascertained that the several groups of expenditure bear the following approximate percentage relation to one another: Food, 35; housing, 20; fuel and light, 6; clothing, 14; miscellaneous items, 25.
It must be apparent, therefore, that while war conditions may have brought about some modification of the above-mentioned proportions, the prices of foods, housing, and fuel and light provide a reasonably complete and sound basis for statements as to variations in general cost of living.
So far as the following tables are concerned, it is necessary to explain that in order that the index numbers for the smaller centres may be comparable with the index numbers given for the four chief centres for past years the same "base" has been retained throughout—viz., the "annual aggregate expenditure" in the four chief centres in the five years 1909-13.
The quarterly index numbers given below are based on the average prices of the three months in the quarter, so that they differ materially from the prices current at the end of the quarters. In comparing different quarters consideration must be given to the influence of seasonal fluctuations in price and consumption of some commodities, including such important articles as milk, butter, potatoes, eggs.
The tables are comparable both horizontally and vertically, since each column has the same base. Horizontally they show variations in time, vertically variations according to locality.
Index Numbers for each Quarter of 1918, and for the Average of the Four Quarters of 1918 and of 1917, for Twenty five Representative Towns in New Zealand.
(Base: Average aggregate annual expenditure, four chief centres, 1909-13 = 1000.)
| Town. | First Quarter, 1918. | Second Quarter, 1918. | Third Quarter, 1918. | Fourth Quarter, 1918. | Average of Four Quarters, 1918. | Average of Four Quarters, 1917. |
|---|---|---|---|---|---|---|
| Auckland | 1323 | 1451 | 1512 | 1557 | 1461 | 1268 |
| Wellington | 1471 | 1538 | 1597 | 1711 | 1579 | 1395 |
| Christchurch | 1310 | 1333 | 1430 | 1594 | 1417 | 1279 |
| Dunedin | 1369 | 1445 | 1523 | 1676 | 1503 | 1248 |
| Whangarei | 1435 | 1512 | 1581 | 1680 | 1552 | 1340 |
| Hamilton | 1381 | 1457 | 1530 | 1615 | 1496 | 1314 |
| Rotorua | 1463 | 1521 | 1617 | 1694 | 1574 | 1416 |
| Waihi | 1340 | 1455 | 1496 | 1532 | 1456 | 1311 |
| Gisborne | 1503 | 1564 | 1586 | 1685 | 1585 | 1386 |
| Napier | 1493 | 1490 | 1559 | 1665 | 1552 | 1404 |
| Dannevirke | 1424 | 1406 | 1460 | 1608 | 1475 | 1427 |
| New Plymouth | 1338 | 1350 | 1421 | 1548 | 1414 | 1267 |
| Wanganui | 1327 | 1367 | 1429 | 1523 | 1412 | 1271 |
| Taihape | 1475 | 1522 | 1595 | 1714 | 1577 | 1381 |
| Palmerston North | 1339 | 1396 | 1464 | 1564 | 1441 | 1323 |
| Masterton | 1440 | 1499 | 1562 | 1691 | 1548 | 1383 |
| Blenheim | 1426 | 1477 | 1549 | 1669 | 1530 | 1372 |
| Nelson | 1399 | 1449 | 1516 | 1598 | 1491 | 1341 |
| Greymouth | 1389 | 1389 | 1452 | 1593 | 1456 | 1289 |
| Ashburton | 1309 | 1366 | 1398 | 1533 | 1402 | 1268 |
| Timaru | 1359 | 1361 | 1447 | 1661 | 1457 | 1276 |
| Oamaru | 1377 | 1410 | 1482 | 1696 | 1491 | 1395 |
| Alexandra | 1498 | 1595 | 1657 | 1718 | 1617 | 1414 |
| Gore | 1388 | 1448 | 1538 | 1638 | 1503 | 1328 |
| Invercargill | 1391 | 1433 | 1542 | 1750 | 1529 | 1279 |
| Dominion weighted average | 1373 | 1440 | 1512 | 1626 | 1488 | 1305 |
The weighted average index number for the Dominion shows an increase of 183 points in 1918 over the average for the previous year. The increase, to a varying extent, has been common to each of the twenty-five towns covered by the inquiry. Wellington maintains its position with considerably higher grocery-prices than prevail in the other three chief centres. It should be pointed out that movements as between succeeding quarters are by no means uniform. The effect of seasonal fluctuations in prices of such commodities as potatoes and onions renders it necessary that comparisons should be made either between corresponding quarters of the two years or between the average of the four quarters as given in the above table.
Index Numbers for each Quarter of 1918, and for the Average of the Four Quarters of 1918 and of 1917, for Twenty-five Representative Towns in New Zealand.
(Base: Average aggregate annual expenditure, four chief centres, 1909-13 = 1000.)
| Town. | First Quarter, 1918. | Second Quarter, 1918. | Third Quarter, 1918. | Fourth Quarter, 1918. | Average of Four Quarters, 1918. | Average of Four Quarters, 1917. |
|---|---|---|---|---|---|---|
| Auckland | 1403 | 1517 | 1438 | 1413 | 1443 | 1362 |
| Wellington | 1467 | 1520 | 1465 | 1453 | 1476 | 1425 |
| Christchurch | 1266 | 1343 | 1357 | 1344 | 1328 | 1318 |
| Dunedin | 1417 | 1474 | 1425 | 1411 | 1432 | 1351 |
| Whangarei | 1348 | 1404 | 1341 | 1322 | 1354 | 1263 |
| Hamilton | 1386 | 1461 | 1415 | 1416 | 1420 | 1334 |
| Rotorua | 1384 | 1454 | 1431 | 1407 | 1419 | 1330 |
| Waihi | 1358 | 1452 | 1404 | 1390 | 1401 | 1322 |
| Gisborne | 1379 | 1474 | 1393 | 1395 | 140 | 1343 |
| Napier | 1473 | 1509 | 1434 | 1433 | 1462 | 1361 |
| Dannevirke | 1365 | 1429 | 1388 | 1380 | 1391 | 1313 |
| New Plymouth | 1326 | 1404 | 1421 | 1425 | 1394 | 1265 |
| Wanganui | 1338 | 1422 | 1375 | 1362 | 1374 | 1338 |
| Taihape | 1459 | 1570 | 1512 | 1484 | 1506 | 1364 |
| Palmerston North | 1362 | 1436 | 1378 | 1335 | 1378 | 1301 |
| Masterton | 1411 | 1470 | 1422 | 1401 | 1426 | 1309 |
| Blenheim | 1335 | 1404 | 1402 | 1388 | 1382 | 1306 |
| Nelson | 1387 | 1448 | 1412 | 1400 | 1412 | 1335 |
| Greymouth | 1312 | 1563 | 1517 | 1417 | 1452 | 1321 |
| Ashburton | 1394 | 1457 | 1428 | 1424 | 1426 | 1344 |
| Timaru | 1262 | 1321 | 1339 | 1363 | 1321 | 1234 |
| Oamaru | 1402 | 1451 | 1406 | 1393 | 1413 | 1358 |
| Alexandra | 1418 | 1484 | 1452 | 1415 | 1442 | 1400 |
| Gore | 1381 | 1436 | 1477 | 1441 | 1434 | 1363 |
| Invercargill | 1304 | 1394 | 1409 | 1404 | 1378 | 1371 |
| Dominion weighted average | 1380 | 1459 | 1417 | 1402 | 1415 | 1353 |
The index numbers for the dairy-produce group again show substantial increases over the previous year. The Dominion weighted index number advanced during 1918 by 62 points, the increase being shared by all centres.
This group is subject to much greater seasonal influences than are the groceries or meat groups. The fluctuation in prices of milk and butter, in accordance with the supply at different periods of the year, invariably brings about a high index number in the June quarter, to be followed, in most cases, by a fall in the September quarter's figures.
Taihape and Wellington show the highest prices of dairy-produce, while the least expensive are Timaru and Christchurch
Index Numbers for each Quarter of 1918, and for the Average of the Four Quarters of 1918 and of 1917, for Twenty-five Representative Towns in New Zealand.
(Base: Average aggregate annual expenditure, four chief centres, 1909-13 = 1000.)
| Town. | First Quarter, 1918. | Second Quarter, 1918. | Third Quarter, 1918. | Fourth Quarter, 1918. | Average of Four Quarters, | 1918. Average of Four Quarters, 1917. |
|---|---|---|---|---|---|---|
| Auckland | 1574 | 1570 | 1574 | 1580 | 1575 | 1500 |
| Wellington | 1455 | 1464 | 1489 | 1497 | 1476 | 1380 |
| Christchurch | 1534 | 1535 | 1535 | 1554 | 1540 | 1449 |
| Dunedin | 1498 | 1499 | 1520 | 1512 | 1507 | 1417 |
| Whangarei | 1707 | 1692 | 1662 | 1662 | 1681 | 1610 |
| Hamilton | 1444 | 1445 | 1459 | 1555 | 1476 | 1390 |
| Rotorua | 1699 | 1692 | 1695 | 1698 | 1696 | 1599 |
| Waihi | 1644 | 1644 | 1640 | 1708 | 1659 | 1638 |
| Gisborne | 1516 | 1516 | 1571 | 1605 | 1552 | 1517 |
| Napier | 1504 | 1505 | 1506 | 1505 | 1505 | 1488 |
| Dannevirke | 1501 | 1518 | 1519 | 1522 | 1515 | 1444 |
| New Plymouth | 1594 | 1597 | 1600 | 1597 | 1597 | 1552 |
| Wanganui | 1582 | 1587 | 1603 | 1599 | 1593 | 1575 |
| Taihape | 1574 | 1578 | 1534 | 1396 | 1521 | 1631 |
| Palmerston North | 1552 | 1549 | 1561 | 1574 | 1559 | 1546 |
| Masterton | 1514 | 1516 | 1519 | 1523 | 1518 | 1498 |
| Blenheim | 1494 | 1500 | 1505 | 1519 | 1505 | 1353 |
| Nelson | 1521 | 1499 | 1560 | 1572 | 1538 | 1331 |
| Greymouth | 1554 | 1578 | 1693 | 1867 | 1673 | 1548 |
| Ashburton | 1611 | 1647 | 1647 | 1647 | 1638 | 1483 |
| Timaru | 1581 | 1583 | 1584 | 1598 | 1587 | 1478 |
| Oamaru | 1590 | 1588 | 1626 | 1638 | 1611 | 1620 |
| Alexandra | 1497 | 1530 | 1541 | 1578 | 1537 | 1433 |
| Gore | 1658 | 1663 | 1669 | 1685 | 1669 | 1520 |
| Invercargill | 1656 | 1655 | 1657 | 1659 | 1657 | 1491 |
| Dominion weighted average | 1535 | 1537 | 1549 | 1559 | 1545 | 1464 |
This group shows a greater increase over the base period (1909-13) than either of the other two food groups. The increase in the index number for 1918 over that for 1917 is shown to be 81 points.
Of the four chief centres Auckland has much the highest number, being 99 points in advance of Wellington, and approximately 70 and 35 points higher than Dunedin and Christchurch respectively. Prices in the three latter centres are somewhat lower than the average for the Dominion as a whole.
The largest increase over 1917, as among the chief towns, has taken place in Wellington and Christchurch. Rotorua meat-prices were the highest in the Dominion, Wellington and Hamilton prices being the lowest, the difference between the two index numbers on the average of the four quarters of 1918 amounting to 220 points exactly.
Index Numbers for each Quarter of 1918, and for the Average of the Four Quarters of 1918 and of 1917, for Twenty-five Representative Towns in New Zealand.
(Base: Average aggregate annual expenditure, four chief centres, 1909-13 = 1000.)
| Town. | First Quarter, 1918. | Second Quarter, 1918. | Third Quarter, 1918. | Fourth Quarter, 1918. | Average of Four Quarters, 1918. | Average of Four Quarters, 1917. |
|---|---|---|---|---|---|---|
| Auckland | 1428 | 1507 | 1516 | 1531 | 1496 | 1369 |
| Wellington | 1465 | 1509 | 1530 | 1578 | 1521 | 1397 |
| Christchurch | 1376 | 1404 | 1449 | 1522 | 1438 | 1371 |
| Dunedin | 1424 | 1470 | 1499 | 1559 | 1488 | 1328 |
| Whangarei | 1507 | 1548 | 1553 | 1591 | 1550 | 1414 |
| Hamilton | 1404 | 1454 | 1479 | 1549 | 1472 | 1344 |
| Rotorua | 1525 | 1563 | 1600 | 1629 | 1579 | 1458 |
| Waihi | 1448 | 1518 | 1524 | 1559 | 1512 | 1417 |
| Gisborne | 1478 | 1527 | 1536 | 1590 | 1533 | 1426 |
| Napier | 1492 | 1500 | 1512 | 1557 | 1515 | 1423 |
| Dannevirke | 1437 | 1449 | 1463 | 1526 | 1469 | 1406 |
| New Plymouth | 1422 | 1446 | 1482 | 1536 | 1472 | 1364 |
| Wanganui | 1416 | 1455 | 1476 | 1512 | 1465 | 1390 |
| Taihape | 1505 | 1552 | 1555 | 1552 | 1541 | 1462 |
| Palmerston North | 1416 | 1457 | 1477 | 1514 | 1466 | 1394 |
| Masterton | 1459 | 1498 | 1515 | 1567 | 1510 | 1405 |
| Blenheim | 1428 | 1468 | 1500 | 1553 | 1487 | 1361 |
| Nelson | 1438 | 1466 | 1507 | 1543 | 1489 | 1336 |
| Greymouth | 1427 | 1494 | 1549 | 1645 | 1529 | 1384 |
| Ashburton | 1432 | 1483 | 1490 | 1547 | 1488 | 1359 |
| Timaru | 1412 | 1427 | 1469 | 1570 | 1470 | 1335 |
| Oamaru | 1455 | 1480 | 1513 | 1606 | 1514 | 1420 |
| Alexandra | 1479 | 1547 | 1570 | 1600 | 1549 | 1417 |
| Gore | 1478 | 1518 | 1569 | 1609 | 1544 | 1402 |
| Invercargill | 1461 | 1500 | 1550 | 1638 | 1537 | 1377 |
| Dominion weighted average | 1430 | 1478 | 1503 | 1551 | 1491 | 1370 |
It will be remembered that the Dominion weighted average for Group I shows an increase of 183 points over 1917, while Groups II and III have increased 62 points and 81 points respectively. The three groups in combination show an increase in the Dominion weighted average of 121 points. Over the year 1918 Christchurch was the cheapest town for foodstuffs, while Rotorua was the dearest.
The, cost of housing is an important item in the expenditure of the majority of families, and to obtain a record of fluctuations in this cost may be regarded as essential to a reasonably complete treatment of the subject of "cost of living." An attempt has accordingly been made to trace the movement of house-rents over a period of years, on the grounds that house-rentals provide a reasonably accurate indication of housing-costs in general, not only for those classes of persons who may be paying rent, but also for those who own or partially own the dwellings they occupy.
By reason of the fact that leases, infrequent changes of residence, and the difficulty of departing from customary rents all tend to make the movement of the general level of rents comparatively slow, it is not necessary to attempt to measure the changes over short periods. The data upon which the rent figures given hereafter have been compiled are collected each half-year in the months of February and August. Figures quoted in reference to rent for any quarter of the year are therefore based upon the data obtained at the previous half-yearly inquiry.
One collection only was made during 1914, and for years prior to that year the required particulars were obtained by a special retrospective investigation.
Commencing with August, 1916, a new system of collection of information with regard to rentals has been instituted, persons or firms collecting rents being required to state the actual number, of houses of each class (according to the number of rooms) for which rents are collected, and the aggregate rent receivable from such houses. Previously house agents were asked to state what was in their opinion the predominating rent for each class of house, and while the information thus obtained was approximately correct, it did not possess the mathematical exactness of the new system.
There was an undoubted tendency to base statements on the rentals at which houses had recently been let or relet, thus ignoring the great majority of existing rentals.
As a result of the adoption of the new method, information is now received each half-year showing the actual rentals paid for approximately 12,000 houses, and on such information reliable figures can be compiled from year to year.
This improvement in the system of collection of information, however, has since been supplemented by an improvement in the system of compiling index numbers to record the movements in house-rents. Index numbers published in previous Year-books have been based upon the average rentals as ascertained for the following classes of houses: Houses having three rooms or under; four rooms; five rooms; six rooms; seven rooms; eight rooms: and nine rooms and over. It was found, however, that the inclusion of the first and the last two classes sometimes resulted in the index numbers being materially altered by changes in the particular houses covered by the returns. In other words, the limited number of large and small houses which were included in the returns made it possible for the average rental for the large and small houses to fluctuate to a fictitious extent. It was considered advisable, therefore, to use in the index numbers the information relative to houses of four, five, six. and seven rooms only. Such houses comprise the great majority of the dwellings in the Dominion, and consequently the "field" covered by the index numbers has not been materially reduced by the exclusion of houses of less than four or more than seven rooms.
On account of these alterations in methods of collection and tabulation of information relative to rents, a totally new series of rent indices has been compiled, and figures given hereafter are comparable over the whole period of the retail-prices investigation.
It is advisable to specially mention that the index numbers in respect of rent indicate the movement in the average rentals of a large number of houses, and that they do not purport to convey any statement as to the price at which housing-accommodation may be obtained from time to time. At the present time the exceptional demand for housing - accommodation accompanied by restrictive legislation against advancement of house-rents has caused a wide disparity between the rentals of houses which have been let for some time and the rents charged to the new occupants of houses being relet at the present time. In so far as the number of "relettings" is relatively small, there has not been the substantial advance in house-rents during the past few years which might be gathered from an inspection of the price charged for the occupancy of houses now falling vacant.
The index numbers for each of the twenty-five towns, according to returns collected in February and August, 1918, are given below, together with similar information for the previous year:—
Index Numbers for 1917 and 1918 for House-rent in Twenty-five Towns of New Zealand.
(Base: Average aggregate annual expenditure, four chief centres, 1909-13 = 1000.)
| Town. | February, 1917. | August, 1917. | 1917. | February, 1918. | August, 1918. | 1918. |
|---|---|---|---|---|---|---|
| Auckland | 969 | 984 | 977 | 994 | 1016 | 1005 |
| Wellington | 1223 | 1257 | 1240 | 1294 | 1295 | 1295 |
| Christchurch | 966 | 967 | 967 | 973 | 1040 | 1007 |
| Dunedin | 946 | 944 | 945 | 974 | 994 | 984 |
| Whangarei | 850 | 877 | 864 | 917 | 887 | 902 |
| Hamilton | 1167 | 1187 | 1177 | 1116 | 1147 | 1132 |
| Rotorua | 982 | 1011 | 997 | 997 | 975 | 986 |
| Waihi | 567 | 568 | 568 | 578 | 572 | 575 |
| Gisborne | 1054 | 1070 | 1062 | 1063 | 1104 | 1084 |
| Napier | 1092 | 1025 | 1059 | 1049 | 1066 | 1058 |
| Dannevirke | 767 | 734 | 751 | 685 | 771 | 728 |
| New Plymouth | 994 | 990 | 992 | 1015 | 1032 | 1024 |
| Wanganui | 1017 | 996 | 1007 | 1019 | 1030 | 1025 |
| Taihape | 1208 | 1170 | 1189 | 1229 | 1132 | 1181 |
| Palmerston North | 968 | 968 | 968 | 978 | 998 | 988 |
| Masterton | 924 | 833 | 879 | 851 | 858 | 855 |
| Blenheim | 784 | 849 | 817 | 776 | 803 | 790 |
| Nelson | 907 | 923 | 915 | 916 | 925 | 921 |
| Greymouth | 723 | 759 | 741 | 700 | 713 | 707 |
| Ashburton | 843 | 859 | 851 | 862 | 878 | 870 |
| Timaru | 988 | 934 | 961 | 896 | 893 | 895 |
| Oamaru | 835 | 850 | 843 | 860 | 777 | 819 |
| Alexandra | 662 | 662 | 662 | 679 | 681 | 680 |
| Gore | 784 | 788 | 786 | 810 | 808 | 809 |
| Invercargill | 821 | 809 | 815 | 820 | 827 | 824 |
| Dominion weighted. average | 1002 | 1008 | 1005 | 1022 | 1044 | 1033 |
An alternative statement of the difference in price-levels as between each of the twenty-five towns considered is given in the following table. Similar figures may easily be compiled for the various quarters by working from the index numbers and equating 1000 to 20s. The purchasing-power of money in the average of the five years 1909-13 in the four centres is taken as the base and equated to 20s., the indices being worked out proportionately. The amounts displayed in the table may be compared vertically but not horizontally, since the various groups have different bases.
| Town. | Group i. Groceries. | Group II. Dairy-produce. | Group III. Meat. | Groups I-III. Food Groups. | Group iv. House-rent.* | ||||||||||||||
|---|---|---|---|---|---|---|---|---|---|---|---|---|---|---|---|---|---|---|---|
* Based on average of figures for February and August, 1918. | |||||||||||||||||||
| s. | d. | s. | d. | s. | d. | s. | d. | s. | d. | ||||||||||
| Auckland | 29 | 2 3/4 | 28 | 10 1/4 | 31 | 6 | 29 | 11 | 20 | 1 1/4 | |||||||||
| Wellington | 31 | 7 | 29 | 6 1/4 | 29 | 6 1/4 | 30 | 5 | 25 | 10 3/4 | |||||||||
| Christchurch | 28 | 4 | 26 | 6 3/4 | 30 | 9 1/2 | 28 | 9 | 20 | 1 3/4 | |||||||||
| Dunedin | 30 | 0 3/4 | 28 | 7 3/4 | 30 | 1 3/4 | 29 | 9 | 19 | 8 1/4 | |||||||||
| Whangarei | 31 | 0 1/2 | 27 | 1 | 33 | 7 1/2 | 31 | 0 | 18 | 0 1/2 | |||||||||
| Hamilton | 29 | 11 | 28 | 4 3/4 | 29 | 6 1/4 | 29 | 5 1/4 | 22 | 7 3/4 | |||||||||
| Rotorua | 31 | 5 3/4 | 28 | 4 1/2 | 33 | 11 | 31 | 7 | 19 | 8 3/4 | |||||||||
| Waihi | 29 | 1 1/2 | 28 | 0 1/4 | 33 | 2 1/4 | 30 | 3 | 11 | 6 | |||||||||
| Gisborne | 31 | 8 1/2 | 28 | 2 1/2 | 31 | 0 1/2 | 30 | 8 | 21 | 8 1/4 | |||||||||
| Napier | 31 | 0 1/2 | 29 | 3 | 30 | 1 1/4 | 30 | 3 1/2 | 21 | 2 | |||||||||
| Dannevirke | 29 | 6 | 27 | 9 3/4 | 30 | 3 1/2 | 29 | 4 1/2 | 14 | 6 3/4 | |||||||||
| New Plymouth | 28 | 3 1/4 | 27 | 10 1/2 | 31 | 11 1/4 | 29 | 5 1/4 | 20 | 5 3/4 | |||||||||
| Wanganui | 28 | 3 | 27 | 5 3/4 | 31 | 10 1/4 | 29 | 3 1/2 | 20 | 6 | |||||||||
| Taihape | 31 | 6 1/2 | 30 | 1 1/2 | 30 | 5 | 30 | 9 3/4 | 23 | 7 1/2 | |||||||||
| Palmerston North | 28 | 9 3/4 | 27 | 6 3/4 | 31 | 2 1/4 | 29 | 3 3/4 | 19 | 9 | |||||||||
| Masterton | 30 | 11 1/2 | 28 | 6 1/4 | 30 | 4 1/4 | 30 | 2 1/2 | 17 | 1 1/4 | |||||||||
| Blenheim | 30 | 7 1/4 | 27 | 7 3/4 | 30 | l 1/4 | 29 | 9 | 15 | 9 1/2 | |||||||||
| Nelson | 29 | 9 3/4 | 28 | 3 | 30 | 9 | 29 | 9 1/4 | 18 | 5 | |||||||||
| Greymouth | 29 | 1 1/2 | 29 | 0 1/2 | 33 | 5 1/2 | 30 | 7 | 14 | 1 3/4 | |||||||||
| Ashburton | 28 | 0 1/2 | 28 | 6 1/4 | 32 | 9 | 29 | 9 | 17 | 4 3/4 | |||||||||
| Timaru | 29 | 1 3/4 | 26 | 5 | 31 | 9 | 29 | 4 3/4 | 17 | 10 3/4 | |||||||||
| Oamaru | 29 | 9 3/4 | 28 | 3 | 32 | 2 3/4 | 30 | 3 1/4 | 16 | 4 1/2 | |||||||||
| Alexandra | 32 | 4 | 28 | 10 | 30 | 9 | 30 | ll 3/4 | 13 | 7 1/4 | |||||||||
| Gore | 30 | 0 3/4 | 28 | 8 1/4 | 33 | 4 1/2 | 30 | 10 1/2 | 16 | 2 1/4 | |||||||||
| Invercargill | 30 | 7 | 27 | 6 3/4 | 33 | 1 3/4 | 30 | 9 | 16 | 5 3/4 | |||||||||
| Dominion weighted average | 29 | 9 | 28 | 3 1/2 | 30 | 10 3/4 | 29 | 9 3/4 | 20 | 8 | |||||||||
To see at a glance the positions occupied by the various towns in order of "cost of living," a diagram is given in the form of what may be called "cost-of-living" thermometers, whereon each town is shown opposite a point corresponding to its index number in the table referring to expenditure on the three food groups, for the four quarters of 1918. The thermometers not only show the relative positions of the towns from the point of view of higher or lower "cost of living," but also give a good indication of the increases or decreases in any town throughout the year.
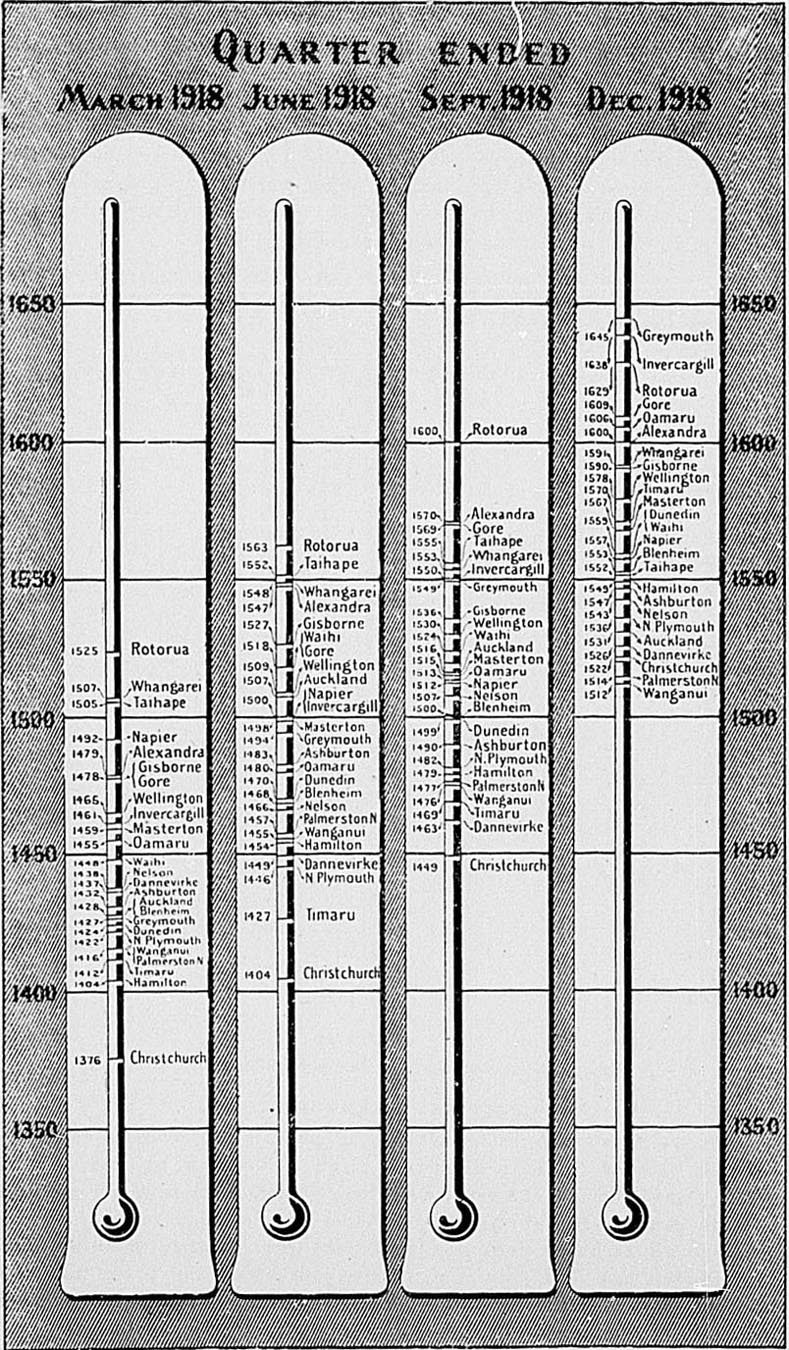
To obtain a general estimate of the course of prices for the whole Dominion it has been necessary to obtain a weighted average of the index numbers for each town. It is obvious that it would not be strictly correct to obtain a simple average of the prices in Alexandra, with a population of less than 700. and in Auckland, with a population of over 134,000. Prices in each town have therefore been weighted in accordance with the number of people concerned, and a composite index number has been obtained, which, though artificial, represents the average level of retail prices in the Dominion.
The twenty-five towns considered have a total population of approximately half that of New Zealand, and they are therefore fully representative of the Dominion. The four chief centres, which include a third of the Dominion's population, account for about 70 per cent. of the population of the twenty-five towns, so that their influence in the Dominion index number is naturally predominating. This, however, is justifiable, since the chief centres not only comprise a great part of the people of the Dominion, but also set the standard which is generally followed throughout the country. The Dominion weighted index number obtained is shown in the table below:—
| Group. | First Quarter, 1918. | Second Quarter, 1918. | Third Quarter, 1918. | Fourth Quarter, 1918. | Average of Four Quarters, 1918. | Average of Four Quarters, 1917. |
|---|---|---|---|---|---|---|
| Groceries | 1373 | 1440 | 1512 | 1626 | 1488 | 1305 |
| Dairy-produce | 1380 | 1459 | 1417 | 1402 | 1415 | 1353 |
| Meat | 1535 | 1537 | 1549 | 1559 | 1545 | 1463 |
| Three food groups | 1430 | 1478 | 1503 | 1551 | 1491 | 1370 |
| House-rent | 1022 | 1022 | 1044 | 1044 | 1033 | 1005 |
| Food and rent | 1282 | 1315 | 1335 | 1371 | 1326 | 1240 |
A comparison between the yearly figures for 1918 and 1917, as shown in the last two columns, affords a clear indication of the extent to which prices have moved. As previously mentioned, the greatest advance during 1918 is shown by the groceries group, while both dairy-produce and meat prices have also risen considerably.
An inspection of the quarterly figures discloses the substantial seasonal fluctuations in prices of dairy-produce, and the comparatively steady increase throughout the year in prices of meat. The usual seasonal fluctuation in prices of groceries has been obscured by the substantial movement in prices of imported articles included in that group.
Taking the three food groups together, the seasonal movements are less marked and the increase is fairly steady and continuous, being greates as between the first and second and the third and fourth quarters of the year.
The comparatively slow movement of house-rents tends to reduce the extent of the change recorded by the index numbers for food and rents combined.
The following table gives a comparison between price-levels during 1918 in the four chief centres and in the twenty-one smaller towns from which information is collected.
| Group. | Weighted Average of Four Chief Centres. (a.) | Weighted Average of Twenty-one Smaller Centres. (b.) | Excess of (a ) over (b ). |
|---|---|---|---|
* Excess of (b ) over (a ). | |||
| Groceries | 1487 | 1490 | 3* |
| Dairy-produce | 1422 | 1398 | 24 |
| Meat | 1530 | 1580 | 50* |
| Three food groups | 1487 | 1499 | 12* |
| House-rent | 1072 | 937 | 135 |
| Food and rent | 1337 | 1300 | 37 |
These figures indicate that there is no very considerable difference between the general level of food-prices in the four chief towns and in the average of the twenty-one smaller centres, higher grocery and meat prices in the small towns being to some extent offset by lower prices for dairy-produce. House accommodation, however, as may be expected, is considerably cheaper in the country towns than in the more closely populated cities.
Until April, 1917, detailed information with reference to war increases in prices was published each month in the Journal of the Department of Labour. Since that date, however, these figures have been given in the "Monthly Abstract of Statistics" published by the Census and Statistics Office. For full details, reference should accordingly be made to those publications. The "Abstract" gives each month the latest available information on the subject. It is advisable to shortly indicate here the advance in prices in 1918 over those ruling at the outbreak of war.
TABLE SHOWING THE PERCENTAGE OF INCREASE IN FOOD -PRICES RULING DURING 1918 OVER PRICES RULING ON 31ST JULY , 1914.
| Group. | First Quarter, 1918. | Second Quarter, 1918. | Third Quarter, 1918. | Fourth Quarter, 1918. | Average of Year 1918. | |||||
|---|---|---|---|---|---|---|---|---|---|---|
| Index Number. | Percentage Increase.* | Index Number. | Percentage Increase.* | Index Number. | Percentage increase.* | Index Number.* | Percentage Increase.* | Index Number. | Percentage Increase.* | |
* Over July, 1914. | ||||||||||
| Groceries (index number, July, 1914: 1033) | 1373 | 32.91 | 1440 | 39.40 | 1512 | 46.37 | 1626 | 57.41 | 1488 | 44.05 |
| Dairy-produce (index number, July, 1914: 1057) | 1380 | 30.56 | 1459 | 38.03 | 1417 | 34.06 | 1402 | 32.64 | 1415 | 33.87 |
| Meat (index number, July, 1914: 1127) | 1535 | 36.20 | 1537 | 36.38 | 1549 | 37.44 | 1559 | 38.33 | 1545 | 37.09 |
| Three food groups (index number, July, 1914: 1070) | 1430 | 33.64 | 1478 | 38.13 | 1503 | 40.47 | 1551 | 44.95 | 1491 | 39.35 |
It will be seen that, over the average for the year, food-prices show an in crease since the outbreak of war of 39.35 per cent. The increases shown by the various groups have been approximately the same until the third quarter of the year, when the groceries group advanced somewhat ahead of the other two groups.
The following general survey of the course of retail prices over a number of years has been brought up to date by the inclusion of the figures for 1918:—
INDEX NUMBERS FOR FOUR CHIEF CENTRES , 1909-18.
(Base: Average aggregate annual expenditure, four chief centres, 1909-13= 1000.)
| Year. | Auckland. | Wellington. | Christchurch. | Dunedin. | Average of Four Centres. |
|---|---|---|---|---|---|
| 1909 | 1007 | 985 | 927 | 972 | 973 |
| 1910 | 1036 | 1017 | 964 | 1039 | 1014 |
| 1911 | 981 | 989 | 934 | 968 | 968 |
| 1912 | 1050 | 1013 | 986 | 1039 | 1022 |
| 1913 | 1064 | 1029 | 964 | 1036 | 1023 |
| 1914 | 1035 | 1082 | 1046 | 1056 | 1055 |
| 1915 | 1172 | 1227 | 1210 | 1219 | 1207 |
| 1916 | 1196 | 1269 | 1197 | 1192 | 1214 |
| 1917 | 1268 | 1395 | 1279 | 1248 | 1298 |
| 1918 | 1461 | 1579 | 1417 | 1503 | 1490 |
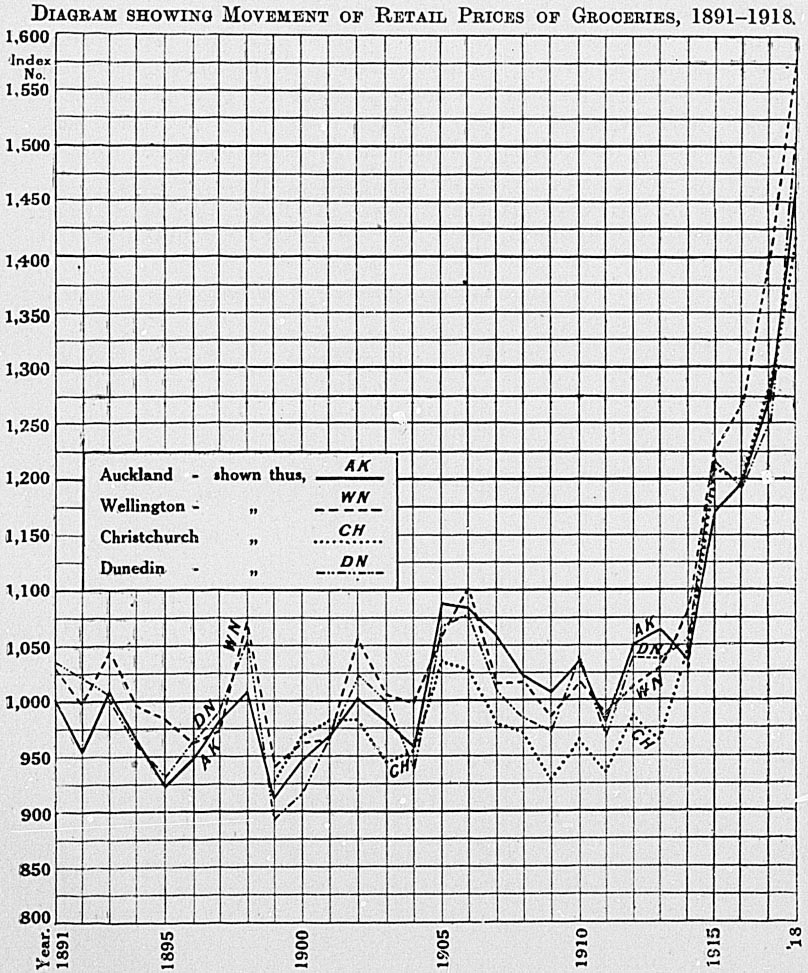
The outstanding feature illustrated by this diagram is, of course, the substantial advance in prices since the outbreak of war. The year 1916, however, saw a slight decline in prices in Christchurch and Dunedin as compared with the previous year.
The close relation between prices in the four chief centres is clearly illustrated by the sympathetic movement of the graph-lines.
The items grouped under the heading "Groceries" are varied in nature, and may be treated in three subgroups as under:—
Group 1A .—Groceries, excluding bread, flour, oatmeal, potatoes, onions, and sugar.
Group 1B .—Bread, flour, oatmeal, potatoes, and onions.
Group 1C .—Sugar.
The fundamental distinction is that the items comprising Group 1A are almost wholly imported from overseas, while those in the second are almost wholly produced and consumed in the country. Sugar is not strictly a product of New Zealand, the raw material being imported and refined in the Dominion, but it is such an important commodity that it has been deemed advisable to treat it separately. The prices of the first two subgroups follow quite different courses, as may be seen from the following table and graph. It is evident that the five home products not only fluctuate more, but have risen considerably during the period covered. A cyclical movement may also be traced in the prices of the five home products.
ANNUAL AND QUINQUENNIAL INDEX NUMBERS OF RETAIL PRICES OF THE GROUPS 1A (GENERAL GROCERIES ) AND 1B (BREAD , FLOUR , OATMEAL , POTATOES , AND ONIONS ), AVERAGED OVER THE FOUR CHIEF CENTRES., 1909-18.
| Year. | Annual Index Numbers. | Quinquennial Index Numbers. | ||
|---|---|---|---|---|
| General Groceries. | Bread, Flour, Oatmeal, Potatoes, and Onions. | General Groceries. | Bread, Flour, Oatmeal, Potatoes, and Onions. | |
| 1909 | 986 | 981 | 996 | 1002 |
| 1910 | 990 | 1053 | 994 | 1005 |
| 1911 | 992 | 937 | 1000 | 1000 |
| 1912 | 1002 | 1027 | 1015 | 1023 |
| 1913 | 1029 | 1001 | 1033 | 1084 |
| 1914 | 1063 | 1098 | 1055 | 1159 |
| 1915 | 1078 | 1355 | 1095 | 1235 |
| 1916 | 1101 | 1314 | 1175 | 1354 |
| 1917 | 1205 | 1406 | .. | .. |
| 1918 | 1427 | 1599 | .. | .. |
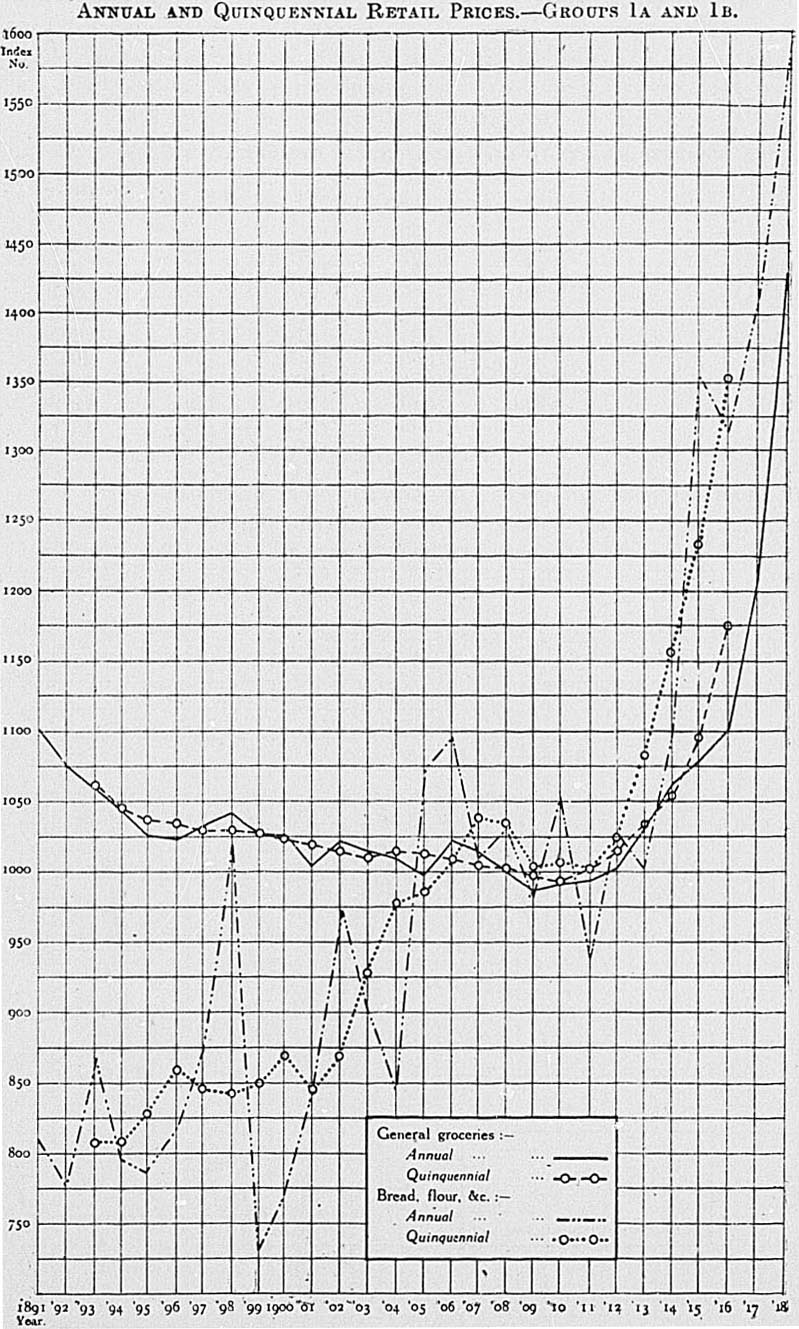
The price of sugar has been greatly influenced by the Customs tariff, and the effect of this influence is especially noticeable after the adoption of the new tariff of 1907. In that year prices immediately dropped in all the four centres, owing to the removal of the last 1/2d.-per-pound duty on this commodity. Since 1910, however, prices have risen considerably, so that the index numbers for 1918 are practically on the same level as those for the year 1891.
INDEX NUMBERS SHOWING THE VARIATIONS IN THE RETAIL PRICES OF SUGAR .
| Year. | Auckland. | Wellington. | Christchurch. | Dunedin. | Average of Four Centres. |
|---|---|---|---|---|---|
| 1909 | 881 | 913 | 961 | 883 | 910 |
| 1910 | 946 | 987 | 1003 | 974 | 978 |
| 1911 | 941 | 965 | 1045 | 972 | 981 |
| 1912 | 1045 | 1029 | 1115 | 1078 | 1092 |
| 1913 | 1117 | 980 | 1071 | 1094 | 1065 |
| 1914 | 983 | 1055 | 1145 | 1025 | 1052 |
| 1915 | 1191 | 1211 | 1290 | 1228 | 1230 |
| 1916 | 1208 | 1310 | 1304 | 1294 | 1279 |
| 1917 | 1219 | 1399 | 1344 | 1354 | 1329 |
| 1918 | 1266 | 1428 | 1359 | 1423 | 1369 |
(Base: Average aggregate annual expenditure, four chief centres, 1909-13 = 1000).
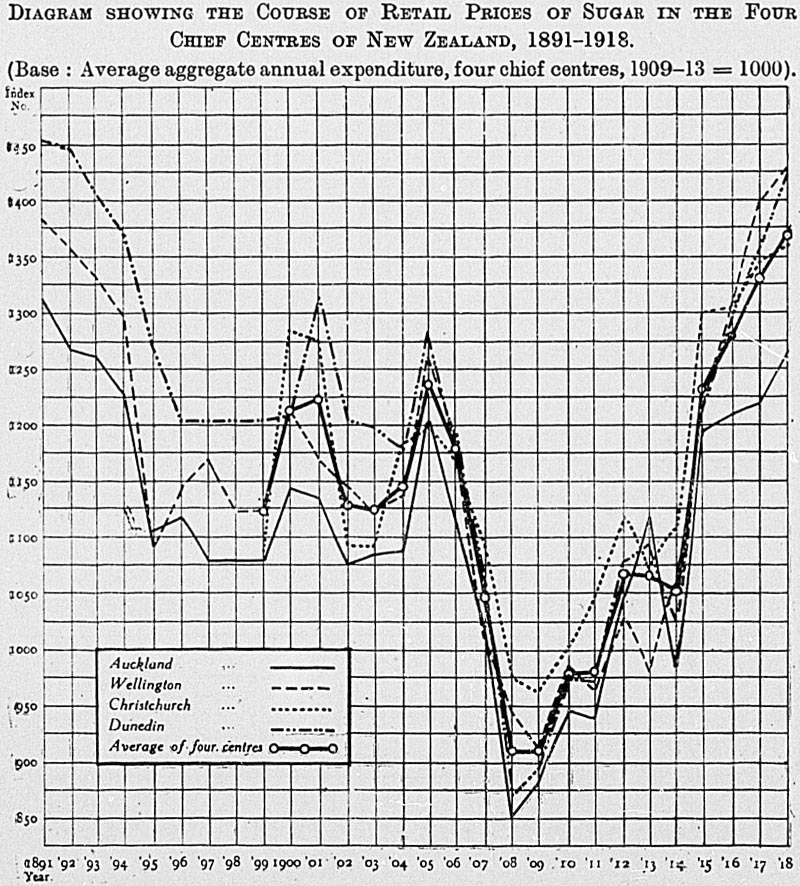
The prices of commodities included in the dairy-produce group have shown an almost continuous increase since 1891—an increase which during the war period has been considerably accelerated. The year 1916 disclosed a greater and more rapid movement than took place in any previous year for which prices are recorded. The increases in 1917 and 1918 have also been substantial.
INDEX NUMBERS FOR , FOUR CHIEF CENTRES , 1909-18.
(Base: Average aggregate annual expenditure, four chief centres, 1909-13 = 1000.)
| Year. | Auckland. | Wellington. | Christchurch. | Dunedin. | Average of Four Centres. |
|---|---|---|---|---|---|
| 1909 | 974 | 975 | 912 | 972 | 958 |
| 1910 | 965 | 996 | 920 | 997 | 970 |
| 1911 | 986 | 1018 | 948 | 1021 | 993 |
| 1912 | 998 | 1076 | 992 | 1052 | 1029 |
| 1913 | 1028 | 1124 | 1003 | 1044 | 1050 |
| 1914 | 1019 | 1114 | 1016 | 1065 | 1054 |
| 1915 | 1140 | 1196 | 1133 | 1146 | 1154 |
| 1916 | 1288 | 1350 | 1251 | 1263 | 1288 |
| 1917 | 1362 | 1425 | 1318 | 1351 | 1364 |
| 1918 | 1443 | 1476 | 1328 | 1432 | 1420 |
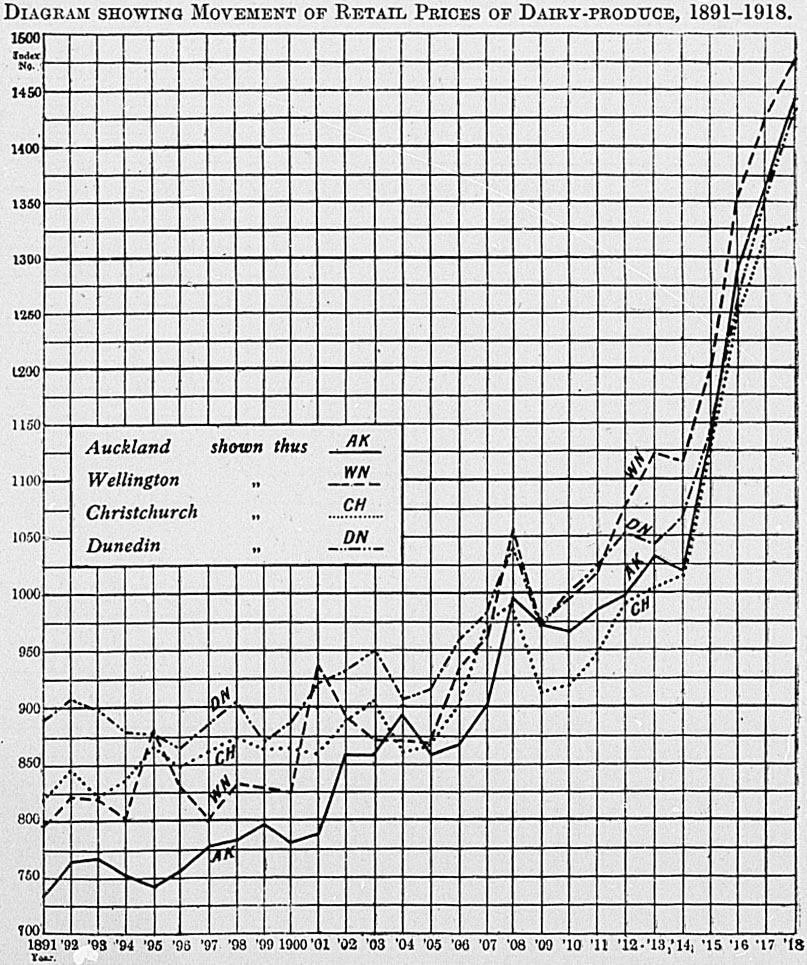
The index numbers for the meat group disclose no exceptional movement beyond the increase brought about by war conditions. Auckland continues to maintain its position considerably in advance of the other three centres, while Dunedin prices have gradually risen so that they are now approximately on a level with prices in Wellington and Christchurch.
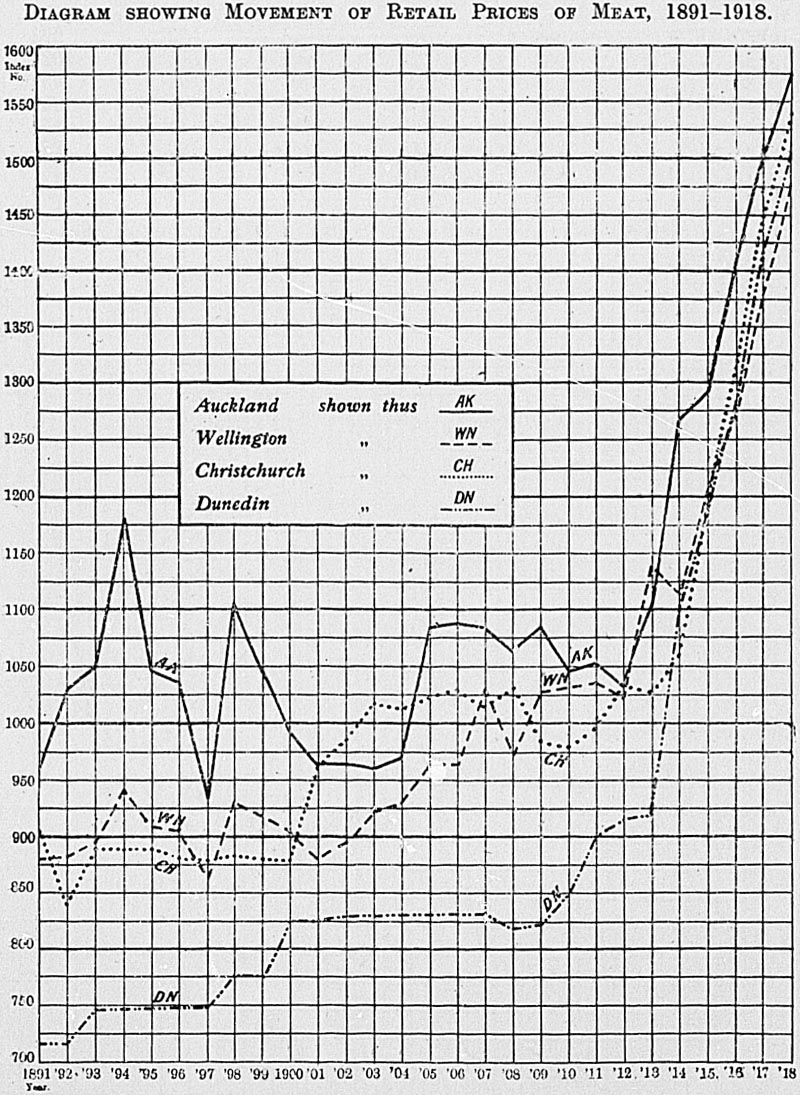
INDEX NUMBERS FOR FOUR CHIEF CENTRES , 1909-18.
(Base: Average aggregate annual expenditure, four chief centres, 1909-13 = 1000.)
| Year. | Auckland. | Wellington. | Christchurch. | Dunedin. | Average of Four Centres. |
|---|---|---|---|---|---|
| 1909 | 1084 | 1026 | 984 | 824 | 980 |
| 1910 | 1047 | 1029 | 980 | 851 | 977 |
| 1911 | 1052 | 1034 | 995 | 900 | 995 |
| 1912 | 1033 | 1024 | 1034 | 915 | 1001 |
| 1913 | 1104 | 1139 | 1027 | 917 | 1047 |
| 1914 | 1266 | 1112 | 1061 | 1103 | 1136 |
| 1915 | 1293 | 1205 | 1191 | 1190 | 1220 |
| 1916 | 1413 | 1274 | 1313 | 1283 | 1321 |
| 1917 | 1500 | 1380 | 1449 | 1417 | 1437 |
| 1918 | 1575 | 1476 | 1540 | 1507 | 1525 |
The index numbers given in the following table have been compiled from records of prices of the three separate food groups in such manner as to show the movement of the general level of food-prices, care being taken to give each group its due importance:—
INDEX NUMBERS FOR FOUR CHIEF CENTRES , 1909-18.
(Base: Average aggregate annual expenditure, four chief centres, 1909-13 = 1000.)
| Year. | Auckland. | Wellington. | Christchurch. | Dunedin. | Average of Four Centres. |
|---|---|---|---|---|---|
| 1909 | 1026 | 997 | 943 | 922 | 972 |
| 1910 | 1023 | 1016 | 960 | 965 | 991 |
| 1911 | 1006 | 1011 | 958 | 957 | 983 |
| 1912 | 1032 | 1031 | 1004 | 1000 | 1017 |
| 1913 | 1069 | 1089 | 995 | 997 | 1037 |
| 1914 | 1110 | 1100 | 1044 | 1074 | 1082 |
| 1915 | 1206 | 1216 | 1176 | 1191 | 1197 |
| 1916 | 1291 | 1290 | 1249 | 1244 | 1268 |
| 1917 | 1369 | 1397 | 1346 | 1328 | 1360 |
| 1918 | 1496 | 1521 | 1438 | 1488 | 1486 |
It will be noted that food-prices in the four centres, as recorded by the above index numbers, move with considerable uniformity, although the extent of the movement varies as between the different cities.
In pre war years food-prices were slightly higher in Auckland and Wellington than in the two southern centres, this being mainly due to the difference in prices of agricultural products (flour, oatmeal, &c), and meat; and while all four centres have experienced substantial increases in prices since the commencement of the war, Dunedin and Christchurch still show lower index numbers than either Auckland or Wellington.
The following table brings into prominence the high level of weekly rentals in Wellington as compared with the other three centres. During the war period and for some years prior to 1914 the increase in house-rents in Wellington has been such as to increase the disparity between the level of rents in that city and in the other three chief centres of the Dominion.
To 1918 the war increase in house-rents has been very evident in the three southern centres, while Auckland, which was experiencing a boom in the years 1912-14, has shown a fall in rents during the years 1915-17.
INDEX NUMBERS FOR FOUR CHIEF CENTRES , 1909-18.
(Base: Average aggregate annual expenditure, four chief centres, 1909-13 = 1000.)
| Year. | Auckland. | Wellington. | Christchurch. | Dunedin. | Average of Four Centres. |
|---|---|---|---|---|---|
| 1909 | 981 | 1104 | 944 | 932 | 990 |
| 1910 | 991 | 1100 | 933 | 936 | 990 |
| 1911 | 998 | 1088 | 923 | 938 | 987 |
| 1912 | 1065 | 1093 | 920 | 950 | 1007 |
| 1913 | 1044 | 1164 | 937 | 958 | 1026 |
| 1914 | 1044 | 1173 | 961 | 965 | 1036 |
| 1915 | 1005 | 1186 | 967 | 970 | 1032 |
| 1916 | 987 | 1216 | 949 | 965 | 1029 |
| 1917 | 977 | 1240 | 967 | 945 | 1032 |
| 1918 | 1005 | 1295 | 1007 | 984 | 1073 |
The great increase in house-rent in each of the four centres is unmistakably represented in the graph given on the following page. How far this increase in rent represents the improvement in the style of houses, better building, more conveniences, and greater ornament, and how far it represents an increase of site-values due to increasing population it is impossible to determine.
Auckland and Wellington, it is interesting to notice, have shown since 1891 the greatest and most continuous increases in rent; and these are the towns which have increased most in population. Dunedin, which has increased least in population, shows the steadiest movement of rent, while Christchurch seems to have had a boom in 1906, and falling rents thereafter till 1912.
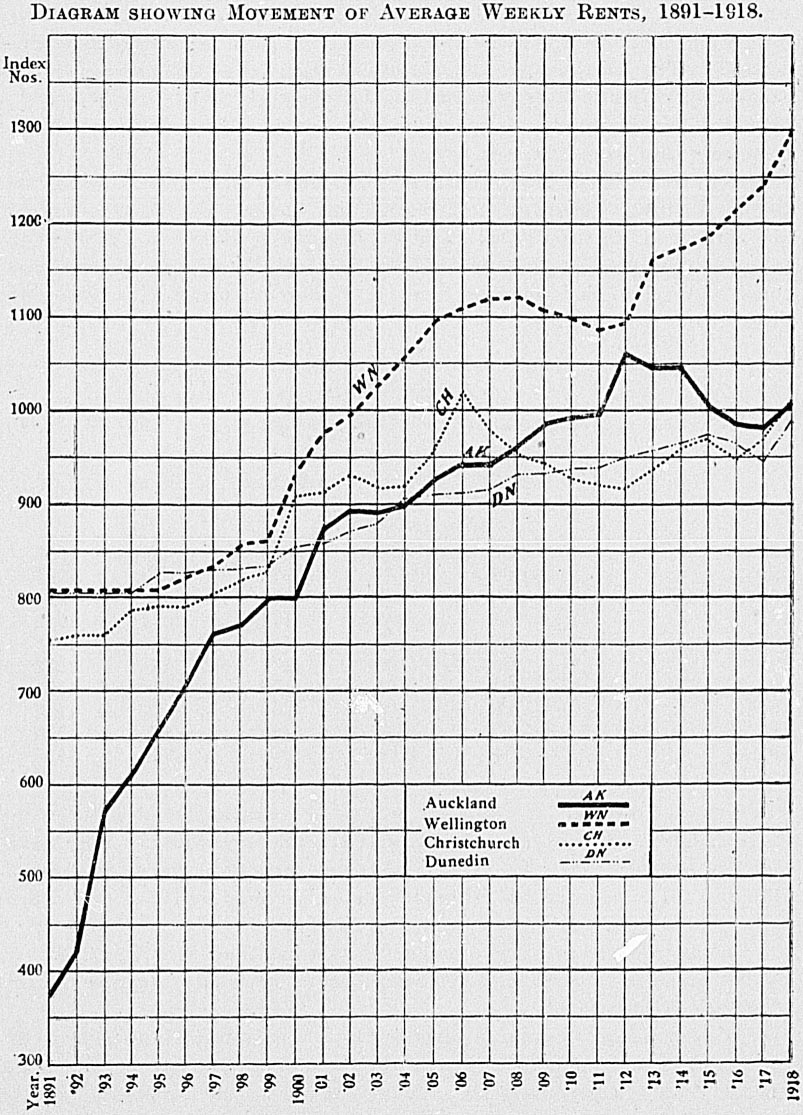
Considerable difficulties are met with in any attempt to follow accurately the course of prices in this group. It has, in fact, been impossible to settle on any list of commodities which were used during the period under review in anything approaching comparable proportions in the four chief centres. The comparative usages of electric light, gas, kerosene, and candles vary greatly even between the four centres. Coal, too, presents a difficulty for comparative purposes in the several different classes of coal commonly used in the different towns.
However, a small group of seven items—coal, coke, firewood, kerosene, gas for lighting, electricity for lighting, and candles—has been considered, and prices in the four chief centres have been collected for as many past years as possible. Complete index numbers for this group have been compiled for 1907 and subsequent years. Figures for the past ten years are given in the table below.
INDEX NUMBERS OF COSTS OF FUEL AND LIGHTING (GROUP V) FOR FOUR CHIEF CENTRES , 1909-18.
(Base: Average aggregate annual expenditure, four chief centres, 1909-13 = 1000.)
| Year. | Auckland. | Wellington. | Christchurch. | Dunedin. | Average of Four Centres. |
|---|---|---|---|---|---|
| 1909 | 899 | 1097 | 1079 | 896 | 993 |
| 1910 | 898 | 1054 | 1075 | 896 | 981 |
| 1911 | 899 | 1053 | 1074 | 893 | 980 |
| 1912 | 919 | 1091 | 1117 | 920 | 1012 |
| 1913 | 928 | 1101 | 1150 | 960 | 1035 |
| 1914 | 971 | 1160 | 1174 | 905 | 1052 |
| 1915 | 991 | 1155 | 1172 | 964 | 1071 |
| 1916 | 1100 | 1202 | 1252 | 1072 | 1157 |
| 1917 | 1283 | 1335 | 1489 | 1214 | 1330 |
| 1918 | 1378 | 1408 | 1591 | 1333 | 1427 |
Over the average of the four centres a considerable advance in the index numbers of this group has been noticeable since 1911. This movement is common to all four cities, and was particularly rapid as between 1916 and 1917, when the general index number increased by 173 points. There was a further considerable increase during 1918.
Among the commodities considered in the fuel and light group, coal is by far the most important, and changes in its price are therefore worthy of special consideration.
It is possible to gain complete data of coal-prices throughout the whole period, and these are shown in the table and graph on the next page. Though coal is largely used all over the Dominion, the varieties of coal in different localities vary greatly. Following the method used throughout this investigation, the retail prices considered have been the predominant or most frequent prices of the quality or grade most usually sold. It will be noticed that Auckland and Dunedin prices of coal have generally been considerably lower than those of Christchurch and Wellington. This is due to the use of local brown coals—Waikato in Auckland, and Kaitangata and Green Island in Dunedin. Prices of coal in Auckland and Dunedin have, however, advanced considerably during 1917 and 1918, so that Auckland prices were in those years higher than prices in Wellington. Prices in all four centres have made a considerable advance during both 1917 and 1918.
INDEX NUMBERS OF RETAIL PRICES OF COAL IN THE FOUR CHIEF CENTRES OF NEW ZEALAND , 1909-18.
(Base: Average aggregate annual expenditure, four chief centres, 1909-13 = 1000.)
| Year. | Auckland. | Wellington. | Christchurch. | Dunedin. | Average of Four Centres. |
|---|---|---|---|---|---|
| 1909 | 923 | 1103 | 1096 | 837 | 990 |
| 1910 | 923 | 1039 | 1096 | 837 | 974 |
| 1911 | 923 | 1039 | 1096 | 837 | 974 |
| 1912 | 952 | 1089 | 1154 | 873 | 1017 |
| 1913 | 966 | 1096 | 1197 | 923 | 1046 |
| 1914 | 1039 | 1212 | 1212 | 865 | 1082 |
| 1915 | 1042 | 1188 | 1212 | 952 | 1099 |
| 1916 | 1165 | 1203 | 1289 | 1084 | 1185 |
| 1917 | 1356 | 1271 | 1594 | 1237 | 1365 |
| 1918 | 1445 | 1344 | 1688 | 1342 | 1447 |
DIAGRAM SHOWING MOVEMENT OF RETAIL PRICES OF COAL , 1891-1918.
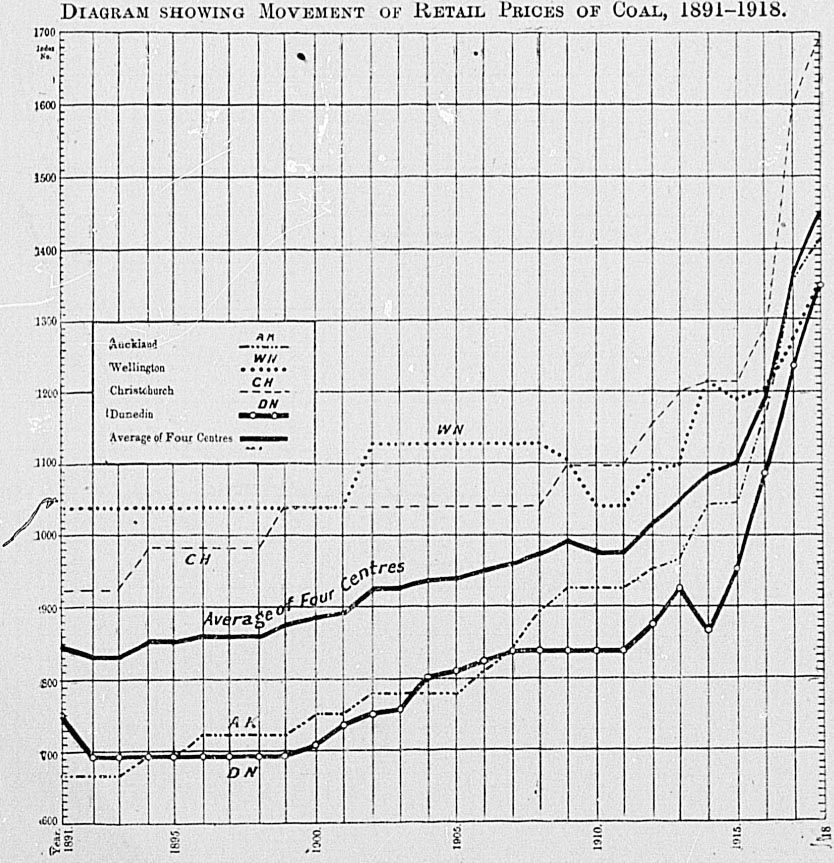
INDEX NUMBERS FOR AUCKLAND , WELLINGTON , CHRISTCHURCH , DUNEDIN , AND FOR AVERAGE OF FOUR CENTRES FOR EACH YEAR , 1909-18.
(Base: Average aggregate annual expenditure, four chief centres, 1909-13 = 1000.)
| Year. | Auckland. | Wellington | Christchurch. | Dunedin. | Average of Four Centres. |
|---|---|---|---|---|---|
| 1909 | 1010 | 1035 | 943 | 926 | 979 |
| 1910 | 1012 | 1046 | 950 | 955 | 991 |
| 1911 | 1004 | 1038 | 946 | 950 | 985 |
| 1912 | 1044 | 1053 | 974 | 982 | 1013 |
| 1913 | 1061 | 1115 | 974 | 983 | 1033 |
| 1914 | 1087 | 1125 | 1015 | 1035 | 1066 |
| 1915 | 1135 | 1201 | 1101 | 1114 | 1138 |
| 1916 | 1186 | 1262 | 1144 | 1140 | 1183 |
| 1917 | 1231 | 1339 | 1210 | 1194 | 1244 |
| 1918 | 1320 | 1439 | 1281 | 1306 | 1337 |
The index numbers given above show the movement of prices of food and of house-rents combined. These figures accordingly present concise information as to the movement in the cost of a substantial proportion of the ordinary domestic necessities—food and housing.
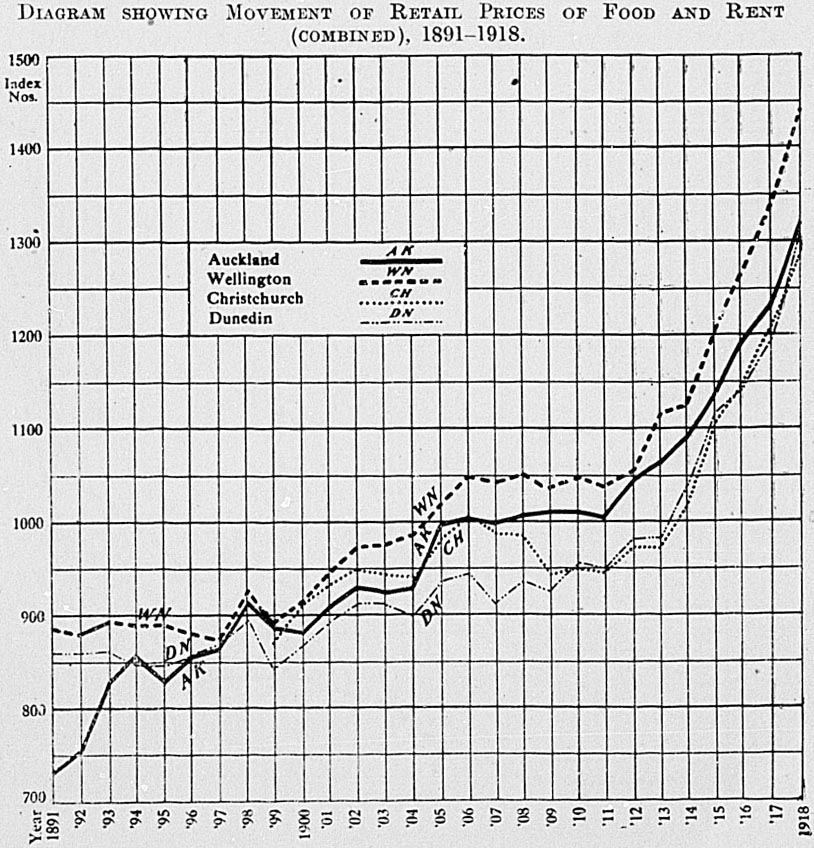
INDEX NUMBERS OF RETAIL PRICES OF ALL GROUPS OF COMMODITIES IN THE AVERAGE OF THE FOUR CHIEF CENTRES , 1909-18.
(Base: Average aggregate annual expenditure, four chief centres, 1909-13 = 1000.)
| Year. | Group I: Groceries. | Group II: Dairy-produce. | Group III: Meat. | Group I-III: Food Groups. | Group IV: House-rent. | Groups I-IV. Food and Rent. | Group V: Fuel and Light. | Group I-V. Food Rent, Fuel and Light. |
|---|---|---|---|---|---|---|---|---|
| 1909 | 973 | 958 | 980 | 972 | 990 | 979 | 993 | 980 |
| 1910 | 1014 | 970 | 977 | 991 | 990 | 991 | 981 | 990 |
| 1911 | 968 | 993 | 995 | 983 | 987 | 985 | 980 | 984 |
| 1912 | 1022 | 1029 | 1001 | 1017 | 1007 | 1013 | 1012 | 1013 |
| 1913 | 1023 | 1050 | 1047 | 1037 | 1026 | 1033 | 1035 | 1034 |
| 1914 | 1055 | 1054 | 1136 | 1082 | 1036 | 1066 | 1052 | 1065 |
| 1915 | 1201 | 1154 | 1222 | 1197 | 1032 | 1138 | 1071 | 1130 |
| 1916 | 1214 | 1288 | 1321 | 1268 | 1029 | 1183 | 1157 | 1180 |
| 1917 | 1298 | 1364 | 1437 | 1360 | 1032 | 1244 | 1330 | 1249 |
| 1918 | 1490 | 1420 | 1525 | 1486 | 1073 | 1337 | 1427 | 1346 |
The following table, which is based on the average of the index numbers of the four chief centres as set out in the preceding table, gives an indication (in money figures) of the extent to which prices have risen during the period 1909-18. The table shows the amount necessary, on the average, to purchase the same quantity of foodstuffs, house accommodation, and fuel and light as would have cost 20s. on the average in the four chief centres during the base period 1909-13.
| Year. | Group I: Groceries | Group II: Dairy Products. | Group III: Meat. | Group I-III: Food Groups. | Group IV: House-rent. | Group I-IV: Food and Rent. | Group V: Fuel and Light. | Group I-V: Food, Rent. Fuel and Light. | ||||||||
|---|---|---|---|---|---|---|---|---|---|---|---|---|---|---|---|---|
| s. | d. | s. | d. | s. | d. | s. | d. | s. | d. | s. | d. | s. | d. | s. | d. | |
| 1909 | 19 | 5 1/2 | 19 | 2 | 19 | 7 1/4 | 19 | 5 1/4 | 19 | 9 1/2 | 19 | 7 | 19 | 10 1/4 | 19 | 7 1/4 |
| 1910 | 20 | 3 1/4 | 19 | 4 3/4 | 19 | 6 1/2 | 19 | 9 3/4 | 19 | 9 1/2 | 19 | 9 3/4 | 19 | 7 1/2 | 19 | 9 1/2 |
| 1911 | 19 | 4 1/4 | 19 | 10 1/4 | 19 | 10 3/4 | 19 | 8 | 19 | 9 | 19 | 8 1/2 | 19 | 7 1/4 | 19 | 8 1/4 |
| 1912 | 20 | 5 1/4 | 20 | 7 | 20 | 0 1/4 | 20 | 4 | 20 | 1 3/4 | 20 | 3 | 20 | 3 | 20 | 3 |
| 1913 | 20 | 5 1/2 | 21 | 0 | 20 | 11 1/4 | 20 | 9 | 20 | 6 1/4 | 20 | 8 | 20 | 8 1/2 | 20 | 8 1/4 |
| 1914 | 21 | 1 1/4 | 21 | 1 | 22 | 8 3/4 | 21 | 7 3/4 | 20 | 8 3/4 | 21 | 3 3/4 | 21 | 0 1/2 | 21 | 3 1/2 |
| 1915 | 24 | 0 1/4 | 23 | 1 | 24 | 5 1/4 | 23 | 11 1/4 | 20 | 7 3/4 | 22 | 9 | 21 | 5 | 22 | 7 1/4 |
| 1916 | 24 | 3 1/4 | 25 | 9 | 26 | 5 | 25 | 4 1/4 | 20 | 7 | 23 | 8 | 23 | 1 3/4 | 23 | 7 1/4 |
| 1917 | 25 | 11 1/2 | 27 | 3 1/4 | 28 | 9 | 27 | 2 1/2 | 20 | 7 3/4 | 24 10 1/2 | 26 | 7 1/4 | 24 | 11 3/4 | |
| 1918 | 29 | 9 1/2 | 28 | 4 3/4 | 30 | 6 | 29 | 8 3/4 | 21 | 51/2 | 26 | 9 | 28 | 6 1/2 | 26 | 11 |
NOTE .—These figures are comparable vertically but not horizontally. See above re figures for rent.
The general increase in prices has materially reduced the purchasing-power of the sovereign, as is shown by the following table, which sets out the relative "worth" in terms of commodities (but stated for convenience in terms of money) represented by a sovereign during the years 1909-18. The average "worth" in the years 1909-13 has been taken as a base and equated to 20s. the figures throughout are based on the average prices of the four chief centres.
| Year. | Group I: Groceries | Group II: Dairy Products. | Group III: Meat. | Group I-III: Food Groups. | Group IV: House-rent. | Group I-IV: Food and Rent. | Group V: Fuel and Light. | Group I-V: Food, Rent. Fuel and Light. | ||||||||
|---|---|---|---|---|---|---|---|---|---|---|---|---|---|---|---|---|
| s. | d. | s. | d. | s. | d. | s. | d. | s. | d. | s. | d. | s. | d. | s. | d. | |
| 1909 | 20 | 6 3/4 | 20 | 10 1/2 | 20 | 5 | 20 | 7 | 20 | 2 1/2 | 20 | 5 1/4 | 20 | 1 3/4 | 20 | 5 |
| 1910 | 19 | 8 3/4 | 20 | 7 1/2 | 20 | 5 3/4 | 20 | 2 1/4 | 20 | 2 1/2 | 20 | 2 1/4 | 20 | 4 3/4 | 20 | 2 1/2 |
| 1911 | 20 | 8 | 20 | 1 3/4 | 20 | 1 1/4 | 20 | 4 1/4 | 20 | 3 1/4 | 20 | 3 3/4 | 20 | 5 | 20 | 4 |
| 1912 | 19 | 6 3/4 | 19 | 5 1/4 | 19 | 11 3/4 | 19 | 8 | 19 | 10 1/4 | 19 | 9 | 19 | 9 1/4 | 19 | 9 |
| 1913 | 19 | 6 1/2 | 19 | 0 1/2 | 19 | 1 1/4 | 19 | 3 1/2 | 19 | 6 | 19 | 4 1/4 | 19 | 4 | 19 | 4 |
| 1914 | 18 | 11 1/2 | 18 | 11 3/4 | 17 | 7 1/4 | 18 | 5 3/4 | 19 | 3 3/4 | 18 | 9 1/4 | 19 | 0 | 18 | 9 1/4 |
| 1915 | 16 | 7 3/4 | 17 | 4 | 16 | 4 1/4 | 16 | 8 1/2 | 19 | 4 1/2 | 17 | 7 | 18 | 8 | 17 | 8 1/2 |
| 1916 | 16 | 5 3/4 | 15 | 6 1/2 | 15 | 1 1/2 | 15 | 9 1/4 | 19 | 5 1/4 | 16 | 10 3/4 | 17 | 3 1/2 | 16 | 11 1/2 |
| 1917 | 15 | 5 | 14 | 8 | 13 | 11 | 14 | 8 1/2 | 19 | 4 1/2 | 16 | 1 | 15 | 0 1/2 | 16 | 0 1/2 |
| 1918 | 13 | 5 | 14 | 1 | 13 | 1 1/2 | 13 | 5 1/2 | 18 | 7 3/4 | 14 | 11 1/2 | 14 | 0 1/4 | 14 | 10 1/4 |
NOTE .—These figures are comparable vertically but not horizontally.
In the consideration of this table care must be taken that the figures are given their correct significance. In short, they represent—in money figures—the worth (or purchasing-power) of a sovereign expended in purchasing the commodities shown at the heads of the columns, as compared with a sovereign of full purchasing-power in the average of the years 1909-13.
Another fact which must be noted is that the figures shown in this table will not rise or fall to equal extent with any movements shown in the index number, and the percentage rise or fall will not be the same both in this table and in the table of index numbers.
This may be explained by pointing out that an index number of 1333 would represent in the above table approximately 15s., 1000 being equal to 20s. In that case prices are 33 1/3 per cent. higher than previously; or, in other words, the sovereign will purchase only 75 per cent. of the amount of goods for which it could have been exchanged in the "base" period. It will accordingly be seen that the index number will reach 2000 before the purchasing-power of money has fallen another 5s.— i.e., from 15s. to 10s.—and would move as high as 4000 before the purchasing-power of the sovereign fell to 5s. On the other hand, a falling index number will move relatively less rapidly than would the corresponding figure indicating the increasing purchasing-power of the sovereign.
TABLE SHOWING THE COMPARATIVE COSTS OF AS ASSUMED WEEKLY HOUSE -HOLD CONSUMPTION OF CERTAIN FOODSTUFFS , AND THE RENT OF A FOUR -ROOMED HOUSE , 1891-1918.
(Based on the average of the four chief centres.)
| Commodity. | Quantity. | Average Cost, 1891. | Average Cost, 1901. | Average Cost, 1911. | Average Cost, 1916. | Average Cost, 1917. | Average Cost, 1918. | ||||||||||||
|---|---|---|---|---|---|---|---|---|---|---|---|---|---|---|---|---|---|---|---|
| Groceries— | £ | s. | d. | £ | s. | d. | £ | s. | d. | £ | s. | d. | £ | s. | d. | £ | s. | d. | |
| Bread | 7 2 lb. loaves | 0 | 1 | 10 1/2 | 0 | 1 | 9 1/2 | 0 | 1 | 11 | 0 | 2 | 6 1/2 | 0 | 2 | 9 3/4 | 0 | 3 | 0 1/4 |
| Flour | 3 lb. | 0 | 0 | 5 | 0 | 0 | 3 1/2 | 0 | 0 | 4 | 0 | 0 | 6 | 0 | 0 | 6 3/4 | 0 | 0 | 7 |
| Oatmeal | 1 lb. | 0 | 0 | 1 1/2 | 0 | 0 | 1 1/2 | 0 | 0 | 2 | 0 | 0 | 2 3/4 | 0 | 0 | 3 | 0 | 0 | 4 |
| Rice | 1 lb. | 0 | 0 | 3 | 0 | 0 | 2 1/2 | 0 | 0 | 2 1/2 | 0 | 0 | 2 1/2 | 0 | 0 | 2 3/4 | 0 | 0 | 3 1/4 |
| Tea | 1/2 lb. | 0 | 1 | 0 1/2 | 0 | 0 | 10 1/2 | 0 | 0 | 9 | 0 | 0 | 10 | 0 | 0 | 10 1/4 | 0 | 0 | 11 1/2 |
| Cocoa | 1/8 lb. | 0 | 0 | 5 | 0 | 0 | 5 | 0 | 0 | 5 | 0 | 0 | 5 1/2 | 0 | 0 | 5 3/4 | 0 | 0 | 6 1/2 |
| Sugar | 3 lb. | 0 | 0 | 8 1/2 | 0 | 0 | 7 1/2 | 0 | 0 | 6 | 0 | 0 | 9 | 0 | 0 | 8 3/4 | 0 | 0 | 9 |
| Jam | 2 lb. | 0 | 0 | 10 | 0 | 0 | 10 | 0 | 0 | 9 1/2 | 0 | 1 | 0 1/4 | 0 | 1 | 1 1/4 | 0 | 1 | 3 |
| Raisins | 4 lb. | 0 | 0 | 4 1/2 | 0 | 0 | 3 1/2 | 0 | 0 | 3 | 0 | 0 | 3 1/4 | 0 | 0 | 3 3/4 | 0 | 0 | 4 |
| Potatoes | 14 lb. | 0 | 0 | 7 | 0 | 0 | 9 | 0 | 0 | 10 1/2 | 0 | 1 | 5 1/4 | 0 | 1 | 3 1/2 | 0 | 1 | 8 3/4 |
| Totals | .. | 0 | 6 | 7 1/2 | 0 | 6 | 2 1/2 | 0 | 6 | 2 1/2 | 0 | 8 | 3 | 0 | 8 | 7 | 0 | 9 | 9 1/4 |
| Increase per cent. over 1891 | .. | .. | -6.29 | -6.29 | 24.53 | 29.56 | 47.48 | ||||||||||||
| Dairy-produce— | |||||||||||||||||||
| Milk | 7 pts. | 0 | 0 | 11 1/2 | 0 | 0 | 11 1/2 | 0 | 1 | 1 | 0 | 1 | 4 1/2 | 0 | 1 | 5 1/4 | 0 | 1 | 6 |
| Butter | 3 lb. | 0 | 2 | 8 | 0 | 3 | 2 1/2 | 0 | 3 | 7 1/2 | 0 | 4 | 8 1/4 | 0 | 4 | 10 1/4 | 0 | 4 | 11 |
| Cheese | 1/4 lb. | 0 | 0 | 2 | 0 | 0 | 2 | 0 | 0 | 2 | 0 | 0 | 2 3/4 | 0 | 0 | 3 1/4 | 0 | 0 | 3 1/4 |
| Bacon | 1 lb. | 0 | 0 | 9 | 0 | 0 | 8 | 0 | 0 | 10 | 0 | 1 | 2 1/2 | 0 | 1 | 4 | 0 | 1 | 5 1/2 |
| Totals | .. | 0 | 4 | 6 1/2 | 0 | 5 | 0 | 0 | 5 | 8 1/2 | 0 | 7 | 6 | 0 | 7 | 10 3/4 | 0 | 8 | 1 3/4 |
| Increase per cent. over 1891 | .. | .. | 10.09 | 25.69 | 65.14 | 73.85 | 79.36 | ||||||||||||
| Meat— | |||||||||||||||||||
| Beef— | |||||||||||||||||||
| Sirloin | 3 lb. | 0 | 1 | 4 | 0 | 1 | 5 1/2 | 0 | 1 | 7 | 0 | 2 | 0 1/2 | 0 | 2 | 1 3/4 | 0 | 2 | 2 3/4 |
| Stewing-steak | 2 lb. | 0 | 0 | 9 | 0 | 0 | 9 | 0 | 0 | 10 | 0 | 1 | 2 | 0 | 1 | 3 | 0 | 1 | 4 |
| Corned roll | 2 lb. | 0 | 0 | 4 | 0 | 0 | 4 | 0 | 0 | 4 1/2 | 0 | 0 | 6 3/4 | 0 | 0 | 7 1/4 | 0 | 0 | 7 3/4 |
| Sausages | 2 lb. | 0 | 0 | 7 1/2 | 0 | 0 | 7 1/2 | 0 | 0 | 8 | 0 | 0 | 9 3/4 | 0 | 0 | 10 | 0 | 0 | 10 3/4 |
| Mutton— | |||||||||||||||||||
| Leg | 3 lb. | 0 | 1 | 0 1/2 | 0 | 1 | 2 | 0 | 1 | 4 1/2 | 0 | 1 | 8 1/4 | 0 | 1 | 10 3/4 | 0 | 2 | 0 1/4 |
| Shoulder | 2 lb. | 0 | 0 | 6 1/2 | 0 | 0 | 7 1/2 | 0 | 0 | 8 1/2 | 0 | 0 | 11 1/2 | 0 | 1 | 0 3/4 | 0 | 1 | 1 1/2 |
| Chops | 2 lb. | 0 | 0 | 9 1/2 | 0 | 0 | 10 1/2 | 0 | 1 | 0 | 0 | 1 | 2 1/4 | 0 | 1 | 3 3/4 | 0 | 1 | 4 3/4 |
| Totals | .. | 0 | 5 | 5 | 0 | 5 | 10 | 0 | 6 | 6 1/2 | 0 | 8 | 5 | 0 | 9 | 1 1/4 | 0 | 9 | 7 3/4 |
| Increase per cent. over 1891 | .. | .. | 7.69 | 20.77 | 55.38 | 68.08 | 78.08 | ||||||||||||
| Rent | 4 rooms | 0 | 7 | 0 1/4 | 0 | 9 | 8 3/4 | 0 | 11 | 1 1/4 | 0 | 11 | 7 3/4 | 0 | 11 | 9 | 0 | 12 | 0 1/4 |
| Increase per cent. over 1891 | .. | .. | 38.58 | 58.16 | 65.88 | 67.26 | 71.22 | ||||||||||||
| Totals of budget | .. | 1 | 3 | 7 1/4 | 1 | 6 | 9 1/4 | 1 | 9 | 6 3/4 | 1 | 15 | 9 3/4 | 1 | 17 | 4 | 1 | 19 | 7 |
| Increase percent. over 1891 | .. | .. | 13.42 | 25.24 | 51.72 | 58.16 | 67.70 | ||||||||||||
The minus sign (-) signifies a decrease.
The above assumed weekly budget has been drawn up mainly with the object of setting out the percentage increases in prices of those commodities which may be classed as absolute necessities, bulking largely in the regimen of families of small income. It is not intended that this should be taken as an estimate of the amount of food required properly to sustain a family, and there are, without doubt, a considerable number of commodities in common use which have not been included above. The foods shown in the budget, however, may be said to be indispensable, and it is for the purpose of showing the increase in the cost of such commodities, together with the increase in the cost of housing, that the budget is published.
During the year 1917 a system for the regular collection of information regarding wholesale prices was put into operation, and this system will be continued in future.
A considerable volume of data has been obtained from merchants and traders by means of retrospective investigations covering the years 1891 to 1917, and the Census and Statistics Office has now been able to obtain sufficient information upon which to calculate index numbers to record the movement of wholesale prices over the period from 1891 to date.
The general index number is based upon the prices of 106 commodities or grades of commodities. From 1909 more detailed information is available, and index numbers for eight groups of commodities can be given. These groups cover the following numbers of articles: Group I, agricultural produce, 15; Group II, flour, bran, pollard, and oatmeal, 4; Group III, wool, hides, tallow, butter, and cheese, 14; Group IV. general merchandise and crockery, 44; Group V, building-materials (ironmongery and timber), 31; Group VI, leather, 7; Group VII, chemicals and manures, 21; Group VIII, coal, 4. The group index numbers accordingly represent, in toto , the price fluctuations of 140 articles or grades of commodities. Each article has been given a weight relative to its average annual pre-war consumption in the Dominion and, further, relative to its price. This system of weighting, known as the "aggregate-expenditure method," is the one adopted in the retail-prices inquiry.
A full report of the inquiry into the movement of wholesale prices will be published as early as circumstances permit. In the meantime index numbers for the years 1891 to 1918 are published in this section of the Year-book. Index numbers of current wholesale prices will be found in each issue of the "Monthly Abstract of Statistics."
Average wholesale prices for the four quarters of 1918 (as reported by a number of wholesale traders in the four chief centres) are given below.
[NOTE .—Where not otherwise stated, prices represent the average of the four chief centres.]
| Article or Commodity. | Unit of Quantity. | First Quarter, 1918. | Second Quarter, 1918. | Third Quarter, 1918. | Fourth Quarter, 1918. | Average of Four Quarters, 1918. | |||||||||||
|---|---|---|---|---|---|---|---|---|---|---|---|---|---|---|---|---|---|
* Christchurch prices only. * Christchurch and Dunedin prices averaged. † Auckland prices only. *Christchurch and Dunedin prices averaged. † Average of hydraulic-lime prices in Auckland and Wellington, and white-lime prices in Christchurch and Dunedin. *Auckland prices only. | |||||||||||||||||
| Agricultural Produce. | |||||||||||||||||
| Wheat*— | £ | s. | d. | £ | s. | d. | £ | s. | d. | £ | s. | d. | £ | s. | d. | ||
| Tuscan | Per bushel | 0 | 6 | 0 | 0 | 6 | 0 1/4 | 0 | 6 | 1 | 0 | 6 | 1 1/4 | 0 | 6 | 0 3/4 | |
| Hunters | Per bushel | 0 | 6 | 0 | 0 | 6 | 0 1/4 | 0 | 6 | 1 | 0 | 6 | 1 1/4 | 0 | 6 | 0 3/4 | |
| Velvet | Per bushel | 0 | 6 | 0 | 0 | 6 | 0 1/4 | 0 | 6 | 1 | 0 | 6 | 1 1/4 | 0 | 6 | 0 3/4 | |
| Fowl | Per bushel | 0 | 5 | 9 3/4 | 0 | 5 | 10 | 0 | 5 | 11 1/4 | 0 | 5 | 1 1/4 | 0 | 5 | 10 1/2 | |
| Oats†— | |||||||||||||||||
| Garton's A | Per bushel | 0 | 4 | 3 | 0 | 4 | 9 | 0 | 5 | 2 3/4 | 0 | 5 | 9 3/4 | 0 | 5 | 0 1/4 | |
| Garton's B | Per bushel | 0 | 4 | 1 1/4 | 0 | 4 | 7 3/4 | 0 | 5 | 1 1/4 | 0 | 5 | 8 | 0 | 4 | 10 1/2 | |
| Sparrowbills | Per bushel | 0 | 4 | 5 | 0 | 4 | 7 1/2 | 0 | 5 | 1 3/4 | 0 | 5 | 7 | 0 | 4 | 11 1/4 | |
| Barley— | |||||||||||||||||
| Malting | Per bushel | 0 | 5 | 10 3/4 | 0 | 6 | 5 | 0 | 6 | 5 3/4 | 0 | 6 | 2 1/4 | 0 | 6 | 3 | |
| Feed | Per bushel | 0 | 4 | 11 | 0 | 5 | 6 1/4 | 0 | 5 | 8 | 0 | 5 | 3 1/4 | 0 | 5 | 4 1/2 | |
| Cocksfoot* (M.D.) | Per lb. | 0 | 1 | 6 3/4 | 0 | 1 | 10 | 0 | 1 | 9 1/4 | 0 | 1 | 10 | 0 | 1 | 9 | |
| Rye-grass*— | £ | s. | d. | £ | s. | d. | £ | s. | d. | £ | s. | d. | £ | s. | d. | ||
| Italian (M.D.) | Per bushel | 0 | 5 | 10 1/4 | 0 | 5 | 10 3/4 | 0 | 5 | 11 | 0 | 5 | 8 3/4 | 0 | 5 | 10 1/4 | |
| Perennial (M.D.) | Per bushel | 0 | 6 | 0 1/4 | 0 | 6 | 3 3/4 | 0 | 6 | 5 1/4 | 0 | 6 | 0 3/4 | 0 | 6 | 2 1/2 | |
| Potatoes | Per ton | 6 | 7 | 11 1/2 | 7 | 17 | 6 3/4 | 10 | 2 | 3 1/4 | 14 | 16 | 5 | 9 | 16 | 0 3/4 | |
| Onions | Per ton | 8 | 13 | 0 1/4 | 8 | 8 | 3 1/4 | 24 | 8 | 9 1/4 | 33 | 15 | 1 1/4 | 18 | 16 | 3 1/2 | |
| Maize† | Per bushel | 0 | 7 | 9 3/4 | 0 | 7 | 6 3/4 | 0 | 7 | 5 3/4 | 0 | 7 | 9 1/4 | 0 | 7 | 8 | |
| Milling Products. | |||||||||||||||||
| Flour | Per ton | 15 | 5 | 2 1/2 | 15 | 13 | 4 1/2 | 15 | 13 | 7 | 15 | 13 | 5 1/2 | 15 | 11 | 5 | |
| Bran | Per ton | 4 | 10 | 10 1/4 | 6 | 3 | 6 3/4 | 6 | 4 | 8 1/2 | 6 | 4 | 8 3/4 | 5 | 15 | 11 1/2 | |
| Pollard | Per ton | 7 | 12 | 0 1/2 | 8 | 4 | 6 1/2 | 8 | 5 | 0 1/2 | 8 | 5 | 5 | 7 | 1 | 9 1/4 | |
| Oatmeal | Per ton | 21 | 17 | 8 1/4 | 24 | 16 | 5 1/2 | 27 | 19 | 11 1/4 | 31 | 5 | 9 1/4 | 26 | 9 | 11 1/2 | |
| Wool, Hides, Tallow, Butter, and Cheese. | |||||||||||||||||
| Wool— | |||||||||||||||||
| Merino, medium to good | Per lb. | 0 | 1 | 4 1/2 | 0 | 1 | 4 1/2 | 0 | 1 | 4 1/2 | 0 | 1 | 4 1/2 | 0 | 1 | 4 1/2 | |
| Merino, inferior | Per lb. | 0 | 1 | 2 | 0 | 1 | 2 | 0 | 1 | 2 | 0 | 1 | 2 | 0 | 1 | 2 | |
| Half-bred, medium to good | Per lb. | 0 | 1 | 4 3/4 | 0 | 1 | 4 3/4 | 0 | 1 | 4 3/4 | 0 | 1 | 4 3/4 | 0 | 1 | 4 3/4 | |
| Half-bred, inferior | Per lb. | 0 | 1 | 2 3/4 | 0 | 1 | 2 3/4 | 0 | 1 | 2 3/4 | 0 | 1 | 2 3/4 | 0 | 1 | 2 3/4 | |
| Crossbred, medium to good | Per lb. | 0 | 1 | 3 1/2 | 0 | 1 | 3 1/2 | 0 | 1 | 3 1/2 | 0 | 1 | 3 1/2 | 0 | 1 | 3 1/2 | |
| Crossbred, inferior | Per lb. | 0 | 1 | 1 | 0 | 1 | 1 | 0 | 1 | 1 | 0 | 1 | 1 | 0 | 1 | 1 | |
| Hides— | |||||||||||||||||
| Ox, heavy | Per lb. | 0 | 1 | 0 | 0 | 0 | 11 1/2 | 0 | 0 | 11 3/4 | 0 | 0 | 11 3/4 | 0 | 0 | 11 3/4 | |
| Ox, medium | Per lb. | 0 | 0 | 11 3/4 | 0 | 0 | 10 3/4 | 0 | 0 | 10 3/4 | 0 | 0 | 11 | 0 | 0 | 11 | |
| Ox, light | Per lb. | 0 | 0 | 11 | 0 | 0 | 10 1/4 | 0 | 0 | 10 | 0 | 0 | 10 1/4 | 0 | 0 | 10 1/2 | |
| Cow, heavy | Per lb. | 0 | 0 | 11 | 0 | 0 | 9 3/4 | 0 | 0 | 10 | 0 | 0 | 10 1/4 | 0 | 0 | 10 1/4 | |
| Cow, medium | Per lb. | 0 | 0 | 10 1/2 | 0 | 0 | 9 1/2 | 0 | 0 | 9 1/4 | 0 | 0 | 9 3/4 | 0 | 0 | 9 3/4 | |
| Cow, light | Per lb. | 0 | 0 | 9 3/4 | 0 | 0 | 9 1/4 | 0 | 0 | 9 1/4 | 0 | 0 | 9 1/4 | 0 | 0 | 9 1/2 | |
| Yearling | Per lb. | 0 | 0 | 10 1/4 | 0 | 0 | 9 1/4 | 0 | 0 | 9 1/4 | 0 | 0 | 9 1/4 | 0 | 0 | 9 1/2 | |
| Calf | Per lb. | 0 | 0 | 11 3/4 | 0 | 0 | 11 3/4 | 0 | 1 | 1 1/4 | 0 | 1 | 2 3/4 | 0 | 1 | 1 | |
| Tallow | Per cwt. | 1 | 11 | 11 3/4 | 1 | 11 | 4 1/4 | 1 | 10 | 7 1/2 | 1 | 10 | 6 | 1 | 11 | 1 1/2 | |
| Butter | Per lb. | 0 | 1 | 6 | 0 | 1 | 6 | 0 | 1 | 6 | 0 | 1 | 6 | 0 | 1 | 6 | |
| Cheese | Per lb. | 0 | 0 | 10 1/4 | 0 | 0 | 10 1/2 | 0 | 0 | 10 1/2 | 0 | 0 | 10 1/2 | 0 | 0 | 10 1/2 | |
| General Merchandise. | |||||||||||||||||
| Tinned Fruits— | |||||||||||||||||
| Apricots, 2 1/2 lb. tins | Per doz. | 0 | 14 | 0 | 0 | 15 | 0 | 0 | 15 | 7 | 0 | 15 | 11 | 0 | 15 | 1 1/2 | |
| Peaches, 2 1/2 lb. tins | Per doz. | 0 | 13 | 11 1/2 | 0 | 14 | 10 3/4 | 0 | 15 | 5 3/4 | 0 | 15 | 10 | 0 | 15 | 0 1/2 | |
| Pears, 2 1/2 lb. tins | Per doz. | 0 | 14 | 9 1/2 | 0 | 15 | 7 | 0 | 10 | 2 1/4 | 0 | 16 | 7 1/2 | 0 | 15 | 9 1/2 | |
| Dried Fruits— | |||||||||||||||||
| Currants | Per lb. | 0 | 0 | 8 1/4 | 0 | 0 | 9 | 0 | 0 | 9 3/4 | 0 | 0 | 9 1/2 | 0 | 0 | 9 1/4 | |
| Sultanas | Per lb. | 0 | 0 | 8 1/4 | 0 | 0 | 8 1/2 | 0 | 0 | 9 | 0 | 0 | 8 3/4 | 0 | 0 | 8 3/4 | |
| Prunes | Per lb. | 0 | 0 | 7 | 0 | 0 | 7 | 0 | 0 | 7 | 0 | 0 | 7 | 0 | 0 | 7 | |
| Herrings | Per doz. 1 lb. tins | 0 | 13 | 4 1/2 | 0 | 13 | 6 3/4 | 0 | 13 | 9 3/4 | 0 | 13 | 5 3/4 | 0 | 13 | 6 3/4 | |
| Salmon | Ditto | 0 | 15 | 8 3/4 | 0 | 16 | 0 | 0 | 16 | 5 3/4 | 0 | 16 | 8 1/4 | 0 | 16 | 2 3/4 | |
| Sardines | Per doz. 1/2 lb. tins | 0 | 14 | 7 3/4 | 0 | 15 | 0 | 0 | 15 | 7 | 0 | 15 | 8 1/2 | 0 | 15 | 2 3/4 | |
| Coffee | Per lb. | 0 | 1 | 5 | 0 | 1 | 4 3/4 | 0 | 1 | 5 | 0 | 1 | 6 | 0 | 1 | 5 1/4 | |
| Cocoa | Per lb. | 0 | 3 | 4 1/4 | 0 | 3 | 4 3/4 | 0 | 3 | 3 3/4 | 0 | 3 | 1 1/2 | 0 | 3 | 3 1/2 | |
| Tea | Per lb. | 0 | 1 | 7 1/4 | 0 | 1 | 8 1/4 | 0 | 1 | 8 3/4 | 0 | 1 | 8 1/2 | 0 | 1 | 8 1/4 | |
| Sugar, No. 1A | Per ton | 23 | 16 | 2 1/2 | 23 | 19 | 9 1/4 | 24 | 9 | 8 1/2 | 24 | 9 | 10 1/4 | 24 | 3 | 10 3/4 | |
| Golden syrup, 2 lb. tins | Per doz. | 0 | 5 | 8 3/4 | 0 | 5 | 8 | 0 | 0 | 2 3/4 | 0 | 6 | 3 | 0 | 5 | 11 3/4 | |
| Treacle | Per doz. | 0 | 5 | 2 1/2 | 0 | 5 | 3 1/4 | 0 | 5 | 9 | 0 | 5 | 9 | 0 | 5 | 6 | |
| Sago | Per cwt. | 1 | 15 | 1 1/4 | 1 | 14 | 7 | 1 | 12 | 11 1/4 | 1 | 10 | 3 | 1 | 13 | 2 3/4 | |
| Tapioca | Per cwt. | 1 | 17 | 1 1/4 | 1 | 16 | 4 1/2 | 1 | 14 | 9 1/4 | 1 | 12 | 1 1/4 | 1 | 15 | 1 | |
| Rice | Per cwt. | 1 | 3 | 7 3/4 | 1 | 5 | 6 1/2 | 1 | 5 | 8 1/2 | 1 | 5 | 6 | 1 | 5 | 1 1/4 | |
| Salt- | |||||||||||||||||
| Common | Per ton | 16 | 3 | 3 3/4 | 16 | 12 | 0 1/4 | 16 | 14 | 8 1/4 | 15 | 18 | 6 | 16 | 7 | 1 1/2 | |
| Table, 7 lb. bags | Per ton | 17 | 6 | 3 | 17 | 16 | 8 | 19 | 6 | 1 1/4 | 20 | 3 | 7 1/4 | 18 | 13 | 2 | |
| Cream of tartar | Per lb. | 0 | 3 | 6 | 0 | 3 | 10 1/2 | 0 | 4 | 0 1/4 | 0 | 3 | 11 1/2 | 0 | 3 | 10 | |
| Carbonate of soda | Per cwt. | 2 | 2 | 11 | 2 | 8 | 6 1/4 | 2 | 8 | 11 1/4 | 2 | 2 | 3 1/2 | 2 | 5 | 8 | |
| Vinegar | Per gallon | 0 | 1 | 1 | 0 | 1 | 1 | 0 | 1 | 0 3/4 | 0 | 1 | 0 3/4 | 0 | 1 | 1 | |
| Mustard | Per lb. | 0 | 2 | 3 1/2 | 0 | 2 | 5 | 0 | 2 | 9 | 0 | 2 | 10 1/4 | 0 | 2 | 7 | |
| Pepper | Per lb. | 0 | 1 | 4 1/4 | 0 | 1 | 6 1/4 | 0 | 1 | 8 1/4 | 0 | 1 | 8 | 0 | 1 | 6 1/4 | |
| Starch | Per cwt. | 2 | 18 | 0 3/4 | 3 | 0 | 1 1/4 | 3 | 0 | 0 1/2 | 3 | 0 | 1 1/2 | 2 | 19 | 7 | |
| Soap (New Zealand) | Per ton | 33 | 5 | 5 3/4 | 34 | 12 | 9 | 35 | 19 | 6 3/4 | 35 | 14 | 3 1/2 | 34 | 18 | 0 1/4 | |
| Blue | Per lb. | 0 | 0 | 9 3/4 | 0 | 0 | 10 1/2 | 0 | 0 | 10 3/4 | 0 | 0 | 11 1/4 | 0 | 0 | 10 1/4 | |
| Candles, wax | Per lb. | 0 | 0 | 9 1/2 | 0 | 0 | 10 1/4 | 0 | 0 | 11 | 0 | 0 | 11 | 0 | 0 | 10 1/2 | |
| Tobacco, plug (duty paid) | Per lb. | 0 | 6 | 1 3/4 | 0 | 6 | 11 3/4 | 0 | 6 | 11 3/4 | 0 | 7 | 3 1/2 | 0 | 6 | 10 1/4 | |
| Kerosene (per case. 8 1/3 gal.) | Per case | 0 | 15 | 6 1/2 | 0 | 15 | 10 1/4 | 0 | 16 | 3 3/4 | 0 | 16 | 5 1/2 | 0 | 16 | 0 1/2 | |
| Ham | Per lb. | 0 | 1 | 2 1/2 | 0 | 1 | 2 1/2 | 0 | 1 | 2 1/2 | 0 | 1 | 2 3/4 | 0 | 1 | 2 1/2 | |
| Bacon | Per lb. | 0 | 1 | 2 1/4 | 0 | 1 | 2 | 0 | 1 | 2 | 0 | 1 | 2 1/2 | 0 | 1 | 2 1/4 | |
| Lard | Per lb. | 0 | 0 | 11 1/4 | 0 | 0 | 11 1/2 | 0 | 0 | 11 3/4 | 0 | 0 | 11 3/4 | 0 | 0 | 11 1/2 | |
| Honey | Per lb. | 0 | 0 | 8 | 0 | 0 | 9 1/2 | 0 | 0 | 9 3/4 | 0 | 0 | 9 3/4 | 0 | 0 | 9 1/4 | |
| Corn-sacks* | Per doz. | 0 | 11 | 10 | 0 | 12 | 6 | 0 | 15 | 10 3/4 | 0 | 18 | 0 | 0 | 14 | 6 3/4 | |
| Woolpacks | Each | 0 | 4 | 11 1/2 | 0 | 5 | 3 3/4 | 0 | 5 | 8 | 0 | 5 | 10 1/2 | 0 | 5 | 5 1/2 | |
| Ironmongery and Bricks. | |||||||||||||||||
| Iron— | |||||||||||||||||
| Pig, mixed, No. 1 | Per ton | 17 | 14 | 7 | 18 | 1 | 3 | 17 | 13 | 4 | 17 | 5 | 6 3/4 | 17 | 13 | 8 1/4 | |
| Bar | Per ton | 31 | 18 | 10 1/4 | 32 | 4 | 10 3/4 | 32 | 3 | 2 3/4 | 31 | 17 | 4 3/4 | 32 | 1 | 1 1/4 | |
| Angle and tee | Per ton | 39 | 19 | 7 | 41 | 14 | 4 1/2 | 43 | 7 | 1 | 42 | 15 | 10 | 41 | 19 | 2 3/4 | |
| Plate | Per ton | 77 | 9 | 9 3/4 | 81 | 2 | 9 1/4 | 84 | 10 | 7 3/4 | 88 | 1 | 1 1/4* | 82 | 16 | 1 | |
| Hoop | Per ton | 53 | 6 | 1 1/4 | 58 | 3 | 4 | 61 | 6 | 9 3/4 | 61 | 16 | 11 1/4 | 58 | 13 | 3 1/2 | |
| Corrugated galvanized, 26 gauge | Per ton | 80 | 10 | 4 3/4 | 80 | 3 | 3 1/4 | 91 | 1 | 3 1/2 | 98 | 15 | 0 | 87 | 12 | 6 | |
| Fencing-wire, No. 8 | Per ton | 46 | 0 | 1 3/4 | 50 | 16 | 7 1/4 | 55 | 10 | 4 1/4 | 56 | 15 | 7 1/2 | 52 | 5 | 8 1/4 | |
| Nails, 4 in. wire | Per cwt. | 2 | 9 | 3 1/2 | 2 | 13 | 1 3/4 | 2 | 17 | 11 3/4 | 3 | 4 | 3 1/4 | 2 | 16 | 2 | |
| Zinc, sheet | Per ton | 157 | 12 | 7 | 159 | 14 | 1 | 158 | 4 | 5 1/4 | 158 | 13 | 4 | 158 | 11 | 1 1/4 | |
| Lead, sheet | Per ton | 43 | 15 | 1 3/4 | 44 | 4 | 9 1/2 | 44 | 10 | 5 1/4 | 46 | 6 | 10 1/4 | 44 | 14 | 3 3/4 | |
| Tinned plates, I.C. coke | Per box of 108 lb. | 3 | 14 | 9 1/4 | 3 | 17 | 9 1/4 | 4 | 5 | 5 | 4 | 6 | 8 | 4 | 1 | 2 | |
| Copper, sheet | Per lb. | 0 | 3 | 3 | 0 | 3 | 3 1/2 | 0 | 3 | 3 3/4 | 0 | 3 | 4 1/2 | 0 | 3 | 3 3/4 | |
| Lime† | Per cwt. | 0 | 2 | 5 1/4 | 0 | 2 | 5 1/4 | 0 | 2 | 8 1/4 | 0 | 2 | 9 3/4 | 0 | 2 | 7 1/4 | |
| Cement | Per ton | 4 | 4 | 0 1/2 | 4 | 3 | 11 3/4 | 4 | 19 | 0 | 4 | 19 | 8 1/4 | 4 | 11 | 8 1/4 | |
| White-lead | Per ton | 95 | 16 | 8 | 86 | 1 | 4 3/4 | 92 | 0 | 3 3/4 | 89 | 0 | 1 | 90 | 14 | 7 1/2 | |
| Linseed-oil, raw | Per gallon | 0 | 11 | 3 3/4 | 0 | 11 | 3 1/2 | 0 | 11 | 6 1/4 | 0 | 11 | 3 | 0 | 11 | 4 1/4 | |
| Bricks | Per 1,000 | 2 | 18 | 0 | 2 | 19 | 9 | 3 | 0 | 7 1/2 | 3 | 2 | 8 1/2 | 3 | 0 | 3 1/4 | |
| Leather and Calico. | |||||||||||||||||
| Sole, New Zealand | Per lb. | 0 | 2 | 1 | 0 | 2 | 1 | 0 | 2 | 1 1/4 | 0 | 2 | 1 1/2 | 0 | 2 | 1 1/4 | |
| Sole, imported | Per lb. | 0 | 4 | 5 | 0 | 4 | 4 1/4 | 0 | 4 | 1 3/4 | 0 | 4 | 1 3/4 | 0 | 4 | 3 1/4 | |
| Kip, New Zealand | Per lb. | 0 | 3 | 0 1/4 | 0 | 3 | 0 1/4 | 0 | 3 | 0 1/4 | 0 | 3 | 0 1/2 | 0 | 3 | 0 1/4 | |
| Split kip, New Zealand | Per lb. | 0 | 1 | 8 3/4 | 0 | 1 | 8 3/4 | 0 | 1 | 8 3/4 | 0 | 1 | 9 | 0 | 1 | 8 3/4 | |
| Chrome calf, imported | Per ft. | 0 | 2 | 6 1/2 | 0 | 2 | 10 1/2 | 0 | 2 | 11 1/4 | 0 | 3 | 0 1/4 | 0 | 2 | 10 1/4 | |
| Chrome sides, New Zealand | Per ft. | 0 | 1 | 4 1/2 | 0 | 1 | 4 1/4 | 0 | 1 | 4 1/4 | 0 | 1 | 4 1/4 | 0 | 1 | 4 1/4 | |
| Glace kid, imported | Per ft. | 0 | 2 | 2 | 0 | 2 | 2 | 0 | 2 | 1 | 0 | 2 | 1 1/4 | 0 | 2 | 1 1/2 | |
| Horrockses' "Al" calico | Per run. yd. | 0 | 1 | 0 1/2 | 0 | 1 | 3 | 0 | 1 | 5 | 0 | 1 | 7 | 0 | 1 | 4 | |
| Crewdson's No. 2 calico | Ditto | 0 | 1 | 2 1/4 | 0 | 1 | 4 3/4 | 0 | 1 | 7 1/4 | 0 | 1 | 8 3/4 | 0 | 1 | 5 3/4 | |
| Crockery. | |||||||||||||||||
| London, W. and G. cups and saucers | Per doz. | 0 | 10 | 11 | 0 | 13 | 2 1/4 | 0 | 14 | 6 1/4 | 0 | 14 | 11 1/4 | 0 | 13 | 4 3/4 | |
| Norwich, W. and G. cups and saucers | Per doz. | 0 | 12 | 0 1/2 | 0 | 15 | 1 1/2 | 0 | 16 | 3 1/4 | 0 | 16 | 11 | 0 | 15 | 1 | |
| Worcester shape, gold edge, London size | Per doz. | 0 | 13 | 6 1/4 | 0 | 15 | 11 1/4 | 0 | 16 | 11 1/2 | 0 | 19 | 2 | 0 | 16 | 4 3/4 | |
| Worcester shape, gold edge, Irish size | Per doz. | 0 | 16 | 11 1/2 | 0 | 19 | 4 | 1 | 0 | 10 3/4 | 1 | 3 | 0 3/4 | 1 | 0 | 0 3/4 | |
| Worcester shape, gold edge, breakfast size | Per doz. | 0 | 18 | 10 | 1 | 1 | 10 | 1 | 1 | 10 1/2 | 1 | 4 | 1 3/4 | 1 | 1 | 8 | |
| White granite and semi-porcelain dinnerware, 10 in. plate | Per doz. | 0 | 9 | 6 | 0 | 10 | 8 3/4 | 0 | 11 | 7 1/4 | 0 | 12 | 10 3/4 | 0 | 11 | 2 1/4 | |
| White granite toilet sets, six pieces, size 9 | Per set | 1 | 2 | 7 3/4 | 1 | 6 | 5 1/4 | 1 | 7 | 5 | 1 | 7 | 7 | 1 | 6 | 0 1/4 | |
| Tumblers, quart, plain, heavy bottom | Per doz. | 0 | 5 | 4 3/4 | 0 | 6 | 4 1/2 | 0 | 7 | 4 1/2 | 0 | 8 | 4 1/2 | 0 | 6 | 10 1/2 | |
| Coal. | |||||||||||||||||
| New Zealand, screened | Per ton | 1 | 14 | 7 | 1 | 14 | 7 | 1 | 14 | 7 | 1 | 16 | 0 | 1 | 14 | 11 1/4 | |
| New Zealand, unscreened | Per ton | 1 | 9 | 10 3/4 | 1 | 9 | 10 3/4 | 1 | 9 | 11 | 1 | 11 | 7 | 1 | 10 | 4 | |
| New Zealand, small | Per ton | 0 | 19 | 8 | 0 | 19 | 8 | 0 | 19 | 8 1/4 | 1 | 0 | 1 3/4 | 0 | 19 | 9 1/2 | |
| Newcastle, screened | Per ton | 1 | 18 | 10 3/4 | 1 | 19 | 0 | 1 | 19 | 0 | 1 | 19 | 8 | 1 | 19 | 1 3/4 | |
| Timber. | |||||||||||||||||
| Kauri, heart, 1st grade* | Per 100 sup. ft. | 1 | 11 | 2 1/4 | 1 | 12 | 5 | 1 | 13 | 6 1/4 | 1, | 15 | 4 1/4 | 1 | 13 | 1 1/2 | |
| Kauri, heart, 2nd grade* | Ditto | 1 | 4 | 6 3/4 | 1 | 5 | 2 | 1 | 5 | 2 | 1 | 8 | 6 3/4 | 1 | 5 | 10 1/2 | |
| Kauri, heart, 3rd grade* | Ditto | 0 | 17 | 4 3/4 | 0 | 18 | 0 | 0 | 19 | 2 | 0 | 19 | 10 | 0 | 18 | 7 1/4 | |
| Rimu, clean heart | Ditto | 1 | 11 | 5 1/4 | 1 | 13 | 0 3/4 | 1 | 14 | 4 1/2 | 1 | 16 | 4 | 1 | 13 | 9 3/4 | |
| Rimu, bridge quality | Ditto | 1 | 2 | 1 1/4 | 1 | 4 | 10 1/4 | 1 | 6 | 1 1/2 | 1 | 7 | 7 3/4 | 1 | 5 | 2 1/4 | |
| Rimu, O.B. | Ditto | 0 | 18 | 7 1/4 | 1 | 0 | 4 | 1 | 1 | 6 1/2 | 1 | 3 | 3 1/2 | 1 | 0 | 11 1/4 | |
| Matai, heart | Ditto | 1 | 10 | 3 3/4 | 1 | 11 | 11 | 1 | 12 | 9 3/4 | 1 | 14 | 8 1/2 | 1 | 12 | 5 1/4 | |
| Matai, O.B. | Ditto | 1 | 1 | 4 3/4 | 1 | 2 | 8 1/4 | 1 | 4 | 10 1/2 | 1 | 5 | 2 3/4 | 1 | 3 | 6 1/2 | |
| Totara, heart, bridge quality | Ditto | 1 | 15 | 5 1/2 | 1 | 17 | 10 1/2 | 1 | 18 | 9 1/2 | 2 | 0 | 5 1/4 | 1 | 18 | 1 3/4 | |
| Totara, O.B. | Ditto | 1 | 3 | 7 1/4 | 1 | 5 | 5 | 1 | 6 | 1 1/4 | 1 | 7 | 6 | 1 | 5 | 8 | |
| White-pine | Ditto | 0 | 19 | 11 1/2 | 1 | 0 | 11 1/2 | 1 | 3 | 8 1/4 | 1 | 4 | 10 1/2 | 1 | 2 | 4 1/2 | |
| Oregon, merchantable | Ditto. | 1 | 13 | 7 3/4 | 1 | 14 | 9 3/4 | 1 | 17 | 7 | 1 | 19 | 8 1/4 | 1 | 16 | 5 1/4 | |
| Jarrah, sawn | Ditto | 1 | 18 | 2 3/4 | 1 | 18 | 2 | 1 | 19 | 7 3/4 | 2 | 2 | 11 | 1 | 19 | 9 | |
| Ironbark, hewn | Ditto | 2 | 8 | 4 | 2 | 8 | 3 | 2 | 7 | 5 | 2 | 7 | 10 | 2 | 7 | 11 1/2 | |
| Chemicals. | |||||||||||||||||
| Boracic acid | Per cwt. | 7 | 10 | 8 1/4 | 7 | 19 | 3 3/4 | 7 | 19 | 11 1/4 | 8 | 1 | 2 1/4 | 7 | 17 | 9 1/2 | |
| Carbolic acid, crude | Per gallon | 0 | 7 | 4 3/4 | 0 | 7 | 6 1/2 | 0 | 7 | 6 1/2 | 0 | 7 | 6 3/4 | 0 | 7 | 6 1/4 | |
| Tartaric acid | Per lb. | 0 | 4 | 4 1/4 | 6 | 4 | 6 1/2 | 0 | 4 | 7 3/4 | 0 | 4 | 7 1/4 | 0 | 4 | 6 1/2 | |
| Alum | Per cwt. | 2 | 2 | 4 1/4 | 2 | 5 | 8 1/2 | 2 | 5 | 8 1/2 | 2 | 6 | 1 1/4 | 2 | 4 | 11 3/4 | |
| Caustic soda | Per cwt. | 4 | 0 | 8 | 5 | 12 | 8 | 5 | 17 | 4 | 5 | 17 | 4 | 5 | 7 | 0 | |
| Cod-liver oil | Per gallon | 1 | 5 | 6 | 1 | 5 | 0 | 1 | 4 | 8 | 1 | 4 | 5 | 1 | 4 | 10 3/4 | |
| Epsom salts | Per cwt. | 1 | 13 | 6 3/4 | 1 | 14 | 1 | 1 | 14 | 6 1/4 | 1 | 14 | 9 | 1 | 14 | 2 3/4 | |
| Jeyes' fluid | Per 5-gal. drum | 1 | 18 | 11 1/4 | 2 | 2 | 6 | 2 | 9 | 1 | 2 | 8 | 0 3/4 | 2 | 4 | 7 3/4 | |
| Resin | Per cwt. | 3 | 2 | 2 | 3 | 1 | 3 | 3 | 2 | 1 | 3 | 3 | 9 | 3 | 2 | 3 3/4 | |
| Saltpetre | Per cwt. | 4 | 8 | 2 | 4 | 17 | 11 1/4 | 5 | 3 | 0 1/2 | 5 | 5 | 7 1/4 | 4 | 18 | 8 1/4 | |
| Sulphur, ground | Per cwt. | 1 | 14 | 5 | 1 | 15 | 0 | 1 | 18 | 7 3/4 | 1 | 17 | 7 3/4 | 1 | 16 | 5 1/4 | |
| Bluestone. | Per cwt. | 4 | 4 | 11 1/4 | 4 | 14 | 3 1/4 | 4 | 19 | 10 | 4 | 18 | 11 | 4 | 14 | 6 | |
| Manures. | |||||||||||||||||
| Superphosphate, 39-43 per cent. | Per ton | 8 | 9 | 7 | 8 | 10 | 10 | 8 | 11 | 8 | 8 | 8 | 4 | 8 | 10 | 1 1/4 | |
| Superphosphate, 36-38 per cent. | Per ton | 7 | 7 | 4 1/4 | 7 | 14 | 5 1/4 | 7 | 17 | 6 | 7 | 15 | 0 | 7 | 13 | 7 | |
| Guano, 60 - per - cent. analysis | Per ton | 7 | 15 | 0 | 7 | 16 | 8 | 7 | 15 | 0 | 7 | 11 | 8 | 7 | 14 | 7 | |
| Basic slag | Per ton | 7 | 3 | 4 | 7 | 10 | 0 | 7 | 10 | 0 | 7 | 10 | 0 | 7 | 8 | 4 | |
| Bonedust, pure | Per ton | 11 | 14 | 11 1/2 | 13 | 1 | 3 | 13 | 12 | 9 1/4 | 13 | 13 | 3 1/2 | 13 | 0 | 6 3/4 | |
| Sulphate of potash | Per ton | 31 | 13 | 4 | 46 | 16 | 1 1/4 | 67 | 18 | 4 | 75 | 0 | 0 | 55 | 6 | 11 1/4 | |
| Sulphate of ammonia | Per ton | 40 | 0 | 0 | 45 | 0 | 0 | 53 | 6 | 8 | 53 | 6 | 8 | 47 | 18 | 4 | |
| Nitrate of soda | Per ton | 33 | 17 | 1 | 36 | 16 | 8 | 38 | 15 | 6 3/4 | 40 | 0 | 0 | 37 | 7 | 4 | |
| Kainit | Per ton | 12 | 3 | 4 | 12 | 6 | 8 | 15 | 0 | 0 | 15 | 0 | 0 | 13 | 12 | 6 | |
The following tables of index numbers have been compiled as indicated on page 802:—
(Base: Average aggregate annual expenditure, four chief centres, 1909-13 = 1000.)
| Quarter ended | Group I: Agricultural Produce. | Group II: Flour, Bran, Pollard, and Oatmeal. | Group III: Wool, Hides, Tallow, Butter, and Cheese. | Group IV: General Merchandise and Crockery. | Group V: Building-material. | Group VI: Leather. | Group VII: Chemicals and Manures. | Group VIII: Coal. |
|---|---|---|---|---|---|---|---|---|
| 1914. | ||||||||
| March | 907 | 990 | 1123 | 1078 | 1103 | 1172 | 1064 | 1003 |
| June | 969 | 1031 | 1159 | 1077 | 1109 | 1180 | 1077 | 1003 |
| September | 1033 | 1131 | 1115 | 1077 | 1123 | 1187 | 1080 | 1003 |
| December 1915. | 1176 | 1326 | 1067 | 1125 | 1144 | 1198 | 1082 | 1008 |
| March | 1542 | 1589 | 1196 | 1175 | 1148 | 1286 | 1160 | 1016 |
| June | 1621 | 1727 | 1305 | 1186 | 1192 | 1349 | 1195 | 1014 |
| September | 1641 | 1605 | 1371 | 1216 | 1256 | 1368 | 1244 | 1014 |
| December 1916. | 1517 | 1298 | 1315 | 1229 | 1273 | 1388 | 1272 | 1031 |
| March | 1480 | 1361 | 1337 | 1271 | 1334 | 1440 | 1375 | 1082 |
| June | 1305 | 1273 | 1402 | 1252 | 1448 | 1458 | 1417 | 1118 |
| September | 1461 | 1306 | 1436 | 1340 | 1485 | 1472 | 1494 | 1175 |
| December 1917. | 1702 | 1300 | 1430 | 1345 | 1508 | 1510 | 1495 | 1204 |
| March | 1499 | 1419 | 1431 | 1367 | 1564 | 1676 | 1574 | 1267 |
| June | 1500 | 1447 | 1452 | 1407 | 1676 | 1795 | 1650 | 1330 |
| September | 1535 | 1459 | 1468 | 1463 | 1838 | 1853 | 1719 | 1432 |
| December 1918. | 1529 | 1436 | 1512 | 1551 | 2009 | 1901 | 1753 | 1445 |
| March | 1582 | 1475 | 1470 | 1592 | 2007 | 1899 | 1817 | 1461 |
| June | 1716 | 1557 | 1462 | 1665 | 2077 | 1907 | 1965 | 1462 |
| September | 1902 | 1573 | 1463 | 1727 | 2209 | 1891 | 2070 | 1463 |
| December | 2181 | 1587 | 1467 | 1756 | 2300 | 1903 | 2071 | 1525 |
GENERAL . INDEX NUMBERS OF WHOLESALE PRICES : AVERAGE OF THE FOUR CHIEF CENTRES , 1891-1918.
(Base: Average aggregate annual expenditure, four chief centres, 1909-13 = 1000.)
| Year. | Index Number. | Year. | Index Number. | Year. | Index Number. |
|---|---|---|---|---|---|
| 1891 | 991 | 1901 | 931 | 1910 | 984 |
| 1892 | 937 | 1902 | 975 | 1911 | 994 |
| 1893 | 925 | 1903 | 954 | 1912 | 1041 |
| 1894 | 927 | 1904 | 922 | 1913 | 1051 |
| 1895 | 920 | 1905 | 994 | 1914 | 1077 |
| 1896 | 943 | 1906 | 1028 | 1915 | 1269 |
| 1897 | 1005 | 1907 | 1016 | 1916 | 1380 |
| 1898 | 962 | 1908 | 1006 | 1917 | 1555 |
| 1899 | 893 | 1909 | 949 | 1918 | 1809 |
| 1900 | 917 |
(Base: Average aggregate annual expenditure, four chief centres, 1909-13 = 1000.)
| Year. | Group I: Agricultural Produce. | Group II: Flour, Bran, Pollard, and Oatmeal. | Group III: Wool, Hides, Tallow, Butter, and Cheese. | Group IV: General Merchandise and Crockery. | Group V: Building Material. | Group VI: Leather. | Group VII: Chemicals And Manures. | Group VIII: Coal. |
|---|---|---|---|---|---|---|---|---|
| 1909 | 932 | 1082 | 939 | 946 | 951 | 913 | 956 | 986 |
| 1910 | 1021 | 989 | 981 | 969 | 957 | 986 | 994 | 985 |
| 1911 | 991 | 972 | 1008 | 993 | 995 | 982 | 986 | 985 |
| 1912 | 1089 | 970 | 1029 | 1053 | 1037 | 993 | 1022 | 1011 |
| 1913 | 967 | 981 | 1047 | 1055 | 1063 | 1127 | 1035 | 1038 |
| 1914 | 1021 | 1120 | 1116 | 1089 | 1120 | 1184 | 1076 | 1004 |
| 1915 | 1580 | 1555 | 1297 | 1202 | 1217 | 1348 | 1218 | 1019 |
| 1916 | 1487 | 1310 | 1401 | 1302 | 1444 | 1470 | 1445 | 1145 |
| 1917 | 1516 | 1440 | 1466 | 1447 | 1772 | 1806 | 1674 | 1369 |
| 1918 | 1845 | 1548 | 1466 | 1685 | 2148 | 1900 | 1981 | 1478 |
The following table shows the average export prices of mutton (per pound) in the Canterbury District during three quarters of 1918, and also the average for 1917:—
| Item. | Average of Three Quarters, 1917. | First Quarter, 1918. | Second Quarter, 1918 | Third Quarter, 1918. | Average of Three Quarters, 1918. |
|---|---|---|---|---|---|
| d. | d. | d. | d. | d. | |
| Prime lambs up to 42 lb. | 9 | 8 1/4 | 8 3/4 | 9 1/4 | 8 3/4 |
| Prime wethers up to 72 lb. | 7 | 6 1/4 | 6 3/4 | 7 1/4 | 6 3/4 |
| Prime ewes up to 72 lb. | 6 1/2 | 5 3/4 | 6 1/4 | 6 3/4 | 6 1/4 |
NOTE .—Figures for the fourth quarter of each year are not available.
It will be noticed that, on the average, prices in 1918 were slightly below those of the previous year.
In March, 1915, the Imperial Government requisition of frozen beef, mutton, and lamb came into operation. Since that time the New Zealand output of various other commodities has also been purchased by the British Government.
Full particulars regarding the prices paid for these commodities, together with other information on the subject, will be found in Subsection E of Section XIII of this book.
The Board of Trade, set up under the provisions of the Cost of Living Act, 1915, has carried out the functions of a price controlling and fixing authority since March, 1916.
The work of the Board has been referred to in previous issues of the Year-book; its operations, particularly in the matter of price-control, during the year ended 31st March, 1919, are briefly summarized here.
On the 1st April, 1918, the price of good milling-wheat was governed and its distribution among mills controlled under an Order in Council gazetted on the 22nd December, 1917.
The following scale of prices was fixed for good milling-wheat grown in the South Island:—
In January. February, or March, 1918. 5s. 10d. per bushel.
In April, 1918, 5s. 10 1/2d. per bushel.
In May, 1918, 5s. 11d. per bushel.
In June, 1918, 5s. 11 1/2d. per bushel.
In July, 1918, 6s. per bushel.
In August; 1918, 6s. 0 1/2d. per bushel.
In or after September, 1918, 6s. 1d. per bushel.
NOTE .—These prices are f.o.b. nearest port.
Equivalent prices were provided for wheat sold otherwise than f.o.b. nearest port; and prices for North Island wheat were fixed at 4d. per bushel above prices for South Island wheat. The grain was resold to millers at an advance of 1 1/2d. per bushel.
In view of the anticipated shortage in the New-Zealand-grown supply, two purchases, each of 2,000,000 bushels of wheat, from Australia were effected at a price of 5s. 7 1/2d. per bushel f.o.b.
In order to ensure for the 1918-19 season the production of an adequate local supply, the Government agreed to guarantee to farmers a minimum price of 6s. 4d. per bushel with an open market. In view of the Government purchases of Australian wheat, and the intention to control flour and bread prices, however, it was decided to purchase the wheat crop at 6s. 6d. per bushel, allowing the usual increments of 1/2d. per bushel per month from May to October, 1919.
The increase in wheat-prices made necessary the adjustment of prices of flour and bread. It was decided that instead of permitting any further increases in the price of flour and of bread the Government should subsidize flour-millers. It was further decided that in consideration of the increase in the expenses of baking and delivering bread the price of flour should be reduced by 10s. per ton, millers being further subsidized on this account. After deduction of certain profits made by the Wheat Control Office, the Consolidated Fund will be drawn upon to the extent of approximately £213,000. This arrangement holds good during the year ending 28th February, 1920.
Under the terms of an agreement previously made with the Colonial Sugar Company, the price of sugar (No. 1a) was fixed at £22 10s. per ton, f.o.b., Auckland. Partial failure of the Fiji crops, however, has involved the company in unexpected expense in the matter of securing supplies of raw sugar from Java. To compensate the company for this loss and to meet increased cost of refining, the price for the nine months ending 31st March, 1920, has been increased by £1 5s. per ton—to £23 15s. per ton, f.o.b., Auckland. This price is said to be the lowest now being paid in any country in the world.
The export of timber has been subject to control since August, 1918. The prices of timbers are also under supervision, and will not be increased without the consent of the Board of Trade.
A special inquiry regarding the coal industry as a whole was made by the Board during 1918 and 1919. A summary of the lengthy report issued is given as Subsection C of Section XXI of this book.
The system of control of prices of groceries which was brought into operation in March, 1918, has been continued. Any increases in prices must be assented to by the Board.
The prices and supplies of several other commodities have been under investigation, and action has been taken regarding petrol, bacon and ham, potatoes, fish, milk, and cement.
The collection of statistical data relative to industrial matters has recently been proceeded with by the Census and Statistics Office, but as yet no considerable amount of tabulated information can be published.
An examination of the movement of wages and hours of labour as revealed by awards and industrial agreements made under the provisions of the Industrial Conciliation and Arbitration Act has been carried out by Mr. G. W. Clinkard, of the Census and Statistics Office. The results of this inquiry, which have been presented as a thesis for Honours in Commerce in the University of New Zealand, are embodied in a special article (pp. 860-935).
An indication of the extent to which earnings have increased during the war period is afforded by official figures furnished to the Census and Statistics Office by local governing bodies. The statement given on the next page has been compiled from those returns for the years ending 31st March, 1915, 1916, 1917, and 1918, and covers the earnings of employees the great majority of whom are unskilled. Unfortunately, information for earlier years and for the year ended 31st March, 1919, is not available.
RATES OF EARNINGS OF UNSKILLED LABOUR AS SHOWN BY RETURNS OF LOCAL GOVERNING BODIES FOR YEARS ENDING 31ST MARCH , 1915, 1916, 1917, AND 1918.
| Year ending 31st March. | Permanent Employees. | Casual Employees. | Totals. | ||||||||||||
|---|---|---|---|---|---|---|---|---|---|---|---|---|---|---|---|
| Number of Employees. | Amount paid in Wages. | Average Annual Earnings per Employee. | Number of Employees | Amount paid in Wages. | Average Annual Earnings per Employee. | Number of Employees. | Amount paid in Wages. | Average Annual Earnings per Employee. | |||||||
| £ | £ | s. | d. | £ | £ | s. | d. | £ | £ | s. | d. | ||||
| 1915 | 6,522 | 982,988 | 150 | 10 | 0 | 5,455 | 707,295 | 129 | 10 | 0 | 11,977 | 1,690,283 | 141 | 0 | 0 |
| 1916 | 6,198 | 966,710 | 156 | 0 | 0 | 4,643 | 672,880 | 145 | 0 | 0 | 10,841 | 1,639,590 | 151 | 0 | 0 |
| 1917 | 6,268 | 1,020,716 | 163 | 0 | 0 | 4,265 | 681,057 | 160 | 0 | 0 | 10,533 | 1,701,773 | 161 | 10 | 0 |
| 1918 | 6,437 | 1,097,287 | 170 | 10 | 0 | 4,064 | 677,118 | 166 | 10 | 0 | 10,501 | 1,774,405 | 169 | 0 | 0 |
The average annual earnings for both permanent and casual employees for 1914-15 was £141. Three years later (1917-18) the average had risen to £169.
Percentage increase in average annual earnings, 1915-18: Permanent employees, 13.3; casual employees, 28.6; permanent and casual. 19.9
Table of Contents
UNDER the provisions of the Repatriation Act, 1918, a Department was created bearing the name of the "Repatriation Department," whose aim it. was "to help every discharged soldier requiring assistance to secure for himself a position in the community at least as good as that relinquished by him when he- joined the colours." The controlling authority is the Repatriation Board consisting of four Ministers of the Crown, with a Director of Repatriation as chief executive officer. The following account is taken from the first annual report of the Department:—
In order to ensure the expeditious handling of all soldiers' applications for assistance the Board has adopted a policy of decentralization, and for this purpose the Dominion has been divided into four districts, known as the Auckland, Wellington, Canterbury, and Otago Districts.
In each of the four centres District Repatriation Boards, composed of prominent citizens nominated by such bodies as the Returned Soldiers' Association, the National Efficiency Board, the labour organizations, and the industrial, commercial, and patriotic interests of the community have been established, and departmental offices have been opened and staffed with discharged soldiers under the control of District Repatriation Officers at Auckland, Wellington, Christchurch, and Dunedin.
Repatriation Committees on a similar basis have been formed in the chief provincial towns, and offices with paid staffs are established in the following centres:—
| Hamilton | Napier | Wanganui | Nelson | Timaru |
|---|---|---|---|---|
| Rotorua | Hastings | Palmerston North | Blenheim | Oamaru |
| Gisborne | New Plymouth | Masterton | Greymouth | Invercargill. |
In addition to this some fifty honorary committees have been established throughout the country, and further committees are being formed from time to time in smaller places as recommended by the District Boards.
Under the Repatriation Act and the instructions issued in connection therewith a wide range of assistance is available to discharged soldiers. This assistance may be summarized under three main headings, viz.:—
Employment.—The placing in suitable employment of all discharged soldiers who apply to the Department for assistance in that direction.
Training.—The educational and vocational training of discharged soldiers and soldiers' widows.
Financial Assistance.—The granting of financial assistance to discharged soldiers for the purpose of purchasing or establishing businesses, obtaining furniture, tools of trade, equipment, &c.
Perhaps this is the most important section in the work of repatriation, and one of the biggest tasks, for, although large numbers of men require vocational training or financial assistance to start in business, &c., by far the larger proportion require help to obtain suitable employment. Up to the present time no great difficulty has been encountered in this connection, the experience being that only some 25 per cent. of the discharged soldiers desire the assistance of the Government. The remaining 75 per cent. apparently either resume their pre-war billets or find no difficulty in obtaining the work they desire.
The following table shows the number of men placed in the various groups of industry in each of the four districts:—
| Group. | Auckland. | Wellington. | Canterbury. | Otago. | Total. |
|---|---|---|---|---|---|
| 1. Wood, furniture, timber, &c. | 121 | 202 | 125 | 76 | 524 |
| 2. Engineers, metal-workers | 141 | 249 | 131 | 101 | 622 |
| 3. Food, tobacco, &c. | 71 | 148 | 78 | 49 | 346 |
| 4. Clothing, boots, &c. | 77 | 126 | 73 | 67 | 343 |
| 5. Books, printing, &c. | 42 | 62 | 55 | 30 | 189 |
| 6. Other manufacturing | 80 | 70 | 70 | 35 | 255 |
| 7. Building | 67 | 72 | 82 | 39 | 260 |
| 8. Mining, quarrying, &c. | 43 | 82 | 81 | 38 | 244 |
| 9. Rail and tram services | 67 | 150 | 91 | 47 | 355 |
| 10. Other land transport | 78 | 147 | 100 | 47 | 372 |
| 11. Shipping, wharf labour, &c. | 50 | 66 | 64 | 33 | 213 |
| 12. Pastoral, agriculture, &c. | 222 | 451 | 227 | 139 | 1,039 |
| 13. Domestic, hotels, &c. | 73 | 180 | 101 | 62 | 416 |
| 14. General labour, and miscellaneous | 424 | 895 | 427 | 285 | 2,031 |
| 15. Clerical | 145 | 303 | 166 | 118 | 732 |
| 16. Government | 156 | 464 | 163 | 143 | 926 |
| Totals | 1,857 | 3,667 | 2,034 | 1,309 | 8,867 |
So far as New Zealand is concerned, a very satisfactory position is disclosed, for at the present time (20th August, 1919) the number of men on the unemployment sustenance list for the whole of the Dominion is only seventeen out of a total of 66,309 returned to date.
Unemployment sustenance (inclusive of pension) is paid on the following basis: Soldier, £2 2s. per week; wife, 10s. per week; children (not exceeding four), 3s. 6d. per week each. A widower with children is entitled to sustenance allowance as though his wife were living.
Transportation and Medical Fees.—The Department pays transportation of soldiers proceeding to employment, &c., and medical fees of those examined for appointment to the Public Service, the payments to date under these headings being £1,750.
The educational and vocational training of discharged soldiers is a most important feature, and great care has to be exercised in considering the medical, technical, economic, and personal factors when selecting suitable trades or callings for men suffering from various disabilities. It is necessary to provide training for—
Partially disabled soldiers who owing to war service are unable to resume their pre-war occupations:
Those who enlisted at a comparatively early age and who had not yet acquired a trade or calling:
Apprentices whose indentures had been interrupted by war service:
Soldiers' widows.
The arrangements made and the financial assistance provided during tuition are set out hereunder.
Subsidized Workers.—Discharged soldiers desirous of learning new trades or occupations, and who can be best trained within the environment of the trade itself, are placed in the workshops or factories of private employers under the subsidized-wages scheme.
The employer undertakes to train the applicant in the particular trade or calling, and pays the trainee a wage as fixed by a wages committee consisting of a representative of the trade-union concerned, the employer, and a representative of the Repatriation Department. The difference between the employer's wage and £3 per week is made up by the Department, such subsidy being quite irrespective of any pension allowance which the trainee is receiving. The wage paid by the employer is reviewed quarterly by the wages committee, and any increase granted during the currency of the permit is paid to the trainee and does not affect the Government subsidy. A proportion of the subsidy payable (amounting to 5s. per week) is retained by the Department, and is paid to the trainee on the satisfactory completion of the training.
Under this scheme, which is greatly assisted by the co-operation of the various trade-unions, training and employment has been arranged for a total of 1,186 men, and at the present time 1,013 are actually being trained in workshops and factories throughout the Dominion.
Special Soldier Classes and Technical Schools.—Vocational training in new trades is also arranged in the various technical schools, and special soldier classes have been formed in the main centres. The principal subjects taught are engineering (electrical, motor, mechanical), woodwork (carpentry, cabinetmaking, &c.), commercial (book-keeping, correspondence, general office practice), and wool-classing. The instruction is of a practical nature, and the trainees receive intensive training of from six to seven hours per day. The workshops are well equipped with machinery, and the instructors are the best obtainable in their particular line. These classes are controlled by the technical schools through the Education Department, and the Repatriation Department provides the funds necessary for the extra instructors, the additional equipment, and for the trainees' sustenance. Should a trainee from one of these classes be unable (after a reasonable period of tuition) to obtain a position at the ruling rate of wage the Department will further assist him under its subsidized-wages scheme.
Sustenance to trainees: Sustenance is paid to technical trainees as follows:—
Attending special soldier classes thirty hours or more per week: Soldier, £2 10s. per week; wife, 10s. per week; children (not exceeding four), 3s. 6d. per week each, plus pension.
Attending ordinary technical-school classes: Soldier, £2 10s. per week; wife, 10s. per week; children (not exceeding four), 3s. 6d. per week each, inclusive of pension.
Training under this particular scheme has been arranged for 557 men to date, and there are 418 attending the classes at the present time.
Soldiers desiring educational training with a view to improving their education and who are working at their trades during the day receive free tuition at technical classes in the evenings.
University training: Fees for the professional training of discharged soldiers, also grants for necessary text-books up to £5 5s., are paid by the Department in approved cases, and sustenance is paid on the same basis as that laid down for technical trainees. Preference is given to men whose course of study was interrupted by their military service, or men who show special aptitude and ability, particularly if they are disabled.
The Department's educational committees are in close touch with the University and college authorities, and review the progress of the students from time to time.
At the present time 188 men are being assisted to learn professions— divinity, medical, law, accountancy, teaching, &c.
An instructional boot-factory is being built at Auckland. This class will be conducted on practical lines, and will probably be self-supporting. Special classes have also been established in Auckland for soldiers who desire to become sheet-metal workers or to learn motor driving and repairing.
Facilities have been arranged to offer encouragement to discharged soldiers to take up farming pursuits. The Ruakura Government Experimental Farm, near Hamilton, affords instruction in beekeeping, fruitgrowing, and poultry-raising. Fit men requiring training in specialized subjects are also accommodated at the Weraroa Training-farm at Levin. A special training-farm is now in operation in the Wairarapa, and a farm at Tauherenikau for tubercular men.
The sustenance allowance payable to trainees at Ruakura, Weraroa, Wairarapa, and Tauherenikau is: Soldier, £2 10s. per week; wife, 10s. per week; children (not exceeding four), 3s. 6d. per week each, plus pension. £1 per week is deducted for the soldier's board and lodging.
Other farms in the vicinity of Christchurch, and in Central Otago, will shortly be in operation.
Discharged soldiers requiring training in general farm-work—i.e., men who have had no previous experience and who may later desire to take up land under the Discharged Soldiers Settlement Act—are given training with a practical farmer under the subsidized-wages scheme. The wage paid by the farmer is subsidized by the Department in order to assure the trainee an income of £2 per week and his keep over and above pension allowance, and any increase in wages granted by the employer during the training does not affect the subsidy.
At the present time seventy-two men are being trained under this scheme, and indications go to show that as the fit men are discharged larger numbers are likely to seek assistance in this direction in the future.
Accommodation is provided for discharged soldiers at the State forest plantations at Waireka (Rotorua) and Tapanui (Central Otago). Eighty-seven are at present thus employed.
Discharged soldiers whose apprenticeship has been broken by war service and who are compelled to resume work at a small wage are financially assisted in order that their income may be not less than £3 per week, irrespective of any pension they may be receiving.
Training facilities in useful occupations for soldiers' widows without children, and sustenance whilst undergoing training at such rate as will bring their income, inclusive of pension, up to £1 15s. per week, may also be afforded.
Up to the present eight discharged soldiers have returned to the Dominion suffering from total blindness, and each of these men is drawing the full pension with an allowance for his attendant. Immediately upon his return the Repatriation Department communicates with each man to see how he can be best assisted. Notice of each man's arrival in the Dominion is also forwarded to the Secretary, Jubilee Institute for the Blind, Auckland, and to the Secretary, Commercial Travellers' and Warehousemen's Blind Soldiers' and Sailors' Fund, Victoria Street, Wellington.
The total number of men for whom training has been arranged to date under the various schemes is 1,927, and of this number 1,615 are still in training.
Of the 312 who have finished their training, the majority completed their course satisfactorily and were placed in suitable positions. A few, however, were unfortunately compelled to give up on account of ill health, whilst in a few cases the training had to be discontinued owing to the misconduct of the trainees.
The following table shows the number of men at present being trained in the various groups of industry in each of the four districts:—
| Group. | Auckland. | Wellington. | Canterbury. | Otago. | Total. |
|---|---|---|---|---|---|
| Wood | 87 | 40 | 30 | 66 | 223 |
| Leather | 36 | 25 | 28 | 24 | 113 |
| Metal | 162 | 118 | 80 | 109 | 469 |
| Clothing | 8 | 18 | 13 | 14 | 53 |
| Commercial | 75 | 74 | 57 | 62 | 268 |
| Farming | 52 | 68 | 5 | 16 | 141 |
| Professional | 76 | 22 | 18 | 72 | 188 |
| Other groups | 56 | 41 | 48 | 15 | 160 |
| Totals | 552 | 406 | 279 | 378 | 1,615 |
Under the instructions issued in connection with the Repatriation Act, District Boards or Local Committees are empowered to grant financial assistance to discharged soldiers or soldiers' widows on the following terms:—
Business Loans.—Loans not exceeding £300 to establish or purchase businesses may be made for a term of years with or without security; £50 is loaned free of interest, the remainder bearing interest at 5 per cent. per annum.
A great amount of work has been done by the various Boards and Committees in investigating applications under this heading. Each applicant is carefully examined, the suitability and prospects of the business are fully gone into, and the loan is not granted unless the Board is convinced that by approving it they are serving the soldier's best interests. It is laid down as a guiding principle that except in exceptional circumstances loans are not to be granted to applicants (1) who are already in situations equal to their pre-war positions, (2) who are satisfactorily settled in business, or (3) who are in a position to finance themselves.
All loans exceeding £50 must be approved by the Ministerial Board, and up to the 20th August a total of 1,178 loans have been ratified, entailing an expenditure of £264,849.
The character of the businesses thus assisted exhibits a remarkable diversity.
Furniture, Tools of Trade, Equipment, & c.—Loans not exceeding £50 (free of interest) may be made for the purchase of household furniture, tools of trade, professional instruments, or such other articles of personal equipment as may be deemed necessary to the applicant in exercising his calling. Applicants are required to furnish the vendor's price-list of the articles required.
These loans are granted only to married men (or men with dependants requiring a home) who are in employment, or who are established in business, or are subsidized workers; and also to soldiers' widows.
The number of applications approved to date under this heading is over 2,400, and of this number over 1,800 are for the purchase of household furniture.
Assisted Passages.—Grants not exceeding £50 may be made to an incapacitated soldier or the widow of a deceased soldier in respect of passage-money beyond New Zealand, provided the Board or Local Committee is satisfied that such a change of location is desirable or necessary. Very few applications have been received under this heading, and only forty have been approved to date.
The total amount advanced to or expended on behalf of soldiers from the inception of the Department to the 20th August, 1919, is as follows:—
| Loans:— | £ | s. | d. |
|---|---|---|---|
| Businesses | 193,951 | 6 | 8 |
| Furniture. | 56,580 | 4 | 6 |
| Tools, &c. | 5,337 | 11 | 5 |
| Grants: — | |||
| Training sustenance. | 16,868 | 9 | 10 |
| Unemployment sustenance | 3,089 | 0 | 5 |
| Transportation | 1,275 | 11 | 1 |
| Total | £277,102 | 3 | 11 |
Of this total it will be noted that the bulk (93 per cent.) is by way of loan and is repayable by the soldier. Returns to hand show that £6,600 has already been repaid, mostly in very small sums; and reports from the District Repatriation Officers indicate that almost without exception the men are loyally meeting their obligations in the matter of repayments.
Administration expenses to the same date were £16,750.
Table of Contents
THE 1914 issue of this book contains a fairly detailed account of the Public Trust Office, dealing with its constitution, the powers and duties of the Public Trustee, and the various classes of business undertaken by the Office.
The Office is designed mainly to afford, at low rates of commission, a secure and convenient recourse in every case where a person residing either in New Zealand or abroad, and desiring to form a trust or appoint an agent or attorney in the Dominion, may be in doubt or difficulty as to the choice of a trustee, executor, agent, or attorney. The Office is also designed to relieve those who may be appointed trustees of property in the Dominion, or who, after having accepted the trusts of such property, may, for various reasons, be unwilling or unable to undertake or continue the administration.
The constitution of the Office was altered by the Public Trust Office Amendment Act, 1917, which provided for the creation of a Public Trust Office Board, consisting of the Public Trustee and two Assistant Public Trustees, to administer the Office.
The Act also constitutes a Public Trust Office Investment Board, the sole function of which is to control the investment of Office funds. It consists of the Minister of Finance, the Public Trustee and the Assistant Public Trustees, the Government Insurance Commissioner, the Valuer-General, and the Superintendent of the State Advances Office.
The Public Trust Office has been in operation since 1873. At the end of that year the number of estates administered by the Office was 257, of a total value of £17,500; by the 31st December, 1890, the number had risen to 1,678, of a value of £1,240,097; and at the 31st March, 1919, was 15,223, of a value of £12,807,214. The figures for each year up to 1918-19 (with the exception of 1916-17) are as given in the table following. For the year 1916-17 the particulars were not extracted and the information is accordingly not available.
| Calendar Year ended 31st December. | Number. | Value. |
|---|---|---|
| £ | ||
| 1873 | 257 | 17,500 |
| 1874 | 293 | 28,930 |
| 1875 | 347 | 42,163 |
| 1876 | 412 | 59,720 |
| 1877 | 575 | 67,675 |
| 1878 | 627 | 73,940 |
| 1879 | 713 | 96,315 |
| 1880 | 770 | 117,980 |
| 1881 | 836 | 150,750 |
| 1882 | 911 | 204,545 |
| 1883 | 1,024 | 317,680 |
| Calendar Year ended 31st December. | Number. | Value. |
| 1884 | 1,082 | 392,315 |
| 1885 | 1,190 | 457,620 |
| 1886 | 1,293 | 576,010 |
| 1887 | 1,304 | 715,860 |
| 1888 | 1,483 | 954,675 |
| 1889 | 1,561 | 1,130,960 |
| 1890 | 1,678 | 1,240,097 |
| 1891 | 1,825 | 1,252,625 |
| 1892 | 1,912 | 1,284,745 |
| 1893 | 2,022 | 1,450,918 |
| Financial Year ended 31st March. | Number. | Value. |
|---|---|---|
* Not available. | ||
| £ | £ | |
| 1895 | 2,086 | 1,562,269 |
| 1896 | 2,236 | 1,806,953 |
| 1897 | 2,334 | 1,898,163 |
| 1898 | 2,413 | 1,950,314 |
| 1899 | 2,491 | 2,110,316 |
| 1900 | 2,667 | 2,192,594 |
| 1901 | 2,898 | 2,326,954 |
| 1902 | 3,049 | 2,467,614 |
| 1903 | 3,314 | 2,706,785 |
| 1904 | 3,470 | 3,152,882 |
| 1905 | 3,685 | 3,577,355 |
| 1906 | 3,977 | 4,009,992 |
| 1907 | 4,276 | 4,590,157 |
| 1908 | 4,718 | 4,065,989 |
| 1909 | 4,946 | 4,644,795 |
| 1910 | 5,466 | 5,184,840 |
| 1911 | 5,966 | 5,477,675 |
| 1912 | 6,456 | 5,951,231 |
| 1913 | 7,225 | 6,782,532 |
| 1914 | 7,538 | 7,288,447 |
| 1915 | 8,026 | 7,942,158 |
| 1916 | 8,734 | 8,217,500 |
| 1917 | * | * |
| 1918 | 14,187 | 10,835,085 |
| 1919 | 15,223 | 12,807,214 |
Up to 1893 the end of the Public Trust Office year was reckoned as the 31st December, but since then the end of the financial year has been adopted.
The above table does not include the following classes of accounts and funds: Investment agencies; sinking funds; pension funds: Maori Land Board funds; funds under the Land Settlement Finance Act, 1909; Office funds; miscellaneous funds; miscellaneous Native accounts; Office premises, furniture, &c.
The following was the total number of estates, accounts, &c., in the Public Trust Office on the 31st March, 1913 to 1918:—
| Class. | Number of Estates and Accounts. | ||||
|---|---|---|---|---|---|
| On 31st March, 1913. | On 31st March, 1914. | On 31st March, 1915. | On 31st March, 1916. | On 31st March, 1918. | |
| Wills and trusts | 2,455 | 2,921 | 3,354 | 3,945 | 7,704 |
| Investment agencies | 221 | 284 | 394 | 472 | 441 |
| Intestates' estates | 1,828 | 1,747 | 1,818 | 1,971 | 2,339 |
| Convicts' estates | 1,953 | 1,877 | 1,900 | 1,880 | 2,739 |
| Mental patients' estates | 17 | 19 | 15 | 18 | 32 |
| Native reserves | 94 | 94 | 94 | 94 | 99 |
| West Coast Settlement reserves | 460 | 460 | 460 | 460 | 460 |
| Unclaimed lands and property | 418 | 420 | 385 | 366 | 373 |
| Sinking funds | 242 | 408 | 506 | 582 | 635 |
| Pension funds | 8 | 11 | 12 | 11 | 11 |
| Land Settlement finance Act, 1909 | 35 | 38 | 44 | 45 | 44 |
| Miscellaneous | 99 | 105 | 154 | 120 | 239 |
| Miscellaneous Native accounts | 666 | 839 | 893 | 934 | 1,477 |
| Totals | 8,496 | 9,223 | 10,029 | 10,898 | 16,593 |
NOTE .—On the 31st March, 1917, the total was 13,612, but details are not available.
The value of these estates and accounts are shown in the next table:—
| Class. | Value of Estates and Accounts. | ||||
|---|---|---|---|---|---|
| On 31st March, 1913. | On 31st March, 1914. | On 31st March, 1915. | On 31st March, 1916. | On 31st March, 1918. | |
| £ | £ | £ | £ | £ | |
| Wills and trusts | 4,366,450 | 4,771,855 | 5,271,616 | 5,418,994 | 7,002,691 |
| Investment agencies | 162,362 | 199,984 | 250,064 | 356,643 | 476,400 |
| Intestates' estates | 474,072 | 590,456 | 698,674 | 787,183 | 1,265,522 |
| Mental patients' estates | 524,095 | 509,442 | 570,561 | 602,023 | 689,855 |
| Convicts' estates | 8,450 | 6,485 | 7,239 | 17,231 | 8,791 |
| Native reserves | 430,000 | 430,000 | 430,000 | 430,000 | 430,000 |
| West Coast Settlement reserves | 940,000 | 940,000 | 940,000 | 940,000 | 940,000 |
| Miscellaneous Native accounts | 213,027 | 233,449 | 248,075 | 255,053 | 283,767 |
| Unclaimed lands and property | 39,465 | 40,209 | 24,068 | 22,069 | 21,826 |
| Sinking funds | 2,300,603 | 2,408,337 | 2,508,574 | 2,597,242 | 3,326,535 |
| Pension funds | 997,284 | 1,208,825 | 1,442,772 | 820,334 | 1,026,262 |
| Land Settlement Finance Act, 1909 | 465,516 | 501,493 | 566,046 | 556,539 | 560,652 |
| Maori Land Board funds | 75,347 | 117,850 | 185,134 | 272,732 | 345,674 |
| Miscellaneous funds | 94,963 | 118,935 | 198,359 | 234,299 | 446,149 |
| Office funds | 94,604 | 120,125 | 151,161 | 192,463 | 219,100 |
| Office premises, furniture, &c. | 82,073 | 85,438 | 88,593 | 95,939 | 109,807 |
| Totals | 11,268,311 | 12,282,883 | 13,580,936 | 13,598,744 | 17,153,031 |
NOTE .—On the 31st March, 1917, the total was £15,065,583, and on the 31st March, 1919, £19,242,347, but details for these two years are not available.
The capital funds of the Public Trust Office invested amounted on the 31st March, 1919, to £9,816,108. The investments are as follows:—
| 1919. | |
|---|---|
| £ | |
| New Zealand Government securities | 910,661 |
| Land Settlement Finance Act debentures | 77,194 |
| Local bodies' debentures | 1,224,125 |
| Mortgages of real estates | 7,127,659 |
| Freehold property and furniture | 137,175 |
| Advances to estates and accounts | 338,704 |
| Fixed deposits | 590 |
| £9,816,108 |
The net profits of the Office during each of the past ten years are shown below:—
| Year ended 31st March. | Net Profits |
|---|---|
| £ | |
| 1910 | 11,738 |
| 1911 | 11,241 |
| 1912 | 25,919 |
| 1913 | 27,551 |
| 1914 | 29,222 |
| 1915 | 32,508 |
| 1916 | 46,108 |
| 1917 | 58,862 |
| 1918 | 68,602 |
| 1919 | 70,156 |
Section 7 of the Expeditionary Forces Amendment Act, 1918, authorized payment of "a free gift by the State in recognition of the honourable service of soldiers of the Expeditionary Forces in the present war." Such bonus was to be in accordance with a scale to be prescribed by Order in Council.
On the 19th September, 1919, the scale and conditions on which the gratuities were to be paid were announced as follows:—
The scale in accordance with which the amount of bonus payable as an overseas war-service gratuity to members of the New Zealand Expeditionary Force having been fixed at 1s. 6d. per day by Order in Council, the said gratuity will be determined subject to the following conditions.
The gratuity cannot be claimed or recovered by any person as a matter of right, but shall be deemed to be a free gift by the State in recognition of the honourable service of members of the Expeditionary Forces in the present war, and may in any case be withheld or deferred at the discretion of the Minister of Defence.
Service for the gratuity will be active service within periods beginning on the 4th August, 1914, and ending on the date of the signing of peace— viz., 28th June, 1919, inclusive.
The gratuity will commence to run for each member of the New Zealand Expeditionary Force from and including the date of embarkation or re-embarkation from New Zealand on active service, or date of enlistment abroad in the New Zealand Expeditionary Force, up to and including the date of decease or discharge abroad, or the date of disembarkation on return to New Zealand, or the 28th June, 1919, whichever comes first.
In the case of members who died while on active service beyond the seas the period for which the gratuity will be payable shall not be less than two years.
In the case of members evacuated sick or wounded from an actual theatre of war and returned to New Zealand as unfit for further overseas service, the period for which the gratuity will be payable shall not be less than eighteen calendar months. The term "theatre of war" shall be as defined in regulations approved from time to time for the issue of war-medals.
Except in the case of members who died on active service abroad, the following periods of service will not reckon as qualifying service for the purpose of gratuity:—
Any period for which gross pay was forfeited by Royal Warrant.
Any period of service exceeding twenty-eight days for which gross pay was ordered to be forfeited.
Any period of service during which hospital stoppages have been charged for illness the result of misconduct, or for illness caused by a soldier rendering himself unfit for service.
The above subparagraphs (a ) and (b ) will not apply to any period of service for which forfeitures have been remitted.
The gratuity or balance of gratuity in the case of a member not already discharged or deceased will not be issuable earlier than twenty-eight days after his return to New Zealand.
Any overpayment made to any member or to his dependants, or any public claim chargeable against him by a Government Department, will be deducted from the gratuity.
Where it appears that any member has, while in the service, omitted to make proper provision for his wife and children, whether legitimate or illegitimate, or in any case in which the circumstances seem to him to so require, the Minister of Defence may direct that the gratuity be applied in or towards the making of provision so far as possible for the said wife or children or as the circumstances may demand. The Defence Department may pay to a person or society considered to be able to distribute the money in the best interests of the family.
In the case of any member who, after service in the Expeditionary Force beyond the seas, has died whilst still a member of that Force, or who, after such service beyond the seas, has died after being honourably discharged from that Force, but without receiving such gratuity, the gratuity may be paid to or divided between his widow, children, father, or mother, as provided by section 7. subsection (3). of the Expeditionary Forces Amendment Act, 1918.
The gratuity will not be paid in the case of an officer whose services are dispensed with or who has resigned or has been struck off the strength from any cause which, in the opinion of the General Officer Commanding, disqualifies him for the gratuity.
The gratuity will not be paid in the case of a soldier—
Discharged with ignominy, or on account of misconduct;
Undergoing a sentence of penal servitude, imprisonment, or detention at the expiration of which he is discharged under (a ) above.
Application forms (E.F. Pay Form 192) for gratuity will be distributed to all post-offices throughout New Zealand. These forms must be completed where necessary, and forwarded to the Officer in Charge War Expenses, Wellington. In the case of deceased members the applications should be made by their legal representatives.
The amount due will be remitted to the Postal Department for either—
Depositing to the credit of the applicant's present account in the Post Office Savings-bank; or
Depositing to the credit of a Post Office Savings-bank account which will be specially opened if the applicant has no other bank account; or
Lodgment at any bank or private savings-bank in New Zealand at which the applicant has a current account as shown in the application; or
Payment to or for the person entitled under paragraph 11 hereof.
In no case will the amount be paid direct to the member by the Pay Office.
Allowances to New-Zealanders who have served with Imperial Naval and Military Forces.
16. In the case of persons domiciled in New Zealand who have served in the Imperial Naval and Military Forces during the war, the difference between the Imperial rates of pay, allowances, and gratuity and the New Zealand rates for the same for equivalent ranks will be paid, less any amounts already received under previous authorities. For the purposes of such payment the pay of a private or equivalent rank in Imperial Forces shall be taken to be one shilling and sixpence per day. Applications should be made to the Paymaster-General, Treasury, Wellington, who will arrange payment.
Cost.
The total cost of the overseas war-service gratuity was estimated at over five and one-half million pounds, made up as follows:—
| £ | £ | |
|---|---|---|
| Estimated cost of paying the gratuity at 1s. 6d. per day from embarkation to the signing of peace—28th June, 1919 | 5,075,000 | |
| Additional to provide for minimum gratuity for two years' service in case of members deceased while on active service abroad | 225,000 | |
| Additional to provide for minimum gratuity for eighteen months' service in case of members evacuated to New Zealand from an actual theatre of war on account of sickness or wounds | 213,000 | |
| 5,513,000 |
New-Zealanders in Imperial Naval and Military Forces.
Estimated cost of paying the difference between Imperial and New Zealand gratuity—
| (1.) Army Reservists and Imperial soldiers | 16,000 | |
| (2.) Naval Reservists and members of Motor-boat Patrol | 23,000 | |
| 39,000 | ||
| £5,552,000 |
There wore 109 registered building societies in operation during the financial year 1918-19. Of these, 74 were terminable societies and 35 were permanent.
The dates upon which these societies close their accounts vary considerably within the year, but the figures given below may be taken as approximately corresponding to the periods stated. The liabilities and assets of all the societies at the close of each of the past five financial years were as follows:—
LIABILITIES OF BUILDING AND INVESTMENT SOCIETIES . 1914-15 TO 1918-19.
| Year. | To Shareholders (including Reserve Funds and Undivided Profits). | Deposits. | To Bankers and other Creditors. | Total Liabilities. |
|---|---|---|---|---|
| £ | £ | £ | £ | |
| 1914-15 | 2,205,326 | 644,280 | 111,621 | 2,961,177 |
| 1915-16 | 2,290,473 | 674,512 | 126,160 | 3,091,145 |
| 1916-17 | 2,277,072 | 725,469 | 138,399 | 3,140,940 |
| 1917-18 | 2,290,924 | 717,188 | 181,092 | 3,189,204 |
| 1918-19 | 2,315,378 | 693,890 | 244,485 | 3,253,753 |
ASSETS OF BUILDING AND INVESTMENT SOCIETIES , 1914-15 TO 1918-19.
| Year. | Advances on Mortgage. | Other Investments. | Cash in Hand and on Deposit. | Total Assets. |
|---|---|---|---|---|
| £ | £ | £ | £ | |
| 1914-15 | 2,772,569 | 75,066 | 113,542 | 2,961,177 |
| 1915-16 | 2,893,956 | 87,577 | 109,612 | 3,091,145 |
| 1916-17 | 2,927,859 | 89,904 | 123,177 | 3,140,940 |
| 1917-18 | 2,971,119 | 100,103 | 117,982 | 3,189,204 |
| 1918-19 | 3,008,289 | 84,732 | 160,732 | 3,253,753 |
During the year ended 31st December, 1918, 200 joint-stock companies were registered, with a total nominal capital of £3,055,351, including 130 private companies, with a nominal capital of £1,289,320.
The following table gives the total number of companies and the aggregate nominal capital registered during each of the five years 1914-18:—
JOINT -STOCK COMPANIES REGISTERED , 1914-18.
| Year. | Number of Companies registered. | Aggregate Nominal Capital. |
|---|---|---|
| £ | ||
| 1914 | 226 | 4,987,526 |
| 1915 | 304 | 4,431,830 |
| 1916 | 258 | 4,072,803 |
| 1917 | 261 | 5,367,201 |
| 1918 | 200 | 3,055,351 |
The Registrar of Friendly Societies received returns for the year 1918 from 731 lodges, courts, tents, &c., having a membership at the end of the year of 67,527. The number of members of these 731 lodges, &c., at the beginning of the year was 68,771. A decrease in membership of 1,244 is thus recorded, largely the result of the service with the Forces of many young men who would otherwise have become members. Prior to 1914 each year showed an increase in membership; subsequent to 1914, a continuous decline.
The total value of the assets of these societies was £2,100,443, of which the value of the sick and funeral benefit funds was £1,948,209.
The receipts during the year on account of the Sick and Funeral Funds amounted to £301,008, and the expenditure to £257,029, of which the sick-pay to members reached the sum of £96,763. In addition to the sick-pay, the sum of £68,950 was paid out of the Medical and Management Expenses Fund for attendance given and medicine supplied to the members and their families.
The total membership and funds of the 731 lodges, courts, &c., and of the various orders at 31st December, 1918, were,—
FRIENDLY SOCIETIES .—MEMBERSHIP AND FUNDS , 1918.
| Name of Order. | Number of Members. | Total Worth of Funds. |
|---|---|---|
| £ | ||
| Independent Order of Odd Fellows, M.U. | 20,633 | 892,159 |
| Independent Order of Odd Fellows of New Zealand | 6,553 | 146,583 |
| National Independent Order of Odd Fellows | 381 | 5,462 |
| British United Order of Odd Fellows | 126 | 3,937 |
| Ancient Order of Foresters | 15,372 | 489,865 |
| Ancient Order of Shepherds | 47 | 1,317 |
| United Ancient Order of Druids | 15,531 | 327,086 |
| Independent Order of Rechabites | 3,771 | 99,802 |
| Sons and Daughters of Temperance | 610 | 25,161 |
| Hibernian Australasian Catholic Benefit Society | 3,144 | 47,110 |
| Protestant Alliance Friendly Society of Australasia | 829 | 27,384 |
| Eden Temperance Benefit Friendly Society | 32 | 2,820 |
| Fountain of Friendship Lodge, Auckland | 498 | 31,757 |
| Totals | 67,527 | 2,100,443 |
The next table shows the progress of the friendly societies of New Zealand during ten years:—
FRIENDLY SOCIETIES .—MEMBERSHIP AND FUNDS , 1909-18.
| Year. | Number of Lodges tabulated. | Number of Members. | Total Funds. | Average Capital. | ||
|---|---|---|---|---|---|---|
| £ | £ | s. | d. | |||
| 1909 | 567 | 64,428 | 1,266,297 | 19 | 13 | 1 |
| 1910 | 609 | 68,006 | 1,367,282 | 20 | 2 | 1 |
| 1911 | 658 | 71,771 | 1,441,353 | 20 | 1 | 8 |
| 1912 | 664 | 73,243 | 1,553,339 | 21 | 4 | 2 |
| 1913 | 681 | 73,691 | 1,643,177 | 22 | 6 | 0 |
| 1914 | 717 | 74,074 | 1,744,456 | 23 | 11 | 0 |
| 1915 | 728 | 73,027 | 1,852,355 | 25 | 7 | 4 |
| 1916 | 727 | 70,360 | 1,954,940 | 27 | 15 | 8 |
| 1917 | 730 | 68,771 | 2,052,753 | 29 | 17 | 0 |
| 1918 | 731 | 67,527 | 2,100,443 | 31 | 2 | 1 |
The value of the various funds and the way in which they are invested will be seen by reference to the following table. the funds include those of the central bodies.
| Funds. | — |
|---|---|
| £ | |
| Sick and Funeral Funds | 1,873,510 |
| Surplus Appropriation Funds, &c. | 74,699 |
| Management Funds, goods, &c. | 97,285 |
| Widows' and Orphans' Funds | 16,964 |
| Distress, Benevolent Funds, &c. | 37,985 |
| Total | 2,100,443 |
| Assets. | — |
| £ | |
| Investments at interest | 1,781,268 |
| Value of land and buildings | 204,218 |
| Cash not bearing interest | 57,470 |
| Value of goods | 12,855 |
| Other assets | 41,114 |
| Owing by Management Fund | 3,518 |
| Total | 2,100,443 |
Interest-bearing investments form 85 per cent. of the total assets. The net income from investments credited to the Sick and Funeral Funds during the year 1918 was £90,424, the average rate of interest earned being 5 per cent., as compared with 4.94 per cent. in 1917 and 5 per cent. in 1916.
Particulars are given of the number of members, the amount of accumulated capital, and the average capital per member of the friendly societies in the States of Australasia arranged in order of membership. Figures are based on returns to the 31st December, 1917.
| State or Dominion. | Number of Lodges. | Number of Members. | Amount of Funds. | Capital per Member. | ||
|---|---|---|---|---|---|---|
| £ | £ | s. | d. | |||
| New South Wales | 1,884 | 178,857 | 2,113,754 | 11 | 16 | 4 |
| Victoria | 1,516 | 158,181 | 3,017,503 | 19 | 1 | 6 |
| New Zealand | 730 | 68,771 | 2,052,753 | 29 | 17 | 0 |
| South Australia | 596 | 66,241 | 1,323,067 | 19 | 19 | 6 |
| Queensland | 548 | 51,383 | 902,210 | 17 | 11 | 2 |
| Tasmania | 190 | 22,138 | 245,666 | 11 | 1 | 11 |
| Western Australia | 275 | 17,969 | 274,546 | 15 | 5 | 7 |
Section 101 of the Friendly Societies Act, 1909, provides that no member of a friendly society shall lose or forfeit any interest he may have in any such society or suffer any fine for non-attendance at meetings occasioned by the performance of his military duties. The departure of many members to the front thus threw a heavy burden upon the societies, especially since the Act did not permit rules to be adopted dealing with the matter as widely as became necessary. In November, 1914, a short Act was passed enabling rules to be registered providing for the postponement or waiver of payment of contributions by (a ) any member who was or thereafter became a member of the Defence Forces of New Zealand on active service, or (b ) any other member during any period of unemployment occasioned by the present war. The Government also undertook to subsidize the reinsurance of death benefits of soldier members on active service to the extent of paying one-half of the premiums. The subsidy was granted to societies whether they reinsured this benefit with outside insurance companies or carried the risk on their own Funeral Funds. On this account the sum of £11,867 was paid to the various friendly societies as the State's share of the liability under this system up to the 30th September, 1916.
As the number of members on active service rapidly increased and the liability assumed correspondingly augmented proportions, the Government decided to establish a Departmental Reinsurance Fund. This fund began operations as from the 1st October, 1916, being administered by a Board consisting of the Hon. the Minister of Finance, the Hon. the Minister in Charge of Friendly Societies, and the Registrar. The premium rate to be charged is fixed by, the Board on consideration of reports from the Actuary as required from time to time. The societies pay into the fund one-half of the premium rate which had been so fixed, the State finding the remaining moiety. In the case of any profit at the close of the war the surplus is to be distributed pro rata amongst the participating societies and the Government; while, on the other hand, should the premium rate prove insufficient and a deficiency be shown, a levy pro rata will be struck for the proportion due from all parties to the scheme. This reinsurance method has been adopted by practically the whole of the societies of the Dominion. The Government's subsidy towards these reinsurances since 1914, both outside and in the departmental fund, amounted to £38,070. The fund terminated its reinsurance operations on the 31st March, 1919, but the full liability will not be ascertainable for twelve months after.
For the purpose of dealing with the problem of after-discharge sickness of soldier members the following method has been devised:—
For the purpose of ascertaining the actual experience of this sickness, each society is to establish a fund called the "After-discharge Sickness Fund." The income of this fund will consist of amounts representing the sick-contribution reserve held on account of these members in the respective Sick Funds; such amounts, at rates fixed by the Actuary, to be transferred from the society or branch Sick and Funeral Funds to the society's After-discharge Sickness Fund. The member will continue to pay his usual contribution as at the present rate.
Out of the After-discharge Sickness Fund is to be paid all the sickness of all discharged soldier members, whether such sickness can be attributed to war causes or not. Every soldier member, therefore, from the date of his discharge is to be reinsured in the After-discharge Sickness Fund for his future sickness. This will have the effect of determining the amount, if any, of excess sickness due to war causes in the discharged soldiers' experience as a group and apart from the normal sickness of the other members. On the yearly ascertainment of this excess sickness, if any, the Government will pay into the society's After-discharge Sickness Fund half the amount of such excess, the remaining half to be made good by levy on the whole of the members of the society.
Societies with a membership of less than 400 will, for the above purposes, require either to attach themselves to the nearest society or district of their order, or to reinsure along with other small societies in an After-discharge Sickness Fund to be established by, and under the direct control of, the Registrar of Friendly Societies.
A scheme for the extension of State benefits to members of friendly societies, on special terms, was embodied in the Finance Act, 1916 (Part IX). The objects of this Part of the Act are,—
To enlarge the administration of maternity assistance by extending its operations to members of provident organizations:
To extend the State's propaganda for the establishment of a contributory system of provision for old ago:
To enable friendly societies to secure a provision in old age for their members at specially low rates, and at the same time relieve their funds in respect of aged-sickness liability.
The conditions of "approval" of friendly societies for participation in these benefits were by the Act to be determined by the National Provident Fund Board. In adopting terms of "approval" the Board was to a certain extent bound by the financial obligations the Act itself imposed, as it was clear that only societies whose funds were established on actuarial principles would be able to conform to requirements. The well-known affiliated societies, such as the Odd Fellows, Foresters, Druids, Rechabites, &c., had no difficulty in satisfying the Board in this respect. In the case of societies which were unable to hold their annual meetings before the end of the year the Board was empowered to grant "provisional approval" to extend only to the time of the first annual meeting at which the "model" rules could be made by the society for registration. Most of the societies were able to obtain "provisional approval" in time for the coming into operation of the Act—1st January, 1917—and thus at once secure for their members the maternity allowance. In those societies whose organization did not permit of "approval" by that date steps were taken to become approved as soon afterwards as possible. By the 1st July, 1916, every actuarially valued society in the Dominion had become either "approved" or "provisionally approved."
Issues of the Year-book up to 1908 contained estimates of the private wealth of the Dominion based on the assumption that the wealth of the living is proportionately equal to that loft by the dead. In making these estimates no consideration was taken of the ages of the deceased or of the age-constitution of the living. This was seen to be a serious defect, as the younger (and more numerous) section of the population do not possess the same amount of accumulated wealth as those at the more advanced ages. Accordingly, the old system of estimating the private wealth of the community was abandoned, and steps were taken for the adoption of a better method by ascertaining the ages of deceased persons leaving estates.
In lieu of obtaining merely the total amounts of estates certified for stamp duty, arrangements wore made for obtaining the name and date of death of each deceased person whose estate was dealt with by the Stamp Office. Where it is possible, the age also is now supplied ; in other cases it is ascertained by reference to the death registers. For a variety of reasons there are, however, a few instances where the ages of persons are not so ascertainable. This difficulty is surmounted by allocating such cases to each age-group in proportion to its contribution to the total. By a system of cards, tables have now been prepared for the ten years 1909-18, giving for quinquennial age-groups the number and value of estates, the average wealth per person dying, and the total estimated private wealth. From the following table compiled from the estates and deaths of the ten years it will be seen that the estimated private wealth of the Dominion amounted on the 31st December, 1918, to £387,673,245, or an average of £350 per head of population, excluding Maoris. Estates left by Maoris are excluded from the calculation.
The average wealth of persons of 20 years of age and over (practically the adult population) is found to be £604.
| Age, in Years. | Number of Estates certified (1909-18). | Total Amount, including Allowance for Unrecorded Estates. | Number of Deaths registered (1909-18). | Average Wealth per Person dying. | Estimated Population 31st Dec., 1918. | Estimated Private Wealth. |
|---|---|---|---|---|---|---|
| £ | £ | £ | ||||
| Under 5 | 23 | 2,355 | 19,820 | 0.1188 | 136,375 | 16,201 |
| 5 and under 10 | 13 | 2,311 | 2,274 | 1.0163 | 126,843 | 128,911 |
| 10 and under 15 | 19 | 3,532 | 1,449 | 2.4375 | 112,805 | 274,962 |
| 15 and under 20 | 99 | 35,819 | 2,282 | 15.6963 | 93,592 | l,468,891 |
| 20 and under 25 | 892 | 585,232 | 3,376 | 173.3507 | 75,747 | 13,130,795 |
| 25 and under 30 | 1,295 | 1,083,199 | 4,549 | 238.1180 | 86,500 | 20,597,207 |
| 30 and under 35 | 1,449 | 1,707,275 | 5,097 | 334.9568 | 90,654 | 30,365,174 |
| 35 and under 40 | 1,478 | 1,690,448 | 5,232 | 323.0979 | 87,913 | 28,404,506 |
| 40 and under 45 | 1,433 | 2,296,568 | 4,515 | 508.6529 | 68,435 | 34,809,661 |
| 45 and under 50 | 1,646 | 3,663,841 | 4,561 | 803.2977 | 62,719 | 50,382,028 |
| 50 and under 55 | 1,813 | 4,530,398 | 4,777 | 948.3772 | 46,583 | 44,178,255 |
| 55 and under 60 | 2,279 | 7,271,163 | 5,288 | 1,375.0308 | 35,459 | 48,757,217 |
| 60 and under 65 | 2,595 | 6,995,611 | 6,001 | 1,165.7409 | 29,624 | 34,533,908 |
| 65 and under 70 | 3,257 | 11,113,868 | 7,557 | 1,470.5396 | 21,475 | 31,579,838 |
| 70 and under 75 | 3,835 | 13,198,772 | 8,936 | 1,477.0336 | 15,668 | 23,142,162 |
| 75 and under 80 | 3,600 | 13,493,624 | 8,972 | 1,503.9706 | 10,889 | 16,376,736 |
| 80 and under 85 | 2,363 | 8,337,567 | 6,339 | 1,315.2811 | 5,036 | 6,623,756 |
| 85 and under 90 | 1,016 | 4,220,364 | 2,991 | 1,411.0211 | 1,684 | 2,376,160 |
| 90 and under 95 | 272 | 1,231,142 | 917 | 1,342.5758 | 310 | 416,198 |
| 95 and over | 66 | 358,171 | 233 | 1,537.2146 | 72 | 110,679 |
| Totals | 29,443 | 81,820,260 | 105,166 | 778.0106 | 1,108,373 | 387,673,245 |
The table well illustrates the defect of the old system. The average value of estates of persons under 20 years of age, who comprise over 40 per cent. of the living population, is only a little over £1, while in the group 80 to 85 years the average is £1,315, and at 85 to 90 £1,411.
The number of estates dealt with during the ten years 1909-18 is equal to only about 28 per cent. of the deaths registered during that period; and as most persons leave some estate, however small, it is necessary to make an allowance for estates which have not passed through the Stamp Duties Office. In this connection it should be noted that estates below £200 in value are exempt from stamp and succession duty, though in many cases estates of a lower value than £200 are dealt with, being passed for probate and for the granting of letters of administration. The allowance made for unrecorded estates in the calculations shown above is 10 per cent., which has been regarded as approximately correct.
It should be noted that the estimate is that of the private wealth in the Dominion, whether owned by residents of the Dominion or by others, and does not, moreover, include estates belonging to New Zealanders but situated in other countries.
Further investigation into the method adopted in past years has, however, revealed a slight weakness consequent upon the adoption of the system of adding, under all age-groups, an amount equal to 10 per cent. of the value of recorded estates.
Under that method the average amount allowed for each unrecorded estate of persons dying at early ages is very low, while the 10-per-cent. allowance for advanced ages gives an excessive amount.
These two factors, however, balance one another, with the result that although the estimate of the private wealth of young persons is too low and of older persons too high, the total for all ages appears to be approximately correct.
As a further test of the matter, the figures for the years 1909-18 have been compiled using, instead of the uniform 10-per-cent. allowance for unrecorded estates, a fixed allowance increasing from £20 for the age-group 15 to 20 years to £100 at ages 35 to 40, with a similar allowance of £100 for all unrecorded estates over that age. No allowance at all was made for estates of persons under 15 years of age.
This computation gives, on the total, only a slightly different result from that obtained by the previous method, although the results for the individual age-groups show considerable variation when the two methods are compared.
The following table shows the results obtained by the two methods:—
| Age, in Years. | Total Private Wealth. | Excess in Favour of | ||
|---|---|---|---|---|
| Using-10-per-cent.-allowance Method. | Using Fixed-allowance Method. | First Method. | Second Method. | |
| £ | £ | £ | £ | |
| Under 5 | 16,201 | 14,728 | 1,473 | .. |
| 5 and under 10 | 128,911 | 117,190 | 11,721 | .. |
| 10 and under 15 | 274,962 | 249,976 | 24,986 | .. |
| 15 and under 20 | 1,468,891 | 3,125,807 | .. | 1,656,916 |
| 20 and under 25 | 13,130,795 | 14,166,416 | .. | 1,035,621 |
| 25 and under 30 | 20,597,207 | 22,437,252 | .. | 1,840,045 |
| 30 and under 35 | 30,365,174 | 32,795,299 | .. | 2,430,125 |
| 35 and under 40 | 28,404,506 | 32,130,100 | .. | 3,725,594 |
| 40 and under 45 | 34,809,661 | 36,316,614 | .. | 1,506,953 |
| 45 and under 50 | 50,382,028 | 49,810,313 | 571,715 | .. |
| 50 and under 55 | 44,178,255 | 43,052,405 | 1,125,850 | .. |
| 55 and under 60 | 48,757,217 | 46,342,445 | 2,414,772 | .. |
| 60 and under 65 | 34,533,908 | 33,075,836 | 1,458,072 | .. |
| 65 and under 70 | 31,579,838 | 29,930,890 | 1,648,948 | .. |
| 70 and under 75 | 23,142,162 | 21,932,717 | 1,209,445 | .. |
| 75 and under 80 | 16,376,736 | 15,539,923 | 836,813 | .. |
| 80 and under 85 | 6,623,756 | 6,337,468 | 286,288 | .. |
| 85 and under 90 | 2,376,160 | 2,271,342 | 104,818 | .. |
| 90 and under 95 | 416,198 | 400,167 | 16,031 | .. |
| 95 and over | 110,679 | 105,778 | 4,901 | .. |
| Totals | 387,673,245 | 390,152,666 | .. | 2,479,421 |
A point that should be borne in mind in regard to both sets of figures given above is that no distinction is made between the wealth of males and that of females. As it is generally understood that the average for males is higher than that for females, and as of the estates passed for probate in 1918 those of males represented three-fourths of the number and more than four-fifths of the total value, it would appear that greater accuracy would be obtained by treating the estates of the two sexes separately. This has been done for the years 1917 and 1918, information for previous years not being available, and the results appear to bear out this contention, although it is unsafe to accept without reserve the figures relating to only two years, which might be unduly influenced by the inclusion of one or two exceptionally large estates.
The figures arrived at for 1917 and 1918 by treating the sexes separately, and by taking the two together (the 10-per-cent.-allowance method being used in both cases), show the following discrepancies:—
| 1917. | 1918. | |
|---|---|---|
| (1.) Sexes taken separately— | £ | £ |
| Males | 472,906,981 | 278,662,668 |
| Females | 82,787,677 | 52,318,434 |
| Totals | 555,694,658 | 330,981,102 |
| (2.) Sexes taken together | 603,282,932 | 373,905,212 |
| Difference | £47,588,274 | £42,924,110 |
The remarkable difference between the figures for the two years for which information has been collected is a striking commentary on the dangers that may arise from taking too short a period as the basis of investigation. From six to twelve months usually elapse from the date of death before the estate is certified for stamp duty. The result is that the number of deaths during the latter part of 1918 as a result of the influenza epidemic has swollen the number of deaths without affecting in any way the number of estates certified. The outcome has been a fictitiously low average wealth of deceased persons for that year, which one may, however, anticipate being wiped out during 1919 on account of the normal number of deaths occurring in that year coupled with the abnormally high number of estates certified.
It is intended that in future years separate records shall be kept relating to the two sexes, in order that a more accurate estimate may be made when information for a sufficient number of years is accumulated.
A table is given showing the number of estates finally passed during 1917 and 1918, classified according to amount. Estates of Maoris are included.
| Amount. | Number of Estates. | Aggregate Net Value. | ||
|---|---|---|---|---|
| 1917. | 1918. | 1917. | 1918 | |
| £ | £ | £ | ||
| Under 500 | 1,652 | 1,732 | 379,619 | 438,785 |
| 500 and under 1,000 | 794 | 1,001 | 559,013 | 671,878 |
| 1,000 and under 2,000 | 553 | 624 | 793,102 | 883,385 |
| 2,000 and under 3,000 | 246 | 314 | 607,588 | 716,774 |
| 3,000 and under 4,000 | 139 | 139 | 478,215 | 496,787 |
| 4,000 and under 5,000 | 99 | 105 | 441,891 | 500,438 |
| 5,000 and under 7,500 | 139 | 138 | 854,369 | 914,875 |
| 7,500 and under 10,000 | 72 | 93 | 622,112 | 769,074 |
| 10,000 and under 15,000 | 70 | 78 | 831,823 | 953,845 |
| 15,000 and under 20,000 | 35 | 34 | 591,786 | 599,193 |
| 20,000 and over | 74 | 89 | 3,583,459 | 4,327,341 |
| Totals | 3,873 | 4,347 | 9,742,977 | 11,272,375 |
The present Act dealing with these subjects was passed in 1911 and came into force on the 1st July, 1912. An amending Act passed in 1914 enables the Governor-General in Council to order the avoidance or suspension of patents or trade-marks of subjects of a State at war with His Majesty. No applications by such enemy subjects are accepted or patents issued; and a special license permitting the payment of renewal fees has now been revoked. Extension of time for filing documents or paying fees may be granted to any person who has been prevented from doing so by circumstances arising from the present war.
By an Order in Council of the 21st December, 1916, power was given the Registrar to prohibit the publication of any invention or design the publication of which in his opinion would not be of advantage owing to the exigencies of the present war. Ho could also prohibit application being made in any neutral or enemy country, and no application could be made in an allied country or any part of His Majesty's dominions without the permission of such person as the Minister of Defence might appoint.
It was further provided that no application could be lodged for the grant of a patent or the registration of a design in any foreign country or within the British dominions unless notice of intention so to do, accompanied by a provisional specification or specimen, had been deposited, nor until the expiration of one month after notice had been received. If during this period the Registrar is satisfied that, on account of the war, publication should be withheld, he may take similar action to that outlined above. Amended regulations provided that in certain cases, with the permission of the Registrar, application for registration could nevertheless be made before the expiration of one month.
Application for a patent may be made by the actual inventor, his nominee or assignee, and either by himself or in conjunction with other persons.
The unauthorized importer of an invention is not entitled to apply.
An invention to be patentable must not have been published or used in New Zealand prior to the date of application for patent, or, in a case where priority is claimed under the International Convention, before the date of the first foreign application. In accordance with the International Convention a person, by applying in one country belonging thereto, may obtain for his applications in the other countries of the Convention the official date of the first application, provided they are made within twelve months thereof. An application must contain a declaration to the above effect, and must be accompanied by a specification, either complete or provisional. In the former case a fee of £1 is payable, in the latter one of 10s. A complete specification must be left within nine months of the date of application, and if it is not accepted within a year of such date the application is void. Extensions of one and three months respectively to allow for filing and acceptance may be granted on application.
The specification, on receipt, is examined so far as the resources of the Office permit. A search is made regarding the novelty of the invention, but such investigation is very restricted, more particularly is this so under present conditions.
Should a specification be accepted, the acceptance is advertised and the particulars are open to public inspection. Notice of opposition may be given within two months of the advertisement. From the Registrar's decision in such circumstances there is an appeal to the Supreme Court.
A fee of £2 is charged on the sealing of a patent. Except in special cases, a patent must be sealed within fifteen months after the date of application.
The date of a patent is the date of application, and the rights exist for fourteen years. An extension of seven (in very exceptional cases, fourteen) years may be obtained, the procedure being by petition to the Supreme Court.
Renewal fees of £3 and £6 are payable at or before the expiry of the third and sixth years respectively from the date of commencement of the patent.
After a patent has been in existence for three years any party interested may petition the Court, alleging that the reasonable requirements of the public in respect of the patent are not being satisfied. If such statement be proved, then compulsory licenses to manufacture may be issued or the patent may be revoked.
Only persons registered as such may practise as patent agents or attorneys. Applicants for registration are examined, and, if successful, are registered, the registration being subject to an annual fee of one guinea.
There were 1,386 applications for letters patent during 1918, 57 more than the number received in 1917; 790 were left with provisional specifications, and 596 with complete specifications; while 261 complete specifications were lodged in respect of applications with which provisional specifications had been previously filed: making a total of 1,647 specifications, as compared with 1,684 for 1917 and 2,051 (the greatest number for any year) in 1913.
The total number of applications received up to the 31st December, 1918, was 41,034, and the patents in force in New Zealand at that date numbered 4,352.
The total number of applications in respect of patents, designs, and trademarks for the year has only slightly increased from the number in 1915, which, as a result of the war, was the lowest received for some years.
| 1914. | 1915. | 1916. | 1917. | 1918. |
|---|---|---|---|---|
| 2,316 | 1,953 | 2,040 | 2,038 | 2,134 |
In the next table are shown the various countries, residents of which applied for patents in New Zealand during the year 1918. Owing to applications being received from joint applicants resident in different countries, also from applicants giving two addresses, the figures total more than the actual number of applications received.
Applications for Patents in New Zealand, 1918.
| Country. | Number. |
|---|---|
| New Zealand | 885 |
| Australia | 223 |
| Great Britain | 156 |
| United States of America | 94 |
| Canada | 9 |
| Italy | 6 |
| Norway | 6 |
| Holland | 5 |
| Denmark | 4 |
| Sweden | 4 |
| Dutch East Indies | 2 |
| France | 2 |
| Germany | 2 |
| Japan | 2 |
| Algeria | 1 |
| Argentina | 1 |
| Brazil | 1 |
| Friendly Islands | 1 |
| Hawaii | 1 |
| Transvaal | 1 |
Any person claiming to be the proprietor of a new and original design applicable to the pattern, shape, or configuration of any article of manufacture may, upon payment of a fee of 5s., apply to have such design registered. The same design may be registered in more than one class. If registered, the design is copyright for a term of five years, the date commencing from the date of application for registration. A further term of five years may be obtained on application and payment of double the original fee, and a third term of five years may, in the discretion of the Registrar, be allowed on application in the manner prescribed. The Registrar, at his discretion, may refuse registration, under which circumstances an appeal lies to the Supreme Court.
Designs are not open to public inspection during the currency of the registration, or such shorter period as may be authorized.
Provision is made that at any time not less than one year after registration any person may petition the Court for an order declaring that the design is not used for manufacture to an adequate extent in New Zealand. If the Court is satisfied to this effect and insufficient reason is given for its non-manufacture, the order will be granted. After the date of such an order copyright in the design will not be infringed by its manufacture in the Dominion by other parties.
Fifty-three applications wore received in 1918, the corresponding figure for 1917 being 83.
A trade-mark must be registered in respect of particular goods or classes of goods. Section 64 of the Patents, &c., Act, 1911, sets forth the essentials of a registrable trade-mark. The procedure for obtaining registration is largely the same as that for obtaining a patent. A fee of 10s. is payable on application, and one of £1 on registration.
Registration is effective for a period of fourteen years, but on payment of prescribed fees may be renewed for like periods indefinitely. No action for infringement can be taken in respect of an unregistered trade-mark.
Assignments and transmissions of a registered trade-mark may be entered on the register. Such trade-marks, in general, pass only with the goodwill of the business concerned.
The table below, which covers the period 1898 to 1918, shows for each year the number of applications for registration of designs and trademarks:—
Designs and Trade-marks.—Applications for Registration, 1898-1918.
| Year. | Designs. | Trademarks. |
|---|---|---|
| 1898 | 10 | 343 |
| 1899 | 12 | 328 |
| 1900 | 15 | 348 |
| 1901 | 18 | 379 |
| 1902 | 28 | 412 |
| 1903 | 26 | 447 |
| 1904 | 24 | 592 |
| 1905 | 54 | 607 |
| 1906 | 36 | 702 |
| 1907 | 57 | 684 |
| 1908 | 79 | 685 |
| 1909 | 51 | 703 |
| 1910 | 46 | 818 |
| 1911 | 21 | 861 |
| 1912 | 44 | 779 |
| 1913 | 65 | 787 |
| 1914 | 55 | 687 |
| 1915 | 89 | 565 |
| 1916 | 113 | 666 |
| 1917 | 83 | 619 |
| 1918 | 53 | 695 |
The total number of applications during 1918 in respect of trade-marks was 695, and the fees received totalled £1,534. The decrease in the amount received in fees from this source is a result of the falling-due in 1917 of the renewal fees in respect of all marks registered prior to 1890.
Of the 695 applications, 222 were made by residents of New Zealand, 170 came from Great Britain, 142 from the United States, and 108 from New South Wales and Victoria.
One application was received for the suspension of registration of a trademark of alleged enemy proprietary, but was refused.
As previously stated, the total applications during 1918 in respect of patents, designs, and trade-marks numbered 2,134, as compared with 2,038 in the previous year. The revenue, £8,176, constituted a record, and surpassed that for 1917 by £1,222; while the expenditure amounted to £2,831, some £407 less than in the previous year.
The Inspection of Machinery Act makes provision for the inspection of all steam boilers and digesters, hydraulic, electric, and other lifts, and of any prime mover such as gas, oil, and air engines used to drive machinery on land, also of machinery used on vessels afloat that are not self-propelled.
It also provides for the issue of certificates to those who pass the prescribed examination for land engineers and engine-drivers in charge of boilers and machinery, for winding-engine drivers for mining purposes, for drivers employed on locomotives working on railway-lines not under the control of the Government Working Railways Department, and for the drivers of traction-engines on roads. Certificates are also issued to electric-tram drivers as provided by the Tramways Amendment Act, 1910. The issue of these certificates is controlled by a Board of Examiners set up by the Act, the Chairman being the Chief Inspector of Machinery.
During the year ended 31st March, 1919, the following certificates were issued:—
| Boiler certificates | 7,005 | |
| Machinery certificates | 15,609 | |
| 22,614 | ||
| Steam stationary— | ||
| Service—First class | 8 | |
| Competency— | ||
| Extra first-class engineer | 3 | |
| First class | 45 | |
| Second class | 182 | |
| Steam winding, competency | 8 | |
| Locomotive and traction, competency | 141 | |
| Locomotive, competency | 1 | |
| Traction, competency | 60 | |
| Electric tram, competency | 117 | |
| 565 | ||
| 23,179 |
The Minister of Internal Affairs may, on the application of any racing club, grant to such racing club a license to use the totalizator or wagering-machine at horse-race meetings held under the control or management of such club, subject to the following conditions:—
The license shall be revocable at any time the Minister thinks fit to determine the same. No more than three totalizators shall be used by the club at any one time, and none outside the race-grounds within the control of the club. The machine must be under the care and management of some competent person appointed by the club, and under the direct supervision of the stewards.
Every license shall be issued in respect of a single race meeting, and shall specify the number of days on which the totalizator may be used at that meeting. The aggregate number of days on which the totalizator may be used by racing clubs in any one year was fixed in 1910 at 250, and the number of days for any one race meeting must not exceed four.
By a short amendment to the Gaming Act passed in 1914 authority was given for the Minister of Internal Affairs to grant in a year not more than thirty-one additional totalizator licenses to clubs not holding such licenses. The additional licenses were to be allocated as follows:—
| To racing clubs, not more than | 15 |
|---|---|
| To hunt clubs, not more than | 8 |
| To trotting clubs, not more than | 8 |
Beginning with the racing season 1917-18, a reduction of the number of days racing in each season has been imposed, such reduction to continue during the currency of the war. The number of days on which the totalizator may be used in any one year has been reduced by ninety-four days (racing days, seventy-four; trotting days, twenty).
A race meeting at which the totalizator is authorized to be used on four days shall not extend over a longer period than eight consecutive days; meetings at which the totalizator is authorized to be used on three days shall not extend over a period of six consecutive days; and a race meeting at which the totalizator is authorized to be used for two days shall not extend over a longer period than four consecutive days; and on expiry of any such maximum period the license to use the totalizator shall lapse: Provided that when at any race meeting a racing club is compelled by inclement weather or any extraordinary circumstances to postpone any racing to a later day, it is lawful for the club to extend that race meeting over such longer period as is rendered necessary.
Racing clubs must not accept any totalizator investments by telegram or telephone, and no investment may be received otherwise than in money, bank-notes, or cheque before or at the time of investment. No investment shall be received from any person under the age of twenty-one years, and any member, agent, or servant of a racing club who permits or authorizes to be received an investment on the totalizator made by any person under twenty-one years is guilty of an offence, and is liable to a fine not exceeding £100; and any person who falsely represents himself as being of the age of twenty-one or upwards is liable to a fine not exceeding £50. The publication of dividends (except on the racecourse) is prohibited, and racing tips and the "double" totalizator are abolished. The totalizator must be closed not later than the time advertised for the starting of a race.
Information as to totalizator licenses issued, amount of investment by the public, and amount paid to the Treasury as percentage of investments is given in the portion of this book dealing with taxation.
Table of Contents
MOST of the statistical information given elsewhere in this book relates only to the three principal islands of the Dominion, with their adjacent islands and islets. There are, however, a number of outlying islands included within the boundaries of the Dominion, and brief descriptions of these are now given.
The outlying group of the CHATHAM ISLANDS , lying between the parallels of 43° 30' and 44° 30' south latitude, and the meridians of 175° 40' and 177° 15' west longitude, 480 statute miles east-south-east from Wellington and 536 miles eastward of Lyttelton, consists of two principal islands and several unimportant islets. They were discovered by Lieutenant Broughton and named by him in honour of the Earl of Chatham. The largest island (Chatham Island) contains about 222,490 acres, of which an irregularly shaped lake or lagoon absorbs 45,960 acres. About one-quarter of the surface of the land is covered with forest, the rest with fern or grass. The hills nowhere rise to a great height. Pitt Island is the next in size; the area is 15,330 acres. The greater portion of both islands is used for grazing sheep, the only other industry carried on to any extent being fishing. The islands are connected with the mainland by wireless telegraph, and there is also steamship communication at fairly regular intervals. The population at the census of 1916 consisted of 219 Europeans and 258 Maoris.
The KERMADEC GROUP of islands is situated between 29° 10' and 31° 30' south latitude, and between 177° 45' and 179° west longitude. They are named the Raoul or Sunday Island, Macaulay Island, Curtis Islands, and L'Espérance or French Rock. The principal island, Sunday, is 600 miles distant from Auckland, and lies a little more than half-way to Tonga, but 100 miles to the eastward of the direct steam route to that place. It is 300 miles eastward of the steam route to Fiji, and 150 miles westward of the steam route from Auckland to Rarotonga. Macaulay Island (named after the father of Lord Macaulay) and Curtis Islands were discovered in May, 1788, by Lieutenant Watts, in the "Penrhyn," a transport ship. The remainder of the group was discovered in 1793 by Admiral Bruni d'Entrecasteaux. The Admiral gave the name of "Kermadec" to the whole group of islands, after the captain of his consort ship "L'Espérance," and the name of the Admiral's ship, "La Recherché," was given to the largest island. The name so given was not continued, but that of "Raoul" has taken its place, which would appear to have been given after the sailing-master of the "La Recherché," whose name was Joseph Raoul. The name of "Sunday" may have become attached to the island from the fact that it was discovered on a Sunday. The islands are volcanic, and in two of them signs of activity are still to be seen. The rainfall is plentiful, but not excessive. The climate is mild and equable, and slightly warmer than the north of New Zealand. The following are the areas of the islands and islets of the group: Sunday Island, 7,200 acres; Herald group of islets, 85 acres; Macaulay Island, 764 acres; Curtis Islands, 128 acres and 19 acres; L'Espérance, 12 acres: total, 8,208 acres. Sunday Island is twenty miles in circumference, roughly triangular in shape, and at the highest point 1,723 ft. above the sea-level. It is rugged and broken over a very large extent of its surface, and, except in a few places, covered with forest. The soil everywhere on the island is very rich, being formed by the decomposition of a dark-coloured pumiceous tuff and a black andesitic lava, with which is closely mixed a fine vegetable mould. The great luxuriance and richness of the vegetation bear witness to the excellence of the soil, which is everywhere—except where destroyed by eruptions, and on the steep cliffs—the same rich loam. Want of water is one of the drawbacks. Three of the four lakes on the island are fresh, but so difficult of approach as to be practically useless. Various attempts at settlement have been made from time to time, but the islands are now uninhabited.
The AUCKLAND ISLANDS were discovered on 18th August, 1806, by Captain Abraham Bristow, in the ship "Ocean." The discoverer named the group after Lord Auckland, again visited the islands in 1807, and then took formal possession of them. They lie about 290 miles south of Bluff Harbour, their accepted position being given as latitude 50° 32' south, and longitude 166° 13' east. They have several good harbours. Port Ross, at the northern end of the principal island, was described by the eminent French commander D'Urville as one of the best harbours of refuge in the known world. At the southern end of the island there is a through passage extending from the east to the west coast. It has been variously named Adams Strait and Carnley Harbour, and forms a splendid sheet of water. The largest of the islands is about 27 miles long by about 15 miles broad, and is very mountainous, the highest part being about 2,000 ft. above the sea. The New Zealand Government maintains at this island a depot of provisions and clothing for the use of shipwrecked mariners.
The ANTIPODES , an isolated group, consisting of several detached rocky Islands lying nearly north and south over a space of four to five miles, accepted position, 49° 41' 15″ south, and longitude 178° 43' east.
The BOUNTY ISLANDS , a little cluster of islets, thirteen in number and without verdure, discovered in 1788 by Captain Bligh, R.N., of H.M.S. "Bounty." Position verified by observation, 47° 43' south, longitude 179° 0 1/2' east.
CAMPBELL ISLAND was discovered in 1810 by Frederick Hazelburgh, master of the brig "Perseverance," owned by Mr. Robert Campbell, of Sydney. It is mountainous, and of a circumference of about thirty miles. There are several good harbours.
The COOK ISLANDS , with others now included within the extended boundaries of the Dominion, are as under:—
RAROTONGA : A magnificent island, rising to a height of 3,000 ft., clothed to the tops of the mountains with splendid vegetation. It has abundant streams, considerable tracts of sloping land, and rich alluvial valleys. The two harbours are poor.
MANGAIA , the south-easternmost of the Cook Group, is of volcanic origin and about thirty miles in circumference. The productions, which are numerous and cheap, are obtained by assiduous labour.
ATIU resembles Mangaia in appearance and extent. It is a mere bank of coral 10 ft. or 12 ft. high, steep and rugged, except where there are small sandy beaches and some clefts, where the ascent is gradual.
AITUTAKI presents a most fruitful appearance, its shores being bordered by flat land on which are innumerable coconut and other trees, the higher ground being beautifully interspersed with lawns. It is eighteen miles in circuit.
MAUKE or Parry Island is a low-lying island; it is about two miles in diameter, well wooded, and inhabited.
MITIARO is a low-lying island, from three to four miles long and one mile wide.
HERVEY ISLANDS : This group consists of two islands surrounded by a reef which is about 10 1/2 miles in circumference.
NIUE , or Savage Island, lying east of the Friendly Islands, is a coral island, thirty-six miles in circumference, rising to a height of 200 ft. It has the usual tropical productions.
PALMERSTON ISLAND , lying about 500 miles east of Niue and about 220 from the nearest island of the Cook Group (Aitutaki), is remarkable as the "San Pablo" of Magellan, the first island discovered in the South Sea. It has no harbour. The soil is fairly fertile, and there is some good hardwood timber.
MANAHIKI , lying about 400 miles eastward of Danger Island, is an atoll, about thirty miles in circumference, valuable from the extent of the coconut groves. The interior lagoon contains a vast deposit of pearl-shell.
PENRHYN ISLAND (Tongareva) lies about 300 miles north-east of Manahiki. It is one of the most famous pearl-islands in the Pacific, and there is a splendid harbour, a lagoon with two entrances, fit for ships of any size.
RAKAANGA is an atoll, three miles in length and of equal breadth.
DANGER ISLAND (Pukapuka): Next to the 10th parallel, but rather north of the latitude of the Navigators, and east of them are a number of small atolls. Of these, the nearest to the Samoan Group—about 500 miles—is Danger Island, bearing north-west of Suwarrow about 250 miles.
SUWARROW ISLAND has one of the best harbours in the Pacific. It lies about 500 miles east of Apia, the capital of German Samoa (now in British possession). It is a coral atoll, of a triangular form, fifty miles in circumference, the reef having an average width of half a mile across, enclosing land-locked lagoon twelve miles by eight, which forms an excellent harbour. The entrance is half a mile wide, and the accommodation permits of ships riding in safety in all weathers, with depths of from three to thirty fathoms. It is out of the track of hurricanes, and supports a scant half-dozen inhabitants, but is capable by its fertility of supporting a larger population. As a depot for the collection of trade from the various islands it should in time be very valuable.
The Pacific islands annexed to New Zealand in pursuance of resolutions passed by the House of Representatives in September and October, 1900, were Rarotonga, Mangaia, Mauke, Atiu, Aitutaki, Mitiaro, Hervey Islands, Palmerston, Niue, Danger, Rakaanga, Manahiki, Penrhyn, and Suwarrow (see above); Takutea and Nassau, not mentioned in the resolutions, also lie within the boundary-lines prescribed by the Imperial Order in Council and the New Zealand Proclamation dealing with the annexation.
The Constitution and laws of the Cook Islands and Niue have been remodelled by the Cook Islands Act of 1915.
The system of government prior to annexation consisted of various Arikis' Courts and Native Councils, loosely united by a Federal Parliament. Acts passed in 1901 and 1904 changed the names to "Federal Council" and "Island Councils." The Arikis' Courts in all islands in which there was a European Resident Agent wore abolished, and the constitution of the Island Councils altered, the Resident Agent and Arikis being ex officio members, while the remainder of the nine were elected by the adult Natives.
The Act of 1915 establishes the office of Secretary for the Cook Islands. Subject to the control of the Minister, this officer is to be responsible for the administration of the islands.
Island Councils are to be continued or established, as the case may be, in Rarotonga and Niue, and in any other islands which the Governor-General in Council decides upon. These Councils may consist either wholly or partly of ex officio , elected, or nominated members. The number of members, their qualifications, tenure of office, and remuneration are subject to alteration at any time by regulations made by the Governor-General in Council. Generally European officials and Arikis or Native chiefs will be Councillors ex officio, and nominated members will hold office during the pleasure of the Governor-General or for a fixed period not exceeding five years. Women are eligible both as members and as electors of Island Councils.
Each Council is empowered to make laws for the good government of the island, with the proviso that such laws must not be repugnant to Acts of the New Zealand Parliament or regulations made thereunder. The maximum penalties imposed by the Ordinance of an Island Council must not exceed three months' imprisonment or a fine of £50. The Council has no power to deal with Customs duties, to borrow money, to establish Courts of justice, or to appropriate expenditure of revenue other than that raised under authority of their Ordinance. No Ordinance has effect until it has received the assent of the Resident Commissioner or the Governor-General. The Governor-General may, by notice in the Gazette, disallow any Ordinance within one year after the Commissioner has given his assent.
Laws are enforced through the High Court, which has all jurisdiction, civil or criminal, necessary for the administration of justice. Judges and Commissioners of the High Court are appointed by the Governor-General; the Chief Judge to reside at Rarotonga, a second at Niue. A Commissioner may, with some exceptions, exercise the full powers and functions of a Judge, but rules of Court may allow appeal from his decision to that of a Judge.
A judgment obtained in a civil proceeding in the High Court may be enforced in the Supreme Court of New Zealand. From any decision in the former Court an appeal lies to the Supreme Court in the Dominion.
The manufacture or importation of intoxicating liquor is prohibited absolutely, except that the Resident Commissioner may import liquor for sale or for public purposes. Liquor imported through the Commissioner must not find its way into the hands of a Native. Attempts are made by the Natives to evade the law by illicitly manufacturing "bush-beer," an offence which the Administration is endeavouring to check.
At the census of 1916 the population of the Cook and other islands annexed in 1901 was found to be 12,797. Fuller information is given in the portion of this book dealing with "Population." A system of compulsory registration of births, deaths, and marriages is now i:a force in the islands (see "Vital Statistics" section), and records of arrivals and departures are kept.
The educational requirements of the islands up to recent years have been largely met by missionary effort. The London Missionary Society has a number of village schools in the various islands, while the Roman Catholic Mission and the Seventh-day Adventists also maintain schools, though to a less extent.
The education provided in this manner is necessarily inadequate, and a system has been inaugurated by which schools have been established on the lines of the Native schools in New Zealand.
In Niue the Tufukia School has been established for some time. At this institution the New Zealand syllabus has been adopted with gratifying results. Special interest is shown in the technical branch, and additional technical classes are given after school hours. The leading pupils are being trained with a view to taking charge of village schools which it is hoped may soon be established in other districts of Niue. At the 31st March, 1919, this school had a roll number of 237 (154 boys and 83 girls), with a teaching staff of one European and several Natives.
Regulations which came into force on the 1st January, 1917, make it compulsory for all children between seven and fourteen years of age to attend school if living within three miles of a public school.
In 1916, when education in the Cook Islands was placed under the control of the Minister, there were three schools in the Group, two being in Rarotonga and one at Aitutaki. These had an attendance of 450 pupils, under nine teachers. Since 1916 two new primary schools have been opened in Rarotonga—viz., Avarua and Titikaveka—one at Palmerston Island, one at Mauke, and one at Mangaia. There are now eight primary schools at work in the Group, and the ninth will be opened at Atiu this year. These primary schools have more than a thousand scholars being taught by twenty-six teachers.
A technical school, also created since 1916, has been established at Avarua, with classes in agriculture, drawing, and woodwork, and an advanced class in carpentry. In most of the schools classes for simple cookery and for mat and basket weaving are held.
Three scholarships for annual competition, tenable for two years at St. Stephen's College, Auckland, and created by the Administration, were allotted this year. The first holders of these scholarships are now at the College. Reports of their work are highly satisfactory.
This year four advanced pupils chosen from the Technical School were sent to Wellington to be apprenticed to trades. They are under a bond to return to Rarotonga on the completion of their apprenticeship. By this method the Administration intends to secure the necessary supply of skilled Native artisans required for the Group.
Various restrictions are placed on the alienation of land by Natives. They may not alienate their holdings by way of freehold or by way of security, nor may customary land be dealt with in any such manner. No will of any Native is of effect as regards his interest in land, nor may a lease be granted for a term of more than sixty years.
Considerable areas have been leased, especially in Rarotonga, to European settlers. It is recognized that the prosperity of the islands depends in great measure upon the settlement of the spare lands by a good class of white planters. It is hoped that before long additional areas in many islands will be available.
Difficulties have been experienced in obtaining leases from the Natives, largely owing to the insecurity of title. The old Land Titles Court has now been replaced by a Native Land Court, whoso functions are to deal with the titles, partitioning, succession, and numerous other matters affecting land. The irregularity in sitting of the former Court caused great inconvenience; in hundreds of cases progress was at a standstill until titles could be properly investigated.
An important obstacle in the path of Native settlement of the land is the lack of roads. Much of the accessible banana land is being worked out, but the Natives are reluctant to move farther inland to the richer soils owing to greater difficulty in transport. The maintenance and construction of roads and bridges was formerly carried out by the Natives under a corvée system, but has now been taken over by the Administration.
Any person desirous of settling in the islands should have a capital equal to at least £10 for each acre ho purposes taking up. The coconut-palm takes from eight to ten years to roach bearing-point, and during that time the planter must maintain himself by growing bananas or securing some outside employment. When the palms are in full bearing, however, the annual value of the crop may be estimated at not less than £6 per acre, and this may be regarded as a practically assured income for sixty years or more.
Cook and Northern Islands.—For the financial year ended the 31st March, 1919, the revenue of the Cook Islands, not including the balance from the previous year, was £13,846, and the expenditure £12,343. There is now a credit balance of £2,785. The following is a comparative statement of revenue and expenditure for the past ten years:—
| Revenue. | Expenditure. | |
|---|---|---|
| Year. | £ | £ |
| 1909-10 | 7,656 | 8,230 |
| 1910-11 | 8,267 | 8,047 |
| 1911-12 | 8,924 | 9,430 |
| 1912-13 | 9,420 | 11,508 |
| 1913-14 | 11,723 | 10,194 |
| 1914-15 | 10,118 | 10,617 |
| 1915-16 | 7,673 | 9,081 |
| 1916-17 | 9,710 | 8,586 |
| 1917-18 | 11,068 | 12,615 |
| 1918-19 | 13,846 | 12,343 |
The principal items in the revenue for 1918-19 were: Customs duties (Rarotonga and New Zealand), £6,708; export duties, £1,380; postage-stamps, £1,857; and fees and fines, High Court, £756.
Niue.—The revenue of Niue for the year ended the 31st March, 1919 (excluding balance from previous year), was £3,604. The expenditure amounted to £3,111. The total funds to the credit of the Niue Government on the 31st March amounted to £1,340.
Cook and Northern Islands .—The value of exports for the year 1918 was £82,708, while the imports amounted to £99,632. The principal items exported were as follows:—
| £ | |
|---|---|
| Bananas, 60,645 cases, 7,550 kits | 17,617 |
| Coconuts, 175,800 number | 1,300 |
| Coffee, 8 tons | 390 |
| Copra, 1,752 tons | 37,224 |
| Kumaras and taro, 65 cases | 20 |
| Oranges, 84,061 cases | 21,015 |
| Pearl-shell, 35 tons | 2,450 |
| Pineapples, 81 cases | 24 |
| Tomatoes, 6,320 cases | 2,528 |
The export of copra and oranges shows considerable increases as compared with 1917. The decline in tomatoes is largely due to want of shipping facilities. Tomatoes are grown during the winter and early spring, and are placed on the New Zealand market during the "off" season, thus fetching good prices.
Trade with the United States is gaining rapidly in importance. The following shows the countries to which the exports were sent:—
| £ | |
|---|---|
| New Zealand | 42,919 |
| United States | 34,344 |
| Tahiti | 5,445 |
| Total | £82,708 |
The amount of the imports is made up as follows:—
| Imports from— | £ |
|---|---|
| New Zealand | 70,773 |
| United States | 15,324 |
| United Kingdom | 8,474 |
| Australia | 1,682 |
| Tahiti | 2,504 |
| Canada | 453 |
| Sweden | 223 |
| Other places | 199 |
| Total | £99,632 |
Niue.—The exports for 1918 amounted to £16,537, and the imports to £17,258. The principal items of export were,—
| £ | |
|---|---|
| Copra, 600 tons | 13,911 |
| Hats, 2.778 dozen | 1,749 |
Of the total imports, New Zealand contributed goods to the value of £14,781, and Australia £555. Two-thirds of the exports went to New Zealand, Samoa and Australia claiming the remainder.
By virtue of the acceptance of the mandate from the League of Nations to administer the government of Western Samoa, these islands have now become for many purposes part of the territories of the Dominion of New Zealand. Under these circumstances a brief glance at the history of the Group, given below, proves interesting.
Four large and many smaller islands, the whole of volcanic origin, form the Group known by its Native name of Samoa. The Native race inhabiting the islands is of typical Polynesian character, with straight hair, brown colouring, good physique, and mild and hospitable disposition. They have no traditions of a great migration, as the Maoris from their famed Hawaiki. The bulk of scientific opinion seems to place their origin in India. The movement, which is believed to have taken place over two thousand years ago, followed, it is claimed, south-east through the East Indies, the north of New Guinea, the New Hebrides, and Fiji to its centre in the Samoan Group. The first known visit of Europeans to the islands was that of a Dutch expedition, under Jacob Roggeveen, in its voyage around the world in 1721-22. In 1768 De Bougainville called at the islands, and in 1787 La Perouse, who named them "Navigators Islands," a name by which they are still frequently described. The first British vessel to pay a visit was H.M.S. "Pandora," in 1790. Missionaries, who were to play an important part in the development of the country, made their advent in the person of two members of the London Missionary Society, arriving at Savaii in 1830.
The first formal recognition of "whites" took place some eight years later, when Captain Bethune, of the British Navy, concluded a commercial treaty with the Native chiefs, by which harbour dues were to be paid and security to European interests guaranteed in return. Next year (1839) Lieutenant Charles Wilkes, in command of a United States exploring expedition, completed a similar treaty.
Three great nations were to have control of the destinies of the Samoans. Great Britain appointed a Consular Agent in 1847, the United States a Commercial Agent in 1853, and Germany her first representative in 1861.
In 1869 one of the frequent internecine wars of the Natives broke out, a war that was to have far-reaching consequences, for the foreign authorities took for the first time direct measures to ensure peace. The trouble arose over rival claimants to the Native chieftainship, and continued, despite several patched-up truces, for several years.
Petitions were presented to Great Britain in 1877, and the United States in 1878, that the islands should be annexed, but the statesmen of those clays did not consider it advisable. That year (1878), however, the United States were given the privilege of forming a naval and coaling station at Pago Pago, in the island of Tutuila, much the best harbour of the Group. Next year similar privileges were granted the other two Powers—Germany at Saluafata, and Great Britain at a place to be settled later.
Finally, at a conference in Berlin in 1889, an Act was signed by the representatives of the three States, guaranteeing the neutrality and independence of the islands. This arrangement lasted until 1898, when, on the death of King Malietoa Laupepa, disturbances again arose over the succession. In accordance with the recommendation of a joint Commission the kingship was abolished. The Anglo-German agreement of the 14th November, 1899, accepted by the United States in January, 1900, gave to Germany all rights over Western Samoa, and to the United States, Tutuila and the other islands of Eastern Samoa.
On the outbreak of war in 1914 between the United Kingdom and Germany, a New Zealand Expeditionary Force took possession of Western Samoa, landing at Apia on the 29th August, and remained in occupation until the establishment of Civil government under the ægis of the Dominion.
The preamble of the Samoan Constitution Order runs as follows:—
Whereas the Territory of Western Samoa, as defined in the First Schedule to this Order, has during the late war with Germany been in the military occupation of His Majesty's Forces, and still remains in such occupation: And whereas by a Treaty of Peace signed on behalf of His Majesty at Versailles on the twenty-eighth clay of June, nineteen hundred and nineteen, the Government of Germany has surrendered all right and title to the said Territory: And whereas the League of Nations has, by mandate in pursuance of that treaty, committed to His Majesty in right of his Dominion of New Zealand full jurisdiction and authority to govern and administer the said Territory as the Mandatory of the League, and in accordance with the provisions of that mandate: And whereas, by Order in Council passed on the clay of , nineteen hundred and nineteen, in pursuance of the Imperial Act known as the Foreign Jurisdiction Act, 1890, His Majesty, with the advice of his Privy Council, has been pleased to authorize and empower the Parliament of New Zealand to exercise on his behalf the jurisdiction and authority so committed to him by the League of Nations, and has been further pleased to authorize and empower the Governor-General of the Dominion of New Zealand in Council to exercise on his behalf the like jurisdiction and authority until the Parliament of New Zealand makes other provision for the government of the said Territory: And whereas by the Treaties of Peace Act, 1919, the Parliament of New Zealand has approved, ratified, and confirmed the acceptance by His Majesty of the said mandate for the government of the said Territory, and has further approved and authorized the exercise by the Governor-General in Council of the jurisdiction so conferred by the aforesaid Order in Council, and has further empowered the Governor-General in Council to make by Order in Council such provisions as may be thought necessary in New Zealand for the due and effective exercise of the authority so conferred for the government of the said Territory, and has enacted that all provisions so made shall have the force of law in New Zealand: And whereas it is expedient that the Governor-General in Council should exercise the authority so conferred by the said Order in Council and by the said Act, and should make laws accordingly for the peace, order, and good government of the said Territory of Western Samoa ...
The Chief Executive Officer is an Administrator, who is stationed at Apia. Colonel R. W. Tate, C.B.E., has been appointed to this position. Ministerial responsibility for the government is centred in the Minister of External Affairs. Laws are based on those of New Zealand, with the necessary modifications.
Western Samoa includes all islands lying between the 13th and 15th degrees of south latitude and the 171st and 173rd degrees of longitude west of Greenwich.
The principal islands are Savaii and Upolu. Savaii is the largest of the two, with a length of 48 miles, a breadth of 25 miles, and a total area of 660 square miles. The island is mountainous, rising to a height of over 4,000 ft. Upolu, which extends some 45 miles in length and 13 in breadth, measures nearly 600 square miles in area. Of the two, Upolu is the more fertile and populous, and contains the port and capital of Apia. Rainfall is plentiful throughout the Group.
The following particulars have been extracted from the Statesman's Year book, 1919: At the census of 1917 the population (excluding the Force in occupation) numbered 41,128, some 1,668 of which were of European descent. Of the Europeans 660 were described as British, 530 as Germans, 236 as Americans, and 42 as Swedes. The influenza epidemic which swept Samoa in common with other countries during 1918-19 caused the loss of over 8,000 lives.
Most of the Natives profess the Christian religion, Protestant, Catholic, or Mormon. Education is chiefly in the hands of the mission schools, which have over 8,000 pupils. The two German Government schools accommodate about 800 pupils.
Roads, which are fairly good, extend sixty miles.
For the financial year ended the 31st March, 1917, the revenue of Western Samoa was £98,937, and the expenditure £89,801.
Communication with the outer world is available through the high-powered wireless station at Apia.
Barely one-third of a degree south of the Equator, and lying some 166.55 degrees east of Greenwich, is the little phosphate island known as Nauru, or Pleasant Island. Prior to the world-wide conflagration of 1914—19 this rich though little-known island was a German possession. A mandate for the administration of the island was conferred by the Allied and Associated Powers upon the British Empire, to come into operation at the same date as the Treaty of Peace with Germany. The mandate is held jointly by the Imperial Government, the Government of Australia, and the New Zealand Government.
An agreement between the three parties to the mandate was drawn up and completed on the 2nd July, 1919. The administrative control of the island is vested in an Administrator, whose term of appointment is five years. The first Administrator is to be appointed by Australia. A Board of Commissioners comprising three members, one appointed by each Government, is established, and will have full control of the working and sale of the deposits and their products.
The yearly production of phosphates is to be allocated between the three Governments in the following proportions: United Kingdom, 42 per cent.; Australia, 42 per cent.; New Zealand, 16 per cent. This scale is subject to revision every five years. Any portion of its share not required by any Government may be disposed of either to the other Governments pro rata, or, if they do not require it, to others.
The value of Nauru lies almost wholly in the enormous quantity of phosphate it contains. Possession of from 80,000,000 tons to 100,000,000 tons of highest-grade (85 to 86 per cent.) phosphate makes Nauru the richest and best of the known phosphate islands of the world. The yearly output is approximately 150,000 tons. The necessity of an ample supply of phosphates for the Dominion should scarcely need emphasis, as the following extract from the report of the Board of Agriculture illustrates:—
"The Necessity of Phosphates to the New Zealand Farmer.
"The function of phosphates in agriculture is to supply this most important constituent of the ash of plants and the bodies of animals, the bones of which are mainly composed of calcium phosphate. Phosphates, as a plant-food, stimulate root-action and hasten the maturing of the plant. In shallow-rooted plants and those with a feeble root-system, such as turnips, phosphates greatly stimulate the young plant past the stage at which it is most attacked by its enemies. It would be practically impossible after the first burn to grow a good turnip crop on an average New Zealand soil without the use of phosphates.
"Phosphates have a most beneficial effect on all clovers and leguminous fodder plants, and thus indirectly increase the store of nitrogenous organic matter in the soil. The improvement of poor pasture by phosphates is probably the most important part they play in increasing the productiveness of New Zealand lands. The effects of phosphates in raising the quality and feeding-value of the crop are very great. The most nutritious pastures in England and the best dairy pastures in France are those richest in phosphates, and this holds good in New Zealand.
"In the North Island there are large areas of country which, owing to the well-distributed rainfall, are well suited for dairying. On account of the deficiency of phosphates, however, this may not be practicable under the present system unless a good phosphates-supply is assured. In fact, the North Island largely owes its prosperity and rapid development to the use of phosphates, the northern land being generally deficient in available phosphates. An example of the successful use of phosphates producing good dairying country out of poor country is that of Matamata, portions of which, owing to the heavy phosphatic manuring, are now yielding as much milk as the best Taranaki land.
"On account of the high cost of handling fertilizers in New Zealand it is desirable that as high a grade of phosphate should be used as possible. Thus a source yielding an 85-per-cent. phosphate should be more suitable than that giving a 60-per-cent. phosphate, and by using the high-grade fertilizer the cost of bagging, freight, cartage, storage, and handling is largely reduced.
"Finally, the fact that the New Zealand farmer finds it necessary to pay about half a million pounds sterling per annum on phosphates should be sufficient indication of the importance of phosphates to New Zealand agriculture under the present system of manuring."
The richness of the deposits may be seen from the following analysis of samples:—
"The composition of the phosphate of the Pinnacles is 84.1 per cent. of tricalcic phosphate. A sample taken 22 ft. deep, under high-grade phosphate, gave 85.05 per cent. A phosphate boulder obtained from a big deposit, 16 ft. deep, gave 87.9 per cent. Another boulder from a depth of 8 ft. gave 88.7 per cent. A phosphate boulder from 10 ft. in the interior of the island gave 86.9 per cent. A hard phosphate from a selected pure boulder field, 12 ft. deep, covered with white chalk-like matter, gave 90.l per cent.
"Nauru phosphate is better than any other phosphate for making superphosphate. Christmas Island comes near, and Ocean, Anguar, and Makatea phosphates are satisfactory. Nauru phosphate works very satisfactorily as regards the consumption of sulphuric acid in making super. At first the superphosphate is very susceptible to pressure, running together into hard lumps. The amount of acid consumed is comparatively small. The chemical change in the mixer and chamber takes place quickly and completely, so that a 19 to 19 1/2 per cent. superphosphate from an 84 to 86 per cent. phosphate, and a 20 to 20.8 per cent. superphosphate from an 86 to 86.5 per cent. phosphate are obtained. It has to be borne in mind that these phosphates contain more calcium than is represented by Ca3PO4)2, and for this plus lime account must be taken in apportioning the amount of acid required."
Nauru, which is encircled by a road 10 miles long, has an area of only 5,000 to 6,000 acres. The island is surrounded by a wide reef. Near the coast is a belt of flat land covered with coconut-trees, of an area of about 1,400 acres. Behind this rises higher land covering some 4,250 acres, and enclosing a lagoon of almost fresh water. This higher country consists of a mass of phosphate of great richness.
There are some 1,200 Native inhabitants, who speak a language akin to that of the Gilbert-Islanders. Most of the workmen employed are Caroline-Islanders and Chinese. Nauru possesses a wireless station.
Table of Contents
| Year. | Population (exclusive of Maoris and for Annexed Pacific Islands) on 31st December. | Births. | Deaths. | Marriages. | ||
|---|---|---|---|---|---|---|
| Males. | Females. | Totals. | ||||
| 1869 | 140,112 | 97,137 | 237,249 | 9,718 | 2,721 | 1,931 |
| 1870 | 145,732 | 102,668 | 248,400 | 10,277 | 2,703 | 1,851 |
| 1871 | 156,431 | 110,555 | 266,986 | 10,592 | 2,642 | 1,864 |
| 1872 | 162,404 | 117,156 | 279,560 | 10,795 | 3,192 | 1,873 |
| 1873 | 170,406 | 125,540 | 295,946 | 11,222 | 3,645 | 2,276 |
| 1874 | 194,349 | 147,511 | 341,860 | 12,844 | 4,161 | 2,828 |
| 1875 | 213,294 | 162,562 | 375,856 | 14,438 | 5,712 | 3,209 |
| 1876 | 225,580 | 173,495 | 399,075 | 16,168 | 4,904 | 3,196 |
| 1877 | 227,681 | 180,937 | 408,618 | 16,856 | 4,685 | 3,114 |
| 1878 | 240,627 | 191,892 | 432,519 | 17,770 | 4,645 | 3,377 |
| 1879 | 257,894 | 205,835 | 463,729 | 18,070 | 5,583 | 3,352 |
| 1880 | 268,364 | 216,500 | 484,864 | 19,341 | 5,437 | 3,181 |
| 1881 | 274,986 | 225,924 | 500,910 | 18,732 | 5,491 | 3,277 |
| 1882 | 283,303 | 234,404 | 517,707 | 19,009 | 5,701 | 3,600 |
| 1883 | 294,665 | 246,212 | 540,877 | 19,202 | 6,061 | 3,612 |
| 1884 | 306,667 | 257,637 | 564,304 | 19,846 | 5,740 | 3,800 |
| 1885 | 312,125 | 263,101 | 575,226 | 19,693 | 6,081 | 3,813 |
| 1886 | 317,646 | 271,740 | 589,386 | 19,299 | 6,135 | 3,488 |
| 1887 | 324,558 | 278,803 | 603,361 | 19,135 | 6,137 | 3,563 |
| 1888 | 324,948 | 282,432 | 607,380 | 18,902 | 5,708 | 3,617 |
| 1889 | 328,588 | 287,464 | 616,052 | 18,457 | 5,772 | 3,632 |
| 1890 | 332,557 | 292,951 | 625,508 | 18,278 | 5,994 | 3,797 |
| 1891 | 336,174 | 297,884 | 634,058 | 18,273 | 6,518 | 3,805 |
| 1892 | 345,146 | 305,287 | 650,433 | 17,876 | 6,459 | 4,002 |
| 1893 | 357,635 | 314,630 | 672,265 | 18,187 | 6,767 | 4,115 |
| 1894 | 363,763 | 322,365 | 686,128 | 18,528 | 6,918 | 4,178 |
| 1895 | 369,725 | 328,981 | 698,706 | 18,546 | 6,863 | 4,110 |
| 1896 | 376,987 | 337,175 | 714,162 | 18,612 | 6,432 | 4,843 |
| 1897 | 384,703 | 344,353 | 729,056 | 18,737 | 6,595 | 4,928 |
| 1898 | 392,124 | 351,339 | 743,463 | 18,955 | 7,244 | 5,091 |
| 1899 | 398,679 | 357,826 | 756,505 | 18,835 | 7,680 | 5,461 |
| 1900 | 403,628 | 364,650 | 768,278 | 19,546 | 7,200 | 5,860 |
| 1901 | 414,223 | 373,434 | 787,657 | 20,491 | 7,634 | 6,095 |
| 1902 | 425,908 | 382,021 | 807,929 | 20,655 | 8,375 | 6,394 |
| 1903 | 439,674 | 392,831 | 832,505 | 21,829 | 8,528 | 6,748 |
| 1904 | 453,992 | 403,547 | 857,539 | 22,766 | 8,087 | 6,983 |
| 1905 | 467,366 | 415,096 | 882,462 | 23,682 | 8,061 | 7,200 |
| 1906 | 481,651 | 427,075 | 908,726 | 24,252 | 8,339 | 7,592 |
| 1907 | 492,649 | 436,835 | 929,484 | 25,094 | 10,066 | 8,192 |
| 1908 | 510,329 | 450,313 | 960,642 | 25,940 | 9,043 | 8,339 |
| 1909 | 520,406 | 462,520 | 982,926 | 26,524 | 8,959 | 8,094 |
| 1910 | 529,928 | 472,751 | 1,002,679 | 25,984 | 9,639 | 8,236 |
| 1911 | 539,729 | 485,677 | 1,025,406 | 26,354 | 9,534 | 8,825 |
| 1912 | 553,212 | 499,415 | 1,052,627 | 27,508 | 9,214 | 9,149 |
| 1913 | 569,109 | 515,553 | 1,084,662 | 27,935 | 10,119 | 8,813 |
| 1914 | 568, | 527,833 | 1,095,994 | 28,338 | 10,148 | 9,280 |
| 1915 | 563,963 | 538,831 | 1,102,794 | 27,850 | 9,965 | 10,028 |
| 1916 | 549,895 | 550,668 | 1,100,563 | 28,509 | 10,596 | 8,213 |
| 1917 | 537,360 | 560,312 | 1,097,672 | 28,239 | 10,528 | 6,417 |
| 1918 | 542,046 | 566,327 | 1,108,373 | 25,860 | 16,364 | 6,227 |
NOTE .—Maori population excluded from above was 49,776 in 1916, and that of Cook and other Islands 12,797 persons.
| Year. | Occupied and Cultivated Holdings over One Acre in Extent. | Land (including Sown Grasses) under Cultivation. | Live-stock. | Coal-mines, Output from. | |||
|---|---|---|---|---|---|---|---|
| Horses. | Horned Cattle. | Sheep. | Pigs. | ||||
| Number. | Acres. | Tons. | |||||
| 1869 | 11,932 | 783,435 | .. | .. | .. | .. | Prior to 1878, 709,931 |
| 1870 | 13,476 | 997,477 | .. | .. | .. | .. | |
| 1871 | 10,211 | 1,140,279 | 81,028 | 436,592 | 9,700,629 | 151,460 | |
| 1872 | 14,874 | 1,226,222 | .. | .. | .. | .. | |
| 1873 | 15,304 | 1,416,933 | .. | .. | .. | .. | |
| 1874 | 15,883 | 1,651,712 | 99,859 | 494,917 | 11,704,853 | 123,921 | |
| 1875 | 16,092 | 1,943,653 | .. | .. | .. | .. | |
| 1876 | 17,250 | 2,377,402 | .. | .. | .. | .. | |
| 1877 | 18,750 | 2,940,711 | .. | .. | .. | .. | |
| 1878 | 20,519 | 3,523,2771 | 137,768 | 578,430 | 13,069,338 | 207,337 | 162,218 |
| 1879 | 21,054 | 3,082,866 | .. | .. | .. | .. | 231,218 |
| 1880 | 23,129 | 4,506,889 | .. | .. | .. | .. | 299,923 |
| 1881 | 24,147 | 4,768,192 | 161,736 | 698,637 | 12,190,215 | 200,083 | 337,262 |
| 1882 | 26,298 | 5,189,104 | .. | .. | .. | .. | 378,272 |
| 1883 | 27,352 | 5,651,255 | .. | .. | .. | .. | 421,764 |
| 1884 | 28,587 | 6,072,949 | .. | .. | .. | .. | 480,831 |
| 1885 | 29,814 | 6,550,399 | .. | .. | .. | .. | 511,063 |
| 1886 | 31,763 | 6,668,920 | ..187,382 | 853,358 | 15,174,263 | 277,901 | 534,353 |
| 1887 | 33,332 | 6,845,177 | .. | .. | .. | .. | 558,620 |
| 1888 | 34,743 | 7,284,752 | .. | .. | .. | .. | 613,895 |
| 1889 | 35,747 | 7,670,167 | .. | .. | .. | .. | 586,445 |
| 1890 | 38,178 | 8,015,426 | .. | .. | .. | .. | 637,397 |
| 1891 | 38,083 | 8,462,495 | 211,040 | 788,919 | 16,753,752 | 222,553 | 668,794 |
| 1892 | 41,224 | 8,893,225 | .. | ... | 18,570,752 | .. | 673,315 |
| 1893 | 42,768 | 9,713,745 | .. | .. | 19,380,369 | .. | 691,548 |
| 1894 | 45,290 | 10,063,051 | .. | 385,305 | 20,230,829 | .. | 719,546 |
| 1895 | 46,676 | 10,128,076 | .. | 964,034 | 19,826,604 | .. | 726,654 |
| 1896 | .. | 10,698,869 | 237,418 | 1,047,901 | 19,138,493 | 239,778 | 792,851 |
| 1897 | 58,940 | 11,550,075 | 249,813 | 1,138,067 | 19,687,954 | 209,834 | 840,713 |
| 1898 | 60,759 | 11,444,563 | 252,834 | 1,209,165 | 19,673,725 | 186,027 | 907,033 |
| 1899 | 61,639 | 11,984,606 | 258,115 | 1,203,024 | 19,348,506 | 193,512 | 975,234 |
| 1900 | 62,485 | 12,474,511 | 261,931 | 1,222,139 | 19,355,195 | 249,751 | 1,093,990 |
| 1901 | 62,786 | 12,636,035 | 266,245 | 1,256,680 | 20,233,099 | 250,975 | 1,227,638 |
| 1902 | 63,982 | 13,083,971 | 279,672 | 1,361,784 | 20,342,727 | 224,024 | 1,362,702 |
| 1903 | 65,034 | 13,357,700 | 286,955 | 1,460,663 | 18,954,553 | 193,740 | 1,420,193 |
| 1904 | 66,092 | 13,504,004 | 298,714 | 1,593,547 | 18,280,806 | 226,591 | 1,537,838 |
| 1905 | 68,680 | 13,868,074 | 314,322 | 1,736,850 | 19,130,875 | 255,320 | 1,585,756 |
| 1906 | 69,942 | 14,114,925 | 326,537 | 1,810,936 | 20,108,471 | 249,727 | 1,729,536 |
| 1907 | 72,338 | 14,382,787 | 342,608 | 1,851,750 | 20,983,772 | 242,273 | 1,831,009 |
| 1908 | 73,367 | 14,884,617 | 352,832 | 1,816,299 | 22,449,053 | 241,128 | 1,860,975 |
| 1909 | 75,152 | 15,566,308 | 363,259 | 1,773,326 | 23,480,707 | 245,092 | 1,911,247 |
| 1910 | .. | .. | .. | .. | 24,269,620 | .. | 2,197,362 |
| 1911 | 73,876 | 16,154,218 | 404,284 | 2,020,171 | 23,996,126 | 348,754 | 2,066,073 |
| 1912 | .. | .. | .. | .. | 23,750,153 | .. | 2,177,615 |
| 1913 | .. | .. | .. | .. | 24,191,810 | .. | 1,888,005 |
| 1914 | .. | .. | .. | .. | 24,798,763 | .. | 2,275,593 |
| 1915 | .. | .. | .. | .. | 24,901,421 | .. | 2,208,624 |
| 1916 | 77,229 | 16,984,174 | 371,331 | 2,417,491 | 24,798,150 | 297,501 | 2,257,135 |
| 1917 | 79,536 | 17,064,797 | 373,600 | 2,575,230 | 25,270,386 | 283,770 | 2,068,419 |
| 1918 | 80,146 | 17,386,160 | 378,050 | 2,869,465 | 26,538,302 | 258,694 | 2,034,250 |
| Year. | Exports (the Produce of New Zealand). | |||||
|---|---|---|---|---|---|---|
| Wool. | Grain. | Frozen Meat. | ||||
| Quantity. | Value. | Quantity. | Value. | Quantity. | Value. | |
| lb. | £ | Centals. | £ | Cwt. | £ | |
| 1869 | 27,765,636 | 1,371,230 | 233,830 | 96,441 | .. | .. |
| 1870 | 37,039,763 | 1,703,944 | 431,050 | 141,135 | .. | .. |
| 1871 | 37,793,734 | 1,606,144 | 483,170 | 164,087 | .. | .. |
| 1872 | 41,886,997 | 2,537,919 | 520,265 | 178,886 | .. | .. |
| 1873 | 41,535,185 | 2,702,471 | 343,442 | 136,832 | .. | .. |
| 1874 | 46,848,735 | 2,834,695 | 660,796 | 291,112 | .. | .. |
| 1875 | 54,401,540 | 3,398,155 | 629,634 | 231,458 | .. | .. |
| 1876 | 59,853,454 | 3,395,816 | 1,030,430 | 338,792 | .. | .. |
| 1877 | 64,481,324 | 3,658,938 | 714,536 | 277,429 | .. | .. |
| 1878 | 59,270,256 | 3,292,807 | 1,195,850 | 508,981 | .. | .. |
| 1879 | 62,220,810 | 3,126,439 | 1,903,917 | 661,134 | .. | .. |
| 1880 | 66,860,150 | 3,169,300 | 2,907,934 | 906,228 | .. | .. |
| 1881 | 59,415,940 | 2,909,760 | 3,158,121 | 996,044 | .. | .. |
| 1882 | 65,322,707 | 3,118,554 | 2,414,992 | 924,137 | 15,244 | 19,339 |
| 1883 | 68,149,430 | 3,014,211 | 3,752,365 | 1,308,742 | 87,975 | 118,328 |
| 1884 | 81,139,028 | 3,267,527 | 2,775,853 | 766,862 | 254,069 | 345,090 |
| 1885 | 86,507,431 | 3,205,275 | 2,158,604 | 513,937 | 296,473 | 373,857 |
| 1886 | 90,853,744 | 3,072,971 | 1,689,899 | 463,597 | 346,055 | 427,193 |
| 1887 | 88,824,382 | 3,321,074 | 1,818,298 | 443,815 | 402,107 | 455,870 |
| 1888 | 83,225,733 | 3,115,008 | 2,530,321 | 668,900 | 552,298 | 628,800 |
| 1889 | 102,227,354 | 3,976,375 | 3,084,485 | 985,447 | 656,822 | 783,374 |
| 1890 | 102,817,077 | 4,150,599 | 4,327,753 | 1,030,415 | 898,894 | 1,087,617 |
| 1891 | 106,187,114 | 4,129,686 | 2,683,592 | 676,368 | 1,000,307 | 1,194,724 |
| 1892 | 118,180,912 | 4,313,307 | 3,196,141 | 818,982 | 869,600 | 1,033,377 |
| 1893 | 109,719,684 | 3,774,738 | 2,518,091 | 585,015 | 903,836 | 1,085,167 |
| 1894 | 144,295,154 | 4,827,016 | 1,057,708 | 226,487 | 1,025,243 | 1,194,545 |
| 1895 | 116,015,170 | 3,662,131 | 1,011,052 | 215,971 | 1,134,097 | 1,262,711 |
| 1896 | 129,151,624 | 4,391,848 | 1,288,950 | 346,902 | 1,103,362 | 1,251,993 |
| 1897 | 135,835,117 | 4,443,144 | 805,213 | 235,948 | 1,407,921 | 1,566,286 |
| 1898 | 149,385,815 | 4,645,804 | 445,355 | 136,395 | 1,551,773 | 1,698,750 |
| 1899 | 147,169,497 | 4,324,627 | 3,439,606 | 721,817 | 1,865,827 | 2,088,856 |
| 1900 | 140,706,486 | 4,749,196 | 4,485,155 | 1,034,014 | 1,844,831 | 2,123,881 |
| 1901 | 146,820,079 | 3,699,103 | 5,880,650 | 1,285,811 | 1,857,547 | 2,253,262 |
| 1902 | 160,419,023 | 3,354,563 | 2,466,324 | 786,548 | 2,138,557 | 2,718,763 |
| 1903 | 155,128,381 | 4,041,274 | 2,210,721 | 533,865 | 2,378,650 | 3,197,043 |
| 1904 | 144,647,376 | 4,673,826 | 1,719,308 | 392,346 | 1,912,979 | 2,793,599 |
| 1905 | 139,912,737 | 5,381,333 | 1,149,368 | 294,574 | 1,690,684 | 2,694,432 |
| 1906 | 154,384,568 | 6,765,655 | 449,104 | 139,474 | 2,025,507 | 2,877,031 |
| 1907 | 171,635,595 | 7,657,278 | 123,366 | 53,205 | 2,354,808 | 3,420,664 |
| 1908 | 162,518,481 | 5,332,781 | 469,119 | 143,223 | 2,120,303 | 3,188,515 |
| 1909 | 189,683,703 | 6,305,888 | 3,123,111 | 823,149 | 2,572,604 | 3,601,093 |
| 1910 | 204,368,957 | 8,308,410 | 1,097,952 | 319,073 | 2,654,196 | 3,850,777 |
| 1911 | 169,424,811 | 6,491,707 | 1,033,170 | 330,186 | 2,250,565 | 3,503,406 |
| 1912 | 188,361,790 | 7,105,483 | 2,348,673 | 741,600 | 2,573,238 | 3,909,569 |
| 1913 | 186,533,036 | 8,057,620 | 341,981 | 131,938 | 2,578,693 | 4,449,933 |
| 1914 | 220,472,898 | 9,318,114 | 750,904 | 270,011 | 3,229,969 | 5,863,062 |
| 1915 | 196,570,114 | 10,387,875 | 405,865 | 215,463 | 3,591,260 | 7,794,395 |
| 1916 | 185,506,859 | 12,386,074 | 180,586 | 86,985 | 3,326,045 | 7,271,318 |
| 1917 | 178,274,486 | 12,175,360 | 71,048 | 74,606 | 2,446,945 | 5,982,404 |
| 1918 | 108,724,575 | 7,527,266 | 56,819 | 73,088 | 2,036,904 | 4,957,576 |
| Year. | Exports (the Produce of New Zealand)— | |||||
|---|---|---|---|---|---|---|
| Butter. | Cheese. | Phormium Fibre. | ||||
| Quantity. | Value. | Quantity. | Value. | Quantity. | Value. | |
| Cwt. | £ | Cwt. | £ | Tons. | £ | |
| 1869 | 2,705 | 14,679 | 2,331 | 8,040 | 2,028 | 45,245 |
| 1870 | 3,435 | 12,995 | 2,735 | 9,327 | 5,471 | 132,578 |
| 1871 | 4,342 | 12,426 | 1,619 | 4,023 | 4,248 | 90,611 |
| 1872 | 1,629 | 4,462 | 1,362 | 4,379 | 3,985 | 99,405 |
| 1873 | 722 | 2,342 | 1,993 | 6,625 | 6,454 | 143,799 |
| 1874 | 357 | 1,168 | 1,326 | 4,408 | 2,038 | 37,690 |
| 1875 | 104 | 660 | 442 | 1,862 | 639 | 11,742 |
| 1876 | 871 | 3,910 | 885 | 3,488 | 897 | 18,285 |
| 1877 | 5,206 | 23,458 | 4,999 | 16,713 | 1,053 | 18,826 |
| 1878 | 3,106 | 12,111 | 3,019 | 9,368 | 622 | 10,666 |
| 1879 | 339 | 1,631 | 172 | 628 | 445 | 7,874 |
| 1880 | 2,717 | 8,350 | 717 | 1,983 | 894 | 15,617 |
| 1881 | 2,426 | 8,496 | 3,056 | 6,112 | 1,308 | 26,285 |
| 1882 | 11,264 | 52,088 | 3,553 | 10,130 | 2,040 | 41,955 |
| 1883 | 8,869 | 42,020 | 2,519 | 6,892 | 2,013 | 36,761 |
| 1884 | 15,766 | 66,593 | 10,342 | 25,074 | 1,525 | 23,475 |
| 1885 | 24,923 | 102,387 | 15,245 | 35,742 | 1,063 | 16,316 |
| 1886 | 23,175 | 105,537 | 16,429 | 45,657 | 1,112 | 15,922 |
| 1887 | 17,018 | 54,921 | 23,913 | 54,562 | 1,578 | 25,094 |
| 1888 | 29,995 | 118,252 | 36,682 | 78,918 | 4,042 | 75,269 |
| 1889 | 37,955 | 146,840 | 26,558 | 67,105 | 17,084 | 361,182 |
| 1890 | 34,816 | 122,701 | 40,451 | 84,986 | 21,158 | 381,789 |
| 1891 | 39,430 | 150,258 | 39,770 | 86,675 | 15,809 | 281,514 |
| 1892 | 53,930 | 227,162 | 41,493 | 91,042 | 12,793 | 214,542 |
| 1893 | 58,149 | 254,645 | 46,201 | 99,626 | 12,587 | 219,375 |
| 1894 | 60,771 | 251,280 | 55,655 | 115,203 | 4,677 | 66,256 |
| 1895 | 57,964 | 227,601 | 76,743 | 150,909 | 1, 806 | 21,040 |
| 1896 | 71,353 | 281,716 | 71,372 | 130,166 | 2,968 | 32,985 |
| 1897 | 99,002 | 402,605 | 77,683 | 150,517 | 2,769 | 30,674 |
| 1898 | 96,801 | 403,690 | 68,711 | 135,776 | 4,850 | 74,556 |
| 1899 | 136,086 | 571,799 | 69,440 | 141,818 | 10,371 | 184,411 |
| 1900 | 172,583 | 740,620 | 102,849 | 229,111 | 15,906 | 332,182 |
| 1901 | 201,591 | 882,406 | 104,294 | 238,685 | 10,171 | 195,728 |
| 1902 | 253,998 | 1,205,802 | 74,746 | 163,539 | 20,852 | 534,031 |
| 1903 | 285,106 | 1,318,067 | 74,780 | 194,998 | 22,652 | 595,684 |
| 1904 | 314,360 | 1,380,460 | 84,526 | 185,486 | 26,936 | 710,281 |
| 1905 | 305,722 | 1,408,557 | 88,562 | 205,171 | 27,877 | 696,467 |
| 1906 | 320,225 | 1,560,235 | 131,206 | 341,002 | 27,779 | 776,106 |
| 1907 | 328,441 | 1,615,345 | 236,833 | 662,355 | 28,547 | 832,068 |
| 1908 | 229,971 | 1,171,182 | 280,798 | 783,419 | 17,403 | 396,288 |
| 1909 | 321,108 | 1,639,380 | 400,607 | 1,105,390 | 14,318 | 306,973 |
| 1910 | 356,535 | 1,811,975 | 451,915 | 1,195,373 | 20,645 | 448,414 |
| 1911 | 302,387 | 1,576,917 | 439,174 | 1,192,057 | 17,366 | 300,209 |
| 1912 | 378,117 | 2,088,809 | 577,070 | 1,680,393 | 18,641 | 376,264 |
| 1913 | 372,258 | 2,061,651 | 611,663 | 1,770,297 | 28,092 | 721,924 |
| 1914 | 434,067 | 2,338,576 | 863,776 | 2,564,125 | 19,702 | 455,214 |
| 1915 | 420,144 | 2,700,625 | 817,258 | 2,730,211 | 23,220 | 571,621 |
| 1916 | 358,632 | 2,632,293 | 949,416 | 3,514,310 | 27,674 | 1,001,725 |
| 1917 | 254,397 | 2,031,551 | 885,743 | 3,949,251 | 23,516 | 1,197,396 |
| 1918 | 431,023 | 3,402,223 | 883,430 | 4,087,278 | 25,167 | 1,387,763 |
| Year. | Exports (the Produce of New Zealand)— | |||||
|---|---|---|---|---|---|---|
| Gold. | Gum (Kauri). | Provisions, Tallow. Timber, &c. | Total New Zealand Produce exported. | |||
| Quantity. | Value. | Quantity. | Value. | Value. | ||
* Not available for publication. † Excluding gold (specie and bullion). | ||||||
| Oz. | £ | Tons. | £ | £ | £ | |
| 1869 | 614,281 | 2,362,995 | 2,850 | 111,307 | 80,197 | 4,090,134 |
| 1870 | 544,880 | 2,157,585 | 4,391 | 175,074 | 212,044 | 4,544,682 |
| 1871 | 730,029 | 2,787,520 | 5,054 | 167,958 | 338,335 | 5,171,104 |
| 1872 | 445,370 | 1,730,992 | 4,811 | 154,167 | 396,976 | 5,107,186 |
| 1873 | 505,337 | 1,987,425 | 2,833 | 85,816 | 412,660 | 5,477,970 |
| 1874 | 376,388 | 1,505,331 | 2,568 | 79,986 | 397,753 | 5,152,143 |
| 1875 | 355,322 | 1,407,770 | 3,230 | 138,523 | 285,674 | 5,475,844 |
| 1876 | 318,367 | 1,268,559 | 2,888 | 109,234 | 350,817 | 5,488,901 |
| 1877 | 366,955 | 1,476,312 | 3,632 | 118,348 | 468,693 | 6,058,717 |
| 1878 | 311,437 | 1,244,190 | 3,445 | 132,975 | 573,521 | 5,784,619 |
| 1879 | 284,100 | 1,134,641 | 3,228 | 147,535 | 483,573 | 5,563,455 |
| 1880 | 303,215 | 1,220,263 | 4,725 | 242,817 | 537,742 | 6,102,300 |
| 1881 | 250,683 | 996,867 | 5,460 | 253,778 | 564,908 | 5,762,250 |
| 1882 | 230,893 | 921,664 | 5,533 | 260,369 | 905,114 | 6,253,350 |
| 1883 | 222,899 | 892,445 | 6,518 | 336,606 | 1,099,239 | 6,855,244 |
| 1884 | 246,392 | 988,953 | 6,393 | 342,151 | 1,116,761 | 6,942,486 |
| 1885 | 222,732 | 890,056 | 5,876 | 299,762 | 1,154,579 | 6,591,911 |
| 1886 | 235,578 | 939,648 | 4,920 | 257,653 | 1,058,504 | 6,386,682 |
| 1887 | 187,938 | 747,878 | 6,790 | 362,434 | 1,085,433 | 6,551,081 |
| 1888 | 229,608 | 914,309 | 8,482 | 380,933 | 1,274,739 | 7,255,128 |
| 1889 | 197,492 | 785,490 | 7,519 | 329,590 | 1,606,605 | 9,042,008 |
| 1890 | 187,641 | 751,360 | 7,438 | 378,563 | 1,440,731 | 9,428,761 |
| 1891 | 251,161 | 1,007,172 | 8,388 | 437,056 | 1,436,641 | 9,400,094 |
| 1892 | 237,393 | 951,963 | 8,705 | 517,678 | 1,197,815 | 9,365,868 |
| 1893 | 227,502 | 915,921 | 8,317 | 510,775 | 1,112,181 | 8,557,443 |
| 1894 | 221,614 | 887,865 | 8,338 | 404,567 | 1,111,929 | 9,085,148 |
| 1895 | 293,493 | 1,162,181 | 7,425 | 418,766 | 1,268,843 | 8,390,153 |
| 1896 | 263,694 | 1,041,428 | 7,126 | 431,323 | 1,268,975 | 9,177,336 |
| 1897 | 251,647 | 980,204 | 6,641 | 398,010 | 1,388,879 | 9,596,267 |
| 1898 | 280,175 | 1,080,691 | 9,905 | 586,767 | 1,562,559 | 10,324,988 |
| 1899 | 389,570 | 1,513,180 | 11,116 | 607,919 | 1,645,313 | 11,799,740 |
| 1900 | 373,614 | 1,439,602 | 10,159 | 622,293 | 1,784,350 | 13,055,249 |
| 1901 | 455,558 | 1,753,784 | 7,541 | 446,114 | 1,935,567 | 12,690,460 |
| 1902 | 507,852 | 1,951,426 | 7,430 | 450,223 | 2,333,704 | 13,498,599 |
| 1903 | 533,314 | 2,037,832 | 9,357 | 631,102 | 2,288,327 | 14,838,192 |
| 1904 | 520,323 | 1,987,501 | 9,203 | 501,817 | 1,976,471 | 14,601,787 |
| 1905 | 520,485 | 2,093,936 | 10,883 | 561,444 | 2,167,616 | 15,503,530 |
| 1906 | 563,843 | 2,270,904 | 9,154 | 522,486 | 2,587,453 | 17,840,346 |
| 1907 | 508,210 | 2,027,490 | 8,708 | 579,888 | 2,934,845 | 19,783,138 |
| 1908 | 506,381 | 2,004,799 | 5,530 | 372,798 | 2,501,525 | 15,894,530 |
| 1909 | 506,371 | 2,006,900 | 8,250 | 552,698 | 3,112,465 | 19,462,936 |
| 1910 | 478,286 | 1,896,318 | 8,693 | 465,044 | 3,648,779 | 21,944,163 |
| 1911 | 454,837 | 1,815,251 | 7,587 | 395,707 | 3,176,458 | 18,781,898 |
| 1912 | 343,163 | 1,345,131 | 7,908 | 401,305 | 3,623,851 | 21,272,405 |
| 1913 | 376,161 | 1,459,499 | 8,780 | 549,106 | 3,375,922 | 22,577,890 |
| 1914 | 227,954 | 895,367 | 8,473 | 497,444 | 3,782,804 | 25,984,717 |
| 1915 | 422,825 | 1,694,553 | 4,575 | 279,133 | 4,668,986 | 31,042,862 |
| 1916 | 292,620 | 1,199,212 | 5,456 | 339,882 | 4,544,108 | 32,975,907 |
| 1917 | * | * | 4,594 | 291,917 | 4,481,578 | †27,894,619 |
| 1918 | * | * | 2,419 | 157,313 | 6,302,112 | 130,184,069 |
| Year. | Total Exports. | Imports. | Total Trade. | |||
|---|---|---|---|---|---|---|
| Total. | From United Kingdom. | From Australia. | From United States. | |||
* Excluding exports and imports of gold (specie and bullion). | ||||||
| £ | £ | £ | £ | £ | £ | |
| 1869 | 4,224,860 | 4,976,126 | 2,458,579 | 2,106,859 | 69,109 | 9,200,986 |
| 1870 | 4,822,756 | 4,639,015 | 2,685,736 | 1,655,086 | 60,497 | 9,461,771 |
| 1871 | 5,282,084 | 4,078,193 | 1,808,636 | 1,969,914 | 59,345 | 9,360,277 |
| 1872 | 5,190,665 | 5,142,951 | 2,685,160 | 2,097,508 | 90,657 | 10,333,616 |
| 1873 | 5,610,371 | 6,464,687 | 3,781,130 | 2,198,849 | 143,273 | 12,075,058 |
| 1874 | 5,251,269 | 8,121,812 | 5,481,036 | 2,076,626 | 191,539 | 13,373,081 |
| 1875 | 5,828,627 | 8,029,172 | 5,103,610 | 2,355,988 | 213,492 | 13,857,799 |
| 1876 | 5,673,465 | 6,905,171 | 4,451,269 | 1,942,590 | 192,287 | 12,578,636 |
| 1877 | 6,327,472 | 6,973,418 | 4,115,544 | 2,288,253 | 269,656 | 13,300,890 |
| 1878 | 6,015,700 | 8,755,663 | 5,333,170 | 2,393,863 | 432,572 | 14,771,363 |
| 1879 | 5,743,126 | 8,374,585 | 5,302,823 | 2,197,452 | 438,399 | 14,117,711 |
| 1880 | 6,352,692 | 6,162,011 | 3,479,217 | 1,930,408 | 238,011 | 12,514,703 |
| 1881 | 6,060,866 | 7,457,045 | 4,530,316 | 1,952,767 | 343,645 | 13,517,911 |
| 1882 | 6,658,008 | 8,609,270 | 5,553,324 | 1,863,865 | 463,493 | 15,267,278 |
| 1883 | 7,095,999 | 7,974,038 | 5,241,847 | 1,576,183 | 419,250 | 15,070,037 |
| 1884 | 7,091,667 | 7,663,888 | 4,934,493 | 1,635,762 | 348,557 | 14,755,555 |
| 1885 | 6,819,939 | 7,479,921 | 5,227,551 | 1,254,908 | 401,532 | 14,299,860 |
| 1886 | 6,672,791 | 6,759,013 | 4,481,101 | 1,317,376 | 337,322 | 13,431,804 |
| 1887 | 6,866,169 | 6,245,515 | 4,173,497 | 1,030,094 | 298,736 | 13,111,684 |
| 1888 | 7,767,325 | 5,941,900 | 3,725,624 | 1,218,593 | 323,069 | 13,709,225 |
| 1889 | 9,341,864 | 6,308,863 | 4,138,077 | 1,107,132 | 342,436 | 15,650,727 |
| 1890 | 9,811,720 | 6,260,525 | 4,221,270 | 1,087,593 | 355,395 | 16,072,245 |
| 1891 | 9,566,397 | 6,503,849 | 4,369,633 | 1,013,549 | 361,795 | 16,070,246 |
| 1892 | 9,534,851 | 6,943,056 | 4,767,369 | 1,112,099 | 381,627 | 16,477,907 |
| 1893 | 8,985,364 | 6,911,515 | 4,481,955 | 1,411,465 | 379,378 | 15,896,879 |
| 1894 | 9,231,047 | 6,788,020 | 3,949,770 | 1,740,965 | 394,691 | 16,019,067 |
| 1895 | 8,550,224 | 6,400,129 | 3,992,359 | 1,261,125 | 394,233 | 14,950,353 |
| 1896 | 9,321,105 | 7,137,320 | 4,714,476 | 1,090,374 | 492,840 | 16,458,425 |
| 1897 | 10,016,993 | 8,055,223 | 5,310,675 | 1,001,003 | 628,044 | 18,072,216 |
| 1898 | 10,517,955 | 8,230,600 | 5,148,833 | 1,158,865 | 800,411 | 18,748,555 |
| 1899 | 11,938,335 | 8,739,633 | 5,526,645 | 1,336,828 | 775,309 | 20,677,968 |
| 1900 | 13,246,161 | 10,646,096 | 6,504,484 | 1,776,978 | 1,061,873 | 23,892,257 |
| 1901 | 12,881,424 | 11,817,915 | 6,885,831 | 1,979,320 | 1,415,260 | 24,699,339 |
| 1902 | 13,644,977 | 11,326,723 | 6,851,452 | 1,715,295 | 1,318,937 | 24,971,700 |
| 1903 | 15,010,378 | 12,788,675 | 7,512,668 | 2,154,966 | 1,441,358 | 27,799,053 |
| 1904 | 14,748,348 | 13,291,694 | 7,982,340 | 1,893,036 | 1,527,915 | 28,040,042 |
| 1905 | 15,655,947 | 12,828,857 | 7,795,284 | 1,815,717 | 1,438,501 | 28,484,804 |
| 1906 | 18,095,137 | 15,211,403 | 9,003,229 | 2,775,312 | 1,405,781 | 33,306,540 |
| 1907 | 20,068,957 | 17,302,861 | 10,278,019 | 3,127,553 | 1,425,596 | 37,371,818 |
| 1908 | 16,317,494 | 17,471,284 | 10,441,837 | 2,841,426 | 1,643,937 | 33,788,778 |
| 1909 | 19,661,996 | 15,674,719 | 9,287,786 | 2,764,210 | 1,166,063 | 35,336,715 |
| 1910 | 22,180,209 | 17,051,583 | 10,498,771 | 2,359,393 | 1,399,737 | 39,231,792 |
| 1911 | 19,028,490 | 19,545,879 | 11,787,300 | 2,944,991 | 1,682,129 | 38,574,369 |
| 1912 | 21,770,581 | 20,976,574 | 12,499,787 | 2,583,887 | 2,049,618 | 42,747,155 |
| 1913 | 22,986,722 | 22,288,302 | 13,312,193 | 2,914,848 | 2,107,990 | 45,275,024 |
| 1914 | 26,261,447 | 21,856,095 | 11,985,946 | 3,376,371 | 2,282,966 | 48,117,542 |
| 1915 | 31,748,912 | 21,728,834 | 11,141,067 | 3,554,535 | 2,600,248 | 53,477,746 |
| 1916 | 33,286,937 | 26,339,283 | 13,869,455 | 4,002,171 | 3,969,925 | 59,626,220 |
| 1917* | 30,683,159 | 20,919,259 | 8,817,513 | 3,660,931 | 3,900,658 | 51,602,418 |
| 1918* | 28,473,497 | 24,233,944 | 8,977,725 | 5,133,349 | 4,980,748 | 52,707,441 |
| Year. | Oversea Shipping. | ||||
|---|---|---|---|---|---|
| Inwards. | Outwards. | Registered Vessels belonging to New Zealand. | |||
| Vessels. | Tonnage. | Vessels. | Tonnage. | Gross Tonnage. | |
| 1860 | 764 | 250,731 | 771 | 247,764 | 25,990 |
| 1870 | 756 | 273,151 | 766 | 265,407 | 26,743 |
| 1871 | 729 | 274,643 | 709 | 265,618 | 27,107 |
| 1872 | 775 | 300,302 | 743 | 285,366 | 23,963 |
| 1873 | 739 | 289,297 | 704 | 281,847 | 30,035 |
| 1874 | 856 | 399,296 | 822 | 385,533 | 38,935 |
| 1875 | 926 | 416,727 | 940 | 417,820 | 42,025 |
| 1876 | 878 | 393,180 | 866 | 393,334 | 44,401 |
| 1877 | 812 | 388,568 | 848 | 400,609 | 42,479 |
| 1878 | 926 | 456,490 | 886 | 428,493 | 46,965 |
| 1879 | 894 | 473,940 | 908 | 475,752 | 64,457 |
| 1880 | 730 | 395,675 | 786 | 424,041 | 66,316 |
| 1881 | 765 | 420,134 | 762 | 413,487 | 72,387 |
| 1882 | 795 | 461,285 | 769 | 438,551 | 76,196 |
| 1883 | 805 | 494,926 | 851 | 507,565 | 84,903 |
| 1884 | 852 | 529,188 | 872 | 534,242 | 92,696 |
| 1885 | 780 | 519,700 | 780 | 513,000 | 95,887 |
| 1886 | 725 | 502,572 | 707 | 488,331 | 94,196 |
| 1887 | 653 | 489,754 | 675 | 493,583 | 94,027 |
| 1888 | 683 | 526,435 | 701 | 531,478 | 86,132 |
| 1889 | 781 | 602,634 | 762 | 593,252 | 87,411 |
| 1890 | 744 | 662,769 | 745 | 649,705 | 98,907 |
| 1891 | 737 | 618,515 | 744 | 625,807 | 102,068 |
| 1892 | 686 | 675,223 | 689 | 656,100 | 101,156 |
| 1893 | 617 | 615,604 | 635 | 642,466 | 100,388 |
| 1894 | 609 | 631,100 | 614 | 631,250 | 99,588 |
| 1895 | 611 | 672,951 | 597 | 648,946 | 100,988 |
| 1896 | 589 | 614,097 | 592 | 627,659 | 105,553 |
| 1897 | 600 | 686,899 | 587 | 675,333 | 119,713 |
| 1898 | 620 | 765,255 | 622 | 765,793 | 126,113 |
| 1899 | 609 | 811,183 | 604 | 807,866 | 129,583 |
| 1900 | 616 | 854,632 | 613 | 825,275 | 137,767 |
| 1901 | 688 | 1,063,274 | 691 | 1,075,906 | 143,183 |
| 1902 | 638 | 1,089,179 | 611 | 1,048,770 | 147,822 |
| 1903 | 617 | 1,102,064 | 608 | 1,113,165 | 150,909 |
| 1904 | 629 | 1,154,569 | 620 | 1,144,764 | 157,334 |
| 1905 | 627 | 1,139,410 | 627 | 1,141,552 | 170,957 |
| 1906 | 629 | 1,243,652 | 631 | 1,238,214 | 180,124 |
| 1907 | 645 | 1,254,266 | 615 | 1,225,382 | 197,001 |
| 1908 | 658 | 1,361,047 | 656 | 1,331,305 | 228,399 |
| 1909 | 605 | 1,263,935 | 596 | 1,253,878 | 230,614 |
| 1910 | 609 | 1,389,031 | 588 | 1,367,207 | 233,531 |
| 1911 | 621 | 1,482,378 | 624 | 1,467,402 | 234,084 |
| 1912 | 677 | 1,672,092 | 666 | 1,668,630 | 245,445 |
| 1913 | 645 | 1,738,985 | 635 | 1,699,807 | 254,117 |
| 1914 | 646 | 1,724,849 | 657 | 1,781,981 | 168,552 |
| 1915 | 638 | 1,641,425 | 649 | 1,635,933 | 150,095 |
| 1916 | 574 | 1,448,517 | 590 | 1,491,593 | 148,497 |
| 1917 | 543 | 1,405,776 | 547 | 1,381,882 | 140,039 |
| 1918 | 543 | 1,279,548 | 544 | 1,310,627 | 141,751 |
| Year. | Government Railways. (Figures to 31st March following.) | Electric Telegraph. (From 1895, figures for 31st March following.) | ||||
|---|---|---|---|---|---|---|
| Miles open for Traffic. | Miles under Construction. | Railway Receipts. | Miles of Line. | Number of Messages. | Cash and Cash Values, including Telephones. | |
| £ | £ | |||||
| 1869 | .. | .. | .. | 1,611 | 173,746 | 32,649 |
| 1870 | .. | .. | .. | 1,887 | 238,195 | 27,422 |
| 1871 | .. | .. | .. | 2,015 | 369,085 | 37,203 |
| 1872 | .. | .. | .. | 2,312 | 491,205 | 44,669 |
| 1873 | 145 | 434 | .. | 2,389 | 637,941 | 55,195 |
| 1874 | 209 | 621 | 21,198 | 2,632 | 844,301 | 62,322 |
| 1875 | 542 | 464 | 72,073 | 3,156 | 993,323 | 74,420 |
| 1876 | 718 | 427 | 469,051 | 3,170 | 1,100,599 | 80,841 |
| 1877 | 1,052 | 251 | 569,898 | 3,307 | 1,182,955 | 85,589 |
| 1878 | 1,089 | 142 | 758,096 | 3,434 | 1,260,324 | 92,433 |
| 1879 | 1,171 | 284 | 762,572 | 3,512 | 1,448,943 | 112,351 |
| 1880 | 1,288 | 192 | 836,077 | 3,758 | 1,304,712 | 100,023 |
| 1881 | 1,333 | 187 | 892,026 | 3,824 | 1,438,772 | 101,566 |
| 1882 | 1,371 | 171 | 953,347 | 3,974 | 1,570,189 | 102,378 |
| 1883 | 1,404 | 224 | 961,304 | 4,074 | 1,599,400 | 102,958 |
| 1884 | 1,479 | 158 | 1,045,712 | 4,264 | 1,654,305 | 101,482 |
| 1885 | 1,613 | 179 | 1,047,418 | 4,463 | 1,774,273 | 112,778 |
| 1886 | 1,721 | 171 | 998,768 | 4,546 | 1,836,266 | 115,666 |
| 1887 | 1,753 | 169 | 994,843 | 4,646 | 1,835,394 | 116,211 |
| 1888 | 1,777 | 163 | 997,615 | 4,790 | 1,765,860 | 104,116 |
| 1889 | 1,809 | 176 | 1,095,569 | 4,874 | 1,802,987 | 106,462 |
| 1890 | 1,842 | 132 | 1,121,701 | 5,060 | 1,961,161 | 110,697 |
| 1891 | 1,869 | 170 | 1,115,432 | 5,349 | 1,968,264 | 117,634 |
| 1892 | 1,886 | 188 | 1,181,522 | 5,479 | 1,904,143 | 103,813 |
| 1893 | 1,948 | 148 | 1,172,792 | 5,513 | 2,069,791 | 112,466 |
| 1894 | 1,993 | 127 | 1,150,851 | 5,823 | 2,046,839 | 136,062 |
| 1895 | 2,014 | 114 | 1,183,041 | 6,245 | 2,124,211 | 148,955 |
| 1896 | 2,018 | 124 | 1,286,158 | 6,285 | 2,520,169 | 152,752 |
| 1897 | 2,055 | 92 | 1,376,008 | 6,484 | 2,696,233 | 160,725 |
| 1898 | 2,090 | 113 | 1,469,665 | 6,736 | 2,960,738 | 170,794 |
| 1899 | 2,104 | 111 | 1,623,891 | 6,910 | 3,469,631 | 192,376 |
| 1900 | 2,212 | 208 | 1,727,236 | 7,249 | 3,898,128 | 222,305 |
| 1901 | 2,235 | 212 | 1,874,586 | 7,469 | 4,167,981 | 234,984 |
| 1902 | 2,291 | 194 | 1,974,038 | 7,749 | 4,559,304 | 248,934 |
| 1903 | 2,328 | 175 | 2,180,641 | 7,779 | 4,965,197 | 261,941 |
| 1904 | 2,374 | 173 | 2,209,231 | 7,944 | 5,159,745 | 270,660 |
| 1905 | 2,407 | 222 | 2,349,704 | 8,355 | 5,640,219 | 298,079 |
| 1906 | 2,458 | 208 | 2,624,600 | 8,953 | 6,396,332 | 325,007 |
| 1907 | 2,474 | 255 | 2,761,938 | 9,656 | 7,042,923 | 348,749 |
| 1908 | 2,674 | 188 | 2,929,526 | 10,404 | 7,425,693 | 374,174 |
| 1909 | 2,717 | 184 | 3,249,790 | 10,901 | 7,846,890 | 399,361 |
| 1910 | 2,753 | 192 | 3,494,182 | 11,316 | 8,360,647 | 438,989 |
| 1911 | 2,798 | 205 | 3,676,509 | 11,805 | 9,063,133 | 479,289 |
| 1912 | 2,851 | 192 | 3,971,002 | 12,508 | 9,944,272 | 528,119 |
| 1913 | 2,854 | 223 | 4,043,328 | 13,044 | 10,694,032 | 579,816 |
| 1914 | 2,945 | 211 | 4,105,457 | 13,434 | 10,827,968 | 665,938 |
| 1915 | 2,970 | 243 | 4,548,356 | 13,684 | 10,836,751 | 846,259 |
| 1916 | 2,970 | 243 | 4,800,810 | 13,896 | 10,875,120 | 855,298 |
| 1917 | 2,983 | 231 | 4,687,700 | 13,687 | 11,624,720 | 868,182 |
| 1918 | 2,983 | 250 | 4,988,632 | 13,813 | 12,091,017 | 993,991 |
| Year. | Banks of Issue. (Average of Four Quarters.) | Savings-banks (Post Office and Private). | Post Office Money-orders issued. | ||||
|---|---|---|---|---|---|---|---|
| Deposits. | Assets. | Liabilities. | Number of Depositors. | Balance to Credit End of Year. | Number. | Amount. | |
| £ | £ | £ | £ | £ | |||
| 1869 | 3,174,831 | 6,231,416 | 3,863,006 | 10,103 | 320,383 | 28,427 | 127,218 |
| 1870 | 3,127,769 | 6,315,354 | 3,819,670 | 12,137 | 388,804 | 31,864 | 140,454 |
| 1871 | 3,334,672 | 5,871,888 | 3,988,400 | 14,275 | 454,966 | 36,291 | 157,397 |
| 1872 | 3,919,838 | 5,429,747 | 4,628,819 | 17,289 | 597,002 | 44,660 | 191,009 |
| 1873 | 4,713,806 | 7,267,720 | 5,538,030 | 21,807 | 812,144 | 52,351 | 219,258 |
| 1874 | 5,564,434 | 9,954,216 | 6,490,504 | 27,215 | 943,753 | 62,712 | 263,164 |
| 1875 | 5,967,205 | 10,987,178 | 6,987,318 | 30,310 | 897,326 | 73,027 | 293,481 |
| 1876 | 6,238,471 | 11,776,070 | 7,221,399 | 32,577 | 905,146 | 80,255 | 310,268 |
| 1877 | 7,185,106 | 12,992,104 | 8,152,230 | 35,709 | 964,430 | 90,672 | 334,973 |
| 1878 | 8,960,369 | 15,393,630 | 10,031,009 | 39,926 | 1,043,204 | 101,017 | 368,255 |
| 1879 | 8,021,073 | 16,054,295 | 9,057,463 | 42,679 | 990,337 | 117,999 | 428,673 |
| 1880 | 8,538,935 | 14,220,275 | 9,550,177 | 47,462 | 1,148,992 | 135,648 | 465,405 |
| 1881 | 9,069,377 | 14,863,645 | 10,083,188 | 61,054 | 1,549,515 | 135,556 | 452,182 |
| 1882 | 8,945,346 | 17,162,234 | 10,015,273 | 68,358 | 1,832,047 | 148,162 | 499,368 |
| 1883 | 8,659,477 | 17,794,761 | 9,706,700 | 73,546 | 1,784,631 | 172,556 | 541,133 |
| 1884 | 9,643,214 | 18,442,139 | 10,691,599 | 79,514 | 1,926,759 | 186,052 | 572,666 |
| 1885 | 10,083,296 | 18,811,567 | 11,130,244 | 85,769 | 2,142,560 | 188,622 | 581,395 |
| 1886 | 10,579,711 | 19,041,827 | 11,603,194 | 91,296 | 2,133,861 | 155,680 | 547,755 |
| 1887 | 11,031,614 | 18,799,847 | 11,995,495 | 97,496 | 2,407,776 | 159,579 | 555,744 |
| 1888 | 11,155,778 | 18,709,444 | 12,108,353 | 103,046 | 2,691,693 | 162,387 | 555,996 |
| 1889 | 11,528,424 | 17,652,915 | 12,486,717 | 110,566 | 2,858,644 | 172,076 | 589,545 |
| 1890 | 12,368,610 | 17,735,259 | 13,356,598 | 118,344 | 3,137,023 | 176,427 | 602,077 |
| 1891 | 12,796,098 | 16,814,518 | 13,820,458 | 126,886 | 3,406,949 | 195,239 | 651,990 |
| 1892 | 13,587,062 | 17,558,168 | 14,623,335 | 135,827 | 3,580,544 | 199,438 | 694,847 |
| 1893 | 14,433,777 | 18,255,534 | 15,489,633 | 147,199 | 3,966,849 | 210,957 | 750,929 |
| 1894 | 13,927,217 | 17,746,421 | 14,930,791 | 154,405 | 4,066,594 | 222,678 | 776,783 |
| 1895 | 13,544,415 | 18,159,781 | 14,491,627 | 163,513 | 4,620,696 | 243,497 | 812,604 |
| 1896 | 14,490,827 | 16,900,199 | 15,520,431 | 175,173 | 5,065,864 | 269,566 | 902,160 |
| 1897 | 14,290,512 | 17,276,771 | 15,380,248 | 187,954 | 5,520,080 | 293,659 | 970,831 |
| 1898 | 14,143,229 | 17,013,404 | 15,299,058 | 199,464 | 5,746,887 | 318,370 | 1,029,241 |
| 1899 | 14,591,223 | 17,190,433 | 15,834,858 | 213,172 | 6,128,297 | 344,664 | 1,118,808 |
| 1900 | 15,570,610 | 17,314,535 | 16,964,582 | 228,883 | 6,665,344 | 369,834 | 1,214,853 |
| 1901 | 16,034,848 | 18,422,274 | 17,490,035 | 245,024 | 7,268,103 | 405,967 | 1,286,508 |
| 1902 | 17,231,767 | 18,999,180 | 18,701,063 | 261,948 | 7,876,877 | 367,207 | 1,277,059 |
| 1903 | 19,011,114 | 19,913,546 | 20,563,879 | 280,011 | 8,432,958 | 396,312 | 1,416,224 |
| 1904 | 19,074,960 | 20,893,096 | 20,643,359 | 297,569 | 8,839,307 | 407,783 | 1,476,887 |
| 1905 | 20,545,601 | 21,770,525 | 22,144,166 | 316,376 | 9,773,954 | 417,441 | 1,541,712 |
| 1906 | 22,422,243 | 23,829,933 | 24,143,008 | 341,114 | 11,170,025 | 439,020 | 1,686,232 |
| 1907 | 23,517,111 | 26,584,239 | 25,334,348 | 364,422 | 12,825,063 | 441,487 | 1,773,591 |
| 1908 | 21,821,753 | 29,098,567 | 23,611,903 | 388,945 | 13,512,266 | 488,084 | 2,050,684 |
| 1909 | 21,996,621 | 26,937,265 | 23,728,326 | 408,770 | 14,065,410 | 538,740 | 2,307,593 |
| 1910 | 24,968,761 | 26,398,927 | 26,742,081 | 432,119 | 15,620,515 | 569,657 | 2,457,523 |
| 1911 | 26,765,122 | 29,433,614 | 28,625,803 | 459,602 | 17,194,461 | 607,764 | 2,759,393 |
| 1912 | 25,622,083 | 31,196,400 | 27,508,348 | 503,927 | 18,043,540 | 666,425 | 3,231,350 |
| 1913 | 25,733,187 | 30,708,932 | 27,591,099 | 532,682 | 18,923,522 | 690,745 | 3,357,774 |
| 1914 | 27,640,507 | 32,502,312 | 29,808,349 | 559,203 | 20,924,754 | 691,518 | 3,427,505 |
| 1915 | 31,433,653 | 33,209,483 | 34,448,270 | 587,109 | 24,238,966 | 664,860 | 3,471,818 |
| 1916 | 37,757,917 | 37,015,486 | 41,977,619 | 619,972 | 28,015,674 | 669,355 | 3,607,087 |
| 1917 | 42,930,713 | 44,979,616 | 48,541,961 | 651,532 | 31,917,099 | 642,683 | 3,476,646 |
| 1918 | 45,562,939 | 48,570,126 | 52,048,732 | 679,398 | 36,529,654 | 638,500 | 3,649,371 |
| Year. | Insurances in Force in the Government Life Insurance Department at End of Year. | Old-age Pensions, 31st March of following Year. | Friendly Societies from which Returns received. | Public Trust Office. | ||||
|---|---|---|---|---|---|---|---|---|
| No. of Policies. | Sums Assured and Bonuses. | No. of Pensions in Force. | Amount represented. | No. of Lodges, &c. | No. of Members. | Number of Estates. | Value of Estates. | |
* From here figures are for year ended 31st March following. † Information not available. | ||||||||
| £ | £ | £ | ||||||
| 1869 | .. | .. | .. | .. | .. | .. | .. | .. |
| 1870 | 59 | 30,250 | .. | .. | .. | .. | .. | .. |
| 1871 | 454 | 200,611 | .. | .. | .. | .. | .. | .. |
| 1872 | 1,689 | 625,421 | .. | .. | .. | .. | .. | .. |
| 1873 | 2,634 | 995,986 | .. | .. | .. | .. | 257 | 17,500 |
| 1874 | 3,953 | 1,453,496 | .. | .. | .. | .. | 293 | 28,930 |
| 1875 | 4,989 | 1,836,859 | .. | .. | .. | .. | 347 | 42,163 |
| 1876 | 6,153 | 2,282,129 | .. | .. | 89 | 8,560 | 412 | 59,720 |
| 1877 | 7,149 | 2,716,907 | .. | .. | 88 | 8,828 | 575 | 67,675 |
| 1878 | 8,711 | 3,251,220 | .. | .. | 110 | 9,759 | 627 | 73,940 |
| 1879 | 10,223 | 3,726,330 | .. | .. | 138 | 13,165 | 713 | 96,315 |
| 1880 | 11,656 | 4,171,504 | .. | .. | 179 | 14,484 | 770 | 117,980 |
| 1881 | 12,411 | 4,471,182 | .. | .. | 272 | 18,634 | 836 | 150,750 |
| 1882 | 15,802 | 5,3,164 | .. | .. | 273 | 18,700 | 911 | 204,545 |
| 1883 | 19,917 | 5,992,111 | .. | .. | 275 | 18,848 | 1,024 | 317,680 |
| 1884 | 21,003 | 6,224,571 | .. | .. | 281 | 21,144 | 1,082 | 392,315 |
| 1885 | 23,218 | 6,552,242 | .. | .. | 302 | 22,794 | 1,190 | 457,620 |
| 1886 | 24,715 | 7,053,276 | .. | .. | 290 | 21,679 | 1,293 | 576,010 |
| 1887 | 25,439 | 7,136,944 | .. | .. | 347 | 24,928 | 1,304 | 715,860 |
| 1888 | 26,168 | 7,362,488 | .. | .. | 353 | 24,938 | 1,483 | 954,675 |
| 1889 | 27,218 | 7,600,537 | .. | .. | 365 | 26,013 | 1,561 | 1,130,960 |
| 1890 | 28,102 | 7,807,792 | .. | .. | 357 | 26,379 | 1,678 | 1,240,097 |
| 1891 | 29,226 | 8,390,803 | .. | .. | 364 | 27,372 | 1,825 | 1,252,625 |
| 1892 | 30,316 | 8,580,817 | .. | .. | 379 | 28,754 | 1,912 | 1,284,745 |
| 1893 | 31,709 | 8,821,255 | .. | .. | 372 | 29,763 | 2,022 | 1,450,918 |
| 1894 | 32,907 | 9,232,543 | .. | .. | 369 | 29,963 | 2,086* | 1,562,269* |
| 1895 | 33,968 | 9,345,229 | .. | .. | 376 | 30,905 | 2,236 | 1,806,953 |
| 1896 | 34,772 | 9,415,693 | .. | .. | 392 | 31,825 | 2,334 | 1,898,163 |
| 1897 | 36,174 | 9,857,010 | .. | .. | 388 | 32,670 | 2,413 | 1,950,314 |
| 1898 | 37,848 | 10,124,227 | 7,443 | 128,082 | 410 | 35,501 | 2,491 | 2,110,316 |
| 1899 | 39,366 | 10,341,702 | 11,285 | 193,718 | 433 | 38,202 | 2,667 | 2,192,594 |
| 1900 | 40,368 | 10,639,978 | 12,405 | 211,965 | 443 | 40,257 | 2,898 | 2,326,954 |
| 1901 | 41,291 | 10,627,263 | 12,776 | 217,192 | 445 | 41,236 | 3,049 | 2,467,614 |
| 1902 | 42,406 | 11,024,734 | 12,481 | 211,595 | 462 | 43,408 | 3,314 | 2,706,785 |
| 1903 | 43,116 | 11,111,807 | 11,926 | 200,915 | 465 | 45,255 | 3,470 | 3,152,882 |
| 1904 | 44,194 | 11,261,080 | 11,770 | 199,081 | 479 | 47,302 | 3,685 | 3,577,355 |
| 1905 | 45,137 | 11,725,977 | 12,582 | 313,018 | 501 | 51,103 | 3,977 | 4,009,992 |
| 1906 | 45,981 | 11,851,491 | 13,257 | 326,084 | 500 | 53,759 | 4,276 | 4,590,157 |
| 1907 | 46,945 | 11,980,123 | 13,569 | 333,340 | 516 | 56,817 | 4,718 | 4,065,989 |
| 1908 | 47,033 | 12,024,699 | 14,396 | 353,343 | 505 | 58,517 | 4,946 | 4,644,795 |
| 1909 | 48,016 | 12,447,748 | 15,320 | 374,699 | 567 | 64,428 | 5,466 | 5,184,840 |
| 1910 | 48,932 | 12,586,798 | 16,020 | 403,020 | 609 | 68,006 | 5,966 | 5,477,675 |
| 1911 | 49,376 | 12,683,277 | 16,649 | 416,530 | 658 | 71,771 | 6,456 | 5,951,233 |
| 1912 | 50,458 | 13,271,699 | 16,509 | 412,408 | 664 | 73,243 | 7,225 | 6,782,532 |
| 1913 | 51,343 | 13,539,467 | 18,050 | 447,765 | 681 | 73,691 | 7,538 | 7,288,447 |
| 1914 | 52,273 | 13,797,075 | 19,352 | 475,970 | 717 | 74,074 | 8,026 | 7,942,158 |
| 1915 | 52,950 | 14,220,945 | 19,804 | 484,232 | 728 | 73,027 | 8,734 | 8,217,500 |
| 1916 | 53,208 | 14,259,372 | 19,697 | 480,559 | 727 | 70,360 | † | † |
| 1917 | 53,058 | 14,188,774 | 19,960 | 740,849 | 730 | 68,771 | 13,746 | 10,358,685 |
| 1918 | 53,803 | 14,770,543 | 19,872 | 731,910 | 731 | 67,527 | 15,223 | 12,807,214 |
| Year. | Scholars at Primary Schools.* | Scholars at Secondary or High Schools.† | Scholars at Private Schools. | New Zealand University Graduates (Direct Degrees). |
|---|---|---|---|---|
* Excluding children attending Native schools and industrial schools. The numbers for 1918 were 5,064 and 516 respectively. † Including in later years secondary pupil's attending technical high schools (2,747 in 1918). | ||||
| 1869 | .. | .. | .. | .. |
| 1870 | .. | .. | .. | .. |
| 1871 | .. | .. | .. | .. |
| 1872 | .. | .. | .. | .. |
| 1873 | .. | .. | .. | .. |
| 1874 | 38,215 | .. | 8,237 | .. |
| 1875 | 45,562 | .. | 7,316 | .. |
| 1876 | 51,964 | 654 | 9,357 | .. |
| 1877 | 56,239 | 716 | 9,992 | .. |
| 1878 | 65,040 | 868 | 9,206 | .. |
| 1879 | 75,556 | 1,417 | 10,234 | .. |
| 1880 | 82,401 | 1,631 | 11,238 | .. |
| 1881 | 83,560 | 1,819 | 9,987 | .. |
| 1882 | 87,179 | 1,899 | 10,002 | .. |
| 1883 | 92,476 | 2,384 | 11,255 | .. |
| 1884 | 97,238 | 2,642 | 12,203 | .. |
| 1885 | 102,407 | 2,659 | 11,989 | 103 |
| 1886 | 106,328 | 2,358 | 12,497 | 117 |
| 1887 | 110,919 | 2,242 | 13,417 | 145 |
| 1888 | 112,685 | 2,120 | 13,893 | 168 |
| 1889 | 115,456 | 2,147 | 13,458 | 199 |
| 1890 | 117,912 | 2,117 | 13,626 | 230 |
| 1891 | 119,523 | 2,205 | 14,142 | 279 |
| 1892 | 122,620 | 2,262 | 14,456 | 323 |
| 1893 | 124,690 | 2,251 | 14,922 | 366 |
| 1894 | 127,300 | 2,454 | 14,627 | 410 |
| 1895 | 129,856 | 2,525 | 14,659 | 464 |
| 1896 | 131,037 | 2,614 | 13,947 | 501 |
| 1897 | 132,197 | 2,709 | 14,447 | 546 |
| 1898 | 131,621 | 2,706 | 14,782 | 603 |
| 1899 | 131,315 | 2,723 | 15,295 | 641 |
| 1900 | 130,724 | 2,792 | 15,555 | 699 |
| 1901 | 131,351 | 2,899 | 15,344 | 757 |
| 1902 | 132,262 | 3,072 | 15,624 | 814 |
| 1903 | 133,568 | 3,722 | 15,609 | 869 |
| 1904 | 135,475 | 4,038 | 16,378 | 929 |
| 1905 | 137,623 | 4,060 | 16,639 | 992 |
| 1906 | 139,302 | 4,270 | 17,131 | 1,083 |
| 1907 | 141,071 | 4,196 | 18,088 | 1,157 |
| 1908 | 147,428 | 6,327 | 18,367 | 1,252 |
| 1909 | 152,416 | 7,063 | 17,930 | 1,327 |
| 1910 | 156,324 | 7,970 | 18,981 | 1,424 |
| 1911 | 161,648 | 6,806 | 19,868 | 1,515 |
| 1912 | 166,264 | 7,357 | 20,238 | 1,631 |
| 1913 | 172,168 | 7,815 | 21,115 | 1,758 |
| 1914 | 178,509 | 8,257 | 22,080 | 1,880 |
| 1915 | 183,214 | 8,860 | 22,339 | 2,002 |
| 1916 | 185,884 | 9,623 | 23,412 | 2,108 |
| 1917 | 190,354 | 10,517 | 25,491 | 2,226 |
| 1918 | 194,934 | 11,796 | .. | 2,317 |
NOTE .—Statistics of schools and scholars not being complete for years prior to 1874, no figures are entered for those years.
Table of Contents
THE RESULTS OF AN INVESTIGATION OF MINIMUM WAGE-RATES AND HOURS OF LABOUR AS DETERMINED BY AWARDS AND INDUSTRIAL AGREEMENTS MADE UNDER THE PROVISIONS OF THE INDUSTRIAL CONCILIATION AND ARBITRATION LAWS OF NEW ZEALAND.
By G. W. CLINKARD , B.Com.. F.R.E.S., Census and Statistics Office, Wellington [The following essay was presented as a thesis for Honours in Commerce in the University of New Zealand.]
So far as I am aware, no comprehensive investigation of the movement of wage-rates in New Zealand has as yet been undertaken, either officially or by private research.
The Department of Labour has from time to time published the results of particular inquiries, which, however, have usually been limited in scope to those occupations directly affected by the factory laws, and which have in no case extended over any period of time greater than one year. Further than this, no attempt appears to have been made to co-ordinate the results obtained, in such manner as to trace the variations in industrial wages or earnings throughout the period over which these restricted inquiries have been scattered. Valuable data have been collected giving information relative to rates of wages actually paid, and as to yearly earnings of various classes of workers, but the investigations have been so spasmodic as to afford no sufficient basis for accurate comparisons over a period of years.
While I have therefore been able to derive from the official statistics information on particular phases of my subject, it has been necessary as a general principle to undertake a distinct research in a field not hitherto covered by any inquiry.
A complete and fully satisfactory statistical treatment of the fluctuations of the rewards of industrial labour should be based entirely upon the actual earnings of the individual workpeople coming within the scope of the inquiry. It is evident, however, that such an investigation can be undertaken only by the possession of power to enforce the furnishing, by private persons and employers, of information which is often rather jealously guarded. In short, the subject of industrial earnings can be satisfactorily surveyed only after extensive and laborious official inquiry.
The next most satisfactory indication of the trend of the monetary rewards of labour lies in the movement of rates of wages. Here again we are faced with the initial difficulties involved in the collection of the requisite information.
The private investigator has in some few countries a final resource embodied in the officially recorded minimum, rates of wages as determined under the various wage laws. In this respect New Zealand provides an excellent field of inquiry. The Industrial Conciliation and Arbitration Act, which was enacted in 1894, came into force in 1896, and although subject to a considerable measure of amendment, this law is still in active operation. The Act was originally designed to prevent the payment of unduly low wages in the few "sweated" industries of the colony, and for some years the tone and extent of the industrial agreements and awards registered under the Act were in marked contrast to the spirit and comprehensive nature of awards made in recent years.
For some three or four years after 1896 the published particulars of awards and agreements were scanty. The number of trades and industries covered by these determinations has constantly increased with the increase in industrial unionism, and while the transactions under the several minimum-wage laws are at the present time comprehensive in all respects, the insufficiency of the information for earlier years presents a substantial obstacle to a full statistical treatment of the subject of wage-rates in any representative number of occupations.
I have accordingly endeavoured to present in the following pages a summary of the results obtained for each selected industry or occupation from the earliest awards or agreements up to the present time, together with a combined record of the movement of general wage-levels from 1901 to 1919.
In addition to this I have extracted from the various awards particulars regarding several allied subjects of industrial importance. With the exception of information relative to hours of labour, none of these matters lend themselves readily to the compilation of statistical tables, although their influence upon the earnings of workpeople is undoubtedly considerable.
Before entering upon a detailed discussion of the methods adopted for the tabulation and compilation of the data, it is advisable to outline briefly the salient features of the New Zealand laws which have been enacted during the past twenty-five years for the purpose of regulating conditions of employment.
The extent tu which the State has intervened in regulating and defining the terms of the labour contract has been a marked characteristic of our industrial system, and, while the people of the Dominion have now come to look upon this intervention as a normal and justifiable State function. Australasia has for a number of years been regarded by outside observers as the locus of a doubtful industrial experiment.
It is no part of my purpose to discuss here the benefits which may have accrued to New Zealand through the early and full acceptance of the principles underlying our radical labour laws. It cannot, however, be denied that for many years those laws have given stability to industrial conditions, and though the necessity for legislative amendments has from time to time been fully apparent, no considerable section of the community now expresses any desire to revert to methods of laissez-faire in the industrial field. In fact, it would be difficult to suggest an alternative basis upon which any considerable section of our labour legislation might reasonably and safely be set aside.
Throughout the years during which New Zealand has taken her part as a unit of the British Empire in the world struggle against Prussian despotism it has been a cause for deep satisfaction that our minimum-wage laws have been firmly established to provide a ready means for adjusting industrial disputes. The realization by the older countries of the world that such legislative provisions were necessary and beneficial has been amply evidenced by the various restrictive labour laws put into operation by such nations as Britain and the United States of America during the past five years.
While the whole scope of our of "semi-socialistic" legislation involves innumerable subjects of economic interest, I shall endeavour to confine myself to a consideration of those laws dealing directly with the settlement of industrial disputes and the fixation of minimum wages and maximum ordinary working-hours.
By far the most important of these is the Industrial Conciliation and Arbitration Act, under the provisions of which have been made the great majority of the awards and agreements which are statistically summarized hereafter. As previously indicated, the original Act was passed in 1894 as a direct result of the occurrence of the great maritime strike of 1890, followed by the energetic agitation of anti-sweating leagues. The general body of public opinion, however, can hardly be said to have given any definite shape to possible corrective action, and the then experimental "policy of compulsory arbitration was thought out and adopted in Australasia by public men of broad popular sympathies rather than by labour leaders."*
The author of the New Zealand Act (the Hon. W. P. Reeves) has referred in the following words to the indifference which accompanied the final enactment of the law: "Mildly interested, rather amused, very doubtful, Parliament allowed it to become a law, and turned to more engrossing and less visional matters."
So far as the more important provisions of the Act are concerned, I cannot do better than quote from an official statement comprised in the preface to the fifth edition (1909) of "The Labour Laws of New Zealand."
* Dr. V. S. Clark, "The Labour Movement in Australasia."
The condition of the law has not been radically altered by amendments subsequent to that date.
"Societies consisting of three or more employers, or of fifteen or more workers, may now be registered and become subject to the provisions of the Act under the title of 'industrial union.' Two or more of these unions may amalgamate, or they may form an industrial association for the sake of solidarity. Conciliation Commissioners are appointed by the Government, and to these Commissioners industrial disputes are to be referred, with power to call together a local Council of Conciliation. This Council consists of a number of experts in the trade concerned, such number being representative of employers and workers —one, two, or three on each side. If the proceedings before the Council do not terminate the dispute, it is automatically referred to the Arbitration Court. This Court consists of a Judge invested with the power and status of a Judge of the Supreme Court, sitting with two members, one appointed on the recommendation of the employers' unions, and one on that of the workers' unions. The Court has exceedingly wide powers in industrial matters, and against its decisions there is no appeal. The provisions of awards, industrial agreements, &c., are intrusted to Inspectors of Factories (who are also Inspectors of Awards) to see that such awards are adhered to; in case of breach, prosecutions follow."
The awards and agreements registered under this Act provide for a constantly increasing number of matters which are often loosely classified into three groups—wages, hours, and general miscellaneous conditions of employment.
Wage-rates and ordinary working-hours are the two main points upon which substantial disputes most frequently arise.
A further law designed for the prevention of dislocations of industry is represented in the Labour Disputes Investigation Act of 1913. Provision was made in that Act for the establishment of Labour Dispute Committees to investigate disputes which may arise between employers and workers in cases where conditions of employment are not already governed by an award or agreement made under the provisions of the Industrial Conciliation and Arbitration Act. Restrictive provisions are made against the hasty and ill-considered adoption of strikes and lock-outs. Generally, therefore, this Act is supplementary to the Arbitration Act, providing as it does a means of settling disputes in trades where the workers are unorganized or where their conditions of employment have not been investigated and decided upon by Conciliation Councils or the Arbitration Court.
The Labour Disputes Investigation Act is not extensively brought into operation, but from time to time more or less troublesome disputes are dealt with under its provisions, and determinations as to wages, hours, and other matters are accordingly made.
The Factories Act, 1908, was a consolidation of former legislation, and, with the several amendments passed in recent years, constitutes what is officially claimed to be "one of the most complete and perfect laws to be found in the statute-book of any country." The provisions of this law cover the whole field of employment conditions in factories. The working-hours of boys and women are limited to forty-five per week, with an exception in the case of woollen-mills, where forty-eight hours may be worked. By an amending Act passed in 1915, however, it was provided that six months after the declaration of peace with Germany the hours of employment of women and boys in woollen-mills should be restricted to forty-five per week. The working-hours of male factory workers are limited to forty-eight per week, while overtime for both males and females is placed under restriction. Boys or girls under fourteen years of age may not be employed in factories, except in special cases under the written authority of an Inspector of Factories. Further restrictions are made regarding the employment of young persons in unhealthy or dangerous surroundings.
The Act further states that to all persons a minimum wage of 5s. per week must be paid, with annual increases of 3s. per week until twenty years of age is reached. This latter provision was designed to prevent the continued exploitation of the labour of young people at a time when their services could be secured for nothing more substantial than a promise of monetary reward in the indefinite future. Fortunately, however, such times have ceased to be, and the legal provision now has little real importance.
The Shops and Offices Act, 1908—a consolidation and extension of previous Acts—has also been subjected to minor amendments during the past ten years. Broadly, the objects of this Act arc to regulate conditions of employment in shops and offices in a somewhat similar manner to that determined for factories and workshops under the provisions of the Factories Act. The hours of shop-assistants are limited to fifty-two per week, overtime under warrant from an Inspector of Factories being provided for. A clause in the Act provides for the payment of minimum wages on the same scale as that laid down in the Factories Act.
Among a large number of other industrial laws there are several of considerable importance, which, however, have little direct bearing upon minimum rates of wages or hours of labour. The Wages Protection and Contractors' Liens Acts, the Workers' Compensation Act, and the Shipping and Seamen Acts are important definitions of the rights and liabilities of employers and employees.
I have previously indicated some of the general difficulties met with in a statistical investigation of the movement of wage-rates in New Zealand. Some of these difficulties—in fact, the great majority of them—have been the direct result of incomplete or otherwise unsatisfactory data, while others have arisen from the necessity for adopting comparatively simple methods of statistical treatment.
The extraction of the basic data from a mass of intricate and largely irrelevant information has proved to be a work of rather regrettable magnitude, leaving an unfortunately short time available for the prosecution of refined methods of subsequent compilation. In the extraction of the prime data, however, regard has been had to the possibility of extending and amplifying the inquiry at a later date, and provision has been made accordingly. Further than this, it has been my main object to attain such a position as would enable me to determine with reasonable accuracy the general movement of wage rates, rather than to indulge in an intensified treatment of a relatively small number of occupations.
In the course of the research it has been necessary to closely examine and tabulate the particulars given in over six hundred awards, agreements, and "accepted recommendations," and their respective amendments. These determinations are embodied in twenty volumes of the "Book of Awards," the latest volume—that for the year 1919—having as yet been published only in part.
A sample of the original tabulation form is given as Appendix A (page 917). This form is largely self-explanatory. Under column 1 has been entered the volume and page reference of each award or agreement. Column 2 was provided for the purpose of recording whether or not the determination in question was an award of the Court or an industrial agreement. This point was sometimes important in deciding the legally effective terms of the decision. Column 7 was inserted to accommodate a statement of the various occupations (or classes of workmen) for which the hourly, daily, or weekly rates of wages were given in column 8. Columns 9 and 10 (overtime rates and proportion of apprentices to journeymen) deal with two important points which are touched upon in a large number of awards and agreements. The variations of overtime rates have undoubtedly had a considerable bearing upon actual earnings, while the determination of the numerical proportion of apprentices to journeymen in particular trades has often been keenly contested. The final column, provided for "remarks," has been burdened with brief notes on many of the varied matters dealt with not only in the awards themselves, but in the illuminative memoranda appended to the Court's decisions.
The next step was to arrive at a decision regarding the occupations or trades which might reasonably be brought within the scope of the inquiry. Arising out of a desire to cover a fully representative field, my inclination has been to include all trades possible of treatment. The work of compilation, however, forced me to the selection of a restricted number of occupations—twenty-eight in all.
I must here explain that while the term "occupation" will generally be used as referring to each industry or trade covered by the inquiry, a number of the distinct branches of the investigation cover an average over several occupations or "grades" of workmen. For example, the figures given relative to wages of bakers are based upon an average of the wage-rates of foremen, journeymen, and bakers' labourers. The reason for the adoption of this method is to obviate any possibility of the charge being made that I have selected, for any trade, the wages of a particular occupation showing specially large or small fluctuations. In short, I have considered that the most reliable indication of the movement of wages in each industry can be gained from an inspection of the average rates of pay of the most important classes of workpeople in that industry.
While an endeavour has been made to ascertain, by independent inquiry, which of the occupations in each trade merited inclusion in the average, I am prepared to find that my own judgment and the advice given in several instances may have been to some extent in error. I am, however, fully convinced that these slight errors in selection are the basis of little material defect in the results obtained. In the majority of the trades investigated the choice has been clear.
In deciding as to which trades should be treated with I have generally selected those possessing one or more of the three following characteristics: (1) Importance in point of view of numbers of workers; (2) continuity of information and length of period available for treatment; and (3) simplicity and clearness of awards or agreements through non-existence of technicalities.
After careful consideration, particulars have been tabulated in respect of the following occupations: Bakers, boilermakers, bookbinders and paper-rulers, bootmakers (males and females separately), builders' labourers, bricklayers, butchers, carpenters, coachbuilders, coal-miners, drivers, engineers (on shore), fellmongers, flour-mill employees, freezing-works employees, furniture-makers, grocers' assistants, iron and brass moulders, painters, plasterers, plumbers, seamen, slaughtermen (export trade), tailoresses (in wholesale clothing-factories) waterside workers, and woollen-mill employees (males and females separately). Approximately fifty-nine distinct occupations or "grades" of workpeople may be said to be included within the averages compiled, while a much greater number are, I consider, fairly represented by the figures of their respective trades or industries.
A further matter which at an early stage called for a decision was that of the fundamental basis upon which the wage-rates should be treated. In some cases awards or agreements provide for wage-payments at hourly rates, in other cases the rates are given per day or per week, and in a few cases per month. Varying provisions have been made for or against deductions from wages in respect of the time lost by reason of sickness, weather conditions, or workers' default.
The question therefore arose as to what period of time should be taken as the standard. Even within the limits of each trade or industry uniformity was not always assured, different standards being provided for at different times and in different districts. It was evident, however, that, if at all possible, a uniform standard should be adopted throughout the whole field of investigation. To secure this it was further evident that some rates would require to be adjusted, either upwards or downwards, according to the acceptance of an hourly, daily, or weekly standard.
The whole matter involved an important principle. The selection of an hourly basis would be tantamount to an endorsement of the "commodity" view of labour—the valuation of a certain quantity of labour-power as measured by a comparatively short period of working-time. To view the matter more from the aspect of possible earning-power over a period of, say, one week would certainly be to follow more closely the spirit of current economic and humanitarian thought.
The great difficulty, however, lay in the fact that many of the occupations investigated are of a casual or intermittent nature. To have "up-graded" the occupations in which hourly rates are provided would have been to disregard the loss of time and wages common to those occupations—a loss which is essentially provided for by relatively high wage-rates in those cases. On the other hand, the industries in which weekly or even daily rates are stipulated are not to any extent subject to loss of wages through "broken time," and no considerable injustice would be involved in reducing those weekly rates to an hourly equivalent.
Under neither system, however, would any serious distortion of the facts take place when we consider that the main intention of the figures given is to afford a comparison over a series of years. Any defects inherent La either standard would be of approximately constant effect in each year, and accordingly would not destroy the value of the comparative results.
So far as the secondary object of the inquiry—the making of comparisons between particular trades—is concerned, however, it is advisable, as previously mentioned, to endeavour to secure uniformity of treatment, and to carry out the statistical tabulation on the most reasonable common basis.
In this connection it is interesting to note that in an inquiry made some years ago by the Australian Bureau of Census and Statistics relative to wage-rates in the Commonwealth the weekly standard was adopted. The following extract is taken from a report* issued by the Bureau:—
"It will be seen that for convenience of comparison the wages are in nearly all cases presented as a weekly rate, though in many industries they are actually based on daily or hourly rates, as specified in awards, determinations, or agreements. This caution is necessary in view of the fact that it is often in those industries and occupations in which employment is of an exceptionally casual or intermittent nature that wages are fixed or paid at a daily or hourly rate. Hence the average weekly earnings in such occupations will probably fall considerably short of the weekly rates specified in the table."
The caution outlined in the above extract appears to indicate that practical difficulties may have been an important influence in deciding the course to be followed.
With a full realization of all relevant circumstances, I have decided to reduce all weekly or daily rates to an hourly equivalent. The reasons for the taking of this course may be summarized as follows:—
The majority of the awards treated have provided for hourly rates, which consequently require no adjustment.
As there appears to be a decidedly increasing tendency for rates to be stated per hour, rather than per day or per week, the amplification and continuation in future of this investigation will be to that extent on increasingly sound grounds.
An hourly standard, with its consequent reduction of weekly and daily rates, is more in harmony with actual industrial conditions than an up-graded and largely fictitious weekly standard could be.
In a few trades or occupations, however, it is quite impossible to arrive at an hourly statement of wage-rates. This is due to the provision, in some instances, of a piecework rate which prevails over the whole period of the inquiry, and in other cases to the fact that hours of work per week are indefinitely or obscurely stated.
* Report No. 2, Labour and Industrial Branch of the Bureau, 1913, p. 28.
For reasons which will be more fully discussed at a later stage, I have not included in the record of the general movement of wage-rates two important occupations in which hours of work cannot be accurately defined. Wages for these two occupations—coal-miners and seamen—have been tabulated on other than hourly rates in order to give some indication of the course of wages irrespective of concessions in regard to actual working-time.
In one case—that of slaughtermen—the piecework rate has been easily traced throughout the whole period covered by awards and agreements; and, since a piecework system may be regarded as being quite independent of considerations of time, this occupation has been included in the general record.
As a leading principle I have based my calculations upon the awards or agreements regulating conditions in the four chief centres—Auckland, Wellington, Christchurch, and Dunedin. The reasons for adopting this course are, 1 think, quite decisive. Although at the present time conditions in many industries are regulated not only in the cities but also in country districts, in the earlier years of the operation of the Acts determinations were relatively seldom made for districts outside a limited radius of the four industrial centres. Further than this, in the case of a number of occupations the chief centres are substantially the only portions of the Dominion in which work is carried on. Finally, no considerable difference appears to exist between awards for country districts and those in force in the cities, and probably any slight variations that prevail between the two classes of awards have been more or less constant throughout the period.
The coal-mining and meat-freezing industries, however, are essentially carried on in country districts, with the result that the principle of selecting city awards has of necessity been departed from in the investigation of the occupations of coal-miners, fellmongers, freezing-works employees, and slaughtermen.
In several further instances awards have not been made for all four centres, and the Dominion average wages in the occupations of flour-mill employees, seamen, and woollen-mill employees (male and females) are in each case and for each year based upon an average of only three awards or agreements.
In the earlier period of the inquiry, too, awards for each of the four centres did not usually come into operation in the same year. For example, a determination regulating the conditions of employment of painters in Auckland was first put into operation in 1898. The first Wellington award for that occupation was effective from 1899, while conditions in Christchurch and Dunedin were regulated from 1897 and 1898 respectively. On account of the difficulty of interpolating, with any degree of accuracy, figures for earlier years, it was considered that the only reasonably safe and justifiable course to pursue was to base calculations upon the limited amount of definite data available in each instance. While this may give grounds for an attack upon the accuracy of a relatively small portion of the inquiry, I feel confident, after carefully examining the figures, that no substantial errors have been made by taking as the standard Dominion wage the figures for one or two districts.
No attempt has been made to give differential importance (by means of weighting) to each of the four districts. It has been assumed throughout that each of the cities has merited equal consideration with the others, and in fact—especially in later years—the uniformity in labour conditions has been such as to make ineffective any system of weighting which might be employed. Moreover, in occupations where awards have been made for all four centres, the industrial importance of the several districts has, in fact, been approximately equal.
Another matter of principle which had to be decided upon was that of determining a rate of wages which could be considered as adequately representative of each particular year. Awards and agreements are, of course, made effective from various dates throughout the calendar year, and although the effective term of most decisions extended over several years, new determinations often gave rise to the existence of two, or even three different rates in one year. It is apparent that absolute accuracy would demand the calculation of a yearly average by means of weighting each wage-rate by the number of days in the year over which that rate was legally effective.
The above remarks apply equally to the determination of yearly averages for hours and for wages, although changes in hours were relatively much less frequent.
The point has its greatest importance so far as wages are concerned in that portion of the inquiry extending over the war years—1914 to 1919—when changes in wages were more numerous and actual increases more important than in pre-war times.
To have attempted to secure this absolute accuracy would have imposed a very heavy burden of detail, which would not have found adequate reward in the increased value of the resulting figures. It would also have given to the calendar year an importance which is not warranted by circumstances. In most industries the seasons have considerable importance, while the calendar year has little or none.
An approximate average for each year can be secured, however, by selecting the wage-rates and hours prevailing at the 30th June. Since changes in conditions were, at least until recent years, relatively infrequent, any amended scale adopted during the first half of the year was in force over the greater portion of that year, while, on the other hand, changes made after the 30th June were effective for a portion of the year less than six months. This arbitrary selection of rates and hours has certainly had the disadvantage of showing more or less fictitious differences between the different cities in cases where a change in one centre has been made just prior to the 30th June while the corresponding movement in another district has been made shortly after that date. Since my leading aims have not included the presentation of comparisons between different districts, the above-mentioned defect is not of outstanding importance.
A further point which favours the adoption of some clear-cut method is that it facilitates comparisons over definite periods. The selection of the 30th June as the "standard" date is particularly fortunate in this respect in so far as discussions of war increases in wages are concerned. It has further enabled me to bring the inquiry up to date by the tabulation of conditions as at the 30th June, 1919.
In this latter connection it should be pointed out that, following the recent decision of the Arbitration Court that the War Legislation and Statute Law Amendment Act of 1918 is mandatory in its reference to the Court's consideration of increases in costs of living, many amendments to award rates of wages are now being made. A number of these amendments were made prior to the 30th June, 1919, while many more have been made since that date. For that reason a substantial difference between the figures for 1919 in different districts will be noted in the tables given hereafter. In other words, the alterations in wage-rates have recently been numerous, and the process of amendment had not at the 30th June reached anything approaching a state of finality.
As previously mentioned, the inquiry has been virtually divided into two main sections, the first and most important dealing with wage-rates, and the second treating with maximum ordinary working-hours.
Since wage-rates have, in the main, been reduced to an hourly basis, the fluctuations in working-hours have been treated as a separate and distinct study, to which particular attention should not be paid in any consideration of the hourly-wage payments. It should perhaps be pointed out here that the error should not be made of placing as a set-off against the increase in wage-rates the decrease in working-hours. This point is more fully explained in the subsection dealing with "Factors affecting Earnings."
To a considerable extent the matters discussed above arc relevant to both wages and hours of labour, and little further remains to be said at this stage with particular reference to the second phase of my subject.
In a number of instances the maximum ordinary working-hours of employees per week have not been stated with a clarity desirable in a statistical treatment of their fluctuations from time to time. Very often it has been necessary to make what were, I hope, reasonable assumptions relative to meal-hours and kindred points of detail.
In some few cases the ordinary working-hours were not provided for beyond the insertion of a declaration as to what should be regarded as overtime. Another difficulty arose in regard to those awards which defined only the maximum ordinary hours per day, and which left unstated the hours on the weekly half-holidays. The principal difficulties in regard to hours, therefore, were those arising out of the unsatisfactory features of the initial data. In the main, however, it has been a comparatively simple matter to determine accurately the ordinary working-hours per week, and I have no reason to believe that any serious errors may possibly have been made in the compilation of the results.
Since the investigation of monetary wages and earnings is a matter closely allied to the inspection of fluctuations in prices of ordinary trade commodities, it is clearly desirable that the methods of treatment employed should as far as possible be uniform. It has for many years been fully recognized that by a system of index numbers the course of commodity-prices can best be recorded. The defects of this method of presenting statistical data have been widely commented upon, and are generally recognized among economists and statisticians, but so far as I am aware no more satisfactory method has been evolved, and the discussions are largely confined to the vices and virtues of particular systems of weighting. An excellent treatment of the whole subject is given in Report No. 1 of the Labour and Industrial Branch of the Australian Commonwealth Bureau of Census and Statistics. The question in all its aspects, both practical and theoretical, is too extensive to be dealt with in an essay of this nature; nor do I consider that there is any material necessity for such a treatment so far as the present investigation is concerned.
It has been possible to determine with reasonable accuracy the minimum rates of wages and the maximum working-hours provided for in the various industries, and it. has further been a comparatively simple matter to reduce that basic information to a condensed statement of average wages and average hours for each trade for each year over the Dominion as a whole.
A system of index numbers in this inquiry is necessary merely in order to provide, for each industry, a means of recognizing with the greatest ease the relative "values" of the average wages or hours determined for each year, and it is not—as is a price inquiry—a question of computing one index number to represent a number of figures of different and varying importance.
It is only when we come to a consideration of the general movement of wages and working-hours that "composite" index numbers are used to co-ordinate in brief form the fluctuations of the wage-rates and hours of various occupations.
In each separate occupation the average wages for the Dominion in the year 1911, and the average ordinary working-hours in the same year, have been made the base for distinct series of index numbers. The year 1911 was selected for the following reasons:—
Conditions in that year were in no sense abnormal—1911 lies outside the war period, during which wages were increasing rapidly.
The effects of increased unionism had made themselves felt in the extension of the operations of the minimum-wage laws to a large number of industries, with the result that reasonably complete information was by that time available.
The year 1911 is the middle year of the base period (1909-1913) used in the officially compiled index numbers of retail prices in New Zealand.
The Australian official statistics of nominal and effective wages and of retail and wholesale prices contain series of index numbers in which the wages or prices of 1911 are used as the base.
In bringing the results in individual occupations into one combined record it has been necessary to make due allowance for the relative importance of each occupation. It would, of course, be manifestly incorrect to allow fluctuations in the wages of, say, plasterers to have an effect upon the combined index number equal to that of the wages of an important class such as drivers.
The much contested question as to the best systems of "weighting" is to a very considerable degree essentially academic. It has been amply proved, and it is now fully admitted, that a meticulous regard for accuracy in the determination of weights serves no practical purpose.
In this connection I take the liberty of quoting from the well-known essay by Dr. James W. McIlraith on "The Course of Prices in New Zealand":—
"However much economists are agreed that some system of weighting is necessary for a theoretically complete tabular standard, there seems no consensus of opinion as to any method the advantage of which will outweigh its cumbersomeness. Experience, however, has tended to show that in this respect elegantia may be purchased, and no other benefit accrue. Weighted and unweighted tables give, for all practical purposes, substantially the same results."
A further noteworthy opinion on the subject is embodied in a report of the British Association for the Advancement of Science, a committee of which dealt exhaustively with the whole subject of index numbers in 1887-90. The following extract is taken from the report referred to:—
"The general method to be adopted should be that of the weighted mean. In case it should be found to be impracticable to get approximate weights, a reasonably good makeshift would be found by selecting twenty important representative commodities and averaging their variations without weighting them."
The need for accuracy in weighting decreases with any increase in the number of fluctuating "units" to be represented in the composite index number. Since I have been able to include twenty-six reasonably important occupations in the general index number, it has not appeared to be necessary to employ anything more than approximately correct weights. Although detailed information as to the occupations of the people is given in the results of the recent censuses of New Zealand, it is virtually impossible to bring the census classification into line with the requirements of the present inquiry.
A valuable indication of the numbers of workers in the various industries is given in the published records of union membership. Since the principle of granting preference of employment to unionists has now been generally adopted, the union membership statistics must reflect fairly accurately the importance of the individual occupations from the standpoint of numbers of workers employed. It is largely from that source, therefore, that I have taken the general outlines of the weights used in the compilation of the composite wage index numbers. Due allowance was made, however, for the fact that the union membership of many skilled tradesmen is, so to speak, "concealed" in the returns of unions in various industries. For example, carpenters may be members of miners' or freezing-workers' unions, while drivers are, I understand, often allied to the unions in the particular industries in which they are employed. Further than this, while I have taken wage-rates in the four chief centres as being representative of the Dominion as a whole, I have fixed the weights for each occupation with due regard to the fact that in some industries large numbers of men are employed in country districts. Again, in one or two instances the wage-rates treated with are representative of large classes of workers in more or less similar occupations, an extension of the weight; being accordingly justifiable. As a case in point I may mention the large class of unskilled labour of which the occupation of builders' labourer may be regarded as typical.
The weights given to each of the twenty-six occupations comprised in the general index numbers are as follows:—
| Bakers | 1,400 |
| Boilermakers | 300 |
| Bookbinders and paper-rulers | 300 |
| Bootmakers— | |
| Males | 1,400 |
| Females | 750 |
| Builders' labourers | 10,000* |
| Bricklayers | 600 |
| Butchers | 2,500 |
| Carpenters | 3,500 |
| Coachbuilders | 1,500 |
| Drivers | 4,500 |
| Engineers | 2,700 |
| Fell mongers | 1,500 |
| Flour-mill employees | 450 |
| Freezing-works employees | 2,000 |
| Furniture-trade employees | 1,600 |
| Grocers' assistants | 2,000 |
| Iron and brass moulders | 500 |
| Painters | 3,000 |
| Plasterers | 400 |
| Plumbers | 2,000 |
| Slaughtermen | 1,600 |
| Tailoresses | 3,000 |
| Waterside workers | 6,000 |
| Woollen-mill employees— | |
| Males | 700 |
| Females | 800 |
| Totals | 55,000 |
While it is realized that these numbers, which in the main are based upon numbers of unionists in the year 1911, are in some cases considerably in excess of the numbers employed in the earlier years of the inquiry, the relative importance of the trades has probably not changed to any material extent over the whole period of the investigation.
In designing the system of weighting, no allowance has been made for the fact that the monetary wages in some occupations are much higher than in others; or, to state the matter in another form, the system of weighting has been based solely upon numbers of workers, and not upon a joint consideration of both the numbers of workers and the average wages payable in each occupation. The "aggregate expenditure" or "aggregate payment" method which is followed by the official Australian statistics of prices and wages has not been adopted in this inquiry, the index numbers, and not the wage-rates themselves, having been weighted by numbers of workpeople employed.
It will, I think, be clear that while the "aggregate expenditure" method in price index numbers has the virtue of allowing for the "price" importance of a commodity as well as for its "consumption" importance, no such considerations are involved in an inspection of the movement of wage-rates.
The tables presenting average minimum-wage rates and maximum ordinary working-hours, together with Dominion index numbers for both wages and hours for each of the occupations investigated, are given as Appendix B of this thesis. In the following pages I have briefly summarized the leading features of the figures for each occupation.
* To represent various classes of unskilled labour.
Until the year 1913 the wages of foremen, second hands, and third hands have been averaged to produce an average wage representative of bakers in general. From 1913 to 1919 the award classification has been altered, and the main grades are now foremen, journeymen, and labourers. No substantial alteration in wage-rates appears to have been caused merely by the alteration in classification.
The first recorded award in this industry was made in Wellington, and became operative from the 7th February, 1898, when the wages for the three classes of workers above mentioned averaged 12.2d. per hour for a 54-hour week. In the compilation of this average the allowance of thirteen loaves per week provided for in the award has been valued at the rate of 3d. per loaf—the approximate price prevailing at that time.
An award in Christchurch and an agreement in Auckland were also made in 1898, followed by an award in Dunedin in December, 1899. An award made in Christchurch in January, 1900, is noteworthy for the fact that the wage-rates were slightly reduced. This is one of the very few instances in which a reduction in wage-rates was decided upon.
The index numbers recording the movement of wages have increased from 897 in 1898 to 1340 in 1919—a percentage increase of 49.39. The average ordinary working hours decreased during the same period by 9.48 per cent. The war increase in wages amounts to 19.96 per cent.
In the year 1915 awards were made under which only one class of journeymen was provided for. Prior to that year tradesmen were divided into two classes—"first-class" and "ordinary" boilermakers, and the average of the wage of these two classes has been used in the earlier years for which awards are available.
The first award was made in Dunedin in September, 1901, wages averaging 15.75d. per hour, and hours being fixed at a maximum of 48 per week. Further awards were made in Auckland and Christchurch in 1907, and in Wellington in 1911.
Until 1916 the average wage for the Dominion did not increase from its earliest recorded level, both the war increase and the increase over the period 1902-19 showing a rise of 36.5 per cent. Hours have only slightly declined (from 48 to 47 per week)—a fall of 2.09 per cent.
For these workers the wages of journeymen have been used throughout the period to provide the basis of wage comparisons. The first award was made in Wellington in July, 1902—wages at £3 per week of 48 hours, averaging 15d. per hour. Awards providing similar conditions were made in Auckland and in Christchurch in 1907, and in Dunedin in 1913.
Wage-rates have advanced since 1903 by 26.0 per cent., the increase from June, 1914, to June, 1919, amounting to 16.34 per cent. The ordinary working-hours per week have remained unchanged. Provision has recently been made, however, whereby the hours in Auckland, Christchurch, and Dunedin will be reduced to 45 per week from and after the 1st January, 1920.
A uniform rate of wages is provided for all adult male workers in the boot- and shoe-making industry, and no difficulty has arisen as to the classes of workers to be covered by the inquiry.
An award was first made in September, 1898, for the purpose of regulating conditions of employment of workers in Dunedin, Christchurch, and Wellington. A determination for the Auckland district was made in July of the following year. Under these awards the hours of work were limited to 48 per week, and a minimum wage of 10d. per hour was fixed. Since that time a material advance in wages has been granted, the rate in 1919 being set down at 18d. per hour—a percentage increase of 80.0. The increase since June, 1914, amounts to 28.52 per cent. Ordinary working hours are now limited to 45 per week, representing, as compared with the limit enforced in 1899, a decline of 6.25 per cent.
The wages of workers having over five years' experience have been taken as the standard for female employees in the boot- and shoe-making industry. Conditions of employment have been regulated by successive Dominion awards since June, 1909, when working-hours were limited to 45 per week, and wages set down at a minimum of £1 7s. 6d. per week, or 7.33d. per hour. No alteration has been made in the maximum working-hours, and until 1916 wages also remained unaltered. The minimum wage in force in June, 1919, was 27.3 per cent. in advance of the pre-war rate.
The conditions of employment of builders' labourers are to a considerable extent representative of a large class of unskilled labour which finds employment with local governing authorities, and with employers in various industries throughout the Dominion. The classified particulars given for this occupation accordingly have an importance beyond that of presenting facts relative to the employment of builders' labourers only. Unfortunately, however, several difficulties have been met with in the tabulation of the wage-rates and hours of these workers. The selection of a class or classes of workers whose wages might reasonably be taken as the standard would have been a comparatively simple matter had it not been for the fact, already mentioned, that the figures given for this occupation are intended to serve as an index of conditions for the general body of unskilled labour.
After consideration of awards in other allied occupations, it has been decided to include in the average for builders' labourers the wage-rates of labourers assisting tradesmen and of men engaged on scaffold work. The latter class have in most awards been granted slightly higher wages than the great majority of the unskilled workers employed in the building trade. It would appear, however, that the wage-rates of the relatively small number of workers employed as "scaffolders" should be included to give adequate representation to what may be regarded as the superior division of unskilled labour. The importance of the point involved manifests itself in the direction of increasing the average wages for builders' labourers by approximately 1/2d. per hour throughout the whole period covered. The index numbers for this occupation are accordingly affected to only a very small extent. It is perhaps little more than a refinement affecting only comparisons based on money wages as between unskilled labour and the labour of skilled workmen.
Although, as a general principle, I have refrained from inserting in the tables rates of wages or hours in cases where particulars have not been definitely available, in this instance (as in one or two other cases) a clearly erroneous result would be obtained by taking for each of the earlier years the average of figures given in the awards actually in force. In other words, it has been necessary, by means of interpolation, to avoid recording movements in wages or hours which would have been plainly the direct result of incomplete data or defects of method. For that reason I have inserted for the years 1901 and 1902 certain figures, as shown in the table for builders' labourers in Appendix B.
The first determination governing conditions for these workers was made in Christchurch in October, 1900. Awards for Wellington and Dunedin were made in 1901; and in February, 1903, the first Auckland award came into force. Hours were variously determined at 47, 45, and 44 per week, while wages for the several classes of labourers were fixed at minima ranging from 10 1/2d. to 1s. 2d. per hour. At the 30th June, 1919, the minimum-wage rates for the four centres showed an average of 17.78d. per hour, while ordinary working-hours had in all districts been fixed at 44 per week. These movements represent an increase in wages from 1901 to 1919 of 40.11 per cent., and a decrease in hours of 2.2 per cent. during the same period. The war increase in wage-rates amounts to 23.65 per cent.
The first bricklayers' award was made in Dunedin in September, 1902, when a wage-rote of 18d. per hour and a 44-hour week were provided for. No determinations for the other districts were made until September, 1906, when an award was given for the Wellington district. In the following year awards were made for Auckland and Christchurch. In Wellington the wage-rate of 19d. per hour which was granted was 1d. in advance of the minimum fixed in the other centres.
The increase in wages between 1903 and 1919 amounted to 30.55 per cent., while the war increase was 28.8 per cent.
So far as working-hours are concerned, the true position is somewhat obscured by the fact that in the years 1903-6 the only information available is afforded by the Dunedin award, which provides for a week of 44 hours: consequently the slight decline in hours in the Auckland and Wellington districts—from 47 to 44 and from 45 to 44 respectively—are not revealed in any comparison between 1903 and 1919. For this reason the hours of bricklayers have been included in the "composite" index numbers from 1907 to 1919 only.
An average of the wages of four grades of workers—first and second shopmen, first small-goods-men, and general hands—has been taken as the wage standard for butchers.
The first determination in the trade was made in Auckland in October, 1899, when hours were fixed at 60 1/2 per week, and wages were arranged on what seems to have been a particularly low scale. This agreement—with its long hours and low weekly rates of wages—gives an average hourly wage of 7.93d. In contrast to this Auckland agreement, an award was made for Wellington in August, 1900, whereby hours were limited to 56 per week, and wages (including a meat allowance of 5s. per week) averaged 14.52d. per hour. On account of the great disparity between these two early awards I have not inserted an index number (either for wages or for hours) for the year prior to that in which both determinations were in force.
It is worthy of note that until 1912 the wage-rates in Auckland were consistently below those of butchers employed in the other centres. This difference is to some extent due to the fact that in Wellington and Dunedin meat allowances (to the value of 5s. per week) were for many years definitely granted by the awards of the Court, while no such additions to money wages were necessarily made by employers in Auckland and Christchurch.
Wages of these workers have, on the average, increased since 1901 by 53.07 per cent. The increase since 1914 has been 18.23 per cent. Hours have decreased since 1901 by 11.36 per cent.
The working-conditions of carpenters have been regulated for a lengthy period, the earliest award having been made in Christchurch in July, 1897.
This occupation affords an excellent example of the tendency towards increased uniformity of industrial conditions in each particular occupation throughout the whole Dominion. In the earlier years covered by the figures given hereafter, the hourly-wage rates for carpenters were fixed at 14d. in Auckland, 16d. in Wellington, 15d. in Christchurch, and 16d. in Dunedin. It was not until 1908 that the Auckland rate was brought into line with the rate of 16d. which had, at that time, prevailed for some years in the other three centres.
Wages have been increased over the period 1898-1919 by 40.32 per cent., and by 20.83 per cent. during the years 1914-19.
A consideration of the maximum ordinary working-hours as fixed by the earliest awards and as provided by determinations current in 1919 reveals the fact that in only one district—viz., Wellington—has any alteration been made. Hours in that city have been reduced from a maximum of 46 in 1898 to 44 in 1914 and subsequent years, while the average, which, for the first two years covered, is based upon the figures for only two districts, shows a. decline from 45 to 44. This again brings into prominence the constantly recurring difficulty due to the fact that the earlier awards for different districts were not all made in the same year. While this defect, so far as it exists, probably loses its importance and effect in the general weighted average covering all occupations, it is a matter which requires to be kept in view when comparisons are being made between the averages for early years and those at later dates.
The wages and working-hours of journeymen coachbuilders have been regulated in Wellington since August, 1900, in Christchurch and Dunedin since 1901, and in Auckland since March, 1906. Awards for the three first-mentioned centres provided for a minimum wage of 15d. per hour, and for a maximum working-week of 48 hours. When the first Auckland award was made in 1906 a wage-rate of only 14d. was provided for, while hours were limited to 4.7 per week. The wage-rate was in 1909 raised to 15d., uniform with the rate in the southern districts. In the years 1906-8, however, the average over the four towns shows a slightly lower figure than that prevailing previously and subsequently. With this exception the average wage moved constantly upward, until in 1919 it was 46.6 per cent. above the level of the year 1901, and 33.3 per cent. above the average of 1914. Since 1901 working-hours have been reduced from 48 to 47 per week—a percentage fall of 2.08.
An accurate statement of the movement of the wage-rates and working-hours of coal-miners is, I think, quite impossible of attainment. The wages of a large proportion of the underground workers are paid on a contract or piecework basis, these contract rates varying as between the different mines, and even as between different portions of the same mine. It is evident, therefore, that comparisons over a period of years must be founded upon the daily or shift wages of those classes of workers for whom time rates have been stipulated.
The ordinary working-hours of miners have been subjected to a reduction, the extent of which is impossible of measurement, inasmuch as it has been brought about by an alteration in the place from which an underground worker's time is counted. In earlier years the "shift" consisted of eight hours' work "at the face"; the eight hours are now counted between the time of departure from and return to the surface—i.e., from bank to bank. Another amendment has been made in the granting of a half-holiday on each alternate Saturday—"pay Saturday."
The wage-rates which are shown for coal-miners in Appendix B are accordingly computed on a "day" or "shift" basis, irrespective of changes in the actual working-time covered by such day or shift. If regard could be had to such reductions in working-time as have been mentioned above, the increase in wages-rates for these workers would, on an hourly standard, be somewhat greater than is shown in the table given hereafter.
It is for the reasons shortly indicated above that I have omitted this occupation from the compilation of the general index numbers recording the movement of wages and hours of labour, and it is only in consideration of the fact that the wages of coal-miners have both a general and special importance at the present time that I have ventured to submit what is, as I am fully aware, an incomplete and inconclusive contribution to the present controversies on the subject.
It will be noted that awards for only two mines—one in the northern field and one in-the West Coast field—have been selected and used to provide the data upon which my figures have been compiled. Although coal is mined in several fields and in a number of mines throughout the Dominion, the northern and West Coast fields are the most important; while the particular mines covered by this investigation are representative of the conditions prevailing in the respective districts.
The average of the wage-rates of shift miners and of truckers on day wages in these two mines shows an increase since 1902 of 53.74 per cent. The increase in the Taupiri Mine from 1900 to 1919 amounts to 62.83 per cent. The war increase over the average of the two mines is represented by war bonuses granted amounting to 30 per cent. That portion of the table which relates to the years 1916-19 is subject to the objection that the figures given are based upon the rates for "time-wage" workers only, in a period when differential war bonuses were being granted to piece and to time workers. This defect, as previously explained, is involved in the impossibility of obtaining comparable data over earlier years to record the wage-movements of contract workers. It is only in the years since 1916, when the rates for those latter workers have been increased by percentage bonuses, that any comparisons relative to their wage-rates have been possible.
The war bonus granted to contract workers at the present time amounts to 25 per cent.—only 5 per cent. less than that granted to wages-men. It should be mentioned in this connection that while legally registered awards or industrial agreements have normally been used to provide the required data, it has been necessary in regard to the most recent increase in miners' wages to accept the evidence of unregistered but widely published agreements on the subject.
The number of horse-drivers and motor-drivers employed throughout the Dominion is very considerable, since practically all industries are forced to maintain delivery and transport systems supplementary to railway and shipping services.
The progressive tendency towards the increased use of commercial motor vehicles has in recent years gone some distance towards displacing horse-drawn vehicles, though the latter are undoubtedly still in the majority. In the earlier years of the inquiry no provisions were laid down relative to the conditions of employment of motor-drivers, and comparisons over the whole period must be restricted to the wages and hours of horse-drivers only. Probably within five years from the present time motor vehicles will be so substantially in the majority that the system here employed will require some amendment.
The figures given hereafter have been based upon an average of the wages of one-horse and two-horse drivers. In arriving at the hourly rate of wages, and in determining the ordinary hours of work per week, "stable time" has been excluded. This exclusion of time necessarily spent on attention to horses is inevitable, since the extent of such time varies considerably, and has been definitely limited only in recent years. There is evidence to show that the amount of "stable time" now required of horse-drivers is less than was normally worked some years ago, and its exclusion has therefore had the effect of understating—though probably to a small extent only—both the increase in hourly wages and the decline in working-hours; a further effect has been to slightly overstate the average money wages per hour as shown in the table given in Appendix B. Briefly, the movement of wages and of hours has been understated and the actual wages have been slightly exaggerated.
An agreement made in Auckland in May, 1899, is the first recorded determination affecting the large class of drivers employed by carrying firms. It is the awards for these workers which have been used to provide the information representative for drivers as a whole. The Auckland agreement referred to provided for an average wage of 8.84d. per hour over a 54-hour week. This low wage of 7s. per day of 9 1/2 hours was increased in 1902 to 42s. and 46s. per week of 47 1/2 hours for one-horse and two-horse drivers respectively. An agreement made in Wellington in December, 1899, provided for an average wage of 10.99d. per hour over a 47 1/2-hour week. Awards in somewhat similar terms were made in Dunedin and Christchurch in 1901 and 1902 respectively.
Presuming, as may reasonably be done, that working-conditions in Auckland for 1899 were representative for the Dominion as a whole, the increase in wage-rates since that date has been 90.16 per cent. If the average of the rates in Auckland and Wellington at 30th June, 1900, are taken as the base, the increase has been 69.45 per cent. The increase since 1914 amounts to 34.48 per cent.
It has previously been pointed out that a difficulty in regard to "stable time" has made it impossible to state with absolute accuracy the variations over the period in the length of the actual working-week. Prior to 1913, hours, exclusive of stable time, were limited to 47 1/2 per week, with the exception that from 1899 to 1901 the working-week in Auckland was 54 hours. In November, 1912, awards were made under the provisions of which hours, exclusive of stable time, were limited to 48 per week, while stable attendance was for the first time placed under a restriction, being limited to 8 hours per week. It is generally recognized that this represented, in toto, a reduction in working-hours, though the difficulties of the position force me to record a slight increase in hours—i.e., from 47 1/2 to 48 per week. Notwithstanding this fact, however, the index numbers record a decrease in working-hours over the period 1899-1919 amounting to approximately 11 per cent.
The figures relative to engineers cover those workers employed in various foundries and engineering-works, and have no reference or relation to the working-conditions of men employed upon steamships, or in connection with power plants. A number of different classes of workmen employed in the various branches of the engineering industry have in the past been subject to the same working-conditions. One minimum-wage rate has normally been awarded, and this rate, which has been payable to turners, fitters, patternmakers, coppersmiths, and other skilled tradesmen, has of course been adopted as the standard for engineering workers.
An award was made in Christchurch in May of 1898, but after being in force for two years this determination legally expired. It is noteworthy that in the year 1900 an amendment to the arbitration law provided that each award shall remain in force (even after the expiry of the term stated in the award) until such time as a. new award or industrial agreement is made. Although this early determination became legally ineffective in May, 1900, there is little doubt that its conditions would virtually be in operation during the years which parsed before a new award was made in 1911. This Canterbury award of 1898 is remarkable in regard to its indefinite provisions relative to minimum wages. In fact, no minimum wage was provided for, a statement being included in the award to the effect that "the rate of wages to be paid to every workman shall be such as shall from time to time be agreed upon between such workmen and his employer or employers."* This permissive declaration is probably unique, since it has always been a prime function of the Arbitration Court to definitely stipulate the minimum wages to be paid to the various classes of workers affected by each particular award. The hours of labour were limited by the award in question to 48 per week, and this has been taken as the ruling working-week in Christchurch during the years prior to the making of the award of 1911.
Awards were first made in Auckland in 1905, and in Wellington and Dunedin in 1908. The increase in wage-rates since 1905 has been 43.33 per cent.; the increase since 1914, 30.3 per cent. Working-hours have declined from 48 to 47 per week, a fall of 2.08 per cent.
A considerable number of men arc employed in New Zealand, both at freezing-works and in independent businesses, in the work of dealing with by-products from the meat-freezing and wool-growing industries. The various branches of this work are carried out by men who are classified as "pullers," "pelt-classers," "trimmers," &c.; these semi-skilled workmen are assisted by a number of unskilled "general labourers." In determining the standard wage for fellmongery employees I have taken the mean of the wages of painters, trimmers, and pelt-classers, and averaged the resulting figure with the prevailing rate for general labourers. In other words, an importance has been given to the large body of unskilled labourers equal to that of all other classes combined.
* Book of Awards, Vol. I, p. 233.
An award made in Christchurch in August, 1901, in respect of "tanners and fellmongers" contains none of the information comparable with that used in later years, and the award appears to have been applicable to fellmongers in name only. The first award which could be used was that made in Christchurch in October, 1904. An award for Auckland district was made in 1906, while the first award for Otago was not made until March, 1914. By reason of this latter fact it has been advisable to interpolate figures for the years 1911-13 on the basis of the conditions prevailing in the neighbouring district of Canterbury. It is, I think, quite reasonable to presume that the similarity in working-conditions which has prevailed as between these two districts since 1914 also existed in the three years prior to the making of the first Otago award.
Awards for the Wellington district have been in existence over a comparatively short period of time, and I have accordingly used the determinations for the important Hawke's Bay district—adjacent to Wellington—as being quite satisfactory and fully representative for a large area of the North Island.
The average wage of 11 1/4d. per hour which was awarded in Canterbury and Auckland in 1904 and 1906 respectively has increased very considerably during recent years, the Dominion average having risen by the 30th June, 1919, to 21 1/2d. per hour. This represents an increase since 1905 of 91.11 per cent., and an increase since 1914 of 54.23 per cent.
Ordinary working-hours have remained throughout the period at 48 per week; a recently completed agreement for the whole Dominion provides, however, that after the 31st August, 1919, the hours of work shall be reduced to 44 per week.
The classes of workers whose wages have been averaged to provide the "standard" wage for flour-mill employees are (1) millers and (2) storemen and packermen.
There are no flour-mills situated in the Wellington district, and accordingly no awards or agreements have been made for that centre. Awards made in Christchurch and Dunedin in 1900, and an agreement made in Auckland in 1901, provided for an average wage of 11.75d. per hour. Hours were at that time limited to 48 in Christchurch and 46 in Auckland and Dunedin. By an agreement made in 1903, however, the hours in Auckland were apparently increased to 48 per week.
Wage-rates have increased during the period 1901 to 1919 by 51.4 per cent., the increase since 1914 having amounted to 36.85 per cent. Ordinary working-hours have, on the average, decreased since 1901 by 3.53 per cent.
The meat-freezing industry in New Zealand is one of very substantial importance, and an increasingly large number of men are engaged in work connected with various departments of the industry.
I have already traced the movement of wage-rates and hours of fellmongers, and will at a later stage give an outline of the conditions under which slaughtermen have been working during past years. In the figures under the general heading of "Freezing-works employees" I have attempted to show the fluctuations in wages and hours of the large numbers of men employed elsewhere than in the fellmongery and slaughtering departments. Many of these miscellaneous workers are commonly referred to as "freezing-chamber hands," while there is also a large number of unskilled labourers employed throughout the works. The wages of these two classes have accordingly been taken as representative of freezing-works employees other than fellmongers and slaughtermen.
For the purpose of following the course of a series of awards or agreements over the longest possible periods the awards for Gisborne district have been used in preference to those in force in the Auckland district, while Wellington is represented by Hawke's Bay awards and Otago by Southland determinations. Since there is usually little or no difference between conditions over very wide areas, the selections made have had no significance beyond that embodied in the object, already mentioned, of covering the longest possible period of years.
The first award tabulated was that made in Christchurch in October, 1902. The average wage was then 11 1/4d. per hour for a 48-hour week. By June, 1919, the average wage had risen to 22d. per hour, working-hours remaining unchanged. The increase in wage-rates between 1903 and 1919 was 95.55 per cent. A considerable portion of this increase has been granted since 1914, the rise since that year amounting to 49.15 per cent. A feature of the movement of wage-rates of these workers is the substantial increase granted by a new agreement which came into force in April of the current year. This increase in 1919 was granted to fellmongers and slaughtermen as well as to the miscellaneous freezing-works employees.
One of the earliest recorded determinations under the provisions of the Industrial Conciliation and Arbitration Act was that agreed upon in December, 1896, by employers and employees in the furniture-making trade in Dunedin. The agreement provided for the payment, apparently to all adult employees, of a minimum wage of 8s. per day of 8 hours. In the following year decisions wore arrived at in Wellington and Canterbury districts, and an agreement for Auckland was completed in 1899.
In later years greater differentiation has been made between the various occupations within the trade, but, notwithstanding this, one leading minimum rate has throughout been decided upon for the majority of the workers who may be regarded as journeymen furniture-makers. This main rate for journeymen has been followed through the whole series of awards and agreements.
Wage-rates, which in June, 1919, were 22d. per hour, were then 83.33 per cent. higher than in 1897, and 35.38 per cent. above the average rate in 1914. Ordinary working-hours were in the earlier years somewhat indefinitely stated, but wore apparently 48 per week. On that assumption the decline to 44 hours per week in 1919 represents a fall of 8.33 per cent.
The wage-rates and working-hours of grocers' assistants have been governed by awards or agreements since 1901 in Dunedin, 1902, in Wellington and Christchurch, and 1903 in Auckland. With the exception of employees in retail butchers' shops, grocers' assistants constitute the only representatives which I have been able to select to illustrate in any way the improvement in working-conditions of shop-assistants. It has been a feature of industrial conditions in New Zealand, as probably in many other countries, that workers in retail distributive trades and occupations have generally been slow to organize and thus to gain increased industrial bargaining-force. The delay in growth of unionism in the retail trades has probably been due to the diffusion of workpeople among a large number of business establishments, and secondly and mainly to the competition of considerable numbers of active or potential workers able to perform this class of unskilled and light work.
The comparatively early date in the history of our industrial arbitration system by which grocers' assistants had taken the steps necessary to bring them within the operation of the system suggests that particular reasons existed for this active unionism. Conditions were probably more favourable than in many other retail trades, in so far as the non-employment of women was concerned—i.e., there was a clear basis for organization, and competition as between the sexes was non-existent. One substantial reason for the early union activity probably lies in the fact that wages, both for adult and junior workers, were low, while working-hours were long.
The provisions of the earliest awards—which may probably be regarded as some improvement on previously unregulated conditions—granted to adult workers a weekly wage of £2 or £2 5s. for 53 hours' work. Lower wages were awarded for young men under the age of twenty-three years.
The wages of men over the age of twenty-two years have increased since 1902 from an average of 9.62d. per hour to 15.96d. per hour—an advance of 65.90 per cent. The increase since 1914 amounts to 38.30 per cent.; while the decrease in working-hours per week—from 53 to 52—represents a fall of only 1.89 per cent.
I have already dealt with the movement of wages and hours of boiler-makers and of engineers, and although the metal-working industries in New Zealand are relatively unimportant, the working-conditions of iron and brass moulders have been so clearly set out in awards made during the past twenty years that I have included this occupation within the scope of the inquiry. Comparisons as to wages have been based upon the wage-rate awarded to journeymen moulders (not including machine moulders).
The earliest award, which was given for the Wellington District in July, 1899, provided for a minimum hourly rate of wages of 13 1/2d., with a maximum ordinary working-week of 46 1/2 hours. The minimum wages was gradually increased until, at the 30th June, 1919, the average for the four centres stood at 21.75d. per hour. This rise in the minimum rate represents an advance since 1900 of 61.11 per cent., and of 31.82 per cent. since June, 1914.
Contrary to the normal course of events, the maximum working-hours of moulders have increased to a small extent during the past twenty years. As mentioned above, the hours fixed in the Wellington award of 1899 were 46 1/2 per week. This was increased in 1906 to 47 per week, bringing the Wellington award into line with those for Auckland and Dunedin. The earliest Otago award provided for a working-week of only 44 hours, but this, too, was increased to 47 in 1912. The increase in hours, in the average of the four centres, since 1900 amounts to 1.08 per cent.
Awards and agreements governing the working-conditions of painters were made very early after the coming into operation of the Industrial Conciliation and Arbitration Act of 1894. In May, 1897, an agreement in Christchurch limited the working-hours to 44 per week and provided for a minimum wage of 12d. per hour. This agreement legally expired on the 31st May, 1898, and an award made in March of the following year increased the minimum wage to 13 1/2d. per hour. Decisions arrived at in the other three centres during 1898 and 1899 fixed minima of 13d., 15d., and 13 1/2d. in Auckland, Wellington, and Dunedin respectively. For a number of years the rate in all four centres was 15d. per hour. Since 1912, however, there has been a further increase, which was, of course, accelerated by war conditions. The average rate over the four centres at the 30th June, 1919, was 20 1/2d. per hour. The increase since 1897 amounts to 70.83 per cent., and the advance since 1914 has been 24.24 per cent.
So far as hours of work are concerned, there has been no change over the whole period beyond that involved in the slight increase in Wellington in 1909, when the previously existing week of 43 hours (41 1/2 per week in four months of the year, and 44 hours during eight months) was changed to 44 hours throughout the year.
The number of plasterers employed in New Zealand is by no means large, though the increase in the number of buildings constructed of "permanent" materials must constantly tend to increase the numerical importance of these workers. I have, however, included this occupation among the number to be dealt with, for the reasons (1) that the provisions made by decisions under the minimum-wage law have been clear-cut and easily tabulated, and (2) that this occupation is remarkable for the high rates of wages awarded in normal times, and the low percentage of increase during the period of years for which awards and agreements have been made.
The first recorded determination affecting plasterers was made in the form of an agreement in Wellington in January, 1901. By that agreement a. minimum wage of 19.20d. per hour was fixed, while hours of work were limited to 45 per week. In June of the same year an award was made in Dunedin which fixed a minimum rate of 18d. per hour for a 44-hour week. Three months later an agreement was made in Christchurch by which is was provided that the minimum-wage rate should be 16 1/2d. per hour. There was thus in the earlier years a substantial difference between rates in operation in the three centres. In order to avoid the indication of a material fall in rates as between 1901 and 1902 I have inserted for the year 1901, in Canterbury District, the rate which was fixed only in September of that year.
In 1908 the first Auckland award was made, and as the rate fixed (18d. per hour) was slightly below the average for the other three centres, a slight fall in the average wage is shown for that year. The fact that the hours of work in Auckland were limited to 47 per week—and not 44 or 45 as in the other centres—has had the effect of showing an increase in hours as between 1907 and 1908. This is another instance of the difficulty—which has previously been pointed out—involved by the introduction from time to time of information relative to conditions in districts which have not previously been governed by an award or industrial agreement. Unfortunately this difficulty is one which can be surmounted only by means of the doubtful expedient of interpolation, and only in extreme cases has that course been adopted.
Wage-rates in 1901 showed an average over the three southern centres of 17.90d. per hour. On the 30th June, 1919, the average stood at 21.50d. per hour—an advance of 20.11 per cent. on the figure for 1901, and of 16.97 per cent. over the average rate in June, 1914.
It will be noted that these percentage increases are the lowest recorded for any occupation included within the scope of my inquiry. The reason for this is twofold. In the first place, wage-rates for plasterers are now placed by the Arbitration Court on the same plane as the rates for other skilled occupations, and plasterers have lost that superiority of standing which they held in pre-war years. There is indeed some indication that within the past ten years the monopoly of skill in this work which was enjoyed by a comparatively small number of men has been broken down, with the result that wage-rates for these workers have not tended to advance so rapidly as might otherwise have been the case. An additional explanation of the small percentage increase recorded lies, of course, in the relatively high "basic" wages upon which increases have been calculated.
In July, 1898, an industrial agreement was made in Wellington whereby it was determined that the minimum-wage rate for competent journeymen should be 16d. per hour. Hours of work were limited to 46 per week. In April of the following year an agreement in Auckland provided for a minimum of 12d. per hour throughout a 47-hour week. The marked difference between these two wage-rates will be readily noted, but cannot be easily explained. An award in Christchurch and an agreement in Dunedin were made in 1900 and 1901 respectively, a minimum rate of 15d. per hour and a working-week of 44 hours being decided upon in both instances.
Wage-rates in all centres have gradually increased until at the 30th June last the average stood at 21 1/2d. per hour, representing an advance on the average for 1899 of 53.57 per cent., and a war increase of 19.44 per cent. Here again the percentage increase since 1914 is comparatively small by reason of the fact that relatively high wage-rates prevailed at the outbreak of war.
The hours of labour, which are now 44 per week in all centres, have on the average declined since 1899 by 5.38 per cent.
As has previously been mentioned, there have been peculiar difficulties involved in any attempt to state, upon a basis uniform with other occupations, the conditions of employment of seamen. In the first place, the actual working-time of seamen has been made dependent upon whether or not the ship is at sea or in port. Further than this, a distinction as to working-hours between stokehold and deck hands had always been made prior to the coming into operation of the current agreement. In view of this difficulty regarding hours of work it has been necessary to make wage comparisons on the basis of the monthly rates laid down in the various awards and agreements. In arriving at an average wage representative of seamen in general I have taken the mean of three wage-rates—those for (1) able seamen, (2) ordinary seamen over eighteen years of age, and (3) firemen and greasers. This selection, while it excludes consideration of the wages of ships' officers and engineers, gives adequate representation to the various grades of essentially manual labour employed in connection with merchant shipping.
Awards made in Wellington and Auckland in 1897 and 1898 respectively, and an agreement made in Dunedin in the earlier year, gave no decision as to wage-rates further than the provision that wages should in all cases be increased by 10s. per month. Since no definite information is available as to the wages paid prior to the making of these early awards, the statement is valueless for statistical purposes.
The awards which first set out the scale of minimum-wage rates payable to seamen were made in Wellington and Dunedin in August and December, 1899. An Auckland award having similar provisions was made in 1902. No awards or agreements have ever been registered in the Canterbury Industrial District, since no necessity in that direction is involved in the trading to Canterbury ports of vessels registered elsewhere.
Since the making of the earlier awards there has been substantially complete uniformity in the conditions existing in regard to all shipping (other than ferry and towage vessels) affected by the various awards and agreements. In fact, the agreements which have governed conditions in the past few years have been made upon a Dominion basis.
Monthly-wage rates have shown a considerable increase since the date of the first awards, the percentage advance since 1900 amounting to 82.05 per cent. The war increase has been 44.90 per cent. In determining the average wage as at the 30th June, 1919, I have included the war-risk bonus granted under the supplementary Dominion agreement made in October, 1918, only so far as that war bonus affected men employed on coastal and intercolonial skipping. The bonus granted for the time spent in the "war zone" has been excluded from consideration.
I have previously commented upon the leading features of the alterations in working-conditions of fellmongers and freezing-works employees. Slaughtermen constitute another large class of workers employed in the meat-export industry. As these men are employed at piece rates it is impossible to tabulate their wages upon the hourly basis generally used throughout this inquiry, but as the piece rates have always been clearly defined, and as these rates contain one main standard feature—the rate per hundred for slaughtering sheep for export—it has been a simple matter to trace the course of wages over a period of years.
The earliest award was made for the Canterbury district in August, 1901. The rate per hundred for slaughtering sheep was then fixed at 20s. No definite provision was made as to the length of the working-week. An award fixing a similar piece rate in the Gisborne. district was made in August, 1904, when a 48-hour week was decided upon. As I have already explained in reference to freezing-work employees, it is preferable to use the awards for Gisborne district in place of those for Auckland. It has not been advisable, however, to use Hawke's Bay awards (as was done for freezing-works employees) instead of those for Wellington, since the slaughtermen's awards made in Hawke's Bay do not extend over more than a few years.
The piece-rate has been increased from time to time over the Dominion as a whole, until at the 30th June, 1919, it stood at 35s. This is an increase on the rate in June, 1902, of 75 per cent., and an increase since June, 1914, of 27.27 per cent. The maximum ordinary working-week is now limited in all districts to 44 hours, representing a fall of 8.33 per cent. since 1905.
I have been desirous of including within the scope of my investigation several of the more important occupations followed by female industrial workers, and have, I think, achieved this aim in tabulating the wages and hours of females employed in the bootmaking, clothing-manufacturing, and woollen-manufacturing industries. Although women are extensively employed in retail distributive trades, their numbers in industry are comparatively small, and the three occupations mentioned above are representative of a very large proportion of the latter section of the female workers of the Dominion.
The clothing-manufacturing industry is one which in the years immediately preceding the institution of the industrial arbitration system gave considerable ground for the agitation by anti-sweating leagues. It is not surprising, therefore, that at an early date the factory tailoresses formed unions and took advantage of the new industrial law. Unfortunately the published particulars of the earliest determination affecting these workers—an agreement made in Auckland in November, 1897—does not provide information sufficiently complete for my purposes. Detailed "logs" relative to piece-work rates were provided for in each of the awards or agreements made prior to 1906, but I have been forced to rely for my wage comparisons upon the weekly rates stipulated in the awards as an alternative to "payment by results."
After consideration of all the available data I selected for the earlier years the weekly rate payable to fully competent coat-machinists. Since the year 1906, when piecework was abolished and all employees were necessarily paid upon a time basis, one leading class of experienced adult worker has been recognized in the awards, and consequently since that year the wage-rates of "journeywomen" have been used for comparative purposes. This apparent change in the standard in 1906 was in effect no change at all, the minimum ate of 25s. per week of 45 hours having been applicable not only to first-class coat-machinists, but also to other classes of competent adult workers for some years prior to the consolidation of rates under the heading "journeywomen" in 1906.
An agreement made in Dunedin in July, 1898, was also indefinite in its terms so far as hours of work were concerned. It has been assumed, however, for the purpose of determining the hourly rate of wages, that the working-week was limited to 45 hours.
The minimum wage from 1899 until 1912 remained at 6.67d. per hour. This rate has been gradually increased since 1913, until it is now 9.55d. per hour—43.18 per cent. above the original rate and 30.29 per cent. in excess of the rate ruling in June, 1914. Hours of work have decreased 2.22 per cent., from 45 per week in early years to 44 per week in 1919.
To revert to the question of wage-rates in the early years covered by the inquiry: It is interesting to note that there is official endorsement of the statement that wages fixed by the first awards and agreements were usually in advance of the rates previously ruling. The following quotation touches upon this point, and also gives interesting information relative to the increase in minimum-wage rates of tailoresses in Auckland between the years 1897 and 1904:—
"In 90 of the 102 awards increased wages were given to journeymen, and the average increase is estimated as 10 per cent. over rates paid under original awards. It must be remembered that the wages paid prior to the Act coming into force were, generally speaking, less than the amounts subsequently given by the Boards and Court. The increased wages amounted in one case (tailoresses, Auckland) from 17s. 6d., awarded in 1897, to 25s. per week awarded in 1904—a rise of 43 per cent."*
This statement relative to the increase granted to tailoresses in Auckland is doubtless based upon good and sufficient grounds. From the particulars available it appears, however, that this official statement is only partially correct, since the workers to whom it apparently relates—first-class finishers—were not fully representative of the occupation, and were for some years being paid a rate of wages below that granted to other workers.
Unlike the important industrial countries of the world, New Zealand is not under the necessity of maintaining a large "reserve army of labour," though something approaching this reserve is represented in the large body of workers who find intermittent employment in the loading and unloading of ships at the various ports of the Dominion. Their numbers fluctuate considerably, and their employment is subject to all the disturbing influences which affect shipping. Many suggestions have been made having as their object the elimination of the casuality of the work, but no scheme which has had the virtues of practicability and acceptance by the workers' unions has so far been brought forward.
* Extract from a letter (date unknown) addressed by the Secretary, Department of Labour, to the Minister of Labour, and quoted in a "Report on the Labour Laws and Labour Conditions of Foreign Countries," by Special Commissioner Weinstock, California, 1910.
I have used the payments for the following three classes of work as the basis upon which to make comparisons of wage-fluctuations: (1) General-cargo work; (2) coal work; and (3) stowing frozen meat in chambers on board ship. While most of the work done is in connection with the handling of general cargo, "coal work" and "frozen-meat work" has been included to give representation to the higher-paid labour. I am fully aware, however, that, for the purpose of showing greater increases in wage-rates, comparisons might have been made upon general-cargo rates only, and the adoption of such a course could have been fully justified on the grounds that the greater portion of the work was adequately represented. I have preferred, however, to include the two remaining important branches of work in order that comparisons of the money rates with those of other occupations may more truly reflect the conditions existing.
For a number of years prior to 1907 awards had been made for Wellington and Dunedin only. In July, 1907, however, an award was made for Auckland. The first determination relating to Lyttelton (Canterbury Industrial District) was not made until December. 1913: and in order that the base year (1911) and all subsequent years should be fully completed I have interpolated for Canterbury district the figures (for 1911-13) appearing for the port of Wellington. This interpolation would appear to be quite justified by the average wages payable at the other ports, and by the relation which Lyttelton wages bear to the wages in other ports for the years 1914-19. So far as the Otago Industrial District is concerned I have followed in recent years the rates payable at Port Chalmers. This appears to be preferable to using awards for Dunedin, which is now a port of secondary importance. There has never been any material difference between the rates payable at the two ports, and since the importance of Dunedin has waned only within comparatively recent years I have felt no hesitation in using Dunedin awards for the years prior to 1914.
It will be noted, on reference to the table given in Appendix B, that the average wage and the maximum ordinary working-hours for Wellington for the years 1900 and 1901 have been interpolated to avoid the appearance of a substantial fall in 1902. It will also be seen that the figures for 1919 are subject to the qualification that at the date of compilation the amending agreement which provided for the increased rates reflected in the table had not been registered. This, however, is of little moment, since the supplementary agreement is in full operation and has been widely published.
Wage-rates, on the average used in my compilation, have increased since 1900 by 60.35 per cent., and since 1914 by 35.03 per cent. As previously mentioned, however, this is probably a minimum statement of the actual increase. Hours of work have shown a decline since 1900 of 7.26 per cent.
Although New Zealand produces a very considerable quantity of wool, approximately only 5 per cent. of the production is absorbed by the woollen-mills of the Dominion, and the manufacture of woollen goods in this country gives employment to a relatively small number of persons. Out of a total of nearly 1,500 workers, approximately 700 are males.
There is only one mill in the Northern (Auckland) Industrial District, and as no awards or agreements have been made for the special purpose of governing conditions in that mill, it is not possible to tabulate particulars for more than three of the four main industrial districts. In recent years, however, awards have had effect over the Dominion as a whole, and accordingly only one rate of wages has prevailed.
The earliest recorded determination was made as an award for the Canterbury district in September, 1902. Averaging the wages of (1) wool-sorters, (2) tuners, (3) warpers, (4) pattern-weavers, (5) spinners, and (6) workers not otherwise classified, the minimum rate of pay in June, 1903, was 12.21d. per hour for a week of 48 hours. Awards for Wellington and Otago districts were first made in 1912, when the average minimum wage in all centres was 12.71d. per hour. The average wage-rate in June, 1919, was 19d. per hour—55.61 per cent. above the average for 1903, and 49.49 per cent. in excess of the rates ruling in June, 1914.
By an award made in May, 1919, the ordinary hours of work were reduced from 48 per week—the limit maintained since 1903—to 45 per week. This represents a decline of 6.25 per cent.
The awards which have been made from time to time in regard to employment in woollen-mills have specified the working-conditions of both males and females. Unfortunately, however, the award made for the Canterbury district in 1902 did not definitely state the minimum rates of wages payable to female workers, but merely provided that the minimum rates should not be lower than the wages being paid at the date of the making of the award. On account of this deficiency in the award referred to the rates which were granted in 1912 have been interpolated for the year 1911. The necessity for interpolation arises out of the need for having a "base" uniform with that used in the tabulation of all other occupations. Although a slight increase in the wages of male employees took place as between 1911 and 1912, there is no evidence to show that any such increase was made applicable to females.
The awards disclose no advance in wage-rates, prior to 1915, when the previously existing average hourly rate of 6.25d. increased to 6.87d. In 1917 the average hourly rate advanced to 8.20d., and in 1919 to 10d. This last-mentioned amount is an increase of 60 per cent. over the figure for 1911 and 1914.
Hours of work were 48 per week from 1903 until 1918. In 1919, as mentioned in regard to male employees, the hours were reduced to 45 per week—a fall of 6.25 per cent.
Having dealt in some detail with the circumstances surrounding the compilation of wage-tables for each particular occupation, and having shortly indicated the leading features of the results obtained in each instance, I am now in a position to set out the main and most important general findings of the inquiry.
I have previously explained the method adopted for the purpose of tabulation of data and for the compilation of a series of general index numbers, but it will be advisable to recapitulate briefly the system followed in so far as it relates to the general-wage indices.
Wage-rates in twenty-six occupations have been brought within the general index numbers, two classes of workers (coal-miners and seamen) being excluded for special reasons previously enumerated. Each of the twenty-six occupations has had assigned to it a "weight" based upon the estimated number of men following that occupation in the year 1911. These weights have been retained unchanged for all the years covered by the investigation.
The index numbers obtained for each separate occupation have been multiplied for each year by the respective weight, and the total of these products for each year from 1901 to 1919 inclusive has been divided by the total of the weights used for each particular year.
It will be understood that, as index numbers for all occupations were not available for years prior to 1911, the general indices for those earlier years have necessarily been based upon the information which could be placed under contribution, and the number of occupations included and the total of the weights used have consequently gradually increased over the period 1901-11.
The year 1901 has been selected as the first year for which a general index number could reasonably be given; prior to that year the number and importance of the occupations covered were not sufficient to warrant the making of any definite statement as to the general level of wage-rates.
The following table indicates (a ) the number of occupations and (b ) the total of the "weights" (or employees) which are represented in the index numbers for each year.
| Year. | Number of Occupations covered. | Total "Weight" or Number of Employees represented. |
|---|---|---|
| 1901 | 15 | 41,750 |
| 1902 | 18 | 45,650 |
| 1903-4 | 22 | 49,250 |
| 1905-8 | 24 | 53,450 |
| 1909-10 | 25 | 54,200 |
| 1911-19 | 26 | 55,000 |
It will be readily recognized from the above figures that, for the whole period of nineteen years, the index numbers produced are based upon what may be regarded as a representative number of occupations. Moreover, the number of workers the movements of whose wage-rates are reflected in the index numbers form a very substantial proportion of the industrial workers of the Dominion.
The general index numbers of minimum-wage rates, as ascertained by the method outlined, are as follows:—
| Year. | Index Number. |
|---|---|
| 1901 | 932 |
| 1902 | 952 |
| 1903 | 951 |
| 1904 | 955 |
| 1905 | 954 |
| 1906 | 957 |
| 1907 | 966 |
| 1908 | 985 |
| 1909 | 991 |
| 1910 | 996 |
| 1911 | 1000 |
| 1912 | 1006 |
| 1913 | 1036 |
| 1914 | 1087 |
| 1915 | 1094 |
| 1916 | 1152 |
| 1917 | 1200 |
| 1918 | 1258 |
| 1919 | 1418 |
It will be noted that in the years 1903 and 1905 there were slight recessions in the index numbers, which would otherwise present an unbroken series of gradual increases. The slight retrograde movement in the two years mentioned may be definitely assigned to the imperfections of the method of compilation.
In considering various systems of recording price-movements by means of index numbers, the problem of introducing new commodities within the scope of the price survey has often been subjected to searching inquiry, but, so far as I am aware, no satisfactory solution of the difficulty has been discovered. The inclusion of new commodities (or factors) tends to bring about fluctuations which are the direct result of such introduction, and which may accordingly convey impressions not justified by actual facts.
While this defect—inherent in all index-number systems—has operated to some extent throughout the compilation of the wage indices, the "inertia" of the occupations already included prevented any violent movement being brought about as the result of the introduction of additional occupations. The slow movement of the wages and wage indices made it possible for several additions in 1903 and 1905 to cause a slight decline in the numbers, but as each addition was made to the list of occupations covered the effect of further additions declined and the indices gained in accuracy.
As an example of the slight effect upon the general index number which results from an alteration of any one occupational index number I may mention that, through an error in compilation, one of the index numbers for a relatively important occupation was found to have been inserted in the general table nearly 60 points below its correct level. The correction of this error in the occupation number moved the general index number by only 1 point. Similarly, a very small effect would result from the addition or omission of an occupational index number. It may also be pointed out that the system of compiling indices for each occupation, with a base common to all occupations, tends to modify the disturbance which would arise from the introduction of additional occupations under a system which combined the actual wage-rates rather than indices. In other words, the combination of monetary statements of wages would involve greater fictitious fluctuations than are possible under an index system.
Reverting to a consideration of the general indices, it will be noticed that the rates have increased at an accelerated speed during the years 1913-19. While the total increase between the index numbers of 1901 and 1919 amounts to 483 points, the increase between 1901 and 1913 has been only 104 points. The increase during recent years has, of course, been caused by the granting of war bonuses or of increased rates in consideration of the substantial increase in living-costs.
As previously mentioned, an instruction to the Arbitration Court was given by Parliament in December, 1918, under the provisions of which the Court has been forced to grant increases in minimum-wage rates equal to the ascertained increase in the cost of living. The effect of this action has been to force wage-rates up by a substantial amount during the current year; and, although this general revision of wages is not yet completed, to a considerable extent it had been carried out before the 30th June, with the result that the index number for 1919 shows a large increase over the number for the previous year.
In this connection it should be mentioned that comparisons of the war increases in wages as between different occupations should be made with a full realization of the fact that during the war period changes in wage-rates have been numerous and often substantial. For the reason outlined above the movement has been accelerated during the past nine months, and has rendered particularly insecure the basis of comparisons involving the level of wages in particular occupations as at the 30th June, 1919.
The movement of the general level of wage-rates over the period 1901-19 is illustrated in the graphic diagram given as Appendix C (page 933) of this essay. The diagram in question also contains graph-lines representing the changes in "real" wages, as referred to at a later stage.
The general indices in themselves reveal little more than the continued upward movement over the whole period, with the more speedy changes brought about by the decline in the purchasing-power of money. Consequently I have grouped the twenty-six occupations in an attempt to disclose disparity or similarity of movement between groups of trades or industries.
Five classes have been created, as follows: (1) Food-distribution, (2) metal-working, (3) building, (4) miscellaneous manufacturing, (5) miscellaneous.
The respective classes contained the following occupations: (1) Bakers, butchers, and grocers' assistants; (2). boilermakers, engineers, and iron and brass moulders; (3) builders' labourers, bricklayers, carpenters, painters, plasterers, and plumbers; (4) bootmakers (males and females), coachbuilders, furniture-makers, tailoresses, woollen-mill employees (males and females); (5) bookbinders and paper-rulers, drivers, fellmongers, flour-mill employees, freezing-works employees, slaughtermen, and waterside workers.
The index numbers ascertained for the several groups are shown in the following table:—
| Year. | Food-distribution. | Metal-working. | Building. | Miscellaneous Manufacturing. | Miscellaneous. |
|---|---|---|---|---|---|
| 1901 | .. | .. | 955 | 941 | .. |
| 1902 | 940 | .. | 964 | 949 | .. |
| 1903 | 955 | .. | 965 | 974 | 920 |
| 1904 | 955 | .. | 965 | 984 | 924 |
| 1905 | 955 | 923 | 972 | 984 | 925 |
| 1906 | 969 | 923 | 972 | 992 | 925 |
| 1907 | 971 | 923 | 981 | 992 | 943 |
| 1908 | 974 | 996 | 992 | 992 | 973 |
| 1909 | 999 | 1000 | 994 | 999 | 980 |
| 1910 | 1000 | 1000 | 994 | 999 | 994 |
| 1911 | 1000 | 1000 | 1000 | 1000 | 1000 |
| 1912 | 1000 | 1000 | 1007 | 1009 | 1003 |
| 1913 | 1088 | 1018 | 1013 | 1072 | 1026 |
| 1914 | 1097 | 1018 | 1098 | 1079 | 1089 |
| 1915 | 1097 | 1018 | 1108 | 1092 | 1094 |
| 1916 | 1196 | 1035 | 1142 | 1142 | 1178 |
| 1917 | 1219 | 1069 | 1166 | 1187 | 1270 |
| 1918 | 1280 | 1228 | 1214 | 1240 | 1318 |
| 1919 | 1377 | 1335 | 1349 | 1454 | 1512 |
It will be noted that index numbers for each and all of the groups are not given for the years 1901-4 inclusive. This is due to the insufficient number of occupations covered in the earlier years.
As in the case of the general index numbers, the group indices show a comparatively steady rise until the war period is entered upon, when the rising movement gained greater speed. The increases for the various groups between 1905 and 1919 have been as follows: Food-distribution, 44.19 per cent.; metal-working, 44.64 per cent.; building, 38.79 per cent.; miscellaneous manufacturing, 47.76 per cent.; miscellaneous, 63.46 per cent.
The percentage of increase in the first four groups show a considerable degree of uniformity. The "miscellaneous" group, however, has advanced over 20 per cent. further than the average of the other groups. This is accounted for by the inclusion within the "miscellaneous" group of several occupations—drivers, fellmongers, freezing-works employees, and slaughtermen—which have shown particularly large increases in wage-rates during the past ten or fifteen years.
Generally speaking, it cannot be said that any striking disparity of movement as between the various groups has been revealed, nor has the comparative uniformity between the increase in several of the groups any particular significance further than that involved in indicating that the policy of the Arbitration Court has apparently tended towards a uniform rise in wages to compensate for the decline in the exchange value of money.
A classification which makes possible comparisons from another standpoint can be based upon the degree of skill represented by the several occupations. Although it is not in each instance easy to arrive at a decision as to the class in which any occupation should be placed, I believe that the following grouping (into three classes—skilled, semi-skilled, and unskilled) is generally in keeping with the practical facts underlying the matter: (1) Skilled —Boilermakers, engineers, iron and brass moulders, bricklayers, carpenters, painters, plasterers, plumbers, coachbuilders, furniture-makers, bookbinders and paper-rulers. (2.) Semi-skilled: Bakers, butchers, bootmakers (males and females), tailoresses, woollen-mill employees (males and females), fellmongers, flour-millers, slaughtermen. (3.) Unskilled: Grocers' assistants, builders' labourers, drivers, freezing-works employees, waterside workers.
The weighted index numbers for these three groups for the years 1901-19 inclusive are as follows:—
| Year. | Skilled. | Semi-skilled. | Unskilled. |
|---|---|---|---|
| 1901 | 929 | 915 | 940 |
| 1902 | 949 | 927 | 965 |
| 1903 | 964 | 935 | 952 |
| 1904 | 965 | 942 | 954 |
| 1905 | 964 | 939 | 955 |
| 1906 | 963 | 949 | 958 |
| 1907 | 963 | 964 | 969 |
| 1908 | 988 | 965 | 992 |
| 1909 | 992 | 982 | 996 |
| 1910 | 992 | 991 | 1001 |
| 1911 | 1000 | 1000 | 1000 |
| 1912 | 1009 | 1006 | 1004 |
| 1913 | 1024 | 1067 | 1025 |
| 1914 | 1073 | 1078 | 1102 |
| 1915 | 1073 | 1086 | 1113 |
| 1916 | 1095 | 1147 | 1193 |
| 1917 | 1124 | 1188 | 1250 |
| 1918 | 1208 | 1247 | 1297 |
| 1919 | 1352 | 1439 | 1451 |
While the indices given for the earlier years are in the main based upon a substantial volume of data, the figures for the years 1901 and 1902 are to some extent affected by the omission of several important occupations. From 1903 onward, however, the figures cover such a wide field as to present a reliable indication of the true position. The percentage increase in each of the three groups between 1903 and 1919 has been as follows: Skilled, 40.25; semiskilled, 53.90; unskilled, 52.42. These figures clearly indicate that the wages of skilled workmen have not increased proportionately to the same extent as have the wages of partially skilled and unskilled workers.
It should perhaps be pointed out here that the error should not be made of regarding the index numbers in this and in the preceding table as comparable horizontally. The figures for each year may be correctly compared with the indices given for other years in the same group only. This will be better understood when attention is drawn to the fact that for the year 1911 the wage-rates throughout are equated to 1,000, and no inference would for that reason be drawn that wage-rates in that year in all occupations were equal in monetary amount.
Upon further examination of the index numbers given above, it will be seen that the decline in the relative position of the skilled trades has been in progress over the whole period of seventeen years. The percentage increases between 1903 and 1911 were—Skilled, 3.73; semi-skilled, 6.95; unskilled, 5.04; and again between 1911 and 1919 the skilled trades advanced by 35.2 per cent. as against 43.9 per cent. and 45.1 per cent. for the semi-skilled and unskilled groups respectively.
This tendency towards the destruction of the relative superiority of the position of skilled workers has undoubtedly been due in large measure to the fact that in New Zealand unskilled workers represent a particularly large proportion of the industrial community, with the result that their collective bargaining-power, as evidenced in industrial agreements, is much greater than that of the skilled trades. New Zealand is essentially a country dependent upon its primary production; there are no large secondary industries; and, apart from agricultural and pastoral workers (who are largely independent farmers), the wage workers are to a considerable extent engaged in the work of transport and retail distribution. Consequently the growth of unionism under the stimulus of the Industrial Conciliation and Arbitration Acts brought a greater degree of advancement to the large unions of unskilled workers than was gained by the small groups of skilled tradesmen.
A graphic diagram given as Appendix E (page 935) shows the comparative movement of the wage-rates of skilled, semi-skilled, and unskilled workers.
In the preliminary discussion of the subject of this investigation it was explained that minimum-wage rates had been dealt with for the reason that such rates afforded the only available basis of calculation as to the movement of wages and earnings. I intend to refer briefly to the divergence between the minimum rates laid down in awards and agreements and the rates which are actually paid to the majority of workpeople. Later I shall carry the subject a step further in order to discuss the probable movement of earnings, which, of course, are affected by influences other than rates of wages.
It is to be regretted that while information regarding wage-payments has been collected by the Labour Department from time to time, no inquiries of a comprehensive nature appear to have been made for some years past relative to the number of employees receiving rates of pay in excess of the legal minimum. The claim has been made, particularly by employers and [their representatives, that the minimum-wage laws have brought about a levelling-down of wage-rates by which the legal minimum wage has become a maximum or standard wage rather than a true minimum. This question has been hotly contested for many years, and so far as I am able to ascertain, no very conclusive arguments or proofs have been brought forward by either of the contesting parties. At the present time the general indecision as to the advisability or otherwise of continuing the arbitration system has brought about a cessation of the discussion on this and other points concerning the effects of minimum-wage fixation—in other words, the parties are unable to decide whether to attack or support the policy of industrial arbitration.
A number of investigators from foreign countries have from time to time gathered information relative to the operation of the minimum-wage laws of the different States of Australia and of New Zealand, and the reports of these special inquiries usually provide excellent statements, in a condensed form, on such matters as the one here considered.
In the course of his report presented to the Government of the State of California in 1910 Special Commissioner Weinstock made mention of this controversy. He quoted a number of statements by persons qualified to express opinions. Several of these statements merit repetition here. The manager of a meat company said,—
"If we pay above the minimum wage, the Court at the next revision of the award is likely to make the maximum the minimum wage to be paid, hence we cannot afford to take this risk, and so the minimum practically becomes the maximum wage at the expense of the efficient worker, who is thus kept down."
This statement, made ten years ago, receives substantial corroboration in the Court's action in recent years, when awards have been made on the basis of the high rates paid through scarcity of labour or for specially efficient work.
Mr. J. G. (now Sir John) Findlay, Attorney-General, said in 1908,—
"Although the wage fixed by the Court is merely the least the employer is allowed to pay, it is in practice the highest the employer will pay. The result of this has been a marked tendency towards a uniform or dead-level wage in each trade, for all workers, good, bad, and indifferent."
Emphatic denials of the existence of this "dead level" in wage-rates were also quoted in. Colonel Weinstock's report. The Commissioner himself said,—
"From talking with employers of unskilled workers, I became reasonably satisfied that in the unskilled trades the minimum wage, as a rule, became the maximum wage."
He further says,—
"I also became reasonably satisfied that the minimum became, as a rule, the maximum wage in the shipping trades and on street-car lines... I further became fairly well satisfied that in the building trades a very large proportion, say 75 per cent., of the workers received the minimum wage."
So far as factory employees are concerned, some evidence on the point is available from the Annual Report of the Department of Labour, 1909. At that time it was found that in the four chief centres the following percentage of employees were receiving in excess of the legal minima: Auckland, 61; Wellington, 57; Christchurch, 47; Dunedin, 47. This official statistical evidence, although covering only a limited number of occupations and employees, proves fairly conclusively that in the skilled and semi-skilled trades a large proportion of the workpeople receive more than the minimum rates.
No particulars are available as to the average amount by which the rates paid exceeded the minimum rates.
Dr. Victor S. Clark, another American investigator, who in 1906 published the results of inquiries made by him in 1903, makes the following comment on the matter:—
"When the Court prescribes a minimum equal to or above the average wage previously paid, the employer may meet this change by two different policies.
In order to keep his pay-roll down he often lowers the pay of his more competent hands, to compensate himself for the higher rate he is obliged by law to give his poorer workers. This brings about a level wage for all employees. Such effect has been remarked by a Royal Commission investigating the operation of the Wage Boards in Victoria, and has been commented upon in the decisions of the Arbitration Court in New Zealand. Statistics indicate that in probably a third of the occupations regulated by the Court in that colony the maximum wage does not exceed the minimum fixed by the award.* The greatest variation usually occurs in industries requiring the highest degree of skill. In such industries the employer, in order to maintain a gradation of wages among his workmen, usually discharges his less efficient employees."
Referring, in another passage, to the Court and its power to effect radical changes in the industrial structure, Dr. Clark says,—
"Its orders must conform to economic law or be speedily rendered ineffective by contact with stubborn facts. Consequently, awards ultimately become mere formal statements of average conditions of employment."
The experience of New South Wales in the operation of the minimum-wage law of that State is worthy of notice. In 1909, in response to a special request by Californian Commissioner Weinstock, an investigation was made as to the number of employees being paid at rates of wages in excess of the legal minima. It was found that those receiving above the minimum wage comprised percentages of the total ranging from 17.1 to 94.5 for the several industries covered by the investigation. The average for all occupations tabulated was 51.4. Here again the figures given are confined to factory-workers, and are inconclusive to the extent that they cover a limited and special field.
After consideration of the unfortunately scanty data bearing upon this subject it is impossible to arrive at anything more than a general conclusion that legal minimum-wage rates tend to remain the maximum or standard rates in unskilled occupations, while in the skilled and semi-skilled trades a proportion of the workers may secure rates in advance of the minima.
A tabulation of the movement of minimum wages does not reflect the true course of wages if it be considered that the relation existing between minimum and actual rates has varied to any material extent over the period in question. I believe that so far as unskilled workers are concerned the minimum-wage rates have been the standard rates throughout all the years of my inquiry. In normal times many unskilled workers (such as waterside labourers, builders' labourers, and freezing-works labourers) are constantly changing from one employer to another, and it would be ridiculous to contend that there is anything more than a negligible proportion of the men paid at more than the minimum rates. I do not think that the shortage of labour brought about by the war has had any material effect on the adherence to minimum rates for unskilled workers. The shortage of labour has in fact been less severe than might have been expected (public works and building operations have been largely curtailed), while the casual nature of the employment of unskilled workers tends always towards the payment of the ruling minimum rate.
* I have been unable to trace the statistics referred to.
The skilled workers, however, have been somewhat differently affected by war conditions. Whatever may have been the position as between minimum and actual wage - rates in pre - war years, there is nothing to indicate that the relationship changed to any extent during the period of years prior to 1914. During the past few years, however, there has been a marked shortage of skilled workers, and wage-rates for such men have undoubtedly tended to advance more quickly and to a greater extent than have the rates laid down by awards of the Court.
It should not be thought, however, that employers have not contested the raising of the minimum rates. While they have been forced through labour shortage to compete for the labour offering, the employers and their associations have realized that any excessively high minimum rate would prove a serious difficulty when men were again available in something approaching normal numbers. I feel, therefore, that it should be mentioned that the figures given in respect of several of the essentially skilled occupations do not fully indicate the advance in wage-rates which has taken place during the past few years. On the average of all occupations, however, there can have been little movement that is not adequately expressed in the general index numbers of minimum wages.
While this essay is primarily directed towards an examination of the movement of wage-rates, there is the more important question of earnings—as distinct from wages—open for consideration.
It is to be regretted that in current discussions on industrial subjects there is often manifested an inclination towards regarding wage-rates as the final measure of the reward of labour. The existence of high or low rates undoubtedly carries a preponderating influence in determining the earnings of particular classes of workers, but, to a varying extent in different occupations, there are in operation other factors which affect the total monetary payment. These factors are all related either to the number of time-units or to payment per time-unit during and for which the employee works. The factors affecting the extent of time for which wage-payments are made are virtually only questions of degree. Nevertheless they are usually referred to as separate and distinct features of the whole matter, and I shall treat them accordingly.
In the first place, due attention should be paid to the effects of alterations in the length of the ordinary working-week. Where rates of pay are stated per hour it is evident that reductions in ordinary working-hours would, apart from other considerations, act in the direction of reducing the total weekly earnings. On the other hand, a reduction in ordinary working-hours is often the cause of an addition—more or less permanent—to the time classed as overtime and paid for at increased rates. For example, if the ordinary hours are reduced from 48 to 45 per week, the change may, in essentials, be merely an increase in the rate of wages payable or 3 hours of the 48 normally worked.
It is hoped that at a later date an inquiry will be made relative to the increase or decrease in the average amount of overtime worked in factories during past years. It will probably be found that the general reduction in ordinary working-hours (commented on hereafter) has been carried out only by a compensating increase in the amount of overtime worked.
Reductions in the ordinary working-week may also bring about an increase in earnings in those occupations for which weekly-wage rates are stipulated, since overtime rates will require to be paid for work done in excess of the reduced ordinary working-time. In fact, the distinction between hourly- and weekly-wage rates has less practical importance in this connection than appears to be popularly believed.
With further reference to overtime and its effects upon earnings, it should not be forgotten that not only has overtime been more common in recent years, but the special rates of wages payable for overtime work have been very substantially increased since the introduction of the minimum-wage laws. In earlier years provision was commonly made by which all overtime work was paid for at the rate of one and a quarter times the ordinary hourly rate. Amendments were gradually brought into force to secure the payment of higher rates for overtime done after lengthy periods of work or at late hours in the evening. The most recent provisions which the Arbitration Court has decided upon determine that overtime must be paid for at one and a half times ordinary rates for the first three hours of overtime in any one day, and at double ordinary rates thereafter.
In view of these facts (and on account of the increase in the ordinary rates themselves) there can be no doubt that earnings have tended to increase much more than the increase in ordinary-time rates would indicate.
Another very important matter affecting earnings is the prevalence or otherwise of "short time" and "lost time." The term "short time" is used to refer to the time for which employees are laid off on account of slackness of work. It is, in fact, the direct converse of "overtime," which of course is normally regarded as being due to pressure or excess of work. Time which might have been worked by employees but for sickness, accidents, inclement weather, &c., is generally referred to as "lost time," and is also generally considered to include time lost through the worker's own default—sometimes spoken of as "absenteeism."
It will readily be understood that when wages are calculated upon an hourly basis any loss of working-time—either as short time or as lost time—reduces the earnings of workers. Here again there is an absolute lack of statistical evidence regarding the increase or diminution of short time and lost time during the past few years, but it can be safely claimed that the prevalence of war conditions has practically eliminated short time. Overtime has, in fact, been a war necessity in a number of industries.
Finally—in consideration of the "time" factors—we come to unemployment, the complete negative, under which earnings become non-existent. Once again the scanty statistical data available affords no sufficient ground for the making of definite statements relative to the fluctuations in the prevalence of unemployment. In common with other countries whose population has been drawn upon for war service New Zealand has undoubtedly been almost entirely free from the evil of unemployment during the past few years. There is every reason, however, for believing that unemployment has been a more or less negligible feature of our industrial life for a considerable number of years past, and for that reason the war demand for labour was probably able to bring about no very material reduction in the unemployment rate.
With the exception of the more or less general strike of 1913 and certain periods of industrial unrest among coal-miners, there have been no serious stoppages of industry since the maritime strike of 1890. The strike of 1913 and the coal-mines disputes of more recent years have reduced the earnings of workers to some extent, and undoubtedly these disturbances would require to be taken into consideration in arriving at an estimate, from the index numbers of wage-rates, of the average earnings of workpeople during each of the past twenty years.
Another relatively unimportant feature of the subject is the transference, during the war period, of men from unskilled to skilled or semi-skilled occupations: in fact, there has been, under the stress of war conditions, an up-grading which has advanced the average earnings of some of the lower-paid workers to an extent not ascertained by an inspection of occupational wage-rates.
To summarize the general conclusions arrived at in regard to this matter, it may be said—
That lack of conclusive evidence precludes the making of definite statements as to the relation existing from time to time between wage-rates and earnings.
Overtime has probably been increased by reason of the general reduction in ordinary working-hours; overtime rates of pay have certainly increased substantially, and consequently earnings will have tended to increase faster than hourly-wage rates.
Until 1913 strikes and other stoppages of industry were negligible. Since that year certain disputes have tended to reduce total earnings.
Unemployment, which has never been serious, was practically nonexistent during the war period; consequently average earnings have slightly increased during that period irrespective of wage-rate increases.
Short time has also ceased to exist during war years, while lost time has probably remained fairly constant over the whole period of years covered by the inquiry.
There is one remaining point which should be referred to at this stage. It has previously been mentioned that in the consideration of the general results of this inquiry the figures with reference to hours of work should be regarded as the results of a separate and wholly distinct inquiry. The decline in hours should not be set off against the increase in the average hourly payment for work as shown in the wage figures. In explanation of this I must point out that in taking as the standard for wage-comparisons the hourly rate as actually stated in some awards, and as given by an average of the weekly rates specified in other occupations, I was fully aware that this was a course the adoption of which would, on first consideration, appear to exaggerate the increase in wages over the whole period. The hourly standard has been used in practically all cases, mainly for the reason that within particular occupations where changes from hourly to weekly or daily rates have been made, it is essential that some uniform standard should be used, and for the further reason that a uniform standard throughout the whole inquiry allows greater scope for the making of comparisons between wages-rates in different occupations. These reasons appear to me to be quite sufficient to outweigh the. above-mentioned defect, which is less important than might at first be thought.
In the majority of the awards investigated hourly-wage rates have been specified, and no consideration of the hours of work was necessary in order to ascertain an average or standard rate. Consequently, so far as those awards and agreements are concerned, the changes in hours of work are of importance in this connection only so far as they affect overtime payments and the weekly total of earnings. In other words, the defect as to exaggeration of wage-rates does not operate over a large portion of the field of the inquiry.
So far as the remaining awards which provided for weekly or daily rates are concerned, the defect certainly has tended to exaggerate the upward movement of wages; but here again the point is less important than might be believed. The increase in hourly rates (as shown in Appendix B) are in only a very small degree brought about by decreases in the number of hours worked per week: the increases have in the great majority of cases been actual increases in the minimum rates stipulated in the awards and agreements.
In the preceding pages attention has been given to the fluctuations of money wages, and wage-rates. This consideration of nominal wages, however, does not by any means determine the true relative position of the wage-earning classes from time to time.
It is hardly necessary to draw attention to the distinction between "nominal" or money wages and "real" or commodity wages, but it is, I think, advisable to give some care to the accurate definition of the methods by which the "commodity" wages are to be ascertained. While it is generally recognized that the money wages of a workman do not provide an accurate indication of the true reward of his labour, widely varying estimates of his "real" wages may be arrived at, according to the nature and quantity of the commodities and services included within the regimen upon which calculations are based.
During the past few years the controversy relative to the measurement of real wages and of increases in the "cost of living" has centred around the difficulties of deciding what commodities, services, or facilities should be included within the computations. It is generally admitted that the calculation of real wages and of fluctuations in the cost of living should be based upon a consideration of all the items entering into the family budget of working-class households. The decision of the question as to the relative importance of these various items, however, is by no means a simple matter. Special inquiries as to expenditure on food, clothing, housing, and other goods and services have been carried out in this country and in Australia.
In 1918 the Sumner Committee reported upon similar inquiries made throughout England and Wales. The conclusions arrived at in that and similar reports have been subjected to criticism (notably by Professor A. L. Bowley) on the grounds that changes in living-conditions brought about by the war tend to vitiate the accuracy of calculations based upon a constant standard.
Without entering upon the merits and demerits of a controversy along those lines, it may be said at once that so far as New Zealand is concerned the scarcity of commodities (and particularly food commodities) upon which Professor Bowley bases his objections has not been evident in any very marked degree. While prices of all commodities have not increased to an equal extent, those goods which have shown the greatest price-increases have generally been manufactured articles imported from countries where supplies were restricted and prices were high. These commodities, so far as they are intended for retail sale, have certainly affected the allocation of domestic expenditure, but the effect upon the family budget as a whole cannot have been great.
On this subject it is interesting to note the remarks made by the Statistician of the Australian Commonwealth:—
"It is obvious the 'effectiveness' of wages can be unequivocally ascertained only when changes in prices vary normally—that is to say, when it is practicable and reasonable to regard the 'composite unit' as continuously applicable. Estimations of the effectiveness of wages when the original regimen or composite unit ceases to be of reasonable application, as may be the case in times of severe drought, war, &c., becomes of more or less questionable validity. At such times some modification of the accustomed regimen may (or should) take place, and in the degree to which such modification may occur effective wages will become involved in uncertainty. It should, consequently, be borne in mind that index numbers of effective wages computed on the supposition of the continual maintenance of a constant regimen cannot be taken to really represent unequivocally the actual effectiveness of wages. They represent rather what would have been the effectiveness of wages had the 'composite unit' throughout been virtually the one in use with the wage-earning community."*
Some readjustment in the proportions of the several branches of household expenditure must have been made, since a period of rising prices may be said invariably to impose a disadvantage upon wage-earners in so far as wages tend to lag behind prices. Foods as an item of household expenditure have probably increased in proportionate importance, while clothing-costs and various miscellaneous payments have probably become less important during the past few years. While this readjustment has undoubtedly taken place, there is no evidence to indicate that in this country the readjustment has been sufficient to materially alter the regimen or to affect in any more than he slightest degree any computations which may be made upon the supposition that the standard has remained unchanged.
* Report No. 7. Labour and Industrial Branch, Commonwealth Bureau of Census and Statistics, Melbourne, June, 1917.
The whole question, however, appears to arise from a confusion of ideas with regard to the particular object in view. So far as the determination of a minimum living-wage is concerned, it seems quite just and proper that investigation should be made relative to the cost of maintaining a certain standard of living. Such an investigation would provide a basis for determining (as is done in Australia) the lower limit of the wages which must be paid by all industries. Beyond the fixation of that limit, however, I do not consider that the commodities and services purchased by any wage worker, nor the relative proportions in which those commodities are combined, should have any direct bearing upon the consideration of what should or should not be considered an adequate reward for the workers' contribution to industry. To determine the lower limit of competition in the wage bargain is one question; to determine the true reward of labour is quite another. The money with which a wage-earner is paid is his by right and reason of his co-operation in production, and has no relation to the amount necessary to maintain existence and provide for the reproduction and continuation of his social class. The true value of that money, therefore—i.e., the exchange value of the "counters" with which he is paid—must be determined by consideration on the fluctuations in the general rate at which money exchanges for commodities, and not upon the basis of exchanges for particular classes of commodities. In other words, I believe that "real" wages should be determined upon the basis of the prices of all commodities, and not upon the prices of particular classes of goods. "The exchange value of money" is a relative term, and depends for its determination upon the commodities for which the money is in fact exchanged. To adopt the attitude, since workers must purchase food and do not normally purchase motor-cars, that the exchange or commodity value of their wages must be measured in terms of food-prices appears to suggest much of the spirit which has hitherto supported the now discredited "commodity" view of labour.
It is realized that this aspect of the question is open to criticism on the ground that the standard of living and the question of its maintenance can be measured only by reference to a constant standard of comfort. Nevertheless, I feel that the correct standard of measurement, and a standard which would be more comprehensive, stable, and truly accurate, is that which takes as its base the whole range of commodities, and not merely that class of commodities which must of necessity bulk largely in the expenditure of the wage-earning section of the community.
While this view of the matter may prove to be indefensible, I think that it is generally admitted that the wholesale prices of a large number of commodities provide, over anything but a short period of time, the best possible indication of the total movement of the "cost of living." While commodities which are retailed for private consumption—i.e., "consumption" goods as distinct from "production" goods—fluctuate in price from time to time independently of movements in wholesale prices or in prices of production goods, the general movements of retail prices must, when averaged over a reasonably long period, conform to the movements of production-costs and of prices in general. In other words, while retail and wholesale prices may not move sympathetically during short periods of time, the fact that "the aim of all production is consumption" gives ground for the statement that retail prices in the long-run are dependent upon the costs of production and the prices of commodities in general.
Consequently, when we consider the difficulties involved in tracing accurately the course of retail prices and in deciding the relative importance of various commodities (and services) when sold retail, there should be little doubt that the best possible index of the movement of living-costs and of the exchange value of money is that obtained by an inspection of the whole sale prices of a large number of commodities.
For these reasons I should probably have used, in ascertaining index numbers of effective wages, a series of wholesale -price indices if such indices had been available. Unfortunately, however, the index numbers of wholesale prices which have been compiled in the Census and Statistics Office are not yet available for publication.* Wholesale-price indices which were compiled by Dr. J. W. McIlwraith in 1911 do not cover recent years when price-changes have been substantial. I have accordingly been forced to utilize the index numbers of retail prices of foods and groceries published by the Census and Statistics Office on the assumption that those index numbers provide an accurate statement of changes in the general exchange value of money. It is probable that, in the present disturbed conditions of economic and industrial affairs, short -time changes in prices, both wholesale and retail, have brought about great fluctuations in the "margin" or relation between wholesale and retail prices. Changes in prices have in many cases been so sharp that retail prices have at particular times been much below the corresponding wholesale prices. It is probable, therefore, that in an abnormal period such as the past five years the inspection of retail prices is the safest course to pursue in order to correctly ascertain the changes in living-costs. That is to say, the short-time fluctuations have been so great, and the relation between wholesale and retail prices has been so disturbed and irregular, that we must confine ourselves to a comparison of prices as they have finally and definitely affected the retail purchaser.
While forsaking wholesale prices during this exceptional period we must not lose sight of the fact that any sectional inspection of retail prices such as is involved in a tabulation of retail prices of foods only cannot be considered as fully determinative.
To summarize, it may be said that—
Wholesale-price index numbers are to be preferred to retail-price index numbers, provided (a ) that the period is not too short to allow the influence of wholesale-price fluctuations to be reflected in retail prices, and (b ) that the relation between wholesale and retail prices is not disturbed by exceptional circumstances.
Wholesale-price indices for New Zealand are not available, and in any case the abnormal war period makes it advisable to use retail-price indices.
The available retail-price indices cover foods and groceries only, and therefore provide an inadequate and "sectional" statement of the position.
These remarks preliminary to the setting-out of index numbers of effective wages are necessary to make clear the defects of the measure adopted, and the difficulties underlying any consideration of the concept of "real" wages.
Having thus touched upon a particularly controversial matter, the way is clear for proceeding to a consideration of results. The following table sets out for the period 1901-19 (1) index numbers of retail prices of foods and groceries, (2) the general index numbers of wage-rates as previously ascertained, and (3) index numbers of effective or "real" wages compiled from columns (1) and (2).
* Those index numbers have since been published in the "Monthly Abstract of Statistics and are also shown on pages 802-7 of this book.
TABLE SHOWING ANNUAL INDEX NUMBERS FOR THE PERIOD 1901-19.
Indicating the Course of (1) Retail Food-prices, (2) Minimum-wage Rates, and (3) "Real" Wages as based upon Minimum Wages and measured in Food-prices.
Base: Year 1911-1000.
| Year. | Retail Food-prices. | Minimum-wage Rates. | "Real" Wages as measured in Food-prices. |
|---|---|---|---|
* June quarter. | |||
| 1901 | 944 | 932 | 987 |
| 1902 | 970 | 952 | 981 |
| 1903 | 962 | 951 | 989 |
| 1904 | 951 | 955 | 1004 |
| 1905 | 1007 | 954 | 947 |
| 1906 | 1020 | 957 | 938 |
| 1907 | 1010 | 966 | 956 |
| 1908 | 1011 | 985 | 974 |
| 1909 | 989 | 991 | 1002 |
| 1910 | 1008 | 996 | 988 |
| 1911 | 1000 | 1000 | 1000 |
| 1912 | 1035 | 1006 | 972 |
| 1913 | 1055 | 1036 | 982 |
| 1914 | 1102 | 1087 | 986 |
| 1915 | 1218 | 1094 | 898 |
| 1916 | 1290 | 1152 | 893 |
| 1917 | 1384 | 1200 | 867 |
| 1918 | 1513 | 1258 | 831 |
| 1919 | 1537* | 1418 | 923 |
It will be seen that the price indices have been converted to a base year (1911) similar to that used for index numbers of wages. This allows the making of more accurate comparisons; and, as effective wage indices are calculated, for each year, by dividing the nominal wage index number multiplied by 1000 by the index for food-prices, the series of effective wage indices is also based upon the year 1911.
A much improved view of the movement of wage-rates as compared with food-prices is obtained by means of a system of moving averages which eliminates temporary fluctuations; but before considering such averages it is advisable to note certain facts in regard to the figures for individual years.
While the index numbers of wage-rates have shown an almost constant increase, the food-price indices have fluctuated in a somewhat remarkable manner. For example, in 1904 the price index fell to 951, and although the wage index rose by only 4 points, the effective-wage index was forced up very considerably. In the following year prices rose sharply, causing a decline of almost 60 points in the effective-wage index numbers.
From these facts we may draw the conclusion that the variations in the effective-wage indices have been caused mainly by fluctuations in prices, and not by any sudden movements in the comparatively sluggish wage-rates.
To gain the clearer view of the movements of all three series of index numbers which is secured by eliminating the temporary fluctuations, it is merely necessary to compile moving averages over two or more years. I have chosen a triennial period for the reason that while the use of this average eliminates short-time fluctuations, it does not wholly obliterate the record of comparatively important changes.
The following table gives these triennial index numbers for the three series—food-prices, minimum-wage rates, and effective wages:—
TABLE SHOWING INDEX NUMBERS BASED UPON THE TRIENNIAL MOVING AVERAGES FOR THE PERIOD 1901-19.
Indicating the Course of (1) Retail Food-prices, (2) Minimum-wage Rates, and (3) "Real" Wages as based upon Minimum Wages and measured in Food-prices.
Base: Year 1911-1000.
| Year. | Retail Food-prices. | Minimum-wage Rates. | "Real" Wages as measured in Food-prices. |
|---|---|---|---|
| 1902 | 959 | 945 | 985 |
| 1903 | 961 | 953 | 992 |
| 1904 | 973 | 953 | 979 |
| 1905 | 993 | 955 | 962 |
| 1906 | 1012 | 959 | 948 |
| 1907 | 1014 | 969 | 956 |
| 1908 | 1003 | 981 | 978 |
| 1909 | 1003 | 991 | 988 |
| 1910 | 999 | 996 | 997 |
| 1911 | 1014 | 1001 | 987 |
| 1912 | 1030 | 1014 | 984 |
| 1913 | 1064 | 1043 | 980 |
| 1914 | 1125 | 1072 | 953 |
| 1915 | 1203 | 1111 | 924 |
| 1916 | 1297 | 1149 | 886 |
| 1917 | 1396 | 1203 | 862 |
| 1918 | 1478 | 1292 | 874 |
It will of course be understood that no indices can be given for the years 1901 and 1919, since the average for the three years 1901-3 is set opposite the middle year 1902, and the average for the final three years, 1917-19, is shown against 1918. Care must accordingly be taken in regard to the making of comparisons between figures which may appear to represent individual years but which are in fact representative of three years. Consequently, percentage increases or decreases should generally be calculated from the figures given in the preceding table of annual indices.
That table shows that between 1901 and 1919 food-prices increased by approximately 63 per cent., minimum-wage rates increased by over 52 per cent., and "effective" wages (as calculated upon minimum-wage rates and food-prices decreased by approximately 6.5 per cent. So far as the war period (1914-19) is concerned, food-prices show an advance of 39.47 per cent., minimum wages an increase of 30.45 per cent., and effective wages a fall of 6.39 per cent. These figures amply demonstrate the truth of the statement that, in a period of rising prices, wages tend to lag behind prices, and the wage-earning section of the community suffers accordingly. It is worthy of notice that effective wages reached their highest level in the period 1909-11. Prior to that time the increase in wages was sufficient to keep pace with the upward price-movement, but in later years the speed with which prices have advanced has been such as to outstrip the movement in wage-rates. The very substantial increase in wages which took place between 1918 and 1919, however, went some distance towards reinstating effective wages in their pre-war position, the effective-wage index numbers having increased by nearly 100 points during the past year. The substantial wage-increases which are still being granted by the Arbitration Court will probably carry effective wages to a relatively high level.
For the purpose of presenting an alternative statement of the movement of effective wages—or, in other words, to measure "effectiveness" according to another standard—I have compiled index numbers which are based not upon food-prices only, but upon the indices of housing and food costs combined, as published by the Census and Statistics Office. These latter indices, which, as stated, cover both food and rent, are much more steady in their movements. Not only are temporary price-fluctuations eliminated by the inclusion of rent, but the inertia of housing-costs tends to reduce the price-increase which has taken place over a period of years.
The following table shows, for the period 1901-19, both the annual and triennial average index numbers for (a ) food and rent combined, (b ) minimum-wage rates, and (c ) "real" wages as based upon (a ) and (b ).
TABLE SHOWING ANNUAL AND TRIENNIAL INDEX NUMBERS FOR THE PERIOD 1901-19.
Indicating the Course of (1) Retail Food-prices and Rent (combined), (2) Minimum-wage Rates, and (3) "Real" Wages as based upon Minimum Wages and measured in Prices of Foods and Housing.
Base: Year 1911-1000.
| Year. | Food-prices and Rents. | Minimum-wage Rates. | Real Wages as measured in Prices of Food and Housing. | |||
|---|---|---|---|---|---|---|
| Annual. | Triennial. | Annual. | Triennial. | Annual. | Triennial. | |
* June quarter. | ||||||
| 1901 | 934 | .. | 932 | .. | 998 | .. |
| 1902 | 957 | 948 | 952 | 945 | 995 | 997 |
| 1903 | 954 | 955 | 951 | 953 | 997 | 998 |
| 1904 | 953 | 968 | 955 | 953 | 1002 | 985 |
| 1905 | 998 | 989 | 954 | 955 | 956 | 966 |
| 1906 | 1016 | 1005 | 957 | 959 | 942 | 954 |
| 1907 | 1001 | 1009 | 966 | 969 | 965 | 960 |
| 1908 | 1009 | 1001 | 985 | 981 | 976 | 980 |
| 1909 | 994 | 1003 | 991 | 991 | 997 | 988 |
| 1910 | 1006 | 1000 | 996 | 996 | 990 | 996 |
| 1911 | 1000 | 1011 | 1000 | 1001 | 1000 | 990 |
| 1912 | 1028 | 1026 | 1006 | 1014 | 979 | 988 |
| 1913 | 1049 | 1058 | 1036 | 1043 | 988 | 991 |
| 1914 | 1083 | 1096 | 1087 | 1072 | 1004 | 978 |
| 1915 | 1155 | 1146 | 1094 | 1111 | 947 | 969 |
| 1916 | 1201 | 1206 | 1152 | 1149 | 959 | 953 |
| 1917 | 1263 | 1272 | 1200 | 1203 | 950 | 946 |
| 1918 | 1352 | 1334 | 1258 | 1292 | 930 | 969 |
| 1919 | 1386* | .. | 1418 | .. | 1023 | .. |
As already mentioned, the index numbers for food-prices and rent are comparatively steady and accordingly the effective-wage indices in the above table show less fluctuation than was recorded when food-prices only were made the standard of measurement.
It is remarkable that the effective-wage index number for 1919 is higher than that recorded for any previous year. Over the whole period, however, (as shown by the triennial indices of effective wages), there has been surprisingly little variation.
On the figures given in the above table, food and housing prices have advanced by 48.39 per cent. since 1901, while minimum-wage rates have risen by 52.14 per cent., and effective wages have increased by 2.5 per cent. As between 1914 and 1919 increases have been—Food and housing prices, 27.98 per cent.; minimum wages, 30.45 per cent.; effective wages, 2.1 per cent.
It is interesting in this connection to note the results obtained in similar investigations carried out by the Australian Commonwealth Bureau of Census and Statistics. The wages upon which the Australian index numbers are based are stated to be, in the great majority of cases, the minimum rates fixed by industrial tribunals. The effective-wage indices for Australia have been calculated by reference to the movement of prices of food and housing, and accordingly comparisons must be made with the figures shown in the table given immediately above.
The nominal and effective wage index numbers for the two countries are set out in the following table:—
TABLE SHOWING NOMINAL AND EFFECTIVE WAGE INDEX NUMBERS FOR AUSTRALIA AND NEW ZEALAND DURING THE PERIODS 1891-1918 AND 1901-19 RESPECTIVELY .
Base: Year 1911-1000.
| Year. | Nominal-wage Index Numbers. | Effective-wage Index Numbers. | ||
|---|---|---|---|---|
| Australia. | New Zealand. | Australia. | New Zealand. | |
| 1891 | 848 | .. | 872 | .. |
| 1896 | 816 | .. | 991 | .. |
| 1901 | 848 | 932 | 964 | 998 |
| 1902 | .. | 952 | .. | 995 |
| 1903 | .. | 951 | .. | 997 |
| 1904 | .. | 955 | .. | 1002 |
| 1905 | .. | 954 | .. | 956 |
| 1906 | 866 | 957 | 960 | 942 |
| 1907 | 893 | 966 | 996 | 965 |
| 1908 | 900 | 985 | 946 | 976 |
| 1909 | 923 | 991 | 974 | 997 |
| 1910 | 955 | 996 | 985 | 990 |
| 1911 | 1000 | 1000 | 1000 | 1000 |
| 1912 | 1051 | 1006 | 955 | 979 |
| 1913 | 1076 | 1036 | 975 | 988 |
| 1914 | 1085 | 1087 | 952 | 1004 |
| 1915 | 1102 | 1094 | 862 | 947 |
| 1916 | 1184 | 1152 | 894 | 959 |
| 1917 | 1252 | 1200 | 950 | 950 |
| 1918 | 1296 | 1258 | 952 | 930 |
| 1919 | .. | 1418 | .. | 1023 |
The Australian figures are available from 1891 to 1906 at quinquennial periods only. A graphic diagram, given as Appendix D, (page 934) shows the movement of effective wages in the two countries since 1906.
It will be seen that although the fluctuations are much more violent in the Australian than in the New Zealand figures, there is considerable similarity in general movement. This is more clearly apparent when the movement is "smoothed" by means of moving averages. Using the well-known formula devised by Professor Karl Pearson, I have computed a coefficient of correlation for the two series of index numbers, and the result—a positive coefficient of 0.761 with a probable error of only 0.085—shows a high degree of correlation. Admittedly, the period of years—eleven—is short, but the coefficient is so high that as previously stated the probable error amounts to 0.085 only. While it is not contended that the correlation is due to causes acting in any very direct manner, it is, I think, undoubtedly proved that wages in relation to prices have in the two countries moved along very similar lines. There is, of- course, undeniable correlation in so far as prices, wage-rates, and general industrial and economic conditions in the two countries tend towards a rough equality.
Although much has been written during the past few years bearing upon the subject of the relation between prices and wages, it can hardly be said that any noteworthy additions have been made to the principles which found general acceptance in pre-war years. It does not come within the scope of this brief essay to discuss at length the varying opinions which have been so copiously set forth by parties and persons closely and materially interested in this phase of current economics, but since the data from which I have compiled my wage-index numbers have been taken mainly from the determinations of the Arbitration Court, I have considered it advisable to touch briefly upon the declared policy and views of the Court with reference to the question of "cost of living" and the level of wages.
In the course of the inquiry I have noted a number of highly interesting memoranda which the Court has set out in extension of its various judgments, and of these memoranda a number have special reference to the subject here under consideration.
With reference to an award made for building trades labourers in May, 1915, the Court said,—
"The only questions referred to the Court in this dispute were as to wages and preference. The Court has granted an increase of 1d. per hour in the minimum rate of wages for workers coming within the scope of this award. This must not, however, be regarded as establishing a standard wage for similar workers in other parts of the Dominion, as the increase is granted owing to the exceptionally high rents which workers in this district have to pay for suitable dwellinghouses."*
This memorandum provides a clear indication of the Court's endeavour to fix wages with due regard to the living-expenses of the lowest-paid workmen.
* Book of Awards, Vol. 16, p. 91.
In the earlier years of the war period the Court adopted the attitude (which may or may not have been justifiable) that the "war burden" was one which should be borne by all sections of the community, and that for that reason wages should not be increased strictly to the same extent as the advance in prices. This view is set out in a memorandum to the Canterbury Builders, Contractors, and General Labourers' ward made in February, 1917.
After referring to the difficulties of measuring the movement in the cost of living, the memorandum says,—
"It has also to be remembered that the increased cost of living, so far as it is caused by the war, is a burden which has to be borne by the whole community, and that to relieve one class of its proper proportion of that burden simply means adding that proportion to the burden already being borne by the other classes of the community. The lowest-paid worker, however, is the least able to bear such burden, and should be relieved to some extent if reasonably possible."*
Undoubtedly the Court was correct in its statement that to increase wages would be to move the burden to other shoulders. In so far as the Court had in mind those classes whose incomes are derived entirely or mainly from interest or dividends, there was considerable justification for the refusal to increase wages and so increase the burden of the persons having fixed incomes. But when it is considered that the latter class are persons having accumulated resources which must tend in a period of rising prices to return an increasing monetary income, and when it is further considered that currency and credit inflation brought about by war conditions certainly involves no "burden" for the traders and producers of the community, it is difficult to find any reason for objecting to workmen obtaining the increased money payments warranted by the decreased purchasing-power of the monetary units.
Professor F. W. Taussig, when dealing in his "Principles of Economics" with the subject of money and the mechanism of exchange, makes reference to the comparative effects upon wages and prices of an inflation of the currency. The following extract is quoted from his chapter (22) dealing with "Changes in Prices":—
"The chief explanation of the optimism and activity which business men as a class show in times of rising prices arises from the relation which they as a class hold to the labourers as a class. At bottom, their main operation is to hire labourers; and they hire labourers to advantage at such time because the prices of commodities go up faster than money wages ... To the extent that prices of commodities advance faster than expenses for the labour they buy, the payers of wages gain."
The Court's view of the matter changed somewhat as a result of the continued increase in prices. In a memorandum to an award made in May, 1917, the following appears:—
"In granting to workers covered by this award a war bonus of 2d. per hour over and above the existing minimum rate of 1s. 6d. per hour the Court has to some extent departed from its original intention to grant such bonuses only to the lowest-paid workers, whose margin for retrenchment and economy to meet the increased cost of living was small, if it existed at all. The Court, however, is of opinion that it is justified in this course for the following reasons:—
"(1.) Because the cost of living still continues to increase:
"(2.) Because employers in various industries have themselves voluntarily conceded increases in wages to workers in their employ, which has not only contributed in some measure to the increased cost of living, but has disturbed the established relation between workers in different industries, thereby causing dissatisfaction and unrest among those workers who have not obtained equivalent increase:
"(3.) Because the total amount of the wages of carpenters and joiners on a building forms a comparatively small proportion of the total cost of a building."
* Book of Awards, Vol. 18, p. 71.
The continued rise in prices forced the Court to grant increased wages, and when Parliament, through the War Legislation and Statute Law Amendment Act of 1918, directed that the Court should increase wages strictly in accordance with increases in the "cost of living," the pre-war position was essentially regained, and the movement of prices and wages was more closely correlated.
Throughout the discussion of wage-movements much has necessarily been said on the subject of changes in hours of work: in fact, the two matters are essentially branches of the one subject—changes in earnings. For this reason little remains to be said with reference to the decline in ordinary working-hours.
A series of composite index numbers, based upon the same twenty-six occupations as were covered by the wage indices, has been compiled to show the downward movement in ordinary working-hours since 1901. The number of occupations actually represented in the index numbers for the earlier years of the period are as shown on page 892.
The index numbers of ordinary working-hours are as follows:—
| Year. | Index Number. |
|---|---|
| 1901 | 1017 |
| 1902 | 1008 |
| 1903 | 1007 |
| 1904 | 1005 |
| 1905 | 1007 |
| 1906 | 1007 |
| 1907 | 1006 |
| 1908 | 1005 |
| 1909 | 1003 |
| 1910 | 1000 |
| 1911 | 1000 |
| 1912 | 1000 |
| 1913 | 998 |
| 1914 | 986 |
| 1915 | 985 |
| 1916 | 983 |
| 1917 | 982 |
| 1918 | 982 |
| 1919 | 979 |
It will be seen that the general movement has been very slow, the decline since 1901 amounting to only 3.74 per cent. In other words, if the average ordinary working-week in 1901 was 48 hours, it is now approximately 46 hours.
As explained in regard to the wage index numbers, the indices for the earlier years shown above are subject to certain reservations on account of the disturbance caused by introducing additional occupational indices. One of the most noteworthy movements was that between 1913 and 1914. This comparatively substantial fall of 12 points has been due to reductions in hours granted to a number of different classes of workers, chief among which were builders' labourers and waterside workers.
When it is considered that working-hours in New Zealand have for many years been much shorter than in most other countries, it will be realized that the reductions in hours which have been put into effect in this country during the past twenty years represent a relatively important change in industrial conditions. The decisions of various bodies which have recently investigated in England and America the intensity of the physical strain involved in the working of long hours have been used in New Zealand as the basis of claims for still shorter working-time in the Dominion.
There is now no doubt that to a large extent the anticipated increase in hourly production which was to compensate the reduction in working-time has not been realized. In England it has recently been announced that reductions in hours have brought about proportionate reductions in output. If this has proved to be the case in instances where the hours have been (and still are) much longer than in New Zealand, and industrial fatigue has been more prevalent, it follows that the reductions in hours which have taken place in New Zealand can most certainly have been effected only at the expense of corresponding reduction in output. In other words, it must be evident that the Dominion has more than reached the stage where additional concessions in hours must tend to reduce the "effective" wage payment. It is realized, of course, that other factors affecting output may eventually make possible the granting of further reductions in hours, and of additional increases in wages, but it is advisable that trade-union leaders should recognize that reductions in hours—and therefore decreased production—must inevitably operate against the payment of increased real wages.
On this subject Professor Taussig has several excellent passages:—
"The debatable question concerns the effect of shorter hours on wages. The demand for them is invariably combined with a demand for the same wages; less work, or at least less hours, but not less pay. Are these combined demands reconcilable ? Will not shorter hours lessen the product of labour—the source from which wages must come—and so bring inevitably a lowering of wages? Shorter hours do not necessarily lessen the output. Where work is done by the piece, men often accomplish as much in eight hours as in ten. Even where work is done not by the piece but by the day or hour, this is often feasible; though such an outcome is not probable in the absence of the stimulus which piecework gives, since the rooted disposition to make employment then operates without check. Even where machinery sets the pace, a reduction in hours may be offset by a gain in efficiency. Machinery never fixes the pace quite without regard to the intelligence and watchfulness of those who set it in motion. An alert and wide-awake labouring force may turn out as much in ten hours as a weary one in twelve.
"But all this holds good only within comparatively narrow limits. Pieceworkers and skilled mechanics can perhaps do as much in eight hours as in ten; but they cannot do as much in seven hours or in six. Factory operatives can often do as much in ten hours as in twelve; but it is very rarely that they can do as much in eight as in ten. The universal introduction of the eight-hour day would mean (other things unchanged) a lessening of the national dividend. ... With the general increase in the productivity of labour the working-people have a choice between several alternatives: higher wages with the same hours; lower wages with less hours; or a middle course—somewhat higher wages and yet somewhat lower hours."*
In New Zealand, as elsewhere, the pressure has been towards the attainment of both higher wages and a reduced working-week. The reduction in hours has certainly been secured, and nominally, at least, increased wages have also been granted.
The period covered by my investigation has been one of rising prices, and to that extent has been lacking in any general variation. I have endeavoured to indicate, by means of a record of the movement of minimum-wage rates, the extent of the advance in the earnings of wage workers.
* "Principles of Economics," Vol. 2, pp. 294-96.
I fully appreciate the limitations involved in the restrictive difficulties which have imposed themselves upon any fully satisfactory treatment of this subject, and, while I have endeavoured to point out the extent and importance of those limitations, there must remain a considerable margin of possible error. Before dealing shortly with the general aspects of the whole matter it is advisable to view in retrospect the conclusions which I consider may be fairly drawn from the statistical results presented:—
It has been clearly demonstrated that the minimum wage rates for different occupations have increased to a widely varying degree.
The rates for skilled classes have increased to a smaller extent than have the rates for unskilled or semi-skilled workers.
The increase in wage-rates has been very substantially accelerated during the war period.
Assuming that minimum-wage rates provide a reasonably correct statement of the movement in earnings, real or commodity wages were definitely increasing until about the year 1911.
Maintaining the assumption that minimum wages reflect the true level of earnings, real wages declined during the earlier portion of the war period, but increased again during the year ended 30th June, 1919.
Ordinary hours of work have steadily decreased over the whole period.
It would be well to point out here that so far as the war period is concerned the minimum wages of some classes of workers have advanced beyond the point necessitated by the advances in actual "living-costs," though the average over minimum wages generally shows a recession in the true position of the working-class. Further than this, however, as we have already seen, the greatest advance has been gained by the unskilled classes. Therefore, when it is realized that at the present time the position of the skilled workers is (through a general shortage of skilled labour) much more advantageous than the legal-minimum-wage rates would indicate, it will be clear that both skilled and unskilled workers are, to a considerable extent, earning higher real wages than have been shown by the average index numbers given above.
The world-wide rise in prices which has taken place during the past twenty years has been beneficial to New Zealand inasmuch as there has been a more than proportionate increase in the prices of the commodities which form the great bulk of New Zealand's production. This fact has been the foundation for an increase in industrial wages greater than was necessary to compensate for the decline in the general purchasing-power of money. In other words, New Zealand has enjoyed an exceptional prosperity by reason of the nature of her production, and this prosperity has to some extent been shared by the industrial workers of the Dominion, who, though not to any extent directly concerned with primary production, are nevertheless very materially dependent upon the continued prosperity of the extractive industries. Further than this, and in addition to the general advancement and success of modern production, there has undoubtedly accrued to the labouring classes a certain measure of benefit from the increase in bargaining-power due to increased unionism. The system of compulsory arbitration was founded upon unionism, and, working through Conciliation Councils and the Arbitration Court, the unions have been able to secure an increased share of the national dividend. That this has been so will be admitted by all who concede the truth of the contention that the present social and economic system allows for a certain elasticity or "slack" which is inevitably appropriated by that factor in production which from time to time exercises the greatest bargaining-force.
It is reasonable to assume therefrom that the introduction of a system which at one step conferred upon labour increased power and increased bargaining-facilities must have resulted in some advancement in the relative position of wage-earners as a class.
New Zealand at the present time is experiencing peculiar difficulties as the result of a policy in marked contrast to that pursued in the older countries of the world. It is well recognized that in countries passing through the earliest stages of development there is a demand for unskilled labour greater, in proportion to artisans and factory operatives, than in more highly developed industrial states. This fact, combined with the high profit of primary production in the Dominion (due to natural resources large in proportion to population), has brought about the payment of wages to untrained workmen which are high in relation to the wages of skilled tradesmen. This position has been given effective backing by the Arbitration Court. The result has been that, instead of a multiplication of classes among employees such as has taken place in the United States and Great Britain, there has been a gradual movement towards eliminating the relative advantages possessed by the skilled classes. This has caused an increasing scarcity of skilled labour: artisans have to some extent forsaken their trades and joined the ranks of the untrained workers, while boys willing to spend a number of years learning a trade are difficult to obtain. The difficulty will eventually tend to bring about its own correction, but the high minimum rates granted for certain unskilled work will prove a substantial obstacle to a speedy adjustment of the position.
On the subject of the general effects of the minimum-wage law it may be said that, while the system has given greater bargaining-power to those unions which are numerically weak, and has otherwise modified the comparative level of wages in the different industries, the general level of wages has been a matter essentially beyond the control of any Court. It has been well said that the workers expected too much from the system. During the first ten years it did much for them in the direction of shortening working-hours, raising wages, granting preference to unionists, and awarding a multitude of lesser benefits; but no scheme of compulsory industrial arbitration could move the whole economic and social structure unless and until its investigations and jurisdiction governed the whole field of production and distribution.
Finally, however, it must be admitted that the system has protected the weak; prevented unfair competition by unscrupulous employers; regulated, standardized, and recorded the wages and working-conditions for particular industries and districts; and in a period of rising prices has tended to minimize the loss suffered by wage-earners as a result of the decrease in the purchasing-power of money. In this respect the arbitration laws have been beneficial. It remains to be seen whether or not there is sufficient elasticity in the system to bear the strain which must inevitably result when a decline in prices takes place and a downward adjustment of wages becomes necessary.
Industry, trade, or occupation: District: Sheet No.:
| 1. Reference. | 2. Award, Agreement, &c. | 3. Date effective from. | 4. Period. | 5. Date of Expiry. | 6. Ordinary Hours. | 7. Occupation or Grade. | 8. Wages. | 9. Overtime Rates. | 10. Proportion of Apprentices. | 11. Remarks. | |||
|---|---|---|---|---|---|---|---|---|---|---|---|---|---|
| Per Day. | Per Week. | Per Hour. | Per Day. | Per Week. | |||||||||
Industry, trade, or occupation: BAKERS .
Classes of workers covered: (1) Foremen, (2) second hands, (3) third hands; later —(1) foremen, (2) journeymen, and (3) labourers.
| As at 30th June, | Minimum Wages (in Pence) per Hour. | Maximum Ordinary Working-hours Per Week. | ||||||||||
|---|---|---|---|---|---|---|---|---|---|---|---|---|
| Auckland. | Wellington. | Canterbury. | Otago. | Average. | Index Number: Base, 1911. | Auckland. | Wellington. | Canterbury. | Otago. | Average. | Index Number: Base, 1911. | |
* Partially (wages of labourers) interpolated. | ||||||||||||
| 1898 | 10.33 | 12.20 | 11.18 | .. | 11.24 | 897 | 54 | 54 | 51 | .. | 53.00 | 1055 |
| 1899 | 10.33 | 12.20 | 12.16 | .. | 11.56 | 923 | 54 | 54 | 51 | .. | 53.00 | 1055 |
| 1900 | 10.33 | 12.20 | 10.98 | 11.57 | 11.27 | 899 | 54 | 54 | 51 | 51 | 52.50 | 1045 |
| 1901 | 11.48 | 12.20 | 10.98 | 12.16 | 11.71 | 935 | 54 | 54 | 51 | 51 | 52.50 | 1045 |
| 1902 | 11.48 | 12.20 | 10.98 | 12.16 | 11.71 | 935 | 54 | 54 | 51 | 51 | 52.50 | 1045 |
| 1903 | 11.48 | 12.20 | 12.16 | 12.16 | 12.00 | 958 | 54 | 54 | 51 | 51 | 52.50 | 1045 |
| 1904 | 11.48 | 12.16 | 12.16 | 12.16 | 11.99 | 957 | 54 | 51 | 51 | 51 | 51.75 | 1030 |
| 1905 | 11.48 | 12.16 | 12.16 | 12.16 | 11.99 | 957 | 54 | 51 | 51 | 51 | 51.75 | 1030 |
| 1906 | 11.48 | 12.16 | 12.16 | 12.16 | 11.99 | 957 | 54 | 51 | 51 | 51 | 51.75 | 1030 |
| 1907 | 11.48 | 12.16 | 12.16 | 12.16 | 11.99 | 957 | 54 | 51 | 51 | 51 | 51.75 | 1030 |
| 1908 | 11.48 | 12.86 | 12.16 | 12.16 | 12.17 | 971 | 54 | 51 | 51 | 51 | 51.75 | 1030 |
| 1909 | 12.92 | 12.86 | 12.16 | 12.16 | 12.53 | 1000 | 48 | 51 | 51 | 51 | 50.25 | 1000 |
| 1910 | 12.92 | 12.86 | 12.16 | 12.16 | 12.53 | 1000 | 48 | 51 | 51 | 51 | 50.25 | 1000 |
| 1911 | 12.92 | 12.86 | 12.16 | 12.16 | 12.53 | 1000 | 48 | 51 | 51 | 51 | 50.25 | 1000 |
| 1912 | 12.92 | 12.86 | 12.16 | 12.16 | 12.53 | 1000 | 48 | 51 | 51 | 51 | 50.25 | 1000 |
| 1913 | 14.00 | 14.00 | 14.00 | 14.00 | 14.00 | 1117 | 48 | 48 | 48 | 48 | 48.00 | 955 |
| 1914 | 14.00 | 14.00 | 14.00 | 14.00 | 14.00 | 1117 | 48 | 48 | 48 | 48 | 48.00 | 955 |
| 1915 | 14.00 | 14.00 | 14.00 | 14.00 | 14.00 | 1117 | 48 | 48 | 48 | 48 | 48.00 | 955 |
| 1916 | 15.25 | 15.25 | 15.25* | 15.25 | 15.25 | 1217 | 48 | 48 | 48 | 48 | 48.00 | 955 |
| 1917 | 15.25 | 15.25 | 15.25* | 15.25 | 15.25 | 1217 | 48 | 48 | 48 | 48 | 48.00 | 955 |
| 1918 | 17.50 | 15.25 | 17.50* | 16.92 | 16.79 | 1340 | 48 | 48 | 48 | 48 | 48.00 | 955 |
| 1919 | 17.50 | 15.25 | 17.50* | 16.92 | 16.79 | 1340 | 48 | 48 | 48 | 48 | 48.00 | 955 |
Industry, trade, or occupation: BOILERMAKERS .
Classes of workers covered: Until 1916—First-class boilermakers and "ordinary" boilermakers; later —only one class provided for.
| As at 30th June, | .Minimum Wages (in Pence) per Hour. | Maximum Ordinary Working-hours Per Week. | ||||||||||
|---|---|---|---|---|---|---|---|---|---|---|---|---|
| Auckland. | Wellington. | Canterbury. | Otago. | Average. | Index Number: Base, 1911. | Auckland. | Wellington. | Canterbury. | Otago. | Average. | Index Number: Base, 1911. | |
* Interpolated to complete base year. | ||||||||||||
| 1902 | .. | .. | .. | 15.75 | 15.75 | 1000 | .. | .. | .. | 48 | 48.00 | 1005 |
| 1903 | .. | .. | .. | 15.75 | 15.75 | 1000 | .. | .. | .. | 48 | 48.00 | 1005 |
| 1904 | .. | .. | .. | 15.75 | 15.75 | 1000 | .. | .. | .. | 48 | 48.00 | 1005 |
| 1905 | .. | .. | .. | 15.75 | 15.75 | 1000 | .. | .. | .. | 48 | 48.00 | 1005 |
| 1906 | .. | .. | .. | 15.75 | 15.75 | 1000 | .. | .. | .. | 48 | 48.00 | 1005 |
| 1907 | .. | .. | .. | 15.75 | 15.75 | 1000 | .. | .. | .. | 48 | 48.00 | 1005 |
| 1908 | 15.75 | .. | 15.75 | 15.75 | 15.75 | 1000 | 47 | .. | 48 | 48 | 47.67 | 998 |
| 1909 | 15.75 | .. | 15.75 | 15.75 | 15.75 | 1000 | 47 | .. | 48 | 48 | 47.67 | 998 |
| 1910 | 15.75 | .. | 15.75 | 15.75 | 15.75 | 1000 | 47 | .. | 48 | 48 | 47.67 | 998 |
| 1911 | 15.75 | 15.75* | 15.75 | 15.75 | 15.75 | 1000 | 47 | 48* | 48 | 48 | 47.75 | 1000 |
| 1912 | 15.75 | 15.75 | 15.75 | 15.75 | 15.75 | 1000 | 47 | 48 | 48 | 48 | 47.75 | 1000 |
| 1913 | 15.75 | 15.75 | 15.75 | 15.75 | 15.75 | 1000 | 47 | 48 | 48 | 48 | 47.75 | 1000 |
| 1914 | 15.75 | 15.75 | 15.75 | 15.75 | 15.75 | 1000 | 47 | 48 | 48 | 48 | 47.75 | 1000 |
| 1915 | 15.75 | 15.75 | 15.75 | 15.75 | 15.75 | 1000 | 47 | 48 | 48 | 48 | 47.75 | 1000 |
| 1916 | 16.50 | 16.50 | 17.27 | 16.50 | 16.69 | 1060 | 47 | 47 | 47 | 47 | 47.00 | 984 |
| 1917 | 17.50 | 16.50 | 17.27 | 16.50 | 16.94 | 1076 | 47 | 47 | 47 | 47 | 47.00 | 984 |
| 1918 | 20.00 | 19.50 | 19.50 | 19.50 | 19.63 | 1246 | 47 | 47 | 47 | 47 | 47.00 | 984 |
| 1919 | 21.00 | 21.00 | 22.00 | 22.00 | 21.50 | 1365 | 47 | 47 | 47 | 47 | 47.00 | 984 |
Industry, trade, or occupation: BOOKBINDERS AND PAPER -RULERS .
Classes of workers covered: Journeymen.
† Interpolated. | ||||||||||||
|---|---|---|---|---|---|---|---|---|---|---|---|---|
| 1903 | .. | 15.00 | .. | .. | 15.00 | 1000 | .. | 48 | .. | .. | 48 | 1000 |
| 1904 | .. | 15.00 | .. | .. | 15.00 | 1000 | .. | 48 | .. | .. | 48 | 1000 |
| 1905 | .. | 15.00 | .. | .. | 15.00 | 1000 | .. | 48 | .. | .. | 48 | 1000 |
| 1906 | .. | 15.00 | .. | .. | 15.00 | 1000 | .. | 48 | .. | .. | 48 | 1000 |
| 1907 | 15.00 | 15.00 | .. | .. | 15.00 | 1000 | 48 | 48 | .. | .. | 48 | 1000 |
| 1908 | 15.00 | 15.00 | 15.00 | .. | 15.00 | 1000 | 48 | 48 | 48 | .. | 48 | 1000 |
| 1909 | 15.00 | 15.00 | 15.00 | .. | 15.00 | 1000 | 48 | 48 | 48 | .. | 48 | 1000 |
| 1910 | 15.00 | 15.00 | 15.00 | .. | 15.00 | 1000 | 48 | 48 | 48 | .. | 48 | 1000 |
| 1911 | 15.00 | 15.00 | 15.00 | 15.00† | 15.00 | 1000 | 48 | 48 | 48 | 48† | 48 | 1000 |
| 1912 | 15.00 | 15.00 | 15.00 | 15.00† | 15.00 | 1000 | 48 | 48 | 48 | 48† | 48 | 1000 |
| 1913 | 15.00 | 15.00 | 15.00 | 15.00† | 15.00 | 1000 | 48 | 48 | 48 | 48† | 48 | 1000 |
| 1914 | 16.25 | 16.25 | 16.25 | 16.25 | 16.25 | 1083 | 48 | 48 | 48 | 48 | 48 | 1000 |
| 1915 | 16.25 | 16.25 | 16.25 | 16.25 | 16.25 | 1083 | 48 | 48 | 48 | 48 | 48 | 1000 |
| 1916 | 16.25 | 16.25 | 16.25 | 16.25 | 16.25 | 1083 | 48 | 48 | 48 | 48 | 48 | 1000 |
| 1917 | 17.50 | 17.50 | 17.50 | 17.50 | 17.50 | 1167 | 48 | 48 | 48 | 48 | 48 | 1000 |
| 1918 | 17.50 | 17.50 | 17.50 | 17.50 | 17.50 | 1167 | 48 | 48 | 48 | 48 | 48 | 1000 |
| 1919 | 19.37 | 17.50 | 19.37 | 19.37 | 18.90 | 1260 | 48 | 48 | 48 | 48 | 48 | 1000 |
Industry, trade, or occupation: BOOTMAKERS (MALE ).
Classes of workers covered: All classes—adults.
| As at 30th June | Minimum Wages (In Pence) per Hour. | Maximum Ordinary Working-hours per Week. | ||||||||||
|---|---|---|---|---|---|---|---|---|---|---|---|---|
| Auckland. | Wellington. | Canterbury. | Otago. | Average. | Index Number: Base, 1911 | Auckland. | Wellington. | Canterbury. | Otago. | Average. | Index Number: Base, 1911 | |
| 1899 | .. | 10.00 | 10.00 | 10.00 | 10.00 | 816 | .. | 48 | 48 | 48 | 48 | 1067 |
| 1900 | 10.00 | 10.00 | 10.00 | 10.00 | 10.00 | 816 | 48 | 48 | 48 | 48 | 48 | 1067 |
| 1901 | 10.50 | 10.50 | 10.50 | 10.50 | 10.50 | 857 | 48 | 48 | 48 | 48 | 48 | 1067 |
| 1902 | 10.50 | 10.50 | 10.50 | 10.50 | 10.50 | 857 | 48 | 48 | 48 | 48 | 48 | 1067 |
| 1903 | 10.50 | 10.50 | 10.50 | 10.50 | 10.50 | 857 | 48 | 48 | 48 | 48 | 48 | 1067 |
| 1904 | 11.25 | 11.25 | 11.25 | 11.25 | 11.25 | 918 | 45 | 45 | 45 | 45 | 45 | 1000 |
| 1905 | 11.25 | 11.25 | 11.25 | 11.25 | 11.25 | 918 | 45 | 45 | 45 | 45 | 45 | 1000 |
| 1906 | 12.00 | 12.00 | 12.00 | 12.00 | 12.00 | 980 | 45 | 45 | 45 | 45 | 45 | 1000 |
| 1907 | 12.00 | 12.00 | 12.00 | 12.00 | 12.00 | 980 | 45 | 45 | 45 | 45 | 45 | 1000 |
| 1908 | 12.00 | 12.00 | 12.00 | 12.00 | 12.00 | 980 | 45 | 45 | 45 | 45 | 45 | 1000 |
| 1909 | 12.25 | 12.25 | 12.25 | 12.25 | 12.25 | 1000 | 45 | 45 | 45 | 45 | 45 | 1000 |
| 1910 | 12.25 | 12.25 | 12.25 | 12.25 | 12.25 | 1000 | 45 | 45 | 45 | 45 | 45 | 1000 |
| 1911 | 12.25 | 12.25 | 12.25 | 12.25 | 12.25 | 1000 | 45 | 45 | 45 | 45 | 45 | 1000 |
| 1912 | 12.25 | 12.25 | 12.25 | 12.25 | 12.25 | 1000 | 45 | 45 | 45 | 45 | 45 | 1000 |
| 1913 | 14.00 | 14.00 | 14.00 | 14.00 | 14.00 | 1143 | 45 | 45 | 45 | 45 | 45 | 1000 |
| 1914 | 14.00 | 14.00 | 14.00 | 14.00 | 14.00 | 1143 | 45 | 45 | 45 | 45 | 45 | 1000 |
| 1915 | 14.00 | 14.00 | 14.00 | 14.00 | 14.00 | 1143 | 45 | 45 | 45 | 45 | 45 | 1000 |
| 1916 | 15.75 | 15.75 | 15.75 | 15.75 | 15.75 | 1286 | 45 | 45 | 45 | 45 | 45 | 1000 |
| 1917 | 15.75 | 15.75 | 15.75 | 15.75 | 15.75 | 1286 | 45 | 45 | 45 | 45 | 45 | 1000 |
| 1918 | 15.75 | 15.75 | 15.75 | 15.75 | 15.75 | 1286 | 45 | 45 | 45 | 45 | 45 | 1000 |
| 1919 | 18.00 | 18.00 | 18.00 | 18.00 | 18.00 | 1469 | 45 | 45 | 45 | 45 | 45 | 1000 |
Industry, trade, or occupation: BOOTMAKERS (FEMALE ).
Classes of workers covered: Workers having over five years' experience.
| 1909 | Awards covering whole Dominion | 7.33 | 1000 | Awards covering whole Dominion | 45 | 1000 |
| 1910 | 7.33 | 1000 | 45 | 1000 | ||
| 1911 | 7.33 | 1000 | 45 | 1000 | ||
| 1912 | 7.33 | 1000 | 45 | 1000 | ||
| 1913 | 7.33 | 1000 | 45 | 1000 | ||
| 1914 | 7.33 | 1000 | 45 | 1000 | ||
| 1915 | 7.33 | 1000 | 45 | 1000 | ||
| 1916 | 8.40 | 1146 | 45 | 1000 | ||
| 1917 | 8.40 | 1146 | 45 | 1000 | ||
| 1918 | 8.40 | 1146 | 45 | 1000 | ||
| 1919 | 9.33 | 1273 | 45 | 1000 |
Industry, trade, or occupation: BUILDERS' LABOURERS .
Classes of workers covered: Labourers assisting tradesmen, and men on scaffold-work.
| As at 30th June | Minimum Wages (in Pence) per Hour. | Maximum Ordinary Working-hours per Week. | ||||||||||
|---|---|---|---|---|---|---|---|---|---|---|---|---|
| Auckland. | Wellington. | Canterbury. | Otago. | Average. | Index Number: Base, 1911. | Auckland. | Wellington. | Canterbury. | Otago. | Average. | Index Number: Base, 1911. | |
* Interpolated to avoid recording a fictitious fall in wages and an increase in hours. | ||||||||||||
| 1901 | 12.50* | 13.50* | 12.00 | 12.75* | 12.69 | 976 | 47* | 45* | 44 | 44* | 45.00 | 1000 |
| 1902 | 12.50* | 13.50 | 12.00 | 12.75 | 12.69 | 976 | 47* | 45 | 44 | 44 | 45.00 | 1000 |
| 1903 | 12.50 | 13.50 | 12.00 | 12.75 | 12.69 | 976 | 47 | 45 | 44 | 44 | 45.00 | 1000 |
| 1904 | 12.50 | 13.50 | 12.00 | 12.75 | 12.69 | 976 | 47 | 45 | 44 | 44 | 45.00 | 1000 |
| 1905 | 12.50 | 13.50 | 12.00 | 12.75 | 12.69 | 976 | 47 | 45 | 44 | 44 | 45.00 | 1000 |
| 1906 | 12.50 | 13.50 | 12.00 | 12.75 | 12.69 | 976 | 47 | 45 | 44 | 44 | 45.00 | 1000 |
| 1907 | 12.50 | 13.50 | 12.75 | 12.75 | 12.88 | 991 | 47 | 45 | 44 | 44 | 45.00 | 1000 |
| 1908 | 12.50 | 14.00 | 12.75 | 12.75 | 13.00 | 1000 | 47 | 45 | 44 | 44 | 45.00 | 1000 |
| 1909 | 12.50 | 14.00 | 12.75 | 12.75 | 13.00 | 1000 | 47 | 45 | 44 | 44 | 45.00 | 1000 |
| 1910 | 12.75 | 14.00 | 12.75 | 12.75 | 13.00 | 1000 | 47 | 45 | 44 | 44 | 45.00 | 1000 |
| 1911 | 12.75 | 14.00 | 12.75 | 12.75 | 13.00 | 1000 | 47 | 45 | 44 | 44 | 45.00 | 1000 |
| 1912 | 12.75 | 14.50 | 12.75 | 12.75 | 13.13 | 1010 | 47 | 45 | 44 | 44 | 45.00 | 1000 |
| 1913 | 12.75 | 14.50 | 12.75 | 12.75 | 13.13 | 1010 | 47 | 45 | 44 | 44 | 45.00 | 1000 |
| 1914 | 14.00 | 14.50 | 14.50 | 14.50 | 14.38 | 1106 | 44 | 45 | 44 | 44 | 44.25 | 983 |
| 1915 | 14.00 | 15.50 | 14.50 | 14.50 | 14.63 | 1125 | 44 | 44 | 44 | 44 | 44.00 | 978 |
| 1916 | 15.40 | 15.50 | 14.50 | 15.95 | 15.34 | 1180 | 44 | 44 | 44 | 44 | 44.00 | 978 |
| 1917 | 15.40 | 15.50 | 15.95 | 15.95 | 15.70 | 1208 | 44 | 44 | 44 | 44 | 44.00 | 978 |
| 1918 | 15.40 | 17.05 | 15.95 | 15.95 | 16.09 | 1238 | 44 | 44 | 44 | 44 | 44.00 | 978 |
| 1919 | 17.05 | 18.50 | 18.50 | 17.05 | 17.78 | 1368 | 44 | 44 | 44 | 44 | 44.00 | 879 |
Industry, trade, or occupation: BRICKLAYERS .
Classes of workers covered: Journeymen.
† Interpolated. | ||||||||||||
|---|---|---|---|---|---|---|---|---|---|---|---|---|
| 1903 | .. | .. | .. | 18.00 | 18.00 | 986 | .. | .. | .. | 44 | 44 | 978 |
| 1904 | .. | .. | .. | 18.00 | 18.00 | 986 | .. | .. | .. | 44 | 44 | 978 |
| 1905 | .. | .. | .. | 18.00 | 18.00 | 986 | .. | .. | .. | 44 | 44 | 978 |
| 1906 | .. | .. | .. | 18.00 | 18.00 | 986 | .. | .. | .. | 44 | 44 | 978 |
| 1907 | 18.00† | 19.00 | 18.00† | 18.00 | 18.25 | 1000 | 47† | 45 | 44† | 44 | 45 | 1000 |
| 1908 | 18.00 | 19.00 | 18.00 | 18.00 | 18.25 | 1000 | 47 | 45 | 44 | 44 | 45 | 1000 |
| 1909 | 18.00 | 19.00 | 18.00 | 18.00 | 18.25 | 1000 | 47 | 45 | 44 | 44 | 45 | 1000 |
| 1910 | 18.00 | 19.00 | 18.00 | 18.00 | 18.25 | 1000 | 47 | 45 | 44 | 44 | 45 | 1000 |
| 1911 | 18.00 | 19.00 | 18.00 | 18.00 | 18.25 | 1000 | 47 | 45 | 44 | 44 | 45 | 1000 |
| 1912 | 18.00 | 19.00 | 18.00 | 18.00 | 18.25 | 1000 | 47 | 45 | 44 | 44 | 45 | 1000 |
| 1913 | 18.00 | 19.00 | 18.00 | 18.00 | 18.25 | 1000 | 47 | 45 | 44 | 44 | 45 | 1000 |
| 1914 | 18.00 | 19.00 | 18.00 | 18.00 | 18.25 | 1000 | 47 | 45 | 44 | 44 | 45 | 1000 |
| 1915 | 18.00 | 19.00 | 18.00 | 18.00 | 18.25 | 1000 | 47 | 45 | 44 | 44 | 45 | 1000 |
| 1916 | 19.50 | 19.50 | 19.50 | 19.50 | 19.50 | 1068 | 44 | 44 | 44 | 44 | 44 | 978 |
| 1917 | 19.50 | 19.50 | 19.50 | 19.50 | 19.50 | 1068 | 44 | 44 | 44 | 44 | 44 | 978 |
| 1918 | 21.50 | 19.50 | 19.50 | 21.50 | 20.50 | 1123 | 44 | 44 | 44 | 44 | 44 | 978 |
| 1919 | 23.50 | 23.50 | 23.50 | 23.50 | 23.50 | 1288 | 44 | 44 | 44 | 44 | 44 | 978 |
Industry, trade, or occupation: BUTCHERS .
Classes of workers covered: First and second shopmen, first small-goods-men, and general hands.
| As at 30th June, | Minimum Wage (in Pence) per Hour. | Maximum Ordinary Working-hours Per Week. | ||||||||||
|---|---|---|---|---|---|---|---|---|---|---|---|---|
| Auckland. | Wellington. | Canterbury. | Otago. | Average. | Index Number: Base. 1911. | Auckland. | Wellington. | Canterbury. | Otago. | Average. | Index Number: Base, 1911. | |
* Partially (wages of second shopmen) interpolated. figure as previous award. | ||||||||||||
| 1900 | 7.93 | .. | .. | .. | 7.93 | .. | 60 1/2 | .. | .. | 60.50 | .. | |
| 1901 | 7.93 | 14.52 | .. | .. | 11.23 | 826 | 60 1/2 | 56 | .. | .. | 58.25 | 1040 |
| 1902 | 9.12 | 14.52 | 13.45 | 14.52 | 12.90 | 949 | 60 | 56 | 56 | 56 | 57.00 | 1018 |
| 1903 | 9.12 | 14.52 | 13.45 | 14.52 | 12.90 | 949 | 60 | 56 | 56 | 56 | 57.00 | 1018 |
| 1904 | 9.12 | 14.52 | 13.45 | 14.52 | 12.90 | 949 | 60 | 56 | 56 | 56 | 57.00 | 1018 |
| 1905 | 9.12 | 14.52 | 13.45 | 14.52 | 12.90 | 949 | 60 | 56 | 56 | 56 | 57.00 | 1018 |
| 1906 | 9.81* | 14.52 | 13.45 | 14.52 | 13.08 | 962 | 59 | 56 | 56 | 56 | 56.75 | 1012 |
| 1907 | 9.81* | 14.52 | 13.45 | 14.52 | 13.08 | 962 | 59 | 56 | 56 | 56 | 56.75 | 1012 |
| 1908 | 9.81* | 14.52 | 13.45 | 14.52 | 13.08 | 962 | 59 | 56 | 56 | 56 | 56.75 | 1012 |
| 1909 | 11.92 | 14.52 | 13.45 | 14.52 | 13.60 | 1000 | 56 | 56 | 56 | 56 | 56.00 | 1000 |
| 1910 | 11.92 | 14.52 | 13.45 | 14.52 | 13.60 | 1000 | 56 | 56 | 56 | 56 | 56.00 | 1000 |
| 1911 | 11.92 | 14.52 | 13.45 | 14.52 | 13.60 | 1000 | 56 | 56 | 56 | 56 | 56.00 | 1000 |
| 1912 | 11.92 | 14.52 | 13.45 | 14.52 | 13.60 | 1000 | 56 | 56 | 56 | 56 | 56.00 | 1000 |
| 1913 | 13.45 | 15.63 | 13.45 | 14.52 | 14.26 | 1049 | 56† | 52 | 56 | 56 | 55.00 | 982 |
| 1914 | 13.45 | 15.63 | 13.45 | 15.63 | 14.54 | 1069 | 56† | 52 | 56 | 52 | 54.00 | 964 |
| 1915 | 13.45 | 15.63 | 13.45 | 15.63 | 14.54 | 1069 | 56† | 52 | 56 | 52 | 54.00 | 964 |
| 1916 | 15.87 | 15.63 | 13.45 | 15.63 | 15.15 | 1114 | 52 | 52 | 56 | 52 | 53.00 | 946 |
| 1917 | 15.87 | 15.87 | 15.87 | 15.87 | 15.87 | 1167 | 52 | 52 | 52 | 52 | 52.00 | 928 |
| 1918 | 15.87 | 15.87 | 15.87 | 15.87 | 15.87 | 1167 | 52 | 52 | 52 | 52 | 52.00 | 928 |
| 1919 | 17.97 | 15.87 | 17.45 | 17.45 | 17.19 | 1264 | 50 1/2 | 52 | 52 | 52 | 51.63 | 922 |
Industry, trade, or occupation: CARPENTERS .
Classes of workers covered: Journeymen.
† Not definitely stated; taken at same | ||||||||||||
|---|---|---|---|---|---|---|---|---|---|---|---|---|
| 1898 | .. | 16.00 | 15.00 | .. | 15.50 | 961 | .. | 46 | 44 | .. | 45.00 | 1017 |
| 1899 | .. | 16.00 | 15.00 | .. | 15.50 | 961 | .. | 46 | 44 | .. | 45.00 | 1017 |
| 1900 | 14.00 | 16.00 | 16.00 | 16.00 | 15.50 | 961 | 44 | 46 | 44 | 44 | 44.50 | 1006 |
| 1901 | 14.00 | 16.00 | 16.00 | 16.00 | 15.50 | 961 | 44 | 46 | 44 | 44 | 44.50 | 1006 |
| 1902 | 15.00 | 16.00 | 16.00 | 16.00 | 15.75 | 976 | 44 | 45 | 44 | 44 | 44.25 | 1000 |
| 1903 | 15.00 | 10.00 | 16.00 | 16.00 | 15.75 | 976 | 44 | 45 | 44 | 44 | 44.25 | 1000 |
| 1904 | 15.00 | 16.00 | 16.00 | 16.00 | 15.75 | 976 | 44 | 45 | 44 | 44 | 44.25 | 1000 |
| 1905 | 15.00 | 16.00 | 16.00 | 16.00 | 15.75 | 976 | 44 | 45 | 44 | 44 | 44.25 | 1000 |
| 1906 | 15.00 | 16.00 | 16.00 | 16.00 | 15.75 | 976 | 44 | 45 | 44 | 44 | 44.25 | 1000 |
| 1907 | 15.00 | 16.00 | 16.00 | 16.00 | 15.75 | 976 | 44 | 45 | 44 | 44 | 44.25 | 1000 |
| 1908 | 16.00 | 16.00 | 16.00 | 16.00 | 16.00 | 992 | 44 | 45 | 44 | 44 | 44.25 | 1000 |
| 1909 | 16.00 | 16.00 | 16.00 | 16.00 | 16.00 | 992 | 44 | 45 | 44 | 44 | 44.25 | 1000 |
| 1910 | 16.00 | 16.00 | 16.00 | 16.00 | 16.00 | 992 | 44 | 45 | 44 | 44 | 44.25 | 1000 |
| 1911 | 16.50 | 16.00 | 16.00 | 16.00 | 16.13 | 1000 | 44 | 45 | 44 | 44 | 44.25 | 1000 |
| 1912 | 16.50 | 16.50 | 16.50 | 16.50 | 16.50 | 1023 | 44 | 45 | 44 | 44 | 44.25 | 1000 |
| 1913 | 16.50 | 16.50 | 16.50 | 16.50 | 16.50 | 1023 | 44 | 45 | 44 | 44 | 44.25 | 1000 |
| 1914 | 18.00 | 18.00 | 18.00 | 18.00 | 18.00 | 1116 | 44 | 44 | 44 | 44 | 44.00 | 994 |
| 1915 | 18.00 | 18.00 | 18.00 | 18.00 | 18.00 | 1116 | 44 | 44 | 44 | 44 | 44.00 | 994 |
| 1916 | 18.00 | 18.00 | 18.00 | 18.00 | 18.00 | 1116 | 44 | 44 | 44 | 44 | 44.00 | 994 |
| 1917 | 20.00 | 18.00 | 18.00 | 18.00 | 18.50 | 1147 | 44 | 44 | 44 | 44 | 44.00 | 994 |
| 1918 | 20.00 | 20.00 | 20.00 | 20.00 | 20.00 | 1240 | 44 | 44 | 44 | 44 | 44.00 | 994 |
| 1919 | 22.00 | 21.00 | 22.00 | 22.00 | 21.75 | 1348 | 44 | 44 | 44 | 44 | 44.00 | 994 |
Industry, trade, or occupation: COACHBUILDERS .
Classes of workers covered: Journeymen.
| As at 30th June, | Minimum Wages (in Pence) per Hour. | Maximum Ordinary Working-hours per Week. | ||||||||||
|---|---|---|---|---|---|---|---|---|---|---|---|---|
| Auckland. | Wellington. | Canterbury. | Otago. | Average. | Index Number: Base. 1911. | Auckland. | Wellington. | Canterbury. | Otago. | Average. | Index Number: Base, 1911. | |
| 1901 | .. | 15.00 | 15.00 | .. | 15.00 | 1000 | .. | 48 | 48 | .. | 48.00 | 1005 |
| 1902 | .. | 15.00 | 15.00 | 15.00 | 15.00 | 1000 | .. | 48 | 48 | 48 | 48.00 | 1005 |
| 1903 | .. | 15.00 | 15.00 | 15.00 | 15.00 | 1000 | .. | 48 | 48 | 48 | 48.00 | 1005 |
| 1904 | .. | 15.00 | 15.00 | 15.00 | 15.00 | 1000 | .. | 48 | 48 | 48 | 48.00 | 1005 |
| 1905 | .. | 15.00 | 15.00 | 15.00 | 15.00 | 1000 | .. | 48 | 48 | 48 | 48.00 | 1005 |
| 1906 | 14.00 | 15.00 | 15.00 | 15.00 | 14.75 | 981 | 47 | 48 | 48 | 48 | 47.75 | 1000 |
| 1907 | 14.00 | 15.00 | 15.00 | 15.00 | 14.75 | 981 | 47 | 48 | 48 | 48 | 47.75 | 1000 |
| 1908 | 14.00 | 15.00 | 15.00 | 15.00 | 14.75 | 981 | 47 | 48 | 48 | 48 | 47.75 | 1000 |
| 1909 | 15.00 | 15.00 | 15.00 | 15.00 | 15.00 | 1000 | 47 | 48 | 48 | 48 | 47.75 | 1000 |
| 1910 | 15.00 | 15.00 | 15.00 | 15.00 | 15.00 | 1000 | 47 | 48 | 48 | 48 | 47.75 | 1000 |
| 1911 | 15.00 | 15.00 | 15.00 | 15.00 | 15.00 | 1000 | 47 | 48 | 48 | 48 | 47.75 | 1000 |
| 1912 | 15.00 | 15.00 | 15.00 | 15.00 | 15.00 | 1000 | 47 | 48 | 48 | 48 | 47.75 | 1000 |
| 1913 | 15.00 | 15.00 | 16.50 | 16.50 | 15.75 | 1050 | 47 | 48 | 48 | 48 | 47.75 | 1000 |
| 1914 | 16.50 | 16.50 | 16.50 | 16.50 | 16.50 | 1100 | 47 | 48 | 48 | 48 | 47.75 | 1000 |
| 1915 | 16.50 | 16.50 | 16.50 | 16.50 | 16.50 | 1100 | 47 | 48 | 48 | 48 | 47.75 | 1000 |
| 1916 | 16.50 | 16.50 | 16.50 | 16.50 | 16.50 | 1100 | 47 | 48 | 48 | 48 | 47.75 | 1000 |
| 1917 | 18.00 | 18.00 | 18.00 | 18.00 | 18.00 | 1200 | 47 | 47 | 47 | 47 | 47.00 | 984 |
| 1918 | 18.00 | 18.00 | 18.00 | 18.00 | 18.00 | 1200 | 47 | 47 | 47 | 47 | 47.00 | 984 |
| 1919 | 22.00 | 22.00 | 22.00 | 22.00 | 22.00 | 1466 | 47 | 47 | 47 | 47 | 47.00 | 984 |
Industry, trade, or occupation: COAL -MINERS .
Classes of workers covered: (1) Shift miners, (2) truckers on day-wages.
| As at 30th June, | Minimum Wages (in Pence) per Day or Shift. | Maximum Ordinary Working-hours per Week. | ||||||||||
|---|---|---|---|---|---|---|---|---|---|---|---|---|
| Auckland.* | Wellington. | Canterbury. | Otago. | Average. | Index Number: Base, 1911. | Auckland. | Wellington. | Canterbury. | Otago. | Average. | Index Number: Base, 1911. | |
* Awards and agreements affecting Taupiri coal-mines. † Awards and agreements affecting Blackball coal-mines. ‡ Agreement not formally registered at date of compilation. | ||||||||||||
| 1900 | 99.00 | .. | .. | .. | 99.00 | 795 | Hours of work not stated in such manner as to allow of statistical treatment. | |||||
| 1901 | 99.00 | .. | .. | .. | 99.00 | 795 | ||||||
| 1902 | 99.00 | .. | 120.00 | .. | 109.50 | 880 | ||||||
| 1903 | 102.00 | .. | 120.00 | .. | 111.00 | 892 | ||||||
| 1904 | 102.00 | .. | 120.00 | .. | 111.00 | 892 | ||||||
| 1905 | 102.00 | .. | 120.00 | .. | 111.00 | 892 | ||||||
| 1906 | 102.00 | .. | 120.00 | .. | 111.00 | 892 | ||||||
| 1907 | 111.00 | .. | 120.00 | .. | 115.50 | 928 | ||||||
| 1908 | 111.00 | .. | 120.00 | .. | 115.50 | 928 | ||||||
| 1909 | 111.00 | .. | 132.00 | .. | 121.50 | 976 | ||||||
| 1910 | 117.00 | .. | 132.00 | .. | 124.50 | 1000 | ||||||
| 1911 | 117.00 | .. | 132.00 | .. | 124.50 | 1000 | ||||||
| 1912 | 117.00 | .. | 132.00 | .. | 124.50 | 1000 | ||||||
| 1913 | 123.00 | .. | 132.00 | .. | 127.50 | 1024 | ||||||
| 1914 | 123.00 | .. | 135.00 | .. | 129.00 | 1036 | ||||||
| 1915 | 123.00 | .. | 135.00 | .. | 129.00 | 1036 | ||||||
| 1916 | 135.30 | .. | 135.00 | .. | 135.15 | 1086 | ||||||
| 1917 | 148.80 | .. | 162.00 | .. | 155.40 | 1248 | ||||||
| 1918 | 148.80 | .. | 162.00 | .. | 155.40 | 1248 | ||||||
| 1919 | 161.20‡ | .. | 175.50‡ | .. | 168.35 | 1352 | ||||||
Industry, trade, or occupation: DRIVERS .
Classes of workers covered: (1) One-horse drivers, (2) two-horse drivers.
| As at 30th June, | Minimum Wages (in Pence) per Hour.* | Maximum Ordinary Working-hours per Week. | ||||||||||
|---|---|---|---|---|---|---|---|---|---|---|---|---|
| Auckland. | Wellington. | Canterbury. | Otago. | Average. | Index Number: Base, 1911. | Auckland. | Wellington. | Canterbury. | Otago. | Average. | Index Number: Base, 1911. | |
* Exclusive of stable time. | ||||||||||||
| 1899 | 8.84 | .. | .. | .. | 8.84 | 749 | 54 | .. | .. | .. | 54 | 1137 |
| 1900 | 8.84 | 10.99 | .. | .. | 9.92 | 840 | 54 | 47 1/2 | .. | .. | 50.75 | 1068 |
| 1901 | 8.84 | 10.99 | .. | .. | 9.92 | 840 | 54 | 47 1/2 | .. | .. | 50.75 | 1068 |
| 1902 | 11.12 | 12.00 | .. | 11.12 | 11.41 | 966 | 47 1/2 | 47 1/2 | .. | 47 1/2 | 47.50 | 1000 |
| 1903 | 11.12 | 12.00 | 11.12 | 11.12 | 11.34 | 952 | 47 1/2 | 47 1/2 | 47 1/2 | 47 1/2 | 47.50 | 1000 |
| 1904 | 11.12 | 12.00 | 11.12 | 11.12 | 11.34 | 952 | 47 1/2 | 47 1/2 | 47 1/2 | 47 1/2 | 47.50 | 1000 |
| 1905 | 11.12 | 11.87 | 11.12 | 11.12 | 11.31 | 958 | 47 1/2 | 47 1/2 | 47 1/2 | 47 1/2 | 47.50 | 1000 |
| 1906 | 11.12 | 11.87 | 11.12 | 11.12 | 11.31 | 958 | 47 1/2 | 47 1/2 | 47 1/2 | 47 1/2 | 47.50 | 1000 |
| 1907 | 11.12 | 11.87 | 11.12 | 11.12 | 11.31 | 958 | 47 1/2 | 47 1/2 | 47 1/2 | 47 1/2 | 47.50 | 1000 |
| 1908 | 11.12 | 12.38 | 11.12 | 11.12 | 11.44 | 969 | 47 1/2 | 47 1/2 | 47 1/2 | 47 1/2 | 47.50 | 1000 |
| 1909 | 11.62 | 12.38 | 11.62 | 11.12 | 11.69 | 990 | 47 1/2 | 47 1/2 | 47 1/2 | 47 1/2 | 47.50 | 1000 |
| 1910 | 11.62 | 12.38 | 11.62 | 11.62 | 11.81 | 1000 | 47 1/2 | 47 1/2 | 47 1/2 | 47 1/2 | 47.50 | 1000 |
| 1911 | 11.62 | 12.38 | 11.62 | 11.62 | 11.81 | 1000 | 47 1/2 | 47 1/2 | 47 1/2 | 47 1/2 | 47.50 | 1000 |
| 1912 | 11.62 | 12.38 | 11.62 | 11.62 | 11.81 | 1000 | 47 1/2 | 47 1/2 | 47 1/2 | 47 1/2 | 47.50 | 1000 |
| 1913 | 12.50 | 12.50 | 12.50 | 12.50 | 12.50 | 1058 | 48 | 48 | 48 | 48 | 48.00 | 1011 |
| 1914 | 12.50 | 12.50 | 12.50 | 12.50 | 12.50 | 1058 | 48 | 48 | 48 | 48 | 48.00 | 1011 |
| 1915 | 12.50 | 12.50 | 12.50 | 12.50 | 12.50 | 1058 | 48 | 48 | 48 | 48 | 48.00 | 1011 |
| 1916 | 12.50 | 12.50 | 12.50 | 12.50 | 12.50 | 1058 | 48 | 48 | 48 | 48 | 48.00 | 1011 |
| 1917 | 15.00 | 15.00 | 15.00 | 15.00 | 15.00 | 1270 | 48 | 48 | 48 | 48 | 48.00 | 1011 |
| 1918 | 15.00 | 15.00 | 15.00 | 15.00 | 15.00 | 1270 | 48 | 48 | 48 | 48 | 48.00 | 1011 |
| 1919 | 16.81 | 16.81 | 16.81 | 16.81 | 16.81 | 1423 | 48 | 48 | 48 | 48 | 48.00 | 1011 |
Industry, trade, or occupation: ENGINEERS (ON SHORE ).
Classes of workers covered: One general class covering "all first-class engineers" (fitters, blacksmiths, coppersmiths, patternmakers, turners, milling machinists, and brassfinishers).
† Wages not stipulated in award made in May, 1898, but "to be agreed upon between employers and individual employees." This award legally expired on 30th April, 1900. Next award made, 1911. | ||||||||||||
|---|---|---|---|---|---|---|---|---|---|---|---|---|
| 1898 | .. | .. | † | .. | .. | .. | .. | .. | 48 | .. | 48.00 | 1021 |
| 1899 | .. | .. | † | .. | .. | .. | .. | .. | 48 | .. | 48.00 | 1021 |
| 1900 | .. | .. | † | .. | .. | .. | .. | .. | 48 | .. | 48.00 | 1021 |
| 1901 | .. | .. | † | .. | .. | .. | .. | .. | 48 | .. | 48.00 | 1021 |
| 1902 | .. | .. | † | .. | .. | .. | .. | .. | 48 | .. | 48.00 | 1021 |
| 1903 | .. | .. | † | .. | .. | .. | .. | .. | 48 | .. | 48.00 | 1021 |
| 1904 | .. | .. | † | .. | .. | .. | .. | .. | 48 | .. | 48.00 | 1021 |
| 1905 | 15.00 | .. | † | .. | 15.00 | 909 | 47 | .. | 48 | .. | 47.50 | 1011 |
| 1906 | 15.00 | .. | † | .. | 15.00 | 909 | 47 | .. | 48 | .. | 47.50 | 1011 |
| 1907 | 15.00 | .. | † | .. | 15.00 | 909 | 47 | .. | 48 | .. | 47.50 | 1011 |
| 1908 | 16.50 | .. | † | 16.50 | 16.50 | 1000 | 47 | .. | 48 | 47 | 47.33 | 1007 |
| 1909 | 16.50 | 16.50 | † | 16.50 | 16.50 | 1000 | 47 | 47 | 48 | 47 | 47.25 | 1005 |
| 1910 | 16.50 | 16.50 | † | 16.50 | 16.50 | 1000 | 47 | 47 | 48 | 47 | 47.25 | 1005 |
| 1911 | 16.50 | 16.50 | 16.50 | 16.50 | 16.50 | 1000 | 47 | 47 | 47 | 47 | 47.00 | 1000 |
| 1912 | 16.50 | 16.50 | 16.50 | 16.50 | 16.50 | 1000 | 47 | 47 | 47 | 47 | 47.00 | 1000 |
| 1913 | 16.50 | 16.50 | 16.50 | 16.50 | 16.50 | 1000 | 47 | 47 | 47 | 47 | 47.00 | 1000 |
| 1914 | 16.50 | 16.50 | 16.50 | 16.50 | 16.50 | 1000 | 47 | 47 | 47 | 47 | 47.00 | 1000 |
| 1915 | 16.50 | 16.50 | 16.50 | 16.50 | 16.50 | 1000 | 47 | 47 | 47 | 47 | 47.00 | 1000 |
| 1916 | 16.50 | 16.50 | 17.27 | 16.50 | 16.69 | 1012 | 47 | 47 | 47 | 47 | 47.00 | 1000 |
| 1917 | 17.50 | 16.50 | 17.27 | 17.27 | 17.14 | 1038 | 47 | 47 | 47 | 47 | 47.00 | 1000 |
| 1918 | 20.00 | 19.50 | 20.00 | 20.00 | 19.88 | 1205 | 47 | 47 | 47 | 47 | 47.00 | 1000 |
| 1919 | 21.00 | 21.00 | 22.00 | 22.00 | 21.50 | 1303 | 47 | 47 | 47 | 47 | 47.00 | 1000 |
Industry, trade, or occupation: FELLMONGERS .
Classes of workers covered: (1) Painters, trimmers, and pelt-classers; (2) general labourers or workers not otherwise enumerated.
| As at 30th June, | Minimum Wages (in Pence) per Hour. | Maximum Ordinary Working-hours per Week. | ||||||||||
|---|---|---|---|---|---|---|---|---|---|---|---|---|
| Auckland. | Wellington. | Canterbury. | Otago. | Average. | Index Number: Base. 1911. | Auckland. | Wellington. | Canterbury. | Otago. | Average. | Index Number: Base, 1911. | |
| 1905 | .. | .. | 11.25 | .. | 11.25 | 916 | .. | .. | 48 | .. | 48 | 1000 |
| 1906 | 11.25 | .. | 11.25 | .. | 11.25 | 916 | 48 | .. | 48 | .. | 48 | 1000 |
| 1907 | 11.25 | .. | 11.25 | .. | 11.25 | 916 | 48 | .. | 48 | .. | 48 | 1000 |
| 1908 | 11.25 | .. | 11.25 | .. | 11.25 | 916 | 48 | .. | 48 | .. | 48 | 1000 |
| 1909 | 11.25 | 11.62 | 11.25 | .. | 11.37 | 926 | 48 | 48 | 48 | .. | 48 | 1000 |
| 1910 | 11.25 | 11.62 | 11.25 | .. | 11.37 | 926 | 48 | 48 | 48 | .. | 48 | 1000 |
| 1911 | 11.25 | 12.12 | 12.88 | 12.88† | 12.28 | 1000 | 48 | 48 | 48 | 48† | 48 | 1000 |
| 1912 | 12.50 | 12.12 | 12.88 | 12.88† | 12.60 | 1026 | 48 | 48 | 48 | 48† | 48 | 1000 |
| 1913 | 12.50 | 12.12 | 12.88 | 12.88† | 12.60 | 1026 | 48 | 48 | 48 | 48† | 48 | 1000 |
| 1914 | 12.50 | 14.50 | 14.37 | 14.37 | 13.94 | 1135 | 48 | 48 | 48 | 48 | 48 | 1000 |
| 1915 | 12.50 | 14.50 | 14.37 | 14.37 | 13.94 | 1135 | 48 | 48 | 48 | 48 | 48 | 1000 |
| 1916 | 14.19 | 14.50 | 17.25 | 17.25 | 15.80 | 1287 | 48 | 48 | 48 | 48 | 48 | 1000 |
| 1917 | 15.19 | 14.50 | 17.25 | 17.25 | 16.05 | 1307 | 48 | 48 | 48 | 48 | 48 | 1000 |
| 1918 | 15.19 | 18.75 | 17.25 | 17.25 | 17.11 | 1393 | 48 | 48 | 48 | 48 | 48 | 1000 |
| 1919 | 21.62 | 21.12 | 21.62 | 21.62 | 21.50 | 1751 | 48 | 48 | 48 | 48 | 48 | 1000 |
Industry, trade, or occupation: FLOUR -MILL EMPLOYEES .
Classes of workers covered: (1) Millers (flour, oat, and barley); (2) storemen and packermen.
* Hawke's Bay awards for earlier years. † Interpolated to complete the base year-1911. ‡ No awards for Wellington district. § Hours rather indefinitely stated; apparently mostly 44 per week. | ||||||||||||
|---|---|---|---|---|---|---|---|---|---|---|---|---|
| 1901 | .. | † | 11.75 | 11.75 | 11.75 | 965 | .. | † | 48 | 46 | 47.00 | 993 |
| 1902 | 11.75 | † | 11.75 | 11.75 | 11.75 | 965 | 46 | † | 48 | 46 | 40.67 | 986 |
| 1903 | 11.75 | † | 11.75 | 11.75 | 11.75 | 965 | 46 | † | 48 | 46 | 46.67 | 986 |
| 1904 | 11.75 | † | 11.75 | 11.75 | 11.75 | 965 | 48 | † | 48 | 46 | 47.33 | 1000 |
| 1905 | 11.75 | † | 11.75 | 11.75 | 11.75 | 965 | 48 | † | 48 | 46 | 47.33 | 1000 |
| 1906 | 11.75 | † | 11.75 | 11.75 | 11.75 | 965 | 48 | † | 48 | 46 | 47.33 | 1000 |
| 1907 | 11.75 | † | 11.75 | 11.75 | 11.75 | 965 | 48 | † | 48 | 46 | 47.33 | 1000 |
| 1908 | 11.75 | † | 11.75 | 11.75 | 11.75 | 965 | 48 | † | 48 | 46 | 47.33 | 1000 |
| 1909 | 11.75 | † | 12.50 | 11.75 | 12.00 | 986 | 48 | † | 48 | 46 | 47.33 | 1000 |
| 1910 | 11.75 | † | 12.50 | 11.75 | 12.00 | 986 | 48 | † | 48 | 46 | 47.33 | 1000 |
| 1911 | 11.75 | † | 13.00 | 11.75 | 12.17 | 1000 | 48 | † | 48 | 46 | 47.33 | 1000 |
| 1912 | 13.00 | † | 13.00 | 11.75 | 12.58 | 1034 | 48 | † | 48 | 46 | 47.33 | 1000 |
| 1913 | 13.00 | † | 13.00 | 11.75 | 12.58 | 1034 | 48 | † | 48 | 46 | 47.33 | 1000 |
| 1914 | 13.00 | † | 13.00 | 13.00 | 13.00 | 1068 | 48 | † | 48 | 44 § | 46.67 | 986 |
| 1915 | 13.00 | † | 13.00 | 13.00 | 13.00 | 1068 | 48 | † | 48 | 44 § | 46.67 | 988 |
| 1916 | 15.00 | † | 15.00 | 15.00 | 15.00 | 1233 | 48 | † | 44 § | 44 § | 45.33 | 958 |
| 1917 | 15.00 | † | 15.00 | 15.00 | 15.00 | 1233 | 48 | † | 44 § | 44 § | 45.33 | 958 |
| 1918 | 15.00 | † | 15.00 | 15.00 | 15.00 | 1233 | 48 | † | 44 § | 44 § | 45.33 | 958 |
| 1919 | 19.25 | † | 19.12 | 19.12 | 19.17 | 1583 | 48 | † | 44 § | 44 § | 45.33 | 958 |
Industry, trade, or occupation: FREEZING -WORKS EMPLOYEES .
Classes of workers covered: (1) Freezing-chamber hands', (2) general labourers not otherwise classified.
| As at 30th June, | Minimum Wage (in Pence) per Hour. | Maximum Ordinary Working-hours Per Week. | ||||||||||
|---|---|---|---|---|---|---|---|---|---|---|---|---|
| Auckland. | Wellington. | Canterbury. | Otago. | Average. | Index Number: Base, 1911. | Auckland. | Wellington. | Canterbury. | Otago. | Average. | Index Number: Base, 1911. | |
| 1903 | .. | .. | 11.25 | .. | 11.25 | 811 | .. | .. | 48 | .. | 48 | 1000 |
| 1904 | .. | .. | 11.25 | .. | 11.25 | 811 | .. | .. | 48 | .. | 48 | 1000 |
| 1905 | 11.25* | .. | 11.25 | .. | 11.25 | 811 | 48* | .. | 48 | .. | 48 | 1000 |
| 1906 | 11.25* | .. | 11.25 | .. | 11.25 | 811 | 48* | .. | 48 | .. | 48 | 1000 |
| 1907 | 12.75* | .. | 11.25 | .. | 12.00 | 865 | 48* | .. | 48 | .. | 48 | 1000 |
| 1908 | 12.75* | .. | 13.12 | 13.12‡§ | 13.00 | 937 | 48* | .. | 48 | 48‡ | 48 | 1000 |
| 1909 | 12.75* | 12.75† | 13.12 | 13.12‡§ | 12.94 | 932 | 48* | 48† | 48 | 48‡ | 48 | 1000 |
| 1910 | 14.25* | 12.75† | 13.12 | 13.12‡§ | 13.31 | 959 | 48* | 48† | 48 | 48‡ | 48 | 1000 |
| 1911 | 14.25* | 14.25† | 13.50 | 13.50‡§ | 13.88 | 1000 | 48* | 48† | 48 | 48‡ | 48 | 1000 |
| 1912 | 14.25* | 14.25† | 13.50 | 13.50‡§ | 13.88 | 1000 | 48* | 48† | 48 | 48‡ | 48 | 1000 |
| 1913 | 15.00* | 14.25† | 13.50 | 13.50‡§ | 14.06 | 1013 | 48* | 48† | 48 | 48‡ | 48 | 1000 |
| 1914 | 15.00* | 15.25† | 15.25 | 13.50‡§ | 14.75 | 1063 | 48* | 48† | 48 | 48‡ | 48 | 1000 |
| 1915 | 15.00* | 15.25† | 15.25 | 15.50‡ | 15.25 | 1099 | 48* | 48† | 48 | 48‡ | 48 | 1000 |
| 1916 | 15.00* | 15.25† | 17.25 | 15.50‡ | 15.75 | 1135 | 48* | 48† | 48 | 48‡ | 48 | 1000 |
| 1917 | 16.50* | 15.25† | 17.25 | 18.75‡ | 16.94 | 1220 | 48* | 48† | 48 | 48‡ | 48 | 1000 |
| 1918 | 16.50* | 18.75† | 17.25 | 18.75‡ | 17.81 | 1211 | 48* | 48† | 48 | 48‡ | 48 | 1000 |
| 1919 | 22.00* | 22.00† | 22.00 | 22.00‡ | 22.00 | 1585 | 48* | 48† | 48 | 48‡ | 48 | 1000 |
Industry, trade, or occupation: FURNITURE -MAKERS .
Classes of workers covered: Journeymen cabinetmakers, chairmakers, carvers, upholsterers, &c.
* Awards covering Gisborne freezing-works. † Awards covering Hawke's Bay freezing-works. ‡ Awards covering Southland freezing-works. § General labourers' wages interpolated at same rate as in Canterbury awards. | ||||||||||||
|---|---|---|---|---|---|---|---|---|---|---|---|---|
| 1897 | .. | .. | .. | 12.00 | 12.00 | 784 | .. | .. | .. | 48 | 48.00 | 1038 |
| 1898 | .. | 13.50 | 12.75 | 12.00 | 12.75 | 833 | .. | 48 | 44 | 48 | 46.67 | 1009 |
| 1899 | .. | 13.50 | 12.75 | 12.75 | 13.00 | 849 | .. | 48 | 44 | 48 | 46.67 | 1009 |
| 1900 | 13.00 | 13.50 | 12.75 | 12.75 | 13.00 | 849 | 47 | 48 | 44 | 48 | 46.75 | 1011 |
| 1901 | 13.00 | 13.50 | 12.75 | 12.75 | 13.00 | 849 | 47 | 48 | 44 | 48 | 46.75 | 1011 |
| 1902 | 13.00 | 15.65 | 12.75 | 12.75 | 13.54 | 884 | 47 | 46 | 44 | 48 | 46.25 | 1000 |
| 1903 | 15.00 | 15.65 | 15.00 | 15.00 | 15.16 | 990 | 47 | 46 | 44 | 48 | 46.25 | 1000 |
| 1904 | 15.00 | 15.65 | 15.00 | 15.00 | 15.16 | 990 | 47 | 46 | 44 | 48 | 46.25 | 1000 |
| 1905 | 15.00 | 15.65 | 15.00 | 15.00 | 15.16 | 990 | 47 | 46 | 44 | 48 | 46.25 | 1000 |
| 1906 | 15.00 | 15.75 | 15.00 | 15.00 | 15.19 | 992 | 47 | 46 | 44 | 48 | 46.25 | 1000 |
| 1907 | 15.00 | 15.75 | 15.00 | 15.00 | 15.19 | 992 | 47 | 46 | 44 | 48 | 46.25 | 1000 |
| 1908 | 15.00 | 15.75 | 15.00 | 15.00 | 15.19 | 992 | 47 | 46 | 44 | 48 | 46.25 | 1000 |
| 1909 | 15.00 | 15.75 | 15.00 | 15.00 | 15.19 | 992 | 47 | 46 | 44 | 48 | 46.25 | 1000 |
| 1910 | 15.00 | 15.75 | 15.00 | 15.00 | 15.19 | 992 | 47 | 46 | 44 | 48 | 46.25 | 1000 |
| 1911 | 15.50 | 15.75 | 15.00 | 15.00 | 15.31 | 1000 | 47 | 46 | 44 | 48 | 46.25 | 1000 |
| 1912 | 15.50 | 16.50 | 16.50 | 15.00 | 15.88 | 1037 | 47 | 44 | 44 | 48 | 45.75 | 989 |
| 1913 | 15.50 | 16.50 | 16.50 | 16.50 | 16.25 | 1061 | 47 | 44 | 44 | 44 | 44.75 | 968 |
| 1914 | 15.50 | 16.50 | 16.50 | 16.50 | 16.25 | 1061 | 47 | 44 | 44 | 44 | 44.75 | 968 |
| 1915 | 15.50 | 16.50 | 16.50 | 16.50 | 16.25 | 1060 | 47 | 44 | 44 | 44 | 44.75 | 968 |
| 1916 | 18.00 | 18.00 | 18.00 | 18.00 | 18.00 | 1176 | 44 | 44 | 44 | 44 | 44.00 | 951 |
| 1917 | 18.00 | 18.00 | 18.00 | 18.00 | 18.00 | 1176 | 44 | 44 | 44 | 44 | 44.00 | 951 |
| 1918 | 19.80 | 19.80 | 19.80 | 19.80 | 19.80 | 1293 | 44 | 44 | 44 | 44 | 44.00 | 951 |
| 1919 | 22.00 | 22.00 | 22.00 | 22.00 | 22.00 | 1437 | 44 | 44 | 44 | 44 | 44.00 | 951 |
Industry, trade, or occupation: GROCERS' ASSISTANTS .
Classes of workers covered: One class-adult workers.
| As at 30th June, | Minimum Wages (in Pence) per Hour. | Maximum Ordinary Working-hours Per Week. | ||||||||||
|---|---|---|---|---|---|---|---|---|---|---|---|---|
| Auckland. | Wellington. | Canterbury. | Otago. | Average. | Index Number: Base, 1911. | Auckland. | Wellington. | Canterbury. | Otago. | Average. | Index Number: Base, 1911. | |
| 1902 | .. | 10.19 | .. | 9.06 | 9.62 | 931 | .. | 53 | .. | 53 | 53.00 | 1014 |
| 1903 | 10.19 | 10.19 | 10.19 | 9.06 | 9.91 | 959 | 53 | 53 | 53 | 53 | 53.00 | 1014 |
| 1904 | 10.19 | 10.19 | 10.19 | 9.06 | 9.91 | 959 | 53 | 53 | 53 | 53 | 53.00 | 1014 |
| 1905 | 10.19 | 10.19 | 10.19 | 9.06 | 9.91 | 959 | 53 | 53 | 53 | 53 | 53.00 | 1014 |
| 1906 | 10.19 | 10.19 | 10.19 | 10.19 | 10.19 | 996 | 53 | 53 | 53 | 53 | 53.00 | 1014 |
| 1907 | 10.19 | 10.19 | 10.38 | 10.19 | 10.24 | 991 | 53 | 53 | 52 | 53 | 52.75 | 1010 |
| 1908 | 10.19 | 10.19 | 10.38 | 10.19 | 10.24 | 991 | 53 | 53 | 52 | 53 | 52.75 | 1010 |
| 1909 | 10.19 | 10.38 | 10.38 | 10.19 | 10.29 | 996 | 53 | 52 | 52 | 53 | 52.50 | 1005 |
| 1910 | 10.38 | 10.38 | 10.38 | 10.19 | 10.33 | 1000 | 52 | 52 | 52 | 53 | 52.25 | 1000 |
| 1911 | 10.38 | 10.38 | 10.38 | 10.19 | 10.33 | 1000 | 52 | 52 | 52 | 53 | 52.25 | 1000 |
| 1912 | 10.38 | 10.38 | 10.38 | 10.19 | 10.33 | 1000 | 52 | 52 | 52 | 53 | 52.25 | 1000 |
| 1913 | 11.54 | 11.54 | 11.54 | 11.54 | 11.54 | 1117 | 52 | 52 | 52 | 52 | 52.00 | 995 |
| 1914 | 11.54 | 11.54 | 11.54 | 11.54 | 11.54 | 1117 | 52 | 52 | 52 | 52 | 52.00 | 995 |
| 1915 | 11.54 | 11.54 | 11.54 | 11.54 | 11.54 | 1117 | 52 | 52 | 52 | 52 | 52.00 | 995 |
| 1916 | 13.27 | 13.27 | 13.27 | 13.27 | 13.27 | 1285 | 52 | 52 | 52 | 52 | 52.00 | 995 |
| 1917 | 13.27 | 13.27 | 13.27 | 13.27 | 13.27 | 1285 | 52 | 52 | 52 | 52 | 52.00 | 995 |
| 1918 | 13.27 | 15.23 | 15.23 | 13.27 | 14.25 | 1379 | 52 | 52 | 52 | 52 | 52.00 | 995 |
| 1919 | 16.75 | 15.23 | 16.62 | 15.23 | 15.96 | 1545 | 52 | 52 | 52 | 52 | 52.00 | 995 |
Industry, trade, or occupation: IRON AND BRASS MOULDERS .
Classes of workers covered: Journeymen (not including machine moulders).
| 1900 | .. | 13.50 | .. | .. | 13.50 | 923 | .. | 46 1/2 | .. | .. | 46.50 | 1005 |
| 1901 | .. | 13.50 | .. | .. | 13.50 | 923 | .. | 46 1/2 | .. | .. | 46.50 | 1005 |
| 1902 | 13.50 | 13.50 | 13.50 | 15.00 | 13.88 | 949 | 47 | 46 1/2 | 47 | 44 | 46.13 | 997 |
| 1903 | 13.50 | 13.50 | 13.50 | 15.00 | 13.88 | 949 | 47 | 46 1/2 | 47 | 44 | 46.13 | 997 |
| 1904 | 13.50 | 13.50 | 13.50 | 15.00 | 13.88 | 949 | 47 | 46 1/2 | 47 | 44 | 46.13 | 997 |
| 1905 | 13.50 | 13.50 | 13.50 | 15.00 | 13.88 | 949 | 47 | 46 1/2 | 47 | 44 | 46.13 | 997 |
| 1906 | 13.50 | 13.50 | 13.50 | 15.00 | 13.88 | 949 | 47 | 47 | 47 | 44 | 46.25 | 1000 |
| 1907 | 13.50 | 13.50 | 13.50 | 15.00 | 13.88 | 949 | 47 | 47 | 47 | 44 | 46.25 | 1000 |
| 1908 | 15.00 | 13.50 | 13.50 | 15.00 | 14.25 | 974 | 47 | 47 | 47 | 44 | 46.25 | 1000 |
| 1909 | 15.00 | 13.50 | 15.00 | 15.00 | 14.63 | 1000 | 47 | 47 | 47 | 44 | 46.25 | 1000 |
| 1910 | 15.00 | 13.50 | 15.00 | 15.00 | 14.63 | 1000 | 47 | 47 | 47 | 44 | 46.25 | 1000 |
| 1911 | 15.00 | 13.50 | 15.00 | 15.00 | 14.63 | 1000 | 47 | 47 | 47 | 44 | 46.25 | 1000 |
| 1912 | 15.00 | 13.50 | 15.00 | 15.00 | 14.63 | 1000 | 47 | 47 | 47 | 44 | 46.25 | 1000 |
| 1913 | 16.50 | 16.50 | 16.50 | 16.50 | 16.50 | 1128 | 47 | 47 | 47 | 47 | 47.00 | 1016 |
| 1914 | 16.50 | 16.50 | 16.50 | 16.50 | 16.50 | 1128 | 47 | 47 | 47 | 47 | 47.00 | 1016 |
| 1915 | 16.50 | 16.50 | 16.50 | 16.50 | 16.50 | 1128 | 47 | 47 | 47 | 47 | 47.00 | 1016 |
| 1916 | 16.50 | 16.50 | 17.27 | 16.50 | 16.69 | 1141 | 47 | 47 | 47 | 47 | 47.00 | 1016 |
| 1917 | 18.00 | 18.00 | 18.00 | 18.00 | 18.00 | 1230 | 47 | 47 | 47 | 47 | 47.00 | 1016 |
| 1918 | 20.00 | 19.50 | 19.50 | 19.50 | 19.63 | 1342 | 47 | 47 | 47 | 47 | 47.00 | 1016 |
| 1919 | 21.00 | 22.00 | 22.00 | 22.00 | 21.75 | 1487 | 47 | 47 | 47 | 47 | 47.00 | 1016 |
Industry, trade, or occupation: PAINTERS .
Classes of workers covered: Journeymen.
| As at 30th June, | Minimum Wages (in Pence) per Hour. | Maximum Ordinary Working-hours per Week. | ||||||||||
|---|---|---|---|---|---|---|---|---|---|---|---|---|
| Auckland. | Wellington. | Canterbury. | Otago. | Average. | Index Number: Base. 1911. | Auckland. | Wellington. | Canterbury. | Otago. | Average. | Index Number: Base, 1911. | |
* Approximate: 41 1/2 hours in four months of year and 44 hours during eight months. | ||||||||||||
| 1897 | .. | .. | 12.00 | .. | 12.00 | 800 | .. | .. | 44 | .. | 44.00 | 1000 |
| 1898 | .. | .. | 12.00 | 13.50 | 12.75 | 850 | .. | .. | 44 | 44 | 44.00 | 1000 |
| 1899 | 13.00 | .. | 13.50 | 13.50 | 13.33 | 889 | 44 | .. | 44 | 44 | 44.00 | 1000 |
| 1900 | 13.00 | 15.00 | 13.50 | 15.00 | 14.13 | 942 | 44 | 43* | 44 | 44 | 43.75 | 994 |
| 1901 | 13.00 | 15.00 | 13.50 | 15.00 | 14.13 | 942 | 44 | 43* | 44 | 44 | 43.75 | 994 |
| 1902 | 13.00 | 15.00 | 15.00 | 15.00 | 14.50 | 953 | 44 | 43* | 44 | 44 | 43.75 | 994 |
| 1903 | 13.00 | 15.00 | 15.00 | 15.00 | 14.50 | 953 | 44 | 43* | 44 | 44 | 43.75 | 994 |
| 1904 | 13.00 | 15.00 | 15.00 | 15.00 | 14.50 | 953 | 44 | 43* | 44 | 44 | 43.75 | 994 |
| 1905 | 15.00 | 15.00 | 15.00 | 15.00 | 15.00 | 1000 | 44 | 43* | 44 | 44 | 43.75 | 994 |
| 1906 | 15.00 | 15.00 | 15.00 | 15.00 | 15.00 | 1000 | 44 | 43* | 44 | 44 | 43.75 | 994 |
| 1907 | 15.00 | 15.00 | 15.00 | 15.00 | 15.00 | 1000 | 44 | 44 | 44 | 44 | 44.00 | 1000 |
| 1908 | 15.00 | 15.00 | 15.00 | 15.00 | 15.00 | 1000 | 44 | 44 | 44 | 44 | 44.00 | 1000 |
| 1909 | 15.00 | 15.00 | 15.00 | 15.00 | 15.00 | 1000 | 44 | 44 | 44 | 44 | 44.00 | 1000 |
| 1910 | 15.00 | 15.00 | 15.00 | 15.00 | 15.00 | 1000 | 44 | 44 | 44 | 44 | 44.00 | 1000 |
| 1911 | 15.00 | 15.00 | 15.00 | 15.00 | 15.00 | 1000 | 44 | 44 | 44 | 44 | 44.00 | 1000 |
| 1912 | 15.00 | 15.00 | 15.00 | 15.00 | 15.00 | 1000 | 44 | 44 | 44 | 44 | 44.00 | 1000 |
| 1913 | 16.50 | 15.00 | 15.00 | 15.00 | 15.38 | 1025 | 44 | 44 | 44 | 44 | 44.00 | 1000 |
| 1914 | 16.50 | 16.50 | 16.50 | 16.50 | 16.50 | 1100 | 44 | 44 | 44 | 44 | 44.00 | 1000 |
| 1915 | 16.50 | 16.50 | 16.50 | 16.50 | 16.50 | 1100 | 44 | 44 | 44 | 44 | 44.00 | 1000 |
| 1916 | 16.50 | 18.00 | 16.50 | 16.50 | 16.88 | 1125 | 44 | 44 | 44 | 44 | 44.00 | 1000 |
| 1917 | 16.50 | 18.00 | 16.50 | 18.00 | 17.25 | 1150 | 44 | 44 | 44 | 44 | 44.00 | 1000 |
| 1918 | 16.50 | 18.00 | 16.50 | 18.00 | 17.25 | 1150 | 44 | 44 | 44 | 44 | 44.00 | 1000 |
| 1919 | 20.00 | 22.00 | 20.00 | 20.00 | 20.50 | 1367 | 44 | 44 | 44 | 44 | 44.00 | 1000 |
Industry, trade, or occupation: PLASTERERS .
Classes of workers covered: Journeymen.
† Interpolated in order to avoid recording a substantial but fictitious fall in wages and hours. | ||||||||||||
|---|---|---|---|---|---|---|---|---|---|---|---|---|
| 1901 | .. | 19.20 | 16.50† | 18.00 | 17.90 | 978 | .. | 45 | 44* | 44 | 44.33 | 985 |
| 1902 | .. | 19.20 | 16.50 | 18.00 | 17.90 | 978 | .. | 45 | 44 | 44 | 44.33 | 985 |
| 1903 | .. | 19.20 | 16.50 | 18.00 | 17.90 | 978 | .. | 45 | 44 | 44 | 44.33 | 985 |
| 1904 | .. | 19.20 | 18.00 | 18.00 | 18.40 | 1005 | .. | 45 | 44 | 44 | 44.33 | 985 |
| 1905 | .. | 19.20 | 18.00 | 18.00 | 18.40 | 1005 | .. | 45 | 44 | 44 | 44.33 | 985 |
| 1906 | .. | 19.20 | 18.00 | 18.00 | 18.40 | 1005 | .. | 45 | 44 | 44 | 44.33 | 985 |
| 1907 | .. | 19.20 | 18.00 | 18.00 | 18.40 | 1005 | .. | 45 | 44 | 44 | 44.33 | 985 |
| 1908 | 18.00 | 19.20 | 18.00 | 18.00 | 18.30 | 1000 | 47 | 45 | 44 | 44 | 45.00 | 1000 |
| 1909 | 18.00 | 19.20 | 18.00 | 18.00 | 18.30 | 1000 | 47 | 45 | 44 | 44 | 45.00 | 1000 |
| 1910 | 18.00 | 19.20 | 18.00 | 18.00 | 18.30 | 1000 | 47 | 45 | 44 | 44 | 45.00 | 1000 |
| 1911 | 18.00 | 19.20 | 18.00 | 18.00 | 18.30 | 1000 | 47 | 45 | 44 | 44 | 45.00 | 1000 |
| 1912 | 18.00 | 19.20 | 18.00 | 18.00 | 18.30 | 1000 | 47 | 45 | 44 | 44 | 45.00 | 1000 |
| 1913 | 18.00 | 19.50 | 18.00 | 18.00 | 18.38 | 1004 | 44 | 45 | 44 | 44 | 44.25 | 983 |
| 1914 | 18.00 | 19.50 | 18.00 | 18.00 | 18.38 | 1004 | 44 | 45 | 44 | 44 | 44.25 | 983 |
| 1915 | 18.00 | 19.50 | 18.00 | 18.00 | 18.38 | 1004 | 44 | 45 | 44 | 44 | 44.25 | 983 |
| 1916 | 18.00 | 19.50 | 18.00 | 18.00 | 18.38 | 1004 | 44 | 45 | 44 | 44 | 44.25 | 983 |
| 1917 | 19.50 | 19.50 | 19.50 | 19.50 | 19.50 | 1006 | 44 | 44 | 44 | 44 | 44.00 | 978 |
| 1918 | 21.00 | 21.50 | 19.50 | 19.50 | 20.38 | 1114 | 44 | 44 | 44 | 44 | 44.00 | 978 |
| 1919 | 21.00 | 21.50 | 21.50 | 22.00 | 21.50 | 1175 | 44 | 44 | 44 | 44 | 44.00 | 978 |
Industry, trade, or occupation: PLUMBERS .
Classes of workers covered: First-grade journeymen.
| As at 30th June, | Minimum Wages (in Pence) per Hour. | Maximum Ordinary Working-hours Per Week. | ||||||||||
|---|---|---|---|---|---|---|---|---|---|---|---|---|
| Auckland. | Wellington. | Canterbury. | Otago. | Average. | Index Number: Base. 1911. | Auckland. | Wellington. | Canterbury. | Otago. | Average. | Index Number: Base, 1911. | |
| 1899 | 12.00 | 16.00 | .. | .. | 14.00 | 836 | 47 | 46 | .. | .. | 46.50 | 1051 |
| 1900 | 12.00 | 16.00 | 15.00 | .. | 14.33 | 856 | 47 | 46 | 44 | .. | 45.67 | 1032 |
| 1901 | 12.00 | 16.00 | 15.00 | .. | 14.33 | 856 | 47 | 46 | 44 | .. | 45.67 | 1032 |
| 1902 | 14.00 | 16.00 | 15.00 | 15.00 | 15.00 | 896 | 47 | 46 | 44 | 44 | 45.25 | 1023 |
| 1903 | 14.00 | 16.00 | 15.00 | 15.00 | 15.00 | 896 | 47 | 46 | 44 | 44 | 45.25 | 1023 |
| 1904 | 14.00 | 16.00 | 15.00 | 15.00 | 15.00 | 896 | 47 | 46 | 44 | 44 | 45.25 | 1023 |
| 1905 | 14.00 | 16.00 | 15.00 | 15.00 | 15.00 | 896 | 47 | 46 | 44 | 44 | 42.25 | 1023 |
| 1906 | 14.00 | 16.00 | 15.00 | 15.00 | 15.00 | 896 | 47 | 44 | 44 | 44 | 45.25 | 1023 |
| 1907 | 14.00 | 16.00 | 15.00 | 15.00 | 15.00 | 896 | 47 | 46 | 44 | 44 | 45.25 | 1023 |
| 1908 | 16.00 | 17.00 | 15.00 | 15.00 | 15.75 | 940 | 44 | 45 | 44 | 44 | 44.25 | 1000 |
| 1909 | 16.00 | 17.00 | 16.00 | 15.00 | 16.00 | 955 | 44 | 45 | 44 | 44 | 44.25 | 1000 |
| 1910 | 16.00 | 17.00 | 16.00 | 15.00 | 16.00 | 955 | 44 | 45 | 44 | 44 | 44.25 | 1000 |
| 1911 | 17.00 | 17.00 | 16.00 | 17.00 | 16.75 | 1000 | 44 | 45 | 44 | 44 | 44.25 | 1000 |
| 1912 | 17.00 | 17.00 | 16.00 | 17.00 | 16.75 | 1000 | 44 | 45 | 44 | 44 | 44.25 | 1000 |
| 1913 | 17.00 | 17.00 | 16.00 | 17.00 | 16.75 | 1000 | 44 | 45 | 44 | 44 | 44.25 | 1000 |
| 1914 | 18.00 | 18.00 | 18.00 | 18.00 | 18.00 | 1075 | 44 | 44 | 44 | 44 | 44.00 | 994 |
| 1915 | 18.00 | 18.00 | 18.00 | 18.00 | 18.00 | 1075 | 44 | 44 | 44 | 44 | 44.00 | 994 |
| 1916 | 18.00 | 18.00 | 18.00 | 18.00 | 18.00 | 1075 | 44 | 44 | 44 | 44 | 44.00 | 994 |
| 1917 | 18.00 | 18.00 | 18.00 | 18.00 | 18.00 | 1075 | 44 | 44 | 44 | 44 | 44.00 | 994 |
| 1918 | 20.00 | 20.00 | 20.00 | 20.00 | 20.00 | 1194 | 44 | 44 | 44 | 44 | 44.00 | 994 |
| 1919 | 22.00 | 22.00 | 22.00 | 20.00 | 21.50 | 1284 | 44 | 44 | 44 | 44 | 44.00 | 994 |
Industry, trade, or occupation: SEAMEN .
Classes of workers covered: (1) Able seamen, (2) ordinary seamen over eighteen years of age; (3) firemen and greasers.
| As at 30th June, | Minimum Wages (in Pence) per Month. | Maximum Ordinary Working. hours per Week. | ||||||||||
|---|---|---|---|---|---|---|---|---|---|---|---|---|
| Auckland. | Wellington. | Canterbury. | Otago. | Average. | Index Number: Base, 1911. | Auckland. | Wellington. | Canterbury. | Otago. | Average. | Index Number: Base. 1911. | |
* No awards or agreements registered in this district. † Earlier awards made in 1898 and 1897 provided for an "increase of 10s. per month," but no information available as to previous wage-rates. ‡ Not including war-risk bonus for time actually worked in war zone. | ||||||||||||
| 1897 | .. | † | † | .. | .. | .. | Hours of work not stated in such manner as to allow of statistical treatment. | |||||
| 1898 | † | .. | .. | .. | .. | .. | ||||||
| 1899 | .. | .. | .. | .. | .. | .. | ||||||
| 1900 | .. | 1560.00 | .. | 1560.00 | 1560.00 | 907 | ||||||
| 1901 | .. | 1560.00 | .. | 1560.00 | 1560.00 | 907 | ||||||
| 1902 | .. | 1560.00 | .. | 1560.00 | 1560.00 | 907 | ||||||
| 1903 | 1560.00 | 1560.00 | .. | 1560.00 | 1560.00 | 907 | ||||||
| 1904 | 1560.00 | 1560.00 | .. | 1560.00 | 1560.00 | 907 | ||||||
| 1905 | 1560.00 | 1560.00 | .. | 1560.00 | 1560.00 | 907 | ||||||
| 1900 | 1560.00 | 1560.00 | .. | 1560.00 | 1560.00 | 907 | ||||||
| 1907 | 1560.00 | 1560.00 | .. | 1560.00 | 1560.00 | 907 | ||||||
| 1908 | 1720.00 | 1720.00 | .. | 1720.00 | 1720.00 | 1000 | ||||||
| 1909 | 1720.00 | 1720.00 | .. | 1720.00 | 1720.00 | 1000 | ||||||
| 1910 | 1720.00 | 1720.00 | .. | 1720.00 | 1720.00 | 1000 | ||||||
| 1911 | 1720.00 | 1720.00 | .. | 1720.00 | 1720.00 | 1000 | ||||||
| 1912 | 1720.00 | 1720.00 | .. | 1720.00 | 1720.00 | 1000 | ||||||
| 1913 | 1720.00 | 1720.00 | .. | 1720.00 | 1720.00 | 1000 | ||||||
| 1914 | 1960.00 | 1960.00 | .. | 1960.00 | 1960.00 | 1140 | ||||||
| 1915 | 1960.00 | 1960.00 | .. | 1960.00 | 1960.00 | 1140 | ||||||
| 1916 | 2260.00 | 2260.00 | .. | 2260.00 | 2260.00 | 1314 | ||||||
| 1917 | 2520.00 | 2520.00 | .. | 2520.00 | 2520.00 | 1465 | ||||||
| 1918 | 2520.00 | 2520.00 | .. | 2520.00 | 2520.00 | 1465 | ||||||
| 1919 | 2840.00‡ | 2840.00‡ | 2840.00‡ | 2840.00‡ | 1651 | |||||||
Industry, trade, or occupation: SLAUGHTERMEN (EXPORT TRADE ).
Classes of workers covered: Slaughtermen killing sheep and lambs for export.
| As at 30th June, | Minimum Wages (in fence) per Hundred "Freezing" Sheep slaughtered. | Maximum Ordinary Working-hours per Week. | ||||||||||
|---|---|---|---|---|---|---|---|---|---|---|---|---|
| Auckland. | Wellington. | Canterbury. | Otago. | Average. | Index Number: Base. 1911. | Auckland. | Wellington. | Canterbury. | Otago. | Average. | Index Number: Base, 1911. | |
* Not fixed. | ||||||||||||
| 1902 | .. | .. | 240 | .. | 240 | 800 | .. | .. | * | .. | .. | .. |
| 1903 | .. | .. | 240 | .. | 240 | 800 | .. | .. | * | .. | .. | .. |
| 1904 | .. | .. | 240 | .. | 240 | 800 | .. | .. | * | .. | .. | .. |
| 1905 | 240 | .. | 240 | .. | 240 | 800 | 48 | .. | * | .. | 48.00 | 1091 |
| 1906 | 240 | .. | 240 | .. | 240 | 800 | 48 | .. | * | .. | 48.00 | 1091 |
| 1907 | 276 | 276 | 276 | .. | 276 | 920 | 48 | 44 | 50 | .. | 47.33 | 1076 |
| 1908 | 276 | 276 | 276 | 276 | 276 | 920 | 48 | 44 | 50 | 50 | 48.00 | 1091 |
| 1909 | 276 | 276 | 276 | 276 | 276 | 920 | 48 | 44 | 50 | 50 | 48.00 | 1091 |
| 1910 | 300 | 300 | 300 | 300 | 300 | 1000 | 44 | 44 | 44 | 44 | 44.00 | 1000 |
| 1911 | 300 | 300 | 300 | 300 | 300 | 1000 | 44 | 44 | 44 | 44 | 44.00 | 1000 |
| 1912 | 300 | 300 | 300 | 300 | 300 | 1000 | 44 | 44 | 44 | 44 | 44.00 | 1000 |
| 1913 | 330 | 330 | 300 | 300 | 315 | 1050 | 44 | 44 | 44 | 44 | 44.00 | 1000 |
| 1914 | 330 | 330 | 330 | 330 | 330 | 1100 | 44 | 44 | 44 | 44 | 44.00 | 1000 |
| 1915 | 330 | 330 | 330 | 330 | 330 | 1100 | 44 | 44 | 44 | 44 | 14.00 | 1000 |
| 1916 | 330 | 330 | 330 | 330 | 330 | 1100 | 44 | 44 | 44 | 44 | 44.00 | 1000 |
| 1917 | 360 | 360 | 360 | 360 | 360 | 1200 | 44 | 44 | 44 | 44 | 44.00 | 1000 |
| 1918 | 360 | 360 | 360 | 360 | 360 | 1200 | 44 | 44 | 44 | 44 | 44.00 | 1000 |
| 1919 | 420 | 420 | 420 | 420 | 420 | 1400 | 44 | 44 | 44 | 44 | 44.00 | 1000 |
Industry, trade, or occupation: TAILORESSES (FACTORY ).
Classes of workers covered: First-class coat-machinists or journeywomen.
| As at 30th June, | Minimum Wages (in Pence) per Hour. | Maximum Ordinary Working-hours per Week. | ||||||||||
|---|---|---|---|---|---|---|---|---|---|---|---|---|
| Auckland. | Wellington. | Canterbury. | Otago. | Average. | Index Number: Base, 1911. | Auckland. | Wellington. | Canterbury. | Otago. | Average. | Index Number: Base, 1911. | |
| 1898 | * | .. | .. | .. | .. | .. | * | .. | .. | .. | .. | .. |
| 1899 | * | .. | .. | 6.67† | 6.67 | 1000 | * | .. | .. | 45† | 45 | 1000 |
| 1900 | * | .. | .. | 6.67† | 6.67 | 1000 | * | .. | .. | 45† | 45 | 1000 |
| 1901 | * | .. | .. | 6.67† | 6.07 | 1000 | * | .. | .. | 45† | 45 | 1000 |
| 1902 | 6.67 | 6.67 | 6.67 | 6.67 | 6.67 | 1000 | 45 | 45 | 45 | 45 | 45 | 1000 |
| 1903 | 6.67 | 6.67 | 6.67 | 6.67 | 6.67 | 1000 | 45 | 45 | 45 | 45 | 45 | 1000 |
| 1904 | 6.67 | 6.67 | 6.67 | 6.67 | 6.67 | 1000 | 45 | 45 | 45 | 45 | 45 | 1000 |
| 1905 | 6.67 | 6.67 | 6.67 | 0.67 | 6.67 | 1000 | 45 | 45 | 45 | 45 | 45 | 1000 |
| 1906 | 6.67 | 6.67 | 6.67 | 6.67 | 6.67 | 1000 | 45 | 45 | 45 | 45 | 45 | 1000 |
| 1907 | 6.67 | 6.67 | 6.67 | 6.67 | 6.67 | 1000 | 45 | 45 | 45 | 45 | 45 | 1000 |
| 1908 | 6.67 | 6.67 | 6.67 | 6.67 | 6.67 | 1000 | 45 | 45 | 45 | 45 | 45 | 1000 |
| 1909 | 6.67 | 6.67 | 6.67 | 6.67 | 6.67 | 1000 | 45 | 45 | 45 | 45 | 45 | 1000 |
| 1910 | 6.67 | 6.67 | 6.67 | 6.67 | 6.67 | 1000 | 45 | 45 | 45 | 45 | 45 | 1000 |
| 1911 | 6.67 | 6.67 | 6.67 | 6.67 | 6.67 | 1000 | 45 | 45 | 45 | 45 | 45 | 1000 |
| 1912 | 6.67 | 6.67 | 6.67 | 6.67 | 6.67 | 1000 | 45 | 45 | 45 | 45 | 45 | 1000 |
| 1913 | 7.33 | 7.33 | 7.33 | 7.33 | 7.33 | 1099 | 45 | 45 | 45 | 45 | 45 | 1000 |
| 1914 | 7.33 | 7.33 | 7.33 | 7.33 | 7.33 | 1099 | 45 | 45 | 45 | 45 | 45 | 1000 |
| 1915 | 7.33 | 7.33 | 7.33 | 7.33 | 7.33 | 1099 | 45 | 45 | 45 | 45 | 45 | 1000 |
| 1916 | 7.88 | 7.88 | 7.88 | 7.88 | 7.88 | 1181 | 45 | 45 | 45 | 45 | 45 | 1000 |
| 1917 | 7.88 | 7.88 | 7.88 | 7.88 | 7.88 | 1181 | 45 | 45 | 45 | 45 | 45 | 1000 |
| 1918 | 8.07 | 8.07 | 8.07 | 8.07 | 8.07 | 1210 | 45 | 45 | 45 | 45 | 45 | 1000 |
| 1919 | 9.55 | 9.55 | 9.55 | 9.55 | 9.55 | 1432 | 44 | 44 | 44 | 44 | 44 | 978 |
Industry, trade, or occupation: WATERSIDE WORKERS .
Classes of workers covered: (1) General-cargo workers; (2) coal-workers (main class); (3) workers handling frozen meat in freezing-chambers on board ship.
* Published particulars of previous agreements not sufficiently complete to provide information required. † Hours not definitely stated-presumed to be 45. ‡ Port of Lyttelton. § Port of Port Chalmers. ‖ Interpolated at same level as Wellington, which is same from 1914 onwards. ¶ Registration of amending agreement not actually effected to date. Interpolated in order to avoid recording a fictitious fall in 1902. | ||||||||||||
|---|---|---|---|---|---|---|---|---|---|---|---|---|
| 1900 | .. | 15.83 | † | 17.00§ | 16.42 | 956 | .. | 47** | † | 48§ | 47.50 | 1011 |
| 1901 | .. | 15.83** | † | 17.00§ | 16.42 | 956 | .. | 47** | † | 48§ | 47.50 | 1011 |
| 1902 | .. | 15.83 | † | 17.00§ | 16.42 | 956 | .. | 47 | † | 48§ | 47.50 | 1011 |
| 1903 | .. | 15.83 | † | 17.00§ | 16.42 | 956 | .. | 47 | † | 48§ | 47.50 | 1011 |
| 1904 | .. | 16.17 | † | 17.00§ | 16.59 | 966 | .. | 47 | † | 48§ | 47.50 | 1011 |
| 1905 | .. | 16.17 | † | 17.00§ | 16.59 | 966 | .. | 47 | † | 48§ | 47.50 | 1011 |
| 1906 | .. | 16.17 | † | 17.00§ | 16.59 | 966 | .. | 47 | † | 48§ | 47.50 | 1011 |
| 1907 | .. | 16.17 | † | 17.00§ | 16.59 | 966 | .. | 47 | † | 48§ | 47.50 | 1011 |
| 1908 | 19.00 | 16.33 | † | 17.00§ | 17.44 | 1016 | 47 | 47 | † | 48§ | 47.33 | 1001 |
| 1909 | 19.00 | 16.33 | † | 17.00§ | 17.44 | 1016 | 47 | 47 | † | 47§ | 47.00 | 1007 |
| 1910 | 19.00 | 16.33 | † | 17.00§ | 17.44 | 1016 | 47 | 47 | † | 47§ | 47.00 | 1000 |
| 1911 | 19.00 | 16.33 | 16.33‡‖ | 17.00§ | 17.17 | 1000 | 47 | 47 | 47‡‖ | 47§ | 47.00 | 1000 |
| 1912 | 19.00 | 16.33 | 16.33‡‖ | 17.00§ | 17.17 | 1000 | 47 | 47 | 47‡‖ | 47§ | 47.00 | 1000 |
| 1913 | 19.00 | 16.33 | 16.33‡‖ | 17.00§ | 17.17 | 1000 | 47 | 47 | 47‡‖ | 47§ | 47.00 | 9000 |
| 1914 | 21.33 | 18.66 | 18.66‡ | 19.33§ | 19.50 | 1136 | 44 | 44 | 44‡ | 44§ | 44.00 | 360 |
| 1915 | 21.33 | 18.66 | 18.66‡ | 19.33§ | 19.50 | 1136 | 44 | 44 | 44‡ | 44§ | 44.00 | 936 |
| 1916 | 23.83 | 21.66 | 21.66‡ | 22.33§ | 22.37 | 1303 | 44 | 44 | 44‡ | 44§ | 44.00 | 936 |
| 1917 | 23.83 | 21.66 | 21.66‡ | 22.33§ | 22.37 | 1303 | 44 | 44 | 44‡ | 44§ | 44.00 | 936 |
| 1918 | 25.66 | 23.66 | 23.66‡ | 24.33§ | 24.33 | 1417 | 44 | 44 | 44‡ | 44§ | 44.00 | 936 |
| 1919 | 27.66¶ | 25.66¶ | 25.66‡¶ | 26.33§¶ | 26.33¶ | 1533 | 44 | 44 | 44‡ | 44§ | 44.00 | 936 |
Industry, trade, or occupation: WOOLLEN -MILL EMPLOYEES (MALES ).
Classes of workers covered: (1) Wool-sorters; (2) tuners; (3) warpers; (4) pattern weavers; (5) spinners; (6) workers not otherwise classified.
| As at 30th June, | Minimum Wages (in Pence) per Hour. | Maximum Ordinary Working-hours per Week. | ||||||||||
|---|---|---|---|---|---|---|---|---|---|---|---|---|
| Auckland. | Wellington. | Canterbury. | Otago. | Average. | Index Number: Base. 1911. | Auckland. | Wellington. | Canterbury. | Otago. | Average. | Index Number: Base, 1911. | |
| 1903 | * | .. | 12.21 | .. | 12.21 | 1000 | * | .. | 48 | .. | 48 | 1000 |
| 1904 | * | .. | 12.21 | .. | 12.21 | 1000 | * | .. | 48 | .. | 48 | 1000 |
| 1905 | * | .. | 12.21 | .. | 12.21 | 1000 | * | .. | 48 | .. | 48 | 1000 |
| 1906 | * | .. | 12.21 | .. | 12.21 | 1000 | * | .. | 48 | .. | 48 | 1000 |
| 1907 | * | .. | 12.21 | .. | 12.21 | 1000 | * | .. | 48 | .. | 48 | 1000 |
| 1908 | * | .. | 12.21 | .. | 12.21 | 1000 | * | .. | 48 | .. | 48 | 1000 |
| 1909 | * | .. | 12.21 | .. | 12.21 | 1000 | * | .. | 48 | .. | 48 | 1000 |
| 1910 | * | .. | 12.21 | .. | 12.21 | 1000 | * | .. | 48 | .. | 48 | 1000 |
| 1911 | * | .. | 12.21 | .. | 12.21 | 1000 | * | .. | 48 | .. | 48 | 1000 |
| 1912 | * | 12.71 | 12.71 | 12.71 | 12.71 | 1041 | * | 48 | 48 | 48 | 48 | 1000 |
| 1913 | * | 12.71 | 12.71 | 12.71 | 12.71 | 1041 | * | 48 | 48 | 48 | 48 | 1000 |
| 1914 | * | 12.71 | 12.71 | 12.71 | 12.71 | 1041 | * | 48 | 48 | 48 | 48 | 1000 |
| 1915 | * | 13.42 | 13.42 | 13.42 | 13.42 | 1099 | * | 48 | 48 | 48 | 48 | 1000 |
| 1916 | * | 13.42 | 13.42 | 13.42 | 13.42 | 1099 | * | 48 | 48 | 48 | 48 | 1000 |
| 1917 | * | 15.46 | 15.46 | 15.46 | 15.46 | 1266 | * | 48 | 48 | 48 | 48 | 1000 |
| 1918 | * | 15.46 | 15.46 | 15.46 | 15.46 | 1266 | * | 48 | 48 | 48 | 48 | 1000 |
| 1919 | * | 19.00 | 19.00 | 19.00 | 19.00 | 1556 | * | 45 | 45 | 45 | 45 | 937 |
Industry, trade, or occupation; WOOLLEN -MILL EMPLOYEES (FEMALES ).
Classes of workers covered: Females after four years' experience.
* Only one award made-an extension of the Wellington award in 1914. † Award in force but wages not definitely stated. ‡ Interpolated to provide a complete base year uniform with other trades and occupations. | ||||||||||||
|---|---|---|---|---|---|---|---|---|---|---|---|---|
| 1903 | .. | .. | † | 48 | .. | 48 | 1000 | |||||
| 1904 | .. | .. | † | 48 | .. | 48 | 1000 | |||||
| 1905 | .. | .. | † | 48 | .. | 48 | 1000 | |||||
| 1906 | .. | .. | † | 48 | .. | 48 | 1000 | |||||
| 1907 | .. | .. | † | 48 | .. | 48 | 1000 | |||||
| 1908 | .. | .. | † | 48 | .. | 48 | 1000 | |||||
| 1909 | .. | .. | † | 48 | .. | 48 | 1000 | |||||
| 1910 | .. | 6.25‡ | † | 48 | .. | 48 | 1000 | |||||
| 1911 | .. | 6.25‡ | 6.25‡ | 6.25 | 6.25 | 1000 | .. | 48‡ | 48 | 48‡ | 48 | 1000 |
| 1912 | .. | 6.25 | 6.25 | 6.25 | 6.25 | 1000 | .. | 48 | 48 | 48 | 48 | 1000 |
| 1913 | .. | 6.25 | 6.25 | 6.25 | 6.25 | 1000 | .. | 48 | 48 | 48 | 48 | 1000 |
| 1914 | .. | 6.25 | 6.25 | 6.25 | 6.25 | 1000 | .. | 48 | 48 | 48 | 48 | 1000 |
| 1915 | .. | 6.87 | 6.87 | 6.87 | 6.87 | 1099 | .. | 48 | 48 | 48 | 48 | 1000 |
| 1916 | .. | 6.87 | 6.87 | 6.87 | 6.87 | 1099 | .. | 48 | 48 | 48 | 48 | 1000 |
| 1917 | .. | 8.20 | 8.20 | 8.20 | 8.20 | 1312 | .. | 48 | 48 | 48 | 48 | 1000 |
| 1918 | .. | 8.20 | 8.20 | 8.20 | 8.20 | 1312 | .. | 48 | 48 | 48 | 48 | 1000 |
| 1919 | .. | 10.00 | 10.00 | 10.00 | 10.00 | 1600 | .. | 45 | 45 | 45 | 45 | 937 |
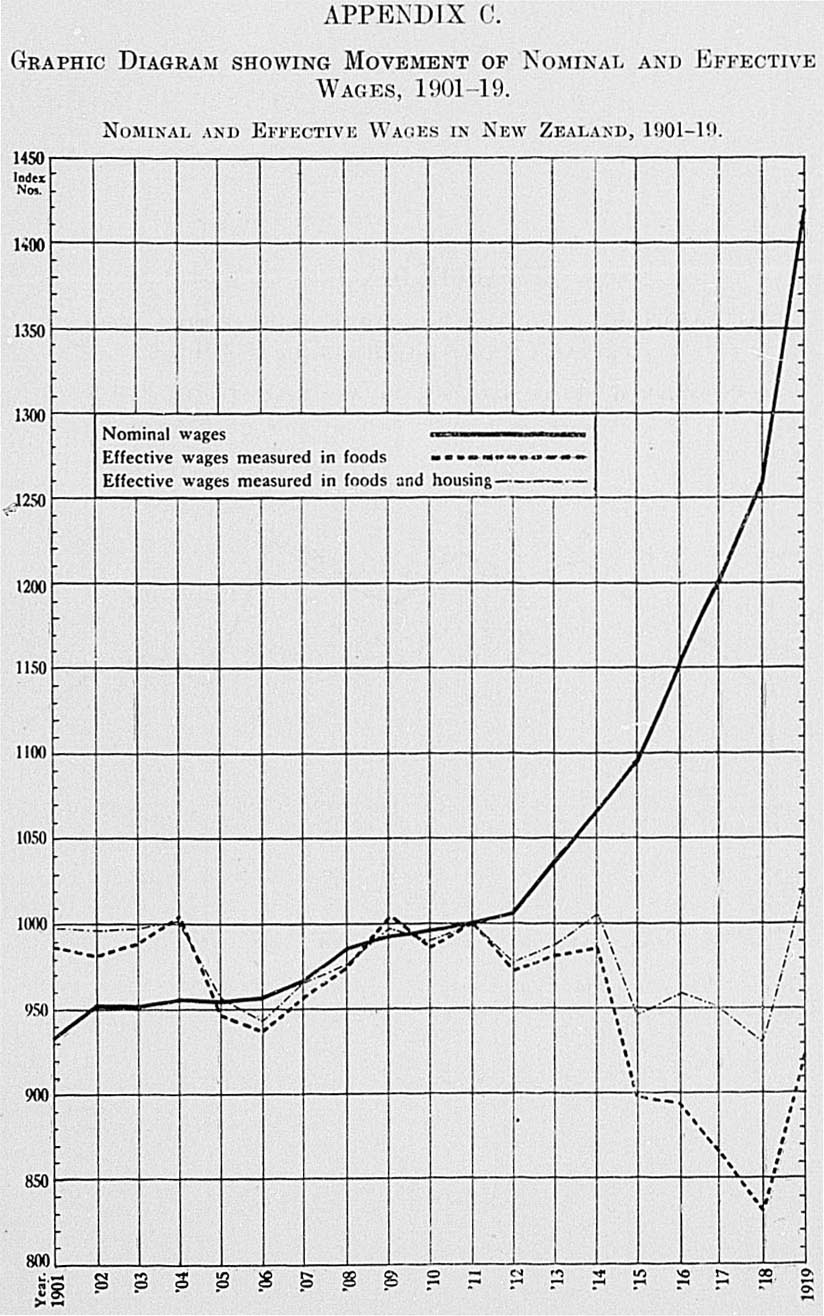
EFFECTIVE WAGES IN NEW ZEALAND AND IN AUSTRALIA , 1906-18.
NOTE .—The above graph lines show the movements of effective wages, but do not indicate the comparative levels of wages, either real or nominal, in the two countries.
MOVEMENT OF NOMINAL WAGE -RATES OF SKILLED , SEMI -SKILLED , AND UNSKILLED WORKERS IN NEW ZEALAND , 1903-19.
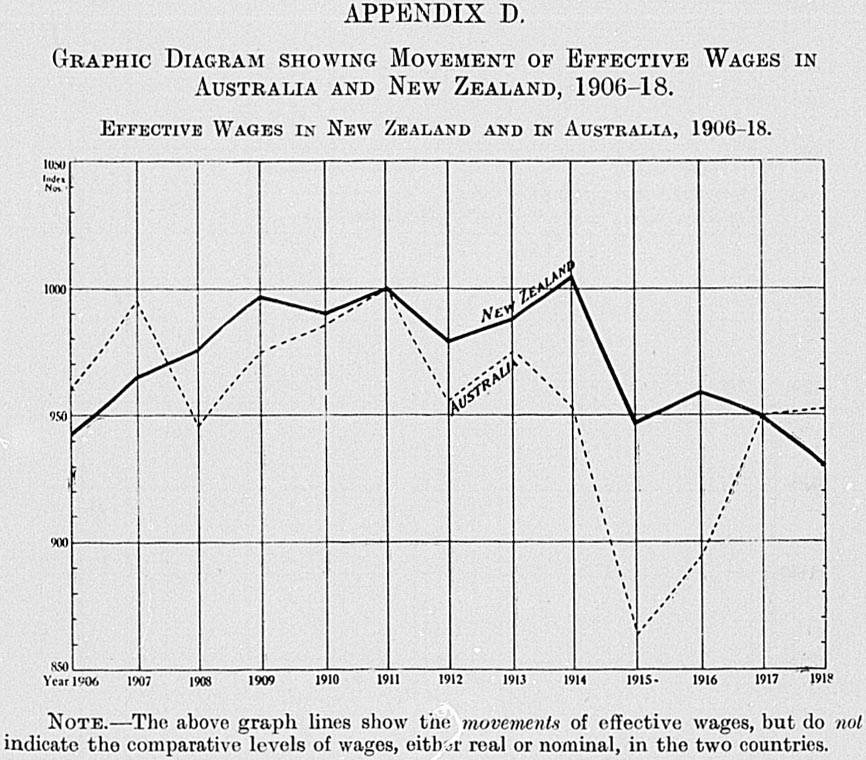
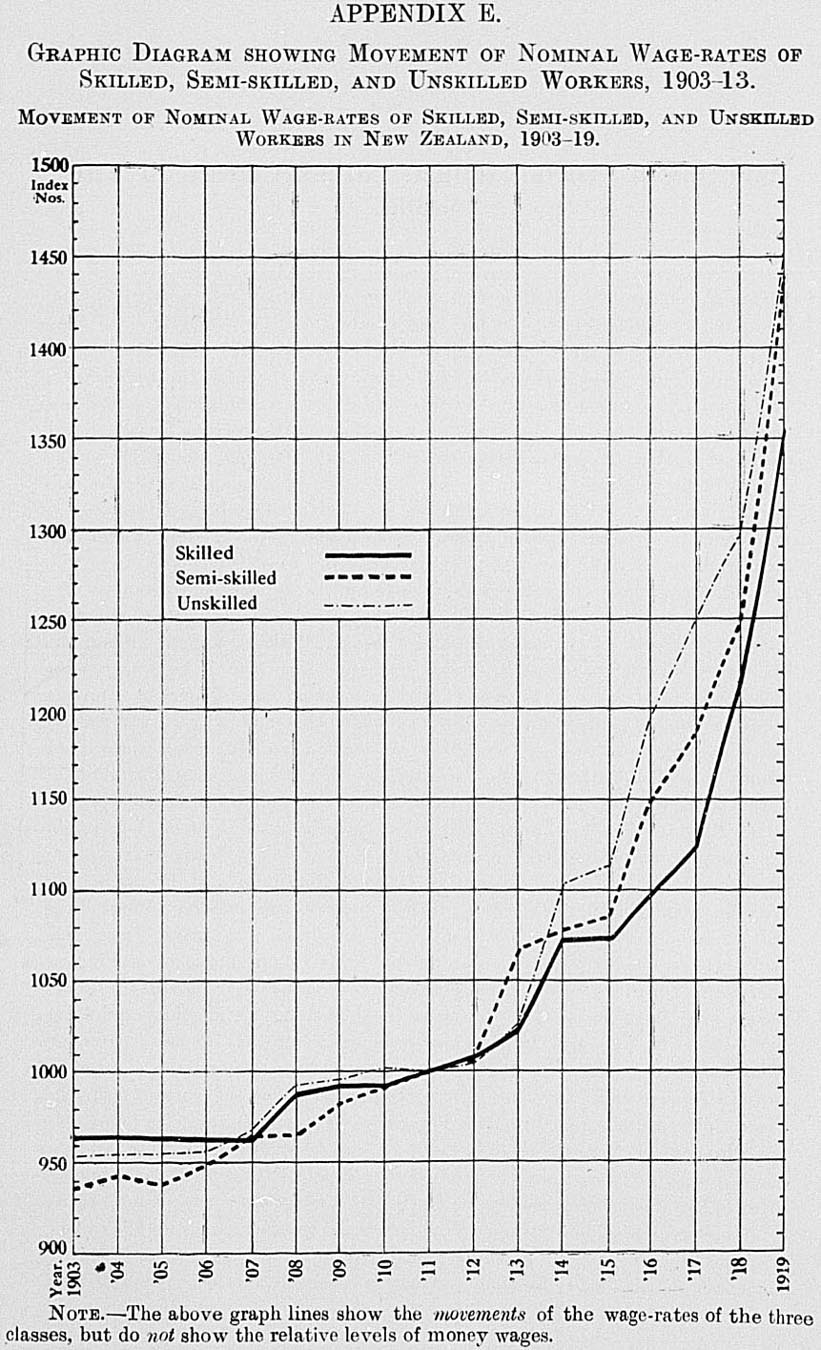
NOTE .—The above graph lines show the movements of the wage-rates of the three classes, but do not show the relative levels of money wages.
By ELSDON BEST .
MAORI nomenclature is a subject of much interest, inasmuch as it casts some light on the customs, modes of life, and mentality of the Native folk of these isles. In regard to those names given in the following list, we have in most cases no precise knowledge as to their origin, and to guess the meanings of such names is a hazardous and unwise procedure. A knowledge of how and under what circumstance a place was named is necessary in all cases. This means the collection of traditions concerning such namings, and little of this sort of orally preserved knowledge has been recorded. In most cases the only plan to adopt with the following names is to give the principal meanings of the word, or of the component words of the name; and in cases where each such word has several meanings, as is usually the case, this opens up a wide field of conjecture, and reduces one's attempt to explain the meaning of a place-name to the wildest guess. Observe the remarks under Hikutaia, Mataroa, Papanui, Pareora, Tuturau, Waikaka, Whitianga, &c. When one has ten or twenty meanings to choose from, the wise man is ho who remains silent. In most cases it is easy to give a moaning to a Native place-name, but it must be a mere guess unless we know how and why it was named. Many of these place-names are those of persons, and in many cases these cannot be identified as such. Regarding such names as Ohinetahi and Otamakura, we may assume that such places wore named after two persons called Hinetahi and Tamakura; but others give no such signs of their origin.
Another difficulty that presents itself is that many Native place-names are misspelt by us. Such forms as Onaero, Retaruke, and Pohangina are exceedingly mystifying, whereas if spelled correctly as Onaeroa, Rere-taruke, and Pou-hangina they become intelligible at once. In many cases local knowledge is necessary in order to detect errors in our mode of spelling, as where we write Murupara as Muripara, and Wai-o-tahe as Waiotahi. Although munga is a Maori word, yet Mungaroa (near Wellington) should certainly be Mangaroa. In Kaiwarra we at once recognize error, for no two consonants come together in Maori. An inquiring beginner might suspect a gerundial form in Ngahauranga, pertaining to ngahau or hau, but the correct form Nga Uranga disposes of conjecture. In Petone we have something quite impossible, but Pito-one, or "beach end," is clear, for one is applied only to a sandy or gravel beach. Some might be disposed to compare Petone to Petane, but the" latter is not Maori, being merely the Native pronunciation of the name Bethany.
Our pronunciation of these place-names is another sad stumbling-block, inasmuch as we pay no attention whatever to vowel quantities—a highly important matter—and accent or stress is deemed unworthy of attention.
Vowel sounds generally are distorted: thus we hear Makara pronounced so as to rhyme with "packerer," whereas Mā-kārā bears no resemblance to the European pronunciation. The Maori a has always the sound of "a" in "father," though it may be long or short. The fact that vowel quantities are not marked at once reduces an inquirer to helplessness—for which see remarks under Waikaka.
Many places have been named from incidents—this was a common Maori practice—and hence we note such place-names as Te Whakatakanga o Te Piki, and Te Whakairinga o te patu a Te Uoro. The cumbrous length of these names caused the abbreviated forms Te Whakatakanga and Te Whakairinga to come into use. As to long place-names, the following is one in the Waiapu district: Te Koiritanga o nga pirita o te Kupenga a Pawa. Te Haka a Uenuku-kopako, usually called Te Haka, was so named because a travelling party under one Uenuku-kopako halted at that place in order to rehearse a posture dance and song. Many places have been named from trifling incidents. Any place where a person of importance chanced to sit down and rest during a journey might be named after him. Hence we have such place-names as Te Taumata o Te Riu (The Resting-place of Te Riu), Te Taumata o Te Puia, Te Taumata o Te Raiti, &c. Valleys are often called after the names of rivers flowing through them. Many place-names are tree-names: these are often preceded by the definite article. Uru, meaning a grove or clump of trees, also enters into place-names, as Te Uru-Kahika, such names often betokening the former existence of trees at places where none are now seen. Motu (an island, a clump of trees) also enters into place-names, as do awa (a river or stream), whanga (a harbour or inlet), puke (h ll), maunga (range, mountain), manga (a creek), and other words denoting natural features. The definite article is often a part of a place-name, both in its singular form—as Te Puke (The Hill), Te Apiti (The Gorge)—and plural form—Nga Mahanga (The Twins).
In some cases a person's name forms a place-name, often with O prefixed —as Otaneatua and Otamahaka, so called after persons named Tane-atua and Tama-haka. In others such personal name merely forms a part of a place-name, as in Te Whanga nui a Tara, or The Great Harbour of Tara (Wellington Harbour), and Te Tapapatanga o Irakewa (The Reclining-place of Irakewa). Agam, a place-name is often composed of a noun followed by a qualifying expression or adjective, as Te Awa-nui (The Big Stream) and Puke-roa (Long Hill). When Pawa, a chief of olden times, was travelling in the East Cape district he remarked on the mahuruhuru (placid) appearance of the waters of a stream, hence it was named Wai-mahuru. At another place he adorned his head with some feathers of the koko bird, and that spot was named Tatai-koko (tatai, to adorn).
There is another aspect to be considered. A large number of Native place-names have been introduced from Polynesia. These were brought hither by the ancestors of the Maori when they colonized these isles many generations ago. Some of such introduced names pertain to ancient myths connected with the original homeland of the race, such as Taranaki and Tapu-te-ranga. Others are place-names of the hidden homeland, such as Hiku-rangi. a mountain name. Another prized place-name is Tawhiti-nui, the name of some land in the far west at which the ancestors of the Maori sojourned during their ocean wanderings. Many scores of our place-names may be traced to Polynesia; a considerable number to the isles of the Society Group, from which the Maori came to New Zealand. Among the latter are Rangiatea, Rangitoto, Tuhua, Whangaroa, Ahuahu, Takaka, Motueka, Muriwhenua, Puke-hapopo, Titirangi, Whangara, Waima-tuhi-rangi, Arahura, Whangarei, Whangape, Wairarapa, &c. In some cases the local place-name here includes the words mai Tawhiti, showing it to be introduced, as in Te Mania-mai-Tawhiti.
A great deal might be written concerning Maori nomenclature, topographical and otherwise, but this is not the place for a monograph on the subject. It is sufficient herein to draw attention to a few of the peculiarities pertaining to Maori place-names.
In regard to dialectic differences, the most pronounced is the change of the nasal "ng" to "k" in the South Island dialect, so that kainga becomes kaika, and tangata is transformed into takata. Among the Aotea folk, from Whanganui to Taranaki, the aspirate is slurred over, hence our early settlers wrote Wanganui, which form is still retained by us. In this peculiarity the Aotea folk resemble the Rarotongans. In the Matatua dialect the pronounced nasal sound represented by "ng" is softened to a curious nasal-dental sound represented by the letter "n."
The principal lesson learned in a study of Maori topographical nomenclature is the high value of caution, and the futility of attempting to give the meaning of Native place-names without precise information. It would puzzle us to give a meaning to the name of Wellington. These remarks will be emphasized in the following pages:—
Ahaura. Possibly a corrupt form. The initial vowel is puzzling. Haura —an invalid. Ohaura would be intelligible.
Ahi-aruhe. Ahi —fire. Aruhe —edible rhizome of Pteris aquilina, an important food-supply in pre-European days. It was roasted before a fire, then pounded with a wooden beater.
Ahi-houka (Featherston). Should be Ahi-kouka. Ahi —fire. Kouka —the so-called cabbage-tree (Cordyline ), of which the fecula contained in the taproot formed a scant food-supply. In connection with this use of the word ahi it may equally apply to the old steam-oven.
Ahi-para. Ahi —fire. Para —various roots used as food, as of Marattia fraxinea and Gastrodia.
Ahuriri. A funnel-shaped fish-net. (2) Weir, dyke. (3) A low form of fence.
Akaaka. Fibrous roots so termed.
Aka-roa. Said to be equivalent to the North Island form Whanga-roa (Long or Great Harbour). (See Whanga-rei.) The ng of the North Island becomes k in the South Island dialect. It should probably be Haka-roa or Whaka-roa.
Aka-tarawa. Aka —stem of any climbing plant. Tarawa —probably should be tarewa (pendant), as in te aka e tarewa mai na (the aka hanging yonder).
Aka-tore. Aka —climbing plant. Tore —to cut or split.
Akeake. A tree (Olearia Cunninghamii ).
Aki-tio. Said to have been named after a famed greenstone nephrite) weapon.
Akura. Entrance to an eel-pot is so called.
Ana-koha. Ana —a cave. Koha has many meanings, none of which seem applicable in this case.
Anatoki. Ana —a cave. (2) Adze, axe.
Aohanga. A variety of Phormium tenax.
Ao-kautere. Ao —a cloud. Kautere —to float or move freely.
Aonga-tete or Ao-ngatete. Ao —cloud. Ngatete —to move.
Aorangi. A famed mountain-name, as Aorai peak at Tahiti; Aorangi Range at Wairarapa (often misspelt Haurangi). It is also the name of Mount Cook, and of hills in various places in New Zealand. (See Hikurangi.)
Aorere. A certain garment. Ao-rere —scud.
Ao-roa. Ao —cloud. Roa —long.
Aotea. Maori name of Great Barrier Isle. A place-name. Name of a vessel that came to New Zealand from eastern Polynesia four hundred years ago.
Ao-tea. White cloud.
Aparima. Fivefold.
Apa-rima. Apa —a slave; a party of workmen, &c. Rima —five.
Apiti. A chasm or gorge, narrow pass.
Aponga. Gerundial form of apo —to gather together, to heap up.
Ara-hura. Ara —track, path; means of conveyance, &c. Hura —to discover, to find out, to disclose.
Ara-kihi. A peculiar name—possibly misspelt.
Ara-moana. Sea road, sea route.
Ara-moho. Ara —track, path, &c. Moho —birds of the rail family. Moho also denotes stupidity, and there is some story connected with this meaning that assigns a meaning to the place-name.
Aranga. As a verb, means to become known or famous, to appear. Also aranga (gerundial form of ara )—to rise, to awake, &c.
Ara-nui. Ara —path. Nui —important.
Ara-pae. Pae has many meanings. The two words might denote a form of connecting-path or surrounding-path.
Arapawa-nui. We know Arapawa as a place-name only. A compound form evidently. Pawa —smoke. (2) A form of bird-snare. Nui —numerous, big, important.
Ara-pito. Ara —path. Pito —end, extremity.
Ara-pohue. Ara —path. Pohue —a plant (convolvulus).
Ara-rata. Ara —path. Rata, with both vowels long, is a tree-name (Metro-sideros ); with both vowels short, a seer. (2) Divination. As an adjective —clear, red-hot. (3) Sharp.
Ara-rimu. Ara —path. Rimu —a forest-tree (Dacrydium cupressinum). (2) Sea-weed. (3) Moss.
Ara-rua. Ara —path. Rua —two. (2) Pit or hole.
Ara-tapu. Ara —path. Tapu —prohibited.
Ara-tika. Ara —path. Tika —direct, straight.
Ara-toha. Ara —path. Toha —to spread out, scatter, distribute.
Ara-toro. Ara —path. Toro —to discover, explore, reconnoitre, &c.
Arawhata. A ladder or bridge.
Arero. The tongue.
Aria. With first vowel long—a pool, &c.; with final vowel long—form of incarnation of a god, &c.
Aro-whana. Apparently a place-name introduced from eastern Polynesia.
Aro-whenua. Aro —face or front. Aro maunga —mountain-face. Aro tai—sea-front. As a verb—to face, &c. Whenua —land.
Atarau. Moon, moonlight.
Atawhai. Liberality, kindness.
Atea. Syn. Watea—personified form of space. As an adjective—clear, free from obstruction, cautious.
Auroa. Prolonged, extended. As two words: Au —smoke, cloud, mist, current; cloak-pin, &c. Roa —long, tall, delayed.
Awa. A stream, river, channel, gully, groove, ditch, &c.
Awa-huri. Awa (see above). Huri —to overflow, to turn.
Awa-iti. Awa (see above). Iti —small.
Awa-kaponga. (See Awa and Kaponga.)
Awakeri. A ditch.
Awa-kino. Awa (see above). Kino —bad, objectionable, &c.
Awa-mangu. Awa (see above). Mangu —black.
Awa-marino. Awa (see above). Marino —calm.
Awa-moa. Awa (see above). Moa —Dinornis. Awamoa was so named by the late W. B. D. Mantell.
Awa-moko. Awa (see above). Moko —lizard.
Awanga. South-west wind. (2) A variety of Phormium tenax. (3) A variety of taro (Colocasia antiquorum ).
Awa-nui. Area (see above). Nui —large, extensive, numerous.
Awa-puni. Awa (see above). Puni —blocked, stopped up.
Awa-riki. Awa (see above). Riki —small.
Awa-roa. Awa (see above). Roa —long.
Awa-rua. Awa (see above). Rua —two, both; pit-hole. As one word: Awarua —a fosse, moat. (2) Dogskin cloak.
Awatea. Daylight, midday.
Awa-toitoi. Awa (see above). Toitoi —a small fresh-water fish. (2) A bird. (3) A variety of phormium: possibly in error for toetoe (Arundo conspicua and other plants).
Awa-toto. Awa (see above). Toto: both vowels short—blood; both long—name of a ceremony; first short and second long—to gush forth, to trickle.
Awa-tuna. Awa (see above). Tuna —eel.
Awhitu. Cautious. (2) To feel regret, to yearn for, &c.
Eke-tahuna. Eke —to come to land, to get aground. Tahuna —a shoal, sandbank.
Epuni. An incorrect form. Te Puni, of Ngati-Awa, so called by early settlers. The prefixed E is a vocative used in address only, as E Puni!—Oh, Puni!
Hamama. As an adjective—open, vacant, exempt. As a verb—to shout.
Hamua. Elder branch of a family; elder brother or sister. Also a species of rat.
Hangaroa. A plant. A species of shell, perhaps Dentalium.
Hanga-tiki. Hanga, as a verb—to fashion, to make, &c. Tiki —an image in human form. A neck-pendant of grotesquely human form.
Hapua. A hollow, pool, or lagoon.
Hapuka. An unknown word. A common corruption of a fish-name, hapuku (Oligorus gigas, or groper).
Harakeke. Phormium tenax, the so-called "flax."
Harapepe or Hara-pepe. Obscure; both words have a number of meanings.
Harihari. Names of shellfish. (2) Song to make people pull together. (3) Reduplicate of hari —to carry.
Hatuma. Apparently a personal name.
Hau-moana. Sea-wind.
Haunui. Wide. As two words—strong wind.
Hau-pouri. Hau —angle, corner. Pouri —dark, gloomy.
Hau-tapu. As one word—death by violence. As two words: Hau —vital essence of man, land, forests, &c. (2) Property. (3) Food used in certain ceremonies, &c. Tapu —prohibited.
Hau-tere. Hau —wind, &c. Tere —swift.
Hau-turu. Obscure. It might be rendered as "dripping dew."
Hawera. A clearing in woods or scrub made by fire; a burned patch.
Henui. A corruption of Tehe-nui.
Here-kino. Here —a tying-cord. (2) A bird-spear. (3) A guide. As a verb—to tie, to conciliate, to guide. Kino —evil, objectionable, ugly, &c.; worthless.
Hihi-tahi. Hihi —ray of sunlight. (2) Tentaculæ. (3) Long wands at prow of a war-canoe; any long slender appendage. (4) A garment. (5) A bird. (6) Front gable of a house, &c. Tahi —one, singly, together, througho t, altogether; to sweep, to trim, &c.
Hikurangi. A famed mountain-name in traditional history. A mountain in the original homeland. Also in Polynesia, as the Hikurangi peak at Rarotonga. A mountain on the east coast, North Island of New Zealand. Also many hills in New Zealand so named. Perhaps hiku —point or summit; rangi —the heavens.
Hiku-taia. Hiku — tail of a fish. (2) Rear of a body of travellers. (3) Tip or point, as of a leaf. (4) Eaves of a house. (5) Headwaters of a river. (6) Frost-fish. Taia —Passive and imperative forms of ta, a word that has thirty-three meanings.
Himatangi is Hi-matangi. Often written as Himitangi, which can only mean "the wailing chemise"—a most unusual procedure.
Hinuera. Should be Hinu-wera.
Hoki-tika. Hoki —to return. Tika —straight, direct, in a direct manner.
Horopito. Name of a tree (Drimys axillaris ).
Horo-rata. Horo —to fall off, waste away: to slip, as land; to drop off or out; to run, escape; to swallow. As a noun—a landslip. As an adjective—speedy. Rata (see Ara-rata).
Horo-tiu. Horo (see Horo-rata). Tiu —to soar, wander, swing; swift, prompt. As a noun—north, north wind.
Hukere-nui. Hukere —a cascade. (2) Steep. Nui —great, extensive, &c.
Kaha-ranaki. Should be Kahu-ranaki.
Kaiapoi. A doubtful form. Probably Kai-a-poi. Said to have been so named because kai (food-supplies) were poia to the old fortified village of that name. Poi means to swing or wave, but quite possibly has another meaning. The South Island dialect has never been really studied.
Kai-kohe. Kai —food; to eat, &c. A tree (syn, matai ). Kohe —a tree (Dysoxylum spectabile ); also a climbing-plant. Kaikohe might denote a babbling, irresponsible person.
Kai-koura. Kai —food; to eat, &c. Koura —crayfish. But Kaikoura might be used to denote persons engaged in catching crayfish. The word kai ahs many meanings.
Kairanga. A dubious form. It might denote a body of men making a charge, or of avengers, or persons performing a rite. An obscure and doubtful term.
Kai-taia. Taia here is hopeless without local inquiry.
Kai-tangata. As words of the vernacular they denote cannibalism, but kai is used in other senses. Tangata —person, man (homo).
Kaiteratahi (Cook County). Should be Kai-taratahi.
Kai-ti. Kai —food. (2) To eat. Ti—Cordyline (cabbage-tree). Perhaps ti -eating, or ti -eaters.
Kakahi. Fresh-water mussel.
Kamo. The eye, eyelash. As a verb—to wink. (2) To bubble up.
Kaponga. A species of tree-fern (Cyathea dealbata). (2) The gerundial form of kapo —to snatch or clutch.
Kapuni. Carries the sense of assembling or assemblage by puni.
Karanga-hake. Here again local inquiry is absolutely necessary. Karanga —to call, to welcome. Hake —crooked. (2) A bowl or trough. In karangahape we have a shell-name.
Karori. A word that implies something devious, entangled, or irregular.
Kau-kapakapa. Kau —to swim, to wade. As a noun—stalk. (2) Pupil of eye. (3) Multitude, company. (4) Ancestor. Kapakapa gives the sense of movement, fluttering. As a noun—wing of a bird or insect. Conjecture is useless in these cases.
Kaupokonui. Probably Kaupoko-nui, though we do not know kaupoko as a Maori word.
Kawakawa. Name of a small tree (Macropiper excelsum), also of a fern (Lomaria fluviatilis ). (2) A variety of greenstone. (3) A channel or depression.
Kawhaiki (Whanganui). Should be Kaiwhaiki.
Kawhia. Name of a fish.
Kekerangu. Should be Kekerengu.
Kihikihi. The cicada or tree-locust.
Kimihia. Passive and imperative forms of kimi —to seek.
Kohukohu. The name of a tree (Pittosporum tenuifolium ), also of a plant. As an adjective—hollow, concave.
Konini. Fruit of native fuchsia.
Kumara. Name of the sweet potato (Ipomœa batatas ), formerly much cultivated by Natives. Kurow. A corrupt form.
Maheno. An island. (2) To untie. (3) Untied.
Makarewa. Probably Manga-rewa. The ng becomes k in the South Island dialect. Manga —a stream. Rewa has nine different meanings—a hopeless number.
Makikihi. Probably should be Ma-kikihi. Ma as the first syllable of a place-name is often an abbreviation of manga —a stream. Kikihi— cicada. (2) To murmur, make a faint sound.
Makirikiri. Ma, manga —stream. Kirikiri —gravel, shingle.
Mamaku. A tree-fern (Cyathea medullaris ). (2) A variety of taro.
Manaia (Waimate Plains) was so named by Europeans after a local Maori chief. The writer was a member of a force, consisting of No. 2 Company, Armed Constabulary, and the Arawa Native Contingent, that built a redoubt there in the "seventies." It was built on the site of an old Maori earthwork fort named Te Taheke, on the right bank of the Wai-o-kura Creek, and was named Fort Manaia. Manaia is a very old personal name among the Taranaki Natives, who are the descendants of an old-time Polynesian sea-rover of that name who voyaged hither from eastern Polynesia twenty-seven or twenty-eight generations ago.
Mana-kau. Mana —authority, control, prestige, influence, power, psychic force; authoritative, possessing influence, &c.; effectual. Kau —alone, only, empty, to no purpose; ancestor.
Manawaru. Anxious, apprehensive, enraptured. A fairly common and an old place-name. Probably an introduced one.
Manga-papa. Manga —a, stream. Papa may be the soft rock or indurated clay of that name; otherwise papa has many meanings.
Manga-tainoka. Manga —a stream. Tainoka —a shrub, the native broom (Carmichaelia australis ).
Manga-toki. Tokitoki —calm; but toki is difficult to explain here, as toki —stone adze. Perhaps a corruption of toke —earthworm.
Manga-weka. Manga —a stream. (2) A bird-snare. Weka —a bird, the woodhen (Ocydromus australis ).
Mangere. As an adjective—indolent. As a noun—third month of Maori year.
Manu-nui. Manu —bird (generic term). (2) Kite—toy. Nui —large.
Manu-rewa (see Manu-nui). Rewa —elevated, high up. (2) To float, &c.
Manu-tuke. Manu (see above). Tuke —angle bend, elbow. (2) To jerk, twitch. Cf. Manu-tute.
Matakana. Wary, watchful, shy, distrustful.
Matamata. Point, extremity, headland, source; a fish-name.
Matamau. Stingy.
Matapu. A bird-name. (2) A wind-name. (3) Wall-plate of a house.
Mataroa. Mata has twenty-seven meanings.
Mata-ura might be rendered as "red-eyed" or "angry," but is doubtful.
Matawai (Waikohu County). Usually pronounced Mātāwai, but should probably be Mātāwai—source, fountain-head. It was so pronounced in 1874-75 when the writer lived at Waikohu. The block of land was called Waikohu-Mātāwai.
Matiere. It is a question if this should not be Matihere.
Matemateonga. Possibly a corruption of Matemate-a-one.
Mauku. Cordyline pumilio; also Asplenium bulbiferum.
Maunu. Grey duck. As a verb—to be drawn out, be loosened, be taken off, to emigrate, to begin to ebb (of tide).
Meremere. The planet Venus. (2) A weapon.
Motueka. Should be Motu-weka. Motu —an island, clump of trees, forest. Weka —a bird, the woodhen.
Moutere. An island.
Nainai. Unknown form. Probably in error for Ngaengae or Naenae.
Ngaere. To quake, as a bog. Probably is named from the swamp known as Te Ngaere.
Nga-rua-wahia. Nga —definite article plural, the. Rua —store-pit. Wahia—broken into or open. Probably denotes "The pillaged food-stores." Place-names often originated in similar incidents, as Whare-tomokia (the burglarized house) near Te Whaiti.
Nga-tapa. Nga —plural form of definite article. Tapa —margin-edge.
Ngongo-taha. Ngongo —a tube, nectar of flowers, sick person, a spear, a sea-bird, a pool, &c. As a verb—to waste away, to suck, to sail close to the wind. As an adjective—sad, silent, lowborn. Taha —side, margin. (2) To miss, as a blow, to pass by, &c.
Oamaru. Probably O-a-maru. O —food - supplies for a journey. A —of. Maru —probably a personal name in this case.
Oaonui. The initial O evidently a prefix. Ao —cloud, &c. Nui —large.
Ohakune. O (see Oaonui above). Hakune may have been a personal name; otherwise hakune. means to be deliberate or careful.
Ohaupo. O (see Oaonui above). Haupo —probably a personal name.
Ohinewai. O (see Oaonui above). Hinewai —a personal name.
Ohinga-iti. The initial O may be a prefix, which would leave Hinga-iti, possibly a personal name. Ohinga denotes childhood, youth. Iti —small, unimportant.
Okahukura. Probably named after one Kahukura.
Okaiawa. Perhaps named after one Kaiawa.
Okato. Perhaps named after one Kato. The O is a prefix. Kato —flowing. (2) To end or break off.
Omaranui (Hawke's Bay) should be Omarunui.
Onaero (Taranaki) should be Onaeroa.
One-hunga. A beach composed of sand mixed with mud is so termed. Any sandy beach is one. A rocky coast-line is akau.
One-rahi. One —a sandy beach. Rahi —extensive.
Ongaonga. The nettle Urtica ferox, &c.
Opotiki. O—a possessive prefix; here equivalent to "'s" in English. This place was named after an ancestor called Potiki-mai-Tawhiti, an immigrant from Polynesia centuries ago. A Maori would prefix O to a person's name in naming a place after him, as we would say "Wilson's" instead of employing the longer form "Wilson's place."
Opunake. O here is a prefix. Punake —the fore end of a canoe-hull. In such a case as this the place might well have been named after a person called Punake. (See Opotiki.)
Orepuki. A corruption of Aropaki.
O-tahuhu. The O is a prefix. It is often employed when a place is named after a person. This place may have been named after a person whose name was Tahuhu. Otherwise tahuhu denotes the ridge-pole of a house, also a direct line of ancestry, &c.
Otaika. Taika —to lie in a heap. Or Ota —to eat in a raw state. Ika —fish.
Otakeho. Takeho unknown as a Maori word.
Otaki. The O here is a prefix. An old legend has it that taki here alludes to an incident of olden days, when a traveller stuck his staff in the ground at that place. In an old song describing many incidents of the traveller's journey we find—
Waiho te awa iti hei ingoa mona ko Ohau Takina te tokotoko ko Otaki.
(The small river was called Ohau after him. Where his staff was stuck in [the place was named] Otaki.)
Otane. The O is a prefix (see Opotiki). Tane may be a personal name, or tane—man, male (vir ).
Otaua. The O a prefix. Taua is perhaps a personal name.
Otautau. The O a prefix. Tautau is probably a personal name. Tautau also means pendant, pendulous. The greenstone ear-pendant with curved lower end is termed a tautau.
Otekaike. A corrupt form.
Otira. The O a prefix. Tira —a company of travellers, a file or row of persons; rays or beams, &c.
Otokia. The O a prefix. Tokia —passive form of to —to anoint, to moisten, perhaps to affect.
Otorohanga. The O a prefix. Torohanga may be a personal name, or the gerundial form of toro, a verb that carries many meanings, as explore, discover, visit, extend, survey, &c.
Owaka. The O a prefix. Waka—canoe, trough, box, &c. (2) Human medium of a god, &c.
Owhango. The O a prefix. Whango describes any hoarse or nasal sound as applied to speech.
Pae-kakariki. Pae —perch, rest, part of an apparatus used by fowlers in taking birds. Kakariki —parrakeet (Cyanoramphus Novœ Zealandiœ).
Paeroa. An even range of hills. (2) A shore wind, one that blows along the shore.
Pahi-atua. Pahi —company of travellers. (2) A camping-place. Atua —god, demon; anything supernatural, weird, or terrifying. A folklore tale relates that a company of demons carried a certain ancestor to that place.
Papakura. Some form of red glow, apparently celestial. As two words, papa kura, several improbable meanings might be given.
Papanui. Platform in a tree used by fowlers. As two words papa has sixteen. meanings, and nui eleven. Comment is needless.
Papa-roa (see Papanui). Roa has five meanings. ***Pâpāroa —scarce. Whaka-paparoa —to make scarce.
Papa-toitoi. Here toitoi is almost certainly in error for toetoe (Arundo conspicua and certain sedges). Papa-toetoe would denote a place overgrown with toetoe.
Parapara-umu. Oven-refuse.
Parawai. An ornamental cloak made of Phormium fibre. (2) Sandal. (3) Projecting flange on a barge-board.
Pare-ora. Pare has ten meanings; ora has only eight.
Patea. Name of a garment. (2) A variety of sweet potato.
Patu-mahoe. Patu —a weapon, &c. Mahoe —a tree-name, or timber of same.
Pa-tu-tahi, or Pa-tutahi, might be rendered as—lone or isolated pa (fortified village).
Petone. A corruption of Pito-one. Pito —end, extremity. One —a sandy beach. The place is so situated.
Pihama. Named after a Native chief, Hone Pihama.
Piopio. Name of the native thrush (Turnagra tanagra ). (2) A plant (Dianella intermedia ). (3) A stranger.
Pipi-riki. Pipi —cockle (generic term). (2) Small splitting-wedge. (3) A form of cloud, cirro-stratus. Riki —small, few.
Pokeno. Pokeno —turbid. Po —night. Keno —night, underworld.
Pongaroa. Name of a game.
Po-rangahau. Po —night. (2) Season. (3) Spirit world. Rangahau —to seek, to pursue.
Pori-rua. Said to have been so named on account of the harbour having two arms or inlets; but we know of no meaning for pori that supports this. Pori —a tribe, people, dependants. Rua —two, both.
Puke-kohe. Puke —a hill. Kohe —a tree (Dysoxylum spectabile ). Probably named on account of a former abundance of such trees.
Puke-rau. Puke —hill, hillock. Rau —many.
Putaruru. Should be Puta-a-ruru. Puta —hole, opening. As a verb—to come forth, to appear. A —after the manner of. Ruru— the owl (Ninox Novœ Zealandiœ).
Rae-tihi. Rae —forehead. (2) Promontory, headland. Tihi —summit, top, peak, point. (2) Top-knot of hair, &c.
Rakaia. Possibly Rangaia is the proper form, as ng becomes k in the South Island dialect. Rakaia is the passive form of the verb rakai —to adorn; but wai-rakaia is said to denote a pool of water used as a mirror during such adornment. This usage is an unexplained one.
Rangataua. A large grasshopper so called. Or it may be two words, ranga taua, both of which have a number of meanings.
Rangiora. A shrub (Brachyglottis repanda ).
Rangiotu. A puzzling name. It may be Rangi-o-tu or Rangi-otu. Otu probably has a meaning not recorded. If Rangi-o-tu is the correct form, then Tu is probably a personal name. Rangi has a dozen meanings, including sky, weather, day, tune, head, chief, &c.
Raumai. Perhaps Rau-mai—i.e., two words. Ran has many meanings; conjecture is useless.
Rau-rimu. Rau —leaf. (2.) Multitude. (3.) Blade of a weapon. Rimu —the red-pine (Dacrydium cupressinum ).
Rawene. Meaning obscure.
Retaruke. Should be Rere-taruke.
Riwaka. Perhaps Ri-waka. Ri —a screen. (2.) Bond. As a verb—to screen, to bind. Waka (see Owaka).
Rongo-tea. Possibly named after a person. The two words do not lend themselves to a lucid explanation.
Rotorua. Roto —a lake. Rua —two, second; also pit-hole.
Ruawai. Ruawai means to vomit. This name may be Rua-wai. Rua —a pit or hole. Wai —water.
Runanga. An assembly or council. Gerundial form of runa —to assemble or draw together.
Tahuna-nui. Tahuna — shoal, sandbank, battle-ground, &c. Nui — great or numerous, many.
Taihape. Unknown as a word, though not an improbable form. (Cf. Waihape.)
Tai-tapu. Tai —sea, tide, coast. Tapu —prohibited. The concrete form Tai-tapu seems to be genuine, but meaning is unknown.
Takaka. A plant; the common bracken (Pteris aquilina ).
Takapau. A mat for sleeping on.
Takapuna. Probably Taka-puna. Many meanings of both these words. Conjecture useless; local inquiry necessary.
Taneatua. The name of a chief who came from eastern Polynesia and settled in the Whakatane district about four hundred years ago. The small hill in the Taneatua Township is Otarahioi, and is said to represent the dog of Taneatua; hence it is often alluded to as Te Kuri a Taneatua. Europeans adopted Taneatua as a name for the township.
Tapa-nui. Tapa —edge, margin. Nui —great or many. As one word, Tapanui —a pattern of carving. (2.) A species of mussel.
Taratahi. A form of kite (toy) was so called. (2.) Isolated. (3.) Single-pointed.
Tariki. A doubtful word.
Taumaru-nui. Taumaru — shaded, overshadowing. Nui — denotes quantity, abundance, intenseness, &c. Often equivalent to "much."
Taupiri. Denotes attachment. (Cf. piri —to stick to, adhere, &c.)
Tauranga. Gerundial form of the verb tau. A canoe anchorage, a fishing-ground, a resting-place.
Te Aroha. Te —the. Aroha —love, affection, sympathy, kindness, token of kindness, compassion. Also used as a verb—to feel affection or pity, to regard favourably.
Te Awa-mutu. Te —definite article singular, the. Awa —stream, river. Mutu—end or ended, cut short, brought to an end.
Te Kopuru. Te —the. Kopuru—heavy clouds. (2.) A species of moss.
Te Kuiti. Te —the. Kuiti —narrow, confined. The narrowness, or narrow place.
Te Mata. Te —the. Mata has twenty-six meanings. Vowel quantities necessary.
Temuka. Said to be a corruption of Te-Umu-kaha. Te —the. Umu-kaha was the name of an ancient ceremony, but that may not he its application in this case.
Te Puke. Te—the. Puke—hill, hillock. (2) (modern)—a ship.
Te Rehunga. Te —the. Rehunga (gerundial form of rehu )—to chip, to obscure, to render drowsy, &c.
Ti-maru. Ti —the so-called cabbage-tree (Cordyline ). Maru —shelter, or shaded, sheltered. As ti is occasionally employed as a causative prefix, then timaru, whakamaru —to shade, to shelter, to protect.
Tokomaru. Name of a vessel that reached New Zealand from eastern Polynesia many generations ago.
Tolaga. Corrupt form.
Tuakau. Rhizome of Pteris esculenta, an important food-supply. The tuakau is an inferior variety. (2) Sterile land.
Tuatapere, or Tua-tapere. If correctly spelled, is unexplainable.
Tutu-rau. The word tutu has fourteen meanings, but it has three forms, tūtū, tÛt&cmacr;, and tÛtÛ. The latter represents the name of a common shrub, Coriaria ruscifolia. Rau signifies many, a multitude, definitely a hundred. As a verb—to gather, as into a basket; also, to contain. As an adjective—entangled, &c.
Utiku. Named after a person.
Wai-aniwa. Wai —water, stream, river, &c. Aniwa here probably equals aniwaniwa —deep water. (2) Black. (3) Rainbow.
Waihi. An old Polynesian place-name, probably introduced by immigrants.
Wai-hou. Wai —water, &c. Hou —cold, recent, new. Wai-hou is equivalent to Awa-hou, a name applied to a stream or river that changes part of its course, cuts a new channel. One meaning of hou as a verb is to force downward or under.
Wai-kaia. If correctly spelt, a doubtful form. The k of kaiu can scarcely be the North Island ng. Kaia —to steal. As a noun—thief. (2) A plant, Acœma sanguisorbœ. As an adjective—stealthy.
Wai-kaka. Kaka is a word having fourteen recorded meanings, and has four forms, kākā, kâkâ, kâkā and kâkâ. Care in assigning correct vowel quantities in such cases is highly necessary. Kākā—a parrot (Nestor meridionalis ), must not be confused with kākâ—the bittern (Botaurus pœciloptilus ); nor kâkâ—a garment—with kâkā—red-hot. To ascertain which of fourteen meanings is the correct one in such a case as this is hopeless; a knowledge of how and why the place was so named alone can enlighten us, and that calls for inquiry from local Natives. Moreover, as Wai-kaka is in Southland, the k may be the North Island ng, and nganga has eight recorded meanings.
Waikari. Syn. Waikeri—a ditch. As two words: Wai —water, &c. Kari —to dig, to dig for; to rush along violently, to strike.
Wai-kino. Wai —water, &c. Kino —bad, evil, unpleasant, &c.
Wai-kiwi. Kiwi —a bird (Apteryx spp.).
Wai-kohu. Wai —water, river. Kohu —fog, mist. Though wai is sometimes used as a prefix the value of which is not clear, as in Waiora, Waimate, Waimarie. Also as one word: Waikohu —mist, fog.
Wai-kumete. Kumete —a wooden trough or bowl.
Wai-mate. As one word, denotes apprehension, &c. As two words: Wai—water, river, creek. Mate —calmed, slack (as tide).
Wai-pawa. Wai —water, river. Pawa —smoke; but here perhaps the name of a person.
Waipu. Red, reddened. (2) A volley of gunfire.
Wai-pukurau or Wai-puku-rau. Wai —water, river. Pukurau —a species of fungus. Or puku-rau, for which many meanings might be given.
Wai-roa. A common place-name. Wai —water; but often denoting a river in place-names. Roa —long.
Wai-tahuna. Tahuna —dry, dried up, a shoal, sandbank, beach, seaside, battle-field, &c. Tahuna is also the imperative and passive forms of tahu —to set fire to, to burn, to cook, &c. The modern Maori employs this word in cases where we would not use the word "cook," as in referring to tea-making—tahu ti.
Wai-tara. Wai —water, river, stream. Tara has many meanings. Waitara (as one word)—hail. (2) Also denotes difficult problem or scheme.
Wai-tati. Tati may be a Maori word, but we know nought of it. Possibly a corrupt form.
Wai-toa. Toa —male of animals; brave, victorious, rough, stormy; a brave man, a warrior; bravery; roughness of the sea; a fish-name. As a verb—to romp or frolic.
Wai-uku. Wai —water, stream, river. Uku —clay.
Wai-uta. Uta —land as opposed to water area; inland, interior. As a verb—to load a canoe, &c.
Wai-wera. Wera —hot, heated.
Wanganui. Should be Whanga-nui. Whanga —bay, estuary, &c. (see under Whanga-rei). Nui —great, extensive.
Wera-roa. Wera —burnt, &c. Roa —long, extensive, &c.
Whakatane. Whaka —a causative prefix. Tane —man (vir ). Hence whakatane —to play the man, to act as a man. The more ancient name of this place was Kakaho-roa. A tradition concerning the naming of Whakatane is to be found in the Journal of the Polynesian Society, Vol. 3, p. 60.
Whangarei. Whanga —harbour, bay, bight. But whanga and tawhanga may be employed to denote an estuary or a stretch of water such as Cook Strait. Whanga may denote an expanse of water or land, or of air; hence whanga—space. Rei has a number of meanings, as tusk, large tooth, ivory, anything made of ivory; any much-cherished possession; boundary; swampy ground. As an adjective—wet, sodden.
Whare-huia. Whare—house, hut. (2) People of a house, &c. Huia —a bird (Heteralœha acutirostris ). Huia is also the passive form of hui —to assemble, &c.
Whata-upoko. Whata —a stage, platform, rack, &c. Upoko —the head.
Whenua-kura. Whenua —land. Kura has sixteen meanings, including those of red, red ochre, red feathers. Anything highly prized may be so termed.
Whitianga. Gerundial form of whiti —to cross over, &c.; hence a crossing-place is so termed, such as a ferry. Whiti has many other meanings, as to change, to shine, to spring, to awake, &c.—about twenty meanings in all.
Table of Contents
[NOTE .—Dates of principal events prior to August, 1914, are given in issues of the Year-book for 1915 and previous years.]
1914. Aug. 5. His Excellency the Governor publicly notified that war bad been declared between Great Britain and Germany.
Aug. 15. New Zealand Advance Expeditionary Force left Wellington.
Aug. 29. New Zealand Advance Expeditionary Force landed at Apia, Samoa, unopposed.
Sept. 12. Huntly coal-mine explosion whereby 43 lives were lost.
Oct. 16. New Zealand Main Expeditionary Force left Wellington.
1915. April 25. Australian and New Zealand Infantry effected a landing on Gallipoli.
Aug. 12. National Cabinet formed.
Dec. 19. Australian and New Zealand troops evacuated Gallipoli.
1916. April —. New Zealand Division transferred to Western front.
Aug. 1. Military Service Act passed providing for compulsory enrolment of men for war service.
Sept. 15. New Zealand Division distinguished itself at Flers.
Oct. 15. Census of New Zealand taken.
Nov. 16. First ballot under Military Service Act.
1917. June 7. Messines Village captured by New Zealand troops.
June 28. Earl of Liverpool sworn in as first Governor-General of New Zealand.
Oct. 4-12. New Zealand Division took prominent part in operations north-east of Ypres.
1918. June 26. Huddart-Parker's s.s. "Wimmera" sunk off North Cape by hostile mine.
July 20. Otira Tunnel pierced.
Aug. 21,-Nov 11. New Zealand Division took a meritorious part in the final British offensive.
Sept. 19. Turks heavily defeated in Palestine.
Sept. 29. Bulgarian surrender signed.
Oct. 30. Turkish armistice signed.
Nov. 2. Austrian armistice signed.
Nov. 11. Armistice signed by German High Command.
Nov. 21. German Fleet surrendered.
Nov.-Dec. Influenza epidemic prevalent throughout the Dominion.
1919. Jan. —. Visit of French Mission under General Pau.
April 10. Special licensing poll taken.
Aug. 20. H.M.S. "New Zealand" arrived at Wellington on her second visit to the Dominion, bringing Admiral of the Fleet Viscount Jellicoe of Scapa, G.C.B., O.M., G.C.V.O.
Aug. 21. Dissolution of National Ministry.
Oct. 2. Women's Parliamentary Eights Bill passed its second reading in the Legislative Council.
Dec. 17. General elections.
The following list contains the names of some of the principal works dealing with New Zealand, but it does not purport to be a complete list of all the important works on the Dominion. The year of publication is given in each case, and the list is arranged as far as possible in chronological order of issue.
1807. New Zealand. By Dr. Savage. London—J. Murray.
1817. Voyage to New Zealand. By John L. Nicholas. London—Black.
1823. Journal of Ten Months' Residence in New Zealand. By Captain Cruise. London—Longmans.
1830. The New-Zealanders (Library of Entertaining Knowledge). London—Chas. Knight.
1832. Nine Months' Residence in New Zealand. By Augustus Earle. London—Longmans.
1836. Two Visits to New Zealand. By Dr. Marshall. London—Nisbet and Co.
1840. Manners and Customs of the New-Zealanders. By J. S. Polack. London—Madden and Co.
1843. Travels in New Zealand. By E. Dieffenbach. London—Murray.
1855. Te-Ika-a-Maui, or New Zealand and its Inhabitants. By Rev. Richard Taylor. London—Wertheim and Macintosh.
1856. Traditions and Superstitions of the New-Zealanders. By Edward Short-land. London—Longmans.
1859. Story of New Zealand. By Dr. Thompson. London—John Murray.
1863. Old New Zealand. By Judge Mailing. Auckland—Creighton and Scales.
1874. Life of Henry Williams. By Hugh Carleton. Auckland—Upton.
1879. Reminiscences of the War in New Zealand. By T. W. Gudgeon. London—Sampson Low.
1879. George Augustus Selwyn. By Rev. H. W. Tucker. London—W. W. Gardner.
1885. Polynesian Mythology and Maori Legends. By Sir G. Grey.
1889. Ancient History of the Maori. By John White. London.
1890. Early History of New Zealand. By R. A. Sherrin and J. H. Wallace. Edited by Thomas W. Leys. (Brett's Historical Series.) Auckland—Brett.
1893. Captain Cook's Journal during his First Voyage round the World. Edited by Captain W. J. L. Wharton, R.N. London—Elliot Stock.
1895. History of New Zealand. By G. W. Rusden. Melbourne—Melville, Mullen, and Slade.
1896. The Art Workmanship of the Maori Race in New Zealand. By Augustus Hamilton. Dunedin—Fergusson and Mitchell.
1896. Journal of Sir Joseph Banks. Edited by Sir Joseph D. Hooker. London —Macmillan and Co.
1897. New Zealand Rulers and Statesmen (1844-97). By W. Gisborne. London.
1898. Abel Janszoon Tasman's Journal of His Discovery of Van Diemen's Land and New Zealand in 1642, &c. By J. E. Heeres. Amsterdam—F. Mueller and Co.
1898. Contributions to the Early History of New Zealand. By T. M. Hocken. London.
1898. New Zealand (Story of the Empire Series). By W. P. Reeves. London—Marshall and Sons.
1900. Old Marlborough. By T. L. Buick. Palmerston North—Hart and Keeling.
1901. Newest England. By H. D. Lloyd. London.
1901. New Zealand. By R. A. Loughnan. Wellington.
1902. The Progress of New Zealand in the Century. By R. F. Irvine and O. T. J. Alpers. London.
1902. State Experiments in Australia and New Zealand. By W. P. Reeves. London—Grant Richards.
1903. Old Manawatu. By T. L. Buick. Palmerston North—Buick and Young.
1904. La Démocratie en Nouvelle Zélande. Paris, 1904. Translated by E. V. Burns, 1914. London.
1905. The Maori Race. By E. Tregear. Wanganui—A. D. Willis.
1905. The Animals of New Zealand. An Account of the Colony's Air-breathing Vertebrates. By Captain F. W. Hutton and James Drummond. Third Edition, 1907. Christchurch—Whitcombe and Tombs (Limited).
1906. Adrift in New Zealand. By E. W. Elkington. London.
1907. The Plants of New Zealand. By R. M. Laing and E. W. Blackwell. Second and Revised Edition. Christchurch—Whitcombe and Tombs (Limited).
1907. Maori and Polynesian. By J. M. Brown. London.
1907. Our Feathered Immigrants. Evidence for and against Introduced Birds in New Zealand, together with Notes on Native Avifauna. Illustrated. By J. Drummond. Wellington —Government Printer.
1908. New Zealand. By F. W. Wright and W. P. Reeves. London—Black.
1908. New Zealand. (Romance of Empire Series.) By Reginald Horsley. London—T. C. and E. C. Jack.
1908. Adventures in New Zealand. By E. J. Wakefield. New Edition. Wellington—Whitcombe and Tombs (Limited).
1908. Bibliography of the Literature relating to New Zealand By T. M. Hocken. Wellington.
1908. Historical Records of New Zealand. Vol. i (1770-1839). By Robert McNab. Wellington—Government Printer. (Another volume is in preparation.)
1909. New Zealand in Evolution, Industrial, Economic, and Political. By G. H. Scholefield, with an introduction by W. P. Reeves. London—T. F. Unwin.
1909. Murihiku. A History of the South Island of New Zealand and the Islands Adjacent and Lying to the South, from 1642 to 1835. By Robert McNab. Wellington—Whitcombe and Tombs (Limited).
1909. The Dominion of New Zealand. By A. P. Douglas. London.
1910. The Maoris of New Zealand. By J. Cowan. Wellington—Whitcombe and Tombs (Limited).
1910. The Geology of New Zealand. By James Park. Christchurch—Whitcombe and Tombs (Limited).
1910. New Zealand Plants and their Story. By L. Cockayne, Ph.D., F.L.S. Wellington—Government Printer.
1911. Hawaiki: The Original Home of the Maori. By S. Percy Smith. Third Edition. Christchurch—Whitcombe and Tombs (Limited).
1911. The Course of Prices in New Zealand. By James W. McIlwraith, LL.B. Litt.D. Wellington—Government Printer.
1911. State Socialism in New Zealand. By J. E. Le Rossignol and W. Downie Stewart. London—G. G. Harrop and Co.
1911. New Zealand. By the Hon. Sir Robert Stout, K.C.M.G., LL.D., and J. Logan Stout. LL.B. Cambridge—University Press.
1913. New Zealand, its History, Commerce, and Industrial Resources. By S. Playne. London.
1913. Social Welfare in New Zealand. By H. H. Lusk. London.
1913. The Lore of the Whare Wananga. Third Volume of Memoirs of Polynesian Society. On Maori Religion, Myths, Cosmogony, &c.
1914. The Constitutional History and Law of New Zealand. By J. Hight, Litt.D., and H. D. Bamford, LL.D. Christchurch—Whitcombe and Tombs (Limited).
1914. The Wilds of Maoriland. By M. J. Bell. London.
1914. Oxford Survey of the British Empire. Vol. v. Australasian Territories.
London.
1915. The Long White Cloud, Aotearoa. By W. P. Reeves. London—Horace Marshall and Sons. Revised Edition.
1915. Report on the Cost of Living in New Zealand, 1891-1914. By Malcolm Fraser, Government Statistician. Wellington—Government Printer.
1917. A Natural History of Australia, New Zealand, and the Adjacent Islands. By R. P. Thomson. London.
| Article on | Appeared for the Last or Only Time in Year-book of | |
|---|---|---|
| Year | Page | |
| Acclimatization | 1894 | 430 |
| Agriculture in New Zealand (by M. Murphy, P.L.S.) | 1912 | 809 |
| Building-stones | 1892 | 194 |
| Cancer mortality in New Zealand | 1917 | 776 |
| Chatham Islands, the | 1900 | 531 |
| Cheviot Estate, the | 1895 | 264 |
| Christchurch to West Coast, journey from | 1899 | 548 |
| Coal-deposits of New Zealand, the | 1900 | 479 |
| Cook Islands, the laws of | 1902 | 573 |
| Co-operative system of constructing public works | 1894 | 234 |
| Exotic trees in Canterbury | 1904 | 569 |
| External trade of New Zealand, the | 1915 | 858 |
| Fauna of New Zealand | 1914 | 957 |
| Forest trees and the timber industry | 1899 | 470 |
| Frozen-meat trade, the | 1894 | 311 |
| Geology of New Zealand | 1914 | 943 |
| Gold-dredging industry, the | 1899 | 509 |
| Government training-ship "Amokura" | 1913 | 942 |
| Hanmer Thermal Springs | 1905 | 631 |
| Hemp industry, the | 1900 | 477 |
| H.M.S. "New Zealand" | 1913 | 932 |
| Kauri-gum | 1900 | 489 |
| Labour in New Zealand | 1894 | 362 |
| Lakes of New Zealand, the | 1915 | 963 |
| Land and income-tax assessment | 1913 | 884 |
| Laws of England and New Zealand, difference between | 1896 | 281 |
| Maori, ancient, his amusements, games, &c. | 1907 | 707 |
| Maori, ancient, his clothing | 1908 | 734 |
| Maori, chant (tangi) | 1907 | 711 |
| Maori, colour-sense of the | 1905 | 637 |
| Maori, marriage customs | 1906 | 638 |
| Maori, mythology | 1900 | 536 |
| Maori, neolithic, the | 1902 | 578 |
| Maori, religion | 1901 | 530 |
| Maori, sociology | 1903 | 641 |
| Maori, songs | 1908 | 739 |
| Marlborough Sounds, the | 1901 | 517 |
| Midland Railway, the | 1894 | 386 |
| Mineral waters of New Zealand | 1913 | 896 |
| Moa, heir of the | 1899 | 517 |
| Mount Cook, a night on | 1900 | 525 |
| Mount Cook, district, the | 1899 | 554 |
| Mount Cook, its glaciers, and the Hermitage | 1898 | 552 |
| Mount Sefton, ascent of | 1900 | 519 |
| New Zealand Contingents for South Africa | 1900 | 449 |
| New Zealand International Exhibition | 1907 | 701 |
| Otago lakes, the | 1901 | 523 |
| Patents, designs, and trade-marks | 1893 | 350 |
| Article on | Appeared for the Last or Only Time in Year-book of | |
|---|---|---|
| Year | Page | |
| Pumice-stone deposits of New Zealand | 1900 | 486 |
| Railways in New Zealand, their history and progress | 1894 | 377 |
| Rivers of New Zealand | 1914 | 948 |
| Scenic wonderland, a | 1898 | 565 |
| Sheep, crossbreeding of | 1894 | 308 |
| Sheep-farming | 1894 | 302 |
| Shipping Companies— | ||
| New Zealand Shipping Company | 1895 | 392 |
| Shaw, Savill, and Albion Company | 1895 | 393 |
| Union Company of New Zealand | 1895 | 389 |
| Southern Alps, the | 1894 | 474 |
| State farms | 1894 | 243 |
| Sydney Pageant, the | 1901 | 527 |
| Thermal-springs district | 1905 | 614 |
| Timber-trees of the world | 1903 | 605 |
| Tokaanu to Raetihi | 1899 | 539 |
| Tree-planting | 1906 | 611 |
| Tuhoeland | 1899 | 546 |
| Varieties of soil | 1892 | 193 |
| Waihi Gold-mining Company | 1897 | 432 |
| Waikato district and through to Wanganui | 1899 | 520 |
| Waiouru to Mangaonoho | 1899 | 543 |
| Wanganui River, up the, to Tokaanu | 1900 | 509 |
| Wattle-growing in the Auckland Provincial District | 1897 | 430 |
| Wellington-Manawatu Railway, the | 1895 | 381 |
| West Coast Sounds, the | 1894 | 472 |
| White Island, a day on | 1906 | 637 |
A.
- Absolute Decrees in Divorce, 266.
- Accident Insurance, 720.
- Government Office, 722.
- Accidental Deaths, 178, 291.
- Accidents, 177, 201, 291.
- In Factories, 667.
- Mining, 596.
- Railway, 471.
- Acclimatization of Fishes, 572.
- Accommodation in Mental Hospitals, 220.
- Accommodation Licenses, 296.
- Acreage and Yield of Crops, 516, 517.
- Adenoids: Hospital Cases, 196.
- Adjacent Islands. Population of, 112.
- Administration of Land Laws, 482.
- Admissions to Hospitals, 185.
- Admissions to Mental Hospitals, 216.
- Adopted Children, Registration of, 116.
- Advances by Banks, 708.
- Advances, Kauri-gum Industry, 593.
- Advances to Local Authorities, 676.
- Advances to Settlers, 672.
- Advances to Workers, 678.
- Aerated-water and Cordial Factories, 650.
- Afforestation, 566-571.
- After-lifetime, Average, 148.
- Age, Mean, at Death, 148.
- Age, Mean, at Marriage, 140.
- Agents-General, Successive, 8.
- Ages, 90.
- At Death, 147.
- Of Industries, 629.
- Of Inmates of Hospitals, 187.
- Of Inmates of Mental Hospitals, 218
- Of Issue left, 157.
- Of Parents, 126.
- Of Parties in Divorce Cases, 267.
- Of Persons arrested and convicted, 273.
- Of Persons married, 139.
- Of Persons unemployed, 98.
- Of Prisoners, 285.
- Of Public-school Pupils, 227.
- Of Widows, 161.
- Aggregation of Land, 487.
- Agricultural Bursaries, 251.
- Agricultural College, Lincoln, 252.
- Agricultural-implement Factories, 657.
- Agricultural Produce exported, 340.
- Agriculture, 514-526.
- Aid, State—
- To Dairy Industry, 559.
- To Friendly Societies, 825.
- To Kauri-gum Industry, 593.
- To Local Authorities, 676.
- To Mining, 596.
- To Settlers, 672.
- To Tree-planting, 566.
- To Water-power, 620.
- To Workers, 675.
- Aides-de-camp to Governor-General, 5.
- Aitutaki, Island of, 839.
- Alcoholic Liquors, Consumption of, 281, 395.
- Alienation of Land, 486.
- Alienation of Native Lands, 497.
- Alien Immigrants, 84.
- Aliens, Naturalized, 86.
- Aliens, Registration of, 87.
- Allocation of Public Debt and of Increase, 759.
- Alluvial-gold Mining, 582.
- "Amokura" Training-ship, 262.
- Anglican Church, 11, 94.
- Angora Goats, 564.
- Animals, Domestic, 527-565.
- Antipodes Islands, 838.
- Anti-treating Regulations, 298.
- Apiculture, 565.
- Appeal Board, Public Service, 53.
- Appeal Court, 264.
- Appendicitis Cases in Hospitals, 197.
- Applicants for Crown Land, 483.
- Arbitration Court, 664.
- Area of New Zealand, 1.
- Area under Cultivation, 515.
- Armistice, 256.
- Arrested Persons convicted, 272.
- Arrivals, 79.
- Race Aliens, 84.
- Articles on Special Subjects—
- In Previous Issues, 951.
- Maori Place-names, 936-946.
- Wages and Working-hours, (189 1919), 860-935.
- Assembly, General, 6.
- Asses and Mules, 562.
- Assessment of Land and Income Tax, 749.
- Assets of Banks, 708.
- Assisted Immigrants. 83.
- Assurance, Life, 715.
- Asylums, 215-221.
- Atiu, Island of, 839.
- Atmospheric Pressure, 71.
- Auckland Fish-market. 575.
- Auckland Islands, 838
- Audit of Expenditure. 727
- Australasia—
- Birth-rates of, 123.
- Death-rates of, 150.
- Standardized, 153.
- Debt of, 770.
- Deposits in Banks of Issue in, 708.
- Friendly Societies in, 825.
- Gold-production of, 583.
- Illegitimacy Rates of, 131.
- Index of Mortality of, 152.
- Infantile-mortality Rates, 163.
- Live-stock in, 541.
- Marriage-rates of, 137.
- Mineral Production of, 581.
- Oat Crop of, 521.
- Potato Crop of, 522.
- Railway Revenue of, 469.
- Railway Rolling-stock in, 465.
- Savings-banks Deposits in, 714.
- Sheep in, 553.
- Sown Grasses in, 526.
- Standardized Death-rates, 153.
- Wheat Crop of, 520.
- Automatic Telephones, 480.
B.
- Bacon-curing Works, 645.
- Balance of Trade, 333.
- Balances of Accounts, 743.
- Ballot, Military Service, 257.
- Banking, 705-714.
- Bank-notes, Issue of, 710.
- Tax on, 744.
- Bank of New Zealand Account, 741.
- Bankruptcy, 265.
- Banks of Issue, 705.
- Banks, Savings—
- Post Office, 710.
- Private, 713.
- Baptist Union, 13.
- Barley, 521.
- Barometer-readings, 71.
- Baronets, New Zealand, 14.
- Battle-cruiser "New Zealand," 261.
- Beans and Peas, 522.
- Export of, 366, 522.
- Bee-farming, 565.
- Beef consumed and exported, 558.
- Beer, Consumption of, 281, 395.
- Beer Duty, 439, 781.
- Bertillon Classification of Causes of Death, 166, 188.
- Best, Elsdon, Article by, 936-947.
- Bibliography, 949.
- Birthplaces, 88.
- Of Persons arrested and convicted, 273, 278.
- Of Prisoners, 285.
- Births, 115-133.
- Illegitimate, 128, 130.
- Notification of, 115, 165.
- Plural, 125.
- Premature, 199.
- Sexes of, 124.
- Still, 132.
- Biscuit-factories, 647.
- Blind, Jubilee Institute for, 247.
- Blind, Number who are, 99.
- Board of Trade, 808.
- Report on Coal Industry, 606-617.
- Boarding of School-children, 227.
- Boatbuilding Industry, 659.
- Boats, Fishing, licensed, 576.
- Boiling-down Works, 644.
- Bones, Diseases of the, treated in Hospitals, 200.
- Bookbinding Establishments, 656.
- Boot and Shoe Factories, 661.
- Boroughs—
- Finances of, 304.
- Population of, 108.
- Value of Land and Improvements, 322-326.
- Boundaries and Area of Dominion, 1.
- Bounty Islands, 838.
- Brass-foundries, 656.
- Bread, Regulations re Sale of, 208.
- Breeding-ewes, 543.
- Breweries, 648.
- Brick, Tile, and Pottery Works, 655.
- Brides and Grooms—
- Ages of, 139.
- Condition of, 137.
- Mark Signatures of, 142.
- Bronchitis Cases in Hospitals, 196.
- Broncho-pneumonia Cases in Hospitals, 196.
- Building Societies, 822.
- Building-stones, 594.
- Bullion, Movement of, 335.
- Bursaries, 240, 250.
- Homo Science, 251.
- Butter—
- Export of, 340-383.
- Factories, 559, 645.
- Production and Consumption of, 560.
- Requisition of, 450.
- Wholesale Prices, 807.
- By-elections, 292.
C.
- Cabinet, Members of, 5.
- Cable, Pacific, 481.
- Cadets, Senior, 260.
- Campbell Island, 838.
- Canadian Trade Commissioner, 10.
- Cancellation of License, 299.
- Cancer, 174, 191.
- Candle-works, 650.
- Canterbury Agricultural College, 252.
- Capital in the Coal Industry, 609.
- Capital of Banks of Issue, 705.
- Capital of Registered Companies, 631.
- Capital Value of Land, 315.
- Cash Lands, 485.
- Cassiterite, 588.
- Casualties in the War, 257.
- Catholic (Roman) Church, 12, 94.
- Cattle, 527-540, 555-559.
- Slaughtered for Food, 558.
- Causes of Death, 166-178.
- Causes of Insanity, 217.
- Cement-works, 655.
- Census (see Population section).
- Cereals, 516.
- Certificates of Marine Officers, 461.
- Certificates of Title issued, 501.
- Certificates, Secondary School, 240.
- Character of Organization of Manufactories and Works, 630.
- Character of Stock, 763.
- Charges before Magistrates, 270.
- Charitable Aid, 209.
- Charitable Institutions, 212.
- Chatham Islands, 837.
- Cheese—
- Exported, 340-383, 559.
- Factories, 559, 645.
- Produced and consumed, 560.
- Requisitioned, 449.
- Wholesale Prices, 807.
- Cheviot Estate Account, 737.
- Chief Centres (see under Cities).
- Childbirth, Deaths in, 177.
- Childbirth: Hospital Cases, 199.
- Children born, Sexes of, 124.
- Children, Deaths of, 161.
- Children to a Marriage, 127, 141.
- Children's Homes, 215.
- Children's Welfare, 244.
- Chinese in New Zealand, 85.
- Church of Christ, 13.
- Church of England, 11, 94.
- Cinnabar, 587.
- Circulatory System, Diseases of the, treated in Hospitals, 196.
- Cities—
- Births and Birth-rates, 121.
- Deaths and Death-rates, 155.
- Infantile Mortality, 156.
- Population, 109.
- Civil Law Cases, 263.
- Civil Marriages, 143.
- Class-books, School, 228.
- Classification of Lands, 483.
- Classification, Public Service, 52.
- Climate and Meteorology, 64-74.
- Clinkard, G. W., Special Article by, 860-935.
- Clothing-factories, 660.
- Clover-seeds, 366, 525.
- Coachbuilding, 657.
- Coal exported, 366.
- Coal Industry, Board of Trade's Report on, 606-617.
- Coal, Retail Prices of, 797.
- Coal-miners' Relief Fund, 601.
- Coal-mines Account, 735.
- Coal-mining, 590.
- Accidents, 591, 596.
- Coastwise Shipping, 459.
- Cocksfoot, 506.
- Coin-in-slot Telephones, 480.
- Cold-storage Advances Account, 742
- Coleridge, Lake, Water-power, 620.
- Colleges, University, 249.
- Colonial Office, The, 9.
- Colonies, Crown Agents for, 9.
- Commerce, 329-454.
- Companies, Joint-stock, 823.
- Companies, Registered, Capital of, 631, 823.
- Compulsory Training, 260.
- Concessions to Soldier Crown Tenants, 495.
- Conciliation Councils, 664.
- Condensed Milk, Requisition of, 451.
- Confectionery-works, 647.
- Confinement Cases in Hospitals, 199.
- Confinement, Deaths in, 177.
- Congregational Union, 13.
- Conjugal Condition, 92.
- Of Parties marrying, 137.
- Consolidated Fund, 728.
- Consols Account, 741.
- Constitution and Laws of Islands annexed in 1901, 840.
- Constitution of New Zealand, 4.
- Construction of Railways, Cost of, 465.
- Consuls, Foreign, 10.
- Consumption—
- Of Alcoholic Liquors, 281, 395.
- Of Beef, 558.
- Of Butter and Cheese, 560.
- Of Food and Drink, 395.
- Of Mutton and Lamb, 552.
- Of Pork, &c., 564.
- Of Timber, 571.
- Phthisis, 171.
- Conversion Account, 738.
- Conveyance of Children to School, 227.
- Convictions—
- For Drunkenness, 278.
- In Superior Courts, 276.
- Of Juveniles, 275.
- Of Maoris, 282.
- Of Persons arrested, 272.
- Summary, 270.
- Cook and other Pacific Islands, 837-848.
- Births, 133.
- Deaths, 179.
- Exports to, 384.
- Imports from, 425.
- Marriages, 143.
- Population, 114.
- Co-operative Public Works, 669.
- Cooperages. 651.
- Copper, 587.
- Cordial-factories, 650.
- Corn Crops, Acreage and Yield of, 516.
- Correspondents, Imperial Trade, 10.
- Cost of Living, 776.
- Act, 808.
- Cost of Production of Coal, 609.
- Cost of Railway-construction, 467.
- Council, Executive, 5.
- Council, Legislative, 6.
- Counties—
- Finances of, 304.
- Live-stock in, 529.
- Population of, 106.
- Receipts from Government, 303.
- Sheep in, 529-540, 543.
- Value of Land and Improvements in, 317-321.
- Courts—
- Appeal, 264.
- Arbitration, 664.
- Bankruptcy, 265.
- Divorce, 266.
- Magistrates', 263, 270.
- Native Land, 497.
- Supreme, 264.
- Cow-testing, 556.
- Creameries, 560.
- Crime, Law and, 263-291.
- Criminal Cases, 270-291.
- Criminals, Habitual, 288.
- Crops, Principal, 516.
- Crown Agents for the Colonies, 9.
- Crown Lands, 482-495.
- Cultivation, Area in, 515.
- Customs Revenue and Tariff, 427-446.
- Customs Taxation, 427, 748.
- Cycle-works, 658.
D.
- Dairy Industry, 559, 645.
- Dairy-produce, 559.
- Export of, 340-383, 560.
- Grading of, 559.
- Retail Prices, 773, 778, 791.
- Danger Island, 839.
- Dates of Maturity of Loans, 764.
- Dates of Principal Events, 948.
- Deaf, School for the, 246.
- Deaf-and-dumb, Numbers of, 99.
- Death Duties, 752.
- Deaths, 145-179.
- In Expeditionary Force, 257.
- In Hospitals, 192.
- In Mental Hospitals, 219.
- Debentures, Public, 764.
- Debt of Local Bodies, 310.
- Debt, Public, 757-770.
- Deceased Husband's Brother, Marriage with, 134.
- Deceased Males, Occupations of, 155.
- Deceased Wife's Sister, Marriage with, 134.
- Decisions of Arbitration Court, 665.
- Decorations and Medals, 21.
- Foreign, 48.
- Decrees in Divorce, 266.
- Deeds Registration, 498.
- Defence, 254-262.
- War Expenditure, 739.
- Deferred-payment Lands, 485.
- Denominational Schools, 233.
- Density of Population, 104.
- Dentists, Registration of, 207.
- Departures, 79.
- Deposit Accounts, 736.
- Deposits in Banks, 708, 713.
- Designs, 831.
- Destination of Exports, 348, 364.
- Detention, Reformative, 288.
- Development of Banking, 706.
- Development of Mining, 596.
- Development of Tariff (Customs), 428.
- Development of Trade, 330.
- Export, 339.
- Import, 387.
- Diamond Drills, 600.
- Diarrhœa Cases in Hospitals, 197.
- Differential Tariff, 443.
- Diplomas in Public Health, 205.
- Direction of Import Trade, 398.
- Direction of Oversea Shipping, 458.
- Discharged Soldiers Settlement, 490.
- Account, 742.
- Discharges from Hospitals, 185, 192.
- Discharges from Mental Hospitals, 219.
- Diseases, Notification of Infectious, 180.
- Diseases, Principal, Deaths from, 167.
- Diseases treated in Public Hospitals, 187.
- Dislocations treated in Hospitals, 202.
- Dissolution of Marriages, 266.
- Distribution of—
- Coal, Cost of, 612.
- Population, 105.
- Wealth, 823.
- District High Schools, 248.
- Dividend Duty, 755.
- Divorce, 266.
- Domestic Produce exported, 340-383.
- Dominion Rifle Association, 260.
- Drainage Boards, Finances of, 304.
- Dredging, Gold, 582.
- Drills, Prospecting, 600.
- Drowning, Deaths by, 178, 291.
- Drugs, Sale of, 207.
- Drunkenness, 277.
- Ducks, 565.
- Dumb, Number who are, 99.
- Dunedin Medical School, 214, 240.
- Duntroon Military College, 258.
- Duration of Marriage and Number of Issue, 126.
- Dutiable Imports, 439.
- Duties, Customs and Excise, 427-446.
- Duties, Death, 752.
- Dwellings—
- Numbers, &c. (Census), 101.
- Soldiers, 492.
- Workers, 678
- Account, 740.
E.
- Early Trade, 329.
- Earnings of Mine Workers, 615.
- Ears, Diseases of the, treated in Hospitals, 195.
- Ecclesiastical, 11.
- Education, 222-253.
- Education Boards, Receipts and Expenditure of, 232.
- Education in Islands annexed in 1901, 841.
- Educational Association, Workers', 251.
- Educational Endowments, 484.
- Effect of Prices on Exports, 368-383.
- Egg-production, 565.
- Electoral, 292-295.
- Electric—
- Current, 620, 654.
- Telegraph, 479.
- Tramways, 654.
- Elsdon Best, Article by, 936-947.
- Emigration, 78.
- Employees in Factories. 633.
- Employees, Postal, 474.
- Employees, Railway, 470.
- Employers and Employed (Census), 97.
- Employment Branches of Labour Department, 671.
- Employment of Discharged Soldiers, 812.
- Endowments, Educational, 484.
- Endowments, National, 484.
- Account, 740.
- Engineering, School of, 242.
- Engineering-works, 656.
- Enteritis Cases in Hospitals, 197.
- Entrepôt Trade, 337, 367.
- Epidemic General Diseases, 188.
- Epidemic of Influenza, 167-171.
- Equalization (Butter) Funds. 450.
- Estate Duty, 752.
- Estates acquired for Settlement, 488.
- Estates passed for Probate, 827.
- Estimated Population, 75.
- Events, Dates of, 948.
- Ewes, Breeding, 543.
- Examinations, Annual Education, 252.
- Examiners under Coal - mines and Mining Acts, Boards of, 601.
- Excess-profits Taxation, 747.
- Excise Duties, 439.
- Taxation by means of, 748.
- Executive Council, 5.
- Expectation of Life, 148.
- Expeditionary Forces, 254.
- Acquisition of Land by Members, 490.
- Expenditure of Public Debt. 759.
- Expenditure, Revenue and, 727-743.
- Exports, 339-386.
- By Classes, 345.
- External Migration, 78.
- Extinction of Public Debt, 768.
- Eyes, Diseases of the, treated in Hospitals, 195.
F.
- Factories, 624-663, 666.
- Accidents in, 667.
- Farmers, Tree-planting by, 569.
- Farming, 514-565.
- Fathers, Ages of, 126.
- Fauna, 4.
- Feeble-minded—
- Number of, 101.
- School for, 247.
- Fellmongeries, 658.
- Female Genital Organs, Diseases of: Hospital Cases, 198.
- Fertility of Marriages, 141.
- Fibre, Phormium, 340-383, 523.
- Fifty Years' Progress, 849-859.
- Finance, Public, 727-770.
- Financial Assistance to Soldiers, 492, 815.
- Financial Concessions to Soldier Crown Tenants. 495.
- Fire Inquests, 291.
- Fire Insurance, 723.
- State, 724.
- First Offenders' Probation, 288.
- Fish Curing and Preserving Works, 645.
- Fish exported, 579.
- Fisheries, 572-579.
- Fish-hatcheries, 572.
- Fishing-boats licensed, 576.
- Fish-markets, Municipal, 575.
- Flax (Phormium Tenax), 523.
- Exports, 340-383.
- Mills, 662.
- Floating Debt, 764.
- Flora, 4.
- Flotation of Loans, 764.
- Flour: Prices fixed, 808.
- Flour: Wholesale Prices, 779.
- Flour-mills, 646.
- Food and Drink: Import and Consumption, 395.
- Food and Drugs, Sale of, 207.
- Food Groups and Rent: Index Numbers, 780. 786, 793, 798.
- Footwear Regulation Act, 669.
- Foreign Consuls, 10.
- Foreign Insurance Companies, 725.
- Foreigners naturalized, 86.
- Forest Products exported, 346.
- Forestry, 566—571.
- Forests Account, State, 567, 736.
- Foundation Scholarships, 239.
- Foundries, 656.
- Foveaux Straits Oysters, 572.
- Fowls, 565.
- Fractures: Hospital Cases, 202.
- Free and Dutiable Imports, 439.
- Freehold Tenure, 486.
- Free Secondary Education, 237.
- Free University Education, 250.
- Freezing-works, 644.
- Friendly Societies, 823.
- Frozen Meat exported, 340-383.
- Frozen Meat requisitioned, 447.
- Fruit Industry, The, 523.
- Fruit - preserving and Jam - making, 648.
- Fruit-preserving Industry Advances Account, 742.
- Fuel and Light: Retail Prices, 796.
- Furniture-factories, 660.
- Future Settlement, Land for, 487.
G.
- Gaming and Lotteries, 291.
- Gaols, Prisoners in, 283-290.
- Gardens and Plantations, Acreage in, 523.
- Gasworks, 653.
- Gauge, Railway, 464.
- Geese, 565.
- General Assembly, The, 6.
- Genital Organs, Diseases of the, treated in Hospitals, 198.
- Geological Survey, History of, 603-605.
- Geology of New Zealand, 1.
- German Samoa, Exports to, 385.
- Gift Duty, 753.
- Glaxo, Requisition of, 451.
- Goats, 527-540, 563.
- Gold, Export Duty on, 428.
- Gold exported, 340-383.
- Goldfields, Subsidized Roads on, 599.
- Gold-mining, 581.
- Goods carried on Railways, 465.
- Government Insurance Offices, 718.
- Government Schools, Attendance at, 227.
- Government Valuation of Land, &c., 314-328.
- Governor-General, 4.
- Grading of Dairy-produce, 559.
- Graduated Land-tax, 750.
- Grain Crops, 516.
- Grain mills, 646.
- Grapes, 515, 525.
- Grass Lands, Acreage of, 525.
- Grass-seed, 366, 525.
- Gratuity, War-service, 819-822.
- Grazing-runs, Small, 484-486.
- Greasy Wool exported, 554.
- Greenstone, 594.
- Groceries: Index Numbers, 777, 787.
- Groceries: Prices fixed, 809.
- Gross Indebtedness, 758.
- Grounds for Divorce, 266.
- Growth of Population, 75.
- Growth of Trade, 330.
H.
- Habitual Criminals, 289.
- Habitual Drunkards, 280.
- Half-castes, 113.
- Ham- and Bacon-curing Works, 645.
- Hands employed in Factories, 633.
- Harbour Boards, Finances of, 304.
- Harness-works, 658.
- Hauraki Plains Settlement Account, 739.
- Health, Public, 203-209.
- Heart-disease Cases in Hospitals, 196.
- Hebrew Church, 13.
- Hernia: Hospital Cases, 197.
- Hervey Islands, 839.
- Hides exported, 340-383.
- Requisition of, 453.
- High Commissioners, Successive, 8.
- High Schools, 236.
- District, 248.
- Technical, 243.
- Hindu Immigrants, 84.
- History, 4.
- H.M.S. "New Zealand," 261.
- H.M.S. "Philomel," 261.
- Holdings, Occupied, 506.
- Home Produce exported, 340-383.
- Value affected by Prices, 368-383.
- Home-science Bursaries, 251.
- Homes, Children's, 215.
- Honey, 565.
- "Honourable," Holders of Title of, 14.
- Honours held, 14.
- Hops, 522.
- Horses, 527-541, 561-563.
- Hosiery-factories, 661.
- Hospitals, 185-202, 209-215.
- Maternity, 213.
- Mental, 215-221.
- Private, 213.
- Private Mental, 220.
- Public, 185-202, 209-212.
- St. Helens, 213.
- Hours of Employment, (1897-1919), 860-935.
- House of Representatives, Members of, 7.
- House-rent, 102, 775, 780, 794.
- Houses: Numbers, &c., 101.
- Housing Act (1919), 678.
- Housing-conditions of Miners, 615.
- Hydro-electric Power, 618-623.
I.
- Illegitimate Births, 128, 130.
- Immigration, 78.
- Assisted, 83.
- Restriction, 83.
- Imperial Government Supplies, 447-454, 807.
- Imperial Trade Correspondents, 10.
- Implement (Agricultural) Factories, 657.
- Imports, 338, 387-426.
- According to Rate of Duty, 441.
- By Classes, 397.
- Free and Dutiable, 439.
- Improvement of Land selected, 484.
- Income-tax, 744, 749.
- Payers, 751.
- Increase in Food-prices during War, 786.
- Increase in Public Debt, 758.
- Increase of Population, 75, 118.
- Indebtedness of Local Bodies, 310.
- Indebtedness, Public, 757-770.
- Index Numbers, Cost of Living, 785.
- Index Numbers of Export Values, 370.
- Index of Mortality, 152.
- Industrial, 664-671.
- Industrial Conciliation and Arbitration, 664.
- Industrial Disputes dealt with, 664, 667.
- Industrial Life Assurance, 716.
- Industrial Manufacture, 624.
- Industrial Schools, 244.
- Industrial Unions registered, 665.
- Industries, 624-663.
- Inebriates, 277.
- Infancy, Diseases of, 165, 201.
- Infantile Mortality, 161.
- Infant-life Protection, 115, 165, 246.
- Infectious Diseases, Notification of, 180.
- Infectious Diseases, Prevention of, 203.
- Infirmities, 99.
- Influenza Epidemic, 167-171.
- Influenza: Hospital Cases, 189.
- Inland Fisheries, 574.
- Inmates of Gaols, 283-290.
- Inmates of Hospitals, 185.
- Inmates of Mental Hospitals, 215.
- Inquests, 291.
- Insanity, 215-221.
- Inscribed Stock, 764.
- Insolvency, 265.
- Inspection, Medical, of School-children, 227.
- Inspection of Machinery, 834.
- Institute for the Blind, 247.
- Instruction, Public, 224.
- Insurance, 715-726.
- Interest on Debt of Local Bodies, 312.
- Interest on Public Debt, 765.
- Inter-urban Telephones, 479.
- Intervals between Births, 128.
- Intestinal Obstruction: Hospital Cases, 197.
- Investment Societies, 822.
- Iron and Brass Foundries, 656.
- Ironsands and Ores, 584.
- Islands, Adjacent, Population of, 112.
- Islands, Outlying, 837-848.
- Issue born to Marriage, 127-141.
- Issue of Bank-notes, 710.
- Issue of Deceased Males, 157.
- Under 14 Years of Age, 159.
- Under 16 Years of Age, 159.
- Under 21 Years of Age, 160.
J.
- Jam-making Works, 648.
- Joint-stock Companies. 823.
- Journal, School, 229.
- Jubilee Institute for the Blind, 247.
- Judges, Supreme Court, entitled "Honourable," 15.
- Judicial Separation, 266.
- Juvenile Offenders, 274.
K.
- Kauri-gum, 593.
- Exported, 340-383.
- Industry Account, 742.
- Kermadec Islands, 837.
- Knights, New Zealand, 15.
L.
- Labour Department: Employment Branches, 671.
- Lake Coleridge Works, 620.
- Lakes, 3.
- Lamb, Consumption and Export of, 552.
- Land and Income Tax, 744, 749.
- Land Boards, 482.
- Maori, 497.
- Land Districts, 482.
- Land Drainage Boards, Finances of, 304.
- Land for Settlements, 488.
- Account, 737.
- Land, Government Valuation of, 314-328.
- Land: Islands annexed in 1901, 842.
- Land Laws Amendment Acts, 488.
- Land, Occupation and Ownership of, 506-513.
- Land Offices, 482.
- Land Purchase Commissioners, 488.
- Land-settlement Finance Associations, 490.
- Land-tax, 744, 749.
- Land Tenure and Settlement, 482-513.
- Land Transfer and Deeds Registration, 498-505.
- Land, Valuation of, 314-328.
- Law and Crime, 263-291.
- Lease, Renewable, 485.
- Legislation of 1918 Session, 53-63.
- Legislative Council, Members of, 6.
- Legitimate Births, 127.
- Legitimation Act, 131.
- Letters posted, 476.
- Liabilities of Banks, 707.
- Libraries, School, 228.
- Licensed Houses, 296.
- Licenses and Local Option, 296-301.
- Licenses, Fishing-boat, 576.
- Licenses, Publicans', 296.
- Licensing Laws, 298.
- Breaches of, 297.
- Licensing Poll, Results of, 300.
- Life Assurance, 715.
- State, 718.
- Life, Expectation of, 148.
- Light, Fuel and: Index Numbers, 796.
- Lighthouses, 462.
- Lime and Cement Works, 655.
- Lincoln Agricultural College, 252.
- Liquor Trade, War Regulations affecting, 298.
- Liver, Diseases of the, treated in Hospitals, 197.
- Liverpool, Earl of, 4.
- Live-stock, 527-565.
- Living, Cost of, 776-784.
- Loan Expenditure of Boroughs, 309.
- Loans, Allocation of, 759.
- Loans, Dates of Maturity of, 764.
- Loans, Flotation of, 764.
- Loans of Local Bodies, 310.
- Local Bodies, 302-313.
- Account, 736.
- Advances to, 676.
- Superannuation, 701.
- Taxation by, 755.
- Local Option. 296-301.
- Local Taxation, 755.
- Location of Industries, 625.
- Lodges, 823.
- Lotteries, Gaming and, 291.
- Lower Departments of Secondary Schools, 242.
- Lunacy, 101, 215-221.
M.
- Machinery Inspection, 834.
- Magistrates' Courts—
- Civil Cases, 263.
- Criminal Cases, 270.
- Mail-services, 477.
- Main Body, Expeditionary Force, 254.
- Main Groups of Imports, 390.
- Main Items of Export, 340.
- Maize, 521.
- Male and Female Death-rates, 145
- Malformations: Hospital Cases, 201.
- Malthouses, 649.
- Manahiki Island, 839.
- Mangaia Island, 838.
- Manganese-ore, 587.
- Mangolds, 523.
- Mangrove Oysters, 573.
- Manual Education, 228.
- Manufactories and Works, 624-663.
- Maori Councils, 496.
- Maori Land Boards, 496.
- Maori Lands, 496.
- Maoris, 113.
- Births of, 133.
- Law re Registration, 115.
- Children attending Schools, 235.
- Crime amongst, 282.
- Deaths of, 179.
- Hall-castes, 113.
- In Mental Hospitals, 218.
- Marriages of, 142.
- Place-names, 936-947.
- Population, 113.
- Schools for, 235.
- Topographical Nomenclature of, 936-947.
- Wars with, 105.
- Maori-war Pensions, 684.
- Marine Fish-hatchery, 572.
- Marine Officers' Certificates, 461.
- Mark Signatures of Persons married, 142.
- Market Gardens, 523.
- Marriages, 119, 127, 134-144.
- Dissolution of, 266.
- Materials of which Houses constructed, 103.
- Maternity Allowances, 702.
- Maternity Hospitals, 213.
- Maturity of Loans, Dates of, 764.
- Mauke Island, 839.
- Meat—
- Export of, 340-383.
- Freezing and Preserving Works, 644.
- Requisition of, 447.
- Retail Prices, 774, 779. 792.
- Fixed, 808.
- Medals and Decorations, 21.
- Foreign, 48.
- Medical Inspection of School-children, 227.
- Medical Practitioners, Registration of, 206.
- Medicine, School of, Dunedin, 214, 249.
- Members of House of Representatives, 7.
- Members of Legislative Council, 6.
- Memorabilia, 948.
- Mental Defectives, 215.
- Mental Hospitals, 215-221.
- Mercantile Marine, Training of Boys for, 262.
- Mercury-mines, 587.
- Metal Mines, Accidents at, 596.
- Meteorology, 64-74.
- Methodist Church, 12, 94.
- Metropolitan and Suburban Areas (see also Cities)—
- Population, 109.
- Midwives, Registration of, 215.
- Migration, External, 78.
- Military Forces, 254-262.
- Military Pensions, 684.
- Military Service Act, 257.
- Milking-machines, 556.
- Milk-testing, 556.
- Mills, Wool used at, 554.
- Minerals, 340.
- Export of, 580.
- Miners' Pensions, 602, 685.
- Mines and Minerals, 580-617.
- Mining, 580-617.
- Produce exported, 340-383.
- Water-power used for, 623.
- Mining Act, Board of Examiners under, 601.
- Mining Advances, 596.
- Account, 741.
- Mining Districts Land Occupation Leases, 485.
- Ministers of each Denomination, 144.
- Marriages by, 143.
- Minors, Marriages of, 141.
- Mitiaro Island, 839.
- Money-orders issued and paid, 478.
- Money, Purchasing-power of, 783.
- Morbidity, 180-202.
- Mortality, Index of, 152.
- Mortality, Infantile, 161.
- Mortality Investigation, 148.
- Mortgages, 501.
- Mothers, Ages of, 126.
- In Illegitimate Cases, 128.
- Motive-power in Factories, 635.
- Motor and Cycle Works, 658.
- Movement in Retail Prices, 787.
- Movement of Specie and Bullion, 335.
- Mules, 562.
- Municipal Fish-markets, 575.
- Mutton consumed and exported, 552.
- Mutton, Export Prices of, 807.
N.
- Names (Maori), Meanings of, 936-947.
- Nassau Island, 840.
- National Endowment Account, 740.
- National Endowments, 484.
- National Ministry, 5.
- National Provident Fund, 702.
- National Scholarships, 239.
- Nationalities, 88.
- Nationality of Vessels, 457.
- Native Grasses, 525.
- Native Land Act (1909), 496.
- Marriages under Section 191 (1) (b ), 143.
- Native Land Court, 496.
- Native Land Purchase Board, 497.
- Native Land Settlement Account, 738.
- Native Lands, 496, 497.
- Native Schools, 235.
- Natural Increase of Population, 78, 118.
- Naturalization, 86.
- Nature of Dwellings, 102.
- Nauru Island, 846.
- Naval Defence, 260.
- Navigator Islands, 844.
- Nephrite, 594.
- Nervous System. Diseases of, treated in Hospitals, 194.
- Net Indebtedness, 758.
- Newspapers—
- Posted, 476.
- Registered, 478.
- New-Zealand-born, 88.
- Crime amongst, 273.
- Drunkenness amongst, 278.
- Prisoners, 287.
- "New Zealand," H.M.S., 261.
- New Zealand Produce exported, 340-383.
- New Zealand University, 249.
- Nisi Decrees in Divorce, 266.
- Niue, Island of (vide Cook Islands).
- Nomenclature, Maori, 936-947.
- Note-issue of Banks, 710.
- Tax on, 744.
- Notification of Births, 115, 165.
- Notification of Infectious Diseases, 180.
- Nullity of Marriage, 266.
- Nurseries, 523.
- State, 568.
- Nurses, Registration of, 215.
O.
- Oats, 520.
- Exported, 365, 521.
- Obstruction, Intestinal: Hospital Cases, 197.
- Occupancy of Dwellings, Nature of, 102.
- Occupants to a Dwelling, 104.
- Occupation, Area of Land in, 507, 515.
- Occupation of Land, 484, 506.
- Occupation with Right of Purchase, 483, 485.
- Occupations—
- Of Bankrupts, 266.
- Of Deceased Males, 155.
- Of the People, 96.
- Ocean Cables, 481.
- Offences by Juveniles, 274.
- Offences of Convicted Persons, 273.
- Offences of Prisoners, 285.
- Office, Colonial, 9.
- Officers, Training of, 257.
- Official Assignees, 265.
- Official Section, 1-53.
- Officiating Ministers, 144.
- Oil, 593.
- Oilskin-making Works, 659.
- Old Age, Deaths from, in Hospitals, 201.
- Old-age Pensions, 679.
- Opening up Crown Lands for Settlement Account, 737.
- Optional System of selecting Land, 483, 485.
- Orchards, 523.
- Orders of Knighthood, 15.
- Foreign, 48.
- Organic Heart-disease: Hospital Cases, 196.
- Ornamental Stones, 594.
- Orphanages, 215.
- Orphanhood, 157.
- Otekaike Special School, 244.
- Outlying Islands, 837-848.
- Oversea Shipping, 456.
- Overseas Forces, 254.
- Ownership of Land, 506.
- Oyster-picking, 572.
P.
- Pacific Cable, 481.
- Pacific Islands annexed in 1901, 839.
- Packet Licenses, 296.
- Palmerston Island, 839.
- Parapara Iron-ore Deposit, 584.
- Parcel-post, 477.
- Parents, Ages of, 126.
- Parliament, Members of, 7.
- Parry Island (Mauke). 839.
- Passengers, Railway, 465.
- Passports, 80.
- Pastoral Licenses in Mining Districts, 484, 485.
- Pastoral Produce exported, 340.
- Pastoral Runs, 484, 486.
- Pasture Grasses 525.
- Patents, Designs, and Trade-marks, 831.
- Patients in Mental Hospitals, 215.
- Patients in Public Hospitals, 185.
- Peas and Beans, 522.
- Export of, 365, 522.
- Pelts, Export of, 340-383.
- Penrhyn Island, 839.
- Pensions, 679-694.
- Military (Maori War), 684.
- Miners', 685.
- Old-age, 679.
- Police, 693.
- South African War, 693.
- War, 685.
- Widows', 683.
- Permanent Military Forces, 257.
- Permission to enter New Zealand, 82.
- Permits and Passports, 80.
- Petroleum, 593.
- "Philomel," H.M.S., 261.
- Phormium Tenax, 523.
- Fibre exported, 340-383, 523.
- Phosphate Rock, 594.
- Phthisis, 171, 177, 190.
- Miner's, 602.
- Physical Instruction of School-children, 227.
- Pickle-making, 650.
- Pig-iron Manufacture, 585.
- Pigs, 527-541, 563.
- Place-names, Maori, 936-947.
- Plantations, 523.
- State, 568.
- Platinum, 588.
- Pleasant Island, 846.
- Plumbers Registration Act, 209.
- Plural Births, 125.
- Ages of Parents, 126.
- Pneumonia Cases in Hospitals, 196.
- Pneumonic Influenza, 167.
- Police, 268.
- Pensions, 693.
- Policies, Life-assurance, 716.
- Poll, Licensing, Results of, 300.
- Population, 75-114.
- Pork consumed, 564.
- Portobello Marine Fish-hatchery, 572.
- Ports—
- Exports, 383.
- Imports, 394.
- Shipping, 458-461.
- Postal and Telegraphic, 472-481.
- Postal Notes, 478.
- Post Office Savings-bank, 710.
- Postponement of Rent of Crown Tenants, 484.
- Potatoes, 366, 522.
- Pottery-works, 655.
- Poultry-farming, 565.
- Pounamu, 594.
- Power in Factories, 635.
- Power, Water, 618-623.
- Preferential Tariff, 443.
- Premature Births, 199.
- Presbyterian Church, 11, 94.
- Preservation of Scenery Account, 736.
- Prevention of Quackery Act, 208.
- Previous Issue of Parents, 127.
- Prices, 771.
- Effect on Exports, 368-383.
- (Export) of Mutton, 807.
- Of Coal, 614, 797.
- Of Fish, 573, 576.
- Of Stock, 760.
- Retail, 771.
- Wholesale, 802.
- Primage Duty, 430.
- Primary Schools, 226.
- Principal Countries of Import, 399.
- Principal Exports, 346, 355.
- Principal Events, Dates of, 948.
- Principal Imports, 357, 406.
- Printing and Bookbinding Establishments, 656.
- Prisoners, 283-290.
- New-Zealand-born, 287.
- Tree-planting by, 289.
- Prisons, 283-290.
- Prisons Board, 289.
- Private Hospitals, 213, 220.
- Private Railways, 471.
- Private Savings-banks, 713.
- Private Scholarships, 240.
- Private Schools, 233.
- Private Wealth, 823.
- Privy Councillors, 14.
- Probate, Estates passed for, 827.
- Probation Act, First Offenders'. 288.
- Production of Coal, Cost of, 609.
- Profits, Excess, Taxation on, 747.
- Profits in the Coal Industry, 614.
- Progress, Fifty Years', 849-859.
- Property and Plant of Factories, 632.
- Prospecting-drills, 600.
- Prospecting-fields, 597.
- Protection of Infant Life, 115, 165, 246.
- Provident Fund, National, 762.
- Provincial Districts—
- Industries in, 625.
- Population, 106.
- Public Debt, 757-770.
- Extinction Fund, 768.
- Public Finance, 727-770.
- Public Health, 203-209.
- Diplomas in, 205.
- Public Hospitals—
- Admissions and Discharges, 185.
- Ages of Patients, 187.
- Diseases treated in, 187.
- Finances, 209.
- Public Instruction, 224.
- Public Reserves, 484.
- Public Service, 51.
- Appeal Board, 53.
- Classification, 52.
- Examinations, 252.
- Superannuation, 694.
- Public Schools, 226.
- Public Trust Office, 817.
- Public Works Co-operative System, 669.
- Public Works Fund, 733.
- Publicans' Licenses, 296.
- Puerperal Accidents and Diseases, 177, 199.
- Pukapuka Island, 839.
- Pulmonary Tuberculosis, 172.
- Punishments by Courts, 277.
- Pupils at Public Schools, 227.
- Purchase of Estates by Government, 488.
- Purchase of Native Lands, 497.
- Purchase of Products by Imperial Government, 447, 807.
- Purchasing-power of Money, 783.
Q.
- Quackery Prevention Act, 208.
- Quarantine, 205.
- Quarries (Stone), 595.
- Quartz-mining, 581.
- Quicksilver-mining, 587.
- Quinnat Salmon, 574.
- Quotations, New Zealand Stock, 769.
R.
- Rabbits, Requisition of, 451.
- Race Aliens, 84.
- Racing, Tax on, 754.
- Radio-telegraph, 480.
- Railway Districts, Finances of, 304.
- Railways, 464-471.
- Private, 471.
- Superannuation Fund, 699.
- Rainfall, 64.
- Rakaanga Island, 839.
- Rangitaiki Land Drainage Account, 741.
- Rarotonga Island, 838.
- Rateable Value of Land, 314-328.
- Rates collected by Local Bodies, 304.
- Rebate of Rent to Crown Tenants, 484.
- Reciprocity, 428.
- With South Africa, 439.
- Re-exports, 337, 367.
- Reformative Detention, 288.
- Registered Companies, Capital of, 631.
- Registered Factories, 666.
- Registered Vessels, 455.
- Registrars, Marriages before, 143.
- Registration—
- Of Adopted Children, 116.
- Of Aliens, 87.
- Of Births, 115.
- Of Dairy Companies, 559.
- Of Deaths, 145.
- Of Deeds, 498.
- Of Dentists, 207.
- Of Factories, 666.
- Of Industrial Unions, 665.
- Of Marriages. 134.
- Of Medical Practitioners, 206.
- Of Newspapers, 478.
- Of Nurses and Midwives, 215.
- Of Plumbers, 209.
- Of Vessels, 455.
- Under Defence Act, 260.
- Regulations, War, 298.
- Reinforcements, 254.
- Relief Fund, Coal-miners', 601.
- Religious Denominations, 11, 93.
- Marriages by Ministers of, 143.
- Ministers on Marriage List, 143.
- Renewable Leases, 485.
- Rent, Restrictions on, 669, 678.
- Rents, House, 102, 775, 780, 794.
- Rents, Rebate of, for Crown Tenants, 484.
- Repatriation of Soldiers, 811-816.
- Representation, 292.
- Representatives, Members of House of, 7.
- Requisitions for War Purposes—
- Butter, 450.
- Cheese, 449.
- Condensed Milk, 451.
- "Glaxo," 451.
- Meat, 447.
- Rabbits, 451.
- Scheelite, 451.
- Skins and Hides, 453.
- Wool, 452.
- Reserve Fund Account, 741.
- Reserve Funds of Banks, 705.
- Reserves administered by Land Boards, 484.
- Residence of Crown Tenants, 484.
- Respiratory Diseases: Cases in Hospitals, 196.
- Restriction, Immigration, 83.
- Restrictions on Rant, 669, 678.
- Restrictions on Sale of Liquor, 299.
- Retail-price Movements, 787.
- Retail Prices, 771.
- Retired Judges of Supreme Court, 15.
- Revenue and Expenditure, 727-743.
- Cook Islands, 843.
- Revenue, Customs, 427-446.
- Revenue, Public, 727-743.
- Revenue, Railway, 467.
- Rifle Association, 260.
- Rifle Clubs, 260.
- River Boards, Finances of, 304.
- Rivers, 2.
- Road Boards, Finances of, 304.
- Roads, Expenditure on, 735.
- Roads on Goldfields, Subsidized, 599.
- Rock Oysters, 572.
- Roll of M.L.C.s, 6.
- Roll of M.P.s, 7.
- Rolling-stock, Railways, 465.
- Roman Catholic Church, 12, 94.
- Roman Catholic Schools, 233.
- Rooms to a Dwelling, 103.
- Root Crops, 522.
- Rope and Twine Works, 663.
- Runs. Pastoral, 484, 486.
- Runs, Small Grazing, 484, 486.
- Rural Population, 106.
- Rye-grass, 525.
S.
- Saddlery and Harness Works, 658.
- Sail-, Tent-, and Oilskin-making Works, 659.
- St. Helens Hospitals, 214.
- Sale of Food and Drugs, 207.
- Sale of Liquor Restriction, 299.
- Salmon, Acclimatization of, 574.
- Salvation Army, 14.
- Maternity Homes, 214.
- Samoa (German), 844.
- Exports to, 385.
- Sanatoria, 191.
- Sanitation, 203.
- San Pablo Island, 839.
- Sash and Door Factories, 651.
- Sauce, Pickle, and Vinegar Making, 650.
- Savage or Niue Island (vide Cook Islands).
- Savings-banks, 710-714.
- Sawmills, 651.
- Scaffolding Inspection Act, 668.
- Scenery Preservation Account, 736.
- Scheelite, 586.
- Requisition for War Purposes, 451, 587.
- Scholars, 225.
- Scholarships, 239.
- School Journal, 229.
- School Libraries and Class-books, 228.
- Schools, 222-253.
- Of Mines, 242, 601.
- Scoured Wool exported, 554.
- Seals, 574.
- Secondary Education, 236.
- Free, 237.
- Technical, 242.
- Seeds, Grass and Clover, exported, 366.
- Selections of Land, 485.
- Senility, Deaths from, 201.
- Senior Cadets, 260.
- Sentences of Criminals, 277.
- Settlement Conditions, Selections under, 485.
- Settlements, Land for, 488.
- Account, 737.
- Settlers, Advances to, 672.
- Sexes—
- Of Children born, 124.
- Of Issue of Deceased Males, 157.
- Of Persons dying, 147.
- Of Public-school Children, 227.
- Proportions, 92.
- Sheep, 527-555.
- Sheep-skins and Pelts exported, 340-383.
- Requisition of, 453.
- Ship- and Boat-building Industry, 659.
- Shipping, 455-463.
- Shoe-factories, 661.
- Shops and Offices Act, 668.
- Signatures, Mark, of Persons married, 142.
- Silver, Production of, 584.
- Sinking Funds, 767.
- Size of Dwellings, 103.
- Skimming-stations, 560.
- Skin-diseases treated in Hospitals, 200.
- Skins and Hides, Requisition of, 453.
- Slaughter of Animals for Food—
- Cattle, 558.
- Pigs, 564.
- Sheep and Lambs, 552.
- Sleeping-accommodation at Mental Hospitals, 220.
- Sliped Wool exported, 554.
- Sly-grog Selling, 298.
- Small Grazing-runs, 484, 486.
- Soap and Candle Works, 650.
- Social Conditions of Miners, 615.
- Soldiers, 254.
- Acquisition of Land by, 490.
- Dwellings, 490.
- Financial Assistance to, 492, 816.
- Pensions, 685.
- Repatriation of, 811-816.
- Votes at Licensing Poll, 301.
- Soldiers (Discharged) Settlement, 490.
- Account, 742.
- South Africa, Reciprocity with, 442.
- South African War Pensions, 693.
- Sown Grasses, Extent of, 526.
- Special Articles in this Issue—
- Topographical Nomenclature of the Maori, 936-947.
- Wages and Working-hours in New Zealand (1897-1919), 860-935.
- Special Schools, 244.
- Special Trade, 337.
- Specie, Movement of, 335.
- Spirits, Consumption of, 281, 395.
- Stakes, Tax on, 755.
- Standardized Death-rates, 152.
- State Advances, 672-678.
- State Afforestation, 566.
- State Aid—
- To Dairy Industry, 559.
- To Friendly Societies, 825.
- To Kauri-gum Industry, 593.
- To Local Authorities, 676.
- To Mining, 596.
- To Settlers, 672.
- To Tree-planting, 566.
- To Water-power, 620.
- To Workers, 675.
- State Coal-mines, 592.
- Account, 736.
- State Forests Account, 568, 736.
- State Instruction, 224.
- State Insurance—
- Accident, 722.
- Fire, 724.
- Life, 718.
- State Schools, 226.
- Statement of Balances, 743.
- Statistical View of Fifty Years' Progress, 849-859.
- Still-births, 132.
- Stipendiary Magistrates' Courts—
- Civil Cases, 263.
- Criminal Cases, 270.
- Stock, Character of, 763.
- Stock, Live, 527-565.
- Stock, Quotations for, 770.
- Stomach, Diseases of the, treated in Hospitals, 197.
- Stones, Building and Ornamental, 594.
- Strikes, 667.
- Subdivision of Land, 487.
- Subsidized Prospecting, 596.
- Subsidized Roads on Goldfields, 599.
- Suburban Areas, Population of, 109.
- Succession Duty, 753.
- Sugar-boiling Works, 647.
- Sugar imported and consumed, 395.
- Sugar-prices fixed, 809.
- Sugar: Index Numbers of Prices, 790.
- Suicide, 178.
- Sulphur, 589.
- Summary Convictions, 270.
- Summary of Index Numbers, 799.
- Summary of Legislation (1918), 53-63.
- Sumner School for Deaf, 246.
- Superannuation, 694-704.
- Supplies for Imperial Government, 447, 807.
- Supplies of Forest Timber, 570.
- Supreme Court—
- Civil Cases, 264.
- Criminal Cases, 275.
- Judges entitled "Honourable," 14
- Surtax, 430.
- Preferential, 443.
- Survey (Geological), Account of, 603-605.
- Survey of Ships, 461.
- Suwarrow Island, 839.
- Swamp Land Drainage Account, 742.
- Syphilis Cases in Hospitals, 191.
T.
- Takutea Island, 840.
- Tallow exported, 340-383.
- Tanning-works, 658.
- Taranaki Ironsand, 585.
- Tariff, Customs, 427-446.
- Development, 428.
- Preferential, 443.
- Tax, Land and Income, 749.
- Tax on Totalizator Investments, 754.
- Taxation, 729, 744-756.
- Taxpayers, Number of, 751.
- Teachers, Public-school, 229.
- Superannuation Fund, 697.
- Training of, 230.
- Tea imported and consumed, 395.
- Technical Education, 242.
- Technical High Schools, 243.
- Telegraphic and Postal, 472-481.
- Telephones, 479.
- Temperature, 70.
- Tent-making Works, 659.
- Tenure of Occupied Lands, 483, 513.
- Territorial Forces, 260.
- Thermometer, Cost of Living, 783.
- Three Food Groups, Retail Prices of, 780, 793.
- Tile-works, 655.
- Timber—
- Consumption of, 571.
- Control of, 809.
- Export of, 340-383.
- Plantations, 568.
- Supplies of, 570.
- Tin, 588.
- Tinware-factories, 655.
- Tobacco-culture, 523.
- Tobacco imported and consumed, 395.
- Customs and Excise Revenue from, 436.
- Tolls, 306.
- Tomato-culture, 525.
- In Cook Islands, 843.
- Tongareva Island, 839.
- Tonnage of Vessels entered and cleared, 456.
- Tonsils: Hospital Cases, 196.
- Topographical Nomenclature, Maori, 936-947.
- Torrens System, 498.
- Totalizator, 754, 835.
- Totalizator Taxation, 754.
- Total Taxation, 744.
- Total Trade, 329-454.
- Town Districts—
- Finances of, 304.
- Population of, 111.
- Receipts from Government, 306.
- Value of Land and Improvements, 327.
- Trade, 329-454.
- Board of, 808.
- Commissioners, 9.
- Cook Islands, 843.
- Correspondents, Imperial, 10.
- Trade-marks, 831.
- Training of Defence Forces, 260.
- Training of Discharged Soldiers, 812.
- Training of Officers, 257.
- Training of Teachers, 230.
- Training-ship "Amokura," 262.
- Train-miles run, 469.
- Tramway Boards, Finances of, 304.
- Tramways, Electric, 654.
- Transfer, Land, 499-505.
- Transit Trade, 337, 367.
- Treating prohibited, 298.
- Tree-planting, 566.
- By Farmers, 569.
- By Prisoners, 289.
- Triplets born, 125.
- Trout, Acclimatization of, 574.
- Tuberculosis, 171, 177, 190.
- Tungsten, 451, 586.
- Turkeys, 565.
- Turnips, 523.
- Twine-works, 663.
- Twins and Triplets born, 125.
- Ages of Parents, 126.
U.
- Undesirables on Licensed Premises, 298.
- Undeveloped Water-power, 623.
- Unemployment (Census), 98.
- Unimproved Value of Land, 315.
- Rating on, 305.
- Unions registered, 665.
- Unitarian Association, 13.
- University of New Zealand, 249.
- Scholarships and Bursaries, 250.
- Urban Population, 108.
- Urewera Reserve, 497.
- Urinary System, Diseases of the, treated in Hospitals, 198.
V.
- Vaccination, 205.
- Valuation of Land, 314-328.
- Value of Exports affected by Prices, 368-383.
- Value of Factory Property, 632.
- Value of Output of Factories, 636.
- Venereal Diseases: Hospital Cases, 191.
- Vessels entered and cleared, 456.
- Nationality of, 457.
- Vessels registered, 455.
- Vinegar-making, 650.
- Vineyards, 515, 525.
- Violence, Deaths from, 178.
- Hospital Cases, 201.
- Vital Statistics, 115-202.
- Voluntary Inmates of Mental Hospitals, 218.
W.
- Wages, 809.
- Wages and Working - hours in New Zealand (1897-1919), 860-935.
- Wages paid to Factory Employees, 634
- Waimarino Bush-fire Relief Account, 738.
- Waipori Power-supply, 619.
- Wakari Private Mental Hospital, 220.
- War, 254.
- Bursaries, 240.
- Expenses Account, 739.
- Honours, 15.
- Increases in Food-prices, 786.
- Loans, 473.
- Pensions, 685.
- Taxation, 745.
- War-service Gratuity, 819.
- Washed Wool exported, 554.
- Water-power, 618, 623
- Waterproof-factories, 660.
- Water-races, 599.
- Water-supply Boards. Finances of, 304.
- Wealth, Private, 823.
- Weather, 64-74.
- Weekly Budgets, 801.
- Weekly Rents, 780, 794.
- Welfare of Children, 244.
- Wellington Fish-market, 576.
- Whaling, 573.
- Wheat, 519.
- Export of, 340-383.
- Prices, 808.
- Whitefish-ova imported, 579.
- White Island Sulphur, 589.
- Wholesale Prices, 802.
- Widows left by Married Men, 160.
- Widows' Pensions, 683.
- Wind, 71.
- Wine, Consumption of, 281, 395.
- Wine Licenses, 296.
- Wireless Telegraphy, 480.
- Women, Deaths of, in Childbirth, 177, 199.
- Women on Licensed Premises, 298.
- Women's Branch, Labour Department, 671.
- Wool, 553.
- Exported, 340-383.
- Requisition of, 452.
- Used at Local Mills, 453, 554.
- Woollen-mills, 660.
- Wool used at, 554.
- Wool-scouring Works, 658.
- Workers, Advances to, 675.
- Workers' Compensation Act, 668.
- Workers' Dwellings, 678.
- Account, 740.
- Workers' Educational Association, 251.
- Working-hours and Wages (1897-1919), 860-935.
- World's Coal-production, 592.
- World's Gold-production, 584.
- World's Sheep Flocks, 553.
- Wounded Soldiers, Land for, 490.
- Wrecks, 462.
Y.
- Yields of Crops, 516.