
Table of Contents
SINCE the First Part of the Year-book was printed the following changes have taken place:—
FOREIGN CONSULS (See p. 23).
French Vice-consulship at Wellington abolished. Viscount Alexandre Louis Ferdinand de Jouffroy D'Abbans appointed to act as French Consul at Wellington.
EXTRA AIDE-DE-CAMP (See p. 26).
Captain R. W. P. Clarke-Campbell-Preston appointed, vice Captain Stewart, resigned.
LEGISLATIVE COUNCIL (See p. 28).
Honourable Robert Hart, since deceased.
BISHOPS (See p. 31).
For the Bishopric of Waiapu, the Venerable Archdeacon William Leonard Williams, B.A., has been elected by the Diocesan Synod.
For the Bishopric of Wellington, the Reverend Frederick Wallis, M.A., has been nominated. Consecration fixed for 25th January, 1895.
LATESTESTIMATESOF POPULATION.
The Colony: June, 1894 (excluding Maoris)—678,586 persons. Capital City, Wellington, January, 1894—35,013 persons, or, including suburbs, 38,298.
LANDFOR SETTLEMENTS ACT, 1894.
The passing of this Act alters that of 1892 by empowering the Government to take land compulsorily, where it is necessary, for small holdings, and where no agreement can be come to with the owners. It also allows of the exchange of high pastoral country belonging to the Crown for agricultural land suitable for small holdings. The sum which may be expended annually in acquisition of lands has been increased to £250,000.
ERRATUM.
On p. 39.—Native Land Court Judges: Add “H. W. Brabant.” Recorders Delete the same name.
Two important financial Acts, the New Zealand Consols Act and the Government Advances to Settlers Act, have also been passed.
“THE NEW ZEALAND CONSOLS ACT, 1894.”
The purpose of this Act is, by providing an inscription of New Zealand Consols, to give further facilities for the safe investment of savings. Practically, it establishes another branch of the Government Savings-Bank, with extended power of investment. Under section 3 the Colonial Treasurer is authorised to receive by way of deposits from persons in the colony sums of money up to £500,000, but the amount deposited in any one year must not be more than £250,000. The currency of such deposits is not to exceed forty years; the rate of interest shall not be above 4 per cent. per annum, and will probably be fixed at 31/2 per cent.
In case an inscriber desires to make use of his deposit, or any portion of it, to the extent of £5, or a multiple of £5, he can obtain a Consols certificate, which is payable to bearer and is transferable by delivery. This certificate entitles the holder to receive interest half-yearly at the same rate as the original inscription. and also to payment of the principal sum on the due date.
The Act also provides for the deposit of moneys by minors, which, it is felt, will be very acceptable to parents in encouraging habits of thrift in their children.
Post-office Money-order Offices throughout the colony will be made use of to receive applications for inscription, and also for payment of the half-yearly interest on the amounts deposited.
“THE GOVERNMENT ADVANCES TO SETTLERS ACT, 1894.”
This Act enables the Government to assist settlers by advancing money to them on mortgage at a reasonable rate of interest. The term of the mortgage will be for thirty-six years and a half. The loan will be repayable by half-yearly instalments of £3 for every £100 advanced, including 5 per cent. per annum for interest and 1 per cent. per annum for redemption of the principal sum.
Such advances can be made on rural lands only, up to three-fifths of the value of the property, and the maximum amount of a loan to any one borrower is fixed at £2,500, and the minimum at £25.
The Government have power to raise a sum not exceeding three millions, of which only one and a half millions shall be raised in each year for two years; and the power to raise the three millions shall absolutely cease at the end of two years from the date of the passing of the Act.
Interest on the money borrowed for the purposes of the Act is to be at the rate of 31/2 per cent. per annum, and the difference of 11/2 per cent. between this rate and the 5-per-cent. rate charged to the borrower will be used to provide an assurance fund of one-half per cent., and to defray the expenses of administering the Act.
A General Board and District Boards are to be established; also a Superintendent, who shall be Chairman of the General Board; Valuers will be appointed to assist the Boards, and fees according to scale will require to be paid by borrowers.
THE Year-book for 1894 will be found to contain the usual revised official information, and statistics in the form of a considerably enlarged report, which, with some exception, gives figures brought down to the end of the year 1893.
To do the fullest justice to the statistics of 1893 in the report, it would have been necessary to delay the publication of the Year-book until the early part of 1895, printing the work after the termination of the present session of Parliament. Some of the figures were available only at the time when, to meet the present requirement, it was necessary to begin printing, and there was not sufficient time for exhaustive analysis in respect of several heads of information. But the report is nevertheless far more complete than was the previous one, and the statistics relating to last year are published earlier than in the neighbouring colonies.
There has also been difficulty about some of the special articles, because new information was continually coming out in departmental reports during the time that the book was in the press, and fresh legislation has been in progress.
Of the special articles, seventeen are entirely new, the rest being matter which it has been found desirable to give again after revision. Most of these articles will be extensively circulated separately in pamphlets, besides forming part of this work.
Although the number of copies printed of the previous Year-book (1893) was very considerable, and far in excess of the number struck off of the original Handbook for 1892, the supply has not been found in excess of the demand; and consideration of this fact has led to the reproduction of some matter which will probably be kept for leaflets only after this year.
The assistance of the various Government Departments is gratefully acknowledged.
E. J. VON DADELSZEN.
Registrar-General's Office,
Wellington, 29th September, 1894.
Table of Contents
Table of Contents
THE Colony of New Zealand consists of three main islands, with several groups of smaller islands lying at some distance from the principal group. The main islands, known as the North, the Middle, and Stewart Islands, have a coast-line amounting to 4,330 miles in length—North Island, 2,200 miles; Middle Island, 2,000 miles; and Stewart Island, 130 miles. The other islands now included within the colony are the Chatham Islands, Auckland Islands, Campbell Islands, Antipodes Islands, Bounty Islands, and Kermadec Islands. A protectorate over the Cook Islands (Hervey Group) is exercised by the Imperial Government, the Governor of New Zealand acting as responsible adviser.
New Zealand is mountainous in many parts, but has, nevertheless, large plains in both North and Middle Islands. In the North Island, which is highly volcanic, is situated the famous Thermal-Springs District, of which a special account will be given. The Middle Island is remarkable for its lofty mountains, with their magnificent glaciers, and the deep sounds or fiords on the western coast.
New Zealand is firstly a pastoral, and secondly an agricultural country. Sown grasses are grown almost everywhere, the extent of land laid down being upwards of eight millions of acres. The soil is admirably adapted for receiving these grasses, and, after the bush has been burnt off, is mostly sown over without previous ploughing. In the Middle Island a large area is covered with native grasses, all used for grazing purposes. The large extent of good grazing-land has made the colony a great wool- and meat-producing country; and its agricultural capabilities are, speaking generally, very considerable. The abundance of water and the quantity of valuable timber are also leading characteristics.
New Zealand is, besides, a mining country. Large deposits of coal are met with, chiefly on the west coast of the Middle Island. Gold, alluvial and in quartz, is found in both islands, the yield having been over forty-nine millions sterling in value to the present time. Full statistical information on this subject is given further on, compiled up to the latest dates.
The first authentic account of the discovery of New Zealand is that given by Abel Jansen Tasman, a Dutch navigator. He left Batavia on the 14th August, 1642, in the yacht “Heemskirk,” accompanied by the “Zeehaen” (or “Sea-hen”) fly-boat. After having visited Mauritius and discovered Tasmania, named by him “Van Diemen's Land,” in honour of Anthony van Diemen, the Governor of the Dutch possessions in the East Indies, he steered eastward, and on the 13th December of the same year sighted the west coast of the Middle Island of New Zealand, described by him as “a high mountainous country, which is at present marked in the charts as New Zealand.”
Tasman, under the belief that the land he saw belonged to a great polar continent, and was part of the country discovered some years before by Schouten and Le Maire, to which the name of Staaten Land had been given, gave the same name of Staaten Land to New Zealand; but within about three months after this date Schouten's “Staaten Land” was found to be merely an inconsiderable island. Upon this discovery being announced, the country that Tasman had called Staaten Land received again the name of “New Zealand,” by which it has ever since been known. Tasman sailed along the coast to a bay, where he anchored. To this he gave the name of Murderers (now Massacre) Bay, on account of an unprovoked attack on a boat's crew by the natives, and the massacre of four white men. Thence he steered along the west coast of the North Island, and gave the name of Cape Maria van Diemen to the north-western extremity thereof. After sighting the islands of the Three Kings he finally departed, not having set foot in the country.
There is no record of any visit to New Zealand after Tasman's departure until the time of Captain Cook, who, after leaving the Society Islands, sailed in search of a southern continent then believed to exist. He sighted land on the 6th October, 1769, and on the 8th of that month cast anchor in Poverty Bay. After having coasted round the North Island and the Middle and Stewart Islands—which last he mistook for part of the Middle Island—he took his departure from Cape Farewell on the 31st March, 1770, for Australia. He visited New Zealand again in 1773, in 1774, and in 1777.
M. de Surville, a French officer in command of the vessel “Saint Jean Baptiste,” while on a voyage of discovery, sighted the northeast coast of New Zealand on the 12th December, 1769, and remained for a short time. A visit was soon after paid by another French officer, M. Marion du Fresne, who arrived on the west coast of New Zealand on the 24th March, 1772, but was treacherously murdered by the Natives on the 12th June following.
In 1793 the “Dædalus,” under the command of Lieutenant Hanson, was sent by the Government of New South Wales to New Zealand, and two chiefs were taken thence to Norfolk Island. There was after this an occasional intercourse between the islands of New Zealand and the English settlements in New South Wales.
In 1814 the first missionaries arrived in New Zealand—Messrs. Hall and Kendall—who had been sent as forerunners to Mr. Marsden. After a short stay they returned to New South Wales, and on the 19th November of that year again embarked in company with Mr. Marsden, who preached his first sermon in New Zealand on Christmas Day, 1814, and returned to Sydney on the 23rd March, 1815. Six years later, in 1821, the work of evangelization was put on a somewhat permanent basis; but the first station, established by Mr. Leigh, a Wesleyan missionary, and his wife, at the valley of the Kaeo, Whangaroa, was not taken possession of until the 10th June, 1823.
Prior to the colonisation of New Zealand by Europeans, the earliest navigators and explorers found a race of people already inhabiting both islands. Papers written in 1874 by Mr. (afterwards Sir) William Fox, and Sir Donald McLean, then Native Minister, state that at what time the discovery of these islands was made by the Maoris, or from what place they came, are matters lost in the obscurity enveloping the history of a people without letters. Nor is there anything on record respecting the origin of the Maori people themselves. Little more can now be gathered from their traditions than that they were immigrants, and that when they came there were probably no other inhabitants of the country. The tradition runs that, generations ago, the Maoris dwelt in a country named Hawaiki, and that one of their chiefs was driven thence by a storm, and, after a long voyage, fetched the northern island of New Zealand. Returning to his home with a flattering description of the country he had discovered, this chief, it is said, persuaded a number of his followers to join him, and with a large fleet of double canoes started for the new land. The names of most of the canoes are still remembered, and each tribe agrees in its account of the doings of the people of the principal canoes after their arrival in New Zealand; and from these traditional accounts the descent of the numerous tribes has been traced. Calculations, based on the genealogical staves kept by the tohungas, or priests, indicate that about twenty-seven generations have passed since the migration, which may therefore be assumed to have taken place about six hundred and seventy years ago. The locality of the legendary Hawaiki is unknown, but many places in the South Seas have been thus named in memory of the mother-land. The Maoris speak a very pure dialect of the Polynesian language, the common tongue, with more or less variation, in all the Eastern Pacific Islands. When Captain Cook first visited New Zealand he availed himself of the services of a native from Tahiti, whose speech was easily understood by the Maoris. In this way much information respecting the early history of the country and its inhabitants was obtained which could not have otherwise been had.
A special article will be found further on dealing with the subject of the numbers and present condition of the Maoris.
The first attempt at colonisation was made in 1825 by a company formed in London. An expedition was sent out under the command of Captain Herd, who bought two islands in the Hauraki Gulf and a strip of land at Hokianga. The attempt, however, was a failure, owing to the savage character of the inhabitants. In consequence of frequent visits of whaling-vessels to the Bay of Islands, a settlement grew up at Kororareka—now called Russell—and in 1833 Mr. Busby was appointed British Resident there. A number of Europeans—generally men of low character—gradually settled in different parts of the country, and married Native women.
In 1838 a colonisation company, known as the New Zealand Company, was formed to establish settlement on systematic principles. A preliminary expedition, under the command of Colonel William Wakefield, was despatched from England on the 12th May, 1839, and arrived in New Zealand in the following August. Having purchased land from the Natives, Colonel Wakefield selected the shore of Port Nicholson, in Cook Strait, as the site of the first settlement. On the 22nd January, 1840, the first body of immigrants arrived, and founded the town of Wellington. About the same time—namely, on the 29th January, 1840—Captain Hobson, R.N., arrived at the Bay of Islands, empowered, with the consent of the Natives, to proclaim the sovereignty of the Queen over the islands of New Zealand, and to assume the government thereof. A compact called “The Treaty of Waitangi,” to which in less than six months five hundred and twelve names were affixed, was entered into, whereby all rights and powers of sovereignty were ceded to the Queen, all territorial rights being secured to the chiefs and their tribes. New Zealand was then constituted a dependency of the Colony of New South Wales, but on the 3rd May, 1841, was proclaimed a separate colony. The seat of Government had been previously established at Waitemata (Auckland), round which a settlement was formed.
The New Zealand Company having decided to form another settlement, to which the name of “Nelson” was to be given, despatched a preliminary expedition from England in April, 1841, for the purpose of selecting a site, which resulted in the establishment of the settlement at the head of Blind Bay. About the same time a number of pioneers arrived in Taranaki, despatched thither by the New Plymouth Company, a colonising society which had been formed in England, and had bought 50,000 acres of land from the New Zealand Company.
The next important event in the progress of colonisation was the arrival at Port Chalmers, in March, 1848, of two emigrant ships sent out by the Otago Association for the foundation of a settlement by persons belonging to or in sympathy with the Free Church of Scotland.
In 1849 the “Canterbury Association for founding a Settlement in New Zealand” was incorporated. On the 16th December, 1850, the first emigrant ship despatched by the association arrived at Port Cooper, and the work of opening up the adjoining country was set about in a systematic fashion, the intention of the promoters being to establish a settlement complete in itself, and composed entirely of members of the then United Church of England and Ireland.
The Proclamation of Captain Hobson on the 30th January, 1840, gave as the boundaries of the colony the following degrees of latitude and longitude: On the north, 34° 30′ S. lat.; on the south, 47° 10′ S. lat.; on the east, 179° 0′ E. long.; on the west, 166° 5′ E. long. These limits excluded small portions of the extreme north of the North Island and of the extreme south of Stewart Island.
In April, 1842, by Royal Letters Patent, and again by the Imperial Act 26 and 27 Vict., c. 23 (1863), the boundaries of the colony were altered so as to extend from 33° to 53° of south latitude and from 162° of east longitude to 173° of west longitude. By Proclamation bearing date the 21st July, 1887, the Kermadec Islands, lying between the 29th and 32nd degrees of south latitude and the 177th and 180th degrees of west longitude, were declared to be annexed to and to become part of the Colony of New Zealand.
The following now constitute the Colony of New Zealand:—
The island commonly known as the North Island, with its adjacent islets, having an aggregate area of 44,468 square miles, or 28,459,580 acres.
The island known as the Middle Island, with adjacent islets, having an aggregate area of 58,525 square miles, or 37,456,080 acres.
The South or Stewart Island, and adjacent islets, having an area of 665 square miles, or 425,390 acres.
The Chatham Islands, situate 536 miles eastward of Lyttelton, in the Middle Island, with an area of 375 square miles, or 239,920 acres.
The Auckland Islands, about 200 miles south of Stewart Island, extending about 30 miles from north to south, and nearly 15 from east to west, the area being 210,650 acres.
The Campbell Islands, in latitude 52° 33′ south, and longitude 169° 8′ west, about 30 miles in circumference, with an area of 45,440 acres.
The Antipodes Islands, about 458 miles in a south-easterly direction from Port Chalmers, in the Middle Island. These are-detached rocky islands, and extend over a distance of between 4 and 5 miles from north to south. Area, 12,960 acres.
The Bounty Islands, a small group of islets, thirteen in number, lying north of the Antipodes Islands, and about 415 miles in an east-south-easterly direction from Port Chalmers. Area, 3,300 acres.
The Kermadec Islands, a group lying about 614 miles to the north-east of Russell, in the Bay of Islands. Raoul or Sunday Island, the largest of these, is about 20 miles in circuit. The next in size is Macaulay Island, about 3 miles round. Area of the group, 8,208 acres.
The total area of the colony is thus about 104,471 square miles, of which the aggregate area of the outlying groups of islands that are practically useless for settlement amounts to about 438 square miles.
A protectorate is exercised by the Imperial Government over the Cook Islands (or Hervey Group) by Proclamation dated the 27th October, 1888. The British Resident* is appointed on the recommendation of the New Zealand Government. He acts as Government Agent for the colony in all matters of trade.
* Frederick J. Moss, Esq., late M.H.R., is now British Resident. His salary is paid by this colony.
The areas of the several Australian Colonies, as given by different authorities, vary considerably. The total area of the Australian Continent is given as 2,944,628 square miles, according to a computation made by the late Surveyor-General of Victoria, Mr. J. A. Skene, from a map of Continental Australia compiled and engraved under his direction; but the following areas are taken from the official records of each colony:—
| Square Miles. | |
|---|---|
| Queensland | 668,497 |
| New South Wales | 310,700 |
| Victoria | 87,884 |
| South Australia | 903,425 |
| Western Australia | 1,060,000 |
| Total Continent of Australia | 3,030,506 |
| Tasmania | 26,215 |
| New Zealand (including the Chatham and other islands) | 104,471 |
| Total Australasia | 3,161,192 |
The size of these colonies may be better realised by comparison of their areas with those of European countries. The areas of the following countries—Austria - Hungary, Germany, France, Belgium, Holland, Denmark, Sweden and Norway, Portugal, Spain, Italy (including Sardinia and Sicily), Switzerland, Greece, Roumania, Bulgaria, Servia, Eastern Roumelia, and Turkey in Europe—containing on the whole rather less than 1,600,000 square miles, amount to little more than half the extent of the Australian Continent. If the area of Russia in Europe be added to those of the other countries the total would be about one-seventh larger than the Australian Continent, and about one-twelfth larger than that of the Australasian Colonies, including New Zealand.
The area of the Colony of New Zealand is little more than one-seventh less than the area of Great Britain and Ireland, that of the Middle Island of New Zealand being a little larger than the combined areas of England and Wales.
| United Kingdom. | Area in Square Miles. |
|---|---|
| England and Wales | 58,311 |
| Scotland | 30,463 |
| Ireland | 32,531 |
| Total | 121,305 |
| New Zealand. | Area in Square Miles. |
|---|---|
| North Island | 44,468 |
| Middle Island | 58,525 |
| Stewart Island | 665 |
| Chatham Islands | 375 |
| Other islands | 438 |
| Total | 104,471 |
The North Island extends over a little more than seven degrees of latitude—a distance in a direct line from north to south of 430 geographical or 498 statute miles; but, as the northern portion of the colony, which covers more than three degrees of latitude, trends to the westward, the distance in a straight line from the North Cape to Cape Palliser, the extreme northerly and southerly points of the island, is about 515 statute miles.
This island is, as a whole, hilly, and, in parts, mountainous in character, but there are large areas of plain or comparatively level country that are, or by clearing may be made, available for agricultural purposes. Of these, the principal are the plains in Hawke's Bay on the East Coast, the Wairarapa Plain in the Wellington District, and a strip of country along the West Coast, about 250 miles in length, extending from a point about thirty miles from the City of Wellington to a little north of New Plymouth. The largest plain in the North Island, Kaingaroa, extends from the shore of Lake Taupo in a north-north-easterly direction to the sea-coast in the Bay of Plenty; but a large portion is covered with pumice-sand, and is unfitted for tillage or pasture. There are several smaller plains and numerous valleys suitable for agriculture; The level or undulating country in this island fit, or capable of being made fit, for agriculture has been roughly estimated at 13,000,000 acres. This includes lands now covered with standing forest, and swamps that are capable of drainage; also large areas of clay-marl and pumice-covered land. The clay-marl in its natural state is cold and uninviting to the farmer, but under proper drainage and cultivation it can be brought to a high state of productiveness. This kind of land is generally neglected at the present time, as settlers prefer soils more rapidly remunerative and less costly to work. The larger portion of the North Island was originally covered with forest. Although the area of bush-land is still very great, yet year by year the amount is being reduced, chiefly to meet; the requirements of settlement, the trees being cut down and burnt, and grass-seed sown on the ashes to create pasture. Hilly as the country is, yet from the nature of the climate it is especially suited for the growth of English grasses, and wherever there is any soil, however steep the land may be, grasses will flourish; consequently very little of the land is unfit to supply food for cattle and sheep when treated as above or otherwise laid down in grass. The area of land in the North Island deemed purely pastoral or capable of being made so, while too steep for agricultural purposes, is estimated at 14,200,000 acres. In the centre of the island is a lake, about twenty miles across either way from the extreme points, called Taupo. A large area adjacent to the lake is at present worthless pumice-country. The Waikato River, the largest in the North Island, flows out of its north-eastern point, and runs thence north-westward until it flows into the ocean a little distance south of the Manukau Harbour. This river is navigable for small steamers for about a hundred miles from its mouth. The Maori King country, occupied by Natives who for several years isolated themselves from the Europeans, lies between Lake Taupo and the western coast. The River Thames, or Waihou, having its sources north of Lake Taupo, flows northward into the Firth of Thames. It is navigable for small steamers only for about fifty miles. The other navigable rivers in this island are the Wanganui and Manawatu, which flow towards the south-west into Cook Strait.
The mountains in the North Island are estimated to occupy about one-tenth of the surface, and do not exceed 4,000ft. in height, with the exception of a few volcanic mountains that are more lofty. Of these, the three following are the most important:—
The Tongariro Mountain, situated to the southward of Lake Taupo. It consists of a group of distinct volcanic cones, the lava-streams from which have so overlapped in their descent as to form one compact mountain-mass at the base. The highest of these cones is called Ngauruhoe, and attains an elevation of 7,515ft. The craters of Ngauruhoe, the Red Crater (6,140ft.), and Te Mari (4,990ft.) are the three vents from which the latest discharges of lava have taken place, the most recent having occurred in 1868. These craters are still active, steam and vapour issuing from them with considerable force and noise, the vapours being charged with pungent gases and acids, making it dangerous to approach too near the crater-lips.
Ruapehu. This mountain lies to the south of Tongariro. It is an extinct volcanic cone, and reaches the height of 9,100ft., being in part considerably above the line of perpetual snow. The most remarkable feature of this mountain is the crater-lake on its summit. This lake lies at the bottom of a funnel-shaped crater, the steep sides of which are mantled with ice and snow. The water occupies a circular basin about 500ft. in diameter, and is about 300ft. below the enclosing peaks, and quite inaccessible except by ropes. It is much disturbed by eddies, from which steam or vapour is given off. This lake, and the three craters previously mentioned on Tongariro, are all in one straight line, which, if produced, would pass through the boiling springs at Tokaanu on the southern margin of Lake Taupo, the volcanic country north-east of that lake, and White Island, an active volcano in the Bay of Plenty, situated about twenty-seven miles from the mainland.
Mount Egmont. This is also an extinct volcanic cone, rising to a height of 8,300ft. The upper part is always covered with snow. This mountain is situated close to New Plymouth, and is surrounded by one of the most fertile districts in New Zealand. Rising from the plains in its solitary grandeur, it is an object of extreme beauty, the cone being one of the most perfect in the world.
It is estimated that the area of mountain-tops and barren country at too high an altitude for sheep, and therefore worthless for pastoral purposes, amounts, in the North Island, to 300,000 acres.
Without a doubt the hot springs form the most remarkable feature of the North Island. They are found over a large area, extending from Tongariro, south of Lake Taupo, to Ohaeawai, in the extreme north—a distance of some 300 miles; but the principal seat of hydrothermal action appears to be in the neighbourhood of Lake Rotorua, about forty miles north-north-east from Lake Taupo. By the destruction of the famed Pink and White Terraces and of Lake: Rotomahana during the eruption of Mount Tarawera on the 10th June, 1886, the neighbourhood has been deprived of attractions unique in character and of unrivalled beauty; but the natural features of the country—the lakes, geysers, and hot springs, the number of which is very great, and some of which possess remarkable curative properties for certain complaints—still afford considerable attraction for tourists and invalids. Recently the world-wide importance of conserving this region as a sanatorium for all time has been recognised by the Government, and it is now dedicated by Act of Parliament to that purpose.
Notwithstanding the length of coast-line, good harbours in the North Island are not numerous. Those on the west coast north of New Plymouth are bar-harbours, not suitable for large vessels. The principal harbours are the Waitemata Harbour, on which Auckland is situated—this is rather a deep estuary than a harbour; several excellent havens in the northern peninsula; and Port Nicholson, on the borders of which Wellington is situated. This is a landlocked harbour, about six miles across, having a comparatively narrow but deep entrance from the ocean. The water is deep nearly throughout.
Cook Strait separates the North and Middle Islands. It is about sixteen miles across at its narrowest part, but in the widest about ninety. The strait is invaluable for the purpose of traffic between different parts of the colony.
The extreme length of the Middle Island, from Jackson's Head,’ in Cook Strait, to Puysegur Point, at the extreme south-west, is about 525 statute miles; the greatest distance across at any point is in Otago (the southernmost) District, being about 180 miles.
The Middle Island is intersected along almost its entire length by a mountainous range known as the Southern Alps. Some of the summits reach a height of from 10,000ft. to 12,000ft., Mount Cook, the highest peak, rising to 12,349ft.
In the south, in the neighbourhood of the sounds and Lake Te Anau, there are many magnificent peaks, which, though not of great height, are, owing to their latitude, nearly all crowned with perpetual ice and snow. Further north the mountains increase in height—Mount Earnslaw, at Lake Wakatipu; and Mount Aspiring, which has aptly been termed the New Zealand Matterhorn, nearly 10,000ft. in height, at Lake Wanaka. Northward beyond this a fine chain of peaks runs as the backbone of the Middle Island to where Mount Cook, or Aorangi, towers supreme in the midst of the grandest scenes of the Southern Alps.
For beauty and grandeur of scenery the Southern Alps of New Zealand may worthily compare with, while in point of variety they are said actually to surpass, the Alps of Switzerland. In New Zealand no one has actually succeeded in making a complete ascent of any of the highest mountains. Many of the peaks and most of the glaciers are as yet unnamed; and there is still, in parts of the Middle Island, a fine field for exploration and discovery—geographical, geological, and botanical. The wonders of the Southern Alps are only beginning to be known; but the more they are known the more they are appreciated. The snow-line in New Zealand being so much lower than in Switzerland, the scenery, though the mountains are not quite so high, is of surpassing grandeur.
There are extensive glaciers on both sides of the range, those on the west being of exceptional beauty, as, from the greater abruptness of the mountain-slopes on that side, they descend to within about 700ft. of the sea-level, and into the midst of the evergreen forest. The largest glaciers on each side of the range are easily accessible.
The following gives the sizes of some of the glaciers on the eastern slope:—
| Name. | Area of Glacier. | Length of Glacier. | Greatest Width. | Average Width. | |||
|---|---|---|---|---|---|---|---|
| Acres. | Miles | ch. | Miles | ch. | Miles | ch. | |
| Tasman | 13,664 | 18 | 0 | 2 | 14 | 1 | 15 |
| Murchison | 5,800 | 10 | 70 | 1 | 5 | 0 | 66 |
| Godley | 5,312 | 8 | 0 | 1 | 55 | 1 | 3 |
| Mueller | 3,200 | 8 | 0 | 0 | 61 | 0 | 50 |
| Hooker | 2,416 | 7 | 25 | 0 | 54 | 0 | 41 |
The Alletsch Glacier in Switzerland, according to Ball, in the “Alpine Guide,” has an average width of one mile. It is in length and width inferior to the Tasman Glacier.
Numerous sounds or fiords penetrate the south-western coast. They are long, narrow, and deep (the depth of water at the upper part of Milford Sound is 1,270ft., although at the entrance only 130ft.), environed by giant mountains clothed with foliage to the snow-line, with waterfalls, glaciers, and snowfields at every turn. Some of the mountains rise almost precipitously from the water's edge to 5,000ft. and 6,000ft. above the sea. Near Milford, the finest of these sounds, is the great Sutherland Waterfall, 1,904ft. high.
The general surface of the northern portion of the Middle Island, comprising the Provincial Districts of Nelson and Marlborough, is mountainous, but the greater part is suitable for grazing purposes. There are some fine valleys and small plains suitable for agriculture, of which the Wairau Valley or Plain is the largest. Deep sounds, extending for many miles, break the coast-line abutting on Cook Strait. The City of Nelson is situated at the head of Blind Bay, which has a depth inwards from Cook Strait of about forty statute miles.
The Provincial District of Canterbury lies to the south of the Marlborough District, and on the eastern side of the island. Towards the north the land is undulating; then there is a stretch of almost perfectly level country extending towards the south-west 160 miles, after which, on the south, the country is undulating as far as the borders of the Otago District. On the east a block of hill-country rises abruptly from the plain and extends for some miles seaward. This is Banks Peninsula, containing several good harbours, the principal being Port Cooper, on the north, on which is situated Lyttelton, the chief port of the district: the harbour of Akaroa, considered one of the finest in the colony, is on the southern coast of this peninsula.
The District of Otago is, on the whole, mountainous, but has many fine plains and valleys suitable for tillage. The mountains, except towards the west coast, are generally destitute of timber, and are suitable for grazing sheep. There are goldfields of considerable extent in the interior of this district. The inland lakes are very important features in Otago. Lake Wakatipu extends over fifty-four miles in length, but its greatest width is not more than four miles. It is 1,070ft. above sea-level, and has a depth varying from 1,170ft. to 1,296ft. It covers an area of 114 square miles. Te Anau Lake is still larger, having an area of 132 square miles. These lakes are bounded on the west by broken, mountainous, and wooded country, extending to the ocean.
The chief harbours in Otago are Port Chalmers, at the head of which Dunedin is situated, and the Bluff Harbour, at the extreme south.
The District of Westland, extending along the west coast of the Middle Island, abreast of Canterbury, is more or less auriferous throughout. The western slopes of the central range of mountains are clothed with forest-trees to the snow-line; but on the eastern side timber is scarce, natural grasses covering the ground.
The rivers in the Middle Island are for the most part mountain-torrents, fed by glaciers in the principal mountain-ranges. When the snow melts they rise in flood, forming, where not confined by rocky walls, beds of considerable width, generally covered by enormous deposits of shingle. The largest river in the colony as regards volume of water is the Clutha. It is 154 miles in length, but is only navigable for boats or small river-steamers for about thirty miles. The Rivers Buller, Grey, and Hokitika, on the West Coast, are navigable for a short distance from their mouths. They form the only ports in the Westland District. In their unimproved state they admitted, owing to the bars at their mouths, none but vessels of small draught; but, in consequence of the importance of the Grey and Buller Rivers as the sole ports available for the coal-export trade, large harbour-works have been undertaken, resulting in the deepening of the beds of these rivers, and giving a depth of from 18ft. to 24ft. of water on the bars.
The area of level or undulating land in the Middle Island that may be available for agriculture is estimated at about 15,000,000 acres. About 13,000,000 are suitable for pastoral purposes only, or may become so when cleared of forest and sown with grass-seed. The area of barren land and mountain-tops is estimated at about 8,000,000 acres.
Foveaux Strait separates the Middle from Stewart Island. This last island has an area of only 425,390 acres. It is mountainous, and for the most part covered with forest.
The outlying group of the Chatham Islands, 480 statute miles east-south-east from Wellington, and 536 miles eastward of Lyttelton, consists of. two principal islands and several unimportant islets. The largest island contains about 222,490 acres, of which an irregularly-shaped lake or lagoon absorbs 45,960 acres About one-quarter of the surface of the land is covered with forest, the rest with fern or grass. The hills nowhere rise to a great height. Pitt Island is the next in size; the area is 15,330 acres. The greater portion of both islands is used for grazing sheep.
The Kermadec group of islands, four in number, are situated between 29° 10′ and 31° 30′ south latitude, and between 177° 45′ and 179° west longitude. They are named Raoul or Sunday Island, Macaulay Island, Curtis Island, and L'Espérance or French Rock. The principal island, Sunday, is 600 miles distant from Auckland. The islands are volcanic, and in two of them signs of activity are still to be seen. The rainfall is plentiful, but not excessive. The climate is mild and equable, and slightly warmer than the north of New Zealand. The following are the areas of the islands and islets of the group: Sunday Island, 7,200 acres; Herald group of islets, 85 acres; Macaulay Island, 764 acres; Curtis Islands, 128 acres and 19 acres; L'Espérance, 12 acres: total, 8,208 acres. Sunday Island is twenty miles in circumference, roughly triangular in shape, and at the highest point 1,723ft. above the sea-level. It is rugged and broken over a very large extent of its surface, and, except in a few places, covered with forest. The soil everywhere on the island is very rich, being formed by the decomposition of a dark-coloured pumiceous tuff and a black andesitic lava, with which is closely mixed a fine vegetable mould. The great luxuriance and richness of the vegetation bear witness to the excellence of the soil, which is everywhere—except where destroyed by eruptions, and on the steep cliffs—the same rich loam. Want of water is one of the drawbacks. Three of the four lakes on the island are fresh, but so difficult of approach as to be practically useless.
The Auckland Islands are about 290 miles south of Bluff* Harbour, their position being given on the Admiralty chart as latitude 50° 31′ 29” S., and longitude 166° 19′ 12” E. They have several good harbours. Port Boss, at the north end of the principal island, was described by the eminent French commander, D'Urville, as one of the best harbours of refuge in the known world. At the southern end’ of the island there is a through passage extending from the east to the west coast. It has been variously named Adam's Strait or Carnley Harbour, and forms a splendid sheet of water. The largest of the islands is about 27 miles long by about 15 miles broad, and is very mountainous, the highest part being about 2,000ft. above the sea. The west coast is bold and precipitous, but the east coast has several inlets. The wood on the island is, owing to the strong prevailing wind, scrubby in character. The New Zealand Government maintains at this island a depot of provisions and clothing for the use of shipwrecked mariners.
British sovereignty was proclaimed over New Zealand in January, 1840, and the country became a dependency of New South Wales until the 3rd May, 1841, when it was made a separate colony. The seat of Government was at Auckland, and the Executive included the Governor, and three gentlemen holding office as Colonial Secretary, Attorney-General, and Colonial Treasurer.
The successors of these gentlemen, appointed in August, 1841, May, 1842, and January, 1844, respectively, continued in office until the establishment of Responsible Government on the 7th May, 1856. Only one of them—Mr. Swainson, the Attorney-General—sat as a member of the first General Assembly, opened on the 27th May, 1854. During the session of that year there were associated with the permanent members of the Executive Council certain members of the General Assembly. These latter held no portfolios.
The Government of the colony was at first vested in the Governor, who was responsible only to the Crown; but in 1852 an Act granting representative institutions to the colony was passed by the Imperial Legislature. Under it the constitution of a General Assembly for the whole colony was provided for, consisting of a Legislative Council, the members of which were to be nominated by the Governor, and an elective House of Representatives. The first session of the General Assembly was opened on the 27th May, 1854, but the members of the Executive were not responsible to Parliament. The first Ministers under a system of Responsible Government were appointed on the 18th April, 1856. By the Act of 1852 the colony was divided into six provinces, each to be presided over by an elective Superintendent, and to have an elective Provincial Council, empowered to legislate, except on certain specified subjects. The franchise amounted practically to household suffrage. In each case the election was for four years; but a dissolution of the Provincial Council by the Governor could take place at any time, necessitating a fresh election both of the Council and of the Superintendent. The Superintendent was chosen by the whole body of electors of the province; the members of the Provincial Council by those of the electoral districts. The Provincial Governments, afterwards increased to nine, remained as integral parts of the Constitution of the colony until the 1st November, 1876, when they were abolished by an Act of the General Assembly, that body having been vested with the power of altering the Constitution Act. On the same day an Act of the General Assembly which subdivided the colony (exclusive of the areas included within municipalities) into counties, and established a system of local county government, came into operation.
The Governor is appointed by the Queen. His salary is £5,000 a year, and is provided by the colony.
Members of the Legislative Council hold their seats under writs of summons from the Governor. Till the year 1891 the appointments were for life; but in September of that year an Act was passed making such appointments after that time tenable for seven years only, though Councillors may be reappointed. In either case seats may be vacated by resignation or extended absence. Two members of the Council are aboriginal native chiefs.
The members of the House of Representatives are elected for three years from the time of each general election; but at any time the dissolution of Parliament by the Governor may necessitate such general election. Four of the members are representatives of Native constituencies. An Act was passed in 1887 which provided that, on the termination of the then General Assembly, the number of members to be thereafter elected to the House of Representatives should be seventy-four in all, of whom four were to be elected, under the provisions of the Maori Representation Acts, as representatives of Maori electors only. For the purposes of European representation the colony is divided into sixty-two electoral districts, four of which—the Cities of Auckland, Wellington, Christ-church, and Dunedin—return each three members, and all the other electorates one each. Members of the House of Representatives are chosen by the votes of the inhabitants in every electoral district appointed for that purpose.
In 1889 an amendment of the Representation Act was passed, which contained a provision prohibiting any elector from giving his vote in respect of more than one electorate at any election. “The Electoral Act, 1893,” has extended to women of both races the right to register as electors, and to vote at the elections for members of the House of Representatives. The qualification for registration is the same for both sexes, and remains, under the Act of 1893, substantially unaltered. No person is entitled to be registered on more than one electoral roll within the colony, whatever the number or nature of the qualifications he or she may possess, or wherever they may be. Women are not qualified to be elected as members of the House of Representatives. The changes in the electoral laws, with remarks on the results of the election of November, 1893, are the subject of a special article in Part III. of this work. Every man registered as an elector, and not coming within the meaning of section 8 of “The Electoral Act, 1893,” is qualified to be elected a member of the House of Representatives for any electoral district. For European representation every adult person, if resident one year in the colony and three months in one electoral district, can be registered as an elector. Freehold property of the value of £25 held for six months preceding the day of registration also entitles a man or woman to register, if not already registered under the residential qualification. Maoris possessing a £25 freehold under Crown title can also register. For Maori representation every adult Maori resident in any Maori electoral district (of which there are four only in the colony) can vote. Registration is not required in Native districts. The proportion of representation to population at the last general election for the House of Representatives, in November, 1893, was one European member to every 9,603 inhabitants, and one Maori member to every 10,498 Natives.
Up to the year 1865 the seat of Government of New Zealand was at Auckland. Several attempts were made by members of Parliament, by motions in the Legislative Council and House of Representatives, to have it removed to some more central place; but it was not until November, 1863, that Mr. Domett (the then ex-Premier) was successful in carrying resolutions in the House of Representatives that steps should be taken for appointing some place in Cook Strait as the permanent seat of Government in the colony. The resolutions adopted were: “(1.) That it has become necessary that the seat of Government in the colony should be transferred to some suitable locality in Cook Strait. (2.) That, in order to promote the accomplishment of this object, it is desirable that the selection of the particular site in Cook Strait should be left to the arbitrament of an impartial tribunal. (3.) That, with this view, a Bill should be introduced to give effect to the above resolutions.” On the 25th November an address was presented to the Governor, Sir George Grey, K.C.B., by the Commons of New Zealand, requesting that the Governors of the Colonies of New South Wales, Victoria, and Tasmania might each be asked to appoint one Commissioner for the purpose of determining the best site in Cook Strait. Accordingly, the Hon. Joseph Docker, M.L.C., New South Wales; the Hon. Sir Francis Murphy, Speaker of the Legislative Council, Victoria; and R. C. Gunn, Esq., Tasmania, were appointed Commissioners.
These gentlemen, having made a personal inspection of all suitable places, arrived at the unanimous decision “that Wellington, in Port Nicholson, was the site upon the shores of Cook Strait which presented the greatest advantages for the administration of the government of the colony.”
The seat of Government was, therefore, in accordance with the recommendations of the Commissioners, removed to Wellington in February, 1865.
Nearly all the public works of New Zealand are in the hands of the Government of the colony, and in the early days they simply kept pace with the spread of settlement. In 1870, however, a great impetus was given to the progress of the whole country by the inauguration of the “Public Works and Immigration Policy,” which provided for carrying out works in advance of settlement. Railways, roads, and water-races were constructed, and immigration was conducted on a large scale. As a consequence, the population increased from 267,000 in 1871 to 501,000 in 1881, and 672,265 at the close of the year 1893, exclusive of Maoris.
SUCCESSIONOF GOVERNORSOF NEW ZEALAND, ANDTHE DATESONWHICHTHEYASSUMEDANDRETIREDFROMTHE GOVERNMENT.
Captain William Hobson, R.N., from Jan., 1840, to 10 Sept., 1842.
[British sovereignty was proclaimed by Captain Hobson in January, 1840, and New Zealand became a dependency of the Colony of New South Wales until 3rd May, 1841, at which date it was proclaimed a separate colony. From January, 1840, to May, 1841, Captain Hobson was Lieutenant-Governor of New Zealand under Sir George Gipps, Governor of New South Wales, and from May, 1841, Governor of New Zealand; the seat of Government being at Auckland, where he died in September, 1842. From the time of Governor Hobson's death, in September, 1842, until the arrival of Governor Fitzroy, in December, 1843, the Government was carried on by the Colonial Secretary, Lieutenant Shortland.]
Lieutenant Shortland, Administrator, from 10 Sept., 1842, to 26 Dec., 1843.
Captain Robert Fitzroy, R.N., from 26 Dec., 1843, to 17 Nov., 1845.
Captain Grey (became Sir George Grey, K.C.B., in 1848), from 18 Nov., 1845, to £31 Dec., 1853.
[Captain Grey held the commission as Lieutenant-Governor of the colony until the 1st January, 1848, when he was sworn in as Governor-in-Chief over the Islands of New Zealand, and as Governor of the Province of New Ulster and Governor of the Province of New Munster. After the passing of the New Zealand Constitution Act, Sir George Grey was, on the 13th September, 1852, appointed Governor of the colony, the duties of which office he assumed on the 7th March, 1853. In August, 1847, Mr. E. J. Eyre was appointed Lieutenant-Governor of New Munster: he was sworn in, 28th January, 1848. On 3rd January, 1848, Major- General George Dean Pitt was appointed Lieutenant-Governor of New Ulster: he was sworn in, 14th February, 1848; died, 8th January, 1851; and was succeeded as Lieutenant-Governor by Lieutenant-Colonel Wynyard, appointed 14th April, 1851; sworn in, 26th April, 1851. The duties of the Lieutenant-Governor ceased on the assumption by Sir George Grey of the office of Governor, on the 7th March, 1853.]
Lieutenant-Colonel Robert Henry Wynyard, C.B., Administrator, from 3 Jan., 1854, to 6 Sept., 1855.
Colonel Thomas Gore Browne, C.B., from 6 Sept., 1855, to 2 Oct., 1861.
Sir George Grey, K.C.B., Administrator, from 3 Oct., 1861; Governor, from 4 Dec., 1861, to 5 Feb., 1868.
Sir George Ferguson Bowen, G.C.M.G., from 5 Feb., 1868, to 19 Mar., 1873.
Sir George Alfred Arney, Chief Justice, Administrator, from 21 Mar. to 14 June, 1873.
Sir James Fergusson, Baronet, P.C., from 14 June, 1873, to 3 Dec., 1874.
The Marquis of Normanby, P.C., Administrator, from 3 Dec., 1874 Governor, from 9 Jan., 1875, to 21 Feb., 1879.
James Prendergast, Chief Justice, Administrator, from 21 Feb. to 27 Mar., 1879.
Sir Hercules George Robert Robinson, G.C.M.G., Administrator, 27 Mar., 1879; Governor, from 17 April, 1879, to 8 Sept., 1880.
James Prendergast, Chief Justice, Administrator, from 9 Sept. to 29 Nov., 1880.
Sir Arthur Hamilton Gordon, G.C.M.G., from 29 Nov., 1880, to 23 June, 1882.
Sir James Prendergast, Chief Justice, Administrator, from 24 June, 1882, to 20 Jan., 1883.
Lieutenant - General Sir William Francis Drummond Jervois, G.C.M.G., C.B., from 20 Jan., 1883, to 22 Mar., 1889.
Sir James Prendergast, Chief Justice, Administrator, from 23 Mar. to 2 May, 1889.
The Earl of Onslow, G.C.M.G., from 2 May, 1889, to 24 Feb., 1892.
Sir James Prendergast, Chief Justice, Administrator, from 25 Feb. to 6 June, 1892.
The Earl of Glasgow, G.C.M.G., from 7 June, 1892.
MEMBERSOFTHE EXECUTIVE COUNCILOFTHE COLONYOF NEW ZEALANDPREVIOUSTOTHE ESTABLISHMENTOF RESPONSIBLE GOVERNMENT (NOTINCLUDINGTHE OFFICERS COMMANDINGTHE FORCES).
Willoughby Shortland, Colonial Secretary, from 3 May, 1841, to 31 Dec., 1843; succeeded by Mr. Sinclair.
Francis Fisher, Attorney-General, from 3 May to 10 Aug., 1841; succeeded by Mr. Swainson.
George Cooper, Colonial Treasurer, from 3 May, 1841, to 9 May, 1842; succeeded by Mr. Shepherd.
William Swainson, Attorney-General, from 10 Aug., 1841, to 7 May, 1856.
Alexander Shepherd, Colonial Treasurer, from 9 May, 1842, to 7 May, 1856.
Andrew Sinclair, Colonial Secretary, from 6 Jan., 1844, to 7 May, 1856.
[The three gentlemen last mentioned were nominated by Her Majesty as ex officio members of the Executive Council. Two of them, the Colonial Secretary and the Colonial Treasurer, were not members of the General Assembly, opened for the first time 27th May, 1854, but all three remained in office until the establishment of Responsible Government.]
James Edward FitzGerald, M.H.R., without portfolio, from 14 June to 2 Aug., 1854.
Henry Sewell, M.H.R., without portfolio, from 14 June to 2 Aug., 1854.
Frederick Aloysius Weld, M.H.R., without portfolio, from 14 June to 2 Aug., 1854.
Francis Dillon Bell, M.L.C., without portfolio, from 30 June to 11 July, 1854.
Thomas Houghton Bartley, M.L.C., without portfolio, from 14 July to 2 Aug., 1854.
Thomas Spencer Forsaith, M.H.R., without portfolio, from 31 Aug. to 2 Sept., 1854.
Edward Jerningham Wakefield, M.H.R., without portfolio, from 31 Aug. to 2 Sept., 1854.
William Thomas Locke Travers, M.H.R., without portfolio, 31 Aug. to 2 Sept., 1854.
James Macandrew, M.H.R., without portfolio, from 31 Aug. to Sept., 1854.
NUMBEROF PARLIAMENTSSINCETHE CONSTITUTION ACTPASSEDFORCONFERRING REPRESENTATIVE INSTITUTIONSUPONTHE COLONYOF NEW ZEALAND, WITHTHE DATESOF OPENINGOF SESSIONSAND DATESOF CLOSINGOR DISSOLUTION.
| No. of Parliament. | Date of Opening of Sessions. | Date of Closing or Dissolution. |
|---|---|---|
| First Parliament | 27 May, 1854 | 9 August, 1854. |
| 31 August, 1854 | 16 September, 1854. | |
| 8 August, 1855 | 15 September, 1855. | |
| Second Parliament | 15 April, 1856 | 16 August, 1856. |
| (There was no session held in the year 1857.) | ||
| 10 April, 1858 | 21 August, 1858. | |
| (There was no session held in the year 1859.) | ||
| 30 July, 1860 | 5 November, 1860. | |
| Third Parliament | 3 June, 1861 | 7 September, 1861. |
| 7 July, 1862 | 15 September, 1862. | |
| 19 October, 1863 | 14 December, 1863. | |
| 24 November, 1864 | 13 December, 1864. | |
| 26 July, 1865 | 30 October, 1865. | |
| Fourth Parliament | 30 June, 1866 | 8 October, 1866. |
| 9 July, 1867 | 10 October, 1867. | |
| 9 July, 1868 | 20 October, 1868. | |
| 1 June, 1869 | 3 September, 1869. | |
| 14 June, 1870 | 13 September, 1870. | |
| Fifth Parliament | 14 August, 1871 | 16 November, 1871. |
| 16 July, 1872 | 25 October, 1872. | |
| 15 July, 1873 | 3 October, 1873. | |
| 3 July, 1874 | 31 August, 1874. | |
| 20 July, 1875 | 21 October, 1875. | |
| Sixth Parliament | 15 June, 1876 | 31 October, 1876. |
| 19 July, 1877 | 10 December, 1877. | |
| 26 July, 1878 | 2 November, 1878. | |
| 11 July, 1879 | 15 August, 1879. | |
| Seventh Parliament | 24 September, 1879 | 19 December, 1879. |
| 28 May, 1880 | 1 September, 1880. | |
| 9 June, 1881 | 24 September, 1881. | |
| Eighth Parliament | 18 May, 1882 | 15 September, 1882. |
| 14 June, 1883 | 8 September, 1883. | |
| 5 June, 1884 | 24 June, 1884. | |
| Ninth Parliament | 7 August, 1884 | 10 November, 1884. |
| 11 June, 1885 | 22 September, 1885. | |
| 13 May, 1886 | 18 August, 1886. | |
| 26 April, 1887 | 15 July, 1887. | |
| Tenth Parliament | 6 October, 1887 | 23 December, 1887. |
| 10 May, 1888 | 31 August, 1888. | |
| 20 June, 1889 | 19 September, 1889. | |
| 19 June, 1890 | 3 October, 1890. | |
| Eleventh Parliament | 23 January, 1891 | 31 January, 1891. |
| 11 June, 1891 | 5 September, 1891. | |
| 23 June, 1892 | 12 October, 1892. | |
| 22 June. 1893 | 8 November, 1893. | |
| Twelfth Parliament | 21 June, 1894. | |
SINCETHE ESTABLISHMENTOF RESPONSIBLE GOVERNMENTIN NEW ZEALANDIN 1856.
| Name of Ministry. | Assumed Office. | Retired. | |
|---|---|---|---|
* Owing to the death of the Premier, the Hon. J. Ballance, on 27th April, 1893. | |||
| 1. | Bell-Sewell | 7 May, 1856 | 20 May, 1856. |
| 2. | Fox | 20 May, 1856 | 2 June, 1856. |
| 3. | Stafford | 2 June, 1856 | 12 July, 1861. |
| 4. | Fox | 12 July, 1861 | 6 August, 1862. |
| 5. | Domett | 6 August, 1862 | 30 October, 1863. |
| 6. | Whitaker-Fox | 30 October, 1863 | 24 November, 1864. |
| 7. | Weld | 24 November, 1864 | 16 October, 1865. |
| 8. | Stafford | 16 October, 1865 | 28 June, 1869. |
| 9. | Fox | 28 June, 1869 | 10 September, 1872. |
| 10. | Stafford | 10 September, 1872 | 11 October, 1872. |
| 11. | Waterhouse | 11 October, 1872 | 3 March, 1873. |
| 12. | Fox | 3 March, 1873 | 8 April, 1873. |
| 13. | Vogel | 8 April, 1873 | 6 July, 1875. |
| 14. | Pollen | 6 July, 1875 | 15 February, 1876. |
| 15. | Vogel | 15 February, 1876 | 1 September, 1876. |
| 16. | Atkinson | 1 September, 1876 | 13 September, 1876. |
| 17. | Atkinson (reconstituted) | 13 September, 1876 | 13 October, 1877. |
| 18. | Grey | 15 October, 1877 | 8 October, 1879. |
| 19. | Hall | 8 October, 1879 | 21 April, 1882. |
| 20. | Whitaker | 21 April, 1882 | 25 September, 1883. |
| 21. | Atkinson | 25 September, 1883 | 16 August, 1884. |
| 22. | Stout-Vogel | 16 August, 1884 | 28 August, 1884. |
| 23. | Atkinson | 28 August, 1884 | 3 September, 1884. |
| 24. | Stout-Vogel | 3 September, 1884 | 8 October, 1887. |
| 25. | Atkinson | 8 October, 1887 | 24 January, 1891. |
| 26. | Ballance | 24 January, 1891 | 1 May, 1893.* |
| 27. | Seddon | 1 May, 1893. | |
| Name of Premier. | Name of Premier. |
|---|---|
|
|
WITH DATESOFTHEIR APPOINTMENTAND DATESOF RETIREMENTOR DEATH.
| Name of Speaker. | Date of Appointment. | Date of Retirement or Death. |
|---|---|---|
| Hon. William Swainson | 16 May, 1854 | 8 August, 1855. |
| Hon. Frederick Whitaker | 8 August, 1855 | 12 May, 1856. |
| Hon. Thomas Houghton Bartley | 12 May, 1856 | 1 July, 1868. |
| Hon. Sir John Larkins Cheese Richardson, Kt. | 1 July, 1868 | 14 June, 1879. |
| Hon. Sir William Fitzherbert, K.C.M.G. | 14 June, 1879 | 23 January, 1891. |
| Hon. Sir Harry Albert Atkinson, K.C.M.G. | 23 January, 1891 | 28 June, 1892. |
| Hon. Henry John Miller | 8 July, 1892. |
WITH DATESOFTHEIR ELECTIONAND DATESOF RETIREMENT.
| Name of Speaker. | Date of Election. | Date of Retirement. |
|---|---|---|
| Sir Charles Clifford, Bart. | 26 May, 1854 | |
| 15 April, 1856 | 3 June, 1861. | |
| Sir David Monro, Kt. Bach. | 3 June, 1861 | |
| 30 June, 1866 | 13 Sept., 1870. | |
| Sir Francis Dillon Bell, K.C.M.G., C.B. | 14 August, 1871 | 21 October, 1875. |
| Sir William Fitzherbert, K.C.M.G. | 15 June, 1876 | 13 June, 1879. |
| Sir George Maurice O'Rorke, Kt. Bach. | 11 July, 1879 | |
| 24 September, 1879 | ||
| 18 May, 1882 | ||
| 7 August, 1884 | ||
| 6 October, 1887 | 3 October, 1890. | |
| Major William Jukes Steward | 23 January, 1891 | 8 November, 1893. |
| Hon. Sir George Maurice O'Rorke, Kt. Bach. | 21 June, 1894. |
CONSULSOF FOREIGN COUNTRIESRESIDINGIN, ORWITH JURISDICTIONOVER, NEW ZEALANDINTHE YEAR 1894.
Netherlands.—Dr. Laon Adrian de Vicq, Melbourne, Consul-General; Charles John Johnston, Wellington, Consul; Edward Bowes Cargill, Dunedin, and David Boosie Cruickshank, Auckland, Vice-Consuls.
Belgium.—Gustave Beckx, Melbourne, Consul-General; Charles John Johnston, Wellington, Alexander Beck, Christchurch, and Arthur Masy, Auckland, Consuls.
Italy.—Cavaliere Nicola Squitti, Barone de Palermiti e Guarna, Melbourne, Consul; Alexander Cracroft Wilson, Christchurch, George Fisher, Wellington, Edward Bowes Cargill, Dunedin, Dr. Francesco Rosetti, Hokitika, Geraldo Guiseppe Perotti, Greymouth, and Patrick Comiskey, Auckland, Consular Agents.
German Empire.—A. Pelldram, Sydney, Consul-General; Bendix Hallenstein, Dunedin, Friedrich Augustus Krull, Wanganui, H. Brown (on leave), Eugene Langguth (acting), Auckland, and Hem-rich von Haast, Christchurch, Consuls; Augustus Friedrich Castendyk, Wellington, Vice-Consul.
France.—William Thomas Locke Travers, Wellington, Vice-Consul; David Boosie Cruickshank, Auckland, Percival Clay Neill, Dunedin, and Hon. Edmund William Parker, Christchurch, Consular Agents.
Sweden and Norway.—Edward Pearce, Wellington, Consul; Edward Valdemar Johansen, Auckland, and Frank Graham, Christchurch, Vice-Consuls.
Denmark.—Edward Valdemar Johansen, Auckland, Consul for the North Island; Emil Christian Skog, Christchurch, Consul for the South Island; Francis Henry Dillon Bell, Wellington, and Edmund Quick, Dunedin, Vice-Consuls.
Spain.—Don Francisco Arenas Y. Bonet, Christchurch, Vice-Consul.
Portugal.—John Duncan, Wellington, Consul; Henry Rees George, Auckland, and Edmund Quick, Dunedin, Vice-Consuls.
Austro-Hungary.—Julius Mergell, Sydney, Consul.
United States.—George H. Wallace, Melbourne, Consul-General; John Darcey Conolly, Auckland, Consul (for New Zealand); Leonard A. Bachelder, Auckland, Vice-Consul; Albert Cuff, Christchurch, Henry Stephenson, Russell, Robert Wyles, Mongonui, Thomas Cahill, M.D., Wellington, and Reynolds Driver, Dunedin, Consular Agents.
Nicaragua.—J. H. Amora, Sydney, Consul-General for Australasia.
Chili.—William Henry Eldred, Sydney, Consul-General; Edmund Quick, Dunedin, Consular Agent.
Hawaiian Islands.—James Cruickshank, Auckland, Reynolds Driver (acting), Dunedin, Consuls.
(With their Addresses).
NEW ZEALAND.
Sir W. B. Perceval, K.C.M.G., Westminster Chambers, 13, Victoria Street, S.W. Secretary—Walter Kennaway, C.M.G.
AUSTRALIA.
New South Wales.—The Hon. Sir Saul Samuel, K.C.M.G., C.B., Westminster Chambers, 9, Victoria Street, S.W. Secretary—S. Yardley, C.M.G.
Victoria.—The Hon. Duncan Gillies, 15, Victoria Street, S.W. Secretary—
South Australia.—The Hon. T. Playford, Victoria Chambers, 15, Victoria Street, S.W. Secretary—Samuel Deering.
Queensland.—The Hon. Sir James F. Garrick, K.C.M.G., Westminster Chambers, 1, Victoria Street, S.W. Secretary—Charles Shortt Dicken, C.M.G.
Western Australia.—The Hon. Sir Malcolm Fraser, K.C.M.G., 15, Victoria Street, Westminster, S.W. Secretary—Reginald Hare.
Tasmania.—The Hon. Sir Robert G. W. Herbert, G.C.B., Westminster Chambers, 5, Victoria Street, S.W. Secretary—
(DOWNING STREET, S.W., LONDON), WITH DATESOF APPOINTMENT.
Principal Secretary of State for the Colonies—The Most Hon. the Marquis of Ripon, K.G., 17th August, 1892.
Under-Secretaries: Permanent—The Hon. Sir Robert Henry Meade, K.C.B., 1st February, 1892; Parliamentary—Sydney Charles Buxton, M.P., 17th August, 1892.
Assistant Under-Secretaries—John Bramston, D.C.L., C.B., 30th June, 1876; Edward Wingfield, B.C.L., C.B., 19th July, 1878; Edward Fairfield, C.M.G., 1st February, 1892.
Private Secretary to Secretary of State — F. S. St. Quintin. Assistant Private Secretary—Hartmann W. Just, B.A.
DOWNING STREET, S.W. CITY OFFICE: 1, TOKENHOUSE BUILDINGS, E.C., LONDON.
Crown Agents—Sir Montagu Frederick Ommaney, K.C.M.G., and Ernest Edward Blake.
Bell, Hon. Sir Francis Dillon, Knt. Bach., 1873; K.C.M.G., 1881; C.B., 1886.
Buckley, Hon. Sir Patrick Alphonsus, K.C.M.G., 1892.
Buller, Sir Walter Lawry, F.R.S., C.M.G., 1875; K.C.M.G., 1886.
FitzGerald, James Edward, Esq., C.M.G., 1870.
Grace, Hon. Morgan Stanislaus, C.M.G., 1890.
Grey, Bight Hon. Sir George, K.C.B., 1848; P.C., 1894.
Hall, Hon. Sir John, K.C.M.G., 1882.
Hector, Sir James, F.R.S., C.M.G., 1875; K.C.M.G., 1887.
Larnach, Hon. William James Mudie, C.M.G., 1879.
O'Rorke, Hon. Sir George Maurice, Knt. Bach., 1880.
Perceval, Sir Westby Brook, K.C.M.G, 1894.
Prendergast, Sir James, Knt. Bach., 1881.
Richardson, Hon. Edward, C.M.G., 1879.
Roberts, John, Esq., C.M.G., 1891.
Stafford, Hon. Sir Edward William, K.C.M.G., 1879; G.C.M.G., 1887.
Stout, Hon. Sir Robert, K.C.M.G., 1886.
Vogel, Hon. Sir Julius, C.M.G., 1872; K.C.M.G., 1875.
Whitmore, Hon. Colonel Sir George Stoddart, C.M.G., 1869; K.C.M.G., 1882.
PERSONSALLOWEDTORETAINTHE TITLEOF “HONOURABLE” WITHIN HER MAJESTY'S DOMINIONS.
By despatch from the Secretary of State for the Colonies, dated Downing Street, 15th June, 1893, His Excellency the Governor was apprised that the title of “Honourable,” appertaining to Members of the Executive and Legislative Councils in colonies possessing Responsible Government, whether confined to duration of office or continued for life, is approved by Her Majesty for use and recognition throughout her dominions, either during office or for life, as the case may be.
By further despatch of 10th March, 1894, the Secretary of State announces that he is prepared in future to submit for the approval of the Queen the recommendation of the Governor of any colony having Responsible Government that the President of the Legislative Council or the Speaker of the Legislative Assembly may, on quitting office after three years’ service in their respective offices, be permitted to retain the title of “Honourable.” This title has since been conferred on Sir F. D. Bell, Sir G. M. O'Rorke, and Major William Jukes Steward.
Besides the Members of the Executive and Legislative Councils, the following ex-Ministers whose names do not appear in the list given above are allowed, as such, to retain the title of “Honourable”: Bryce, John, 1884; Dick, Thomas, 1884; Fergus, Thomas, 1891; Gisborne, William, 1873; Haultain, Colonel T. M., 1870; Hislop, Thomas W., 1891; Johnston, Walter W., 1884; Mitchelson, Edwin, 1891; Oliver, Richard, 1884; Reynolds, William H., 1876; Richardson, George F., 1891; Rolleston, William, 1884; Tole, Joseph A., 1888.
GLASGOW, His Excellency the Right Honourable David, Earl of, G.C.M.G., a Captain of the Royal Navy, served in the White Sea during the Russian war, and in the Chinese war of 1857, and retired in 1878; born, 1833; married, in 1873, Dorothea Thomasina, daughter of Sir Edward Hunter-Blair; appointed February 24, and assumed office June 7, 1892, as Governor and Commander-in-Chief in and over Her Majesty's Colony of New Zealand and its Dependencies. Salary, £5,000. Residences: Government House, Wellington; and Government House, Auckland.
Private Secretary and Aide-de-Camp—Edward Hay Mackenzie Elliot (Major, South Lancashire Regiment).
Aide-de-Camp — Edward Francis Clayton (Lieutenant, Scots-Guards). Extra Aide-de-Camp—Stair Hathorn Johnston Stewart (Captain, late 20th Hussars).
ADMINISTRATOROFTHE GOVERNMENT.—A dormant commission empowers the Chief Justice of the Colony for the time being to administer the Government in case of the death, incapacity, removal, or departure of the Governor.
His Excellency the GOVERNOR presides.
Hon. R. J. Seddon, Premier, Minister for Public Works, Minister of Defence, and Native Minister.
Hon. Sir P. A. Buckley, K.C.M.G., Attorney-General and Colonial Secretary.
Hon. W. P. Reeves, Minister of Education, Commissioner of Stamp Duties, and Minister of Labour.
Hon. A. J. Cadman, Minister of Justice and Minister of Mines.
Hon. J. McKenzie, Minister of Lands and Immigration, Minister of Agriculture, and Commissioner of Forests.
Hon. J. G. Ward, Colonial Treasurer, Postmaster-General, Electric Telegraph Commissioner, Commissioner of Customs, Minister of Marine, and Minister of Industries and Commerce.
Hon. J. Carroll (without portfolio), representing the Native race.
Hon. W. Montgomery (without portfolio).
Clerk of Executive Council—Alexander James Willis.
LEGISLATIVE COUNCIL.
The number of members at present constituting the Legislative Council is forty-six. The number cannot be less than ten, but is otherwise unlimited. Prior to 1891 Councillors summoned by the Governor held their appointments for life, but on the 17th of September of that year an Act was passed making future appointments to the Council tenable for seven years only, to be reckoned from the date of the writ of summons of the Councillor's appointment, though every such Councillor may be reappointed. The qualifications are that the person to be appointed be of the full age of twenty-one years, and a subject of Her Majesty, either natural - born or naturalised by or under any Act of the Imperial Parliament or by or under any Act of the General Assembly of New Zealand. All contractors to the public service to an amount of over £50 and Civil servants of the colony are ineligible to become Councillors. Payment of Councillors is at the rate of £150 a year, payable monthly Actual travelling-expenses to and from Wellington are also allowed. A deduction of £1 5s. per sitting day is made in case of an absence, except through illness or other unavoidable cause, exceeding five sitting days in any one session. A seat is vacated by any member of the Council — (1), If he takes any oath or makes any declaration or acknowledgment of allegiance, obedience, or adherence to any foreign Prince or Power; or (2), if he does, or concurs in, or adopts any act whereby he may become a subject or citizen of any foreign State or Power, or is entitled to the rights, privileges, or immunities of a subject of any foreign State or Power; or (3), if he is a bankrupt, or compounds with his creditors under any Act for the time being in force; or (4), if he is a public defaulter, or is attainted of treason, or is convicted of felony or any infamous crime; or (5), if he resigns his seat by writing under his hand addressed to and accepted by the Governor; or (6), if for more than one whole session of the General Assembly he fails, without permission of the Governor notified to the Council, to give his attendance in the Council. The presence of one-fourth of the members of the Council, exclusive of those who have leave of absence, is necessary to constitute a meeting for the exercise of its powers. This rule, however, may be altered from time to time by the Council. The ordinary sitting-days are Tuesdays, Wednesdays, Thursdays, and Fridays, from 2.30 p.m. to 5 p.m., resuming again at 7.30 when necessary.
ROLLOF MEMBERSOFTHE HONOURABLETHE LEGISLATIVE COUNCIL,
Stating the Provincial District and the Date of Writ of Summons.
Speaker—The Hon. HENRY JOHN MILLER.
Chairman of Committees—The Hon. WILLIAM DOUGLAS HALL BAILLIE.
| Name. | Provincial District. | Date of Appointment |
|---|---|---|
| Acland, the Hon. John Barton Arundel | Canterbury | 8 July, 1865. |
| Baillie, the Hon. William Douglas Hall | Marlborough | 8 March, 1861. |
| Barnicoat, the Hon. John Wallis | Nelson | 14 May, 1883. |
| Bolt, the Hon. William Mouat | Otago | 15 October, 1892. |
| Bonar, the Hon. James Alexander | Westland | 27 June, 1868. |
| Bowen, the Hon. Charles Christopher | Canterbury | 23 January, 1891. |
| Buckley, the Hon. Sir Patrick Alphonsus, K.C.M.G. | Wellington | 25 July, 1878. |
| Dignan, the Hon. Patrick | Auckland | 3 February, 1879. |
| Feldwick, the Hon. Henry | Otago | 15 October, 1892. |
| Grace, the Hon. Morgan Stanislaus, C.M.G. | Wellington | 13 May, 1870. |
| Hart, the Hon. Robert; | Wellington | 9 July, 1872. |
| Holmes, the Hon. Mathew | Otago | 19 June, 1866. |
| Jenkinson, the Hon. John Edward | Canterbury | 6 June, 1893. |
| Jennings, the Hon. William Thomas | Auckland | 15 October, 1892. |
| Johnston, the Hon. Charles John | Wellington | 23 January, 1891. |
| Kelly, the Hon. Thomas | Taranaki | 15 October, 1892. |
| Kenny, the Hon. Courtney William Aylmer Thomas | Marlborough | 15 May, 1885. |
| Kerr, the Hon. James | Westland | 15 October, 1892. |
| McCullough, the Hon. William | Auckland | 15 October, 1892. |
| MacGregor, the Hon. John | Otago | 15 October, 1892. |
| McLean, the Hon. George | Otago | 19 December, 1881. |
| Mantell, the Hon. Walter Baldock Durant | Wellington | 19 June, 1866. |
| Miller, the Hon. Henry John (Speaker) | Otago | 8 July, 1865. |
| Montgomery, the Hon. William | Canterbury | 15 October, 1892. |
| Morris, the Hon. George Bentham | Auckland | 15 May, 1885. |
| Oliver, the Hon. Richard | Otago | 10 November, 1881. |
| Ormond, the Hon. John Davies | Hawke's Bay | 23 January, 1891. |
| Peacock, the Hon. John Thomas | Canterbury | 3 June, 1873. |
| Pharazyn, the Hon. Robert | Wellington | 15 May, 1885. |
| Pollen, the Hon. Daniel | Auckland | 12 May, 1873. |
| Reynolds, the Hon. William Hunter | Otago | 6 May, 1878. |
| Richardson, the Hon. Edward, C.M.G. | Wellington | 15 October, 1892. |
| Rigg, the Hon. John | Wellington | 6 June, 1893. |
| Scotland, the Hon. Henry | Taranaki | 24 February, 1868. |
| Shephard, the Hon. Joseph | Nelson | 15 May, 1885. |
| Shrimski, the Hon. Samuel Edward | Otago | 15 May, 1885. |
| Stevens, the Hon. Edward Cephas John | Canterbury | 7 March, 1882. |
| Stewart, the Hon. William Downie | Otago | 23 January, 1891. |
| Swanson, the Hon. William | Auckland | 15 May, 1885. |
| Taiaroa, the Hon. Hori Kerei | Otago | 15 May, 1885. |
| Wahawaha, the Hon. Major Ropata, N.Z.C. | Auckland | 10 May, 1887. |
| Walker, the Hon. Lancelot | Canterbury | 15 May, 1885. |
| Walker, the Hon. William Campbell | Canterbury | 15 October, 1892. |
| Whitmore, the Hon. Sir George Stoddart, K.C.M.G. | Hawke's Bay | 31 August, 1863. |
| Whyte, the Hon. John Blair | Auckland | 23 January, 1891. |
| Williams, the Hon. Henry | Auckland | 7 March, 1882. |
Clerk of Parliaments, Clerk of the Legislative Council, and Examiner of Standing Orders upon Private Bills—Leonard Stowe.
Clerk-Assistant—Arthur Thomas Bothamley.
Second Clerk-Assistant—George Moore.
Interpreter—Henry S. Hadfield.
The number of members constituting the House of Representatives is seventy-four—seventy Europeans and four Maoris. This number was fixed by the Act of 1887, which came for the first time into practical operation at the general election of 1890. Previously (from 1881) the House consisted of ninety-five members—ninety-one Europeans and four Maoris. The North Island returns thirty European members, and the Middle Island forty. The Cities of Auckland, Wellington, Christchurch, and Dunedin return each three members, and all other electoral districts one each. The elections are triennial, except in the case of a dissolution by the Governor. The qualification for membership is simply registration as an elector, and not coming within the meaning of section 8 of “The Electoral Act, 1893.” All contractors to the public service of New Zealand to whom any public money above the sum of £50 is payable, directly or indirectly, in any one financial year, and the Civil servants of the colony, are incapable of being elected as or of sitting or voting as members. The payment made to members of the House of Representatives is £20 per month, amounting to £240 per annum. £2 for every sitting-day exceeding five is deducted on account of absence during session not due to sickness or other unavoidable cause. Travelling-expenses to and from Wellington are also allowed. This scale of payment came into force on the 1st January, 1893, under the provisions of “The Payment of Members Act, 1892.” Twenty members, exclusive of the Speaker, constitute a quorum. Unless otherwise ordered, the sitting-days of the House are Tuesdays, Wednesdays, Thursdays, and Fridays, from 2.30 to 5.30, resuming at 7.30 p.m. Order of admission to the Speaker's Gallery is by ticket obtained from the Speaker. The Strangers’ Gallery is open free to the public.
ROLLOF MEMBERSOFTHE HOUSEOF REPRESENTATIVES,
With the Name of the District for which they are elected, and the Date of Notification of Return of Writ.
Speaker—The Hon. Sir George Maurice O'Rorke, Kt.
Chairman of Committees—Arthur Robert Guinness.
| Name. | Electoral District. | Date of Notification of Return of Writ. |
|---|---|---|
| For European Electorates. | ||
| Allen, James | Bruce | 13 December, 1893. |
| Bell, Francis Henry Dillon | City of Wellington | 13 December, 1893. |
| Buchanan, Walter Clarke | Wairarapa | 13 December, 1893. |
| Buddo, David | Kaiapoi | 13 December, 1893. |
| Buick, Thomas Lindsay | Wairau | 13 December, 1893. |
| Button, Charles Edward | City of Auckland | 13 December, 1893. |
| Cadman, Hon. Alfred Jerome | Waikato | 13 December, 1893. |
| Carncross, Walter Charles Frederick | Taieri | 13 December, 1893. |
| Carnell, Samuel | Napier | 13 December, 1893. |
| Carroll, Hon. James | Waiapu | 13 December, 1893. |
| Collins, William Whitehouse | City of Christchurch | 13 December, 1893. |
| Crowther, William | City of Auckland | 13 December, 1893. |
| Duncan, Thomas | Oamaru | 13 December, 1893. |
| Duthie, John | City of Wellington | 13 December, 1893. |
| Earnshaw, William | City of Dunedin | 13 December, 1893. |
| Flatman, Frederick Robert | Pareora | 13 December, 1893. |
| Fraser, William | Wakatipu | 13 December, 1893. |
| Graham, John | City of Nelson | 13 December, 1893. |
| Green, James | Waikouaiti | 13 December, 1893. |
| Grey, Right Hon. Sir George, P.C., K.C.B. | City of Auckland | 13 December, 1893. |
| Guinness, Arthur Robert | Grey | 13 December, 1893. |
| Hall, Charles | Waipawa | 13 December, 1893. |
| Hall-Jones, William | Timaru | 13 December, 1893. |
| Harris, Benjamin | Franklin | 13 December, 1893. |
| Hogg, Alexander Wilson | Masterton | 13 December, 1893. |
| Houston, Robert Morrow | Bay of Islands | 13 December, 1893. |
| Hutchison, George | Patea | 13 December, 1893. |
| Hutchison, William | City of Dunedin | 13 December, 1893. |
| Joyce, John | Lyttelton | 13 December, 1893. |
| Kelly, James Whyte | Invercargill | 13 December, 1893. |
| Kelly, William | Bay of Plenty | 13 December, 1893. |
| Lang, Frederic William | Waipa | 13 December, 1893. |
| Larnach, Hon. William James Mudie, C.M.G. | Tuapeka | 13 December, 1893. |
| Lawry, Frank | Parnell | 13 December, 1893. |
| McGowan, James | Thames | 13 December, 1893. |
| McGuire, Felix | Egmont | 13 December, 1893. |
| McKenzie, Hon. John | Waihemo | 13 December, 1893. |
| McKenzie, Roderick | Buller | 13 December, 1893. |
| Mackenzie, Thomas | Clutha | 13 December, 1893. |
| Mackintosh, James | Wallace | 13 December, 1893. |
| McLachlan, John | Ashburton | 13 December, 1893. |
| McNab, Robert | Mataura | 13 December, 1893. |
| Maslin, William Stephen | Rangitata | 17 April, 1894. |
| Massey, William Ferguson | Waitemata | 13 December, 1893. |
| Meredith, Richard | Ashley | 13 December, 1893. |
| Millar, John Andrew | Chalmers | 13 December, 1893. |
| Mills, Charles Houghton | Waimea-Sounds | 13 December, 1893. |
| Mitchelson, Hon. Edwin | Eden | 13 December, 1893. |
| Montgomery, William Hugh | Ellesmere | 13 December, 1893. |
| Morrison, Arthur | Caversham | 13 December, 1893. |
| Newman, Alfred Kingcome | Wellington Suburbs | 13 December, 1893. |
| O'Regan, Patrick Joseph | Inangahua | 13 December, 1893. |
| O'Rorke, Hon. Sir George Maurice, Knt. Bach. | Manukau | 13 December, 1893. |
| Pinkerton, David | City of Dunedin | 13 December, 1893. |
| Pirani, Frederick | Palmerston | 13 December, 1893. |
| Reeves, Hon. William Pember | City of Christchurch | 13 December, 1893. |
| Russell, George Warren. | Riccarton | 13 December, 1893. |
| Russell, William Russell | Hawke's Bay | 13 December, 1893. |
| Saunders, Alfred | Selwyn | |
| Seddon, Hon. Richard John | Westland | 13 December, 1893. |
| Smith, Edward Metcalf | New Plymouth | 13 December, 1893. |
| Smith, George John | City of Christchurch | 13 December, 1893. |
| Stevens, John | Rangitikei | 13 December, 1893. |
| Steward, Hon. William Jukes | Waitaki | 13 December, 1893. |
| Stout, Hon. Sir Robert, K.C.M.G. | City of Wellington | 13 December, 1893. |
| Tanner, William Wilcox | Avon | 13 December, 1893. |
| Thompson, Robert | Marsden | 13 December, 1893. |
| Ward, Hon. Joseph George | Awarua | 13 December, 1893. |
| Willis, Archibald Dudingston | Wanganui | 13 December, 1893. |
| Wilson, James Glenny | Otaki | 13 December, 1893. |
| For Maori Electorates. | ||
| Heke, Hone | Northern Maori | 11 January, 1894. |
| Parata, Tame | Southern Maori | 30 December, 1893. |
| Pere, Wi | Eastern Maori | 11 January, 1894. |
| Te Ao, Ropata | Western Maori | 2 January, 1894. |
Clerk of House of Representatives—G. Friend.
Clerk-Assistant—H. Otterson.
Second Clerk-Assistant—A. J. Rutherfurd.
Reader and Clerk of Bills and Papers—Thomas Bracken.
Interpreters—L. M. Grace, —.
Sergeant-at-Arms—
Clerk of Writs—H. Pollen.
Deputy Clerk of Writs—R. H. Govett.
Acting Librarian—H. L. James, B.A.
Chief Hansard Reporter—C. C. N. Barron.
There is no State Church in the colony, nor is State aid given to any form of religion. The Government in the early days of the colony set aside certain lands as endowments for various religious bodies, but nothing of the kind has been done for many years past.
CHURCHOFTHE PROVINCEOF NEW ZEALAND, COMMONLYCALLEDTHE “CHURCHOF ENGLAND.”
Bishops.
The Right Rev. William Garden Cowie, D.D., Auckland; consecrated 1869 (Senior Bishop, Acting Primate).
The Right Rev. Charles Oliver Mules, M.A., Nelson; consecrated 1892.
The Right Rev. Churchill Julius, D.D., Christchurch; consecrated 1890.
The Right Rev. Samuel Tarratt Nevill, D.D., Dunedin; consecrated 1871.
The Right Rev Cecil Wilson, M.A., Melanesia; consecrated 1894.
Bishopric of Waiapu, vacant (June, 1894).
Bishopric of Wellington, vacant (June, 1894).
Archbishop.
The Most Rev. Francis Redwood, S.M., D.D., Archbishop and Metropolitan, Wellington; consecrated 1874.
Bishops.
The Right Rev. John Edmund Luck, D.D., O.S.B., Auckland; consecrated 1882.
The Right Rev. John Joseph Grimes, S.M., D.D., Christchurch; consecrated 1887.
The Most Rev. Patrick Moran, D.D., Dunedin; consecrated 1856.
The principal present heads or officers of the various churches, and the places and times of holding their annual or periodical assemblies or meetings, are as follow:—
Church of England.—For Church purposes, the colony is divided into six dioceses—viz., Auckland, Waiapu, Wellington, Nelson, Christchurch, and Dunedin. The General Synod meets every third year in one of the various dioceses.—President, the Bishop of Auckland, Acting Primate; Secretary, Rev. C. M. Nelson, M.A., Auckland; Lay Secretary, James Allen, Esq., B.A., M.H.R., Dunedin. The Diocesan Synods meet once a year, under the presidency of the Bishop of the diocese. The next General Synod will be held in Nelson, in February, 1895.
Roman Catholic Church.—The diocese of Wellington, established in 1848, was in 1887 created the metropolitan see. There are three suffragan dioceses—Auckland, Christchurch, and Dunedin. A Retreat is held annually in each of the four dioceses.
Presbyterian Church of New Zealand.—The Assembly meets annually, in February, at Auckland, Wellington, and Christchurch, in succession. Moderator, the Very Rev. David Gordon, B.A.; Clerk and Treasurer, Rev. David Sidey, Napier.
Presbyterian Church of Otago and Southland.—The Synod meets annually in October at Dunedin. Moderator, Rev. John Dunlop, M.A., D.D., Dunedin; Clerk, Rev. W. Bannerman, Roslyn, Dunedin; Church Factor, Mr. Edmund Smith, High Street, Dunedin. Theological Professors, Rev. John Dunlop, M.A., D.D., and Rev. Michael Watt, M.A., D.D.
Wesley an Methodist Church.—The annual Conference meets in March, the exact date being determined by the President, who holds office for one year. Each Conference determines where the next one shall assemble. President (1894-95), Rev. David McNicol, Grafton Road, Auckland; Secretary, Rev. Henry Bull, Onehunga. The next Conference is to assemble in Nelson on or about the 1st March, 1895.
Baptist Union of New Zealand. — President, Rev. T. Bray, Nelson; Secretary, Rev. W. E. Woolley, Thames. The Union comprises 30 churches, 3,068 members, 4,952 scholars in the Sunday schools, with 569 teachers, &cc. There are also 100 local preachers, and 27 preaching-stations.
Congregational Union of New Zealand.—The annual meetings are held the second week of February, at such place as may he decided on by vote of the Council. Chairman for 1894, Mr. A. W. Beaven, Christchurch; Chairman Elect, Rev. B. L. Thomas, Auckland; Secretary, Mr. H. J. Le Bailly, Auckland; Treasurer, Mr. W. H. Lyon, Auckland; Registrar, Rev. C. H. Bradbury, Wellington; Head Office, 314, Victoria Arcade, Auckland. In 1895 the meeting of the Council will be held in Dunedin, by invitation from the Otago District Committee.
Primitive Methodists.—A Conference is held every January. The next is to be held in Wellington, commencing 9th January, 1895. The Executive Committee of the Church sits in Auckland. The Conference officials for the present year are: President, Rev. Charles E. Ward, Auckland; Secretary. Rev. Joseph Sharp, Timaru; Secretary of Executive Committee, Mr. D. Goldie, Auckland.
United Methodist Free Churches.—The Assembly meets annually in February, in Canterbury, Auckland, Wellington, or Hawke's Bay. For 1894 the President is the Rev. J. Hosking, Christchurch, and the Secretary Mr. J. A. Flesher, Christchurch.
Hebrews.—Ministers, Rev. S. A. Goldstein, Auckland; Rev. Louis J. Harrison, Dunedin; Rev. H. van Staveren, Wellington; Rev. Adolph T. Chodowski, Christchurch; Mr. Alexander Singer, Hokitika. Annual meetings of the general Congregations are held at these places on the third Sunday in Elul (about the end of August).
Bible Christians.—A District Meeting of the Connexion is held annually. Superintendent, Rev. W. Ready, Dunedin; Connexional Representative and District Treasurer, Rev. J. Orchard, Christchurch; Trust Secretary, Rev. B. H. Ginger, Cromwell; School and Temperance Secretary, Rev. F. T. Read, Addington.
RELIGIOUS DENOMINATIONS, CHURCHESAND CHAPELS, OFFICIATING MINISTERS, ETC.
The following shows the number of persons (exclusive of Maoris) belonging to the different religious denominations in New Zealand, and the number of churches and chapels, according to the census of April, 1891; also, the number of officiating ministers under “The Marriage Act, 1880,” on the 1st June, 1894:—
| Religious Denominations. | Persons. | Churches and Chapels. | Officiating. Ministers |
|---|---|---|---|
* Including 42 Dissenters; 55 Christian Israelites. * Including 2,326 of No denomination, so described. † Including 1,269 of No religion, so described; 123 Atheists; 65 Secularists. ‡ In addition to the number of churches and chapels here given, there are about 400 schoolhouses, dwellings, or public buildings used for public worship, besides 20 buildings open to more than one Protestant denomination. | |||
| Episcopalians— | |||
| Church of England, and Episcopalians not otherwise defined | 250,945 | 345 | 270 |
| Protestants (undescribed) | 2,386 | ||
| Presbyterians— | |||
| Church of Scotland, Free Church of Scotland, Free Presbyterians, Presbyterian Church of New Zealand, Presbyterian Church of Otago and Southland, and Presbyterians otherwise defined | 141,477 | 246 | 185 |
| Methodists— | |||
| Wesleyan Methodists | 53,061 | 213 | 117 |
| Methodists (undefined) | 2,071 | ||
| Primitive Methodists | 5,220 | 41 | 29 |
| United Methodist Free Churches, Free Methodists, United Methodists | 1,905 | 18 | 16 |
| Bible Christians | 1,069 | 9 | 9 |
| Others | 89 | 1 | |
| Baptists | 14,825 | 32 | 20 |
| Congregational Independents | 6,685 | 21 | 19 |
| Lutherans, German Protestants | 5,616 | 13 | 11 |
| Unitarians | 308 | ||
| Society of Friends | 315 | ||
| Other Protestants— | |||
| Church of Christ (including Christian, Church of Christ, Christian Disciples, Disciples of Christ, Disciples) | 5,241 | 15 | 9 |
| Brethren (including Brethren, Christian Brethren, Exclusive Brethren, Open Brethren, Plymouth Brethren) | 3,537 | 3 | |
| Believers in Christ | 193 | ||
| Evangelists (including Evangelical Union, Evangelical Church, Evangelical Christians, Evangelical Brethren) | 93 | ||
| Nonconformists | 77 | ||
| Salvation Army | 9,383 | 34 | 8 |
| Christadelphians | 700 | ||
| Swedenborgians (including New Church, New Jerusalem Church) | 178 | ||
| Seventh-day Adventists | 415 | 1 | 2 |
| Students of Truth | 325 | ||
| Other Protestants (variously returned) | 536* | ||
| Catholics— | |||
| Roman Catholics | 85,856 | 181 | 142 |
| Catholics (undefined) | 1,416 | ||
| Greek Church | 56 | ||
| Catholic Apostolic | 150 | 1 | 1 |
| Other sects— | |||
| Hebrews | 1,463 | 5 | 6 |
| Mormons, Latter-day Saints | 206 | ||
| Spiritualists | 339 | ||
| Buddhists, Pagans, Confucians | 3,928 | ||
| Others (variously returned) | 154 | ||
| No denomination— | |||
| Freethinkers | 4,475 | ||
| Agnostic | 322 | ||
| Deists, Theists | 51 | ||
| Doubtful | 405 | ||
| No denomination (variously returned) | 2,999* | 18 | |
| No religion | l,558† | ||
| Unspecified | 1,288 | ||
| Object to state | 15,342 | ||
| Totals | 626,658 | 1,197‡ | 844 |
CHURCHES, CHAPELS, SCHOOLHOUSES, ETC.
The following return shows the number of churches and chapels, schoolhouses, and other buildings used for public worship by the different religious denominations, in April, 1891; also the number of persons for whom there was accommodation, and the number usually attending, in each provincial district:—
| Provincial Districts. | Churches and Chapels. | School-houses used for Public Worship. | Dwellings or Public Buildings used for Public Worship. | Number of Persons | |
|---|---|---|---|---|---|
| For whom Accommodation. | Attending Services. | ||||
| Auckland | 288 | 68 | 43 | 66,167 | 37,650 |
| Taranaki | 46 | 17 | 11 | 8,472 | 5,322 |
| Hawke's Bay | 58 | 8 | 6 | 11,274 | 7,064 |
| Wellington | 178 | 18 | 19 | 40,192 | 25,631 |
| Marlborough | 30 | 1 | 5,310 | 3,335 | |
| Nelson | 76 | 6 | 10 | 15,030 | 8,879 |
| Westland | 33 | 2 | 3 | 6,705 | 4,445 |
| Canterbury | 256 | 33 | 19 | 60,755 | 41,771 |
| Otago | 232 | 88 | 50 | 64,209 | 42,958 |
| Totals | 1,197 | 241 | 161 | 278,114 | 177,055 |
[June, 1894.]
CIVIL ESTABLISHMENT AT SEAT OF GOVERNMENT.
PREMIER'S OFFICE.
Premier—Hon. R. J. Seddon
Secretary to Premier and to Cabinet—A.J. Willis
Shorthand- and Type-writer—J. Gray
COLONIAL SECRETARY'S DEPARTMENT.
CHIEF OFFICE.
Colonial Secretary—Hon. Sir P. A. Buckley, K.C.M.G.
Under-Secretary—Hugh Pollen
Chief Clerk—R. H. Govett
Clerks—R. F. Lynch, J. F. Andrews, L. W. Loveday, M. J. Hodgins
Housekeeper and Chief Messenger—
AUDIT OFFICE.
Controller and Auditor-General—J. E. FitzGerald, C.M.G.
Assistant Controller and Auditor—J. C. Gavin
Chief Clerk—J. G. Anderson
Clerks—L. C. Roskruge, W. Dodd, P. P. Webb, H. S. Pollen, W. G. Holds-worth, C. M. Georgeson, A. W. Eames, J. T. Dumbell, B. A. Meek
Extra Clerks—D. C. limes, J. Swift, A. E. Bybles, J. Ward
Audit Officer, Agent-General's Office, London—C. F. W. Palliser
Audit Travelling Inspectors—A. H. Maclean, J. King, E. J. A. Stevenson, W. R. Holmes, E. T. Greville, G. H. I. Easton, J. M. Glasgow, C. P. Johnson
REGISTRAR-GENERAL'S OFFICE.
Registrar-General—E. J. Von Dadelszen
Chief Clerk—G. Drury
Clerks—W. C. Sproule, E. F. Norris, S.
Coffey Cadet—M. J. Ryan
PRINTINGAND STATIONERY DEPARTMENT.
Government Printer, Stationery Office Manager, and Controller of Stamp Printing—S. Costall
Superintending Overseer—J. Burns
Chief Clerk and Accountant—B.B. Allen
Clerk and Computer—B. K. Manley
Clerks —F. Barraud, J. W. Hall, R. Watts. A. Stace, W. Phillips
Cadet—R. B. Gray
Overseers—J. J. Gamble, B. Wilson
Overseer, Machine-room—C. Young
Overseer, Binning Branch—W. Franklin
Sub-overseer, Binding Branch—G. F. Broad
Sub-overseer, Jobbing-room—G. Tattle
Night Foreman—J. F. Rogers
Stamp Printer—H. Hume
Stereotyper and Electrotyper — W. J. Kirk
Readers—J. W. Henley, W. Fuller, M. F. Marks, H. S. Mountier
Forewoman, Binding Branch — Miss Marsden
CHIEF OFFICE.
Colonial Treasurer—Hon. J. G. Ward
Secretary to the Treasury, Receiver-General, and Paymaster-General—James B. Heywood
Accountant to the Treasury—Robert J. Collins
Cashier—C. E. Chittey
Corresponding Clerk—H. Blundell
Private Secretary and Shorthand-writer to Colonial Treasurer—F. Hyde
Clerks—C. Meacham, R. B. Vincent, W. E. Cooper, J. R. Duncan, E. L. Mowbray, A. O. Gibbes, T. H. Burnett, J. Radcliffe, J. Holmes, H. N. W. Church, J. Eman Smith, A. J. Morgan, T. J. Davis, F. H. Tuckey
Cadets—C. E. Matthews, H. Hawthorne, W. Jeff, W. Wilson, F. Davies
Officer for Payment of Imperial Pensions at Auckland—B. J. Devaney
FRIENDLY SOCIETIES‘ AND TRADES UNIONS‘ REGISTRY OFFICE.
Registrar—E. Mason
Revising Barrister—L. G. Reid
Clerk—C. T. Benzoni
Minister—Hon. J. G. Ward
Clerk—A. M. Smith
LAND AND INCOME TAX DEPARTMENT.
Commissioner of Taxes—J. McGowan
Deputy Commissioner of Taxes—G. F. C. Campbell
Chief Clerk—F. J. M. D. Walmsley
Accountant—P. Heyes
Clerks—G. Maxwell, H. Nancarrow, A. J. McGowan, J. P. Dugdale, J. M. King, D. R. Purdie, A. F. Oswin, G. W. Jänisch, J. Stevenson, C. V. Kreeft, H. H. Seed, D. G. Clark. T. Oswin, J. R. Smyth, H. L. Wiggins, J. W. Black
Cadets—W. J. Organ, R. Hepworth, J.J. Hunt, C. de R. Andrews, M. J. Crombie
DEPARTMENT OF JUSTICE.
HEAD OFFICE.
Minister of Justice—Hon. A. J. Cadman
Under-Secretary—C. J. A. Haselden, J.P.
Chief Clerk—F. Waldegrave
Translator—G. H. Davies
Clerks—C. B. Jordan, E. W. Porritt, R. C. Sim, B. M. Wilson, R. Hirter
CROWN LAW OFFICE.
Attorney - General — Hon. Sir P. A. Buckley, K.C.M.G.
Solicitor-General—W. S. Reid
Assistant Law Officer—L. G. Reid
Law Draftsman—J. Cumin
Clerk—E. Y. Redward
PATENT OFFICE.
Registrar of Patents, Designs, and Trademarks—C. J. A. Haselden, J.P.
Deputy Registrar—F. Waldegrave
Clerks—J. C. Lewis, F. J. Stewart
JUDICIAL.
Supreme Court Judges.
Chief Justice—
Wellington—Sir J. Prendergast, Knt.
Puisne Judges—
Wellington—C. W. Richmond
Auckland—E. T. Conolly
Christchurch—J. E. Denniston
Dunedin—J. S. Williams
District Court Judges.
Wairarapa, Wanganui, New Plymouth, Hawera, and Palmerston North—C. C. Kettle
Nelson—H. W. Robinson
Ashburton, Timaru, Oamaru, Queens-town, Naseby, Lawrence, Hokitika, Greymouth, Westport, and Reefton—C. D. R. Ward
Invercargill—C. E. Raw-son
Registrars of the Supreme Court.
Auckland—H. C. Brewer
New Plymouth—W. Stuart
Wanganui—C. C. Kettle
Napier—A. Turnbull
Gisborne—W. A. Barton
Wellington—D. G. A. Cooper
Nelson—H. W. Robinson
Blenheim—J. Allen
Christchurch—A. R. Bloxam
Hokitika—A. H. King
Dunedin—C. McK. Gordon
Invercargill—F. G. Morgan
Sheriffs.
Auckland—H. C. Brewer
Taranaki—W. G. P. O'Callaghan
Hawke's Bay—A. Turnbull
Poverty Bay—W. A. Barton
Wellington—D. G. A. Cooper
Wairarapa—T. Hutchison
Wanganui and Rangitikei—A. D. Thomson
Nelson—W. Heaps
Westland North—A. Greenfield
Central Westland—H. Lucas
Marlborough—W. A. Hawkins
Canterbury—A. R. Bloxam
Timaru—C. A. Wray
Westland—A. H. King
Otago—C. McK. Gordon
Southland—W. Martin
Crown Solicitors.
Auckland—Hon. J. A. Tole
New Plymouth—A. Standish
Gisborne—J. W. Nolan
Napier—A. J. Cotterill
Wellington—H. Gully
Wanganui—S. T. Fitzherbert
Nelson—C. Y. Fell
Blenheim—W. Sinclair
Christchurch—T. W. Stringer
Timaru—J. W. White
Hokitika—W. M. Purkiss
Dunedin—B. C. Haggitt
Invercargill—T. M. Macdonald
Oamaru—A. G. Creagh
Crown Prosecutors (District Courts).
New Plymouth—A. Standish
Hawera—E. L. Barton
Wanganui and Palmerston North—S. T. Fitzherbert
Westport and Reefton—C. E. Harden
Hokitika and Greymouth—W. M. Purkiss
Timaru—J. W. White
Oamaru—A. G. Creagh
Nelson—C. Y. Fell
Queenstown—Wesley Turton
Invercargill—T. M. Macdonald
Stipendiary Magistrates.
Auckland—H. W. Northcroft
Pokeno, Waikato, &cc.—T. Jackson
Onehunga, &cc.—R. S. Bush*
* Are also Wardens of Goldfields.
Russell, &cc.—J. S. Clendon
Tauranga, &cc.—J. M. Roberts
Thames, &cc.—H. E. Kenny*
Gisborne, &cc.—J. Booth
New Plymouth, &cc.—W. Stuart
Opunake, &cc.—A. Tuke
Wellington, &cc.—J. C. Martin
Wanganui, &cc—C. C. Kettle
Palmerston North, &cc.—H. W. Brabant
Wairarapa, &cc.—T. Hutchison
Napier, &cc.—A. Turnbull
Nelson, &cc.—H. W. Robinson, Wilson Heaps
Westport, Collingwood, &cc.—A. Greenfield*
Blenheim, &cc.—J. Allen*
Christchurch, &cc.—R. Beetham
Kaiapoi, &cc.—H. W. Bishop
Timaru, &cc.—C. A. Wray
Greymouth, &cc.—H. A. Stratford*
Hokitika, &cc.—D. Macfarlane*
Dunedin, &cc.—E. H. Carew
Oamaru, &cc.—J. Keddell*
Lawrence, &cc.—R. S. Hawkins*
Clyde, &cc.—J. N. Wood*
Naseby—S. M. Dalgleish*
Invercargill. &cc.—C. E. Rawson*
Chatham Islands—F. J. W. Gascoyne
Official Assignees in Bankruptcy.
Auckland—J. Lawson
Wellington—J. Ashcroft
Christchurch—G. L. Greenwood
Dunedin—C. C. Graham
Clerics of District and Magistrates’ Courts.
New Plymouth—W. G. P. O'Callaghan
Hawera—A. Trimble
Wanganui—A. D. Thomson
Palmerston North—W. Matravers
Masterton—F. H. Ibbetson
Nelson—C. H. Webb-Bowen
Hokitika—C. A. Barton
Greymouth—B. Harper
Westport—E. C. Kelling
Reefton—H. Lucas
Timaru—T. Howley
Ashburton—J. R. Colyer
Oamaru—W. G Filleul
Invercargill—W. Martin
Queenstown—H. N. Firth
Lawrence—H. J. Abel
Naseby—E. Rawson
Receivers of Gold Revenue, Mining Registrars, and Clerks of Wardens’ and Magistrates’ Courts.
Thames—F. J. Burgess
Coromandel—T. M. Lawlor
Te Aroha—J. Jordan
Whangarei—T. W. Taylor
Havelock and Cullensville (Marlborough)—W. H. Palmer
Nelson—C. H. Webb-Bowen
Motueka—H E. Gilbert
Collingwood—S. J. Dew
Westport—E. C. Kelling
Charleston—John Bird
Reefton—H. Lucas
Greymouth — B. Harper
Kumara—J. McEnnis
Hokitika—C. A. Barton
Naseby, &cc.—E. Rawson
Gore and Wyndham—C. J. Hinton
Clyde, Blacks, and Alexandra—F. T. D. Jeffrey
Cromwell—J. Fleming
Queenstown and Arrowtown — H. N. Firth
Lawrence—H. J. Abel
Riverton—A. M. Eyes
Clerics of Magistrates’ Courts.
Auckland—J. B. Stoney
Tauranga—J. Thomson
Gisborne—W. A. Barton
Hamilton—T. Kirk
Napier—A. S. B. Foster
Hastings—P. Skerrett
Marlon, &cc.—F. M. Deighton
Wellington—W. P. James
Blenheim—W. A. Hawkins
Christchurch—W. G. Walker
Lyttelton—W. Shanaghan
Kaiapoi—M. Lynskey
Dunedin—W. Somerville
NATIVE LAND COURT.
Chief Judge—G. B. Davy
Judges—A. Mackay, D. Scannell, R. Ward, S. W. von Stürmer, W. E. Gudgeon, W. J. Butler, H. F. Edger, W. G. Mair, L. O'Brien
Registrars—Auckland, J. A. Wilson (acting); Gisborne, H. C. Jackson (Deputy); Wellington, H. D. Johnson
Recorders of the Native Land Court.
H. W. Brabant, R. S. Bush, J. Booth, H. W. Bishop, J. S. Clendon. T. Jackson, C. C. Kettle, J. M. Roberts, W. Stuart, E. H. Carew, F. J. W. Gascoyne, H. E. Kenny
Trust Commissioners under Native Lands Frauds Prevention Act.
The Chief Judge, Judges and Recorders of the Native Land Court, also C. E. Rawson, H. Turton, H. W. Robinson, A. Turnbull, H. W. Northcroft, J. C. Martin
Government Native Agent, Otorohanga—G. T. Wilkinson
PRISONS DEPARTMENT.
Inspector—Lieut.-Colonel Arthur Hume, N.Z.M.
Clerk—T. E. Richardson
Gaolers—Auckland, George Sinclair Reston; Dunedin, Samuel Charles Phillips; Hokitika, Bartholomew Lloyd O'Brien; Invercargill, John Henry Bratby; Lyttelton, Matthew Michael Cleary; Napier, Francis Edward Severne; New Plymouth, Edward Rickerby; Wanganui, Robert T. Noble Beasley; Wellington, Patrick Samuel Garvey; Nelson, Thomas R. Pointon
DEPARTMENT OF LABOUR.
Minister of Labour—Hon. W. P. Reeves
Secretary and Chief Inspector of Factories—E. Tregear
Chief Clerk—James Mackay
Record Clerk—V. L. Willeston
Cadets—F. W. T. Rowley and J. W. Collins
(There are over 200 Bureau Agencies in different parts of the colony.)
INSPECTORSOF FACTORIES.
Wellington—J. Mackay, J. Shanaghan; Wellington and Auckland — Grace Neil; Christchurch—J. Lomas; Auckland — H. Ferguson; Dunedin — H. Maxwell; and 106 local Inspectors.
PUBLIC WORKS DEPARTMENT.
HEAD OFFICE.
Minister for Public Works—Hon. R. J. Seddon
Under-Secretary—H. J. H. Blow
Engineer-in-Chief—W. H. Hales
Resident Engineer (Head Office)—P. S. Hay. M.A., M. Inst. C.E.
Chief Clerk—J. A. McArthur
Accountant—G. J. Clapham
Land-purchase Officer—H. Thompson
Record Clerk—H. W. H. Millais
Clerks—W. D. Dumbell, L. F. Tegnér, W. Gibson, H. R. Roe, J. Williams, W. B. Fisher, W. Butler. E. Horneman
Chief Draughtsman—W. G. Rutherford
Architectural Draughtsman—J. Campbell
Draughtsmen—T. Perham, E. Jackson, W. Withers, W. G. Swan
Engineering Cadets—F. W. Furkert, A. Jack
DISTRICT OFFICES.
District Engineer—Dunedin, E. R. Ussher, M. Inst. C.E.
Resident Engineers—Auckland, C. R. Vickerman; Hunterville, G. Fitzgerald; Wellington, J. A. Wilson, jun.; Eketahuna, G. L. Cook, M. Inst. C.E.; Westport, T. H. Rawson; Greymouth, J. Thomson, B.E. In charge of North Island Main Trunk Railway survey, R. W. Holmes
Assistant Engineers—W. A. Shain, A. C. Koch, H. Macandrew, J. D. Louch,
F. M. Hewson, J. J. Hay, M. A., W. H. Gavin, J. W. Richmond, J. S. Stewart
Engineering Cadets—J. H. Lewis, H. Dickson, J. E. W. McEnnis
Clerks, Draughtsmen, &cc.—W. Black, C. T. Rushbrook, C. Wood, J. Young, A. Biddell, A. E. Kennedy, W. W. Spotswood, T. Douglas, F. G. Ince, J. H. Denton, A. R. Stone, J. Meenan, E. Waddell
INSPECTIONOF MACHINERY BRANCH.
Inspectors of Machinery and Engineer Surveyors of Steamers—Chief Inspector and Principal Engineer Surveyor, W. M. Mowatt; Auckland, W. J. Jobson, L. Blackwood; Wellington, H. A. McGregor, P. J. Carman; Christchurch, G. Croll; Dunedin, R. Duncan, A. Morrison
Clerk—A. W. Dwan
Cadet—B. Anderson
POST OFFICE AND TELEGRAPH DEPARTMENT.
GENERAL POST OOFFICE.
Postmaster-General and Commissioner of Electric Telegraphs—Hon. J. G. Ward
Secretary and Superintendent—W. Gray
Assistant Secretary and Inspector—T. Rose
Telegraph Engineer—J. K. Logan
Controller of Money-orders and Sayings-banks, and Accountant—G. Gray
Assistant Inspector of Post Offices—J. Grubb
Sub-Inspectors of Post Offices—D. Cumming, C. J. A. Tipping
Chief Clerk—D. Robertson
Clerks—W. R. Morris, E. V. Senn, F. V. Waters, H. Plimmer, J. C. Williamson, W. Beswick, W. Crow, G. Cenci, A. P. Dryden, L. Ledger. V. J. Brogan. W. Callaghan, G. W. Morehouse, W. Chegwidden, H. S. B. Miller, H. Huggins, G. V. Hudson, F. Perrin, H. D. Grocott, J. Brennan, H. Cornwall, R. J. Thompson, R. E. Hayes, D. A. Jenkins, H. N. McLeod, J. C. Redmond, C. B. Harton, W. J. Drake, R. F. Smith, J. D. Avery, H. E. Duff, J. G. Roache, J. Coyle, F. W. Faber, W. H. Carter, J. J.’ Murray, P. Tyrrell, E. Bermingham, C. Bermingham, S. Brock, W. Menzies, F. Menzies, E. Harris, B. Kenny, V. Johnston, M. A. McLeod
Electrician—W. C. Smythe
Mechanician—H. F. Smith
Assistant Mechanician—A. W. Macandrew
Storekeeper—J. Black
Assistant. Storekeeper—C. B. Mann
Cadet—C. Nicholls
Circulation Branch (Post Office)—J. Hoggard, Chief Clerk
INSPECTORSOF TELEGRAPHS.
Auckland—E. H. Bold
Christchurch—W. G. Meddings
Dunedin—J. Orchiston
SUB-INSPECTORSOF TELEGRAPHS.
Nelson—J. W. Gannaway
CHIEF POSTMASTERS.
Auckland—S. B. Biss
* Thames—J. E. Coney
* These are combined post- and telegraph-offices.
* Gisborne—W. W. Beswick
Napier—S. J. Jago
* New Plymouth—F. D. Holdsworth
* Wanganui—J. F. McBeth
* Blenheim—J. G. Ballard
* Nelson—H. Calders
* Westport—J. H. Sheath
* Greymouth—C. J. Berry
* Hokitika—A. E. Cresswell
* Christchurch—R. Kirton
* Timaru—R. J. Goodman
* Oamaru—J. A. Hutton
Dunedin—E. Cook
* Invercargill—J. W. Wilkin
OFFICERSIN CHARGEOF TELEGRAPH OFFICES.
Auckland—W. S. Furby
Napier—H. W. Harrington
Wellington—C. C. Robertson
Christchurch—J. W. Mason
Dunedin—A. D. Lubecki
DEPARTMENT OF TRADE AND CUSTOMS.
Commissioner of Trade and Customs—Hon. J. G. Ward
Secretary and Inspector of Customs and Secretary of Marine—W. T. Glasgow
Chief Clerk—T. Larchin
Clerks, Customs—E. T. W. Maclaurin, H. J. Marsh. Audit—H. W. Brewer, H. Crowther (Writer)
COLLECTORSOF CUSTOMS.
Auckland—A. Rose
Poverty Bay—D. Johnston, jun.
New Plymouth—C. S. Nixon
Napier—E. R. C. Bowen
Wellington—D. McKellar
Wanganui—A. Elliott
Wairau—E. W. Pasley
Nelson—W. Heaps
Westport—J. Mills
Grey mouth—A. McDowell
Hokitika—E. Chilman
Lyttelton and Christchurch—E. Patten
Timaru—A. Hart
Oamaru—R. Thompson
Dunedin—C. W. S. Chamberlain
Invercargill and Bluff Harbour—J. Borrie
OFFICERSIN CHARGEOF PORTS, AND COASTWAITERS.
Thames—T. C. Bayldon, Coastwaiter
Russell—H. Stephenson, Coastwaiter
Tauranga—J. Bull, Officer in Charge
Whangaroa—A. G. Ratcliffe, Coastwaiter
Whangarei—J. Munro, Coastwaiter
Mongonui—A. D. Clemett, Officer in Charge
Hokianga—G. Martin, Coastwaiter
Kaipara—J. C. Smith, Officer in Charge
Waitara—J. Cameron, Coast waiter
Foxton—J. B. Imrie, Officer in Charge
Paten—J. W. Glenny, Officer in Charge
Picton—J. B. Gudgeon, Officer in Charge
Chatham Islands—F. J. W. Gascoyne, Officer in Charge
MARINE DEPARTMENT.
Minister of Marine—Hon. J. G. Ward
Secretary—W. T. Glasgow
Chief Clerk—G. Allport
Nautical Adviser—K. Johnson
Clerk—J. J. D. Grix
Cadet—G. Sinclair
Examiners of Masters and Mates—R. Johnson and R. A. Edwin, Com. R.N.
Weather Reporter—R. A. Edwin, Com. R.N.
Examiners of Masters and Mates, Auckland—T. C. Tilly and J. Robertson
Examiner of Masters and Mates, Lyttelton—Sir A. Douglas, Bart.
Examiner of Masters and Mates, Dunedin—Sir A. Douglas, Bart.
Examiners of Engineers, Auckland—W. J. Jobson and L. Blackwood
Examiners of Engineers, Wellington—W. M. Mowatt, H. A. McGregor, and P. Carman
Examiner of Engineers, Christchurch—G. Croll
Examiners of Engineers, Dunedin—R. Duncan and A. Morrison
Master of s.s. “Hinemoa”—J. Fairchild
HARBOURMASTERS.*
* The more important harbours are controlled by local Boards, not by the Marine Department. (See “Ports and Harbours.”)
Collingwood—J. E. Fletcher
Foxton—A. Seabury
Hokianga—G. Martin
Kaipara—J. Christy Smith
Manukau—J. Robertson
Nelson—J. P. Low
Okarito—G. Thomson
Waitapu—S. G. Robinson
STAMP DEPARTMENT.
Commissioner of Stamp Duties—Hon. W. P. Reeves
Secretary for Stamps—C. A. St.G. Hickson
Chief Clerk and Accountant.—H. O. Williams
Custodian and Issuer of Stamps—W. H. Shore
Record and Receiving Clerk—J. P. Murphy
Clerk—J. Murray Chief
Stamper—C. Howe
DEPUTY COMMISSIONERSOF STAMPS.
Auckland—Thomas Hall
Gisborne—W. W. Beswick
Taranaki—W. Stuart
Hawke's Bay—G. G. Bridges
Wellington—C. A. St. G. Hickson
Wanganui—J. F. McBeth
Nelson—W. W. de Castro
Marlborough—A. V. Sturtevant
Canterbury—E. Denham
Timaru—R. J. Goodman
Otago—P. C. Corliss
Southland—F. G. Morgan
Westland—A. H. King
LAND TRANSFER DEPARTMENT AND DEEDS REGISTRY.
Registrar-General of Land and Deeds—G. B. Davy
Secretary, Land and Deeds—C. A. St. G. Hickson
DISTRICT LAND REGISTRARSAND REGISTRARSOF DEEDS.
Auckland—E. Bamford
Taranaki—W. Stuart
Wellington—G. B. Davy
Hawke's Bay—G. G. Bridges
Nelson—H. W. Robinson
Marlborough—J. Allen
Canterbury—J. M. Batham and E. Denham
Otago—H. Turton
Southland—F. G. Morgan
Westland—A. H. King
EXAMINERSOF TITLES.
Auckland—Thomas Hall
Taranaki—W. Stuart
Wellington—G. B. Davy
Hawke's Bay—G. G. Bridges
Nelson—H. W. Robinson
Marlborough—G. B. Davy
Canterbury—J. M. Batham
Otago—H. Turton
Southland—F. G. Morgan
Westland—A. H. King
REGISTRAROF JOINT-STOCK COMPANIES.
C. A. St. G. Hickson
ASSISTANT REGISTRARSOF JOINTSTOCK COMPANIES.
Auckland—Thomas Hall
Taranaki—W. Stuart
Hawke's Bay—G. G. Bridges
Wellington—H. O. Williams
Nelson—W. W. de Castro
Marlborough—A. V. Sturtevant
Canterbury—E. Denham
Otago—P. C. Corliss
Southland—F. G. Morgan
Westland—A. H. King
EDUCATION DEPARTMENT.
Minister of Education (administering also Native schools, industrial schools, and the institution for deaf-mutes)—Hon. W. P. Reeves
Secretary for Education and Inspector-General of Schools—Rev. W. J. Habens. B.A.
Chief Clerk—Sir E. O. Gibbes, Bart.
Clerks—P. K. de Castro. H. B. Kirk, M.A., R. H. Pope, F. L. Severne, A. R. Smithers, E. C. Banks
Organizing Inspector of Native Schools—James H. Pope. Assistant Inspector, H. B. Kirk, M.A.
EDUCATION BOARDS.
Auckland—V. E. Rice, Secretary
Taranaki—E. Veale, Secretary
Wanganui—A. A. Browne, Secretary
Wellington—A. Dorset, Secretary
Hawke's Bay—G. T. Fannin, Secretary
Marlborough—J. Smith, Secretary
Nelson—S. Ellis, Secretary
Grey—W. Riemenschneider, Secretary
Westland—A. J. Morton, B.A., Secretary
Canterbury North—J. V. Colborne-Veel, M.A., Secretary
Canterbury South—J. H. Bamfield, Secretary
Otago—P. G. Pryde, Secretary
Southland—J. Neill, Secretary
SCHOOL, COMMISSIONERS
(Administrators of Education Reserves).
Auckland—H. N. Garland, Secretary
Taranaki—E. Veale, Secretary
Wellington—W. H. Warren, Secretary
Hawke's Bay—E. P. A. Platford, Secretary
Marlborough—J. Smith, Secretary
Nelson—A. T. Jones, Secretary
Westland—A. J. Morton, Secretary
Canterbury—H. H. Pitman, Steward of Reserves
Otago—C. Macandrew, Secretary
INDUSTRIAL SCHOOLS.
Auckland Industrial School—Miss S. E. Jackson, Manager
St. Mary's Industrial School, Ponsonby—Rev. W. B. Purton, Manager
St. Joseph's Industrial School, Wellington—Rev. T. G. Dawson, Manager
St. Mary's Industrial School, Nelson—Rev. W. J. Mahoney, Manager
Burnham Industrial School (Canterbury)—T. Palethorpe, Manager
Caversham Industrial School (Otago)—G. M. Burlinson, Manager
INSTITUTIONFOR DEAF-MUTES, SUMNER.
Director—G. Van Asch
Steward—H. Buttle
LUNATIC ASYLUMS.
Inspector—Duncan MacGregor, M.A., M.B., C.M.
Medical Superintendent, Auckland Asylum—Thomas Burns, L.R.C.P., &cc.
Medical Superintendent, Christchurch Asylum—Gray Hassell, M.D.
Medical Superintendent, Wellington Asylum—Thomas R. King, M.D.
Medical Superintendent, Seacliff Asylum—E. E. Fooks, M.B.
Superintendent, Hokitika Asylum—H. Gribben
Superintendent, Nelson Asylum—J. Morrison
Ashburn Hall, Waikari (private asylum)—Joint proprietors, Dr. Alexander and J. Hume
RAILWAY DEPARTMENT.
Commissioners—Messrs. J. McKerrow (Chief), T. Ronayne, J. L. Scott
Secretary—E. G. Pilcher
Clerks—T. W. Waite, J. P. Bell, C. Isherwood, L. C. E. Hamann, J. E. Widdop, W. S. W. McGowan, W. H. Gifford
Audit Inspectors—C. Wallnutt, D. Munro, C. L. Russell
Railway Accountant—A. C. Fife
Clerks—H. Davidson, G. G. Wilson, M. C. Rowe, J. H. Davies, S. P. Curtis, J. McLean, E. Davy, R. Allen, V. Jänisch, A. Morris, E. P. Brogan, W. F. Ambler, E. J. Fleming, R. J. Loe,
F. W. Lash, A. H. Hunt, W. Bourke, E. R. Nicholson, W. H. Hales, W. E. Ahern
Stores Manager—R. Carrow
Clerks—G. Felton, R. E. Mackay, A. M. Heaton, J. Webster, J. E. Hasloch, L. G. Porter, W. Bushill, F. L. Ward District.
Managers—Whangarei, H. B. Dobbie; Kawakawa, J. D. Harris; Kaihu, T. H. Barstow; Auckland, C. Hudson; Wanganui, H. Buxton; Napier, A. Garstin; Wellington, B. Dawson; Greymouth, D. T. McIntosh; Westport, T. A. Peterkin; Nelson, H. St. J. Christophers; Picton, J. H. Fox; Christchurch, W. H. Gaw; Dunedin, A. Grant; Invercargill, S. F. Whitecombe
Chief Engineer for Working Railways—J. H. Lowe, M.Inst.C.E.
Assistant Engineer—F. W. MacLean Resident. Engineers—Auckland, J. Coom; Napier-Taranaki, J. I. Lawson; Christchurch, James Burnett; Dunedin, T. C. Maltby; Invercargill, C. H. Biss
Locomotive Superintendent—T. F. Rotheram
Locomotive Engineer—H. H. Jackson
Locomotive Managers—Auckland, A. V. Macdonald; Wanganui, A. L. Beattie
MINES DEPARTMENT.
CHIEF OFFICE.
Minister of Mines—Hon. A. J. Cadman
Under-Secretary for Mines—H. J. H. Eliott
Inspecting Engineer—H. A. Gordon
Chief Clerk—T. H. Hamer
Clerks—T. S. M. Cowie, H. E. Radcliffe
Analyst—W. Skey
Assistant Geologist—Alexander McKay, F.G.S.
Draughtsman—C. H. Pierard
INSPECTORSOF MINES.
Thames and Auckland Districts—G. Wilson; Canterbury, Dunedin, and Southland Districts—J. Gow; West Coast Districts, N. D. Cochrane
MANAGERSOF WATER-RACES.
Waimea-Kumara—A. Aitken
Mount Ida—R. Murray
SCHOOLSOF MINES.
Lecturers and Instructors: Thames—James Park; Assistant, F. B. Allen. Reefton—R. M. Aitken
BOARDOF EXAMINERSUNDER “THE COALMINES ACT, 1891.”
The Director of the Geological Survey of New Zealand; the Surveyor-General; the Inspecting Engineer of Mines; W. M. Mowatt, Chief Inspector of Machinery, Wellington; James Bishop, of Brunnerton; Thomas Brown, of Denniston; and William Shore, of Kaitangata
BOARDOF EXAMINERS UNDER “THE MINING ACT, 1891.”
Same official members as above Board, with the following private members: Thomas Dunlop, of Thames; Patrick Quirk Caples, of Reefton; George Casley, of Reefton
The Director of the Geological Survey of New Zealand is Chairman of both Boards.
GEOLOGICAL SURVEY, MUSEUM, AND OBSERVATORIES.
Minister in Charge—The Hon. Minister of Mines
Director—Sir J. Hector, K.C.M.G., M.D., F.R.S.
Clerk, Curator, and Meteorological Observer for Wellington—R. B. Gore
Astronomical Observer—T. King
Meteorological Observer, Auckland—T. F. Cheeseman, F.L.S.
Meteorological Observer, Dunedin—H. Skey
Meteorological Observer, New Plymouth—E. Veale
Meteorological Observer, Hokitika—A. D. Macfarlane
NEW ZEALAND INSTITUTE.
Manager—Sir J. Hector, K.C.M.G., M.D., F.R.S.
Hon. Treasurer—W. T. L. Travers, F.L.S.
Secretary—R. B. Gore
DEFENCE DEPARTMENT.
Minister of Defence—Hon. R. J. Seddon Commandant of the Forces—Colonel F. J. Fox, R.A.
Under - Secretary—Lieut. - Colonel A. Hume (acting)
Clerks—H. S. Royle, J. F. Grey
HARBOUR DEFENCE.
The Chief Engineer—W. H. Hales
NEW ZEALAND PERMANENT MILITIA.
Artillery.
Major F. Y. Goring
Major W. B. Messenger
Major Sir A. P. Douglas, Bart.
Captain H. C. Morrison
Captain J. Coleman
Lieutenant J. E. Hume
Inspector of Submarine Mining Establishment.
Captain J. Falconer
Torpedo Corps.
Captain J. Falconer
Captain W. T. Powell
Quartermaster, Permanent Militia.
Captain S. C. Anderson
Surgeon, Permanent. Militia.
Ernest Edward Foots, M.B.
Honorary Surgeon, Permanent Militia.
Patrick J. O'Neill O'Carroll
Honorary Chaplain, Lyttellon Detachment Permanent Militia.
The Rev. E. E. Chambers
Honorary Chaplain, Wellington Detachment Permanent Militia.
The Rev. W. C. Waters, M.A.
NEW ZEALAND POLICE FORCE.
Head Office.
Commissioner—Lieutenant - Colonel A. Hume
Clerks—J. M. Goldfinch, John Evans, John Tasker
Police Department.
Inspectors, 1st Class—Thomas Broham, John Bell Thomson, Peter Pender, William Stone Pardy
Inspectors, 2nd Class—John Emerson, James Hickson, Francis McGovern
DEPARTMENT OF LANDS AND SURVEY.
Minister of Lands and Immigration—Hon. J. McKenzie
Secretary for Crown Lands and Surveyor-General—S. Percy Smith
Under-Secretary for Crown Lands and Superintending Surveyor—Alexander Barron
HEAD OFFICE.
Chief Draughtsman—F. W. Flanagan
Draughtsmen—J. M. Kemp. G. P. Wilson, H. McCardell, T. M. Grant, H. A. R. Farquhar, G. N. Sturtevant, A. L. Haylock
Auditor of Land Revenue—C. O'H. Smith
Chief Clerk—W.S. Short.
Chief Accountant—H. J. Knowles
Bookkeeper—P. C. Willson
Clerks—F. T. O'Neill, F. Samuel, J. B. Red ward, A. A. S. Danby, R. Leckie, J. P. Kennedy, E. F. Hawthorne
Superintendent of Village-settlements—J. E. March
Overseer of Works, Rotorua Sanatorium—C. Malfroy
Caretaker, Hanmer Springs—J. Rogers
AUCKLAND DISTRICT.
Chief Surveyor and Commissioner of Crown Lands—G. Mueller
District Surveyors—L. Cussen, J. Baber, jun., G. A. Martin
Chief Draughtsman—W. C. Kensington
Receiver of Land Revenue—T. M. Taylor
HAWKE'S BAY DISTRICT.
Chief Surveyor and Commissioner of Crown Lands—T. Humphries
District Surveyors—E. C. Gold-Smith, J. Hay
Chief Draughtsman—F. Simpson
Receiver of Land Revenue—F. Bull
TARANAKI DISTRICT.
Chief Surveyor and Commissioner of Crown Lands—J. Strauchon
District Surveyor—H. M. Skeet
Chief Draughtsman—F. E. Clarke
Receiver of Land Revenue—G. P. Doile
WELLINGTON DISTRICT.
Assistant Surveyor - General and Commissioner of Crown Lands—J. H. Baker
District Surveyors—L. Smith, W. D. B. Murray, J. D. Climie, F. A. Thompson
Chief Draughtsman—J. McKenzie
Receiver of Land Revenue—W. G. Runcie
MARLBOROUGH DISTRICT.
Chief Surveyor and Commissioner of Crown Lands—S. Weetman
Chief Draughtsman and Receiver of Land Revenue—G. Robinson
NELSON DISTRICT.
Chief Surveyor and Commissioner of Crown Lands—J. S. Browning
District Surveyors—J. A. Montgomerie, F. S. Smith, J. Snodgrass, R. J. Sadd
Chief Draughtsman—H. Trent
Receiver of Land Revenue—J. T. Catley
WESTLAND DISTRICT.
Chief Surveyor and Commissioner of Crown Lands—David Barron
District, Surveyor—W. G. Murray
Chief Draughtsman and Receiver of Land Revenue—G. J. Roberts
CANTERBURY DISTRICT.
Chief Surveyor and Commissioner of Crown Lands—J. W. A. Marchant
District Surveyor—T. N. Broderick, G. H. McClure
Chief Draughtsman—C. B. Shanks
Receiver of Land Revenue—A. A. McNab
OTAGO DISTRICT.
Commissioner of Crown Lands—J. P. Maitland
Chief Surveyor—C. W. Adams
District Surveyors—J. Langmuir, E. H. Wilmot
Chief Draughtsman—P. Treseder
Receiver of Land Revenue—G. A. Reade
SOUTHLAND DISTRICT.
Chief Surveyor and Commissioner of Crown Lands—G. W. Williams
District Surveyor—John Hay
Chief Draughtsman—J. G. Clare
Receiver of Land Revenue—H. L. Welch
LAND-PURCHASE BRANCH.
Officer in Charge—P. Sheridan
Land-purchase Officer—G. T. Wilkinson
MEMBERSOF WASTE LANDS BOARDS.
Auckland—G. Müeller, R. Thompson, B. Harris, D. Lundon, L. J. Bagnall
Hawke's Bay—T. Humphries, C. Hall, T. Hyde, R. R. Groom. G. Mathewson
Taranaki—J. Strauchon, T. Kelly, C. K. Stock, J. Heslop
Wellington—J. H. Baker, W. A. Fitzherbert, A. W. Hogg, T. W. Fisher, F. Pirani
Marlborough—S. Weetman, A. P. Seymour, C. H. Mills, J. Redwood, J. A. Parsons
Nelson—J. S. Browning, J. Kerr, D. Bate, F. Hamilton
Westland—D. Barron, J. Bevan, L. Northcroft, A. Matheson
Canterbury—J. W. A. Marchant, W. C. Walker, A. C. Pringle, R. Meredith, D. McMillan
Otago—J. P. Maitland, A. McKerrow, H. Clark, J. Duncan, W. Dallas
Southland—G. W. Williams, C. Cowan, A. Kinross, J. McIntyre
CHIEF OFFICE.
Minister in Charge—Hon. J. McKenzie
Secretary of Agriculture and Chief Inspector of Stock—John D. Ritchie
Assistant Chief Inspector of Stock—W. A. Scaife
Chief Clerk—Richard Evatt
Clerk and Acting Biologist—T. W. Kirk, F.L.S.
Veterinary Surgeon—J. A. Gilruth, M.R.C.V.S.
Produce Commissioner, London—C. R. Valentine
Dairy Instructors—John Sawers, J. T. Lang
Pomologists—W. J. Palmer, J. C. Blackmore
INSPECTORSOF STOCK.
Auckland—E. Clifton (in charge), F. Schaw, Auckland; G. S. Cooke, Whangarei; D. Ross, Hamilton
Napier—J. Drummond (in charge), H. Oldham, Napier; C. Thomson, Gisborne; J. Harvey, Woodville
Wellington—Wairarapa—W. Miller, Masterton
West Coast—Richard Hull (in charge), Wanganui; A. Monro, Hawera; A. K. Blundell. Palmerston North
Nelson—H. M. Campbell, Nelson (in charge)
Marlborough—John Moore. Blenheim
Canterbury-Kaikoura—R. F. Holderness (in charge), J. E. Thomson. Christ-church; C. A. Cunningham, Rangiora, Waiau; W. G. Rees, Ashburton
South Canterbury—H. S. Thomson (in charge), Timaru; E. A. Field, Simon's Pass, Fairlie; C. C. Empson, Kurow
Otago—E. A. Dowden, Dunedin; B. Fullarton, Mosgiel; J. C. Miller, Oamaru; J. L. Bruce, Palmerston; A. Ironside,
Clyde; D. Kerr, Naseby; R. H. Hassall, Tapanui; H. G. J. Hull, Balclutha; H. T. Turner, Invercargill; J. W. Raymond, Bluff
Commissioner—J. H. Richardson
Assistant Commissioner—D. M. Luckie, F.S.S.
Actuary—Morris Fox
Secretary—W. B. Hudson
Chief Medical Officer—T. Cahill, M.D.
Accountant—R. J. S. Todd
Assistant Actuary—G. Leslie
Chief Clerk—G. W. Barltrop
Clerks—R, C. Niven, J. C. Young, G. A. Kennedy, D. J. McG. McKenzie, W. S. Smith, J. W. Kinniburgh, R. V. Blacklock, A. H. Hamerton, G. G. Schwartz, C. E. Galwey, H. Spackman, T. L. Barker, A. R. Kennedy, P. Muter, F. B. Bolt, R. T. Smith, A. L. B. Jordan, A. D. Ellis, J. A. Thomson, F. K. Kelling, H. S. Manning, A. de Castro, F. M. Leckie, C. W. Palmer, J. B. Young, W. C. Marchant, R. P. Hood, A. Avery, H. Rose, G. C. Fache, S. P. Hawthorne, W. H. Woon
Chief Messenger—W. Archer
AUCKLAND AGENCY.
District Manager—W. J. Speight
Chief Clerk—J. K. Blenkhorn
Clerk—J. B. Watkis
NAPIER AGENCY.
Resident Agent—J. H. Dean
WANGANUI AGENCY.
Resident Agent—J. Fairburn
WELLINGTON AGENCY.
District Manager—G. Robertson
Clerks—G. Crichton and G. A. N. Campbell
NELSON AGENCY.
Resident Agent—A. P. Burnes
GREYMOUTHAGENCY.
Resident Agent—Cyrus Webb
BLENHEIM AGENCY.
Agency Clerk—C. H. Ralph
CHRISTCHURCH AGENCY.
District Manager—J. C. Prudhoe
Chief Clerk—J. W. H. Wood
Clerk—A. E. Allison
TIMARU AGENCY.
Agency Clerk—S. T. Wicksteed
DUNEDIN AGENCY.
District Manager—R. S. McGrowan
Clerk—M. J. Heywood
OAMARU AGENCY.
Resident Agent—O. H. Pinel
INVERCARGILL, AGENCY.
Agency Clerk—J. Findlay
PUBLIC TRUST OFFICE.
Public Trustee—J. K. Warburton
Solicitor—F. J. Wilson
Chief Clerk—A. A. Duncan
Accountant and Second Clerk—T. S. Ronaldson
Third Clerk—T. Stephens
Examiner and Fourth Clerk—M. C. Barnett
Clerks—J. C. Matheson, P. Fair, H. Lamb, J. McLellan, P. Hervey, E. C.
Reeves, T. D. Kendall, W. A. Fordham, E. O'S. McCarthy, H. Oswin, A. Purdie, G. A. Smyth
Cadets—M. E. Harrap, S. Dimant, T. H. Andrew, J. Allen, W. Barr
Messenger—A. J. Cross
District. Agent, Christchurch—J. J. M. Hamilton
District Agent, Auckland—E. F. Warren
District Agent, Dunedin—F. H. Morice
District Agent, Greymouth—M. Townsend
West Coast Settlement Reserves Agent—Wilfred Rennell
Clerks—H. A. Eversleigh, C. Zachariah.
The Minister of Justice is charged with all matters relating to the Supreme, District, Magistrates’, and Wardens’ Courts, Crown Law Office, Coroners, patents, designs, and trade-marks, bankruptcy, criminal prosecutions in the higher Courts, Justices of the Peace, Licensing Committees, and prisons. The Supreme Court is presided over by a Chief Justice and four Puisne Judges. The Chief Justice and one Puisne Judge reside in Wellington, and one Judge resides at Auckland, one at Christchurch, and one at Dunedin. They all go on circuit periodically within their districts. Circuit sittings of the Supreme Court are held at fourteen places. There are four District Court Judges, holding Courts at seventeen towns. At nearly every town in which sittings of the Supreme or District Courts are held there is a Crown Prosecutor, paid by fees, and a Sheriff. In the District Courts the Crown Prosecutor exercises the function of a Grand Jury.
The Magistrates’ Courts are presided over by thirty-one Stipendiary Magistrates, and the Courts are held daily in the principal centres, and at convenient times in the smaller towns. The jurisdiction of these Courts may be “ordinary” (which includes, practically, all claims not exceeding £100 in value, except claims for damages for false imprisonment or illegal arrest, malicious prosecution, libel, slander, seduction, or breach of promise of marriage); “extended,” under which money-claims to an amount not exceeding £200 may be entertained; and “special,” which, in addition to the powers given to Courts of “extended” jurisdiction, enables the Court to deal with partnerships, injunctions, and other equity suits. At present eighteen of the Stipendiary Magistrates exercise the “extended” jurisdiction, but none the “special.” When, however, owing to increase of settlement, or pressure of business in the Supreme Court, necessity arises, the power to exercise either the extended or special jurisdiction can be conferred by Order in Council on any Court. The Magistrates exercising the special jurisdiction must be barristers or solicitors.
The procedure of the Courts is remarkably simple, no pleadings being required beyond a statement by the plaintiff sufficient to inform the defendant of the nature and extent of the claim. Due provision is made for counter-claims, and the joinder at any stage of the proceedings of all necessary parties, so that all questions arising in connection with the subject-matter before the Court may be finally dealt with at once. Appeal to the Supreme Court is allowed on points of law in cases where not more than £50 is concerned, and on points of law or fact in cases above that amount. Generally, the procedure is so simple and elastic that in the majority of cases heard it is not necessary to retain the services of a professional man, but, where solicitors are employed, the Court in its judgment settles the costs to be paid according to a prescribed scale. In places where there is not a Magistrate's Court Justices of the Peace have power to hold a Court and deal with claims not exceeding £20 in value, giving judgment “according to equity and good conscience.” The Act constituting these Courts was passed only last year, but experience of its working shows already that it has gone a very great way towards bringing cheap and speedy justice within reach of all. It is a consolidation and amendment of the Act of 1867 and subsequent statutes.
Another important enactment passed last year was “The Criminal Code Act, 1893,” which repeals thirty-three Imperial statutes (so far as this colony is concerned), and also twenty-eight New Zealand statutes, consolidating them all together with the common law as to crime into one Act. This defines the various crimes and prescribes the punishment for each. The only capital offences are treason, murder, and piracy with violence. By this Act penal servitude is abolished, and imprisonment with hard labour substituted therefor.
The Court may reserve any question of law for the Court of Appeal; and, if the Court refuse, the Attorney-General may give leave to move the Court of Appeal for leave to appeal.
The Court may give leave to any person convicted before it to apply to the Court of Appeal for a new trial on the ground that the verdict was against the weight of evidence, and the Court of Appeal may direct a new trial. In cases where the clemency of the Crown is sought, the Governor in Council, if he entertains a doubt whether the convicted person ought to have been convicted, may direct a new trial at such time and before such Court as he may think proper.
The First Offenders’ Probation Act continues to work well, and is the means of reclaiming many a one who but for it would swell the ranks of the criminal class.
Fourteen of the Magistrates are also Wardens, holding Wardens’ Courts in the various goldfields. There are fifty civilian Clerks of Courts, and eighty-two who are also police sergeants or constables.
Every Stipendiary Magistrate holds the office of Coroner, and is paid 10s. 6d. for each inquest, in addition to mileage at 1s. per mile. Besides these, there are thirty-eight Coroners, who are paid £1 1s. for each inquest, and mileage.
Bankrupt estates are administered by four Official Assignees, stationed respectively at Auckland, Wellington, Christchurch, and Dunedin; and by twenty Deputy Assignees, resident at as many other towns. The Supreme and District Courts have jurisdiction in bankruptcy proceedings, and the Governor has power to confer similar jurisdiction in small estates on any of the Magistrates’ Courts, but as yet this has not been found necessary.
The Commission of the Peace contains about seventeen hundred names, and additions are frequently made. A rota is kept in every borough and town of Justices residing within three miles of the Courthouse, and the Justices are required to attend the Court when summoned, or furnish a satisfactory excuse; failing this, they are struck off the Commission. Medical practitioners, Civil servants, and others are exempt from such attendance.
Witnesses in Criminal Courts are paid 6s. per diem, and in addition 4s. for every night they are absent from home. “Witnesses in civil cases are paid variously from 6s. to £1 1s. a day, according to their condition in life.
Intestate estates in New Zealand are dealt with by the Public Trust Office, and are referred to in the article on that institution.
The Licensing and Bankruptcy laws are dealt with in separate articles.
The Attorney-General of the colony is a Cabinet Minister holding other portfolios, but the Solicitor-General is a permanent officer and a member of the Civil Service.
Jury lists are compiled annually by the police, revised by the Bench of Justices, and forwarded to the Sheriffs, who from them prepare special and common jury panels.
The defence forces consist of the Permanent Militia (Artillery and Torpedo Corps), and the auxiliary forces of Volunteers (Cavalry, Naval Artillery, Field Artillery, Engineers, and Rifle companies). The whole of these Forces are commanded by an Imperial officer, belonging to the Royal Artillery, who is under the orders of the Defence Minister. There is also an Under-Secretary for Defence, to whom all questions of expenditure are referred; while the Chief Engineer, Public Works Department, has charge of the defence-works.
MILITIAAND VOLUNTEER DISTRICTS.
The two islands (North and Middle) are divided into eleven districts, each commanded by a Field Officer of Militia or Volunteers, with a competent staff of drill-sergeants.
PERMANENT MILITIA (ARTILLERY).
This Force is divided into four batteries, which are stationed at Auckland, Wellington (head-quarters), Lyttelton, and Dunedin; their principal duties are to look after and take charge of all guns, stores, ammunition, and munitions of war at these four centres. The Force consists of three majors, two captains, one subaltern, with an establishment of 145 of all ranks.
PERMANENT MILITIA (TORPEDO CORPS).
This branch, like the Artillery, is divided amongst the four centres, for submarine and torpedo work, and consists of two captains, with a total of 64 of all ranks. They have charge of four torpedo-boats and four steam-launches, and of all submarine-mining and torpedo stores. They are likewise employed in blowing up rocks and wrecks, and generally improving harbours.
VOLUNTEERS.—CAVALRY.
There are five troops of Cavalry, three in the North Island and two in the Middle Island. These corps are kept in a state of efficiency by going into camp for six days’ training annually. The total strength of the five troops is 294 of all ranks.
VOLUNTEERS.—MOUNTED RIFLES.
There are nine corps of Mounted Rifles, six in the North Island and three in the Middle Island, with a total strength of 453 of all ranks. The efficiency of these corps is, like that of the Cavalry, maintained by their going into camp for an annual training of six days.
VOLUNTEERS.—NAVAL ARTILLERY.
There are sixteen batteries of this branch of the service, seven in the North Island and nine in the Middle Island, having a total strength of 1,023 of all ranks. These corps are divided into port and starboard watches, and one watch is trained to assist the Permanent Artillery in working the heavy ordnance, while the other watch is trained in submarine and torpedo work, as auxiliaries to the Torpedo Corps. These corps have cutters and other boats provided and kept up for them, and are instructed in rowing, knotting, splicing, signalling, and such-like duties.
VOLUNTEERS.—FIELD ARTILLERY.
There are eleven batteries of Field Artillery, three in the North Island and eight in the Middle Island, with a total of 539 of all ranks. They are armed with 6-, 9-, and 12-pounder Armstrong breech-loading rifled guns on field-carriages.
VOLUNTEERS.—ENGINEERS.
This branch consists of three corps, with a total of 179 of all ranks. There is one corps in the North Island and two in the Middle Island. Besides carrying rifles they are provided with entrenching tools and all appliances for blowing up bridges or laying land-mines.
VOLUNTEERS.—RIFLE CORPS.
In this branch of the service there are fifty corps (including one honorary reserve), fourteen being in the North Island and thirty-six in the Middle Island, with a total strength of 2,773 of all ranks, including garrison bands at places where four or more corps have their head-quarters.
VOLUNTEERS.—CADET CORPS.
There is a force of thirty-six cadet corps—viz., six in the North Island and thirty in the Middle Island, with a total strength of 1,885 of all ranks.
ORDNANCE, ARMS, ETC.
The armament at the forts of the four centres consists of 8in. 13-ton breech-loading rifled Elswick Ordnance Company's guns, with 6in. 5-ton of like pattern, all mounted on hydro-pneumatic disappearing carriages; 7in. 7-ton muzzle-loading rifled guns, on traversing slides; 64-pounder rifled muzzle-loading converted 71cwt. guns, on garrison standing carriages and traversing slides; 64-pounder rifled muzzle-loading 64cwt. guns on traversing slides; 6-pounder quick-firing Nordenfeldts, on garrison pillar-mountings, and field-carriages; and Hotchkiss and Maxim quick-firing guns. The Volunteer Field Artillery are armed with 6-, 9-, and 12-pounder Armstrong breech-loading rifled guns, and the whole of the Force have carbines or rifles (short) of Snider pattern.
There is a large stock of Whitehead torpedoes, contact- and ground-mines, in charge of the Torpedo Corps, as well as four Thorneycroft torpedo-boats.
ENROLMENT, ETC.
Members of the Permanent Militia are enrolled for three years’ service, and Volunteers for one year. The Permanent Militia is recruited from men who have one year's efficient service in the Volunteers; and after passing the gunnery course in the Permanent Militia the men are eligible for transfer to police and prison service.
INSTRUCTORS.
The Instructors for Permanent Artillery and Torpedo Corps are obtained from the School of Gunnery at Shoeburyness, and from the Royal Engineers, under a three years’ engagement, on completion of which they return to the Royal Artillery or the Royal Engineers.
CAPITATION.
An annual capitation of £2 10s. is granted to each efficient Volunteer, and a sum not exceeding £20 to each efficient cadet corps. One hundred rounds of Snider ball-cartridge are issued each year free to every Volunteer, and twenty-five rounds to each cadet over thirteen years of age.
The defence forces of New Zealand are administered under “The Defence Act, 1886.”
EXPENDITUREONTHE ESTABLISHMENTAND MAINTENANCEOF DEFENCESFROM 1881–85 TO 1893–94.
| Year. | Military Expenditure. | Harbour Defences. | Total. |
|---|---|---|---|
| £ | £ | £ | |
| 1884–85 | 90,816 | 9,601 | 100,417 |
| 1885–86 | 91,242 | 127,167 | 218,409 |
| 1886–87 | 89,927 | 139,429 | 229,356 |
| 1887–88 | 122,061 | 73,458 | 195,519 |
| 1888–89 | 53,591 | 50,089 | 103,680 |
| 1889–90 | 63,614 | 15,752 | 79,366 |
| 1890–91 | 80,891 | 10,798 | 91,689 |
| 1891–92 | 75,343 | 7,644 | 82,987 |
| 1892–93 | 59,808 | 11,205 | 71,013 |
| 1893–94 | 56,570 net | 3,976 net | 60,546 |
PAIDBYTHE GOVERNMENTOF NEW ZEALAND, ASON 31ST MARCH, 1894.
[By an Act passed in 1871 the pension system was abolished in New Zealand.]
| Name. | Date from which Pension commenced. | Amount. | ||
|---|---|---|---|---|
| Under “The Civil Service Act, 1866.” | ||||
| £ | s. | d. | ||
| Allan, A. S. | 1 Sept., 1888 | 195 | 5 | 0 |
| Arrow, H. | 1 Aug., 1881 | 26 | 0 | 0 |
| Aubrey, H. R. | 1 Nov., 1880 | 223 | 0 | 0 |
| Austin, A. D. | 1 Oct., 1887 | 247 | 10 | 0 |
| Baddeley, H. C. | 12 Jan., 1888 | 225 | 0 | 0 |
| Bailey, B. | 16 May, 1887 | 198 | 13 | 9 |
| Bailie, F. | 1 Feb., 1893 | 77 | 8 | 8 |
| Baker, E. | 1 Nov., 1880 | 214 | 17 | 1 |
| Barnard, W. H. | 1 June, 1880 | 101 | 18 | 1 |
| Barr, A. | 1 Oct., 1888 | 366 | 13 | 4 |
| Batkin, C. T. | 1 April, 1890 | 533 | 6 | 0 |
| Bicknell, F. | 1 Feb., 1882 | 96 | 13 | 4 |
| Blomfield, J. | 21 Mar., 1889 | 101 | 15 | 0 |
| Bridson, W. | 1 Aug., 1893 | 146 | 8 | 7 |
| Brown, S. P. | 23 Mar., 1872 | 80 | 0 | 0 |
| Brown, W. R. E. | 1 Aug., 1892; | 265 | 16 | 8 |
| Buchanan, J. | 1 July, 1886 | 127 | 13 | 6 |
| Bull, E. | 1 July, 1887 | 105 | 14 | 3 |
| Burgess. A. | 1 June, 1886 | 116 | 13 | 4 |
| Burn, J. F. | 1 July, 1887 | 51 | 0 | 0 |
| Butts, E. D. | 1 April, 1893 | 258 | 6 | 8 |
| Campbell, P. E. | 1 Mar., 1890 | 466 | 13 | 0 |
| Carrington, O. | 1 Feb., 1878 | 300 | 0 | 0 |
| Chapman, R. | 1 Jan., 1868 | 255 | 19 | 0 |
| Cheesman, G. H. | 1 Mar., 1893 | 82 | 10 | 0 |
| Cheeseman, W. F. | 1 April, 1890 | 154 | 15 | 1 |
| Clarke, H. T. | 1 Jan., 1879 | 400 | 0 | 0 |
| Clarke, H. | 1 Oct., 1879 | 98 | 13 | 0 |
| Cooper, G. S. | 1 Aug., 1892 | 533 | 6 | 8 |
| Corbett, W. | 2 Jan., 1870 | 273 | 4 | 0 |
| Costall, J. | 10 July, 1892 | 131 | 3 | 10 |
| Creeke, W. | 1 April, 1891 | 52 | 15 | 8 |
| Crowe, A. | 31 Dec., 1885 | 68 | 12 | 3 |
| Culpan, W. | 1 Dec., 1868 | 62 | 10 | 0 |
| Cunningham, J. | 1 Feb., 1888 | 175 | 0 | 0 |
| Cunningham, P. | 1 Mar., 1880 | 65 | 11 | 11 |
| Daniell, H. C. | 1 Jan., 1878 | 266 | 13 | 4 |
| DeCastro, C. D. | 1 Mar., 1892 | 172 | 10 | 0 |
| Dick, S. J. | 1 Feb., 1893 | 250 | 0 | 0 |
| Dickey, A. J. | 1 Nov., 1875 | 122 | 0 | 5 |
| Earle, J. | 13 Nov. 1888 | 104 | 10 | 0 |
| Eliott, G. E. | 30 Nov., 1872 | 400 | 0 | 0 |
| Ensor, J. | 1 Feb., 1893 | 51 | 6 | 8 |
| Falck, F. | 1 Mar., 1893 | 125 | 13 | 4 |
| Fenton, F. D. | 3 Nov., 1881 | 630 | 19 | 0 |
| Gill, R. J. | 1 Sep., 1886 | 228 | 11 | 5 |
| Gisborne, W. | 1 Oct., 1876 | 466 | 13 | 4 |
| Graham, G. H. | 8 Sep., 1891 | 52 | 10 | 0 |
| Gregory, J. | 16 Feb., 1881 | 53 | 6 | 8 |
| Greenway, J. H. | 1 Nov., 1891 | 116 | 16 | 0 |
| Halliday, C. | 31 Aug., 1886 | 96 | 13 | 4 |
| Hamilton, M. | 11 July, 1880 | 200 | 0 | 0 |
| Harsant, W. | 11 June, 1878 | 151 | 13 | 4 |
| Hart, J. T. | 12 Nov., 1890 | 193 | 7 | 0 |
| Hartwright, H. | 1 Jan., 1886 | 152 | 7 | 8 |
| Henn, J. | 1 April, 1893 | 88 | 3 | 4 |
| Hill, E. | 13 Sep., 1871 | 100 | 0 | 0 |
| Hill, F.J. | 1 Aug., 1892 | 95 | 0 | 0 |
| Hill, T. | 1 May, 1892 | 400 | 0 | 0 |
| Holden, T. | 13 Oct., 1878 | 31 | 5 | 0 |
| Jackman, S.J. | 1 May, 1892 | 149 | 6 | 8 |
| Johnston, D. | 15 Dec., 1880 | 366 | 13 | 4 |
| Judd, A. | 1 April, 1887 | 173 | 6 | 8 |
| Keetley, E. | 1 July, 1884 | 18 | 12 | 10 |
| Kelly, J. D. | 1 July, 1891 | 130 | 19 | 0 |
| Kissling, T. | 1 Jan., 1894 | 317 | 5 | 2 |
| Laing, E. B. | 1 April, 1887 | 112 | 10 | 0 |
| Lang, A. | 1 Feb., 1893 | 75 | 15 | 3 |
| Lawlor, H. C | 1 June, 1868 | 130 | 18 | 0 |
| Lincoln, R. S. | 1 Mar., 1839 | 68 | 17 | 0 |
| Lockwood, W. H. | 1 Jan., 1880 | 22 | 18 | 4 |
| Lodge, W. F. | 1 Oct., 1881 | 185 | 0 | 0 |
| Lundon, D. | 1 May, 1892 | 210 | 0 | 0 |
| Lusher, R. A. | 31 Aug., 1880 | 76 | 16 | 8 |
| Mathews, J. | 1 July, 1866 | 81 | 13 | 4 |
| Meech, W. | 1 Jan., 1882 | 64 | 16 | 7 |
| Meikle, A. M. | 1 May, 1887 | 145 | 14 | 3 |
| Mills, W. | 23 Sept., 1875 | 385 | 14 | 4 |
| Mitford, G. M. | 1 Feb., 1869 | 196 | 15 | 0 |
| Monson, J. R. | 1 Oct., 1882 | 271 | 16 | 0 |
| Monro, H. A.H. | 1 Nov., 1880 | 342 | 17 | 2 |
| Morrow, H. | 1 June, 1890 | 120 | 16 | 8 |
| Macarthur, J. | 1 Jan., 1876 | 65 | 0 | 0 |
| McCarthy, S. | 1 Mar., 1878 | 55 | 16 | 8 |
| McCulloch, H. | 1 Aug., 1890 | 233 | 0 | 0 |
| MacDonnell, R. T. | 23 July, 1890 | 150 | 0 | 0 |
| McKellar, H. S. | 1 Aug., 1892 | 433 | 6 | 8 |
| O'Connor, R. | 1 Sept., 1892 | 147 | 0 | 6 |
| Parker, T. W. | 1 June, 1881 | 242 | 3 | 9 |
| Parris, R. | 1 Jan., 1877 | 314 | 5 | 8 |
| Pauling, G. W. | 1 Feb., 1887 | 91 | 1 | 5 |
| Pearson, W. H. | 30 Sept., 1884 | 340 | 9 | 6 |
| Pickett, R. | 1 Aug., 1866 | 209 | 10 | 6 |
| Pinwill, A. | 1 July, 1891 | 120 | 17 | 0 |
| Pitt, H. | 1 May, 1881 | 100 | 0 | 0 |
| Plimpton, R.E.E. | 4 Dec., 1883 | 110 | 14 | 3 |
| Pollen, D. | 30 Oct., 1876 | 418 | 15 | 0 |
| Powell, D. | 1 July, 1893 | 44 | 1 | 8 |
| Rich, E. P. | 1 June, 1892 | 217 | 0 | 0 |
| Robertson, J. | C Oct., 1892 | 155 | 0 | 0 |
| Rodgerson, W. J. | 1 July, 1892 | 248 | 6 | 8 |
| Rogan, J. | 1 Jan., 1878 | 466 | 13 | 4 |
| Rough, D. | 1 May, 1868 | 277 | 1 | 8 |
| Sealy, H. B. | 1 Nov., 1876 | 285 | 14 | 3 |
| Searancke, W. N. | 1 Feb., 1879 | 240 | 0 | 0 |
| Sheath, A. B. | 31 Mar., 1880 | 129 | 9 | 0 |
| Shrimpton, J. | 16 July, 1889 | 146 | 14 | 0 |
| Sinclair, A. | 1 June, 1878 | 195 | 0 | 0 |
| Smith, J. E. | 1 July, 1877 | 484 | 11 | 6 |
| Smith, T. H. | 1 July, 1876 | 371 | 8 | 7 |
| Snoswell, T. | 5 Dec., 1891 | 83 | 14 | 0 |
| Snow, C. H. | 1 Dec., 1887 | 157 | 10 | 0 |
| Stevens, P. | 1 Dec., 1892 | 183 | 0 | 0 |
| Stewart, J. T. | 1 May, 1889 | 300 | 0 | 0 |
| Taylor, G. | 1 Mar., 1893 | 121 | 0 | 0 |
| Thomas, G. W. | 1 Nov., 1875 | 38 | 15 | 0 |
| Tidmarsh, W. | 1 Aug., 1867 | 69 | 7 | 3 |
| Tizard, E. P. | 1 July, 1888 | 180 | 19 | 0 |
| Tucker, W. | 31 Dec., 1880 | 104 | 13 | 4 |
| Veal, J. | 1 Sept., 1885 | 49 | 15 | 3 |
| Veale, J. S. | 1 Sept., 1887 | 56 | 2 | 10 |
| Wardell, H. S. | 1 July, 1888 | 366 | 13 | 0 |
| Watson, R. | 1 Oct., 1892 | 145 | 0 | 0 |
| White, W. | 1 July, 1881 | 36 | 5 | 0 |
| White, W. B. | 1 July, 1873 | 375 | 4 | 9 |
| Wilkin, J. T. W. | 1 Feb., 1874 | 127 | 19 | 4 |
| Willcocks, E. S. | 1 Nov., 1880 | 250 | 0 | 0 |
| Williams, E. M. | 1 April, 1880 | 135 | 0 | 0 |
| Wilson, W. W. | 1 Feb., 1881 | 100 | 14 | 3 |
| Woon, J. G. | 1 July, 1892 | 209 | 10 | 6 |
| Wrigg, H. C. W. | 1 Aug., 1889 | 157 | 2 | 10 |
| Name. | Date from which Pension commenced. | Amount. | ||
|---|---|---|---|---|
* Per diem. (a) 1s. 6d. from 25th October, 1869; increased to 2s. 2d., 7th December, 1870. (b) 1s. from 17th December, 1868, to 17th December, 1869; 1s. 6d. from 17th December, 1869, to 17th December, 1870; 8d. from 17th December, 1870, to 30th September, 1874; increased to 1s. 6d., 1st October, 1874. (c) 2s. from 5th June, 1867, to 5th June, 1868; 2s. from 5th June, 1868, to 5th June, 1869; permanent from 9th November, 1869. (d) 2s. for two years, from 8th April, 1870; renewed for twelve months; again renewed for twelve months; permanent from 1st May, 1874. (e) 2s. from 1st January, 1869, for eighteen months; permanent from 18th May, 1872. (f) 1s. 6d. for twelve months, from 26th April, 1869; renewed for twelve months, 1870; renewed. for twelve months, 1871; permanent from 12th May, 1872. (g) 2nd October, 1869; ceased on 9th April. 1870; renewed, 22nd April, 1874. (h) 1s. 6d. from—, 1867; increased to 2s. from 14th February, 1868. (i) 1s. 6d. for twelve months, from 15th March, 1869; 1s. for twelve months, from March, 1870; 1s. for twelve months, from March, 1871; permanent from 1st April, 1872. (k) 3s. for twelve months, from 9th April, 1870; 2s. 8d., permanent, from 1st May, 1871. (l) 1s. 6d. for twelve months, from 18th October, 1869; 1s. 6d. for twelve months, from October, 1870; permanent from 5th November, 1871. (m) 1s. 6d. for eight months, from 20th September, 1869; 2s. 2d. for twelve months, from 11th June, 1870; 2s. 2d. for twelve months, from 11th June, 1871; 2s. 2d. from 11th June, 1872; permanent from 12th June, 1873. (n) 1s. from 16th May, 1865; renewed for twelve months, April, 1866; again renewed for twelvemonths, 8d. for twelve months, from 1868, to 10th May, 1869; 6d. for twelve months, from May, 1869; permanent from 11th May, 1870. | ||||
| Under “The Hamerton Pension Act, 1891.” | ||||
| £ | s. | d. | ||
| Hamerton, R. C. | 11 Sept., 1891 | 250 | 0 | 0 |
| Under “The Meredith and Others Pensions Act, 1870.” | ||||
| Collins, Mary | 13 Nov., 1869 | 65 | 0 | 0 |
| Hamlin, Rhoda B. | 1865 | 50 | 0 | 0 |
| Under “The Military Pensions Act, 1866.” | ||||
| Arapera to Reo | 1 July, 1870 | 20 | 0 | 0 |
| Brown, M. R. | 75 | 0 | 0 | |
| Buck, Cath. M. | 70 | 0 | 0 | |
| Coffey, M. F. | 25 | 0 | 0 | |
| Hastings, L. | 55 | 0 | 0 | |
| Iritona, Hanita | 8 Nov., 1868 | 12 | 0 | 0 |
| Kopu, Mere Karaka | 1 Oct., 1874 | 36 | 0 | 0 |
| Marara, Ngakoa | 3 Dec., 1860 | 36 | 0 | 0 |
| McDonald, E. | 36 | 0 | 0 | |
| McDonnell, W. | 150 | 0 | 0 | |
| Morrison, Ann | 26 Oct., 1866 | 36 | 0 | 0 |
| Percy, J. A. | 150 | 0 | 0 | |
| Ross, Edward O. | 17 Nov., 1866 | 75 | 0 | 0 |
| Russell, C. | 36 | 0 | 0 | |
| Von Tempsky, A. | 3 Oct., 1868 | 120 | 0 | 0 |
| Adamson, T. | (a) | 0 | 2 | 2* |
| Beamish, J. G. | (b) | 0 | 1 | 6* |
| Corbett, George | (c) | 0 | 2 | 0* |
| Crawford, C. F | 0 | 2 | 0* | |
| Crosby, H. | (d) | 0 | 2 | 0* |
| Dore, G. H. | (e) | 0 | 2 | 0* |
| Gibbons, M. C. | 12 Oct., 1869 | 0 | 2 | 2* |
| Hamblyn, J. | 1 Oct., 1872 | 0 | 2 | 2* |
| Hope, E. L. | (f) | 0 | 1 | 6* |
| Kelly, T. | 9 April, 1870 | 0 | 2 | 2* |
| Kershaw, P. | 9 Aug., 1869 | 0 | 1 | 6* |
| Under “The Military Pensions Act, 1866”—continued. | ||||
| £ | s. | a. | ||
| Lacey, Garrett | 0 | 2 | 2* | |
| Lake, T. | 0 | 2 | 6* | |
| Lloyd, T. | (g) | 0 | 2 | 0* |
| McKay, G. | 0 | 1 | 0* | |
| McMahon, T. | (h) | 0 | 2 | 0* |
| Monck, J. B. | 1 April, ‘72 (i) | 0 | 1 | 0* |
| Shanaghan, J. | 0 | 1 | 6* | |
| Shepherd, R. | (k) | 0 | 2 | 8* |
| Timms, W. | (l) | 0 | 1 | 6* |
| Tuffin, G. | 0 | 2 | 2* | |
| Vance, R. | 8 April, 1870 | 0 | 2 | 2* |
| Walsh, W. | 15 Nov., 1866 | 0 | 1 | 6* |
| Wasley, Edw. O. | (m) | 0 | 2 | 2* |
| Williamson, F. | 1 June, 1869 | 0 | 2 | 0* |
| Anaru Patapu | 14 May, 1865 | 0 | 0 | 9* |
| Anaru Taruke | 1 Jan., 1867 | 0 | 0 | 6* |
| Apera to Keunga | 14 May, 1864 | 0 | 2 | 6* |
| Honi Parake | 1 Jan., 1867 | 0 | 0 | 6* |
| Karena Ruataniwha | 1 July, 1870 | 0 | 1 | 0* |
| Matiu Whitiki | 1 April, 1885 | 0 | 0 | 6* |
| Mauparca | 1 July, 1867 | 0 | 1 | 0* |
| Mehaka Kepa | 2 Aug., 1865 | 0 | 0 | 9* |
| Pera Taitimu | 12 Oct., 1869 | 0 | 1 | 0* |
| Ruihana | 10 April, 1869 | 0 | 0 | 6* |
| Raniera Ngoto | 1 Oct., 1884 | 0 | 0 | 6* |
| Under “The Walsh and Other Pensions Act, 1869”. | ||||
| £ | s. | d. | ||
| Hewett, Ellen A. | 10 Feb., 1865 | 50 | 0 | 0 |
| Under “The Militia Act Amendment Act, 1862.”. | ||||
| Bending, W. | 0 | 2 | 0* | |
| Bilton, F. | 0 | 2 | 0* | |
| Callaghan, D. | 0 | 2 | 2* | |
| Cody, W. | 0 | 1 | 0* | |
| Dunn, A. J. N. | 0 | 2 | 0* | |
| Herford, A. | 130 | 0 | 0 | |
| King, E. M. | 80 | 0 | 0 | |
| Leaf, R. | (n) | 0 | 0 | 6* |
| Oxenham, W. | 0 | 1 | 6* | |
| Sarten, Lucy | 1864 | 0 | 2 | 0* |
| Skinner, W. H. | 0 | 2 | 6* | |
| Vickery, W. | 0 | 2 | 0* | |
| Woolfe, T. | 0 | 2 | 0* | |
| Under “The Schafer, McGuire, and Others Pensions Act, 1872.” | ||||
| McGuire, E. | 29 Sept., 1871 | 0 | 1 | 0* |
| Russell, W. | 1 July, 1871 | 0 | 1 | 0* |
| Schafer, C. | 1 July, 1871 | 30 | 0 | 0 |
| Under “The Supreme Court. Judges Act. 1874.” | ||||
| Gresson, H. B. | 1 April, 1875 | 750 | 0 | 0 |
There are (January, 1894) 178 publications on the register of newspapers for New Zealand. Of these, 52 are daily papers, 15 are published three times a week, 25 twice a week, 62 once a week, 1 fortnightly, and 23 monthly.
The names of the newspapers, with the postal districts and towns in which they are printed, are given in the following list, the second column showing the day or period of publication. M. signifies morning paper; E., evening paper:—
| AUCKLAND. | |
|---|---|
| Aratapu— | |
| Wairoa Bell | Friday. |
| Auckland— | |
| Auckland Evening Star (E.) | Daily. |
| Auckland Weekly News and Town and Country Journal | Saturday. |
| Bible Standard | Monthly. |
| Church Gazette | Monthly. |
| Helping Hand | Monthly. |
| New Zealand ABC Guide | Monthly. |
| New Zealand Craftsman | Monthly. |
| New Zealand Farmer, Bee and Poultry Journal | Monthly. |
| New Zealand Graphic, Ladies’ Journal, and Youths’ Companion | Wednesday. |
| New Zealand Herald (Mi) | Daily. |
| Observer | Saturday. |
| Produce Circular and Monthly Report | Monthly. |
| Sharland's Trade Journal | Monthly. |
| Sporting Review | Saturday. |
| Coromandel— | |
| Coromandel County News (E.) | Tuesday, Friday. |
| Dargaville— | |
| Northern Advertiser | Friday. |
| Hamilton— | |
| Waikato Times and Thames Valley Gazette (M.) | Mon., Wed., Sat. |
| Kamo— | |
| Marsden Times | Wednesday. |
| Kawakawa— | |
| Northern Luminary | Friday. |
| Onehunga— | |
| Manukau Gazette and Onehunga District Weekly Courier | Saturday. |
| Rotorua— | |
| Hot Lakes Chronicle | Wednesday. |
| Whangarei— | |
| Gumdiggers’ Weekly | |
| Northern Advocate (E.) | Wed., Friday. |
| THAMES. | |
|---|---|
| Opotiki— | |
| Korimako Hou | Monthly. |
| Opotiki Herald, Whakatane County and East Coast Gazette (E.) | Tuesday, Friday. |
| Paeroa— | |
| Hauraki Tribune and Thames Valley Advertiser (M.) | Tuesday, Friday. |
| Ohinemuri Gazette | Saturday. |
| Tauranga— | |
| Bay of Plenty Times and Thames Valley Warden (E.) | Mon., Wed., Fri. |
| Te Aroha— | |
| Te Aroha and Ohinemuri News and Upper Thames Advocate (M.) | Wed., Saturday. |
| Thames— | |
| Thames Star (E.) | Daily. |
| Thames Advertiser and Miners’ News (M.) | Daily. |
| GISBORNE. | |
| Gisborne— | |
| Poverty Bay Herald (E.) | Daily. |
| NEW PLYMOUTH. | |
| Inglewood— | |
| lnglewood Record and Waitara News (M.) | Wed., Saturday. |
| New Plymouth— | |
| Budget and Taranaki Weekly Herald | Saturday. |
| Daily News (M.) | Daily. |
| Taranaki Herald (E.) | Daily. |
| Taranaki News | Saturday. |
| Stratford— | |
| Egmont Settler (E.) | Mon., Wed., Fri. |
| NAPIER. | |
| Danevirke— | |
| Bush Advocate (E.) | Tues., Thur., Sat. |
| Napier— | |
| Daily Telegraph (E.) | Daily. |
| Evening News and Hawke's Bay Advertiser (E.) | Daily. |
| Hawke's Bay Herald (M.) | Daily. |
| Hawke's Bay Weekly Courier | Friday. |
| New Zealand Eire and Ambulance Record | Monthly. |
| Waipawa— | |
| Waipawa Mail (E.) | Tues., Thur., Sat. |
| Wairoa— | |
| Wairoa Guardian and County Advocate (M.) | Wed., Saturday. |
| WANGANUI. | |
| Hawera— | |
| Egmont Star | Saturday. |
| Hawera and Normanby Star, Patea County Chronicle, and Waimate Plains Gazette (E.) | Daily. |
| Hunterville— | |
| Paraekaretu Express, Hunterville, Ohingaiti, Moawhango, and Rata Advertiser (E.) | Tuesday, Friday. |
| Manaia— | |
| Waimate Witness (E.) | Wed., Saturday. |
| Marton— | |
| Mercury (E.) | Daily. |
| Rangitikei Advocate and Manawatu Argus (E.) | Daily. |
| Patea— | |
| Patea County Press (E.) | Mon., Wed., Fri. |
| Wanganui— | |
| Wanganui Chronicle and Patea-Rangitikei Advertiser (M.) | Daily. |
| Wanganui Herald (E.) | Daily. |
| Weekly Chronicle and Patea-Rangitikei Record | Saturday. |
| Yeoman | Friday. |
| WELLINGTON. | |
| Carterton— | |
| Wairarapa Observer, Featherston Chronicle, East. Coast Advertiser, and South County Gazette (E.) | Tues., Thur., Sat. |
| Feilding— | |
| Feilding Star (E.) | Daily. |
| Foxton— | |
| Manawatu Herald (E.) | Tues., Thur., Sat. |
| Greytown— | |
| Wairarapa Standard (E.) | Mon., Wed., Fri. |
| Masterton— | |
| Eketahuna and Pahiatua Mail (M.) | Daily. |
| Wairarapa Daily Times (E.) | Daily. |
| Wairarapa Star (E.) | Daily. |
| Wairarapa Weekly Times | Wednesday. |
| Weekly Star and Wellington District Advertiser | Thursday. |
| Otaki— | |
| West Coast Mail and Horowhenua County Advertiser (M.) | Tuesday, Friday. |
| Pahiatua— | |
| Pahiatua Herald (E.) | Mon., Wed., Fri. |
| Palmerston North— | |
| Manawatu Daily Standard, Rangitikei Advertiser, and West Coast Gazette (M.) | Daily. |
| Manawatu Daily Times (E.) | Daily. |
| Petone— | |
| Hutt and Petone Chronicle | Wednesday. |
| Shannon— | |
| Manawatu Farmer and Horowhenua County Chronicle (E.) | Mon., Wed., Fri. |
| Wellington— | |
| Church Chronicle | Weekly. |
| Evening Post (E.) | Daily. |
| Evening Press (E.) | Daily. |
| Fair Play | Saturday. |
| New Zealand Central Trade Report | Monthly. |
| New Zealand Mail, Town and Country Advertiser | Friday, |
| New Zealand Times (M.) | Daily. |
| Register and Property Investors’ Guide | Monthly. |
| Typo | Monthly. |
| Weekly Herald | Weekly. |
| Wellington Price Current and New Zealand Trade Review | Monthly. |
| Woodville— | |
| Woodville Examiner (E.) | Mon., Wed., Fri. |
| BLENHEIM. | |
| Blenheim— | |
| Evening Star | Saturday. |
| Marlborough Daily Times and Town and Country Advertiser (M.) | Daily. |
| Marlborough Express (E.) | Daily. |
| Marlborough Weekly News | Friday. |
| Havelock— | |
| Pelorus Guardian and Miners’ Advocate (M.) | Tuesday, Friday. |
| Kaikoura— | |
| Kaikoura Star and North Canterbury and South Marlborough News (E.) | Tuesday, Friday. |
| Picton— | |
| Marlborough Press, County of Sounds Gazette (M.) | Tuesday, Friday. |
| NELSON. | |
| Collingwood— | |
| Golden Bay Argus | Friday. |
| Nelson— | |
| Colonist (M.) | Daily. |
| Nelson Evening Mail (E.) | Daily. |
| Takaka— | |
| Takaka News and Collingwood Advertiser | Thursday. |
| WESTPORT. | |
| Charleston— | |
| Charleston Herald, Brighton Times, and Croninville Reporter (M.) | Wed., Saturday. |
| Lyell— | |
| Lyell Times and Central Buller Gazette | Saturday. |
| Westport— | |
| Buller Miner | Friday. |
| Westport News (M.) | Daily. |
| Westport Times and Evening Star (E.) | Daily. |
| GREYMOUTH. | |
| Brunnerton— | |
| Brunnerton News, Blackball Courier, and Grey Valley Advertiser (E.) | Daily. |
| Greymouth— | |
| Evening Star and Brunnerton Advocate (E.) | Daily. |
| Grey River Argus (M.) | Daily. |
| Weekly Argus | Weekly. |
| Reefton— | |
| Inangahua Herald and New Zealand Miner (M.) | Daily. |
| Inangahua Times (M.) | Daily. |
| Reefton Guardian (E.) | Daily. |
| HOKITIKA. | |
| Hokitika— | |
| Hokitika Guardian and Evening Star (E.) | Daily. |
| Leader | Thursday. |
| West Coast Times (M.) | Daily. |
| Kumara— | |
| Kumara Times and Dillman's and Goldsborough Advertiser (E.) | Daily. |
| Ross— | |
| Ross and Okarito Advocate and Westland Advertiser (M.) | Wed., Saturday. |
| CHRISTCHURCH. | |
| Akaroa— | |
| Akaroa Mail and Banks Peninsula Advertiser (M.) | Tuesday, Friday. |
| Ashburton— | |
| Ashburton Guardian (E.) | Daily. |
| Ashburton Mail, Rakaia, Mount Somers, and Alford Forest Advertiser (M.) | Tues., Thur., Sat. |
| Christchurch— | |
| Canterbury Times | Friday. |
| Lyttelton Times (M.) | Daily. |
| Mercantile and Bankruptcy Gazette of New Zealand | Friday. |
| New Zealand Baptist | Monthly. |
| New Zealand Church News | Monthly. |
| New Zealand Methodist | Saturday. |
| New Zealand Railway Review | Monthly. |
| New Zealand Schoolmaster | Monthly. |
| New Zealand Volunteer and Civil Service Gazette and Naval and Military Chronicle | Monthly. |
| New Zealand War Cry and Official Gazette of the Salvation Army | Tuesday. |
| Press (M.) | Daily. |
| Prohibitionist (fortnightly) | Saturday. |
| Star (E.) | Daily. |
| Truth (E.) | Daily. |
| Weekly Press | Friday. |
| Young Soldier | Saturday. |
| Oxford (East)— | |
| Oxford and Cust Observer | Saturday. |
| Rangiora— | |
| Standard and North Canterbury Guardian (M.) | Wed., Saturday. |
| Southbridge— | |
| Ellesmere Guardian | Wed., Saturday. |
| TIMARU. | |
| Temuka— | |
| Geraldine Guardian (M.) | Tues., Thur., Sat. |
| Temuka Leader (M.) | Tues., Thur., Sat. |
| Timaru— | |
| South Canterbury Times (E.) | Daily. |
| Timaru Herald (M.) | Daily. |
| Waimate— | |
| Waimate Times (M.) | Wed., Saturday. |
| OAMARU. | |
| Oamaru— | |
| North Otago Times (M.) | Daily. |
| Oamaru Mail (E.) | Daily. |
| DUNEDIN. | |
| Balclutha— | |
| Clutha Leader | Friday. |
| Free Press | Friday. |
| Clinton— | |
| Clutha County Gazette and Popotunoa Chronicle and Clinton Advertiser | Friday. |
| Clyde— | |
| Dunstan Times, Vincent County Gazette, and General Goldfields Advertiser | Friday. |
| Cromwell— | |
| Cromwell Argus and Northern Goldfields Gazette | Tuesday. |
| Dunedin— | |
| Evening Star (E.) | Daily. |
| Farmers’ Circular | Thursday. |
| Katipo | Monthly. |
| Licensed Victuallers’ Gazette and Hotel Guide | Saturday. |
| New Zealand Insurance, Finance, and Mining Journal | Monthly. |
| New Zealand Presbyterian | Monthly. |
| New Zealand Public Opinion and Saturday Advertiser | Saturday. |
| New Zealand Tablet | Friday. |
| Otago Daily Times (M.) | Daily. |
| Otago Witness | Saturday. |
| Otago Workman, Dunedin and Suburban Advertiser | Saturday. |
| People's Journal | Friday. |
| Phonographic Magazine and Typewriting News | Monthly. |
| Lawrence— | |
| Tuapeka Times (M.) | Wed., Saturday. |
| Milton— | |
| Bruce Herald (M.) | Tuesday, Friday. |
| Mosgiel— | |
| Taieri Advocate (M.) | Wed., Saturday. |
| Naseby— | |
| Mount Ida Chronicle (Thurs. E. and Sat. M.) | Thur., Saturday. |
| Palmerston— | |
| Palmerston and Waikouaiti Times | Friday. |
| Roxburgh— | |
| Mount Benger Mail | Saturday. |
| Tapanui— | |
| Tapanui Courier and Central Districts Gazette | Wednesday. |
| LNVERCARGILL. | |
| Arrow River— | |
| Lake County Press | Thursday. |
| Gore— | |
| Mataura Ensign (M.) | Tuesday, Friday. |
| Southern Standard (M.) | Tuesday, Friday. |
| Invercargill— | |
| Southern Cross | Saturday. |
| Southlander | Friday. |
| Southland Daily News (E.) | Daily. |
| Southland Times (M.) | Daily. |
| Weekly Times | Friday. |
| Queenstown— | |
| Lake Wakatipu Mail (E.) | Friday. |
| Riversdale— | |
| Waimea Plains Review and Market Report | Friday. |
| Riverton— | |
| Western Star and Wallace County Gazette (M.) | Wed., Saturday. |
The foregoing towns are arranged according to the postal district in which they are situated.
Taking the provincial districts, Auckland has 33 publications registered as newspapers. Taranaki 9, Hawke's Bay 9, Wellington 34, Marlborough 7, Nelson 13, Westland 8, Canterbury 27, and Otago 38.
Table of Contents
Table of Contents
[The progress of the colony from the beginning is shown in the statistical broadsheets which follow the General Index.]
THE estimated population of New Zealand on the 31st December, 1893, with the increase for the year by excess of births over deaths and by immigration over emigration, was as under:—
| Persons. | Males. | Females. | |
|---|---|---|---|
| Estimated population (exclusive of Maoris) on 31st December, 1892 | 650,433 | 345,146 | 305,287 |
| Increase during the year 1893— | |||
| Persons. | Males. | Females. | |
|---|---|---|---|
| Excess of births over deaths | 11,420 | 5,367 | 6,053 |
| Excess of arrivals over departures | 10,412 | 7,122 | 3,290 |
| 21,832 | 12,489 | 9,343 | |
| Estimated population (exclusive of Maoris) on 31st December, 1893 | 672,265 | 357,635 | 314,630 |
| Maori population, census 1891 | 41,993 | 22,861 | 19,132 |
| Total estimated population of the colony on 31st December, 1893 | 714,258 | 380,496 | 333,762 |
The estimated number of Chinese in the colony at the end of the year 1893 was 4,044 persons, of whom 17 were females. These are included in the above table. At the census of April, 1891, the number in the colony was 4,414, so that in the space of two years and nine months a reduction of 400, or 10 per cent., had taken place, caused mainly by the excess of departures over arrivals.
The Maori population can be given only for the date of the census, as very few births or deaths of Natives are registered; but the movement of Native population, judged by the results of the enumeration of 1886 (when the number was 41,969) compared with the number in 1891 (41,993), is so small that to use the same figures for several years in succession does not give rise to any great degree of error. Over 100 Maoris lost their lives at the eruption of Tarawera, which occurred between the census of 1886 and that of 1891.
Included in the population, as stated above, are the half-castes, who numbered 4,865 at the time of the census; 2,681 of these were half-castes living as members of Maori tribes, and 2,184 half-castes living as Europeans. The half-castes living as Europeans increased between 1886 and 1891 by 227, or at the rate of 11.6 per cent. The number of Maori wives of Europeans was 251 in 1891, against 201 in 1886.
The estimated European population of the principal divisions of the colony on 31st December, 1893, was—
| Persons. | Males. | Females. | |
|---|---|---|---|
| North Island and adjacent islets (exclusive of Maoris) | 303,428 | 161,577 | 141,851 |
| Middle Island and adjacent islets (exclusive of Maoris) | 368,324 | 195,771 | 172,553 |
| Stewart Island | 212 | 123 | 89 |
| Chatham Islands (exclusive of natives) | 293 | 159 | 134 |
| Kermadec Islands | 8 | 5 | 3 |
| Total for the colony (exclusive of Maoris) | 672,265 | 357,635 | 314,630 |
To obtain these estimates of population in the different islands the census figures have been corrected (1) by adding the natural increases, that is, the excess of births over deaths, to the population of each island, and (2) by allocating the excess of immigration over emigration for the whole colony proportionately to the population of each island at census time. By this plan, no doubt, the North Island has suffered somewhat. But the arrivals are all counted at the first and the departures at the last port touched at, so that it becomes necessary to distribute the total gain in the manner indicated above. Moreover, what is far more serious, there are no records of the movements of population from one island to another. In all probability the North Island population is in reality decidedly greater than is here shown, and the Middle Island less.
During the interval between the census of March, 1886, and that of April, 1891, the increase of population in the North Island was far in excess of that in the Middle Island. The figures are: North Island, 1891, 281,455 persons, against 250,482 in 1886, a difference of 30,973, or at the rate of 12.36 per cent.; Middle Island, 1891, 344,711 persons, against 327,592 in 1886, a difference of only 17,119, or 5.22 per cent. The European population of Stewart Island did not increase, but that of the Chatham Islands rose from 199 to 271 persons. The Kermadec Islands appeared for the first time in 1891 as part of New Zealand, with a population of 19 persons.
The Australian Colonies as a whole contained on the 31st December, 1893, an estimated population amounting to 4,110,311 persons (exclusive of the aboriginal natives of Queensland and South and Western Australia, but including the New Zealand Maoris).
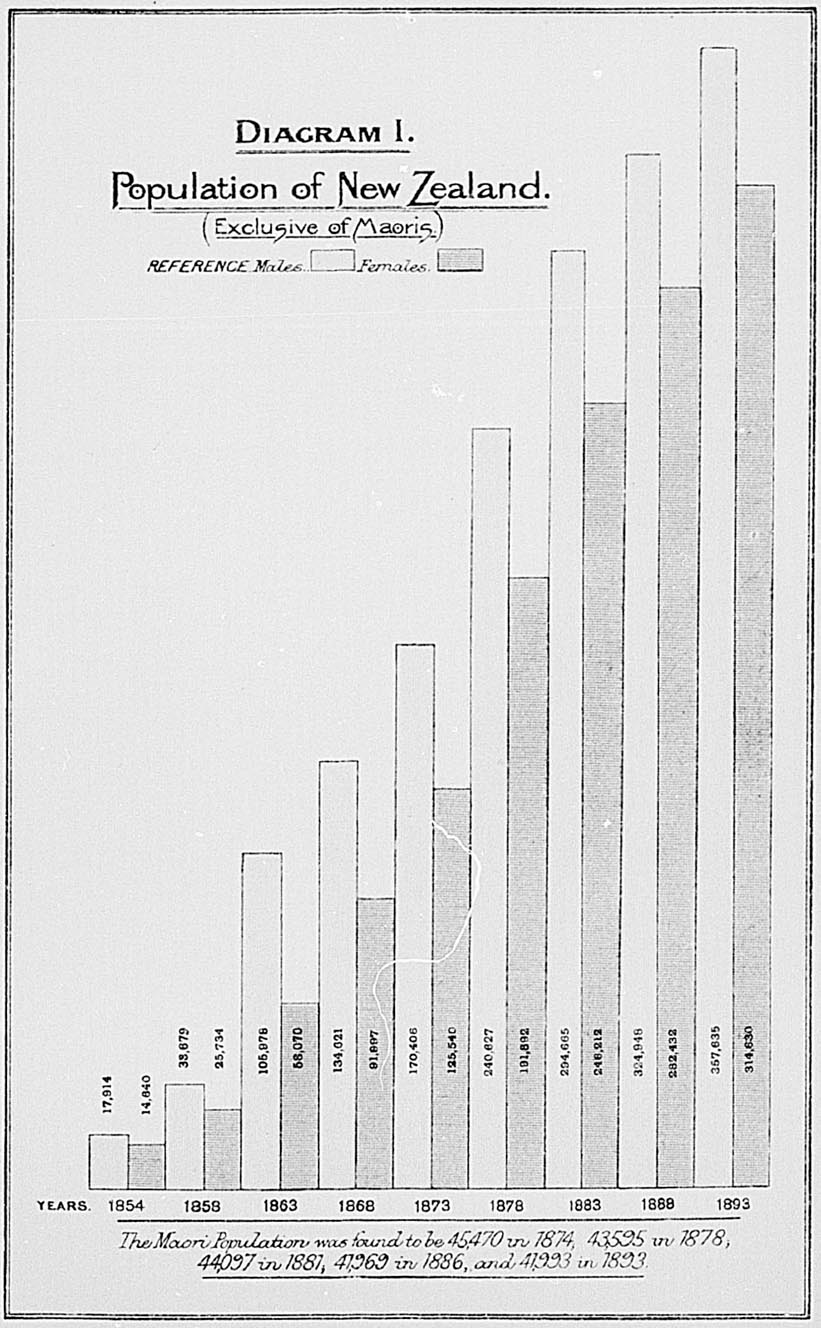
AUSTRALASIAN COLONIES.—ESTIMATED POPULATIONON 31ST DECEMBER, 1893.
| Persons. | Males. | Females. | |
|---|---|---|---|
* Including the Northern Territory. | |||
| Queensland | 432,299 | 243,793 | 168,506 |
| New South Wales | 1,223,370 | 658,990 | 564,380 |
| Victoria | 1,174,022 | 608,065 | 565,957 |
| South Australia* | 346,874 | 181,752 | 165,122 |
| Western Australia | 65,064 | 41,014 | 24,050 |
| Tasmania | 154,424 | 81,978 | 72,446 |
| New Zealand | 714,258 | 380,496 | 333,762 |
| Total Australasian Colonies | 4,110,311 | 2,196,088 | 1,914,223 |
Religions and Birthplaces. 1891
The subjoined table gives a summary of the results of the census of 1891 as to the religions of the people, with the proportion of each denomination to the whole population at that and each of the three previous censuses:—
| Denominations. | Number of Adherents in 1891. | Proportions per Cent. of Population. | |||
|---|---|---|---|---|---|
| 1878. | 1881. | 1886. | 1891. | ||
† In calculating the proportions for 1891 the “Unspecified” have not been taken into account. | |||||
| Church of England, and Protestants (undefined) | 253,331 | 42.55 | 41.50 | 40.17 | 40.51 |
| Presbyterians | 141,477 | 22.95 | 28.08 | 22.59 | 22.62 |
| Wesleyan Methodists | 53,061 | 7.79 | 8.07 | 7.81 | 8.49 |
| Other Methodists | 10,354 | 1.35 | 1.46 | 1.74 | 1.65 |
| Baptists | 14,825 | 2.21 | 2.34 | 2.48 | 2.37 |
| Congregational Independents | 6,685 | 1.34 | 1.38 | 1.35 | 1.07 |
| Lutherans | 5,616 | 1.36 | 1.18 | 1.02 | 0.90 |
| Salvation Army | 9,383 | 0.91 | 1.50 | ||
| Society of Friends | 315 | 0.04 | 0.05 | 0 05 | 0.05 |
| Unitarians | 308 | 0.11 | 0.10 | 008 | 0.05 |
| Other Protestants | 11,295 | 1.08 | 1.26 | 1.55 | 1.82 |
| Roman Catholics, and Catholic; (undefined) | 87,272 | 14.21 | 14.08 | 13.94 | 13.96 |
| Greek Church | 56 | 0.02 | 0.01 | 001 | 0.01 |
| Hebrews | 1,463 | 0.34 | 0.31 | 0.27 | 0.23 |
| Buddhists, Confucians | 3,928 | 1.05 | 1.01 | 0.77 | 0.63 |
| Other denominations | 849 | 0.05 | 0.11 | 0.10 | 0.12 |
| No denomination | 8,252 | 0.53 | 0.89 | 1.05 | 1.32 |
| No religion | 1,558 | 005 | 0.06 | 0.17 | 0.25 |
| Unspecified | 1,288 | 0.42 | 0.27 | 0.50 | † |
| Object to state | 15,342 | 2.55 | 2.85 | 3.44 | 2.45 |
| Totals | 626,658 | 100.00 | 100.00 | 100.00 | 100.00 |
These returns of religions show that 81.03 per cent. of the people belonged to various Protestant denominations; 13.96 were Roman Catholics; and the remainder belonged to other sects, were of no denomination, or objected to state their religious views. The proportion of Roman Catholics is much less in New Zealand than in Australia.
Methodists increased between 1886 and 1891 at the rate of 14.61 per cent.; Church of England adherents increased 9.02 per cent.; Presbyterians, 8.29 per cent.; Roman Catholics, 8.12 per cent.; while the Salvation Army had the highest rate of increase, 77.84 per cent.
Freethinkers numbered 4,475 persons in 1891 and 3,925 in 1886. They are included above in the numbers for “No denomination.”
The returns of birthplaces gave the following particulars:—
| Born in | Persons. Census 1891. | 1886. Per Cent. | 1891. Per Cent. |
|---|---|---|---|
| New Zealand | 366,716 | 51.89 | 58.61 |
| England | 117,070 | 21.72 | 18.71 |
| Scotland | 51,916 | 9.48 | 8.30 |
| Ireland | 47,634 | 8.89 | 7.61 |
| Wales | 2,214 | 0.34 | 0.35 |
| Australia and Tasmania | 15,943 | 2.98 | 2.55 |
| Other British possessions | 3,703 | 0.68 | 0.59 |
| Denmark, Sweden, and Norway | 4,755 | 0.86 | 0.77 |
| Germany | 4,663 | 0.87 | 0.75 |
| China | 4,470 | 0.79 | 0.71 |
| Other countries, and at sea | 6,557 | 1.50 | 1.05 |
| Unspecified | 1,017 | ||
| Totals | 626,658 | 100.00 | 100.00 |
The New-Zealand-born population increased between 1886 and 1891 at the rate of 22.16 per cent., but the numbers born in the Mother-country, Australian Colonies, other British dominions, and foreign parts diminished more or less in each case during the quinquennium.
Education, 1891.
Of both sexes, 77.25 per cent. of the persons could read and write, 3.98 read only, and 18.77 could not read. Comparing with previous censuses, and for each sex separately, the proportion per cent. able to read and write will be found to rise steadily, while the proportions of those reading only, and unable to read, diminish. The under-mentioned figures illustrate this:—
| Census. | Proportion per Cent. (Males). | Proportion per Cent. (Females). | ||||
|---|---|---|---|---|---|---|
| Read and Write. | Bead only. | Cannot Read. | Read and Write. | Read only. | Cannot Read. | |
| 1881 | 73.31 | 5.01 | 21.68 | 68.94 | 6.39 | 24.67 |
| 1886 | 75.40 | 4.36 | 20.24 | 72.41 | 5.31 | 22.28 |
| 1891 | 77.95 | 3.74 | 18.31 | 76.47 | 4.24 | 19.29 |
Occupations of the People, 1891.
The number in each class of occupation as at the census of 1891, and the proportion per cent. of the total, will found in the following table, which also shows the population divided into two sections, A and B, breadwinners and non-breadwinners or dependents:—
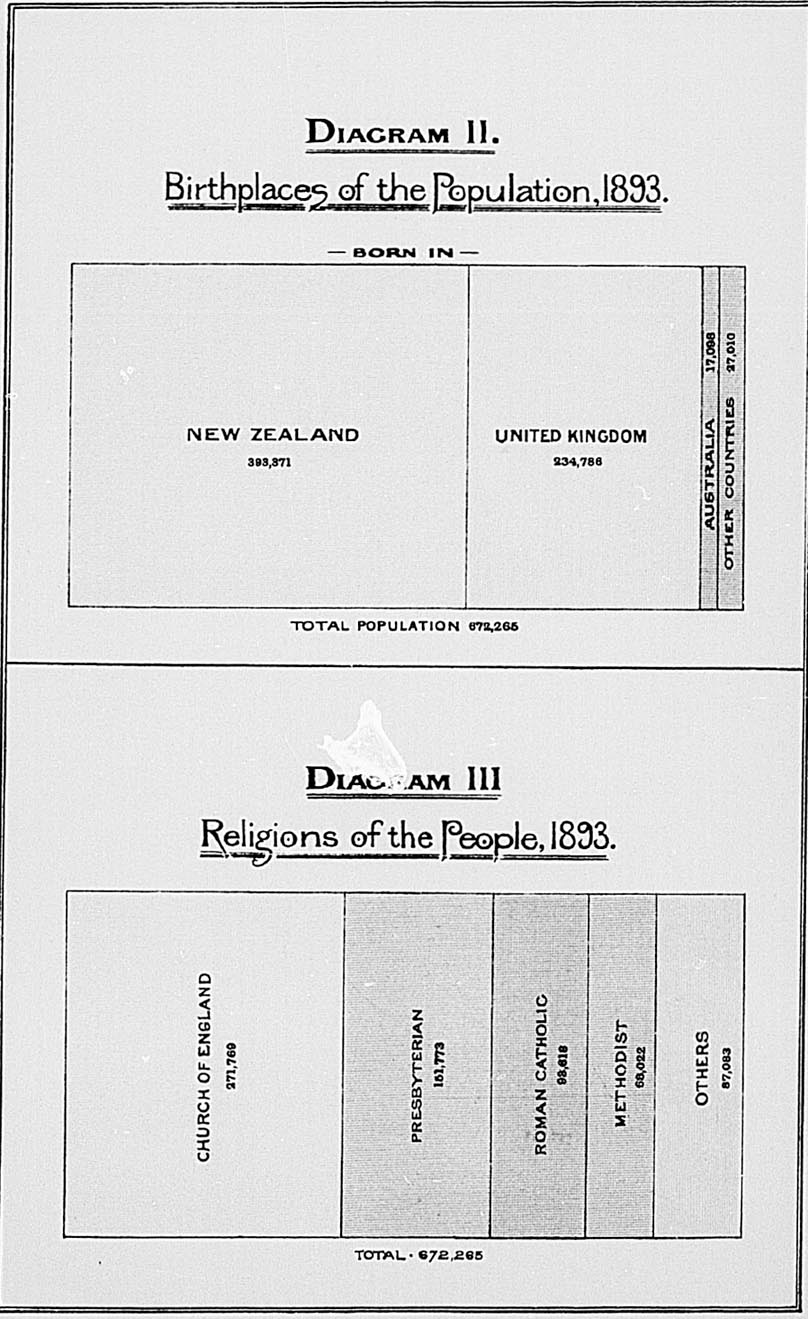
| Occupations. | Numbers. | Proportions per Cent. | ||||
|---|---|---|---|---|---|---|
| Persons. | Males. | Females. | Persons. | Males. | Females. | |
| Total population | 626,658 | 332,877 | 293,781 | 100.00 | 100.00 | 100.00 |
| Section A.—Breadwinners. | ||||||
| Class I. Professional | 15,821 | 10,082 | 5,739 | 2.52 | 3.03 | 1.95 |
| Class II. Domestic | 24,928 | 5,537 | 19,391 | 3.98 | 1.66 | 6.60 |
| Class III. Commercial— | ||||||
| Sub-cl. A. Property and finance | 3,756 | 3,414 | 342 | 0.60 | 1.03 | 0.12 |
| Sub-cl. B. Trade | 22,992 | 20,613 | 2,379 | 3.67 | 6.19 | 0.81 |
| Sub-cl. C. Storage | 1,035 | 1,034 | 1 | 0.17 | 0.31 | 0.00 |
| Sub-cl. D. Transport and communication | 15,413 | 15,269 | 144 | 2.46 | 4.59 | 0.05 |
| Class IV. Industrial | 70,521 | 59,196 | 11,325 | 11.25 | 17.78 | 3.86 |
| Class V. Agricultural, pastoral, and other primary producers— | ||||||
| Sub-cl. A. Agricultural | 59,058 | 56,671 | 2,387 | 9.42 | 17.03 | 0.81 |
| Sub-cl. B. Pastoral | 9,549 | 9,279 | 270 | 1.52 | 2.79 | 0.09 |
| Sub-cl. C. Mineral | 16,929 | 16,906 | 23 | 2.70 | 5.08 | 0.01 |
| Sub-cl. D. Other primary producers | 5,010 | 5,004 | 6 | 0.80 | 1.50 | 0.00 |
| Class VI. Indefinite | 7,751 | 4,341 | 3,410 | 1.24 | 1.30 | 1.16 |
| Section B.—Dependents (Non-breadwinners). | ||||||
| Class VII. Dependents— | ||||||
| Sub-cl. A. Dependent on natural guardians | 369,178 | 122,410 | 246,768 | 58.92 | 36.77 | 84.00 |
| Sub-cl. B. Dependent upon the State, or upon public or private support | 4,717 | 3,121 | 1,596 | 0.75 | 0.94 | 0.54 |
No less than 37.71 per cent. of the male population are shown to be dependent, and 84.54 per cent. of the females. These consist of 122,410 males and 246,768 females dependent upon natural guardians; and 3,121 males and 1,596 females, persons dependent upon the State or upon public or private support. The greater number of those dependent upon natural guardians were scholars and students. There were also a large number of dependent relatives not stated to be performing domestic duties, and a large number of females performing domestic duties for which remuneration was not paid.
The classes are divided into 24 orders, which again are divided into 103 suborders. The items of the suborders are the specific occupations. In the tables belonging to Part VII. of the census volume each specific occupation is given according to the classification there adopted, with explanatory notes showing the assistants and particulars of others included in the numbers for the various employments.
Conjugal Condition, 1891.
Of persons of both sexes, 67.62 per cent. were found to be unmarried, 29.18 married, and 3.20 widowed. Taking the male sex, and comparing the results of three censuses, the proportions of unmarried and married diminish, but the proportion of widowed increases. On the female side, the proportions of unmarried and widowed increase, while the married diminish. The figures are as under:—
| Census. | Proportion per Cent. (Males). | Proportion per Cent. (Females). | ||||
|---|---|---|---|---|---|---|
| Unmarried. | Married. | Widowed. | Unmarried. | Married. | Widowed. | |
| 1881 | 70.39 | 27.73 | 1.88 | 63.64 | 33.05 | 3.31 |
| 1886 | 70.35 | 27.61 | 2.04 | 64.59 | 31.74 | 3.67 |
| 1891 | 70.02 | 27.61 | 2.37 | 64.95 | 30.94 | 4.11 |
The Chinese are not included in the figures from which these calculations are made.
The number of bachelors aged 20 and upwards was 70,197, and of spinsters aged 15 and upwards 67,000, being 105 bachelors to every 100 spinsters. Only in Canterbury and Otago were the spinsters in excess of the bachelors, but notably so in Canterbury.
The number of husbands was 90,371, and of wives 90,765, giving an excess of 394 of the latter.
Proportions of the Sexes.
Excluding the Maori population, the females in the colony are now7 in the proportion of 87.97 to every 100 males. At the time of the census the proportion of females to males was greater in New Zealand than in Queensland, New South Wales, and Western Australia, but less than in Victoria, South Australia, and Tasmania.
| Females to every 100 Males at Census, 1891. | |
|---|---|
| Queensland | 76.04 |
| New South Wales | 84.12 |
| Victoria | 90.16 |
| South Australia | 92.33 |
| Western Australia | 66.79 |
| Tasmania | 89.10 |
| New Zealand | 88.25 |
Populations of Provincial Districts.
The following table gives the population in each provincial district estimated for the 31st December, 1893. It must, however, be pointed out that at a distance of two years and nine months from the census it is impossible to guarantee the correctness of these figures. There are no records of interprovincial arrivals and departures, and therefore in times of change the further the date from the last census the greater the liability to error. New Zealand being insular, the excess of arrivals over departures taken for the whole colony can be fairly well arrived at, and the excess of births over deaths, or natural increase, can also be found, giving a close estimate to the population of the colony for any year; but the internal movement of population cannot be determined, and therefore the subjoined figures must be accepted as approximations only. As stated previously, the provincial districts of the North Island are no doubt under-estimated in the allocation that has been made of the excess of arrivals over departures:—
| 31st December, 1893. | |||
|---|---|---|---|
| Persons, | Males. | Females. | |
| Auckland | 142,663 | 75,042 | 67,621 |
| Taranaki | 24,086 | 12,832 | 11,254 |
| Hawke's Bay | 30,995 | 17,051 | 13,944 |
| Wellington | 105,684 | 56,652 | 49,032 |
| Marlborough | 13,797 | 7,641 | 6,156 |
| Nelson | 37,146 | 20,690 | 16,456 |
| Westland | 16,541 | 9,562 | 6,979 |
| Canterbury | 137,370 | 71,123 | 66,247 |
| Otago | 163,682 | 86,878 | 76,804 |
| Chatham Islands | 293 | 159 | 134 |
| Kermadec Islands | 8 | 5 | 3 |
| Totals | 672,265 | 357,635 | 314,630 |
Populations of Counties.
These can only be given as at the date of the last census. The same objections that may be lodged against the endeavour to estimate the populations of the provincial districts at a distance of time from the census will apply with still greater force to any calculation of the numbers at present resident in the several counties and boroughs. The figures are therefore left as they were determined by the census. For statistical, as for administrative purposes, each borough is treated as distinct from the county wherein it lies. In April, 1891, the number of the counties was 78. (This number has since been increased to 79 by the division in 1893 of Oroua into two counties, Oroua and Kiwitea.) Of these the North Island had 45, with a county population amounting altogether to 155,057 persons. The Middle Island had 32 counties, the population being 196,838 persons. Stewart Island is a county in itself. The names and populations of the various counties in the colony were as under at the date of the enumeration:—
| Counties. | Persons. | M. | F. |
|---|---|---|---|
| Mongonui | 1,389 | 788 | 601 |
| Whangaroa | 878 | 487 | 391 |
| Hokianga | 1,494 | 871 | 623 |
| Bay of Islands | 2,562 | 1,437 | 1,125 |
| Hobson | 3,293 | 2,154 | 1,144 |
| Whangarei | 6,120 | 3,456 | 2,664 |
| Otamatea | 2,054 | 1,190 | 864 |
| Rodney | 3,170 | 1,681 | 1,469 |
| Waitemata | 6,184 | 3,492 | 2,692 |
| Eden | 13,782 | 6,791 | 6,991 |
| Manukau | 11,925 | 6,111 | 5,814 |
| Coromandel | 2,846 | 1,694 | 1,152 |
| Thames | 4,340 | 2,353 | 1,987 |
| Ohinemuri | 1,516 | 982 | 534 |
| Piako | 2,517 | 1,428 | 1,089 |
| Waikato | 2,738 | 1,473 | 1,265 |
| Waipa | 3,395 | 1,761 | 1,634 |
| Raglan | 1,090 | 654 | 436 |
| Kawhia | 308 | 196 | 112 |
| West Taupo | 119 | 91 | 28 |
| East Taupo | 152 | 100 | 52 |
| Rotorua | 418 | 253 | 165 |
| Tauranga | 1,393 | 783 | 610 |
| Whakatane | 1,524 | 846 | 678 |
| Waiapu | 379 | 256 | 123 |
| Cook | 3,945 | 2,239 | 1,706 |
| Clifton | 908 | 523 | 385 |
| Taranaki | 7,905 | 4,237 | 3,668 |
| Stratford | 2,521 | 1,416 | 1,105 |
| Hawera | 4,347 | 2,448 | 1,899 |
| Patea | 2,608 | 1,484 | 1,124 |
| Waitotara | 2,255 | 1,289 | 966 |
| Wanganui | 2,281 | 1,297 | 984 |
| Rangitikei | 4,433 | 2,559 | 1,879 |
| Oroua | 7,418 | 4,160 | 3,258 |
| Manawatu | 2,725 | 1,594 | 1,131 |
| Horowhenua | 2,289 | 1,495 | 794 |
| Wairoa | 1,246 | 756 | 490 |
| Hawke's Bay | 6,028 | 3,571 | 2,457 |
| Waipawa | 7,906 | 4,432 | 3,474 |
| Patangata | 2,044 | 1,378 | 666 |
| Pahiatua | 2,365 | 1,414 | 951 |
| Wairarapa North | 5,143 | 3,092 | 2,051 |
| Wairarapa South | 4,980 | 2,863 | 2,117 |
| Hutt | 6,114 | 3,242 | 2,872 |
| Sounds | 720 | 426 | 294 |
| Marlborough | 6,520 | 3,827 | 2,693 |
| Kaikoura | 1,460 | 817 | 643 |
| Collingwood | 2,103 | 1,174 | 929 |
| Waimea | 8,942 | 4,740 | 4,202 |
| Buller | 4,65 | 2,823 | 1,836 |
| Inangahua | 4,648 | 2,892 | 1,756 |
| Grey | 4,330 | 2,950 | 1,380 |
| Westland | 5,031 | 3,191 | 1,840 |
| Amuri | 967 | 679 | 288 |
| Cheviot | 164 | 120 | 44 |
| Ashley | 12,396 | 6,577 | 5,819 |
| Selwyn | 36,375 | 18,699 | 17,676 |
| Akaroa | 3,771 | 2,083 | 1,688 |
| Ashburton | 9,501 | 5,335 | 4,166 |
| Geraldine | 14,588 | 7,543 | 7,045 |
| Mackenzie | 1,180 | 689 | 491 |
| Waimate | 4,043 | 2,364 | 1,679 |
| Waitaki | 8,375 | 4,609 | 3,766 |
| Waihemo | 2,040 | 1,181 | 859 |
| Waikouaiti | 4,334 | 2,321 | 2,013 |
| Peninsula | 2,701 | 1,361 | 1,340 |
| Taieri | 7,079 | 3,873 | 3,206 |
| Bruce | 4,696 | 2,567 | 2,129 |
| Clutha | 5,574 | 3,246 | 2,328 |
| Tuapeka | 6,327 | 3,830 | 2,497 |
| Maniototo | 2,927 | 1,732 | 1,195 |
| Vincent | 3,718 | 2,380 | 1,338 |
| Lake | 2,919 | 1,885 | 1,034 |
| Southland | 19,373 | 10,970 | 8,403 |
| Wallace | 5,306 | 3,098 | 2,208 |
| Fiord | 71 | 65 | 6 |
| Stewart Island | 202 | 115 | 87 |
The county population amounted to 56.18 per cent. of the total.* The counties include all towns not constituted municipal boroughs, while, on the other hand, the population in many of the boroughs partakes of a rural character. The population in boroughs, which is given in detail further on, was 270,343 persons, or 43.14 per cent. of the whole. For every 100 persons resident in counties in 1891 there were 76 dwelling in boroughs. In 1886 the counties had 327,328 persons, and boroughs 245,612; or, for every 100 persons in counties, 75 were residents of the boroughs. Thus it will be seen that the proportion of the town to the county population was slightly greater in 1891 than in 1886.
* For population of ridings, road districts, and localities, see census volume, pp. 11 and 31.
Population of Boroughs.
There were 87 municipal boroughs in existence when the census of 1891 was taken.
Since the time of the census seven new boroughs have been constituted, as under:—
| Boroughs. | Population. Census, April, 1891. |
|---|---|
* Population, 1893. | |
| Danevirke, taken from Waipawa County | 838 |
| Pahiatua, taken from Pahiatua County | 782 |
| Karori, taken from Hutt County | 966 |
| Richmond, taken from Waimea County | 452 |
| Linwood, taken from Selwyn County | 4,580 |
| Sumner, taken from Selwyn County | 614 |
| Woolston, taken from Selwyn County | 2,288* |
A complete list of the boroughs in the colony as in April, 1891, with populations, is here shown:—
| Boroughs. | Population, 1891. |
|---|---|
| Birkenhead | 455 |
| Devonport | 2,455 |
| Auckland | 28,613 |
| Newton | 2,087 |
| Newmarket | 1,586 |
| Parnell | 3,967 |
| Onehunga | 2,924 |
| Thames | 4,618 |
| Hamilton | 1,212 |
| Cambridge | 850 |
| Tauranga | 1,055 |
| Gisborne | 2,153 |
| New Plymouth | 3,350 |
| Hawera | 1,284 |
| Patea | 676 |
| Wanganui | 5,011 |
| Marton | 976 |
| Feilding | 1,583 |
| Palmerston North | 4,303 |
| Foxton | 1,223 |
| Hastings | 2,303 |
| Napier | 8,341 |
| Woodville | 971 |
| Masterton | 3,114 |
| Carterton | 1,112 |
| Greytown | 1,141 |
| Wellington | 31,021 |
| Onslow | 979 |
| Melrose | 1,224 |
| Petone | 2,178 |
| Lower Hutt | 1,329 |
| Picton | 788 |
| Blenheim | 3,294 |
| Nelson | 6,626 |
| Westport | 2,622 |
| Greymouth | 3,787 |
| Brunner | 2,231 |
| Hokitika | 2,178 |
| Ross | 822 |
| Kumara | 1,176 |
| Kaiapoi | 1,371 |
| Rangiora | 1,783 |
| Lyttelton | 4,037 |
| St. Albans | 5,247 |
| Christchurch | 16,223 |
| Sydenham | 9,680 |
| Akaroa | 571 |
| Ashburton | 1,900 |
| Timaru | 3,668 |
| Waimate | 1,379 |
| Oamaru | 5,621 |
| Hampden | 300 |
| Palmerston South | 790 |
| Hawkesbury | 743 |
| Port Chalmers | 2,028 |
| North-East Valley | 3,337 |
| Maori Hill | 1,426 |
| West Harbour | 1,297 |
| Dunedin | 22,376 |
| Roslyn | 3,845 |
| Caversham | 4,690 |
| Mornington | 3,523 |
| St. Kilda | 1,153 |
| South Dunedin | 4,222 |
| Green Island | 687 |
| Mosgiel | 1,304 |
| Milton | 1,158 |
| Kaitangata | 1,145 |
| Balclutha | 867 |
| Lawrence | 1,026 |
| Roxburgh | 410 |
| Tapanui | 428 |
| Naseby | 496 |
| Cromwell | 474 |
| Alexandra | 310 |
| Arrowtown | 426 |
| Queenstown | 779 |
| Invercargill | 4,950 |
| Invercargill North | 717 |
| Invercargill East | 736 |
| Invercargill South | 1,559 |
| A venal | 302 |
| Gladstone | 287 |
| Campbelltown | 650 |
| Gore | 1,618 |
| Winton | 288 |
| Riverton | 843 |
There is not in New Zealand, as in each of the other Australasian Colonies, one metropolitan centre of population overshadowing, by comparison, the other towns of the colony. The peculiar configuration of the colony made it specially adapted for the establishment of settlements comparatively remote from one another. As a result the colony was formerly divided into nine provinces, each having its capital town. Of these, the principal are the Cities of Auckland, Wellington, Christchurch, and Dunedin.
Auckland City, situate in the northern part of the North Island, had in April, 1891, a population of 28,613. As the population of the suburbs amounted to 22,671, the total number of persons dwelling in and around Auckland was 51,287.
The City of Wellington, the seat of Government, is situated on the border of Port Nicholson, at the southern extremity of the North Island. It contained in April, 1891, as many as 31,021 persons. The suburban population is small, amounting, at the above date, to 3,169 persons only. The whole population in and around Wellington thus numbered 31,190.
The City of Christchurch is situated in the Canterbury District of the Middle Island. The census returns gave a population of 16,223 in that borough, and of 31,623 in the suburbs—that is, within the boundaries of the Christchurch Health District—making the total number in the Borough and suburbs of Christchurch 47,846.
The City of Dunedin, the principal town of the former Province of Otago, is the centre of a population amounting to 45,869, of which the borough itself contained 22,376; the remainder being distributed among eight surrounding boroughs, which are practically suburbs of Dunedin.
Increase of Population.
The increase of population during 1893 was 21,832. As the number of births exceeded the number of deaths by 11,420, the difference between that number and 21,832 represents the excess of immigration over emigration, amounting to 10,112.
There is good reason to believe that few of the births or deaths that occur remain unregistered. Where a limit of time is given within which a birth has to be registered it follows as a matter of course that there wall be occasional instances of neglect of the requirements of the law; but it would appear that such neglect is very exceptional, and that the number of unregistered events is so small as not appreciably to affect the numbers given.
The following shows the excess of births over deaths in each of past ten years:—
| 1884 | 14,106 |
| 1885 | 13,612 |
| 1886 | 13,164 |
| 1887 | 12,998 |
| 1888 | 13,194 |
| 1889 | 12,685 |
| 1890 | 12,284 |
| 1891 | 11,755 |
| 1892 | 11,417 |
| 1893 | 11,420 |
In 1893 the population of the colony was greater than in 1884 by 19.13 per cent. Nevertheless the excess of births over deaths for 1893 is less than that for 1884 by 19.06 per cent.
The excess of births over deaths in 1893 was equivalent to 1.73 per cent. of the mean population for the year, the actual increase of population being at the rate of 3.36 per cent.
A table is given showing the increase of population for ten years. It was remarked in the last Year-book that there seemed to be every probability of the increase shown for 1892 being exceeded in 1893, and this has actually taken place. Indeed, the increase by excess of arrivals over departures for the latter year was more than double that for 1892, and larger than any recorded since 1879. Thus the position that existed in the period 1885-91 has been completely reversed, owing chiefly to the large number of persons leaving Australia, on account of the great depression there, to seek employment in New Zealand.
| Year. | Estimated Population on the 31st December. | Increase during the Year | Centesimal Increase on Population of Previous Year. | ||
|---|---|---|---|---|---|
| By Excess of Births over Deaths. | By Excess of Immigration over Emigration.* | Net Increase. | |||
*Corrected in accordance with census results of 1886 and 1891. The amount of loss by departures, though correct in the aggregate, cannot be allocated with exactness to the respective years. † Loss. | |||||
| 1884 | 564,304 | 14,106 | 9,321 | 23,427 | 4.33 |
| 1885 | 575,172 | 13,612 | -2,744† | 10,868 | 1.93 |
| 1886 | 539,386 | 13,164 | -17,194† | 58,886 | 10.24 |
| 1887 | 603,361 | 12,998 | |||
| 1888 | 607,380 | 13,194 | |||
| 1889 | 616,052 | 12,685 | |||
| 1890 | 625,508 | 12,284 | |||
| 1891 | 634,058 | 11,755 | |||
| 1892 | 650,433 | 11,417 | 4,958 | 16,375 | 2.58 |
| 1893 | 672,265 | 11,420 | 10,412 | 21,832 | 3.36 |
It will be observed that in the period 1885 to 1891 the total increase to the population was less than the natural increase by excess of births over deaths, owing to the fact that the outgo of population by departures was greater than the gain by arrivals. But another state of things prevailed in 1892 and 1893, when not only was the natural increase preserved to the colony, but additions by excess of arrivals over departures amounting to 4,958 persons and 10,412 persons were also obtained. Of a loss by excess of departures over arrivals for the period 1886–91 amounting to 17,194, the excess of arrivals in 1892 and 1893 replaced no less than 15,370 persons, and the March quarter of the current year is estimated to have replaced some 1,500 more.
Arrivals and Departures.
The number of persons who arrived in the colony in the year 1893 was 26,135, an increase of 8,013 on the number for the previous year. Of the arrivals in 1893, 22,596 persons were classified as adults, being above the age of twelve years, and 3,539 as children. The total number of males was 17,385, and of females 8,750. The arrivals from the United Kingdom numbered 2,929, those from Victoria 7,937, from New South Wales and Queensland 13,134, from South and Western Australia 13, from Tasmania 1,267. Thus the arrivals from Australia amounted to 22,351 persons. Besides these, 261 persons came from Fiji, and 591 from Hawaii, the South Seas, and other parts, including arrivals by mail-steamers from San Francisco.
The practice of nominating immigrants to be brought out partly at the Government expense has been discontinued since the 16th “December, 1890, and there was no free immigration in the year 1893.
One hundred and sixteen Chinese arrived and 134 left the colony during 1893, the number of departures thus exceeding the arrivals by 18. The arrivals were 112 men and 3 women from Australia, and 1 man from California. The departures—128 men, 2 women, 3 boys, and 1 girl—were all for Australia.
The following table shows the immigration for twenty years—distinguishing between arrivals from the United Kingdom, the Australian Colonies, and other places. The arrivals during 1893 will be found to exceed those in any other year comprised in the period except 1874 and 1875, when the numbers were largely swollen by assisted immigrants from the United Kingdom; and it will also be noticed that the year 1893 witnessed by far the largest number of arrivals from Australia, being 22,351 persons, or 86 per cent. of the total immigration:—
| Year. | Arrivals from United Kingdom. | |||||
|---|---|---|---|---|---|---|
| Government or Assisted. | Unassisted. | Total. | Australian Colonies. | Other Places. | Total Arrivals. | |
| 1874 | 31,774 | 4,626 | 36,400 | 5,504 | 2,061 | 43,965 |
| 1875 | 18,324 | 3,444 | 21,768 | 6,328 | 3,641 | 31,737 |
| 1876 | 8,242 | 2,890 | 11,132 | 4,956 | 2,326 | 18,414 |
| 1877 | 5,298 | 2,337 | 7,635 | 4,500 | 852 | 12,987 |
| 1878 | 6,580 | 2,629 | 9,209 | 6,348 | 706 | 16,263 |
| 1879 | 10,311 | 6,424 | 16,735 | 6,413 | 809 | 23,957 |
| 1880 | 2,689 | 5,825 | 8,514 | 5,899 | 741 | 15,154 |
| 1881 | 303 | 3,404 | 3,507 | 5,579 | 602 | 9,688 |
| 1882 | 726 | 2,479 | 3,205 | 6,975 | 765 | 10,945 |
| 1883 | 5,902 | 4,496 | 10,398 | 8,056 | 761 | 19,215 |
| 1884 | 3,888 | 5,972 | 9,860 | 9,064 | 1,097 | 20,021 |
| 1885 | 1,072 | 6,169 | 7,241 | 7,899 | 1,059 | 16,199 |
| 1886 | 917 | 5,976 | 6,893 | 8,133 | 1,075 | 16,101 |
| 1887 | 1,286 | 3,620 | 4,906 | 8,035 | 748 | 13,689 |
| 1888 | 485 | 3,653 | 4,138 | 8,784 | 684 | 13,606 |
| 1889 | 91 | 3,184 | 3,275 | 11,212 | 905 | 15,392 |
| 1890 | 144 | 2,668 | 2,812 | 11,539 | 677 | 15,028 |
| 1891 | 44 | 2,391 | 2,435 | 11,144 | 852 | 14,431 |
| 1892 | 2,555 | 2,555 | 14,674 | 893 | 18,122 | |
| 1893 | 2,929 | 2,929 | 22,351 | 855 | 26,135 | |
Here the arrivals increased from 14,431 in 1891 to 26,135 in 1893, and those from Australia from 11,144 in the former year to 22,351 in the latter, or more than twice as many in 1893 as in 1891.
In 1881 an Act was passed imposing a tax on every Chinese landing in the colony, except in the case of any one of a crew of a vessel not intending to remain in the colony. The object of the Act was so to restrict the introduction of Chinese as to prevent an increase of that element in the population. The following figures show that the desired effect has been so far obtained; for, although the arrivals in 1892 and 1893 exceed those in 1891, the departures were still greater in each year than the arrivals. In 1881 the Chinese population amounted to 5,004, in 1886 the number had fallen to 4,542, and when the recent census was taken there were only 4,444 Chinese in the colony. The estimated number for December, 1893, is 4,044 persons.
The numbers of arrivals and departures of Chinese in each of the past thirteen years were:—
| Year. | Arrivals. | Departures. |
|---|---|---|
| 1881 | 1,029 | 371 |
| 1882 | 23 | 168 |
| 1883 | 44 | 297 |
| 1884 | 84 | 306 |
| 1885 | 94 | 164 |
| 1886 | 239 | 181 |
| 1887 | 354 | 246 |
| 1888 | 308 | 211 |
| 1889 | 16 | 104 |
| 1890 | 18 | 169 |
| 1891 | 5 | 160 |
| 1892 | 58 | 197 |
| 1893 | 116 | 134 |
Restrictive legislation on the immigration of Chinese has been passed in the Australian Colonies as well as in New Zealand.
In New South Wales, an Act of 1888 raised the poll-tax imposed in 1881 to £100, and vessels were prohibited from carrying to the colony more than one Chinese passenger to every 300 tons. Chinese cannot engage in mining without express authority, and are not allowed naturalisation. The Act is stated to have resulted in the entire cessation of Chinese immigration.
Every effort is made to obtain correct statements of the migration to and from the colony, but there is still difficulty in regard to the departures. The arrivals are doubtless correct, but many people leave the colony for Australia without booking their passages, paying their fares on board after the steamer has cleared: in these cases the returns from the Customs authorities are deficient. As has been pointed out before, the difficulty is met to a large extent by arrangements under which the pursers of the intercolonial steamers belonging to the Union Steamship Company, on their return to this colony, post to the Registrar-General a statement of the number of passengers on the previous outward voyage. But during any period of cheap fares and strong competition between rival companies steamers may carry more passengers than can lawfully be taken, and of the number in excess no return is likely to be made.
The number of persons who left this colony in 1893 was 15,723, of whom 14,150 were over and 1,573 were under twelve years of age. The males numbered 10,263, and the females 5,460. The departures for the United Kingdom amounted to 1,583 persons. 4,329 left for Victoria, 8,257 for New South Wales and Queensland, and 691 for Tasmania — making 13,277 for Australia altogether. 167 persons left for Fiji, and 696 for Hawaii, South Seas, and other parts (including passengers for San Francisco).
The total excess of arrivals over departures—10,412 persons—is made up as under:—
| Excess of Arrivals. | Excess of Departures. | |
|---|---|---|
| From United Kingdom | 1,346 | |
| From Australia | 9,074 | |
| From Fiji | 94 | |
| From Hawaii, South Seas, and other parts | 102 |
The following table shows the recorded movements of population between New Zealand and the United Kingdom in each of the past ten years:—
| UNITED KINGDOM. | ||
|---|---|---|
| Arrivals therefrom. | Departures thereto. | |
| 1884 | 9,860 | 1,457 |
| 1885 | 7,241 | 1,857 |
| 1886 | 6,893 | 2,385 |
| 1887 | 4,906 | 2,086 |
| 1888 | 4,138 | 1,964 |
| 1889 | 3,275 | 2,039 |
| 1890 | 2,812 | 1,863 |
| 1891 | 2,435 | 1,705 |
| 1892 | 2,555 | 1,612 |
| 1893 | 2,929 | 1,583 |
| Totals | 47,044 | 18,551 |
These figures, which may be taken as correct, show a gain of 28,493 persons from intercourse with the United Kingdom. But the total gain by excess of arrivals over departures during the ten years, after correcting the populations by means of the census results of 1886 and 1891, is found to be 4,753 persons only; it follows, therefore, that the loss to Australia and other places amounted to 23,740 during the decennial period, of which number at least 90 per cent. must have gone to Australia. The figures for 1892 and 1893 show a different result for the two last years of the decennium, there having been a net gain from intercourse with Australia of 13,079 persons. Of the loss prior to 1892, by far the largest amount in any one year occurred in 1888, when the expenditure of loan-money by the General Government was reduced to one-half of what it had been in the previous year, 1887.
The returns published by the Board of Trade do not distinguish between the departures from the United Kingdom for New Zealand and those for Australia. Only the departures for Australasia as a whole are given. In 1893 these amounted to 11,412. The number of persons who arrived in New Zealand direct from the United Kingdom was 2,929, or equal to nearly 26 per cent. of the entire direct emigration from the United Kingdom to the Australasian Colonies. This proportion is greater than in any previous year; but the number does not represent all the persons who come from the United Kingdom to this colony, as many travel viâ the Suez Canal or San Francisco, and thus appear as arrivals either from Australia or foreign ports.
According to the foregoing table the arrivals from the United Kingdom fell in number in regular annual sequence from 9,860 in 1884 to 2,435 in 1891; but New Zealand has since then somewhat increased her gain of population from the Old Country, the arrivals for 1892 numbering 2,555, and those for 1893 2,929 persons, while the departures for the United Kingdom have fallen year by year since 1889. In 1893 the excess of arrivals from the United Kingdom over the departures thereto was as high as 1,346 persons. In 1891 it was only 730 persons.
There has been a large annual decrease of late years in the number of persons who leave the United Kingdom for these southern colonies:—
| Year. | Emigration from United Kingdom to Australasia. | Arrivals in New Zealand from United Kingdom. | Arrivals in New Zealand per 100 Departures for Australasia from United Kingdom. |
|---|---|---|---|
| 1884 | 45,944 | 9,860 | 21.46 |
| 1885 | 40,689 | 7,241 | 17.80 |
| 1886 | 44,055 | 6,893 | 15.65 |
| 1887 | 35,198 | 4,906 | 13.94 |
| 1888 | 31,725 | 4,138 | 13.04 |
| 1889 | 28,834 | 3,275 | 11.36 |
| 1890 | 21,570 | 2,812 | 13.03 |
| 1891 | 19,957 | 2,435 | 12.20 |
| 1892 | 16,183 | 2,555 | 15.79 |
| 1893 | 11,412 | 2,929 | 25.67 |
As the population of New Zealand (exclusive of Maoris) comprises 16.52 per cent. of the population of Australasia, not including Fiji, it is evident from the above figures that this colony during 1893 offered greater attractions to emigrants than did Australia; and it must be remembered that the above numbers do not include persons who arrive from England viâ Australia and the United States.
The following shows the immigration and emigration for each of the Australasian Colonies during the year 1893. The figures for departures are for all the colonies admittedly imperfect, on account of the number of persons leaving by sea of whose departure no record is obtained:—
| Colony. | Arrivals, 1893. | Departures, 1893. | Excess of Arrivals over Departures, 1893. |
|---|---|---|---|
* Including estimated number of unrecorded departures. † Excess of departures. | |||
| Queensland | 22,007 | 19,704 | 2,303 |
| New South Wales | 112,084 | 110,547 | 1,537 |
| Victoria (by sea only) | 74,047 | 87,458* | -13,411† |
| South Australia | 50,556 | 45,816 | 4,740 |
| Western Australia | 8,928 | 3,705 | 5,223 |
| Tasmania | 18,089 | 19,954 | -1,865† |
| New Zealand | 26,135 | 15,723 | 10,412 |
BIRTHS.
The births registered in the colony during 1893 numbered 18,187, or at the rate of 27.50 per 1,000 of the mean population. Numerically, the births registered in 1893 are found to be 311 in excess of the number for 1892; nevertheless the birth-rate fell from 27.83 in the former year to 27.50 in the latter. From the year 1884, when the births were 19,846, to 1892, when they numbered only 17,876, there was a regular annual decrease, notwithstanding the increase of population. In 1893 a change came; but the numerical increase of 311 in the registrations of births was not sufficient to alter the position as regards the birth-rate per 1,000 of the population, which has been decreasing ever since the year 1881.
That there should be a continuous fall in the birth-rate of New Zealand is only what might be expected, as the same process is going on in Australia; but the fall here has been greater, and it is noticeable that New Zealand has now a lower birth-rate than any of the colonies of Australia.
The following table shows that, with increasing population and, since 1886, a numerical increase of marriages, there has been an annual decrease of births registered from 1881 to 1892, and in the birth-rate since 1881:—
| Year. | Mean Population (excluding Maoris). | Number of Marriages. | Number of Births. | Births per 1,000 of the Population. |
|---|---|---|---|---|
| 1881 | 493,482 | 3,277 | 18,372 | 37.95 |
| 1882 | 509,309 | 3,600 | 19,009 | 37.32 |
| 1883 | 529,292 | 3,612 | 19,202 | 36.28 |
| 1884 | 552,590 | 3,800 | 19,846 | 35.91 |
| 1885 | 573,362 | 3,813 | 19,693 | 34.35 |
| 1886 | 582,117 | 3,488 | 19,299 | 33.15 |
| 1887 | 596,374 | 3,563 | 19,135 | 32.09 |
| 1888 | 605,371 | 3,617 | 18,902 | 31.22 |
| 1889 | 612,716 | 3,632 | 18,457 | 30.07 |
| 1890 | 620,780 | 3,797 | 18,278 | 29.44 |
| 1891 | 629,783 | 3,805 | 18,273 | 29.01 |
| 1892 | 642,245 | 4,002 | 17,876 | 27.83 |
| 1893 | 661,349 | 4,115 | 18,187 | 27.50 |
It has been before remarked that a fall in the birth-rate in a young country is to a certain point a natural result of the increase in the proportion of the population under twenty-one years of age; but in New Zealand the proportion under twenty-one at the census of 1891 was found to be slightly lower than that in 1886, so that there must be further reasons to account for a decrease in the actual number of births such as is found up to the year 1893.
Inquiry was made of District Registrars to discover whether many births escaped registration, through the colony not being sufficiently subdivided for registration purposes; but the replies did not tend to show that the cause of decrease was want of facilities for registration, though it is nevertheless desirable to subdivide further when representations are made of fresh requirements.
Substantial decreases in the numbers of births registered were found in certain registration districts, of which the following are instances: Taking the same area in each year, the births in the Auckland and Onehunga Registration Districts were 2,384 in 1886, 1,962 in 1889, and 1,908 in 1893. Similarly, in the Wellington and Hutt Districts the births in 1886 were 1,342; in 1890, 1,355; and in 1893 only 1,338, notwithstanding a large increase in the city population. In the Christchurch District, which includes all the suburbs as well as some surrounding country, the decline is very marked. In 1886 the births were 1,873; in 1889 they had fallen to 1,597; and in 1893 to 1,443. For the Dunedin District, which also includes suburban boroughs and some adjacent country, the fall was from 1,589 births in 1886 to 1,369 in 1889, and 1,245 in 1893.
Here is shown a falling-off of births registered at and around the largest centres of population, where there can be no question of distance from the Registrar's office or of insufficient convenience to the public such as might arise in country places. But the fact of the births throughout the colony decreasing numerically as well as proportionately to population—while the marriages of late have increased in number—shows sufficiently well that the decline in the rate is not due to want of facilities for registration.
The decrease in the birth-rate all over the civilised world has been freely and openly commented on of late, and the voluntary limitation of families is no doubt largely resorted to in communities where there exists a high standard of comfort in living, with a great multiplication of wants and extension of education. In New Zealand there were, in 1881, 5.72 births to every marriage in the previous year, and in 1893 the proportion had fallen to 4.37 births to each marriage.
It was ascertained, after the census of 1881 had been compiled, that the married women of reproductive age in the colony averaged 314 to every 100 of legitimate births, which is equal to an average of one birth to every married woman at the age for child-bearing in every 3.14 years. In 1886 the average was found, on calculation, to be 333 wives to 100 births, or an average of one birth to each wife in 3.33 years. In 1891 there were 17,635 legitimate births, and the number of married women at the time of the census at the period 15 to 45 years was 63,165, which gives an average of 358 wives to each 100 births, or, deducting one child in each case of twins, the average becomes 362 wives to every 100 births, being a birth to each wife every 3.62 years. The census results therefore prove that the average interval between each birth in the case of married women at the child-bearing ages advanced from 3.14 years in 1881 to 3.33 years in 1886, and 3.62 years in 1891; so that this factor must evidently be taken into account in considering the question of the causes of the falling birth-rate.
Dr. J. S. Billings, of the Surgeon-General's Office, Washington, writing in the Forum on the diminishing birth-rate in the United States, calls attention to a fact which is not often referred to—namely, that the birth-rate is declining even more in the United States than in other countries.
In the United States the proportions per 1,000 for 1880 and 1890 were respectively 36.0 and 30.7; in England and Wales, 31.2 and 30.2; in Scotland, 33.6 and 30.2; in Ireland, 24.7 and 22.3; in France, 24.5 and 21.8; in Belgium, 31.1 and 28.7; in German Empire, 37.6 and 35.7; in Austria, 38.0 and 36.7; in Switzerland, 29.6 and 26.6; in Denmark, 31.8 and 30.6; in Norway, 30.7 and 30.3; and in the Netherlands, 35.5 and 32.9.
Dr. Billings discusses the question as to the cause of this remarkable decrease, and the following is his conclusion:—
The most important factor in the change is the deliberate and voluntary avoidance or prevention of child-bearing on the part of a steadily-increasing number of married people, who not only prefer to have but few children, but who know how to obtain their wish. The reasons for this are numerous, but I will mention only three.
The first is the diffusion of information with regard to the subject of generation by means of popular and school treatises on physiology and hygiene, which diffusion began between thirty and forty years ago. Girls of twenty years of age at the present day know much more about anatomy and physiology than did their grandmothers at the same age, and the married women are much better informed than were those of thirty years ago. To some extent this may also be true as regards the young men; but I do not think this is an important factor.
The second cause has been the growth of the opinion that the abstaining from having children on the part of a married couple is not only not in itself sinful, or contrary to the usual forms of religious creeds, but that it may even be under certain circumstances commendable.
The third cause is the great increase in the use of things which were formerly considered as luxuries, but which now have become almost necessities. The greater temptations to expenditure for the purpose of securing or maintaining social position, and the correspondingly greater cost of family life in what may be called the lower middle classes, lead to the desire to have fewer children, in order that they may be each better provided for, or perhaps, in some cases, from the purely selfish motive of desire to avoid care and trouble, and of having more to spend on social pleasures.
The fall in the birth-rates of the Australian Colonies over a period of nine years is shown in the following table:—
BIRTH-RATESPER 1,000 OF POPULATION.
| Colony. | 1885. | 1886. | 1887. | 1888. | 1889. | 1890. | 1891. | 1892. | 1893. |
|---|---|---|---|---|---|---|---|---|---|
| Queensland | 3666 | 40.21 | 38.09 | 37.77 | 36.27 | 40.95 | 36.35 | 35.84 | 33.73 |
| New South Wales | 37.64 | 37.03 | 36.42 | 36.18 | 33.73 | 35.35 | 34.50 | 34.41 | 32.23 |
| Victoria | 30.74 | 31.23 | 32.39 | 32.49 | 32.95 | 33.60 | 33.57 | 32.54 | 31.25 |
| South Australia | 37.30 | 35.32 | 34.63 | 33.34 | 32.37 | 32.75 | 33.92 | 32.32 | 31.71 |
| Western Australia | 35.22 | 39.21 | 37.34 | 35.88 | 37.14 | 32.55 | 34.85 | 33.01 | 34.14 |
| Tasmania | 35.08 | 34.15 | 33.87 | 33.10 | 31.94 | 33.49 | 33.37 | 32.48 | 33.92 |
| New Zealand | 34.35 | 33.15 | 32.09 | 31.32 | 30.07 | 29.44 | 29.01 | 27.83 | 27.50 |
In the year 1880 New Zealand had the highest birth-rate of the above colonies, 40.78; but since 1887 the position has been reversed, and the rate the lowest of all.
The birth-rates for five years in Great Britain and certain countries of the European Continent are given from the report of the Registrar-General of England. The rates in England and Wales, and in Scotland, are higher than those in New Zealand, but the rate for Ireland is lower. For 1890–91 France has the lowest rate of all quoted.
BIRTH-RATESIN EUROPEAN COUNTRIES, 1887 TO 1891.
| Countries. | Number of Births per 1,000 of Mean Population. | ||||
|---|---|---|---|---|---|
| 1887. | 1888. | 1889. | 1890. | 1891. | |
| Hungary | 44.1 | 43.8 | 43.7 | 40.3 | .. |
| Austria | 38.2 | 37.9 | 37.9 | 36.7 | 38.1 |
| Italy | 390 | 37.6 | 38.4 | 35.9 | 37.3 |
| Prussia | 37.6 | 37.4 | 37.1 | 36.6 | 37.7 |
| German Empire | 36.9 | 36.6 | 36.4 | 35.7 | 37.0 |
| Netherlands | 33.7 | 33.7 | 33.2 | 32.9 | 33.7 |
| England and Wales | 31.9 | 31.2 | 31.1 | 30.2 | 31.4 |
| Scotland | 31.8 | 31.3 | 30.9 | 30.2 | 31.2 |
| Norway | 30.8 | 30.8 | 29.7 | 30.3 | 30.9 |
| Belgium | 29.4 | 29.1 | 29.5 | 28.7 | 29.6 |
| Sweden | 29.7 | 28.8 | 27.7 | 28.0 | .. |
| Switzerland | 27.9 | 27.7 | 27.6 | 26.6 | 28.2 |
| France | 23.5 | 23.1 | 23.0 | 21.8 | 22.6 |
| Ireland | 23.1 | 22.8 | 22.7 | 22.3 | 23.1 |
The male births in New Zealand in 1893 numbered 9,310, and the female 8,877: the proportion was thus 104.88 males to 100 females. In 1892 the proportion was 103.72 males, and in 1891, 105.41. There are on an average more male to female births in each of the Australasian Colonies than in England, but the proportion of male births is still greater in many European countries.
There were 188 cases of twin births (376 children) in 1893; there was also one case of triplets. The number of children born was 18,187; the number of mothers was 17,997: thus on an average 1 mother in every 101 gave birth to twins. In 1892 the proportion was one in 102, in 1891 one in 101, and in 1890 one in 95.
The births of 673 children were illegitimate: thus 37 in every 1,000 children born were born out of wedlock.
The following table gives the rates of illegitimacy in each of the Australasian Colonies. The rate in New Zealand is less than in any other of the Australasian Colonies except South Australia:—
PROPORTIONOF ILLEGITIMATE BIRTHSIN EVERY 100 BIRTHS.
| Year. | Queens-land. | New South Wales. | Victoria. | South Australia. | Western Australia. | Tasmania. | New Zealand. |
|---|---|---|---|---|---|---|---|
| 1884 | 4.05 | 4.40 | 4.29 | 2.10 | .. | 4.46 | 2.95 |
| 1885 | 4.08 | 4.60 | 4.36 | 2.42 | .. | 4.55 | 3.20 |
| 1886 | 3.97 | 4.65 | 4.75 | 2.38 | .. | 4.13 | 3.12 |
| 1887 | 4.49 | 4.59 | 4.78 | 2.49 | .. | 3.40 | 3.23 |
| 1888 | 4.13 | 5.08 | 4.80 | 2.67 | .. | 3.62 | 3.05 |
| 1889 | 4.68 | 5.33 | 4.97 | 2.47 | .. | 4.02 | 3.32 |
| 1890 | 4.85 | 5.26 | 5.09 | 2.50 | .. | 4.05 | 3.30 |
| 1891 | 4.65 | 5.36 | 5.36 | 2.93 | .. | 3.72 | 3.49 |
| 1892 | 5.05 | 5.63 | 5.59 | 2.93 | 5.89 | 4.75 | 3.32 |
| 1893 | .. | .. | 5.46 | 2.84 | 4.17 | 4.41 | 3.70 |
The rates in the Colonies of Queensland, New South Wales, and Victoria are somewhat higher than the rate in England, which was. 4.2 in 1891. The rate for New Zealand is less. In Scotland the rate was as high as 7.6 in the year 1890. In Ireland it was only 2.7 in 1891. Of European continental countries the rate is highest in Austria, 14.7. In the German Empire it is 9.3, in France 8.1, in Italy 6.8, and in Switzerland 4.6.
It is held that the average number of children to a marriage may be ascertained by comparing the number of legitimate births for a series of years with the number of marriages during a series of years of the same number, but commencing with the year preceding that for which the first number of births is taken; for, although in the earlier years births will be included that are the fruits of marriages solemnised prior to the commencement of the period, yet there will be omitted the number of children born subsequently to the period, of parents married within the given time. This method probably gives results approximately true:—
| Year. | Marriages. | Legitimate Births. | Proportion of Births to every Marriage solemnised in the Preceding Year. |
|---|---|---|---|
| 1888 | 3,617 | .. | .. |
| 1889 | 3,632 | 17,845 | 4.93 |
| 1890 | 3,797 | 17,675 | 4.87 |
| 1891 | 3,805 | 17,635 | 4.64 |
| 1892 | 4,002 | 17,283 | 4.54 |
| 1893 | .. | 17,514 | 4.37 |
| Sums and proportion | 18,853 | 87,952 | 4.67 |
The average number of births per marriage was, for the last five years, 4.67, and a decrease in the number of births to a marriage from 4.93 to 4.37 is exhibited for the quinquennium. In the Australian Colonies a similar decrease is noticeable. It has been remarked that in all the Australian Colonies, except Tasmania, and possibly New South Wales, there is a tendency for the average number of children to a marriage to decrease. The number given in the Victorian Year-book for each of the colonies named is as follows:—
CHILDRENTOA MARRIAGE, 1880–91.
| — | Victoria. | New South Wales. | Queensland. | South Australia. | Tasmania |
|---|---|---|---|---|---|
* Mean of seven years. | |||||
| Mean of numbers for twelve years, 1880–91 | 4.20 | 4.72 | 4.60 | 4.72 | 4.74* |
The following statement of the average number of children to a marriage in various European countries is taken from the same source:—
| Children to each Marriage. | ||
|---|---|---|
| Ireland | 5.46 | |
| Italy | 4.56 | |
| Scotland | 4.43 | |
| Holland | 4.34 | |
| Belgium | 4.21 | |
| England | 4.16 | |
| Sweden | 4.01 | |
| Denmark | 3.55 | |
| France | 2.98 | |
The excess per cent. of births over deaths for each of the Australasian Colonies is stated in the Victorian Year-book as under, for a mean of ten years ending with 1892, New Zealand having the largest for such period:—
EXCESSPER CENT. OF BIRTHSOVER DEATHS.
| New Zealand | 213 |
| South Australia | 172 |
| New South Wales | 156 |
| Queensland | 136 |
| Tasmania | 126 |
| Western Australia | 113 |
| Victoria | 110 |
For the year 1892 New Zealand occupies the fourth place, the ratio of excess being highest in South Australia.
Aliens residing in the colony may, on taking the oath of allegiance to Her Majesty, obtain letters of naturalisation which entitle them to enjoy all the rights and privileges that a natural-born subject of the United Kingdom can enjoy or transmit within this colony. Five hundred and ninety-six aliens were naturalised in 1893.
As the diversity of nationalities is considerable, the following statement is given of the number of each:—
NUMBEROF ALIENSNATURALISEDIN 1893.
| Natives of | |
|---|---|
| Sweden and Norway | 146 |
| Denmark | 100 |
| Germany | 194 |
| Switzerland | 15 |
| Russia | 12 |
| Poland | 4 |
| Finland | 13 |
| Austria | 28 |
| China | 25 |
| Prance | 14 |
| Italy | 15 |
| Syria | 6 |
| Belgium | 4 |
| Netherlands | 6 |
| Greece | 5 |
| Portugal | 2 |
| Samoa | 2 |
| Turkey | 2 |
| United States of America | 3 |
| Total | 596 |
The number of natives of each country naturalised during the last twelve years is shown hereunder:—
| Natives of | |
|---|---|
| Germany | 915 |
| Sweden and Norway | 633 |
| Denmark | 473 |
| China | 202 |
| Switzerland | 105 |
| Italy | 101 |
| Austria | 87 |
| Russia | 99 |
| France | 45 |
| Netherlands | 24 |
| Portugal | 19 |
| Greece | 21 |
| United States of America | 11 |
| Belgium | 11 |
| Turkey | 8 |
| Other countries | 15 |
| Total | 2,769 |
Of the number naturalised in the period 1882–93, natives of Germany comprised 33 per cent., Swedes arid Norwegians 23 per cent., Danes 17 per cent., and Chinese 7 per cent.
By section 2 of “The Aliens Act Amendment Act, 1882,” repealed and re-enacted by section 2 of “The Aliens Act Amendment Act, 1892,” it is provided that when the father, or mother being a widow, has obtained naturalisation in the colony, every child who during infancy has become resident with them in New Zealand shall be deemed to be naturalised and have the rights and privileges of a natural-born subject.
The number of marriages in 1893 was 4,115, an increase of 113 on the number in 1892. The marriage-rate was 6.22 per 1,000 persons living, the number of marriages being the greatest and the rate the highest since 1885, except in 1892, when it was 6.23 per 1,000 persons. The marriage-rate seems to have reached its lowest in the year 1889 (5.91). Since then it has risen again somewhat; but the position of New Zealand as regards the marriage-rate is, nevertheless, different from what it was in the year 1874. In that year the figures for the Australasian Colonies stood as follow:—
MARRIAGE-RATESIN 1874.
| New Zealand | 881 per 1,000 of mean population. |
| Queensland | 8.62 per 1,000 of mean population. |
| South Australia | 800 per 1,000 of mean population. |
| New South Wales | 770 per 1,000 of mean population. |
| Western Australia | 6.96 per 1,000 of mean population. |
| Tasmania | 6.83 per 1,000 of mean population. |
| Victoria | 6.33 per 1,000 of mean population. |
The respective rates for the Australasian Colonies for the last ten years are shown in the following table:—
MARRIAGESPER 1,000 OFTHE POPULATION.
| Year. | Queensland. | New South Wales. | Victoria. | South Australia. | Western Australia. | Tasmania. | New Zealand. |
|---|---|---|---|---|---|---|---|
| 1884 | 891 | 8.49 | 7.73 | 8.13 | 7.11 | 7.81 | 6.87 |
| 1885 | 8.93 | 8.18 | 7.72 | 7.66 | 7.51 | 7.97 | 6.65 |
| 1886 | 8.67 | 7.99 | 7.84 | 6.24 | 7.98 | 7.26 | 5.99 |
| 1887 | 8.21 | 7.42 | 7.62 | 6.31 | 7.58 | 6.71 | 5.97 |
| 1888 | 8.63 | 7.37 | 8.03 | 6.70 | 7.18 | 6.58 | 5.97 |
| 1889 | 8.37 | 6.76 | 8.14 | 6.47 | 6.99 | 6.50 | 5.94 |
| 1890 | 8.49 | 7.14 | 8.21 | 7.06 | 5.80 | 6.64 | 6.12 |
| 1891 | 7.18 | 7.39 | 7.69 | 7.31 | 8.00 | 6.63 | 6.04 |
| 1892 | 6.67 | 6.77 | 6.64 | 6.51 | 7.29 | 6.51 | 6.23 |
| 1893 | 5.91 | 6.40 | 5.99 | 6.26 | 6.34 | 5.51 | 6.22 |
Taking this range of years, the marriage-rate is shown to be less in New Zealand than in the colonies of Australia, and it is also lower than in most European countries.
MARRIAGESINEVERY 1,000 OFTHE POPULATION.
| England and Wales, 1891 | 7.8 |
| Scotland, 1891 | 6.9 |
| Ireland, 1891 | 4.6 |
| Denmark, 1891 | 6.8 |
| Sweden, 1890 | 6.0 |
| Austria, 1891 | 7.7 |
| Hungary, 1890 | 8.2 |
| Switzerland, 1891 | 7.1 |
| German Empire, 1891 | 0.8 |
| Netherlands 1891 | 7.1 |
| Belgium, 1891 | 7.4 |
| France, 1891 | 7.5 |
| Spain, 1884 | 6.7 |
| Italy, 1891 | 7.5 |
The greatest number of marriages in 1893 occurred in the autumn quarter, ending the 30th June, and the smallest number in the winter quarter, ending the 30th September.
Of the marriages which were solemnised in 1893, 3,625 were between bachelors and spinsters, 161 between bachelors and widows, 209 between widowers and spinsters, and 120 between widowers and widows. Divorced men and women have been classified as bachelors or spinsters: 5 divorced men and 8 divorced women were married during the year.
The proportion of each class of marriage to all the marriages varies but little from year to year as shown by the figures for 1888 and 1893.
PROPORTIONPER 100 MARRIAGES.
| Marriages between | 1868. | 1893. |
| Bachelors and spinsters | 86.04 | 88.09 |
| Bachelors and widows | 4.75 | 3.91 |
| Widowers and spinsters | 6.47 | 5.08 |
| Widowers and widows | 2.74 | 2.92 |
| 100.00 | 100.00 |
The number of marriages given does not include those between persons both of whom are of the aboriginal native race, these persons being exempted from the necessity of complying with the provisions of the Marriage Act, although they are at liberty to take advantage thereof. Only 7 marriages in which both parties were Maoris were contracted in 1893 in terms of that Act.
Of the marriages in the past year, 23.06 per cent. were solemnised by ministers of the Church of England, 26.58 per cent. by ministers of the Presbyterian Churches, 16.13 per cent. by ministers of the Wesleyan and other Methodist Churches, 8.99 per cent. by ministers of the Roman Catholic Church, 6.66 per cent. by ministers of other denominations, and 18.58 per cent. by Registrars.
Comparing with 1890, the proportions of marriages solemnised by ministers of the Church of England and by Wesleyans in 1893 are found to be higher; the proportion of marriages by Presbyterian ministers, by the Roman Catholic clergy, and by Registrars are found to be lower.
The following shows the proportions of marriages by ministers of the principal denominations in the past seven years, and the percentages of these denominations to the total population:—
| Denomination. | Percentage of Marriages. | Percentage of Denomination to Total Population in 1891. | ||||||
|---|---|---|---|---|---|---|---|---|
| 1887. | 1688. | 1889. | 1890. | 1891. | 1892. | 1893. | ||
| Church of England | 21.60 | 21.95 | 23.11 | 21.66 | 22.18 | 20.78 | 23.06 | 40.51 |
| Presbyterians | 24.49 | 24.33 | 26.75 | 27.59 | 27.23 | 29.38 | 26.58 | 22.62 |
| Wesleyans and other Methodists | 14.73 | 14.10 | 15.08 | 15.58 | 14.72 | 14.82 | 16.13 | 10.14 |
| Roman Catholics | 11.81 | 11.69 | 10.40 | 10.45 | 10.07 | 9.74 | 8.99 | 13.96 |
| Other denominations | 4.15 | 5.70 | 5.23 | 5.27 | 5.67 | 6.34 | 6.66 | 12.77 |
| By Registrars | 23.22 | 22.23 | 19.43 | 19.45 | 20.13 | 18.94 | 18.58 | |
| 100.00 | 100.00 | 100.00 | 100.00 | 100.00 | 100.00 | 100.00 | 100.00 | |
It will be observed that the proportions of marriages by ministers of the Presbyterian and Wesleyan Churches are greater than the percentages of these denominations to the total population. It is manifest that the marriages solemnised by them include those of members of other religious bodies, and that the persons married before Registrars consist, to a large extent, of nominal members of the Church of England. As all marriages between members of the Roman Catholic Church are, by requirement of that Church, solemnised by the ministers thereof, it appears that fewer marriages in proportion to their numbers occur among the members of that Church than among members of other bodies. The proportion of marriages by the Roman Catholic clergy out of every 100 marriages solemnised is steadily falling. In 1887 it was as high as 11.81, against 8.99 in 1893, notwithstanding that the proportion of Roman Catholics in every 100 of the population was found by the census of 1886 to be 13.95, while in 1891 it was almost the same (13.96). Marriages by Registrars, which increased from 10.50 per cent. in 1875 to 23.22 per cent. of the total in 1887, fell to 18.58 per cent. in 1893.
Of the men married in 1893, 47, or 11.42 in every 1,000, and of the women 70, or 17.01 in every 1,000, signed the register by marks.
The illiteracy of the people, as measured by the proportion of married persons who affix marks instead of signatures to the marriage register, has greatly decreased of late, having fallen since 1881 to the extent of about 64 per cent. among men, and about 66 per cent. among women. This is shown in the following table: —
PERSONSINEVERY 1,000 MARRIEDWHOSIGNEDBY MARK.
| Denomination. | 1881. | 1886. | 1890. | 1893. | ||||
|---|---|---|---|---|---|---|---|---|
| M. | F. | M. | F. | M. | F. | M. | F. | |
| Church of England | 16.59 | 27.15 | 9.33 | 12.00 | 6.08 | 4.86 | 7.38 | 13.70 |
| Presbyterians | 10.25 | 29.61 | 9.79 | 7.62 | 8.59 | 15.27 | 8.23 | 4.57 |
| Wesleyan and other Methodists | 32.41 | 41.79 | 6.33 | 14.78 | 15.20 | 10.14 | 4.51 | 12.05 |
| Roman Catholics | 117.78 | 133.33 | 46.45 | 65.57 | 35.26 | 42.82 | 16.22 | 35.14 |
| Other denominations | 10.36 | 20.72 | 11.49 | 22.99 | 15.00 | 0.00 | 3.65 | 7.30 |
| By Registrars | 39.22 | 93.51 | 35.98 | 62.03 | 29.77 | 40.60 | 27.45 | 37.91 |
| Total marriages | 32.01 | 50.20 | 19.21 | 28.96 | 16.33 | 19.23 | 11.42 | 17.01 |
The proportion of illiterates in 1893 was greatest among those married before Registrars, but it must be remembered that, as previously stated, a large proportion of the persons married before Registrars are nominally members of the Church of England. Hitherto the proportion has been largest among Roman Catholics; but since 1881 it has, as shown by the table, most remarkably decreased.
Of the persons married in 1893, 72 males and 812 females were under 21 years of age—1 youth was 16 years old, and 6 of the males were between 18 and 19. But 291 of the females were under 19: of these, 8 were between 15 and 16, and 22 between 16 and 17 years of age. The proportion of males married is greatest at the ages of 25 to 30, and that of the females at from 21 to 25 years.
The following are the proportions of men and women married at each age-period to every 100 marriages in the years 1888 and 1893:—
| Age. | 1888. | 1893. | ||
|---|---|---|---|---|
| M. | F. | M. | F. | |
| Under 21 years | 1.85 | 24.30 | 1.75 | 19.73 |
| 21 and under 25 | 28.17 | 42.05 | 27.39 | 43.69 |
| 25 and under 30 | 33.81 | 21.15 | 36.13 | 23.26 |
| 30 and under 40 | 26.02 | 8.98 | 25.35 | 9.50 |
| 40 and under 50 | 6.69 | 2.74 | 5.69 | 2.75 |
| 50 and under 60 | 2.52 | 0.61 | 2.82 | 0.83 |
| 60 and under 70 | 0.88 | 0.14 | 0.75 | 0.22 |
| 70 and upwards | 0.06 | 0.03 | 0.12 | 0.02 |
Registrars of Marriages in New Zealand are prohibited by law from issuing certificates for the marriage of minors without the consent of their parents or lawful guardians, if there he any in the colony. If a declaration he made in any case that there is no-parent or lawful guardian in the colony, then a certificate may be issued after the expiration of fourteen days following the date on which the notice of intended marriage is given.
A marriage may not be solemnised in New Zealand except after the delivery to the minister or Registrar who officiates of a certificate issued by a Registrar authorising such marriage, and if any persons knowingly and wilfully intermarry without such certificate. the marriage is null and void; and no clergyman or minister of any denomination is empowered to solemnise marriages until his name has been placed on the Registrar-General's list of officiating ministers for the year.
The ages at which persons may contract binding marriages are the same as in England—namely, 12 years for females and 14 for males. Marriage may be contracted at earlier ages than those stated, but would be voidable at the discretion of either of the parties upon reaching the age of 12 or 14, as the case may be, and without the necessity of proceedings in Court.
The ages at which persons can contract binding marriage in the United States are 21 for males and 18 for females, according to the “Annual Statistician” (McCarty, San Francisco). In France and Belgium the ages are 18 and 15 respectively; in Germany, 18 and 14; in Austria, 14 and 14; and in Russia, 18 and 16.
The average age of the males in this colony who married in 1893 was 29–72 years, and of the females, 25–07 years. In England the mean age of those whose ages were stated was (in the year 1891) 28–37 years for men, and 26–08 years for women. Thus the average age at which men marry is higher in the colony than in England, but that of the women is lower.
The proportion of males marrying under 21 in England is much greater than in New Zealand; but the proportion of females under 21 who marry is much greater in the colony.
In England, in 1891, of every 1,000 males married whose ages were stated, 59 were under 21 years of age, and of every 1,000 females 190 were under 21 years of age. In New Zealand, in 1893. the proportions were 17 males and 197 females in every 1,000 married. While in New Zealand the proportion of bridegrooms under 21 years of age fluctuates within narrow limits, the proportion of brides under 21 years of age is steadily decreasing: this is shown by the following proportions for each sex under 21 years of age in every 100 married:—
| Year. | Bridegrooms under 21 in every 100. | Brides under 21 in every 100. |
|---|---|---|
| 1882 | 1.80 | 29.39 |
| 1883 | 1.52 | 27.18 |
| 1884 | 1.87 | 27.10 |
| 1885 | 1.97 | 26.49 |
| 1886 | 1.95 | 26.09 |
| 1887 | 1.91 | 25.49 |
| 1888 | 1.85 | 24.30 |
| 1889 | 1.62 | 23.02 |
| 1890 | 1.89 | 22.75 |
| 1891 | 1.55 | 20.79 |
| 1892 | 1.65 | 20.14 |
| 1893 | 1.75 | 19.73 |
The deaths in 1893 numbered 6,767, being equivalent to a rate of 10–23 in every 1,000 persons living. This is higher than the rate (10–06) in 1892, but less than that for 1891 (10–35). In each of the years, 1888, 1889, 1890, the rate was under 10 per 1,000.
The death-rate in New Zealand contrasts very favourably with those in the other Australasian Colonies and in European countries, and furnishes evidence of the great salubrity of the climate of the colony. The following table gives the death-rates for a series of years in the several countries named:—
| Country. | 1884. | 1885. | 1886. | 1887. | 1888. | 1889. | 1890. | 1891. | 1892. | 1893. |
|---|---|---|---|---|---|---|---|---|---|---|
* Excluding Northern Territory. | ||||||||||
| New Zealand | 10.39 | 10.76 | 10.54 | 10.29 | 9.43 | 9.44 | 9.66 | 10.35 | 10.06 | 10.23 |
| Queensland | 22.97 | 19.58 | 17.29 | 14.56 | 14.66 | 15.44 | 14.98 | 12.77 | 12.66 | 13.34 |
| New South Wales | 16.14 | 16.41 | 14.89 | 13.15 | 13.54 | 13.42 | 12.90 | 14.24 | 13.22 | 13.25 |
| Victoria | 14.46 | 14.98 | 15.15 | 15.70 | 15.34 | 17.54 | 16.10 | 16.24 | 13.63 | 14.11 |
| South Australia* | 15.24 | 12.48 | 13.38 | 12.77 | 12.52 | 11.49 | 12.40 | 13.26 | 11.38 | 13.42 |
| Western Australia | 21.87 | 17.61 | 21.56 | 16.83 | 15.91 | 14.19 | 11.26 | 16.96 | 16.63 | 15.27 |
| Tasmania | 15.50 | 15.40 | 14.58 | 15.45 | 14.11 | 14.10 | 14.74 | 15.00 | 13.53 | 13.47 |
| England | 19.5 | 19.0 | 19.3 | 18.8 | 17.8 | 17.9 | 19.5 | 20.2 | 19.0 | .. |
| Scotland | 19.4 | 19.1 | 18.6 | 18.7 | 17.6 | 18.0 | 19.7 | 20.7 | 18.5 | .. |
| Ireland | 17.6 | 18.4 | 17.9 | 18.3 | 18.0 | 17.5 | 18.2 | 18.4 | 19.4 | .. |
| Denmark | 18.4 | 17.9 | 18.2 | 18.3 | 19.7 | 18.6 | 19.0 | 20.0 | 19.4 | .. |
| Norway | 16.4 | 16.5 | 16.1 | 16.6 | 16.9 | 17.4 | 17.9 | 17.5 | 17.7 | .. |
| Sweden | 17.5 | 17.8 | 16.6 | 16.1 | 16.0 | 16.0 | 17.1 | 16.8 | .. | .. |
| Austria | 29.2 | 29.9 | 29.4 | 28.9 | 29.2 | 27.3 | 29.4 | 27.9 | 28.8 | .. |
| Hungary | 30.8 | 31.6 | 31.4 | 33.5 | 31.7 | 29.9 | 32.4 | 33.1 | .. | .. |
| Switzerland | 20.2 | 21.3 | 20.7 | 20.2 | 19.9 | 20.3 | 20.9 | 20.7 | 19.3 | .. |
| German Empire | 26.0 | 25.7 | 26.2 | 24.2 | 23.8 | 23.8 | 24.4 | 23.4 | 24.1 | .. |
| Netherlands | 22.2 | 21.0 | 21.5 | 19.7 | 20.4 | 20.1 | 20.5 | 20.7 | 21.0 | .. |
| France | 22.2 | 21.9 | 22.5 | 22.0 | 21.8 | 20.5 | 22.6 | 22.6 | 22.6 | .. |
| Italy | 26.7 | 26.6 | 28.3 | 27.5 | 27.0 | 24.9 | 26.4 | 26.2 | 26.2 | .. |
A comparison of the above rates appears to place the Australasian Colonies as a whole in the foremost rank for salubrity of climate and healthiness of people, New Zealand standing well above the rest; but it must be admitted that the ratio of all deaths to the 1,000 of population living in the middle of the year, although a good test of the sanitary condition of the same country from year to year, and also useful for comparing the healthfulness of such countries as contain the same or nearly the same proportionate numbers of persons living at each age-period of life, cannot be regarded as a perfectly fair index when new countries are compared with old, or even when new countries are compared one with another, should the proportions living at the several age-periods vary considerably.
The truest rates of mortality are obtained by ascertaining the proportion of deaths at each age-period to the numbers living at those ages.
The total number of deaths registered at the four chief towns in 1893 was 1,374, or an increase of 123 on the number registered in the previous year, and of 43 on the number registered in 1891. A numerical increase of deaths in 1893 over 1892 is noticed at each city, but is greatest in Wellington. The deaths and death-rates for the last three years are stated:—
| — | Deaths, 1891. | Deaths, 1892. | Deaths, 1893. | |||
|---|---|---|---|---|---|---|
| No. | Per 1,000 No. of Population. | No. | Per 1,000 of Population. | No. | Per 1,000 of Population. | |
| Auckland | 390 | 13.63 | 382 | 12.52 | 404 | 12.90 |
| Wellington | 453 | 14.60 | 405 | 12.27 | 462 | 13.43 |
| Christchurch | 185 | 11.40 | 197 | 11.89 | 219 | 12.80 |
| Dunedin | 303 | 13.54 | 267 | 11.59 | 289 | 12.26 |
Here the rates are all higher for 1893 than for 1892, and in the case of Christchurch higher than in 1891. Of the rates for 1893 that of Wellington is the highest, Auckland coming next.
If the infantile mortality be excluded, the death-rate of Wellington still stands as the highest in 1893, but Dunedin takes second, Auckland third, and Christchurch the last place.
| Deaths per 1,000 of Population, excluding Infants (under One Year of Age). | |||
| 1891. | 1892. | 1893. | |
| Auckland | 9.91 | 9.05 | 9.66 |
| Wellington | 11.02 | 9.32 | 10.26 |
| Christchurch | 8.83 | 8.51 | 9.24 |
| Dunedin | 11.45 | 9.51 | 10.18 |
A comparison of the death-rates of the chief towns of New Zealand for 1892 and 1893 with those of Australia shows the rates in this colony to be lower:—
| Principal Cities. | Deaths per 1,000 of Population. | |
|---|---|---|
| 1892. | 1893. | |
| Perth (including suburbs) | 27.23 | 23.62 |
| Hobart | 21.80 | 21.37 |
| Melbourne | 15.98 | 17.07 |
| Adelaide | 14.11 | 17.58 |
| Sydney | 13.59 | 15.57 |
| Brisbane | 14.02 | 14.57 |
| Auckland (excluding suburbs) | 12.52 | 12.90 |
| Wellington | 12.27 | 13.43 |
| Christchurch | 11.89 | 12.80 |
| Dunedin | 11.59 | 12.26 |
The rate for Wellington in 1893 is found to be 1–14 per 1,000 less than that for Brisbane, but the rate for Brisbane is the lowest of those quoted for Australian cities, while that of Wellington is the highest given for New Zealand.
The degree of infantile mortality is exhibited in the proportion of deaths of children under one year of age to every 100 births. The results for five years are given, showing that the mean rate is highest at Christchurch, next at Auckland, Wellington and Dunedin following. The same order prevails in the proportions for the year 1893.
| Deaths of Children under One Year to every 100 Births. | ||||||
|---|---|---|---|---|---|---|
| 1889. | 1890. | 1891. | 1892. | 1893. | Mean of Five Years. | |
| Auckland | 10.80 | 9.89 | 13.36 | 14.28 | 12.64 | 12.19 |
| Wellington | 12.42 | 9.77 | 12.14 | 11.50 | 12.26 | 11.62 |
| Christchurch | 13.11 | 11.94 | 12.71 | 16.81 | 18.60 | 14.63 |
| Dunedin | 9.59 | 8.22 | 9.87 | 9.51 | 11.16 | 9.67 |
VITAL STATISTICS OF AUSTRALASIAN CAPITALS, 1893. (HAYTER.)
| Capital Cities.* | Estimated Mean Population. | Births. | Deaths. | Excess of Births over Deaths. | |||
|---|---|---|---|---|---|---|---|
| Total Number. | Number per 1,000 of the Population. | Total Number. | Number per 1,000 of the Population. | Numerical. | Centesimal. | ||
* With suburbs. † If the births and deaths occurring in hospitals, asylums, &c., be excluded, the rate per 1,000 of the population of Greater Melbourne of births would be 31–98, and of deaths, 14–21; whilst the excess of births over deaths would be 8,051, or 125 per cent. ‡ The figures in this line have been partly derived from estimates made in the office of the Government Statist, Melbourne. | |||||||
| Melbourne | 457,230 | 15,338 | 33.55† | 7,805 | 17.07† | 7,533 | 97 |
| Sydney | 416,370 | 13,945 | 33.49 | 6,483 | 15.57 | 7,462 | 115 |
| Brisbane‡ | 104,560 | 3,454 | 33.03 | 1,523 | 14.57 | 1,931 | 127 |
| Adelaide | 138,658 | 4,568 | 32.94 | 2,438 | 17.58 | 2,130 | 87 |
| Perth | 11,770 | 541 | 45.96 | 278 | 23.62 | 263 | 95 |
| Hobart | 35,000 | 1,198 | 34.23 | 748 | 21.37 | 450 | 60 |
| Wellington | 37,656 | 1,062 | 28.20 | 495 | 13.15 | 567 | 115 |
Of the persons who died in 1893, 266 males and 191 females were at or over 75 years of age. Of these, 121 males and 88 females were under 80 years of age, 93 males and 62 females were 80 and under 85, 45 males and 27 females were from 85 to under 90, 5 males and 11 females were from 90 to 95, 2 males and 2 females were between 95 and 100 years, and 1 woman reached the age of 100 years.
The combined ages of all the males who died amounted to 125,305 years, and those of the females to 78,471 years, giving an average age at death of 31–86 years for the males and 27–79 years for the females.
The average age at death of persons of each sex, in each of the past five years, was as follows:—
| Males. | Females. | |
| 1889 | 32.29 years | 27.69 years. |
| 1890 | 33.81 years. | 28.62 years. |
| 1891 | 33.11 years. | 29.25 years. |
| 1892 | 32.97 years. | 28.95 years. |
| 1893 | 31.86 years. | 27.79 years. |
More males than females are horn annually, and more male than female infants die in proportion to the number of each sex born. In 1893 the number of male children born was 9,310, and the number of deaths of male infants under one year of age was 922, being at the rate of 99 in every 1,000 born; the number of females born was 8,877, and the number that died under one year of age was 678, being in the proportion of 76 in every 1,000 born.
Subjoined is a classified statement of the deaths of infants under one year during 1893, with the ratio of the deaths in each class to the 1,000 births during the year:—
| Year. | Sex. | Under 1 Month. | 1 and under 3 Months. | 3 and | 6 and under 12 Months. | Total under 12 Months. |
|---|---|---|---|---|---|---|
| NUMBER OF DEATHS. | ||||||
| 1893 | Male | 313 | 193 | 159 | 257 | 922 |
| Female | 221 | 116 | 150 | 191 | 678 | |
| DEATHS TO THE 1,000 BIRTHS. | ||||||
| 1893 | Male | 33.62 | 20.73 | 17.08 | 27.60 | 99.03 |
| Female | 24.90 | 13.07 | 16.90 | 21.51 | 76.38 | |
It will he seen from these figures that the chances of living during the first year of age are far stronger in favour of female than of male infants. Thus, during the year 1893 there were—
| 100 deaths of males to 70–60 deaths of females under 1 month of age; | 100 deaths of males to 60–10 deaths of females under 1 to 3 month of age; | 100 deaths of males to 94–34 deaths of females under 3 to 6 month of age; | 100 deaths of males to 74–32 deaths of females under 6 to 12 month of age; | 100 deaths of males to 73–54 deaths of females under 12 month of age; |
The rates of infantile mortality—that is, the proportion the deaths of children under one year of age bear to the births—are higher in the Australian Colonies than in New Zealand. The following table gives the rate in the several colonies named for each of the ten years 1882–91:—
NUMBER OF DEATHS OF CHILDREN UNDER ONE YEAR OF AGE TO EVERY 100 BIRTHS.
| Year. | Queensland. | New South Wales. | Victoria. | South Australia. | Tasmania. | New Zealand. |
|---|---|---|---|---|---|---|
| 1882 | 13.95 | 13.12 | 13.91 | 15.19 | 10.36 | 8.83 |
| 1883 | 13.34 | 11.48 | 11.44 | 14.56 | 12.39 | 10.39 |
| 1884 | 14.74 | 12.62 | 11.37 | 13.42 | 9.98 | 7.93 |
| 1885 | 14.85 | 13.12 | 12.57 | 11.34 | 11.26 | 8.92 |
| 1886 | 12.59 | 12.85 | 12.73 | 12.62 | 10.48 | 9.84 |
| 1887 | 11.29 | 10.59 | 13.00 | 11.12 | 10.09 | 9.38 |
| 1888 | 12.07 | 11.09 | 12.75 | 9.59 | 9.43 | 7.07 |
| 1889 | 13.62 | 12.50 | 15.21 | 9.42 | 10.64 | 7.89 |
| 1890 | 10.05 | 10.45 | 11.74 | 9.65 | 10.55 | 7.87 |
| 1891 | 10.12 | 11.89 | 12.62 | 9.09 | 9.45 | 9.12 |
Infantile mortality is as a rule greatest in the large towns, where the population is dense and the sanitary conditions are less favourable than in country districts. The absence in New Zealand of any such large centres of population as are found in some of the Australian Colonies may partially account for the lower rates of infantile mortality in this colony. The proportions of infantile deaths to births in each of the four principal boroughs in New Zealand during the past five years have been previously stated.
“The Registration of Births and Deaths Act Amendment Act, 1882,” requires that on the registration of the death of any person the age of each living child of the deceased shall be entered in the register. The particulars so recorded for several years have been tabulated, and the detailed, results are shown in the two tables on pages 62 and 63 of the “Statistics of New Zealand, 1893.” One of those tables deals with the year 1893 only; the other gives the aggregate results for the four years 1890 to 1893 inclusive. They show the total number of men who died at each year of age from 20 to 65, the number of married men (husbands and widowers) stated in the registers to have died childless, the number who died leaving children living, and the number and ages of the children so left.
From the first of these tables it is found that during 1893 there died 1,610 men between the ages of 20 and 65, of whom 836 were married; 701 married men left children at their deaths, while 135 are stated to have been childless. The proportions of married men and bachelors in every 100 males dying were 51–93 and 48–07 respectively. The proportions at the census of 1891 for the total number living at the above ages were: Married men, 56–81 per cent.; bachelors, 42–92 per cent.; and unspecified, 0–27 per cent. The differences here shown would tend to prove that the death-rate amongst married men at the ages under review is lighter than amongst bachelors; but it must be borne in mind that when registering a death the informant is not always in possession of full particulars as to the conjugal condition of the deceased, and that therefore the number of married men as shown in the tables may be somewhat short of the actual fact.
Assuming the ratio of married men at 20 to 65 to the total male population at those ages to be the same in 1893 as obtained at the census of 1891, the death-rate is found to be 8–69 per 1,000 living, whereas the rate for all males at the same age-period was in 1891 9–60 per 1,000.
| Ages. | 1891. | 1893. | ||||
|---|---|---|---|---|---|---|
| Total Number of Males living at each Age-period. | Total Number of Male Deaths. | Death-rate per 1,000 living. | Estimated Number of Married Men living. | Number of Deaths of Married Men. | Death-rate per 1,000 living. | |
| 20–25 | 28,337 | 148 | 5.22 | 2,473 | 5 | 2.02 |
| 25–30 | 23,704 | 108 | 4.56 | 9,213 | 45 | 4.88 |
| 30–35 | 22,021 | 114 | 5.18 | 13,668 | 45 | 3.29 |
| 35–40 | 20,513 | 139 | 6.78 | 15,052 | 80 | 5.31 |
| 40–45 | 17,755 | 139 | 7.83 | 13,444 | 87 | 6.47 |
| 45–50 | 17,028 | 183 | 10.75 | 13,572 | 108 | 7.96 |
| 50–55 | 16,770 | 272 | 16.22 | 13,534 | 143 | 10.57 |
| 55–60 | 10,945 | 252 | 23.02 | 8,933 | 139 | 15.56 |
| 60–65 | 7,685 | 227 | 29.54 | 6,319 | 184 | 29.12 |
| 164,758 | 1,582 | 9.60 | 96,208 | 836 | 8.69 | |
The total number of children left by the 836 married men who died in 1893 was 3,352. Of these, 1,577 were under 15 years of age, 673 between 15 and 21, and 1,031 over 21, leaving 71 in respect of whom no information could be obtained. Thus the average number of children of all ages left by each married man dying between 20 and 65 would be 4.01, or 1.89 under 15, 0.80 between 15 and 21, 1.23 over 21 years of age, and 0.09 of unspecified age. Discarding the number (135) of fathers said to have died childless, the average number of children left by each of the others would be 4.78 of all ages—2.25 under 15, 0.96 between 15 and 21, 1.47 over 21, and 0.10 of unspecified age. Almost identical results are obtained if the figures for the four years 1890–93 be used instead of those for 1893 only.
| Ages. | Estimated Number of Husbands and Widowers living in 1693. | Total Number of Male Deaths. | Number of Married Men who died | Number and Ages of Children left. | |||||
|---|---|---|---|---|---|---|---|---|---|
| Childless. | Leaving Children. | Under 15. | 15 to 21. | 21 and upward. | Unspecified. | Total. | |||
| 20–25 | 2,473 | 154 | 2 | 3 | 3 | 3 | |||
| 25–30 | 9,213 | 161 | 14 | 31 | 61 | 61 | |||
| 30–35 | 13,668 | 107 | 8 | 37 | 103 | 6 | 109 | ||
| 35–40 | 15,052 | 145 | 15 | 65 | 202 | 10 | 11 | 223 | |
| 40–45 | 13,444 | 131 | 9 | 78 | 308 | 55 | 2 | 365 | |
| 45–50 | 13,572 | 166 | 9 | 99 | 301 | 114 | 41 | 23 | 479 |
| 50–55 | 13,534 | 249 | 22 | 121 | 272 | 177 | 192 | 12 | 653 |
| 55–60 | 8,933 | 216 | 19 | 120 | 196 | 164 | 286 | 19 | 665 |
| 60–65 | 6,319 | 281 | 37 | 147 | 131 | 153 | 510 | 794 | |
| 96,208 | 1,610 | 135 | 701 | 1,577 | 673 | 1,031 | 71 | 3,352 | |
An important fact brought out by the statistics quoted above is that every year upwards of 1,500 children under 15 years of age are left fatherless—how many without adequate means of living it is not possible to say.
The deaths registered during the last five years, when distributed among the several classes according to their assigned causes, give the rates shown hereunder:—
| Causes of Death. | Rate per 10,000 living. | ||||
|---|---|---|---|---|---|
| 1889. | 1890. | 1891. | 1892. | 1893. | |
| Zymotic diseases | 12.03 | 13.26 | 17.38 | 15.67 | 17.95 |
| Parasitic diseases | 0.26 | 0.32 | 0.21 | 0.42 | 0.36 |
| Dietetic diseases | 0.97 | 0.74 | 0.98 | 1.31 | 1.07 |
| Constitutional diseases | 16.53 | 17.19 | 16.89 | 17.61 | 17.56 |
| Developmental diseases | 7.01 | 7.68 | 7.43 | 7.83 | 7.65 |
| Local diseases | 43.71 | 44.33 | 47.48 | 45.16 | 46.40 |
| Violence | 8.31 | 8.39 | 8.03 | 8.24 | 8.24 |
| Ill-defined and not-specified causes | 5.54 | 4.64 | 5.08 | 4.34 | 3.09 |
| All causes | 94.36 | 96.55 | 103.48 | 100.58 | 102.32 |
The following statement gives the number of deaths for 1893 according to the various classes of disease, and the proportion of deaths in each class and order to the total number of deaths:—
| Causes of Death. | Number of Deaths. | Proportion to Total Deaths. | Proportion per 10,000 living. | ||||
|---|---|---|---|---|---|---|---|
| Male. | Female. | Total. | Male. | Female. | Total. | ||
| Per Cent. | Per Cent. | Per Cent. | |||||
| Class I. Specific febrile or zymotic diseases,— | |||||||
| Order 1. Miasmatic diseases | 503 | 414 | 917 | 12.76 | 14.66 | 13.55 | 13.87 |
| Order 2. Diarrhóal diseases | 107 | 86 | 193 | 2.71 | 3.05 | 2.85 | 2.92 |
| Order 3. Malarial diseases | 3 | 1 | 4 | 0.08 | 0.04 | 0.06 | 0.06 |
| Order 4. Zoogenous diseases | |||||||
| Order 5. Venereal diseases | 12 | 8 | 20 | 6.30 | 0.28 | 0.30 | 0.30 |
| Order 6. Septic diseases | 17 | 36 | 53 | 0.43 | 1.27 | 078 | 0.80 |
| Total Class I. | 642 | 545 | 1,187 | 16.28 | 19.30 | 17.54 | 17.95 |
| Class II. Parasitic diseases | 14 | 10 | 24 | 0.36 | 0.35 | 0.35 | 0.36 |
| Class III. Dietetic diseases | 47 | 24 | 71 | 1.19 | 0.85 | 1.05 | 1.07 |
| Class IV. Constitutional diseases | 631 | 530 | 1,161 | 16.00 | 18.77 | 17.16 | 17.56 |
| Class V. Developmental diseases | 284 | 222 | 506 | 7.20 | 7.86 | 7.48 | 7.65 |
| Class VI. Local diseases,— | |||||||
| Order 1. Diseases of nervous system | 432 | 316 | 748 | 1096 | 11.19 | 11.05 | 11.31 |
| Order 2. Diseases of organs of special sense | 6 | 4 | 10 | 0.15 | 0.14 | 0.15 | 0.15 |
| Order 3. Diseases of circulatory system | 340 | 180 | 520 | 8.62 | 6.38 | 7.68 | 7.86 |
| Order 4. Diseases of respiratory system | 515 | 391 | 906 | 13.06 | 13.85 | 13.39 | 13.70 |
| Order 5. Diseases of digestive system | 314 | 227 | 541 | 7.96 | 8.04 | 7.99 | 8.18 |
| Order 6. Diseases of lymphatic system | 7 | 8 | 15 | 0.18 | 0.28 | 0.22 | 0.22 |
| Order 7. Diseases of urinary system | 139 | 58 | 197 | 353 | 2.05 | 2.91 | 2.98 |
| Order 8. Diseases of reproductive system,— | |||||||
| (a.) Of organs of generation | 4 | 33 | 37 | 0.10 | 1.17 | 0.55 | 0.56 |
| (b.) Of parturition | … | 54 | 54 | … | 1.91 | 0.80 | 0.82 |
| Order 9. Diseases of locomotive system | 15 | 6 | 21 | 6.38 | 021 | 6.31 | 0.32 |
| Order 10. Diseases of integumentary system | 8 | 12 | 20 | 0.20 | 042 | 0.30 | 0.30 |
| Total Class VI. | 1,780 | 1,289 | 3,069 | 45.14 | 45.64 | 45.35 | 46.40 |
| Class VII. Violence,— | |||||||
| Order 1, Accident or negligence | 380 | 91 | 471 | 9.64 | 3.22 | 6.96 | 7.12 |
| Order 2. Homicide | 2 | 1 | 3 | 0.05 | 0.04 | 0.04 | 0.04 |
| Order 3. Suicide | 55 | 15 | 70 | 1.39 | 053 | 1.03 | 1.06 |
| Order 4. Execution | 1 | … | 1 | 0.03 | … | 0.02 | 0.02 |
| Total Class VII. | 438 | 107 | 545 | 11.11 | 3.79 | 8.05 | 8.24 |
| Class VIII. Ill-defined and not-specified causes | 107 | 97 | 204 | 2.72 | 3.44 | 3.02 | 3.09 |
| Grand totals | 3,943 | 2,824 | 6,767 | 100.00 | 100.00 | 10000 | 102.32 |
The following table exhibits the number of deaths in 1893 from each specific disease:—
CAUSES OF DEATH.
| Class. | Causes of Death. | Males. | Females. | Total. | |
|---|---|---|---|---|---|
| Orders and Diseases. | |||||
| I.—SPECIFIC FEBRILE OR ZYMOTIC DISEASES. | ORDER 1.—Miasmatic. | ||||
| Small-pox | ... | ... | ... | ||
| Chicken-pox | ... | 1 | 1 | ||
| Measles | 281 | 230 | 611 | ||
| Epidemic rose-rash, rubeola | 7 | 7 | 14 | ||
| Scarlet fever, scarlatina Typhus | ... | 1 | 1 | ||
| Dengue | ... | ... | ... | ||
| Relapsing fever | ... | 1 | 1 | ||
| Influenza | 61 | 45 | 106 | ||
| Whooping-cough | 31 | 24 | 55 | ||
| Mumps | ... | ... | ... | ||
| Diphtheria | 54 | 74 | 128 | ||
| Cerebro-spinal fever | ... | ... | ... | ||
| Simple and ill-defined fever | 1 | 2 | 3 | ||
| Enteric fever, typhoid | 68 | 29 | 97 | ||
| Other miasmatic diseases | ... | ... | ... | ||
| Total Order 1 | 503 | 414 | 917 | ||
| ORDER 2.—Diarrhœal. | |||||
| Simple cholera | 23 | 22 | 45 | ||
| Diarrhœa | 74 | 58 | 132 | ||
| Dysentery | 10 | 6 | 16 | ||
| Total Order 2 | 107 | 86 | 193 | ||
| ORDER 3.—Malarial. | |||||
| Remittent fever | 3 | 1 | 4 | ||
| Ague | ... | ... | ... | ||
| Beriberi | ... | ... | ... | ||
| Total Order 3 | 3 | 1 | 4 | ||
| ORDER 4.—Zoogenous. | |||||
| Hydrophobia | ... | ... | ... | ||
| Glanders | ... | ... | ... | ||
| Splenic fever | ... | ... | ... | ||
| Cow-pox and other effects of vaccination | .. | .. | ... | ||
| Total Order 4 | ... | ... | ... | ||
| ORDER 5.—Venereal. | |||||
| Syphilis | 8 | 8 | 16 | ||
| Gonorrhœea, stricture of urethra, ulcer of groin | 4 | ... | 4 | ||
| Total Order 5 | 12 | 8 | 20 | ||
| ORDER 6.—Septic. | |||||
| Phagedæna | 1 | ... | 1 | ||
| Erysipelas | 6 | 2 | 8 | ||
| Pyæmia, septicæmia | 10 | 10 | 20 | ||
| Puerperal fever, pyæmia, septicæmia | ... | 24 | 24 | ||
| Total Order 6 | 17 | 36 | 53 | ||
| Total Class I. | 642 | 545 | 1,187 | ||
| II.—PARASITIC DISEASES. | Thrush | 6 | 4 | 10 | |
| Other diseases from vegetable parasites | ... | ... | ... | ||
| Hydatid disease | 5 | 3 | 8 | ||
| Worms | 3 | 2 | 5 | ||
| Other diseases from animal parasites | ... | 1 | 1 | ||
| Total Class II. | 14 | 10 | 24 | ||
| III.—DIETETIC DISEASES. | Starvation | 1 | ... | 1 | |
| Want of breast-milk | 18 | 11 | 29 | ||
| Scurvy | ... | ... | ... | ||
| Intemperance— | |||||
| Chronic alcoholism | 23 | 9 | 32 | ||
| Delirium tremens | 5 | 1 | 6 | ||
| Opium-smoking | ... | 1 | 1 | ||
| Other dietetic diseases | ... | 2 | 2 | ||
| Total Class III. | 47 | 24 | 71 | ||
| IV.—CONSTITUTIONAL DISEASES. | Rheumatic fever | 10 | 6 | 16 | |
| Rheumatism | 11 | 13 | 24 | ||
| Gout | 2 | 1 | 3 | ||
| Rickets | 1 | 1 | 2 | ||
| Cancer | 188 | 144 | 332 | ||
| Tabes mesenterica, tubercular peritonitis | 27 | 22 | 49 | ||
| Tubercular meningitis, acute hydrocephalus | 35 | 37 | 72 | ||
| Phthisis | 295 | 250 | 545 | ||
| Other forms of tuberculosis, scrofula | 33 | 30 | 63 | ||
| Purpura, hæmorrhagic diathesis | 5 | 2 | 7 | ||
| Anæmia, chlorosis, leucocythæmia | 4 | 8 | 12 | ||
| Diabetes mellitus | 19 | 13 | 32 | ||
| Other constitutional diseases | 1 | 3 | 4 | ||
| Total Class IV. | 631 | 530 | 1,161 | ||
| V.—DEVELOPMENTAL DISEASES. | Premature birth | 133 | 95 | 228 | |
| Atelectasis | 10 | 8 | 18 | ||
| Cyanosis | 7 | 9 | 16 | ||
| Spina bifida | 4 | 5 | 9 | ||
| Imperforate anus | 3 | 2 | 5 | ||
| Cleft palate, hare-lip | 2 | 1 | 3 | ||
| Other congenital defects | 11 | 7 | 18 | ||
| Old age | 114 | 95 | 209 | ||
| Total Class V. | 284 | 222 | 506 | ||
| VI.—LOCAL DISEASES. | ORDER 1.—Diseases of Nervous System. | ||||
| Inflammation of the brain or its membranes | 39 | 57 | 96 | ||
| Cerebro-spinal meningitis | 3 | 2 | 5 | ||
| Apoplexy | 100 | 82 | 182 | ||
| Softening of brain | 15 | 10 | 25 | ||
| Hemiplegia, brain paralysis | 19 | 13 | 32 | ||
| Paralysis (undescribed) | 35 | 24 | 59 | ||
| Paralysis agitans | ... | 2 | 2 | ||
| Insanity, general paralysis of insane | 44 | 9 | 53 | ||
| Chorea | 1 | 1 | 2 | ||
| Epilepsy | 25 | 16 | 41 | ||
| Convulsions | 83 | 65 | 148 | ||
| Laryngismus stridulus | 3 | 1 | 4 | ||
| Idiopathic tetanus | 4 | 4 | 8 | ||
| Paraplegia, diseases of spinal cord | 15 | 6 | 21 | ||
| Locomotor ataxia | 8 | ... | 8 | ||
| Other diseases of nervous system | 38 | 24 | 62 | ||
| Total Order 1 | 432 | 316 | 748 | ||
| ORDER 2.—Diseases of Organs of Special Sense. | |||||
| Otitis, otorrhœa | 3 | 3 | 6 | ||
| Epistaxis, and diseases of nose | 1 | ... | 1 | ||
| Ophthalmia, and diseases of eye | 2 | 1 | 3 | ||
| Total Order 2 | 6 | 4 | 10 | ||
| ORDER 3.—Diseases of Circulatory System. | |||||
| Endocarditis, valvular disease | 194 | 120 | 314 | ||
| Pericarditis | ... | 1 | 1 | ||
| Hypertrophy of heart | 4 | ... | 4 | ||
| Fatty degeneration of heart | 34 | 7 | 41 | ||
| Angina pectoris | 5 | 3 | 8 | ||
| Syncope | 42 | 30 | 72 | ||
| Aneurism | 34 | 7 | 41 | ||
| Senile gangrene | 11 | 4 | 15 | ||
| Embolism, thrombosis | 3 | 3 | 6 | ||
| Phlebitis | 1 | 1 | 2 | ||
| Varicose veins, piles | ... | ... | ... | ||
| Other diseases of circulatory system | 12 | 4 | 16 | ||
| Total Order 3 | 340 | 180 | 520 | ||
| ORDER 4.—Diseases of Respiratory System. | |||||
| Laryngitis | 11 | 7 | 18 | ||
| Croup | 34 | 25 | 59 | ||
| Other diseases of larynx and trachea | 2 | ... | 2 | ||
| Asthma, emphysema | 20 | 12 | 32 | ||
| Bronchitis | 200 | 155 | 355 | ||
| Pneumonia | 202 | 148 | 350 | ||
| Pleurisy | 13 | 14 | 27 | ||
| Other diseases of respiratory system | 33 | 30 | 63 | ||
| Total Order 4 | 515 | 391 | 906 | ||
| ORDER 5.—Diseases of Digestive System. | |||||
| Stomatitis, cancrum oris | 10 | 3 | 13 | ||
| Dentition | 36 | 31 | 67 | ||
| Sore throat, quinsy | 6 | 8 | 14 | ||
| Dyspepsia | 7 | 4 | 11 | ||
| Hæmatemesis | 5 | ... | 5 | ||
| Melæna | 3 | 3 | 6 | ||
| Diseases of stomach, gastritis | 28 | 35 | 63 | ||
| Enteritis | 74 | 59 | 133 | ||
| Ulceration, perforation, of intestine | 1 | 4 | 5 | ||
| Ileus, obstruction of intestine | 20 | 9 | 29 | ||
| Stricture or strangulation of intestine | ... | ... | ... | ||
| Intussusception of intestine | 7 | 4 | 11 | ||
| Hernia | 12 | 2 | 14 | ||
| Fistula | 2 | 1 | 3 | ||
| Peritonitis | 24 | 17 | 41 | ||
| Ascites | ... | 4 | 4 | ||
| Gall-stones | 6 | 2 | 8 | ||
| Cirrhosis of liver | 24 | 7 | 31 | ||
| Other diseases of liver, hepatitis, jaundice | 44 | 28 | 72 | ||
| Other diseases of digestive system | 5 | 6 | 11 | ||
| Total Order 5 | 314 | 227 | 541 | ||
| ORDER 6—Diseases of Lymphatic System and Ductless Glands. | |||||
| Diseases of lymphatic system | 3 | 4 | 7 | ||
| Diseases of spleen | ... | 1 | 1 | ||
| Bronchocele | 1 | 2 | 3 | ||
| Addison's disease | 3 | 1 | 4 | ||
| Total Order 6 | 7 | 8 | 15 | ||
| ORDER 7.—Diseases of Urinary System. | |||||
| Acute nephritis | 9 | 11 | 20 | ||
| Bright's disease | 60 | 29 | 89 | ||
| Uræmia | 7 | 4 | 11 | ||
| Suppression of urine | 7 | ... | 7 | ||
| Calculus | 2 | ... | 2 | ||
| Hæmaturia | ... | ... | ... | ||
| Diseases of bladder and prostate | 33 | 5 | 38 | ||
| Other diseases of urinary system (kidney diseases undescribed) | 21 | 9 | 30 | ||
| Total Order 7 | 139 | 58 | 197 | ||
| ORDER 8.—Diseases of Reproductive System. | |||||
| (a.) Diseases of organs of generation,— | |||||
| Ovarian disease | ... | 11 | 11 | ||
| Diseases of uterus and vagina | ... | 16 | 16 | ||
| Disorders of menstruation | ... | 4 | 4 | ||
| Pelvic abscess | 1 | 2 | 3 | ||
| Perineal abscess | 2 | ... | 2 | ||
| Diseases of testes, penis, scrotum, &c. | 1 | ... | 1 | ||
| (b.) Diseases of parturition,— | |||||
| Abortion, miscarriage | ... | 6 | 6 | ||
| Puerperal mania | ... | 2 | 2 | ||
| Puerperal metritis | ... | 1 | 1 | ||
| Puerperal convulsions | ... | 7 | 7 | ||
| Placenta prævia (flooding) | ... | 18 | 18 | ||
| Phlegmasia dolens | ... | 2 | 2 | ||
| Other accidents of childbirth | ... | 18 | 18 | ||
| Total Order 8 | 4 | 87 | 91 | ||
| ORDER 9.—Diseases of Organs of Locomotion. | |||||
| Caries, necrosis | 7 | 1 | 8 | ||
| Arthritis, ostitis | 2 | ... | 2 | ||
| Other diseases of organs of locomotion | 6 | 5 | 11 | ||
| Total Order 9 | 15 | 6 | 21 | ||
| ORDER 10.—Diseases of Integumentary System. | |||||
| Carbuncle | ... | 1 | 1 | ||
| Phlegmon, cellulitis | ... | 2 | 2 | ||
| Lupus | ... | ... | ... | ||
| Ulcer, bed-sore | 1 | 2 | 3 | ||
| Eczema | 4 | 6 | 10 | ||
| Pemphigus | 2 | ... | 2 | ||
| Other diseases of integumentary system | 1 | 1 | 2 | ||
| Total Order 10 | 8 | 12 | 20 | ||
| Total Class VI. | 1,780 | 1,289 | 3,069 | ||
| VII—Violence. | ORDER 1.—Accident or Negligence. | ||||
| Fractures, contusions | 168 | 17 | 185 | ||
| Gunshot wounds | 7 | ... | 7 | ||
| Cut, stab | 10 | 2 | 12 | ||
| Burn, scald | 20 | 29 | 49 | ||
| Sunstroke | 3 | 1 | 4 | ||
| Poison | 8 | 5 | 13 | ||
| Drowning | 129 | 20 | 149 | ||
| Suffocation | 15 | 12 | 27 | ||
| Otherwise | 20 | 5 | 25 | ||
| Total Order 1 | 380 | 91 | 471 | ||
| ORDER 2.—Homicide. | |||||
| Murder, manslaughter | 2 | 1 | 3 | ||
| Wounds in battle | ... | ... | ... | ||
| Total Order 2 | 2 | 1 | 3 | ||
| ORDER 3.—Suicide. | |||||
| Gunshot wounds | 18 | 1 | 19 | ||
| Cut, stab | 8 | 1 | 9 | ||
| Poison | 10 | 9 | 19 | ||
| Drowning | 5 | 1 | 6 | ||
| Hanging | 13 | 3 | 16 | ||
| Otherwise | 1 | ... | 1 | ||
| Total Order 3 | 55 | 15 | 70 | ||
| ORDER 4.—Execution. | |||||
| Hanging | 1 | ... | 1 | ||
| Total Class VII. | 438 | 107 | 545 | ||
| VIII—Ill-Defined and Not Specified Causes. | Dropsy | ... | 1 | 1 | |
| Marasmus, &c. | 103 | 92 | 195 | ||
| Mortification, gangrene | ... | ... | ... | ||
| Tumour | ... | ... | ... | ||
| Abscess | ... | ... | ... | ||
| Hæmorrhage | ... | ... | ... | ||
| Sudden (cause unascertained) | 2 | ... | 2 | ||
| Other ill-defined and not-specified causes | 2 | 4 | 6 | ||
| Total Class VIII | 107 | 97 | 204 | ||
| General totals | 3,943 | 2,824 | 6,767 | ||
The deaths in 1893 from specific febrile or zymotic diseases amounted to 1,187, a proportion of 179 in every 100,000 persons living, and an increase of 181 on the number of deaths in 1892 from the same causes. Under all the principal heads the deaths in 1893 were fewer than in 1892, except in case of measles, from which there were 525 deaths. The epidemic of this complaint seems to have begun in 1893, as no deaths are found recorded for the previous year.
The following are the diseases in this class which caused the greatest mortality in the past nine years:— 7
| Diseases. | 1885. | 1886. | 1887. | 1888. | 1889. | 1890. | 1891. | 1892. | 1893. |
|---|---|---|---|---|---|---|---|---|---|
* Including rubeola (14). | |||||||||
| Measles | 1 | 49 | 28 | 5 | 2 | 1 | 1 | 525* | |
| Scarlet fever and scarlatina | 12 | 7 | 18 | 21 | 19 | 31 | 24 | 4 | 1 |
| Diphtheria | 104 | 78 | 92 | 143 | 113 | 116 | 86 | 195 | 128 |
| Whooping-cough | 91 | 132 | 138 | 72 | 19 | 82 | 242 | 115 | 55 |
| Influenza | 5 | 11 | 9 | 9 | 9 | 70 | 210 | 144 | 106 |
| Diarrhóal diseases | 399 | 455 | 475 | 214 | 355 | 290 | 319 | 329 | 193 |
| Enteric or typhoid fever | 118 | 123 | 158 | 130 | 118 | 145 | 119 | 134 | 97 |
| Puerperal fever | 48 | 33 | 24 | 39 | 25 | 19 | 27 | 29 | 24 |
From smallpox there were no deaths. Growing neglect of vaccination has been commented on before; but the records of the year 1893 show still greater disregard to the requirements of the law. The numbers of children under one year of age successfully vaccinated, and the proportion to the total number of births, are given for 1893 and the six preceding Years:—
| Provincial Districts. | Total Vaccinations registered. | Number of Births registered. | Proportion of Successful Vaccinations of Children under 1 Year of Age to Total Births. Per Cent. | Proportion of Successful Vaccinations of Children under 14 Years of Age to Total Births. Per Cent. |
|---|---|---|---|---|
| Auckland | 902 | 3,951 | 14.50 | 22.83 |
| Taranaki | 281 | 862 | 17.98 | 32.60 |
| Hawke's Bay | 462 | 1,003 | 28.51 | 46.06 |
| Wellington | 993 | 3,283 | 21.96 | 30.25 |
| Marlborough | 80 | 384 | 13.54 | 20.83 |
| Nelson | 468 | 896 | 21.99 | 52.23 |
| Westland | 33 | 265 | 3.02 | 12.45 |
| Canterbury | 2,066 | 3,531 | 47.13 | 58.51 |
| Otago | 2,127 | 4,006 | 36.25 | 53.10 |
| Chatham Islands | .. | 6 | .. | .. |
| Totals, 1893 | 7,412 | 18,187 | 28.09 | 40.75 |
| Totals, 1892 | 8,216 | 17,876 | 32.41 | 45.96 |
| Totals, 1891 | 9,284 | 18,273 | 38.81 | 50.81 |
| Totals, 1890 | 9,357 | 18,278 | 42.66 | 51.19 |
| Totals, 1889 | 11,913 | 18,457 | 48.37 | 64.55 |
| Totals, 1888 | 12,782 | 18,902 | 51.10 | 67.62 |
| Totals, 1887 | 12,919 | 19,135 | 53.79 | 67.52 |
Thus it would appear that only one child in every three born is successfully vaccinated, which is a serious matter enough when the possibility of an epidemic of smallpox is taken into consideration.
The proportions of successful vaccinations of all children under fourteen years of age to the total of births show a similar decrease.
In England the deaths from smallpox for the year 1891 were only 49 in number; and the deaths caused by the effects of vaccination were 43. A system, defined as “moderate compulsion,” has been recommended there, under which persons who have been fined –1, or have been fined in two penalties of any amount, for neglecting to have their children vaccinated would be exempted from any further proceedings.
Deaths from scarlet fever fell from 4 in 1892 to 1 in 1893. From diphtheria there were 128 deaths in 1893, a decrease of 67 in the number in the previous year, but an increase on the mortality in 1891 of 42. Deaths from whooping-cough numbered only 55, against 115 in 1892, and 242 in 1891. The epidemic of influenza;— from which complaint there were only 9 deaths in each of the years 1887, 1888, and 1889—caused 70 deaths in 1890, 210 in 1891, 144 in 1892, and 106 in 1893. Deaths from diarrhœal diseases fell from 329 in 1892 to 193 in 1893.
The death-rate from diarrhœal diseases fluctuates considerably from year to year, and often, though not invariably, rises and falls with the varying temperature of seasons and years. The following table, showing the mean maximum temperature in the summer months at the stations specified, exhibits the rise or fall of mortality from these diseases with the rise and fall of temperature:—
MEAN MAXIMUM TEMPERATURE IN SHADE FOR THE THREE MONTHS, JANUARY, FEBRUARY, MARCH.
| 1887. | 1888. | 1889. | 1890. | 1891. | 1892. | 1893. | |
|---|---|---|---|---|---|---|---|
| Fahr. | Fahr. | Fahr. | Fahr. | Fahr. | Fahr. | Fahr. | |
| ° | ° | ° | ° | ° | ° | ° | |
| Auckland | 76.53 | 70.77 | 74.46 | 73.60 | 73.07 | 73.93 | 72.43 |
| Wellington | 71.83 | 67.00 | 68.83 | 69.30 | 67.77 | 69.57 | 67.50 |
| Lincoln | 74.30 | 71.03 | 72.47 | 70.26 | 70.57 | 69.60 | 69.50 |
| Dunedin | 71.77 | 66.13 | 67.83 | 68 00 | 63.93 | 64.20 | 63.70 |
| Averages | 73.60 | 68.73 | 70.89 | 70.29 | 68.84 | 69.33 | 68.28 |
| Deaths in year from diarrhœal diseases per 10,000 persons living | 7.96 | 3.53 | 5.78 | 4.67 | 5.06 | 5.12 | 2.92 |
The mortality from typhoid fever was lower in 1893 than in 1892, the numbers of deaths being 97 and 134. The proportion per 10,000 persons living was 1.5 in 1893, against 2.9 in 1892 and 1.89 in 1891. For the years 1887 to 1891 the proportions for the various Australasian Colonies are given in the Victorian Year-book, from which it appears that New Zealand has the lowest:—
DEATHS FROM TYPHOID FEVER, 1887–91, PER 10,000 PERSONS LIVING.
| 1887. | 1888. | 1889. | 1890. | 1891. | |
|---|---|---|---|---|---|
| Queensland | 7.07 | 6.31 | 10.28 | 3.40 | 3.11 |
| New South Wales | 4.32 | 4.26 | 5.35 | 2.82 | 2.35 |
| Victoria | 6.21 | 5.13 | 8.35 | 5.46 | 3.10 |
| South Australia | 4.92 | 3.84 | 4.37 | 313 | 2.52 |
| Western Australia | 3.12 | 1.65 | 1.16 | 0.42 | 2.34 |
| Tasmania | 8.37 | 6.12 | 8.06 | 3.41 | 5.57 |
| New Zealand | 2.82 | 2.30 | 1.98 | 2.40 | 1.89 |
The rate for England and Wales for the year 1891 was 1–68 per 10,000 living.
There are more deaths from phthisis than from any other cause. The number of deaths was 524 in 1892 and 545–295 males and 250 females—in 1893. The deaths in 1893 were in the proportion of 8–24 in every 10,000 persons living. The rate among males was higher—8.40 per 10,000 persons living—than among females, who suffered in the proportion of 8.06 per 10,000.
The death-rate from phthisis in New Zealand is the lowest for the Australasian Colonies, as will be seen from the figures quoted below:—
DEATH-RATES FROM PHTHISIS PER 10,000 PERSONS LIVING.
| 1890. | 1891. | |
| Queensland | 13.35 | 12.38 |
| New South Wales | 934 | 9.21 |
| Victoria | 14.58 | 12.93 |
| South Australia | 9.29 | 10.36 |
| Western Australia | 8.97 | 9.56 |
| Tasmania | 9.60 | 9.00 |
| New Zealand | 8.38 | 7.86 |
In all the Australasian Colonies the rate is materially increased by the deaths of persons who have come out either already suffering from phthisis or predisposed thereto. There is no reason for believing that this circumstance has more effect on the death-rate in Australia-than in New Zealand; so that the lower rate obtaining in this colony may be taken as an indication of the superiority of its climate for withstanding consumptive tendencies.
The death-rate of England and Wales from phthisis is far higher than that of New Zealand. In 1891, when a lower rate obtained there than in any previous year, excepting 1888 and 1889, the rate was, nevertheless, 15–99 per 10,000 persons living. The Registrar-General of England remarks in his report that “the apparent arrest, in 1890 and 1891, of the almost continuous decline in phthisis mortality is partially attributable to the epidemic of influenza, which carried off many phthisical persons at an earlier stage than would otherwise have been the case.”
Phthisis is now known to be and is treated as an infectious preventible disease caused by the bacillus tuberculosis, communicable in many ways, and to the reception of which certain constitutions are much more predisposed than others, especially under conditions of life unfavourable to robust health, when a nidus is formed for the development of the bacillus.
Compulsory legislative interference has been recommended to protect the life and health of the people from tubercle, and isolation of consumptives, as well as means for disinfecting of sputa and things coming in contact with patients, are suggested from time to time as necessary measures.
A table is given, as in previous years, to show the ages, with the length of residence in the colony, of persons who died from phthisis in 1893:—
DEATHS FROM PHTHISIS.
| Length of Residence in the Colony. | Age at Death. | ||||||||||
|---|---|---|---|---|---|---|---|---|---|---|---|
| Under 5 Years. | 5 to 10. | 10 to 15. | 15 to 25. | 25 to 35. | 35 to 45. | 45 to 55. | 55 to 65. | 65 to 75. | 75 and upwards. | Total. | |
| MALES. | |||||||||||
| Under 1 month. | .. | .. | .. | .. | 1 | .. | .. | .. | .. | .. | 1 |
| 1 to 6 months | .. | .. | .. | 2 | 4 | .. | .. | 1 | . | .. | 7 |
| 6 to 12 months | .. | .. | .. | 3 | 2 | 1 | .. | .. | .. | .. | 6 |
| 1 to 2 years | .. | 1 | .. | 1 | 1 | .. | 1 | .. | .. | .. | 4 |
| 2 to 3 years | .. | .. | .. | .. | 1 | .. | .. | .. | .. | .. | 1 |
| 3 to 4 years | .. | .. | .. | .. | .. | .. | .. | .. | .. | .. | .. |
| 4 to 5 years | .. | .. | .. | 2 | 3 | .. | .. | .. | .. | .. | 5 |
| .5 to 10 years | .. | .. | .. | 4 | 7 | 7 | 1 | 1 | .. | .. | 20 |
| 10 to 15 years | .. | .. | .. | 1 | 6 | 10 | 4 | 1 | 2 | .. | 24 |
| 15 to 20 years | .. | .. | .. | 2 | 8 | 16 | 7 | 1 | 1 | .. | 35 |
| 20 to 25 years | .. | .. | .. | 1 | 6 | 3 | 10 | 3 | 1 | .. | 24 |
| 25 years and upwards | .. | .. | .. | .. | 7 | 2 | 17 | 17 | 7 | 2 | 52 |
| Not known | .. | .. | .. | .. | 8 | 4 | 6 | 2 | 1 | .. | 21 |
| Born in colony | 3 | 2 | 5 | 42 | 38 | 5 | .. | .. | .. | .. | 95 |
| Totals | 3 | 3 | 5 | 58 | 92 | 48 | 46 | 26 | 12 | 2 | – |
| FEMALES | |||||||||||
| Under 1 month | .. | .. | .. | .. | .. | .. | 1 | .. | .. | .. | 1 |
| 1 to 6 months | .. | .. | .. | 2 | .. | .. | .. | .. | .. | .. | 2 |
| 6 to 12 months | .. | .. | .. | .. | .. | 1 | .. | 1 | .. | .. | 2 |
| 1 to 2 years | .. | .. | .. | .. | .. | .. | .. | .. | .. | .. | .. |
| 2 to 3 years | .. | .. | .. | .. | .. | .. | .. | .. | .. | .. | .. |
| 3 to 4 years | .. | .. | .. | .. | 1 | .. | .. | 1 | .. | .. | 2 |
| 4 to 5 years | .. | .. | .. | .. | 1 | .. | .. | .. | .. | .. | 1 |
| 5 to 10 years | .. | .. | .. | 2 | 3 | 1 | .. | .. | .. | .. | 6 |
| 10 to 15 years | .. | .. | .. | 1 | 4 | 7 | 2 | 2 | .. | .. | 16 |
| 15 to 20 years | .. | .. | .. | 13 | 12 | 7 | 7 | 2 | .. | .. | 41 |
| 20 to 25 years | .. | .. | .. | 3 | 5 | 7 | 2 | 2 | .. | .. | 19 |
| 25 years and upwards | .. | .. | .. | .. | 7 | 5 | 9 | 6 | 2 | 1 | 30 |
| Not known | .. | .. | .. | 2 | 1 | 6 | .. | .. | .. | .. | 9 |
| Born in colony | 5 | 7 | 5 | 66 | 33 | 3 | 2 | .. | .. | .. | 121 |
| Totals | 5 | 7 | 5 | 89 | 67 | 37 | 23 | 14 | 2 | 1 | 250 |
| Totals of both sexes | 8 | 10 | 10 | 147 | 159 | 85 | 69 | 40 | 14 | 3 | 545 |
Cancer was returned as having caused 332 deaths in 1893. In 1892 the deaths stated were 307; in 1891, 295; in 1890, the same number; in 1889, 260; and in 1888, 263. The death-rates for England and New Zealand, which are given below, would lead to the belief that there has been a most serious increase in mortality from this cause of late years.
DEATHS FROM CANCER IN EVERY 10,000 PERSONS LIVING.
| Year. | New Zealand. | England |
| 1881 | 2.69 | 5.20 |
| 1882 | 2.89 | 5.34 |
| 1883 | 2.99 | 5.49 |
| 1884 | 3.46 | 5.63 |
| 1885 | 3.13 | 5.72 |
| 1886 | 3.68 | 5.90 |
| 1887 | 3.99 | 6.15 |
| 1888 | 4.34 | 6.21 |
| 1889 | 4.25 | 6.56 |
| 1890 | 4.75 | 6.76 |
| 1891 | 4.68 | 6.92 |
| 1892 | 4.78 | .. |
| 1893 | 5.02 | .. |
It has been held, however, that the apparent increase in cancer is the result of more careful definition of the causes of death, and of improved diagnosis. To this the Registrar-General of England replies: “In the face of the constant and great growth of mortality under the head of cancer, and the expressed belief of medical practitioners especially engaged in dealing with this class of diseases that they are becoming more and more common, it seems scarcely possible to maintain the optimistic view that the whole of the apparent increase can be thus explained; and it must be admitted as at any rate highly probable that a real increase is taking place in the frequency of these malignant affections.” But the results of a careful investigation made by Mr. George King (Honorary Secretary, Institute of Actuaries), and Dr. Nensholme lead to conclusions differing from the above, it being now contended that there is no increase of cancer whatever, as will be seen by the following extract from the “Proceedings of the Royal Society, London”:—
The statistics for Frankfort-on-the-Main enable us to classify cancer in accordance with the part of the body primarily affected. We have, therefore, classified the returns into two groups, according as the cancer is “accessible” or easy of diagnosis, and “inaccessible” or difficult of diagnosis. The results of this classification show that in those parts of the body in which cancer is easily accessible and detected there has been no increase in cancer mortality between 1860 and 1889. It is true that the majority of the deaths from “accessible” cancer are among women—the deaths from “accessible” cancer among men at Frank-fort-on-the-Main being too few to be, when considered alone, trustworthy; but we know of no reason for supposing that, while female cancer of “accessible” parts has remained stationary, male and female cancer of the other parts of the body has really increased.
The general conclusions arrived at are these:—
Males and females suffer equally from cancer in those parts of the body common to man and woman, the greater prevalence of cancer among females being due entirely to cancer of the sexual organs.
The apparent increase in cancer is confined to what we have called inaccessible cancer. This is shown (a) by the Frankfort figures, (b) by the fact that the difference between the rates for males and females respectively is approximately constant, and does not progressively increase with the apparent increase in cancel in each of the sexes, and (c) because the apparent increase in cancer among the well-to-do assured lives, who are presumably attended by medical men of more than average skill, is not so great as among the general population.
The supposed increase in cancer is only apparent, and is clue to improvement in diagnosis and more careful certification of the causes of death. This is shown by the fact that the whole of the increase has taken place in inaccessible cancer difficult of diagnosis, while accessible cancer easily diagnosed has remained practically stationary.
As to the nature of cancer, Dr. R. G. Macdonald, of Dunedin, in his notes on Cancer Statistics, writes,—
The German schools assert that cancer can be inoculated, and is contagious, while some of our English schools as positively assert that it is not, but is due to the exigencies of cell life. The contest now lies between the bacillus and the cell, and it remains to be seen who shall win the day.
The one is a foreigner, ab extra, of desperately evil repute; the other a native product, per excessum, which has thrown off allegiance to the parent stock, and has set out on a madcap career of its own. It is difficult for the individual attacked to say whether the cell or the bacillus would be preferable, and, indeed, it matters not, as it would be a choice between Scylla and Charybdis. To the great majority of humanity, however, it is of the utmost importance that the battle should be decided, as, should the bacillus theory prevail, much can be done to destroy its potency. Our food-supplies, and those already affected, would be much more carefully attended to, and general hygiene would require a fresh stimulus. It would, doubtless, be dealt with much the same as tubercle, and with the prospect of gradually eradicating it. Should the cell theory be triumphant, we must clamour for the millennium or “Looking Backward” at once; as, while the world goes as it does, it is impossible to get rid of worry or other neurotic causes; and it is equally impossible to get rid of the majority of cases arising from local injury or irritation.
He gives also, as conclusive proof that flesh-eating cannot he put down as the origin of the evil, Surgeon Major Hendley's account of cancer at the Jeypore Hospital: —
The records of the Jeypore Hospital, which is under my charge, show no such immunity of vegetarians from cancer. From January, 1880, to the present date, 102 major operations have been performed in the hospital in cases of cancer. Of these, forty-one were on the persons of meat-eaters, and sixty-one on those of strict vegetarians, who had never oaten meat since their birth. Amongst them are six Saraogis, a class of Jains who even reject many kinds of vegetables.
The following table gives the death-rates from cancer in New Zealand of males and females for the past ten years:—
DEATHS FROM CANCER IN EVERY 10,000 PERSONS OF EACH SEX LIVING IN NEW ZEALAND.
| Year. | Males. | Females. |
| 1884 | 3.26 | 3.69 |
| 1885 | 2.82 | 3.43 |
| 1886 | 3.69 | 3.67 |
| 1887 | 3.96 | 4.03 |
| 1888 | 4.19 | 4.53 |
| 1889 | 3.47 | 4.06 |
| 1890 | 4.72 | 4.79 |
| 1891 | 4.61 | 4.77 |
| 1892 | 5.08 | 4.44 |
| 1893 | 5.35 | 4.65 |
Violent deaths form a very large proportion of the total mortality. In the year 1893 the proportion per 10,000 of males living was 12.47, and the proportion in the same number of females 3.45. Differently expressed, one out of every 802 males living, and one out of every 2,897 females, met with a violent death.
Of 438 males who died violent deaths, 55, or 12.56 per cent., were suicides. The deaths of females by violence were far fewer, amounting to no more than 107, and out of these 15 committed suicide, a proportion of 14.02 per cent. The table on page 97 gives the full list of deaths from external or violent causes for the year 1893.
Accidental deaths numbered 471—males 380 and females 91. Of the total number (380) of male deaths 168 resulted from fractures or contusions, and 129 from accidental drowning.
The accidental deaths in 1892 were 377 males and 83 females; and suicides, 54 males and 5 females.
The following figures, taken from the Victorian Year-book of 1893, show the death-rate from violence in the Australasian Colonies and the United Kingdom, from which it would appear that the rate in New Zealand is higher than in the Home-country, South Australia, Victoria, and Tasmania, but lower than in New South Wales, Queensland, and Western Australia:—
| Colonies or Countries. | Proportion per 100,000 living of Deaths by Violence. |
|---|---|
| Queensland | 163.8 |
| Western Australia | 161.7 |
| New South Wales | 111.7 |
| New Zealand | 95.7 |
| Victoria | 94.6 |
| United Kingdom | 77.5 |
| Tasmania | 74.5 |
| South Australia | 74.2 |
The number of the deaf-and-dumb returned at the census of 1891 was 166 of both sexes, the males being 93 and females 73. Included amongst these are 26 persons described as “dumb” only. Out of a total number of 166, 134 were under 30 years of age.
It would appear that the proportion of the deaf-and-dumb in the colony is increasing with time, but not to any very great degree. The figures are given for five census periods:—
DEAF-AND-DUMB.—PROPORTIONS PER 10,000 OF POPULATION.
| Persons. | Males. | Females. | |
|---|---|---|---|
| Census 1874 | 1.90 | 2.05 | 1.71 |
| Census 1878 | 2.22 | 2.25 | 2.18 |
| Census 1881 | 233 | 2.23 | 2.45 |
| Census 1886 | 2.30 | 2.37 | 2.22 |
| Census 1891 | 2.65 | 280 | 2.49 |
The number of deaf-and-dumb under 15 years of age was 75. The report of the Hon. the Minister of Education states that the Deaf-mute Institution at Sumner had 50 pupils in December, 1891, from which it may be inferred that about 25 juvenile deaf-mutes exist in the colony who do not participate in the advantage of the oral system of teaching and the other benefits to be derived from that establishment.
The number of the population of the colony under 15 years of age was 250,368 at the date of the census, so that, with a total number of 75 deaf-mutes at that period of life, there was 1 deaf-mute in every 3,338 children. The proportion of deaf-mutes of ail ages to the total population of the colony was 1 in every 3,775 persons.
The proportion of deaf-mutes to the total population at the census of 1891 for each of the Australasian Colonies was—
| South Australia | 1 deaf-mute to every 1,369 persons. |
| Queensland | 1 deaf-mute to every 2,557 persons |
| Tasmania | 1 deaf-mute to every 2,716 persons |
| New South Wales | 1 deaf-mute to every 2,867 persons |
| Victoria | 1 deaf-mute to every 3,133 persons |
| New Zealand | 1 deaf-mute to every 3,775 persons |
| Western Australia | 1 deaf-mute to every 4,526 persons |
In the 1891 census 274 persons were returned as “blind” or “nearly blind.” Of these, 164 were males and 110 females. The results of five censuses are compared in the following table, which shows a steady rise in the numbers of the blind considered in proportion to population, and also that blindness amongst males is somewhat more prevalent in New Zealand than amongst females:—
PROPORTIONS OF BLIND TO EVERY 10,000 OF THE POPULATION.
| Persons. | Males. | Females. | |
| Census 1874 | 2.34 | 2.45 | 2.18 |
| Census 1878 | 256 | 2.42 | 2.73 |
| Census 1881 | 2.82 | 2.93 | 2.68 |
| Census 1886 | 3.22 | 3.65 | 2.70 |
| Census 1891 | 4.37 | 4.91 | 3.74 |
The proportion of the blind per 10,000 persons living is—for England, about 8–79; for Ireland, 11.30; for Scotland, 6.95; for Germany, 7.93; for France, 8.37; and for Italy, 7.63. For the Australian Colonies the figures are: Victoria, 8.72; New South Wales, 6.59; Australian Continent, 7.38.
The greater prevalence of blindness in Australia than in New Zealand is best seen by the following comparison for 1891:—
| Tasmania | 1 blind person to every 889 persons. |
| Western Australia | 1 blind person to every 922 persons. |
| Victoria | 1 blind person to every 1,146 persons. |
| South Australia | 1 blind person to every 1,297 persons. |
| New South Wales | 1 blind person to every 1,517 persons. |
| Queensland | 1 blind person to every 1978 persons. |
| New Zealand | 1 blind person to every 2,287 persons. |
Of 274 blind persons, only 66 were found to be under 40 years of age, blindness being a disease more common to the later periods of life.
Blind persons are returned in the census under many heads of occupation, as might be expected, considering the fact, already alluded to above, that blindness is more common in later life than in youth. No doubt the occupations stated must be looked upon in many instances as past occupations—to which the persons referred to were brought up, and which they followed before they became blind.
The occupations for 1891 are as follow: —
OCCUPATIONS (PAST AND PRESENT) OF THE BLIND.
| Persons. | M. | F. | |||
|---|---|---|---|---|---|
| Under 20. | Over 20. | Under 20. | Over 20. | ||
| Justice of the Peace | 1 | .. | 1 | .. | .. |
| Monthly nurse | 1 | .. | .. | .. | 1 |
| School-teacher | 2 | .. | 1 | .. | 1 |
| Instructor to the blind | 1 | .. | 1 | .. | .. |
| Photographer | 1 | .. | 1 | .. | .. |
| Music-teacher | 2 | .. | 2 | .. | .. |
| Boarding-house keeper | 1 | .. | 1 | .. | .. |
| Housekeeper | 1 | .. | .. | .. | 1 |
| Capitalist | 3 | .. | 2 | .. | 1 |
| Proprietor of land | 1 | .. | 1 | .. | .. |
| News vendor | 1.. | 1 | .. | .. | .. |
| Bootlaces and match vendor | 1 | .. | 1 | .. | .. |
| Draper | 1 | .. | 1 | .. | .. |
| Butcher | 1 | .. | 1 | .. | .. |
| Greengrocer | 1 | .. | 1 | .. | .. |
| Grocer | 1 | .. | 1 | .. | .. |
| Labourer in coal-yard | 1 | .. | 1 | .. | .. |
| Storekeeper | 2 | .. | 2 | .. | .. |
| General dealer | 2 | .. | 2 | .. | .. |
| Hawker | 1 | .. | 1 | .. | .. |
| Commission agent | 1 | .. | 1 | .. | .. |
| Clerk | 1 | .. | 1 | .. | .. |
| Assisting carrier | 1 | .. | .. | .. | .. |
| Piano-tuner | 1 | .. | 1 | .. | .. |
| Basket-maker | 3 | .. | 3 | .. | .. |
| Coach-painter | 1 | .. | 1 | .. | .. |
| Boatbuilder | 1 | .. | 1 | .. | .. |
| Chair-mender | 1 | .. | 1 | .. | .. |
| Boot- and shoe-maker | 1 | .. | 1 | .. | .. |
| Baker | 1 | .. | 1 | .. | .. |
| Brewer | 1 | .. | 1 | .. | .. |
| Cordial-maker | 1 | .. | 1 | .. | .. |
| Sawyer | 1 | .. | .. | .. | .. |
| Brickmaker | 1 | .. | 1 | .. | .. |
| Tinsmith | 1 | 1 | .. | .. | .. |
| Blacksmith | 1 | .. | 1 | .. | .. |
| Moulder | 1 | .. | 1 | .. | .. |
| Carpenter | 4 | .. | 4 | .. | .. |
| Labourer on roads | 1 | .. | 1 | .. | .. |
| Engineer | .. | .. | 1 | .. | .. |
| Labourer (undefined) | 13 | .. | 13 | .. | .. |
| Farmer | 11 | .. | 11 | .. | .. |
| Relative assisting farmer | 1 | .. | 1 | .. | .. |
| Farm labourer | 2 | .. | 2 | .. | .. |
| Gardener | 1 | .. | 1 | .. | .. |
| Dairy-farmer | 1 | .. | 1 | .. | .. |
| Gold-miner | 2 | .. | 2 | .. | .. |
| Quarryman | 1 | .. | 1 | .. | .. |
| Gum-digger | 1 | .. | 1 | .. | .. |
| Pensioner | 3 | .. | 3 | .. | .. |
| Annuitant | 2 | .. | 1 | .. | 1 |
| Independent means and retired | 11 | .. | 4 | .. | 7 |
| Not stated, and no occupation | 87 | 6 | 35 | 7 | 39 |
| Domestic duties | 41 | .. | .. | 2 | 39 |
| Governmt. scholar | 1 | 1 | .. | .. | .. |
| Receiving tuition at home | 3 | 2 | .. | 1 | .. |
| Dependent relatives | 8 | 3 | .. | 5 | .. |
| Inmate of hospital | 3 | .. | 2 | .. | .. |
| Inmate of benevolent asylum | 29 | .. | 25 | .. | 4 |
| Inmate of industrial school | 1 | 1 | .. | .. | .. |
| Receiving charitable aid | 1 | .. | 1 | .. | .. |
| Totals | 274 | 15 | 149 | 15 | 95 |
The lunatics returned in the census numbered 1,798 of both sexes, 1,088 being males and 710 females.
As in the case of the blind, the census results exhibit continuous increase in the proportion to population, and also show that lunacy is more prevalent amongst males than amongst females.
LUNATICS.—PROPORTIONS PER 10,000 OF POPULATION.
| Persons. | Males. | Females. | |
| Census 1874 | 19.93 | 2328 | 15.48 |
| Census 1878 | 20.85 | 25.07 | 15.54 |
| Census 1881 | 22.86 | 27.30 | 17.43 |
| Census 1886 | 26.50 | 31.03 | 21.18 |
| Census 1891 | 27.82 | 31.28 | 23.92 |
The number of lunatics stated in the asylum returns as for the 1st January, 1891, was 1,797, or just one fewer than the number brought out by the census. Although the asylum returns include certain idiots and inebriates not included in the census figures as lunatics, the comparison is sufficiently close to show that, with small exception, the lunatics of the colony are all cared for in the various institutions set apart for their reception, of which there are seven under Government, as well as one private asylum licensed by the Governor.
Referring to the proportions at age-periods, it is found that, taking both sexes, the proportion of lunatics in every 10,000 persons was only 2–61 at 15–20 years, but after that period rose rapidly to 96.67 at 45–50 years, from which time of life the proportions are somewhat less. The proportion of lunatic females of all ages to the total female population was less than that of males; nevertheless at the period 45–50 years 98.89 per 10,000 of females were lunatics, while the highest proportion shown for males is 96.85, at the period 55–60 years.
The number of idiots at the date of the last census was 128. These are not included as lunatics in the census numbers. The proportion per 10,000 of the population was 2.03 per 10,000 of both sexes; for males 2.32, and for females 1.7, per 10,000. At the census of 1886 only 89 persons were returned as idiots.
Insanity, including idiocy, exists in Ireland at the rate of 45.04 insane persons per 10,000 persons living. The rate in Scotland is 38.43; in Victoria, 36.17; in England, 32.53; in New South Wales, 30.38; in New Zealand, 29.85; in France, 25.1; in Sweden, Norway, and Denmark, 20.59.
The shipping entered inwards for the year 1893 included 617 vessels, of 615,604 tonnage. 635 vessels were cleared outwards, of a tonnage amounting to 642,466. These figures show a decrease of 69 vessels and 59,619 tons entered, and 54 vessels of 13,634 tons cleared. Of the vessels inwards, 166, of 290,323 tons, were British; 405, of 272,250 tons, colonial; and 46, of 53,031 tons, foreign. Of those outwards, 186, of 317,130 tons, were British; 400, of 270,308 tons, colonial; and 49, of 55,028 tons, foreign. The decrease on the shipping inwards for 1893 is found to include 37 vessels, of 45,254 tons, British, and 26 vessels, of 20,846 tons, foreign. There was a. decrease of 6 in the number, but an increase of 6,481 in the tonnage, of colonial vessels entered. Of the vessels inwards, 319, of 166,170 tons, were sailing-vessels, and 298, of 449,434 tons, steamers. Of those outwards, 331, of 177,929 tons, were sailing-vessels, and 304, of 464,537 tons, steamers. The shipping inwards and outwards for ten years is exhibited in the following statement:—
| Year. | Total Number. | British. | Colonial. | Foreign. | ||||||||
|---|---|---|---|---|---|---|---|---|---|---|---|---|
| Vessels. | Tons. | Crews. | Vessels. | Tons. | Crews. | Vessels. | Tons. | Crews. | Vessels. | Tons. | Crews. | |
| NOTE.—Coasting-vessels are not included in the above table. | ||||||||||||
| VESSELS ENTERED, 1884–93. | ||||||||||||
| 1884 | 852 | 529,188 | 20,717 | 174 | 193,265 | 6,345 | 625 | 299,797 | 12,834 | 53 | 36,126 | 1,538 |
| 1885 | 786 | 519,700 | 20,252 | 140 | 179,944 | 6,130 | 586 | 299,881 | 12,613 | 60 | 39,875 | 1,509 |
| 1886 | 725 | 502,572 | 19,525 | 116 | 149,167 | 4,418 | 534 | 294,859 | 12,660 | 75 | 58,546 | 2,447 |
| 1887 | 653 | 489,754 | 19,806 | 109 | 144,482 | 4,202 | 472 | 275,085 | 11,828 | 72 | 70,187 | 3,056 |
| 1888 | 683 | 526,435 | 20,783 | 130 | 182,020 | 5,352 | 497 | 276,624 | 12,401 | 56 | 67,791 | 3,030 |
| 1889 | 781 | 602,634 | 22,649 | 158 | 206,825 | 5,348 | 547 | 319,131 | 14,162 | 76 | 76,678 | 3,139 |
| 1890 | 744 | 662,769 | 23,475 | 190 | 280,105 | 6,786 | 477 | 298,497 | 13,598 | 77 | 84,167 | 3,091 |
| 1891 | 737 | 618,515 | 21,889 | 169 | 265,164 | 6,817 | 507 | 291,800 | 12,951 | 61 | 61,551 | 2,121 |
| 1892 | 686 | 675,223 | 22,038 | 203 | 335,577 | 8,274 | 411 | 265,769 | 11,303 | 72 | 73,877 | 2,461 |
| 1893 | 617 | 615,604 | 20,935 | 166 | 290,323 | 7,289 | 405 | 272,250 | 11,745 | 46 | 53,031 | 1,901 |
| VESSELS CLEARED, 1884–93. | ||||||||||||
| 1884 | 872 | 534,242 | 20,737 | 176 | 191,599 | 6,036 | 637 | 305,459 | 13,081 | 59 | 37,184 | 1,620 |
| 1885 | 780 | 513,000 | 19,882 | 135 | 177,186 | 6,052 | 589 | 297,432 | 12,393 | 56 | 38,382 | 1,437 |
| 1886 | 707 | 488,331 | 19,052 | 102 | 134,660 | 3,870 | 530 | 295,469 | 12,771 | 75 | 58,202 | 2,411 |
| 1887 | 675 | 493,583 | 19,155 | 113 | 142,890 | 4,070 | 494 | 282,499 | 12,098 | 68 | 68,194 | 2,987 |
| 1888 | 701 | 531,478 | 20,961 | 109 | 157,871 | 4,509 | 533 | 305,264 | 13,396 | 59 | 68,343 | 3,056 |
| 1869 | 762 | 593,252 | 22,647 | 160 | 211,872 | 5,714 | 527 | 307,083 | 13,762 | 75 | 74,297 | 3,171 |
| 1890 | 745 | 649,705 | 23,260 | 195 | 284,635 | 7,168 | 477 | 283,735 | 13,076 | 73 | 81,335 | 3,016 |
| 1891 | 744 | 625,807 | 22,080 | 168 | 271,533 | 7,002 | 515 | 291,938 | 12,947 | 61 | 62,336 | 2,131 |
| 1892 | 689 | 656,100 | 21,679 | 189 | 315,633 | 7,934 | 424 | 263,504 | 11,241 | 76 | 76,963 | 2,504 |
| 1893 | 635 | 642,466 | 21,448 | 186 | 317,130 | 7,839 | 400 | 270,308 | 11,665 | 49 | 55,028 | 1,944 |
The above figures apply to the foreign trade only; but in a new country like New Zealand, as yet deficient in roads, but having an extensive seaboard and a number of good harbours, the coastal trade must be relatively very large, as is evidenced by the figures next given:—
| Shipping entered Coastwise, 1893. | Shipping cleared Coastwise, 1893. | |||||||
|---|---|---|---|---|---|---|---|---|
| Number. | Tons. | Number. | Tons. | |||||
| Sailing-vessels | 4,168 | 256,213 | Sailing-vessels | 4,138 | 255,786 | |||
| Steamers | 13,309 | 4,074,922 | Steamers | 13,230 | 4,024,688 | |||
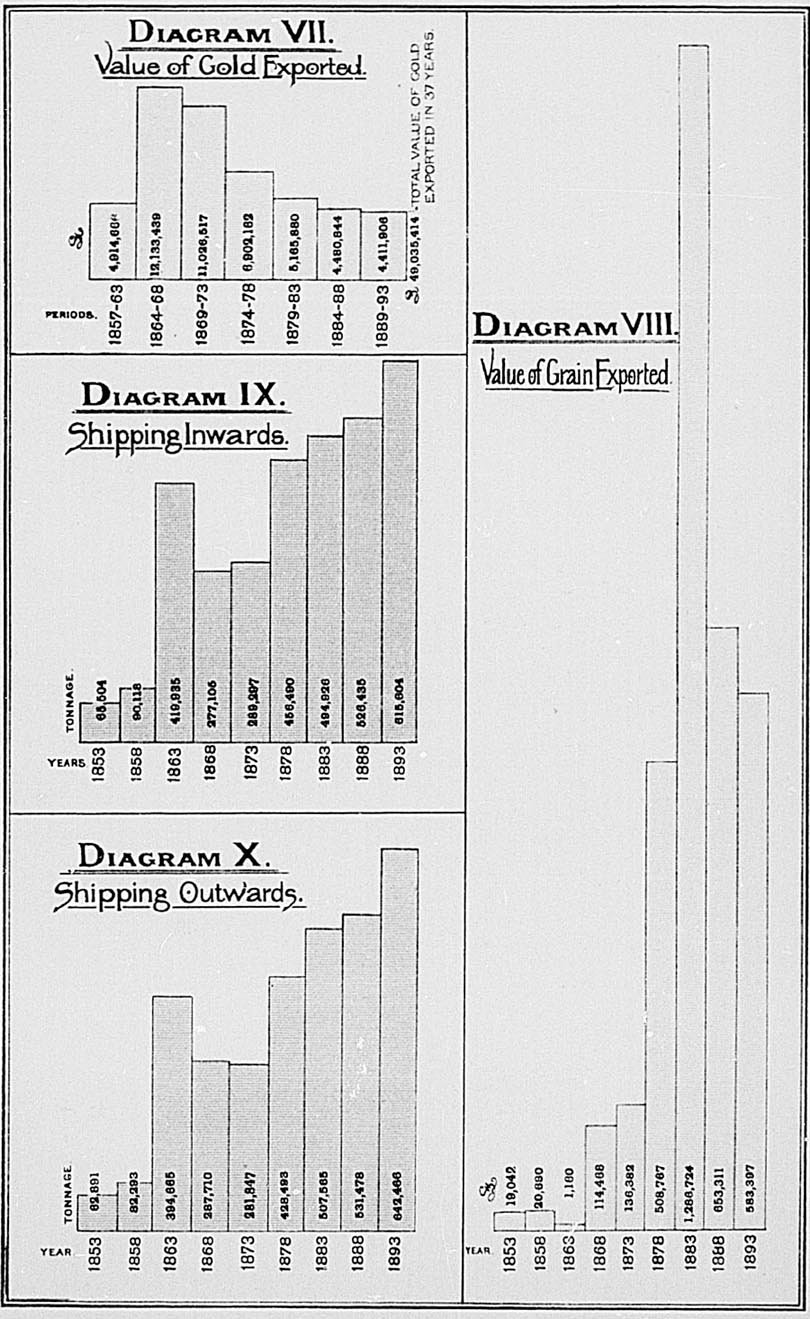
The total number of vessels entered coastwise is 17,477, of 4,331,135 tons, being an increase of 53 vessels and 134,533 tons on the figures for 1892. The total cleared coastwise is 17,368 vessels, of 4,280,474 tons, an increase of 83 vessels and 143,953 tons on the number for the previous year. The number and tonnage of the registered vessels belonging to the several ports on the 31st December, 1893 (distinguishing sailing-vessels and steamers), was as under:—
| REGISTERED VESSELS, 31st DECEMBER, 1893. | ||||||
|---|---|---|---|---|---|---|
| Ports. | Sailing-vessels. | Steam-vessels. | ||||
| Vessels. | Gross Tonnage. | Net Tonnage. | Vessels. | Gross Tonnage. | Net Tonnage. | |
| Auckland | 164 | 10,660 | 10,418 | 61 | 8,168 | 5,228 |
| Napier | 9 | 1,106 | 1,080 | 11 | 830 | 488 |
| Wellington | 14 | 4,321 | 4,196 | 23 | 4,108 | 2,454 |
| Nelson | 18 | 509 | 509 | 12 | 995 | 625 |
| Lyttelton | 31 | 5,087 | 4,946 | 9 | 956 | 419 |
| Dunedin | 45 | 10,557 | 10,429 | 59 | 50,055 | 30,137 |
| Invercargill | 19 | 2,732 | 2,634 | 8 | 304 | 190 |
| Totals | 300 | 34,972 | 34,212 | 178 | 65,416 | 39,541 |
The total declared values of the imports in 1893 amounted to £6,911,515, being a decrease on the corresponding total in 1892 of £31,541. These figures are, however, somewhat misleading, as they include specie. The coin brought into the colony in 1893 was more than double the value of that imported in the previous year, and, if this item be deducted in either case, the decrease on the values of all other articles will be found to reach the sum of £248,265.
The following table gives the value of imports for each of the past ten years: —
| Year. | Imports, inclusive of Specie. £ | Imports, exclusive of Specie. £ |
|---|---|---|
| 1884 | 7,663,888 | 7,326,208 |
| 1885 | 7,479,921 | 7,278,101 |
| 1886 | 6,759,013 | 6,319,223 |
| 1887 | 6,245,515 | 6,064,281 |
| 1888 | 5,941,900 | 5,430,050 |
| 1889 | 6,308,863 | 5,980,583 |
| 1890 | 6,260,505 | 5,928,625 |
| 1891 | 6,503,849 | 6,431,101 |
| 1892 | 6,943,056 | 6,742,544 |
| 1893 | 6,911,515 | 6,494,279 |
It will be seen that the value of imports, exclusive of specie, fell by degrees from £7,326,208 in 1884 (the first year of the series) to £5,430,050 in 1888; that from the latter year it rose steadily till it reached £6,742,544 in 1892; and that in 1893 it again showed a decline—3.68 per cent. as compared with the figures for the foregoing year.
Since 1885 the value of New Zealand produce exported has been every year in excess of the value of the imports, and since 1887 (despite the fall in prices of wool, mutton, &c.) very greatly in excess. This being the case, it might have been expected that the rise in the value of imports observable during the five years 1888–92 would be maintained in 1893; but, owing to a variety of causes, not by any means indicating generally decreased consumption, the total value of the importations for last year is somewhat less than that for 1892.
Of £6,494,279, total value of goods imported during 1893, the chief items were as under:—
| Articles. | Value. £ | Proportion per Cent. |
|---|---|---|
| Clothing, drapery, &c. | 1,809,046 | 27.86 |
| Metal, machinery, and implements | 920,626 | 14.18 |
| Tea and sugar | 465,668 | 7.17 |
| Wine, beer, spirits, and tobacco | 407,279 | 6.27 |
| Paper and books | 294,738 | 4.54 |
| Other imports | 2,596,922 | 39.98 |
| 6,494,279 | 100.00 |
The value of the clothing, drapery, &c., imported fell from £1,871,843 in 1892 to £1,809,046 in 1893. In 1883, with a population smaller by some 20 per cent., the value of the import was £2,013,565. The metal, machinery, and implements imported in 1893 were valued at £920,626, a decrease of £80,289 on the corresponding figures for 1892 (£1,000,915). In 1883 the import of these goods was valued at £1,341,697.
The value of sugar (including molasses and treacle) imported in 1893 was less than in any of the previous ten years. The values of these imports for the last three years averaged £363,579 per annum, but for the three years 1881, 1882, and 1883 the average, with a much smaller population, was £572,187 for each year. The smaller average amount for the last three years was due to a decrease in the value of sugar, not to a reduction in the total amount imported, which in the years 1881–83 gave an annual average of 40,580,904lb., against an annual average for the years 1891–93 of 58,979,173lb. It must, however, be observed that the amount of sugar imported in 1893 (48,916,278lb.) was about three-fourths only of the quantity imported in 1892 (64,576,461lb.).
The import of any article in a given year is seldom identical with the amount consumed in that time. To ascertain the latter we must look to the quantity actually entered at the Customs for home consumption and subjected to duty within the twelve months. Thus, the quantity of sugar, including glucose, molasses, and treacle, entered for consumption in 1893 was 59,719,861lb., which gave an average of 90.3lb. for every person, exclusive of Maoris; but persons of this race are estimated to consume, on an average, about one-fourth as much as Europeans. By deducting the quantity estimated to be used by Maoris, the average annual consumption of sugar per head of the European population is found to be 88.89lb.
The following table, giving the consumption per head of sugar in different countries, is, saving the figures for New Zealand, taken from the Victorian Year-book of 1892. The figures stating the consumption of tea, given further on, are taken from the same source.
| ANNUAL CONSUMPTION OF SUGAR PER HEAD IN VARIOUS COUNTRIES. | |||||
|---|---|---|---|---|---|
| Lb. | Lb. | Lb. | |||
| South Australia | 102.11 | Denmark | 29.69 | Norway | 11.37 |
| Western Australia | 93.51 | Holland | 28.37 | Finland | 11.22 |
| Victoria | 90.75 | Switzerland | 22.81 | Portugal | 9.56 |
| Tasmania | 90.49 | France | 22.61 | Roumania | 7.71 |
| New Zealand | 89.23 | Sweden | 17.52 | Russia | 7.69 |
| United Kingdom | 68.99 | Belgium | 15.74 | Spain | 5.11 |
| Queensland | 62.93 | Germany | 15.01 | Servia | 4.41 |
| New South Wales | 60.95 | Austria-Hungary | 13.23 | Italy | 3.20 |
| Argentine Republic | 50.04 | ||||
The quantity of tea entered for consumption in 1893 was 4,284,028lb. Supposing Maoris to use, on an average, 1 lb. per head per annum, the consumption of tea per head of the population, exclusive of Maoris, would be 6.41lb. in 1893.
The Australasian Colonies seem to be, in proportion to population, the largest tea-consumers in the world. The amount annually used in New South Wales is estimated to be 7.5lb. per head. The consumption of Victoria has been given by the Government Statist of that colony as 10lb., and of Tasmania as 5.35lb.; the figures for the United Kingdom being 4.7lb., for Canada 3.69lb., and for the United States 1.4lb. The consumption in New Zealand is thus somewhat less than in Victoria or New South Wales, but greater per head of population than in the other countries mentioned.
| ANNUAL CONSUMPTION OF TEA PER HEAD. | |||||
|---|---|---|---|---|---|
| Lb. | Lb. | Lb. | |||
| Western Australia | 10.70 | United Kingdom | 4.70 | Switzerland | 0.10 |
| Victoria | 10.01 | Canada | 3.69 | Norway | 0.09 |
| Queensland | 8.96 | United States | 1.40 | Germany | 0.07 |
| Australia | 8.68 | Holland | 1.16 | Belgium | 0.03 |
| New South Wales | 7.55 | Russia | 0.61 | Sweden | 0.03 |
| South Australia | 7.24 | Denmark | 0.37 | France | 0.03 |
| New Zealand | 6.41 | Persia | 0.13 | Austria-Hungary | 0.02 |
| Tasmania | 5.35 | Portugal | 0.12 | Spain | 0.01 |
During 1893 excise duty was paid on 4,873,600 gallons of beer; and 229,383 gallons of beer, 461,283 gallons of spirits, and 112,115 gallons of wine were entered at the Customs for home consumption. The following table gives the consumption per head of alcoholic liquors by the people, excluding and including Maoris, showing separately the proportion of beer, wine, and spirits for the last eleven years. To the amount of beer manufactured in the colony in each year on which excise duty was paid has been added the amount brought into consumption from imports:—
| Year. | Beer. | Spirits. | Wine. | |||
|---|---|---|---|---|---|---|
| Excluding Maoris. | Including Maoris. | Excluding Maoris. | Including Maoris. | Excluding Maoris. | Including Maoris. | |
| Gal. | Gal. | Gal. | Gal. | Gal. | Gal. | |
| 1883 | 9.435 | 8.709 | 1.088 | 1.005 | 0.315 | 0.291 |
| 1884 | 8.769 | 8.121 | 0.999 | 0.923 | 0.272 | 0.253 |
| 1885 | 8.414 | 7.840 | 0.899 | 0.825 | 0.261 | 0.243 |
| 1886 | 7.861 | 7.333 | 0.820 | 0.765 | 0.212 | 0.198 |
| 1887 | 7.651 | 7.148 | 0.770 | 0.719 | 0.198 | 0.185 |
| 1888 | 7.133 | 6.670 | 0.820 | 0.767 | 0.167 | 0.156 |
| 1889 | 7.624 | 7.136 | 0.598 | 0.560 | 0.176 | 0.165 |
| 1890 | 7.899 | 7.402 | 0.693 | 0.649 | 0.184 | 0.172 |
| 1891 | 7.646 | 7.168 | 0.699 | 0.655 | 0.172 | 0.161 |
| 1892 | 7.807 | 7.328 | 0.708 | 0.664 | 0.174 | 0.163 |
| 1893 | 7.716 | 7.255 | 0.697 | 0.656 | 0.170 | 0.159 |
The very considerable reduction in the rate of consumption of these liquors in the last eleven years should give every encouragement to the advocates of temperance principles in the prosecution of their work. And it if most satisfactory to observe how favourably the above rates of consumption in this colony compare with those of other countries. The comparison can be made by means of the following statement of the annual consumption of beer and spirits per head in various places:—*
| — | Beer. | Spirits. |
|---|---|---|
| Gal. | Gal. | |
| United Kingdom | 28.74 | 1.00 |
| South Australia | 20.04 | 0.49 |
| Germany | 19.38 | 0.95 |
| Holland | 19.05 | 2.08 |
| Victoria | 19.36 | 1.12 |
| New South Wales | 11.94 | 1.15 |
| United States | 10.74 | 1.34 |
| Queensland | 10.23 | 1.59 |
| Tasmania | 10.02 | 059 |
| Switzerland | 8.15 | 1.04 |
| New Zealand (including Maoris) | 7.25 | 0.66 |
| Austria-Hungary | 6.83 | 0.63 |
| France | 4.53 | 0.85 |
| Canada | 3.05 | 1.19 |
| Sweden | 2.52 | 4.20 |
The actual quantity of colonial beer made and used in the colony does not seem to increase in any great degree, as will be seen by the next figures:—
| BEER MANUFACTURED IN NEW ZEALAND ON WHICH EXCISE DUTY WAS PAID. | |
|---|---|
| Gal. | |
| 1884 | 4,456,240 |
| 1885 | 4,402,720 |
| 1886 | 4,243,760 |
| 1887 | 4,264,160 |
| 1888 | 4,050,560 |
| 1889 | 4,402,480 |
| 1890 | 4,676,240 |
| 1891 | 4,567,920 |
| 1892 | 4,752,720 |
| 1893 | 4,873,600 |
The quantity of tobacco entered for consumption in 1893 was 1,462,241lb., an increase of 85,373lb. on the quantity entered in 1892. This gave a consumption per head of population—including Maoris, who are heavy smokers—of 2.08lb. The average per head for the seven years 1887–93 was 1.97lb.
* Taken, except as regards New Zealand, from the Victorian Year-book of 1892.
It appears from the following statement of the consumption of tobacco in different countries that in New Zealand it is, proportionately to population, less than in the chief colonies of Australia, very much less than in the United States, and below the average of most European countries.
| AVERAGE ANNUAL CONSUMPTION PER HEAD OF TOBACCO IN VARIOUS COUNTRIES. | |
|---|---|
| Lb. | |
| Holland | 6.92 |
| United States | 4.40 |
| New South Wales | 3.53 |
| Queensland | 3.49 |
| Western Australia | 3.26 |
| Switzerland | 3.24 |
| Belgium | 3.15 |
| Germany | 3.00 |
| Victoria | 2.93 |
| Austria-Hungary | 2.73 |
| Finland | 2.73 |
| Norway | 2.29 |
| Denmark | 2.24 |
| Canada | 2.11 |
| France | 2.05 |
| New Zealand | 1.97 |
| Sweden | 1.87 |
| Tasmania | 1.85 |
| Russia | 1.82 |
| South Australia | 1.70 |
| United Kingdom | 1.38 |
| Italy | 1.28 |
| Spain | 1.10 |
The imports from the United Kingdom to New Zealand in 1893 were valued at £4,481,953, or a decrease of £285,414 on the imports from this source for the previous year. From Australia and Tasmania the imports were £1,411,465, which is an increase of £299,366 on the amount for 1892.
The following are the values of imports from different countries in 1892 and 1893, given in the order of the increase or decrease from each country:—
| Country. | 1892. £ | 1693. £ | Increase. £ |
|---|---|---|---|
| Australia and Tasmania | 1,112,099 | 1,411,465 | 299,366 |
| India and Ceylon | 171,716 | 265,760 | 94,044 |
| Pacific Islands | 45,191 | 57,071 | 11,880 |
| Japan | 8,342 | 13,614 | 5,272 |
| Other European countries | 10,951 | 15,058 | 4,107 |
| Cape Colony | 25 | 1,563 | 1,538 |
| West Indies | 589 | 589 | |
| Belgium | 6,515 | 6,712 | 197 |
| Sumatra | 116 | 116 | |
| Decrease. | |||
| United Kingdom | 4,767,369 | 4,481,955 | 285,414 |
| Mauritius | 55,031 | 205 | 54,826 |
| Java | 30,519 | 156 | 30,363 |
| Fiji and Norfolk Island | 165,315 | 143,315 | 22,000 |
| Germany | 89,810 | 68,665 | 21,145 |
| Hongkong and China | 51,866 | 37,039 | 14,827 |
| Philippine Islands | 13,102 | 3,615 | 9,487 |
| Singapore | 12,787 | 10,044 | 2,743 |
| United States | 381,627 | 379,378 | 2,249 |
| Dominion of Canada | 4,148 | 2,433 | 1,715 |
| France | 13,554 | 11,856 | 1,698 |
| Asia Minor | 1,667 | 654 | 1,013 |
| Africa | 1,147 | 230 | 917 |
| Brazil | 30 | 22 | 8 |
The imports from India and Ceylon show the very large increase of £94,044, on a value in 1892 of £171,716, or at the rate of 55 per cent.
The values of imports in each provincial district during 1893 were as under:—
| £ | |
|---|---|
| Auckland | 1,512,654 |
| Taranaki | 53,524 |
| Hawke's Bay | 200,437 |
| Wellington | 1,770,480 |
| Marlborough | 13,573 |
| Nelson | 139,150 |
| Westland | 60,972 |
| Canterbury | 1,379,733 |
| Otago | 1,756,429 |
The value of imports by parcel-post (£24,563) must be added to the above figures in order to make up the total of £6,911,515.
The value of all the exports in 1893 was £8,985,364; the value of New Zealand produce exported £8,557,443, being at the rate of £12 18s. 9d. per head of population. The following table gives the values of the several exports of New Zealand produce in each of the past ten years:—
| EXPORTS OF NEW ZEALAND PRODUCE. | ||||||||
|---|---|---|---|---|---|---|---|---|
| Year | Wool. | Gold. | Frozen Meat. | Butter and Cheese. | Agricultural Produce. | Manufactures | Other N.Z. Produce. | Total. |
| £ | £ | £ | £ | £ | £ | £ | £ | |
| 1884 | 3,267,527 | 988,953 | 345,090 | 91,667 | 968,517 | 104,425 | 1,176,307 | 6,942,486 |
| 1885 | 3,205,275 | 890,056 | 373,857 | 138,129 | 688,415 | 120,539 | 1,175,640 | 6,591,911 |
| 1886 | 3,072,971 | 934,648 | 427,193 | 151,194 | 688,804 | 109,656 | 997,216 | 6,386,682 |
| 1887 | 3,321,074 | 747,878 | 455,370 | 109,383 | 588,022 | 124,382 | 1,204,372 | 6,551,081 |
| 1888 | 3,115,098 | 914,309 | 628,800 | 197,170 | 905,907 | 233,383 | 1,260,461 | 7,255,128 |
| 1889 | 3,976,375 | 785,490 | 783,374 | 213,945 | 1,424,297 | 569,880 | 1,288,647 | 9,042,008 |
| 1890 | 4,150,599 | 751,360 | 1,087,617 | 207,6871 | 1,289,864 | 547,947 | 1,393,687 | 9,428,761 |
| 1891 | 4,129,686 | 1,007,172 | 1,194,724 | 236,933 | 894,467 | 420,357 | 1,516,755 | 9,400,094 |
| 1892 | 4,313,307 | 951,963 | 1,033,377 | 318,204 | 1,035,637 | 367,677 | 1,345,703 | 9,365,868 |
| 1893 | 3,774,738 | 915,921 | 1,085,167 | 354,271 | 716,546 | 345,636 | 1,365,164 | 8,557,443 |
The most important items of export under the heading “Other New Zealand Produce” are coal, silver, and minerals, kauri-gum, timber, bacon, salted and preserved meats, tallow, sheep- and rabbit-skins, hides, horses, and sausage-skins. The aggregate value of these in 1893 was £1,308,238.
Although the above table shows that the value of the exports of New Zealand produce fell from £9,428,761 in 1890 to £9,400,094 in 1891, and again from £9,365,868 in 1892 to £8,557,443 in 1893, it must not be inferred from this that the export trade is diminishing in every direction. On the contrary, a just comparison of quantities will show increased activity in many most important lines. To exhibit this properly it is necessary to use the figures for the years ending 31st March, 1893, and 31st March, 1894, on account of late shipmen of the wool-clip of 1893.
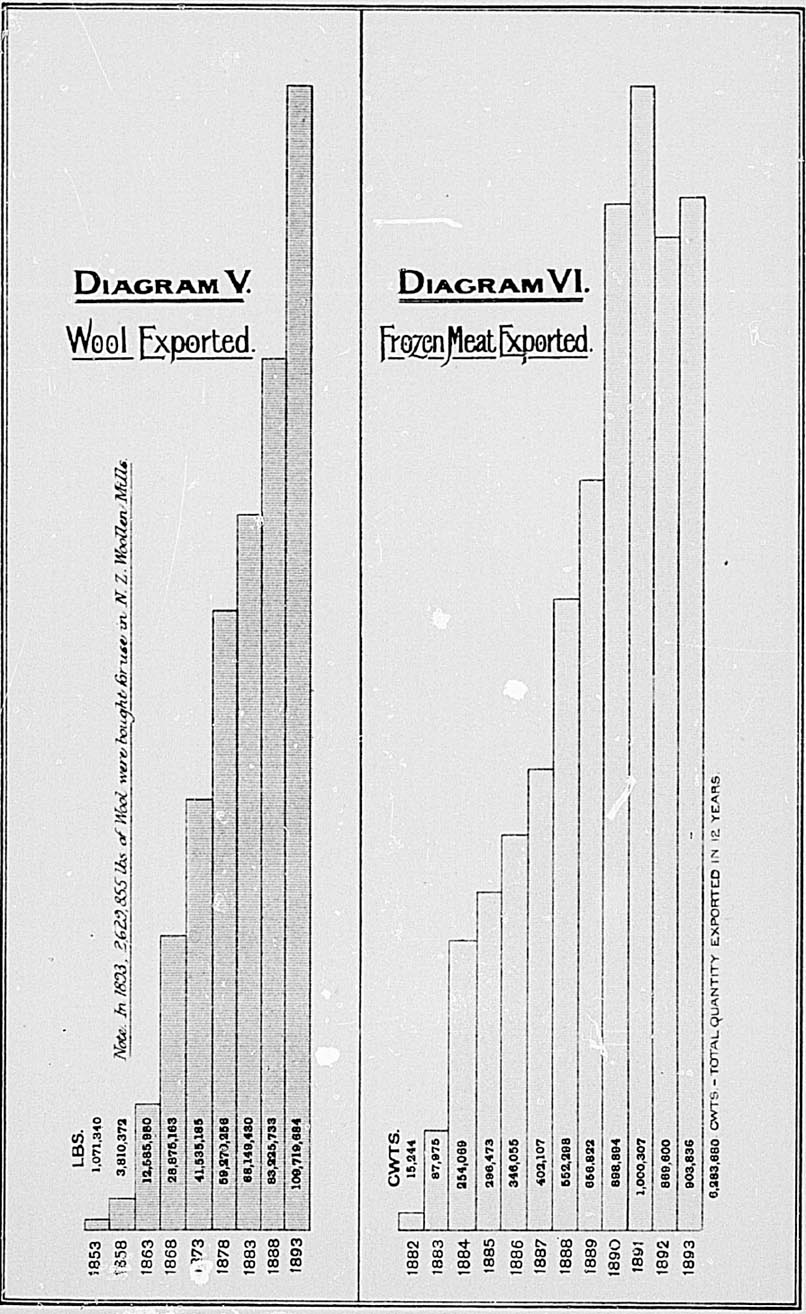
The quantities exported are shown, with the increase or decrease for 1893–94:—
| QUANTITIES OF THE PRINCIPAL ARTICLES OF NEW ZEALAND PRODUCE EXPORTED. | ||||
|---|---|---|---|---|
| Items. | Year 1892–93. | Year 1893–94. | Increase in 1693–94. | Decrease in 1893–94. |
| The Mine:— | ||||
| Coal Tons | 69,922 | 69,234 | 688 | |
| Gold Oz. | 229,665 | 240,697 | 11,032 | |
| Silver Oz. | 39,242 | 47,597 | 8,355 | |
| Minerals Tons | 2,484 | 1,170 | 1,314 | |
| The Fisheries:— | ||||
| Fish Cwt. | 7,166 | 5,076 | 2,090 | |
| Oysters Doz. | 614,690 | 650,778 | 36,088 | |
| The Forest:— | ||||
| Fungus Cwt. | 4,597 | 4,898 | 301 | |
| Gum (kauri) Tons | 8,984 | 8,235 | 749 | |
| Timber (sawn and hewn) Ft. | 22,818,666 | 27,243,442 | 4,424,776 | |
| Animals and Produce:— | ||||
| Bacon and hams Cwt. | 4,218 | 1,368 | 2,850 | |
| Beef (salted) Cwt. | 7,035 | 5,680 | 1,355 | |
| Butter Cwt. | 51,663 | 62,500 | 10,837 | |
| Cheese Cwt. | 46,314 | 37,361 | 8,953 | |
| Hides No. | 18,596 | 11,517 | 7,079 | |
| Live-stock No. | 7,174 | 9,150 | 1,976 | |
| Meat (preserved) Cwt. | 32,632 | 23,731 | 8,901 | |
| Meat (frozen) Cwt. | 850,905 | 873,032 | 22,127 | |
| Sausage-skins Cwt. | 3,834 | 5,200 | 1,366 | |
| Skins (rabbit) No. | 16,065,194 | 17,636,460 | 1,571,266 | |
| Skins (sheep) No. | 2,326,171 | 2,574,702 | 248,531 | |
| Tallow Tons | 8,109 | 8,094 | 15 | |
| Wool Lb. | 117,334,601 | 125,249,212 | 7,914,611 | |
| Agricultural Products:— | ||||
| Bran and sharps Tons | 9,762 | 3,314 | 6,448 | |
| Chaff Tons | 360 | 40 | 320 | |
| Flour Tons | 4,613 | 2,025 | 2,588 | |
| Grain (barley) Bush. | 46,398 | 29,084 | 17,314 | |
| Grain (beans and peas) Bush. | 92,904 | 167,194 | 74,290 | |
| Grain (malt) Bush. | 84,661 | 34,370 | 50,291 | |
| Grain (oats) Bush. | 3,047,829 | 1,806,411 | 1,241,418 | |
| Grain (wheat) Bush. | 3,018,383 | 2,058,265 | 960,118 | |
| Grain (maise) Bush. | 120,849 | 29,986 | 90,863 | |
| Hops Cwt. | 2,015 | 1,786 | 229 | |
| Meal (oat) Cwt. | 32,220 | 20,618 | 11,602 | |
| Potatoes Tons | 28,931 | 5,734 | 23,197 | |
| Seeds (grass and clover) Cwt. | 42,400 | 30,516 | 11,884 | |
| Manufactures:— | ||||
| Leather Cwt. | 15,202 | 13,765 | 1,437 | |
| Phormium Tons | 11,992 | 10,410 | 1,582 | |
Some of the most important proportional increases are the following:—
| Export of | Rate of Increase per Cent. in 1893–94. |
|---|---|
| Live-stock | No. 27.54 |
| Silver | Oz. 21.29 |
| Butter | Cwt. 20.98 |
| Sawn timber | Ft. 19.39 |
| Sheep-skins | No. 10.68 |
| Rabbit-skins | No. 9.78 |
| Wool | Lb. 6.75 |
| Gold | Oz. 4.80 |
| Frozen meat | Cwt. 2.60 |
On the other hand, the decline in the quantities of agricultural products, kauri-gum, cheese, hides, leather, and Phormium exported is very considerable.
The declared values of the chief articles exported in the calendar year 1893 are given in the table immediately below:—
| £ | |
|---|---|
| THE MINE. | |
| Coal | 72,699 |
| Gold | 915,921 |
| Silver and minerals | 15,561 |
| Total | 1,004,181 |
| THE FISHERIES. | |
| Fish | 5,935 |
| Oysters | 2,785 |
| Other | 927 |
| Total | 9,647 |
| THE FOREST. | |
| Fungus | 6,724 |
| Kauri-gum | 510,775 |
| Timber— | |
| Sawn and hewn | 101,082 |
| Other | 7,193 |
| Total | 625,774 |
| ANIMALS AND PRODUCE. | |
| Bacon and hams | 6,532 |
| Beef and pork (salted) | 6,226 |
| Butter | 254,645 |
| Cheese | 99,626 |
| Hides | 8,390 |
| Live-stock— | |
| Cattle | 979 |
| Horses | 22,663 |
| Sheep | 7,562 |
| Pigs and other live-stock | 1,435 |
| Preserved meats | 46,601 |
| Frozen meats | 1,085,167 |
| Rabbit-skins | 138,952 |
| Sausage-skins | 29,407 |
| Sheep-skins and pelts | 172,294 |
| Tallow | 183,588 |
| Wool | 3,774,738 |
| Other | 4,135 |
| Total | 5,842,940 |
| AGRICULTURAL PRODUCTS. | |
| £ | |
| Bran and sharps | 12,075 |
| Chaff | 166 |
| Flour | 13,932 |
| Grain— | |
| Barley | 6,922 |
| Beans and peas | 24,677 |
| Maize | 7,505 |
| Malt | 10,573 |
| Oats | 190,094 |
| Wheat | 343,626 |
| Hops | 9,668 |
| Oatmeal | 11,086 |
| Potatoes | 23,308 |
| Seeds (grass and clover) | 57,554 |
| Other | 5,360 |
| Total | 716,546 |
| MANUFACTURES. | |
| Ale and beer | 1,949 |
| Apparel | 3,320 |
| Cordage | 1,223 |
| Leather | 71,004 |
| Phormium (Now Zealand hemp) | 219,375 |
| Soap | 4,427 |
| Woollen manufactures | 7,434 |
| Other manufactures | 86,904 |
| Total | 345,636 |
| Miscellaneous | 12,719 |
| Total exports (colonial produce and manufactures) | 8,557,443 |
| Specie | 304,519 |
| Other exports (British and foreign) | 123,402 |
| Total exports | £8,985,364 |
The re-export trade of the colony would seem from the subjoined figures to have been almost stationary for the last ten years:—
| Exports of British, Foreign, and other Colonial Produce (excluding Specie). | |
|---|---|
| £ | |
| 1884 | 147,741 |
| 1885 | 146,951 |
| 1886 | 147,831 |
| 1887 | 129,691 |
| 1888 | 148,078 |
| 1889 | 139,347 |
| 1890 | 140,555 |
| 1891 | 160,765 |
| 1892 | 125,052 |
| 1893 | 123,402 |
With these sums may be compared the re-export trade of New South Wales—a colony having less than double the population of New Zealand—which, exclusive of specie, amounted in 1893 to £2,847,722.
The quantity of wool exported in 1893 was 109,719,684lb., valued at £3,774,738. The annual production and the increase can be better estimated by taking the exports for the twelve months immediately preceding the commencement of shearing, and adding thereto the quantity used in the colony for manufacturing purposes.
The following shows the produce on that basis for each of the last ten years, ending respectively on the 30th September:—
| Year ending 30th September. | Quantity exported. | Quantity purchased by Local Mills. | Total Annual Produce. |
|---|---|---|---|
| Lb. | Lb. | Lb. | |
| 1884 | 77,022,894 | 1,580,000 | 78,602,894 |
| 1885 | 78,174,034 | 1,922,932 | 80,096,966 |
| 1886 | 89,485,757 | 1,879,999 | 91,365,756 |
| 1887 | 95,914,181 | 2,001,155 | 97,915,336 |
| 1888 | 89,276,268 | 4,079,563 | 93,355,831 |
| 1889 | 95,618,507 | 3,556,004 | 99,174,511 |
| 1890 | 102,522,185 | 2,979,293 | 105,501,478 |
| 1891 | 108,619,473 | 2,918,073 | 111,537,546 |
| 1892 | 110,860,050 | 3,388,954 | 114,249,004 |
| 1893 | 119,643,874 | 2,629,855 | 122,273,729 |
From these figures it appears that the wool-clip has increased 64 per cent. within the last ten years, and this notwithstanding the large increase in the export of rabbit-skins, from 9,807,665 in 1884 to 17,041,106 in 1893,—which does not indicate any great relief from the rabbit-pest.
The increase in the wool-production is of course mainly due to the greater number of sheep—namely, 19,380,369 in April, 1893, against 14,056,266 in May, 1884. It will be apparent from the following table that the tendency of increase is towards the multiplication of the smaller flocks, whose owners are better able to cope with the rabbit difficulty than the large runholders:—
| NUMBER OF FLOCKS, 1884 TO 1893. | ||||||||||
|---|---|---|---|---|---|---|---|---|---|---|
| Size of Flocks. | 1884. | 1885. | 1886. | 1887. | 1888. | 1889. | 1890. | 1891. | 1892. | 1893. |
| Under 500 | 5,422 | 5,622 | 6,024 | 6,247 | 6,579 | 7,063 | 7,662 | 8,272 | 8,822 | 9,629 |
| 500 and under 1,000 | 1,033 | 1,146 | 1,189 | 1,139 | 1,182 | 1,381 | 1,528 | 1,691 | 2,033 | 2,239 |
| 1,000 and under 2,000 | 672 | 718 | 747 | 723 | 794 | 826 | 854 | 969 | 1,193 | 1,315 |
| 2,000 and under 5,000 | 473 | 505 | 532 | 531 | 524 | 597 | 586 | 666 | 761 | 836 |
| 5,000 and under 10,000 | 256 | 270 | 263 | 289 | 287 | 279 | 283 | 287 | 314 | 341 |
| 10,000 and under 20,000 | 211 | 213 | 228 | 221 | 213 | 239 | 236 | 239 | 231 | 241 |
| 20,000 and upwards | 154 | 157 | 166 | 166 | 166 | 152 | 160 | 169 | 176 | 178 |
| Total | 8,221 | 8,631 | 9,149 | 9,316 | 9,745 | 10,537 | 11,309 | 12,293 | 13,530 | 14,779 |
The following table,* showing the estimated wool-supply of the world since 1860, put forth by the London Board of Trade, is not without interest in this connection:—
| Sources of Supply. | 1860. | 1870 | 1880. | 1889. |
|---|---|---|---|---|
| Increased to 690,000,000lb in 1892 | ||||
| Lb. | Lb. | Lb. | Lb. | |
| United Kingdom | 140,000,000 | 150,000,000 | 149,000,000 | 134,000,000 |
| Continent; of Europe | 500,000,000 | 485,000,000 | 450,000,000 | 450,000,000 |
| North America | 110,000,000 | 176,000,000 | 270,000,000 | 330,000,000 |
| Australasia | 60,000,000 | 175,000,000 | 308,000,000 | 450,000,000† |
| Cape of Good Hope | 26,000,000 | 43,000,000 | 60,000,000 | 70,000,000 |
| River Plate | 43,000,000 | 197,000,000 | 256,000,000 | 360,000,000 |
| Other countries | 76,000,900 | 69,000,000 | 133,000,000 | 156,000,000 |
| Grand total | 955,000,000 | 1,295,000,000 | 1,626,000,000 | 1,950,000,000 |
The centres of wool-production have gradually shifted, as will be seen by the next table,* showing the percentage of the total imports into the United Kingdom at different periods:—
* Taken from “Wool and Manufactures of Wool,” published by the Bureau of Statistics, Treasury Department, U.S.A.
| — | 1844. | 1850. | 1860. | 1870. | 1880. | 1890. |
|---|---|---|---|---|---|---|
| Per Cent. | Per Cent. | Per Cent. | Per Cent. | Per Cent. | Per Cent. | |
| Australasia | 26.8 | 52.5 | 39.9 | 66.5 | 64.9 | 66.2 |
| Germany | 33.2 | 12.3 | 12.4 | 1.7 | 1.5 | 1.1 |
| South America | 5.7 | 7.1 | 6.0 | 4.8 | 2.2 | 1.8 |
| British possessions— | ||||||
| South Africa | 3.3 | 7.7 | 11.2 | 12.5 | 11.1 | 13.8 |
| East Indies | 4.2 | 4.7 | 13.6 | 4.2 | 63 | 5.4 |
At the beginning of this century most of the merino wool required in England for her manufactures was obtained from Spain. The Spanish merino wool was superseded by Saxony and Silesian wools; subsequently Australasian wools began to take the place of the German merino, and have now command of the market.
The following paragraphs, on the subject of increasing density of population in Europe and parts of America creating a demand for Australasian wools, are taken from a report made to the Department of State in February, 1892, by United States Consul-General Bourn, based upon an official publication of the Italian Government:—
With an increased density of population in Europe there has been a gradual decrease in the number of sheep, as lands formerly used for pasturage were converted into tillage lands to meet the increased demand for food. From 1890 to 1890 the population of Europe increased from 286,000,000 to 356,000,000 —an increase of 70,000,000, or about 25 per cent., necessitating a tillage of at least 25 per cent. more land to supply food for this increase.
During this period the number of sheep in Europe decreased from 229,600,000 in 1860 to 192,240,000 in 1890—a decrease of 37,000,000, or about 16 per cent.; while the number in the chief extra European wool-producing and -exporting countries increased from 63,200,000 in 1860 to 264,560,000 at the date of the latest estimates. But Europe in 1890 consumed fully 66 per cent. more wool than in 1860, while there were 16 per cent. less sheep to supply the requirement. It is easy, therefore, to see why new fields have been sought in other continents for the deficiencies both in food and clothing.
In 1860 there were not more than 40,200,000 sheep in the La Plata country, Australia, and South Africa, or scarcely 18 per cent. of the number in Europe. In 1890 this amount had increased to 221,500,000, or about the number in Europe in 1860.
There were 8,806,500 sheep in Italy in 1860, but in 1875 there were only 6,977,000. The number then grew again to 8,596,000 in 1881, to be again reduced to 6,900,000 in 1890—a decrease of 21 per cent. since 1860, as compared with 16-per-cent. decrease for all Europe.
In the United States the process has been substantially the same. The increasing density of population in the east has gradually †driven the flocks westward into newer territory, where they have largely increased, though not so rapidly as in the La Plata country, Australia, and South Africa. From 23,000,000 in 1800 they increased to 41,000,000 in 1870. At this time the market for wool was so depressed that the farmers found it profitable to kill upwards of 9,000,000, thus reducing the amount to 31,000,000. Since then the gradual increase brought the number to about 50,000,000 in 1884, to be again reduced by the competition of Australian wool to about 43,000,000 on the 1st January, 1891. This variation in the number of sheep has, however, its compensation in the greatly increased production per head. The yield in 1871 was about 5lb. for each sheep, while in 1884 and 1891 it was respectively about 6lb. and 7lb.
The amount of gold exported in 1893 was 227,502oz.
The total quantity of gold entered for duty to the 31st December, 1893, which may be reckoned as approximately the amount obtained in the colony, was 12,535,107oz., of the value of £49,300,999.
Frozen meat now takes second place among the exports of New Zealand produce. An account of the development of this industry is given in a special article further on.
To ascertain the total value of the meat-export in 1893 it is necessary to take into consideration, with the amount of £1,085,167, value of frozen meat before stated, the value of preserved meats, £46,601; of salted beef and pork, £6,226; and of bacon and hams, £6,532.
The value of the grain exported in 1893 was £583,397. The grain exports were made up as under:—
| Bush. | £ | |
|---|---|---|
| Wheat | 2,619,398 | 343,626 |
| Oats | 1,945,537 | 190,094 |
| Barley | 40,540 | 6,922 |
| Malt | 41,902 | 10,573 |
| Maize | 49,671 | 7,505 |
| Peas and beans | 158,320 | 24,677 |
| Total value | .. | £583,397 |
The quantity of butter exported amounted to 58,149cwt., the declared value of which was £254,645. Of this quantity, 52,363cwt., valued at £228,435, were shipped to the United Kingdom; 3,291cwt., value £14,638, to Victoria; and 682cwt., value £3,322, to Western Australia.
If the export of butter is to assume any large dimensions it must be through the production of an article suitable to the requirements of the English market, on which the colony has for the present to rely. It has been satisfactorily proved that butter from New Zealand can be delivered in good condition in England, and that for good samples remunerative prices are obtainable; but it is necessary that the butter sent should be not only sound, but also uniform in quality and colour. Such uniformity can be obtained only by the methods used in butter-factories. Upon the multiplication of these factories the future of the butter-export trade, with all its great possibilities, seems to depend.
The cheese exported was 46,201cwt., of a declared value of £99,626, of which 41,567cwt., valued at £88,497, were sent to the United Kingdom; 2,351cwt., value £5,426, to Queensland; l,174cwt., value £2,994, to Victoria; and 482cwt., value £1,191, to New South Wales.
The following statement shows the total quantity of butter and cheese exported in the past ten years, and the amount of each sent to the United Kingdom:—
| Year. | Total Export of Butter. | Butter exported to the United Kingdom. | Total Export of Cheese. | Cheese exported to the United Kingdom. |
|---|---|---|---|---|
| Cwt. | Cwt. | Cwt. | Cwt. | |
| 1884 | 15,766 | 2,613 | 10,343 | 3,237 |
| 1885 | 24,923 | 273 | 15,245 | 272 3/4 |
| 1886 | 23,175 | 635 | 16,429 | 17 |
| 1887 | 17,018 | 6,937 | 23,913 | 9,900 3/4 |
| 1888 | 29,995 | 11,460 | 36,682 | 25,436 1/4 |
| 1889 | 37,955 | 21,099 | 26,558 | 7,633 |
| 1890 | 34,816 | 26,579 | 40,451 | 31,043 |
| 1891 | 39,430 | 28,989 | 39,770 | 29,565 |
| 1892 | 53,930 | 41,509 | 41,493 | 30,000 |
| 1893 | 58,149 | 52,363 | 46,201 | 41,567 |
The export of phormium for 1893 shows a falling-off. The market price continues low—averaging barely £17 a ton—a state of things not encouraging to producers. Any considerable increase in the value of the fibre will doubtless result in temporarily increasing the output; but a large permanent development of this industry depends upon the invention of such improvements in the machinery used as will serve to lessen the cost of production and improve the quality of the fibre.
There were 8,317 tons of kauri-gum, valued at the rate of £61 8s. 3d. a ton, exported from the colony in 1893. This gum is obtained only in the extreme northern part of the colony. A special article is devoted to an account of the industry.
The following table gives the values of the exports from each port in New Zealand for 1893, arranged in order of magnitude:—
| £ | |
|---|---|
| Lyttelton | 1,863,113 |
| Auckland | 1,256,450 |
| Dunedin | 1,220,939 |
| Wellington | 1,117,384 |
| Napier | 801,530 |
| Invercargill and Bluff | 681,023 |
| Timaru | 540,793 |
| Oamaru | 272,033 |
| Greymouth | 266,440 |
| Wanganui | 225,408 |
| Poverty Bay | 166,051 |
| Wairau and Picton | 158,284 |
| New Plymouth and Waitara | 121,405 |
| Hokitika | 99,637 |
| Nelson | 64,382 |
| Kaipara | 60, 690 |
| Westport | 37,545 |
| Patea | 24,981 |
| Russell | 2,547 |
| Tauranga | 3 |
The total value of the external trade in 1893 was £15,896,879, equivalent to £24 0s. 9d. per head of the population, excluding Maoris. It will be seen from the figures given further on that the ratio of trade to population has varied but little for several years. The highest record was in 1873, when the total trade per head reached £41 19s. 3d.,—the imports, in consequence of the large expenditure of borrowed money, having then amounted to £22 9s. 4d. per head, against £10 9s. in 1893.
It has been customary to leave the Maoris out of count in estimating the trade per head, for their industries and necessities swell the volume of trade in comparatively so slight a measure that the amount per bead of European population can be more truly ascertained by excluding them altogether.
The values of imports and exports per head of population, excluding Maoris, were, for each of the past ten years, as follow:—
| Year. | Imports per Head. | Exports per Head. | Total. | ||||||
|---|---|---|---|---|---|---|---|---|---|
| £ | s. | d. | £ | s. | d. | £ | s. | d. | |
| 1884 | 13 | 17 | 4 | 12 | 16 | 8 | 26 | 14 | 0 |
| 1885 | 13 | 4 | 9 | 12 | 1 | 5 | 25 | 6 | 2 |
| 1886 | 11 | 12 | 2 | 11 | 9 | 3 | 23 | 1 | 5 |
| 1887 | 10 | 9 | 5 | 11 | 10 | 3 | 21 | 19 | 8 |
| 1888 | 9 | 16 | 4 | 12 | 16 | 7 | 22 | 12 | 11 |
| 1889 | 10 | 5 | 6 | 15 | 4 | 5 | 25 | 9 | 11 |
| 1890 | 10 | 0 | 2 | 15 | 13 | 8 | 25 | 13 | 10 |
| 1891 | 10 | 6 | 6 | 15 | 3 | 10 | 25 | 10 | 4 |
| 1892 | 10 | 16 | 3 | 14 | 16 | 11 | 25 | 13 | 2 |
| 1893 | 10 | 9 | 0 | 13 | 11 | 9 | 24 | 0 | 9 |
The trade with the United Kingdom amounted to £11,518,470, comprising 72.5 per cent. of the total trade.
With the Australian Colonies and Tasmania trade was done during 1893 to the value of £2,686,255, of which New South Wales claimed £1,364,507 and Victoria £1,097,419, made up as follows:—
| EXPORTS FROM NEW ZEALAND. | EXPORTS TO NEW ZEALAND. | ||
|---|---|---|---|
| £ | £ | ||
| To New South Wales, 1893 | 678,904 | From New South Wales, 1893 | 685,603 |
| To Victoria, 1893 | 527,500 | From Victoria, 1893 | 569,919 |
The last two amounts are the declared values of the imports into New Zealand from the colonies mentioned, not their export-value as given in the New South Wales and Victorian returns.
Included in the value of exports from New South Wales is £108,625, the value of the coal sent, and £225,000, the value of the gold coin. Of the exports from Victoria, £186,400 was the value of gold coin.
The trade with Fiji decreased slightly during the year. In 1889 it was £170,181; in 1890, £184,684, in 1891, £221,603; in 1892, £214,183; and in 1893, £194,729. The trade with the other Pacific Islands (including Norfolk Island) increased from £137,052 in 1892 to £150,206 in 1893.
Of the exports to the United States in 1893 the values of the principal New Zealand products were: Kauri-gum, £255,443; phormium, £169,065; gold, £51,803; sheepskins, £3,419; and sausage-skins, £6,804.
The following table shows the value of the total trade with the United States for each of the past ten years:—
| TRADE WITH THE UNITED STATES. | |||||
|---|---|---|---|---|---|
| Year. | Imports from | Exports: to | Total Trade. | ||
| Atlantic Ports. | Pacific Ports. | Atlantic Ports. | Pacific Ports. | ||
| £ | £ | £ | £ | £ | |
| 1884 | 300,185 | 48,372 | 183,939 | 30,430 | 562,926 |
| 1885 | 366,873 | 34,659 | 130,053 | 274,825 | 806,410 |
| 1886 | 304,571 | 32,751 | 166,926 | 80,474 | 584,722 |
| 1887 | 263,377 | 35,359 | 241,388 | 168,092 | 708,216 |
| 1888 | 285,864 | 37,205 | 204,302 | 119,414 | 646,785 |
| 1889 | 307,156 | 35,280 | 242,778 | 98,584 | 683,798 |
| 1890 | 321,047 | 34,348 | 364,332 | 218,802 | 938,529 |
| 1891 | 317,913 | 43,882 | 395,386 | 119,822 | 877,003 |
| 1892 | 344,799 | 36,828 | 459,314 | 61,483 | 902,424 |
| 1893 | 345,743 | 33,635 | 430,842 | 65,706 | 875,926 |
By telegram dated Washington, the 4th July, it was announced that the new Tariff Bill, admitting raw wool duty free, had passed both Houses of Congress; but it is not known at the time of writing whether the President has given his assent to the bill. The repeal of the heavy duty that has hitherto been in force in the States could hardly fail to increase the export trade from this colony.
The trade with India (including Burmah and Ceylon) reached a total of £273,540. The imports—tea, rice, castor-oil, woolpacks, &c.—were reckoned at £265,760, leaving a balance of only £7,780 for exports. It would appear that ships arriving with cargoes from Calcutta or Rangoon do not return to those places, but load here with wool or other colonial produce for England.
The following table gives the value of the imports and exports of the Australasian Colonies for the year 1893:—
| Colony. | Total Value of | Excess of | ||
|---|---|---|---|---|
| Imports. | Exports. | Imports over Exports. | Exports over Imports. | |
| £ | £ | £ | £ | |
| Queensland | 4,352,783 | 9,632,662 | .. | 5,279,879 |
| New South Wales | 18,107,035 | 22,921,223 | .. | 4,814,188 |
| Victoria | 13,283,814 | 13,308,551 | .. | 24,737 |
| South Australia | 7,934,200 | 8,463,936 | .. | 529,736 |
| Western Australia | 1,400,821 | 878,147 | 522,674 | .. |
| Tasmania | 1,057,683 | 1,352,184 | .. | 294,501 |
| New Zealand | 6,911,515 | 8,985,364 | .. | 2,073,849 |
The total excess of exports over imports was thus £12,494,216, while in 1892 the total excess for the same colonies was £5,561,677, and in 1891 only £829,707. The total imports, which in 1891 stood as high as £72,219,507, fell in 1892 to £59,813,818, and in 1893 to £53,047,851. In 1890 there was an excess of imports over exports of £3,266,303; but in 1893 the position was completely reversed, and the great excess of exports (over twelve millions sterling) shown for that year points to a vast contraction in purchasing power of the Australasian colonies, consequent on financial disturbances.
The trade per head of the population in each of the colonies was as follows:—
| TRADE PER HEAD OF THE POPULATION IN 1893. | ||||||||||
|---|---|---|---|---|---|---|---|---|---|---|
| Colony. | Mean Population, 1893. | Imports. | Exports. | Total Trade. | ||||||
| £ | s. | d. | £ | s. | d. | £ | s. | d. | ||
| Queensland | 426,798 | 10 | 4 | 0 | 22 | 11 | 5 | 32 | 15 | 5 |
| New South Wales | 1,210,510 | 14 | 19 | 2 | 18 | 18 | 8 | 33 | 17 | 10 |
| Victoria | 1,170,330 | 11 | 7 | 0 | 11 | 7 | 5 | 22 | 14 | 6 |
| South Australia | 336,413 | 23 | 11 | 8 | 25 | 3 | 2 | 48 | 14 | 10 |
| Western Australia | 62,510 | 22 | 8 | 2 | 14 | 1 | 0 | 36 | 9 | 2 |
| Tasmania | 153,784 | 6 | 17 | 7 | 8 | 15 | 10 | 15 | 13 | 5 |
| New Zealand (exclusive of Maoris) | 661,349 | 10 | 9 | 0 | 13 | 11 | 9 | 24 | 0 | 9 |
The values of the exports of the Australian Colonies—more especially New South Wales, Victoria, and South Australia—are largely increased by the inclusion of articles the produce or manufacture of other colonies and countries.
The value of home productions or manufactures exported from each colony in 1892, and the rate per head of the population, were as follow:—
| Colony. | Home Produce exported. | Per Head of Population. | ||
|---|---|---|---|---|
| £ | £ | s. | d. | |
| Queensland | 9,010,613 | 21 | 13 | 4 |
| New South Wales | 17,707,102 | 14 | 19 | 10 |
| Victoria | 11,410,808 | 9 | 16 | 3 |
| South Australia | 3,232,259 | 9 | 18 | 9 |
| Western Australia | 870,814 | 15 | 8 | 1 |
| Tasmania | 1,330,144 | 8 | 14 | 0 |
| New Zealand | 9,365,868 | 14 | 11 | 8 |
The following table sets forth the amount of the trade of each of the above-named colonies with the United Kingdom in 1892:—
| Colony. | Imports from the United Kingdom. | Exports to the United Kingdom. | Total Trade with the United Kingdom. |
|---|---|---|---|
| £ | £ | £ | |
| Queensland | 2,049,359 | 4,096,937 | 6,146,296 |
| New South Wales | 8,883,983 | 7,653,915 | 16,537,898 |
| Victoria | 6,857,090 | 7,599,501 | 14,456,591 |
| South Australia | 2,372,185 | 3,167,298 | 5,539,483 |
| Western Australia | 592,496 | 395,700 | 988,196 |
| Tasmania | 541,619 | 315,836 | 857,455 |
| New Zealand | 4,767,369 | 7,483,618 | 12,250,987 |
The following statement shows the relative importance of the Australasian Colonies as a market for the productions of the United Kingdom:—
| EXPORTS OF HOME PRODUCTION FROM THE UNITED KINGDOM, IN 1892, TO— | |
|---|---|
| £ | |
| British India and Ceylon | 28,847,623 |
| United States | 26,547,234 |
| Australasia | 19 |
| Germany | £412 |
| France | 14,886,894 |
| Holland | 8 |
The exports to other countries did not amount to £8,000,000 in any one case.
The Australasian Colonies as a whole, with a population of 4,000,000, thus take the third place in importance as cons of British produce, the exports thereto being about two-thirds of the value of the similar exports to British India, with its 290,000,000 inhabitants.
The main products of these colonies must for some time to come arise from the work of the runholder, the farmer, and the miner. So long as there remain large areas of land capable of improvement and more lucrative occupation, as well as considerable mineral resources awaiting further development, no such increase in manufactures can be looked for as would enable colonial to supersede English goods in any material degree. The consumption ad may fall somewhat in the future as the proportion of adults increases owing to lessened immigration; but the relatively high rates of wages, and the absence of any widespread pauperism, should maintain a standard of living far above that existing in older countries. The rapid growth of population in Australasia may thus be expected largely to increase the demand for British products; indeed, there is every reason to believe that in the near future these colonies will become the most important market open to the British manufacturers.
There were 1,305 post-offices in New Zealand at the end of 1893.
The correspondence delivered and posted in each of the three last years, with the increase in each case in 1893, is shown:—
| Correspondence, &c. | 1891. | 1892. | 1893. | Increase in 1893. |
|---|---|---|---|---|
*Decrease. | ||||
| Letters delivered | 23,867,402 | 25,079,938 | 26,340,704 | 1,260,766 |
| Letters posted | 23,745,462 | 25,530,804 | 25,744,745 | 213,941 |
| Post-cards delivered | 1,097,788 | 1,224,938 | 1,309,568 | 84,630 |
| Post-cards posted | 1,181,141 | 1,346,098 | 1,387,542 | 41,444 |
| Books and packets delivered | 3,342,781 | 6,508,463 | 7,611,279 | 1,102,816 |
| Books and packets posted | 3,827,980 | 6,774,924 | 6,548,789 | 226,135* |
| Newspapers delivered | 9,768,226 | 9,538,945 | 10,699,299 | 1,160,354 |
| Newspapers posted | 8,733,686 | 9,018,620 | 8,856,731 | 161,889* |
It will be noticed that in the above table the figures for 1892 show in many cases very large increase on the numbers for the previous year. These abnormally large increases were mainly due to the introduction in 1892 of the minimum rates of postage for printed matter.
The average number of letters, &c., posted per head of the population in each of the past four years was,—
| 1890. | 1891. | 1892. | 1893. | |
|---|---|---|---|---|
| Letters | 34.64 | 37.70 | 39.75 | 38.93 |
| Post-cards | 1.60 | 1.88 | 2.10 | 2.10 |
| Books and parcels | 5.35 | 6.08 | 10.55 | 10.13 |
| Newspapers | 14.00 | 13.87 | 14.04 | 13.39 |
The facilities afforded for the transmission of parcels through the Post Office to places within and without the colony has proved of much convenience to the public. The regulations admit of parcels up to 11lb. in weight being sent to almost all the important countries of the world.
The number and weight of parcels posted in 1890, 1892, and 1893 are given. The word “parcels” in the preceding table includes the parcels herein mentioned:—
| Parcels. | 1890. | 1892. | 1893. | |||
|---|---|---|---|---|---|---|
| No. | Weight. | No. | Weight. | No. | Weight. | |
| Parcels posted | 121,292 | Lb. 336,644 | 148,049 | Lb. 448,887 | 153,328 | Lb. 476,764 |
Owing to the greatly reduced book-post rates a large number of the lighter packets of the classes formerly sent by parcel-post continue to be diverted to the packet- and sample-post. This fact accounts for the small increase in the number of parcels. The weight and declared values, however, show satisfactory increases.
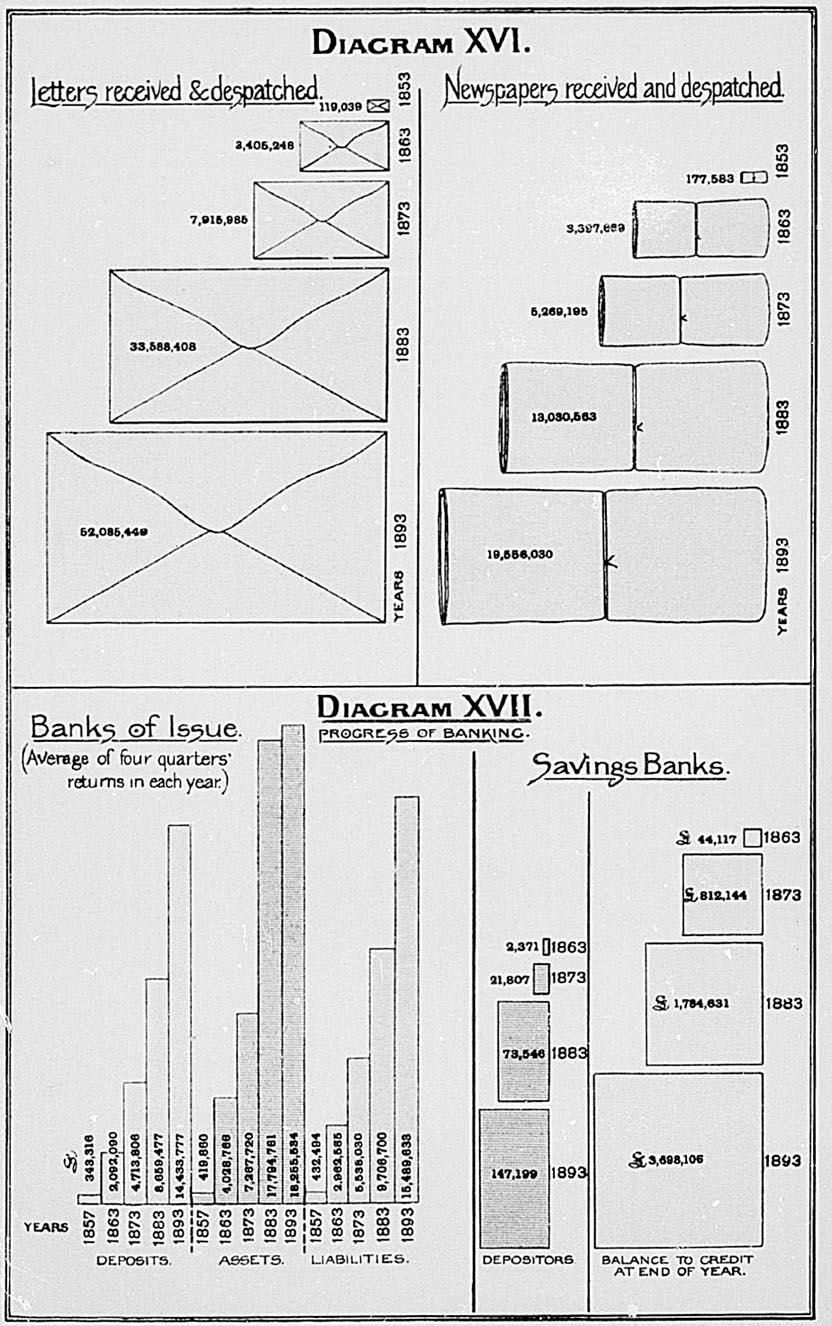
The following table shows the number of parcels exchanged with the United Kingdom, the Australian Colonies, &c., in 1892 and 1893:—
| Country. | Number of Parcels. | |||
|---|---|---|---|---|
| Received. | Despatched. | |||
*From October, 1893. †From August, 1893. From April, 1893. | ||||
| 1892. | 1893. | 1892. | 1893. | |
| United Kingdom and foreign offices via London | 13,988 | 13,586 | 2,961 | 2,962 |
| Victoria | 2,252 | 2,722 | 1,111 | 1,209 |
| New South Wales* | 575 | 399 | ||
| Queensland | 125 | 163 | 47 | 173 |
| South Australia | 156 | 219 | 94 | 142 |
| Tasmania | 120 | 184 | 278 | 274 |
| Western Australia | 13 | 29 | 45 | 75 |
| Samoa† | 11 | 11 | ||
| Tonga† | 2 | 7 | ||
| Rarotonga† | 9 | 5 | ||
| Ceylon‡ | 23 | 6 | ||
| Straits Settlements‡ | 20 | 6 | ||
| Totals | 16,654 | 17,543 | 4,536 | 5,269 |
The declared value of the parcels received from places outside the colony was £27,941, on which the Customs duty amounted to £5,279.
During 1893, 210,957 money-orders, for a total amount of £750,929 5s. 10d., were issued by the various post-offices in the colony. The money-orders from places beyond New Zealand which were paid in the colony numbered 19,425, for the amount of £73,545 19s. 7d.
The cost of the various mail-services between England and New Zealand was, in 1893, as follows:—
| SAN FRANCISCO SERVICE. | |||
|---|---|---|---|
| £ | s. | d. | |
| Payments— | |||
| Subsidies, &c. | 25,499 | 4 | 11 |
| Interprovincial and other charges | 3,467 | 9 | 9 |
| 28,966 | 14 | 8 | |
| Receipts— | |||
| Postages received from England and the Australian Colonies | 10,339 | 2 | 7 |
| Postages collected in the colony | 10,698 | 3 | 10 |
| 21,037 | 6 | 5 | |
| Loss to the colony | £7,929 | 8 | 3 |
| PENINSULAR AND ORIENTAL AND ORIENT LINES SERVICES. | |||
|---|---|---|---|
| £ | s. | d. | |
| Payments— | |||
| To P. and O. and Orient Lines | 2,695 | 7 | 7 |
| Transit across Australia | 88 | 7 | 0 |
| Transit across European Continent | 473 | 11 | 1 |
| Intercolonial services | 1,695 | 11 | 11 |
| 4,952 | 17 | 7 | |
| Receipts— | |||
| Postages collected from England and foreign offices | 843 | 14 | 11 |
| Postages collected in the colony | 2,287 | 15 | 3 |
| 3,131 | 10 | 2 | |
| Loss to the colony | £1,821 | 7 | 5 |
The total amount of postages collected and contributions received for all these services in 1893 was £24,168 16s. 7d.
The average number of days in 1893 within which the mails were delivered between London and each of the under-mentioned ports in New Zealand was as follows:—
| San Francisco Service. | P. and O. Line. | Orient Line. | |
|---|---|---|---|
| London to— | |||
| Auckland | 33.38 | 41.00 | 41.92 |
| Wellington | 35.00 | 41.92 | 41.58 |
| Dunedin | 36.61 | 42.33 | 42.33 |
| Bluff | 37.36 | 41.58 | 41.58 |
There were 5,513 miles of telegraph-line open at the end of 1893, requiring 13,515 miles of wire. 2,069,691 telegrams were transmitted during the year; of these, the private and Press, messages numbered 1,825,646, which, together with other telegraph receipts, yielded a revenue of £112,465 15s. 9d.
There were fourteen telephone exchanges and ten sub-exchanges on the 31st March. 1894. The number of subscribers increased from 3,811 in March, 1893, to 4,244 in March, 1894. The subscriptions to these exchanges during the year amounted to £21, 771 4s. 4d., and the working-expenses, maintenance, interest on capital cost, and allowance for depreciation, to £22,217 10s. 2d.
The capital expended in connection with the several telephone exchanges up to the 31st December, 1893, including spare material on hand, was £117,680 4s. 8d.
The revenue of the General Government is of two kinds—ordinary and territorial. The ordinary revenue for the year ended 31st March, 1894, amounted to £4,055,479, and the territorial to £313,059, giving a total revenue of £4,368,538.
The principal heads of ordinary revenue were: Customs, £1,655,503; Stamps (including Postal and Telegraph cash receipts), £674,647; land-tax, £285,327; income-tax, £75,238; property-tax, £1,412; beer duty, £61,808; Railways, £1,175,548; registration and other fees, £49,290; Marine, £20,183; and miscellaneous, £56,523.
The territorial revenue comprised receipts from pastoral runs, rents, and miscellaneous items, £184,389, together with proceeds of lend sales, £128,670.
The total revenue (ordinary and territorial), including the proceeds of £284,500, debentures issued under “The Consolidated Stock Act, 1884,” for the accretions of Sinking Fund for the year, amounted to £4,653,038.
The Customs duties constitute the largest item of revenue, nearly all classes of imports being subject to taxation.
The ordinary expenditure under permanent and annual appropriations was £4,386,359, the chief items being—Charges of the public debt, £1,885,697; Working Railways, £731,844; public instruction, £388,652; Postal and Telegraph, £292,433; Defence and Police, £171,073; subsidies and other payments to local bodies, £149,810; Crown Lands, Surveys, and Inspection of Stock, £119,996; Justice, £115,924; Hospitals, Lunatic Asylums, and Charitable Institutions, £115,858; and pensions, compensations, and other expenditure under special Acts of the Legislature, £80,984.
In addition to (£4,386,359) the ordinary expenditure, £250,000 was transferred to the Public Works Fund for the construction of reproductive works, and in aid of settlement of the land; and an additional extraordinary charge of £10,220 in connection with the purchase of the Cheviot Estate was provided.
It has been previously shown that the total ordinary and territorial revenue, together with the proceeds of debentures issued for the accretions of Sinking Fund, amounted to £4,653,038. It will therefore be seen that the revenue for the year exceeded the expenditure (including the sums transferred to the Public Works and Cheviot Estate purchase accounts) by £6,459; and that, by adding the credit balance brought forward at the beginning of the year (£283,779), there remains a net surplus on 31st March, 1894, of £290,238.
Besides expenditure out of revenue, there was also an expenditure out of the Public Works Fund of £409,475, of which £176,254 9 was for construction of railways, £147,668 for roads, £4,320 for purchase of Native lands, £44,032 for public buildings, £16,127 for telegraph extension, £6,588 for lighthouses and harbour defences, £8,406 for the Public Works Department, £5,272 for waterworks on goldfields, £415 for rates on Native lands, £343 for immigration, and £50 on services not provided for.
In addition to the above, the sum of £78,985 was expended during the year in acquiring Native lands under provisions of “The Native Land Purchases Act, 1892,” £2,000 being paid in debentures, the remainder in cash; purchase of estates under “The Land for Settlements Act, 1892,” absorbed a further sum of £37,542, provided for by the issue of debentures; and out of receipts from cash sales, rents, &c., the sum of £18,346 was paid for the surveying, roading, &c., of the lately acquired Cheviot Estate.
Besides the revenue raised by the General Government, all the County and Borough Councils, Town, Road, River, Harbour, and Drainage Boards have power to levy rates and obtain revenue from other sources.
The colony is divided into 94 boroughs and 79 counties; within the latter there are 250 road districts and 40 town districts, not including the special town district of Rotorua, constituted under “The Thermal-Springs Districts Act, 1881.”
The following table shows the receipts from rates and other sources, with the expenditure and outstanding loans of the local governing bodies, for six financial years:—
| Year. | Receipts of Local Bodies. | Expenditure. | Outstanding Loans. | |
|---|---|---|---|---|
| From Rates. | From Government and other Sources, including Loans. | |||
* Not including loans amounting to £546,049, repayable to General Government by annual instalments. | ||||
| £ | £ | £ | £ | |
| 1887.88 | 433,831 | 1,306,661 | 1,819,787 | 5,812,803 |
| 1888.89 | 445,928 | 992,567 | 1,560,604 | 5,892,050 |
| 1889.90 | 460,302 | 914,413 | 1,476,539 | 5,978,059 |
| 1890.91 | 463,581 | 899,666 | 1,381,319 | 6,042,693 |
| 1891.92 | 488,824 | 907,420 | 1,400,467 | 6,081,934 |
| 1892.93 | 508,157 | 709,676 | 1,482,548 | 6,203,869* |
Full particulars relating to local finance will be found under the head “Local Governing Bodies.”
The direct taxation prior to 1892 consisted of a property-tax of 1d. in the pound on all assessed real and personal property (with exemption of £500) and the stamp duties; but in 1891 a Land and Income Assessment Act was passed repealing the property-tax. A full description of the system of the land- and income-tax is given by the Commissioner in a special article in Part III. of this book, and to this attention is particularly directed. The leading features only are shortly stated here.
The Assessment Act of 1891 provides for an ordinary land-tax on the actual value of land, and an owner is allowed to deduct any amount owing by him secured on a registered mortgage. Under the original Act the deduction for improvements might not exceed £3,000; but, by the Amendment Act of 1893, the value of all improvements whatsoever is exempted from liability to land-tax. Besides this, an exemption of £500 is allowed when the balance, after making deductions as above stated, does not exceed £1,500; and above that a smaller exemption is granted, but it ceases when the balance amounts to £2,500. Mortgages are subject to the land-tax. The revenue from the land-tax is, in round numbers, £285,000 per annum. The rate of ordinary land-tax for 1893–94 was 1d. in the pound.
In addition to the ordinary land-tax, there is a graduated land-tax which commences when the unimproved value is £5,000. For the graduated land-tax, the present value of all improvements is deducted; but mortgages are not deducted. The Act of 1893, while reducing the ordinary taxation on land by exempting all improvements, increased the graduated-tax, and the revised rates are now one-eighth of a penny in the pound sterling when the value is £5,000 and is less than £10,000, from which the rate increases by further steps of an eighth of a penny with the value of the property, until the maximum of 2d. in the pound is reached, payable when the value is £2,10,000, or exceeds that sum.
This graduated tax yields, in round numbers, £83,000 per annum, which is included in the sum of £285,000 given above. Twenty per cent. additional tax is levied in case of persons who have been absent from the colony for three years or more prior to the passing of the yearly taxing Act. This amounts to about £1,000, and is included in the £83,000 shown above.
Income-tax is levied on all incomes above £300, and from taxable incomes a deduction of £300 is made. The rate of income-tax for 1893–94 was 6d. in the pound on the first taxable £1,000, and 1s. in the pound on taxable incomes over £1,000.
Companies pay 1s. in the pound, and are not allowed the £300 exemption. The Act of 1893 further disallowed the £300 exemption in the case of persons not domiciled in New Zealand.
The indirect taxation is made up of Customs duties and excise duty on beer made in the colony. The following statement shows the amount raised by taxation in each of the past twelve years:—
| Amount of Revenue raised by Taxation. | Amount per Read of Population (excluding Maoris). | |||
|---|---|---|---|---|
| £ | £ | s. | d. | |
| 1882 | 1,956,557 | 3 | 16 | 10 |
| 1883 | 1,957,080 | 3 | 13 | 11 |
| 1884 | 1,815,674 | 3 | 5 | 9 |
| 1885 | 2,016,730 | 3 | 10 | 10 |
| 1886 | 1,882,050 | 3 | 4 | 8 |
| 1887 | 1,876,235 | 3 | 2 | 11 |
| 1888 | 2,031,658 | 3 | 7 | 1 |
| 1889 | 2,090,405 | 3 | 8 | 4 |
| 1890 | 2,173,985 | 3 | 10 | 0 |
| 1891 | 2,179,739 | 3 | 9 | 2 |
| 1892 | 2,339,511 | 3 | 12 | 10 |
| 1893 | 2,353,250 | 3 | 11 | 2 |
As the Maoris contribute somewhat to the Customs revenue, an allowance should he made on that account to ascertain more correctly the amount of taxation per head of the rest of the people. By including Maoris the Customs duties per head of the rest, of the population would be reduced by 3s. 1d. for the year 1893. If this amount be deducted from the taxation per head given for that year, the rate would be reduced from £3 11s. 2d. to £3 8s. 1d. This latter rate may fairly be used for comparison with the rates in the neighbouring colonies.
The following were the rates of taxation per head in the Australasian Colonies in 1892, specifying the proportions derived from Customs and other taxes:—
| Colonies. | Rate of Taxation per Head of Mean Population. | Proportion of Taxation from Customs Duties. | Ratio of Taxation by Customs to Value of Imports. | ||||||||
|---|---|---|---|---|---|---|---|---|---|---|---|
| From Customs. | Other Taxes. | Total Taxation. | |||||||||
* Exclusive of Northern Territory. | |||||||||||
| £ | s. | d. | £ | s. | d. | £ | s. | d. | Per Cent. | Per Cent. | |
| Queensland | 2 | 13 | 11 | 0 | 13 | 7 | 3 | 7 | 6 | 79.86 | 25.58 |
| New South Wales | 2 | 5 | 4 | 0 | 13 | 1 | 2 | 18 | 5 | 77.62 | 12.89 |
| Victoria | 2 | 1 | 1 | 0 | 13 | 1 | 2 | 14 | 2 | 75.86 | 13.91 |
| South Australia* | 1 | 15 | 10 | 0 | 12 | 3 | 2 | 8 | 1 | 74.49 | 7.88 |
| Western Australia | 4 | 17 | 10 | 0 | 10 | 0 | 5 | 7 | 10 | 90.74 | 39.88 |
| Tasmania | 2 | 1 | 8 | 0 | 15 | 8 | 2 | 17 | 4 | 72.67 | 21.27 |
| New Zealand | 2 | 11 | 7 | 1 | 1 | 3 | 3 | 12 | 10 | 70.83 | 23.87 |
The various local bodies levied taxation in the form of rates for the year ended 31st March, 1893, to the amount of £508,157, or 15s. 3d. per head of European population.
The gross public debt of the colony on 31st March, 1894, was £39,826,415, an increase of £568,575 on the amount at the close of the preceding year. Of this increase £477,466 consisted of debentures issued for purposes giving immediate returns: viz., £72,000 under “The Native Land Purchases Act, 1892,” £38,966 under “The Land for Settlements Act, 1893,” £250,000 under “The Cheviot Estate Payment Act, 1893,” and £116,500 under “The Government Loans to Local Bodies Act, 1886.”
There was a further issue of £16,300 under “The Naval and Military Settlers’ and Volunteers’ Land Act, 1892,” and £902,000 of Debentures were converted into £1,038,180 of 3 1/2-per-cent. Stock. Towards the annual accretions of Sinking Fund £284,500 of debentures under “The Consolidated Stock Act, 1884,” were issued.
On the other hand, there were redeemed £266,071 of debentures under the last-named Act, £51,300 of “Consolidated Loan Act, 1867” debentures, and £28,500 of “Lyttelton and Christchurch Railway Loan Ordinance, 1860” debentures; while, as before stated, £902,000 debentures were converted.
The net public Debt, after deducting the accrued Sinking Lund (£951,924) was on 31st March, 1894, £38,874,491, an increase of £730,421 during the year.
The following shows the debt of each of the Australasian Colonies on the 31st December, 1892:—
| Colony. | Amount of Debt. | Accrued Sinking Fund. | Net Indebtedness. | Rate of Net Indebtedness per Head of Population at End of Year. | ||
|---|---|---|---|---|---|---|
* Including £5,052,884 Treasury Bills. | ||||||
| £ | £ | £ | £ | s. | d. | |
| Queensland | 29,457,134 | 29,457,134 | 69 | 18 | 5 | |
| Now South Wales* | 54,209,933 | 54,209,933 | 45 | 5 | 9 | |
| Victoria | 46,774,125 | 203,413 | 46,570,712 | 39 | 17 | 10 |
| South Australia | 21,230,700 | 12,500 | 21,218,200 | 63 | 0 | 4 |
| Western Australia | 2,261,864 | 114,294 | 2,147,570 | 36 | 12 | 0 |
| Tasmania | 7,399,000 | 115,515 | 7,283,485 | 47 | 11 | 2 |
| New Zealand | 39,192,519 | 1,037,557 | 38,154,962 | 58 | 13 | 3 |
The amount of net indebtedness per head of population was thus greater in Queensland and South Australia than in New Zealand. The net indebtedness per head in this colony has a tendency to decrease. In March, 1889, it was £60 12s. 2d.; in 1890, £60 5s. 4d.; in 1891, £59 11s. 11d.; in 1892, £59 2s.; in 1893, £58 2s. 7d.; and in 1894, £57 8s. 10d.: the increase of the population having been proportionally greater than the increase of debt.
| Years ended 31st March. | Amount of Debentures and Stock in Circulation. | Gross Indebtedness; per Head of European Population. | Amount of Sinking Fund accrued. | Net Indebtedness. | Net Indebtedness per Head of European Population. | Annual Charge (Interest and Sinking Fund). | ||||
|---|---|---|---|---|---|---|---|---|---|---|
| £ | £ | s. | d. | £ | £ | £ | s. | d. | £ | |
| 1889 | 38,375,050 | 62 | 17 | 10 | 1,395,389 | 36,979,661 | 60 | 12 | 2 | 1,866,588 |
| 1890 | 38,667,950 | 62 | 10 | 1 | 1,383,432 | 37,284,518 | 60 | 5 | 4 | 1,851,421 |
| 1891 | 38,830,350 | 61 | 19 | 4 | 1,486,427 | 37,343,923 | 59 | 11 | 11 | 1,864,575 |
| 1892 | 38,713,068 | 60 | 14 | 8 | 1,037,862 | 37,675,206 | 59 | 2 | 0 | 1,842,686 |
| 1893 | 39,257,840 | 59 | 16 | 7 | 1,113,770 | 38,144,070 | 58 | 2 | 7 | 1,837,169 |
| 1894 | 39,826,415 | 58 | 17 | 0 | 951,924 | 38,874,491 | 57 | 8 | 10 | 1,873,682 |
The debt of the colony as above stated does not include the unpaid loans raised by the several local bodies, amounting at the end of March, 1893, to £6,203,869. These will be referred to when the particulars of the finance of local bodies are being dealt with.
Of the existing loans some portions were raised by the several Provincial Governments, while others represent loans raised for the purpose of paying off provincial liabilities. It is now almost impossible to ascertain the exact expenditure by these Governments on public works, or the allocation of the proceeds of the loans raised by them.
The burden of a public debt depends greatly on the extent to which it is expended on reproductive works, and on the degree of prosperity enjoyed by the people. The generally rugged character of this country, and the natural difficulties appertaining to many of the sites on which the chief towns were built, very early necessitated a large outlay on roads and public works. The need was fully recognised, and to some extent met, by most of the Provincial Governments, which have justly received great credit for their far-seeing and liberal exertions. A great deal of road-making, often of a very costly character, was accomplished, harbour and other improvements begun, and immigration encouraged. Some railways were made in Canterbury, Otago, and Southland. The City of Christchurch and the agricultural plains of Canterbury were connected with the Port of Lyttelton by a railway, which required the construction of a long and very costly tunnel through the hills surrounding Lyttelton. In Otago, the City of Dunedin was connected with Port Chalmers by railway, constructed by private enterprise under the guarantee of the Otago Provincial Government; and some miles of railway were made in Southland, extending from the Town of Invercargill into the interior; but no general and comprehensive scheme of public works could be carried out by the separate exertions of the Provincial Governments. The General Government, therefore, in 1870, brought forward its public-works and immigration policy, by which it was proposed to raise a loan of ten millions for the construction of main trunk railways, roads, and other public works of importance to the colony as a whole, and for the promotion of immigration on a large scale, the expenditure to be extended over a period of ten years. This policy was accepted by the Legislature, and embodied in “The Immigration and Public Works Act, 1870.”
The demands for local railways and other works soon caused the original proposals to be exceeded, and entailed an expenditure at a much more rapid rate and to a far greater amount than was originally contemplated. Although many of the works undertaken have been directly unremunerative, yet the effect of the policy, as a whole, has been largely to develop the settlement of the country, and enormously to increase the value of landed property; land, in parts which before the construction of railways was valued at from £1 to £2 per acre, having been subsequently sold at prices varying from £10 to £20 per acre. In addition to the important indirect results of the policy, the railway and telegraph-lines yield a revenue which covers a large proportion of the interest on their cost after paying working-expenses.
The following may be stated as approximately representing the loan expenditure by the General Government on certain public works to the 31st March, 1894: —
| £ | |
|---|---|
*Including £1,104,281 spent on railways by Provincial Governments, of which sum £82,259 was paid for the Dunedin and Port Chalmers line. | |
| Telegraphs | 679,793 |
| Waterworks on goldfields | 572,441 |
| Immigration | 2,146,552 |
| Roads and bridges | 3,855,455 |
| Land-purchases | 1,297,517 |
| Lighthouses, harbours, and defence works | 906,958 |
| Public buildings, including schools | 1,890,711 |
| Coal-mines and thermal springs | 25,435 |
| Railways (by the Provincial and General Governments) | 15,759,308* |
The above several items of expenditure give a total of £27,134,170. To this must be added so much of the loans raised by the various local bodies as have been devoted to the construction of harbours, roads, and other public works, together with the amounts expended out of loan by the Provincial Governments on immigration and public works other than railways. The expenditure on directly reproductive works—railways, telegraphs, and waterworks—has been £17,011,542. The expenditure on land is also partly reproductive, and that on immigration, roads, bridges, and lighthouses indirectly so.
Statistics purporting to illustrate the importance of, and progress made by, any colony or country are evidently defective if no mention be made of the accumulated wealth of its inhabitants.
An effort has been made to ascertain the amount of private wealth in New Zealand. It seems but right to endeavour to give some idea of the value of private property, though many difficulties present themselves in the course of the work. One method of estimating private wealth is to add together the values of all estates admitted to probate in any one year, and divide the sum by the number of deaths occurring in that year. The quotient would then represent the average wealth per head. But any inference drawn from the figures for a single year would be untrustworthy. For in a thinly-peopled country such as New Zealand an epidemic among young children, who have no property to leave, will unduly lower the average; while, on the other hand, the deaths of a few wealthy persons will raise it unwarrantably. By putting the figures for several years together, and taking the average for the term, we may partially, if not entirely, get rid of these disturbing elements, and arrive at fairly correct results, as thus:—
| Years, inclusive. | Amount sworn to. | Total Number of Deaths. | Average Amount left by each Person. | Average Number of Persons living. | Average Total Wealth for each Year of the Period. | ||
|---|---|---|---|---|---|---|---|
| £ | £ | s. | d. | £ | |||
| 1889.93 | 7,814,669 | 31,510 | 232 | 2 | 9 | 633,175 | 146,984,034 |
From this it will be seen that the average total private wealth for each of the five years 1889–93 was £146,984,034. It is manifest, however, that this average does not exhibit with sufficient accuracy the actual present amount of wealth. If the average amount per head —£232 2s. 9d.—for the period 1889–93 were the same at the end of the year 1893, then the total wealth possessed by the 672,265 persons in the colony on 31st December of that year would amount to £156,058,273; or if for purposes of this estimate the mean population for the year be taken the total estimated private wealth of the colony would be £153,524,184.
These figures do not, however, represent the full amount of private wealth, as the values sworn to do not include those estates on which no stamp duty is payable—viz., lands and goods passing to the husband or wife of the deceased, and properties under £100. The total of these must he considerable, and should give a substantial increase to the average amount per head, and therefore to the total wealth.
The increase in private wealth is shown by the following figures:—
| Year. | Amount. | Average per Head. |
|---|---|---|
| £ | £ | |
| 1882 | 110,789,298 | 214 |
| 1888 | 131,345,925 | 216 |
| 1889 | 133,135,134 | 215 |
| 1890 | 142,631,461 | 228 |
| 1891 | 145,780,502 | 230 |
| 1892 | 152,065,087 | 236 |
| 1893 | 156,058,273 | 232 |
By the other and direct method of estimating private wealth the Government Statistician of New South Wales arrived at a value for New Zealand for the year 1890 of £150,192,000; and pursuing a similar course, but somewhat differing in detail, a calculation for the year 1892 was made in the Registrar-General's Office here, the results of which approximated closely to the sum arrived at by using the probate returns. The figures are admittedly open to many objections, as is always the case in such calculations; but though some items may be deemed to be assessed at too high a value, and others the reverse, the total would seem to be somewhat too low, judging from comparison with the result of the probate method, which must be considered as representing the net private wealth.
Land, Buildings, and Improvements privately owned.— The value of privately-owned land with improvements was estimated to be £96,066,000. In the year 1883 the sum was £84,208,230, and in 1891 it had increased to £92,373,166, or at the rate of about 3 per cent. per annum. By allowing a slightly higher rate of increase for 1892, which was considered justifiable, the above estimate was arrived at.
Live-stock. — For purposes of the calculation, horses were valued at £9 10s., cattle at £4 10s., sheep at 10s., and pigs at £1 5s. The total value of all kinds of stock was estimated at £15,299,189.
Shipping.—The value of steamers was taken at £20 per ton, and sailing-vessels at £8. The total value of the shipping at these rates was £1,591,672.
Railways (not Government).—The cost of the two private lines in the colony was returned at £1,613,000.
Produce and Merchandise.—The value of goods and manufactures, with that of the produce on hand, was estimated at £14,408,015.
Furniture and Household Goods.—The furniture was valued by allotting a certain sum to every house, according to the number of rooms, using for this purpose the number of houses of each class as returned at the last census. For clothing and other effects an average of £4 per head was accepted. The estimated value was £8,937,678.
The Machinery and Plant belonging to the larger industries were valued in the census returns at £3,051,700; adding to this £1,500,000 for machinery in smaller works, and £650,000 for agricultural implements, the total was found to be £5,201,700.
Coin and Bullion.—The coin and bullion in the banks, together with an allowance of £3 10s. per head of population (the estimate of the coin in actual use) were taken to represent the amount for the colony. The sum was £4,799,340.
Mines and Sundries. — There is included in the total of £7,000,000 set down under this head what was believed to be the value of the interest of companies and persons in coal- and goldmines on Crown lands (the value of such mines on freehold lands being included in item No. 1), also sundry small sums not accounted for elsewhere. This estimate was not closely calculated.
The summary of the above gives the total of private property as under:—
| PRIVATE PROPERTY, 1892. | £ |
|---|---|
| 1. Land, buildings, and improvements | 96,066,000 |
| 2. Live-stock | 15,299,000 |
| 3. Shipping | 1,592,000 |
| 4. Railways (not Government) | 1,613,000 |
| 5. Produce and merchandise | 14,408,000 |
| 6. Furniture and household goods | 8,938,000 |
| 7. Machinery and plant | 5,202,000 |
| 8. Coin and bullion | 4,799,000 |
| 9. Mines and sundries | 7,000,000 |
| Total | £154,917,000 |
Working on a similar system, the Government Statistician of New South Wales estimated the private wealth of the seven colonies of Australasia for the year 1890 at £1,169,434,000.
It is interesting to compare this estimate of the wealth of the Australasian Colonies with the results of similar calculations for other parts of the world. A table giving this information for various countries has accordingly been introduced; but in comparing the wealth of one country with another it must be remembered that the purchasing-power of money in different parts of the world varies considerably, and without any information on this head bare statements of wealth per inhabitant are of very little use, and often misleading. Besides this, the question as to what extent Government undertakes such functions as the construction and working of railways disturbs comparisons of private wealth. The figures are for the most part taken from Mulhall's Dictionary of Statistics:—
| WEALTH OF PRINCIPAL COUNTRIES. | ||
|---|---|---|
| Country. | Private Wealth. | Average Amount per Head of Population. |
| £ | £ | |
| United Kingdom | 9,400,000,000 | 247 |
| France | 8,598,000,000 | 222 |
| Germany | 6,437,000,000 | 133 |
| Russia | 5,089,000,000 | 55 |
| Austria-Hungary | 3,855,000,000 | 96 |
| Italy | 2,963,000,000 | 98 |
| Spain | 2,516,000,000 | 143 |
| Portugal | 408,000,000 | 83 |
| Sweden and Norway | 880,000,000 | 122 |
| Denmark | 404,000,000 | 192 |
| Holland | 980,000,000 | 213 |
| Belgium | 1,007,000,000 | 165 |
| Switzerland | 494,000,000 | 165 |
| United States | 12,824,000,000 | 205 |
| Canada | 980,000,000 | 196 |
In the year 1885 the property-tax returns gave £40,304,000 as the value of public property in the colony, including Crown lands, educational, municipal, and other reserves, with public works— namely, railways, telegraphs, lighthouses, buildings, harbour-works, and water-supply on goldfields. In 1888 the value of the above had risen to £42,505,000, and it is supposed that in 1893 the sum would probably be about £45,000,000. There are also from nine to ten millions of acres of lands the property of the Maoris. In 1889 the Native lands were valued at £3,000,000 sterling. The present value is probably not so much; some land has been sold, and, on the other hand, some of that retained may have increased in value.
The incomes of the people of New Zealand for 1893 have been the subject of two calculations made on different principles, but yielding similar results.
The first method adopted was to allot a probable income to each description of occupation found in the census of 1891 (the census figures being raised to the population of 1893). Whatever may be thought of the plan of basing a calculation on a series of arbitrarily assumed average incomes for various occupations as a basis, it has been adopted by Mr. Hayter, and no doubt serves as a sort of check on Mr. Mulhall's method.
The result for New Zealand shows an estimated aggregate of incomes amounting to between £27,000,000 and £28,000,000,* giving an average of about £41 per head of population of all ages and both sexes, and £91 per head of breadwinners.
Mr. Mulhall's method may be thus described: 90 per cent. of agricultural, pastoral, and mining produce, and 60 per cent. of manufactures are taken. Transport is computed at 10 per cent. on the gross value of the foregoing products; house rent according to the nearest estimate; commerce at 10 per cent. on the imports and exports; shipping, 30s. per ton; banking, 5 per cent. on banking power.
An allowance of 10 per cent. on the total of the preceding items is made to cover the earnings of servants, professional men, Civil Service, &c. The method is said to be one answering fairly well for comparative purposes.
The earnings of the people of New Zealand calculated on the above principle would be:—
| Heads of Income. | Amount. |
|---|---|
* This sum being the total of all the incomes in the colony, much money is necessarily included several times over. | |
| £ | |
| From agricultural, pastoral, and mining produce | 12,915,000 |
| From manufactures | 3,181,000 |
| From transport | 1,965,000 |
| From house rent | 4,500,000 |
| From commerce and shipping | 1,700,000 |
| From banking | 991,000 |
| From earnings of professional men, Civil Service, servants, &c. | 2,525,000 |
| £27,777,000* | |
The average earnings per inhabitant in other countries have been calculated on the above method, by Mr. Mulhall, with the following results:—
| Country. | Average per Inhabitant. | ||
|---|---|---|---|
| £ | s. | d. | |
| United Kingdom | 33 | 7 | 0 |
| Franco | 27 | 8 | 0 |
| Germany | 22 | 2 | 0 |
| Russia | 11 | 5 | 0 |
| Austria | 15 | 5 | 0 |
| Italy | 12 | 2 | 0 |
| Spain | 16 | 5 | 0 |
| Portugal | 12 | 1 | 0 |
| Sweden | 22 | 0 | 0 |
| Norway | 20 | 5 | 0 |
| Denmark | 32 | 5 | 0 |
| Holland | 22 | 6 | 0 |
| Belgium | 28 | 0 | 0 |
| Switzerland | 19 | 0 | 0 |
| United States | 39 | 0 | 0 |
| Canada | 26 | 0 | 0 |
| Australia | 40 | 2 | 0 |
| Argentina | 24 | 0 | 0 |
Dealing only with persons returned as in receipt of wages or salary, and discarding all who derive their incomes from professional or trade profits, it is roughly estimated that the aggregate of the wages paid in the colony for the year amounts to £12,998,546, of which sum £11,983,521 is earned by males, and £1,015,025 by females, the average yearly earnings being £92 12s. for the one sex, and £33 18s. for the other:—
| Occupations. (For details of Classes see report on Census, 1891.) | Males. | Females. | ||||
|---|---|---|---|---|---|---|
| Estimated Number of Wage-earners, 1893. | Average Annual Earnings | Aggregate Earnings, 1893. | Estimated Number Average of Wage-earners, Annual Earnings 1893. | Average Annual Earnings | Aggregate Earnings, 1893. | |
* Here again the total, being the sum of all wages paid in the colony, must be understood as a gross amount, including much money counted several times over. | ||||||
| £ | £ | £ | £ | |||
| I. Professional | 7,472 | 141.5 | 1,057,452 | 4,046 | 49.7 | 200,945 |
| II. Domestic | 3,536 | 84.1 | 297,394 | 16,718 | 32.1 | 536,641 |
| III. Commercial | 29,444 | 121.9 | 3,590,876 | 1,179 | 23.8 | 28,016 |
| IV. Industrial | 48,556 | 800 | 3,886,058 | 7,751 | 31.7 | 245,535 |
| V. Agricultural pastoral, mineral, &c. | 39,470 | 77.7 | 3,068,948 | 121 | 17.6 | 2,126 |
| VI. Indefinite., | 961 | 86.2 | 82,793 | 114 | 15.5 | 1,762 |
| Totals | 129,439 | 92.6 | 11,983,521 | 29,929 | 33.9 | 1,015,025 |
| Total wages, males | £11,983,521 | |||||
| Total wages, females | 1,015,025 | |||||
| Total | £12,998,546* | |||||
An estimate has been made of the cost of living in New Zealand, which shows a total expenditure of £23,349,623 on food, drink, stimulants, clothing, fuel, light, rent, and furniture, with allowance for such matters as attendance (personal and medical), and other accessories to the primary needs of life. The rate arrived at per head of population is £35 6s. 1d.
Mr. Mulhall gives the average expenditure per head of population for various countries as below:—
| Country. | Average Expenditure per Head. | ||
|---|---|---|---|
| £ | s. | d. | |
| United Kingdom | 29 | 14 | 9 |
| France | 23 | 19 | 4 |
| Germany | 20 | 3 | 4 |
| Russia | 10 | 1 | 11 |
| Austria | 14 | 4 | 9 |
| Italy | 11 | 11 | 0 |
| Spain | 15 | 12 | 6 |
| Portugal | 11 | 5 | 6 |
| Sweden | 20 | 8 | 4 |
| Norway | 19 | 0 | 0 |
| Denmark | 28 | 11 | 5 |
| Holland | 20 | 17 | 4 |
| Belgium | 25 | 8 | 2 |
| Switzerland | 18 | 0 | O |
| United States | 32 | 16 | 2 |
| Canada | 23 | 6 | 2 |
| Australia | 33 | 10 | 3 |
| Argentina | 27 | 9 | 1 |
Mr. Coghlan's estimate for Australasia is as high as £42 1s. 3d. per head.
The quantities used per head of population in New Zealand of some of the principal articles of consumption are next shown. The figures are the averages for the last five years:—
| Average Consumption. | |
|---|---|
| Articles. | Per In. habitant. |
| Food, Drinks, and Stimulants. | |
| Wheat bush. | 7.01 |
| Potatoes lb. | 462.00 |
| Cocoa and chocolate lb. | 0.43 |
| Coffee and chicory lb. | 0.46 |
| Tea lb. | 5.88 |
| Sugar lb. | 81.76 |
| Rice lb. | 8.39 |
| Fruits, dried (imported) lb. | 6.72 |
| Fruits, fresh (imported) lb. | 22.06 |
| Mustard lb. | 0.28 |
| Pickles doz. pts | 0.02 |
| Sauces doz. pts | 0.02 |
| Spices and pepper lb. | 0.53 |
| Salt lb. | 33.98 |
| Vinegar gal. | 0.12 |
| Tobacco, snuff, cigars lb. | 1.99 |
| Spirits gal. | 0.68 |
| Wine gal. | 0.18 |
| Beer gal. | 7.26 |
| Other Articles. | |
| Kerosene gal. | 2.19 |
| Soap, imported lb. | 055 |
| Soap, New Zealand lb. | 14.58 |
| Candles, imported lb. | 2.54 |
| Candles, New Zealand lb. | 2.66 |
| Matches gross | 0.17 |
| Soda, carbonate lb. | 0.19 |
| Soda, crystals lb. | 0.73 |
| Coal tons | 1.11 |
The length of Government railways open for traffic on the 31st March, 1894, was 1,948 miles, the total cost thereof having been £15,137,036, and the average cost per mile £7,770. The cash revenue for the year 1893–94 amounted to £1,172,792 17s. 2d., excluding the value of postal services; and the total expenditure to £735,358 15s. 1d. The net cash revenue—£437, 434—was equal to a rate of £2 17s. 9d. per cent. on the capital cost; the percentage of expenditure to revenue was 62.7.
The following statement shows the number of miles of Government railways open, the number of train-miles travelled and of passengers carried, and the tonnage of goods traffic for the past six years:—
| Year. | Length open. | Train-mileage. | Passengers. | Season Tickets issued. | Goods and Live-stock.* |
|---|---|---|---|---|---|
* The equivalent tonnage for live-stock has been given. | |||||
| 1888.89 | 1,773 | 2,796,007 | 3,132,803 | 11,817 | 1,954,126 |
| 1889.90 | 1,813 | 2,868,203 | 3,376,459 | 12,311 | 2,112,734 |
| 1890.91 | 1,842 | 2,894,776 | 3,433,629 | 13,881 | 2,134,023 |
| 1891.92 | 1,869 | 3,010,489 | 3,555,764 | 16,341 | 2,122,987 |
| 1892.93 | 1,886 | 3,002,174 | 3,759,044 | 16,504 | 2,258,235 |
| 1893.94 | 1,9,48 | 3,113,231 | 3,972,701 | 17,226 | 2,128,709 |
It will be observed that the number of passengers during the year 1893–94 was greater than in any previous year.
The particulars of the revenue and expenditure for the past six years are given herewith:—
| Year. | Passenger Fares. | Parcels and Luggage. | Goods and Live-stock. | Rents and Miscellaneous. | Total. | Expenditure. | Net Revenue. | Percentages of Expenditure to Revenue. | Percentage of Revenue to Capital Cost. | ||
|---|---|---|---|---|---|---|---|---|---|---|---|
| £ | £ | £ | £ | £ | £ | £ | £ | s. | d. | ||
| 888.89 | 323,447 | 34,102 | 610,488 | 29,578 | 997,615 | 647,045 | 350,570 | 64.86 | 2 | 12 | 0 |
| 1889.90 | 369,348 | 37,097 | 655,007 | 34,117 | 1,095,569 | 682,787 | 412,782 | 62.32 | 2 | 19 | 5 |
| 1890.91 | 353,593 | 38,997 | 690,779 | 38,332 | 1,121,701 | 700,703 | 420,998 | 62.47 | 2 | 18 | 11 |
| 1891.92 | 364,617 | 41,795 | 671,469 | 37,550 | 1,115,431 | 706,517 | 408,914 | 63.34 | 2 | 15 | 9 |
| 1892.93 | 390,619 | 44,801 | 707,785 | 38,316 | 1,181,521 | 732,141 | 449,380 | 61.97 | 3 | 1 | 0 |
| 1893.94 | 402,019 | 45,206 | 686,469 | 39,098 | 1,172,792 | 735,358 | 437,434 | 62.70 | 2 | 17 | 9 |
Although not included in the figures for the revenue, the real gain to the colony is greater than the net revenue shown by the value of the postal services performed by the railways (carriage of mails, &c.), amounting to £27,000 per annum.
In addition to the above railways there were 164 miles of private lines open for traffic on the 31st March, 1894—namely, the Wellington-Manawatu Railway, 84 miles; the Kaitangata Railway Company's line, 4 miles; and the Midland Railway, 76 miles.
The cost of the construction of the Wellington-Manawatu Railway was £763,729, being at the rate of £9,092 per mile. The term “cost of construction,” as used with railways, includes value of equipment, rolling-stock, &c., not merely the road-line and buildings. The revenue for the twelve months ending the 28th February, 1894, amounted to £88,304, and the working-expenses to £41,127, equivalent to 46.6 per cent. of the revenue.
The traffic returns from the opened part of the Midland line were for the year ended the 30th June, 1893, £12,765 1s. 4d., and the expenditure was £8,356 5s. 4d., equivalent to 65.5 per cent. of the revenue. The total expenditure on this line to the 30th June, 1893, was £1,177,503.
The following statement gives the number of miles of railway open for traffic and in course of construction in the Australian Colonies at the end of 1892:—
| Colony. | Number of Miles open for Traffic on 31st December. | Number of Miles course of Construction on 31st December. | |
|---|---|---|---|
| Private. | State. | ||
| Queensland | .. | 2,353 | 53 |
| New South Wales | 81 | 2,185 | 333 |
| Victoria | .. | 2,921 | 56 |
| South Australia | 17 | 1,664 | 57 |
| Western Australia | 453 | 198 | 292 |
| Tasmania | 48 | 475 | .. |
| New Zealand (March, 1893) | 150 | 1,836 | 188 |
The development of banking in New Zealand since the year 1857 has been very great. Taking for each year the average of the four quarters’ returns made by the banks of issue, the figures for 1857, 1873, 1883, and 1893 are:—
| Year. | Deposits. | Assets. | Liabilities. |
|---|---|---|---|
| £ | £ | £ | |
| 1857 | 313,316 | 419,860 | 432,494 |
| 1873 | 4,713,806 | 7,267,720 | 5,538,030 |
| 1883 | 8,659,477 | 17,794,761 | 9,706,700 |
| 1893 | 14,433,777 | 18,255,534 | 15,489,633 |
In 1873 the deposits of these banks were £16.38 per head of the population. In 1893 they were £21.82 per head. The ratio of advances to deposits, which was 104.48 per cent. in 1873, reached its maximum in 1883, when the rate was 173.35 per cent. The proportion has since that year fallen steadily, till in 1893 it was only 88.66 per cent.
The averages for 1893 compared with those of the previous year show an increase in deposits of £846,715; in assets, of £697,366; and in liabilities, of £866,298.
| 1892 | 1893. | |
|---|---|---|
| £ | £ | |
| Deposits | 13,587,062 | 14,433,777 |
| Assets | 17,558,168 | 18,255,534 |
| Liabilities | 14,623,335 | 15,489,633 |
In 1886 the average amount of advances made by the banks was £15,853,420, equal to £27.23 per head of the mean population. The advances gradually declined in amount and proportion to population until 1891, when they were in value £11,549,145, or £18.34 per head. During the year 1892, however, there was an increase, the average of the advances having been £12,228,425, equal to an amount of £19.04 per head of population; and there was a further increase in 1893, the average being £12,797,563, equal to £19.35 per head of population. The discounts were less in 1893 than in any year since 1873. The largest amount of discounts in any year was £6,061,959 in 1879, a rate of £13.53 per head of population. In 1889 the discounts were £2,850,944, equal to £4.66 per head of population; in 1890, £2,524,573, equal to £4.07 per head; in 1891, £2,314,325, or £3.68 per head; in 1892, £2,361,813, being again nearly £3.68 per head; and in 1893, £2,307,649, equal to £3.49 per head.
There was an increase of £846,715 in the deposits, which stood at £14,433,777 in 1893, against £13,587,062 in 1892. Exclusive of Government deposits, the deposits bearing interest increased from £9,439,660 to £9,897,541, or by £457,881; and the deposits not bearing interest from £3,742,952 to £4,063,760, or by £320,808. Thus, there was an increase of £778,689 in the average total of private deposits.
The following shows the average amount of notes in circulation, notes and bills discounted, and bullion and specie in the banks in each of the two past years:—
| Average Amount of | 1892. | 1893. | Increase (+) or Decrease.(-) |
|---|---|---|---|
| £ | £ | £ | |
| Notes in circulation | 959,943 | 973,894 | + 13,951 |
| Notes and bills discounted | 2,361,813 | 2,307,650 | -54,163 |
| Specie and bullion | 2,450,712 | 2,627,367 | + 176,655 |
An Act was passed last year intituled “The Banks and Bankers Act Amendment Act, 1893,” under which, notwithstanding anything in previous legislation, the shareholders or proprietors of any bank may, from time to time by extraordinary resolution, authorise its capital to be increased to such an amount and upon such terms as are deemed by them to be expedient. The holders of shares in such increased capital may be granted special privileges notwithstanding anything contained in the charter of the bank.
Any increased capital may be raised by the issue of new shares of such amount as may be determined on by extraordinary resolution of the shareholders or proprietors.
Besides the above, “The Bank-note Issue Act, 1893,” was passed, under which it is permanently enacted (Part I.) that notes issued or circulated in the colony by any bank shall, to the amount of the authorised issue, be a first charge on all the assets and property of such bank, and that the notes shall be payable in gold only at the office of the bank at the place of issue of the said notes.
The assets and property of a bank are defined as assets for the payment of debts or other obligations contracted or entered upon or due and payable in the colony.
The temporary enactments (Part II. of the same Act, which have force for twelve months only from the 2nd September, 1893,* or if Parliament be then not in session until two months after the beginning of the next session) enable the Governor to declare by Proclamation the notes of any bank therein named to be a legal tender of money to the amount therein expressed to be payable. The period of time is to be limited by the Proclamation, and no such Proclamation is to be made unless the Governor in Council is satisfied that, as between the bank and its creditors, its assets exceed its liabilities by at least the sum of the paid-up capital and the reserved profits.† The bank must further pay all such notes in gold on presentation after expiry of the time limited at the office of the bank at the place of issue. At any time within six months after the period limited by the Proclamation, the Colonial Treasurer, on being satisfied that a bank-note covered by the Proclamation has been presented and not paid, shall pay the same in gold to any bona fide holder.
† Qualified by provisions of Amendment Act, 1894. See post.
* Extended to 2nd September, 1895. by Act of 1894. See post.
On the 29th June, 1894, the Colonial Treasurer introduced in the House of Representatives three Bills relating to banking, which were thereupon passed through all stages and became law forthwith.
The most important of these, intituled “An Act to guarantee out of the Consolidated Fund a Special Issue of Shares by the Bank of New Zealand to the Amount of two Million Pounds Sterling,” provides that it shall be lawful for the directors of the bank to increase the capital by the issue of shares ‡ to an amount not exceeding two million pounds sterling in guaranteed shares of ten pounds each without further liability. These shares are preferential in respect of both capital and dividend, and the liability of the holders of ordinary shares is to secure payment of the guaranteed shares and the dividends thereon. The directors can refuse to register the transfer of ordinary shares, and no transfer, though passed by directors, is to be held valid till authorised in writing by the President of the bank. The directors are to call up one-third (£500,000) of the reserve capital within twelve months of the date on which they may be required to do so by the Colonial Treasurer. The guaranteed shares are to be called in at the end of ten years, and cancelled on payment of the principal sum with accrued dividend. The rate of dividend on preferential shares is not to exceed 4 per cent. per annum, and is to be paid by the bank. The guaranteed or preferential shares and dividends thereon are to ho a charge upon and in case of default by the bank, payable out of the Consolidated Fund of the colony; but if at any time any money shall be payable under the guarantee, the assets and property of the bank are to be security for the repayment of money so advanced; if the money be not repaid, the Colonial Treasurer may appoint a receiver.
‡ By further Amendment Act these shares may be issued in the form of negotiable stock certificates or warrants to bearer, of such amounts as the directors may determine. The certificates with warrants or coupons are transferable by delivery. The holders of stock certificates or warrants may exchange these for registered stock, which is made transferable in such amounts as directors may sanction. Shares or stock may be held by any person without limit as to number, provided that the total value does not exceed two millions sterling.
One-half of the sum of two million pounds authorised by the Act to be raised is to be at the disposal of the bank for use in its ordinary business, and the remainder is to be invested as the Colonial Treasurer may approve, or as may be specially provided by law. Until the guaranteed shares are called in and cancelled, no dividend is to he paid to ordinary shareholders without the consent of the Colonial Treasurer, who is empowered to satisfy himself that any proposed dividend will not unduly affect the security of the colony in respect of the guarantee.
The removal of the head office of the bank to Wellington is provided for, as well as the election of a new board of directors, the President of whom is to be appointed by the Governor in Council. The Governor in Council is also empowered to appoint a banking expert as auditor of the business outside the United Kingdom. An auditor of the business in the United Kingdom is to be appointed by the Agent-General of the colony in London.
If an unfavourable report by one or both of the auditors, confirmed by the President, as to the conduct of the business of the bank be received by the Colonial Treasurer, the directors are to amend the management in such manner as the Treasurer may demand in writing.
The shares held in the Bank of New Zealand Estates Company (Limited) by the bank are, pending the completion of liquidation, to be treated in valuing as at par.
By “The Bank-note Issue Act 1893 Amendment Act, 1894,” the provisions of Part II. of the Act of 1893 are to continue in force until the 2nd September, 1895, and if at the end of that period Parliament be not in session, then until the commencement of the then next session and for two months thereafter. The words “and the reserve profits” at the end of the first proviso in section 5 of the Act of 1893 are repealed, so that a Proclamation can issue when the assets exceed the liabilities by the sum of the paid-up capital.
“The Bank Shareholders Act, 1894,” provides that the directors of any bank may decline to register any transfer of shares upon which there is any liability made by a shareholder to any person of whose responsibility they may not be satisfied. “The Bank Directors and Shares Transfer Act, 1894” gives authority to directors to refuse approval, without assigning reasons, to any transfer of shares on which there is liability. It limits the number of directors to not less than five or more than seven.
The number of post-offices open for the transaction of money-order and savings-bank business at the end of 1893 was 339.
There were 29,755 new accounts opened in the year, and 19,599 accounts were closed. The total number of open accounts at the end of 1893 was 122,634, of which 89,260 were for amounts not exceeding £20. 10
The deposits received during the year amounted to £2,386,089 10s. 7d., and the withdrawals to £2,122,521 16s. 8d., the excess of deposits over withdrawals having thus been £263,567 13s. 11d, The total sum standing at credit of all accounts on the 31st December, 1893, was £3,241,998 £7s. 10d., which gave an average of £26 8s. 6d. to the credit of each account.
There are seven savings-banks in the colony not connected with the Post Office. The total amount deposited in them in 1893 was £456,262 13s. 10d., of which the deposits by Maoris comprised £154 15s. 10d. The withdrawals reached the sum of £479,006 15s. 8d., being in excess of the deposits by £22,7.4 1s. 10d. The total amount to the credit of the depositors at the end of the year was £724,851 4s. 1d., of which sum £326 12s. 7d. belonged to Maoris.
The deposits above stated for the banks of issue represent the average for the four quarters of the year. If the total deposits at the end of the year be assumed to be equal to the average for the last quarter, then it may be affirmed that, exclusive of Government deposits, the deposits in the several banks of issue and in the two classes of savings-banks amounted at the end of 1893 to £17,507,566. In addition, there are the deposits with building societies, which in 1892 were £270,263; and it is known that there were also deposits with financial companies, of which no particulars have been supplied to the department. The known deposits amount on an average to £26 17s. 7d. per head of the population, exclusive of Maoris.
There were 48 registered building societies in operation in the colony at the end of 1892. Of these, 8 were terminable societies, the rest were permanent.
The total receipts by these societies during their financial year amounted to £658,686 2s. 6d., of which deposits comprised £291,355 14s. 6d.
The assets at the end of the year were valued at £975,193 4s. 10d. The total liabilities to shareholders, reserve fund, &c., were £701,872 9s. 8d., those to depositors, £270,262 12s. 3d., and those to other creditors, £3,058 2s. 1ld.
The Registrar of Friendly Societies received returns for the year 1892 from 379 lodges, courts, tents, &c., of various friendly societies throughout the colony, also from 30 central bodies. The number of members at the end of 1892 was 28,754.
The total value of the assets of these societies was £501,155, equivalent, to £17 8s. 7d. per member. Of the total assets, the value of the sick and funeral benefit funds was £394,761.
The receipts during the year on account of the sick and funeral funds amounted to £64,953, and the expenditure to £51,718, of which the sick-pay to members reached the sum of £29,400. In addition to the sick-pay, the sum of £27,052 was paid out of the medical and management expenses fund for medical attendance and medicine supplied to the members and their families.
There were existing in the colony at the close of the year 1892 as many as 60,660 life insurance policies, an average of over 93 in every 1,000 persons living. The gross amount represented by these policies was £16,915,141 16s., an average of £278 17s. for each policy, and of £26 0s. 1d. for every European inhabitant of the colony at the end of the year. The distribution of these policies among the various life assurance offices is shown in the following table:—
| NEW ZEALAND BBUSINESS OF | Number of Years of Business in the Colony. | Number of existing Policies at End of Year 1892. | Gross Amount insured by Policies at End of Year 1892. | ||
|---|---|---|---|---|---|
| £ | s. | d. | |||
| The Australian Mutual Provident Society | 31 | 18,494 | 5,541,659 | 0 | 0 |
| The Colonial Mutual Life Assurance Society (Limited) | 9 | 3,294 | 1,004,008 | 1 | 11 |
| The Equitable Life Assurance Society of the United States | 8 | 887 | 433,959 | 0 | 0 |
| The Mutual Assurance Society of Victoria (Limited) | 9 | 1,067 | 233,804 | 17 | 11 |
| The Mutual Life Association of Australasia | 16 | 3,419 | 845,244 | 16 | 2 |
| The National Mutual Life Association of Australasia (Limited) | 13 | 2,991 | 742,572 | 0 | 0 |
| The New York Life Insurance Company | 6 | 192 | 77,674 | 0 | 0 |
| The Life Insurance Department of the New Zealand Government | 23 | 30,316 | 8,036,220 | 0 | 0 |
| Totals | 60,660 | 16,915,141 | 16 | 0 | |
It will be observed that nearly half the policies are held in the Government Life Insurance Department. A special article concerning this institution will be found in the third part of this volume.
Before referring to the results of each of the various systems in operation in 1893 for the disposal of Crown lands it is desirable to state that a description of these systems will be found in the first of the special articles in Part III. of this work.
There were 26,275 acres of Crown land sold for cash or money-scrip during the year, the cash received amounting to £24,987 17s. 9d., and the scrip representing a value of £1,798. The lands absolutely disposed of without sale amounted to 198,323 acres 1 rood 34 perches, of which the reserves set apart for public purposes comprised 35,071 acres 2 roods 10 perches; the grants to Natives or Europeans under the Native Land Acts, 160,995 acres 2 roods 13 perches; and those in satisfaction of land-scrip or otherwise, 2,256 acres 1 rood 11 perches.
The total area of land alienated from the foundation of the colony to the 31st December, 1893, was 20,702,000 acres. This does not include lands sold by Natives to Europeans direct, for which no Crown grants have been issued. The exact quantity so sold cannot be ascertained, but is believed to be very small.
In 1893, 12,359 acres were taken up under the deferred-payment system. The total area of land taken up under this system, from its commencement to the 31st December, 1893, was 1,253,062 acres. Of this quantity, the area forfeited was 250,144 acres, while 567,318 acres had been finally alienated by completion of payments. The area still held under the system at the end of 1893 was, therefore, 435,600 acres. The following statement gives the number of acres taken up under this system in each of the past ten years:—
| Acres. | |
|---|---|
| 1884 | 48,502 |
| 1885 | 58,722 |
| 1886 | 52,711 |
| 1887 | 38,832 |
| 1888 | 82,017 |
| 1889 | 45,016 |
| 1890 | 39,106 |
| 1891 | 36,604 |
| 1892 | 27,785 |
| 1893 | 12,359 |
The operation of the perpetual-lease system with right of purchase, which became part of the land-law of the colony in 1882, had the effect of lessening the demand for land on deferred payment, as under the perpetual-lease system the rental was only 5 per cent. on the upset value of the land, and thus, until the purchase was made, if it was made at all, the settler had all his capital available for beneficial improvements. On the 31st December, 1893, 1,100,537 acres were in occupation under this system, in 4,200 holdings. During the year, 10,337 acres, in 47 holdings, were taken up and 52,808 acres converted into freehold. This tenure is now superseded by the methods introduced by “The Land Act, 1892,” under which from the date of the passing of the Act up to 31st December last, 138,073 acres had been selected for occupation with right of purchase by 505 selectors, and 208,785 acres as leaseholds in perpetuity by 810 lessees.
The lands disposed of for village settlements are included in the sales of land previously stated, but the following details of the number and area of selections to the 31st December, 1893, are given in order to show the extent of these settlements:—
| No. | A. | R. | P. | |
|---|---|---|---|---|
| Village sections for cash | 932 | 618 | 3 | 6 |
| Village sections on deferred payments | 330 | 185 | 0 | 30 |
| Small-farm sections for cash | 695 | 6,132 | 3 | 18 |
| Small-farm sections on deferred payments | 1,167 | 14,834 | 2 | 4 |
The freeholds acquired have been—
| Village sections | 241 | 381 | 0 | 2 |
| Small-farm sections | 761 | 8,990 | 2 | 0 |
The forfeitures were—
| No. | A. | R. | P. | |
| Village sections | 84 | 53 | 3 | 38 |
| Small-farm sections | 155 | 1,904 | 1 | 4 |
During 1893, 14 selectors took up 71 acres in village-homestead special settlements on perpetual lease, under arrangements made prior to the passing of the Act of 1892. Since that Act came into force, village-homestead settlements can he taken up on lease in perpetuity only.
The area of lands held from the Government on depasturing leases (exclusive of small grazing-runs) amounted to 11,896,110 acres, in 1,481 runs, yielding an annual rental of £125,351.
The total area of land occupied as small grazing-runs was, at the end of last year, 893,874 acres, held by 477 persons, and the total rent received in 1893 was £18,892.
The results of the last census show that in April, 1891, there were in New Zealand 43,777 occupied holdings of over 1 acre in extent, covering an area of 19,397,529 acres, of which 12,410,242 acres were freehold of the occupiers, and 6,987,287 acres were rented from—(1) private individuals, (2) Natives, (3) public bodies, and (4) the Crown (for other than pastoral purposes). The following table shows the number of holdings of various sizes, and number of acres held in fee-simple and on lease, excluding the Crown lands rented for pastoral purposes only:—
| Sizes of Holdings. | Number of Holdings. | Acreage | ||
|---|---|---|---|---|
| Freehold. | Leasehold, &c.* | Total. | ||
* Excluding Crown pastoral leases. | ||||
| Acres. Acres. | ||||
| 1 to 10 | 11,116 | 28,124 | 24,343 | 52,467 |
| 10 to 50 | 8,899 | 148,965 | 105,751 | 254,716 |
| 50 to 100 | 5,613 | 277,135 | 158,128 | .435,263 |
| 100 to 200 | 6,851 | 654,729 | 374,022 | 1,028,751 |
| 200 to 320 | 3,916 | 609,857 | 403,462 | 1,013,319 |
| 320 to 640 | 3,802 | 1,057,676 | 660,070 | 1,717,746 |
| 640 to 1,000 | 1,321 | 662,612 | 395,849 | 1,058,461 |
| 1,000 to 5,000 | 1,675 | 2,144,627 | 1,280,558 | 3,425,185 |
| 5,000 to 10,000 | 247 | 1,208,819 | 559,980 | 1,768,799 |
| 10,000 to 20,000 | 189 | 1,911,063 | 788,341 | 2,699,404 |
| 20,000 to 50,000 | 117 | 2,507,848 | 833,083 | 3,340,931 |
| 50,000 to 100,000 | 24 | 801,647 | 723,000 | 1,524,647 |
| Upwards of 100,000 acres | 7 | 397,140 | 680,700 | 1,077,840 |
| Totals, 1891 | 43,777 | 12,410,242 | 6,967,287 | 19,397,529 |
| Totals, 1886 | 36,485 | 11,728,236 | 5,348,838 | 17,077,074 |
| Totals, 1881 | 30,832 | 10,309,170 | 4,897,727 | 15,206,897 |
The extent of land rented from the Crown for pastoral purposes, including the small grazing-runs, amounted, in April, 1891, to 12,469,976 acres.
The number of persons engaged in agricultural and pastoral pursuits in 1891, as ascertained from the results of the census taken in April of that year, was 68,607, of whom 65,950 were males and 2,657 females. Of this number 56,671 males and 2,387 females were directly engaged in agricultural, and 9,279 males and 270 females in pastoral occupations.
The agricultural statistics, which are collected annually in February or March, take into account only such occupied holdings as are wholly or partly under cultivation, and moreover do not include those occupied by aboriginal natives. Information concerning the farming carried on by the Maoris is obtained only when a census of the Native race is taken. In 1891 the Maoris had under wheat a total area of 11,203 acres; under maize, 5,599 acres; potatoes, 16,093 acres; other crops, 16,221 acres; and in sown grasses, 26,718 acres.
A summary of the results of the agricultural statistics collected in February, 1894, is exhibited in the two following tables: the first showing the produce of the principal crops in each provincial district; the second, the number of holdings, and the acreage under various kinds of crops and in sown grasses:—
| Provincial Districts. | Wheat. | Oats. | Barley. | Hay. | Potatoes. |
|---|---|---|---|---|---|
| Bush. | Bush. | Bush. | Tons. | Tons. | |
| Auckland | 81,271 | 170,803 | 19,509 | 14,050 | 20,592 |
| Taranaki | 17,265 | 142,133 | 4,967 | 5,935 | 5,188 |
| Hawke's Bay | 9,922 | 154,784 | 25,343 | 8,512 | 4,086 |
| Wellington | 103,255 | 487,606 | 7,150 | 10,697 | 13,846 |
| Marlborough | 54,241 | 109,830 | 90,075 | 2,517 | 5,889 |
| Nelson | 56,227 | 98,453 | 94,611 | 4,276 | 5,618 |
| Westland | 15 | 367 | 1,085 | ||
| Canterbury | 3,407,842 | 4,172,690 | 273,965 | 24,710 | 42,422 |
| Otago | 1,161,672 | 6,816,769 | 209,018 | 15,134 | 27,814 |
| Total | 4,891,695 | 12,153,068 | 724,653 | 86,198 | 126,540 |
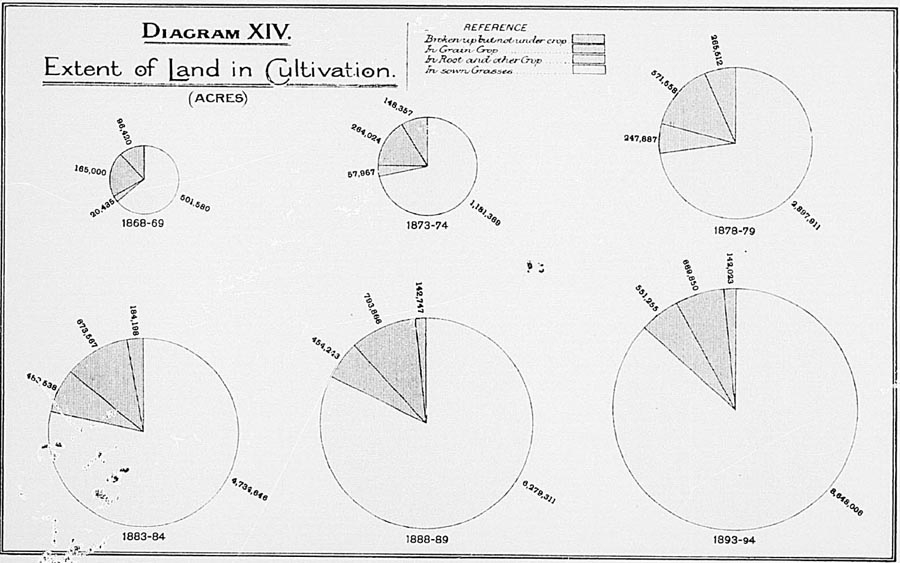
| Provincial Districts. | Number of Holdings. | Number of Acres broken up, but not under Crop. | Number of Acres under Crop. | Total under all Kinds of Crops (including Sown Grasses), and of Land broken up, but not under Crop. | |||||||||||
|---|---|---|---|---|---|---|---|---|---|---|---|---|---|---|---|
| In Grain and Pulse. | In Green and other Crops. | In Sown Grasses. | |||||||||||||
| Wheat. | Oats. | Barley. | Other Crops. | Total-under Grain-crops | Oats sown for Green Food or Hay. | Potatoes. | Other Crops. | Total under Green and other Crops. | Hay. | In Grass including Land in Hay) after having been broken up. | Grass-sown Lands (including Lands in Hay) not previously ploughed. | ||||
| Auckland | 10,878 | 27,836 | 3,072 | 6,124 | 848 | 5,341 | 15,385 | 18,182 | 3,585 | 35,168 | 56,935 | 11,737 | 425,335 | 891,375 | 1,416,866 |
| Taranaki | 3,237 | 1,287 | 553 | 3,757 | 196 | 230 | 4,736 | 1,730 | 868 | 4,197 | 6,795 | 5,379 | 98,309 | 295,166 | 406,293 |
| Hawke's Bay | 2,153 | 14,794 | 384 | 5,290 | 1,264 | 269 | 7,207 | 2,788 | 742 | 26,279 | 29,809 | 5,815 | 336,797 | 1,041,144 | 1,429,751 |
| Wellington | 6,392 | 6,832 | 4,364 | 16,007 | 286 | 551 | 21,208 | 7,778 | 1,994 | 25,111 | 34,888 | 6,860 | 210,626 | 1,650,948 | 1,924,497 |
| Marlborough | 1,174 | 5,655 | 3,862 | 3,434 | 3,865 | 1,545 | 12,706 | 4,698 | 752 | 4,694 | 10,144 | 1,664 | 71,562 | 140,179 | 240,246 |
| Nelson | 2,340 | 3,348 | 3,192 | 4,073 | 4,231 | 269 | 11,765 | 8,221 | 1,041 | 5,149 | 14,411 | 3,457 | 83,127 | 203,330 | 315,981 |
| Westland | 437 | 216 | 1 | 2 | 3 | 382 | 235 | 273 | 890 | 349 | 3,228 | 13,413 | 17,750 | ||
| Canterbury | 8,565 | 38,900 | 174,252 | 141,211 | 11,365 | 9,962 | 336,790 | 32,829 | 6,309 | 131,206 | 170,344 | 17,105 | 1,385,616 | 377,918 | 2,309,568 |
| Otago | 10,114 | 43,474 | 53,058 | 196,750 | 6,801 | 3,441 | 260,050 | 53,496 | 5,595 | 168,660 | 227,751 | 8,374 | 1,250,748 | 220,076 | 2,002,099 |
| Totals | 45,290 | 142,342 | 242,737 | 376,646 | 28,857 | 21,610 | 669,850 | 130,104 | 21,121 | 400,737 | 551,962 | 60,740 | 3,865,348 | 4,833,549 | 10,063,051 |
From these tables it will be seen that the final results of the recent collection give the number of cultivated holdings over 1 acre in extent occupied by Europeans as 45,290. It should, however, be observed that it is a common practice in Otago and Canterbury for persons to take unimproved lands from the proprietors in order to raise one, two, or three grain-crops therefrom, the land being afterwards sown down with grass-seed. Lands so occupied are returned as separate holdings. When the low price of grain renders cropping unprofitable, either land is not taken up in this manner, or land so occupied reverts to the owner and is included with the rest of his holding.
In 1876 the number of occupied and cultivated holdings was estimated to be, on an average, 14.88 to every 100 adult males; in 1881, 17.30; in 1886, 20.17; and in 1891, 22.79. Assuming the ratio of adult males to total male population to he still the same as existed at the census of 1891, the number of holdings in 1894 gives an average of 24.97 to every 100 of the adult male population. It is highly satisfactory to observe this progress, indicating as it does that a continually increasing proportion of the grown people are settling upon the land.
The extent of land in cultivation (including sown grasses and land broken up but not under crop) amounted to 10,063,051 acres. Of this area, land under artificial grasses comprised 86.44 per cent.; land under grain-crops, 6.66 per cent.; land under green and other crops, 5.49 per cent.; and land in fallow, 1.41 per cent.
More than half the land under grain-crops was in the Canterbury Provincial District, and more than one-third in Otago; but while the area of land in wheat was greater in Canterbury than in Otago by 121,194 acres, that under oats was less by 55,539 acres.
Of the total extent (28,857 acres) of land in barley, 11,365 acres were in Canterbury, 6,801 in Otago, 4,231 in Nelson, 3,865 in Marlborough, and 1,264 in Hawke's Bay.
The total area under wheat at the beginning of 1894 was 242,737 acres, and the produce was estimated at 4,891,695 bushels, an average yield per acre of 20.15 bushels. In 1893 the gross produce of wheat was returned as 8,378,217 bushels, giving an average of 21.98 bushels per acre. It has been maintained that the estimate for 1894 is far too high, and that the better plan would be to wait till after harvest before taking an account of the produce. The law, however, requires the account to be taken in February, and any delay therein causes loud complaints that the returns are too late to be of use. The estimates are checked wherever possible by comparison with the quantities actually threshed out. Deductions were also made this year to cover loss by bad weather, pests, &c.; but, nevertheless, the estimate is declared to be in excess of the actual yield.
The area under wheat in New Zealand, the estimated gross produce in bushels, and the average yield per acre for each of the last ten years is shown. It will be noticed that the breadth of land laid down in wheat was nearly twice as great in 1892 as in 1894.
| Year. | Land under Wheat. | Estimated Gross Produce. | Average Yield per Acre. |
|---|---|---|---|
| Acres. | Bushels. | Bushels. | |
| 1885 | 270,043 | 6,866,777 | 25.43 |
| 1886 | 173,891 | 4,242,285 | 24.40 |
| 1887 | 253,025 | 6,297,638 | 24.89 |
| 1888 | 357,359 | 9,424,059 | 26.37 |
| 1889 | 362,153 | 8,770,246 | 24.22 |
| 1890 | 335,861 | 8,448,506 | 25.15 |
| 1891 | 301,460 | 5,723,610 | 18.99 |
| 1892 | 402,273 | 10,257,738 | 25.50 |
| 1893 | 381,245 | 8,378,217 | 21.98 |
| 1894 | 242,737 | 4,891,695 | 20.15 |
The following gives the area in wheat and the estimated produce for the Australian Colonies for the season of 1893:—
| Colony. | Wheat-crop, 1893. | ||
|---|---|---|---|
| Acres. | Bushels. | Bushels per Acre. | |
| Queensland | 28,993 | 413,094 | 14.25 |
| New South Wales | 452,921 | 6,817,457 | 1505 |
| Victoria | 1,342,504 | 14,814,645 | 11.04 |
| South Australia | 1,520,580 | 9,240,108 | 6.08 |
| Western Australia | 35,060 | 429,497 | 12.25 |
| Tasmania | 58,897 | 1,018,550 | 17.29 |
| New Zealand (1894) | 242,737 | 4,891,695 | 20.15 |
The amount of wheat consumed or used up by the people in any year is estimated by deducting from the gross yield both the amount exported in that year and the quantity of seed required for the next crop. It is impossible, however, to give by this means an exact statement of the quantity required for actual consumption for two reasons: (1) The crop itself is an estimate, and the actual harvested yield may be either more or less; (2) the amount retained in any one year may be very much in excess of local requirements, and may form part of the following year's exports, thus largely increasing the apparent amount retained one year for consumption, and reducing the apparent amount so retained the following year. It is thus clear that the results for any one year cannot by themselves be taken for the purpose of ascertaining the requirements of the people, and that even the average for a term of years will probably vary somewhat, as any year's results are added to or subtracted from the computation.
The total average consumption of wheat in New Zealand for the period 1877 to 1893, inclusive, estimated according to the foregoing method, was, apparently, 8.45 bushels per head of population, including Maoris. From this has to be deducted the wheat required for seed-purposes, estimated at 2 bushels to the acre. The remainder, being the amount required for food and other items of local consumption, averaged 7.40 bushels per head. The particulars for each year and the results for the whole period are here given:—
| TABLE SHOWING THE AMOUNT OF WHEAT ANNUALLY RETAINED IN THE COLONY. | ||||||||
|---|---|---|---|---|---|---|---|---|
| Year. | Produce (including Estimated Quantity of Maori-grown Wheat and Imports of Wheat and Flour).* | Exports of Wheat Mini Flour.* | Retained in the Colony. | Used as Seed at 2 Bushels per Acre. | Difference for Food-consumption. | Mean Population (including Maoris). | Proportion per Head retained. | |
| For Food, &c. | Total retained | |||||||
* In equivalent bushels of wheat. | ||||||||
| Bushels. | Bushels. | Bushels. | Bushels | Bushels. | Persons. | Bush. | Bush. | |
| 1877 | 4,374,620 | 906,543 | 3,468,077 | 486,812 | 2,981,265 | 451,943 | 6.60 | 7.66 |
| 1878 | 6,537,770 | 1,897,354 | 4,640,416 | 529,722 | 4,110,694 | 467,000 | 8.80 | 9.94 |
| 1879 | 6,272,914 | 2,580,798 | 3,692,116 | 540,396 | 3,151,720 | 491,386 | 6.41 | 7.51 |
| 1880 | 7,801,892 | 3,147,586 | 4,654,306 | 649,898 | 4,004,408 | 518,275 | 7.73 | 8.98 |
| 1881 | 8,264,167 | 3,918,107 | 4,346,060 | 731,430 | 3,614,630 | 537,579 | 6.72 | 8.08 |
| 1882 | 8,360,295 | 3,721,812 | 4,638,483 | 781,636 | 3,856,847 | 552,991 | 6.91 | 8.39 |
| 1883 | 10,329,907 | 5,195,703 | 5,134,204 | 755,412 | 4,378,792 | 572,539 | 7.65 | 8.97 |
| 1884 | 9,934,101 | 2,885,390 | 7,048,711 | 540,086 | 6,508,625 | 595,411 | 1093 | 11.84 |
| 1885 | 6,950,854 | 1,596,820 | 5,354,034 | 347,782 | 5,006,252 | 615,757 | 8.13 | 8.66 |
| 1886 | 4,290,826 | 1,675,201 | 2,615,625 | 506,050 | 2,109,575 | 624,086 | 3.38 | 4.19 |
| 1887 | 6,368,140 | 707,182 | 5,660,958 | 614,718 | 5,046,240 | 638,343 | 7.90 | 8.87 |
| 1888 | 9,472,895 | 2,547,033 | 6,925,862 | 724,306 | 6,201,556 | 647,340 | 958 | 10.70 |
| 1889 | 8,784,801 | 3,397,752 | 5,387,049 | 671,722 | 4,715,327 | 655,799 | 7.19 | 8.21 |
| 1890 | 8,468,853 | 4,899,069 | 3,569,784 | 602,920 | 2,966,864 | 664,460 | 4.47 | 5.37 |
| 1891 | 5,950,244 | 1,610,973 | 4,339,271 | 804,546 | 3,534,725 | 671,776 | 5.26 | 6.46 |
| 1892 | 10,538,337 | 2,659,382 | 7,878,955 | 762,490 | 7,116,465 | 684,238 | 10.40 | 11.51 |
| 1893 | 8,626,914 | 2,709,311 | 5,917,603 | 485,474 | 5,432,129 | 703,342 | 7.72 | 8.41 |
| Totals and Averages | 131,327,530 | 46,056,016 | 85,271,514 | 10,535,406 | 74,736,114 | 10,092,765 | 7.40 | 8.45 |
The difficulty of correctly computing the consumption of bread-stuffs is shown by the great differences in the estimates arrived at.
The average quantity required per head of the population (exclusive of that used for seed) is estimated by Mr. Coghlan at 6.4 bushels for New South Wales, and by Mr. Hayter at 4 1/2 to 5 bushels for Victoria.
The amount of wheat required annually for use in the United Kingdom averages 5.65 bushels per head of the population.
The consumption of wheaten breadstuffs in New Zealand is thus considerably in excess of that in Victoria, and is also in excess of the amount consumed per head in New South Wales and the other Australian Colonies. The flour used in the colony is produced by local mills, the quantity produced elsewhere imported in 1893 having, been only 109 centals—about 4 tons, while the quantity exported reached 2,009 tons.
The following is the average annual consumption of wheat per inhabitant for some of the principal countries of the world:—
| United Kingdom | 5.6 bushels. |
| Canada | 6.6 bushels. |
| Franco | 8.1 bushels. |
| Germany | 3.0 bushels. |
| Russia | 2.1 bushels. |
| Italy | 5.4 bushels. |
| United States | 5.4 bushels. |
Taking 7.40 bushels per head as the amount of wheat actually required for home consumption in the colony by a population of 724,000 persons (the estimated mean for 1894), and allowing seed for 245,000 acres at 2 bushels an acre, it will he seen that this year's harvest so far from leaving any surplus available for export actually falls short of local requirements by 731,839 bushels. There was, however, in February a total of 557,307 bushels remaining on hand with farmers from last year's crop, and if this be taken into account the deficiency will be reduced to 174,532 bushels. The stocks held by grain merchants, of which no returns are collected, have also to be reckoned in. Besides, the estimate of 7.40 bushels a head is probably too high, owing to the collection of agricultural statistics being made so early as February, when the expected produce is returned in excess of the actual yield subsequently threshed out.
The number of acres under oats (for grain) at the commencement of 1894 was 376,646, and the produce was estimated at 12,153,068 bushels, giving an average yield per acre of 32.27 bushels. Of the land in oats in 1894, rather more than 52 per cent., producing over 56 per cent. of the total crop, was in Otago. Canterbury took second place for oat-production, with 37.49 per cent. of the area and 34.33 per cent. of the produce.
The oat-crop in 1893 for the Australasian Colonies was as follows:—
| Acres. | Bushels. | Average per Acre. | |
|---|---|---|---|
| Queensland | 606 | 12,095 | 19.96 |
| New South Wales | 20,890 | 466,603 | 22.29 |
| Victoria | 177,645 | 4,574,816 | 25.76 |
| South Australia | 15,745 | 166,489 | 10.57 |
| Western Australia | 1,694 | 29,645 | 17.50 |
| Tasmania | 22,976 | 631,746 | 27.50 |
| New Zealand (1894) | 376,646 | 12,153,068 | 32.27 |
There were 28,857 acres returned as under barley in 1894, the estimated crop being 724,653 bushels, an average yield per acre of 25.11 bushels. Last year the area under barley was 24,906 acres, and the crop 654,231 bushels.
The estimated potato-crop was 126,540 tons from 21,121 acres, or an average yield per acre of 5.99 tons.
A comparison of the gross, yield of potatoes with the amount exported in each of the past eleven years shows that for the period 1883–93 an average of 598lb. a head was retained in the colony. Allowing for waste, pig-feed, and quantity used for seeding, the average amount retained for human consumption is found to be 449lb. a head. Particulars are given in a table annexed.
| Year. | Produce (including estimated Quantity of Maori-grown Potatoes and Imports). | Quantity Exported. | Retained in the Colony. | Used for Seed at 12cwt. per Acre. | Pig-feed, &c., and Waste (estimated). | Difference for Food (Human Consumption). | Mean Population (including Maoris). | Proportion per Head retained. | |
|---|---|---|---|---|---|---|---|---|---|
| For Food. | Total. | ||||||||
| Tons. | Tons. | Tons. | Tons. | Tons. | Tons. | Lb.. | Lb.. | ||
| 1883 | 157,555 | 10,151 | 147,404 | 20,551 | 15,718 | 111,135 | 572,539 | 435 | 577 |
| 1884 | 165,921 | 19,226 | 146,695 | 20,699 | 16,580 | 109,416 | 595,411 | 412 | 550 |
| 1885 | 176,228 | 14,036 | 162,192 | 22,784 | 17,610 | 121,798 | 615,757 | 443 | 590 |
| 1886 | 167,667 | 7,923 | 159,744 | 24,500 | 16,635 | 118,609 | 624,086 | 426 | 573 |
| 1887 | 187,687 | 15,688 | 171,999 | 23,093 | 18,757 | 130,149 | 638,343 | 457 | 604 |
| 1888 | 190,681 | 16,598 | 174,083 | 23,689 | 19,066 | 131,328 | 647,340 | 454 | 602 |
| 1889 | 186,295 | 21,609 | 164,686 | 26,236 | 18,628 | 119,822 | 655,799 | 409 | 563 |
| 1890 | 223,734 | 28,877 | 194,857 | 29,270 | 22,373 | 143,214 | 664,460 | 483 | 657 |
| 1891 | 242,123 | 35,610 | 206,513 | 26,015 | 24,212 | 156,286 | 671,776 | 521 | 689 |
| 1892 | 226,059 | 28,961 | 197,098 | 20,659 | 22,605 | 153,834 | 684,238 | 504 | 644 |
| 1893 | 168,185 | 5,804 | 162,381 | 22,321 | 16,818 | 123,242 | 703,342 | 393 | 517 |
| Totals | 2,092,135 | 204,483 | 1,887,652 | 259,817 | 209,002 | 1,418,833 | 7,073,091 | 449 | 598 |
Turnips and rape form a most important crop in a sheep-breeding country such as New Zealand, and in 1892 the area of land under this crop amounted to no less than 422,359 acres. The returns for 1893 gave only 379,447 acres, a decrease of over 10 per cent., while the returns for the present year show 385,437 acres as under this crop.
778 acres were under hops in 1894, giving a total produce of 7,665cwt., as against 706 acres and 7,059cwt. last year. Small as this area is it is more than sufficient to supply local requirements, as the import of hops in 1893 amounted only to 494cwt., while the export reached l,667cwt. In 1890 the total quantity used by the breweries in the colony amounted to 3,940cwt. Of the land under hops in 1894, 642 acres were in the Waimea County and 105 in Collingwood, both in the Provincial District of Nelson.
The growing of tobacco does not progress in New Zealand. In 1889, 34 acres were being cultivated; in 1890, 25 acres; in 1891, 16 acres; in 1892, 6 acres; in 1893, 4 acres; and in 1894, 4 acres, producing 2,290lb. of dried leaf.
There were 21,088 acres in orchards in 1894, an increase of 1,003 acres on the area so returned in the previous year. The fruit-crop of the colony is supplemented by a considerable import from the Australian Colonies and Fiji.
New Zealand is essentially suited for grazing purposes. Wherever there is light and moisture English grasses thrive when the natural bush and fern are cleared oil*. In fact, the white-clover gradually overcomes the fern; and, from the mildness of the winter season, there are few places where there is not some growth, even in the coldest months of the year. In all parts of the colony stock live, although in varying condition, without other food than such as they can pick up. Sown-grass lands, as might be expected, heads the list of cultivations.
In February, 1894, there were 8,698,897 acres under artificial grasses. Of these, 3,865,348 acres had been previously ploughed, presumably under grain or other crops, and 4,833,549 acres had not been ploughed. A great part of the latter consisted of bush- or forest-land sown down in grass after the timber had been wholly or partially burnt off.
The following shows the acreage in sown grasses in the Australasian Colonies in 1893:—
| Acres. | |
|---|---|
| Queensland | 18,346 |
| New South Wales | 361,280 |
| Victoria | 249,719 |
| South Australia | 20,210 |
| Western Australia (1891) | 23,344 |
| Tasmania | 217,905 |
| New Zealand (1894) | 8,698,897 |
It will be observed that the acreage of land under sown grasses was nearly ten times as great in New Zealand as in the whole of Australia and Tasmania. When compared in size with the colonies of Australia, New Zealand is relatively small—about one-thirtieth of their total area—but in respect of grazing-capabilities the relative importance of New Zealand is much greater. Australia is generally unsuitable, owing to conditions of climate, for the growth of English grasses, and the amount of feed produced by the natural grasses throughout the year is very much less per acre than that obtained from the sown-grass lands in New Zealand—so much so that it may be stated that the average productiveness of the grass land in New Zealand is probably about nine times as great as that in Australia; and that the land of this colony covered with artificial grass may be considered equal, for grazing purposes, to an area of Australian land about nine times as great.
The total quantity of grass-seed produced was, in 1894, returned at 753,493 bushels, of which 226,981 bushels were cocksfoot, 513,857 bushels ryegrass, and 12,655 bushels other kinds. The value of all the grass-seed is calculated to be about £135,722.
The total value of all agricultural produce, &c., for the current year is reckoned at about £3,781,898, made up as follows:—
| £ | |
|---|---|
| Grain and pulse | 1,575,899 |
| Root-crops | 927,274 |
| Hops and other crops | 50,878 |
| Hay and green forage (excluding grass) | 550,533 |
| Grass-seed | 135,722 |
| Garden- and orchard-produce | 541,592 |
| Total value of agricultural produce | £3,781,898 |
Returns of sheep are sent in April of each year to the Agricultural Department, but full returns of other stock are obtained only when a census is taken. The number of each kind of live-stock, according to the returns from the European portion of the population, in the colony in each of the census years 1886 and 1891 is given below:—
| Live-stock. | Census, 1891. | Census, 1886. |
|---|---|---|
| Horses | 211,040 | 187,382 |
| Brood-mares (included in foregoing) | 31,276 | 29,853 |
| Asses and mules | 348 | 297 |
| Cattle (including calves) | 788,919 | 853,358 |
| Breeding-cows (included in foregoing) | 280,711 | 279,136 |
| Milch-cows (also included in breeding-cows) | 206,906 | Not specified. |
| Sheep (including lambs) | 17,865,423 | 16,564,595 |
| Breeding-ewes (included in foregoing) | 7,371,429 | 6,457,355 |
| Goats | 9,055 | 10,220 |
| Pigs | 222,553 | 277,901 |
| Poultry | 1,790,070 | 1,679,021 |
| Ostriches | 179 |
The above statement does not include the live-stock owned by Maoris. A census was taken in 1891 of the Native race, their stock and cultivations, about the time of the general census, but not of so elaborate a character. In this way the following numbers of stock owned by Maoris were ascertained: Sheep, 262,763; cattle, 42,912; pigs, 86,259; no statement of the horses, of which they have many, being given. The full numbers of sheep, cattle, and pigs in the colony were therefore,—
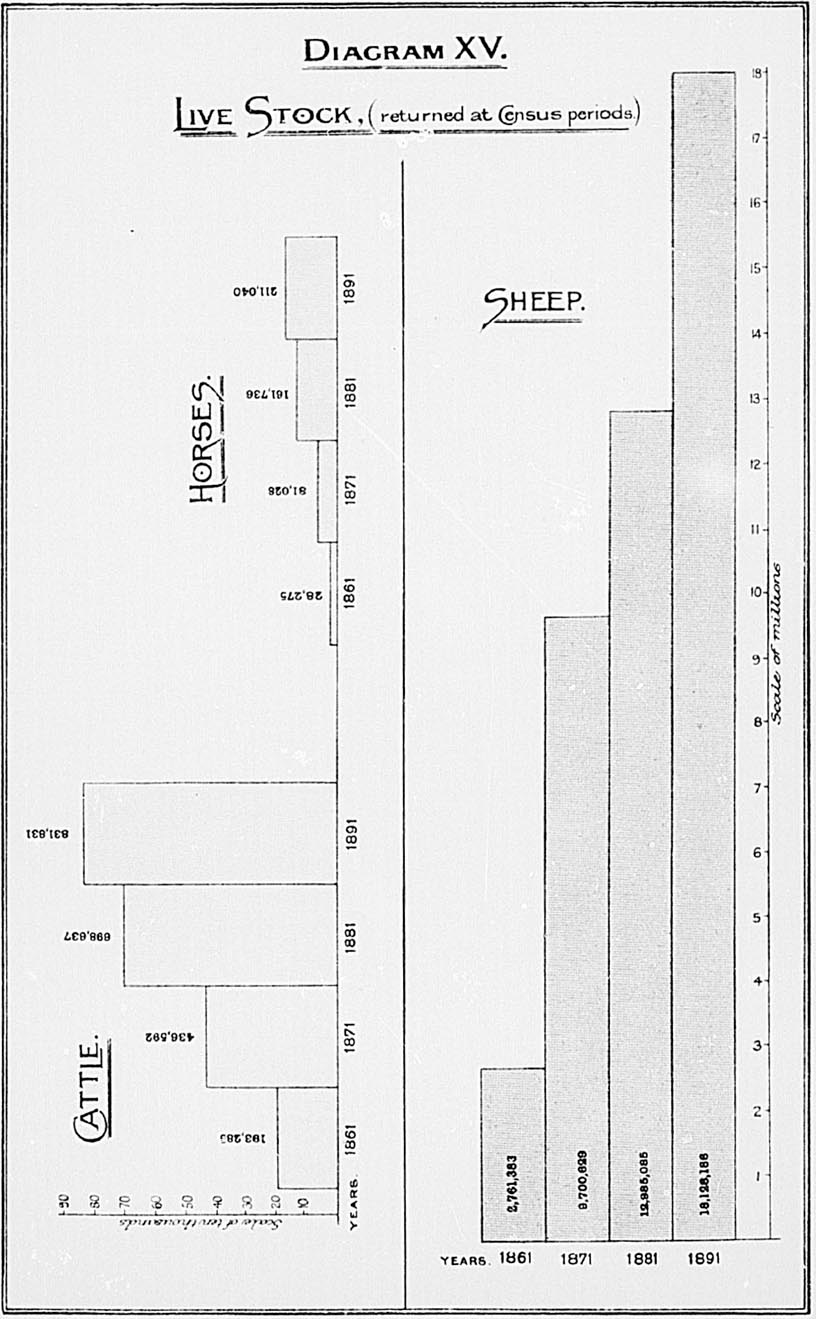
| Sheep | 18,128,186 |
| Cattle | 831,831 |
| Figs | 308,812 |
The number of sheep in the colony on 30th April, 1893, according to returns made to the Department of Agriculture was 19,380,369, and it is expected that the tables now being compiled will, when complete, show that the number in April of the present year exceeded twenty millions.
It has been estimated that the annual consumption of mutton in New Zealand is equivalent to 2.25 sheep per inhabitant, and that the number of sheep required in the present year for food will be about 1,629,000. (Maoris, for the purposes of this calculation, have been included in the population.)
The following gives the number of the principal kinds of livestock in the several Australasian Colonies for the year 1891:—
| Sheep. | Cattle. | Horses. | |
|---|---|---|---|
* Including those owned by Maoris. † Excluding those owned by Maoris. ‡Includes only British India and Ceylon; French East Indies; Java, Hongkong, Japan, Russia in Asia (Caucasia and Trans-Caucasia), and Cyprus. | |||
| Queensland | 20,289,633 | 6,192,759 | 399,364 |
| New South Wales | 61,831,416 | 2,046,347 | 459,755 |
| Victoria | 12,919,428 | 1,813,159 | 440,496 |
| South Australia | 7,646,239 | 399,077 | 188,587 |
| Western Australia | 1,962,212 | 133,690 | 40,812 |
| Tasmania | 1,619,256 | 162,440 | 31,165 |
| New Zealand | *18,128,186 | *831,831 | †211,040 |
New Zealand thus takes third place in order for number of sheep, and fourth for the number of her cattle.
The following statement, based on returns published by the Statistician of the Department of Agriculture of the United States, shows the approximate numbers of cattle, horses, sheep, and pigs in the civilised world:—
| Cattle. | Horses. | Sheep. | Pigs. | |
|---|---|---|---|---|
| North America | 57,887,438 | 17,717,139 | 51,292,797 | 48,059,045 |
| South America | 57,610,183 | 5,486,036 | 96,242,137 | 2,723,516 |
| Europe | 104,430,093 | 36,483,400 | 187,144,203 | 49,164,341 |
| Asia‡ | 60,846,904 | 4,279,241 | 39,922,366 | 488,937 |
| Africa | 6,094,883 | 1,238,574 | 35,589,208 | 546,909 |
| Australasia and Fiji | 11,872,360 | 1,786,644 | 124,645,606 | 1,156,325 |
| Oceania | 131,796 | 4,066 | 12,607 | 33,151 |
| Totals | 298,873,657 | 66,995,100 | 534,848,924 | 102,172,224 |
The numbers owned in the United Kingdom, her colonies and possessions, are:—
| Cattle. | Horses. | Sheep. | Pigs. | |
|---|---|---|---|---|
| United Kingdom | 11,519,417 | 2,067,549 | 33,642,808 | 3,265,898 |
| British India and Ceylon | 53,766,050 | 1,055,385 | 30,074,606 | 486,700 |
| Australasia and Fiji | 11,872,360 | 1,786,644 | 124,645,606 | 1,156,325 |
| Canada | 4,117,799 | 1,231,831 | 3,513,419 | 1,732,313 |
| Cape of Good Hope, Natal, and Basutoland | 3,226,115 | 587,418 | 17,665,352 | 333,866 |
| Other British Possessions | 188,332 | 138,703 | 959,696 | 30,285 |
| Totals | 84,690,073 | 6,867,530 | 210,501,487 | 7,005,337 |
Butter has always held an important position among the productions of the New Zealand small-farmer. Made by different persons and in different ways, it has not been generally suitable for the requirements of the English market, although considerable quantities have been exported to Australia and also to the United Kingdom; but the success attending the efforts made to produce butter of uniform superior character in dairy factories, and the fairly remunerative prices realised for such butter in England, have caused great attention to be given to co-operative dairying for the purpose of supplying produce for the English market.
It is only in census years that any information is obtained of the quantity of butter and cheese annually produced in the colony, and the returns given by farmers must be considered as estimates only, as the majority of them do not keep accounts of their productions.
The following are the results of the returns made in the census years mentioned. The numbers represent the quantities produced in the preceding years:—
| Census Year. | Cheese. Lb. | Butter. Lb. |
|---|---|---|
| 1881 | 3,178,694 | 8,453,815 |
| 1886 | 4,594,795 | 12,170,964 |
| 1891 | 6,975,698 | 16,310,012 |
The figures for 1891 include l,969,759lb. of butter and 4,390,400lb. of cheese made in factories.
The importance of the dairy industry to New Zealand caused the Government to appoint a Dairy Instructor, to visit factories and give lectures and addresses on the benefits of co-operative dairying, the making of cheese and butter, and subjects relating thereto. Particulars of this industry will be found in a separate article further on.
The growing importance of our export trade of butter and cheese with the United Kingdom, which must be regarded as the market chiefly to be considered, is shown in the table on page 120.
The natural mineral resources of New Zealand are very great, and have exercised in the past a most important influence on the development and progress of the colony. Gold to the value of £49,300,999 was obtained prior to the 31st December, 1893. The gold produce in 1893 was of the value of £913,138. In the earlier years the gold was obtained from alluvial diggings, but at the present time it is mostly taken from gold-bearing quartz, which is distributed widely through several parts of the colony, and thus there is a much better prospect of the permanency of this industry than was afforded by the alluvial diggings. The amount of silver extracted to the end of 1893 amounted to only £153,887 in value, but recent discoveries of ore give promise of large production in the future. Of other minerals, the product to the same date amounts to £11,617,524, of which kauri-gum yielded £6,860,196, and coal, with coke, £4,525,933. The following gives the quantities and values of precious metals and minerals obtained during the year 1893, and the total value of mining produce since 1853:—
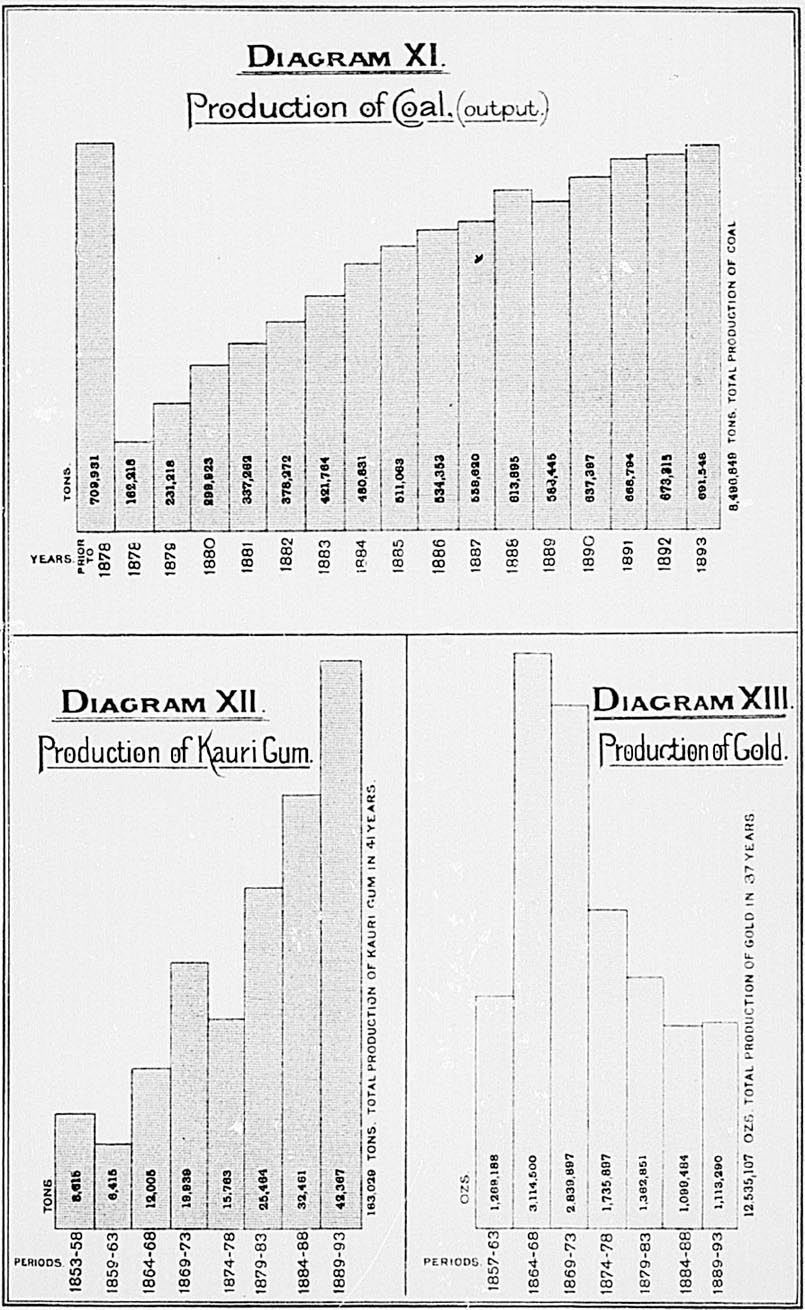
| 1893 | Total Value since 1853. | ||
|---|---|---|---|
| Oz. | £ | £ | |
| Gold | 226,811 | 913,138 | |
| Silver | 63,076 | 9,743 | |
| 289,887 | 922,881 | 49,454,886 | |
| Tons. | |||
| Copper-ore | 17,866 | ||
| Chrome-ore | 37,367 | ||
| Antimony-ore | 331 | 3,467 | 49,507 |
| Manganese-ore | 319 | 943 | 56,107 |
| Hæmatite-ore | 226 | ||
| Mixed minerals | 37 | 650 | 70,322 |
| Coal | 691,548 | 383,905 | 4,502,290 |
| Coke (exported) | 51 | 53 | 23,643 |
| Kauri-gum | 8,317 | 510,775 | 6,860,196 |
| £1,822,674 | £61,072,410 | ||
The approximate total output of the coal-mines up to the 31st December, 1893, was 8,496,849 tons.
[For full account of mines and minerals see special article, post.]
Statistics of manufactories or works are taken every five years only at the time of the census. The number of industries returned in 1891–2,570—shows an increase on the number—2,268 —in 1886, but the rate of increase—13.32 per cent.—was not so large as might have been expected. Between 1881 and 1886 the industries returned increased from 1,643 to 2,268, or at the rate of 38 per cent. Gold-quartz-mining and hydraulic mining-works are included in the above, increasing the number of industries by 209; 95 collieries are also included, with 2 antimony mines and 1 manganese, besides 9 building-stone quarries.
To include mining works among manufactories may appear strange at first, but the Census Act requires returns to be furnished 11 for such works, and they have machinery and plant which must be included in any account of the machinery in use within the colony.
The remarks of the Registrar-General in the report on the census of 1886 as to what are included in the returns are reprinted, as again applicable: “There is difficulty in defining what works should be included and what omitted. For example, some of the furniture factories consist of large workshops in rear of shops, in which several hands are employed in making furniture; hut there are numerous cabinetmakers who also employ one or two hands in making furniture, but whose works can hardly be classed as manufactories. There are many industries in a similar condition, so that no hard-and-fast rule can he laid down; otherwise many industries that are in the aggregate of considerable magnitude, and of growing importance, would have to be omitted, or the table filled up with the enumeration of what are in reality retail businesses combined with the doing of a limited amount of work on the premises, either by way of repairs or as new work. Consequently, much discretion has to be exercised in the selection for the returns, possibly causing some little roughness in the result. Much additional work to that given is no doubt being performed by these minor industries. Some small industries have been given on account of their possessing a special character, or of being the germ of what may grow to some importance.”
The hands and horse-power employed were—
| Hands employed. | Horse-power employed. | ||
|---|---|---|---|
| Males. | Females. | ||
| Census, 1881 | 16,599 | 1,399 | 13,601 |
| Census, 1886 | 23,161 | 2,494 | 19,315 |
| Census, 1891 | 26,911 | 2,969 | 33,392 |
Here the male hands employed are shown to have increased by 10,312 or 62.12 per cent. in ten years, and by 3,750 or 16.19 per cent. in the period 1886–91. The increase in the case of females is much greater for the ten-year period than in case of the males, being 112.22 per cent. for 1881–91, and for the quinquennium 1886–91, 1905 per cent.
The increase in horse-power is 145.51 per cent. for 1881–91, and 72.88 per cent. for 1886–91.
At the census of 1891 an attempt was made for the first time to obtain information as to the wages paid in those factories or large works supplying wholesale orders, and making use of machinery and plant, which are dealt with in the industrial returns. The amount for the year 1890 was £2,106,860 paid to males, and £102,999 to females, of all ages. The total value of materials operated upon was £3,471,767, so far as returned. The deficiency is not considered to be such as very materially to affect the figures given. The annual value of the manufactures and produce was obtained in 1886 as well as in 1891, and a comparison is consequently possible:—
| Annual Value of Manufactures and Produce. | |
|---|---|
| £ | |
| Census, 1891 | 9,422,146 |
| Census, 1886 | 7,436,649 |
| Increase | 1,985,497 |
or 26.70 per cent.
It will be observed that while the industries increased between 1886 and 1891 in number by only 13.82 per cent., as previously stated, the proportionate increase on the actual result of the work, as shown by the value of the manufactures or produce, was at the higher rate of 26.70 per cent. The hands increased at the rate of 16.19 per cent. for males, and 19.05 per cent. for females.
The approximate value of the land, buildings, machinery, and plant used in the manufactories or works can be compared for four census-periods:—
| Value of Laud and Buildings used for Manufactories or Works. | Centesimal Increase or Decrease. | Value of Machinery and Plant used for Manufactories or Works. | Centesimal Increase. | |
|---|---|---|---|---|
| £ | £ | |||
| Census, 1878 | 1,761,694 | 13.15 | 1,289,378 | 25.03 |
| Census, 1881 | 1,993,330 | 46.98 | 1,612,141 | 71.65 |
| Census, 1886 | 2,929,828 | 2,767,289 | ||
| Census, 1891 | 2,775,277 | - 5.57 | 3,051,699 | 10.28 |
The value of the lands used for mining is not included in the above figures, and the value of Crown lands has been omitted throughout.
The order of the provincial districts, arranged according to the number of industries belonging to each, is as under: —
| Number of Industries including Gold-quartz-mining Works, Collieries, &c. | Number of Industries excluding Gold-quartz-mining Works, Collieries, &c. | |
|---|---|---|
| Otago | 705 | 541 |
| Auckland | 650 | 577 |
| Canterbury | 386 | 380 |
| Wellington | 333 | 333 |
| Nelson | 204 | 142 |
| Hawke's Bay | 85 | 85 |
| Marlborough | 78 | 77 |
| Taranaki | 68 | 68 |
| Westland | 61 | 51 |
The values of the manufactures for the provincial districts were respectively as follows:—
| Value of Manufactures including Output of Gold-quartz-mining Works, Collieries, &c. | Value of Manufactures excluding Output of Gold-quartz-mining Works, Collieries, &c. | |
|---|---|---|
| £ | £ | |
| Auckland | 2,396,060 | 2,184,401 |
| Otago | 2,237,246 | 2,078,365 |
| Canterbury | 2,061,921 | 2,056,412 |
| Wellington | 1,412,465 | 1,412,465 |
| Hawke's Bay | 525,394 | 525,394 |
| Nelson | 394,481 | 146,020 |
| Marlborough | 168,814 | 161,714 |
| Taranaki | 155,772 | 155 772 |
| Westland | 69,993 | 53 294 |
The following shows the most important industries arranged according to value of manufactures or produce, and specifying all amounts over £100,000:—
| Total Value of all Manufactures or Produce, including Repairs. | |
|---|---|
* Returns unsatisfactory. | |
| £ | |
| Meat-freezing, -preserving, and boiling-down works | 1,464,659 |
| Tanning, fellmongering, and wool-scouring establishments | 1,026,349 |
| Grain-mills | 991,812 |
| Sawmills | 832,959 |
| Boot-and-shoe factories | 403,736 |
| Iron- and brass-foundries, boiler-making, machinists and millwrights | 403,635 |
| Printing establishments | 354,559 |
| Breweries | 300,508 |
| Collieries | 279,777 |
| Woollen-mills | 279,175 |
| Gold-mining, quartz-mining and -crushing works | 278,893 |
| Flax-mills | 234,266 |
| Gasworks | 178,947 |
| Clothing-factories | 166,579* |
| Soap-and-candle works | 155,714 |
| Cheese-and butter-factories | 150,957 |
| Agricultural-implement factories | 144,472 |
| Coach-building and -painting works | 139,660 |
| Furniture-factories | 131,314 |
| Biscuit-factories | 127,147 |
| Other industries, in which the value of manufactures was under £100,000 | 1,877,028 |
| £9,422,146 | |
The order of the principal industries arranged according to the number of hands employed was:—
| No of Hands. | |
|---|---|
| Sawmills | 3,266 |
| Flax-mills | 3,204 |
| Printing establishments | 2,569 |
| Gold-mining, quartz-mining and -crushing works | 1,971 |
| Boot-and-shoe factories | 1,943 |
| Iron- and brass-foundries, boiler-making, machinists, and millwrights | 1,787 |
| Collieries | 1,655 |
| Meat-freezing, -preserving, and boiling-down works | 1,568 |
| Clothing-factories | 1,290 |
| Tanning, fellmongering, and wool-scouring establishments | 1,196 |
| Woollen-mills | 1,175 |
| Other industries | 8,256 |
| 29,880 |
The principal industries returned at the census of 1891, and particulars relating thereto, are given in detail in the following, table:—
| Nature of Industry. | Total Number of Industries. | Number of Hands employed. | Wages paid. | Amount of Horse-power employed. | Value of all Manufactured or Produce (including Repairs) for the Year 1890. | Approximate Value of Land, Buildings, Machinery, and Plant. | ||||
|---|---|---|---|---|---|---|---|---|---|---|
| Males. | Females. | Total. | To Males. | To Females. | Total. | |||||
| £ | £ | £ | £ | £ | ||||||
| Printing, &c., establishments | 142 | 2,373 | 196 | 2,569 | 207,067 | 7,118 | 214,185 | 328 | 354,559 | 341,683 |
| Machines, tools, and implements | 36 | 526 | 2 | 528 | 45,246 | 41 | 45,287 | 148 | 144,472 | 73,478 |
| Coach-building and -painting | 108 | 675 | 3 | 678 | 52,526 | 75 | 52,601 | 94 | 139,660 | 96,225 |
| Tanning, fellmongering, and wool-scouring | 104 | 1,190 | 6 | 1,196 | 92,166 | 276 | 92,442 | 474 | 1,026,349 | 153,592 |
| Ship-and boat-building | 37 | 145 | .. | 145 | 10,831 | .. | 10,831 | 28 | 35,847 | 10,172 |
| Sail-and oilskin-factories | 32 | 68 | 56 | 124 | 4,909 | 1,426 | 6,335 | .. | 31,083 | 16,799 |
| Furniture-factories | 94 | 551 | 34 | 585 | 41,392 | 1,351 | 42,743 | 105 | 131,314 | 96,543 |
| Chemical-works | 8 | 55 | .. | 55 | 5,754 | .. | 5,754 | 65 | 41,568 | 23,766 |
| Woollen-mills | 8 | 602 | 573 | 1,175 | 52,250 | 26,790 | 79,040 | 930 | 279,175 | 259,955 |
| Clothing-factories | 19 | 229 | 1,061 | 1,290 | 19,489 | 33,265 | 52,754 | 7 | 166,579 | 59,735 |
| Hat- and cap factories | 16 | 51 | 61 | 112 | 4,138 | 2,138 | 6,276 | .. | 21,628 | 26,005 |
| Boot- and shoe-factories | 47 | 1,475 | 468 | 1,943 | 107,040 | 17,950 | 124,990 | 46 | 403,736 | 82,137 |
| Rope- and twine-works | 24 | 222 | .. | 222 | 13,658 | .. | 13,658 | 129 | 76,711 | 36,086 |
| Flax-mills | 177 | 3,196 | 8 | 3,204 | 116,168 | .. | 116,168 | 1,994 | 234,266 | 146,792 |
| Meat-preserving, -freezing, and boiling-down works | 43 | 1,561 | 7 | 1,568 | 138,312 | 147 | 138,459 | 5,112 | 1,464,659 | 476,151 |
| Bacon-curing establishments | 33 | 83 | 1 | 84 | 6,671 | 25 | 6,696 | 7 | 83,435 | 14,180 |
| Cheese- and butter-factories | 74 | 218 | 51 | 269 | 13,800 | 1,128 | 14,928 | 387 | 150,957 | 100,453 |
| Grain-mills | 129 | 499 | .. | 499 | 52,384 | .. | 52,384 | 2,906 | 991,812 | 391,828 |
| Biscuit-factories | 22 | 284 | 47 | 331 | 16,150 | 1,049 | 17,199 | 134 | 127,147 | 48,960 |
| Fruit-preserving and jam-making works | 15 | 74 | 43 | 117 | 3,781 | 961 | 4,742 | 33 | 27,255 | 10,042 |
| Breweries | 102 | 476 | .. | 476 | 54,825 | .. | 54,825 | 409 | 300,508 | 236,825 |
| Malthouses | 27 | 87 | .. | 87 | 7,875 | .. | 7,875 | 47 | 80,341 | 42,442 |
| Carried forward | 1,297 | 14,640 | 2,617 | 17,257 | 1,066,432 | 93,740 | 1,160,172 | 13,383 | 6,313,061 | 2,743,849 |
| Brought forward | 1,297 | 14,640 | 2,617 | 17,257 | 1,066,432 | 93,740 | 1,160,172 | 13,383 | 6,313,061 | 2,743,849 |
| Aërated-water factories | 112 | 253 | 8 | 261 | 16,982 | 39 | 17,021 | 155 | 91,691 | 73,147 |
| Coffee-and-spice works | 17 | 79 | 2 | 81 | 6,512 | 50 | 6,562 | 93 | 64,024 | 30,850 |
| Soap-and-candle works | 19 | 201 | 8 | 209 | 21,194 | 200 | 21,394 | 259 | 155,714 | 74,443 |
| Sawmills | 243 | 3,260 | 6 | 3,266 | 271,783 | 31 | 271,814 | 4,637 | 832,959 | 500,272 |
| Chaff-cutting establishments | 63 | 203 | 2 | 205 | 7,260 | 70 | 7,330 | 269 | 63,236 | 36,300 |
| Gasworks | 27 | 249 | .. | 249 | 31,700 | .. | 31,700 | 117 | 178,947 | 730,490 |
| Brick-, tile-, and pottery- works | 106 | 484 | 10 | 494 | 24,938 | 252 | 25,190 | 459 | 56, 830 | 119,780 |
| Iron and brass foundries | 79 | 1,785 | 2 | 1,787 | 157,245 | 27 | 157,272 | 954 | 403,635 | 268,887 |
| Spouting-and-ridging works | 12 | 100 | .. | 100 | 7,981 | .. | 7,981 | 25 | 33,140 | 29,670 |
| Gold- and quartz mining works | 135 | 1,971 | .. | 1,971 | 183,582 | .. | 183,582 | 2,656 | 278,893 | 241,715 |
| Hydraulic gold-mining and gold-dredging | 74 | 495 | .. | 495 | 32,904 | .. | 32,904 | 7,728 | 73,713 | 154,270 |
| Collieries | 95 | 1,655 | .. | 1,655 | 173,538 | .. | 173,538 | 1,185 | 279,777 | 155,671 |
| Other industries | 291 | 1,536 | 314 | 1,850 | 104,809 | 8,590 | 113,399 | 1,472 | 596,526 | 667,632 |
| Totals | 2,570 | 26,911 | 2,969 | 29,880 | 2,106,860 | 102,999 | 2,209,859 | 33,392 | 9,422,146 | 5,826,976 |
The Government Printing Office and the Railway workshops have not been included in making up the preceding table (and indeed the information was not all obtained). This is in accordance with the practice observed at previous censuses in New Zealand, but is open to question, and it has, at least, the disadvantage of disturbing comparisons with other colonies where such Government establishments are included.
Sittings of the Supreme Court are held for trial of civil cases at Auckland, Gisborne, New Plymouth, Napier, Wellington, and Wanganui, in the North Island; and at Blenheim, Nelson, Hokitika, Christchurch, Timaru, Oamaru, Dunedin, and Invercargill, in the Middle Island.
The number of writs of summons tested in the Supreme Court in 1898 was 717, against 744 in 1891, and 929 in 1890. The number of civil cases tried decreased from 184 in 1891 to 129 in 1892. Of these 17 were tried before a common jury, 27 by special jury, and 85 by Judge without jury. The total of amounts for which judgments were recorded in 1892 was £48,316. There were 87 writs of execution issued during the year.
Seventy-one cases were dealt with at sixteen District Courts in 1892. Eleven of these cases were tried before juries, and 88 before Judge only, making a total of 49 cases tried. Nineteen cases lapsed or were discontinued, and 8 remained pending. The total of amounts sued for was £7,455, and judgments were recorded for £2,225. Before the Magistrates’ Courts 18,803 cases were tried, against 18,217 in 1891; the total sum sued for being £246,167, and the total for which judgment was given £133,762.
The petitions in bankruptcy numbered 507 in 1892, of which 479 were made by debtors and 28 by creditors. This number was the lowest for seven years.
The following gives the number of petitions, the total amount of the unsecured assets, the amount of debts proved, and the amount paid in dividends and preferential claims for the past seven years:—
| Year. | No. of Petitions in Bankruptcy. | Debtors Statements of Assets, excluding Amounts secured to Creditors. | Amounts realised by Official Assignees. | Amount of Debts proved. | Amounts paid in Dividends and Preferential Claims. |
|---|---|---|---|---|---|
| £ | £ | £ | £ | ||
| 1886 | 1,089 | 415,953 | 128,370 | 566,291 | 102,966 |
| 1887 | 1,036 | 311,745 | 135,633 | 503,759 | 109,255 |
| 1888 | 881 | 252,322 | 98,213 | 571,741 | 79,843 |
| 1889 | 724 | 441,874 | 187,048 | 755,165 | 95,032 |
| 1890 | 652 | 262,733 | 112,951 | 381,124 | 122,276 |
| 1891 | 605 | 141,970 | 84,341 | 302,712 | 72,571 |
| 1892 | 507 | 122,049 | 66,497 | 238,953 | 43,661 |
A special article on the present bankruptcy law of New Zealand will be found in Part III. of this book. Reference is made in it to a mode of private assignment which has come into such frequent use as to prevent conclusions being drawn from a comparison of the figures above given.
Of the bankruptcies in 1892, in 27 cases the liabilities were under £50; in 102 cases, from £50 to £100; in 167 cases, from £100 to £250; in 105 cases, from £250 to £500; in 55 cases, from £500 to £1,000; in 29 cases, from £1,000 to £2,000; in 14 cases, from £2,000 to £5,000; and in 8 cases, £5,000 and upwards.
The petitions in 1892 under “The Divorce and Matrimonial Causes Act, 1867,” were 38 in number—2 more than in 1891: 30 were for dissolution of marriage, and 8 for judicial separation; 18 decrees for dissolution of marriage were granted. The proceedings under the Act for the past six years ware as follows: —
| Year. | Petitions for | Decrees for | ||
|---|---|---|---|---|
| Dissolution of Marriage. | Judicial Separation. | Dissolution of Marriage. | Judicial Separation. | |
| 1887 | 26 | 6 | 16 | 1 |
| 1888 | 35 | 3 | 32 | .. |
| 1889 | 26 | 7 | 17 | 1 |
| 1890 | 24 | 8 | 21 | 3 |
| 1891 | 31 | 5 | 20 | 3 |
| 1892 | 30 | 8 | 18 | 1 |
The petitions for dissolution of marriage amounted on the average for the six years to 7.67 in every 1,000 marriages, and the decrees for dissolution to 5.53.
The proportion of petitions and decrees for dissolution of marriage to the number of marriages is higher in New Zealand than in England and Wales, but lower than New South Wales or Victoria. The proportion in every 1,000 marriages for these countries is as follows:—
| Country. | Petitions for Dissolution of Marriage. | Decrees for Dissolution of Marriage. |
|---|---|---|
| New Zealand (1892) | 7.50 | 4.50 |
| England and Wales | 1.83 | 0.95 |
| New South Wales (1892) | .. | 8.85 |
| Victoria (1892) | 21.75 | 11.80 |
In 1889 an Act was passed in Victoria to allow of divorces being granted for wilful desertion, habitual drunkenness with cruelty or neglect, imprisonment under certain circumstances of either party, and adultery on the part of the husband. These additional causes for divorce have largely increased the proportion of decrees in that colony.
By an Act passed in 1891 in New South Wales, facilities for obtaining divorce have been multiplied on similar lines.
In respect of criminal statistics New Zealand compares favourably with the colonies of Australia, as will be seen on reference to the following figures, taken from the Victorian Year-book for 1893:—
| 1891. | Proportion per 1,000 of Population of | Proportion per 10,000 of Population of | ||
|---|---|---|---|---|
| Apprehensions and Summonses.* | Summary Convictions. | Commitments. | Convictions after Commitment | |
* Not including civil eases. | ||||
| Queensland | 46.26 | 35.19 | 14.21 | 6.00 |
| New South Wales | 66.29 | 48.72 | 13.83 | 8.43 |
| Victoria | 52.27 | 36.97 | 9.96 | 6.36 |
| South Australia | 25.56 | 21.85 | 5.04 | 2.84 |
| Western Australia | 97.67 | 64.67 | 18.93 | 8.59 |
| Tasmania | 41.44 | 31.96 | 6.58 | 2.96 |
| New Zealand (exclusive of Maoris) | 27.29 | 20.72 | 7.34 | 3.50 |
Judging by the number of summary convictions in 1891, the amount of crime in New Zealand appears to have been at that time proportionately less than in any one of the Australian Colonies. The proportion of convictions after commitment in New Zealand was somewhat higher than in South Australia and Tasmania, but decidedly lower than in any other colony.
The number of charges against persons for various offences brought before the Resident Magistrates’ Courts in 1892 was 18,017. These include repeated charges against the same person. In 1891 the number was 17,613; in 1890,18,701; in 1889, 18,845; and in 1888, 19,167. Of the charges in 1892, 430 were against persons of the aboriginal native race, an increase of 6 on the number for the previous year.
If the Maoris be excluded the number of charges in 1892 is found to be 17,587, an increase of 398 upon the number for 1891, and the proportion per 1,000 of population is 27.38, against 27.29 for 1891.
The figures, both numerical and proportional for a series of eleven years, are subjoined:—
| Year. | Number. | Proportion per 1,000 of Population. |
|---|---|---|
| 1882 | 22,108 | 43.41 |
| 1883 | 22,511 | 42.52 |
| 1884 | 23,105 | 41.81 |
| 1885 | 22,709 | 39.61 |
| 1886 | 21,227 | 36.46 |
| 1887 | 19,924 | 33.41 |
| 1888 | 18,829 | 30.82 |
| 1889 | 18,476 | 30.10 |
| 1890 | 18,247 | 29.39 |
| 1891 | 17,189 | 27.29 |
| 1892 | 17,587 | 27.38 |
A comparison of the number of persons in New Zealand summarily convicted and convicted in the superior Courts during five-years ending with 1892, shows a decrease in the proportion of these convictions per 1,000 of the population. The figures given exclude the Maoris: —
| SUMMARY CONVICTIONS. | CONVICTIONS IN SUPERIOR COURTS. | |||
|---|---|---|---|---|
| Years. 1888. | Number. | Proportion per 1,000 of Mean Population. | Number. | Proportion per 1,000 of Mean Population. |
| Offences against the person | 715 | 1.18 | 42 | 0.07 |
| Offences against property | 1,246 | 2.06 | 178 | 0.29 |
| Other offences | 12,298 | 20.31 | 35 | 0.06 |
| Totals 1889. | 14,259 | 23.55 | 255 | 0.42 |
| Offences against the person | 716 | 1.17 | 30 | 005 |
| Offences against property | 1,377 | 2.24 | 152 | 0.25 |
| Other offences | 11,768 | 19.16 | 43 | 0.07 |
| Totals 1890. | 13,861 | 22.57 | 225 | 0.37 |
| Offences against the person | 794 | 1.28 | 18 | 0.03 |
| Offences against property | 1,273 | 2.05 | 138 | 0.22 |
| Other offences | 11,818 | 19.04 | 36 | 0.06 |
| Totals 1891. | 13,885 | 22.37 | 192 | 0.31 |
| Offences against the person | 751 | 1.19 | 31 | 0.05 |
| Offences against property | 1,312 | 2.08 | 141 | 0.23 |
| Other offences | 10,988 | 17.45 | 42 | 0.07 |
| Totals 1892. | 13,051 | 20.72 | 214 | 0.35 |
| Offences against the person | 771 | 1.20 | 29 | 0.05 |
| Offences against property | 1,294 | 201 | 127 | 0.20 |
| Other offences | 11,225 | 17.48 | 24 | 0.04 |
| Totals | 13,290 | 20.69 | 180 | 0.29 |
It will be observed, however, that, looking to the various classes of offences, the proportion to population of summary convictions for offences against the person was slightly higher in 1892 than in 1888, though the proportion of these convictions before the superior Courts was less. Convictions for offences against property have de creased in proportion to the people, and the same holds good of other offences. The general results shown in the above table are borne out in a most satisfactory manner by the marked decrease in crime during the quinquennium exhibited by the statistics relating to prisoners in gaol, which will be found further on.
The summary convictions in 1892 numbered 13,583, including 293 Maoris. 366 persons were committed for trial at the Supreme and District Courts, a decrease of 114 on the number committed in 1891.
“The Justice of the Peace Act, 1882,” provides that sundry indictable offences may with the consent of the accused be summarily dealt with by Magistrates. The increasing use of this provision may account for the fall in the number of convictions in the higher Courts shown in the five-year table.
Including 15 Maoris, the convictions in the superior Courts numbered 195.
The number of summary convictions in the various Resident Magistrates’ Courts for certain of the most numerous offences in each of the past five years, together with the proportion per 1,000 of the mean population (excluding Maoris) is given herewith:—
| Numbers. | |||||
|---|---|---|---|---|---|
* Including embezzlement, receiving, and false pretences. | |||||
| 1888. | 1889. | 1890. | 1891. | 1892. | |
| Assaults | 633 | 636 | 705 | 675 | 656 |
| Larceny * | 971 | 1,085 | 905 | 934 | 904 |
| Drunkenness | 5,402 | 5,152 | 5,677 | 5,118 | 5,055 |
| Proportions per 1,000 of the Population. | |||||
| 1888. | 1889. | 1899. | 1891. | 1892. | |
| Assaults | 1.05 | 1.04 | 1.14 | 1.07 | 1.02 |
| Larceny * | 1.60 | 1.77 | 1.45 | 1.48 | 1.41 |
| Drunkenness | 8.92 | 8.39 | 9.14 | 8.13 | 7.87 |
The proportion of assaults is found to be less for 1892 than for any of the previous four years. In the year 1887 it was as high as 1.23 per 1,000. For larceny the proportion was highest in the year 1889, when it stood at 1.77 per 1,000 persons. The figures for 1892 (1.41) are the lowest for the quinquennium. Similarly, for drunkenness, the record for 1892 shows a lower rate than obtained in the other years. The range for seven years is from 10.28 per 1,000 persons in 1886 to 7.87 in 1892.
To judge by the consumption of beer, wine, and spirits in 1886 and 1892 respectively, there has been a falling-off during the last seven years in the use of alcoholic liquors in this colony.
| Beer. | Wine. | Spirits. | |
|---|---|---|---|
| Gal. | Gal. | Gal. | |
| 1886 | 7.861 | 0.212 | 0.820 |
| 1892 | 7.807 | 0.174 | 0.708 |
At the same time a comparison of the convictions for drunkenness in the two years shows that excessive drinking was not quite so prevalent in 1892 as in 1886. The prison statistics are here of great value, as showing for several years back the number of distinct prisoners received into gaol after being convicted of drunkenness. The figures for the years 1885–92 are as follow (readmissions of the same person not counted):—
| 1885 | 1,200 |
| 1887 | 1,038 |
| 1889 | 802 |
| 1891 | 694 |
| 1886 | 1,077 |
| 1888 | 938 |
| 1890 | 808 |
| 1892 | 638 |
Here the decrease proceeds rapidly and almost uniformly from year to year. It is true that the option of a line is generally given to a person convicted of drunkenness, but there is nothing to show that the proportion of lines for this offence has increased of late, so that a fall in the number of distinct persons imprisoned may fairly be accepted as evidence of increased sobriety among the people.
In New South Wales and Victoria the consumption per head of alcoholic liquors is much greater than it is here. The figures are,—
| Beer. | Wine. | Spirits. | |
|---|---|---|---|
| Gal. | Gal. | Gal. | |
| Victoria (Hayter) | 16.33 | 1.01 | 1.12 |
| New South Wales (Cogh.) | 10.91 | 0.86 | 100 |
In each of these colonas also in Queensland and South Australia, arrests for drunkenness are in proportion to population far more numerous than in New Zealand. The order of the colonies in this respect is as under:—
| New South Wales | 19.30 per 1,000 | Victoria | 15.74 per 1,000 |
| Queensland | 13.68 per 1,000 | South Australia | 9.41 per 1,000 |
| New Zealand | 8.55 per 1,000 | Tasmania. | 7.70 per 1,000 |
The Native population of the colony may be regarded as stationary, and the numbers of summary convictions by the higher and lower Courts for the last ten years would lead to the conclusion that crime amongst the Maoris is not increasing. The figures, especially those relating to the convictions by the superior Courts, though small, are considered sufficient to justify this general conclusion:—
| 1883 | 354 | 1884 | 296 |
| 1885 | 238 | 1886 | 277 |
| 1887 | 279 | 1888 | 213 |
| 1889 | 221 | 1890 | 243 |
| 1891 | 298 | 1892 | 293 |
| Year. | Convictions. | Number of Poisons convicted. |
|---|---|---|
| 1883 | 41 | 42 |
| 1884 | 27 | 22 |
| 1885 | 15 | 13 |
| 1886 | 22 | 27 |
| 1887 | 11 | 13 |
| 1888 | 10 | 10 |
| 1889 | 10 | 10 |
| 1890 | 31 | 35 |
| 1891 | 7 | 7 |
| 1892 | 16 | 15 |
The total number of prisoners received in the different gaols of the colony during the year 1892 was 3,698, including persons awaiting trial but not convicted within the year, and counting repeated admissions of the same person, with transfers from gaol to gaol of convicts undergoing sentence. In 1891 the number received was 3,735, so that the figures for 1892 show a decrease of 37. Of 3,698 admissions for 1892, 53 were for debt and 69 on account of lunacy; while 115 persons were Maoris admitted for various offences. If the debtors, lunatics, and Maoris be excluded, the number of persons received into gaol is reduced to 3,469, against 3,498 in 1891—a decrease of 29. In 1881, when the mean population was only 493,482 persons, the corresponding number of admissions was 4,207.
The number of persons in gaol (including Maoris) at the end of each of twelve years is next given, with the proportion per 1,000 of the population (also including Maoris) for 1881 and 1892, showing again a great decrease in the number of prisoners:—
| Year. | Undergoing Sentence. | Debtors and Lunatics. | On Remand and awaiting Trial. | Total. |
|---|---|---|---|---|
| 1881 | 631 | 10 | 57 | 698 |
| 1882 | 570 | 8 | 58 | 636 |
| 1883 | 561 | 6 | 46 | 613 |
| 1884 | 560 | 5 | 64 | 629 |
| 1885 | 531 | 8 | 50 | 589 |
| 1886 | 558 | 6 | 61 | 625 |
| 1887 | 633 | 5 | 53 | 691 |
| 1888 | 605 | 2 | 34 | 641 |
| 1889 | 611 | 3 | 19 | 633 |
| 1890 | 517 | 3 | 42 | 562 |
| 1891 | 494 | 4 | 36 | 534 |
| 1892 | 433 | 5 | 38 | 476 |
| Proportion of prisoners in confinement at end of year per 1,000 of population, including Maoris | 1881. | 1892. |
|---|---|---|
| 1.28 | 0.69 |
It is claimed by the Inspector of Prisons that the steady decrease in the number of prisoners observable since 1881 may be looked upon as evidence that the object of legal punishment has been to a great extent achieved; and he states in his report for the year 1892 that the significance of “these figures” (e., the prison statistics) “cannot be overrated as a practical test of the preventive and punitive measures in force.” In his opinion, the only efficient method devised for the repression of crime is complete isolation of prisoners, as free intercourse with one another gives grand opportunities to the whole body for perfecting themselves in the criminal art. “Each prisoner should have a separate cell, and so prevent moral contagion and opportunities of rebellious combination.” But “it must be clearly understood that the cellular system advocated does not mean ‘solitary’ confinement, but merely separation from evil companions.”
Of the prisoners previously convicted received in 1892, 411 men and 50 women had been convicted once; 191 men and 38 women twice; 774 men and 509 women three or more times: making a total of 1,376 men and 597 women.
Of 3,698 prisoners received, 3,092 were able to read and write, 158 could read only, 411 were unable to read, and 37 were of superior education.
Besides the returns from the Prisons Department, a separate card for each admission is furnished for every gaol. The cards that show convictions are arranged alphabetically, and where several are found referring to the same person, all are thrown out but one; then the number of cards retained equals the actual number of distinct convicted prisoners received in the various gaols during the year. In 1892 this number (excluding Maoris) was 2,164, an increase of 51 on the number in 1891. These figures do not include children committed to the industrial schools simply on the ground that they are neglected or destitute.
The following shows the number of distinct persons (exclusive of Maoris) imprisoned in the past seven years after conviction, only one cause being given when the person was imprisoned at different times either for the same or for some other offence: —
| Offences. | 1886. | 1887. | 1888. | 1889. | 1890. | 1891. | 1892. |
|---|---|---|---|---|---|---|---|
| Felony and larceny | 594 | 526 | 563 | 527 | 516 | 506 | 455 |
| Misdemeanour | 90 | 120 | 97 | 131 | 101 | 120 | 113 |
| Injury to property | 54 | 62 | 47 | 53 | 65 | 51 | 61 |
| Assault and resisting the police | 209 | 178 | 162 | 170 | 206 | 179 | 190 |
| Acts of vagrancy | 205 | 238 | 251 | 351 | 333 | 225 | 376 |
| Drunkenness | 1,077 | 1,038 | 938 | 802 | 808 | 694 | 638 |
| Other offences | 545 | 477 | 473 | 365 | 368 | 338 | 331 |
| Totals | 2,774 | 2,639 | 2,531 | 2,399 | 2,397 | 2,113 | 2,164 |
Thus in 1886 these convicted prisoners averaged 47.82 in every 10,000 of the population; in 1887, 44.25; in 1888, 41.81; in 1889, 39.00; in 1890, 38.61; in 1891, 33.55; and in 1892, 33.69. There has been since 1886 a decrease at the rate of 23.83 per cent. in the number of distinct convicted prisoners, and a reduction of 14.13 in the proportion to population. In New South Wales the proportion for 1892 was at the rate of 75 per 10,000 persons.
It must be understood that the actual number of imprisonments for some of the above offences was much in excess of the figures given, as many were several times imprisoned, either for offences differing in kind or for repetitions of the same offence. Thus, many persons returned as imprisoned for larceny underwent other imprisonments for drunkenness, &c. Many returned as convicted of drunkenness were several times in gaol during the year for the same offence, or for some other, such as assault, riotous or indecent conduct, &c. Often there were several charges against the same person at the one time, of which the most serious followed by conviction has been selected.
The following table shows the number of distinct persons (exclusive of Maoris) received into gaol after conviction during 1892, classified according to nature of offence, religion, birthplace, and age:—
| Distinct Convicted Prisoners Received in Gaol, 1892. | ||||||||||||||||
|---|---|---|---|---|---|---|---|---|---|---|---|---|---|---|---|---|
| — | Felony and Larceny. | Misdemeanour. | Injury to Property. | Assault and resisting Police. | Vagrancy. | Drunkenness. | Other Offences. | Totals | ||||||||
| M. | F. | M. | F. | M. | F. | M. | F. | M. | F. | M. | F. | M. | F. | M. | F. | |
| Note.—In this and the following tables a prisoner convicted of more than one offence during the year is reckoned once only under the heading of the principal offence—e.g., a prisoner convicted three times of drunkenness, twice of vagrancy, and once of larceny is counted only once under the heading “Larceny.” Debtors and lunatics received into gaol, and children committed to the industrial schools, but not convicted of any crime, are omitted. | ||||||||||||||||
| Religions— | ||||||||||||||||
| Church of England | 197 | 17 | 52 | 3 | 17 | 3 | 86 | 4 | 133 | 40 | 209 | 42 | 129 | 3 | 823 | 112 |
| Roman Catholic | 111 | 13 | 30 | … | 19 | 7 | 57 | 3 | 83 | 46 | 183 | 53 | 102 | 10 | 585 | 132 |
| Presbyterian | 65 | 9 | 15 | 2 | 6 | 2 | 28 | 1 | 38 | 12 | 85 | 22 | 42 | 4 | 279 | 52 |
| Wesleyan | 19 | 1 | 6 | … | 2 | 1 | 1 | … | 7 | 2 | 22 | 3 | 14 | 1 | 71 | 8 |
| Others | 23 | … | 5 | … | 3 | 1 | 10 | … | 15 | … | 17 | 2 | 26 | … | 99 | 3 |
| Totals | 415 | 40 | 108 | 5 | 47 | 14 | 182 | 8 | 276 | 100 | 516 | 122 | 813 | 18 | 1,857 | 307 |
| Birthplaces— | ||||||||||||||||
| England and Wales | 129 | 10 | 36 | 1 | 13 | 2 | 67 | 3 | 94 | 30 | 186 | 33 | 120 | 4 | 645 | 83 |
| Scotland | 43 | 8 | 14 | 1 | 5 | 1 | 25 | 1 | 28 | 9 | 74 | 22 | 36 | 3 | 225 | 45 |
| Ireland | 66 | 15 | 18 | … | 13 | 6 | 37 | 4 | 60 | 29 | 154 | 51 | 64 | 11 | 412 | 116 |
| New Zealand | 110 | 5 | 23 | 2 | 10 | 5 | 28 | … | 41 | 25 | 26 | 10 | 43 | … | 281 | 47 |
| Australian Colonies | 22 | … | 3 | 1 | 1 | … | 6 | … | 19 | 3 | 15 | 3 | 6 | … | 72 | 7 |
| Other British Possessions | 6 | 2 | 3 | … | ... | … | 3 | … | 9 | 3 | 10 | 1 | 10 | … | 41 | 6 |
| China | 1 | … | … | … | ... | ... | … | … | 1 | … | … | ... | 1 | ... | 3 | .. |
| Other countries | 38 | … | 11 | … | 5 | … | 16 | … | 24 | 1 | 51 | 2 | 33 | … | 178 | 3 |
| Totals | 415 | 40 | 108 | 5 | 47 | 14 | 182 | 8 | 276 | 100 | 516 | 122 | 313 | 18 | 1,857 | 307 |
| Ages— | ||||||||||||||||
| Under 10 years | 1 | .. | .. | .. | .. | .. | .. | .. | .. | .. | .. | .. | .. | .. | 1 | .. |
| 10 and under 12 years | 1 | .. | .. | .. | .. | .. | .. | .. | .. | .. | .. | .. | .. | .. | 1 | .. |
| 12 and under 15 years | 15 | .. | .. | .. | .. | .. | .. | .. | .. | .. | .. | .. | 1 | .. | 16 | .. |
| 15 and under 20 years | 58 | 1 | 9 | 1 | 5 | 2 | 4 | .. | 12 | 7 | 2 | 2 | 19 | .. | 109 | 13 |
| 20 and under 25 years | 65 | 1 | 8 | 1 | 7 | 1 | 33 | 1 | 27 | 17 | 23 | 6 | 41 | .. | 204 | 27 |
| 25 and under 30 years | 50 | 3 | 10 | .. | 6 | 2 | 37 | 1 | 42 | 17 | 44 | 11 | 53 | .. | 242 | 84 |
| 30 and under 40 years | 94 | 11 | 33 | 2 | 10 | 2 | 47 | 2 | 57 | 32 | 135 | 35 | 71 | 6 | 447 | 90 |
| 40 and under 50 years | 72 | 16 | 29 | 1 | 8 | 6 | 35 | 1 | 62 | 21 | 151 | 37 | 60 | 8 | 417 | 90 |
| 50 and under 60 years | 41 | 7 | 15 | .. | 7 | 1 | 17 | 3 | 43 | 8 | 99 | 27 | 49 | 4 | 271 | 45 |
| 60 years and over | 18 | 1 | 4 | .. | 4 | .. | 9 | .. | 33 | 3 | 62 | 4 | 19 | .. | 149 | 8 |
| Totals | 415 | 40 | 108 | 5 | 47 | 14 | 182 | 8 | 276 | 100 | 516 | 122 | 313 | 18 | 1,857 | 307 |
Of the above prisoners convicted, 11 (9 men and 2 women) were released upon probation under “The First Offenders’ Probation Act, 1886,” as against 24 in 1891. During the year 1892, 51 persons were placed upon probation, as against 72 in 1891. Of these, 22 carried out the conditions of their licenses satisfactorily and were discharged, 3 were rearrested and committed to prison, and 26 were still at the end of the year under the supervision of the Probation Officers completing their respective terms of probation. The Inspector of Prisons remarks, as to the working of the Act from the beginning, that “Of the 499 persons placed on probation since the Act came into force in October, 1886, 420 have been discharged after satisfactorily carrying out the terms of their licenses, 25 were rearrested and sentenced to various terms of imprisonment, 2 have died, 11 have eluded the vigilance of the Probation Officer and absconded, and 41 still remain on probation. From these facts it may be gathered that the Probation Officers continue to carry out their duties conscientiously and fearlessly, with tact and discretion. In all respects this most valuable statute is working most satisfactorily, and has saved many a trivial offender from becoming a confirmed criminal.” But it is considered that the Act is not so fully taken advantage of as it might be in cases of persons of good character. The whole question of prisoners awaiting trial is beset with difficulties, for while some of these persons are guilty others are innocent, and the often unduly-prolonged delay between committal and trial makes it impossible, with limited accommodation, to carry out proper separation.
The proportions of adherents of each of the four principal religions denominations in every 100 distinct convicted prisoners during the past five years are shown in the next table, with the percentages of population belonging to the same denominations at the date of the last census: —
Religious Denominations of Distinct Convicted Prisoners received in 1892.
| Denominations of Convicted Prisoners | Proportion per 100 of Convicted Prisoners. | Proportion of Denomination per 100 of Population at Census of 1891. | ||||
|---|---|---|---|---|---|---|
| 1888. | 1889 | 1890. | 1691, | 1892. | ||
| Church of England | 42.99 | 4331 | 43.18 | 42.17 | 43.21 | 4051 |
| Roman Catholic | 31.88 | 32.85 | 32.29 | 33.18 | 33.13 | 13.98 |
| Presbyterian | 16.48 | 15.21 | 15.68 | 15.19 | 15.30 | 22.62 |
| Wesleyan | 2.45 | 2.71 | 3.09 | 2.84 | 3.65 | 10.14 |
Still excluding Maoris, the following are the proportions of distinct convicted prisoners, classified according to birthplace, for each of the past five years: —
Birthplaces of Distinct Convicted Prisoners received in Gaol, 1892.
| Birthplaces. | Number of Convicted Prisoners. | Proportion of each Nationality to every 100 Prisoners. | Proportion of Persons of each Nationality to every 100 of Population, 1891. | ||||||||
|---|---|---|---|---|---|---|---|---|---|---|---|
| 1883. | 1889. | 1890. | 1891. | 1892. | 1888. | 1889. | 1890. | 1891. | 1892. | ||
| England and Wales | 848 | 807 | 811 | 708 | 728 | 33.51 | 33.64 | 33.83 | 33.51 | 33.64 | 19.06 |
| Scotland | 328 | 313 | 309 | 259 | 270 | 12.96 | 13.05 | 12.89 | 12.26 | 12.48 | 8.30 |
| Ireland | 703 | 639 | 633 | 530 | 528 | 27.78 | 26.64 | 26.41 | 25.08 | 24.40 | 7.61 |
| New Zealand | 319 | 294 | 316 | 273 | 328 | 12.60 | 12.25 | 13.18 | 12.92 | 15.16 | 58.61 |
| Australian Colonies | 102 | 107 | 95 | 119 | 79 | 4.03 | 4.46 | 3.96 | 5.63 | 3.65 | 2.55 |
| Other British Possessions | 44 | 27 | 33 | 33 | 47 | 1.74 | 1.13 | 1.38 | 1.56 | 2.17 | 059 |
| China | 12 | 19 | 10 | 14 | 3 | 0.47 | 0.79 | 0.42 | 0.66 | 0.14 | 0.71 |
| Other Foreign Countries | 175 | 193 | 190 | 177 | 181 | 6.91 | 8.04 | 7.93 | 8.38 | 8.36 | 2.57 |
That the number of prisoners born in the United Kingdom should fall off year by year was only to be expected, but the small-ness of the increase in the number of New-Zealand-born (only 2.56 per cent. in the five years) is remarkable. While the New-Zealand-born formed at the last census 58 per cent. of the whole population of the colony, they contributed in 1892 not more than 15 per cent. of the prisoners received in gaol.
The following are the respective proportions of the convicted prisoners received at each age-period of life to every 100 prisoners of either sex for the years 1891 and 1892: —
Ages of distinct Convicted Prisoners received in Gaol, 1892.
| Age | Male Prisoners. | Per 100 Male Prisoners. | Female Prisoners. | Per 100 Female Prisoners. | ||||
|---|---|---|---|---|---|---|---|---|
| 1891. | 1892. | 1891. | 1892. | 1891. | 1892. | 1891. | 1892. | |
| Under 20 years | 122 | 127 | 6.81 | 6.84 | 10 | 13 | 3.12 | 4.23 |
| 20 and under 30 years | 410 | 446 | 22.88 | 24.02 | 67 | 61 | 20.87 | 19.87 |
| 30 and under 40 years | 500 | 447 | 27.90 | 24.07 | 105 | 90 | 32.71 | 29.32 |
| 40 and under 50 years | 376 | 417 | 20.98 | 22.46 | 84 | 90 | 26.16 | 29.32 |
| 50 and under 60 years | 278 | 271 | 15.51 | 14.59 | 45 | 45 | 14.02 | 14.66 |
| 60 years and upwards | 106 | 149 | 5.92 | 8.02 | 10 | 8 | 3.12 | 2.60 |
| Totals | 1,792 | 1,857 | 100.00 | 100.00 | 321 | 307 | 100.00 | 100.00 |
The subjoined table deals with New-Zealand-horn prisoners only (excluding Maoris):—
Distinct New Zealand-born Convicted Prisoners received during the Year 1892.
| Offences | Under 10. | 10 and under 12. | 12 and under 15. | 15 and under 20. | 20 and under 25. | 25 and under 30. | 30 and under 40. | 40. and upwards. | Totals. | |||||||||
|---|---|---|---|---|---|---|---|---|---|---|---|---|---|---|---|---|---|---|
| M. | F. | M | F. | M. | F. | M. | F. | M. | F. | M. | F. | M. | F. | M. | F. | M. | F. | |
| Felony and larceny | 1 | .. | 1 | .. | 14 | .. | 47 | 1 | 26 | 1 | 10 | 1 | 11 | 1 | 1 | 1 | 111 | 5 |
| Misdemeanour | .. | .. | .. | .. | ... | .. | 7 | 1 | 3 | 1 | 1 | .. | 7 | .. | 4 | .. | 22 | 2 |
| Injury to property | .. | .. | .. | .. | .. | ... | 4 | 2 | 1 | 1 | 4 | 2 | 3 | .. | .. | .. | 12 | 5 |
| Assault and resisting police | .. | .. | .. | ... | ... | .. | 3 | .. | 9 | .. | 7 | .. | 5 | .. | 2 | .. | 26 | .. |
| Acts of vagrancy | .. | .. | .. | .. | .. | ... | 4 | 7 | 16 | 11 | 8 | 5 | 8 | 2 | 5 | .. | 41 | 25 |
| Drunkenness | .. | .. | .. | .. | .. | ... | .. | 1 | 12 | 2 | 5 | 4 | 5 | 1 | 4 | 2 | 26 | 10 |
| Others | .. | .. | .. | .. | 1 | .. | 13 | .. | 11 | ... | 10 | .. | 6 | .. | 2 | .. | 43 | .. |
| Totals, 1892 | 1 | .. | 1 | .. | 15 | .. | 78 | 12 | 78 | 16 | 45 | 12 | 45 | 4 | 18 | 3 | 281 | 47 |
| Totals, 1891 | 1 | .. | 2 | .. | 14 | .. | 69 | 7 | 70 | 17 | 26 | 9 | 31 | 10 | 14 | 3 | 227 | 46 |
| Totals, 1890 | 6 | .. | 5 | 1 | 20 | .. | 63 | 15 | 85 | 19 | 41 | 12 | 28 | 8 | 10 | 3 | 258 | 58 |
| Totals, 1889 | 2 | .. | 4 | 1 | 15 | 4 | 62 | 14 | 59 | 20 | 42 | 12 | 37 | 2 | 15 | 5 | 236 | 58 |
| Totals, 1888 | 5 | .. | 10 | .. | 35 | .. | 63 | 19 | 61 | 11 | 40 | 9 | 42 | 13 | 9 | 2 | 265 | 54 |
Here the total number of distinct prisoners received for the year 1892, amounting to 328 persons, is found to be but slightly in excess of the number for 1888–319 persons; of those received in 1892, 107 were under twenty years of ago.
The figures tend to show that the New-Zealander is singularly free from drunkenness, and but little addicted to deeds of violence; but, on the other hand, more given to larceny and its cognate offences. The proportion of New-Zealand-born prisoners convicted of felony and larceny was, in 1892, 3537 per cent.; while for all prisoners the proportion was only 21.03 per cent.
As before stated, the plan adopted in preparing the six foregoing tables is to count each prisoner only once, and to exclude all who were not convicted prisoners, besides dealing with the number received during the year only, instead of with the full number in gaol, which would, of course, include those brought forward from the previous year. The comparative results for a series of years given by this method are held to be more valuable than those brought out by one which includes prisoners merely awaiting trial, and continual repetitions of the same individuals.
The inquests on bodies held in 1892 numbered 764. In 604 cases the bodies were of males, and in 160 cases of females. Of the above, 14 were Maoris. The verdicts may be classified as under:—
| Nature of Verdict. | Inquests on Persons. | ||
|---|---|---|---|
| Males. | Females. | Total. | |
| Accident | 300 | 55 | 355 |
| Disease and natural causes | 232 | 95 | 327 |
| Intemperance | 7 | 1 | 8 |
| Homicide | 3 | 3 | |
| Suicide | 50 | 8 | 58 |
| Not classed | 12 | 1 | 13 |
| 604 | 160 | 764 | |
Of the accidental deaths, the most fatal form is still drowning. The verdicts show that 154 bodies were found drowned, giving a percentage of 43.38 on the accidental deaths from all causes.
The inquests on suicidal deaths in 1892 were in excess of the number in 1891, but fewer than in 1890. The numbers are,—
| Year. | Inquests on Suicides. | ||
|---|---|---|---|
| Males. | Females. | Total. | |
| 1890 | 52 | 11 | 63 |
| 1891 | 46 | 8 | 54 |
| 1892 | 50 | 8 | 58 |
The inquests on fires held during 1892 were 32. In nine cases the verdict was incendiarism, in seven cases accident, and in sixteen cases no evidence was forthcoming.
It has been found impossible to collect complete statistics relating to education for the year 1893 in time for this publication, and the following figures for the previous year are accordingly given. An account of the Government schools for 1893 will, however, be found in the special article dealing with the system of education in the colony:—
At the end of 1892 there were 1,686 schools of all classes, at which members of the European and Maori races were being educated. This was an increase of 40 on the number in 1891. The public primary schools numbered 1,302 in 1892, against 1,255 in 1891. The number of aided or endowed colleges, grammar and high schools was 24, the same as in the previous year. The number of private schools from which returns were received by the Registrar-General was 274 in 1892, a decrease of 7 in the year. There were also 10 industrial schools and orphanages, public and private, as well as 1 school for deaf-mutes subsidised by Government. A school for the blind is included amongst the private schools.
The number of schools established for the education of the Native or Maori race was 75, the same as in 1891.
Education at the public schools is free (except that at such as are also district high schools fees are charged for the teaching of the higher branches) and purely secular. The attendance of all children between the ages of 7 and 13 is compulsory, except when special exemptions are granted, or they are being otherwise sufficiently educated.
The subjects of instruction at the primary schools are required by the Education Act to be the following: Reading, writing, arithmetic, English grammar and composition, geography, history, elementary science and drawing, object-lessons, vocal music, and (in the case of girls) sewing and needlework, and the principles of domestic economy. It is also required that provision shall be made for the instruction in military drill of all boys in these schools.
The number of boys and girls of European descent, including half-castes living among Europeans, on the rolls of attendance of the various schools in the last quarter of 1892 was 139,841, an increase on the corresponding number in 1891 of 3,390. Of these, 122,023 attended the public schools, 2,262 attended the colleges, grammar and high schools, 14,456 attended private schools, 694 were inmates of orphanages and industrial schools, 360 attended Native village schools, and 46 were deaf-mutes at the Government institution.
There was an increase (exclusive of Maoris) during the year of 3,077 in the number attending the public schools, and of 314 in the number attending private schools. The attendance at the college, grammar, and high schools increased by 57, and the number of European children at Native village schools decreased by 43.
Exclusive of Maoris, but including 415 male and 421 female half-castes living among the Europeans, there were 62,996 boys and 59,027 girls in attendance at the public primary schools during the last quarter of 1892, an increase on the numbers in 1891 of 1,614 boys and 1,463 girls.
There were 1,356 male and 1,824 female teachers (exclusive of 160 sewing-mistresses) at the public schools at the end of 1892. Of the males, 258, and of the females, 787, were pupil-teachers.
Of the secondary or superior schools, 24 in number, 8 were for boys only, 7 for girls only, and 9 for boys and girls. The number of regular instructors in 1892 was 120, and of visiting instructors 46. The number of pupils on the roll for the last term of 1892 was 2,262; of these, 1,332 were boys and 930 girls. There was thus an increase of 7 on the corresponding number of boys, and of 50 on the corresponding number of girls, for the last term of 1891.
The New Zealand University is not a teaching body; the undergraduates for the most part keep their terms at one of the following affiliated institutions: the Auckland University College, the Canterbury College, and the University of Otago, each of which has a staff of professors and lecturers. On the 1st June, 1893, the number of graduates who had obtained direct degrees was 366. The number of undergraduates on the roll of the University at that date was 1,407 (not including those who had not performed any academical act for a period of ten years), but only 676 were keeping terms, of whom 415 were males and 261 females. Thirty-six of the males and 4 of the females were medical students. The numbers of students attending lectures at the affiliated institutions during the year 1892–93 were as follow: At the Auckland University College, 57 matriculated and 80 non-matriculated; at Canterbury College. 186 matriculated and 159 non-matriculated; at the Otago University, 176 matriculated and 37 non-matriculated.
There were 274 private schools in the colony at the end of 1892, a decrease of 7 on the number in 1891; 29 were for boys, 47 for girls, and 198 for children of both sexes. The number of pupils attending them was 14,456—namely, 6,321 boys and 8,135 girls, not counting Maoris—7 boys and 4 girls. The number of European pupils at these schools was greater than in 1891 by 314. Of the private schools 105 were Roman Catholic, with an attendance of 10,111 pupils.
The following gives, for the past seven years, the number of private schools and of Europeans attending them, the number of Roman Catholic schools and pupils being also shown separately: —
| Year | Number of Private Schools. | Pupils. | Total Pupils. | Included in previous Numbers. | ||
|---|---|---|---|---|---|---|
| Boys. | Girls. | Roman Catholic Schools. | Pupils at Roman Catholic Schools. | |||
| 1886 | 288 | 5,216 | 7,257 | 12,473 | 83 | 7,991 |
| 1887 | 299 | 5,771 | 7,616 | 13,387 | 90 | 8,946 |
| 1888 | 299 | 5,874 | 7,979 | 13,853 | 96 | 9,346 |
| 1889 | 293 | 5,778 | 7,680 | 13,458 | 95 | 9,024 |
| 1890 | 298 | 5,759 | 7,867 | 13,626 | 108 | 9,474 |
| 1891 | 281 | 6,234 | 7,908 | 14,142 | 110 | 10,144 |
| 1892 | 274 | 6,321 | 8,135 | 14,456 | 105 | 10,111 |
The total number of children of European descent (including such half-castes as live among Europeans) known to be receiving education at school at the end of 1892 was 139,841; of these, 134,197 were from 5 to 15 years of age.
The distribution of the private schools in the various provincial districts of the colony is shown in the two following tables:—
PRIVATE SCHOOLS, 3892.
| Towns or Districts. | Number of Schools. | Number of Teachers. | Number of Scholars (exclusive of Maoris). | Daily Average Attendance. | |||||||||
|---|---|---|---|---|---|---|---|---|---|---|---|---|---|
| Boys. | Girls. | Mixed. | Total. | Male. | Female. | Total. | Male. | Female. | Total. | Male. | Female. | Total. | |
* Exclusive of 11 Maoris—7 boys and 4 girls. | |||||||||||||
| Auckland | 5 | 11 | 65 | 84 | 25 | 139 | 164 | 1,359 | 1,942 | ,301 | 1,101 | 1,560 | 2,661 |
| Taranaki | 8 | 8 | 16 | 16 | 86 | 193 | 279 | 67 | 152 | 219 | |||
| Hawke's Bay | 2 | 2 | 10 | 14 | 7 | 30 | 37 | 337 | 467 | 804 | 280 | 368 | 648 |
| Wellington | 7 | 8 | 25 | 40 | 42 | 89 | 131 | 1,264 | 1,352 | 2,616 | 1,125 | 1,216 | 2,341 |
| Marlborough | 1 | 3 | 4 | 8 | 12 | 12 | 92 | 204 | 296 | 70 | 182 | 252 | |
| Nelson | 4 | 4 | 7 | 15 | 5 | 21 | 26 | 329 | 401 | 730 | 290 | 341 | 6.1 |
| Westland | 1 | 6 | 7 | 3 | 25 | 28 | 329 | 385 | 714 | 281 | 353 | 634 | |
| Canterbury | 6 | 13 | 41 | 60 | 22 | 145 | 167 | 1,432 | 1,743 | 3,175 | 1,239 | 1,506 | 2,745 |
| Otago | 3 | 6 | 32 | 41 | 12 | 99 | 111 | 1,093 | 1,448 | 2,541 | 920 | 1,232 | 2,152 |
| Totals | 29 | 47 | 198 | 274 | 116 | 576 | 692 | 6,321 | 8,135 | 14,456* | 5,373 | 6,910 | 12,283 |
NOTE.—denominational schools, such as Roman Catholic and Anglican, are included in the above as private schools. Particulars for the Roman Catholic schools in December, 1892. are as under.
SUMMARY OF ROMAN CATHOLIC SCHOOLS.
| Towns or Districts. | Number of Schools. | Number of Teachers. | Number of Scholars (exclusive of Maoris). | Daily Average Attendance. | |||||||||
|---|---|---|---|---|---|---|---|---|---|---|---|---|---|
| Boys. | Girls. | Mixed. | Total. | Male. | Female. | Total. | Male. | Female. | Total. | Male. | Female. | Total. | |
| Auckland | 3 | 6 | 18 | 27 | 10 | 60 | 70 | 876 | 1,085 | 1,961 | 695 | 834 | 1,529 |
| Taranaki | 3 | 3 | 9 | 9 | 59 | 127 | 186 | 47 | 104 | 151 | |||
| Hawke's Bay | 1 | 1 | 3 | 5 | 3 | 18 | 21 | 257 | 359 | 616 | 204 | 279 | 483 |
| Wellington | 3 | 3 | 9 | 15 | 22 | 46 | 68 | 781 | 924 | 1,705 | 687 | 833 | 1,520 |
| Marlborough | 1 | 1 | 1 | 3 | 1 | 6 | 7 | 80 | 150 | 230 | 60 | 136 | 196 |
| Nelson | 2 | 3 | 3 | 8 | 2 | 15 | 17 | 260 | 357 | 617 | 225 | 301 | 526 |
| Westland | 1 | 5 | 6 | 3 | 24 | 27 | 334 | 377 | 711 | 279 | 349 | 628 | |
| Canterbury | 3 | 5 | 9 | 17 | 10 | 60 | 70 | 951 | 1,088 | 2,039 | 812 | 929 | 3,741 |
| Otago | 3 | 2 | 16 | 21 | 12 | 58 | 70 | 948 | 1,098 | 2,046 | 806 | 941 | 1,747 |
| Totals | 17 | 21 | 67 | 105 | 63 | 296 | 359 | 4,546 | 5,565 | 10,111 | 3,815 | 4,706 | 8,521 |
The number of children 5 to 15 years of age shown by the census of April, 1891, was 167,164, and, assuming the proportions living at the various age-periods to remain constant, we get 173,536 as the estimated number at the end of 1892. There would therefore be a proportion of 77.33 per cent. of all children from 5 to 15 years of age in attendance at school. But the census showed 8,178 children being educated by means of home tuition, most of whom would be from 5 to 15 years old. Adding these, the proportion per cent. of European children at this age-period accounted for in respect of education is found to be 82.
The number of Native village schools at the end of 1892 either supported or subsidised by the Government was 67—the same as in 1891. In addition, there were 4 boarding-schools for Native children, the cost of whose maintenance was paid either by the Government or from endowments, and 4 private Native schools, one a Mormon institution.
The number of Maori children attending schools at the end of 1892 was 2,705—namely, 1,580 males and 1,125 females. These included 67 children of mixed European and Native blood living as members of Native tribes.
The number at the several schools in each of two past years was as follows:—
| Schools. | Maori Children attending Schools. | |||||
|---|---|---|---|---|---|---|
| Boys. | Girls. | Total of both Sexes. | ||||
| 1891. | 1892. | 1891. | 1892. | 1891. | 1892. | |
| At public European schools | 355 | 387 | 222 | 210 | 577 | 597 |
| At Native village schools | 1,030 | 998 | 798 | 775 | 1,828 | 1,773 |
| At subsidised or endowed boarding-schools | 119 | 111 | 75 | 83 | 194 | 194 |
| At private European or Native schools | 101 | 84 | 96 | 57 | 197 | 141 |
| Totals | 1,605 | 1,580 | 1,191 | 1,125 | 2,796 | 2,705 |
There was thus in 1892 a decrease of 25 in the number of Maori boys and 66 in that of Maori girls attending school.
It is stated in the report to the Minister of Education on the work of 1892 that “For some time past the attendance at Native schools has been declining, while the efficiency of the teachers has been increasing. The payments to the teachers under the Native School Code of 1886 were made to depend much more on efficiency than on average attendance, with the result that the capitation cost came at last to be unjustifiably high. A new code has therefore been issued, which took effect at the beginning of April, 1893, and establishes a close relation between attendance and cost. It is computed that under the new code the total of the salaries of Native-school teachers will be reduced by more than £2,000.”
The total income of the various Education Boards for the year 1892 was £413,504 6s. 4d. The grants by the Government amounted to £372,521 8s. 5th. a decrease of £36,461 11s. 10d. on the grants in 1891. These grants consist of (1) a statutory allowance of £3 15s. per child in daily average attendance, (2) a further capitation allowance of 1s. 6d. for scholarships, and (3) a varying sum for school-buildings. The income from reserves amounted to £37,373 11s. 9d.
The total expenditure in 1892 amounted to £428,015 13s. 1d., of which the sum of £355,254 4s. 0d. was laid out on the maintenance of the schools, £11,017 3s. 9d. used to meet expenses of the Boards, £11,685 7s. 8d. spent on inspection of schools and examination of pupil-teachers, £49,088 18s. 4d. on school-buildings, and £969 19s. 4d. on miscellaneous services.
The expenditure in 1892 on account of Native village schools was £11,766 2s. 3d., against £12,380 19s. 7d. in 1891. Further sums were expended for the following purposes: Maintenance of Maori children at subsidised boarding-schools, £1,462 8s. 1d.; inspection, £637 3s. 8d.; and general charges, £354 2s. 1d.
The expenditure on the Government industrial schools was less for 1892 than for 1891, the net cost (to Government) having diminished by £2,200, an alteration due in great part to the payment by Charitable Aid Boards of large sums that were in arrear.
COST OF GOVERNMENT INDUSTRIAL SCHOOLS, 1892.
| School. | Cost of School. | Cost of boarding out. | Recoveries. | Net Cost. | ||||||||
|---|---|---|---|---|---|---|---|---|---|---|---|---|
| £ | s. | d. | £ | s. | d. | £ | s. | d. | £ | s. | d. | |
| Auckland | 418 | 15 | 5 | 340 | 15 | 6 | 116 | 5 | 8 | 643 | 5 | 3 |
| Kohimarama | 1,180 | 14 | 10 | 762 | 15 | 6 | 511 | 17 | 10 | 1,431 | 12 | 6 |
| Burnham | 3,260 | 3 | 11 | 2,984 | 15 | 7 | 3,510 | 2 | 8 | 2,734 | 16 | 10 |
| Caversham | 2,913 | 2 | 7 | 3,021 | 7 | 2 | 3,982 | 15 | 8 | 1,951 | 14 | 1 |
| Totals, 1892 | 7,772 | 16 | 9 | 7,109 | 13 | 9 | 8,121 | 1 | 10 | 6,761 | 8 | 8 |
| Totals, 1891 | 8,040 | 2 | 3 | 7,471 | 19 | 5 | 6,563 | 1 | 9 | 8,948 | 19 | 11 |
GOVERNMENT EXPENDITURE ON PRIVATE INDUSTRIAL, SCHOOLS, 1892.
| School. | Payments. | Recoveries. | Net Expenditure by Government. | ||||||
|---|---|---|---|---|---|---|---|---|---|
| £ | s. | d. | £ | s. | d. | £ | s. | d. | |
| St. Mary's, Ponsonby (Auckland) | 606 | 6 | 0 | 67 | 5 | 4 | 539 | 0 | 8 |
| St. Joseph's, Wellington | 108 | 18 | 7 | 17 | 3 | 7 | 91 | 15 | 0 |
| St. Mary's, Nelson | 1,735 | 6 | 10 | 205 | 8 | 11 | 1,529 | 17 | 11 |
| Totals | 2,450 | 11 | 5 | 289 | 17 | 10 | 2,160 | 13 | 7 |
The Government expenditure on private schools which are industrial schools was rather larger for 1892 than for 1891, the increase being accounted for by the greater number of children at these schools.
The children at the deaf-and-dumb institution at Sumner, near Christchurch, were 46 in December, 1892, being 4 fewer than in December, 1891. The institution is a Government one. Until lately the director received a capitation for the board of pupils, but this arrangement has now been cancelled. The items of expenditure for 1892 were: salaries, £1,259; board of pupils, £1,520; rent, £399; travelling, £33; Commissions of Inquiry, £75; and sundries, £161. The children are taught to speak with the mouth, and to read articulate speech by observing the movement of the lips. The census showed a total number of 98 deaf-and-dumb persons under 20 years of age residing in the colony, so that about one-half of the full number would appear to be living at the institution.
The blind pupils formerly sent to Melbourne or Sydney are now provided for in the Jubilee Institution for the blind at Auckland. The number at the end of the year was 19. In cases where necessity has been shown, the Education Department pays at the rate of £25 a year for each pupil, recovering what is possible from parents. The number of blind persons under 20 years of age returned at last census as living in the colony was 30, of which about two-thirds would seem to be in the new institution.
There were in New Zealand on the 31st March, 1893, 93 boroughs and 78 counties for purposes of local government. Contained within the counties were 249 road districts and 42 town districts,* but a large portion of the area of the counties is outlying country not included within any road districts. There were also 28 River Boards, 21 Harbour Boards, and 1 Drainage Board. The full details of the rates struck by these bodies, and the receipts and expenditure of each, are given in the tables of the statistical volume for 1892, pp. 395 to 421, but are too lengthy for insertion here. Particulars of summarised results only will be dealt with in this report.
* One of these is the special Town District of Rotorua, constituted under “The Thermal Springs Districts Act, 1881.”
The amount of direct taxation imposed on the people by these local bodies in the form of rates amounted to a gross sum of £508,157 for the year 1892–93, equivalent to an average of 15s. 10d. per head of mean European population for that year.
The receipts (distinguishing revenue from other sources of income) and expenditure of the various local bodies, with the amount of rates collected and the amount of indebtedness on account of loans for each of the past thirteen years are shown in the following table:—
LOCAL GOVERNING BODIES.—RATES, RECEIPTS, EXPENDITURE, LOANS, 1881 TO 1898.*
* The figures for the Drainage and Harbour Boards included are for the calendar years ended three months previous to the financial years.
| Year. | Receipts of Local Bodies. | Expenditure of Local Bodies.† | Outstanding Loans of Local Bodies (excluding Government Loans, for which see the following Columns). | Government Loans to Local Bodies. | ||||||||
|---|---|---|---|---|---|---|---|---|---|---|---|---|
| Revenue. | Receipts not Revenue. | Total Receipts | Under “The Roads and Bridges Construction Act, 1882.” | Under “The Government Loans to Local Bodies Act, 1886” (including Debentures under the Roads and Bridges Construction Act, converted). | ||||||||
| From Rates. | From Government and other Sources. | |||||||||||
† Not including balances, deposits returned, amounts paid to sinking funds and for redemption of debentures. ‡ On the 30th June. § In February. | ||||||||||||
| £ | £ | £ | £ | £ | £ | £ | s. | d. | £ | s. | d. | |
| Year ended 31st March, 1881 | 249,037 | 814,142 | 889,705 | 1,952,934 | 1,871,752 | 3,039,807 | .. | .. | ||||
| 1882 | 297,328 | 694,652 | 419,608 | 1,411,588 | 1,637,337 | 3,277,584 | .. | .. | ||||
| 1883 | 327,129 | 600,450 | 311,466 | 1,239,045 | 1,397,863 | 3,540,046 | .. | .. | ||||
| 1884 | 398,659 | 744,527 | 331,994 | 1,475,180 | 1,499,117 | 3,962,330 | 77,439 | 0 | 0 | .. | ||
| 1885 | 401,393 | 841,895 | 430,561 | 1,673,849 | 1,653,706 | 4,313,223 | 123,086 | 5 | 5‡ | .. | ||
| 1886 | 410,639 | 882,618 | 514,728 | 1,807,985 | 1,644,706 | 4,943,270 | 134,533 | 18 | 7 | .. | ||
| 1887 | 434,237 | 790,063 | 992,633 | 2,216,933 | 1,885,001 | 5,620,747 | 113,071 | 12 | 10 | .. | ||
| 1888 | 433,832 | 795,067 | 511,594 | 1,740,493 | 1,819,787 | 5,812,803 | 18,635 | 0 | 0 | 196,239 | 3 | 9 |
| 1889 | 445,929 | 676,428 | 316,139 | 1,438,496 | 1,560,605 | 5,892,050 | 10,495 | 1 | 0 | 280,290 | 1 | 3 |
| 1890 | 460,303 | 707,725 | 206,688 | 1,374,716 | 1,476,540 | 5,978,059 | 9,676 | 4 | 0 | 328,980 | 15 | 6§ |
| 1891 | 463,581 | 662,765 | 236,902 | 1,363,248 | 1,381,320 | 6,042,693 | 4,316 | 15 | 6 | 380,463 | 16 | 7 |
| 1892 | 488,824 | 693,296 | 214,124 | 1,396,244 | 1,400,467 | 6,081,934 | 4,244 | 15 | 6 | 464,004 | 12 | 9 |
| 1893 | 508,157 | 709,676 | 340,538 | 1,558,371 | 1,482,548 | 6,203,869 | 2,684 | 11 | 6 | 543,363 | 19 | 0 |
The indebtedness of the local bodies outside moneys repayable to the General Government by instalments under “The Roads and Bridges Construction Act, 1882,” and moneys advanced under “The Government Loans to Local Bodies Act, 1886,” has thus increased during the period included in the table from about three to over six million sterling, and from March, 1833 to March, 1893, from £3,540,046 to £6,203,869.
Of the total indebtedness in March, 1893, the debt of the Harbour Boards formed the largest item, £3,369,410, while the Borough Councils owed £2,567,095. It will be seen from the table following (p. 188) that the accrued sinking funds for all loans of local bodies amounted to £391,521, leaving a net indebtedness of £5,812,348, exclusive of the sums owing to the General Government, and that the total annual charge for interest and sinking fund stood at £373,713.
In a third table (p. 189) will be found a classification of the amounts raised by loan, according to the rates of interest paid, distinguishing loans raised in the colony from those raised outside. It will be noticed that the amount raised abroad (£5,074,150) is nearly five times as great as that raised in New Zealand (£1,129,719). The lowest rate of interest paid was 3 per cent. (this is a 6 per cent. rate temporarily reduced), but the large sum of £2,565,850 was raised at 5 per cent., and £2,594,929 at 6 per cent., while £386,860 bore interest as high as 7 per cent.
A summary of all the transactions for the year 1892–93 is subjoined (p. 191). The total revenue of the local bodies for the financial year was £1,217,833, besides a sum of £340,538 which could not properly be termed “revenue,” making altogether a grand total of receipts amounting to £1,558,371. The rates constituted nearly 42 per cent. of the revenue proper. Licenses, rents, and other sources yielded 47 per cent., and 11 per cent. was granted by the General Government.
The expenditure of the local bodies amounted to £1,482,549. In the counties the cost of management, including salaries, travelling-expenses, rent, printing and advertising, collection of rates or tolls, legal expenses, and sundries was £37,879 out of a total expenditure of £335,295. The boroughs expended in the same way £41,762 out of £503,231; and the Road Boards £17,745 out of £178,324. The percentages borne by the cost of management to the total receipts and total expenditure were,—
| Cost of Management per Cent. of Total Receipts. Total Expenditure. | ||
|---|---|---|
| Counties | 11.4 | 11.3 |
| Boroughs | 7.5 | 8.3 |
| Road Boards | 10.0 | 9.9 |
LOANS OF LOCAL BODIES.—NET IDEBTEDNESS, 1893, AND ANNUAL CHARGE, 1892–93.
| — | Amount of Debentures and Stock in Circulation. | Amount of Accrued Sinking Fund. | Net Indebtedness. | Annual Charge (excluding Exchange and Commission). | ||
|---|---|---|---|---|---|---|
| Interest. | Sinking Fund. | Total. | ||||
* Repayable by 26 annual instalments, representing 5 per cent. per annum on the principal sum inscribed. † Amounts for 1892–93. | ||||||
| £ | £ | £ | £ | £ | £ | |
| Counties | 11,660 | 123 | 11,537 | 739 | 80 | 819 |
| Boroughs | 2,567,095 | 221,242 | 2,345,853 | 148,610 | 10,180 | 158,790 |
| Town Boards | 1,311 | .. | 1,311 | 85 | .. | 85 |
| Road Boards | 8,088 | .. | 8,088 | 502 | .. | 502 |
| River Boards | 46,305 | 4,766 | 41,539 | 2,579 | 855 | 3,434 |
| Harbour Boards | 3,369,410 | 151,695 | 3,217,715 | 176,068 | 20,015 | 196,083 |
| Drainage Board | 200,000 | 13,695 | 186,305 | 12,000 | 2,000 | 14,000 |
| Totals | 6,203,869 | 391,521 | 5,812,348 | 340,583 | 33,130 | 373,713 |
| Inscribed debt of local: bodies under “The Government Loans to Local Bodies Act, 1886” | 453,486 | .. | 453,486* | .. | .. | 22,674† |
| Inscribed stock exchanged for debentures under “The Roads and Bridges Construction Act, 1882” | 89,878 | .. | 89,878* | .. | .. | 4,494† |
| Outstanding debentures under “The Roads and Bridges Construction Act, 1882” | 2,685 | .. | 2,685 | .. | .. | 813† |
| Totals | 6,749,918 | 391,521 | 6,358,397 | .. | .. | 401,694 |
LOANS OF LOCAL BODIES RAISED WITHIN AND WITHOUT THE COLONY.
TABLE showing the Amount of Indebtedness of Counties, Boroughs, Town, Road, and River Boards, as on the 31st March, 1893, and of Harbour and Drainage Boards as on the 31st December, 1892, classified according to the Rates of Interest paid, distinguishing Loans raised in the Colony from those raised elsewhere. (See note.)
Loans raised in the Colony.
| Local Bodies. | 3%. | 4% | 4 1/2% | 5% | 5 1/4% | 5 1/2% | 5 3/4% | 6% | 6 1/4% | 6 1/2% | 7% | 8% | 9% | Total. |
|---|---|---|---|---|---|---|---|---|---|---|---|---|---|---|
* Temporarily reduced from 6 per cent. to 3 per cent. † Not including loans, amounting to £546,048 10s. 6d., repayable by annual instalments under “The Roads and Bridges Construction Act 1882,” and “The Government Loans to Local Bodies Act, 1886.” | ||||||||||||||
| £ | £ | £ | £ | £ | £ | £ | £ | £ | £ | £ | £ | £ | £ | |
| Counties | .. | .. | .. | 2,150 | .. | .. | .. | 3,500 | .. | .. | 6,010 | .. | .. | 11,660 |
| Boroughs | .. | .. | .. | 88,900 | 18,000 | 46,500 | 8,000 | 277,245 | .. | 2,000 | 160,700 | 1,600 | .. | 602,945 |
| Town Boards | .. | .. | .. | .. | .. | .. | .. | 711 | .. | 500 | .. | .. | 100 | 1,311 |
| Road Boards | .. | .. | .. | .. | .. | .. | .. | 5,588 | .. | 1,500 | 1,000 | .. | .. | 8,088 |
| River Boards | .. | .. | .. | 4,000 | .. | .. | .. | 12,085 | 3,320 | 3,400 | 2,500 | .. | .. | 25,305 |
| Harbour Boards | 15,650* | .. | 10,110 | 405,500 | .. | 35,000 | .. | 3,250 | .. | 10,250 | 650 | .. | .. | 480,410 |
| Total | 15,650* | .. | 10,110 | 500,550 | 18,000 | 81,500 | 8,000 | 302,379 | 3,320 | 17,650 | 170,860 | 1,600 | 100 | 1,129,719† |
| Loans raised outside the Colony. | ||||||||||||||
| Boroughs | .. | .. | 150,300 | 562,200.. | .. | .. | 1,037,350 | .. | .. | 214,300 | .. | .. | 1,964,150 | |
| River Boards | .. | .. | .. | 21,000 | .. | .. | .. | .. | .. | .. | .. | .. | .. | 21,000 |
| Harbour Boards | .. | 250,000 | 100,000 | 1,482,100 | .. | .. | .. | 1,055,200 | .. | .. | 1,700 | .. | .. | 2,889,000 |
| Drainage Board | .. | .. | .. | .. | .. | .. | .. | 200,000 | .. | .. | .. | .. | .. | 200,000 |
| Total | .. | 250,000 | 250,300 | 2,065,300 | .. | .. | .. | 2,292,550 | .. | .. | 216,000 | .. | .. | 5,074,150 |
| Total Loans raised. | ||||||||||||||
| Counties | .. | .. | .. | 2,150 | .. | .. | .. | 3,500 | .. | .. | 6,010 | .. | .. | 11,660 |
| Boroughs | .. | .. | 150,300 | 651,100 | 18,000 | 46,500 | 8,000 | 1,314,595 | .. | 2,000 | 375,000 | 1,600 | .. | 2,567,095 |
| Town Boards | .. | .. | .. | .. | .. | .. | .. | 711 | .. | 500 | .. | .. | 100 | 1,311 |
| Road Boards | .. | .. | .. | .. | .. | .. | .. | 5,588 | .. | 1,500 | 1,000 | .. | .. | 8,088 |
| River Boards | .. | .. | .. | 25,000 | .. | .. | .. | 12,085 | 3,320 | 3,400 | 2,500 | .. | .. | 46,305 |
| Harbour Boards | 15,650* | 250,000 | 110,110 | 1,887,600 | .. | 35,000 | .. | 1,058,450 | .. | 10,250 | 2,350 | .. | .. | 3,369,410 |
| Drainage Board | .. | .. | .. | .. | .. | .. | .. | 200,000 | .. | .. | .. | .. | .. | 200,000 |
| Total loans raised | 15,650* | 250,000 | 260,410 | 2,565,850 | 18,000 | 81,500 | 8,000 | 2,594,929 | 3,320 | 17,650 | 386,860 | 1,600 | 100 | 6,203,869† |
The particulars of amounts received representing Government support to the various bodies are stated in the following table: —
LOCAL GOVERNING BODIES.—RECEIPTS FROM GOVERNMENT, 1892–93.
| — | Counties. | Boroughs. | Town Boards. | Road Boards. | River Boards (excluding Inch-Clutha, also Road Board). | Harbour Boards. | Drainage Board. | Totals. | ||||||||||||||||
|---|---|---|---|---|---|---|---|---|---|---|---|---|---|---|---|---|---|---|---|---|---|---|---|---|
| £ | s. | d. | £ | s. | d. | £ | s. | d. | £ | s. | d. | £ | s. | d. | £ | s. | d. | £ | s. | d. | £ | s. | d. | |
| Rates on Crown and Native lands | 18 | 16 | 1 | 156 | 7 | 4 | 13 | 13 | 7 | 188 | 17 | 0 | ||||||||||||
| One-third receipts from land sold on deferred payment and from perpetual lease | 14,954 | 16 | 6 | 92 | 18 | 6 | 19,017 | 0 | 0 | 34,064 | 15 | 0 | ||||||||||||
| One-fourth of rents from small grazing-runs | 5,065 | 10 | 5 | 141 | 0 | 10 | 5,207 | 11 | 3 | |||||||||||||||
| Goldfields revenue and gold duty | 14,804 | 3 | 0 | 1,388 | 16 | 7 | 44 | 12 | 1 | 114 | 8 | 10 | 16,352 | 0 | 6 | |||||||||
| Subsidies under the Local Bodies’ Finance and Powers Act | 31,518 | 12 | 10 | 12,742 | 15 | 9 | 635 | 7 | 5 | 18,023 | 16 | 4 | 62,920 | 12 | 4 | |||||||||
| Fees and fines under the Financial Arrangements Act, and other receipts | 3,810 | 2 | 4 | 4,747 | 16 | 8 | 17 | 13 | 0 | 2,530 | 8 | 0 | 50 | 0 | 0 | 7,125 | 8 | 2 | 17,781 | 8 | 2 | |||
| Total Revenue Account | 69,654 | 5 | 1 | 18,898 | 5 | 1 | 790 | 11 | 0 | 39,983 | 1 | 4 | 63 | 13 | 7 | 7,125 | 8 | 2 | 136,515 | 4 | 3 | |||
| Loans under Government Loans to Local Bodies Act | 33,058 | 1 | 5 | 8,303 | 15 | 0 | 300 | 0 | 0 | 24,884 | 15 | 0 | 911 | 6 | 2 | 67,457 | 17 | 7 | ||||||
| Grants for special works | 23,344 | 1 | 9 | 100 | 0 | 0 | 700 | 0 | 0 | 24,144 | 1 | 9 | ||||||||||||
| Total loans and grants from Government | 56,402 | 3 | 2 | 8,403 | 15 | 0 | 300 | 0 | 0 | 24,884 | 15 | 0 | 1,611 | 6 | 2 | 91,691 | 19 | 4 | ||||||
| Total receipts from Government | 126,056 | 8 | 3 | 67,362 | 0 | 1 | 1,090 | 11 | 0 | 64,867 | 16 | 4 | 1,674 | 19 | 9 | 7,125 | 8 | 2 | 228,117 | 3 | 7 | |||
LOCAL GOVERNING BODIES.—RECEIPTS, EXPENDITURE, AND LOANS.
| — | Financial Year ended 31st March, 1893. | Financial Year ended 31st December, 1892. | Totals—all Local Bodies. | ||||||||||||||||||||||||
|---|---|---|---|---|---|---|---|---|---|---|---|---|---|---|---|---|---|---|---|---|---|---|---|---|---|---|---|
| Counties. | Boroughs. | Town Boards. | Road Boards. | River Boards (excluding Inch-Clutha, also Road Board). | Totals. | Harbour Boards. | Drainage Board. | ||||||||||||||||||||
* Not including loans amounting to £546,048 10s. 6d., repayable by instalments under “The Roads and Bridges Construction Act, 1882,” and “The Government Loans to Local Bodies Act. 1886.” NOTE.—The return of receipts and expenditure in this summary represents the net receipts and expenditure of the year, exclusive of credit and deb it balances, bank overdrafts, deposits, amounts paid to sinking funds, and for redemption of debentures. | |||||||||||||||||||||||||||
| Receipts:— | £ | s. | d. | £ | s. | d. | £ | s. | d. | £ | s. | d. | £ | s. | d. | £ | s. | d. | £ | s. | d. | £ | s. | d. | £ | s. | d. |
| Revenue from— | |||||||||||||||||||||||||||
| Rates | 147,557 | 17 | 7 | 223,441 | 18 | 5 | 3,733 | 17 | 3 | 87,283 | 6 | 6 | 7,215 | 9 | 5 | 469,232 | 9 | 2 | 22,446 | 6 | 0 | 16,478 | 7 | 4 | 508,157 | 2 | 6 |
| Rents, licenses, and other sources | 39,040 | 3 | 1 | 205,177 | 1 | 8 | 7,758 | 12 | 11 | 13,600 | 19 | 9 | 3,074 | 0 | 3 | 268,650 | 17 | 8 | 297,685 | 17 | 9 | 799 | 9 | 6 | 567,136 | 4 | 11 |
| Government | 69,654 | 5 | 1 | 18,898 | 5 | 1 | 790 | 11 | 0 | 39,983 | 1 | 4 | 63 | 3 | 7 | 129,389 | 16 | 1 | 7,125 | 8 | 2 | 136,515 | 4 | 3 | |||
| County | 298 | 1 | 1 | 5,726 | 18 | 6 | 6,024 | 19 | 7 | 6,024 | 19 | 7 | |||||||||||||||
| Total revenue | 256,252 | 5 | 9 | 447,517 | 5 | 2 | 12,581 | 2 | 3 | 146,594 | 6 | 1 | 10,353 | 3 | 3 | 873,298 | 2 | 6 | 327,257 | 11 | 11 | 17,277 | 16 | 10 | 1,217,833 | 11 | 3 |
| Receipts not revenue | 74,102 | 1 | 4 | 109,459 | 2 | 11 | 547 | 3 | 6 | 30,595 | 8 | 1 | 1,620 | 6 | 2 216,324 | 2 | 0 | 124,214 | 3 | 5 | 340,538 | 5 | 5 | ||||
| Total receipts | 330,354 | 7 | 1 | 556,976 | 8 | 1 | 13,128 | 5 | 9 | 177,189 | 14 | 2 | 11,973 | 9 | 5 | 1,089622 | 4 | 6 | 451,471 | 15 | 4 | 17,277 | 16 | 10 | 1,558,371 | 16 | 8 |
| Expenditure:— | |||||||||||||||||||||||||||
| Public works | 229,925 | 7 | 2 | 189,665 | 9 | 1 | 8,396 | 17 | 5 | 129,235 | 8 | 10 | 5,357 | 19 | 5 | 562,581 | 1 | 11 | 188,277 | 4 | 3 | 4,920 | 17 | 9 | 755,779 | 3 | 11 |
| Charitable aid and hospitals | 29,269 | 2 | 3 | 23,248 | 3 | 3 | 247 | 15 | 11 | 7,799 | 15 | 6 | 60,555 | 16 | 11 | 60,555 | 16 | 11 | |||||||||
| Management | 37,879 | 16 | 5 | 41,762 | 8 | 11 | 2,564 | 13 | 8 | 17,745 | 9 | 2 | 1,351 | 16 | 10 | 101,304 | 5 | 0 | }234,619 | 12 | 0 | 12,262 | 10 | 0 | 666,214 | 14 | 4 |
| Other expenditure | 38,221 | 0 | 0 | 248,555 | 18 | 2 | 2,091 | 19 | 4 | 23,552 | 17 | 2 | 5,906 | 12 | 8 | 318,328 | 7 | 4 | |||||||||
| Total expenditure | 335,295 | 5 | 10 | 503,231 | 19 | 5 | 13,301 | 6 | 4 | 178,324 | 10 | 8 | 12,616 | 8 | 11 | 1,042,769 | 11 | 0 | 422,596 | 16 | 3 | 17,183 | 7 | 9 | 1,482,549 | 15 | 2 |
| Liabilities (including loans) | 404,742 | 12 | 5 | 2,780,265 | 9 | 11 | 4,935 | 18 | 7 | 284,805 | 2 | 4 | 58,600 | 9 | 9 | 3,533,349 | 13 | 0 | 3,470,927 | 11 | 10 | 211,334 | 17 | 4 | 7,215,612 | 2 | 2 |
| Loans (excluding loans under Roads and under Roads and Bridges Construction Act and Government Loans to Local Bodies Act) | 11,660 | 0 | 0 | 2,567,095 | 0 | 0 | 1,311 | 0 | 0 | 8,088 | 0 | 0 | 46,305 | 0 | 0 | 2,634,459 | 0 | 0* | 3,369,410 | 0 | 0 | 200,000 | 0 | 0 | 6,203,869 | 0 | 0 |
The total value of real property in the colony, according to returns furnished by the local bodies, amounted to £122,472,252 in March, 1893.
This includes £113,410,732 value of rateable property, and £9,061,520 the value of unoccupied Crown and Native lands which are not rateable.
This division of the total sum—£122,472,252—is not strictly accurate, because in six counties the value of property outlying road districts is given in one amount, without separating the unoccupied Crown and Native lands from those that are rateable.
Some of the boroughs and town districts rate on a capital value, but most of them upon an annual value of property. In the succeeding statement the capital value has, where necessary, been computed at 16.6 times the annual value.
In case of the boroughs, the Act under which the valuation is made provides for a reduction from the renting-value of 20 per cent. on houses and buildings, and 10 per cent. on land. The actual annual value of the properties will, therefore, be greater than the rating value by 11 to 25 per cent.
| Local Governing Bodies. | Rateable Property. | Unoccupied Crown and Native Lands. | Total Value, March, 1893. |
|---|---|---|---|
* Including (£3,223,893) the value of all outlying property in six counties, where the value of the unoccupied Crown and Native lands is not separately stated. † Section 14 of “The Hating Act, 1882.” ‡ Value of unoccupied Crown and Native lands not returned by boroughs. | |||
| £ | £ | £ | |
| Counties (outlying road and town districts) | 30,899,153* | 6,581,094 | 37,480,247 |
| Boroughs† | 3,257,647 | + | 3,257,647‡ |
| Boroughs (annual value capitalised at 6 per cent.)† | 34,879,916 | + | 34,879,916£ |
| Road districts | 42,892,265 | 2,450,409 | 45,342,674 |
| Town districts | 956,794 | 22,684 | 979,468 |
| Town districts (annual value capitalised at 6 per cent.) | 524,967 | 7,333 | 532,300 |
| Totals | 113,410,732 | 9,061,520 | 122,472,252 |
Here the total value of property in counties amounts to £84,334,689, and that in boroughs to £38,137,563.
At a general valuation of land (including tenements, buildings, and hereditaments), with all improvements made under “The Land and Income Assessment Act. 1891,” in November of that year, the following results were arrived at. The value of the improvements is shown distinct from that of the unimproved lands.
All the land is included, whether occupied or unoccupied, whether belonging to companies or private persons, local bodies, Natives, or the Crown.
VALUE OF PROPERTY: ASSESSMENT UNDER LAND AND INCOME ASSESSMENT: ACT, NOVEMBER, 1891.
| Counties or Boroughs. | Actual Value, including Improvements. | Value of Improvements. | Unimproved Value. |
|---|---|---|---|
| £ | £ | £ | |
| Counties | 85,818,167 | 27,922,735 | 57,880,233 |
| Boroughs | 36,406,862 | 18,442,562 | 17,907,662 |
| Totals | 122,225,029 | 46,365,297 | 75,787,895 |
Since 1891 the total value of property in the boroughs has been increased by the constitution of new boroughs, and that of the counties correspondingly reduced. This will account for the increase in the town and the decrease in the county property shown in the local bodies’ returns for March, 1893.
The figures for the North and Middle Islands, according to the above assessment, together with the results of the previous assessment made in 1888, are reproduced as being still interesting, and as affording a good index of the progress of the colony: —
| 1888. | 1891. | Increase. | |
|---|---|---|---|
| £ | £ | £ | |
| North Island | 49,607,873 | 57,441,115 | 7,833,242 |
| Middle Island | 61,529,841 | 64,783,914 | 3,254,073 |
| Totals | 111,137,714 | 122,225,029 | 11,087,315 |
The annual and capital values of property in town districts (1893) were as follow: —
| Town Districts. | Annual Value of Property. | Capital Value of Property. |
|---|---|---|
| £ | £ | |
| Kamo | .. | 16,812 |
| Whangarei | .. | 48,021 |
| Helensville | 3,194 | .. |
| Papakura | 1,501 | .. |
| To Aroha | 3,135 | .. |
| Te Awamutu | .. | 20,602 |
| Kihikihi | .. | 12,189 |
| Ngaruawahia | .. | 1 7,517 |
| Opotiki | .. | 32,785 |
| Raleigh | .. | 30,000 |
| Opunake | .. | 23,757 |
| Inglewood | .. | 14,171 |
| Stratford | .. | 35,505 |
| Normanby | .. | 13,559 |
| Manaia | .. | 24,719 |
| Waverley | .. | 21,327 |
| Lethbridge | 1,601 | .. |
| Bull's | 3,647 | .. |
| Halcombe | 1,680 | .. |
| Clyde | .. | 42,866 |
| Taradale | .. | 81,611 |
| Ormondville | 2,524 | .. |
| Waipawa | 6,265 | .. |
| Kaikora North | 2,543 | .. |
| Featherston | .. | 45,128 |
| Johnsonville | .. | 45,683 |
| Havelock | .. | 17,242 |
| Amberley | 2,288 | .. |
| Woolston | .. | 86,000 |
| Southbridge | .. | 36,213 |
| Hampstead | .. | 59,113 |
| Tinwald | .. | 46,559 |
| Temuka | .. | 55,120 |
| Arowhenua | .. | 24,179 |
| Geraldine | .. | 37,443 |
| Grey | .. | 7,621 |
| Outram | .. | 23,734 |
| Clinton | 1,567 | .. |
| Mataura | .. | 41,600 |
| Wyndham | 1,993 | .. |
| Otautau | .. | 13,392 |
The names of the various boroughs, and the value of the rateable property in each returned by these bodies as on the 31st March, 1893, were:—
| Name of Borough. | Estimated Annual (or Renting) Value or Rateable Property in March, 1893. | Total Value of Rateable Property, March, 1893. |
|---|---|---|
| Birkenhead | 4,992 | .. |
| Devonport | 18,288 | .. |
| Auckland | 297,728 | .. |
| Newton | 15,677 | .. |
| Newmarket | 10,782 | .. |
| Parnell | 22,957 | .. |
| Onehunga | 16,000 | .. |
| Thames | 29,000 | .. |
| Hamilton | 6,759 | .. |
| Cambridge | 4,570 | .. |
| Tauranga | .. | 56,322 |
| Gisborne | 25,745 | .. |
| New Plymouth | 21,090 | .. |
| Hawera | 8,407 | .. |
| Patea | 4,827 | .. |
| Wanganui | 36,120 | .. |
| Marton | 8,824 | .. |
| Feilding | 10,767 | .. |
| Palmerston North | .. | 517,000 |
| Foxton | 6,871 | .. |
| Hastings | 25,727 | .. |
| Napier | 80,520 | .. |
| Danevirke | 5,949 | .. |
| Woodville | 9,460 | .. |
| Pahiatua | .. | 59,923 |
| Masterton | 26,098 | .. |
| Carterton | .. | 86,245 |
| Greytown | 7,925 | .. |
| Wellington | 322,450 | .. |
| Onslow | .. | 118,504 |
| Melrose | .. | 201,746 |
| Karori | 6,750 | .. |
| Petone | 17,250 | .. |
| Lower Hutt | .. | 226,736 |
| Picton | .. | 76,271 |
| Blenheim. | 27,458 | .. |
| Nelson | 56,537 | .. |
| Richmond | .. | 82,935 |
| Westport | 21,456 | .. |
| Grey mouth | 22,638 | .. |
| Brunner | 12,224 | .. |
| Hokitika | 14,076 | .. |
| Boss | .. | 16,404 |
| Kumara | 4,488 | .. |
| Kaiapoi | 8,123 | .. |
| Rangiora | .. | 153,828 |
| Lyttelton | 22,892 | .. |
| Christchurch | 196,325 | .. |
| Linwood | .. | 341,799 |
| Sydenham | .. | 659,668 |
| St. Albans | .. | 515,917 |
| Sumner | 7,072 | .. |
| Akaroa | .. | 46,337 |
| Ashburton | 17,892 | .. |
| Timaru | 35,652 | .. |
| Waimate | 6,895 | .. |
| Oamaru | 33,252 | .. |
| Hampden | .. | 10,979 |
| Palmerston South | .. | 43,888 |
| Hawkesbury | .. | 43,140 |
| Port Chalmers | 11,707 | .. |
| North-east Valley | 17,911 | .. |
| Maori Hill | 10,877 | .. |
| West Harbour | 9,543 | .. |
| Dunedin | 251,000 | .. |
| Roslyn | 26,678 | .. |
| Caversham | 28,850 | .. |
| Mornington | 21,441 | .. |
| St. Kilda | 8,949 | .. |
| South Dunedin | 19,697 | .. |
| Green island | 3,356 | .. |
| Mosgiel | 7,859 | .. |
| Milton | 5,764 | .. |
| Kaitangata | 6,259 | .. |
| Balclutha | 5,337 | .. |
| Lawrence | 8,019 | .. |
| Roxburgh | 1,464 | .. |
| Tapanui | 2,510 | .. |
| Naseby | 2,693 | .. |
| Cromwell | 3,361 | .. |
| Alexandra | 1,292 | .. |
| Arrowtown | 2,659 | .. |
| Queenstown | 5,831 | .. |
| Invercargill | 48,526 | .. |
| Invercargill North | 3,762 | .. |
| Invercargill East | 3,589 | .. |
| Invercargill South | 5,593 | .. |
| Avenal | 1,744 | .. |
| Gladstone | 2,316 | .. |
| Campbelltown | 6,011 | .. |
| Gore | 13,279 | .. |
| Winton | 2,100 | .. |
| Riverton | 4,303 | .. |
The road districts and value of property in each, grouped according to the counties in which situated, are shown hereunder: —
| County and District. | Property in District. |
|---|---|
* No Board. | |
| Mongonui— | £ |
| Oruaiti | 17,180 |
| Oruru | 44,593 |
| Whangaroa (no road districts). | |
| Bay of Islands (no road districts). | |
| Hokianga (no road districts). | |
| Hobson (no road districts). | |
| Whangarei— | |
| Hikurangi | 13,797 |
| Kaurihohore | 13,119 |
| Kensington | 20,440 |
| Maungakaramea | 20,497 |
| Maunu | 47,176 |
| Otonga | 11,947 |
| Otonga East | 17,643 |
| Parua Bay | 21,712 |
| Ruarangi | 9,891 |
| Waikiekie | 20,636 |
| Waipu North | 21,419 |
| Whareora | 8,677 |
| Otamatea— | |
| Mangawai | 22,112 |
| Matakohe | 25,986 |
| Rodney— | |
| Ahuroa | 5,137 |
| Albertland North | 7,012 |
| Albertland South | 25,148 |
| Komokoriki | 12,200 |
| Mahurangi East | 10,985 |
| Mahurangi Lower | 14,797 |
| Mahurangi Upper | 46,948 |
| Mainene | 7,051 |
| Matakana East | 8,932 |
| Matakana West | 14,007 |
| Omaha | 38,948 |
| Puhoi | 20,647 |
| Tauhoa | 19,560 |
| Wharehine | 12,744 |
| Waitemata— | |
| Kaukapakapa | 47,364 |
| Pukeatua | 36,350 |
| Whangaparaoa | 7,932 |
| Eden- | |
| Arch Hill | 85,665 |
| Avondale | 88,436 |
| Eden Terrace | 88,691 |
| Epsom | 141,275 |
| Eden— | |
| Mount Albert | 146,428 |
| Mount Eden | 297,952 |
| Mount Roskill | 105,651 |
| Mount Wellington | 149,847 |
| One-tree Hill | 169,712 |
| Panmure Township | 12,980 |
| Point Chevalier | 109,388 |
| Remuera | 385,779 |
| Tamaki West | 92,543 |
| Manukau— | |
| Awhitu | 29,416 |
| Howick Town | 15,100 |
| Hunua | 20,508 |
| Karaka | 21,835 |
| Mangare | 170,185 |
| Manurewa | 29,582 |
| Maraetai | 10,100 |
| Mauku | 44,150 |
| Maungatawhiri | 28,804 |
| Mercer Township | 15,870 |
| Opaheke | 41,526 |
| Opaheke North | 33,167 |
| Otahuhu | 58,675 |
| Pakuranga | 48,410 |
| Papakura | 40,534 |
| Paparata | 37,652 |
| Paparoa | 10,270 |
| Papatoitoi | 50,850 |
| Pokeno | 35,531 |
| Pollok Settlement | 10,784 |
| Pukekohe East | 87,246 |
| Pukekohe West | 116,375 |
| Tamaki East | 93,309 |
| Turanga | 21,746 |
| Waipipi | 87,714 |
| Wairoa South | 80,166 |
| Waiuku | 55,875 |
| Coromandel (no road districts). | |
| Thames (no road districts). | |
| Ohinemuri (no road districts). | |
| Piako— | |
| Matamata | 68,454 |
| Taotaoroa | 42,623 |
| Waitoa | 250,492 |
| Waikato— | |
| Cambridge | 113,457 |
| Kirikiriroa | 335,556 |
| Tamahere | 64,773 |
| Waipa— | |
| Newcastle | 63,182 |
| Pukekura | 126,072 |
| Rangiaohia | 70,329 |
| Tuhikaramea | 18,855 |
| Raglan— | |
| Karamu | * |
| Onewhero | 11,082 |
| Pirongia | 21,550 |
| Te Akau | * |
| Whaingaroa | 25,860 |
| Kawhia (no road districts). | |
| West Taupo (no road districts). | |
| East Taupo (no road districts). | |
| Rotorua (no road districts). | |
| Tauranga— | |
| Katikati | 35,259 |
| Te Puke | 67,780 |
| Te Puna | 48,542 |
| Whakatane— | |
| Opotiki | 128,030 |
| Whakatane | 93,900 |
| Waiapu (no road districts). | |
| Cook— | |
| Kaiti | 46,100 |
| Ormond | 68,628 |
| Patutahi | 143,603 |
| Poverty Bay | 184,207 |
| Te Arai | 208,989 |
| Waikohu | 262,297 |
| Ngatapa | 244,154 |
| Waimata | 212,438 |
| Whataupoko | 88,000 |
| Clifton (no road districts). | |
| Taranaki— | |
| Barrett | 29,530 |
| Carrington | 18,623 |
| Egmont | 63,368 |
| Elliot | 13,758 |
| Frankley | 19,764 |
| Henui | 27,975 |
| Hurford Upper | 6,031 |
| Mangorei | 24,202 |
| Moa | 189,871 |
| Oakura | 43,132 |
| Okato | 43,983 |
| Omata | 30,796 |
| Parihaka | 231,345 |
| Tataraimaka | 23,922 |
| Waitara West | 87,298 |
| Waiwakaiho | 30,185 |
| Stratford— | |
| Manganui | 102,877 |
| Hawera— | |
| Waimate | 690,997 |
| Patea— | |
| Kohi | 49,995 |
| Motoroa | 23,384 |
| Okotuku | 51,172 |
| Patea East | 121,538 |
| Patea West | 185,026 |
| Wairoa | 39,559 |
| Waitotara-Momohaki | 91,532 |
| Whenuakura-Waitotara | 124,539 |
| Waitotara (no road districts). | |
| Wanganui— | |
| Kaitoke | 114,382 |
| Kaukatea | 84,367 |
| Mangawhero | 503,306 |
| Purua | 159,931 |
| Upper Wangaehu | 250,880 |
| Rangitikei (no road districts). | |
| Oroua— | |
| Fitzherbert | 288,751 |
| Kiwitea | 363,675 |
| Manawatu | 594,922 |
| Manchester | 751,260 |
| Pohangina | 275,100 |
| Manawatu (no road districts). | |
| Horowhenua— | |
| Otaki | 177,618 |
| Te Horo | 164,491 |
| Wirokino | 512,471 |
| Wairoa (no road districts). | |
| Hawke's Bay— | |
| Havelock | 448,197 |
| Heretaunga | 648,736 |
| Maraekakaho | 353,460 |
| Waipawa— | |
| Danevirke | 299,328 |
| Kumeroa | 106,123 |
| Maharahara | 61,313 |
| Maungaatua | 81,860 |
| Norsewood | 157,872 |
| Ruataniwha | 301,432 |
| Ruataniwha North | 278,129 |
| Takapau | 142,299 |
| Waipawa | 60,471 |
| Waipukurau | 292,830 |
| Woodville | 116,945 |
| Patangata— | |
| Oero | 290,163 |
| Patangata | 149,993 |
| Porangahau | 294,764 |
| Tamumu | 510,024 |
| Wallingford | 341,092 |
| Wanstead | 126,140 |
| Weber | 115,392 |
| Pahiatua (no road districts). | |
| Wairarapa North— | |
| Akiteo | 215,970 |
| Alfredton | 123,935 |
| Castlepoint | 287,040 |
| Eketahuna | 164,439 |
| Masterton | 653,074 |
| Mauriceville | 99,679 |
| Upper Taueru | 86,196 |
| Wairarapa South— | |
| Featherston | 1,126,336 |
| Taratahi-Carterton | 682,245 |
| Hutt— | |
| Makara | 80,594 |
| Seatoun | 34,108 |
| Sounds (no road districts). | |
| Marlborough— | |
| Awatere | 555,335 |
| Omaka | 315,901 |
| Pelorus | 234,862 |
| Picton | 152,014 |
| Spring Creek | 160,000 |
| Wairau | 377,210 |
| Kaikoura (no road districts). | |
| Collingwood— | |
| Collingwood | 126,196 |
| Takaka | 153,202 |
| Waimea— | |
| Dovedale | 30,753 |
| Motueka | 90,879 |
| Moutere Upper | 34,173 |
| Riwaka | 80,861 |
| Stoke | 227,400 |
| Suburban North | 98,030 |
| Waimea West | 76,722 |
| Buller (no road districts). | |
| Inangahua (no road districts). | |
| Grey (no road districts). | |
| Westland (no road districts). | |
| Amuri (no road districts). | |
| Cheviot— | |
| Cheviot (no Board) | 486,765 |
| Ashley— | |
| Ashley | 297,330 |
| Cust | 119,274 |
| Eyreton | 388,071 |
| Eyreton West | 190,150 |
| Kowai | 491,061 |
| Mandeville and Rangiora | 602,846 |
| Oxford | 366,878 |
| Waipara | 1,165,657 |
| Selwyn— | |
| Avon | 539,203 |
| Courtenay | 769,782 |
| Ellesmere | 1,214,861 |
| Halswell | 303,646 |
| Heathcote | 540,346 |
| Lake Coleridge | 225,276 |
| Lincoln | 331,216 |
| Malvern | 138,364 |
| Malvern East | 112,521 |
| Malvern South | 87,687 |
| Rakaia | 359,083 |
| Riccarton | 943,049 |
| Spreydon | 138,779 |
| Springs | 508,037 |
| Taitapu | 98,070 |
| Templeton | 367,146 |
| Upper Waimakariri | 104,298 |
| Akaroa— | |
| Akaroa and Wainui | 310,464 |
| Le Bon's Bay | 71,724 |
| Little River | 367,685 |
| Okain's Bay | 99,344 |
| Pigeon Bay | 109,017 |
| Port Levy | 107,226 |
| Port Victoria | 76,847 |
| Ashburton— | |
| Anama | 42,564 |
| Ashburton Upper | 568,711 |
| Coldstream | 204,037 |
| Longbeach | 471,071 |
| Mount Hutt | 715,931 |
| Mount Somers | 267,855 |
| Rangitata | 344,230 |
| South Rakaia | 512,058 |
| Wakanui | 393,632 |
| Geraldine— | |
| Geraldine | 487,030 |
| Levels | 1,028,501 |
| Mount Peel | 414,351 |
| Temuka | 700,690 |
| Mackenzie (no road districts) | |
| Waimate (no road districts). | |
| Waitaki (no road districts). | |
| Waihemo (no road districts). | |
| Waikouaiti (no road districts) | |
| Peninsula— | |
| Otago Heads | 33,502 |
| Peninsula | 197,335 |
| Portobello | 145,334 |
| Tomahawk | 31,970 |
| Taieri (no road districts). | |
| Bruce— | |
| Balmoral | 225,382 |
| Inch - Clutha (Road and River) | 68,343 |
| Mount Stuart | 109,563 |
| Clutha (no read districts). | |
| Tuapeka (no road districts). | |
| Maniototo (no road districts). | |
| Vincent (no road districts). | |
| Lake (no road districts). | |
| Southland— | |
| Invercargill (no Board) | 111,641 |
| Knapdale | 249,220 |
| Lindhurst | 168,000 |
| Otaraia | 145,903 |
| Oteramika | 272,238 |
| Tuturau | 146,990 |
| Waimumu | 195,779 |
| Wyndham | 73,441 |
| Wallace (no road districts). | |
| Fiord (no road districts). | |
| Stewart Island (no road districts). | |
There are 74 fire-brigades in the colony, having a total strength of 214 officers and 1,149 men. The number of brigades in 1893 shows an increase of 5 as compared with the number for the previous year; on the other hand, the effective strength of several corps has considerably diminished, as will he seen on comparison with the figures for 1892—brigades, 69; officers., 223; men, 1,195. Of the 74 brigades now existing, 59 belong to the United Fire-brigades Association of New Zealand, which has a membership of 1,250.
The fifteenth annual meeting of the association was held at Napier on the 5th and 6th March, 1894, the balance-sheet showing a credit balance of over £350. Competitions were held on the 7th, 8th, and 9th, at which £360 were given in prizes, and over 200 men took part.
An Accident Assurance Society, registered under the Friendly Societies Act, has been established in connection with the association, which provides for an allowance of 30s. per week if a member be incapacitated from following his usual employment by accident happening to him whilst on duty as a fireman, and for payment of £50 if he be totally disabled or killed.
At the second annual meeting of delegates held on the 6th March, the report showed that the receipts for contributions and interest amounted to £101 3s. 2d., and the claims paid for accidents during the year were five, the benefits amounting to £13 10s.
The total number of members belonging to the society is 430, and there is a cash balance of £221 13s. 8d.
The “Fire and Ambulance Record,” a paper devoted to fire-brigade matters, is published monthly at Napier, and is the official organ of the New Zealand Fire-brigades Association.
| Year. | Total Number of Totalisator Licenses issued. | Total number of Days of Racing on which the use of the Totalisator was authorised. |
|---|---|---|
* The amount of the percentages from investments on the totalisator paid to the Treasury was in 1892–93, £10,800 11s. 9d., and in 1893–94, £10,875 2s. 5d. | ||
| 1889-90 | 187 | 241 |
| 1890-91 | 219 | 278 |
| 1891-92 | 234 | 300 |
| 1892–93* | 240 | 307 |
| 1893–94* | 247 | 318 |
Table of Contents
Table of Contents
By S. Percy Smith, F.R.G.S., Secretary for Crown Lands and Surveyor-General.
THE Crown lands of New Zealand are administered under “The Land Act, 1892,” and the regulations made thereunder.
The distinguishing features of the present land system are the outcome of ideas which have been gradually coming to maturity for some years past in this colony. These features involve the principle of State-ownership of the soil, with a perpetual tenancy in the occupier. This, whatever may be the difference in detail, is the prevailing characteristic in the several systems under which land may now be selected. In New Zealand, this tendency to State-ownership has taken a more pronounced form than in any other of the Australasian Colonies, and the duration of the leases has become so extended as to warrant the name, frequently given to the system, of “everlasting leases.” In point of fact, most of the Crown lands are now disposed of in leases which have a currency of 999 years. They are leased at a fixed rental based on the assessed value of the land at the time of disposal, without recurring valuations or increase in rent. Under this system there is a fixity of tenure practically equal to freehold, and which, like freehold, necessarily carries with it the power of sale, sub-lease, disposition by will, or mortgage. Since all lands held under the Crown “by lease in perpetuity” are subject to the land-tax, the necessity for the periodical revaluations under the perpetual-lease system is done away with, the State reaping the advantage of the unearned increment through the before-mentioned tax. At the same time the improvements made in the soil by cultivation, &c., are secured to the tenant.
The values placed on the Crown lands are, as a rule, low, for the State does not so much seek to raise a revenue directly therefrom as to encourage the occupation of the lands by the people; it secures indirectly an increased revenue and other advantages from having a numerous rural population. The advantages of this system to the selector are manifest. When it is taken into consideration that, with few7 exceptions, the Crown lands are, in their prairie condition, incapable of producing anything until brought into cultivation, the advantage to the settler of having his capital free to develop the capabilities of the soil, rather than having to expend it in the purchase of a freehold, is very apparent. One of the most striking results of this system is the advantage it gives to the poor man, who, with little more capital than his strong right arm, is enabled to make a home for himself; which, under the freehold system, he is frequently not able to accomplish.
Again, underlying the whole of the New Zealand land system is a further application of the principle of “the land for the people,” that of the restriction as to area which any man may hold. This principle has been forced upon the attention of the Legislature by defects in former systems, under which one individual with means at his command could appropriate large areas, to the exclusion of his poorer fellow-settler. Under a system where the price at which the land is offered is fixed, and where choice of selection is by ballot, the poor settler has the same chance as the rich one, and may, should he wish it, hold as much land. The limit that a selector may hold is so fixed as to encourage the class of small farmers, and up to that limit the amount he selects is left entirely to himself. The Act defines the amount of land any one can select at 640 acres of first-class, or 2,000 acres of second-class land, inclusive of any land he may already hold. These limits apply to lands which are thrown open for “free selection,” as it is termed, but in some cases, where found desirable, the limit is by regulation made much smaller.
In addition to the many advantages offered by the “lease-in-perpetuity” system, the Land Act provides others to meet the wants of different classes. The rule is almost invariable, that land thrown open for so-called “free selection.” is offered to the public under three different tenures, and the choice left entirely to the would be settler. The three tenures are: —
For cash, in which one-fourth of the purchase-money is paid down at once, and the remainder within thirty days. The title does not issue until certain improvements have been made on the land.
Lease with a purchasing clause, at a 5-per-cent. rental on the value of the land; the lease being for twenty-five years with the right to purchase at the original upset price at any time after the first ten years.
Lease in perpetuity, at a rental of 4 per cent. on value, as already described above.
The present land-laws have been in force since the 1st November, 1892, and, therefore, the returns of the Department of Lands and Survey for the year ending the 31st March, 1894, will give a fair idea as to how far these systems have been taken advantage of during the past twelve months. The figures given below include the “special settlements,” all of which are held on lease in perpetuity:—
Selected for cash, 596; area, 47,667 acres.
Occupation with right of purchase, 471; area, 108,499 acres.
Lease in perpetuity, 1,228; area, 255,348 acres.
“The Land Act, 1892,” provides for a special class of settlement which has been taken advantage of to a very considerable extent during the last two years. This system is known as the “small-farm association” system. It provides that, where not less than twelve individuals have associated themselves together for mutual help, such an association can, with the approval of the Minister of Lands, select a block of land of not more than 11,000 acres, but there must be a selector to each 200 acres in the block. The extreme limit that one person can hold is fixed at 320 acres. Lands under this system are held on “lease in perpetuity” for 999 years, in the same way as lands under the same tenure when thrown open for free selection. The conditions of residence and improvement are the same. The system offers many advantages to the settler, so long as the blocks of land are judiciously selected, having regard to quality of land, access, markets, and the probability of employment being obtained in the neighbourhood. In the eagerness to obtain lands on such easy terms, these points have, in the past, not been sufficiently attended to by some of the associations, and in consequence the success of many remains to be proved.
The following figures show the extent to which settlers have availed themselves of this class of settlement during the two years ending the 31st March, 1894; the figures represent approved applications only: 1,128 selectors took up 266,233 acres, in thirty-five blocks.
The “village settlement system” of New Zealand has become widely known in the Australian Colonies, and has excited much inquiry with a view to its adoption in other parts. It is believed, however, that this, and the “small farm association” system referred to above, are often confounded in the minds of the public, for of recent years there has been no very great extension of the village-settlement system in this colony. (For details see Mr. March's article, post). The system was initiated in 1886 by the late Hon. John Ballance, with the intention of assisting the poorer classes to settle on the land. It became immediately very popular, and by its means a considerable number of people were settled on the land, who otherwise would possibly never have become landholders. The features of the system were, originally, the possession of a small farm, not exceeding 50 acres in extent, held under a perpetual lease for terms of thirty years, with recurring valuations at the end of each term. The rental was 5 per cent. on a capital value of not less than £1 an acre. Residence and improvement of the soil were compulsory. The new and important feature in the village-settlement system, however, was the advance by the State of a sum not exceeding £2 10s. per acre, up to 20 acres, for the purpose of enabling the settler to cultivate the land, and of a further sum not exceeding £20 to build a house with, on which ho paid interest at the rate of 5 per cent. Road-works were also very frequently undertaken in the neigh-hood of these settlements, which have been of very great help to the settlers. Under this system a number of settlements were formed, and, where the sites were chosen judiciously, a large measure of success has resulted therefrom.
The present law admits of similar village settlements, but the area which a selector may hold has been increased to 100 acres, and the tenure changed to a “lease in perpetuity” for 999 years, on a 4-per-cent. rental. Advances for clearing and house-building have, however, practically ceased, and, indeed, few settlements have lately been started, one of the principal reasons being the dearth of suitable localities in which to plant them. This is owing to the limited area of Crown lands adapted to the special features of “village settlements.”
A modification of the system has been introduced, however, which, so far as can be judged at present, will eventually take its place. In order to find work for the unemployed, considerable areas of forest-clad Crown lands have been set aside, and small contracts for the clearing, burning, and sowing these with grass have been let. The ultimate intention is to subdivide these areas into small farms, to be let on “lease in perpetuity,” on a rental sufficient to cover the cost of clearing, &c., together with a fair rental of the land. Only one such settlement under this system has at present been allocated to settlers, and, so far, is successful.
With respect to other methods of dealing with the Crown estate, the “Digest of the Land-laws” appended hereto will give sufficient particulars.
Allusion has already been made to the dearth of Crown lands suitable for small settlements in localities where they are most needed, i.e., in settled districts, where the lands are frequently held in large estates, whose owners employ a good deal of labour. Not only is this the case in many parts of the colony, but there is also a want of land where the sons of settlers can obtain farms, not far from the homes of their parents. To meet this want the Hon. J. McKenzie, the present Minister of Lands, introduced into the Legislature in the session of 1892 a Bill entitled “The Land for Settlements Act,” which authorised the purchase from private individuals of suitable properties for subdivision into small farms not exceeding 320 acres in extent. Under the provisions of this Act several properties have been acquired and subsequently divided into small farms, and leased in perpetuity at a 5-per-cent. rental on a capital value fixed at a sufficient rate to cover first cost, together with survey, administration, and roads (if required). The process of acquisition is as follows: Whenever a property is offered to the Government, if it is so situated as to meet the object of the Act, a report on it is obtained by a qualified Government officer, and, should his report be favourable, the question of purchase is then referred to a Board of Land-Purchase Commissioners, composed of four Government officers whose training and duties qualify them to advise the Government as to whether the purchase is a suitable one, and as to the price which should be given for the property. It is only on the advice of this Board that the Government acts. In nearly all cases the properties acquired have been improved farms, situated in settled districts, where the tenants have some chance of obtaining employment in the vicinity. The amount which may be expended per annum under the Act quoted is £50,000. An extension of the provisions of the Act would prove beneficial in providing homes for a large class of persons, who, from inexperience or other reasons, are in a measure prohibited from occupying the waste lands of the Crown; and, moreover, as the properties acquired are all more or less improved, they seem to afford to the small-farmer class of the Old Country an opening for building up homes for themselves where their previous experience will be of use, instead of having to learn—often by sad experience—the methods adapted to a new and wild country.
By J. E. March, Superintendent.
Very few subjects have occupied so much public attention, and there are few on which there has been such a diversity of opinion, as the village-homestead settlement scheme initiated by the late Hon. Mr. Ballance. Not only has this been the case in New Zealand, but beyond the colony as well. Thus, in the early part of 1891, the Hon. Mr. Copley, Commissioner of Crown Lands in South Australia, paid an official and special visit to New Zealand, the object being, as stated in his report, “to inquire into the working of the village-homestead special settlements, concerning which so many conflicting statements had been made in South Australia.”
Again, at the end of last year, the Hon. Mr. McIntyre, Commissioner of Crown Lands, Victoria, paid an official visit to this colony for the purpose of “inquiring into the system of land settlement, and inspecting the village settlements.” In his report, dated Melbourne, 19th February, 1894, the Hon. Mr. McIntyre says: “From my personal observation, and from the information I was enabled to obtain through the documents placed at my disposal, I think I am perfectly justified in stating that the success of the village-settlement movement in New Zealand has been proved. It has got beyond the experimental stage; and the system, if I mistake not, is firmly grafted on the land-policy of that country. Any apprehensions which I may have entertained of the ultimate success of our Victorian village settlements have entirely disappeared in the light of the experience gained in New Zealand.”
The plan of forming village settlements was first commenced in the Provincial District of Canterbury by the Hon. Mr. Rolleston. It was on a small scale, but it worked admirably. In 1874 and 1875, there was a difficulty in finding quarters or employment for immigrants, who had arrived in Canterbury in considerable numbers, and it was decided to try the experiment of settling them on the land in districts where they were likely to obtain work. The course adopted was briefly as follows: On the line of railway, or adjacent thereto, as at Rakaia, Orari. and Arowhenua, blocks of Government land were laid off into sections, varying in area from one quarter to five acres. Assistance was given to the extent of £10 towards the erection of a small hut or cottage. The “terms of occupation were as follows: For the first year, rent free; and for the second and third years, a rental of 2s. per week was charged, to recoup the Treasury the amount advanced.
In the formation of some of these settlements, notably at Geraldine, Timaru, and Waimate, the idea was not to permanently locate the immigrants, on whose behalf the plan had been adopted, but merely allow them to occupy the land temporarily; and it was considered that in three years they would be enabled to find situations or places elsewhere. All traces of the settlements formed in the localities named have long since disappeared.
The land comprised in the village settlements formed at Rakaia, Arowhenua, Beaconsfield, and other districts in Canterbury, was sold to the original settlers on the deferred-payment system.
From 1876 to 1886, a period of ten years, very little was done in extending the system, but in the latter year the late Hon. Mr. Ballance, then Minister of Lands, introduced regulations for the formation of village-homestead special settlements. These were of a liberal character; and the assistance granted by way of loans for dwelling-houses, bush-felling, grassing, &c., enabled an industrious man to make and establish a comfortable home, while he was precluded from parting with the freehold.
A large number of settlements were thus formed, and, generally speaking, the settlers and their families have comfortable homes, and look healthy and contented; the financial results prove conclusively that the settlements are successful.
During the period from October, 1887, to January, 1891, no new village-homestead settlements were formed; on the contrary, it was decided early in 1888 to withdraw all the unselected sections in the settlements already formed from occupation under that system, and to open the land under ordinary conditions of settlement—namely, for cash, deferred payment, or perpetual lease.
The original system was again introduced by the Hon. Mr. McKenzie, Minister of Lands, in March, 1891, with a modification in the amount to be advanced, which was limited to a sum not exceeding £10, to assist a selector in the erection of a dwelling-house on his section.
Considerable progress has been made under the ordinary village system of land settlement, and during the past year 293 new selectors have taken up sections of land, representing an area in the aggregate of 5,530 acres. No monetary advances, however, have been made in these cases. Without doubt the system is one which fosters a spirit of independence, and habits of industry and self-help. It has had a most beneficial effect in the colony, having been the means of providing settled and comfortable homes for many people, who previously found that rent and cost of living absorbed all their earnings.
The success, however, is best shown by the financial results. The returns for the year ending March 31st last show the position of the settlements to be as follows: —
| Total number of settlers under the village-homestead system | 1,155 | |
| Total area occupied (acres) | 27,301 | |
| Total amount advanced from the commencement of the system for dwelling-houses, bush-felling, &c. | £25,318 | |
| Payments made by settlers during the last year— | ||
| Rent | £1,990 | |
| Interest | 891 | |
| £2,881 | ||
| Total payments made by settlers from the commencement of the system to the 31st March, 1894— | ||
| Rent | £9,509 | |
| Interest | 3,895 | |
| £13,404 | ||
| Value of improvements now on the land | £70,006 | |
These figures prove conclusively that the system is one to encourage and extend.
The Treaty of Waitangi, under which the Crown assumed sovereignty over New Zealand, confirmed and guaranteed to the chiefs and tribes of New Zealand the full, exclusive, and undisturbed possession of their lands and estates, forests, fisheries, and other properties which they then collectively or individually possessed; and to Her Majesty the exclusive right of pre-emption over any such lands as the proprietors thereof might be disposed to alienate. By “The Native Lands Act, 1862,” the Crown relinquished this right of pre-emption.
Between the date of the treaty (6th February, 1840) and the year 1870 the Native title was extinguished by purchase over an area of 6,000,000 acres in the North Island.
The Native rebellion of 1860–69 brought Native-land purchases, for the time being, practically to a standstill.
The Immigration and Public Works Acts of 1870 and 1873 appropriated £200,000 and £500,000, respectively, for the purchase of lands in the North Island; and these amounts have, up to the 31st of March, 1894, been augmented by further annual appropriations from the Public Works Fund and other loan moneys, covering altogether a total expenditure since 1870 of £1,396,077, with the following results: Area finally acquired in the North Island from Natives, from 1870 to 31st March, 1894, 5,833,664 acres. Area under negotiation in the North Island on 31st March, 1894, 1,482,023 acres; interests therein finally acquired, 301,524 acres.
The whole of the Middle Island, with the exception of reserves for the original Native owners, was acquired prior to the passing of “The Native Lands Act, 1862.” Stewart Island was purchased from the Native owners by deed dated 29th June, 1864.
The Crown lands are administered, under the authority of “The Land Act, 1892,” by the Hon. the Minister of Lands at Wellington. For convenience the colony is divided into ten land districts, each being under the local direction of a Commissioner and a Land Board. The Commissioner's office is known as the principal land office, and in some of the larger districts there are one or more sub-offices. It is with these land offices the selector has to transact all business, from the first consultation of the maps to the final receipt of the Crown title.
The names of the land districts and of the towns where each principal office is situated are, beginning with the most northerly and taking them geographically, as under: —
| Land District. | Town where Principal Land Office is situated. |
|---|---|
| Auckland | Auckland. |
| Taranaki | New Plymouth. |
| Hawke's Bay | Napier. |
| Wellington | Wellington. |
| Nelson | Nelson. |
| Marlborough | Blenheim. |
| Canterbury | Christchurch. |
| Otago | Dunedin. |
| Southland | Invercargill. |
| Westland | Hokitika. |
Crown lands are divided into three classes:—
Town and village lands, the upset prices of which are, respectively, not less than £20 and £3 per acre; such lands are sold by auction:
Suburban lands, the upset price of which may not be less than £2 an acre; these lands are also sold at auction:
Rural lands, which may be disposed of at not less than £1 per acre for first-class, and 5s. an acre for second-class lands; such lands may be sold or leased by auction, or sold or leased on application.
No rural section may be larger than 640 acres in extent if first-class land, or 2,000 acres if second-class land, whether offered by auction or application. No person can select more than 640 acres of first-class or 2,000 acres of second-class land, including therein any land which he then holds. Pastoral runs are limited to areas which will carry 20,000 sheep or 4,000 cattle. No person can select more than one run.
Crown lands may be acquired as follows: —
By auction, after survey, in which case one-fifth of the price is paid down at the time of sale, the balance within thirty days:
By application, after the lands have been notified as open for selection, in which case the applicant fills up a form (to be obtained at any of the Land Offices) and makes the declaration and deposit required by the particular system he wishes to select under.
All applications, whether for surveyed or unsurveyed lands, are deemed to be simultaneous if made on the same day, and, if there be more than one applicant for the same land, the right of selection is determined by ballot.
Lands thrown open for application may be either surveyed or unsurveyed, and those not selected the first day remain open.
Lands for selection are notified as open for application on and after a stated day, and, at the option of the applicant, may be obtained on any of the three following tenures: (a.) Cash; (b.) Occupation with the right of purchase; (c.) Lease in perpetuity.
If the land is surveyed, one-fifth of the price is to be paid down at the time of application, and the balance within thirty days; or, if the land is not completely surveyed, the survey-fee is paid on application, and goes towards the purchase of the land; the balance must he paid within thirty days of notice that the survey is completed.
A certificate of occupation will issue to the purchaser on final payment, which will be exchanged for a Crown title so soon as the Board is satisfied that the improvements herein mentioned have been completed.
Lands selected on this tenure are held under a license for twenty-five years. At any time subsequent to the first ten years, and alter having resided and made the improvements herein described, the licensee can, on payment of the upset price of the land, acquire the freehold. If the land be not purchased the license may be exchanged for a lease in perpetuity.
The rent is 5 per cent. on the cask price of the land; a half-year's rent has to be paid in with the application, if surveyed land, which represents the half-year's rent due in advance on the 1st day of January or July following the selection. If the land is unsurveyed, the cost of survey is to be deposited, and is credited to the selector as so much rent paid in advance, counted from the 1st day of January or July following thirty days’ notice of the completion of survey.
Residence and improvement of the land are compulsory, as herein described.
Lands selected on this tenure are leased for 999 years, subject to the conditions of residence and improvements herein described. The rental is 4 per cent. on the cash price of the land, and applications are dealt with in the same way as under the previous tenure (b), but there is at no time a right of purchase.
Two or more persons may make a joint application to hold as tenants in common under either of the two last-named tenures.
Under the two last-mentioned tenures, the conditions as to residence and improvements are:
RESIDENCE—
Must commence on bush or swamp lands within four years, and in open or partly open land within one year, from the date of selection;
Must be continuous for six years on bush or swamp land, and for seven years on open or partly open land, on lands occupied with a right of purchase;
Must be continuous for a term of ten years on lease-in-perpetuity lands.
The Board has power to dispense with residence in certain cases, such as where the selector is residing on adjacent lands, or is a youth or unmarried woman living with parents, and in a few other-cases.
RESIDENCE implies the erection of a habitable house to be approved of by the Board.
IMPROVEMENTS which must be made are as follows: —
Cash-tenure lands must be improved within seven years to an amount of £1 an acre for first-class land, and 10s. an acre for second-class land.
Lands held on lease with right of purchase, or on lease in perpetuity, must be improved to an amount equal to 10 per cent. of the value of the land within one year from the date of the license or lease: within two years must be improved to the amount of another 10 per cent.; within six years must be improved to the value of another 10 per cent., making 30 per cent. in all within the six years. In addition to the above, the land must be further improved to an amount of £1 an acre for first-class land, and on second-class land to an amount equal to the not price of the land, but not more than 10s. an acre.
Improvements may consist of reclamation from swamps, clearing of bush, planting with trees or hedges, cultivation of gardens, fencing, draining, making roads, wells, water-tanks, water-races, sheep-dips, embankments or protective-works, or in any way improving the character or fertility of the soil; or the erection of any building, &c.; and cultivation includes the clearing of land for cropping, or clearing and ploughing for laying down with artificial grasses, &c.
Under the existing regulations any number of persons, not less than twelve, may apply for a block of land of not less than 1,000 acres or more than 11,000 acres in extent, but the number of members must be such that there shall be one for every two hundred acres in the block, and no one can hold more than 320 acres, except in swamp lands, when the area may be 500 acres.
The capital value of lands within a special settlement is fixed after survey by special valuation, but may not be less than 10s. an acre; the rental is not less than 4 per cent. on the capital value, and the tenure is a lease in perpetuity.
Residence, occupation, and improvements are generally the same as already described, and applications have to be made in manner prescribed by regulations.
Applicants should apply to a Commissioner for a copy of the regulations, as they are liable to change at any time.
Village settlements are disposed of under regulations made from time to time by the Governor, but the main features are as follows:—
Such settlements may be divided into,—
Village allotments not exceeding one acre each, which are disposed of either by auction among the applicants, or by application as already described, with option of tenure, the cash price being not less than £3 per allotment:
Homestead allotments not exceeding 100 acres each, which are leased in perpetuity at a 4-per-cent. rental on a capital value of not less than 10s. per acre.
Residence, improvements, and applications are the same as already described. The leases are exempt from liability to be seized or sold for debt or bankruptcy.
The Colonial Treasurer is empowered in certain cases to advance small sums for the purpose of enabling selectors to profitably occupy their allotments.
Small grating-runs are divided into two classes: first-class, not exceeding 5,000 acres; second-class, not exceeding 20,000 acres in area. The rental in both cases is not less than 2 1/2 per cent. on the capital value per acre, but such capital value cannot be less than 5s. per acre. Small grazing-runs are leased for terms of twenty-one years, with right of renewal for other twenty-one years, at a rent of 2 1/2 per cent. on the then value of the land. The runs are declared open for selection, and applications and declarations on the forms provided have to he filled in and left at the Land Office, together with the deposit of one half-year's rent, which represents that due on the 1st day of March or September following the selection.
No holder of a pastoral run, and no holder of freehold or leasehold land of any kind whatever, over 1,000 acres in area exclusive of the small grazing run applied for, may he a selector under this system, and only one small grazing run can he held by any one person.
The lease entitles the holder to the grazing rights, and to the cultivation of any part of the run, and to the reservation of 150 acres round his homestead through which no road may be taken; but the runs are subject to the mining laws.
Residence is compulsory, if bush or swamp land, within three years; if open, within one year; and must be continuous to the end of the term, but may in a few cases be relaxed. Improvements necessary are as follows: Within the first year, to the amount of one year's rent; within the second year, to another year's rent; and, within six years, to the value of two other years’ rent: making in all a sum equal to four years’ rental, which must be expended within six years. In addition to these improvements, bush-covered first-class runs must be improved to an amount of 10s. an acre, and second-class bush-clad runs to an amount of 5s. an acre.
These runs may be divided, after three years’ compliance with the conditions, amongst the members of the selector's family.
Pastoral country is let by auction for varying terms not exceeding twenty-one years; and, excepting in extraordinary circumstances, runs must not be of a greater extent than would carry 20,000 sheep or 4,000 head of cattle. Runs are classified from time to time by special Commissioners into: (1) Pastoral lands, which are suitable only for depasturing more than 5,000 sheep; (2) Pastoral-agricultural lands suitable for subdivision into areas of under 5,000 acres, which may be either let as pastoral runs, generally for short terms, or cut up for settlement in some other form. Leases of pastoral lands may not be resumed; leases of pastoral-agricultural lands may be resumed at any time after twelve months’ notice without compensation.
No one can hold more than one run; but in case of any one holding a run of a carrying-capacity less than 10,000 sheep, he may take up additional country up to that limit.
Runs are offered at auction from time to time, and half a year's rent has to be paid down at the time of sale, which represents that due in advance on the first day of March or September following the sale, and the purchaser has to make the declaration required by the Act. All leases begin on the first day of March, and they entitle the holder to the grazing rights, but not to the soil, timber, or minerals;and the lease terminates over any part of the run which may be leased for some other purpose, purchased, or reserved. The tenant has to prevent the burning of timber or bush; in open country to prevent the growth of gorse, broom, or sweet-briar; and to destroy the rabbits on his run. With the consent of the Land Board the interest in a run may be transferred or mortgaged, but power of sale under a mortgage must be exercised within two years.
In case it is determined again to lease any run on expiry of the lease, the new lease must be offered by auction twelve months before the end of the term, and if, on leasing, it shall be purchased by someone other than the previous lessee, valuation for improvements, to be made by an appraiser, shall be paid by the incoming tenant, but to a value not greater than three times the annual rent— excepting in the case of a rabbit-proof fence, which is to be valued separately. If the run is not again leased, the value of rabbit-proof fencing is paid by the Crown, but the tenant has no claim against the Crown beyond the value of the rabbit-proof fence; he may, however, within three months of sale, remove fences, buildings, &c. Runs may also be divided with the approval of the Board.
The following is the scale of charges for surveys of unsurveyed lands: —
Not exceeding 30 acres, £6.
Exceeding 30 and up to 50 acres, 3s. 6d. per acre, but not less than £6.
Exceeding 50 and up to 100 acres, 3s. per acre, but not less than £8 15s.
Exceeding 100 and up to 200 acres, 2s. 6d. per acre, but not less than £15.
Exceeding 200 and up to 300 acres, 2s. per acre, but not less than £25.
Exceeding 300 and up to 500 acres, 1s. 8d. per acre, but not less than £30.
Exceeding 500 and up to 1,000 acres, 1s. 4d. per acre, but not less that £41 10s.
Exceeding 1,000 and up to 2,000 acres, 1s. per acre, but not less than £66 10s.
For the survey of any area of rural land, being open land, the scale of charges shall be two-thirds the foregoing rates.
By G. B. Davy, Registrar-General of Land.
A recent distinguished visitor to the colony (Lord Folkestone) is reported to have expressed the opinion that little progress would be made in England in settling the people on the soil, or in subdividing the land, until the cumbrous and antiquated system of land-tenure and land transfer was reformed and made as simple and inexpensive as in New Zealand. It is, indeed, only by comparison with the system of conveyancing which it was intended to supersede, and which still obtains in the Old Country, that the value of the method of dealing with real property introduced into this colony by “The Land Transfer Act, 1870,” can be fully appreciated. As a matter of fact, however, there still are, and have been since 1870, two systems of dealing with land in the colony: that is to say, the “deeds registration,” or, as it is familiarly called, the “old” system, which is a reproduction, plus registration, of the old English system of conveyancing, and the Land Transfer system proper, which, under the name of the “Torrens” system, was originally adopted by the Legislature of South Australia in 1857, and subsequently by the other Australian Colonies. It is, of course, to the latter of these that the remarks above quoted refer. It is the merit of that system to have freed the lands of the colony from the trammels of English Real Property Law, and to have assimilated the mode of dealing with real property to that which regulates dealings with ships, and with the large class of personal property represented by stocks and shares in public companies and in the public funds. Its introduction was the first of a series of reforms tending in the direction of abolishing the artificial distinction created by law between the two classes of property, a distinction which was, by lawyers of the old school, deemed insuperable.
As already staled, however, it is to the Legislature of South Australia that the honour belongs of being the first to break away from English precedents, and to bring the long-vexed question of Land Transfer inform to a practical solution. “The Land Transfer Act (New Zealand), 1870,” only adopted with such modifications as circumstances required the Act of the sister colony. Nor has the subject been entirely overlooked by the Imperial Legislature. “The Land Transfer Act (England), 1875,” tentatively introduced the system in England; but, as its adoption is entirely optional on the part of landed proprietors, it has as a practical reform remained almost in abeyance. In these colonies, however, where the same difficulties and prejudices have not existed, the Land Transfer system has been from the first a popular institution, and it would at this date be superfluous to adduce any argument in its favour but that of experience. That it has not as yet been universally adopted is due not to any doubt on the part of landowners as to its utility or perfect efficiency, but to other causes hereafter referred to.
The fundamental principle of the system, as distinguished from ordinary conveyancing, and from the system of deeds registration, is “registered proprietorship”—in other words, the ascertainment from the register with absolute certainty of the person or persons with whom it is safe for an intending purchaser to deal. This is precisely the difficulty which, under the old system of conveyancing, causes so much trouble, expense, and uncertainty. The person with whom you are proposing to deal may have all the “indicia”of ownership—i.e., he may be in possession of the, land under a duly-registered conveyance, hacked by an imposing array of legal documents. But, for all these, there is no guarantee that he is actually what he is represented to be. To ascertain this, you must follow the land through all its devolutions and changes of ownership, for say thirty or forty years, and test carefully every link in the chain of evidence which constitutes what is called the “title.” You must ascertain that each act in the series is in order, that every instrument has been executed by the proper person or persons and with all requisite formalities, and that there are no outstanding interests of any kind. Failure in any of these respects may vitiate the title. And although the complete system of deeds registration which was established in the colony from an early period greatly facilitates such an investigation, it will be found in many cases sufficiently tedious and complicated. The parcel of land miller investigation may perhaps have been acquired through several distinct lines of title, each of which, with all its ramifications, has to be separately traced and verified. Each or any of these again may be complicated by wills, settlements, intestacies, and other incidents of the devolution of real estate, out of which may arise difficult questions and contingencies more or less remote, to be guarded against; to say nothing of errors and misdescriptions due to the careless preparation of deeds, &c., which are by no means infrequent. All this is sufficiently annoying to the vendor, who, unless guarded by carefully prepared conditions of sale, will perhaps be called on to remove at considerable cost and trouble some doubt or defect, or to supply additional evidence, and may think himself fortunate if he is able to comply with the requisition. On the other hand, the ingenuity of the purchaser, or rather, of his legal adviser (for he, too, must have a lawyer at his elbow), is stimulated to the utmost in the detection of flaws and possible contingencies by the knowledge that when he, in his turn, becomes the vendor, the same process will be repeated with himself as the victim, and the title subjected to a similar inquisition on the part of the next purchaser. And so the matter goes on with ever-increasing complexity, and without hope of finality. But once let the land be brought under the Land Transfer Act and all this trouble and annoyance becomes a thing of the past. The title is investigated once for all by the officers appointed for the purpose, and if accepted, the thenceforth useless title-deeds are consigned to oblivion in the archives of the department, the proprietor receiving in lieu thereof a certificate of title shewing the exact nature of his interest. On this certificate are noted all leases, encumbrances, &c., affecting the ownership, the position and boundaries of the land being indicated by diagram. A duplicate of this certificate is retained in the Land Transfer Office, and when bound with other certificates in the Register-book constitutes what is called a “folium” of the Register. Should the proprietor thereafter propose to deal with the land, all that an intending purchaser has to do is to consult this folium, which he is entitled to do on payment of a small fee, and he will see at a glance all that it concerns him to know in order to enable him to complete the transaction with absolute security. This done, the original proprietor hands over to the purchaser the certificate of title, together with a duly-executed transfer, on production of which to the Registrar the purchaser becomes in his turn the registered proprietor and the holder of the existing certificate of title.
It could he wished that a system, the advantages of which are so obvious could at once have been made applicable to all dealings with land throughout the colony. This, however, has not been found practicable, and the operation of the Act has hitherto been. limited to land alienated by the Crown since 1870, and to such other land as may be brought under the operation of the Act on the voluntary application of the proprietor. Although the old system is in this way in gradual course of extinction, it is likely to be many-years before the process is completed; and the land not under the Act being for the most part in the cities and older settlements, represents a very considerable proportion in point of value. Many landowners still hold their land by the original Crown grant, or by titles but little removed from it, and to such the Land Transfer Act offers no present inducement. Some, again, are deterred by unwillingness to submit for investigation and public notification claims which may be still open to question. For, be it understood, the Land Transfer Act does not profess to validate doubtful claims, or to convert a bad title into a good one. On the contrary, no title would be accepted under the Act which was not considered, at all events, a good holding title. But the great obstacle to the general adoption of the system is the want of reliable surveys, and the cost and trouble to which persons seeking to bring land under the Act are often subjected in consequence. There seems no remedy for this, and experience makes the necessity for strictness in the matter of survey more and more apparent. Applications are not unfrequently withdrawn on this account, and, in fact, the survey question is the main difficulty with which the Land Transfer Department has had to contend.
Intimately connected with the survey question, and indeed largely dependent on it, is that of indefeasibility of title. Indefeasibility, absolute and unqualified, is the popular idea of a Land Transfer title, and, so far as legislative enactments can achieve indefeasibility, it has been achieved. As we have already seen, each devolution of title acquires by registration an independent validity, which places the certificate of title on a level in point of simplicity and security with a Crown grant. But, unfortunately, no legislative ingenuity can overcome the difficulties and defects inherent in the instruments with which it has to work, and the imperfection of the survey system has, to some extent, communicated itself to the land transfer. Though sufficient for the primary purposes of settlement, the early surveys of the colony are for the most part inadequate and untrustworthy as the basis of a system to which perfect accuracy in this respect is essential, and serious discrepancies between title and actual occupation are not infrequent. Nor have the private surveys, made for the purposes of the Act, proved always reliable. The consequence: is that the calling in and revision of certificates of title, though theoretically impossible, is by no means uncommon; and it muss be admitted that a purchaser cannot always depend on maintaining the precise boundaries indicated. This, however, is a difficulty which will be gradually eliminated, and ample provision is made by the Act for pecuniary compensation in such cases. Practically, therefore, the protection afforded to a bona fide purchaser in dealing with the registered proprietor is absolute.
And here at the outset appeared a difficulty. It is of course impossible to ignore the existence of trusts and equitable interests, and a registered proprietor may be, and often is, a mere trustee for the benefit of others, whose interests might be prejudicially affected by this unqualified power of disposition. It was pointed out that the old system, with all its inconveniences, provided certain checks on improper dealing with land by persons in fiduciary positions which would not exist under the system of registered proprietorship; whilst to admit notice of trust on the register would be to sacrifice the principle of the Act and to revert to an inconvenient extent to the former practice. Clearly the difficulty had to be met, and the risk of fraud narrowed to the utmost. It has been observed that breaches of trust most frequently occur in the case of sole trustees, who may (contrary perhaps to the original intention) have become such by death or resignation of co-trustees. To meet this contingency the Act provides that where two or more persons who are trustees are registered as joint proprietors the words “No survivorship” may, at the instance of the person creating the trust, be indorsed on the certificate of title. The effect of this is that daring the continuance of the trust the original number of trustees must be maintained in order to effect any dealing with the property. But a more effective provision is the right given by the Act to persons claiming under any unregistered right or interest to enter a “caveat,” or caution, upon the register, indicating the existence of such interest, and prohibiting any dealing with the land inconsistent therewith. The purchaser who finds this entry on the register will be put on his guard, and must be careful how he parts with his money, as until the caveat is removed no dealing of any kind will be registered. That these provisions have proved effectual may be inferred from the fact that in the course of twenty-three years and upwards no fraudulent dealing has come to light in this colony which can be said to have been specially referable to the Land Transfer system. Should any such occur, it will probably be due to neglect on the part of the persons defrauded to use necessary precautions.
From the foregoing it will appear that, except as the subject of a caveat (in which case it would be under the protection of the Supreme Court in its equitable jurisdiction), no estate or interest of any kind can exist in land under the Land Transfer Act otherwise than by registration. As a consequence, the acquirement of rights in land by adverse possession and user, or what is called title by prescription, is impossible. This is a considerable innovation on English law, and whether it may be claimed as an improvement is possibly matter of opinion. It is obviously, however, a necessary result of the principle of registered proprietorship.
Another important incident in the Land Transfer system is economy in legal charges. The necessity for legal assistance in bringing land under the Act is, of course, dependent upon the nature of the title and the degree of complexity attending it. But for dealing with land after the issue of a certificate of title no technical knowledge is requisite, and a large proportion of Land Transfer business is transacted by unprofessional persons licensed as land brokers, whose charges are limited by the Act.
Reference has been made to payment of compensation in cases where, for any reason, the certificate of title may have failed of effect. This compensation is payable out of a fund called the “Land Transfer Assurance Lund,” established for that purpose under the provisions of the Act, and kept as a separate fund in the hands of the Public Trustee. The fund is at present maintained by a contribution of a halfpenny in the pound on the value of all land brought under the Act on the application of the proprietor. The claims on the Assurance Fund have not hitherto been either large or numerous, and have been principally in respect of deficiency in area or measurement arising from errors in survey.
It only remains to be said that persons bringing land under the Act are required to be perfectly frank in their dealings with the department, as the suppression or falsification of any material fact might, so long as the land remained in the hands of the original applicant, involve cancellation of the title, to say nothing of penalties. But no fraud or misrepresentation on the part of the applicant would affect the position of a purchaser, who, in any bond fide transaction, would be fully protected by the fact that he was dealing with a registered proprietor.
As to the practical working, the colony is divided into ten land registration districts, corresponding to the ten provincial districts, or former provinces. In each of these is a District Land Registrar, who acts also in most cases as Examiner of Titles, and has full power to accept titles under the Act. An appeal lies from his decision to the Registrar-General of Land, and ultimately to the Supreme Court. The bulk of the land under the Act has, however, become so by reason of having been alienated from the Crown since 1870.
The foregoing is an outline of the principal features of the Land Transfer system as established in New Zealand. The Act under winch the system is at present administered is “The Land Transfer Act, 1885,” being a consolidation of the Act of 1870 and its amendments. The Act, with all necessary instructions for conduct of business, is published by the New Zealand Government in the form of a Land Transfer Handy-Book, obtainable from the Government Printer, Wellington.
FEES PAYABLE TO DISTRICT LAND REGISTRARS UNDER “THE LAND TRANSFER ACT, 1885.”
| £ | s. | d. | |
|---|---|---|---|
| For the bringing land under the provisions of this Act (over and above the cost of advertisements)— | |||
| When the title consists of a Crown grant, and none of the land included therein has been dealt with | 0 | 2 | 0 |
| When the title is of any other description and the value exceeds £300 | 1 | 0 | 0 |
| When the title is of any other description and the value exceeds £200 and does not exceed £300 | 0 | 15 | 0 |
| When the title is of any other description and the value exceeds £100 and does not exceed £200 | 0 | 10 | 0 |
| When the title is of any other description and when the value docs not exceed £100 | 0 | 5 | 0 |
| Contribution to the Assurance Fund upon first bringing land under the Act, and upon the registration of an estate of freehold in possession derived by settlement, will, or intestacy— | |||
| In the pound sterling | 0 | 0 | 1/2 |
| Other fees— | |||
| For every application to bring land under the Act | 0 | 5 | 0 |
| For every certificate of title on transfer where the consideration deeds not exceed £100 | 0 | 10 | 0 |
| For every other certificate of title | 1 | 0 | 0 |
| Registering memorandum of transfer, mortgage, incumbrance, or lease | 0 | 10 | 0 |
| Registering transfer or discharge of mortgage or of incumbrance, or the transfer or surrender of a lease | 0 | 5 | 0 |
| Registering proprietor of any estate or interest derived by settlement or transmission | 0 | 10 | 0 |
| For every power of attorney deposited | 0 | 10 | 0 |
| For every registration abstract | 1 | 0 | 0 |
| For cancelling registration abstract | 0 | 5 | 0 |
| For every revocation order | 0 | 10 | 0 |
| Noting caveat | 0 | 10 | 0 |
| Cancelling or withdrawal of caveat, and for every notice relating to any caveat | 0 | 5 | 0 |
| For every search | 0 | 2 | 0 |
| For every general search | 0 | 5 | 0 |
| For every map or plan deposited | 0 | 5 | 0 |
| For every instrument declaratory of trusts, and for every will or other instrument deposited | 0 | 10 | 0 |
| For registering recovery by proceeding in law or equity or re-entry by lessee | 0 | 10 | 0 |
| For registering vesting of lease in mortgagee, consequent on refusal of Trustee in Bankruptcy to accept the same | 0 | 10 | 0 |
| For entering notice of marriage or death | 0 | 10 | 0 |
| For entering notice of writ or order of Supreme Court | 0 | 10 | 0 |
| Taking affidavit or statutory declaration | 0 | 5 | 0 |
| For the exhibition of any deposited instrument, or for exhibiting deeds surrendered by applicant proprietor | 0 | 5 | 0 |
| For certified copy, not exceeding five folios | 0 | 5 | 0 |
| For every folio or part folio after first five | 0 | 0 | 6 |
| For every notice to produce deeds or instruments | 0 | 5 | 0 |
| For every outstanding interest noted on certificate of title | 0 | 5 | 0 |
| When any instrument purports to deal with land included in more than one grant or certificate, for each registration memorial after the first | 0 | 2 | 0 |
All fees under the Act shall be due and payable in advance.
Where several properties are included in one form of application, there shall be charged in respect of each property an application fee and a fee for bringing the land under the Act. Land included within one outer boundary shall be deemed one property for the purpose of this regulation.
In all cases a fee of one pound (£1) is hereby prescribed as the charge to be made for advertising notice of application; provided that, whenever it is necessary that unusual publicity shall be given to any application, the District Land Registrar may require payment of such additional sum as shall, in his judgment, be sufficient to defray the cost of such advertisements.
In all cases where application is made to bring land under the Act, and the certificate of title is directed to issue and is issued in the name of the applicant, the fees for bringing such land under the Act, with the exception of the “application fee,” may, at the request of the applicant, remain unpaid until such land is dealt with by him as registered proprietor. The District Land Registrar shall retain any such certificate of title until the fees due upon the same have been paid, and, until such payment, shall not register any dealing with the land included in such certificate of title.
Printed forms supplied by the Registrar for use under the Act shall be charged for at the rate of one shilling each. Solicitors, land-brokers, and others having forms printed for their own use, and at their own expense, shall, on approval of such forms by the Registrar, be entitled to have the same sealed free of charge.
By E. Tregear, Secretary, Department of Labour.
“The Labour Laws of New Zealand” are issued by the Government bound in a small volume.
They comprise “The Factories Act, 1891,” “The Factories Act Amendment Act, 1892,” “The Shops and Shop-assistants Act 1892,” “The Employers’ Liability Act, 1882,” “The Employers’ Liability Act Amendment Act, 1891,” “The Employers’ Liability Act Amendment Act, 1892,” “The Workmen's Wages Act, 1893,” “The Truck Act, 1891,” “The Contractors’ and Workmen's Lien Act, 1892,” and “The Servants’ Registry Offices Act, 1892.”
These Acts, in their general scope, are intended for the purpose of granting protection and help to manual workers whose circumstances show that such protection is needed. In many ways these labour laws are in advance of legislative enactments elsewhere, and it is in the hope that a digest of their provisions may prove useful to inquirers that the following condensation of their principal powers and restrictions has been compiled.
THESE have been added to in a very important degree by the work of the Parliamentary session of 1894. The completion of the present volume has prevented a full digest of the new Acts from being inserted, but the following remarks will give a general idea of their scope and bearing. They have been introduced and carried through by the Hon. W. P. Reeves, Minister of Labour. The first and most important of these is—
The object of the Act is to encourage the formation of industrial unions and associations, and to facilitate the settlement of industrial disputes by conciliation and arbitration. It is divided into five parts, three of them dealing respectively with: (1) The registration of industrial unions and associations; (2) industrial agreements; (3) conciliation and arbitration.
Part I.—A society of not less than seven persons, associated for the purpose of protecting or furthering the interests of employers or workmen, may be registered as an industrial union by complying with certain provisions of the Act. Full and detailed information as to constitution, rules, names of officers and members, & c., must be sent to the Registrar, who will issue a certificate of registry and incorporation. The effect of registration will be to render the industrial or trade-union so registered subject to the jurisdiction of the Board and Court appointed under the Act.
Part II.—The parties to industrial agreement may be—(1) trade-unions, (2) industrial unions, (3) industrial associations, (4) employers. Every industrial agreement shall be for a specified time not exceeding three years, and is to be filed in the Supreme Court office within thirty days of making. It is binding on both sides, and if any association or person thus bound fails in carrying it out there is a penalty not exceeding the amount fixed by the agreement, or, if no amount is fixed, not exceeding £500.
Part III.—“Industrial districts” are to be constituted and gazetted, and for every such industrial district a Board of Conciliation and a Clerk of Awards is to be appointed. The Act defines the powers of the Court and Board and the duties of the Clerk, and provides that, when a dispute is referred to Board or Court, no strike or lock-out may take place until the decision is given. A Board of Conciliation is to consist of not more than six or less than four persons, chosen by the industrial unions of employers and of workmen in the respective districts, and a Chairman is to be elected outside the members of the Board. Should a Conciliation Board fail to effect settlement the dispute may be referred to the Court of Arbitration. There is to be one Court of Arbitration for the whole colony, consisting of three members, one appointed on the recommendation of the council of associations of employers, one on the recommendation of the council of associations of workmen, and the third a Judge of the Supreme Court; every member to hold office for three years, and to be eligible for reappointment. If any party to a proceeding before the Court fail to appear without cause the Court may proceed ex parte. The award is to be made within one month, and may include costs and expenses; but no costs will be allowed for agents, counsel, or solicitors appearing for any party, and it shall be framed in such manner as to express the decision of the Court whilst avoiding technicalities. The award may be enforced in the same manner as a judgment of the Supreme Court. The amount for which an award may be enforced against an association is limited to £500.
Part IV.—The Fourth Part of the Act provides that the Railway Commissioners and the Amalgamated Society of Railway Servants may be respectively registered, and may refer any industrial dispute between them to the Court of Arbitration, hut Boards of Conciliation are to have no jurisdiction in these cases.
Other Acts are “The Factories Act, 1894,” for supervising and regulating factories and workrooms, “The Shops and Shop-assistants Act, 1894,” and “The Shipping and Seamen's Act Amendment Act, 1894.”
The new Factories Act is a consolidation of previous Acts, together with sundry amendments and extensions that have been found advisable from practical experience gained in the working of the law during the past two years. The most important changes and additions are as follows: “Child‘’ in former Acts was defined as “boy under thirteen and girl under fourteen years”; it now means boy or girl under fourteen. “Factory or workroom” formerly meant any office, building, or place in which three or more persons are engaged working for hire; this is now altered to two or more persons. An important section is that requiring every occupier of a factory or workroom who shall give out piece-work to affix a printed label, according to schedule, to every garment and every article wholly or partially made in unregistered workrooms or private dwellings. “Every merchant, wholesale dealer, shopkeeper, agent, or distributor who shall issue textile or shoddy material for the purpose of being made up by piece-workers or home-workers into articles for sale shall be deemed to be the occupier of a factory within the meaning of this section.” The regulations for the safeguarding of all machinery are very strict, and the use of any machinery may be prohibited by the Inspector until the required safeguards are provided. Outside lire-escapes from all factories and workrooms situated on the third or fourth stories of buildings are made compulsory, and all factory doors, whether internal or external, must be made to open outwards. An Inspector of Factories shall have power to inspect every shearing-shed wherein four or more persons are employed, and also every building erected for the use and accommodation of shearers, and it is his duty to ascertain, at least once a year, that such dwelling-places and working-places are in a cleanly, fit, and proper state. Persons under sixteen years are not to be employed unless they have passed the Fourth Public School Standard, or an equivalent examination. Every woman and young person under eighteen shall have holidays on Christmas Day, New Year's Day, Good Friday, Easter Monday, the Sovereign's Birthday, and every Saturday from 1 p.m. without deduction of wages. There is, however, an exemption from these half-holidays at certain seasons for makers of perishable goods. Finally, all cases brought into Court under this Act are to be heard and determined before a Stipendiary Magistrate alone, and not before local Justices of the Peace.
This Act will come into force in January, 1895. Its provisions cover both offices and shops. All shops in a city, borough, or town district are to be closed in the afternoon of one working-day in each week, such day being appointed by the Borough Council or Town Board. A few places are exempt, such as fruiterers, confectioners, & c., and also shops kept by Europeans in which the owners or their young children are the only persons serving. In country districts each shop-assistant must have a half-holiday on some afternoon of the week, but the shop need not be closed. A shop may also be kept open on the half-holiday for the sole purpose of supplying a departing vessel. Where boroughs adjoin, a common half-holiday is to be decided upon by a meeting of delegates.
The hours of women and young persons working in shops are restricted to nine and a half per diem, except on one day in each week, when eleven and a half may be worked. Provision is made for overtime at certain seasons. Regulations are made as to the sitting accommodation and sanitary arrangements of all shops.
All offices (except shipping, tramway, and newspaper offices) have to close at 5 p.m. on week-days, except on Saturdays, when they must shut at 1 p.m. Cashiers, ledger-keepers, & c., may, however, balance their books before leaving, and arrangements are made for overtime at certain periods.
This Act is to be read with “The Shipping and Seamen's Act, 1877,” and will come into force in January, 1895. It is a measure for the protection not only of seamen, but of passengers, whose lives are sometimes risked through want of supervision. The Act provides that each vessel shall carry a certain number of sailors, and all steamers a number of sailors and firemen regulated in proportion to tonnage. All seamen are to be engaged and discharged at the Customhouse. Regulations are made as to the proper rating of able-bodied seamen, firemen, and others, and as to masters giving certificates of character when discharging hands. The amount of space for the sleeping accommodation of the crew is greatly enlarged from that required by the former Act, and overcrowding of passengers is stringently dealt with. The load-line, boat accommodation, & c., have sections devoted to their improvement. All masters in charge of vessels over 20 tons (formerly over 80 tons) must be certificated. No person can pilot a vessel round the coast unless he holds a pilot's certificate.
“The Factories Act, 1891,” was passed on the 21st September, 1891, and came into force on the first day of January, 1892. An Amendment Act of a few sections was passed on the 11th of October, 1892, but is for the most part of a technical character, and does not affect the spirit of the original Act. A factory or workroom is defined as meaning “any office, building, or place in which three or more persons are engaged, directly or indirectly, in working for hire or reward in any handicraft, or in preparing or manufacturing articles for trade or sale, and any office, building, or place in which steam or other mechanical power is used for the purpose of manufacture.”
An “occupier” means the person, company, or association employing any persons in any factory or workroom, or occupying any office, building, or place intended as, or about to be used as, a factory or workroom, and includes any agent, manager, foreman, or other person acting, or apparently acting, in the general management or control of any such factory or workroom.
An “Inspector” means an Inspector of Factories under this Act; and a “child” means a boy under the age of thirteen or a girl under the age of fourteen.
It is seen by these interpretations over how wide a field the provisions of the Act extend. Not only do all factories, workshops, mills, &c., in the ordinary acceptation of the word “factory” fall under the Act, but handicrafts, or preparation of articles for trade or sale. Thus laundries, bakeries, packing establishments, freezing-works, brick-yards, breweries, dairy factories, &c., all come within reach of its provisions. It will be found, however, that, in regard to some of these, its provisions are only partial, that while it oversees the sanitation of all industrial establishments, its main object is the protection of women and children, and it does not meddle with the hours, holidays, &c., of adult men. Those places, also, which employ machinery in lieu of human labour, and would escape if counted only by the number of hands employed, are thus brought into comparison with establishments using manual labour.
A few initiatory sections of the Act deal with the Governor's power to proclaim Factory Districts, appoint Inspectors, a Chief Inspector, and medical authorities, and at section 9 we reach the administrative portion of the Act. Each “occupier” (i.e., employer) has to furnish to the Inspector and local Board of Health descriptive schedules of their buildings and business, and in case of commencing in a new building to furnish a plan of such buildings to the Board for approval. He then has to apply to the Inspector for the registration of the factory, and pay a fee according to the schedule, which is, by the amended Act, as follows:—
| Fees for Registration of Factories or Workrooms. | £ | s. | d. |
|---|---|---|---|
| Every factory or workroom in which more than thirty persons are employed, per annum | 2 | 2 | 0 |
| Every factory or workroom in which more than ten persons and not more than thirty persons are employed, per annum | 1 | 1 | 0 |
| Every factory in which more than two and not more than ten persons are employed, per annum | 0 | 5 | 0 |
This fee, according to the number of persons employed, has to be paid during the month of January of each year. When the Inspector has visited the factory, and found that all the requirements of the Act have been complied with, he issues the certificate of registration for such factory. If the occupier does not conform to the requirements of the Act, the Inspector must inform him to that effect, and, if he continues to proceed with the work of his factory without a certificate, he is liable to a penalty.
The Inspector has the power to enter and inspect a factory or workroom at all reasonable hours by day and night, and to enter by day any place which he has reasonable cause to believe to be used as a factory. The Inspector may take a constable with him, or may take with him for sanitary purposes any officer of the Board of Health, or, in cases of accident, may be accompanied by a medical officer. The Inspector has power to demand and copy books and records, to examine as a witness any person found in the factory, and to make him or her sign a declaration as to the truth of statements made. Every person wilfully delaying an Inspector, or not producing books and records, or concealing persons from appearing, or attempting to do so, is deemed guilty of obstructing an Inspector, and is liable to a fine of £5, or if the offence take place at night of £20. On the other hand, the Inspector is bound to produce his certificate of appointment, if it is demanded, and any one who forges such certificates, or personates the Inspector, is liable to be imprisoned for a period not exceeding six months, with or without hard labour.
In every factory or workroom registers have to be kept of the names of all persons employed, with the ages of all those under twenty years of age, and a record of the kind of work upon which they are engaged. The occupier has also to fix up in a conspicuous place a notice containing the names and addresses of the Inspector and Board, and of the working-hours and holidays of the factory. Bach occupier must keep a record of the work done outside the factory (generally piecework), with the name and address of the person to whom the work is given. To this the Inspector alone has access, and any Inspector divulging the contents is guilty of a misdemeanour. Heavy penalties are declared against persons forging certificates, or personating others, or falsifying records and books. The Inspector must prepare reports for the Minister in charge of the factories Act—i.e., the Minister of Labour—who in his turn is to prepare an annual report, and lay it before Parliament in one session in each year. The report of the Minister is to be of a statistical character, and must show, if possible, the whole number of persons engaged in factories or workrooms, classifying them according to age, sex, and average weekly earnings, whether by wages or piecework, the hours of labour, scale of pay, &c.
If an accident happens from the use or abuse of machinery, or of vats, pans, &c., and is of such a nature that the person injured cannot continue at his employment, within forty-eight hours the Inspector and medical authority must receive a written notice from the occupier, or be liable to a fine. The medical authority is to report to the Inspector, in order that the Inspector may investigate the cause of blame.
When members of both sexes are working in the same factory, different water-closets must be provided for each sex, separated so as to insure privacy. All factories have to be kept clean and free from offensive smells. No overcrowding may be allowed, and all workrooms must be ventilated; the cubic space of air to be allotted to each worker is to be notified by regulation. There is an appeal possible in this cast from the dictum of the Inspector to the decision of the Board of Health, and the decision of the Board is to be final. Drinking-water has to be provided by the occupier for his work-people. All inside walls, ceilings, &c., of workrooms and passages in a factory are to be lime-washed every fourteen months, or to be painted or varnished once in seven years, and places so painted or varnished must be washed with soap and hot water every fourteen months. Exemptions from this lime-washing and painting, &c., are made in certain cases, such us foundries, blacksmiths’ shops, brick-works, &c., where such precautions are unnecessary or impossible.
The outer doors of factories must be kept unfastened so as to allow free exit and entrance. Boys under eighteen years of age and women are not allowed to be kept for more than four hours and a half without a meal. Boys under sixteen and women are not permitted to take their meals in rooms where work is being carried on, unless the factory is of open construction. When more than six women are employed in a factory a proper dining-room must be provided. Certain employments may be declared by Government to be noxious trades, and in the workrooms of these trades no person, male or female of whatever age, is allowed to take meals. Specially stringent rules apply to the cleansing and sanitary appliances of bakehouses. Sleeping-places are prohibited in them. No drains, water-closets, or ashpits are allowed to have openings by pipes or otherwise within the bakehouse. Windows of certain dimensions must be put in, and free ventilation of air provided for.
In factories or workshops where grinding, glazing, polishing on a wheel, or other processes by which dust is generated, are carried on the Inspector may order the use of fans or other mechanical means for preventing workmen inhaling the dust. A boy under eighteen of a woman may not be employed in any part of a factory where wet spinning is carried on, unless means are employed for protecting the spinner from being wetted, and also for preventing the escape of steam into the rooms where the spinners are at work. By a schedule to the Act the ages of persons employed in certain industries are restricted thus: Where the silvering of mirrors or the making of white-lead is carried on no person under the age of eighteen is to be employed. Where melting or annealing glass is in progress no boy under fourteen and no girl under eighteen may work. In the making or finishing of tiles, or making or finishing salt, no girl under sixteen may be employed. Where the dipping of lucifer matches or dry-grinding in the metal trade is being carried on no person under sixteen years may be employed.
Any woman or person under eighteen years of age who works in any way, whether for wages or not, in a factory is deemed to be employed within the meaning of the Act, and this provision includes all apprentices.
In a woollen mill no female may be employed for more than forty-eight hours a week, nor between the hours of 6 o'clock in the afternoon and 7 o'clock in the morning.
In any other factory or workroom no boy under sixteen may be employed for more than forty-eight hours in one week, nor any woman or girl for more than eight hours in any one day, nor between the hours of 6 o'clock in the afternoon and 8 o'clock in the morning. With the consent of the Inspector, however, overtime may be worked for three hours in any day for not more than twenty days in a year, on condition that such overtime is paid for at a rate agreed upon. No child—i.e., a boy under thirteen or a girl under fourteen—may be employed in a factory. A person under sixteen may not be employed unless the Inspector certifies that he is satisfied as to the fitness of such person, after a birth certificate or statutory declaration by some competent person has been produced. The parents of children are also liable to a penalty if with their consent the Act is infringed. No girl under fifteen may work as a typesetter in a printing office. No deductions may be made from the wages of a woman or young person on the ground of absence from or leaving work except to the amount of damage actually sustained by the employer through such absence from work.
Every person under eighteen years of age, and every woman employed in a factory (except pieceworkers) must have certain holidays—viz., Christmas Day, New Year's Day, Good Friday, Easter Monday, and Her Majesty's Birthday. They must also have a half-holiday every week, either on Saturday afternoon or some other week-day proclaimed by the local authorities in lieu thereof. Wages are to be paid to these workers for such holidays at the same rate as their ordinary daily wage. Informations for offences against the Act shall be brought before a Stipendiary Magistrate or two Justices of the Peace, but the information must be laid within a month of the committal of the offence, or, if for an offence punishable with imprisonment, within two months. The occupier is liable to a heavy penalty if, through any breach of the Inspection of Machinery Act, he causes the death or serious injury of an employed person; and this docs not bar the injured person from stung to recover damages in an ordinary Court. When an occupier proves that an offence with which he is charged has not been committed with his knowledge and consent, the action may proceed against his agent, servant, or any other person whom the Court considers the actual offender. Fees received from occupiers of factories must be paid into the Consolidated Fund, and the salaries of Inspectors are to be paid out of an annual appropriation by the General Assembly.
“An Act for limiting the Hours of Business in Shops,” became law on the 11th October, 1892.
After defining the words “Inspector” (meaning an Inspector of Factories) “shop,” “shop assistant,” and “shopkeeper,” the Act sets forth that “Every shop-assistant employed in a shop shall, on some working-day in each week, have a half-holiday from the hour of one o'clock in the afternoon; and if any shopkeeper shall offend against the provisions of this section he shall be liable to a penalty not exceeding five pounds for each offence.” This provision does not apply in a town in any week wherein a public general holiday has been observed or declared.
A woman or a person under eighteen years of age is not allowed to work for hire in or about any shop, nor at any work in connection with the shop, for a longer period than fifty-eight hours, including mealtimes, in any one week, nor shall any woman or person under eighteen be employed in any shop if she or he has already worked the proper hours in a factory. In every shop wherein women or young persons are employed, a notice shall be exhibited referring to the provisions of the Act, and stating the number of hours in the week during which such women and young persons may lawfully be employed therein. Sitting accommodation has to be supplied for all women and girls employed in a shop, and if not supplied the shopkeeper is liable to a penalty.
A shopkeeper may justifiably plead that an offence with which he has been charged has been committed by his agent, who is liable to the same penalty as the employer. The Inspector has the same right of entry, examination, &c., in a shop as in a factory, and any shopkeeper obstructing or impeding the Inspector is liable to the same penalty as the occupier of a factory who commits the same offence. Prosecutions under the Act are to be heard before a Stipendiary Magistrate, or before two Justices of the Peace. The information must be laid within one month of committal of offence, and the right of appeal to a higher Court is granted.
These Acts are “The Employers’ Liability Act, 1882,” “The Employers’ Liability Act Amendment Act, 1891,” and “The Employers’ Liability Acts Amendment Act, 1892.”
They interpret expressions as follows: —
“A person who has superintendence intrusted to him” means a person whose sole or principal duty is superintendence.
An “employer” includes a body of persons, corporate or incorporate, the Governor, any Minister of the Crown, and the Railway Commissioners.
“Workman” includes nearly all classes of working-men and -women, except domestic servants. Railway servants and seamen are specially included. These “workmen” must be under contract, either oral, written, or implied, to perform manual labour.
When personal injury is caused to a workman he (or, in case of death, the relatives) shall have the same right of compensation and remedies against the employer as if he had not been engaged in the employer's service—but only if right is claimed on the following grounds—namely, if the accident happened—
By reason of any defect in the condition of the ways, works, machinery, plant, spars, tackle, furniture, &c., used in the business of the employer. (But not unless the injury arose through the negligence of the employer or his officers.)
By reason of negligence on the part of the superintendent.
By reason of negligence of any person in the employer's service to whose orders the workmen was bound to conform.
By reason of the act or omission of any person in the service of the employer done or made in obedience to the rules or by-laws of the employer or in obedience to the instructions of any person delegated with the authority of the employer. (But not unless the injury arose from some impropriety or defect in the rules, by-laws, or instructions.)
By reason of the negligence of any person in the service of the employer who has charge or control of any signal-point, locomotive-engine, or train upon a railway.
But not in any of the above cases if the workman knew of the defect or negligence which caused his injury, and did not cause information to be given to the employer or his officers.
The amount of compensation recoverable is not to exceed such sum as may be equivalent to the estimated earnings, during the three years preceding the injury, of a person in the same grade employed during those years in the like employment, and in the district in which the workman is employed at the time of the injury, unless the Judge shall, at the instance of the foreman of a jury, upon being requested by three-fourths of such jury, direct that in his opinion such earnings would not be a fair compensation under such circumstances, and no compensation is to exceed £500 in any one cause of action.
There shall be deducted from any compensation award made by the Court all penalties or parts of penalties paid to such injured workmen under any other Act of the General Assembly. Also, there shall be deducted from such award any payment or contribution made by the employer to the injured person for his injury, and also the value of any amount subscribed by the employer to any insurance fund. An employer's having made a payment or contribution is not admission of liability. The action for compensation shall not be maintainable unless notice in writing to the employer, or any one of the employers, is given within six weeks of time of injury, and the action must be commenced within six months. In case of death, action may commence within twelve months, but in such a case the want of notice is not a bar if the Judge holds that no negligence was shown. Notice may be given by solicitor or agent, and in certain cases of physical or mental collapse of the injured workman the right of action may be extended.
The action for the recovery of compensation may be brought in any Court of competent jurisdiction, or may, with the consent of both parties, be brought in a Stipendiary Magistrate's Court, even if the amount claimed is beyond his ordinary jurisdiction. Assessors may be appointed to ascertain the amount of compensation, and their appointment, remuneration, &c., shall be fixed by regulations. Every covenant, contract, or agreement, hereafter made or entered into, whereby any workman or person binds himself or his personal representatives, either expressly or by implication, not to claim any benefit or enforce any right under these Liability Acts, shall be null and void. The representatives of a workman, illegitimate by birth, who has been killed in an employer's service, have the same claim as if he had been legitimate. A workman shall not be deemed to have voluntarily incurred the risk of injury if he remained in his employer's service after he knew of negligence, omission, &c., causing the injury. If the injury was caused by his own negligence a workman has no claim for compensation. The compensation for death injury may be divided by a Judge or Magistrate in such shares to the several relations as he may direct. An action may be brought against the representatives of a deceased employer.
An employer cannot avoid payment of compensation by pleading that the injured workman was working for a contractor or sub-contractor. The Act of 1892 likewise abolishes the defence of “common employment” in cases where the negligent workman and the workman injured are in the employ of different masters. The employer is entitled to be indemnified by the workman whose negligence shall have caused the injury, to the extent of any such damages and cost the employer may have paid.
This Act repealed the previous Act of 1884, and is in its full title “An Act to consolidate and amend the Law relating to Workmen's Wages and to make Better Provision for securing the Payment thereof.” It became law7 on the 6th October, 1893.
It interprets an “employer” as any person at whose request or upon whose credit or upon whose behalf, with his privity and consent, work is done, and includes all persons claiming under him whose rights are acquired after the work in question has commenced. “Contractor” means a person who contracts directly with the employer for the performance of work done by him, and “sub-contractor” means a person who contracts with a contractor. “Wages” include any money or things contracted to be paid as recompense or consideration for service or labour, and “workman” means any person, male or female, of whatever age, employed in manual labour, or in work of any kind.
In absence of an agreement in writing to the contrary, wages are to be paid to any workman at intervals of not more than one week. Wages due to workmen shall be a first charge upon moneys due to a contractor. Every assignment, legal charge, &c., of or upon the moneys due under the contract;, given by the contractor to any person other than his workmen for wages due to them, shall have no force in law or equity against wages due to workmen. Moneys received by the contractor shall not be liable to attachment until all wages due to workmen be paid. The contractor is to keep full accounts, and produce such accounts on demand to workmen whose wages are eight clear days in arrear, and the workmen may take a copy of such accounts. If the employer pay the contractor in advance, such payment cannot be set off against the workman's claim for wages. A workman, whose wages remain unpaid for twenty-four hours after they become payable and have been demanded, may serve the employer with a notice of attachment of all money due to the contractor, and such moneys shall be retained by the employer until the claim is heard in Court. Any employer may pay into Court the sum mentioned in the notice of attachment, and the Clerk of the Court may give a receipt as a full discharge. If a workman obtains a judgment against the contractor for the wages claimed, the Court may order the employer to pay him. At the expiration of seven days from the service of such order, the employer shall pay the amount stated in the order, a receipt being given by the workman. All moneys attached shall be paid by the employer in priority according to the service of the notices of attachment, but all notices served within seven days of the first notice shall be deemed simultaneous. All demands for wages served simultaneously shall rank equally amongst themselves, and shall be paid in full if sufficient money is in the hands of the employer, otherwise they shall abate in equal proportions among themselves. Any employer served with a notice is not liable for a greater amount than that due by him to the contractor.
If the employer served with a notice of attachment shall fail to pay, the workman may sue for and recover, in his own name, the moneys attached by any proceeding which the contractor might, have taken had there been no attachment, subject to the right of the employer to set off against the demand all moneys properly paid by the employer to the contractor prior to the service of the notice of attachment. Upon satisfaction of the workman's demands, mentioned in the order for payment, the attachment of moneys shall cease to operate. Nothing in this Act shall prejudice or affect any other remedy which a workman may have against his contractor in respect of a debt due to him. The Court may settle, in a summary manner, all questions and disputes between contractor, employer, and workman, and may award costs to any of the parties. If the employer or contractor, without good reason, fails to comply with the provisions of the Act he is liable to a penalty not exceeding £50, or three months’ imprisonment. If an agent has committed such offence he is liable to the same penalty, and the contractor or employer can exempt himself on conviction of actual offenders. A workman in service of a sub-contractor shall have the same rights and remedies as the workmen in service of contractor against employers. The Act is to be read with the Truck Act and Contractors’ and Workmen's Lien Act.
The full title of this Act is “An Act to prohibit the Payment of Wages in Goods or otherwise than in Money.” It was passed on the 2nd August, 1891, and came into force on the 1st day of November, 1891.
The Act interprets as follows: —
“Contract” includes any agreement, understanding, arrangement, &c., to which the employer and workman are parties.
“Employer” includes any master, manager, foreman, &c., engaged in the hiring, employment, or superintendence of service, work, or labour of any workman.
“Money” means the coin of the realm, and includes banknotes.
“Wages” means any money or thing contracted to be paid or delivered as recompense, &c., for service or labour done.
“Workman” means any person employed in manual labour.
In every contract made with any workman the wages of such workman shall be made payable in money only, and not otherwise; and if by agreement, custom, or otherwise, a workman is entitled to receive, in anticipation of the regular period of the payment of his wages, an advance as part or on account thereof, it shall not be lawful for the employer to withhold such advance or make any deduction on account of poundage, discount, interest, or any similar charge.
If in any contracts the whole or part of such wages shall be made payable in any manner other than in money, such contract is declared illegal and void, so far as any promise or consideration therein relates to such payment of wages; and such part of the contract relating to the wages shall be severable from the other part. No employer shall, directly or indirectly, impose on any workman in his employment any terms or stipulations as to how his wages, or any portion of them, are or is to be expended, nor shall any employer dismiss his workman on account of the place or manner in which the wages are expended. The entire amount of the wages is to be paid in money, and not otherwise, at intervals of not more than a month, if demanded, and every payment made to the workmen in goods, or otherwise than in money, is null and void.
A workman can recover from his employer the whole or so much of his wages as has not been paid in money. In any action to be brought for recovery of wages due the defendant shall not be allowed to plead any set-off or counter-claim, either in respect of goods received by the plaintiff or by his agents on account of wages, or by reason of goods sold, delivered, or supplied at any shop or store belonging in any degree to the employer. The employer shall not be able to maintain any action in Court for or in respect of goods supplied to workmen. No deduction shall be made from a workman's wages for sharpening or repairing tools except by agreement. Payment may be made by cheque (not crossed), by order, draft, &c., on any New Zealand bank for payment of money; but if the cheques or drafts be dishonoured, the amount with damages maybe recovered by the workman in Court, in addition to wages due. An agent may suffer penalty in place of the employer if offence has been committed by the agent, and the employer can prove in Court that he had no knowledge of such offence.
The penalties are: Not exceeding £10 for first offence, not exceeding £25 for second offence, not exceeding £50 for third or subsequent offence. These penalties may be recovered in a summary way before a Stipendiary Magistrate or two Justices of the Peace; but no person can be punished as for a second offence unless ten days have intervened between first and second convictions, nor as for a third offence unless ten days have intervened between second and third convictions. An offence is deemed a first offence if there is no evidence of previous conviction, or if six months have intervened since commission of a previous offence.
No person shall be liable under this Act for an offence committed by his partner without the knowledge of the said person; but the goods or chattels of partners are liable to distress or sale for penalty ordered by the Court, if the offending partner refuses or neglects to pay.
The exceptions to the Act are as follows:—
Where an employer or his agent supplies or contracts to supply to any workman medicine, medical attendance, fuel, tools, materials, appliances, or implements to be used by the workman in his occupation.
Where an employer or his agent supplies or contracts to supply any workman or workmen who have engaged with him to fell bush or clear land, with the necessary outfit of support and materials or tools requisite for commencing their engagement, to any amount not exceeding in any case the amount of two months’ wages to be earned by such workman or workmen in such engagement.
Where such employer contracts to supply hay, corn. &c., for a horse or beast of burden employed by the workman at his work.
Where such employer allows the use of a tenement as part of or in addition to wages.
Where such employer contracts to supply cooked victuals or any drink (non-intoxicating) to be consumed by such workman under the employer's roof.
The Act does not prevent such employer making stoppage from wages in respect of the above-mentioned medicine, fuel, rent, corn, food, &c.; nor does it prevent such employer from advancing and stopping from wages money paid by him to the workman for friendly society, life-assurance fund, or for the relief of the workman's wife or family in sickness; nor does it apply to seamen or to persons engaged in agricultural or pastoral pursuits: Provided that no deduction shall exceed the value of the fuel, tools, corn, food, &c., supplied; and also that the exemptions shall not apply to any contractor or sub-contractor for work executed under the Government, local authority, or contractor for railway or road-making work, except in respect of money paid or advanced for medicine or medical attendance.
This Act was passed on 1st October, 1892. and came into force on the 1st January, 1893. Its full title is, “An Act to make Better Provision for securing the Payment of Money due to Contractors and Workmen, and for Other Purposes.”
“A contractor, or sub-contractor, or workman who does, or procures to be done, any work upon or in connection with any land, building, or improvement, or in connection with any chattel, is entitled to a lien upon the whole interest of the employer in that land and chattel for the contract-price of his work. He is, however, subject to the following limitations: A contractor's or sub-contractor's lien must not exceed the amount due to him for the time being under the contract; or a workman's lien exceed the amount for the time being payable to him for his work. The lien of a workman in respect of one contract is not to exceed thirty days’ earnings.
The estate or interest of the owner who is not an employer is subject to lien or liability only to the extent to which he has consented in writing. A sub-contractor is entitled to a charge on money payable to his contractor, and a workman is entitled to charge on money payable to any superior contractor. In case of a lien on mortgaged land, the mortgage has priority over the lien. The several liens and charges have priority as follows: (1) The workmen's liens and charges for wages; (2) those of sub-contractors; (3) those of contractors. A person who intends to claim a lien must, before the completion of the work in respect of which it is claimed, or within thirty days after completion, give notice to the owner, specifying his claim, and he must also give notice to the person who would be entitled to the money if the notice had not been given to the owner. Notice must also be given in the same manner by a sub-contractor or a workman in respect to money payable by superior contractors. On receiving the notice of lien the person upon whom it is served must retain sufficient money to pay the charge, otherwise he is personally liable for the amount. All payments up to three-fourths of the contract-price to he paid for the work shall operate as a discharge of the lien; hut this shall not apply if such payment he made for the purpose of impairing or defeating a claim to a lien under this Act. An employer or contractor shall retain in his hands one-fourth part of the money payable under the contract to the contractor or the sub-contractor until the expiration of thirty-one days after the completion of the work. Every contractor who sub-lets work shall immediately give written notice to the employer stating name of sub-contractor, amount of sub-contract, and mode of payment; if he does not, he is liable to a penalty not exceeding £50.
If notice to claim a lien does not bring about the payment of the amount, summary proceedings to enforce the lien may be taken before a Stipendiary Magistrate or in any Court having jurisdiction; but if the claim of lien exceeds £200, the case must be heard in a District Court. Appeal to higher Courts may be made. By paying the amount claimed into Court, the owner may release his property from lien. The Court may order means to be taken for the custody or preservation of property concerned. A claim for wages may include the claims of any number of workmen whose primary charge is against the same person, and who may choose to join in it.
A claim of lien upon land must be registered not more than. thirty days after the completion of the contract. If judgment is delivered against an employer or owner upon a claim of lien, the Court may direct a sale of the land or chattel after one month from the recovery of the judgment. Any person alleging that he is prejudicially affected by a lien may apply to the Court to have such a claim cancelled. If any person vexatiously and without sufficient grounds gives notice of claim of lien, he shall be liable to pay to the person prejudicially affected such compensation as may be awarded by the Court.
When a workman has done work on a chattel in his possession, by way of alteration or improvement, he is entitled to a lien upon such chattel, and, if the amount to which he is entitled remains unpaid for two months after it ought to have been paid, he may cause the chattel to be sold by auction, after a week's notice by proper advertisement in a newspaper. The proceeds, after paying the amount clue to the workman for his work, advertising, &c., must be paid to the Clerk of the Stipendiary Magistrate's Court to be handed to the owner. Nothing in this Act is to impair an action under “The Workmen's Wages Act, 1884,” or to prevent a personal action to recover debt. Liens cannot, however, be created against Crown lands, lands vested in the Railway Commissioners, or lands vested in public bodies.
This Act is an “Act for the Licensing and Registration of Servants’ Registry Offices,” and became law on the 11th October, 1892. The principal interpretations are as follows: —
“Clerk” means the clerk of any local authority, Town Board, County Council, &c., and includes the person appointed by the Governor to keep the register of registry offices.
“Servants’ registry office,” or “office,” means an office at which a register is kept of persons requiring employment, whether as domestic, farm, or agricultural servants.
Within two months of a house or office being used as a servants’ registry office the occupying tenant or keeper of such office shall register such office by delivering a notice in proper form to the clerk of the local authority, together with a certificate of character in the form set out in schedule, and signed by the Stipendiary Magistrate of the district. Such notice shall be registered by such local authority on payment of a fee of 10s., and a license shall be issued, to continue in force till cancelled. The local authority may refuse to register without a certificate of character, and may at any time after notice in writing to the tenant or keeper of such office, and after hearing him, should he appear, cancel the license issued.
If such tenant or keeper of such office is dissatisfied with the decision of the local authority he may, within fourteen days thereafter, appeal to the Stipendiary Magistrate, who, after giving notice in writing to the local authority, may confirm or reverse the decision, and make such order as may be just and reasonable.
The local authority shall keep a register in which shall be entered the names and residences of keepers of all registry offices within his jurisdiction. A copy of an entry in such register, certified as a true copy, shall be received in all Courts as prima facie evidence. Every tenant or keeper of a licensed office shall cause to be kept a book in which shall be entered the name of employer, with address and occupation, the name of employé, the term of engagement, rate of wages, and terms of engagement. Such book shall always be open at reasonable hours for inspection by any member of the local authority issuing the license, or by any person authorised by the local authority to inspect the same; and any employer or employé may inspect any entry in such book relating to any agreement entered into by him, and may take a copy of such entry.
The local authority may make by-laws for regulating all registry offices within its jurisdiction, for fixing particulars of information to be supplied to persons seeking employment, for the prevention of the misguidance of such persons, for limiting maximum fees to be charged, and for any other purposes for the better administration of the objects of the Act.
Penalties are provided for non-registration, for having misleading notices painted on premises implying that an unlicensed registry office is licensed, and for lending or hiring out a license to another. On second or subsequent conviction the Court may prohibit the keeper of a registry office from keeping such an office for five years after such conviction.
All proceedings may be taken and all penalties recovered in a summary way before a Stipendiary Magistrate or two Justices of the Peace.
By H. J. H. Blow, Under-Secretary for Public Works.
The great bulk of our railway- and road-works, and much of our building-work in New Zealand is now carried out under what is known as the co-operative system, an arrangement which has only been brought into operation within the last three years or so.
The contract system had many disadvantages. It gave rise to a class of middlemen, in the shape of contractors, who often made large profits out of their undertakings, and at times behaved with less liberality to their workmen than might have been expected under the circumstances. Even in New Zealand, where the labour problem is less acute than in older countries, strikes have occurred in connection with public works contracts, with the result that valuable time has been lost in the prosecution of the works, much capital has been wasted by works being kept at a standstill and valuable plant lying idle, and large numbers of men being for some time unemployed; and considerable bitterness of feeling has often been engendered. The contract system also gave rise to sub-contracting, which is worse again; for not only is it subject to all the drawbacks of the parent system, but by relegating the conduct of the works to contractors of inferior standing, with little or no capital, the evil of “sweating” was admitted. Very often too the business people who supplied stores and materials were unable to obtain payment for them, and not seldom the workmen also failed to receive the full amount of their wages. The result in such cases was that, instead of the expenditure proving a great boon to the district in which the works were situated, as would have been the case if the contract had been well managed, and properly carried out, such contracts frequently brought disaster in their train. The anomaly of the principal contractor making a large profit, his sub-contractor being ruined and his workmen left unpaid, also occasionally presented itself, and thus tie taxpayer who provided the money had the mortification of seeing one man made rich (who would perhaps take his riches to Europe or America to enjoy them) and a number of others reduced to poverty, or in some instances cast upon public charity.
Contracting also sometimes led to congestion of the labour-market in the very districts where works were in progress. When large undertakings were advertised for tender, workmen out of employment naturally gravitated to the districts where such works were to be constructed, in the hope of obtaining employment upon them when operations were commenced. But if the successful tenderer happened to be a contractor residing in some other part of the colony, who already possessed a good staff of workmen, or knew where to find reliable men who had worked for him before, he generally took his men with him, so that instead of the works being a relief to the local labour-market they would have quite the reverse effect.
The co-operative system was designed to overcome these evils, and to enable the work to be let direct to the workmen, so that they should be able, not only to earn a fair day's wage for a fair day's work, but also to secure for themselves the profits which a contractor would otherwise have made on the undertaking.
It also places the workman on a much higher plane, and enables him to comprehend more fully the dignity of labour. Under the co-operative system every workman is a contractor, and has a personal interest in the economical and successful carrying-out of the work. He is also his own master.
Not only does the system offer these solid and very real advantages to the workmen, but it also offers substantial advantages to the State. Under this system works are carried out for their actual value—no more and no less.
The work is valued by the Engineer appointed to have charge of it, before it is commenced, and his valuations are submitted to the Engineer-in-Chief of the colony for approval. When approved, they constitute the contract-price for the work; but they are not absolutely unchangeable as in the case of a binding, strictly legal contract. It frequently happens under an ordinary contract that work turns out to be more easy of execution than was anticipated, and the State has to see its contractors making inordinate profits. Sometimes, on the other hand, works cost more than expected; but in most cases of this kind the contractor either becomes bankrupt, so that the State has, after all. to pay full value for the work, or, if the contractor happens to be a moneyed man, he will probably find some means of getting relieved of his contract, or of obtaining special consideration for his losses on completion of his work. Under the co-operative system, if it is found that the workmen are earning unusually high rates, their contracts can be determined, and be relet at lower rates, either to the same party of men, or to others, as may be necessary. Similarly, if it is shown, after a fair trial of any work, that capable workmen are not able to earn reasonable rates upon it, the prices paid can, with the approval of the Engineer-in-Chief, be increased, so long as the department is satisfied that the work is not costing more than it would have cost if let by contract at ordinary fair paying prices.
An illustration in support of the contention that contractors sometimes make unreasonable and quite unexpected profits occurred on one of the railway-works recently. After very careful inquiries in the neighbourhood, and also after prospecting all the likely places thoroughly, the conclusion was come to that no suitable and easily-obtainable material was available for ballasting the eight-miles extension of the Whangarei-Kamo Railway to Hikurangi. It was therefore determined to ballast it with broken metal, the stone for breaking being taken from an extensive limestone deposit at one end of the line. No contractor would have prospected the district more thoroughly than the Government engineers did, and so, if the work had been tendered for, all the tenderers would doubtless have-allowed for ballasting with broken metal, every yard of which would have cost at least 2s. 6d. After the formation-works had been in hand for more than a year, however, and just as platelaying was about to be begun, an extensive deposit of very suitable scoria-ash was discovered quite accidentally and quite unexpectedly. The deposit was situated so conveniently to the line that the ballast only cost about 6d. per yard, delivered on the railway; hence the saving to the Government by this fortunate discovery will not be less than £2,000. Under the co-operative contract this money will be absolutely saved to the taxpayers of the colony, whereas, under the old contract system, it would all have gone into the pockets of the lucky contractor.
Another great advantage of co-operation is that it gives the Government complete control over its expenditure. Under the old plan, when large contracts were entered into, the expenditure thereunder was bound to go on, even though, through sudden depression or other unlooked-for shrinking of the revenue, the Government would gladly have avoided or postponed the outlay. To propose a postponement of the works, however, would only be to invite claims for compensation from the contractor—possibly entailing a loss to the State fully as large as any loss that could accrue from going on with the works in the face of an unfavourable money market. Under the co-operative method the works can be proceeded with more leisurely, or discontinued altogether, by simply giving a week's notice to the men.
Not only has the Government complete control over the expenditure, but in the matter of the time within which works are to be completed the control is much superior to that possessed when the works are in the hands of a contractor. When once a given time is allowed to a contractor in which to complete a work, any request to finish it in less time would at once provoke a demand for extra payment; but under the co-operative system the Government reserves the right to increase the numbers employed in any party to any extent considered desirable, so that if any sudden emergency arises, or an unusually rapid development in any district takes place, it is quite easy to arrange for the maximum number possible of men being employed on the works in hand, with no more loss of time than is required to get the men together.
Work also is better done under the co-operative than under the contract system. Under the former method the Government finds its own materials, which are carefully selected to insure their being of the best class; and the workmen, therefore, have no interest in stinting the use of material to try to effect savings, while the Government overseers, of course, see that there is no waste. No attempts are now made to put whiting into the paint, instead of white-lead, or to introduce inferior brands of cement or iron into the works, and no walls are built dry in the centre, or filled in with bats, as it is easier for the men to construct the work of sound materials than with rubbish. All stores are purchased by the Government's own officers, and are supplied to the co-operative contractors from the Government store, so that the department knows exactly what class of materials is used. The workmanship put in is also of a superior kind. The men are the contractors themselves; they take a pride in their work, and have no taskmaster standing over them, finding fault with them for being too particular and taking too much pains. All the work done under the co-operative system will bear comparison with any similar work done by contract, and will generally show to advantage.
The system was first tried in connection with formation-works on roads and railways, including small bridges and culverts, and other similar works, but it has now been extended to the erection of iron bridges (the ironwork being supplied and delivered at the sites of the bridges by the department), the supply of sleepers, the laying of the permanent-way, the construction of timber bridges up to £2,000 in value, and of masonry abutments and piers for bridges, and the erection of stations and other public buildings, &c.
The first work to be carried out under the co-operative system was the formation of certain sections of the Ngakawau-Mokihinui Goal Railway. Some portions of this line had been let by contract in the ordinary way, and the contracts thrown up as unremunerative, when, as a large number of men were in need of employment in the district, it was decided to let the work to them on the co-operative principle. They were asked to arrange themselves into parties of about fifty each, and to select certain persons to act as trustees under regular deeds of trust, the trustees to take the work from the Government at the amount of the Engineer's estimate, but all the men to have an equal interest therein, and the wages and profits to be divided equally. The plan worked well from the start; but further experience with it has shown the advisableness of modifying some of the details. For example: The parties are smaller now, and no trustees are insisted upon. It was found difficult in practice to get fifty or sixty men to work harmoniously together, owing to differences, not only in the temperament of the men, but also in their abilities as workmen. The parties now for the most part do not exceed ten or twelve men, and they probably do not average much over six. Then, instead of trustees, acting under regular deeds of trust, there now are merely two “headmen,” and if the party prefers it (as they sometimes do) only one “head-man.”
The method followed in letting and carrying out the work is somewhat as follows: When a length of railway is to be constructed on the co-operative principle the formation-work is divided into sections of suitable size. Where the work is heavy, one cutting and one embankment will be sufficient for a party, but in lighter works sometimes as much as half a mile, or even a mile, of formation may be intrusted to one set of men. Plans and sections of the work are prepared, and a brief and simple specification provided. The Engineer who is to have charge of the work then carefully computes the quantities of the several classes of excavation and other work requiring to be done, assesses the value of the same, and forwards his estimates to the head office, where they are submitted to the Engineer-in-Chief for an expression of opinion as to their reasonableness or otherwise. The rates are based on the current rate of wages ruling in the district for similar work, with a small percentage added to represent in some degree the profits which a contractor would have made had the work been let by tender in the ordinary way. That is, the price fixed should enable a first-class workman to earn an average wage per day of eight hours slightly in excess of what a contractor would pay him for the same work, while workmen of less strength and ability would earn proportionately less. There is, however, an understood proviso that the work shall not cost more than if let by contract at fair rates, and experience has generally given favourable results in this respect. When the prices have been approved by the Engineer-in-Chief, they constitute the basis of the contract with the men, the contract being a “schedule rate,” and not a “lump sum” one. The engineer's estimate of the quantities is not, however, binding on either the Government or the men, the work done being measured monthly, and the actual quantity executed paid for. The men go to work at these prices, finding their own picks and shovels, but all plant of an expensive character, such as trucks, rails, barrows, &c., is supplied by the Government, the price allowed for the work being, of course, largely dependent on the class of plant supplied for performing it. The men are also furnished with tents in the first instance, but they are required to keep them in repair, or to be at the cost of supplying new ones when the old ones become worn out or unserviceable. If horses or drays are required the men make their own arrangements for procuring them, as there is never any difficulty in hiring them from settlers living in the neighbourhood. The men also provide their own explosives, or requisition for them on the Government store, in which case they are charged a small percentage over the actual cost to the Government, the sum being deducted at the end of the month from the sum payable under the contract. Separate contracts are let for bush-felling and clearing, fencing, construction of culverts, &c.
A very similar procedure is adopted with regard to other works. If the contract is to be for the erection of a timber bridge, the department first takes out the detail quantities of all timber and ironwork required, and obtains tenders for the supply of the same, and arranges for delivery on the ground. The value of the labour required in the erection of the structure is then carefully assessed and submitted for the approval of the Engineer-in-Chief, as in the case of earthwork contracts; the number of men required to carry out the work properly and economically is determined upon, and a contract let accordingly. The same is done with masonry work, except that the excavation of the foundations and the cutting of the inlets and outfalls is usually let to one party, and the actual masonry work to another, so as to avoid having to include labourers and mechanics in the same party. When the line is ready for the laying of the permanent-way, the department first supplies all the rails, fastenings, points and crossings, and sleepers necessary for the work, and then arranges contracts as follows: (1.) For notching and boring the sleepers. (2.) For getting and filling ballast into trucks. (3.) For laying the permanent-way, including linking-in, spreading the ballast when tipped on the road from ballast-wagons, lifting and packing, and final lifting and straightening. The department supplies its own engine and wagons, and does the hauling for the men.
In the erection of buildings, separate contracts are let for each trade employed. First, a contract to a party of labourers for levelling or otherwise preparing the site; then another contract to a party of bricklayers for all brickwork required; still another contract to a party of carpenters and joiners for the woodwork; and another to a party for the plumbing work; and another for the painting, and so on. The Government finding all materials in each case.: The work done is measured monthly, and payments made to the head men of parties in cash, and to the full value of the work done, no percentage or “reserve” being retained, the head men being left to pay whatever debts may have been contracted by the party, and to divide the balance equally among all the members thereof.
The department does not guarantee payment to storekeepers supplying the men with goods and provisions, but, with the view of assisting them in the collection of their accounts, the Engineers are instructed to notify storekeepers known to be supplying goods to the men of the dates on, and places at which, payments are to be made, and generally to assist the storekeepers in obtaining payment of their accounts; and, whenever any storekeeper intimates his intention of taking proceedings against a party, the Engineer will withhold payment for a few days to enable the storekeeper to obtain an order of the Court attaching the moneys due, or so much thereof as may be owing to him.
As it often happens that men are working at a distance from where their families live, the Government Paymaster is instructed to offer his services in conveying remittances to the nearest money-order office for transmission to their wives, or for deposit in the Post-Office Savings-Bank: and any men not remitting to their families, but allowing them to become a charge upon public charity, are dismissed from the works.
Should any of the men desire to leave the works, no impediment is placed in the way of their doing so. On the occasion of any monthly pay they can resign from their party and leave immediately, their places being filled by other men obtained by the Engineer through the Government Labour Bureau. A change can also be made in the head-man or head-men of the party, either by the Engineer in charge of the works, or by a majority of the workmen comprising the party. The Engineer, if he considers a change necessary in the interests of the work, is empowered to depose the head-men, and to call upon the party to elect others in their place; and the workmen, in their turn, are also entitled to depose the head-men and elect others, provided that a majority of the party agree upon such a course, and forwards notice in writing to the Engineer of such having been done. The Engineer is authorised also to discharge a man or any number of men from a party for any reason that he may consider sufficient, and is responsible to the department only for such action.
The engineers see that the men make due and satisfactory progress with their work, and if the progress is not satisfactory they can either determine the contract altogether, and relet it to another party, or they can draft additional men into the party, as they may think best. They also see that the men do not make unduly high wages by working extra hours, the regulation hours not exceeding forty-eight per week.
All men employed on Government co-operative works are selected by the Government Labour Bureau, and in selecting them the following rules apply: —
Applicants not previously employed on Government cooperative works have priority of claim over men who have recently been so employed.
Men resident in the neighbourhood of the works have priority over non-residents.
Married men have priority over single men.
In recording the applications of men who have previously been employed on Government co-operative works, the dates when they left such works are noted, and those longest off such works are considered first.
All applicants for work must have been at least one week out of employment before they can apply, and all men previously employed on Government co-operative works must have been at least fourteen days off such works prior to re-registration as applicants for further work.
If there are more applicants for work than there are vacancies to fill, a ballot is taken to determine the particular men to be employed. Such ballots are conducted in the presence of the men interested, and members of local bodies in the district may also be present if they wish.
The qualifications of the men as workmen, and their persona characters, are also, of course, taken into consideration.
All parties of men when they finish their contracts are discharged, and are not again employed except under the above-mentioned rules.
It sometimes happens, of course, that men who are not up to the standard which a contractor would require are selected for employment on the works; but it is claimed as one of the advantages of the system that men of all capacities can be employed under it, since payments are made according to results, so that the men get just what they earn, whether the amount be great or small.
If men are sent to work at a distance too great for them to walk to, their railway or coach fares are paid by the Government on their signing an order authorising the amount thereof to be deducted from their first month's earnings, and the amounts so paid are deducted from the earnings of the party accordingly.
In reporting each month on the progress of the work in hand, the Engineer in Charge of the same sends in a statement showing the number of parties employed, the number and names of the men in each party, the work on which they are employed, the amount of work done during the month, the rate paid for same, and the total amount earned by each party. From this latter amount he deducts all payments made by the party for horse-hire, explosives, tools, &c., thus showing the net amount available for distribution amongst the members as their actual earnings. The return also shows the days and hours each man worked, and from this is worked out and shown the actual wages earned per man by each party for each day worked, and also per standard day of eight hours. For some of the information contained in this return — as for example, the number of days and hours worked by each man- the Engineer has to depend mainly upon information furnished by the head-men of the parties; but the Government overseers check the information supplied as far as possible. The department takes every care by supplying each party with time-sheets, and instructing its overseers to examine them as frequently as possible, to secure the accuracy of these returns, and there is no reason to believe that the information furnished is untrustworthy.
The number of men employed under the co-operative system from time to time varies greatly; but about 2,000 may be taken as the average number for the last year or so. For the month of February, 1894, the following numbers were employed on the works stated: —
Road-works under the Lands and Survey Department. | |||
|---|---|---|---|
| Artisans. | Labourers. | ||
| Wellington District | 420 | ||
| Auckland District | 81 | ||
| Taranaki District | 187 | ||
| Canterbury District | 156 | ||
| Otago District | 70 | ||
| Southland District | 123 | ||
| Pemberton Improvement Farm, Wellington | 15 | ||
| Levin State Farm, Wellington | 3 | 26 | |
| Totals | 3 | 1,078 | |
| 1,081 | |||
| Railway and Other Works under the Public Works Department. | |||
|---|---|---|---|
| Kamo-Hikurangi Railway | 5 | 36 | |
| Paeroa-Te Aroha Railway | 4 | 22 | |
| North Island Main Trunk Railway, north end | 5 | 72 | |
| North Island Main Trunk Railway. south end | 17 | 133 | |
| Eketahuna-Woodville Railway | 221 | ||
| Blenheim-Awatere Railway | 14 | ||
| Greymouth—Hokitika Railway | 47 | ||
| Catlin's River Railway | 1 | 32 | |
| Otago Central Railway | 20 | 206 | |
| Seaward Bush Railway | 13 | 47 | |
| Point Halswell Road, Wellington | 22 | ||
| Blackball Road, Nelson | 33 | ||
| Great South Road, Westland | 10 | ||
| Public buildings | 16 | 5 | |
| Totals | 81 | 900 | |
| 981 | |||
| Gross total | 2,062 | ||
[From the Report of the Department of Labour, 1894.]
The Hon. Mr. J. McKenzie, Minister of Lands, has successfully initiated a system of paying parties of working-men to fell bush on Crown lands, giving to these men the option of choice of lands so felled and cleared. In several places, as at Pemberton and Chas-land's River, the scheme is working well, and small thriving communities have been established. These people are already asking for school-houses to be erected, and showing other signs of permanent occupancy. The plan at first adopted was to fell and clear bush on several parts of the future settlement, and then allow the men working thereon to ballot for the sections. This was found to be unsatisfactory, as the ballot sometimes resulted in giving a man a piece of land to which he had taken a dislike, or which was unsuitable to the conditions and number of his family. The later method adopted is to have the land roughly surveyed into sections of from 100 to 500 acres, the lots being shown by short side-lines starting from the frontage of roads already surveyed and definitely fixed. Each man, knowing approximately the position of his boundaries, can go on clearing for himself until the permanent boundaries are marked off. The acreage is not rigidly kept to round numbers, but is fixed so as to suit, as far as possible, the needs and wishes of the occupier.
A State Farm proper of about 1,000 acres has been commenced at Levin, on the Manawatu Railway-line, Wellington Provincial District. Fifty-two men, eight women, and twenty-five children are on the ground, the men doing the preparatory work, cutting roads through the forest, felling bush for burning, planting orchards, &c., getting ready for starting the permanent homestead. Another farm, to the south of Dunedin, has been selected and marked off, but it is as yet in its infancy. The men employed (and to be employed) on the State Farm are engaged on the co-operative system, and are not paid wages except in rare cases, where contract is inadmissible. The workers are generally elderly men, drafted off as to a dépôt, where their services can be utilised until suitable work for them can be found, if desirable. The manner in which the work is contracted for is as follows: The Manager names a price per chain for some fencing, and some half-dozen men group themselves and take it by contract at that price. Again, if the Manager requires an acre of land dug over with the spade, or firewood cut and stacked, or drains dug: for any of these things he names his price, and the workers accept it if content. As the Manager learns by experience the working abilities of the men, and is instructed to offer them a price which will insure an equivalent to a fair wage if worked at steadily, the men generally accept. Of course, continual refusal to accept work at a fair price would necessitate the removal of the discontented person from the farm. The families on the farm, if arriving destitute, are provided with tents, &c., by the Government. They will not have to pay any rent, but have to erect cottages for themselves with some small State concessions as to timber obtained on the spot. Each family has a half-acre allotted to its occupation, for garden and domestic purposes. On a family leaving the farm, an allowance will be made for improvements made under the approval of the Manager. This institution is by no means at present an experiment on self-governing principles. Those who wish to form such societies must do so in their own manner by means of special settlements, &c.; but the State Farm is directed by an able agriculturist as Manager, who is appointed by the Government, and who has all the powers of an ordinary employer in arranging the details of his work, subject to his responsibility to the Department of Labour, and in consonance with the co-operative system. It is the intention of the Government, when, after some years, the farm has been cleared of bush and brought under skilled cultivation, to make its working purely co-operative. By that time sufficient knowledge will have been gained as to the character of the men and their families to act as a guide in determining who are to be the permanent residents. The idle and incapable will have been weeded out, and it will be possible, doubtless, to allow the farm to be worked for their own profit by a committee or council of those who have been employed for a long period. In the meantime, it is to be hoped that other farms in the rough state can he acquired and brought into good order on the same system. They would prove of service, not only as outlets for the relief of the temporary congestion of the labour-market, but for the permanent settlement of families to whom town life offers neither livelihood nor inducement.
There is every probability that the State farm will become a paying investment on the capital expended, as well as an outlet for a description of labour—viz., that of elderly men—which cannot find occupation elsewhere in times of pressure, but which has deserved well of the colony by previous long and hard service.
By John McGowan, Commissioner of Taxes.
One of the cardinal principles of the method of land taxation in force in New Zealand lies in adjusting the rate payable to the value of the holdings subject to the tax; and the end sought to be attained by the whole scheme is to compel contribution to the requirements of the State according to the ability of those who are called upon to contribute thereto.
In 1891 an Act was passed for the assessment of land and income, and the new system took the place of that under which the property-tax was levied. The land-tax and income-tax, generally spoken of as forming one whole, are really distinct, although dealt with under the same Assessment Act.
The leading features of the scheme of taxation may be briefly summarised as follows: —
The more important branch of the dual impost is the land-tax, and from it, under the provisions of the Act of 1891, a revenue of— in round numbers—£285,000 was derived. Under the Amendment Act of 1893 the revenue was reduced by about £18,000 a year, by the exemption of all improvements. A mortgagee is treated as part owner of the land on which his mortgage is secured. For the ordinary land-tax an owner is allowed to deduct from the value of his land the amount owing by him secured by registered mortgage; the mortgagee returning the amount owing to him on registered mortgage, and being assessed thereon. A person owning land and holding mortgages is assessed on both as land, and from the assessment there is deducted any sum owing by him on registered mortgage. A provision exists for assessing a mortgage at its value to the mortgagee; this applies in cases where the value of the security does not equal the mortgage-debt. By allowing an owner to deduct his mortgage, and crediting the amount to the mortgagee, the whole value of the land, subject to the deductions and exemptions allowed by law, is assessed for land-tax. The same principle applies to land and mortgages of companies, excepting that land and mortgages of building societies, and mortgages held by banks, are exempt from land-tax, the interest derived by banks from mortgages being returnable with other profits for income-tax.
The deduction of mortgages and of improvements renders very many owners exempt from land-tax, the number of land-tax payers being about 12,000 out of a total of upwards of 90,000 owners of land in the colony. An owner whose land and mortgages, after the deduction of mortgages owing by him and of improvements, does not exceed £1,500 is allowed a deduction by way of exemption of £500; and this amount gradually diminishes until it vanishes, when an owner's assessed value, less deductions, reaches £2,500. The allowance of this special exemption reduces still further the number of taxpayers.
In addition to the ordinary land-tax, a graduated land-tax is levied; and for arriving at the amount assessible under this, all improvements are likewise deducted. An owner is not, however, allowed to deduct mortgages owing by him; and, on the other hand, he does not include in his return any mortgages owing to him. This tax does not fall on any owner the value of whose land, less the improvements thereon, falls short of £5,000. The lowest rate imposed is 1/8 d. in the pound, gradually rising until it reaches 2d. in the pound on an unimproved value of £210,000 or more. There is a provision for levying 20 per cent. additional graduated tax in the case of owners who have been absent from or resident out of the colony for a period of three years or over prior to the passing of the yearly Tax Act. The yield of the graduated tax may he set down in round figures at £83,000, the absentee tax forming a very small part of this, viz., £1,040. When land belongs to two or more persons, and one partner resides in the colony, the absentee tax is not levied; and it does not apply to companies. Under the original Act, improvements up to £3,000 only were exempted from taxation. The Act of 1893 exempted all improvements. This was expected to reduce the receipts by £37,000, hut the increased scale of the graduated tax was estimated to produce £18,000, thus leaving the net loss to the revenue by the exemption of improvements, £19,000. The actual figures are: loss through exemption of improvements, £34,635; extra graduated tax, £16,383; net loss, £18,252.
Under the existing law the value of land and improvements thereon is ascertained by an assessment made every three years throughout the colony. Owners make returns of their land, and have ample opportunity afforded them to object to the departmental values; any objections which are not allowed by the Commissioner being referred to a Board of Review sitting in open Court, who hear evidence and decide the value. The reviewers are, as a rule, chosen from residents in the district in which the lands are situated, and their decision is final.
If, after the sitting of a Board of Review, an owner should not be satisfied with the value at which a property was assessed, he can call on the Commissioner either to reduce the assessed value of the property to the sum at which he, as owner, returned it, or to purchase the property at the sum so returned by such owner.
Another provision enables the Commissioner to call upon an owner to agree to what the Commissioner may consider the actual value of the property, and, should the owner not so agree, the Commissioner may, with the approval of the Governor in Council, purchase the property at the value entered in the owner's return, with 10 per cent. added thereto.
In considering the income-tax it is necessary to remember that many incomes are declared to be exempt from this tax. Land and mortgages being reached by the land-tax, all incomes derived from interest on mortgages, and from rents, and from the use or produce of land enjoyed by the owner or occupier, are exempt from income-tax. This materially reduces the number of income-tax payers, and, as all companies pay on their incomes, shareholders do not include in their returns of income dividends received by them. An exemption of £300 is allowed to each person resident in New Zealand, and this is deducted from all taxable incomes, which are further reduced by an allowance up to £50 in respect of life insurance premiums paid by the taxpayer on his own life. The £300 exemption is not allowed to companies.
When all incomes derived from mortgages and rents, and from the use or produce of land enjoyed by the owner or occupier, or from dividends from shares, are omitted, it will be recognised that the number of taxable incomes must bear a very small proportion to the total number of incomes earned. The attention which has lately been devoted to the criticism of income-tax returns has resulted in a very considerable addition to the incomes returned, both as to number and amount. While a proportion of these were, no doubt, the result of ignorance or inadvertence, it can hardly be supposed that no instances of making wilfully false returns have occurred. Such cases are found wherever there is an income-tax. Objections to the assessment of income are heard by a Stipendiary Magistrate sitting as a Board of Review, and the proceedings are private.
Summarising results, it may be stated—using round figures— that the land-tax yields £285,000, including £83,000 for graduated tax, and the income-tax yields £75,000, making a total of £360,000. The expenditure for a triennial period may be set down as £23,000 for each of two years, and £7,000 the third year, making a total of £53,000. The revenue for three years would, at present rates, be about £1,100,000.
The rates of tax at present are: the ordinary land-tax is 1d. in the pound; the graduated tax commences at one-eighth of a penny in the pound on the unimproved value, and rises to 2d. where the unimproved value of the land of an owner is £210,000, or exceeds that sum. The rate of income-tax is 6d. in the pound on the first taxable £1,000, i.e., after deducting the £300 exemption; and 1s. in the pound on taxable incomes over £1,000. That is, a person having an income of £1,900 would be thus taxed: £300 would be exempted; £1,000 would pay 6d. in the pound; and the remaining £600, 1s. in the pound, making a total of £55 a year. The tax on an income of £400 would be, at 6d. on £100, equal to £2 10s. Income-tax payable by companies is at the rate of 1s. in the pound, and no exemption is allowed. The exemption is also disallowed in the case of persons not domiciled in New Zealand.
The schedule of rates of graduated tax is given below: —
| Where the value is | £5,000 and is less than £10,000, | one-eighth of a penny in the pound sterling. |
| Where the value is | £10,000 and is less than £15,000, | two-eighths of a penny in the pound sterling. |
| Where the value is | £15,000 and is less than £20,000, | three-eighths of a penny in the pound sterling. |
| Where the value is | £20,000 and is less than £25,000, | four-eighths of a penny in the pound sterling. |
| Where the value is | £25,000 and is less than £30,000, | five-eighths of a penny in the pound sterling. |
| Whore the value is | £30,000 and is less than £40,000, | six-eighths of a penny in the pound sterling. |
| Where the value is | £40,000 and is less than £50,000, | seven-eighths of a penny in the pound sterling. |
| Where the value is | £50,000 and is less than £70,000, | one penny in the pound sterling. |
| Where the value is | £70,000 and is less than £90,000, | one penny and one-eighth of a penny in the pound sterling. |
| Where the value is | £90,000 and is less than £110,000, | one penny and two-eighths of a penny in the pound sterling. |
| Where the value is | £110,000 and is less than £130,000, | one penny and three-eighths of a penny in the pound sterling. |
| Where the value is | £130,000 and is less than £150,000, | one penny and four-eighths of a penny in the pound sterling. |
| Where the value is | £150,000 and is less than £170,000, | one penny and five-eighths of a penny in the pound sterling. |
| Where the value is | £170,000 and is less than £190,000, | one penny and six-eighths of a penny in the pound sterling. |
| Where the value is | £190,000 and is less than £210,000, | one penny and seven-eighths of a penny in the pound sterling. |
| Where the value is | £210,000 or exceeds that sum, | twopence in the pound sterling. |
Under the Rating Act of 1893, the rolls for local rating purposes will not be supplied by the Commissioner of Taxes, valuations being made by the local bodies themselves. As nearly all boroughs now make their own valuations the alteration will affect very few boroughs. The rolls of harbour, drainage, river conservation, and other district Boards, will be compiled from the county rolls. The counties will also supply Road Board rolls, the cost being borne by the local bodies concerned.
In the present session of Parliament a measure will be introduced for abolishing triennial valuations of land, and a scheme will be devised for adjusting values when necessary.
In order to show the amount of work involved in making a general valuation for the colony, it will be sufficient to state that upwards of 200 land assessors are generally employed, as well as a large number of temporary clerks. The total cost of an assessment, exclusive of the salaries of permanent officers, is upwards of £30,000. It will thus be seen that by the abolition of the triennial assessment a very material saving of expenditure by the State will be effected.
The administration of the Land and Income Assessment Act is vested in the Commissioner of Taxes, but the appointments of officers, assessors, and reviewers are made by the Governor—that is, on the recommendation of the Colonial Treasurer as the Ministerial head of the department.
[Extract from Report by the Commissioner of Taxes, 28th July, 1893.]
The attached table gives a classification of land- and income-tax payers by occupation or designation, and of companies according to the business they carry on. Results are contrasted with those of the last assessment for property-tax in 1888, which were published in 1889.
Under both systems the largest contributions were by graziers, sheepfarmers, farmers, dairymen, &c.—that is, by owners of country lands—the total for land- and income-tax being £89,341, and for property-tax £81,544. The number of the property-tax payers was 8,611. The number of land-tax payers is 4,760, who are assessed for ordinary land-tax £60,203; 766 are assessed for graduated land-tax £28,015; and 97 are assessed for income-tax £1,123. In considering these and other results it should be remembered that some who pay graduated tax do not pay land-tax, but it may be taken to be the rule that the land-tax payers include those who pay graduated tax, and the number of the latter is therefore omitted in these comparisons. Further, some of those who pay land-tax also pay income-tax. Land companies (15) were assessed for property-tax £12,049; and land companies (19) were assessed for land-tax £16,579, and graduated tax £15,232, making up, with income-tax £396, a total of £32,207, which shows an increase of £20,158 in the present as compared with the late system. Loan companies contribute £30,923 for land- and income-tax as against £38,147 property-tax; life insurance companies, £11,790, as against £11,749; fire and marine insurance companies, £8,279, as against £6,652; banks pay £10,184, as against £14,244; mercantile companies, £16,302, as against £9,384; manufacturing companies, £7,549, as against £3,784; manufacturing and mercantile, £5,622, as against £5,807; coal-mining £1,425, as against £1,498; gold-mining (23), £2,735, as against (113) £2,545; building societies,*
Note
* Now exempt. See section 4 of “The Land and Income Assessment Acts Amendment Act, 1893.”
In amounts paid by persons, the table shows that, as a rule, the totals contributed in the various classes under the two systems do not differ very materially, excepting in the class including “working storemen, mechanics, labourers, shepherds, miners, sailors, &c.”: 2,242 paid property-tax, £4,053; and 249 paid land-and income-tax, £543.
CLASSIFICATION of TAXPAYERS according to Occupation.
| Designation | Land- and Income-tax Payers, 1892–93. | Property-tax, 1889. | |||||||
|---|---|---|---|---|---|---|---|---|---|
| Number of Taxpayers. | Land-tax. | Number of Tax-payers. | Graduated Land-tax. | Number of Taxpayers. | Income-tax. | Total Tax. | Number of Taxpayers. | Tax. | |
| £ | £ | £ | £ | £ | |||||
| Professional: clergymen, lawyers, doctors, authors, editors, engineers, surveyors, and architects | 449 | 6,612 | 42 | 755 | 652 | 6,153 | 13,520 | 1,155 | 11,677 |
| Civil servants, officers of local bodies, teachers, &c. | 173 | 773 | 5 | 10 | 391 | 1,498 | 2,281 | 547 | 2,216 |
| Retired professional men, merchants, and others | 154 | 6,610 | 45 | 1,660 | 89 | 692 | 8,962 | 342 | 12,808 |
| Merchants, importers, warehousemen, contractors, &c.—firms | 92 | 2,603 | 22 | 243 | 111 | 8,383 | 11,229 | 336 | 10,326 |
| Merchants, importers, warehouseman, contracters, &c.—persons | 300 | 5,770 | 56 | 1,306 | 127 | 2,010 | 9,086 | 667 | 9,658 |
| Tradesmen, wholesale and retail shopkeepers, storekeepers, carriers. &c. | 1,251 | 6,182 | 41 | 204 | 558 | 5,592 | 11,978 | 3,156 | 14,721 |
| Working storemen, mechanics, labourers, shepherds, miners, sailors, &c. | 220 | 474 | 2 | 7 | 29 | 62 | 543 | 2,242 | 4,053 |
| Manufacturers, brewers, millers, founders, sawmillers, shipbuilders, &c. | 170 | 1,697 | 19 | 176 | 139 | 2,280 | 4,152 | 525 | 5,046 |
| Graziers, sheepfarmers, farmers, dairymen, &c. | 4,760 | 60,203 | 766 | 28,015 | 97 | 1,123 | 89,341 | 8,611 | 81,544 |
| Land, commission, or general agents, auctioneers, accountants, brokers, commercial and other managers, clerks, bookkeepers, master-mariners | 397 | 4,220 | 35 | 323 | 914 | 6,112 | 10,655 | 1,858 | 13,675 |
| Widows, wives’ trustees, spinsters | 1,837 | 13,574 | 57 | 689 | 58 | 483 | 14,746 | 3,760 | 22,274 |
| Other trust estates and estates of deceased persons | 1,522 | 33,455 | 210 | 6,738 | 26 | 362 | 40,555 | 1,492 | 32,287 |
| Absentees | 784 | 21,053 | 114 | 4,109 | 20 | 139 | 25,301 | 1,150 | 25,977 |
| Companies— | |||||||||
| Banks | 6 | 4,596 | 6 | 2,512 | 4 | 3,076 | 10,184 | 6 | 14,244 |
| Life insurance | 6 | 6,771 | 6 | 446 | 8 | 4,573 | 11,790 | 10 | 11,749 |
| Loan | 30 | 26,567 | 14 | 2,700 | 15 | 1,656 | 30,923 | 36 | 38,147 |
| Land | 19 | 16,579 | 13 | 15,232 | 3 | 396 | 32,207 | 15 | 12,049 |
| Mercantile | 36 | 4,850 | D | 492 | 84 | 10,960 | 16,302 | 101 | 9,384 |
| Manufacturing | 23 | 1,832 | 8 | 463 | 44 | 5,254 | 7,549 | 58 | 3,784 |
| Manufacturing and mercantile | 15 | 1,495 | 5 | 791 | 21 | 3,336 | 5,622 | 28 | 5,807 |
| Mining (coal) | 6 | 92 | 2 | 8 | 7 | 1,325 | 1,425 | 10 | 1,498 |
| Mining (gold) | 23 | 2,735 | 2,735 | 113 | 2,545 | ||||
| Fire and marine insurance | 9 | 2,631 | 3 | 221 | 28 | 5,427 | 8,279 | 33 | 6,652 |
| Building societies | 37 | 1,968 | 1 | 19 | 1,987 | ||||
| Church property— | |||||||||
| Corporations and trusts | 64 | 1,974 | 10 | 762 | 2,736 | 76 | 2,046 | ||
| Totals | 12,360 | 232,581 | 1,491 | 67,880 | 3,448 | 73,627 | 374,088 | 26,327 | 354,167 |
BY E. J. Von Dadelszen, Registrar-General.
On the basis of the results of the census of 1891 the colony is, in accordance with the Representation Act Amendment Acts, 1887 and 1889, divided into sixty-two districts for purposes of European representation, fifty-eight rural districts having one member each, and four city electorates three members each. The names and boundaries of these districts were duly proclaimed in the New Zealand Gazette on the 26th January, 1892. The method laid down in the Act of 1889 for computing, for the purposes of that Act, the population of the colony, is to add 28 per cent. to the population not contained in any city, borough, or town district having a population of over 2,000 persons. The total population of the colony (other than Maoris), with the addition aforesaid, having been ascertained, was then divided by the number of members (70), and the quotient thus obtained formed the quota. The four city electoral districts (which have three members each) were so defined as to extent that the population should be three times the quota. Inasmuch as it would be impossible to divide the country into a given number of districts all having exactly the precise quota of population, the law permits the Commissioners to make an allowance of 750 persons by way of addition to or deduction from the population of rural districts, and 100 persons in case of city electorates; and due consideration is given to community of interest, facilities of communication, and topographical features, as far as possible, in forming the districts.
A table showing the names of the electoral districts as at the last general election, with the number of members returnable, the actual town and rural population as at the census of April, 1891, and the nominal population for each district, was given in the Official Year-book for 1898, on page 30.
The North Island with its adjacent islands includes 27 electoral districts, having 31 members; the Middle and Stewart Islands having 35 districts and 39 members.
These districts, with 70 members, are, as above stated, for purposes of European representation. But the colony is again divided into four districts for purposes of Maori representation, under Part V. of “The Electoral Act, 1893,” each district having one Native member elected by the Maoris: so that the House of Representatives consists of 74 members altogether—70 Europeans and 4 Maoris.
By this Act, which came into operation on the 19th September, 1893, the great step was taken of admitting women to the franchise, and other changes were made in the electoral law, the most important of which are here referred to.
By section 3, the word “person,” wherever it occurs throughout the Act, includes “Woman,” and the words and expressions in the Act importing the masculine gender include women, except when otherwise expressly stated. Under the provisions of section 6 the qualifications of electors become the same for each sex.
These qualifications are possessed by—
Every adult (not a Maori) having a freehold of the value of £25 in his (or her) own right, to which he has been entitled for six months before the registration of his vote, and who is not registered in respect of a freehold or residential qualification in the same or another district.
Every adult (not a Maori) who has resided for one year in the colony, and in the electoral district for which he claims to vote during the three months preceding the registration of his (or her) vote, and is not registered in respect of a freehold or residential qualification for the same or any other district.
An important clause is added, bringing into operation what is known as the “one-person-one-roll” principle. It runs:—
“No person shall be entitled to be registered on more than one electoral roll within the colony, whatever the number or nature of the qualifications he may possess, or wherever they may be.” There is a penalty under section 13 for breach of this. [What is termed the “one-man-one-vote” principle, which prohibits an elector voting in more than one electorate has been in operation since 1889.]
Maori voting has been restricted; in accordance with the “one-person -one-roll” principle, by the provisions of section 7; and the position now is that it is competent for a Maori having a freehold estate of the value of £25, and for every half-caste who has the qualification above referred to under section 6, to demand registration on the roll of electors for European representation; but no such person can vote at elections of Maori members, nor become a candidate for a Maori district as long as his (or her) name remains on such European roll.
Section 9 defines the qualification of men for election as members of the House of Representatives, which is simply that of being an elector whose name is registered on any electoral roll. But following on the above, it is enacted that women are not capable of nomination, or of being elected members of the House of Representatives, or of being appointed members of the Legislative Council.
By section 61, commercial travellers are allowed to take out electors’ rights as well as seamen, and section 3 of “The Electoral Laws Amendment Act, 1893,” extends the provisions relating to voting by commercial travellers by means of electors’ rights to shearers, the word “shearer” being held to mean a person who is bonâ fide employed by an owner of sheep for shearing purposes during the season of the year.
The Act brings into force, under section 126, a system by which the name of every qualified elector who fails to record his vote is removed from the roll after the election. It is made the duty of the returning officer to mark a fair copy of the roll so as to indicate every voter who has voted at an election, and to write the words “candidate” or “prohibited from voting” opposite the names of such persons as were candidates or prohibited by law from voting at such election. The returning officer has to transmit the roll, so marked, to the Registrar of Electors, who thereupon erases the names of all voters who are not indicated as having voted. But electors whose names have been so removed can immediately apply to be replaced on the roll.
“Maori” is defined by section 148 of the Act to be an aboriginal inhabitant of New Zealand, and includes half-castes and their descendants by Natives.
The four Native members are chosen by the votes of the Maoris inhabiting the four Maori electoral districts into which the colony is divided, and every Maori (not being registered as an elector for voting at the European representation) who is twenty-one years of age and upwards and not specially disqualified is entitled to vote as an elector for the district he resides in, without registration.
Every Maori male elector is qualified to be a member of the House of Representatives for any Maori electoral district.
For purposes of this election 1,440 polling-places were appointed. This number is 418 in excess of the number made use of at the previous election in the year 1890.
A table is given by which it will be seen that the total number of electors on the rolls was 302,997. Of these 193,536 were stated to be men, and 109,461 women. There is no doubt that the number of names of males on the rolls was considerably in excess of what it ought to have been, for the total adult male population of the colony at the census of 1891 was only 167,762, and an estimate for the date of the election shows this number to have increased to only 180,247.
The total number (302,997) must therefore be regarded as too high, owing to repetition of names of persons who had moved from district to district, and other causes. It is, however, shown in the table that there were 72,376 electors in the contested districts who did not vote, and whose names will since have been struck off the rolls, thereby purging them. The voters who recorded then-votes numbered 220,082. In the case of the four city constituencies voters had each the right of exercising their vote in respect of three members.
| District. | Number of Members. | Electors on Roll. | Number of Voters who recorded Votes. | Number to be struck off Roll. |
|---|---|---|---|---|
| Bay of Islands | 1 | 4,916 | 3,030 | 1,886 |
| Marsden | 1 | 4,207 | 2,900 | 1,307 |
| Waitemata | 1 | 4,717 | 3,131 | 1,586 |
| Eden | 1 | 4,632 | 3,521 | 1,111 |
| City of Auckland | 3 | 16,788 | 11,328 | 5,460 |
| Parnell | 1 | 4,194 | 3,266 | 928 |
| Manukau | 1 | 4,038 | 2,803 | 1,235 |
| Franklin | 1 | 4,122 | 3,279 | 843 |
| Waipa | 1 | 3,737 | 2,893 | 844 |
| Waikato | 1 | 2,779 | 2,241 | 538 |
| Thames | 1 | 3,807 | 2,989 | 818 |
| Bay of Plenty | 1 | 4,166 | 2,835 | 1,331 |
| Waiapu | 1 | 5,161 | 3,905 | 1,256 |
| Hawke's Bay | 1 | 4,934 | 3,598 | 1,336 |
| Napier | 1 | 4,220 | 3,708 | 512 |
| Waipawa | 1 | 4,902 | 3,989 | 913 |
| New Plymouth | 1 | 4,110 | 3,236 | 874 |
| Egmont | 1 | 3,667 | 2,670 | 997 |
| Patea | 1 | 3,621 | 2,631 | 990 |
| Masterton | 1 | 5,409 | 3,764 | 1,645 |
| Wairarapa | 1 | 4,375 | 3,549 | 826 |
| Wanganui | 1 | 4,487 | 3,504 | 983 |
| Rangitikei | 1 | 5,369 | 4,024 | 1,345 |
| Palmerston | 1 | 5,113 | 3,687 | 1,426 |
| Otaki | 1 | 3,987 | 2,465 | 1,522 |
| City of Wellington | 3 | 16,497 | 13,384 | 3,113 |
| Wellington Suburbs | 1 | 4,544 | 3,554 | 990 |
| City of Nelson | 1 | 3,766 | 3,287 | 479 |
| Buller | 1 | 4,054 | 3,421 | 633 |
| Inangahua | 1 | 3,482 | 2,881 | 601 |
| Waimea-Sounds | 1 | 2,812 | 1,990 | 822 |
| Wairau | 1 | 4,139 | 3,226 | 913 |
| Grey | 1 | 4,633 | 3,450 | 1,183 |
| Westland (uncontested) | 1 | 4,186 | ||
| Ashley | 1 | 4,026 | 2,835 | 1,191 |
| Kaiapoi | 1 | 3,721 | 3,087 | 634 |
| Avon | 1 | 4,321 | 3,190 | 1,131 |
| City of Christchurch | 3 | 14,612 | 12,302 | 2,310 |
| Lyttelton | 1 | 3,589 | 2,789 | 800 |
| Riccarton | 1 | 3,883 | 2,928 | 955 |
| Ellesmere | 1 | 3,376 | 2,859 | 517 |
| Selwyn | 1 | 3,361 | 2,438 | 923 |
| Ashburton | 1 | 5,247 | 3,466 | 1,781 |
| Rangitata | 1 | 4,014 | 2,560 | 1,454 |
| Pareora | 1 | 3,994. | 2,971 | 1,023 |
| Timaru | 1 | 4,212 | 3,421 | 791 |
| Waitaki | 1 | 3,642 | 2,570 | 1,072 |
| Oamaru | 1 | 4,142 | 3,108 | 1,034 |
| Waihemo | 1 | 3,886 | 3,268 | 618 |
| Waikouaiti | 1 | 3,227 | 2,188 | 1,039 |
| Chalmers | 1 | 4,811 | 3,389 | 1,422 |
| City of Dunedin | 3 | 16,936 | 12,877 | 4,059 |
| Caversham | 1 | 3,499 | 2,582 | 917 |
| Taieri | 1 | 3,565 | 2,724 | 841 |
| Bruce (uncontested) | 1 | 3,224 | ||
| Tuapeka | 1 | 3,654 | 2,865 | 789 |
| Clutha | 1 | 4,119 | 3,110 | 1,009 |
| Mataura | 1 | 4,204 | 3,081 | 1,123 |
| Wakatipu | 1 | 4,026 | 2,890 | 1,136 |
| Wallace | 1 | 4,398 | 2,841 | 1,557 |
| Invercargill | 1 | 4,608 | 3,604 | 1,004 |
| Awarua (uncontested) | 1 | 3,129 | ||
| Grand totals | 70 | 302,997 | 220,082 | 72,376 |
The voters and votes recorded in the four city electorates where the electors had the right of voting for three members are given next, with the full number of votes exercisable, showing that some of the voters avoided voting for more than one or two candidates.
| City. | Number of Members. | Number of Electors on Roll. | Number of Voters who recorded Votes. | Number of Votes recorded. | Number of Votes exercisable. |
|---|---|---|---|---|---|
| Auckland | 3 | 16,788 | 11,328 | 30,584 | 33,984 |
| Wellington | 3 | 16,497 | 13,384 | 36,102 | 40,152 |
| Christchurch | 3 | 14,612 | 12,302 | 32,715 | 36,906 |
| Dunedin | 3 | 16,936 | 12,877 | 34,584 | 38,631 |
| Totals | 12 | 64,833 | 49,891 | 133,985 | 149,678 |
Another table is given which shows the total number of women on the rolls to have been 109,461 out of an estimated adult female population amounting to 139,915, and the proportion of women who registered as electors is thus found to be 78.23 per cent. The number who voted was 90,290, being the high proportion of 85.18 per cent. of the number on the rolls, excluding the districts in which there was no contest.
WOMEN ON ROLLS, AND NUMBER WHO VOTED.
| Electoral Districts. | Number of Women on Rolls. | Number of Women who voted. |
|---|---|---|
* No contest. | ||
| Bay of Islands | 1,051 | 828 |
| Marsden | 1,267 | 963 |
| Waitemata | 1,335 | 1,126 |
| Eden | 1,777 | 1,571 |
| City of Auckland | 6,660 | 5,283 |
| Parnell | 1,925 | 1,695 |
| Manukau | 1,679 | 1,877 |
| Franklin | 1,679 | 1,481 |
| Waipa | 1,306 | 1,073 |
| Waikato | 987 | 840 |
| Thames | 1,387 | 1,271 |
| Bay of Plenty | 1,172 | 1,003 |
| Waiapu | 1,437 | 1,312 |
| Hawke's Bay | 1,278 | 938 |
| Napier | 1,849 | 1,660 |
| Waipawa | 1,482 | 1,299 |
| Masterton | 1,458 | 1,212 |
| Wairarapa | 1,503 | 1,313 |
| New Plymouth | 1,465 | 1,289 |
| Egmont | 877 | 803 |
| Patea | 1,126 | 961 |
| Wanganui | 1,660 | 1,454 |
| Rangitikei | 1,548 | 1,355 |
| Palmerston | 1,702 | 1,443 |
| Otaki | 964 | 767 |
| City of Wellington | 7,280 | 6,146 |
| Wellington Suburbs | 1,860 | 1,622 |
| City of Nelson | 1,629 | 1,473 |
| Waimea-Sounds | 740 | 622 |
| Wairau | 1,428 | 1,314 |
| Buller | 1,431 | 1,284 |
| Inangahua | 998 | 916 |
| Grey | 1,376 | 1,198 |
| Westland | 1,278 | * |
| Ashley | 1,263 | 1,072 |
| Kaiapoi | 1,420 | 1,299 |
| Avon | 1,732 | 1,443 |
| City of Christchurch | 6,710 | 5,989 |
| Lyttelton | 1,581 | 1,324 |
| Riccarton | 1,634 | 1,417 |
| Ellesmere | 1,373 | 1,166 |
| Selwyn | 1,207 | 1,006 |
| Ashburton | 1,573 | 1,330 |
| Rangitata | 1,119 | 958 |
| Pareora | 1,277 | 1,171 |
| Timaru | 1,804 | 1,612 |
| Waitaki | 1,227 | 994 |
| Oamaru | 1,638 | 1,423 |
| Waihemo | 1,357 | 1,267 |
| Waikouaiti | 1,291 | 948 |
| Chalmers | 1,818 | 1,584 |
| City of Dunedin | 7,644 | 6,306 |
| Caversham | 1,552 | 1,277 |
| Taieri | 1,356 | 1,117 |
| Bruce | 1,200 | * |
| Tuapeka | 1,115 | 1,007 |
| Clutha | 1,353 | 1,168 |
| Mataura | 1,348 | 993 |
| Wakatipu | 1,142 | 923 |
| Wallace | 1,186 | 906 |
| Invercargill | 1,968 | 1,643 |
| Awarua | 979 | * |
| Totals | 109,461 | 90,290 |
A feature of the election was the orderliness and sobriety of the people. Female voters were in no way molested. Canvassing was carried on by the female electors with considerable energy in many places.
Out of a total Maori population amounting to 41,993 persons (the census figures are used), 11,269 voted at the general election. This number includes persons of both sexes. At the election of 1890. when women did not possess the franchise, 7,086 males gave their votes, the population being then about the same as it was in 1893. Of the four districts into which the colony is divided, referred to in the preliminary portion of this article, the voting was highest in proportion to population in the Eastern, and lowest in the Western District.
| Electoral Districts. | Number who voted. | Per cent. of Population at all Ages. |
|---|---|---|
| North Island— | ||
| Northern Maori Electoral District | 1,674 | 1866 |
| Eastern Maori Electoral District | 6,305 | 43.66 |
| Western Maori Electoral District | 2,741 | 16.75 |
| South Island— | ||
| Southern Maori Electoral District | 549 | 24.75 |
By C. J. A. Haselden, Under-Secretary for Justice.
“The Licensing Act, 1881,” which is at present the main statute, was chiefly the work of the late Sir William Fox. Its leading features were small districts, local option, and Committees of live persons elected by the ratepayers to administer the Act. These have all been changed by the Act passed in 1893, of which more will be said presently. Under the Act of 1881 the Committees were elected annually, but an Act passed in 1889 made the elections triennial, and that principle is continued by the Act of 1893. Among minor provisions of the main Act are special districts where the ordinary administration cannot be effectually carried out, and Native districts where a majority of the population are Natives, and it is desirable to prevent them from obtaining intoxicants. In each of the latter districts an elected Maori assessor is a member of the Committee, and his consent is indispensable for the granting of any application. Experience has proved that the Maoris are generally quite indifferent in the matter, for it is often extremely difficult to get an assessor elected, and, when he is elected, to induce him to attend the meetings of the Committee. In one instance the assessor was in prison for some breach of the law, and the meeting had to be adjourned till his sentence had expired, when he took his seat beside the Magistrate who had committed him to gaol. In another case there was good reason for believing that the assessor had levied blackmail on publicans under threat of vetoing their applications for licenses. The Act of 1889, however, makes provision for removing such persons from office, and appointing others in their stead. There are seven kinds of licenses, the most general, of course, being the publican's license. The Committees meet quarterly, but new licenses can be granted only at the annual meeting held in June. Provision is made for objections by the police, corporate bodies, or ratepayers to the grant or renewals of any licenses.
The annual fee for a publican's license is £40 within a borough, and £25 in other places. Accommodation licenses for houses situated more than live miles by road from any other licensed house may be granted for such sum, not exceeding £20, as the Committee may think lit.
The license-fees are payable to the funds of the Borough Council or other local body within whose jurisdiction the premises are situated, and such body is charged with the payment of the costs of election of Committees, and with other expenses of administering the Act.
The revenue from licenses amounts to about £60,000 per annum.
The main Act further deals with the duties, liabilities, and protection of licensees, inspection by the police, &c. It also provides for the issue of charters to clubs, and the Act of 1893 provides for inspection of clubs. The Acts of 1882 and 1889 amend the main Act in minor particulars.
Turning now to “The Alcoholic Liquors Sale Control Act, 1893,” to which reference has already been made, we find some important changes in the law. Instead of 395 ordinary districts as formerly, there are now only 62. Each electoral district constituted for the election of a member of the House of Representatives is a licensing district, and the electors for the House of Representatives are also electors under the Licensing Acts. This means practically that nearly every man and woman in the colony may have a voice in the choice of members of Licensing Committees, and also a vote in the local-option poll.
Unusual interest was taken in the recent election and poll in consequence of the new powers conferred on women, and there was much speculation and anxiety as to the result. Both the temperance party and the “trade” worked vigorously in most districts for their “cause.”
The poll is taken at the same time as the election of the Committee, and the questions for the decision of the voters as regards publicans’, accommodation, and bottle licenses respectively are,—
Whether the present number of licenses is to continue;
Whether the number is to be reduced;
Whether any licenses are to be granted.
On each of the first and second questions an absolute majority of the votes in favour of the proposal carries it, hut as regards the third question three-fifths of the total votes recorded must be given in favour of the proposal or it is deemed to be not carried. When prohibition is not carried the votes in its favour are to be credited in favour of reduction.
These results are, however, subject to the condition that at least half the voters on the roll record their votes. Should such not be the case the poll is void and matters are to continue as they were.
It has been found impossible to obtain strictly accurate returns of the results of the elections and polls from all the returning-offices, but the following table is substantially correct: —
* Many had been struck off for not voting at the recent general election for Parliament. | |
|---|---|
| Number of electors on the rolls* | 248,194 |
| Number of men who voted at election of Committees | 71,763 |
| Number of women who voted at election of Committees | 45,022 |
| Total number of voters | 116,785 |
| Number of men who voted at local-option poll | 74,372 |
| Number of women who voted at local-option poll | 47,862 |
| Total number of voters | 122,234 |
| Number of districts in which the poll has been declared void | 33 |
| Number of districts in favour of reduction | 14 |
| Number of districts in favour of no alteration | 12 |
| Number of districts in favour of no licenses | 1 |
| Number of districts in which no proposal was carried | 2 |
| Total number of districts | 62 |
| Clutha is the one district which carried prohibition. | |
| Publicans’ Licenses. | |
| Number of votes in favour of continuance of present number | 42,429 |
| Number of votes in favour of a reduction | 16,096 |
| Number of votes in favour of no licenses | 48,993 |
| Total | 107,518 |
| Accommodation Licenses. | |
| Number of votes in favour of continuance of present number | 31,342 |
| Number of votes in favour of reduction of present number | 9,823 |
| Number of votes in favour of no accommodation licenses | 35,442 |
| Total | 76,607 |
Bottle licenses can be granted only in the Provincial Districts of Hawke's Bay, Otago, Westland, Marlborough, and Nelson; and in those districts there are not more than sixty. The returns of votes respecting them are too incomplete to be of any Value. It is alleged by the New Zealand Temperance Alliance that most of the Returning Officers decided that informal voting in respect of any one of the three kinds of licenses, or failure to vote in respect of all three, made the whole voting-paper bad, while others decided that the informality attached only to the particular proposal in respect of which it occurred, and counted the votes accordingly. But for this and other discrepancies of practice, which should be put beyond doubt by a new Act, the result in soma of the districts might have been different. It is impossible to give any positively correct statement as to the results of the election of the Committees from a party view. The Prohibitionist claims “Victory nearly all along the line,” while the Evening Post states that thirty-nine districts have elected Committees in which the “moderate” members are in a majority, and in twenty-three Committees the extreme temperance party are in a majority.
The new Act increases the number of members of a committee from five to eight, with the addition of the Stipendiary Magistrate as Chairman, ex officio. Every application for a new license, or for a transfer, must be accompanied by a certificate from a Stipendiary Magistrate of the fitness of the applicant to hold a license.
No increase in the number of licenses is to be allowed until after the next census, and then only where there shall have been an increase of 25 per cent. of the population of the district, and a poll has resulted in three-fifths of the voters being in favour of an increase, one-half at least of the electors having voted. In such a case, the Committee may grant new licenses to the extent of one for every increase of 700 people. There is, however, special provision for granting licenses when there is at any time any sudden increase of the population. The new Act practically gives a licensee three years’ tenure if during that period no charge is proved against him.
Licensing meetings are to be held in the most convenient Courthouse.
No paid officer of the Government or of any local body is eligible for election as a member of a Licensing Committee.
Two Justices in Court may forbid the sale of intoxicants to any drunkard under a penalty of £10 to be paid by the seller, or £5 to be paid by any other person procuring liquor for the prohibited person, and £10 to be paid by such person.
Where a poll is in favour of a reduction of the number of licenses, the Committee may reduce the number to the extent of one-fourth. Those licenses which have been indorsed for breaches of law are to be reduced first, and then those where the premises provide insufficient accommodation for travellers.
Having now given a summary of the existing law, and shown some of the results of recent amendments, it remains to add that the working of the law as altered has made it plain that in matters of detail there is room for such improvement as will obviate difficulties and prevent questions being raised, and that a consolidating and amending Act is most desirable.
Since the above was written a new Bill has been prepared and circulated, but it would be premature to specify its provisions at present.
By Rev. W. J. Habens, B.A., Secretary for Education.
The provision made in New Zealand for public instruction under “The Education Act, 1877,” is on a liberal scale. The whole cost of primary schools is borne by the State; the instruction imparted in them is wholly secular; and the committee of any school may bring into operation, within its district, certain sections of the Act for the purpose of compelling parents to send their children to school. The primary schools—“public schools” as they are designated in the Act—number 1,355. The average attendance of pupils during the first quarter of 1894 was 103,288. The salaries of teachers at the rates in force at the end of 1893 amounted to £320,058. The number of teachers receiving not less than £400 each was 7; 49 others were in receipt of not less than £300 each; 221 had less than £300, but not less than £200; 1,124 had less than £200, but not less than £100; and 2,025 (including 1,061 pupil-teachers and 160 teachers of sewing) had less than £100 each.
The country is divided into thirteen education districts, over each of which an Education Board presides, and into smaller districts, in each of which a school committee, elected by the householders, has authority, subject to the general control of the Board. The Board is elected by the school committees. The Board of an education district receives and disburses the money voted by the General Assembly for purposes of primary instruction, and, subject to the condition of consultation with the committee of the school district, appoints the teachers. The Boards also appoint the inspectors; but the inspectors work under regulations made by the Governor in Council, who also makes the regulations under which the Minister grants certificates to teachers after examination and adequate experience.
The regular income of the Boards consists of a capitation allowance of £3 15s. a year for every unit of average attendance, together with a capitation grant of not more than 1s. 6d. for the maintenance of scholarships tenable in secondary schools, and a grant in aid of inspection. A parliamentary grant (varying considerably from year to year) is distributed among the Boards, and expended by them on the erection of school-buildings. The following statement shows the aggregate income and expenditure of the thirteen Boards for the year 1893: —
| DR. | £ | s. | d. |
|---|---|---|---|
| To Balances, 1st January, 1893 | 51,098 | 17 | 6 |
| Government grants— | |||
| Maintenance | 350,465 | 13 | 11 |
| Buildings | 47,273 | 0 | 0 |
| Reserves revenues | 37,169 | 11 | 0 |
| Local receipts- | |||
| Fees, donations, etc. | 2,349 | 6 | 11 |
| Rents, sales, &c. | 552 | 6 | 10 |
| Interest | 487 | 18 | 9 |
| Refunds, deposits, &c. | 1,014 | 14 | 6 |
| Total | £490,411 | 9 | 5 |
| CR. | £ | s. | d. |
|---|---|---|---|
| By Board's administration | 11,360 | 10 | 11 |
| Inspection and examination | 11,882 | 10 | 3 |
| Teachers’ salaries and allowances, and training | 328,828 | 13 | 8 |
| Incidental expenses of schools | 35,302 | 19 | 6 |
| Scholarships | 7,073 | 7 | 10 |
| Interest | 207 | 9 | 0 |
| Buildings, sites, plans, &c. | 44,387 | 2 | 4 |
| Refunds and sundries | 659 | 2 | 4 |
| Balances | 50,709 | 13 | 7 |
| Total | £490,411 | 9 | 5 |
The sum of the numbers on the rolls of the several schools at the end of 1893 was 124,690. Of this number there were 31,634 in preparatory classes, and 3,459 pupils who had passed the sixth (the highest) standard, leaving 89,597 in the standard classes.
The numbers in the several standard classes, beginning with the class to be next presented for examination in the First Standard, were: 17,625, 17,508, 18,438, 16,431, 12,005, 7,590. Boys and girls are in the proportion of 51.6 to 48.4; and pupils under ten years old to pupils above ten are as 52.8 to 47.2. More than 94 per cent. of the pupils receive instruction in drawing, and five-sixths of the girls are taught needlework.*
Note
* NOTE.—School children not over fifteen years of age, living in a neighbourhood where there is a railway-station but no public school, can obtain free second-class tickets to and from a station in the neighbourhood of the nearest primary school; and all children under fifteen can obtain free tickets to enable them to attend a private school. Also, second-class tickets are issued at 10s. a quarter to children under sixteen, to enable them to go to any school their parents choose.
The secondary schools of the colony are not supported directly by the State, nor are they open to all pupils without charge. Some of these schools have endowments of land, originating in agreements between colonising companies and the early settlers, or in State grants; and some receive aid from the School Commissioners, who administer the public reserves for education. At the end of 1893 there were twenty-four schools, with an average attendance of 2,133 pupils. The aggregate income of these incorporate schools from school-fees (not including boarding-fees) was £19,810, and from endowments, £26,351.
The University of New Zealand is a corporate body which does not itself maintain a staff of professors or lecturers, but has its functions restricted to the encouragement of learning by the conferring of degrees and certificates of proficiency, and by a liberal system of scholarships. The University has a statutory grant of £3,000 a year from the Treasury, and an income of about £2,000 from the fees paid for examinations and degrees. Members of Senate were formerly nominated by the Governor, but vacancies are now filled up by election, the right of election being exercised alternately by the Senate and by the Convocation or body of graduates. There are three institutions in which most of the undergraduates keep terms and receive instruction: the University of Otago, founded and endowed by the Provincial Government of Otago; Canterbury College, similarly instituted by the Provincial Government of Canterbury; and Auckland University College, established by Act of Parliament since the abolition of provinces, and endowed with a statutory grant of £4,000 a year. The number of students at each of these institutions in 1893 was as follows: Otago University, 213; Canterbury College, 340; Auckland University College, 127. As the result of the examinations at the end of 1893, degrees were conferred as follows: B.A., 45; B.Sc., 4; LL.B., 2; M.B., 1; M.A., 14. At the same examinations, 13 gained honours in Arts; 1 gained honours in Science; 90 passed sections of examinations for degrees; 44 passed various examinations for admission to the legal profession; and 427 qualified for matriculation (35 by passing with credit at the junior scholarship examination). The number of graduates by examination is now 422; B.A., 217; B.A. and B.Sc., 3; B.A. and LL.B., 9; B.A. and M.B., 3; B.Sc., 4; LL.B., 6; M.B., 14; M.A., 137; M.A. and B.Sc., 11; M.A. and LL.B., 9; M.A. and M.B., 1; M.A. and D.Sc., 1; M.A. and LL.D., 1; LL.D., 1; LL.D. and B.A., 1; M.D., 4.
The Department of Education, over which the Minister of Education presides, is charged with the general administration of the public-school system. It has also the direct management of between 60 and 70 Native schools (with about 2,000 pupils), of industrial schools, and of an institution for deaf-mutes (conducted on the pure oral system); and it takes an active interest in the instruction of the blind.
At the end of 1893 there were 1,550 names on the books of the industrial schools; 589 were living in the schools, 409 boarded-out, 393 at service, and 125 on probation with their friends. Each boarded-out child is under the eye of a lady-visitor, who reports once a month. The children sent to these schools are some of them merely indigent; others are vagrant; some have committed offences rendering them liable to imprisonment; some have been taken from disreputable homes. In every case the manager of the school is the legal guardian of an inmate, and the guardianship continues until the inmate is discharged by warrant under the hand of the Governor, or reaches the age of twenty-one.
Prior to the abolition of provinces the hospitals of the colony were supported mainly out of provincial revenues. Subsequently thereto, the expenditure for hospitals became to a large extent a charge on the revenue of counties and municipal corporations, until October, 1885, when “The Hospitals and Charitable Institutions Act, 1885,” came into operation.
The portion of the colony included within the three principal islands—the North, Middle, and Stewart Islands—was by the above Act divided into twenty-eight hospital districts, each consisting of one or more counties with the interior boroughs, to be presided over by elected Boards, designated “Hospital and Charitable-aid Boards.”
The revenues of these boards accrue from the following sources:—
Rents and profits of land and endowments vested in the Board, or set apart for the benefit of particular, institutions;
Voluntary contributions;
Grants from contributory local authorities; and
Subsidies from the Consolidated Fund (these being at the rate of 10s. for every £1 of bequests, but in no case exceeding £500 in respect of any one bequest; £1 4s. for every £1 of voluntary contributions; and £1 for every £1 received from any local authority).
The contributory local authorities—being the County and Borough Councils, and Boards of road and town districts where the Counties Act is not in operation—are empowered by the Act to raise, by special rates, the amounts assessed by the Hospital District Boards, as the proportionate contributions for the purpose of the Hospital and Charitable-aid Fund.
The District Boards undertake the general management and control of those hospitals that are not incorporated in terms of the Act, and are required to contribute to the support of the incorporated hospitals. Incorporated hospitals are those which have not less than one hundred subscribers, contributing not less than £100 annually by amounts of not less than 5s., and which have been declared by the Governor in Council, after receipt by him. of a duly signed petition, to be a body politic and corporate, governed by trustees.
There are 39 hospitals in the colony, of which 21 are incorporated institutions, and 18 are directly managed and controlled by District Boards. In 1893 these hospitals afforded accommodation for 1,013 male and 471 female patients, a total of 1,484. The number of cubic feet of space included within the walls of all the sleeping-wards was 1,958,699, which gave an average of 1,320 cubic feet to each bed. 5,909 males and 2,430 females were admitted as patients during the year 1893, and 593 male and 185 female patients were inmates at the end of the year. The total number of indoor patients during the year was 9,068, viz., 6,454 males and 2,614 females.
The various benevolent asylums and charitable institutions are placed on a similar footing to the hospitals. The Boards of hospital districts are constituted Hospital and Charitable-aid Boards; but, for the purpose of distributing charitable aid only, some of the hospital districts have been united into larger districts, so that, although there are 28 Boards for hospital purposes, there are only 21 for charitable-aid purposes.
Returns were received in 1893 from 15 benevolent asylums (not including orphanages), established for the support of indigent persons. The number of inmates in these institutions at the end of 1893 was 782, of whom 567 were males and 215 females. Outdoor relief was given by four of these institutions to 3,081 persons, including 1,781 children.
There is a Sailors’ Home at Auckland for the use of seafaring men resident in or visiting the town. The late Edmund Costley having left a largo sum for charitable purposes, it was resolved to employ the bequest in building and endowing an institution where sailors might be received without distinction of nationality or religious belief, and board, lodging, and refreshments provided for them, together with such amusements and instruction as might tend to promote their social comfort and general welfare.
The Home, built in 1887, has room for 35 inmates, who are charged 15s. a week for board and lodging. It is managed by a council consisting of eight members elected by the subscribers to the institution, together with the Anglican Bishop of Auckland (the Right Rev. W. G. Cowie), who first originated the scheme, as life president.
There were in 1893 six orphan asylums in the colony, two maintained by District Hospital Boards, one by the Church of England authorities, and three by clergy of the Roman Catholic Church; four*
Note
* One of these, the Thames Orphanage and Industrial School, was closed on the 31st December last.
Exclusive of the children so committed, 9 male and 26 female orphans were received during the year 1893, and 41 male and 91 female orphans remained as inmates at the end of the year.
The orphanages that receive committed children are, for that purpose, constituted “industrial schools.” The particulars of the committed children will be found included with those of the committed children attending the Government industrial schools.
There are seven public lunatic asylums in the colony (one being, however, only an auxiliary institution to the district asylum), maintained wholly or in part out of the public revenue. There is also one private asylum, licensed by the Governor for the reception of lunatics. There were, at the end of 1893, 1,229 male and 808 female patients belonging to these asylums. Of these, 1,103 males and 708 females were supposed to be incurable, 25 males and 25 females were out on trial, and 101 males and 75 females were supposed to be curable. 123 male and 112 female patients were discharged during the year.
The following shows the proportion of insane—or. rather, of inmates of lunatic asylums—to the population (exclusive in each case of Maoris) at the end of the years stated: —
| 1884, 1 insane person to every 393 of population. |
| 1885, 1 insane person to every 382 of population. |
| 1886, 1 insane person to every 370 of population. |
| 1887, 1 insane person to every 360 of population. |
| 1888, 1 insane person to every 365 of population. |
| 1889, 1 insane person to every 349 of population. |
| 1890, 1 insane person to every 348 of population. |
| 1891, 1 insane person to every 343 of population. |
| 1892, 1 insane person to every 339 of population. |
| 1893, 1 insane person to every 330 of population. |
It must not be overlooked that the proportions are increased by the admission into the asylums of inebriates, idiots, and others, who should not properly be there.
In making a selection of facts and figures from the available mass of statistics bearing upon the history and working of the Government Insurance Department of New Zealand, it is difficult to know what to reject when all that concerns this great scheme of State insurance possesses so much interest. As, however, the limits of space necessitate a free application of the pruning-knife, precedence has been given to those matters which are new, or to which attention has not been drawn hitherto.
It is needless to dwell upon the foundation of the institution in 1869—at a time when New Zealanders had poor facilities for the insurance of their lives—nor is it necessary to speak in detail of the history of the early years of the office. But it may be said that at a very early stage it was thought advisable to adopt the practice of employing paid canvassers, and without them it is quite certain that no voluntary scheme of life insurance, however attractive, can become completely successful. Since that time the principles on which the department has been managed have been much the same as might guide any progressive and soundly-conducted private life insurance office.
The result is pithily described by a New York paper, The Monitor, which says: “The legendary New Zealander who stood, or was to stand, on the broken arches of London Bridge and moralise over the ruins of that great city was a savage. New Zealand, so recently as the time when Macaulay made his cynical remark, was barbarous; that was what gave point to the remark. To-day, the inhabitants of New Zealand carry more life insurance in proportion to their numbers than the people of any other nation on the globe. Life insurance is one of the refinements of modern civilisation; it is one of the highest evidences of progress; it is one of the best results of prosperity and intelligence, confirming domestic tranquility and business security. A quarter of a century ago there was very little life insurance in New Zealand; a half-century ago there was none; and a century ago the savage Maoris were in full possession of that land.” For this result the State office is responsible to the extent of holding, approximately, one-half of the total insurance of the colony.
The major part of the business is composed of ordinary whole-life and endowment assurance policies, which are almost equally fancied by the insuring public of New Zealand; in 1893 there were issued 1,447 now policies payable at death for £389,000, and 1,757 endowment assurances for £348,000. The total amount insured by the policies on the books of the department has now reached nine millions sterling, being over £12 for every man, woman, and child within the area of its operations.
The following comparison will show the progress of the office in twenty years: —
| Year. | Policies in force. | Sum assured and Bonuses. | Annual Income. | Funds. |
|---|---|---|---|---|
| £ | £ | £ | ||
| 1873 | 2,634 | 996,000 | 31,000 | 37,000 |
| 1893 | 31,709 | 9,098,000 | 362,000 | 2,129,000 |
Of course the excellent security which is given with every policy is largely responsible for the great success which these figures indicate, but the entire freedom of the policy from oppressive conditions or restrictions has contributed thereto in a marked degree. On this point the latest prospectus says: “The Government Insurance Department's policy is practically free from conditions of any kind, except the payment of premiums as they fall due. The desire of the department is to grant to everyone the freest form of policy compatible with sound and prudent management. Improvements have been adopted from time to time as they have been found to be safe, with the result that the policy contract is now practically free from all restrictions, with the single exception, framed in the interest of public policy, that the Commissioner may declare the contract void if the assured commits suicide within six months of date of entry.” For many years women and men have been charged the same rates for insurance; and “all policies are world-wide from date of issue.” At the time of proposal the department requires proposers to state clearly their occupation and intended place of residence, and when these are extra hazardous an extra premium may be charged to meet the special circumstances. When once insured, however, policy-holders may change occupation and place of residence as often as they wish, without in any way endangering their policies or rendering themselves liable to pay extra premiums. In fact, they may go where they please and do what they like, and if death occur in Central Africa, at the North Pole, or on the battle-field, the policy-money with accrued bonuses will be promptly paid to the relatives, the department assuring the policy-holder against these and all other risks.
The department allots profits triennially, and there have been recently sent to the policy-holders bonus certificates representing the divisible cash surplus for the years 1891, 1892, and 1893; the total amount of cash bonus thus divided for the three years being no less than £140,000.
Not the least interesting fact in connection with this insurance department is the diversity of the classes from which insurants are drawn. It seems that nearly every possible calling is represented, from a Chief Justice to a sausage-casing man. In the table given on the next page will be found a complete list of the occupations, as described in the proposals, of the 253 women and 3,010 men who insured their lives during 1893. In addition to showing the healthy variety of occupation of the policy-holders of the Government Insurance Department, the table will not be devoid of interest in drawing attention to the nature of the arts and industries practised by the people of New Zealand.
TABLE SHOWING THE OCCUPATIONS OF PERSONS WHO INSURED IN THE GOVERNMENT INSURANCE DEPARTMENT IN 1893. | |
|---|---|
| Males. | |
| Farmers | 423 |
| Government officials | 276 |
| Labourers | 196 |
| Clerks | 144 |
| Railway employés | 138 |
| Farm labourers | 120 |
| Miners | 85 |
| Permanent militiamen | 83 |
| School-teachers | 77 |
| Carpenters | 64 |
| Butchers | 60 |
| Stationers | 54 |
| Storekeepers | 50 |
| Blacksmiths, shepherds (each) | 44 |
| Storemen | 42 |
| Bakers | 39 |
| Drapers and clothiers | 36 |
| Bootmakers | 34 |
| Engineers, policemen, scholars (each) | 33 |
| Grocers, printers (each) | 32 |
| Carriers and carters | 28 |
| Accountants, contractors (each) | 27 |
| Journalists, sawmillers (each) | 25 |
| Plumbers and tinsmiths | 24 |
| Officers of merchant service | 22 |
| Saddlers | 21 |
| Tailors | 20 |
| Medical practitioners, merchants, painters (each) | 19 |
| Lawyers | 18 |
| Cabinetmakers and upholsterers | 16 |
| Company managers | 14 |
| Clergymen, coachbuilders, gardeners (each) | 13 |
| Commercial travellers, gentlemen, millers, station managers, surveyors (each) | 12 |
| Hotelkeepers, ironmongers, warehousemen (each) | 11 |
| Builders, dairy factory managers, salesmen (each) | 10 |
| Fellmongers, grooms, marine engineers (each) | 9 |
| Auctioneers, hank managers, hush-men, watchmakers and jewellers (each) | 8 |
| Agents, booksellers, chemists, dairymen, mechanical engineers, photographers, survey hands (each) | 7 |
| Bricklayers, coach-drivers, coachmen, coach proprietors, commission agents, dentists, hairdressers (each) | 6 |
| Brickmakers, civil engineers, cooks, curriers, engine-drivers, insurance agents, musicians, settlers, stewards, stokers, tanners, wheelwrights (each) | 5 |
| Coal-merchants, factory hands, fishermen, flaxmillers, mariners, rabbit agents, roadmen (each) | 4 |
| Architects, book-keepers, cheese-makers, coopers, draughtsmen, fruit-growers, gumdiggers and sorters, pursers, road foremen, soapmakers, storemen, tobacconists (each) | 3 |
| Accommodation - house keepers, aerated water manufacturers, artists, battery managers, boarding-house keepers, boilermakers, butter-factory assistants, chaff-cutters, coffee - stall keepers, coachsmiths, collar - makers, fancy goods dealers, fruiterers, gunmakers, land agents, night watch men, papermakers, potters, sailmakers, Salvation officers, sheep-dealers, tallow-makers, town clerks, veterinary surgeons (each) | 2 |
| Assayer, asphalter, barman, brewer, Chief Justice, coal-mine overseer, corn-factor, custodian, dyer, electrician, engraver, foreman of works, hawker, japanner, lighthouse keeper, livery-stable keeper, locksmith, maltster, messenger, millwright, moulder, music - seller, perambulator manufacturer, piano-tuner, picture - frame - maker, planter, plasterer, ranger, sausage-casing man, sexton, umbrella-maker, waiter, wool - buyer, wool -scourer, wool-sorter (each) | 1 |
| Females. | |
| Married women | 88 |
| School-teachers | 39 |
| Spinsters | 26 |
| Widows | 17 |
| Servants | 15 |
| Dressmakers | 13 |
| Government officials, scholars, storekeepers (each) | 5 |
| Drapers, farmers (each) | 4 |
| Boarding-house keepers, compositors, cooks, hotelkeepers (each) | 3 |
| Barmaids, clerks, insurance agents, stewardesses (each) | 2 |
| Book-keeper, hoot machinist, college matron, confectioner, darner, fancy goods dealer, fruiterer, industrial-school manager, lady - help, laundress, saleswoman, waitress (each) | 1 |
By J. K. Warburton, Public Trustee.
The Public Trust Office has been established for the purpose of affording at low rates of commission a secure and convenient recourse for persons resident as well abroad as in New Zealand, who may desire to form trusts in the colony, and who may be in doubt or difficulty as to the choice of trustees or executors. The office is also designed to relieve those who may be appointed trustees of property in the colony, or who, after having accepted trusts, may for various reasons be unable or unwilling to undertake or continue the administration.
The administration of the estates of persons dying intestate falls on the office in cases where the persons entitled to administer request the Public Trustee to do so, or neglect to obtain, within three months after the death of the intestate, the necessary authority to themselves administer. But the Public Trustee may at any time exercise the necessary powers of executor or administrator for the protection of the estate, and his authority to assume this temporary power extends to testate as well as intestate estates. This authority is highly serviceable to the interests of estates in every case where a property may be suffering, or in danger of suffering, injury in consequence of neglect or delay to take out probate or administration. The security of property is strengthened by the existence of an authority which can be invoked when protection is required.
The Public Trustee is also authorised by “The Lunacy Act, 1882,” to undertake the administration of the estates of lunatics in every case where no committee may be appointed for the estate; and it may be remarked as an interesting fact that of the estates of the lunatics in the asylums of the colony fully 90 per cent. are administered by the Public Trustee.
For the purpose of the administration of statutory trusts the Public Trust Office renders very valuable and important services to the Government and to the colony. It is, and must obviously be of great moment to the people that the administration of many lands and properties should be such as should leave no doubt that the directions of the trust will be faithfully carried out. Where a fund or property of which the Government may desire to create a trust is not specially authorised by statute to be placed in the Public Trust Office, the purpose is served by the execution of an ordinary trust instrument.
The administration of a Public Trustee is exposed to a stronger light of public criticism than that of a private trustee could be, and any reasonable complaints from the beneficiaries or from anyone would be echoed by the Press as matters of public concern; and these considerations must be sufficient to assure a careful and strictly conscientious observance by the Public Trustee of his obligations to his trusts.
The Public Trust Office was constituted by “The Public Trust Office Act, 1872,” and its functions have since been much enlarged by amending Acts, necessary to enable the office to meet the growing requirements of the public and of the business. The Amendment; Acts of 1891 and 1893 present many new and important features. They facilitate the administration of properties placed in the office; provide for the administration by the Public Trustee of intestate estates of a value not exceeding £250 without the expense of an order of the Court; provide for the disclosure to the Public Trustee of the money and property of deceased persons, by persons, &c., having the custody of such property and knowing it to be vested in the Public Trustee; authorise a more prompt distribution of the residue of testate and intestate estates; provide absolute security from loss in all cases where the funds may be invested at the discretion of the Public Trustee in mortgages of real estate within the colony, or in General Government securities of the colony; and insure the regular and punctual payment of interest on such funds. By these provisions, and also by rendering practicable a more efficient conduct of the office and of the arrangement of the accounts, these Acts have raised the office in the estimation of the public.
The security and fidelity of the administration of the Public Trustee must undoubtedly afford great inducements to any person who may contemplate the appointment of a trustee. The Public Trust Office is a Government department. The fidelity fit its administration is guaranteed by statute; and, by “The Public Trust Office Acts Amendment Act, 1891,” the colony guarantees the integrity of the capital funds of properties placed in the Public Trust Office where there is no direction for the investment of such funds, or where there is no direction for such investment other than generally that the funds are to be invested at the option of the Public Trustee, in General Government securities of New Zealand or in mortgage of real estate within the colony.
The colony also guarantees on such capital funds for investment a common rate of interest, to be determined from time to time by Order in Council, and to be credited quarterly, free of all office charges of the Public Trust Office, to the properties from which the funds arise; and the value of this guarantee will be obvious when it is considered that it is—
The guarantee of the colony against loss from investments in bad or insufficient securities;
The guarantee of the colony against loss from delay in the investment of moneys;
The guarantee of the colony that the interest determined from time to time by Order in Council shall be regularly and punctually paid, free of all charges of the Public Trust Office.
A person making a will or arranging a trust must always be seriously concerned as to the security of the capital funds; and the larger the amount of capital funds the greater will be the concern for security, and the less for the rate of interest.
The Public Trustee, in his official capacity, never dies, never leaves the country, and never becomes disqualified or involved in private difficulties, or distrusted. It will thus, be evident that, by his appointment as trustee, the preparation of the numerous deeds, and the consequent expense, which might become necessary in the case of a private trustee are altogether obviated. These advantages will be readily appreciated by all who have any knowledge of the incidents of trusteeships.
To any one desiring to appoint a trustee, or to any present trustee wishing to be relieved of a trust, the Public Trust Office is a satisfactory recourse, unless the trust should be such as the Public Trustee could not carry out, or the transfer would probably result in casting upon him the odium of a faulty administration for winch he would not really be responsible.
Any property can be vested in the Public Trustee upon trusts defined in the deed creating the trust, and the income from such property can be paid as may be desired.
The draft of a will, or of a deed of trust or settlement, in which the Public Trustee is to be appointed executor or trustee, is examined in the Public Trust Office free of charge, for the purpose of bringing to light any provisions which may be either ambiguous or such as the Public Trustee could not follow.
Wills of living persons, whether under such wills the Public Trustee is or is lot appointed executor, may be deposited in the office for safe custody. Testators who may appoint the Public Trustee to be their executor are recommended to secure the advantage of a provisional acceptance of their wills by the Board of the office, and, thus, to learn whether the Public Trustee would accept the trusts of their wills, besides to obtain free of charge a careful consideration of any objections.
As executor of a will, the Public Trustee must act alone. The law forbids him to act in conjunction with another person.
It is gratifying to be able to state that the reputation and services of the office have attracted attention in the United Kingdom, and that already several trusts of money belonging to persons resident there have been accepted by the office.
In the very large number of cases where persons die intestate— that is, without making any provision by will—it is the duty of the Public Trustee to administer if the relatives of the deceased are unknown, or are known to reside out of the colony, or where the person entitled by law to administer declines or neglects to apply for letters of administration within due time after death. Very few persons who have realised the care and responsibility which are inseparable from the administration of an estate, who understand what services the Public Trust Office is capable of rendering, and what relief may be obtained through the agency of the office, would not prefer to allow an estate in which they may themselves be interested, or which they are expected to manage, to be administered by the Public Trustee, who is a competent officer appointed by the Legislature, and experienced in this class of work. After the assets of an estate are realised, and the debts and expenses paid, the Public Trustee, on receiving satisfactory proofs of kinship, distributes the residue in accordance with the law. If the relatives have to be found, the Public Trustee takes active steps to trace them.
The Public Trustee's authority to administer, without an order of the Court, intestate estates of a value not exceeding £250, is conducive to expedition and economy in the administration.
When all the property in an estate has been realised and the money has been transferred to the common fund of the Public Trust Office, the income is paid to beneficiaries free of all office commission; but during the progress of administration, and the realisation of the property, certain moderate fees and percentages are charged. These charges are no more than sufficient for the expense of maintaining the department without loss. It will be found that the charges for the administration of a property by the Public Trustee will compare very favourably with the expense of an administration by any other agency.
The legal expenses attending the administration of trusts are minimised by the appointment of the Public Trustee. The office solicitor's advice on all matters of administration is given without expense to the estates; and the beneficiaries of properties administered by the Public Trustee can obtain from him, free of charge, all the information that he can afford respecting their own interest in such properties.
The following is a statement of the number and value of estates remaining in the Public Trust Office at the close of the years 1890, 1891, 1892, and 1893:—
| Class. | Number of Estates | Value of Estates | ||||||
|---|---|---|---|---|---|---|---|---|
| On Dec. 31, 1890. | On Dec. 31. 1891. | On Dec. 31, 1892. | On Dec. 81, 1693. | On Dec. 31, 1890. | On Dec. 31, 1891. | On Dec. 31, 1892. | On Dee. 31, 1893. | |
| £ | £ | £ | £ | |||||
| Wills and trusts | 288 | 343 | 354 | 371 | 418,047 | 415,160 | 442,671 | 543,238 |
| Intestate estates | 752 | 794 | 845 | 886 | 75,305 | 83,381 | 81,650 | 84,486 |
| Unclaimed realty | 109 | 114 | 117 | 117 | 23,496 | 24,190 | 22,705 | 23,465 |
| Lunatic estates | 137 | 181 | 202 | 271 | 32,918 | 34,913 | 40,380 | 51,278 |
| Native reserves | 99 | 100 | 101 | 162 | 340,869 | 344,692 | 346,498 | 346,500 |
| West Coast Settlement Reserves | 293 | 293 | 293 | 293 | 349,462 | 350,289 | 350,853 | 400,000 |
| Totals | 1,678 | 1,825 | 1,912 | 2,040 | 1,240,097 | 1,252,625 | 1,284,757 | 1,450,917 |
By J. ASHCROFT, Official Assignee.
The law relating to bankruptcy is necessarily complicated, because it touches on all sides so many various interests in property. It affects the mortgagee, the bill of sale holder, the married woman, the partner or joint owner, the banker and his liens, the preferred creditor, the wage-earner, and his liens on contracts, as well as every conceivable engagement or agreement under which liability is incurred, including shares in companies, and in this colony undefined Native interests in land (for even the Maoris have learned how to become bankrupt). In one instance lately over £4,000 was realised for the joint interests of two Native holders of communal rights, and this did not nearly cover their liabilities.
In 1883 a new Bankruptcy Act was passed in New Zealand, following as far as possible the lines of the last English Act. During nine years’ experience of working, defects were discovered, and in 1892 this law with its various amendments was repealed, and a fresh Act passed, which consolidates the various amendments and makes new provisions for administration. Briefly, the mode of administration is this: The officers are under the control of the Justice Department. Bankruptcy is, in fact, entirely within the charge of the State. Four Official Assignees are appointed by the Governor in Council, with salaries of £450 a year. These are stationed at Auckland, Wellington, Christ-church, and Dunedin, and there are twenty Deputies in various parts of the colony attached to local Courts and under the control of the chief officers, but with full powers. The Judges of the Supreme Court have jurisdiction in some places and the District Judges at others. Each Assignee and Deputy finds security. The property vests in these Assignees immediately on adjudication, which may be by creditors’ petition or by bankrupt's own petition. The latter, on presentation to the Registrar and payment of the fee, acts at once as an adjudication, without reference to the Judge. On a creditor's petition the Judge has, of course, to adjudicate; but, on presentation of such petition and before adjudication, he may appoint the Official Assignee or Deputy receiver and manager to hold the property pending a final decision on the petition. By this means in a recent case an Assignee recovered £1,000 placed in different banks in different names by an absconding bankrupt, who within a day or two would otherwise have transferred the money to Sydney. The Court fee in each case is £6, which covers the cost of the necessary notice by advertisement in a local paper and the Government Gazette. Upon adjudication the bankrupt himself, his books and papers, and all his property are under the full control of the Assignee, who has power to examine all persons on oath, and, failing proper answers, to obtain committal for contempt. A public examination before the Judge can be obtained if desired by the creditors, but is seldom resorted to. The creditors are called together, and though the Assignee has full power of realisation, he is bound to consult the creditors, who can, if they please, appoint supervisors to act with him. This system works very well; the assignees have no interest but to do the best for the creditors. Only the Deputies are paid by commission, with a minimum of £2 2s. from the department in each case. All commissions are paid by stamps affixed to books provided for the purpose and cancelled. The Deputies’ remuneration is paid out of these commissions by the department when estates are closed. Accounts are audited free of cost by the Government Audit Department, all letters are post-free, and Court fees for filing necessary documents are for the most part dispensed with. The commissions charged are 5 per cent. on £1,000, 2 1/2 per cent. on second £1,000, and 1 per cent. for all amounts over this, of assets realised after deducting secured debts.
Considerable recoveries were made under the 1883 Act and its amendments for sums paid away within three months of bankruptcy and not in the ordinary course of business, on the ground of fraudulent preference. But the words introduced into that Act, “whether under pressure of a creditor or not,” have been left out in the present Act. to bring it into accord with English law, and therefore the English cases regarding pressure apply and greatly weaken the clause. Settlements are void if made within twelve months, and voidable if made within three years of bankruptcy, unless the debtor can show he was solvent at the time of execution. Dills of sale are void, except for money advanced at the time, if executed within four months of bankruptcy. Six months’ rent and four months’ wages are preferential, but efforts have been made to do away with the landlord's preference, and even to abrogate the right of distress for rent. Bankrupts must come up for discharge within four months, if called on to do so by the Assignee, and are then dealt with by the Judge, who not infrequently makes orders to a certain extent against future wages, or profits, till a certain sum in the pound —usually 5s. or 10s.—is paid to the creditors. The Judge also has power to enter up judgment for a fixed sum, retaining control as to execution.
One of the most important amendments in the Act deals with prosecutions in cases of fraud, or certain offences, such as omitting to keep proper books, or recklessness and extravagance, or misrepresentation, or buying without means to pay. The course now is for the Assignee to lay a case before the Crown Prosecutor, who certifies whether there is a probability of conviction, and in that case information is laid and the matter is taken up as a Crown prosecution, the Assignee being protected. Absconding bankrupts have been frequently stopped and punished under these clauses, but there needs reciprocal action between the colonies in bankruptcy law to enable absconders to be promptly arrested in another colony, and legislation might establish a simple and inexpensive procedure, whereby the acts of a Court in one colony might be recognised in another, both for arresting offenders and recovering property. In cases of prosecution the Court may order, but never has ordered, the expenses to be paid out of the estate. This would only be reasonable in a case where considerable recoveries of assets resulted from the proceedings.
The figures show a considerable reduction in bankruptcies since 1886 as follows:—
| 1886. | 1893. | |
|---|---|---|
| Number of petitions | 1,089 | 484 |
| Debtors’ statements of assets | £415,953 | £111,483 |
| Amounts realised | £128,370 | £68,844 |
| Debts proved | £566,291 | £474,274 |
| Paid in dividends, &c. | £102,966 | £37,721 |
It must be observed, however, that of late resort has been very often had to private deeds of assignment, as involving less publicity and giving the control to a few leading creditors. Such deeds are not, however, validated by the Act, and are binding on no one who does not sign. Indeed, for three months after execution such a deed is an act of bankruptcy, on which any creditor who has not signed can present a petition for adjudication, and this has not seldom occurred. The Court may declare a deed valid and not an act of bankruptcy, but seldom does if opposed by a considerable creditor, and even then there is nothing to prevent the aggrieved creditor suing. The principle of allowing a majority of creditors to validate such assignment has for some time been abandoned in this colony, as abuses arose therefrom. The impartial administration of the Act by officials who are under Government control and perfectly audited is regarded by the commercial community at large as the best safeguard against fraud.
Table of Contents
By M. MURPHY, F.L.S.
IT may be said, without fear of contradiction, that there is no part of the British dominions where agriculture, in its widest sense, can be carried on with so much certainty and with such good results as in New Zealand. The range of latitude, extending as it docs from 34° to 47° south, secures for the colony a diversity of climate which renders it suitable for all the products of subtropical and temperate zones, while the insular position protects it from the continuous and parching droughts which periodically inflict such terrible losses on the agriculturist and pastoralist of Australia and South America.
Again, the climate, although somewhat variable, never reaches the extremes of heat or cold. So genial, indeed, is it that most animals and plants, when first introduced to the colony, assume a vigour unknown to them before.
All the best forage-plants and grasses thrive most admirably, continuing to grow throughout the year with little intermission. Stock of every sort thrive and fatten rapidly on the pastures, coming to maturity at an early age without the aid of roots or condimental foods. All cereals flourish equally well, more especially Indian corn, which produces from fifty to eighty bushels per acre.
So full is the soil of plant-food that several continuous crops of potatoes and cereals may be taken with little apparent exhaustion. Wheat, oats, and barley thrive where the soil is not too rich; otherwise they produce enormous crops of straw, without a corresponding yield of corn. The tobacco-plant thrives well, as do also hops and sorghum, broom-corn, peanut, hemp, ramee or rheea (China grass), together with a large variety of economic plants, the growth of which will one day afford employment for a large population. In addition to these, oranges, lemons, limes, olives, and vines, with all the British, Chinese, and Japanese fruits, flourish abundantly, requiring but ordinary care. Potatoes are grown to a considerable extent, and yield heavy crops.
Much of the country along the south-west and west coast is being rapidly taken up, and the primeval forest is fast disappearing before the settler's axe. For the most part, the soil is fertile, and the growth of grass and clover is extremely rapid and vigorous when sown on the surface, after the felled timber has been destroyed by fire.
To the British husbandman it will seem almost incredible that the best pasture-grasses grow and thrive as they do with no other preparation than the ashes resulting from the burnt timber—with no ploughing and no previous loosening of the soil—this, of course, being impossible amongst the forest of stumps—and yet, in less than a year from the date of scattering the seed, this same land will fatten from five to six sheep per acre.
So rapidly are these fertile forest-lands being cleared and converted into pastures that the demand for stock (principally dairy) has greatly increased, and this demand must continue for a series of years before it is fully met.
Before the introduction of the factory system stock were so un-saleable, especially in the North Island, that little or no attention was paid to this branch of rural economy; and the supply fell to the lowest ebb. The demand which has now set in is chiefly due to the settlement of the bush-lands with small selectors and the development of the dairy industry.
Those who in the past have watched the progress of New Zealand, especially of the North Island, have always maintained that as soon as the Maori difficulties should be ended, and other impediments to settlement overcome, the prosperity of the country would advance at a very rapid rate. The time has now come, and all that is required to enhance and expedite the coming prosperity is wise legislation with respect to settlement, so that the unoccupied lands may be taken up by a thrifty class of small settlers.
There are millions of acres yet unoccupied, a great portion of which is of good quality, and only waiting the hand of man to make it carry, with very little cost, large herds on dairy stock, with flocks of long-wool and crossbred sheep. The west coast of the island is essentially a cattle-country. Considerable areas of the midland districts are adapted to long-wool sheep, as is also the country along the east coast. Much of the country may he described as being good sheep-land, a large portion of which is quite capable of carrying two sheep to the acre, and some of it as many as three or four.
If the North Island has a splendid inheritance in her forests, the Middle Island can boast of her magnificent plain-lands, rolling clowns, and vast mountain-ranges, all of which to a greater or less degree, have already been made to contribute to the wealth of the colony.
The central portion of the Middle Island presented to the first-comers a vast plain, covered only with waving tussock-grass, offering little or no obstruction to the plough.
Travelling south, the country assumes a different character: easy, undulating downs, well watered, here and there interspersed with fertile plains, the greater portion admirably adapted for agriculture, and all of it suited for pastoral purposes.
The climate of the Middle Island is not so warm in summer nor so mild in winter as that experienced in the North Island. However, as has already been stated, there are no extremes of heat or cold. Much more might be said in praise of this portion of the colony. It is deemed necessary to say so much in order that readers may better comprehend the comparative ease with which every kind of farming is carried on in New Zealand as compared with other countries less favourably situated.
Reviewing the past year from a farmer's point of view, the colony cannot be congratulated. The development of our agricultural resources has been materially affected by circumstances over which there was no control. During the early part of the season the wheat-crop looked remarkably well, and promised a bountiful yield of grain. As the season advanced, however, the weather became most variable, characterised by rapid changes from warm summer days to cold blighting winds. The frequent recurrence of this kind of weather, accompanied by drenching rains, just as the wheat was blooming—which is the most critical period of its growth—had a disastrous effect, preventing the natural process of fertilisation, and resulting in badly-filled heads. In addition to these most unfavourable conditions, there occurred later on a series of warm showers, attended by close sultry days and nights, conditions said to be eminently favourable to the development of rust in its worst form. Whether this assumption be correct or not, it is certain that this mysterious and destructive fungoid growth was more prevalent in certain districts of Canterbury than has been noted for many years past, resulting, as the threshing showed, in shrivelled ill-conditioned grain. With the above statement of facts, it will readily be understood how it was that the wheat crops throughout the colony have yielded so badly.
A reference to the agricultural statistics on another page reveals the fact that there has been a very material falling-off in the quantity of wheat grown, but this is accounted for in part by the causes already stated, and partly by the diminished area under that cereal. It will, however, be observed that there is a substantial increase in bushels of oats, which largely counterbalances the shrinkage in wheat. The troubles of our wheat-growers will not prove an unmixed evil: indeed, they may be said to be bearing fruit already, as farmers are being driven to the conclusion that wheat-growing as a staple crop is rapidly becoming a thing of the past, and are realising a fact which has been repeatedly urged upon them—viz., that it is impossible for New Zealand farmers to grow wheat as a main crop with the prospect of anything like a satisfactory result. They cannot continue to compete with other countries where land is cheaper, &c.
If this be so—and it is coming to be admitted—we have the satisfaction of knowing chat the humidity of our climate and the fertility of the soil are such that we can with certainty produce root-crops, grain, and forage plants which will compare favourably with those grown in any other part of the world.
Happily, farmers are realising the position, and in a little time the method of farming hitherto in vogue will be abandoned, and one having for its object the growth of root-crops and grass, &c., will take its place. The more rapidly this system extends itself the sooner the farming community of the whole colony will be benefited. We are forced to this conclusion by taking a retrospective glance at the gradual decline in price of wheat during the last ten or twelve years. In May, 1882, wheat was worth 4s. 9d. to 5s. per bushel; in May, 1894, it was worth only 2s. 2d. to 2s. 5d. per bushel; while oats for the corresponding periods were worth 3s. 6d. and 1s. 6d. It is admitted on all sides that wheat cannot be grown in the colony with any margin for profit under at least 3s. per bushel, and the crop must be a good one at that. Farmers must therefore place more reliance in the animal products of the soil. In those countries where continuous corn-growing has been practised the ultimate exhaustion of the soil has been the result; whereas stock-raising with its auxiliaries has the effect of increasing the fertility of the soil; so that the partial cessation of wheat-growing is not an unmixed evil.
Since the publication of the “Official Year-book” for 1893, matters agricultural and pastoral have in the aggregate been fairly prosperous, save and except in the price of wheat, which has remained abnormally low throughout the year, causing some heavy losses to farmers and shippers.
On the other hand, the rise in price of horned stock, with the rapid development of the dairy industry, have somewhat compensated for the heavy deficiency which has been experienced in the returns from the wheat crop of 1893-94. This falling-off is also in a measure balanced by the increased yield of oats.
The primitive mode of agriculture pursued from the foundation of the colony—viz., wheat-growing, followed by wheat so long as the land would bear it—is rapidly giving place to a regular system of crop rotation.
The farming of the future will have for its main object the production of wool and mutton as well as dairy produce, pork, poultry, fruit, &c.; and, although grain-growing will be continued to a greater or less extent, it will cease to take the leading position which it occupied in the past.
The production of mutton, pork, and dairy produce involves, in the Middle Island at least, the growth over large areas of turnips, grass, and fodder crops, thus bringing greater fertility to the soil, and, consequently, advancing prosperity to the farming community.
The Canterbury Plains, the great wheat-growing area (in the past) of the Middle Island, extend 150 miles north and south, running inland from the sea for forty miles, the whole forming an area of about 3,000,000 acres. The greater portion of this vast plain is admirably adapted for the production of wheat of the best quality, the growing of which has been carried on extensively in the past, more especially since the introduction of the reaper-and-binder. The area under this cereal in Canterbury in 1893-94 was 174,252 acres, with an estimated yield of 3,407,842 bushels. The land is for the most part free from stones or impediments of any kind. Single-furrow ploughs are now rarely seen, double- and three-furrow ploughs being in general use. Three horses, occasionally four, with a man or boy, can turn over three acres per day on the plains, at a cost of 5s. or 6s. per acre. A stroke of the disc or other harrow, followed by the seed-drill and light harrows, completes the operation of sowing.
Seed-sowing commences in May, and can be continued as weather permits through the winter, and in the heavy swamp land on into September and even October. From 1 1/4 to 1 1/2 and 2 bushels of seed per acre are usually sown, the quantity increasing as the season advances.
Good results are in general obtained by feeding-off the early-sown grain with sheep, followed by the harrows and roller. The usual average on the better class of soil in favourable seasons is from 40 to 60 bushels per acre of dressed grain. The general average of the whole colony is usually 25 to 26 bushels, but this varies with the season. This discrepancy is accounted for by the fact that so much wheat is grown on the lighter soils.
Several varieties of wheat are grown, but Hunter's White, Pearl, and Velvet Chaff are the favourite kinds for winter sowing. Red and White Tuscan ore usually sown in spring.
In view of the periodical attacks of rust, advantage will doubtless be taken of the experience gained by carefully-conducted experiments which have been carried on during the past few years in Victoria, New South Wales, and Queensland, where it is claimed that certain wheats have been found impervious to the attacks of rust, thus minimising the losses caused by that fungus. Several varieties are named as rust-resisting, and farmers should combine and procure these varieties in order to give them a trial. It was reported that early-sowing was the best preventive measure, for the reason that the older the leaves are the tougher they become. This theory, however, has not been borne out in this colony, as the early-sown crops were equally attacked, if not to so great an extent.
Dressing the seed with genuine bluestone is found to he a certain specific for smut in its various forms.
The Oamaru (North Otago) district is famous for the quality of its wheat, grown on limestone soil.
Otago and Southland also grow wheat, hut they excel in the production of oats, the respective acreages last season being 53,058 acres of wheat, yielding 1,161,672 bushels, and 196,750 acres of oats, yielding 6,816,769 bushels, while Canterbury produced only half this quantity of oats.
The usual yield of oats in Otago and Southland is from 40 to 80 bushels per acre, the cost of production being about the same as wheat—viz., £2 per acre when grown out of grass-land, and £1 10s. from stubble. The varieties of oats most in favour are Winter Dun, Canadians, Sparrowbill, Tartary, and Danish.
Malting barley, of very superior quality, is grown in Nelson and Marlborough, where the soil and climate appear to be peculiarly adapted to its culture.
The total area and yield of cereals grown in New Zealand last season was—Wheat, 242,737 acres, yielding 4,891,695 bushels; oats, 376,646 acres, yielding 12,153,068 bushels; barley, 28,857 acres, yielding 724,653 bushels; maize, 5,116 acres, yielding 224,539 bushels; rye, 4,856 acres, yielding 73,693 bushels; peas and beans, 11,638 acres, yielding 370,459 bushels.
The phenomenally low prices of wheat and other cereals raises the question whether matters might not be improved by the exercise of a little more care in preparing the grain for market. Nothing but the plumpest corn should be shipped, for there can be little doubt that a far better use can be found for the inferior grain in feeding pigs, poultry, dairy cattle, and sheep with it on the farm, thereby increasing the fertility of the soil. Carefully-dressed wheat would yield at least 65lb. to the bushel, and oats, similarly treated, would go 50lb. to the bushel measure, insuring for it a ready sale at the highest rate. The late Mr. Mechi, of agricultural fame in England, used to argue that, when wheat and other grain fell below a certain figure, then it paid best to be driven to market on four legs rather than on four wheels. This limit has long since been reached in New Zealand, and therefore the sooner Mr. Mechi's advice is put into practice the better it will be for all concerned.
Potatoes: Potatoes are largely grown throughout New Zealand. On suitable soils very heavy crops are raised, it being no uncommon thing to dig from eight to ten tons per acre, although the general average is much lower, for the reason that unsuitable land is frequently devoted to this crop. The bulk of the crop is planted without manure, but, where used, bonedust and superphosphate (from 1cwt. to 2cwt. per acre) is applied with good results. The potato is, however, an expensive crop to grow, costing from £5 to £6 per acre, and many farmers are now devoting their potato-land to grass. The land is usually broken out of grass, skim-ploughed in autumn, ploughed deeply in spring, and thoroughly tilled. The seed—15cwt. per acre—is then ploughed in under every third furrow, the after-culture consisting of harrowing just as the crop is appearing over ground. By this means myriads of seedling weeds are destroyed, drill - grubbing, hoeing, horse-hoeing, and earthing-up being the subsequent operations. A heavy crop of wheat, beans, or any other cereal can always be relied upon after potatoes, season permitting.
Turnips: The turnip-crop has now become one of the most important in the colony. The area under this crop this season, according to the agricultural statistics, is 385,437 acres, as against 242,737 acres under wheat. On virgin soil turnips can always be relied upon as a certain crop, even on a single furrow and a couple of strokes of the harrow. But as very much of the soil in Canterbury has already been cropped, turnips cannot now be successfully grown there without the aid of manure. In the nature of things, farm-yard manure cannot be procured; artificial manures are therefore largely used, from 1cwt. to 1 1/2 cwt. of superphosphate of lime per acre being now applied with the best results, securing ample crops of sound roots, from 15 to 30 tons per acre. The seed is sometimes sown in drills on the flat, the manure being dropped in front of the seed by the same machine, from -Mb. to 1lb. per acre of seed being used. When sown broadcast a smaller quantity will suffice. Sometimes the manure is deposited in a liquid state by machines manufactured for the purpose: this system invariably secures a rapid and vigorous braird, forcing the young plant into the rough leaf, after which it is secure from the attack of the turnip-beetle. So soon as the turnip-plants reach the third or fourth leaf, they are thinned in a primitive and yet efficient manner. A scuffler, made for the purpose, is drawn across the drills, bunching the turnips and thoroughly loosening the soil. The drill-grubber and scuffler are used as required till the leaves meet. This kind of culture produces capital crops. A very large quantity is also sown broadcast, and, if found too thickly sown, the harrows are run through them; in any case a stroke of the harrows is a great help to the growth of the plant. The varieties used are Devonshire Grey for early and very late sowing; Purple- and Green-top Aberdeen are the most generally grown, Swede turnips from their proneness to the attack of the blight aphis are not so much sown; they, however, produce enormous crops in suitable soils. The turnip-crop is always fed-off by sheep intended for freezing. It is estimated that an acre of good turnips, with a little bay or chaff, will fatten from eight to fourteen sheep. Turnip-sowing commences in November, and may be continued till the end of December. Stubble turnips may be sown in March, but this can be considered only as a catch-crop. It, however, often proves of great value, supplying an abundance of green feed for ewes with early lambs. Turnip-land is usually sown with spring wheat, oats, or barley.
Rape is largely grown as sheep-feed, and may be sown either in early spring or immediately after harvest, the stubble being skim-ploughed. This crop is invaluable in the early spring, and may be fed-off in time for oats or barley.
Mangolds and Carrots are largely grown in some districts. They cost more money than turnips to produce, as they must he hand hoed; nor are they so suitable a crop for cleaning the land. Turnip-sowing does not commence till November or December, affording ample time for the destruction of seedling weeds; this important opportunity is largely lost in the culture of the mangold, which is usually sown in October and November. The mangold is, however, an invaluable crop on a stock farm, as they do not reach their primest condition until the turnip-supply is exhausted. From thirty to sixty tons per acre is not an uncommon yield of these roots, often without the aid of manure.
Carrots are also a valuable crop, especially for horses; on sandy loams the yield reaches fifteen to twenty tons per acre.
Clover: Since the introduction of the humble-bee into New Zealand, growing clover for seed has become a lucrative industry, adding materially to the farmers’ income. Glover is sown with a spring crop, usually of corn, lightly grazed in the following autumn, and then reserved for a crop of hay, which, according to the season, yields from two to three tons per acre when cut in November or early in December. The after-growth is then allowed to flower and seed, which it does very freely. Thousands of humble-bees may be seen in the clover-fields during the months of January and February. The seed ripens in March, and is then cut and dried, and threshed out by machines known as clover-shellers. From 200lb. to 300lb. of seed per acre is considered a fair crop, and sells readily at 4d. to 6d. per pound. Thus, an acre of clover may yield in hay and seed quite £10 or £11, as well as a considerable amount of feeding, since clover-haulm is much sought after by stock of all kinds.
Grass-seed Saving: All the most valuable of the strong-growing grasses flourish throughout New Zealand. Cocksfoot has been a staple product of Banks Peninsula for many years, the soil for the most part consisting of decomposed volcanic rocks and vegetable mould. The seed is of the finest description, frequently weighing 20lb. to the bushel (12lb. being a standard bushel). Much of the seed on the Peninsula was this season ruined by the inclemency of the weather, and it is estimated that the loss amounted to 100,000 bushels. This grass thrives on a very wide range of soil, from the richest to the poorest, preferring, of course, the former. It may be found on the dry stony plains of the interior green and healthy, while the surrounding herbage has yielded to the heat of the summer sun. Large quantities of the seed are grown in the North Island as well. Out of the total of 226,981 bushels of cocksfoot-seed produced last year, 75,893 bushels were grown in the North Island. This seed sells readily at from 2 1/2d. to 4d. per pound.
Growing ryegrass for seed is also an important industry. Last season 513,857 bushels were gathered. Of this, the North Island contributed 101,482 bushels. The seed is usually secured by stripping;sometimes the grass is cut and tied, and afterwards threshed by machinery. The average yield is from 15 to 20 bushels per acre. A common practice is to graze the land till midsummer; to take the stock off for a few weeks, and then to run the stripper over the ground. By this primitive method 10 bushels per acre are sometimes secured. Ryegrass-seed is usually in good demand, and sells readily at from 3s. 6d. to 4s. per bushel.
Meadow-fescue, one of the most valuable of all the grasses for permanent pasture on good land, is grown both in the North and Middle Islands, but as yet not very largely. There can be no doubt that the growing of grass-seeds, including the finer varieties, must become in the near future a very lucrative industry.
Small Seeds: New Zealand, from the nature of her soil and climate, offers a fine field for growing all kinds of farm and garden seeds. This circumstance has already attracted the attention of some of the larger seed-merchants of Great Britain, whose agents have recently visited the colony with a view to inducing farmers and others to grow certain kinds of seeds. Such an industry is peculiarly adapted to small holdings, and well suited to young persons, the work being light and of an interesting character. Ready sale can be found for carefully-grown and carefully-cleaned seeds.
Pulse: Peas and beans are largely grown for pig-feeding and export, and also form an excellent preparation for wheat. An extensive trade in peas of a certain description is done in the manufacturing towns of Great Britain; and efforts are now being made to secure a share of this trade for the colony by producing peas suitable for splitting for human food. The business is likely to prove a most remunerative one. Thirty bushels of peas is considered a fair crop, while 40 to 70 bushels of beans are often secured.
Cape Barley: The demand for early-spring feed has resulted in the growing of this plant for forage purposes. Its extreme hardiness renders it well adapted for autumn sowing. If sown in March it is ready for feeding-oil in May; it may be fed off again in July, and on till the beginning of October, when, if allowed to run to seed, it will produce 40 to 60 bushels per acre, or it (the barley) may be ploughed-in for turnips. It is equally adapted for dairy-stock, horses, and pigs.
Tares are also grown, but not so largely as they deserve to be, especially for dairy-stock. Mixed with oats, barley, or rye, they are excellent milk-producers; and when grown luxuriantly they destroy all kinds of woods, and leave the land in fine condition for a spring corn-crop.
Lucerne: This permanent fodder-plant thrives admirably in most parts of New Zealand, yielding three to live cuttings in the year; and, if properly attended to, it will continue to yield liberal cuttings for seven or eight years. This is a most excellent crop for the small or large farmer, furnishing, as it does, an abundant supply of succulent fodder during the drier months of midsummer, as well as in the early spring. It may be mentioned that lucerne is the sheet-anchor of the Queensland farmer.
With a view of encouraging the growth of this fibre-plant, the Minister of Agriculture for Victoria has offered a bonus of £2 per acre for every acre grown of this crop, and £5 per ton for the fibre produced. This is a wise step, because the successful introduction of this industry would afford a large amount of employment, most of it being of a light character and well adapted to small holdings.
Some few years ago an attempt was made to establish this industry in Canterbury, but wheat was then realising a fair price, farmers did not take kindly to the new idea, and the project failed. Good, however, resulted from the attempt, for it was proved beyond doubt that the flax-plant would grow most luxuriantly, producing plenty of fibre (and seed when allowed to ripen). It was found that 5cwt. to 7cwt. of fibre could be produced per acre, and from 15 to 30 bushels of seed, which under proper management should find a lucrative sale for use in the manufacture of boiled and raw linseed oil. The fact that the manufacture of oil has already been attempted, with but indifferent success, is no argument against a fresh effort being made; but it is an argument in favour of the production of the seed at a lower rate than was the case at the time referred to. The time has now arrived when the growing of flax on a large scale should be undertaken. The collapse in the wheat-market renders it necessary to open up new fields for the employment of labour, and Government may sec its way to offer a substantial bonus for the production of fibre suitable, in the first instance, for the manufacture of binding-twines, commercial twines, ropes, &c., and ultimately for the manufacture of fabrics. The value of linseed-oil imported into the colony during the year 1893 was £17,918.
The low price of wheat and other agricultural produce has again revived the question so ardently pressed by Sir Julius Vogel—viz., the cultivation of beet for sugar-making. The Government in 1884- offered a considerable bonus for the encouragement of the growth of beet, with a view to establishing this industry in the colony. Nothing, however, was done in the matter, and the bonus lapsed: not that any effort which was made indicated that the soil or climate of the colony was unsuitable for the growth of this plant; on the contrary, it was proved that beet of superior quality could be grown. The real cause of inaction on the part of farmers and others lay in this—that wheat-growing was an industry with which they were familiar, and from which a reasonable profit could, then, be derived with a minimum of labour. They had not, therefore, sufficient inducement to embark in an industry with which they were not familiar. This, coupled with the price of labour—which, after all, Was the chief deterrent—is largely responsible for the failure which attended the laudable efforts of the Government.
Ten years have brought about quite a new order of things. Wheat has fallen fully 50 per cent. during the decade, and farmers are now prepared for any industry which promises a means of supplementing their annual returns. It is more than probable that the growth of sugar-beets where much manual labour had to be employed would still prove unremunerative. Beet must be grown cheaply, or else it cannot compete with that grown in Europe, where labour is so much cheaper than it is in this colony. Nor could it compete with cane-sugar produced by semi-slave labour. Under the small-farms system, however, the matter assumes a more hopeful aspect, for, like European flax, the growing of beet is eminently adapted for small holdings, where only the labour of the family is employed. Under such conditions the industry should take root, and afford a large amount of employment for the families of the settlers.
Sugar-beet-growing, to prove remunerative, should be carried on on a large scale, not necessarily on each farm, but it should be grown on a large number of farms close to one another, so that the quantity grown would warrant the erection of crushing-plants. It is an industry which should be carried on in conjunction with dairy-farming, as the pulp is excellent food, either as ensilage, or as raw pulp mixed with chaff, for dairy cows or for pigs.
In Victoria an effort is now being made to induce farmers to embark in growing beet for the manufacture of sugar. The following figures are instructive as indicating what the successful establishment of the industry would mean to that colony: 50,000 tons of sugar are annually imported into Victoria, valued at £1,000,000. The beet-root required to make this would be, approximately, 450,000 tons. The value to the farmer of this quantity of roots, estimated at 15s. per ton, would be £337,500. Fifteen tons per acre is considered a fair average crop, so that 30,000 acres of beet would be needed annually to produce the required quantity of sugar.
The value of the sugar imported into New Zealand annually is approximately £405,000. It will thus be seen that there is room for the development of the industry in this colony as well. But, as has already been said, it is essentially a small-farm industry; or the principle of co-operation might with advantage be adopted for its more rapid development.
A cursory glance has now been taken at arable farming in New Zealand. Every impartial mind will admit that Nature has been lavish of her gifts—she has supplied all the raw material, with climate and soil; all that is necessary to secure the success of the settler is industry, guided by intelligence and perseverance.
It may be thought, because remuneration for manual labour is higher in the colony than it is in Great Britain, that therefore farming operations must cost more.
This assumption is, however, erroneous. It is within the mark to assert that five hundred acres or more can he worked at less cost than it would probably take to work a hundred-acre farm in Great Britain, for the following reasons: first, the genial nature of the climate is such that it is unnecessary to house stock during the winter months, and so the cost of attendance is saved; secondly, farming operations may be carried on continuously throughout the ploughing and sowing season; thirdly, the paddocks are so large, and usually so level, that the double- and treble-furrow plough may be worked by one man or youth. The colonial farmer has availed himself of all the most modern labour-saving machinery.
The hay-crop is simply cut one day, raked into windrows next, and in a couple more it is ready for stacking.
Wheat is cut and tied by machinery, and stooked, requiring no capping. It is frequently threshed out of the stook in favourable seasons, thereby saving the cost of stacking and thatching; but this method is not recommended except in hot, dry seasons.
The manure bill, which is such a heavy item of annual expenditure with the British farmer, is unknown or nearly so to the colonial farmer. As has already been stated, 1cwt. to 1 1/2cwt. of superphosphates per acre is used with the turnip and other root-crops, and in a large number of cases not even this. It will thus be seen how many advantages the colonial farmer has over the farmer of the old country.
Sheep: New Zealand has proved itself to be admirably adapted for the breeding of all classes of sheep, from the fine-combing Merino to the strongest type of Lincoln, with the intermediate breeds. The Merino occupies and thrives on the wild lands of the colony, from the snow-line to the border of the plains, as well as on the drier portions of the plains. The Merino ewe furnishes the foundation for all the crossbred varieties. On the rich, moist soils the Lincoln and Romney Marsh flourish, while the finer English and Border Leicesters occupy the drier lands.
Crossbred Sheep: Those bred from Merino ewes and long-wool rams are the most suitable for the frozen-meat trade, and are known as “freezers.”
The dapper little Southdowns flourish wherever crossbreds thrive. Their more ponderous cousins, the Shropshire and Hampshire Downs, have their admirers, especially the Shropshire, which is largely used for crossing, with a view to producing early-maturing lambs. English Leicesters are also much sought after for this purpose.
Since the development of the frozen-meat trade, sheep-farming in the colony has undergone a radical change. At one time wool was the chief consideration, the surplus stock finding its way into the boiling-down vat, the tallow and pelts being the only products of value. Things have marvellously altered since 1882, the inaugural year of the frozen-meat trade. Farming has assumed a new phase, sheep-raising for mutton being now its most profitable branch. Sheep have risen 100 per cent. in value since this industry took hold in the colony. Small and large flocks of pure and crossbred sheep are now kept on all farms which are suitable for them, the object being the production of early lambs for freezing, which sell readily at from 10s. 6d. to 12s. each. The percentage of increase all over the colony is very high, especially in the paddocks, where 100 to 125 per cent. is not uncommon in favourable seasons, while on the hill and unimproved country it varies from 45 to 80 per cent.
Shearing commences in September, and continues till January. The usual price per hundred is 15s. to £1. Shearing-machines are gradually coming into use, and will doubtless become general when better understood.
The average clips for the various breeds of sheep are approximately as follow: Merino from 4lb. to 7lb.; quarter-breds, about 6 1/2lb.; half-breds, 7 1/2lb,; three-quarter-breds, 8 1/2lb.; Leicester, 10 1/2lb.; Lincoln, 11lb. Of course, very much larger clips are obtained from special flocks, as much as 25lb. to 80lb. per sheep; but the above figures represent general averages.
The staple of New Zealand wool, especially the long-wool and cross-bred, is remarkable for its freedom from breaks and other imperfections incidental to countries subject to long droughts and scarcity of feed.
The coining sheep for New Zealand will be that which combines the best fleece and the most suitable carcase for freezing purposes, together with early maturity. This is the problem which some sheep-breeders have set themselves to work out. Whether such an animal, having fixity of type, can be evolved remains to be proved.
The capability of New Zealand for producing mutton has not nearly reached its limit. When the frozen-meat trade was first seriously considered, an assertion which was made to the effect that the colony could find 1,000,000 sheep per annum for freezing without impairing the breeding-flocks was treated as highly chimerical by sheep-breeders of long experience. It is found, however, on reference to the statistical returns, that during the year 1892 1,607,754 sheep and lambs were exported from New Zealand; nevertheless the flocks have gone on steadily increasing, numbering, according to returns made to the Agricultural Department, 19,380,369 in 1893, as against 18,570,752 in 1892, showing an increase of 809,617 sheep. There are twenty-one freezing-works in the colony, with a full freezing-capacity of 3,665,000 per annum.
There are few, if indeed any, climates better adapted for the breeding and rearing of horses of all kinds than that of New Zealand. Horses, light and heavy, are always in demand in the Australian Colonies, commanding remunerative prices; and it is more than probable that a lucrative trade will he done in the near future with the Western States of America. Indeed, shipments have already been made to that country of heavy Clydesdales. Some of the best blue blood of this breed has from time to time been imported from Scotland, with the result that the breed is now well established in the colony.
The light-horse stock of the colony has risen into note through the production of animals which have rendered themselves famous on the Australian turf. The demand for horses suitable for remounts for the cavalry service in India is a continuous one, affording a ready market for the proper stamp of animal. Shipments have from time to time been made to that country with considerable success, and this trade is likely to increase. There is, however, a great scope for enterprise in this direction. The breeding of horses has been of late neglected. Steps are now, however, being taken to repair the loss entailed by such neglect, and it is hoped the colony will therefore soon regain its partially-lost prestige in this direction.
At the date of last census—April, 1891—there were, including 42,912 owned by Maoris, 831,831 head of cattle in the colony; and although for the last few years the demand has not been encouraging to breeders, it is now satisfactory to note that, with the improved demand for dairy produce and frozen beef, prices for cattle have advanced considerably, and, for the future, better returns may be looked for.
The colony possesses all the best strains of blood, and this is evidenced by the superior class of cattle to be met with throughout the settled districts.
The trade in frozen beef is now attaining considerable proportions. Last year 11,059cwt. of beef, valued at £11,224, were shipped, principally from the North Island. This trade is likely to increase largely, more especially so when the contemplated new methods of chilling and thawing are brought into general use.
The breeding of dairy stock offers an ample field for profitable investment. Milking-cattle now command a comparatively high price, and will continue to do so for an indefinite period, owing to the fact that stock were allowed to run low for want of a market, which has lately sprung up with the building of factories. The rearing of well-bred heifer calves will amply repay all the time and trouble bestowed thereon. It may be well to remark that separated milk, although relieved of its butter-fat, loses little of its feeding value; the addition of a little linseed meal will restore the fatty constituents, which, however, are not the most valuable for feeding purposes. An acre or so of European flax should be grown upon every farm where stock-rearing is carried on. Much has yet to be done in the way of improving the dairy stock of the colony, a matter which is now attracting a large share of attention. The yield of milk from fairly good milking-cattle is approximately 500gal. per annum, although 700gal. are frequently obtained from selected herds. The average quantity obtained will no doubt be increased as more attention is paid to breeding and proper feeding.
The average yield of butter from milk passed through the separator is 1lb. for every 2 1/2gal. of milk of 10-Mb.; so that the average cow produces annually 200lb. of butter, or 500lb. of cheese, which, estimated at 4 1/2d. the pound, will be worth about as much as the butter. There is thus a good margin of profit.
From £5 to £8 per head can now be readily obtained for young milking-stock. A few years ago they were hardly saleable at all. To the British farmer this may not appear a satisfactory value; but when it is considered that no housing or hand-feeding is required, the price leaves a very good return.
New Zealand may claim to be the Denmark of the South, without any very keen competition with the Denmark of the North, for the reason that our seasons are opposite. The dairy industry is steadily growing into a very important one. In the North Island, along the west coast, factories are springing up in all directions. This will be the great dairying district of the colony, the humidity of its climate rendering it better adapted to this industry than any other. The luxuriance of the pastures has to be seen to be appreciated. Large tracts of bush-lands are being thrown open for small settlements, and are eagerly taken up, for the most part by thrifty hard-working men. Land is procurable either by purchase, or on lease in perpetuity, on the easiest terms. Homes are being built up in all directions, dairy farming being the staple business of the occupants. The very nature of the industry renders it peculiarly suited to small selectors.
It is hardly necessary to point out that all butter and cheese intended for export will have to be factory made, for the reasons that no other will command the highest price, and that so much more can be made of the milk by the use of the separator. One illustration will serve for our purpose. Experience has demonstrated to a certainty that 26 1/2lb. (or 2 1/2gal.) of fairly good milk will produce 1lb. of butter which averages 2d. per pound more than ordinary farmers’ butter; whereas it takes 33lb. (or 3gal.) of milk, treated in the old-fashioned manner of setting in pans, to produce the same quantity of butter—which means exactly 50 per cent. more returns from the milk treated on the factory method.
The factory system is now fairly well established. With judicious supervision, and the institution of regulations providing for the grading and proper handling of butter for export, the industry is sure to go on flourishing, and will secure to thousands lucrative employment.
In the Middle Island it has not taken root to the same extent as in the North. It is true that cheese-factories are becoming numerous in Otago and Southland, with a few butter-factories. As in all other new industries, losses have been made; happily, however, the initial stage has been passed, and, with good prices for the output last season, averaging 4d. to 5d. per pound for cheese at the factory, matters are now in a satisfactory condition. In Canterbury, the dairy-factory system has only been partially adopted. This apparent apathy may be accounted for by the fact that the Canterbury farmers have, from the first, devoted themselves to wheat-growing; subsequently, sheep-raising was added to their usual occupations with considerable profit. A large quantity of butter was made on farms in former years, but the price obtainable was as low as from 3d. to 4d. per pound, so that to a very large extent the business was abandoned. It is now found that butter and cheese give a more certain and remunerative return; hence the desire for factories is becoming more general. They are accordingly springing up in all the suitable districts of the colony, principally on the co-operative principle—the one best adapted for carrying on the dairy industry. The plan of feeding the factories by creameries situated in the surrounding districts, wherever from two to three hundred or more milking cows are guaranteed—the milk-suppliers taking up the shares necessary to build the creamery, which costs, thoroughly equipped, about £400—is obviously the most economical. A properly equipped butter-factory cannot well be built under a cost of £2,500, including refrigerating machinery. No factory can be said to be complete without this latter. Such a factory would be capable of working up the cream of three to four thousand cows, or even more, supplied from some twenty creameries. It will thus be seen how great is the saving of capital effected. Nor does the advantage end here. The butter being made at one centre will naturally be of more uniform quality; and, by the aid of freezing machinery, can be manufactured and packed under the most favourable conditions during the hottest weather—a matter of the utmost moment. For if we are to take the lead, and keep in the front rank of butter-producing countries, we must avail ourselves of every advantage suggested by science. The Canterbury Co-operative Central Dairy Factory is such an one as has here been described, and will compare. most favourably with any other of its size in the colonies. The output of butter from this factory during its first year's operations has been 209 tons, for which satisfactory prices have been realised.
The removal of the restrictions on the importation of New Zealand sheep into Australia has had the effect of opening up a market for long-wooled stud sheep in the sister colonies.
The determination of Australian flock-masters to cut into the frozen-meat trade has given rise to this demand for our long-wool sheep of superior quality, and New Zealand breeders have consequently been enabled to extend their operations beyond our own borders; and although the trade may not prove a very extensive or lasting one, it will give encouragement to those who have spent time and money in building up their now famous stud-flocks.
It is more than probable that there will always he a certain demand for sires bred in New Zealand, for the reason that this climate is better suited than the Australian for producing robust and hardy animals. It may be well here to correct an erroneous impression which has been fostered in some quarters, and appears to have gained credence in the minds of some sheep-owners in Australia. It is to the effect that merino ewes cannot lamb to Lincoln rams; and as one fact is generally considered to be worth one hundred theories, the following will serve to set the matter at rest: Mr. H. Overton, Highfield, Kirwee, purchased a draft of strong merino ewes and put some of his stud Lincoln rams to them; the result was that from 210 ewes he tailed 234 prime lambs, which averaged him £1 per head; thus showing the fallacy of the idea above referred to.
These useful adjuncts to the dairy hold a very important position on almost all arable farms. The favourite breed in New Zealand is the improved Berkshire. The large and small breeds of White Yorkshire are also to be met with, but are not so generally approved of as the black pigs. The rearing and fattening of pigs is a profitable investment. Unlike the pampered pigs of Britain, they require no better attention than a good grass paddock, with a liberal supply of roots, a little unthreshed pea-haulm for a few weeks before killing, with plenty of water, and shelter from the sun during the warmest summer months.
It is more than probable that a rapidly-increasing trade will be done in raising pigs to meet the demand for curing purposes. One of the largest firms in England, whose speciality is the providing of mess-pork for the navies of the world, as well as the mercantile marine, has had an agent in the colony for some time past making inquiries as to the prospect of opening up branch establishments. With a view to testing the quality of our pork for his purpose, he prepared some carcases by a process patented by the firm. These he shipped to his principals in England, the result being a cablegram to the effect that the meat and the curing were “perfection.” The result is that arrangements are now being made for opening up an extensive trade throughout the colony. The firm referred to are prepared to erect factories, at a cost of £20,000 each, in districts where there is a reasonable prospect of obtaining, say, 2,000 pigs per week.
Another result that will follow an unlimited demand for pigs is that a market will be provided on the farm for all inferior grain, which may be converted into mutton and pork.
It may not be generally known that young stock and pigs may be raised and fattened on separated milk, quite (or nearly) as well as on whole milk. It is only necessary to supply the fat removed by the separator. This can be cheaply done by the addition of a little linseed gruel or mucilage, made by steeping or boiling the seeds, whole or crushed, of European flax, the addition of which supplies the elements removed in the butter-fat. Every farmer ought to grow a patch of this useful plant—say, one acre, which should produce from 15 to 20 bushels of seed. The straw, if worked up, will supply all the twine and ropes required on the farm, or may be used for thatching purposes. We know a Canterbury farmer who grows a patch of flax each year: the seed is used as above, the straw is retted and dressed, and all the twine and rope required is manufactured on the farm by simple machinery worked by a home-made waterwheel. What one man can do another should be able to do also, provided the two are equal in industry and intelligence.
From the North Cape to the Bluff Hill, in the extreme south of the Middle Island, the climate and soil are eminently adapted for the growth of a large variety of fruits. Generally speaking—Pears, plums, quinces, apricots, figs, walnuts, cherries, gooseberries, currants, strawberries, and raspberries grow luxuriantly, producing abundant crops of fruit. In the Auckland District, oranges, lemons, and limes flourish: many groves are now coming into full bearing, and afford light and pleasant employment to a large number of persons. This employment will go on increasing as the trees become older. The olive flourishes, bearing heavy crops of fruit, and the manufacture of oil will one day become a very important industry.
Vine-growing is also carried on with tolerable success in many districts, tons of fruit being sold in the Auckland markets annually.
A way in the far north the banana grows and ripens its fruit, but it is not thought that it will ever enter into successful competition with those imported at so cheap a rate from the Pacific Islands.
Extensive orchards of apples have existed in Auckland for more than half a century, producing abundance of fruit of excellent quality, yielding returns equal to £40 or £50 per acre, provided they are kept free from pests. Orchard-planting is progressing rapidly, and must one day become a very important industry. Fruit-growing is expected to pay well in Central Otago, where the climate is admirably suited for all the fruits of the temperate zone, and to progress rapidly so soon as the district is tapped by railway communication.
Now that the problem of landing the fruit in good condition on the London market has been satisfactorily solved, considerable quantities have been shipped Home with varying success. It is encouraging to note that fruits of the proper varieties, and properly packed, have invariably realised remunerative prices. Much has yet to be done in the way of arriving at the best methods of packing and the best treatment on the voyage, the best varieties to grow, and the exact stage of ripening at which the fruit should be picked. Up to the present the trade with the United Kingdom has been mostly of an experimental character. Shipments have been sent Home as ordinary cargo, at little more than half the cost for freight in the cool-chamber, and have realised as much as 16s. per case, leaving a fair profit; but this method cannot be relied upon, and is not recommended. The present cost of shipping apples in the cool-chamber is 4s. 4d. per case, the other expenses bringing it up to nearly 8s. per case. Shipped as general cargo the charges would be, approximately, 5s. 6d. per case. If shipping as ordinary cargo is found successful the industry will at once become a most profitable one, adding immensely to the general prosperity of the colony.
Little has yet been done in the way of bottling or drying fruit for home use. This is an industry which only awaits development.
A good deal of cider is made, and fruit wines are gradually finding their way into consumption.
A considerable trade is also done in colonial-made jams.
Before the planting of fruit-trees was commenced on a large scale, with a view to the export trade, little attention was paid to the varieties selected. The result is that many bearing trees have proved unsuitable to the new requirements, and are now being cut down and regrafted or replaced with more suitable kinds. According to latest advices, the following varieties of apple are said to be in most request in the London market, always commanding a quick sale at good prices—namely, Ribstone Pippin, Cox's Orange Pippin, Waltham Abbey, Stunner Pippin, Scarlet Pearmain, Adam's Pear-main, and New York Pippin. The soil best adapted for growing apples is a strong loam with a clay subsoil; but they will thrive in almost any kind of soil, provided it is in good heart and that water does not stagnate in the subsoil.
Owing to the comparative mildness of the New Zealand climate, all kinds of fruit-trees are forced into bearing at an earlier stage than is the case in Great Britain.
The Government, recognising the importance of tree-planting, and in view of the marvellous results which have been achieved by the setting aside in the United States of America of one day in the year to be called Arbor Day, proclaimed the 4th of August last year as a general holiday to be devoted to tree-planting. It would be well for the settlers on the treeless Canterbury Plains had a movement of this kind been set on foot in the early days of the settlement. The movement, although so general and popular in America, attracted very little attention in New Zealand. However, as each year comes round more interest will be taken, till the institution becomes as popular as an annual cattle-show day. The planting of trees should not, however, be confined to one day in the year. The wholesale destruction of our grand primeval forests must hasten the time when timber will be as scarce in the North Island as it is on the plains of Canterbury. While our native supply is diminishing, the demand for timber is rapidly on the increase. It would therefore be a wise provision to encourage extensive planting of trees. The 1st of August this year (1894) was set apart for “Arbor Day.”
Among the encouragements of forestry in America the establishment of what is known as Arbor Day deserves to be mentioned. The credit of inaugurating a day specially devoted to tree-planting belongs to Nebraska, in which State, by a resolution of the State Board of Agriculture in January, 1874, the second Wednesday of April in each year was dedicated to the work of planting trees. The resolution was welcomed by the people of the State, and, as a result, it has been claimed that on the first Arbor Day and during the year 1874 more than 12,000,000 trees were planted, and that there are now 100,000 acres of planted forest in the State. The example of Nebraska was quickly followed, especially by those States most lacking forest-growth. In Iowa, Arbor Day was adopted in 1874 by the State Horticultural Society. Since then it has been established by legislative enactment. In Michigan, the Governor proclaimed Arbor Day in 1876, and in 1881 it was formally established by the Legislature. In Minnesota, it was proclaimed by the State Forestry Association in 1876, and 1,500,000 trees were reported as planted that year. The day is now established by law. In Ohio, Arbor Day was established in 1882 by the Legislature. In West Virginia it was extensively adopted, in 1883, under the lead of the Hon. B. L. Butcher, Superintendent of Public Schools. In accordance with an Act of the Legislature it was proclaimed in New Jersey in 1885. It was adopted the same year in Massachusetts and New Hampshire by the action of the State Granges of the Patrons of Husbandry, and more recently by the Legislatures of these States. In 1886 it was established by New York, Maine, Connecticut, Rhode Island, Pennsylvania, and Florida. It has been adopted also in Vermont, Georgia, Wisconsin, Colorado, and Indiana. Recently the interest in Arbor Day has been increased by engaging the pupils of the public schools in its observance. The way has thus been opened for getting the facts relating to tree-growth and the practical uses of trees before the minds of old and young alike, and for creating and diffusing through the community a sentiment which promises much good to the cause of forestry. It is this educational aspect which makes Arbor Day a specially desirable means of forestry reform.
A large and increasing demand for a certain class of timber is growing up each year in New Zealand in one department of industry alone, namely, the dairy, where hundreds of thousands of boxes will be required for packing butter. It is said that the timber of Pinus insignis is admirably adapted for boxes for packing butter, and that it is largely used in America for that purpose. This tree is a rapid grower, affording good shelter as it grows. It is true that it suffers from high winds, but if planted in sufficient numbers the trees shelter one another. While advocating the planting of Pinus insignis (provided that it is found suitable for the above purpose), it must not be forgotten that it is good policy to plant other trees, such as ash, elm, beech, and larch. A small quantity of ash grown in Canterbury has already come into use for coach-building, and has been pronounced by competent experts to be of excellent quality. Plantations of larch might advantageously be made on the southern slopes of the foot-hills skirting the Canterbury Plains and elsewhere. There can be no doubt that a demand will be found for large quantities of larch-poles for mining purposes and for scaffolding long before trees now planted would be lit for use. Trees of this description in the Old Country are fit for cutting for such purposes in about twenty years from planting, and are worth £20 per acre.
This industry is assuming important dimensions, and is incidental to the frozen-meat trade, resulting from the by-products in the shape of offal. The blood is manufactured into a nitrogenous manure of great value, containing from 11 to 12 per cent. of nitrogen, the other refuse being manufactured into what is commercially known as animal guano.
Those who have been watching the course of events in other countries, so far as they affect the agricultural interests of New Zealand, must ere now have come to the conclusion that New Zealand will have to pay greater attention to the quality of her agricultural exports than has been given to them in the past, when competition was not nearly so keen as it is now in every branch of industry. Our farmers cannot hope to compete with such countries as Australia and South America, where land is so much cheaper, and where mutton and beef of fairly good quality can be produced. For cheap meat these must command the markets of the world. Happily for New Zealand, our climate and pastures are such that we can not only produce mutton equal to the finest English or Scotch, but we can produce more per acre than can be done in Australia. Of course, we are now speaking generally. Our dairy produce should be second to none. All that is necessary is that it shall be the best. carefully prepared and graded. This remark applies with equal force to our cereal crops.
Farming operations may now be undertaken either on a large or small scale with something approaching mathematical precision. The farmer can calculate on at least 3d. per gallon for his milk, from 3d. to 4d. per pound for his pork, from 12s. to 17s. for his lambs, and prices varying from 10s. to 20s. for his store and fat sheep. Contrast this state of things with that which prevailed before the advent of the dairy industry, when butter could hardly find a market at 3d. to 5d. per pound during the summer months, which meant from 1d. to 1 1/2d. per gallon for his milk; when his pigs were often unsaleable, and dairy and fat cattle were of little value. In fact, there never was in the history of the colony a time when an industrious man with a frugal family could calculate on making a competency so surely as he can at present. A peculiarity of New Zealand is that small areas can be farmed to profit; this is one of the results of a generous soil, and a humid climate. The Agent-General was perfectly right, when he stated in his recent pamphlet that the kind of persons for whom there is room in New Zealand are farmers with a little capital—men who know their business, and are prepared to do it: to such New Zealand offers special advantages. There are thousands of acres in the North Island adapted to settlers of this kind, where the land is cheap, and procurable on exceptionally easy terms. It may safely be asserted that men with a reasonable amount of capital will, ere long, be able to settle on land already cleared and under cultivation in. the Middle Island; and that every acre of available land would find purchasers if offered at its agricultural or pastoral value, and on easy terms of payment. There is little difficulty, with all the data now available, in fixing with tolerable accuracy the value of land.
Above are enumerated a few of the salient points which go to prove conclusively that, as a country for settlement, New Zealand is not surpassed by any part of the British possessions, being one where the industrious man with moderate means can settle down with much comfort. The land, it is true, is perhaps dearer in some districts than that which may be found in South America, South Africa, or Canada, but this difference in price is far outweighed by other considerations, such as superiority of climate, and security to life and property. Pit these advantages against the insecurity of life and property in South America and South Africa, or the rigour of Canadian winters, and the balance will be immensely in favour of New Zealand. Another great advantage enjoyed by the agriculturist of New Zealand is that he is nowhere far from the sea-board, giving him the advantage of cheap water-carriage for his produce to the markets of the world.
The above notes would hardly be complete without some reference to the prevalence of small birds. Amongst other birds, the English sparrow found his way to New Zealand some three and twenty years ago. Many of the early settlers remember his first appearance, and the pleasurable feelings elicited by the sound of his once familiar chirp, recalling reminiscences of the Old Land. New Zealand is singularly destitute of the feathered enemies of small birds, and, owing to this and to the genial climate, the sparrow and other birds have long since become so numerous that drastic methods have to be adopted to preserve the balance of power. Large sums of money are paid annually by the Road Boards for the destruction of small birds. The want, however, of concerted action on the part of farmers at the time of poisoning is responsible for the undue increase of the pest. While treating small birds as pests, it must not, however, be forgotten that before their advent farmers suffered very heavy losses from the periodical attacks of caterpillars, which frequently devastated their barley and oat crops, and that the birds are the farmers’ friends in this matter. It must also be remembered that the birds live for about nine months in the year on insects and seeds of weeds; so that if accounts could be squared they would not be such debtors after all. All that must be done is to keep them n check.
The following tables have been carefully compiled from the agricultural returns for the whole colony made in February and March last; they are approximately correct. It will be seen that the area under wheat in 1893 was 381, 245 acres, as against 242,737 acres in 1894, or a decrease of 138,508 acres, with a corresponding decrease in bushels of 3,486,522. As a set-off, however, against this apparent shrinkage of grain, it will be observed, on reference to the appended tables, that there is an increase of oats amounting to 2,259,079 bushels. There is also an increase of 70,422 bushels of barley. In potatoes there is an increase of 22,367 tons, and in turnips and other crops 8,061 acres. There is a falling-off of land under crops amounting to 75,634 acres. To counterbalance this there is a very material increase in the area under grass, equal to 436,852 acres. Owing to contingencies already referred to, the crops of cocksfoot and rye-grass seed showed a decrease of 187,893 bushels. The total number of holdings for 1894 was 45,290, showing an increase of 2,522, which must be regarded as very satisfactory.
| TABLE SHOWING THE GROSS RETURN FOR THE COLONY, OF WHEAT, OATS, BARLEY, ETC. | ||
|---|---|---|
| Bushels. | Bush. | |
| Wheat. | ||
| 1893—Number of acres,381,245 | yield,8,378,217 | average per acre, 21.98 |
| 1894—Number of acres,242,737 | yield, 4,891,695 | average per acre,20.15 |
| Decrease in acres,138,508 | 3,486,522— | Decrease in bshls. for 1894. |
| Oats. | ||
| 1893—Number of acres,326,531 | yield,9,893,989 | average per acre,3030 |
| 1894—Number of acres,376,646 | yield,12,153,068 | average per acre,32.27 |
| Increase in acres,50,115 | 2,259,079— | Increase in bshls. for 1894. |
| Barley. | ||
| 1893—Number of acres,24,906 | yield,654,231 | average per acre,26.27 |
| 1894—Number of acres,28,857 | yield,724,653 | average per acre,25.11 |
| Increase in acres,3,951 | 70,422— | Increase in bshls. for 1894. |
| TABLE SHOWING THE NUMBER OF ACRES UNDER WHEAT, OATS, BARLEY, AND POTATOES IN 1894, AND YIELD PER ACRE IN BUSHELS AND TONS, FOR THE SEVERAL PROVINCIAL DISTRICTS. | |||
|---|---|---|---|
| Bushels. | Bushels. | ||
| Wheat. | |||
| Canterbury | 174,252 acres | yield,3,407,842 | average per acre,19.56 |
| Otago | 53,058 acres | yield, 1,161,672 | average per acre,21.89 |
| Wellington | 4,364 acres | yield, 103,255 | average per acre, 23.66 |
| Marlborough | 3,862 acres | yield, 54,241 | average per acre,14.04 |
| Auckland | 3,072 acres | yield, 81,271 | average per acre,26.46 |
| Nelson | 3,192 acres | yield, 56,227 | average per acre,17.61 |
| Taranaki | 553 acres | yield, 17,265 | average per acre,31.22 |
| Hawke's Bay | 384 acres | yield, 9,922 | average per acre,25.83 |
| Totals | 242,737 | 4,891,695 | 20.15 |
| Oats. | |||
| Otago | 196,750 acres | yield, 6,816,769 | average per acre,34.65 |
| Canterbury | 141,211 acres | yield, 4,172,690 | average per acre,29.55 |
| Wellington | 16,007 acres | yield, 487,606 | average per acre,30.46 |
| Auckland | 6,124 acres | yield, 170,803 | average per acre,27.89 |
| Hawke's Bay | 5,290 acres | yield, 154,784 | average per acre,29.26 |
| Nelson | 4,073 acres | yield, 98,453 | average per acre,21.72 |
| Taranaki | 3,757 acres | yield, 142,133 | average per acre,37.83 |
| Marlborough | 3,434 acres | yield, 109,830 | average per acre,31.98 |
| Totals | 376,646 | 12,153,068 | 32.27 |
| Barley. | |||
| Canterbury | 11,365 acres | yield, 273,965 | average per acre,24.11 |
| Otago | 6,801 acres | yield, 209,018 | average per acre, 30.73 |
| Nelson | 4,231 acres | yield, 94,611 | average per acre,22.36 |
| Marlborough | 3,865 acres | yield, 90,075 | average per acre, 23.31 |
| Hawke's Bay | 1,264 acres | yield, 25,343 | average per acre,20.05 |
| Auckland | 848 acres | yield, 19,509 | average per acre,23.00 |
| Wellington | 286 acres | yield, 7,150 | average per acre,25.00 |
| Taranaki | 196 acres | yield, 4,967 | average per acre,25.34 |
| Westland | 1 acres | yield, 15 | average per acre,15.00 |
| Totals | 28,857 | 724,653 | 25.11 |
| Grass-seeds. | ||
|---|---|---|
| Cocksfoot. Ryegrass. Bushels of 12lb. | Bushels of 20lb. | |
| Canterbury | 132,266 | 138,226 |
| Taranaki | 32,502 | 5,523 |
| Wellington | 16,183 | 5,456 |
| Hawke's Bay | 13,257 | 28,984 |
| Auckland | 13,951 | 61,519 |
| Otago | 12,957 | 266,863 |
| Nelson | 2,934 | 1,863 |
| Marlborough | 2,931 | 5,423 |
| Totals | 226,981 | 513,857 |
| Potatoes. | ||
|---|---|---|
| 1893—Number of acres | 18,338 | yield in tons,104,173 |
| 1894—Number of acres | 21,121 | yield in tons,126,540 |
| Increase in acres | 3,783 | Increase 22,367 |
| Potatoes. | ||
|---|---|---|
| Tons. | ||
| Canterbury | 6,309 acres | yield,42,422 |
| Otago | 5,595 acres | yield,27,814 |
| Auckland | 3,585 acres | yield,20,592 |
| Wellington | 1,994 acres | yield,13,846 |
| Nelson | 1,041 acres | yield, 5,618 |
| Taranaki | 868 acres | yield,5,188 |
| Marlborough | 752 acres | yield,5,889 |
| Hawke's Bay | 742 acres | yield,4,086 |
| Westland | 235 acres | yield,1,085 |
| Totals | 21,121 | 126,540 |
| TABLE SHOWING THE TOTAL NUMBER OF ACRES UNDER TURNIPS AND RAPE. | ||
|---|---|---|
| 1894. | 1893. | |
| Otago | 166,512 | 153,664 |
| Canterbury | 125,732 | 127,574 |
| Auckland | 31,830 | 30,289 |
| Hawke's Bay | 24,311 | 24,008 |
| Wellington | 24,612 | 28,184 |
| Nelson | 4,284 | 6,431 |
| Marlborough | 3,986 | 4,179 |
| Taranaki | 3,913 | 4,802 |
| Westland | 257 | 316 |
| Totals | 385,437 | 379,447 |
Increase for 1894, 5,990 acres.
Number of acres under other crops, 1894, 36,910 acres; 1893, 34,839 acres: showing an increase of 2,071 acres.
| TABLE SHOWING THE TOTAL NUMBER OF ACRES UNDER OATS FOR GREEN FODDER AND HAY, IN 1894, AS COMPARED WITH 1893. | ||
|---|---|---|
| 1894.Acres. | 1893.Acres. | |
| Otago | 53,496 | 47,679 |
| Canterbury | 32,829 | 42,179 |
| Auckland | 18,182 | 18,563 |
| Wellington | 7,778 | 6,955 |
| Nelson | 8,221 | 7,824 |
| Marlborough | 4,698 | 4,086 |
| Hawke's Bay | 2,788 | 2,920 |
| Taranaki | 1,730 | 1,377 |
| Westland | 382 | 557 |
| Totals | 130,104 | 132,140 |
| TABLE SHOWING THE TOTAL NUMBER OF ACRES UNDER OATS FOR GREEN FODDER AND HAY, IN 1894, AS COMPARED WITH 1893. | ||
|---|---|---|
| 1894.Acres. | 1893.Acres. | |
| Canterbury | 1,385,616 | 1,242,663 |
| Otago | 1,250,748 | 1,214,637 |
| Auckland | 425,335 | 402,646 |
| Hawke's Bay | 336,797 | 301,027 |
| Wellington | 210,626 | 216,523 |
| Taranaki | 98,309 | 92,563 |
| Nelson | 83,127 | 73,201 |
| Marlborough | 71,562 | 62,088 |
| Westland | 3,228 | 6,045 |
| Totals | 3,865,348 | 3,611,393 |
Increase for 1894, 253,955 acres.
| TABLE SHOWING THE NUMBER OF ACRES OF GRASS - SOWN LANDS (SURFACE-SOWN), NOT PREVIOUSLY PLOUGHED, INCLUDING SUCH AS WERE IN HAY, IN 1894, AS COMPARED WITH 1893. | ||
|---|---|---|
| 1894.Acres. | 1893.Acres. | |
| Wellington | 1,650,948 | 1,625,897 |
| Hawke's Bay | 1,041,144 | 1,028,357 |
| Auckland | 891,375 | 828,305 |
| Canterbury | 377,918 | 333,013 |
| Taranaki | 295,166 | 276,068 |
| Otago | 220,076 | 204,746 |
| Nelson | 203,330 | 171,400 |
| Marlborough | 140,179 | 171,992 |
| Westland | 13,413 | 10,874 |
| Totals | 4,833,549 | 4,650,652 |
Increase for 1894, 182,897 acres.
| TABLE SHOWING THE TOTAL NUMBER OF ACRES UNDER CROPS, EXCLUSIVE OF GRASS-LANDS, 1894. | |||
|---|---|---|---|
| Under Crop (1894).Acres. | Under Crop (1893).Acres. | Broken up, but not under Crop, 1894.Acres. | |
| Canterbury | 507,134 | 579,378 | 38,900 |
| Otago | 487,801 | 474,101 | 43,474 |
| Auckland | 72,320 | 73,836 | 27,836 |
| Wellington | 56,091 | 62,288 | 6,832 |
| Hawke's Bay | 37,016 | 40,454 | 14,794 |
| Nelson | 26,176 | 32,039 | 3,348 |
| Marlborough | 22,850 | 21,252 | 5,655 |
| Taranaki | 11,531 | 12,957 | 1,287 |
| Westland | 893 | 1,141 | 216 |
| Totals | 1,221,812 | 1,297,446 | 142,342 |
Decrease for 1894, 75,634 acres
| TABLE SHOWING THE TOTAL NUMBER OF HOLDINGS OVER ONE ACRE, AND TENURE. | ||||
|---|---|---|---|---|
| Freehold. | Rented. | Part Freehold, Part Rented, | Total Number of Holdings. | |
| 1894 | 28,635 | 10,745 | 5,910 | 45,290 |
| 1893 | 27,737 | 10,231 | 4,800 | 42,768 |
| Increase | 898 | 514 | 1,110 | 2,522 |
By J. A. JOHNSTONE.
The production of wool and mutton is undoubtedly the premier industry of the colony, as is clearly shown by the fact that out of a total of £8,984,290, representing the whole of the past year's exports, no less than £5,261,248, or nearly 59 per cent., were due to sheep-farming, made up as follows:—
| Value of wool exported | 3,774,738 |
| Value of sheepskins | 172,294 |
| Value of mutton | 1,084,027 |
| Value of tallow | 183,588 |
| Value of preserved meats | 46,601 |
| Total | £5,261,248 |
As the country is probably not much more than half tested in respect of its sheep-carrying capacity, and its consequent power of production, it can readily be seen that, when increased areas have been opened up and laid down in English grasses, and more winter feed—such as turnips, mangolds, &c.—is grown, New Zealand will offer a wide and lucrative field for industrious men possessed of moderate means and an intelligent knowledge of that most valuable of all animals—the sheep.
In a brief article like this it is impossible to go into minute details with regard to sheep-farming in New Zealand; and, in consequence, the statements which follow must be regarded as general in their character, but nevertheless as absolutely trustworthy.
It is a well-known fact that climate and soil exercise the most potent influence on the development of animals as well as human beings, and, these conditions being exceedingly favourable in this colony, render it the most suitable of the British possessions for sheep-farming.
It may unhesitatingly be asserted that not even Great Britain itself is so favourable to the production of the sheep as is New Zealand, for the colony possesses all the climatic and soil advantages of the Mother-country without the drawbacks of long and severe winters, wet seasons, foot-and-mouth disease, &c.; and the prolonged droughts of the Australian Continent are unknown.
As may be expected, New Zealand, covering, as it does, about thirteen degrees of latitude, and containing, especially in the Middle Island, a large proportion of mountainous and hilly country, has a very varied climate; it follows, therefore, that in some districts one cross or breed of sheep is found to do better than another. Until the commencement of the frozen-meat industry, in 1882. the production of wool was the great object of the New Zealand sheep-farmer. In the North Island, with its rich pastures, the Lincoln and Romney Marsh breeds were most used, but in the Middle Island by far the greater proportion of the sheep were merinoes. Since 1882, however, the frozen-meat trade has quite revolutionised sheep-breeding. The aim of the flock-master is now early maturity and good fleece combined. What is wanted is a sheep that can be turned off fat at from eighteen to twenty-four months old, weighing from 56lb. to 65lb. freezing weight, and at the same time giving a good fleece of wool. The merinoes of the Middle Island and the heavy long-wools of the North Island having been found unsuitable for the export trade, the desired result has been obtained by crossing the long-wool ewes of the North Island with Shropshire, Hampshire, and Southdown rams, and the merinoes of the Middle Island with one or other of the various long-wool breeds. The Border Leicester has been most used for this purpose, but in some of the wetter parts the Romney Marsh has been tried extensively, and with success, while on the rich heavy lands the Lincoln is most thought of. The Cheviot, too, has been employed with good results on high, mountainous, cold country. The great shrinkage in the value of merino wool which has been going on steadily for the last four years has caused many merino owners, who would not otherwise have gone in for cross-breeding, to turn their attention to this. At the present time there are just about the same number of cross-bred and long-wool sheep in the Middle Island as merinoes, and the latter are steadily losing ground; in fact, they promise ere long to be, except perhaps in very cold, mountainous country, almost entirely supplanted by either half-breds or cross-breds. In crossing the merino and long-wool breeds, the second cross or three-quarter-bred, that is, the cross between the half-bred ewe and the long-wool ram is found to be the best for freezing purposes. The half-bred does not mature early enough, and it is also very liable to foot-rot if placed on rich, heavy lands to fatten. For wool, too, the three-quarter-bred is quite equal, if not superior, to the half-bred. The three-quarter-bred wool has of late been running the half-bred very close in value per pound, and the additional weight obtained from the former quite makes up the difference. These three-quarter-bred sheep fatten readily, and, if they have been fairly well kept, they can be turned off fat at from eighteen to twenty-four months at an average of about 60lb. freezing weight, which is just the weight required for export. A fat wether or maiden ewe of this description is now worth from 12s. to 16s. at the nearest shipping-port, the price varying according to the value of the skin, which, of course, depends chiefly upon the time that has elapsed since shearing.
By continually using long-wool rams the sheep become coarser and heavier than is wanted. To prevent this many breeders have put their ewes to merino rams, the result of this cross being a sheep with a very nice fleece, but one which does not come to maturity early enough, and is a slow feeder. To avoid these faults, first-cross rams have been used with the coarser ewes with good results. There have been several attempts made to establish a breed of pure half-breds and with a considerable amount of success, as two or three flocks have been bred continually in this way for the last fourteen or sixteen years without, it is claimed, any deterioration. As good lines of merino ewes for crossing purposes are every year becoming harder to get, these half-bred rams will come more and more into use to put to the coarser ewes. The rearing of fat lambs for export is a source of considerable profit to New Zealand sheep-farmers, and with those who bare suitable country, and give their ewes proper attention, pays almost better than any other class of sheep-farming. Good sound-mouthed cross-bred or long-wool ewes are required for the purpose. These sheep, of which there are always plenty available, are bought in the autumn, and put to Down or sometimes Leicester rams. They require to be well kept during the winter, and, after lambing, put on good clean pasture, where the grass is not too old. Lambs that are not fit for freezing when taken from their mothers are topped off on rape or some other suitable feed. On suitable country, and under good management, from 70 to 90 per cent. of the lambs dropped can be turned off fat at from four to six months old at an average of about 36lb. These lambs are worth from 10s. to 11s. at the nearest shipping-port. The ewes, after one or two crops of lambs have been taken from them in this way, should be fattened, and a fresh lot bought. Many sheep-owners who do not go in properly for breeding fat lambs, tempted, no doubt, by the prices obtainable, select the fattest of their lambs from their flocks every year for freezing purposes. This course cannot be too strongly condemned, as it can have only one result, and that is, the rapid deterioration of the flock. Sheep-farmers are, however, profiting by experience, and giving up this ruinous practice by degrees; and it is to be hoped that before long the rearing of fat lambs will be looked upon as quite a distinct branch of sheep-farming.
The frozen-meat trade has since its start prospered in a remarkable manner, and has been of incalculable benefit to the sheep-owners of the colony. From the small beginning made in 1882 the trade increased rapidly, until, in 1893, 1,830,612 sheep and lambs, and about 180 head of cattle, of the value of £1,085,167, were exported, and this without in any way taxing the producing powers of the country, in fact, the reverse has happened, for never in the history of the colony have the flocks increased so rapidly as they have done since the inception of the frozen-meat trade, there being at the present time over six million more sheep in the country than there were when the first cargo of frozen mutton left these shores. When once the colony reaches the limit of its carrying-capacity, which, with the large tracts of new country now being opened up in the North Island, and the better methods of cultivation in course of adoption everywhere, will not take place until the present number of sheep has, at least, been doubled, the quantity available for export will not be less than three times, and will probably come to be four times, as large as it is at present.
The breeding and rearing of stud-sheep will always be a very profitable occupation in New Zealand to men with the necessary knowledge and means, for, as already mentioned, it is doubtful if any part of the world is better adapted to the breeding of long-wool sheep, and, if Australia succeeds in its endeavours to establish itself in the frozen-meat trade, it will offer a very large market for New Zealand long-wool rams for many years to come. An idea of the extent of the market which a breeder of first-class stud-sheep has at his command may be gathered from the fact that Australasia already possesses nearly one-fourth of the entire number of sheep in the world, and, considering the possibilities opened up by improved methods of cultivation, irrigation, artesian wells, &c., it may safely be said to be as yet only about half-stocked.
Two other important points in connection with sheep-farming in New Zealand call for the special notice of the would-be colonist— namely: (1) the low cost of the production of mutton, (2) the high percentage of natural increase. Respecting the first point, it has been proved beyond all doubt that, under ordinary conditions, the very choicest of mutton can be produced so as to pay the grower handsomely when sold at 2d. per pound for the carcase at the nearest shipping-port. To the British sheep-farmer this statement, of course, is valueless by itself; but, when we add that this mutton would cost the London butcher, deliveredex steamer at the dock, only 3 1/2d. per pound, he will be able to realise in some measure what a wonderful grazing-country New Zealand is, and to understand how it is that settlers of the right stamp have done so well. Then, with regard to the high percentage of increase, there need only be cited a few average returns from well-known flocks to show what excellent lambings New Zealand farmers obtain under good management.
| LAMBING RETURNS.—AVERAGES. | ||||||
|---|---|---|---|---|---|---|
| Locality. | Breed of Flock. | Breed of Rams. | Breed of Ewes. | No. of Ewes. | Percentage of Lambs. | Remarks. |
| North Island | Lincoln | Lincoln | Lincoln | 7,517 | 81.04 | Land merely surface - sown in English grass pasture.- |
| North Island | Lincoln | Lincoln | Lincoln | 5,301 | 85.05 | |
| North Island | Lincoln | Lincoln | 7/8 Lincoln | 12,177 | 100.00 | |
| North Island | Romney | Romney | Romney | 1,141 | 96.17 | |
| North Island | Lincoln | Southd'n | Lincoln | 2,033 | 94.71 | |
| Middle Island | Merino | Merino | Merino | 14,765 | 75.36 | Mountainous country in n'tive past're, unimproved. |
| Middle Island | Merino | B. Leic'str | Merino | 4,235 | 88.94 | |
| Middle Island | Cross-bred | B. Leic'str | Cross-bred | 8,624 | 80.82 | In English-grass pasture. |
| Middle Island | Half-bred | B. Leic'str | Half-bred | 2,747 | 82.79 | |
| Middle Island | Half-bred | B. Leic'str | B. Leic'str | 778 | 90.77 | |
| Middle Island | Lincoln | Lincoln | Lincoln | 452 | 88.08 | |
| Middle Island | R. Marsh | R. Marsh | R. Marsh | 253 | 111.46 | |
| Middle Island | E. Leic'str | E. Leic'str | E. Leic'str | 464 | 93.34 | |
| Middle Island | Shropsh're | Shropsh're | Shropsh're | 168 | 97.41 | |
| Middle Island | Southd'n | Southd'n | Southd'n | 114 | 96.87 | |
The above returns are fair average ones, but much higher might have been exhibited if exceptional cases had been selected.
As showing the actual cost of managing two large estates in New Zealand (Middle Island), No. 1 carrying 20,000 cross-bred sheep and No. 2 carrying 40,000, the subjoined table may prove interesting:—
| No. 1. Per Head. | No. 2. Per Head. | |||
|---|---|---|---|---|
| s. | d. | s. | d. | |
| Cost of shearing, including scouring and putting wool f.o.b. | 0 | 6.5 | 0 | 6.3 |
| Management, shepherding, dipping, &c. | 0 | 10 | 0 | 9.6 |
| Cost of providing special feed (turnips, green feed, chaff, &c.) | 1 | 1 | 1 | 6.3 |
| Cost of renewing English grass | 2 | 0 | 1 | 5 |
| Total per head | 4 | 5.5 | 4 | 32 |
As to the general management and feeding of sheep: In the earlier days of sheep-farming in New Zealand, when the flocks bred were principally merino, and the country they were run on for the most part tussock and native grasses, stock received but little care beyond mustering for lamb-marking and shearing, these operations being sometimes done at the same time; hut, with the advent of long-wools and the increase in the value of sheep, greater attention has been given to the management of flocks, and Home farmers coming to the colony will find long-wool sheep-breeding and -feeding carried on, at all events in the case of the better-managed estates and farms, on much the same lines as in Great Britain. The ewes are carefully-selected and annually culled for constitution and wool, and regular drafts made of aged stock, whilst first-class rains can be had from breeders who make the different varieties a specialty. Lincolns, Leicesters, both Border and English, Romney Marsh, and the different breeds of Downs all have their admirers, and can usually be bought at an average of about three guineas. The flocks from which these are to be obtained all had their origin in those of the best Home sheep-owners, and fresh importations are made to keep up the standard of the different breeds.
As the climate and soil of New Zealand vary much in different parts of the country, so also do the methods adopted of feeding sheep. In the North Island, with its warmer climate and short winters, the supply of winter feed is not the necessity that it is in the Middle Island. The pastures, however, are apt to get foul with continual feeding, and the sheep do not keep as healthy as they do in the Middle Island. On many places the pastures are cleaned with the aid of cattle, the farm or station being divided into blocks, which are grazed by cattle alone alternately for one year, and the lambs are then weaned each year on to the block thus cleaned.
In the Middle Island, and the parts of the North Island where cultivation is gone in for extensively, long-wool lambs are usually weaned on to stubbles or young grass which has been sown in spring to be ready against weaning-time, and as winter approaches are put on turnips, and thus brought in good order through that trying season and on to shearing. They are then, in most cases, well grazed through the summer, and fed off during the succeeding winter on turnips; merino lambs bred on high lands being, on the other hand, weaned on to a piece of country previously spelled and kept clean for the purpose.
To secure a good crop of turnips, and thus supply a winter feed for his stock, is the aim of the careful sheep-fanner in the Middle Island. On virgin soil, two, and sometimes three, very good crops of turnips are obtained by simply sowing the turnips broadcast without any assistance in the way of manures. On land broken up out of lea artificial manures have to be used to insure a crop, and the turnips are generally put in with a broadcast drill-machine, or, better still, are sown in drills, and hand-hoed. The following particulars as to the cost of growing turnips sown broadcast and in drills may be interesting to Home farmers and would-be colonists, viz.: Broadcast—Ploughing, 5s. 6d. per acre; harrowing, 3s. per acre; rolling, 1s. per acre; seed and sowing, 1s. 6d. per acre: total, 11s. per acre. Drill—Ploughing, 5s. 6d.; grubbing, 3s.; harrowing, 3s.; rolling, 1s.; drilling, 3s. 6d.; hand-hoeing, 10s.; horse-hoeing, 5s.; seed and sowing, 2s. 6d.; manure, 10s. to 15s.: total, £2 3s. 6d. to £2 8s. 6d.
A fair broadcast crop of turnips will carry about thirty sheep per acre for a month, while good crops of drilled turnips will carry three times as many. While being fed on turnips, sheep are also supplied with oaten sheaves cut into line chaff and put into large covered boxes so constructed that as the sheep eat the chaff fresh supplies fall into the troughs. Half a pound of oaten chaff per day will cost id. per week for each sheep, and the outlay is well repaid, as sheep are much healthier and feed much more quickly when thus supplied with a little dry food. A breadth of oats or Cape barley is usually sown to come in at early spring, when the turnips are exhausted and before the young grass is forward enough to stock.
Seeds are used much as in Great Britain, the following being a common mixture: Perennial ryegrass, 25lb. to 30lb. per acre; cocksfoot, 2lb.; alsyke, 2lb.; timothy, 3lb.; cowgrass, 2lb.; red clover, 2lb.; white clover, 2lb.; rape, 1lb.: total, 39lb. to 44lb. per acre. Pastures are renewed at intervals of from four to eight years, according to the nature of the land.
A few deaths from inflammation occur amongst turnip-fed sheep, but the mortality from this cause is not to be compared with that resulting from the same complaint at Home. Indeed, almost the only ailment sheep are subject to in New Zealand is lungworm. This is most prevalent in the North Island, where the abundance of grass enables the farmer to carry four to six sheep per acre, and the ground thus being foul promotes the disease. A dose of turpentine and oil, in proportion of 1 of turpentine to 2 of linseed-oil or milk, and of this mixture 1 to 3 tablespoonfuls for a lamb, 2 to 4 for a weaner, and 3 to 6 for a full-grown sheep, followed by a change to fresh pastures, usually gets rid of the parasite.
New Zealand may be said to be the only country in the world free from disease of a contagious nature amongst its stock. Scab is now eradicated, and foot-rot, to a great extent, can be avoided by keeping the class of sheep least liable to it and best adapted to the districts in which there is a tendency to it. The blow-fly, which is such a pest to Home shepherds, is here very little trouble; and when it is stated that the average death-rate of an estate carrying 40,000 sheep, of which the number of breeding ewes is 15,000, is only from 4 to 6 per cent., it will be readily understood that few countries can compete with this one as regards the health of the Hocks.
The following paper on the cross-breeding of sheep was read by Mr. Roberts at the meeting of the Australasian Stock Conference, held at Wellington on the 27th October, 1892:—
The development of the frozen-meat industry during the past few years has made the breeding from long-woolled sheep a greater necessity than it used to be in years prior to the initiation of the export of frozen mutton. Merinoes are admittedly unsuitable sheep for export purposes, and, this being so, the question of what is the most desirable cross-bred sheep for purposes alike of wool and mutton is an all-important one to sheep-breeders in the colonies. Most sheep-growers in New Zealand have had somewhat lengthened experience in crossbreeding, and, as I personally have had a fair opportunity of judging of the respective merits of the different crosses, I desire to give a shortrésumé of my own experience, and the conclusions I have come to as to the most suitable cross for use. Our Australian friends who are with us are no doubt considerably interested in the question to which I purpose to devote this paper, and, although they will, in travelling this country, receive opinions somewhat contradictory to those which I express herein, I give them my own personal experience for what it is worth, and trust that any guidance which I may afford may prove of some little benefit to our fellow-colonists on the other side of the water.
The following breeds of long-woolled sheep have been chiefly used in this colony for the purposes of cross-breeding: Leicester (English and Border), Lincolns, Romneys, Cotswolds, Southdowns, Hampshire Downs, and Shropshire Downs. I do not purpose going into the question at any length as to the respective merits for freezing purposes of any of these breeds, pure or close up to the pure, but I purpose to confine my remarks chiefly to the question as to which is most suited for producing a prime half-bred sheep bred from the merino ewe.
In arriving at a conclusion as to what is the best and most suitable sheep to use for the somewhat small-carcased merino ewe, we must take into consideration the question as to which of the pure breeds possesses the qualifications necessary for the successful breeding from the smaller female; these qualifications must of necessity consist in the main of small head, small bone, and a good fleece of wool. The Southdowns are perhaps the smallest in frame; the Shropshire Downs are also useful enough sheep to use for the first cross; but both of these Downs, being light-fleeced, produce in the first cross such light-clipping sheep as to make the use of these rams very inadvisable for breeding for export. These two classes of black-faces are very suitable for use for breeding early lambs, and they have been used with considerable success in this direction, by putting them to white-faced long-woolled ewes. In breeding, however, from the merino, the fleece from these sheep is so extremely light and unprofitable as to decide the question against their use for purposes of growing mutton and wool conjointly.
The Hampshire Downs are heavier in the fleece than either of the other sheep, and they also have a somewhat less defined type of wool than the white-faced long-wools, and the advantages which they afford are not equal to those which can be secured from other breeds.
The Lincoln, Romney, and Cotswold are, in my opinion too strong in the head and heavy in the bone to justify their use with merino ewes. Experience points to the inadvisability of using these heavy-carcased sheep for first crosses, as the difficulty of lambing is so great, and the loss arising therefrom very heavy.
Maiden merino ewes ought on no account to be put to long-woolled rams of any kind.
I now come to deal with the Leicester breed, of which there are “English” and the “Border.” The English Leicester is in many respects a very excellent sheep, and one which carries a fairly heavy and useful fleece of wool, while it also possesses considerable merit in the shape of being fine in the bone. They, however, lack the perfect butcher's carcase of the Border; and, seeing that carcase is one of the first considerations in cross-breeding, I altogether lean to the Border Leicester as being the best long-woolled sheep to use for crossing with merino ewes. They possess a fine quality of head, fine bone, excellent constitution, the best of carcases, and a fair weight of good-stapled wool. This class of sheep has been very much used in New Zealand for crossing purposes, and I think it deserves, and fully deserves, the reputation it has secured. The first-cross sheep from this breed is, when properly fed and matured, the best for the frozen-meat trade. If these sheep are well done to when hoggets they can be turned off fat good weights and excellent mutton at about twenty to twenty-two months; if they are not. well done to when lambs, they require to be about two and a half years old before they are fit for export. With this cross excessive weights are not at all common, and they can be always reckoned on to come up to the primest standard of weights—say, 55lb. to 70lb. They are ready feeders, and are sheep that can be kept on their feet, not being liable to foot-rot, and they carry a fleece of wool on the average about 2lb. heavier than the merino, and of a quality which has for years past realised higher prices in London than merino grown alongside of it.
Altogether the Leicester cross is, to my mind, the finest sheep for freezing purposes, and I have no hesitation in affirming that our Australian neighbours will find the Border Leicester the most suitable sheep for crossing their merino flocks with. It is a very hardy cross, and we find that it will depasture and thrive on native grasses at high altitudes quite as well as the merino will. They are not, of course, quite as hardy as mecrinoes, but if the country which they are running on is at all fairly grassed they thrive very well. On the ordinary average run of New Zealand tussock country they will do as well as merinoes. If any breed beyond the first cross is wished for, the heavier-fleeced sheep are desirable, and for breeding three-quarter-breeds no doubt can exist about the advisability of using these heavy-fleeced sheep, such as Lincoln, Romney, and Cotswold, as against the Leicester.
For some years a number of sheep-breeders in New Zealand have been experimenting with a view to the production of a sheep as a separate type resembling the first cross. I know of several breeders who for years have been closely following this, and I myself have been interested, and have paid considerable attention to it. If we can only secure as a separate and distinct type a sheep somewhat resembling the first cross between the long-wool and the merino, we shall secure something which will be of great advantage not only to this colony, but also to the other colonies. The establishment of a permanent and distinct breed of any new typo is of necessity a matter of some importance, and must occupy a very considerable period in its accomplishment.
In dealing with a cross-bred sheep which is the outcome of two such violent extremes as the merino and long-wool, much difficulty, and more than ordinary difficulty, must be experienced, owing to the very extreme component parts of the blend. This must, of necessity, tend towards frequent throwing back to the original strain, on one side or the other; and J do not anticipate that the permanent establishment of the half-bred sheep in the colony as a distinct type will be as easily secured as was the half-bred sheep which is now bred in the south of Scotland, and which originally came from Cheviot and Leicester. Most of the gentlemen attending this Conference will doubtless have heard that some breeders in the south of Scotland claim to have established a half-bred Cheviot Leicester sheep as a distinct and separate breed. When in the Home-country last year I had an opportunity of discussing this somewhat pet subject of mine (cross-breeding) at one of the farmers’ clubs in the south of Scotland, and I found that a large bulk of the farmers were of opinion that the inbred half-bred was not the success that the advocates of the breed claim it to be. I found the majority of the farmers of opinion that these sheep did not breed so well as the first cross between Cheviots and Leicesters. They held that lambs bred from first-cross rams are much sappier and better-thriving animals than those from the inbred sheep; indeed, some went the length of saying that they would give 4s. a head more for those got by the first-cross sheep. The advocates for the inbred sheep, on the other hand, were equally strong in affirming that such was not the case, and they contended that the one sheep bred as well as the other. I mention this matter, however, so as to show the differences of opinion which exist in the Home-country regarding the merits of sheep bred in this way.
As the ultimate result of this experiment in breeding is still in the somewhat distant future, it is, perhaps, unnecessary for me to refer to the matter much further; it still remains to be seen how long it will take to establish the breed as a breed, and, after it is so far established, whether the advantages to be gained by the use of such sheep are equal to the expectations of those who are prosecuting the venture. I have sheep which for four generations have been bred in-and-in, and, although a considerable percentage of the lambs require to be rejected, I find that a fair proportion—perhaps one-fourth—turn out to be sheep of very much the type at which I aim. These sheep I got from Mr. Tanner, of Hawke's Bay, and they are originally the result of the merino ram and the Lincoln ewe. I am keeping them by themselves, so as to follow the breeding-up and see how it results; but I am also experimenting with the Merino-Leicester cross-bred from stud merino ewes by a Leicester ram. This mode of breeding with the long-woolled ram is, I think, to be preferred to the other. I do not approve breeding from the merino ram, as it is usually found that the progeny partakes of the characteristics of the frame of the sire. The merino ram gets a considerable percentage of his lambs thin in the wither and somewhat flat in the rib, whereas the cross from the long-woolled ram, as a rule, has a good flat wither and well-sprung rib. As regards wool, I find these half-bred sheep maintain their position fairly well, and I think the in-bred animal is quite equal in this respect to the first cross. Very heavy culling is necessary in order to free the flock of sheep diverse from the type which is sought to be produced, and I expect for many years that this will be necessary. I hope, however, that in the course of years the desired type will be established, and that a good useful sheep will be produced. The chief advantage to be gained in the production of the cross-bred sheep is to enable sheep-owners continuously to use the one class, and not to be compelled, as at present, to buy in merino ewes in order to keep up the owe flocks.
The come-back sheep, which is the progeny of the strong long-woolled owe put to the merino ram, is a very poor feeder, and one which is much disliked by graziers. I have, during the past two years, with a view to avoid breeding back with the merino ram, used first-cross sheep with considerable success, and I find that these, when put to three-quarters or seven-eighths ewes, produce a most excellent, good-thriving, and ready-fattening sheep.
In conclusion, I may say that I regret that I have not had time to make a more exhaustive paper on the subject. I should have liked to have collected a good many facts and figures as to the actual weights of wool-clips, &c., and I regret that the time at my disposal has been such as to prevent my doing this. I trust, however, that the information contained herein, although hurriedly and roughly put together, will be of some little service to the gentlemen attending this Conference.
By DILNOT S...DDEN.
No flowers of speech are necessary in introducing the subject of an industry which has developed with such extraordinary rapidity, and attained such a magnitude, as the export of frozen meat from New Zealand.
This industry, started by the settlers, who themselves formed the original freezing companies, has attained its present dimensions by the aid of private enterprise alone, and to it the splendid fleets of steamers now trading between England and New Zealand may be said in a great measure to owe their existence.
The introduction of meat into the London market in a frozen state can hardly be said to have advanced beyond the experimental stage until the year 1881, in which year upwards of 17,000 carcases of frozen mutton were delivered in London from Australia, as well as a limited quantity of beef. Of this quantity only one-third arrived in good condition, another third being described as irregular in condition, while the balance was unsatisfactory. No frozen meat was exported from New Zealand in this year, but in 1882 two shipments were made, comprising a little under 9,000 carcases, which reached England in good order. In 1883 nearly 130,000 carcases of mutton and a small quantity of beef were shipped from New Zealand, while only about half as much was shipped from Australia.
The first shipment from New Zealand was made by the New Zealand and Australian Land Company, under the auspices of Mr. Brydone, the general manager of the company, in the Shaw-Savill Company's ship “Dunedin,” from Port Chalmers, the vessel being fitted with a Bell-Coleman machine. The success of this shipment gave the signal for the almost simultaneous erection of freezing-works in Dunedin, Christchurch, Wellington, Auckland, and Napier, and from that time the history of the trade has been one continued advance, with scarcely a check, until, in 1893, the export from New Zealand amounted to upwards of 1,840,000 carcases of mutton and lamb.
The improvements made in the machinery and appliances essential to the trade have been on a par with its rapid extension. For nearly ten years the work of refrigeration, both on shore and afloat, was carried on by compressed-air machines, of which the Bell-Coleman was the first. This was followed by the Haslam machine, which was rapidly developed and improved by its enterprising maker, and most of the freezing-works in New Zealand, as well as the meat-carrying steamers, were originally furnished with Haslam's improved compound engines. Machines upon similar principles by other makers—Hall, Goodfellow, and Lightfoot—are also in regular use, and have given satisfactory results.
For the benefit of those not conversant with such matters, the compressed-air machine may be briefly described as follows: Connected directly with the steam-engines are cylinders in which air is compressed, to a pressure of about 50lb. to the square inch; the result of this pressure is to heat the air to a high degree, and the temperature is reduced by passing it between pipes through which cold water is circulated by pumps. The air thus cooled, but still compressed, passes between another set of pipes, which are cooled by the air returning from the freezing-chambers, and by this means its temperature is still further reduced, while it is also caused to deposit its moisture, thus reducing the quantity of snow, which it deposits in the freezing-chambers at a later stage in its course. The compressed air is then returned to the expansion cylinders of the engines, and by its expansive force assists to drive the machine, returning, in fact, to the engines about two-thirds of the power expended in compressing it. As the air leaves the expansion cylinders, expanded to its original volume, the absence of the heat extracted from it when in a compressed state causes the most intense cold, and the air frequently leaves the ports at a temperature of 70° below zero. From the engine it is circulated through the freezing-chambers by a reticulation of large wooden boxes or pipes, until, having finished the circuit, it returns to the engine at a much higher temperature, and is again compressed, cooled, and expanded to repeat the same circle. Thus, at every stroke the engine simultaneously sends out a fresh supply of cold air and draws into the compressors a fresh charge of the air which has performed its task.
It may here be remarked that with all types of refrigerating machinery the heat abstracted is carried off by water, so that the first essential is a good supply of water, and the lower its temperature the better will be the results. It will be understood, therefore, that with all refrigerating machines the consumption of fuel will increase and fall with the temperature of the water available for circulation.
Within the last few years several of the freezing companies in New Zealand have erected machinery for freezing by the compression, in some instances of ammonia, and in others of anhydrous carbonic-acid gas. These methods are extensively used in the United States, the Argentine Republic, and in Australia. Of the two latest additions to the fleets of steamers carrying meat from New Zealand to England, the “Gothic,” of the White Star line, is fitted with Hall's carbonic anhydride machines, while the “Perthshire,” of the Shire line, is furnished with the Linde ammonia machine. The Linde machine is also at work at the Meat Export Company's works near Wellington, the Hall machine at Nelson Brothers and the North British Company's works in Hawke's Bay, and at the Canterbury Company's works near Christchurch, while the Gear Company are about erecting similar works near Wellington. All the above companies are also using Haslam machines, but have adopted the other types in adding to their works.
The main advantage which the ammonia and carbonic anhydride processes have over the compressed-air machine is in economy of fuel, the consumption of coal being reduced by at least one-half: and it seems not unlikely that in the future preference will be given to them where new works are erected or extensions made to those now in existence. In these machines the specific gas is compressed instead of air. It is heated by compression, and the heat so generated is abstracted by water in the same way as with. the compressed air, with the result that the gas becomes liquefied. Its escape is then regulated by valves, and it volatilises and expands in its passage through a series of coils which are immersed in a solution of chloride of calcium. This solution does not freeze at the temperature required for freezing meat, and is technically described as brine. The expansion of the gas in the coils reduces the temperature of the brine to a low degree, considerably below zero if required, and the brine thus cooled is either applied by circulation through the freezing-chambers in pipes or hollow iron walls, or is brought into actual contact with large volumes of air circulated through the chambers by fans. With some ammonia systems the gas circulates through pipes in the freezing-chambers, producing its cooling effect upon the air without the intervention of brine. In all machines which operate by the compression of gas, the gas, after being compressed, cooled, and expanded, returns to the compressors to do duty again, so that there is no expenditure except through leakage or accident. Both ammonia and carbonic anhydride are imported in cylinders of cast steel under very high pressure, the cylinders being submitted to an immense pressure to test them before they are charged.
In concluding this cursory description of the various processes it may be explained that they are all thoroughly effective for the purpose of freezing meat, and have all their special advantages and disadvantages, opinions being divided as to which is the most economical.
The collateral industries which are carried on in connection with large freezing establishments are scarcely less important than the freezing-works themselves. Side by side with the latter are to be found tallow-works, both for fine edible tallow and the ordinary tallow of commerce, fellmongeries, meat-tinning works, sausage-skin and fiddle-string factories, oil- and manure-works. These are in many instances furnished with the very best and latest appliances, but could not be described within the limits of the present article. Suffice it to say that gradually every waste product is being utilised, not with a view to economy alone, but also to provide for the rapid removal and manipulation of all waste animal matter, so as to insure the most perfect sanitary conditions, without which the slaughtering of thousands of animals daily could not be satisfactorily carried on.
At some establishments absolutely nothing is thrown away, and all waste matter is converted into manure within twenty-four hours after the animals are killed, while hundreds of tons of the various classes of manures may be seen stacked in sacks in a perfectly in-offensive state. As the whole of these manures is sold in New Zealand, every part of the slaughtered animals which is not required for export goes back to renovate the soil, and is thus made to play its proper part in the great economy of nature.
The number of freezing establishments in the colony has gradually increased, until they now number no less than twenty-one, of which twelve are in the North Island and nine in the South. These works are collectively capable of “freezing upwards of four millions of sheep per annum if kept steadily employed throughout the year. Although the annual output at present amounts to barely half that quantity, the capacity of the various freezing-works is taxed to the utmost during the first four or live months of the year, as the bulk of the stock for freezing comes forward during that time. As the steamers cannot carry the meat as fast as it is frozen during the busy season, a great deal has to be stored in the works, and at the present time (6th May) the storage-capacity of nearly every freezing establishment in the colony is taxed to the utmost.
The charges for preparing, freezing, and shipping meat have gradually been reduced from id. per pound to 3/8d., and in some instances less, while the increased freezing and shipping accommodation renders it unnecessary, as was formerly done, to call upon the settlers to guarantee regular quantities of stock at stated intervals. The total charges upon mutton, including slaughtering, freezing, freight, insurance, and London charges, now average slightly less than 2d. per pound.
The original system, under which each owner shipped his sheep at his own risk, has been, to a great extent, altered, and by far the greater number of the sheep shipped are now purchased by the freezing companies. The fluctuations of the London market have, however, been so great as to be out of all proportion to the moderate profit which can be expected from the ordinary freezing charges; and, as the sheepfarmer has been apt to value his mutton according to the London prices of the day, while some months have to elapse before it can reach the market, the result has frequently been to leave the freezing companies heavy losers. They are, therefore, as a rule, unwilling to run the risk of buying large quantities of meat to be placed upon an open market which they are helpless to control. A custom is rapidly growing in favour under which the risk is borne by companies and syndicates in England, who are nearer the consumer and better able to foresee the probable tendency of the market from time to time. Very large purchases are now made in this way from the freezing companies in New Zealand, who are thus enabled to fix the prices which they can pay to graziers, while the purchasers in England on their part make time contracts for the supply of regular quantities of meat at fixed prices, and so relieve themselves to a great extent of the element of risk. In this connection it should be mentioned that Messrs. Nelson Brothers are not only the largest owners of freezing-works in the colony, but have also the largest frozen-meat stores in London, and are the most extensive importers of frozen mutton into England. This firm purchases largely from other freezing companies, as well as from stock-owners, and, in their combined capacity as a freezing company and as importers and distributors in England, occupy the leading position in the New Zealand meat trade.
The enterprise of the settlers in establishing freezing-works would have availed but little had not shipowners been found to equip ships for carrying the meat. It happened that the inception of the trade was simultaneous with a general clamour for a direct steam service, and it was soon apparent that, although sailing-vessels could be utilised to some extent, steamers would be required if the export of meat was to be considerably developed. After a few sailing-ships had been equipped for the trade by the Shaw, Savill, and Albion Company and the New Zealand Shipping Company, both these companies turned their attention to steam, and in a very short time had monthly services of steamers specially designed for carrying meat. Messrs. Turnbull and Martin, of the Shire Line, and the Tyser Company also followed suit, special inducements being given by the various freezing companies in the shape of guarantees of specified quantities of sheep at stated intervals. The earlier steamers were designed with sufficient speed for a passenger-and mail-service, and carried 20,000 to 25,000 carcases each; but their meat-space was soon increased to from 30,000 to 35,000 carcases each. Cargo-steamers have been built from time to time of continually increasing size, some of them capable of carrying 100,000 sheep; and only a short time since the four largest meat-carrying steamers in the trade were in the Port of Wellington at the same time—viz., the “Gothic,” “Ruahine,” “Perthshire,” and “Waikato,” their collective capacity being nearly 350,000 sheep. The freight upon mutton has gradually been reduced from 2d. per pound to 1d., at which it now stands.
The number of vessels now employed in the New Zealand meat trade is thirty-six, of winch six are sailing-vessels, and their total carrying-capacity is about three million sheep per annum. As the output from New Zealand does not fully occupy this fleet during the winter season, some of the cargo-steamers are partially employed in carrying meat from Australian ports, the export from Queensland, New South Wales, and Victoria having increased more rapidly than the tonnage available. These colonies are looking with admiring and envious eyes upon the gigantic success achieved by New Zealand in the export of meat, and are making efforts to follow in the same steps. The various Governments are collecting information and preparing to foster the industry, the Victorian Government being about to erect works, while in Queensland the Government has already given financial aid to some of the companies, and vigorous efforts are being made to increase the output from New South Wales.
It is clear, therefore, that New Zealand is going to find powerful competitors in the neighbouring colonies, and, while it is probable that frozen meat may be pushed into new markets in the Old World, and outlets thus found for large quantities in the future, still, the graziers and freezing companies of New Zealand will have to spare no efforts to maintain the superior quality of their meat if they hope to obtain the same prices as heretofore. New Zealand, with its temperate climate, and well-watered pastures, is undoubtedly better adapted for the production of crossbred sheep than either of the other colonies; and, although the latter are already crossing their merinoes with longwoolled sheep, it is doubtful if they will be able to produce in any quantity the class of mutton which commands the highest price in England.
With beef the case is different, as the surplus in New Zealand can only be limited, and, as a matter of fact, the export for the last two years has been very small. Sheep are found so much more profitable than cattle that the tendency has been to substitute the former in most places where the country is suitable, and this explains the marked falling-off in the export of beef which is shown a little further on. In this connection, it must not be forgotten that the number of cattle employed for dairy purposes upon small holdings is rapidly on the increase, and, although the classes of cattle best adapted for dairying are not the most suitable for beef, there is a prospect of the total number of cattle in New Zealand being considerably increased at no distant date. Should this be the case, the surplus available for export can hardly fail to be increased. Queensland is exporting beef in large quantities, and, although the quality is, perhaps, scarcely up to New Zealand standard, there is little doubt that in the quantity available for export she can far outstrip us.
The position occupied by New Zealand in the frozen-meat trade can be best illustrated by the following tables, which are extracted from Messrs. Weddel's interesting and comprehensive review of the frozen-meat trade for the year 1893:—
SUMMARY of Importations of Chilled and Frozen Beef into the United Kingdom during the past Six Years.
| — | 1888. | 1889. | 1890. | 1891. | 1892. | 1893. |
|---|---|---|---|---|---|---|
| Cwt. | Cwt. | Cwt. | Cwt. | Cwt. | Cwt. | |
| Australia | 864 | 24,865 | 21,426 | 41,615 | 57,629 | 225,000 |
| New Zealand | 40,490 | 75,131 | 88,495 | 107,433 | 62,065 | 15,000 |
| River Plate | 3,678 | 8,665 | 8,933 | 14,485 | 8,309 | 37,000 |
| United States | 784,429 | 1,275,948 | 1,693,148 | 1,747,578 | 1,951,887 | 1,470,000 |
| Canada | 98 | 148 | 27,911 | 287 | 161 | 100 |
| Other Countries | 7,105 | 995 | 14,680 | 9,113 | 654 | 52,900 |
| Totals | 836,659 | 1,385,752 | 1,854,593 | 1,920,511 | 2,080,705 | 1,800,000 |
SUMMARY of the Importations of Mutton and Lamb into the United Kingdom from all Sources since the Commencement of the Frozen-meat Trade.
| Year. | Australia. | New Zealand. | Falkland Islands. | River Plate. | Total. | |
|---|---|---|---|---|---|---|
| London. | Liverpool, &c. | |||||
* Including 55,250 carcases delivered in Liverpool. †Including 34,228 carcases delivered in Liverpool. ‡ Including 36,003 carcases delivered in Liverpool. | ||||||
| Carcases. | Carcases. | Carcases. | Carcases. | Carcases. | Carcases. | |
| 1880 | 400 | 400 | ||||
| 1881 | 17,275 | 17,275 | ||||
| 1882 | 57,256 | 8,839 | 66,095 | |||
| 1888 | 63,733 | 120,893 | 17,165 | 201,791 | ||
| 1884 | 111,745 | 412,349 | 103,823 | 632,917 | ||
| 1885 | 95,051 | 492,269 | 190,571 | 777,891 | ||
| 1886 | 66,960 | 655,888 | 30,000 | 331,245 | 103,454 | 1,187,547 |
| 1887 | 88,811 | 766,417 | 45,552 | 242,903 | 398,963 | 1,542,646 |
| 1888 | 112,214 | 939,231 | 169,282 | 754,721 | 1,975,448 | |
| 1889 | 86,547 | 1,068,286 | 167,986 | 842,000 | 2,164,769 | |
| 1390 | 207,984 | 1,533,393 | 10,168 | 124,413 | 1,072, 118 | 2,948,076 |
| 1891 | 334,684 | 1,894,105 | 18,897 | 160,340 | 950,797 | 3,358,823 |
| 1892 | 504,738* | 1,539,605† | 17,818 | 166,508 | 1,081,353 | 3,310,022 |
| 1893 | 605,692 | 1,893,604‡ | 16,425 | 109,808 | 1,263,915 | 3,889,444 |
| Totals | 2,353,090 | 11,324,879 | 138,860 | 1,788,994 | 6,467,321 | 22,073,144 |
From these tables it will be seen that New Zealand has supplied about half of the total quantity of frozen mutton and lamb imported into the United Kingdom-since the commencement of the trade, the Plate district having contributed in round figures two-fifths, and Australia one-tenth.
New Zealand, however, plays but a very insignificant part in the first table, having contributed in 1893 only 15,000cwt. out of a total of 1,800,000cwt. of chilled and frozen beef imported during that year. The falling-off since 1888 is very marked, the quantity exported in that year having been 40,490cwt., while in 1891 it reached 107,433cwt. Even in the latter year, however, New Zealand's contribution was only about one-eighteenth of the whole, while in 1893 it fell to a hundred and twentieth part of the total importations into England.
Despite the fact that during a short period of each year the demand for space taxes the capacity of both freezing-works and steamers to the utmost, it has been shown that both are considerably in excess of the requirements of New Zealand, taking the year throughout; and the question naturally arises, How far can we increase the surplus of stock available for export, more particularly in the winter season? Some idea of the possibilities in this direction may be gathered from the fact that of the total number of sheep in the United Kingdom about 40 per cent. are slaughtered annually. With 19,357,730 sheep in New Zealand on the 30th April, 1893, the number of sheep and lambs killed for export during the year 1893 was 1,900,702. If we add to this a million killed for consumption in the colony, the total number slaughtered amounts to less than 15 per cent. of the whole. If the proportion available for slaughter could be raised to the same as obtains in the United Kingdom, the annual export from New Zealand would be increased from under two millions to upwards of seven millions and a half. It may reassure English graziers to know that there is no present prospect of such a result. Our nineteen millions of sheep includes six millions of merinoes, and as these are not suitable for export it might at the first glance be supposed that they should be deducted for the purpose of our calculations. This, however, would be fallacious, as a number of the best sheep and lambs exported are obtained by crossing the merinoes with Downs and long-woolled sheep. So that, although merino wethers are not available for export, the progeny of merino ewes are exported in large numbers. In addition to this many of the sheep killed for consumption in the colony are merinoes, their mutton, which is not appreciated in England, being greatly esteemed here.
In a speech delivered by Mr. Brydone, which was published in the Year-book for 1893, he says,—
In the Middle Island, the bulk of the land suitable for growing English grass and turnips has been cultivated, and, as sheep are all fattened on these, we can hardly expect to increase our output to any great extent unless by reducing grain-growing; but the North Island is in a different position, having large tracts of rich soil covered with bush, which, when cleared, will carry and fatten sheep well. I should say there is every prospect of New Zealand being able to export four million sheep ten years hence, as easily as we export two million now.
The practice gradually coming into vogue of producing sheep suitable for the English market at the age of eighteen months has the effect of increasing the proportion of our flocks which can be annually exported. Flock-masters in the Middle Island have utilised the advantages which they possess in their large areas of arable land by growing turnips, oats, and other crops available for winter feeding, and are able to produce the most suitable class of sheep and lambs for export in much larger numbers than would be possible if they relied upon grass alone. This system also enables them to ship during the winter, and thus distributes their output throughout the year. In the North Island the proportion of land which can be brought under the plough is less, while the grass is good for a longer period of the year. The result is that less artificial feed is grown, and comparatively few sheep are fattened during the winter, while only a small proportion of the two-toothed sheep are sufficiently forward for export. The following extract from Mr. Brydone's speech gives a clear idea of the system which has been found best in the Middle Island, and has resulted in giving “Canterbury “mutton the premier place in the market:—
Breeders differ widely in their opinions, and men generally favour the sheep they have been most accustomed to. A good deal depends also upon the nature of the country, as one breed of sheep would thrive well where another would starve. Having had very considerable experience in breeding cross-bred sleep in Canterbury and Otago during the last quarter of a century, and having experimented with most of the popular breeds, the result of our experience has taught us to favour the Border Leicester cross as the most profitable all round. The Border Leicester, as now produced in New Zealand, is a very different sheep from the Home Leicester, as ho has been bred with an eye to producing wool as well as mutton, whereas at Home they look principally to the carcase. We put the Border Leicester ram with the merino ewe, which produces a sheep carrying a profitable fleece and fattening early, and afterwards we use the Leicester, excepting with ewes that may be light in their wool, and to these we put the Lincoln rams. The Canterbury farmers who breed for export mostly favour the Leicester blood, although a few still prefer Lincolns and Downs. In the North Island Lincolns and Romneys have been most in favour, and that may account for the difference in price between Canterbury and Wellington mutton.
The farmers in the North Island are, however, rapidly improving their system of farming and are in many instances introducing the Down and Leicester breeds, which have proved so successful with their southern neighbours, with the result that some of the “Wellington “mutton is now sold at the same prices as “Canterbury,” and it is probable that the difference in value between the mutton exported from the two Islands will lessen year by year.
The following table shows the quantities of meat furnished by the respective districts of New Zealand in the year 1893, the figures being compiled from Mr. P. Cunningham's half-yearly summaries:—
| — | Mutton. | Lamb. | Beef. | ||||
|---|---|---|---|---|---|---|---|
| Carcases. | Legs. | Pieces. | Weight in Pounds. | Carcases. | Weight in Pounds. | Weight in Pounds. | |
| Auckland | 23,220 | .. | 30 | 1,368,476 | 6,852 | 222,138 | 25,040 |
| Gisborne | 33,785 | 181 | 424 | 2,043,686 | 940 | 29,415 | .. |
| Napier | 226,340 | 20,272 | 1,553 | 13,793,015 | 26,199 | 820,931 | .. |
| Waitara | 4,173 | .. | .. | 232,250 | 1,993 | 67,708 | 828,825 |
| Wanganui | 40,392 | 30,490 | .. | 2,719,438 | 4,826 | 168,052 | 68,861 |
| Wellington | 270,071 | 110,535 | 534 | 16,897,411 | 34,450 | 1,167,000 | 90 |
| Picton | 11,580 | 219 | 23 | 579,914 | 6,338 | 212,366 | .. |
| Lyttelton | 352,119 | .. | .. | 21,262,138 | 240,204 | 9,285,811 | .. |
| Timaru | 100,881 | .. | .. | 6,318,534 | 48,376 | 1,786,935 | .. |
| Oamaru | 52,662 | .. | .. | 3,287,213 | 29,297 | 1,067,244 | .. |
| Dunedin | 16,238 | .. | .. | 971,282 | 16,910 | 609,150 | .. |
| Bluff | 206,716 | .. | .. | 12,114,130 | 65,292 | 2,315,400 | .. |
| 1,338,177 | 161,697 | 2,564 | 81,587,487 | 481,677 | 17,752,150 | 922,816 | |
The total export of frozen meat from New Zealand for the different years since the commencement of the trade, in pounds, is as follows:—
| Year. | Lb. |
|---|---|
| 1882 | 1,707,328 |
| 1883 | 9,853,200 |
| 1884 | 8,445,228 |
| 1885 | 33,204,976 |
| 1886 | 38,758,160 |
| 1887 | 45,035,984 |
| 1888 | 61,857,376 |
| 1889 | 73,564,064 |
| 1890 | 100,934,756 |
| 1891 | 110,199,082 |
| 1892 | 97,636,557 |
| 1893 | 100,262,453 |
A slight discrepancy may be noted between Mr. Cunningham's figures and those of Messrs. Weddel and Co., which is accounted for by the fact that the former computes from the dates upon which the steamers leave the colony, and the latter from the dates of arrival in England.
Notwithstanding the very large quantity of frozen mutton imported into the United Kingdom, it is doubtful if colonists in general realise how small a proportion it forms of the annual consumption of meat.
The following table, from Messrs. Weddel and Co.'s report, shows in an admirably concise and comprehensive form the various sources from which the meat-supply of the United Kingdom is drawn and their respective contributions:—
| Description. | Sources of Supply. | Quantities. | Total Supply of each Description of Meat. | Percentages of Frozen Beef and Frozen Mutton. | Percentages of Imported Beef and Imported Mutton. | Percentages of Total Yearly Consumption of all kinds of Meats. | ||
|---|---|---|---|---|---|---|---|---|
| Dead Meat. | Dead and Preserved Meat. | Live, Dead, and Preserved Meat. | ||||||
| Tons. | Tons. | Tons. | Tons. | |||||
| Beef and veal. | Home production Imported— | .. | .. | 771,000 | .. | .. | .. | 36.40 |
| Live animals Dead meat— | .. | .. | 176,000 | .. | .. | .. | 830 | |
| United States | 95,000 | .. | .. | .. | .. | 92.00 | 4.50 | |
| Australia | 5,000 | .. | .. | .. | 62.50 | 4.60 | 020 | |
| New Zealand | 2,000 | .. | .. | .. | 25400 | 1.80 | 0.09 | |
| Argentine Republic | 1,000 | .. | .. | .. | 12.50 | 0.80 | 005 | |
| Sundry | 1,000 | 104,000 | .. | .. | .. | 0.80 | 005 | |
| Preserved | .. | 42,000 | .. | .. | .. | .. | 1.98 | |
| 146,000 | ||||||||
| 1,093,000 | .. | .. | .. | |||||
| 10000 | 100.00 | .. | ||||||
| Mutton and lambs. | Home production Imported— | .. | .. | 421,000 | .. | .. | .. | 19.80 |
| Live animals Dead meat— | .. | .. | 2,000 | .. | .. | .. | 0.09 | |
| United States | .. | .. | .. | .. | .. | .. | .. | |
| Australia | 8,000 | .. | .. | .. | 10.95 | 9.50 | 0.35 | |
| New Zealand | 43,000 | .. | .. | .. | 5890 | 49.50 | 2.02 | |
| Argentine Republic | 22,000 | .. | .. | .. | 30.15 | 26400 | 1.03 | |
| Continent | 9,000 | .. | .. | .. | .. | 11.25 | 0.42 | |
| Sundry | 3,000 | .. | .. | .. | .. | 3.75 | 015 | |
| 85,000 | .. | .. | .. | .. | .. | |||
| Preserved | .. | 3,000 | .. | .. | .. | .. | 0.15 | |
| 88,000 | .. | .. | .. | .. | ||||
| 511,000 | .. | .. | .. | |||||
| 100 00 | 100.00 | |||||||
| Pork &c. | Homo production Imported— Dead meat— | .. | .. | 227,000 | .. | .. | .. | 10.70 |
| United States | 252,000 | .. | .. | .. | .. | .. | 11.87 | |
| Continent and sundry | 39,000 | .. | .. | .. | .. | .. | 1.85 | |
| 291,000 | 291,000 | .. | .. | .. | .. | |||
| 518,000 | ||||||||
| 2,122,000 | .. | .. | 100.00 | |||||
From the above table it will be seen that the consumption of beef and mutton (including lamb and pork) is as follows:—
| Beef | 51.57 per cent. |
| Mutton and lamb | 24.01 per cent. |
| Pork, &c. | 24.42 per cent. |
| 100.00 per cent. |
Of the 24.01 per cent. of mutton and lamb, New Zealand contributes 2.02 per cent.; Argentine Republic, 1.03 per cent.; and Australia, 0.35 per cent.: total, 3.40 per cent. So that the total imports of frozen mutton at present represent only 3.10 per cent. of the total meat consumption in the United Kingdom.
The prospects of the trade can hardly be better summarised than by quoting the following extract from Messrs. Weddel and Co.'s concluding remarks: —
The import of all kinds of live and dead meat into this country now represents just one-third of the total consumption, or, say, 700,000 tons out of 2,122,000 tons. The home production of beef and mutton does not increase so rapidly as do the requirements of the growing population, and the quantities of imported dead meats of all kinds have risen from 13 5lb. per head in 1873 to 19.1lb. in 1883, and 29.0lb. in 1891 (the latest official return). Apart from the question of the increasing annual consumption, these figures reveal a steadily-growing dependence on foreign supplies, and afford a guarantee of a sustained demand for colonial beef and mutton. The last census returns show clearly that, out of a population of 37,704,283 persons in the United Kingdom, about 25,000,000 represented working-men and their families. Twenty years ago the great bulk of the homo production of meat was consumed by the upper and middle classes, the working-man using comparatively little meat then. The scale of living amongst the masses of our population is now, however, undoubtedly rising steadily, and the low price of frozen meats is fostering a taste which could not be gratified until within recent years. The capabilities of this undeveloped field cannot be gauged even approximately; but at a moderate level of prices, and with the rate of increase reasonably regulated, there can be little doubt that the outlet will prove to be co-extensive with the producing-capacities of the colonies.
Continental markets are also rapidly coming into view; and, though there are Customs regulations, prejudices, heavy expenses, and other drawbacks attendant on opening of trade relations with new countries having protective tariffs, it only requires patience to secure these avenues to colonial shippers.
On the whole, the prospect seems hopeful, and, although fluctuations will, no doubt, take place in the Home-market, and we may have at times to accept somewhat reduced prices, it seems probable that in the future prime sheep will rarely fail to command such a price as will enable a good farmer to live and make a profit.
By JOHN SAWERS, Chief Dairy Instructor.
New Zealand is admirably adapted for dairy farming. The best-known breeds of milch-cows can be maintained almost in a state of perfection. Indeed, the colony is a natural home for milch-cows, the soil, climate, and water-supply uniting to promote the growth of grasses and green crops generally in such a manner that when one fails its place can be wed supplied by another. It has been well said that the ideal of comfortable cow-life is in alluvial meadow, rich with the best grasses and clovers, shaded by hedging and wide-branching single trees, with a plenteous supply of pure running water, where during the whole year cows can obtain abundance of the best food for the secretion of first-class milk without wandering over large spaces, but feeding, ruminating, and resting undisturbed. The farmer is saved much worry and labour in not having to grow feed, and care for his cows under cover for a long season; in fact, throughout the greater part of the colony the cows are never stabled during the winter months. Consequently, more profit from dairy husbandry is retained by the farmers than it is possible to retain in almost any other country conducting dairying on a large scale.
The fact that the colony can supply fresh grass-made summer butter and cheese during the English winter months gives New Zealand a signal advantage. The antipodean climate we possess in relation to the Mother-country, which must be our chief market, is a very important circumstance in our favour. Not only can we produce our goods under the most favourable natural conditions, but we can place our dairy produce in the Home-markets at a season when all northern supplies, both European and American, are scant. This fully compensates for the disadvantage of distance from the chief market.
In a country possessing such advantages for the production of butter and cheese of the very best quality, it is not surprising to find dairy farming assuming importance as one of the principal sources of the colony's agricultural progress and prosperity. The business is now being taken up by the settlers with much zeal, and the great interest its development commands is daily spreading wider and wider throughout the colony. Farmers as a class are quick and intelligent enough to appreciate now ideas, but proverbially slow in putting them in practice. Although the progress of co-operative dairying in the colony was somewhat slow for a few years after its inauguration—the result of indifference on the part of the settlers, and the empirical knowledge displayed in connection with the building, equipment, and management of the then existing factories—still, the rapid and steady growth of the system of late is matter for congratulation. Indeed, dairy farming on the co-operative plan as a branch of agriculture is daily becoming more fully recognised as one of the permanently profit-able methods of obtaining satisfactory returns from the productions of the farm, without exhausting the fertility of the soil. It is also the means, not only of increasing the available food-supply per acre, but of providing a remunerative and quick return to the farmer for the labour and money expended. No efforts should be spared to keep alive in the settlers the spirit of enterprise which is now manifesting itself on every side and in so many different ways. All experience goes to show that dairying must, as a matter of course, take a prominent part in the agricultural work of the colony, especially where land is held in suitable areas, and has because valuable through close settlement. Indeed, it would seem that great division of New Zealand farming—i.e. the purely pastoral-become greatly modified, for the fanning of the future points very clearly to the introduction of mixed husbandry—the growing of grain, beef, wool, and mutton, combined with the production of milk, pork, fruit, &c. This is a consummation highly to be desired, as this system of farming argues the increased earning-powers of the land per acre, and additional marketable value of the land devoted to such uses. The practice of many of the large landed proprietors in combining dairying with grazing is now rapidly on the increase. Within the past few years several large estates have been cut up into moderately-sized holdings, and pub under dairying, the system proving profitable not only to those employed, but to the landowners themselves. Increased knowledge, new appliances, and improved methods have brought the cost of the production of dairy produce so much under the control of the farmers that no difficulty is experienced in causing them to sec that the business is a profit able one. The prejudices entertained by many of the colonial farmers towards the associated system of dairying have now almost disappeared. The conviction has been gradually forced upon them that there must be something in. the means by which farmers of other countries, not so favourably situated, have made such strides in the advancement of this industry. If Nature has done more for New Zealand in offering advantages superior to those of other countries, ought not New Zealand farmers to respond, and, with a willing hand, prove that they are ready to turn the inherent characteristics of the colony to account? There is no question as to the power of the New Zealand farmer to land dairy produce and other concentrated food-products in the Home-market and compete successfully with less distant countries. Competition in the Home markets is now world-wide. The improved carrying facilities of the world have made competitors out of producers who are far removed from each other. Geographical lines do not prevent competition nowadays. The New Zealand dairy farmer has become a market rival to the producer of Denmark and other European countries. Canada, and America.
The development of a well-organized system of co-operative dairying for the colony has for the past six years formed part of the educational programme of the Department of Agriculture. The object is of a fourfold nature: First, to promote, encourage, and extend co-operative dairying in all its branches in all parts of the colony that are deemed suitable; second, to improve the quality and uniformity, and to increase the yield, of butter and cheese; third, to improve the means of transit and treatment of butter and cheese from the factories to the ports; and fourth, to effect a better means for the disposal and distribution of the produce in the English and other markets. The Government has secured the services of five men to act as dairy instructors. It is the duty of these itinerant instructors to visit the dairy factories, giving ocular demonstrations in the manufacture of butter and cheese, with a view to improve the quality and uniformity of the produce, to reduce the cost of making by the teaching of economic methods, and to point out to factory-proprietors any impediment existing in the way of progress. Free intercourse, by correspondence, between the Department of Agriculture and the settlers is encouraged, and the department is represented at meetings of settlers convened for the purpose of establishing dairy factories or organizing the industry. Persons desiring information about the industry can obtain it free of cost on application to the department. To those contemplating the establishment of dairy factories or creameries full and detailed information is forwarded regarding the building, equipment, and management of such establishments. By-laws specifying conditions of milk-purchase, and general information concerning the business basis, have been printed in pamphlet form for circulation among the farmers. The demand for information about dairy factories is daily increasing, and indications are not wanting of a large increase to the number now at work. This is highly satisfactory, for it will bring about economy of labour in connection with the manufacture of dairy produce, and effect a uniformity and general excellence of quality in the output of butter and cheese.
It has now been decided to issue dairy bulletins, at intervals, to spread information about dairying among the settlers. This is necessary for educational purposes, and to meet the expressed needs of many settlers.
With a view to further promote the sale and reputation of New Zealand dairy produce in the English markets, the Government has appointed a Produce Commissioner, who will now be attached to the Agent-General's Department, London, and whose duty it will be to attend to matters affecting the trade both before the goods reach the English market and after arrival. It is believed that this step will prove advantageous to colonial producers. The Commissioner will be able to clear off hindrances at present standing in the way of placing the produce well before the British consumers. Everything will be done on this side to improve the quality of the produce; and, with proper representation in England, a better demand and better prices will be established. Such a course has already been pursued by other countries, Denmark in particular, with most satisfactory results.
The Government of New Zealand cannot fairly be charged with want of interest or proper action as regards fostering the dairy industry. There is legislation regulating the manufacture of dairy produce, providing for the purity of milk used in manufacture, and to prevent the deceptive branding of butter and cheese. By this means it is hoped to create and command confidence in England. The Dairy Industry Act was passed by the Legislature in 1892, and has already done a great deal of good.
The formation of dairy associations for the purpose of guarding the interests of the industry has already shown what good service such institutions are capable of rendering. The National Dairy Association -of New Zealand has been in existence for nearly four years. This organization receives a liberal grant from the public Treasury of the colony, and it would be difficult to conceive of public money being spent to more advantage. What association has done for dairying in other countries it will do for dairying in New Zealand. The colony will reap its reward from this judicious outlay, for it means more information, instruction, and enthusiasm to all interested in dairy farming. Another dairy association is now formed for the North Island, called the North Island Dairy Association of New Zealand, which will be of incalculable benefit to the dairy interests of Taranaki, Wellington, and Hawke's Bay.
In 1882 co-operative dairying started in New Zealand, a bonus of £500 being offered by the Government for the first 50 tons of cheese produced on a factory system, as an inducement to establish factories. It is found that dairying on co-operative lines, when conducted as a branch of the agricultural work of the farm, gives a certain, quick, and remunerative return; and there are now at work in the colony fifty-five cheese-factories, sixty-two butter-factories, sixty creameries, and two milk-condensing factories. Thirty-live new factories and creameries are now in course of erection, and will be ready for the receipt of milk early in the ensuing season. Although a fair start is made, we have not by any means reached the limit of our possibilities in cooperative dairying. There is yet an immense area of land highly suitable for the production of milk, and capable of enormously increasing our output of butter and cheese. Even with the present number of factories and creameries, and with the area of land now devoted to the carrying of milch-cows for the support of these establishments, we can greatly augment the present output. To produce butter and cheese of uniform quality, and to find by joint action the best market and mode of distribution, are the functions of co-operative dairying. All those connected with the work know that as fine a grade of butter or cheese can be, and is, produced in the private dairy as in any creamery or factory, granting all the modern appliances and the skill necessary to use them are at hand. But such a result requires an individual plant on a large scale, and even then, in the majority of cases, there will be an unavoidable lack of uniformity in the produce during portions of the year, an unsatisfactory factor in the productions of any country largely depending on an export trade. A well-organized cooperative system is the only remedy. Its good effects are soon seen. More care is bestowed in the breeding, selection, and care of cows, because the settler is paid for milk according to its productive character. One of the first things he does is to discard unprofitable cows in favour of better stock. There is much more in this than may at first be apparent. The system affords the dairyman an easy method of testing his cows, and, in fact, compels him to do it. It teaches him to breed, select, and manage for profit. It enables him to compare the returns from his own herd with the herds of other milk-suppliers, and the comparison stimulates him to do better. The cash returns come in frequently, and so lead the farmer to regard dairying more in the light of a permanent business than he would otherwise do. The majority of the factories and creameries now working in the colony are conducted on purely co-operative lines; they return to the milk-supplier the full value of his milk, less the actual cost of manufacturing the produce. This equalises the value of all contributions with perfect justice to each one, and gives to the farmer an increased return for his milk, with less labour expended, than he could realise in any other way. It enables him to utilise the skim-milk and whey on the farm to the best advantage; in fact, nothing is wasted or lost to the producer of milk. It is an immense saving of trouble and uncertainty.
The English returns for the dairy-factory and creamery butter and cheese have been satisfactory The factory-cheese is hold in much repute by English buyers, who say that the quality is exceptionally fine. Tim prices realised for New Zealand “full cream” factory-cheese during the past season ranged from £2 8s. to £3 2s. per hundredweight; and for factory or creamery butter of the best quality from £4 15s. to £5 16s. per hundredweight. These prices leave—after paying for manufacturing expenses, railage, freight, dock-charges, commission, &c.—satisfactory returns to the contributors of milk. The price paid for milk at the factories and creameries ranges from 3d. to 4 1/4d. per gallon of 11lb., according to its productive character. This gives a return varying from £7 to £11 per cow per annum.
The average capital of co-operative dairy companies ranges from £1,000 to £2,000, usually in £1 shares. This is ample to meet all the requirements of a prosperous business. The business is generally first chargeable with interest at the rate of 5 or 6 per cent. per annum on the paid-up capital before any dividends or bonuses on the milk-supply are declared. This gives every shareholder a fair rate of interest for the amount of capital invested in the company.
The factories and creameries are, on the whole, substantially built, and planned with a view to economy in working. They are all equipped with modern machinery and plant. To the old plan of creaming milk the separator, in the colony, bears a comparison as striking as the reaper-and-binder to the hook, or the threshing-machine to the flail.
The statement below shows the number of cheese-factories, butter-factories, and creameries in each provincial district of the colony; also, an estimate of the number of cows milked by patrons supplying those factories and creameries, the approximate annual output of cheese and butter, and the number of workmen employed.
| District. | Number of Factories. | Number of Creameries | Approximate Number of Cows milked for Factory and Creamery Supply. | Approximate Annual Output of cheese, and Value. | Approximate Annual Output of Butter, and Value. | Number of Workmen employed in Factories and Creameries. | |||||||
|---|---|---|---|---|---|---|---|---|---|---|---|---|---|
| Cheese. | Butter. | Quantity. | Value. | Quantity. | Value. | ||||||||
| Lb. | £ | s. | d. | Lb. | £ | s. | d. | ||||||
| Auckland | 5 | 9 | 21 | 11,400 | 675,000 | 11,953 | 2 | 6 | 1,713,461 | 64,254 | 15 | 9 | 52 |
| Taranaki | 7 | 26 | 5 | 12,820 | 1,372,500 | 24,304 | 13 | 9 | 1,690,961 | 63,411 | 0 | 9 | 73 |
| Hawke's Bay | 4 | 5 | 4 | 3,300 | 360,000 | 6,375 | 0 | 0 | 432,692 | 16,225 | 19 | 0 | 23 |
| Wellington | 6 | 7 | 10 | 6,870 | 787,500 | 13,945 | 6 | 3 | 886,153 | 33,230 | 14 | 9 | 40 |
| Nelson | 1 | 300 | 51,923 | 1,947 | 2 | 3 | 2 | ||||||
| Marlborough | 1 | 2 | 600 | 103,846 | 3,894 | 4 | 6 | 4 | |||||
| Canterbury | 4 | 5 | 10 | 6,300 | 315,000 | 5,578 | 2 | 6 | 969,230 | 36,346 | 2 | 6 | 31 |
| Otago | 12 | 7 | 8 | 9,500 | 2,182,500 | 38,648 | 8 | 9 | 804,807 | 30,180 | 5 | 3 | 62 |
| Southland | 17 | 1 | 5,900 | 2,475,000 | 43,828 | 2 | 6 | 69,230 | 2,596 | 2 | 6 | 43 | |
| Totals | 55 | 62 | 60 | 56,990 | 8,167,500 | 144,632 | 16 | 3 | 6,722,303 | 252,086 | 7 | 3 | 330 |
Returns collected at the census of 1891 showed a total annual production of butter for the colony amounting to 16,310,012lb., of which 1,969,759, lb. was stated to be made in factories. The cheese made was 6,975,698lb., of which 4,390,400lb. was from factories. The development of the export is very great. The figures are given on page 120.
By Professor T. KIRK, F.L.S.
If the relative importance of the various branches of colonial industry be determined by the value of the output of each, the timber industry occupies the fourth place; but, if it be based on the amount of remunerative employment afforded by each, this industry occupies nearly the first place. The number of saw-mills in working-order at the date of the last census (1891*
Note
* A year of intense depression; many mills were entirely closed, and others worked only half-time, or even less.
The character of the forest varies greatly in different localities, according to the kind of trees composing it and the degree of luxuriance which they attain. New Zealand forests are usually of a mixed character, some one or two kinds predominating to a greater or less extent. It is but rarely that large areas of forest consist of a single species only; but there are noteworthy exceptions—thus, the mountain forests consist of mountain-beech exclusively; the Oxford and Alford Forests of entire-leaved beech; some large areas are altogether covered with tawa; kahikatea forms uniform forests in swampy districts, and smaller areas are occasionally found containing nothing but kauri. Still, the great bulk of the forest is of a mixed character. This renders it difficult to lay down well-defined areas for the principal timbers, more especially as most of the trees are generally distributed through the colony. Nevertheless, certain districts may be roughly defined according to the prevailing tree or trees, although the boundaries must of necessity be somewhat vague.
This may be defined as that part of the colony lying north of a line drawn from Tauranga to Port Waikato, the kauri being the predominating tree over large portions of the area. In some parts only single trees are found, in others they occur in clumps or groups, sometimes forming extensive groves, or even large blocks, almost to the exclusion of all other trees. Most frequently the kauri will be found mixed with rimu, kahikatea, tanekaha, miro, totara, totara-kiri-kotukutuku, northern rata, puriri, tawa, tarairi, matai, and many other trees, the tawa, as a rule, being most abundant. The nikau, or southern palm, is plentiful all through the district, and is everywhere accompanied by noble tree-ferns and palm-lilies. The underwood is composed of numerous shrubs, and the ground is carpeted with a rich growth of delicate filmy ferns. A large kauri forest is one of the grandest sights to be found in the entire range of the vegetable kingdom; massive columnar trunks, 4ft. to 8ft. in diameter, clothed with smooth grey bark, rise close together often to the height of a hundred feet or more, their spreading arms and deep green leaves presenting a picture of the greatest luxuriance and vigour. At the base of each tree is a large mound of humus, formed by the decay of bark through successive centuries. The surface-soil as well as the humus is charged with resin which has exuded from the fallen leaves or twigs. Some of the most ancient specimens are among the oldest trees in the world, and must have originated in a period long before the Christian era, yet they still exhibit all the life and exuberance of early youth.
In the extensive swamps by the Northern Wairoa and other rivers, the kahikatea forms forests of a remarkable character. The uniformly straight naked trunks often exceed a hundred feet in height, carry very short branches at their tops, and are so close together that at the distance of a few yards the view is completely blocked, and nothing is to be seen but the column-like trunks from 2ft. to 5ft. in diameter; the undergrowth being insignificant.
Although the totara is distributed throughout the colony, it occurs in larger masses in the central portions of the North Island, more especially on the eastern side. Large areas, in which it is the prevailing tree, are found in many parts south of the Lower Waikato, more especially in the southern parts of Hawke's Bay, the northern portion of the Wellington District, and the Seventy-Mile Bush. In a large portion of the area the totara is sparsely scattered, and even when most dense is usually intermixed with rimu, tawa, totara-kiri-kotukutuku, kamahi, hinau, kahikatea and other trees. Unlike the kauri the bark of the totara is of a deep brown colour and much furrowed, while the short narrow leaves are of a brownish green. Amongst the most conspicuous trees of this area are two which demand special mention, the northern rata and the black maire, which occur in vast abundance in many localities. The former is often found with a distorted trunk of gigantic dimensions clothed with rough brown bark. The latter has a pale hark and yields a timber remarkable alike for its density, strength, and durability. Large portions of the forest, especially on the western side consist chiefly of tawa, rimu, and kahikatea, which are extensively converted throughout the district, the first-named for dairyware and butter-kegs, the two latter for building and general purposes. Tooth-leaved beech, entire-leaved beech, and silver-beech are plentiful on the lower slopes of the mountains, but rarely descend to the sea-level, while mountain beech forms the bulk of the forest at high levels. Rimu and kahikatea are the chief timbers of the moist forests in the valleys of the Manawatu, Rangitikei, and Wairarapa.
This might be termed the low-land pine district of the Middle Island, as practically it comprises all the forest country in that island below a level of 1,000ft, Although in nearly all localities the forest is of a mixed character, yet from Marlborough to Stewart Island the rimu must be considered the predominating tree, and is the most extensively converted. The kahikatea stands next in abundance, and is closely approached by the kamai, while the miro, matai, totara, Hall's totara, are generally distributed; but the northern rata and pukatea scarcely occur south of Greymouth. The Westland silver-pine, yellow silver-pine, and quintinia, although not peculiar to Westland, are more abundant there than in any other part of the colony; while the southern rata, which extends to Stewart Island, is especially plentiful in the Tautuku Forest, where it attains very large dimensions. Cedar or pahautea, pokaka and hinau, are not unfrequent, while most of the beeches are plentiful, especially in the southern parts of the district. The undergrowth contains a large variety of shrubs or small trees, many of which afford timbers suitable for ornamental cabinet-work and inlaying.
Much of the rimu and kahikatea in the south-western portion of the Nelson District, and in Westland, is of great height, and extremely well-grown, in some cases yielding 80,000 superficial feet of converted timber per acre.
The area of heavy forest on the eastern side of the Middle Island is extremely small; the inland Oxford and Alford Forests consisting chiefly of entire-leaved beech.
This may be roughly defined as that portion of the Middle Island between 1,000ft. and 4,000ft. in altitude, for, although the rimu and kahikatea are often found above 1,000ft., yet they rarely occur in any great quantity, or exhibit great luxuriance; so, on the other hand, the different beeches occasionally descend even to the sea-level, although rarely forming any large portion of the forest at extremely low levels. The most valuable forest-tree is the tooth-leaved beech, which attains exceptional luxuriance and large dimensions in the neigh-bourhood of Te Anau Lake, and many other localities. Silver-beech and entire-leaved-beech are found as far south as Preservation Inlet and the Tautuku Forest, while the mountain-beech prefers higher levels, although occasionally a few specimens descend to the rimu district. None of the beeches extend to Stewart Island, which in many parts is covered with a dense growth of rimu, kamahi, and rata, the kahikatea being extremely rare.
The following statement of the approximate areas still under forest was published in the report of the Survey Department for the year ending 31st March, 1893:—
| Acres. | |
|---|---|
| Auckland Land District— | |
| North of Auckland | 1,800,000 |
| South | 3,420,000 |
| Taranaki | 1,850,000 |
| Hawke's Bay | 1,900,000 |
| Wellington | 3,400,000 |
| Marlborough | 400,000 |
| Nelson | 3,240,000 |
| Westland | 2,394,000 |
| Canterbury | 492,000 |
| Otago | 1,182,000 |
| Southland | 500,000 |
| 20,578,000 | |
The State forest reserves, including those made for climatic purposes, comprised 1,136,467 acres.
The trees are felled and cross-cut into suitable lengths for conversion, the logs being conveyed to the mill by flotation, by tramline, or, more rarely, hauled by oxen or horses.
Flotation is the method most commonly used in the kauri districts, which are much broken by deep gullies and small streams, opening into tidal creeks. After the trunks are cut into lengths a “rolling-road” is formed to the nearest creek. All the scrub is closely cut down for a width of from twenty-five to thirty feet, and all stumps are removed, while inequalities are reduced so as to obtain an approximately even surface, inclined towards the creek. The logs are forced along this road by timber-jacks, which the bushmen use with remarkable skill, and are impelled with a rapidity which is simply astonishing to persons unused to the process. If the creek contains plenty of water the logs float to the nearest booms without further trouble, and are drawn out of the water as required, but in many cases the creek does not contain sufficient water to float the logs, and then they are left until heavy rains afford the requisite depth. Often it is necessary to construct costly dams to impound the water in the upper parts of the creek, in order that it may be suddenly liberated when the water in the lower parts is at its greatest depth, so that the entire assem-blage of logs may be “driven :‘ to the booms. In dry seasons the logs may remain in the bed of the creek for months, and, occasionally, after a successful “drive,” the harvest of logs is carried out to sea and lost, through the booms breaking from the immense pressure behind them. Kauri-logs, thus set free, often drift to the coast of the Kermadec Islands, nearly seven hundred miles north-east of the Hauraki Gulf. Tramlines are less common in the kauri district than in the southern parts of the colony.
In portions of the Taranaki District, where milling timber is somewhat sparse, timber-wheels are commonly used; but in nearly all places where milling timber is plentiful a tramway is constructed. Kamahi, or other common timbers are used for sleepers. Bails are sawn out of better stuff, and laid in notches cut in the sleepers, being tightly fixed by wooden wedges. Haulage is usually effected by horse-power, but in some cases the tramway is built in a more substantial manner, light steel rails being used instead of wood, and the logs are hauled by a steam motor. The maximum proportion of tramway required is half a chain per acre. Loading places are constructed alongside the line, at a distance of twenty or thirty chains apart, to which the logs are hauled by oxen. If of large size, the timber-jack is employed to facilitate loading. It is not considered profitable to haul logs from a greater distance than ten chains on either side of the tramway. It is in the Southland forests, where there is a large extent of comparatively level land, that the tramway is most used.
The sawmill is usually worked by steam power, rarely by water, and may vary from the magnificent mills of the Auckland District to the small portable engine and movable saw-bench commonly seen in a block newly opened for settlement. For their completeness, and the quality of their machinery, the Auckland mills are equal to any in the world. They are fitted with vertical breaking-down saws, capable of dividing the largest logs into halves or flitches, as may be required; vertical frame-saws for converting the flitches into boards, and circular saw-benches having rack adjustments for the conversion of scantling. Planing machines of the best pattern, tongueing and grooving machinery, moulding machines, as well as machines for the manufacture of doors and sashes, coopers’ staves, gates, wheelwrights’ stuff, &c., &c., are to be seen on all sides. Some of the mills are furnished with the electric light, so as to allow of work being carried on through the night when required, and in a few cases arrangements are made for seasoning converted timber by the hot air process. In the totara and rimu districts the mills are less complex, of smaller extent, and driven by less powerful engines. Breaking-down is commonly effected by the circular-saw, and in the case of very large logs by two circular-saws, an upper and a lower working in the same vertical plane. Vertical frame-saws can scarcely be said to have been brought into general use, although they are becoming more common. A circular-saw-bench, with rack adjustment, serves for the conversion of boards and scantling. Planing is effected by a simple machine with revolving cutters. Machines for tongueing and grooving and for moulding are to be found in nearly every mill, the former usually combined with the planing-machine. Planing-machines of a better type are coming into use, and at one or two of the Hokitika mills, wide boards and panels, suitable for ornamental cabinet work, are turned out by frame-saws in a style that could not be surpassed in England or the United States.
The value of the total output of sawn timber, planed flooring and skirting, mouldings, doors, and sashes, for the entire colony during the year 1890, was stated by the Registrar-General to be £832,959. Owing to the severe depression experienced during that year, this amount is no less than £344,754 below that of the previous census, 1886. At the census of 1891, twenty-five mills had been closed, and the number of persons employed had fallen from 5,042 to 3,266, many of the mills working even less than half-time. Since that date, the trade has greatly improved, and its volume is largely increased. Of the total output for 1890 the forty-seven Auckland mills contributed more than one-half, the value of their output being £416,978, while the manufactures of the 196 mills in the other provincial districts were valued at only £415,981. The sum paid in wages during the same year is stated at £271,783; but this includes only a portion of the amount paid to the bushmen, fellers, and others engaged in preparing the logs for conversion, as many mills purchase logs from settlers, or employ contractors, who deliver the logs at the mill at fixed rates.
The approximate value of land, buildings, machinery, and plant was returned as under: Land, £160,750; buildings, £92,848; machinery and plant, £246,674: total, £500,272.
According to the report of the Department of Labour, the average wages paid per week for sawmill work during the year ending the 31st March, 1893, at the undermentioned ages, were as follows: 14 years, 5s. to 8s. 6d.; 15 years, 7s. to 15s.; 16 years, 11s. to 16s.; 17 years, 12s. 9d. to 21s.; 18 years, 12s. to 30s.; 19 years, 18s. 11d. to 30s.; 20 years, 20s. 4d. to 39s.; adults, 36s. 4d. to 56s. 9d.; or, for piece-work, 40s. to 60s. per week.
In the kauri district, bush-hands are commonly paid 20s., or rarely 18s. per week, with board and lodgings, the accommodation in sonic cases being plain, but amply sufficient; in so mild a climate, the board plentiful and of good quality. In some instances, married bush-hands put up a rough cottage, the larger part of the material being supplied by the manager free of cost, and sometimes enclose a small garden; in this case, saving the cost of rent and firing, while securing a large amount of comfort at a minimum of expenditure. On the other hand, the cost of flour and other provisions is somewhat higher than in the town, on account of the heavy charges for freight.
At page 49 of the Report of the Labour Department (H.-10,1893), it is stated that a sawmill hand returned his average yearly earnings, after allowing for lost time, at £115. A bushman, under the same conditions, returned his earnings at £92 8s. As a general rule, wages for adults are a little higher in Westland than in any other district on account of the higher cost of living. On the other hand, they are slightly lower in the Auckland District, where compensation is found in the greatly-reduced cost of living. In Southland, at this date (May, 1894) benchmen are paid at the rate of 9s. per day, or £12 per month when in work; ordinary mill-hands, 6s. 6d. to 8s.; planing-machine men and bushmen, 8s. per day; engine-drivers, 7s. to 8s.; bullock-drivers, 7s. to 8s.
The following table shows the gradual development of the export trade, and its present position:—
| Year. | Sawn and Hewn Timber. | |
|---|---|---|
| Quantity. | Value. | |
| Ft. | £ | |
| 1871 | 3,214,742 | 14,200 |
| 1875 | 5,225,627 | 26,914 |
| 1881 | 13,180,280 | 65,119 |
| 1888 | 43,474,434 | 177,877 |
| 1889 | 42,588,600 | 176,608 |
| 1890 | 42,098,863 | 181,689 |
| 1891 | 42,824,365 | 182,431 |
| 1892 | 22,860,551 | 87,581 |
| 1893 | 26,718,046 | 101,082 |
By far the greater portion of exported timber consists of kauri, the proportion of other timbers being almost insignificant; thus, in 1887 the quantity of kauri exported was 30,230,084 superficial feet, valued at £124,347; all other timbers, 1,404,380 superficial feet, valued at £4,475. The export of rimu and kahikatea is, however, increasing, although not very rapidly; up till now the greater part has been shipped from the Bluff, but the recent completion of the Hokitika and Greymouth Railway will lead to considerable shipments being made from the latter port. Figured rimu, which is plentiful in the Westland forests, could be placed on the London market at a low price, either as selected board or as logs, and would command a ready sale if arrangements could be made for shipments at regular intervals.
The remarkable falling-off in the export of 1892 was caused by the terrible commercial depression experienced throughout the Australian colonies as well as in New Zealand. The return for 1893 shows that a marked improvement has already taken place.
The chief timbers and timber-trees of New Zealand may fairly be divided into three classes:—
I.—Timbers of Great Durability and Large Dimensions, suitable for Constructive Works, House-building, or for Special Purposes.
Kauri (Agathis australis), Salisbury.
Totara (Podocarpus totara), A. Cunningham.
Totara-kiri-kotukutuku (Podocarpus hallii), T. Kirk.
Matai (Podocarpus spicata), R. Brown.
Kawaka (Libocedrus doniana), Eudlicher.
Pahautea, or cedar (Libocedrus bidwillii), Hooker f.
Northern manoao (Dacrydium kirkii), F. Mueller.
Southern manoao (Dacrydium colensoi), Hooker.
Westland pine (Dacrydium westlandicum), T. Kirk.
Yellow silver-pine (Dacrydium intermedium), T. Kirk.
Puriri (Vitex littoralis), A. Cunningham.
Tawhai raunui, tooth-leaved beech (Fagus fusca), Hooker f.
Tawhai rauriki, entire-leaved beech (Fagus solandri), Hooker f.
Tawhai, Blair's beech (Fagus blairii), T. Kirk.
Maire raunui (Olea cunninghamii), Hooker f.
Maire (Olea lanccolata), Hooker f.
Narrow-leaved maire (Olea montana), Hooker f.
The northern rata (Metrosideros robusta), A. Cunningham.
The southern rata (Metrosideros lucida), Menzies.
Pohutukawa (Metrosideros tomentosa), A. Cunningham.
*
21. Small-leaved pohutukawa (Metrosideros polymorpha), Forster.Note
* Found only in the Kermadecs.
Manuka rauriki (Leptospermum ericoides), A. Richard.
Maire tawhake (Eugenia maire), A. Cunningham.
24.Kowhai (Sophora tetroptera), Aiton.
II.—Timbers suitable for General Building Purposes, or for Special Uses, but of less Durability than the preceding kinds.
Rimu, red-pine (Dacrydium cupressinum), Solander.
Kahikalea, white-pine (Podocarpus dacrydioides), A. Richard.
Miro toromiro (Podocarpus ferruginea), Don.
Tanekaha (Phyllocladus trichomanoides), Don.
Toatoa (Phyllocladus glauca), Carr.
Mountain toatoa (Phyllocladus alpinus), Hooker f.
Tawhai rauriki, mountain beech (Fagus cliffortioides), Hooker f.
Tawhai, silver beech (Fagus menziesii), Hooker f.
Pukatea (Laurelia novœ-zelandiœ), A. Cunningham.
Hinau (Elœocarpus dentatus), Vahl.
Pokaka (Elœocarpus hookerianus), Raoul.
Tarairi (Beilschmiedia tarairi), Bentham and Hooker f.
Tawa (Beilschmiedia tawa), Bentham and Hooker f.
Titoki, tokitoki (Alectryon excelsum), De Candolle.
Tawari (Ixerba brexioides), A. Cunningham.
Mangeao, tangeao (Litsea calicaris), Bentham and Hooker f.
Rewarewa (Knightia-excelsa), R. Brown.
Tawhero (Weinmannia silvicola), Banks and Solander.
Towhai, or kamahi (Weinmannia racemosa), Forster.
Porokaiwhiri (Hedycarya dentata), Forster.
Kohekohe (Dysoxylum spectabile), Hooker f.
III.—Timbers of Small Dimensions adapted to Special Purposes.
Horopito (Drimys axillaris), Forster.
Tarata (Pittosporum eugenioides), A. Cunningham.
Karo (Pittosporum crassifolium), Banks and Solander.
Tawhiwhi (Pittosporum tenuifolium), Banks and Solander.
Mahoe (Melicytus ramiflorus), Forster.
Hui, or manatu (Plagianthus betulinus), A Cunningham.
Wharangi (Melicope ternata), Forster.
Kaikomako (Pennantia corymbosa), Forster.
Ake (Dodonœa viscosa), Linné.
Karaka (Corynocarpus laevigata), Forster.
Putaputa-weta (Carpodetus serratus), Forster.
Kumarahou (Quintina serrata), A. Cunningham.
Makamaka (Ackama rosœfolia), A. Cunningham.
Manuka, or kahikatoa (Leptospermum scoparium), Forster.
Ramarama (Myrtus bullata), Banks and Solander.
Small-leaved Ramarama (Myrtus ralphii), Hooker f.
Rohutu (Myrtus obcordata), Hooker f.
Rohutu (Myrtus pedunculate), Hooker f.
Kotukutuku, or kohutuhutu (Fuschsia excorticata), Linné.
Horoeka, lancewood (Pseudopanax crassifolium), Seemau.
Toothed lancewood (Pseudopanax ferox), T. Kirk.
Papauma (Griselinia littoralis), Raoul.
Puka (Griselinia lucida), Foster.
Tree karamu (Coprosma arborea), T. Kirk.
Yellow-wood (Coprosma linariifolia), Hooker f.
Tupari (Olearia colensoi), Hooker f.
Akeake (Olearia traversii), Hooker f.
Heketara (Olearia cunninghamii), Hooker f.
Akeake (Olearia avicinniœfolia), Hooker f.
Neinei (Dracophyllum latifolium), Hooker f.
Mountain neinei (Dracophyllum traversii), Hooker f.
Inaka (Dracophyllum longifolium), R. Brown.
Toro (Myrsine salicina), Howard.
Mapau (Myrsine australis), A. de Candolle.
Tawaapou (Sideroxylon costatum), Bentham and Hooker f.
Maire (Fusanus cunninghamii), Bentham and Hooker f.
82.Ngaio (Myoporum Iœtum), Banks and Solander.
Toru (Persoonia toro), A. Cunningham.
Milk-tree (Paratrophis microphyllus), Bentham and Hooker f.
Makomako (Aristotelia racemosa), Hooker f.
Tumatukuru (Discaria toumatou), Raoul.
To describe all the above species in detail would require more space than can be given to the subject in this volume: it is proposed, however, to print them in full in next year's issue. Meanwhile, descriptions of the four timbers most in demand are given below:—
KAURI (Agathis australis), Salisbury; “Forest Flora of New Zealand,” Plates 79 to 81. North Cape to Maketu and Kawhia.
This is the finest tree in New Zealand, and affords the most valuable timber It varies from 80ft. to 100ft. and upwards in height, with a trunk from 3ft. to 8ft. in diameter; hut specimens have been measured with a diameter of fully 22ft.
The bark is smooth, of a dark-grey colour, and falls away in large flat flakes. The leaves are rather close-set, very thick and rigid, 1in. to 3in. long; and the handsome globular cone is nearly 3in. in diameter.
The timber is of the highest value, and combines a larger number of good qualities in a high degree of perfection than any other pine timber in general use; for, while of great strength, it is of high durability, and unites a firm, compact texture with great silkiness, so that it is worked quite as easily as the best Quebec yellow pine.
Many logs are beautifully clouded, feathered, or mottled, and are highly valued for ornamental cabinet-work, panelling, &c., realising from £7 to £10 per 100ft. superficial. Ordinary wood without figure is used for wharves, bridges, and constructive works generally; squared piles, railway sleepers, ship-building (especially for deck planking), house-building, fencing, and other purposes too numerous to mention.
It is exported to a greater extent than any other New Zealand timber, and affords employment to nearly one-third of the entire number of persons engaged in timber conversion. Its turpentine constitutes the valuable resin known as kauri-gum, in gathering which nearly 7,000 persons are employed.
Its specific gravity varies from 0.498 to 0.700. Its relative strength when compared with English oak is as 892 to 1,000; weight per cubic foot when seasoned, 37.11lb. to 42lb. The mean average breaking-weight obtained from twelve specimens is 165.5lb.
TOTARA (Podocarpus totara), A. Cunningham; “Forest Flora,” Plate 115. Mongonui to Southland.
The totara stands next to the kauri for general utility, and, being more widely distributed, is by some considered of equal, or even greater, value; but, though equalling kauri in durability and the facility with which it can be worked, it is inferior in strength, and will not take so high a finish. The tree is usually from 60ft. to 80ft. in height, the trunk having a diameter of from 2ft. to 6ft., but specimens 100ft. high, with a diameter of 8ft are not infrequent. The trunk is clothed with fibrous brown bark, which is deeply furrowed, and in very old specimens is fully 3in. thick. The leaves are about fin. long, linear, and of a greenish-brown tint. The wood is of a reddish-brown colour, and does not warp or twist. It is clear and straight in the grain, and, therefore, easily worked. It is of extreme durability, and is largely employed for building purposes, bridges, wharves, telegraph-posts, railway-sleepers, house-blocks, fencing-posts, and various other purposes. Owing to its unrivalled power of resisting the attacks of the teredo, it is highly valued for marine piles, and is unquestionably the best timber in the colony for that purpose. Many of the large canoes of the Maoris were hewn out of a single trunk.
A well-grown totara forest has an imposing effect: majestic trunks, 60ft. or 80ft. to the first branch, tapering with the greatest regularity, grow in such close proximity that very little top is developed; and the yield of first-class timber is enormous, sometimes amounting to 80,000 or even 100,000 superficial feet per acre. Usually, however, the trees are of smaller dimensions, and the trunks are often distorted, and cannot be converted without a large proportion of waste.
The specific gravity of totara is 55.9; weight per cubic foot when seasoned, 35.17lb.; breaking-weight, 133.6lb., the mean average of seventeen specimens.
RIMU, RED-PINE (Dacrydium cupressinum), Solander; “Forest Flora,” Plates 18 to 22. North Cape to Stewart Island.
In the young state, under favourable circumstances, the rimu is one of the most charming trees known; its conical outline and long pendulous branchlets suggest the idea of a living fountain. In old specimens this symmetrical outline is completely lost; the arms spread irregularly, and carry the uneven drooping branchlets at the tips, so that the tree often presents a ragged, uneven appearance. It attains the height of from 40ft. to 80ft., with a trunk from 2ft. to 4ft. in diameter, clothed with rugged bark, which alone is sufficient; to distinguish it from any other New Zealand pine. The leaves are awl-shaped, from 1/12in. to 1/4in. long, closely overlapping all round the branchlets, and very uniform in old trees. The fruit is a nut, seated on a red, fleshy receptacle, having a few green scales on its surface. Rimu is the chief building timber employed over two-thirds of the colony, and is used for framing, flooring, joists, weatherboards, mantelpieces, &c.
It is of a brown colour, varying greatly in intensity, but often beautifully shaded, resembling some varieties of rosewood, so that it is extensively used in the manufacture of plain and ornamental furniture, for which indeed it is especially suited.
Although not durable when exposed, it is of great strength, and may be used for beams under cover. In Taranaki, selected logs are sometimes employed in the construction of bridges, great care being taken to prevent the access of water at the joists; but its general use, in exposed constructive works, is certainly unwise, although occasionally the heart-wood of very old logs is so thoroughly saturated with resin that it may be used for railway-sleepers, and other purposes where strength and durability is required.
Its specific gravity is 0.550 to 0.664, and its weight per cubic foot, when seasoned, is from 24.38lb. to 40.11lb. Its breaking-weight is 350.88lb., so that it is equal to English oak in strength. Rimu occupies a larger portion of the forest area than any other New Zealand timber.
KAHIKATEA, WHITE-PINE (Podocarpus dacrydioides), A. Rich; “Forest Flora,” Plate 31. Mongonui to Southland.
A noble tree, 60ft. to 150ft. high, with a remarkable straight trunk, 2ft. to 4ft. and upwards in diameter. It often forms vast forests in swampy situations, but is also found on the hills. Old swamp specimens often develope fluted buttresses, but usually the trunk is remarkably symmetrical. In young trees the leaves are 1/4in. long, spreading, and of a deep brown colour, arranged in a single row on each side of the branches. In the mature state they are reduced to small scales, about 1/12in. long, closely appressed to the branchlets, which resemble those of a cypress. The fruit is a red drupe, the jet-black seed being partly exserted at the apex. The wood is white or pale-yellow, tough, elastic, and of great strength, but it is not of great durability when exposed, although often employed for general building purposes, especially for flooring. It is extensively used for cheap furniture, and is exported to a considerable extent. Unhappily, it is often attacked by a small boring-beetle, the larvae of which drive their miniature tunnels through it in all directions until at length it crumbles to pieces.
In the Marl borough and Nelson districts a variety of this plant, growing chiefly on the hills, produces timber of a yellow colour, which is considered to be much more durable than the ordinary kind.
The specific gravity of the seasoned timber is 0.459 to 0.557; its weight per cubic foot 29.11lb. to 29.505lb. A piece 2ft. long and 1in. square, supported at each end and loaded in the middle, requires a weight of from 308lb. to 358lb. to break it. Occasionally logs are met with having a much higher specific gravity.
By Professor T. KIRK, F.L.S.
Although a true resin, this is usually miscalled kauri-gum. It is the solidified turpentine of the kauri, and occurs in great abundance in a fossil condition in the northern part of the Auckland Provincial District, from the North Cape to Middle Waikato, and is dug up alike on the driest fernhills and the deepest swamps. The purest samples are found on the Cape Colville Peninsula. A large quantity is also obtained from the forks of living trees, but is considered of inferior quality and fetches a lower price. At the present time gum-digging employs nearly or quite 7,000 persons, including Maoris and aliens.
In the fossil state kauri resin occurs in larger or smaller lumps, from the size of a walnut to that of a man's head. Pieces have been found weighing upwards of 100lb. When scraped the best specimens are of a rich brown colour, varying greatly in depth of tint. Sometimes, translucent or even transparent specimens are found, occasionally with leaves, seeds, or small insects enclosed. When obtained from swamps the resin is very dark coloured, or even almost black, and fetches a low price. Waikato resin is the darkest of all. Transparent or semi-transparent specimens fetch very high prices, being used as a substitute for timber in the manufacture of mouthpieces for cigar-holders, pipes, &c. The great bulk is used in the manufacture of oil varnishes, and in all countries where much varnish is made it holds the chief place in the market. It is exported chiefly to England and the United States of North America. In 1860 the export was only 1,046 tons, valued at £9 per ton; in 1893 it amounted to 8,317 tons, valued at £61 per ton. The following statement, taken from the Customs returns, shows the quantity exported in each year from 1883 to 1893, with the total value and average per ton.
| Year. | Quantity. | Total Value. | Average per Ton. | ||
|---|---|---|---|---|---|
| Tons. | £ | £ | s | d. | |
| 1883 | 6,5181/2 | 336,606 | 51 | 12 | 10 |
| 1884 | 6,393 | 342,151 | 53 | 10 | 4 |
| 1885 | 5,875 3/4 | 299,762 | 51 | 0 | 3 |
| 1886 | 4,9203/4 | 257,653 | 52 | 7 | 1 |
| 1887 | 6,790 | 362,434 | 53 | 7 | 6 |
| 1888 | 8,482 | 380,933 | 44 | 18 | 0 |
| 1889 | 7,519 | 329,590 | 43 | 16 | 8 |
| 1890 | 7,438 | 378,563 | 50 | 17 | 11 |
| 1891 | 8,388 | 437,056 | 52 | 2 | 1 |
| 1892 | 8,705 | 517,678 | 59 | 9 | 4 |
| 1893 | 8,317 | 510,775 | 61 | 8 | 3 |
Owing to the severe commercial depression, experienced alike in Great Britain and in the United States, the demand last year fell off very much, while at the same time the supply was augmented by the increased number of diggers, so that prices fell rapidly and low-grade qualities became unsaleable. At the time of writing prices show an upward tendency. Low-grade sorts, which have been quoted at nominal prices for some months, are coming into demand, and the trade is assuming a more healthy condition. The following are the prices paid in Auckland at this date, May, 1894: Poor ordinary, £24 per ton; ordinary, £28 to £30 per ton; good ordinary, £36 per ton; East Coast, £52 per ton.
Making a fair allowance for the comparatively small quantity of East Coast gum, the average rate would be about £30 per ton for all grades. In order to allow of a fair comparison with the; yearly average stated in the table, from £8 to £9 per ton must be added to cover the cost of cases and packing.
The digger's equipment is of a simple character: a gum spear, that is, a light pointed iron rod fixed in a convenient handle, is used to test the ground; the gum is then dug out with a spade and carried home in a sack. In many cases the spear is dispensed with, and the entire area is dug over to such depth as the digger thinks likely to prove profitable. An old knife is used to scrape the gum, the scrapings being utilised in the manufacture of fire-kindlers.
Diggers are supposed to pay a license of 5s. per annum for permission to dig on Crown land, but this does not restrict them to any one spot; 10s. is charged for permission to dig in State forest reserves during the winter months only. As no provision is made for collecting the ordinary Crown lands fees, the revenue from this source is very trivial: for the year ending March 31st, 1893, it amounted to £83 10s. only; it should have been upwards of £1,000. Persons digging on private lands usually pay a license-fee of from £1 to £4 per annum, and are required to sell the resin to the owner or lessee of the field at a fair market price. In many cases the fee is not exacted; in others, a royalty of £1 per ton is charged. The total area of the gumfields is variously estimated at from 1,500,000 to 1,800,000 acres.
The number of persons now obtaining their living by gum-digging is not far short of 7,000, making all proper allowances for settlers who dig only during a small portion of the year, and for Maoris and children. A Commission appointed last year to inquire into the state of the industry, gives the number of persons on the gumfields in May, 1893, as under: British, 4,303; settlers, 416; Maoris, 1,244; Austrians, 519; other foreigners, 415: total, 6,897.
The Commissioners remark: “The numerical totals of Maoris and settlers are greater than those above given, but they have been reduced to what we believe to be their equivalent in able-bodied men working full-time. These classes only work during half the year, and, in the case of the Maoris, women and children preponderate. We have reduced the number of settlers to one-half, and the Maoris to two-fifths.” Gum-digging is a standing resource for the industrious unemployed, and has enabled Auckland to tide over periods of serious commercial depression with comparatively little difficulty. It has also been of vast benefit to hundreds of settlers with but small capital; not a few, who have attained a large measure of prosperity, look back gratefully to the help afforded by casual work on the gumfields.
In the Commissioners’ report it is stated that the average earnings of the digger on leased or private land are £1 7s. per week, while the actual cost of living is from 10s. to 12s. As the digger has no difficulty in constructing a weatherproof hut, he is not called upon to pay house-rent; his firewood also is obtained free of cost, so that he clears from 15s. to 17s. per week above the cost of living. As a matter of fact, the industrious digger is in a more favourable position than the figures just given indicate, since the average earnings are unduly lowered by the presence of a number of old people, who have taken to the work, as well as of others who are content to live from hand to mouth and do as little hard work as possible. To men of a roving disposition, the free independent life has great attractions, and when coupled with the certainty of earning sufficient for a livelihood, there is little cause for wonder that so many prefer it to the somewhat monotonous existence of the ordinary settler. It would he difficult to name any other product which can be so easily obtained in such remunerative quantities without any previous outlay.
The namePhormium tenax is taken from the Greek word Φoρμoç (a basket) and Latintenax (strong). Fifty-five different names are applied to the Phormium plant by the Maoris, but it is doubtful if more than twenty marked varieties can be distinguished. The Phormium plant grows in bunches or groups of plants or shoots; each shoot has five leaves. On the average ten of these shoots, or, in all, fifty leaves, go to a bunch. These vary, according to the soil, from oft. to 10ft. in length, and each consists of a double-bladed leaf, which, when closed, is from 2in. to 4in. wide.
Phormium fibre made from this plant, and known as Maori flax, is the oldest of New Zealand exports, the trade therein having begun as early as 1809. Between the years 1828 and 1832, although New Zealand was then visited only by whalers and a few traders, no less than fifty thousand pounds’ worth was sold in Sydney alone. At that time Maori hand-dressed flax fetched a very high price in the English market. Machine-dressed flax remained in little request till 1861, when the increasing demand for white rope, owing to the limited quantity of manila, led to a rise in its value from £21 to £56 per ton, and even to £76 per ton in America, during the civil war there. These high prices stimulated the endeavour to introduce Phormium fibre for competing with manila. The Maoris were careful in the selection of the leaves, taking only those in which the fibre was properly ripened, instead of cutting over the whole plant indiscriminately and at all seasons, as is the present practice of Europeans supplying the mills. The popular notion that there is present in the leaves a gummy, oily, or mucilaginous substance which has to be got rid of, has been disproved by accurate observation. Improved machinery is therefore only a small factor in the problem that has to be solved before the fibre prepared by Europeans can rival the old Maori flax. The greatest improvement of the present system will be effected by the cultivation and careful selection of the leaves, and by the substitution of a chemical retting process for the prolonged washing and sun bleaching, which at present, while causing the fibre in some degree to resemble manila, at the same time greatly reduces its strength and durability. No doubt there will always be a considerable demand for cheaply-produced and harsh fibre for the manufacture of twine suitable for reaping-and-binding machines; but the full value of the New Zealand flax, as distinguished from New Zealand hemp, can be obtained only by the use of a combined scraping and chemical process applied to the properly-matured leaves. The sodic-sulphite process suggested by Mr. Cross appears to be the most promising. The advantage of this process over any other is the very high yield of fibre it achieves, which exceeds one-fourth of the weight of the green leaf; no other process having yielded more than one-sixth. The quality of the fibre produced resembles the Native-made fibre in lustre and strength. The fibre extracted by the Native process was, however, only about one-fortieth part by weight of the green leaves. Its value was from £50 to £70 per ton; and it has been suggested that, owing to its tensile strength and the facility with which it took bright, lustrous dyes, that it was used for mixing with silk in the manufacture of certain goods. For the future, if the Phormium plant is to become a source of fibre-supply for the world's market, its cultivation must be established in favourable situations. The natural supply is now difficult to collect, and still more difficult to renew and perpetuate. It should become one of the established crops of the country; and, if the proper method of manufacture for obtaining the full value of the natural product is adopted, the industry may be expected to provide permanent employment for a number of people.
Select Committees have at various times been appointed by the General Assembly to consider all matters pertaining to the flax industry; their reports have been published in the Journals of the House of Representatives, and have had good results. The latest of these reports was brought up on the 1st September, 1893. The Committee recommended that an expert grader should be appointed in the interests of the producers, and that the Government should offer a bonus of £4,000, to be distributed in the following manner:—
£3,000 for a machine or process of flax-dressing which will materially reduce the cost of production;
£500 for a machine or process which will increase the value of dressed fibre; and
£500 for a mode of utilising the waste products of the industry.
The bonuses offered by the Government were £1,750 for improvements in machinery and £250 for a process of utilising waste products. Several claims have been received, and the Committee of investigation is now at work.
A former Committee, appointed in 1890, urged that flax-owners should see that the flax is cut in such a manner as to leave the heart of the flax-fans uninjured, and that attention should be given to the planting and cultivation of the best varieties of flax, with a view to the production of fibre of superior quality. They found that the market price in London was prejudicially affected by the fact that the contents of a single bale, as well as the several bales of one consignment, often vary very widely; also, that, although the Phormium fibre is not liable to spontaneous combustion, dampness has the effect of rotting, or so seriously discolouring it as to render it almost valueless on reaching the Home market.
With all these drawbacks to the industry, which it is sought to overcome, the export is fluctuating, although the number of flax-mills in the colony rose from 30 in 1886 to 177 at the census of 1891; the number of hands employed increased correspondingly from 249 to 3,204; and the approximate value of the manufacture, during the same period, from £43,094 to £234,266; but a large permanent development of this industry depends upon the invention of improvements in the means used to lessen the cost of production and improve the quality of the fibre.
The export of Phormium for the years 1881 and 1888-93, with the quantities and values, was as follows:—
| Year. | Tons. | £ |
|---|---|---|
| 1881 | 1,308 | 26,285 |
| 1888 | 4,042 | 75,269 |
| 1889 | 17,084 | 361,182 |
| 1890 | 21,158 | 381,789 |
| 1891 | 15,809 | 281,514 |
| 1892 | 12,793 | 214,542 |
| 1893 | 12,587 | 219,375 |
These are exporters’ declared values, which would doubtless be higher than the values given by mill-owners, quoted above, in the figures showing the output.
By H. A. GORDON, F.G.S., Inspecting Engineer, Mines Department.
The discovery of metalliferous ore and minerals in New Zealand was made shortly after gold was found in Australia. It is said that Mr. Hargreaves, the first discoverer of gold in New South Wales, before visiting that colony, told several people in the Auckland District that gold would be found there, as the formation of the country reminded him of California, where he had previously been. It was not, however, until 1852 that the discovery of auriferous deposits was made generally known by Mr. C. Ring, of Coromandel, who obtained a small quantity of gold, intermixed with quartz, in a creek which now bears, his name; but the hostility of the Natives prevented further discovery until 1862, when the district was proclaimed a goldfield.
In the Middle Island, small samples of gold were discovered in the Otago District in 1853, at a place known as the Fortifications, which is now in the West Taieri goldfield. Intimation of gold being found in this district was officially given by Mr. C. W. Ligar, then Surveyor-General of the colony, to Captain Cargill, at that time Superintendent of Otago; and afterwards, on several occasions, rumours were circulated that gold had been found in the beds of several of the creeks and streams in the interior of Otago, and small parcels were occasionally brought to Dunedin. But at that time the gold-diggings attracted little or no attention in this colony.
The first payable goldfield was at Collingwood, in the Nelson District, which was opened in 1857; and in that year 10,437oz. of gold were produced. Owing, however, to the smallness of the population at that time in the colony, as well as to the great attraction presented by the Australian goldfields, very little attention was given to the gold discoveries in New Zealand. From 1857 up to 1861, when gold was discovered at Tuapeka, or Gabriel's Gully, in Otago, the produce of the Collingwood goldfield amounted only to 41,872oz. of gold.
Early in 1861 gold was discovered near the Lindis River. The Provincial Government at that time were constructing a road to give access to the pastoral districts beyond the Lindis Pass, when the workmen came accidentally on an auriferous deposit, which gave fair prospects of becoming a valuable discovery; but the general yield of gold from this portion of the Otago District has never been great.
Shortly after the discovery of gold at the Lindis, Mr. Gabriel Read, formerly a digger on the Victorian goldfields, found gold in Gabriel's Gully, where the auriferous deposits were so rich and so easily worked that the discovery flashed like lightning throughout the whole of the Australian goldfields, then just beginning to be on the wane; and thousands of miners on the Australian soil quickly collected all their belongings, which in those days were easily carried, and came to New Zealand to try and better their fortunes. It may be mentioned that the first real discoverer of gold in payable quantities for working was Mr. Edward Peters, a native of Bombay, who, in 1858, found gold in the south branch of the Tokomairiro River, known afterwards as the Woolshed diggings, and who stated at that time that the ground was payable for working, showing a good sample of gold that he had obtained. After this he again found gold in a gully near the north bank of the Tuapeka River, not far from the afterwards celebrated Gabriel's Gully, discovered at a later date by Mr. Gabriel Read. In Mr. Read's report of the discovery to Major Richardson, Superintendent of Otago, he says:—
I take the liberty of troubling you with a short report of the result of a prospecting tour which I commenced about a fortnight ago. During that period I travelled inland about thirty-live miles, and examined the ravines and tributaries of the Waitahuna and Tuapeka Rivers. My equipment consisted of a tent, blanket, spade, tin dish, butcher's knife, and about a week's supply of provisions. I examined a large area of country, washed dishfuls of earth in different localities, and found gold in many places, which would hold out a certainty that men with proper appliances would be munificently remunerated. In one place, for ten hours’ work, with pan and butcher's knife, I was enabled to collect about 7oz. of gold.
This discovery was made known in June, 1861, and by the end of December in that year 187,696oz. of gold, representing a value of £727,321, had been produced from this locality alone; and the population of Otago had increased in six months from 12,000 to 30,000.
As soon as the rush set in to Gabriel's Gully, Weatherstone's, Munroe's, and Waitahuna Gullies were opened; and early in 1862 further auriferous deposits were found at Waipori and the Woolshed; the latter being the place which, three years previously, Mr. Edward Peters reported would pay for working. Discoveries of smaller extent were afterwards found at Turnbull Gully, Deepdell Creek, Fillyburn, and Murphy's Gully.
In August, 1862, Messrs. Hartley and Reilly arrived at Dunedin with l,047oz. gold, which they had found by cradling and washing the sands on the beaches of the Clutha River, between the sites of the present towns of Clyde and Cromwell. As soon as this became known the excitement was so great that men left lucrative employment and comfortable homes to follow the life of a digger. Prices of agricultural produce and food of all descriptions went up, and the demand for teamsters to take goods and tools to this new Eldorado was so great that £120 per ton was paid for the carriage of goods from Dunedin; and on the arrival of the first wagon with flour, at Mr. Sheenan's station, nine miles from the diggings, it was surrounded by a crowd of miners from the field, when the whole of the flour was handed out and equally distributed to the crowd at 2s. 6d. a pannikinful. The demand for sawn timber was also so great that boards were stripped from drays and wagons, and sold, the usual price for an empty gin-case being £5. Every one at that time was thoroughly satisfied with his earnings— the beaches along the river were literally strewn with golden sand. But this state of things did not last long. As soon as the snow on the mountains began to melt, the water in the river rose to a height of from 16ft. to 20ft., covering all the auriferous gravel-beaches, leaving those who had been working there in a very despondent state. By this time a large mining population had gathered on the field, and they turned their attention to the beds of the different streams and creeks flowing into the Clutha River, and almost immediately rich deposits of auriferous drift were discovered at Conroy's, Butcher's, Potter's, and Campbell's Gullies, also at Bannockburn, Cardrona, Arrow, Shotover, Skipper's, Nokormai, and the Nevis, all of which have largely contributed to the product of gold. Before the end of December, 1862, over 70,000oz. of gold were forwarded by escort from Dunstan alone to Dunedin.
In March, 1863, and the following months, the Teviot, Benger, and Upper Manuherikia goldfields were opened up; and in May of the same year another important find was made by Mr. W. Parker, at Hogburn, which afterwards led to further discoveries of auriferous drifts at Hill's Creek, Dunstan Creek, Kyeburn, Hyde, Hamilton's, Macrae's, and Mount Burster. This last place is at so high an elevation (nearly 4,000ft. above sea-level) that the rich auriferous deposits existing there can be worked only for about six or seven months in the year.
Further discoveries have been made from time to time at Cambrian's, Tinker's, Matakanui, Bound Hill, Orepuki, and, in recent years, at Mount Criffel—the latter being 4,000ft. above sea-level— where are found some of the oldest drifts that exist in the Otago District. Gold intermixed with platinum has also been found on the beaches of the Waiau River, south of Orepuki.
About the end of 1863 gold was found at Wakamarina, in the Marlborough District, where some very rich finds were obtained from the beds of the Deep Creek, Dead-horse Creek, and the Wakamarina River. This field still continues to support a small number of miners.
Early in 1864 a party of Maoris, while searching for greenstone—which was formerly used by them for making tomahawks and adzes, and is still highly prized as an ornament—found gold in the bed of the Greenstone River, on the west coast of the Middle Island. This discovery led to a large rush from other parts of New Zealand, and also from the Australian Colonies. This portion of the colony, which was at that time in its natural state, covered with a dense forest and tangled undergrowth, has now a European population of about 33,000, all of whom are either directly or indirectly supported by the mining industry.
As soon as the rush set in to the West Coast, the auriferous deposits at Waimea, Kanieri, Blue Spur, and Jones's (now known as floss), were discovered; and these led to further discoveries in the Grey Valley, No Town, Red Jack's, Noble's, Orwell Creek, Antonio's, Maori Gully, Lyell, Charleston, and Brighton; the last extensive field opened up on the West Coast being Kumara, where a large population has been employed for the last fifteen years, and where gold to the value of about £1,250,000 has been taken from within a comparatively small area—a compass of 2,000 acres—the actual gold-workings not exceeding 600 acres.
During the early period of mining in the colony, gold-mining operations were chiefly confined to alluvial drifts. This was especially the case in regard to mining in the Middle Island; but in the North Island all the gold has been obtained from quartz lodes. In July, 1867, gold was discovered in a creek-bed at the Thames in pieces of quartz, and on the 10th August of the same year Messrs. Hunt, White, Clarkson, and Cobley found a very rich leader of auriferous quartz in the Kuranui Stream. This led to discoveries of large quantities of gold in the Shotover, Moanataiari, Long Drive, Caledonian, and other claims. The dividends from the Caledonian claim in one year amounted to about £657,000. Several years later gold-bearing lodes were discovered at Karangahake, Waitekauri, Waihi, Te Aroha, and Kuaotunu; and at the present time some of the mines at Karangahake and Waihi are giving excellent returns. The average value of the ore for three months’ crushing from the Crown claim at Karangahake was about £15 per ton from a very large lode.
In 1872 the Reefton field was discovered; and since then, up to the end of December, 1893, a period of nearly twenty-one years, 616,092 tons of quartz have been crushed, yielding an average of an ounce to the ton. The total value of gold produced from this field, both from quartz and alluvial workings, is about £2,222,032, out of which dividends have been paid by quartz companies to the amount of £543,351. The lodes in this district are not particularly rich, but large bodies of ore exist which can be made to pay for working, with proper machinery and appliances.
The following table shows the quantity and value of gold entered for duty for exportation from the colony up to the 31st March, 1894; but this does not necessarily show the whole of the gold produced, as no doubt a considerable quantity has been taken out of the colony from time to time by private individuals who have evaded the duty, and a considerable quantity also manufactured into jewellery and ornaments:—
| Quantity. | Value. | |
|---|---|---|
| oz. | £ | |
| Auckland | 1,789,951 | 6,731,545 |
| Wellington | 188 | 706 |
| Marlborough | 79,118 | 307,655 |
| Nelson | 244,982 | 969,543 |
| West Coast | 5,432,065 | 21,581,825 |
| Canterbury | 48 | 192 |
| Otago | 5,054,592 | 19,975,412 |
| Totals | 12,600,944 | 49,566,878 |
From this it will be seen that Auckland contributed about 13.4 per cent.; Wellington, Nelson, Marlborough, and Canterbury, 2.6 per cent.: West Coast, 43.5 per cent.; and Otago, 404.5 per cent. of the gold produced.
It is only a few years since people began to look for argentiferous ore. In 1885 Mr. La Monte came to this colony for the purpose of erecting a smelting-furnace, to treat the auriferous ores found on the Hauraki Peninsula by the same process as he had adopted at Sunny Corner, in New South Wales; and, on examining the lodes in the Karangahake district, he found rich argentiferous ore being thrown over the mullock-tips. This fact, together with the technical education which has since been given at the Schools of Mines, has induced the miners in the northern districts to search for silver as well as gold; and within the last two years a considerable quantity of bullion has been exported. All the gold found in the North Island contains a considerable percentage of silver, but it is purchased by the banks for the value of the gold according to assay, the silver being afterwards separated; the only silver, therefore, hitherto exported is that which has been separated by the banks, At Waihi and Karangahoke from about three-fourths to one-half of the bullion is silver; and at the Thames and Coromandel the gold sold to the banks contains about one-fourth of the weight in silver. The price given for gold varies from £2 13s. to £3 per ounce. Recently, a large number of argentiferous lodes have been found at Puhipuhi, but these have not yet been properly prospected, and the method employed for extracting the silver from the ore, which contains about 98 per cent. of silica, has hitherto been very crude. Only 100 tons of ore have yet been treated, which produced about 1,200oz. of silver. Silver-ore is also found in the Collingwood district, and at Mount Rangitoto, on the West Coast, but no systematic method of mining has ever been carried on at either of these places. The total quantity of silver exported up to the end of December last was 667,762oz., representing a value of £153,887.
Copper-ore has been found and worked in different parts of the colony. An English company in the early period of the colony's history worked a lode on the Island of Kawau for some time. Copper-ore has also been worked on the Great Barrier Island, near Auckland; at the Dun Mountain, and also near the Boding River, in the Nelson District. Lodes occur also in D'Urville Island, Cook Strait; in several places on the West Coast; and at Waitahuna, Waipori, and Moke Creek, in the district of Otago. A considerable quantity of native copper was found at the Dun Mountain and near the Boding River, but not sufficient to pay the great cost of transit to a port of shipment. A good deal of copper-pyrites is found in some of the auriferous and argentiferous lodes in the North Island, associated with galena and zinc-blende; and at the present time prospecting operations are being carried on at Maharahara, in the district of Napier, on a large lode containing copper-ore. Recently, a lode of chalcopyrite ore has been discovered in the Whangaroa County, in the Auckland District, averaging fully 6ft. in width. It was lately examined by Mr. Alexander McKay, F.G.S., Assistant Geologist, and samples of it brought by him, which were tested at the Colonial Laboratory, gave 31 per cent. of copper. This is apparently the best lode as yet discovered in the colony. The quantity of copper-ore exported up to the end of December last was 1,394 tons, having a value of £17,866.
Antimony-ore is found associated with gold and silver in quartz lodes in a great many places in the colony, mainly at Puhipuhi, Thames, and Te Aroha, in the Auckland District; and in the Middle Island at Reefton, and at Langdon's, near Brunnerton, on the West Coast, and also in several localities in the Otago District. There is a company at the present time working a large lode of antimony at Endeavour Inlet, which is likely to prove remunerative to the owners. A sulphide lode occurs a few miles south of Collingwood, which contains, on assay, about 186oz. of silver to the ton. The total quantity of ore and star antimony exported from the colony up to the end of December last was 3,481 tons, representing a value of £49,507.
Large deposits of manganese-ore occur in different portions of the colony; and in many places in the North Island it is worked with profit, where adjacent to a harbour for shipment. Deposits of this ore are worked successfully at the Island of Waiheke, Puerua Bay, Helena Bay, and Mangapai. Formerly, large quantities were got at the Bay of Islands. There is also a deposit of good ore at Hikurangi, but the cost of transit from the latter place to a port of shipment prevents it from being worked successfully. In 1890, some 320 tons of ore were obtained from the Island of Kawau, and it is said that the deposit there is likely to be soon reworked. Ores are also found in Wellington, Napier, and Otago; and at Port Hardy, in D'Urville Island. Recently, W. Jaffray and Company, of Sydney, have leased a portion of Waiheke Island, and are said to have entered into arrangements to supply 2,000 tons per annum from thence. The total quantity of manganese-ore exported up to the end of December last was 17,2961/2 tons, representing a value of £56,107.
This ore is chiefly associated with magnesian rock. Previous to 1867, lodes of this mineral were worked in the vicinity of Aniseed Valley and the Dun Mountain, District of Nelson. The total quantity of ore exported has been 5,666 tons, having a value of £37,367. In recent years no work has been done on any of these lodes.
This occurs as galena, in different districts. It generally contains a certain percentage of silver; on the Hauraki Peninsula it occurs in auriferous lodes, and is generally associated in this neighbourhood with zinc-blende, as at the Champion Mine, Tui Creek, and Sylvia Mine, Tararu Creek. At Wangapeka, and between there and the Owen Reefs, some of the quartz lodes carry a large percentage of galena. It is also found in the Collingwood district, where, at Richmond Hill, there is an argentiferous lode which gives an assay value of £50 per ton. The ore occurs also in quartz lodes at Mount Rangitoto, and further southwards, in the Westland District.
There are in the colony large deposits of iron-ore of various kinds, such as impure magnetite at Manukau, Auckland, containing 70 per cent. of iron; bog-iron ore, at Spring Swamp, Auckland, which has 51 per cent., and brown-iron ore at Raglan, with from 46 to 51 per cent. of iron. There is also magnetite and hæmatite at Dunstan, Otago, and at the Dun Mountain, Nelson, giving from 62 to 68 per cent. of iron. There is a large deposit of hæmatite at Parapara, with bituminous coal within four miles of it, and alongside the hæmatite is a belt of limestone, all these being within a mile of the ocean-beach, where large vessels could be brought if a wharf were erected. This hæmatite contains from 42 to about 60 per cent. of iron. There are also deposits of hæmatite near Kamo, in the Whangarei District, and also in the Tararu Creek, at the Thames. On the ocean-beaches on the west coast of both Islands large quantities of magnetic ironsand are found, showing that there is abundance of iron-ore in the colony.
This mineral exists in many parts of the colony, especially in alluvial drifts. In very few instances has it been foundin situ. Bounded pellets of cinnabar are to be observed among the auriferous drift-gravels at Waipori, and between that place and Waitahuna. It was also discovered recently at Puhipuhi, by Mr. A. McKay, F.G.S., Assistant Geologist, amongst the loose drift in the bed of a gully. At Tui Creek, near Te Aroha, cinnabar is found in the centre of a large lode of quartz, which also contains gold, silver, galena, and zinc-blende; and, on the opposite side of the Te Aroha Range, it has been found in the bed of the Waiorongomai Stream. Again, at Ohaeawai, in the Bay of Islands County, there are large deposits of cinnabar near the hot pools, where pure quicksilver can be seen, in minute particles, amongst the black mud, having been extracted from the ore through condensation on coming in contact with the vapour, and exposure to the atmosphere. Prospecting for this ore is now being carried on at Ohaeawai, and a lode has recently been struck, but so far it is of a rubbly character.
Tin-ore is found widely distributed amongst the gravel-drifts in the neighbourhood of the Remarkables, in Stewart Island; and a lode occurs following the ridge of these mountains which also contains wolfram. But none of the deposits yet found will pay for working at the present time.
About thirty years ago mineral oils, or, rather, traces of them, were found in the colony. A very thick, heavy petroleum oil—more of a lubricant than an illuminant—was found oozing out on the sea-beach, near the Sugar Loaves, at New Plymouth. Petroleum was also found many years ago near Gisborne, as well as near the East Cape. According to the analyses of these oils made in the Colonial Laboratory, all taken at a temperature of 60°, the sample from New Plymouth had a specific gravity of 096, while that from Gisborne and the East Cape had a specific gravity of 0.83 and 0.84 respectively. Bores have been put down at each of the places named, the deepest of which was at the East Cape, being about 1,700ft.; the one near Gisborne, about 1,320ft.; and the one at New Plymouth, 930ft.; but no steady supply of oil was got in any of them. Recently some gentlemen have taken up a lease of land for mineral oil about twenty miles from Rotorua, near the Waiotapu Valley. Large quantities of petroleum can be seen at one place on the top of some of the hot pools.
The vast extent of coal-measures in New Zealand will make coal-mining one of the largest industries in the colony, especially on the west coast of the Middle Island, where bituminous coal exists equal, if not superior, to that found in any part of the world.
The coal-mining industry has hitherto been limited to the demand for coal within the colony. The present state of our harbours on the west coast of the Middle Island, where our large bituminous coalfields exist, will not permit of sufficient quantity being shipped on one bottom to a foreign market, so as to be able to compete successfully with coal from New South Wales and other countries in the world. But the harbour-works now in course of construction, when completed, will enable coal-mine proprietors in the colony to compete with those of other countries in foreign markets. This refers specially to bituminous coal, which, so far, has been found only on the west coast of the Middle Island.
A semi-bituminous coal is also found at Kawakawa, near the Bay of Islands, and recently two mines have been opened up at Hikurangi, some distance to the south. From the Kawakawa Mine most of the workable coal has been taken out, but there is an extensive field of semi-bituminous coal between Hikurangi and Hukerenui awaiting development.
The following table will show the progressive increase in the output of coal from 1878 to the end of 1893:—
| Year. | Raised in the Colony. | Imported. | Total raised in the Colony and imported per Annum. | Exported. | Total Consumption of Coal within the Colony. | Yearly increased Consumption within the Colony. | |
|---|---|---|---|---|---|---|---|
| Total. | Yearly Increase. | ||||||
| Tons. | Tons. | Tons. | Tons. | Tons. | Tons. | Tons. | |
| 1878 | 162,218 | 174,148 | 336,366 | 3,921 | 332,445 | ||
| 1879 | 231,218 | 69,000 | 158,076 | 389,294 | 7,195 | 382,099 | 49,654 |
| 1880 | 299,923 | 68,705 | 123,298 | 423,221 | 7,021 | 416,200 | 34,101 |
| 1881 | 337,262 | 37,339 | 129,962 | 467,224 | 6,626 | 460,598 | 44,398 |
| 1882 | 378,272 | 41,010 | 129,582 | 507,854 | 4,245 | 503,609 | 43,011 |
| 1883 | 421,764 | 43,492 | 123,540 | 545,304 | 7,172 | 538,132 | 34,523 |
| 1884 | 480,831 | 59,067 | 143,444 | 629,275 | 6,354 | 622,921 | 84,789 |
| 1885 | 511,063 | 30,232 | 130,202 | 641,265 | 2,371 | 638,894 | 15,973 |
| 1886 | 534,353 | 23,290 | 119,873 | 654,226 | 2,862 | 651,364 | 12,470 |
| 1887 | 558,620 | 24,267 | 107,230 | 665,850 | 12,951 | 652,899 | 1,535 |
| 1888 | 613,895 | 55,275 | 101,341 | 715,236 | 27,678 | 687,558 | 34,659 |
| 1889 | 586 445 | 27,450 | 123,063 | 714,508 | 39,290 | 675,218 | 12,340 |
| 1890 | 637,397 | 50,952 | 110,939 | 748,336 | 33,404 | 714,932 | 39,714 |
| 1891 | 668,794 | 31,397 | 125,318 | 794,112 | 29,093 | 764,019 | 49,087 |
| 1892 | 673,315 | 4,521 | 125,453 | 798,768 | 28,169 | 770,599 | 6,580 |
| 1893 | 691,548 | 18,233 | 117,444 | 808,992 | 24,288 | 784,704 | 14,105 |
It will be seen from the above table that there has been a steady increase in the output of coal from the mines in the colony, year after year, since the records have been kept by the Mines Department—with the exception of the year 1889, when the output was 27,450 tons less than for the year previous. The yearly increased output is principally due to the greater demand for consumption within the colony. During a period of fifteen years the consumption of coal in New Zealand has increased to the extent of 452,259 tons per annum, showing that new industries are quickly springing up, requiring fuel for generating motive-power.
The following table will show the output of the different classes of coal in the colony for the last two years, and the total output since records were kept by the Mines Department:—
| Name of Coal. | Output of Coal. | Total Output of Coal from Mines in the Colony. | |
|---|---|---|---|
| 1892. | 1893. | ||
| Tons. | Tons. | Tons. | |
| Bituminous | 406,828 | 380,901 | 4,319,478 |
| Pitch | 89,549 | 131,071 | 1,333,585 |
| Brown | 149,460 | 156,154 | 2,580,978 |
| Lignite | 27,478 | 23,422 | 262,808 |
| Totals | 673,315 | 691,548 | 8,496,849 |
This shows that the output of pitch and brown coal is increasing, while the output of bituminous coal decreased last year by 25,927 tons. The output of lignite depends entirely on the consumption within the district in which it is raised.
The following table will also show the quantity of coal raised in the different localities in the colony for the same periods as shown in the previous table:—
| Name of District. | Output of Coal. | Increase. | Decrease. | Approximate Total Output of Coal to 31st Dec., 1893. | |
|---|---|---|---|---|---|
| 1892. | 1893. | ||||
| Tons. | Tons. | Tons. | Tons. | Tons. | |
| Kawakawa | 18,515 | 11,307 | 7,208 | 799,068 | |
| Whangarei, Kamo, and Whauwhau | 9,924 | 23,379 | 13,455 | 299,163 | |
| Waikato | 57,894 | 57,251 | 643 | 711,674 | |
| Mokau | 1,823 | 781 | 1,042 | 7,505 | |
| Pelorus | 711 | ||||
| West Wanganui | 1,981 | 2,471 | 490 | 44,566 | |
| Westport | 208,076 | 227,178 | 19,102 | 1,627,121 | |
| Reefton | 4,368 | 3,904 | 464 | 56,012 | |
| Greymouth | 178,244 | 138,179 | 40,065 | 1,838,453 | |
| Malvern | 11,101 | 10,700 | 401 | 296,129 | |
| Timaru | 1,446 | 1,220 | 226 | 8,108 | |
| Otago | 157,610 | 174,236 | 16,626 | 2,550,828 | |
| Southland | 22,333 | 40,942 | 18,609 | 257,511 | |
| Totals | 673,315 | 691,548 | 18,233 | 8,496,849 | |
The principal districts where bituminous coals are worked are Westport, Greymouth, West Wanganui, and Kawakawa; but at the last place the present mines are pretty well exhausted, and the two first named may be looked on as the principal bituminous-coal producing districts in the future. The output last year may be said to have been from two mines chiefly—the Westport Colliery, at Denniston, and the Greymouth Coal Company's Mine, Brunnerton: the output from the former being 223,701 tons, and from the latter 134,104 tons. There are two large mines being opened out—one at Mokihinui, in the Westport district, and one at the Blackball, in the Greymouth district, which will soon largely augment the output from these districts. According to rough surveys made by the Geological Department, the area of the coalfields in the colony is estimated at 485,700 acres, of which about 255,400 acres contain bituminous coal. The thickness of the various bituminous coal seams in the colony varies from 3ft. to 20ft.
As regards the quality of the coal, it cannot be surpassed. The late Sir John Coode, in his presidential address to the Institute of Civil Engineers, London, stated: “The bituminous coal found on the west coast of the Middle Island is declared by engineers to be fully equal, if not superior, to the best description from any part of the world.”
The following table shows the composition of the coal found in different parts of the colony:—
| Name of Mine or Locality. | Class of Coal. | Number of Samples Analysed. | Analysis. | Evaporative Power. | ||||
|---|---|---|---|---|---|---|---|---|
| Fixed Carbon. | Hydrocarbon. | Water. | Ash. | 1. | 2. | |||
| Coalbrookdale, Westport | Bituminous | 3 | 71.60 | 22.78 | 1.55 | 4.05 | 9.27 | 15.75 |
| Tyneside, Greymouth | ‘’ | 2 | 63.59 | 29.18 | 0.82 | 6.41 | 8.26 | 13.99 |
| Wallsend, Greymouth | ‘’ | 2 | 57.98 | 33.55 | 1.52 | 6.92 | 7.53 | 12.70 |
| Grey River, Greymouth | ‘’ | 3 | 50.19 | 40.03 | 4.39 | 5.35 | 6.52 | 11.03 |
| Preservation Inlet, South'd | ‘’ | 1 | 60.88 | 30.69 | 4.33 | 6.19 | 7.01 | 13.39 |
| Mokihinui, Westport | ‘’ | 3 | 57.33 | 35.62 | 3.72 | 3.28 | 7.44 | 12.61 |
| Brunner Mine, Greymouth | ‘’ | 3 | 55.66 | 36.45 | 1.86 | 6.05 | 7.23 | 12.24 |
| Westport, Greymouth | ‘’ | 1 | 56.01 | 37.17 | 2.60 | 4.23 | 7.28 | 12.32 |
| Otama Creek, Southland | ‘’ | 1 | 52.89 | 86.63 | 2.19 | 8.29 | 6.90 | 11.63 |
| Coromandel | ‘’ | 3 | 44.20 | 30.94 | 4.03 | 20.82 | 5.74 | 9.72 |
| Coal Creek, Greymouth | ‘’ | 3 | 52.96 | 33.23 | 4.14 | 9.36 | 6.86 | 11.65 |
| Mokihinui | ‘’ | 3 | 61.35 | 38.75 | 5.40 | 4.46 | 7.97 | 13.49 |
| Blackball Mine, Grey | ‘’ | 6 | 51.33 | 42.69 | 4.41 | 2.22 | 6.67 | 11.28 |
| Cape Farewell, Collingwood | ‘’ | 1 | 48.59 | 43.17 | 2.18 | 6.06 | 6.31 | 10.68 |
| Coal-pit Heath, Grey | ‘’ | 2 | 58.24 | 38.63 | 1.02 | 2.01 | 7.57 | 12.80 |
| Cobden, Greymouth | ‘’ | 15 | 56.25 | 32.45 | 5.84 | 4.84 | 7.31 | 12.37 |
| Bay of Islands | Semi - bituminous | 1 | 55.55 | 39.96 | 3.33 | 1:16 | 7.20 | 12.22 |
| Banbury, Westport | Ditto | 1 | 69.97 | 25.71 | 0.99 | 8.33 | 909 | 15.39 |
| Pakawau, Nelson | ‘’ | 2 | 51.58 | 37.95 | 4.20 | 6.27 | 6.69 | 11.34 |
| Kamo, Whangarei | Drown | 1 | 50.83 | 40.50 | 6.17 | 250 | 6.60 | 11.18 |
| Fernhill, Otago | ‘’ | 2 | 47.25 | 35.04 | 14.75 | 2.50 | 6.24 | 10.39 |
| Malvern Hills, Christchurch | ‘’ | 3 | 57.27 | 29.11 | 9.53 | 4.08 | 7.42 | 1259 |
| Allandale, Otago | ‘’ | 3 | 46.42 | 33.61 | 14.60 | 5.63 | 6.03 | 10.21 |
| Kaitangata, Otago | ‘’ | 3 | 42.96 | 34.74 | 15.86 | 6.43 | 5.41 | 9.45 |
| Shag Point, Otago 23 | ‘’ | 5 | 42.55 | 29.63 | 15.40 | 12.39 | 5.52 | 9.36 |
| Name of Mine or Locality. | Class of Coal. | Number of Samples Analysed. | Analysis. | Evaporative Power. | ||||
|---|---|---|---|---|---|---|---|---|
| Fixed Carbon | Hydro-Carbon. | Water. | Ash. | 1. | 2. | |||
NOTE.—The columns “Evaporative power” are based on coefficients used by the following gentlemen: No. 1 column by Sir James Hector, Colonial Laboratory, New Zealand; No. 2 column by Professor Liversedge, Sydney University, New South Wales. | ||||||||
| Home Bush, Canterbury | Brown | 2 | 43.81 | 36.89 | 16.24 | 3.05 | 5.69 | 9.63 |
| Hokonui, Southland | ‘’ | 2 | 44.23 | 36.82 | 17.58 | 1.35 | 5.78 | 9.73 |
| Nightcaps, Southland | ‘’ | 2 | 38.78 | 36.21 | 17.49 | 7.50 | 6.03 | 8.52 |
| Springfield, Canterbury | ‘’ | 2 | 42.18 | 32.51 | 17.64 | 6.66 | 5.48 | 9.27 |
| Orepuki, Southland | ‘’ | 5 | 41.37 | 28.03 | 20.75 | 9.83 | 5.37 | 9.10 |
| St. Helen's, Otago | ‘’ | 2 | 38.56 | 48.21 | 15.17 | 6.05 | 5.01 | 8.48 |
| Benhar, Otago | ‘’ | 2 | 37.72 | 39.13 | 17.89 | 5.71 | 4.90 | 8.29 |
| Allandale, Otago | ‘’ | 2 | 45.98 | 32.29 | 15.70 | 5.44 | 5.97 | 1011 |
| Wallsend, Greymouth | Bituminous | 1 | 62.87 | 31.64 | 1.66 | 3.83 | 8.10 | 13.83 |
| Mount Somers, Canterbury | Brown | 1 | 35.33 | 34.44 | 15.07 | 17.16 | 4.33 | 7.33 |
| Green Island, Otago | ‘’ | 1 | 41.93 | 39.61 | 1742 | 1.34 | 5.45 | 9.22 |
| Walton Park, Waikato | ‘’ | 2 | 44.52 | 31.93 | 17.76 | 5.79 | 5.79 | 9.79 |
| Miranda, Waikato | ‘’ | 1 | 36.18 | 46.14 | 13.50 | 4.18 | 4.70 | 7.95 |
| Waikato | ‘’ | 1 | 50.57 | 33.86 | 12.14 | 3.43 | 6.57 | 11.12 |
| Sheffield, Canterbury | ‘’ | 1 | 37.50 | 47.17 | 13.32 | 4.01 | 4.87 | 8.25 |
| Ruahine Ranges; Welling'n | ‘’ | 1 | 40.32 | 42.69 | 14.28 | 2.71 | 5.24 | 8.37 |
| Takaka, Nelson | ‘’ | 1 | 45.31 | 30.73 | 21.27 | 2.19 | 5.90 | 10.07 |
| Hunua, Auckland | ‘’ | 2 | 38.74 | 28.50 | 19.22 | 13.53 | 5.03 | 8.52 |
| Broken River | ‘’ | 2 | 40.95 | 35.39 | 14.33 | 9.32 | 5.32 | 9.00 |
| Hastings, Hawke's Bay | ‘’ | 1 | 30.47 | 19.40 | 2001 | 30.12 | 3.96 | 4.70 |
| Tripp, Canterbury | ‘’ | 3 | 4002 | 22.67 | 17.32 | 8.48 | 5.20 | 8.80 |
| Dome Mountain | ‘’ | 1 | 50.18 | 25.99 | 19.61 | 4.22 | 6.52 | 11.03 |
| Rangitikei District | ‘’ | 2 | 34.20 | 30.40 | 11.30 | 24.10 | 4.40 | 7.52 |
| Te Anau | ‘’ | 2 | 41.11 | 35.17 | 19.70 | 3.96 | 5.30 | 9.04 |
| Turinawiwi, West Wanganui | ‘’ | 1 | 35.76 | 43.63 | 16.40 | 4.21 | 4.64 | 7.86 |
| One-tree Hill | ‘’ | 1 | 44.04 | 36.52 | 16.21 | 3.23 | 5.70 | 9.78 |
| Kawakawa, Bay of Islands | ‘’ | 3 | 59.15 | 33.82 | 3.06 | 3.95 | 7.68 | 13.00 |
| Shag Point, Otago | ‘’ | 1 | 43.19 | 30.15 | 15.83 | 10.94 | 5.61 | 9.50 |
| Blackball Creek, Grey River | Bituminous | 3 | 48.34 | 42.76 | 6.27 | 2.28 | 6.27 | 10.63 |
| Kamo, Whangarei | Brown | 2 | 50.42 | 39.09 | 7.39 | 2.59 | 6.55 | 11.18 |
| Walton's, Whangarei | ‘’ | 4 | 48.81 | 35.35 | 8.56 | 7.27 | 6.30 | 10.73 |
| Grey River, Greymouth | Bituminous | 1 | 34.72 | 55.48 | 6.20 | 2.60 | 4.51 | 7.63 |
| Cabbage Bay, Coromandel | Brown | 1 | 63.78 | 27.67 | 4.12 | 4.43 | 8.29 | 14.03 |
| Mokau | ‘’ | 1 | 45.81 | 35.97 | 12.12 | 6.10 | 5.95 | 10.07 |
| Whangarei | 1 | 59.71 | 26.64 | 9.81 | 10.84 | 6.80 | 11.59 | |
| Rakaia | Glance | 1 | 64.51 | 21.27 | 6.76 | 7.46 | 8.30 | 14.19 |
| Whangarei | Brown | 1 | 50.11 | 38.68 | 8.01 | 3.20 | 6.50 | 11.02 |
| Acheron, Canterbury | Anthracite Lignite | 1 | 84.12 | 2.06 | 1.80 | 12.12 | 10.93 | 18.50 |
| Halcombe, Wellington | 2 | 36.15 | 30.88 | 24.74 | 8.22 | 4.67 | 4.67 | 7.95 |
| Gisborne | ‘’ | 1 | 6.19 | 9.74 | 16.25 | 67.81 | 8.04 | 1.36 |
| Fernhill, Masterton | ‘’ | 1 | 35.40 | 22.57 | 23.21 | 18.82 | 4.60 | 7.78 |
| Not given | ‘’ | 2 | 26.40 | 42.50 | 17.26 | 13.85 | 5.80 | |
| Newcastle, N.S.W. | Bituminous | 2 | 55.83 | 32.19 | 2.58 | 11.17 | 7.20 | 12.28 |
This mineral is found in many pants of the colony—namely, at Wakatipu, Cromwell, Waipori, Waitahuna, Macrae's, and other places in Otago; and at Wakamarina, in Marlborough. A company was formed some years ago to work a mine at Bucklerburn, at the head of Lake Wakatipu, in Otago, where scheelite is found intermixed in a quartz lode. Some 37 tons of ore were shipped to Germany, at that time the only market for this mineral. This realised prices varying from £17 to £29 per ton for ore containing about 62 per cent. of scheelite. The demand then almost ceased, and the company suspended operations, and has done no work for the last five years. The ore occurs in pockets or bunches amongst the quartz, but not in large enough quantities to justify any one entering into contracts to supply fixed amounts within stated periods.
Rubies have been found recently in boulders, intermixed with the alluvial drift, in the neighbourhood of Rimu, in the district of West-land, Middle Island; but so far they have been too small to be of much value. One of the boulders containing rubies was sent to Professor Ulrich, of the Otago University, who stated that they are the true “Oriental rubies,” a variety of corundum, as conclusively proved by their strong dichrosive, crystalline form— hexagonal prism—and hardness, which exceeds that of a topaz, being 9° according to Mob's scale. They are found embedded in an emerald-green matrix, being an infusible silicate of alumina, coloured green by chromium oxide. This discovery was made two years ago. No one, previous to this, ever dreamed of rubies being found in these boulders. In some of the river-beds there are large quantities of what is termed ruby-sand; but this is ground up to such an extent that it is not of great value.
In comparing New Zealand with other mining countries in the world, it is found to offer advantages which very few possess. The elevations at which the auriferous drifts are found give great facilities for the storage of tailings. The mineral and metalliferous lodes are distributed throughout the length and breadth of the colony; the extensive areas of auriferous drifts in the Middle Island can be commanded with an abundant water-supply; the large rapid-flowing rivers can be made to supply a motive-power for driving every class of machinery; and even when not close at hand their rapid currents can still be utilised to generate electrical force, as is done at Skipper's, where a crushing-battery of thirty head of stampers and air-compressing machinery is driven by electricity transmitted over a range about 2,000ft. above the level of the sea, and for a distance of nearly two miles. And, again, the same power is used in working dredging machinery—for lifting the auriferous drifts in the bed of the Shotover River, at the Sandhills; the electrical plant being placed about a mile and a half from the spot where dredging operations are carried on.
By HENRY A. GORDON, F.G.S., Inspecting Engineer, Mines Department.
The result of gold-mining operations for the year ending the 31st March last has been, on the whole, satisfactory. The yield of gold was 12,043oz. more than for the previous year, a result due in a measure to the extended operations of the Waihi Gold- and Silver-mining Company at Waihi, and the Crown Gold-raining Company at Karangahake, both in the Ohinemuri district, in the North Island.
The gold-workings in the North Island are entirely confined to quartz lodes, some of which have been in the past extremely rich in gold, the richest ore being found in the Thames and Coromandel districts.
The peculiar feature in regard to the auriferous lodes at Coromandel is that very rich specimen-stone is occasionally obtained in the lode, some of which will yield as much as 6oz. of gold to 1lb. of quartz; yet the lode in which this class of stone is found, after taking out the specimen-stone, may not yield 1oz., of gold to the ton. In some portions of the district gold has been got in thin sheets in a narrow thread-like vein, as, for instance, at the Success Claim. In this claim, some years ago, a thin seam having a little quartz grit was found with a thin sheet of gold, which could be rolled up. This district has been in a depressed state for the past two years; but recently some rich ore has been discovered in the Coromandel Company's ground, and this find has given an impetus to prospecting in the neighbourhood.
In this district the richness of the ore discovered, the favourable formation of the ground, the extent of country almost unprospected. the many facilities for working the ground, the abundant supply of timber, and the height and steepness of the ranges, all point to a cheap method by which mines can be easily worked, and where prospecting is likely to be attended with success. The country is extremely well suited in many places for the construction of aërial tramways to bring down the ore to the flat ground, where crushing machinery can be erected. The workings in the Tokatea Range, Waikoromiko, Tiki, and other places can be called mere surface-scratching only- notwithstanding that the sides of the ranges in places on the Tokatea Hill have drives in all directions, like a rabbit-warren. The gold is found not only in the main lodes traversing the country, but also in thread-like veins from 1/8in. to, in some places, din. in thickness, running in all directions through the tufaceous sandstone, which is the country rock in this district There is no better field in the colony for the individual quartz-miner than Coromandel.
The more recent discovery of gold at Kuaotunu has induced many of the miners that formerly were working at Coromandel to try this field, but, although the gold is more distributed in the lodes, there are no such rich specimens to be obtained as at Coromandel; and more capital is required to work the mines, as it is only through crushing a large quantity of stone that the ground can be made to pay for working; whereas at Coromandel over 100oz. of gold are sometimes obtained from a few hundredweights of quartz.
The following statement shows the aggregate area of the mining claims in each district from which gold was taken, the number of men employed, the quantity of quartz crushed, and the yield of gold therefrom for the year ending the 31st March last:—
| Goldfield. | Area. | Number of Men employed. | Quartz crushed. | Gold obtained. | Tailings. | ||||||||
|---|---|---|---|---|---|---|---|---|---|---|---|---|---|
| Quantity treated. | Gold obtained. | ||||||||||||
| Coromandel. | A. | R. | P. | Tons. | cwt. | lb. | Oz. | dwt. | gr. | Tons. | Oz. | dwt. | |
| Tokatea | 66 | 0 | 15 | 26 | 37 | 15 | 3 | 557 | 0 | 9 | |||
| Kapanga | 128 | 0 | 3 | 45 | 328 | 3 | 28 | 876 | 4 | 3 | |||
| Kauri Block | 7 | 0 | 0 | 2 | 20 | 9 | 4 | 50 | 4 | 0 | 20 | 15 | 18 |
| Tiki | 1 | 0 | 1 | 0 | 5 | 0 | 0 | ||||||
| Waikoromiko | 24 | 0 | 0 | 6 | 7 | 19 | 8 | 255 | 6 | 0 | |||
| Opitonui | 25 | 0 | 0 | 4 | 67 | 7 | 81 | 99 | 8 | 0 | 128 | 16 | 19 |
| Mahakirau | 12 | 0 | 0 | 4 | 0 | 0 | 18 | 6 | 10 | 0 | |||
| Matarangi | 39 | 1 | 35 | 8 | 120 | 0 | 0 | 92 | 15 | 0 | |||
| Kuaotunu | 233 | 0 | 32 | 107 | 9,660 | 0 | 40 | 4,602 | 10 | 0 | 2,240 | 3,441 | 11 |
| Total | 534 | 3 | 5 | 203 | 10,241 | 15 | 7O | 6,544 | 17 | 12 | 2,388 | 3,474 | 8 |
This field may be said at the present time to be the largest quartz-mining field in the North Island. Some of the claims have yielded large quantities of gold. The Caledonian, the Long Drive, Shotover, Golden Crown, Moanataiari, the Queen of Beauty, and, of more recent years, the Prince Imperial, the Cambria, and Saxon Mines, have all yielded a great deal of gold, and even at the present time there are mines which are being worked and are proving good investments to the shareholders. The Waiotahi Mine has paid dividends steadily for the last fifteen years, and very few shares in it ever change hands. The manager is allowed to carry on mining operations to the best advantage, so as to make the venture a commercial success. He keeps prospectors always at work, so that by the time one place is worked out he has always another open ready to get into.
The great drawback at the Thames is the expense of drainage, and some of the mines, being worked down to the greatest depth at which the present pumping appliances can take the water, the number on which the drainage rate falls is necessarily reduced. The deepest workings on the field are those of the Queen of Beauty, the shaft being 748ft. in depth, and rich specimen stone has been taken from the bottom of this shaft. It is about 100ft. deeper than the Big Pump shaft. The deepest workings which have been carried on of late years are in the Saxon Mine, and the lode underfoot in the lowest level that can be drained shows that good ore is still going down.
The workings on the Thames are unlike any other goldfield in the colony where quartz-mining is carried on. The whole of the mines are within a radius of two miles, and the greater portion of them within a radius of one mile. The yield from the mines on this field last year was about the same as that for the previous year; but the workings are getting deeper year by year, and the proprietors begin to fear that unless steps are taken shortly to prospect the country to a greater depth, and find payable lodes, it will not be possible to carry on operations when the drainage-level is reached; and that unless combined action be taken to procure and erect other pumping machinery their mines will in a few years be valueless.
The following shows the gold return, &c., for the Thames district for year ending the 31st March, 1894:—
| Locality and Name of Mine or Company. | Area. | Number of Men employed. | Quartz crushed. | Gold obtained. | Tailings. | |||||||
|---|---|---|---|---|---|---|---|---|---|---|---|---|
| Quantity treated. | Gold obtained. | |||||||||||
| Thames County. | A. | R. | P. | T. | cwt. | lb. | Oz. | dwt. | Tons. | Oz. | dwt. | |
| Tapu | 61 | 1 | 20 | 13 | 1,50 | 10 | 0 | 201 | 18 | |||
| Waiomo | 1 | 0 | 0 | 1 | 0 | 7 | 0 | 143 | 9 | |||
| Puru | 18 | 0 | 0 | 1 | 0 | 5 | 137 | 18 | 0 | 37 | 9 | |
| Tararu | 266 | 1 | 0 | 17 | 378 | 0 | 5 | 291 | 12 | |||
| Shellback | 15 | 3 | 31 | 5 | 26 | 0 | 0 | 33 | 4 | |||
| Kuranui | 44 | 2 | 30 | 62 | 11,850 | 10 | 0 | 4,202 | 9 | |||
| Moanataiari | 206 | 2 | 14 | 200 | 24,742 | 11 | 72 | 12,624 | 19 | |||
| Grahams town | 34 | 1 | 30 | 36 | 708 | 0 | 0 | 617 | 5 | 13,220 | 2,411 | 4 |
| Waiotahi | 161 | 0 | 21 | 103 | 4,621 | 0 | 44 | 5,640 | 2 | |||
| Waiokaraka | 196 | 0 | 21 | 103 | 4,916 | 11 | ||||||
| Karaka | 92 | 3 | 0 | 43 | 1,180 | 14 | 16 | 1,744 | 10 | |||
| Una Hill and | 91 | 3 | 5 | 41 | 1,006 | 11 | 15 | 1,293 | 3 | |||
| Te Papa | ||||||||||||
| Hape Creek | 52 | 3 | 31 | 14 | 338 | 4 | 86 | 274 | 3 | |||
| Otanui | 30 | 0 | 0 | 4 | 10 | 0 | 0 | 5 | 6 | |||
| Matatoke | 10 | 0 | 0 | 11 | 0 | 90 | 2 | 8 | ||||
| Tairua | 45 | 0 | 0 | 7 | 71 | 2 | 0 | 179 | 14 | |||
| Ohui | 30 | 0 | 0 | 2 | 8 | 0 | 0 | 17 | 10 | |||
| Total | 1,357 | 3 | 22 | 660 | 49,224 | 9 | 104 | 32,225 | 15 | 13,220 | 2,411 | 4 |
The gold-workings in the Ohinemuri field are extending every year, and fresh lodes are being from time to time discovered; this, together with the improved appliances in the treatment of the ore, has made gold-mining a success. Three of the finest crushing plants in the colony are erected in this district—namely, at Waihi, Karangahake, and Waitekauri. All of these have cyanide plants in connection with them. At Waihi the lode, now being worked with highly payable results, for eight years previous to the present company purchasing it scarcely paid the expenses of mining and crushing, giving an average return of about 4dwt. of gold per ton, though nothing was worked but the best portion of the lode. As soon as the present company commenced operations they sent the whole of the stone to the crushing battery, the lode in one place being about 60ft. in width, and, with the improved methods of treating the ore, they have been getting large returns.
At Karangahake the Crown Company have recently erected a most complete plant for dry-crushing, and treating the pulverised ore with cyanide of potassium. This was the first company to introduce the cyanide process into the colony, and it has since then made great improvements in the process. There are a number of lodes in the Karangahake Range in which gold is found, but the ore is of a somewhat refractory character, so that anything like a fair percentage of the gold it contains could not be obtained by crushing and treating it by the ordinary battery process; but by the judicious use of cyanide of potassium this difficulty has been overcome, hence the success.
New discoveries of recent years have been made at Komata and Upper Waitekauri. Birnie's New Find, between Lawrie's lode and Waitekauri. is likely to be a remunerative venture, and the discovery made by Lawrie Brothers at Upper Waitekauri has turned out even better than was expected.
The following statement shows the return of gold from these districts for the past year:—
| Locality and Name of Mine. | Area. | Number of Men employed. | Quartos crushed. | Bullion obtained. | Tailings. | |||||
|---|---|---|---|---|---|---|---|---|---|---|
| Quantity treated. | Bullion obtained. | |||||||||
*Bullion from Waihi Company's tailings, treated by Cassel's Company. | ||||||||||
| Ohinemuri. | A. | R. | P. | Tons. | Oz. | dwt. | Tons. | Oz. d | wt. | |
| Maratoto | 18 | 0 | 0 | 3 | 200 | 2,349 | 5 | |||
| Karangahake | 217 | 1 | 16 | 146 | 5,200 | 12,791 | 15 | |||
| Owharoa | 42 | 1 | 22 | 11 | 1,286 | 235 | 10 | |||
| Waitekauri | 93 | 0 | 36 | 86 | 2,428 | 10,758 | 0 | 1,075 | 5,610 | 0 |
| Waihi | 410 | 0 | 38 | 208 | 19,458 | 35,411 | 5 | 1,625* | 1,447 | 8 |
| Total | 781 | 0 | 32 | 454 | 28,572 | 61,545 | 15 | 2,700 | 7,057 | 8 |
| Piako. | ||||||||||
| Waiorongomai and Te Aroha | 46 | 0 | 36 | 29 | 1,928 | 513 | 18 | 592 | 2,001 | 2 |
At Te Aroha there are only a few parties at work, but, nevertheless, this is a field that will yet come to the front, and one in which a large number will find profitable employment. There is a large lode traversing the range, which can be seen exposed on the surface for about three miles. In some portions of this lode stone has been crushed and treated by the ordinary battery process, which has yielded 2oz. of gold to the ton, but scarcely any prospecting has been done on other portions of this reef.
The “West Coast still continues to yield nearly one-half of the gold annually obtained in the colony; but the greater portion of it is from alluvial workings. The only large quartz field on the West Coast is Reefton, and here the quartz-mines extend over a distance of thirty miles. During the past year the total yield on the West Coast was 98,930oz., representing a value of £395,738, the largest producing field being Kumara, where the workings do not extend over more than 2,000 acres. Most of the alluvial workings are carried on by hydraulic sluicing, and, wherever a large supply of water can be got to command a gravel terrace, the ground can generally be made to pay. Indeed, it may be said that the whole of the West Coast is more or less auriferous, and it would be difficult to say where gold will not be found if water is available. Addison's Mat, Charleston, Moonlight, Black Ball, the whole of the Grey Valley, Kumara, Waimea, Kanieri, and Boss are all considerable mining centres, where alluvial workings are carried on.
The following statement shows the results obtained from the quartz-mines on the West Coast during the past year:—
| District. | Quartz crushed. Tons. | Amalgam. Oz. | Retorted Gold. Oz. |
|---|---|---|---|
| Collingwood | 4,561 | 2,257 | 914 |
| Reefton | 35,214 | 57,040 | 19,367 1/2 |
| Lyell | 9,876 | 21,920 | 9,186 |
| Total | 49,651 | 81,217 | 29,467 1/2 |
This district is specially adapted for hydraulic sluicing, and almost every available stream on the goldfields is diverted to work the ground. The formation of Otago is much older than that of either the West Coast or the North Island, and there are immense belts of auriferous drifts traversing the country. These are known as “quartz drift “or “granite wash,” and extend from Maerewhenua to Mount Burster, Kyeburn, Hyde, Hamilton's, Blackstone Hill, St. Bathan's, Tinker's, Waikaia, Switzer's, Mount Criffel, and many other places, and almost wherever it is found there are in it auriferous bands and hills. All the goldfields of Otago are of a highly quartzose schist formation, and the large deposit of the quartz drift now found is, no doubt, due to denudation from the mountains. The schist has passed away in suspension in the rivers and streams, after being decomposed by the action of the atmosphere and water, and has left the indissoluble portion of the material behind.
Very rich gold-bearing drifts have been worked on every gold-field in Otago, and, while the shallow workings are getting nearly exhausted, there are hundreds of square miles of country where auriferous gravel is found and scarcely any work has yet been done, partly because a water-supply cannot be got at a reasonable cost. There is sufficient evidence in Otago that great changes have taken place since the gold was first deposited; the rivers are now flowing in channels different from those they followed in former ages, and the immense old lake-basins, seen in different places, mark the changes that have taken place.
The principal gold-producing fields are Tuapeka, Waipori, Switzer's, Nevis, the Clutha Valley, Tinker's, St. Bathan's, Naseby, Hamilton's, Hyde, Kyeburn, Cardrona, and the Shotover. At the latter place the terraces alongside the river are clearly marked, showing the level of the river-bed in former ages, some of the river-gravels being now 700ft. above the bed of the present river, and wherever water can be got these high terraces will pay for working.
There are only a few quartz-mines in Otago, and the gold from these forms but a small portion of the yield from the field. The Achilles Mine at Skipper's, the Premier at Macetown, the Excelsior at Bald Hill, and the Barewood Mine, have been the principal gold producers for the past year. Taking the whole of the gold-mines in the colony, it may be said that about 37 1/3 per cent. of the gold obtained last year was from quartz workings, and 62 2/3 per cent. from alluvial workings.
The following shows the result of the quartz workings in Otago for the past year:—
| Battery situated at | Quantity crushed. | Amalgam. | Gold obtained. Retorted. | Melted |
|---|---|---|---|---|
| Tons. | Oz. | Oz. | Oz. | |
| Nenthorn | 1,599 | 1,769 | 537 | |
| Hindon | 87 | 79 | 29 | |
| Barewood | 1,447 | 549 | ||
| Serpentine | 75 | 68 | ||
| Bald Hill Flat | 336 | 93 | 638 | |
| Cromwell | 571 | 1,056 | 354 1/2 | |
| Macetown | 3,163 | 1,985 | ||
| Skipper's | 1,714 | 1,076 | 517 | 520 |
| Shotover | 731 | 376 | ||
| Totals | 9,723 | 4,073 | 3,000 1/2 | 2,573 |
By EDWARD TREGEAR, F.R.G.S., F.R. Hist. S., Secretary, Labour Department.
The beneficial exercise of human energy demands not only that labour should be employed, but that its force should be exerted in directions at once profitable for the labourer and remunerative to the community of which he forms part. Granting these ends, there are few countries in which labour can find a field which will compare with the Colony of New Zealand. In a climate which knows neither the heat of a tropical summer nor the rigour of extreme winter work can go on with unfailing regularity, and is not interrupted by the siesta through which the Brazilian settler slumbers at mid-day, nor by the period of hibernation which the Canadian has to endure through long months of snow and frost. Here, if anywhere, climate is the friend of work and the ally of practical energy. Nor will the settler have to contend with difficulties which must be met by men whose choice of a home has led them elsewhere. He has to face no wide expanse of barren plain, of salt-prairie, of mountain-ranges shutting out markets. New Zealand, girdled by the ocean, from which no part of her islands is far away, has many ports and gateways to the markets of the crowded nations beyond seas. Railways, telegraph-lines, and open roads have dissolved the difficulties which environed the early settlers, and diminished distances which isolated the pioneer families from one another. There are great tasks waiting to be performed, labour of the sternest and most strenuous kind to be yet exerted, wealth to be extracted from mine and pasture, flock and factory; but the dangers from savage Natives and the loneliness of primitive settlements are things which have passed away, and are known only by the reminiscences of old settlers, most of whom have prospered with a vigorous young colony. For those who wish to share in the successes still to be achieved. the following remarks are intended.
As in most countries where civilisation is a new factor in the order of things, the agricultural and pastoral industries engage the attention of the bulk of the people. It is to the country districts that most newcomers turn their steps, for the hope of one day occupying or possessing acres is the ruling idea with the majority of those who seek new homes. The means by which such homes may be obtained differ, of course, according to the capacities of the individual and the amount of capital he brings with him. Some purchase property at once, relying upon knowledge gained elsewhere, while others are content to become helpers and wages-men to older settlers in the hope of gaining “colonial experience.” These, even if possessed of capital, are by no means unwise if they thus resolve to learn by the tuition of others, sometimes even at others’ expense, until the novelty of life under altered conditions has worn off. To those without capital, labour for others is a necessity, but it is generally entered upon in the hope that some day a farm, either freehold or under lease in perpetuity, may be the reward of exertion and of careful thrift.
If the farm on which the new settler is engaged should be in the bush (i.e., forest-country), the process of opening it up will supply endless sources of interest. The lore of the woodman must be acquired, and the proper handling of tools to which the immigrant is probably unaccustomed. He must learn the names of the trees, all of which are strangers to Europeans; he must know the value of the timber, so as to spare from the fire those good for splitting or sawing, and find which are the worthless woods only useful as ashes to manure his land. With the billhook he will clear the dense undergrowth from under the larger trees, so that the axe may have free play at the solid trunks, and the skilful “scarf” bitten in by the keen blade may fell the tree in a proper direction without danger to the axeman. When the forest-trees have lain drying in the sun for some weeks fire is applied, and logging-up the half-burnt logs follows. Upon the ashes grass-seed is scattered, and a soft green vegetation takes the place of the charred and blackened clearing; posts and rails are split, and cattle are put on to wander among the stumps and fatten on the sweet new grass. Sometimes the grass is left to seed, and the heavy crops of grass-seed grown upon the fertile ashes of the “new7 burn” often help considerably to lighten the cost of felling bush on the farm, and, moreover, the grass-seed harvest leads to the employment of much labour and many extra hands at the time of its ripening. If the farm selected is in the open country— that is, when in its primitive state it is covered with fern or manuka scrub—neither the expense nor labour of clearing it is so great as that required for laying down forest-land in pasture. The plough and harrow take the place of axe and billhook, and the multitudinous duties attending the cultivation of the soil commence at once, with the erection of necessary buildings, the subdivision of the land into paddocks, fencing, draining, road-making, and sowing the soil with grain or grass. The lessons necessary for agricultural life under strange conditions have to be learnt; the changing climate, with what is at first the baffling substitution of antipodean summer and winter for their accustomed months in the Old Country; the suitable crops, and the modes of transit to the nearest markets; all these are branches of knowledge which can be acquired only by experience and the friendly hints of. neighbours. However well versed a man may be in the system in vogue in European countries. he will find too sure a reliance upon his own judgment a fatal mistake until some of the new lessons have been learnt and practised.
Large quantities of grain in comparison to the acreage under crop are produced in some districts of New Zealand, particularly in the central part of the Middle Island, but it is probable that this country, with its variable climate, will never be able to compete in regard to cereals with other lands where vast areas of level land may be brought into cultivation under a changeless sky and with nearer markets. Moreover, in regard to labour, the improvements in machinery year by year lessen the demand for human assistance, both in sowing the crop and reaping the harvest; so that the farmer becomes more and more independent of outside aid in developing and working his acres. The most prosperous branch of farming in New Zealand has been the pastoral industry. Sheep were formerly grown in this country almost entirely for the wool-clip, but the discovery that the flock could be profitably increased for the purpose of shipping the carcases to Europe as frozen mutton gave an immense impetus to the work of sheep-breeding. The quality of the flesh was improved by judicious crossing, fell-mongeries were established for removing the wool and dressing the skins of the slaughtered animals, the work of preparing and freezing the mutton employed numbers of hands, lines of splendid steamers were built or purchased for transit purposes, and the trade suddenly assumed immense proportions. At the same time dairy farming began to receive encouragement from the erection of dairy factories. Each farmer had produced his small supply of butter or cheese by means of the hand-churn, and the product differed greatly in quality, according to the ability, cleanliness, and carefulness of the farmer's wife and daughters. The supply, too, in the absence of any large market, was so small, and the reward so precarious, that many of the smaller farmers lost heart, and would only produce sufficient for home consumption. With the growth of the factory system all was changed; the factories are mostly co-operative, and to these the milk is supplied. The owner of the cow receives a certain price per gallon for the milk, and the profits of the sale of butter and cheese are divided according to the ratio of the milk supplied. This system has not only removed a large share of the work which formerly fell upon the farmer's family, but assures a certain and far more remunerative price for the articles produced. The change to be noticed by any one passing through the dairy-farming districts after ten years’ absence is most noticeable. There is an air of steadily increasing prosperity everywhere, the herds are carefully selected and bred for increase, large areas of new country are being laid down in nourishing grasses, and the farm-dwellings are improved. It is to this branch of farming that the newcomer, if not possessed of large capital, should turn his attention, for in this occupation the risk of losing money is little, manual labour is not excessive, and the profits are such that a steady and intelligent man can look forward to a good income as the result of his exertions.
Those whose tastes lie in the direction of the wider pastoral life may find in the occupation of stock-rider, shepherd, &c., a vent for their activities. In some cases the “runs,” as they are called, consist of large areas of very rich land, acquired from the Natives in the early days of the colony, when the Maoris were encouraged to part with their ancestral acres to private persons. Most of the runs consist of areas of broken or second-class land, unfitted for cutting up into small holdings, or for arable farming. Thousands of acres of land are often let as single runs, and, as these include mountainous regions, and are sometimes cut through by rapid rivers and deep valleys, the work of mustering sheep and cattle is not unattended with danger. The life is one of vicissitude, days of idleness alternating with others of hardest toil and risk, so that to the hardy and daring spirit the occupation is not devoid of interest and charm. On a cattle-run the mustering the half-wild herds and branding of young stock call for the display of considerable powers of rough-riding, while on a sheep-run the lambing-time calls on the shepherd, and the shearing-time on all hands, for the utmost exercise of endurance and strength. As shearing-time approaches, a constant stream of “swagsmen” seeking employment flows through the sheep-farming districts. These sturdy wanderers are difficult to wean from their nomadic life to more settled pursuits, but, as their labour is needed at certain times, and at certain times only, on sheep-run and farm, it is difficult to see how this casual supply of labour could be done away with without affecting the interests of those more settled and wealthier persons who are their employers. If to the love of animals and of free life in the saddle is joined the possession of sufficient means to allow of the purchase of a run with flocks and herds, then there are few occupations which offer such openings for success in life as the breeding of cattle and sheep in New Zealand.
There are many pursuits connected with outdoor life in the colony beside pastoral and agricultural occupations. The timber industry is one of the most notable of these, as it employs some thousands of men, and in many different ways. Timber is of far more general use in New Zealand than in England, because the labour of procuring stone and making bricks is more costly in a place where wages are high, and transit expensive. The houses are, in most parts, built of wood, and the bridges for roads and railways are more generally constructed of timber than of iron. The vast extent, also, of forest-country causes wood to be easily procurable and cheaply supplied. The mode of working the timber differs with the locality. Among the kauri-pines of the far north the trees after being felled are cross-cut into logs, and are then rolled or levered by means of screw-jacks into the nearest large “creek,” as the mountain-streams are called. Here the logs are left till the arrival of heavy rains, which cause the creeks to swell, till, dammed by the obstructing timber, they rise high above their usual level, and at last, breaking through the obstructions, rush toward the sea, bearing the floating logs in huge tumbling masses. It is magnificent to behold the wave of foaming water bearing the timber headlong on its way, and to hear the deep roar of its progress through the underwood of the bush. At the mouths of the streams a line of floating logs have been previously fastened together with iron “dogs” and short chains; this is called a “boom,” and prevents the timber getting away to sea. The logs are then fastened together in rafts, and, guided by men armed with long poles shod. with iron (called rafting-spears), are conveyed to the mills, which are generally situated on some bay of the harbour or arm of the sea. This method is suitable to the kauri, which is remarkably buoyant, even when green, but is not practicable for heavier timber. In the south, and in places where the country is not broken, rough tramways have to be laid along tracks cut into the forests, and along these tramways the logs are carried on strong low trucks drawn by horses or by bullock-teams. At the mills the huge baulks of timber are “broken down “by vertical saws into “flitches” (in one mill the endless-band saw is used), and the flitches are then passed on to circular saws to be ripped up into boards and scantling. All this work demands a great variety of labour; some men are felling trees, some cross-cutting logs, others jacking them to the creeks or tramways, others rafting or driving teams. Many hands are employed at the mills themselves in attending the machinery, stacking the sawn timbers, loading carts, and conveying the boards to market. Some suitable occupation can almost always be found for a hardy man or a willing boy about a sawmill in the bush.
The flax industry is the next to attract notice. New Zealand flax, or hemp is the product of a plant peculiar to this country. It grows in clumps which look like bunches of broad sword-blades, of a dark glossy green, each leaf being between 2in. or 3in. wide, and oft. to 8ft. in height. The clumps sometimes grow thickly together over large tracts of country, especially in shallow swamp and boggy land. Most of the men employed in this work are occupied in cutting the flax-leaves close to the ground, binding them up into bundles, and carrying them to the mill. This mill consists of cleaning and scutching machinery, which removes the green part of the leaf, or outer skin, and leaves the fibrous portions like bundles of long white string. These fibres are tied into hanks, pressed into bales, and are shipped away to Europe and America to be made into cordage, much of which is used for the binder of harvesting machines. New Zealand hemp would command a higher price in the market if some cheap and effective plan could be devised for thoroughly cleansing away the gum of the plant; this, when the material gets dry. causes ropes made from it to become brittle when bent, and thus unfitted for sole use in cordage intended to run over blocks and pulleys, but when mixed with manila and other hemps it is of much practical utility. The flaxmills exert a great influence for good when the material is in demand, for they employ a large number of men whose services could be classed only as “unskilled” or “casual” labour. This is, of course, in the work of cutting and carrying the hemp. The men and boys actually engaged in the manipulation of the material in the mill must possess a certain knowledge of machinery and acquire deftness at their business, although such skill and knowledge is by no means difficult of acquirement.
The District of Auckland has found one of its most valuable sources of revenue in the large fields of kauri-gum which it contains. Kauri-gum is the product of the giant kauri-pine, a tree still existing in the forests of the north, but which once covered large areas of land which are now open fern-country utterly destitute of timber. This fact is known by the deposits of amber-like gum, the resin of vanished pines, which are found beneath the soil. The outfit of a gum-digger consists of a spear, a spade, and a sack only; so it is no wonder that men unpossessed of capital turn to an employment in which the necessaries to be provided are so few, and the reward to some extent certain. Thousands have availed themselves of this occupation, and the tent of the gum-digger is to be seen in places whose barren appearance accounts for the absence of the farmer and settler, but which have produced in monetary value results such as the casual observer would never have suspected. The process of procuring gum is as follows: With the spear the digger prods about in places which seem to be probable hiding-placs of his treasure, and, on the “feel” of the brittle gum along the spear beneath the surface, he quickly brings it to the light of day by means of his spade. Then the sack is brought into use. and the gum is carried to camp, to be scraped and cleaned by the light of the evening fire. As succeeding parties of diggers passed over the soil, the gum near the surface became exhausted, and it was feared that the supply was at an end; but research has made clear that layer beneath layer of this valuable resin exists, and for many years it has been a staple export and an outlet for the “unemployed.” From £2 to £4 a week has been earned by the men engaged in this pursuit, but the reward varies with the market, and still more with the skill and “luck “of the individual. The life is a solitary one in many cases; it is laborious, and sometimes full of hardship and exposure, but it is a free and masterless existence, with much of the hope and fear of mining about it. There is always the expectation of coming upon an unusually rich “patch “of gum, and this hope and uncertainty gives a zest to those who would find settled employment and regular hours to be irksome and unbearable. A heavy fall in the price of kauri-gum in the Home-markets has at present caused a cloud of depression to rest upon the industry, and many anticipate that the diggers will for some time have hard work to make ends meet; but it is probable that the depression is transient only, and that before long a rise in prices may cause a revival of prosperity.
Orchards are to be found planted near the dwellings of most New Zealand farmers, some of them merely for the fruit-supply of the family, but many for business purposes. Apples, pears, plums, quinces, and all fruit-bearing trees of temperate climates grow freely in both Islands, while in the warmer atmosphere of the North oranges., lemons, and other subtropical plants flourish. Large areas of land are being planted every year with oranges and lemons, and bid fair soon to assume such proportions as to warrant the supposition that a lucrative and extensive trade in this direction will before long spring up. The smaller kinds of fruit-bearing plants, such as strawberries, gooseberries, currants, all grow in profusion, and, not only give encouragement to the erection of jam-factories, but promise also to supply work for women and children, as many hands have to be employed in picking and preparing the fruit.
An industry essentially local is that of gathering fungus for export. This fungus is a curious plant, in appearance something like the human ear, but of larger size. In colour it is dark brown, and feels like damp indiarubber. It grows generally on fallen trees and logs, and after being gathered has to be set in the sun for some days to dry. The work is generally confined to old men and children, and the payment is a very welcome addition to small incomes. The immense amount of fallen timber lying in old clearings and piled up along the sides of roads in forest country causes the fungus to be very plentiful at certain times of the year. It is bought up by agents for export to China. The purpose for which it is procured is unknown to colonists, but it is believed that the Chinese have some process by means of which they can use it as food. Nineteen thousand pounds’ worth of fungus was exported from New Zealand in one year.
In other places in this book will be found references to the mineral wealth of the colony, and to the number of people engaged in mining pursuits. Therefore it will be unnecessary here to speak on this subject except as concerning the class of workmen and the kind of labour employed. Perhaps of all men to be found in the colonies, the strongest, bravest, and hardiest is the miner, particularly the gold-miner. Living mostly in the wildest and most broken parts of the country, where roads are almost impassable, where provisions are hard to obtain, exposure to the elements incessant, and danger ever present, he is one of the most cheerful and hopeful of men. Sometimes wealth rewards his efforts; but if it does not, the gleam of possible nuggets to be found is before his eyes from youth to age, and persuades him to herculean tasks of self-denial and energy. The nature of the labour expended differs much according to the kind of mining being carried on. Sometimes it is prospecting, when, with a spade, a pick, and a washing-dish, the digger pushes his way through tangled bush, over precipice and mountain-range, into the most lonely and almost inaccessible parts of the country. When the gold has been found in what promises to be payable quantities the sluice-boxes are set up, streams dammed, and “paddocks “of auriferous gravel excavated. If successful, hydraulic mining begins, water-races are constructed, and these lead streams which under high pressure are forced through nozzles similar to those used for fire-hoses, but more powerful. These nozzles direct the water against the faces of the hills, tearing away the masses of loose stone, and washing thedébris into sluice-boxes and tail-races, the gold being saved by suitable arrangements for the purpose. It is wet and heavy work, but profitable in many cases. Although it gives a desolate and forlorn look to the stripped and denuded country, it is carried on generally in places too barren and broken to be of much account for any other purpose. Another variety of gold-finding is done by means of dredges anchored in the rivers. These machines do their work of lifting the sand exactly as steam mud-dredges do in harbours, but the result of the dredging in this case is washed over by gold-saving apparatus of the usual land. The most important work in mining for precious metals is quartz - reeling; here the system differs little from that of ordinary underground mining in general. Shafts are sunk or drives put in to follow or cut the reef, or layers of stone containing the ore, which, when brought to the surface, is committed to “batteries” or crushing-mills, where the stone is stamped or ground to powder. It is then washed over sloping tables, containing grooves which hold mercury, and this unites with the gold in an amalgam; the rubbish is washed away. The amalgam is a dull pasty mass, which, when subjected to heat, loses its quicksilver and sets the gold free. Most of the diggers on prospecting alluvial claims work for themselves, with a mate or two, or else in little companies; but in the larger and long-established claims they are employed as wages-men, at about £3 a week each.
There are large coalfields in New Zealand, and many men are employed thereon, but there is no point of interest in the colonial method of working, which is the same as that pursued all the world over. The coal-miners are generally paid for working small contracts; but long experience among both employers and employed has produced an accuracy of estimate in letting and taking such contracts which tends to keep the profits of labour nearly in the position which would result from the payment of regular wages, say, of about 8s. per diem. Silver is not worked extensively, most of it obtained in the colony being extracted from the gold-bearing ores; but antimony, manganese, and copper have been mined for with success, and cinnabar, iron, lead, and other minerals are to be found, which will some day produce wealth to prospectors and owners.
Let us turn from contemplation of the agricultural and mineral fields for labour and enterprise in another direction—that of winning from the ocean surrounding New Zealand the never-failing “harvest of the sea. “Every bay and harbour (besides many of the open roadsteads) is the haunt of vast numbers of fish, almost all of which are fit for the table, and some of them of great delicacy. They can be caught with little trouble, and without that terrible risk which fills with care and often with sorrow the hearts of the wives and children of fishermen who sail the stormy seas of Northern Europe. There are a few fishermen in the vicinity of each of the chief towns of the colony, as is sure to be the case with a calling that only requires a small boat, some nets, and a few lines for an outfit, and where a profitable and certain market rewards very slight exertion; but here there are no fishing villages, no fleets of trawlers, no capital invested. The fishing trade is in its earliest infancy, and offers inducements to any industrious man who would turn his energies in this direction.
We have dealt previously with those employments which have the country districts for their area of usefulness. For various reasons, life in the country or in the out-settlements is distasteful to many people. Early town life in youth; the gregarious tendencies of the human being; more widely diffused education, resulting in the wish to be near libraries, debating societies, &c.; the general bustle and excitement of urban living when compared with the quietness of the country; special training in some trade or occupation only to be carried on where hands are plentiful: any or all of these induce certain of our people to flock into the cities, and make their homes in centres of population. In these centres such a variety of trade and business now exists that very little difference can be found between the life of the city man in New Zealand and that of his brother in Great Britain. Here are rows of streets, with shops for the retail disposal of commodities, warehouses for the storage and transference of merchandise, banks, insurance offices, and agencies full of busy clerks, factories and workshops in full swing, with their crowds of men and women workers. Here are factories for the production of woollen goods, clothing, hats, boots, leather, saddlery, agricultural implements, carriages, bicycles, tinware, ironware, railway material, paper, glass, soap, candles, cordage, casks, baskets, tinned meats, biscuits, confectionery, &c. Besides these there are huge Hour-mills, grain elevators, breweries, gasworks electric-light works, freezing-works, foundries, dye-works, fellmongeries, and a hundred other businesses with which an advancing civilisation supplies the necessities of a growing people.
With a view to encourage and help the working-classes as much as possible, the New Zealand Government has formed a Department of Labour, which is under the direction of the Hon. W. P. Reeves. Minister of Labour, and is administered by the Secretary. The central office is in Wellington, but it has other offices in Auckland, Christchurch, and Dunedin, and agents in all the towns and most of the settlements of the colony. The care of all the workers in factories and workshops is in the charge of the Labour Department, and the Inspectors of Factories have the control of labour agencies. In the country districts police-sergeants and local constables undertake the labour agencies, as their knowledge of their districts is of great service to both workmen and employers. The agencies send in regular reports to the central office, which is thus enabled to regulate the labour market by giving information as to the districts in which men are wanted, or the reverse. Most substantial aid is also given by the department in giving men proceeding to work their travelling-fares as advances, to be repaid from earnings. Information of all kinds is given to applicants at one of the Government agencies, and any one wishing to become a colonist would do well on arriving in the colony to inquire, personally or by letter, at the office of the department.
The subject of labour in New Zealand would be incomplete without reference to the position held by women in the colony. In the country the wives and daughters of settlers find occupation in duties which present an unceasing round of service. These duties are now in many cases being lightened by the institution of dairy factories, which relieve the women of butter-making; still, the house-cleaning, cooking, washing, and making clothes for a family, if properly carried out, prevents any idleness or ennui from visiting the household. There are riding parties, picnics, lawn-tennis, flower-shows, agricultural shows, races, lectures, socials, &c., &c., to fill up the intervals in the busy season on the farms and runs. The life on the whole is a happy one, blest by the buoyant health of those who live in the clear fresh ah; and, except in the cases of the more isolated farms, there is plenty of visiting and flitting about. No people are so constantly on the wing as those of New Zealand, as the crowded trains and steamers testify. Domestic service attracts few young women, and it is difficult to keep a good female servant, as her worth soon becomes known to young men, and she is triumphantly borne off in marriage. In towns, the tendency for the young women is to obtain work either in the shops or factories, and they prefer the slightly higher wages and regular hours of manufacturing and trading occupations to the obligations of domestic servitude. It is a preference which does not tend to fit them for the care of a home when they marry and have to provide for the comfort of husband and children; but the semi-independence, the shorter hours, and the pleasure of working together in society explain its attractiveness. If those who employ servants are annoyed by finding them hard to get and harder to keep, the community as a whole gain by having many useful hands employed in developing the industrial resources of the country, and making it less dependent on outside sources for the supply of manufactured articles.
We have attempted to summarise and describe the occupations of those who in New Zealand have shown their energy in the field of labour. Let us glance, in conclusion, at the reasons why some might find in this colony only a place of failure and of utter disappointment. Those who can make up their minds to put heart and muscle into such varieties of work as have been described will find themselves not unrewarded, but those who are by training or nature unfit for such occupations will do well to pause before they attempt the hazards of colonial life. We do not refer to idle people or sickly people—the idler or the sickly can prosper nowhere, and is a failure in the old country as in the new—we allude to those of diligent and industrious habits, but trained in some calling not required in the colony, and insusceptible of change; or perhaps well fitted for some business that has already too many followers in the colony. The clerk, the shopman, the schoolmaster, the music-teacher, the governess, the highly-educated but penniless man—these will find it hard to get employment in their several callings; their places are filled, and well filled, already; before them is only health-breaking competition and heart-breaking disappointment. If, on the other hand, there is adaptability, a determination to perform any work, and to do it thoroughly, to begin on the lowest step of the ladder, and go up little by little, to practise thrift and temperance, keeping the hands busy and the mind active, then there is no reason to doubt success, nor why any such worker should not attain the possession of one of the many pleasant homes which dot the hills and shores of New Zealand.
AVERAGE RATES OF WAGES IN EACH PROVINCIAL DISTRICT OF NEW ZEALAND DURING THE YEAR 1893.
| Description of Labour. | Auckland. | Taranaki. | Hawke's Bay. | Wellington | Marlborough | Nelson. | Westland (Goldfield) | Canterbury | Otago (Part Goldfield; |
|---|---|---|---|---|---|---|---|---|---|
* Per day. † Without board. ‡ 0s. to 10s. per 1,000 bushels. | |||||||||
| 1. AGRICULTURAL LABOUR. | |||||||||
| Farm-labourers: | |||||||||
| With board, per week | 12/ to 18/ | 15/ | 20/ to 25/ | 12/ to 20/ | 20/ | 24/ | 25/ | 20/ | 15/ to 17/6 |
| Without board, per day | 4/6 to 5/6 | 5/ | 6/ to 7/ | 6/ | 6/ | 6/ to 8/ | 8/ | ||
| Ploughmen: | |||||||||
| With board, per week | 20/ | 20/ | 25/ to 30/ | 20/ to 30/ | 25/ | 24/ | 30/ | 20/ to 25/ | 15/ to 20/ |
| Without board, per day | 7/ | 8/ | 6/ to 8/ | 7/ | 6/ | 6/ to 8/ | 10/ | ||
| Reapers: | |||||||||
| With board, per week | 5/* | 30/ | 30/ to 40/ | 40/ | 24/ | 30/ to 40/ | 20/ to 25/ | ||
| Without board, per day Mowers: | 10/ | 8/ | 6/ to 8/ | 8/ | 6/ | 8/ to 10/ | 10/ | ||
| With board, per week | 6/* | 20/ | 30/ to 40/ | 40/ | 24/ | 30/ to 40/ | 25/ to 30/ | ||
| Without board, per day | 8/ | 8/ | 6/ to 8/ | 8/ | 6/ | 8/ to 10/ | 11/ | ||
| Threshers: | |||||||||
| With board, per week | 6/* | 20/ | 30/ | 40/ | 30/ | ‡ | 25/ | ||
| Without board, per day | 8/ | 8/ | 6/ to 8/ | 8/ | 6/ | 10/ | |||
| 2. PASTORAL LABOUR. | |||||||||
| Shepherds, with board, per annum | £40 | £65 to £75 | £40 to £80 | £60 | £50 | £75 to £85 | £45 to £65 | ||
| Stockkeepers, with board, per annum | £65 to £75 | £40 to £60 | £60 | £52 | 25/ p. wk. | £75 | £50 to £65 | ||
| Hutkeepers, with board, per annum | £50 | £50 to £55 | £60 | £52 to £60 | £40 to £50 | ||||
| Station-labourers: | |||||||||
| With board, per week | 20/ to 25/ | 20/ | 20/ | 20/ | 20/ | 20/ | |||
| Without board, per day | 4/ | ||||||||
| Sheep washers: | |||||||||
| With board, per week | 20/ to 25/ | 20/ to 30/ | 25/ | 25/ to 30/ | 25/ | ||||
| Without board, per day | 4/ | ||||||||
| Shearers, with board, per 100 sheep sheared | 20/† | 17/6 | 15/ to 20/ | 16/8 | 16/8 | 20/ | 20/ | 15/ | |
| Men-cooks on stations, with board, per week | 20/ | 20/ to 25/ | 15/ to 25/ | 25/ | 17/6 | 25/ to 30/ | 20/ to 25/ | ||
| 3. ARTISAN LABOUR (per day, without board). | |||||||||
| Masons | 10/ | 8/ | 11/ | 12/ to 14/ | 10/ | 12/ | 10/ | 9/ to 10/ | |
| Plasterers | 10/ | 12/ | 9/ to 13/ | 10/ | 10/ | 12/ | 9/ | 9/ to 10/ | |
| Bricklayers | 10/ | 7/ | 12/ | 8/ to 12/ | 10/ | 10/ | 12/ | 10/ | 9/ to 10/ |
| Carpenters | 8/ | 8/ to 10/ | 10/ | 8/ to 10/ | 9/ | 8/ | 12/ | 9/ | 8/ to 9/ |
| Smiths | 8/ | 8/ | 10/ | 9/ to 12/ | 9/ | 7/ to 8/ | 10/ | 10/ | 8/ to 9/ |
| Wheelwrights | 8/ | 8/ | 10/ | 9/ to 12/ | 8/ | 8/ to 10/ | 10/ | 10/ | 9/ to 10/ |
| Shipwrights | 8/ | 12/ | 12/ to 14/ | 8/ | 10/ | 12/ | 10/ | 12/ | |
| Plumbers | 8/ | 8/ to 10/ | 10/ | 9/ to 10/ | 8/ | 10/ | 10/ | 10/ | 9/ to 10/ |
| Painters | 8/ | 7/ | 9/ | 6/ to 10/ | 8/ | 9/ to 10/ | 10/ | 9/ | 8/ to 9/ |
| Saddlers | 5/ to 10/ | 8/ | 8/ to 11/ | 8/ to 12/ | 8/ | 7/ to 8/ | 10/ | 9/ | 9/ |
| Shoemakers | 5/ to 10/ | 7/ | 8/ to 10/ | 8/ to 10/ | 8/ | 7/6 | 10/ | 9/ | 7/ to 10/ |
| Coopers | 5/ to 7/ | 6/ | 10/ | 8/ to 10/ | 10/ | 12/ | 10/ | 8/ to 10/ | |
| Watchmakers | 10/ | 8/ | 10/ | 10/ to 15/ | 9/ | 9/ to 10/ | 15/ | 12/ | 10/ to 14/ |
| 4. SERVANTS. | |||||||||
| Married couples without family, with board, per annum | £50 to £70 | £50 | £70 to £90 | £50 to £75 | £65 | £60 | £65 to £70 | £65 to £70 | |
| Married couples with family, with board, per annum | £60 | £70 to £90 | £40 to £65 | £65 | £60 to £65 | £50 to £65 | |||
| Grooms, with board, per week | 10/ to 20/ | 20/ | 20/ to 25/ | 20/ to 30/ | 20/ | 25/ | 40/ | 40/ | 15/ to 20/ |
| Gardeners: | |||||||||
| With board, per week | 10/ to 20/ | 20/ | 20/ to 25/ | 20/ to 30/ | 30/ | 30/ to 40/ | 25/ to 30/ | ||
| Without board, per day | 6/ | 6/ to 7/ | 10/ | 7/ to 8/ | 6/ to 8/ | ||||
| Cooks, with board, per week | 15/ to 20/ | 10/ | 15/ | 12/ to 30/ | 15/ | 12/ | 25/ | 12/ to 15/ | 15/ to 20/ |
| Laundresses, with board, per week | 12/ to 15/ | 4/ per day* | 15/ | 15/ to 25/ | 12/ | 15/ | 15/ | 15/ to 20/ | 15/ |
| General house-servants, with board, per week | 8/ to 12/ | 8/ | 12/ | 8/ to 15/ | 10/ | 10/ | 15/ | 10/ to 12/ | 10/ to 15/ |
| Housemaids, with board, per week | 7/ to 9/ | 9/ | 12/ | 10/ to 15/ | 10/ | 8/ | 15/ | 8/ to 10/ | 10/ to 12/6 |
| Nursemaids, with board, per week | 4/ to 6/ | 6/ | 8/ | 5/ to 8/ | 8/ | 6/ | 10/ | 5/ to 8/ | 6/to 10/ |
| 4. SERVANTS—continued. | |||||||||
| Needlewomen: | |||||||||
| With board, per week | 10/ to 15/ | 2/6* | 15/ | 15/ to 20/ | 20/ | 20/ | 20/ | 12/6 to 15/ | 15/ |
| Without board, per day | 3/ to 5/ | 5/ | 5/ | 5/ | |||||
| 5. MISCELLANEOUS. | |||||||||
| General labourers, without board, per day | 5/ to 7/ | 6/ | 8/ | 6/ to 8/ | 7/ | 6/ to 7/ | 9/ | 6/ to 8/ | 5/ to 8/ |
| Stonebreakers, without board, per cubic yard | 3/6 to 4/6 | 3/ | 2/6 | 2/6 | 2/6 | 2/ to 3/ | |||
| Seamen, with board, per month | £4 | £5 to £6 | £6 | £6 | £4 to £8 | £4 to £6 | £210—£410 | ||
| Miners, without board, per day | 8/Per day. | ..Per day. | ..Per day. | ..Per day. | 8/Per day. | 7/ to 8/Per day. | 10/Per day. | 9/ to 10/Per day. | 8/ to 10/Per day. |
| Engine-drivers, without board | 9/ | 10/ | 10/ | 8/ to 15/ | 8/ | 12/Per week. | 10/ to 12/ | 7/ to 10/ | |
| Tailors, without board | 8/ | 8/ | 8/ to 10/ | 8/ to 10/ | 8/ | 7/ to 9/ | 60/ | 10/ | 6/ to 10/ |
| Tailoresses, without board | 3/ to 4/ | 6/ | 8/ to 6/ | 3/ to 5/ | 5/ | 2/ to 6/ | 35/Per day. | 2/6 to 5/ | 2/ to 5/ |
| Dressmakers, without board | 2/ to 3/ | 6/ | 3/ to 6/ | 2/6 to 5/ | 5/ | 4/ to 6/Per week. | 3/Per week. | 2/6 to 5/ | 2/ to 4/2 |
| Milliners, without board | 3/ to 5/ | 5/ | 4/ to 6/ | 3/ to 6/ | 5/ | 20/ | 40/ | 2/6 to 5/ | 2/ to 5/ |
| Machinists, without board | 2/6 to 3/6 | 6/ | 5/ to 7/ | 2/6 to 5/Per week. | 5/ | 15/Per day. | 20/ | 3/6 to 5/ | 4/ to 5/ |
| Storekeepers, without board | 10/ to 15/ | 50/ to 80/ | 10/ | 6/8 Per week. | 70/ | 7/6 to 12/ | 5/ to 15/ | ||
| Storekeepers’ assistants, without board | 5/ to 9/ | 4/ | 5/ to 8/ | 40/ to 50/ | 6/ | 30/ | 50/ | 5/ | 2/ to 10/ |
| Drapers’ assistants, without board | 4/ to 10/ | 4/ | 7/ to 10/ | 40/ to 60/ | 8/ | 40/ | 60/ | 7/6 to 10/ | 3/6 to 15/ |
| Grocers’ assistants, without board | 3/ to 9/ | 4/ | 7/ to 9/ | 40/ to 60/ | 6/ | 40/ Per day. | 50/ | 7/6 | 2/ to 10/ |
| Butchers, | 4/ to 6/ | 7/ | 8/ to 10/ | 40/ to 60/ | 7/ | 7/ | 50/ | 8/4 | 3/6 to 10/ |
| Bakers, without board | 5/ to 10/ | 7/ | 9/ | 50/ to 60/ | 7/ | 8/Per week. | 60/ | 8/ | 5/ to 12/ |
| Storemen, without board | 4/ to 9/ | 6/ | 8/ | 40/ to 50/ | 8/ | 45/ | 60/ | 7/6 | 8/ to 10/ |
| Compositors, without board | 5/ to 10/ | 8/ | 10/ | 60/ | 8/ | 50/ to 60/ | 60/ | 10/ to 12/ | 7/ to 12/ |
AVERAGE PRICES OF PRODUCE, LIVE-STOCK, PROVISIONS, ETC., IN EACH PROVINCIAL DISTRICT OF NEW ZEALAND DURING THE YEAR 1893.
| Produce, &c. | Auckland. | Taranaki. | Hawke's Bay. | Wellington. | Marlborough. | Nelson. | Westland (Goldfield). | Canterbury. | Otago (Part Goldfield). |
|---|---|---|---|---|---|---|---|---|---|
| I. AGRICULTURAL PRODUCE. | |||||||||
| Wheat per bushel (60lb.) | 2/9 | 3/9 | 3/3 | 3/ to 3/6 | 2/9 | 3/ | 3/3 | 2/6 | 2/9 to 3/6 |
| Barley per bushel (47lb.) | 3/ | 3/6 | 3/ | 3/ to 4/ | 3/ | 3/ | 3/ | 3/7 | 2/6 to 3/6 |
| Oats per bushel (40lb.) | 2/6 | 3/ | 3/ | 2/6 to 2/9 | 2/5 | 2/ | 2/9 | 1/11 | 2/ to 2/6 |
| Maize per bushel (56lb.) | 2/10 | 4/ | 3/6 | 3/ to 4/6 | 4/ | 3/6 | 4/ | 3/10 | 4/3 |
| Bran per bushel (20lb.) | 9d. | 1/6 | 1/6 | 7 1/2d. to 1/ | 1/ | 1/ | 1/ | 6d. | 9d. to 1/3 |
| Hay per ton | £4 | £4 | £3 5/ | £210/ to £4 | £3 | £4 | £4 | £2 10/ | £3 to £3 10/ |
| II. FLOUR AND BREAD. | |||||||||
| Flour, wholesale per ton of 2,000lb. | £8 10/ | £8 10/ | £9 10/ | £810/ to £9 | £9 10/ | £9 10/ | £10 | £9 | £7 10/-11 |
| Flour, retail per bag of 50lb. | 5/ | 5/6 | 6/ | 5/8 to 5/6 | 5/ | 6/ | 6/ | 4/10 | 4/ to 7/ |
| Bread per 4lb. loaf | 5d. | 6d. | 6d. | 6d. | 7d. | 7d. | 7d. | 5d. | 4d. to 7d. |
| III. LIVE-STOCK AND MEAT. | |||||||||
| Horses, draught per head | £15 to £35 | £25 | £25 | £19 to £30 | £26 | £25 | £30 | £16 | £20 to £25 |
| Horses, saddle and harness per head | £4 to £16 | £12 | £15 | £7 10/-16 | £18 | £15 | £15 to £20 | £12 | £10 to £15 |
| Cattle, fat per head | £5-10 10/ | £410-610 | £7 10/ | £6 to £7 | £8 | £6 10/ | £10 | £11 | £6 to £8 10/ |
| Cattle, milch cows per head | £3 to £7 10/ | £5 | £7 | £5 to £6 | £8 | £5 | £7 | £8 | £5 10/ to £7 |
| Sheep, fat per head | 9/ to 16/ | 11/6 | 10/ | 8/ to 10/ | 12/ | 11/ | 18/ | 15/ | 12/ to 17/ |
| Lambs, fat per head | 6/ to 14/ | 8/ | 7/ | 6/6 to 9/ | 8/ | 10/ | 15/ | 11/ | 8/ to 10/ |
| Butchers’ meat: | |||||||||
| Beef per lb. | 5d. | 3d. | 5d. | 4d. to 5d. | 6d. | 4d. | 5d. | 4d. | 4d. to 6d. |
| Mutton per lb. | 3 1/2d. | 3d. | 4d. | 3d. to 4d. | 4d. | 3 1/4d. | 5d. | 3d. | 3d. to 5d. |
| Veal per lb. | 3 3/4d. | 3d. | 4d. | 4d. to 6d. | 5d. | 3 1/2d. | 5d. | 4d. | 3d. to 6d. |
| Pork per lb. | 5d. | 4d. | 5d. | 4d. to 6d. | 6d. | 4d. | 5d. | 6d. | 5d. to 6d. |
| Lamb per lb. | 4d. | 4d. | 5d. | 5d. to 6d. | 4d. | 4d. | 6 1/2d. | 4 1/2d. | 3d. to 6d. |
| IV. DAIRY PRODUCE. | |||||||||
| Butter, fresh per lb. | 9d. | 9d. | 1/ | 8d. to 1/ | 9d. | 8d. | 1/3 | 10d. | 9d. to 1/ |
| Butter, salt per lb. | 8d. | 6d. | 8d. | 7d to 8d. | 7d. | 7d. | 1/ | 8d. | 8d. to 9d. |
| Cheese, colonial per lb. | 5d. | 7d. | 6d. | 6d. to 8d. | 6d. | 7d. | 7d. | 5d. | 5d. to 8d. |
| Cheese, imported per lb. | 9d. | 1/ | 8d. to 1/3 | 1/ | 1/6 | 1/9 | |||
| Milk per quart | 3d. | 4d. | 3d. | 3d. | 3d. | 4d. | 6d. | 3d. | 3d. to 4d. |
| V. FARM-YARD PRODUCE. | |||||||||
| Geese per pair | 10/ | 5/ | 9/ | 4/ to 7/6 | 5/ | 5/ | 7/6 | 5/ | 6/ |
| Ducks per pair | 3/6 | 4/ | 4/6 | 3/ to 5/ | 4/ | 4/6 | 5/ | 3/ | 4/ to 4/6 |
| Fowls per pair | 2/6 | 3/ | 4/ | 2/ to 3/6 | 2/6 | 2/6 | 3/6 | 2/6 | 2/ to 2/6 |
| Turkeys per head | 5/ | 5/ | 5/ | 4/ to 8/ | 6/ | 3/ | 7/6 | 6/6 | 4/ to 8/ |
| Bacon per lb. | 9d. | 8d. | 9d. | 6d. to 9d. | 7d. | 8d. | 9d. | 9d. | 7d. to 9d. |
| Ham per lb. | 11d. | 11d. | 10d. | 8d. to 10d. | 9d. | 10d. | 10d. | 9d. | 9d. to 10d. |
| Eggs per doz. | 10d. | 9d. | 1/3 | 9d. to 1/ | 9d. | 8d. | 1/6 | 10d. | 10d. to 1/ |
| VI. GARDEN PRODUCE. | |||||||||
| Potatoes, wholesale per ton | £5 | £6 | £4 10/ | £3 10/ to £5 | £3 | £4 | £8 | £4 10/ | £4 to £8 |
| Potatoes, retail per cwt. | 5/ | 7/ | 6/ | 5/ to 5/6 | 4/ | 6/ | 10/ | 5/6 | 4/6 to 10/ |
| Onions per lb. | 1d. | 3d. | 3d. | 1 1/2d. to 2d. | 3d. | 1d. | 2d. | 2d. | 1d. to 3d. |
| Carrots per doz. bnchs. | 1/ | 2/ | 1/9 | 10d. to 1/6 | 1/ | 2/ | 3/ | 1/6 | 6d. to 2/ |
| Turnips per doz. bnchs. | 1/ | 2/ | 1/9 | 9d. to 1/6 | 1/ | 2/ | 3/ | 1/6 | 6d. to 2/ |
| Cabbages per doz. | 2/ | 2/ | 2/ | 1/ to 2/ | 3/ | 2/6 | 3/ | 2/ | 9d. to 3/ |
| VII. MISCELLANEOUS ARTICLES. | |||||||||
| Tea per lb. | 2/ | 2/ | 2/6 | 2/ to 3/6 | 2/6 | 2/3 | 2/6 | 2/ | 1/6 to 2/6 |
| Coffee per lb. | 1/9 | 1/10 | 1/8 | 1/6 to 2/ | 1/9 | 1/9 | 1/9 | 1/5 | 1/4 to 2/ |
| Sugar per lb. | 3d. | 3d. | 3d. | 3d. to 5d. | 4d. | 3d. | 3 1/4d. | 2 3/4d. | 2 3/4d. to 4d. |
| Rice per lb. | 2 3/4d. | 3d. | 3d. | 3d. | 3 1/2d. | 3d. | 3d. | 2 1/2d. | 2 1/4d. to 3d. |
| Salt per lb. | 1d. | 1d. | 1d. | 1d. | 1d. | 1d. | 1 1/2d. | 1d. | 1/2d. to 2d. |
| Soap per cwt. | 18/ | 10/6 | 22/ | 16/ to 28/ | 20/ | 16/ | 17/6 | 16/ | 12/ to 18/ |
| Candles per lb. | 6d. to 10d. | yd. | 9d. | 6d. to 10d. | 9d. | 8d. | 9d. | 6d. | 5 1/4d. to 7d. |
| Tobacco per lb. | 4/6 to 6/6 | 6/ | 5/6 | 5/ to 7/ | 6/6 | 6/ | 6/ | 5/ | 5/ to 6/ |
| Coal per ton | 24/ to 30/ | 45/ | 40/ | 36/ to 50/ | 40/ | 30/ | 25/ | 30/ | 20/ to 25/ |
| Firewood per cord | 23/ | 20/ | 32/ | 20/ to 40/ | 28/ | 22/6 | 25/ | 38/ | 15/ to 30/ |
| VIII. BEER, WINE, SPIRITS. | |||||||||
| Beer, colonial per hhd. | £4 5/ | £4 10/ | £4 15/ | £3 10 to £4 5/ | £4 13/ | £5 | £4 15/ | £3 15/ | £4 10—£5 3 |
| Beer, English, bottled per doz. qts. | 13/ | 16/ | 14/ | 10/ to 13/6 | 16/6 | 14/ | 15/ | 12/ | 12/6 to 18/ |
| Brandy per gallon | 27/ | 30/ | 26/ | 27/6 to 36/ | 25/ | 25/ | 25/ | 25/ | 23/ to 26/ |
| Rum per gallon | 27/ | 27/6 | 24/ | 26/ to 28/ | 24/ | 22/6 | 23/ | 26/6 | 21/ to 24/ |
| Whisky per gallon | 27/ | 30/ | 26/ | 27/6 to 30/ | 25/ | 24/ | 24/ | 24/6 | 22/ to 27/ |
| Gin per gallon | 27/ | 27/6 | 24/ | 25/ to 26/ | 24/ | 22/6 | 25/ | 22/6 | 20/ to 23/ |
| Wine, Australian per gallon | 15/ | 15/ | 17/6 | 16/ to 19/ | 13/ | 13/6 | 15/ | 9/6 to 15/ | 10/ to 18/ |
| Wine, European per gallon | 18/ | 25/ | 19/6 | 15 to 30/ | 15/ | 15/6 | 18/ | 25/ | 16/ to 20/ |
Table of Contents
E. G. Pilcher, Secretary to the Railway Commissioners.
“NEXT to a prolific soil and the possession of great natural resources otherwise, there is,” says a prominent English writer on the subject, “no adjunct of material progress that is so generally important and exercises so vital an influence on national characteristics as the growth of the railway system. “This being so, the Colony of New Zealand may fairly claim to he supplied with the principal requirements for well-being and prosperity, inasmuch as Nature has provided, the former, and the enterprise of its inhabitants has attended to the latter.
When the extent and magnitude of railway operations at the present day is considered, it seems hardly credible that but little more than sixty years have elapsed since the inauguration in Great Britain of railway communication, the marvellous development of which has been such a remarkable feature of the progressive Victorian era. It was about the time when the period of excitement known as the “railway mania “was agitating England that affairs in the far-off and then little-known islands of New Zealand were beginning to assume an aspect; of tranquillity. The Proclamation constituting the infant settlements a separate colony under British sovereignty had been made but a few years previously—indeed, almost concurrently with the opening of the London and Birmingham Railway, one of the first important connections between a manufacturing centre and a seaport.
It was thus impossible for many of the colonial pioneers to have seen a railway, or to have participated in the great social changes which immediately followed on the initiation of this novel mode of transit.
The march of events proceeded so rapidly that by the time later settlements were formed there were among the colonists many who had a keen perception of the advantages that would attend the introduction of railways into the new countries they were helping to found. The progress of colonisation was, however, naturally, somewhat slow in those days, and it was not until 1860 that a contract was let for the construction of the first New Zealand railway; although in the neighbouring colonies of New South Wales and Victoria, where the gold discoveries had attracted larger populations, railways had been running some years previously, the first turf of the first railway in the Australian Colonies having been turned near Sydney, on the 3rd July, 1850. Ten years later the enterprising settlers of Canterbury, New Zealand, obtained parliamentary sanction for the promotion of a railway to overcome the natural difficulties in the way of communication between Christchurch, the chief town, and Lyttelton, the seaport, and generally to facilitate intercourse between the port and the country. A high range of hills divided the towns, the only means of access at that time being by two difficult roads around the base of the range, and by the Heathcote River, which was obstructed by a shifting sand-bar. The first portion of this line was completed and opened for traffic on the 1st December, 1863; and, until the piercing of the tunnel through the dividing-range was accomplished, traffic was carried on by means of the river and the opened portion of the line as far as Ferrymead Junction. An account of the opening is given in theIllustrated London News of 5th March, 1864, which states that “the ceremony was performed by his Honour the Superintendent, who, with his Executive, and other members of the Government, made the first trip down the line. The event, as may be supposed, was one of no ordinary interest to the province, and drew together a large number of inhabitants. Trains continued to run up and down throughout the day, and afforded gratuitous rides, as well as immense amusement, to crowds of colony-bred young people, to whom a ride in a railway-train was, perhaps, a novelty, as well as to many others who had not enjoyed that mode of conveyance since they emigrated from the Old Country. The day's festivities were crowned with adéjeÛner, given by Messrs. George Holmes and Edward Richardson [now Hon. E. Richardson, C.M.G.], the enterprising contractors, to which more than five hundred invited guests sat down. The sturdy Maoris, too, who had laboured as ‘navvies,’ were not forgotten, but were regaled by their employers in good old English style. “The completion of the remaining portion of the line to Lyttelton, opened on the 1st December, 1867, including the great work of piercing the tunnel, a mile and a half in length, through the dividing-range, was also hailed with great rejoicing. Pending the completion of this work, lines were also being proceeded with inland towards the Canterbury Plains, and other provinces were not slow to follow the example of Canterbury.
In 1863 the Provincial Council of Auckland put in hand the construction of a line between Auckland and Drury, with a branch to Onehunga; and it is interesting to note that this railway was projected in view of the ultimate establishment of a main trunk line to Wellington, although the immediate necessity which gave rise to the undertaking appears to have been the want of military transport to the seat of war in the Waikato. Fighting was suspended, however, and the railway was not finished for some years later, after undergoing many vicissitudes. In the same year an Act was passed to authorise the construction of the Bluff Harbour and Invercargill Railway by the Provincial Council of Southland, and this line was finished and opened for traffic on the 5th February, 1867. At a later date it was extended inland to Winton, and many odd stories are told of the primitive style of travelling on this portion, which was little better than a broad-gauge wooden tramway.
Meantime the Province of Marlborough had been making strenuous efforts to obtain railway communication between Picton and the “Wairau district; and eventually an Act was passed, in 1865, authorising its promotion by a company; but the undertaking lapsed, and was not revived until the public-works policy was proceeded with.
In view of the probable extension of railway enterprise, the question of what should be the proper gauge for lines constructed in the colony had not been lost sight of. As early as 1860, the Government were asked, in regard to the Lyttelton-Christchurch line, then under construction, what steps had been taken to ascertain this important particular. The reply was that, on the recommendation of the late Robert Stephenson, the oft. 6in. gauge had been adopted as best suited to the circumstances of the colony. The gauge of oft. 3in., known as the Irish gauge, was, however, afterwards approved and used for the Canterbury lines; and this decision must have been further modified later, for we find that the Auckland—Drury, Dunedin-Clutha, Nelson-Foxhill, and other lines were originally laid out or projected on the standard English gauge of 4ft. 8 1/2in. Had the construction of railways proceeded piecemeal by the provinces in the fashion it commenced, no doubt the inconvenience and expense now being experienced in Australia would have found a counterpart in this colony; but the inauguration of the public-works policy finally settled the question as far as New Zealand was concerned.
Up to 1870 there were in operation forty-six miles of railway only. In that year, when the colony was feeling the disheartening effects of the Native war, then just ended, the Colonial Treasurer, Mr. (now Sir Julius) Vogel, promulgated his famous public-works policy, under which some ten millions of pounds were borrowed from the British capitalist and expended in the encouragement of immigration, the construction of railways and roads in all parts of the colony, the extension of telegraphic communication, the supply of water to the goldfields, and the purchase of Native lands. The primary object of the scheme was the final settlement of the Native difficulties in the North Island. Provision having been made by Parliament for the necessary borrowing powers and administration, the Railways Act of 1870 authorised certain lines to be constructed on specified terms, and surveys of others to be made for consideration by the General Assembly. Of these lines the extensions in Canterbury were vigorously carried on out of provincial funds. Authority had been given to construct others on terms involving a guarantee by the colony of 5 1/2 per cent. interest; these were held over, pending negotiations with English capitalists; and, finally, arrangements were made on modified terms with Messrs. Brogden and Sons, the well-known English railway contractors, for the construction of several sections of light narrow-gauge lines, which were designed with a view to the early production of revenue, and at some sacrifice of convenience in travelling and in working. Severe gradients were adopted in preference to expending large sums for flatter lines; and, similarly, curves of sharp radius were allowed in place of easier but more costly routes.
Unfortunately, the inception of the scheme gave rise to so many demands from all parts of the country that considerable variations had to be made in the original proposals, with the result that railway accommodation has in some parts been provided in advance of actual requirements, thus reducing the productiveness of the system as a whole.
The increase of population and the growing settlement of the country have further rendered necessary considerable alterations in the original character of the lines and their equipments, and, in order to keep up with popular demands and increased traffic, continual improvement is going on in the more advanced districts.
In 1876, the abolition of the provinces placed the earlier-constructed railways in the hands of the General Government, and the gauge of the line in Canterbury was assimilated to that of the Government system. At the present time the gauge all over the colony is 3ft. 6in., and, although the greater part of the permanent-way was originally laid in 40lb. material, the increase of traffic has since compelled its renewal in heavier metals, and a uniform weight of 53lb. steel rail is now nearly always used in this process.
There are now open for traffic 1,948 miles of railway, the construction of which has cost about £7,770 per mile. This includes the expenditure on the Provincial Government lines, and the purchase-money paid for district railways built by local syndicates and taken over by the Government, also the cost of rolling-stock and equipments. There are in addition 164 miles of private lines in the colony, of which the principal is the Wellington-Manawatu Railway, connecting the capital with the main trunk line through the North Island. The lines under construction by the New Zealand Midland Company, incorporated for the purpose of connecting the east and west coasts of the Middle Island and Nelson, will, when that purpose is accomplished, form no inconsiderable portion of the colonial system. At present the only portions open for traffic are the lines from Brunner to Reefton, 39 miles, on the Greymouth. Nelson Section, and from Stillwater to Jackson, 31 miles, and Springfield to Kowai, 5 miles, at the respective ends of the Grey-mouth-Christchurch Section.
In spite of many peculiar disadvantages, due chiefly to the physical configuration of the country, the New Zealand railways have realised profits nearly sufficient to cover the total interest payable on the cost of construction—a result which may be considered satisfactory when it is remembered that they were not constructed with that expectation. The average rate of interest earned for the past twelve years is about three per cent. This is sufficiently accounted for by the large mileage of railway in proportion to the population, the location of the latter along the coast-line mainly, the active competition of water-carriage against the railways at many points, the very short distances over which traffic can be carried, the importation by sea of the great proportion of mercantile products which are used by the inhabitants, the extension of the railways inland to mountainous and pastoral districts almost devoid of settlement, which together form such a combination of circumstances adverse to the railway system as probably has no parallel in any other country. The imposition of rates for carriage has also to be largely guided by the peculiar circumstances attending colonial settlement.
The whole railway system of the colony is at present divided into eleven sections, all varying in their characteristics. The Kawakawa and Whangarei Sections, in the extreme north, are at present short lines to coalfields, but in course of time will no doubt be extended to tap largo timber-areas further inland, a class of country for which also the Kaihu Section (17 miles), recently taken over by the Government, was originally constructed by a private company. The Auckland Section forms the northern portion of the North Island Main Trunk Railway, terminating eventually at Wellington, on the shores of Cook Strait, and traversing in its course immense forests of valuable timber and a large area of rich country. By means of its branches, also, the marvellous regions of the Thermal-springs District are brought within easy reach of the traveller for health and excitement. The Napier (114 miles), Taranaki (218 miles), and Wellington (92 miles) group of lines serves the southern portion of the North Island, and these sections are well supplied with business arising from the frozen-meat industry and timber trade, besides live-stock, and general traffic incidental to the rapid growth of settlement in the grand pastoral country through which the lines run.
In the northern portion of the Middle Island the character of the country has prevented little more than the first link in the chain of through communication being accomplished. On the West Coast, however, the lines and harbour-works constructed for the purpose of developing the vast mineral wealth of that region have been highly successful, and rank among the best-paying portions of the system. During last year 134,000 tons of coal and coke were carried over the Greymouth Section, and 240,000 tons over the Westport line. In connection with the latter, the Westport Coal Company's incline, between the mine and the railway, deserves special reference as a peculiar and almost unique specimen of engineering work.
It is on the East Coast, however, that the actual working portion of the main trunk line is to be found. The present terminus is Culverden, from whence extension will be made northward. From Culverden to Amberley the country is but sparsely settled; but beyond that point to Christchurch there are numerous small farms and holdings. Around Christchurch are branch lines in various directions, serving districts of more or less importance. The main line proceeds south across the extensive Canterbury Plains, touching at Rakaia, Ashburton, and Timaru, all centres of large agricultural and pastoral districts. Near Oamaru the character of the country changes to undulating limestone-downs of great fertility, and particularly well adapted for the growth of wheat. Approaching Dunedin the line has to pass through some hilly country, involving some heavy cuttings and tunnelling. Between Christ-church and Dunedin a daily express - train is run, doing the distance—230 miles—in nine hours and three-quarters including stoppages.
In the country south, and on to Invercargill and the Bluff, the southernmost port in the colony, and, indeed, all along the line from Christchurch, evidences may be seen on every side of industrial enterprise in the shape of meat-preserving and freezing works, chemical manufactories, dairy factories, coal-mines, sawmills, and timber dépôts, all of which assist in the production of traffic, the development of which is generally regarded as an indication of the colony's progress. Large supplies of brown coal are drawn from the mines in the Canterbury and Otago Districts, and are used for locomotive purposes, in addition to meeting the local requirement for home consumption.
The management of the New Zealand State railways was a few years ago placed by Parliament in the hands of three Commissioners, and freed from party control, although still remaining subject to parliamentary direction. The respective sections are under the control of local District Officers, representing the traffic, locomotive, and maintenance branches, except on the smaller lines, where one officer combines the three charges. At head-quarters the two latter branches are controlled by a Locomotive Superintendent and a Chief Engineer respectively, the traffic branch being directly under the supervision of the Commissioners. The total number of men employed in all ranks is about 4,500.
There are workshops at all the large centres, the principal one being at Addington, near Christchurch, at which, for many years, the building of rolling-stock, and more recently the construction of locomotives, has been successfully carried on.
Prior to 1872, when operations under the public-works policy commenced, there were only 65 miles open for traffic. On the 31st March, 1894, twenty-two years later, there were 1,948, producing a gross annual revenue of £1,172,793; the net revenue being £437,434, equal to a dividend of £2 17s. 9d. per cent. on the total cost of all opened lines to that date.
Nearly all the stations are connected by telegraph or telephone, and at many of them the combined duties of a post- and telegraph-office are carried on. As regards signalling, the lines are practically all single track, and do not require elaborate arrangements in that respect. On portions where extra precaution is necessary, the “Winter” block system is in operation. The “Vacuum” automatic brake is in use in some parts.
The working-expenses of the lines for the year ending the 31st March, 1894, amounted to £735,359, absorbing 62.70 per cent. of the receipts; but, as the cost of improvement in renewing rails and in reconstructing rolling-stock, and more permanent structures, is borne by working-expenses, they are thus made to appear heavier than they otherwise would do.
The gradual but steady growth of the business of the railways is illustrated by the following table, taken from the latest annual report of the Commissioners:—
COMPARISON OF TRAFFIC, REVENUE, AND EXPENDITURE FOR THE LAST FIFTEEN FINANCIAL YEARS.
| Year. | Miles | Revenue. | Expenditure. | Expenditure per Cent. of Revenue. | Tonnage. | Parcels, Horses, and Dogs. | Cattle, sheep, and Pigs. | Passengers. | Season tickets |
|---|---|---|---|---|---|---|---|---|---|
| £ | £ | No. | No. | No. | .No. | ||||
| 1879–80 | 1,172 | 762,573 | 580,010 | 76.06 | 1,108,108 | 180,331 | 285,209 | 2,967,090 | 5,077 |
| 1880–81 | 1,277 | 836,454 | 521,957 | 62.40 | 1,377,783 | 286,865 | 300,704 | 2,849,561 | 6,499 |
| 1881–82 | 1,319 | 892,026 | 523,099 | 58.64 | 1,437,714 | 316,611 | 343,751 | 2,911,477 | 7,207 |
| 1882–83 | 1,358 | 953,347 | 592,821 | 62.18 | 1,564,793 | 341,186 | 477,075 | 3,283,378 | 8,621 |
| 1883–84 | 1,396 | 961,304 | 655,990 | 68.24 | 1,700,040 | 359,896 | 686,287 | 3,272,644 | 9,036 |
| 1884–85 | 1,477 | 1,045,712 | 690,026 | 65.99 | 1,749,856 | 347,425 | 729,528 | 3,232,886 | 8,999 |
| 1885–86 | 1,613 | 1,047,419 | 690,340 | 65.91 | 1,823,767 | 349,428 | 858,662 | 3,362,266 | 10,717 |
| 1886–87 | 1,727 | 998,768 | 699,072 | 69.99 | 1,747,754 | 372,397 | 942,017 | 3,426,403 | 11,821 |
| 1887–88 | 1,758 | 994,843 | 687,328 | 69.09 | 1,735,762 | 399,109 | 940,209 | 3,451,850 | 11,518 |
| 1888–89 | 1,777 | 997,615 | 647,045 | 64.86 | 1,920,431 | 399,056 | 919,392 | 3,132,803 | 11,817 |
| 1889–90 | 1,809 | 1,095,570 | 682,787 | 62.32 | 2,073,955 | 405,838 | 1,068,575 | 3,376,459 | 12,311 |
| 1890–91 | 1,842 | 1,121,701 | 700,703 | 62.47 | 2,086,011 | 413,074 | 1,348,364 | 3,433,629 | 13,881 |
| 1891–92 | 1,869 | 1,115,432 | 706,517 | 63.34 | 2,066,791 | 430,216 | 1,153,501 | 3,555,764 | 16,341 |
| 1892–93 | 1,886 | 1,181,522 | 732,142 | 61.97 | 2,193,330 | 460,383 | 1,393,457 | 3,759,044 | 16,504 |
| 1893–94 | 1,948 | 1,172,793 | 735,359 | 62.70 | 2,060,645 | 486,787 | 1,433,679 | 3,972,701 | 17,226 |
For the past year the tonnage of the principal products of the colony carried over the railways was: Wool, 101,340 tons; timber and firewood, 267,850 tons; grain, 411,191 tons; minerals, 864,538 tons. There was a considerable decrease in the quantity of grain forwarded during the past year, owing to a poor harvest and a fall in prices.
The receipts from passenger traffic were £402,019, including season tickets, £23,540.
The average revenue per mile of railway was £613 3s. 2d., and the average expenditure £384 9s. 3d., equal to 7s. 6 1/4d. and 4s. 8 1/2d. per train-mile respectively.
The cost of maintenance per mile for last year, 1893–94, was £140 3s. 8d.
The total number of miles travelled by trains was 3,113,231; and the statement below shows the traffic ton-mileage and rate of working for the five chief sections of the system for four years:—
| Section. | 1890–91. | 1891–92. | 1892–93. | 1893–94. | ||||
|---|---|---|---|---|---|---|---|---|
| Ton-mil'ge | d | Ton-mil'ge | d. | Ton-mil'ge | d. | Ton-mil'ge | d. | |
| Auckland | 9,228,869 | 1.85 | 9,899,396 | 1.76 | 10,146,797 | 1.80 | 10,508,134 | 1.80 |
| Napier-Taranaki | 10,093,156 | 2.51 | 11,710,544 | 2,15 | 13,205,014 | 2.15 | 13,581,490 | 2.23 |
| Wellington | 5,063,457 | 2.35 | 5,632,828 | 2.11 | 5,816,437 | 2.21 | 5,999,468 | 2.02 |
| Hurunui-Bluff | 53,350,677 | 1.93 | 50,106,636 | 2.00 | 51,699,231 | 2.04 | 51,221,958 | 1.92 |
| Totals | 77,736,159 | 2.02 | 77,349,404 | 2.00 | 80,867,479 | 2.04 | 81,311,050 | 1.97 |
There are 268 locomotives of various classes in use on all lines, ranging from the light shunting-engine of 11 tons weight to the larger goods-engines of English and American types, 54 tons in weight. There are also in use several locomotives built in the colony, the principal being those recently constructed in the Addington workshops, and specially designed by the local officers for working over heavy grades at moderate speeds.
Of carriages, first-class, second-class, and composite, there are 496, including several saloon cars of a special design for express and tourist traffic. There are 8,418 wagons in use, a number of these being specially constructed to serve the frozen-meat industry, which forms so large a proportion of the traffic in some districts.
The passenger fares on the New Zealand railways are generally at the rate of 2 1/2d. per mile first-class, and 1 2/3d. per mile second-class; the return fare being calculated at one-third increase on these rates. For suburban and local traffic, however, the rates are much lower; in some cases of commutation tickets being as low as 7/8d. first-class, and id. second-class, per mile; white excursion and tourist traffic is encouraged by greatly reduced fares during the season for such business.
Compared with the Australian lines, which are better circumstanced as regards the absence of competition, and as serving a larger population, especially in suburban areas, the New Zealand railways may be said to fairly hold their own. The principal points of interest in the working of the chief colonial lines are. shown in the following comparisons:—
| Colony. | Train-miles run. | Gross Earnings per Train-mile. | Cost per Train-male | Population (estimated). | Miles open per 1,000 of Population. |
|---|---|---|---|---|---|
* To 30th Juno, 1893. † To 31st March, 1894. | |||||
| Victoria* | 10,775,134 | 6517 | 41.21 | 1,170,330 | 2.54 |
| New South Wales* | 7,505,310 | 93.60 | 55.59 | 1,210,510 | 1.94 |
| South Australia* | 3,670,390 | 65.85 | 41.86 | 336,413 | 4.95 |
| Queensland* | 3,755,655 | 65.25 | 40.75 | 426,798 | 5.56 |
| New Zealand* | 3,113,231 | 90.25 | 56.69 | 676,749 | 2.88 |
| Colony. | Miles open. | Cost of Construction. | Net Revenue. | Rates of Interest. | Percentage of Expenditure to Revenue. |
|---|---|---|---|---|---|
| £ | £ | ||||
| Victoria* | 2,975 | 37,462,372 | 1,075,657 | 2.87 | 63.23 |
| New South Wales* | 2,851 | 34,657,571 | 1,188,540 | 3.48 | 59.39 |
| South Australia* | 1,664 | 11,936,256 | 366,937 | 3.07 | 63.56 |
| Queensland* | 2,373 | 16,230,490 | 383,788 | 2.36 | 62.47 |
| New Zealand† | 1,948 | 15,137,036 | 437,434 | 2.88 | 62.70 |
The question of results cannot, however, be decided by a glance at such figures alone. There are many factors to be taken into account when judging of the benefits gained by a country through the construction of railways. The advance of settlement, the opening up of new country and the increase in its productiveness, the provision of employment for large numbers, the cheapening of transit both for goods and passengers, and many other items, must all be reckoned as value obtained for the expenditure, in addition to the mere monetary returns; and, if this is done, the net gain to the colony due to the public-works policy must be generally admitted. Had the building of railways been left to private enterprise, there is little doubt that the colony would not at this date have been so well supplied with those means of communication which have proved so large a factor in its advancement. The construction and working of the lines by the State seems in new communities to be a necessary preliminary to the development of its resources, for private undertakings are to a great extent controlled by the expectation of immediate returns, which in the case of the State can well be deferred so long as collateral advantages are being obtained in other directions.
BY NORMAN H. M. DALSTON, Acting General Manager.
The New Zealand Midland Railway Company (Limited) is what is generally known as a “land-grant” railway constructing corporation, and was formed in England in 1886 by a syndicate taking over a contract, dated 17th January, 1885, entered into between the Government of New Zealand and certain New Zealand gentlemen.
That contract was subsequently annulled, and a new one, dated 3rd August, 1888, entered into between the New Zealand Government and the present company. This contract provides, amongst other matters, that the company shall construct a line from Springfield in Canterbury to Brunnerton in Westland., thence by way of Reefton, to Belgrove, in Nelson, the entire distance being about 235 miles, of which eighty-two miles have been completed. As an inducement to the company to build the railway, all Crown lands remaining at the time of signing this contract in the Provincial Districts of Canterbury, Westland, and Nelson (aggregating about 6,000,000 acres, and of an estimated value of £3,150,000) were ear-marked, and cut up into blocks, each block being valued in a schedule attached to the contract, and none at less than 10s. per acre. The entire line was divided into sections, for the purpose of allocating the proportionate estimated cost of the construction of each particular section; the company, upon the completion of a section, being enabled to select blocks of land in any of the three mentioned provincial districts upon the basis of 10s. worth of land for each £1 spent upon the construction of the railway. The company has, in almost every instance, sold the lands so earned, and at prices realising on an average about 35 per cent. over the schedule value.
So far, the largest expenditure has been devoted to the Nelson division, of which a section of thirty-nine miles has been completed and opened between Brunnerton and Reefton, and also a section of about seven miles formed from the Belgrove end.
The Reefton section of railway runs up the valleys of the Grey and Mawhera-iti Rivers, is tunnelled through the watershed range, and descends to the Inangahua Valley, in which Reefton is situated. Following a course parallel to rivers which receive the drainage of 1,600 square miles, fed by an average annual rainfall of not less than 90in., the line crosses a large number of tributary rivers and streams all subject to sudden and heavy floods. The cost of this section was therefore enhanced by the necessity for an unusually large amount of bridge and culvert work. Within thirty-five miles there are fifty bridges, varying in length from 22ft. to 968ft., aggregating 6,786ft., and including forty-six spans of 66ft. iron girders, twenty-eight of 44ft., 103 of 22ft., and twenty-one small timber spans; with forty-seven iron-cylinder piers, seventy-seven concrete piers and abutments, and 147 iron-bark piled piers.
A mile and a half from Brunnerton, the Christchurch and Nelson line diverges at Stillwater Junction, where the company's workshop and stores are established; and about six miles nearer Reefton, at Ngahere, are the sidings, storage-bins, and connections of the Blackball Coal Company. This company has opened and developed the Blackball Coalfield, and has connected the mines with the Midland Railway by means of an aërial tramway, three miles long, which was completed at the end of 1893. At present, all the coal produced is conveyed by railway to Greymouth, for shipment and local consumption; but, eventually, the completion of the East and West Coast Railway, and the superior quality of the coal, will enable it to command much of the large Canterbury trade. At the Belgrove end of the Nelson and West Coast division, six miles and a half of formation have been constructed, including the Spooner's Range Tunnel, which is 67 chains long, and the longest in the colony excepting that at Lyttelton. This section, when open for traffic to the Motueka Valley, will enable the settlers south of Spooner's Range to send their produce to the Nelson market, which they are unable to do at present, owing to the prohibitive expense of cartage over the range. Of the East and West Coast division, a section is completed and opened for traffic between Stillwater Junction and Jackson, situated on the south bank of the Teremakau River, 32 miles from Brunnerton. The line runs from Stillwater up the valley of the Arnold River, skirts the eastern shore of Lake Brunner, passes through extensive flat country between Mounts Tekinga and Alexander, by Lake Poerua, and crosses the Teremakau on a bridge 968ft. long.
At the Canterbury end of the division, about six miles of railway are completed, including much heavy earthwork, and a large bridge of the Kinzua type over the Kowai River. A similar, but larger bridge, is in progress over Patterson's Creek.
Between Jackson in Westland, and Patterson's Creek in Canterbury, 57 1/2 miles are uncompleted, including the Incline Section over the dividing rangevia Arthur's Pass. The line has been surveyed and staked out by the company's engineers, ready for formation. The following brief description of this section may be of interest:—
Starting from the completed railway at Jackson, which is 604ft. above Greymouth high-water level, the line continues up the valley of the Teremakau, and its tributary, the Otira, to Goat Creek, where the Otira Station will be situated, 42 miles 70 chains from Brunnerton, and 1,252ft. above high-water level. This will be the marshalling station, connecting the flat grade and incline systems. The line from Brunnerton to Otira has a ruling gradient of i in 60, with flat curves. From Goat Creek, the line continues up the Otira Valley and Gorge to the summit, excepting for a detour made up the Rolleston tributary for the purpose of gaining height, and has a ruling gradient of 1 in 15, with 12 1/2-chain curves. The Summit Station is 50 miles 15 chains from Brunnerton. and 45 1/4 miles from Springfield, and is at an elevation of 2,298ft. above Greymouth, or 2,990ft. above eastern high-water level. From the summit, the line descends the Bealey Gorge to the Bealey marshalling station, which is 52 miles 70 chains from Brunnerton, and 2,463ft. above high-water level, the ruling gradient and curvature being the same as on the western side. Thus the incline central-rail system is confined to a section ten miles long, ascending 1,746ft. on the western, and 527ft. on the eastern slope. Although the construction will be necessarily of a heavy and expensive character, the section when completed will be an exceedingly safe and solid one, with little or no liability to damage from slips or other causes. The works on it include 179 chains of rock-tunnels, ten in number, the longest being 53 chains, and the shortest 11/2 chains in length.
From the Bealey Station, the line proceeds down the Bealey Valley to the left-hand bank of the Waimakariri River, then crosses to the right-hand bank, which it descends to the Cass River, where it leaves the valley and makes for the saddle of Mt. St. Bernard, whence it descends by the long valley of Slovens's Creek to the Waimakariri Gorge, in which the constructed line at Patterson's Creek is situated. From the Bealey Station to Springfield the ruling gradient is 1 in 60 going east, and 1 in 50 going west.
Springfield is 1,353ft. above high-water level, or 1,737ft. lower than the summit of Arthur's Pass.
Between Bealey Station and Waimakariri Gorge the construction will not be costly, but rather below the average. The portion in the Waimakariri Gorge will be exceedingly heavy and costly, and includes fifteen tunnels, varying from 3 1/2 chains to 29 chains, and aggregating 199 1/2 chains in length; also three large Kinzua viaducts, and a great quantity of concrete, earth-work, &c.
It is only within the last three years that any practical attempt has been made in Westland to open up the timber industry. This can be accounted for by the fact of there being hitherto no railway extending into the wooded country by which the sawmiller could convey his timber to the port of shipment; therefore the business is comparatively in its infancy. It is now very apparent that the facilities offered by the Midland Company's Railway (a great portion of which passes through dense forests of magnificent timber, including red- and white-pine, red birch, and silver-pine) will lead to very considerable development of the sawmilling industry. At present there are some twenty-five mills in full work, while several others are in course of erection. The total quantity of timber exported from this district during 1893 amounted to 4,800,000 superficial feet, while 2,700,000ft. were cut for local purposes, making a total of 7,500,000ft. It is anticipated that this quantity will be doubled during the present year, as the quality of Westland timber is rapidly growing in favour in the different markets to which it is being shipped. In addition to the quantity already exported there is a large demand for railway sleepers, and at present it is presumed that orders for some 4,000,000ft. will be arranged for.
It is also reasonable to assume that, on the completion of the Midland Railway to Springfield, those engaged in sawmilling in this district may look forward to a material extension of their present trade, enabling them to supply the greater portion of the 23,000,000ft. of timber annually used in the Canterbury district.
This, with an improved condition in the Australian markets, will no doubt make the timber trade of Westland one of the most important industries of New Zealand.
It may be well to mention that the shipping facilities afforded at Greymouth have greatly improved within the last two years, enabling vessels of large tonnage to come for cargoes, thus helping to increase the timber export to the North Island ports and also Australia.
The capital of the company is £500,000, in £10 shares, of which -6250,000 has been issued and subscribed. Debentures to the amount of £745,000 have, up to the present, been issued, and 5 per cent. has been paid annually to both shareholders and debenture-holders.
To complete the construction of the east and west line, or, in other words, to connect Canterbury with Westland and Reefton, a further sum of about £1,090,500 will be required.
The head office of the company is at 61 and 62, Gracechurch Street. London, E.C.; the Engineer-in-Chief. and General Manager is Mr. Robert Wilson, F.R.S.E., M.I.C.E., &c.; and the Secretary is Mr. Æneas R. McDonell.
[Inserted for general information, but not for navigation purposes.]
Harbour Boards are constituted under special Acts of Parliament to regulate the management of harbours, and to make provision for matters connected therewith. The Boards are elective, or partly elective and partly nominated by the Government; they can impose wharfage-dues and other charges on shipping. There are at the present time twenty Harbour Boards in the colony, each having special local by-laws in force. Ports where there are no Harbour or River Boards are under direct control of the Government. In six cases the control of the harbours is vested in the Borough and County Councils.
The following are the principal harbours and rivers in New Zealand, with the depth of water at entrance and at anchorage, taken from the “New Zealand Pilot” and other official sources; also the berthage accommodation and depth of water at quayage, and other particulars of importance:—
The Auckland Harbour is an extensive land-locked estuary at the southern end of the Hauraki Gulf, on the east coast of the North Island of New Zealand. It is situated in latitude 36° 10’ S., and longitude 174° 47’ E. The outer harbour commences about six miles from the North Head, a promontory which forms the northern boundary of the inner harbour (known as Waitemata).
The inner harbour is about fifteen miles long, by a width varying from two miles at the entrance to a mile. The deep-channel has an average width of three-quarters of a mile. The harbour is completely sheltered from all winds by an outlying chain of islands and the headland above referred to, and is capable of affording safe and sheltered anchorage for the whole of the world's navies.
There is a depth of nine fathoms at low-water spring-tides, which shoals in some places to live fathoms. The tide rises and falls from 8ft. to 12ft.
The whole harbour and the approaches are lit by powerful lights, and the channels, shoals, &c., are all well and clearly marked by buoys and beacons, so that at any hour the port may be entered with safety. (Full directions as to lights, &c., are given in the “New Zealand Pilot.”)
The port has excellent appliances and conveniences for carrying on an extensive commerce. Large and commodious wharves (four in number, with numerous tees) have been erected by the port authorities close to the main streets of the city. These wharves are brilliantly lit with gas, have powerful cranes, and extensive shed accommodation for the housing of cargo. Upwards of 16,500 tons of cargo can be stored at one time in these sheds. The depth of water at the Queen Street Wharf is 26ft. at low-water ordinary springtides. There is a berthage accommodation at the wharves of nearly 14,000ft. The railway communicating with the interior runs to the end of the Railway Wharf. The export stores for frozen-meat are adjacent to the last-named wharf, and the ocean-going cargo-steamers load large quantities of frozen beef and mutton with rapidity from these stores. An abundant supply of the purest water, brought by the city waterworks from distant springs, is available at the wharves, a flow for shipping purposes of 60,000 gallons per hour being obtainable.
There are two graving docks—the “Calliope” on the northern shore, and the “Auckland” on the southern. The former is one of the biggest and most commodious docks in the world, and has, on occasions, accommodated two of the largest of Her Majesty's war vessels at the same time. Its dimensions are 525ft. in length, and 100ft. in width, with a depth of water on the sill of 33ft. The Auckland Dock, which is used for smaller vessels, is 312ft. long by 65ft. wide, and has a depth on the sill of 13 1/2ft.
There is a large staff of skilled workmen always available, and in the city there are several well-equipped foundries and engineers’ shops, so that extensive repairs can be speedily effected to vessels putting into the port to refit, &c.
The Harbour Board has made provision for the adjustment of ships’ compasses. Dolphins for vessels to swing at have been constructed in a sheltered bay, free from local attraction, about six miles from the wharves. Vessels are signalled when about thirty-miles distant from the signal station on Mount Victoria, from which there is telephone communication with the city.
Pilotage is not compulsory, because of the safety of the approaches to the harbour, but efficient pilots are provided by the Harbour Board for all vessels requiring their aid. There is a large and commodious Sailors’ Home, which has been liberally endowed through the generosity of a wealthy citizen, recently deceased (Mr. Costley). In 1893 there arrived at the port 2,301 sailing vessels, and 2,224 steamers, with an aggregate tonnage of 638,189 tons. The port charges are very low, and the dock dues are light to merchant ships, while war vessels of all nations are permitted the free use of the docks. The Harbour Board, which governs the port and harbour, is richly endowed with landed property, hence it is enabled to reduce the taxes on shipping to a minimum.
The revenue of the Board during 1893 was £34,844 8s. 11d. The port has a large and increasing trade with the South Sea Islands, and from its geographical position there can be little doubt that it will command, in the near future, the bulk of the commerce of the South Pacific.
M. Brigham, Secretary, Auckland Harbour Board; I. J. Burgess, Harbourmaster.
The former townships of Grahamstown, Shortland, and Tararu are now amalgamated in the Town of Thames, situated two miles south-eastward of Tararu Point, on the right bank of the entrance to Kauaeranga River. At the northern end of the town is a solid training-wall about 1,500ft. in length, with 350ft. of berthage-space, and having 9ft. to 10ft. of water alongside at high-water springs. Shortland Wharf is one mile south-eastward of the training-wall, on the eastern side of the mouth of the Kauaeranga River. It has 400ft. of berthage-space, and vessels drawing oft. to 6ft. can load alongside in smooth water. The depth on the bar of the Waihou (Thames River) at 4 miles from the mouth and in the channel is 16ft. at high-water springs, and 13ft. 6in. at neaps. At low water there is only 4ft. 6in. Within the mouth are three timber jetties— viz., Kopu Wharf, Kirikiri, and Turua, each with a berthage-space of 40ft. Vessels of 400 tons can be berthed at these wharves. Above Paeroa, 22 miles from the mouth, the river is navigable for only very small launches and flat punts, owing to the large amount of drainage into the channel.
William Carpenter, Secretary, Thames Harbour Board; Thomas C. Bayldon, Harbourmaster and Coastwaiter, H.M. Customs.
This harbour is 1 mile wide at the entrances, and carries a depth of upwards of 5 fathoms for nearly 1 mile inside. There is a wharf at the head of McGregor Bay with 9ft. to 10ft. alongside it at high-water ordinary springs.
This large inlet, 30 miles south-east of Cape Colville, is 5 miles wide at its entrance, and is the seat of a considerable timber trade. The least depth to be passed over by vessels proceeding to the anchorage in Mangrove River, just within the heads, is 2 1/4 fathoms at low water.
This is the only harbour on the East Coast between Mercury Bay and Port Nicholson that affords shelter in all winds for vessels of burthen. The least depth to be passed over by a vessel proceeding to the anchorage under Maunganui, or off Maketu Mound, is about 21ft. at low water, and 27ft. at high water.
There are two wharves, with berthage for vessels drawing 16ft. and 12ft. respectively. To approach the wharves the least depth is 9ft. at low water, and 15ft, at high water.
Within the south head of Tolago Bay is the cove where Captain Cook watered, and beyond is to be seen the remarkable arch in the cliffs which he has described. Several initials are cut on the rock where the artificial well exists, made by his crew.
Is 5 miles in breadth from head to head, and nearly 4 miles in depth. There are two small rivers in the bay—Turanganui and Waipaoa. The shore of the former is celebrated as the place where Captain Cook first landed in New Zealand. From the untoward circumstances attending his landing and his failure to obtain provisions, he named the bay “Poverty.”
The town of Gisborne is situated on the right bank of the Turanganui River, near the entrance. The extent of harbour-works actually constructed comprises a timber wharf and viaduct, 1,580ft. long; sea-mole, 1,100ft. (out of 1,900ft. proposed); and a training-wall in lieu of a groin on the west beach (only partly completed).*
Note
* A contract has been let, which expires presently, for an addition to the old training-wall, 360ft. towards the shore and 360ft. seawards.
James Wm. Witty, Secretary, Gisborne Harbour Board.
Nineteen miles westward of Long Point, on the north shore of Hawke's Bay, is the entrance to the River Wairoa, and eleven miles further to the south-westward is the small River Mohaka. Both entrances are difficult; the mouths also shift.
For the past three years (to June, 1894) the entrance to the Wairoa River has been exceptionally good, and open almost continuously during that period for vessels of 5ft. to 6ft. draught. The mouth of the river during that time has remained near the signal-station on the western head. Owing, however, to freshets that have occurred from time to time, the channel inside the river has shoaled very considerably during the last Few months, so much so that vessels are constantly getting stuck on the mud-flats. The Harbour Board has applied to Government for assistance to confine the river at certain points.
There are now two steamers plying between Napier and the Wairoa, the largest being of 50 tons register. The Mohaka River can be entered by vessels drawing not over 4ft. of water.
J. W. Sargisson, Secretary, Wairoa Harbour Board.
This port is the only harbour deserving the name between Tauranga and Port Nicholson. The entrance is narrow, but inside it expands into a large sheet of water. The depth at entrance between the piers at ordinary high-water springs is 15ft., at high water slack 14ft., at low water lift. 6in., and at low water slack 13ft. The length of quayage is 2,280ft. The depth at the wharves is from 8ft. to 13ft. at low water. There is one crane capable of lifting 15 tons, and good anchorage will be found in the roadstead, where vessels can load and discharge by lighters. A breakwater is in course of construction, and already affords considerable shelter. A western arm is to be constructed, thus making an enclosed harbour of 120 acres in area, with a depth up to 35ft. at low water. This harbour will give accommodation to the largest vessels afloat.
Since the breakwater has been under construction, the “bar,” which was formerly outside the entrance to the inner harbour, has disappeared.
Francis E. Saunders, Secretary, Napier Harbour Board.
This is an excellent harbour, having an area of about 20,000 acres, for the most part sheltered, with good holding ground for anchorage, and a depth of from 6 1/2 to 14 fathoms at low water. The main entrance has a clear breadth of not less than 6 cables for a distance of one and a half miles; and, the prevailing winds being in the direction of the channel, the entrance is at all times safe and easy.
The wharfage accommodation is at the City of Wellington, in the western arm of the harbour, and comprises the Queen's, Railway, and Wool Wharves, having a combined berthage of 6,880ft. lineal, with from 12ft. to 30ft. at low water; in addition to which there are 600ft. of breastwork berths, having depths at low-water of from 5ft. to 6ft., available for small coastal crafts. Extensions to the Queen's Wharf are in progress, which will give an additional length of berthage age of 600ft. When completed, there will be seven berths for ocean steamers: three with 29ft., one with 26ft., and three with 23ft. at low water. The rise and fall of the tide is from 3ft. to 4ft.
The import and transhipping trade is done for the most part at the Queen's Wharf, where ample storage accommodation is provided at each berth. The export trade is largely carried on at the Railway and Wool Wharf, where there are capacious stores in connection with the railway system, having every appliance for handling wool and hemp.
The Harbour Board act as wharfingers, receiving goods from the vessels, and taking care of them for the consignees or shippers; and, for the purpose of facilitating the cheap handling of cargo, there is a complete and elaborate system of hydraulic plant, comprising lifting-gear in all the stores and sheds, seven presses for dumping wool and hemp for shipment, and five 2-ton cranes fixed on the wharf for loading carts. There are also worked by the same system, to aid in the discharge of cargo from ocean steamers and sailing vessels, movable winches, as well as twelve movable double-powered 2-ton cranes, having variable rakes up to 32ft.; one 10-ton crane, fixed at the outer tee of the Queen's Wharf, having a similar rake, and commanding the hatches of the largest steamers entering the port; and at Jervois Quay a 40-ton derrick-crane, at a berth where the depth at low-water is 23ft. The Board have also a large brick bonded-store, where goods may be stored in bond, and a luggage-store, where passengers may leave their luggage and obtain a receipt therefor.
A Sailors’ Rest (supported by voluntary subscriptions) is provided in one of the Board's buildings.
Wellington, being situated on Cook Strait, has a considerable trade in supplying coal to steamers, a large tonnage of coal being always stored in hulks in the harbour, and vessels calling for coals are exempt from port-charges.
William Ferguson, Secretary, Wellington Harbour Board; John Holliday, Harbourmaster.
The entrance lies in the depth of the great bight between Gape Terawhiti and Cape Egmont, and about an equal distance from both. The depth on the bar is 3ft. to 6ft. at low-water springs, and 9ft. to 12ft. at high water. Vessels drawing 10ft. can load at the town wharf; vessels over 10ft. draught load at the lower anchorage, two miles from the town. The harbour extends from the mouth of the river twenty miles inland. The depth of water varies at high- and low-water springs from 13ft. to 10ft. There are two wharves—the Railway and the Cattle Wharf—aggregating 1,800ft. berthage. The breakwater in course of construction has reached a length of 900ft. from the North Head. Power of Government cranes, 5 tons.
John Notman, Secretary, Wanganui Harbour Board.
The bar of this river has shifted very little since the harbour-works have been in progress. It has a depth of 10ft. to 13ft. at high-water springs, and at neaps 7ft. to 8ft. A rubble and concrete breakwater, 955ft. long and 20ft. wide, has been constructed to keep the channel over the bar straight. The width from the breakwater to the North Spit is 139ft., the depth of water at end of and along the breakwater 17ft. The depth of water in the harbour varies from 2ft. to 6ft., and in the river-channel from 6ft. to loft., according to tide. There are two wharves—Railway Wharf, 550ft., and Town Wharf, 100ft.; the berthing space being 650ft., at which vessels from 70 to 100 tons burthen, and drawing not more than bit. to 10ft. can be accommodated.
Edward Horner, Secretary, Patea Harbour Board.
This port and roadstead is 18 miles north-eastward of Cape Egmont. A. breakwater has been constructed from a point nearly half a mile north-eastward of the main Sugarloaf. Its present extent is 1,950ft., in a N.E. by N. 1/2 N. direction.
There is a wharf south-eastward of the breakwater, with berthage of 400ft. in length on each side, which is connected with New Plymouth by railway, and has a depth of 12ft. at low water at its outer end, and 8ft. at its inner end. Berthage is on the east side of the wharf only, owing to silting up on the west side at low water.
Clarence Rennell, Secretary, New Plymouth Harbour Board.
This river is 10 miles north-eastward of New Plymouth, and its mouth is about 13 miles to the north-east of the Sugarloaf Island. Length of Railway Quay, 442ft.; depth at quay-side at ordinary springtides, high water, 10ft.; low water, 7ft. There is a bar at the entrance to the port, with 12ft. of water at high-water ordinary spring-tides and Oft. at neap-tides. Two cranes, to lift from 2 to 5 tons each, can be obtained at the Railway Quay. There are two cattle-wharves, which can be reached only by vessels drawing Oft. or less, and which have 10ft. and 12ft. respectively at high water, and oft. and 7ft. at low water. Two training-walls have been constructed to improve the channel. The south-west training-wall is 1,254ft. long, and the north-east training-wall about 700ft. The bar projects but little seaward of the line of coast at low water, and is much sheltered from the prevailing south-west swell by the reefs to the westward, but is open to the north-west, from which quarter, at times, heavy seas set in. During the summer mouths but little rain falls, and the water immediately inside of the bar occasionally becomes very low; sand-flats are then formed and remain until a fresh comes down and washes them away, which usually happens about the middle of May. Inside the bar the river is navigable as far up as the bridge, where the Railway Wharf is situated, a distance of about three-quarters of a mile from the bar. Occasionally, no doubt, ships drawing 10ft. of water could enter the river with safety, but they would be unsuitable for the trade. Vessels drawing from 7ft. to 8ft. of water may trade habitually with little or no risk.
Besides the foregoing there is an open roadstead at the port, where the direct steamers for London load frozen meat and other produce, from large punts specially constructed for the purpose.
J. Cameron, Secretary, Waitara Harbour Board.
This harbour is the most considerable inlet on the west coast south of Manukau Harbour. The south channel is the only one used, being nearly two cables wide, with 17ft. in it at low water; the northern has nearly closed. Within, when the flats are covered, the harbour presents a considerable expanse of water, 6 miles in length by 4 miles in width. The channel, which for the first mile is between sandbanks, is little more than a cable wide, with 4 and 5 fathoms; the banks have only 2ft. or 3ft. on them, and are distinguished by the stream.
This extensive inlet, immediately opposite to Auckland Harbour, from which it is separated by an isthmus about 6 or 7 miles wide at its narrowest part, is of considerable importance, as by its means Auckland enjoys rapid communication with Taranaki, Wellington, Nelson, and all the ports on the western coast. The bar of the main channel, a quarter of a mile in breadth, had, in 1890, a least depth in the channel of 21ft. at low-water springs. This channel is, however, seldom used. In the same year there was a depth of 5 fathoms in the south channel, abreast of Heron Spit, gradually shoaling to 2 1/2 fathoms between the inner shoals. Onehunga, the port of entry, is about 6 miles from Auckland, and is connected by an excellent road, and also a railway.
John Robertson, Harbourmaster.
Kaipara Harbour, 40 miles north of Manukau Harbour, is one of the largest inlets in New Zealand. The entrance to it, as is the case with all the ports on the west coast of this island, is attended with difficulties, but, when once within, there is perfect security for any number of vessels of the largest size. There is an extent of 700 miles of water-frontage inside.
Five miles within the heads three large rivers branch off in different directions, winding through land abounding with the kauri and other valuable timber. These rivers are navigable for many miles for vessels of moderate tonnage. The Kaipara itself, the southern branch, flows through a valley formed by the hills which bound the coast between Kaipara and Manukau Harbours, and is separated from an inlet of Auckland Harbour by a distance of about 3 miles only.
In December, 1890, the least depth on the line of the leading beacons of Kaipara bar was 5 fathoms at low water. Inside the bar a depth of 6 to 9 fathoms is maintained for 1 3/4 miles, when the water gradually deepens, the channel narrowing to three-quarters of a mile.
At Helensville, the depth alongside the Kauri Timber Company's wharf is 9ft. at low water, oft. alongside West Brothers’, and 4ft. at Douglas Brothers’.
At Te Kopuru the depth alongside the Kauri Timber Company's wharf is 4ft. to 12ft. at low water; and alongside the same company's wharf at Aratapu the depth is 2ft. to 6ft.
At Dargaville, vessels load alongside the Railway Wharf, where there is a depth of 11ft. at low water, and 22ft. at high water. A railway has been constructed from Dargaville up the Kaihu Valley to assist the kauri-timber trade.
J. C. Smith, Harbourmaster.
Hokianga River is the northernmost port on the West Coast accessible to ships of moderate burthen. It flows in a north-easterly direction for 20 miles between the wooded ranges of Waima and Pungahuru, whose steep sides approach to within a few miles of the banks. Large tributaries flow from these ranges into the main river. The river is navigable, and has few obstructions for a distance of 15 miles from the heads, the depth in the channel varying from 4 to 26 fathoms, mud and sand, and the water is salt to its head. The shoals forming the bar at the river-entrance extend in a north-west and south-east direction for about 2 miles, at the distance of 1 1/2 to 1 3/4 miles from the heads, with two channels, the north channel having a depth of about 12ft. at low water, and the south channel of 10ft. The signal-staff is in communication with the telegraph system of New Zealand (the nearest station being at Omapere, about 2 1/2 miles distant).
George Martin, Harbourmaster.
Is in the south-east corner of Doubtless Bay, distant from Flathead Islet nearly 5 miles. It is 1/2 cables wide at the entrance. The depth in the fairway between the heads at low water is 4 fathoms.
The average width of the main branch of this harbour is about one-third of a mile. The most convenient anchorage is in Kaouou Bay, on the western side of the harbour, immediately inside the entrance.
This extensive bay or gulf is comprised between Capes Wiwiki and Brett, is nearly 10 miles wide at its entrance, and is deep enough to take the largest vessel afloat; a peninsula, 3 miles in length, may be said to divide it into two distinct portions. On the western side of the peninsula just mentioned is Kororareka (Port Russell), the principal and best-known anchorage. In the eastern portion of the bay are the numerous islands from which its name is derived.
There is no bar or shallow to be crossed in the Bay of Islands by vessels proceeding to Port Russell, the water shoaling gradually from the entrance to the anchorage. The water-area is about two square miles. The depth of water at the outer end of the Government Wharf at low-water springs is 15 1/2ft.; length of quayage, 300ft.; the depth alongside at ordinary springs is, at high water, 23ft.; and low water, 17ft. There is one hand ballast-crane, capable of discharging 7 tons per hour. In going to Opua coaling-wharf the least depth is about 22ft. at low water, and 31ft. at high-water springs. The length of the Government Wharf is 450ft.; the depth alongside at ordinary springs is, at high water, 24ft.; low water 18ft. There are three steam ballast-cranes, capable of discharging 50 tons per hour.
The least depth to be passed over by vessels proceeding to either Passage Island or Single-tree Point anchorages is 4 1/4 fathoms at low water, and 5 1/2 fathoms at high water. There is a railway wharf, which can be reached at high-water springs by vessels of 14ft. draught.
The Whangarei County Council exercises the powers of a Harbour Board within this harbour.
Is a large inlet westward of Kawau Island.*
Note
* Kawau Island was for many years and till recently the private property and residence of the Right Hon. Sir George Grey, P.C., K.C.B., M.H.R., twice Governor of New Zealand. During his residence here he stocked the island with cattle, sheep, deer, kangaroos, and various sorts of birds. Every rare plant that will live at Madeira flourishes at Kawau, the climate of which island is similar to that of St. Michael's, in the Azores.
Is a good and spacious harbour, accessible in all weathers, and a frequent port of refuge for vessels unable to enter Port Nicholson or to pass through Cook Strait. It lies at the north end of Cloudy Bay, and is 32 miles from the entrance of Port Nicholson.
After winding through the plain of the same name, for a distance of 90 miles, this river falls into Cloudy Bay, 5 1/2 miles from White Bluff, and 9 miles from Port Underwood. It is one of the principal outlets for the produce of the Wairau and surrounding districts. Steamers drawing oft. to 6ft. trade regularly from Wellington to Marlboroughtown, 8 miles up the river, and also up the Opawa River to Blenheim, 11 miles.
Port Robinson, or Gore Bay, is a natural harbour on the east side of the Cheviot Estate, about six miles southward of the Waiau-ua River, and three miles northward of the Hurunui, both of which rivers rise in the Wakarewa and Tekoa Mountains, distant over thirty miles inland. The port is well sheltered on the south by a high headland. On the north it is partly enclosed by the Midbay Reef, the entrance for vessels being from due east and in line with the slip. Inside, the depth of water varies from 4 1/2 to 3 fathoms, and there is good anchorage all over the bay. The country in the neighbourhood of Port Robinson, known as the Cheviot, is one of the finest grazing districts in New Zealand. Vessels discharge into and load from a cargo-boat with a carrying capacity of about 12 tons. The cargo-boat is hauled up the slip and under the goods-shed, so that all goods are loaded and unloaded under cover. The goods-shed is a very substantial building 90ft. by 32ft. and 12ft. high, and the floor is capable of supporting 400 tons. Land is now being reclaimed for storing coals and timber, and for future shed extension when required.
The Port of Lyttelton, situate on the north-western side of Banks Peninsula, and opening to the north-east, is the chief seaport town of the Provincial District of Canterbury. It is 7 miles distant from Christchurch, the capital, and is connected therewith by a line of railway. The Moorhouse Tunnel (1 3/4 miles in length) is on this section.
The breakwaters are formed of rubble, the outer slopes of which are protected or faced with huge blocks of stone.
The Officer's Point, or eastern breakwater, is some 2,010ft. in length, with a width of 40ft. on top, and having an elevation of 6ft. above high-water spring-tides. The Naval Point breakwater is 1,400ft. in length. The former breakwater has also a timber breastwork built along its inner face for nearly its entire length—known as the Gladstone Pier.
The area of water enclosed within the breakwater is about 107 acres.
The present depth of water inside the breakwaters and at the wharves varies from 20ft. up to 25ft. at low tide. The inner harbour has been deepened by dredging, so that vessels drawing 25ft. may be berthed inside the moles at high tide. The rise of tide is about 6 1/2ft. Vessels of 5,000 tons can now be safely berthed at several of the wharves.
Sets of Mitchell's patent screw-moorings are laid down in the inner harbour, 2in. chain, capable of holding vessels up to 3,000 tons.
The berthage-space at the wharves is: No. 1, Gladstone Pier, 1,740ft.; timber breastwork, from Gladstone Pier westward to Naval Point, 3,850ft.; Jetties—No. 2, Screw-pile Jetty, 1,030ft.; No. 3, Intermediate, 800ft.; No. 4, Intermediate, 800ft.; No. 5, Intermediate, 800ft.; No. 6, Tunnel-mouth Jetty, 480ft.; Breastwork Jetty, 250ft.; No. 7, Ocean-steamer Jetty, 1,000ft.: making a total of 10,750ft., which would be capable of berthing the following number of vessels, without double-banking: 19 ocean ships and steamers, up to 6,000 tons, when loaded to 26ft. 9in.; 9 intercolonial steamers; 6 schooners, &c. This berthage-space is still capable of very considerable extension by the construction of additional jetties.
A special wharf for ocean steamers is provided. Its length is over 500ft., and it will accommodate two of the largest steamers visiting the port at the same time. Besides this, two. of the other jetties have a depth alongside of about 26ft.
Special berthage-space is provided for men-of-war. Several vessels can be berthed at the moorings inside the breakwaters. without in any way interfering with the ordinary shipping of the port.
The whole of the wharves and jetties in Lyttelton have lines of rails laid down upon them, and are worked by the Railway Department. Extensive shed-accommodation is also provided on the wharves and in the Lyttelton Station-yards.
The Harbour Board have a cool and freezing-chamber (Linde process) near the ocean-steamers’ jetty, solely for the accommodation of butter, cheese, meat, &c., prior to shipment. The cool-chamber building is divided into four perfectly separate compartments to hold 150 tons each, which can be used quite independently of each other, either as cool chambers or for freezing purposes, as may be required.
Provision has been made by the Lyttelton Harbour Board for the storage of grain and agricultural produce in Lyttelton at most reasonable rates, namely, 1d. per ton per week, with receiving and delivery charges added. The Board at present have storage-space for 15,000 tons.
C. Hood Williams, Secretary and Treasurer, Lyttelton Harbour Board; J. W. Clark, Harbourmaster.
Penetrates Banks Peninsula in a northerly direction more than 8 miles, its inner part approaching within 4 miles of the head of Pigeon Bay. It is a magnificent port, affording secure and landlocked anchorage to any number of vessels, and is easy of access. The harbour entrance is nearly a mile in breadth, increasing to a mile and a quarter, which it carries to the anchorage in Pakaeriki Bay, on the eastern shore, nearly 6 miles from the heads, where there is excellent anchorage in 4 fathoms at low water, little more than half a mile off the town.
At the extreme end of the Ninety-mile Beach is a rocky point on the northern part of which is the Township of Timaru, the site formerly of an old whaling-station, but now a port of considerable importance for the southern part of the Canterbury District. The breakwater—constructed for the formation of the harbour—commences upwards of one cable eastward of the lighthouse, and runs out N.E. by N. 1,250ft., thence curving to the northward for a further distance of 1,028ft making a total length of 2,278ft. exclusive of the shore-approach. It is 30ft. wide on the top, and is formed principally of concrete blocks, each weighing 30 tons. A rubble wall—north mole—commences from the shore one-quarter of a mile north-westward of the breakwater shore-end, and extends 2,400ft. in an easterly direction to a point 350ft. from the breakwater, and somewhat within its extremity. Latterly, the trade of the port has been entirely carried on under the breakwater, and now the north mole is completed smooth water is assured at all times. Several sets of moorings have been laid down within the breakwater. Dredging is proceeding within the harbour, and the ocean steam-vessels’ berth has a depth of 22ft. at low-water springs. The general depth in the harbour is (June, 1894) 12ft. to 23ft. Eighteen sailing-vessels and fifteen steamers were laden with grain, wool, and frozen meat, and despatched to the United Kingdom during the year 1893. The wharves are worked by the Railway Department, and are provided with five travelling steam-cranes, their lifting-power being from 2 to 30 tons. The space enclosed has an area of 50 acres. Moody Wharf has berthage-accommodation of 250ft. on each side, with 18ft. at low-water springs; the main wharf, 1,000ft. on one side, with 23ft. at low-water spring-tides.
A powerful combined tug-dredge is maintained by the Board.
William James Tennent, Secretary, Timaru Harbour Board; T. N. Clarkson, Harbourmaster.
Formerly, like Timaru, an open roadstead, has been constructed in the first bight northward of Cape Wanbrow, and is the shipping-port of a large grain-producing district in the Middle Island. The breakwater commences a cable north-westward of the principal lighthouse, and runs in a north-by-west direction 1,850ft.; it is 36ft. wide on the top. A mole, 1,700ft. in length, runs in an easterly direction from the shore, commencing half a mile north-westward of the inner end of the breakwater. The mole and breakwater thus enclose a space 60 acres in extent, forming a safe harbour, with an entrance 600ft. in width, the channel and harbour varying from 10ft. to 28ft. in depth. Four wharves—Macandrew (350ft.), Cross (310ft.), Normanby (507ft.), and Sumpter (743ft.)—have, collectively, berthage of 1,910ft. in length, with 8ft. to 20ft. of water at low spring-tides. The railway is connected with all the wharves, and there are four cranes, varying from 1 1/2 to 5 tons each. Moorings have been laid down in the harbour.
Thomas Forrester, Secretary, Oamaru Harbour Board; William Sewell, Harbourmaster.
At the entrance to this harbour there is a mole at the North Head 4,100ft. long, projecting in a north-easterly direction from the low sandbank on the western side of the harbour entrance. Within the entrance a spacious sheet of water extends to the south-westward for a distance of 11 miles, the area being, approximately, 12,750 acres, and at its head stands the City of Dunedin.
The Town of Port Chalmers is at the head of Koputai Bay, about 6 miles above the bar, where there is good anchorage for large vessels in 5 fathoms.
The depth of water in the lower harbour (Port Chalmers) ranges up to 60ft. at low water, and in the upper harbour (Dunedin) to 20ft. at low water, to which 6ft. 6in. have to be added for high-water springs. The depth on the bar at the lower harbour is 24ft., in the new channel 18ft. at present, and in the channel to Port Chalmers 22ft.: all at low water. In Victoria Channel, at the upper harbour, there is 13ft. 6in. at present at low water, to which 6ft. 6in. should be added for high-water springs. In this (upper) harbour there is a half-tide training-wall 5 miles in length. 14,520ft. of walling has been run round the Board's endowment on the foreshore, 4,661ft. of which have been faced with wharves. The berthage at the six wharves at Dunedin aggregates 5,332ft., and at the three piers at Port Chalmers 2,560ft. There are nine cranes in use, ranging from 1 to 10 tons, and extensive storage accommodation in commodious sheds at Dunedin.
The wharves at Port Chalmers are worked by the Railway Department.
John L. Gillies, Secretary, Otago Harbour Board; Daniel McCallum, Harbourmaster.
Awarua or Bluff Harbour, the first port of call and last of departure of the intercolonial steamers running between Hobart and Melbourne, and Dunedin, Lyttelton and Wellington, is, at high tide, an extensive sheet of water, stretching, in two arms, to the north and east respectively 4 and 5 miles. The available space for anchorage, however, is narrow and confined, and for vessels of large tonnage does not extend much above a mile from the entrance.
Campbelltown, on the northern side of the Bluff Hill, is the port for Southland. It has extensive stores for grain, which is here shipped in large quantities for the Australian Colonies and Europe. There are also two meat-freezing works.
The wharfage accommodation is 2,200ft., and the depth of water alongside the wharves, of which there are three, varies from 24ft. to 14ft. These depths are being gradually increased by dredging operations. Vessels discharge directly into the railway-trucks.
Steam-vessels of moderate size and power can enter or leave Bluff Harbour at all times, irrespective of the tides.
James E. Fox, Secretary, Bluff Harbour Board; N. Macdonald, Harbourmaster.
The New River Harbour is accessible in moderate weather, and has a depth at low water of 14ft., and at high water of 21ft.
The berthing space at Invercargill Jetty is 200ft., at which vessels drawing 9 1/2ft. may be berthed. There is a crane to lift 5 tons, and also a siding connecting with the railway system.
Training-walls have been built for 50 chains on each side of the channel near the jetty.
Invercargill, situated on the east side of the estuary, about 10 miles from the bar, is the principal town in the County of Southland. The Invercargill Borough Council is the Harbour Board.
J. E. Hannah, Treasurer, New River Harbour Board.
From New River the coast trends in a long sandy beach to the north-west, 15 miles, when it curves round to Howell Point, and forms a bay or bight just within it, having a depth of, say from 10ft. to 40ft. In this bight, at 1 1/2 miles north-west of that point, is Riverton Township, at the entrance of Jacob's River, the bar of which is nearly dry at low water; but vessels of 7ft. or 8ft. draught can enter at high water. There is an area within the harbour of about 1,500 acres, having a depth of from 12ft. to 4ft. at high- and low-water springs. The depth of the channel varies from 5ft. to 16ft. There is a wharf with 180ft. of berthage, and a jetty of 100ft. The depth of water at the wharf is 12ft., and vessels of 120 tons can be berthed.
It is proposed to construct a mole, 1,900ft. in length, at Howell's Point, to build a large wharf within for vessels drawing loft, to 27ft, water, and to connect with Riverton by a railway.
George O. Cassels, Secretary, Riverton Harbour Board.
The only natural harbours along the whole extent of the west coast of the Middle Island—a distance of 500 miles—are those singular and truly remarkable sounds or inlets which penetrate its south-western shores between the parallels of 44° and 46° south latitude. These are thirteen in number. The larger sounds are generally divided into several arms, penetrating the coast in some instances for a distance of 20 miles, with a breadth rarely exceeding a mile, and studded with numerous islets. The smaller sounds run in for a distance of from 6 to 8 miles, with a width of about half a mile, and anchorage is seldom to be found except at their inner extremes. The shores, which rise almost perpendicularly from the water's edge, are, in the immediate neighbourhood of the sounds, covered with trees suitable for all purposes, among them the red-pine, which, although heavier and inferior to the kauri of the North Island, is well adapted for masts; and a vessel requiring spars could procure them of any size with little difficulty. The most remarkable feature, common to the whole, is the great depth of water. Soundings can rarely be obtained under 80 or 100 fathoms, and frequently at much greater depths; and the shores within a few yards are quite steep. These sounds form the subject of a separate article.
This bay is 55 miles northward of Milford Sound. With the exception of the roadstead under Cape Foulwind, Jackson's Bay is the northernmost anchorage on the west coast of the Middle Island where shelter can be procured for large vessels in southerly winds.
This river is usually navigable for vessels up to 10ft. draught for a distance of three-quarters of a mile from the entrance, but the bar is constantly shifting its position and varying in depth.
The harbour-works at this port are in an unfinished state; neither of the two training-walls has been carried out as far seaward as was originally intended by the late Sir John Coode. The north wall has been completed to a length of 2,000ft., the south wall to a length of 670ft., and the latter has been well protected by stone. To be of any permanent benefit they should be extended out beyond the line of the sea-beach, say, from 10 chains to 20 chains further to the westward.
The depth of the channel over the bar at high-water ordinary springs varies from 9ft. to 15ft. Spring-tides range from 8ft. to 10ft. The berthing-space at Gibson's Quay amounts to 1,000ft., and the depth of water at the wharf varies from 18ft. to 22ft. at high water.
G. W. Bignell, Secretary and Harbourmaster, Hokitika Harbour Board.
The Mawhera or Grey River flows through an extensive valley, the river trending from its mouth in an easterly direction, about 15 miles, when it divides.
On account of the extensive deposits of coal being worked in and near the valley, which are connected with Greymouth (the port town) by railway, two breakwaters have been constructed at the mouth of the river to deepen the channel at the entrance, and enable larger steamers to enter. These, on the recommendation of the late Sir John Coode, have been carried out—the north breakwater 1,125ft., and the south breakwater 3,392ft., into the sea, to confine the river and direct the current square on to the bar. There are also internal training-walls constructed. These works have so far been perfectly successful; they have really done somewhat more than was expected of them. Prior to their initiation there was seldom more than 10ft. of water on the bar, and the channel was tortuous and constantly changing its position; now the channel is straight and permanent, and for the most time the channel has 25 1/2ft. at high-water springs, and 8ft. to 16ft. at low-water springs. The average depth at high-water on the bar during the year 1892 was 18ft. 10in., and during 1893 19ft. 7in.
The berthing-space is 1,824ft., being 1,032ft. with 12ft. at low-water springs at the upper wharf, and 792ft. at the lower wharf, with 16ft. at low-water springs. Vessels of 1,000 tons can now be berthed at the wharf.
As showing the bearing of the Greymouth Harbour-works on the progress of the colony, it is stated that the output of coal in the Brunner (Grey River) mines for the three years ending December, 1880, averaged 29,840 tons only; whereas the output for the three years ending December, 1893, has averaged 154,061 tons, an increase of 124,221 tons per annum. The output from the Blackball Mine, situated about 20 miles from the port, commenced in November, 1893. There are six cranes in use on the wharves, the lifting-power being from 1 1/2 tons to 12 tons.
To facilitate the trade of this port, the towage charge on sailing vessels, with or without cargo, has been reduced to 1s. a ton on the register tonnage in and out. The maximum charge on any sailing-vessel is not to exceed £20; the minimum charge to be £5.
A powerful steam-tug, the property of the Harbour Board, is at the service of the shipping trading to this port.
Thomas Allen, Secretary, Greymouth Harbour Board; John Connor, Harbourmaster.
The bar-entrance of this river bears E.N.E. distant 6 miles from Cape Foulwind, and E. 3/4 N. from the Northern Steeple. It is one of the largest rivers in New Zealand, and has its source in the Lakes Rotoroa and Rotoiti, 40 miles south-westward of Nelson. In its course to the sea it receives the accession of several smaller streams; its width varies from a quarter to one-third of a mile. In the neighbourhood vast deposits of excellent coal are being successfully hewn.
The general plan of the Westport Harbour-works is much the same as at Greymouth, but on a larger scale.
The works executed to date consist in the completion of the west and east breakwaters to the points proposed by the late Sir J. Coode. The west breakwater is 4,276ft. long, and the east breakwater is 4,736ft. The west breakwater overlaps the east breakwater by 400ft., and the waterway at the entrance to the breakwaters at low-water spring-tides is 700ft. wide.
The berthages at the merchandise wharf are 15ft. deep at low-water springs, for 50ft. in width; outside of this the depth gradually lessens, until 150ft. off the wharf there is 5ft. at low-water springs. The berthages at the coal-staiths are from 20ft. to 22ft. deep at low-water spring tides, and at the lower end, for a width of 200ft., 9ft. deep.
The fairway inside the bar has been dredged, and at present gives about 20ft. at high-water springs.
The merchandise wharf is 350ft. long, and 10ft. above high-water springs.
The coal-staiths are 1,200ft. long, and rise from 20ft. above high-water springs at the up-stream end to 36ft. above the same level at the down-stream end. They are capable of storing 2,000 tons of coal in thirty-six bins, and have nineteen shoots. The lips of the bins and shoots, to which telescopic shoots are fitted, range from 7ft. 9in. to 25ft. 4in. above high-water spring tides. The despatch in coal-loading at the staiths is from 200 tons to 250 tons per hour.
The principal coal-mines are connected by railway with the coal-staiths.
The average depth on the bar is about 24ft. at high-water spring tides, the range of tide being 9ft. 6in. at springs, and 5ft. 6in. at neaps.
The harbour-works at Westport promise to be a complete success. Before these works began, the usual depth of water on the bar was from 9ft. to 14ft., and since the completion of the works the usual depth is from 18ft. to 25ft. These depths are taken at high water, the rise of tide being from 6ft. to 10ft. The internal works for deepening and maintaining the deep water in the berthages and fairway inside the bar consist of half-tide training walls, now under construction, of which 6,200ft. have been completed to date (March, 1894), out of a total length of 9,850ft. provided for under the scheme of works. The completion of these walls, with proposed dredging, is expected to maintain a greater depth in the fairway of the river, and a greater width of deep water for swinging vessels.
Although only in its infancy, the coal trade of Westport is fast assuming large proportions. For the three years ending the 31st December, 1893, the annual output of the mines has averaged 213,800 tons. This progress is mainly duo to the success of the harbour-works. The coal trade at Westport is extending very surely, each year's output showing an increase over the previous one. For the year ended 31st December, 1893, the output was 227,178 tons.
Charles N. Greenland, Secretary, Westport Harbour Board; S. A. Leech, Harbourmaster.
This river, 22 miles north of the Buller, has a depth of 6ft. to 7ft. at low water within the bar. The wharf and coal-staiths are connected with the coal-mines by a railway three miles in length. The port is also connected with Ngakawau and Westport by a railway 27 miles in length, which was opened on the 7th August, 1893, the whole of the funds being found by the Westport Harbour Board.
The coal-measures of this district are extensive, and the quality good.
Lies at the head of Blind Bay. At a distance of 4 1/2 miles from the entrance commences the long and remarkable Boulder-bank, which forms a natural breakwater to the harbour. The least depth to be passed over by vessels entering Nelson Haven is about 6ft. 6in. at low water, and 19ft. at high-water springs. There is good anchorage outside the bar in moderate weather. The berthage accommodation at the Railway Wharf amounts to 1,025ft., and at the Albion Wharf to 422ft. The lifts consist of one sheer-legs, 20 tons; stationary hand-crane, 1 1/2 tons; and a steam-crane on wheels, 3 tons. The draught of water at low-water springs varies at the Railway Wharf from 18ft. to 23ft.; and at the Albion Wharf, 7ft. There is a good fresh-water service at the Railway and Albion Wharves for the use of shipping. James P. Low, Harbourmaster.
This great inlet extends in a southerly direction about 25 miles, branching off to the eastward and westward into numerous arms and creeks, and embracing a coast-line of no less an extent than 250 miles. The depth of water in this sound varies from 45 to 16 fathoms, gradually decreasing towards its head, where it receives two rivers—the Pelorus (Hoiere) and Kaituna—between which is situated the Township of Havelock. The Mahakipawa gold-diggings are situated in an arm of the Sound near Havelock.
The entrance to this Sound lies between Capes Koamoru and Jackson, distant from each other little more than 6 miles. The Sound runs in a S.S.W. direction 14 miles to the western entrance of Tory Channel, and then S.W. by W. 1/2 W. for 11 miles to its head, near which is the Town of Picton. The depth of water generally varies from. 20 to 25 fathoms. It is indented on either side with numerous bays, particularly on the north side, there being ten above Ship Cove. All these bays afford secure anchorage, but the least depth of water to be found in them is 16 fathoms, except at the head of the sound. There is anchorage in 6 and 9 fathoms near the head of the eastern arm, off the Town of Picton, which is built on the site formerly occupied by the Maori village of Waitohi. The wharf at Picton has a depth of 25ft. alongside at low water.
Picton is the chief port of Marlborough, and vessels are laden there direct for London with cargoes of wool, grain, flax, and other produce. There are saw-mills in the vicinity, and coal has been found near at hand, but not in sufficient quantities to be worked. Antimony mines are in operation, and there is gold amongst the hills bordering the Sound. Picton is connected with the chief town, Blenheim, by rail, the distance being 18 miles.
G. W. White, Harbourmaster.
This portion of New Zealand, which was first seen by Captain Cook in 1770, and taken by him for part of the Middle Island, was, in 1808, discovered to be an island by the master of a merchant-vessel, whose name by common consent it has since retained. It possesses, on its eastern and south-eastern sides, several excellent ports, affording every facility for shipping.
The following is a list of the principal rivers in New Zealand, showing, approximately, the areas drained, the average annual rainfall, and the estimated discharge for each:—
River.
| River | Area Drained. | Average Annual Rainfall. | Estimated Discharge in Cubic Feet per Minute. |
|---|---|---|---|
NOTE.—Rivers marked (*) have mountain sources not trapped by lakes, and are therefore subject to exceptional floods. | |||
| Sq. Miles. | Inches. | ||
| North Island. | |||
| Waikato | 4,768 | 40 | 839,168 |
| Kaipara | 2,622 | 47 | 545,376 |
| Wanganui | 2,525 | 47 | 525,200 |
| Manawatu* | 2,239 | 65 | 642,593 |
| Thames and Piake | 1,779 | 48 | 377,148 |
| Rangitaiki | 1,633 | 30 | 215,556 |
| Rangitikei | 1,435 | 50 | 315,700 |
| Wairoa* | 1,303 | 45 | 257,994 |
| Mohaka | 1,034 | 45 | 204,732 |
| Whakatane | 1,014 | 35 | 156,156 |
| Ngaruroro* | 843 | 40 | 148,368 |
| Tukituki | 815 | 35 | 125,510 |
| Mokau | 815 | 60 | 215,445 |
| Patea | 622 | 55 | 151,146 |
| Waipaoa, Poverty Bay* | 602 | 30 | 80,066 |
| Hokianga | 560 | 50 | 123,760 |
| Waiapu* | 505 | 40 | 88,880 |
| Waitara | 501 | 56 | 123,747 |
| Tutaekuri and Esk | 487 | 35 | 73,998 |
| Turanganui | 75 | 35 | 11,550 |
| Middle Island. | |||
| Clutha | 8,248 | 30 | 1,088,736 |
| Waitaki | 4,730 | 26 | 539,220 |
| Waiau | 3,079 | 41 | 557,299 |
| Mataura* | 2,378 | 30 | 316,274 |
| Buller* | 2,341 | 95 | 990,879 |
| Taieri | 2,317 | 37 | 379,988 |
| Waimakariri* | 1,922 | 55 | 345,546 |
| Grey* | 1,572 | 90 | 624,084 |
| Wairau* | 1,562 | 35 | 240,548 |
| Oreti | 1,422 | 40 | 250,272 |
| Rakaia* | 1,401 | 50 | 308,220 |
| Milford Lagoon and Opihi | 888 | 28 | 109,224 |
| Rangitata* | 752 | 48 | 159,424 |
| Selwyn (Lake Ellesmere) | 718 | 30 | 94,776 |
| Jacob's | 633 | 40 | 111,408 |
| Haast* | 412 | 125 | 227,424 |
| Hokitika* | 382 | 120 | 202,460 |
| Kaduka (Martin's Bay) | 283 | 127 | 158,480 |
The Waikato, in the North Island, and the Clutha, in the Middle Island, are the two largest rivers in New Zealand.
The Waikato flows out of Lake Taupo, in the middle of the North Island, and has several tributaries, the principal of which is the Waipa. It has a shifting bar, and is accessible to small vessels only. It is navigable for vessels of 30 tons for 60 or 70 miles, and for a much greater distance for boats. There are 3 1/2 fathoms at low water within the entrance.
The Clutha (Matau) River runs into Molyneux Bay. The old entrance, 4 1/2 miles north-westward of Nugget Point, has silted up, and is nearly dry at low water. The present entrance, opened by a flood in 1879, is situated further northward, and is shallow and dangerous. This river is estimated at 220 miles in length, having its source north of the Wanaka Lake, at a height of 974ft. above the sea-level, and calculated to discharge 1,088,736 cubic feet of water per minute. The quantity of water is greater and the temperature lower in summer than winter, this being caused by the melting of the snows on the western ranges of mountains. Several tributaries flow into the Clutha River, the most notable being the Pomahaka, Manuherikia, Cardrona, and Kawarau, the latter draining Lake Wakatipu.
Vessels visiting New Zealand, and requiring docking or repairs, will find ample accommodation at the principal ports of the colony.
There are in New Zealand four graving-docks; two of these are situated in Auckland, one at Lyttelton, and one at Port Chalmers.
The dimensions of the docks at Auckland are as follow:—
| Calliope Dock. | Auckland Dock. | |
|---|---|---|
| Length over all | 525 feet. | 312 feet. |
| Length on floor | 500 feet. | 300 feet. |
| Breadth over all | 110 feet. | 65 feet. |
| Breadth on floor | 40 feet. | 42 feet. |
| Breadth at entrance | 80 feet. | 43 feet. |
| Depth of water on sill at high water (ordinary spring tides) | 33 feet. | 13 1/2 feet. |
The graving-dock at Lyttelton also is capable of docking a first-class ironclad, or any of the large ocean-steamers now running to the colony; its general dimensions are:—
| Length over all | 503 feet. |
| Length on floor | 450 feet. |
| Breadth over all | 82 feet. |
| Breadth on floor | 46 feet. |
| Breadth at entrance | 62 feet. |
| Breadth where ship's bilge would be | 54 feet. |
| Depth of water on sill at high-water springs | 23 feet. |
There are electric lights, one on each side of the graving-dock. There is a workshop alongside the dock, and several other places within a short distance of it, where repairs and heavy foundry-work can he done.
Alongside the dock is a patent slip, with a cradle 150ft. in length, suitable for vessels of 300 tons.
The docks at Auckland and Lyttelton are the property of the respective Harbour Boards, but that at Port Chalmers is vested in the Otago Dock Trust, a body entirely distinct from the Otago Harbour Board. Vessels of large size can he taken in the Otago Dock, as the following measurements will show:—
| Length over all | 335 feet. |
| Length on the floor | 328 feet. |
| Breadth over all | 68 feet. |
| Breadth on floor | 41 feet. |
| Breadth where ship's bilge would be | 43 feet. |
| Breadth at dock-gates | 50 feet. |
| Depth of water on sill at high-water, ordinary tides | 17 1/2 feet. |
Connected with the Otago Dock are a large machine-shop, steam-hammer, and forge, with all the appliances necessary for performing any work that may be required by vessels visiting the port. An 80-ton sheer-legs has also recently been erected for heavy lifts.
There is also a patent slip, used only for taking up small vessels.
It is proposed to build a new graving-dock at Port Chalmers, to be 500ft. in length, with a depth of 25ft. on the sill.
The Port of Wellington has no dock; but there is a well-equipped patent slip in Evans Bay, on which vessels of 2,000 tons can be safely hauled up This slip is the property of a private company, and in no way connected with the Harbour Board. The slip is 1,070ft. long, with a cradle 260ft. in length. There is a depth of 32ft. at high water at the outer end of the slip. A dolphin and buoys are laid down for swinging ships in Evans Bay.
The company has convenient workshops, which contain the machinery necessary for effecting all ordinary repairs to vessels using the dip.
The coasts of New Zealand are, considering their extent, fairly-well lighted, but there are still many places where lights are wanted. Additions to the existing lights are made from time to time as funds are available.
The lighthouse towers are built of either iron, stone, or timber, the latter material having been selected partly for cheapness and partly from fear of earthquakes; but the use of it for this purpose is now abandoned.
There are twenty-seven coastal lights in New Zealand—namely, eight of the first order, thirteen of the second order, three of the third order, and three of smaller orders.
The apparatus used to concentrate the rays of the light are all, with one exception, of the system known as “dioptric,” where the optical agent is wholly glass. The exception is Dog Island, a “catadioptric” light, where the optical agents are glass and metallic reflectors.
The forms of the apparatus used are all of the most approved type, and of the latest pattern known at the time of their erection.
The lamps used are of various kinds; in some of them the oil flows into the wicks by gravity; these are called “fountain” lamps; in others, the oil is supplied by small pumps driven by clockwork; these are known as “mechanical” lamps; whilst in others, called “pressure” lamps, the oil is forced up by a piston.
The light itself is produced by the consumption of lighthouse paraffin—a mineral oil distilled from shale—in lamps with burners having concentric wicks, the number of wicks increasing with the power of the apparatus, the maximum number being five, as used in Cuvier Island and Stephens Island Lighthouses. The burners are those known as Captain Doty's patent.
The following are the kinds of lights used in New Zealand:—
The “fixed” light, in which the light is always seen.
The “revolving” light, in which the light, at equal periods, gradually comes into view, attains its full power, and disappears.
The “flashing” light, showing flashes, either single or in groups, at short, regular intervals.
There has been no special difficulty in the erection of lighthouses in New Zealand, apart from the trouble caused by indifferent landings. There are no lighthouses built in the sea, such as the well-known Eddystone or Bell Rock. That on The Brothers is the only one which it is considered necessary to keep as a rock-station: that is, the keepers are relieved from time to time, three being always at the station and one on shore.
The cost of the erection of the lighthouses has been about £160,000; the annual consumption of oil is about 19,000gals.; and the cost of maintenance, irrespective of the cost of maintaining the lighthouse steamer, is about £12,000 a year.
The following table shows the names of the lighthouses, indicating also their situation, the order of apparatus, description, period (in seconds), and colour of the lights, and of what material the respective towers are built:—
| Name of Light-house. | Order of Apparatus. | Description. | Period of Revolving Light, in. | Colour of Light. | Tower built of |
|---|---|---|---|---|---|
| Seconds. | |||||
| Dioptric. | |||||
| Cape Maria van Diemen | 1st order | Revolving Fixed | 60 | White Red, to show over Columbia Reef | Timber. |
| Moko Hinou | 1st order | Flashing | 10 | White | Stone. |
| Tiri-Tiri (Auckland) | 2nd order | Fixed | White, with red are over Flat Rock | Iron. | |
| Ponui Passage | 5th order | White and red | Timber. | ||
| Cuvier Island | 1st order | Revolving | 30 | White and red | Iron. |
| 2nd order | Revolving | 30 | White and red | ||
| Portland Island | Fixed | Red, to show over Bull Rock | Timber. | ||
| Pencarrow Head | 2nd order | White and red | Iron. | ||
| Cape Egmont | 2nd order | White and red | Iron. | ||
| Manukau Head | 3rd order | White and red | Timber. | ||
| Kaipara Head | 2nd order | Flashing | 10 | White and red | Timber. |
| Brothers (in. Cook Strait) | Fixed | Red, to show over Cook Rock | Timber. | ||
| Cape Campbell | 2nd order | Revolving | 60 | While and red | Timber. |
| Godley Head (Lyttelton) | 2nd order | Fixed | White and red | Stone. | |
| Akaroa Head | 2nd order | Flashing | 10 | White and red | Timber. |
| Moeraki | 3rd order | Fixed | White and red | Timber. | |
| Taiaroa Head | 3rd order | Fixed | Red | Stone. | |
| Cape Saunders | 2nd order | Revolving | 60 | White | Timber. |
| Nugget Point | 1st order | Fixed | White | Stone. | |
| Waipapapa Point | 2nd order | Flashing | 10 | White | Timber. |
| Catadioptric. | |||||
| Dog Island | 1st order | Revolving | 30 | White | Stone. |
| Dioptric. | |||||
| Centre Island | 1st order | Fixed | White, with red arcs over inshore dangers | Timber. | |
| Puysegur Point | 1st order | Flashing | 10 | White | Timber. |
| Cape Foul wind | 2nd order | Revolving | 30 | White | Timber. |
| Farewell Spit | 2nd order | Revolving | 60 | White, with red are over Spit end | Timber. |
| Nelson | 4th order | Fixed | White, with red are to mark limit of anchorage | Iron. | |
| French Pass | 6th order | Fixed | Red and white, with white light on beacon | Iron | |
| Stephens Island | 1st order | Group flashing | 30 | White | Iron. |
As eleven of the crew of the barque “Spirit of the Dawn,” which was wrecked on the Antipodes Island on the 4th September, 1893, remained on the island for eighty-eight days without becoming aware of the existence of the depot of provisions and clothing for castaways which is established there, attention may usefully be drawn to the fact that such depots are maintained by the New Zealand Government on that island, and on the Auckland, Campbell, Bounty, and Kermadec Islands, and that it is proposed to establish one on the Snares.
The following are the positions of the depots:—
Auckland Islands.—A depot is placed on the south side of Erebus Cove, Port Ross, and another in Camp Cove, Carnley Harbour. A third has been placed at the head of Norman Inlet. One boat is placed on the north-west end of Adams Island, another on Enderby Island, and another on Rose Island.
Campbell Island.—A dépôt is erected in Tucker Cove, Perseverance Harbour, and a boat has been placed at the head of that harbour.
Antipodes Islands.—A depot is placed abreast the anchorage on the north-east side of the principal island.
Bounty Islands.—There is a depot on the principal island.
Snares Island.—A depot has been established on this island in Boat Harbour.
Kermadec Islands.—A dépôt is established on Macaulay Island, near Lava Cascade, on the north-east end of the island, and another on Curtis Island, at the head of Macdonald Cove, on the north-western end of the island.
Finger-posts to indicate the direction of the dépôts have been erected on the islands.
The Government steamer visits the Auckland, Campbell, Antipodes, Bounty, and Snares Islands twice a year, and the Kermadec Islands once a year.
One of the most successful enterprises to which this colony has given birth is the Union Steam Ship Company of New Zealand (Limited). Its history is a reflex, to a great extent, of the later history of the colony—as the one has grown, the other has expanded. Thirty-three years ago a small paddle-steamer was found sufficient for the requirements of Otago, and continued so until the opening of the Otago goldfields in 1862, when the sudden increase of trade resulting therefrom necessitated the employment of additional tonnage; and, one after another, five steamers were purchased, and connections formed with other ports in the Middle Island. In course of time, as trade grew, it became apparent that a hold step must be taken if it were to be retained in the hands of those under whom it had grown, and this feeling eventuated in the formation, in 1875, of the Union Steam Ship Company of New Zealand (Limited), with a powerful proprietary and an influential Board of directors.
The trade of the company was at first confined to the coastal services of the colony, with an occasional extension to Sydney; the intercolonial service being carried on by the fleet of Messrs. McMeckan, Blackwood, and Co., of Melbourne. In 1878, however, the Union Company purchased the steamers and interests of that firm; and in this way the entire intercolonial and the bulk of the New Zealand coastal trade passed into their hands. Energetic steps were taken to develop the intercolonial and coastal trades, and, with a boldness which was at the time considered temerity, orders were sent Home to build several new steamers of the latest design.
The courage of the directors was rewarded by seeing their fleet fully occupied, and, in pursuance of their policy to keep well ahead of the colony's requirements, they continued to order steamer after steamer, each more luxuriously fitted than its predecessor. Every scientific improvement, either in the machinery or the fitting of vessels, was brought into requisition, so that from the modest beginning already noted, the fleet of the Union Steam Ship Company has grown to be the largest and most powerful in the Southern Hemisphere.
It is unnecessary to record how, year after year, the fleet and trade of the company have grown to their present dimensions; it need only be stated that at the present time the fleet engaged in regular employment numbers fifty-one steamers, of an aggregate tonnage of 57,000.
The connections of the company have extended with their fleet. In 1885, in conjunction with the Oceanic Steamship Company of San Francisco, they took up the mail-service between the Colonies and America, and have retained it ever since. In 1891 they purchased the plant and business of the Tasmanian Steam Navigation Company, which for many years had carried on the trade between Tasmania and Australia. Besides the New Zealand coastal and the intercolonial services between New Zealand, Tasmania, and Australia, the company run regular services from New Zealand and Australia to Fiji, Tonga, Samoa, and other South Sea Islands, and send vessels to Calcutta periodically.
The company's interests are so closely interwoven with those of the colony that it is regarded as almost a national institution. It gives employment to a large number of people, and its operations necessitate the circulation of a large sum of money. It employs, afloat and ashore, over 2,600 persons, and expends in wages and other disbursements in the colonies over £800,000 per annum.
At the annual meeting of shareholders, held on 22nd November, 1892, the Chairman of Directors, referring to the expenditure of the company, stated that £89,000 had been disbursed during the year in provisions, as supplies for passengers and crews. Of this sum £25,646 had been spent on meat alone, the quantity consumed being 2,486,255lb., or an average exceeding 2 1/2lb. per man per day for passengers, officers, and crews. Poultry and game absorbed £5,000; fish, £3,000; vegetables, £5,500; fruit, £5,500. The consumption of eggs was 33,000 dozen, costing £2,000; while 181,160 loaves were consumed, at a cost of £3,700, in addition to the bread baked on board the steamers. In harbour and light dues £32,000 was expended. As showing the extent of its traffic, it may be mentioned that last year, 1893, the company's steamers carried 157,710 passengers; 494,394 tons of general cargo, and 427,512 tons of coal; and that they steamed 1,858,452 miles, in the course of which they consumed 181,765 tons of coal, of which about one-half was from New Zealand mines.
The directors take a special interest in the welfare of the company's employés. Their crews enjoy peculiar comforts and privileges. A benefit society has been established in the interests of their men afloat, to which the company contributes an annual subsidy; the company further pays a considerable proportion of the annual premiums of their officers’ life insurances.
Although the progress of the company is largely the result of the prosperity of the colony—and the state of trade of the latter has a barometric effect on the company's operations—it could not have attained and held its present position without wise heads and good judgment to direct its affairs. It has always been fortunate in numbering amongst its directors men who hold leading positions in the commercial community, and whose energy and judgment are generally recognised. More especially, however, is the pre-eminence of the company due to the conduct of its affairs by the two leading members of the Board — the Hon. George McLean, M.L.C., its Chairman, and Mr. James Mills, the Managing Director of the company since its formation. The name of Mr. John Darling, one of the London directors, designer of the boats and Resident Marine Superintendent in England, is also closely associated with its history.
The Head Office of the company is in Dunedin, and it possesses thirty branches and agencies throughout the colonies, and an office and local Board in London. The Inspector is Mr. E. P. Houghton, and Secretary, Mr. T. W. Whitson.
The following are the names of the company's vessels, with their gross registered tonnage: Monowai, 3,433; Mararoa, 2,465; Tekapo, 2,439; Rotokino, 2,004; Tarawera, 2,003; Waihora, 2,003; Talune, 2,000; Hauroto, 1,988; Wakatipu, 1,944; Wairarapa, 1,786; Manapouri, 1,783; Rotomahana, 1,727; Oonah, 1,700; Taieri, 1,668; Te Anau, 1,652; Taviuni, 1,490; Pukaki, 1,443; Corinna, 1,280; Flora, 1,273; Pateena, 1,212; Ovalau, 1,200; Poherua, 1,175; Arawata, 1,098; Ringarooma, 1,096; Upolu, 1,000; Penguin, 935; Takapuna, 930; Rotorua, 926; Janet Nicoll, 779; Ohau, 740; Taupo, 737; Rosamond, 721; Wainui, 640; Dingadee, 640; Omapere, 601; Moreton, 581; Mawhera, 554; Grafton, 548; Brunner, 540; Wareatea, 460; Australia, 459; Orowaiti, 453; Kawatiri, 453; Mahinapua, 423; Southern Cross, 263; Oreti, 219; Moa, 188; Manawatu, 183; Beautiful Star, 177; Maori, 174; Waihi, 92. Total tonnage, 57,241. The indicated horse-power ranges from 100 to 2,800.
The New Zealand Shipping Company is a colonial enterprise. It was founded at Christchurch, New Zealand, in 1872, with a capital of £100,000. In the following year the capital was increased to £250,000; and it now stands at £800,000 authorised capital, of which £475,048 has been subscribed.
Prior to 1872 the trade to and from the colony was in the hands of two firms; but in that year a combination of merchants and farmers in New Zealand formed the company, considering that the time had arrived when their interests demanded the establishment of an independent line. At first the newly-fledged institution had to depend mainly on chartered ships, but gradually they secured a fleet of their own, in which large numbers of passengers were conveyed, and neither pains nor expense were spared to have it thoroughly equipped for safety and comfort. Many of these vessels have been noted for speed; and one of them—the Otaki—made, in 1877, the fastest passage homewards on record, completing the trip in 69 days from Port Chalmers to the London Docks, or 63 days from land to land.
Between the years 1877 and 1882, inclusive, when the New Zealand Shipping Company was under contract with the New Zealand Government to carry immigrants from the Old Country, their vessels brought out close on 20,000 immigrants and passengers.
During the years 1873–82, the company confined its operations to loading and despatching, from London, a monthly line of sailing-vessels to each of the principal ports in New Zealand; but in January, 1883, a new departure was made by despatching from London the s.s. British King, 3,559 tons register, as the pioneer of a direct monthly line of steamers. A feeling had been growing in the colony for some time that, for want of a regular direct steam service, a number of desirable immigrants were diverted to Australia, whilst merchants and others, who required supplies quickly from England, were often put to great inconvenience through the delay-inseparable from transhipment at Melbourne and Sydney. On the other hand, the success of the frozen-meat trade gave the New Zealand colonists the opportunity for the disposal of their beef and mutton, which they so much needed, and increased the desire for rapid steam-service. Accordingly, in 1882, the Colonial Legislature agreed to call for tenders for a monthly service of steamers from England, the voyages each way to be made in 50 days. Pending the decision as to this service, the New Zealand Shipping Company inaugurated a direct steam service by the despatch of the British King, as above-mentioned, which steamer made the passage out to the colony in 49 days, having been detained two days at Capetown for coal.
Foreseeing, however, that a fifty-days’ service would not meet the desires of the New Zealand public, the company determined on constructing steamers which would make the passages with regularity under 45 clays out and 42 days Home. With such a service they thought the colony might enjoy direct mail communication with the Mother-country; and, at the same time, the shippers of frozen meat would get the quicker passages so desirable for that commodity. They contracted, therefore, with the firm of Messrs. John Elder and Co., Glasgow, for the building of five steamers, all fitted with refrigerating machinery, and chambers capable of carrying 12,000 to 15,000 carcases of mutton, and with accommodation for about 80 first-class, 80 second-class, and 250 third-class passengers. The meat chambers have since been enlarged, and will now carry more than double the above quantities. Several small chambers have also been constructed, which are kept at a somewhat higher degree of temperature than the meat chambers; these in the season are filled with dairy produce and fruit.
To show the great regularity with which these steamers make their passages, the company recently compiled a series of results showing that the five steamers have completed 73 voyages round the world, the longest average passage being—homeward, 40 days 1 hour; and the shortest, 39 days 2 hours; and outward, longest, 43 days 4 hours; shortest, 41 days 20 hours; and all these 73 voyages have been performed without any serious casualty or loss of life.
The latest addition to this fine fleet of mail-steamers is the Ruahine, a vessel of 6,127 tons register, specially built to carry a large quantity of frozen meat, dairy-produce, and general cargo, and at the same time fitted for conveying a large number of passengers of all classes. All the arrangements on board are of the most modern type, and calculated to insure the comfort and safety of those who travel by her. Her cabins are unusually large.
The great expansion of trade soon demanded more accommodation for cargo than was afforded by the mail liners, and the company promptly responded to the colonists’ requirements by acquiring three cargo-steamers—the Tekoa, 4,050 tons register, the Otarama, 3,808 tons register, the Waikato, 4,766 tons register, and by chartering other cargo steamers, in addition to the mail-boats, thereby starting a monthly line of cargo boats.
During the wool season the company despatches cargo steamers more frequently than once a month from New Zealand.
During the past four years the company has been despatching vessels to the United States, carrying flax and gum, and has now become the principal carrier between that country and New Zealand.
The company's fleet now consists of—
Mail-steamers: Tongariro, 4,163 tons register, carries 27,000 carcases frozen mutton; Aorangi, 4,196 tons, 27,000 carcases; Ruapehu, 4,202 tons, 27,000 carcases; Kaikoura, 4,507 tons, 34,500 carcases; Rimutaka, 4,515 tons, 37,000 carcases; Ruahine, 6,127 tons, 71,000 carcases.
Cargo-steamers: Tekoa, 4,050 tons register, carries 60,000 carcases frozen mutton; Otarama, 3,808 tons, 53,000 carcases; Waikato, 4,766 tons, 71,000 carcases.
Sailing-vessels: Opawa, 1,131 tons register, 11,000 carcases frozen mutton; Turakina, 1,247 tons, 13,000 carcases; Rangitikei, 1,227 tons; Waimea, 871 tons; Waimate, 1,156 tons; Wairoa, 1,057 tons; Hurunui, 1,053 tons; Waitangi, 1,161 tons; Waipa, 1057 tons; Mataura, 898 tons.
In addition to these the company charters a large number of sailing-vessels, for homeward loading.
The number of vessels despatched from the colony during the twelve months ending the 30th June, 1893, was as follows: Mail-boats, 14 steamers; cargo-boats, 13 steamers; sailing-vessels, 52 ships, 14 of which were to the United States.
The company has its head office for Australasia at Christchurch, New Zealand; and the General Manager for the colonies is Mr. Isaac Gibbs. There are branch offices and agents in New Zealand at Lyttelton, Auckland, Wellington, Palmerston North, Dunedin, Napier, Timaru, Ashburton, Rangiora, Rakaia, Oamaru, Invercargill, Gisborne, New Plymouth, Wanganui, Nelson, Blenheim, Greymouth, and Hokitika; also agents at Plymouth, Capetown, Hobart, Melbourne, Sydney, Adelaide, Newcastle, Brisbane, Maryborough, Rockhampton, Townsville, Rio de Janeiro, Madeira, and Teneriffe.
Early in the sixties, the firm of Shaw-Savill and Co. (then trading under the name of Willis, Gann, and Co.) established a line to this colony, and some time later the Albion Company, of Glasgow, followed suit. These two firms subsequently amalgamated under the title of Shaw-Savill and Albion Company, Limited, and now possess a large fleet of magnificent, full-powered steamships trading from New Zealand to London, viâ Rio de Janeiro, Teneriffe, and Plymouth, and outwards viâ Madeira, Cape of Good Hope, and Hobart, on alternate Thursdays, doing either trip in about 42 days.
The mail-steamer Gothic, 7,730 tons, can accommodate 140 saloon passengers; the Ionic, 4,753 tons, Tainui, 5,031 tons, Doric, 4,744 tons, Arawa, 5,026 tons, and Coptic, 4,448 tons register, can each carry about 60 saloon and 60 second-class passengers.
Like the sister firm (the New Zealand Shipping Company), the Shaw-Savill and Albion Company have greatly aided the growth of the frozen-meat trade by providing first-class steamships-fitted with refrigerating-chambers, and thus meeting the requirements of the colony in this respect.
The following table shows the estimated cargo capacities of this company's steamships for the carriage of frozen meat, wool, dairy-produce, &c.:—
| Steamer. | Frozen-meat Capacity. | Wool capacity (Dumped). | Cool-chamber Capacity. |
|---|---|---|---|
| Sheep. | Bales. | Tons Measurement. | |
| Doric | 31,800 | 4,000 | 110 |
| Arawa | 30,500 | 1,800 | 160 |
| Coptic | 30,500 | 3,500 | 100 |
| Ionic | 32,500 | 4,000 | 125 |
| Tainui | 31,150 | 1,800 | 135 |
| Mamari | 41,000 | 3,500 | 360 |
| Matatua | 38,000 | 2,400 | 218 |
| Maori | 70,000 | 7,000 | As required. |
| Rangatira | 45,000 | 5,000 | 230 |
| Pakeha | 45,000 | 5,000 | 200 |
| Gothic | 70,000 | 6,000 | As required. |
In addition to the mail- and cargo-steamers, the Shaw-Savill and Albion Company has a fleet of thirty-three first-class steel sailing-ships. These vessels are despatched at regular intervals, carrying goods from and to all ports in New Zealand. Occasionally the sailing-ships take a few passengers who may prefer the longer voyage of about three months. Of these sailing-ships, six are fitted up as “freezers” for the carriage of meat, with a capacity of about 10,000 sheep each.
Wellington to Cape Horn, 4,400 miles; to Rio de Janeiro, 6,750; to Teneriffe, 10,240; to Madeira, 10,445; to Plymouth, 11,655; to Gravesend, 11,946 miles. Gravesend to Plymouth, 291 miles; to Madeira, 1,501; to Teneriffe, 1,706; to Capetown, 6,291; to Hobart, 11,951; to Otago, 13,013; to Lyttelton, 13,203; to Wellington, 13,345 miles.
| Miles. | |
|---|---|
| Auckland to Onehunga | 8 |
| Auckland to Kaukapakapa | 44 |
| Auckland to Frankton Junction | 85 |
| Auckland to To Awamutu | 100 |
| Auckland to Te Kuiti | 126 |
| Auckland to Cambridge | 101 |
| Auckland to Lichfield | 145 |
| Auckland to Mercer | 43 |
| Auckland to To Aroha | 115 |
| Auckland to Helensville | 38 |
| Opua to Kawakawa | 8 |
| Whangarei Wharf to Kamo | 6 |
| Napier to Hastings | 12 |
| Napier to Ormondville | 66 |
| Wellington to Palmerston North | 89 |
| Wellington to Masterton | 71 |
| Wellington to Eketahuna | 93 |
| Wellington to Featherston | 50 |
| Wellington to Foxton | 104 |
| Wellington to Patea | 186 |
| Wellington to Hawera | 204 |
| Wellington to Feilding | 100 |
| Wellington to Wanganui | 151 |
| Wellington to New Plymouth | 251 |
| Wellington to Lower Hutt | 8 |
| Wellington to Longburn Junction | 84 |
| Wellington to Napier | 200 |
| Wellington to Spit | 202 |
| Wanganui to Rangatira | 19 |
| Picton to Blenheim | 18 |
| Nelson to Belgrove | 22 |
| Grey mouth to Brunnerton | 8 |
| Grey mouth to Reefton | 52 |
| Westport to Waimangaroa | 10 |
| Westport to Ngakawau | 20 |
| Christchurch to Rangiora | 20 |
| Christchurch to Kaiapoi | 14 |
| Christchurch to Culverden | 69 |
| Christchurch to Oxford (West) | 41 |
| Christchurch to Southbridge | 31 |
| Christchurch to Little River | 36 |
| Christchurch to Springfield | 44 |
| Christchurch to Whitecliffs | 42 |
| Christchurch to Methven | 58 |
| Christchurch to Lyttelton | 7 |
| Christchurch to Ashburton | 53 |
| Christchurch to Temuka | 89 |
| Christchurch to Timaru | 100 |
| Christchurch to Oamaru | 152 |
| Christchurch to Dunedin | 230 |
| Ashburton to Springburn | 30 |
| Timaru to Fairlie | 39 |
| Timaru to Waihao Downs | 41 |
| Oamaru to Hakateramea | 43 |
| Oamaru to Tokaraki | 25 |
| Oamaru to Ngapara | 17 |
| Dunedin to Palmerston South | 41 |
| Dunedin to Lawrence | 60 |
| Dunedin to Port Chalmers | 8 |
| Dunedin to Milton | 36 |
| Dunedin to Clinton | 74 |
| Dunedin to Kingston | 174 |
| Dunedin to Invercargill | 139 |
| Dunedin to Dunback | 50 |
| Dunedin to Mosgiel | 10 |
| Dunedin to Outram | 19 |
| Dunedin to Stirling | 50 |
| Dunedin to Kaitangata | 55 |
| Dunedin to Middlemarch | 49 |
| Dunedin to Balclutha | 53 |
| Invercargill to Kingston | 87 |
| Invercargill to Bluff Harbour | 17 |
| Invercargill to Riverton | 26 |
| Invercargill to Orepuki | 43 |
| Invercargill to Clinton | 66 |
| Invercargill to Heriot | 76 |
| Invercargill to Glenham | 33 |
| Invercargill to Mokotua | 13 |
| Riverton to Nightcaps | 31 |
| Lumsden to Gore | 37 |
| Lumsden to Kingston | 38 |
| Lumsden to Invercargill | 50 |
| Miles | |
|---|---|
* Direct. †ViâC French Pass. | |
| Auckland to Russell | 128 |
| Auckland to Tauranga | 133 |
| Auckland to Gisborne | 301 |
| Auckland to Napier | 387 |
| Wellington | 564 |
| Wellington to Lyttelton | 175 |
| Port Chalmers to Bluff Harbour | 132 |
| Tauranga to Gisborne | 206 |
| Gisborne to Napier | 86 |
| Napier to Wellington | 203 |
| Lyttelton to Akaroa | 44 |
| Akaroa to Port Chalmers | 159 |
| Lyttelton to Port Chalmers | 190 |
| Manukau Harbour to New Plymouth | 135 |
| New Plymouth to Wanganui | 100 |
| New Plymouth to Nelson | 148 |
| New Plymouth to Wellington* | 172 |
| Wellington to Port Chalmers* | 332 |
| Nelson to Picton† | 85 |
| Picton to Wellington | 53 |
| Nelson to Wellington* | 101 |
| Nelson to Westport | 160 |
| Westport to Greymouth | 63 |
| Greymouth to Hokitika | 20 |
| Nelson to Greymouth* | 208 |
| Miles. | |
|---|---|
| Auckland to Sydney | 1,281 |
| Auckland to Levuka (Fiji) | 1,172 |
| Russell to Sydney | 1,172 |
| Wellington to Sydney | 1,239 |
| Wellington to Melbourne | 1,479 |
| Bluff to Melbourne | 1,200 |
| Bluff to Hobart | 930 |
| Hokitika to Newcastle | 1,085 |
| Greymouth to Melbourne | 1,266 |
Table of Contents
By Sir James Hector, K.C.M.G., M.D., F.R.S.
Meteorological observations have been taken ever since the founding of the colony, though at first they were of an irregular character, and made only with the view of comparing the climate of New Zealand with that of other countries. From 1853 meteorological reports appear regularly appended to the Registrar-General's statistics; but it was not until 1859 that systematic observations were undertaken by a Government department. In that year nine stations, equipped with carefully - compared instruments, were established at Mongonui, Auckland, Napier, New Plymouth, and Wellington, in the North Island; Nelson, Christchurch, Dunedin, and Invercargill, in the Middle Island; and some years later two more were added—one at Hokitika, and the other at the Bealey.
Subsequently, several new stations were established, making in all fifteen, from which monthly returns were sent to the head office in Wellington. Since then the number of chief stations has been reduced to six, but the number of secondary stations at which rainfall and weather is recorded has been increased to seventy-nine in number.
In this respect the climate resembles that of Great Britain, but is more equable, the extremes of daily temperature varying throughout the year by an average of 20° only. London is 7° colder than the North and 4° colder than the Middle Island of New Zealand. The mean annual temperature of the North Island is 57°, and of the Middle Island 52°, that of London and New York being 51°.
The mean annual temperature of the different seasons for the whole colony is: In spring, 55°; in summer, 63°; in autumn, 57°; and in winter, 48°.
The following are the means for the two warmest and the two coldest months in the several localities, with their differences:—
| Auckland. | New Plymouth. | Wellington. |
|---|---|---|
| 69.6 | 64.7 | 64.6 |
| 53.1 | 49.3 | 47.8 |
| 16.5 | 15.4 | 16.8 |
| Nelson. | Christchurch. | Dunedin. |
|---|---|---|
| 63.6 | 65.2 | 58.0 |
| 45.9 | 44.3 | 43.2 |
| 17.7 | 20.49 | 14.8 |
The average difference between the mean temperature of the warmest and coldest months in New Zealand is 17°; at Rome it is 27°; at Montpellier, 33°; at Milan, 38°; and in Jersey, 22°.
Meteorological observations were taken in 1893, at 9.30 a.m. daily, at six different stations—namely, at Auckland, in the northern part of the North Island; at Te Aroha and Rotorua, in the hot-springs district; at Wellington, at the extreme south of the North Island; at Lincoln, in the Canterbury District, about midway in the Middle Island; and at Dunedin, in the southern district of the Middle Island. The differences between the several stations in respect of situation—Auckland, Wellington, and Dunedin being seaports, the other three inland towns,—of elevation, and of latitude, involve considerable differences of temperature.
The mean temperature of air in the shade for the year 1893, at each station, and the maximum and minimum temperature recorded are given:—
| Station. | 1893. | |||
|---|---|---|---|---|
| Mean Temp. in Shade. | Max. Temp. recorded. | Min. Temp. recorded. | Extreme Range. | |
| °Fahr | °Fahr | °Fahr. | °Fahr. | |
| Auckland | 60.5 | 81.5 | 38.5 | 43.0 |
| Te Aroha | 60.4 | 90.5 | 27.5 | 63.0 |
| Rotorua | 56.5 | 87.5 | 24.0 | 63.5 |
| Wellington | 56.7 | 82.0 | 34.0 | 48.0 |
| Lincoln (Canterbury) | 54.1 | 93.8 | 22.0 | 71.8 |
| Dunedin | 50.9 | 88.0 | 30.0 | 58.0 |
It will be observed that, although the mean temperature for the year was highest at Auckland, the highest temperature reached was at Lincoln, in the Middle Island.
The climate on the west coast is more equable than on the east, the difference between the average summer and winter temperatures in the north-west portion of the North Island being nearly four degrees less than in the south-east, while, as between the corresponding portions of the Middle Island, the differences vary by some seven degrees. This is due to the action of cyclonic disturbances of the atmosphere, the centres of which in most cases pass south of New Zealand in their eastward progress, thus causing westerly winds to impinge on the west coast. The extent of their influence can be better appreciated by comparing the annual fluctuations of temperature on the opposite sea-boards of the Middle Island. Thus, at Christchurch, on the east, the range of temperature is greater by seven degrees than it is at Hokitika, on the west.
The averages ascertained in respect of the temperature of the climate of New Zealand are given below:—
I.—GENERAL ABSTRACT.
| Stations. | S. Lat. | Long. E. from Greenwich | No. of Years of Observation. | Year. | Winter. | Spring. | Summer. | Autumn. | Difference of the Warmest and Coldest Months. | Averages of Yearly Extremes. | Yearly Fluctuation. | |||
|---|---|---|---|---|---|---|---|---|---|---|---|---|---|---|
| Max. | min. | |||||||||||||
* Height above sea, 2,104ft. † Height above sea, 550ft. ‡ Height above sea, 1,070ft. | ||||||||||||||
| ° | ° | ° | ° | ° | ° | ° | ° | ° | ° | ° | ||||
| ° | ' | ° | ' | Fah. | Fah. | Fah. | Fah. | Fah. | Fah. | Fah. | Fah. | Fah. | ||
| North Island. | ||||||||||||||
| Mongonui | 35 | 1 | 173 | 28 | 10 | 59.90 | 53.06 | 58.28 | 66.56 | 61.52 | 15.12 | 89.10 | 31.82 | 57.28 |
| Auckland | 36 | 50 | 174 | 51 | 20 | 59.54 | 52.34 | 57.56 | 66.92 | 61.16 | 16.02 | 88.52 | 33.26 | 55.26 |
| New Plymouth | 39 | 4 | 174 | 5 | 14 | 87.56 | 50.90 | 55.94 | 64.58 | 58.82 | 15.66 | 86.90 | 30.02 | 56.88 |
| Napier | 39 | 29 | 176 | 55 | 10 | 57.56 | 49.10 | 57.74 | 66.20 | 57.62 | 19.26 | 90.00 | 32.10 | 57.90 |
| Wellington | 41 | 16 | 174 | 47 | 14 | 55.58 | 48.74 | 54.50 | 62.24 | 56.66 | 14.76 | 78.44 | 32.18 | 46.26 |
| Wanganui | 39 | 56 | 175 | 6 | 3 | 55.90 | 48.71 | 53.31 | 63.31 | 57.12 | 16.70 | 86.00 | 29.00 | 57.00 |
| South Island. | ||||||||||||||
| Nelson | 41 | 16 | 173 | 19 | 11 | 54.86 | 46.58 | 54.50 | 62.78 | 55.76 | 17.10 | 82.04 | 27.32 | 54.72 |
| Hokitika | 42 | 42 | 170 | 59 | 10 | 52.34 | 45.50 | 51.62 | 59.18 | 53.06 | 14.76 | 74.12 | 28.22 | 45.90 |
| Bealey* | 43 | 2 | 171 | 31 | 9 | 46.76 | 37.40 | 40.01 | 54.86 | 48.56 | 18.18 | 78.08 | 32.38 | 65.70 |
| Christchurch | 43 | 32 | 172 | 39 | 12 | 52.88 | 43.52 | 53.24 | 61.52 | 53.00 | 18.72 | 88.16 | 25.16 | 33.00 |
| Dunedin † | 45 | 52 | 170 | 31 | 17 | 50.72 | 43.52 | 50.54 | 57.20 | 51.80 | 15.30 | 84.74 | 29.84 | 54.90 |
| Invercargill | 46 | 17 | 168 | 20 | 14 | 50.36 | 42.26 | 51.26 | 58.10 | 50.00 | 16.92 | 83.84 | 20.12 | 63.72 |
| Queenstown ‡ | 45 | 2 | 165 | 39 | 3 | 51.01 | 40.01 | 50.92 | 64.02 | 52.31 | 21.25 | 84.60 | 23.21 | 61.39 |
II.—DAILY RANGE OF TEMPERATURE.
Difference of the Mean Daily Extremes.
| Stations. | Jan. | Feb. | Mar. | Apr. | May. | June | July. | Aug. | Sept. | Oct. | Nov. | Dec. | Year. |
|---|---|---|---|---|---|---|---|---|---|---|---|---|---|
| . | ° | ° | ° | ° | ° | ° | ° | ° | ° | ° | ° | ° | ° |
| Fah. | Fah. | Fah. | Fah. | Fah. | Fah. | Fah. | Fah. | Fah. | Fah. | Fah. | Fah. | Fah. | |
| North Island | |||||||||||||
| Mongonui | 16.74 | 15.30 | 19.08 | 18.18 | 16.92 | 15.30 | 15.66 | 16.92 | 16.02 | 14.58 | 16.74 | 15.48 | 16.38 |
| Auckland | 19.80 | 20.88 | 19.80 | 19.08 | 16.92 | 15.30 | 15.48 | 16.74 | 15.84 | 16.56 | 18.00 | 18.90 | 17.82 |
| New Plymouth | 21.60 | 20.16 | 21.42 | 19.44 | 15.84 | 15.30 | 14.40 | 16.56 | 18.00 | 16.74 | 18.54 | 19.62 | 18.18 |
| Napier | 21.60 | 21.78 | 17.82 | 15.12 | 14.94 | 13.86 | 15.30 | 15.12 | 18.00 | 18.18 | 19.08 | 18.72 | 17.46 |
| Wellington | 13.50 | 12.42 | 12.42 | 11.70 | 11.16 | 10.62 | 10.62 | 11.52 | 11.88 | 12.24 | 13.50 | 13.32 | 12.06 |
| South Island. | |||||||||||||
| Nelson | 23.40 | 20.70 | 21.24 | 17.10 | 17.62 | 19.08 | 19.08 | 19.62 | 21.06 | 21.42 | 22.14 | 20.34 | 20.16 |
| Hokitika | 11.16 | 13.32 | 12.60 | 12.78 | 13.86 | 14.58 | 13.68 | 14.76 | 15.66 | 12.24 | 11.52 | 11.34 | 13.14 |
| Christchurch | 18.36 | 16.56 | 17.46 | 17.10 | 16.33 | 14.94 | 16.56 | 16.02 | 16.20 | 18.54 | 19.08 | 17.10 | 17.10 |
| Dunedin | 15.66 | 15.66 | 15.12 | 13.68 | 11.52 | 10.44 | 10.62 | 12.06 | 13.32 | 13.68 | 15.30 | 16.20 | 18.68 |
| Invercargill | 21.78 | 22.50 | 22.68 | 18.00 | 16.02 | 17.64 | 16.92 | 19.44 | 22.32 | 21.06 | 21.06 | 22.50 | 20.16 |
The next table shows the shade temperatures for each month in New Zealand, Australian Colonies, and certain other British possessions. The figures given are the means of four years. (H signifies highest, and L lowest):—
| British Possessions (Stations and Height in Feet above Sea Level where known). | Jan. | Feb. | March. | April. | May. | June. | July. | Aug. | Sept. | Oct. | Nov. | Dec. | Year. | |||||||||||||
|---|---|---|---|---|---|---|---|---|---|---|---|---|---|---|---|---|---|---|---|---|---|---|---|---|---|---|
| H. | L. | H. | L. | H. | L. | H. | L. | H. | L. | H. | L. | H. | L. | H. | L. | H. | L. | H. | L. | H. | L. | H. | L. | H. | L. | |
| °F. | °F. | °F. | °F. | °F. | °F. | °F. | °F. | °F. | °F. | °F. | °F. | °F. | °F. | °F. | °F. | °F. | °F. | °F. | °F. | °F. | °F. | °F. | °F. | °F. | °F. | |
| New Zealand— | ||||||||||||||||||||||||||
| Wellington (140) | 78 | 45 | 78 | 47 | 76 | 44 | 70 | 43 | 66 | 39 | 62 | 34 | 58 | 33 | 62 | 34 | 65 | 37 | 69 | 44 | 74 | 33 | 75 | 44 | 78 | 33 |
| Queensland— | ||||||||||||||||||||||||||
| Brisbane (130) | 92 | 64 | 93 | 63 | 91 | 61 | 85 | 54 | 80 | 50 | 76 | 42 | 75 | 30 | 78 | 41 | 85 | 40 | 91 | 50 | 94 | 57 | 97 | 61 | 97 | 30 |
| New South Wales— | ||||||||||||||||||||||||||
| Sydney (155) | 92 | 59 | 69 | 58 | 84 | 59 | 79 | 51 | 72 | 48 | 67 | 44 | 63 | 39 | 70 | 42 | 77 | 45 | 88 | 48 | 87 | 54 | 94 | 57 | 94 | 39 |
| Victoria— | ||||||||||||||||||||||||||
| Melbourne (91) | 101 | 48 | 99 | 47 | 99 | 45 | 86 | 40 | 74 | 37 | 64 | 37 | 62 | 32 | 68 | 34 | 74 | 34 | 81 | 40 | 94 | 44 | 96 | 45 | 101 | 32 |
| South Australia— | ||||||||||||||||||||||||||
| Adelaide (140) | 108 | 49 | 106 | 50 | 100 | 48 | 89 | 45 | 78 | 40 | 67 | 38 | 65 | 36 | 74 | 39 | 79 | 41 | 86 | 41 | 96 | 45 | 101 | 48 | 108 | 36 |
| Western Australia— | ||||||||||||||||||||||||||
| Perth (47) | 107 | 50 | 102 | 53 | 98 | 52 | 96 | 57 | 81 | 40 | 70 | 38 | 70 | 37 | 73 | 38 | 80 | 42 | 83 | 42 | 93 | 48 | 100 | 51 | 107 | 37 |
| Tasmania— | ||||||||||||||||||||||||||
| Hobart (160) | 91 | 45 | 94 | 45 | 93 | 44 | 75 | 38 | 71 | 37 | 61 | 34 | 59 | 33 | 66 | 33 | 72 | 35 | 77 | 35 | 92 | 40 | 86 | 43 | 94 | 33 |
| Hongkong— | ||||||||||||||||||||||||||
| Observatory (110) | 73 | 47 | 78 | 46 | 77 | 49 | 84 | 58 | 89 | 68 | 91 | 73 | 91 | 74 | 91 | 74 | 92 | 70 | 90 | 66 | 82 | 55 | 79 | 49 | 91 | 46 |
| Straits Settlements— | ||||||||||||||||||||||||||
| Singapore (80) | 88 | 70 | 90 | 70 | 91 | 71 | 91 | 73 | 90 | 73 | 90 | 72 | 90 | 72 | 89 | 72 | 89 | 71 | 89 | 71 | 89 | 71 | 89 | 70 | 91 | 70 |
| Mauritius— | ||||||||||||||||||||||||||
| Royal Alfred Observatory (179) | 84 | 69 | 84 | 71 | 84 | 70 | 82 | 70 | 80 | 62 | 77 | 60 | 75 | 59 | 75 | 59 | 77 | 62 | 80 | 62 | 82 | 66 | 84 | 68 | 84 | 59 |
| Natal— | ||||||||||||||||||||||||||
| Durban (150) | 99 | 63 | 95 | 61 | 94 | 60 | 94 | 58 | 89 | 52 | 86 | 49 | 88 | 48 | 91 | 49 | 96 | 50 | 91 | 53 | 97 | 57 | 98 | 59 | 99 | 49 |
| Cape Town— | ||||||||||||||||||||||||||
| Royal Observatory (37) | 94 | 54 | 90 | 51 | 92 | 49 | 86 | 45 | 80 | 42 | 76 | 39 | 74 | 37 | 76 | 37 | 83 | 39 | 86 | 44 | 89 | 48 | 90 | 52 | 94 | 37 |
| Canada— | ||||||||||||||||||||||||||
| Toronto (350) | 47 | -3 | 45 | -3 | 51 | 6 | 71 | 22 | 78 | 31 | 86 | 44 | 88 | 46 | 89 | 47 | 82 | 41 | 71 | 27 | 56 | 13 | 45 | -1 | 89 | -3 |
| Montreal(187) | 45 | -14 | 42 | -13 | 44 | 0 | 59 | 24 | 81 | 32 | 87 | 43 | 88 | 50 | 86 | 50 | 81 | 39 | 70 | 27 | 59 | 11 | 43 | -11 | 88 | -13 |
| St. John (N.B.) (116) | 49 | -7 | 46 | -7 | 47 | 4 | 62 | 22 | 69 | 33 | 81 | 42 | 79 | 49 | 77 | 48 | 73 | 37 | 60 | 26 | 56 | 16 | 49 | -3 | 81 | -7 |
| Halif (122) | 50 | -1 | 46 | -3 | 50 | 10 | 63 | 22 | 73 | 32 | 83 | 39 | 84 | 48 | 84 | 49 | 80 | 36 | 69 | 29 | 60 | 21 | 51 | 3 | 84 | -3 |
| Charlottetown, Prince Edward Island (38) | 47 | -6 | 43 | -9 | 47 | 5 | 60 | 20 | 70 | 31 | 77 | 39 | 80 | 49 | 79 | 49 | 75 | 39 | 66 | 30 | 58 | 19 | 47 | 1 | 80 | -9 |
| Winnipeg, Manitoba (764) | 34 | -37 | 32 | -37 | 49 | -25 | 76 | 3 | 82 | 20 | 90 | 35 | 87 | 40 | 91 | 34 | 86 | 30 | 73 | 17 | 53 | -16 | 39 | -29 | 91 | -37 |
| Victoria, British Columbia (10) | 51 | 14 | 55 | 22 | 60 | 30 | 67 | 29 | 73 | 38 | 76 | 39 | 79 | 43 | 76 | 44 | 71 | 38 | 64 | 35 | 55 | 30 | 51 | 23 | 79 | 14 |
| St. John's, Newfoundland (125) | 48 | -6 | 50 | -8 | 50 | 11 | 61 | 15 | 71 | 27 | 76 | 33 | 81 | 41 | 79 | 42 | 78 | 33 | 60 | 24 | 62 | 19 | 51 | 9 | 81 | -8 |
| Barbados— | ||||||||||||||||||||||||||
| Joes River (430) | 81 | 67 | 81 | 67 | 83 | 69 | 84 | 70 | 84 | 71 | 85 | 72 | 84 | 70 | 85 | 70 | 85 | 71 | 85 | 71 | 84 | 70 | 83 | 69 | 85 | 67 |
| Bahamas— | ||||||||||||||||||||||||||
| Military Hospital | 77 | 63 | 79 | 68 | 79 | 67 | 84 | 69 | 89 | 72 | 88 | 73 | 89 | 78 | 89 | 73 | 87 | 75 | 86 | 77 | 82 | 70 | 77 | 67 | 89 | 63 |
| Jamaica— | ||||||||||||||||||||||||||
| Kingston (60) | 91 | 63 | 90 | 63 | 90 | 62 | 91 | 68 | 91 | 70 | 92 | 71 | 95 | 71 | 93 | 73 | 92 | 70 | 93 | 69 | 91 | 67 | 90 | 63 | 95 | 62 |
| Trinidad (130) | 86 | 67 | 87 | 68 | 88 | 69 | 88 | 70 | 89 | 70 | 86 | 71 | 86 | 71 | 86 | 70 | 89 | 70 | 83 | 70 | 87 | 70 | 85 | 69 | 89 | 67 |
The rainfall varies much at the different stations, and from year to year. The following shows the rainfall for the last four years at the chief stations:—
| Station. | 1890. | 1891. | 1892. | 1893. | ||||
|---|---|---|---|---|---|---|---|---|
| Rainfall. | Number of Days on which Rain fell. | Rainfall. | Number of Days on which Rain fell. | Rainfall. | Number of Days on which Rain fell. | Rainfall. | Number of Days on which Rain fell. | |
| Inches. | Inches. | Inches. | Inches. | |||||
| Auckland | 46.100 | 176 | 36.040 | 149 | 41.331 | 177 | 5381 | 203 |
| Te Aroha | 64.110 | 129 | 43.270 | 119 | 54.080 | 144 | 61.91 | 161 |
| Rotorua | 50.411 | 162 | 48.940 | 132 | 66.230 | 166 | 93.72 | 168 |
| Welling'n | 45.230 | 165 | 35.125 | 166 | 67.656 | 184 | 53.03 | 186 |
| Lincoln | 14.836 | 104 | 20.575 | 98 | 27.883 | 124 | 22.05 | 115 |
| Dunedin | 27.984 | 155 | 32.734 | 151 | 47.552 | 160 | 54.49 | 184 |
The annual average rainfall at the thirteen town stations in New Zealand since 1864 has been:—
| Inches. | |
|---|---|
| Mongonui | 54.33 |
| Auckland | 41.78 |
| Napier | 35.82 |
| Taranaki | 58.64 |
| Wellington | 37.37 |
| Nelson | 60.42 |
| Christchurch | 25.10 |
| Hokitika | 119.91 |
| Greymouth | 94.77 |
| Dunedin | 35.67 |
| Queenstown | 32.84 |
| Invercargill | 45.80 |
The greatest rainfall for any one of these years was 154.45in., at Hokitika, in 1878; and the smallest was 13.54in., at Christchurch, in the same year.
During the year 1893 the rainfall was recorded at seventy-nine stations, forty-nine in the North Island, twenty-nine in the Middle Island, and one at Chatham Islands. The general average was 68.75; the rainfall in the North Island being 79.20, and in the Middle Island 57.27.
But a more useful comparison is obtained by taking the averages for the different climatic aspects of New Zealand:—
| NORTH ISLAND. | Average Rainfall. |
|---|---|
| N.E. aspect, from North Capo to East Cape | 72.14 |
| W. aspect, from North Cape to Cape Egmont | 128.73 |
| S.W. aspect, from Cape Egmont to Cape Terawhiti | 52.11 |
| S.E. aspect, from East Cape to Cape Palliser | 63.83 |
| MIDDLE ISLAND. | |
|---|---|
| N. aspect, from Capo Farewell to Cape Koamoru | 49.46 |
| W. aspect, from Cape Farewell to Puysegur Point | 123.16 |
| E. aspect, Cape Koamoru to Cape Saunders | 36.90 |
| S. aspect, Cape Saunders to Puysegur Point | 35.24 |
Averaging these aspects, we find that when the coast-line faces N. and N.E. the rainfall is 60.8; when W. and N.W., 125.94; when S. and S.W., 43.67; and when E. and S.E., 50.36.
The greatest fall in 1593 was at Puysegur Point, 174.14, and the least on the Port Hills, East of Christchurch, 19.12.
I.—REVIEW OF THE PROPORTIONS OF RAIN IN NEW ZEALAND.
| Stations. | Rainfall. | Probability of Rain. | Mean Max. in 24 Hours. | ||||||||
|---|---|---|---|---|---|---|---|---|---|---|---|
| Winter. | Spring. | Summer. | Autumn. | Total for Year. | Winter. | Spring. | Summer. | Autumn. | Year. | ||
| Percentage. | In. | In. | In. | In. | In. | In. | In. | ||||
| North Island— | |||||||||||
| Mongonui | 36 | 24 | 23 | 17 | 58.132 | 0.66 | 0.50 | 0.33 | 0.39 | 0.47 | 3.500 |
| Auckland | 32 | 25 | 19 | 24 | 47.008 | 0.61 | 0.52 | 0.33 | 0.41 | 0.47 | 3.358 |
| New Plymouth | 29 | 27 | 20 | 23 | 59.442 | 0.52 | 0.51 | 0.35 | 0.38 | 0.44 | 2.520 |
| Napier | 39 | 15 | 35 | 11 | 36.004 | 0.26 | 0.22 | 0.24 | 0.17 | 0.22 | |
| Wellington | 29 | 24 | 24 | 22 | 51.542 | 0.51 | 0.43 | 0.37 | 0.40 | 0.43 | 2.610 |
| South Island— | |||||||||||
| Nelson | 27 | 26 | 29 | 17 | 61.599 | 0.27 | 0.25 | 0.22 | 0.18 | 0.23 | 7.189 |
| Hokitika | 24 | 28 | 28 | 20 | 111.653 | 0.52 | 0.61 | 0.57 | 0.48 | 0.54 | 3.532 |
| Bealey | 22 | 28 | 31 | 18 | 105.340 | 0.53 | 0.61 | 0.56 | 0.47 | 0.54 | 3.512 |
| Christchurch | 31 | 21 | 25 | 23 | 25.536 | 0.36 | 0.33 | 0.28 | 0.24 | 0.30 | 1.622 |
| Dunedin | 23 | 23 | 28 | 26 | 31.682 | 0.51 | 0.55 | 0.58 | 0.54 | 0.54 | 2.079 |
| Invercargill | 26 | 23 | 26 | 26 | 49.732 | 0.47 | 0.47 | 0.40 | 0.49 | 0.46 | 1.130 |
II.—TOTALS OF MONTHLY RAINFALL IN INCHES.
| Stations. | Jan. | Feb. | Mar. | April | May. | June In. | July. | Aug. | Sept. | Oct. | Nov. | Dec. |
|---|---|---|---|---|---|---|---|---|---|---|---|---|
| In. | In. | In. | In. | In. | In. | In. | In. | In. | In. | In. | In. | |
| North Island — | ||||||||||||
| Mongonui | 3.209 | 7.787 | 1.492 | 2.882 | 5.461 | 8.319 | 6.598 | 6.241 | 5.831 | 3.701 | 4.272 | 2.339 |
| Auckland | 2.071 | 3.272 | 3.150 | 3.402 | 4.771 | 5.721 | 5.279 | 4.331 | 4.331 | 3.520 | 3.752 | 3.409 |
| New Plymouth | 3.221 | 3.908 | 2.579 | 3.520 | 7.720 | 5.914 | 6.299 | 5.177 | 5.252 | 5.969 | 4.858 | 4.921 |
| Napier | 3.571 | 3.650 | 1.130 | 1.358 | 1.532 | 3.402 | 3.681 | 6.870 | 2.414 | 1.539 | 1.201 | 5.630 |
| Wellington | 3.882 | 4.453 | 3.780 | 3.280 | 4.540 | 5.212 | 5.658 | 4.299 | 3.941 | 5.000 | 3.500 | 3.999 |
| South Island— | ||||||||||||
| Nelson | 5.358 | 8.331 | 2.063 | 3.221 | 5.177 | 4.441 | 6.319 | 6.233 | 6.319 | 5.000 | 4.815 | 4.319 |
| Hokitika | 8.902 | 9.871 | 6.752 | 8.611 | 6.370 | 8.240 | 9.633 | 9.130 | 5.878 | 13.402 | 12.690 | 12.169 |
| Bealey | 9.681 | 8.902 | 3.921 | 7.433 | 8.079 | 5.019 | 10.378 | 7.799 | 5.811 | 15.501 | 8.733 | 14.087 |
| Christchurch | 2.311 | 2.370 | 1.752 | 1.811 | 2.280 | 3189 | 2.449 | 2.319 | 1.161 | 2.142 | 2130 | 1.622 |
| Dunedin | 3.599 | 2.142 | 2.220 | 2.122 | 3.949 | 2.441 | 2.500 | 2.228 | 2.000 | 2.500 | 2.969 | 3.012 |
| Invercargill | 5.279 | 3.921 | 3980 | 3.571 | 5.401 | 5.019 | 3.441 | 4.390 | 2.661 | 3.929 | 4.520 | 3.622 |
The seasonal observations in Tables I. and II., above, show that the northern part of New Zealand is within the influence of the subtropical winter rainfall, the probability of rainfall in winter in that part of the colony being twice as great as in summer.
In the south, however, the rainfall, though irregular, is distributed more equally over the year. The chief difference to be observed is that on the west coast spring rains prevail, and on the east coast summer rains; while in the middle of the colony the driest season is autumn, and in the south it is winter and spring.
The contrast between the east and west coasts in the matter of rainfall is as striking as the difference in temperature. Thus, in the North Island, Napier on the east has only half the amount of rain that falls in Taranaki on the west. But the Middle Island, with its longitudinal range of lofty mountains, exhibits this feature in a still more marked manner, for the rainfall on the west is nearly five times that on the east. The excess of precipitation on the coast is clearly illustrated by the distribution of the glaciers on the opposite sides of the range: those on the west slope have an excessive supply of snow, and descend to a line where the mean annual temperature is 50° Fahr., while on the east slope they descend only to the mean annual temperature of 37°. The winter snow-line of the Southern Alps on the east side is 3,000ft., and on the west side 3,700ft.
Periods of lasting drought are almost unknown in New Zealand, and in two instances only do the records show a whole month at any station without rain.
Owing to the fact that most atmospheric disturbances pass from west to east, with the centre of the depression either to the north or to the south of New Zealand, there is a marked prevalence of north-westerly followed by south-westerly winds throughout all seasons, but they are much modified by the form of the land.
When the centre passes to the north of New Zealand, the result is that north-east winds impinge on the east coast, bringing rain, followed by cold south-easters, with heavy storms of rain and snow during winter in the south.
When the centre of the disturbance passes south of New Zealand —which is the more frequent course—westerly winds begin in the north-north-west, bringing heavy rain on the west coast, and gradually veer to south-west, after which fair bright weather sets in on that coast; but the same southerly wind, sweeping along the east side of the islands, brings heavy strong weather, locally known as “southerly bursters,” which, from the shape of the coast, reach the region of Cook Strait as south-east storms. All the other winds are either land- or sea-draughts, with light fine weather, or are moderate winds produced by the circulation of the atmosphere round anticyclonic areas of high barometric pressure which are far more persistent in their influence than the fast-moving cyclonic or low-pressure areas.
The effect of the prevalence of clouded sky is best illustrated by the average difference between the readings of the black-bulb maximum thermometer in the sun, and of the minimum thermometer exposed to the night sky, and for this purpose two stations on either side of the Southern Alps may be selected.
| — | Christchurch, East Coast, 43° 32’ S.L. | Hokitika, West Coast, 42° 42’ S.L. | ||||
|---|---|---|---|---|---|---|
| Insulation. | Radiation. | Difference. | Insulation. | Radiation. | Difference. | |
| Summer | 131.72 | 44.78 | 86.94 | 84.02 | 48.38 | 35.64 |
| Autumn | 111.92 | 37.94 | 73.98 | 73.04 | 41.72 | 31.32 |
| Winter | 91.22 | 28.04 | 63.18 | 61.70 | 33.44 | 28.26 |
| Spring | 124.52 | 34.34 | 90.18 | 75.02 | 39.56 | 35.46 |
| Extremes | 158.00 | 14.54 | 143.46 | 97.34 | 21.92 | 75.42 |
By A. J. Rutherfurd.
New Zealand, a land of temperate climate, magnificent scenery, and clear flowing water, was found by the early settlers to be free from noxious animals: the home of curious varieties of birds, but having only a few fresh-water fish, of little economic value. Year by year the quaint native birds retreated before the advance of civilisation; many of them are now extinct, and, though late in the day, an attempt is being made to preserve some of the rarer varieties that are left, by setting aside two wooded islands adjacent to the mainland as reserves for them. Recognising the suitability of the country for European forms of life, the settlers in different parts of the colony formed voluntary associations for the carrying out of the work of acclimatisation; and these societies have been recognised by statute.
Various European and American birds were imported, and in many instances have thriven and spread throughout the colony. The skylark, blackbird, thrush, goldfinch, and other varieties of finches, starlings, minahs, linnets, sparrows, &c., are now everywhere to be found in considerable numbers; at one time, pheasants and quail were very numerous, and partridges were to be seen in places. The rapid increase of game-birds bid fair to make this colony most attractive to the sportsman, but many years previously some private persons had thoughtlessly introduced the rabbit. For a time no one noticed the rapid spread of this pest, and in many places rabbits were actually protected. Between the years 1876–80 they spread to such an alarming extent as to become a frightful evil, ruining scores of hard-working farmers and runholders, and causing a loss of millions of money to the colony. Then commenced a desperate uphill fight with the nuisance, involving the widespead use by the Government and settlers of poisoned grain, the importation of supposed natural enemies (the ferret, stoat, weasel, &c.), and the encouragement of hawks and cats. As a result, the imported game died in thousands, partridges were nearly exterminated, and a death-blow was given to the hope of ground game-birds becoming plentiful throughout the colony. In some districts, however, game is yet to be had, and is on the increase. Good duck shooting can still be obtained in many places; and here and there, in the Middle Island, pheasants and Californian quail are still to the fore, while in those parts of the North Island to which rabbits have not spread these birds are still numerous, and afford capital shooting. The season for shooting native and imported game usually opens on the 1st of May, and closes at the end of July, and a license costing £1 has to be taken out at the post-office in each district before permission can be obtained to shoot imported game.
The rabbits have, in many districts, been so much reduced in numbers as to do away with the necessity for laying poisoned grain, and the societies are endeavouring to breed and liberate a fresh lot of pheasants to re-stock the country.
A few valuable animals have been introduced; notably the red deer, the axis and fallow deer, the Ceylon elk, hares, and the Tasmanian black opossum.
The red deer have spread and thriven well in places, and already good deer-stalking can be had during the months of March and April in Otago, Nelson, and on the East Coast of Wellington, on payment of a license-fee of £1 in Wellington and Nelson, or £3 in Otago. The fallow and axis deer are confined to private property in Otago, Wanganui, Nelson, and Auckland, and there are a few Ceylon elk on private property in the Manawatu District of the North Island. The red deer grow rapidly in the colony, and carry magnificent antlers. Hares are numerous in many parts of the colony, and afford good shooting and coursing. Tasmanian black opossums are fairly numerous in Southland, and are being liberated in the forests in different parts of the colony, where, it is hoped, they will soon increase, and be of economic value for their skins.
Previous to the recent formation of the Agricultural Department, the Government had, for twenty years, done good service, through the manager of the Colonial Botanic Garden, in importing and distributing valuable forest trees and shrubs; whilst the introduction of the humble-bee, to help to fertilise the red-clover and other plants, was effected by the Canterbury Acclimatisation Society with such marked success, that in a few years the bees spread all over the colony.
It is strange that in islands surrounded by an ocean teeming with fish, with abundant rainfall, temperate climate, full of rivers, lakes, and streams of the finest fresh water, there should have been so few native fish of economic value as are found in our rivers. Large numbers of varieties of eels, many of them of great size, and excellent eating, are widely distributed. The upokororo (Prototroctes oxyrhynchus), a native grayling of somewhat erratic habits, is to be found in some of the rivers, and at certain times of the year affords good sport.
Several varieties of smelt (Retropinna) called by the Natives “inanga,” a diminutive representative of the Salmonidœ; bullheads of different sorts, and a slimy fish the “kokopu” (Galaxias fasciatus) the young of which are supposed to be the New Zealand “white-bait,” are widely distributed, also a small fresh-water crayfish, the lamprey, and a few other minor varieties of fish of little value. Mullet, flounders, and whitebait are to be found in the estuaries, and ascend the rivers for long distances, entering some of the shallow lakes inland. In the North Island, a predatory variety of fish, the “kahawai” (Arripis salar) runs up the tidal estuaries, affording excellent sport for the minnow fisher. In the Auckland District the grey mullet are generally taken in nets while ascending the rivers, and are of great commercial importance. New Zealand abounds in ideal trout-streams, and early in the “sixties” the question of how to import these fish occupied the minds of many of the settlers. In a short paper, as this must necessarily be, it would be invidious to mention names: suffice it to say that the scientific men of the Old and New World gladly aided their “antipodean” brethren, and, after much research and many failures, the ova of Salmonidœ were at last safely carried to their new home, in insulated ice-chests, the hatching being retarded by cold for a sufficient time to allow of the voyage being made by sailing vessels. Since those days, the strides made in artificial freezing and steam navigation have rendered what was then an extremely difficult undertaking comparatively easy, and large numbers of the ova of many varieties of Salmonidœ have been introduced from the Northern Hemisphere of both the Old and the New World.
The Acclimatisation Societies, notably those in the Middle Island, were not slow to avail themselves of the advance in science, and, about the year 1871, the work of stocking the rivers with trout, obtained in the first instance from fish imported into Tasmania, was commenced. The results fully justified the undertaking in the course of a few years: a system of fish-ponds and hatcheries, copied as a rule from the American pattern, was established, and trout poured into the rivers and streams. Later on, about 1884, the work was undertaken in the North Island on a large scale, and now capital trout-fishing is to be had in nearly all the suitable streams in the colony, making these islands a veritable paradise to the trout-fisherman, with thousands of miles of beautiful rivers and streams teeming with fish.
There are now a number of hatcheries in the colony doing good work. In the North Island the Auckland society have started one at Okoroire, near the Hot Springs District, where they have been very successful in introducing the rainbow trout (Salmo irideus), a variety that seems to be adapted to water of a higher temperature than its congeners thrive in. Further south the North Island streams have been stocked from the Wellington Acclimatisation Society's central hatchery at Masterton. To give an idea of the scale on which this work is carried on, the following distribution of trout-fry and ova was made from this hatchery alone in 1893: 677,490 brown trout, 72,000 Loch Leven trout, 2,500 Scotch burn trout, 4,240 Californian rainbow trout, and 44,250 American brook char; making a total of 800,480 in all. This year (1894) the “egg harvest” at the Masterton hatchery has been a plentiful one, the number of ova obtained from the different kinds of trout being as follows: Brown trout, 1,055,000; Scotch burn trout, 10,000; Loch Leven trout, 73,000; rainbow trout, 36,000; and American brook char, 60,000: making a total of 1,234,000. Of this total, 50,000 eyed ova have been sent to the Fisheries Department of New South Wales, 108,500 eyed ova have been sent out to different acclimatisation societies, and about 800,000 young fish are now being distributed in the rivers in the North Island. In the Middle Island the principal hatcheries are at Clinton in Otago, Christchurch, Oamaru, and Nelson; large numbers of Brown and Loch Leven trout being annually liberated from these establishments. The expense of maintaining these hatcheries is defrayed by the societies out of license-fees for fishing and shooting, and the sale of trout fry and ova. The license for trout fishing, which is practically available throughout the colony, as each society indorses fishing licenses issued by kindred societies, costs £1, and the season usually extends from the 1st October to the 31st March, opening and closing in some districts a fortnight earlier and later. The rivers are practically free, as few landowners object to fishermen going on their properties, and the banks of most of the larger rivers are Crown lands.
Capital fishing can be obtained throughout the season by taking the earlier rivers in the North first, and later on in the year moving down to the snow-fed rivers in the South, in which the fish are later in growing into condition. The style of tackle required is much the same as in other parts of the world—a fourteen-foot rod for minnow fishing in the larger rivers, and, say, a twelve-foot rod for fly-fishing in the small streams. As the fish often run large (10lb. to 16lb) the tackle must be of the best quality. Outfits can be bought at reasonable prices at any of the larger centres of the colony, and the local officers of the acclimatisation societies will be found willing to give any information.
Many interesting phenomena have been observed in connection with the introduction of the various varieties of trout. The sea trout, the brown trout, the Loch Leven trout, and the rainbow trout all promise to thrive in the rivers; but the American brook char (Salvelinus fontinalis), large numbers of which have been turned out, though thriving well in captivity, have apparently not taken kindly to our rivers, and have disappointed the societies liberating them. At first the trout, liberated in virgin water, full of food, grew abnormally, in many cases upwards of 2lb. a year, attaining in some instances a weight of 30lb. in some of the large lakes; but as the rivers gradually became more densely stocked, the fish fell away in size, and the large fish dropping down the rivers in search of more food, followed the shoals of small migratory fish out to sea, developing into a powerful sea-going variety of, shall we say, “Trutta novœ-zealandiœ,” growing to a heavy weight, and somewhat like a salmon in appearance. These fish run up the large rivers to spawn, and their progeny are to be caught in numbers up to a considerable weight before they go out to sea, where they are frequently taken by the fishermen in their set-nets. It will thus be seen that stocking the rivers involves stocking the coast-line at the same time.
The Government, some years ago. introduced from America a number of whitefish ova, which were hatched out and liberated in Te Anau and other deep lakes; but as yet no reliable information has been obtained as to how they have thriven, the shores of the lakes being sparsely inhabited, and these fish not being caught with a rod and line. Both perch and tench have thriven well in waters in which they have been liberated, and fair perch-fishing is now obtainable, especially in the streams and lakes near the lower part of the Clutha River, permission to fish for perch being included in a trout-fishing license.
With reference to the much vexed question of the introduction of the Atlantic and Pacific varieties of salmon, it should be observed that large numbers of the ova of both kinds have been imported by the Government, hatched out by the societies, and liberated in many rivers, notably, the river Aparima in Southland, which has been extensively stocked with salmon from the Tweed and other Scottish rivers. Salmon have been kept in ponds and ova taken from them, but they do not thrive in captivity without access to saltwater, and degenerate rapidly where it has been tried, the development of the land-locked variety of America having probably been a work of ages. Past experience has shown that, so far as the fresh water is concerned, they thrive admirably up to the smolt stage, when they are ready to go to sea. Parr and salmon smolt have frequently been observed in the rivers, and even “quasi”-grilse taken, that have probably not been outside the range of brackish water; but, so far as the writer is aware, no “full” salmon, returned for the second time from the sea, have been taken and identified. They may be on our coasts, and in some of the rivers, or they may have somewhat changed their form with new surroundings, and be now and again mistaken for large trout.
It is probably in the ocean that the danger lies. There are many theories advanced. Trout thrive on our coasts, but they do not go to sea as a rule till they are large enough to protect themselves, and it is doubtful whether they leave the shallow water of the coast-line. Salmon smolt, on the other hand, go to sea while quite young, and fall easy victims to numerous swift predatory fish, such as the barracouta, the kahawai, kingfish, &c., that infest the coast; the fish on these coasts corresponding to some extent to those found in the Atlantic Ocean between the island of Madeira and the coast of Spain. The variation in the temperature of the ocean-currents, and the rapidly-shelving coast-line, which soon dips into fathomless ocean-depths, may partly account for the difficulty experienced in acclimatising the king of fish. The writer advances no theory, but merely points out past experience, and does not despair of ultimate success. A successful result would be most desirable and should be steadily and perseveringly aimed at.
The above paper has been written to give any one who may care to glance over it a short condensed sketch of the useful work that has been carried out by the acclimatisation societies in this colony.
The enthusiasts engaged are few in number, and for the most part struggling men of small means, with but little leisure time at their disposal. It is much to be regretted that there are so few scientific men with means and leisure in the colony who care to devote themselves to working out the problems of nature in a new country—a wide and most interesting field for any one who could see his way to explore some portion or it. Our fresh- and saltwater fisheries would pay handsomely for development. To quote Sir James Maitland, “It requires only the collection and distribution of the knowledge of the world's work in fish-culture to make an acre of water more valuable than an acre of land, and the toilers of the sea reap manifold their present harvest.”
By Sir James Hector, K.C.M.G., M.D., F.R.S.
New Zealand is singularly rich in springs of water holding mineral salts in solution, and these are already noted for their valuable medicinal properties. Some of the acid baths of greatest repute, such as the “Priest's” Bath, at Rotorua, have nothing equal to them in use in any part of the world.
Both hot and cold springs are found, the former being, with few exceptions, confined to the districts of the North Island where superficial volcanic forces have been active since the commencement of the Tertiary period, and are not yet altogether dormant. A few thermal springs are found to escape from the Upper Mesozoic rocks, in places where the source of heat can be attributed only to chemical decomposition of bituminous matters and sulphides; and in a few instances warm waters spring from Palæozoic rock-formations in the Middle Island. The cold mineral springs have a wider distribution, but have only as yet been examined from comparatively few localities.
The mineral waters of New Zealand are classified, from analyses made in the Colonial Laboratory, under the following groups:—
Saline.—Containing chiefly chloride of sodium.
Alkaline.—Containing carbonates and bicarbonates of soda and potash.
Alkaline Siliceous.—Waters containing much silicic acid, but changing rapidly on exposure to the atmosphere, and becoming alkaline.
Hepatic or Sulphurous.—Waters the prominent character of which is the presence of sulphuretted hydrogen and sulphurous acid.
Acid Waters.—In which there is an excess of mineral acids, such as hydrochloric and sulphuric acid.
Mud Baths.—In addition to the clear-water baths, there are what are termed mud baths, in which the mineral waters are mixed with a pasty clay. Their properties vary with the nature, strength, and temperature of the mineral waters, the latter being maintained by steam jets. The best known mud bath is at Sulphur Point, Rotorua. It is an acid bath, and is also rich in sulphuretted hydrogen, one gallon including as much as 10.12 grains of this gas. It has, therefore, a very powerful action on the liver, but is somewhat dangerous, and must be used with caution.
| ANALYSIS. | Grains per Gallon. |
|---|---|
| Sulphate of soda | 13.32 |
| Sulphate of lime | 4.08 |
| Sulphate of magnesia | 4.86 |
| Sulphate of iron (protoxide) | 1.46 |
| Sulphate of alumina | 15.70 |
| Silica | 13.61 |
| Hydrochloric acid | 5.44 |
| Sulphuric acid | 4.36 |
| 62.83 |
The following is a list of the best known mineral springs, full details concerning which are to be found in the Official Laboratory Reports, the analyses having been performed by William Skey:—
| No. | Name and Locality. | Temp. Fahr. | Grains per Pint. | Chemical Character of Water. |
|---|---|---|---|---|
| Deg. | ||||
| Bay of Islands District. | ||||
| 1 | Ohaeawai and Pakaraka | 60–116 | 16.8 | Acid, aluminous; deposits mercury. |
| Hauraki District. | ||||
| 2 | Waiwera | 110 | 17.7 | Alkaline, saline. |
| 3 | Puriri | 60 | 67.1 | Carbonated, alkaline, |
| 3A | Te Aroha No. 1 | 102 | 73.0 | Carbonated, alkaline, |
| Te Aroha No. 2 | 112 | 67.9 | Carbonated, alkaline, | |
| Te Aroha No. 3 | 112 | 67.6 | Carbonated, alkaline, | |
| Te Aroha No. 4 | 92 | 39.9 | Carbonated, alkaline, | |
| Te Aroha No. 5 | 100 | 73.8 | Carbonated, alkaline, | |
| Te Aroha No. 6 | 104 | 77.3 | Carbonated, alkaline, | |
| Te Aroha No. 7 | 86 | 70.5 | Carbonated, alkaline, | |
| Bay of Plenty. | ||||
| 4 | White Island Lake | 97-212 | 1850.8 | Strongly acid. |
| 5 | White Island Springs | 210 | 26.1 | Strongly acid. |
| Whakarewarewa. | ||||
| 6 | Turikore, or Spirit Bath | 96-120 | 10-9 | Sulphurous. |
| 7 | Koroteoteo, or Oil Bath | 214 | 13.0 | Caustic, alkaline. |
| 8 | Ngatarawa, Gas Pool | 124 | 8.4 | Sulphurous. |
| 9 | Papatangi, Lobster-pot | 110 | 5-7 | Sulphurous. |
| No. | Name and Locality. | Temp. Fahr. | Grains per Pint. | Chemical Character of Water. |
|---|---|---|---|---|
| Deg. | ||||
| Arikikapakapa. | ||||
| 10 | Mud Bath | 98 | 9.2 | Saline, acidic. |
| 11 | Sulphur Pool | 160 | 6.8 | Acidic. |
| 12 | Sulphur Spring | 73-98 | 100 | Acidic. |
| 13 | Sulphur Stream | 80 | 8.5 | Acidic. |
| 14 | Mud Lake | 65 | 6.8 | Acidic. |
| Rotorua. | ||||
| 15 | Tapui te Koutou, Graham's Farm Bath | 90-108 | 91 | Alkaline. |
| 16 | Kuirau, Washing Spring | 136-156 | 9.9 | Alkaline, siliceous. |
| 17 | Waihunuhunukuri, Lake House Clear Bath | 130-170 | 7.3 | Alkaline. |
| 18 | Lake House Acid Bath | 150 | 11.4 | Acidic. |
| 19 | Waikite (a), Morrison's Hotel Bath | 120 | 9.4 | Alkaline. |
| 20 | Waikite (b), Scott's Bath | 116 | 9.6 | Alkaline. |
| 21 | Hinemaru, Hughes's Baths | 170 | 16.7 | Alkaline. |
| 22 | To Kauwhanga (a), Cameron's Bath | 105 | 9.9 | Acidic. |
| 23 | Te Kauwhanga (b), Painkiller | 204 | 13.8 | Acidic and hepatic. |
| 24 | Perekari, Sulphur Point Boiling Pool | 130-150 | 7.0 | Acidic. |
| 25 | Mud Bath, Sulphur Point | 120 | 7.8 | Acidic and hepatic. |
| 26 | Hot Pool, Sulphur Point | 200 | 12.1 | Acidic. |
| 27 | Whangapipiro, Madame Rachel's Bath | 170.210 | 14.7 | Alkaline and siliceous |
| 28 | Otamawhata | 144 | 11.4 | Alkaline. |
| 29 | Hospital Lake | 66 | 11.3 | Acidic. |
| 30 | Te Pupunitanga, Priest's Bath | 94-110 | 12.1 | Acidic. |
| 31 | Matatuatonga | 172 | 13.8 | Saline. |
| 32 | Toko, or Postmaster's Bath | 120 | 119 | Acidic. |
| 32A | Waikupapapa, or Saddler's Bath | 120 | 7.0 | Acidic. |
| 32B | Ngaruapuia, or Gemini Bath | 108 | 7.8 | Acidic. |
| 32C | Waikirihou, or Vaux's Bath | 112 | 12.8 | Acidic. |
| Rotoiti. | ||||
| 33 | Te Kute, mud lake at Tikitere | 100-212 | 6.1 | Acidic, hepatic. |
| 34 | To Mimi, hot waterfall, from 33° C. | 90-112 | 3.8 | Acidic. |
| Taupo District. | ||||
| 35 | Rotokawa, Black Water | 192 | 17.8 | Acidic. |
| 36 | Rotokawa, Yellow Water | 152 | 22.0 | Acidic. |
| 37 | Wairakei, Kiriohinekai, or White Water | 112 | 1.8 | Alkaline. |
| 38 | Ruahine, Crow's Nest | 180 | 19.2 | Alkaline. |
| 39 | Ruahine, Witches’ Cauldron | 192 | 20.8 | Alkaline. |
| 40 | Ruahine, Ohinekahoro | 195 | 23.0 | Alkaline. |
| 41 | Ruahine, spring on flat near track | 132 | 2.2 | Feebly saline. |
| 42 | Otumahike, Acacia | 136 | 3.9 | Feebly alkaline. |
| 43 | Lofley's Gully, McPherson's | 96 | 1.9 | Feebly alkaline. |
| 44 | Lofley's Gully, cold stream | 76 | 1.3 | Feebly alkaline. |
| 45 | Lofley's Gully, warm stream | 114 | 2.8 | Feebly alkaline. |
| 46 | Lofley's Sumach | 106 | 3.0 | Lofley's |
| 47 | Lofley's Source No. 1 | 106 | 30 | Alkaline, siliceous. |
| 48 | Lofley's Source No. 2 | 136 | 19.0 | Alkaline, saline. |
| 49 | Lofley's Kokowai | 104 | 2.0 | Feebly saline. |
| 50 | Waipahihi, A.C. Bath No. 1 | 110 | 4.7 | Chlorinated saline. |
| 51 | Waipahihi, A.C. Bath No. 2 | 146 | 5.7 | Saline. |
| 52 | Waipahihi, Tea-tree Spring | 170 | 13.4 | Alkaline, siliceous. |
| 53 | Waipahihi, Source No. 1 | 160 | 10.8 | Alkaline. |
| 54 | Waipahihi, Source No. 2 | 166 | 13.0 | Waipahihi, |
| 55 | Waipahihi, Waipahihi Stream | 98 | 8.6 | Saline. |
| 56 | Left bank, Waikato, Waiariki | 125 | 10.8 | Chlorinated saline. |
| Waikato District. | ||||
| 57 | Whangape | 160-200 | 6.0 | Alkaline. |
| 57A | Okoroire | 99-113 | 5.29 | Chlorinated saline. |
| Ruapehu District. | ||||
| 58 | Onetapu, Waikato | 70 | 58.0 | Sulphurous. |
| East Cape District. | ||||
| 59 | Roparoa, Waiapu | Cold | Saline, bituminous. | |
| 60 | Manutahi Waiapu | Cold | Saline, bituminous. | |
| 61 | Pepoti Waiapu | Cold | Hydrocarbon gas. | |
| 62 | Waipaoa, Poverty Bay | Cold | Bituminous. | |
| 63 | Waipiro, Waiapu | 144 | Calcareous, bituminous | |
| Wellington District. | ||||
| 64 | Wallingford | 60 | 10.4 | Acid. |
| 65 | Pahua | Cold | 184.2 | Alkaline. |
| 66 | Burton's Spring | Cold | ||
| 67 | Akiteo (a) | Cold | 62.4 | Alkaline. |
| 68 | Akiteo (b) | Cold | 4.8 | Sulphurous. |
| 68A | Kawara, Wanganui River | Cold | 5.4 | Alkaline, carbonate. |
| South Island. | ||||
| 69 | Hanmer Plain Springs, Amuri | 90-104 | 10.8 | Alkaline. |
| 69A | The Forks, Nelson | Cold | 105.6 | Sulphurous. |
| 70 | Sumner Lake Springs | 93 | 2.3 | Saline. |
| 71 | Amberley Spring, Canterbury | Cold | 11.7 | Chalybeate. |
| 71A | Waimate, Canterbury | Cold | 57.5 | Chalybeate. |
| 71B | Ross, Westland | 134 | 3.5 | Saline. |
| 72 | Wickliffe Bay Spring, Otago | 34.6 | Saline. | |
| 73 | Gibson's Spring, Southland | Cold | 2.3 | Alkaline. |
Ohaeawai, Auckland.—A group of springs used as baths, 17 miles from Bay of Islands, the waters of which are acidic, depositing sulphur and alum on cooling. Silica is deposited as a granular sediment only. These springs are chiefly interesting from their being accompanied by an escape of mercurial vapour, which deposits cinnabar and metallic mercury. Their medicinal action is tonic and chalybeate, and they have a specific alterative action in skin diseases.
Waiwera, on the coast, 30 miles north of Auckland.—A powerful escape of weakly alkaline and saline water, extensively used as baths for rheumatic and dyspeptic complaints; used internally it has also a mild antilithic action. This spring is largely resorted to, and most comfortable accommodation is provided for visitors.
Grains per Gallon. Chloride of sodium 116.715 Chloride of potassium 0.091 Chloride of lithium Traces Iodide of magnesium Traces Sulphate of soda 0.383 Bicarbonate of soda 87.513 Bicarbonate of lime 10.692 Bicarbonate of magnesia 0.954 Bicarbonate of iron 0.683 Alumina Traces Silica 2.464 219.495 Puriri, about ten miles from Grahamstown.—A cold, effervescent water, having valuable properties from the presence of a large percentage of alkaline carbonates. It is bottled both as still and aerated water, and is coining into repute as an antilithic aperient, and would probably be useful in cases of acid dyspepsia and in disorders of the kidneys and bladder. In chemical properties it approaches very closely to the Fachingen and Ems waters, of Nassau in Germany.
Grains per Gallon. Chloride of sodium 21.938 Iodide of magnesium Traces Sulphate of soda 0.940 Sulphate of potash 4.938 Carbonate of iron Traces Bicarbonate of lime 28.506 Bicarbonate of magnesia 25.625 Bicarbonate of soda 452.393 Bicarbonate of lithia Traces Silica 2.772 Phosphoric acid Not determined 587.112 3A. Te Aroha, one of the most favourite health resorts in New Zealand, is very prettily situated on the Waihou (Thames) River, 36 miles southward from the Thames, and within easy reach of Auckland by rail. The township takes its name from the adjoining mountain, which rises to a height of over three thousand feet, and contains numerous valleys and gullies filled with a great variety of tree-ferns and other forms of luxuriant vegetation. The climate is equable, dry, and salubrious. The accommodation for visitors is very good, and the natural attractiveness of the place has been largely added to by improvements carried out by the local authorities.
There are eighteen springs in the township (see next page) tinder the control of a Domain Board; fifteen of the springs are hot or tepid. Seven large bath-houses have been comfortably fitted up; there is also a large building, containing a number of private single baths, and a summer-house, with fountain, providing the mineral water for internal use. The waters are, with the exception of the sulphur springs, saline and feebly alkaline, and strongly charged with carbonic acid gas, which is constantly escaping from the springs in large quantities, rendering them effervescent and pleasant. These springs are very similar to those of Vichy (France), Ems (Germany), and Bilin (near Teplitz, Bohemia), and are quite equal to them in strength. Potash exists in all these waters, but only in very small quantity. Baths Nos. 1 to 15 inclusive, and No. 18, are colourless, with the exceptions of Nos. 4, 13, and 14, which are pale-yellow. No. 16 is turbid, owing to the presence of precipitated sulphur.
Bath No. 1, pleasantly situated up the hill, is set apart for ladies, and is much used.
Bath No. 2 is of large size, with waiting and dressing-rooms attached. A short distance from it is a reservoir of hot water, containing 15,000 gallons. Three-fourths of the water from the springs supplying it is at a temperature of 90 degrees, and the temperature of the balance, from certain springs, ranges up to 119 degrees.
No. 3 bath-house is divided into eight private rooms, with a bath in each, fitted with hot and cold water valves to regulate the temperature as desired, and each provided with a shower.
Nos. 4, 5, and 6 are extensively patronised, and good bathing-houses are erected over the springs.
No. 15 spring is largely used for drinking, and according to Dr. Alfred Wright, the late physician to the Thermal Springs Domain) from whose admirable little handbook on Te Aroha some of the particulars here given have been taken), its water is a valuable adjunct to the treatment of certain forms of dyspepsia and kidney affections. No. 8 is also a drinking spring, but of lower temperature. No. 16 (cold) has little overflow. Sulphur is found in small quantities in the surrounding clay, and there is emitted a strong sulphuretted hydrogen gas. No. 17, also a cold spring, is used for application in cases of eye affections. No. 18 is a cold soda-water spring.
In order to meet the demand which has sprung up for a portable supply of Te Aroha mineral water for drinking elsewhere than at the fountain, Government sanction has been given to granting a sole right for a term of years to a company, formed for the purpose of working and distributing the mineral waters, and the Te Aroha Soda and Mineral Water Company (Limited), had a large exhibit of these waters in the New Zealand Court at the Melbourne Centennial Exhibition of 1888.
ANALYSIS OF EIGHTEEN MINERAL WATERS FROM TE AROHA.—No. 4423.
Alkaline Waters 1 to 15, 17 to 18.
| No. | Temp. in de. Fah. | Dimensions of Bath. | Quantity of Water in each. | Chloride of Sodium. | Chloride of Potassium. | Sulphate of Soda. | Carbonate of Lime. | Carbonate of Magnesia. | Carbonate of Soda. | Alumina. | Iron Oxide. | Silica. | Total Grains per Gallon. |
|---|---|---|---|---|---|---|---|---|---|---|---|---|---|
| Ft. in. Ft. in. | Gals | ||||||||||||
| 1 | 102 | 9 10 x 7 0 | 1,607 | 60.25 | 1.72 | 38.32 | 10.77 | 6.86 | 461.56 | Trace | Trace | 7.56 | 586.99 |
| 2 | 112 | 9 7 x 8 5 | 1,725 | 60.45 | 1.90 | 32.67 | 7.12 | 4.21 | 426.29 | Trace | Trace | 7.12 | 539.76 |
| 3 | 112 | 60.51 | with the sodium chloride. | 32.82 | 7.24 | 4.20 | 429.19 | Trace | Trace | 7.21 | 541.17 | ||
| 4 | 92 | 11 0 x 9 0 | 1, 771 | 34.24 | 19.16 | 4.62 | 214 | 246.49 | Trace | Trace | 5.17 | 311.82 | |
| 5 | 100 | 6 7 x 5 8 | ,998 | 68.77 | 36.92 | 6.91 | 3.15 | 476.58 | Trace | Trace | 6.10 | 598.43 | |
| 6 | 104 | 11 0 x 9 0 | 2,660 | 66.23 | 35.14 | 7.12 | 2.99 | 499.75 | Trace | Trace | 7.14 | 618.37 | |
| 7 | 86 | 7 6 x 5 0 | 1,009 | 67.13 | 34.04 | 7.46 | 4.34 | 444.20 | Trace | Trace | 7.01 | 564.18 | |
| 8 | 109 | 66.14 | 1.96 | 32.91 | 7.47 | 4.21 | 451.97 | Trace | Trace | 8.60 | 573.26 | ||
| 9 | 112 | 41.29 | 22.16 | 4.94 | 2.61 | 30.117 | Trace | Trace | 6.44 | 378.61 | |||
| 10 | 96 | 35.24 | 19.19 | 4.67 | 2.31 | 276.19 | Trace | Trace | 6.00 | 34360 | |||
| 11 | 88 | 34.69 | 20.12 | 5.11 | 2.56 | 261.44 | Trace | Trace | 6.11 | 330.03 | |||
| 12 | 88 | 41.66 | 22.96 | 5.12 | 2.99 | 300.97 | Trace | Trace | 7.11 | 380.81 | |||
| 13 | 120 | 40.67 | 21.86 | 6.11 | 3.13 | 301.64 | Trace | Trace | 6.86 | 380.27 | |||
| 14 | 122 | 42.61 | 23.16 | 7.14 | 3.49 | 321.64 | Trace | Trace | 6.66 | 404.70 | |||
| 15 | 139 | 43.11 | 22.16 | 6.91 | 3.61 | 331.76 | 7.05 | 414.60 | |||||
| 17 | 2.71 | 3.92 | £64 | £27 | 9.36 | Trace | Trace | 4.21 | 21.11 | ||||
| 18 | 16.12 | 8.16 | 197 | 1.01 | 131.72 | Trace | Trace | 13.14 | 172.12 |
4-5White Island.—A conical island in the Bay of Plenty, formed by the summit of an extinct volcanic mountain rising out of deep water. The crater is occupied by a lake of strong mineral water, which is fed by intermittent geysers and boiling springs surrounding it. All these waters are intensely acid, and deposit sulphate of lime; while the accompanying vapours form irregular deposits of pure sulphur. The first water is too powerful to be used medicinally in its natural state, but might be turned to valuable account in certain chemical manufactures.
6-34(Rotorua, &c.) are associated geographically as all coming from the famous Rotorua and Rotoiti Districts. They, however, present considerable variety in quality, and may be classed as follows:—
6-16Alkaline and Siliceous Waters. — These differ from the ordinary alkaline waters in the presence of silicic instead of carbonic acid as the combining agent. They are remarkable from their building extensive mounds and terraces, composed of silica deposited by the cooling water, and involving as it solidifies a certain amount of granular silica, which is held in mechanical suspension; in this manner the wonderful pink and white terraces of Rotomahana and the domes of Whakarewarewa were formed. This class of water invariably contains carbonic-acid gas, and in some cases also sulphuretted hydrogen in large quantity, the oxidation of which leads to the formation of sulphurous and sulphuric acid and the liberation of hydrochloric acid, and by this reaction gives rise to the acidic waters. When used as baths they have an undoubted alterative action, and are very useful in rheumatic affections, especially in gouty constitutions. This is probably due to the specific action of silicates in promoting the discharge of uric acid from the system, as has lately been pointed out by French chemists.
17–34. Acidic Waters.—In the case of these waters the carbonates have been wholly eliminated, and the alkaline salts are formed by a mineral acid, either sulphuric or hydrochloric. In some cases the acid is greatly in excess, forming a bath which has a powerful action upon the liver, and upon diseases consequent on the derangement of that important organ. In some, the presence of sulphurous and hydro-sulphuric acid in large quantities gives these baths great efficacy in cutaneous diseases.
The following are the analyses of the four chief types of mineral waters in the Rotorua District:—
30“Te Pupunitanga,” commonly known as the “Priest's Spring and Bath;” aluminous and strongly acid (reaction acid).
| Grains per Gallon. | ||
|---|---|---|
| Spring (1881). | Bath (1893). | |
| Sulphate of soda | 19.24 | 8.42 |
| Sulphate of potash | Traces | Traces |
| Sulphate of lime | 7.41 | 4.64 |
| Sulphate of magnesia | 3.03 | 1.24 |
| Sulphate of alumina | 21.67 | 11.27 |
| Sulphate of iron | 1.24 | Traces |
| Sulphuric acid | 22.12 | 1.42 |
| Hydrochloric acid | 3.65 | 8.43 |
| Silica | 18.41 | 7.86 |
| 96.77 | 43.28 | |
| Sulphuretted hydrogen | 2.98 | 3.92 |
| Carbonic-acid gas | 2.16 | |
“Whangapipiro,” commonly known as “Madame Rachel's Bath;” saline waters with silicates (reaction alkaline).
| Grains per Gallon. | |
|---|---|
| Chloride of sodium | 69.43 |
| Chloride of potassium | 3.41 |
| Chloride of lithium | Traces |
| Sulphate of soda | 1.53 |
| Silicate of soda | 31.02 |
| Silicate of lime | 4.24 |
| Silicate of magnesia | 109 |
| Iron and alumina oxides | 2.41 |
| Silica | 18.21 |
| 131.34 | |
| Carbonic-acid gas | 3.79 |
“Te Kauwhanga” (a), commonly known as “Cameron's Bath;” hepatic, feebly saline, with excess of acid (reaction acid).
| Grains per Gallon. | |
|---|---|
| Sulphate of soda | 50.39 |
| Sulphate of potassium | 0.79 |
| Sulphate of calcium | 5.68 |
| Sulphate of magnesia | Traces |
| Sulphate of alumina | 0.29 |
| Silica | 12.64 |
| Hydrochloric acid | 13.62 |
| Iron oxides | 1.29 |
| Sulphuric acid (free) | 5.29 |
| 89.99 | |
| Sulphuretted hydrogen | 8.81 |
| Carbonic-acid gas | 1.96 |
“Turikore.” Faintly acid reaction, which turns to alkaline on boiling.
| Grains per Gallon. | |
|---|---|
| Silicate of soda | 16.32 |
| Silicate of lime | 1.61 |
| Silicate of magnesia | 1.14 |
| Silicate of iron | 0.39 |
| Sulphate of soda | 13.47 |
| Chloride of potassium | 1.24 |
| Chloride of sodium | 53.61 |
| Phosphate of alumina | Traces |
| 87.78 |
35–56. With the exception of the first two these waters are saline and faintly acid in character. They are reported to be suitable for internal and external use, as alteratives, in scorbutic and tubercular diseases, also in chronic nervous affections and cutaneous eruptions. The presence in them of iodine, which was formerly reported, has been disproved by recent analyses of authentic samples.
57Whangape, Waikato, is a hot alkaline water, having a composition similar to the springs at Puriri and Waiwera.
57A.Okoroire Hot Springs and Sanatorium: These are situated in a picturesque gorge in the upper part of the Thames Valley, near Oxford, at an altitude of 350ft. Excellent hotel accommodation is provided, and both enclosed and open-air baths can be enjoyed. The climate is very invigorating, and capital trout-fishing is to be had in the numerous streams of the district. The following analyses of the principal springs have been furnished by Professor P. D. Brown, of Auckland University College:—
Upper, or No. 2, Bath: Temperature, 113°; flow, 1,300 gallons per hour.
| Grains per Gallon. | |
|---|---|
| Calcium sulphate | 2.77 |
| Magnesium chloride | 0.69 |
| Sodium chloride | 9.48 |
| Sodium carbonate | 17.18 |
| Potassium carbonate | 1.42 |
| Iron oxide | 1.10 |
| Silica and silicates | 9.70 |
| 42.34 |
Lower or Open-air Bath, No. 4; Temperature, 99°; flow, 4,100 gallons per hour.
| Grains per Gallon. | |
|---|---|
| Calcium sulphate | 2.42 |
| Calcium carbonate | 1.84 |
| Magnesium carbonate | 1.03 |
| Sodium chloride | 4.34 |
| Alkaline carbonate | 11.41 |
| Iron oxide | 0.70 |
| Silica and silicates | 9.82 |
| 31.56 |
General remarks: Apart from the medicinal value which these springs possess in common with most other alkaline hot springs, they are remarkable for the large flow of water, and for their freedom from any unpleasant odour or deposit. This fact should render the springs specially attractive to persons in good health.
58Onetapu Desert, at the sources of the Waikato and Wangaehu Rivers. This powerful spring, which issues at the base of Ruapehu, is so strongly charged with sulphates of iron and alumina as to taint the water of the latter river from its source to the sea, a distance of seventy miles. It is only one of the many mineral springs which occur in the still active volcanic district of Tongariro.
59–62. In the East Cape and Poverty Bay District are four—out of some seventeen different springs which have been discovered— that yield hydrocarbons, either in the form of gas or oil, associated with saline waters. The source of these springs is probably to be found in certain bituminous shales at the base of the cretaceous formation.
63Waipiro is interesting as being both a hot saline spring in the same district (in which there is no evidence of any volcanic action), and as depositing immense quantities of carbonate of lime in acicular crystals. This lime-deposit is built up in the form of a wall, marking the line of fissure through which the water escapes.
64, 65. Are cold springs in the Wellington District, and belong to the class of saline waters, which are generally feebly acid. Springing from rocks of Lower Secondary formation, they are interesting from the large proportion of iodine and other exceptional elements which they contain. Pahua is the most notable in this respect, and has the following composition:—
| Grains per Gallon. | |
|---|---|
| Chloride of sodium | 1,303.329 |
| Chloride of potassium | 0.501 |
| Chloride of magnesium | 34.960 |
| Chloride of calcium | 120.885 |
| Iodide of magnesium | 0.582 |
| Bromide of magnesium | Traces |
| Sulphate of lime | 3.026 |
| Phosphate of alumina | 0.641 |
| Phosphate of iron | Traces |
| Phosphate of lime | 0.430 |
| Bicarbonate of lime | 6.451 |
| Silica | 1.696 |
| Iodine, free | 1.595 |
| 1,474.096 |
Total quantity of iodine to the gallon (free and combined), 2.177 grains.
66.Burton's, Taipo, in addition to iodine, contains traces of arsenic.
67, 68. Akiteo (a) is a strong saline water containing iodides and bromides, while Akiteo (b) is an aerated chalybeate water, and would be valuable as a tonic, being similar to the springs at Pyrmont, Waldeck, and Recoaro, Venetia. Aërated chalybeate waters of medicinal value are found in many other parts of New Zealand; among these may be mentioned a locality near Whangarei, in the North Island, and Chain Hills, near Dunedin, in the Middle Island.
69.The springs at the Hanmer Plains, Amuri (Middle Island), are alkaline, with a strong escape of sulphuretted hydrogen, and form useful baths in hepatic and cutaneous diseases.
The water from the springs in question was in 1892 quite clear and colourless. It emitted a very offensive odour, and manifested a strong alkaline reaction after being boiled for a short time. The following are the results obtained by analysis of its fixed salts per gallon. The small quantity of sediment that had formed is excluded from the results:—
| Grains per Gallon. | |
|---|---|
| Chloride of sodium | 62.09 |
| Chloride of potassium | 0.15 |
| Chloride of lithium | Trace |
| Iodide of magnesium | Trace |
| Carbonate of lime | 0.55 |
| Carbonate of magnesia | 1.77 |
| Carbonate of iron | 0.05 |
| Sulphate of soda | 7.48 |
| Carbonate of soda | 2.66 |
| Phosphate of alumina | Traces |
| Silica | 2.63 |
| 77.38 |
The total quantity of carbonic acid was not estimated, owing to the small quantity of water sent. The quantity of sulphuretted hydrogen amounted to 2.19 grains per gallon. The water having been analysed as a mineral water, the organic matter has not been estimated, or tested as to nature; but a former analysis made by Professor Bickerton in 1882 is very interesting, as it gives the nature of the sediment and organic matter contained in the water. The sample was taken from spring No. 8 before it was incorporated with No. 1. It is as follows:—
| Sediment—silica and free sulphur | 1.400 | |
| Nitrogen as free ammonia | 0.092 | |
| Nitrogen as albuminoid ammonia | 0.048 | |
| Nitrogen as nitric acid | 0.047 | |
| Total nitrogen | 0.187 | |
| Sulphuretted hydrogen, free | 3.430 | |
| Sulphate of lime | 9.940 | |
| Sulphate of potash | 1.960 | |
| Sulphate of soda | 0.400 | |
| Bicarbonate soda | 7.770 | |
| Chloride soda | 56.230 | |
| Bicarbonate of magnesia | 0.640 | |
| Total fixed matter | 76.940 | |
| Total grains per gallon | 81.957 | |
The total amount of fixed salts in the two analyses correspond very closely. The sulphates and carbonates in either case are so small that the fact of their varying in the two analyses is a matter of no importance. The fact of the discovery of traces of iodine and lithium in the recent analysis is interesting.
It will be noticed that iodine occurs in this water, but in such small quantity that it can be found only by concentration. The water is hepatic, moderately saline, and should prove useful in diseases of the liver and the skin. The water from these springs was formerly reported on and partially analysed in May, 1867, with very similar results (Hector, “Transactions N.Z. Institute,” Vol. iii., p. 297, 1870). A sanatorium has been established by Government at this place, of which a short account is appended.
70. At the distance of a few miles from Sumner Lake the water has a temperature of 93° Fahrenheit, as it gushes from the sandstone rock, but it does not contain sufficient matters in solution to entitle it to rank as a mineral, water.
71.Amberley. This was analysed by Professor Bickerton, of Canterbury College, and reported by him to be a chalybeate water, but unfit for use on account of the organic matter present. The analysis gave the following quantitative results:—
| Grains per Gallon | |
|---|---|
| Total dissolved solids | 37.6 |
| Volatile | 8.8 |
| Fixed | 28.8 |
| Carbonate of lime | 3.6 |
| Carbonate of magnesia | 2.2 |
| Chlorine | 10.5 |
| Iron protoxide | 2.3 |
| Free ammonia | 0.069 |
| Albuminoid ammonia | 0.034 |
| Sediment | 165.2 |
72.Wickliffe Bay, Otago. An analysis of this water is given by-Professor Black, of Otago University. It appears to be a saline water:—
| Grains per Gallon. | |
|---|---|
| Sulphuric acid (combined) | 39.3 |
| Chlorine | 112.0 |
| Magnesia | 18.3 |
| Lime | 11.5 |
| Alkalies | 83.0 |
| Carbonic acid (combined) | 12.6 |
| 276.7 |
73.Gibson's Spring, Southland, is a water which is stated to be a specific in diarrhœa, and contains a large amount of organic matter, to some astringent in which its medicinal qualities are probably due.
The route is from Christchurch to the railway terminus at Culverden, a distance of sixty-nine miles, and thence by coach to Hanmer Plains, a distance of twenty-four miles. The journey is accomplished in ten hours, allowing an hour at Culverden for luncheon.
The sanatorium buildings have been erected by Government on a five-acre enclosure, and provide amply for the comfort of visitors. Accommodation is to be had at two hotels in the vicinity at moderate rates. The establishment has become a very favourite resort, over seven thousand baths being taken in the year.
The springs are ten in number; their chemical character analysis shows to be one and the same, the fixed salts in each varying slightly in quantity but not in quality. Nos. 5, 6, 9, and 10 are cold, and, having no outflow, are valueless. Nos. 2 and 3 are small holes without overflow, having temperatures respectively of 94° Fahr. and 114° Fahr. Nos. 1, 8, 4, and 7 are the springs utilised. Nos. 1 and 8 are converted into tanks, having the respective areas of 15ft. by 21ft. and 18ft. by 25ft.; they are connected by a 3 1/2in. galvanised-iron pipe, and give the total supply of hot water used in the baths, which is equivalent to about 25 gallons per minute, running to waste eighteen hours out of the twenty-four.
No. 7 is a circular pool some 25ft. in diameter, enclosed by a corrugated-iron fence, and used as a swimming-pool. Its temperature varies, being usually about 80° Fahr., but sometimes cold. There are five dressing-boxes connected with it. No. 4 is a round open pool some 15ft. in diameter, also fenced in with corrugated iron. The water has a temperature of 83° Fahr., and is used for cooling the supply from Nos. 1 and 8. It is the only mineral water available for the purpose. Its outflow is not allowed to run to waste, but is drawn upon as required. The supply is 4,500 gallons daily.
By A. Ginders, M.D., L.R.C.P. (D.P.H., Cantab.), Medical Superintendent, Rotorua Sanatorium.
The geographical position of the North Island of New Zealand will naturally suggest something of the character of its inland climate at an elevation of 1,000ft. Rotorua is some forty miles from the coast. Its elevation is 990ft. above the sea-level. The atmosphere is drier and more bracing than that of the coast—in winter considerably colder, and in summer perhaps somewhat hotter, but of a dry pleasant heat, free from the moist oppressiveness which characterizes the summer heat of Auckland and other coast towns. The mean temperature of spring is 53°, of summer 66°, of autumn 57°, and of winter 45°. The relative moisture of the air for the four seasons (taking complete saturation at 100°) is—for spring, 74°; for summer, 66°; for autumn, 67°: and for winter, 74°. The steam which rises so abundantly and perpetually all over the district no doubt adds considerably to the moisture of the atmosphere. This was clearly shown in the month of June, 1886, when the great eruption of Tarawera took place. The relative moisture for that month was 10° in excess of the average, owing to the immense amount of vapour caused by the eruption. The rainfall for the year is about 50in., and the number of days on which rain falls about 140. Auckland has 18in. less rain, and thirteen more rainy days. The daily range of temperature is greatest in the summer and least in the winter. This condition obtains throughout the whole of New Zealand, and constitutes one of the greatest charms of its climate. No matter how hot a summer's day may be, the nights are invariably cool. The mean daily range of temperature for spring is 21°, for summer 28°, for autumn 23°, and for whiter 20°.
These annual means, it must be remembered, are based on observations extending over seven years only, and consequently have only a relative value. For example, the rainfall for the six years ending with the year 1891 averaged 50in. per annum, but in 1892 it was 67in., and in 1893—an exceptionally wet year—it reached 93in.; so that for these averages to have an absolute value they must be based on observations extending over a far longer period.
The most agreeable months of the year for an invalid to visit Rotorua are February, March, and April; the least pleasant are August, September, and October; but, as there is ample boarding accommodation close to the baths, the invalid is virtually independent of the weather. A climate better adapted to the necessities of the class of patients visiting this health-resort could not be desired. They are, as a rule, persons in fairly vigorous health, in whom it is desirable to maintain the normal power of adaptation and resistance to climatic changes. A climate in which the same conditions prevailed for long periods of the year would fail to secure this end; but one in which the various factors of temperature, moisture, light, electricity, wind, and atmospheric pressure are subject to moderate variations, is, in every way, the one to be desired.
It is most desirable that invalids visiting Rotorua should be well informed as to the character of our climate. I have found that considerable misapprehension exists on this point, particularly amongst our visitors from Otago and Southland, their impression being that Rotorua is a very warm place, and that in summer they have to bring only the lightest possible clothing. This is a great mistake, as will be understood at once when I say that in February and March it is not uncommon to find in twenty-four hours a thermometric range of 100 degrees between the solar and terrestrial radiation temperatures. Our visitors, therefore, should provide themselves with both light and heavy clothing, no matter at what season of the year they may arrive.
The Thermal-springs District of New Zealand comprises an area of upwards of 600,000 acres, or close on 1,000 square miles. The length of the district is some fifty miles, with an average breadth of twenty miles. Its altitude varies from 1,000ft. to 2,000ft. above the sea-level.
The general physical features of this region embrace extensive pumice-plains, intersected in various directions by high ranges of igneous formation, which are relieved here and there by enormous trachytic cones. Forests of extraordinary luxuriance and beauty clothe the mountains and border the extensive plateaux, while hot lakes, boiling geysers, and thermal springs are dotted far and wide over the country. The Thermal-springs District, however, as defined on the maps, by no means embraces the whole volcanic and hydrothermal activity of the island. Although the volcanic 29 slopes of Ruapehu and Tongariro bound this region on the south, hot springs are found here and there for fully 250 miles beyond its western boundary—in fact, as far north as the Bay of Islands. Within the district it is no exaggeration to say that hundreds of hot springs exist, to say nothing of mud-volcanoes, solfataras, and fumeroles.
These springs are of the most varied chemical character, and of every degree of temperature from 60° to 212°. Numbers have yet to be submitted to analysis. Those which have been examined in the laboratory of the Geological Survey Department in Wellington are divided by Sir James Hector into five classes: (1) Saline, containing chiefly chloride of sodium; (2) alkaline, containing carbonates and bicarbonates of soda and potash; (3) alkaline-siliceous, containing much silicic acid, but changing rapidly on exposure to the atmosphere, and becoming alkaline; (4) hepatic, or sulphurous, characterized by the presence of sulphuretted hydrogen and sulphurous acid; and (5) acidic, containing an excess of sulphuric or hydrochloric acid, or both. In addition to these we have saline waters, containing iodine, cold acidulous chalybeates, and saline acidulous chalybeates. These, however, are in situations at present inaccessible to the invalid, or, if not out of reach, at least destitute of the conveniences and comforts essential to the sick, but they are no doubt destined in the near future to attain a high medical reputation.
The Government of New Zealand has very wisely chosen the southern shore of Lake Rotorua as the basis of operations for opening-up this wonderful district. Here are grouped together numerous examples of the five classes of springs I have enumerated, and here the Government fixed their first sanatorium and bathing establishment. The sanatorium reserve at Rotorua comprises an area of some 50 acres, bounded on the north and east by the lake, and on the west and south by the Township of Rotorua. Ten years ago this was a howling wilderness, covered with manuka scrub, and diversified only by clouds of steam rising from the various hot springs. Here the adventurous invalid of that day had to pitch his tent, and be satisfied with a hole in the ground for a bath; and if the spring he wished to use happened to be too hot for his purpose he probably had to dig the hole for himself, and regulate the supply and temperature of the water to the best of his hydraulic ability. In many instances he immortalised himself by giving his name to the spring—a name still retained. Thus we have “Cameron's Bath,” “McHugh's Bath,” “Mackenzie's Bath,” and “The Priest's Bath.” Other springs have received their names from some real or imaginary quality. Thus we have “Madame Rachel,” “The Pain-killer,” “The Coffee-pot,” and “The Blue Bath.” Now this area of desolation is completely transformed. Walks and drives planted with evergreen trees traverse it from end to end, fountains and flower-gardens delight the eye, and commodious buildings for the entertainment of invalids are springing up on every side. The principal of these are the Sanatorium Hospital, the medical residence, the Priest's Pavilion, the Rachel Pavilion, the Blue Swimming-bath (to which is attached the sulphur-vapour bath), and Brent's boarding-house.
Considerable improvements in the way of extended accommodation are being carried out, both at the Swimming Bath and at the Rachel Pavilion. From the former the natural sulphur-vapour bath has been separated, and made a distinct department, so that it may be used by ladies while gentlemen occupy the swimming bath, and vice versâ. At the Rachel Pavilion, four new private baths have been constructed, with two dressing-rooms attached to each. This is a distinct advance, and will enable the attendant to put two bathers through the one bath in the time usually occupied by one bather when the bath-room is used both for dressing and undressing.
The hospital, which was opened in 1886, was unfortunately destroyed by fire in November, 1888. A new and far larger building has just been erected by the Government. It is designed to accommodate twenty-one patients—twelve males and nine females. The stipulations made by the Government with regard to admission are that the patient shall be able to show that his case is one likely to be benefited by the use of the baths, and that he is unable to pay the usual hotel or boarding-house charges.
The following is a copy of the regulations under which patients are admitted to the institution:—
Applications for admission of persons shall be addressed to the Resident Medical Officer at the Sanatorium, Rotorua.
No person shall be admitted (unless in accordance with Regulations 5, 6, and 7) except on the recommendation of the Hospital or Charitable Aid Board of the district to which he belongs, or of the Trustees of the benevolent society or hospital (if separate institutions) of the town in which he lives.
The charge for maintenance and treatment is 21s. a week.
The Board or Trustees, in making such recommendation, shall guarantee the cost of such patient, shall send him or her at their own charge to Rotorua, be responsible for his or her return-passage, and provide a sufficient supply of clothing. They shall also furnish a report on the case by a duly-qualified medical. practitioner, in order that it may be seen whether the case is one that is likely to profit by treatment at the Sanatorium.
Members of any duly-registered friendly society may be admitted, on the recommendation of the lodge to which they belong, on the same terms as patients recommended by a Hospital or Charitable Aid Board, and Regulations 3 and i shall be read as applying to them in all respects: Provided that not more than three of such persons shall be resident at the Sanatorium at any one time, and that all the hospital beds are not required by patients admitted under Regulation 2.
When all the beds are not occupied by patients admitted under Regulations 2 and 5, the Resident Medical Officer may, at his discretion, admit persons, being bond fide hospital cases, and who have undertaken to pay 30s. a week for maintenance and treatment.
When all the beds are not occupied by patients admitted under Regulations 2, 5, and 6, persons may be admitted on the following conditions:—
That the Resident Medical Officer has certified that each such person is likely to be benefited by treatment at the Sanatorium.
That the expenses to and from Rotorua are provided by each such person, together with a sufficient supply of clothing.
That not more than four such persons shall be resident at the Sanatorium at one time.
The stay of each patient is limited to three months, but the Resident Medical Officer can, at his discretion, extend the period to six months.
This means, in brief, that patients sent by the Charitable Aid Boards of the country are to be admitted at all times at one guinea per week; that three beds may be occupied by members of registered friendly societies on the same terms; that not more than four free patients shall be resident at the same time; and that if all the beds are not occupied by the three classes of patients enumerated, the medical officer may, at his discretion, admit suitable cases, paying for themselves, at the rate of 30s. per week. Such patients, if they wish to avoid disappointment, should not leave their homes until they have communicated with the resident medical officer, and been assured by him that their cases are suitable, and that they will be admitted on arrival.
It should be distinctly understood that Hospital Trustees, or Charitable Aid Boards, or Friendly Societies recommending patients to this institution are held responsible for payment in case such patients are unable or fail to pay for themselves.
It cannot be too widely known that there is no private accommodation in this institution; whatever the regulations under which the patients are admitted, they are on equal terms; they take their meals together in the same hall; the women have their own sitting-room and dormitory, containing nine beds; and the men have their sitting-room and dormitory, containing twelve beds. Patients are admitted for three months, and if, in the opinion of the medical superintendent, a second period of three months is desirable, it is granted; but in all cases six months is the extreme limit.
The great object of this institution, as at present constituted, is to enable the Charitable Aid Boards of the country to send up for treatment a class of patients who would not otherwise be able to avail themselves of the springs, while at the same time in no way interfering with the private enterprise of hotel and boarding-house proprietors.
Patients who frequent our springs are always anxious to see the analysis of the waters in which they bathe, and are usually under the impression that they absorb into their systems the entire list of salts enumerated. This is an error. The body cannot absorb any salts from an aqueous solution. If the water, or any portion of it, is allowed to dry on the skin, a minute quantity of the constituent solids, of course, remains, which through the friction of the clothing becomes incorporated with the fatty elements of the integument, and is eventually absorbed. After a course of sulphur baths the underclothing is redolent of sulphur for some time after leaving the springs, and silver carried in the pockets becomes blackened, showing that a considerable amount of sulphur has been absorbed in the manner described. The shipwrecked sailor adrift in a boat finds his thirst relieved for a time by saturating his shirt with sea-water; if he absorbed the salt his suffering would be only intensified, but the wet shirt by temporarily checking the transpiration and evaporation of moisture from his body affords him relief. The direct influence of hot mineral water used for bathing—apart from the effect of temperature—is twofold, according to its chemical character: it either excites and stimulates the nervous and vascular elements of the skin, as in the case of acid sulphur waters; or it exercises a soothing and emollient effect, as in the case of alkaline siliceous waters. We should never lose sight of the fact that the skin is the most important emunctory of the body; and that, as a means of maintaining its normal functional activity, bathing, well-advised and regulated, is the most efficient agent we can employ; and that in skin diseases especially our cures are brought about not by any absolution of fixed salts contained in the water, but by the prolonged maceration of the cuticle, causing the ready removal of the débris of dead and diseased cells, and their gradual replacement by cells of a more healthy character, due to the employment of a suitable regimen and the influence of a highly vitalising climatic environment.
The following springs are those which have the most valuable properties, and whose therapeutic action is best known:—
Te Pupunitanga, or “The Priest's Bath,” at Rotorua, only a few feet from the lake's edge; the water is strongly acidic and aluminous, depositing flocculent sulphur on the bed and sides of the bath; reaction, acid. There are four large public baths or piscinœ (each 16ft. by 12ft.), two for each sex, with sixteen comfortable private dressing-rooms attached, and provided with cold fresh-water showers, and hot or tepid douches; also two private baths (each 6ft. by 6ft.) for special cases. It is considered the finest and most curative bath in the southern hemisphere. Analysis (in grains per gallon): Sulphate of soda, 19.24gr.; sulphate of potash, traces; sulphate of lime, 7.41gr.; sulphate of magnesia, 3.03gr.; sulphate of alumina, 21.67gr.; sulphate of iron, l.24gr.; sulphuric acid, 22.12gr.; hydrochloric acid, 3.65gr.; silica, 18.41gr.—total, 96.77gr.; also, sulphuretted hydrogen, 2.98gr.; and carbonic acid gas, 2.16gr. Temperature: From 98° Fahr. to 106° Fahr.; average, 99° Fahr. Special indications: Gout, dyspepsia, sciatica, skin diseases, disorders of the liver, sexual impotence, cold feet, amenorrhœa, dropsy, and all forms of rheumatism.
We have no spring in the district that has attained a higher reputation, or proved itself more generally useful, than that known as the Priest's Bath. The variation in temperature is due to the rise and fall of the lake and the direction of the wind. When the lake is high and the wind blowing towards the baths the conditions are favourable to a high temperature, and vice versâ, the cold water of the lake affording a more efficient barrier to the escape of heat than the open pumice-gravel of which the shore is composed. A patient emerging from his bath looks like a boiled lobster, and I regard this determination of blood to the skin as a most important therapeutic factor: the vascular and nervous apparatus of the skin is powerfully stimulated by it, and internal congestions are relieved. Our alkaline waters, on the other hand, which contain the chlorides and silicates of the alkalies, have a soothing and emollient effect on the skin, and are of great value in eczema, and other cutaneous ailments. The water of the Priest's Spring is brilliantly clear when undisturbed, and pale-green in colour. A faint odour of sulphuretted hydrogen pervades the neighbourhood, which gas, together with sulphurous acid, is copiously evolved. Since the eruption of Tarawera this offensive odour has been much modified, owing, I believe, to an increased evolution of sulphurous-acid gas at that time. Fortunately for the nasal organs and general comfort of the bathers, these gases effect a mutual decomposition, resulting in the formation of sulphur and water, thus—2H2S + SO2 = 3S + 2H2O; which means that two parts of sulphuretted hydrogen, combining with one part of sulphurous acid, form three parts of sulphur and two of water. Wherever steam charged with these gases is able to penetrate, sulphur is deposited. This is the origin of all the sulphur in the district. It permeates readily the siliceous sinter rock, forming beautiful needle-like crystals of sulphur in its interspaces. Sulphur being thus constantly transformed from the gaseous to the solid state in the water of this spring, it is very possible that, coining into contact with the skin in this nascent and impalpable form, its therapeutic power may be considerably enhanced: there can be no doubt about its absorption, for our patients tell us that their underclothing is redolent of sulphur for weeks after returning home. The Priest's Bathing-pavilion is a building 74ft. long by 44ft. wide, having a superficial area of 3,256 square feet. It is divided into male and female departments. Each department comprises two public piscinœ, 16ft. by 12ft., with two private baths for special cases, lounging-grooms, and comfortable dressing-rooms. Each bath is provided with a cold fresh-water shower, and douches either hot or tepid, thus materially enhancing the hydropathic efficiency of this remarkable water.
Whangapipiro, or “Madame Rachel's Bath‘’ at Rotorua.— Analysis (in grains per gallon): Chloride of sodium, 69.43gr.; chloride of potassium, 3.41gr.; chloride of lithium, traces; sulphate of soda, 11.80gr.; silicate of soda, 18.21gr.; silicate of lime, 4.24gr.; silicate of magnesia, 1.00gr.; iron and alumina oxides, 2.41gr.; silica, 5.87gr. — total, 116.46gr. in one gallon; also, carbonic acid gas, 3.79gr. Temperature: Formerly 174° Fahr., but rose to 194° Fahr. after eruption in June, 1886. Special indications: Diseases of the skin, especially psoriasis. By internal administration (whereby an increase in the elimination of urea and uric acid is produced) in rheumatism, gout, and certain forms of dyspepsia.
The “Rachel” bathing-pavilion adjoins Te Pupunitanga, or “The Priest's Bath.” Here we have a water diametrically opposite in character to the last described—an alkaline siliceous water, having a temperature at its source of 180°. This source is a cauldron of enormous depth, situated some 200 yards from the bathing-pavilion, and yielding 50,000 gallons daily. We have a simple system of cooling by which the water may be used at any desired temperature. Here also is a separate department for either sex, each containing a public piscina 16ft. square, four private baths, a lounging- or waiting-room kept at a constant temperature of 70° by hot-water pipes, and dressing-rooms. The reaction of the water is alkaline, and it contains a small amount of sulphuretted hydrogen. The delicious sense of bien-être produced by bathing in this water, with the soft satiny feeling it communicates to the skin, must be felt to be appreciated. It is useful in all forms of skin-disease— indeed, in eczema it may be considered specific if continued long enough, together with a suitable regimen. I frequently recommend the internal use of this water. Its taste is not unpleasant, and its action is mildly antilithic. Waters containing silicates are said to be useful in the uric-acid diathesis, and I certainly have found it suit gouty patients admirably.
Oruawhata, or “The Blue Bath,” within the Rotorua Hospital grounds, a large reservoir, built of concrete, 36ft. by 20ft., provided with hot- and cold-water douches and showers. This water is of saline character with, silicates. Analysis (in grains per gallon): Chloride of sodium, 60.44gr.; chloride of magnesium, 1.04gr.; sulphate of lime, 5.48gr.; silicate of magnesia, 0.32gr.; silicate of soda, 8.38gr.; silicate of iron oxide, l.42gr.; silica, 14.20gr.—total, 91.28gr. in one gallon. Sulphuretted hydrogen, 5.52gr.; carbonic acid, 2.21gr. Temperature: 140° Fahr. Special indications: Almost identical with those of the foregoing spring (Whangapipiro).
The Blue Bath is a warm swimming bath 62ft. long by 24ft. wide. It is built of stone and concrete, with a smooth surface of Portland cement, has a depth of from 4ft. 6in. to 3ft., and contains about 30,000 gallons of water, maintained at a temperature of 98°. This is the popular pleasure-bath of the Sanatorium, in which our rheumatic invalids are able to take exercise without undue fatigue. It was completed in 1885, and opened by Mr. George Augustus Sala. While excavating this bath the workmen struck upon a remarkable sulphur-cavern, its roof and sides thickly coated with brilliant acicular crystals of sulphur, and at its base a hot-spring yielding steam so strongly impregnated with sulphur-gases as to be quite irrespirable. This we have conducted to the surface, and employ as a sulphur-vapour bath, diluting it as occasion requires with steam of a milder character. In sciatica, and all forms of rheumatism, this is one of our most popular and efficacious remedies.
Cameron's Bath (known as “Laughing-gas Bath‘’), within the Rotorua Sanatorium Reserve, a quarter-mile from the bath-pavilion, on the shores of Lake Rotorua, at a point called Te Kauwhanga. It is a muddy pool 30ft. in diameter, with a constant discharge of gas (sulphuretted hydrogen, with sulphurous acid), which, when inhaled, causes faintness and great excitement of the respiratory and vascular functions. The pool has no outflow; the water is a dirty chocolate colour, hepatic, feebly saline, and has a persistent acid reaction and offensive odour. Bathing in the spring itself is to be deprecated. Analysis (in grains per gallon): Sulphate of soda, 44.54gr.; chloride of potassium, 1.67gr.; chloride of sodium, 12.04gr.; chloride of calcium, 5.22gr.; chloride of magnesium, 1.28gr.; chloride of aluminium, 0.62gr.; silica, 9.22gr.; hydrochloric acid, 5.92gr.—total, 80.51gr. in one gallon. Sulphuretted hydrogen, 4.42gr. Temperature: 109° Fahr. to 115° Fahr.
The Pain-killer Bath, situated at Te Kauwhanga, resembles the above water (No. 4), but is a little more saline and hepatic; it is one of the most valuable sulphurous springs in the reserve. The water has a distinct acid reaction, an offensive odour, and deposits a brownish sediment on being boiled. This bath has great curative properties, and two baths with sheltered dressing-accommodation have been erected in connection with it. Analysis: Chloride of sodium, 46.42gr.; chloride of potassium, 1.71gr.; chloride of calcium, 2.66gr.; chloride of magnesium, 1.47gr.; chloride of iron and aluminium, 4.22gr.; sulphate of soda, 29.14gr.; hydrochloric acid, 6.84gr.; silica, 18.02gr.—total, 110.48gr. in one gallon. Sulphuretted hydrogen, 4.84gr. Temperature: 204° Fahr.
The Coffee-pot, also situated at Te Kauwhanga, a small mud spring, 10ft. in diameter; the water is thick, brown, and muddy, covered with an oily slime, in fact, of a most uninviting appearance; it has a persistent acid reaction and an offensive odour; hepatic and feebly saline. Analysis: Silica, 13.86gr.; sulphate of soda, 23.71gr.; chloride of potassium, 0.77gr.; chloride of aluminium, 1.46gr.; chloride of calcium, 2.04gr.; chloride of magnesium, 1.62gr.; chloride of iron, 1.47gr.; hydrochloric acid, 7.66gr.; sulphuric acid, 7.60gr.— total, 60.19gr. in one gallon. Sulphuretted hydrogen, 3.19gr. Temperature: 80° to 100° Fahr. Special indications of the last throe baths (Nos. 4, 5, and 6): Chronic rheumatism and gout, chronic rheumatoid arthritis, cutaneous diseases.
Hinemaru (“Stonewall Jackson‘’ or “McHugh's Bath‘’), situated in the Rotorua Sanatorium Reserve. The water is of a yellowish colour, of a saline character, with silicates; reaction, alkaline. Analysis: Chloride of sodium, 93.46gr.; chloride of potassium, 4.69gr.; chloride of lithium, traces; sulphate of soda, 2.76gr.; mono-silicate of soda, 6.41gr.; silicate of lime, 2.89gr.; silicate of magnesia, 1.02gr.; iron and aluminium oxides, 2.10gr.; silica, 8.29gr.—total, 121.62gr. in one gallon. Temperature: From 98° Fahr. to 118° Fahr. Special indications: Cutaneous diseases, rheumatism; if filtered, suitable for internal administration in atonic dyspepsia and the uratic diathesis (dose, one tumbler thrice daily between meals).
The above analyses were made in 1881 and 1882, and a re-analysis was made last year by the Government Analyist, who reports as follows: “These results show that some changes have taken place in the constitution of several of these waters since their analysis in 1881 and 1882—that is, prior to the volcanic eruption of Tarawera. The ‘Painkiller’ spring has evidently acquired quite a new character, being an alkaline in place of an acidic water. The Hinemaru Spring (McHugh's Bath) contains a little less chloride of sodium than formerly, and more silica, while Rachel's Spring contains a little less of the alkaline sulphate. These facts are interesting, but, with the exception of the total change of character of the ‘Painkiller’ water, nothing has been elicited to show that any of them have changed so much as to seriously affect them for the medical purposes to which they have hitherto been applied.” This should reassure those who may have been led astray by a report—diligently circulated by certain interested individuals—that our springs are weaker and less efficacious than formerly. It is true that there is no spring in the district so erratic in its temperature and density as the Priest's Bath, but, fortunately, temperature and density are not its most important therapeutic factors. The analysis of 1893, as compared with that of 1881, shows that there has been a falling-off in certain of its negative ingredients, but the curative properties of the water are maintained by an actual increase in two, at least, of its more positive constituents—free hydrochloric acid and sulphuretted hydrogen. No one has a better opportunity of judging of the physiological and curative effects of this water than I, who, for the last ten years, have had the advantage of daily observation, and my deliberately expressed opinion is, that the water of the Priest's Bath is as powerful a skin stimulant and as valuable a curative agent as it was ten years ago.
Perhaps the most interesting information offered in this report is the first analysis of five new springs which have lately been brought into notice, owing to the overcrowding of the Priest's and Rachel Baths. No doubt they will shortly be brought under the control of the Government authorities, as part of the Sanatorium Reserve, and suitable bathing accommodation built. They are as follows:—
(1.) Matuatonga, or “Corlett's Bath.”
| Grains per Gallon. | |
|---|---|
| Chloride of sodium with a little potassium | 66.44 |
| Chloride of calcium | 6.72 |
| Chloride of magnesium | 0.31 |
| Sulphate of lime | 10.32 |
| Carbonate of lime | 0.21 |
| Alumina | Trace |
| Soda silicate with a little carbonate | 29.27 |
| 113.27 | |
| Sulphuretted hydrogen | 2.21 |
This is a water very similar to that of the Rachel Spring, and calculated to fulfil similar therapeutic indications.
(2.) Toko, or “The Postmasters Bath.”
| Grains per Gallon. | |
|---|---|
| Sulphate of soda | 45.09 |
| Sulphate of potash | 0.41 |
| Sulphate of lime | 2.45 |
| magnesia | 0.30 |
| Sulphate of alumina | 1.34 |
| Iron oxides | 0.71 |
| Sulphuric acid (free) | 17.86 |
| Hydrochloric acid (free) | 7.40 |
| Silica | 10.11 |
| 85.67 | |
| Sulphuretted hydrogen | 5.69 |
This is a strongly acidic water, fulfilling all the therapeutic indications of the Priest's Spring.
(3.) Waikupapapa, or “the Saddler's Bath.”
| Grains per Gallon. | |
|---|---|
| Sulphate of soda | 33.18 |
| Sulphate of potash | 0.26 |
| Sulphate of lime | 2.44 |
| Sulphate of magnesia | 0.24 |
| Sulphate of alumina | 0.32 |
| Iron oxides | Trace |
| Sulphuric acid (free) | 4.29 |
| Hydrochloric acid (free) | 7.49 |
| Silica | 8.23 |
| 56.45 | |
| Sulphuretted hydrogen | 3.61 |
This is an acidic water, similar to the foregoing, but less stimulating, and consequently more suitable for delicate skins.
(4.) Ngaruapuia or “the Gemini Bath.”
| Grains per Gallon. | |
|---|---|
| Sulphate of soda | 29.80 |
| Sulphate of potash | 0.64 |
| Sulphate of lime | 6.87 |
| Sulphate of magnesia | 0.31 |
| Sulphate of alumina | |
| Iron oxides | Trace |
| Sulphuric acid (free) | 3.11 |
| Hydrochloric acid (free) | 6.76 |
| Silica | 12.01 |
| 59.50 | |
| Sulphuretted hydrogen | Traces. |
This is a valuable acidic water, less astringent and stimulating than the foregoing, and, in many cases of skin disease, from the fact of its containing less free acid and more silica, a most desirable intermediate water between the soothing alkaline waters and the more powerful waters of the acid type.
(5.) Waikirihou, or “Vaux's Bath.”
| Grains per Gallon. | |
|---|---|
| Sulphate of soda | 32.87 |
| Sulphate of potash | 1.24 |
| Sulphate of lime | 4.93 |
| Sulphate of magnesia | 1.83 |
| Sulphate of alumina | 33.22 |
| Iron oxides | 4.42 |
| Sulphuric acid (free) | 30.32 |
| Hydrochloric acid (free) | 6.14 |
| Silica | 17.61 |
| 132.58 | |
| Sulphuretted hydrogen | 3.02 |
This is the strongest acidic water in the district, and most valuable as a local application to rheumatic or injured joints, but, for immersion of the whole body, requiring the greatest care and caution. These five baths being open and free to the public, and all the more popular on that account, are becoming a source of considerable anxiety to the local officers in charge. Not only is this free bathing lessening our legitimate revenue, but it is attended with the gravest danger to the bathers themselves. Only the other day the body of a young man was found drowned in the Postmaster Bath. He had gone alone to bathe, and either from the effect of the gaseous emanations from the water, or some inherent heart weakness, had evidently become unconscious, slipped under water, and so lost his life. Such an accident could not possibly have occurred in any of the baths under Government control, as no one is allowed to bathe alone. Fainting is not infrequent, but as there is always plenty of help at hand no fatal accident occurs, and had this young man had a friend with him no doubt his life would have been saved. It cannot, therefore, be too strongly impressed upon the public mind that it is dangerous to bathe alone in any hot mineral spring.
At Whakarewarewa, two miles from Rotorua, there are two springs which have a well-merited reputation.
Turikore, or the “Spout Bath.”—This water is in great repute among the Maoris for the cure of cutaneous diseases, rheumatism, lumbago, sciatica, and kidney complaints. It is of a sulphurous character, and has a faintly acid reaction, which changes to alkaline on boiling the water. Analysis: Silicate of soda, 16.32gr.; silicate of lime, 1.61gr.; silicate of magnesia, 1.14gr.;silicate of iron, 0.39gr.; sulphate of soda, 13.47gr.; chloride of potassium, 1.24gr; chloride of sodium, 53.61gr.; phosphate of alumina, traces—total, 87.78gr. in one gallon. Temperature: 96° Fahr. to 120° Fahr. Special indications: Cutaneous diseases, lumbago, chronic rheumatism, local palsy of muscles.
Koroteoteo, or the “Oil Bath.”—This water is alkaline and slightly caustic. Analysis: Mono-silicate of soda, 2.08gr.; mono-silicate of lime, 3.16gr.; mono-silicate of magnesia, 0.76gr.; mono-silicate of iron, 0.85gr.; sulphate of soda. 7.49gr.; chloride of potassium, 1.46gr.; chloride of sodium, 66.34gr.; chloride of lithium, traces—total, 104.54gr. in one gallon. Temperature, 212° Fahr. Special indications: Cutaneous diseases.
The selection of cases suitable for treatment at Rotorua is a most important matter. I am aware that there is a strong tendency both with physician and patient to try anything as a dernier ressort. It is a serious matter, however, to put a patient to the trouble and expense, and possibly pain, of making a long and weary journey, to rob him of the comforts of home and the society of his friends, without at least some reasonable hope that his labour will not be thrown away.
The two most important questions to be answered before deciding to send a case to Rotorua are—(1) Has the patient sufficient strength to bear the journey? and (2) is the case one likely to benefit by the treatment? With regard to the first question, it must be remembered that the long thirty-four miles coaching journey over a bad road is a thing of the past. The rails are already within eight miles of us, and through communication with Auckland will be complete before the beginning of the season 1894–95. Still, a ten-hours’ railway journey will not be accomplished by an invalid without some fatigue, and possibly increase of pain, but if there be sufficient vitality to render such inconvenience a matter of mere temporary concern only, it is no insurmountable barrier. Nor need the partial or even total loss of the patient's locomotive power prevent his coming. We have many instances on record of patients who on arrival required the aid of crunches, or had actually to be carried to the bath, and yet went away enjoying the full use of their limbs. In considering the second question, medical men will not need to be reminded that where profound organic structural change exists very little benefit can be expected, so that considerable discrimination must be exercised in selecting cases of paralysis for treatment. Where nerve-elements are extensively destroyed hot water has no regenerating power that I am aware of. The same may be said of osteoarthritis or chronic rheumatic arthritis, with structural change and great deformity of the joints. Such cases may improve in general health, gain weight, and lose pain, but there the improvement ends. Our treatment is contra-indicated in phthisis as long as active destructive change is going on in the lungs. Certain chronic poitrinaires, however, pay us periodical visits with advantage.
There is a form of incomplete paraplegia very common amongst old miners; the patient gets about a little with the help of a stick; his walk is shaky and tottering; his general health usually good: often the mind is somewhat crippled—a mild form of dementia; the bowels are generally torpid; there is often dribbling of urine, or, at best, very feeble control of the sphincter; the muscles are not atrophied, and respond normally to both the galvanic and faradic currents. I consider such cases incurable. Hot baths are certainly useless. Their mental condition, however, is capable of great improvement by proper discipline and diet, and the bowels and bladder may be kept in a state of perfect comfort by galvanism intelligently applied. As they may enjoy this amount of benefit in any hospital, it is useless to send them to Rotorua. Cases of paraplegia in which the muscles are extensively atrophied, and there is absolutely no response to either galvanism or faradism, are usually hopeless. In hemiplegia, on the other hand, presumably from cerebral embolism or from small hæmorrhages, as, for example, from rupture of the miliary aneurisms of Charcot, we have had some excellent results.
Primary functional paralysis, in which there is reason to believe that the nerve-centres have undergone no organic change—such paralysis, for example, as may be induced by depressing morbid influences, as malaria, influenza, sexual excesses, mental or physical fatigue, exposure to wet and cold, alcoholism, or hysteria, are likely to benefit by treatment at Rotorua.
Several cases in point are given in the New Zealand Year-book for 1893. One illustrative case will be sufficient to quote here.
H. C., a bushman, aged twenty-three, had become completely paraplegic, presumably from exposure to wet and cold. He had been for many months dependant on a Charitable-aid Board, who sent him to Rotorua. For three weeks he was carried to his bath, at the end of which time he was able to stand alone. At the end of five weeks he could walk with two sticks, and ride on horseback. In three months he was as well as he had ever been in his life.
Rheumatism and skin-diseases, and these usually in a very chronic form, furnish fully 75 per cent. of the cases we are called upon to treat. In rheumatism and rheumatic gout we have much success, especially where arthritic degeneration is not too pronounced. Hot acidic sulphur-baths at a temperature not exceeding 104°, or sulphur-vapour up to 115°, taken twice daily for a carefully-regulated time, according to individual tolerance—which we find to vary greatly—forms our routine treatment. These waters redden the skin, and cause some tingling sensation for an hour or two. Occasionally some irritation of the skin occurs, which is readily allayed by a few warm alkaline showers or douches. In those numerous and well-known cases of chronic hip-rheumatism, often due to injury, we find nothing so efficacious as the hot douche. The beneficial result is due partly to the quality of the water, and largely to its mechanical action: fortunately, our arrangements are so complete that we are able to vary the temperature and percussive power of the douche at will. We are able to quote several cases of cure even where a considerable amount of fibrous anchylosis has existed. If the rheumatic patient progresses favourably under the bath-treatment alone, neither medicines nor electricity are employed, but if after a few weeks we find his progress is not satisfactory, we find galvano-faradism a valuable adjunct. Usually thirty cells are put into circuit with a faradic machine, and the double current applied in the labile manner to the parts affected for fifteen minutes daily. We find this answers better than either current alone. In cases of muscular atrophy faradism is resorted to from the commencement.
Perhaps there is no class of diseases in which we meet with more uniform success than those affecting the skin. The solid and gaseous constituents of the waters are no doubt important; but I have more confidence in the influence of change, and all that it implies in its effect on both mind and body, combined with the prolonged maceration of the cuticle, and the constant exposure of the skin to air and light which frequent bathing entails. General eczema, which may have resisted every form of treatment for years, is generally cured in a period varying from six to thirteen weeks if the patient is willing to submit himself to rigorous medical discipline. The same may be said of psoriasis,—at least, as far as its disappearance for a longer or shorter period is concerned. It is rare indeed to see psoriasis completely eradicated. For ringworm and the impetiginous eczema of children the water of the Priest's Spring is a specific. In sycosis epilation is necessary, after which our alkaline waters complete the cure.
Neuralgias, as a rule, do remarkably well. Patients suffering from sciatica are a numerous class with us, most of them presenting a very chronic history. When the disease is not distinctly associated with the gouty or rheumatic diathesis, is not of long standing, and has been caused by exposure to cold, it is very quickly cured. A few baths relieve the pain, and there is rarely any stiffness or weakness remaining. Chronic cases are not so easily dealt with—they require great patience and perseverance on the part of both physician and patient. Our routine treatment consists of hot baths, sulphur-vapour, the douche, and galvanism. After sis or eight weeks it often happens that nothing remains to remind the patient of his old enemy, beyond some slight weakness or soreness of the limb, and I usually advise him to try a week's sea-bathing on his way home. In order to accomplish this he should arrive in Rotorua not earlier than September or later than February. We have had some good results in the treatment of cervico-brachial neuralgia. An interesting case is detailed in the last Year-book.
To enumerate every ailment in which our thermal springs have proved useful would prolong this paper indefinitely. Suffice it to say that in many cases their healing power has been discovered accidentally. Many women bathing for rheumatism have found themselves cured of chronic metritis and leucorrhœa, and as a result of such cures have proved fruitful after years of sterility. Congestion of the liver, biliary catarrh, with jaundice and hemorrhoids, have been cured by the acid sulphur waters, which also prove useful as a topical application in ozæna and ulcerated throat. This class of water also tends to reduce plethora and corpulency without prostration, insures healthy action of the skin, and relieves torpor of the bowels.
The mention of ulcerated throat reminds me of two most interesting cases which presented themselves recently from the island of New Caledonia. In this island, it appears, chronic laryngitis is common.
The first case was that of a French gentleman engaged in business whose throat ailment was of long standing; he remained with us a few weeks, used the water of the Priest's Spring as a gargle, and as a wet compress to the throat at night, and bathed in the same water twice daily; he left perfectly cured.
The second case was a much more serious one. The patient was a French Roman Catholic priest. He attributed his ailment to excessive use of his voice in preaching, teaching, and singing, He had constant cough, his voice was hoarse and scarcely audible, and there was occasional slight hæmorrhage from the laryngeal ulcers. After pursuing for four weeks the treatment described in the foregoing case, he left very much improved, but by no means well. To my surprise, in a few weeks after his departure he wrote to our Resident Engineer, Mr. Malfroy, stating that to his great delight he found himself perfectly cured, and that he could use his voice in preaching and singing as well as he ever did in his life.
During the past eight years my correspondence with patients proposing to come to Rotorua, and with those who have left after a longer or shorter experience of our bath treatment, has been considerable. No fact has struck me more forcibly than this, that patients who have left greatly benefited, but not cured, almost invariably write to say that, after being a short time at home, they realise the benefit they have derived, and, in most cases, they find themselves permanently cured.
It appears that whatever it is that our patients take into their systems by absorption or inhalation, and, whatever may be the influence of change of climate, change of scene, change of occupation, relaxation, and rest, time is required for assimilation, and the true benefit is only realised some time after their return to their former surroundings.
I am glad to find that this experience is not peculiar to New Zealand, but is quite common with those who frequent the spas of Europe.
That department of medicine which relates to the discovery and application of remedies to the cure of diseases being known as Therapeutics, it follows that we may appropriately speak of the application of thermo-mineral waters to the cure of diseases as balneo-therapeutics, of massage, as masso-therapeutics, and of galvanism as galvano-therapeutics. Now, any one writing in this day on balneo-therapeutics could scarcely afford to ignore the subsidiary agencies of galvanism and massage. I say subsidiary advisedly; since both find their truest value and highest use as adjuncts to bath treatment, bathing diminishing the resistance of the skin to the galvanic current, and by its emollient influence greatly assisting the manipulations of the masseur. We hear a good deal now-a-days about massage, there is scarcely a spa in Europe where it is not practised. Aix les Bains appears to be its headquarters. Some of these who desire to -be considered professors of the art are too apt to represent it as a panacea for all human ills, and so mislead the unwary. It is desirable, therefore, that the general public should get some definite idea of its real worth. The following is what a lecturer on therapeutics at the Westminister Hospital, and Examiner in Materia Medico, to the Royal College of Physicians of London, says about it: “By masso-therapeutics. I mean the scientific aspect of the subject; massage, that is, simply as a therapeutic agent, and not massage as a means of earning a living, or as a modified form of hotel-keeping. It must be admitted that many people regard massage and all that appertains to it with a good deal of suspicion, and not without reason. The difficulty is, not that massage fails to receive the credit to which it is entitled, but that it is employed in a number of cases for which it is unsuited. No discrimination is exercised, but its use is advocated for all sorts of chronic ailments. This is a grave mistake, and greatly to be deplored. The work is too often carried on by people who know little or nothing about it, and have not mastered even its most elementary details. They regard it as a special system of treatment, whereas, in reality, it is only one of a number of therapeutic agents at the disposal of every physician. They practise without knowledge, and often do incalculable harm. It is not pleasant to hear of an aneurism or an ulcer of the stomach being ruptured by the efforts of a too zealous rubber; and such mishaps are not unfrequent. The so-called masseur, or masseuse, who goes about the country armed with a ‘certificate,’ which is simply a receipt for money paid, is an abomination, and has been the means of bringing a legitimate mode of treatment into disrepute.”
For these reasons we have been shy of giving encouragement to unknown persons desirous of practising massage at Rotorua. We have long recognised the desirability of having a thoroughly competent masseur established here: the difficulty has been to secure the services of a man who has had the necessary training and experience. A trained operator has, however, lately been here, and the want will, I trust, be soon supplied.
There are two questions which are perpetually propounded by visitors to Rotorua. The first is usually put in this way: “How is it that the Government of New Zealand does not advertise these springs”? Little or nothing is known of them in Australia, or America, or England (or wherever the questioner happens to hail from). I should not have been here, but that I heard, quite casually, that a friend of mine had been cured here; and if I am cured I shall be able to send you dozens of patients.” My usual reply is: “We believe that good medical work will advertise itself, and your remarks confirm the assertion. It is evident you believe in your own advertising power, and so do we. It will be quite time enough to spend money in advertising when we find that our bathing-accommodation is in excess of the demand made upon it; at present it is barely equal to it. At the same time our resources are practically unlimited. We have one spring in Ohinemutu estimated to discharge not less than a million gallons daily, which means that it is capable of supplying 10,000 baths daily of 100 gallons each. This is at present running to waste. At Whakarewarewa there is a spring almost, if not quite, equal to it. Should the time ever come when these springs are not equal to the demand made upon them we have the Waiotapu Valley to fall back upon, which surely is destined in the future to be the centre of the Thermal-springs District of New Zealand. Immense as our resources are at Rotorua, they sink into insignificance when compared with those of the Waiotapu Valley.”
The second question usually takes this form: “How do your springs compare with those of Europe?” This is a much larger and more interesting subject. The first fact that strikes the inquirer is this: that cold mineral spas, of high therapeutic value as internal remedies, are abundant in Europe, whereas they are rare in New Zealand. In the Rotorua district our mineral waters are all hot, and more suitable for bathing than for internal administration. It does not necessarily follow that because a water is hot it is unfit for internal use. The water of our Rachel Spring is an admirable dietetic-water for gouty and dyspeptic patients, used either hot or cold; and a spring has recently been discovered at the head of Lake Roto Ehu containing, in spite of its high temperature, a large amount of carbonic-acid gas, which holds in solution a fair amount of carbonate of iron. After keeping a sample of this water securely bottled for about three weeks, I sent it to a chemical friend for examination. His report was as follows: “On opening the bottle of ‘iron-water’ from Roto Ehu I found a good deal of free carbonic-acid gas, the water effervescing briskly like ordinary soda-water; it contained what was equivalent to 172 cubic inches per gallon. Of course this estimate is not to be relied on, as it would only represent a part of the gas contained in the water direct from the spring. There is more iron than I thought would be in it. This most probably exists in the water as ferrous carbonate dissolved in the carbonic acid. It resembles the European water of Pyrmont, with this difference, that it contains more chlorine and silica. As far as I have gone I find the water to contain, in grains per gallon: Chlorine, 11.2; lime (CaO), 12.74; magnesia, 1.177; silica, 10.266; iron (FeO), 1.177—total solids per gallon, 36.560; carbonic acid, 172 cubic inches.” This spring has an enormous outflow, and is destined to be of great value in the future both for external and internal use.
The next fact that strikes the inquirer is this: that the thermal springs of the Rotorua district contain a far smaller amount of dissolved salts than those of Europe. The difference amounts to 7 to 1 in favour of Europe. If we take the mean of the total solids in grains per gallon of the nine springs first enumerated, we find that they amount to 96.51gr. only, whereas if we take any nine European springs at haphazard—say, Vichy, Ems, Baden Baden, Marienbad, Seidlitz, Wiesbaden, Saltzbrunnen, Kreuznach, and Leuk—we find that their dissolved constituents amount to 708gr. per gallon.
Fortunately, the therapeutic efficacy of a thermal spring is not to be measured by the quantity of fixed salts it may contain. It would be a fortunate thing, of course, if we could discover in our district a cold mineral spring like that of Hunyadi-Janos, in Hungary, of which a wineglassful is an efficient aperient; but we can scarcely expect this in a volcanic region like ours. The so-called “chemically-indifferent springs,” such as Gastein and Wildbad, in Germany, contain absolutely less mineral matter than our ordinary drinking water. Thus, the New River water contains 2 1/2gr. of solid matter to the pint, the East London Company 3gr., and that supplied by the Hampstead Company 4 1/2gr. Yet these waters cause no apparent effect, whilst the springs of Wildbad, with 3 1/2gr. of salt to the pint, and Gastein 2gr., are capable of producing therapeutic results mainly due perhaps to the temperature at which they are employed. The chemically-indifferent baths, especially the cooler ones, possess peculiarly sedative effects, not only allaying nervous irritation, but also diminishing vascular excitement, whilst the warmer springs of the same class, being more stimulant, are chiefly used in aggravated cases of chronic rheumatism and rheumatoid arthritis. One important fact has been definitely established by experiment, —whatever may be Nature's secret in the preparation of these remedies, it can never be discovered by science or imitated by art. We must be content, therefore, with the empirical knowledge that certain mineral waters produce certain effects.
There are other salient points of difference between our springs and those of Europe. Our waters contain abundance of silica and silicates, and little or no lime, while those of Europe contain abundance of lime, and little or no silica or silicates. Our district appears to be one in which silica takes the place of lime, the latter being almost a chemical curiosity.
Another curious fact is that hepatic or sulphurous waters, characterized by the presence of sulphuretted hydrogen and free sulphuric acid, as in the case of the Priest's Bath, are abundant here, but absolutely unknown in Europe. The one sole point of similarity—common not only to Europe and New Zealand, but to all thermal springs in the world—is the prevalence of chloride of sodium (common salt) as a leading ingredient.
The Rotorua district enjoys the patronage of three classes of visitors the tourist, the invalid-tourist, and the invalid proper. The question of common interest to them all is, what have they to do, and what have they to see when they get there? The best thing we can do for the tourist is to place in his hands a local guide-book, and then transfer him into the hands of a local guide. The most delightful trip he can take in fine weather—say from December to March—is to join a party, and do the round of the lakes.
Crossing from the old township of Ohinemutu in a steam-launch, he will first visit the Island of Mokoia, in the centre of Lake Rotorua; thence to the beautiful cold spring of Hamarana, one of the most charming picnicing spots in the district; thence through the Ohau Creek into Lake Roto-iti; here he would do well to camp for the night, and spend the following clay in exploring the cosy bays and inlets with which the lake abounds, and visiting the hot spring of Manapirua, and the waterfall and hot springs in the neighbourhood of Taheke.
Crossing over to the western shore of the lake, and landing at Tapuaeharuru, a short walk of a mile or two will bring him to Lake Roto Ehu. Crossing this in a canoe, he will find the hot iron spring already alluded to, and may readily convince himself of the presence of iron in the water by attempting to make tea with it, or using it to dilute his brandy.
Another walk of a mile will disclose one of the loveliest lakes in the district, Lake Roto-Ma. The general consensus of opinion is, that this lake is a vision of beauty, which every visitor lingers round as long as possible and leaves with regret. This trip shows the visitor the Paradise of the district: he will find the Inferno at Tikitere. When George Augustus Sala visited this spot some seven years ago, he called it at once “Hell's Gates.” It is certainly a most weird and awe-inspiring place. The steam rising from its boiling pools and mud-geysers is a never-failing landmark seen from every point of the Rotorua basin. The hydro-thermal action is so powerful at this spot that the visitor feels the earth vibrating under his feet; and yet, in spite of these dismal horrors, invalids—ladies even—will spend weeks here in order to get the benefit of the healing springs, which are justly credited with many most remarkable cures. Tikitere is eleven miles from Rotorua, and the trip may be comfortably made in half a day.
The next point of interest for the tourist is the Wai-o-Tapu Valley, distant from Rotorua some twenty miles. Leaving his hotel after an early breakfast, say at 7 a.m., the visitor may see the chief points of interest in the valley, and return in time for dinner at 6 p.m., but only to regret the inadequacy of a one-day's visit to fully inform himself of the wonderful resources of this remarkable district.
Perhaps there is no more enjoyable trip for the young and strong than the journey to Tarawera Mountain, the scene of the eruption on the 10th of June, 1886. A ride of ten miles on horseback brings the visitor to the buried village of Wairoa; thence a voyage by boat some nine miles, across Lake Tarawera, lands him at the foot of the mountain. The ascent will occupy an hour and a half, and having arrived at the summit, he cannot but feel well rewarded for his toil. No verbal description can possibly convey an adequate idea of the scene of devastation and desolation which this standpoint reveals.
The best advice we can give to the invalid tourist is to attend to business first and pleasure afterwards. If he really wishes to derive benefit from the hot springs, he must not bathe irregularly on the advice of Dick, Tom, and Harry; taking a long fatiguing journey one day, and possibly three hot baths the next, and then wondering how it is that he feels so limp and exhausted; this kind of thing will only disappoint him, and do no credit to the springs. He may very well spend the first three weeks of his visit in bathing systematically, filling up his intervals of leisure by visiting places of interest near his hotel or boarding-house—and there are many, though usually neglected because they are so easy of access.
Not one in twenty of the visitors staying at the Lake or Palace Hotels takes the nearest route across the Pukeroa Recreation Reserve to the Government baths; and yet from this elevation a most magnificent panoramic view of the whole Rotorua basin is obtained— 80,000 acres in extent. Standing on the highest point, and looking towards the north, the visitor sees spread out before him the tranquil beauty of Lake Rotorua—20,000 acres of water, with the lofty volcanic island of Mokoia in its centre. The lights and shadows on the sur-sounding hills, the cloud scenery reflected in the water, the white cliffs to the north and north-east gleaming in the sunlight, the steam column rising from Tikitere, the bluff of Wahanga—the most northerly point of the Tarawera Range — just peering above the intervening hills, and in the foreground the Maori village and the English Church on a promontory jutting into the lake, form a picture which would certainly delight the artist, who usually sees when he looks, if not the tourist, who too often looks without seeing. Turning to the south and south-west, I know of no prospect more lovely on a calm summer's evening at sunset. The steam columns of Whakarewarewa are thrown into relief by the dark background of hills, and through the Hemo Gorge a glimpse is caught of the deep blue Paeroa Ranges in the extreme distance. In the west is the bold bluff of Paparata, with its sky-line clothed with forest, through which the setting sun throws a flood of crimson light, making it look like a veritable bush on fire. North of west is the Ngongotaha Mountain, rising 1,600ft. above the level of the lake, from the summit of which may be seen on a clear day the Bay of Plenty, with its numerous islands, and inland the snowcapped mountains of Ruapehu and Tongariro.
At Whakarewarewa, only two miles from Rotorua, the visitor will find an epitome of all that the district contains; hotel and bathing-accommodation, geysers, hot springs, boiling pools, mud volcanoes, hot waterfalls, and siliceous terrace formation. It will interest the visitor to know that in our Thermal-springs District exist the only geysers in that British Empire on which the sun is said never to set. Geysers are found in the Yellowstone Park District, in Iceland, and in Thibet. Of the latter we know very little, but geologists tell us that, of the geysers of the world, those of the States of Wyoming and Idaho are the oldest, those in New Zealand the next in age, and, strange to say, those of Iceland, with which most of us were first acquainted, the youngest.
It will be seen, therefore, that the invalid tourist has plenty to interest him close at home, without interfering in any way with a profitable use of the numerous hot springs at his disposal.
This geyser broke out in June, 1893, and occasioned a profound sensation in the district. Those who have seen it declare it to be the most wonderful and astounding phenomenon in New Zealand, and, for power and grandeur as a geyser, second to none in the world. It has been very appropriately named “the Terrific.”The Government on hearing of the outbreak, commissioned our Resident Engineer, Mr. C. Malfroy, to visit and report upon it. To give his report in extenso would occupy too much space, but that portion of it which describes the route to be taken in order to reach it, and the eruption he witnessed, will be read with interest.
SIR,—I have the honour to report that on Receipt of your telegram of the 8th instant I took immediate action and made arrangements for the journey, leaving Rotorua on the 11th for muri in a buggy, with a Maori to act as guide and interpreter. We arrived in opening, slept there; and at 7 a.m. on the 12th we started for Orakeikorako on horseback.
We followed the Taupo Road for about two miles and a half, when we turned off to the left into a gully, following a Maori track for about three miles, which took us to the western bank of the Waikato River. This we followed up for about four miles, reaching Orakeikorako at 9.30 a.m. The track is by no means bad, but it is very narrow, overgrown with tussock-grass, and manuka on each side, and cut down deeply by traffic and rain. This renders travelling very slow. It could, however, be made into a good horse-track at a small cost; but from information gathered I am led to believe that a shorter and more attractive and interesting road could be made to Orakeikorako by following the south-west bank of the Waikato all the way from Ateamuri. It would pass by the Rainbow Falls and the several rapids of that part of this beautiful river, and open up a country which, judging from the abundance of tussock-grass, should be well adapted for general grazing purposes.
The Geyser is situated on the Tutukau East Block, on the south-west bank of the Waikato River, about ten chains from the said river, and the same distance in a northerly direction from the nearest whares of the native village. is at the foot of a clay-bank and upper end of an old silica terrace formation light salmon-colour, two or three acres in extent, and reaching down to the river-bank. It is fifty yards in a north-west direction from the old ngawa known as the Orakeikorako Pool, which latter has become quiescent since the abnormal eruption of the geyser started, about the middle of June last. The actual geyser spring consists of an oystershell-shaped basin, 12ft. to 15ft. long and 6ft. to 8ft. wide, starting from nothing at the outer edge to about 5ft. deep at the geyser end, with two well-defined apertures, one a vertical hole, about 12in. in diameter, now blocked up with two large stones silicated fast into it; the other is an horizontal fissure 18in. long by 4in. or 5in. wide, emerging into the vertical hole almost at a right angle at a depth of about 4ft. below the level of the terrace formation, and just above the obstruction of the vertical geyser pipe.
The Native ferryman, Watene, told us on our arrival that the last eruption took place at about 4 o'clock a.m., and that it would play again about noon. Arriving at the geyser basin at 10 a.m., we found it full, and the water flowing out gently through an old drain cut in the silica formation years ago, into a second basin, which has also gone cold since this new geyser action started, and the water of which seems to leak out during the period of the geyser's quiescence. This outflow continued for an hour and a half, increasing gradually. The water in the geyser basin then began to boil up, first slowly, then more and more fiercely, for about half an hour, when the first phase of the eruption started. The steam or eruptive force coming out of the side fissure heretofore described, with great force, ejected the water from the geyser basin, part of which ran back into the basin, to be re-ejected repeatedly by the force, thus causing a great commotion of the water and loud thudding noise as the water and steam battled together. This lasted for about fifteen minutes, when the eruptive force had cleared all the water out of the basin, throwing it in a parabolic spray to a distance of over two chains. Then the second phase of the eruption started, consisting of a jet of superheated steam and water of a bluish-purple tint, into which I could not thrust a pointed stick. Emerging from the fissure, and striking against the projecting rock, it was lifted up at an angle of about 45° degrees, throwing a fine spray for a distance of fully three chains. The terrific force with which the steam is ejected against the rock and its sudden expansion as it emerges from the fissure cause a terrific roaring noise, which can be heard at a considerable distance. It was with the greatest difficulty we could hear each other speak in the vicinity of the geyser. This second phase continued for over an hour, the pent-up force dying away gradually, the water, falling hack into the geyser basin, reentered and disappeared in the fissure, and the geyser action stopped altogether. We could then see in comfort the apertures hereinbefore described; the edges of the fissure were blackish brown, smooth on the inner side, but there was no sign of volcanic heat, or fire, no glassy formation, though the Natives say that sixteen months ago tongues of flame were seen by them issuing from the orifice. We only saw one eruption, but the Native man, Watene, says that they are all similar, and take place at intervals of about six hours, with two to two and a half hours’ duration, thus giving about three eruptions in the twenty-four hours.
Having seen “Pohutu,” “Wairoa,” the “Crow's Nest,” and “Wairakei” geysers, also the blow-hole at Karapiti, in action, I have no hesitation in saying they sink into insignificance when compared with the “Terrific” of Orakeikorako (which is the very appropriate name given to it by Mr. R. S. Thompson, who first saw and described it).
As regards accommodation and entertainment, two classes of visitors—the tourist and invalid tourist—may be safely left to private enterprise; but the third and more numerous and important class—the invalid proper—will soon become a serious consideration for the Government. I do not anticipate that at first the railway will make any great difference in the tourist traffic. Occasional excursion trains in the middle of our season will no doubt strain the existing accommodation—the law of supply and demand will, however, quickly rectify this; but that the number of invalids resorting to Rotorua will very soon be doubled can scarcely be doubted. What are we to do with them? There is only one answer to the question: additional bathing-accommodation should be proceeded with at once. In the months of February and March last year our baths were overcrowded, and the attendants had, for the first time, to ask for assistance. The same has been found necessary this year.
The number of visitors to Rotorua for the year ending 31st March, 1893, was 2,560; and the number of baths taken, 17,838. Fifty-eight patients passed through the Government Sanatorium during the same period, twenty-five of whom were cured, twenty-six greatly benefited, and seven unimproved.
For the year ending 31st March, 1894, the number of visitors was 3,880, and the number of baths taken would have been proportionately greater than last year, had it been possible to keep a record of the free bathing in outlying baths not under Government control. Fifty-six patients passed through the Sanatorium during the year; the number of cured, benefited, and unimproved being about the same as in the previous year.
With regard to the existing boarding-house and hotel accommodation provided for tourists and invalids, we have, at a distance of one mile from the Sanatorium, three hotels, each possessing valuable thermal springs, with comfortable bath-houses, the use of which is free to visitors staying in the hotels. The tariff varies from 8s. to 10s. per day, but for visitors who wish to remain several weeks a lower tariff may be arranged for. There are four boarding-houses, “Terrace House,” “Tarawera House,” “Mokoia View,” and Brent's “Bathgate House.” The tariff varies from £2 2s. to £1 8s. per week. Brent's “Bathgate House” is within a few yards of the Government baths, and accommodates forty-eight visitors; this house has recently been greatly enlarged and unproved, and gives general satisfaction.
The most direct route for visitors from the Australian Colonies is from Sydney to Auckland, and thence by rail to Rotorua. Those who may desire to see something more of the country may take steamer from Melbourne to the Bluff, and from thence on to Wellington, continuing the journey overland to Rotorua—a four days’ trip, most enjoyable in fine weather. Patients should be recommended to bring plain, warm clothing, and substantial boots and shoes. Rotorua is essentially a convenient place for the wearing out of old clothes. Frills and furbelows, jewellery and valuable watches, had better be left at home as they are not improved by the sulphurous vapours arising from the springs. The watch par excellence for Rotorua is the nickel-plated “Waterbury.”
There are within a distance of 120 miles, on the south-west coast of the Middle Island of New Zealand, no less than thirteen deep inlets or sounds running inland, some of them a distance of twenty miles. These sounds are surrounded by high and precipitous mountains, many rising almost perpendicularly from the water's edge to heights varying from 3,000ft. to 6,700ft. The names of these thirteen deep inlets, south to north, are: Preservation and Chalky Inlets (Edwardson Sound); Dusky, Breaksea, Daggs, Doubtful, Thompson, Nancy, Charles, Caswell, George, Bligh, and Milford Sounds.
By far the most majestic and awe-inspiring of all these is Milford Sound, the northernmost of the series. Though comparatively inconsiderable in extent, yet, in remarkable features and magnificent scenery, it far surpasses the rest. The mountains by which it is surrounded are the highest on the coast. Pembroke Peak, about three miles inland, perpetually snow-capped, rises over its northern side to a height of 6,700ft., and Llawrenny Peak, a very remarkable saddle-backed mountain, attains nearly the same elevation on the southern side. But, perhaps, the most striking features are the remarkably-shaped Mitre Peak, rising abruptly to a height of 5,560ft., immediately over the south side of the sound, and a dome-shaped mountain on the opposite shore, nearly bare of vegetation, which, from its peculiar colour, resembles a huge mass of metal. From Anita Bay the sound runs south-east for a mile and a half, when the narrow entrance is reached, barely exceeding a quarter of a mile in width, towering perpendicular cliffs rising on either side, the soundings in mid-channel being sixty fathoms. The sound then trends in an easterly and south-east direction for six miles between stupendous cliffs, the widths varying from one-third to three-quarters of a mile. Near the north shore, where there is a large waterfall, the depth is 214 fathoms. The following is a description given of this sound by the Rev. W. S. Green, a member of the English Alpine Club:—
Vertical cliffs rose for thousands of feet on either hand, and we drove in before a blast so strong as almost to make steaming unnecessary. The surface of the sea would now and then be torn off in sheets, driven along in spindrift, and again all would be calm as glass. Waterfalls, resembling the Staubach, came down the cliffs from far above the clouds, and were blown away into spray while in mid-air by the fury of the storm. Wherever vegetation could get a footing on these immense precipices lovely tree-ferns and darker shrubs grew in profusion, all dripping with moisture, and running up the cliffs in long strips of verdure till lost to our view aloft in the torn white mists. The vivid green of the foliage was the feature of all this wondrous scene which struck mo most. Two or three miles up the sound, we steamed close to an immense waterfall which, in one plunge of 300ft., leaped into the sound with a roar like thunder, drowning our voices and sending great gushes of spray over the steamer's deck. The face of another great cliff was so draped with numberless small falls that it seemed to be covered with a veil of silver gauze about 300 yards in width. While passing along hero we fired a gun: echo after echo resounded from cliff to cliff, and from invisible crags high over our heads the echo again returned as a voice from the clouds. The mist now showed an inclination to clear off, the rain ceased, and as we entered the inner basin of the sound the forest increased in beauty. The totara pines, draped with festoons of grey lichen, contrasted well with the soft green of the great fern-fronds, and formed a suitable background to the scarlet blossoms of the rata (Metrosideros lucida) which here and there lit up the upper surface of the forest with patches of intense colour. Gleams of sunshine began to dart through the clouds, giving a momentary flash on one of the numerous cascades, and then, passing over forest and cliff, added new beauties of light and shade. When about eight miles from the open sea a booming sound rose higher over the voices of the numerous cascades, growing louder as we advanced, and, rounding a forest-clad point, we came upon the grandest of New Zealand waterfalls—the great Bowen Fall. Its first fall is only about 50ft. into a rocky basin, but, leaping from it upwards and outwards in a most wonderful curve, it plunges down with a deafening roar in a single leap of 300ft. The “Te Anau” was allowed to drift up in the eddy caused by the fall, and, being caught by the stream in the midst of drenching clouds of spray, she was spun round as though she were a mere floating twig; then, steaming to a short distance, she stopped again. The weather had now taken up sufficiently for us to see through an opening in the clouds the snow-clad top of Mitre Peak, which rises in one grand precipice of 5,560ft. from the surface of the sound. The glacier on Pembroke Peak showed for a few minutes, and then was lost to view! but what we saw formed the grandest combination of scenery upon which my eyes had ever rested. As these sounds are from 200 to 300 fathoms deep, there are but few places in them where a ship could anchor; had we stayed there for the night, we should have made the steamer fast to the trees.
The country about Milford Sound is covered with dense forest, and the mountains are rugged in the extreme. The neighbourhood of all the other sounds is similar—access overland being most difficult.
Of late years, during the summer season, the Union Steamship Company has facilitated transit to this rugged Sounds country by inaugurating special excursions, which have been largely and gladly made use of by tourists from all parts of the world.
Some years ago, Sutherland, a prospector, established for himself a home seven miles up Milford Sound, at a bend known as the Freshwater Basin, where the ever-rushing stream of the Bowen Falls mingles with the silent and deep waters of the sound. In the course of his ramblings Sutherland discovered an immensely high waterfall, which has now become famous as “The Sutherland Fall.” It is in three leaps, but the total fall is 1,904ft. Thus there is added to the already well-known grandeur of the Sounds this additional charm for those who delight in beholding the wondrous works of Nature. The distance from the place where the steamers anchor in Milford Sound to the waterfall is about fifteen miles—viz., Milford Sound to Lake Ada is two and a half miles, then boat up the lake four miles, then track from head of lake to falls eight and a half miles. There is a travellers’ hut at the head of the lake, where the night can be spent.
The Government is making a horse track between Milford Sound and Sutherland Falls. This is now completed from the sound to Lake Ada and from the head of Lake Ada for about four miles up the Poseidon Valley, leaving about four and a half miles to complete to the falls. The present old track between the head of the new road and Lake Te Anau, viâ Clinton River, is maintained by the Government.
The Southern Alps of New Zealand extend in one almost unbroken chain along the west side of the Middle Island. In the neighbourhood of the Sounds, and of Lake Te Anau, there are many magnificent peaks, which, though not of great height, are, owing to their southerly position, nearly all crowned with perpetual snow and ice. Going further north, the mountains increase in height, till at Lake Wakatipu, Mount Earnslaw and his satellites are reached, and at Lake Wanaka, Mount Aspiring—which has aptly been termed the New Zealand Matterhorn—nearly 10,000ft. in height. Northward, beyond this, a fine chain of peaks runs as the back-bone of the
* Mainly from “Aorangi: or, the Heart of the Southern Alps,” by Malcolm Ross, Vice-President, New Zealand Alpine Club.
Middle Island to where Mount Cook, or Aorangi, towers majestic 12,349ft. in air. At Mount Cook the tourist is in the midst of the grandest scenes of the Southern Alps, and here it is that he will see the wonders daily being worked by the Ice King on the grandest scale.
The scenery of the Southern Alps of New Zealand in many instances excels in beauty and grandeur that of the Alps of Switzerland, while in the former there is far greater variety. Then, again, there is the charm of novelty. Every tourist delights in getting out of the beaten track. In Switzerland this is hardly possible nowadays. In New Zealand, on the other hand, it is easy of accomplishment. In the Swiss Alps there is now hardly a peak unclimbed—one after another having gone down before the indomitable pluck and perseverance of the members of the English Alpine Club. In New Zealand, though several have tried, no one has actually succeeded in making a complete ascent of any of our highest mountains; and there are scores of splendid peaks awaiting the enterprise of the British or Colonial mountaineer, ready to be won. Many of the peaks, and most of the glaciers, are, as yet, unnamed, and there is still in parts of the Middle Island a fine field for exploration and discovery—geographical, geological, and botanical. The wonders of the Southern Alps are only beginning to be known; but the more they are known, the more they are appreciated; and it is safe to predict that in a very few years there will be sight-seekers in large numbers, from all parts of the world, flocking to the Switzerland of Australasia.
In the south, in the region of the West Coast Sounds, there are beautiful lakes, waterfalls, and mountains, while the scenery of the sounds is said to rival that of the fiords of Norway. A great tract of mountainous country lying between these sounds and Lakes Manapouri and Te Anau is still marked on the maps as “Unexplored,” and among these mountain fastnesses discoveries of importance may yet be made. It has long been a popular belief that the unknown country lying behind Lakes Manapouri and Te Anau was inhabited by a tribe of Maoris. Tradition has it that the northern Maoris, under one of their warlike chiefs, drove some of the southern tribes to the shores of Lake Te Anau, where a terrible battle was fought, and it was supposed that the remnant had retreated back into the mountains. Many relics of a lost tribe, in the shape of greenstone implements and ornaments (of which Mr. Mitchell, of Manapouri Station, has a unique and interesting collection) have been found on the shores of Manapouri and Te Anau, but the Maoris themselves have evidently gone to that bourne whence no traveller returns.
It is only of recent years that passes have been discovered between the lakes and the sounds, and, although these passes do not lead the traveller beyond the sub-alpine heights, they take him through scenery of the most beautiful and wonderful character—a fitting introduction to the greater marvels of the Ice King's home in the heart of the Southern Alps, at Aorangi, or Mount Cook. Formerly it was a matter of considerable expense and difficulty to visit this part of the country. Now all is changed, and from either Dunedin or Christchurch there is only a train-journey of half a day, and two days’ coaching (shortly to be reduced to one), while there is excellent accommodation at the end of the journey, at the Hermitage. Taking Timaru as the starting point: by rail from Dunedin, 130 miles; or from Christchurch, 991/2 miles, the distances and times usually taken to get to the Hermitage are: Timaru to Fairlie, 371/4 miles by rail, 23/4 hours; Fairlie to Pukaki, 56 miles by coach, 10 hours; Pukaki to the Hermitage, 40 miles by coach, 8 hours.
At Fairlie, horses and vehicles also may be hired for the excursion.
There is good hotel accommodation at Fairlie, Lakes Tekapo, and Pukaki. At Mount Cook, the Hermitage, a large and comfortable hotel, has been erected on a beautiful spot near the Hooker River, close to the Mueller Glacier, and commanding lovely views of the surrounding mountains. Here tourists will be supplied with full information as to the best methods of exploring the wonders of this district.
During the winter months the coach does not run as far as the Hermitage, but to Bourke's Pass, twice, and Pukaki, once weekly from Fairlie.
Possessed of great intelligence, susceptible of civilising influences, and owners of an immense area of land, the Natives form an important element in the New Zealand population.
According to the census of 1891, the total Maori population amounted to 41,993 persons, of whom 22,861 were males and 19,132 females. In 1886 the population was returned as 41,969 persons—males 22,840, females 19,129. As more than 100 Maoris lost their lives in the Tarawera eruption, which took place subsequently to the census of 1886, it would seem that the Maori population is not on the decline. Included in these numbers are the half-castes living as members of Maori tribes.
The North Island had in 1891 a Maori population of 39,535 persons. The Middle Island had only 1,883, and Stewart Island 136. The Native population of the Chatham Islands was 188 persons, 40 of whom were Morioris. 251 Maori women were found to be wives of European husbands.
Of the half-caste population, some are living as members of Maori tribes and others amongst and as Europeans. The numbers for two censuses were as under:—
| Census. | Half-castes living as Members of Maori Tribes. | Half-castes living as Europeans. | Total half-caste Population. |
|---|---|---|---|
| Persons. | Persons. | Persons. | |
| 1891 | 2,681 | 2,184 | 4,865 |
| 1886 | 2,254 | 1,958 | 4,212 |
For the whole colony the proportionate strength of the two races is 1 Maori to about 15 Europeans. Omitting from the calculation the 251 Maori wives married to European husbands, it is found that in the North Island the proportion of Maoris is 1 to every 7 Europeans, in the Middle Island 1 to 183, in Stewart Island 1 to 1.5, and in the Chatham Islands 1 to 1.4; the percentage of each race to the total population being,—
| European. | Maori. | |
|---|---|---|
| Per Cent. | Per Cent. | |
| North Island | 87.68 | 12.32 |
| Middle Island | 99.46 | 0.54 |
| Stewart Island | 59.76 | 40.24 |
| Chatham Islands | 59.04 | 4096 |
| Colony | 93.72 | 6.28 |
At the census of 1891, the enumerators were directed to report to the Native Department on the general health of the Maoris, with any other information bearing on the population question deemed to be important. Inquiry into increase or decrease in different localities seemed to show that Natives move from one place to another frequently, and often depart from their usual place of abode for the purpose of gum-digging and other pursuits, thus swelling for a while the population of one locality at the expense of another.
In reports on previous censuses it is stated that the tendency to racial decrease, which is indicated by the low proportion of the number under 15 years of age to the whole population, is attributable to the following causes: An excessive infantile mortality, owing to improper food, exposure, want of ordinary care and cleanliness; the fact that the constitutions of the parents are often undermined; the practice of placing their sick in the hands of the Native doctor (tohunga), instead of applying to the medical officer of the district; the sterility induced by widespread immorality among quite young females before marriage; the partial adoption of European habits and costume, and the occasional reversion to the habits and costume of barbarism with a system rendered more susceptible to external influences, especially those of a humid and changeable climate, and more liable therefore to the attacks of disease, especially such as affect the respiratory organs; and, to a certain extent, the continual introtribal marriages, resulting in diminished fruitfulness and enfeebled constitutions. These evils, and the habit of living in crowded whares, still continue to a great extent. There is, however, no reason to suppose that there has been much general decrease of population since last census, though it is decreasing rapidly in Taranaki. During the years 1892 and 1893 many of the Natives were attacked by the then prevailing epidemics of influenza and measles, which visited nearly all their settlements, but the number of deaths from these diseases was not large in spite of the habits of the people. Simple directions for the treatment of the sick were issued by the Department of Justice, with good results. Where necessary, medical men were sent to attend the sufferers.
The Natives are rich in land. It is estimated that they own more than ten millions of acres. In this area there are valuable lands, but allowance must be made for mountain-ranges and portions where the soil is poor. The following figures will show that the Natives are utilising their lands, although not to the extent that might be wished. According to the census of 1891, they had, in crop and grass, 75,833 acres: of which 11,203 acres were in wheat, 5,599 acres in maize, 16,093 acres in potatoes, 16,220 acres in other crops, and 26,718 acres in sown grasses. They also owned 262,763 sheep, 42,912 cattle, 86,259 pigs, besides horses, of which no account has been taken.
The Maoris take no small interest in education, and the aptitude for learning shown by their children at the schools provided for them is most marked. For many years the Government has maintained schools in Native districts, and solid work has been done in giving the children an English education. In December, 1893, the number on the rolls of the ordinary Native schools, public schools, and boarding-schools was 2,570. At the same date the number of Native village schools was 62, and of boarding-schools 4. There were further 103 children attending private schools, making a total of 2,673. This is a little smaller than the corresponding total for the previous year (2,705), but the slight decrease is more than accounted for by the prevalence of measles during 1893. The Native schools are inspected periodically by the Government Inspector, and the day on which this official makes his inspection is one of no small interest and excitement to the youthful Maori.
The Natives are represented in Parliament. There are four constituencies, each sending a member of the Native race to the House of Representatives. There are also two Maoris in the Legislative Council. The Native members take a keen and intelligent interest in all questions affecting their people, and are well able to hold their own on the floor of the House, where they usually speak through an interpreter.
The following table shows, with the population at the census, the large proportional number of votes recorded at the election in December, 1893, of Native members for the House of Representatives, under “The Electoral Act, 1893”:—
| Electoral Districts. | Maori Population. Census, 1891. | Number of Votes recorded. | Percentage. |
|---|---|---|---|
| * Being 22,861 males and 19,132 females (including 231 wives of European husbands) | |||
| North Island— | |||
| Northern Maori | 8,970 | 1,674 | 18.66 |
| Eastern Maori | 14,440 | 6,305 | 43.66 |
| Western Maori | 16,365 | 2,741 | 16.75 |
| Middle Island— | |||
| Southern Maori | 2,218 | 549 | 24.75 |
| Totals | 41,993* | 11,269 | 26.84 |
The institution, above all others, in which the Natives take a lively interest is the Native Land Court. This tribunal was established in 1865, for the purpose of giving them legal titles to their lands, and has been in existence ever since. The Natives bring their claims before the Court, and judgment is given upon the evidence, in accordance with the customs of Native land-tenure. Some of these customs are very curious, and there is sometimes great difference of opinion as to what constitutes a good title to land. English law has very little weight in this Court. The main question is generally whether the claimants or their fathers were in possession of the land in 1840, that being the date of the establishment of British sovereignty over the country. Any rights previous to that date are based on conquest, gift, or continuous possession. Large and valuable blocks are constantly being passed through the Court, and at times the claims of the contending parties are keenly contested. In some cases when the blocks are very valuable the attention of the Court is occupied for many weeks. Lands hitherto held by tribe or hapu are partitioned among the members; claims by succession are settled, and negotiable titles given. The Court consists of the Chief Judge and a staff of Judges, Native Assessors, Registrars, Clerks, and Interpreters. The Assessors sit on the bench with the Judges. The Stipendiary Magistrates are also Recorders of the Native Land Court, and hold Courts with the same powers as the Judges. As might be expected, great difficulties have been experienced in dealing with lands belonging to a people emerging from the conditions of life to which the Maoris have been accustomed, and much legislation on the subject has resulted. Probably in no country in the world is there a tribunal like the Native Land Court of New Zealand, and, all things considered, the amount of work it has done has been very considerable. Some persons maintain that one result of this Court is to demoralise the Natives by taking them away from their homes and their usual occupations, causing them to herd together in idleness and under insanitary conditions, but the evil, if it exists, seems at present unavoidable. Except, of course, as to its judicial functions, this Court is controlled by the Department of Justice.
Since the 1st January, 1893, the Department of Justice has been the medium of communication between the Maoris and the Government on matters relating to their lands, land-disputes, roads, surveys, help to the sick and destitute, and other subjects in which they are interested. The Natives are good letter-writers, and do not fail — as the officers of the department well know — to keep up a constant correspondence with the Government. It is considered that, as so many Natives have been taught English in the schools, the time has come when they may be expected to correspond in that language, and in many cases replies to their letters are no longer written in Maori but in English. It is a curious fact that many Maoris who can speak English fluently will plead inability to do so if an interpreter be available. The Justice Department disburses annually the sum of £7,000 set apart by the Constitution Act for Native purposes. The amount is mainly spent in pensions to Natives for valuable services rendered to the Crown, and in providing medical and charitable aid to indigent Natives.
A good deal of distress, caused by the destruction of the crops through floods, has been relieved during the past year by the issue of large quantities of potatoes for food and seed, and by providing work at road-making for those able to do it.
The Native question now has lost much of the importance it once possessed. The days of Maori disturbances are happily past, and the whistle of the railway-engine may now be heard in places where the Maoris once fought with us. Flocks of sheep belonging to Natives are now to be found in the so-called King-country, as well as within the Uriwera District and other places, formerly hotbeds of disaffection. Occasionally Maoris seek to assert their rights to lands by obstructing surveys, but the arrest and imprisonment of the obstructionists teach the necessity of obedience to the law and of recourse to the Courts of justice for redress of wrongs, if such exist.
Many of the Maoris are now well off, from the rents of their lands. Others earn their living by cultivating land, cutting flax, digging kauri-gum, working at flax-mills, or stripping wattle-bark. The last is a new industry well suited to the Natives. As a rule, the men dress as do Europeans; the women are fond of bright colours, and do not succeed in dressing according to the latest fashion. The wealthy Natives live in good houses, and some keep excellent buggies and horses. They own a good many agricultural machines and implements.
Drunkenness has much decreased among the Maoris. One great hindrance to the progress of the Natives in civilisation is the community of property, which prevents individual effort. Their crops are the common property of the tribe, and so with almost everything else. If a chief buys a buggy and horses, all his kinsfolk think they have a perfect right to use them when they please. A Maori started a coach to run from a railway station to a township. His friends and neighbours patronised him freely, but thought it quite out of the question to pay their fare, and said if they had to pay they might as well go by the pakeha's coach. The result, of course, was that the Maori had to sell out. Another hindrance to their well-being is improvidence. They live only for to-day, and leave to-morrow to take care of itself. Most of them own far more land than is necessary for their subsistance, and were they but careful and industrious they would have plenty of comforts and more luxuries; but, while many, as has been said, are well off, many are dependent upon the charity of others, or of the Government, whenever a “rainy day” comes, and this is mainly owing to their lack of perseverance and continuous industry.
NUMBERSOFTHE PRINCIPAL MAORI TRIBES, AND AGESOFTHE PEOPLE. ACCORDINGTOTHE RESULTSOFTHE CENSUSOF APRIL, 1891.
| Principal Tribe. | Numbers under and over 15 years. | Total Population. | |||||
|---|---|---|---|---|---|---|---|
| Under 15. | Over 15. | ||||||
* Including 119 males and 118 females; ages not specified. † Including 1 male and 1 female; ages not specified. ‡ Including 120 males and 119 females; ages not specified. | |||||||
| Male. | Female. | Male. | Female. | Male. | Female. | Persons. | |
| Arawa | 678 | 564 | 1,369 | 1,102 | 2,047 | 1,666 | 3,713 |
| Muaupoko | 6 | 2 | 45 | 36 | 51 | 38 | 89 |
| Ngatiporou | 628 | 581 | 1,348 | 1,138 | 1,976 | 1,719 | 3,695 |
| Ngatikahungunu | 938 | 796 | 1,963 | 1,497 | 2,901 | 2,293 | 5,194 |
| Ngaiterangi | 235 | 192 | 505 | 384 | 740 | 576 | 1,316 |
| Ngapuhi | 1,357 | 1,205 | 2,095 | 1,657 | 3,452 | 2,862 | 6,314 |
| Ngatimaniapoto | 284 | 256 | 527 | 464 | 811 | 720 | 1,531 |
| Ngatimaru | 203 | 188 | 542 | 416 | 745 | 604 | 1,349 |
| Ngatiawa | 326 | 280 | 806 | 615 | 1,132 | 895 | 2,027 |
| Ngatiraukawa | 291 | 248 | 576 | 484 | 867 | 732 | 1,599 |
| Ngatiruanui | 107 | 67 | 373 | 288 | 480 | 355 | 835 |
| Ngatiwhatua | 72 | 65 | 195 | 139 | 267 | 204 | 471 |
| Rangitane | 14 | 14 | 43 | 27 | 57 | 41 | 98 |
| Rarawa | 414 | 382 | 701 | 526 | 1,115 | 908 | 2,023 |
| Taranaki | 91 | 65 | 260 | 193 | 351 | 258 | 609 |
| Urewera | 204 | 245 | 418 | 344 | 622 | 589 | 1,211 |
| Waikato | 665 | 636 | 1,502 | 1,120 | 2,167 | 1,756 | 3,923 |
| Whauau-a-Apanui | 142 | 108 | 225 | 221 | 367 | 329 | 696 |
| Whanganui | 310 | 224 | 676 | 537 | 986 | 761 | 1,747 |
| Whakatohea | 101 | 99 | 179 | 167 | 280 | 266 | 546 |
| Unspecified | 40 | 26 | 67 | 53 | 246 | 197 | 443* |
| Others | 17 | 12 | 48 | 29 | 65 | 41 | 106 |
| Population. | |||||||
| North Island | 7,123 | 6,255 | 14,483 | 11,437 | 21,725 | 17,810 | 39,535* |
| Middle Island | 374 | 366 | 598 | 543 | 973 | 910 | 1,883† |
| Stewart Island | 31 | 34 | 41 | 30 | 72 | 64 | 136 |
| Chatham Islands: Maoris | 22 | 40 | 43 | 43 | 65 | 83 | 148 |
| Morioris | 4 | 2 | 22 | 12 | 26 | 14 | 40 |
| Maori wives living with European husbands- | .. | .. | .. | 251 | .. | 251 | 251 |
| Totals | 7,554 | 6,697 | 15,187 | 12,316 | 22,861 | 19,132 | 41,993‡ |
Table of Contents
Table of Contents
By G. MUELLER, Chief Surveyor.
THE Auckland Land District covers about four and a half degrees of latitude, extending from 34° 30’ to 39° S., its greatest length being about 365 miles, from the North Cape to the 39th parallel, south of Lake Taupo, whilst its greatest width is about 180 miles. Indented as it is on nearly every side by harbours and arms of the sea, and with a mean width between the Pacific Ocean and Tasman Sea, north of the Isthmus of Auckland, of a little over forty miles, the range of temperature is not great, and the frosts hardly worth mentioning, at any rate north of 37° of latitude. The thermometer seldom registers above 80° in the shade in the middle of summer, whilst the heat is always tempered by a cool breeze, bringing the mean summer temperature to under 70° in the shade. The minimum register is seldom below 40° for the district north of Auckland; south of that city, sharp white frosts occur very often, more especially beyond 38° of latitude, and snow lies upon the summits of some of the highest hills or mountains in winter.
This land district may be said to have no real mountains, as the most prominent peaks of the several scattered ranges or hills seldom exceed 3,000ft. in height above the sea-level, an altitude just enough—south of 38°—to clothe the last 1,000ft. with snow in the depth of winter. North of Hokianga and the Bay of Islands there is one well-defined range of hills rising to a height of 2,463ft.; whilst south of these places, and extending to the Wairoa River on one side and the Whangarei Harbour upon the other, the country is all more or less broken into ranges from 1,000ft. to 2,000ft. in height, with valleys between. The next really well developed main range lies within the Coromandel and Thames Peninsula. With a length of over 150 miles, it has an average height of over 2,800ft., commencing with Moehau, or Cape Colville. 2,800ft.; next, To Aroha, a peak of 3,176ft.; and ending at Weraiti, with a height of 2,527ft. There are two other well-defined ranges—namely, Tawairoa and Hauturu—lying between the West Coast and the Waipa basin, with the highest peak at Pirongia, which rises to a height of 3,156ft., and is often snow-capped. There are other ranges forming the watershed between the basins of the Waikato and Waipa Rivers, and dividing both from the streams running into the western side of Lake Taupo. Their highest peak is Pureora, rising to 3,793ft. The eastern side of the land district is occupied by a very broken, forest-clad country known as the Urewera Country, the average height of which is about 2,500ft. It is practically unexplored, and, being still in the hands of the Natives, is not as yet available for settlement. To the east of Lake Taupo lie the Kaimanawa Ranges, of about 4,500ft., and generally open on the ridges, with valleys clothed in beech forests. The whole of the Auckland Land District is indented on both coasts with numerous harbours and arms of the sea, forming a cheap and easy means of access. Of rivers, properly so called, there are only two of any great length—namely, the Wairoa and Waikato. The first empties itself into the Kaipara Harbour, a large arm, or rather succession of arms, of the sea, giving hundreds of miles of inland water-carriage to all parts of the Counties of Hobson, Otamatea, Rodney, and Waitemata. This river is navigable from its mouth to its junction with its tributaries Wairua and Mangakahia, a distance of ninety-one miles from the sea, and for forty miles it is navigable for ships of large burden. The River Waikato has a course of 200 miles, measured from its source in the Ruapehu Mountain through Lake Taupo to the sea on the West Coast. It is navigable for river-steamers for seventy-five miles from its mouth. Another river—the Thames, or Waihou—though of no great length, affords a valuable means of inland water-carriage, and is navigable for steamers for twenty-five miles from its mouth. Generally speaking, every part of the district has an abundant water-supply, now and then lessened for a short time at the end of a very dry summer.
Of plains proper this district has only the stretch of country called Kaingaroa, extending from the eastern side of Lake Taupo towards the Bay of Plenty, all more or less of a pumice formation; the valley of the Thames, which is generally level, the quality of the soil varying very much in different parts; and the Central Waikato basin, already thickly settled. Here and there in the North there are level plateaux of volcanic soil, more or less densely wooded, and along the main rivers there are stretches of level country, but there are no large plains of alluvial soil such as the South Island can show.
Of these, which add so much to the scenery of a country, this district possesses a fair share, there being eight principal lakes, with some twenty or more smaller ones. To the north of Auckland, in the Bay of Islands district, there is only one lake of any size, called Omapere, three miles by two miles, an old crater. In the Waikato are Lakes Waikari and Whangape, the first six miles and a half long by three miles across, and the second five miles by one mile. These lakes are generally covered with numerous wild swans and ducks, and, being both connected with the Waikato River by navigable creeks, form a convenient waterway for transport of goods to settlers living around their shores. All the remaining lakes of large size are within the watershed of the Thermal-springs District, and are mostly of seven to eight miles long, and from three to six miles wide, except Taupo Moana, the queen of the North Island lakes, which is twenty-five miles long and eighteen miles broad, with a depth of 500ft. The scenery around its western shores is of the most romantic description.
The greater part of the Auckland Land District has been covered in the past with dense forests, which are now fast disappearing under the axe of the settler and being transformed into rich pasture-land. The only really good Crown lands fit for settlement in the North are still all covered with forest, and must be cleared and sown before any returns can follow. The area of forest-land in the Auckland District at the present time is about 1,800,000 acres north of Auckland, and 3,420,000 acres south of it. The forests contain a mixture of trees of all kinds, from the giant kauri to scrubby tea-tree or manuka, but all the bush is useful for building, fencing, and household purposes, or at any rate may be converted into charcoal for sale. Of the giant kauri (the most valuable tree in New Zealand) vast quantities are being yearly cut and exported, or used for home consumption—to the value of about £400,000 per annum. To give some idea of the size of these trees, and the amount of timber contained in thorn, it is estimated that upon the Crown land to the north of Auckland, in the Counties of Hokianga, Hobson, Bay of Islands, and Whangarei, there is still remaining 498,000,000ft., of a value, as it stands, of £1,294,000.
With respect to the soils of Auckland, nowhere in New Zealand within such short distances is there such a diversity in the quality—a distance of half a mile often makes all the difference between rich alluvial and barren pipe clay. To the north of the Bay of Islands and Hokianga the lands are chiefly clay and sandstone, with here and there a volcanic area intervening. In the Hokianga County, and in and about the valley of the Mangonuiowae River, there is some of the richest alluvial soil in the district; and, taking the whole Crown land remaining to the north of a line between the Hokianga and Bay of Islands Harbours, the really available good land fit for settlement would be about 40,000 acres. There are large areas outside of this which will carry good grass and feed one or two sheep to the acre, after clearing and laying down in grass, and there is also land highly suitable for fruit-growing. South of Hokianga, and between that place and the Wairoa River, the soil is, generally speaking, very good, being both volcanic and alluvial. Here the Crown has probably 200,000 acres of such land fit for settlement. Immediately south of the Bay of Islands, and extending thence to Whangarei, the soil is, generally speaking, clay lying upon sandstone or marl, with alluvial flats in the bottoms of the valleys; but these are, as a rule, very narrow. Within the Puhipuhi State Forest there is an area, say, of 16,000 acres, more or less volcanic soil, over a large portion of which a fire has run; having been surface-sown with grass, it is now carrying most luxuriant pasture. Approaching Whangarei, at Hikurangi, the limestone crops out, overlying coal-deposits, and round Whangarei itself the soil becomes a rich volcanic, in a high state of cultivation. South of Whangarei Harbour, and from there to Auckland, the Crown lands generally are of a broken character, with soil varying from alluvial swamps—as in the case of the Tokatoka Swamp of 16,000 acres—to the limestone areas round Maungaturoto, the sandstone and clay lands of Rodney County, and the poorer clay-lands immediately north of the City of Auckland, which have, however, proved eminently suitable for fruit-growing.
For about 200 miles south of Auckland the land (with the exception of the Cape Colville Ranges) is, generally speaking, far less broken, and gradually opens out into large tracts of level country in the Waikato and Waipa basins. Immediately south of Auckland the land is rich volcanic until it is gradually superseded by the prevailing clays; the greater portion of Manukau County, for thirty miles south of Auckland, may be classed as pastoral, and is under occupation as such. The Crown areas available for settlement—say, 16,000 acres—are chiefly in the Otau Parish, varying from volcanic clay to ordinary clay land, forest-clad, and well adapted for pastoral purposes. In the Counties of Waikato, Raglan, Waipa, Piako, West Taupo, and Kawhia, there is a still greater diversity of soils, whilst on the right hand (Raglan County) there are large areas of good limestone country, broken, but with rich black soil, and carrying most luxuriant grass. The lower Waikato County consists of clay soil and extensive swamps almost undrainable, but at a distance of eighty miles from Auckland is found a flat and undulating country, lying partly within the Waikato and Waipa basins, and partly within the valleys of the Piako and Waihou Rivers, formed mainly of alluvial deposits of rhyolite sands brought down from the volcanic districts. In the Kawhia County there are some 300,000 acres of excellent limestone land, a large portion of which is heavily timbered, with numerous warm valleys. Most of this land is now being acquired by the Government from the Native owners. Beyond this there is a large stretch of country consisting alternately of open valleys and forest-clad hills, a fair proportion of which is good land, both pastoral and agricultural. The County of Coromandel, with portions of Thames and Ohinemuri Counties, is chiefly devoted to the mining industry. The soil is nearly all clay, the land very broken, but will be suitable for pastoral purposes when cleared of the dense forest that now covers it. The western portion, however, of the Thames and Ohinemuri Counties contain largo areas of alluvial and swamp lands, now in the hands of the Crown, but through want of drainage not yet available for settlement.
In the County of Tauranga, the clay-lands extend from Te Aroha Mountain to Katikati entrance, changing, near Tauranga, to sandstone and black pumice soil of rich character, which improves towards Te Puke and Maketu, where the land is all good and more or less volcanic. In Whakatane County there are very extensive swamps, of which large portions are drainable, and back from the coast seven miles or so are large areas of Crown lands, broken and forest-covered, open for settlement. The soil is chiefly clay or light loam, with alluvial flats in the valleys, and all well watered. This description of country extends to the boundary of the land district. The coastal lands are nearly all alluvial flats in a high state of cultivation, and the settlers mostly well-to-do.
Briefly to set forth the capabilities of the Crown lands in the district, it will suffice to say that north of the Bay of Islands and Hokianga the land is suitable chiefly for two classes of persons—the gum-digger and the fruit-grower or small farmer. The former has the range over large areas of Crown lands upon paying a small fee, and his earnings average from 5s. to 10s. a clay. As for the latter, in and around Hokianga, with its harbour- and tidal-waters covering some 250 miles of water-frontage, almost anything can be grown, from the tropical banana to the more prosaic potato, whilst oranges and lemons flourish side by side with all kinds of apples, pears, and plums. Wheat does fairly well, and maize gives a return of 50 to 60 bushels an acre. Sheep also thrive, and most of the lands, when properly grassed with artificial grasses, will carry two or three sheep to an acre; but ordinary rough-grassed lands only one and a half to two sheep per acre. The clearing of forest-lands, ring-fencing and grassing them, will cost about £3 to £3 10s. per acre. The same remarks apply to the Bay of Islands and Whangarei, and to the country as far south as Auckland. Round about Whangarei district, and under similar conditions of culture, the average return per acre for good agricultural or pastoral lands would be fully 12s. per acre per annum. South of Auckland, throughout the Waikato, Piako, Waipa, and Raglan Counties, and thence south to the district boundaries, the land is both agricultural and pastoral. All the cereals do well, wheat averaging 27 to 30 and up to 40 bushels per acre, and oats 30 bushels per acre. Potatoes average from 5 to 7 tons per acre. Dairy-farming is carried on, yielding (upon well-cultivated farms) a net profit of 15s. to 20s. an acre per annum. Whilst sheep-farming yields a profit of from 5s. to 7s. 6d. a sheep per annum, on very large estates, with greater losses from disease, &c., the average return would be 4s. per sheep. The cost of clearing fern and scrub is generally from 7s. to 10s. an acre, and laying down fern-land by surface-sowing and harrowing is generally about 17s. an acre.
The seaward counties of Tauranga and Whakatane are both agricultural and pastoral, growing wheat and maize alike to great perfection. In fact, the County of Whakatane, upon its alluvial shores and uplands, grows the greater portion of the maize produced in the district, and from the ports of Whakatane and Opotiki in one year have been exported some 34,000 sacks. In these counties the average yield of wheat has been from 22 to 25 bushels per acre, oats about 29 bushels per acre, and maize 45 to 60 bushels per acre. It is quite possible within this district to select land early in the winter, fell and burn off by the ensuing summer, sow in seed in the autumn, and put on stock within twelve months from selection.
The rainfall during the year averages about 39in., the greater portion of which, as a rule, falls between the 1st of May and 1st of November, or during the winter and spring months. Owing to the constant changes of wind, induced by the configuration of the coast-line, the short distance between the two coasts, and the influence, greater or less, of the trade-winds, it is quite common for some neighbourhoods to have double the rainfall of others, even though separated by only a distance of twenty miles. Droughts of more than a couple of months are practically unknown, and grass is always abundant.
One of the chief means whereby the great healthiness of the climate is maintained is the constant presence of fine breezes, blowing both summer and winter, the prevailing winds being north-east and south-west, and very seldom passing into really heavy gales. In the middle of summer, the sea-breeze during the day and the land-breeze at night are almost unvarying.
Timber.—The vast forests of kauri and other valuable trees have given this district the foremost place for production and export of timber. There are many safe and sheltered harbours for shipping, while streams and rivers without number form convenient highways for conveying logs to the mills or ports. Some idea of the extent of this industry may be given by quoting from the official returns made at the time of the last census. There were then forty-seven steam saw-mills situated in various parts of the district, with engines of a total of some 1,500-horse power. These mills employ over a thousand men, and produce yearly some 70,000,000ft. of sawn timber, valued at about £27,000; of timber resawn into flooring, skirting, &c., some 15,000,000ft., valued at upwards of £76,000, not to mention posts and rails, mouldings, sashes, and doors. Besides this output, in the remoter parts of the district large quantities of timber are hand-sawn. The durable puriri is converged into railway-sleepers, for which there is a great demand, and the totara is largely sought after for telegraph-posts and wharf-piles.
Kauri-gum.—The most unique production of this portion of the colony is kauri-gum, obtained for the most part from the country north of Auckland. It is formed by the hardening of the exuded turpentine from the kauri tree, and is dug out of ground from which the forest has been burnt off. The Royal Commission lately appointed elicited the fact that the procuring of the gum gives employment to the large number of 6,897 persons, who dug, in 1893, some 8,000 tons of gum, of a value of £517,000. The kauri-gum is extensively used in the manufacture of varnish, and also for glazing calico. Nearly two-thirds of the varnishes in the market are produced from this gum. The average earnings of the diggers may be taken at £1 7s. to £1 10s. per week.
Flax (Phormium tenax).—An industry, which is for the present in a languishing condition, is that of converting the broad leaves of the Phormium tenax into marketable flax suitable for the manufacture of rope, twine, mats, mattresses, and numerous other articles. The flax-mills are scattered over different parts of the district, as near rail- or water-carriage as possible, and employ three hundred men and boys, whilst the local rope-and-twine works give work to some fifty-three men and boys.
Gold.—This district has in the past produced largo quantities of gold, but the area over which the auriferous quartz reefs have been discovered is limited to the Counties of Coromandel, Thames, Ohiuemuri, and a small portion of Piako. In each of the last two or three years the output of this neighbourhood has been about 18 per cent. of all the gold produced in New Zealand, and was last year valued at about £189,000 all told. The average annual earning per man of the miners is £116 2s. 6d., the highest in the colony. From 1878 to 1892 the Thames Goldfield alone produced some 600,000oz. It is believed that gold and silver will be obtained from the quartz reefs in these counties for many years to come, as there are many parts where practically no systematic exploration or prospecting has yet taken place. At the Thames there is a School of Mines, under an able director, well attended, and showing good results. The average attendance of regular students is about fifty-two.
Coal.—Coal is found in most parts of this district, and is being worked with more or less success at Kawakawa, Hikurangi, Kamo, and Ngunguru, to the north of Auckland; whilst in the south there are three mines at Huntly, all turning out a good household coal. The total output of all the mines is between 20,000 and 30,000 tons per annum.
Fruit.—The climate in the Auckland District is excellently well adapted for the growth of the orange, lemon, vine, and olive, as also for the fruits of England, America, and Japan. The subtropical kinds flourish about Hokianga, in the north; those of the temperate regions in the Waikato and neighbourhood. Now that the problem of how to land fruit in good condition in the London marker has been solved, orchard planting is rapidly progressing, and it has been found that the culture of the hard varieties of the apple will repay export to England. Of late years a demand has set in for the poor clay-land that used to contain gum, as it is admirably suited for fruit-growing. Orchards are now planted in neighbourhoods where the soil has lain idle for years, for it has been proved that apples grown on this poor soil keep longer than those grown on richer land. More attention is being just now paid to stone fruits, for which there is always a steady local market, than to apples, which have of late years been heavily handicapped by blight. The fruit industry in Auckland is yet in its infancy, but is capable of great extension. At present peaches are the only fruit canned, though there is also a good deal done in the way of drying fruits and vegetables by the process of evaporation.
Fishing.—The sea and harbours abound in all kinds of fish. At least eighteen different varieties, suitable for the table, are caught with little labour, and settlers resident near the sea-coast, or any one of the many harbours and tidal rivers, can always obtain enough for all necessities. At present the canning industry for export is confined to mullet, of which there is a large amount exported, and an equal amount used for home consumption. The rock-oyster is found over a large area on these coasts, and is largely exported both to the southern ports of the colony and also to Australia.
The City of Auckland lies on the southern shore of the Waitemata Harbour, one of the finest havens in the colony, on a narrow neck of land between the Waitemata and the Manukau. Alike from the sea and from the neighbouring hills the city and surrounding country present a charming picture. Especially fine is the view from Mount Eden, a low volcanic hill in the suburbs. Facing the town are the green hills and white houses of the North Shore, and the remarkable peak of Rangitoto; beyond lie the many islands of the Hauraki Gulf, with the blue hills of Coromandel and the Great Barrier in the far distance. Clustered near the foot of the hill, and scattered for many miles to the southward, are charming villa-like houses, with tasteful gardens and shrubberies, while to the north-west the view is closed by high, wooded ranges. The city is unrivalled for its commercial position; it has at its door water-communication with both sides of the Island, while on the north the Kaipara and Wairoa Rivers leading almost to the Bay of Islands, and to the south the Waikato and Thames Rivers leading into the heart of the Island, give it excellent natural facilities for inland communication. The population of the city and suburbs, in 1891, amounted to 51,287 persons. The city is well supplied with gas and water, and amongst public buildings may be noticed Government House, the new Government Offices, Post and Telegraph Offices, Supreme Court, &c. There is a Free Public Library and Art Gallery, and a good Museum, containing what is probably the best Maori collection in the world. The Auckland University College is affiliated to the New Zealand University. The Victoria Arcade, the Exchange, Harbour Board Offices, hotels and clubs, as well as many commercial buildings, compare favourably with those in other parts of the colony. There are admirable recreation-grounds, including the Government Domain of about 180 acres, as well as the Botanic Garden and the Albert Park in the centre of the city. There is a tramway system extending through the suburbs. Auckland has numerous industries, including, amongst others, ship-building, sugar-refining, timber-converting, sash-and-door, and many other manufactories; rope-and-twine, pottery, brick-and-tile, varnish, printing-offices, &c. A description of the Waitemata Harbour will be found in the special article on Ports and Harbours on pp. 389–90 of the present volume, and the Calliope Dock is also described in detail on the same page and at p. 410.
The City of Auckland is the centre from which radiate all railway-, road-, and steamer-routes. From it, by rail, lies the way to all Crown lands south of the Waitemata, while the Kaipara Railway connects it with the country north of Helensville. All lands to the north and along the Bay of Plenty are reached from its wharves by the Northern Company's steamers. The chief centres to the north are,—
Warkworth, on the East Coast, forty miles from Auckland, with communication by coach and steamer nearly every day. It is a thriving township, with post- and telegraph-office, public halls, hotels, &c., and is the starting-point for the Tauhoa and Pakiri Crown lands. It is also the site of important hydraulic lime-and-cement works. A good deal of agricultural and pastoral farming is carried on in its neighbourhood.
A still more important centre on the West Coast is Helensville, on the Kaipara Harbour, reached by rail from Auckland, and distant thirty-six miles. It has all the conveniences required by travellers in the shape of good hotels, stores, &c., and is the starting-point of the river-steamers running to all places in the Otamatea and Hobson Counties. It is also one of the main centres for saw-milling, and for the export of balk timber by large vessels to other colonies, and has several flax-mills in operation.
Dargaville, on the Wairoa River, is a town of about 500 inhabitants, with all conveniences for travellers. It is reached by rail and steamer from Auckland three times a week. Dargaville is the starting-point of the Kaihu Valley Railway, which is open for traffic for twenty miles from the town, and from the terminus of the railway all the Crown lands in the neighbourhood are reached, even so far north as Hokianga. The town is also the centre of a very large timber export. There are only two townships of any importance north of Dargaville—Port Rawene, or Hokianga, and Kohukohu, about four miles further up. Both have post- and telegraph-stations, and comfortable hotels, with fortnightly steam-communication from Auckland.
Whangarei, on the East Coast, is distant seventy-five miles from Auckland, with which it has steam-communication twice a week. The town is a thriving and important place, having a population approaching 1,000, and is the centre of a large and well-cultivated agricultural and pastoral country. In the neighbourhood is also a large coal-bearing and gum-producing district, while the export of oranges and lemons, which thrive magnificently on the rich volcanic soil, is fast developing. From here a coach runs weekly to Kawakawa, upon the arrival of the Northern Company's steamer, and from it, by carriage or horse, all lands can be visited within a radius of thirty to forty miles.
Kawakawa, at the head of the tidal portion of the river of the same name, is connected by a short railway-line with Opua, the calling-place of steamers from Auckland. Kawakawa possesses good inns, and a branch of the Bank of New Zealand. From it coaches run weekly to Hokianga and Whangarei. It is the centre of a coal and gum industry, and a port of lading for these products. The old town of Russell is situated further down the bay, and has good inns, besides having post- and telegraph-office, and a branch of the Bank of New Zealand. To Whangaroa and Mangonui the Northern Company's steamers run every week. Whangaroa is famed for its exquisite scenery, and is the centre of a large timber- and gum-export trade. Mangonui is the starting-point and centre from which to visit, by carriage or horse, all the Crown lands in the Mangonui County, and from it the steamer “Staffa” runs to Awanui and ports beyond, in connection with the weekly steamer from Auckland.
South of Auckland, along the Waikato Railway, there are numerous townships of more or less importance, but no starting-point for Crown lands, until Mercer is reached at a distance of forty-three miles. It is situated at the borders of what is known as the Waikato Country, upon the Waikato River, which is tidal up to this point. Mercer is the centre of a large flax industry, and has post- and telegraph - office and other conveniences. At sixty-five miles from Auckland by rail is Huntly, also on the Waikato River, a flourishing township, with a very large output of valuable coal. It has also pottery-, brick-, and tile-works. On the opposite side of the Waikato River large areas of Crown lands are being brought into cultivation, and are carrying many sheep and cattle. The next town is Ngaruawahia, or Newcastle, seventy-four miles from Auckland, situated at the junction of the Waikato and Waipa River, with hotels, bank, post- and telegraph-office. It is a centre from which portions of Crown lands in Raglan County are reached, and also from it river-steamers run north and south to the various settlements. Ngaruawahia has a flourishing creamery, a brewery, and a coopering establishment. At eighty-four miles from Auckland the train reaches Frankton Junction, where the line branches off to Hamilton, To Aroha, and Oxford, the main line going to Te Awamutu, ninety-nine miles from Auckland. The latter is a thriving town; but to reach available lands for future settlement the traveller passes on by rail to Otorohanga and Te Kuiti, fifteen and twenty miles further on respectively, at both of which places there are accommodation-houses, forming convenient centres for visiting the fertile undulating limestone lands in the vicinity. Hamilton is a busy, flourishing town, situated on both sides of the Waikato River, with a population of about 1,300 persons, and is the centre of a large agricultural and pastoral district. It possesses a creamery, flax-mill, brewery, and two soap-factories, besides other local industries. Cambridge, about thirteen miles by road and fifteen miles by rail from Hamilton, has a population of about 900, and is the headquarters of the Farmers’ Club. It is a busy, thriving township, surrounded by good agricultural and pastoral country. Between Hamilton and Cambridge, and in the district around, there are numerous creameries, cheese- and butter-factories; wine- and cider-making is also successfully pursued, and there are several apiaries, from which large quantities of honey are produced. There are three flour-mills in the district, one at Cambridge, one at Hamilton, and the third at the terminus of one of the before-mentioned branch lines. One hundred and sixteen miles from Auckland by rail is To Aroha, a quiet township, celebrated for its thermal springs and good hotels.
The settlements at the Thames and Coromandel are essentially mining townships. The first is situated thirty-eight miles by steamer from Auckland, on the Firth of Thames and at the month of the Waihou River. It has a population of about 5,000 persons. There is daily steam-communication with Auckland, and a railway connecting it with Paeroa and Te Aroha is now in course of construction. Coromandel is about thirty-five miles from Auckland, with which it has constant communication by steamer; it is another mining centre, situated at the head of a picturesque harbour. Tauranga, with a population of about 1,100, is situated on the harbour of that name on the Bay of Plenty. Coaches run thither from the Thames, and from Rotorua; it has also constant communication by steamer with Auckland, and with Matata, Whakatane, and Opotiki. From the fact of the harbour being the only one on the East Coast capable of receiving large vessels the town is bound to be of importance in the future. Tauranga has a new and well-appointed flour-mill upon the Waimapu River, also a chemical and sulphuric-acid works, and a, cheese factory.
Opotiki, the second town of importance in the Bay of Plenty, is situated about sixty-five miles by steamer or road from Tauranga. It has weekly steam communication with Auckland, and is connected with Gisborne by a bridle-track. It is the headquarters of the maize-producing district, and has rich alluvial lands, from which good returns are obtained. It is a good starting-point from which large blocks of Crown lands suitable for pastoral purposes may be reached. The Township of Rotorua is situated on the shores of Rotorua Lake, at a distance of 172 miles from Auckland. The railway now in course of construction will probably be open this year, when travellers will be able to reach Rotorua in one day from Auckland. It is the chief township in the hot-lakes district, and has also a large area of fairly good Crown land near, adapted for pastoral purposes, and considerable quantities of sulphur are obtained from its neighbourhood.
In the Mangonui County the Crown possesses 31,460 acres of fairly good forest-land, tolerably easy of access.
In the Bay of Islands County there are only about 25,000 acres of available Crown land, both forest and open, but the Natives still own about 156,000 acres, chiefly forest-land, except about Kaikohe, where it is open and rich volcanic land, most of it broken, but fit for settlement.
In Hokianga County there are some 150,000 acres of available Crown land, of good quality, nearly all covered with forest, and fit for immediate settlement. The Natives still own some 127,000 acres, almost all good land, and fit for settlement.
In Whangarei County there are only about 10,000 acres of available Crown land, mostly broken and forest-clad. The Natives still retain some 54,000 acres of land, some of it very rich.
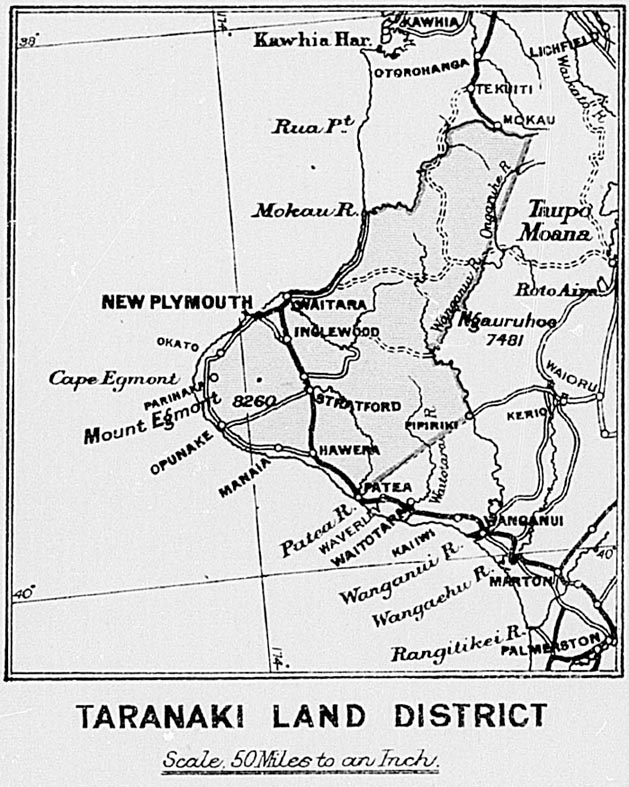
In the Otamatea County the Crown retains only about 18,000 acres, a good deal of this being alluvial swamp, and well worth draining. The Natives still own about 20,000 acres, but not much of it is fit for settlement.
In the Rodney and Waitemata Counties about 10,000 acres of Crown lands are left, most of it fit only for pastoral or fruit-growing purposes. The Natives still own about 14,000 acres in these two counties, some of it very good land.
In the Manukau County the Crown owns some 18,000 acres of broken forest land, fit for pastoral purposes. The Natives still own about 15,000 acres, a portion of which is fairly good.
In the Waikato and Raglan Counties the Crown lands amount to about 20,000 acres, all fairly good land, mostly forest, and easy of access. In Raglan County the Natives still own the freehold of 150,000 acres, all good land, but difficult to secure.
In the Coromandel, Thames, and Ohinemuri Counties there are about 50,000 acres of available Crown lands. In the last two counties a good deal of the land is swampy, and requires draining. The Natives still own 60,000 acres, much of which is very good.
In Tauranga, Whakatane, and Rotorua Counties the Crown owns 100,000 acres, nearly all forest-clad and generally broken; but in the last-named county the Natives retain a very large area, the greater part too broken and too much covered with pumice or volcanic ash to be fit for settlement.
In the Kawhia and West Taupo Counties the Crown is acquiring from the Natives large areas of very good land, all fit for settlement and easy of access. About 300,000 acres are really first-class land, and about 1,000,000 acres fairly good land, all suitable for pastoral purposes, and accessible from the Main Trunk Railway-line.
By S. WEETMAN (revised by J. STRAUCHON, now Chief Surveyor).
The Taranaki Land District is situated on the western side of the North Island of New Zealand, at about its widest part, and may be said to be the most compact and fertile district of the colony, for, with the exception of the upper half of Mount Egmont, and of the ranges adjoining, which absorb about 36,000 acres, the whole of the area—minus what is taken up by the rivers, streams, and lakes—is suitable for settlement, and certainly two-thirds of the district is good land. The gross area of the district is 2,430,000 acres.
Of mountains, the principal one is the beautiful volcanic cone from which the district takes its name, Taranaki, otherwise called Mount Egmont, which has an altitude of 8,260ft. This mountain is the centre of distribution for a radius of twenty miles of the volcanic formation known as the “drift,” which covers the volcanic rocks below an altitude of 3,000ft. Hummocks composed of trachyte boulders and cement crop up here and there and make excellent metal-quarries.
Beyond the volcanic formation—that is, from about Urenui on the north and Hawera on the south—the country is generally broken, and the formation is known as papa, a calcareous blue clay, capped in many places by shelly limestone.
The northern portion, between the Tongaporutu and the Mokau Rivers, contains also limestone, greensands, and coal outcrops. At Pauirau, a small tributary of the Mokau, about thirty miles from the sea, there is an isolated patch of volcanic agglomerate and tufas, which formation obtains also at the northeastern corner of the district.
Eastward of the base of Mount Egmont there are few, if any, mountains worthy of the name, although there are many ranges varying in height from 1,000ft. to 1,500ft. above sea-level, and in a few instances—such as the Mate-mateonga and Waiaria Ranges—they run up to 2,500ft.
The principal river is the Wanganui, which hounds the district on the east between Taumarunui and Pipiriki, a distance of about ninety miles. Its average width varies from 2 to 3 chains, For nearly the whole distance it is shut in by high precipitous hills, and many places by perpendicular walls of rock. The scenery is very grand and beautiful. There are numerous rapids, but few of them are dangerous to skilful canoeists. A steamer runs regularly from Wanganui to Pipiriki, a distance of fifty-six miles. The principal tributaries of the Wanganui on the Taranaki side are the Ongaruhe, Ohura, and Tangarakau Rivers.
The next river in size is the Mokau, bounding the district on the north. It is navigable for small steamers of 20 tons or 30 tons as far as the coal-mines, about twenty-four miles from its mouth, and for canoes as far as Totoro, twenty-six miles further up. Several outcrops of coal are found on its hanks, and, as limestone is also present, the river is likely to become the most important waterway of the district. The scenery on either side, although not on quite so grand a scale as may be seen on the Wanganui, is very beautiful.
The other large rivers are the Waitara and Patea. The former has its source about midway between the coast and the Wanganui River, in an easterly direction from Pukearuhe, between New Plymouth and the Mokau. It is about a hundred miles in length, and runs out at the Town of Waitara, some ten miles north-east from New Plymouth. There is a bar at the mouth, but steamers of 300 tons can enter safely in calm weather, and, although there are numerous rapids on its course, it is navigable for canoes for about ninety miles.
The Patea River rises in Mount Egmont, and, after traversing a tortuous course of about 110 miles, runs out at the extreme southern end of the provincial district. It has a bar-harbour, with a depth of 13ft. to 14ft. at spring-tides. Steamers of from 40 tons to 50 tons trade regularly to the Town of Patea, which is situated a mile or so north of the mouth. The Patea is navigable for canoes for fifty miles.
Besides these rivers there are many smaller ones, and streams innumerable—in fact, no district in the world could be better watered, and at the same time so secure from disastrous floods. It is estimated that between the Mokau and the Patea there are no fewer than eighty-five named streams emptying themselves into the Tasman Sea, fully sixty of which flow from Mount Egmont.
The only level country is the Ngaere Swamp, which is open land, 3,700 acres in area, and situated in the Ngaere Block, close to Eltham.
There are no plains, properly so called, in the district, although the stretch of very fertile country lying between the Waingongoro and Otakeho Rivers is known as the Waimate Plains, and comprises an area of about 25,000 acres. Of this area 13,500 acres have been disposed of, and the remainder, 11,500 acres, has been handed back to the Natives as a reserve.
There are no lakes worthy of the name. The largest sheet of water is Lake Rotokare, situate about twelve miles from Eltham; it is about half a mile in length, with an average width of six chains. There are also a few small lakes at the southern end of the district inland from Waverley.
The whole of the district, with the exception of a fringe of open country along the coast from Pukearuhe to Patea averaging three miles in width, and containing about 250,000 acres, and some valleys at the north-eastern corner of the district, about 150,000 acres in extent, was originally covered with heavy forest. Estimating the area already cleared for settlement at 170,000 acres, it will be seen that there still remain about 1,850,000 acres under bush.
The larger timber is chiefly rata, rimu, matai, tawa, kahikatea, kohekohe, pukatea, rewarewa, hinau, with a few totara scattered here and there. Among the smaller trees may be mentioned the kotukutuku or fuchsia, karaka, and mahoe.
As regards the timber industry, there are altogether thirteen saw-mills, and the total quantity cut last year (1893) was 10,000,000ft., chiefly rimu (red-pine), kahikatea (white-pine), and matai (black-pine). Exported, 46,280ft.; imported, 230,700ft., mostly kauri.
An area of 72,565 acres, measuring six miles on every side from the summit of Mount Egmont, has been set apart as a forest-reserve. At about two miles within the reserve the forest begins to get stunted; and at three miles it gives place to low wiry scrub, which ceases at four miles, or an elevation of about 4,000ft. At 5,000ft. the moss ends; beyond this point to the summit the mountain is composed of loose scoriæ and lava.
A comfortable mountain-house has been built at an elevation of 3,000ft. on the northern face of the mountain, at a distance of nineteen miles from New Plymouth by the Junction and Egmont Roads. Fifteen miles can be driven over and the remaining four ridden. This house is maintained by the North Egmont Forest Board of Conservators, and is open for accommodation of visitors from the middle of December to the end of March in each year. The keeper acts as guide also. There are women's rooms at one end of the house, men's at the other, with large common living- and dining-room in the centre. Visitors provide and cook their own food; a small charge is made of 2s. for the first and 1s. for each successive night the visitor remains. Guide's fee for mountain, £1 per party. During the past season there were 351 visitors, remaining various periods of from one to two days to as many weeks. In fine weather, when the snow is off, the mountain can be ascended without risk by various routes.
The volcanic soil, the boundaries of which have been already described, varies a good deal in quality. The best is believed to be on the south side of the mountain—between Stratford, Hawera, and Opunake, but not less than two or three miles from the forest-reserve boundary. It is thought that the country now being opened to the north and east of the volcanic deposit—that is, the papa and limestone formation—will, from the presence of lime, be much richer and more lasting as pasture-land than that around the mountain. The carrying-capacity of the land is, on an average, three sheep to the acre.
Taranaki is essentially a grazing and dairying district, its chief product being butter, of which, during the year 1893, there were 2,241 tons exported, valued at £246,500. There are thirty-three dairy factories and ten creameries scattered over the district.
Agriculture has not hitherto been carried on largely. The total area under grain-crops this year (1894) was 4,736 acres; under green and other crops, 6,795 acres; while the total area under all kinds of crops, including sown grasses, was 406,293 acres.
The average yield of different grain-crops in bushels per acre was, last season: Wheat, 31; oats, 38; maize, 26; barley, 25.
The only mining going on at present is at the Mokau coal-mines, situate, as already remarked, about twenty-four miles up the Mokau River. The coal is sold at New Plymouth at 30s. per ton, and, when mixed with coke, answers very well for domestic purposes.
Ironsand is found in great abundance on the seashore from Mokau to Patea, a distance of 130 miles. It produces, when smelted, from 50 to 60 per cent. of iron of the finest quality. The first attempt to smelt this sand was made in 1848, and several trials have been made since, but the heavy cost of production and the absence of capital and modern appliances have, so far, retarded the industry.
The climate of Taranaki is remarkably healthy, without any extremes of temperature. Of late years no meteorological records have been kept, but it is possible to give a table of mean temperatures for the ten years ending December, 1874,—from which it will be seen that the greatest difference was 15–8.
| Jan. | Feb. | Mar. | April. | May. | June. | July. | Aug. | Sept. | Oct. | Nov. | Dec. |
|---|---|---|---|---|---|---|---|---|---|---|---|
| 64.4 | 65.1 | 61.1 | 57.5 | 53.8 | 50 | 49.3 | 49.3 | 52.9 | 55.8 | 59.1 | 63.1 |
The average rainfall at New Plymouth is about 60in. for twelve months, or an average of 5in. per month. But it varies considerably with locality: for instance, at Waipuku, on the highest point of the railway, about east from Mount Egmont, the annual rainfall is 10ft.
The principal town of the district is New Plymouth (population about 3,500), situate on the seashore, about two miles from, and to the north-east of, the picturesque rocky islets known as the Sugar Loaves. The general appearance of the town is very attractive, and it abounds in neatly-kept gardens. The Recreation Grounds, from which a good view of Mount Egmont is obtained, form a favourite resort.
New Plymouth is 258 miles by rail from Wellington, the railway running in a northerly direction through the district from Patea to Sentry Hill, where it turns at right-angles westward for eight miles to New Plymouth. From Sentry Hill there is a branch line to Waitara, two miles distant.
The Port of New Plymouth is situated at the Sugar Loaves, two miles from the town. Protection for shipping is provided by a concrete mole or breakwater running in a north-east direction for a distance of 1,900ft. Under the lee of this there is wharf-accommodation provided for the coastal trade. Steamers of 500 tons can be berthed here in almost all weathers. The wharf is connected with New Plymouth by both rail and road. The breakwater was built at a cost of £200,000, borrowed under security of one-fourth of the land-revenue of the Provincial District of Taranaki, and the right to levy a rate over certain lands. The present rate levied is 3/4d. in the pound on the capital value.
Manufactures in New Plymouth are represented by a sash-and-door factory, a boat-, a butter-keg-, and three coach-factories. There are also an iron-foundry, a tannery, a flour-mill, and a bone-mill. The town has both water and gas laid on.
Hawera, the next largest town, is situate on the eastern edge of the Waimate Plains. The population is about 1,300. The Wellington-New Plymouth Railway runs close to it, and it is distant about forty-eight miles by rail from New Plymouth. Hawera is surrounded by a first-class grazing country.
The Town of Patea is situated on the coast, at the extreme southern end of the district, and has a population of about 700. There is a splendid grazing district inland, with a largo area of land yet to be opened up. The principal industry is the canning, freezing, and boiling-down of meat. A dumping-plant has been erected by the Harbour Board; and last year (1893) 5,703 bales of wool and 4,385 cases of butter were shipped. Corn, grass-seed, hides, tallow, &c., are also largely exported. The imports for the year were valued at £12,230.
Stratford, a comparatively young town, lies about midway between Patea and New Plymouth. It has already a population of about 1,000, and is growing fast. The height above sea-level is 1,000ft., and the climate is bracing though somewhat moist. The main road to Auckland—known as the Stratford-Ongaruhe Road—starts here. It has been formed as a cart-road for thirty miles, and the remaining distance is in course of construction. If the work is continued, communication with Auckland should be opened up in about four or five years’ time.
Waitara, a small seaport town of 600 inhabitants, situated on the river of same name, a mile up from the sea, and about ten miles north-east from New Plymouth. The meat-freezing works, which formerly did a big trade, are temporarily closed. During 1893, 1,668 bales of wool and large quantities of butter, &c., were exported. 103 steamers and fourteen sailing-vessels, representing a gross tonnage of 19,339 tons, visited the port.
Inglewood is a flourishing little town of some 600 inhabitants, rapidly coming to the front, situated on the railway-line, sixteen miles south-east of New Plymouth.
The only other towns of importance are Eltham, Opunake, and Manaia.
The chief means of communication is the railway from Wellington, which traverses the district between Patea and New Plymouth—a distance of sixty-six miles. Trains run every day between New Plymouth and Palmerston North—174 miles—and on Tuesdays and Fridays there are through trains between New Plymouth and Wellington—258 miles. The Main North Road runs from New Plymouth, passing through the Towns of Waitara and Urenui; it is formed as a cart-road as far as Pukearuhe, a distance of thirty miles. From here a horse-track connects with the Mokau and Awakino Rivers, and from Awakino there is a track to Te Kuiti, in the Auckland District. About midway between New Plymouth and Waitara on the above road the Mountain Road diverges and runs almost duo south, and chiefly along the railway, for a distance of forty miles, connecting with the Main South Road at the Town of Hawera. This is at present the principal road in the district, tapping, as it does, large numbers of district roads, and passing through the Towns of Inglewood, Midhurst, Stratford, Eltham, and Normanby.
The East Road branches from the Mountain Road at Stratford, and is formed for a distance of thirty miles; it is being extended into the interior so as eventually to connect with Auckland, and will open up a large area of fertile country.
The Main South Road from New Plymouth follows the trend of the coast to the south, and was at one time the coach-road to Wellington. It passes through the Villages of Omata, Oakura, Okato, Rahotu, Otakeho, Manutahi South, and Kakaramea, and the Towns of Opunake, Manaia, Hawera, and Patea.
The Junction Road runs south-east from New Plymouth, and crosses the Mountain Road and railway at Inglewood. It is formed and metalled for five miles, and formed only for a further distance of twenty-five miles beyond this point. Eventually it will connect with the East Road at a distance of thirty-two miles from Stratford. This road bisects a number of district roads; hence its name.
The Opunake Road runs from Stratford to Opunake, twenty-six miles, skirting the southern base of Mount Egmont. It is formed and metalled for twelve miles from Stratford and seven miles from Opunake; the remainder is open for horse-traffic only.
The Eltham Road runs from Eltham to Opunake, twenty-five miles, connecting with the Opunake Road at Punehu, seven miles from Opunake. This is formed throughout and partly gravelled.
The other main roads in course of construction are the Mimi Read, branching from the Main North Road at the Mimi; the Motukawa Road, diverging from the Junction Road near Tarata; the Anderson Road, leaving the Mountain Road near Eltham; and the Waitotara Valley Road, starting from the Main South Road at Waitotara Township.
| Crown Lands available for Settlement. | Acres. |
|---|---|
| Crown lands available for settlement | 415,000 |
| Taumatamahoe, Whitianga, and Maraekowhai Blocks, Native lands being acquired | 153,230 |
| Native lands undealt with | 512,900 |
| 1,081,130 |
Of the above about 150,000 acres are open valleys and hills in the north-east corner of the district; a good deal of it more or less pumice-land, but still suitable for grazing. From the rest we may subtract perhaps 10,000 acres for area absorbed by rivers, gorges, &c., and there remains 921,000 acres of forest-land yet to be dealt with. Of this area, perhaps 50,000 acres, made up of strips of fiats and terraces, may be suitable for agriculture, while the balance—871,130 acres—will be good pastoral land.
It may be said, in conclusion, that there is every sign of genuine prosperity within the district, which has advanced rapidly during the last three or four years, and will, no doubt, continue to do so.
By T. HUMPHRIES, Chief Surveyor.
The Land District of Hawke's Bay comprises that portion of the east coast of the North Island from Cape Turnagain, in latitude 40° 30’, northwards to Lottin Point, about thirty miles beyond the East Cape.
It has a seaboard of 300 miles, with an average depth from the coast of forty-five miles, and embraces an area of 6,063,000 acres. Its western limit is defined by the Ruahine, Kaweka, Ahimanawa, Raukumara, and other high ranges that form the watershed between the rivers flowing through it to the sea and those that run to the west coast and the Bay of Plenty.
The Ruahine Range extends northwards for about sixty miles from the Manawatu Gorge as far as the valley of the Ngaruroro River. Its altitude varies from 3,000ft. to 6,000ft., and for a considerable distance its summit is snow-clad during the winter months.
The Kaweka, a shorter range, divided from the Ruahine by the Ngaruroro River, attains an altitude of 5,650ft., is very rugged and steep, and a prominent feature in the landscape in winter, covered as it then is with snow.
From these two ranges, which fall very abruptly on the Hawke's Bay side, the land slopes gradually to the sea, forming in some parts fine rolling hills—the essence of a sheep-country—in others extensive plains, with comparatively little poor soil.
Northwards from the Kaweka there is a series of forest-clad ranges of varying height, stretching away in the direction of the East Cape. Hikurangi, the highest point, is a bold peak, with an elevation of 5,606ft., rising so abruptly on all sides that the ascent can be made only at one point, and that with difficulty.
The only lake in the district of any extent is Waikaremoana, so famous for its magnificent scenery. It lies about thirty-five miles inland of the Wairoa (Clyde), and is eleven miles in length, with a breadth at the widest part of about eight miles. Nestled among precipitous mountain-ranges, wooded to the water's edge, with numerous bays and inlets, it has a natural beauty hardly to be surpassed.
From Wairoa there is a formed road to within six miles of the lake, and for the rest of the way a good riding-track.
The principal plains are: (1.) the Ruataniwha, some fifty miles south of Napier. This is 120 square miles in extent, is for the most part occupied as sheep-runs, and carries a large quantity of stock. (2.) The Heretaunga Plain, with an area of ninety square miles, lying immediately to the south of Napier. This is rich alluvial land; a largo portion is closely settled, the remainder utilised for grazing and agriculture. The only other plain of any extent is at Poverty Bay. It has an area of sixty-five square miles, is very fertile, well cultivated, and bears a large population.
The land district throughout is well watered by numerous rivers and streams, but only the Wairoa and Turanganui are navigable for vessels of light draught. These are both tidal, and form the ports to the Towns of Wairoa (Clyde) and Gisborne.
The main outlets from Napier are three in number. First, the Napier-Palmerston Railway, which traverses the centre of the southern part of the district for its whole length of 100 miles, forming the arterial means of communication. Parallel to it throughout runs an excellent gravelled road, which was in existence prior to the construction of the railway. On either side there are numerous branch roads, which act as feeders, making a very complete system of internal communication. Another main road runs in a westerly direction to Kuripapanga, distant forty-five miles, a favourite resort in the summer time, removed as it is from the heat of the country near the coast. A coach runs thither twice a week, and on thence to Inland Patea, where the Napier road meets the roads to Hunterville, Taupo, and the Wanganui River.
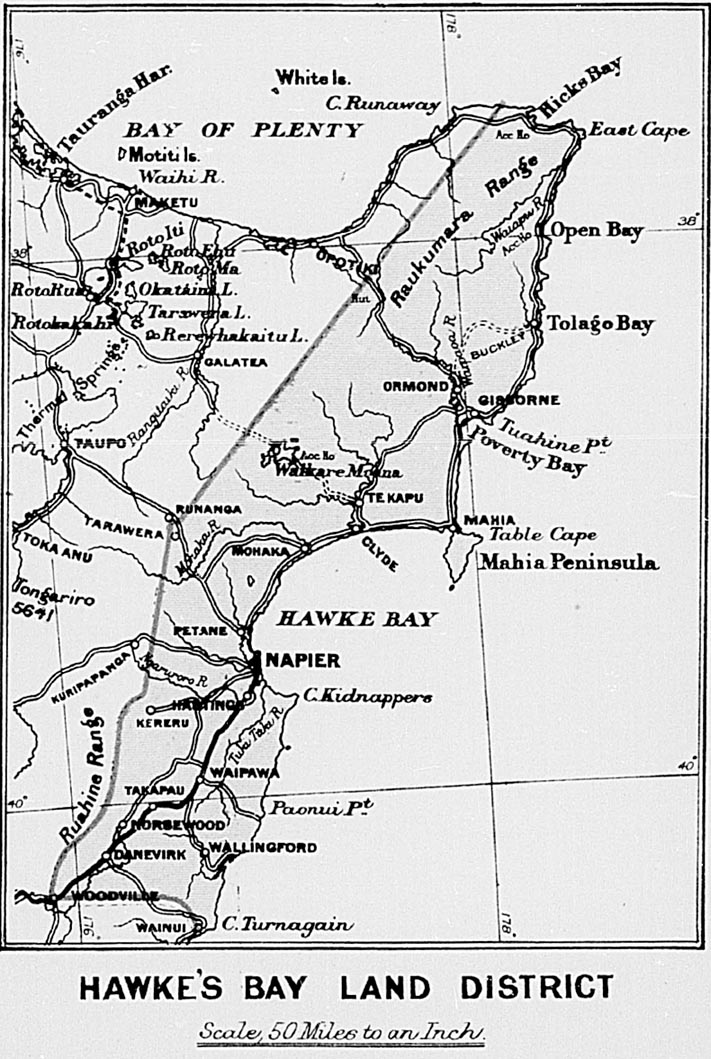
The part of the district served by these two main lines of communication—viz., that between Napier and Woodville—has the largest portion of the population, and from the extent of arable land it contains it is likely in the future to be very thickly peopled. At last census (1891), notwithstanding that so much of the Native land in this part is unoccupied, and in its natural state, the holdings embraced 2,300,000 acres, carrying 2,519,534 sheep and 52,060 cattle, and the population, inclusive of towns and villages, was 27,593 persons.
The only main road northwards from Napier is the coach route to Taupo, which, soon after leaving the fertile Petane Valley, begins to traverse poor country, and twenty-five miles out enters the light pumice soil.
From Napier to the Wairoa the journey must be done on horseback, as there is a break of thirty-five miles between Tongoio and Mohaka unfit for wheeled traffic; but this is being gradually remedied. As a natural consequence, the traffic between these two places has to be done by small steamers.
From the Wairoa a main road runs northward, through the Village of Tiniroto and on to Gisborne, a distance of seventy-five miles. For a considerable distance it runs through hilly country, and, as it has not been gravelled, wheeled traffic is suspended during the winter months, but a coach runs weekly for nine or ten months out of the year.
Between Gisborne and Opotiki, in the Bay of Plenty, communication is not good. The road, which is 120 miles in length, has been formed only to the edge of the Motu Forest, a distance of fifty miles. In the neighbourhood of the forest a large area of Crown lands has been taken up and settled in the last two or three years. The rest of the journey must be done on horseback.
In the country north of Gisborne formed roads for wheeled traffic are few in number, and not continuous, hut small steamers trade regularly along the coast, calling in at Waipiro, Tuparoa and Awanui, Kawakawa, and other small bays.
The Hawke's Bay Land District is pre-eminently a sheep-grazing county. The aggregate of the holdings at the date of last census was 3,802,061 acres, and notwithstanding that a considerable amount is unused, or forest country—and therefore unproductive—while other parts are made use of for tillage only, it was at that time carrying 3,587,221 sheep, besides 75,693 cattle. The value of the wool exported during the twelve months ending 30th June, 1892, was considerably over a million pounds sterling, that shipped from Napier alone representing £935,500.
Freezing-works have been established at Woodville. Waipukurau, Tomoana, Napier, and Gisborne, and the export of frozen meat from the port of Napier-alone during the same period was of a value of £195,689, while further shipments were made from Gisborne. This industry gives employment to a large number of persons, both directly to those engaged in breeding, shearing, freezing, and shipping, and indirectly to those who labour at bush-felling, grass-seed sowing. fencing, and otherwise opening up new country. Nor must the cutting of the immense amount of firewood consumed at the works be forgotten. All this benefits the settler with limited means, by providing him with funds to improve his holding, and to this is due, in a great measure, the general prosperity.
Agriculture is not carried on to the extent it might ho with so much land suitable for root- and grain-crops. No doubt this is due to the profits made in sheep farming. It is chiefly confined to the Heretaunga Plains and the flat lands near Gisborne. The soil is favourable to root-crops; potatoes range from 12 to 15 tons to the acre, and in some instances exceed this amount. Only a moderate quantity of grain is grown; barley, for which the soil seems well adapted, returning from 20 to 60 bushels to the acre, and of a good sample.
Settlers are now turning their attention to dairying, and lately factories have been established in the bush districts at Norsewood, Maharahara, and Woodvillle, whilst several others are in contemplation. At the last-mentioned town a cheese-factory has been in existence for some years, and turns out an excellent article much sought after in other parts of the colony.
The timber industry is extensive, numerous saw-mills being in full work in different parts of the district. In the forest between Takapau and Woodville there are twelve, with an estimated yearly output of 10,000,000ft. This tract of forest is the one most utilised for milling purposes, and will yield a plentiful supply for a long time to come, notwithstanding that for years past a large amount of totara timber has been taken out of it to send to other parts of the colony. Further north there is no totara in any quantity, though rimu, white-pine, and other milling timbers are to be found scattered throughout the forests, and in the Poverty Bay district puriri is found in considerable quantities.
Other industries, such as fellmongeries, soap-works, boot-, coach-, and sash-and-door factories, &c., are established in the principal towns.
The climate is generally of a mild character, and, though hot along the coast-lands in the height of summer, it is, owing to the dryness of the atmosphere, not so relaxing as in parts of the Island farther north. The rainfall is light, excepting in the bush districts and high inland country.
Napier itself is recommended by many medical men as a resort for invalids suffering from pulmonary complaints, chiefly on account of the mildness of its winter season.
Napier is pleasantly situated on the peninsula known as Scinde Island, which is joined to the mainland by a narrow shingle-bank of several miles in length. It is a busy town, with a population of 9,000. The business part is on the flat land at the foot of the group of hills that constitutes the greater part of the peninsula. These hills, formerly barren and waste, are now occupied by numerous private residences, and the very general tree-planting has given the upper town a distinctive and pleasing character. There is an excellent water-supply, derived wholly from artesian wells of large size, and pumped by machinery to reservoirs on the tops of the hills. The shipping trade, as the large exports show, is especially active during the wool and frozen-meat season. It is at present carried on at Port Ahuriri, about a mile from the town; but will, before long, in a large measure be transferred to the fine breakwater which is now advancing towards completion.
Gisborne, the trade-centre and port of what is known as the Poverty Bay district, is a prosperous town of about 3,000 inhabitants, rapidly increasing in size and importance, as the large quantity of unimproved land in the Cook County is fast becoming settled and made productive. At the date of last census there were nearly half a million of sheep in the county, and since then much forest-land has been cleared and the stock largely increased in number.
Clyde, the county town and port of the Wairoa County, is picturesquely situated on the Wairoa River, about three miles from the mouth. The river is navigable for small craft as far as the village of Frasertown, twelve miles further up.
With a few exceptions, the towns and villages to the south of Napier are all situated on the line of railway running from Napier to Palmerston North. The principal are Hastings, a rising town of about 3,000 inhabitants, Waipawa, Waipukurau, Danevirke, and finally Woodville, about three miles from the Manawatu Gorge, and distant ninety-eight miles from Napier. It is at this end of the district that the Crown has, in the last few years, successfully planted settlement, and, in place of the continuous forest known as the Seventy-mile Bush of earlier days, there are now prosperous townships, with various thriving industries established.
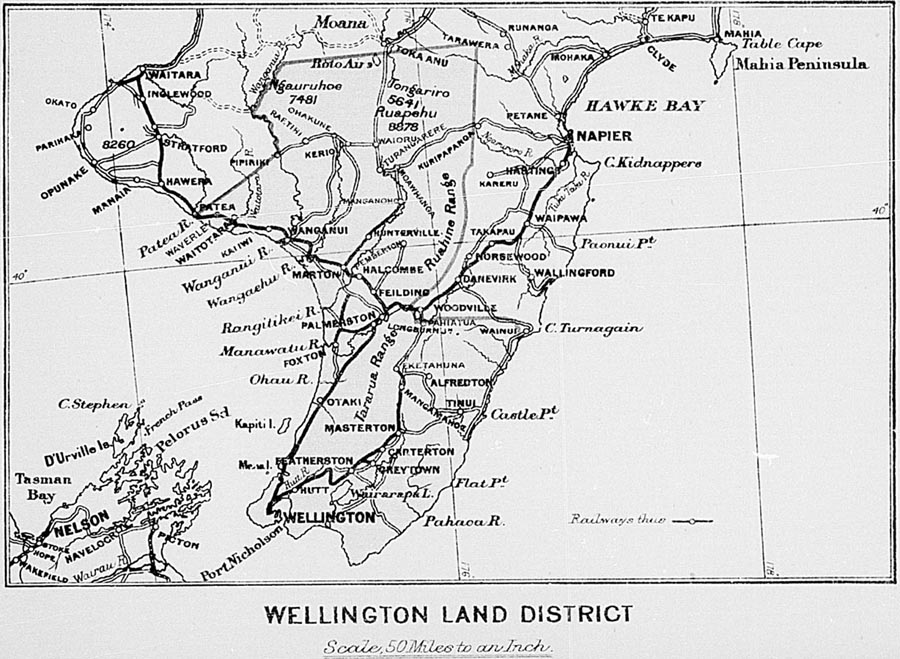
The land held by tenants of the Crown under the various systems of tenure amounts to about 470,000 acres, and there remains about the same quantity not yet dealt with in any manner.
The latter is, for the most part, suitable for pastoral purposes only, any fit for agriculture lying in small, isolated spots, widely scattered, and such as could not be selected independently of the surrounding inferior land. Nearly the whole is broken forest country, fitted more for sheep than cattle, and having an average carrying-capacity, when cleared, of about one sheep to the acre, though the best of it might possibly graze from two to three. The land is chiefly in the Hangaroa and Motu districts, and the back-country of the Waiapu County.
About 30,000 acres are now open for selection. Of these, 6,000 are in the Nuhaka North Survey District, not many miles from the Mahia Peninsula. This is hilly, forest country, with light soil, but well suited for grazing purposes. In the Waiau Survey District, near Waikaremoana, there are over 8,000 acres, also hilly country, of limestone formation. In the Mata and Hikurangi Survey Districts, situated from fifteen to twenty miles inland of Waipiro, there are 13,000 acres of rough forest limestone country, at the present time not easy to get at; but a road to the block will shortly be put in hand.
Of the Native lands in this district, a very considerable portion has been leased to Europeans, but there still remains in the hands of the Maoris a valuable estate, comprising both agricultural and pastoral country, and including some 800,000 acres of excellent land that has not yet come before the Native Land Court for investigation of title. This land lies for the most part in the Waiapu County, in the direction of the East Cape.
By J. H. BAKER, Assistant Surveyor-General.
The Wellington Land District is bounded on the north by the Districts of Auckland and Hawke's Bay, on the west by that of Taranaki, on the east by the sea, and on the south and south-west by Cook Strait. The area contained within these limits is about 6,000,000 acres. It lies between the parallels of 39° and 41° 30’ south latitude; its greatest length north and south is about 180 miles, and its mean width cast and west about sixty miles.
The district is divided into two well-defined parts by a mountain range, which forms part of the backbone of the North Island. At its northern end this range—there known by the name of Ruahine, and averaging a height of about 4,000ft.—divides Wellington from Hawke's Bay; but after passing the point where it is intersected by the Manawatu River, the range takes the name of Tararua for many miles, until, at about forty miles from its termination on the shores of Cook Strait, it divides into two main ranges, known respectively under the general names of Rimutaka and Tararua, both ranges averaging from 2,500ft. to 3,500ft. in height, the highest point being Mitre Peak, 5,154ft. Parallel to the main range, and divided from it by the Wairarapa Plain and the undulating country to the north, are a series of ranges at a few miles inland from the East Coast, known as the Puketoi, Taipo, Maungaraki, and Haurangi Ranges. Lying on the northern border of the district are the Kaimauawa Ranges, an offshoot from the Rushine. They are for the most part open and grass-covered, rising to a mean height of about 4,500ft. Westward from the latter mountains, and divided from them by a deep, broad valley, in which flow the Waikato and Wangaehu Rivers, is the volcanic chain of mountains containing Ruapehu, 8,878ft., and Ngauruhoe, an active volcano. 7,515ft. high. The long sweeping curve of Cook Strait, forming the south-western limit of the district, is bordered from the Patea River to within thirty miles of Wellington by a comparatively level and undulating country, now nearly all under cultivation, having an average width of about fifteen miles. This country is one of the finest parts of the colony, and is celebrated for its stock-raising capabilities. It was originally in a great measure open, though the southern part, where the plain is narrowed in between the sea and the Tararua Range, has a good deal of forest on it, now fast disappearing under the axe of the settler.
Inland of this coastal plain, at varying distances from the sea, the country gradually rises to a mean height of about 1,500ft. to 1,800ft., and becomes a good deal broken in character. It was originally forest-clad almost throughout. It is much cut, up by rivers and streams flowing from the interior to the sea, of which the principal, commencing from the north, are these: The Waitotara, the Wanganui, the Wangaehu, the Rangitikei, the Oroua, the Pohangina, and the Manawatu, which last, after leaving the gorge in the Ruahine Ranges, runs through level land to its mouth in Cook Strait. This broken country, being everywhere composed of papa or marly formation which takes grass excellently, promises in the near future to be a large sheep-carrying district.
At about fifteen miles south of the volcanic peaks of Ruapehu Mountain the papa country terminates in a fairly well-marked escarpment, giving place to a more level and undulating country formed of volcanic matter, the greater portion of which is forest-clad, though on the south-east, east, and west sides of that mountain there are open grassy plains, of no great fertility, but yet suited to pastoral pursuits.
To the eastward of the main range formed by the Rimutaka and Tararua Ranges is the great depression known at its southern end as the Wairarapa Plain, which gradually rises northwards from the lake of that name into wooded, somewhat broken country, of no great height, at a distance of some forty-five miles from the sea. From here the country falls again slightly to the Upper Manawatu River, the depression in this part being marked by the extensive flats in the neighbourhood of Pahiatua, and by the shallow valleys of the Mangahao, Mangatainoko, and Tiraumea Rivers and their branches. For thirty miles from the sea this great valley is mostly open, with patches of forest here and there, but becomes more plentifully wooded at the base of the Rimutaka and Tararua Ranges. The quality of the soil varies from light and stony on the Wairarapa Plains proper, to rich papa country, as the northern end is approached. The southern end of this country is watered by the Ruamahanga River and its tributaries. Generally the district is a pastoral one, though agriculture is also pursued successfully. The neighbourhood of the Puketoi Ranges is in many places composed of limestone, and promises in the future to become a very rich pastoral district, such as will carry a considerable population. In the forks formed by the Tararua and Rimutaka Ranges the Hutt River takes its rise, and runs in a southerly direction through an undulating or level country, finally falling into Port Nicholson. The valley contains some very fine land, generally held small holdings. The slopes of the bounding ranges are everywhere clothed in forest.
The largest plain on the eastern side of the district lies in the Wairarapa Valley, extending northward from the lake of that name for about forty-seven miles, with an average width of about nine miles. In some parts, especially on the flats along the Ruamahanga River, the soil is alluvial and rich; in others, though stony and unfit for cultivation, it is nevertheless grassed, and carries stock well in the winter and rainy seasons. The plain is watered by the Waiohine, Waingawa, and Ruamahanga Rivers, and contains altogether about 200,000 acres, much of which is good agricultural land. On the other side of the district, west of the Tararua and Ruahine Ranges, there is a large block of land so nearly level that it may be called a plain, extending from Paikakariki (thirty miles from Wellington) to Marton (a few miles north of the Rangitikei River), and containing about half a million acres. Starting as a narrow strip between the hills and the sea, the plain widens out by degrees until at Feilding it is at least twenty miles in breadth. Along the beach runs a fringe of sandhills, but behind this is to be found some of the best farming and grazing land in the colony. There are two. plains inland—Murimotu and Waimarino—both lying some 2,200ft. above sea-level in the neighbourhood of Mount Ruapehu, the former to the south and the latter to the north-west of the mountain. The soil is covered with a coarse native tussock, and, though capable of carrying stock, is of a light porous nature, and cannot be classed as agricultural land.
First among these is the Wanganui—“the Rhine of New Zealand”—with a length of over 110 miles from its source, near Mount Tongariro, to its outlet. The Rangitikei, the next in size, rises in the Ruahine Mountains, and flows through the Awarua country, where it is joined by the Hautapu and other large tributaries. After a course of over a hundred miles it reaches the sea some little distance below the Township of Bulls, on the West Coast. The Manawatu is third in importance. Rising in the Ruahines, it flows through the picturesque Manawatu Gorge, joining the sea just below the port of Foxton. Lesser rivers on the West Coast are the Waitotara (north of Wanganui). the Wangaehu (which takes its rise in Mount Ruapehu. and from its source to its mouth is so strongly impregnated with sulphur that fish cannot live in it), the Turakina, and the Otaki. The only other rivers of any size are the Hutt (Heretaunga), emptying itself into the Wellington Harbour, the Ruamahanga, flowing through the Wairarapa Valley and lakes into Palliser Bay, and on the East Coast the Pahaoa, Aohanga, and Akitio.
The only lake of any size in the Wellington District is the Wairarapa, lying between the Rimutaka and Haurangi Ranges, towards the southern end of the Wairarapa Valley. It is about twelve miles long and four broad, and is connected by the Ruamahanga river with Onoke, a small lake separated from Palliser Bay by a narrow shingle spit only. A passage through the spit is opened from time to time when the lake rises above its natural level and overflows the low-lying fiats along its margin. Water-fowl of every kind—among them numbers of black swans—are to be found round about the lakes.
The views obtained from the railway-line in the ascent and descent of the Rimutaka Range are among the best in the neighbourhood of Wellington, and the road through the Forty-mile Bush was long considered one of the most beautiful drives in the North Island; but much of its pristine beauty has been destroyed by the felling of the bush consequent on the increase of settlement. The same may be said of the Manawatu Gorge, famed in the old coaching days for its lovely scenery, but now sadly marred by the construction of the railway-line. The most beautiful drive now left is through the Awarua Bush, from Ohingaiti to Moawhango. From this road, as it winds round the spurs, most charming glimpses are obtained of the Rangitikei River and the blue hills beyond, and at other points the traveller looks up deep ravines where the graceful fern-tree stands out in bright relief against the dark green of the native bush. Another road from Pipiriki, on the Wanganui River, to the Murimotu Plain, traverses one of the most magnificent forests in the North Island. Here the bushman's axe has felled only the timber standing on the road-line, and the track runs beneath the shade of the largest and stateliest maire and rimu known. Beautiful as those drives are, the scenery on the Wanganui River is more lovely still. A few miles below Taumaranui the river enters a series of gorges, shut in by high precipitous cliffs. Sometimes the canoe glides slowly through quiet reaches, sometimes shoots rapids which make the traveller hold his breath till they are passed, and then again traverses places where the water is ever in turmoil, boiling and eddying in whirlpools, taxing the energies of the most skilful Native steersman, and testing the nerve of the most courageous tourist. These experiences, with the views obtained of the banks, densely wooded even where the papa rock rises almost straight from the water's edge, make the eighty miles journey from Taumaranui to Pipiriki an event not easily effaced from the memory. Between Pipiriki and Wanganui an excellent steamer is now running, so that the beauties of the lower part of the river may be seen by all without trouble or discomfort.
The Wellington District is essentially a forest country, for out of the 6,000,000 acres contained within its borders 3,400,000 are still under bush. By far the largest forest is the Waimarino, having an area of at least three-quarter million acres, a large portion of it being nearly level land, containing magnificent timber, principally totara, maire, matai, rimu, and other pines. This forest is as yet hardly touched, though one sawmill has lately been started at Raetihi to cut timber for the settlers now making their homes in the neighbourhood. The distance from the settled districts or any port will render the timber in this part useless as a marketable commodity until the country is opened up by the proposed Auckland Main Trunk Railway.
The next largest is the Rangitikei-Hautapu Forest, containing an area of about 400,000 acres, a considerable portion in the Awarua Block being first-class milling timber, which will he available as soon as the extension of the Hunterville Railway-line taps it. Between this and the Waimarino Forest there is a large extent of bush land, drained by the Turakina, Mangamahu, and Wangaehu Rivers, extending up to the Wanganui River, and containing about 350,000 acres. Very little of this, from its inaccessibility, will be utilised for saw-milling purposes, but a great deal of it, together with a further block of 230,000 acres on the west side of the Wanganui River, will be cleared by the settlers and sown down with grass. A further block of about 100,000 acres of forest-land lies in the Pohangina Valley, and on the slopes of the Ruahine Range. A large portion of this has been taken up and is now being settled.
The forest-land on the West Coast extends from Pukerua to the Manawatu Gorge, on the west side of the Tararua Range, and contains an area of about 380,000 acres, the bulk of it being fit only for turning into pasture country. The most available part of it, alongside the Wellington-Manawatu Railway, is being extensively cut into by sawmills at Levin and other places on that line.
After this in size is the forest commonly known as the Forty-mile Bush, containing 260,000 acres. It lies immediately north of Masterton, and is tapped by the Wairarapa Railway and the proposed extension to Woodville. It is at present being quickly denuded of timber by the sawmills established at Eketahuna and Pahiatua, and by the increasing number of settlers. A tract of fully 100,000 acres lying to the east of the Puketoi Range cannot be utilised for milling purposes, as it is not tapped by any branch railway-line, and its distance from the main line would render the business unprofitable. Nor are there any suitable ports along the coast where timber could be shipped.
The other forests are, one near Lake Taupo, the Wairarapa-Tararua forest on the east side of the Tararua Range, and its continuation on both sides of the Rimu-taka Range, and the Haurangi Forest on the east side of the Wairarapa Lake. These consist for the most part of birch-covered hills, and cannot be considered as valuable for milling purposes.
It may be said that the Wellington Land District contains within its borders a greater quantity of good land than any other in the North Island, very little, except the mountain-tops, being unfitted for use, while some of it is of very superior qualify, suited for the growth of the productions of every temperate climate. As much of it is still forest-clad, settlers must look forward to having to make their farms by felling and burning the bush before grass can be sown, and, as it takes from ten to fifteen years before the plough can be used in bush-land, grazing, for which the climate and soil are admirably adapted, will be the principal industry for some time to come. It is generally calculated that the cost of felling and burning ordinary bush varies from 25s. to 35s. an acre. To this must be added about 20s. for seed and fencing. It is no uncommon thing for a return to be received at from twelve to eighteen months after felling. The usual practice is to put sheep on to the new lands soon after the grass has obtained a good hold. The process of improving the lands by the gradual “logging up” and burning of the fallen tree-trunks is a long one, but it pays in the end, for in this way fine pasture-lands are obtained on the hills, and agricultural lands on the flats.
The climate of Wellington District is healthy and mild, the mean annual temperature (in the city) being 54.8, whilst the mean rainfall is 48.3in. per annum. The rainfall differs, however, according to locality. Inland and near the ranges it is much greater. The top of Ruapehu Mountain is covered with perpetual snow, which lies also on the tops of Kaimanawa, Ruahine, and Tararua in the winter. Frosts also are heavy in the interior.
The coasts of Wellington are not so well supplied in this respect as are some other parts of the colony; but what is lost in number is made up in a great measure by the excellence of the chief haven—Port Nicholson—which, from the position it occupies, at the meeting-point, as it wore, of the coastal traffic of both islands, and from its sheltered position and depth of water, may be considered one of the most convenient harbours in the world. The Wanganui River, which has been considerably improved by artificial means, is the second port in the district, and has a considerable trade carried on by coastal steamers. Patea and Manawatu Rivers are also used by coastal steamers, whilst several other places along the shore afford shelter and stopping-places, according to the direction of the wind. The extension of railways along both coasts has, in a large measure, done away with the inconveniences arising from want of harbours.
The capital of the colony—Wellington—is situated in the south-west angle of Fort Nicholson, on Lambton Harbour. The wharfage accommodation here is second to none in the colony, and the wharves present always a busy scene of life with the numerous steamers and sailing-vessels continuously loading or discharging. From two to four ocean-going steamers are not infrequently seen alongside, loading with wool, frozen meat, and other products, for conveyance to Europe. The port possesses a patent slip at Evans’ Pay, within a short distance of the city. Founded in 1840 by the New Zealand Company, the city occupies the flats skirting the original shore-line, long since obliterated by the reclamation of the foreshore, which is now mostly covered with fine buildings. Rising close behind the old shore-line is a range of hills, the lower parts of which are all built over. The population of the city in 1893. was 34,190. Being the seat of Government, it contains the residence of the Governor and the headquarters of the Government departments, which are placed in what is said to be the largest wooden building in the southern hemisphere. There are several noticeable public buildings, amongst which must be mentioned the Parliamentary Buildings, containing a valuable library, General Post Office, Government Life Insurance Offices, Public Library, School of Art, and Harbour Board Office. There is the Colonial Museum, under the management of Sir James Hector, and Botanical Gardens. The city is lighted by electricity, and its streets are well kept and clean, whilst an excellent supply of water is obtained from the Wainui-o-mata River, on the other side of the harbour. The principal industries are represented by iron- and brass-foundries, factories, sawmills, soap-and-candle works, boot-factories, aerated water, meat-freezing works, coach-building, rope-and-twine works, sash-and-door factories, brick-, tile-, and pottery-works, besides innumerable other smaller works of various kinds. The city is increasing with rapid strides; its excellent position, together with the fine back-country, places it in the front rank of New Zealand towns. Its principal suburbs are Onslow, Melrose, and Karori, each containing from 1,000 to 2,000 inhabitants.
The Township of Petone is situated near the mouth of the River Hutt, seven miles from Wellington, on the railway-line. It had in 1893 a population of 2,175, and is a rising township, containing the Government Railway Workshops, a woollen factory, and a meat-freezing establishment. The Lower Hutt, almost immediately adjoining, has also a large population, and some suburban residences, with beautiful gardens. The Upper Hutt, situated at the head of the valley, has many small farms, owned by some of the very early settlers. The railway here starts the ascent of the Rimutaka Range.
Featherston, situated at the foot of the Wairarapa Valley, fifty-one miles by rail from Wellington, is a small township, with butter- and cheese-factories in the vicinity. Roads lead from it to Martinborough and the East Coast, and also down the Wairarapa Valley to Palliser Bay.
Greytown North is situated three miles off the main line of railway, and near the middle of the Wairarapa Valley, fifty-three miles from Wellington. The chief industries are sawmilling and coachbuilding. The population in 1893 was 1,175.
A few miles further north is the Town of Carterton, where are to be found timber-mills, cheese-factories, &c., and a population of over 1,100 persons. There is some splendid farming land in this locality on the banks of the Ruamahanga River.
Masterton is situated at the head of the Wairarapa Valley, on the Wellington-Eketahuna Railway, sixty-seven miles from the capital. It is the centre of an agricultural and pastoral country, and had a population of 3,600 in 1893. It is lit by gas, and has several industries, such as fellmongery, rope-making, flax-mills, coach-factory, &c., and, in addition, has some excellent fish-breeding ponds, from which many of the rivers in the colony have been supplied with trout. An important coach-road leads from here through a fine pastoral district to Tenui, and on to Castlepoint on the East Coast, where a large quantity of wool is annually shipped to Wellington for export.
North of Masterton is the Opaki Plain, and beyond is the entrance of the Forty-mile Bush, which is now fast becoming a thriving pastoral, agricultural, and dairying district. Butter-factories have been established at Hastwell and Mauriceville, where a large number of Scandinavians are settled, forming hardworking and thriving communities.
Eketahuna is the present terminus of the Government railway, ninety-four miles from Wellington. From there a main road leads to Alfredton, and up the Tiraumea Valley. The road is in process of extension through the East Puketoi country, now being opened up in farm-homestead settlements, and will eventually lead to Weber and Danevirke, on the Napier Railway-line.
Pahiatua, a rising township about fifteen miles beyond Eketahuna, has a population of nearly 1,000 inhabitants. It is the county and market-town of a large and improving district, and will probably also become the centre of a large dairying industry. Coaches run daily from Eketahuna through Pahiatua, and eleven miles farther on to Woodville, where they connect with the main railway-line. Several branch roads run from Pahiatua into the adjoining country, the principal one leading to Makuri through a beautifully-wooded gorge. From there another branch road passes over the Makuri saddle into the East Puketoi country.
On the West Coast, Pauatahanui, at the head of the Porirua Harbour, is the centre of a small agricultural community of early settlers, the old coach-road to Paikakariki running through it; and there is a branch-road leading over to Hayward's in the Hutt Valley. Paikakariki, twenty-seven miles from Wellington, may be considered the commencing-point of the West Coast settlements, which are springing up in every available valley along the coast. At Otaki, forty-seven miles from Wellington, there is a small township, and a large Native settlement. At Manakau, Levin, and Shannon also small townships have arisen since the Manawatu Railway Company opened up the land round about, much of it being rich farming and grazing country. Between Shannon and the Manawatu River there is a large raupo or flax swamp, named Makurarua, containing at least 15,000 acres of fine alluvial soil, which is being gradually drained by the company, and will at some future period become the finest grazing-land in the district.
Foxton, a township at the month of the Manawatu River, is a small shipping port, containing in 1893 a population of 1,223. It is connected with Palmerston by a branch railway, and is the outlet for a large area of good agricultural land.
Palmerston North is an inland town at the junction of the Wellington-New Plymouth and the Palmerston-Napier Railways, situated on a fine plain in the midst of a most excellent farming district at a point eighty-eight miles from Wellington, and 110 miles from Napier. Its population in 1893 was 5,793. It is lit with gas, and has a good water-supply. A fine bridge across the Manawatu River connects it with the Fitzherbert Block, a tract of rich agricultural land Nine miles from Palmerston is the Township of Ashurst, at the mouth of the Pohangina Valley, up which settlement has now extended for a distance of twenty-two miles. Several large farm-homestead association blocks have been selected up this valley.
Feilding, 104 miles from Wellington by rail, with a population of 2,080, is becoming one of the most important towns on the West Coast, as it is the centre of a very fine district, and the outlet for a large tract of inland country, the forest on which is fast being felled. A coach-road connects it with Birmingham and Pemberton, about thirty-two miles distant. On the seaward side for a distance of twenty miles there is also much good agricultural land, extending on the north-west to the Rangitikei River, and including the Township of Halcombe. There are several dairy factories established in the district.
Marton, 123 miles from Wellington, with a population of 1,100, one of the earliest of the West Coast settlements, is also the centre of an agricultural district. The Township of Bulls, on the north side of the Rangitikei River, lies between Marton and the coast. From Marton Junction the southern part of the North Island Main Trunk Railway extends up the Rangitikei Valley to Hunterville, a good-sized township in the centre of a grazing district, and from thence as far as Mangaonoho, twenty-three miles from Marton; from there a coach-road has been made to Ohingaiti, beyond the Makohine, where a largo viaduct has to be built before the railway-line can be continued. From Ohingaiti the coach-road has been made to Turangarere, and from thence to Tokaanu, on Lake Taupo, in the Auckland District.
Wanganui, situated near the mouth of the river of that name, is the oldest town in the district after Wellington, from which it is 151 miles by rail—the distance by sea being only a hundred miles. It is the centre of an excellent farming district, and has a considerable trade, and several manufactories. Near the mouth of the river are freezing-works, the meat from which is conveyed by lighters to the large English steamers lying off the mouth of the river. The town is lit with gas, and has a good water-supply. Not far from it are some extensive railway workshops. Altogether it is a thriving place, with a population in 1893 of 5,100. The Wanganui River is navigable for a light-draught steamer up to Pipiriki, a distance of eighty miles, and for canoes a further distance of eighty miles to Taumaranui. A branch road extends from Pipiriki through the Waimarino Forest to Ohakune, and on to Karioi on the Murimotu Plains, thence by way of Turangarere and Moawhango to Napier.
In the North and North-east Puketoi Blocks there is still an area of about 5,500 acres of second-class pastoral land open for selection. In the East Puketoi country 6,800 acres will be shortly opened for selection under the Land Act of 1892. The Pungaroa Village-settlement Block, containing 1,800 acres, will also be opened early in the spring.
In the Wainuioru Block there are about 5,000 acres of rather rough and hilly second-class pastoral land, which will be shortly reopened for sale in large-sized sections.
On the cast side of the Wairarapa Lake there are 43,000 acres, known as the Dry River-Haurangi Block, but it can be considered only second-class pastoral country. It has not been opened for sale yet, owing to the difficulty of getting proper access into it.
Not far from the Dry River Block is another block of 23,000 acres of pastoral country still under forest, which, owing to its rough and mountainous-character, will probably not be settled for many years to come, until other more-suitable country has been taken up.
On the west side of Carterton and Eketahuna three blocks, called Kaitangata, Te Mara, and Kaiparoro, containing about 58,000 acres of second-class pastoral country, have lately been opened up for sale. There is a further area of 155,000 acres in the Tararua Mountains, some of the valleys in which may eventually be settled, but the difficulty of getting roads into it is too great to be undertaken at present.
South of the Kawatau, on the east side of the Rangitikei River, a small block of 4,500 acres of second-class pastoral country is to be opened for selection shortly.
Out of the Awarua Block, lying north of Ohingaiti, several blocks, containing over 140,000 acres, have lately been purchased from the Natives by the Crown. A great deal of this land is of first-class quality, and it is now being surveyed into township, village settlement, homestead, and ordinary fanning sections, with the view of these being placed in the market for selection next summer.
Waimarino.—Three blocks, containing about 10,000 acres, have had road-lines laid out through them, and are now open for application. A further block of about 40,000 acres, on the Retaruke River, has had roads surveyed through it, and will be opened for selection next summer. There is an additional block of 27,000 acres, which will probably be offered as grazing-runs later on. The rest of the Waimarino country, containing about 250,000 acres, is more or less broken, and will probably be opened as second-class pastoral country or small grazing-runs to enable it to be taken up in larger sections.
Tongariro, Rangipopo, and Kaimanawa Blocks.—105,000 acres have been acquired by the Crown, but none of it is likely to be taken up for settlement for a long time to come.
Native Lands.—The blocks under lease to Europeans contain about 475,000 acres, the principal being the Murimotu, Rangipowaiu, Owhaoko, Mangohane, and Ruanui, to Mr. Studholme; and the Oroumatua, leased to Mr. Birch. Of others passed through the Native Land Court there are about 526,000 acres which are fit for settlement, the principal being the balance of the Awarua and the Motukawa, Raketapauna, and Rangiwera Blocks in the central district, Raetihi in the Waimarino district, and Tauakira on the Wanganui River. Those not-suitable for settlement at present are the Te Hautu, Ohuanga, and Kaimanawa, on the east side, and the Oahukura on the west side, of Tongariro Mountain, containing an area of about 345,000 acres.
The Native lands which have not passed the Native Land Court contain an area of about 140,000 acres, the principal being the Tupapanui and Mairekura Blocks, between the Wangachu and Wanganui Rivers, and some others on the west side of the latter river.
The pastoral industry is by far the more important, the total area in grass in 1894 being 1,861,574 acres, as compared with 56,091 acres under crop. Of the area in crop only about 4,364 acres were in wheat, 16,007 in oats, and 24,612 acres in turnips or rape, the rest being in potato or other crops.
The following figures will show the average return per acre of grain, &c., for the year 1894: Wheat, 23.66 bushels; oats, 30.46 bushels; barley, 25 bushels; hay, 1.56 tons; potatoes, 6.94 tons.
The area in sown grass now exceeds that in any other district in the colony, though the area under crop is very small as compared with either the Otago or Canterbury Districts. The stock carried in 1893 included 3,364,867 sheep, and 155,144 cattle, the horses being returned in 1891 as 30,542. The carrying-capacity of the West Coast districts is apparently much greater than the East Coast, the former carrying on 769,682 acres of grassed land 1,801,295 sheep and 86,295 cattle, as compared with 1,375,501 sheep and 66,587 cattle carried on 844,485 acres in grass in the East Coast districts, there being only 2,721 acres more land under turnips in the West Coast districts. This shows the last named carries fully half a sheep to the acre more than the East Coast country. The total area in gardens is given as 1,179 acres; in orchards, 2,869 acres; and in plantations, 2,173 acres.
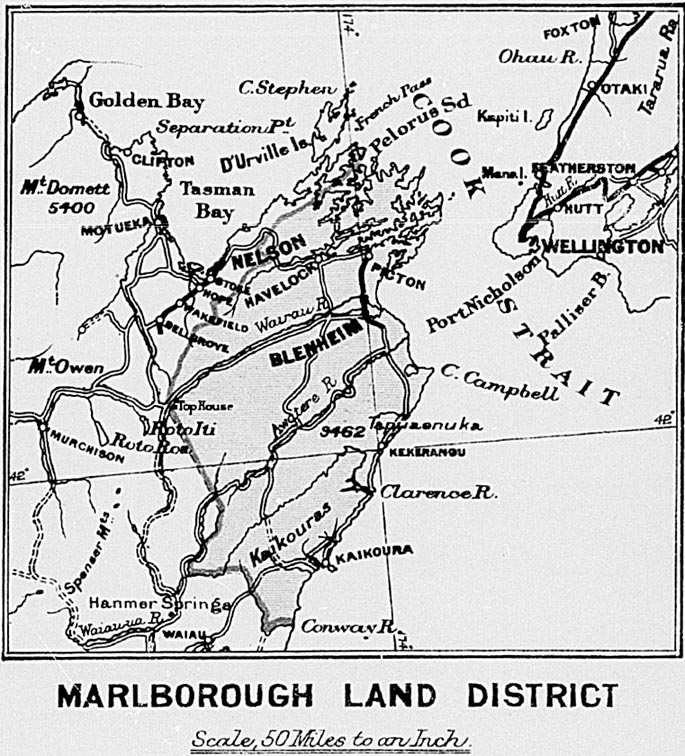
Both soil and climate are well adapted for the production of butter and cheese and hence we find creameries and butter-factories increasing in number very considerably each year, and the export constantly augmenting.
Nine butter- or cheese-factories were returned in 1893 as at work in the Wairarapa and Forty-mile Bush districts, and fourteen on the West Coast. The factories have no doubt since increased.
The principal flax-mills working are at Featherston, Carterton, and Martinborough, in the Wairarapa, and at Foxton on the West Coast. This industry fluctuates greatly, in accordance with the price ruling for the dressed article. In 1891 thirty-four mills were at work, employing 723 and 171 boys; the machines driven by water-wheel or engine working up to 401-horse power; the turn-out being 4,595 tons of dressed fibre, valued at £72,290, the largest output in the colony.
Sawmills are to be found in different parts of the district where the means of communication are sufficient, the timbers cut being principally totara and redpine, both of which are largely used in house construction and other works. Others of the native woods are very beautiful, but are utilised only to a small extent.
The principal mills are at Pahiatua, Ekatahuna, Masterton, and Carterton, in the Forty-mile Bush and Wairarapa districts, and at Levin on the West Coast, besides which there are several mills in Wellington for dressing the rough material. In the whole district there are forty-eight mills, of an aggregate of 820-horse power, engaged in this industry, employing 615 hands, the output of sawn timber being 27,044,739ft., and the total value, including posts and rails, resawn timber, doors, sashes, &c., £128,522, which, next to Auckland, is the highest for any provincial district in the colony.
By H. G. CLARK and SIDNEY WEETMAN, Chief Surveyors.
The Marlborough Land District, occupying the north-east corner of the Middle Island, and containing about 2,560,000 acres of land, is bounded generally on the north and east by Cook Strait and the East Coast as far as the Conway River; thence by that river to its source; from this point it is bounded by straight lines, rivers, and the summits of watersheds to the western side of Tennyson Inlet, Pelorus Sound. From the Conway to Pelorus Sound the boundary is common to the Land District of Nelson.
The widest part of the district is from Cape Campbell to Tophouse, a distance of about sixty-seven miles.
The district throughout is generally mountainous, but none even of the highest peaks are covered with perpetual snow, although Tapuaenuku, the highest of the Inland Kaikouras, attains an altitude of 9,462ft. Of the Seaward Kaikouras, or Looker-on Mountains, the highest points are Kaitarau and Whakari, which are 8,700ft. and 8,500ft. respectively. There are several lesser, from 4,000ft. upwards.
The view from Kauhautara Bluff, south of Kaikoura Settlement, looking northwards, when the Looker-on Mountains are snow-capped, is said to be one of the finest in New Zealand.
Geologically, the district may be briefly described as follows: North of the Wairau River the rocks belong chiefly to the Upper and Lower Devonian series, with a belt of Silurian between them, embracing the country along the west of Queen Charlotte Sound to Cook Strait. Within these series auriferous deposits are found, and at present worked at Mahakipawa, Wakamarina, and Wairau Valley. In Endeavour Inlet an antimony-mine has been worked for some time. The country south of the Wairau River may be said to belong chiefly to the Carboniferous Age, with patches, along the coast and up the Clarence Valley, of Cretaceo-Tertiary and Lower Greensand formations; while along and between the Awatere and Clarence Rivers volcanic formation and numerous intrusive dykes occur. The Red Hills also, at the head of the Wairau Valley, are of volcanic origin.
Coal has been discovered in the neighbourhood of Picton, and in the Clarence Valley, but none has been as yet successfully worked within the district. A narrow belt of Tertiary limestone, suitable for building purposes, extends, with small interruptions, from Cape Campbell to the boundary of the Canterbury Provincial District. The Marlborough land may he divided into three classes: Open land, generally covered with associated grasses; forest-land; and intermediate, or land partly forest, partly covered with scrub, fern, or other rank vegetation. This original condition of the soil naturally gave rise to a localisation of industries, and a very unequal distribution of the population. Thus the open country was taken up for pastoral purposes; in the forest country the timber industry developed, and the intermediate land passed into the hands of farmers. Though agriculture is now extending into the pastoral and forest country, and considerable areas of forest-land have been cleared and laid down in grass, the portions of the district characterized by these respective industries are still well defined.
In the northern part of the district, bounded by Cook Strait, numerous deep fiords and bays run far into the land. The principal of these we Queen Charlotte and Pelorus Sounds, which are remarkable for the number of their reaches and inlets, and the beauty of their precipitous and forest-clad hills, culminating in Mount Stokes, 3,943ft. above the sea.
Four considerable rivers, the Wairau, Awatere, Clarence, and Conway, rise towards the western boundary of the district: the two former, running east and north, fall into Cook Strait; the two latter, taking a southerly and easterly course, discharge into the sea on the eastern side of the Island. These rivers water large and fertile valleys, but none can be entered by vessels except the Wairau, which is navigable for small steamers for about ten miles from its mouth.
The Wairau Plain, containing about 65,000 acres, on which stands Blenheim, the capital of Marlborough, is the principal block of agricultural land within the district. The soil, generally good, is, on the lower or seaward side of the plain, extremely fertile, especially near Blenheim, which is surrounded by numerous fine gardens, well sheltered with trees. The average yield of wheat for the plain is about 25 bushels per acre; of oats and barley, 35; of peas, 30; and of potatoes, 6 tons per acre. Hops have been successfully grown for many years in the neighbourhood of the town, but, owing to the high price of labour, their cultivation has not extended. The plain, traversed in all directions by good macadamised roads, and dotted over with numerous homesteads, standing in clumps of trees amidst well-cultivated fields, has already an old-world appearance. More than half the population of the Marlborough Land District—12,782, according to the last census—is centred in the Town of Blenheim and on the Wairau Plain. Besides this plain there are several thousand acres of terrace flats and valleys along the larger rivers, notably at Starborough, on the Lower Awatere.
There are not any lakes worthy the name. The largest is Kapara te Hau, more familiarly known as Grassmere, situate on the coast between the Awatere River and Cape Campbell. It is about three miles in diameter, and very shallow, being, indeed, no more than a lagoon, as during a dry season there is little or no water in it.
The only other known lake is Lake McRae, situate in the open country between the Awatere and the Clarence Rivers.
The portion of Marlborough north-west of the Wairau River, extending to the boundary of the Nelson Land District, and including the County of Sounds, in all about 280,000 acres, was originally covered with dense forest. In the valleys and on the lower hill-slopes, rimu, kahikatea, matai, totara, miro, and tawa were the principal forest-trees. The higher portion of the hills and steep spurs were clothed with the various species and varieties of birch (beech), to which along the shores of the sounds were added pukatea and kohekohe, the latter locally called cedar.
During the last thirty-three years sawmills have been at work in various parts of the district. Thirty-two mills have been erected, and have worked for longer or shorter periods. Havelock, on the Pelorus Sound, is at present the headquarters of the timber trade.
The hills along the shores of the sound, will, for many years, furnish birch sleepers. There are other timbers left in places, but nowhere sufficient to justify the erection of a mill, unless pukatea wood, hitherto neglected, could be utilised. It is a light, tough timber, well adapted for packing-cases. The quantity of pine timber remaining in the Kaituna and Onamalutu Valleys is small, but there is a good supply of birch and other wood, suitable for fencing and firewood. On these valleys the Wairau Plain is mainly dependent.
The Pelorus Valley, with its tributaries the Rae and Wakamarina, still contain about 200,000,000ft. of convertible timbers, exclusive of the birch, of which there is a large amount of the best quality on the hills and terraces.
In the neighbourhood of Kaikoura, along the base of Mount Fyffe, and in the Hapuku Valley, there is another small block of forest-land in which three small sawmills have been erected. The quantity of timber suitable for sawmill purposes in this block is very limited, but it will furnish the neighbouring country with firewood and fencing for many years.
During the past year about 3,000 acres of forest have been cleared and grassed.
The Wairau Plain, which is the principal block of agricultural land, has been already dealt with. The second agricultural centre is in the neighbourhood of Kaikoura. The land extending along the base of Mount Fyffe, between the Kohai and Hapuku Rivers, about 13,000 acres in extent, is held in small or moderate-sized farms; the soil is good, the block known as “The Swamp,” between Mount Fyffe and the Peninsula, being particularly rich. In the Pelorus, Kaituna, and Onamalutu Valleys, and in the Sounds, settlers following in the wake of the sawmills have already converted much of the land worked over into grazing-farms. The land is of three descriptions—alluvial flats, terraces, and hill-sides. On the flats in the larger valleys the soil is rich, producing heavy crops of oats, peas, beans, and potatoes, wherever it has been brought into cultivation. The terrace-land varies much in quality, but generally grows good grass, as do also the hills on which tawa formerly grew; the birch country being very barren. On the small bush-farms cattle-grazing is the chief pursuit. Out of over 7,000 head kept in Marlborough, 4,000 belong to the forest country.
About 1,700,000 acres of the Marlborough Land District are at present devoted to keeping sheep; in this are included 900,000 acres of Crown land, held under leases that will expire for the most part in 1896. The leaseholds in the northern part of the district contain a large extent of scrub- and fern-covered country, now producing little or no food for sheep, but capable of improvement. The total number of sheep depastured is 828,518, distributed as follows amongst the counties into which the land district is divided: Marlborough County, 540,618; Sounds County, 90,000; Kaikoura County, 197,900. On the natural pasture of the open country merino sheep are kept almost exclusively, the land carrying from half to one sheep per acre. In the forest country, on sown grass, the land keeps from two to four crossbred sheep per acre. Along the shores of the sounds large areas of hill-land have been taken up on lease, and are now being cleared and laid down in grass expressly for keeping sheep, but generally throughout the forest country the holdings are small or of moderate size, hence this is, after the Wairau Plain, the most populous portion of the district. The export of wool during last year amounted to 12,620 bales.
Gold-mining has been carried on for some years, principally at Mahakipawa, Wakamarina, and Wairau Valley, but at present not much gold is being obtained.
At Endeavour Inlet, in Queen Charlotte Sound, the Star Antimony Company has been at work for some years, with a fair amount of success. A new process of smelting has lately been commenced.
There are at present seven sawmills at work within the district—two at Kaikoura. and the others in the Pelorus, Kaituna, and Onamalutu Valleys, and in Pelorus Sound. The principal one is Messrs. Brownlee and Co.'s, in the Pelorus Valley, the annual output being about 3,600,000 superficial feet. The value of the sawn timber shipped in 1892 from the company's wharf was £11,000. The mills at Kaikoura have turned out 112,000ft.
Owing to the low price of dressed flax several of the mills have recently been closed, there being only four or five at work. The quantity of hemp shipped during the year was 8,475 bales.
In connection with one of the mills, a rope-factory has been established, in which binder twine made of short flax or tow is the main product.
There are two flour-mills at work—one at Spring Creek, near Blenheim, owned by Messrs. Redwood Bros. This is a complete roller-mill, driven by water-power, and can turn out about 14 tons of Hour in twenty-four hours. It is electric-lighted, and the sack-working machinery is driven by electric motor. The mill is not worked full time, but during the year the output was 1,200 tons of Hour and 420 tons of bran and sharps. The other mill, which is also worked by water-power, is Messrs. W. B. Parker and Co.'s, at Blenheim.
A dairy factory—the first in the district—was opened at Spring Creek in November last. It contains all the latest improvements in machinery. At present it is being supplied by 400 cows, the estimated number for next year being between 600 and 700. The daily average supply of milk is 700 gallons. 315cwt. of butter have been produced since the opening.
A meat-preserving factory has lately been reopened at Blenheim.
The original distribution of the open and forest lands of Marlborough was entirely due to climatic causes. At Cape Campbell, one of the barest places in the district, the annual rainfall is only 23.in.; in the Pelorus Valley, the centre of the forest country, it is over Coin. Tins difference between the climates of the north-western and south-eastern portions of the district explains why the artificial pasture-land, when compared with the natural pasture, supports such a large amount of stock. Winter and spring are the wettest seasons, hence the dry climate is not unfavourable for agriculture. Wherever the soil is suitable, crops sown in winter and harvested in early summer can be successfully grown. Everywhere near the coast the range of temperature, considering the latitude, is very small. The thermometer seldom falls below 30deg., or rises above 78deg. Along the shores of the sounds the mildness of the winter, owing to the curious distribution of land and water, allows lemons, oranges, passion-fruit, figs, and other subtropical fruits to be grown in favourable situations. On the lower hills and terraces of the forest country the chestnut (Castanea vulgaris) grows rapidly, and commences to bear fruit in five or six years. A few trees planted in the Pelorus Valley some twenty years ago are now yielding annually about 2cwt. of nuts a tree. In all parts of the low country the common English fruit-trees—apple, plum, pear, cherry, &c.—yield abundantly, the fruit, owing to the clearness of the atmosphere, being of excellent quality. In the high country, where snowfalls occasionally during winter, the red, white, and blackcurrants can be produced in such quantities that with little labour they might be made an article of export to the warmer parts of Australia.
The chief town, Blenheim, is situate on the Wairau Plain, at the junction of the Opawa and Omaka Rivers—a third river, the Taylor, would join at about the same point were it not that when not in flood it disappears beneath the surface, about three miles south of the town. Blenheim has been termed a miniature Christchurch, doubtless from its extreme flatness. Considering this, its streets are surprisingly crooked and lamentably narrow. It does not possess any public or other buildings worthy of note. It is, however, well planted with deciduous and evergreen trees, which help much to relieve an otherwise monotonous appearance. It is about eighteen and a half miles from Picton by rail, and about nine miles from the sea by the Opawa River, which is navigable for small steamers. Blenheim is lit with gas, and supplied with water principally by artesian wells. The population at the last census was 3,294.
The next town in importance is Picton, the principal port, only fifty-three miles by sea from Wellington. This little town, both in position and appearance, may be said to be the antithesis of Blenheim, being most picturesquely situated at the head of Queen Charlotte Sound, and nestling among hills, some of the higher ones still densely covered with birch and other forest. There is frequent communication with Wellington and Nelson by steamers averaging 500 tons, and vessels of 1,200 tons can lie at the wharf at low-water, where there is a depth of 25ft. Vessels of the largest tonnage can approach within half a mile. The direct exportation of frozen meat from Picton commenced in 1892, when 16,433 carcases were shipped; last year Messrs. Nelson Brothers, who have a freezing-hulk at work, shipped 25,632 carcases. Picton possesses a malting establishment, also producing for export, as the excellent quality of the barley grown on the Wairau Plain insures a ready market. A small quantity of oysters, mostly procured in Queen Charlotte Sound, is annually exported from Picton; with culture the supply might be almost indefinitely increased, many of the sheltered bays in both sounds being well adapted for the purpose. What is now being done along the Marlborough coast is a mere trifle compared with what might be accomplished if capital and knowledge were brought to bear on the fishing industry. Around the whole coast, from the mouth of the Conway to near the French Pass, the sea abounds in fish. Within the sounds and amongst the islands of Cook Strait, hapuku, schnapper, moki, barracouta, raturi, kahawai, and rock-cod are extremely plentiful. Immense-shoals of the southern herring (Clupea sagax) and of anchovies (Engranlis encrasicholus) frequent the inlets at certain seasons of the year, and quantities of fresh fish are exported thence to various places within the colony. As steamers arrive at and leave Picton almost daily, shipments can be made without delay to all parts. Picton possesses a good gravitation water-supply. Its population is about 800.
Havelock, situated at the head of Pelorus Sound, is, as has been already stated, the present headquarters of the timber trade, Messrs. Brownlee and Co.'s steam sawmill, at the mouth of the Pelorus River, being only a mile or. so from the town. A steamer runs fortnightly between Havelock and Wellington, delivering mails at Ketu Bay, Maud Island, Homewood, and Maori Bay, all in Pelorus Sound. In addition, a small steamer has lately commenced running within the sound, which also receives a weekly mail from Picton, conveyed by steamer to Torea, in Queen Charlotte Sound, and thence overland and by boat to Kenepuru and Manaroa. Between Picton and Havelock there is a bi-weekly service, viâ Cullensville, on the Mahakipawa Goldfields. The population of Havelock is about 320.
The Town of Kaikoura, the greater part of which is built on a raised shingle-Leach, is situate at Kaikoura Peninsula, near the southern boundary of the district. The town, with the adjoining settlement of small farms, forms one of the most picturesque spots in New Zealand, lying as it does under the Seaward Kaikouras, or Looker-on Mountains. At the back of the town the peninsula, which is composed of Cretaceo-Tertiary limestone, rises abruptly for about 100ft., and affords splendid sites for dwelling-houses. Kaikoura is connected with Blenheim by a weekly coach service, the distance being about ninety-five miles. There is also direct steamer-communication with Wellington and Lyttelton. The population of the town is about 370.
The only railway is that between Picton and Blenheim, about 181/2 miles in length. The train starting from Picton runs twice a day, and three times on Saturdays. The railway has been completed for a distance of three miles south of Blenheim—as far as the racecourse at Riverlands, whither the train runs on race-days.
The main north road to Nelson—distant seventy-eight miles—is a good, metalled road nearly the whole way. It runs up the Wairau Valley from Blenheim for about six miles, crosses the Wairau River into the Kaituna Valley, which it follows as far as Havelock—about twenty-eight miles. It then runs up the Pelorus and Rae Valleys, and ascends by easy gradients to the Brown Saddle, where it crosses the boundary into the Nelson Province. An excellent coach-service—probably the best in the colony—has been established for some years, the coach running to and from Nelson on alternate days, covering the distance in eleven hours.
The main south road, running over the Taylor Pass into the Awatere Valley, and through the Starborough, Flaxbourne, Kekerangu, and other properties, connects Blenheim with Kaikoura and the south, and is a good road during dry weather, although it might he much improved in places.
The portion between the Clarence River—over which a fine bridge was built some years ago—and the Hapuku River runs along the coast under steep and picturesque hills covered with forest. Were a coast-road constructed south of Kaikoura to connect with Cheviot it would open up some of the most beautiful coast scenery in New Zealand.
A good road has been formed up the Wairau Valley, passing through the Bankhouse, Erina, Lansdowne, Hillersden, and Birch-hill properties, and connecting with Tophouse, just outside the boundary, and distant fifty-six miles from Blenheim. At Tophouse there is an hotel and a telegraph-station, and from thence a good road leads to Belgrove, the present terminus of the Nelson Railway.
A coach runs twice a week between Blenheim and Wairau Valley—twenty-five miles—where there is an hotel, a post- and telegraph-office, and one or two stores.
There is also a good cart-road running up the Awatere River—which it crosses and recrosses several times—as far as Molesworth Station, about seventy miles from Blenheim. Between these points there is a weekly coach- and mail-service.
There are other minor roads and bridle-tracks throughout the district too numerous to specify.
The area of Crown lands at present available for settlement is about 243,600 acres, but of this area 135,000 acres is of very poor quality, being chiefly the summits of high, rugged country, and not likely to be taken up until it has been brought in with portions of the Marlborough waste-land leases, which for the most part will expire in 1896. The balance of available area lies principally in the Pelorus, Rae, and Wakamarina Valleys, and in the Sounds, and will doubtless be readily taken up when thrown open for selection.
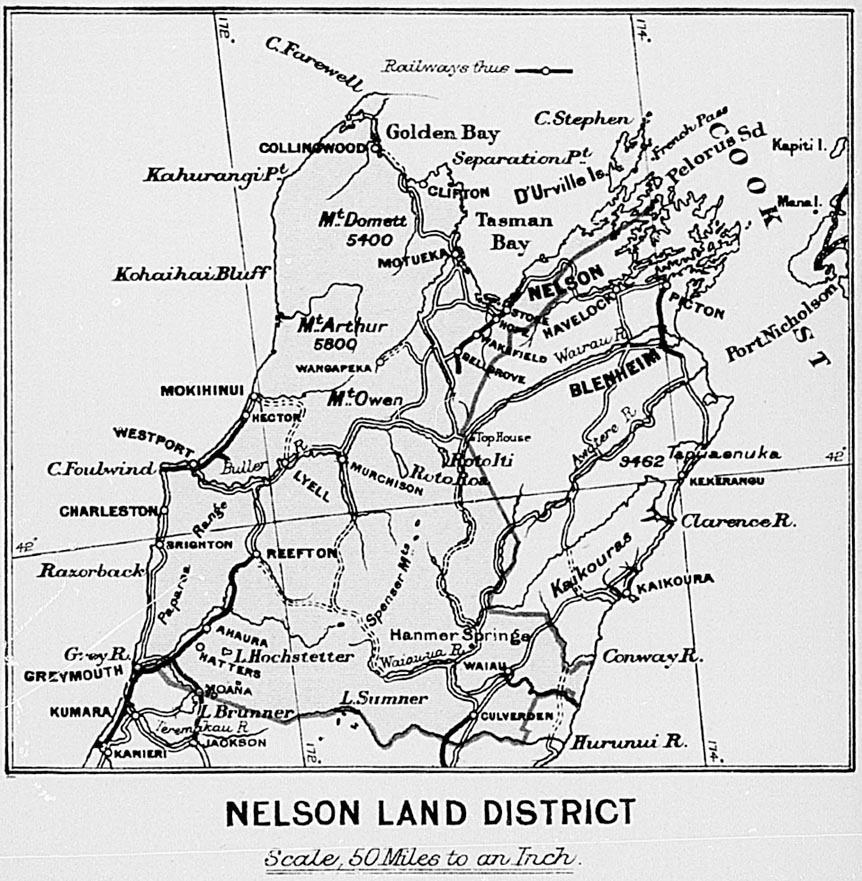
By J. S. BROWNING, Chief Surveyor.
The Nelson Land District comprises the north and north-western portion of the Middle Island, the greater part being high and mountainous, and on the western and inland ranges covered with dense forest to the bush-limit, at from 4,000ft to 4,500ft. Cape Farewell, the northernmost point, is situate at the western entrance of Cook Strait, on the south side of which lie Golden or Massacre Bay, and Tasman Bay, more commonly called Blind Day. The former derives its name from the massacre of a boat's crew belonging to Tasman, who visited it on the occasion of his discovery of New Zealand in 1642. At the head of the latter, which has a depth of fifty-four miles from its entrance, stands the town of Nelson. From Separation Point, on the western side of Blind Bay, a range of mountains from 3,000ft. to 4,000ft. in elevation extends southward to Mount Murchison. It consists of a granitic formation, with slates, limestone, and sandstone belts. From Pelorus Sound, on the east, commences another range—a portion of which is serpentine forming a mineral belt immediately south of Nelson City. It reaches an elevation of 6,000ft., and runs in a south-westerly direction to the St. Arnaud Range terminating in the Spencer Mountains, a large central mass attaining a height of 8,000ft. above the sea-level. To the westward of the Spencer Ranges and those on the further side of Blind Bay are the Brunner, Lyell, Marine, and Tasman Mountains, from 5,000ft. to 6,500ft. in height. Still further westward along the coast are the Paparoa, Buckland Peaks, and Papahaua Mountains, about 4,500ft. at their highest elevation, and the Whakamara Range, extending from Rocks Point to Cape Farewell There are also a number of isolated mountain-masses here and there through the district.
The inland Spencer Mountains are the source of the principal rivers of the district south of the Duller River, and are thus described by Sir Julius von Haast: “On the southern slopes of this wild alpine-slack we find the principal sources of the Grey, or Pohaturoha; on its north-east side the sources of the Wairau; on its eastern side those of the Acheron and Clarence; and in the deep recesses of these snow-clad giants those of the Waiau-ua, or Dillon: so we may say that with the exception of the Takaka and Aorere, which fall into Massacre Bay, the Wangapeka and Motueka, which run into Blind Bay, the Karamea and smaller streams which reach the sea on the West Coast to the north of the Duller River, all the rivers of any size in the northern part of this island take their rise in this magnificent chain.”
The Buller River (Kawatiri) has its source at a point about sixty miles southwest from Nelson, where it flows out of the beautiful alpine lake Rotoiti lying 1,800ft. above sea-level at the foot of the lofty St. Arnaud Range. This river breaks through the massive mountain chains of the interior in a transverse or easterly direction, forming, where it receives no tributaries, a succession of magnificent rocky gorges, and, after a course of about one hundred miles, finally discharges its waters into the ocean on the West Coast. The Gowan River, a tributary, has its source in another exquisite lake, Rotoroa, 1,623ft. above sea-level. Other tributaries of the Duller are: the Matakitaki, Maruia, Owen, Matiri, and Inangahua, all of which take their rise in the snowy ranges.
The Grey River (Mawhera), also discharging its waters on the West Coast, takes its rise in Lake Christabel, near the western flank of the Spencer Range. It has a very large basin, and numerous tributaries, of which the Ahaura is the chief.
The rivers on the eastern side, named above as taking their rise in this district flow for the most part through mountain ranges and open valleys utilised as pastoral land.
The lakes of the district are alpine in character, surrounded by grand mountain and bush scenery. The principal are: Rotoiti, lying east, and Rotoroa south-east, of Mount Murchison; Matiri, to the west of Owen Range, 980ft. above the sea; Lakes Tennyson, 3,614ft., and Guyon, 2,658ft., on the eastern flank of the Spencer Mountains; Lake Christabel, on their western flunk; Lake Hochstetter and Lake Sumner, the latter 1,725ft., lying under Mount Emerson, 6,000ft. above sea-level.
The plains of this district are limited in extent, the principal being the Amuri, in the valleys of the Hurunui and Waiau-ua, in the centre of which rises a partly isolated mass of hills called the Percival Ranges, the highest peak of which is Mount Percival, 5,335ft. These plains, being well covered with native tussock-grass, were either purchased or taken up with pre-emptive rights as pastoral land very soon after the commencement of the settlement. The Waimea Plains, near Nelson, with the Lower Motueka, Riwaka, and Takaka Valley lands, formed part of the original settlement of the New Zealand Company, and are occupied mostly by small settlers. Inland are the Tiraumea Plains, 1,100ft. above sea-level, and the Maruia, 1,800ft. These are, together, about 30,000 acres in extent. They are surrounded by high mountains heavily timbered, and the land is of only second-rate quality. On the West Coast the level lands are Totara Flat and Ikamatua Plains, in the Grey Valley; Mawhera-iti and Inangahua Valleys, lying on the eastern flanks of the Paparoa coastal range. There are also open pakihis at Addison's Flat, on the south side of the Buller, and low swampy lands on the north side; northward is the heavily timbered country of the special settlement at the mouth of the Karamea.
The area of the district is estimated at about 7,000,000 acres, of which the area of open land under 2,000ft. in altitude is, approximately, 1,835,000 acres; the area of forest-land under 2,000ft., about 1,745,000 acres; open land over 2,000ft., about 1,470,000 acres, including summits. The forest-lands may be approximately estimated at 3,290,000 acres, including good forest, mountain-forest, timber patches in gullies, &c. Of this area probably about 1,000,000 acres would be the utmost available for clearing. The timber on the western side consists of red- and white-pine, matai (or black-pine), totara, awhaka (or cedar), rata, and occasional silver-pine, besides black-and red-birch (Fagus fusca). These varieties are also found, but in smaller areas, on the eastern side; birch preponderating. A large amount of timber is used in the mining industry for props and planking, and throughout the districts generally for shingles, fencing, firewood, sleepers, &c. There are thirty-four sawmills at work, with an output of about 8,000,000 superficial feet per annum.
Nelson has little land suitable for agriculture, and of that little most has been already taken up. On the Waimea Plains is grown excellent barley, a small quantity of which is exported. Oats and chaff are sent in large amounts to the West Coast and elsewhere. Hops also form one of the chief exports. Wheat, maize, rye, and root-crops of most varieties are grown, and fruit is plentiful. The weekly wage of a farm-labourer is 20s. with board; without board he would receive 6s. a clay. Ploughmen can get 25s. per week with board; without, 7s. 6d. a day.
The total area of pastoral lands held under the Crown by 258 tenants on the 31st March, 1894, amounted to 643,279 acres. By the last census returns, of April, 1891, there were 30,717 cattle and 898,738 sheep in the district. As the agricultural land is limited, settlers are turning their attention to the timbered mountain-slopes for grazing purposes. These, when the timber is felled and burnt, and the ground sown with suitable grass, will, alter three to four years, carry about, two sheep to an acre on fair soil, and more on the limestone country. The cost of felling and burning green timber is from 15s. to 20s. per acre; cost of mixed grass-seeds and sowing, about 15s. per acre; and a good paling-fence on ordinary bush-lands with double No. 8 wires at top and bottom, with £1/2in. palings and 7in. posts sunk 2ft. in the ground, can be erected at about 12s. per chain.
The western side of the Nelson District was a terra incognita till about the year 1863, when gold was first discovered in large quantities. Miners flocked in at first from the other goldfields in New Zealand, then from Australia, California, and other parts of the world, until in 1865 the whole coast-line was peopled from Broken River in the north to Jackson's Bay in the south. Mining, at first altogether alluvial, developed into quartz-reefing, and hydraulic-sluicing of large areas. The agricultural lands in the Grey and Inangahua Valleys were taken up and cultivated; and, as mining became a more settled industry, the miners occupied and tilled the non-auriferous alluvial flats in the many valleys: hence at the present time a number of homesteads are scattered throughout the district.
Reefton and its neighbourhood forms one of the chief quartz-mining districts in New Zealand; and the West Coast, including Westland, contributes about 45 per cent. of the total amount raised in the colony. The oldest alluvial field is at Collingwood. Minerals other than gold found in the district are: silver, copper, chrome, antimony, manganese, hæmatite, and oilier ores. Extensive deposits of coal are found on the West Coast, within the areas of the Grey and Buller Coalfields Reserves. Coal is also found in Collingwood, in Blind Bay, and in West Wanganui Inlet; and there are numerous smaller areas of coal-bearing strata here and there throughout the district. The output from the mines at work within the district during the year ending 31st December, 1893, was 371,732 tons. Copper-ore is found in a serpentine rock-formation near Nelson, but the companies which have worked the ore hare not hitherto been successful—the last one “The Champion,” failing from want of sufficient capital. Deposits of chrome-ore are also found here. Silver-ore has been worked in the Collingwood District; and at Para-para, in Blind Bay, the Onehunga Iron Company are starting to work the extensive deposits of hæmatite iron-ore, which are found combined with limestone and coal in the immediate neighbourhood. There is also a small industry in flax. It will be readily gathered from the above brief description that mining is the chief industry of the Nelson District.
The chief town is Nelson, situated at the head of Blind Bay, in 41° 16’ S., and surrounded on all sides, except the north, by mountains reaching an elevation of 3,500ft. With a mean temperature of 54° 8’ Fahr. it possesses a climate almost unequalled for its beneficial effects on invalids suffering from pulmonary diseases. There are many picturesque spots in the suburbs, and the town itself, with its cleanly-looking buildings and well-kept gardens, is one of the most charming spots in New Zealand. There is an old-established Boys’ College, and a High School for Girls, besides Government and other schools. The Anglican Pro-Cathedral, situated on the summit of a central hill, memorable as being the site of fortifications erected in the early days of the settlement for defence against an expected attack of the Natives, is a striking feature. The Roman Catholic Church, Convent, and school-buildings cover a large extent of ground. There is also at Stoke, a small village three miles from Nelson, a central Catholic Orphanage, surrounded by grounds of considerable area. There is a good supply of excellent water from a reservoir in the hills at the back of the town, and the streets are well lighted with gas. The several Government departments are housed in one roomy building, containing a large hall used for Supreme Court sittings and other public purposes. Nelson has a small natural harbour, formed by a boulder-bank running eight miles parallel to the shore, deep enough at high tide to admit vessels of 1,000 tons burden. It is a port of call for the Union Steamship Company's intercoastal steamers, and has a small local fleet plying between the West Coast, Blind Bay, Picton, and Wellington. The town is reached from the eastward by a good main road from Marlborough. A railway-line has been constructed up country to the southward for thirty miles, passing through the farming villages of Stoke, Richmond, Brightwater, Wakefield, Foxhill, and Belgrove. Leaving for the West Coast by a good main road, the traveller starts from the Belgrove Station on one of Cobb and Co.'s coaches, crosses Spooner's Range, the Clarke and Hope River saddles, and enters the Buller Valley at the junction of the Hope, about sixty-seven miles from town. He then enjoys a succession of views of mountain-gorge scenery, and, after traversing a gorge of seventeen miles in length, arrives at the Lyell, 107 miles from his starting-point. This is an Alpine township, in a small quartz-mining neighbourhood. Here is a fine cast-iron-girder bridge, spanning a rocky gorge of the Buller, and springing boldly from a bluff on the northern side. At 116 miles the junction of the Inangahua with the Buller is reached, the main road continuing to Reefton, with a branch road twenty-eight miles to Westport, which for twenty miles passes through some of the grandest river-gorge scenery in New Zealand.
Westport, the town next in importance to Nelson, is situated at the mouth of the Buller River. The harbour is sheltered from southerly gales by Cape Foul wind and its outlying rocks, and is accessible in nearly all weathers. A large sum has been spent on a system of harbour-works, designed by the late Sir John Coode. Westport is the place of shipment for the coal-mines lying northward as far as the Mokihinui River. The character of this coal for steam purposes stands almost unrivalled. The long line of coal-staiths on the northern bank of the river, with a fleet of steam-colliers loading alongside, does not fail at once to impress a visitor with a sense of the importance of the trade. Though much has already been done, yet the industry, from the extent of the coal-bearing strata, is callable of much larger expansion when the necessary capital can be found. The Westport-Ngakawau Railway to Mokihinui, connected with the mines by the company's line, conveys the coal to the port. At the foot of the Mount Rochfort plateau, nine miles from Westport, is Waimangaroa, and on the plateau itself is Denniston—both coal-mining villages. The latter, built at an elevation of 1,960ft., is said to be the highest township in New Zealand. On a clear day it is well worth a visit, for the sake of enjoying the magnificent panoramic view of the southern Alps, which reach their highest point in Mount Cook, 12,349ft. high, about 100 miles south. South of Westport are the alluvial gold-mining centres of Addison's Flat, Cronadon, Nine-mile Beach, and Charleston.
From the Inangahua Junction, the main road continues southward through the Inangahua Valley, passing through cultivated lands, which are being gradually won from the heavy bush, and at a distance of 136 miles from Nelson reaches the township of Reefton. Here, as at Westport, are good hotels, and, as in every one of the larger coast towns, a hospital receiving a Government grant in aid. This town was the first in New Zealand to be lighted by electricity. Through the Midland Railway Company's extension of the Grey-Brunner Government line, Reefton is now connected by rail with Greymouth, from whence it is for the most part supplied. About two miles inland from Reefton is Black's Point mining township, with several batteries at work in and about the place, a visit to which is generally paid by tourists wishing to see something of the gold-mining industry. Other small mining townships are: Boatman's, Capleston, Antonio's, Noble's, Orwell Creek, Hatters’, Nelson Creek, and Twelve-mile.
Leaving Reefton by rail, and passing into the Grey Valley through a short tunnel, and a bridge over the Grey River, Totara Flat is reached, nineteen miles distant. Here there is a considerable area under cultivation. Seven miles farther on is the decayed mining township of Ahaura. Small townships are springing up along the railway-line, and several large sawmills are working.
At the Grey River Gorge, eight miles from Greymouth, we enter the township of Brunnerton. This place is the oldest centre of coal-mining in this district. Owing to the effect of the coal-smoke from the coke-ovens on the surrounding cliffs and bush, and the appearance of the numerous miners’ cottages nestling on the mountain-slopes, it has the look of a veritable “Black Country,” such as may be seen in some coal-districts in England.
Under the terms of their contract, the Midland Railway Company have selected, subject to existing rights, the coal-area contained in the Blackball Reserves, about four miles inland from Brunnerton. As these are situate on the side of the Grey River opposite to the company's constructed railway, a branch line with a heavy bridge is necessary to connect the two. At present an aerial tramway serves that purpose. Several large sawmills are at work between this place and Greymouth, which we reach at a distance of 180 miles from Nelson, the centre of the Grey River from its junction with the Arnold being the southern boundary of the district at this part. The Midland Railway Company's contract line, to connect with Canterbury by way of Arthur's Pass in the Otira Gorge, has been constructed on the Westland side of the Arnold River to Lake Brunner, the eastern shores of which it skirts for some distance, and from thence to the Teramakau River. An attempt which promises well is being made by the Midland Company to utilise the valuable timber growing in this part of the district, and to create an export trade to Australia.
The town of Greymouth is situated on the south bank of the Grey River, in the Westland District, and is the shipping-port for the products of the coal-basin included within the area of the Grey Coalfields Reserve, the larger portion of which lies on the north bank of the river in the Nelson District.
The small town of Cobden is situate opposite the town of Greymouth, and is connected with it by a substantial bridge.
Situate on the coast, fifty miles north of Westport, is the Karamea Special Settlement, principally settled from the Nelson and Motueka Valley districts. This part of the district contains some excellent but heavily-timbered land, and is reached from Westport by a good road, connecting with the Westport-Ngakawau Railway at the Mokihinui River. A bridle-track, also, connecting with Collingwood and Golden Bay, is nearly completed by the Government. This track passes along the coast northwards, thence up the Heaphy Valley to the Golden Downs, and down the Aorere Valley to Golden Bay. Here again is another coal-basin, which, though of inferior value to the older deposits on the western side, is likely to become of importance, having at the present time one mine in full work. At the Parapara Creek, about five miles south of Collingwood, extensive deposits of hæmatite-ore are found. These are now in the hands of the Onehunga Iron Company, which possesses also works in Auckland for reducing ironsand. The company are making preparations for reducing the ore, the surrounding conditions being favourable, as both limestone and coal are abundant in the locality. Another coal-basin exists at West Wanganui and Pakawau.
In the Aorere Valley, of which Collingwood is the port, alluvial mining is still found to be payable, and the country contains some valuable timber in the upper part not yet utilised. Nineteen miles south, in Blind Bay, lies the small port of Waitapu, from which a considerable amount of sawn timber is exported, drawn from the Takaka Valley, and brought; down by a steam tramway from the upper mills. From the head of this valley the main road is carried over a pass in the Pikikirunga Range, 3,476ft. high, through the villages of East and West Takaka, Riwaka, Motueka, and Moutere to the township of Richmond, eight miles from Nelson. Inland are also the villages of Ngatimoti, Dovedale, Tadmor, and Sherry, each the centre of a number of small farms, and all connected by fairly-good dray-roads.
An inland road, partly bridle-track and partly dray-road, has been made from Nelson to Canterbury, by way of Tophouse, Wairau Gorge, Tarndale, Clarence Valley, Jollie's Pass, and the Waiau Plains. On the Hanmer, a tributary of the Waiau-ua, is a Government Sanatorium, at an elevation of 1,000ft. above sea-level, and situate among hills 6,000ft. high. Here there are hot mineral springs, much visited by persons suffering from rheumatism and skin-diseases. It is reached by coach and rail from Christ church in ten hours. The main-trunk railway-line is constructed to Culverden, twelve miles north of the Hurunui, the southern boundary of the district. From Culverden a good coach-road passes through Rotherham and Waiau-ua to the East Coast at Kaikoura, connecting with Blenheim and Nelson.
About 4,000,000 acres of land in the southern part of the district has been set apart as an area of selection for the Midland Railway Company, according to the terms of their contract, but as yet a very small area has been dealt with.
About 3,000,000 acres of Crown lands still remain in the northern part of this district to be dealt with; they consist principally of high bush-country, with occasional patches of good valley-lands, the greater part being classed as second-class land. Of these, the area open for selection to date comprises of 41,380 acres of surveyed lands, and 212,213 acres unsurveyed lands, of which the location, nature of soil, &c., have been briefly described in the foregoing pages.
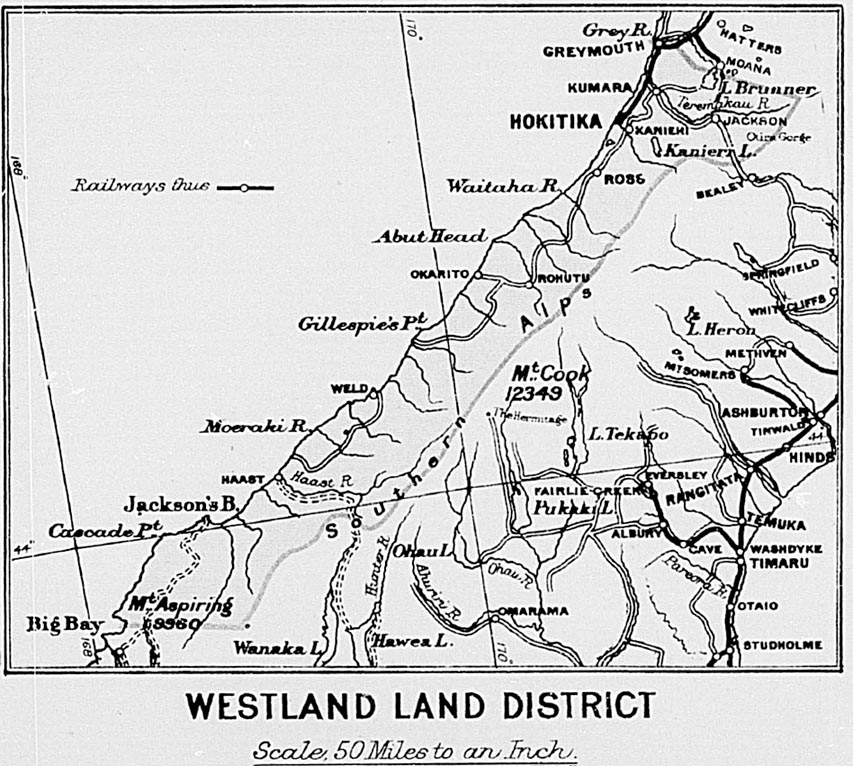
By J. STRAUCHON (revised by D. BARRON, Chief. Surveyor).
The main range (Southern Alps), forming the backbone of the Middle Island, extends along the eastern boundary of Westland from Harper's Saddle (Hurunui Pass) on the north to Mount Aspiring in the south, at distances varying from fifteen to over forty-two miles from the sea-coast. On this range are many peaks ranging in altitude from 4,000ft. to 12,349ft., the latter being the height of the magnificent snow-clad dome of Aorangi, or Mount Cook; while there are at least six others, between Elie do Beaumont and Mount Sefton, reaching an altitude of over 10,000ft., with Mount Aspiring close up at 9,960ft., above sea-level. From the main range descend immense snowfields and glaciers in profusion, and from these the principal rivers take their rise, running with the exception of the Waiatoto and Arawata (which flow north and west) in a generally south-westerly direction to the sea. These glaciers are most interesting and beautiful, and the terminal faces of some of them extend down to a very low altitude, notably those of the Fox and Franz Josef, which are only some 600ft. or 700ft. above sea-level, and can be approached on horseback without any danger.
These are numerous, swift, and strong, but of no great length. The principal ones, beginning from the north, are: The Grey (Mawhera), Arnold, Teremakau, Arahura, Hokitika, Mikonui, Waitaha, Wanganui, Poerua (Little Wanganui), Wataroa, Waitangi, Taona, Okarito, Waiho, Cook's, Karangarua, Makawiho, Maintain, Paringa, Moeraki, Haast, Okuru, Turnbull, Waiatoto, Arawata, Cascade, Gorge, and Awarua. Most of them are seldom fordable on horseback unless in winter time, which is consequently the best season for travelling; being nearly all snow-fed, they come down in raging torrents in the spring and early summer months.
There are also numerous lakes, none of any great area, but most of them very pretty. The largest are—Lake Brunner, six miles by three miles and a half; Kanieri, five miles by one mile and a half; Okarito, six miles by one mile and a quarter; Mapourika, three miles by one mile and a half; Mahinapua, Ianthe, Rotokino, Wahapo, Saltwater Lagoon, Paringa, Moeraki, and Ellery. Some are very deep, their bottoms being hundreds of feet below sea-level.
The soils on the low-lying lands are pretty much the same throughout Westland, and vary from gravel to fine sandy loam and stiff clay. There is usually a fringe, varying in width from a quarter of a mile to three miles, along either bank of each river on which the land is fairly good silt and loam, with timber ranging from light scrub to heavy bush. Towards the foot of the range or terrace the ground is more swampy, with stiff subsoil of clay, or cemented sand and gravel. On the terraces the soil is, as a rule, poor and thin, with a hard bottom. Numbers of pakihis, or open lands (mostly of a peaty nature), and also swamps, many of the latter of considerable area and good quality, are scattered here and there, but as yet no attempt has been made to reclaim any of them. No doubt some capital is necessary to begin with, for, although the land requires no clearing, a good deal of drain-cutting would be needed in so moist a climate in order to keep the surface dry; still, the land is good, and will some day repay the labour of reclamation, as each acre so redeemed will be worth a dozen on the terraces. The good farming land in Westland is very limited in area, but grass grows well throughout.
The total area of forest amounts to 2,394,951 acres, of which 903,785 acres are at an altitude of over 2,000ft. above sea-level, and 1,491,166 acres under that altitude. The supply of timber is practically inexhaustible, and the principal drawbacks to the extension of the saw-milling and timber industry appear to be the length of carriage before reaching a shipping port; the want of frequent and regular communication with such ports as we have south of Hokitika (unfortunately mostly bar-harbours); the lack of railways, tramways, or good dray-roads to open up the virgin bush inland; and last, but not least, want of capital and energy to push trade.
From the Grey River southward along the coast, and for a few miles inland, silver-pine, the most valuable and durable timber we have, is to be found, generally in belts fringing the margins of swamps and pakihis. There is also a large supply of good furniture timber, and along the mountain-sides a number of twisted, gnarled, and knotted trees that would show a most beautiful grain, and be valuable for veneering and similar purposes. The timber industry, next to minerals, is the most valuable asset of this district.
The harbours and ports of Westland are the following:—
Greymouth: Twenty-four miles north-east of Hokitika. Extensive harbour-works have been carried out. A breakwater or sea-wall extends some 3,360ft. seaward from the mouth of the river on the south side, and on the north side to 1,100ft., with internal half-tide training-walls, the result being an average depth of water on the bar of from 18 1/2ft. to 26 1/2ft. at high-water spring tides, and of from 8ft. to 16ft. at low-water springs. Vessels of 1,000 tons can now come alongside the wharf, where there is berthage accommodation of 1,824ft., with a minimum depth of from 12ft. to 16ft. at low water.
The principal exports are gold, coal, coke, and timber; and these for the financial year ended 31st March, 1894, were as follows: Gold, 65,025oz.; coal, 163,000 tons; coke, 1,811 tons; timber, 4,260,100 superficial feet. The number of vessels using the port during the year 1893 was: 638 steamers, tonnage 134,009; sailing-vessels 35, tonnage 3,303; being a gross tonnage of 137,312 for the year.
The train runs down the wharf, and the coal-trucks (specially made for the purpose) are lifted and emptied into the vessel's bold by means of powerful cranes, of which there are six, with capacities of from 11/2 tons to 12 tons, so that every encouragement is given to quick despatch.
Hokitika: Two training-walls have been constructed, the one on the north side being about 2,000ft. long, while that on the south is 670ft. The bar is one of shifting sand, and the depth at high water varies from Oft. to 15ft., while inside the depth is from 6ft. to 22ft. for three-quarters of a mile up from entrance. For ten months out of the twelve the port is usually safe for vessels drawing 8ft. to 10ft. of water. The berthage space amounts to 1,000ft., with from 18ft. to 22ft. of water. The exports for the financial year ended 31st March, 1894, were: Gold, 25,043oz., valued at £100,173; timber, 416,971 superficial feet red-pine, and 625,971ft. silver-pine for railway-sleepers. The number of vessels using the port during 1893 was 190; gross tonnage, 14,443.
Okarito, fifty-five miles south-west of Hokitika: A bar entrance, sometimes completely blocked by a high sand-bank thrown up by heavy seas. When open the entrance is good, with a maximum depth of 10ft. There is a small jetty about half a mile from the entrance.
Bruce Bay, ninety-five miles south-west of Hokitika: An open roadstead, well sheltered from south and south-westerly winds by Heretaniwha Point, which juts out fully a mile to the northward. Good anchorage in 18ft. of water opposite the Green Rock, which stands up out of the water. Good boat-landing with above winds.
Paringa River, 104 miles south-west of Hokitika: Open roadstead. Vessels coming in or out should give Hauata Reef (off the north head) a wide berth. There is also a sunken reef, awash at low water, in the middle of the bay, and a dangerous sunken rock just off the south head, two or three chains away, facing a small sandy bay, and right abreast of the trig, station. Vessels lie inside and a little to the northward of this rock, about a quarter of a mile from shore, and quite safe with southerly winds.
Haast River, 118 miles south-west of Hokitika: A constantly-shifting bar at entrance, which is nearly opposite and a little to southward of the Alhambra Rock. This rock stands well out of water, and vessels entering can go on either side with safety. Average depth on bar, from 6ft. to 8ft.
Okuru and Turnbull Rivers, 138 miles south-west of Hokitika: These rivers join just inside the entrance. Good, straight channel; average depth, 8ft. to 10ft. The Open Bay Islands lie just opposite the entrance, bearing a trifle west of north, and about three miles off. A dangerous reef lies about two miles and a half from south-west point of the smaller island, and immediately to northwest side of a line drawn from the last-named point to extreme end of Jackson's Head.
Jackson's Bay, 153 miles south-west of Hokitika: Good shelter and anchorage, open only to north-east, with 12ft. of water to within a few chains of shore. Jackson's Head runs out about one mile and a half in a north-easterly direction from the southern end of the bay. This is the only ocean harbour on the coast above Milford Sound, and could be converted into a first-class port at comparatively small cost. No doubt Jackson's Bay will eventually form a great coal port, as the recent discovery of a practicable pass through the main range, viâ the Waiatoto and Axius Rivers, will make it in the not-distant future the natural outlet for the Lake Wanaka country.
Cascade River, 169 miles south-west of Hokitika: Bar entrance; but once in, the river is navigable for five miles. No steamer has yet been in, but there is no apparent difficulty in the way. Depth of water said to be 8ft. to 10ft. at entrance.
Big, or Awarua, Bay, 200 miles south-west of Hokitika: At extreme southwest corner at Westland. An open roadstead, with good anchorage in fine weather, sheltered from east and south-west winds; 24ft. of water on south side anchorage and 30ft. on north side, just opposite Crayfish Rock, in a spot sheltered from northerly winds.
The district is fairly provided with roads and horse-tracks, most of which, however, run parallel to the sea-coast. Of the former there are over 290 miles; of the latter, 376 miles. The Midland Railway Company's line is now open for traffic from Reefton as far as Jackson, a distance of 70 miles.
Brunnerton, a borough of about 2,250 inhabitants, is a coal-mining centre. Coke and fireclay bricks are also manufactured. Railway communication with Greymouth Port, with Reefton, and Lake Brunner.
Greymouth Borough: Population, 3,800; shipping port for Grey Valley (see Ports and Harbours, p. 405); railway communication with Reefton, also Hokitika; railway workshops, foundry, quarries. The principal business portion of town is built on Native land, rents being paid to Public Trustee, who distributes them to Natives entitled thereto.
Kumara: Borough of 1,200 inhabitants. This is a brisk little mining town, and is probably the largest hydraulic-sluicing mining centre in New Zealand. It has two suburbs—Dillmanstown and Larrikin's—with populations of 480 and 240 respectively.
Hokitika: Borough of 2,200 inhabitants. This is a pretty little town, the political capital of Westland, the port for shipping and centre of supply for a number of little townships, and for the whole district south of Teremakau.
Ross: Borough, population, 850; a clean and neat little town, the centre of a considerable mining district, with a few good sluicing-claims on a large scale.
In addition to the above, there are several smaller mining centres, such as Stafford, Kanieri, Woodstock, Rimu, Blue Spur, Okarito, and Gillespie's.
The District of Westland contains the greatest area of alluvial auriferous ground on the West Coast. In the Mines Report of 1894, the number of miners employed is given as 2,111; and the amount of gold produced as 33,610oz. valued at £134,443.
All the Westland rivers carry move or less gold, but the two great golden rivers are the Arahura and Waiho, the bars and ripples in which appear to be replenished with fresh deposits of gold after each flood. Standing on the summit of Mount Turiwhate, the ancient beds of the Arahura can easily be traced northward to the Kumara, and southward to the Rimu diggings. Similarly, the Waiho has in olden times flowed both northward down the course of the Okarito River, and southward to the Omoeroa River, the lateral terraces in both directions being well defined and gold-bearing.
There are three leading deposits of gold in West and first, what may be called riverine leads, running generally westward; second, beach leads, consisting of those along the present coast-line, and others running parallel thereto at distances varying from one-quarter to three miles inland, and at levels from a few feet below to a couple of hundred feet above sea-level; third, extensive masses of auriferous gravel, &c., occurring in large isolated patches, as at Big Dam Hill, Humphrey's Gully, Mount Greenland, and Bald Hill, north of the Haast. These drifts have all one notable peculiarity—viz., that they invariably coat the seaward faces of the hills, and neither gold nor drift is found on the inland slopes. Gold-bearing fans from Mount Greenland have been found at different levels on Ross Flat, having probably been deposited in deep water by successive land-slides.
Hydraulic sluicing on a large scale is successfully carried on in various portions of the northern district, and will doubtless be extended to many other localities. The tapping of the Arahura River by the Humphries Gully Sluicing Company will, when completed, enable the miners of Blue Spur, Kanieri, and Rimu to obtain a permanent supply of water, and command a large area of auriferous country at present unworkable from want of water at a sufficient altitude. Numerous and costly experiments have been made with dredges of different types in the endeavour to work economically the gold-bearing sands which lie along the sea-beaches for a distance of over 140 miles; but none has proved a success as yet. A considerable number of miners (blacksanders) work on some of these beaches, and seem to make a fair living, many of them having been so employed in one neighbourhood for over twenty years. Gold-bearing quartz has been found throughout the district, the most promising finds being at Taipo Range, Browning's Pass, and Cedar Creek; but, as yet, this quartz has nowhere been properly worked. Silver-ores have been found, notably at Mount Rangitoto; but the main lode has not yet been discovered, although systematic search is still going on. Copper has also been found in many places, more especially at Browning's Pass, and on the western slopes of the Matakitaki Range, where good coal and limestone are also at hand.
The pastoral lands amount to 2,002,577 acres, of which 1,898,776 acres are covered with forest, and 103,801 acres are open lands, the latter being for the most part the mountain-slopes above the timber-line. Hitherto (speaking generally) only cattle have been grazed; usually on the open river-beds and adjoining forest-lands. The settlers are only now beginning to sec the value of the mountain-slopes as a summer run for sheep, and to introduce the latter animals in numbers. For several years past the rabbits have crossed the dividing-range at different points into the upper valleys of some of the South Westland rivers, making their way for a few miles downward before returning—which they generally do. The common opinion seems to be that the climate and ground are both too moist for them ever to spread much.
The agricultural lands comprise 355,981 acres, of which 332,715 are forest and 23,266 acres are open lands, consisting principally of river-flat and swamplands. There is but little real farming clone in the district, and only such grain is sown as is necessary to provide feed for stock. Most of the grain is therefore cut before maturing, either as green food or for hay and chaff, a considerable amount of which, together with nearly all the oats consumed, is still imported from Nelson or Canterbury. Comparatively few turnips and mangolds are grown, although they thrive well, most of the farmers devoting their attention to growing grass, dairying, and fattening cattle, for which the district is well suited.
Of Crown lands available there still remain 2,359,000 acres, of which the above remarks hold good as regards description and quality. The Native lands in Westland are virtually freeholds, and most of them already Crown-granted.
Very erroneous ideas of the Westland climate appear to exist in other districts, the general impression being that it is raining nearly all the year round. Such, however, is far from being the case, the average climate being simply delightful, and very even; no extremes, and very little cold wind. It is freely asserted that the climate is very much better now than in the early clays of settlement on the Coast. We have no available authentic meteorological records since 1880, but for the fifteen years previous to that date they were regularly kept, and show an average rainfall of 119in. per annum, with an average of 202 wet days. The mean barometric reading over the same period was 29.944, and the mean temperature 53.61.
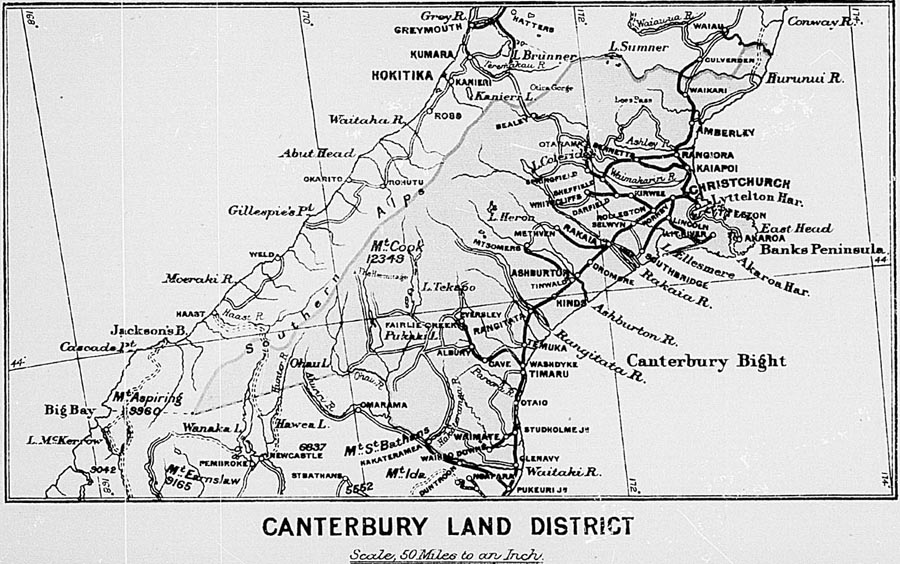
By J. W. A. MARCHANT, Chief Surveyor.
The Land District of Canterbury comprises the central portion of the Middle Island, and is bounded towards the north by the Hurunui River, with an extension northward to the Waiau-ua River for about twelve miles from the sea; towards the westward by the summit of the Southern Alps to Mount Aspiring; thence towards the south by a right line and by the Ohau and Waitaki Rivers to the sea; and towards the cast by the South Pacific Ocean. It lies between south latitudes 42° 45’ and 44° 55’, and east longitudes 168° 50’ and 173° 20’. The length of the district north-east and south-west is about 190 miles; the breadth W.N.W. and E.S.E., from the summit of the Alps to the sea, averages seventy miles. The sea-board has a length of about 240 miles, consisting generally of low-lying beaches, broken by the projection eastward of Banks Peninsula, which contains the only large natural harbours. That portion of the district which fronts the ocean between the Ashley and Opihi Rivers is flat land, about 2,500,000 acres in extent; north and south of those limits the plain is interspersed with undulating and hilly country.
This great plain stretches westward, rising and merging into downs and hills, which again extend westward and merge into the Southern Alps and the offshoots therefrom. Banks Peninsula, which has an area of about 250,000 acres, is wholly composed of ridges and hills, deeply intersected by basins and gullies, the result of volcanic action.
The Southern Alps, which form the backbone of the island, are a continuous chain of mountains, with a succession of magnificent peaks, attaining their culminating point in Mount Cook, or Aorangi, 12,349ft. above sea-level; there are, besides, numerous peaks ranging in altitude between 7,000ft. and 10,000ft. Offshoots, extending to great distances eastward and south-eastward from the main range, attain elevations of 6,000ft. to 9,000ft. On these mountain-ranges are numerous and extensive glaciers, from which emanates the river-system of the district, comprising the Hurunui, about 85 miles in length; Waimakariri, 90 miles; Rakaia, 85 miles; Ashburton, 64 miles; Rangitata, 74 miles; the Waitaki and its main feeders, 140 miles. These rivers rush down from the mountain-gorges, through the intervening ranges and hills, and traverse the plains to the sea. The channels on the plains are shallow, and extend in some instances over a mile in width.
Associated with these rivers is a portion of the lake system of the Middle Island, Lake Sumner being connected with the Hurunui, Lakes Coleridge and Heron with the Rakaia, and the Mackenzie-country lakes—Tekapo, Pukaki, and Ohau—with the Waitaki. Another important lake is that known as Lake Ellesmere—west of Banks Peninsula; it is separated from the ocean by a narrow shingle-spit only 5 chains across at one point, through which, at certain seasons, the flood-waters force a channel to the sea.
The climate of Canterbury is well suited to Europeans. It resembles that of Great Britain, but on the plains is far more equable, the mean daily range of temperature being 17.10° Fahr. Observations taken at Lincoln (fourteen miles from Christchurch) for a period of ten years ending December, 1892, give the following results: Barometer, reduced to 32° Fahr. and sea-level, 30.06; mean maximum daily temperature, 61.47; mean minimum daily temperature, 43.27; mean average temperature, 52.37. The extremes of temperature were 92° and 22° Fahr. The rainfall for the same period averaged 26.809in. per annum, the extremes being 35.287in. in 1886 and 14.836in. in 1890. The average annual number of days on which rain fell was 123, the extremes being 149 in 1887 and 98 in 1891. Snowfalls are very light on the plains, but in the high uplands the climate is much colder and more severe. The changes of weather and temperature are sudden, calms and gales, rain and sunshine, heat and cold alternating. The prevailing winds are north-east, south-west, and north-west—the last a hot wind. The climate, as a whole, is splendidly healthy, bracing, and most enjoyable.
The district was occupied, in the first instance, by settlers sent out by the Canterbury Association, which was formed in 1848, and incorporated by Royal Charter in 1849, under the auspices of prominent men in England, including the Archbishop of Canterbury and Lord Lyttelton. The step was not taken until after due inquiry as to the most suitable part in which to establish a settlement. Captain (now Sir George) Grey, at that time Governor, recommended the Wairarapa, but it was finally decided to take over from the New Zealand Company a tract of the Canterbury Plains, in the neighbourhood of Port Cooper. Captain Thomas, the agent of the association, who had advised the selection, superintended the surveys and the preparations for receiving intending settlers. The original intention of the founders was that the settlement should be independent and complete in itself, and should embrace only such persons as were members of the Church of England and were approved of by the association. This was frustrated by the influx of numbers of persons of all classes and beliefs. The first body of emigrants arrived at Port Cooper on the 16th December, 1850, and the settlement remained under the control of the association, as directed by a committee of management in England, and under the active personal supervision of Mr. John Robert Godley, until 1853, when the whole of Canterbury became a province of New Zealand by the provisions of “The Constitution Act, 1852.”
Thenceforward the control of the settlement was vested in the Superintendent and the Provincial Council. The first Superintendent was Mr. James Edward FitzGerald, who held office till 1857; he was followed in succession by Mr. William Sefton Moorhouse, 1857–1863; Mr. Samuel Bealey, 1863-1866; Mr. Moorhouse again till 1868; and Mr. William Rolleston till the abolition of the provinces in 1876, when the district came directly under the control of the General Government.
The area of the Canterbury Land District is 8,776,655 acres, of which the estimated area of forest-land is 492,130 acres. Forest-lands are found in Banks Peninsula and in the Mount Peel and Waimate districts, where the timber consists chiefly of rimu, totara, and matai; at the sources of the Ashley, Waimakariri, Rakaia, Hopkins, and Hunter Rivers, at Lake Wanaka and near Springfield and Methven, the timber in these localities being mostly native beech; and near Oxford, where the beech is interspersed with rimu, totara, matai, &c.
The lands of Canterbury are classed as follows: First class, 1,840,681 acres; second class, 4,707,173 acres; third class (barren lands and lands of small value), 2,228,801 acres: total, 8,776,655 acres.
| The disposition of lands is as under:— | No. of Holders. | Area in Acres. |
|---|---|---|
| 1. Crown lands disposed of for cash, and under Midland Railway Act | .. | 3,295,106 |
| 2. Lands held on deferred payments | 108 | 22,717 |
| 3. Lands held on perpetual lease | 327 | 78,146 |
| 4. Lands held as leaseholds in perpetuity | 217 | 51,396 |
| 5. Lands held in occupation with right of purchase | 16 | 3,099 |
| 6. Lands held as village-homestead special settlements | 296 | 8,129 |
| 7. Lands held as small grazing-runs | 40 | 93,407 |
| 8. Lands held as grazing-farms | 18 | 26,023 |
| 9. Pastoral licenses, including small area of barren country | 128 | 2,896,585 |
| 10. Special-settlement associations | 32 | 3,023 |
| 11. Land granted under Midland Railway Act (area also included in 1 and 13) 271,983 acres. | ||
| 12. Reserves held under license | 190 | 80,199 |
| 13. Area of land reserved and granted under various Acts (exclusive of 12) | 664,481 | |
| 14. Land purchased and disposed of under Land for Settlements Act (included in 1) 1,251 acres | 43 | |
| 15. Crown lands open for selection | 18,269 | |
| 16. Crown lands being prepared for selection | 44,181 | |
| 17. Barren lands | 1,491,894 | |
| Total | 8,776,655 |
In explanation, it may be noted that No 1 comprises the freehold lands conveyed, and that tenants of Nos. 2, 3, and 5 have the right of acquiring the freehold, which is not the case with tenants of Nos. 4, 6, 7, 8, 9, 10, 12, and 13. Crown lands proper are—15, open for selection; 16, being prepared for selection.
In no part of New Zealand are the means of communication better than in Canterbury. The natural facilities of the country have been abundantly supplemented by railways and roads. Lyttelton, the chief port, is connected by rail with Christchurch, the heart and centre of the whole district. From Christchurch the main line extends northwards to Culverden, striking the Hurunui River at a distance of 57 miles; southward the main trunk line runs to Waitaki, 138 3/4 miles. These lines tap and serve the whole coastal district, and the lands adjoining on the western side. As feeders to these trunk lines, eight branch lines have been constructed westward, and two lines south-eastward; the former, in most instances, extending to the foot of the hills.
Combined with the railway system is a complete network of main, district, and subsidiary roads, extending into all parts of Canterbury. The total length of railways is 455 miles, and the roads probably exceed 10,000 miles in the aggregate. The completion of this splendid system is due, partly to the foresight of the original settlers, partly to the exertions of the Provincial Government, and partly to the railway and public-works policy of Sir Julius Vogel.
According to Sir James Hector, the main western ranges are composed of Upper Palæozoic rocks, having at their base extensive plains of Tertiary fluviatile formation, with occasional protruding ridges of Upper Mesozoic, forming low mountain-ranges subordinate to the main axis. Banks Peninsula consists of basic volcanic rocks.
The Southern Alps and mountains adjoining are, owing to their great altitude, subject to disintegration, and form for the most part rocky barren wastes.
The lower ranges and hills, the high tablelands, and the light stony portions of the plain form the pastoral areas.
In the northern and southern districts and in the great central plain are the agricultural areas. This latter class of land comprises rich alluvial tracts about Cheviot, Rangiora, Kaiapoi, Lincoln, Ellesmere, Longbeach, Temuka, and Waimate, and the splendid plain- and down-lands which extend from Cheviot to the Waitaki.
Banks Peninsula, where the soil is of a rich volcanic nature, though exceedingly hilly, has alluvial areas in the valleys and about the bays.
Below a certain level the mountainous and hilly regions, and the high upland country in the western and northern part, are covered by Native grasses, with an admixture of English forage-plants where the character of the soil and other circumstances are favourable.
The pasturage, which is very suitable for sheep-farming, is taken full advantage of by the pastoral tenants of the Crown, and is used to some extent by freeholders. The light stony portions of the plains also contain native grass lands, well adapted to merino sheep.
The lower hills, downs, and better kinds of plain-country have been widely cultivated, and have proved well fitted for the production both of cereals and of grasses.
The chief crops grown are wheat, oats, barley, turnips, rape, clover- and grass-seed; while amongst other crops produced are maize, rye, peas, and beans.
Of the cereals, wheat is the most largely grown, and has been for many years a large item of export. The Canterbury Plains, which comprise about 3,000,000 acres, extending over 150 miles from north to south, constitute the main wheat-producing area of the colony.
In 1894 the area under crop was 174,252 acres; the yield, 3,407,842 bushels, or 19.56 bushels per acre, equal to about two-thirds of the whole yield for the colony.
Oats also are very successfully grown, the figures for the same period being 141,211 acres, yielding 4,172,690 bushels; average, 29.55 bushels per acre, or nearly one-third of total yield for colony.
Barley of superior quality is also produced, the figures being 11,365 acres, 273,965 bushels: average per acre, 24.11 bushels, or over one-third of total yield. Grass-seeds are abundantly grown, cocksfoot mainly on the splendid Banks Peninsula country, and rye throughout the land district. The yield in 1894 was—cocksfoot, 132,266 bushels of 12lb.; and ryegrass, 138,226 bushels of 20lb.: the proportion of each to the total yield for the colony being respectively about one-half and one-fourth.
Play was grown on 17,105 acres.
Potatoes, which yield crops of excellent quality, were grown in 1894 on 6,309 acres, the yield being 42,422 tons, or 6.72 tons per acre—nearly one-third of the yield for the colony. Turnips and rape were grown on 125,732 acres, being about one-third of the total acreage for the colony. The combined area of other crops grown, including rye, peas, beans, mangolds, beet, carrots, and onions, was 15,436 acres. The area of oats for green fodder and hay was 32,629 acres. The area ploughed and laid down in English grasses was 1,385,616 acres. Surface-sown lands comprised 377,918 acres. For the same year, 1894, the total area under crop was 507,134 acres, and the area broken up but not in crop, 38,900 acres.
The pastoral and agricultural lands provide grazing and fodder for a largo number of sheep, cattle, horses, and other stock. Of late years the value of the plains has been much enhanced and the carrying-capacity thereof greatly-increased by the water-race system, which supplies water throughout the length and breadth of the dry areas, and enables the country to be occupied in smaller holdings than would otherwise be possible.
The following table shows the extent, cost, and other particulars regarding the water-race system in the several counties:—
| County. | Area watered. | Miles of Races. | Total Cost. | Cost per Acre watered. | Amount of Water distributed every Twenty-four Hours. | Annual Charge for Use of Water. | |
|---|---|---|---|---|---|---|---|
| £ | s. | d. | |||||
| Selwyn | 326,338 | 1,084 | 67,679 | 4 | 13/4 | 70,940,960 | 8s. 4d. to £1 3s. per 100 acres. |
| Ashburton | 586,000 | 1,050 | 27,000 | 0 | 11 | 75,000,000 | About £3 per mile of race. |
| Geraldine | 71,212 | 260 | 9,010 | 2 | 61/2 | 29,520,000 | About 7d. per acre, including a rate for payment of principal and interest on loans, and a rate for maintenance. |
| Waimate | 28,000 | 105 | 4,100 | 2 | 11 | 7,200,000 | Races are maintained by a small rate on the annual value of lands watered. |
The number of stock in April, 1891, was as follows: Horses, including 6,754 brood mares, 47,567; mules and asses, 97; cattle, including calves, and including 34,922 breeding-cows, of which 31,250 were milch cows, 81,772; sheep, excluding lambs, and including 1,693,339 breeding-ewes, 4,307,732; goats, 397; pigs, 75,984; poultry, 404,355. In 1893 the number of sheep in the provincial district was 5,484,981, made up as follows: Merinoes—wethers, 1,129,932; ewes, 1,665,197. Other breeds: Wethers, 898,169; ewes, 1,791,683.
The district has a well-deserved reputation for the classes and splendid quality of its sheep. On the mountains and higher lands the merino still predominates; but on the richer low-lying ranges, hills, and plains the prevailing types are crosses between the merino and Leicester, Lincoln, Romney Marsh, and other breeds. In proof of the superior character of the flocks, pasturage, and climatic conditions in the Middle Island, the following percentages of lambing returns are quoted—these are “fair average returns, but much higher might have been exhibited”: Mountain native pasture—pure merino, 75.36; pure merino and Border Leicester, 88.94: English-grass pasture—crossbred and Border Leicester, 80.8; half-bred Border Leicester, 82.79; Border Leicester, 90.77; Lincoln, 88.08; Romney Marsh, 111.46; English Leicester, 93.34; Shropshire, 97.41; South-downs, 96.87. It must be borne in mind that the flocks and herds are supported by the natural and artificial pastures without housing.
Owing to the development of the frozen-meat trade a great impetus has been given to sheep-breeding. The bulk of the primest meat exported from the colony is supplied by this district, and commands the highest price in the London markets. In the year 1890 the number of carcases frozen was 640,723, of the value of £369,574, being over one-third of the total output of the colony in this line. 197,037lb. of beef, valued at £2,052, and 554,593lb. of preserved meat, valued at £12,622, were also produced. Other productions during 1890 were as under: Tallow, 1,521 tons, value £33,254; bonedust, 668 tons, value £3,674; neatsfoot- and trotter-oil, 3,162 gallons, value £530; bones, hoofs, horns, &c., 479 tons, value £1,900.
The frozen meat exported from Canterbury during the year ended 31st December, 1893, comprised: Sheep, 453,009 carcases; weight, 27,580,672lb.; average weight per carcase, nearly 61lb. Lambs, 288,580 carcases; weight, 11,072,746lb.; average weight per carcase, 38.6lb. At Belfast, Islington, and Timaru freezing-works are established, each containing a complete plant for carrying on the industry, as well as departments for curing, preserving, boiling-down, tallow-rendering, fellmongering, and the manufacture of manures. The Belfast company have at their command steam-power equal to 500 horse-power, and employ about 220 men. They have storage for 26,000 sheep, and can put through 3,000 a day. The Islington and Timaru works, which are owned by the Christchurch Meat Company, employ from 250 to 300 men. The former can put through 2,000 sheep and 1,000 pigs per diem, and have storage for 36,000 carcases. The latter can deal with 1,000 sheep in a day.
In the year 1893 there were shipped at Lyttelton and Timaru 29,002,030lb. of wool, valued at £1,092,766; and during the same period 1,011,742lb. of wool, valued at £30,600, were bought for manufacture by the woollen-mills in the district. Thus the gross amount of wool produced during the year was 30,013,772lb., valued at £1,123,366. The staple of the New Zealand wool, especially the long-wool and crossbred, is remarkable for its freedom from breaks and other imperfections. The average clips are approximately as follows: Merino, 4lb. to 7lb.; quarter-breds, 61/2lb.; half-breds, 71/2lb.; three-quarters, 81/2lb.; Leicesters, 101/2lb.; Lincoln, 11lb. From special flocks clips up to 25lb. and 30lb. are obtained.
Banks Peninsula and the rich tracts of country previously mentioned are excellently suited for dairy-farming. The pasturage and climatic conditions are favourable, and a great increase in the production of butter and cheese may be looked for, more especially as housing and hand-feeding are in some districts unnecessary. A central co-operative dairy factory has been established at Addington, served by nine creameries situate at Marshlands, Halswell, Springston, Doyleston, Oxford, Little River, Ladbrooks, Lakeside, and Kaiapoi, each capable of dealing with the milk of 1,000 cows. In the spring the company propose opening creameries at Tinwald, Flemington, Woodend, View Hill, Leithfield, Brookside, and Russell's Flat. There are also very complete factory dairies at Taitapu, Sefton, Temuka, Southbrook, Belfast, and Le Bon's Bay.
In 1890 the production of butter amounted to 2,268,758lb., and of cheese to 1,313,027lb.
The sawmilling industry finds its development chiefly in the Oxford, Little River, Mount Somers, and Waimate districts. The number of mills in Canterbury in 1890 was twenty, employing 250 hands, the horse-power being 281. The output was 3,978,146ft., valued at £16,049. The timber comprises birch, totara, red-and white-pine. The first-named is used chiefly for sleepers and fencing, the rotara and pines for building purposes. Including the work done by the planning-and moulding-mills, the value of all the manufactures under this head was £41,447.
In 1890, the drying and preparation of this plant gave employment to 16 mills and 313 hands; the aggregate horse-power of the engines was 222; 15,409 tons of raw material turned out 2,125 tons of fibre, valued at £36,960.
The district is eminently adapted for the growth of a large variety of fruits, especially all those which flourish in Great Britain. Attention has recently been directed to landing supplies of fruit in London; the attempts so far have proved satisfactory, and point to the possibility of a large trade being established.
Brown coal is found at the Malvern Hills, Homebush, Whitecliffs, Springfield, Mount Somers, Albury, and various other places. Lignite is also commonly distributed. For the year 1893, the output from 12 collieries, employing 38 hands, was 11,929 tons, bringing the total amount raised from 16 collieries up to the 31st December, 1893, to 304,237 tons. The seams worked vary from 16ft. to 2ft. 3in., the average width being 8ft. At Acheron, near Lake Coleridge, a true anthracite is found, the other pits in the district being of brown coal or lignite.
The building-stones of Canterbury comprise some excellent varieties. The Halswell quarries produce an exceedingly hard and close-grained stone of a dull leaden-grey colour. Granular trachytes are obtained from Governor's Bay, Lyttelton; porphyrites at Malvern Hills; good limestone at Malvern Hills, Waikari, Mount Somers, and various other places; bluestone rock is found at Timaru suitable for millstones. There is abundance of limestone in North Canterbury, Mount Somers, Castle Hill, and various other parts, which is well adapted for making lime.
Deep-sea fishing is carried on from Lyttelton and Akaroa, the kinds of fish chiefly caught being groper (hapuku), ling, conger, moki, butterfish, barracouta, soles, whiting, red-cod, herrings, guffy, and garfish. From Lake Ellesmere and the river-estuaries excellent flounders are obtained. At the present time there are employed on the lake and along the coast about 87 boats, manned by 182 men.
Trout thrive amazingly in the rivers and fresh-water lakes, affording excellent sport.
The total number of manufactories in Canterbury in 1890 was 386, employing 4,197 males and 465 females, their annual wages respectively being £328,812 and £16,965; the number of engines 391, of 4,677 horse-power.
The total value of manufactures for 1890 was £2,061,921, and the value of land, machinery, and buildings was £1,099,444. Included in the above were 16 printing, 12 agricultural-implement, 32 coach-building and -painting, 25 fell-mongering, tanning, currying, and wool-scouring establishments, 4 ship- and boat-building works, 7 sail- and oilskin-factories, 2 woollen-mills, 2 clothing, 10 boot-and-shoe factories, 3 rope-and-twine works, 16 flax-mills, 6 boiling-down, meat-preserving, and freezing works, 4 cheese- and butter-factories, 40 grain-mills, 1 fruit- and jam-making works, 19 breweries, 5 malt-houses, 21 aërated waters and cordial works, 1 sauce- and pickle-making factory, 4 soap- and candle-works, 20 sawmills and sash-and-door factories, 4 gasworks, 18 brick, tile, and pottery manufactories, 11 iron- and brass-foundries, and 6 collieries.
As an indication of the progress of the district, it may be noted that there were in 1891 sixty-six public libraries, mechanics’ institutes, and scientific institutions. with a membership of 8,263; and 256 churches or chapels, attended by 41,771 persons.
Primary Schools.—The district is divided into two parts, termed North and South Canterbury, each presided over by an Educational Board. Under the control of the Boards schools have been established throughout the whole country wherever population warrants their erection.
The number of children attending the public primary schools in Canterbury, December, 1893, was—males, 13,613; females, 12,783: total, 26,396. Average daily attendance, 21,826. Number of teachers—males, 305; females, 406: total, 711: and 67 sewing-mistresses. Number of schools, 239. School Committees, 226.
The income from primary educational endowments for the year 1893 amounted to £15,719 11s. 7d.
There is a Normal School at Christchurch for the training of teachers.
For the further education of children ample provision has been made by the establishment of secondary schools. The principal schools of this class are the Boys’ and Girls’ High Schools at Christchurch, Rangiora, Ashburton, Timaru, Waimate, Akaroa, and Temuka.
The amounts received by secondary schools in this district from rents of endowments for the year ending December, 1893, were as follow: Christ-church Boys’ High School, £3,296 0s. 6d.; Christchurch Girls’ High School, £313 5s. 4d.; Christ's College Grammar School, £2,696 14s. 6d.; Akaroa High School, £152 6s.; Ashburton High School, £554 14s. 1d.; Rangiora High School, £96 14s.; Timaru High School, £1,199 19s. 8d.; Waimate High School, £246 4s. 6d.: total, £8,555 18s. 7d.
For more advanced students Canterbury College, Christchurch, is available. This institution was founded and endowed by the Provincial Government in 1873. It is presided over by a Board of Governors. In 1893 the teaching staff comprised four professors and five lecturers, and the number of students attending lectures was 278.
In reference to this institution, it should be recorded that the Provincial Government of Canterbury recognised its duties as regards higher education when the work of the Canterbury Association ceased. It made reserves for the purpose of endowment for the following objects: (1) College, 101,640 acres, reserved June, 1873; (2) technical science, 103,000 acres, reserved July, 1873; (3) School of Agriculture, 100,950 acres, reserved June, 1873; (4) Boys’ High School, 9,220 acres, reserved at various dates: (5) Classical School, 8,953 acres, reserved at various dates. To these were subsequently added the following: (6) Girls High School, 2,578 acres, reserved January, 1878; (7) Medical School, 5,000 acres, reserved December, 1877.
There are numerous private schools, independent of the State, the chief amongst them being Christ's College, Christchurch, connected with the Church of England. The Roman Catholics support schools of their own in Christchurch, Lyttelton, Timaru, Addington, Papanui, Halswell, Ashburton, Arowhenua, and Waimate. There are besides, in Christchurch, some excellent private boarding and day-schools for both boys and girls.
Canterbury has the advantage of possessing many flourishing public institutions. The School of Art, Christchurch, was established by the College Governors in 1882; the Art Gallery owes its origin to the Art Society, the site being the gift of the Government. The School of Agriculture, Lincoln, also founded by the College Governors, is surrounded by 660 acres of land. The commodious buildings, which cost over £20,000, provide accommodation for the Director and teaching-stall, and for forty-five students. The fees are on a low scale. The farm-buildings are complete, and include a well-equipped dairy. Instruction is given in agriculture, chemistry, botany, mechanics, physics, surveying, &c.
The Public Library, Christchurch, under the control of the College Governors, contains reading-rooms, a circulating library of over 14,000 books, and a reference library of over 8,700 volumes. Numbers of magazines and newspapers are provided.
The Museum, Christchurch, is a handsome pile of stone buildings; the collections are large and varied. They are separated into two groups—(1) Those from New Zealand; (2) those from foreign countries. In the New Zealand department the skeletons of whales and of moas, as well as the collections of shells (tertiary and fossils) and rocks, are specially good; and the Maori collection, exhibited in a Maori house, is also of considerable interest. In the foreign department, the geological, mineralogical, and ethnological collections are the most extensive, but there is also a good illustrative series of Egyptian and Roman antiquities, as well as of the remains of prehistoric man in Europe and America.
This institution owes its origin and success to the foresight, skill, and energy of the late Sir Julius von Haast, and to the munificence of the Provincial Government.
The philanthropic institutions embrace the Christchurch, Akaroa, Ashburton, Timaru, and Waimate Hospitals; the Sunnyside Asylum for the Insane; the Rhodes Convalescent Home; the Memorial Home for the Aged at Woolston; the City Mission and Destitute Men's Home, Christchurch; the Deaf-and-dumb Asylum at Sumner; the Orphanage, Lyttelton; and the Industrial School at Burnham.
Christchurch, the capital city of the Canterbury District, is situated on the plains. It is practically level, laid out in rectangular form, two miles by one mile and a quarter, and is intersected by a diagonal street. The streets are 66ft. in width. There are numerous open spaces, including the Cathedral Square in the centre, Cranmer and Latimer Squares. The Avon, a pretty stream, overhung by willows, runs through the town, presenting from all points charming vistas. The city is surprisingly English in its appearance, architecture, and surroundings. The central portion, where stand the Cathedral, Government offices, and other substantial structures, has a handsome, well-built look. Other parts contain fine public buildings, such as the Museum, Canterbury College, High Schools, &c. The whole is admirably set off by Hagley Park, 400 acres in extent, the Domain and Botanical Gardens, 79 acres, Lancaster Park, the town belts, and other public and private gardens and plantations. The suburbs can show many handsome houses and beautifully kept grounds.
The city is surrounded by the populous boroughs and districts of Sydenham, St. Albans, Linwood, Papanui, Woolston, &c. The population of the city was at the last census 16,223, in 3,318 houses; including the adjacent boroughs and other suburbs the population amounts to 47,846. Tramways connect the city with the suburbs of Addington, Sydenham, and Papanui, and with the seaside villages of New Brighton and Sumner. The city has been drained at considerable expense, the sewage being conveyed three miles and discharged on the sand-wastes near the sea. A pure and copious water-supply has been provided by nature, and is obtained by artesian wells. The affairs of the municipality are controlled by the City Council, presided over by the Mayor. Christchurch is the centre of trade and commerce for the North Canterbury agricultural and pastoral country, and the head-quarters of many manufacturing industries, including carriage-, boot-, and clothing-factories, Hour-mills, breweries, meat-preserving and -freezing, biscuit, planing and moulding, bicycle, and other works.
There are large and well-equipped show-grounds at Addington.
Recreation and amusement are provided for by the Theatre Royal and various public halls, the famous Riccarton racecourse, the numerous cricket and football grounds, &c.
The Avon and Heathcote estuary meet the requirements of boating men.
Christchurch is connected with the outside world by Port Lyttelton, seven miles distant. The railway-tunnel of 15/8 miles in length, through the Port Hills, is on this line. Christchurch is not only the centre of the splendid Canterbury Plains, but it also is one of the chief railway centres of the colony. Addington railway-workshops are extensive and fully equipped.
Lyttelton, the chief port of the district, is situated on the northern shores of the inlet of that name, sometimes called Port Cooper. The surrounding country consists of high precipitous hills, which separate the harbour from Christchurch and the plains; but by the construction of the railway and tunnel the natural difficulties have been overcome, with the result that the whole of the imports and exports of northern and central Canterbury pass through Lyttelton. The origination and accomplishment of this great engineering work is due to the late William Sefton Moorhouse, at that time Superintendent of the province. The natural advantages of the port have been enhanced by reclamation and harbour-works, which include two breakwaters, 2,010ft. and 1,400ft. in length respectively, extending from Officer and Naval Points, enclosing about 107 acres; long lengths of wharf-accommodation, 10,041ft.; a patent slip for ships up to 400 tons; and a splendid graving-dock 450ft. long, width on top and bottom 82ft. and 46ft. respectively, the entrance being 62ft. wide, well equipped with machinery and all requisites for repairs. Ships drawing up to 25ft. can berth alongside the spacious wharves and sheds. The railway, electric-light, machinery, and appliances are available throughout, which renders loading and unloading practicable both by clay and by night. The town nestles on the side of the range, the streets being generally steep, flanked by solid stone buildings; and a background of green spurs and bold rocky faces gives to the whole a charming and picturesque appearance. The water-supply is obtained from artesian wells on the Christ-church side of the hills. To Christchurch there is a bridle-track over the range, and a carriage-road viâ Sumner. The harbour is well defended by fortifications and batteries on Ripa Island and the mainland. The population in 1891 was 4,087, with 790 houses.
Timaru, the third town in importance, is situated on the coast and railway-line between Christchurch (100 miles) and Dunedin (131 miles). It has a well-constructed artificial harbour, the port of shipment for the agricultural and pastoral districts of Geraldine, Timaru, and Waimate. The harbour is enclosed by a breakwater built of blocks of concrete; a rubble wall—the North Mole—commences from the shore three-quarters of a mile away to the north, and extends easterly from the breakwater. The enclosed space is 50 acres. The town is picturesquely situated on rolling hills overlooking the sea. The streets are irregular, but the public and commercial buildings, churches, and private houses are generally well and handsomely built of stone. The chief industries are meat-freezing, saw-milling, flour-milling, &c. The town has a good high-pressure water-supply, and is connected by well-made roads with the surrounding districts, and by rail with Fairlie, the route to the Mackenzie Country and Mount Cook. The population in 1891 was 3,668, with 738 houses.
Of other towns in Canterbury the following deserve mention: Rangiora, population 1,783, with 367 houses, twenty miles from Christchurch by northern line of railway, is situated in the centre of a fine farming country, and possesses manufactories including seven flax-mills, flour-mill, and brewery. The town and neighbourhood are much benefited by plantations.
Kaiapoi, on the Waimakariri, population 1,371, about fourteen miles from Christchurch by the northern railway-line, lies in a rich agricultural district, rendered pleasing and attractive by the extent and variety of plantations and gardens. There are factories and various other works, including ham- and bacon-works, saw-mills, brewery, and agricultural-implement works. Here also is the famed Kaiapoi Woollen-mill, which employs 600 hands when in full work. The Waimakariri is navigable for small vessels to the centre of the town.
Ashburton, the newest of the towns, has a population of 1,900, with 341 houses, and is fifty-three miles from Christchurch on the southern trunk line. It is a well-built town, with extensive and beautiful recreation-grounds and gardens. It owes its existence to the settlement of the plains, the surrounding country being well adapted for farming. There are two breweries, a cordial-factory, three flour-mills, gasworks, ironworks, woollen-mill, brickworks, &c.
Geraldine, population 794, is situated on the Waihi River, four miles from Orari Railway-station, about eighty-six miles south-west from Christchurch. It is a neat and pretty town, in a first-class farming district, and has a beautiful park of native forest-trees.
Temuka, population 1,309, eighty-eight miles from Christchurch on the southern railway-line, is a well-built town, with good agricultural land all around. It possesses three flour-mills, a butter- and cheese-factory, brewery, foundry, fell-mongery, and paper-mill. There is a beautiful park and domain.
Waimate, population 1,379, is situated on the Waihao Forks Railway, about four miles from Studholme Junction, some 111 miles from both Christchurch and Dunedin. This town is the centre for an extensive back-country, and a splendid agricultural area. It owes its origin to the sawmill industry of the Waimate bush. Industries: saw-milling, flour-milling, &c.
Akaroa, situated on the noble harbour of that name, was founded in 1840, in the first instance by the French. It is a quiet, picturesque little place, much patronised by Christchurch residents and others as a summer resort and watering-place. It was hero that Captain Stanley hoisted the British flag on 11th August, 1840, when he took possession of the Middle Island on behalf of the Crown, forestalling the French by a few hours only.
By C. W. ADAMS, Chief Surveyor.
The Otago Land District lies between the 44th and 47th parallels of south latitude, and extends from 167° 20’ to 171° 10’ of east longitude. It is bounded on the north by the Canterbury Land District; on the south-east and south by the ocean; on the west and south by the Waikawa, Mokoreta, Slopedown, Waikaka, Chatton, Wendon, Waikaia, Gap, Rockyside, and Kingston Survey Districts, the western and southern shores of Lake Wakatipu, the Mid-Wakatipu, Mavora, Swinton, Eglinton, Arran, and Doon Survey Districts, and a straight line from the north-east corner of the last-mentioned district to the nearest arm of George Sound, and by George Sound to the ocean; and on the north-west by the ocean to Big Bay.
The district measures about 160 miles from Milford Sound on the west coast to Waikouaiti Bay on the east coast, and the same distance from north to south. Its area is 9,004,800 acres.
The country generally is mountainous, the highest land being to the north-west, and culminating in Mount Aspiring, 9,960ft. above the level of the sea.
The west coast mountains are remarkably rugged and grand; and of the thirteen sounds that pierce this coast, three are within the limits of the Otago Land District, the remaining ten being on the west coast of the Southland Land District. These three are Milford Sound, Bligh Sound, and George Sound. Milford Sound, though only eight miles in length, contains some of the grandest scenery in the world; and fourteen miles inland from its head is the great Sutherland Waterfall, 1,904ft. high, possibly the highest waterfall known. Bligh Sound is smaller than Milford, and not nearly so interesting; but George Sound is larger, and very picturesque.
A rough tourist track has been opened from the head of Te Anau Lake to Milford Sound, and a practicable route has also been discovered from the north-West arm of the middle fiord of Te Anau Lake to the head of George Sound.
For nearly one hundred miles inland from the west coast the country is very mountainous, but at a distance of sixty or seventy miles from the south-east coastline it begins to get gradually lower, taking the form of rolling hills and downs along the sea-shore.
The largest rivers are the Clutha, Taieri, and Waitaki: the first-named drains Lakes Wakatipu, Wanaka, and Hawea; the last, Lakes Ohau, Pukaki, and Tekapo, in the Canterbury District. The largest lake in the Middle Island is Te Anau, lying chiefly in the Southland District. The dimensions of these lakes are as follows:—
| Lakes. | Length in Miles. | General Breadth in Miles. | Area in Square Miles. | Height above Sea-level in Feet. |
|---|---|---|---|---|
| Te Anau | 38 | 1 to 6 | 332 | 694 |
| Wakatipu | 50 | 1 to 31/2 | 114 | 1,069 |
| Wanaka | 29 | 1 to 3 | 75 | 928 |
| Hawea | 19 | 3 | 48 | 1,062 |
| Ohau | 11. | 1 to 3 | 23 | 1,720 |
| Pukaki | 11 | 21/2 to 5 | 31 | 1,588 |
| Tekapo | 15 | 1 to 31/2 | 321/2 | 2,325 |
These lakes are situated in mountainous country; they are of glacial origin, and all very deep.
The Clutha River is the largest in New Zealand, and is estimated to discharge over 1,000,000 cubic feet per minute. It has a rapid current, but is navigable for a small steamer for a distance of forty miles from its mouth. The Waitaki is not a navigable river. For some seventeen miles from its mouth the Taieri River is affected by tides, which run up one branch into the Waihola Lake, and up the other branch as far as Greytown.
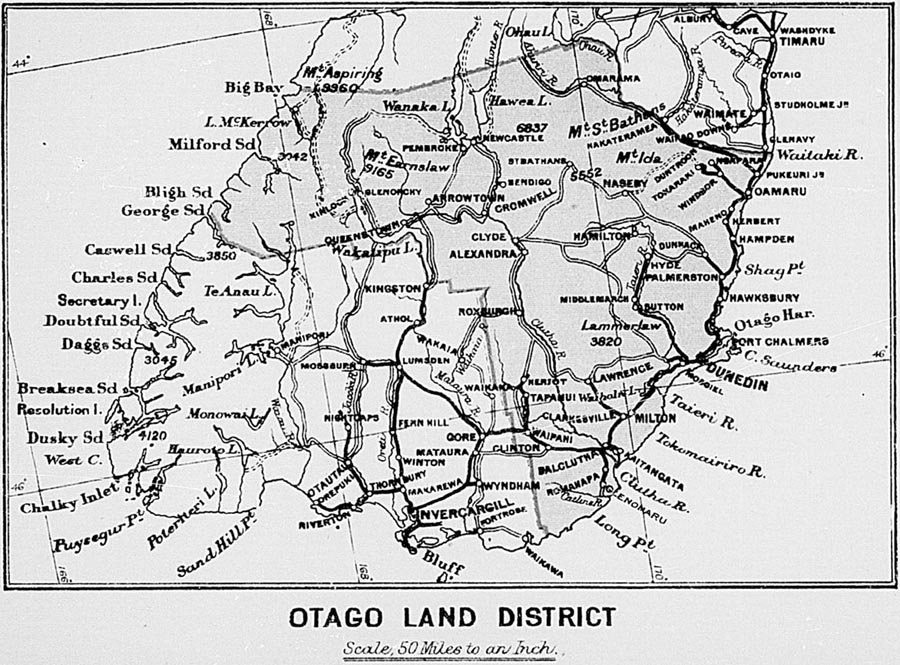
There is a small steamer on Waihola Lake, and another on the Taieri River at Henley. During the summer season both run excursion trips to the mouth of the river when required. The distance in each case is about eight miles.
There are some considerable areas of tolerably level land in the interior, the largest being the Maniototo Plains, the Idaburn, Manuherikia, and Upper Clutha Valleys. Their dimensions are approximately as follows: Maniototo Plains, length, twenty-eight miles; average breadth, ten miles; Idaburn Valley, twenty-five miles by four miles; Manuherikia Valley, thirty-five miles by four miles; Upper Clutha Valley, thirty-three miles by five miles.
The Taieri Plain, nearer the coast, is about the same size as the Idaburr. Valley, and is very fertile. Other plains are the Waitaki in the north, the Tokomairiro, the Strath-Taieri, the Tapanui, and the fertile Inch-Clutha, lying between the two branches of the Clutha River, and consisting entirely of alluvial deposit. There is also a good deal of low country, consisting chiefly of rolling downs, on the south-west side of the Clutha near the sea.
The forest-land lies chiefly along the sea-coast, the largest area of bush being Tautuku Forest, about forty miles in length and fifteen miles in breadth. The western part of this forest is in the Southland District. The other principal forest-areas are in the following localities, viz.: north of Dunedin, east of the Tapanui mountains, in the upper valley of the Waikaia River, and towards the north-west coast.
The forests of Otago contain a large variety of useful timber, both hard and softwood; some being suitable for building purposes, while other varieties are highly ornamental, and much prized for cabinet-work.
Building-stones of good quality are found in various places throughout Otago. The Port Chalmers quarries afford an inexhaustible supply of bluestone, a basaltic stone of great hardness and durability. A hard freestone of excellent quality is found at Waikawa, where there is a large hill of it close to the water's edge. Blocks of very great size can be obtained. A soft while building-stone—the well-known Oamaru limestone—is found in large quantities along the railway-line near Oamaru, from whence a good deal is exported to other parts of New Zealand, and to the neighbouring colonies. A similar kind of stone is found at Otekaike, about two miles from the railway-station, and it. may be interesting to note that during the lust three years about 3,000 tons of stone have been sent from the Otekaike quarries to form the facings of the Melbourne Fish-market.
No first-class coals have yet been discovered in Otago suitable for steamships making long voyages, but very excellent, brown coal exists in various neighbourhoods, large quantities of which are used on the railways. There are sixty-four coalmines in operation in Otago, in eighteen different places, furnishing very good fuel for household and domestic purposes. The output for the year was 174,236 tons. Beds of lignite are also found in numerous localities, chiefly round the margins of the old lake-basins, and along the courses of the older river-valleys.
Limestone is found in the following places: Oamaru, Otekaike, Otepopo, Waihemo, Maniototo Plains, Waikouaiti, Lower Harbour, Peninsula, Waihola, Millburn, and Wakatipu.
The Millburn Lime and Cement Company burn large quantities of lime at their Millburn works, from whence it is sent to all parts of Otago, for building purposes, gasworks, &c. It is also largely used for agricultural purposes, and the fertility of the Tokomairiro Plain has been greatly increased of late years by its application to the soil. Extensive cement-works belonging to the same company have been in operation for some years on the reclaimed land in Otago Harbour, near Dunedin. The cement manufactured at these works is considered fully equal, if not superior, to the best imported, and is largely used in building and other constructive works.
The climate of Otago varies greatly in different neighbourhoods, and sometimes a distance of a few miles only separates districts very dissimilar in this respect. A large area in the interior of Otago has what may be called a dry climate. This area includes the Maniototo Plains, the Idaburn and Manuherikia Valleys, and extends to Lakes Wakatipu, Wanaka, Hawea, and Ohau on the west and north, and to the Waitaki River on the north-east. From Oamaru the direction would be across country to the Lammerlaw Ranges, and thence to Mount Benger and the southern end of Lake Wakatipu. This part of the country is well adapted for sheep of all kinds, especially merinos. Some of the runs in the billy country are capable of carrying 20,000 sheep. The Wolseley shearing machines have been introduced on about ten stations; the number of machines in each woolshed varying generally from ten to fifteen, though there is one shed at Benmore, near Lake Ohau where there are twenty-eight machines driven by a turbine.
There are some fine fruit-growing districts in the valley of the Clutha, from below Roxburgh right up to Lake Wanaka. At Roxburgh and other places the summers are warm and dry and favourable to ripening common fruits. Apricots, peaches, &c., come to maturity fully a month before they do at Dunedin, and grapes will ripen in the open air in sunny spots.
Cereals of all kinds do well inland, although they sometimes suffer from want of rain. The average yield per acre of the various crops in February, 1894, was as follows: Wheat, 22 bushels; oats, 34 bushels; barley, 31 bushels; rye, 16 bushels; peas, 18 bushels; beans, 29 bushels; hay, 2 tons; potatoes, 5 tons.
In marked contrast to central Otago is the West Coast District, which may be described as having a wet climate. Not that the number of wet days in the year is very great, but it is subject to very heavy rains from the north-west, the fall generally exceeding 100in. per annum. But, although wet, the climate is mild, and the vegetation is consequently luxuriant. The only inhabitants of this part of the country are Mr. and Mrs. Sutherland, who keep a house of accommodation for tourists at the head of Milford Sound. There are very few visitors to the Sounds during winter, but in summer the tourist traffic is considerable. Towards the south-east and south coasts of the district the climate is moist, being somewhat similar to that of Dunedin, where the average rainfall is 35in., distributed over 163 days in the year.
The total number of sheep in Otago Provincial District on the 1st April, 1893 was 4,287,867, of which rather more than half were merinos. On an average, about one-third of the flocks consist of breeding-ewes. The value of the Otago wool-clip is about £700,000. There were in the provincial district at the time of the last census 50,206 horses, including 7,837 brood mares; 72 mules and asses; 152,000 cattle; 2,000 goats; 38,200 pigs; and 443,000 poultry.
The rabbit-pest is still a severe tax on the stock-owners; the number of skins exported last year for the whole colony being 16,065,194, of which number Otago contributes about one-third.
There are two freezing establishments in Otago—namely, at Oamaru and at Burnside. They both belong to the New Zealand Refrigerating Company. At Oamaru there are two Bell-Coleman machines. The capacity of the smaller one is 60,000 cubic feet of cold air per hour; and the larger one can supply 90,000 cubic feet per hour. The smaller machine is driven by water, obtained from the Oamaru town supply. The larger one is driven by steam. They can freeze 800 sheep per day, and there is storage-room for 20,000 carcases. At Burnside there are two Haslam machines, both driven by steam. One can supply 40,000 cubic feet of cold air per hour, and the other 60,000. The Burnside works can freeze 500 sheep per day, and have storage-room for 14,000 carcases.
There are four woollen-mills at work in Otago, employing upwards of 600 hands. The amount paid in wages is about £46,000 per annum, and the machinery is 610 horse-power. £67,000 worth of wool is used per annum, and the turn-out of manufactured goods exceeds £150,000 yearly. It will thus be seen that, taking each item as given above, the extent of the woollen industry in Otago exceeds that in all the other districts of New Zealand taken together.
In clothing-factories, also, Otago takes the lead, having five, employing 664 hands, whose wages amount to £27,000 per annum.
There are about twenty flax-mills in different parts of the district, employing nearly 400 hands, paying wages amounting to £8,000 yearly, and turning out £16,000 worth of manufactured material per annum.
Otago takes also a good position as regards cheese- and butter-factories and creameries, whether in respect of the number of hands employed, wages paid, or the value of the annual output, which amounts to about £60,000. There are twenty-seven factories at present, and new ones are being started from time to time.
Otago produces about one-third of all the gold taken out in New Zealand. Last year the export was 77,660oz., valued at £313,239. This was obtained by 5,091 miners, of whom about 30 per cent. are Chinese.
Gold is found very generally distributed throughout Otago, except in the southern portion of the district. The principal localities are: Clutha Valley, Tuapeka, Shotover, Cardrona, Tinker's, St. Bathan's, Mount Ida, Nevis, Bannockburn and Maerewhenua.
The following are flu; chief towns of Otago, with their population, including all having a population of 1,000 and upwards: Dunedin and suburbs, 46,000: Oamaru, 5,600; Port Chalmers, 2,000; Mosgiel, 1,300; Milton, 1,100; Kaitangata, 1,100; Lawrence, 1,000.
Dunedin, the capital city of Otago, is situated at the head of Otago Harbour, which is divided into two parts—the upper and lower. The lower harbour is six miles long from Taiaroa Heads to Port Chalmers. The upper harbour, from Port Chalmers to Dunedin, is seven miles in length. Dunedin and Port Chalmers are also connected by railway.
Although the hills surrounding Dunedin are rather tame in character and outline, the city itself is picturesquely situated. The business part of it is on level land near the harbour, and the residences occupy the sloping hills which rise on the west side of the city. The city proper is about two miles and a half long by seven-eighths of a mile wide, and is surrounded on the land side by what is called the Town Belt. This reserve averages one-fifth of a mile in width, and comprises 500 acres, a great part of which is virgin bush. A pretty road, called the Queen's Drive, has been laid out through the Belt from end to end, from which many fine views of the town and harbour can be obtained.
It is thirteen miles down the harbour to the Heads in a north-easterly direction, but the Ocean Beach, lying to the south-east, is only two miles from the centre of the city, and the favourite seaside resort—St. Clair—is about three miles. Trains run to both these places at short intervals. The city is also connected with the suburban boroughs, lying on the hills overlooking the town, by excellent cable-tramways. The Botanical Gardens to the north of the city are well laid out, the native hush contrasting with the cultivated parts. The Reservoir also, which is within easy walking distance, and the drive to Blueskin Bay, have many beauties.
Dunedin is well supplied with elementary schools, there being six large schools in the city proper, and seven more in the suburbs.
There is also in Dunedin a training-college for teachers. The number of students in training is thirty-five males and thirty-seven females. They devote every fifth week during the session to practice in teaching and management of classes in the ten associated schools of the city and suburbs. The day classes are attended by 103 students, the teachers’ and pupil-teachers’ classes (which are free) by 147 students, and the evening classes by 103 students; making 353 in all.
The Otago Boys’ High School, the largest, high school in the colony, stands on a commanding plateau 300ft. above the business part of the city and the harbour. The school was opened on the 3rd August, 1863. in the building in Dowling Street now occupied as the Otago Girls’ High School. The new buildings were opened by Sir William Jervois, Governor, in February, 1885. The teaching staff, including the Rector, is ten; the attendance is 240.
The Otago Girls’ High School was opened on the 6th February, 1871, with a roll of 78 pupils, and by the end of the quarter there were 102 in attendance. The present attendance is 187, with a teaching staff of eleven. Otago holds the proud distinction of having established the first Girls’ High School in the Australasian Colonies. Among the earnest band of workers who laboured to establish this first High School for girls the name of Miss Dalrymple stands pre-eminent, and will ever be held in grateful remembrance by the people of Otago.
The Otago University was founded in 1869, and opened in 1871. It is well housed in a handsome pile of buildings in the domestic Gothic style. There are three separate faculties in the University—viz., arts and science, medicine, and mining. The School of Medicine provides the full course for a medical degree of the University of New Zealand. There is a Medical Museum in the University buildings containing anatomical, pathological, and other preparations and models. The teaching staff numbers at present twenty-six professors and lecturers. Of undergraduates keeping terms there are 197—viz., 160 males and 37 females. The University Library contains over 5,000 specially selected volumes, and is open to the public under certain conditions for purposes of reference. The Chemical and Physical Laboratories are well fitted up, and furnished with all necessary instruments and appliances. There are six scholarships tenable at the University, ranging in value from £15 to £40 per annum.
The public Museum, of which the Professor of Biology is Curator, is under the control of the University Council. It is situated in King street, about five minutes walk from the University. There is an art gallery attached, which contains a few good works of art. Up to the present time only the centre portion of the original design has been erected.
These classes were first established in 1889, and are held in the evenings during the winter months from April to September, inclusive. Three hundred and eighteen pupils were enrolled in 1891, 364 in 1892, 390 in 1893, and during this year 503 have been enrolled up to the time of writing. The numbers attending each class are as follows: English, 39; Latin, 27; French, 17: mathematics, 68; book-keeping, 24; chemistry, 43; botany, 15; physics, 15; engineering, 9; shorthand, 65; type-writing, 24; wood-carving, 9; carpentry, 13; plumbing, 15; cooking, 40; drawing, 80: total, 503. The fee is 7s. 6d. a quarter, except for the cookery class, the fee for which is 5s. a quarter.
The Dunedin Athenæum and Mechanics’ Institute possesses a fine library of over 16,000 volumes, and a membership of over 1,000 subscribers. Besides the Circulating Library there is a Reference Library, and two good reading-rooms, well supplied with newspapers and magazines.
There are some fine specimens of architecture in Dunedin, the buildings for the most part having an air of permanence and solidity. Some of the churches are very handsome, and St. Joseph's Cathedral (Roman Catholic) has a particularly imposing appearance, although only about one-third of the original design has been completed. It is built of stone in the decorated Gothic style. The portion at present constructed will seat 1,000 persons, and has cost £23,000.
The First Church, in Moray Place, and Knox Church, in George street, belong to the Presbyterians, and are both handsome stone structures. The Cargill Monument, which was erected to the memory of the late Captain Cargill, the founder of the Otago settlement, stands in the Triangle, between the Customhouse and the Bank of New Zealand. It is an ornate specimen of early decorated Gothic architecture.
Dunedin is defended by three batteries on the Ocean Beach, to the south-east of the town. Of these, the central battery is the most powerful. Port Chalmers and the entrance to the harbour are defended by several batteries placed on Taiaroa Heads, as well as by a system of submarine mines. The Land District, of Otago is subdivided into two Volunteer districts, Dunedin and Oamaru. In the Dunedin District there are eleven garrison corps containing 657 men, and five country corps containing 256 men. In the Oamaru District there are live corps, containing 260 men.
For a description of the accommodation for shipping at Dunedin, Port Chalmers, and Oamaru Harbours, sec “Ports and Harbours,” page 402, ante.
The Port Chalmers Graving-dock is described in the article on page 411.
There is not space to give in detail particulars of the various local industries throughout Otago, but a few, amongst others, may be noticed. Besides the woollen-mills, clothing-factories, meat-freezing works, and dairy-factories before mentioned, there are three bone-mills and artificial-manure manufactories, where substances that might otherwise go to waste, or pollute the air and water, are turned to profitable account and made to increase the fertility of the soil. There are six lime- and cement-works, the chief of which, those at Dunedin, have already been mentioned. There are thirty-three brick, tile, and pottery manufactories, the most extensive pottery-works being at Milton, where all kinds of useful household crockery ware are made. Seventeen agricultural-implement factories are in operation in Otago, and turn out annually a large supply. And lastly, there is a piano manufactory in Dunedin, which has been open for the last nine years. During that period 185 pianos have been manufactured and 175 sold. The types manufactured are cottage-pianos and upright grands, at prices ranging from thirty to sixty guineas. The present output is from twenty-five to thirty pianos per annum.
The principal lines are as follows: (1.) The main trunk line from Dunedin to Christchurch, with branches from Oamaru to Hakateramen, forty-three miles; and Oamaru to Ngapara and Tokoraki, twenty-five miles; also, Palmerston to Dunback, nine miles. (2.) The main trunk line, Dunedin to Invercargill, with branches, Mosgiel to Outran), nine miles; Milton to Lawrence, twenty-four miles; Stirling to Kaitangata, five miles; Balclutha to Glenomaru, twelve miles; and Waipahi to Heriot, twenty miles. (3.) The Otago Central, from Wingatui to Hyde, fifty-six miles.
The total population of Otago Land District at date of last census, 5th April, 1891, was 117,638.
Area of Otago Land District: Open land below 2,000ft., 5,252 square miles; forest-land below 2,000ft., 1,919 square miles; open land above 2,000ft., 6,480 square miles; forest-land above 2,000ft., 419 square miles; area of lakes, &c., 275 square miles: total, 14,345 square miles.
The following table shows the disposition of the land in Otago District on 1st January, 1894:—
| Holdings. | Acres. | |
|---|---|---|
| * Approximate. | ||
| 1. Crown lands alienated, comprising freehold land and vested reserves | 2,619,714 | |
| 2. Lands held on deferred payment, including village settlements | 352 | 77,003 |
| 3. Lands held on perpetual lease, including village settlements | 693 | 151,649 |
| 4. Lands held on lease in perpetuity, including village-homestead allotments | 211 | 51,825 |
| 5. Lands held under occupation-with-right-of-purchase clause | 39 | 7,741 |
| 6. Lands held under village-homestead special settlement | 109 | 1,727 |
| 7. Lands held under special-settlement association | 15 | 2,955 |
| 8. Lands held under small-grazing-run system | 196 | 399,252 |
| 9. Lands held under pastoral license, not including bush | 347 | 4,047,825 |
| 10. Lands open for application under pastoral licenses | 17 | 130,757 |
| 11. Lands held under agricultural lease on goldfields | 53 | 4,785 |
| 12. Lands held under lease and license for miscellaneous purposes, exclusive of gold-mining | *300 | 12,500 |
| 13. Crown lands open for selection | 67,500 | |
| 14. Crown lands being prepared for selection | 175,000 | |
| 15. Land held by aboriginal natives | 16,141 | |
| 16. Tautuku Forest, unsurveyed | 120,000 | |
| 17. Balance of Crown lands, including mining reserves, public reserves not vested, bush-lands, roads, barren country, &c. | 1,118,426 | |
| 18. Lakes, and Clutha and Taieri Rivers | 176,000 | |
| Total area of district: 14,345 square miles = 9,180,800 | ||
Item No. 1 includes 338,070 acres of vested reserves, of which about 26,470 acres have been sold, leaving a balance of 311,600 acres, a portion of which will probably be open for sale at a future date.
Tenants of lands included in 2 and 5 have the right of acquiring the freehold, as have also tenants of 3 up to twelve years from the date of issue of the leave and of 11 in the case of leases issued prior to the Act of 1891. There is no right of acquiring the freehold for tenants of lands included in 4, 6, 7, 8, 9, and 12.
The Crown lands proper are (13) open for selection (see Crown Lands Guide), 67,500 acres, and (14) being prepared for selection, 175,000 acres.
Total area under cultivation at last census, 5th April, 1891: Sown grasses on unploughed land, 135,933 acres; sown grasses on ploughed land, 685,589 acres; land broken up but not cropped, 33,448; land under crop, 299,334 acres; land in gardens, 1,384 acres; land in orchard, 1,307 acres; land in plantation, 2,466 acres; area of boroughs (more or less cultivated), 27,202 acres: total, 1,186,663 acres = 1,854 square miles.
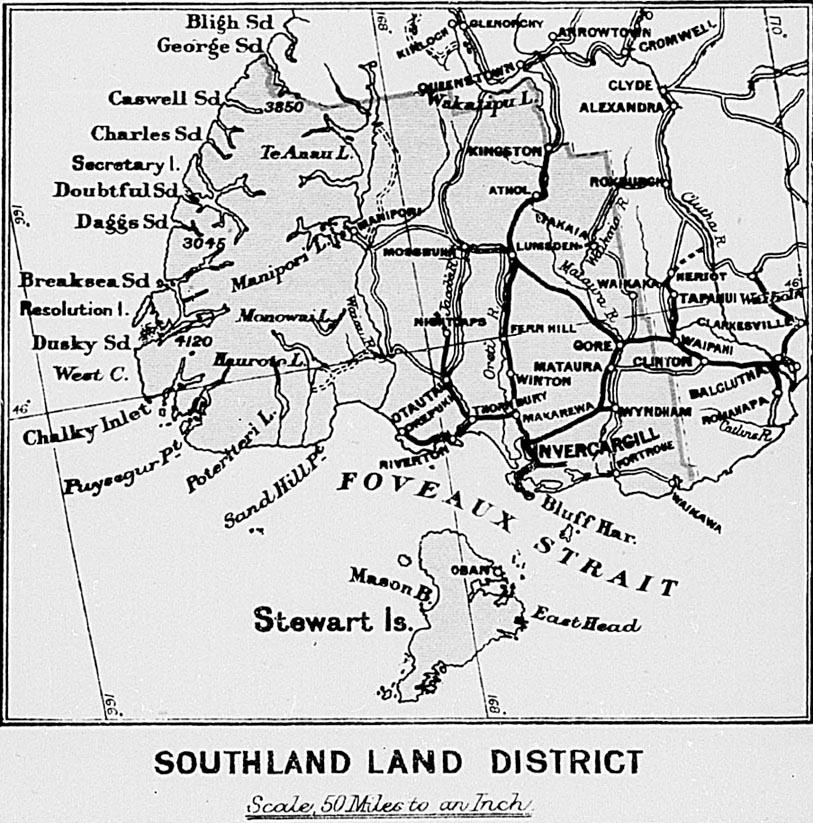
By G. W. WilliamsChief Surveyor.
The Southland District, comprising the Counties of Southland, Wallace, Fiord, and Stewart Island, bounded on the north and east by the Otago District, and on the south and west by the Tasman Sea, may be roughly said to lie between south latitudes 45° and 47° and east longitudes 166° 15’ and 169° 15’. For administrative purposes, however, the Snares, Auckland, Enderby, Campbell, Antipodes, Bounty, and all other islands within the limits of the colony south of the 47° parallel of south latitude are included in it.
The total area of the district, including Stewart Island, but exclusive of Solander and Ruapuke and the other small islands enumerated above, is 6,966,592 acres, of which 500,000 are covered with bush. The bulk of the bush-land lies between the lakes and the south and west coasts, in the neighbourhood of Forest Hill, Hokonui, Waikawa, & c. The timbers of commercial value are totara, rimu, miro, matai, rata, and kamai, in mixed bushes; but Fagus fusca and other birches predominate on the high lands between the lakes and the fiords on the west coast.
The open land in its natural state carries tussock and snow-grass, fern, flax, and manuka, &c., and there is a very considerable area of marsh-land, interspersed here and there with peat bogs.
The disposition of the land is as follows:—
| Acres. | |
|---|---|
| Crown lands alienated to date | 1,395,564 |
| Lands held on deferred payment | 51,328 |
| Lands held on perpetual lease | 55,692 |
| Lands held on lease in perpetuity | 48,495 |
| Lands held in occupation with right of purchase | 20,874 |
| Village-homestead special settlements | 652 |
| Small grazing-runs | 68,553 |
| Pastoral runs | 1,221,023 |
| Endowments and miscellaneous purposes | 589,310 |
| Open for selection | 243,650 |
| Under preparation for settlement | 68,000 |
| Pastoral runs open for lease | 937,730 |
| Held by aboriginal natives | 11,890 |
| Lands of small value not open for sale | 450,281 |
| Barren mountain-tops, &c. | 1,803,550 |
| Total area | 6,966,592 |
The most striking feature of this district is the number of well-defined rivers and valleys, the latter often widening out to such an extent as to form very extensive plains. Commencing with the eastern side, the Mataura, Oreti (or New River), Aparima (or Jacob's River), and Waiau are the most prominent illustrations of this; but these rivers by no means exhaust the list, as they all have numerous tributaries, which exhibit the same features on a smaller scale.
Speaking generally, the watersheds of these rivers do not attain any great height until followed far inland, and near the great lakes to be presently noticed. From what has been said above it follows that the extensive plains and valleys referred to are of alluvial formation, in many places of very rich and fertile quality, and capable of raising crops of every known product, subject, of course, to climatic limitations. Generally these plains and valleys rise from the river-levels in a very gradual slope, sometimes into a series of terraces from 10ft. to 50ft. in height, and sometimes into undulating hills, intersected at frequent intervals by lateral gullies, affording natural drainage and an abundant supply of water.
These hills are covered with an indigenous growth, consisting of tussock and other grasses, fern, flax, &c., and even in their native state afford excellent grazing for sheep.
Near the large lakes, such as Wakatipu, Te Anau, Manapouri, Hauroto, and others, and between these and the West Coast, the country becomes very high, often reaching the elevations of 5,000ft. and 6,000ft., with very steep and rugged spurs and ravines, these in most cases being covered with a dense growth of timber, principally of the birch or beech tribe, for two-thirds of their height: the tops, however, often carry tussock and other herbage, affording admirable pasture for sheep in summer; but stock have to be removed from April to October, during which period this country is generally covered with snow.
Southland does not contain so much forest as most of the North Island districts, nevertheless there is a very considerable quantity in the eastern, southern, and western ports, and a large export trade is done in the different kinds of pines and other timbers used for building, engineering, and furniture purposes, &c.
From what has been said of the river systems it will be evident that the country is well supplied with water, although none of the rivers can be used for purposes of internal communication; but the plains are traversed by railways for considerable distances from the principal towns, and where the railways end communication is continued by good roads, so that there is probably no part of the colony so well off for means of transit.
Having already touched on the character of the soil, it only remains to say that the plains, terraces, and lower hills are well adapted for raising wheat, oats, and other cereals, turnips, mangolds, beets, and the various other crops common to temperate climates. Wheat is not so widely grown as it might be, for the reason, probably, that the pastoral branches of farming receive more attention than the agricultural, and wheat is not required for these; whereas oats are largely grown to feed sheep in the form of chaff; turnips also are much cultivated for winter food. Where wheat is grown the yields are very satisfactory, ranging from 40 to 60 bushels per acre, while oats frequently give 80 bushels.
Dairy-farming is becoming a very important industry, and is rapidly expanding under the impetus it has received through improved appliances and the favourable state of the Home markets. There are a number of cheese- and butter-factories, and one for preserving milk on the Swiss system. One firm makes Stilton cheese, which is considered to be equal to that of the same kind in England.
By far the most important industries are those connected with the rearing and export of sheep and wool. Some years ago this kind of farming was much hindered by the inroads of rabbits; but owing to the repressive measures adopted there has been a marked abatement of the pest, even on high back-country, and thus it has come to pass that country which a few years ago was absolutely denuded of vegetation now shows unmistakable signs of recovery. The hill-country, although it does not carry a large proportion of stock to area, is eminently healthy. The average carrying-capacity over the whole district would probably be under one sheep to the acre. Until within the last few years most of the runs were stocked with merino sheep, but owing to the decline in price of merino wool, and to the carcase being unacceptable to the European market, these sheep have, generally speaking, been replaced by Leicesters, Lincolns, Romney Marsh, Cheviot, and crossbreds of various kinds, better suited to the existing conditions. Large establishments for slaughtering and freezing sheep are at work. The latest of these, erected near the Bluff Harbour, is considered to be the most complete in the colony, being provided with all possible labour-saving machinery and appliances for working up the by-products into articles of commerce.
There are extensive seams of coal and lignite distributed over the district, and in many places the animal output is considerable. Peat is also found in some up-country neighbourhoods, and is used for fuel where wood and coal are scarce. Gold is found all over the district, and a large number of persons are engaged in obtaining it either by sluicing or dredging. A considerable amount of capital has been invested in beach-dredges worked by steam. Not long ago gold-bearing reefs, reported to be of great richness, were discovered at Wilson's River, near Preservation Inlet.
Salt-water fish abound in great quantities in the waters surrounding Stewart Island, and oysters are found on banks between that island and the Bluff. All the large rivers, and many of the tributaries, are well stocked with trout, and one river—the Aparaima—had salmon-spawn put into it some years ago.
The small English fruits, such as gooseberries, currants, raspberries, strawberries, &c., grow in great profusion, as do also apples. Stone-fruits are not so common, although peaches, nectarines, apricots, &c., do well when trained against nursery-walls in favourable aspects.
The climate is bracing in winter, and warm and genial in spring and summer. The old residents state that there has been a marked decrease in the rainfall within the last decade. No regular observations have been recorded for the last few years, but it is believed that the. average is about 30in. a year. It may, however, be observed that more rain falls near the coast than inland, and also that the rainfall is more evenly distributed throughout the year than is the case in the northern part of the colony. The temperature varies from 40° in winter to 70° in summer.
Invercargill, the chief town, was from the first well laid out with wide streets, and liberal reserves in the town belts for recreation purposes. The Corporation exercises a paternal care in providing water, gas, and in disposing of sewage, &c., for the citizens; and the streets are well lighted, paved, and maintained. Artesian water is pumped to the top of a handsome brick tower—which, by the way, is a very conspicuous landmark—and stored there in a tank, from which most of the houses within the town boundaries are supplied. The population, including suburbs, is nearly 10,000. All religious denominations are represented. There are rope-and-twine, carriage- and implement-factories, flour- and saw-mills, fellmongeries, brick-and pottery-works, iron-foundries, and various other industries. Exceptionally good beer is brewed here, and there are three first-class hotels. The Government Buildings, lately enlarged, are on a scale not often seen in a town of the same size. A clock and chimes of New Zealand make have been placed in the central tower. Although the Bluff is the principal port, Invercargill is provided with a second harbour for smaller vessels, in the New River Estuary, where there is a jetty with appliances for handling and receiving goods within the town boundaries.
The Bluff Harbour, which is connected by rail with Invercargill, does a very large shipping business, and derives additional importance from being the first and last port of call for steamers trading with Victoria and Tasmania.
Next in size to Invercargill is the town of Gore, situated on the Mataura River, and at the junction of the trunk railway with the Waimea Plains Branch. Owin to this fact, and to the town being surrounded with good agricultural land, Gore is rapidly growing in size and importance.
Riverton is a pretty little town, about twenty-five miles from Invercargill, with which it is connected by rail, and is situated on the estuary of Aparima or Jacob's River. This is the oldest settlement in Southland, and was a great resort for whalers in former years. The harbour is available for coasting-vessels, hut the principal carrying-trade is done by rail. There are several sawmills in the neighbourhood.
The town of Winton is on the Invercargill-Kingston Railway, about twenty miles distant from the latter, and is the centre for a good farming, sawmilling, and coal-mining district.
Lumsden is the junction of the Kingston and Waimea Plains lines. Coaches starting from this place take passengers and mails to the Lake country.
East of Invercargill is Fortrose, on the estuary of Mataura River, which is available for coasting-steamers. This place is surrounded by an exceptionally fertile agricultural and pastoral country.
Eastward of Fortrose and about midway between that place and Catlin's River is Waikawa, a newly-settled township with a first-class harbour for coasters, and a very large area of Crown land around it available for settlement. Steamers trading with Dunedin and Invercargill call here and at Fortrose at regular intervals.
There remains for disposal a very large area of Crown land, probably more than 500,000 acres, but this can only be estimated roughly, because much of the district west of Waiau River is practically unexplored. It is true that this is chiefly forest-land, but it is beginning to be recognised here, as in the North Island, than when such land is once cleared and laid down with grass it is distinctly superior to most open country for purposes of grazing; and grazing is and will long remain the principal industry of the colony. The land referred to lies around Waikawa Harbour, along the Waikawa-Catlin's Road, between the Jacob's and Waiau Rivers, and to the west of the Waiau. Stewart Island also contains a wide extent of Crown lands, mostly forest-clad. There are also considerable areas of open hilly country carrying natural grasses still in the hands of Government. These are to be found in various parts of the district, but are being rapidly taken up.
- Animals 431
- Birds 430
- Fish 431
- Fish Hatcheries 432
- Insects and Plants 431
- Average, of Persons Married 86
- Of Orphan Children 93
- Of Prisoners 177
- Artificial Manures 296
- Average Clips 288
- Butter-factory, cost of Equipment 291
- Butter, New Zealand 290
- Cattle 289
- Cereals 280
- Cross-breeding of Sheep, The 287, 308
- Cost of Growing Oats 281
- Cost of Growing Potatoes 281
- Cost of Working a Farm in New Zealand 287
- Dairy Industry, The 290
- Dairy Stock 289
- European Flax 285
- Fruit Industry 293
- Horse-breeding 289
- In Middle Island 277
- In North Island 276
- Lambing Returns—Averages 305
- Pigs 292
- Prices of Wheat 279
- Root-crops 281
- Scab, New Zealand free from 291, 308
- Seeds 283
- Seed-sowing (Wheat) commences 280
- Sizes of Holdings 149
- Sugar-beet 285
- Statistics149, 298
- Stock 287
- Tree-planting 294
- Turnips282
- Apprehensions and Summonses 169
- Of United Kingdom compared with New Zealand 7
- Of Basins of Principal Rivers, in Square Miles 409
- Compared with European Countries 6
- Chinese 73
- Excess of, over Departures 71
- Lunatic 265
- Orphan265
- Population 63
- Banking, Development in 143
- Banking Legislation 144
- Bank Directors and Shares Transfer Act 145
- Bank-note Issue Act 144
- Bank of New Zealand Guarantee Act 144
- Banks and Bankers Act Amendment Act 144
- Bank Shareholders Act 145
- Absconding Bankrupts 274
- Administration of Act 273
- Audit of Accounts 274
- Commissions Charged 274
- Court. Fee 273
- Private Deeds of Assignment 275
- Prosecutions in Cases of Fraud 274
- Transactions in 1893 167,275
- Advances and Discounts 143
- Assets and Liabilities 143
- Deposits 143
- In all Classes of Banks, Average per Head 146
- Notes in Circulation, &c. 144
- Post-office Savings 145
- Deposits, Withdrawals, Open Accounts, Amounts to Credit 146
- Private Savings y
- Deposits, Withdrawals 146
- Yield in Bushels Y
- Export of 120
- Causes of Decline in 78
- Decline of, in New Zealand 76
- In European Countries 79
- Causes of Fall in Birth-rate 78
- Decrease, Gradual 76
- Excess of, over Deaths, for Ten Years 70
- Illegitimate 80
- In Australasian Capitals 89
- In Australasian Colonies, Proportion of Illegitimate 80
- Legitimate 80
- Of Twins 79
- To Marriages, Proportion of 89
- Constituted since 1891 69
- Expenditure of 191
- In Colony 69,194
- Auckland, with suburbs 70
- Christchurch, with suburbs 70
- Dunedin, with suburbs 70
- Wellington, with suburbs facing page 1, 70
- Indebtedness 1of 188,189
- Population of 69
- Revenue of 191
- Value of Rateable Property in 192,194
- Amounts deposited with 146
- Income, Assets, Liabilities, Reserve Funds 146
- Bush Land, Cost of Clearing 503,514
- Butter and Cheese 160,322
- Annual Production of 160,327
- Export to United Kingdom, Ten Years 120
- Factory, Cost of a 291
- Factory, Capital required for 326
- Industry 290,322
- Milk required to Produce 1lb. of 290, 322
- Prices realised for 326
- Increase in 102
- Nature of 103
- 35
- In Australian Colonies, Number of 159
- Cancer 101
- Measles 97
- Percentage of Deaths from each 94
- Phthisis 100
- Ages and Length of Residence in Colony of Persons dying from 101
- Typhoid Fever 99
- Factories, Number of 325,327
- Prices realised 326
- Immigration and Emigration of 73
- Poll-tax on 73
- In Provincial Districts 35
- Comparison between East and West Coast Climates 42
- Meteorological Stations 424
- Rainfall 427
- Temperature 423,425
- In New Zealand, Australia, and other British possessions 426
- Winds 429
- Export of 93, 115,116, 351
- Found in Colony, Analysis of 353
- Import of 352
- Output of 161
- Crown Agents for the 24
- Population of facing page 1
- For Drunkenness 171
- Advantages of 235
- First tried 237
- Government control over Expenditure 236
- Method of Letting, &c.238
- Number of Men employed 241
- Rules for Selection of Workmen 240
- Work better done under 237
- Management of Local Governing Bodies 187
- Working a Farm in New Zealand 287
- Legislative, Roll of Members of the 27
- Successive Speakers of the Legislative 22
- Civil Cases, Supreme and District 167
- Divorce and Separation 168
- Resident Magistrates’, Civil Cases 160
- Charges for Offences before 169
- Committals 169
- Summary Convictions before 169
- Supreme and District, Convictions 170
- Average Price 290
- Mode of Acquiring 209
- Barley 155
- Extent of Land in 152
- Holdings over One Acre occupied 152
- To every 100 Adult Males 152
- Hops 157
- Land in Sown Grasses in Australasian Colonies 157
- Under Grain-crops in Provincial Districts 150
- Oats 155
- In Australasian Colonies 155
- Orchards 157
- Potatoe 155
- Tobacco 157
- Turnips 157
- Wheat 152
- In Australasian Colonies 153
- Proportion of Taxation derived from, 1892 132
- 1893 Broadsheet
- Number in Colony and being Built 325
- Number in Colony, Output, Hands employed, &c.327
- Industry 120, 160, 290, 322
- Produce. Export of 120
- In Census Years, 1881, 1886, 1891 160
- Stock 289
- Causes of 93
- From Cancer 102,103
- From Phthisis 100
- From Typhoid Fever 99
- In Four Principal Cities 88
- In Principal Cities of Australia 89
- Of Married Men 91
- Inquests on 179
- Number of, in 1893 87
- Of Infants 90
- Of Infants to every 100 Births 91
- Of Married Men 93
- Violent 104
- Of Local Bodies 188, 189
- Administration; Artillery, Permanent Militia; Cadet Corps, Volunteers; Capitation; Cavalry, Volunteers; Engineers. Volunteers; Enrolment, &c.; Expenditure and Maintenance; Field Artillery, Volunteers; Instructors; Militia and Volunteer Districts; Mounted Rifles, Volunteers; Naval Artillery, Volunteers; Ordnance, Arms, &c.; Rifle Corps, Volunteers; Torpedo Corps, Permanent Militia
- I. Population; II. Birthplaces of the People; III. Religions of the People; IV. Trade; V. Wool Exported; VI. Frozen Meat Exported; VII. Value of Gold Exported; VIII. Value of Grain Exported; IX. Shipping, Inwards; X. Shipping, Outwards; XI Output of Coal; XII. Production of Kauri-gum; XIII. Production of Gold; XIV. Extent of Land in Cultivation; XV. Live Stock; XVI. Letters and Newspapers received and despatched; XVII. Progress of
- Banking With Part II
- Of Gold in New Zealand 343
- Homewards and Onwards 421
- In other Countries 139
- Wages 140
- Of the People, Degree of Y
- Technical 536
- Universities and Colleges 181
- University, New Zealand Y
- Polling-places 253
- Voters, Number of 253,254
- Votes recorded 253,254
- In City Electorates 255
- Women on Rolls 255
- Voting 255
- “Electoral Act, 1893,” extends Franchise to Women 15, 251
- Charges of Public Debt 129,133
- General Government 129
- Local Bodies 130, 185
- On Education 129
- On Railways 141
- On Reproductive Public Works 135
- Out of Public Works Fund by General Government 129
- Butter and Cheese to United Kingdom, for Ten Years 120
- Coal 116
- From United Kingdom to various Countries and Colonies 125
- Frozen Meat 114
- Value, Ten Years 114
- Gold 114,119
- Grain 120
- Australasian Colonies, 1892 124
- Home, Produce, 1893 Broadsheet
- Kauri-gum 121
- Of Australasian Colonies 123
- Other New Zealand Produce 114,115
- Phormium 121
- Quantities of Principal Articles, 1892–93 and 1893–94 115
- Re-exports, exclusive of Specie 117
- Of New South Wales compared with New Zealand 117
- To United States 123
- Value of, from different Ports 121
- Principal Articles of New Zealand Produce 114
- Wool, Ten Years 114,117
- Butter and Cheese. (See Dairy Factories.)220
- Sheep 287, 302
- Of the North Island y
- Export of 121,343
- Preparation, &c.341
- Price of 121
- Forest-trees and Timber Industry (see also Timber Industry)328
- Export Trade, Value of 334
- Forest, Timbers, Varieties of335
- Strength of New Zealand Timbers 337, 338
- Timber Industry and Produce for Year 1890 164, 333
- Lodges, &c., Assets, Receipts of Sick and Funeral Funds, Expenditure, Sick Pay, Management Expenses 146
- Ammonia and Carbonic Anhydride Process 312
- Beef 316
- Charges for Freezing, &c.314
- Collateral Industries313
- Compressed-air Process 311
- History of the 311
- Import of Chilled and Frozen Beef into United Kingdom 316
- Import of Mutton and Lamb into United Kingdom 316
- Improvements in Machinery 311
- Meat used in United Kingdom 320
- Meat, Value of Export114,119
- Number of Freezing-works 314
- Number of Vessels employed in Trade 315
- Preserved Meats, Values exported 119
- Quantities of Meat Furnished by each Port in New Zealand 319
- Works and Hands employed, Number of 165
- Development of the Trade 304
- Large Increase in Numbers of Sheep 117
- Antimony 348
- Chrome 349
- Cinnabar 350
- Coal 350
- Composition of 353
- Consumption of 357
- Output of 352
- Copper 348
- Discovery of Gold in New Zealand 343
- Gold exported119
- Gold produced 119, 347
- Iron 349
- Lead 349
- Manganese 348
- Mineral Oils 350
- Minerals exported 115
- Mining, generally 355
- Scheelite 355
- Silver 347
- Stones, Precious 355
- Tin 350
- Bonus Certificates 267
- Business 266
- Occupations of Persons insured 268
- Progress of Business for Twenty Years 267
- Grown in each Provincial District (see also Cultivation)150
- Prices, per lb 158, 284
- Sown, per Acre 307
- Weight of Bushel 299
- Auckland Docks 410
- Lyttelton Dock and Patent Slip 410
- Port Chalmers Dock 410
- Wellington Patent Slip 411
- Water, Analysis of 445
- Middle Island 399
- North Island 389
- Industries; Agricultural Pursuits; Dairying; Timber Industry; Climate;
- Crown Lands; Native Lands 496
- Accommodation and Indoor Patients 263
- General Management 263
- Number of Districts 263
- Outdoor Relief 264
- Revenues of Boards, how raised 263
- Speakers of the 22
- Assisted and Unassisted Immigrants (Twenty Years)72
- Each Australian Colony 76
- From United Kingdom, Australian Colonies, and other Places 72
- Gain by net Immigration from United Kingdom in Ten Years 74
- Nominating Immigrants discontinued 72
- Of Chinese 73
- Poll-tax on Chinese 73
- Each Australian Colony, 1893 123
- Beer, Spirits, and Wine, Consumption of 112
- Clothing, &c.110
- Coal 351
- Excess of, over Exports 123
- From different Countries, 1892–93, Values of 113
- United Kingdom 113
- United Kingdom to Australasia 125
- United States, Ten Years 123
- Inclusive and exclusive of Specie, Ten Years 109
- Into Australasia 123
- Per Head of Population, Ten Years 124
- Principal Articles, in Groups, 1893 y
- Spirits 112
- Sugar and Tea, Imports of 111
- Consumption of, per Head of Population 111
- Tobacco, Consumption of y
- To each Provincial District 114
- Value of, inclusive and exclusive of Specie, for Ten Years y
- Per Head of Population, Australasian Colonies 124
- Land and 244
- Aggregate of 139
- Average per Head 137
- Heads of 139
- In Principal Countries 139
- Of Local Bodies 188,189
- For Twelve Years 186
- To Persons outside Colony 189
- In Provincial Districts 163
- Fire Y
- Government Life 266
- Area of the Australasian Colonies 6
- Colony of New Zealand 7
- Boundaries and Area of New Zealand 5
- Colonisation 4
- Constitution 13
- Cook Strait 10
- Discovery and Early Settlement
- Foveaux Strait 12
- Glaciers in Middle Island 11
- Government 14
- Outlying Islands 2
- Physical Features of the Middle Island 10
- North Island 7
- Public Works Y
- Seat of Government 16
- Iron 349
- Machinery, &c., imported, Value of 110
- Antipodes 5
- Auckland 5, 13
- Bounty 6
- Campbell 5
- Chatham 5, 13
- Kermadec 6, 13
- Middle 5, 10
- North 7
- Stewart 5, 12
- Average Earnings of Diggers 340
- Average Price of 121, 339
- Number of Diggers Y
- Quantities and Values exported 121, 339
- Where found and Method of Searching for it 338, 339
- In New Zealand 362
- Prices of Provisions, Live-stock, &c.375
- Various Industries 375
- Wages, Average Rates of 372
- Inspectors’ Powers, Ages of Employés, and Hours of Labour, Accommoda
- tion, Holidays, &c.220
- Contractors’ and Workmen's Lien Act 231
- Employers’ Liability Acts 225
- Factories Act y
- Servants’ Registry Offices Act 233
- Truck Act 229
- Workmen's Wages Act 227
- Alienated from Foundation of Colony 148
- And Income-tax 131, 244
- Crown, open for Selection. (See Land Districts.)
- Disposed of without Sale 147
- Fit for Agriculture and Pasture 8, 12
- Grass 157
- Held as Pastoral Runs 149
- Revenue from 149
- Held as Small Grazing-runs 149
- Increased Value of, with Improvements
- Laws, Digest of the 208
- On Perpetual Lease, Lease in Perpetuity, and Occupation with Right of Purchase 148
- Revenue from 149
- Sold for Cash 147
- Sold on Deferred Payments 148
- Graduated 131,245
- Transfer Act 213
- Tillage Settlements, sold on Deferred Payments and for Cash 118
- Auckland, 483; Canterbury, 522; Hawke's Bay, 496; Marlborough,.
- 507; Nelson, 513; Otago, 532; Southland, 539; Taranaki, 491;
- Wellington, 499; Westland, 518
- Administration 208
- Classification of Lands, &c.208
- Grazing-runs, Small 211
- Improvements, Residence and 210
- Land Districts and Principal Land Offices 208
- Mode of Acquiring Crown Lands 209
- Optional System of Selection 209
- Cash Tenure 209
- Leases in Perpetuity y
- Occupation with Right of Purchase 209
- Pastoral Runs 212
- Residence and Improvements 210
- Special-settlement Associations 211
- Survey Charges on Unsurveyed Lands 213
- Village Settlements 204,211
- Assurance Fund 218
- Practical Working of 218
- Principle of 214
- Protection Afforded by 217
- Regulations 220
- Native, Purchase of, by Government 207
- Survey Charges on Unsurveyed 213
- Results of Assessments, 1888 and 1891 193
- Total Valuations in Boroughs, Counties, Road and Town Districts 192
- Native Members of the 15
- Roll of Members of 27
- Alcoholic Liquors Sale Control Act 257
- Annual Fees 257
- Bottle Licenses 258
- Committees 259
- No Increase in Number of Licenses allowed 259
- Reduction permitted 259
- Result of Recent Polls 258
- Revenue from Licenses Y
- Business for the Year 1892 147
- Progress of Business for Twenty Years 267
- Average Prices of 375
- Export of 115,116
- In Australasian Colonies 159
- In the World 159
- In various Countries 140
- General Government. (See Public Debt.)
- Of Local Bodies, Outstanding, at various Rates of Interest 189
- Of Local Bodies, Net Indebtedness 188
- Cost of Management 187
- Expenditure of Y
- Indebtedness 188,189
- Thirteen Years 186
- Number of 185
- Outstanding Loans at various Rates of Interest 189
- Property in, Value of 192,193
- Rates collected in Thirteen Years 186
- Revenue and Expenditure of Boroughs, Counties, Drainage Board, Harbour Boards, River Boards, Road Boards, Town Boards 185
- Taxation by 185
- Hands employed, Value of Machinery, Value of Output, Wages paid 165
- Ages of 481
- Charged with Offences 169
- Children attending Schools 481
- Contribute towards Revenue 132
- Convicted of Offences, Ten Years 172
- Education of 183, 262, 178
- Electoral Districts and Votes recorded
- Lands 478
- Native Affairs 480
- Land Court 479
- Numbers and Condition as at present 476
- Population 61,476
- Representation 15, 256, 478
- Tribes, Numbers of the Principal 481
- Decrees for Dissolution of 168
- Decrees for Judicial Separation 168
- Rates in New Zealand, Australian Colonies, and European Countries 83
- Ages at which Marriage may be contracted y
- Ages of Persons Married 85, 86
- Proportion by each Denomination 84
- Proportion of each Sex signing Register by Mark y
- Proportion of Births to 80
- Industry, Frozen 311
- Used in United Kingdom 320
- Legislative Council, Roll of 27
- Ports, Harbours, &c.399
- Average Yield of Butter from 290
- Average Yield per Cow 290
- Price per Gallon 297
- Remarks on 355
- Number of Officiating, under Marriage Act 34
- Egmont 9, 493
- Ruapehu 9
- Tongariro 8
- Consumption per head 159
- Native Land Court 159
- Native Lands purchased by Government 207
- Naturalisation 81
- Nelson Land District—General Description; Rivers, Lakes, Plains, Forest;
- Agricultural, Pastoral, Mining; Towns; Railways, &c.513
- Newspapers55
- Posted 126
- Abolition of Provincial Governments in 14
- Area of, Boundaries and Y
- Arrival of Missionaries in 3
- Captain Cook's Visits to 2
- Colonisation of Y
- Colony divided into Six Provinces 14
- Company 4
- County Government in 14
- Discovery and Early Settlement of 2
- General Assembly of 26
- Government Life Insurance 266
- Governor of 26
- Governors of, Successive 17
- Labour in 362
- Lieutenant Hanson's Visit to Y
- Made a Separate Colony 4
- Newspapers 55
- Permanent Militia 49
- Premiers of 21
- Provincial Governments abolished in 14
- Representative Government granted in 14
- Settlement at Port Nicholson 4
- Canterbury 5
- Nelson 4
- New Plymouth 4
- Otago 5
- Shipping Company, The 417
- Sovereignty of Queen proclaimed 4
- Surville, and Marion du Fresne's Visits 2
- Tasman's Visit 2
- Treaty of Waitangi 4
- University of 181, 261
- Cost of growing 281
- Cultivation of 155,281
- Export of 120
- For Fodder and Hay, Acres under 300
- Charges for, before Resident Magistrates’ Courts 169
- Committals for 169
- Convictions for 170
- Maoris charged with 169
- Convicted before Supreme and District Courts 170
- Summarily convicted 170
- Office, The Colonial 24
- Official List 36
- Value of Produce of, per Acre 293
- Value of Imports by 114
- Members of 27
- Lands held under 149
- Receipts from 149
- Export of 121, 343
- Mills 164, 165, 342
- Deaths from, 1893 101
- North Island 7
- Pigs 158, 292
- Market for inferior Grain 292
- Raising Young Stock 293
- Arrivals and Departures 72
- From and to United Kingdom 74
- Of Chinese 73
- Birthplaces of 64
- Chinese 61
- Conjugal Condition of 66
- Degree of Education of 64
- European 62
- Increase of 62, 70
- In different Islands 62
- In Principal Cities and Suburbs 70
- In Provincial Districts 67
- Maori 61
- Occupations of the 65
- Of Australasian Colonies 63
- Of Boroughs 69
- Of Capital City facing page 1
- Of Counties 67
- Of Provincial Districts 67
- Proportions of the Sexes in New Zealand and Australian Colonies 66
- Religious Denominations 63
- Middle Island 399
- North Island Y
- Average Number of Days within which Mails from London delivered 128
- Books and Parcels 126
- Increase of Correspondence 126
- Letters posted, per Head of Population 126
- Mail-service, England and New Zealand, Cost of 127
- Money-orders 127
- Newspapers 126
- Savings-banks 115
- Cost of growing 281
- Cultivation of 155,281
- Export of 115,116
- Seed, per Acre y
- Yield of 155
- Ages of Distinct convicted 175,177
- Birthplaces of 175,177
- Convicted, Number of 175
- Distinct convicted, 1892, Classified y
- Now Zealand-born, convicted 178
- Offences, Seven Years 174
- Religious Denominations of 175,176
- Principal Countries 138
- Average Prices of 375
- Mining 161
- Annual Charge 132
- Net Indebtedness 132
- Of Australasian Colonies 132
- Old Provincial Loans 134
- Sinking Fund accrued, Amount of 133
- Administration y
- Average Attendance at Schools 260
- In the several Standards 261
- Number of Districts 260
- On Rolls at end of Year 261
- Secondary Schools 180
- Administration of Statutory Trusts 269
- Charges 272
- Constitution and Objects 270
- Intestate Estates 271
- Number and Value of Estates administered 272
- Security, Capital, and Interest guaranteed 270
- Wills and Trusts y
- Co-operative System of constructing y
- Expenditure on y
- Australasian Colonies, Miles of, in 142, 385
- Carriages and Wagons 384
- Comparative Statement of Mileage open in Australasian Colonies385
- Comparison of Traffic, Revenue, and Expenditure for Fifteen Years 383
- Cost of Maintenance y
- Government, Goods and Live-stock carried 142
- Length and Cost 141
- Locomotives, Number of 384
- Particulars of Revenue from 142
- Passenger Fares 384
- Passengers 142
- Profit on Working 141, 142, 382
- Train-miles 142, 384
- In New Zealand: Their History and Progress 377
- Management 382
- Midland Railway 386
- Miles of Railway open for Traffic 141, 382
- Passenger Fares y
- Traffic 383
- Private 142, 380
- Cost of Construction, Revenue, and Working 142
- Traffic, Revenue, and Expenditure for Fifteen Years 383
- Working-expenses 141,142
- Totals of Monthly 428
- In Road Districts 195
- Outlying Districts y
- Town Districts 193
- 36
- Bodies, Annual Meetings and Officers of 32
- Electoral Districts 251
- European 251
- Maori 251
- Electors’ Rights 252
- Method of computing Population 251
- One Person one Roll 252
- Purging of Rolls 253
- Qualifications of Electors—
- European 252
- Maori 253
- Quota, how obtained 251
- Women admitted to the Franchise 251
- Civil Cases 167
- From Government Railways 129
- From Land- and Income-tax 129,131,247
- From Property-tax 129
- General Government (Ordinary and Territorial)129
- Local Government 130,191
- Of Boroughs, Counties, Drainage Board, Harbour Boards, River Boards, Road Boards, and Town Boards 191
- Territorial 129
- In North and Middle Islands, Area of Basin and Estimated Discharge 409
- Districts, Value of Property in 195
- Legislative Council 27
- Private 146
- Deaf and Dumb 185
- Industrial 184,262
- Native 183,262
- Primary or Public 179,260
- Attendance at 180, 260
- Teachers at Y
- Private 181,182
- Roman Catholic 182
- Secondary 180, 261
- Proportions of the 66
- Cross-breeding of Y
- Decrease of, in Europe 119
- In Colony, Increase in Number of 159
- Number and Size of Flocks 118
- Prices of 288, 303
- Cost of Management 306
- Cost of growing Turnips 307
- Cross-breeding of Sheep y
- Grass-seed sown per Acre 307
- Lambing Returns 305
- Scab eradicated 308
- Value of Lambs 304
- Coastwise, Vessels and Tonnage 108
- Inwards and Outwards, Ten Years y
- New Zealand Company (Limited)417
- Registered Vessels 109
- Shaw-Savill and Albion Company (Limited)420
- Union Steam Ship Company of New Zealand (Limited)414
- Legislative Council 27
- New Zealand, compared with Australia 157
- Legislative Council 27
- Legislative Council, Successive 22
- Bonus Certificates 267
- Business y
- Occupations of Persons insured 268
- Progress in Twenty Years 267
- In Australasian Colonies 159
- In the World 159
- Ministries 21
- Premiers 21
- Incidence of Land- and Income-tax 249, 250
- Income-tax 131, 246
- Land-tax (ordinary)131, 244
- Graduated 131, 245
- Per Head in New Zealand, for Twelve Years, excluding Maoris 132
- In Australasian Colonies 132
- Proportion derived from Customs, 1892 132
- Proportion derived from Customs, 1893 Broadsheet
- Rate of, per Head, including Maoris 132
- Rates of Land-tax 247
- Messages transmitted 128
- Miles of Line y
- Receipts 128
- Comparative, of New Zealand y
- Daily Range of 425
- Highest and Lowest in Shade, in New Zealand, the Australian Colonies, and other British Possessions 426
- Accommodation at Rotorua 471
- Analysis and Action of the Waters 435, 452
- Area of Thermal-springs District y
- Benefits realised, Permanent 463
- Cases suitable for Treatment 460
- Climate of Rotorua 448
- Comparison of Rotorua Springs with those of Europe 465
- Cures in Severe Rheumatism 462
- Geyser at Orakeikorako 469
- Hanmer Plains Sanatorium 417
- Hospital, The (at Rotorua)451
- Massage 464
- Mineral Waters, Curative Effects of 463
- Varieties of 450
- Names of the Principal Baths y
- Neuralgia 462
- Paralysis, Cases of 461
- Paraplegia cured 461
- Physical Features y
- Principal Baths 450
- Properties of the Principal Bath Springs 453
- Regulations and Tariff 451
- Remarkably Successful Case 451
- Resources, Magnitude of 465
- Rheumatism and Skin-diseases 461
- Rotorua and its Surroundings 467
- Rotorua Basin 468
- Rotorua Sanatorium 450
- Routes from Australian Colonies y
- Skin-disease, Great Success in 462
- Tarawera 468
- Treatment, Cases Suitable for 460
- Ulcerated Throats 463
- Varieties of Waters 450
- Whakarewarewa Baths 459, 469
- Industry, Forest-trees and 328
- Area of Forest-land 331
- Average Wages paid 333, 334
- Beech District 330
- Capital invested in 333
- Character of the Forest 328
- Exploitation and Conversion 331
- Export of Timber Y
- Kahikatea (White-pine)338
- Kauri, Description of the Y
- District 329
- Output and Labour 333
- Rimu (Red-pine), Description of the Y
- District Y
- Sawmills and Machinery 332
- Totara, Description of the Y
- District Y
- Varieties of Trees 334
- Cultivation of 157
- Value of Property in 193
- Australasian Colonies as Markets for Great Britain, Importance of 125
- External, Total Value of 121
- Per Head of Population, Ten Years y
- With Atlantic and Pacific Ports of United States, Ten Years 123
- With Australia 122
- With India y
- With United Kingdom y
- Of Australasian Colonies, Value of, per Head y
- Of Australasian Colonies with United Kingdom 125
- (See Exports.)
- (See Imports.)
- Shipping. (See Shipping.)
- Fish-hatcheries, Number established 432
- Average Number of Sheep per Acre fattened on 282
- Cost of growing 307
- Seed sown per Acre 282
- Yield per Acre y
- Graduates 262
- Students y
- Undergraduates y
- Average Rates of 372
- Calculated from Probate Returns 136
- Of Australasia y
- Of Principal Countries 138
- Of United Kingdom 138
- Consumption of, in New Zealand 154
- Annual Average, Principal Countries 155
- Crops of Australasian Colonies y
- Cultivation y
- Deficiency of Crop 155
- Export in 1893 120
- Oats, Barley, and Potatoes, Yield of 150, 298
- Prices of 279
- Maximum Velocity in Miles y
- Average of Clips 288
- Decrease of Sheep in Europe 119
- Exported 114, 115, 117
- Imported into United Kingdom 118
- Increase in Production of, Ten Years y
- Number of Flocks, Ten Years y
- Percentage of Australasian Wool imported into United Kingdom 118
- Production, Increase in y
- Supply of the World 118
- Used at Local Mills 117
- Mills, Number of 165
- Public 17
- Expenditure on 129,135
(For Summary, Years 1840 to 1852, see back.)
| Year | Population (exclusive of Maoris) on 31st December. | Births. | Deaths. | Marriages. | Immigration, Excess over Emigration. | Crown Lands.* | Occupied and Cultivated Holdings over One Acre in Extent. | |||||||
|---|---|---|---|---|---|---|---|---|---|---|---|---|---|---|
| Males. | Females. | Totals. | Waste Lands sold for Cash in each Year. | Cash realised. | Lands finally alienated under the Deferred-payment System. | Free Grants.* | Let on Perpetual Lease | |||||||
| Land taken up. | In Occupation on December 31. | |||||||||||||
* The waste or Crown lands sold or granted in each year prior to 1856 cannot be accurately stated. The total gross quantity of land disposed of by Crown grants up to the end of 1893, including both lands sold and including both lands sold and lands disposed of without sale, was 20,702,000 statute acres. The figures under the head “Free Grants” represent in each year the total quantity of free grants to immigrants and naval and military settlers', grants for public purposes, Native reserves and old land-claims; also, from the year 1872, grants to Natives under the provisions of the Native Land Acts. † This information is given for the years formation is given for the years in which a census of the colony was taken. ‡ Corrected by means of results of census taken in April, 1891. The population of the colony (other than Maoris) according to the census of 5th April, 1891, was 626,658 at that date; the Maori population was 41,993. § Excluding those owned by Maoris. | Including those owned by Maoris. ¶ Government Railways; there are, besides, 164 miles of: there are, besides, 164 miles of private lines. ** There were taken up in addition 13,170 acres in 1892 and 125,618 acres in 1893 under the new tenure of “occupation with right of purchase,” and 17,984 acres in 1892 and 190,013 acres in 1893 on “lease in perpetuity.” These tenures have now superseded the perpetual-lease and deferred-payment systems. | ||||||||||||||
| Acres. | £ | Acres. | Acres. | Acres. | Acres. | Number. | ||||||||
| 1853 | 1091 | |||||||||||||
| 1854 | 17914 | 14640 | 32554 | 2057 | ||||||||||
| 1855 | 20781 | 16411 | 37192 | 1460 | 470 | 406 | 3937 | |||||||
| 1856 | 25356 | 20184 | 45540 | 1722 | 406 | 404 | 2525 | 51972 | 33156 | 14 | ||||
| 1857 | 27606 | 22196 | 49802 | 1966 | 434 | 478 | 3042 | 141159 | 79060 | 6169 | ||||
| 1858 | 33679 | 25734 | 59413 | 2272 | 582 | 534 | 6130 | 239128 | 150839 | 6277 | ||||
| 1859 | 41107 | 30486 | 71593 | 2647 | 704 | 603 | 8637 | 477021 | 222885 | 45730 | ||||
| 1860 | 45394 | 34317 | 79711 | 3146 | 1092 | 690 | 6064 | 424254 | 204113 | 47016 | ||||
| 1861 | 61062 | 37959 | 99021 | 3441 | 1109 | 878 | 16222 | 449358 | 285365 | 18834 | ||||
| 1862 | 79680 | 46132 | 125812 | 4064 | 1231 | 1091 | 20991 | 658337 | 506657 | 40335 | ||||
| 1863 | 105978 | 58070 | 164048 | 5115 | 1983 | 1485 | 35120 | 529437 | 380998 | 66853 | ||||
| 1864 | 106580 | 65578 | 172158 | 6501 | 2921 | 1878 | 8527 | 691174 | 595858 | 47198 | ||||
| 1865 | 117376 | 73231 | 190607 | 7490 | 2757 | 1908 | 12309 | 503112 | 341091 | 62681 | ||||
| 1866 | 125080 | 79034 | 204114 | 8466 | 2540 | 2038 | 7599 | 603406 | 528028 | 55975 | ||||
| 1867 | 131929 | 86739 | 218668 | 8918 | 2702 | 2050 | 4859 | 288917 | 287416 | 76743 | ||||
| 1868 | 134621 | 91997 | 226618 | 9391 | 2662 | 2085 | 860 | 199309 | 182065 | 42205 | 11932 | |||
| 1869 | 140112 | 97137 | 237249 | 9718 | 2721 | 1931 | 3641 | 112211 | 115941 | 145449 | 13476 | |||
| 1870 | 145732 | 102668 | 248400 | 10277 | 2703 | 1851 | 3577 | 76766 | 88419 | 37256 | 10211 | |||
| 1871 | 156431 | 110555 | 266986 | 10592 | 2642 | 1864 | 4786 | 92642 | 110973 | 123796 | 14874 | |||
| 1872 | 162404 | 117156 | 279560 | 10795 | 3194 | 1873 | 4973 | 338516 | 389107 | 183673 | 15304 | |||
| 1873 | 170406 | 125540 | 295946 | 11222 | 3645 | 2276 | 8811 | 790245 | 980758 | 484541 | 15883 | |||
| 1874 | 194349 | 147511 | 341860 | 12844 | 4161 | 2828 | 38106 | 648800 | 860471 | 238581 | 16092 | |||
| 1875 | 213294 | 162562 | 375856 | 14438 | 5712 | 3209 | 25270 | 318682 | 448697 | 486335 | 17250 | |||
| 1876 | 225580 | 173495 | 399075 | 16168 | 4904 | 3196 | 11955 | 497416 | 846831 | 31145 | 18750 | |||
| 1877 | 227681 | 180937 | 408618 | 16856 | 4685 | 3114 | 6376 | 777862 | 1314480 | 40314 | 20519 | |||
| 1878 | 240627 | 191892 | 432519 | 17770 | 4645 | 3377 | 10502 | 642667 | 1252993 | 79324 | 54861 | 21048 | ||
| 1879 | 257894 | 205835 | 463729 | 18070 | 5583 | 3352 | 18723 | 79575 | 146733 | 37953 | 23129 | |||
| 1880 | 268364 | 216500 | 484864 | 19341 | 5437 | 3181 | 7231 | 131798 | 184488 | 18978 | 41972 | 24147 | ||
| 1881 | 274986 | 225924 | 500910 | 18732 | 5491 | 3277 | 1616 | 235815 | 351430 | 39494 | 530650 | 26298 | ||
| 1882 | 283303 | 234404 | 517707 | 19009 | 5701 | 3600 | 3489 | 138512 | 209004 | 27487 | 122100 | 27352 | ||
| 1883 | 294665 | 246212 | 540877 | 19202 | 6061 | 3612 | 10029 | 113500 | 141251 | 24229 | 228698 | 26786 | 26364 | 28587 |
| 1884 | 306667 | 257637 | 564304 | 19846 | 5740 | 3800 | 9321 | 96267 | 124928 | 40023 | 121611 | 20975 | 41561 | 29814 |
| 1885 | 312125 | 263101 | 575226 | 19693 | 6081 | 3813 | 4504 | 59613 | 84282 | 34637 | 456080 | 24441 | 51367 | 31763 |
| 1886 | 317646 | 271740 | 589386 | 19299 | 6135 | 3488 | 1064 | 39964 | 43836 | 29292 | 185764 | 46367 | 93868 | 33332 |
| 1887 | 324558 | 278803 | 603361 | 19135 | 6137 | 3563 | 977 | 21154 | 25330 | 18496 | 316488 | 64595 | 150218 | 31743 |
| 1888 | 324948 | 282432 | 607380 | 18902 | 5708 | 3617 | -9,175 Dec, | 64898 | 52379 | 23630 | 142351 | 178138 | 312495 | 35747 |
| 1889 | 328588 | 287464 | 616,052 | 18457 | 5772 | 3632 | 214 | 42617 | 47950 | 24773 | 60708 | 242790 | 544914 | 38178 |
| 1890 | 332557 | 292951 | 625,508 | 18278 | 5994 | 3797 | -1,782 Dec. | 98479 | 108959 | 46808 | 135763 | 271736 | 798571 | 38083 |
| 1891 | 336174 | 297884 | 634058 | 18273 | 6518 | 3805 | -3,198 Dec. | 56060 | 53568 | 52021 | 209432 | 273087 | 1019405 | 41224 |
| 1892 | 345146 | 305237 | 650433 | 17876 | 6459 | 4002 | 4958 | 33659 | 34156 | 41726 | 243008 | 196,075** | 1188071 | 42768 |
| 1893 | 357635 | 314630 | 672265 | 18187 | 6767 | 4115 | 10412 | 26275 | 26786 | 44779 | 198323 | 10,337** | 1100537 | 45290 |
| Land (including Sown Grasses) under Cultivation. | Live Stock. | Postals | Electric Telegraph. | Miles of Railway. | Year | ||||||||||||
|---|---|---|---|---|---|---|---|---|---|---|---|---|---|---|---|---|---|
| Horses. | Horned Cattle. | Sheep. | Pigs. | Letters (received and despatched). | Newspapers (received and despatched). | Postal. Revenue. | Money Orders issued. | Amount of Money Orders issued. | Miles of Line. | Number of Messages. | Cash and Cash Values. | Open for Traffic. | Under Construction. | Railway Receipts. | |||
* The waste or Crown lands sold or granted in each year prior to 1856 cannot be accurately stated. The total gross quantity of land disposed of by Crown grants up to the end of 1893, including both lands sold and including both lands sold and lands disposed of without sale, was 20,702,000 statute acres. The figures under the head “Free Grants” represent in each year the total quantity of free grants to immigrants and naval and military settlers', grants for public purposes, Native reserves and old land-claims; also, from the year 1872, grants to Natives under the provisions of the Native Land Acts. † This information is given for the years formation is given for the years in which a census of the colony was taken. ‡ Corrected by means of results of census taken in April, 1891. The population of the colony (other than Maoris) according to the census of 5th April, 1891, was 626,658 at that date; the Maori population was 41,993. § Excluding those owned by Maoris. | Including those owned by Maoris. Government Railways; there are, besides, 164 miles of: there are, besides, 164 miles of private lines. ¶ There were taken up in addition 13,170 acres in 1892 and 125,618 acres in 1893 under the new tenure of “occupation with right of purchase,” and 17,984 acres in 1892 and 190,013 acres in 1893 on “lease in perpetuity.” These tenures have now superseded the perpetual-lease and deferred-payment systems. | |||||||||||||||||
| Acre | Number | Number | £ | Number | £ | £ | £ | ||||||||||
| 119039 | 177583 | 1853 | |||||||||||||||
| 138482 | 201381 | 1854 | |||||||||||||||
| 171407 | 238522 | 1855 | |||||||||||||||
| 196760 | 271254 | 1856 | |||||||||||||||
| 121648 | 337721 | 498163 | 1857 | ||||||||||||||
| 141007 | 14912 | 137204 | 1523324 | 40734 | 482856 | 684348 | 6024 | 1858 | |||||||||
| 156940 | 707870 | 839385 | 7812 | 1859 | |||||||||||||
| 890369 | 1029356 | 10068 | 1860 | ||||||||||||||
| 226621 | 28275 | 193285 | 2761583 | 43270 | 1236768 | 1428351 | 14108 | 1861 | |||||||||
| 2122232 | 2064123 | 22710 | 1410 | 6590 | 1862 | ||||||||||||
| 3403248 | 3397669 | 32329 | 11586 | 55703 | 1863 | ||||||||||||
| 382655 | 49409 | 249760 | 4937273 | 61276 | 4151142 | 4306017 | 39302 | 16591 | 78556 | 1864 | |||||||
| 4443473 | 4206992 | 46475 | 17236 | 78576 | 1865 | ||||||||||||
| 4758644 | 4373039 | 49598 | 22710 | 108779 | 699 | 48231 | 9114 | 1866 | |||||||||
| 676909 | 65715 | 312835 | 8418579 | 115104 | 4811240 | 3060888 | 55331 | 24473 | 115610 | 714 | 87436 | 14295 | 1867 | ||||
| 783435 | 4977199 | 3283615 | 57107 | 25854 | 118211 | 1471 | 134647 | 26224 | 1868 | ||||||||
| 997477 | 5016595 | 3563147 | 58007 | 28427 | 127218 | 1611 | 173746 | 32649 | 1869 | ||||||||
| 1140279 | 5645879 | 3889662 | 55780 | 31864 | 140454 | 1887 | 238195 | 27422 | 1870 | ||||||||
| 1226222 | 81028 | 436592 | 9700629 | 151460 | 6081697 | 4179784 | 70249 | 36291 | 157397 | 2015 | 369085 | 37203 | 1871 | ||||
| 1416933 | 6958543 | 4411091 | 94733 | 44660 | 191009 | 2312 | 491205 | 44669 | 1872 | ||||||||
| 1651712 | 7915985 | 5269195 | 94706 | 52351 | 219258 | 2389 | 637941 | 55195 | 145 | 434 | 1873 | ||||||
| 1943653 | 99261 | 494113 | 11674863 | 123741 | 9058456 | 6306692 | 104371 | 62712 | 263164 | 2632 | 844301 | 62322 | 209 | 621 | 21198 | 1874 | |
| 2377402 | 10427851 | 6811277 | 122496 | 73027 | 293481 | 3156 | 993323 | 74420 | 542 | 464 | 72073 | 1875 | |||||
| 2940711 | 11770737 | 7962748 | 129263 | 80255 | 310268 | 3170 | 1100599 | 80841 | 718 | 427 | 469051 | 1876 | |||||
| 3523277 | 13054870 | 8066311 | 143600 | 90672 | 334973 | 3307 | 1182955 | 85589 | 1052 | 251 | 569898 | 1877 | |||||
| 3982866 | 137768 | 578430 | 13069338 | 207337 | 15524761 | 9410366 | 158998 | 101017 | 368255 | 3434 | 1260324 | 92433 | 1089 | 142 | 758096 | 1878 | |
| 4506889 | 20957818 | 10057944 | 141448 | 117999 | 428673 | 3512 | 1448943 | 112351 | 1171 | 284 | 762572 | 1879 | |||||
| 4768192 | 22824468 | 10272917 | 149517 | 135648 | 465405 | 3758 | 1304712 | 100023 | 1288 | 192 | 836077 | 1880 | |||||
| 5189104 | 161736 | 698637 | 12985085 | 200083 | 25557931 | 12248043 | 156579 | 135556 | 452182 | 3824 | 1438772 | 101566 | 1333 | 187 | 892026 | 1881 | |
| 5651255 | 30525579 | 13313099 | 168325 | 148162 | 499368 | 3974 | 1570189 | 102378 | 1371 | 171 | 953347 | 1882 | |||||
| 6072949 | 33588408 | 13030563 | 172665 | 172556 | 541133 | 4074 | 1599400 | 102958 | 1404 | 224 | 961304 | 1883 | |||||
| 6550399 | 35257846 | 14093742 | 188772 | 186052 | 572666 | 4264 | 1654305 | 101482 | 1479 | 158 | 1045712 | 1884 | |||||
| 6668920 | 35829855 | 14233878 | 197456 | 188622 | 581395 | 4463 | 1774273 | 112778 | 1613 | 179 | 1047418 | 1885 | |||||
| 6845177 | 187382 | 853358 | 16564595 | 277901 | 38084592 | 14324047 | 206029 | 155680 | 547755 | 4546 | 1836266 | 115666 | 1721 | 171 | 998768 | 1886 | |
| 7284752 | 39377774 | 15381323 | 213355 | 159579 | 555744 | 4646 | 1835394 | 116211 | 1753 | 169 | 994843 | 1887 | |||||
| 7670167 | 40398020 | 16202849 | 212247 | 162387 | 555996 | 4790 | 1765860 | 104116 | 1777 | 163 | 997615 | 1888 | |||||
| 8015426 | 42301233 | 16721016 | 222978 | 172076 | 589545 | 4874 | 1802987 | 106462 | 1809 | 176 | 1095569 | 1889 | |||||
| 8462495 | 43917200 | 17912734 | 229867 | 176427 | 602077 | 5060 | 1961161 | 110697 | 1842 | 132 | 1121701 | 1890 | |||||
| 8893225 | 211,040§ | 831,831| | 18,128,186| | 308,812| | 47612864 | 18501912 | 245395 | 195239 | 651990 | 5349 | 1968264 | 117634 | 1869 | 170 | 1115432 | 1891 | |
| 9713745 | 50610742 | 18557565 | 252494 | 199438 | 694847 | 5479 | 1904143 | 103813 | 1886 | 188 | 1181522 | 1892 | |||||
| 10063051 | 885305 | 19380369 | 52085449 | 19556030 | 253457 | 210957 | 750929 | 5513 | 2069791 | 112466 | 1,948¶ | 143 | 1172792 | 1893 | |||
| Year | Shipping | Exports (the Produce of New Zealand). | Exports (the Produce of New Zealand). | |||||||||||||||||
|---|---|---|---|---|---|---|---|---|---|---|---|---|---|---|---|---|---|---|---|---|
| Inwards. | Outwards. | Registered Vessels belonging to the Colony. | Wool. | Grain. | Frozen Meat. | Flax (Phormium). | Gold. | Gum (Kauri). | Provisions, Tallow, Timber, &c. | |||||||||||
| Number of Vessels. | Tonnage. | Number of Vessels. | Tonnage. | Number Vessels. | Gross Tonnage. | Quantity. | Value. | Quantity. | Value. | Quantity. | Value. | Quantity. | Value. | Quantity. | Value. | Quantity. | Value. | Value. | Total Value. | |
*Post Office Savings-Banks were first opened in 1867. † Statistics of schools and scholars not being complete for years prior to 1874, no figures are entered. ‡ Exclusive of charges for sinking fund met by debentures issued to an equivalent amount. § Approximate. | There was in December, 1893. an accued sinking fund amounting to £828,046, leaving a net indebtedness of £38,901,330. ¶ In addition to these there were in December, 1893, 2,196 children attending the Native schools, nearly all of which are maintained by Government, 721 at industrial schools and orphanages, and 2,251 scholars at high schools. | ||||||||||||||||||||
| 1853 | 238 | 65504 | 229 | 62891 | 1071340 | 66507 | 59959 | 19042 | 46 | 1046 | 829 | 15971 | 200706 | 303282 | ||||||
| 1854 | 293 | 74831 | 293 | 76718 | 1254416 | 70103 | 94600 | 41019 | 48 | 1563 | 1660 | 28864 | 179341 | 320890 | ||||||
| 1855 | 378 | 88614 | 341 | 79825 | 1772344 | 93104 | 150352 | 82302 | 150 | 4674 | 355 | 4514 | 181273 | 365867 | ||||||
| 1856 | 326 | 85748 | 323 | 82991 | 2559618 | 146070 | 66150 | 24132 | 22 | 552 | 1440 | 18591 | 129088 | 318433 | ||||||
| 1857 | 289 | 78309 | 283 | 76524 | 186 | 6662 | 2648716 | 176579 | 81757 | 29676 | 38 | 710 | 10436 | 40442 | 2521 | 35250 | 86737 | 369394 | ||
| 1858 | 339 | 90118 | 322 | 82293 | 189 | 6852 | 3810372 | 254022 | 71403 | 20680 | 64 | 1516 | 13533 | 52443 | 1810 | 20036 | 85252 | 433949 | ||
| 1859 | 438 | 136580 | 398 | 120392 | 213 | 7883 | 5096751 | 339779 | 118740 | 39016 | 77 | 1593 | 7336 | 28427 | 2010 | 20776 | 91717 | 521308 | ||
| 1860 | 398 | 140276 | 398 | 140293 | 238 | 8527 | 6665880 | 444392 | 55683 | 13112 | 61 | 1240 | 4538 | 17585 | 1046 | 9851 | 62953 | 549133 | ||
| 1861 | 596 | 197986 | 546 | 205350 | 252 | 9144 | 7855920 | 523728 | 8118 | 2518 | 2 | 43 | 194234 | 752657 | 856 | 9888 | 50407 | 1339241 | ||
| 1862 | 813 | 301365 | 783 | 288647 | 287 | 10825 | 9839265 | 674226 | 6602 | 1821 | 13 | 261 | 410862 | 1591389 | 1103 | 11107 | 79216 | 2358020 | ||
| 1863 | 1154 | 419935 | 1094 | 394665 | 343 | 15189 | 12585980 | 830495 | 3238 | 1160 | 13 | 251 | 628450 | 2431723 | 1400 | 27027 | 52235 | 3342891 | ||
| 1864 | 1117 | 426004 | 1089 | 433253 | 423 | 22573 | 16691666 | 1070997 | 3580 | 722 | 7 | 170 | 480171 | 1857847 | 2228 | 60590 | 60308 | 3050634 | ||
| 1865 | 862 | 295625 | 783 | 283020 | 466 | 24484 | 19180500 | 1141761 | 25447 | 6076 | 3 | 75 | 574574 | 2226474 | 1867 | 46060 | 82975 | 3503421 | ||
| 1866 | 1019 | 330303 | 986 | 306979 | 493 | 26787 | 22810776 | 1354152 | 32610 | 7297 | 45 | 996 | 735376 | 2844517 | 2535 | 70572 | 118556 | 4396100 | ||
| 1867 | 944 | 309568 | 950 | 308169 | 366 | 23240 | 27152966 | 1580608 | 158812 | 26986 | 126 | 4256 | 686753 | 2700275 | 2685 | 77491 | 89848 | 4479464 | ||
| 1868 | 851 | 277105 | 873 | 287710 | 372 | 24539 | 28875163 | 1516548 | 633676 | 114468 | 534 | 8137 | 637474 | 2504326 | 2690 | 72493 | 52790 | 4268762 | ||
| 1869 | 764 | 250731 | 771 | 247764 | 381 | 25990 | 27765636 | 1371230 | 520556 | 96441 | 2028 | 45245 | 614281 | 2362995 | 2850 | 111307 | 102916 | 4090134 | ||
| 1870 | 756 | 273151 | 766 | 265407 | 384 | 26743 | 37039763 | 1703944 | 854897 | 141135 | 5471 | 132578 | 544880 | 2157585 | 4391 | 175074 | 234366 | 4544682 | ||
| 1871 | 729 | 274643 | 709 | 265618 | 371 | 27107 | 37793734 | 1606144 | 1032902 | 164087 | 4248 | 90611 | 730029 | 2787520 | 5054 | 167958 | 354784 | 5171104 | ||
| 1872 | 775 | 300302 | 743 | 285366 | 364 | 23963 | 41886997 | 2537919 | 1058480 | 178886 | 3985 | 99405 | 445370 | 1730992 | 4811 | 154167 | 405817 | 5107186 | ||
| 1873 | 739 | 289297 | 704 | 281847 | 411 | 30035 | 41535185 | 2702471 | 587881 | 136382 | 6454 | 143799 | 505337 | 1987425 | 2833 | 85816 | 422077 | 5477970 | ||
| 1874 | 856 | 399296 | 822 | 385533 | 471 | 38935 | 46848735 | 2834695 | 1162782 | 291103 | 2038 | 37690 | 376388 | 1505331 | 2568 | 79986 | 403338 | 5152143 | ||
| 1875 | 926 | 416727 | 940 | 417820 | 502 | 42025 | 54401540 | 3398155 | 1276927 | 231417 | 639 | 11742 | 355322 | 1407770 | 3230 | 138523 | 288237 | 5475844 | ||
| 1876 | 878 | 393180 | 866 | 393334 | 538 | 44401 | 59853454 | 3395816 | 2172098 | 337878 | 897 | 18285 | 318367 | 1268559 | 2888 | 109234 | 359129 | 5488901 | ||
| 1877 | 812 | 388568 | 848 | 400609 | 533 | 42479 | 64481324 | 3658938 | 1323910 | 276452 | 1053 | 18826 | 366955 | 1476312 | 3632 | 118348 | 509841 | 6078484 | ||
| 1878 | 926 | 456490 | 886 | 428493 | 541 | 46965 | 59270256 | 3292807 | 2112214 | 508767 | 622 | 10666 | 311437 | 1244190 | 3445 | 132975 | 595214 | 5780508 | ||
| 1879 | 894 | 473940 | 908 | 475752 | 563 | 64457 | 62220810 | 3126439 | 3470344 | 660557 | 445 | 7874 | 284100 | 1134641 | 3228 | 147535 | 486409 | 5563455 | ||
| 1880 | 730 | 395675 | 786 | 424041 | 559 | 66316 | 66860150 | 3169300 | 5540445 | 898997 | 894 | 15617 | 303215 | 1220263 | 4725 | 242817 | 555306 | 6102400 | ||
| 1881 | 765 | 420134 | 762 | 413487 | 572 | 72387 | 59415940 | 2909760 | 5815960 | 986072 | 1308 | 26285 | 250683 | 996867 | 5460 | 253778 | 589488 | 5762250 | ||
| 1882 | 795 | 461285 | 769 | 438551 | 584 | 76196 | 65322707 | 3118554 | 4310984 | 907961 | 15244 | 19339 | 2040 | 41955 | 230893 | 921664 | 5533 | 260369 | 983508 | 6253350 |
| 1883 | 805 | 494926 | 851 | 507565 | 579 | 84903 | 68149430 | 3014211 | 6723303 | 1286724 | 87975 | 118328 | 2013 | 36761 | 222899 | 892445 | 6518 | 336606 | 1170169 | 6855244 |
| 1884 | 852 | 529188 | 872 | 534242 | 583 | 92696 | 81139028 | 3267527 | 5361167 | 743807 | 254069 | 345090 | 1525 | 23475 | 246392 | 988953 | 6393 | 342151 | 1231483 | 6942486 |
| 1885 | 786 | 519700 | 780 | 513000 | 597 | 93887 | 86507431 | 3205275 | 4478264 | 496371 | 296473 | 373857 | 1063 | 16316 | 222732 | 890056 | 5876 | 299762 | 1310274 | 6591911 |
| 1886 | 725 | 502572 | 707 | 488331 | 571 | 94196 | 90853744 | 3072971 | 3441803 | 449415 | 346055 | 427193 | 1112 | 15922 | 235578 | 939648 | 4920 | 257653 | 1223880 | 6386682 |
| 1887 | 653 | 489754 | 675 | 493583 | 557 | 94027 | 83824382 | 3321074 | 3987189 | 419525 | 402107 | 455870 | 1578 | 25094 | 187938 | 747878 | 6790 | 362434 | 1219206 | 6551081 |
| 1888 | 683 | 526435 | 701 | 531478 | 524 | 86132 | 83225733 | 3115008 | 4997587 | 653311 | 552298 | 628800 | 4042 | 75269 | 229608 | 914309 | 8482 | 380933 | 1487498 | 7255128 |
| 1889 | 781 | 602634 | 762 | 593252 | 520 | 87411 | 102227354 | 3976375 | 6027201 | 970695 | 656822 | 783374 | 17084 | 361182 | 197492 | 785490 | 7519 | 329590 | 1835302 | 9044607 |
| 1890 | 744 | 662769 | 745 | 649705 | 521 | 98907 | 102817077 | 4150599 | 7999139 | 1074354 | 898894 | 1087617 | 21158 | 381789 | 187641 | 751360 | 7438 | 378563 | 1604479 | 9428761 |
| 1891 | 737 | 618515 | 744 | 625807 | 521 | 102058 | 105187114 | 4129686 | 5877059 | 676338 | 1000307 | 1194724 | 15809 | 281514 | 251161 | 1007172 | 8388 | 437056 | 1673604 | 9400094 |
| 1892 | 686 | 675223 | 689 | 656100 | 491 | 101156 | 118180912 | 4313307 | 6625525 | 816272 | 869600 | 1033377 | 12793 | 214542 | 237393 | 951963 | 8705 | 517678 | 1518729 | 9365868 |
| 1893 | 617 | 615604 | 635 | 642466 | 478 | 100388 | 109719684 | 3774733 | 4855368 | 583397 | 903836 | 1085167 | 12587 | 219375 | 227502 | 915921 | 8317 | 510775 | 1468070 | 8557443 |
| Imports. | Coal-mines, Output from. | Revenue. (Calendar Year.) | Expenditure. (Calendar Year.) | Public Debt (Debentutes and Stock in Circulation). | Debt of Local Bodies. | Banks. (Average of Four Quarters.) | |||||
|---|---|---|---|---|---|---|---|---|---|---|---|
| Total Value. | Ordinary. | Terrestrial. | Total for Year. | Out of Revenue. | Out of Loan. | Deposits. | Assets. | Liabilities. | |||
*Post Office Savings-Banks were first opened in 1867. † Statistics of schools and scholars not being complete for years prior to 1874, no figures are entered. ‡ Exclusive of charges for sinking fund met by debentures issued to an equivalent amount. § Approximate. | There was in December, 1893. an accued sinking fund amounting to £828,046, leaving a net indebtedness of £38,901,330. ¶ In addition to these there were in December, 1893, 2,196 children attending the Native schools, nearly all of which are maintained by Government, 721 at industrial schools and orphanages, and 2,251 scholars at high schools. | |||||||||||
| £ | Tons. | £ | £ | £ | £ | £ | £ | £ | £ | £ | £ |
| 597827 | 83069 | 66751 | 149820 | ||||||||
| 891201 | 111214 | 180826 | 292040 | ||||||||
| 813460 | 113596 | 62300 | 175896 | ||||||||
| 710868 | 112152 | 76177 | 188329 | ||||||||
| 992994 | 157064 | 91193 | 248257 | 343316 | 419860 | 432494 | |||||
| 1141273 | 179856 | 161799 | 341655 | 448078 | 705738 | 616769 | |||||
| 1551030 | 217767 | 241882 | 459649 | 541213 | 1003584 | 678474 | |||||
| 1548333 | 248978 | 215760 | 464739 | 644521 | 992082 | 801588 | |||||
| 2493811 | 344110 | 347354 | 691464 | 882754 | 1235952 | 1097162 | |||||
| 4626082 | 579179 | 606830 | 1186009 | 836000 | 1596446 | 2691117 | 2092497 | ||||
| 7024674 | 856432 | 524404 | 1380836 | 1289750 | 2092090 | 4028766 | 2962585 | ||||
| 7000655 | 894071 | 714770 | 1608841 | 2219450 | 2480303 | 5063458 | 3343172 | ||||
| 5594977 | 1025782 | 500045 | 1525827 | 4368681 | 2638414 | 5455289 | 3522146 | ||||
| 5894863 | 1202282 | 776429 | 1978711 | 5435728 | 3097473 | 5891532 | 4010110 | ||||
| 5344607 | 1302425 | 561730 | 1864155 | 5781193 | 2904594 | 5947160 | 3737695 | ||||
| 4985748 | 1195512 | 425323 | 1620835 | 7182743 | 3102727 | 5734745 | 3838220 | ||||
| 4976126 | 1072925 | 382070 | 1454995 | 7360616 | 3174831 | 6231416 | 3863006 | ||||
| 4639015 | 1057050 | 327589 | 1384639 | 7841891 | 3127769 | 6315354 | 3819670 | ||||
| 4078193 | 964417 | 377699 | 1342116 | 8900991 | 3334672 | 5871888 | 3988400 | ||||
| 5142951 | 1056044 | 618772 | 1674816 | 9985386 | 3919838 | 5429747 | 4628819 | ||||
| 6464687 | 1510600 | 1265788 | 2776388 | 10913936 | 4713806 | 7267720 | 5538030 | ||||
| 8121812 | 1917712 | 1150900 | 3068612 | 2960710 | 2725893 | 13366936 | 5564434 | 9954216 | 6490504 | ||
| 8029172 | 2125206 | 688722 | 2813928 | 3431972 | 3107867 | 17400031 | 5967205 | 10987178 | 6987318 | ||
| 6905171 | 2430672 | 1149622 | 3580294 | 4305337 | 2066104 | 18678111 | 6238471 | 11776070 | 7221399 | ||
| 6973418 | 2340841 | 1575182 | 3916023 | 3822425 | 1827904 | 20691111 | 7185106 | 12992104 | 8152230 | ||
| 8755663 | 162218 | 2658708 | 1509181 | 4167889 | 4365275 | 1287869 | 22608311 | 8960369 | 15393630 | 10031009 | |
| 8374585 | 231218 | 2816244 | 318661 | 3134905 | 3845035 | 1973239 | 23958311 | 8020073 | 16054295 | 9057463 | |
| 6162011 | 299923 | 2895128 | 389914 | 3285042 | 4019850 | 2228990 | 28583231 | 8538935 | 14220275 | 9550177 | |
| 7457045 | 337262 | 3206554 | 550939 | 3757493 | 3675797 | 1069927 | 29659111 | 3039807 | 9069377 | 14863645 | 10083188 |
| 8609270 | 378272 | 3408351 | 508809 | 3917160 | 3824735 | 821976 | 30235711 | 3277584 | 8945346 | 17162234 | 10015273 |
| 7974038 | 421764 | 3470191 | 401076 | 3871267 | 3924005 | 1191784 | 31385411 | 3540046 | 8659477 | 17794761 | 9706700 |
| 7663888 | 480831 | 3280115 | 427373 | 3707488 | 3,853,618 | 1565748 | 32860982 | 3962330 | 9643214 | 18442139 | 10691599 |
| 7479921 | 511063 | 3464252 | 395744 | 3859996 | 4,045,901 | 1178884 | 35790422 | 4313223 | 10083296 | 18811567 | 11130244 |
| 6759013 | 534353 | 3349891 | 338125 | 3688016 | 4,170,465 | 1583723 | 37587776 | 4943270 | 10579711 | 19041827 | 11603194 |
| 6245515 | 558620 | 3141573 | 321922 | 3463495 | 3,954,290 | 1572786 | 38225537 | 5620747 | 11031614 | 18799847 | 11995495 |
| 5941900 | 613895 | 3779581 | 330234 | 4109815 | 3,962,912 | 824880 | 38325550 | 5812803 | 11155778 | 18709444 | 12108353 |
| 6308863 | 586445 | 3635768 | 356151 | 3991919 | 3,981,721 | 515058 | 38483250 | 5892050 | 11528424 | 17652915 | 12486717 |
| 6260525 | 637397 | 3843862 | 364166 | 4208028 | 4,081,566 | 398817 | 38802350 | 5978059 | 12368610 | 17735259 | 33356598 |
| 6503849 | 668794 | 3804307 | 341923 | 4146230 | 4,135,543 | 518348 | 38844914 | 6042693 | 12796098 | 16814518 | 13820458 |
| 6943056 | 673315 | 4039401 | 349850 | 4389251 | 4,044,690 | 488781 | 39192519 | 6081934 | 13387062 | 17558168 | 14623335 |
| 6911515 | 691548 | 4063131 | 344832 | 4407963 | 4,170,616 | 852275 | 39,729,376| | 6203869 | 14433777 | 18255534 | 15489633 |
| Savings-Banks.* | Friendly Societies registered. | Schools and Scholars. | Convictions in Superior Courts. | Year. | |||||
|---|---|---|---|---|---|---|---|---|---|
| Primary School. | Private Schools. | ||||||||
| Number of Depositors. | Balance to Credit on 31st Dec. | Number of | No. of Member. | School | Scholars. | School | Scholars. | ||
*Post Office Savings-Banks were first opened in 1867. † Statistics of schools and scholars not being complete for years prior to 1874, no figures are entered. ‡ Exclusive of charges for sinking fund met by debentures issued to an equivalent amount. § Approximate. | There was in December, 1893. an accued sinking fund amounting to £828,046, leaving a net indebtedness of £38,901,330. ¶ In addition to these there were in December, 1893, 2,196 children attending the Native schools, nearly all of which are maintained by Government, 721 at industrial schools and orphanages, and 2,251 scholars at high schools. | |||||||||
| £ | |||||||||
| 13 | 1853 | ||||||||
| 21 | 1854 | ||||||||
| 31 | 1855 | ||||||||
| 28 | 1856 | ||||||||
| 27 | 1857 | ||||||||
| 715 | 7862 | 62 | 1858 | ||||||
| 802 | 7996 | 70 | 1859 | ||||||
| 1104 | 12450 | 91 | 1860 | ||||||
| 1144 | 22921 | 100 | 1861 | ||||||
| 1496 | 29768 | 145 | 1862 | ||||||
| 2371 | 44117 | 234 | 1863 | ||||||
| 4669 | 94248 | 262 | 1864 | ||||||
| 4304 | 87400 | 332 | 1865 | ||||||
| 4513 | 91863 | 277 | 1866 | ||||||
| 6579 | 156855 | 240 | 1867 | ||||||
| 8121 | 243615 | 248 | 1868 | ||||||
| 10103 | 320383 | 277 | 1869 | ||||||
| 12137 | 388804 | 231 | 1870 | ||||||
| 14275 | 454966 | 180 | 1871 | ||||||
| 17289 | 597002 | 190 | 1872 | ||||||
| 21807 | 812144 | 189 | 1873 | ||||||
| 27215 | 943753 | 544 | 38215 | 188 | 8237 | 194 | 1874 | ||
| 30310 | 897326 | 599 | 45562 | 182 | 7316 | 257 | 1875 | ||
| 32577 | 905146 | 680 | 51964 | 244 | 9357 | 249 | 1876 | ||
| 35709 | 964430 | 89 | 8560 | 730 | 56239 | 252 | 9992 | 250 | 1877 |
| 39926 | 1043204 | 88 | 8828 | 748 | 65040 | 236 | 9206 | 292 | 1878 |
| 42679 | 990337 | 110 | 9759 | 817 | 75556 | 257 | 10234 | 296 | 1879 |
| 47462 | 1148992 | 138 | 13165 | 836 | 82401 | 278 | 11238 | 330 | 1880 |
| 61054 | 1549515 | 179 | 14484 | 869 | 83560 | 266 | 9987 | 270 | 1881 |
| 68358 | 1832047 | 272 | 18634 | 911 | 87179 | 262 | 10002 | 265 | 1882 |
| 73546 | 1784631 | 315 | 121882 | 943 | 92476 | 257 | 11255 | 258 | 1883 |
| 79514 | 1926759 | 323 | 23107 | 987 | 97238 | 265 | 12203 | 287 | 1884 |
| 85769 | 2142560 | 334 | 23,500§ | 1021 | 102407 | 280 | 11989 | 266 | 1885 |
| 91296 | 2133861 | 358 | 25,000§ | 1054 | 106328 | 288 | 12497 | 286 | 1886 |
| 97496 | 2407776 | 372 | 25,300§ | 1093 | 110919 | 299 | 13417 | 347 | 1887 |
| 103046 | 2691693 | 372 | 25,500§ | 1128 | 112685 | 299 | 13893 | 308 | 1888 |
| 110566 | 2858644 | 387 | 26,200§ | 1155 | 115456 | 293 | 13516 | 276 | 1889 |
| 118344 | 3137023 | 387 | 26,700§ | 1200 | 117912 | 298 | 13626 | 270 | 1890 |
| 126886 | 3406949 | 390 | 28,000§ | 1255 | 119523 | 281 | 14142 | 283 | 1891 |
| 135827 | 3580544 | 400 | 28,250§ | 1302 | 122620 | 274 | 14456 | 241 | 1892 |
| 147199 | 3966849 | 403 | 29,000§ | 1355 | 124,690¶ | 299 | 14922 | 304 | 1893 |
| STATISTICAL SUMMARY OF THE COLONY OF NEW ZEALAND FOR THE YEARS 1840 TO 1852 (INCLUSIVE). | ||||||||||
|---|---|---|---|---|---|---|---|---|---|---|
| Year. | Population of European Descent (excluding the Military and their Families.)* | Trade. | Revenue and Expenditure. | |||||||
| Imports | Exports. | Revenue from Customs. | Revenue from Land Sales and Crown Lands. | Revenue from Post Office, Fees. Fines, Licenses, and other Incidental Sources. | Total Revenue from Previous Sources. | Parliamentary Grant, or Receipts in aid of Revenue. | Appropriations from the Commissariat Chest for Military and Naval Expenditure. | Total Expenditure. | ||
* The Maori population was estimated at 56,400 persons in the year 1853. † The data are drawn from several official sources, and the information is only approximate. ‡ Raised by debentures at different issues. The following are particulars respecting the European population, their cultivations, and live stock for the year 1851:— Religious Denominations.—Church of England, 14,179 persons; Presbyterians, 4,124; Wesleyans, 2,529; Primitive Methodists, 226; Independents, 333; Baptists, 400; Unitarians, 74; Lutherans, 186; Quakers, 8; Protestants not specifically defined, 614; Roman Catholics, 3,473; Jews, 65; refused to state, 496. Education.—Could not read, 7,818 persons; read only, 4,353; read and write, 14,536. Land in Cultivation.—Acres—in wheat, 5,514; barley, 1,329; oats, 2,324; maize, 259; potatoes, 2,256; grass, 15,589; gardens or orchard, 1,188; other crops, 679: total under crop, 29,140. Acres fenced, 40,625. Live Stock.—Horses, 2,890; mules and asses, 60; cattle, 34,787; sheep, 233,043; goats, 12,121; pigs, 16,4. [The above table is compiled from information given in Dr. Thomson's work on New Zealand, which is stated by Sir George Grey to have been supplied from official sources when he was Governor.] | ||||||||||
| Persons. | £ | £ | £ | £ | £ | £ | £ | £ | £ | |
| 1840 | 2,050 | 926 | 926 | 926 | ||||||
| 1841 | 5,000 | 85,062 | 10,836 | 6,407 | 28,540 | 2,443 | 37,390 | 43,347 | 804 | 81,541 |
| 1842 | 10,992 | 166,783 | 18,670 | 18,568 | 11,723 | 2,298 | 32,589 | 17,494 | 1,426 | 51,509 |
| 1843 | 11,848 | 191,207 | 53,945 | 16,241 | 1,613 | 3,544 | 21,398 | 9,562 | 8,093 | 39,053 |
| 1844 | 12,447 | 111,619 | 49,647 | 11,099 | 405 | 2,445 | 13,949 | 30,815 | 9,782 | 54,546 |
| 1845 | 12,774 | 116,980 | 76,911 | 8,899 | 155 | 3,845 | 12,899 | 200,000 | 212,899 | |
| 1846 | 13,274 | 155,478 | 82,656 | 21,319 | 615 | 4,711 | 26,645 | 35,673 | 190,000 | 252,313 |
| 1847 | 14,477 | 202,355 | 45,485 | 36,472 | 835 | 5,958 | 43,265 | 37,752 | 153,038 | 234,055 |
| 1848 | 17,166 | 233,844 | 44,215 | 38,366 | 3,337 | 5,779 | 47,482 | 36,000 | 155,653 | 239,135 |
| 1849 | 19,543 | 254,679 | 133,662 | 41,931 | 3,600 | 4,877 | 50,408 | 20,000 | 151,455 | 221,863 |
| 1850 | 22,108 | 43,612 | 8,559 | 7,127 | 52,298 | 41,730 | 131,100 | 232,128 | ||
| 1851 | 26,707 | 49,208 | 12,261 | 5,580 | 67,049 | 20,000 | 110,600 | 197,649 | ||
| 1852 | 27,633 | 50,527 | 14,281 | 10,956 | 75,764 | 10,000 | 91,600 | 177,364 | ||
| AUSTRALASIAN STATISTICS FOR THE YEARALASIAN STATISTICS FOR THE YEAR 1893. | ||||||||||||||||||
|---|---|---|---|---|---|---|---|---|---|---|---|---|---|---|---|---|---|---|
| Colonies. | Population. (1) | Births. | Illegitimate Births. | Deaths. | Arrivals. | Departure. | ||||||||||||
| On 31st December. | Mean for Year. | Number. | Rate per 1,000 of Mean Population. | Number. | Proportion to every 100 Births. | Number | Rate per 1,000 of Mean Population. | |||||||||||
| Males. | Females. | Total. | Males. | Females. | Total. | Males. | Females. | Total. | Males. | Females. | Total. | |||||||
NOTE.—The chief statistics (1893) for Fiji are: Population, 122,712 (including Fijians, natives of Rotumah, Indian and Polynesian immigrant labourers, and others). At the census of 1891, the Europeans (excluding 1,076 half-castes) numbered 2,036. Temperature in shade at Suva: Highest, 94 Fahr.; lowest, 62° Fahr. Total rainfall, 96.45in. Revenue, 76,774; expenditure, 85,982. Public debt, 239,682. Cultivated land: Cocoanuts, 17,427 acres; sugarcane, 15,760 acres; bananas, 2,031 acres; maize, 435 acres; tea, 460 acres; peanuts, sisal, hemp, rice, tobacco, &c., 1,198 acres. * No information. (1) The aboriginal population of New South Wales and Victoria is included in the numbers given in the table. At the time of the census (April, 1891) there were estimated to be 565 aborigines in Victoria and 8,280 in New South Wales. Aborigines are excluded from the populations of the under-mentioned colonies, for which the census returns gave the following estimates of the native peoples: Queensland (1881), 20,585 persons; South Australia (1891), 23,789, of whom 20,655 were in the Northern Territory; New Zealand (1891), 41,993 (22,861 males and 19,132 females). (1a) Exclusive of the Northern Territory, containing 4,913 persons. | ||||||||||||||||||
| Queensland | 243,793 | 188,506 | 432,299 | 240,879 | 185,919 | 426,798 | 14,394 | 33.73 | 715 | 4.97 | 5,695 | 13.34 | 15,771 | 6,236 | 22,007 | 13,716 | 5,988 | 19,704 |
| New South Wales | 658,990 | 564,380 | 1,223,370 | 652,765 | 557,745 | 1,210,510 | 40,215 | 33.22 | * | * | 16,032 | 13.24 | 72,427 | 39,657 | 112,084 | 71,455 | 39,092 | 110,547 |
| Victoria | 608,049 | 565,957 | 1,174,006 | 607,570 | 562,760 | 1,170,330 | 36,552 | 31.23 | 1,997 | 5.46 | 16,508 | 14.11 | 50,674 | 23,373 | 74,047 | 54,271 | 26,189 | 80,460 |
| South Australia(1a) | 177,219 | 164,759 | 341,978 | 174,146 | 162,267 | 336,413 | 10,683 | 31.76 | 303 | 2.84 | 4,520 | 13.44 | 35,710 | 14,846 | 50,556 | 32,587 | 13,229 | 45,816 |
| Western Australia | 41,014 | 24,050 | 65,064 | 39,027 | 23,483 | 62,510 | 2,112 | 33.79 | 88 | 4.17 | 945 | 15.12 | 7,546 | 1,382 | 8,928 | 3,022 | 683 | 3,705 |
| Tasmania | 81,978 | 72,446 | 154,424 | 81,993 | 71,791 | 153,784 | 5,216 | 33.92 | 230 | 4.41 | 2,071 | 13.47 | 11,124 | 6,965 | 18,089 | 11,865 | 6,784 | 18,649 |
| New Zealand | 357,635 | 314,630 | 672,265 | 351,391 | 309,958 | 661,349 | 18,187 | 27.50 | 673 | 3.70 | 6,767 | 10.23 | 17,385 | 8,750 | 26,135 | 10,263 | 5,460 | 15,723 |
| Colonies. | Shipping. | Trade. | |||||||||||||||||
|---|---|---|---|---|---|---|---|---|---|---|---|---|---|---|---|---|---|---|---|
| Inwards. | Outwards. | Value of Imports from | Value of Imports per Head of Mean Population. | United Kingdom. | New Zealand. | ||||||||||||||
| Shipping Vessels. | Steam Vessels. | Sailing Vessels. | Steam Vessels. | ||||||||||||||||
| Number. | Tonnage. | Number. | Tonnage. | Number. | Tonnage. | Number. | Tonnage. | United Kingdom- | New Zealand. | Australian Colonies. | Other British Possessions. | Foreign States. | Total. | ||||||
NOTE.—The chief statistics (1893) for Fiji are: Population, 122,712 (including Fijians, natives of Rotumah, Indian and Polynesian immigrant labourers, and others). At the census of 1891, the Europeans (excluding 1,076 half-castes) numbered 2,036. Temperature in shade at Suva: Highest, 94° Fahr.; lowest, 62° Fahr. Total rainfall, 96.45in. Revenue, .76,774; expenditure, .85,982. Public debt, .239,682. Cultivated land: Cocoanuts, 17,427 acres; sugarcane, 15,760 acres; bananas, 2,031 acres; maize, 435 acres; tea, 460 acres; peanuts, sisal, hemp, rice, tobacco, &c., 1,198 acres. (2) Steamers and sailing vessels not distinguished. | |||||||||||||||||||
| £ | £ | £ | £ | £ | £ | £ | s. | d. | £ | £ | |||||||||
| Queensland | (2) 599 vessels, 464,581 tons | (2)615 vessels, 481,047 tons | 1,559,475 | 24,137 | 2,465,535 | 150,908 | 152,728 | 4,352,783 | 10 | 4 | 0 | 3,694,534 | 114,999 | ||||||
| New South Wales | 569 | 473,206 | 2,345 | 2,117,165 | 603 | 492,936 | 2,313 | 2,110,021 | 7,218,124 | 756,433 | 8,139,354 | 565,491 | 1,427,633 | 18,107,035 | 14 | 19 | 2 | 8,269,507 | 533,262 |
| Victoria | 191 | 144,713 | 1,698 | 1,864,474 | 197 | 151,049 | 1,690 | 1,869,502 | 5,511,735 | 460,035 | 5,415,634 | 577,939 | 1,318,471 | 13,283,814 | 11 | 7 | 0 | 7,490,804 | 315,911 |
| South Australia | 202 | 172,526 | 746 | 1,007,707 | 222 | 197,641 | 749 | 1,014,726 | 1,925,985 | 3,434 | 5,174,861 | 185,085 | 644,835 | 7,934,200 | 23 | 11 | 8 | 3,477,579 | 17,874 |
| Western Australia | 67 | 43,256 | 226 | 496,697 | 75 | 46,829 | 213 | 484,636 | 733,001 | 748 | 664,252 | 67,780 | 28,657 | 1,494,438 | 23 | 18 | 1 | 349,080 | 400 |
| Tasmania | 99 | 19,078 | 594 | 447,234 | 104 | 19,685 | 586 | 448,442 | 344,360 | 9,480 | 690,110 | 3,886 | 9,847 | 1,057,683 | 6 | 17 | 7 | 284,334 | 32,699 |
| New Zealand | 319 | 166,170 | 298 | 449,434 | 331 | 177,929 | 304 | 464,537 | 4,481,955 | 1,411,465 | 448,926 | 569,169 | 6,911,515 | 10 | 9 | 0 | 7,036,515 | ||
| Colonies | Postal. | Electric Telegraph. | Telephones. | Postal, &c. | ||||||||||||
|---|---|---|---|---|---|---|---|---|---|---|---|---|---|---|---|---|
| Number passing through Office once of | No. of Miles of Line on 31st December. | No. of Miles of Wire on 31st December. | Number of Telegraph Offices. | Number of Telegrams transmitted during Year. | Number of Exchanges. | Number of Connections. | Miles of Wire. | Postal (estimated). | Telegraph. | |||||||
| Number of Post-offices. | Letters and Post-cards. | Newspapers. | Books and Packets. | Parcels. | Open. | Being made. | Open. | |||||||||
NOTE.—The chief statistics (1893) for Fiji are: Population, 122,712 (including Fijians, natives of Rotumah, Indian and Polynesian immigrant labourers, and others). At the census of 1891, the Europeans (excluding 1,076 half-castes) numbered 2,036. Temperature in shade at Suva: Highest, 94° Fahr.; lowest, 62° Fahr. Total rainfall, 96.45in. Revenue, 76,774; expenditure, 85,982. Public debt, 239,682. Cultivated land: Cocoanuts, 17,427 acres; sugarcane, 15,760 acres; bananas, 2,031 acres; maize, 435 acres; tea, 460 acres; peanuts, sisal, hemp, rice, tobacco, &c., 1,198 acres. * No information. (5) And 404 receiving offices. (6) And 366 miles of cables. (7) And 222 on private lines. (8) Included in telegraphs. (9) Postal revenue for year ended 30th June, 1893. | ||||||||||||||||
| £ | £ | |||||||||||||||
| Queensland | 963 | 16,297,827 | 10,545,185 | 3,925,415 | 67,487 | 10,004 | 17,810 | 363 | 958,193 | 16 | 717 | 135,518 | 76,771 | |||
| New South Wales | (5)1,423 | 78,390,920 | 44,927,900 | 12,060,600 | 93,224 | 12,097 | 22 | 27,326 | 1 | 724 | 2,376,793 | 17 | 2,957 | (8) | 466,453 | 160,796 |
| Victoria | 1,733 | * | * | * | 215,733 | 7,105 | 14,220 | 6 | 779 | 2,476,178 | 13 | 2,308 | 9,026 | (9)396,934 | 105,740 | |
| South Australia | 638 | 16,629,260 | 7,741,221 | 1,424,821 | 5,546 | 10,894 | 249 | 747,563 | 8 | (7)839 | 2,188 | 120,142 | 87,673 | |||
| Western Australia | 195 | 7,002,913 | 6,001,946 | 1,401,146 | 6,011 | 3,578 | 375 | 4,303 | 60 | 283,592 | 2 | 234 | 677 | 22,787 | 16,388 | |
| Tasmania | 337 | 5,721,964 | 4,231,868 | 1,399,973 | (6)1,821 | (6)3,031 | 210 | 207,591 | 3 | 668 | 489 | 50,563 | 17,650 | |||
| New Zealand | 1,305 | 28,862,600 | 8,054,770 | 12,167,688 | 170,871 | 5,513 | 13,515 | 640 | 2,069,691 | 24 | 4,244 | 231,481 | 91,425 | |||
| Marriages. | Vital Statistics of Capital Cities (including Suburbs). | Meteorology (Capital City). | |||||||||||
|---|---|---|---|---|---|---|---|---|---|---|---|---|---|
| Number. | Rate per 1,000 of Mean Population. | Capital City. | Population. | Births. | Deaths. | Temperature. | Rainfall | ||||||
| On 31st December. | Mean for Year. | Number. | Rate per 1,000 of Mean Population. | Number. | Rate per 1,000 of Mean Population. | Highest in Shade. | Lowest in Shade. | Total Rainfall in Year. | Maximum Fall in any 24 Hours. | Number of Days on which Rain fell. | |||
NOTE.—The chief statistics (1893) for Fiji are: Population, 122,712 (including Fijians, natives of Rotumah, Indian and Polynesian immigrant labourers, and others). At the census of 1891, the Europeans (excluding 1,076 half-castes) numbered 2,036. Temperature in shade at Suva: Highest, 94° Fahr.; lowest, 62° Fahr. Total rainfall, 96.45in. Revenue, 76,774; expenditure, 85,982. Public debt, 239,682. Cultivated land: Cocoanuts, 17,427 acres; sugarcane, 15,760 acres; bananas, 2,031 acres; maize, 435 acres; tea, 460 acres; peanuts, sisal, hemp, rice, tobacco, &c., 1,198 acres. * No information. | |||||||||||||
| Fahr. | Fahr. | Inches. | Inches. | ||||||||||
| 2,524 | 5.91 | Brisbane | * | * | 2,003 | * | 1,024 | * | 105.9 | 39.0 | 88.264 | * | 147 |
| 7,744 | 6.40 | Sydney | 421,030 | 416,370 | 13,945 | 33.49 | 6,483 | 15.57 | 93.6 | 38.7 | 49.561 | 3.30 | 208 |
| 7,004 | 5.98 | Melbourne | 444,832 | 457,230 | 15,338 | 33.55 | 7,805 | 17.07 | 105.5 | 31.0 | 26.81 | 1.64 | 140 |
| 2,110 | 6.27 | Adelaide | 140,549 | 138,657 | 4,568 | 32.94 | 2,438 | 17.58 | 108.0 | 35.7 | 21.485 | 1.42 | 129 |
| 392 | 6.27 | Perth | 12,424 | 11,770 | 541 | 43.54 | 278 | 22.38 | 106.0 | 35.0 | 40.12 | 2.08 | 145 |
| 848 | 5.51 | Hobart | 26,222 | 26,113 | 917 | 35.12 | 512 | 19.61 | 94.0 | 34.0 | 27.48 | 1.47 | 146 |
| 4,125 | 6.24 | Wellington | 38,298 | 37,655 | 1,062 | 28.20 | 495 | 13.15 | 82.0 | 34.0 | 53.034 | 5.70 | 186 |
| Value of Exports to | Value of Exports per Head of Mean Population. | Value of Exports the Produce and Manufacture of the Colony. | Railways (State). | ||||||||||
|---|---|---|---|---|---|---|---|---|---|---|---|---|---|
| Australian Colonies. | Other British Possessions. | Foreign States. | Total. | No. of Miles of Line open on 31st December. | No. of Miles of Line in course of Construction on 31st December. | Cost of Construction of Open Lines. | Gross Receipts. | Working Expenses. | Percentage of Net Revenue to Cost. | ||||
NOTE.—The chief statistics (1893) for Fiji are: Population, 122,712 (including Fijians, natives of Rotumah, Indian and Polynesian immigrant labourers, and others). At the census of 1891, the Europeans (excluding 1,076 half-castes) numbered 2,036. Temperature in shade at Suva: Highest, 94° Fahr.; lowest, 62° Fahr. Total rainfall, 96.45in. Revenue, .76,774; expenditure, .85,982. Public debt, 239,682. Cultivated land: Cocoanuts, 17,427 acres; sugarcane, 15,760 acres; bananas, 2,031 acres; maize, 435 acres; tea, 460 acres; peanuts, sisal, hemp, rice, tobacco, &c., 1,198 acres. (3) For year ended 30th June. 1893. (3a) For the year 1892. (4) The figures given for New Zealand are for the year ended 31st March, 1894. There were in New Zealand at that date, 164 miles of private lines open for traffic; the mileage of private railways in the other colonies has not been returned, but in 1892 was—New South Wales, 81 miles; South Australia, 17 miles; Tasmania, 48 miles; and Western Australia, 453 miles. | |||||||||||||
| £ | £ | £ | £ | s. | d. | £ | £ | £ | £ | % | |||
| 5,710,467 | 81,343 | 31,319 | 9,632,662 | 22 | 11 | 5 | 9,080,599 | 2,379 | 16,348,945 | 943,617 | 634,683 | 1.89 | |
| 9,317,776 | 419,264 | 4,351,414 | 22,921,223 | 18 | 18 | 9 | 17,094,213 | 2,351 | 179 | 34,657,571 | 2,927,056 | 1,738,516 | 3.48 |
| 3,301,185 | 359,517 | 1,841,134 | 13,308,551 | 11 | 7 | 5 | 10,293,926 | 2,975 | 93 | 37,451,487 | (3)2,925,948 | (3)1,850,291 | 2.89 |
| 3,555,888 | 1,001,151 | 411,444 | 8,463,936 | 25 | 3 | 2 | 3,295,475 | 1,664 | 57 | 11,996,970 | 1,055,395 | 609,219 | 3.72 |
| 478,957 | 79,186 | 10,524 | 918,147 | 14 | 13 | 9 | 870,437 | (3a)198 | (3a)292 | (3a)914,823 | (3a)94,201 | (3a)90,654 | (3a)0.38 |
| 1,035,111 | 40 | 1,352,184 | 8 | 15 | 10 | 1,336,586 | 475 | 3,759,898 | 167,094 | 141,801 | 0.67 | ||
| 1,274,790 | 71,356 | 602,703 | 8,985,364 | 13 | 11 | 9 | 8,557,443 | (4)1,948 | 143 | 15,137,036 | 1,172,793 | 735,359 | 2.89 |
| Postal, &c., Revenue. | Working Expenses Post, Telegraph, and Telephone. | Banks of Issue.(10) | Savings-Banks. | |||||||
|---|---|---|---|---|---|---|---|---|---|---|
| Telephone. | Total. | Average of | Post Office. | Private. | ||||||
| Liabilities. | Assets. | Deposits. | Advances. | Number of Depositors. | Amount to Credit of Depositors at End of Year. | Number of Depositors. | Amount to Credit of Depositors at End of Year. | |||
NOTE.—The chief statistics (1893) for Fiji are: Population, 122,712 (including Fijians, natives of Rotumah, Indian and Polynesian immigrant labourers, and others). At the census of 1891, the Europeans (excluding 1,076 half-castes) numbered 2,036. Temperature in shade at Suva: Highest, 94° Fahr.; lowest, 62° Fahr. Total rainfall, 96.45in. Revenue, 76,774; expenditure, 85,982. Public debt, 239,682. Cultivated land: Cocoanuts, 17,427 acres; sugarcane, 15,760 acres; bananas, 2,031 acres; maize, 435 acres; tea, 460 acres; peanuts, sisal, hemp, rice, tobacco, &c., 1,198 acres. * No information. (11) General or trustee. No returns of private savings-banks. | ||||||||||
| £ | £ | £ | £ | £ | £ | £ | £ | £ | ||
| 4,432 | 216,721 | 302,775 | 11,079,630 | 19,739,959 | 10,827,205 | 16,428,380 | 47,885 | 1,875,615 | ||
| 16,320 | 643,569 | 811,171 | 34,102,172 | 50,887,179 | 32,141,959 | 40,024,354 | 114,070 | 2,915,650 | 65,657 | 3,302,469 |
| 39,197 | 541,871 | 614,922 | 33,639,618 | 56,644,511 | 32,027,354 | 45,942,599 | 122,315 | 2,959,795 | (11)202,074 | (11)3,755,648 |
| 13,288 | 221,103 | 197,756 | 7,596,687 | 8,971,059 | 7,180,989 | * | 81,798 | 2,318,309 | ||
| 1,967 | 41,142 | 57,884 | * | * | * | * | * | * | * | * |
| 3,347 | 71,560 | 82,536 | 3,682,939 | 3,826,498 | 3,552,953 | 2,970,642 | 4,965 | 90,911 | 23,225 | 489,527 |
| 21,771 | 344,677 | 293,704 | 15,489,633 | 18,255,534 | 14,433,777 | 12,797,563 | 122,684 | 3,241,998 | 24,515 | 724,851 |
| Colonies. | Public Revenue. | Taxation. | Public Expenditure. | ||||||||||||||||||||
|---|---|---|---|---|---|---|---|---|---|---|---|---|---|---|---|---|---|---|---|---|---|---|---|
| From Taxation. | Railways. | Post and Telegraph. | Sales and Rents of Crown Lands | Other Revenue. | Total Revenue. | Rate per Head of Mean Population. | Not including Loan Expenditure. | ||||||||||||||||
| Customs. | Other Taxes. | Total Taxation. | Customs. | Other Taxes. | Total. | Interest and Charges of Public Debt. | Railways. | Post and Telegraph. | Education. | Other Expenditure. | Total. | ||||||||||||
(12) And tramways. (13) Including 163,750, Treasury bills in aid of revenue. (14) Including 58,700, redemption of loans; and 10,406, Treasury bills sinking fund. (14a) Excluding 284,500, met by debentures issued to an equivalent amount. | |||||||||||||||||||||||
| £ | £ | £ | £ | £ | £ | £ | £ | £ | s. | d. | £ | s. | d. | £ | s. | d. | £ | £ | £ | £ | £ | £ | |
| Queensland | 1,063,228 | 272,326 | 1,335,554 | 947,195 | 210,529 | 624,332 | 220,175 | 3,337,785 | 2 | 9 | 10 | 0 | 12 | 9 | 3 | 2 | 7 | 1,255,181 | 628,683 | 302,861 | 229,390 | 1,105,751 | 3,521,866 |
| New South Wales | 2,127,645 | 706,834 | 2,834,479 | (12)3,253,272 | 643,849 | 2,206,272 | 768,862 | 9,706,734 | 1 | 15 | 2 | 0 | 11 | 8 | 2 | 6 | 10 | 2,687,898 | (12)1,895,347 | 774,502 | 805,330 | 4,125,945 | 10,289,022 |
| Victoria | 1,739,285 | 783,494 | 2,522,779 | 2,912,788 | 546,404 | 482,466 | 494,792 | 6,959,229 | 1 | 9 | 9 | 0 | 13 | 4 | 2 | 3 | 1 | 1,836,185 | 1,769,145 | 716,138 | 782,676 | 2,885,613 | 7,989,757 |
| South Australia | 508,798 | 224,464 | 733,262 | 1,091,265 | 220,767 | 221,634 | (13)404,567 | 2,671,495 | 1 | 10 | 3 | 0 | 13 | 4 | 2 | 3 | 7 | 833,283 | 622,608 | 197,757 | 152,042 | (14)777,791 | 2,583,481 |
| Western Australia | 259,495 | 33,841 | 293,336 | 120,822 | 41,142 | 77,919 | 37,432 | 570,651 | 4 | 3 | 0 | 0 | 10 | 10 | 4 | 13 | 10 | 114,368 | 94,735 | 57,884 | 16,347 | 357,467 | 640,801 |
| Tasmania | 285,456 | 114,244 | 399,700 | 152,525 | 59,044 | 53,824 | 41,879 | 706,972 | 1 | 17 | 2 | 0 | 14 | 10 | 2 | 12 | 0 | 323,150 | 136,420 | 75,289 | 45,120 | 256,438 | 836,417 |
| New Zealand | 1,678,896 | 674,354 | 2,353,250 | 1,169,987 | 322,906 | 322,930 | 238,890 | 4,407,963 | 2 | 10 | 9 | 1 | 0 | 5 | 3 | 11 | 2 | (14a)1,601,890 | 724,080 | 282,478 | 418,610 | 1,143,558 | 4,170,616 |
| Colonies. | Agriculture, 1893—94. | |||||||||||||
|---|---|---|---|---|---|---|---|---|---|---|---|---|---|---|
| Number of Cultivated Holdings over One Acre in Extent. | Land in Crop. | Land broken up but not under Crop. | Land in Sown Grasses. | Total Land in Cultivation, including Sown Grasses. | Principal Crops. | |||||||||
| In Wheat. | In Oats. | In Barley. | ||||||||||||
| Land. | Produce. | Yield per Acre. | Land. | Produce. | Yield per Acre. | Land. | Produce. | Yield per Acre. | ||||||
NOTE.—The chief statistics (1893) for Fiji are: Population, 122,712 (including Fijians, natives of Rotumah, Indian and Polynesian immigrant labourers, and others). At the census of 1891, the Europeans (excluding 1,076 half-castes) numbered 2,036. Temperature in shade at Suva: Highest, 94° Fahr.; lowest, 62° Fahr. Total rainfall, 96.45in. Revenue, 76,774; expenditure, 85,982. Public debt, 239,682. Cultivated land: Cocoanuts, 17,427 acres; sugarcane, 15,760 acres; bananas, 2,031 acres; maize, 435 acres; tea, 460 acres; peanuts, sisal, hemp, rice, tobacco, &c., 1,198 acres. * No information. (19) Including 52,059 acres cleared land. (20) Including 118,730 acres “other cultivated land.” | ||||||||||||||
| Acres. | Acres. | Acres. | Acres. | Acres. | Bushels. | Bushels. | Acres. | Bushels. | Bushels. | Acres. | Bushels. | Bushels. | ||
| Queensland | * | 243,249 | 8,826 | 18,346 | 270,421 | 28,993 | 413,094 | 14.25 | 606 | 12,095 | 19.96 | 495 | 8,396 | 16.96 |
| New South Wales | 55,250 | 1,206,992 | 303,412 | 1,509,404 | 593,810 | 6,502,715 | 10.95 | 34.148 | 701,804 | 20.55 | 6,113 | 114,272 | 18.69 | |
| Victoria | 34,547 | 2,319,165 | 457,082 | 242,762 | 3,019,009 | 1,469,359 | 15,255,200 | 10.38 | 218,904 | 4,951,371 | 22.62 | 49,105 | 1,033,861 | 21.09 |
| South Australia | 20,355 | 2,168,029 | 563,371 | 26,904 | 2,758,304 | 1,732,711 | 13,618,062 | 7.86 | 13,619 | 172,605 | 12.67 | 13,072 | 205,577 | 15.73 |
| Western Australia | * | 83,713 | 40,806 | (19)176,578 | 42,673 | 520,198 | 12.19 | 2,571 | 47,597 | 18.51 | 3,603 | 48,330 | 13.41 | |
| Tasmania | * | 191,951 | 23,888 | 216,296 | (20)550,865 | 55,312 | 833,771 | 15.07 | 33,755 | 837,720 | 24.82 | 4,876 | 110,174 | 22.60 |
| New Zealand | 45,290 | 1,221,812 | 142,342 | 8,698,897 | 10,063,051 | 242,737 | 4,891,695 | 20.15 | 376,646 | 12,153,068 | 32.27 | 28,857 | 724,653 | 25.11 |
| Loan Expenditure. | Public Debt. | State Education. | ||||||||||
|---|---|---|---|---|---|---|---|---|---|---|---|---|
| Railway Construction. | Roads and Bridges. | Other Expenditure. | Total Loan Expenditure. | Amount on 31st December. | Accrued Sinking Fund on 31st December. | Net Indebtedness on 31st December. | Rate of Net Indebtedness per Head of Population at End of Year. | Number of Schools at End of Year. | Number of Teachers. | Number of Scholars on Roll at End of Year. | ||
NOTE.—The chief statistics (1893) for Fiji are: Population, 122,712 (including Fijians, natives of Rotumah, Indian and Polynesian immigrant labourers, and others). At the census of 1891, the Europeans (excluding 1,076 half-castes) numbered 2,036. Temperature in shade at Suva: Highest, 94° Fahr.; lowest, 62° Fahr. Total rainfall, 96.45in. Revenue, 76,774; expenditure, 85,982. Public debt, 239,682. Cultivated land: Cocoanuts, 17,427 acres; sugarcane, 15,760 acres; bananas, 2,031 acres; maize, 435 acres; tea, 460 acres; peanuts, sisal, hemp, rice, tobacco, &c., 1,198 acres. * No information. (12) And tramways. (13) Including 163,750, Treasury bills in aid of revenue. (14) Including 58,700, redemption of loans; and 10,406, Treasury bills sinking fund. (14a) Excluding 284,500, met by debentures issued to an equivalent amount. (15) Excluding redemptions, 40,300. (16) On 1st January, 1894. (17) Excluding 50,000, Treasury bills in aid of revenue; and 2,419,900, available for redemption of loans about to fall due. (18) Annual or gross enrolment. | ||||||||||||
| £ | £ | £ | £ | £ | £ | £ | £ | s. | d. | |||
| 132,591 | 253,129 | 385,720 | 30,639,534 | 30,639,534 | 70 | 17 | 6 | 691 | 1,484 | (18)78,330 | ||
| (12)1,143,330 | 63,305 | 722,945 | (15)1,929,580 | (16)58,079,033 | (16)58,079,033 | (16)47 | 9 | 6 | 2,520 | 4,527 | (18)210,277 | |
| 373,210 | 152 | 387,838 | 761,200 | (17)46,033,227 | 63,238 | (17)45,969,989 | 39 | 3 | 2 | 2,038 | 4,968 | 236,508 |
| 262,726 | 16,239 | 307,419 | 586,384 | 21,697,000 | 13,750 | 21,683,250 | 62 | 10 | 2 | 606 | 1,135 | (18)56,302 |
| 451,775 | 3,140 | 199,647 | 654,562 | 2,873,098 | 129,099 | 2,743,999 | 42 | 3 | 6 | * | * | * |
| 13,542 | 67,946 | 92,539 | 174,027 | 7,645,604 | 136,591 | 7,509,013 | 48 | 12 | 6 | 253 | 517 | 20,475 |
| 179,034 | 133,305 | 539,936 | 852,275 | 39,729,376 | 828,046 | 38,901,330 | 57 | 17 | 4 | 1,355 | 3,268 | 124,690 |
| Principal Crops. | Live-Stock. | |||||||||||
|---|---|---|---|---|---|---|---|---|---|---|---|---|
| In Maize. | In Hay. | In Potatoes. | Horses. | Cattle. | Sheep. | Pigs. | ||||||
| Land. | Produce. | Yield per Acre. | Land. | Produce. | Yield per Acre. | Land. | Produce. | Yield per Acre. | ||||
(21) Number at census (April, 1891), excluding 86,259 pigs owned by Maoris; of their horses, no account was taken. (22) Number in February, 1894, excluding 42,912 owned by Maoris. (23) Number on 30th April, 1894. | ||||||||||||
| Acres. | Bushels. | Bushels. | Acres. | Tons. | Tons. | Acres. | Tons. | Tons. | ||||
| 93,556 | 1,824,108 | 19,50 | 22,505 | 42,353 | 1,88 | 8,306 | 17,165 | 2,07 | 429,734 | 6,693,200 | 18,697,015 | 68,086 |
| 205,885 | 7,011,526 | 34,06 | 205,424 | 235,424 | 1,15 | 26,559 | 83,838 | 3,16 | 481,399 | 2,155,500 | 56,980,688 | 240,860 |
| 6,485 | 180,442 | 27,82 | 412,223 | 503,355 | 1,22 | 40,909 | 144,708 | 3,54 | 463,903 | 1,817,291 | 13,098,725 | 328,162 |
| 361,145 | 334,769 | 0,93 | 6,510 | 22,958 | 3,53 | 187,666 | 423,600 | 7,267,642 | 86,468 | |||
| 37 | 573 | 15,49 | 29,589 | 33,039 | 1,10 | 630 | 2,309 | 3,67 | 45,747 | 173,747 | 2,220,642 | 26,233 |
| 47,500 | 54,889 | 1,16 | 19,068 | 76,769 | 4,02 | 31,587 | 169,141 | 1,535,047 | 51,952 | |||
| 5,116 | 224,539 | 43,89 | 60,740 | 86,198 | 1,42 | 21,121 | 126,540 | 5,99 | (21)211,040 | (22)885,305 | (23)20,122,556 | (21)222,553 |