
Table of Contents
The Handbook published last year met with so favourable a reception that the Government decided on publishing a similar work annually, to be called the “New Zealand Official Year-Book.” This volume will therefore be one of a series.
As the demand for the Handbook was largely in excess of the number printed, it seemed evident that some of the special articles, after having been revised, would bear repetition. But there is a large quantity of completely new matter introduced into this book, especially in the portions relating to agriculture, sheep-farming, meat-freezing, butter- and cheese-making, climate and temperature, mineral waters, thermal springs, land- and income-tax methods, &c. Of the articles dealing with these subjects, some appear for the first time, while others have been re-written and enlarged.
The whole of Part III. is entirely new. It consists of a digest of the land-laws and descriptions of the various land districts, giving such particulars as the nature of the soil—whether fit for agricultural, pastoral, or mining purposes—the timber, and other natural products; besides mentioning the industries pursued, the towns and settlements, the means of communication, with other leading features.
The statistical information, with small exceptions, will be found to contain the latest figures. The difficulty of obtaining complete figures for 1892 covering such a range of subjects as is here dealt with, early enough to print in a book to be presented to Parliament during this session, was found to be very considerable; and the date at which many figures became available left little time for analysis or comment thereon. But certainly the information is made public at a much earlier date than is the case in the neighbouring colonies.
The able and kindly assistance rendered by the heads of the various Government Departments is again acknowledged. Without cordial co-operation it would have been impossible to do so much as has been performed, especially in so short a space of time.
E. J. von Dadelszen.
Registrar-General's Office,
Wellington, 25th August, 1893.
OFFICE ASSISTANCE.
For Statistical and Critical Work Officers of Registrar-General's Department.
For general assistance Mr. Charles Janion.
N.B. Every care has been taken to avoid errors, but if any be discovered it is requested that they may be reported. Suggestions will also receive consideration.
Since the First Part of the Year-book was printed the following changes have taken place:—
The Franchise (See p. 16).
“The Electoral Act, 1893,” has extended to women of both races the right to register as electors, and to vote at the elections for members of the House of Representatives. The qualification for registration is the same for both sexes, and remains substantially unaltered. No person is entitled to be registered on more than one electoral roll within the colony, whatever the number or nature of the qualifications he or she may possess, or wherever they may be. Women are not qualified to be elected as members of the House of Representatives.
Foreign Consuls (see p. 23.)
Mr. J. H. Amora, of Sydney, appointed Consul-General in Australasia, for Nicaragua.
Mr. Frank Graham, recognised as Vice-consul for Sweden and Norway, at Christchurch.
Mr. E. V. Johansen, of Auckland, Consular jurisdiction for Denmark to extend over the whole of the North Island.
Mr. E. C. Skog, of Christchurch, to be Consul for Denmark, for the South Island.
Executive Council (see p. 25).
The Hon. Alfred Jerome Cadman sworn in (6th September) as a member, and appointed Minister of Justice and Minister of Mines. The Hon. R. J. Seddon appointed Native Minister.
HONOURS HELD BY COLONISTS.
Bell, Sir Francis Dillon, Knt. Bach., 1873; K.C.M.G., 1881; C.B., 1886.
Buckley, Hon. Sir Patrick Alphonsus, K.C.M.G., 1892.
Buller, Sir Walter Lawry, F.R.S., C.M.G., 1875; K.C.M.G., 1886.
FitzGerald, James Edward, Esq., C.M.G., 1870.
Grace, Hon. Morgan Stanislaus, C.M.G., 1890.
Grey, Sir George, K.C.B., 1848.
Hall, Hon. Sir John, K.O.M.G., 1882.
Hector, Sir James, F.R.S., C.M.G., 1875; K.C.M.G., 1887.
Larnach, Hon. William James Mudie, C.M.G., 1879.
O'Rorke, Sir George Maurice, Knt. Bach., 1880.
Prendergast, Sir James, Knt. Bach., 1881.
Richardson, Hon. Edward, C.M.G., 1879.
Roberts, John, Esq., C.M.G., 1891.
Stafford, Hon. Sir Edward William, K.C.M.G., 1879; G.C.M.G., 1887.
Stout, Hon. Sir Robert, K.C.M.G., 1886.
Vogel, Hon. Sir Julius, C.M.G., 1872; K.C.M.G., 1875.
Whitmore, Hon. Colonel Sir George Stoddart, O.M.G., 1869; K.C.M.G., 1882.
By despatch from the Secretary of State for the Colonies, dated Downing Street, 15th June, 1893, His Excellency the Governor has been apprised that the title of “Honourable,” appertaining to members of the Executive and Legislative Councils in colonies possessing responsible government, whether confined to duration of office or continued for life, is approved by Her Majesty for use and recognition throughout Her dominions, either during office or for life, as the case may be.
Besides the Members of the Executive and Legislative Councils the following ex-Ministers whose names do not appear in the list given above, are allowed, as such, to retain the title of “Honourable”: Bryce, John, 1884; Dick, Thomas, 1884; Fergus, Thomas, 1891; Gisborne, William, 1873; Haultain, C. T. M., 1870; Hislop, Thomas W., 1891; Johnston, Walter W., 1884; Mitchelson, Edwin, 1891; Oliver, Richard, 1884; Reynolds, William H., 1876; Richardson, George F., 1891; Rolleston, William, 1884; Tole, Joseph A., 1888.
Table of Contents
Table of Contents
The Colony of New Zealand consists of three main islands, with several groups of smaller islands lying at some distance from the principal group. The former are known as the North, the Middle, and Stewart Islands. These three islands have a coast-line amounting to 4,330 miles in length—namely, North Island, 2,200 miles; Middle Island, 2,000 miles; and Stewart Island, 130 miles. The other islands now included within the colony are the Chatham Islands, Auckland Islands, Campbell Islands, Antipodes Islands, Bounty Islands, and Kermadec Islands. A protectorate over the Cook Islands (Hervey Group) is exercised by the Imperial Government, the Governor of New Zealand acting as responsible adviser.
New Zealand is a mountainous country in many parts, but has, nevertheless, large plains in both North and Middle Islands. In the North Island, which is highly volcanic, is situated the famous-Thermal-Springs District, of which a special account will be given. The Middle Island is remarkable for its lofty mountains, with their magnificent glaciers, and the deep sounds or fiords on the western coast.
New Zealand is firstly a pastoral, and secondly an agricultural country. Sown grasses are grown almost everywhere, the extent of land laid down being upwards of eight millions of acres. The land is admirably adapted for receiving these grasses, which, after the bush has been burnt off, is mostly sown over without previous ploughing. In the Middle Island a large area is covered with native grasses, all used for grazing purposes. The large extent of good grazing-land has made the colony a great wool- and meat-producing country; and its agricultural capabilities are, speaking generally, very considerable. The abundance of water and quantity of valuable timber are also leading characteristics.
New Zealand is, besides, a mining country. Coal is found in immense quantities, chiefly on the west coast of the Middle Island. Gold, alluvial and in quartz, is found in both islands, the yield having been over forty-eight millions sterling in value to the present time. Full statistical information is given further on, compiled up to the latest dates.
The first authentic account of the discovery of New Zealand is that given by Abel Jansen Tasman, a Dutch navigator. He sailed from Batavia on the 14th August, 1642, in the yacht “Heemskirk,” accompanied by the “Zeehaen” (or “Sea-hen”) fly-boat. After having visited Mauritius and discovered Tasmania, named by him “Van Diemen's Land,” in honour of Anthony van Diemen, the Governor of the Dutch possessions in the East Indies, he sailed in an easterly direction, and on the 13th December of that year sighted the west coast of the Middle Island of New Zealand, described by him as “a high mountainous country, which is at present marked in the charts as New Zealand.”
It has been assumed as probable that the first European who visited New Zealand was Juan Fernandez, who, having started from one of the ports of the west coast of South America in 1576, after sailing for about a month in a south-westerly direction, reached a land described by him as fertile and pleasant, and inhabited by a race of white people, well made, and dressed in a kind of woven cloth. People of brown complexions were often described as white by the Spaniards; and, although there is no direct evidence that the land so discovered was New Zealand, yet no other seems to answer his description. It appears, however, certain that the country was visited before the date of Tasman's arrival in 1642, as the land he came to was shown in the Dutch chart used by him, and was named thereon “Zeland Nova,” William Bleau, a Dutchman, who died in 1638, having published an atlas in which a line of coast is indistinctly shown with the name against it, “Zelandia Nova.”
Tasman, under the belief that the land he saw formed part of a great polar continent, and was part of that country (subsequently found to be an island) discovered some years before by Schouten and Le Maire, to which the name of Staaten Land had been given, gave the same name of Staaten Land to New Zealand. Within about three months after this date Schouten's “Staaten Land” was found to be merely an inconsiderable island. Upon this discovery being announced, the country which Tasman had called by the same name received instead that of “New Zealand”—an evident restoration of the name previously given—by which name it has ever since been known. Tasman sailed along the coast to a bay, where he anchored. To this he gave the name of Murderers (now Massacre) Bay, on account of an unprovoked attack on a boat's crew by the natives, and the massacre of four white men. Thence he sailed along the west coast of the North Island, and gave the name of Cape Maria van Diemen to the north-western extremity thereof. After sighting the islands of the Three Kings he finally departed, not having set foot on the country.
There is no record of any visit to New Zealand after Tasman's departure until that of Captain Cook, who, after leaving the Society Islands, sailed in a southerly direction in search of a southern continent then believed to exist. He sighted land on the 6th October, 1769, and on the 8th of that month cast anchor in Poverty Bay. After having circumnavigated the North Island and the Middle and Stewart Islands—the latter having been considered as part of the Middle Island—he sailed from Cape Farewell on the 31st March, 1770, for Australia. He again visited New Zealand in 1773, in 1774, and in 1777.
M. de Surville, a French officer in command of the vessel “Saint Jean Baptiste,” being on a voyage of discovery, sighted the northeast coast of New Zealand on the 12th December, 1769, and remained for a short time. Another visit was soon after paid by a French officer, M. Marion du Fresne, who arrived on the west coast of New Zealand on the 24th March, 1772, but was treacherously murdered by the Natives on the 12th June following.
In 1793 the “Dædalus,” under the command of Lieutenant Hanson, was sent by the Government of New South Wales to New Zealand, and two chiefs were taken thence to Norfolk Island. There was after this an occasional intercourse between the islands of New Zealand and the English settlements in New South Wales.
In 1814 the first missionaries arrived in New Zealand—Messrs. Hall and Kendall—who had been sent as forerunners to Mr. Marsden. After a short stay they returned to New South Wales, and on the 19th November of that year again embarked, in company with Mr. Marsden, who preached his first sermon in New Zealand on Christmas Day, 1814, and returned to Sydney on the 23rd March, 1815. It was not until 1821 that the work of evangelization was put on a somewhat permanent basis; but the first station, established by Mr. Leigh, a Wesleyan missionary, and his wife, at the valley of the Kaeo, Whangaroa, was not taken possession of until the 10th June, 1823.
Prior to the discovery and colonisation of New Zealand by Europeans, the earliest navigators and explorers found a race of people already inhabiting both islands. Papers written in 1874 by Mr., now Sir, William Fox, and Sir Donald McLean, then Native Minister, state that at what time the discovery was made by the Maoris, or from what place they came, are matters which are lost in the obscurity enveloping the history of a people without letters. Nor is there anything on record respecting the origin of the Maori people themselves. Little more can now be gathered from their traditions than that they were immigrants, and that when they came there were probably no other inhabitants of the country. The tradition runs that, generations ago, the Maoris dwelt in a country named Hawaiiki, and that one of their chiefs was driven thence by a storm and, after a long voyage, fetched the northern island of New Zealand. Returning to his home with a flattering description of the country he had discovered, this chief, it is said, set on foot a scheme of emigration, whereupon a large fleet of double canoes started for the new land. The names of most of the canoes are still remembered, and each tribe agrees in its account of the doings of the people of the principal “canoes” after their arrival in New Zealand; and from these traditional accounts the descent of the numerous tribes has been traced. Calculations, based on the genealogical staves kept by the tohungas, or priests, indicate that about twenty-seven generations have passed since the migration, which would give for its date about the beginning of the fourteenth century. The position of Hawaiiki is not known, but there are several islands of this or a somewhat similar name. Similarity of language indicates a Polynesian origin, which would prove that the Maoris advanced to New Zealand through various groups of the Pacific islands, in which they left families of the same race, who to this day speak the same or nearly the same tongue. When Captain Cook first visited New Zealand, he availed himself of the assistance of a native from Tahiti, whose language proved to be almost identical with that of the New Zealanders, and through the medium of whose interpretation a good deal of information respecting the early history of the country and its inhabitants was obtained, which could not have been had without it.
A special article will be found further on dealing with the subject of the numbers and present condition of the Maoris.
The first attempt at colonisation was made in 1825 by a company formed in London. An expedition was sent out under the command of Captain Herd, who bought two islands in the Hauraki Gulf and a strip of land at Hokianga. The attempt, however, was a failure, owing to the savage character of the inhabitants. In consequence of frequent visits of numerous whaling-vessels to the Bay of Islands, a settlement grew up at Kororareka—now called Russell—and in 1833 Mr. Busby was appointed British Resident there. A number of Europeans—generally men of low character—gradually settled in different parts of the country, and married Native women.
In 1838 a colonisation company, known as the New Zealand Company, was formed to establish settlement on systematic principles. A preliminary expedition, under the command of Colonel William Wakefield, was despatched from England on the 12th May, 1839, and arrived in New Zealand in the following August. Having purchased land from the Natives, Colonel Wakefield selected the shore of Port Nicholson, in Cook Strait, as the site of the first settlement. On the 22nd January, 1840, the first body of immigrants arrived, and founded the town of Wellington. About the same time—namely, on the 29th January, 1840—Captain Hobson, R.N., arrived at the Bay of Islands, empowered, with the consent of the Natives, to proclaim the sovereignty of the Queen over the islands of New Zealand, and to assume the government thereof. A treaty called “The Treaty of Waitangi,” to which in less than six months five hundred and twelve names were affixed, was entered into, by which all rights and powers of sovereignty were ceded to the Queen, all territorial rights being secured to the chiefs and their tribes. New Zealand was then constituted a dependency of the Colony of New South Wales; but on the 3rd May, 1841, it was proclaimed a separate colony. The seat of Government had been previously established at Auckland, round which a settlement was formed.
The New Zealand Company having decided to form another settlement, to which the name of “Nelson” was to be given, despatched a preliminary expedition from England in April, 1841, for the purpose of selecting a site, which resulted in the establishment of the settlement at the head of Blind Bay. About the same time a settlement was commenced at New Plymouth, by the arrival, on the 31st March, 1841, of a body of immigrants despatched by the New Plymouth Company, an organization for purposes of colonisation that had been formed in England, and had purchased 50,000 acres of land from the New Zealand Company.
The next important event in the progress of colonisation was the arrival at Port Chalmers, in March, 1848, of two ships containing immigrants, despatched by the Otago Association for the foundation of a settlement in that part of the colony by persons who belonged to or were in sympathy with the Free Church of Scotland.
In 1849 the “Canterbury Association for founding a Settlement in New Zealand” was incorporated. On the 16th December, 1850, the first emigrant ship despatched by the association arrived at Port Cooper, and the settlement of the adjoining country was commenced in a systematic manner, the intention having been to establish a settlement complete in itself, and composed entirely of members of the then United Church of England and Ireland.
The Proclamation of Captain Hobson on the 30th January, 1840, gave as the boundaries of the colony the following degrees of latitude and longitude: On the north, 34° 30' S. lat.; on the south, 47° 10' S. lat.; on the east, 179° 0' E. long.; on the west, 166° 5' E. long. These limits excluded small portions of the extreme north of the North Island and of the extreme south of Stewart Island.
In April, 1842, by Royal Letters Patent, and again by the Imperial Act 26 and 27 Vict., c. 23 (1863), the boundaries of the colony were altered so as to extend from 33° to 53° of south latitude and from 162° of east longitude to 173° of west longitude. By Proclamation bearing date the 21st July, 1887, the Kermadec Islands, lying between the 29th and 32nd degrees of south latitude and the 177th and 180th degrees of west longitude, were declared to be annexed to and to become part of the Colony of New Zealand.
The following now constitute the Colony of New Zealand:-
-
The island commonly known as the North Island, with its adjacent islets, having an aggregate area of 44,468 square miles, or 28,459,580 acres.
-
The island known as the Middle Island, with adjacent islets, having an aggregate area of 58,525 square miles, or 37,456,080 acres.
-
The South or Stewart Island, and adjacent islets, having an area of 665 square miles, or 425,390 acres.
-
The Chatham Islands, situate 536 miles eastward of Lyttelton, in the Middle Island, with an area of 375 square miles, or 239,920 acres.
-
The Auckland Islands, about 200 miles south of Stewart Island, extending about 30 miles from north to south, and nearly 15 from east co west, the area being 210,650 acres.
-
The Campbell Islands, in latitude 52° 33' south, and longitude 169° 8' west, about 30 miles in circumference, with an area of 45,410 acres.
-
The Antipodes Islands, about 458 miles in a south-easterly direction from Port Chalmers, in the Middle Island. These are detached rocky islands, and extend over a distance of between four and five miles from north to south. Area, 12,960 acres.
-
The Bounty Islands, a small group of islets, thirteen in number, lying north of the Antipodes Islands, and about 415 miles in nearly an east-south-easterly direction from Port Chalmers. Area, 3,300 acres.
-
The Kermadec Islands, a group of which the largest is called Sunday or Raoul Island, lie about 614 miles to the north-east of Russell, in the Bay of Islands. Sunday Island is about 20 miles in circuit. The next in size is Macaulay Island, about three miles in circumference. Area of the group, 8,208 acres.
The total area of the colony is thus about 104,471 square miles, of which the aggregate area of the outlying groups of islands that are practically useless for settlement amounts to about 438 square miles.
A protectorate is exercised by the Imperial Government over the Cook Islands (or Hervey Group) by Proclamation dated the 27th October, 1888. The British Resident* is appointed on the recommendation of the New Zealand Government. He acts for the colony as Government Agent in all matters of trade.
*Frederick J. Moss, Esq., late M.H.R., is now British Resident. His salary is paid by this colony.
The areas of the various Australian Colonies, as given by different authorities, differ considerably. Mr. Hayter, in his “Victorian Year-book,” gives the total area of the Australian Continent at 2,944,628 square miles, according to a computation made by the late Surveyor-General of Victoria, Mr. J. A. Skene, from a map of Continental Australia compiled and engraved under his direction; but in the case of each colony, except Victoria, the area computed by Mr. Skene differs from that given in the official records of that colony, the difference in the case of Western Australia amounting to over 84,000 square miles. The following areas are, therefore, taken from the official records of each colony:-
| Square Miles. | |
| Queensland | 668,497 |
| New South Wales | 310,700 |
| Victoria | 87,884 |
| South Australia | 903,425 |
| Western Australia | 1,060,000 |
| Total Continent of Australia | 3,030,506 |
| Tasmania | 26,215 |
| New Zealand (including the Chatham and other islands) | 104,471 |
| Total Australasia | 3,161,192 |
The size of these colonies may be better realised by the comparison of their areas with those of European countries. The areas of the following countries—Austria-Hungary, Germany, France, Belgium, Holland, Denmark, Sweden and Norway, Portugal, Spain, Italy (including Sardinia and Sicily), Switzerland, Greece, Roumania, Bulgaria, Servia, Eastern Roumelia, and Turkey in Europe—containing on the whole rather less than 1,600,000 square miles, amount to little more than half the area of the Australian Continent. If the area of Russia in Europe be added to those of the other countries the total area would be about one-seventh larger than the Australian Continent, and about one-twelfth larger than that of the Australasian Colonies, including New Zealand.
The area of the Colony of New Zealand is little more than one-seventh less than the area of Great Britain and Ireland, that of the Middle Island of New Zealand being a little larger than the combined areas of England and Wales.
| United Kingdom. | Area in Square Miles. |
| England and Wales | 58,311 |
| Scotland | 30,463 |
| Ireland | 32,531 |
| Total | 121,305 |
| New Zealand. | Area in Square Miles. |
| North Island | 44,468 |
| Middle Island | 58,525 |
| Stewart Island | 665 |
| Chatham Islands | 375 |
| Other islands | 438 |
| Total | 104,471 |
The North Island extends over a little more than seven degrees of latitude—a distance in a direct line from north to south of 430 geographical or 498 statute miles; but, as the northern portion of the colony, which extends over more than three degrees of latitude, takes a north-westerly direction, the distance in a straight line from the North Cape to Cape Palliser, the extreme northerly and southerly points of the island, is about 515 statute miles.
This island is, as a whole, hilly, and, in parts, mountainous in character, but there are large areas of plain or comparatively level country, which either are now, or will be in the future when clear of forest and other indigenous vegetation, available for agricultural purposes. Of these, the principal are the plains in Hawke's Bay on the East Coast, the Wairarapa Plain in the Wellington District, and a strip of country along the West Coast extending from a point about thirty miles from the City of Wellington to a little north of New Plymouth, which is about 250 miles distant from Wellington. The largest plain in the North Island, Kaingaroa, extends from the shore of Lake Taupo in a north-north-easterly direction to the sea-coast in the Bay of Plenty; but a large portion is covered with pumice sand, and is unsuitable for tillage or pasture. There are several smaller plains and numerous valleys suitable for agriculture. The level or undulating country in this island suitable for or capable of being made fit for agriculture has been estimated roughly at 13,000,000 acres. This includes lands now covered with standing forest, and swamps that are capable of drainage; also considerable areas of clay-marl and pumice-covered land. The clay-marl in its natural state is cold and uninviting to the agriculturist, but under proper drainage and cultivation it can be brought to a high state of productiveness. This kind of land is generally neglected at the present time, as settlers prefer soils more rapidly remunerative and less costly to work. The larger portion of this island was originally covered with forest. Although the area of forest-covered land is still very great, yet year by year the amount is being reduced, chiefly to meet the requirements of settlement, the trees being cut down and burnt, and grass-seed being then sown on the ashes to create pasture. Hilly as the country is, yet from the nature of the climate it is especially suited for the growth of English grasses, and wherever there is any soil, however steep the land may be, grasses will flourish; consequently very little of the land is incapable of being made to supply food for cattle and sheep when treated as above or otherwise laid down in grass. The area of land in the North Island deemed purely pastoral or capable of being made so, being too steep for agricultural purposes, is estimated at 14,200,000 acres. In the centre of the island is a lake, about twenty miles across either way from the extreme points, called Taupo. A large area adjacent to the lake is at present worthless pumice-country. The Waikato River, the largest in the North Island, flows out of its north-eastern point, and trends thence in a north-westerly direction until it flows into the ocean a little distance south of the Manukau Harbour. This river is navigable for small steamers for about a hundred miles from its mouth. The Maori King country, occupied by Natives who for several years isolated themselves from the Europeans, lies between Lake Taupo and the western coast. The River Thames, or Waihou, having its sources north of Lake Taupo, flows northward into the Firth of Thames. It is navigable for small steamers only for about fifty miles. The other navigable rivers in this island are the Wanganui and Manawatu, which flow in a south-westerly direction into Cook Strait.
The mountains in the North Island are estimated to occupy about one-tenth of the surface, and do not exceed 4,000ft. in height, with the exception of a few volcanic mountains that are more lofty. Of these, the three following are the most important:—
-
The Tongariro Mountain, situated to the southward of Lake Taupo. It consists of a group of distinct volcanic cones, the lava-streams from which have so overlapped in their descent as to form one compact mountain-mass at the base. The highest of these cones is called Ngauruhoe, and attains an elevation of 7,515ft. The craters of Ngauruhoe, Ketetahi (6,140ft.), and Te Mari (4,990ft.) are the three vents from which the latest discharges of lava have taken place, the most recent having occurred in 1868. These craters are still active, steam and vapour issuing from them with, at times, considerable force and noise, the vapours being charged with pungent gases and acids, making it dangerous to approach too near the crater-lips.
-
Ruapehu. This mountain lies to the south of Tongariro. It is an extinct volcanic cone, and reaches the height of 9,100ft., being in part considerably above the line of perpetual snow. The most remarkable feature of this mountain is the crater-lake on its summit. This lake is situated at the bottom of a funnel-shaped crater, the steep sides of which are mantled with ice and snow. The water occupies a circular basin about 500ft. in diameter, and is about 300ft. below the enclosing peaks, and quite inaccessible except by ropes. It is much disturbed by eddies, from which steam or vapour is given off. This lake, and the three craters previously mentioned on Tongariro, are all in one straight line, which, if produced, would pass through the boiling springs at Tokaanu on the southern margin of Lake Taupo, and through other hot springs on the north of the lake in the direction of White Island, an active volcano in the Bay of Plenty, situated about twenty-seven miles from the mainland.
-
Mount Egmont. This is also an extinct volcanic cone, rising to a height of 8,300ft. The upper part is always covered with snow. This mountain is situated close to New Plymouth, and is surrounded by one of the most fertile districts in New Zealand. Rising from the plains in its solitary grandeur, it is an object of extreme beauty and ceaseless admiration.
It is estimated that the area of mountain-tops and barren country at too high an altitude for sheep, and therefore worthless for pastoral purposes, amounts, in the North Island, to 300,000 acres.
The most remarkable feature of the North Island is the numerous hot springs, which occur in hundreds from Tongariro, south of Lake Taupo, to Ohaoawai, situated at almost the extreme north of the colony—a distance of 300 miles. Clouds of sulphurous steam are seen rising at different places over this extensive area, but the principal seat of hydrothermal action appears to be in the neighbourhood of Lake Rotorua. The district is generally known as the Hot or Thermal-Springs District.
This district is situated about forty miles in a north-north-east direction from Lake Taupo. By the destruction of the famed Pink and White Terraces and of Lake Rotomahana on the occasion of the eruption of Mount Tarawera on the 10th June, 1886, the district has been deprived of attractions unique in character and of unrivalled beauty; but the natural features of the country—the lakes, geysers, and hot springs, the number of which is very great, and some of which possess remarkable curative properties for certain complaints—still afford considerable attraction for tourists and invalids. Recently the world-wide importance of conserving this region as a sanatorium for all time has been recognised by the Government, and it is now dedicated by Act of Parliament to that purpose. A very interesting account of the thermal springs of the North Island will be found further on.
Notwithstanding the length of coast-line, good harbours in the North Island are not numerous. Those on the west coast north of New Plymouth are bar-harbours, not suitable for large vessels. The principal harbours are the Waitemata Harbour, on which Auckland is situated—this is rather a deep estuary than a harbour; several excellent havens in the northern peninsula; and Port Nicholson, on the borders of which Wellington is situated. This is a landlocked harbour, about six miles across, having a comparatively narrow but deep entrance from the ocean. The water is deep nearly throughout.
Cook Strait separates the North and Middle Islands. It is about sixteen miles across at its narrowest part, but in the widest about ninety. The strait is invaluable for the purpose of traffic between different parts of the colony, and is constantly traversed by vessels of the magnificent line of coastal steamers that trade in New Zealand waters.
The extreme length of the Middle Island, from Port Jackson, in Cook Strait, to Puysegur Point, at the extreme south-west, is about 525 statute miles; the greatest distance across at any point is in Otago (the southern) District, being about 180 miles.
The Middle Island is intersected along almost its entire length by a mountainous range known as the Southern Alps. Some of the summits reach a height of from 10,000ft. to 12,000ft., Mount Cook, the highest peak, rising to 12,349ft.
In the south, in the neighbourhood of the sounds and Lake Te Anau, there are many magnificent peaks, which, though not of great height, are, owing to their southerly position, nearly all crowned with perpetual ice and snow. Further north the mountains increase in height—Mount Earnslaw, at Lake Wakatipu; and Mount Aspiring, which has aptly been termed the New Zealand Matterhorn, nearly 10,000ft. in height, at Lake Wanaka. Northward beyond this a fine chain of peaks runs as the backbone of the Middle Island to where Mount Cook, or Aorangi, towers majestic in the midst of the grandest scenes of the Southern Alps.
The scenery of the Southern Alps of New Zealand in many instances excels in beauty and grandeur that of the Alps of Switzerland, while in the Southern Alps there is also greater variety. In New Zealand no one has actually succeeded in making a complete ascent of any of the highest mountains. Many of the peaks and most of the glaciers are as yet unnamed; and there is, in parts of the Middle Island, still a fine field for exploration and discovery—geographical, geological, and botanical. The wonders of the Southern Alps are only beginning to be known; but the more they are known the more they are appreciated. The snow-line in New Zealand being so much lower than in Switzerland, the scenery, though the mountains are not quite so high, is of surpassing grandeur.
There are extensive glaciers on both sides of the range, those on the western side being of exceptional beauty, as, from the greater abruptness of the mountain-slopes on that side, they descend to within about 700ft. of the sea-level, and into the midst of the evergreen New Zealand forest vegetation. The largest glaciers on each side of the range are easily accessible.
The following gives the sizes of some of the glaciers on the eastern slope:—
| Name. | Area of Glacier. | Length of Glacier. | Greatest Width. | Average Width. |
|---|---|---|---|---|
| Acres. | Miles ch. | Miles ch. | Miles ch. | |
| Tasman | 13,664 | 18 0 | 2 14 | 1 15 |
| Murchison | 5,800 | 10 70 | 1 5 | 0 66 |
| Godley | 5,312 | 8 0 | 1 55 | 1 3 |
| Mueller | 3,200 | 8 0 | 0 61 | 0 50 |
| Hooker | 2,416 | 7 25 | 0 54 | 0 41 |
The Alletsch Glacier in Switzerland, according to Ball, in the “Alpine Guide,” has an average width of one mile. It is in length and width inferior to the Tasman Glacier.
Numerous sounds or fiords penetrate the south-western coast. They are long, narrow, and deep (the depth of water at the upper part of Milford Sound is 1,270ft., although at the entrance only 130ft.), environed by giant mountains clothed with foliage to the snow-line, with waterfalls, glaciers, and snowfields at every turn. Some of the mountains rise almost precipitously from the water's edge to 5,000ft. and 10,000ft. above the sea. The great Sutherland waterfall, 1,904ft. high, is near Milford, the finest of these sounds.
The general surface of the northern portion of the Middle Island, comprising the Provincial Districts of Nelson and Marlborough, is mountainous, but the greater part is suitable for grazing purposes. There are some fine valleys and small plains suitable for agriculture, of which the Wairau Valley or Plain is the largest. Deep sounds, extending for many miles, break the coast-line abutting on Cook Strait. The City of Nelson is situated at the head of Blind Bay, which has a depth inwards from Cook Strait of about forty statute miles.
The Provincial District of Canterbury lies to the south of the Marlborough District, and on the eastern side of the island. Towards the north the land is undulating; then there is a stretch of almost perfectly level country extending in a south-westerly direction for 160 miles, after which, on the south, the country is undulating as far as the borders of the Otago District. On the east a block of hill-country rises abruptly from the plain and extends for some miles seaward. This is Banks Peninsula, containing several good harbours, the principal being Port Cooper, on the north, on which is situated Lyttelton, the chief port of the district: the harbour of Akaroa, considered one of the finest in the colony, is on the southern coast of this peninsula.
The southern district of Otago is, on the whole, mountainous, but has many fine plains and valleys suitable for agricultural purposes. The mountains, except towards the west coast, are generally destitute of timber, and are suitable for grazing sheep. There are gold-fields of considerable extent in the interior of this district. The interior lakes are very important features in Otago. Lake Wakatipu extends over fifty-four miles in length, but is not more than four miles at its greatest width. It is 1,070ft. above sea-level, and has a depth varying from 1,170ft. to 1,296ft. It covers an area of 114 square miles. Te Anau Lake is still larger, having an area of 132 square miles. These lakes are bounded on the west by broken, mountainous, and chiefly wooded country, extending to the ocean.
The chief harbours in the Otago District are those of Port Chalmers, at the head of which Dunedin is situated, and the Bluff Harbour, at the extreme south.
The District of Westland extending along the west coast of the Middle Island, abreast of the District of Canterbury, is more or less auriferous throughout. The western slopes of the central range of mountains are clothed with forest-trees to the snow-line; but on the eastern slopes timber is scarce, natural grasses covering the ground.
The rivers in the Middle Island are for the most part mountain-torrents, fed by glaciers in the principal mountain-ranges. When the snow melts they become of considerable size, and their beds, when not confined by rocky walls, extend over considerable areas, chiefly covered by enormous deposits of shingle. The largest river, as regards volume of water, in the colony is the Clutha. It is 154 miles in length, but is only navigable for boats or small river-steamers for about thirty miles. The rivers Buller, Grey, and Hokitika, on the West Coast, are navigable for a short distance from their mouths. They constitute the only ports in the Westland District. In their unimproved state they admitted, owing to the bars at their mouths, only vessels of small draught; but, in consequence of the importance of the Grey and Buller Rivers as the only ports available for the coal-export trade, large harbour-works have been undertaken, resulting in the deepening of the beds of these rivers, and giving a depth of from 18ft. to 24ft. of water on the bars.
The area of level or undulating land in the Middle Island that may be available for agriculture is estimated at about 15,000,000 acres. About 13,000,000 are suitable for pastoral purposes only, or may become so when cleared of forest and sown with grass-seed. The area of barren land and mountain-tops is estimated at about 8,000,000 acres.
Foveaux Strait separates the Middle from Stewart Island. This last island has an area of only 425,390 acres. It is mountainous in character, and chiefly covered with forest.
The outlying group of the Chatham Islands, 480 statute miles east-south-east from Wellington, and 536 miles eastward of Lyttelton, consists of two principal islands and several unimportant islets. The largest island contains about 222,490 acres, of which a large and irregularly-shaped lake or lagoon absorbs 45,960 acres. About one-quarter of the surface of the land is covered with forest, the rest with fern or grass. The hills nowhere rise to a great height. Pitt Island is the next in size; the area is 15,330 acres. The greater portion of both islands is occupied as sheep-runs.
The Kermadec group of islands, four in number, are situated between 29° 10' and 31° 30' south latitude, and between 177° 45' and 179° west longitude. They are named Raoul or Sunday Island, Macaulay Island, Curtis Island, and L'Espérance or French Rock. The principal island, Sunday, is 600 miles distant from Auckland. The islands are volcanic, and in two of them signs of activity are still to be seen. The rainfall is plentiful, but not excessive. The climate is mild and equable, and slightly warmer than the north of New Zealand. The following are the areas of the islands and islets of the group: Sunday Island, 7,200 acres; Herald group of islets, 85 acres; Macaulay Island, 764 acres; Curtis Islands, 128 acres and 19 acres; L'Espérance, 12 acres: total, 8,208 acres. Sunday Island is twenty miles in circumference, is roughly triangular in shape, and the highest point on it is 1,723ft. above the sea-level. It is rugged and broken over a very large extent of its surface, and, except in a few places, it is covered with forest. The soil everywhere on the island is very rich, being formed by the decomposition of a dark-coloured pumiceous tuff and a black andesitic lava, with which is closely mixed a fine vegetable mould. The great luxuriance and richness of the vegetation all bear witness to the excellence of the soil, which is everywhere—except where destroyed by the eruptions, and on the steep cliffs—the same rich loam. Want of water is one of the drawbacks. Three of the four lakes on the island are fresh, but so difficult of approach as to be practically useless.
The Auckland Islands are about 290 miles south of Bluff Harbour, their position being given on the Admiralty chart as latitude 50° 31' 29” S., and longitude 166° 19' 12” E. They have magnificent harbours. Port Ross, at the north end of the principal island, has been described by the eminent French commander, D'Urville, as one of the best harbours of refuge in the known world. At the southern end of the island there is a through passage extending from the east to the west coast. It has been variously named Adam's Strait or Carnley Harbour, and forms a splendid sheet of water. The largest of the islands is about twenty-seven miles long by about fifteen miles broad, and is very mountainous, the highest part being about 2,000ft. above the sea. The west coast is bold and precipitous, but the east coast has several inlets. The wood on the island is, owing to the strong prevailing wind, scrubby in character. The New Zealand Government maintains at this island a dépôt of provisions and clothing for the use of shipwrecked mariners. These have already been found of inestimable value by an unfortunate shipwrecked crew condemned to some months' residence on the island.
British sovereignty was proclaimed over New Zealand in January, 1840, and the country became a dependency of New South Wales until the 3rd May, 1841, when it was made a separate colony. The seat of Government was at Auckland, and the Executive comprised, with the Governor, three gentlemen, holding offices as Colonial Secretary, Attorney-General, and Colonial Treasurer.
In August, 1841; May, 1842; and January, 1844, three new members were nominated by Her Majesty as ex officio members of the Executive Council. They were not members of the General Assembly, opened for the first time on the 27th May, 1854, although they remained in office until the establishment of Responsible Government on the 7th May, 1856. Between the 14th June and the 2nd September, 1854, the Executive Council was variously constituted with three or four members of the House of Representatives and two Legislative Councillors, without portfolios.
The Government of the colony was at first vested in the Governor, who was responsible only to the Imperial Government; but in 1852 an Act was passed by the Imperial Legislature which granted representative institutions to the colony. Under it the constitution of a General Assembly for the whole colony was provided for, consisting of a Legislative Council, the members of which were to be nominated by the Governor, and an elective House of Representatives. The first session of the General Assembly was opened on the 27th May, 1854, but the members of the Executive were not responsible to Parliament. The first Ministers under a system of Responsible Government were appointed on the 18th April, 1856. By the Act of 1852 the colony was divided into six provinces, each to be presided over by an elective Superintendent, and to have an elective Provincial Council, empowered to legislate, except on certain specified subjects. The franchise practically amounted to household suffrage. In each case the election was for four years; but a dissolution of the Provincial Council by the Governor could take place at any time, necessitating a fresh election both of the Council and of the Superintendent. The Superintendent was chosen by the electors of the whole province; the members of the Provincial Council by those of the electoral districts. The Provincial Governments remained as integral parts of the Constitution of the colony until the 1st November, 1876, when they were abolished by an Act of the General Assembly, that body having been vested with the power of altering the Constitution Act. On the same day an Act of the General Assembly which subdivided the colony (exclusive of the areas included within municipalities) into counties, and established a system of local county government, came into operation.
The Governor is appointed by the Queen. His salary is £5,000 a year, and is provided by the colony.
Members of the Legislative Council hold their seats under writs of summons from the Governor. Till the year 1891 the appointments were for life; but in September of that year an Act was passed making such appointments after that time tenable for seven years only, though Councillors may be reappointed. In either case seats may be vacated by resignation or extended absence. Two members of the Council are aboriginal native chiefs.
The members of the House of Representatives are elected for three years from the time of each general election; but at any time the dissolution of Parliament by the Governor necessitates such general election. Four of the members are representatives of Native constituencies, three members for the Maori districts being aboriginal natives and one a half-caste. An Act was passed in 1887 which provided that, on the termination of the then General Assembly, the number of members to be thereafter elected to the House of Representatives should be seventy-four in all, of whom four were to be elected, under the provisions of the Maori Representation Acts, as representatives of Maori electors only. For the purposes of European representation the colony is divided into sixty-two electoral districts, four of which—the Cities of Auckland, Wellington, Christchurch, and Dunedin—return each three members, and all the other electorates one each. Members of the House of Representatives are chosen by the votes of the inhabitants in every electoral district appointed for that purpose.
In 1889 an amendment of the Representation Act was passed, which contained a provision prohibiting any elector from giving his vote in respect of more than one electorate at any election. This provision greatly increased the effective power of those voters who were registered for one electoral district only, and resulted in a considerable addition to the number of so-called labour members in the House of Representatives. Every man registered as an elector, and not coming within the meaning of section 2 of “The Public Offenders Disqualification Act, 1867,” is qualified to be elected a member of the House of Representatives for any electoral district. For European representation every adult male, if resident one year in the colony and six months in one electoral district, can be registered as an elector. Freehold property of the value of £25 held for six months preceding the day of registration also entitles a man to register, if not already registered under the residential qualification. Maoris possessing a £25 freehold under Crown title, or being on any ratepayers' roll, can also register. For Maori representation every adult Maori resident in any Maori electoral district (of which there are four only in the colony) can vote. Registration is not required in Native districts. The proportion of representation to population at the last general election for the House of Representatives, in December, 1890, was one European member to every 8,952 inhabitants, and one Maori member to every 10,413 Natives.
Up to the year 1865 the seat of Government of New Zealand was at Auckland. Several attempts were made by members of Parliament, by motions in the Legislative Council and House of Representatives, to have it removed to some more central place; but it was not until November, 1863, that Mr. Domett (the ex-Premier) was successful in carrying resolutions in the House of Representatives that steps should be taken for appointing some place in Cook Strait as the permanent seat of Government in the colony. The resolutions adopted were: “(1.) That it has become necessary that the seat of Government in the colony should be transferred to some suitable locality in Cook Strait. (2.) That, in order to promote the accomplishment of this object, it is desirable that the selection of the particular site in Cook Strait should be left to the arbitrament of an impartial tribunal. (3.) That, with this view, a Bill should be introduced to give effect to the above resolutions.” On the 25th November an address was presented to the Governor, Sir George Grey, K.C.B., by the Commons of New Zealand, requesting that the Governors of the Colonies of New South Wales, Victoria, and Tasmania might be asked to each appoint one Commissioner for the purpose of determining the best site in Cook Strait. Accordingly, the Hon. Joseph Docker, M.L.C., New South Wales; the Hon. Sir Francis Murphy, Speaker of the Legislative Council, Victoria; and R. C. Gunn, Esq., Tasmania, were appointed Commissioners.
These gentlemen, having made a personal inspection of all suitable places, arrived at the unanimous decision “that Wellington, in Port Nicholson, was the site upon the shores of Cook Strait which presented the greatest advantages for the administration of the government of the colony.”
The seat of Government was, therefore, in accordance with the recommendations of the Commissioners, removed to Wellington in February, 1865.
Nearly all the public works of New Zealand are in the hands of the Government of the colony, and in the early days they simply kept pace with the spread of settlement. In 1870, however, a great impetus was given to the progress of the whole country by the inauguration of the “Public Works and Immigration Policy,” which provided for carrying out works in advance of settlement. Railways, roads, and water-races were constructed, and immigration was conducted on a large scale. As a consequence, the population increased from 267,000 in 1871 to 501,000 in 1881, and 650,433 at the close of the year 1892, exclusive of Maoris.
Succession of Governors of New Zealand, and the Dates on which they assumed and retired from the Government.
Captain William Hobson, R.N., from Jan., 1840, to 10 Sept., 1842.
[British Sovereignty was proclaimed by Captain Hobson in January, 1840, and New Zealand became a dependency of the Colony of New South Wales until 3rd May, 1841, at which date it was proclaimed a separate colony. From January, 1840, to May, 1841, Captain Hobson was Lieutenant-Governor of New Zealand under Sir George Gipps, Governor of New South Wales, and from May, 1841, Governor of New Zealand; the seat of Government being at Auckland, where he died in September, 1842. From the time of Governor Hobson's death, in September, 1842, until the arrival of Governor Fitzroy, in December, 1843, the Government was carried on by the Colonial Secretary, Lieutenant Shortland.]
Lieutenant Shortland, Administrator, from 10 Sept., 1842, to 26 Dec., 1843.
Captain Robert Fitzroy, R.N., from 26 Dec., 1843, to 17 Nov., 1845.
Captain Grey (became Sir George Grey, K.C.B., in 1848), from 18 Nov., 1845, to 31 Dec., 1853.
[Captain Grey held the commission as Lieutenant-Governor of the colony until the 1st January, 1848, when he was sworn in as Governor-in-Chief over the Islands of New Zealand, and as Governor of the Province of New Ulster and Governor of the Province of New Munster. After the passing of the New Zealand Constitution Act, Sir George Grey was, on the 13th September, 1852, appointed Governor of the colony, the duties of which he assumed on the 7th March, 1853. In August, 1847, Mr. E. J. Eyre was appointed Lieutenant-Governor of New Munster: he was sworn in, 28th January, 1848. On 3rd January, 1848, Major-General George Dean Pitt was appointed Lieutenant-Governor of New Ulster: he was sworn in, 14th February, 1848; died, 8th January, 1851; and was succeeded as Lieutenant-Governor by Lieutenant-Colonel Wynyard, appointed 14th April, 1851; sworn in, 26th April, 1851. The duties of the Lieutenant-Governor ceased on the assumption by Sir George Grey of the office of Governor, on the 7th March, 1853.]
Lieutenant-Colonel Robert Henry Wynyard, C.B., Administrator, from 3 Jan., 1854, to 6 Sept., 1855.
Colonel Thomas Gore Browne, C.B., from 6 Sept., 1855, to 2 Oct., 1861.
Sir George Grey, K.C.B., Administrator, from 3 Oct., 1861; Governor, from 4 Dec., 1861, to 5 Feb., 1868.
Sir George Ferguson Bowen, G.C.M.G., from 5 Feb., 1868, to 19 Mar., 1873.
Sir George Alfred Arney, Chief Justice, Administrator, from 21 Mar. to 14 June, 1873.
Sir James Fergusson, Baronet, P.C., from 14 June, 1873, to 3 Dec., 1874.
The Marquis of Normanby, P.C., Administrator, from 3 Dec., 1874; Governor, from 9 Jan., 1875, to 21 Feb., 1879.
James Prendergast, Chief Justice, Administrator, from 21 Feb. to 27 Mar., 1879.
Sir Hercules George Robert Robinson, G.C.M.G., Administrator, 27 Mar., 1879; Governor, from 17 April, 1879, to 8 Sept., 1880.
James Prendergast, Chief Justice, Administrator, from 9 Sept. to 29 Nov., 1880.
Sir Arthur Hamilton Gordon, G.C.M.G., from 29 Nov., 1880, to 23 June, 1882.
Sir James Prendergast, Chief Justice, Administrator, from 24 June, 1882, to 20 Jan., 1883.
Lieutenant-General Sir William Francis Drummond Jervois, G.C.M.G., C.B., from 20 Jan., 1883, to 22 Mar., 1889.
Sir James Prendergast, Chief Justice, Administrator, from 23 Mar. to 2 May, 1889.
The Earl of Onslow, G.C.M.G., from 2 May, 1889, to 24 Feb., 1892.
Sir James Prendergast, Chief Justice, Administrator, from 25 Feb. to 6 June, 1892.
The Earl of Glasgow, G.C.M.G., from 7 June, 1892.
Members of the Executive Council of the Colony of New Zealand previous to the Establishment of Responsible Government (not including the Officers Commanding the Forces).
Willoughby Shortland, Colonial Secretary, from 3 May, 1841, to 31 Dec., 1843; succeeded by Mr. Sinclair.
Francis Fisher, Attorney-General, from 3 May to 10 Aug., 1841; succeeded by Mr. Swainson.
George Cooper, Colonial Treasurer, from 3 May, 1841, to 9 May, 1842; succeeded by Mr. Shepherd.
William Swainson, Attorney-General, from 10 Aug., 1841, to 7 May, 1856.
Alexander Shepherd, Colonial Treasurer, from 9 May, 1842, to 7 May, 1356.
Andrew Sinclair, Colonial Secretary, from 6 Jan., 1844, to 7 May, 1856.
[The holders of these three last-mentioned offices were nominated by Her Majesty as ex officio members of the Executive Council. They were not members of the General Assembly, opened for the first time 27th May, 1854, although they remained in office until the establishment of Responsible Government.]
James Edward FitzGerald, M.H.R., without portfolio, from 14 June to 2 Aug., 1854.
Henry Sewell, M.H.R., without portfolio, from 14 June to 2 Aug., 1854.
Frederick Aloysius Weld, M.H.R., without portfolio, from 14 June to 2 Aug., 1854.
Francis Dillon Bell, M.L.C., without portfolio, from 30 June to 11 July, 1854.
Thomas Houghton Bartley, M.L.C., without portfolio, from 14 July to 2 Aug., 1854.
Thomas Spencer Forsaith, M.H.R., without portfolio, from 31 Aug. to 2 Sept., 1854.
Edward Jerningham Wakefield, M.H.R., without portfolio, from 31 Aug. to 2 Sept., 1854.
William Thomas Locke Travers, M.H.R., without portfolio, 31 Aug. to 2 Sept., 1854.
James Macandrew, M.H.R., without portfolio, from 31 Aug. to 2 Sept., 1854.
Number of Parliaments since the Constitution Act Passed for conferring Representative Institutions upon the Colony of New Zealand, with the Dates of Opening of Sessions and Dates of Closing or Dissolution.
| No. of Parliament. | Date of Opening of Sessions. | Date of Closing or Dissolution. | |
|---|---|---|---|
| First Parliament |

| 27 May, 1854 | 9 August, 1854. |
| 31 August, 1854 | 16 September, 1854. | ||
| 8 August, 1855 | 15 September, 1855. | ||
| Second Parliament |

| 15 April, 1856 | 16 August, 1856. |
| (There was no session held in the year 1857.) | |||
| 10 April, 1858 | 21 August, 1858. | ||
| (There was no session held in the year 1859.) | |||
| 30 July, 1860 | 5 November, 1860. | ||
| Third Parliament |

| 3 June, 1861 | 7 September, 1861. |
| 7 July, 1862 | 15 September, 1862. | ||
| 19 October, 1863 | 14 December, 1863. | ||
| 24 November, 1864 | 13 December, 1864. | ||
| 26 July, 1865 | 30 October, 1865. | ||
| Fourth Parliament |

| 30 June, 1866 | 8 October, 1866. |
| 9 July, 1867 | 10 October, 1867. | ||
| 9 July, 1868 | 20 October, 1868. | ||
| 1 June, 1869 | 3 September, 1869. | ||
| 14 June, 1870 | 13 September, 1870. | ||
| Fifth Parliament |

| 14 August, 1871 | 16 November, 1871. |
| 16 July, 1872 | 25 October, 1872. | ||
| 15 July, 1873 | 3 October, 1873. | ||
| 3 July, 1874 | 31 August, 1874. | ||
| 20 July, 1875 | 21 October, 1875. | ||
| Sixth Parliament |

| 15 June, 1876 | 31 October, 1876. |
| 19 July, 1877 | 10 December, 1877. | ||
| 26 July, 1878 | 2 November, 1878. | ||
| 11 July, 1879 | 15 August, 1879. | ||
| Seventh Parliament |

| 24 September, 1879 | 19 December, 1879. |
| 28 May, 1880 | 1 September, 1880. | ||
| 9 June, 1881 | 24 September, 1881. | ||
| Eighth Parliament |

| 18 May, 1882 | 15 September, 1882. |
| 14 June, 1883 | 8 September, 1883. | ||
| 5 June, 1884 | 24 June, 1884. | ||
| Ninth Parliament |

| 7 August, 1884 | 10 November, 1884. |
| 11 June, 1885 | 22 September, 1885. | ||
| 13 May, 1886 | 18 August, 1886. | ||
| 26 April, 1887 | 15 July, 1887. | ||
| Tenth Parliament |

| 6 October, 1887 | 23 December, 1887. |
| 10 May, 1888 | 31 August, 1888. | ||
| 20 June, 1889 | 19 September, 1889. | ||
| 19 June, 1890 | 3 October, 1890. | ||
| Eleventh Parliament |

| 27 January, 1891 | 31 January, 1891. |
| 11 June, 1891 | 5 September, 1891. | ||
| 23 June, 1892 | 12 October, 1892. | ||
| 22 June, 1893. | |||
Since the Establishment of Responsible Government in New Zealand in 1856.
| Name of Ministry. | Assumed Office. | When retired. |
|---|---|---|
| * Owing to the death of the Premier, the Hon. J. Ballance, on 27th April, 1893. | ||
| 1. Bell-Sewell | 7 May, 1856 | 20 May, 1856. |
| 2. Fox | 20 May, 1856 | 2 June, 1856. |
| 3. Stafford | 2 June, 1856 | 12 July, 1861. |
| 4. Fox | 12 July, 1861 | 6 August, 1862. |
| 5. Domett | 6 August, 1862 | 30 October, 1863. |
| 6. Whitaker-Fox | 30 October, 1863 | 24 November, 1864. |
| 7. Weld | 24 November, 1864 | 16 October, 1865. |
| 8. Stafford | 16 October, 1865 | 28 June, 1869. |
| 9. Fox | 28 June, 1869 | 10 September, 1872. |
| 10. Stafford | 10 September, 1872 | 11 October, 1872. |
| 11. Waterhouse | 11 October, 1872 | 3 March, 1873. |
| 12. Fox | 3 March, 1873 | 8 April, 1873. |
| 13. Vogel | 8 April, 1873 | 6 July, 1875. |
| 14. Pollen | 6 July, 1875 | 15 February, 1876. |
| 15. Vogel | 15 February, 1876 | 1 September, 1876. |
| 16. Atkinson | 1 September, 1876 | 13 September, 1876. |
| 17. Atkinson (reconstituted) | 13 September, 1876 | 13 October, 1877. |
| 18. Grey | 15 October, 1877 | 8 October, 1879. |
| 19. Hall | 8 October, 1879 | 21 April, 1882. |
| 20. Whitaker | 21 April, 1882 | 25 September, 1883. |
| 21. Atkinson | 25 September, 1883 | 16 August, 1884. |
| 22. Stout-Vogel | 16 August, 1884 | 28 August, 1884. |
| 23. Atkinson | 28 August, 1884 | 3 September, 1884. |
| 24. Stout-Vogel | 3 September, 1884 | 8 October, 1887. |
| 25. Atkinson | 8 October, 1887 | 24 January, 1891. |
| 26. Ballance | 24 January, 1891 | 1 May, 1893.* |
| 27. Seddon | 1 May, 1893 | |
| Name of Premier. | Name of Premier. |
|---|---|
| Henry Sewell. | Sir Julius Vogel, K.C.M.G. |
| William Fox. | Harry Albert Atkinson. |
| Edward William Stafford. | Harry Albert Atkinson (Ministry reconstituted). |
| William Fox. | |
| Alfred Domett. | Sir George Grey, K.C.B. |
| Frederick Whitaker. | Hon. John Hall. |
| Frederick Aloysius Weld. | Frederick Whitaker, M.L.C. |
| Edward William Stafford. | Harry Albert Atkinson. |
| William Fox. | Robert Stout. |
| Hon.. Edward William Stafford. | Harry Albert Atkinson. |
| George Marsden Waterhouse. | Sir Robert Stout, K.C.M.G. |
| Hon. William Fox. | Sir Harry Albert Atkinson, K.C.M.G. |
| Hon. Julius Vogel, C.M.G. | John Ballance. |
| Daniel Pollen, M.L.C. | Richard John Seddon. |
| Name of Speaker. | Date of Appointment. | Date of Retirement or Death. |
|---|---|---|
| Hon. William Swainson | 16 May, 1854 | 8 August, 1855. |
| Hon. Frederick Whitaker | 8 August, 1855 | 12 May, 1856. |
| Hon. Thomas Houghton Bartley | 12 May, 1856 | 1 July, 1868. |
| Hon. Sir John Larkins Cheese Richardson, Kt. | 1 July, 1868 | 14 June, 1879. |
| Hon. Sir William Fitzherbert, K.C.M.G. | 14 June, 1879 | 23 January, 1891. |
| Hon. Sir Harry Albert Atkinson, K.C.M.G. | 23 January, 1891 | 28 June, 1892. |
| Hon. Henry John Miller. | 8 July, 1892. |
| Name of Speaker. | Date of Election. | Date of Retirement. |
|---|---|---|
| Sir Charles Clifford, Bart. | 26 May, 1854 | |
| 15 April, 1856 | 3 June, 1861. | |
| Sir David Monro, Kt. | 3 June, 1861 | |
| 30 June, 1866 | 14 August, 1871. | |
| Sir Francis Dillon Bell, K.C.M.G.,C.B. | 14 August, 1871 | 15 June, 1876. |
| Sir William Fitzherbert, K.C.M.G. | 15 June, 1876 | 13 June, 1879. |
| Sir George Maurice O'Rorke, Kt. | 11 July, 1879 | |
| 24 September, 1879 | ||
| 18 May, 1882 | ||
| 7 August, 1884 | ||
| 6 October, 1887 | 22 January, 1891. | |
| Major William Jukes Steward | 22 January, 1891. |
Consuls of Foreign Countries residing in, or with Jurisdiction over, New Zealand in the Year 1893.
Netherlands.—Dr. Laon Adrian de Vicq, Melbourne, Consul-General; Charles John Johnston, Wellington, Consul; Edward Bowes Cargill, Dunedin, and David Boosie Cruickshank, Auckland, Vice-Consuls.
Belgium.—Gustave Beckx, Melbourne, Consul-General; Charles John Johnston, Wellington, Alexander Beck, Christchurch, and Arthur Masy, Auckland, Consuls.
Italy.—Cavaliere Nicola Squitti, Barone de Palermiti e Guarna, Melbourne, Consul; Alexander Cracroft Wilson, Christchurch, George Fisher, Wellington, Edward Bowes Cargill, Dunedin, Dr. Francesco Rosetti, Hokitika, Geraldo Guiseppe Perotti, Greymouth, and Patrick Comiskey, Auckland, Consular Agents.
German Empire.—A. Pelldram, Sydney, Consul-General; Bendix Hallenstein (on leave), Willi Fels (acting), Dunedin, Friedrich Augustus Krull, Wanganui, H. Brown (on leave), Carl Seegner (acting), Auckland, and Heinrich von Haast, Christchurch, Consuls; Augustus Friedrich Castendyk, Wellington, Vice-Consul.
France.—Felix Jacques de Lostalot de Bachoué, Wellington, Vice-Consul; David Boosie Cruickshank, Auckland, Percival Clay Neill, Dunedin, and Hon. Edmund William Parker, Christchurch, Consular Agents.
Sweden and Noway.—Edward Pearce (on leave), Arthur Edward Pearce (acting), Wellington, Consul; Harlan Page Barber, Auckland, Vice-Consul; Edmund Quick, Dunedin, Consular Agent.
Denmark.—Edward Valdemar Johansen, Auckland, Consul; Edmund Quick, Dunedin, Emil Christian Skog, Christchurch, and A. F. Castendyk, Wellington, Vice-Consuls.
Spain.—Don Francisco Arenas Y. Bonet, Christchurch, Vice-Consul.
Portugal.—John Duncan, Wellington, Consul; Henry Rees George, Auckland, and Edmund Quick, Dunedin, Vice-Consuls.
United States.—George H. Wallace, Melbourne, Consul-General; John Darcey Conolly, Auckland, Consul (for New Zealand); Leonard A. Bachelder, Auckland, Vice-Consul; Albert Cuff, Christchurch, Henry Stephenson, Russell, Robert Wyles, Mongonui, William Hort Levin, Wellington, and Reynolds Driver, Dunedin, Consular Agents.
Chili.—William Henry Eldred, Sydney, Consul-General; David Boosie Cruickshank, Auckland, Consul; Edmund Quick, Dunedin, Consular Agent.
Columbia.—Thomas P. Fallon, Melbourne, Consul-General.
Hawaiian Islands.—James Cruickshank, Auckland, Reynolds Driver (acting), Dunedin, Consuls.
Table of Contents
W. B. Perceval, Esq., Westminster Chambers, 13, Victoria Street, S.W. Secretary—Walter Kennaway, C.M.G.
New South Wales.—Sir Saul Samuel, K.C.M.G., C.B., Westminster Chambers, 9, Victoria Street, S.W. Secretary—S. Yardley, C.M.G.
Victoria.—, 15, Victoria Street, S.W. Secretary—C. H. Pearson.
South Australia.—Sir John Cox Bray, K.C.M.G., Victoria Chambers, 15, Victoria Street, S.W. Secretary—Samuel Deering.
Queensland.—Sir James F. Garrick, K.C.M.G., Q.C., Westminster Chambers, 1, Victoria Street, S.W. Secretary—Charles Shortt Dicken, C.M.G.
Western Australia.—Sir Malcolm Fraser, K.C.M.G., 15, Victoria Street, Westminster, W. Secretary—Reginald Hare.
Tasmania.—Sir Edward N. Coventry Braddon, K.C.M.G., Westminster Chambers, 5, Victoria Street, S.W.
(Downing Street, S.W., London), with Dates of Appointment.
Principal Secretary of State for the Colonies—The Most Hon. the Marquis of Ripon, K.G., 17th August, 1892.
Under-Secretaries: Permanent—The Hon. Robert Henry Meade, C.B., 1st February, 1892; Parliamentary—Sydney Charles Buxton, M.P., 17th August, 1892.
Assistant Under-Secretaries—John Bramston, D.C.L., C.B., 30th June, 1876; Edward Wingfield, B.C.L, C.B., 19th July, 1878; Edward Fairfield, C.M.G., 1st February, 1892.
Private Secretary to Secretary of State—F. S. St. Quintin. Assistant Private Secretary—Hartmann W. Just, B.A.
Downing Street, S.W. City Office: 1, Tokenhouse Buildings, E.C., London.
Crown Agents—Sir Montagu Frederick Ommaney, K.C.M.G., and Ernest Edward Blake.
Glasgow, His Excellency the Right Honourable David, Earl of, G.C.M.G., a captain of the Royal Navy, served in the White Sea during the Russian war, and in the Chinese war of 1857, and retired in 1878; born, 1833; married, in 1873, Dorothea Thomasina, daughter of Sir Edward Hunter-Blair; appointed February 24, and assumed office June 7, 1892, as Governor and Commander-in-Chief in and over Her Majesty's Colony of New Zealand and its dependencies, and Vice-Admiral of the same. Salary, £5,000. Residences: Government House, Wellington; and Government House, Auckland.
Private Secretary—Colonel Pat Boyle (late Grenadier Guards).
Assistant Private Secretary—George Maurice Gillington.
Aides-de-camp—Reginald Stanley Hunter-Blair (Captain, Gordon Highlanders), and Edward Francis Clayton (Lieutenant, Scots Guards).
Administrator of the Government.—A dormant commission empowers the Chief Justice of the Colony for the time being to administer the Government in case of the death, incapacity, removal, or departure of the Governor.
Hon. R. J. Seddon, Premier, Minister for Public Works, Minister of Mines, and Minister of Defence.
Hon. Sir P. A. Buckley, K.C.M.G., Attorney-General, Colonial Secretary, and Minister of Marine.
Hon. W. P. Reeves, Minister of Education, Commissioner of Stamp Duties, Minister of Labour, and Minister of Justice.
Hon. J. McKenzie, Minister of Lands and Immigration, Minister of Agriculture, and Commissioner of Forests.
Hon. J. G. Ward, Colonial Treasurer, Postmaster-General, Electric Telegraph Commissioner, and Commissioner of Trade and Customs.
Hon. J. Carroll (without portfolio), representing the Native race.
Hon. W. Montgomery (without portfolio).
Clerk of Executive Council—Alexander James Willis.
Table of Contents
The number of members at present constituting the Legislative Council is forty-six. The number cannot be less than ten, but is otherwise unlimited. Prior to 1891 Councillors summoned by the Governor held their appointments for life, but on the 17th of September of that year an Act was passed making future appointments to the Council tenable for seven years only, to be reckoned from the date of the writ of summons of the Councillor's appointment, though every such Councillor may be reappointed. The qualifications are that the person to be appointed be of the full age of twenty-one years, and a subject of Her Majesty, either natural-born or naturalised by or under any Act of the Imperial Parliament or by or under any Act of the General Assembly of New Zealand. All contractors to the public service to an amount of over £50 and Civil servants of the colony are ineligible to become Councillors. Payment of Councillors is at the rate of £150 a year, payable monthly. Deductions of £2 2s. per sitting day are made in case of absence, except through illness or other unavoidable cause. A seat is vacated by any member of the Council—(1), If he takes any oath or makes any declaration or acknowledgment of allegiance, obedience, or adherence to any foreign Prince or Power; or (2), if he does, or concurs in, or adopts any act whereby he may become a subject or citizen of any foreign State or Power, or is entitled to the rights, privileges, or immunities of a subject of any foreign State or Power; or (3), if he is a bankrupt, or compounds with his creditors under any Act for the time being in force; or (4), if he is a public defaulter, or is attainted of treason, or is convicted of felony or any infamous crime; or (5), if he resigns his seat by writing under his hand addressed to and accepted by the Governor; or (6), if for more than one whole session of the General Assembly he fails, without permission of the Governor notified to the Council, to give his attendance in the Council. The presence of one-fourth of the members of the Council, exclusive of those who have leave of absence, is necessary to constitute a meeting for the exercise of its powers. This rule, however, may be altered from time to time by the Council. The ordinary sitting-days are Tuesdays, Wednesdays, Thursdays, and Fridays, from 2.30 p.m. to 5 p.m., resuming again at 7.30 when necessary.
Stating the Provincial District and the Date of Writ of Summons.
Speaker—The Hon. Henry John Miller.
Chairman of Committees—The Hon. William Douglas Hall Baillie.
| Name. | Provincial District. | Date of Appointment. |
|---|---|---|
| Aclannd, the Hon. John Barton Arundel | Canterbury | 8 July, 1865. |
| Baillie, the Hon. William Douglas Hall | Marlborough | 8 March, 1861. |
| Barnicoat, the Hon. John Wallis | Nelson | 14 May, 1883. |
| Bolt, the Hon. William Mouat | Otago | 15 October, 1892. |
| Bonar, the Hon. James Alexander | Westland | 27 June, 1868. |
| Bowen, the Hon. Charles Christopher | Canterbury | 23 January, 1891. |
| Buckley, the Hon. Sir Patrick Alphonsus, K.C.M.G. | Wellington | 25 July, 1878. |
| Dignan, the Hon. Patrick | Auckland | 3 February, 1879. |
| Feldwick, the Hon. Henry | Otago | 15 October, 1892. |
| Grace, the Hon. Morgan Stanislaus, C.M.G. | Wellington | 13 May, 1870. |
| Hart, the Hon. Robert | Wellington | 9 July, 1872. |
| Holmes, the Hon. Mathew | Otago | 19 June, 1866. |
| Jenkinson, the Hon. John Edward | Canterbury | 6 June, 1893. |
| Jennings, the Hon. William Thomas | Auckland | 15 October, 1892. |
| Johnston, the Hon. Charles John | Wellington | 23 January, 1891. |
| Kelly, the Hon. Thomas | Taranaki | 15 October, 1892. |
| Kenny, the Hon. Courtney William Aylmer Thomas | Marlborough | 15 May, 1885. |
| Kerr, the Hon. James | Westland | 15 October, 1892. |
| McCullough, the Hon. William | Auckland | 15 October, 1892. |
| MacGregor, the Hon. John | Otago | 15 October, 1892. |
| McLean, the Hon. George | Otago | 19 December, 1881. |
| Mantell, the Hon. Walter Baldock Durant | Wellington | 19 June, 1866. |
| Miller, the Hon. Henry John (Speaker) | Otago | 8 July, 1865. |
| Montgomery, the Hon. William | Canterbury | 15 October, 1892. |
| Morris, the Hon. George Bentham | Auckland | 15 May, 1885. |
| Oliver, the Hon. Richard | Otago | 10 November, 1881. |
| Ormond, the Hon. John Davies | Hawke's Bay | 23 January, 1891. |
| Peacock, the Hon. John Thomas | Canterbury | 3 June, 1873. |
| Pharazyn, the Hon. Robert | Wellington | 15 May, 1885. |
| Pollen, the Hon. Daniel | Auckland | 12 May, 1873. |
| Reynolds, the Hon. William Hunter | Otago | 6 May, 1878. |
| Richardson, the Hon. Edward, C.M.G. | Wellington | 15 October, 1892. |
| Rigg, the Hon. John | Wellington | 6 June, 1893. |
| Scotland, the Hon. Henry | Taranaki | 24 February, 1868. |
| Shephard, the Hon. Joseph | Nelson | 15 May, 1885. |
| Shrimski, the Hon. Samuel Edward | Otago | 15 May, 1885. |
| Stevens, the Hon. Edward Cephas John | Canterbury | 7 March, 1882. |
| Stewart, the Hon. William Downie | Otago | 23 January, 1891. |
| Swanson, the Hon. William | Auckland | 15 May, 1885. |
| Taiaroa, the Hon. Hori Kerei | Otago | 15 May, 1885. |
| Wahawaha, the Hon. Major Ropata, N.Z.C. | Auckland | 10 May, 1887. |
| Walker, the Hon. Lancelot | Canterbury | 15 May, 1885. |
| Walker, the Hon. William Campbell | Canterbury | 15 October, 1892. |
| Whitmore, the Hon. Sir George Stoddart, K.C.M.G. | Hawke's Bay | 31 August, 1863. |
| Whyte, the Hon. John Blair | Auckland | 23 January, 1891. |
| Williams, the Hon. Henry | Auckland | 7 March, 1882. |
Clerk of Parliaments, Clerk of the Legislative Council, and Examiner of Standing Orders upon Private Bills—Leonard Stowe.
Clerk-Assistant—Arthur Thomas Bothamley.
Second Clerk-Assistant—George Moore.
Interpreter—Henry S. Hadfield.
The number of members constituting the House of Representatives is seventy-four—seventy Europeans and four Maoris. This number was fixed by the Act of 1887, which came for the first time into practical operation at the general election of 1890. Previously (from 1881) the House consisted of ninety-five members—ninety-one Europeans and four Maoris. The North Island returns thirty European members, and the Middle Island forty. The cities of Auckland, Wellington, Christchurch, and Dunedin return each three members, and all other electoral districts one each. The elections are triennial, except in the case of a dissolution by the Governor. The qualification for membership is simply registration as an elector, and not coming within the meaning of section 2 of “The Public Offenders' Disqualification Act, 1867.” All contractors to the public service of New Zealand, when any public money above the sum of £50 is payable, directly or indirectly, to such person in any one financial year, and the Civil servants of the colony, are incapable of being elected as or of sitting or voting as members. The payment made to members of the House of Representatives is £20 per month, amounting to £240 per annum. Travelling expenses to and from Wellington are also allowed. This scale of payment came into force on the 1st January, 1892, under the provisions of “The Payment of Members Act, 1892.” Twenty members, exclusive of the Speaker, constitute a quorum. Unless otherwise ordered, the sitting-days of the House are Tuesdays, Wednesdays, Thursdays, and Fridays, from 2.30 to 5.30, resuming at 7.30 p.m. Order of admission to the Speaker's Gallery is by ticket to be obtained from the Speaker. The Strangers' Gallery is open free to the public.
Speaker—The Hon. William Jukes Steward.
Chairman of Committees—Arthur Robert Guinness.
| Name. | Electoral District. | Date of Notification of Return of Writ. |
|---|---|---|
| Allen, James | Bruce | 12 May, 1892. |
| Blake, Edwin | Avon | 18 December, 1890. |
| Bruce, Robert Cunningham | Rangitikei | 13 July, 1892. |
| Buchanan, Walter Clarke | Wairarapa | 18 December, 1890. |
| Buckland, William Francis | Manukau | 18 December, 1890. |
| Buick, Thomas Lindsay | Wairau | 18 December, 1890. |
| Cadman, Alfred Jerome | City of Auckland | 9 August, 1893. |
| Carncross, Walter Charles Frederick | Taieri | 18 December, 1890. |
| Carroll, Hon. James | Eastern Maori | 6 January, 1891. |
| Dawson, William | Dunedin Suburbs | 18 December, 1890. |
| Duncan, Thomas | Oamaru | 18 December, 1890. |
| Duthie, John | City of Wellington | |
| Earnshaw, William | Peninsula | 18 December, 1890. |
| Fergus, Hon. Thomas | Wakatipu | 18 December, 1890. |
| Fish, Henry Smith | City of Dunedin | 18 December, 1890. |
| Fisher, George | City of Wellington | 18 December, 1890. |
| Fraser, William | Te Aroha | 18 July, 1891. |
| Grey, Sir George, K.C.B. | Newton | 8 April, 1891. |
| Guinness, Arthur Robert. | Grey | 18 December, 1890. |
| Hall, Hon. Sir John, K.C.M.G. | Ellesmere | 18 December, 1890. |
| Hall-Jones, William | Timaru | 18 December, 1890. |
| Hamlin, Ebenezer | Franklin | 18 December, 1890. |
| Harkness, Joseph George | City of Nelson | 18 December, 1890. |
| Hogg, Alexander Wilson | Masterton | 18 December, 1890. |
| Houston, Robert Morrow | Bay of Islands | 18 December, 1890. |
| Hutchison, George | Waitotara | 18 December, 1890. |
| Hutchison, William | City of Dunedin | 18 December, 1890. |
| Joyce, John | Akaroa | 18 December, 1890. |
| Kapa, Eparaima te Mutu | Northern Maori | 21 February, 1891. |
| Kolly, James | Invercargill | 18 December, 1890. |
| Kelly, William | East Coast | 18 December, 1890. |
| Lake, Edward | Waikato | 12 October, 1891. |
| Lawry, Frank | Parnell | 18 December, 1890. |
| Mackenzie, Mackay John Scobie | Mount Ida | 18 December, 1890. |
| Mackenzie, Thomas | Clutha | 18 December, 1890. |
| Mackintosh, James | Wallace | 18 December, 1890. |
| McGowan, James | Thames | 31 July, 1893. |
| McGuire, Felix | Egmont | 24 February, 1891. |
| McKenzie, Hon. John | Waitaki | 18 December, 1890. |
| McLean, William | City of Wellington | 20 January, 1892. |
| Meredith, Richard | Ashley | 18 December, 1890. |
| Mills, Charles Houghton | Waimea-Picton | 18 December, 1890. |
| Mills, James | Port Chalmers | 18 December, 1890. |
| Mitchelson, Hon. Edwin | Eden | 18 December, 1890. |
| Moore, Richard | Kaiapoi | 18 December, 1890. |
| Newman, Alfred Kingcome | Hutt | 18 December, 1890. |
| O'Conor, Eugene Joseph | Buller | 18 December, 1890. |
| Palmer, Jackson | Waitemata | 18 December, 1890. |
| Parata, Tamo | Southern Maori | 6 January, 1891. |
| Pinkerton, David | City of Dunedin | 18 December, 1890. |
| Reeves, Hon. William Pember | City of Christchurch | 18 December, 1890. |
| Rhodes, Arthur Edgar Gravenor | Geraldine | 18 December, 1890. |
| Richardson, Hon. George Frederick | Mataura | 18 December, 1890. |
| Rolleston, Hon. William | Halswell | 18 December, 1890. |
| Russell, William Russell | Hawke's Bay | 18 December, 1890. |
| Sandford, Ebenezer | City of Christchurch | 14 October, 1891. |
| Saunders, Alfred | Selwyn | 18 December, 1890. |
| Saddon, Hon. Richard John | Westland | 18 December, 1890. |
| Shera, John McEffer | City of Auckland | 18 December, 1890. |
| Smith, Edward Metcalf | New Plymouth | 18 December, 1890. |
| Smith, William Cowper | Waipawa | 18 December, 1890. |
| Steward, Hon. William Jukes | Waimate | 18 December, 1890. |
| Stout, Hon. Sir Robert, K.C.M.G. | Inangahua | 16 June, 1893. |
| Swan, George Henry | Napier | 18 December, 1890. |
| Taipua, Hoani | Western Maori | 6 January, 1891. |
| Tanner, William Wilcox | Heathcote | 18 December, 1890. |
| Taylor, Richard Molesworth | City of Christchurch | 18 December, 1890. |
| Thompson, Robert | Marsden | 18 December, 1890. |
| Thompson, Thomas | City of Auckland | 18 December, 1890. |
| Valentine, Hugh Sutherland | Tuapeka | 18 December, 1890. |
| Ward, Hon. Joseph George | Awarua | 18 December, 1890. |
| Willis, Archibald Dudingston | Wanganui | 13 June, 1893. |
| Wilson, James Glenny | Palmerston | 18 December, 1890. |
| Wright, Edward George | Ashburton | 18 December, 1890. |
Clerk of House of Representatives—G. Friend.
Sergeant-at-Arms—Lieut.-Colonel P. F. de
Quincey.
Clerk of Writs—H. Pollen.
Deputy-Clerk of Writs—R. H. Govett.
Clerk-Assistant—H. Otterson.
Second Clerk-Assistant—A. J. Rutherfurd.
Reader and Clerk of Bills and Papers—E.
D. O'Rorke.
Interpreters—FS.
Hamlin and G. Mair.
Acting
Librarian H. L. James, B.A.
The existing Parliament of New Zealand will expire by effluxion of time during the present year (1893). On the basis of the results of the census of 1891 the colony has, in accordance with the Representation Act Amendment Acts, 1887 and 1889, been divided afresh into sixty-two districts for purposes of European representation. The names and boundaries of these districts were duly proclaimed in the New Zealand Gazette on the 26th January, 1892. The method laid down in the Act of 1889 for computing, for the purposes of that Act, the population of the colony, is to add 28 per cent, to the population not contained in any city, borough, or town district having a population of over 2,000 persons. The total population of the colony (other than Maoris), with the addition aforesaid, having been ascertained, was then divided by the number of members (70), and the quotient thus obtained formed the quota. The four city electoral districts were so defined as to extent that the population should be three times the quota. Inasmuch as it would be impossible to divide the country into a given number of districts all having exactly the exact quota of population, the law permits the Commissioners to make an allowance of 750 persons by way of addition to or deduction from the population of rural districts, and 100 persons in case of city electorates; and due consideration is given to community of interest, facilities of communication, and topographical features, as far as possible, in forming the districts.
The following table shows the names of the electoral districts for the purposes of the coming general election, with the number of members returnable, the actual town and rural population as at the census of April, 1891, and the nominal population for each district:—
| Electoral Districts, etc. | |||||
|---|---|---|---|---|---|
| Quota, 10,454. | |||||
| Name of Electoral District. | No. of Members. | Actual Population. (Census, 1891.) | Actual Total. (Census, 1891.) | Nominal Population. | |
| Town. | Rural. | ||||
| North Island. | |||||
| Bay of Islands | 1 | .. | 8,681 | 8,681 | 11,111 |
| Marsden | 1 | .. | 8,231 | 8,231 | 10,535 |
| Waitemata | 1 | .. | 8,209 | 8,209 | 10,507 |
| Eden | 1 | 2,455 | 6,606 | 9,061 | 10,910 |
| City of Auckland | 3 | 31,082 | 362 | 31,444 | 31,545 |
| Manukau | 1 | 2,994 | 5,998 | 8,992 | 10,671 |
| Parnell | 1 | 3,967 | 5,332 | 9,299 | 10,791 |
| Thames | 1 | 4,664 | 4,583 | 9,247 | 10,530 |
| Franklin | 1 | .. | 8,720 | 8,720 | 11,161 |
| Waikato | 1 | .. | 7,880 | 7,880 | 10,086 |
| Waipa | 1 | .. | 8,240 | 8,240 | 10,547 |
| Bay of Plenty | 1 | .. | 8,283 | 8,283 | 10,602 |
| Waiapu | 1 | 2,172 | 6,578 | 8,750 | 10,591 |
| Hawke's Bay | 1 | 2,303 | 6,487 | 8,790 | 10,606 |
| Napier | 1 | 8,545 | 1,602 | 10,147 | 10,595 |
| Waipawa | 1 | .. | 8,805 | 8,805 | 11,270 |
| Masterton | 1 | 3,114 | 5,912 | 9,026 | 10,081 |
| Wairarapa | 1 | .. | 7,877 | 7,877 | 10,082 |
| New Plymouth | 1 | 3,350 | 5,753 | 9,103 | 10,713 |
| Egmont | 1 | .. | 8,080 | 8,080 | 10,342 |
| Patea | 1 | .. | 7,728 | 7,728 | 9,891 |
| Wanganui | 1 | 5,074 | 4,105 | 9,179 | 10,328 |
| Rangitikei | 1 | .. | 8,769 | 8,769 | 11,224 |
| Palmerston | 1 | 4,303 | 5,150 | 9,453 | 10,895 |
| Otaki | 1 | .. | 8,757 | 8,757 | 11,208 |
| City of Wellington | 3 | 31,690 | .. | 31,690 | 31,690 |
| Wellington Suburbs | 1 | 2,178 | 6,827 | 9,005 | 10,916 |
| Middle Island. | |||||
| Nelson | 1 | 6,684 | 2,768 | 9,452 | 10,227 |
| Waimea Sounds | 1 | .. | 7,724 | 7,724 | 9,886 |
| Buller | 1 | 2,779 | 5,604 | 8,333 | 9,952 |
| Inangahua | 1 | .. | 7,843 | 7,843 | 10,039 |
| Grey | 1 | 6,043 | 3,247 | 9,290 | 10,199 |
| Westland | 1 | 2,186 | 7,029 | 9,215 | 11,183 |
| Wairau | 1 | 3,301 | 5,591 | 8,892 | 10,457 |
| Ashley | 1 | .. | 8,390 | 8,390 | 10,739 |
| Kaiapoi | 1 | .. | 8,562 | 8,562 | 10,959 |
| Avon | 1 | 4,580 | 4,881 | 9,461 | 10,827 |
| Riccarton | 1 | .. | 8,665 | 8,665 | 11,091 |
| City of Christchurch | 3 | 31,150 | 304 | 31,454 | 31,539 |
| Lyttelton | 1 | 4,559 | 5,219 | 9,778 | 11,239 |
| Ellesmere | 1 | .. | 8,794 | 8,794 | 11,256 |
| Selwyn | 1 | .. | 8,160 | 8,160 | 10,444 |
| Ashburton | 1 | .. | 8,599 | 8,599 | 11,006 |
| Rangitata | 1 | .. | 7,660 | 7,660 | 9,804 |
| Pareora | 1 | .. | 7,728 | 7,728 | 9,891 |
| Timaru | 1 | 3,761 | 5,238 | 8,999 | 10,465 |
| Waitaki | 1 | .. | 7,788 | 7,788 | 9,971 |
| Oamaru | 1 | 5,724 | 3,695 | 9,419 | 10,453 |
| Waihemo | 1 | .. | 7,742 | 7,742 | 9,909 |
| Waikouaiti | 1 | .. | 7,820 | 7,820 | 10,009 |
| Chalmers | 1 | 6,848 | 2,945 | 9,793 | 10,617 |
| City of Dunedin | 3 | 30,004 | 1,153 | 31,157 | 31,479 |
| Caversham | 1 | 7,658 | 2,102 | 9,760 | 10,348 |
| Taieri | 1 | .. | 7,781 | 7,781 | 9,959 |
| Bruce | 1 | .. | 7,667 | 7,667 | 9,813 |
| Clutha | 1 | .. | 8,696 | 8,696 | 11,130 |
| Tuapeka | 1 | .. | 7,667 | 7,667 | 9,813 |
| Wakatipu | 1 | .. | 8,508 | 8,508 | 10,890 |
| Mataura | 1 | .. | 8,623 | 8,623 | 11,037 |
| Awarua | 1 | .. | 8,168 | 8,168 | 10,455 |
| Invercargill | 1 | 4,959 | 4,093 | 9,052 | 10,198 |
| Wallace | 1 | .. | 8,223 | 8,223 | 10,525 |
The North Island with its adjacent islands includes 27 electoral districts, having 31 members and an actual population of 281,446 persons. The Middle and Stewart Islands have 35 electoral districts, 39 members, and 344,913 persons actual population.
These 62 districts with 70 members are for purposes of European representation. The House of Representatives consists, however, of 74 members, 4 of whom represent Maori constituencies, under the Maori Representation Acts of 1867, 1872, and 1876, of which the Native population was ascertained by the Maori census of February, 1891, to be as under:—
| Electoral Districts. | Maori Population (Census, 1891). |
|---|---|
| North Island— | Persons. |
| Northern Maori | 8,970 |
| Eastern Maori | 14,440 |
| Western Maori | 16,365 |
| Middle Island— | |
| Southern Maori | 2,218 |
| Total | 41,993 |
No less than 7,086 Maoris out of the above number voted at the election in October, 1890.
The last general election for European members took place on the 5th December, 1890.
Table of Contents
There is no State Church in the colony, nor is State (pecuniary) aid given to any form of religion. The Government in the early days of the colony set aside certain lands as endowments for various religious bodies. This has ceased, however, to be done for many years past, and no endowments are ever made now for that purpose.
The Right Rev. William Garden Cowie, D.D., Auckland; appointed 1869.
The Right Rev. Edward Craig Stuart, D.D., Waiapu; appointed 1877.
The Most Rev. Octavius Hadfield,* Primate; Wellington; appointed 1870.
The Right Rev. Charles Oliver Mules, M.A., Nelson; appointed 1892.
Bishop Hadfield has given notice of his intention, by reason of the infirmity of age, of resigning his office as Bishop of Wellington on the 9th October, 1893.
The Right Rev. Churchill Julius, D.D., Christchurch; appointed 1890.
The Right Rev. Samuel Tarratt Nevill, D.D., Dunedin; appointed 1871.
The Bishop of Melanesia (Bishopric, June, 1893, vacant.)
The Most Rev. Francis Redwood, S.M., D.D., Archbishop and Metropolitan, Wellington; consecrated 1874.
The Right Rev. John Edmund Luck, D.D., O.S.B., Auckland; consecrated 1882.
The Right Rev. John Joseph Grimes, S.M., D.D., Christchurch; consecrated 1887.
The Most Rev. Patrick Moran, D.D., Dunedin; consecrated 1856.
The principal present heads or officers of the various churches, and the places and times of holding their annual or periodical assemblies or meetings, are as follow:—
Church of England.—For Church purposes, the colony is divided into six dioceses—viz., Auckland, Waiapu, Wellington, Nelson, Christchurch, and Dunedin. The General Synod meets every third year in one of the various dioceses.—President, Bishop Hadfield, Primate, Wellington; Secretary, Rev. C. M. Nelson, M.A., Auckland; Lay Secretary, James Allen, Esq., M.H.R., Dunedin. The next General Synod will be held in Nelson, in February, 1894.
Roman Catholic Church.—The diocese of Wellington, established in 1848, was in 1887 created the metropolitan see. There are three suffragan dioceses—Auckland, Christchurch, and Dunedin. A Retreat is held annually in each of the four dioceses.
Presbyterian Church of New Zealand.—The Assembly meets annually, in February, at Auckland, Wellington, and Christchurch, in succession. Moderator, the Very Rev. William Gillies; Clerk and Treasurer, Rev. David Sidey, Napier.
Presbyterian Church of Otago and Southland.—The Assembly meets annually in October at Dunedin. Moderator, Rev. Robert Ewen, Limestone Plains, Invercargill; Clerk, Rev. W. Bannerman, Roslyn, Dunedin; Church Factor, Mr. Edmund Smith, High Street, Dunedin.
Wesleyan Methodist Church.—The annual Conference meets in March, the exact date being determined by the President, who holds office for one year. Each Conference determines where the next one shall assemble. President (1893–94), Rev. W. Keall, Palmerston North; Secretary, Rev. Henry Bull, Onehunga. The next Conference is to assemble in Christchurch on or about the 1st March, 1894.
Baptist Union of New Zealand.—President, Rev. G. D. Cox, Auckland; Secretary, Rev. W. R. Woolley, Thames. The Union comprises 30 churches, 2,915 members, and 4,881 scholars in the Sunday schools. There are also 90 local preachers, and 19 mission stations.
Congregational Union.—The annual meetings are held about the middle of February, at such place as may be decided by the vote of the Council. Chairman, Rev. H. W. J. Miller, Onehunga; Chairman Elect, Mr. A. W. Beaven, Christchurch; Secretary, Mr. H. J. Le Bailly, Auckland; Treasurer, Mr. W. H. Lyon, Auckland; Registrar, Rev. J. Foster, Ravensbourne, Dunedin. In 1894 the meetings will be held in Auckland, by invitation of the District Committee of the Congregational Churches of that city.
Primitive Methodists.—A Conference is held every January. The next, which marks the jubilee of Primitive Methodism in New Zealand, is to be held in New Plymouth, where the Rev. Robert Ward, the first Primitive Methodist missionary to these shores, landed in 1844. The Conference officials for the present year are: President, Rev. James Guy, Auckland; Secretary, Rev. William Woollass, Invercargill.
United Methodist Free Churches.—The Assembly meets annually in January, in Canterbury, Auckland, Wellington, or Hawke's Bay. President, Rev. C. Penney; Secretary, Rev. A. Peters, Austin street, Wellington.
Hebrew Church.—Ministers, Rev. S. A. Goldstein, Auckland; Rev. J. L. Harrison, Dunedin; Rev. H. van Staveren, Wellington; Rev. Adolph T. Chodowski, Christchurch; Mr. Alexander Singer, Hokitika. Annual meetings of the general Congregations are held at these places on the third Sunday in Elul (about the end of August).
Bible Christians.—A General Conference of the Connexion is held annually. Superintendent, Rev. J. Orchard, Christchurch; Secretary, Rev. W. Ready, Dunedin; Trust Secretary, Rev. B. H. Ginger, Cromwell; School Secretary, Rev. F. T. Read, Addington, Christchurch. The next District Meeting is to be held at Christchurch, to commence its sittings on the 4th January, 1894.
The following shows the number of persons (exclusive of Maoris) belonging to the different religious denominations in New Zealand, and the number of churches and chapels, according to the census of April, 1891; also, the number of officiating ministers under “The Marriage Act, 1880,” on the 1st June, 1893.
| Religious Denominations. | Persons. | Churches and Chapels. | Officiating Ministers. |
|---|---|---|---|
|
* Including 42 Dissenters; 55 Christian Israelites. Including 2,326 of No denomination, so described. † Including 1,269 of No religion, so described; 123 Atheists; 65 Secularists. ‡ In addition to the number of churches and chapels here given, there are about 400 schoolhouses, dwellings, or public buildings used for public worship, besides 20 buildings open to more than one Protestant denomination. | |||
| Episcopalians— | |||
| Church of England, and Episcopalians not otherwise defined | 250,945 | 345 | 274 |
| Protestants (undescribed) | 2,386 | .. | .. |
| Presbyterians— | |||
| Church of Scotland, Free Church of Scotland, Free Presbyterians, Presbyterian Church of New Zealand, Presbyterian Church of Otago and Southland, and Presbyterians otherwise defined | 141,477 | 246 | 179 |
| Methodists— | |||
| Wesleyan Methodists | 53,061 | 213 | 111 |
| Methodists (undefined) | 2,071 | .. | .. |
| Primitive Methodists | 5,220 | 41 | 27 |
| United Methodist Free Churches, Free Methodists, United Methodists | 1,905 | 18 | 14 |
| Bible Christians | 1,069 | 9 | 8 |
| Others | 89 | 1 | .. |
| Baptists | 14,825 | 32 | 18 |
| Congregational Independents | 6,685 | 21 | 18 |
| Lutheran, German Protestants | 5,616 | 13 | 10 |
| Unitarians | 308 | .. | .. |
| Society of Friends | 315 | .. | .. |
| Other Protestants— | |||
| Church of Christ (including Christian, Church of Christ, Christian Disciples, Disciples of Christ, Disciples) | 5,241 | 15 | 8 |
| Brethren (including Brethren, Christian Brethren, Exclusive Brethren, Open Brethren, Plymouth Brethren) | 3,537 | 3 | 1 |
| Believers in Christ | 193 | .. | .. |
| Evangelists (including Evangelical Union, Evangelical Church, Evangelical Christians, Evangelical Brethren) | 93 | .. | .. |
| Nonconformists | 77 | .. | .. |
| Salvation Army | 9,£3 | 34 | 8 |
| Christadelphians | 700 | .. | .. |
| Swedenborgians (including New Church, New Jerusalem Church) | 178 | .. | .. |
| Seventh-day Adventists | 415 | 1 | 3 |
| Students of Truth | 325 | .. | .. |
| Other Protestants (variously returned) | 536* | .. | .. |
| Catholics— | |||
| Roman Catholics | 85,856 | 181 | 132 |
| Catholics (undefined) | 1,416 | .. | .. |
| Greek Church | 56 | .. | .. |
| Catholic Apostolic | 150 | 1 | 1 |
| Other sects— | |||
| Hebrews | 1,463 | 5 | 7 |
| Mormons, Latter-day Saints | 206 | .. | .. |
| Spiritualists | 339 | .. | .. |
| Buddhists, Pagans, Confucians | 3,928 | .. | .. |
| Others (variously returned) | 154 | .. | .. |
| No denomination— | |||
| Freethinkers | 4,475 | .. | .. |
| Agnostic | 322 | .. | .. |
| Deists, Theists | 51 | .. | .. |
| Doubtful | 405 | .. | .. |
| No denomination (variously returned) | 2,999* | 18 | .. |
| No religion | 1,558† | .. | .. |
| Unspecified | 1,288 | .. | .. |
| Object to state | 15,342 | .. | .. |
| Totals | 626,658 | 1,197‡ | 819 |
The total number specified as to religion is 625,370 out of the number of adherents to the various Churches given above.
The following return shows the number of churches and chapels, schoolhouses, and other buildings used for public worship by the different religious denominations, in April, 1891; also the number of persons for whom there was accommodation, and the number usually attending, in each provincial district:—
| Provincial Districts. | Churches and Chapels. | School-houses used for Public Worship. | Dwellings or Public Buildings used for Public Worship. | Number of Persons | |
|---|---|---|---|---|---|
| For whom Accommodation. | Attending Services. | ||||
| Auckland | 288 | 68 | 43 | 66,167 | 37,650 |
| Taranaki | 46 | 17 | 11 | 8,472 | 5,322 |
| Hawke's Bay | 58 | 8 | 6 | 11,274 | 7,064 |
| Wellington | 178 | 18 | 19 | 40,192 | 25,631 |
| Marlborough | 30 | 1 | .. | 5,310 | 3,335 |
| Nelson | 76 | 6 | 10 | 15,030 | 8,879 |
| Westland | 33 | 2 | 3 | 6,705 | 4,445 |
| Canterbury | 256 | 33 | 19 | 60,755 | 41,771 |
| Otago | 232 | 88 | 50 | 64,209 | 42,958 |
| Totals | 1,197 | 241 | 161 | 278,114 | 177,055 |
CIVIL ESTABLISHMENT AT SEAT OF GOVERNMENT.
Premier's Office.
Premier—Hon. R. J. Seddon
Secretary to Premier and to Cabinet—A. J. Willis
COLONIAL SECRETARY'S DEPARTMENT.
Chief Office.
Colonial Secretary—Hon. Sir P. A. Buckley, K.C.M.G.
Under-Secretary—Hugh Pollen
Chief Clerk—R. H. Govett
Clerks—R. F. Lynch, L. W. Loveday, R. Leckie, M. J. Hodgins
Housekeeper and Chief Messenger—F. H. Revell
Audit Office.
Controller and Auditor-General—J. E. FitzGerald, C.M.G.
Assistant Controller and Auditor—J. C. Gavin
Chief Clerk—J. G. Anderson
Clerks—L. C. Roskruge, W. Dodd, P. P. Webb, A. Rowband, H. S. Pollen, W. G. Holdsworth, C. M. Georgeson, A. W. Eames, J. T. Dumbell, B. A. Meek
Extra Clerks—D. C. Innes, J. Swift, A. E. Bybles, J. Ward
Audit Officer, Agent-General's Office, London—C. E. W. Palliser
Audit Travelling Inspectors—A. H. Maclean, J. King, E. J. A. Stevenson, W. R. Holmes, E. T. Greville, G. H. I. Easton, J. M. Glasgow, C. P. Johnson
Registrar-General's Office.
Registrar-General—E. J. Von Dadelszen Chief Clerk—G. Drury
Clerks—W. C. Sproule, E. F. Norris, S. Coffey
Printing and Stationery Department.
Government Printer, Stationery Store Manager, and Controller of Stamp Printing—S. Costall
Superintending Overseer—J. Burns
Chief Clerk and Accountant—
Clerk and Computer—B. B. Allen
Clerks—F. Barraud, R. Watts, A. Stace, W. Phillips, B. K. Manley, J. W. Hall
Overseers—J. Gamble, B. Wilson
Overseer, Machine-room—C. Young
Overseer, Binding Branch—W. Franklin
Sub-overseer, Binding Branch—G. F. Broad
Sub-overseer, Jobbing-room—G. Tattle'
Night Foreman—J. F. Rogers
Stamp Printer—H. Hume
Stereotyper and Electrotyper—W. J. Kirk
Readers—A. F. Warren, J. W. Henley, W. Fuller, M. F. Marks
Forewoman, Binding Branch—Miss Marsden
COLONIAL TREASURER'S DEPARTMENT.
Chief Office.
Colonial Treasurer—Hon. J. G. Ward
Secretary to the Treasury, Receiver-General, and Paymaster-General—James B. Heywood
Accountant to the Treasury—Robert J. Collins
Cashier—C. E. Chittey
Corresponding Clerk—H. Blundell
Clerks—A. M. Smith, C. Meacham, W. E. Cooper, R. B. Vincent, J. F. Andrews, J. R. Dunean, E. L. Mowbray, T. H. Burnett, J. Radcliffe, T. J. Davis, H. N. W. Church, J. Holmes, A. O. Gibbes, J. Eman Smith, A. J. Morgan, F. H. Tuckey
Cadets—C. E. Matthews, H. Hawthorne, H. Hirter, W. Jeff, A. J. Will
Officer for Payment of Imperial Pensions at Auckland—B. J. Devaney
Friendly Societies' and Trades Unions' Registry Office.
Registrar—E. Mason
Revising Barrister—L. G. Reid
Clerk—C. T. Benzoni
LAND - AND INCOME-TAX DEPARTMENT.
Commissioner of Taxes—C. M. Crombie
Deputy - Commissioner of Taxes—J. McGowan
Chief Clerk—G. F. C. Campbell
Clerks—D. Walmsley, G. Maxwell, A. F. Oswin, H. Nancarrow, D. R. Purdie, J. P. Dugdale, M. C. Barnett, A. J. McGowan, J. M. King, C. V. Kreeft, G. W. Jänisch, H. H. Seed, T. Oswin, D. G. Clark, J. Stevenson, J. R. Smyth, H. L. Wiggins, J. W. Black
Cadets—J. J. Hunt, C. de R. Andrews, R. Hepworth, W. J. Organ
DEPARTMENT OF JUSTICE.
Head Office.
Minister of Justice and Native Minister—Hon. A. J. Cadman
Under-Secretary—C. J. A. Haselden, J.P.
Chief Clerk—F. Waldegrave
Translator—G. H. Davies
Clerks—C. B. Jordan, E. W. Porritt, R. C. Sim, T. G. Poutawera, B. M. Wilson
Crown Law Office.
Attorney - General—Hon. Sir P. A. Buckley, K.C.M.G.
Solicitor-General—W. S. Reid
Assistant Law Officer—L. G. Reid
Law Draftsman—J. Curnin
Clerk—E. Y. Redward
Patent Office.
Registrar of Patents, Designs, and Trademarks—C. J. A. Haselden, J.P.
Deputy Registrar—F. Waldegrave
Clerks—J. C. Lewis, F. J. Stewart
Judicial.
Supreme Court Judges.
Chief Justice—
Wellington—Sir J. Prendergast, Knt. Bach.
Puisne Judges—
Wellington—C. W. Richmond
Auckland—E. T. Conolly
Christchurch—J. E. Denniston
Dunedin—J. S. Williams
District Court Judges.
Wairarapa—
Wanganui, New Plymouth, Hawera, and Palmerston North—C. C. Kettle
Nelson—H. W. Robinson
Ashburton, Timaru, Oamaru, Queens-town, Naseby, Lawrence, Hokitika, Greymouth, Westport, and Reefton—C. D. R. Ward
Invercargill—C. E. Rawson
Registrars of the Supreme Court.
Auckland—H. C. Brewer
New Plymouth—W. Stuart
Napier—A. Turnbull
Gisborne—W. A. Barton
Wellington—D. G. A. Cooper
Nelson—H. W. Robinson
Blenheim—J. Allen
Christchurch—A. R. Bloxam
Hokitika—A. H. King
Dunedin—C. McK. Gordon
Invercargill—F. G. Morgan
Sheriff's.
Auckland—H. C. Brewer
Taranaki—J. J. Freeth
Hawke's Bay—A. Turnbull
Poverty Bay—W. A. Barton
Wellington—D. G. A. Cooper
Wairarapa—
Wanganui and Rangitikei—A. D. Thomson
Nelson—W. Heaps
Westland North—A. Greenfield
Central Westland—H. Lucas
Marlborough—W. G. P. O'Callaghan
Canterbury—A. R. Bloxam
Timaru—C. A. Wray
Westland—A. H. King
Otago—C. McK. Gordon
Southland—W. Martin
Crown Solicitors.
Auckland—Hon. J. A. Tole
New Plymouth—A. Standish
Gisborne—J. W. Nolan
Napier—A. J. Cotterill
Wellington—H. Gully
Wanganui—S. T. Fitzherbert
Nelson—C. Y. Fell
Blenheim—W. Sinclair
Christchurch—T. W. Stringer
Timaru—J. W. White
Hokitika—W. M. Purkiss
Dunedin—B. C. Haggitt
Invercargill—T. M. Macdonald
Oamaru—A. G. Creagh
Crown Prosecutors.
New Plymouth—A. Standish
Hawera—E. L. Barton
Wanganui and Palmerston North—S. T. Fitzherbert
Westport and Reefton—C. E. Harden
Hokitika and Greymouth—W. M. Purkiss
Timaru—J. W. White
Camaru—A. G. Creagh
Nelson—C. Y. Fell
Queenstown—Wesley Turton
Invercargill—T. M. Macdonald
Resident Magistrates.
Auckland—J. Giles
Pokeno, Waikato, &c.—T. Jackson
Onehunga, &c.—R. S. Bush*
Mongonui, &c.—J. S. Clendon
Tauranga, &c.—J. M. Roberts
Thames, &c.—H. W. Northeroft*
Gisborne, &c.—J. Booth
* Are also Wardens of Goldfields.
New Plymouth—W. Stuart
Opanake, &c.—A. Tuke
Wellington, &c.—J. C. Martin
Wanganui, &c.—C. C. Kettle
Palmerston North, &c.—H. W. Brabant
Wairarapa—
Napier, &c.—A. Turnbull
Nelson, &c.—H. W. Robinson
Westport, Collingwood, &c.—A. Greenfield
Blenheim, &c.—J. Allen*
Christchurch, &c.—R. Beetham
Kaiapoi, &c.—H. W. Bishop
Timaru, &c.—C. A. Wray
Greymouth, &c.—H. A. Stratford*
Hokitika, &c.—D. Macfarlane*
Dunedin, &c.—E. H. Carew
Oamaru, &c.—J. Keddell*
Lawrence, &c.—R. S. Hawkins*
Clyde, &c.—J. N. Wood*
Naseby—S. M. Dalgleish*
Invercargill, &c.—C. E. Rawson
Chatham Islands—F. J. W. Gascoyne
Clerks of District and Resident Magistrates' Courts.
New Plymouth—J. J. Freeth
Hawera—A. Trimble
Wanganui—A. D. Thomson
Palmerston North—W. Matravers
Wairarapa—F. H. Ibbetson
Nelson—C. H. W. Bowen
Hokitika—C. A. Barton
Greymouth—B. Harper
Westport—E. C. Kelling
Reefton—H. Lucas
Timaru—T. Howley
Ashburton—J. R. Colyer
Oamaru—W. G. Filleul
Invercargill—W. Martin
Queenstown—H. N. Firth
Lawrence—H. J. Abel
Naseby—E. Rawson
Official Assignees in Bankruptcy.
Auckland—J. Lawson
Wellington—J. Asheroft
Christchurch—G. L. Greenwood
Dunedin—C. C. Graham
Receivers of Gold Revenue, Mining Registrars, and Clerks of Wardens' and Resident Magistrates' Courts.
Thames—F. J. Burgess
Coromandel—T. M. Lawlor
Te Aroha—J. Jordan
Whangarei—T. W. Taylor
Havelock and Cullensville (Marlborough)—W. A. Hawkins
Nelson—C. H. W. Bowen
Motueka—H. E. Gilbert
Collingwood—J. Mayne
Westport—E. C. Kelling
Charleston—A. A. Winterburn
Reefton—H. Lucas
Greymouth—B. Harper
Kumara—J. McEnnis
Hokitika—C. A. Barton
Naseby, &c.—E. Rawson
Gore and Wyndham—C. J. Hinton
Clyde, Blacks, and Alexandra—F. T. D. Jeffrey
Cromwell—J. Fleming
Queenstown and Arrowtown—H. N. Firth
Lawrence—H. J. Abel
Riverton—A. M. Eyes
Clerks of Resident Magistrates' Courts.
Auckland—J. B. Stoney
Whangarei—T. W. Taylor
Tauranga—J. Thomson
Gisborne—W. A. Barton
Hamilton—T. Kirk
Napier—A. S. B. Foster
Hastings—P. Skerrett
Marton, &c.—F. M. Deighton
Wellington—W. P. James
Blenheim—W. G. P. O'Callaghan
Christchurch—W. G. Walker
Lyttelton—W. Shanaghan
Kaiapoi—M. Lynskey
Dunedin—W. Somerville
Native Land Court.
Chief Judge—H. G. Seth-Smith
Judges—A. Mackay, D. Scannell, R. Ward, G. E. Barton, S. W. von Stürmer, W. E. Gudgeon, W. J. Butler
Registrars—Auckland, W. J. Morpeth; Gisborne, £. Brooking; Wellington, H. F. Edger
Recorders of the Native Land Court.
R. S. Bush, J. Booth, H. W. Bishop, J. S. Clendon, T. Jackson, H. W. Northcroft, C. C. Kettle, J. M. Roberts, W. Stuart, E. H. Carew, F. J. W. Gascoyne
Trust Commissioners under Native Lands Frauds Prevention Act.
The Chief Judge and Judges of Native Land Court; also J. Booth, C. E. Rawson, H. Turton, H. W. Robinson, J. Giles, T. Jackson, C. C. Kettle, R. S. Bush, J. S. Clendon, H. W. Brabant, A. Turnbull, H. W. Northcroft, W. Stuart.
Government Native Agent, Otorohanga—G. T. Wilkinson
Prisons Department.
Inspector—Lieut.-Colonel Arthur Hume, N.Z.M.
Clerk—T. E. Richardson
Gaolers—Auckland, George Sinclair Reston; Dunedin, Samuel Charles Phillips; Hokitika, Bartholomew Lloyd O'Brien; Invercargill, John Henry Bratby; Lyttelton, Matthew Michael Cleary; Napier, Francis Edward Severne; New Plymouth, Edward Rickerby; Wanganui, Robert T. Noble Beasley; Wellington, Patrick Samuel Garvey; Nelson, Thomas R. Pointon
DEPARTMENT OF LABOUR.
Minister of Labour—Hon. W. P. Reeves Secretary and Chief Inspector of Factories—E. Tregear
Chief Clerk—James Mackay
Clerks—J. Shanaghan, V. L. Willeston (There are over 200 Bureau Agencies in different parts of the colony.)
Inspectors of Factories.
Wellington—J. Mackay and J. Shanaghau; Christchurch—J. Lomas; Auckland—H. Ferguson; Dunedin—T. K. Weldon; and 102 local Inspectors.
PUBLIC WORKS DEPARTMENT.
Head Office.
Minister for Public Works—Hon. R. J. Seddon
Under-Secretary—H. J. H. Blow
Engineer-in-Chief—W. H. Hales
Resident Engineer (Head Office)—P. S. Hay, M. A., M. Inst. C.E.
Chief Clerk—J. A. McArthur
Accountant—G. J. Clapham
Land-purchase Officer—H. Thompson
Record Clerk—H. W. H. Millais
Clerks—W. D. Dumbell, W. Gibson, H. R. Rae, W. Butler, E. Horneman
Chief Draughtsman—W. G. Rutherford
Architectural Draughtsman—J. Campbell
Draughtsmen—T. Perham, E. Jackson
District Offices.
District Engineer—Dunedin, E. R. Ussher, M. Inst. C.E.
Resident Engineers—Auckland, C. R. Vickerman; Hunterville, G. Fitzgerald; Wellington, J. A. Wilson, jun. Eketahuna, G. L. Cook, M. Inst. C.E.; Westport, T. H. Rawson; Greymouth, J. Thomson, B.E. In charge of North Island Main Trunk Railway survey, R. W. Holmes
Assistant Engineers—W. A. Shain, A. C. Koch, H. Macandrew, J. D. Louch, J. J. Hay, M.A., W. H. Gavin, J. W. Richmond, J. S. Stewart
Clerks, Draughtsmen, &c.—W. Black, C. T. Rushbrook, C. Wood, J. Young, A. E. Kennedy, W. W. Spotswood, T. Douglas, A. R. Stone, J. Meenan
POST OFFICE AND TELEGRAPH DEPARTMENT.
General Post Office.
Postmaster-General and Commissioner of Electric Telegraphs—Hon. J. G. Ward
Superintendent—C. Lemon, Ph.D.
Secretary—W. Gray
Inspector—T. Rose
Controller of Money-orders and Savings-banks, and Accountant—G. Gray
Assistant Inspector of Post Offices—J. Grubb
Sub-Inspectors of Post Offices—D. Cumming, C. J. A. Tipping
Chief Clerk—D. Robertson
Clerks—W. R. Morris, E. V. Senn, F. V. Waters, H. Plimmer, J. C. Williamson, W. Beswick, G. Cenci, A. P. Dryden, L. Ledger, V. J. Brogan, W. Callanghan, G. W. Moorhouse, W. Chegwidden, H. S. B. Miller, H. Huggins, G. V. Hudson, F. Perrin, J. Brennan, H. Cornwall, R. J. Thompson, R. E. Hayes, D. A. Jenkins, J. C. Redmond, C. B. Harton, W. J. Drake, R. F. Smith, J. D. Avery, H. E. Duff, J. G. Roache, J. Coyle, F. W. Faber, W. H. Carter, J. J. Murray, P. Tyrrell, E. Bermingham, C. Bermingham, S. Brock, W. Menzies, F. Menzies, C. A. Ferguson, E. Harris, B. Kenny, V. Johnston, M. A. McLeod
Electrician—W. C. Smythe
Mechanician-H. F. Smith
Storekeeper—J. Black
Assistant Storekeeper—C. B. Mann
Circulation Branch (Post Office)—J. Hoggard, Chief Clerk
Inspectors of Telegraphs.
Napier—E. H. Bold
Christchurch—W. G. Meddings
Dunedin—J. K. Logan
Sub-Inspectors of Telegraphs.
Auckland—J. Orchiston
Nelson—J. W. Gannaway
Chief Postmasters.
Auckland—S. B. Biss
*Thames—J. E. Coney
*Gisborne—W. W. Beswick
Napier—S. J. Jago
*New Plymouth—F. D. Holdsworth
*Wanganui—J. F. McBeth
*Blenheim—J. G. Ballard
*Nelson—H. Calders
*Westport—J. H. Sheath
*Greymouth—C. J. Berry
*Hokitika—A. E. Cresswell
Christchurch—R. Kirton
*Timaru—R. J. Goodman
*Oamaru—J. A. Hutton
Dunedin—E. Cook
*Invercargill—J. W. Wilkin
Officers in Charge of Telegraph Offices.
Auckland—W. S. Furby
Napier—H. W. Harrington
Wellington—C. C. Robertson
Christchurch—J. W. Mason
Dunedin—A. D. Lubecki
DEPARTMENT OF TRADE AND CUSTOMS.
Commissioner of Trade and Customs—Hon. J. G. Ward
Secretary and Inspector of Customs and Secretary of Marine—W. T. Glasgow
Chief Clerk, Customs—T. Larchin
Clerks, Customs—E. T. W. Maclaurin, H. J. Marsh. Audit—H. W. Brewer, H. Crowther (Writer)
Collectors of Customs.
Auckland—A. Rose
Poverty Bay—D. Johnston, jun.
New Plymouth—C. S. Nixon
Napier—E. R. C. Bowen
Wellington—D. McKellar
Wanganui—A. Elliott
Wairau—E. W. Pasley
Nelson—W. Heaps
Westport—J. Mills
Greymouth—A. McDowell
Hokitika—E. Chilman
Lyttelton and Christchurch—E. Patten
Timaru—A. Hart
Oamaru—R. Thompson
Dunedin—C. W. S. Chamberlain
Invercargill and Bluff Harbour—J. Borrie
These are combined post- and telegraph-offices.
Officers in Charge of Ports, and Coastwaiters.
Thames—T. C. Bayldon, Coastwaiter
Russell—W. J. Walsh, Officer in Charge
Tauranga—J. Bull, Officer in Charge
Whangaroa—A. G. Ratcliffe, Coastwaiter
Whangarei—J. Munro, Coastwaiter
Mongonui—A. D. Clemett, Officer in Charge
Hokianga—G. Martin, Coastwaiter
Kaipara—J. C. Smith, Officer in Charge
Waitara—J. Cameron, Coastwaiter
Foxton—J. B. Imrie, Officer in Charge
Patea—J. W. Glenny, Officer in Charge
Picton—J. B. Gudgeon, Officer in Charge
Chatham Islands—F. J. W. Gascoyne, Officer in Charge
MARINE DEPARTMENT.
Minister of Marine—Hon. Sir P. A. Buckley, K.C.M.G.
Assistant Secretary—L. H. B. Wilson
Chief Clerk—G. Allport
Nautical Adviser—R. Johnson
Clerk—J. J. D. Grix
Examiners of Masters and Mates—R. Johnson and R. A. Edwin, Com. R.N.
Weather Reporter—R. A. Edwin, Com. R.N.
Examiner of Masters and Mates, Auckland—J. Robertson
Examiner of Masters and Mates, Lyttelton—Sir A. Douglas, Bart.
Examiner of Masters and Mates, Dunedin—Sir A. Douglas, Bart.
Examiners of Engineers, Auckland—W. J. Jobson and L. Blackwood
Examiners of Engineers, Wellington—W. M. Mowatt and H. A. McGregor
Examiner of Engineers, Christchurch—G. Croll
Examiners of Engineers, Dunedin—R. Duncan and A. Morrison
Master of s.s. “Hinemoa”—J. Fairchild
Harbourmasters.*
Collingwood—J. E. Fletcher
Foxton—A. Seabury
Hokianga—G. Martin
Kaipara—J. Christy Smith
Manukau—J. Robertson
Nelson—J. P. Low
Okarito—G. Thomson
Waitapu—S. G. Robinson
* The more important harbours are controlled by local Boards, not by the Marine Department. (See “Ports and Harbours.”)
STAMP DEPARTMENT.
Commissioner of Stamp Duties—Hon. W. P. Reeves
Secretary for Stamps—C. A. St. G. Hickson
Chief Clerk and Accountant—D. O. Williams
Custodian and Issuer of Stamps—W. H. Shore
Record and Receiving Clerk—J. P. Murphy
Clerk—J. Murray
Chief Stamper—C. Howe
Deputy-Commissioners of Stamps.
Auckland—Thomas Hall
Gisborne—W. W. Beswick
Taranaki—W. Stuart
Hawke's Bay—E. Bamford
Wellington—C. A. St. G. Hickson
Wanganui—J. F. McBeth
Nelson—W. W. de Castro
Marlborough—A. V. Sturtevant
Canterbury—E. Denham
Timaru—R. J. Goodman
Otago—G. G. Bridges
Southland—F. G. Morgan
Westland—A. H. King
LAND TRANSFER DEPARTMENT AND DEEDS REGISTRY.
Registrar-General of Land and Deeds—G. B. Davy
Secretary, Land and Deeds—C. A. St. G. Hickson
District Land Registrars and Registrars of Deeds.
Auckland—T. Kissling
Taranaki—W. Stuart
Wellington—G. B. Davy
Hawke's Bay—E. Bamford
Nelson—H. W. Robinson
Marlborough—J. Allen
Canterbury—J. M. Batham and E. Denham
Otago—H. Turton
Southland—F. G. Morgan
Westland—A. H. King
Examiners of Titles.
Auckland—Thomas Hall
Taranaki—W. Stuart
Wellington—G. B. Davy
Hawke's Bay—E. Bamford
Nelson—H. W. Robinson
Marlborough—G. B. Davy
Canterbury—J. M. Batham
Otago—G. G. Bridges
Southland—F. G. Morgan
Westland—A. H. King
Registrar of Joint-stock Companies.
C. A. St. G. Hickson
Assistant Registrars of Joint-stock Companies.
Auckland—Thomas Hall
Taranaki—W. Stuart
Hawke's Bay—E. Bamford
Wellington—H. O. Williams
Nelson—W. W. de Castro
Marlborough—A. V. Sturtevant
Canterbury—E. Denham
Otago—G. G. Bridges
Southland—F. G. Morgan
Westland—A. H. King
EDUCATION DEPARTMENT.
Minister of Education (administering also Native schools, industrial schools, and the institution for deaf-mutes)—Hon. W. P. Reeves
Secretary for Education and Inspector-General of Schools—Rev. W. J. Habens, B.A.
Chief Clerk—Sir E. O. Gibbes, Bart.
Clerks—F. K. de Castro, H. B. Kirk, M. A., R. H. Pope, F. L. Severne
Organising Inspector of Native Schools—James H. Pope. Assistant Inspector, H. B. Kirk, M.A.
Education Boards.
Auckland—V. E. Rice, Secretary
Taranaki—E. Veale, Secretary
Wanganui—A. A. Browne, Secretary
Wellington—A. Dorset, Secretary
Hawke's Bay—G. T. Fannin, Secretary
Marlborough—J. Smith, Secretary
Nelson—S. Ellis, Secretary
Grey—E. T. Robinson, Secretary
Westland—A. J. Morton, B.A., Secretary
Canterbury North—J. V. Colborne-Veel, M.A., Secretary
Canterbury South—J. H. Bamfield, Secretary
Otago—P. G. Pryde, Secretary
Southland—J. Neill, Secretary
School Commissioners
(Administrators of Education Reserves).
Auckland-H. N. Garland, Secretary
Taranaki—E. Veale, Secretary
Wellington—W. H. Warren, Secretary
Hawke's Bay—E. P. A. Platford, Secretary
Marlborough—J. Smith, Secretary
Nelson—A. T. Jones, Secretary
Westland—E. T. Robinson, Secretary
Canterbury—H. H. Pitman, Steward of Reserves
Otago—C. Macandrew, Secretary
Industrial Schools.
Auckland Industrial School—Miss S. E. Jackson, Manager
St. Mary's Industrial School, Ponsonby—Rev. G. M. Lenihan, Manager
Thames Orphanage—Thomas Fulljames, Manager
St. Joseph's Industrial School, Wellington—Rev. T. G. Dawson, Manager
St. Mary's Industrial School, Nelson—Rev. W. J. Mahoney, Manager
Burnham Industrial School (Canterbury)—T. Palethorpe, Manager
Caversham Industrial School (Otago)—G. M. Burlinson, Manager
Institution for Deaf-mutes, Sumner.
Director—G. Van Asch
Steward—H. Buttle
Lunatic Asylums.
Inspector—Duncan MacGregor, M.A., M.B., C.M.
Medical Superintendent, Auckland Asylum—Gray Hassell, M.D.
Medical Superintendent, Christchurch Asylum—E. G. Levinge, M.B.
Medical Superintendent, Wellington Asylum—E. E. Fooks, M.B.
Medical Superintendent, Seacliff Asylum—F. T. King, M.B.
Superintendent, Hokitika Asylum—H. Gribben
Superintendent, Nelson Asylum—J. Morrison
Ashburn Hall, Waikari (private asylum)—Joint proprietors, Dr. Alexander and J. Hume
RAILWAY DEPARTMENT.
Commissioners—Messrs. J. McKerrow (Chief), J. P. Maxwell, M. Inst. C. E., W. M. Hannay
Secretary—E. G. Pilcher
Clerks—T. W. Waite, J. F. Bell, C. Isherwood, J. A. Tripe, B.A., F. S. Pope, J. E. Widdop, W. S. W. McGowan
Audit Inspectors—H. Baxter, C. Wallnutt, D. Munro, C. L. Russell
Railway Accountant—A. C. Fife
Clerks—H. Davidson, G. G. Wilson, M. C. Rowe, J. H. Davies, S. P. Curtis, J. McLean, E. Davy, R. Allen, V. Jänisch, A. Morris, E. P. Brogan, W. F. Ambler, F. Hardwick, E. J. Fleming, R. J. Loe, F. W. Lash, A. H. Hunt, W. Bourke, E. R. Nicholson, J. M. O'Brien
Stores Manager—R. Carrow
Clerks—G. Felton, R. E. Mackay, A. M. Heaton, J. Webster, J. E. Hasloch, L. G. Porter, W. B. Dyer, F. L. Ward
District Managers—Whangarei, H. B. Dobbie; Kawakawa, J. D. Harris; Kaihu, T. H. Barstow; Auckland, C. Hudson; Wanganui (Traffic Agent), H. Buxton; Napier (Traffic Agent), A. Garstin; Wellington (Traffic Agent), B. Dawson; Greymouth, T. Ronayne; Westport, T. A. Peterkin; Nelson, £P. W. Maclean; Picton, H. St. J. Christophers; Christchurch, W. H. Gaw; Dunedin, A. Grant; Invercargill, S. F. Whitcombe
Chief Engineer for Working Railways—J. H. Lowe, M. Inst. C. E.
Resident Engineers—Auckland, J. Coom; Wanganui, J. I. Lawson; Wellington—Napier, W. R. Carruthers; Christchurch, James Burnett; Dunedin, T. C. Maltby; Invercargill, C. H. Biss
Locomotive Superintendent—T. F. Rotheram
Locomotive Engineers—Auckland, H. H. Jackson; Wellington and Napier–Taranaki, A. L. Beattie; Hurunui–Bluff, A. V. Macdonald
MINES DEPARTMENT.
Chief Office.
Minister of Mines—Hon. R. J. Seddon
Under-Secretary for Mines—H. J. H. Fliott
Inspecting Engineer—H. A. Gordon
Clerks—T. H. Hamer, T. S. M. Cowie, H. E. Radcliffe
Analyst—W. Skey
Assistant Geologist—Alexander McKay, F.G.S.
Draughtsman—C. H. Pierard
Inspectors of Mines.
Thames and Auckland Districts—G. Wilson; Dunedin and Southland Districts—J. Gow; West Coast Districts, N. D. Cochrane
Managers of Water-races.
Waimea-Kumara—A. Aitken
Mount Ida—R. Murray
Schools of Mines.
Lecturers and Instructors: Thames—James Park; Assistant, F. B. Allen. Reefton—R. M. Aitken
Board of Examiners under “The Coal-mines Act, 1891.”
The Director of the Geological Survey of New Zealand; the Surveyor-General; the Inspecting Engineer of Mines; W. M. Mowatt, Chief Inspector of Machinery, Wellington; James Bishop, of Brunnerton; Thomas Brown, of Denniston; and William Shore, of Kaitangata
Board of Examiners under “The Mining Act, 1891.”
Same official members as above Board, with the following private members:—Thomas Dunlop, of Thames; Patrick Quirk Caples, of Reefton; George Casley, of Reefton
The Director of the Geological Survey of New Zealand is Chairman of both Boards.
Geological Survey, Museum, and Observatories.
Minister in Charge—The Hon. Minister of Mines
Director—Sir J. Hector, K.C.M.G., M.D., F.R.S.
Clerk, Curator, and Meteorological Observer for Wellington—H. B. Gore
Astronomical Observer—T. King
Meteorological Observer, Auckland—T. F. Cheeseman, F.L.S.
Meteorological Observer, Dunedin—H. Skey
New Zealand Institute.
Manager—Sir J. Hector, K.C.M.G.
Hon. Treasurer—W. T. L. Travers, F.L.S.
Secretary—R. B. Gore
DEFENCE DEPARTMENT.
Minister of Defence—Hon. R. J. Seddon
Commandant of the Forces—Colonel F. J. Fox, R.A.
Under - Secretary—Lieut.-Colonel A. Hume (acting)
Clerks—H. S. Royle, T. F. Grey
Harbour Defence.
The Chief Engineer—W. H. Hales
New Zealand Permanent Militia.
Artillery.
Major F. Y. Goring
Major W. B. Messenger
Major Sir A. P. Douglas, Bart.
Captain H. C. Morrison
Captain J. Coleman
Lieutenant J. E. Hume
Inspector of Submarine Mining Establishment.
Captain J. Falconer
Torpedo Corps.
Captain J. Falconer
Captain W. T. Powell
Quartermaster, Permanent Militia.
Captain S. C. Anderson
Honorary Surgeon.
Patrick J. O'Neill O'Carroll
New Zealand Police Force.
Head Office.
Commissioner—Lieutenant-Colonel A. Hume
Clerks—J. M. Goldfinch, John Evans, John Tasker
Police Department.
Inspectors, 1st Class—Thomas Broham, John Bell Thomson, Peter Pender, William Stone Pardy
Inspectors, 2nd Class—John Emerson, James Hickson, Francis McGovern
DEPARTMENT OF LANDS AND SURVEY.
Minister of Lands and Immigration—Hon. J. McKenzie
Secretary for Crown Lands and Surveyor-General—S. Percy Smith
Under-Secretary for Crown Lands and Superintending Surveyor—Alexander Barron
Head Office.
Chief Draughtsman—F. W. Flanagan
Draughtsmen—J. M. Kemp, G. P. Wilson, H. McCardell, T. M. Grant, H. A. R. Farquhar, G. N. Sturtevant, A. L. Haylock, D. Watt
Auditor of Land Revenue—C. O'H. Smith
Chief Clerk—W. S. Short
Chief Accountant—H. J. Knowles
Bookkeeper—P. C. Willson
Clerks—F. T. O'Neill, F. Samuel, J. B. Redward, A. A. S. Dauby, H. M. Gore
Cadet—E. F. Hawthorne
Superintendent of Village-settlements—J. E. March
Overseer of Works, Rotorua Sanatorium—C. Malfroy
Caretaker, Hanmer Springs—J. Rogers
Auckland District.
Chief Surveyor and Commissioner of Crown Lands—G. Müeller
District Surveyors—L. Cussen, J. Baber, jun., G. A. Martin
Chief Draughtsman—W. C. Kensington
Receiver of Land Revenue—T. M. Taylor
Hawke's Bay District.
Chief Surveyor and Commissioner of Crown Lands—T. Humphries
District Surveyors—E. C. Gold-Smith, J. Hay
Chief Draughtsman—F. Simpson
Receiver of Land Revenue—F. Bull
Taranaki District.
Chief Surveyor and Commissioner of Crown Lands—J. Strauchon
District Surveyor—H. M. Skeet
Chief Draughtsman—J. Bird
Receiver of Land Revenue—G. P. Doile
Wellington District.
Assistant Surveyor - General and Commissioner of Crown Lands—J. H. Baker
District Surveyors—L. Smith, W. D. B. Murray, J. D. Climie
Chief Draughtsman—J. McKenzie
Receiver of Land Revenue—W. C. Runcie
Marlborough District.
Chief Surveyor and Commissioner of Crown Lands—S. Weetman
Chief Draughtsman and Receiver of Land Revenue—G. Robinson
Nelson District.
Chief Surveyor and Commissioner of Crown Lands—J. S. Browning
District Surveyors—J. A. Montgomerie, F. S. Smith, J. Snodgrass, R. J. Sadd
Chief Draughtsman—H. Trent
Receiver of Land Revenue—J. T. Catley
Westland District.
Chief Surveyor and Commissioner of Crown Lands—D. Barron
District Surveyor—W. G. Murray
Chief Draughtsman and Receiver of Land Revenue—F. E. Clarke
Canterbury District.
Chief Surveyor and Commissioner of Crown Lands—J. W. A. Marchant
District Surveyor—J. N. Broderick
Chief Draughtsman—C. B. Shanks
Receiver of Land Revenue—J. Williams
Otago District.
Commissioner of Crown Lands—J. P. Maitland
Chief Surveyor—C. W. Adams
District Surveyors—J. Langmuir, E. H. Wilmott
Chief Draughtsman—P. Treseder
Receiver of Land Revenue—G. A. Reade
Southland District.
Chief Surveyor and Commissioner of Crown Lands—G. W. Williams
District Surveyor—John Hay
Chief Draughtsman—J. G. Clare
Receiver of Land Revenue–A. A. MeNab
Land-purchase Branch.
Officer in Charge—P. Sheridan
Land-purchase Officer—G. T. Wilkinson
Members of Waste Lands Boards.
Auckland—G. Müeller, R. Thompson, B. Harris, D. Lundon, L. J. Bagnall
Hawke's Bay—T. Humphries, C. Hall, T. Hyde, R. Harding
Taranaki—J. Strauchon, J. Livingstone, T. Kelly, R. Trimble, C. K. Stock
Wellington—J. H. Baker, W. A. Fitzherbert, A. W. Hogg, T. W. Fisher, F. Pirani
Marlborough—S. Weetman, A. P. Seymour, C. H. Mills, J. Redwood, J. A. Parsons
Nelson—J. S. Browning, J. Kerr, D. Bates, F. Hamilton
Canterbury—J. W. A. Marchant, R. Meredith, D. MeMillan
Otago—J. P. Maitland, A. McKerrow, H. Clark, J. Duncan, W. Dallas
Southland—G. W. Williams, C. Cowan, A. Kinross, J. G. Fraser, J. McIntyre
Westland—D. Barron, J. Bevan, L. Northcroft, A. Matheson
AGRICULTURAL AND LIVESTOCK DEPARTMENT.
Chief Office.
Minister in Charge—Hon. J. McKenzie
Secretary of Agriculture and Chief Inspector of Stock—John D. Ritchie
Chief Clerk—Richard Evatt
Clerk and Acting Biologist—T. W. Kirk
Veterinary Surgeon—
Dairy Instructor—John Sawers
Fruit Expert—
Inspectors of Stock.
Auckland—E. Clifton (in charge), F. Schaw, Auckland; G. S. Cooke, Whangarei; W. A. P. Sutton, Hamilton
Napier—J. Drummond (in charge), H. Oldham, Napier; C. Thomson, Gisborne; D. Munro, Waimata, Herbertville
Wellington-Wairarapa—J. W. Smith, J. Harvey, jun., Masterton
West Coast—Richard Hull (in charge), Wanganui; A. Monro, Hawera; A. K. Blundell, Palmerston North
Nelson—T. G. Richardson (in charge), H. M. Campbell. Nelson
Marlborough—John Moore, Blenheim
Canterbury-Kaikoura—R. F. Holderness (in charge), J. E. Thomson, Christ-church; C. A. Cunningham, Rangiora; W. A. Scaife, Waiau; W. G. Rees, Ashburton
South Canterbury—H. S. Thomson (in charge), Timaru; E. A. Field, Lake Tekapo; C. C. Empson, Kurow
Otago—E. A. Dowden, Dunedin; B. Fullarton, Mosgiel; W. Miller, Oamaru; A. Ironside, Clyde; J. C. Miller, Naseby; R. H. Hassall, Tapanui; H. G. J. Hull, Balclutha; H. T. Turner, Invercargill; J. W. Raymond, Bluff
GOVERNMENT LIFE INSURANCE DEPARTMENT.
Commissioner—J. H. Richardson
Assistant Commissioner—D. M. Luckie, F.S.S.
Actuary—Morris Fox
Secretary—W. B. Hudson
Chief Medical Officer—J. Henry, L.R.C.P., Lond., &c.
Accountant—R. J. S. Todd
Assistant Actuary—G. Leslie
Chief Clerk—G. W. Barltrop
Clerks—R. C. Niven, J. C. Young, G. A. Kennedy, D. J. McG. McKenzie, W. S. Smith, J. W. Kinniburgh, R. V. Blacklock, A. H. Hamerton, G. G. Schwartz, T. L. Barker, C. E. Galwey, R. T. Smith, G. von Schoen, A. R. Kennedy, P. Muter, F. B. Bolt, A. D. Ellis, J. A. Thomson, F. K. Kelling, L. B. Jordan, H. S. Manning, E. J. Gormley, A. de Castro, F. M. Leckie, G. D. Gardner, C. W. Palmer, J. B. Young, W. C. Marchant, R. P. Hood, A. Avery, H. Rose, G. C. Fache, G. A. N. Campbell, S. P. Hawthorne, W. H. Woon
Chief Messenger—W. Archer
Auckland Agency.
District Manager—W. J. Speight
Chief Clerk—J. K. Blenkhorn
Clerk—J. K. Watkis
Napier Agency.
Resident Agent—J. H. Dean
Wanganui Agency.
Resident Agent—J. Fairburn
Wellington Agency.
District Manager—G. Robertson
Clerks—G. Crichton and C. H. Ralph
Nelson Agency.
Resident Agent—J. W. H. Wood
Greymouth Agency.
Resident Agent—Cyrus Webb
Blenheim Agency.
Acting Resident Agent—A. P. Burnes
Christchurch Agency.
District Manager—J. C. Prudhoe
Chief Clerk—H. Todd
Clerk—A. E. Allison
Timaru Agency.
Agency Clerk—S. T. Wicksteed
Dunedin Agency.
District Manager—R. S. McGowan
Clerk—M. J. Heywood
Oamaru Agency.
Resident Agent—O. H. Pinel
Invercargill Agency.
Agency Clerk—J. Findlay
PUBLIC TRUST OFFICE.
Public Trustee—J. K. Warburton
Solicitor—F. J. Wilson
Chief Clerk—A. A. Duncan
Accountant—E. F. Warren
Examiner—T. S. Ronaldson
Clerks—T. T. Stephens, M. Townsend, H. Beyer, T. D. Kendall, W. A. Fordham, F. Hyde, H. Oswin, E. C. McCarthy, P. Fair, J. C. Matheson
Cadets—G. Smyth, A. Purdie, M. E. Harrap, T. H. Andrew, J. Allen
Messenger—A. J. Cross
District Agent, Christchurch—J. J. M. Hamilton
District Agent, Greymouth—F. H. Morice
West Coast Settlement Reserves Agent—Wilfred Rennell
Clerks—H. A. Eversleigh, Alfred Trimble
The Minister of Justice is charged with all matters relating to the Supreme, District, Resident Magistrates', and Wardens' Courts, Native Land Court, Crown Law Office, Coroners' inquests, Patents, designs, and trade-marks, bankruptcy, criminal prosecutions in the higher Courts, Justices of the Peace, Licensing Committees, and prisons. Circuit sittings of the Supreme Court are held at fourteen places, and offices of the Court are maintained at eleven places. There are five District Court Judges, who hold Courts at seventeen towns. At nearly every town in which sittings of the Supreme or District Courts are held there is a Crown Prosecutor, paid by fees, and a Sheriff.
There are twenty-nine salaried Resident Magistrates, who hold Courts at about one hundred and fifty-four places. Twelve of these gentlemen are also Wardens, holding Wardens' Courts in the various goldfields. There are fifty civilian Clerks of Courts, and eighty-two who are also police sergeants or constables.
All the Resident Magistrates hold the office of Coroner, and are paid 10s. 6d. for each inquest, in addition to mileage at 1s. per mile, or actual expenses of locomotion. Besides these, there are thirty-six Coroners, who are paid £1 1s. for each inquest, and mileage.
Bankrupt estates are administered by four Official Assignees, stationed at Auckland, Wellington, Christchurch, and Dunedin; and by twenty Deputy Assignees, resident at as many other towns. The Supreme and District Courts have jurisdiction in bankruptcy proceedings, and the Governor has power to confer similar jurisdiction in small estates on some of the Resident Magistrates' Courts.
The Commission of the Peace contains about seventeen hundred names, and additions are frequently made.
Witnesses in Criminal Courts are paid 6s. per diem, and in addition 4s. for every night they are absent from home. Witnesses in civil cases are paid variously from 6s. to £1 1s. a day, according to their condition in life.
Intestate estates in New Zealand are dealt with by the Public Trust Office, and are referred to in the article on that institution.
The Native Land Court is an institution for the purpose of enabling Maoris to obtain legal titles to their lands. Its constitution and mode of procedure are referred to in the special article on the numbers and present condition of the Maoris. There is one Chief Judge, and eight Judges.
Table of Contents
The defence forces consist of the Permanent Militia (Artillery and Torpedo Corps), and the auxiliary forces of Volunteers (Cavalry, Naval Artillery, Field Artillery, Engineers, and Rifle companies). The whole of these Forces are commanded by an Imperial officer, belonging to the Royal Artillery, who is under the orders of the Defence Minister. There is also an Under-Secretary for Defence, to whom all questions of expenditure are referred; while the Chief Engineer has charge of the defence-works.
The two islands (North and Middle) are divided into eleven districts, commanded by a Field Officer of Militia or Volunteers, with a competent staff of drill-sergeants.
This Force is divided into four batteries, which are stationed at Auckland, Wellington (head-quarters), Lyttelton, and Dunedin; their principal duties are to look after and take charge of all guns, stores, ammunition, and munitions of war at these four centres. The Force consists of three majors, two captains, one subaltern, with an establishment of 145 of all ranks.
This branch, like the Artillery, is divided amongst the four centres, for submarine and torpedo work, and consists of two captains, with a total of 64 of all ranks. They have charge of four torpedo-boats and four steam-launches, and all submarine-mining and torpedo-stores. They are likewise employed in blowing up rocks and wrecks, and generally improving harbours.
There are five troops of Cavalry, three in the North Island and two in the Middle Island. These corps are kept in a state of efficiency by going into camp for six days' training annually. The total strength of the five troops is 310 of all ranks.
There are ten corps of Mounted Rifles, seven in the North Island and three in the Middle Island, with a total strength of 529 of all ranks. The efficiency of these corps is, like the Cavalry, maintained by their going into camp for an annual training of six days.
There are seventeen batteries of this branch of the service, seven in the North Island and ten in the Middle Island, having a total strength of 1,089 of all ranks. These corps are divided into port and starboard watches, and one watch is trained to assist the Permanent Artillery in working the heavy ordnance, while the other watch is trained in submarine and torpedo work, as auxiliaries to the Torpedo Corps. These corps have cutters and other boats provided and kept up for them, and are instructed in rowing, knotting, splicing, signalling, and such-like duties.
There are eleven batteries of Field Artillery, three in the North Island and eight in the Middle Island, with a total of 580 of all ranks. They are armed with 6-, 9-, and 12-pounder Armstrong breech-loading rifled guns on field-carriages.
This branch consists of three corps, with a total of 169 of all ranks. There is one corps in the North Island and two corps in the Middle Island. Besides carrying rifles they are provided with entrenching tools and all appliances for blowing up bridges or laying land-mines.
In this branch of the service there are fifty-seven corps, eighteen being in the North Island, and thirty-nine in the Middle Island, with a total strength of 3,144 of all ranks, which includes garrison bands at places where four or more corps have their head-quarters.
There is a force of thirty-nine cadet corps—viz., eight in the North Island and thirty-one in the Middle Island, with a total strength of 2,012 of all ranks.
The armament at the forts of the four centres consists of 8in. 13-ton breech-loading rifled Elswick Ordnance Company's guns, with 6in. 5-ton of like pattern, and the whole mounted on hydropneumatic disappearing carriages; 7in. 7-ton muzzle-loading rifled guns, on traversing slides; 64-pounder rifled muzzle-loading converted 71cwt. guns, on garrison standing carriages and traversing slides; 64-pouuder rifled muzzle-loading 64cwt. guns on traversing slides; 6-pounder quick-firing Nordenfeldts, on garrison pillar mountings, and field-carriages; and Hotchkiss and Maxim quick-firing guns. The Volunteer Field Artillery are armed with 6-, 9-, and 12-pounder Armstrong breech-loading rifled guns, and the whole of the Force have carbines or rifles (short) of Snider pattern.
There is a large stock of Whitehead torpedoes, contact- and ground-mines, in charge of the Torpedo Corps, as well as four Thorneycroft torpedo-boats.
The Permanent Militia are enrolled for three years' service, and Volunteers for one year. The Permanent Militia is recruited from men who have one year's efficient service in the Volunteers; and after passing the gunnery course in the Permanent Militia men are eligible for transfer to police and prison service.
The Instructors for Permanent Artillery and Torpedo Corps are obtained from the School of Gunnery at Shoeburyness, and from the Royal Engineers, under a three years' engagement, on completion of which they return to the Royal Artillery or the Royal Engineers.
An annual capitation of £2 is granted to each efficient Volunteer, and a sum not exceeding £20 to each efficient cadet corps. One hundred rounds of Snider ball-cartridge are issued each year free to every efficient Volunteer, and twenty-five rounds to each efficient cadet over thirteen years of age.
| Year. | Military Expenditure. | Harbour Defences. | Total. |
|---|---|---|---|
| £ | £ | £ | |
| 1884–85 | 90,816 | 9,601 | 100,417 |
| 1885–86 | 91,242 | 127,167 | 218,409 |
| 1886-87 | 89,927 | 139,429 | 229,35C |
| 1887–88 | 122,061 | 73,458 | 195,519 |
| 1888–89 | 53,591 | 50,089 | 103,680 |
| 1889–90 | 63,614 | 15,752 | 79,366 |
| 1890–91 | 80,891 | 10,798 | 91,689 |
| 1891–92 | 75,343 | 7,644 | 82,987 |
| 1892–93 | 59,808 | 11,205 | 71,013 |
Table of Contents
[By an Act passed in 1871 the pension system was abolished in New Zealand.]
| Name. | Date from which Pension commenced. | Amount. | ||
|---|---|---|---|---|
|
*Per diem. (a) 1s. 6d. from 25th October, 1869; increased to 2s. 2d., 7th December, 1870. (b) 1s. from 17th December, 1868, to 17th December, 1869; 1s. 6d. from 17th December, 1869, to 17th December, 1870; 8d. from 17th December, 1870, to 30th September, 1874; increased to 1s. 6d., 1st October, 1874. (c) 2s. from 5th June, 1867, to 5th June, 1868; 2s. from 5th June, 1868, to 5th June, 1869; permanent from 9th November, 1869. (d) 2s. for two years, from 9th April, 1870; renewed for twelve months; again renewed for twelve months; permanent from 1st May, 1874. (e) 2s. from 1st January, 1869, for eighteen months; permanent from 18th May, 1872. (f) 1s. 6d. for twelve months, from 26th April, 1869; renewed for twelve months, 1870; renewed for twelve months, 1871; permanent from 12th May, 1872. (g) 2nd October, 1869; ceased on 9th April, 1870; renewed, 22nd April, 1874. (h) 1s. 6d. from—, 1867; increased to 2s. from 14th February, 1868. (i) 1s. 6d. for twelve months, from 15th March, 1869; 1s. for twelve months, from March, 1870; 1s. for twelve months, from March, 1871; permanent from 1st April, 1872. (k) 3s. for twelve months, from 9th April, 1870; 2s. 8d., permanent, from 1st May, 1871. (l) 1s. 6d. for twelve months, from 18th October, 1869; 1s. 6d. for twelve months, from October, 1870; permanent from 5th November, 1871. (m) 1s. 6d. for eight months, from 20th September, 1869; 2s. 2d. for twelve months, from 11th June, 1870; 2s. 2d. for twelve months, from 11th June, 1871; 2s. 2d. from 11th June, 1872; permanent from 12th June, 1873. (n) 1s. from 10th May, 1865; renewed for twelve months, April, 1866; again renewed for twelve months; 8d. for twelve months, from 1868, to 10th May, 1869; 6d. for twelve months, from May, 1869; permanent from 11th May, 1870. | ||||
| Under “The Civil Service Act, 1866.” | ||||
| £ | s. | d. | ||
| Allan, A. S. | 1 Sept., 1888 | 195 | 5 | 0 |
| Arrow, H. | 1 Aug., 1881 | 26 | 0 | 0 |
| Aubrey, H. R. | 1 Nov., 1880 | 223 | 0 | 0 |
| Austin, A. D. | 1 Oct., 1887 | 247 | 10 | 0 |
| Baddeley, H. C. | 12 Jan., 1888 | 225 | 0 | 0 |
| Bailey, B. | 16 May, 1887 | 198 | 13 | 9 |
| Bailie, F. | 1 Feb., 1893 | 77 | 8 | 8 |
| Baker, E. | 1 Nov., 1880 | 214 | 17 | 1 |
| Barnard, W. H. | 1 June, 1880 | 101 | 18 | 1 |
| Barr, A. | 1 Oct., 1888 | 366 | 13 | 4 |
| Batkin, C. T. | 1 April, 1890 | 533 | 6 | 0 |
| Bicknell, F. | 1 Feb., 1882 | 96 | 13 | 4 |
| Blomfield, J. | 21 Mar, 1889 | 101 | 15 | 0 |
| Buchanan, J. | 1 July, 1886 | 127 | 13 | 6 |
| Brewer, H. N. | 1 Jan., 1876 | 124 | 7 | 6 |
| Brown, S. P. | 28 Mar., 1872 | 80 | 0 | 0 |
| Brown, W. R. E. | 1 Aug., 1892 | 265 | 16 | 8 |
| Bull, E. | 1 July, 1887 | 105 | 14 | 3 |
| Burn, J. F. | 1 July, 1887 | 51 | 0 | 0 |
| Burgess, A. | 1 June, 1886 | 116 | 13 | 4 |
| Campbell, F. E. | 1 Mar., 1890 | 466 | 13 | 0 |
| Carrington, O. | 1 Feb., 1878 | 300 | 0 | 0 |
| Chapman, R. | 1 Jan., 1868 | 255 | 19 | 0 |
| Cheeseman, W. F. | 1 April, 1890 | 154 | 15 | 1 |
| Clarke, H. T. | 1 Jan., 1879 | 400 | 0 | 0 |
| Clarke, H. | 1 Oct., 1879 | 98 | 13 | 0 |
| Corbett, W. | 2 Jan., 1870 | 273 | 4 | 0 |
| Cooper, G. S. | 1 Aug., 1892 | 533 | 6 | 8 |
| Costall, J. | 10 July, 1892 | 131 | 3 | 10 |
| Creeke, W. | 1 April, 1891 | 52 | 15 | 8 |
| Crowe, A. | 31 Dec., 1885 | 68 | 12 | 3 |
| Culpan, W. | 1 Dec., 1868 | 62 | 10 | 0 |
| Cunningham, J. | 1 Feb., 1888 | 175 | 0 | 0 |
| Cunningham, J. | 1 Mar., 1880 | 65 | 11 | 11 |
| Curry, H. | 1 Jan., 1878 | 65 | 0 | 0 |
| Daniell, H. C. | 1 Jan., 1878 | 266 | 13 | 4 |
| Dickey, A. J. | 1 Nov., 1875 | 122 | 0 | 5 |
| Earle, J. | 13 Nov. 1888 | 104 | 10 | 0 |
| Eliott, G. E. | 30 Nov., 1872 | 400 | 0 | 0 |
| Ensor, J. | 1 Feb., 1893 | 51 | 6 | 8 |
| Falck, F. | 1 Mar., 1893 | 125 | 13 | 4 |
| Fenton, F. D. | 3 Nov., 1881 | 630 | 19 | 0 |
| Frazer, D. | 1 Sep., 1890 | 100 | 0 | 0 |
| Gill, R. J. | 1 Sep., 1886 | 228 | 11 | 5 |
| Gisborne, W. | 1 Oct., 1876 | 466 | 13 | 4 |
| Goring, F. | 1 April, 1890 | 150 | 0 | 0 |
| Graham, G. H. | 8 Sep., 1891 | 52 | 10 | 0 |
| Gregory, J. | 16 Feb., 1881 | 53 | 6 | 8 |
| Greenway, J.H. | 1 Nov., 1891 | 116 | 16 | 0 |
| Halliday, C. | 31 Aug., 1886 | 96 | 13 | 4 |
| Hamilton, M. | 11 July, 1880 | 200 | 0 | 0 |
| Harsnnt, W. | 11 June, 1878 | 151 | 13 | 4 |
| Hart, J. T. | 12 Nov., 1890 | 193 | 7 | 0 |
| Hartwright, H. | 1 Jan., 1886 | 152 | 7 | 8 |
| Hill, E. | 13 Sep., 1871 | 100 | 0 | 0 |
| Hill, F. J. | 1 Aug., 1892 | 95 | 0 | 0 |
| Hill, T. | 1 May, 1892 | 400 | 0 | 0 |
| Holden, T. | 13 Oct., 1878 | 31 | 5 | 0 |
| Jackman, S. J. | 1 May, 1892 | 149 | 6 | 8 |
| Johnston, D. | 15 Dec., 1880 | 366 | 13 | 4 |
| Judd, A. | 1 April, 1887 | 173 | 6 | 8 |
| Keetley, E. | 1 July, 1884 | 18 | 12 | 10 |
| Kelly, J. D. | 1 July, 1891 | 130 | 19 | 0 |
| Laing, E. B. | 1 April, 1887 | 112 | 10 | 0 |
| La Nauze, R. J. | 5 July, 1892 | 146 | 8 | 7 |
| Lawlor, H. C. | 1 June, 1868 | 130 | 18 | 0 |
| Lincoln, R. S. | 1 Mar., 1889 | 68 | 17 | 0 |
| Lockwood, W. H. | 1 Jan., 1880 | 22 | 18 | 4 |
| Lodge, W. F. | 1 Oct., 1881 | 185 | 0 | 0 |
| Lundon, D. | 1 May, 1892 | 210 | 0 | 0 |
| Lusher, R. A. | 31 Aug., 1880 | 76 | 16 | 8 |
| Mathews, J. | 1 July, 1866 | 81 | 13 | 4 |
| Meech, W. | 1 Jan., 1882 | 64 | 16 | 7 |
| Meikle, A. M. | 1 May, 1887 | 145 | 14 | 3 |
| Mills, W. | 23 Sept., 1875 | 385 | 14 | 4 |
| Mitford, G. M. | 1 Feb., 1869 | 196 | 15 | 0 |
| Monson, J. R. | 1 Oct., 1882 | 271 | 16 | 0 |
| Monro, H. A. H. | 1 Nov., 1880 | 342 | 17 | 2 |
| Morrow, H. | 1 June, 1890 | 120 | 16 | 8 |
| McArthur, J. | 1 Jan., 1876 | 65 | 0 | 0 |
| McCarthy, S. | 1 Mar., 1878 | 55 | 16 | 8 |
| McCulloch, H. | 1 Aug., 1890 | 233 | 0 | 0 |
| McDonnell, R. T. | 23 July, 1890 | 150 | 0 | 0 |
| McKellar, H. S. | 1 Aug., 1892 | 433 | 6 | 8 |
| O'Connor, R. | 1 Sept., 1892 | 147 | 0 | 6 |
| Ollivier, J. | 1 July, 1888 | 250 | 0 | 0 |
| Parker, T. W. | 1 June, 1881 | 242 | 3 | 9 |
| Parris, R. | 1 Jan., 1877 | 314 | 5 | 8 |
| Pauling, G. W. | 1 Feb., 1887 | 91 | 1 | 5 |
| Pearson, W. H. | 30 Sept., 1884 | 340 | 9 | 6 |
| Pickett, R. | 1 Aug., 1866 | 209 | 10 | 6 |
| Pinwell, A. | 1 July, 1891 | 120 | 17 | 0 |
| Pitt, H. | 1 May, 1881 | 100 | 0 | 0 |
| Plimpton, E. E. E. | 4 Dec., 1883 | 110 | 14 | 3 |
| Pollen, D. | 30 Oct., 1876 | 418 | 15 | 0 |
| Rich, E. F. | 1 June, 1892 | 217 | 0 | 0 |
| Robertson, J. | 6 Oct., 1892 | 155 | 0 | 0 |
| Rodgerson, W. J. | 1 July, 1892 | 248 | 6 | 8 |
| Rogan, J. | 1 Jan., 1878 | 466 | 13 | 4 |
| Rough, D. | 1 May, 1868 | 277 | 1 | 8 |
| Sealy, H. B. | 1 Nov., 1876 | 285 | 14 | 3 |
| Searancke, W. N. | 1 Feb., 1879 | 240 | 0 | 0 |
| Sheath, A. B. | 31 Mar., 1880 | 129 | 9 | 0 |
| Shrimpton, J. | 16 July, 1889 | 146 | 14 | 0 |
| Sinclair, W. | 1 June, 1878 | 195 | 0 | 0 |
| Smith, J. E. | 1 July, 1877 | 484 | 11 | 6 |
| Smith, T. H. | 1 July, 1876 | 371 | 8 | 7 |
| Snoswell, T. | 5 Dec., 1891 | 83 | 14 | 0 |
| Snow, C. H. | 1 Dec., 1887 | 157 | 10 | 0 |
| Stevens, F. | 1 Dec., 1892 | 183 | 0 | 0 |
| Stewart, J. T. | 1 May, 1889 | 300 | 0 | 0 |
| Thomas, W. E. | 1 July, 1887 | 145 | 16 | 8 |
| Thomas, G. W. | 1 Nov., 1875 | 38 | 15 | 0 |
| Tidmarsh, W. | 1 Aug., 1867 | 69 | 7 | 3 |
| Tizard, E. F. | 1 July, 1888 | 180 | 19 | 0 |
| Tucker, W. | 31 Dec., 1880 | 104 | 13 | 4 |
| Veal, J. | 1 Sept., 1885 | 49 | 15 | 3 |
| Veale, J. S. | 1 Sept., 1887 | 56 | 2 | 10 |
| Warde, C. M. | 1 July, 1889 | 186 | 13 | 0 |
| Wardell, H. S. | 1 July, 1888 | 366 | 13 | 0 |
| Watson, R. | 1 Oct., 1892 | 145 | 0 | 0 |
| White, W. | 1 July, 1881 | 36 | 5 | 0 |
| White, W. B. | 1 July, 1873 | 375 | 4 | 9 |
| Wilkin, J. T. W. | 1 Feb., 1874 | 127 | 19 | 4 |
| Willcocks, E. S. | 1 Nov., 1880 | 250 | 0 | 0 |
| Williams, E. M. | 1 April, 1880 | 135 | 0 | 0 |
| Wilson, W. W. | 1 Feb., 1881 | 100 | 14 | 3 |
| Woon, J. G. | 1 July, 1892 | 209 | 10 | 6 |
| Wrigg, H. C. W. | 1 Aug., 1889 | 157 | 2 | 10 |
| Young, W. | 1 Jan., 1866 | 350 | 0 | 0 |
| Under “The Hamerton Pension Act, 1891.” | ||||
| Hamerton, R. C. | 11 Sept., 1891 | 250 | 0 | 0 |
| Under “The Meredith and Others Pensions Act, 1870.” | ||||
| Collins, Mary | 13 Nov., 1869 | 65 | 0 | 0 |
| Hamlin, Rhoda B. | 1865 | 50 | 0 | 0 |
| Under “The Military Pensions Act, 1866.” | ||||
| Arapera to Reo | 1 July, 1870 | 20 | 0 | 0 |
| Brown, M. R. | .. | 75 | 0 | 0 |
| Buck, Cath. M. | .. | 70 | 0 | 0 |
| Hastings, L. | .. | 55 | 0 | 0 |
| Iritona, Hanita | 8 Nov., 1868 | 12 | 0 | 0 |
| Marara, Ngakoa | 3 Dec., 1860 | 36 | 0 | 0 |
| McDonald, E. | .. | 36 | 0 | 0 |
| Mere Karaka Kopu | 1 Oct., 1874 | 36 | 0 | 0 |
| Morrison Ann | 26 Oct., 1866 | 36 | 0 | 0 |
| Russell, C. | .. | 36 | 0 | 0 |
| Von Tempsky, A. | 3 Oct., 1868 | 120 | 0 | 0 |
| Adamson, T. | (a) | 0 | 2 | 2* |
| Beamish, J. G. | (b) | 0 | 1 | 6* |
| Coffey, M. F. | .. | 25 | 0 | 0 |
| Corbett, George | (c) | 0 | 2 | 2* |
| Crawford, C. F. | .. | 0 | 2 | 0* |
| Crosby, H. | (d) | 0 | 2 | 0* |
| Dore, G. H. | (e) | 0 | 2 | 0* |
| Gibbons, M. C. | 12 Oct., 1869 | 0 | 2 | 2* |
| Hamblyn, J. | 1 Oct., 1872 | 0 | 2 | 2* |
| Hope, E. L. | (f) | 0 | 1 | 6* |
| Kelly, T. | 9 April, 1870 | 0 | 2 | 2* |
| Kershaw, P. | 9 Aug., 1869 | 0 | 1 | 6* |
| Lacey, Garrett | .. | 0 | 2 | 2* |
| Lake, T. | .. | 0 | 2 | 6* |
| Lloyd, T. | (g) | 0 | 2 | 0* |
| McDonnell, W | .. | 150 | 0 | 0 |
| McKay, G. | .. | 0 | 1 | 0* |
| McMahon, T. | (h) | 0 | 2 | 0* |
| Monck, J. B. | 1 April, '72(i) | 0 | 1 | 0* |
| Percy, J. A. | .. | 150 | 0 | 0 |
| Ross, Edward O. | 17 Nov., 1866 | 75 | 0 | 0 |
| Shanaghan, J. | .. | 0 | 1 | 6* |
| Shepherd, R. | (k) | 0 | 2 | 8* |
| Timms, W. | (l) | 0 | 1 | 6* |
| Tuffin, G. | .. | 0 | 2 | 2* |
| Vance, R. | 8 April, 1870 | 0 | 2 | 2* |
| Walsh, W. | 15 Nov., 1860 | 0 | 1 | 6* |
| Wasley, Edw. O. | (m) | 0 | 2 | 2* |
| Williamson, F. | 1 June, 1869 | 0 | 2 | 0* |
| Anaru Patapu | 14 May, 1865 | 0 | 0 | 9* |
| Anaru Taruke | 1 Jan., 1867 | 0 | 0 | 6* |
| Apera te Keunga | 14 May, 1864 | 0 | 2 | 6* |
| Honi Parake | 1 Jan., 1867 | 0 | 0 | 6* |
| Karena Ruatani-wha | 1 July, 1870 | 0 | 1 | 0* |
| Matiu Whitiki | 1 April, 1885 | 0 | 0 | 6* |
| Mauparoa | 1 July, 1867 | 0 | 1 | 0* |
| Mehaka Kepa | 2 Aug., 1865 | 0 | 0 | 9* |
| Pera Taitanui | 12 Oct., 1869 | 0 | 1 | 0* |
| Ruihana | 10 April, 1869 | 0 | 0 | 6* |
| Hemi Tonganui | 9 Nov., 1868 | 0 | 1 | 0* |
| Raniera Ngoto | 1 Oct., 1884 | 0 | 0 | 6* |
| Under “The Walsh and Other Pensions Act, 1869.” | ||||
| Hewett, Ellen A. | 10 Feb., 1865 | 50 | 0 | 0 |
| Under “The Militia Act Amendment Act, 1862.” | ||||
| Bending, W. | .. | 0 | 2 | 0* |
| Bilton, F. | .. | 0 | 2 | 0* |
| Callaghan, D. | .. | 0 | 2 | 2* |
| Cody, W. | .. | 0 | 1 | 0* |
| Dunn, A. J. N. | .. | 0 | 2 | 0* |
| Hereford, A. | .. | 130 | 0 | 0 |
| King, E. M. | .. | 80 | 0 | 0 |
| Leaf, R. | (n) | 0 | 0 | 6* |
| Oxenham, W. | .. | 0 | 1 | 6* |
| Sarten, Lucy | 1864 | 0 | 2 | 0* |
| Skinner, W. H. | .. | 0 | 2 | 6* |
| Vickery, W. | .. | 0 | 2 | 0* |
| Woolf, T. | .. | 0 | 2 | 0* |
| Under “The Schafer, McGuire, and Others Pensions Act, 1872.” | ||||
| M'Guire, E. | 29 Sept., 1871 | 0 | 1 | 0* |
| Russell, W. | 1 July, 1871 | 0 | 1 | 0* |
| Schafer, C. | 1 July, 1871 | 30 | 0 | 0 |
| Under “The Supreme Court Judges Act, 1874.” | ||||
| Gresson, H. B. | 1 April, 1875 | 750 | 0 | 0 |
There are (June, 1893) 174 publications on the register of newspapers for New Zealand. Of these 52 are daily papers, 15 triweekly, 26 bi-weekly, 59 weekly, and 22 monthly.
The names of the newspapers, with the postal districts and towns in which they are printed, are given in the following list, the second column showing the day or period of publication. M. signifies morning paper; E., evening paper:—
| Auckland. | |
| Aratapu— | |
| Wairoa Bell (E.) | Friday. |
| Auckland— | |
| Auckland Evening Star (E.) | Daily. |
| Auckland Weekly News and Town and Country Journal (M.) | Saturday. |
| Bible Standard (M.) | Monthly. |
| Church Gazette (M.) | Monthly. |
| Helping Hand | Monthly. |
| New Zealand A B C Guide | Monthly. |
| New Zealand Craftsman (M.) | Monthly. |
| New Zealand Farmer, Bee and Poultry Journal (M.) | Monthly. |
| New Zealand Graphic, Ladies' Journal, and Youths' Companion | Wednesday. |
| New Zealand Herald (M.) | Daily. |
| Observer (M.) | Saturday. |
| Produce Circular and Monthly Report (M.) | Monthly. |
| Sharland's Trade Journal | Monthly. |
| Sporting Review | Saturday. |
| Coromandel— | |
| Coromandel News and Peninsula Gazette (E.) | Tuesday, Friday. |
| Dargaville— | |
| Northern Advertiser (E.) | Friday. |
| Hamilton— | |
| Waikato Times and Thames Valley Gazette (M.) | Mon., Wed., Sat. |
| Kawakawa— | |
| Northern Luminary (M) | Saturday. |
| Onehunga— | |
| Manukau Gazette and Onehunga District Weekly Courier (M.) | Saturday. |
| Rotorua— | |
| Hot Lakes Chronicle (E.) | Friday. |
| Wangarei— | |
| Northern Advocate (E.) | Friday. |
| Thames. | |
| Opotiki— | |
| Korimako Hou | Monthly. |
| Opotiki Herald, Whakatane County and East Coast Gazette (E.) | Tuesday, Friday. |
| Paeroa— | |
| Hauraki Tribune and Thames Valley Advertiser (M.) | Tuesday, Friday. |
| Ohinemuri Gazette (M.) | Saturday. |
| Tauranga— | |
| Bay of Plenty Times and Thames Valley Warden (E.) | Mon., Wed., Fri. |
| To Aroha— | |
| Te Aroha and Ohinemuri News and Upper Thames Advocate (M.) | Wed., Saturday. |
| Thames— | |
| Evening Star (E.) | Daily. |
| Thames Advertiser and Miners' News (M.) | Daily. |
| Gisborne. | |
| Gisborne— | |
| Poverty Bay Herald (E.) | Daily. |
| New Plymouth. | |
| Inglewood— | |
| Inglewood Record and Waitara News (M.) | Wed., Saturday. |
| New Plymouth— | |
| Budget and Taranaki Weekly Herald (M.) | Saturday. |
| Daily News (M.) | Daily. |
| Taranaki Herald (E.) | Daily. |
| Taranaki News (M.) | Saturday. |
| Stratford— | |
| Egmont Settler (E.) | Mon., Wed., Fri. |
| Napier. | |
| Danevirke— | |
| Bush Advocate (E.) | Tues., Thur., Sat. |
| Napier— | |
| Daily Telegraph (E.) | Daily. |
| Evening News and Hawke's Bay Advertiser (E.) | Daily. |
| Hawke's Bay Herald (M.) | Daily. |
| Hawke's Bay Weekly Courier (M.) | Friday. |
| New Zealand Fire and Ambulance Record | Monthly. |
| Waipawa— | |
| Waipawa Mail (E.) | Tues., Thur., Sat. |
| Wairoa— | |
| Wairoa Guardian and County Advocate (M.) | Wed., Saturday. |
| Wanganui. | |
| Hawera— | |
| Egmont Star (M.) | Saturday. |
| Hawera and Normanby Star, Patea County Chronicle, and Waimate Plains Gazette (E.) | Daily. |
| Hunterville— | |
| Paraekaretu Express, Hunterville, Ohingaiti, Moawhango, and Rata Advertiser (E.) | Tuesday, Friday. |
| Manaia— | |
| Waimate Witness (E.) | Wed., Saturday. |
| Marton— | |
| Mercury (E.) | Daily |
| Rangitikei Advocate and Manawatu Argus (E). | Daily |
| Patea— | |
| Patea County Press (E.) | Mon., Thursday. |
| Wanganui— | |
| Stage (E.) | Wednesday. |
| Wanganui Chronicle and Patea-Rangitikei Advertiser (M.) | Daily. |
| Wanganui Herald (E.) | Daily. |
| Weekly Chronicle and Patea-Rangitikei Record (M.) | Saturday. |
| Yeoman (M.) | Friday. |
| Wellington. | |
| Carterton— | |
| Wairarapa Observer, Featherston Chronicle, East Coast Advertiser, and South County Gazette (E.) | Tues., Thur., Sat. |
| Feilding— | |
| Feilding Star (E.) | Tues., Thur., Sat. |
| Foxton— | |
| Manawatu Herald (E.) | Tues., Wed., Sat. |
| Greytown— | |
| Wairarapa Standard (E.) | Mon., Wed., Fri. |
| Masterton— | |
| Eketahuna and Pahiatua Mail (M.) | Daily. |
| Wairarapa Daily Times (E.) | Daily. |
| Wairarapa Star (E.) | Daily. |
| Wairarapa Weekly Times (E.) | Thursday. |
| Weekly Star and Wellington District Advertiser (M.) | Thursday. |
| Otaki— | |
| West Coast Mail and Horowhenua County Advertiser (M.) | Tuesday, Friday. |
| Pahiatua— | |
| Pahiatua Star and Eketahuna Advertiser (E.) | Mon., Wed., Fri. |
| Palmerston North— | |
| Manawatu Daily Standard, Rangitikei Advertiser, and West Coast Gazette (M.) | Daily. |
| Manawatu Daily Times (E.) | Daily. |
| Petone— | |
| Hutt and Petone Chronicle (M.) | Wednesday. |
| Wellington— | |
| Catholic Times (M.) | Friday. |
| Church Chronicle (M.) | Weekly. |
| Evening Post (E.) | Daily. |
| Evening Press (E.) | Daily. |
| New Zealand Central Trade Report | Monthly. |
| Now Zealand Mail, Town and Country Advertiser (M.) | Friday. |
| New Zealand Times (M.) | Daily. |
| Register and Property Investors' Guide | Monthly. |
| Typo | Monthly. |
| Weekly Herald (M.) | Weekly. |
| Wellington Price Current and New Zealand Trade Review (M.) | Monthly. |
| Woodville— | |
| Examiner (E.) | Mon., Wed., Fri. |
| Blenheim. | |
| Blenheim— | |
| Evening Star (E.) | Saturday. |
| Marlborough Daily Times and Town and Country Advertiser (M.) | Daily. |
| Marlborough Express (E.) | Daily. |
| Marlborough Weekly News (M.) | Friday. |
| Havelock— | |
| Pelorus Guardian and Miners' Advocate (M.) | Tuesday, Friday. |
| Kaikoura— | |
| Kaikoura Star and North Canterbury and South Marlborough News (E.) | Tuesday, Friday. |
| Picton— | |
| Marlborough Press, County of Sounds Gazette (M. Tues., E. Thurs.) | Tues., Thursday |
| Nelson. | |
| Collingwood— | |
| Golden Bay Argus (M.) | Friday. |
| Nelson— | |
| Colonist (M.) | Daily. |
| Nelson Evening Mail (E.) | Daily. |
| Takaka— | |
| Takaka News and Collingwood Advertiser (E.) | Thursday. |
| Westport. | |
| Charleston— | |
| Charleston Herald, Brighton Times, and Croninville Reporter (M.) | Wed. Saturday. |
| Lyell— | |
| Lyell Times and Central Buller Gazette (M.) | Saturday. |
| Westport— | |
| Buller Miner (M.) | Friday. |
| Westport News (M.) | Daily. |
| Westport Times and Evening Star (E.) | Daily. |
| Greymouth. | |
| Brunnerton— | |
| Brunnerton News, Blackball Courier, and Grey Valley Advertiser (E.) | Daily. |
| Greymouth— | |
| Evening Star and Brunnerton Advocate (E.) | Daily. |
| Grey River Argus (M.) | Daily. |
| Weekly Argus (M.) | Weekly. |
| Reefton— | |
| Inangahua Herald and New Zealand Miner (M.) | Tu., Thur., Sat. |
| Inangahua Times (M.) | Daily. |
| Reefton Guardian (E.) | Daily. |
| Hokitika. | |
| Hokitika— | |
| Hokitika Guardian and Evening Star (E.) | Daily. |
| Leader (M.) | Thursday. |
| West Coast Times (M.) | Daily. |
| Kumara— | |
| Kumara Times and Dillman's and Goldsborough Advertiser (E.) | Daily. |
| Ross— | |
| Ross and Okarito Advocate and Westland Advertiser (M.) | Wed., Saturday. |
| Christchurch. | |
| Akaroa— | |
| Akaroa Mail and Banks Peninsula Advertiser (M.) | Tuesday, Friday. |
| Ashburton— | |
| Ashburton Guardian (E.) | Daily. |
| Ashburton Mail, Rakaia, Mount Somers and Alford Forest Advertiser (M.) | Tu., Thur., Sat. |
| Christchurch— | |
| Canterbury Times (M.) | Friday. |
| Lyttelton Times (M.) | Daily. |
| Mercantile and Bankruptcy Gazette of New Zealand (E.) | Friday. |
| New Zealand Baptist | Monthly. |
| New Zealand Church News (M.) | Monthly. |
| New Zealand Methodist | Saturday. |
| New Zealand Railway Review | Monthly. |
| New Zealand Schoolmaster (E.) | Monthly. |
| New Zealand Volunteer and Civil Service Gazette and Naval and Military Chronicle (M.) | Monthly. |
| Now Zealand War Cry and Official Gazette of the Salvation Army (M.) | Tuesday. |
| Press (M.) | Daily. |
| Prohibitionist | Saturday. |
| Star (E.) | Daily. |
| Telegraph (E.) | Daily. |
| Truth (E.) | Daily. |
| Weekly Press (M.) | Friday. |
| Young Soldier | Saturday. |
| Oxford (East)— | |
| Oxford and Cust Observer (M.) | Saturday. |
| Rangiora— | |
| Standard and North Canterbury Guardian (M.) | Wed., Saturday. |
| Southbridge— | |
| Ellesmere Guardian | Wed., Saturday. |
| Timaru. | |
| Temuka— | |
| Geraldine Guardian (M.) | Tues., Thur., Sat. |
| Temuka Leader (M.) | Tues., Thur., Sat. |
| Timaru— | |
| South Canterbury Times (E.) | Daily. |
| Timaru Herald (M.) | Daily. |
| Waimate— | |
| Waimate Times (M.) | Wed., Saturday. |
| Oamaru. | |
| Oamaru— | |
| North Otago Times (M.) | Daily. |
| Oamaru Mail (E.) | Daily. |
| Dunedin. | |
| Balclutha— | |
| Clutha Leader (M.) | Friday. |
| Free Press (M.) | Friday. |
| Clinton— | |
| Clutha County Gazette and Popotunoa Chronicle and Clinton Advertiser (M.) | Friday. |
| Clyde— | |
| Dunstan Times, Vincent County Gazette, and General Goldfields Advertiser (M.) | Friday. |
| Cromwell— | |
| Cromwell Argus and Northern Goldfields Gazette (M.) | Tuesday. |
| Dunedin— | |
| Evening Star (E.) | Daily. |
| Farmers' Circular (M.) | Thursday. |
| Globe (E.) | Daily. |
| Katipo | Monthly. |
| New Zealand Insurance, Finance and Mining Journal (M.) | Monthly. |
| New Zealand Presbyterian (M.) | Monthly. |
| New Zealand Public Opinion and Saturday Advertiser (M.) | Saturday. |
| New Zealand Tablet (M.) | Friday. |
| Otago Daily Times (M.) | Daily. |
| Otago Witness (M.) | Saturday. |
| Otago Workman, Dunedin and Suburban Advertiser (M.) | Saturday. |
| Lawrence— | |
| Tuapeka Times (M.) | Wed., Saturday. |
| Milton— | |
| Bruce Herald (M.) | Tuesday, Friday. |
| Mosgiel— | |
| Taieri Advocate (M.) | Wed., Saturday. |
| Naseby— | |
| Mount Ida Chronicle (Thurs. E. and Sat. M.) | Thur., Saturday. |
| Palmerston— | |
| Palmerston aud Waikouaiti Times (M.) | Friday. |
| Roxburgh— | |
| Monnt Benger Mail (M.) | Saturday. |
| Tapanui— | |
| Tapanui Courier and Central Districts Gazette (M.) | Wednesday. |
| Invercargill. | |
| Arrow River— | |
| Lake County Press (E.) | Thursday. |
| Gore— | |
| Mataura Ensign (M.) | Tuesday, Friday. |
| Southern Standard (M.) | Tuesday, Friday. |
| Invercargill— | |
| Southern Cross | Saturday. |
| Southlander (M.) | Friday. |
| Southland Daily News (E.) | Daily. |
| Southland Times (M.) | Daily. |
| Weekly Times (M.) | Friday. |
| Queenstown— | |
| Lake Wakatipu Mail (E.) | Friday. |
| Riverton— | |
| Western Star and Wallace County Gazette (M.) | Wed., Saturday. |
The foregoing towns are arranged, for the convenience of the postal authorities, according to the postal district in which they are situated.
Taking the provincial districts, Auckland has 31 publications registered as newspapers, Taranaki 10, Hawke's Bay 9, Wellington 33, Marlborough 7, Nelson 15, Westland 6, Canterbury 28, and Otago 35.
Table of Contents
[The progress of the colony from the beginning is shown in the statistical broadsheets which follow the General Index.]
The estimated population of New Zealand as on the 31st December, 1892, with the increase by excess of births over deaths, and of immigration over emigration, which accrued during the year, was as under:—
| Persons. | Males. | Females. | ||||
|---|---|---|---|---|---|---|
| Estimated population (exclusive of Maoris) on 31st December, 1891 | 634,058 | 336,174 | 297,884 | |||
| Increase during the year 1892— | Persons. | Males. | Females. | |||
| Excess of births over deaths | 11,417 | 5,310 | 6,107 | |||
| Excess of arrivals over departures | 4,958 | 3,662 | 1,296 | |||
| 16,375 | 8,972 | 7,403 | ||||
| Estimated population (exclusive of Maoris) on 31st December, 1892 | 650,433 | 345,146 | 305,287 | |||
| Maori population, census 1891 | 41,993 | 22,861 | 19,132 | |||
| Total estimated population of the colony on 31st December, 1892 | 692,426 | 368,007 | 324,419 |
The estimated number of Chinese in the colony at the end of the year 1892 was 4,087 persons, of whom 17 were females. These are included in the above table. At the census of April, 1891, the number in the colony was 4,444, so that a reduction has taken place in the space of one year and nine months to the number of 357, or 8 per cent., caused mainly by the balance of departures over arrivals.
The Maori population can be given only for the date of the census, as very few births or deaths of Natives are registered; but the movement of Native population, judged by the results of the enumeration of 1886 (when the number was 41,969) compared with the number in 1891 (41,993) is so small, that to use the same figures for several years in succession does not give rise to any great degree of error. Over 100 Maoris lost their lives at the eruption of Tarawera, which occurred between the census of 1886 and that of 1891.
Included in the population, as stated above, are the half-castes, who numbered 4,865 at the time of the census; 2,681 of these were half-castes living as members of Maori tribes, and 2,184 half-castes living as Europeans. The half-castes living as Europeans have increased since 1886 by 227, or at the rate of 116 per cent. The number of Maori wives of Europeans was 251 in 1891, against 201 in 1886.
The estimated European population of the principal divisions of the colony on 31st December, 1892, was—
| Persons. | Males. | Females. | |
|---|---|---|---|
| North Island and adjacent islets (exclusive of Maoris) | 292,894 | 155,573 | 137,321 |
| Middle Island and adjacent islets (exclusive of Maoris) | 357,042 | 189,296 | 167,746 |
| Stewart Island | 205 | 118 | 87 |
| Chatham Islands (exclusive of Natives) | 284 | 154 | 130 |
| Kermadec Islands | 8 | 5 | 3 |
| Total for the colony (exclusive of Maoris) | 650,433 | 345,146 | 305,287 |
To obtain these estimates of population in the different islands the census figures have been corrected (1) by adding the natural increases, that is, the excess of births over deaths, to the population of each island, and (2) by allocating the excess of immigration over emigration for the whole colony proportionately to the population of each island at census time. By this plan, no doubt, the North Island has suffered somewhat. But the arrivals are all counted at the first and the departures at the last port touched at, so that it becomes necessary to distribute the total gain in the manner indicated above. Moreover, what is more important by far, there are no records of the movements of population from one island to another. In all probability the North Island population is in reality somewhat greater than is here shown, and the Middle Island less.
During the interval between the census of March, 1886, and that of April, 1891, the increase of population in the North Island was far in excess of that in the Middle Island. The figures are: North Island, 1886, 250,482 persons, against 281,455 in 1891, a difference of 30,973, or at the rate of 12,36 per cent.; Middle Island, 1886, 327,592 persons, against 344,711 in 1891, a difference of only 17,119, or 5,22 per cent. The European population of Stewart Island did not increase, but that of the Chatham Islands rose from 199 to 271 persons. The Kermadec Islands appeared for the first time in 1891 as part of New Zealand, with a population of 19 persons.
The Australian Colonies, as a whole, contained on the 31st December, 1892, an estimated population amounting to 4,026,667 persons (exclusive of the aboriginal natives of Queensland and South and Western Australia, but including New Zealand Maoris).
Australasian Colonies.—Estimated Population on 31st December, 1892.
| Persons. | Males. | Females. | |
|---|---|---|---|
|
* Including Polynesians. † Including the Northern Territory | |||
| Queensland* | 421,297 | 237,965 | 183,332 |
| New South Wales | 1,197,050 | 646,378 | 550,672 |
| Victoria | 1,167,374 | 607,795 | 559,579 |
| South Australia† | 336,702 | 176,101 | 160,601 |
| Western Australia | 58,674 | 36,095 | 22,579 |
| Tasmania | 153,144 | 82,009 | 71,135 |
| New Zealand | 692,426 | 368,007 | 324,419 |
| Total Australasian Colonies | 4,026,667 | 2,154,350 | 1,872,317 |
The subjoined table gives a summary of the results of the census of 1891 as to the religions of the people, with the proportion of each denomination to the whole population at that and each of the three previous censuses:—
| Denominations. | Number of Adherents in 1891. | Proportions per Cent. of Population. | |||
|---|---|---|---|---|---|
| 1878. | 1881. | 1886. | 1891. | ||
| ‡ In calculating the proportions for 1891 the “Unspecified” have not been taken into account. | |||||
| Church of England, and Protestants (undefined) | 253,331 | 42.55 | 41.50 | 40.17 | 40.51 |
| Presbyterians | 141,477 | 22.95 | 23.08 | 22.59 | 22.62 |
| Wesleyan Methodists | 53,061 | 7.79 | 8.07 | 7.81 | 8.49 |
| Other Methodists | 10,354 | 1.35 | 1.46 | 1.74 | 1.65 |
| Baptists | 14,825 | 2.21 | 2.34 | 2.48 | 2.37 |
| Congregational Independents | 6,685 | 1.34 | 1.38 | 1.35 | 1.07 |
| Lutherans | 5,616 | 1.36 | 1.18 | 1.02 | 0.90 |
| Salvation Army | 9,383 | .. | .. | 0.91 | 1.50 |
| Society of Friends | 315 | 0.04 | 0.05 | 0.05 | 0.05 |
| Unitarians | 308 | 0.11 | 0.10 | 0.08 | 0.05 |
| Other Protestants | 11,295 | 1.08 | 1.26 | 1.55 | 1.82 |
| Roman Catholics, and Catholics (undefined) | 87,272 | 14.21 | 14.08 | 13.94 | 13.96 |
| Greek Church | 56 | 0.02 | 0.01 | 0.01 | 0.01 |
| Hebrews | 1,463 | 0.34 | 0.31 | 0.27 | 0.23 |
| Buddhists, Confucians | 3,928 | 1.05 | 1.01 | 0.77 | 0.63 |
| Other denominations | 849 | 0.05 | 0.11 | 0.10 | 0.12 |
| No denomination | 8,252 | 0.53 | 0.89 | 1.05 | 1.32 |
| No religion | 1,558 | 0.05 | 0.06 | 0.17 | 0.25 |
| Unspecified | 1,288 | 0.42 | 0.27 | 0.50 | ‡ |
| Object to state | 15,342 | 2.55 | 2.85 | 3.44 | 2.45 |
| Totals | 626,658 | 100.00 | 100.00 | 100.00 | 10.000 |
These returns of religions show that 81.03 per cent. of the people belonged to various Protestant denominations; 13.96 were Roman Catholics; and the remainder belonged to other sects, were of no denomination, or objected to state their religious views. The proportion of Roman Catholics is much greater in Australia than in New Zealand.
Methodists increased between 1886 and 1891 at the rate of 14.61 per cent.; Church of England adherents increased 9.02 per cent.; Presbyterians, 8.29 per cent.; Roman Catholics, 8.12 per cent.; while the Salvation Army had the highest rate of increase, 77.84 per cent.
Freethinkers numbered 4,475 persons in 1891 and 3,925 in 1886. They are included above in the numbers for “No denomination.”
The returns of birthplaces gave the following particulars:—
| Born in | Persons. Census 1891. | 1886. Per Cent. | 1891. Per Cent. |
|---|---|---|---|
| New Zealand | 366,716 | 51.89 | 58.61 |
| England | 117,070 | 21.72 | 18.71 |
| Scotland | 51,916 | 9.48 | 8.30 |
| Ireland | 47,634 | 8.89 | 7.61 |
| Wales | 2,214 | 0.34 | 0.35 |
| Australia and Tasmania | 15,943 | 2.98 | 2.55 |
| Other British possessions | 3,703 | 0.68 | 0.59 |
| Denmark, Sweden, and Norway | 4,755 | 0.86 | 0.77 |
| Germany | 4,663 | 0.87 | 0.75 |
| China | 4,470 | 0.79 | 0.71 |
| Other countries and at sea | 6,557 | 1.50 | 1.05 |
| Unspecified | 1,017 | .. | .. |
| Totals | 626,658 | 100.00 | 100.00 |
The New-Zealand-born population increased between 1886 and 1891 at the rate of 22.16 per cent., but the population born in the Mother-country, Australian Colonies, other British dominions, and foreign parts diminished more or less in each case during the quinquennium.
Education, 1891.
Of both sexes, 77.25 per cent. of the persons could read and write, 3.98 read only, and 18.77 could not read. Comparing with previous censuses, and for each sex separately, the proportion per cent. able to read and write will be found to rise steadily, while those reading only, or unable to read, diminish in number. The under-mentioned figures illustrate this:—
| Census. | Proportion per Cent. (Males). | Proportion per Cent. (Females). | ||||
|---|---|---|---|---|---|---|
| Read and Write. | Read only. | Cannot Read. | Read and Write. | Read only. | Cannot Read. | |
| 1881 | 73.31 | 5.01 | 21.68 | 68.94 | 6.39 | 24.67 |
| 1886 | 75.40 | 4.36 | 20.24 | 72.41 | 5.31 | 22.28 |
| 1891 | 77.95 | 3.74 | 18.31 | 76.47 | 4.24 | 19.29 |
Of persons of both sexes, 67.62 per cent. were found to be unmarried, 29.18 married, and 3.20 widowed. Taking the male sex, and comparing the results of three censuses, the proportions of unmarried and married diminish, but the proportion of widowed increases. On the female side, the proportions of unmarried and widowed increase, while the married diminish. The figures are as under:—
| Census. | Proportion per Cent. (Males). | Proportion per Cent. (Females). | ||||
|---|---|---|---|---|---|---|
| Unmarried. | Married. | Widowed. | Unmarried. | Married. | Widowed. | |
| 1881 | 70.39 | 27.73 | 1.88 | 63.64 | 33.05 | 3.31 |
| 1886 | 70.35 | 27.61 | 2.04 | 64.59 | 31.74 | 3.67 |
| 1891 | 70.02 | 27.61 | 2.37 | 64.95 | 30.94 | 4.11 |
The Chinese are not included in the figures from which these calculations are taken.
The number of bachelors aged 20 and upwards was 70,197, and of spinsters aged 15 and upwards 67,000, being 105 bachelors to every 100 spinsters. In Canterbury and Otago only were the spinsters in excess of the bachelors, but notably so in Canterbury.
The number of husbands was 90,371, and of wives 90,765, giving an excess of 394 of the latter.
Excluding the Maori population, the females in the colony are now in the proportion of 88.45 to every 100 males. The proportion of females to males is greater in New Zealand than in Queensland, New South Wales, and Western Australia, but less than in Victoria, South Australia, and Tasmania.
| Females to every 100 Males at Census, 1891. | |
|---|---|
| Queensland | 76.04 |
| New South Wales | 84.12 |
| Victoria | 90.16 |
| South Australia | 92.33 |
| Western Australia | 66.79 |
| Tasmania | 89.10 |
| New Zealand | 88.25 |
The following table gives the population in each provincial district estimated for the 31st December, 1892. It must, however, be pointed out that at a distance of one year and nine months from the census it is impossible to guarantee the correctness of these figures.
There are no records of interprovincial arrivals and departures, and therefore in times of change the further the date from the last census the greater the liability to error. New Zealand being insular, the excess of arrivals over departures taken for the whole colony can be fairly well arrived at, and the excess of births over deaths, or natural increase, can also be found, giving a close estimate to the population of the colony for any year; but the internal movement of population cannot be determined, and therefore the subjoined figures must be accepted as approximations only. As stated previously, the probability is that the provincial districts of the North Island are underestimated in the allocation of the excess of arrivals over departures that has been made:—
| 31st December, 1892. | |||
|---|---|---|---|
| Persons. | Males. | Females. | |
| Auckland | 138,100 | 72,408 | 65,692 |
| Taranaki | 23,093 | 12,283 | 10,810 |
| Hawke's Bay | 29,818 | 16,400 | 13,418 |
| Wellington | 101,883 | 54,482 | 47,401 |
| Marlborough | 13,325 | 7,371 | 5,954 |
| Nelson | 35,971 | 20,032 | 15,939 |
| Westland | 16,179 | 9,375 | 6,804 |
| Canterbury | 133,097 | 68,613 | 64,484 |
| Otago | 158,675 | 84,023 | 74,652 |
| Chatham Islands | 284 | 154 | 130 |
| Kermadec Islands | 8 | 5 | 3 |
| Totals | 650,433 | 345,146 | 305,287 |
These can be given only as at the date of the last census. The same objections that may be lodged against the endeavour to estimate the populations of the provincial districts at a distance of time from the census would apply with still greater force to any calculation of the numbers at present resident in the several counties and boroughs. The figures are therefore left as they were determined by the census. For statistical, as for administrative purposes, each borough is treated as distinct from the county wherein it lies. In April, 1891, the number of the counties was 78. Of these the North Island had 45, with a county population amounting altogether to 155,057 persons. The Middle Island had 32 counties, the population being 196,838 persons. Stewart Island is a county in itself. The names and populations of the various counties in the colony were as under at the date of the enumeration:—
| Counties. | Persons. | M. | F. |
|---|---|---|---|
| Mongonui | 1,389 | 788 | 601 |
| Whangaroa | 878 | 487 | 391 |
| Hokianga | 1,494 | 871 | 623 |
| Bay of Islands | 2,562 | 1,437 | 1,125 |
| Hobson | 3,298 | 2,154 | 1,144 |
| Whangarei | 6,120 | 3,456 | 2,664 |
| Otamatea | 2,054 | 1,190 | 864 |
| Rodney | 3,170 | 1,681 | 1,489 |
| Waitemata | 6,184 | 3,492 | 2,692 |
| Edon | 13,782 | 6,791 | 6,991 |
| Manukau | 11,925 | 6,111 | 5,814 |
| Coromandel | 2,846 | 1,694 | 1,152 |
| Thames | 4,340 | 2,353 | 1,987 |
| Ohinemuri | 1,516 | 982 | 534 |
| Piako | 2,517 | 1,428 | 1,089 |
| Waikato | 2,733 | 1,473 | 1,265 |
| Waipa | 3,395 | 1,761 | 1,634 |
| Raglan | 1,090 | 654 | 436 |
| Kawhia | 308 | 196 | 112 |
| West Taupo | 119 | 91 | 28 |
| East Taupo | 152 | 100 | 52 |
| Rotorua | 418 | 253 | 165 |
| Tauranga | 1,393 | 783 | 610 |
| Whakatane | 1,524 | 846 | 678 |
| Waiapu | 379 | 256 | 123 |
| Cook | 3,945 | 2,239 | 1,706 |
| Clifton | 908 | 523 | 385 |
| Taranaki | 7,905 | 4,237 | 3,668 |
| Stratford | 2,521 | 1,416 | 1,105 |
| Hawera | 4,347 | 2,448 | 1,899 |
| Patea | 2,608 | 1,484 | 1,124 |
| Waitotara | 2,255 | 1,289 | 966 |
| Wanganui | 2,281 | 1,297 | 984 |
| Rangitikei | 4,438 | 2,559 | 1,879 |
| Oroua | 7,418 | 4,160 | 3,258 |
| Manawatu | 2,725 | 1,594 | 1,131 |
| Horowhenua | 2,289 | 1,495 | 794 |
| Wairoa | 1,246 | 756 | 490 |
| Hawke's Bay | 6,628 | 3,571 | 2,457 |
| Waipawa | 7,906 | 4,432 | 3,474 |
| Patangata | 2,044 | 1,378 | 666 |
| Pahiatua | 2,365 | 1,414 | 951 |
| Wairarapa North | 5,143 | 3,092 | 2,051 |
| Wairarapa South | 4,980 | 2,863 | 2,117 |
| Hutt | 6,114 | 3,242 | 2,872 |
| Sounds | 720 | 426 | 294 |
| Marlborough | 6,520 | 3,827 | 2,693 |
| Kaikoura | 1,460 | 817 | 643 |
| Collingwood | 2,103 | 1,174 | 929 |
| Waimea | 8,942 | 4,740 | 4,202 |
| Buller | 4,659 | 2,823 | 1,836 |
| Inangahua | 4,648 | 2,892 | 1,756 |
| Grey | 4,330 | 2,950 | 1,380 |
| Westland | 5,031 | 3,191 | 1,840 |
| Amuri | 967 | 679 | 288 |
| Cheviot | 164 | 120 | 44 |
| Ashley | 12,396 | 6,577 | 5,819 |
| Selwyn | 36,375 | 18,699 | 17,676 |
| Akaroa | 3,771 | 2,083 | 1,688 |
| Ashburton | 9,501 | 5,335 | 4,166 |
| Geraldine | 14,588 | 7,543 | 7,045 |
| Mackenzie | 1,180 | 689 | 491 |
| Waimate | 4,043 | 2,364 | 1,679 |
| Waitaki | 8,375 | 4,609 | 3,766 |
| Waihemo | 2,040 | 1,181 | 859 |
| Waikouaiti | 4,334 | 2,321 | 2,013 |
| Peninsula | 2,701 | 1,361 | 1,340 |
| Taieri | 7,079 | 3,873 | 3,206 |
| Bruce | 4,696 | 2,567 | 2,129 |
| Clutha | 5,574 | 3,246 | 2,328 |
| Tuapeka | 6,327 | 3,830 | 2,497 |
| Maniototo | 2,927 | 1,732 | 1,195 |
| Vincent | 3,718 | 2,380 | 1,338 |
| Lake | 2,919 | 1,885 | 1,034 |
| Southland | 19,373 | 10,970 | 8,403 |
| Wallace | 5,306 | 3,098 | 2,208 |
| Fiord | 71 | 65 | 6 |
| Stewart Island | 202 | 115 | 87 |
The county population amounted to 56.18 per cent. of the total.* The counties include all towns not constituted municipal boroughs, and the population in many of the boroughs partakes of a rural character. The population in boroughs, which is given in detail further on, was 270,343 persons, or 43.14 per cent. of the whole. For every 100 persons resident in counties in 1891 there were 76 dwelling in boroughs. In 1886 the counties had 327,328 persons, and boroughs 245,612; or, for every 100 persons in counties, 75 were residents of the boroughs. Thus it will be seen that the proportion of the town to the county population was slightly greater in 1891 than in 1886.
* For population of ridings, road districts, and localities, see census volume, pp. 11 and 31.
There were 87 municipal boroughs in existence when the census of 1891 was taken.
Since the time of the census six new boroughs have been constituted, as under:—
| Boroughs. | Population, Census, April, 1891. |
|---|---|
| Dannevirke, taken from Waipawa County | 838 |
| Pahiatua taken from Pahiatua County | 782 |
| Karori, taken from Hutt County | 966 |
| Richmond taken from Waimea County | 452 |
| Linwood taken from Selwyn County | 4,580 |
| Sumner taken from Selwyn County | 614 |
A complete list of the boroughs in the colony as in April, 1891, with populations, is here shown:—
| Boroughs. | Population, 1891. |
|---|---|
| Birkenhead | 455 |
| Devonport | 2,455 |
| Auckland | 28,613 |
| Newton | 2,087 |
| Newmarket | 1,586 |
| Parnell | 3,967 |
| Onehunga | 2,924 |
| Thames | 4,618 |
| Hamilton | 1,212 |
| Cambridge | 850 |
| Tauranga | 1,055 |
| Gisborne | 2,158 |
| New Plymouth | 3,350 |
| Hawera | 1,284 |
| Patea | 676 |
| Wanganui | 5,011 |
| Marton | 976 |
| Feilding | 1,583 |
| Palmerston North | 4,303 |
| Foxton | 1,223 |
| Hastings | 2,303 |
| Napier | 8,311 |
| Woodville | 971 |
| Masterton | 3,114 |
| Carterton | 1,112 |
| Greytown | 1,141 |
| Wellington | 31,021 |
| Onslow | 979 |
| Melrose | 1,224 |
| Petone | 2,178 |
| Lower Hutt | 1,329 |
| Picton | 788 |
| Blenheim | 3,294 |
| Nelson | 6,626 |
| Westport | 2,622 |
| Greymouth | 3,787 |
| Brunner | 2,231 |
| Hokitika | 2,178 |
| Ross | 822 |
| Kumara | 1,176 |
| Kaiapoi | 1,371 |
| Rangiora | 1,783 |
| Lyttelton | 4,087 |
| St. Albans | 5,247 |
| Christchurch | 16,223 |
| Sydenham | 9,680 |
| Akaroa | 571 |
| Ashburton | 1,900 |
| Timaru | 3,668 |
| Waimate | 1,379 |
| Oamaru | 5,621 |
| Hampden | 300 |
| Palmerston South | 790 |
| Hawkesbury | 743 |
| Port Chalmers | 2,028 |
| North-East Valley | 3,337 |
| Maori Hill | 1,426 |
| West Harbour | 1,297 |
| Dunedin | 22,376 |
| Roslyn | 3,845 |
| Caversham | 4,690 |
| Mornington | 3,523 |
| St. Kilda | 1,153 |
| South Dunedin | 4,222 |
| Green Island | 687 |
| Mosgiel | 1,304 |
| Milton | 1,158 |
| Kaitangata | 1,145 |
| Balclutha | 867 |
| Lawrence | 1,026 |
| Roxburgh | 410 |
| Tapanui | 428 |
| Naseby | 496 |
| Cromwell | 474 |
| Alexandra | 310 |
| Arrowtown | 426 |
| Queenstown | 779 |
| Invercargill | 4,950 |
| Invercargill North | 717 |
| Invercargill East | 736 |
| Invercargill South | 1,559 |
| Avenal | 302 |
| Gladstone | 287 |
| Campbelltown | 650 |
| Gore | 1,618 |
| Winton | 288 |
| Riverton | 843 |
There is not in New Zealand, as in each of the other Australasian Colonies, one metropolitan centre of population overshadowing, by comparison, the other towns of the colony. The configuration and physical features of the colony made it specially adapted for the establishment of settlements comparatively remote from one another. As a result the colony was formerly divided into nine provinces, each having its capital town. Of these, the principal are the Boroughs of Auckland, Wellington, Christchurch, and Dunedin.
Auckland Borough, situate in the northern part of the North Island, had in April, 1891, a population of 28,613. As the population of the suburbs amounted to 22,674, the total number of persons dwelling in and around Auckland was 51,287.
The Borough of Wellington, the seat of Government, is situated on the border of Port Nicholson, at the southern extremity of the North Island. It contained in April, 1891, as many as 31,021 persons. The suburban population is small, amounting only to 3,169 persons. The whole population in and around Wellington thus numbered 34,190.
The Borough of Christchurch is situated in the Canterbury District of the Middle Island. The census returns gave a population of 16,223 in that borough, and of 31,623 in the suburbs—that is, within the boundaries of the Christchurch Health District. The total number in the Borough and suburbs of Christchurch was thus 47,846.
The Borough of Dunedin, the principal town of the former Province of Otago, is the centre of a population amounting to 45,869, of which the Borough itself contained 22,376; and eight surrounding boroughs, which are practically suburbs of Dunedin, 23,493.
Increase of Population.
The increase of population during 1892 was 16,375. As the number of births exceeded the number of deaths by 11,417, the difference between that number and 16,675 represents the excess of immigration over emigration, amounting to 4,958.
There is good reason to believe that very few of the births or deaths that occur remain unregistered. Where a limit of time is given within which a birth has to be registered it follows as a matter of course that there will be occasional instances of neglect of the requirements of the law; but it has been made evident that such neglect is very exceptional, and that the number of unregistered events is so small as not appreciably to affect the numbers given.
The following shows the number of births in excess of the number of deaths in each of the past ten years:—
| 1883 | 13,341 |
| 1884 | 14,106 |
| 1885 | 13,612 |
| 1886 | 13,164 |
| 1887 | 12,998 |
| 1888 | 13,194 |
| 1889 | 12,685 |
| 1890 | 12,284 |
| 1891 | 11,755 |
| 1892 | 11,417 |
It is a very striking fact that in 1892, when the population was greater than in 1883 by over 20 per cent., or 109,556 persons, the excess of births over deaths should have been less than in 1883 by about 12 per cent.
The excess of births over deaths in 1892 was equivalent to 1.78 per cent. of the mean population for the year, the actual increase to population being at the rate of 2.58 per cent.
A table is given showing the increase of population for ten years, numerical and centesimal. Though the figures throughout are not all that could be desired, there is now every reason to believe that the efflux of population has ended with the year 1891, and that the increase by arrivals for 1893 will exceed that of 1892. And even in regard to the loss that New Zealand suffered prior to 1892, the remarks in the Registrar-General's report for 1890 will bear repetition here:—
At first it may appear that New Zealand has been a great sufferer through this loss of population. If all those who left had been of a class that would settle down to country pursuits and help to develop the resources of the colony that opinion might be well founded; but the large expenditure on public works that has obtained for years has brought to, or developed in, the colony a class of persons living solely by such expenditure, who have realised rates of wages that could not be profitably given by farmers. On the cessation of such expenditure the result might reasonably be expected that numbers, unacquainted with farm-labour and disinclined thereto as being less remunerative than the labour they had been accustomed to, should migrate to places where the prospect of employment by expenditure on public works would be better. If they remained in the colony they would, in all probability, swell the number of those who call for further public expenditure, and, not being producers, it is questionable whether the loss to the colony in instances like these is such as to be deplored.
| Year. | Estimated Population on the 31st December. | Increase during the Year | Centesimal Increase on Population of Previous Year. | |||
|---|---|---|---|---|---|---|
| By Excess of Births over Deaths. | By Excess of Immigration over Emigration.* | Net Increase. | ||||
|
* Corrected in accordance with census results of 1886 and 1891. The amount of loss by departures, though correct in the aggregate, cannot be allocated with exactness to the respective years. † Loss. | ||||||
| 1883 | 540,877 | 13,141 | 10,029 | 23,170 | 4.48 | |
| 1884 | 564,304 | 14,106 | 9,321 | 23,427 | 4.33 | |
| 1885 | 575,172 | 13,612 | -2,744† | 10,868 | 1.93 | |
| 1886 | 539,386 | 13,164 |

| -17,194† | 58,886 | 10.24 |
| 1887 | 603,361 | 12,998 | ||||
| 1888 | 607,380 | 13,194 | ||||
| 1890 | 625,508 | 12,284 | ||||
| 1891 | 634,058 | 11,755 | ||||
| 1892 | 650,433 | 11,417 | 4,958 | 16,375 | 2.58 | |
It will be observed that in the period 1885 to 1891 the total increase to the population was less than the natural increase by excess of births over deaths, owing to the fact that the outgo of population by departures was greater than the gain by arrivals. But a better state of things prevailed in 1892, when, not only was the natural increase of 11,417 preserved to the colony, but an addition by excess of arrivals over departures amounting to 4,958 persons was also obtained.
Every effort is made to obtain correct statements of arrivals and departures at and from the colony, but there is still difficulty in regard to the latter. The arrivals are doubtless correct, but many people leave the colony for Australia without booking their passages, paying their fares on board after the steamer has cleared: in these cases the returns from the Customs authorities are deficient. As has been pointed out before, the difficulty is met to a large extent by arrangements under which the pursers of the intercolonial steamers belonging to the Union Steamship Company, on their return to this colony, post to the Registrar-General a statement of the number of passengers outwards on the previous voyage. But during any period of cheap fares and strong competition between rival companies steamers may carry more passengers than may lawfully be taken, and of the number in excess no return is likely to be made.
The number of persons who arrived in the colony in the year 1892 was 18,122, an increase of 3,691 on the number for the previous year. Of the arrivals in 1892, 16,023 persons were classified as adults, being above the age of twelve years, and 2,099 as children. The total number of males was 12,131, and of females 5,991. The immigrants from the United Kingdom numbered 2,555, those from Victoria 5,390, from New South Wales and Queensland 7,916, from South and Western Australia 10, from Tasmania 1,358. Thus the arrivals from Australia amounted to 14,674 persons. Besides these, 200 persons came from Fiji, and 693 from Hawaii, the South Seas, and other parts, including arrivals by mail-steamers from San Francisco.
The practice of nominating immigrants, to be brought out partly at the Government expense, has been discontinued since the 16th December, 1890, and of free immigration there was none in the year 1892.
Fifty-eight Chinese arrived and 197 left the colony during 1892, the number of departures thus exceeding the arrivals by 139. The arrivals were all adult males from Australia, except one from South Seas. The departures were all for Australia, and consisted of 194 adult males and 3 children.
The following table shows the immigration—distinguishing between the unassisted and the assisted—for the past ten years:—
| Year. | Unassisted Immigrants. | Free and Assisted Immigrants. | Total Immigrants. |
|---|---|---|---|
| 1883 | 13,313 | 5,902 | 19,215 |
| 1884 | 16,133 | 3,888 | 20,021 |
| 1885 | 15,127 | 1,072 | 16,199 |
| 1886 | 15,184 | 917 | 16,101 |
| 1887 | 12,403 | 1,286 | 13,089 |
| 1888 | 13,121 | 485 | 13,606 |
| 1889 | 15,301 | 91 | 15,392 |
| 1890 | 14,884 | 144 | 15,028 |
| 1891 | 14,387 | 44 | 14,431 |
| 1892 | 18,122 | .. | 18,122 |
In 1881 an Act was passed imposing a tax on every Chinese landing in the colony, except in the case of any one of a crew of a vessel who might not remain in the colony. The object of the Act was so to restrict the introduction of Chinese as to prevent an increase of that part of the population. The following figures show that the desired effect has been so far obtained. In 1881 the Chinese population amounted to 5,004, in 1886 the number had fallen to 4,542, and when the recent census was taken there were only 4,444 Chinese in the colony.
The following shows the number of arrivals in and departures from the colony of Chinese in each of the past twelve years:—
| Year. | Arrivals. | Departures. |
|---|---|---|
| 1881 | 1,029 | 371 |
| 1882 | 23 | 168 |
| 1883 | 44 | 297 |
| 1884 | 84 | 306 |
| 1885 | 94 | 164 |
| 1886 | 239 | 181 |
| 1887 | 354 | 246 |
| 1888 | 308 | 211 |
| 1889 | 16 | 104 |
| 1890 | 18 | 169 |
| 1891 | 5 | 160 |
| 1892 | 58 | 197 |
Restrictive legislation on the immigration of Chinese has been passed in the Australian Colonies as well as in New Zealand.
In New South Wales, the legislation of 1888 raised the poll-tax passed in 1881 to £100, and vessels were prohibited from carrying to the colony more than one Chinese passenger to every 300 tons. Chinese cannot engage in mining without express authority, and are not allowed naturalisation, The Act, writes Mr. Coghlan, the New South Wales Government Statistician, has operated to the entire cessation of Chinese immigration.
The number of persons who left this colony in 1892 was 13,164, of whom 11,627 wore over and 1,537 were under twelve years of age. The males numbered 8,469, and the females 4,695. The departures. for the United Kingdom amounted to 1,612 persons. 3,515 left for Victoria, 6,415 for New South Wales and Queensland, 28 for South and Western Australia, and 711 for Tasmania—making 10,669 for Australia altogether. 170 persons left for Fiji, and 713 for Hawaii, South Seas, and other ports (including passengers for San Francisco).
The total excess of arrivals over departures—4,958 persons—is made up as follows:—
| Excess of Arrivals. | Excess of Departures. | |
|---|---|---|
| Persons. | Persons. | |
| From United Kingdom.. | 943 | |
| From Australia | 4,005 | |
| From Fiji | 30 | |
| From Hawaii, South Seas, and other ports | 20 |
The following table shows the recorded movements of population between New Zealand and the United Kingdom in each of the past ten years:—
| United Kingdom. | ||
|---|---|---|
| Arrivals therefrom. | Departures thereto. | |
| 1883 | 10,398 | 912 |
| 1884 | 9,860 | 1,457 |
| 1885 | 7,241 | 1,857 |
| 1886 | 6,893 | 2,385 |
| 1887 | 4,906 | 2,086 |
| 1888 | 4,138 | 1,964 |
| 1889 | 3,275 | 2,039 |
| 1890 | 2,812 | 1,863 |
| 1891 | 2,435 | 1,705 |
| 1892 | 2,555 | 1,612 |
| Totals | 54,513 | 17,880 |
These figures, which may be taken as correct, show a gain of 36,633 persons from intercourse with the United Kingdom. But the total gain by excess of arrivals over departures during the ten years, after correcting the populations by means of the census results of 1886 and 1891, was found to be 4,370 persons only; it follows, therefore, that the loss to Australia and other places amounted to 32,263 during the decennial period, of which number at least 90 per cent. must have gone to Australia. But the figures for 1892 show a satisfactory state of things for the last of the ten years, there having been a net gain from intercourse with Australia of 4,005 persons. Of the loss prior to 1892, by far the largest amount in any one year occurred in 1888, when the expenditure of loan money by the General Government was reduced to one-half of what it had been in the previous year, 1887.
The returns made by the Board of Trade do not distinguish between the departures from the United Kingdom for New Zealand and those for Australia. Only the departures for Australasia as a whole are given. In 1892 these amounted to 16,183. The number of persons who arrived in New Zealand direct from the United Kingdom was to 2,555, or equal to nearly 16 per cent. of the entire direct emigration from the United Kingdom to the Australasian Colonies. This proportion is greater than in any year since 1885, but the number does not represent all the persons who come from the United Kingdom to this colony, as many travel viâ the Suez Canal or San Francisco, and thus appear as arrivals either from Australia or foreign ports.
There has been a large annual decrease of late years in the number of persons who leave the United Kingdom for these southern colonies:—
| Year. | Emigration from United Kingdom to Australasia. | Arrivals in Now Zealand from United Kingdom. | Arrivals in New Zealand per 100 Departures for Australasia from United Kingdom. |
|---|---|---|---|
| 1881 | 24,093 | 3,507 | 14.55 |
| 1882 | 38,604 | 3,205 | 8.30 |
| 1883 | 73,017 | 10,398 | 14.24 |
| 1884 | 45,944 | 9,860 | 21.46 |
| 1885 | 40,689 | 7,241 | 17.80 |
| 1886 | 44,055 | 6,893 | 15.65 |
| 1887 | 35,198 | 4,906 | 13.94 |
| 1888 | 31,725 | 4,138 | 13.04 |
| 1889 | 28,834 | 3,275 | 11.36 |
| 1890 | 21,570 | 2,812 | 13.03 |
| 1891 | 19,957 | 2,435 | 12.20 |
| 1892 | 10,183 | 2,555 | 15.79 |
As the population of New Zealand (exclusive of Maoris) comprises 16.32 per cent. of the population of Australasia, not including Fiji, it might be thought from the above figures that this colony offered fewer attractions to emigrants than does Australia; but, as previously stated, the above numbers do not take account of persons who arrive from England viâ Australia and the United States.
The following shows the immigration and emigration for each of the Australasian Colonies during the year 1892. As there is no record of those who travel overland from one Australian colony to another, the numbers given refer only to those who arrive and depart by sea, except that those for Queensland, New South Wales, and South Australia include arrivals and departures by train across the border. The figures for departures are for all the colonies admittedly imperfect, on account of the number of persons who leave by sea of whose departure no record is obtained:—
| Colony. | Arrivals, 1892. | Departures, 1892. | Excess of Arrivals over Departures, 1892. |
|---|---|---|---|
| * Excess of departures. | |||
| Queensland | 14,646 | 13,564 | 1,082 |
| New South Wales | 62,197 | 54,799 | 7,398 |
| Victoria | 62,951 | 69,214 | *–6,263 |
| South Australia | 17,433 | 14,474 | 2,959 |
| Western Australia | 7,440 | 2,968 | 4,472 |
| Tasmania | 23,744 | 24,407 | *–663 |
| New Zealand | 18,122 | 13,164 | 4,958 |
The number of births registered in 1892 was 17,876, being in the proportion of 27.83 per 1,000 of the population. The number of births was less by 397 than in 1891, and the proportion the lowest on record in the colony. The great decrease in the birth-rate is shown in the following table:—
| Year. | Number of Births. | Births per 1,000 of the Population. |
|---|---|---|
| 1881 | 18,372 | 37.95 |
| 1882 | 19,009 | 37.32 |
| 1883 | 19,202 | 36.28 |
| 1884 | 19,846 | 35.91 |
| 1885 | 19,693 | 34.35 |
| 1886 | 19,299 | 33.15 |
| 1887 | 19,135 | 32.09 |
| 1888 | 18,902 | 31.22 |
| 1889 | 18,457 | 30.07 |
| 1890 | 18,278 | 29.44 |
| 1891 | 18,273 | 29.01 |
| 1892 | 17,876 | 27.83 |
It will be observed that the number of births was less in 1892 than in 1884 by 1,970. A fall in the birth-rate in a young country is to a certain point a natural result of the increase in the proportion of the population under twenty-one years of age, but in New Zealand the proportion under twenty-one at the census of 1891 was found to be only slightly lower than that in 1886; so that a decrease in the actual number of births is quite different from what might reasonably have been looked for. The number of births given in each year is the number that was registered, but there is good reason to believe that very few births remain unregistered, and that the registration may at the present time be deemed as complete as can be expected.
The smaller proportion of wives under forty-five years of age and their higher average age would have an influence in lowering the birth-rate, but it is evident that lessened fertility is only one of the causes of the decrease in question, another being the fall in the marriage-rate: probably the most potent is a disinclination to assume the responsibilities and burdens of a large family.
The birth-rate (27.83) in 1892 is lower than any on record for the whole of England and Wales, where the lowest was that of the year 1890, being 30.2 per 1,000 of population. Nevertheless, in 1891 the rates in eleven counties of England and Wales did not exceed 27.5 per 1,000 persons, and were thus lower than the New Zealand rate for 1892. The rate in this colony was also lower than that (30.3) in Scotland, but considerably higher than that (22.3) in Ireland in 1890.
The rate in New Zealand in 1892 was the lowest in the Australasian colonies. The following shows the birth-rates of those colonies in each of the past eight years:—
| Colony. | 1885. | 1886. | 1887. | 1888. | 1889. | 1890. | 1891. | 1892. |
|---|---|---|---|---|---|---|---|---|
| Queensland | 36.66 | 40.21 | 38.09 | 37.77 | 36.27 | 40.95 | 36.35 | 35.84 |
| New South Wales | 37.64 | 37.03 | 36.42 | 36.18 | 33.73 | 35.35 | 34.50 | 34.41 |
| Victoria | 30.74 | 31.23 | 32.39 | 32.39 | 32.95 | 33.60 | 33.57 | 32.54 |
| South Australia | 37.30 | 35.32 | 34.63 | 33.34 | 32.37 | 32.75 | 33.92 | 32.32 |
| Western Australia | 35.22 | 39.21 | 37.34 | 35.88 | 37.14 | 32.55 | 34.85 | 33.01 |
| Tasmania | 35.08 | 34.15 | 33.87 | 33.10 | 31.94 | 33.49 | 33.37 | 32.48 |
| New Zealand | 34.35 | 33.15 | 32.09 | 31.32 | 30.07 | 29.44 | 29.01 | 27.83 |
In the year 1880 New Zealand had the highest birth-rate of the above colonies, 40.78; but since 1887 the position has been reversed, and the rate is the lowest of all.
The male births in New Zealand in 1892 numbered 9,101, and the female 8,775: the proportion was thus 103.72 males to 100 females. In 1891 the proportion was 105.41 males to 100 females. There are on an average more male to female births in each of the Australasian Colonies than in England, but the proportion of male births is still greater in many of the European States.
There were 172 cases of twin births (344 children) in 1892; there was also one case of triplet births. The number of children born was 17,876; the number of mothers was 17,702: thus on an average 1 mother in every 102 gave birth to twins. In 1891 the proportion was 1 in 101, in 1890 it was 1 in 95, in 1889 1 in 120, and in 1888 1 in 97.
The births of 593 children were illegitimate: thus 33 in every 1,000 children born were born out of wedlock.
The following table gives the rates of illegitimacy in each of the Australasian Colonies. The rate of illegitimacy in New Zealand is less than in any other of the Australasian Colonies except South Australia:—
| Year. | Queensland. | New South Wales. | Victoria. | South Australia. | Tasmania. | New Zealand. |
|---|---|---|---|---|---|---|
| 1883 | 3.66 | 4.24 | 4.69 | 1.75 | 3.90 | 2.78 |
| 1884 | 4.05 | 4.40 | 4.29 | 2.10 | 4.46 | 2.95 |
| 1885 | 4.08 | 4.60 | 4.36 | 2.42 | 4.55 | 3.20 |
| 1886 | 3.97 | 4.65 | 4.75 | 2.38 | 4.13 | 3.12 |
| 1887 | 4.49 | 4.59 | 4.78 | 2.49 | 3.40 | 3.23 |
| 1888 | 4.13 | 5.08 | 4.80 | 2.67 | 3.62 | 3.05 |
| 1889 | 4.68 | 5.33 | 4.97 | 2.47 | 4.02 | 3.32 |
| 1890 | 4.85 | 5.26 | 5.09 | 2.50 | 4.05 | 3.30 |
| 1891 | 4.65 | 5.36 | 5.36 | 2.93 | 3.72 | 3.49 |
| 1892 | .. | .. | .. | .. | .. | 3.32 |
The rates in the Colonies of Queensland, New South Wales, and Victoria are somewhat higher than the rate in England, which was 4.2 in 1891. The rate for New Zealand is less. In Scotland the rate was as high as 8.0 in the year 1889. In Ireland it was only 2.8.
The average number of children to a marriage may be ascertained by comparing the number of legitimate births for a series of years with the number of marriages during a series of years of the same number, but commencing with the year preceding that for which the first number of births is taken; for, although in the earlier years births will be included that are the fruits of marriages solemnised prior to the commencement of the period, yet there will be omitted the number of children born subsequently to the period, of parents married within the given time.
As the records of illegitimate births prior to 1875 cannot be accepted as in any degree trustworthy, that year has been taken as the starting-point for the calculation:—
| Year. | Marriages. | Legitimate Births. | Proportion of Births to every Marriage solemnised in the Preceding Year. |
|---|---|---|---|
| 1875 | 3,209 | .. | .. |
| 1876 | 3,196 | 16,807 | 5.24 |
| 1877 | 3,114 | 16,505 | 5.16 |
| 1878 | 3,377 | 17,341 | 5.57 |
| 1879 | 3,352 | 17,655 | 5.23 |
| 1880 | 3,182 | 18,870 | 5.63 |
| 1881 | 3,279 | 18,198 | 5.72 |
| 1882 | 3,600 | 18,463 | 5.63 |
| 1883 | 3,614 | 18,668 | 5.19 |
| 1884 | 3,802 | 19,259 | 5.33 |
| 1885 | 3,815 | 19,063 | 5.01 |
| 1886 | 3,489 | 18,697 | 4.90 |
| 1887 | 3,565 | 18,518 | 5.31 |
| 1888 | 3,617 | 18,325 | 5.14 |
| 1889 | 3,632 | 17,845 | 4.93 |
| 1890 | 3,797 | 17,675 | 4.87 |
| 1891 | 3,797 | 17,635 | 4.64 |
| 1892 | .. | 17,283 | 4.54 |
| Sums and proportion | 59,445 | 306,807 | 5.16 |
The average number of births per marriage was, for the first seven years 5.45, and for the last ten years 4.98, thus showing in the last period a decrease in the number of births to a marriage in the ratio of 9 per cent. In the Australian Colonies a similar decrease is noticeable. The Government Statist of Victoria has remarked that in all the Australian Colonies, except Tasmania, there is a tendency for the average number of children to a marriage to decrease. The average number of children to a marriage is greater in New Zealand than in the other Australasian Colonies. The number given in the Victorian Year-book for each of the colonies named is as follows:—
| — | Victoria. | New South Wales. | Queensland. | South Australia. | Tasmania. |
|---|---|---|---|---|---|
| Mean of numbers for eleven years, 1880–90 | 4.22 | 4.70 | 4.60 | 4.73 | 4.51 |
The following statement of the average number of children to a marriage in various European countries is taken from the Victorian Year-book:—
| Children to each Marriage. | |
|---|---|
| Ireland | 5.46 |
| Italy | 4.56 |
| Scotland | 4.43 |
| Holland | 4.34 |
| Belgium | 4.21 |
| England | 4.16 |
| Sweden | 4.01 |
| Denmark | 3.55 |
| France | 2.98 |
It will be seen that if we except Ireland the number of children to a marriage is larger in New Zealand than in any other of the countries or colonies mentioned; nor are the figures given for Ireland absolutely free from doubt, for the registration of marriages is not so complete in that country as the registration of births.
The excess per cent. of births over deaths for each of the Australasian Colonies is stated in the Victorian Year-book as under, for a mean of ten years ending with 1891, New Zealand having the largest for such period:—
| New Zealand | 218 |
| South Australia | 168 |
| New South Wales | 152 |
| Queensland | 128 |
| Tasmania | 124 |
| Western Australia | 118 |
| Victoria | 106 |
For the year 1891 New Zealand occupies the second place, the ratio of excess being highest in Queensland.
Aliens residing in the colony may, on taking the oath of allegiance to Her Majesty, obtain letters of naturalisation which entitle them to enjoy all the rights and capacities that a natural born subject of the United Kingdom can enjoy or transmit within this colony. Sixty-three aliens were naturalised in 1892.
By section 2 of “The Aliens Act Amendment Act, 1882,” repealed and re-enacted by section 2 of “The Aliens Act Amendment Act, 1892,” it is provided that when the father, or mother being a widow, has obtained naturalisation in the colony, every child who during infancy has become resident with them in New Zealand, shall be deemed to be naturalised and have the rights and privileges of a natural-born subject.
As the diversity of nationalities is considerable, the following statement is given of the number of each:—
| Natives of | |
|---|---|
| Sweden and Norway | 14 |
| Denmark | 12 |
| Germany | 11 |
| Switzerland | 5 |
| Russia | 3 |
| Poland | 1 |
| Finland | 1 |
| Austria | 3 |
| China | 3 |
| France | 3 |
| Italy | 3 |
| Syria | 2 |
| Belgium | 1 |
| Netherlands | 1 |
| Total | 63 |
The number of natives of each country naturalised during the last twelve years is shown hereunder:—
| Natives of | |
|---|---|
| Germany | 765 |
| Sweden and Norway | 504 |
| Denmark | 389 |
| China | 186 |
| Switzerland | 94 |
| Italy | 86 |
| Austria | 74 |
| Russia | 71 |
| France | 33 |
| Netherlands | 19 |
| Portugal | 19 |
| Greece | 16 |
| United States of America | 12 |
| Belgium | 7 |
| Turkey | 6 |
| Other countries | 7 |
| Total | 2,288 |
Of the number naturalised in the period 1881–92, natives of Germany comprised 34 per cent., Swedes and Norwegians 23 per cent., Danes 17 per cent., and Chinese 8 per cent.
The deaths in 1892 numbered 6,459, being equivalent to a rate of 10.06 in every 1,000 persons living. This is lower than the rate (10.35) in 1891, but higher than the rates for the period 1888–90.
The death-rate in New Zealand contrasts very favourably with those in the other Australasian Colonies and in European countries, and furnishes evidence of the great salubrity of the climate of the colony. The following table gives the death-rates for a series of years in the several countries named:—
| Country. | 1883. | 1884. | 1885. | 1886. | 1887. | 1888. | 1889. | 1890. | 1891. | 1892. |
|---|---|---|---|---|---|---|---|---|---|---|
| *Excluding Northern Territory | ||||||||||
| New Zealand | 11.45 | 10.39 | 10.76 | 10.54 | 10.29 | 9.43 | 9.44 | 9.66 | 10.35 | 10.06 |
| Queensland | 18.82 | 22.97 | 19.58 | 17.29 | 14.56 | 14.36 | 15.44 | 14.98 | 12.77 | 12.66 |
| New South Wales | 14.68 | 16.14 | 16.41 | 14.89 | 13.15 | 13.54 | 13.42 | 12.90 | 14.24 | 13.22 |
| Victoria | 14.28 | 14.46 | 14.98 | 15.15 | 15.70 | 15.34 | 17.54 | 16.10 | 16.24 | 13.63 |
| South Australia* | 14.55 | 15.24 | 12.48 | 13.38 | 12.77 | 12.52 | 11.49 | 12.40 | 13.26 | 11.38 |
| Western Australia | 17.93 | 21.87 | 17.61 | 21.56 | 16.83 | 15.91 | 14.19 | 11.26 | 16.96 | 16.63 |
| Tasmania | 17.06 | 15.50 | 15.40 | 14.58 | 15.45 | 14.11 | 14.10 | 14.74 | 15.00 | 13.53 |
| England | 19.5 | 19.5 | 19.0 | 19.3 | 18.8 | 17.8 | 17.9 | 19.5 | 20.2 | .. |
| Scotland | 201 | 19.4 | 19.1 | 18.6 | 18.7 | 17.6 | 18.0 | 19.7 | 20.7 | .. |
| Ireland | 19.2 | 17.6 | 18.4 | 17.9 | 18.3 | 18.0 | 17.5 | 18.2 | 18.4 | .. |
| Denmark | 18.4 | 18.4 | 17.9 | 18.2 | 18.3 | 19.7 | 18.0 | 19.0 | 20.0 | .. |
| Norway | 17.1 | 16.4 | 16.5 | 16.1 | 16.0 | 16.9 | 17.4 | 17.8 | 17.5 | .. |
| Sweden | 17.3 | 17.5 | 17.8 | 16.6 | 16.1 | 16.0 | 16.0 | 17.1 | .. | |
| Austria | 30.1 | 29.2 | 29.9 | 29.4 | 28.9 | 29.2 | 27.3 | 29.4 | 27.9 | .. |
| Hungary | 32.0 | 30.8 | 31.6 | 31.4 | 33.5 | 31.7 | 29.8 | 32.3 | .. | |
| Switzerland | 20.4 | 20.2 | 21.3 | 20.7 | 20.2 | 19.9 | 20.3 | 20.9 | 20.8 | .. |
| German Empire | 25.9 | 26.0 | 25.7 | 26.2 | 24.2 | 23.8 | 23.8 | 24.4 | 23.4 | .. |
| Netherlands | 21.8 | 22.2 | 21.0 | 21.5 | 19.7 | 20.4 | 20.1 | 20.5 | 20.7 | .. |
| France | 22.2 | 22.2 | 21.9 | 22.5 | 22.0 | 21.8 | 20.5 | 22.8 | 22.6 | .. |
| Italy | 27.5 | 26.7 | 26.6 | 28.3 | 27.5 | 27.0 | 24.9 | 26.4 | 26.2 | .. |
A comparison of the above rates appears to place the Australasian Colonies as a whole in the foremost rank for salubrity of climate and healthiness of people, New Zealand standing well above the rest; but it must be admitted that the ratio of all deaths to the 1,000 of population living in the middle of the year, although a good test of the sanitary condition of the same country from year to year, and also useful for comparing the healthfulness of such countries as contain the same or nearly the same proportionate numbers of persons living at each age-period of life, cannot be regarded as a perfectly fair index of the comparative healthfulness of new and old countries, or even of that of new countries compared one with another, when the proportions living at the several age-periods vary considerably.
The truest rates of mortality are obtained by ascertaining the proportion of deaths at each age-period to the numbers living at those ages.
The deaths in the four principal boroughs in 1892 numbered 1,251, against 1,331 in 1891, although the present Richmond ward is not included as part of Christchurch for the earlier year. The number of deaths for 1892 is thus shown to be 80 less than the number for 1891, but it is greater than the number for 1896 by 51. At Auckland, Wellington, and Dunedin the deaths were fewer last year than in 1891; at Christchurch they were slightly more numerous, but, if Richmond were excluded, might be less. The deaths and death-rates per 1,000 of population for the last three years are shown:—
| Boroughs. | Deaths, 1890. | Deaths, 1891. | Deaths, 1892. | |||
|---|---|---|---|---|---|---|
| Number. | Per 1,000 of Population. | Number. | Per 1,000 of Population. | Number. | Per 1,000 of Population. | |
| Auckland | 336 | 11.34 | 390 | 13.63 | 382 | 12.52 |
| Wellington | 386 | 12.64 | 453 | 14.60 | 405 | 12.27 |
| Christchurch | 163 | 11.04 | 185 | 11.40 | 197 | 11.89 |
| Dunedin | 315 | 14.20 | 303 | 13.54 | 267 | 11.59 |
From the above it will be seen that the death-rates in Auckland and Wellington for 1892, although lower than the rates shown for the previous year, are higher than in Christchurch and Dunedin. One reason for this is that in the two North Island cities the birth-rates are higher, the mortality among infants being always very great compared with that of persons at the more advanced ages. At Dunedin, where the death-rate was 11.59, the birth-rate was 23.27 per 1,000 persons; and at Christchurch the death-rate was 11.89, and the birth-rate 21.19.
The death-rates of the towns, after eliminating the element of infantile mortality, compare as follows:—
| Deaths per 1,000 of Population (excluding Infants under 1 Year of Age). | ||
|---|---|---|
| 1891. | 1892. | |
| Auckland | 9.91 | 9.05 |
| Wellington | 11.02 | 9.32 |
| Christchurch | 8.83 | 8.51 |
| Dunedin | 11.45 | 9.60 |
Dunedin now stands first, having a higher death-rate than Wellington, which comes next.
The death-rates for the capital cities of Australia are higher than the rates for the principal towns in New Zealand. A comparison is given below, in which the figures for 1891 and 1892 are stated:—
| Deaths per 1,000 of Population. | ||
|---|---|---|
| Principal Cities. | 1891. | 1892. |
| Perth | 26.95 | 27.22 |
| Hobart | 24.15 | 22.12 |
| Melbourne | 19.05 | 15.98 |
| Adelaide | 16.96 | 14.11 |
| Sydney | 16.36 | 13.58 |
| Brisbane | 13.97 | 14.02 |
| Auckland | 13.63 | 12.52 |
| Wellington | 14.60 | 12.27 |
| Christchurch | 11.40 | 11.89 |
| Dunedin | 13.54 | 11.59 |
It is interesting to compare the death-rates for nine towns of the United Kingdom with those given above:—
| Deaths per 1,000 of Population. | |
|---|---|
| Dublin | 30.6 |
| Manchester | 28.7 |
| Liverpool | 23.7 |
| Glasgow | 23.2 |
| Edinburgh | 19.8 |
| Birmingham | 19.7 |
| London | 19.6 |
| Derby | 17.1 |
| Brighton | 16.9 |
The death-rate of Brighton is the lowest of those of fifty-nine towns in the United Kingdom for which the rates are stated in the Victorian Year-book of 1892, but is nevertheless considerably higher than the rate in any of the four centres of this colony.
| Capital Cities.* | Estimated Mean Population. | Births. | Deaths. | Excess of Births over Deaths. | |||
|---|---|---|---|---|---|---|---|
| Total Number. | Number per 1,000 of the Population. | Total Number. | Number per 1,000 of the Population. | Numerical. | Centesimal. | ||
|
* With suburbs. † If the births and deaths occurring in hospitals, asylums, &c., be excluded, the rate per 1,000 of the population of Greater Melbourne of births would be 34.53, and of deaths, 13.13, whilst the excess of births over deaths would be 10,214, or 163 per cent. ‡ The figures in this line have been partly derived from estimates made in the offices of the Government Statist, Melbourne. | |||||||
| Melbourne | 481,550 | 17,399 | 36.13† | 7,697 | 15.98† | 9,702† | 126† |
| Sydney | 405,820 | 14,070 | 34.67 | 5,512 | 13.58 | 8,558 | 155 |
| Brisbane‡ | 98,900 | 3,627 | 36.67 | 1,387 | 14.02 | 2,240 | 161 |
| Adelaide | 134,670 | 4,432 | 32.91 | 1,900 | 14.11 | 2,532 | 133 |
| Perth | 10,580 | 471 | 44.52 | 288 | 27.22 | 183 | 63 |
| Hobart | 34,450 | 1,097 | 31.84 | 762 | 22.12 | 335 | 44 |
| Wellington | 35,348 | 1,013 | 28.66 | 438 | 12.39 | 575 | 131 |
The estimated population of Greater Melbourne at the end of 1892 was 474,810, as compared with 491,942 at the same period of the previous year. There was thus an apparent decrease of 17,132, or about 3 1/2 per cent.
The infantile mortality for the year 1892 was highest at Christchurch. Compared with 1891, the rates for Christchurch and Auckland show an increase, but those for Wellington and Dunedin a diminished rate. The proportion of deaths of children under 1 year of age to every 100 births for each of five years is exhibited by the following statement:—
| 1888. | 1889. | 1890. | 1891. | 1892. | Mean of Five Years. | |
|---|---|---|---|---|---|---|
| Auckland | 11.36 | 10.80 | 9.89 | 13.36 | 14.28 | 11.94 |
| Wellington | 10.41 | 12.42 | 9.77 | 12.14 | 11.50 | 11.25 |
| Christchurch | 13.23 | 13.11 | 11.94 | 12.71 | 16.81 | 13.56 |
| Dunedin | 7.30 | 9.59 | 8.22 | 9.87 | 9.51 | 8.90 |
Christchurch is thus shown to have had the highest infantile mortality during 1892, and for four out of five consecutive years. Auckland has the next highest rate, both for 1892 and generally. At Wellington the mean for five years is nearly as high as that of Auckland. At Dunedin the mortality amongst infants is decidedly lower throughout than at the other three towns.
The infantile mortality of Greater Melbourne for 1891 was as high as 15.88 per 100 births, the rate for Sydney being nearly the same as that of Melbourne, and those for Brisbane and Adelaide higher.
Of the persons who died in 1892, 256 males and 209 females were at or over 75 years of age. Of these, 116 males and 90 females were under 80 years of age, 88 males and 65 females were 80 and under 85, 40 males and 37 females were from 85 to under 90, 12 males and 14 females were from 90 to 95, 2 females were between 95 and 100 years, and 1 female reached the age of 100 years.
The combined ages of all the males who died amounted to 124,986 years, and those of the females to 77,241 years, giving an average age at death of 32.97 years for the males and 28.95 years for the females.
The average age at death of persons of each sex, in each of the past five years, was as follows:—
| Males. | Females. | |
|---|---|---|
| 1883 | 32.16 years | 27.85 years. |
| 1889 | 32.29 years | 27.69 years |
| 1890 | 33.81 years | 28.62 years |
| 1891 | 33.11 years | 29.25 years |
| 1892 | 32.97 years | 28.95 years |
More males than females are born annually, and more male than female infants die in proportion to the number of each sex born. In 1892 the number of male children born was 9,101, and the number of deaths of male infants under 1 year of age was 910, being at the rate of 100 in every 1,000 born; the number of females born was 8,775, and the number that died under 1 year of age was 684, being in the proportion of 78 in every 1,000 born.
Subjoined is a classified statement of the deaths of infants under 1 year during 1892, with the ratio of the deaths in each class to the 1,000 births during the year:—
| Year. | Sex. | Under 1 Month. | 1 and under 3 Months. | 3 and under 6 Months. | 6 and under 12 Months. | Total under 12 Months. |
|---|---|---|---|---|---|---|
| Number of Deaths. | ||||||
1892 | Male | 326 | 184 | 188 | 212 | 910 |
| Female | 227 | 131 | 154 | 172 | 684 | |
| Deaths to the 1,000 Births. | ||||||
1892 | Male | 35.82 | 20.22 | 20.66 | 23.29 | 99.99 |
| Female | 25.87 | 14.93 | 17.55 | 19.60 | 77.95 | |
It will be seen from these figures that the chances of living during the first year of age are far stronger in favour of female than of male infants. Thus, during the year 1892 there were—
| 100 deaths of males to 69.63 | deaths of females under 1 month of age; |
| 100 deaths of males to 71.20 | deaths of females from 1 to 3 months of age; |
| 100 deaths of males to 81.91 | deaths of females from 3 to 6 months of age; |
| 100 deaths of males to 81.13 | deaths of females from 6 to 12 months of age; |
| 100 deaths of males to 75.16 | deaths of females under 12 months of age. |
The rates of infantile mortality—that is, the proportion the deaths of children under 1 year of age bear to the births—are higher in the Australian Colonies than in New Zealand. The following table gives the rate in the several colonies named for each of the ten years 1881–90:—
| Year. | Queens-land. | New South Wales. | Victoria. | South Australia. | Tasmania. | New Zealand. |
|---|---|---|---|---|---|---|
| 1881 | 11.17 | 11.56 | 11.49 | 12.74 | 10.34 | 9.24 |
| 1882 | 13.95 | 13.12 | 13.91 | 15.19 | 10.36 | 8.83 |
| 1883 | 13.34 | 11.48 | 11.44 | 14.56 | 12.39 | 10.39 |
| 1884 | 14.74 | 12.62 | 11.37 | 13.42 | 9.98 | 7.93 |
| 1885 | 14.85 | 13.12 | 12.57 | 11.34 | 11.26 | 8.92 |
| 1886 | 12.59 | 12.85 | 12.73 | 12.62 | 10.48 | 9.84 |
| 1887 | 11.29 | 10.59 | 13.00 | 11.12 | 10.09 | 9.38 |
| 1888 | 12.07 | 11.09 | 12.75 | 9.59 | 9.43 | 7.07 |
| 1889 | 13.62 | 12.50 | 15.21 | 9.42 | 10.64 | 7.89 |
| 1890 | 10.05 | 10.45 | 11.74 | 9.65 | 10.55 | 7.87 |
Infantile mortality is as a rule greatest in the large towns, where the population is dense and the sanitary conditions are less favourable than in country districts. The absence in New Zealand of any such large centres of population as are found in some of the Australian Colonies may partially account for the lower rates of infantile mortality in this colony. The following shows the proportion of infantile deaths to births in each of the four principal boroughs in New Zealand during the past seven years:—
| Boroughs. | 1886. | 1887. | 1888. | 1889. | 1890. | 1891. | 1892. |
|---|---|---|---|---|---|---|---|
| Auckland | 17.31 | 14.40 | 11.36 | 10.80 | 9.89 | 13.36 | 14.28 |
| Wellington | 17.26 | 16.16 | 10.41 | 12.42 | 9.77 | 12.14 | 11.50 |
| Christchurch | 15.03 | 12.25 | 13.23 | 13.11 | 11.94 | 12.71 | 16.81 |
| Dunedin | 11.25 | 10.09 | 7.30 | 9.59 | 8.22 | 9.87 | 9.51 |
The following statement gives the classification of diseases, with the percentage of deaths therefrom to the total mortality, and the proportion to the 10,000 of population in each class and order, in the years 1890, 1891, and 1892:—
| Class and Order. | Per 100 Deaths. | Per 10,000 of the Population. | ||||
|---|---|---|---|---|---|---|
| 1890. | 1891. | 1892. | 1890. | 1891. | 1892. | |
| Class I. — Specific Febrile or Zymotic Diseases— | ||||||
| Order 1. Miasmatic diseases | 7.62 | 10.57 | 9.40 | 7.36 | 10.94 | 9.45 |
| Order 2. Diarrhœal diseases | 4.84 | 4.89 | 5.09 | 4.67 | 5.06 | 5.12 |
| Order 3. Malarial diseases | 0.02 | 0.02 | 0.05 | 0.02 | 0.02 | 0.05 |
| Order 4. Zoogenous diseases | .. | 0.02 | .. | .. | 0.02 | .. |
| Order 5. Venereal diseases | 0.30 | 0.20 | 0.18 | 0.29 | 0.21 | 0.19 |
| Order 6. Septic diseases | 0.95 | 1.09 | 0.85 | 0.92 | 1.13 | 0.86 |
| Total Class I... | 13.73 | 16.79 | 15.57 | 13.26 | 17.38 | 15.67 |
| Class II.—Parasitic Diseases | 0.33 | 0.20 | 0.42 | 0.32 | 0.21 | 0.42 |
| Class III.—Dietetic Diseases | 0.77 | 0.95 | 1.30 | 0.74 | 0.98 | 1.31 |
| Class IV.—Constitutional Diseases | 17.80 | 16.32 | 17.51 | 17.19 | 16.89 | 17.61 |
| Class V.—Developmental Diseases | 7.96 | 7.18 | 7.79 | 7.68 | 7.43 | 7.83 |
| Class VI.—Local Diseases— | ||||||
| Order 1. Diseases of nervous system | 11.19 | 10.23 | 10.76 | 10.81 | 10.59 | 10.82 |
| Order 2. Diseases of organs of special sense | 0.15 | 0.17 | 0.19 | 0.14 | 0.17 | 0.19 |
| Order 3. Diseases of circulatory system | 7.56 | 8.10 | 7.82 | 7.30 | 8.38 | 7.86 |
| Order 4. Diseases of respiratory system | 12.61 | 13.39 | 12.14 | 12.18 | 13.86 | 12.21 |
| Order 5. Diseases of digestive system | 9.23 | 8.42 | 9.40 | 8.91 | 8.72 | 9.45 |
| Order 6. Diseases of lymphatic system and ductless glands | 0.15 | 0.26 | 0.23 | 0.14 | 0.27 | 0.23 |
| Order 7. Diseases of urinary system | 2.67 | 3.41 | 2.63 | 2.58 | 3.53 | 2.68 |
| Order 8. Diseases of reproductive system— | ||||||
| (a) Of organs of generation | 0.43 | 0.29 | 0.36 | 0.42 | 0.30 | 0.36 |
| (b) Of parturition | 1.34 | 1.04 | 0.80 | 1.29 | 1.08 | 0.81 |
| Order 9. Diseases of organs of locomotion | 0.23 | 0.32 | 0.32 | 0.22 | 0.33 | 0.33 |
| Order 10. Diseases of integumentary system | 0.35 | 0.25 | 0.22 | 0.34 | 0.25 | 0.22 |
| Total Class VI. | 45.91 | 45.88 | 44.90 | 44.33 | 47.48 | 45.16 |
| Class VII.—Violence— | ||||||
| Order 1. Accident or negligence | 7.51 | 6.80 | 7.12 | 7.25 | 7.03 | 7.16 |
| Order 2. Homicide | 0.11 | 0.11 | 0.16 | 0.11 | 0.11 | 0.16 |
| Order 3. Suicide | 1.07 | 0.86 | 0.91 | 1.03 | 0.89 | 0.92 |
| Order 4. Execution | .. | .. | .. | .. | .. | .. |
| Total Class VII. | 8.69 | 7.77 | 8.19 | 8.39 | 8.03 | 8.24 |
| Class VIII.—Ill-defined and Not-specified Causes | 4.81 | 4.91 | 4.32 | 4.64 | 5.08 | 4.34 |
The deaths in 1892 from specific, febrile, or zymotic diseases amounted to 1,006, a proportion of 157 in every 100,000 persons living, and a decrease of 88 compared with the deaths in 1891 from the same causes. The mortality from diphtheria was more than double that of 1891, and there was a slight increase in the deaths from diarrhœal diseases, typhoid fever, and puerperal fever; but a greatly diminished mortality from scarlet fever, whooping-cough, and influenza.
The following are the diseases in this class which caused the greatest mortality in the past eight years:—
| Diseases. | 1885. | 1886. | 1887. | 1888. | 1889. | 1890. | 1891. | 1892. |
|---|---|---|---|---|---|---|---|---|
| Measles | 1 | 49 | 28 | 5 | 2 | 1 | 1 | .. |
| Scarlet fever and scarlatina | 12 | 7 | 18 | 21 | 19 | 31 | 21 | 4 |
| Diphtheria | 104 | 78 | 92 | 143 | 113 | 116 | 86 | 195 |
| Whooping-cough | 91 | 132 | 138 | 72 | 19 | 82 | 242 | 115 |
| Influenza | 5 | 11 | 9 | 9 | 9 | 70 | 210 | 144 |
| Diarrhœal diseases | 399 | 455 | 475 | 214 | 355 | 290 | 319 | 329 |
| Enteric or typhoid fever | 118 | 123 | 158 | 130 | 118 | 145 | 119 | 134 |
| Puerperal fever | 48 | 33 | 24 | 39 | 25 | 19 | 27 | 29 |
From smallpox there were no deaths. Growing neglect of vaccination has been commented on before; but the records of the year 1892 show still greater disregard to the requirements of the law. The number of children under 1 year of age successfully vaccinated, and the proportion to the total number of those born are given for four years:—
| Year. | Children under 1 Year Successfully Vaccinated. | Proportion of Successful Vaccinations of Children under 1 Year of Age to Total Births. |
|---|---|---|
| 1889 | 8,928 | 48.37 per cent. |
| 1890 | 7,798 | 42.66 per cent. |
| 1891 | 7,091 | 38.81 per cent. |
| 1892 | 5,794 | 32.41 per cent. |
Thus it would appear that only one child in every three born is successfully vaccinated, which is a serious matter enough when the possibility of an epidemic of smallpox is taken into consideration.
The proportions of successful vaccinations of all children under 14 years of age to the total of births for the same four years show a similar decrease, the figures being—for the year 1889, 61.55 per cent.; 1890, 51.19 per cent.; 1891, 50.81 per cent.; and 1892, 45.96 per cent.
The deaths in England from smallpox for the year 1891 were only 49 in number; and the deaths caused by the effects of vaccination were 43.
Although the mortality from scarlet fever was lower in 1892 (the deaths numbering only 4) than in any year since 1885, the deaths from diphtheria show a most formidable increase, from 86 in 1891 to 195 in 1892. This disease prevailed most in the Provincial District of Wellington, where there were 74 deaths in 1892, or 38 per cent, of the total number in the colony. The numbers for the various provincial districts were:—
| Provincial Districts. | Total Number. | Males. | Females. |
|---|---|---|---|
| Wellington | 74 | 33 | 41 |
| Canterbury | 41 | 21 | 20 |
| Taranaki | 27 | 12 | 15 |
| Otago | 19 | 11 | 8 |
| Nelson | 11 | 4 | 7 |
| Auckland | 9 | 3 | 6 |
| Hawke's Bay | 9 | 5 | 4 |
| Marlborough | 4 | 2 | 2 |
| Westland | 1 | 1 |
Though the deaths from whooping-cough were far fewer in 1892 than in 1891, the number was greater than in 1890, and six times as great as in 1889. The deaths from influenza show the existence of an epidemic, for in 1887, 1888, and 1889 there were only 27 deaths from this cause, 9 in each year, but in 1891 and 1892 the numbers were 210 and 144 respectively. From diarrhœal diseases the mortality in 1892 was slightly greater than in 1890 and 1891, but not so great as in 1889.
The death-rate from these diseases fluctuates considerably from year to year, and, though not invariably, often rises and falls with the varying temperature of seasons and years. The following table, showing the mean maximum temperature in the summer months at the stations specified, exhibits the rise or fall of mortality from diarrhœal diseases with the rise and fall of temperature:—
| 1887. | 1888. | 1889. | 1890. | 1891. | 1892. | |
|---|---|---|---|---|---|---|
| Fahr. | Fahr. | Fahr. | Fahr. | Fahr. | Fahr. | |
| ° | ° | ° | ° | ° | ° | |
| Auckland | 76.53 | 70.77 | 74.46 | 73.60 | 73.07 | 73.93 |
| Wellington | 71.83 | 67.00 | 68.83 | 69.30 | 67.77 | 69.57 |
| Lincoln | 74.30 | 71.03 | 72.47 | 70.26 | 70.57 | 69.60 |
| Dunedin | 71.77 | 66.13 | 67.83 | 68.00 | 63.93 | 64.20 |
| Averages | 73.60 | 68.73 | 70.89 | 70.29 | 68.84 | 69.33 |
Deaths in year from diarrhœal diseases
per 10,000 persons living | 7.96 | 3.53 | 5.78 | 4.67 | 5.06 | 5.12 |
The mortality from typhoid fever was higher in 1892 than in 1891, the numbers of deaths being 134 and 119. The proportion per 10,000 persons living was 2.9 in 1892, against 1.89 in 1891. For the years 1881.90 the average proportions for the various Australian Colonies are given in the Victorian Year-book, from which it appears that New Zealand has by far the lowest:—
| Queensland | 9.61 per 10,000 persons living. |
| Victoria | 5.69 per 10,000 persons living. |
| New South Wales | 4.77 per 10,000 persons living. |
| Tasmania | 4.76 per 10,000 persons living. |
| South Australia | 4.18 per 10,000 persons living. |
| New Zealand | 2.48 per 10,000 persons living. |
The rate for England and Wales for the period 1881–90 was even lower than in New Zealand, being only 2.23 per 10,000 living, though not so low as for this colony in 1891 and 1892.
There are more deaths from phthisis than from any other cause. The number of deaths was 495 in 1891 and 524–276 males and 248 females—in 1892. The deaths in 1892 were in the proportion of 8.16 in every 10,000 persons living. The rate among males was lower—8.10 per 10,000 persons living—than among females, who suffered in the proportion of 8.22 per 10,000.
The death-rate from phthisis in New Zealand is the lowest for the Australasian Colonies, as will be seen from the figures quoted below:—
| Rate per 10,000 Persons. | ||
|---|---|---|
| Colonies. | Years 1881–90. | Year 1890. |
|
* High rate due to deaths of Polynesians. †10.47 excluding deaths of Polynesians. | ||
| Queensland | *15.15 | †13.35 |
| Victoria | 14.34 | 14.58 |
| New South Wales | 10.62 | 9.34 |
| South Australia | 10.47 | 9.29 |
| Tasmania | 10.37 | 9.60 |
| New Zealand | 8.74 | 8.38 |
In all the Australasian Colonies the rate is materially increased by the deaths of persons who have come out either already suffering from phthisis or predisposed thereto. There is no reason for believing that this is any truer of Australia than of New Zealand; so that the lower rate obtaining in this colony may be taken as an indication of the superiority of its climate for withstanding consumptive tendencies. The death-rate from this cause in New Zealand is about half of that for England.
A table is given, as in previous years, to show the ages, with the length of residence in the colony, of persons who died from phthisis in 1892:—
| Length of Residence in the Colony. | Age at Death. | ||||||||||
|---|---|---|---|---|---|---|---|---|---|---|---|
| Under 5 Years. | 5 to 10. | 10 to 15. | 15 to 25. | 25 to 35. | 35 to 45. | 45 to 55. | 55 to 65. | 65 to 75. | 75 and upwards. | Total | |
| Males. | |||||||||||
| Under 1 month | .. | .. | .. | 1 | 3 | 1 | .. | .. | .. | .. | 5 |
| 1 to 6 months | .. | .. | .. | 2 | 4 | .. | .. | .. | .. | .. | 6 |
| 6 to 12 months | .. | .. | .. | 1 | 3 | 1 | .. | .. | .. | .. | 5 |
| 1 to 2 years | .. | .. | .. | 2 | 2 | .. | .. | .. | .. | .. | 4 |
| 2 to 3 years | .. | .. | .. | 2 | 3 | 1 | .. | .. | .. | .. | 6 |
| 3 to 4 years | .. | .. | .. | .. | 1 | 1 | .. | .. | .. | .. | 2 |
| 4 to 5 years | .. | .. | .. | 1 | .. | .. | .. | .. | .. | 1 | |
| 5 to 10 years | .. | .. | .. | 1 | 8 | .. | 4 | 1 | 1 | .. | 15 |
| 10 to 15 years | .. | .. | .. | 1 | 6 | 4 | 2 | 5 | .. | .. | 18 |
| 15 to 20 years | .. | .. | .. | 3 | 6 | 14 | 6 | 4 | 1 | .. | 34 |
| 20 to 25 years | .. | .. | .. | .. | 4 | 5 | 4 | 2 | 1 | 1 | 17 |
| 25 years and upwards | .. | .. | .. | .. | 2 | 7 | 15 | 17 | 5 | .. | 46 |
| Not known | .. | .. | .. | 3 | 6 | 5.. | 6 | 5 | 1 | 1 | 27 |
| Born in colony | 2 | 2 | 3 | 44 | 26 | 12 | 1 | .. | .. | .. | 90 |
| Totals | 2 | 2 | 3 | 61 | 74 | 51 | 38 | 34 | 9 | 2 | 276 |
| Females. | |||||||||||
| 1 to 6 months | .. | .. | .. | .. | 2 | .. | .. | .. | .. | .. | 2 |
| 6 to 12 months | .. | .. | .. | .. | 1 | .. | .. | .. | .. | .. | 1 |
| 1 to 2 years | .. | .. | .. | .. | 1 | .. | .. | .. | .. | .. | 1 |
| 2 to 3 years | .. | .. | .. | .. | 1 | .. | 1 | .. | .. | .. | 2 |
| 3 to 4 years | .. | .. | .. | .. | .. | .. | .. | .. | .. | .. | .. |
| 4 to 5 years | .. | .. | .. | .. | .. | .. | .. | .. | .. | .. | .. |
| 5 to 10 years | .. | .. | 1 | 3 | 7 | 3 | 1 | .. | .. | .. | 15 |
| 10 to 15 years | .. | .. | .. | 5 | 9 | 6 | 2 | .. | .. | .. | 22 |
| 15 to 20 years | .. | .. | .. | 8 | 8 | 9 | 6 | 2 | .. | .. | 33 |
| 20 to 25 years | .. | .. | .. | 4 | 1 | 2 | 3 | .. | .. | .. | 10 |
| 25 years and upwards | .. | .. | .. | .. | 9 | 4 | 16 | 3 | 2 | 1 | 35 |
| Not known | .. | .. | 1 | 1 | 3 | 1 | 2 | .. | .. | .. | 8 |
| Born in colony | 6 | .. | 7 | 71 | 29 | 6 | .. | .. | .. | .. | 119 |
| Totals | 6 | .. | 9 | 92 | 71 | 31 | 31 | 5 | 2 | 1 | 248 |
| Totals of both sexes | 8 | 2 | 12 | 153 | 145 | 82 | 69 | 39 | 11 | 3 | 524 |
Cancer was given as the cause of 307 deaths in 1892. In 1891 the number of deaths from this disease was 295; in 1890, 295; in 1889, 260; and in 1888, 263. The increase in the mortality from cancer in New Zealand, as well as in England, is considerable. In reference to this subject, the Registrar-General of England made the following remarks in his fifty-second report:—
To what causes such increase may be due is a question outside a purely statistical report; but it may be pointed out that, if it be true, as appears to be the general though not the universal opinion of medical experts, that the development of new growths is often due to a constitutional and inheritable tendency, and if, as undoubtedly is the case, such development does not, as a rule, manifest itself till after the usual age of marriage and of parturition, it must follow as a necessary arithmetical consequence that the tendency will spread wider and wider among the population. In the case of a disease such as tubercular phthisis, which in a large proportion of cases manifests itself before the age of marriage, there will be—at any rate, to a certain extent—a constant, if an insufficient, weeding-out from the candidates for matrimony of those who are most seriously liable to this disease; but in the case of cancer there will be no such preservative influence, and, so long as persons with this inherited tendency marry, practically without let or hindrance of any kind, there must, as already said, be a constantly-growing proportion of the population that shares in the constitutional defect.
The rapidity of the increase in the death-rate from cancer, both in England and in New Zealand, is shown by the following table:—
| Year. | Now Zealand. | England. |
|---|---|---|
| 1881 | 2.69 | 5.20 |
| 1882 | 2.89 | 5.34 |
| 1883 | 2.99 | 5.49 |
| 1884 | 3.46 | 5.63 |
| 1885 | 3.13 | 5.72 |
| 1886 | 3.68 | 5.90 |
| 1887 | 3.99 | 6.15 |
| 1888 | 4.34 | 6.21 |
| 1889 | 4.25 | 6.56 |
| 1890 | 4.75 | 6.76 |
| 1891 | 4.68 | 6.92 |
| 1892 | 4.78 | .. |
The increase, especially in the case of deaths of males, has been deemed to be partially due to improved diagnosis and a more careful definition of the cause of death; but, as medical practitioners conversant with the treatment of this disease are of opinion that it is becoming more common, the increase shown by the death-registers may be considered as to a large extent an actual one, and more especially so in the case of females, as cancerous affections among them are less difficult of recognition than among males.
The following table gives the death-rates from cancer of males find females for the past ten years:—
| Year. | Males. | Females. |
|---|---|---|
| 1883 | 2.70 | 3.32 |
| 1884 | 3.26 | 3.69 |
| 1885 | 2.82 | 3.43 |
| 1886 | 3.69 | 3.67 |
| 1887 | 3.96 | 4.03 |
| 1888 | 4.19 | 4.53 |
| 1889 | 3.47 | 4.06 |
| 1890 | 4.72 | 4.79 |
| 1891 | 4.61 | 4.77 |
| 1892 | 5.08 | 4.44 |
Violent deaths form a very large proportion of the total mortality. In the year 1892 the proportion per 10,000 of males living was 12.89, and the proportion in the same number of females 2.98. Differently expressed, one out of every 776 males living, and one out of every 3,356 females, met with a violent death.
Of 439 males who died violent deaths, 54, or 12.30 per cent., were suicides. The deaths of females by violence were far fewer, amounting to no more than 90, and out of these only 5 committed suicide, a proportion of 5.55 per cent. The following gives the number of deaths from external or violent causes for the year 1892:—
| Accident or negligence— | Males. | Females. |
|---|---|---|
| Fractures, &c. | 160 | 10 |
| Gunshot wounds | 6 | .. |
| Cut, stab | 6 | 1 |
| Burns and scalds | 22 | 25 |
| Sunstroke | 4 | 1 |
| Poison | 6 | 6 |
| Drowning | 142 | 25 |
| Suffocation | 13 | 8 |
| Otherwise, or unspecified | 18 | 7 |
| 377 | 83 | |
| Homicide— | ||
| Murder or manslaughter | 8 | 2 |
| Suicide— | ||
| Gunshot wounds | 8 | .. |
| Cut, stab | 8 | .. |
| Poison | 9 | 1 |
| Drowning | 9 | 1 |
| Hanging | 13 | 3 |
| Unspecified | 7 | .. |
| 54 | 5 |
The accidental deaths in 1891 were 362 males and 81 females; and suicides, 48 males and 8 females.
The following figures, taken from the Victorian Year-book of 1892, show the death-rate from violence in the Australasian Colonies and the United Kingdom, from which it would appear that New Zealand has a higher rate than the Home-country, South Australia, Victoria, and Tasmania, but one lower than those in New South Wales, Queensland, and Western Australia:—
| Colonies or Countries. | Proportion per 100,000 living of Deaths by Violence. |
|---|---|
| Queensland | 163.8 |
| Western Australia | 161.7 |
| New South Wales | 111.7 |
| New Zealand | 95.7 |
| Victoria | 94.6 |
| United Kingdom | 77.5 |
| Tasmania | 74.5 |
| South Australia | 74.2 |
The shipping entered inwards for the year 1892 comprised 686 vessels, of 675,223 tonnage—viz., 385 sailing-vessels, of 216,832 tons, and 301 steamers, of 458,391 tons. Entered outwards were 395 sailing-vessels, of 210,501 tons, and 294 steamers, of 445,596 tons, making a total of 689 vessels and 656,100 tons. Of 686 vessels inwards, 203, with 335,577 tonnage, were British; 411, with 265,769 tonnage, colonial, and 72, with 73,877 tons, were foreign.
Of vessels cleared, 189, with 315,633 tons, were British, 424 having 263,504 tons were colonial, and 76, of 76,963 tons, were foreign.
The following table gives the number and tonnage of vessels inwards and outwards, with the numbers of crews, during the past ten years:—
| Year. | Vessels Inwards. | Vessels Outwards. | ||||
|---|---|---|---|---|---|---|
| Number. | Tons. | Crews. | Number. | Tons. | Crews. | |
| 1883 | 805 | 494,926 | 18,385 | 851 | 507,565 | 18,291 |
| 1884 | 852 | 529,188 | 20,717 | 872 | 534,242 | 20,737 |
| 1885 | 786 | 519,700 | 20,252 | 780 | 513,000 | 19,882 |
| 1886 | 725 | 502,572 | 19,525 | 707 | 488,331 | 19,052 |
| 1887 | 653 | 489,754 | 19,806 | 675 | 493,583 | 19,155 |
| 1888 | 683 | 526,435 | 20,783 | 701 | 531,478 | 20,961 |
| 1889 | 781 | 602,634 | 22,649 | 762 | 593,252 | 22,647 |
| 1890 | 744 | 662,769 | 23,475 | 745 | 649,705 | 23,260 |
| 1891 | 737 | 618,515 | 21,889 | 744 | 625,807 | 22,080 |
| 1892 | 686 | 675,223 | 22,038 | 689 | 656,100 | 21,679 |
The above figures apply to the foreign trade only; but in a new country like New Zealand, as yet deficient in roads, but having an extensive seaboard and a number of good harbours, the coastal trade must be relatively very large, as is evidenced by the figures next given:—
| Number | Tons. | |
|---|---|---|
| Sailing-vessels | 3,982 | 253,696 |
| Steamers | 13,303 | 3,882,825 |
The total value of imports for the year 1892 was £6,943,056, or, deducting specie, £6,712,511. The yearly values of imports during the past ten years are subjoined:—
| Year. | Imports, inclusive of Specie. | Imports, exclusive of Specie. |
|---|---|---|
| £ | ||
| 1883 | 7,974,638 | 7,773,966 |
| 1884 | 7,663,888 | 7,326,208 |
| 1885 | 7,479,921 | 7,278,101 |
| 1886 | 6,759,013 | 6,319,223 |
| 1887 | 6,245,515 | 6,064,281 |
| 1888 | 5,941,900 | 5,430,050 |
| 1889 | 6,308,803 | 5,980,583 |
| 1890 | 6,260,505 | 5,928,625 |
| 1891 | 6,503,849 | 6,431,101 |
| 1892 | 6,943,056 | 6,742,544 |
The following is a list of the chief imports during 1892, arranged in groups, with the value set opposite each:—
| £ | |
|---|---|
| Apparel and slops | 357,904 |
| Boots and shoes | 141,968 |
| Cotton piece-goods | 409,140 |
| Drapery | 354,944 |
| Haberdashery | 102,096 |
| Hats and caps | 64,958 |
| Hosiery | 78,209 |
| Linen manufactures | 53,443 |
| Millinery | 24,946 |
| Silks | 09,714 |
| Woollen piece - goods and blankets | 214,521 |
| Total | 1,871,843 |
| Agricultural implements | 6,184 |
| Cutlery | 20,148 |
| Hardware and ironmongery | 193,402 |
| Iron rails and railway-bolts, &c. | 6,473 |
| Iron, other—pig, wrought, wire, &c. | 450,880 |
| Machinery | 183,013 |
| Nails | 31,475 |
| Railway plant | 17,537 |
| Sewing-machines | 22,084 |
| Steel and steel rails | 25,225 |
| Tools, artificers' | 44,494 |
| Total | £1,000,915 |
| Sugar | 408,400 |
| Tea | 139,876 |
| Total | 548,276 |
| Beer | 57,183 |
| Spirits | 164,798 |
| Tobacco | 121,664 |
| Wine | 48,012 |
| Total | 391,657 |
| Paper | 119,170 |
| Printed books | 107,422 |
| Stationery | 79,587 |
| Total | 306,179 |
| Bags and sacks | 79,465 |
| Coals | 116,553 |
| Fancy goods | 78,825 |
| Fruits (including fresh, preserved, bottled, dried) | 121,308 |
| Oils | 119,533 |
| Other imports (excluding specie) | 2,117,930 |
| Total (excluding specie) | 6,742,544 |
| Specie imported | 200,512 |
| Total imports | £6,943,056 |
The import of any article in a given year is seldom identical with the amount consumed in that time. To ascertain the latter we must look to the quantity actually entered at the Customs for home consumption and subjected to duty within the twelve months. Thus, the quantity of sugar, including glucose, molasses, and treacle, entered for consumption in 1892 was 58,241,856lb., which gave an average of 90.68lb. for every person, exclusive of Maoris; but the persons of this race are estimated to consume, on an average, about one-fourth as much as Europeans. By deducting the quantity estimated to be consumed by Maoris, the average annual consumption of sugar per head of the European population is found to be 89.23lb.
The quantity of tea entered for consumption in 1892 was 4,088,349lb. Supposing Maoris to use, on an average, 1lb. per head per annum, the consumption of tea per head of the population, exclusive of Maoris, would be 6.30lb. in 1892.
The Australasian Colonies seem to be, in proportion to population, the largest tea-consumers in the world. The amount annually used in New South Wales is estimated to be 7.8lb. per head. The consumption of Victoria has been given by the Government Statist of that colony as 10.7lb., and of Tasmania as 5.35lb.; the figures for the United Kingdom being 4.70lb., for Canada 3.69lb., and for the United States 1.40lb. The consumption in New Zealand is thus somewhat less than in Victoria or New South Wales, but greater per head of population than in the other places.
The following table gives the consumption per head of alcoholic liquors by the population, including and excluding Maoris, showing separately the proportion of beer, wine, and spirits for the last ten years. To the amount of beer manufactured in the colony in each year, on which excise duty was paid, has been added the amount brought into consumption from imports:—
| Year. | Beer. | Spirits. | Wine | |||
|---|---|---|---|---|---|---|
| Excluding Maories. | Including Maoris. | Excluding Maories. | Including Maoris. | Excluding Maories. | Including Maoris. | |
| Gal. | Gal. | Gal. | Gal. | Gal. | Gal. | |
| 1883 | 9.435 | 8–709 | 1.088 | 1.005 | 0.315 | 0.291 |
| 1884 | 8.769 | 8.121 | 0.999 | 0.923 | 0.272 | 0.253 |
| 1885 | 8.414 | 7.840 | 0.899 | 0.825 | 0.261 | 0.243 |
| 1886 | 7.861 | 7.333 | 0.820 | 0.765 | 0.212 | 0.198 |
| 1887 | 7.651 | 7.148 | 0.770 | 0.719 | 0.198 | 0.185 |
| 1888 | 7.133 | 6.670 | 0.820 | 0.767 | 0.167 | 0.156 |
| 1889 | 7.624 | 7.136 | 0.598 | 0.560 | 0.176 | 0.165 |
| 1890 | 7.899 | 7.402 | 0.693 | 0.649 | 0.184 | 0.172 |
| 1891 | 7.646 | 7.168 | 0.699 | 0.655 | 0.172 | 0.161 |
| 1892 | 7.807 | 7.328 | 0.708 | 0.664 | 0.174 | 0.163 |
The quantity of tobacco entered for use in 1892 was 1,376,868lb. This gave a consumption per head of population—including Maoris, who are heavy smokers—of 2.011b. For the five years 1888–92 the average per head was 1.94lb.
Subjoined are the values of imports from various countries for 1892, arranged in order of magnitude:—
| £ | |
|---|---|
| United Kingdom | 4,767,369 |
| Australia and Tasmania | 1,112,099 |
| United States | 381,627 |
| India and Ceylon | 171,716 |
| Fiji and Norfolk Island | 165,315 |
| Germany | 89,810 |
| Mauritius | 55,031 |
| Hong Kong and China | 51,866 |
| Pacific Islands | 45,191 |
| Java | 30,519 |
| France | 13,519 |
| Philippine Islands | 13,102 |
| Singapore | 12,787 |
| Japan | 8,342 |
| Belgium | 6,515 |
| Canada | 4,148 |
| Holland | 2,975 |
| Portugal | 2,519 |
| Italy | 1,962 |
| Greece | 1,753 |
| Asia Minor | 1,667 |
| Egypt | 1,060 |
| Switzerland | 759 |
| Spain | 404 |
| Austria | 367 |
| Malta and Gibraltar | 107 |
| Canary Islands | 87 |
| Sweden | 61 |
| Denmark | 31 |
| Brazil | 30 |
| Cape Colony | 25 |
| Norway | 13 |
| Whale-fisheries | 245 |
| Total | £6,943,056 |
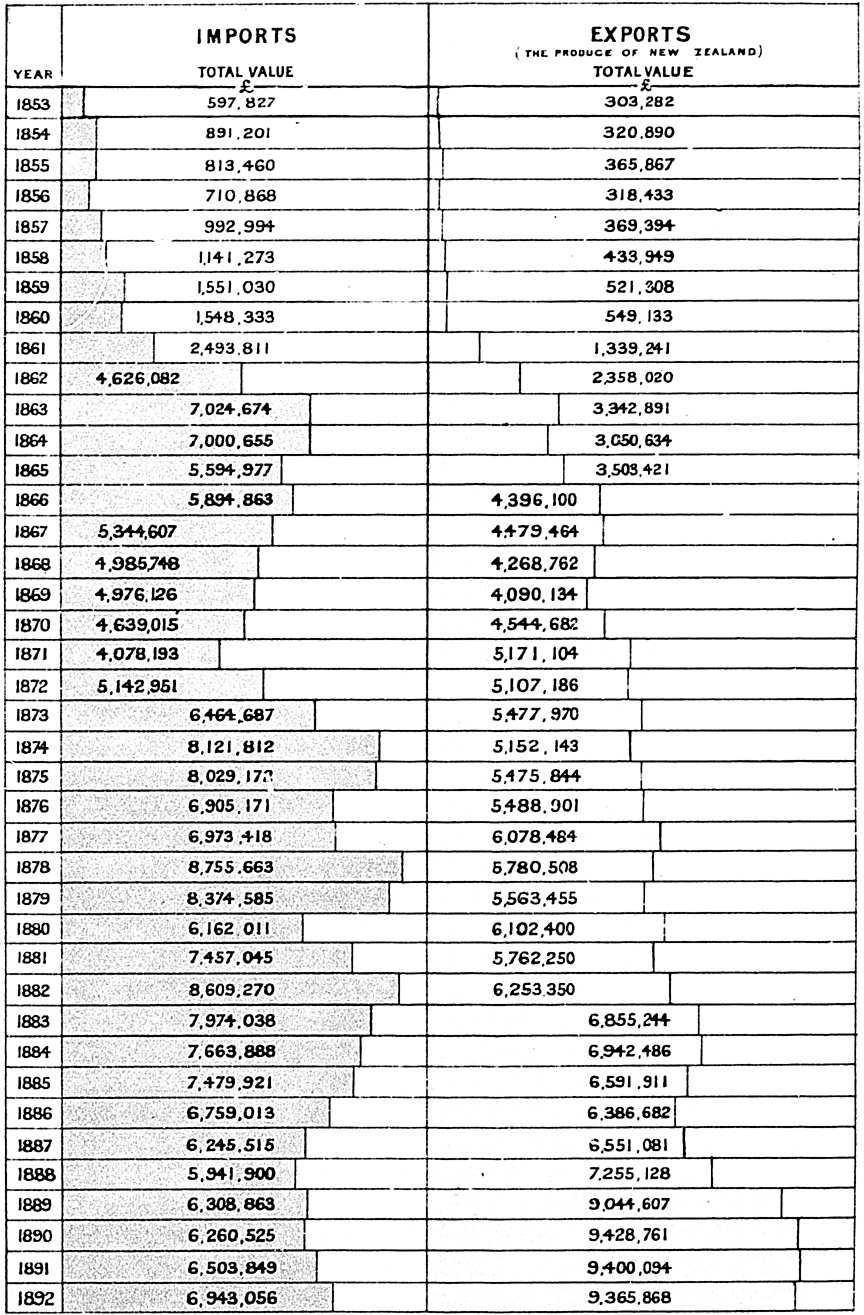
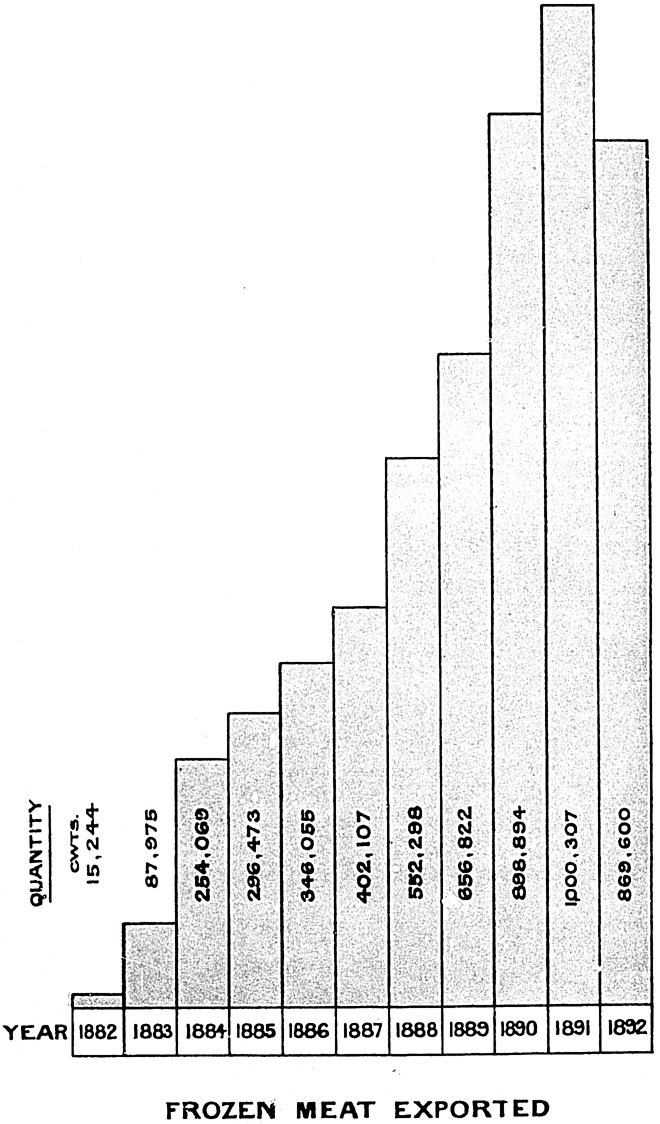
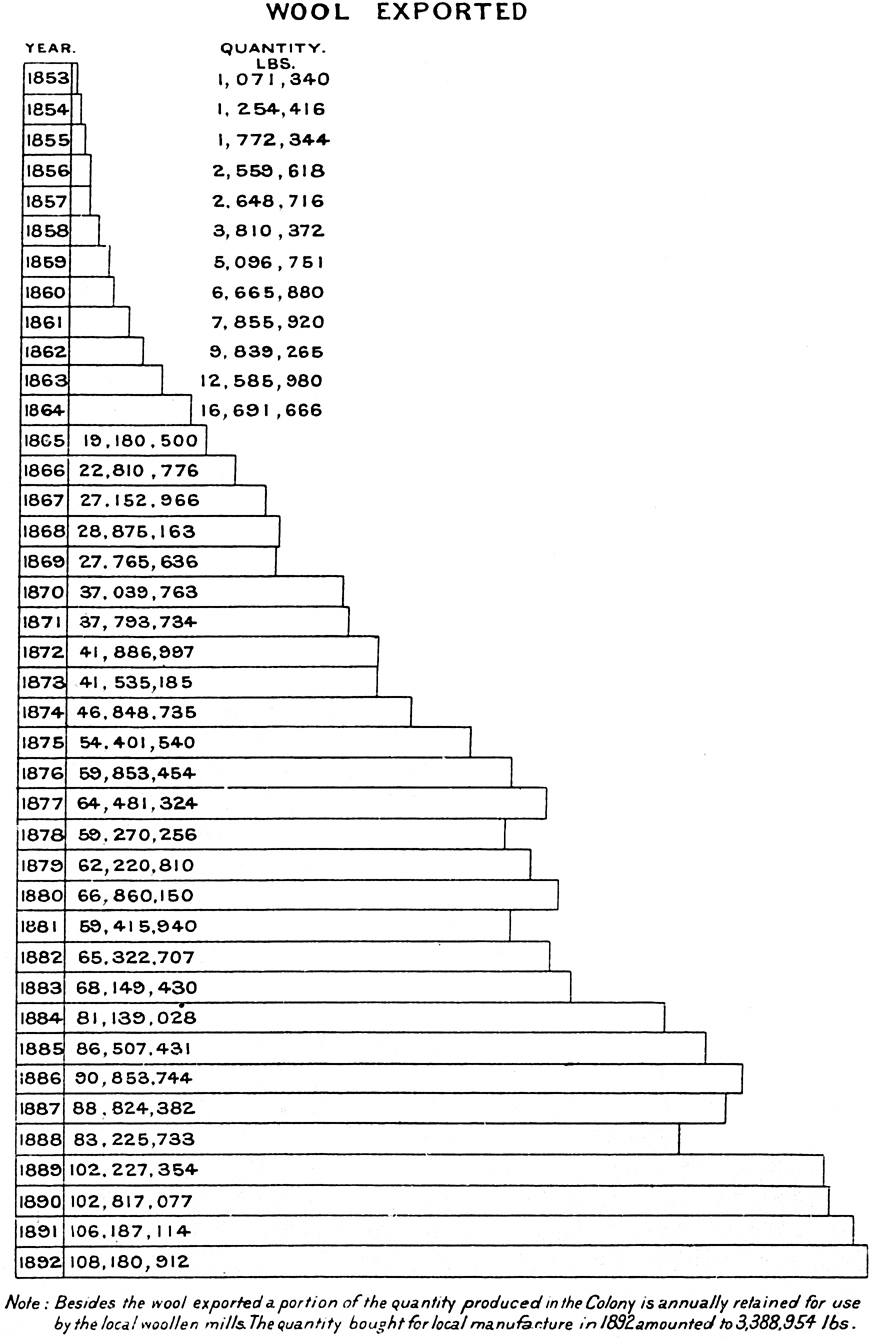
The values of imports in each provincial district during 1892 were as under:—
| £ | |
|---|---|
| Auckland | 1,667,499 |
| Taranaki | 43,269 |
| Hawke's Bay | 221,499 |
| Wellington | 1,607,053 |
| Marlborough | 18,254 |
| Nelson | 151,141 |
| Westland | 43,885 |
| Canterbury | 1,304,862 |
| Otago | 1,860,733 |
The value of imports by parcel-post (£24,861) must be added to the above figures, in order to make up the total of £6,943,056.
The value of all the exports in 1892 was £9,534,851; the value of New Zealand produce exported £9,365,868, being at the rate of £11s. 8d. per head of population. The following table gives the values of the several exports of New Zealand produce in each of the past ten years:—
| Year | Wool. | Gold. | Frozen Meat. | Butter and Cheese. | Agricultural Produce. | Manufactures | Other N.Z. Produce. | Total. |
|---|---|---|---|---|---|---|---|---|
| £ | £ | £ | £ | £ | £ | £ | £ | |
| 1883 | 3,014,211 | 892,445 | 118,328 | 48,912 | 1,537,015 | 121,446 | 1,122,887 | 6,855,244 |
| 1834 | 3,267,527 | 988,953 | 345,090 | 91,667 | 968,517 | 104,425 | 1,176,307 | 6,942,486 |
| 1885 | 3,205,275 | 890,056 | 373,857 | 138,129 | 688,415 | 120,539 | 1,175,640 | 6,591,911 |
| 1886 | 3,072,971 | 934,648 | 427,193 | 151,194 | 668,804 | 109,656 | 997,216 | 6,386,682 |
| 1887 | 3,321,074 | 747,878 | 455,870 | 109,383 | 588,022 | 124,382 | 1,204,372 | 0,551,081 |
| 1888 | 3,115,098 | 914,309 | 628,800 | 197,170 | 905,907 | 233,383 | 1,260,461 | 7,255,128 |
| 1889 | 3,976,375 | 785,490 | 783,374 | 213,945 | 1,424,297 | 569,880 | 1,288,647 | 9,042,008 |
| 1890 | 4,150,599 | 751,300 | 1,087,617 | 207,687 | 1,289,864 | 547,947 | 1,393,687 | 9,428,761 |
| 1891 | 4,129,686 | 1,007,172 | 1,194,724 | 236,933 | 894,467 | 420,357 | 1,516,755 | 9,400,094 |
| 1892 | 4,313,307 | 951,963 | 1,033,377 | 318,204 | 1,035,637 | 367,677 | 1,345,703 | 9,365,868 |
The most important items of export under the heading “Other New Zealand Produce” are coal, silver, and minerals, kauri-gum, timber, bacon, salted and preserved meats, tallow, sheep- and rabbit-skins, hides, horses, and sausage-skins. The aggregate value of these in 1892 was £1,288,075. The declared values of the chief articles exported are given in the table immediately below:—
| The Mine. | £ |
|---|---|
| Coal | 80,225 |
| Gold | 951,963 |
| Silver and minerals | 12,757 |
| Total | 1,044,945 |
| The Fisheries. | |
| Fish | 7,717 |
| Oysters | 3,795 |
| Other | 665 |
| Total | 12,177 |
| The Forest. | £ |
| Fungus | 5,274 |
| Kauri-gum | 517,678 |
| Timber— | |
| Sawn and hown | 87, 581 |
| Other | 7,071 |
| Total | 617,604 |
| Animals and Produce. | |
| Bacon and hams | 16,088 |
| Beef and pork (salted) | 10,686 |
| Butter | 227,162 |
| Cheese | 91,042 |
| Hides | 15,148 |
| Live-stock— | |
| Cattle | 3,491 |
| Horses | 12,754 |
| Sheep | 1,980 |
| Pigs and other live-stock | 2,350 |
| Preserved meats | 69,420 |
| Frozen meats | 1,033,377 |
| Rabbit-skins | 121,775 |
| Sausage-skins | 21,919 |
| Sheep-skins and pelts | 156,531 |
| Tallow | 165,513 |
| Wool | 4,313,307 |
| Other | 8,737 |
| Total | 6,271,280 |
| Agricultural Products. | |
| Bran and sharps | 31,712 |
| Chaff | 1,259 |
| Flour | 43,879 |
| Grain— | |
| Barley | 6,742 |
| Beans and peas | 17,229 |
| Maize | 12,470 |
| Malt | 22,638 |
| Oats | 341,610 |
| Wheat | 415,583 |
| Hops | 11,759 |
| Oatmeal | 15,977 |
| Potatoes | 44,431 |
| Seeds (grass and clover) | 59,110 |
| Other | 11,238 |
| Total | 1,035,637 |
| Manufactures. | |
| Ale and beer | 2,123 |
| Apparel | 4,530 |
| Cordage | 2,667 |
| Leather | 77,843 |
| Phormium (New Zealand hemp) | 214,542 |
| Soap | 4,607 |
| Woollen manufactures | 9,940 |
| Other manufactures | 51,425 |
| Total | 367,677 |
| Miscellaneous | 16,548 |
| Total exports (colonial produce and manufactures) | 9,365,868 |
| Specie | 43,931 |
| Other exports (British and foreign) | 125,052 |
| Total exports | £9,534,851 |
The re-export trade of the colony would seem from the subjoined figures to have been almost stationary for the last ten years.
| £ | |
|---|---|
| 1883 | 156,784 |
| 1884 | 147,741 |
| 1885 | 146,951 |
| 1886 | 147,831 |
| 1887 | 129,691 |
| 1888 | 148,078 |
| 1889 | 139,347 |
| 1890 | 140,555 |
| 1891 | 160,765 |
| 1892 | 125,052 |
With these sums may be compared the re-export trade of New South Wales—a colony having less than double the population of New Zealand—which, exclusive of specie, amounted in 1892 to £2,017,559.
The quantity of wool exported in 1892–118,180,912lb.—was greater than in any previous year by 11,993,798lb. The value of the wool exported in 1892 was £4,313,307. The annual production and the increase can be best estimated by taking the exports for the twelve months immediately preceding the commencement of shearing, and adding thereto the quantity used in the colony for manufacturing purposes.
The following shows the produce on that basis for the last ten years, ending respectively on the 30th September:—
| Year ending 30th September. | Quantity Exported. | Quantity Purchased by Local Mills. | Total Annual Produce. |
|---|---|---|---|
| Lb. | Lb. | Lb. | |
| 1883 | 72,842,949 | 1,900,000 | 74,742,949 |
| 1884 | 77,022,894 | 1,580,000 | 78,602,894 |
| 1885 | 78,174,034 | 1,922,932 | 80,096,966 |
| 1886 | 89,485,757 | 1,879,999 | 91,365,756 |
| 1887 | 95,914,181 | 2,001,155 | 97,915,336 |
| 1888 | 89,276,268 | 4,079,563 | 93,355,831 |
| 1889 | 95,618,507 | 3,556,004 | 99,174,511 |
| 1890 | 102,522,185 | 2,979,293 | 105,501,478 |
| 1891 | 108,619,473 | 2,918,073 | 111,537,546 |
| 1892 | 110,860,050 | 3,388,954 | 114,249,004 |
From these figures, it appears that the wool-clip has increased 53 per cent. within the last ten years, and this notwithstanding the large increase in the export of rabbit-skins, from 9,891,805 in number in 1883 to 15,899,787 in 1892, which does not indicate any great relief from the rabbit-pest.
The increase in the wool-production is of course mainly due to the greater number of sheep—namely, 18,570,752 in April, 1892, against 13,384,075 in May, 1883. It will be apparent from the following table that the tendency of increase is in the direction of the multiplication of the smaller flocks, the owners of which would be better able to cope with the rabbit difficulty than the large runholders:—
| Size of Flocks. | 1883. | 1884. | 1885. | 1886. | 1887. | 1888. | 1889. | 1890. | 1891. | 1892. |
|---|---|---|---|---|---|---|---|---|---|---|
| Under 500 | 5,039 | 5,422 | 5,622 | 6,024 | 6,247 | 6,579 | 7,063 | 7,662 | 8,272 | 8,822 |
| 500 and under 1,000 | 970 | 1,033 | 1,146 | 1,189 | 1,139 | 1,182 | 1,381 | 1,528 | 1,691 | 2,033 |
| 1,000 and under 2,000 | 609 | 672 | 718 | 747 | 723 | 794 | 826 | 854 | 969 | 1,193 |
| 2,000 and under 5,000 | 467 | 473 | 505 | 532 | 531 | 524 | 597 | 586 | 666 | 761 |
| 5,000 and under 10,000 | 244 | 256 | 270 | 263 | 289 | 287 | 279 | 283 | 287 | 314 |
| 10,000 and under 20,000 | 200 | 211 | 213 | 228 | 221 | 213 | 239 | 236 | 239 | 231 |
| 20,000 and upwards | 149 | 154 | 157 | 166 | 166 | 166 | 152 | 160 | 169 | 176 |
| Total | 7,678 | 8,221 | 8,631 | 9,149 | 9,310 | 9,745 | 10,537 | 11,309 | 12,293 | 13,530 |
The amount of gold exported in 1892 was 237,393oz., but the produce (represented by the amount entered for duty) was 238,079oz.
The total quantity of gold entered for duty to the 31st December, 1892, which may be reckoned as approximately the amount obtained in the colony, was 12,308,296oz., of the value of £48,387,861.
Frozen meat now takes second place among the exports of New Zealand produce. An account of the development of this industry is given in a special article further on.
To ascertain the total value of the meat-export in 1892 it is necessary to take into consideration, with the amount of £1,033,377, value of frozen meat before stated, the value of preserved meats, £09,420; of salted beef and pork, £10,686; and of bacon and hams, £16,088.
The value of the grain exported in 1892 was £816,272. The grain exports were made up as under:—
| Bushels. | £ | |
|---|---|---|
| Wheat | 2,460,774 | 415,583 |
| Oats | 3,830,444 | 341,610 |
| Barley | 43,578 | 6,742 |
| Malt | 91,979 | 22,638 |
| Maize | 96,650 | 12,470 |
| Peas and beans | 102,100 | 17,229 |
| Total value | £816,272 |
The quantity of butter exported amounted to 53,930cwt., the declared value of which was £227,162. Of this quantity, 41,5083/4 cwt., valued at £170,123, was shipped to the United Kingdom; 6,129 1/2 cwt., value £20,993, to Victoria; and 1,888 1/⅓cwt., value £8,810, to New South Wales.
If the export of butter is to assume any large dimensions it must be through the production of an article suitable to the requirements of the English market, on which the colony must for the present rely. It has been satisfactorily proved that butter from New Zealand can be delivered in good condition in England, and that for good samples remunerative prices are obtainable; but it is necessary that the butter sent should be not only good, but also uniform in quality and colour. Such uniformity can be obtained only by the methods in use in butter-factories. Upon the multiplication of these factories the future of the butter-export trade, with all its great possibilities, seems to depend.
The cheese exported was 41,492 3/4cwt., of a declared value of £91,042, of which 29,999 3/4cwt., valued at £64,534, was sent to the United Kingdom; 5,213 1/2cwt., value £11,517, to Queensland; 3,903 3/4cwt., value £9,149, to Victoria; and 850 1/4cwt., value £2,210, to New South Wales.
The following statement shows the total quantity of butter and cheese exported in the past eight years, and the amount of each sent to the United Kingdom:—
| Year. | Total Export of Butter. | Butter exported to the United Kingdom. | Total Export of Cheese. | Cheese exported to the United Kingdom. |
|---|---|---|---|---|
| Cwt. | Cwt. | Cwt | Cwt. | |
| 1885 | 24,923 | 273 | 15,245 | 272 3/4 |
| 1886 | 23,175 | 635 | 16,429 | 17 |
| 1887 | 17,018 | 6,937 | 23,913 | 9,900 3/4 |
| 1888 | 29,995 | 11,460 | 36,682 | 25,436 1/4 |
| 1889 | 37,955 | 21,099 | 26,558 | 7,633 |
| 1890 | 34,816 | 26,579 | 40,451 | 31,043 |
| 1891 | 39,430 | 28,989 | 39,770 | 29,565 |
| 1892 | 53,930 | 41,509 | 41,493 | 30,000 |
These figures abundantly demonstrate not only our power to place satisfactory produce on the English market, but also the importance of that market as an outlet for our surplus production.
The export of phormium for 1892 shows a falling-off. The market price continues low—averaging barely 17 a ton—a condition of things not encouraging to producers. Any considerable increase in the value of the fibre will doubtless result in temporarily increasing the output; but a large permanent development of this industry depends upon the invention of improvements in the machinery used that will result in lessening the cost of production and improving the quality of the fibre.
There were 8,705 tons of kauri-gum, valued at the rate of 59 9s. a ton, exported from the colony in 1892. This gum is obtained only in the extreme northern part of the colony. A special article is devoted to an account of this industry.
The following table gives the values of the exports from each port in New Zealand for 1892, arranged in order of magnitude :—
| £ | |
|---|---|
| Lyttelton | 1,863,256 |
| Wellington | 1,316,882 |
| Auckland | 1,214,878 |
| Napier | 1,159,147 |
| Dunedin | 1,152,649 |
| Invercargill and Bluff | 693,550 |
| Timaru | 495,104 |
| Oamaru | 275,701 |
| Greymouth | 264,667 |
| Wanganui | 251,566 |
| Poverty Bay | 243,957 |
| Wairau and Picton | 165,011 |
| New Plymouth and Waitara | 140,857 |
| Hokitika | 105,828 |
| Nelson | 57,665 |
| Westport | 51,064 |
| Kaipara | 45,375 |
| Patea | 26,294 |
| Russell | 7,251 |
| Tauranga | 37 |
The total value of the external trade in 1892 was £16,477,907, equivalent to £25 13s. 2d. per head of the population, excluding Maoris. It will be seen from the figures given further on that the ratio of trade to population has varied but little for several years. The highest record was in 1873, when the total trade per head reached £41 19s. 3d., the imports, in consequence of the large expenditure of borrowed money, having then amounted to £22 9s. 4d. per head, against £10 16s. 3d. in 1892.
It has been the practice not to take the Maori population into consideration in estimating the trade per head, for, although they have a certain influence on the amount of trade, that influence is proportionately so much less than in the case of Europeans that a nearer approximation to correctness in respect of the amount per head of the European portion of the population is obtained by excluding than by including them. The effect of including them would be to reduce the proportion from £25 13s. 2d. to £24 1s. 8d.
The values of imports and exports per head of population, excluding Maoris, were, for each of the past ten years, as follow:—
| Year. | Imports per Head. | Exports per Head. | Total. | ||||||
|---|---|---|---|---|---|---|---|---|---|
| £ | s. | d. | £ | s. | d. | £ | s. | d. | |
| 1883 | 15 | 1 | 3 | 13 | 8 | 2 | 28 | 9 | 5 |
| 1884 | 13 | 17 | 4 | 12 | 16 | 8 | 26 | 14 | 0 |
| 1885 | 13 | 4 | 9 | 12 | 1 | 5 | 25 | 6 | 2 |
| 1886 | 11 | 12 | 2 | 11 | 9 | 3 | 23 | 1 | 5 |
| 1887 | 10 | 9 | 5 | 11 | 10 | 3 | 21 | 19 | 8 |
| 1888 | 9 | 16 | 4 | 12 | 16 | 7 | 22 | 12 | 11 |
| 1889 | 10 | 5 | 6 | 15 | 4 | 5 | 25 | 9 | 11 |
| 1890 | 10 | 0 | 2 | 15 | 13 | 8 | 25 | 13 | 10 |
| 1891 | 10 | 6 | 6 | 15 | 3 | 10 | 25 | 10 | 4 |
| 1892 | 10 | 16 | 3 | 14 | 16 | 11 | 25 | 13 | 2 |
The trade with the United Kingdom amounted to £12,250,987, comprising 74.3 per cent, of the total trade.
With the Australian Colonies and Tasmania trade was done during 1892 to the value of £2,479,413, of which New South Wales claimed £1,162,491 and Victoria £1,029,778. The exports to New South Wales amounted in value to £699,933, and the exports to Victoria to £520,646.
The value of the trade between New Zealand and New South Wales and Victoria is here shown:—
| £ | |
|---|---|
| From New South Wales, 1892 | 462,558 |
| From New Victoria, 1892 | 509,132 |
The last two amounts are the values of the imports into New Zealand from the colonies mentioned, not their export value as given in the New South Wales and Victorian returns.
Included in the value of exports from New South Wales is £115,724, the value of the coal sent. Of the exports from Victoria, £120,000 was the value of gold coin.
The trade with Fiji decreased slightly during the year. In 1888 it was £149,839; in 1889, £170,181; in 1890, £184,684; in 1891, £221,603; and in 1892, £214,183. The trade with the other Pacific Islands and Norfolk Island, which increased from £27,727 in 1889 and £135,592 in 1890 to £173,161 in 1891, fell during 1892 to £137,052.
The following table shows the value of the total trade with the United States in each of the past ten years:—
| Year. | Imports from | Exports to | Total Trade. | ||
|---|---|---|---|---|---|
| Atlantic Ports. | Pacific Ports. | Atlantic Ports. | Pacific Ports. | ||
| £ | £ | £ | £ | £ | |
| 1883 | 357,871 | 61,379 | 158,426 | 272,563 | 850,239 |
| 1884 | 300,185 | 48,372 | 183,939 | 30,430 | 562,926 |
| 1885 | 366,873 | 34,659 | 130,053 | 274,825 | 806,410 |
| 1886 | 304,571 | 32,751 | 166,926 | 80,474 | 584,722 |
| 1887 | 263,377 | 35,359 | 241,388 | 168,092 | 708,216 |
| 1888 | 285,864 | 37,205 | 204,302 | 119,414 | 646,785 |
| 1889 | 307,156 | 35,280 | 242,778 | 98,584 | 688,798 |
| 1890 | 321,047 | 34,348 | 364,332 | 218,802 | 938,529 |
| 1891 | 317,913 | 43,882 | 395,386 | 119,822 | 877,003 |
| 1892 | 344,799 | 36,828 | 459,314 | 61,483 | 902,424 |
Of the exports to the United States in 1892 the values of the principal New Zealand products were—kauri-gum, £345,902; phormium, £111,724; gold, £32,342; sheepskins, £3,864; and sausage-skins, £1,865.
The trade with India (including Burmah and Ceylon) reached a total of £175,987. The imports—tea, rice, castor-oil, woolpacks, &c.—were reckoned at £171,716, leaving a balance of only £4,271 for exports. It would appear that ships arriving with cargoes from Calcutta or Rangoon do not return to those places, but load here with wool or other colonial produce for England.
The following table gives the value of the imports and exports of the Australasian Colonies for the year 1892:
| Colony | Total Value of | Excess of | ||
|---|---|---|---|---|
| Imports. | Exports. | Imports over Exports. | Exports over Imports. | |
| * Exclusive of overland trade in live-stock. | ||||
| Queensland* | 4,248,441 | 8,578,071 | .. | 4,329,630 |
| New South Wales | 20,475,848 | 21,920,037 | .. | 1,444,189 |
| Victoria | 17,159,613 | 14,214,546 | 2,945,067 | .. |
| South Australia | 7,395,178 | 7,819,539 | .. | 424,361 |
| Western Australia | 1,391,109 | 882,148 | 508,961 | .. |
| Tasmania | 1,497,171 | 1,346,965 | 150,206 | .. |
| New Zealand | 6,943,056 | 9,534,851 | .. | 2,591,795 |
The trade per head of the population in each of the colonies was as follows:—
| Colony. | Mean Population, 1892. | Imports. | Exports. | Total Trade. | ||||||
|---|---|---|---|---|---|---|---|---|---|---|
| £ | s. | d. | £ | s. | d. | £ | s. | d. | ||
| Queensland | 415,813 | 10 | 4 | 4 | 20 | 12 | 7 | 30 | 16 | 11 |
| New South Wales | 1,181,175 | 17 | 6 | 8 | 18 | 11 | 2 | 35 | 17 | 10 |
| Victoria | 1,162,526 | 14 | 15 | 2 | 12 | 4 | 7 | 26 | 19 | 9 |
| South Australia | 331,234 | 22 | 6 | 6 | 23 | 12 | 2 | 45 | 18 | 8 |
| Western Australia | 55,980 | 24 | 17 | 0 | 15 | 15 | 2 | 40 | 12 | 2 |
| Tasmania | 152,882 | 9 | 15 | 10 | 8 | 16 | 3 | 18 | 12 | 1 |
| New Zealand (exclusive of Maoris) | 642,245 | 10 | 16 | 3 | 14 | 16 | 11 | 25 | 13 | 2 |
The values of the exports of these colonies—chiefly those of New South Wales, Victoria, and South Australia—are largely increased by the inclusion of articles the produce or manufacture of other colonies and countries.
The following shows the value of home productions or manufactures exported from each colony in 1891, and the rate per head of the population:—
| Colony. | Home Produce exported. | Per Head of Population. | ||
|---|---|---|---|---|
| £ | £ | s. | d. | |
| Queensland | 7,979,080 | 19 | 14 | 3 |
| New South Wales | 21,103,816 | 18 | 9 | 1 |
| Victoria | 13,026,426 | 11 | 7 | 2 |
| South Australia | 4,685,313 | 14 | 10 | 7 |
| Western Australia | 788,874 | 15 | 7 | 11 |
| Tasmania | 1,367,927 | 9 | 3 | 8 |
| New Zealand (1892) | 9,365,868 | 14 | 11 | 8 |
The amount of the trade of each of these colonies with the United Kingdom in 1891 is set fifth below:—
| Colony. | Imports from the United Kingdom. | Exports to the United Kingdom. | Total Trade with the United Kingdom. |
|---|---|---|---|
| £ | £ | £ | |
| Queensland | 2,814,006 | 3,307,674 | 6,121,680 |
| New South Wales | 10,580,230 | 8,855,465 | 19,435,695 |
| Victoria | 8,953,599 | 7,993,489 | 16,947,088 |
| South Australia | 2,876,548 | 4,524,396 | 7,400,944 |
| Western Australia | 568,570 | 427,693 | 996,263 |
| Tasmania | 655,006 | 379,822 | 1,034,828 |
| New Zealand (1892) | 4,767,369 | 7,483,618 | 12,250,987 |
The following statement shows the relative importance of the Australasian Colonies as markets for the productions of the United Kingdom:—
| £ | |
|---|---|
| British India and Ceylon | 32,194,541 |
| United States | 27,544,553 |
| Australasia | 25,500,194 |
| Germany | 18,804,329 |
| France | 16,429,665 |
| Holland | 9,463,300 |
The exports to other countries did not amount to £9,000,000 in any one case.
The Australasian Colonies as a whole, with a population under 4,000,000, thus take the third place in importance as consumers of British produce, the exports thereto being about two-thirds of the value of the similar exports to British India, with its 290,000,000 inhabitants.
The principal productions of these colonies will, for a lengthened period, be those arising from pastoral, agricultural, and mining pursuits. The immense areas of land capable of improvement and more beneficial occupation, and the large mineral resources only partially developed, forbid any expectation for a very considerable time of such an increase in manufacturing industries as would enable colonial to supersede English products to any material extent. The consumption per head of the population may be somewhat less in the future as the proportion of adults decreases owing to lessened immigration and increase by births; but the relatively high rates of wages, and the absence of causes for any widespread pauperism, will make the proportionate consumption of products for a long time high. The rapid growth of the Australasian population may thus be expected largely to increase the demand for British products; indeed, there is every reason to believe that in the near future the Australasian Colonies will become the most important market open to the British manufacturers.
There were 1,263 post-offices in New Zealand at the end of 1892.
The correspondence delivered and posted in each of the two past years, and the increase in each case, was:—
| Correspondence, &c. | 1891. | 1892. | Increase in 1892. |
|---|---|---|---|
| * Decrease. | |||
| Letters delivered | 23,867,402 | 25,079,938 | 1,212,536 |
| Letters posted | 23,745,462 | 25,530,804 | 1,785,342 |
| Post-cards delivered | 1,097,788 | 1,224,938 | 127,150 |
| Post-cards posted | 1,181,141 | 1,346,098 | 164,957 |
| Books and packets delivered | 3,342,781 | 6,508,463 | 3,165,682 |
| Books and packets posted | 3,827,980 | 6,774,924 | 2,946,944 |
| Newspapers delivered | 9,768,226 | 9,538,945 | 229,281* |
| Newspapers posted | 8,733,686 | 9,018,620 | 284,934 |
The average number of letters, &c., posted per head of the population in each of the past three years was—
| 1890. | 1891. | 1892. | |||
|---|---|---|---|---|---|
| Letters | .. | .. | 34.64 | 37.70 | 39.75 |
| Post-cards | .. | .. | 1.60 | 1.88 | 2.10 |
| Books and parcels | .. | .. | 5.35 | 6.08 | 10.55 |
| Newspapers | .. | .. | 14.00 | 13.87 | 14.04 |
The facilities afforded for the transmission of parcels through the Post Office to places within and without the colony has proved of much convenience to the public. The regulations admit of parcels up to 11lb. in weight being sent to almost all the important countries of the world.
The following shows the number and weight of parcels posted in the last three years. The word “parcels” in the previous table includes the parcels herein mentioned:—
| Parcels. | 1890. | 1891. | 1892. | |||
|---|---|---|---|---|---|---|
| No. | Weight. | No. | Weight. | No. | Weight. | |
| Parcels posted | 121,292 | lb. 336,644 | 162,282 | lb. 432,635 | 148,049 | lb. 448,887 |
Owing to the large reduction in the book-post rates a great number of the lighter packets of the classes formerly sent by parcel-post have been diverted to the packet- and sample-post. This fact accounts for the decrease in the number of parcels, while the weight and declared values have increased.
The following table shows the number of parcels exchanged with the United Kingdom and the Australian Colonies in 1891 and 1892:—
| Country. | 1891. | 1892. | ||
|---|---|---|---|---|
| Received. | Despatched. | Received. | Despatched. | |
| * Service inaugurated in August. | ||||
| United Kingdom and foreign offices, viâ London | 17,115 | 3,253 | 13,988 | 2,961 |
| Victoria | 1,649 | 1,176 | 2,252 | 1,111 |
| South Australia | 113 | 107 | 156 | 94 |
| Tasmania | 76 | 250 | 120 | 278 |
| Western Australia | 14 | 31 | 13 | 45 |
| Queensland | .. | .. | 125 | 47* |
The declared value of the parcels received from places outside the colony was £25,299, on which the Customs duty amounted to £4,929.
During 1892, 199,438 money-orders, for a total amount of £694,847 4s. 5d., were issued by the various post-offices in the colony. The money-orders from places beyond New Zealand which were paid in the colony numbered 19,443, for the amount of £70,414 1s. 1d.
The cost of the various mail-services between England and New Zealand was, in 1892, as follows:—
| Payments— | £ | s. | d. |
| Subsidies, &c. | 23,756 | 5 | 9 |
| Interprovincial and other charges | 3,414 | 10 | 9 |
| 27,170 | 16 | 6 | |
| Receipts— | |||
| Postages received from England and the Australian Colonies | 10,159 | 4 | 0 |
| Postages collected in the colony | 9,525 | 13 | 4 |
| 19,684 | 17 | 4 | |
| Loss to the colony | £7,485 | 19 | 4 |
| Payments— | £ | s. | d. |
| To P. and O. and Orient Lines | 1,503 | 13 | 11 |
| Transit across Australia | 46 | 18 | 11 |
| Transit across European Continent | 266 | 17 | 11 |
| Intercolonial services | 1,101 | 17 | 0 |
| 2,919 | 7 | 9 | |
| Receipts— | |||
| Postages collected from England and foreign offices | 756 | 11 | 3 |
| Postages collected in the colony | 1,278 | 14 | 0 |
| 2,035 | 5 | 3 | |
| Loss to the colony | £884 | 2 | 6 |
The total amount of postages collected and contributions received for all these services in 1892 was £21,720 2s. 7d.
The average number of days in 1892 within which the mails were delivered between London and each of the under-mentioned ports in New Zealand was as follows:—
| San Francisco | P. and O. | Orient | |
|---|---|---|---|
| London to— | Service. | Line. | Line. |
| Auckland | 34.46 | 41.78 | 41.31 |
| Wellington | 36.46 | 42.33 | 42.38 |
| Dunedin | 37.77 | 41.90 | 42.29 |
| Bluff | 38.52 | 41.15 | 41.54 |
There were 5,479 miles of telegraph-line open at the end of 1892, requiring 13,459 miles of wire. 1,904,143 telegrams were transmitted during the year; of these, the private and Press messages numbered 1,686,064, which, together with other telegraph receipts, yielded a revenue of £103,813 8s. 6d.
There were fourteen telephone exchanges and eight sub-exchanges on the 31st March, 1893. The number of subscribers increased from 3,083 in March, 1892, to 3,811 in March, 1893. The subscriptions to these exchanges during the year amounted to £19,155 11s. 5d., and the working-expenses, maintenance, interest on capital cost, and allowance for depreciation, to £19,734 1s. 1d.
The capital expended in connection with the several telephone exchanges up to the 31st March, 1893, including spare material on hand, was £107,254 1s. 3d.
The revenue of the General Government is of two kinds—ordinary and territorial. The ordinary revenue for the year ended 31st March, 1893, amounted to £4,029,216, and the territorial to £300,675, giving a total revenue of £4,329,891.
The principal heads of ordinary revenue were: Customs, £1,642,590; Stamps (including Postal and Telegraph receipts), £658,424; land-tax, £297,181; income-tax, £67,367; property-tax, £17,126; beer duty, £59,388; Railways, £1,174,099; registration and other fees, £44,952; Marine, £20,354; and miscellaneous, £47,735.
The territorial revenue included receipts from pastoral runs, rents, and miscellaneous items, £190,320, together with proceeds of land sales, £110,355.
The total revenue (ordinary and territorial), including the proceeds of £280,300, debentures issued under “The Consolidated Stock Act, 1884,” for the accretions of Sinking Fund for the year, amounted to £4,610,191.
The Customs duties constitute the largest item of revenue, nearly all classes of imports being subject to taxation.
The ordinary expenditure under permanent and annual appropriations was £4,153,125, the chief items being—Charges of the public debt, £1,821,129; subsidies and other payments to local bodies, £208,065; pensions, compensations, and other expenditure under special Acts of the Legislature, £87,217; Working Railways, £729,277; public instruction, £377,941; Postal and Telegraph, £277,224; Defence and Police, £173,220; and Justice, £116,809.
The expenditure out of the Land Fund was £141,044. Of this sum £114,238 was expended on surveys, and £26,161 was paid to local bodies on account of their endowments. The total ordinary and territorial expenditure was therefore £4,294,169; but, in addition to this, £200,000 was transferred to the Public Works Fund to give effect to the policy of the Government of carrying on public works out of revenue instead of out of borrowed money.
It was previously shown that the total ordinary and territorial revenue, together with the proceeds of debentures issued for the annual accretions of Sinking Fund, amounted to £4,610,191. It will therefore be seen that the revenue for the year exceeded the expenditure by £116,022; and that, by adding the surplus at the beginning of the year (£167,758), there remains a net surplus on 31st March, 1893, of £283,780.
Debentures to the value of £210,720 were redeemed during the year out of Sinking Fund moneys under “The Consolidated Loan Act, 1867,” and “The Consolidated Stock Act, 1884.”
Besides expenditure out of revenue, there was also an expenditure out of the Public Works Fund of £472,952, of which £220,894 was for construction of railways, £105,506 for roads, £57,187 for purchase of Native lands, £31,101 for public buildings, £29,245 for telegraph extension, £11,205 for lighthouses and harbour defences, £7,790 for the Public Works Department, £5,356 to meet charges and expenses of raising loans, £3,811 for waterworks on goldfields, £615 for rates on Native lands, and £242 for immigration.
In addition to the above, the sum of £19,575 was expended during the year in acquiring Native lands under provisions of “The Native Land Purchases Act, 1892;” £7,700 of this amount was paid in debentures, the remainder (£11,875) in cash. The operations were by means of debentures created, amounting for the year to £27,700.
Besides the revenue raised by the General Government, all the County and Borough Councils, Town, Road, River, Harbour, and Drainage Boards have power to levy rates and obtain revenue from other sources.
The colony is divided into 93 boroughs and 78 counties; within the latter there are 254 road districts and 41 town districts, not including the special town district of Rotorua, constituted under “ The Thermal-Springs Districts Act, 1881.”
The following table shows the receipts from rates and other sources, with the expenditure and outstanding loans of the local governing bodies, for five financial years:—
| Year. | Receipts of Local Bodies. | Expenditure. | Outstanding Loans. | |
|---|---|---|---|---|
| From Rates. | From Government and other Sources, including Loans. | |||
| *Not including loans amounting to £468,249, repayable to General Government by annual instalments. | ||||
| £ | £ | £ | £ | |
| 1887–88 | 433,831 | 1,306,661 | 1,819,787 | 5,812,803 |
| 1888–89 | 445,928 | 992,567 | 1,560,604 | 5,892,050 |
| 1889–90 | 460,302 | 914,413 | 1,476,539 | 5,978,059 |
| 1890–91 | 463,581 | 899,666 | 1,381,319 | 6,042,693 |
| 1891–92 | 488,824 | 907,420 | 1,400,467 | 6,081,934* |
Further particulars relating to local finance will be found under the head “Local Governing Bodies.”
The direct taxation prior to 1892 consisted of a property-tax of 1d. in the pound on all assessed real and personal property (with exemption of £500) and the stamp duties; but in 1891 a Land and Income Assessment Act was passed repealing the property-tax. A full description of the system of the land- and income-tax is given by the Commissioner in a special article in Part II. of this book, and to this attention is particularly directed. The leading features only are shortly stated here.
The Assessment Act of 1891 provides for an ordinary land-tax on the actual value of land, a deduction being allowed to each owner of the present value of improvements up to £3,000; and an owner is also allowed to deduct any amount owing by him secured on a registered mortgage. In addition to the above deductions, there is an exemption of £500 allowed when the balance, after making deductions as stated, does not exceed £1,500; and above that a smaller exemption is allowed, but it ceases when the balance amounts to £2,500. Mortgages are subject to the land-tax. The revenue from the land-tax is, in round numbers, £300,000 per annum. The rate of ordinary land-tax for 1892–93 was 1d. in the pound.
In addition to the ordinary land-tax, there is a graduated land-tax which commences when the unimproved value is £5,000. For the graduated land-tax, the present value of all improvements is deducted; but mortgages are not deducted. The scale is as follows:—
Where the value is £5,000 and is less than £10,000 one-eighth of a penny in the pound sterling.
Where the value is £10,000 and is less than £20,000 two-eighths of a penny in the pound sterling.
Where the value is £20,000 and is less than £30,000 three-eighths of a penny in the pound sterling.
Where the value is £30,000 and is less than £40,000 four-eighths of a penny in the pound sterling.
Where the value is £40,000 and is less than £50,000 five-eighths of penny in the pound sterling.
Where the value is £50,000 and is less than £70,000 six-eighths of a penny in the pound sterling.
Where the value is £70,000 and is less than £90,000 seven-eights of a penny in the pound sterling.
Where the value is £90,000 and is less than £110,000 one penny and one-eighth of a penny in the pound sterling.
Where the value is £110,000 and is less than £130,000 one penny and one-eighth of a penny in the pound sterling.
Where the value is £130,000 and is less than £150,000 one penny and two-eighths of a penny in the pound sterling.
Where the value is £150,000 and is less than £170,000 one penny and three-eighths of a penny in the pound sterling.
Where the value is £170,000 and is less than £190,000 one penny and four-eighths of a penny in the pound sterling.
[To face page 106.]
“The Land and Income Assessment Acts Amendment Act, 1893,” exempts from liability to land-tax the value of all improvements on land, instead of deducting improvements up to the value of three thousand pounds only. The same Act increases the scale of the graduated tax, so that the highest rate is twopence in the pound instead of one penny and six-eighths.
[For full particulars relating to these and other changes see “Addendum”—special article on Land and Income Tax—additional report, p. 422.]
Where the value is £190,000 and is less than £210,000 one penny and five-eighths of a penny in the pound sterling.
Where the value is £210,000 or exceeds that sum one penny and six-eighths of a penny in the pound sterling.
This graduated tax yields, in round numbers, £70,000 per annum, which is included in the sum of £300,000 given above. Twenty per cent. additional tax is levied in case of persons who have been absent from the colony for three years or more prior to the passing of the yearly taxing Act.
Income-tax is levied on all incomes above £300, and from taxable incomes a deduction of £300 is made. The rate of income-tax for 1892–93 was 6d. in the pound on the first taxable £1,000, and 1s. in the pound on taxable incomes over £1,000.
The indirect taxation is by way of Customs duty and excise duty on beer made in the colony. The following statement shows the amount raised by taxation in each of the past eleven years:—
| Amount of Revenue raised by Taxation. | Amount per Head of Population (excluding Maoris). | |
|---|---|---|
| £ | £ s. d. | |
| 1882 | 1,956,557 | 3 16 10 |
| 1883 | 1,957,080 | 3 13 11 |
| 1884 | 1,815,674 | 3 5 9 |
| 1885 | 2,016,730 | 3 10 10 |
| 1886 | 1,882,050 | 3 4 8 |
| 1887 | 1,876,235 | 3 2 11 |
| 1888 | 2,031,658 | 3 7 1 |
| 1889 | 2,090,405 | 3 8 4 |
| 1890 | 2,173,985 | 3 10 0 |
| 1891 | 2,179,739 | 3 9 2 |
| 1892 | 2,339,511 | 3 12 10 |
As the Maoris contribute somewhat to the Customs revenue, an allowance should be made on that account to ascertain more correctly the amount of taxation per head of the rest of the population. By including the Maori population the Customs duties per head of the rest of the population would be reduced by 4s. 5d. for the year 1892. If this amount be deducted from the taxation per head given for that year, the rate would be reduced from £3 12s. 10d. to £3 8s. 5d. This last rate may fairly be used for comparison with the rates in the neighbouring colonies.
The following were the rates of taxation per head in the Australasian Colonies in 1891:—
| £ s. d. | |
|---|---|
| Queensland | 3 14 3 |
| New South Wales | 2 11 0 |
| Victoria | 2 16 9 |
| South Australia | 2 12 5 |
| Western Australia | 5 2 4 |
| Tasmania | 3 7 5 |
| New Zealand | 3 6 1 |
The gross public debt of the colony on 31st March, 1893, was £39,257,840, as against £38,713,068 on 31st March, 1892, an increase of £544,772. The accretions of Sinking Fund increased by £75,908—from £1,037,862 to £1,113,770. By deducting the accrued Sinking Fund from the gross debt, it will be seen that the net public debt on 31st March, 1893, was £38,144,070, or an increase of £468,864 on the year's transactions. No less than £333,446 of the increase of the gross debt was due to operations relating to the conversion of loans during the year; and although the capital amount has been increased, a very substantial annual saving of interest (some £53,000) results from these conversions.
The following shows the debt of each of the Australasian Colonies on the 31st December, 1891:—
| Colony. | Amount of Debt. | Accrued Sinking Fund | Rate of Net Indebtenss per Head of Population at End of Year. |
|---|---|---|---|
| £ | £ | £ s. d. | |
| Queensland | 29,457,134 | .. | 71 15 9 |
| New South Wales | 52,498,533 | .. | 45 1 0 |
| Victoria | 43,638,897 | 156,100 | 37 11 2 |
| South Australia | 21,133,300 | .. | 65 17 10 |
| Western Australia | 1,613,594 | 99,325 | 28 8 4 |
| Tasmania | 7,110,290 | 145,004 | 45 12 9 |
| New Zealand | 38,844,914 | 972,584 | 59 14 7 |
The amount of indebtedness per head of population was thus greater in Queensland and South Australia than in New Zealand. The net indebtedness per head in this colony has a tendency to decrease. In March, 1889, it was £60 12s. 2d.; in 1890, £60 5s. 4d.; in 1891, £59 11s. 11d.; in March, 1892, £59 2s. 2d.; and in March, 1893, £58 2s. 7d.; the increase of the population having been proportionally greater than the increase of debt.
| Years ended 31st March. | Amount of Debentures and Stock in Circulation. | Gross Indebtedness per Head of European Population. | Amount of Sinking Fund accrued. | Net Indebtedness. | Net Indebtedness per Head of European Population. | Annual Charge (Interest and Sinking Fund). |
|---|---|---|---|---|---|---|
| £ | £ s. d. | £ | £ | £ s. d. | £ | |
| 1889 | 38,375,050 | 62 17 10 | 1,395,389 | 36,979,661 | 60 12 2 | 1,866,588 |
| 1890 | 38,667,950 | 62 10 1 | 1,383,432 | 37,284,518 | 60 5 4 | 1,851,421 |
| 1891 | 38,830,350 | 61 19 4 | 1,486,427 | 37,343,923 | 59 11 11 | 1,864,575 |
| 1892 | 38,713,068 | 60 14 8 | 1,037,862 | 37,675,206 | 59 2 0 | 1,842,686 |
| 1893 | 39,257,840 | 59 16 7 | 1,113,770 | 38,144,070 | 58 2 7 | 1,837,169 |
The debt of the colony as stated does not include the unpaid loans raised by the several local bodies, amounting at the end of March, 1892, to £6,081, 934. These will be referred to when the particulars of the finance of local bodies are being touched upon.
Portions of the existing loans were either raised by the several Provincial Governments or consist of loans raised for the purpose of paying off provincial liabilities. It is now almost impossible to ascertain the exact expenditure by these Governments on public works, or the allocation of the proceeds of the loans raised by them.
The burden of a public debt depends greatly on the extent to which it is expended on reproductive works, and the degree of prosperity enjoyed by the people. The generally rugged character of this country, and the natural difficulties appertaining to many of the sites on which the chief towns were built, very early necessitated a large outlay on roads and public works. The necessity was fully recognised, and to some extent met, by most of the Provincial Governments, which have justly received great credit for their far-seeing and liberal exertions in that direction. A great deal of road-making, often of a very costly character, was accomplished, harbour and other improvements begun, and immigration encouraged. Some railways were made in Canterbury, Otago, and Southland. The City of Christchurch and the agricultural plains of Canterbury were connected with the Port of Lyttelton by a railway, which required the construction of a long and very costly tunnel through the hills surrounding Lyttelton. In Otago, the City of Dunedin was connected with Port Chalmers by railway, constructed by private individuals under the guarantee of the Otago Provincial Government; and some miles of railway were made in Southland, extending from the Town of Invercargill into the interior; but no general and comprehensive scheme of public works could be carried out by the separate exertions of the Provincial Governments. The General Government, therefore, in 1870, enunciated its public-works and immigration policy, by which it was proposed to raise a loan of ten millions for the construction of main trunk railways, roads, and other public works of colonial importance, and for the promotion of immigration on a large scale, the expenditure to be extended over a period of ten years. This policy was accepted by the Legislature, and embodied in “The Immigration and Public Works Act, 1870.”
The demands for local railways and other works soon caused the original proposals to be departed from, and entailed an expenditure at a much more rapid rate and to a far greater amount than was originally contemplated. Although many of the works undertaken have been directly unremunerative, yet the effect of the policy, as a whole, has been largely to develop the settlement of the country, and enormously to increase the value of landed property; land, in parts which before the construction of railways was valued at from £1 to £2 per acre, having been subsequently sold at prices varying from £10 to £20 per acre. In addition to the important indirect results of the policy, the railway and telegraph-lines yield a revenue which covers a large proportion of the interest on their cost after paying working-expenses.
The following may be stated as approximately representing the loan expenditure by the General Government on certain public works to the 31st March, 1893:—
| £ | |
|---|---|
| Telegraphs | 663,666 |
| Waterworks on goldfields | 567,169 |
| Immigration | 2,146,209 |
| Roads and bridges | 3,708,817 |
| Land-purchases | 1,295,625 |
| Lighthouses, harbours, and defence works | 900,670 |
| Public buildings, including schools | 1,846,679 |
| Coal-mines and thermal springs | 25,435 |
| Railways (by the Provincial and General Governments) | 15,583,004 |
The total of these various items of expenditure amounts to £26,736,974. The expenditure by local bodies on harbours, roads, and other public works out of loans raised by them is not included, nor are the amounts expended out of loans by the Provincial Governments before their abolition on immigration and public works, except their outlay on railways, which, including the sum of £82,259 paid for the Dunedin and Port Chalmers line, reached a total of £1,104,281. The expenditure on directly reproductive works—railways, telegraphs, and waterworks—has been £16,813,839. The expenditure on land is also partly reproductive, and that on immigration, roads, bridges, and lighthouses is of an indirectly reproductive character.
Statistics purporting to illustrate the importance of, and progress made by, any colony or country are evidently defective if no mention is made of the accumulated wealth of its inhabitants.
As to the subject of private wealth, an effort has been made to ascertain the amount in New Zealand. It seems but right to endeavour to give some idea of its magnitude, though many difficulties present themselves in the course of the work of making a reliable estimate. One method of estimating private wealth is by adding together the values of all estates admitted to probate in any one year, and dividing the sum by the number of deaths occurring in that year. The quotient would then represent the average wealth per head. But any inference drawn from the figures for a single year would be untrustworthy. For in a thinly-peopled country such as New Zealand an epidemic among young children, who have no property to leave, will unduly lower the average; while, on the other hand, the deaths of a few wealthy persons will raise it unwarrantably. By putting the figures for several years together, and taking the average for the term, we may partially, if not entirely, get rid of these disturbing elements, and arrive at fairly correct results, as thus:—
| Years, inclusive. | Amount sworn to. | Total Number of Deaths. | Average Amount left by each Person. | Average Number of Persons living. | Average Total Wealth for each year of the period. |
|---|---|---|---|---|---|
| £ | £. s. d. | £ | |||
| 1888–92 | 7,209,918 | 30,451 | 236 15 5 | 622,179 | 147,314,048 |
From this it will be seen that the average total private wealth for each of the five years 1888–92 was £147,314,048. It is manifest, however, that this average does not exhibit with sufficient accuracy the actual present amount of wealth. If the average amount per head—£236 15s. 5d.—for the period 1888–92 was the same at the end of the year 1892, then the total wealth possessed by the 650,143 persons in the colony on 31st December of that year would amount to £154,003,700; or if for purposes of this estimate the mean population for the year be taken instead of that as in December, the total estimated private wealth of the colony would be £152,065,087.
These figures do not, however, represent the full amount of private wealth, as the amounts sworn to do not include the values of estates on which no stamp duty is payable—viz., lands and goods passing to the husband or wife of the deceased, and properties under £100. The total of these must be considerable, and they should give a substantial increase to the average amount per head, and therefore to the total wealth.
By the other and direct method of estimating private wealth the Government Statistician of New South Wales arrived at a value for New Zealand for the year 1890 of £150,192,000; and pursuing a similar course, but somewhat differing in detail, a calculation for the year 1892 has been made in the Registrar-General's Office, here, the results of which approximate closely to the sum of £154,003,700 shown by using the probate returns. The figures are admittedly open to many objections, as is always the case in such calculations; but though some items may be deemed to be stated at too high a value, and others somewhat low, the total would seem to be not far from the truth, judging from comparison with the result of the probate method.
-
Land, Buildings, and Improvements privately owned.—The value of privately-owned land with improvements is estimated to be £96,066,000. In the year 1888 the sum was £84,208,230, and in 1891 it had increased to £92,371,166, or at the rate of about 3 per cent. per annum. By allowing a slightly higher rate of increase for 1892, which is considered justifiable, the above estimate is arrived at.
-
Live-stock.—For purposes of the calculation, horses have been valued at £9 10s., cattle at £4 10s., sheep at 10s., and pigs at £1 5s. The total value of all kinds of stock is estimated at £15,299,189.
-
3. Shipping.—The value of steamers has been taken at £20 per ton, and that of sailing-vessels at £8. The total value of the shipping at these rates is £1,591,672.
-
Railways (not Government).—The cost of the two private lines in the colony is returned at £1,613,000.
-
Produce and Merchandise.—The value of the goods and manufactures, with that of the produce on hand, is estimated at £14,408,015.
-
Furniture and Household Goods.—The furniture has been valued by estimating a certain sum for every house, according to the number of rooms, using the census results for the number of houses. For clothing and other effects an amount of £4 per head has been accepted. The estimated value is £8,937,678.
-
The Machinery and Plant belonging to the larger industries were valued in the census returns at £3,051,700; adding to this £1,500,000 for machinery in smaller works, and £650,000 for agricultural implements, the total is found to be £5,201,700.
-
Coin and Bullion.—The coin and bullion in the banks, together with an allowance of £3 10s. per head of population (the latter is the estimate of the coin in circulation) has been taken to represent the amount for the colony. The sum is £4,799,340.
-
Mines and Sundries.—There is included in the total of £7,000,000 set down under this head what is believed to be the value of the interest of companies and persons in coal- and goldmines on Crown lands (the value of such mines on freehold lands being included in the £96,066,000 in item No. 1), also sundry small sums not accounted for elsewhere. This estimate has not been closely calculated.
The summary of the above gives the total of private property as under:—
| Private Property, 1892.£ | £ |
|---|---|
| 1. Land, buildings, and improvements | 96,066,000 |
| 2. Live-stock | 15,299,000 |
| 3. Shipping | 1,592,000 |
| 4. Railways (not Government) | 1,613,000 |
| 5. Produce and merchandise | 14,408,000 |
| 6. Furniture and household goods | 8,938,000 |
| 7. Machinery and plant | 5,202,000 |
| 8. Coin and bullion | 4,799,000 |
| 9. Mines and sundries | 7,000,000 |
| Total | £154,917,000 |
Working on a similar system, the Government Statistician of New South Wales estimated the private wealth of the seven colonies of Australasia for the year 1890 at £1,169,434,000. The latest figures available, showing the amount per head of population, are given below for each colony. All of these, except those for New Zealand, are quoted from the above authority:—
| Colony. | Private Wealth. Average Amount per Head of Population |
|---|---|
| £ | |
| New South Wales, 1891 | 347 |
| Victoria 1890 | 304 |
| Queensland 1890 | 301 |
| South Australia 1890 | 310 |
| Western Australia 1890 | 218 |
| Tasmania 1890 | 236 |
| New Zealand 1892 | 237 |
It is interesting to compare the wealth per head of population in the Australasian Colonies with similar calculations for other parts of the world. A table giving this information for various countries has accordingly been introduced; but in comparing the wealth of one country with another it must be remembered that the purchasing-power of money in different parts of the world varies considerably, and without any information on this head bare statements of wealth per inhabitant are of very little use, and often misleading. Besides this, the question as to what extent Government undertakes such functions as the control of railways disturbs comparisons of private wealth. The figures are for the most part taken from the authority quoted above:—
| Country. | Private Wealth. | Average Amount per Head cf Population. |
|---|---|---|
| £ | £ | |
| United Kingdom | 9,400,000,000 | 247 |
| Franc | 8,598,000,000 | 222 |
| Germany | 6,437,000,000 | 133 |
| Russia | 5,089,000,000 | 55 |
| Austria-Hungary | 3,855,000,000 | 96 |
| Italy | 2,963,000,000 | 98 |
| Spain | 2,516,000,000 | 143 |
| Portugal | 408,000,000 | 83 |
| Sweden and Norway | 880,000,000 | 122 |
| Denmark | 404,000,000 | 192 |
| Holland | 980,000,000 | 213 |
| Belgium | 1,007,000,000 | 165 |
| Switzerland | 494,000,000 | 165 |
| United States | 12,824,000,000 | 205 |
| Canada | 980,000,000 | 196 |
The length of Government railways open for traffic on the 31st March, 1893, was 1,886 miles, the total cost thereof having been £14,733,120, and the average cost per mile £7,812. The cash revenue for the year 1892–93 amounted to £1,181,521 13s. 10d., excluding the value of postal services; and the total expenditure to £732,141 11s. 10d. The net cash revenue—£449,380 2s.—was equal to a rate of £3 1s. per cent. on the capital cost; the percentage of expenditure to revenue was 61.97.
The following statement shows the number of miles of Government railways open, the number of train-miles travelled and of passengers carried, and the tonnage of goods traffic for the past five years:—
| Year. | Length open. | Train mileage. | Passengers. | Season Tickets issued. | Goods and Live-stock.* |
|---|---|---|---|---|---|
| *The equivalent tonnage for live-stock has been given. | |||||
| 1887–88 | 1,754 | 2,994,786 | 3,451,850 | 11,518 | 1,770,638 |
| 1888–89 | 1,773 | 2,796,007 | 3,132,803 | 11,817 | 1,954,126 |
| 1889–90 | 1,813 | 2,868,203 | 3,376,459 | 12,311 | 2,112,734 |
| 1890–91 | 1,842 | 2,894,776 | 3,433,629 | 13,881 | 2,134,023 |
| 1891–92 | 1,869 | 3,010,489 | 3,555,764 | 16,341 | 2,122,987 |
| 1892–93 | 1,886 | 3,002,174 | 3,759,044 | 16,504 | 2,258,235 |
It will be observed that the number of passengers during the year 1892–93 was greater than in any previous year. Considerable increase in receipts from goods traffic is also shown for the year ended 31st March, 1893, the percentage of revenue to capital cost (£3 1s.) being the highest point reached since 1883.
The particulars of the revenue and expenditure for the past five years are herewith given:—
| Year. | Passenger Fares. | Parcels and Luggage. | Goods and Live-stock. | Rents and Miscellaneous. | Total. | Expenditure. | Net Revenue. | Percentages of Expenditure to Revenue. | Percentages of Revenue to Capital Cost. | ||
|---|---|---|---|---|---|---|---|---|---|---|---|
| £ | £ | £ | £ | £ | £ | £ | £ | s. | d. | ||
| 1888–89 | 323,447 | 34,102 | 610,488 | 29,578 | 997,615 | 647,045 | 350,570 | 64.86 | 2 | 12 | 0 |
| 1889–90 | 369,348 | 37,097 | 655,007 | 34,117 | 1,095,569 | 682,787 | 412,782 | 62.32 | 2 | 19 | 5 |
| 1890–91 | 353,593 | 38,997 | 690,779 | 38,332 | 1,121,701 | 700,703 | 420,998 | 62.47 | 2 | 18 | 11 |
| 1891–92 | 364,617 | 41,795 | 671,469 | 37,550 | 1,115,431 | 706,517 | 408,914 | 63.34 | 2 | 15 | 9 |
| 1892–93 | 390,619 | 44,801 | 707,785 | 38,316 | 1,181521 | 732,141 | 449,380 | 61.97 | 3 | 1 | 0 |
Although not included in the figures for the revenue, the real gain to the colony is greater than the amount of net revenue shown by the value of the postal services performed by the railways (carriage of mails, &c.), amounting to £26,000 per annum.
In addition to the above railways there were 150 miles of private lines open for traffic on the 31st March, 1893—namely, the Wellington–Manawatu Railway, 84 miles; the Kaitangata Railway Company's line, 4 miles; and the Midland Railway, 62 miles.
The cost of the construction of the Wellington–Manawatu Railway was £766,598, being at the rate of £9,099 1s. 8d. per mile. The term “construction” includes equipment, rolling-stock, &c., not merely the construction of the road-line and buildings. The revenue for the twelve months ending the 28th February, 1893, amounted to £84,565, and the working-expenses to £34,580, equivalent to 40.89 per cent. of the revenue.
The revenue from the opened part of the Midland line was for the year ended the 30th June, 1892, £12,948 18s. 1d., and the expenditure £8,659 19s. 6d., equivalent to 66.88 per cent. of the revenue. The total expenditure on this line to the 30th June, 1892, was £1,023,669.
The following statement gives the number of miles of railway open for traffic and in course of construction in the Australian Colonies at the end of 1891 or 1892, where figures have been available:—
| Colony. | Number of Miles open for Traffic on 31st December. | Number of Miles in course of Construction on 31st December. |
|---|---|---|
| Queensland | 2,304 | 102 |
| New South Wales (1892) | 2,185 | 333 |
| Victoria | 2,798 | 103 |
| South Australia (1892) | 1,664 | 57 |
| Western Australia | 651 | 287 |
| Tasmania | 425 | 47 |
| New Zealand (March, 1893) | 1,886 | 188 |
The total average liabilities and assets of the banks within the colonies for the last two years were as follows:—
| 1891. | 1892. | |||||
|---|---|---|---|---|---|---|
| £ | s. | d. | £ | s. | d. | |
| Liabilities | 13,820,457 | 19 | 8 | 14,623,335 | 5 | 11 |
| Assets | 16,814,518 | 9 | 7 | 17,558,167 | 16 | 5 |
There was thus in the later year an increase of £802,877 6s. 3d. in the liabilities, and of £743,649 6s. 10d. in the assets.
In 1886 the average amount of advances made by the banks was £15,853,420, equal to £27.23 per head of the mean population. The advances gradually declined in amount and proportion to population until 1891, in which year they were in value £11,549,145, or £18.34 per head. During the year 1892, however, there was an increase, the average of the advances having been £12,228,435, equal to an amount of £19.04 per head of population. The amount of discounts, though showing a slight increase on the figures for 1891, was less than in any year since 1873. The largest amount of discounts in any year was £6,061,959 in 1879, at the rate of £13.53 per head of population. In 1889 the amount was £2,850,944, equal to £4.66 per head of population; in 1890, £2,524,573, equal to £4.07 per head; in 1891, £2,315,325, or £3.68 per head; and in 1892, £2,361,813, being again nearly £3.68 per head.
There was an increase of £790,964 in the deposits, which amounted to £13,587,062 in 1892, against £12,796,098 in 1891. Exclusive of Government deposits, the deposits bearing interest increased from £8,673,326 to £9,439,660, or by £766,334; and the deposits not bearing interest from £3,621,117 to £3,742,952, or by £121,835.
Thus, there was an increase of £888,169 in the average amount of private deposits.
The following shows the average amount of notes in circulation, notes and bills discounted, and bullion and specie in the banks in each of the two past years:—
| Average Amount of | 1891. | 1892. | Increase. |
|---|---|---|---|
| £ | £ | £ | |
| Notes in circulation | 937,309 | 959,943 | 22,634 |
| Notes and bills discounted | 2,315,325 | 2,361,813 | 46,488 |
| Specie and bullion | 2,405,099 | 2,450,712 | 45,613 |
The number of post-offices open for the transaction of moneyorder and savings-bank business at the end of 1892 was 331.
There were 26,232 new accounts opened in the year, and 18,171 accounts were closed. The total number of open accounts at the end of 1892 was 112,528, of which 80,999 were for amounts not exceeding £20.
The deposits received during the year amounted to £1,878,270 6s. 4d., and the withdrawals to £1,821,318 18s. 1d., the excess of deposits over withdrawals having thus been £56,921 8s. 3d. The total amount standing at credit of all accounts on the 31st December, 1892, was £2,863,670 12s. 10d., which gave an average amount at credit of each account of £25 9s.
There are seven savings-banks in the colony which are not connected with the Post Office. The total amount deposited in them in 1892 was £377,826 3s. 4d., of which the deposits by Maoris amounted to £109 1s. 8d. The withdrawals amounted to £402,920 1s., being in excess of the deposits by £25,093 17s. 8d. The total amount to the credit of the depositors at the end of the year was £716,873 12s. 1d., of which the sum of £199 12s. was to the credit of Maoris.
The deposits above stated for the banks of issue represent the average for the four quarters of the year. If the amount of deposits at the end of the year be assumed to be equal to the average amount for the last quarter, then it may be affirmed that, exclusive of Government deposits, the deposits in the several banks of issue and in the two classes of savings-banks amounted at the end of 1892 to £17,036,381. In addition, there was in 1891 an amount of £258,346 deposited with building societies; and it is known that there were also deposits with financial companies, of which no particulars have been supplied to the department. The known deposits amount on an average to £26 11s. 9d. per head of the population, exclusive of Maoris.
There were 43 registered building societies in operation in the colony at the end of 1891. Of these, 3 were terminable societies, the rest were permanent.
The total receipts by these societies during their financial year amounted to £652,384 15s. 7d., of which deposits comprised £250,456 0s. 1d.
The assets at the end of the year amounted to £988,223 15s. 2d., and the liabilities to £988,903 2s. 2d., of which the liabilities to shareholders, reserve fund, £c., amounted to £709,162 10s. 8d., those to depositors to £258,345 19s. 4d., and those to other creditors to £21,394 12s. 2d.
The Registrar of Friendly Societies received returns for the year 1891 from 365 lodges, courts, tents, £c., of various friendly societies throughout the colony, also from 31 central bodies. The number of members at the end of 1891 was 27,400.
The total value of the assets of these societies was £476,133, equivalent to £17 7s. 6d. per member. Of the total assets, the value of the sick and funeral benefit funds amounted to £425,070.
The receipts during the year on account of the sick and funeral funds amounted to £60,903, and the expenditure to £41,645, of which the sick-pay to members amounted to the sum of £26,082. In addition to the sick-pay, the sum of £25,667 was paid out of the medical and management expenses fund for medical attendance on and medicine supplied to the members and their families.
There were existing in the colony at the close of the year 1891 as many as 56,751 life insurance policies, an average of over 89 in every 1,000 persons living. The gross amount represented by these policies was £16,714,740 16s., equal to an amount of £294 10s. 7d. for each policy, and of £26 7s. 3d. for every European inhabitant of the colony at the end of the year. The distribution of these policies among the various life assurance offices is shown in the following table:—
| New Zealand Business of | Number of Years of Business in the Colony. | Number of existing Policies at End of Year 1891. | Gross Amount insured by Policies at End of Year 1891. |
|---|---|---|---|
| £ s. d. | |||
| The Australian Mutual Provident Society | 30 | 16,761 | 5,149,945 0 0 |
| The Colonial Mutual Life Assurance Society (Limited) | 8 | 2,928 | 950,358 1 11 |
| The Equitable Life Assurance Society of the United States | 7 | 930 | 456,014 0 0 |
| The Mutual Assurance Society of Victoria (Limited) | 8 | 981 | 231,556 17 11 |
| The Mutual Life Association of Australasia | 15 | 3,135 | 792,809 16 2 |
| The National Mutual Life Association of Australasia (Limited) | 12 | 2,580 | 658,149 0 0 |
| The New York Life Insurance Company | 5 | 210 | 85,105 0 0 |
| The Life Insurance Department of the New Zealand Government | 22 | 29,226 | 8,390,803 0 0 |
| Totals | .. | 56,751 | 16,714,740 16 0 |
It will be observed that more than half the policies are held in the Government Life Insurance Department. A special article concerning this institution will be found in the second part of this volume.
Before referring to the results of each of the various systems in operation in 1892 for the disposal of Crown lands it is necessary to state that a description of these systems will be found in the digest of the land-laws of New Zealand in Part III. of this work.
There were 33,659 acres of Crown land sold for cash or money scrip during the year, the cash received having amounted to £32,243 11s. 10d., and the scrip representing a value of £1,912 4s. 8d. The lands absolutely disposed of without sale amounted to 243,008 acres and 24 perches, of which the reserves set apart for public purposes amounted to 21,841 acres 1 rood 38 perches; the grants to Europeans or Natives under Native Reserves Acts, £c., or in fulfilment of engagements, to 10 acres 3 roods 9 perches; those to Natives or Europeans under the Native Land Acts, to 150,288 acres and 5 perches; and those in satisfaction of land-scrip or otherwise, to 70,867 acres 3 roods 12 perches.
The total land alienated from the foundation of the colony to the 31st December, 1892, amounted to 20,364,209 acres. This does not include lands sold by Natives to Europeans direct, for which no Crown grants have been issued. The exact quantity so sold cannot be ascertained, but is believed to be very small.
In 1892, 27,785 acres were taken up under the deferred-payment system. The total area of land taken up under this system, from its commencement to the 31st December, 1892, was 1,240,412 acres. Of this quantity, the area forfeited was 246,489 acres, and 522,539 acres had been finally alienated by completion of payments. The area still held under the system at the end of 1892 was, therefore, 471,384 acres. The following statement gives the number of acres taken up under this system in each of the past ten years:—
| Acres. | Acres. | ||
|---|---|---|---|
| 1883 | 138,414 | 1888 | 82,017 |
| 1884 | 48,502 | 1889 | 45,016 |
| 1885 | 58,722 | 1890 | 39,106 |
| 1886 | 52,711 | 1891 | 36,604 |
| 1887 | 38,832 | 1892 | 27,785 |
The operation of what is called the perpetual-lease system with right of purchase, which became part of the land-law of the colony in 1882, has had the effect of lessening the demand for land on deferred payment, as under the perpetual-lease system the rental is only 5 per cent. on the upset value of the land, and thus, until the purchase be made, if made at all, the settler has all his capital available for beneficial improvements. 1,188,071 acres were in occupation under this system on the 31st December, 1892, in 4,498 holdings. 196,075 acres, in 749 holdings, were taken up during the year, but only 25,753 acres were converted into freehold. Although the right of converting the land from lease to freehold is highly valued, yet the temptation to postpone the use of that right is very great while interest at from 6 1/2 to 7 per cent. can be had on good investments, and only 5 per cent. need be paid in the form of rental to the Government.
Under provisions of “The Land Act, 1892,” up to 31st December last, 13,170 acres were selected for occupation with right of purchase by thirty-eight selectors, and 17,984 acres as leaseholds in perpetuity by thirty-six lessees.
The lands in the village settlements are disposed of partly upon deferred payments and partly for cash. The transactions are included in the sales of land previously stated, but the following details of the number and area of selections to the 31st December, 1892, are given in order to show the extent of these settlements:—
| No. | A. | R. | P. | |
|---|---|---|---|---|
| Village sections for cash | 926 | 616 | 2 | 22 |
| Village sections on deferred payments | 330 | 135 | 0 | 30 |
| Small-farm sections for cash | 695 | 6,132 | 3 | 20 |
| Small-farm sections on deferred payments | 1,166 | 14,784 | 2 | 13 |
The freeholds acquired have been—
| Village sections | 212 | 113 | 0 | 34 |
| Small-farm sections | 693 | 7,871 | 2 | 18 |
The forfeitures were—
| Village sections | 84 | 53 | 3 | 38 |
| Small-farm sections | 149 | 1,788 | 2 | 36 |
During 1892, 102 selectors took up 1,347 acres in village-homestead special settlements on perpetual lease.
The area of lands held from the Government on depasturing leases (exclusive of small grazing-runs) amounted to 12,769,751 acres, in 1,543 runs, yielding an annual rental of £142,211.
The total area of land in occupation as small grazing-runs was, at the end of last year, 749,678 acres, held by 406 persons, and the rent received in 1892 amounted to £19,267 9s.
The results of the last census show that in April, 1891, there were in New Zealand 43,777 occupied holdings of over 1 acre in extent, covering an area of 19,397,529 acres, of which 12,410,242 acres were freehold of the occupier, and 6,987,287 acres were rented from—(1) private individuals, (2) Natives, (3) public bodies, and (4) the Crown (for other than pastoral purposes). The following table shows the number of holdings of various sizes, and number of acres held in freehold and leasehold, excluding the Crown lands rented for pastoral purposes only:—
| Sizes of Holdings. | Number of Holdings. | Acreage. | ||
|---|---|---|---|---|
| Freehold. | Leasehold, £c.* | Total. | ||
| *Excluding Crown pastoral leases. | ||||
| Acres. Acres. | ||||
| 1 to 10 | 11,116 | 28,124 | 24,343 | 52,467 |
| 10 to 50 | 8,899 | 148,965 | 105,751 | 254,716 |
| 50 to 100 | 5,613 | 277,135 | 158,128 | 435,263 |
| 100 to 200 | 6,851 | 654,729 | 374,022 | 1,028,751 |
| 200 to 320 | 3,916 | 609,857 | 403,462 | 1,013,319 |
| 320 to 640 | 3,802 | 1,057,676 | 660,070 | 1,717,746 |
| 640 to 1,000 | 1,321 | 662,612 | 395,849 | 1,058,461 |
| 1,000 to 5,000 | 1,675 | 2,144,627 | 1,280,558 | 3,425,185 |
| 5,000 to 10,000 | 247 | 1,208,819 | 559,980 | 1,768,799 |
| 10,000 to 20,000 | 189 | 1,911,063 | 788,341 | 2,699,404 |
| 20,000 to 50,000 | 117 | 2,507,848 | 833,083 | 3,340,931 |
| 50,000 to 100,000 | 24 | 801,647 | 723,000 | 1,524,647 |
| Upwards of 100,000 acres | 7 | 397,140 | 680,700 | 1,077,840 |
| Totals, 1891 | 43,777 | 12,410,242 | 6,987,287 | 19,397,529 |
| Totals, 1886 | 36,485 | 11,728,236 | 5,348,838 | 17,077,074 |
| Totals, 1881 | 30,832 | 10,309,170 | 4,897,727 | 15,206,897 |
The extent of land rented from the Crown for pastoral purposes, including the small grazing-runs, amounted, in April, 1891, to 12,469,976 acres.
The number of persons engaged in agricultural and pastoral pursuits in 1891, as ascertained from the results of the census taken in April of that year, was 68,607, of whom 65,950 were males and 2,657 females. Of this number 56,671 males and 2,387 females were directly engaged in agricultural, and 9,279 males and 270 females in pastoral occupations.
The agricultural statistics, which are collected annually in February or March, take into account only such occupied holdings as are wholly or partly under cultivation, and moreover do not include those occupied by aboriginal natives. Information concerning the farming carried on by the Maoris is obtained only when a census of the Native race is taken. In 1891 the Maoris had under wheat a total area of 11,203 acres; under maize, 5,599 acres; potatoes, 16,093 acres; other crops, 16,221 acres; and in sown grasses, 26,718 acres.
A summary of the results of the agricultural statistics collected in February, 1893, is exhibited in the two following tables: the first showing the number of holdings, and the acreage under various kinds of crops and in sown grasses; the second, the produce of the principal crops in each provincial district:—
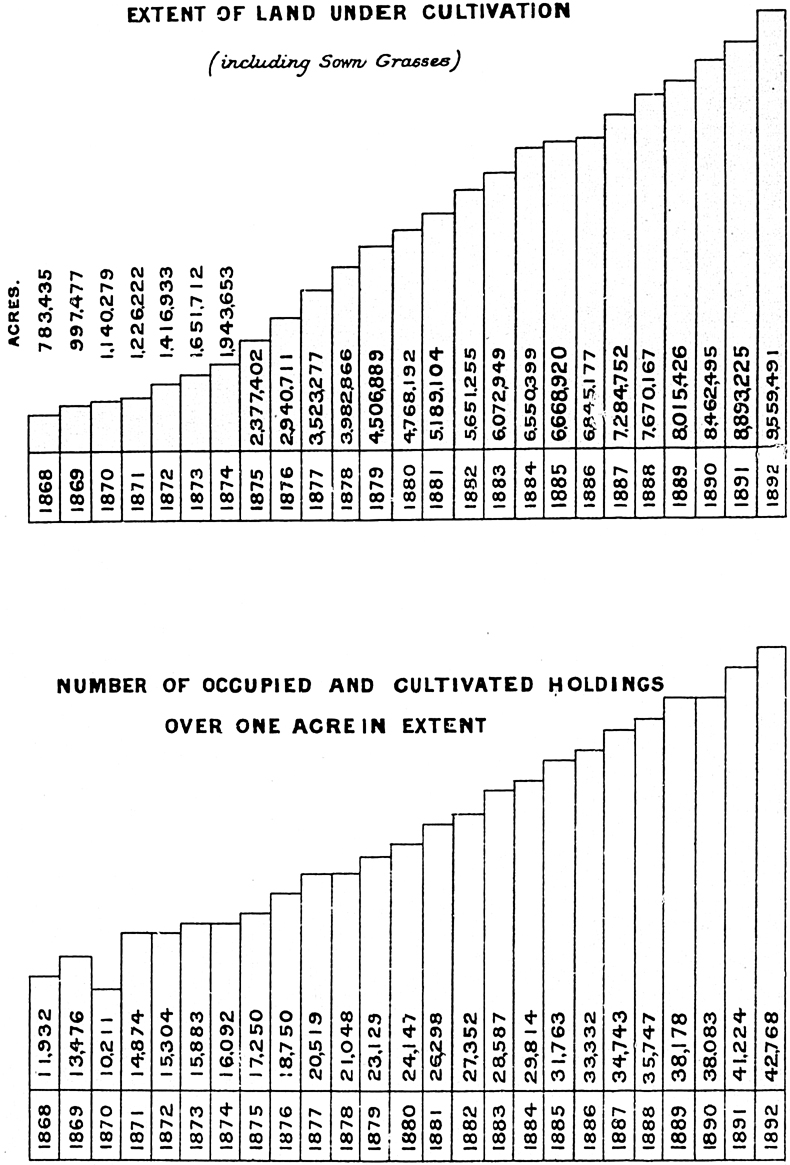
| Provincial Districts. | Number of Holdings. | Number of Acres broken up, but not under Crop. | Number of Acres under Crop. | Total under all Kinds of Crops (including Sown Grasses), and of Land broken up, but not under Crop. | |||||||||||
|---|---|---|---|---|---|---|---|---|---|---|---|---|---|---|---|
| In Grain and Pulse. | In Green and other Crops. | In Sown Grasses. | |||||||||||||
| Wheat. | Oats. | Barley. | Other Crops. | Total-under Grain-crops | Oats sown for Green Food. | Potatoes. | Other Crops. | Total under Green and other Crops. | Hay. | In Grass including Land in Hay) after having been broken up. | Grass-sown Lands (including Lands in Hay) not previously ploughed. | ||||
| Auckland | 10,226 | 29,364 | 6,733 | 6,270 | 702 | 4,676 | 18,381 | 18,563 | 3,448 | 33,444 | 55,455 | 14,129 | 402,646 | 828,305 | 1,334,151 |
| Taranaki | 2,938 | 1,313 | 1,412 | 4,021 | 107 | 108 | 5,648 | 1,377 | 783 | 5,149 | 7,309 | 4,049 | 92,563 | 276,068 | 382,901 |
| Hawke's Bay | 2,002 | 13,716 | 809 | 6,266 | 2,229 | 529 | 9,833 | 2,920 | 801 | 26,900 | 30,621 | 7,298 | 301,027 | 1,028,357 | 1,383,554 |
| Wellington | 6,421 | 5,180 | 8,768 | 15,484 | 285 | 496 | 25,033 | 6,955 | 1,682 | 28,618 | 37,255 | 7,126 | 216,523 | 1,625,897 | 1,909,888 |
| Marlborough | 815 | 4,873 | 5,589 | 2,212 | 2,318 | 1,596 | 11,715 | 4,086 | 667 | 4,784 | 9,537 | 2,080 | 62,088 | 171,992 | 260,205 |
| Nelson | 2,146 | 2,770 | 5,977 | 4,740 | 4,466 | 276 | 15,459 | 7,824 | 890 | 7,866 | 16,580 | 3,199 | 73,201 | 171,400 | 279,410 |
| Westland | 433 | 18 | 3 | 9 | .. | 4 | 16 | 557 | 229 | 339 | 1,125 | 310 | 6,045 | 10,874 | 18,078 |
| Canterbury | 8,245 | 50,708 | 270,780 | 112,894 | 9,569 | 8,662 | 401,905 | 42,179 | 4,996 | 130,298 | 177,473 | 17,097 | 1,242,663 | 333,013 | 2,205,762 |
| Otago | 9,542 | 46,312 | 81,174 | 174,635 | 5,230 | 4,062 | 265,101 | 47,679 | 4,842 | 156,479 | 209,000 | 6,523 | 1,214,637 | 204,746 | 1,939,796 |
| Totals | 42,768 | 154,254 | 381,245 | 326,531 | 24,906 | 20,409 | 753,091 | 132,140 | 18,338 | 393,877 | 544,355 | 61,811 | 3,611,393 | 4,650,652 | 9,713,745 |
| Provincial Districts. | Wheat. | Oats. | Barley. | Hay. | Potatoes. |
|---|---|---|---|---|---|
| Bush. | Bush. | Bush. | Tons. | Tons. | |
| Auckland | 173,154 | 176,596 | 18,572 | 18,895 | 17,303 |
| Taranaki | 36,528 | 155,230 | 2,949 | 6,983 | 4,423 |
| Hawke's Bay | 20,312 | 177,206 | 66,741 | 12,964 | 5,686 |
| Wellington | 193,288 | 488,287 | 7,543 | 11,353 | 11,926 |
| Marlborough | 74,590 | 53,574 | 38,920 | 2,946 | 3,276 |
| Nelson | 87,243 | 104,017 | 118,934 | 4,158 | 4,561 |
| Westland | 50 | 315 | .. | 392 | 1,125 |
| Canterbury | 5,672,238 | 2,968,807 | 248,422 | 24,983 | 31,584 |
| Otago | 2,120,814 | 5,769,957 | 152,150 | 10,619 | 24,289 |
| Total | 8,378,217 | 9,893,989 | 654,231 | 93,293 | 104,173 |
From these tables it will be seen that the final results of the recent collection give the number of cultivated holdings over 1 acre in extent occupied by Europeans as 42,768. It should, however, be observed that it is a common practice in Otago and Canterbury for persons to take unimproved lands from the proprietors in order to raise one, two, or three grain-crops therefrom, the land being after-wards sown down with grass-seed. Lands so occupied are returned as separate holdings. When the low price of grain renders cropping unprofitable, either land is not taken up in this manner, or land so occupied reverts to the owner and is included with the rest of his holding.
In 1876 the number of occupied and cultivated holdings was estimated to be, on an average, 14.88 to every 100 adult males; in 1881, 17.30; in 1886, 20.17; and in 1891, 22.79. Assuming the ratio of adult males to total male population to be still the same as existed at the census of 1891, the number of holdings in 1893 gives an average of 24.39 to every 100 of the adult male population. It is highly satisfactory to observe this progress, indicating as it does that a continually increasing proportion of the grown people are settling upon the land.
The extent of land in cultivation (including sown grasses and land broken up but not under crop) amounted to 9,713,745 acres. Of this area, land under artificial grasses comprised 85.06 per cent.; land under grain-crops, 7.75 per cent.; land under green and other crops, 5.60 per cent.; and land in fallow, 1.59 per cent.
More than half the land under grain-crops was in the Canterbury Provincial District, and more than one-third in Otago; but while the area of land in wheat was greater in Canterbury than in Otago by 189,606 acres, that under oats was less by 61,741 acres.
Of the total extent (24,906 acres) of land in barley, 9,569 acres were in Canterbury, 5,230 in Otago, 4,466 in Nelson, 2,318 in Marlborough, and 2,229 in Hawke's Bay.
The total area under wheat at the beginning of 1893 was 381,245 acres, and the produce was estimated at 8,378,217 bushels, an average yield per acre of 21.98 bushels. In 1892 the gross produce of wheat was returned as 10,257,738 bushels, which gave an average of 25.50 bushels per acre, but it is believed that the estimates in that year were too high. For the current year the estimates given by the farmers have been carefully checked by means of threshing-mill statements received. Deductions have also been made on account of loss by weather and other causes. The apparent decrease in the wheat-crop as shown by comparing one year with the other is therefore not entirely due to the lessened yield, but results partly from the fact that the statistics for this year are more trustworthy than those of 1892.
The area under wheat in New Zealand, the estimated gross produce in bushels, and the average yield per acre for each of the last ten years is here shown:—
| Year. | Land under Wheat. | Estimated Gross Produce. | Average Yield per Acre. |
|---|---|---|---|
| Acres. | Bushels. | Bushels. | |
| 1884 | 377,706 | 9,827,136 | 26.02 |
| 1885 | 270,043 | 6,866,777 | 25.43 |
| 1886 | 173,391 | 4,242,285 | 24.40 |
| 1887 | 253,025 | 6,297,638 | 24.89 |
| 1888 | 357,359 | 9,424,059 | 26.37 |
| 1889 | 362,153 | 8,770,246 | 24.22 |
| 1890 | 335,861 | 8,448,506 | 25.15 |
| 1891 | 301,460 | 5,723,610 | 18.99 |
| 1892 | 402,273 | 10,257,738 | 25.50 |
| 1893 | 381,245 | 8,378,217 | 21.98 |
The following gives the area in wheat and the estimated produce for the Australian Colonies for the season of 1892:—
| Colony. | Wheat-crop, 1892. | ||
|---|---|---|---|
| Acres. | Bushels. | Bushels per Acre. | |
| Queensland | 19,306 | 392,309 | 20.32 |
| New South Wales | 356,666 | 3,963,668 | 11.11 |
| Victoria | 1,332,683 | 13,679,268 | 10.26 |
| South Australia | 1,552,423 | 6,436,488 | 4.15 |
| Western Australia | 26,866 | 295,526 | 11.00 |
| Tasmania | 47,584 | 937,680 | 19.71 |
| New Zealand (1893) | 381,245 | 8,378,217 | 21.98 |
The amount of wheat consumed by the population or used up by them in any year is estimated by deducting from the gross yield the amount exported in that year and the quantity of seed required for the next crop. It is impossible, however, by this means to give an exact statement of the quantity required for actual consumption for several reasons: (1.) The crop itself is an estimate, and the actual harvested yield may be either more or less; (2) the amount retained in any one year may be largely in excess of local requirements, and may form part of the following year's exports, thus apparently largely increasing the amount retained one year for consumption, and reducing the apparent amount retained for consumption the following year. It is thus clear that the results for any one year cannot by themselves be taken for the purpose of ascertaining the requirements of the people, and that even the average for a term of years will probably vary somewhat, as any year's results are added to or subtracted from the computation.
The total average consumption of wheat in New Zealand for the period 1877 to 1892, inclusive, estimated according to the foregoing method, was, apparently, 8.45 bushels per head of population, including Maoris. From this has to be deducted the wheat required for seed-purposes, estimated at 2 bushels to the acre. The remainder, being the amount required for food and other items of local consumption, averaged 7.38 bushels per head. The particulars for each year and the results for the whole period are here given:—
Table showing the Amount of Wheat annually retained in the Colony.
| Year. | Produce (including Estimated Quantity of Maori-grown Wheat and Imports of Wheat and Flour).* | Exports of Wheat and Flour.* | Retained in the Colony. | Used as Seed at 2 Bushels per Acre. | Difference for Food-Consumption. | Mean Population (including Maoris). | Proportion per Head retained. | |
|---|---|---|---|---|---|---|---|---|
| For Food &c. | Total retained | |||||||
| * In equivalent bushels of wheat. | ||||||||
| Bushels. | Bushels. | Bushels. | [Bushels. | Bushels. | Persons. | Bush. | Bush. | |
| 1877 | 4,374,620 | 906,543 | 3,468,077 | 486,812 | 2,981,265 | 451,943 | 6.60 | 7.66 |
| 1878 | 6,537,770 | 1,897,354 | 4,640,416 | 529,722 | 4,110,694 | 467,000 | 8.80 | 9.94 |
| 1879 | 6,272,914 | 2,580,798 | 3,692,116 | 540,396 | 3,151,720 | 491,886 | 6.41 | 7.51 |
| 1880 | 7,801,892 | 3,147,586 | 4,654,306 | 649,898 | 4,004,408 | 518,275 | 7.73 | 8.98 |
| 1881 | 8,264,167 | 3,918,107 | 4,346,060 | 731,430 | 3,614,630 | 537,579 | 6.72 | 8.08 |
| 1882 | 8,360,295 | 3,721,812 | 4,638,483 | 781,636 | 3,856,847 | 552,991 | 6.91 | 8.39 |
| 1883 | 10,329,907 | 5,195,703 | 5,134,204 | 755,412 | 4,378,792 | 572,539 | 7.65 | 8.97 |
| 1884 | 9,934,101 | 2,885,390 | 7,048,711 | 540,086 | 6,508,625 | 595,411 | 10.93 | 11.84 |
| 1885 | 6,950,854 | 1,596,820 | 5,354,034 | 347,782 | 5,006,252 | 615,757 | 8.13 | 8.66 |
| 1886 | 4,290,820 | 1,675,201 | 2,615,625 | 506,050 | 2,109,575 | 624,086 | 3.38 | 4.19 |
| 1887 | 6,368,140 | 707,182 | 5,660,958 | 614,718 | 5,046,240 | 638,343 | 7.90 | 8.87 |
| 1888 | 9,472,895 | 2,547,033 | 6,925,862 | 724,306 | 6,201,556 | 647,340 | 9.58 | 10.70 |
| 1889 | 8,784,801 | 3,397,752 | 5,387,049 | 671,722 | 4,715,327 | 655,799 | 7.19 | 8.21 |
| 1890 | 8,468,853 | 4,899,069 | 3,569,784 | 602,920 | 2,966,864 | 664,460 | 4.47 | 5.37 |
| 1891 | 5,950,244 | 1,610,973 | 4,339,271 | 804,540 | 3,534,725 | 671,776 | 5.26 | 6.46 |
| 1892 | 10,538,337 | 2,659,382 | 7,878,955 | 762,490 | 7,116,465 | 684,238 | 10.40 | 11.51 |
| Totals and Averages | 122,700,616 | 43,346,705 | 79,353,911 | 10,049,926 | 69,303,985 | 9,389,423 | 7.38 | 8.45 |
The difficulty of correctly computing the consumption of bread-stuffs is shown by the great differences in the estimates arrived at.
The average quantity required per head of the population (exclusive of that for seed) is estimated by the Government Statistician of New South Wales at 6.4 bushels for that colony, and by the Statist of Victoria at 4 1/2 to 5 bushels for the last-mentioned colony.
The amount of wheat required annually for use in the United Kingdom averages 5.65 bushels per head of the population.
The consumption of wheaten breadstuffs in New Zealand is thus considerably in excess of that in Victoria, and is also in excess of the amount consumed per head in New South Wales and the other Australian Colonies. The flour used in the colony is produced by local mills, the quantity imported in 1892 having been only 212 centals—about 10 tons; but the quantity exported reached 4,568 tons.
The following is the average annual consumption of wheat per inhabitant for some of the principal countries of the world:—
| United Kingdom | 5.6 bushels. |
| Canada | 6.6 bushels. |
| France | 8.1 bushels. |
| Germany | 3.0 bushels. |
| Russia | 2.1 bushels. |
| Italy | 5.4 bushels. |
| United States | 5.4 bushels. |
If, in New Zealand, 7.38 bushels per head be taken as the amount of wheat actually required for home consumption by an estimated mean population in 1893 of 705,000 persons, and allowing seed for 400,000 acres at 2 bushels per acre, there would, on the wheat-crop of 1893, be a surplus available for export of 2,375,317 bushels, equivalent to about 63,624 imperial tons.
The number of acres under oats (for grain) at the commencement of 1893 was 326,531, and the produce was estimated at 9,893,989 bushels, giving an average yield per acre of 30.30 bushels. Of the land in oats in 1893, rather more than 53 per cent., producing over 58 per cent. of the total crop, was in Otago. Canterbury took second place for oat-production, with 34.58 per cent. of the area and 30.01 per cent. of the produce.
The oat-crop in 1892 for the Australian Colonies was as follows:—
| Acres. | Bushels. | Average per Acre. | |
|---|---|---|---|
| Queensland | 715 | 16,669 | 23.31 |
| New South Wales | 12,958 | 276,259 | 21.32 |
| Victoria | 190,157 | 4,455,451 | 23.43 |
| South Australia | 12,637 | 80,876 | 6.16 |
| Western Australia | 1,301 | 18,214 | 14.00 |
| Tasmania | 28,360 | 876,573 | 30.91 |
| New Zealand (1893) | 326,531 | 9,893,989 | 30.30 |
There were 24,906 acres returned as under barley in 1893, the estimated crop being 654,231 bushels, an average yield per acre of 26.27 bushels. In the previous year the area under barley was 24,268 acres, and the crop 688,683 bushels.
The estimated potato-crop was 104,173 tons from 18,338 acres, or an average yield per acre of 5.68 tons.
Turnips and rape form a most important crop in a sheep-breeding country such as New Zealand, and in 1892 the area of land under this crop amounted to no less than 422,359 acres. The returns of the present year give only 379,447 acres, a decrease of over 10 per cent.
Only 706 acres were under hops in 1893, giving a total produce of 7,059cwt., but even this comparatively small area is more than sufficient to supply local requirements, the imports in 1892 having been slightly over 330cwt., while the exports amounted to 2,124cwt. In 1890 the total quantity used by the breweries in the colony amounted to 3,940cwt. Of the land under hops in 1893, 589 acres were in the Waimea County and 95 in Collingwood, both in the Provincial District of Nelson.
The growing of tobacco does not progress in New Zealand. In 1889, 34 acres were being cultivated; in 1890, 25 acres; in 1891, 16 acres; in 1892, 6 acres; and in 1893, only 4 acres, producing 2,212lb. of dried leaf.
There were 20,085 acres in orchards in 1893, an increase of 458 acres on the area so returned in the previous year. Nevertheless, the fruit-crop of the colony has still to be supplemented by a considerable import from the Australian Colonies and Fiji.
New Zealand is essentially suited for grazing purposes. Wherever there is light and moisture English grasses thrive when the natural bush and fern and other vegetation are cleared off, In fact, the white-clover gradually overcomes the fern; and, from the mildness of the winter season, there are few places where there is not some growth, even in the coldest months of the year. In all parts of the colony stock live, although in varying condition, without other food than such as they can pick up. Sown grass, as might be expected, heads the list of cultivations.
In February, 1893, there were 8,262,045 acres under artificial grasses. Of these, 3,611,393 acres had been previously ploughed, and presumably under grain or other crops, and 4,650,652 acres had not been ploughed. A great part of the latter was bush- or forest-land sown down in grass after the timber had been wholly or partially burnt off.
The following shows the acreage in sown grasses in the Australian Colonies in 1892:—
| Acres. | |
|---|---|
| Queensland | 20,921 |
| New South Wales | 333,238 |
| Victoria | 174,982 |
| South Australia | 17,519 |
| Western Australia (1891) | 23,344 |
| Tasmania | 208,596 |
| New Zealand (1893) | 8,262,045 |
It will be observed that the acreage of land under sown grasses was over ten times greater in New Zealand than in the whole of Australia and Tasmania. When compared in size with the colonies of Australia, New Zealand is relatively small—about one-thirtieth of their total area—but in respect of grazing-capabilities the relative importance of New Zealand is much greater. Australia is generally unsuitable, owing to conditions of climate, for the growth of English grasses, and the amount of feed produced by the natural grasses throughout the year is very much less per acre than that obtained from the sown-grass lands in New Zealand—so much so that it may be stated that the average productiveness of the grass land in New Zealand is probably about nine times as great as that in Australia; and that the land of this colony covered with artificial grass may be considered equal, for grazing purposes, to an area of Australian territory about nine times as great.
The total quantity of grass-seed produced was, in 1893, returned at 928,731 bushels, of which 362,321 bushels were cocksfoot and 566,410 bushels ryegrass. The value of both kinds together is calculated to be about £160,444.
The total value of all agricultural produce, &c., based on the returns for 1893 is estimated to amount to about £3,937,747, made up as follows:—
| £ | |
|---|---|
| Grain and pulse | 2,027,119 |
| Root-crops | 639,169 |
| Hops and other crops | 44,930 |
| Hay and green forage (excluding grass) | 618,365 |
| Grass-seed | 160,444 |
| Garden-and orchard-produce | 447,720 |
| Total value of agricultural produce | £3,937,747 |
Returns of sheep are sent in April of each year to the Agricultural Department, but full returns of other stock are only obtained when a census is taken. The number of each kind of live-stock, according to the returns from the European portion of the population, in the colony in each of the census years 1886 and 1891 is given below:—
| Live-stock. | Census, 1891. | Census, 1886. |
|---|---|---|
| Horses | 211,040 | 187,382 |
| Brood-mares (included in foregoing) | 31,276 | 29,853 |
| Asses and mules | 348 | 297 |
| Cattle (including calves) | 788,919 | 853,358 |
| Breeding-cows (included in foregoing) | 280,711 | 279,136 |
| Milch-cows (also included in breeding-cows) | 206,906 | Not specified. |
| Sheep (including lambs) | 17,865,423 | 16,564,595 |
| Breeding-ewes (included in foregoing) | 7,371,429 | 6,457,355 |
| Goats | 9,055 | 10,220 |
| Pigs | 222,553 | 277,901 |
| Poultry | 1,790,070 | 1,679,021 |
| Ostriches | 179 | .. |
The above statement does not include the live-stock owned by Maoris. A census was taken of the Native population, their stock and cultivations, about the same time the census of the rest of the population was taken, but not of so elaborate a character. The result of the Native census gave the following numbers of stock owned by them: Sheep, 262,763; cattle, 42,912; pigs, 86,259; no statement of the horses, of which they have many, being given. The full number of those kinds of stock for the colony was, therefore,—
| Sheep | 18,128,186 |
| Cattle | 831,831 |
| Pigs | 308,812 |
The number of sheep in the colony on 30th April, 1892, according to returns made to the Department of Agriculture was 18,570,752, and it is expected that the returns now being compiled will, when complete, show that the number in April of the present year exceeded nineteen millions.
No statement as to the annual consumption of mutton in this colony has hitherto been made, since no returns from slaughterhouses are rendered to the Government, and reliable information as to the number of sheep slaughtered for local use is not otherwise obtainable. Mr. Coghlan, Government Statistician of New South Wales, estimated (in 1888) that two sheep per inhabitant were required for home consumption in Australia. If this average held good for New Zealand, the number of sheep required annually for consumption in this colony would be about 1,385,000. (Maoris, for the purposes of this calculation, have been included in the population.)
The following gives the number of the principal kinds of live-stock in the several Australasian Colonies for the year 1891:—
| Sheep. | Cattle. | Horses. | |
|---|---|---|---|
|
*Including those owned by Maoris. † Excluding those owned by Maoris. | |||
| Queensland | 20,289,633 | 6,192,759 | 399,364 |
| New South Wales | 61,831,416 | 2,046,347 | 459,755 |
| Victoria | 12,919,428 | 1,813,159 | 440,496 |
| South Australia | 7,646,239 | 399,077 | 188,587 |
| Western Australia | 1,962,212 | 133,690 | 40,812 |
| Tasmania | 1,619,256 | 162,440 | 31,165 |
| New Zealand | *18,128,186 | *831,831 | †211,040 |
New Zealand thus takes third place in order for number of sheep and fourth for the number of her cattle.
The following statement, based on returns published by the Statistician of the Department of Agriculture of the United States, shows the approximate numbers of cattle, horses, sheep, and pigs in the civilised world:—
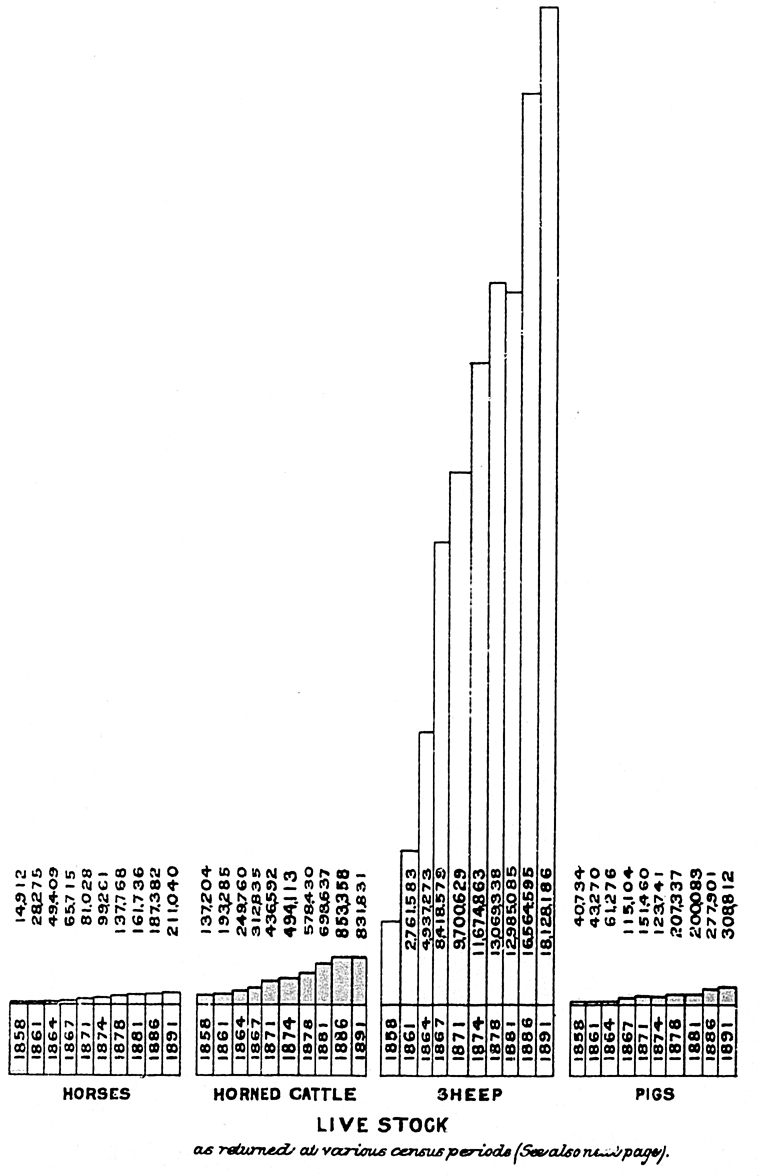
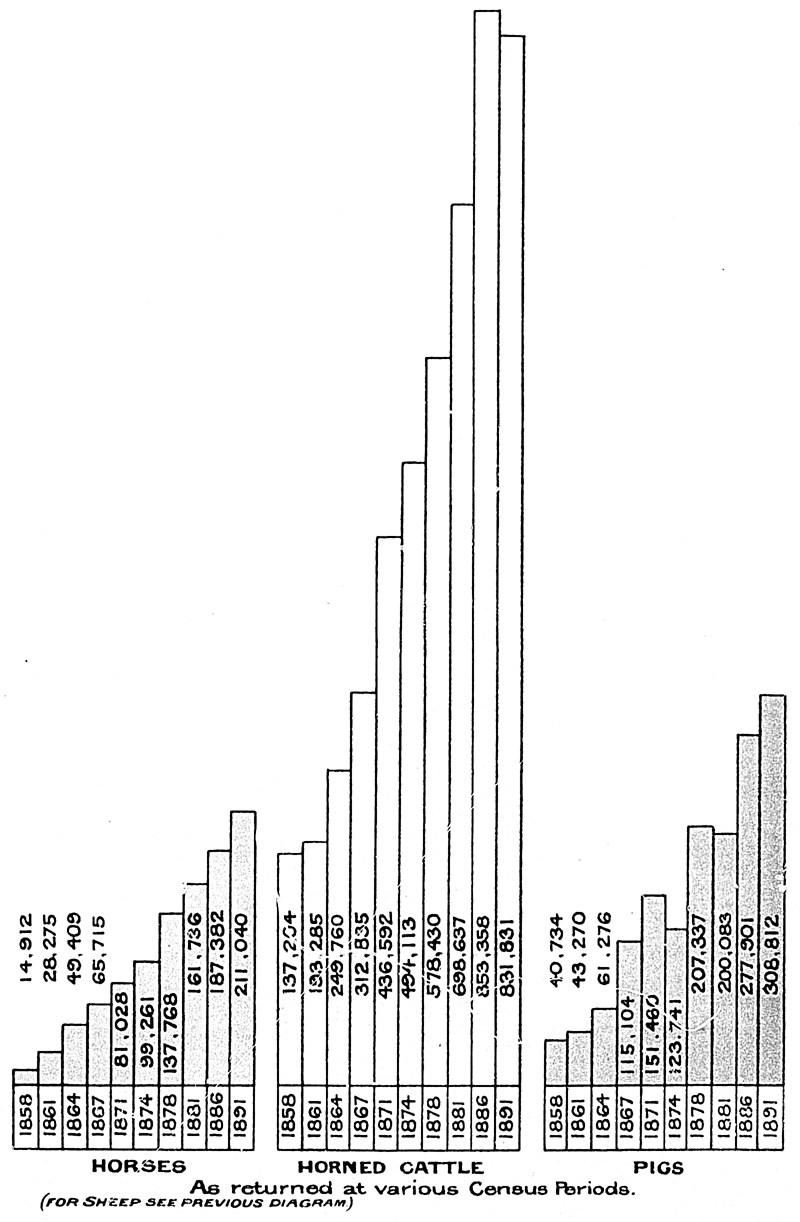
| Cattle. | Horses. | Sheep. | Pigs. | |
|---|---|---|---|---|
| *Includes only British India and Ceylon; French East Indies; Java, Hong Kong, Japan, Russia in Asia (Caucasia and Trans-Caucasia), and Cyprus. | ||||
| North America | 57,887,438 | 17,717,139 | 51,292,797 | 48,059,045 |
| South America | 57,610,183 | 5,486,036 | 96,242,137 | 2,723,516 |
| Europe | 104,430,093 | 36,483,400 | 187,144,203 | 49,164,341 |
| Asia* | 60,846,904 | 4,279,241 | 39,922,366 | 488,937 |
| Africa | 6,094,883 | 1,238,574 | 35,589,208 | 546,909 |
| Australasia and Fiji | 11,872,360 | 1,786,644 | 124,645,606 | 1,156,325 |
| Oceania | 131,796 | 4,066 | 12,607 | 33,151 |
| Totals | 298,873,657 | 66,995,100 | 534,848,924 | 102,172,224 |
The numbers of each kind of animal owned in the United Kingdom, her colonies and possessions, are:—
| Cattle. | Horses. | Sheep. | Pigs. | |
|---|---|---|---|---|
| United Kingdom | 11,519,417 | 2,067,549 | 33,642,808 | 3,265,898 |
| British India and Ceylon | 53,766,050 | 1,055,385 | 30,074,606 | 486,700 |
| Australasia and Fiji | 11,872,360 | 1,786,644 | 124,645,606 | 1,156,325 |
| Canada | 4,117,799 | 1,231,831 | 3,513,419 | 1,732,313 |
Cape of Good Hope, Natal, and Basutoland | 3,226,115 | 587,418 | 17,665,352 | 333,866 |
| Other British Possessions | 188,332 | 138,703 | 959,696 | 30,285 |
| Totals | 84,690,073 | 6,867,530 | 210,501,487,7,005,387 |
Butter has always held an important position among the productions of the New Zealand small-farmer. Made by different persons and in different ways, it has not been generally suitable for the requirements of the English market, although considerable quantities have been exported to Australia and also to the United Kingdom; but the success attending the efforts made to produce butter of uniform superior character in dairy factories, and the fairly remunerative prices realised for such butter in England, have caused great attention to be given to the dairy factories for the purpose of supplying produce for the English market.
It is only in census years that any information is obtained of the quantity of butter and cheese annually produced in the colony, and the returns given by farmers must be considered as estimates only, as the majority of them do not keep occupied of their productions.
The following are the results of the returns made in the census years mentioned. The numbers represent the quantities produced in the preceding years:—
| Cheese. | Butter. | |
|---|---|---|
| Lb. | Lb. | |
| Census year, 1881 | 3,178,694 | 8,453,815 |
| 1886 | 4,594,795 | 12,170,964 |
| 1891 | 6,975,698 | 10,310,012 |
The figures for 1891 include 1,969,759lb. of butter and 4,390,400lb. of cheese made in factories.
The importance of the dairy industry to New Zealand caused the Government to appoint a Chief Dairy Instructor, to visit factories and give lectures and addresses on the benefits of co-operative dairying, the manufacture of cheese and butter, and subjects relating thereto. Particulars of this industry will be found in a separate article further on.
The growing importance of our export trade of butter and cheese with the United Kingdom, which must be regarded as the market chiefly to be considered, is shown in the table on page 96.
Important as are the grazing and dairy interests to New Zealand, yet her future is likewise intimately bound up with mining interests. The natural mineral resources are very great, and have exercised in the past a most important influence on the development and progress of the colony. Gold to the value of £48,387,861 was obtained prior to the 31st December, 1892. The gold produce in 1892 was of the value of £954,744. In the earlier years the gold was obtained from alluvial diggings, but at the present time it is mostly taken from gold-bearing quartz, which is distributed widely through several parts of the colony, and thus there is a much better prospect for the permanency of this industry than was afforded by the alluvial diggings. The amount of silver extracted to the end of 1892 amounted to only £144,144 in value, but recent discoveries of ore give promise of large production in the future. Of other minerals, the product to the same date amounts to £10,717,879, of which kauri-gum yielded £6,349,421, and coal, with coke, £4,141,975. The following gives the quantities and values of precious metals and minerals obtained during the year 1892, and the total value of mining produce since 1853:—
| 1892. | Total Value since 1853. | ||
|---|---|---|---|
| Oz. | £ | £ | |
| Gold | 238,079 | 954,744 | |
| Silver | 22,053 | 3,996 | |
| 260,132 | 958,740 | 48,532,005 | |
| Tons. | |||
| Copper-ore | 2 1/2 | 148 | 18,014 |
| Chrome-ore | 37,367 | ||
| Antimony-ore | 364 | 4,900 | 46,040 |
| Manganese-ore | 521 | 1,239 | 55,164 |
| Hámatite-ore | 226 | ||
| Mixed minerals | 84 | 631 | 69,672 |
| Coal | 673,315 | 377,427 | 4,118,385 |
| Coke (exported) | 4,306 | 5,691 | 23,590 |
| Kauri-gum | 8,705 | 517,678 | 6,349,421 |
| £1,866,454 | £59,249,884 | ||
The approximate total output of the coal-mines to the 31st December, 1892, amounted to 7,805,301 tons.
[For full account of mines and minerals see special article, post.]
Statistics of manufactories or works are not taken annually in New Zealand, but every five years, at the time of the census. The figures for 1891 show an increase on the number of industries at the previous census, but not to the extent that was anticipated. They are—2,570 for 1891, against 2,268 in 1886, or at the rate of 13.32 per cent. Between 1881 and 1886 the industries returned increased from 1,643 to 2,268, or the rate of 38 per cent. Gold-quartz-mining and hydraulic mining-works are included in the above, increasing the number of industries by 209; 95 collieries are also included, with 2 antimony mines and 1 manganese, besides 9 building-stone quarries. Important machinery and plant being used in these mining-works, they are included, the Act requiring the returns.
The remarks of the Registrar-General in the report on the census of 1886 as to what are included in the returns are reprinted, as again applicable: “There is difficulty in defining what works should be included and what omitted. For example, some of the furniture factories consist of large workshops in rear of shops, in which several hands are employed in making furniture; but there are numerous cabinetmakers who also employ one or two hands in making furniture, but whose works can hardly be classed as manufactories. There are many industries in a similar condition, so that no hard-and-fast rule can be laid down; otherwise many industries that are in the aggregate of considerable magnitude, and of growing importance, would have to be omitted, or the table filled up with the enumeration of what are in reality retail businesses combined with the doing of a limited amount of work on the premises, either by way of repairs or as new work. Consequently, much discretion has to be exercised in the selection for the returns, possibly causing some little roughness in the result. Much additional work to that given is no doubt being performed by these minor industries. Some small industries have been given on account of their possessing a special character, or of being the germ of what may grow to some importance.”
The hands and horse-power employed were—
| Hands Males. | employed. Females. | Horse-power employed. | |
|---|---|---|---|
| Census, 1881 | 16,599 | 1,399 | 13,601 |
| Census, 1886 | 23,161 | 2,494 | 19,315 |
| Census, 1891 | 26,911 | 2,969 | 33,392 |
Here the male hands employed are shown to have increased by 10,312 or 62.12 per cent. in ten years, and by 3,750 or 16.19 per cent. in the period 1886–91. The increase in the case of females is much greater for the ten-year period than in case of the males, being 112.22 per cent. for 1881–91, and in the quinquennium 1886–91, 19.05 per cent.
The increase in horse-power is 145.51 per cent. for 1881–91, and 72.88 per cent. for 1886–91.
At the census of 1891 an attempt was made for the first time to obtain information as to the wages paid in those factories or large works supplying wholesale orders, and employing machinery and plant, which are dealt with in the industrial returns. The amount for the year 1890 was £2,106,860 paid to males, and £102,999 to females, of all ages. The total value of materials operated upon was £3,471,767, so far as returned. The deficiency is not considered to be such as very materially to affect the figures given. The annual value of the manufactures and produce was obtained in 1886 as well as in 1891, and a comparison is consequently possible:—
| Annual Value of Manufactures and Produce. | |
|---|---|
| £ | |
| Census, 1891 | 9,422,146 |
| Census, 1886 | 7,436,649 |
| Increase | 1,985,497 |
or 26.70 per cent.
It will be observed that while the industries increased between 1886 and 1891 in number by only 13.32 per cent., as previously stated, the proportionate increase on the actual result of the work, as shown by the value of the manufactures or produce, was at the higher rate of 26.70 per cent. The hands increased at the rate of 26.19 per cent. for males, and 19.05 per cent. for females.
The approximate value of the land, buildings, machinery, and plant used in the manufactories or works can be compared for four census-periods:—
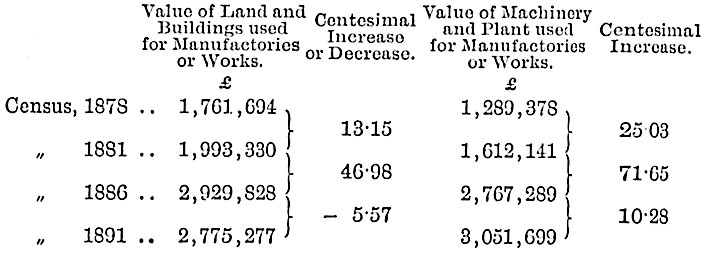
The value of the lands used for mining is not included in the above figures, and the value of Crown lands has been omitted throughout.
The principal industries returned at the census of 1891, and particulars relating thereto, are given in detail in the following table:—
| Nature of Industry. | Total Number of Industries. | Number of Hands employed. | Wages paid. | Amount of Horse-power employed. | Value of all Manufactures or Produce (including Repairs) for the Year 1890. | Approximate Value of Land, Buildings, Machinery, and Plant. | ||||
|---|---|---|---|---|---|---|---|---|---|---|
| Males. | Females. | Total. | To Males. | To Females. | Total. | |||||
| £ | £ | £ | £ | £ | ||||||
| Printing, &c., establishments | 142 | 2,373 | 196 | 2,569 | 207,067 | 7,118 | 214,185 | 328 | 354,559 | 341,683 |
| Machines, tools, and implements | 36 | 526 | 2 | 528 | 45,246 | 41 | 45,287 | 148 | 144,472 | 73,478 |
| Coach-building and-painting | 108 | 675 | 3 | 678 | 52,526 | 75 | 52,601 | 94 | 139,660 | 96,225 |
| Tanning, fellmongering, and wool-scouring | 104 | 1,190 | 6 | 1,196 | 92,166 | 276 | 92,442 | 474 | 1,026,349 | 153,592 |
| Ship-and boat-building | 37 | 145 | .. | 145 | 10,831 | .. | 10,831 | 28 | 35,847 | 10,172 |
| Sail-and oilskin-factories | 32 | 68 | 56 | 124 | 4,909 | 1,426 | 6,335 | .. | 31,083 | 16,799 |
| Furniture-factories | 94 | 551 | 34 | 585 | 41,392 | 1,351 | 42,743 | 105 | 131,314 | 96,543 |
| Chemical-works | 8 | 55 | .. | 55 | 5,754 | .. | 5,754 | 65 | 41,568 | 23,766 |
| Woollen-mills | 8 | 602 | 573 | 1,175 | 52,250 | 26,790 | 79,040 | 930 | 279,175 | 259,955 |
| Clothing-factories | 19 | 229 | 1,061 | 1,290 | 19,489 | 33,265 | 52,754 | 7 | 166,579 | 59,735 |
| Hat-and cap-factories | 16 | 51 | 61 | 112 | 4,138 | 2,138 | 6,276 | .. | 21,628 | 26,005 |
| Boot-and shoe-factories | 47 | 1,475 | 468 | 1,942 | 107,040 | 17,950 | 124,990 | 46 | 403,736 | 82,137 |
| Rope-and twine-works | 24 | 222 | .. | 222 | 13,658 | .. | 13,658 | 129 | 76,711 | 36,086 |
| Flax-mills | 177 | 3,196 | 8 | 3,204 | 116,168 | .. | 116,168 | 1,994 | 234,266 | 146,792 |
| Meat-preserving, -freezing, and boiling-down works | 43 | 1,561 | 7 | 1,568 | 138,312 | 147 | 138,459 | 5,112 | 1,464,659 | 476,151 |
| Bacon-curing establishments | 33 | 83 | 1 | 84 | 6,671 | 25 | 6,696 | 7 | 83,435 | 14,180 |
| Cheese-and butter-factories | 74 | 218 | 51 | 269 | 13,800 | 1,128 | 14,928 | 387 | 150,957 | 100,453 |
| Grain-mills | 129 | 499 | .. | 499 | 52,384 | .. | 52,384 | 2,906 | 991,812 | 391,828 |
| Biscuit-factories | 22 | 284 | 47 | 331 | 16,150 | 1,049 | 17,199 | 134 | 127,147 | 48,960 |
| Fruit-preserving and jam-making works | 15 | 74 | 43 | 117 | 3,781 | 961 | 4,742 | 33 | 27,255 | 10,042 |
| Breweries | 102 | 476 | .. | 476 | 54,825 | .. | 54,825 | 409 | 300,508 | 236,825 |
| Malthouses | 27 | 87 | .. | 87 | 7,875 | .. | 7,875 | 47 | 80,341 | 42,442 |
| Carried forward | 1,297 | 14,640 | 2,617 | 17,257 | 1,066,432 | 93,740 | 1,160,172 | 13,383 | 6,313,061 | 2,743,849 |
| Brought forward | 1,297 | 14,640 | 2,617 | 17,257 | 1,066,432 | 93,740 | 1,160,172 | 13,383 | 6,313,061 | 2,743,849 |
| Aërated-water factories | 112 | 253 | 8 | 261 | 16,982 | 39 | 17,021 | 155 | 91,691 | 73,147 |
| Coffee-and-spice works | 17 | 79 | 2 | 81 | 6,512 | 50 | 6,562 | 93 | 64,024 | 30,850 |
| Soap-and-candle works | 19 | 201 | 8 | 209 | 21,194 | 200 | 21,394 | 259 | 155,714 | 74,443 |
| Saw-mills | 243 | 3,260 | 6 | 3,266 | 271,783 | 31 | 271,814 | 4,637 | 832,959 | 500,272 |
| Chaff-cutting establishments | 63 | 203 | 2 | 205 | 7,260 | 70 | 7,330 | 269 | 63,236 | 36,300 |
| Gasworks | 27 | 249 | .. | 249 | 31,700 | .. | 31,700 | 117 | 178,947 | 730,490 |
| Brick-, tile-, and pottery- works | 106 | 484 | 10 | 494 | 24,938 | 252 | 25,190 | 459 | 56,830 | 119,780 |
| Iron and brass foundries | 79 | 1,785 | 2 | 1,787 | 157,245 | 27 | 157,272 | 954 | 403,635 | 268,887 |
| Spouting-and-ridging works | 12 | 100 | .. | 100 | 7,981 | .. | 7,981 | 25 | 33,140 | 29,670 |
| Gold-and quartz-mining works | 135 | 1,971 | .. | 1,971 | 183,582 | .. | 183,582 | 2,656 | 278,893 | 241,715 |
| Hydraulic gold-mining and gold-dredging | 74 | 495 | .. | 495 | 32,904 | .. | 32,904 | 7,728 | 73,713 | 154,270 |
| Collieries | 95 | 1,655 | .. | 1,655 | 173,538 | .. | 173,538 | 1,185 | 279,777 | 155,671 |
| Other industries | 291 | 1,536 | 314 | 1,850 | 104,809 | 8,590 | 113,399 | 1,472 | 596,520 | 667,632 |
| Totals | 2,570 | 26,911 | 2,969 | 29,880 | 2,106,860 | 102,999 | 2,209,859 | 33,392 | 9,422,146 | 5,826,976 |
The Government Printing Office and the Railway workshops have not been included in making up the preceding table (and indeed the information was not all obtained). This is in accordance with the practice observed at previous censuses in New Zealand, but is open to question, and it has, at least, the disadvantage of disturbing comparisons, as will be found further on, with other colonies where such Government establishments are included.
The order of the provincial districts, arranged according to the number of industries belonging to each, is as under:—
| Number of Industries including Gold-quartz-mining Works, Collieries, &c. | Number of Industries excluding Gold-quartz-mining Works Collieries, &c. | |
|---|---|---|
| Otago | 705 | 541 |
| Auckland | 650 | 577 |
| Canterbury | 386 | 380 |
| Wellington | 333 | 333 |
| Nelson | 204 | 142 |
| Hawke's Bay | 85 | 85 |
| Marlborough | 78 | 77 |
| Taranaki | 68 | 68 |
| Westland | 61 | 51 |
The values of the manufactures for the provincial districts were respectively as follows:—
| Value of Manufactures including Output of Gold-quartz-mining Works, Collieries, &c. | Value of Manufactures excluding Output of Gold-quartz-mining Works, Collieries, &c. | |
|---|---|---|
| £ | £ | |
| Auckland | 2,396,060 | 2,184,401 |
| Otago | 2,237,246 | 2,078,365 |
| Canterbury | 2,061,921 | 2,056,412 |
| Wellington | 1,412,465 | 1,412,465 |
| Hawke's Bay | 525,394 | 525,394 |
| Nelson | 394,481 | 146,020 |
| Marlborough | 168,814 | 161,714 |
| Taranaki | 155,772 | 155,772 |
| Westland | 69,993 | 53,294 |
The following shows the most important industries arranged in order of the value of their manufactures or produce, and specifying all amounts over £100,000:—
| Total Value of all Manufactures or Produce, including Repairs. | |
|---|---|
| £ | |
|
Unsatisfactory returns. | |
| Meat-freezing, -preserving, and boiling-down works | 1,464,659 |
| Tanning, fellmongering, and wool-scouring establishments | 1,026,349 |
| Grain-mills | 991,812 |
| Saw-mills | 832,959 |
| Boot-and-shoe factories | 403,736 |
| Iron- and brass-foundries, boiler-making, machinists, and millwrights | 403,635 |
| Printing establishments | 354,559 |
| Breweries | 300,508 |
| Collieries | 279,777 |
| Woollen-mills | 279,175 |
| Gold-mining, quartz-mining and -crushing works | 278,893 |
| Flax-mills | 234,266 |
| Gasworks | 178,947 |
| Clothing-factories | 166,579* |
| Soap-and-candle works | 155,714 |
| Cheese- and butter-factories | 150,957 |
| Agricultural-implement factories | 144,472 |
| Coach-building and -painting works | 139,660 |
| Furniture-factories | 131,314 |
| Biscuit-factories | 127,147 |
| Other industries, in which the value of manufactures was under £100,000 | 1,377,028 |
| £9,422,146 | |
The order of the principal industries arranged according to the number of hands employed is:—
| No. of Hands. | |
|---|---|
| Saw-mills | 3,266 |
| Flax-mills | 3,204 |
| Printing establishments | 2,569 |
| Gold-mining, quartz-mining and -crushing works | 1,971 |
| Boot-and-shoe factories | 1,943 |
| Iron- and brass-foundries, boiler-making, machinists, and millwrights | 1,787 |
| Collieries | 1,655 |
| Meat-freezing, -preserving, and boiling-down works | 1,568 |
| Clothing-factories | 1,290 |
| Tanning, fellmongering, and wool - scouring establishments | 1,196 |
| Woollen-mills | 1,175 |
| Other industries | 8,256 |
| 29,880 |
A comparison has been made under four heads between the results of the industrial returns for New Zealand and those for Victoria and New South Wales, taken at the time of the census, excepting in each case those relating to mining works. According to the plan adopted at successive censuses in New Zealand, the Government Printing Office and Government Railway workshops for this colony have not been included in the previous tables. The figures for these are now added, and those for mining works deducted, for the sake of comparison. The figures for the two other colonies have been taken from a table published in December, 1891, by the Government Statist of Victoria.
| Colonies. | Number of Establishments. | Hands employed. | Horse-power of Engines. | Value of Machinery and Plant. |
|---|---|---|---|---|
| New Zealand (including Government Railway workshops and Government Printing Office, but deducting mining works) | No. | Persons. | H.P. | £ |
| 2,270 | 26,540 | 22,148 | 2,592,993 | |
| Victoria | 3,296 | 58,175 | 30,078 | 6,604,322 |
| New South Wales | 2,619 | 46,525 | 24,909 | 4,557,022 |
The returns for New South Wales show 349 more establishments than those for New Zealand, and those for Victoria show an excess of 1,026 over the New Zealand figures. The average number of hands in New Zealand was also less than in the other two colonies, as shown below:—
| Average Number of Hands per Industrial Establishment. | |
|---|---|
| New Zealand | 11.7 |
| New South Wales | 17.8 |
| Victoria | 17.7 |
The value of the machinery and plant in New Zealand is not much more than one-half that given for New South Wales, and little over one-third of that in Victoria. But, while these facts are noted, it must be remembered that the population of each of the other colonies was over a million of persons at the time of the census, while that of New Zealand was only six hundred and twenty-six thousand persons, leaving out the Maoris. Certain details of the comparison are given in the following table. Only those industries having in New Zealand manufactures or produce of a value exceeding £100,000 have been specified:—
| Description of Manufactory, Works, &c. | New Zealand. | Victoria. | New South Wales. | |||||||||
|---|---|---|---|---|---|---|---|---|---|---|---|---|
| Number of Establishments. | Hands employed. | Horse-power of Engines. | Value of Machinery and Plant. | Number of Establishments. | Hands employed. | Horse-power of Engines. | Value of Machinery and Plant. | Number of Establishments. | Hands employed. | Horse-power of Engines. | Value of Machinery and Plant. | |
|
* Including Government Printing Office and railway-carriage works. † Including railway-carriage works. ‡ Mining works are not included in this table, though given for New Zealand in the previous tables. | ||||||||||||
| £ | £ | £ | ||||||||||
| Printing establishments, bookbinding, and paper-ruling | *143 | 2,746 | 378 | 204,775 | 175 | 5,085 | 871 | 544,346 | 131 | 4,067 | 651 | 422,930 |
| Agricultural-implement factories | 36 | 528 | 148 | 27,046 | 71 | 1,090 | 461 | 74,080 | 17 | 304 | 110 | 16,830 |
| Coach-building, &c., works | *114 | 1,373 | 444 | 84,902 | †207 | 2,791 | 351 | 96,360 | †156 | 5,632 | 1,399 | 244,936 |
| Tanning, fellmongery, and wool-scouring establishments | 104 | 1,196 | 474 | 37,953 | 132 | 1,669 | 824 | 153,055 | 125 | 1,739 | 1,084 | 112,352 |
| Furniture-and bedding-factories | 25 | 617 | 110 | 10,627 | 105 | 1,854 | 543 | 62,855 | 77 | 1,041 | 189 | 20,413 |
| Woollen-mills | 8 | 1,175 | 930 | 166,288 | 7 | 791 | 760 | 153,436 | 4 | 155 | 134 | 20,500 |
| Clothing-factories | 19 | 1,290 | 7 | 4,535 | 105 | 5,536 | 64 | 32,602 | 21 | 2,698 | 3 | 4,550 |
| Boot-and shoe-factories | 47 | 1,943 | 46 | 18,627 | 92 | 3,787 | 122 | 63,201 | 60 | 2,806 | 132 | 32,248 |
| Meat-preserving, -freezing, bacon, fishcuring, and boiling-down works | 103 | 1,792 | 5,119 | 183,818 | 42 | 449 | 245 | 35,780 | 34 | 603 | 439 | 44,845 |
| Flax-mills | 177 | 3,204 | 1,994 | 66,649 | .. | .. | .. | .. | .. | .. | .. | .. |
| Cheese- and butter-factories | 74 | 269 | 387 | 27,409 | 53 | 200 | 275 | 45,522 | 291 | 1,563 | 816 | 52,103 |
| Grain-mills | 129 | 499 | 2,906 | 166,181 | 104 | 800 | 3,617 | 368,386 | 74 | 541 | 2,022 | 200,338 |
| Biscuit-factories | 22 | 331 | 134 | 19,991 | 7 | 627 | 128 | 35,570 | 10 | 544 | 109 | 50,787 |
| Breweries | 102 | 476 | 409 | 56,496 | 68 | 1,185 | 752 | 254,206 | 41 | 784 | 656 | 190,077 |
| Soap-and -candle works | 19 | 209 | 259 | 47,511 | 33 | 427 | 386 | 95,710 | 27 | 194 | 257 | 27,380 |
| Saw-mills | 243 | 3,266 | 4,637 | 246,674 | 321 | 5,440 | 5,329 | 424,908 | 407 | 4,766 | 6,325 | 394,810 |
| Gasworks | 27 | 249 | 117 | 619,163 | 31 | 866 | 150 | 1,625,489 | 35 | 1,188 | 467 | 476,586 |
| Iron-and brass-foundries, boiler-making, machinists, and millwrights | 110 | 2,012 | 1,009 | 153,650 | 217 | 8,395 | 3,916 | 876,864 | 159 | 3,550 | 1,787 | 353,070 |
| Other industries | 768 | 3,365 | 2,640 | 450,698 | 1,526 | 17,183 | 11,284 | 1,661,952 | 950 | 14,350 | 8,329 | 1,892,267 |
| Totals‡ | *2,270 | 26,540 | 22,148 | 2,592,993 | †3,296 | 58,175 | 30,078 | 6,604,322 | †2,619 | 46,525 | 24,909 | 4,557,022 |
Sittings of the Supreme Court are held for trial of civil cases at Auckland, Gisborne, New Plymouth, Napier, Wellington, and Wanganui, in the North Island; and at Blenheim, Nelson, Hokitika, Christchurch, Timaru, Oamaru, Dunedin, and Invercargill, in the Middle Island.
The number of writs of summons tested in the Supreme Court in 1891 was 744, against 929 in 1890, and 1,023 in 1889. But the number of civil cases tried increased from 182 in 1890 to 184 in 1891. Of these 23 were tried before a common jury, 51 by special jury, and 110 by Judge without jury. The total of amounts for which judgments were recorded in 1891 was £57,356. 131 writs of execution were issued during the year.
Seventy-two cases were disposed of at fifteen District Courts in 1891. Thirty of these cases were tried before juries, and 23 before the Judge only, making a total of 53 cases tried. Nineteen cases lapsed or were discontinued, and 6 cases remained pending. The total of amounts sued for was £7,599, and judgments were recorded for £1,588. 18,217 cases were tried before the Resident Magistrate's Courts, against 17,790 in 1890; the total of amounts sued for being £253,982, and the total for which judgment was given £131,774.
The petitions in bankruptcy numbered 605 in 1891, of which 573 were made by debtors and 32 by creditors. This number was the lowest for six years.
The following gives the number of petitions, the total amount of the unsecured assets, the amount of debts proved, and the amount paid in dividends and preferential claims for the past six years:—
| Year. | No. of Petitions in Bankruptcy. | Debtors' Statements of Assets, excluding Amounts secured to Creditors. | Amounts realised by Official Assignees.; | Amount of Debts proved. | Amounts paid in Dividends and Preferential Claims. |
|---|---|---|---|---|---|
| £ | £ | £ | £ | £ | |
| 1886 | 1,089 | 415,953 | 128,370 | 566,291 | 102,966 |
| 1887 | 1,036 | 311,745 | 135,633 | 503,759 | 109,255 |
| 1888 | 881 | 252,322 | 98,213 | 571,741 | 79,843 |
| 1889 | 724 | 441,874 | 187,048 | 755,165 | 95,032 |
| 1890 | 652 | 262,733 | 112,951 | 381,124 | 122,276 |
| 1891 | 605 | 141,970 | 84,341 | 302,712 | 72,571 |
Not only is there progressive decrease shown as regards the number of petitions, but the money-figures point to a much better state of things than that existing in the first year for which information is given.
Of the bankruptcies in 1891, in 30 cases the liabilities were under £50; in 116 cases, from £50 to £100; in 198 cases, from £100 to £250; in 123 cases, from £250 to £500; in 59 cases, from £500 to £1,000; in 37 cases, from £1,000 to £2,000; in 31 cases, from £2,000 to £5,000; and in 7 cases, £5,000 and upwards.
The petitions in 1891 under “The Divorce and Matrimonial Causes Act, 1867,” were 36 in number—4 more than in 1890: 31 were for dissolution of marriage, and 5 for judicial separation; 20 decrees for dissolution of marriage were granted. The proceedings under the Act for the past five years were as follows:—
| Year. | Petitions for | Decrees for | ||
|---|---|---|---|---|
| Dissolution of Marriage. | Judicial Separation. | Dissolution of Marriage. | Judicial Separation. | |
| 1887 | 26 | 6 | 16 | 1 |
| 1888 | 35 | 3 | 32 | .. |
| 1889 | 26 | 7 | 17 | 1 |
| 1890 | 24 | 8 | 21 | 3 |
| 1891 | 31 | 5 | 20 | 3 |
The petitions for dissolution of marriage amounted on the average for the five years to 7.71 in every 1,000 marriages, and the decrees for dissolution to 5.76.
The proportion of petitions and decrees for dissolution of marriage to the number of marriages is higher in New Zealand than in England and Wales, but lower than New South Wales, or Victoria. The proportion in every 1,000 marriages for these countries is as follows:—
| Country. | Petitions for Dissolution of Marriage. | Decrees for Dissolution of Marriage. |
|---|---|---|
| New Zealand (1891) | 8.15 | 5.26 |
| England and Wales | 1.88 | 0.95 |
| New South Wales (1891) | .. | 5.91 |
| Victoria (1891) | 17.42 | 11.27 |
In 1889 a Divorce Act was passed in Victoria to allow of divorces being granted for wilful desertion, habitual drunkenness with cruelty or neglect, imprisonment under certain circumstances of either party, and adultery on the part of the husband. These additional causes for divorce have doubtless largely increased the proportion of decrees in that colony for the year 1891.
By an Act passed in 1891 in New South Wales, the conditions for obtaining divorce have been extended in similar directions to those of the Victorian Act.
In respect of criminal statistics New Zealand compares favourably with the colonies of Australia, as will be seen on reference to the following figures, taken from the Victorian Year-book for 1892:—
| 1890 | Proportion per 1,000 of Population of | Proportion per 10,000 of Population of | ||
|---|---|---|---|---|
| Apprehensions and Summonses.* | Summary Convictions. | Commitments. | Convictions after Commitment. | |
| Queensland | 49–24 | 37.77 | 12.80 | 7.13 |
| New South Wales | 59.98 | 43.66 | 13.40 | 8.66 |
| Victoria | 57.92 | 39.71 | 10.09 | 5.92 |
| South Australia | 22.12 | 18.81 | 5.34 | 2.59 |
| Western Australia | 97.81 | 66.76 | 13.76 | 8.55 |
| Tasmania | 44.60 | 34.52 | 8.14 | 3.20 |
| New Zealand (exclusive of Maoris) | 29.39 | 22.37 | 7.38 | 3.09 |
Thus the proportion of crime in New Zealand, whether judged by the number of summary convictions or by the convictions in the superior Courts, proved in the year 1890 to be lower than the rate then obtaining in any one of the Australian Colonies, excepting South Australia only. Mr. Hayter connects this fact with the depression at that time prevalent in New Zealand. But in the following year (1891), along with returning prosperity, there was a still further fall in the number of charges and convictions before Magistrates, while the proportion of convictions in the superior Courts showed only a slight increase, as under:—
| Apprehensions. &c. | Summary Convictions. | Commitments. | Convictions after Commitment. | |
|---|---|---|---|---|
| 1891 | 27.29 | 20.72 | 7.34 | 3.40 |
The number of charges brought before the Resident Magistrates' Courts in 1891 was 17,613. These include repeated charges against the same person. In 1890. the number was 18,701; in 1889, 18,815; in 1888, 19,167; and in 1887, 20,336. Of these charges in 1891, 424 were against persons of the aboriginal native race, a decrease of 30 on the corresponding number in 1890.
The summary convictions numbered 13,349, including 298 Maoris. 480 persons were committed for trial by the superior Courts, a decrease of 16 persons on the number committed in 1890.
221 persons were convicted in the superior Courts, including 7 Maoris.
The number of summary convictions in the various Magistrates' Courts for certain of the most numerous offences, in each of the past five years, together with the proportion per 1,000 of the mean population (exclusive of Maoris) is given herewith:—
* Not including civil cases
| Number. | |||||
|---|---|---|---|---|---|
| 1887. | 1888. | 1889. | 1890. | 1891. | |
|
* Including embezzlement, receiving, and false pretences. | |||||
| Assaults | 731 | 633 | 636 | 705 | 675 |
| Larceny* | 850 | 971 | 1,085 | 905 | 934 |
| Drunkenness | 5,372 | 5,402 | 5,152 | 5,677 | 5,118 |
| Per 1,000 of the Population. | |||||
|---|---|---|---|---|---|
| 1887. | 1888. | 1889 | 1890. | 1891. | |
| Assaults | 1.23 | 1.05 | 1.04 | 1.14 | 1.07 |
| Larceny | 1.43 | 1.60 | 1.77 | 1.45 | 1.48 |
| Drunkenness | 9.01 | 8.92 | 8.39 | 9.14 | 8.1.3 |
The proportion of assaults is thus found to be less for 1891 than for 1890, but greater than in 1888 and 1889. The highest proportion for larceny during the quinquennium occurs in 1889, and the lowest in 1887. For drunkenness the convictions were fewer in 1891 than for any of the four previous years, and the proportion to population smaller. In 1886 the proportion per 1,000 persons convicted of drunkenness was as high as 10.28 (excluding Maoris), against 8.13 in 1891.
Further on will be found the number of distinct prisoners received in the various gaols given for a series of six years, showing a fall from 1,077 in the year 1886 to 694 in 1891.
The order of the colonies as regards prevalence of drunkenness for the year 1890 in proportion to population is given as under:—
| Arrests, etc., for Drunkenness in Proportion to Population. | |||
|---|---|---|---|
| New South Wales | 16.93 per 1,000 | New Zealand | 9.14 per 1,000 |
| Victoria | 16.54 per 1,000 | Tasmania | 8.01 per 1,000 |
| Queensland | 16.41 per 1,000 | South Australia | 7.53 per 1,000 |
Here the highest proportion stands first, and New Zealand appears as exceeded in sobriety by Tasmania and South Australia only.
While there was during 1891, excluding Maoris, a decrease in the number of charges brought before the various Magistrates' Courts, and a decrease in the actual number of convictions in these Courts, the convictions in the superior Courts increased in the same year both numerically and proportionally:—
| Year. | Charges before Magistrates. | Summary Convictions. | Convictions in Superior Courts. | |||
|---|---|---|---|---|---|---|
| Number. | Proportion per 1,000 of Population. | Number. | Proportion per 1,000 of Population. | Number. | Proportion per 1,000 of Population. | |
| 1882 | 22,108 | 43.41 | 16,220 | 31.85 | 200 | .39 |
| 1883 | 22,511 | 42.52 | 16,590 | 31.35 | 189 | .36 |
| 1884 | 23,105 | 41.81 | 17,672 | 31.98 | 219 | .39 |
| 1885 | 22,709 | 39.61 | 17,566 | 30.64 | 223 | .39 |
| 1886 | 21,227 | 36.46 | 16,428 | 28.22 | 259 | .44 |
| 1887 | 19,924 | 33.41 | 15,278 | 25.61 | 334 | .56 |
| 1888 | 18,829 | 30.92 | 14,259 | 23.55 | 255 | .42 |
| 1889 | 18,476 | 30.10 | 13,861 | 22.57 | 225 | .37 |
| 1890 | 18,247 | 29.39 | 13,885 | 22.37 | 192 | .31 |
| 1891 | 17,189 | 27.29 | 13,051 | 20.72 | 214 | .34 |
The convictions for offences against the person and property in the inferior and superior Courts were in each of the past five years in the following proportions per 1,000 of the population:—
| 1887. | 1888. | 1889. | 1890. | 1891. | |
|---|---|---|---|---|---|
| Offences against the person | 1.43 | 1.25 | 1.22 | 1.31 | 1.24 |
| Offences against property | 2.46 | 2.35 | 2.49 | 2.27 | 2.31 |
In 1891 there were 393 Maori males and 31 Maori females charged in the various Magistrates' Courts with the commission of various offences. Of these, 281 males and 17 females were summarily convicted, and 17 males and 1 female were committed for trial by the superior Courts. 7 Maoris, all males, were convicted in the Supreme Court during the year.
The Inspector of Prisons, in his report for the year 1891, writes thus: “The steady decrease in the number of prisoners for the last ten years in the colony may be looked upon as clearly indicating that the ideal object of punishment of criminals has to a certain extent been grasped, and that the sentence is not only the legal payment of a debt which has been incurred, both to the law and to society, but that it is also a deterrent from crime.” It is his opinion that the only efficient system devised for the repression of crime is entire separation and prevention of social intercourse by the cellular system, as the free intercourse of prisoners with one another gives grand opportunities to the whole body for perfecting themselves in the criminal art.
The returns from the various gaols give a total of 3,735 prisoners received during the year 1891, a decrease of 595 on the number in 1890. Of those received in 1891, 137 (including 6 cases of delirium tremens) were confined on account of debt or lunacy, including 5 Maoris, and 100 were Maoris charged with various offences. Exclusive of debtors, lunatics, and Maoris, 3,498 persons were received into the gaols during the year, a decrease of 576 on the number in 1890.
The number received includes persons awaiting trial but not convicted during the year, also the repeated admissions of the same persons, and transfers from gaol to gaol of convicts undergoing sentence.
In addition to the returns from the Prisons Department, a separate card for each admission is furnished for every gaol. These are arranged alphabetically, and, where several cards are found referring to the same person, all are thrown out but one; then the number of cards retained equals the actual number of distinct prisoners received in the various gaols during the year. The number of distinct persons (exclusive of Maoris) received in gaols in 1891, and convicted of offences, was 2,113, a decrease of 284 on the number in 1890. These numbers do not include children committed to the industrial schools but not convicted of any statutory offence.
The following shows the number of distinct persons (exclusive of Maoris) imprisoned in the past six years after conviction, only one cause being given when the person was imprisoned at different times either for the same or for some other offence:—
| Offences. | 1886. | 1887. | 1888. | 1889. | 1890. | 1891. |
|---|---|---|---|---|---|---|
| Felony and larceny | 594 | 526 | 563 | 527 | 516 | 506 |
| Misdemeanour | 90 | 120 | 97 | 131 | 101 | 120 |
| Injury to property | 54 | 62 | 47 | 53 | 65 | 51 |
| Assault and resisting the police | 209 | 178 | 162 | 170 | 206 | 179 |
| Acts of vagrancy | 205 | 238 | 251 | 351 | 333 | 225 |
| Drunkenness | 1,077 | 1,038 | 938 | 802 | 808 | 694 |
| Other offences | 545 | 477 | 473 | 365 | 368 | 338 |
| Totals | 2,774 | 2,639 | 2,531 | 2,399 | 2,397 | 2,113 |
The very satisfactory result is arrived at, that in 1885 these convicted prisoners averaged 53.56 in every 10,000 of the population; in 1886 the average was 47.82; in 1887, 44.25; in 1888, 41.81; in 1889, 39.00; in 1890, 38.61; and in 1891, 33.55. There has been since 1886 a decrease at the rate of 23.83 per cent. in the number of distinct convicted prisoners, and a reduction of 20.01 in the proportion to the 10,000 of the population.
It must be understood that the actual number of imprisonments for some of the above offences were much more numerous than the figures given, as a considerable number of persons underwent repeated imprisonments for either the same or some other offence. Thus, many persons returned as imprisoned for larceny underwent other imprisonments for drunkenness, &c. Many imprisoned for drunkenness were several times in gaol during the year for the same or some other offence, such as assault, riotous or indecent conduct, &c. In many cases there were several charges against the same person at the one time, of which the most serious followed by conviction has been selected. These numbers do not include Maori prisoners.
The following table shows the number of distinct persons (exclusive of Maoris) received into gaol after conviction during 1891, classified according to nature of offence, religion, birthplace, and age:—
Note.—In this table a prisoner convicted of more than one offence during the year is reckoned once only under the heading of the principal offence—e.g., a prisoner convicted three times of drunkenness, twice of vagrancy, and once of larceny is counted only once under the heading “Larceny.” Debtors and lunatics received into gaol, and children committed to the industrial schools but not convicted of any statutory offence, have been omitted.
| —— | Felony and Larceny. | Misdemeanour. | Injury to Property. | Assault and resisting Police. | Vagrancy. | Drunkenness. | Other Offences. | Totals. | ||||||||
|---|---|---|---|---|---|---|---|---|---|---|---|---|---|---|---|---|
| M. | F. | M. | F. | M. | F. | M. | F. | M. | F. | M. | F. | M. | F. | M. | F. | |
| Religions— | ||||||||||||||||
| Church of England | 217 | 22 | 50 | ... | 22 | 2 | 69 | 3 | 71 | 26 | 217 | 49 | 130 | 13 | 776 | 115 |
| Roman Catholic | 118 | 21 | 30 | 4 | 14 | 3 | 63 | 11 | 51 | 28 | 189 | 55 | 89 | 25 | 554 | 147 |
| Presbyterian | 65 | 5 | 20 | 1 | 6 | 2 | 16 | 1 | 23 | 9 | 104 | 25 | 39 | 5 | 273 | 48 |
| Wesleyan | 21 | 1 | 6 | ... | ... | ... | 3 | ... | 3 | 4 | 16 | 2 | 4 | ... | 53 | 7 |
| Others | 35 | 1 | 9 | ... | 2 | ... | 13 | ... | 9 | 1 | 35 | 2 | 33 | ... | 136 | 4 |
| Totals | 456 | 50 | 115 | 5 | 44 | 7 | 164 | 15 | 157 | 68 | 561 | 133 | 295 | 43 | 1,792 | 321 |
| Birthplaces— | ||||||||||||||||
| England and Wales | 153 | 14 | 41 | 1 | 16 | 2 | 55 | 3 | 57 | 17 | 193 | 38 | 108 | 10 | 623 | 85 |
| Scotland | 48 | 4 | 14 | ... | 4 | 1 | 13 | ... | 18 | 11 | 89 | 20 | 34 | 3 | 220 | 39 |
| Ireland | 64 | 17 | 20 | 3 | 11 | 3 | 46 | 8 | 41 | 21 | 165 | 48 | 60 | 23 | 407 | 123 |
| New Zealand | 103 | 7 | 14 | 1 | 3 | 1 | 25 | 2 | 18 | 16 | 25 | 14 | 39 | 5 | 227 | 46 |
| Australian Colonies | 33 | 5 | 11 | ... | 4 | ... | 8 | 1 | 7 | 2 | 25 | 7 | 15 | 1 | 103 | 16 |
| Other British Possessions | 4 | 1 | 4 | ... | 2 | ... | 3 | 1 | 2 | ... | 8 | 3 | 5 | ... | 28 | 5 |
| China | 10 | ... | 1 | ... | ... | ... | ... | ... | 1 | ... | ... | ... | 2 | ... | 14 | ... |
| Other countries | 41 | 2 | 10 | ... | 4 | ... | 14 | ... | 13 | 1 | 56 | 3 | 32 | 1 | 170 | 7 |
| Totals | 456 | 50 | 115 | 5 | 44 | 7 | 164 | 15 | 157 | 68 | 561 | 133 | 295 | 43 | 1,792 | 321 |
| Ages— | ||||||||||||||||
| Under 10 years | 1 | ... | ... | ... | ... | ... | ... | ... | ... | ... | ... | ... | ... | ... | 1 | ... |
| 10 and under 12 years | 2 | ... | ... | ... | ... | ... | ... | ... | ... | ... | ... | ... | 1 | ... | 3 | ... |
| 12 and under 15 years | 10 | ... | ... | ... | ... | ... | ... | ... | ... | ... | ... | ... | 3 | ... | 13 | ... |
| 15 and under 20 years | 64 | 3 | 5 | ... | 1 | ... | 6 | ... | 5 | 2 | 3 | 3 | 21 | 2 | 105 | 10 |
| 20 and under 25 years | 62 | 2 | 7 | ... | 5 | 1 | 30 | 2 | 16 | 12 | 32 | 8 | 51 | 3 | 203 | 28 |
| 25 and under 39 years | 51 | 9 | 15 | 1 | 12 | 1 | 28 | 1 | 13 | 11 | 43 | 10 | 45 | 6 | 207 | 39 |
| 30 and under 40 years | 125 | 15 | 40 | 3 | 13 | 2 | 44 | 7 | 36 | 21 | 161 | 47 | 81 | 10 | 500 | 105 |
| 40 and under 50 years | 77 | 13 | 30 | 1 | 8 | 3 | 27 | 5 | 36 | 17 | 146 | 33 | 52 | 12 | 376 | 84 |
| 50 and under 60 years | 45 | 4 | 16 | ... | 3 | ... | 18 | ... | 36 | 4 | 128 | 28 | 32 | 9 | 278 | 45 |
| 60 years and over | 19 | 4 | 2 | ... | 2 | ... | 11 | ... | 15 | 1 | 48 | 4 | 9 | 1 | 106 | 10 |
| Totals | 456 | 50 | 115 | 5 | 44 | 7 | 164 | 15 | 157 | 68 | 561 | 133 | 295 | 43 | 1,792 | 321 |
Of the above prisoners convicted, 19 males and 5 females were released on probation under “The First Offenders' Probation Act, 1886.” The Inspector of Prisons, in his report published in 1891, made the following remarks in reference to the operation of that Act: “It is exceedingly gratifying to be again able to report that this Act continues to work successfully and well, and generally carries out the intentions and purport of its introduction; in fact, the more it is known the better it is liked. It has certainly already rescued many from a career of crime. . . . The great argument in favour of the First Offenders' Probation Act is that it endeavours to work reformation in persons who are only just entering on a dishonest course. . . . If by any means short of increasing crime persons can be saved or reformed when young, or even when come to years of discretion, without being sent to prison, then surely a great and good work is being done. . . . In New Zealand there is every reason to believe and hope that the more the judicious exercise of the First Offenders' Probation Act is extended the greater, in a corresponding degree, will be the decrease of crime.”
During the year 1891, 72 offenders were brought under the provisions of the above-named Act, as against 93 in 1890 and 83 in 1889. Of the 72 offenders, 30 satisfactorily carried out the conditions of their licenses and were discharged, 3 were rearrested and committed to prison, and 1 absconded, leaving 38 still under the supervision of the Probation Officers, to complete their term. Since the Act came into force, in October, 1886, 448 persons have been placed on probation.
The following are the proportions of those belonging to each of the four principal denominations in every 100 distinct convicted prisoners in each of the five past years:—
| Religious Denominations of Prisoners. | ||||||
|---|---|---|---|---|---|---|
| Denominations of Convicted Prisoners. | proportion per 100 of Convicted Prisoners. | Proportion of Denomination per 100 of Population at Census of 1891. | ||||
| 1887. | 1888. | 1889. | 1890. | 1891. | ||
| Church of England | 43.54 | 42.99 | 43.31 | 43.18 | 42.17 | 40.51 |
| Roman Catholic | 32.51 | 31.88 | 32.85 | 32.29 | 33.18 | 13.96 |
| Presbyterian | 15.31 | 16.48 | 15.21 | 15.68 | 15.19 | 22.62 |
| Wesleyan | 2.61 | 2.45 | 2.71 | 3.09 | 2.84 | 10.14 |
Still excluding Maoris, the following are the proportions of distinct convicted prisoners, classified according to birthplace, for each of the past five years:—
| Birthplaces of Prisoners. | |||||||||||
|---|---|---|---|---|---|---|---|---|---|---|---|
| Birthplaces. | Number of Convicted Prisoners. | Proportion of each Nationality to every 100 Prisoners. | Proportion of Persons of each Nationality to every 100 of Population, 1891. | ||||||||
| 1887. | 1888. | 1889. | 1890. | 1891. | 1887. | 1888. | 1889. | 1890. | 1891. | ||
| England and Wales | 912 | 848 | 807 | 811 | 708 | 34.56 | 33.51 | 33.64 | 33.83 | 33.51 | 19.06 |
| Scotland | 337 | 328 | 313 | 309 | 259 | 12.77 | 12.96 | 13.05 | 12.89 | 12.26 | 8.30 |
| Ireland | 701 | 703 | 639 | 633 | 530 | 26.56 | 27.78 | 26.64 | 26.41 | 25.08 | 7.61 |
| New Zealand | 302 | 319 | 294 | 316 | 273 | 11.44 | 12.60 | 12.25 | 13.18 | 12.92 | 58.61 |
| Australian Colonies | 108 | 102 | 107 | 95 | 119 | 4.09 | 4.03 | 4.46 | 3.96 | 5.63 | 2.55 |
| Other British Possessions | 56 | 44 | 27 | 33 | 33 | 2.12 | 1.74 | 1.13 | 1.38 | 1.56 | 0.59 |
| China | 17 | 12 | 19 | 10 | 14 | 0.65 | 0.47 | 0.79 | 0.42 | 0.66 | 0.71 |
| Other Foreign Countries | 206 | 175 | 193 | 190 | 177 | 7.81 | 6.91 | 8.04 | 7.93 | 8.38 | 2.57 |
A considerable decrease is observable in the number of prisoners born in the United Kingdom. This result, as years progress and the population of the colony consists more and more of those born therein, might naturally be expected. So also, for a similar reason, might an increase be expected in the number of New-Zealand-born prisoners. But in 1887 the number of native-born prisoners was 302, in 1891 273. This is a small proportion considering that the New-Zealand born comprise more than half of the population.
The following were the respective proportions of the convicted prisoners at each age-period of life to every 100 prisoners of either sex for the past two years:—
| Ages of distinct Convicted Prisoners. | ||||||||
|---|---|---|---|---|---|---|---|---|
| Age. | Male Prisoners. | Per 100 Male Prisoners. | Female Prisoners. | Per 100 Female Prisoners. | ||||
| 1890. | 1891. | 1890. | 1891. | 1890. | 1891. | 1890. | 1891. | |
| Under 20 years | 137 | 122 | 6.70 | 6.81 | 25 | 10 | 7.12 | 3.12 |
| 20 and under 30 years | 481 | 410 | 23.51 | 22.88 | 77 | 67 | 21.94 | 20.87 |
| 30 and under 40 years | 524 | 500 | 25.61 | 27.90 | 102 | 105 | 29.06 | 32.71 |
| 40 and under 50 years | 441 | 376 | 21.55 | 20.98 | 93 | 84 | 26.50 | 26.16 |
| 50 and under 60 years | 311 | 278 | 15.20 | 15.51 | 43 | 45 | 12.25 | 14.02 |
| 60 years and upwards | 152 | 106 | 7.43 | 5.92 | 11 | 10 | 3.13 | 3.12 |
| 2,046 | 1,792 | 100.00 | 100.00 | 351 | 321 | 100.00 | 100.00 | |
The following table relates to the New-Zealand-born prisoners (exclusive of Maoris). These are also so many distinct persons:—
| Distinct New-Zealand-born Convicted Prisoners Received during the Year 1891. | ||||||||||||||||||
|---|---|---|---|---|---|---|---|---|---|---|---|---|---|---|---|---|---|---|
| Offences. | Under 10. | 10 and under 12. | 12 and under 15. | 15 and under 20. | 20 and under 25. | 25 and under 30. | 30 and under 40. | 40 and upwards. | Totals. | |||||||||
| M. | F. | M. | F. | M. | F. | M. | F. | M. | F. | M. | F. | M. | F. | M. | F. | M. | F. | |
| Felony and larceny | 1 | .. | 2 | .. | 10 | .. | 46 | 2 | 21 | 2 | 8 | 1 | 12 | 1 | 3 | 1 | 103 | 7 |
| Misdemeanour | .. | .. | .. | .. | .. | .. | 4 | .. | 2 | .. | 2 | 1 | 4 | .. | 2 | .. | 14 | 1 |
| Injury to property | .. | .. | .. | .. | .. | .. | .. | .. | 3 | 1 | .. | .. | .. | .. | .. | .. | 3 | 1 |
| Assault and resisting police | .. | .. | .. | .. | .. | .. | 2 | .. | 14 | 1 | 5 | .. | 4 | 1 | .. | .. | 25 | 2 |
| Acts of vagrancy | .. | .. | .. | .. | .. | .. | 4 | 2 | 9 | 7 | 1 | 4 | 1 | 3 | 3 | .. | 18 | 16 |
| Drunkenness | .. | .. | .. | .. | .. | .. | 2 | 1 | 8 | 4 | 3 | 3 | 6 | 4 | 6 | 2 | 25 | 14 |
| Others | .. | .. | .. | .. | 4 | .. | 11 | 2 | 13 | 2 | 7 | .. | 4 | 1 | .. | .. | 39 | 5 |
| Totals, 1891 | 1 | .. | 2 | .. | 14 | .. | 69 | 7 | 70 | 17 | 26 | 9 | 31 | 10 | 14 | 3 | 227 | 46 |
| Totals, 1890 | 6 | .. | 5 | 1 | 20 | .. | 63 | 15 | 85 | 19 | 41 | 12 | 28 | 8 | 10 | 3 | 258 | 58 |
| Totals, 1889 | 2 | .. | 4 | 1 | 15 | 4 | 62 | 14 | 59 | 20 | 42 | 12 | 37 | 2 | 15 | 5 | 236 | 58 |
| Totals, 1888 | 5 | .. | 10 | .. | 35 | .. | 63 | 19 | 61 | 11 | 40 | 9 | 42 | 13 | 9 | 2 | 265 | 54 |
| Totals, 1887 | 4 | .. | 4 | .. | 17 | 1 | 79 | 19 | 60 | 11 | 39 | 7 | 37 | 15 | 6 | 3 | 246 | 56 |
There were, for all offences, 273 distinct New-Zealand-born convicted prisoners, against 316 in 1890; of these, in 1891, 93 were under 20 years of age. The decrease in 1891 is found to obtain throughout all classes of offence.
Inquests were held during the year on the bodies of 626 males and 186 females. Of these, 303 males and 52 females were found to have met their deaths through accident of one kind or another. The most fatal form of accident continues to be drowning. The deaths from this cause (121 males and 5 females) were 38.31 per cent. of the sum of accidental deaths.
There were 54 inquests on suicidal deaths, 46 on males and 8 on females. In 1890 the corresponding numbers were—males 52 and females 11.
There were 37 inquests held after fires in 1891, but in only 9 instances was there a verdict of incendiarism given. Five verdicts were to the effect that the cause of fire was accidental. In 23 cases there was no evidence to enable a decision as the cause of fire to be arrived at.
It has been found impossible to collect complete statistics relating to education for the year 1892 in time for this publication, and the following figures for the previous year are accordingly given. An account of the Government schools for 1892 will, however, be found in the special article dealing with the system of education in the colony:—
At the end of 1891 there were 1,646 schools of all classes, at which members of the European and Maori races were being educated. This was an increase of 41 on the number in 1890. The public primary schools numbered 1,255 in 1891, against 1,200 in 1890. The number of aided or endowed colleges, grammar and high schools was 24, an increase of 2 on the number in the previous year. The number of private schools from which returns were received by the Registrar-General was 281 in 1891, a decrease of 17 in the year. There were also 10 industrial schools and orphanages, public and private, and 1 Government school for deafmutes. A school for the blind is included amongst the private schools.
The number of schools established for the education of the Native or Maori race was 75, an increase of 1 on the number in 1890.
Education at the public schools is free (except when these have been converted into district high schools, at which the pupils The subjects of instruction at the primary schools are required by the Education Act to be the following: Reading, writing, arithmetic, English grammar and composition, geography, history, elementary science and drawing, object-lessons, vocal music, and (in the case of girls) sewing and needlework, and the principles of domestic economy. It is also required that provision shall be made for the instruction in military drill of all boys in those schools.
The number of young people of European descent, including half-castes living among Europeans, on the rolls of attendance of the various schools in the last quarter of 1891 was 136,451, an increase on the corresponding number in 1890 of 2,134. Of these, 118,946 attended the public schools, 2,205 attended the colleges, grammar and high schools, 14,142 attended private schools, 705 were inmates of orphanages and industrial schools, 403 attended Native village schools, and 50 were deaf-mutes at the Government institution.
There was an increase (exclusive of Maoris) during the year of 1,538 in the number attending the public schools, and of 516 in the number attending private schools. The attendance at the college, grammar, and high schools increased by 88, and the number of European children at Native village schools decreased by 3.
Exclusive of Maoris, but including 362 male and 411 female half-castes living among the Europeans, there were 61,382 boys and 57,564 girls in attendance at the public primary schools during the last quarter of 1891, an increase on the numbers in 1890 of 838 boys and 700 girls.
There were 1,323 male and 1,742 female teachers (exclusive of 154 sewing-mistresses) at the public schools at the end of 1891. Of the males, 243, and of the females, 744, were pupil-teachers.
Of the secondary or superior schools, 24 in number, 8 were for boys only, 7 for girls only, and 9 for boys and girls. The number of regular instructors in 1891 was 112, and that of visiting instructors 63. The number of pupils on the roll for the last term of 1891 was 2,205; of these, 1,325 were boys and 880 girls. There was an increase of 32 in the number of the boys, and of 56 in the number of girls, on the rolls for the last term of 1891.
The New Zealand University is not a teaching body; the undergraduates for the most part keep their terms at one of the affiliated institutions, which are the following: the Auckland University College, the Canterbury College, and the University of Otago, each having a staff of professors. The number of graduates on the 1st June, 1892, who had obtained direct degrees was 323. The number of undergraduates on the roll of the University at that date was 1,455, but only 608 were keeping terms, of whom 384 were males and 224 females. 33 of the males were medical students at the University of Otago. The number of students attending lectures at the affiliated institutions during the year 1891–92 was as follows: At the Auckland University College, 55 matriculated and 101 non-matriculated; at Canterbury College, 172 matriculated and 177 non-matriculated; at the Otago University, 152 matriculated and 48 non-matriculated.
There were 281 private schools in operation in the colony at the end of 1891, a decrease of 17 in the number in 1890; 39 were for boys, 41 for girls, and 201 for children of both sexes. The number of pupils attending them was 14,142, viz., 6,234 boys and 7,908 girls, not counting Maoris, 2 boys and 32 girls. The number of European pupils at these schools was greater than in 1890 by 451. Of the private schools 110 were Roman Catholic, with an attendance, of 10,144 pupils.
The following gives, for the past six years, the number of private schools and of Europeans attending them, the number of Roman Catholic schools and pupils being also shown separately:—
| Year. | Number of Private Schools. | Pupils. | Total Pupils. | Included in previous Numbers. | ||
|---|---|---|---|---|---|---|
| Boys. | Girls. | Roman Catholic Schools. | Pupils at Roman Catholic Schools. | |||
| 1886 | 288 | 5,216 | 7,257 | 12,473 | 83 | 7,991 |
| 1887 | 299 | 5,771 | 7,616 | 13,387 | 90 | 8,946 |
| 1888 | 299 | 5,874 | 7,979 | 13,853 | 96 | 9,346 |
| 1889 | 293 | 5,778 | 7,680 | 13,458 | 95 | 9,024 |
| 1890 | 298 | 5,759 | 7,867 | 13,626 | 108 | 9,474 |
| 1891 | 281 | 6,234 | 7,908 | 14,142 | 110 | 10,144 |
The total number of children of European descent (including such half-castes as live among Europeans) known to be receiving education at school at the end of 1891 was 136,451; of these 131,160 were from 5 to 15 years of age.
The number of children 5 to 15 years of age shown by the census of April, 1891, was 167,164, and raising this number by 1 per cent. we get 168,835 as the estimated number at the end of 1891. There would therefore be a proportion of 78.2 per cent. of all children from 5 to 15 years of age in attendance at school. But the census showed 8,178 children being educated by means of home tuition, most of whom would be from 5 to 15 years old. Adding these, the proportion per cent. of European children at this age-period accounted for in respect of education is found to be 83.
The number of Native village schools at the end of 1891 either supported or subsidised by the Government was 67–1 less than in 1890. In addition, there were 4 boarding-schools for Native children, the cost of whose maintenance was paid either by the Government or from endowments, and 4 private Native schools, one a Mormon institution.
The number of Maori children attending schools at the end of 1891 was 2,796—namely, 1,605 males and 1,191 females. These included 60 children of mixed European and Native blood living as members of Native tribes.
The number at the several schools in each of the two past years was as follows:—
| Schools. | Maori Children attending Schools. | |||||
|---|---|---|---|---|---|---|
| Boys. | Girls. | Total of both Sexes. | ||||
| 1890. | 1891. | 1890. | 1891. | 1890. | 1891. | |
| At public European schools | 307 | 355 | 197 | 222 | 504 | 577 |
| At Native village schools | 1,032 | 1,030 | 821 | 798 | 1,853 | 1,828 |
| At subsidised or endowed boarding-schools | 124 | 119 | 58 | 75 | 182 | 194 |
| At private European or Native schools | 54 | 101 | 66 | 96 | 120 | 197 |
| Totals | 1,517 | 1,605 | 1,142 | 1,191 | 2,659 | 2,796 |
There was thus in 1891 an increase of 88 in the number of Maori boys and 49 in that of Maori girls attending school.
The total income of the various Education Boards for the year 1891 was £446,603 6s. 2d. The grants by the Government amounted to £408,983 0s. 3d., an increase of £52,323 17s. 3d. on the grants in 1890. These grants consist of (1) a statutory allowance of £3 15s. per child in daily average attendance, (2) a further capitation allowance of 1s. 6d. for scholarships, and (3) a varying sum for school-buildings. The income from reserves amounted to £34,741 11s. 1d.
The total expenditure in 1891 amounted to £408,683 4s. 4d., of which the sum of £343,880 3s. 5d. was laid out on the maintenance of the schools, £10,549 19s. 5d. used to meet expenses of the Boards, £11,143 10s. 6d. spent on inspection of schools and examination of pupil-teachers, £42,150 17s. 4d. on school-buildings, and £958 13s. 8d. on miscellaneous services.
The expenditure in 1891 on account of Native village schools was £12,380 19s. 7d., against £14,939 16s. 4d. in 1890. Further sums were expended for the following purposes: Maintenance of Maori children at subsidised boarding-schools, £1,544 14s. 5d. inspection, £654 19s. 9d.; and general charges, £579 6s. 8d.
The following was the cost of the Government industrial schools in 1891:—
| School. | Cost of School. | Cost of boarding out. | Recoveries. | Net Cost. | ||||||||
|---|---|---|---|---|---|---|---|---|---|---|---|---|
| £ | s. | d. | £ | s. | d. | £ | s. | d. | £ | s. | d. | |
| Auckland | 502 | 3 | 5 | 339 | 4 | 7 | 133 | 8 | 2 | 707 | 19 | 10 |
| Kohimarama | 1,310 | 9 | 2 | 839 | 18 | 3 | 567 | 18 | 7 | 1,582 | 8 | 10 |
| Burnham | 3,458 | 16 | 4 | 3,162 | 2 | 4 | 2,863 | 4 | 3 | 3,752 | 14 | 5 |
| Caversham | 2,773 | 13 | 4 | 3,130 | 14 | 3 | 2,998 | 10 | 9 | 2,905 | 16 | 10 |
| Totals | 8,040 | 2 | 3 | 7,471 | 19 | 5 | 6,563 | 1 | 9 | 8,948 | 19 | 11 |
Among the children enumerated as attending school are 50 deaf mute pupils at the Government institution for deaf-mutes, at Sumner, near Christchurch. The children are taught to speak with the mouth, and to read articulate speech by observing the movement of the lips. Many of the pupils who have passed through the institution have thus become qualified to take a part in conversation, and to be useful members of society. The number of the deaf-and-dumb returned at last census as under 20 years of age was 98.
During the year 1891, 9 blind pupils were maintained by the Government at a school in Melbourne and 2 at a school in Sydney, but these have since been sent to a new institution at Auckland, which had received 18 pupils altogether in June of 1892. Thirty persons under 20 years of age resident in the colony were returned at last census as blind.
For purposes of local government New Zealand had on the 31st March, 1892, 90 boroughs and 78 counties. Contained within the latter there were 255 road districts and 45 town districts. A large portion of the area of the counties is outlying country, not being included within the road districts. There were also 28 River Boards, 21 Harbour Boards, and 1 drainage district.
The amount of direct taxation imposed on the people by these local bodies in the form of rates amounted to a gross sum of £488,824 for the year 1891–92, equivalent to an average of 15s. 6d. per head of the European population.
The total revenues of the various County and Borough Councils and Road, Town, River, Drainage, and Harbour Boards for the financial year 1891–92 amounted to £1,182,120 4s. 5d., of which the receipts from rates were £488,824 4s. 11d., and those from the General Government £109,022 1s. 5s.
The following shows the receipts and expenditure, with the amount of rates collected and the amount of indebtedness on account of loans for each of the past twelve financial years:—
| Local Governing Bodies.—Rates, Receipts, Expenditure, Loans, 1881 to 1892.* | ||||||||||||
|---|---|---|---|---|---|---|---|---|---|---|---|---|
| Year ended 31st March, | Receipts of Local Bodies. | Expenditure of Local Bodies.† | Outstanding Loans of Local Bodies. | |||||||||
| From Rates. | From Government and other Sources, including those from Loans. | |||||||||||
|
* The figures for the Drainage and Harbour Boards included are for the calendar years ended three months previous to the financial years. † Not including balances, deposits returned, amounts paid to sinking funds and for redemption of debentures. ‡ Not including loans to local bodies repayable by instalments under “The Roads and Bridges Construction Act, 1882.” The outstanding debentures under this Act amounted to £77,439 for 1883–84.; on the 30th June, 1885, to £123,086 5s. 5d.; on the 31st March, 1886, to £134,533 18s. 7d.; and on the 31st March, 1887, to £113,071 12s. 10d. § Not including value of outstanding debentures under “The Roads and Bridges Construction Act, 1882,” viz., £18,635 in March, 1888, £10,495 1s. in March, 1889, £9,676 4s. in March, 1890, £4,316 15s. 6d. in March, 1891, and £4,244 15s. 6d. in March, 1892, nor moneys advanced under “The Government Loans to Local Bodies Act, 1886” (including debentures issued under “The Roads and Bridges Construction Act, 1882,” converted in terms of sections 27 to 31), viz., £196,239 3s. 9d. in March, 1888, £280,290 1s. 3d. in March, 1889, £328,980 15s. 6d. in February, 1890, £380,463 16s. 7d. in March, 1891, and £464,004 12s. 9d. in March, 1892. | ||||||||||||
| £ | s. | d. | £ | s. | d. | £ | s. | d. | £ | s. | d. | |
| 1881 | 249,087 | 4 | 9 | 1,703,846 | 19 | 11 | 1,871,752 | 1 | 2 | 3,039,807 | 0 | 0 |
| 1882 | 297,327 | 18 | 9 | 1,114,259 | 15 | 8 | 1,637,337 | 4 | 11 | 3,277,584 | 0 | 0 |
| 1883 | 327,128 | 8 | 11 | 911,916 | 14 | 7 | 1,397,863 | 6 | 3 | 3,540,046 | 0 | 0 |
| 1884 | 398,659 | 5 | 11 | 1,076,520 | 15 | 4 | 1,499,117 | 8 | 0 | 3,962,330 | 0 | 0‡ |
| 1885 | 401,392 | 18 | 6 | 1,272,455 | 14 | 2 | 1,653,706 | 6 | 0 | 4,313,223 | 0 | 0‡ |
| 1886 | 410,638 | 15 | 3 | 1,397,345 | 12 | 9 | 1,644,705 | 16 | 2 | 4,943,270 | 0 | 0‡ |
| 1887 | 434,236 | 12 | 2 | 1,782,696 | 10 | 8 | 1,885,000 | 17 | 2 | 5,620,747 | 0 | 0‡ |
| 1888 | 433,831 | 12 | 7 | 1,306,661 | 7 | 2 | 1,819,787 | 8 | 2 | 5,812,803 | 0 | 0§ |
| 1889 | 445,928 | 19 | 10 | 992,567 | 1 | 6 | 1,560,604 | 11 | 10 | 5,892,050 | 0 | 0§ |
| 1890 | 460,302 | 14 | 9 | 914,413 | 7 | 3 | 1,476,539 | 14 | 4 | 5,978,059 | 0 | 0§ |
| 1891 | 463,581 | 3 | 7 | 899,666 | 13 | 9 | 1,381,319 | 11 | 5 | 6,042,693 | 0 | 0§ |
| 1892 | 488,824 | 4 | 11 | 907,420 | 5 | 4 | 1,400,467 | 7 | 5 | 6,081,934 | 0 | 0§ |
Of the amount—£6,081,934—of indebtedness of local bodies for the year 1891–92, £1,027,484 was raised within and £5,054,450 outside the colony. The debt of the Harbour Boards was the largest item, £3,276,300; the Borough Councils owed £2,539,445; the Christchurch Drainage Board, £200,000; the River Boards, £46,491; Road Boards, £8,700; the counties, £9,660; and the Town Boards, £1,338. The lowest rate of interest paid was 4 per cent.; the sum of £2,628,879 was raised at 6 per cent., £2,448,250 at 5 per cent., and £401,337 bore interest as high as 7 per cent.
| Loans of Local Bodies raised within and without the Colony. | ||||||||||||
|---|---|---|---|---|---|---|---|---|---|---|---|---|
| Table showing the Amount of Indebtedness of Counties, Boroughs, Town, Road, and River Boards, as on the 31st March, 1892, and of Harbour and Drainage Boards as on the 31st December, 1891, classified according to the Rates of Interest paid, distinguishing Loans raised in the Colony from those raised elsewhere. (See note.) | ||||||||||||
| Loans raised in the Colony. | ||||||||||||
| Local Bodies. | 4% | 4 1/2% | 5% | 5 1/2% | 5 3/4% | 6% | 6 1/4% | 6 1/2% | 7% | 8% | 9% | Total. |
| * Not including loans amounting to £468,249 8s. 3d., repayable by annual instalments under “The Roads and Bridges Construction Act, 1882,” and “The Government Loans to Local Bodies Act, 1886,” | ||||||||||||
| £ | £ | £ | £ | £ | £ | £ | £ | £ | £ | £ | £ | |
| Counties | .. | .. | 150 | .. | .. | 3,500 | .. | .. | 6,010 | .. | .. | 9,660 |
| Boroughs | .. | .. | 83,700 | 11,500 | 6,000 | 306,095 | .. | 27,973 | 165,927 | 3,100 | .. | 604,295 |
| Town Boards | .. | .. | .. | .. | .. | 738 | .. | 500 | .. | .. | 100 | 1,338 |
| Road Boards | .. | .. | .. | .. | .. | 5,900 | .. | 1,500 | 1,000 | 300 | .. | 8,700 |
| River Boards | .. | .. | 3,500 | .. | .. | 12,046 | 3,320 | 3,825 | 2,800 | .. | .. | 25,491 |
| Harbour Boards | .. | .. | 303,700 | 35,000 | .. | 19,650 | .. | 10,000 | 9,650 | .. | .. | 378,000 |
| Total | .. | .. | 391,050 | 46,500 | 6,000 | 347,929 | 3,320 | 43,798 | 185,387 | 3,400 | 100 | 1,027,484* |
| Loans raised outside the Colony. | ||||||||||||
| Boroughs | .. | 150,300 | 562,200 | .. | .. | 1,008,350 | .. | .. | 214,300 | .. | .. | 1,935,150 |
| River Boards | .. | .. | 21,000 | .. | .. | .. | .. | .. | .. | .. | .. | 21,000 |
| Harbour Boards | 250,000 | 100,000 | 1,474,000 | .. | .. | 1,072,600 | .. | .. | 1,700 | .. | .. | 2,898,300 |
| Drainage Board | .. | .. | .. | .. | .. | 200,000 | .. | .. | .. | .. | .. | 200,000 |
| Total | 250,000 | 250,300 | 2,057,200 | .. | .. | 2,280,950 | .. | .. | 216,000 | .. | .. | 5,054,450 |
| Total Loans raised. | ||||||||||||
| Counties | .. | .. | 150 | .. | .. | 3,500 | .. | .. | 6,010 | .. | .. | 9,660 |
| Boroughs | .. | 150,300 | 645,900 | 11,500 | 6,000 | 1,314,445 | .. | 27,973 | 380,227 | 3,100 | .. | 2,539,445 |
| Town Boards | .. | .. | .. | .. | .. | 738 | .. | 500 | .. | .. | 100 | 1,338 |
| Road Boards | .. | .. | .. | .. | .. | 5,900 | .. | 1,500 | 1,000 | 300 | .. | 8,700 |
| River Boards | .. | .. | 24,500 | .. | .. | 12,046 | 3,320 | 3,825 | 2,800 | .. | .. | 46,491 |
| Harbour Boards | 250,000 | 100,000 | 1,777,700 | 35,000 | .. | 1,092,250 | .. | 10,000 | 11,350 | .. | .. | 3,276,300 |
| Drainage Board | .. | .. | .. | .. | .. | 200,000 | .. | .. | .. | .. | .. | 200,000 |
| Total loans raised | 250,000 | 250,300 | 2,448,250 | 46,500 | 6,000 | 2,628,879 | 3,320 | 43,798 | 401,387 | 3,400 | 100 | 6,081,934* |
The particulars of amounts received representing Government support afforded to the various bodies are stated in the following:—
| Local Governing Bodies.—Receipts from Government, 1891–92. | ||||||||||||||||||||||||
|---|---|---|---|---|---|---|---|---|---|---|---|---|---|---|---|---|---|---|---|---|---|---|---|---|
| — | Counties. | Boroughs. | Town Boards. | Road Boards. | River Boards (excluding Inch-Clutha, also Road Board). | Harbour Boards. | Drainage Board. | Totals. | ||||||||||||||||
| £ | s. | d. | £ | s. | d. | £ | s. | d. | £ | s. | d. | £ | s. | d. | £ | s. | d. | £ | s. | d. | £ | s. | d. | |
| Rates on Crown and Native lands | 1,133 | 9 | 3 | 72 | 6 | 8 | 1 | 3 | 5 | 486 | 5 | 3 | ... | ... | ... | 1,693 | 4 | 7 | ||||||
| One-third receipts from land sold on deferred payment and from perpetual lease | 11,610 | 3 | 9 | ... | 119 | 0 | 1 | 11,343 | 10 | 1 | ... | ... | ... | 23,072 | 13 | 11 | ||||||||
| One-fourth of rents from small grazing-runs | 2,732 | 6 | 3 | ... | ... | 372 | 5 | 3 | ... | ... | ... | 3,104 | 11 | 6 | ||||||||||
| Goldfields revenue and gold duty | 17,507 | 13 | 8 | 1,628 | 9 | 9 | 4 | 16 | 10 | 321 | 4 | 0 | ... | ... | ... | 19,462 | 4 | 3 | ||||||
| Subsidies under the Local Bodies Finance and Powers Act | 23,674 | 4 | 0 | 8,188 | 10 | 3 | 626 | 1 | 10 | 12,103 | 9 | 6 | ... | ... | ... | 44,592 | 5 | 7 | ||||||
| Fees and fines under the Financial Arrangements Act, and other receipts | 4,349 | 7 | 7 | 2,094 | 19 | 7 | 14 | 1 | 4 | 1,848 | 13 | 1 | 100 | 0 | 0 | 8,690 | 0 | 0 | ... | 17,097 | 1 | 7 | ||
| Total Revenue Account | 61,007 | 4 | 6 | 11,984 | 6 | 3 | 765 | 3 | 6 | 26,475 | 7 | 2 | 100 | 0 | 0 | 8,690 | 0 | 0 | ... | 109,022 | 1 | 5 | ||
| Loans under Government Loans to Local Bodies Act | 52,132 | 2 | 8 | 4,743 | 13 | 5 | 300 | 0 | 0 | 34,656 | 18 | 5 | ... | ... | ... | 91,832 | 14 | 6 | ||||||
| Grants for special works | 17,292 | 17 | 3 | 366 | 18 | 5 | ... | 1,050 | 0 | 0 | ... | ... | ... | 18,709 | 15 | 8 | ||||||||
| Total loans and grants from Government | 69,424 | 19 | 11 | 5,110 | 11 | 10 | 300 | 0 | 0 | 35,706 | 18 | 5 | ... | ... | ... | 110,542 | 10 | 2 | ||||||
| Total receipts from Government. | 130,432 | 4 | 5 | 17,094 | 18 | 1 | 1,065 | 3 | 6 | 62,182 | 5 | 7 | 100 | 0 | 0 | 8,690 | 0 | 0 | ... | 219,564 | 11 | 7 | ||
A summary of the transactions for the year 1891–92 is given herewith:—
| — | Financial Year ended 31st March, 1892. | Financial Year ended 31st December, 1891. | Totals—all Local Bodies. | ||||||||||||||||||||||||
|---|---|---|---|---|---|---|---|---|---|---|---|---|---|---|---|---|---|---|---|---|---|---|---|---|---|---|---|
| Counties. | Boroughs. | Town Boards. | Road Boards. | River Boards (excluding Inch-Clutha, also Road Board). | Totals. | Harbour Boards. | Drainage Board. | ||||||||||||||||||||
|
* Including £147,805 13s. 11d. interest on loans. † Not including loans amounting to £468,249 8s. 3d., repayable by instalments under “The Roads and Bridges Construction Act, 1882,” and “The Government Loans to Local Bodies Act, 1886,” Note.–The return of receipts and expenditure in this summary represents the net receipts and expenditure of the year, exclusive of credit and debit balances, bank overdrafts, deposits, amounts paid to sinking funds, and for redemption of debentures. | |||||||||||||||||||||||||||
| Receipts:– | £ | s. | d. | £ | s. | d. | £ | s. | d. | £ | s. | d. | £ | s. | d. | £ | s. | d. | £ | s. | d. | £ | s. | d. | £ | s. | d. |
| Revenue from– | |||||||||||||||||||||||||||
| Rates | 133,252 | 14 | 8 | 218,182 | 4 | 0 | 5,172 | 2 | 5 | 86,770 | 17 | 8 | 7,783 | 2 | 5 | 451,161 | 1 | 2 | 20,892 | 17 | 11 | 16,770 | 5 | 10 | 488,824 | 4 | 11 |
| Rents, licenses, and other sources | 40,407 | 16 | 7 | 206,333 | 10 | 9 | 8,471 | 8 | 7 | 13,655 | 17 | 2 | 3,397 | 17 | 6 | 272,266 | 10 | 7 | 305,799 | 15 | 4 | 16 | 13 | 10 | 578,082 | 19 | 9 |
| Government | 61,007 | 4 | 6 | 11,984 | 6 | 3 | 765 | 3 | 6 | 26,475 | 7 | 2 | 100 | 0 | 0 | 100,332 | 1 | 5 | 8,690 | 0 | 0 | ... | 109,022 | 1 | 5 | ||
| County | ... | ... | 384 | 4 | 7 | 5,806 | 13 | 9 | ... | 6,190 | 18 | 4 | ... | ... | 6,190 | 18 | 4 | ||||||||||
| Total revenue | 234,667 | 15 | 9 | 436,500 | 1 | 0 | 14,792 | 19 | 1 | 132,708 | 15 | 9 | 11,280 | 19 | 11 | 829,950 | 11 | 6 | 335,382 | 13 | 3 | 16,786 | 19 | 8 | 1,182,120 | 4 | 5 |
| Receipts not revenue | 85,364 | 17 | 0 | 21,987 | 9 | 1 | 1,745 | 12 | 4 | 38,341 | 5 | 5 | ... | 147,439 | 3 | 10 | 65,915 | 5 | 0 | 769 | 17 | 0 | 214,124 | 5 | 10 | ||
| Total receipts | 320,032 | 12 | 9 | 458,487 | 10 | 1 | 16,538 | 11 | 5 | 171,050 | 1 | 2 | 11,280 | 19 | 11 | 977,389 | 15 | 4 | 401,297 | 18 | 3 | 17,556 | 16 | 8 | 1,396,244 | 10 | 3 |
| Expenditure:– | |||||||||||||||||||||||||||
| Public works | 219,850 | 3 | 9 | 136,420 | 15 | 0 | 10,153 | 18 | 0 | 128,826 | 15 | 5 | 2,830 | 6 | 7 | 498,081 | 18 | 9 | 195,443 | 19 | 7 | 5,200 | 3 | 8 | 698,726 | 2 | 0 |
| Charitable aid and hospitals | 26,600 | 5 | 11 | 21,687 | 14 | 5 | 468 | 12 | 9 | 6,770 | 5 | 10 | ... | 55,526 | 18 | 11 | ... | ... | 55,526 | 18 | 11 | ||||||
| Management | 39,676 | 4 | 8 | 42,288 | 18 | 1 | 2,703 | 2 | 7 | 18,972 | 10 | 5 | 1,028 | 6 | 8 | 104,669 | 2 | 5 | {... 12,255 | 0 | 0} | 646,214 | 6 | 6 | |||
| Other expenditure | 36,584 | 12 | 8 | 242,016 | 5 | 7 | |||||||||||||||||||||
| * | 3,646 | 12 | 1 | 18,984 | 13 | 2 | 5,151 | 15 | 5 | 306,383 | 18 | 11 | |||||||||||||||
| Total expenditure | 322,711 | 7 | 0 | 442,413 | 13 | 1 | 16,972 | 5 | 5 | 173,554 | 4 | 10 | 9,010 | 8 | 8 | 964,661 | 19 | 0 | 418,350 | 4 | 9 | 17,455 | 3 | 8 | 1,400,467 | 7 | 5 |
| Liabilities | 373,570 | 1 | 2 | 2,739,745 | 5 | 10 | 5,307 | 16 | 10 | 229,086 | 9 | 7 | 60,730 | 5 | 2 | 3,408439 | 18 | 7 | 3,375,870 | 8 | 3 | 208,996 | 10 | 10 | 6,993,306 | 17 | 8 |
Loans (excluding loans under Roads and Bridges
Construction Act and Government Loans to Local Bodies Act) | 9,660 | 0 | 0 | 2,539,445 | 0 | 0 | 1,338 | 0 | 0 | 8,700 | 0 | 0 | 46,491 | 0 | 0 | 2,605,634 | 0 | 0† | 3,276,300 | 0 | 0 | 200,000 | 0 | 0 | 6,081,934 | 0 | 0 |
The total value of rateable property in counties, but lying outside of any road or town district, was, on the 31st March, 1892, £27,860,130, including the value of the rateable Crown and Native lands. The increase in the total rateable value for the year amounted to £802,068.
The revenue for the financial year 1891–92 of all the counties in which the Counties Act is in full operation was £234,667 15s. 9d. Of this, the sum of £133,252 14s. 8d. was raised by rates.
The expenditure of these counties amounted altogether to £322,711 7s., of which the sum of £219,850 3s. 9d. was spent on public works, £39,676 4s. 8d. on management, and £26,600 5s. 11d. on hospitals and charitable aid.
In the majority of the boroughs the rates are levied on the annual values of the rateable properties, and the returns give only those values; but in sixteen boroughs the capital values only are the bases for rating purposes. The total annual value of properties in seventy-four of the boroughs was, in March, 1892, £2,079,789, an increase of £330 on the total value in 1891. The Act under which the valuation is made provides for a reduction from the renting-value of 20 per cent. on houses and buildings, and 10 per cent. on land. The actual annual value of the properties will therefore be greater than the rating values by 11 to 25 per cent.
The estimated capital value in the remaining sixteen boroughs was £2,934,711.
The total revenues of the boroughs for the past year amounted to £436,500 1s.; of this, the sum of £218,182 4s. was received from rates.
Of a total expenditure by the boroughs amounting to £442,413 13s. 1d., the sum of £136,420 15s. was spent on public works, £21,687 14s. 5d. on hospitals and charitable aid, and £42,288 18s. 1d. on management.
The indebtedness of the boroughs on account of outstanding loans was, at the end of March, 1892, £2,539,445.
The properties in the various town districts are not rated on a uniform system. In the majority of the districts the rate is levied on the total value of the property; in the others, on the annual value; but in each of the road districts the rate is levied on the total value.
The estimated total value of properties in the first-mentioned town districts in March, 1892, was £1,308,094, and the annual value of the properties in the rest of the districts was £37,603. The total revenue of the Town Boards amounted to £14,792 19s. 1d., of which rates yielded £5,172 2s. 5d.
The total rateable value of properties in the road districts was £43,817,092. It should be noted that the figures given for the road and town districts include the value of rateable Crown and unoccupied Native lands, on which rates were paid by Government. This amounted in March, 1892, to £2,526,198 of the total value of rateable properties in road districts; also to £25,355 of the total value, and to £894 of the annual value, of property in town districts.
The total revenue of the Road Boards was £132,708 15s. 9d., of which rates yielded £86,770 17s. 8d.
The total revenue of the River Boards, exclusive of Inchclutha' which is also a Road Board, stood at £11,280 19s. 11d., of which the receipts from rates accounted for £7,783 2s. 5d.
Of the total revenue of the Harbour Boards, reaching the sum of £335,382 13s. 3d., rates yielded £20,892 17s. 11d. There is only one Drainage Board—that for the Christchurch district. The revenue for 1891 amounted to £16,786 19s. 8d., chiefly from rates, which yielded £16,770 5s. 10d.
Table of Contents
Table of Contents
It may be said, without fear of contradiction, that there is no part of the British dominions where agriculture, in its most extended sense, can be carried on with so much certainty and with such good results as in New Zealand. The range of latitude, extending as it does from 34° to 47° south, secures for the colony a diversity of climate which renders it suitable for all the products of subtropical and temperate zones, while the insular position secures it from the continuous and parching droughts which periodically inflict such terrible losses on the agriculturist and pastoralist of Australia and South America.
Again, the climate, although somewhat variable, never reaches the extremes of heat or cold. So genial, indeed, is it that most animals and plants, when first introduced to the colony, assume a vigour unknown to them before.
All the best forage-plants and grasses thrive most admirably, continuing to grow throughout the year with little intermission. Stock of all kinds thrive and fatten rapidly on the pastures, coming to maturity at an early age without the aid of roots or condimental foods. All kinds of cereals flourish equally well, more especially Indian corn, which produces from 50 to 80 bushels per acre.
So full is the soil of plant-food that several continuous crops of potatoes and cereals may be taken with little apparent exhaustion. Wheat, oats, and barley thrive where the soil is not too rich; otherwise they produce enormous crops of straw, without a corresponding yield of corn. The tobacco-plant thrives well, as also hops and sorghum, broom-corn, peanut, hemp, ramee or rheea (China grass), together with a large variety of economic plants, the growth of which will one day afford employment for a large population. In addition to these, oranges, lemons, limes, olives, and vines, with all the British, Chinese, and Japanese fruits, flourish abundantly, requiring but ordinary care. Potatoes are grown to a considerable extent, and yield heavy crops.
Much of the country along the south-west and west coast is being rapidly taken up, and the primeval forest is fast disappearing before the settler's axe. For the most part, the soil is fertile, and the growth of grass and clover is extremely rapid and vigorous when sown on the surface, after the felled timber has been destroyed by fire.
To the British husbandman it will seem almost incredible that the best pasture-grasses grow and thrive as they do with no other preparation than the ashes resulting from the burnt timber—with no ploughing and no previous loosening of the soil, this, of course, being impossible amongst the forest of stumps; and yet, in less than a year from the date of scattering the seed, this same land will fatten from five to six sheep per acre.
So rapidly are these fertile forest-lands being cleared and converted into pastures that the demand for stock (principally dairy) has greatly increased, and this demand must continue for a series of years before it is fully met.
Before the introduction of the factory system stock were so unsaleable, especially in the North Island, that little or no attention was paid to this branch of rural economy; and the supply fell to the lowest ebb. The demand which has now set in is chiefly due to the settlement of the bush-lands with small selectors and the development of the dairy industry.
Those who in the past have watched the progress of New Zealand, especially of the North Island, have always maintained that as soon as the Maori difficulties should be ended, and other impediments to settlement overcome, the prosperity of the country would advance at a very rapid rate. The time has now come, and all that is required to enhance and expedite the coming prosperity is wise legislation with respect to settlement, so that the unoccupied lands may be taken up by a thrifty class of small settlers.
There are millions of acres yet unoccupied, a great portion of which is of good quality, and only waiting the hand of man to make it carry, with very little cost, large herds of dairy stock, with flocks of long-wool and crossbred sheep. The west coast of the island is essentially a cattle-country. Considerable areas of the midland districts are also adapted to long-wool sheep, as is the country along the east coast. Much of the country may be described as being good sheep-land, a large portion of which is quite capable of carrying two sheep to the acre, and some of it as many as three or four.
If the North Island has a splendid inheritance in her forests, the Middle Island can boast of her magnificent plain-lands, rolling downs, and vast mountain-ranges, all of which, to a greater or less degree, have already been made to contribute to the wealth of the colony.
The central portion of the Middle Island presented to the first-comers a vast plain, covered only with waving tussock-grass, offering little or no obstruction to the plough.
Travelling south, the country assumes a different character: easy, undulating downs, well watered, here and there interspersed with fertile plains, the greater portion admirably adapted for agriculture, and all of it suited for pastoral purposes.
The climate of the Middle Island is not so warm in summer nor so mild in winter as that experienced in the North Island. However, as has already been stated, there are no extremes of heat or cold. Much more might be said in praise of this portion of the colony. It is deemed necessary to say so much in order that readers may better comprehend the comparative ease with which every kind of farming is carried on in New Zealand as compared with other countries less favourably situated.
Since the publication of the “Official Handbook” for 1892, matters agricultural and pastoral have continued to prosper in all their branches—save and except in the price of wheat, which has remained abnormally low throughout the year, causing some heavy losses to farmers and shippers.
On the other hand, the continued high prices for sheep of all classes, the advance in wool, and the rise in price of horned stock, with the rapid development of the dairy industry, have, in the aggregate, more than compensated for any deficiency which may have been experienced in the returns from the wheat and other cereal crops of 1892–93.
The primitive mode of agriculture pursued from the foundation of the colony—viz., wheat-growing, followed by wheat-growing so long as the land would bear it—is rapidly (and, we may add, happily) giving place to a regular system of crop rotation.
The farming of the future will have for its main object the production of wool and mutton as well as dairy produce, pork, poultry, fruit, &c.; and, although grain-growing will be continued to a greater or less extent, it will cease to take the premier position which it occupied in the past.
The production of mutton, pork, and dairy produce involves the growth over large areas of turnips, grass, and fodder crops, thus bringing greater fertility to the soil, and, consequently, advancing prosperity to the farming community.
The Canterbury Plains, the great wheat-growing area of the Middle Island, extend 150 miles north and south, running inland from the sea for forty miles, the whole forming an area of about 3,000,000 acres. The greater portion of this vast plain is admirably adapted for the production of wheat of the best quality, the growing of which is carried on extensively, more especially since the introduction of the reaper-and-binder. The area under this cereal in 1892–93 was 270,780 acres, with an estimated yield of 5,672,238 bushels. The land is for the most part free from stones or impediments of any kind. Single-furrow ploughs are now rarely seen, double- and three-furrow ploughs being in general use. Three horses, occasionally four, with a man or boy, can turn over 3 acres per day, at a cost of 5s. or 6s. per acre. A stroke of the disc or other harrow followed by the seed-drill and light harrow completes the operation of sowing.
Seed-sowing commences in May, and can be continued as weather permits through the winter, and on into September and even October. From 1 1/4 to 1 1/2 and 2 bushels of seed per acre are usually sown, the quantity increasing as the season advances.
Good results are in general obtained by feeding-off the early-sown grain with sheep, followed by the harrow and roller. The usual average on the better class of soil is from 40 to 60 bushels per acre of dressed grain. The general average of the whole colony is 25 to 26 bushels. This discrepancy is accounted for by the fact that so much wheat is grown on the lighter soils.
Several varieties of wheat are grown, but Hunter's White, Pearl, and Velvet Chaff are the favourite kinds for winter sowing. Red and White Tuscan are usually sown in spring.
Dressing the seed with genuine bluestone is found to be a certain specific for smut in its various forms.
The Oamaru (North Otago) district is famous for the quality of its wheat, grown on limestone soil.
Otago and Southland also grow wheat, but they excel in the production of oats, the respective acreages last season being 81,174 acres of wheat, yielding 2,120,814 bushels, and 174,635 acres of oats, yielding 5,769,957 bushels, while Canterbury produced only half this quantity of oats.
The usual yield of oats in Otago and Southland is from 40 to 80 bushels per acre, the cost of production being about the same as wheat—viz., £2 per acre when grown out of grass-land, and £1 10s. from stubble. The varieties of oats most in favour are Winter Dun, Canadians, Sparrowbill, Tartary, and Danish.
Malting barley, of very superior quality, is grown in Nelson and Marlborough, where the soil and climate appear to be peculiarly adapted to its culture.
The total area and yield of cereals grown in New Zealand last year was—Wheat, 381,245 acres, yielding 8,378,217 bushels; oats, 326,531 acres, yielding 9,893,989 bushels; barley, 24,906 acres, yielding 654,231 bushels; maize, 4,491 acres, yielding 171,661 bushels; rye, 6,737 acres, yielding 100,885 bushels; peas and beans, 9,181 acres, yielding 281,632 bushels.
Potatoes: Potatoes are largely grown throughout New Zealand. On suitable soils very heavy crops are raised, it being no uncommon thing to dig from eight to ten tons per acre, although the general average is much lower, for the reason that unsuitable land is frequently devoted to this crop. The bulk of the crop is planted without manure, but, where used, bonedust and superphosphate (from 1cwt. to 2cwt. per acre) is applied with good results. The potato is, however, an expensive crop to grow, costing from £5 to £6 per acre, and many farmers are now devoting their potato-land to grass. The land is usually broken out of grass, skim-ploughed in autumn, ploughed deeply in spring, and thoroughly tilled. The seed—15cwt. per acre—is then ploughed in under every third furrow, the after-culture consisting of harrowing just as the crop is appearing over ground. By this means myriads of seedling weeds are destroyed, drill - grubbing, hoeing, horse-hoeing, and earthing - up being the subsequent operations. A heavy crop of wheat, beans, or any other cereal can always be relied upon after potatoes.
Turnips: The turnip-crop has now become one of the most important in the colony, ranking next to wheat and oats. The area under this crop this season, according to the agricultural statistics, is 379,447 acres, as against 381,245 acres under wheat. On virgin soil turnips can always be relied upon as a certain crop, even on a single furrow and a couple of strokes of the harrow. But as very much of the soil in Canterbury has already been cropped, turnips cannot now be successfully grown there without the aid of manure. In the nature of things, farm-yard manure cannot be procured; artificial manures are therefore largely used, from 1cwt. to 1 1/2cwt. of superphosphate per acre being now applied with the best results, securing ample crops of sound roots, from 15 to 30 tons per acre. The seed is sometimes sown in drills on the flat, the manure being dropped in front of the seed by the same machine, from 1/2lb. to 1lb. per acre of seed being used. Sometimes the manure is sown in a liquid state by machines manufactured for the purpose: this system invariably secures a rapid and vigorous braird, forcing the young plant into the rough leaf, after which it is secure from the attack of the turnipbeetle. So soon as the turnip-plants reach the third or fourth leaf, they are thinned in a primitive and yet efficient manner. A scuffler, made for the purpose, is drawn across the drills, bunching the turnips and thoroughly loosening the soil. The drill-grubber and scuffler are used as required till the leaves meet. This kind of culture produces capital crops. A very large quantity is also sown broadcast, and, if found too thickly sown, the harrows are run through them; in any case a stroke of the harrows is a great help to the growth of the plant. The varieties used are Devonshire Grey for early and very late sowing; Purple- and Green-top Aberdeen are the most generally grown. Swede turnips from their proneness to the attack of the blight aphis are not so much sown; they, however, produce enormous crops in suitable soils. The turnip-crop is invariably fed-off by sheep intended for freezing. It is estimated that an acre of good turnips, with a little hay or chaff, will fatten from eight to fourteen sheep. Turnip-sowing commences in November, and may be continued till the end of December. Stubble turnips may be sown in March, but this can only be considered as a catch-crop. It, however, often proves of great value, supplying an abundance of green feed for ewes with early lambs. Turnip-land is usually sown with spring wheat, oats, or barley.
Rape is largely grown as sheep-feed, and may be sown either in early spring or immediately after harvest, the stubble being skimploughed. This crop is invaluable in the early spring, and may be fed-off in time for oats or barley.
Mangolds and Carrots are extensively grown in some districts. They cost more money than turnips to produce, as they must be hand-hoed; nor are they so suitable a crop for cleaning the land. Turnip-sowing does not commence till November, affording ample time for the destruction of seedling weeds; this important opportunity is largely lost in the culture of the mangold, which should be sown in October. The mangold is, however, an invaluable crop on a stock farm, as they have only reached their primest condition when the turnip-supply is exhausted. From thirty to sixty tons per acre is not an uncommon yield of these roots.
Carrots are also a valuable crop, especially for horses; on sandy loams the crop reaches fifteen to twenty tons per acre.
Clover: Since the introduction of the humble-bee into New Zealand, growing clover for seed has become a lucrative industry, adding materially to the farmers' income. Clover is sown with a spring crop, usually of corn, lightly grazed in the following autumn, and then reserved for a crop of hay, which, according to the season, yields from two to three tons per acre when cut in November or early in December. The after-growth is then allowed to flower and seed, which it does very freely. Thousands of humble-bees may be seen in the clover-fields during the months of January and February. The seed ripens in March, and is then cut and dried, and threshed out by machines known as clover-shellers. From 200lb. to 300lb. of seed per acre is considered a fair crop, and sells readily at 5d. to 6d. per pound. Thus, an acre of clover may yield in hay and seed quite £10 of £11, as well as a considerable amount of feeding, since cloverhaul is much sought after by stock of all kinds.
Grass-seed Saving: All the most valuable of the strong-growing grasses flourish throughout New Zealand. Cocksfoot has been a staple product of Banks Peninsula for many years, the soil for the most part consisting of decomposed volcanic rocks and vegetable mould. The seed is of the finest description, frequently weighing 20lb. to the bushel (12lb. being a standard bushel). This grass thrives on a very wide range of soil, from the richest to the poorest, preferring, of course, the former. It may be found on the dry stony plains of the interior green and healthy, while the surrounding herbage has yielded to the heat of the summer sun. Large quantities of the seed are grown in the North Island as well. Out of the total of 362,321 bushels of cocksfoot-seed produced last year, 104,304 bushels were grown in the North Island. This seed sells readily at from 3d. to 4d. per pound.
Growing ryegrass for seed is also an important industry. Last season 566,410 bushels were gathered. Of this, the North Island contributed 207,365 bushel. The seed is usually secured by stripping; sometimes the grass is cut and tied. The average yield is from 15 to 20 bushels per acre. A common practice is to graze the land till midsummer; to take the stock off for a few weeks, and then to run the stripper over the ground. By this primitive method 10 bushels per acre are sometimes secured. Ryegrass-seed is usually in good demand, and sells readily at from 3s. 6d. to 4s. per bushel.
Meadow-fescue, one of the most valuable of all the grasses for permanent pasture on good land, is grown both in the North and Middle Islands, but as yet not very largely. There can be no doubt that the growing of grass-seeds, including the finer varieties, must become in the near future a very lucrative industry.
Small Seeds: New Zealand, from the nature of her soil and climate, offers a fine field for growing all kinds of farm and garden seeds. This circumstance has already attracted the attention of some of the larger seed-merchants of Great Britain, whose agents have recently visited the colony with a view to negotiating with farmers and others to grow certain kinds of seeds. Such an industry is peculiarly adapted to small holdings, and well suited to young persons, the work being light and of an interesting character. Ready sale can be found for carefully-grown and carefully-cleaned seeds.
Pulse: Peas and beans are largely grown for pig-feeding and export, and also form an excellent preparation for wheat. An extensive trade in peas of a certain description is done in the manufacturing towns of Great Britain; and efforts are now being made to secure a share of this trade for the colony by producing peas suitable for splitting for human food. The business is likely to prove a most remunerative one. Thirty bushels of peas is considered a fair crop while 40 to 70 bushels of beans are often secured.
Cape Barley: The demand for early-spring feed has resulted in the growing of this plant for forage purposes. Its extreme hardiness renders it peculiarly adapted for autumn sowing. If sown in March it is ready for feeding-off in May; it may be fed off again in July, and on till the beginning of October, when, if allowed to run to seed, it will produce 40 to 60 bushels per acre, or it (the barley) may be ploughed-in for turnips. It is equally adapted for dairy-stock, horses, and pigs.
Tares are also grown, but not so largely as they deserve to be, especially for dairy-stock. Mixed with oats, barley, or rye, they are excellent milk-producers; and when grown luxuriantly they destroy all kinds of weeds, and leave the land in fine condition for a spring corn-crop.
Lucerne: This permanent fodder-plant thrives admirably in most parts of New Zealand, yielding three to five cuttings in the year; and, if properly attended to, it will continue to yield liberal cuttings for seven or eight years. This is a most excellent crop for the small or large farmer, furnishing, as it does, an abundant supply of succulent fodder during the drier months of midsummer, as well as in the early spring.
A cursory glance has now been taken at arable farming in New Zealand. Every impartial mind will admit that nature has been lavish of her gifts—she has supplied all the raw material, with climate and soil; all that is necessary to secure the success of the settler is industry guided by intelligence and perseverance.
It may be thought, because remuneration for manual labour is higher in the colony than it is in Great Britain, that therefore farming operations must cost more.
This assumption is, however, erroneous. It is within the mark to assert that five hundred acres or more can be worked at less cost than it would probably take to work a hundred-acre farm in Great Britain, for the following reasons: first, the genial nature of the climate is such that it is unnecessary to house stock during the winter months, and so the cost of attendance is saved; secondly, farming operations may be carried on uninterruptedly throughout the ploughing and sowing season; thirdly, the paddocks are so large, and usually so level, that the double- and treble-furrow plough may be worked by one man or youth. The colonial farmer has availed himself of all the most modern labour-saving machinery.
The hay-crop is simply cut one day, raked into windrows next, and in a couple more it is ready for stacking.
Wheat is cut and tied by machinery, and stooked, requiring no capping. It is frequently threshed out of the stook in favourable seasons, thereby saving the cost of stacking and thatching, but this system is not advocated except in hot, dry seasons.
The manure bill, which is such a heavy item of annual expenditure with the British farmer, is unknown or nearly so to the colonial farmer. As has already been stated, 1cwt. to 1 1/2cwt. of superphosphates per acre is used with the turnip and other root-crops, and in a large number of cases not even this. It will thus be seen how many advantages the colonial farmer has over the farmer of the old country.
Sheep: New Zealand has proved itself to be admirably adapted for the breeding of all classes of sheep, from the fine-combing Merino to the strongest type of Lincoln, with the intermediate breeds. The Merino occupies and thrives on the wild lands of the colony, from the snow-line to the border of the plains, as well as on the drier portions of the plains. The Merino ewe furnishes the foundation for all the crossbred varieties. On the rich, moist soils the Lincoln and Romney Marsh flourish, while the finer English and Border Leicesters occupy the drier lands.
Crossbred Sheep: Those bred from Merino ewes and long-wool rams are the most suitable for the frozen-meat trade, and are known as “freezers.”
The dapper little Southdowns flourish wherever crossbreds thrive. Their more ponderous cousins, the Shropshire and Hampshire Downs, have their admirers, especially the Shropshire, which is largely used for crossing, with a view to producing early-maturing lambs. English Leicesters are also much sought after for this purpose.
Since the development of the frozen-meat trade, sheep-farming in the colony has undergone a radical change. At one time wool was the chief consideration, the surplus stock finding its way into the boiling-down vat, the tallow being the only available product. Things have undergone a marvellous change since 1882, the inaugural year of the frozen-meat trade. Farming has assumed a new phase, sheep-raising for mutton being now the most profitable branch of the industry. Sheep have risen 100 per cent. in value since that industry took hold in the colony. Small and large flocks of pure and crossbred sheep are now kept on all farms which are suitable for them, the object being the production of early lambs for freezing, which sell readily at from 10s. 6d. to 12s. each. The percentage of increase all over the colony is very high, particularly so in the paddocks, where 100 to 125 per cent. is not uncommon in favourable seasons, while on the hill and unimproved country it varies from 45 to 80 per cent.
Shearing commences in September, and continues till January. The usual price per hundred is 15s. to £1. Shearing-machines are gradually coming into use, and will doubtless become general when better understood.
The average clips for the various breeds of sheep are approximately as follow: Merino from 4lb. to 7lb.; quarter-breds, about 6 1/2lb.; half-breds, 7 1/2lb,; three-quarter-breds, 8 1/2lb.; Leicester, 10 1/2lb.; Lincoln, 11lb. Of course, very much larger clips are obtained from special flocks, as much as 25lb. to 30lb. per sheep; but the above figures represent general averages.
The staple of New Zealand wool, especially the long-wool and cross-bred, is remarkable for its freedom from breaks and other imperfections incidental to countries subject to long droughts and scarcity of feed.
The coming sheep for New Zealand will be that which combines the best fleece and the most suitable carcase for freezing purposes, together with early maturity. This is the problem which some sheep-breeders have set themselves to work out. Whether such an animal, having fixity of type, can be evolved remains to be proved.
The capability of New Zealand for producing mutton has not nearly reached its limit. When the frozen-meat trade was first seriously considered, an assertion which was made to the effect that the colony could find 1,000,000 sheep per annum for freezing without impairing the breeding-flocks was treated as highly chimerical by sheep-breeders of long experience. It is found, however, on reference to the statistical returns, that during the year 1891 1,785,927 sheep and lambs were exported from New Zealand; and not only so, but the flocks have gone on steadily increasing, numbering, according to returns made to the Agricultural Department, 18,570,752 in 1892, as against 18,128,186 in 1891. There are twenty-one freezing-works in the colony, with a full freezing-capacity of 3,665,000 per annum.
There are few, if indeed any, climates better adapted for the breeding and rearing of horses of all kinds than that of New Zealand. Horses, light and heavy, are always in demand in the Australian Colonies, commanding remunerative prices; and it is more than probable that a lucrative trade will be done in the near future with the Western States of America. Indeed, shipments have already been made to that country of heavy Clydesdales. Some of the best blue blood of this breed has from time to time been imported from Scotland, with the result that the breed is now well established in the colony.
The light-horse stock of the colony has risen into note through the production of animals which have rendered themselves famous on the Australian turf. The demand for horses suitable for remounts for the cavalry service in India is a continuous one, affording a ready market for the proper stamp of animal. Shipments have from time to time been made to that country with considerable success, and this trade is likely to increase. There is, however, a great scope for enterprise in this direction. During the commercial depression which visited New Zealand in common with every other civilised country, but which has now passed away, giving place to an era of advancing prosperity, the breeding of horses was much neglected. Steps are now, however, being taken to repair the loss entailed by such neglect, and it is hoped the colony will therefore soon regain its partially-lost prestige in this direction.
At the date of last census—April, 1891—there were, including 42,912 owned by Maoris, 831,831 head of cattle in the colony; and although for the last few years the demand has not been encouraging to breeders, it is now satisfactory to note that, with the improved demand for dairy produce and frozen beef, prices for cattle have advanced considerably, and for the future better returns may be looked for.
The colony possesses all the best strains of blood, and this is evidenced by the superior class of cattle to be met with throughout the settled districts.
The trade in frozen beef is now attaining considerable proportions. Last year 55,020cwt. of beef, valued at £57,985, were shipped, principally from the North Island. This trade is likely to largely increase.
The breeding of dairy stock offers an ample field for profitable investment. Milking-cattle now command a comparatively high price, and will continue to do so for an indefinite period, owing to the fact that stock were allowed to run low for want of a market, which has lately sprung up with the building of factories. The rearing of well-bred heifer calves will amply repay all the time and trouble bestowed upon them. It may be well to remark that separated milk, although relieved of its butter-fat, loses little of its feeding value; the addition of a little linseed meal will restore the fatty constituents, which, however, are not the most valuable for feeding purposes. An acre or so of European flax should be grown upon every farm where stock-rearing is carried on. Much has yet to be done in the way of improving the dairy stock of the colony, a matter which is now attracting a large share of attention. The yield of milk from fairly good milking-cattle is approximately 500gal. per annum, although 700gal. are frequently obtained from selected herds. The average quantity obtained will no doubt be increased as more attention is paid to breeding and proper feeding.
The average yield of butter from milk passed through the separator is 1lb. for every 2 1/2gal. of milk of 10 1/2lb.; so that the average cow produces annually 200lb. of butter, or 500lb. of cheese, at about equal value with the butter, estimating it at 4 1/2ld. per pound. There is thus a good margin of profit.
From £5 to £8 per head can now be readily obtained for young milking-stock. Three years ago they were hardly saleable at all. To the British farmer this may not appear a satisfactory value; but when it is considered that no housing or hand-feeding is required, the price leaves a very good return.
New Zealand may claim to be the Denmark of the South, without ever having to enter into competition with the Denmark of the North, for the reason that our seasons are opposite. The dairy industry is steadily growing into a very important one. In the North Island, along the west coast, factories are springing up in all directions. This will be the great dairying district of the colony, the humidity of its climate rendering it better adapted to this industry than any other. The luxuriance of the pastures has to be seen to be appreciated. Large tracks of bush-lands are being thrown open for small settlements, and are eagerly taken up, for the most part by thrifty hard-working men. Land is procurable either by purchase, deferred payment, or perpetual lease, on the easiest terms. Homes are being built up in all directions, dairy farming being the staple business of the occupants. The very nature of the industry renders it peculiarly suited to small selectors.
It is hardly necessary to point out that all butter and cheese intended for export will have to be factory made, for the reasons that no other will command the highest price, and that so much more can be made of the milk by the use of the separator. One illustration will serve for our purpose. Experience has demonstrated to a certainty that 26 1/2lb. (or 2 1/2gal.) of fairly good milk will produce 1lb. of butter which averages 2d. per pound more than ordinary farmers' butter, whereas it takes 33lb. (or 3gal.) of milk treated in the old-fashioned manner of setting in pans to produce the same quantity of butter—which means exactly 50 per cent. more returns from the milk treated on the factory system.
The factory system is now fairly well established. With judicious supervision, and the institution of regulations providing for the grading and proper handling of butter for export, the industry is sure to go on flourishing, and will secure to thousands lucrative employment.
In the Middle Island it has not taken root to the same extent as in the North. It is true that cheese-factories are becoming numerous in Otago and Southland, with a few butter-factories. As in all other new industries, losses have been made; happily, however, the initial stage has been passed, and, with good prices for the output last season, averaging 4d. to 5d. per pound for cheese at the factory, matters are now in a satisfactory condition. In Canterbury, the dairy-factory system has only been partially adopted. This apparent apathy may be accounted for by the fact that the Canterbury farmers have, from the first, devoted themselves to wheat-growing; subsequently, sheep-raising was added to their usual occupations with considerable profit. A large quantity of butter was made on farms in former years, but the price obtainable was as low as from 3d. to 4d. per pound, so that to a very large extent the business was abandoned. It is now found that butter and cheese give a more certain and remunerative return; hence the desire for factories is becoming more general. They are accordingly springing up in all the suitable districts of the colony, principally on the co-operative principle—the one best adapted for carrying on the dairy industry. The system of feeding the factories by creameries situated in the surrounding districts, wherever from two to three hundred or more milking cows are guaranteed—the milk-suppliers taking up the shares necessary to build the creamery, which costs, thoroughly equipped, about £400—is obviously the most economical. A properly equipped butter-factory cannot well be built under a cost of £2,500, including refrigerating machinery. No factory can be said to be complete without this latter machine. Such a factory would be capable of working up the cream of three to four thousand cows, or even more, supplied from some twenty creameries. It will thus be seen how great is the saving of capital effected. Nor does the advantage end here. The butter being made at one centre will naturally be of more uniform quality; and by the aid of freezing machinery, can be manufactured and packed under the most favourable conditions during the hottest weather—a matter of the utmost moment. For if we are to take the lead, and keep in the front rank of butter-producing countries, we must avail ourselves of every advantage suggested by science. The Canterbury Co-operative Central Dairy Factory is such a factory as has here been described—a factory which will compare most favourably with any other in the colonies.
The disrepute into which New Zealand butter has recently fallen has not arisen from any fault in the pastures or incapacity to produce a first-rate article. It is admitted on all sides that New Zealand, north and south, with her unlimited supply of the purest water, coupled with a genial and comparatively humid climate, offers advantages for butter-producing unsurpassed if equalled by any in any other part of the world. The fault is not far to seek. It arises from the following causes: (1) Because large quantities of farmers' butter have been blended and packed and branded as finest factory-butter, which, in the very nature of things, could not possibly be otherwise than inferior; (2) then, again, it is feared that sufficient care is not exercised in working the butter at some of the factories. It must not be concluded that we mean that the butter generally is not worked enough; on the contrary, it is probably the fact of its being overworked that has caused some of the mischief referred to. Buyers in the English market complain that “New Zealand butter contains too much moisture.” They prefer Australian butter, for the reason that it is “drier and of better texture.”
These matters are referred to as illustrating the fact that unless New Zealand factory-owners take more pains in all the details of their business, keeping the fact steadily before them that it is a losing game to ship anything but butter of the finest quality, they will have to take a secondary position in the markets of the world. While regretting the disrepute into which much of our early shipments of butter has fallen, it is pleasing to note as a set-off against this that New Zealand stands in the front rank for the quality of her cheese in the Home markets. As we have taken this proud position with cheese, why should we not do so in the matter of butter?
The enforcement of some of the clauses of the Dairy Act which became law last session of Parliament would do much to restore our lost prestige. Mr. D. Wilson, the Victorian dairy expert, who visited New Zealand last year, gave it as his opinion that our pastures could not be surpassed for dairy purposes, and he could see no reason why we should not produce dairy produce of the finest quality. It is hoped that before the issue of another volume of this Year-book matters will have so much improved as to call for congratulations on our part rather than for condemnation.
The removal of the restrictions on the importation of New Zealand sheep into Australia has had the effect of opening up a market for long-wooled stud sheep in the sister colonies.
The determination of Australian flock-masters to cut into our frozen-meat trade has given rise to this demand for our long-wool sheep of superior quality, and New Zealand breeders have consequently been enabled to extend their operations beyond our own borders; and although the trade may not prove a very extensive or lasting one, it will give encouragement to those who have spent time and money in building up their now famous stud-flocks.
It is more than probable that there will always be a certain demand for sires bred in New Zealand, for the reason that this climate is better suited than the Australian for producing robust and hardy animals. It may be well here to correct an erroneous impression which has been fostered in some quarters, and which appears to have gained credence in the minds of some sheep-owners in Australia. It is to the effect that merino ewes cannot lamb to Lincoln rams; and as one fact is generally considered to be worth one hundred theories, the following will serve to set the matter at rest: Mr. H. Overton, Highfield, Kirwee, purchased a draft of strong merino ewes and put some of his stud Lincoln rams to them this last season; the result was that from 210 ewes he tailed 234 prime lambs, which averaged him £1 per head; thus showing the fallacy of the idea above referred to.
These useful adjuncts to the dairy hold a very important position on almost all arable farms. The favourite breed in New Zealand is the improved Berkshire. The large and small breeds of White Yorkshire are also to be met with, but are not so generally approved of as the black pigs. The rearing and fattening of pigs is a profitable investment. Unlike the pampered pigs of Britain, they require no better attention than a good grass paddock, with a liberal supply of roots, a little unthreshed pea-haul for a few weeks before killing, with plenty of water, and shelter from the sun during the warmest summer months.
It is more than probable that a rapidly-increasing trade will be done in raising pigs to meet the demand for curing purposes. One of the largest firms in England, whose speciality is the providing of mess pork for the navies of the world, as well as the mercantile marine, has had an agent in the colony for some months past making inquiries as to the prospect of opening up branch establishments. With a view to testing the quality of our pork for his purpose, he prepared some carcases by a process patented by the firm. These he shipped to his principals in England, the result being a cablegram to the effect that the meat and the curing were “perfection.” The result is that arrangements are now being made for opening up an extensive trade throughout the colony. The firm referred to are prepared to erect factories, at a cost of £20,000 each, in districts where there is a reasonable prospect of obtaining, say, 2,000 pigs per week.
Another result that will follow an unlimited demand for pigs is that a market will be provided on the farm for all inferior grain, which may be converted into mutton and pork. It is not good practice to pay freight on inferior samples of grain; it will pay far better to convert it into mutton and pork, which may be driven to market on four legs, instead of four wheels. The rule applying to our dairy produce—namely, that it should be of the finest quality—applies with equal force to grain intended for shipment.
It may not be generally known that young stock and pigs may be raised and fattened on separated milk, quite (or nearly) as well as on whole milk. It is only necessary to supply the fat abstracted by the separator. This can be cheaply done by the addition of a little linseed gruel or mucilage, made by steeping or boiling the seeds, whole or crushed, of European flax, the addition of which supplies the elements removed in the butter-fat. Every farmer ought to grow a patch of this useful plant—say, one acre, which should produce from 15 to 20 bushels of seed. The straw, if worked up, will supply all the twine and ropes required on the farm, or may be used for thatching purposes. We know a Canterbury farmer who grows a patch of flax each year, the seed is used as above, the straw is retted and dressed, and all the twine and rope required is manufactured on the farm by simple machinery worked by a home-made waterwheel. What one man can do another should be able to do also, provided the industry and intelligence are equal.
From the North Cape to the Bluff Hill, in the extreme south of the Middle Island, the climate and soil are eminently adapted for the growth of a large variety of fruits. Generally speaking—Pears, plums, quinces, apricots, figs, walnuts, cherries, gooseberries, currants, strawberries, and raspberries grow luxuriantly, producing abundant crops of fruit. In the Auckland District, oranges, lemons, and limes flourish: many groves are now coming into full bearing, and afford light and pleasant employment to a large number of persons. This employment will go on increasing as the trees become older. The olive flourishes, bearing heavy crops of fruit, and the manufacture of oil will one day become a very important industry.
Vine-growing is also carried on with tolerable success in many districts, tons of fruit being sold in the Auckland markets annually.
Away in the far north the banana grows and ripens its fruit, but it is not thought that it will ever enter into successful competition with those imported at so cheap a rate from the Pacific Islands.
Extensive orchards of apples have existed in Auckland for more than half a century, producing abundance of fruit of excellent quality, yielding returns equal to £40 or £50 per acre, provided they are kept free from pests. Orchard-planting is progressing rapidly, and must one day become a very important industry.
Now that the problem of landing the fruit in good condition on the London market has been satisfactorily solved, considerable quantities have been shipped Home with varying success. It is satisfactory to note that fruits of the proper varieties, and properly packed, have invariably realised remunerative prices. Much has yet to be done in the way of arriving at the best methods of packing and the best treatment on the voyage, the best varieties to grow, and the exact stage of ripening at which the fruit should be picked. Up to the present the trade with the United Kingdom has been mostly of an experimental character. Shipments have been sent Home as ordinary cargo, at little more than half the cost for freight in the cool-chamber, and have realised as much as 16s. per case, leaving a fair profit; but this system cannot be relied upon, and is not recommended. The present cost of shipping apples in the cool-chamber is 4s. 4d. per case, the other expenses bringing it up to nearly 8s. per case. Shipped as general cargo the charges would be, approximately, 5s. 6d. per case. If shipping as ordinary cargo is found successful the industry will at once become a most profitable one, adding immensely to the general prosperity of the colony.
Little has yet been done in the way of bottling or drying fruit for home use. This is an industry which only awaits development.
Cider is manufactured to a considerable extent, and fruit wines are gradually finding their way into consumption.
A considerable trade is also done in colonial-manufactured jams.
Before the planting of fruit-trees was commenced on a large scale, with a view to the export trade, little attention was paid to the varieties selected. The result is that many bearing trees have proved unsuitable to the new requirements, and are now being cut down and regrafted or replaced with more suitable kinds. According to latest advices, the following varieties of apple are said to be in most request in the London market, always commanding a quick sale at good prices—namely, Ribstone Pippin, Cox's Orange Pippin, Waltham Abbey, Sturmer Pippin, Scarlet Pearmain, Adam's Pearmain, and New York Pippin. The soil best adapted for growing apples is a strong loam with a clay subsoil; but they will thrive in almost any kind of soil, provided it is in good heart and that water does not stagnate in the subsoil.
Owing to the comparative mildness of the New Zealand climate all kinds of fruit-trees are forced into bearing at an earlier stage than is the case in Great Britain.
The Government, recognising the importance of tree-planting, and in view of the marvellous results which have been achieved by the setting aside in the United States of America of one day in the year to be called Arbor Day, proclaimed the 4th of August last year as a general holiday to be devoted to tree-planting. It would be well for the settlers on the treeless Canterbury Plains had a movement of this kind been set on foot in the early days of the settlement. The movement, although so general and popular in America, attracted very little attention in New Zealand. However, as each year comes round more interest will be taken, till the institution becomes as popular as an annual cattle-show-day. The planting of trees should not, however, be confined to one day in the year. The wholesale destruction of our grand primeval forests must hasten the time when timber will be as scarce in the North Island as it is on the plains of Canterbury. While our native supply is diminishing the demand for timber is rapidly on the increase. It would therefore be a wise provision to encourage extensive planting of trees. The 4th of August this year (1893) has been set apart for “Arbor Day.”
Among the encouragements of forestry in America the establishment of what is known as Arbor Day deserves to be mentioned. The credit of inaugurating a day specially devoted to tree-planting, belongs to Nebraska, in which State, by a resolution of the State Board of Agriculture in January, 1874, the second Wednesday of April in each year was dedicated to the work of planting trees. The resolution was welcomed by the people of the State, and as a result it has been claimed that on the first Arbor Day and during the year 1874 more than 12,000,000 trees were planted, and that there are now 100,000 acres of planted forest in the State. The example of Nebraska was quickly followed, especially by those States most lacking forest-growth. In Iowa Arbor Day was adopted in 1874 by the State Horticultural Society. Since then it has been established by legislative enactment. In Michigan the Governor proclaimed Arbor Day in 1876, and in 1881 it was formally established by the legislature. In Minnesota it was proclaimed by the State Forestry Association in 1876, and 1,500,000 trees were reported as planted that year. The day is now established by law. In Ohio Arbor Day was established in 1882 by the legislature. In West Virginia it was extensively adopted in 1883 under the lead of the Hon. B. L. Butcher, Superintendent of Public Schools. In accordance with an Act of the legislature it was proclaimed in New Jersey in 1885. It was adopted the same year in Massachusetts and New Hampshire by the action of the State Granges of the Patrons of Husbandry, and has been adopted more recently by the legislatures of these States. In 1886 it was adopted by New York, Maine, Connecticut, Rhode Island, Pennsylvania, and Florida. It has been adopted also in Vermont, Georgia, Wisconsin, Colorado, and Indiana. Recently the scope of Arbor Day has been widened and its interest increased by engaging the pupils of the public schools in its observance. The way has thus been opened for getting the facts relating to treegrowth and the practical uses of trees before the minds of old and young alike, and for creating and diffusing through the community a sentiment which promises much good to the cause of forestry. It is this educational aspect which makes Arbor Day a specially desirable means of forestry reform.
A large and increasing demand for a certain class of timber is growing up each year in New Zealand in one department of industry alone, namely, the dairy, where hundreds of thousands of boxes will be required for packing butter. It is said that the timber of Pinns insignis is admirably adapted for boxes for packing butter, and that it is largely used in America for that purpose. This tree is a rapid grower, affording good shelter as it grows. It is true that it suffers from high winds, but if planted in sufficient numbers the trees shelter one another. While advocating the planting of Pinus insignis (provided that it is found suitable for the above purpose), it must not be forgotten that it is good policy to plant other trees, such as ash, elm, beech, and larch. A small quantity of ash grown in Canterbury has already come into use for coach-building, and has been pronounced by competent experts to be of excellent quality. Plantations of larch might advantageously be made on the southern slopes of the foot-hills skirting the Canterbury Plains and elsewhere. There can be no doubt that a demand will be found for large quantities of larch-poles for mining purposes and for scaffolding long before trees now planted would be fit for use. Trees of this description in the Old Country are fit for cutting for such purposes in about twenty years from planting, and are worth £20 per acre.
This industry is assuming important dimensions, and is incidental to the frozen-meat trade, resulting from the by-products in the shape of offal. The blood is manufactured into a nitrogenous manure of great value, containing from 11 to 12 per cent. of nitrogen, the other refuse being manufactured into what is commercially known as animal guano.
There never was a time in the history of the colony when the prospects of the small-farming community were better or more hopeful than they are at the present time.
Farming operations may now be undertaken either on a large or small scale with something approaching mathematical precision. The farmer can calculate on at least 3d. per gallon for his milk, from 3d. to 4d. per pound for his pork, from 12s. to 17s. for his lambs, and prices varying from 10s. to 20s. for his store and fat sheep. Contrast this state of things with that which prevailed before the advent of the dairy industry, when butter could hardly find a market at 3d. to 5d. per pound during the summer months, which meant from 1d. to 1 1/2 d. per gallon for his milk; when his pigs were often unsaleable, and dairy and fat cattle were of little value. In fact, there never was in the history of the colony a time when an industrious man with a frugal family could calculate on making a competency so surely as he can at present. A peculiarity of New Zealand is that small areas can be farmed to profit; this is one of the results of a generous soil, and a humid climate. The Agent-General was perfectly right when he stated in his recent pamphlet that the kind of persons for whom there is room in New Zealand are farmers with a little capital—men who know their business, and are prepared to do it: to such New Zealand offers special advantages. There are thousands of acres in the North Island adapted to settlers of this kind, where the land is cheap, and procurable on exceptionally easy terms. It may safely be asserted that men with a reasonable amount of capital will, ere long, be able to settle on land already cleared and under cultivation in the Middle Island; and we venture to predict that every acre of available land would find purchasers if offered at its agricultural or pastoral value, and on easy terms of payment. There is little difficulty, with all the data now available, in fixing with tolerable accuracy the value of land.
Above are enumerated a few of the salient points which go to prove conclusively that, as a country for settlement, New Zealand is not surpassed by any part of the British possessions, being one where the industrious man, with moderate means, can settle down with much comfort. The land, it is true, is perhaps dearer in some districts than that which may be found in South America, South Africa, or Canada, but this difference in price is far outweighed by other considerations, such as the superiority of climate, and security to life and property; besides which there are all the privileges of living under a stable system of Government. Pit these advantages against the insecurity of life and property in South America and South Africa, and the rigour of Canadian winters, and the balance will be immensely in favour of New Zealand. Another great advantage enjoyed by the agriculturist of New Zealand is that he is nowhere far from the sea-board, giving him the advantage of cheap water-carriage for his produce to the markets of the world.
The following tables have been carefully compiled from the statistics for the year ending 31st March, 1893. It will be seen that the crop of wheat for 1893 fell short of that of the previous year by 1,879,521 bushels. The area of land under this crop was 21,028 acres less in 1893 than in 1892, which accounts for 462,000 bushels, leaving 1,417,000 bushels of a deficiency. The estimates are usually made in February, and although the crops may promise large yields at that date, subsequent contingencies, such as drought or high winds, £c., may make a very material difference, rendering the returns anything but reliable. The unfavourable harvest weather of 1892 (incessantly wet as it was) made serious havoc in the grain crops, lowering the averages materially, and the returns made earlier in the season should have been reduced accordingly. The last harvest was a fair one, but unfavourable weather at the critical period of the plant's growth had a damaging effect on the general average. Recognising the fact that the statistics collected in February would not be reliable, measures were taken to have the estimates checked by actual results from the threshing machines, which, as was expected, revealed a considerable shrinkage.
It will also be observed that there is a corresponding falling-off in oats, and it is fair to assume that the reasons assigned for the deficiency in wheat account for that of oats. As a set-off against the above, it will be seen by the tables below that there has been an increase of 858,164 acres of grass-land, which argues a corresponding increase of sheep and cattle.
New Zealand farmers are now beginning to realise the fact that wheat-growing at best is a most precarious business. It is hardly to be expected that we can compete against countries where land and labour are so much cheaper. Instead of being a leading feature in farm rotation, wheat will become an auxiliary crop. The better lands of New Zealand can now be more profitably employed in growing grass, roots, and forage plants for feeding stock, than for growing wheat at 2s. 6d. per bushel.
| Table showing the Gross Return for the Colony of Wheat, Oats, Barley, etc. | ||
|---|---|---|
| Wheat. | Bush. | |
| 1892—Number of acres, 402,273 | yield, 10,257,738 | average per acre, 25.50 |
| 1893—Number of acres, 381,245 | yield, 8,378,217 | average per acre, 21.98 |
| Decrease in acres, 21,028 | 1,879,521—Decrease in bshls. for 1893. | |
| Oats. | Bush. | |
| 1892—Number of acres, 323,508 | yield, 11,009,020 | average per acre, 34.03 |
| 1893—Number of acres, 326,531 | yield, 9,893,989 | average per acre, 30.30 |
| Increase in acres, 3,023 | 1,115,031—Decrease in bshls. for 1893. | |
| Barley. | Bush. | |
| 1892—Number of acres, 24,268 | yield, 688,683 | average per acre, 28.38 |
| 1893—Number of acres, 24,900 | yield, 654,231 | average per acre, 26.27 |
| Increase in acres, 638 | 34,452—Decrease in bshls. for 1893. | |
| Potatoes. | Tns. cwt. | |
| 1892—Number of acres 27,266 | yield, 162,046 | average per acre 5 19 |
| 1893—Number of acres 18,338 | yield, 104,173 | average per acre, 5 14 |
| Decrease in acres, 8,928 | 57,873—Decrease in yield for 1893. | |
| Table showing the Number of Acres under Wheat, Oats, Barley, and Potatoes in 1893, and Yield per Acre in Bushels and Tons for the Several Provincial Districts. | |||
|---|---|---|---|
| Wheat. | |||
| Bushels. | Bushels. | ||
| Canterbury | 270,780 acres | yield, 5,672,238 | average per acre, 20.95 |
| Otago | 81,174 acres | yield, 2,120,814 | average per acre, 26.13 |
| Wellington | 8,768 acres | yield, 193,288 | average per acre, 22.04 |
| Auckland | 6,733 acres | yield, 173,154 | average per acre, 25.72 |
| Nelson | 5,977 acres | yield, 87,243 | average per acre, 14.60 |
| Marlborough | 5,589 acres | yield, 74,590 | average per acre, 13.35 |
| Taranaki | 1,412 acres | yield, 36,528 | average per acre, 25.87 |
| Hawk's Bay | 809 acres | yield, 20,312 | average per acre, 25.11 |
| Westland | 3 acres | yield, 50 | average per acre, 16.67 |
| Totals | 381,245 | 8,378,217 | 21.98 |
| Oats. | |||
| Bushels. | Bushels. | ||
| Otago | 174,635 acres | yield, 5,769,957 | average average per acre, acre, 33.04 |
| Canterbury | 112,894 acres | yield, 2,958,807 | average per acre, 26.30 |
| Wellington | 15,484 acres | yield, 488,287 | average per acre, 31.54 |
| Auckland | 6,270 acres | yield, 176,596 | average per acre, 28.17 |
| Hawke's Bay | 6,266 acres | yield, 177,206 | average per acre, 28.28 |
| Nelson | 4,740 acres | yield, 104,017 | average per acre, 21.94 |
| Taranaki | 4,021 acres | yield, 155,230 | average per acre, 38.60 |
| Marlborough | 2,212 acres | yield, 53,574 | average per acre, 24.22 |
| Westland acres | 9 | yield, 315 | average per acre, 35.00 |
| Totals | 326,531 | 9,893,989 | 30.30 |
| Barley. | |||
| Bushels. | Bushels. | ||
| Canterbury | 9,569 acres | yield, 248,422 | average average per acre, acre, 25.90 |
| Otago | 5,230 acres | yield, 152,150 | average per acre, 29.09 |
| Nelson | 4,466 acres | yield, 118,934 | average per acre, 26.63 |
| Marlborough | 2,318 acres | yield, 38,920 | average per acre, 16.79 |
| Hawke's Bay | 2,229 acres | yield, 66,741 | average per acre, 29.94 |
| Auckland | 702 acres | yield, 18,572 | average per acre, 26.46 |
| Wellington | 285 acres | yield, 7,543 | average per acre, 26.47 |
| Taranaki | 107 acres | yield, 2,949 | average per acre, 27.56 |
| Totals | 24,906 | 654,231 | 26.27 |
| Grass-seeds. | |||
| Cocksfoot. | Ryegrass. | ||
| Bushels of 121b. | Bushels of 201b. | ||
| Canterbury | 243,992 | 145,751 | |
| Taranaki | 32,947 | 5,434 | |
| Wellington | 30,789 | 14,967 | |
| Auckland | 22,650 | 125,088 | |
| Hawke's Bay | 17,918 | 61,876 | |
| Nelson | 5,457 | 2,570 | |
| Otago | 4,705 | 203,006 | |
| Marlborough | 3,847 | 7,694 | |
| Westland | 16 | 24 | |
| Totals | 362,321 | 566,410 | |
| Potatoes. | |||
| Tons. | Tons. | ||
| Canterbury | 4,996 acres | yield, 31,584 | average average per acre, acre, 6.32 |
| Otago | 4,842 acres | yield, 24,289 | average per acre, 5.02 |
| Auckland | 3,448 acres | yield, 17,303 | average per acre, 5.02 |
| Wellington | 1,682 acres | yield, 11,926 | average per acre, 7.09 |
| Nelson | 890 acres | yield, 4,561 | average per acre, 5.12 |
| Hawke's Bay | 801 acres | yield, 5,686 | average per acre, 7.10 |
| Taranaki | 783 acres | yield, 4,423 | average per acre, 5.65 |
| Marlborough | 067 acres | yield, 3,276 | average per acre, 4.91 |
| Westland | 229 acres | yield, 1,125 | average per acre, 4.91 |
| Totals | 18,338 | 104,173 | 5.68 |
| Table showing the Total Number of Acres under Turnips and Rape. | ||
|---|---|---|
| 1892. | 1893. | |
| Otago | 168,156 | 153,664 |
| Canterbury | 150,034 | 127,574 |
| Auckland | 32,077 | 30,289 |
| Wellington | 29,001 | 28,184 |
| Hawke's Bay | 27,748 | 24,008 |
| Nelson | 6,424 | 6,431 |
| Taranaki | 5,020 | 4,802 |
| Marlborough | 3,638 | 4,179 |
| Westland | 256 | 316 |
| Totals | 422,354 | 379,447 |
| Decrease for 1893, 42,907 acres. | ||
| Table showing Total Number of Acres under Other Crops. | ||
|---|---|---|
| Maize (grown in North Island) | 4,491 acres | produce, 171,661 bushels. |
| Rye and bere | 6,737 acres | produce, 100,885 bushels. |
| Peas | 4,779 acres | produce, 124,338 bushels. |
| Beans | 4,402 acres | produce, 157,294 bushels. |
| Hops | 706 acres | produce, 7,059 cwt. |
| Tobacco | 4 acres | produce, 2,2121b. dried leaf |
| Mangold, beet, carrots, parsnips, and onions | 6,881 acres. | |
| Maize cut green | 2,049 acres | |
| Other crops | 4,790 acres | |
| 34,839 acres. | ||
| Showing an increase of 4,102 acres for 1893. | ||
| Table showing the Total Number of Acres under Oats for Green Fodder and Hay, in 1893, as compared with 1892. | ||
|---|---|---|
| 1892. | 1893. | |
| Acres. | Acres. | |
|
* Of this quantity 23,206 acres were cut for green food, and 108,934 for hay. | ||
| Otago | 44,628 | 47,679 |
| Canterbury | 37,080 | 42,179 |
| Auckland | 16,780 | 18,563 |
| Nelson | 7,283 | 7,824 |
| Wellington | 4,579 | 6,955 |
| Marlborough | 3,116 | 4,086 |
| Hawke's Bay | 3,151 | 2,920 |
| Taranaki | 1,478 | 1,377 |
| Westland | 389 | 557 |
| 118,484 | *132,140 | |
| Table showing the Number of Acres of Grass, after having been broken up, including such as were in Hay, in 1893, as compared with 1892. | ||
|---|---|---|
| 1802. | 1893. | |
| Acres. | Acres. | |
| Canterbury | 1,139,179 | 1,242,663 |
| Otago | 1,157,246 | 1,214,637 |
| Auckland | 350,049 | 402,646 |
| Hawke's Bay | 260,006 | 301,027 |
| Wellington | 201,187 | 216,523 |
| Taranaki | 83,520 | 92,563 |
| Nelson | 65,303 | 73,201 |
| Marlborough | 51,181 | 62,088 |
| Westland | 8,084 | 6,045 |
| Totals | 3,327,755 | 3,611,393 |
| Increase for 1893, 283,638 acres. | ||
| Table showing the Number of Acres of Grass - sown Lands (Surface-sown), not previously ploughed, including such as were in Hay, in 1893, as compared with 1892. | ||
|---|---|---|
| 1892. | 1893. | |
| Acres. | Acres. | |
| Wellington | 1,398,260 | 1,625,897 |
| Hawke's Bay | 921,012 | 1,028,357 |
| Auckland | 748,237 | 828,305 |
| Canterbury | 241,590 | 333,013 |
| Taranaki | 237,068 | 276,068 |
| Otago | 180,502 | 204,746 |
| Nelson | 175,880 | 171,400 |
| Marlborough | 168,644 | 171,992 |
| Westland | 4,933 | 10,874 |
| Totals | 4,076,126 | 4,650,652 |
| Increase for 1893, 574,526 acres. | ||
| Table showing the Total Number of Acres in Hay, in 1893, as compared with 1892. | ||
|---|---|---|
| 1892. | 1893. | |
| Acres. | Acres. | |
| Canterbury | 12,496 | 17,097 |
| Auckland | 10,246 | 14,129 |
| Hawke's Bay | 5,907 | 7,298 |
| Otago | 5,475 | 6,523 |
| Wellington | 5,179 | 7,126 |
| Nelson | 2,630 | 3,199 |
| Taranaki | 2,500 | 4,049 |
| Marlborough | 1,959 | 2,080 |
| Westland | 206 | 310 |
| Totals | 46,652 | 61,811 |
| Increase for 1893, 15,159 acres. | ||
| Estimated gross produce, 93,293 tons. | ||
| Table showing the Total Number of Acres under Crop, exclusive of Grass-lands, 1893. | |||
|---|---|---|---|
| Under Crop (1892). | Under Crop (1893). | Broken up, but not under Crop, 1893. | |
| Acres. | Acres. | Acres. | |
| Canterbury | 615,571 | 579,378 | 50,708 |
| Otago | 481,643 | 474,101 | 46,312 |
| Auckland | 75,513 | 73,836 | 29,364 |
| Wellington | 62,939 | 62,288 | 5,180 |
| Hawke's Bay | 44,187 | 40,454 | 13,716 |
| Nelson | 33,043 | 32,039 | 2,770 |
| Marlborough | 22,131 | 21,252 | 4,873 |
| Taranaki | 12,932 | 12,957 | 1,313 |
| Westland | 931 | 1,141 | 18 |
| Totals | 1,348,890 | 1,297,446 | 154,254 |
| Decrease for 1893, 51,444 acres. | Increase for 1893, 13,800 acres. | ||
Note.—In the returns of agricultural statistics as above summarised, gardens, orchards, plantations of forest-trees, holdings of one more or less in extent, and holdings occupied by aboriginal natives are not included; but the returns for 1893 show a total extent of land—in gardens, of 9,763 acres; in orchards, 20,085 acres; and in plantations of forest-trees, of 40,401 acres.
| Table showing the Total Number of Cattle in the Provincial Districts. | ||
|---|---|---|
| Auckland | 221,481 of which | 73,666 are breeding-cows. |
| Wellington | 155,144 of which | 57,858 are breeding-cows. |
| Otago | 136,612 of which | 59,038 are breeding-cows. |
| Taranaki | 120,700 of which | 47,479 are breeding-cows. |
| Canterbury | 67,850 of which | 30,353 are breeding-cows. |
| Hawke's Bay | 54,241 of which | 20,467 are breeding-cows. |
| Nelson | 31,024 of which | 10,467 are breeding-cows. |
| Westland | 7,721 of which | 2,970 are breeding-cows. |
| Marlborough | 7,666 of which | 2,972 are breeding-cows. |
| Totals | 808,439 of which | 305,270 are breeding-cows. |
| Showing an increase of 61,906 head of cattle for 1893. | ||
The returns also show that at the time of the collection there were 254 silos or ensilage-stacks in the colony, an increase of 36 over those of 1892.
Table of Contents
The production of wool and mutton in New Zealand is undoubtedly the premier industry of the colony, as is clearly shown by the fact that out of a total of £9,534,851, representing the whole of the past year's exports, no less than £5,668,624, or nearly 60 per cent., was due to sheep-farming, made up as follows:—
| £ | |
|---|---|
| Value of wool exported | 4,313,307 |
| Value of sheepskins | 156,531 |
| Value of mutton | 963,853 |
| Value of tallow | 165,513 |
| Value of preserved meats | 69,420 |
| Total | £5,668,624 |
As the country is probably not much more than half tested in respect of its sheep-carrying capacity, and its consequent power of production, it can readily be seen that, when increased areas have been opened up and laid down in English grasses, and more winter feed grown—such as turnips, mangolds, &c.—New Zealand will offer more than ever before a wide and lucrative field for industrious men possessed of moderate means and an intelligent knowledge of the most valuable of all animals—the sheep.
In a brief article like this it is impossible to go into minute details with regard to sheep-farming in New Zealand; and, in consequence, the statements which follow must be regarded as general in their character, but nevertheless absolutely reliable.
It is a well-known fact that climate and soil exercise the most potent influence on the development of animals (as well as human beings) reared in any country, and these conditions being exceedingly favourable in New Zealand render this colony the most suitable of the British possessions for sheep-farming.
It may unhesitatingly be asserted that not even Great Britain itself is so favourable to the production of the sheep as is New Zealand, for the colony possesses all the climatic and soil advantages of the Mother-country without the drawbacks of long and severe winters, wet seasons, foot-and-mouth disease, &c.; and the prolonged droughts of the Australian Continent are unknown.
Until the commencement of the frozen-meat industry, in 1882, sheep-farmers in New Zealand confined their attention exclusively to producing the class of sheep that would cut the heaviest fleece; but of late years the ideal has been early maturity of mutton and good fleece together. The two qualities have been best combined by the judicious crossing of Down rams with long-wool ewes in the North Island; and, in the Middle Island, of Leicester, Lincoln, Romney Marsh, and Cheviot rams with large-framed four-year-old merino ewes. The climate and soil in New Zealand are of such varied character that in some districts it has been found that one cross does better than another. For examples the following are given: In the North Island, until lately, the Lincoln and Romney Marsh breeds have predominated; but since the starting of the frozen-meat trade it has been found necessary, in order to produce an earlier maturing of sheep with a better quality of fleece, to put Hampshire, Shropshire, or Southdown rams to the long-wool ewes; and the desired result has in every case been achieved.
In the Middle Island, where the variations in climate and soil are much greater, and the country, generally speaking, more mountainous, the merino for many years reigned almost supreme. Here, too, however, the export trade of frozen mutton has revolutionised sheep-farming. Merino mutton was not suitable for the Home markets—at all events not so suitable and profitable as the breeding of a larger sheep; besides, it came into competition with the River Plate and Australian mutton, with the result that it fetched a very low price, and, in consequence, judicious crossing, as already stated, was tried, with eminently satisfactory results.
In the most mountainous districts pure-bred merinoes are still kept, and ewes of this breed, when three or four years old, always command very payable prices for putting to the long-wool rams on the downs and low-lying lands. In some districts the cross between the Leicester (especially the Border Leicester) and the merino ewe is found most suitable; in others, again, where the climate is wetter, the Romney Marsh cross is regarded as best; whilst on heavy rich lands some prefer the Lincoln cross, and on high cold country the Cheviot cross is regarded with much favour by others.
The result of this crossing is a sheep which, if nourished well during lambhood and afterwards kept on good pasture until after first shearing, is considered, so far as quality of mutton is concerned, equal to the best Welsh and Scotch.
The weight of these half-bred sheep at two-tooth varies, according to feeding and breeding, from 56lb. to 65lb. The Border Leicester cross, maturing earlier than the others, gives the best return at two-tooth, if the climatic conditions are favourable. From the wool-producing point of view, the half-bred sheep is the most profitable; at all events, it has been so for many years. Of course, the weight per fleece is much less than in the case of long-wools, but this deficiency is more than counterbalanced by the extra value of the staple. Given two flocks of equally well fed two-tooth sheep, on properties suitable to each breed—one for instance Lincoln, and the other the half-bred, by Border Leicester rams from Merino ewes—and the result, according to present values, would approximately be this, viz.: Lincoln, two-tooth, clipping 12lb. wool at 6d. = 6s.; half-bred, two-tooth, clipping 9lb. wool at 9d. = 6s. 9d.
Again, the pure-bred sheep would probably have the advantage in weight per carcase to the extent of 4lb. or 5lb.; but the extra value of the half-bred mutton at Smithfield, or any other of the meatmarkets—say, 1/2d. per pound—would give the finer (or half-bred) sheep a further advantage over its coarser competitor of 10d. or 1s. per carcase, making a total of 1s. 7d. or 1s. 9d. per sheep.
Another advantage that the breeding of half-bred sheep possesses is that there is a market in the colony for all the wool of that description that is produced, and the growers, in consequence, very often obtain at their doors more for their wool-clip than they would realise in London, without incurring the very heavy charges incidental to sending it there. American buyers, too, visit the colony annually to purchase this class of wool, and, as it is produced nowhere else in the world to any great extent, New Zealanders may be said practically to have the trade in this class of wool in their own hands.
The first cross, or, as it is called, the half-bred sheep, has been found so suitable to the country that several attempts have been made to perpetuate or form a breed of pure half-breds, and with some success. One flock in New Zealand, started fourteen years ago, now numbers 4,000 ewes. These are put to half-bred rams, and will yield 8lb. of first-class wool. The wethers, too, when under two years old, will dress from 60lb. to 65lb. of mutton in every way suitable for freezing and export.
The difficulty in maintaining a half-bred flock is to retain the quality of the wool without losing in quantity, and to keep the flock sound and healthy. This is usually done by bringing in a proportion of first-cross two-tooth ewes annually, and drafting out a number of the coarser ewes, and also by careful selection of suitable rams.
If this pure half-bred breed can be permanently established, it will be a class of sheep at once fitted for the production of wool and mutton, and adapted to the climate of the country.
Two other important points in connection with sheep-farming in New Zealand call for the special notice of the would-be colonist—namely: (1) the low cost of the production of mutton, (2) the high percentage of natural increase. Respecting the first point, it has been proved beyond all doubt that, under ordinary conditions, the very choicest of mutton can be produced so as to pay the grower handsomely when sold at 2d. per pound for the carcase at the nearest shipping-port. To the British sheep-farmer this statement, of course, is valueless by itself; but, when we add that this mutton would only cost the London butcher, delivered ex steamer at the dock, 3 5/8d. per pound, he will be able to realise in some measure what a wonderful grazing-country New Zealand is, and to understand how it is that settlers of the right stamp have done so well. Then, with regard to the high percentage of increase, there need only be cited a few average returns from well-known flocks to show what excellent lambings New Zealand farmers obtain under good management.
| Locality. | Breed of Flock. | Breed of Rams. | Breed of Ewes. | No. of Ewes. | Percentage of Lambs. | Remarks. | |
|---|---|---|---|---|---|---|---|
| North Island | Lincoln | Lincoln | Lincoln | 7,517 | 81.04 |

| Land merely surface-sown in English-grass pasture. |
| North Island | Lincoln | Lincoln | Lincoln | 5,301 | 85.05 | ||
| North Island | Lincoln | Lincoln | 7/8 Lincoln | 12,177 | 100.00 | ||
| North Island | Romney | Romney | Romney | 1,141 | 96.17 | ||
| North Island | Lincoln | Southd'n | Lincoln | 2,033 | 94.71 | ||
| Middle Island | Merino | Merino | Merino | 14,765 | 75.30 |

| Mountainous country in n'tive past're, unimproved. |
| Middle Island | Merino | B. Leic'str | Merino | 4,235 | 88.94 | ||
| Middle Island | Cross-bred | B. Leic'str | Cross-bred | 8,624 | 80.82 |

| In English-grass pasture. |
| Middle Island | Half-bred | B. Leic'str | Half-bred | 2,747 | 82.79 | ||
| Middle Island | B. Leic'str | B. Leic'str | B. Leic'str | 778 | 90.77 | ||
| Middle Island | Lincoln | Lincoln | Lincoln | 452 | 88.08 | ||
| Middle Island | R. Marsh | R. Marsh | R. Marsh | 253 | 111.46 | ||
| Middle Island | E. Leic'str | E. Leic'str | E. Leic'str | 464 | 93.31 | ||
| Middle Island | Shropsh're | Shropsh're | Shropsh're | 168 | 97.41 | ||
| Middle Island | Southd'n | Southd'n | Southd'n | 114 | 96.87 | ||
The above returns are fair average ones, but much higher might have been exhibited if exceptional cases had been selected.
As showing the actual cost of managing two large estates in New Zealand (Middle Island), No. 1 carrying 20,000 cross-bred sheep and No. 2 carrying 40,000, the subjoined table may prove interesting:—
| No. 1. | No. 2. | |||
|---|---|---|---|---|
| Per | Head. | Per | Head. | |
| s. | d. | s. | d. | |
| Cost of shearing, including scouring and putting wool f.o.b. | 0 | 6.5 | 0 | 6.3 |
| Management, shepherding, dipping, &c. | 0 | 10 | 0 | 9.6 |
| Cost of providing special feed (turnips, green feed, chaff, &c.) | 1 | 1 | 1 | 6.3 |
| Cost of renewing English grass | 2 | 0 | 1 | 5 |
| Total per head | 4 | 5.5 | 4 | 3.2 |
As to the general management and feeding of sheep: In the earlier days of sheep-farming in New Zealand, when the flocks bred were principally merino, and the country they were run on for the most part tussock and native grasses, stock received but little care beyond mustering for lamb-marking and shearing, these operations being sometimes done at the same time; but with the advent of long-wools and the increased value in sheep greater attention has been given to the management of flocks, and Home farmers coming to the colony will find long-wool sheep-breeding and -feeding carried on, at all events in the case of the better-managed estates and farms, on much the same lines as in Great Britain. The ewes are carefully selected and annually culled for constitution and wool, and regular drafts made of aged stock, whilst first-class rams can be had from breeders who make the different varieties a specialty. Lincolns, Leicesters, both Border and English, Romney Marsh, and the different breeds of Downs all have their admirers, and can usually be bought at an average of about three guineas. The flocks from which these are to be obtained all had their origin in those of the best Home sheep-owners, and fresh importations are made to keep up the standard of the different breeds.
Long-wool lambs are usually weaned on to stubbles, or young grass which has been sown in spring to be ready against weaning-time, and as winter approaches are put on turnips, and thus brought in good order through that trying season and on to shearing. They are then, in most cases, well grazed through the summer, and fed off during the succeeding winter on turnips; merino lambs bred on high lands being, on the other hand, weaned on to a piece of country previously spelled and kept clean for the purpose.
To secure a good crop of turnips, and thus supply a winter feed for his stock, is the aim of the careful sheep-farmer in the Middle Island; and the following particulars as to the cost of growing turnips broadcast, may be interesting to Home farmers and would-be colonists, viz.: Ploughing, 5s. 6d. per acre; harrowing, 3s. per acre; rolling, 1s. per acre; seed and sowing, 1s. 6d. per acre: total, 11s. per acre. To this amount, if manure is used, must be added from 10s. to 12s. per acre. At first most of the turnips were broadcasted with turnip cannisters, but since artificial manure began to be used large areas are put in with the broadcast drill machine, sowing them 14in. apart. In many instances, also, they are sown in drills and hand-hoed, as in the Old Country. The cost of this operation, per acre, may be taken as follows: Ploughing, 5s. 6d.; grubbing, 3s.; harrowing, 3s.; rolling, 1s.; drilling, 3s. 6d.; hand-hoeing, 10s.; horse-hoeing, 5s.; seed and sowing, 2s. 6d.: total, £1 13s. 6d.
A fair broadcast crop of turnips will carry about thirty sheep per acre for a month, while good crops of drilled turnips will carry three times as many. While being fed on turnips, sheep are also supplied with oaten sheaves cut into fine chaff and put into large covered boxes so constructed that as the sheep eat the chaff fresh supplies fall into the troughs. Half a pound of oaten chaff per day will cost 1/2d. per week for each sheep, and the outlay is well repaid, as sheep are much healthier and feed much more quickly when thus supplied with a proportion of dry food. A breadth of oats or Cape barley is usually sown to come in at early spring, when the turnips are exhausted and before the young grass is forward enough to stock.
Seeds are used much as in Great Britain, the following being a common mixture: Perennial ryegrass, 25lb. to 30lb. per acre; cocksfoot, 2lb.; alsyke, 2lb.; timothy, 3lb.; cowgrass, 2lb.; red clover, 2lb.; white clover, 2lb.; rape, 1lb.: total, 39lb. to 44lb. per acre. Pastures are renewed at intervals of from four to eight years, according to the nature of the land.
A few deaths from inflammation occur amongst turnip-fed sheep, but the mortality from this cause is not to be compared with that resulting from the same complaint at Home. Indeed, almost the only ailment sheep are subject to in New Zealand is lungworm. This is most prevalent in the North Island, where the abundance of grass enables the farmer to carry four to six sheep per acre, and the ground thus being foul promotes the disease. A dose of turpentine and oil, in proportion of 1 of turpentine to 2 of linseed-oil or milk, and of this mixture 1 to 3 tablespoonfuls for a lamb, 2 to 4 for a weaner, and 3 to 6 for a full-grown sheep, followed by a change to fresh pastures, usually gets rid of the parasite.
New Zealand may be said to be the only country in the world free from disease of a contagious nature amongst its stock. Scab is now eradicated, and foot-rot, to a great extent, can be avoided by keeping the class of sheep least liable to it and best adapted to the districts in which there is a tendency to it. The blow-fly, which is such a pest to Home shepherds, is here very little trouble; and when it is stated that the average death-rate of an estate carrying 40,000 sheep, of which the number of breeding ewes is 15,000, is only from 4 to 6 per cent., it will be readily understood that few countries can compete with this one as regards the health of the flocks.
The North Island with its luxuriant pastures is not so healthy as the Middle Island, but to set against this the sheep-farmers there have so open a winter that they are not put to any expense in providing turnips and winter feed for their stock.
The following paper on the cross-breeding of sheep was read by Mr. Roberts at the meeting of the Australasian Stock Conference, held at Wellington on the 27th October, 1892:—
The development of the frozen-meat industry during the past few years has made the breeding from long-woolled sheep a greater necessity than it used to be in years prior to the initiation of the export of frozen mutton. Merinoes are admittedly unsuitable sheep for export purposes, and, this being so, the question of what is the most desirable cross-bred sheep for purposes alike of wool and mutton is an all-important one to sheep-breeders in the colonies. Most sheep-growers in New Zealand have had somewhat lengthened experience in cross-breeding, and, as I personally have had a fair opportunity of judging of the respective merits of the different crosses, I desire to give a short résumé of my own experience, and the conclusions I have come to as to the most suitable cross for use. Our Australian friends who are with us are no doubt considerably interested in the question to which I purpose to devote this paper, and, although they will, in travelling this country, receive opinions somewhat contradictory to those which I express herein, I give them my own personal experience for what it is worth, and trust that any guidance which I may afford may prove of some little benefit to our fellow-colonists on the other side of the water.
The following breeds of long-woolled sheep have been chiefly used in this colony for the purposes of cross-breeding: Leicester (English and Border), Lincolns, Romneys, Cotswolds, Southdowns, Hampshire Downs, and Shropshire Downs. I do not purpose going into the question at any length as to the respective merits for freezing purposes of any of these breeds, pure or close up to the pure, but I purpose to confine my remarks chiefly to the question as to which is most suited for producing a prime half-bred sheep bred from the merino ewe.
In arriving at a conclusion as to what is the best and most suitable sheep to use for the somewhat small carcased merino ewe, we must take into consideration the question as to which of the pure breeds possesses the qualifications necessary for the successful breeding from the smaller female; these qualifications must of necessity consist in the main of small head, small bone, and a good fleece of wool. The Southdowns are perhaps the smallest in frame; the Shropshire Downs are also useful enough sheep to use for the first cross; but both of these Downs, being light-fleeced, produce in the first cross such light-clipping sheep as to make the use of these rams very inadvisable for breeding for export. These two classes of black-faces are very suitable for use for breeding early lambs, and they have been used with considerable success in this direction, by putting them to white-faced long-woolled ewes. In breeding, however, from the merino, the fleece from these sheep is so extremely light and unprofitable as to decide the question against their use for purposes of growing mutton and wool conjointly.
The Hampshire Downs are heavier in the fleece than either of the other sheep, and they also have a somewhat less defined type of wool than the white-faced long-wools, and the advantages which they afford are not equal to those which can be secured from other breeds.
The Lincoln, Romney, and Cotswold are, in my opinion, too strong in the head and heavy in the bone to justify their use with merino ewes Experience points to the inadvisability of using these heavy-carcased sheep for first crosses, as the difficulty of lambing is so great, and the loss arising therefrom very heavy.
Maiden merino ewes ought on no account to be put to long-woolled rams of any kind.
I now come to deal with the Leicester breed, of which there are “English” and the “Border.” The English Leicester is in many respects a very excellent sheep, and one which carries a fairly heavy and useful fleece of wool, while it also possesses considerable merit in the shape of being fine in the bone. They, however, lack the perfect butcher's carcase of the Border; and, seeing that carcase is one of the first considerations in cross-breeding, I altogether lean to the Border Leicester as being the best long-woolled sheep to use for crossing with merino ewes. They possess a fine quality of head, fine bone, excellent constitution, the best of carcases, and a fair weight of good-stapled wool. This class of sheep has been very much used in New Zealand for crossing purposes, and I think it deserves, and fully deserves, the reputation it has secured. The first-cross sheep from this breed is, when properly fed and matured, the best for the frozen-meat trade. If these sheep are well done to when hoggets they can be turned off fat good weights and excellent mutton at about twenty to twenty-two months; if they are not well done to when lambs, they require to be about two and a half years old before they are fit for export. With this cross excessive weights are not at all common, and they can be always reckoned on to come up to the primest standard of weights—say, 55lb. to 70lb. They are ready feeders, and are sheep that can be kept on their feet, not being liable to foot-rot, and they carry a fleece of wool on the average about 2lb. heavier than the merino, and of a quality which has for years past realised higher prices in London than merino grown alongside of it.
Altogether the Leicester cross is, to my mind, the finest sheep for freezing purposes, and I have no hesitation in affirming that our Australian neighbours will find the Border Leicester the most suitable sheep for crossing their merino flocks with. It is a very hardy cross, and we find that it will depasture and thrive on native grasses at high altitudes quite as well as the merino will. They are not, of course, quite as hardy as merinoes, but if the country which they are running on is at all fairly grassed they thrive very well. On the ordinary average run of New Zealand tussock country they will do as well as merinoes. If any breed beyond the first cross is wished for, the heavier-fleeced sheep are desirable, and for breeding three-quarter-breeds no doubt can exist about the advisability of using these heavy-fleeced sheep, such as Lincoln, Romney, and Cotswold, as against the Leicester.
For some years a number of sheep-breeders in New Zealand have been experimenting with a view to the production of a sheep as a separate type resembling the first cross. I know of several breeders who for years have been closely following this, and I myself have been interested, and have paid considerable attention to it. If we can only secure as a separate and distinct type a sheep somewhat resembling the first cross between the long-wool and the merino, we shall secure something which will be of great advantage not only to this colony, but also to the other colonies. The establishment of a permanent and distinct breed of any new type is of necessity a matter of some importance, and must occupy a very considerable period in its accomplishment.
In dealing with a cross-bred sheep which is the outcome of two such violent extremes as the merino and long-wool much difficulty, and more than ordinary difficulty must be experienced, owing to the very extreme component parts of the blend. This must of necesssity tend towards frequent throwing back to the original strain, on one side or the other; and I do not anticipate that the permanent establishment of the half-bred sheep in the colony as a distinct type will be as easily secured as the half-bred sheep which is now bred in the south of Scotland, and which originally came from Cheviot and Leicester. Most of the gentlemen attending this Conference will doubtless have heard that some breeders in the south of Scotland claim to have established a half-bred Cheviot-Leicester sheep as a distinct and separate breed. When in the Home-country last year I had an opportunity of discussing this somewhat pet subject of mine (cross-breeding) at one of the farmers' clubs in the south of Scotland, and I found that a large bulk of the farmers were of opinion that the inbred half-bred was not the success that the advocates of the breed claim it to be. I found the majority of the farmers of opinion that these sheep did not breed so well as the first cross between Cheviots and Leicesters. They held that lambs bred from first-cross rams are much sappier and better-thriving animals than those from the inbred sheep; indeed, some went the length of saying that they would give 4s. a head more for those got by the first-cross sheep. The advocates for the inbred sheep, on the other hand, were equally strong in affirming but such was not the case, and they contended that the one sheep bred as well as the other. I mention this matter, however, so as to show the differences of opinion which exist in the Home-country regarding the merits of sheep bred in this way.
As the ultimate result of this experiment in breeding is still in the somewhat distant future, it is perhaps unnecessary for me to refer to the matter much further; it still remains to be seen how long it will take to establish the breed as a breed, and, after it is so far established, whether the advantages to be gained by the use of such sheep are equal to the expectations of those who are prosecuting the venture. I have sheep which for four generations have been bred in-and-in, and, although a considerable percentage of the lambs require to be rejected, I find that a fair proportion—perhaps one-fourth—turn out to be sheep of very much the type at which I aim. These sheep I got from Mr. Tanner, of Hawke's Bay, and they are originally the result of the merino ram and the Lincoln ewe. I am keeping them by themselves, so as to follow the breeding-up and see how it results; but I am also experimenting with the Merino-Leicester cross-bred from stud merino ewes by a Leicester ram. This mode of breeding with the long-woolled ram is, I think, to be preferred to the other. I do not approve breeding from the merino ram, as it is usually found that the progeny partakes of the characteristics of the frame of the sire. The merino ram gets a considerable percentage of his lambs thin in the wither and somewhat flat in the rib, whereas the cross from the long-woolled ram, as a rule, has a good flat wither and well-sprung rib. As regards wool, I find these half-bred sheep maintain their position fairly well, and I think the in-bred animal is quite equal in this respect to the first cross. Very heavy culling is necessary in order to free the flock of sheep diverse from the type which is sought to be produced, and I expect for many years that this will be necessary. I hope, however, that in the course of years the desired type will be established, and that a good useful sheep will be produced. The chief advantage to be gained in the production of the cross-bred sheep is to enable sheep-owners continuously to use the one class, and not to be compelled, as at present, to buy in merino ewes in order to keep up the ewe flocks.
The come-back sheep, which is the progeny of the strong long-woolled ewe put to the merino ram, is a very poor feeder, and one which is much disliked by graziers. I have, during the past two years, with a view to avoid breeding back with the merino ram, used first-cross sheep with considerable success, and I find that these, when put to three-quarters or seven-eighths ewes, produce a most excellent, good-thriving, and ready-fattening sheep.
In conclusion, I may say that I regret that I have not had time to make a more exhaustive paper on the subject. I should have liked to have collected a good many facts and figures as the actual weights of wool-clips, &c., and I regret that the time at my disposal has been such as to prevent my doing this. I trust, however, that the information contained herein, although hurriedly and roughly put together, will be of some little service to the gentlemen attending this Conference.
Table of Contents
One of the most remarkable and rapid developments of trade in New Zealand of late years is the freezing of mutton and beef, and its transport to the English market. It is only a little over eleven years ago that the first trial-shipment of frozen mutton, conducted by Mr. Thomas Brydone, the general manager of the New Zealand and Australian Land Company, left Port Chalmers, in the ship “Dunedin,” for London, and since that time the growth of this export has been almost phenomenal. The project of sending fresh meat to England was then regarded as impossible of fulfilment; and Mr. Haslam's statement, that vessels would be able to carry carcases of 10,000 sheep, was considered visionary. But the improvements made by him in refrigerating machinery have enabled his prophecy to be more than fulfilled, as vessels are now fitted to carry six and seven times the number of sheep he mentioned. The yearly export of frozen meat has increased in value from £19,339in 1882 to £1,033,377 in 1892, representing the carcases of 1,316,758 sheep, 290,996 lambs, and parts of carcases—weighing 55,020cwt.—of bullocks. The greatly-improved price of sheep caused by the demand for this export trade has much encouraged the farmers of the colony, and has caused more attention to be given to clearing and laying down bush-land in grass, and otherwise improving holdings, in order to increase the bearing capabilities of the land.
Notwithstanding the large increase in the numbers of sheep exported in 1891, the sheep returns for April, 1892, gave an addition of over 1,800,000 on the number in May of the previous year, thus showing that, even with the present flocks, there is a reserve that might supply a much larger export than at present; and the further progressive increase in the number of sheep that may be looked forward to from the spread of clearing and improvements gives promise of a future export of a magnitude possibly many times greater than the present. The markets of the civilised world are, having regard to the growth of population without a correspondingly increased area for food-production, practically unlimited. This export has had the effect of helping the colony through a period of great depression, and, next to the production of wool, with which it is now inseparably connected, may be regarded as the most important factor in our well-being. It would be an idle speculation to consider in what condition New Zealand would have been had the process for meatfreezing now in use not been discovered; but there can be no doubt that it has been of almost incalculable value to this colony.
At first the trade outgrew the available shipping, but this was soon remedied, and now magnificent cargo and passenger steamships, provided with capacious refrigerating-chambers, owned by the Shaw-Savill and Albion and New Zealand Shipping Companies, are constantly visiting the various ports to take in the frozen carcases and meat to convey them direct to the English market.
The following history of the frozen-meat trade in New Zealand was read by Mr. Brydone at a meeting of the Australasian Stock Conference, held on the 27th October, 1892:—
For some years prior to 1881 the attention of stock-breeders in New Zealand was directed to the serious question of finding a profitable outlet for their fat sheep and cattle, an enormous increase in the numbers of these having taken place owing to the large extent of country brought into cultivation, and the natural capacity of the colony for growing excellent root- and grass-crops.
Up to that time the only outlets for fat stock were the local markets and the boiling-down pot. The requirements of the former were not nearly sufficient to absorb the supply, and the returns from the latter were so poor that little encouragement was held out to breeders in that direction, and the outlook was anything but pleasant.
The carrying of dead meat from America to England by the aid of the Bell-Coleman and other cold-air freezing machines, generally known as the chilling process, having succeeded, and the fact being well known that fish and animal food were preserved in good condition for long periods in Canada and other cold climates, people began to experiment with the freezing of butcher-meat by artificial means with some degree of success. At last some enterprising gentleman connected with Australia made experimental shipments, some twelve or thirteen years ago, from Australia to London, which were so far successful that freezing-works were established in Melbourne, and at Orange, in New South Wales; but, after being in existence for some time, they collapsed, and, until a short time ago, the exportation of frozen mutton from Australia has not received much attention.
New Zealand, however, took up the running, and has succeeded beyond the most sanguine expectations of everyone, having made a thorough success of the trade. I think I may say that the New Zealand and Australian Land Company, with which I have been connected for the last twenty-five years, was the first to initiate freezing in New Zealand. The company possessed large flocks of sheep, principally half-breds, and, having improved their estates, were fattening great numbers of cross-bred sheep, which were valuable simply for their skins and tallow, 70lb. to 80lb. sheep being worth only 7s. 6d. or 8s., mutton of the best quality being really of no value, and put through the digester to make into manure. It was the same all over the colony, and we were at our wits' end to know what to do. Meat - preserving had been tried for a few years, and, after a good deal of English and colonial capital had been invested and lost, it had to be practically abandoned. Well, the new idea of freezing by the dry-air system looked as if it were feasible, and my company thought it worth spending some money in testing it. There were no freezing-works in New Zealand at the time, but we entered into an agreement with the Shaw-Savill and Albion Shipping Company to fit up their sailing-ship, the “Dunedin,” to freeze on board, and carry the cargo that London at a freight of 2 1/4d. a pound. No one here knew anything about fringe; but I took a run over to Orange and Melbourne, and got a few wrinkles, which were of use in the preparing and shipping of the first cargo that left these shores. The pioneer freezing-ship arrived in Port Chalmers in November, 1881, in command of Captain Whitson, a most capable man, well qualified to undertake the important experiment committed to his care. We erected a temporary killing-place at Totara, about seventy miles from the port, killed about two hundred and fifty sheep a day, sent them down by rail, froze them on board, and then stowed them away in the freezing chambers. Everything went on fairly well excepting that one day the crank shaft of the engine broke, and, there being no spare one, we had to take all the sheep out of the vessel and sell them for what they would fetch. After a delay of a couple of weeks we got a new shaft made and started afresh, finally sending the ship off from Port Chalmers on the 15th of February, 1882, with a cargo of 4,311 sheep and 598 lambs. The average weight was 80lb. for the sheep, and 40 1/2lb. for the lambs, and we realised about 6 1/2d. a pound for the mutton in London, which is a better price than we have ever got since. Very considerable risk was experienced during the voyage, as the air-trunks got choked, and but for the ingenuity and capability of Captain Whitson the cargo would have been lost, and meat-freezing in New Zealand might have been delayed for several years; but he overcame the difficulties, and landed his cargo in first-class order. When the sheep were put on the London market the Times had a special article on them, and stated that it was “a prodigious fact;” and no doubt the New Zealand mutton has turned out a prodigious fact to the English farmer. The New Zealand Government of the day gave us £500 as a bonus for the first shipment of meat, which was a very small recognition of the service done to the colony; but we were satisfied with the result that has followed. I may just mention that we chartered the “Dunedin” for ten consecutive voyages; that she always landed her cargo in good order, and died in harness, having been lost on her last voyage three years ago, not a trace of her having ever been discovered. Shortly after this first shipment was made the New Zealand Shipping Company fitted up the barque “Mataura,” loading her in Auckland, but her shipment did not turn out so well as that of the “Dunedin.”
Following closely on these shipments, freezing-works were erected at Dunedin; and steamers, fitted up with dry-air machines by various makers, came to the colony and carried the meat Home for us. The machines which have been most successful are the Bell-Coleman and the Haslam. The Haslam bought up the Bell-Coleman some time ago, and, although several other makers have their machines in some of the steamers, none of them do better than the Haslam, and few as well.
The Shaw-Savill and Albion Company and the New Zealand Shipping Company had foresight enough to see that there was a “big thing” in the frozen-mutton business, and at once began to build steamers and fit them up with refrigerating machinery, at first cautiously, carrying only from 10,000 to 20,000 in one bottom, till now they have steamers carrying 50,000 to 70,000 carcases. Then a new line came into the trade called the “Shire Line,” and still another called the “Tyser;” so that we have good competition, and altogether a carrying-capacity of between two and a half and three millions per annum. In direct shipping alone the frozen-meat trade has done immense good to New Zealand. Before the freezing trade started the most of our shipping was done by sailing-vessels, and now the great bulk, with the exception of grain, is done by steamers. We get our wool Home in half the time; and, but for the many direct steamers, we could not have brought our dairying industry to the successful position which it now occupies. Instead of getting goods that are required in a hurry, such as the latest fashions in soft goods, by way of Melbourne, they now come direct at much less cost; and a lady can get the “latest thing” in hats much cheaper now than before this new era set in; so that the country has to thank the frozen-mutton business for many things besides the benefit it has done the sheep-farmer.
The New Zealand Refrigerating Company's works at Dunedin were the first in operation, but they were closely followed by works at Christchurch, Wellington, Napier, Auckland, Timaru, Oamaru, and Invercargill, and more recently works have been built at various other centres, until there are some twenty-one different works in the colony. The business has increased enormously. It only started in 1882 in a small way, but we are now exporting two million carcases of sheep and lambs per annum, with a total stock of about eighteen millions; and I do not see why we should not go on increasing, not in the same proportion, but in a steady manner. Notwithstanding all this export going on, our sheep-stock has increased by a million and three-quarters during the past year, and I am pleased to say that in the Middle Island we have the biggest lambing that we have ever had, and the prospect for sheep-farmers, so far as increase and wool-clip is concerned, is very good. I wish we could say the same for prices of wool. When freezing was first introduced there was a great diversity of opinion as to the number of sheep which would be available for exportation, and I must say that I for one never anticipated anything like what has resulted; but it only shows what the resources of the colony are. There has been a slight reduction in the numbers exported this last year, but that can be accounted for by the dry seasons we have had. If farmers, in the North Island especially, would only pay more attention to providing proper winter food for their hoggets they would find themselves in possession of many more sheep to shear and export than they have at present.
The trade has had its vicissitudes, like other new industries, and some of our shipments have given very small returns. A friend of mine told me not very long ago that a shipment of good merino wethers which he sent Home netted him only 6d. a head on the station; and we have had several instances of good crossbred wethers returning only 2s. 6d. to 5s., but those are rare occurrences, and on the whole the results have been very satisfactory.
Nelson Brothers, of London and Hawke's Bay, are in the trade more largely than any other firm, and have been severely criticised as trying to establish a monopoly; but some three years ago they offered to enter into contracts to buy sheep at 2d. per pound for the carcase unfrozen, sellers retaining skin and fat, which at once established a value, and many farmers took advantage of the offer, very much to their benefit. Nelson Brothers have now the largest frozen-meat stores in London, and can hold over 300,000 carcases at a time; and, although they deal in mutton and beef direct on their own account, I consider they have done much good to the frozen-meat trade in New Zealand.
The trade being an entirely new one, much has had to be learnt, and many battles fought as to prices for freezing, railway-carriage, charges in London, and particularly freights. With the other costs we had to pay, and with the low prices we were getting at Home, it looked at one time as if the trade was to prove a failure, but by constant pressure we got the shipping companies to reduce their freights by steamers from 2d. per pound and 10 per cent. primage to 1d. per pound and primage, which is the present freight. The freezing companies have also reduced their costs from 1/2d. per pound to 3/8d., and even less; and the Home charges and insurance have also been reduced considerably; so that the total cost of killing, freezing, freight, and selling the mutton is now 2d. per pound, as against fully 3d. when the business first started.
With Messrs. Nelson's price of 2d. per pound for the bare carcase unfrozen, a cross-bred wether averaging 60lb. would, with skin and fat, be worth 14s. to 14s. 6d. in April and May; and in October and November, when there is nearly a full fleece, 16s. to 16s. 6d. This last season, however, sheep have been selling at more than that, as in the Middle Island we have been getting from 17s. 6d. to 16s. 6d. for a 60lb. wether on the station, which suits the farmer much better than taking the risk of shipping on his own account.
The grading of sheep has been rather a vexed question of late. The general idea seems to be that cross-bred sheep (wethers and maiden ewes) weighing from 55lb. to 65lb. should be classed as prime, and that anything above or under those weights should be reckoned as second rate. Nelson Brothers have an elaborate system of grading, having no less than six classes for wethers, which I consider unnecessary and troublesome. My idea is that more attention should be given to the quality of the mutton than to the weight, and that so long as the quality is good, from 50lb. to 70lb. may be fixed as the limits. We all know that a 50lb. sheep, if fat, is likely to be better quality than a 65lb. one in the same condition. The small Welsh mutton is the most valuable in England. When the trade was first started, ten years ago, the wethers were mostly three and four years old, averaging 80lb., and were considered first class; but we have been gradually working down the stock, until now our wethers are only about a year and a half old, very few being shorn a second time, and the average weight is about 60lb. Heavy sheep are considered unsuitable for the London market being objected to by the Home consumers.
In the early stages of the trade the shipping companies insisted upon getting guarantees that certain quantities of sheep would be supplied to their steamers, and the freezing companies got the farmers to take up the bulk of the space. Now, however, that system has been to a great extent abandoned, and the steamers have to take their chance. The cause of this alteration, with us in the Middle Island anyhow, is the fact that most of the sheep are bought by speculators and the shipping companies: the farmer gets his money on the spot, and is saved the risk of the Home market. This last winter the bulk of the sheep sent from the Middle Island were dealt with in this manner, principally in Christchurch and at the Bluff; and remarkably good prices were given, as already stated. Cross-bred wethers weighing from 60lb. to 65lb. were sold for 16s. and 19s. a head in the country. We only hope that this state of things will continue. In the North Island the practice has been rather different from the Middle, as the refrigerating companies have done most of the buying and exporting on their own account, and, so far, have been fairly successful. The average price obtained in London since the trade commenced has been calculated for ordinary mutton at 6 1/4d. a pound in 1883; 5 1/2d., 1884; 5d., 1885; 4 3/4d., 1886; 4d., 1887; 4 1/4d., 1888; 3 7/8d., 1889; 4 3/8d., 1890; 4 1/8d., 1891; and this year about 4d.
The manner of putting the mutton on the London market has been a source of much discussion amongst those interested, and various suggestions have been made from time to time, but no one seems to have sufficient courage to alter the present system of selling through agents. When once a business gets into a groove in London, it is very difficult to shift it; and, although the firms may compete against one another at times, and lower prices, I am afraid it would be difficult to avoid that, even if we had a special agency of our own, as there would always be outsiders in the market to compete with.
The treatment of the meat from the time it arrives at the London docks till the time it is located in the frozen stores seems to be very defective, and some radical change is necessary at that point. Too much time is lost, and the mutton is exposed to a great deal of risk by the system of disembarking and lightering on the Thames, which should be remedied by our representatives on the other side.
The total value of frozen meat exported for the year ending the 30th June, 1892, according to the Customs returns, was £1,140,577, which is a very creditable amount, and shows what the country can do. In the Middle Island, the bulk of the land suitable for growing English grass and turnips has been cultivated, and, as sheep are all fattened on these, we can hardly expect to increase our output to any great extent unless by reducing grain-growing; but the North Island is in a different position, having large tracts of rich soil covered with bush, which, when cleared, will carry and fatten sheep well. I should say there is every prospect of New Zealand being able to export four million sheep ten years hence as easily as we export two million now.
This brings me to the consideration of the future of the frozen-meat trade. At present New Zealand has the command of a section of the trade—that of cross-bred mutton; but as there are districts in Australia which are suitable for the production of similar sheep, and seeing that freezing has again been taken up in Australia, we are likely to have strong opposition ere long, and the prospect from our point of view is not a very pleasant one. At present Australia ships merinos principally, and these compete more with the South American mutton than with ours; but it is better mutton than the South American, and to a certain extent must affect our trade; and, if the Australians take to breeding cross-breds, it is then we shall feel the competition
The natural pastures fatten sheep in Australia as well as our English grasses, and the consequence is that mutton can be produced at less cost there than here; hence they can afford to undersell us. We have the advantage of possessing a cooler climate, which is better suited for the operations of killing, freezing, &c.; in consequence, we should be able to put our mutton on the market in better condition than the Australian, and so secure better prices and a readier sale.
Much of Australia has the disadvantage of being a long distance from a seaport, whereas our pastures are all close to the coast, and no great way from a port. Then again, in Australia they have periodical droughts, which will make a break in their trade. Yet, notwithstanding these drawbacks, I am afraid that ere long we shall feel the effect of their exportation, and, with this in view, it will be to our interest to keep up the standard of our mutton by shipping nothing but what is really first-class, and so retain the favour and confidence of the English consumer.
The discovery of freezing has been a providential thing for us here in providing a market for our surplus, and for the masses in England in supplying them with cheap food. But for the three millions of sheep that England gets from the Australian Colonies and the Argentine, mutton would have been so dear as to have been beyond the reach of the majority of the working-classes, and there is no doubt about this, that many families now use meat that never saw it before, and there are many still who use little or none that, with a small reduction in the price, would be consumers. It looks quite probable that we may have to submit to a reduction of from 1/4d. to 1/2d. in the price during the next year or two, but that will increase the consumption, and in the end the supply and demand will regulate each other.
In talking of the future, the question of cost will have to be carefully kept in view by the shippers, and it is not unlikely that further reductions in freight may be demanded, especially as at present we are paying 1d. per pound, against 13/16d. charged by the same shipping companies from Australia, the assumption being that if they can carry for the lower rate from Australia they can do so from here.
Altogether there are now some ninety vessels in the world carrying frozen mutton, with a capacity of five and a half million sheep per annum, which indicates that the trade has not been an unprofitable one for the shipowner.
And now just a word about the cross best adapted for exportation. Breeders differ widely in their opinions, and men generally favour the sheep they have been most accustomed to. A good deal depends also upon the nature of the country, as one breed of sheep would thrive well where another would starve. Having had very considerable experience in breeding cross-bred sheep in Canterbury and Otago during the last quarter of a century, and having experimented with most of the popular breeds, the result of our experience has taught us to favour the Border Leicester cross as the most profitable all round. The Border Leicester, as now produced in New Zealand, is a very different sheep from the Home Leicester, as he has been bred with an eye to producing wool as well as mutton, whereas at Home they look principally to the carcase. We put the Border Leicester ram with the merino ewe, which produces a sheep carrying a profitable fleece and fattening early, and afterwards we use the Leicester, excepting with ewes that may be light in their wool, and to these we put the Lincoln rams. The Canterbury farmers who breed for export mostly favour the Leicester blood, although a few still prefer Lincolns and Downs. In the North Island Lincolns and Romneys have been most in favour, and that may account for the difference in price between Canterbury and Wellington mutton.
Mr. D. Sladden, the manager of the Wellington Meat Export Company (Limited), has kindly contributed the following account of the later developments of the frozen-meat trade:—
Since Mr. Wakefield's interesting sketch of the New Zealand meat trade (see New Zealand Official Handbook, 1892) was written, the developments have been fully as great as he foreshadowed. No less than thirty steamers and ten sailing-vessels are now engaged in the trade, with a total carrying-capacity of about three million carcases of mutton per annum. As the output from New Zealand does not fully occupy this fleet during the winter season, some of the cargo-steamers have been partially employed in carrying the frozen mutton of New South Wales and Queensland. Some of the steamers are capable of carrying upwards of sixty thousand carcases, and one has been lately launched which, completely equipped, will carry ninety thousand carcases.
The freezing establishments in the colony are now capable of preparing for export no less than four millions of sheep per annum, and a variety of improvements have been made in their appliances. In addition to the cold-air system of freezing, described by Mr. Wakefield, two large plants are now in operation at Hawke's Bay for freezing by the compression of anhydrous carbonic-acid gas, while at another large establishment, near Wellington, freezing is effected by the compression of ammonia. By these systems the expanding gas circulates in coils of pipe placed in tanks, which are filled with a solution of chloride of calcium. This solution will not freeze at the temperature required for freezing meat, and is usually described as brine. The gas having finished its journey through the coils, passes again into the compressors, and keeps up an endless circuit through the brine, reducing its temperature, if required, to considerably below zero. The brine, thus cooled, is either applied by circulation through the freezing-chambers in pipes or hollow metal walls, or is brought in actual contact with large volumes of air which are artificially circulated through the freezing-chambers. These new systems effect a large saving in fuel, and are likely to be further adopted where new freezing-works are erected, or the existing establishments extended. In addition to the improvements in freezing appliances, meat-tinning works, fellmongeries, fallow-, oil-, and manure-works, upon the latest and most scientific principles, are now in operation at many of the freezing establishments, so that absolutely nothing is thrown away. By the conversion of all waste matter into manure, every part of the animal not required for export goes back to renovate the soil, and to appear again in fresh flocks and herds, and so fulfils, as far as possible, the economic laws of nature.
In many instances freezing operations are now carried on inland, some works being upwards of eighty miles from the sea. The transit of the frozen meat is effected by specially-constructed trucks, which run, generally at night, direct from the freezing-works to the ship's side.
It will be seen that the freezing appliances and tonnage available are at the present time in excess of the requirements of New Zealand graziers, and the question arises, How far can we increase the annual surplus of fat stock available for export?
Some idea of the possibilities in this direction may be gathered from the fact that, of the total number of sheep in the United Kingdom, upwards of one sheep in three is slaughtered annually. With 18,570,000 sheep in New Zealand on 30th April, 1892, the number of sheep and lambs exported in the previous twelve months amounted to 1,768,000. If we add to this a million killed for consumption in the colony, the total number slaughtered amounts to two in thirteen, or considerably above one in seven. If the proportion of sheep available for slaughtering each year could be raised to the same as obtains in the United Kingdom, the annual export from the colony, after allowing, as before, a million for home consumption, would be increased from a million and three- quarters to five millions! It may reassure English graziers to know that there is no present prospect of such a result. Our eighteen millions of sheep include six millions of merinos, and as these are not suitable for export, it might at the first glance be supposed that they should be deducted from the total for the purpose of our calculations. This, however, would be altogether fallacious, as a great number of the best sheep and lambs exported are obtained by crossing the merino with long-woolled sheep. So that, although merino wethers are not suitable for exportation, the progeny of the merino ewes are exported in very large numbers. In addition to this, many of the sheep killed for consumption in the colony, especially in the country districts, are merinos; their mutton, which for some reason is not appreciated in England, being here considered inferior to none. It is clear, therefore, that to exclude the merino flocks, or even a large proportion of them, from the numbers upon which we base our estimates for the future would be a serious error.
Taking the figures published by Mr. P. Cunningham, of Christchurch, and counting every 60lb. of pieces of mutton as a sheep, and every 750lb. of beef as a carcase, the relative quantities of frozen meat exported from New Zealand in 1891 and 1892 were as follow, in carcases:—
Sheep. Lambs. Cattle. 1891 1,438,048 341,593 15,797 1892 1,343,095 291,739 8,100 For several years there has been a large increase annually both in the area of land under grass and in the total number of sheep depastured; and the large extent of new country which has been stocked accounts for the slight falling off in the export of 1892. The deficiency in cattle is to be accounted for, to a great extent, in the same way, so that it will be seen that the falling-off in the export is only temporary, and that in the near future the surplus will be greatly augmented by the progeny of the numbers which have been added to the permanent flocks and herds by the stocking of new country.
It is, however, mainly to improved systems of farming that we must look to increase our annual surplus of fat stock. While the North Island has, perhaps, taken the lead in improved appliances for carrying on the business of freezing and its collateral industries, the Middle Island is undoubtedly in the front both for the quality of its mutton and for the number of sheep turned off the land. The Canterbury farmers now carry on the business of growing mutton and lamb for export in the most systematic manner, and have successfully demonstrated what may be done in this direction by good management. The North Island settlers are already fired by their example, and we may confidently expect that there will be before long, alike in the North and in the Middle Island, a large increase in the numbers of sheep and cattle available for export.
There are now twenty-one freezing establishments in the colony—twelve in the North Island and nine in the Middle Island. The weight and value of frozen meat exported during the period 1882–92 were as follow:—
| Cwt. | £ | |
|---|---|---|
| 1882 | 15,244 | 19,339 |
| 1883 | 87,975 | 118,328 |
| 1884 | 254,069 | 345,090 |
| 1885 | 296,473 | 373,857 |
| 1886 | 346,055 | 427,193 |
| 1887 | 402,107 | 455,870 |
| 1888 | 552,298 | 628,800 |
| 1889 | 656,822 | 783,374 |
| 1890 | 898,894 | 1,087,617 |
| 1891 | 1,000,307 | 1,194,724 |
| 1892 | 869,600 | 1,033,377 |
Preserved meats also form a considerable item of export. The total value in 1892 was: Preserved meats, £69,420; salted beef and pork, £10,686; bacon and hams, £16,088.
The results of the census of April, 1891, show the numbers of carcases and value of sheep and lambs frozen, and the quantities and value of beef frozen and meats preserved, in the various provincial districts of the colony, the produce of the year 1890, to have been as follow:—
| Provincial Districts. | Frozen Sheep and Lambs. | Frozen Beef. | Preserved Meats. | |||
|---|---|---|---|---|---|---|
| Carcases. | Value. | Quantity. | Value. | Quantity. | Value. | |
| No. | £ | Lb. | £ | Lb. | £ | |
| Auckland | 61,385 | 39,368 | 400,601 | 2,983 | 1,112,240 | 23,205 |
| Taranaki | 7,347 | 3,822 | 611,902 | 4,050 | 1,234,376 | 15,430 |
| Hawke's Bay | 335,966 | 170,195 | 2,660,300 | 21,514 | 205,636 | 5,215 |
| Wellington | 370,102 | 229,864 | 15,002,432 | 162,792 | 1,350,173 | 23,809 |
| Marlborough | 43,095 | 21,283 | 226,200 | 1,697 | 382,500 | 18,950 |
| Canterbury | 640,723 | 369,574 | 197,037 | 2,052 | 554,593 | 12,622 |
| Otago | 272,293 | 121,930 | 54,947 | 458 | 1,451,760 | 22,999 |
| Totals | 1,730,911 | 956,036 | 19,153,419 | 195,546 | 6,291,278 | 122,230 |
Together with the foregoing must be taken into account the output, during the same period, of the following products:—
| Provincial Districts. | Tallow. | Corned Beef. | Bonedust. | Neatsfoot and Trotter Oil. | Bones, Horns, Hoofs &c. | |||||
|---|---|---|---|---|---|---|---|---|---|---|
| Quan. | Value. | Casks. | Value. | Quan. | Value. | Quan. | Value. | Quan. | Value. | |
| Tons. | £ | No. | £ | Tons. | £ | Gal. | £ | Tons. | £ | |
| Auckland | 1,023 | 19,886 | 5,616 | 12,475 | 800 | 5,600 | 1,928 | 467 | 315 | 1,300 |
| Taranaki | 452 | 9,072 | 193 | 500 | 240 | 1,200 | 362 | 70 | 15 | 60 |
| Hawke's Bay | 1,256 | 24,464 | .. | .. | 115 | 460 | 2,780 | 548 | 2,160 | 1,611 |
| Wellington | 2,402 | 50,377 | 530 | 1,031 | 530 | 2,800 | 1,143 | 178 | 74 | 1,583 |
| Marlborough | 51 | 1,070 | .. | .. | .. | .. | .. | .. | .. | .. |
| Canterbury | 1,521 | 33,254 | .. | .. | 668 | 3,674 | 3,162 | 530 | 479 | 1,900 |
| Otago | 365 | 6,159 | .. | .. | 350 | 1,750 | 1,200 | 217 | 16 | 36 |
| Totals | 7,070 | 144,282 | 6,339 | 14,006 | 2,703 | 15,484 | 10,575 | 2,010 | 3,059 | 6,490 |
The number of works and hands employed, the total value of all products set forth in the two preceding tables, and the approximate value of the land, buildings, machinery, and plant were as follow:—
| Provincial Districts. | No. of Works. | Number of Hands employed. | Total Value of all Produce for the Year 1890. | Approximate Value of | |||
|---|---|---|---|---|---|---|---|
| M. | F. | Land. | Buildings. | Machinery and Plant. | |||
|
* Taranaki exported also 500,000lb. of chilled meat of the value of £4,000, which is included in this sum-total (£38,204) as the product for that provincial district. † This item includes the value of 125 bales rabbitskins (£2,875), and 205 bales sheepskins (£1,700). | |||||||
| £ | £ | £ | £ | ||||
| Auckland | 7 | 189 | 3 | 105,284 | 11,200 | 26,900 | 15,400 |
| Taranaki | 3 | 75 | .. | 38,204* | 340 | 7,500 | 5,750 |
| Hawke's Bay | 6 | 210 | .. | 224,007 | 14,255 | 36,644 | 33,183 |
| Wellington | 8 | 325 | 1 | 472,434 | 23,527 | 41,305 | 41,884 |
| Marlborough | 3 | 115 | .. | 47,575† | 400 | 16,500 | 12,500 |
| Canterbury | 6 | 342 | 3 | 423,606 | 12,200 | 72,250 | 46,650 |
| Otago | 10 | 305 | .. | 153,549 | 5,284 | 28,508 | 23,971 |
| Totals | 43 | 1,561 | 7 | 1,464,659 | 67,206 | 229,607 | 179,338 |
The rapid and steady growth of co-operative dairying in New Zealand shows that this industry is well adapted to greatly increase the profits of farmers all over the colony. It is scarcely twelve years since Government offered, as a means of developing the industry, a bonus of £500 for the first fifty tons of cheese produced in the colony on a factory or co-operative system. Previously dairying in New Zealand was, to say the least of it, in a very crude state. Every farmer ran his dairy according to his own peculiar notions, and disposed of his products as he saw fit. This system was of a very haphazard nature, and tended to leave the farmers, as sellers, very much at the mercy of the buyers. For six years after the inauguration of the factory system the growth of the industry was very slow, owing in great measure to the empirical knowledge of those employed to build and equip the factories, and still more to the want of skill of those employed in the manufacture of the goods. During the last five years the growth of the industry has been considerable, and it now bids fair to take a leading position in our agricultural work in many parts of the country. There are now 104 cheese-factories, butter-factories, and creameries at work throughout the colony, and it is likely that several more will be added before the commencement of the ensuing season (August, 1893). This statement of the number of factories already in existence is sufficient to prove the usefulness of dairying as a branch of our agricultural work. The industry has now got beyond its experimental stage. It is evidently profitable, or so many shrewd business people would not engage in it.
The returns of the factory products have been of a very satisfactory nature to the settlers, and the prices realised from the sales of our cheese-product especially have been, perhaps, higher, on the whole, during the past exporting season than those of any previous year, owing to the greater superiority and uniformity of the produce generally. The prices realised for New Zealand “full-cream” factory cheese have ranged from £2 10s. to £2 18s. per hundredweight, and for factory or creamery butter from £4 15s. to £6 6s. per hundredweight. These prices leave—after paying for manufacturing expenses, railage, freight, dock-charges, commission, &c.—highly satisfactory returns to the contributors of milk. The price paid for milk at the factories is 3d. to 4d. per gallon of 101/2lb., which gives a return of from £7 to £11 3s. 4d. per cow per annum. The latter return (£11 3s. 4d. per cow) was got from the Banks Farm Factory, New Plymouth, in Taranaki. The annual average total of butter per cow for the year ending 31st March, 1893, was 268lb. This was sold at 10d. per pound, showing the return already stated (£11 3s. 4d. per cow per annum). This farm consists of a square block of land—634 acres—situate on the seashore, about fourteen miles south of New Plymouth, and is noted for its splendid pasturing capabilities. The dairy factory is a substantial building, and is well equipped for carrying on the manufacture of butter on a large scale, having every convenience in the shape of modern dairy-plant. The soil of this and many surrounding farms is able, when laid down in grass, to carry large herds of cattle in perfection, and to grow almost every known crop luxuriantly. The stock on the Banks Farm on 31st March last was 177 milch cows, 5 bulls, 22 heifers, 36 calves, 9 horses, 56 pigs, 12 sheep: total, 317. The milk herd is of mixed breed—Jerseys, Ayrshires, and shorthorns, the latter predominating—and has been well culled, as shown by the annual quantity of butter per cow. It is here very desirable to note the fact that the stock through the year received no artificial assistance in the way of hand-feeding beyond about 30 acres of green oats in the early spring. Nor were the milch cows housed summer or winter. To many who may read this article the latter statement will appear astonishing, but it is a fact, nevertheless, and one true not only of the farm in question but also of the greater portion of the colony. The mention of this will serve to prove to many the genial nature of our climate compared with that of the now renowned dairy countries. The reader will be enabled to understand how greatly climatic influences must contribute to propagation and increased production. It is generally conceded by all who visit New Zealand that no country possesses greater inherent advantages for the carrying-on of dairy pursuits. The richness of the pastures has to be seen to be realised. All the best varieties of grasses and other green fodders thrive in a most astonishing manner, and continue to grow throughout the year with but little cessation.
Since most farmers combine dairying with grazing, it would appear from their practice that the colony is excellently suited for producing milk at small cost. In the districts where the finest natural pastures exist, or where artificial pastures of the best sort have been made, two acres will prove ample to maintain a cow. Such conditions are not obtainable all over the colony, as it cannot be expected that soil and climate should be so combined in every part as to promote in the highest degree the growing of all the best varieties of grasses and clovers and green crops generally, so that the one food may supplement the other. The ideal of comfortable cow-life is an unlimited supply of the purest water with the best varieties of grasses and clovers; also plenty of shade and shelter-trees, so that during the whole year they can find food and rest without being forced to wander far for either. These conditions are plentiful in New Zealand, and can be multiplied at little cost.
All experience seems to show that dairying must, as a matter of course, take the lead in parts of the country where land is held in suitable areas and has become valuable through settlement. In such places, undoubtedly, part pasture, part soiling should be the rule rather than, as at present, the exception. The reasons put forward a few years ago by many well-informed persons to prove that dairying would always be at a very low ebb in New Zealand do not now exist. It is only natural to suppose that the men who are conducting the business are men of intelligence, ready to adopt any system of work that will bring them better and surer returns, and especially so when they can easily reason and figure out the conclusions for themselves. Indeed, it would seem that one great division of New Zealand farming, i.e., the purely pastoral, will become greatly modified; for the farming of the future points to the introduction of mixed husbandry—the growing of grain, beef, wool, and mutton, combined with the production of milk, pork, fruit, &c. This system of farming argues the increased earning-power of the land per acre, and additional marketable value of the land devoted to such uses.
In fact, dairy-farming as a branch of agriculture is daily becoming more fully recognised as one of the permanently-profitable methods of obtaining satisfactory returns from farm-products, without exhausting the fertility of the soil; and is the means of greatly increasing the available food-supply per acre. In a country like New Zealand, where nature supplies her choicest advantages for dairy-farming both in climate and in soil-properties, no efforts should be spared to keep alive a disposition towards improvement. While it is gladly and frankly admitted that the work of the past has been attended with the most marvellous success, it must also be asserted that as yet the preliminaries only of the business have been mastered.
The Government is using every legitimate means to improve the position of the industry by employing the services of trained and skilled travelling instructors, realising that it is the duty of the State, in order to obtain and maintain a reputation for the products in the world's markets, to give the makers reliable assistance and advice. Two Government instructors are now employed whose duty it is to visit all factories for the purpose of giving lessons in the various methods and processes, and of generally forwarding the interests of the industry. They are provided with instruments for detecting milk adulteration, which they teach the manufacturers how to use. They further address meetings of farmers on dairy husbandry and cognate subjects. This brings them into close touch with the farming community and with each other, and much good results. The substance of these lectures is fully brought to the attention of farmers through the Press and by the issue of pamphlets. The visits of these instructors have done much good, and are on the whole highly appreciated.
To meet the many inquiries and expressed needs of the industry, plans of several sizes and styles of cheese-factories, butter-factories, and creameries have been prepared, with accompanying memorandum of agreement, general conditions of contract, specifications of building, and sizes and quantity of building-material required, with an approximate estimate of cost; itemised lists of plant and machinery required, with approximate cost; and by-laws specifying conditions of milk-purchase, and general information concerning the business basis have been printed in pamphlet form. These are sent, free of charge, to all persons contemplating the establishment of factories. The demand for information of this character is daily increasing, and would seem to indicate that the co-operative plan of carrying on dairying will at no distant date almost entirely supersede the home-or private-dairy practice. This is a consummation highly to be desired, for it will bring about economy of labour, and uniformity and excellence of quality in the output. The Home market will pay high prices for uniformly fine goods only, so it must prove a loss to ship anything but the finest quality of butter and cheese. Every manufacturer is interested in this, for, as every pound of inferior butter or cheese which finds its way to the consumer's table acts as a barrier to increased consumption, and curtails the demand, so the manufacture of inferior goods inflicts an injury on every producer.
The formation of dairy associations for the purpose of guarding the interests of the industry has already shown what good service such institutions are capable of rendering. The Middle Island Dairy Association has been at work for nearly three years, and has done good work in clearing impediments from the way, and in looking after the interests of the industry generally. This organization receives a liberal grant from the Public Treasury of the colony, and it would be difficult to conceive of public money being spent to more advantage. For, if we look back upon the dairy industry in the now noted butter- and cheese-producing countries, we realise that until the formation of dairy associations the industry in these countries languished, and made little or no progress. New Zealand will reap an immediate, abundant, and lasting harvest from a judicious outlay of this kind, for it means more information, more instruction, and more enthusiasm to all interested in dairying.
From reports coming to hand from time to time from London and Glasgow brokers, it would appear that this season's shipments have arrived in much better condition, on the whole, than in previous years, and complaints have been less numerous.
The best factory butter and “full-cream” factory cheese have met with a ready sale, and the trade for this class of goods seems to be capable of enormous extension. The objection offered some few years back, that the shipments were not sufficiently uniform in quality or regular in arrival, or landed in sufficient quantity to justify the brokers in recognising the article as one worthy of their attention, is no longer raised. The more regular arrival of consignments and improved quality of the articles has, to some extent, obviated these objections; and it would seem that New Zealand dairy produce has now a recognised position in the London and Glasgow markets. Strictly speaking, perhaps, the butter and cheese industry of New Zealand has yet to make for itself a history in the British markets, for, although we have been exporting considerable quantities, it is not known by any special character like the dairy productions of Denmark and Canada. We feel sanguine, however, that the efforts now being made by the Government of the colony in employing experts to give practical demonstration to all interested, assisted by several advanced individuals who are now bestowing much time and thought on the subject, must soon place us as strong competitors in the production of butter for the British markets. Were example necessary, we have it in the returns got for our best factory goods, which show we can already compete successfully in price and quality with anything arriving in the London market. In a letter under date of the 18th March, 1892, Messrs. John McNairn and Co., 157, Ingram Street, Glasgow, write: “The quality of the New Zealand factory cheese this year has been perfection. We have never seen finer New Zealand cheese, and if the same quality is kept up we shall always be able to get a price for it second to none.” Again, the same firm says in a letter dated the 15th April, 1893: “The quality of the New Zealand factory butter and cheese has, we are pleased to say, this season been very fine, and shows a marked improvement in uniformity. The great bulk of the cheese shipments per s.s. ‘Maori’ was, to our minds, of exceptionally fine quality: They were good meat, and well flavoured.” Messrs. Moorehead, Sinclair, and Co., 10, Walls Street, Glasgow, and Mr. William Sample, Gresham House, London, E.C., write in the same strain; but complain bitterly of the arrival of so much farmers' butter and blended butter. The factory butter can always be depended upon to realise good market prices, while the farmers' butters and blended butters, although finding a market, bring very much lower prices, and have a very damaging effect in lowering the reputation and value of our factory productions.
The New Zealand Legislature cannot be accused of any want of interest and proper action in the direction of fostering and protecting the dairying industry. Last year “The Dairy Industry Act, 1892,” which is a wholesome piece of legislation in the interests of New Zealand dairy-farming, was passed. By the Act it is made compulsory for all cheese and all packages containing same, to be branded with the registered trade-mark of the manufactory or exporter, and with the true and exact nature and description of the quality of the goods, whether “full-cream factory cheese,” “half-skim-milk cheese,” “quarter-skim-milk cheese,” “pure-skim-milk cheese,” or “dairy-made cheese,” as the case may be. All packages containing butter must be branded with the registered trade-mark of the manufactory or exporter, and with the words “New Zealand factory or creamery butter,” “New Zealand dairy butter,” or “New Zealand blended butter,” as the case may be. Previous to the passing of the Act it was found that a large quantity of dairy butter and blended butter was being exported under brands representing it to be New Zealand factory or creamery butter; also that a considerable quantity of factory cheese made from milk from which a part of the cream had first been extracted was being made and shipped Home branded “New Zealand full-cream factory cheese,” or without any designating mark to distinguish it as other than “full-cream cheese.” Such proceedings are exceedingly harmful to our dairy interests, and therefore any legislation having a tendency to stop the tampering with the manufacture and branding of our dairy products is of the utmost importance to both consumer and producer. The enforcement of the Act will do much good in assisting us to maintain our prestige. It will have a beneficial effect in extending our export, and in maintaining that confidence necessary to a large and increasing consumption of our products. It will remove the suspicion that might naturally taint all our products, and enable us to sell our genuine full-cream factory cheese and finest factory butter for what they really are, and at the highest market price.
The extent of our export transactions may be seen from an examination of the following table :—
| Butter. | Cheese. | |||
|---|---|---|---|---|
| Owt. | Value. | Cwt. | Value. | |
| Year. | £ | £ | ||
| 1883 | 8,869 | 42,020 | 2,519 | 6,892 |
| 1884 | 15,766 | 66,593 | 10,342 | 25,074 |
| 1885 | 24,923 | 102,387 | 15,245 | 35,742 |
| 1886 | 23,175 | 105,537 | 16,429 | 45,657 |
| 1887 | 17,018 | 54,921 | 23,913 | 54,562 |
| 1888 | 29,995 | 118,252 | 36,682 | 78,918 |
| 1889 | 37,955 | 146,840 | 26,558 | 67,105 |
| 1890 | 34,816 | 122,701 | 40,451 | 84,980 |
| 1891 | 39,430 | 150,258 | 39,776 | 86,675 |
| 1892 | 53,930 | 227,162 | 41,493 | 91,042 |
| Three months ending 31st March, 1893} | 22,917 | 103,696 | 24,995 | 52,347 |
Table of Contents
The indigenous forest of New Zealand is evergreen, and contains a large variety of valuable woods. The general character of these woods resembles the growths of Tasmania and the Continent of Australia, most of them being harder, heavier, and more difficult to work than the general run of European and North American timbers. They vary, however, very much among themselves. Many varieties are very durable, of which manuka, totara, kauri, black-birch, kowhai, and matai appear to be the most highly esteemed on the whole. It is estimated that there are in New Zealand at the present time about 10,000,000 acres of forest-land.
From “The New Zealand Handbook” (1886), by Sir James Hector, is extracted the following information, descriptive of the principal forest-trees:—
Dammara (agathis) australis, Lambert.
Kauri.—The kauri is the finest forest-tree in New Zealand, and attains a height of 120ft. to 160ft. The trunk is sometimes 80ft. to 100ft. high before branching, and attains a diameter at the base of 10ft. to 20ft. The timber is in high repute for masts and spars, deck- and other planking of vessels, and is largely used for house-finishings. There is abundant evidence of its durability for more than fifty years in some of the old mission-buildings at the Bay of Islands. The buried logs of an ancient kauri-forest near Papakura have been excavated and found to be in a perfectly sound condition, and used for sleepers on the Auckland and Waikato Railway. On the Thames Goldfield kauri is used for mine-props, struts, and cap-pieces. It forms the bulk of the timber exported from New Zealand. Some of the largest and soundest kauri timber has richly mottled shading, which appears to be of an abnormal growth, due to the bark being entangled in the ligneous growth, causing shaded parts, broad and narrow, according as the timber is cut relative to their planes. This makes a rich and valuable furniture-wood, and in the market is known as “mottled kauri.” The kauri-pine occurs in abundance only north of Mercury Bay, in the North Island, and grows best near the sea, on wet clay land. The kauri-forests are largely composed of other trees as well as their characteristic tree. The turpentine of this tree forms the celebrated kauri-gum, which is extensively excavated from the sites of old forests. [Fuller particulars concerning this product are given in an article on “Kauri-gum,” and the exports appear on the statistical broadsheet.]
Libocedrus doniana, Endl.
Kawaka, Cypress, Cedar.—This handsome tree attains a height of 60ft. to 100ft., and a diameter of 3ft. to 5ft. Wood reddish, fine-grained, and heavy; used by the Maoris for carving, and said to be excellent for planks and spars; grows in the North Island, being abundant in the forests near the Bay of Islands, and to the north of Auckland.
Libocedrus bidwillii, Hook.
Pahautea, Cedar.—A handsome conical tree, 60ft. to 80ft. high, 2ft. to 3ft. in diameter. In Otago it produces a dark-red free-working timber, rather brittle, chiefly adapted for inside work. Found on the central ranges of the North Island, and common throughout the forests of the Middle Island, growing at altitudes of 500ft. to 4,000ft. This timber has been used for sleepers on the Otago railways of late years, is largely employed in that district for fencing purposes, and is frequently mistaken for totara. In former years it was believed to be suitable for inside work only.
Podocarpus ferruginea, Don.
Miro, Bastard Black-pine of Otago.—A large, ornamental, and useful timber-tree; attains a height of 40ft. to 60ft., trunk 2ft. to 3ft. in diameter. A useful wood, but not so durable as the matai, or true black-pine wood; reddish, close-grained, and brittle; the cross section of the timber shows the heartwood star-shaped and irregular. The timber is generally thought to be unfitted for piles and marine work, except when only partially exposed to the influence of sea-water, as shown in the railway embankment at Bluff Harbour, where it is reported to have been durable. Grows in the North and Middle Islands at altitudes below 1,000ft.
Podocarpus totara, A. Cunn.
Totara.—A lofty and spreading tree, 60ft. to 120ft. high, 4ft. to 10ft. in diameter. Wood very durable and clean-grained, in appearance like cedar, and works with equal freedom; it is adapted for every kind of carpenters' work. It is used extensively in Wellington for house-building and piles of marine wharves and bridges, and railway-sleepers, and is one of the most valuable timbers known. The wood, if felled during the growing-season, resists for a long time the attacks of teredo worms. It splits freely, and is durable as fencing and shingles. Totara post-and-rail fences are expected to last from forty to fifty years. The Maoris made their largest canoes from this tree, and the palisading of their pas consisted almost entirely of this wood. Grows throughout the North and Middle Islands upon both flat and hilly ground; the timber from trees grown on hills is found to be the most durable.
Podocarpus spicata, Br.
Matal, Mai, Black-pine of Otago.—A large tree, 80ft. high, trunk from 2ft. to 4ft. in diameter. Wood yellowish, close-grained, and durable; used for a variety of purposes—piles for bridges, wharves, and jetties, bed-plates for machinery, millwrights' work, flooring, house-blocks, railway-sleepers, and fencing. Bridges in various parts of the colony afford proof of its durability. Mr. Buchanan has described a log of matai that he found had been exposed for at least two hundred years in a dense damp bush in North-east Valley, Dunedin, as proved by its being enfolded by the roots of three large trees of Griselinia littoralis (Papauma), 3ft. 6in. in diameter, with over three hundred growth-rings. Grows in both North and Middle Islands, at altitudes under 1,500ft.
Podocarpus dacrydioides, A. Rich.
Kahikatea, White-pine.—A very fine tree, 100ft. to 150ft. high, trunk 4ft. in diameter. Timber white and tough, soft, and well adapted for indoor work, but will not bear exposure. Abundant throughout the North and Middle Islands. When grown on dry soil it is good for the planks of small boats, but when from swamps it is almost useless for this purpose. A variety of this tree, known as yellow-pine, is largely sawn in Nelson, and considered to be a durable building-timber.
Dacrydium cupressinum, Soland.
Rimu, Red-pine.—Tree pyramidal, with weeping branches when young; trunk 80ft. to 130ft. high, and 2ft. to 6ft. in diameter. An ornamental and useful timber; wood red, clear-grained, heavy, and solid; much used for joisting and planking, and general building purposes, from Wellington southward. Its chief drawback is in being liable to decay through wet. It is largely used in the manufacture of furniture, the old wood being handsomely marked like rosewood, but of a lighter-brown hue. The juice of this pine is agreeable to drink, and was manufactured into spruce beer by Captain Cook. Grows throughout the North and Middle Islands, but is of the best quality in the central district.
Dacrydium colensoi, Hook.
Manoao, Yellow-pine.—A very ornamental tree, 20ft. to 60ft. high. Wood light-yellow. It is the most durable and strongest timber in New Zealand. Posts of this wood have been in use among the Maoris for several hundred years. It is found in the North and Middle Islands at an altitude as great as 4,000ft. This tree is curious from having two kinds of leaves on the same branches. It is greatly valued for furniture.
Phyllocladus trichomanoides, Don.
Tanekaha, Celery-leaved Pine.—A slender handsome tree, 60ft. high; trunk rarely exceeds 3ft. in diameter, wood pale, close-grained, and excellent for planks and spars; in most positions resists decay remarkably well. The bark is highly prized on account of its superior dyeing and tanning properties. It is one of the best vegetable dyes, especially for yellow, pink, and fawn colours. Grows in the North Island, especially in the hilly districts.
Phyllocladus alpinus, Hook.
Taotoa.—A small ornamental and densely-branched tree, sometimes 2ft. in diameter. Bark used for dyeing and making tar. Found in both North and Middle Islands.
Fagus menziesii, Hook.
Tawhai, Red-birch (from the colour of the bark).—A handsome tree, 80ft. to 100ft. high; trunk 2ft. to 3ft. in diameter. The timber is chiefly used in the Lake District in the Middle Island. Durable, and adapted for masts and oars, and for cabinet and coopers' work. Grows in the North Island on the mountain-tops, but abundant in the Middle Island at all altitudes to 3,000ft.
Fagus fusca, Hook.
Tawhai, Tawhairaunui, Black-birch of Auckland and Otago (from colour of bark), Red-birch of Wellington and Nelson (from colour of timber).—This is a noble tree, 60ft. to 90ft. high; the trunk 5ft. to 8ft. in diameter. The timber is excessively tough and hard to cut. It is highly valued in Nelson and Wellington as being both strong and durable for all purposes. It is found from Kaitaia in the North Island to Otago in the Middle Island (though often locally absent from extensive districts), and grows at all heights up to 3,000ft.
Fagus solandri, Hook.
White-birch of Nelson and Otago (from colour of bark), Black-heart Birch of Wellington.—A lofty beautiful evergreen tree, 100ft. high; trunk, 4ft. to 5ft. in diameter. The heart timber is darker than that of Fagus fusca, and is very durable. The wood is well adapted for fencing and bridge-piles, and the bark is useful as a tanning material. This tree occurs only in the southern part of the North Island, but is abundant in the Middle Island, at 3,000ft. to 5,000ft. altitude.
Leptospermum scoparium, Forst.
Kahikatoa, Tea-tree of Cook.—It is ornamental, and useful for fuel and fencing; generally a small shrub, but occasionally 20ft. in height in the South. Abundant throughout the islands.
Leptospermum ericoides, A. Rich.
Manuka.—A slender tree, 10ft. to 80ft. high, highly ornamental, more especially when young. The timber can be had 28ft. to 30ft. long, and 14in. in diameter at the butt, and 10in. at the small end. The wood is hard and dark-coloured, largely used at present for fuel and fencing, axe-handles and sheaves of blocks, and formerly by the Maoris for spears and paddles. The old timber, from its dark-coloured markings, might be used with advantage in cabinet-work, and its great durability might recommend it for many other purposes. Highly valued in Otago for jetty- and wharf-piles, as it resists the marine worm better than any other timber found in the district. It is extensively used for house-piles. The lightest-coloured wood, called “white manuka,” is considered the toughest, and forms an excellent substitute for the “hornbeam” in the cogs of large spur-wheels. It is abundant as a shrub, and is found usually on the poorest soils, but is rare as a tree in large tracts to the exclusion of other trees.
Metrosideros lucida, Menzies.
Rata, Ironwood.—A very ornamental tree; attains a height of from 30ft. to 60ft., and a diameter of 2ft. to 10ft. The timber of this tree forms a valuable cabinet-wood; it is of a dark-red colour; splits freely. It has been much used for knees and timbers in ship-building, and would probably answer well for cogs of spur-wheels. Grows rarely in the North Island, but is abundant in the Middle Island, especially on the West Coast.
Metrosideros robusta, A. Cunn.
Rata.—A tall erect tree, 50ft. to 60ft. high; diameter of trunk 4ft., but the descending roots often form a hollow stem 12ft. in diameter. Timber closely resembles the last-named species, and is equally dense and durable, while it can be obtained of much larger dimensions. It is used for ship-building, but for this purpose is inferior to the pohutukawa. On the tramways at the Thames it has been used for sleepers, which are perfectly sound after some years' wear. Grows in the North Island; usually found in hilly situations from Cape Colville south-wards.
Metrosideros tomentosa, A. Cunn.
Pohutukawa.—This tree has numerous massive arms: its height is from 30ft. to 60ft.; trunk, 2ft. to 4ft. in diameter. The timber is specially adapted for the purposes of the ship-builder, and has usually formed the framework of the numerous vessels built in the northern districts. Grows on rocky coasts, and is almost confined to the Provincial District of Auckland.
Eugenia maire, A. Cunn.
Mairetawhake.—A small tree about 40ft. high; trunk, 1ft. to 2ft. in diameter. Timber compact, heavy, and durable. Used for mooring-posts and jetty-piles on the Waikato, where it has stood well for many years. It is highly valued for fencing. Common on swampy land in the North Island.
Fuchsia excorticata, Linn.
Kotukutuku. The fruit is called Konini.—A small and ornamental tree 10ft. to 30ft. high; trunk sometimes 3ft. in diameter. It appears to furnish a durable timber. House-blocks of this wood, which had been in use in Dunedin for more than twenty years, were still sound and good. The wood might be used as dye-stuff if rasped up and bled in the usual way, and, by mixing iron as a mordant, shades of purple may be produced, even to a dense black, that makes good writing-ink. The juice is astringent and agreeable, and yields a medical extract. Its fruit is pleasant, and forms the principal food of the wood-pigeon. Grows throughout the islands.
Grisclinia littoralis, Raoul.
Papauma, Broadleaf.—An erect and thickly-branched bush-tree, 50ft. to 60ft. high; trunk, 3ft. to 10ft. in diameter. Wood splits freely, and is valuable for fencing and in ship-building; some portions make handsome veneers. Grows chiefly in the Middle Island and near the coasts.
Olearia avicenniœfolia, Hook.
Mingimingi, Yellow-wood.—An ornamental shrub-tree, flowers numerous; trunk, 2ft. in diameter. Wood close-grained, with yellow markings, which render it desirable for cabinet-work; good for veneers. Occurs in Middle Island.
Olearia nitida.
An ornamental shrub-tree, 20ft. high and 2ft. in diameter. Wood close-grained, with yellow markings; useful for cabinet-work. Found in the mountainous region of the North Island and throughout the Middle Island.
Olearia cunninghamii.
An ornamental shrub-tree, 12ft. to 20ft. high, with very showy flowers. Found abundantly on west coast of Middle Island, and not uncommon in North Island.
Dracophyllum longifolium, Br.
Neinei.—An ornamental shrub-tree with long grassy leaves. Wood white, marked with satin-like specks, and adapted for cabinet-work. Grows in Middle Island and in Auckland Group and Campbell Island; none of the Middle Island specimens are as large in the foliage as those in the Auckland Islands. The tree in the vicinity of Dunedin attains a diameter of 10in. to 12in.
Nesodaphne tarairi, Hook.
Tarairi.—A lofty forest-tree, 60ft. to 80ft. high, with stout branches. Wood white, splits freely, but not much valued. Grows in northern parts of North Island.
Nesodaphne tawa, Hook.
Tawa.—A lofty forest-tree, 60ft. to 70ft. high, with slender branches. The wood is light and soft, and is much used for making butter-kegs. Grows in the northern parts of the Middle Island, and also on the North Island, chiefly on low alluvial grounds; is commonly found forming large forests on river-flats.
Atherosperma novœ-zealandiá, Hook.
Pukatea.—Height, 150ft., with buttressed trunk 3ft. to 7ft. n diameter; the buttresses 15ft. thick at the base; wood soft and yellowish, used for small boat-planks. A variety of this tree has dark-coloured wood that is very lasting in water, and greatly prized by the Maoris for making canoes. Grows in the North Island and northern parts of the Middle Island.
Hedycarya dentata, Forst.
Kaiwhiria.—A small evergreen tree, 20ft. to 30ft. high; the wood is finely marked, and suitable for veneering. Grows in the North Island, and as far south as Akaroa in the Middle Island.
Knightia excelsa, Br.
Rewarewa.—A lofty slender tree, 100ft. high. Wood handsome, mottled red and brown; used for furniture and shingles, and for fencing, as it splits easily. It is a most valuable veneering wood. Common in the forests of the North Island, growing upon the hills in both rich and poor soils.
Drimys axillaris, Forst.
Horopito.—Pepper-tree, Winter's Bark.—A small slender evergreen tree, very handsome. Whole plant aromatic and stimulant; used by the Maoris for various diseases. Wood very ornamental in cabinet-work, making handsome veneers. Grows abundantly in forests throughout the islands. At altitudes of 1,000ft. the foliage becomes dense and reddish-coloured.
Drimys colorata, Raoul.
This is a distinct species, very common near Dunedin; it is a very ornamental shrub-tree, with leaves blotched with red.
Hoheria populnea, A. Cunn.
Houhere, Ribbon-wood of Dunedin.—An ornamental shrub-tree, 10ft. to 30ft. high. Bark fibrous and used for cordage, and affords a demulcent drink. Wood splits freely for shingles, but is not durable. Grows abundantly throughout the islands. Bark used for making a tapa cloth by the Maoris in olden times.
Elœocarpus dentatus, Vahl.
Hinau.—A small tree, about 50ft. high, and 18in. thick in stem, with brown bark yielding a permanent blue-black dye, which is used for tanning, and by the Maoris for colouring mats and baskets. Wood a yellowish-brown colour and close-grained; very durable for fencing and piles. Common throughout the islands.
Alectryon excelsum, D.C.
Titoki.—A beautiful tree, with large penicies of reddish flowers. Trunk 15ft. to 20ft. high, and 12in. to 20in. in diameter. Wood has similar properties to ash, and is used for similar purposes. Its toughness makes it valuable for wheels, coachbuilding, &c. The oil of the seeds was used for anointing the person. Grows in the North and Middle Islands; not uncommon in forests.
Coriaria ruscifolia, Linn.
Tupakihi, Tree Tutu.—A perennial shrub, 10ft. to 18ft. high; trunk 6in. to 8in. in diameter. The so-called berries (fleshy petals) vary very much in succulence, the less juicy bearing seeds which, according to Colenso, are not poisonous. The juice is purple, and affords a grateful beverage to the Maoris; and a wine, like elderberry wine, has been made from them. The seeds and leaves contain a poisonous alkaloid, and produce convulsions, delirium, and death, and are sometimes fatal to cattle and sheep. Abundant throughout the islands.
Sophora tetraptera, Aiton.
Kowhai.—A small or middling-sized tree. It has a splendid appearance, with large pendulous yellow flowers. Wood red; valuable for fencing, being highly durable; it is also adapted for cabinet-work. It is used for piles in bridges, wharves, &c. Abundant throughout the islands.
Carpodetus serratus, Forst.
Tawiri.—White Mapau, White-birch (of Auckland).—A small tree, 10ft. to 30ft. high; trunk unusually slender; branches spreading in a fan-shaped manner, which makes it of very ornamental appearance; flower white, profusely produced. The wood is soft and tough, and might be used in the manufacture of handles for agricultural implements and axes. Grows in the North and Middle Islands; frequent by the banks of rivers.
Weinmannia racemosa, Forst.
Towhai, Kamahi.—A large tree; trunk 2ft. to 4ft. diameter and 50ft. high. Wood close-grained and heavy, but rather brittle; might be used for plane-making and other joiners' tools, block-cutting for paper and calico-printing, besides various kinds of turnery and wood-engraving. The bark of this tree is largely used for tanning. The extract of the bark is chemically allied to the gum kind of commerce, their value being about equal. Grows in the middle and southern parts of the North Island and throughout the Middle Island.
Coprosma linariifolia, Hook.
Karamu.—An ornamental shrub-tree; wood close-grained and yellow; might be used for turnery. Grows in mountain localities of the North and Middle Islands. Several other species of this genus grow to a considerable size, and have ornamental timber. It has been proposed to use the berries of Coprosma baueriana as a substitute for coffee.
The following tables gives the results of experiments, extending over a period of some years, made as to the strength of the principal timbers of the colony. The dimensions of the specimens experimented on were 12in. long by 1in. in breadth and thickness:—
| No. | Native Names in Alphabetical Order. | Specific Gravity. | Weight of a Cubic Foot. | Greatest Weight carried with Unimpaired Elasticity. | Transverse Strength. |
|---|---|---|---|---|---|
| Lb. | Lb. | Lb. | |||
| 1 | Hinau, or pokako (Eláocarpus dentatus) | 0.562 | 33.03 | 94.0 | 125.0 |
| 2 | Kahika, supposed white-pine | 0.502 | 31.28 | 57.3 | 77.5 |
| 3 | Kahikatea, white - pine (Podocarpus dacrydioides | 0.488 | 30.43 | 57.9 | 106.0 |
| 4 | Kauri (Agathis or Dammara australis) | 0.623 | 38.96 | 97.0 | 165.5 |
| 5 | Kawaka (Libocedrus doniana) | 0.637 | 39.69 | 75.0 | 120.0 |
| 6 | Kohekohe (Dysoxylum spectabilc) | 0.678 | 42.25 | 92.0 | 117.4 |
| 7 | Kowhai (Sophora tetraptera, var. grandiflora) | 0.884 | 55.11 | 98.0 | 207.5 |
| 8 | Maire, black maire (Olea cunninghamii) | 1.159 | 72.29 | 193.0 | 314.2 |
| 9 | Maire-tawhake (Eugenia maire) | 0.790 | 49.24 | 106.0 | 179.7 |
| 10 | Mako (Aristotelia racemosa) | 0.593 | 33.62 | 62.0 | 122.0 |
| 11 | Manoao (Dacrydium colensoi) | 0.788 | 49.01 | 200.0 | 230.0 |
| 12 | Mangi, or mangeao (Litsea or Tetranthera calicaris) | 0.621 | 38.70 | 109.0 | 137.8 |
| 13 | Manuka (Leptospermum ericoides) | 0.943 | 59.00 | 115.0 | 239.0 |
| 14 | Mapau, red-mapau or red-birch (Myrsine urvillei) | 0.991 | 61.82 | 92.0 | 192.4 |
| 15 | Matipo - tarata, black - mapau (Pittosporum tenuifolium) | 0.955 | 60.14 | 125.0 | 243.0 |
| 16 | Matai (Podocarpus spicata) | 0.787 | 49.07 | 133.0 | 197.2 |
| 17 | Miro (Podocarpus ferruginea) | 0.658 | 40.79 | 103.0 | 190.0 |
| 18 | Puriri (Vitex littoralis) | 0.959 | 59.05 | 175.0 | 223.0 |
| 19 | Rata, or iron - wood (Metrosideros lucida) | 1.045 | 65.13 | 93.0 | 196.0 |
| 20 | Rewarewa (Knightia excelsa) | 0.785 | 48.92 | 93.0 | 161.0 |
| 21 | Rimu, red-pine (Dacrydium cupressinum) | 0.563 | 36.94 | 92.8 | 140.2 |
| 22 | Taraire (Nesodaphne taraire) | 0.888 | 55.34 | 99.6 | 112.3 |
| 23 | Tawa (Nesodaphne tawa) | 0.761 | 47.45 | 142.4 | 205.5 |
| 24 | Tawiri - kohu - kohu, or white - mapau (Carpodetus serratus) | 0.822 | 51.24 | 80.0 | 177.6 |
| 25 | Titoki (Alectryon excelsum) | 0.916 | 57.10 | 116.0 | 248.0 |
| 26 | Totara (Podocarpus totara) | 0.559 | 35.17 | 77.0 | 133.6 |
| 27 | Tawhai, red-birch (Fagus menziesii) | 0.626 | 38.99 | 73.6 | 158.2 |
| 28 | Tawhairaunui, black-birch (Fagus fusca) | 0.780 | 48.62 | 108.8 | 202.5 |
| 29 | Whawhako (see also Maire) (Eugenia maire) | 0.637 | 39.63 | 75.0 | 120.0 |
| 30 | Whau (Entelea arborescens) | 0.187 | 11.76 | 13.0 | 32.0 |
The experiments were conducted in the following manner: A pressure of 50lb. was applied for two minutes (as measured by a sand-glass), and the sample was then released; 75lb. were then applied for the same time, and then 100lb., and so on, increasing by 25lb. each time. Each time the sample was released the point on the deflection-scale to which it returned was read, and when it came to be notably under the original reading it was allowed to remain unloaded for two minutes, to see whether it would in time recover itself. Then the pressure was gradually increased, without being removed, until the specimen broke.
The New Zealand fungus known to commerce is found upon various kinds of decayed timber in the North Island, in what are called new bush-settlements. It favours damp localities. After the trees have been cut down, and fire has passed through them, the growth of fungus commences. The preparation consists of simply spreading the fungus out to dry. It is used by the Chinese for mixing with food, and for medicinal purposes.
In the year 1888, the export of this article reached 9,844cwt., valued at £19,204; in 1891, the figures were 7,934cwt., value £10,943; and in 1892, 4,079cwt., value £5,274.
The following table shows the quantities and values of timber (sawn and hewn) exported in 1871, 1881, and the last five years:—
| Quantity. | Value. | |
|---|---|---|
| Ft. | £ | |
|
* In 1871 the export of logs, spars, shingles, &c., amounted in value to £6,070. | ||
| 1871* | 3,214,742 | 14,200 |
| 1881 | 13,180,280 | 65,119 |
| 1888 | 43,474,434 | 177,877 |
| 1889 | 42,568,600 | 176,608 |
| 1890 | 42,098,863 | 181,689 |
| 1891 | 42,824,365 | 182,431 |
| 1892 | 22,860,551 | 87,580 |
The saw-milling industry stands fourth in importance, estimated by the value of the output of the industries of the colony. The number of mills in the North Island in 1891 was 119, employing 1,990 hands. In the Middle Island there were 124 mills and 1,270 hands.
The total approximate value of the land was £160,750; of the buildings, £92,848; and of the machinery and plant, £246,674.
The details of this industry, showing the number of saw-mills and sash-and-door factories in operation in 1891, the number of hands employed, and amount of horse-power, in the various provincial districts of the colony, also the produce of the several districts, and the total value of all manufactures for the year 1890 are set forth in the following table:—
| Details of the Timber Industry. | ||||||||||||||||
|---|---|---|---|---|---|---|---|---|---|---|---|---|---|---|---|---|
| Provincial Districts. | Number of Mills. | Hands employed. | Amount of Horse-power. | Produce for the Year 1890. | Value of Undressed Timber resawn, &c., at Countrymill Prices. | Value of other materials used. | Total Value of all Manufactures for the Year 1890. | |||||||||
| Sawn Timber. | Value of Posts, Rails, &c. | Resawing, Planed Flooring, Skirting, &c. | Moulding. | Doors and Sashes. | ||||||||||||
| M. | F. | Quantity. | Value. | Quantity. | Value. | Quantity. | Value. | Quan. | Value. | |||||||
| H.P. | Ft. | £ | £ | Ft. | £ | Run. ft. | £ | No. | £ | £ | £ | £ | ||||
| Auckland | 47 | 1,004 | 3 | 1,436 | 70,006,749 | 294,673 | 27,143 | 14,536,398 | 76,694 | 2,904,000 | 7,516 | 21,162 | 10,952 | 62,057 | 340 | 410,978 |
| Taranaki | 11 | 206 | .. | 201 | 6,342,562 | 24,506 | 315 | 908,814 | 4,580 | 213,336 | 1,285 | 1,870 | 6,339 | 3,306 | 1,381 | 37,025 |
| Hawke's B'y | 13 | 165 | .. | 215 | 8,439,565 | 26,849 | 1,263 | 1,680,029 | 4,276 | 138,000 | 335 | 220 | 190 | 3,030 | 100 | 32,913 |
| Wellington | 48 | 615 | 2 | 820 | 27,044,739 | 79,676 | 7,357 | 5,524,885 | 24,167 | 1,429,385 | 7,586 | 6,230 | 9,736 | 14,879 | 2,910 | 128,522 |
| Marlb'rough | 6 | 60 | .. | 116 | 3,260,662 | 8,753 | 216 | 150,000 | 162 | .. | .. | .. | .. | .. | .. | 9,131 |
| Nelson | 34 | 192 | .. | 396 | 10,304,080 | 27,337 | 1,322 | 326,600 | 771 | 487,500 | 852 | 614 | 486 | 834 | 285 | 30,768 |
| Westland | 13 | 72 | .. | 208 | 3,030,747 | 9,133 | 40 | 156,925 | 485 | 26,150 | 47 | 311 | 124 | 29 | 30 | 9,829 |
| Canterbury | 20 | 249 | 1 | 281 | 3,978,146 | 16,049 | 5,469 | 2,224,065 | 12,739 | 1,904,494 | 4,078 | 4,206 | 3,112 | 12,336 | 348 | 41,447 |
| Otago | 51 | 697 | .. | 964 | 29,708,971 | 79,559 | 13,168 | 4,944,233 | 20,221 | 1,333,719 | 4,087 | 17,662 | 9,311 | 15,970 | 3,953 | 126,346 |
| Totals | 243 | 3,260 | 6 | 4,637 | 162,116,221 | 566,535 | 56,293 | 30,451,949 | 144,095 | 8,436,584 | 25,786 | 52,275 | 40,250 | 112,441 | 9,347 | 832,959 |
Phormium (flax) is the oldest of New Zealand exports, the trade therein having begun as early as 1809. Between the years 1828 and 1832, although New Zealand was then visited only by whalers and a few traders, no less than fifty thousand pounds' worth was sold in Sydney alone. At that time Maori hand-dressed flax fetched a very high price in the English market. The Maoris were successful in eliminating the gummy or oily substance in the fibre which so far it has been found impossible to get rid of entirely by the aid of machinery. On account of this imperfection, machine-dressed flax remained in little request till 1861, when the increasing demand for white rope, and the limited quantity of manila, led to a rise in its value from £21 to £56 per ton, and even to £76 per ton in America during the late civil war. These high prices stimulated the endeavour to introduce Phormium fibre for competing with manila. But the greatest difficulty in its preparation has always been how to do away with the gummy or mucilaginous products found in the leaf.
The name Phormium tenax is taken from the Greek word phormos (a basket) and Latin tenax (strong). Sir James Hector, in Appendix I. to his work on the “Phormium Tenax as a Fibrous Plant” (1889), gives fifty-five different names as applied to the Phormium plant by the Maoris, but says it is doubtful if more than twenty marked varieties can be distinguished. The Phormium plant grows in bunches or groups of plants or shoots; each shoot has five leaves. On the average ten of these shoots, or, in all, fifty leaves, go to a bunch. These vary, according to the soil, from 5ft. to 10ft. in length, and each consists of a double-bladed leaf, which, when closed, is from 2in. to 4in. wide.
Select Committees have at various times been appointed by the General Assembly to consider all matters pertaining to the flax industry; their reports have been published in the Journals of the House of Representatives, and have had good results. The latest of these reports was brought up on the 26th August, 1890. The Committee were much impressed with the rapid increase of the export of the New Zealand flax-fibre; and, notwithstanding the serious decline in prices—a decline which was equally shared by kindred fibres—manufacturers were not discouraged, but, on the contrary, were producing largely. Whilst the fibre as now exported is fit only for the manufacture of rope and twine, and for the same purposes for which manila and sisal are used, the Committee was strongly of opinion that the New Zealand fibre is capable of more extended uses; and, that steps might be taken to further the industry, they recommended that the Government should offer a bonus of £10,000 for—
-
A process of flax-dressing which will reduce the cost of production;
-
A process which will improve the quality of dressed fibre, making it suitable for textile purposes; and
-
A mode of utilising the waste products of the industry.
As a result of their investigations, the Committee urged that flax-owners should see that the flax is cut in such a manner as to leave the heart of the flax-fans uninjured, and that attention should be given to the planting and cultivation of the best varieties of flax, with a view to the production of fibre of superior quality. They found that the market price in London was prejudicially affected by the fact that the contents of a single bale, as well as the several bales of one consignment, often vary very widely; also, that, although the Phormium fibre is not liable to spontaneous combustion, dampness has the effect of rotting, or so seriously discolouring the fibre as to render it almost valueless on reaching the Home market.
With all these drawbacks to the industry, which it is sought to overcome, the export is fluctuating, although the number of flaxmills in the colony rose from 30 in 1886 to 177 at the census of 1891; the number of hands employed increased correspondingly from 249 to 3,204; and the approximate value of the manufacture, during the same period, from £43,094 to £234,266; but a large permanent development of this industry depends upon the invention of improvements in the machinery used that will result in lessening the cost of production and improving the quality of the fibre.
The export of Phormium for the years 1881 and 1888–92, with the quantities and values, was as follows:—
| Year. | Tons. | £ |
|---|---|---|
| 1881 | 1,308 | 26,285 |
| 1888 | 4,042 | 75,269 |
| 1889 | 17,084 | 361,182 |
| 1890 | 21,158 | 381,789 |
| 1891 | 15,809 | 281,514 |
| 1892 | 12,793 | 214,542 |
These are exporters' declared values, which would doubtless be higher than the values given by mill-owners, quoted above, in the figures showing the output.
Kauri-gum is formed of the turpentine that has exuded from the kauri-tree, the finest, and, for general purposes, the most useful forest-tree in New Zealand.
Thirty years ago the Maoris were the only people who employed themselves in searching for this gum, which at that time was to be found on, or cropping out of, the surface of the ground where, perhaps ages before, forests of kauri had stood. After a few years' exports this surface-gum became exhausted, and then the Maoris began to dig for the gum that was to be found within a few inches below the surface. As the uses for it increased, its market value rose, and presently Europeans betook themselves to digging for it, until, at the present time, it is estimated that there are as many as four thousand whites and a thousand Maoris engaged in the work in the Auckland Provincial District, where alone the gum is to be found. The best qualities are obtained from the undulating, open, fern land north of Auckland; but considerable quantities, although of inferior grade, are taken from the branches of standing kauri-trees in the forests, and, in the summer time, from the bottoms of many of the swamps.
The country on both sides of the Northern Wairoa River, of which the town of Dargaville is the centre, is the chief source of the supply of this commodity, the output of which has steadily increased over the last thirty years, notwithstanding that it is not being reproduced, except to a very inappreciable extent, in the existing forests—and these are now being rapidly cut down, because of the commercial value of the timber. The cause of the increased output is, of course, that a greater number of men are now engaged in gumdigging, attracted, doubtless, by the higher price paid for the gum, and by the comparatively easy and independent mode of life the occupation affords. Within a measurable period of time the production of this gum must cease; although competent persons estimate that it will take fifty years at least, at the present rate, to exhaust the gum-deposits in the Auckland District. It is a remarkable fact that new parties of diggers have been known to work over the same piece of ground year after year, and that the last to work it have obtained as much gum as the first. In some places gum-bearing land has been purchased from the Crown for settlement purposes, and the gum unearthed in ploughing it has sold for enough to pay the purchase-money of the land, and for ploughing, fencing, and sowing it as well.
The ordinary method of searching for the gum is by first feeling for it a little below the surface with a steel-pointed piece of iron about 1/2in. in diameter and 4ft. long, called a “gum-spear,” and then digging it out with an ordinary spade. A skilful and industrious digger can earn as much at £3 to £4 per week at the work, and even children can make a few shillings a day at it. As, however, the gumfields offer a refuge for all sorts and conditions of men, many who are old and infirm resort to them, and so the average earnings of those engaged in the work are reduced to £1 15s. or £2 per week.
The gum is used principally in the manufacture of varnish, but it is found useful for many other purposes, such as dressing “glazed” calicoes, &c. The best quality, which is scarce, is worth in London as much as £8 to £10 per hundredweight, while the poorest quality is worth only about £1 per hundred weight.
The following are the quantities and values of the exports at ten-year periods since 1853, and for the year 1892:—
| Year. | Tons. | £ |
|---|---|---|
| 1853 | 829 | 15,971 |
| 1863 | 1,400 | 27,027 |
| 1873 | 2,833 | 85,816 |
| 1883 | 6,518 | 336,606 |
| 1892 | 8,705 | 517,678 |
The export in 1892 was the largest in quantity and highest in value yet recorded.
There can be little doubt that as a field of labour New Zealand offers exceptional advantages. The average climate permits of work being done in the open air all the year round, and a large area of the country is fertile. The mineral wealth of the islands is almost inexhaustible, and the geographical position of the colony offers a commercial future of the highest promise. The dangers and hardships endured by the pioneer settlers in the early days are now almost forgotten; and, although there is much heavy work remaining to be done, still, in a country where the Natives are no longer troublesome, and where the lands are traversed by railway- and telegraph-lines, the settler will find his toil lighter and his reward more sure than that of his predecessors. For those wishing to become citizens of the colony and to secure a share of the success which has attended the efforts of many thousands of hard-working and now prosperous people, the following remarks are intended.
The conditions under which men labour in the country districts differ so much according to the individual training, means, and necessities of each person that it is difficult to give one all-round rule suitable for the requirements of each and every would-be settler. Some desire to see themselves at once masters of property, and owning house, farm, and stock; others are contented if they can only find plenty of employment as wages-men. The large majority look forward to some day holding their own farms (either as freehold or under a perpetual lease), and these accept hire from their richer brothers only as a temporary aid enabling them to lay by a store which will some day permit them to become settlers on their own account. They thus gain knowledge as well as pecuniary assistance; and it is a golden rule for the guidance of a new arrival to endeavour to gain his experience by working for another person until the strangeness and novelty of life under altered conditions has worn off. In bush-farming especially everything must be so new to one coming from another country that he will find countless fresh sources of knowledge opening up everywhere. First, the wood-lore has to be learnt; the names of the trees, their usefulness for sawn timber or for fuel; or, on the other hand, their uselessness save for “burning off.” So, also, the handling of axe or bill-hook so as to avoid danger in under-scrubbing, felling, and clearing, is not learnt in a day, and requires time before anything like skill is developed. “Logging up” the great scorched logs on the burnt spaces and sowing down the clearings with grass-seed follow the felling; and when the ground is sufficiently clear for the cattle to be able to wander among the stumps and logs come the tasks of splitting posts and rails for fences, and then of selecting the stock. The expense of felling and burning the bush on forest-land is often lightened by the value of heavy crops of grass-seed (particularly of cocksfoot and ryegrass) which are raised on the newly-burnt clearings. In the season many extra hands are required for the collection of the seed. If the farm selected is in the fern-land or open country so much technical knowledge and so much hard toil is not at first required, but in its place comes the use of plough and harrow. Lessons must be learnt concerning the seasons (with their antipodean changing of winter months for summer), and there must be diligent exercise in acquiring local knowledge from neighbours. However well versed a farmer or a farm-hand may be in the methods used in cultivating land in other countries, he will achieve little in this colony until he has made himself acquainted with a system fitted to the climate, soil, and markets of his colonial farm. The largest grain-producing districts are in the Middle Island, and a yield far above the average of land in the Old Country results, if we take into consideration the absence of high-farming, and that the soil is seldom treated with heavy dressings of manure. Much of the work on dairy-farms has been lessened by the establishment of factories for the manufacture of cheese and butter. They are generally owned by co-operative societies of the farmers supplying the milk, and these receive a certain agreed-upon price for each gallon of milk supplied, and divide the profits of the butter and cheese afterwards on the ratio of the individual milk-supply. These establishments are by degrees removing the work of butter- and cheese-making from the farmer's family; they will help to firmly establish a large and increasing export trade, and to make the market firm by equalising and steadying the quality of the product. Only persons who have travelled through the dairying districts on the west coast of the North Island can appreciate the improved circumstances of settlers who during the last two or three years have devoted their attention to the factory milk-supply, and the breeding of stock for that purpose. A very high general average of prosperity now exists among this industrious and deserving class of New Zealand's settlers. It is to this variety of farm-cultivation that the small capitalist intending to settle in this colony should look forward if he is not already a practical agriculturist in his own country. Neither the risk of loss nor the manual labour is so great as in the operations for grain- and root-cropping, if only diligence and observation be devoted to the new occupation at the outset.
To those whose proclivities tend towards pastoral life, occupation as stockriders, shepherds, &c., on one of the large cattle- and sheep-runs common in the colony may be obtained. These runs in some cases comprise very rich country acquired in early days from the Natives, but such holdings are few. Generally, the runs consist of second-class or slightly-broken land, unfit for the purposes of agriculture; or, if not unfit, still not of so attractive a character as other properties still obtainable from the Crown or private persons. A run usually contains several thousands of acres, and as, very often, parts of it are mountainous, the work of mustering the cattle and sheep is full of excitement and sometimes of danger. The life for some months of the year is by no means a toilsome one, but this is made up for by the long hours required and untiring activity that has to be displayed at other times. On a cattle-run the tasks of mustering and drafting the stock and branding the youngsters are very heavy work, needing the display of considerable powers of rough-riding among the horsemen; while on a sheep-run the lambing and shearing seasons tax every power of the station-hands. A large number of men move about the country as shearing-time approaches, in the hope of being engaged as extra helpers; and these men are hard to wean from their nomadic life to more settled pursuits; but as their labour is almost a necessity at times, both to the sheep-farmer and the agriculturist (at harvest), it is difficult to see how their places could be supplied if their gipsy-life should be discontinued. To those who love the saddle and take interest in the care of animals station-life offers innumerable attractions, and if to this is added (after a due apprenticeship) the ownership of such property, then the hope of a pecuniary reward presents itself of a value greater than the settler can look to obtain in any other pursuit.
We will now consider the employment of labour in the country districts at occupations not strictly of a pastoral or agricultural character. First of these is work about saw-mills. Thousands of men are employed in the business of procuring sawn timber and forwarding it to the market. There is a difficulty in obtaining stone and brick for building purposes in localities far from towns, the materials being costly on account of the high wages of labourers, their actual weight, and the difficulty of transport. The place of these materials is generally supplied by the use of sawn timber, a product almost everywhere obtainable, through New Zealand's wealth of forest-trees. In the far north many of the mills are worked for the sake of the kauri-pine logs. The trees being felled, the logs are rolled down into the streams, which, being dammed up by the timber, rise in times of heavy rain, until they break through in full flood, bearing their burden to the mouths of the rivers, on whose banks the mills are erected, and where the logs are captured. In the south, rough tramways are laid down in the bush, and the logs hauled on low carriages to the mills by horse- or bullock-teams. Here the great round baulks of timber are “broken down,” being cut lengthwise (by saws moving up and down vertically) into “flitches,” which are passed over to the circular-saws to be ripped into boards and scantling. All this necessarily entails a great variety of labour; first, the employment of gangs of men in the bush clearing roads, felling the trees, cross-cutting them into logs, and moving them out with screw-jacks to open points whence they can be shifted to the mill. The team-driving (or, in the north, the rafting), the machine-tending, the handling and cartage of planks, &c., offer diversities of labour and degrees of wages suited to all ages of workers and stages of skill.
Next to the saw-mill work as to the number of hands employed comes the occupation of flax-milling. The New Zealand flax, or hemp, is the product of a plant peculiar to this country. When growing it looks like a clump of broad green sword-like blades, each blade being 2in. or 3in. wide, and rising to 6ft. or 8ft. in height. The clumps stand close together, often covering large tracts of country, much of which is shallow swamp. Men are employed in cutting the leaves close to the ground and gathering them into bundles, which are then carried to the mill. This mill consists of cleaning and scutching machinery, which removes the green portion of the plant and turns out the hemp in long white fibres. These are afterwards tied into hanks, pressed into bales, and sent to Europe and America to be made into cordage and binder-twine. A great deal of the work performed about flax-mills is comparatively unskilled labour, although, of course, a certain knowledge of machinery and deftness of manipulation is necessary in working the actual mill itself. [There is a separate article on this subject.]
A very valuable source of revenue to New Zealand has been the fields of kauri-gum, mostly found in the north of Auckland. Kauri-gum is the product of the giant kauri-pine, a tree still found lifting its huge bulk on the hills of the North Island, but which was formerly widely spread over spaces which now are open country. This fact is known by the deposits of amber-like gum which in large masses are found beneath the soil. A wandering population follows the occupation of seeking for this deposit; and, as the gum-digger's outfit consists of a spear, a spade, and a sack, it is a pursuit to which men often turn when out of employment, without capital or other resources. With the spear the digger prods about in localities which seem to him to be probable hiding-places of his treasure, and on the “feel” of the brittle gum beneath the surface he quickly brings it to the light of day by means of his spade. Then the sack is brought into requisition, and the gum is carried to camp, to be scraped and cleaned by the light of the evening fire. It is a free, careless life, usually solitary, and often full of hardship, but having charms for those to whom regular hours and steady employment under the direction of others would be irksome. Nor is it without monetary reward: diggers often make from £2 to £4 a week each, and a man at this employment must be very idle or very stupid if he cannot earn a fairly good living. [The value of this product is given in a special article.]
Freezing meat for export is a comparatively new industry, which already employs a large body of men in a trade that is assuming very satisfactory and promising proportions.
Large orchards of fruit-trees are now growing to maturity, and, indeed, some of these assume the importance of fruit-farms. These orchards consist mainly of apple-, plum-, pear-, and quince-trees, together with other fruit-bearing products of temperate climes; but, in the North, thriving plantations of orange- and lemon-trees are coming into bearing, and the area of land thus utilised is being added to every season. Success in these directions offers employment in the future to numbers of women and children in the fruit-picking season, in addition to the work needed for the weeding and collection of crops from the smaller fruit-plants such as strawberries, gooseberries, currants, &c., which thrive in New Zealand in a most prolific manner.
Some thousands of pounds are annually earned by the fungus-gatherers. The fungus, which grows on old logs, is a curious-looking substance, somewhat resembling the human ear in shape; it is of a dark-brown colour, and of a consistency resembling soft wet leather; it is, however, easily torn. It is generally gathered by children, or persons not strong enough for heavy work. It is dried and exported to China.
Of our mineral wealth and the large population employed in mining industries it is unnecessary here to speak, since in another portion of this book the subject will receive attention. Suffice it to say that those to whom agricultural or pastoral life seems tame find in the direction of mining for minerals an outlet for their energies. The life is rough and hard, is full of danger and toil, but it is one which, when commenced, exerts a fascination whose spell is hard to break. A life on the plains or in cities offers little temptation to gold-miners, who, in the mountain air, work with intense energy all day, and at night lie down to dream of the riches the hills and rivers could yield if they would disclose their secrets. Of course, among gold-miners there are many who prefer a safe weekly wage to the alternations of hope and disappointment, while among the coal-miners the great bulk of the workers are either wages-men or on small contracts, whose steady yield almost takes the place of regular earnings.
Besides occupation for those working on the soil of the colony, there is a further chance of earning a competency for those willing to gather the ever-renewed “harvest of the sea.” Every bay and harbour (besides many of the open roadsteads) are haunts of vast numbers of fish, almost all of which are fit for the table, and many of them of great delicacy. They can be caught with little trouble, and without that terrible risk which fills with care, and often with sorrow, the breasts of the wives and children of the fishermen who sail the stormy seas of Northern Europe. The fisher-life is followed by a considerable number of persons in New Zealand at the present time, but the work they do is but inconsiderable compared to that which awaits innumerable hands in the future. A few successful attempts have been made to commence the canning and preserving of fish, but the trade is in its infancy, and promises to be an almost unlimited source of profit to those willing to invest their energies and means in its development. As a general rule the fisheries are in the hands of a few poor men, and, as little capital is required for an outfit (a boat, a net, and a few lines), the life offers attractions and reward to any hard-working man.
To many, however, life in the country is hardly endurable. Early habits and training, or the gregarious instinct, induce them to prefer the busy crowded towns to the quiet farm or silent forest. To such at one period New Zealand could offer but small inducement, but with the rapid growth of her cities and encouragement shown to manufacturers a large population now derives its support from industries worked in urban localities. Not only are there numerous shops for the retail distribution of goods, offices and warehouses for the transfer and storage of merchandise, but factories and workshops are everywhere coming into existence, with their attendant workers busily engaged in their various duties. There are factories for the production of woollen goods, clothing, hats, boots, leather, saddlery, agricultural implements, carriages, bicycles, tinware, ironware, railway material, paper, glass, soap, candles, cordage, casks, baskets, tinned meats, biscuits, confectionery, &c.; besides flour-mills, breweries, gasworks, freezing-works, foundries, dye-works, fellmongeries, and many other businesses by means of which advancing civilisation supplies the luxuries and necessities of a people.
With the desire of expediting and assisting the engagement of labour, and encouraging local industries, the Government has formed a department, under the direction of the Minister of Labour, and administered by the Secretary. The central office is the Bureau of Industries, in the Government Building, Wellington. There is a bureau in each of the large towns, viz., in Auckland, Christchurch, and Dunedin, under the charge of the Inspectors of Factories in these cities. In the country districts the police sergeants and local constables everywhere are agents of the Bureau, and send in regular reports as to the requirements of workmen and employers. A new-comer to New Zealand wishing to ascertain the exact position of any particular occupation (as to wages, market, requirements, &c.) will do well to visit some office of this department and obtain the desired knowledge, which the Bureau agents and Inspectors of Factories will be glad to impart.
The subject of labour in the colony would be incomplete without some reference to the position of women's work. On the farms the wives and daughters of settlers find occupation in duties which present an unceasing round of service. These duties are now in many cases being lightened by the institution of dairy factories, which relieve the women of the task of butter-making; still, the housework, cooking, and washing for a family, if properly carried out, prevent any idleness or ennui from visiting the household. The life on the whole is a happy one, blest by the buoyant health of those who live in the clear fresh air; and, except in the cases of the more solitary and isolated farms, there is plenty of visiting and flitting about—no people being so constantly on the wing as those of New Zealand, as is testified by the crowded trains and steamers which serve a people sparse and scattered as it at present is. Domestic service attracts few, and it is difficult to keep good female servants, as they marry as soon as their worth becomes known. In towns the tendency of the young women is to obtain work either in shops or factories, and they prefer the slightly higher wages and regular hours of commerce and manufacture to the obligations of domestic service. It is a preference which does not tend to fit them for the care of a home when they marry and have to provide for the comfort of husband and children; but the semi-independence, shorter hours, and better pay explain its attractiveness for the young; while the necessity for workers, if industries are to be carried on, renders their choice of a calling useful to the bulk of the community.
Having thus briefly spoken of labour for those likely to find employment, it will be well to warn those who are thinking of coming to the colony unprepared to work at any of the occupations mentioned. It is not the mere idler to whom the caution is addressed, for the idle person is as useless in Great Britain as in New Zealand; it is to those who are of diligent and industrious habits, but trained in some calling not required in the colony, and insusceptible of change. The clerk, the shopman, the highly-educated man without capital, will probably find that the openings for employment suitable to them have been already filled or that there are at any rate very many applicants. The chance of a newcomer obtaining a place as clerk or teacher is not great, seeing that he has to compete against sons of men of old standing and influence. It may be broadly stated that the town occupations (even mechanical) are sufficiently well supplied. If, on the other hand, there is a sturdy determination to be ready for any emergency, to rough it in the “bush,” on a farm, a station, a mill, or at any other undertaking which requires pluck and muscle to carry out, then the future need not be feared, but the worker may look forward confidently to the possession of one of the many comfortable and pleasant homes with which New Zealand abounds.
The average rates of wages in each provincial district of the colony are shown in the table next following, and will be found to afford sufficient evidence of satisfactory remuneration for all classes of labour. There is also a table of prices of produce, live-stock, and provisions, which is worthy of attention, especially as regards the prices of meat and other necessaries of life:—
| Average Rates of Wages in each Provincial District of New Zealand during the Year 1892. | |||||||||
|---|---|---|---|---|---|---|---|---|---|
| Description of Labour. | Auckland. | Taranaki. | Hawke's Bay. | Wellington. | Marlb'rough. | Nelson. | Westland (Goldfield). | Canterbury. | Otago ((Part Goldfield). |
|
* Contract price per acre. † Contract price, 8s. per acre. ‡ Contract price, 10s. per acre. * Head milliners, 60/ a week. | |||||||||
| 1. Agricultural Labour. | |||||||||
| Farm-labourers: | |||||||||
| With board, per week | 12/ to 15/ | 15/ to 20/ | 20/ to 25/ | 15/ to 25/ | 20/ | 24/ | 25/ | 16/ to 20/ | 15/ to 20/ |
| Without board, per day | .. | 6/ | .. | 6/ | 7/ | 6/ | .. | 6/ to 8/ | 5/ to 6/ |
| Ploughmen: | |||||||||
| With board, per week | 15/ to 20/ | 20/ | 25/ | 20/ to 30/ | 20/ | 24/ | 30/ | 20/ to 25/ | 20/ to 25/ |
| Without board, per day | .. | 8/ | .. | 6/ | 7/ | 6/ | .. | 7/ to 8/ | .. |
| Reapers: | |||||||||
| With board, per week | 6/ per acre* | 60/ | 1/per hour | 8/ to 10/* | 40/ | 24/ | .. | 35/ to 40/ | 20/ to 40/ |
| Without board, per day | .. | 10/ | .. | 10/ | 8/† | 6/ | .. | 8/ to 10/ | 5/ per acre* |
| Mowers: | with board | with board | |||||||
| With board, per week | 6/per acre* | 30/ | 1/per hour | 4/ to 6/* | 40/ | 24/ | .. | 35/ to 40/ | 25/ to 30/ |
| Without board, per day | .. | 6/ | .. | 9/ | 8/‡ | 6/ | .. | 8/ to 10/ | 8/ |
| Threshers: | with board | with board | |||||||
| With board, per week | 2 1/2d. pr bl. | 20/ | 1/per hour | 10d p. hour 2 1/2d. to 3d. per bushel | 30/ | 30/ | .. | 10/ to 20/ per 100 bush. | 25/ to 40/ |
| Without board, per day | .. | 4/with board | .. | 8/ | 8/ | 6/ | .. | .. | 8/; or 10/ per 100 bush. |
| 2. Pastoral Labour. | |||||||||
| Shepherds, with board, per annum | £30 to £50 | £65 to £75 | £60 to £80 | £60 | £52 | .. | £50 to £60 | £52 to £65 | |
| Stockkeepers, with board, per annum | £30 to £60 | .. | 25/p. week | £65 to £75 | £52 | £52 | 25/p. wk. | £50 to £60 | £50 |
| Hutkeepers, with board, per annum | £20 to £30 | .. | 20/ to 25/per week | £50 | £36 | .. | .. | £40 | £50 |
| Station-labourers: | |||||||||
| With board, per week | 10/ to 15/ | .. | 20/ to 25/ | 15/ to 20/ | 15/ | 20/ | .. | 20/ to 25/ | 15/ to 20/ |
| Without board, per day | .. | .. | .. | .. | 5/ | .. | .. | 8/ | .. |
| Sheep washers: | |||||||||
| With board, per day | 8/ | 20/p. week | 25/p. week | 20/p. week | 5/ | .. | .. | 6/ | 7/ |
| Without board, per day | 10/ | 6/ | .. | .. | 7/ | .. | .. | 7/ | .. |
| Shearers, with board, per 100 sheep sheared | 17/6 to 20/ | 16/ | 17/6 to 20/ | 17/6 | 16/8 | 16/8 | 20/ | 15/ to 18/ | 15/ to 20/ |
| Men-cooks on stations, with board, per week | 10/ to 25/ | .. | 20/ to 25/ | 20/ to 30/ | 25/ | 17/6 | .. | 16/ to 30/ | 25/ to 30/ |
| 3. Artisan Labour (per day, without board). | |||||||||
| Masons | 8/ to 10/ | 8/ | 10/ to 12/ | 9/ to 12/ | 10/ | 10/ | .. | 10/ | 8/ to 10/ |
| Plasterers | 7/ to 8/ | 8/ | 10/ | 9/ to 12/ | 10/ | 10/ | 12/ | 8/6 to 11/ | 10/ to 12/ |
| Bricklayers | 7/ to 8/ | 6/ | 12/ | 9/ to 12/ | 10/ | 10/ | 12/ | 10/ to 10/6 | 12/ |
| Carpenters | 6/ to 8/ | 8/ | 9/ | 8/ to 10/ | 10/ | 8/ | 12/ | 9/ | 10/ |
| Smiths | 8/ to 9/ | 8/ | 10/ | 9/ to 10/ | 10/ | 7/ to 8/ | 10/ | 9/ to 10/ | 10/ to 12/ |
| Wheelwrights | 8/ to 10/ | 8/ | 10/ | 8/6 to 10/ | 10/ | 8/ to 10/ | 10/ | 10/ | 10/ to 12/ |
| Shipwrights | 8/ to 10/ | .. | 10/ to 12/ | 12/ | 10/ | 10/ | 10/ | 10/ to 11/ | 12/ |
| Plumbers | 9/ to 11/ | 8/ | 10/ | 8/ to 12/ | 10/ | 10/ | 10/ | 9/ | 8/ to 10/ |
| Painters | 8/ | 6/ | 8/ | 8/ to 10/ | 8/ | 10/ to 12/ | 10/ | 9/ | 8/ to 10/ |
| Saddlers | 7/ to 9/ | 8/ | 7/ to 10/ | 7/6 to 10/ | 8/ | 7/ to 8/ | 10/ | 7/6 to 9/ | 6/ to 10/ |
| Shoemakers | 6/ to 7/6 | 6/ | 6/ to 8/ | 7/6 to 10/ | 8/ | 7/6 | 10/ | 8/ to 10/ | 7/ to 10/ |
| Coopers | 5/ to 7/ | 6/ | 8/ to 10/ | 7/6 to 10/ | 8/ | 12/ | 10/ | 9/ | 9/ to 10' |
| Watchmakers | 8/ to 10/ | 8/ | 10/ to 12/ | 9/ to 15/ | 10/ | 9/ to 10/ | 15/ | 10/ to 11/6 | 7/ to 13/ |
| 4. Servants. | |||||||||
| Married couples without family, with board, per annum | £32 to £70 | £50 | £70 to £85 | £65 to £90 | £72 | £60 | .. | £60 to £75 | £60 to £80 |
| Married couples with family, with board, per annum | £30 to £60 | .. | .. | £65 to £85 | £60 | .. | .. | £45 to £60 | £50 to £75 |
| Grooms, with board, per week | 15/ to 20/ | 20/ | 25/ | 20/ to 25/ | 20/ | 25/ | 40/ | 20/ to 25/ | 15/ to 25/ |
| Gardeners: | |||||||||
| With board, per week | 10/ to 20/ | .. | 25/ | 20/ to 30/ | 30/ | 30/ | .. | 20/ to 30/ | 20/ to 30/ |
| Without board, per day | .. | 6/ | .. | 6/ to 8/ | 8/ | .. | 10/ | 7/ to 9/ | 7/ to 8/ |
| Cooks, with board, per week | 12/ to 20/ | 20/ | 15/ to 20/ | 12/ to 25/ | 30/ | 12/ | 25/ | 12/ to 30/ | 15/ to 20/ |
| Laundresses, with board, per week | 12/ to 20/ | 4/ per day without board | 10/ to 12/6 | 10/ to 16/ | 16/ | 15/ | 15/ | 11/ to 17/ | 12/ to 15/ |
| General house-servants, with board, per week | 8/ to 12/ | 10/ to 15/ | 10/ to 12/ | 10/ to 15/ | 12/ | 15/ | 15/ | 10/ to 12/ | 10/ to 15/ |
| Housemaids, with board, per week | 8/ to 10/ | 8/ to 12/ | 10/ to 14/ | 10/ to 15/ | 10/ | 8/ | 15/ | 8/ to 10/6 | 10/ to 15/ |
| Nursemaids, with board, per week | 4/ to 7/ | 3/ to 6/ | 6/ to 8/ | 8/ to 12/ | 6/ | 6/ | 10/ | 5/ to 8/6 | 5/ to 10/ |
| Needlewomen: | |||||||||
| With board, per week | 10/ to 15/ | .. | .. | 15/ | 12/ | 20/ | 20/ | 15/6 to 20/ | |
| Without board, per day | .. | 4/ | 2/6 to 5/ | 3/ to 4/ | .. | .. | 5/ | 4/ to 5/ | 3/ to 5/ |
| 5. Miscellaneous. | |||||||||
| General labourers, without board, per day | 5/ to 6/6 | 6/ | 7/ to 8/ | 6/ to 8/ | 7/ | 6/ to 7/ | 9/ | 7/ | 5/ to 7/ |
| Stonebreakers, without board, per cubic yard | 3/ to 3/9 | 4/ | 2/ to 2/6 | 2/6 to 3/6 | .. | .. | .. | 3/ | 2/ to 2/6 |
| Seamen, with board, per month | £610 to £7 | £5 | £7 | £5 to £7 | £7 | £7 | £4 to £8 | £310/ to £6 | £3 to £5 |
| Miners, without board, per day | 7/ to 8/ | 8/ | .. | 10/ | 8/ | 7/ to 8/ | 10/ | 10/ | 7/ to 9/ |
| Per day. | Per day. | Per week. | Per day. | Per day. | Per day. | Per day. | Per day. | Per day. | Per week. |
| Engine-drivers, without board | 7/ to 9/ | 8/ | 60/ | 9/ to 14/ | 8/ | .. | 12/ | 10/ | 10/ 40/ to 60/ |
| Tailors, without board | 6/ to 8/ | 8/ | 40/ to 60/ | 10/ Per week. 40/ to 50/ | 10/ | 7/ to 9/ | 60/ | 9/ | 8/ 50/ to 70/ |
| Tailoresses, without board | 1/ to 2/6 | 5/ | 18/ to 30/ | 15/ to 25/ | 6/ | 2/ to 6/ | 35/Per day. | 4/6 to 5/ | 3/ to 5/ 17/ to 40/ |
| Dressmakers, without board | 3/6 to 4/ | 6/ | 18/ to 25/ | 15/ to 40/ | 6/ | 1/ to 6/Per week. | 3/Per week. | 4/ | 3/ to 5/ 17/ to 30/ |
| Milliners, without board | 4/ to 6/* | 5/ | 15/ to 30/ | 20/ to 45/ | 6/ | 20/ | 40/ | 5/ to 7/ | 6/ 20/ to 40/ |
| Machinists, without board | 2/ to 3/ | 6/ | 27/ to 30/ | 15/ to 25/ | 8/ | 15/Per day. | 20/ | 3/6 to 5/ | 3/ to 5/ 15/ to 20/ |
| Storekeepers, without board | 6/ to 8/ | .. | 30/ to 60/ | 60/ | 8/ | 6/8 Per week. | 70/ | 7/ to 9/ | 8/ 40/ to 80/ |
| Storekeepers' assistants, without board | 4/ to 8/ | 5/ | 30/ to 48/ | 30/ to 50/ | 6/ | 30/ | 50/ | 7/ | 6/ 20/ to 50/ |
| Drapers' assistants, without board | 4/ to 8/ | 5/ | 30/ to 60/ | 30/ to 60/ | 8/ | 40/ | 60/ | 6/6 to 10/ | 6/ 20/ to 40/ |
| Grocers' assistants, without board | 4/ to 8/ | 4/ | 30/ to 60/ | 35/ to 50/ | 8/ | 40/Per day. | 50/ | 6/6 to 7/6 | 6/ 20/ to 50/ |
| Butchers, without board | 6/ to 7/6 | 8/ | 42/ | 30/ to 50/ | 8/ | 7/ | 50/ | 9/ | 8/ 40/ to 60/ |
| Bakers, without board | 7/ to 8/ | 8/ | 60/ | 40/ to 60/ | 8/ | 8/Per week. | 60/ | 9/ | 10/ 40/ to 60/ |
| Storemen, without board | 6/ to 7/6 | 5/ | 48/ to 70/ | 40/ to 60/ | 9/ | 45/ | 60/ | 7/6 to 8/ | 10/ 40/ to 60/ |
| Compositors, without board | 8/ | 8/ | 48/ to 60/ | 40/ to 60/10/ per day. | 8/ | 50/ to 60/ | 60/ | 10/ | 10/ 50/ to 70/ |
| Average Prices of Produce, Live-stock, Provisions, etc., in each Provincial District of New Zealand during the Year 1892. | |||||||||
|---|---|---|---|---|---|---|---|---|---|
| Produce, &c. | Auckland. | Taranaki. | Hawke's Bay. | Wellington. | Marlborough. | Nelson | Westland (Goldfield). | Canterbury. | Otago (Part Goldfield). |
|
* New potatoes on the 31st December, £8 per ton; 9s. 6d. per cwt. | |||||||||
| I. Agricultural Produce. | |||||||||
| Wheat per bushel (60lb.) | 3/ | 3/6 | 3/9 | 3/ to 4/ | 3/6 | 4/ | 3/3 | 2/6 to 3/ | 2/9 to 3/6 |
| Barley per bushel (47lb.) | 3/3 | 3/6 | 3/ | 3/ to 3/9 | 3/3 | 3/6 | 3/ | 2/9 to 3/6 | 1/6 to 2/8 |
| Oats per bushel (40lb.) | 2/6 | 3/ | 2/3 | 2/3 to 3/ | 2/ | 2/ | 2/6 | 1/9 to 2/ | 1/6 to 1/10 |
| Maize per bushel (56lb.) | 2/6 | 3/6 | 2/3 | 3/3 to 4/6 | 4/ | 3/6 | 3/ | 3/6 to 4/6 | 3/ |
| Bran per bushel (20lb.) | 1/ | 1/ | 1/ | 10d. to 1/6 | 1/ | 1/ | 1/ | 8d. to 10d. | 6 1/2d. to 9d. |
| Hay per ton | £4 | £4 | £3 | £4 to £4 10/ | £3 | £4 £4 | £2 12s. 6d. to £3 | £2 to £2 10/ | |
| II. Flour and Bread. | |||||||||
| Flour, wholesale per ton of 2,000lb. | £10 to £11 | £11 10/ | £10 | £10 to £11 | £9 10 | £9 10 | £10 | £9 to £9 15/ | £9 10/ |
| Flour, retail per bag of 50lb. | 4/9 | 7/ | 6/3 | 6/ to 6/9 | 5/6 | 6/9 | 6/ | 5/ to 5/6 | 5/6 |
| Bread per 41b. loaf | 7d. | 7d. | 6d. | 6d. to 7d. | 7d. | 7d. | 7d. | 5d. | 6d. |
| III. Live-stock and Meat. | |||||||||
| Horses, draught per head | £20 to £25 | £15 | £20 to £45 | £18 to £25 | £20 to £30 | £30 | £30 | £12 to £18 | £15 to £25 |
| Horses, saddle and harness per head | £15 | £3 to £10 | 30/ to £30 | £6 to £15 | £10 to £16 | £20 | £17 10s. | £8 to £12 | £12 to £18 |
| Cattle, fat per head | £8 | £6 | £6 10/ | £5 to £8 | £5 to £7 | £6 10 | £10 | £6 to £7 | £6 10/to £7 |
| Cattle, milch cows per head | £6 | £6 to £10 | .. | £4 to £8 | £4 to £6 | £5 | £7 | £4 to £8 | 70/ to 90/ |
| Sheep, fat per head | 12/ | 13/ | 12/ | 10/ to 13/ | 8/ to 10/ | 11/ | 17/ | 12/ to 15/ | 14/ to 15/ |
| Lambs, fat per head | 10/ | 10/ | 7/6 | 8/6 to 9/ | 8/ to 9/ | 10/ | 14/ | 10/ to 11/ | 9/ to 12/ |
| Butchers' meat: | |||||||||
| Beef per lb. | 6d. | 2d. to 5d. | 4d. | 3 1/2d. to 5d. | 3d. to 6d. | 4d. | 5d. | 5d. | 4d. |
| Mutton per lb. | 4d. | 2d. to 4d. | 4d. | 3 1/2d. to 4d. | 3d. to 6d. | 3 1/4d. | 5d. | 3d. | 3d. to 3 1/2d. |
| Veal per lb. | 6d. | 5d. | 4d. | 4d. to 6d. | 2d. to 5d. | 3 1/2d. | 5d. | 4d. to 6d. | 3 1/2d. to 4d. |
| Pork per lb. | 4 1/2d. | 6d. | 4 1/2d. | 5d. to 6d. | 4d. to 6d. | 4d. | 5d. | 4d. to 6d. | 5d. to 6d. |
| Lamb per lb. | 3/ per qr. | 5d. | 5d. | 6d.; 3/per qr. | 4d. to 6d. | 4d. | 6d. | 5d. to 9d. | 4 1/2d. to 5d. |
| IV. Dairy Produce. | |||||||||
| Butter, fresh per lb. | 10 1/4d. | 10d. | 1/ | 10d. | 8d. | 8d. | 1/3 | 9d. to 11d. | 10d. |
| Butter, salt per lb. | 6d. | 8d. | 8d. to 9d. | 8d. to 9d. | 6d. | 7d. | 1/ | 6d. to 7d. | 7d. to 9d. |
| Cheese, colonial per lb. | 5d. | 6d. | 7d. | 6d to 8d. | 6d. | 7d. | 7d. | 5d. | 5d. to 6d. |
| Cheese, imported per lb. | 2/ | .. | 1/3 | 10d. to 1/3 | .. | 1/ | 1/6 | 1/ | 1/6 |
| Milk per quart | 3d. | 3d. | 3d. | 3d. to 4d. | 3d. | 4d. | 6d. | 3d. to 3 1/2d. | 3d. |
| V. Farm-yard Produce. | |||||||||
| Geese per pair | 8/to 10/ | 5/ | 8/ | 5/to 9/ | 6/ | 5/ | 7/6 | 5/to 7/ | 7/ |
| Ducks per pair | 4/ to 5/ | 3/6 | 4/ | 3/6 to 4/6 | 3/ | 4/6 | 5/ | 3/6 to 4/6 | 4/ to 5/ |
| Fowls per pair | 4/ | 2/6 | 3/ | 2/6 to 3/9 | 2/6 | 2/6 | 3/ | 2/6 to 3/6 | 2/6 to 3/ |
| Turkeys per head | 4/ to 5/ | 5/ | 5/ | 3/ to 5/6 | 5/ | 3/ | 7/6 | 5/ to 7/ | 5/ to 7/ |
| Bacon per lb. | 6d. to 8d. | 6d. | 6 1/2d. to 7d. | 6d. | 8d. | 7d. | 7d. to 8d. | 6d. to 7d. | |
| Ham per lb. | 10d. | 8d. | 7d. to 9d. | 9d. to 10d. | 8d. | 10d. | 10d. | 8d. to 10d. | 8d. to 9d. |
| Eggs per doz. | 10d. | 1/ | 1/3 | 1/2 to 1/3 | 8d. | 8d. | 1/6 | 9d. to 10d. | 9d. to 1/ |
| VI. Garden Produce. | |||||||||
| Potatoes, wholesale per ton | £2/10 | £3 | £1/12/6 | £5 to £6/10 | £4 | £4 | £4 | 22/6 to 25/ | 30/ to 40/* |
| Potatoes, retail per cwt. | 3/6 | 3/ | 5/ | 6/ to 8/6 | 6/ | 6/ | 5/ | 1/6 | 2/ to 2/6 |
| Onions per lb. | 1d. to 3d. | 3d. | 2d. | 3/4d. to 2d. | 2d. | 1d. | 2d. | 1d. to 2d. | 1d. |
| Carrots per doz. bnchs. | 9d. | 1/ | 1/6 | 1/ to 2/ | 1/ | 2/ | 3/ | 1/6 to 2/ | 1/ to 1/6 |
| Turnips per doz. bnchs. | 9d. | 1/ | 1/6 | 1/6 to 2/ | 1/ | 2/ | 3/ | 1/6 to 2/ | 1/ to 1/6 |
| Cabbages per doz. | 1/ to 1/6 | 1/ | 1/ | 1/ to 2/ | 2/ | 3/ | 3/ | 1/6 to 2/ | 1/6 |
| VII. Miscellaneous Articles. | |||||||||
| Tea per lb. | 2/6 | 2/ to 3/ | 1/6 to 3/ | 2/ to 3/6 | 2/6 | 2/6 | 2/3 | 1/9 to 2/6 | 2/ |
| Coffee per lb. | 1/6 | 1/10 | 1/4 to 1/9 | 1/6 to 2/ | 1/6 | 1/10 | 1/9 | 1/6 | 1/8 to 1/10 |
| Sugar per lb. | 3d. | 3d. | 3d. to 3 1/2d. | 3d. to 3 1/2. | 3 1/2d. | 3d. | 3d. | 3d. | 3d. |
| Rice per lb. | 2 1/2d. | 2d. | 3d. | 3d. | 3d. | 3d. | 3d. | 2 1/2d. to 3d. | 3d. |
| Salt per lb. | 1/2d. | 1d. | 1d. | 1d. to 1 1/2d. | 1d. | 1d. | 1 1/2d. | 1d. | 1d. |
| Soap per cwt. | 12/ | 28/ | 13/ to 24/ | 15/ to 26/ | 20/ | 16/ | 17/6 | 14/ to 15/ | 15/ to 20/ |
| Candles per lb. | 6d. | 8d. | 6d. to 1/ | 7d. to 10d. | 10d. | 9d. | 8d. | 6d. to 8d. | 7d. |
| Tobacco per lb. | 5/3 | 5/6 | 5/2 to 6/ | 5/ to 6/ | 6/6 | 6/ | 6/ | 5/ to 5/6 | 5/ to 5/4 |
| Coal per ton | 25/ | 40/ | 38/ | 34/ to 50/ | 45/ | 30/6 | 25/ | 30/ to 32/ | 20 to 32/ |
| Firewood per cord | 12/ | 20/ | 35/ | 16/ to 40/ | 24/ | 22/6 | 25/ | 25/ to 30/ | 20/ |
| VIII. Beer, Wine, Spirits. | |||||||||
| Beer, colonial per hhd. | £4 6s. 6d. | £5 | £4 15/ | £4 5/to£4 10/ | £4 13/ | £5 | £4 15/ | £4 to £4 10/ | £4 10/ to £5 |
| Beer, English, bottled per doz. qts. | 13/6 | 16/ | 14/ | 13/ to 15/ | 12/6 | 14/ | 14/ | 12/6 to 15/ | 12/ to 13/ |
| Brandy per gallon | 28/ | 30/ | 30/ | 29/ to 36/ | 25/ | 25/ | 25/ | 26/ to 27/6 | 25/ to 26/ |
| Rum per gallon | 28/ | 27/6 | 25/ | 23/ to 28/ | 25/ | 22/6 | 23/ | 23/ to 26/ | 22/ to 25/ |
| Whisky per gallon | 28/ | 30/ | 30/ | 27/ to 30/ | 26/ | 24/ | 24/ | 26/ | 25/ |
| Gin per gallon | 22/ | 25/ | 20/ | 22/ to 28/ | 20/ | 17/6 | 25/ | 22/6 to 26/ | 24/ to 25/ |
| Wine, Australian per gallon | 20/ | 17/6 | 15/ | 17/ to 18/ | 15/ | 13/6 | 15/ | 9/6 to 15/ | 15/ to 16/ |
| Wine, European per gallon | 20/ | 25/ | 20/ to 30/ | 22/ to 23/ | 16/ | 15/6 | 18/ | 20/ to 25/ | 20/ to 25/ |
New Zealand fishes resemble those which are found on the coast between Madeira and the Bay of Biscay more than they do those which are caught about the shores of Great Britain. Of the sea-fishes that are used as food in New Zealand, we have among the constant residents on all parts of our coast the hapuku, tarakihi, trevally, moki, aua, rock-cod, wrasse, and patiki; and, while the snapper, mullet, and gurnet are only met with in the north, the trumpeter, butterfish, and red-cod are confined to the south. But, with the exception of the patiki, or flounder, and the red-cod, none of these represent fishes common even in the south of England; while from the more northern seas similar fishes are altogether absent.
In addition to those which remain throughout the year, a very large number of the fishes of the New Zealand coast, owing to its geographical position, are pelagic in their habits, and roam over a wide range of ocean, visiting these shores only irregularly in pursuit of food. Of the edible fishes of this class by far the larger number are visitors from warmer latitudes, such as the frostfish, barracouta, horse-mackerel, kingfish, dory, warehou, mackerel, and garfish; while, of more southern types, only the ling, hake, haddock, and a few other fishes rare and worthless as food, reach as far as the New Zealand coast in their migrations.
There is, however, no reason to complain of any want of useful variety in the New Zealand fishes as compared with Britain, for we find that out of 208 species of fishes enumerated as occurring in the British seas, including many which are extremely rare or only occasional visitors, only 40 are considered to have a marketable value. In New Zealand, notwithstanding our very imperfect knowledge (especially with regard to the gregarious tribes, which there is reason to believe inhabit shoals at some distance from land), out of 192 sea-fishes, some of which are only known from single specimens, we have nearly as many varieties used for food as are brought to market in the British Islands.
Of 142 species of fish enumerated as found in New Zealand, 67 species are, so far as we know, peculiar to New Zealand; 75 are common to the coasts of Australia or Tasmania; while 10 species are found in New Zealand and other places, but not in the Australian seas. New Zealand ichthyology thus presents a very distinct character, the thorough deciphering of which affords a wide field for future observation and scientific research.
The following is a list of the fishes which are chiefly met with in the market: Hapuku, kahawai, red-snapper, snapper, tarakihi, moki, trumpeter, frostfish, barracouta, horse-mackerel, trevally, kingfish, warehou, mackerel, rock-cod, gurnard, mullet, sea-mullet, butterfish, haddock, red-cod, whiting, ling, flounder or patiki, sole, garfish, grayling, smelt, kokopu, sardine, sprat, eel (tuna), black-eel, conger-eel, and silver-eel.
A considerable industry has sprung up of recent years in canning and preserving fish. The fish that is principally used for canning is the mullet, which is caught in large quantities in the Auckland district. The total value of fish exported (potted, preserved, dried, pickled, salted, and frozen) during last year amounted to £7,717.
Oysters exist in considerable quantities, the rock-oyster being found in the Auckland district, the deep-sea oyster principally in Foveaux Strait, where the process of dredging for them finds employment for a number of small vessels. 673,020 dozen of oysters, of the value of £3,795, were exported last year.
At the census of 1891 returns were received from 253 fishing industries, employing 667 persons. The boats used were 418 in number, and the tonnage 788; 1,340 nets were in use. For oyster-dredging, 13 boats and 22 dredges were employed.
The fur-seal is found on the islands near the coast of New Zealand, but may not now be killed.
The sperm-whale is found in the region of the ocean lying to the north-east of the colony. The harbours of New Zealand were formerly visited by whalers, for the purpose of refitting, carrying on shore-fishing, and barrelling their oil. The industry is not a great one at the present time, being only carried on by a few shore parties, the export for 1892 having been: Whale-oil—sperm, 3,100gal.; black, 1,572gal.; whalebone, 29cwt.
There have been few, if any, more successful instances of the introduction of exotic forms of life than that afforded by the importation of trout in New Zealand. From a few hundred ova imported in 1867, 1868, and 1869 have sprung the countless numbers that now inhabit many of our rivers. Trout were first introduced into the colony from Tasmania. In 1867 a few hundred were procured, but, of the fry that were hatched out, nearly all appear to have been lost. In 1868 and 1869, however, further shipments were procured and hatched out at the fish-ponds at Opoho, near Dunedin, and at Christchurch. The fish reared from these ova are the parents of the fish now inhabiting our streams, although more recently ova of the Loch Leven and Scotch brown-trout have been introduced, as also a few salmon-trout. It appears to be impossible to trace from what stream in England the trout now in the colony originated; the ova imported into Tasmania were produced from the Wycombe, Bucks; from the Wey, at Acton, Hants; and from Alsford, on the Itchen, Hants; but to which ova the descent of our trout is to be attributed is not now ascertainable.
Fish-hatcheries are now established at several places, the most important being those at Clinton, in the Middle Island (Otago Acclimatisation Society), and at Masterton, in the North Island (Wellington Acclimatisation Society). From these and other hatcheries many thousand young fry and eyed ova are turned out annually; for instance, in 1891–92, 502,760 were turned out by the Otago Society, 425,291 by the Wellington Society, and 201,500 by the Southland Society. The total number of all kinds of trout (including eyed ova) distributed by the Otago Society up to the 31st March last was 4,498,774. These fry are used both to replenish the supply in rivers where trout have already been placed and to stock new waters. Owing to the large quantity of food in New Zealand waters the trout have reached a very great size. Many large fish are caught in Lake Wakatipu by means of nets; but they do not readily take bait in the New Zealand lakes. Large trout are killed in the rivers with rod and line; the largest known to have been so caught was one of 26 1/2lb., killed in Hall's Creek, running into Lake Ellesmere.
The following is a record of one day's fishing at the mouth of the Rakaia, on the 22nd September, 1891: 30 fish, 171lb. 12oz., the largest weighing 11lb.
There is reason to believe that the average size of trout in many rivers will diminish as they increase in numbers.
The habit of the trout appears to have changed considerably since their introduction into New Zealand. The large trout live in the estuaries, and only run up the rivers for the purpose of spawning. Many have also been caught in the sea. These trout, as also the trout found in most of the lakes, are excellent eating.
Besides the common brown-trout (Salmo fario, var. ausonii), the rainbow-trout (Salmo irideus) has been introduced into the Auckland waters, where the temperature of the water is more suited to it than to the brown trout.
Other varieties of trout have also been introduced in New Zealand—namely, the Loch Leven trout (a very fine fish found in Loch Leven), and the Burn trout; but there is reason to believe that these trout will, owing to the feed and climate, merge into one variety.
The American brook-trout (S. fontinalis) has also been introduced in considerable numbers to many streams, but, apparently, without much success, as, except in one or two streams, but few have ever been caught. It would appear that they go to sea and do not return to the rivers.
Besides trout, carp, tench, and perch have been introduced, the last-named of which appears to have been most successful.
In order to fish for trout it is necessary to procure a license from an acclimatisation society. The fee is £1, and it is practically applicable to the whole of New Zealand, as it will be endorsed to make it available in any district. The open season extends from the 1st October to the 31st March.
Table of Contents
The discovery of metalliferous ore and minerals in New Zealand was made shortly after gold was found in Australia. It is said that Mr. Hargreaves, the first discover of gold in New South Wales, before visiting that colony, asserted to several people in the Auckland District that gold would be found there, as the formation of the country reminded him of California, where he had previously been. It was not, however, until 1852 that the discovery of auriferous deposits was made generally known by Mr. C. Ring, of Coromandel, who obtained a small quantity of gold, intermixed with quartz, in a creek which now bears his name; but the hostility of the Natives prevented further discovery until 1862, when the district was proclaimed a goldfield.
In the Middle Island, small samples of gold were discovered in the Otago District in 1853, at a place known as the Fortifications, which is now in the West Taieri goldfield. Intimation of gold being found in this district was officially given by Mr. C. W. Ligar, then Surveyor-General of the colony, to Captain Cargill, the then Superintendent of Otago; and afterwards, on several occasions, rumours were circulated that gold was found in the beds of several of the creeks and streams in the interior of Otago, and small parcels were occasionally brought to Dunedin. But at that time the gold-diggings attracted little or no attention in this colony.
The first payable goldfield was at Collingwood, in the Nelson District, which was opened in 1857; and in that year 10,437oz. of gold were produced. Owing, however, to the small population at that time in the colony, together with the great attraction presented by the Australian goldfields, very little attention was given to the gold discoveries in New Zealand. From 1857 up to 1861, when gold was discovered at Tuapeka, or Gabriel's Gully, in Otago, the produce of the Collingwood goldfield amounted only to 41,872oz. of gold.
Gold was previously discovered in the early portion of 1861 in the vicinity of the Lindis River. The Provincial Government at that time were constructing a road to give access to the pastoral districts beyond the Lindis Pass, when the workmen came, accidentally, on an auriferous deposit, which gave fair prospects of its becoming a valuable discovery; but the general yield of gold from this portion of the Otago District has never been great.
Shortly after the discovery of gold at the Lindis, Mr. Gabriel Read, who had formerly been digging on the Victorian goldfields, found gold in Gabriel's Gully, where the auriferous deposits were so rich and so easily worked that the discovery flashed like lightning throughout the whole of the Australian goldfields, which at that time were beginning to be on the wane; and thousands of miners on the Australian soil quickly collected all their belongings, which in those days were easily carried, and came to New Zealand to try and better their fortunes. It may be mentioned that the first real discoverer of gold in payable quantities for working was Mr. Edward Peters, a native of Bombay, who, in 1858, found gold in the south branch of the Tokomairiro River, known afterwards as the Woolshed diggings, and who stated at that time that the ground was payable for working, showing a good sample of gold that he had obtained. Subsequently, the same person found gold in a gully near the north bank of the Tuapeka River, not far from the afterwards celebrated Gabriel's Gully, discovered at a later date by Mr. Gabriel Read, and which was the means of bringing thousands of people to the country who never otherwise would have come. In Mr. Read's report of the discovery to Major Richardson, Superintendent of Otago, he states:—
I take the liberty of troubling you with a short report of the result of a prospecting tour which I commenced about a fortnight ago. During that period I travelled inland about thirty-five miles, and examined the ravines and tributaries of the Waitahuna and Tuapeka Rivers. My equipment consisted of a tent, blanket, spade, tin dish, butcher's knife, and about a week's supply of provisions. I examined a large area of country, washed dishfuls of earth in different localities, and found gold in many places, which would hold out a certainty that men with proper appliances would be munificently remunerated. In one place, for ten hours' work, with pan and butcher's knife, I was enabled to collect about 7oz. of gold.
This discovery was made known in June, 1861, and by the end of December in that year 187,696oz. of gold, representing a value of £727,321, were produced from this locality alone; and the population of Otago had increased in six months from 12,000 to 30,000.
As soon as the rush set in to Gabriel's Gully, Weatherstone, Munroe's, and Waitahuna Gullies were opened; and early in 1862 further auriferous deposits were found at Waipori and the Woolshed; the latter being the place which, three years previously, Mr. Edward Peters reported would pay for working. Discoveries of smaller extent were afterwards found at Turnbull Gully, Deepdell Creek, Fillyburn, and Murphy's Gully.
In August, 1862, Messrs. Hartley and Reilly arrived at Dunedin with 1,047oz. gold, which they found by cradling and washing the sands on the beaches of the Clutha River, between the sites of the present towns of Clyde and Cromwell. As soon as this became known the excitement was so great that men left lucrative employment and comfortable homes to follow the life of a digger. Prices of agricultural produce and food of all descriptions went up, and the demand for teamsters was so great to take goods and tools to this new Eldorado that £120 per ton was paid for the carriage of goods from Dunedin; and on the arrival of the first wagon with flour, at Mr. Sheenan's station, nine miles from the diggings, it was surrounded by a crowd of miners from the field, when the whole of the flour was handed out and equally distributed to the crowd at 2s. 6d. a pannikinful. The demand for sawn timber was also so great that boards were stripped from drays and wagons, and sold, the usual price for an empty gin-case being £5. Every one at that time was thoroughly satisfied with his earnings—the beaches along the river were literally strewn with golden sand. But this state of things did not last long. As soon as the snow on the mountains began to melt, the water in the river rose to a vertical height of from 16ft. to 20ft., covering all the auriferous gravel-beaches, leaving those who had been previously at work in a very despondent state. By this time a large mining population had gathered on the field, and they turned their attention to the beds of the different streams and creeks flowing into the Clutha River, and almost immediately rich deposits of auriferous drift were discovered at Conroy's, Butcher's, Potter's, and Campbell's Gullies, also at Bannockburn, Cardrona, Arrow, Shotover, Skipper's, Nokomai, and the Nevis, all of which have largely contributed to the product of gold. Before the end of December, 1862, over 70,000oz. of gold were forwarded by escort from Dunstan alone—which was then the general name given to Clyde—to Dunedin.
In March, 1863, and following months, the Teviot, Benger, and Upper Manuherikia goldfields were opened up; and in May of the same year another important discovery was made by Mr. W. Parker, at Hogburn, which afterwards led to further discoveries of auriferous drifts at Hill's Creek, Dunstan Creek, Kyeburn, Hyde, Hamilton's, Macrae's, and Mount Burster. This last place is at so high an elevation (nearly 4,000ft. above sea-level) that the rich auriferous deposits existing there can be worked only for about six or seven months in the year.
Further discoveries have been made from time to time of auriferous deposits at Cambrian, Tinker's, Matakanui, Round Hill, Orepuki, and, in recent years, at Mount Criffel—the latter being 4,000ft. above sea-level—where are found some of the oldest drifts that exist in the Otago District. Gold intermixed with platinum has also been found on the beaches of the Waiau River, south of Orepuki,
About the end of 1863 gold was found at Wakamarina, in the Marlborough District, where some very rich finds were obtained from the beds of the Deep Creek, Dead-horse Creek, and the Wakamarina River. This field still continues to support a small mining population.
Early in 1864 a party of Maoris, while searching for greenstone—which was formerly used by them for making tomahawks and adzes, and is still highly prized as an ornament—found gold in the bed of the Greenstone River, on the west coast of the Middle Island. This discovery led to a large rush taking place from other parts of New Zealand, and also from the Australian Colonies. This portion of the colony, which was at that time in its natural state, covered with a dense forest and tangled undergrowth, has now a European population of about 33,000, all of whom are either directly or indirectly supported by the mining industry.
As soon as the rush set in to the West Coast, the auriferous deposits at Waimea, Kanieri, Blue Spur, and Jones's (now known as Ross), were discovered; and these led to further discoveries in the Grey Valley, No Town, Red Jack's, Noble's, Orwell Creek, Antonio's, Maori Gully, Lyell, Charleston, and Brighton; the last extensive field opened up on the West Coast being Kumara, where a large population has been employed for the last fourteen years, and where gold to the value of about £1,199,000 has been taken from within a comparatively small area—a compass of 2,500 acres—the actual gold-workings not exceeding 600 acres.
During the early period of mining in the colony gold-mining operations were chiefly confined to alluvial drifts. This was especially the case in regard to mining in the Middle Island; but in the North Island all the gold has been obtained from quartz lodes. In July, 1867, gold was discovered in a creek-bed at the Thames in pieces of quartz, and on the 10th August of the same year Messrs. Hunt, White, Clarkson, and Cobley found a very rich leader of auriferous quartz in the Kuranui Stream. This led to discoveries of vast quantities of gold in the Shotover, Moanataiari, Long Drive, Caledonian, and other claims. The dividends from the Caledonian claim in one year amounted to about £657,000. Several years later gold-bearing lodes were discovered at Karangahake, Waitekauri, Waihi, Te Aroha, and Kuaotunu; and at the present time some of the mines at Karangahake and Waihi are giving excellent returns. The average value of the ore for three months' crushing from the Crown claim at Karangahake was about £15 per ton from a very large lode.
In 1872 the Reefton field was discovered; and since then, up to the end of December, 1892, a period of nearly twenty years, 540,324 tons of quartz have been crushed, which yielded an average of an ounce to the ton. The total value of gold produced from this field, both from quartz and alluvial workings, is about £2,127,384, out of which dividends have been paid by quartz companies to the extent of £510,597. The lodes in this district are not particularly rich, but large bodies of ore exist which can be made to pay for working, with proper machinery and appliances.
The following table shows the quantity and value of gold entered for duty for exportation from the colony up to the 31st March, 1893; but this does not necessarily show the whole of the gold produced, as no doubt a considerable quantity has been taken out of the colony from time to time by private individuals who have evaded the duty, and a considerable quantity also manufactured into jewellery and ornaments:—
| Quantity. | Value. | |
|---|---|---|
| oz. | £ | |
| Auckland | 1,737,525 | 6,516,533 |
| Wellington | 188 | 706 |
| Marlborough | 76,856 | 298,618 |
| Nelson | 242,803 | 961,402 |
| West Coast | 5,333,135 | 21,186,097 |
| Canterbury | 48 | 192 |
| Otago | 4,969,687 | 19,633,110 |
| Total | 12,360,242 | 48,596,658 |
From this it will be seen that Auckland contributed about 13.4 per cent.; Wellington, Nelson, Marlborough, and Canterbury, 2.6 per cent.; West Coast, 43.5 per cent.; and Otago, 40.5 per cent. of the gold produced.
It is only a few years ago since people began to look for argentiferous ore. In 1885 Mr. La Monte came to this colony for the purpose of erecting a smelting-furnace to treat the auriferous ores found on the Hauraki Peninsula by the same process that he had adopted at Sunny Corner, in New South Wales; and, on examining the lodes in the Karangahake district, he found rich argentiferous ore being thrown over the mullock-tips. This fact, together with the technical education which has since been given at the Schools of Mines, has induced the miners in the northern districts to search for silver as well as gold; and within the last two years a considerable quantity of bullion has been exported. All the gold found in the North Island contains a considerable percentage of silver, but it is purchased by the banks for the value of the gold according to assay, the silver being afterwards separated; the only silver, therefore, hitherto exported is that which has been separated by the banks. At Waihi and Karangahake from about three-fourths to one-half of the bullion is silver; and at the Thames and Coromandel the gold sold to the banks contains about one-fourth of the weight in silver. The price given for gold varies from £2 13s. to £3 per ounce. Recently, a large number of argentiferous lodes have been found at Puhipuhi, but these have not yet been properly prospected, and the method employed for extracting the silver from the ore, which contains about 98 per cent. of silica, has hitherto been very crude. Only 100 tons of ore have yet been treated, which produced about 1,200oz. of silver. Silver-ore is also found in the Collingwood district, and at Mount Rangitoto, on the West Coast, but no systematic method of mining has been ever carried on at either of these places. The total quantity of silver exported up to the end of December last was 604,686oz., representing a value of £144,144.
Copper-ore has been found and worked in different parts of the colony. An English company in the early period of the colony's history worked a lode on the Island of Kawau for some time. Copper-ore has also been worked on the Great Barrier Island, near Auckland; at the Dun Mountain, and also in the vicinity of the Roding River in the Nelson District. Lodes occur also in D'Urville Island, Cook Strait; in several places on the West Coast; and at Waitahuna, Waipori, and Moke Creek, in the district of Otago. A considerable quantity of native copper was found at the Dun Mountain and in the vicinity of the Roding River, but not sufficient to pay the great cost of transit to a port of shipment. A good deal of copper-pyrites is found in some of the auriferous and argentiferous lodes in the North Island, associated with galena and zinc-blende; and at the present time prospecting operations are being carried on at Maharahara, in the district of Napier, on a large lode containing copper-ore. Recently, a lode of chalcopyrite ore has been discovered in the Whangaroa County, in the Auckland District, which averages fully 6ft. in width. It was lately examined by Mr. Alexander McKay, F.G.S., Assistant Geologist, and samples of it brought by him, which were tested at the Colonial Laboratory, gave 31 per cent. of copper. This is apparently the best lode as yet discovered in the colony. The quantity of copper-ore exported up to the end of December last was 1,394 tons, having a value of £17,866.
Antimony-ore is found associated with gold and silver in quartz lodes in a great many places in the colony, mainly at Puhipuhi, Thames, and Te Aroha, in the Auckland District; and in the Middle Island at Reefton, and at Langdon's, near Brunnerton, on the West Coast, and also in several localities in the Otago District. There is a company at the present time working at a large lode of antimony at Endeavour Inlet, which is likely to prove remunerative to the owners. A sulphide lode occurs a few miles south of Collingwood, which contains, on assay, about 1860z. of silver to the ton. The total quantity of ore and star antimony exported from the colony up to the end of December last was 3,150 tons, representing a value of £46,040.
Large deposits of manganese-ore occur in different portions of the colony; and in many places it is worked with profit in the North Island, where adjacent to a harbour for shipment. Deposits of this ore are worked successfully at the Island of Waiheke, Puerua Bay, Helena Bay, and Mangapai. Formerly, large quantities were got at the Bay of Islands. There is also a deposit of good ore at Hikurangi, but the cost of transit from the latter place to a port of shipment prevents it from being worked successfully. In 1890, some 320 tons of ore were obtained from the Island of Kawau, and it is said that the deposit there is likely to be soon reworked. Ores are also found in Wellington, Napier, and Otago; and at Port Hardy, in D'Urville Island. Recently, W. Jaffray and Company, of Sydney, have leased a portion of Waiheke Island, and are said to have entered into arrangements to supply 2,000 tons per annum from this place. The total quantity of manganese-ore exported up to the end of December last was 16,977 1/2 tons, representing a value of £55,164.
This ore is chiefly associated with magnesian rock. Previous to 1867, lodes of this mineral were worked in the vicinity of Aniseed Valley and the Dun Mountain, District of Nelson. The total quantity of ore exported has been 5,666 tons, having a value of £37,367. In recent years no work has been done on any of these lodes.
This occurs as galena, in different districts. It generally contains a certain percentage of silver; on the Hauraki Peninsula it occurs in auriferous lodes, and is generally associated in this locality with zinc-blende, as at the Champion Mine, Tui Creek, and Sylvia Mine, Tararu Creek. At Wangapeka, and between there and the Owen Reefs, some of the quartz lodes carry a large percentage of galena. It is also found in the Collingwood district, where, at Richmond Hill, there is an argentiferous lode which gives an assay value of £50 per ton. The ore also occurs in quartz lodes at Mount Rangitoto, and further southwards, in the Westland District.
There are large deposits of iron-ore in the colony, of various kinds, such as impure magnetite at Manukau, Auckland, containing 70 per cent. of iron; bog-iron ore, at Spring Swamp, Auckland, which has 51 percent., and brown-iron ore at Raglan, with from 46 to 51 per cent. of iron. There is also magnetite and hámatite at Dunstan, Otago, and at the Dun Mountain, Nelson, which varies from 62 to 68 per cent. of iron. There is a large deposit of hámatite at Parapara, with bituminous coal within four miles of it, and alongside the hámatite is a belt of limestone, the whole of these being within a mile of the ocean-beach, where large vessels could be brought if a wharf were erected. This hámatite contains from 42 to about 60 per cent. of iron. There are also deposits of hámatite near Kamo, in the Whangarei District, and also in the Tararu Creek, at the Thames. On the ocean-beaches on the west coast of both Islands large quantities of magnetic ironsand are found, showing that there is abundance of iron-ore in the colony.
This mineral exists in many parts of the colony, especially in alluvial drifts. In very few instances has it been found in situ. Rounded pellets of cinnabar are to be observed among the auriferous drift-gravels at Waipori, and between there and Waitahuna. It was also discovered recently at Puhipuhi, by Mr. A. McKay, F.G.S., Assistant Geologist, amongst the loose drift in the bed of a gully. At Tui Creek, near Te Aroha, cinnabar is found in the centre of a large lode of quartz, which also contains gold, silver, galena, and zincblende; and, on the opposite side of the Te Aroha Range, it has been found in the bed of the Waiorongomai Stream. Again, at Ohaeawai, in the Bay of Islands County, there are large deposits of cinnabar in the vicinity of the hot pools, where pure quicksilver can be seen, in minute particles, amongst the black mud, having been extracted from the ore through condensation on coming in contact with the vapour, and exposure to the atmosphere. Prospecting for this ore is now being carried on at Ohaeawai, and a lode has recently been struck, but so far it is of a rubbly character.
Tin-ore is found widely distributed amongst the gravel-drifts in the neighbourhood of the Remarkables, in Stewart Island; and a lode occurs following the ridge of these mountains which also contains wolfram. But none of the deposits yet found will pay for working at the present time.
About thirty years ago mineral oils were found in the colony, or, rather, traces of them. A very thick, heavy petroleum oil—more of a lubricant than an illuminant—was found oozing out on the sea-beach, near the Sugar Loaves, at New Plymouth. Petroleum was also found many years ago near Gisborne, as well as near the East Cape. According to the analyses of these oils made in the Colonial Laboratory, all taken at a temperature of 60°, the sample from New Plymouth had a specific gravity of 0.96, while that from Gisborne and the East Cape had a specific gravity of 0.83 and 0.84 respectively. Bores have been put down at each of the places named, the deepest of which was at the East Cape, being about 1,700ft.; the one near Gisborne, about 1,320ft.; and the one at New Plymouth, 930ft.; but no steady supply of oil was got in any of them. Recently some gentlemen have taken up a lease of land for mineral oil about twenty miles from Rotorua, near Waiotapu Valley. Large quantities of petroleum can be seen at one place on the top of some of the hot pools.
The vast extent of coal-measures in New Zealand will make coal-mining one of the largest industries in the colony, especially on the west coast of the Middle Island, where bituminous coal exists equal, if not superior, to that found in any part of the world. The super-excellency of this coal was fully tested on H.M.S. “Calliope” during a hurricane at Samoa, about four years ago, when by its aid she steamed out of the roadstead, the German and American warvessels being torn from their anchorages and driven upon the beach.
The coal-mining industry has hitherto been limited to the demand for coal within the colony. The present state of our harbours on the west coast of the Middle Island, where our large bituminous coalfields exist, will not permit of sufficient quantity being shipped on one bottom to a foreign market, so as to be able to compete successfully with coal from New South Wales and other countries in the world. But the harbour-works now in course of construction, when completed, will enable coal-mine proprietors in the colony to compete with those of other countries in foreign markets. This refers specially to bituminous coal, which, so far, has only been found on the west coast of the Middle Island.
A semi-bituminous coal is also found at Kawakawa, near the Bay of Islands, and recently two mires have been opened up at Hikurangi, some distance to the south. From the Kawakawa mine most of the workable coal has been taken out, but there is an extensive field of semi-bituminous coal between Hikurangi and Hukerenui awaiting development.
The following table will show the progressive increase in the output of coal from 1878 to the end of 1892:—
| Year. | Raised in the Colony. | Imported. | Total raised in the Colony and imported per annum. | Exported. | Total consumption of coal within the Colony. | Yearly increased Consumption within the Colony. | |
|---|---|---|---|---|---|---|---|
| Total | Yearly Increase. | ||||||
|
*Shows a decreased consumption from that of the former year. | |||||||
| Tons. | Tons. | Tons. | Tons. | Tons. | Tons. | Tons. | |
| 1878 | 162,218 | .. | 174,148 | 336,366 | 3,921 | 332,445 | .. |
| 1879 | 231,218 | 69,000 | 158,076 | 389,294 | 7,195 | 382,099 | 49,654 |
| 1880 | 299,923 | 68,705 | 123,298 | 423,221 | 7,021 | 416,200 | 34,101 |
| 1881 | 337,262 | 37,339 | 129,962 | 467,224 | 6,626 | 460,598 | 44,398 |
| 1882 | 378,272 | 41,010 | 129,582 | 507,854 | 4,245 | 503,609 | 43,011 |
| 1883 | 421,764 | 43,492 | 123,540 | 545,304 | 7,172 | 538,132 | 34,523 |
| 1884 | 480,831 | 59,067 | 148,444 | 629,275 | 6,354 | 622,921 | 84,789 |
| 1885 | 511,063 | 30,232 | 130,202 | 641,265 | 2,371 | 638,894 | 15,973 |
| 1886 | 534,353 | 23,290 | 119,873 | 654,226 | 2,862 | 651,364 | 12,470 |
| 1887 | 558,620 | 24,267 | 107,230 | 665,850 | 12,951 | 652,899 | 1,535 |
| 1888 | 613,895 | 55,275 | 101,341 | 715,236 | 27,678 | 687,558 | 34,659 |
| 1889 | 586,445 | *27,450 | 128,063 | 714,508 | 39,290 | 675,218 | *12,340 |
| 1890 | 637,397 | 50,952 | 110,939 | 748,336 | 33,404 | 714,932 | 39,714 |
| 1891 | 668,794 | 31,397 | 125,318 | 794,112 | 29,093 | 764,019 | 49,087 |
| 1592 | 673,315 | 4,521 | 125,453 | 798,768 | 28,169 | 770,599 | 6,580 |
It will be seen from the above table that there has been a steady increase in the output of coal from the mines in the colony, year after year, since the records have been kept by the Mines Department—with the exception of the year 1889, when the output was 27,450 tons less than for the year previous. The yearly increased output is principally due to the greater demand for consumption within the colony. During a period of fourteen years the consumption of coal in New Zealand has increased to the extent of 438,154 tons per annum, showing that other industries are quickly springing up, requiring fuel for generating motive-power.
The following table will show the output of the different classes of coal in the colony for the last two years, and the total output since records were kept by the Mines Department:—
| Name of Coal. | Output of Coal. | Total Output of Coal from Mines in the Colony. | |
|---|---|---|---|
| 1891. | 1892. | ||
| Tons. | Tons. | Tons. | |
| Bituminous | 387,839 | 406,828 | 3,938,577 |
| Pitch | 96,979 | 89,549 | 1,202,514 |
| Brown | 161,904 | 149,460 | 2,424,824 |
| Lignite | 22,072 | 27,478 | 239,386 |
| Totals | 668,794 | 673,315 | 7,805,301 |
This shows that the output of pitch and brown coal is decreasing, while the output of bituminous coal increased last year by 18,989 tons. The output of lignite depends entirely on the consumption within the district in which it is raised.
The following table will also show the quantity of coal raised in the different localities in the colony for the same periods as shown in the previous table:—
| Name of District. | Output of Coal. | Increase. | Decrease. | Approximate Total Output of Coal to 31st Dec., 1892. | |
|---|---|---|---|---|---|
| 1891. | 1892. | ||||
| Tons. | Tons. | Tons. | Tons. | Tons. | |
| Kawakawa | 23,254 | 18,515 | .. | 9,739 | 787,761 |
| Whangarei, Kamo, and Whauwhau | 16,228 | 9,924 | .. | 6,304 | 275,784 |
| Waikato | 55,869 | 57,894 | 2,025 | .. | 654,423 |
| Mokau | 3,713 | 1,823 | .. | 1,890 | 6,724 |
| Pelorus | .. | .. | .. | .. | 711 |
| West Wanganui | 3,328 | 1,981 | .. | 1,347 | 42,095 |
| Westport | 206,184 | 208,076 | 1,892 | .. | 1,399,943 |
| Reefton | 4,556 | 4,368 | .. | 188 | 52,108 |
| Greymouth | 145,351 | 178,244 | 32,893 | .. | 1,700,274 |
| Malvern | 14,775 | 11,101 | .. | 3,674 | 285,429 |
| Timaru | 1,488 | 1,446 | .. | 42 | 6,888 |
| Otago | 164,870 | 157,610 | .. | 7,260 | 2,376,592 |
| Southland | 24,178 | 22,333 | .. | 1,845 | 216,569 |
| Totals | 668,794 | 673,315 | 4,521 | .. | 7,805,301 |
The principal districts where bituminous coals are worked are Westport, Greymouth, West Wanganui, and Kawakawa; but at the last place the present mines are pretty well exhausted, and the two first named localities may be looked on as the principal bituminous-coal producing districts in the future. The output last year may be said to have been principally from two mines—the Westport Colliery, at Denniston, and the Greymouth Coal Company's Mine, Brunnerton: the output from the former being 198,466 tons, and from the latter 178,244 tons. There are two large mines being opened out—one at Mokihinui, in the Westport district, and one at the Blackball, in the Greymouth district, which will soon considerably augment the output from these districts. According to rough surveys made by the Geological Department, the area of the coalfields in the colony is estimated at 485,700 acres, of which about 255,400 acres contain bituminous coal. The thickness of the various bituminous-coal seams in the colony varies from 3ft. to 20ft.
As regards the quality of the coal, it cannot be surpassed. The late Sir John Coode, in his Presidential address to the Institution of Civil Engineers, London, stated: “The bituminous coal found on the west coast of the Middle Island is declared by engineers to be fully equal, if not superior, to the best description from any part of the world.”
The following table shows the composition of the coal found in different parts of the colony:—
| Description. | Name of Mine and District. | Analysis. | Evaporative Power. | |||
|---|---|---|---|---|---|---|
| Fixed Carbon. | Hydro-Carbon | Water. | Ash. | |||
| Anthracite | Acheron, Canterbury | 84.12 | 2.06 | 1.80 | 12.12 | 10.93 |
| Bituminous | Coalbrookdale, Westport | 74.83 | 20.50 | 1.16 | 3.51 | 10.72 |
| Bituminous | Coalbrookdale, Westport | 70.00 | 22.15 | 2.52 | 5.33 | 9.10 |
| Bituminous | Banbury Westport | 69.97 | 25.71 | 0.99 | 3.33 | 9.09 |
| Altered brown coal | Malvern Hills, Canterbury | 68.54 | 19.89 | 4.15 | 7.42 | 8.87 |
| Bituminous | Tyneside, Greymouth | 65.59 | 29.18 | 0.82 | 4.41 | 8.52 |
| Glance coal | Rakaia Gorge, Canterbury | 64.51 | 21.27 | 6.76 | 7.46 | 8.30 |
| Bituminous | Wallsend, Greymouth | 62.87 | 31.64 | 1.66 | 3.83 | 8.17 |
| Bituminous | Grey River Greymouth | 62.37 | 29.44 | 1.99 | 6.20 | 8.01 |
| Pitch coal | Kawakawa, Bay of Islands | 61.16 | 28.00 | 2.51 | 8.33 | 7.95 |
| Bituminous | Preservation Inlet, Southland | 60.88 | 20.69 | 4.33 | 6.19 | 7.91 |
| Pitch coal | Black Ball Creek, Grey River, Greymouth | 60.20 | 29.97 | 8.01 | 1.82 | 7.82 |
| Bituminous | Mokihinui, Westport | 59.75 | 32.14 | 3.97 | 4.14 | 7.76 |
| Bituminous | Coalpit Heath, Greymouth | 58.81 | 38.98 | 1.02 | 1.19 | 7.64 |
| Bituminous | Mokihinui, Westport | 57.92 | 34.94 | 3.96 | 3.18 | 7.50 |
| Bituminous | Brunner Mine, Greymouth | 56.62 | 35.68 | 1.59 | 6.11 | 7.36 |
| Bituminous | Brunner Mine, Greymouth | 56.21 | 37.83 | 1.50 | 4.56 | 7.30 |
| Bituminous | Westport Greymouth | 56.01 | 37.17 | 2.60 | 4.22 | 7.28 |
| Bituminous | Mokihinui, Westport | 55.59 | 38.86 | 3.16 | 2.39 | 7.20 |
| Bituminous | Brunner, Greymouth | 54.16 | 35.85 | 2.50 | 7.49 | 7.04 |
| Altered brown coal | Malvern Hills, Canterbury | 53.29 | 32.04 | 12.65 | 2.02 | 6.92 |
| Bituminous | Otamataura Creek, Southland | 52.89 | 36.63 | 2.19 | 8.29 | 6.90 |
| Bituminous | Wallsend, Greymouth | 53.10 | 35.47 | 1.41 | 10.02 | 6.90 |
| Bituminous | Near Cape Farewell, Colling-wood | 48.59 | 43.17 | 2.18 | 6.06 | 6.31 |
| Pitch coal | Shag Point, Otago | 43.19 | 30.15 | 15.82 | 10.94 | 5.61 |
| Pitch coal | Kawakawa, Bay of Islands | 50.15 | 42.63 | 4.18 | 3.04 | 6.50 |
| Glance coal | Whangarei, Whangarei | 50.11 | 38.68 | 8.01 | 3.20 | 6.50 |
| Pitch coal | Kamo, Whangarei | 50.01 | 37.69 | 9.61 | 2.69 | 6.50 |
| Brown coal | Malvern Hills, Canterbury | 49.99 | 35.42 | 11.79 | 2.80 | 6.49 |
| Brown coal | Fernhill, Otago | 49.95 | 36.95 | 12.00 | 1.10 | 6.49 |
| Brown coal | Allandale Otago | 47.31 | 36.26 | 12.41 | 6.02 | 6.15 |
| Brown coal | Kaitangata Otago | 46.48 | 33.48 | 14.66 | 5.38 | 6.04 |
| Brown coal | Shag Point Otago | 46.21 | 32.65 | 16.02 | 5.12 | 6.00 |
| Brown coal | Homebush, Canterbury | 44.92 | 36.00 | 15.83 | 3.25 | 5.83 |
| Brown coal | Hokonui Canterbury | 44.28 | 38.22 | 16.50 | 1.00 | 5.75 |
| Brown coal | Kaitangata, Otago | 44.11 | 38.32 | 15.44 | 2.13 | 5.74 |
| Brown coal | Nightcaps, Southland | 43.62 | 33.68 | 18.33 | 4.37 | 5.67 |
| Brown coal | Springfield, Canterbury | 42.68 | 33.66 | 18.65 | 5.01 | 5.55 |
| Brown coal | Orepuki, Southland | 42.64 | 36.26 | 14.44 | 6.66 | 5.54 |
| Pitch coal | Walton's, Whangarei, Hikurangi | 38.80 | 41.20 | 7.20 | 12.80 | 4.96 |
| Brown coal | Kaitangata, Otago | 38.29 | 32.48 | 17.50 | 11.78 | 4.47 |
| Brown coal | Shag Point Otago | 35.76 | 30.92 | 13.22 | 20.16 | 4.64 |
| Brown coal | Allandale Otago | 34.72 | 40.26 | 18.99 | 4.86 | 4.51 |
| Pitch coal | Grey River, Greymouth | 34.72 | 55.48 | 6.20 | 2.60 | 4.51 |
This mineral is found in many parts of the colony—namely, Wakatipu, Cromwell, Waipori, Waitahuna, Macrae's, and other places in Otago; and at Wakamarina, in Marlborough. A company was formed some years ago to work a mine at Bucklerburn, at the head of Lake Wakatipu, in Otago, where scheelite is found intermixed in a quartz lode. Some 37 tons of ore were shipped to Germany, which was at that time the only market for this mineral. This realised prices varying from £17 to £29 per ton for ore containing about 62 per cent. of scheelite. The demand then almost ceased, and the company suspended operations, and has done no work for the last five years. The ore occurs in pockets or bunches amongst the quartz, but not in large enough quantities to justify any one entering into contracts to supply certain quantities within stated periods.
Recently rubies have been found in boulders, intermixed amongst the alluvial drift, in the vicinity of Rimu, in the district of Westland, Middle Island; but so far they have been too small to be of much value. One of the boulders containing rubies was sent to Professor Ulrich, of the Otago University, who stated that they are the true “Oriental rubies,” a variety of corundum, as conclusively proved by their strong dichrosive, crystalline form—hexagonal prism—and hardness, which exceeds that of a topaz, being 9° according to Moh's scale. They are found embedded in an emerald-green matrix, being an infusible silicate of alumina, coloured green by chromium oxide. This discovery was made two years ago. No one, previous to this, ever dreamed of rubies being found in these boulders. In some of the river-beds there are large quantities of what is termed ruby-sand; but this is ground up to such an extent that it is not of great value.
In comparing New Zealand with other mining countries in the world, it is found to offer advantages which very few possess. The elevations at which the auriferous drifts are found give great facilities for the storage of tailings. Its mineral and metalliferous lodes are distributed throughout the length and breadth of the colony; its extensive areas of auriferous drifts in the Middle Island can be commanded with an abundant water-supply; its large rapid flowing rivers can be made to supply a motive-power for driving every class of machinery; and when the rivers, creeks, and streams are not in the immediate vicinity of mining operations these rapid currents can be utilised to generate electrical force, as is done at Skipper's, where a crushing-battery of thirty head of stampers and air-compressing machinery is driven by electricity transmitted over a range about 2,000ft. above the level of the sea, and for a distance of nearly two miles. And, again, the same power is used in working dredging machinery—for lifting the auriferous drifts in the bed of the Shotover River, at the sandhills; the electrical plant being placed about a mile and a half from the spot where dredging operations are carried on.
Table of Contents
The topographical features of New Zealand present many advantages for prospecting in search of mineral deposits and metalliferous lodes. The veins in the sides of the different gorges, and faces of the ranges exposed by the denuding action of rapid streams, also the slips from the mountain-ranges, disclose the character of the country rocks, affording great facilities for examining their constituents geologically. There are, however, many difficulties and obstacles to be overcome in carrying on prospecting operations.
Most of the metalliferous lodes are found in the high lands, a great portion of which are covered with forest-timber, having a dense undergrowth, where the country rock is very seldom exposed to view. Although the sides of the cliffs, precipices, gorges, and beds of rapid streams disclose the formation in which metalliferous veins exist, it is very difficult to trace these veins for any great distance. The broken nature of the country renders prospecting a laborious undertaking, as, in general, men have to carry provisions, tools, and tents for miles on their backs, crossing rapid streams and rivers in their search for the precious metals.
In regard to prospecting for auriferous drifts, there is no country in the world which offers better facilities. There is an abundance of water, which is the first consideration in testing and working the ground In the valleys, gold is distributed through the alluvial drifts over a large extent of country, owing to the system of concentration that for thousands of years has been taking place, by flowing rivers and streams sweeping away the lighter materials and sands, and leaving the denser particles behind in beds or layers containing rich deposits of gold. The tops of the mountains in many places show ancient channels where this work of concentration has at some very remote period been going on, as, for instance, on Mount Criffel and Mount Burster, in Otago. The more we travel in New Zealand and study the formation of the country, the more we are impressed with the immense mineral wealth it contains, and the greater is our wonder at the effects of the marvellous convulsions and cataclysms the land must have undergone to leave it in its present state. As yet, comparatively very little has been done to unfold its riches; and the question is, how to arrive at the best method of carrying on prospecting operations in order to develop the natural wealth.
The prospector has no difficulty in recognising gold in the alluvial drifts, and also in many of the lodes: but there are a number of lodes existing, highly auriferous, although gold cannot be recognised in them by the eye. It is found in combination with other metals, which necessitates acquaintance on the part of the prospector with the means of determining whether gold is present, or what metals the ore contains. It may be, therefore, of interest to state some of the principal indications as likely to guide the prospector in searching for lodes or mineral deposits.
Of the minerals and metalliferous ores that exist in New Zealand there are none deserving of more attention than those containing gold and silver. When gold is found in a metallic condition it is generally easily recognisable by its bright yellow colour; but in lodes it is very often found in combination with metallic sulphides, such as iron, arsenical and copper pyrites, zinc-blende, galena, sulphides of antimony, silver, &c., and when in combination with these substances it is in many instances not discernible to the eye, and the ore has to be subjected to a test to prove what it contains. Hence, in order to carry on prospecting in an intelligent manner, the prospector should have a knowledge of the different ores met with, and be able to test their value. For example, the lode in the Sylvia Mine at the Thames contains in many instances a high percentage of gold, and very little of it can be either seen in the ore or extracted by the ordinary battery process; it is in combination with other metallic sulphides—namely, silver, copper, zinc, galena, &c.
The first question the prospector has to consider is the character of the rock and any indication that would be likely to guide him in searching for an auriferous or argentiferous lode. He must divest his mind of all theories that an auriferous or metalliferous lode to be a payable one must run in a certain direction.
Auriferous quartz lodes in New Zealand run in every direction; some of them may be termed east-and-west reefs, dipping to the northwards. But the general run of the quartz lodes on the west coast of the Middle Island, and also in the North Island, is from a few points west of north to north-west and south-east, generally dipping westward. In the North Island these lodes traverse different formations in every direction. They are found in tufaceous sandstone, decomposed diorite, porphyry, porphyritic tufa, earthy clay, and aphanite slates having bands of hard blue rock—anamesite—and hard green dioritic rock running through it. On the west coast of the Middle Island they occur in metamorphic highly-silicious schistose rock, sandstone—some of which is ferruginous in character—and slates belonging to the Maitai series of the carboniferous age; while in Otago they are found in a finely-laminated quartzose, mica, and chlorite schists. The Otago formation is seen again at Waka-marina, Mahakipawa, and Jackson's Head, in the Marlborough District, and both gold and silver are found in a granitoid rock at Mount Rangitoto, in the Westland District, while there is an argentiferous lode in gneissic rock at Richmond Hill, in the Colling-wood district.
Many persons hold that the structural appearance of quartz has a great deal to do with indicating its auriferous or argentiferous character. When the quartz has ribbon-like bands or laminations, with regular streaks between them, or chlorite partings all running parallel with one another, or in wavy bands and lines, with a certain parallelism which gives the quartz a regular structure: wherever lodes containing quartz of this character are found, they should be well prospected; for, although the stone may be barren in some portions of the lode, there is every probability of striking a shot of gold in stone of this description. On the other hand, if the markings or partings of the quartz be very irregular, forming as it were a confused mass of lines or marks, it is very seldom that such quartz contains much gold or silver.
In prospecting for auriferous quartz lodes, if the outcrop cannot be seen on the surface, the prospector, in carrying on operations in a new part of the country, should first search up the beds of creeks and streams, and carefully examine the country rock wherever it is laid bare, either by slips from the ranges or in the cliffs in gorges cut out by the action of water. In some instances he might perchance trace the gold in the alluvial drift in the bed of a stream up to the source from which the gold came, but the chances of doing so are very remote; as, for instance, almost every creek and stream flowing from the high land into the Clutha River contains gold in the gravel-drifts, but very few auriferous lodes have yet been discovered.
After a lode has been found it should be thoroughly prospected, so as fully to ascertain the length of the shot of gold and the depth that it will go down. Different levels should be put in to test its value before incurring any expense in erecting machinery to crush the stone. The eager desire to form companies and erect a crushing-plant before thoroughly prospecting a mine has resulted in many failures in New Zealand, and has done more than anything else to bring the mining industry into disrepute. In many instances, companies have been compelled to give up valuable mining properties, because, having spent all their capital on machinery, they cannot carry on prospecting operations.
In reference to the occurrence of gold in particular places in lodes, this question is not fully understood; but we know from the results of working lodes that in scarcely one instance in New Zealand does a lode carry sufficient gold to pay for working continuously for its whole length. The gold is found in shots, which seldom exceed 400ft. in length; a barren part will come in and cut off the gold, although the structural appearance of the quartz may remain almost the same; still, by driving along the lode for some distance, another shot of gold is likely to be found. The prospector must not be disheartened if a lode cut entirely out, so long as the walls are clearly defined and a parting is distinguishable. The walls may be almost close together, or the fissure may have been filled with soft mullocky substance; but so long as a parting can be seen it should be followed, as there is every probability of auriferous quartz coming in again, especially if it be a true fissure lode—that is, a lode cutting through the country rock at an angle from its bedding-planes. On the other hand, if a lode follows the bedding-planes of the rock, or in the lines of its stratification, there is always a chance of its wedging out, both in depth and lengthways, and there is far less chance of again picking it up than there would be if it were a true fissure lode.
In prospecting alluvial drifts the work is of a more simple character, and the prospector has more to guide him. Every gully, river, creek, and stream has originally been cut out by the action of flowing water, and the light sand, soil, and materials have been carried away with the current, while the denser particles have been left behind. The beds of all the gulches are merely Nature's sluice-boxes, and the rough uneven surfaces of the rocks in their beds are ripples for saving the gold. Therefore, if the prospector cannot find any gold in these, he may be tolerably certain that there is not a large area of auriferous drift in the locality. This applies not only to the present river-beds, but also to ancient watercourses which are found on the mountain-tops, as at Mount Criffel, Mount Burster, and in places on the ranges alongside the Arrow and Shotover Rivers. Wherever these ancient river-beds or watercourses are found, they are likely to contain rich layers of auriferous drift, if there be any in the neighbourhood.
Having briefly described some of the principal indications which tend to guide the prospector, it will be well to refer to the manner in which he can distinguish the metalliferous ores, so as roughly to ascertain whether they are likely to be payable for working.
This is always distinguishable when found in alluvial drifts, and also when it is found in a free state in lodes, by its bright, lustrous, yellow colour, being soft and ductile; but when found in mundic lodes, either as iron, arsenical, or copper pyrites, one can ascertain its presence only by testing it, either by chemicals or by a fire-assay. In some lodes the pyrites contain sufficient gold to pay all expenses in connection with the working of a mine, and therefore it is of the utmost importance that every pyritous ore should be tested, at least to see whether the presence of gold can be detected, which will entail a few chemicals.
The prospector should have a small agate mortar, a small porcelain basin, some nitric and muriatic acids, with a small quantity of sulphate of iron or green coppers, and also a little ferrocyanide of potassium, a spirit-lamp, blow-pipe, some powdered borax, microcosmic salt, and carbonate of soda.
Test.—Pulverise, say, 1lb. of pyrites to the finest powder, put it in the porcelain basin and add some strong nitric acid, which will boil up and give off brown poisonous fumes. Stir up occasionally with glass rod, and keep adding a little nitric acid until the brown fumes cease entirely. Wash the powder thoroughly in clean water by decanting it several times until the water ceases to produce a blue colour, and then add a little ferrocyanide of potassium. This removes all the arsenic, sulphur, iron, and copper. Then add two parts of strong muriatic acid, and one part of nitric acid; place this mixture over the spirit-lamp, and evaporate to dryness; stir up with about one pint of hot water, and filter. Boil down the filtrate to about half a small wineglassful, and add to the clear liquid a few drops of strong muriatic acid, and also add about one-fifth of its bulk of a strong solution of sulphate of iron. If there be gold present, this will gradually give a brown precipitate, which will settle to the bottom of the vessel. After standing about twenty-four hours the liquid may be decanted off, and the brown dust in the bottom will be pure gold.
This metal is, in some forms, hard to distinguish; it occurs in New Zealand principally in combination with gold, and as a sulphide ore. In very few instances is it found as native silver, but more generally as a metallic sulphide, antimonide, chloride, chloro-bromide, arsenide, &c. A very simple test is given by C. H. Aaron for testing the presence of silver in ore, namely:—
Test.—The ore should be finely pulverised and mixed with about one-tenth of its weight in salt and half as much copperas. Get an old frying-pan and line it with clay; place the mixture in the pan, and heat it gently over a fire, and stir it with an iron rod so long as any smell of sulphur can be detected; then subject the mixture to a light red heat for a few minutes, until it swells and becomes sticky when stirred, care being taken not to fuse the ore. The mixture is then taken out and allowed to cool, after which more salt is added, and the stuff mixed with water to a consistency of mortar. Then take a thin strip of copper, carefully cleaned, and insert it in the mixture for about ten minutes; after which, remove the copper and wash it in clean water. If silver be present, the copper will be coated with a white substance; and, if the ore be very rich, it will appear grey and rough.
Where silver is found at Waihi, Karangahake, and Puhipuhi, it is in quartz lodes, the quartz being hard and brittle, having blackish-blue and brownish ribbon-like bands and sometimes ruby silver through it, running parallel to each other. The silver at Waihi and Karangahake is principally in the form of a sulphide, but at Puhipuhi it occurs both as a sulphide and antimonial ore. It can be tested by pulverising a small quantity of the bluish bands or ruby silver in an agate mortar, and boiling a little of the powder in dilute nitric acid, which will dissolve the silver. Add water, and filter through blotting-paper, and add to the filtrate a few drops of muriatic acid or common salt. If silver be present, a white crudy precipitate, as chloride of silver, will be the result; if mercury or lead be in the pulverised ore, the same white crudy precipitate will also be obtained, but if some of the crudy substance be boiled in a test-tube, the chloride of lead will dissolve, while it does not produce the same effect with the chloride of silver. On the white crudy substances being exposed to sunlight, the chloride of silver will turn black, while the chloride of mercury remains white.
Silver-chloride and bromide-silver ores are not affected by acids. Ammonia and cyanide of potassium both dissolve them, and a solution obtained from either of these—nitric acid—will throw down a white crudy precipitate, which turns black on exposure to sunlight. This description of silver-ore is very easily fused into a bead of silver by the blow-pipe, when heated with a little carbonate of soda on charcoal.
Stephanite, pyrargyrite, dycrasite, and proustite are different in appearance. The colour and streak of stephanite is iron-black; the colour of pyrargyrite is all shades of reddish-black, with red streak, while proustite is both red in colour and streak; and dycrasite is in colour and streak white.
Sulphide of silver, when nearly pure, such as argentite, resembles the colour of black-lead, and can be as easily cut with a knife as the hardest leads used in drawing-pencils. The hardness of both this and antimonial silver-ores averages from 2.0 to 2.5, with the exception of dycrasite, which is from 3.5 to 4.0 in hardness.
Chloride and chloro-bromide of silver are exceedingly soft ores—they can be cut like wax with a knife. In colour they are grey, greyish-green, yellowish-green, generally becoming darker by exposure to the atmosphere. As yet, however, very little of this description of ore has been found in New Zealand. Selenides and tellurides of silver—namely, naumanite and hessite—have been found in the range between Te Aroha and Karangahake; but, so far, no large deposit of this ore has yet been discovered.
This metal is always found in its metallic state among the gravel-drifts; not, so far, in situ. Small quantities of it are discovered in the gravel-drifts near the Waiau River, in Southland, amongst the drifts in the Clutha Valley, and in some places on the West Coast. The miners, when working the drifts at the mouth of the Waiau River, got several ounces of this metal along with the gold in their sluices, and for some time did not know what it was. Its colour is steelgrey, and it is found in flattened grains. Unlike most other metals, it is very difficult to fuse, and takes a considerable time to dissolve in boiling aqua regia.
Tin has been found at Stewart Island, both in the alluvial drifts and also in situ, in a lode running along the top of the range termed “The Remarkables.” It is in the form of blackish dark-brown pellets, both in the drifts and in the quartz lode; but in the latter there is more wolfram than tin, which is both similar in colour and appearance, and about the same specific gravity; even the experienced miner, therefore, will have great difficulty in recognising the one from the other; but a simple test with the blow-pipe will leave no doubt on the subject. It can, however, be distinguished from wolfram by its hardness, which is from 5.0 to 5.5, while cassiterite, or tin-ore, is from 6.0 to 7.0. Wolfram has a submetallic lustre, having a dark-grey or brownish-black colour. By scratching it, the streak will be dark reddish-brown to black, while cassiterite has a more adamantine appearance, with tetragonal crystals having a white or greyish-brown streak.
Test.—Take a few grains of the dark heavy pellets of the ore, and pulverise them to fine dust in an agate mortar; scoop out a cavity in a piece of charcoal, and mix the ore with pulverised potassium cyanide and charcoal-dust; place the mixture in the cavity of the charcoal, and use the blow-pipe, and in a few minutes, if the pellets be oxide of tin, it will be reduced to a button of metallic tin; but, if the whole of the ore has not been successfully fused, let the charge be scraped clean out of the cavity in the charcoal and placed in the agate mortar, mixed with a little water, and the mass pounded or crushed with the pestle, when bright discs or flakes of metallic tin will be found. These flakes or metallic buttons may be tested by placing some of them in a porcelain basin, adding strong muriatic acid, and boiling over a spirit-lamp. Hydrogen will be liberated, and chloride of tin formed. Filter through some blotting-paper, and add to the filtrate a solution of sulphuretted hydrogen, which will give a chocolate-brown precipitate.
Cassiterite, or tin-stone—peroxide of tin—contains about 78.5 per cent. of tin and 21.5 per cent. oxygen. It is found disseminated in granite gneiss, clay slate, chlorite and mica slate, and also in beds and veins in irregular masses. It is found associated with quartz, fluor-spar, apatite, and also with wolfram, molybdenum, arsenical iron, and copper pyrites, magnetic iron-ore, blende, copper glance, and other minerals. The lodes, however, always occur in or in close proximity to granitoid rocks.
Antimony-ore is readily recognisable on account of its grey, bluish metallic lustre and fracture; it occurs chiefly in the crystalline slate and in the primary rocks. It is found associated with quartz, gold, silver, copper, iron, lead, and other mineral ores. The largest antimony lode which is being worked at the present time is at Endeavour Inlet, Queen Charlotte Sound, where the ore is in the form of antimonite—sulphide of antimony—and where, in some places, the lode is 4ft. in thickness, traversing through a subschistose rock.
Antimony-ore is also being worked at Waipori, and at Barewood, in Otago, in a quartzose mica schist formation; and a few years ago some workings were carried on at the Carrick Range, near Cromwell. It is abundantly distributed in some of the auriferous lodes at Reefton, and in the Grey district, and also in Coromandel and Puhipuhi, where it gives considerable trouble in the treatment of the auriferous ores.
Test.—Antimonial ores can be tested in the same manner as that described for tin, with the blow-pipe, using the same flux; or, they can be dissolved in hot, strong, muriatic acid, and evaporated to dryness, when the residue will be soluble with tartaric acid, and will give a bright orange precipitate with sulphuretted hydrogen.
Is found in its metallic state in places, but more generally in metallic oxides, carbonates, silicates, and sulphides. It is found in many instances in combination with gold, silver, tin, zinc, lead, quicksilver, nickel, bismuth, sulphur, and arsenic. Copper-ore is abundantly distributed, and disseminated in different formations, all through New Zealand. When found in auriferous and argentiferous lodes, it is generally in the form of copper-pyrites—chalco-pyrite—having a brass-yellow metallic appearance. The ore is found in different geological formations, but chiefly in crystalline slates, metamorphic schist, indurated unaltered sandstone, and Paláozoic slates, granitoid and serpentine rocks, and is found in lodes and veins associated with quartz, fluor-spar, and diabase rock, &c. In New Zealand, copper-ore has been worked at Kawau, Great Barrier, and D'Urville Islands, and considerable workings have been carried on at the Dun Mountain, and also at the head of the Aniseed Valley, in the Nelson District; while indications of copper-ore are found in many places, both in the North Island and Middle Island. Recently Mr. A. McKay, the mining geologist, has discovered a belt of cupriferous schist in the second gorge of the Arahura River, in Westland, and some of the samples from this belt, on being analysed, gave 10 per cent. of copper. The outcrop of copper-ore lodes can, in some places, be distinguished by the quantity of gossan, iron-pyrites, and the green and blue spots here and there, according to the amount of oxygen and carbonic acid it has absorbed; and when the lodes are in serpentine formations bunches of metallic copper are likely to be found; but in this formation the lodes in general are very irregular, the ore occurring more in nests and bunches here and there through the rock in a certain belt. If a good gossan or iron-pyrite lode be found at the outcrop with copper stains through it, that is a good indication of the presence of copper, for in all likelihood rich copper-ore will replace the gossan and iron-pyrites in going down. This has been the case in Cornwall, in England, where very few lodes paid for working until they were some distance under the outcrop at the surface.
Test.—A very simple test will ascertain whether any ore contains copper by merely pulverising it to fine dust, and letting some of it fall into the flame of a spirit-lamp or candle; it produces a green colour. Ores of copper are soluble in nitric acid, and when in solution have a bluish colour, but by adding ammonia in excess will assume a bright blue colour.
The principal ores in New Zealand are galena—sulphide of lead—and cerusite—carbonate of lead. They are generally found in quartz lodes, in combination with gold, silver, zinc, copper, antimony, &c. Sometimes all these metals are found together, as at the Sylvia Claim, Tararu, Thames, and Champion Lode, Tui Creek, Te Aroha, in the Auckland District; while near Mount Owen, in the Nelson District, lead is found for the most part in combination with silver. Lead-ores, however, are to be found of all colours, from white, as in mendipite, to black in descloizite; and they are found in nearly all geological formations, in different parts of the world; but the ores generally found in this colony are galenite and cerusite. The former is of a lead-grey metallic lustre and fracture, and is sometimes found in laminated crystals. Cerusite has more of a whitish-grey appearance, and is not so heavy as galenite, the latter being about three times, while cerusite is about two and a half times, the weight of quartz.
Test.—All ores of lead are easily reduced into a metallic form with the blow-pipe at a low fusing point, and the use of the outer or oxidizing flame of the blow-pipe will cause a yellow or orange incrustation on the charcoal.
This metal is widely distributed over the whole of New Zealand, principally in the form of oxide of manganese, which varies in colour from reddish-brown to iron-black, having a sub-metallic appearance; but, unless lodes of this ore are found near the ocean, where vessels can load, the market price will not admit of its being worked if the cost of transit to a port of shipment is heavy, it being worth only from £2 15s. to £4 per ton when taken to Europe. A load of carbonate of manganese—rhodochrosite—occurs within three miles of the Wellington and Manawatu Railway, near Paraparaumu, which is said to be 30ft. in thickness. This is a rare mineral, and said to be a very valuable one, the pure carbonate being worth from 8d. to 10d. per pound. However, no steps have, as yet, been taken to work it. It has different colours: rose-red, yellowish-grey, dark red, brown, and brownish-black, and the ore is very brittle.
Test.—Pulverise a small quantity in an agate mortar, and add a small quantity of muriatic acid, and warm to dryness. Dissolve the powder in water; filter, and heat in a porcelain basin with a little caustic soda and saltpetre, until the mixture is in a state of perfect fusion. If manganese be present, the mixture will have a deep green colour, darkening to blue on cooling. By adding an excess of either muriatic, tartaric, or sulphuric acid it will have a reddish colour.
This is found in many places in the auriferous and argentiferous lodes in combination with galena, iron, and copper-pyrites, and renders ore very refractory in treatment when extracting the gold and silver. It is generally found in New Zealand in sphalerite—sulphide of zinc—which varies in colour, being brown, brownish-black, bluish-black, sometimes having a reddish and greenish tinge; but in general of a dirty bluish-black appearance, which makes the Cornish miners term it “black-jack.” When pure, it has a whitish-yellow colour, and is semi-transparent. The more iron there is in combination with the blende, the darker and dirtier it looks. By itself it is infusible with the blow-pipe, but, when mixed with powdered charcoal, it can be fused by the reducing inner flame into metallic zinc. In the oxidizing, or outer flame, there will be a yellow incrustation on the charcoal when hot, and white when cold. It dissolves easily in warm, strong muriatic acid, giving off sulphuretted hydrogen, which is easily recognisable by its odour.
About 5,666 tons of chrome-ore have been shipped to Europe from the Nelson District of New Zealand, in which it occurs as chromite or oxide of chrome. The lodes are in a magnesian rock formation, termed dunite, closely resembling serpentine; but no work has been done on the chrome lodes in this district for the last twenty-five years. The ore has a sub-metallic lustre, and is of brownish iron - black colour, and sometimes slightly magnetic. Before the blow-pipe this ore is by itself infusible, but, with micro-cosmic salt and borax, it gives a bead which becomes green when cold.
The only nickel-ore yet found in New Zealand is awaruite, an entirely new mineral, and said to be very valuable. Its name is derived from “Awarua,” the Maori name of Big Bay, on the west coast of the Middle Island, in which neighbourhood it is found. Professor Ulrich, of the Otago University, considers this new mineral identical in its composition with the meteorite oktibbehite. It is found over a large area in the alluvial drifts near the Red Hill, Gorge, and Cascade Rivers; and it has also been found in situ disseminated through some portions of the olivine and serpentine rocks of which the Red Hill is composed. It is found in the drifts and in the serpentine rock in silver-white specks of metallic lustre, and is highly magnetic. In the alluvial drifts of the Gorge River it is found during the process of sluicing for gold, and several samples have been sent up from this locality to the Colonial Laboratory for analysis. This mineral is readily distinguishable by its colour, and its great affinity for the magnet.
Test.—All nickel-ores are, when finely powdered, soluble in either nitric or muriatic acid, or in aqua regia. The testing of nickel-ores, except in case of some of them where the blow-pipe can be used, is too complicated for any ordinary prospector to attempt, as all the different metals in combination with the nickel have to be removed by different precipitants. With the blow-pipe, a little finely-powdered dust, mixed with borax, on a platinum wire in the oxidizing flame will produce a bead of a violet to deep-yellow colour when hot, and brown when cold. The addition of nitre renders the brown bead violet. In the reducing flame metallic nickel is produced, and colours the bead ash-grey at first.
The tungstate of lime is now greatly inquired after by merchants in Europe, who are offering £12 and £14 per ton for ore containing 40 per cent. of this mineral, which is used for the manufacture of tungstic acid, and also in the manufacture of iron and steel castings for the purpose of making them brittle—such as in shells used for war purposes. It is of a yellowish-white colour, very dense and brittle, and about 21/4 times the weight of quartz-rock. It is generally associated with crystalline rocks, and found in connection with cassiterite, fluorite, apatite, molybdenite, or wolfram in quartz. This mineral was worked some years ago by a company at the head of Lake Wakatipu; but at that time the market for its purchase was limited to one or two firms in Europe, and as the demand also was then very small, it did not pay to send it Home at the prices offering.
Test.—Before the blow-pipe, with microcosmic salt, it fuses into a bead, which is green when hot and blue when cold. When finely pulverised, it dissolves in muriatic or nitric acids, forming a salt of lime which is soluble in water, and liberates tungstic acid in the form of a yellow residue. This yellow powder is further distinguished by its becoming blue when brought into contact with lime and dilute sulphuric or muriatic acid.
The recent methods adopted for working on the ocean-beaches and in the beds of rivers deserve attention by the prospector, as there are rich deposits of gold that cannot be obtained by the ordinary method of mining, on account of the water covering the auriferous drifts and sands.
On the west coast of the Middle Island the whole of the ocean-beach sand is less or more auriferous, from Karamea to Milford Sound, and on the east coast, from the mouth of the Clutha River to Preservation Inlet; and gold is found on the ocean-beach between the mouth of the Rakaia River and Lake Ellesmere. The beds of most of the rivers on the West Coast, and also most of the rivers in the Otago District, contain rich auriferous drifts, and have of recent years been made to yield up their treasures by means of dredging machines. Some attempts at working these beaches and river-beds have been very successful; but, at the same time, there have been many failures, principally due to the inefficiency of the gold-saving appliances, and partly to the claims not being sufficiently prospected before starting to use dredging machinery. There is no doubt that this branch of gold-mining will increase every year; but, in order to insure the success of each venture, more money should be expended in prospecting the ground. Tubes should be put down at certain intervals, and the whole of the material in each tube taken out and washed on proper gold-saving tables; or a still better plan would be to use a prospecting-plant having a small wrought-iron cylinder with elevating buckets to lift the material, so that the quantity of gold per cubic yard of the drift or sand could be accurately ascertained.
Far more attention should be paid to prospecting the ground before thinking of any further expenditure in the erection of large dredging-plants; and, if this were carefully attended to, it would insure each dredging venture being made a commercial success, and develop an industry that would soon assume large proportions.
It is patent to every one having a knowledge of the metalliferous and mineral deposits of New Zealand that the wealth of this kind the colony contains must, in the future, be one of the most prominent factors in producing prosperity. Such wealth has in the past contributed largely to the greatness of all countries where minerals are found, and in no case more than in those of Great Britain and the United States of America. When we consider the immense mineral resources New Zealand contains, along with a climate which cannot be surpassed, an abundant water-supply and every facility for carrying on extensive mining operations, we may safely predict that the time will come when these resources will be among the chief means of increasing her prosperity, and raising her to a prominent position.
Table of Contents
Meteorological observations have been made ever since the founding of the colony, though at first they were of an irregular character, and made only with the view of comparing the climate of New Zealand with that of other countries. From 1853 meteorological reports appear regularly appended to the Registrar-General's statistics; but it was not until 1859 that systematic observations were undertaken by a Government department. In that year nine stations, equipped with carefully - compared instruments, were established at Mongonui, Auckland, Napier, New Plymouth, and Wellington, in the North Island; Nelson, Christchurch, Dunedin, and Invercargill, in the Middle Island; and some years later two additional ones—one at Hokitika, and the other at the Bealey.
Subsequently, several new stations were established, making in all fifteen, from which monthly returns were sent to the head office in Wellington. Since then the number of chief stations has been reduced to six, but the number of secondary stations at which rainfall and weather is recorded has been increased to over sixty in number.
The climate resembles that of Great Britain, but is more equable, the extremes of daily temperature varying throughout the year by an average of 20° only, whilst London is 7° colder than the North and 4° colder than the Middle Island of New Zealand. The mean annual temperature of the North Island is 57°, and of the Middle Island 52°, that of London and New York being 51°.
The mean annual temperature of the different seasons for the whole colony is: In spring, 55°; in summer, 63°; in autumn, 57°; and in winter, 48°.
The following are the means for the two warmest and the two coldest months in the several localities, with their differences:—
| Auckland. | New Plymouth. | Wellington. |
| 69.6 | 64.7 | 64.. |
| 53.1 | 49.3 | 47.8 |
| 16.5 | 15.4 | 16.8 |
| Nelson. | Christchurch. | Dunedin. |
| 63.6 | 65.2 | 58.0 |
| 45.9 | 44.3 | 43.2 |
| 17.7 | 20.9 | 14.8 |
The average difference between the mean temperature of the warmest and coldest months for New Zealand is 17°; at Rome it is 27°; at Montpellier, 33°; at Milan, 38°; and at Jersey, 22°.
Meteorological observations were taken in 1892, at 9.30 a.m. daily, at six different stations—namely, at Auckland, in the northern part of the North Island; at Te Aroha and Rotorua, in the hotsprings district; at Wellington, at the extreme south of the North Island; at Lincoln, in the Canterbury District, about midway in the Middle Island; and at Dunedin, in the southern district of the Middle Island. The differences of situation—Auckland, Wellington, and Dunedin being seaports, the other three inland stations—of elevation, and of latitude between the several stations involve considerable differences of temperature.
The mean temperature of air in the shade for the year 1892, at each station, and the maximum and minimum temperature recorded are given:—
| Station. | 18921. | |||
|---|---|---|---|---|
| Mean Temp. in Shade. | Max. Temp. recorded. | Min. Temp. recorded. | Extreme Range. | |
| ° | ° | ° | ° | |
| Fahr | Fahr | Fahr. | Fahr. | |
| Auckland | 60.2 | 80.5 | 39.0 | 41.5 |
| Te Aroha | 59.3 | 88.0 | 24.0 | 64.0 |
| Rotorua | 54.8 | 86.5 | 21.0 | 65.5 |
| Wellington | 55.9 | 77.5 | 32.5 | 45.0 |
| Lincoln (Canterbury) | 53.8 | 86.0 | 27.0 | 59.0 |
| Dunedin | 51.2 | 76.0 | 30.0 | 46.0 |
It will be observed that, although the mean temperature for the year was highest at Auckland, the highest temperature reached was at Te Aroha and the lowest at Rotorua (both in the North Island.)
The climate on the west coast is more equable than on the east, the difference between the average summer and winter temperatures in the north-west portion of the North Island being nearly four degrees less than in the south-east, while, as between the corresponding portions of the South Island, the differences vary by some seven degrees. This is due to the action of the equatorial winds, which impinge on the west coast. The extent of their influence can be better appreciated by comparing the annual fluctuations of temperature on the opposite sea-boards of the Middle Island. At Christchurch, on the east, the range is greater by seven degrees than at Hokitika, on the west.
The averages which have been ascertained in respect of the temperature of the climate of New Zealand are given below:—
| Stations. | S. Lat. | Long. E. from Greenwich. | No. of Years of Observation. | Year. | Winter. | Spring. | Summer. | Autumn. | Difference of tine Warmest and Coldest Months. | Averages of yearly Extremes. | Yearly Fluctuation. | |
|---|---|---|---|---|---|---|---|---|---|---|---|---|
| Max | Min | |||||||||||
|
* Height above sea. 2,104ft. † Height above sea, 550ft. ‡ Height above sea, 1,070ft. | ||||||||||||
| ° | ° | ° | ° | ° | ° | ° | ° | ° | ||||
| North Island. | ° ' | ° ' | Fah. | Fah. | Fah. | Fah. | Fah. | Fha. | Fha. | Fha. | Fha. | |
| Mongonui | 35 1 | 173 28 | 10 | 59.90 | 53.06 | 58.28 | 66.56 | 61.52 | 15.12 | 89.10 | 31.82 | 57.28 |
| Auckland | 36 50 | 174 51 | 20 | 59.54 | 52.34 | 57.56 | 66.92 | 61.16 | 16.02 | 88.52 | 33.26 | 55.26 |
| New Plymouth | 39 4 | 174 5 | 14 | 57.56 | 50.90 | 55.94 | 64.58 | 58.82 | 15.66 | 86.90 | 30.02 | 56.88 |
| Napier | 39 29 | 176 55 | 10 | 57.56 | 49.10 | 57.74 | 66.20 | 57.02 | 19.26 | 90.00 | 32.10 | 57.90 |
| Wellington | 41 16 | 174 47 | 14 | 55.58 | 48.74 | 54.50 | 62.24 | 56.66 | 14.76 | 78.44 | 32.18 | 46.26 |
| Wanganui | 39 56 | 175 6 | 3 | 55.90 | 48.71 | 53.31 | 63.31 | 57.12 | 16.70 | 86.00 | 29.00 | 57.00 |
| South Island. | ||||||||||||
| Nelson | 41 16 | 173 19 | 11 | 54.86 | 46.58 | 54.50 | 62.78 | 55.76 | 17.10 | 82.04 | 27.32 | 54.72 |
| Hokitika | 42 42 | 170 59 | 10 | 52.34 | 45.50 | 51.62 | 59.18 | 53.06 | 14.76 | 74.12 | 28.22 | 45.90 |
| Bealey* | 43 2 | 171 31 | 9 | 46.76 | 37.40 | 46.04 | 54.86 | 48.56 | 18.18 | 78.08 | 12.38 | 65.70 |
| Christchurch | 42 33 | 172 39 | 12 | 52.88 | 43.52 | 53.24 | 61.52 | 53.60 | 18.72 | 88.16 | 25.16 | 63.00 |
| Dunedin † | 45 52 | 170 31 | 17 | 50.72 | 43.52 | 50.54 | 57.20 | 51.80 | 15.30 | 84.74 | 29.84 | 54.90 |
| Invercargill | 46 17 | 168 20 | 14 | 50.36 | 42.26 | 51.26 | 58.10 | 50.00 | 16.92 | 83.84 | 20.12 | 63 72 |
| Queenstown ‡ | 45 2 | 165 39 | 3 | 51.01 | 40.01 | 50.92 | 64.02 | 52 31 | 21.25 | 84.60 | 23.21 | 61.39 |
| Stations. | Dec. | Jan. | Feb. | Mar. | Apr. | May. | June | July. | Aug. | Sept. | Oct. | Nov. | Yr. |
|---|---|---|---|---|---|---|---|---|---|---|---|---|---|
| ° | ° | ° | ° | ° | ° | ° | ° | ° | ° | ° | ° | ° | |
| North Island. | Fah. | Fah. | Fah. | Fah. | Fah. | Fah. | Fah. | Fah. | Fah. | Fah. | Fah. | Fah. | Fah. |
| Mongonui | 15.48 | 16.74 | 15.30 | 19.08 | 18.18 | 16.92 | 15.30 | 15.66 | 16.92 | 16.02 | 14.58 | 16.74 | 16.38 |
| Auckland | 18.90 | 19.80 | 20.88 | 19.80 | 19.08 | 16.92 | 15.30 | 15.48 | 16.74 | 15.84 | 16.56 | 18.00 | 17.82 |
| New Plymouth | 19.62 | 21.60 | 20.16 | 21.42 | 19.44 | 15.84 | 15.30 | 14.40 | 18.66 | 18.00 | 16.74 | 18.54 | 18.18 |
| Napier | 18.72 | 21.60 | 21.78 | 17.82 | 15.12 | 14.94 | 13.86 | 15.30 | 15.12 | 18.00 | 18.18 | 19.08 | 17.46 |
| Wellington | 13.32 | 13.50 | 12.42 | 12.42 | 11.70 | 11.16 | 10.62 | 10.62 | 11.52 | 11.88 | 12.24 | 13.50 | 12.06 |
| South Island. | |||||||||||||
| Nelson | 20.34 | 23.40 | 20.70 | 21.24 | 17.10 | 17.82 | 19.08 | 19.08 | 19.62 | 21.06 | 21.42 | 22.14 | 26.16 |
| Hokitika | 11.34 | 11.16 | 13.32 | 12.60 | 12.78 | 13.86 | 14.58 | 13.68 | 14.76 | 15.66 | 12.24 | 11.52 | 13.14 |
| Christchurch | 17.10 | 18.36 | 16.56 | 17.10 | 17.10 | 16.38 | 14.94 | 16.56 | 16.02 | 16.20 | 18.54 | 19.08 | 17.10 |
| Dunedin | 16.20 | 15.66 | 15.66 | 15.12 | 13.68 | 11.52 | 10.44 | 10.62 | 12.06 | 13.32 | 13.68 | 15.30 | 13.68 |
| Invercargill | 22.50 | 21.78 | 22.50 | 22.68 | 18.00 | 16.02 | 17.64 | 16.92 | 19.44 | 22.32 | 21.06 | 21.66 | 20.16 |
The following tables show the temperature—highest and lowest in shade—in New Zealand, the Australian Colonies, and some other British possessions, given in months for four successive years:—
| TEMPERATURE, HIGHEST (H.) AND LOWEST (L.) IN SHADE, IN NEW ZEALAND, THE AUSTRALIAN COLONIES, AND SOME OTHER BRITISH POSSESSIONS, DURING SUCCESSIVE YEARS. | ||||||||||||||||||||||||||||
|---|---|---|---|---|---|---|---|---|---|---|---|---|---|---|---|---|---|---|---|---|---|---|---|---|---|---|---|---|
| British Possessions (Stations and Height in Feet above Sea Level where known). | Years. | Jan. | Feb. | March. | April. | May. | June. | July. | Aug. | Sept. | Oct. | Nov. | Dec. | Year. | ||||||||||||||
| H. | L. | H. | L. | H. | L. | H. | L. | H. | L. | H. | L. | H. | L. | H. | L. | H. | L. | H. | L. | H. | L. | H. | L. | H. | L. | |||
|
* These figures show for each month the mean maximum and the mean minimum temperature. † Average for the year. | ||||||||||||||||||||||||||||
| °F. | °F. | °F. | °F. | °F. | °F. | °F. | °F. | °F. | °F. | °F. | °F. | °F. | °F. | °F. | °F. | °F. | °F. | °F. | °F. | °F. | °F. | °F. | °F. | °F. | °F. | |||
| New
Zealand— Wellington (140) |

| 1888 | 73 | 47 | 71 | 46 | 73 | 40 | 66 | 43 | 66 | 36 | 62 | 36 | 59 | 35 | 62 | 40 | 64 | 37 | 67 | 40 | 67 | 39 | 71 | 44 | 73 | 35 |
| 1889 | 80 | 52 | 79 | 48 | 73 | 43 | 79 | 40 | 67 | 36 | 60 | 31 | 58 | 33 | 62 | 35 | 65 | 39 | 68 | 41 | 72 | 40 | 73 | 45 | 80 | 31 | ||
| 1890 | 80 | 44 | 82 | 43 | 77 | 44 | 72 | 43 | 68 | 37 | 63 | 37 | 58 | 33 | 63 | 32 | 67 | 37 | 67 | 42 | 74 | 39 | 73 | 44 | 82 | 32 | ||
| 1891 | 72 | 44 | 79 | 48 | 81 | 43 | 69 | 43 | 65 | 37 | 60 | 32 | 58 | 31 | 61 | 34 | 66 | 38 | 70 | 40 | 75 | 40 | 75 | 46 | 81 | 31 | ||
| Queensland— Brisbane (130) |

| 1888 | 99 | 61 | 93 | 64 | 97 | 59 | 86 | 56 | 79 | 44 | 80 | 39 | 76 | 40 | 83 | 40 | 88 | 47 | 90 | 55 | 99 | 57 | 95 | 59 | 99 | 39 |
| 1889 | 89 | 62 | 95 | 62 | 92 | 62 | 86 | 56 | 83 | 53 | 76 | 42 | 76 | 37 | 79 | 42 | 86 | 46 | 88 | 49 | 95 | 60 | 94 | 65 | 96 | 37 | ||
| 1890 | 89 | 63 | 91 | 64 | 86 | 61 | 82 | 55 | 76 | 50 | 77 | 43 | 75 | 36 | 78 | 39 | 86 | 44 | 94 | 52 | 94 | 55 | 96 | 57 | 96 | 36 | ||
| 1891 | 91 | 66 | 89 | 62 | 90 | 60 | 87 | 53 | 81 | 47 | 74 | 41 | 72 | 40 | 75 | 43 | 83 | 45 | 89 | 49 | 91 | 57 | 96 | 62 | 96 | 40 | ||
| New South
Wales— Sydney (155) |

| 1888 | 98 | 58 | 87 | 59 | 92 | 52 | 83 | 48 | 72 | 42 | 72 | 42 | 67 | 39 | 74 | 39 | 80 | 44 | 85 | 49 | 92 | 56 | 85 | 58 | 98 | 39 |
| 1889 | 102 | 58 | 96 | 57 | 91 | 59 | 77 | 53 | 75 | 49 | 68 | 44 | 64 | 41 | 69 | 42 | 83 | 44 | 88 | 48 | 82 | 56 | 99 | 61 | 102 | 41 | ||
| 1899 | 86 | 62 | 85 | 63 | 78 | 58 | 76 | 50 | 68 | 49 | 69 | 45 | 64 | 36 | 76 | 43 | 75 | 44 | 88 | 49 | 94 | 53 | 89 | 52 | 94 | 36 | ||
| 1891 | 97 | 60 | 84 | 53 | 82 | 60 | 84 | 51 | 73 | 46 | 64 | 45 | 62 | 40 | 67 | 44 | 73 | 46 | 86 | 46 | 83 | 54 | 98 | 59 | 98 | 40 | ||
| Victoria— Melbourne (91) |

| 1888 | 104 | 49 | 97 | 43 | 94 | 42 | 89 | 35 | 78 | 40 | 67 | 36 | 64 | 28 | 67 | 30 | 80 | 34 | 86 | 35 | 102 | 38 | 96 | 47 | 104 | 28 |
| 1889 | 99 | 50 | 96 | 45 | 96 | 43 | 88 | 37 | 78 | 39 | 66 | 38 | 62 | 31 | 68 | 32 | 74 | 32 | 84 | 38 | 93 | 41 | 100 | 47 | 100 | 31 | ||
| 1890 | 101 | 49 | 03 | 52 | 95 | 49 | 87 | 40 | 73 | 38 | 66 | 38 | 62 | 29 | 66 | 34 | 75 | 35 | 76 | 43 | 94 | 45 | 89 | 43 | 103 | 29 | ||
| 1891 | 103 | 46 | 101 | 45 | 99 | 46 | 82 | 41 | 73 | 34 | 60 | 35 | 61 | 34 | 70 | 39 | 77 | 36 | 84 | 38 | 97 | 44 | 101 | 45 | 103 | 34 | ||
| South
Australia— Adelaide (140) |

| 1889 | 109 | 54 | 100 | 53 | 102 | 49 | 82 | 49 | 75 | 37 | 68 | 38 | 65 | 36 | 71 | 38 | 76 | 38 | 88 | 42 | 98 | 44 | 98 | 50 | 109 | 36 |
| 1890 | 105 | 54 | 97 | 56 | 97 | 49 | 85 | 46 | 75 | 44 | 67 | 39 | 60 | 34 | 70 | 36 | 83 | 41 | 83 | 41 | 96 | 45 | 95 | 48 | 105 | 34 | ||
| 1891 | 102 | 50 | 102 | 50 | 102 | 50 | 87 | 44 | 78 | 37 | 63 | 36 | 67 | 37 | 74 | 38 | 80 | 42 | 93 | 37 | 99 | 44 | 99 | 48 | 102 | 36 | ||
| Western
Australia— Perth (47) |

| 1888 | 105 | 52 | 101 | 56 | 104 | 56 | 91 | 47 | 79 | 41 | 75 | 39 | 70 | 38 | 73 | 34 | 84 | 38 | 95 | 45 | 97 | 46 | 105 | 55 | 105 | 34 |
| 1889 | 107 | 46 | 99 | 52 | 100 | 52 | 95 | 48 | 76 | 36 | 69 | 37 | 70 | 37 | 77 | 38 | 77 | 42 | 78 | 44 | 89 | 48 | 99 | 52 | 107 | 36 | ||
| 1890 | 106 | 52 | 98 | 54 | 97 | 50 | 99 | 47 | 86 | 43 | 70 | 38 | 68 | 38 | 72 | 38 | 81 | 42 | 85 | 41 | 94 | 49 | 100 | 53 | 106 | 38 | ||
| 1891 | 104 | 50 | 107 | 51 | 98 | 52 | 96 | 47 | 81 | 41 | 73 | 41 | 71 | 36 | 74 | 39 | 80 | 41 | 84 | 42 | 101 | 50 | 97 | 50 | 104 | 36 | ||
| Tasmania— Hobart (160) |

| 1888 | 92 | 42 | 88 | 41 | 87 | 37 | 82 | 33 | 75 | 35 | 62 | 34 | 60 | 29 | 62 | 30 | 79 | 35 | 80 | 34 | 98 | 39 | 91 | 39 | 98 | 29 |
| 1889 | 92 | 44 | 95 | 45 | 89 | 42 | 78 | 37 | 72 | 36 | 60 | 34 | 60 | 34 | 67 | 32 | 70 | 34 | 80 | 32 | 96 | 39 | 87 | 44 | 93 | 32 | ||
| 1890 | 98 | 46 | 96 | 49 | 92 | 44 | 74 | 39 | 69 | 39 | 63 | 36 | 56 | 32 | 61 | 34 | 70 | 35 | 69 | 38 | 89 | 39 | 87 | 42 | 98 | 31 | ||
| 1891 | 87 | 44 | 91 | 43 | 98 | 45 | 72 | 38 | 72 | 36 | 59 | 33 | 59 | 34 | 66 | 35 | 80 | 35 | 84 | 34 | 89 | 39 | 84 | 45 | 98 | 33 | ||
| Hong
Kong— Observatory (110) |

| 1888 | 73 | 43 | 69 | 41 | 78 | 54 | 85 | 59 | 87 | 69 | 88 | 09 | 93 | 70 | 90 | 72 | 89 | 71 | 84 | 04 | 83 | 61 | 75 | 53 | 93 | 41 |
| 1889 | 70 | 47 | 76 | 40 | 78 | 52 | 81 | 62 | 89 | 71 | 90 | 75 | 92 | 75 | 90 | 75 | 91 | 73 | 90 | 67 | 81 | 56 | 78 | 50 | 92 | 40 | ||
| 1890 | 71 | 44 | 79 | 49 | 76 | 47 | 89 | 56 | 91 | 70 | 93 | 73 | 90 | 72 | 91 | 72 | 91 | 67 | 94 | 64 | 83 | 55 | 81 | 53 | 94 | 44 | ||
| 1891 | 75 | 51 | 79 | 45 | 75 | 51 | 81 | 56 | 88 | 66 | 90 | 73 | 90 | 74 | 93 | 73 | 90 | 73 | 89 | 68 | 82 | 57 | 82 | 49 | 93 | 45 | ||
| Straits Settlements— Singapore (30) |

| 1888 | 86 | 71 | 87 | 71 | 88 | 72 | 89 | 74 | 88 | 74 | 88 | 74 | 87 | 74 | 89 | 73 | 87 | 74 | 88 | 74 | 87 | 74 | 87 | 73 | 89 | 71 |
| 1889 | 89 | 69 | 91 | 69 | 92 | 70 | 94 | 73 | 92 | 73 | 92 | 70 | 90 | 72 | 90 | 72 | 90 | 70 | 89 | 71 | 89 | 71 | 90 | 72 | 94 | 69 | ||
| 1890 | 89 | 70 | 88 | 70 | 91 | 70 | 90 | 71 | 91 | 72 | 90 | 71 | 89 | 68 | 88 | 71 | 89 | 71 | 89 | 70 | 89 | 71 | 90 | 68 | 91 | 68 | ||
| 1891 | 87 | 72 | 88 | 71 | 87 | 72 | 88 | 74 | 88 | 75 | 88 | 75 | 88 | 75 | 86 | 74 | 87 | 73 | 87 | 73 | 87 | 73 | 85 | 72 | 88 | 71 | ||
| Mauritius— Royal Alfred Observatory (179) |

| 1888 | 84 | 72 | 85 | 70 | 82 | 67 | 81 | 67 | 80 | 63 | 79 | 59 | 77 | 57 | 77 | 57 | 79 | 60 | 83 | 62 | 85 | 67 | 85 | 66 | 85 | 57 |
| 1889 | 84 | 67 | 84 | 69 | 84 | 72 | 82 | 69 | 81 | 60 | 78 | 58 | 76 | 58 | 76 | 61 | 77 | 59 | 79 | 64 | 81 | 64 | 83 | 67 | 84 | 58 | ||
| 1890 | 84 | 69 | 84 | 69 | 83 | 70 | 82 | 67 | 79 | 60 | 77 | 57 | 75 | 53 | 74 | 56 | 78 | 59 | 79 | 54 | 82 | 63 | 84 | 66 | 84 | 53 | ||
| 1891 | 85 | 65 | 84 | 69 | 84 | 65 | 81 | 69 | 79 | 57 | 77 | 58 | 75 | 58 | 76 | 55 | 78 | 63 | 82 | 64 | 83 | 66 | 86 | 68 | 86 | 55 | ||
| Natal— Durban (150) |

| 1888 | 94 | 56 | 92 | 61 | 90 | 59 | 90 | 58 | 89 | 45 | 88 | 48 | 89 | 48 | 97 | 52 | 85 | 49 | 89 | 54 | 90 | 57 | 98 | 56 | 98 | 45 |
| 1889 | 94 | 62 | 93 | 61 | 91 | 56 | 93 | 59 | 88 | 52 | 85 | 48 | 88 | 46 | 98 | 50 | 90 | 51 | 91 | 54 | 104 | 56 | 98 | 58 | 101 | 46 | ||
| 1890 | 98 | 61 | 98 | 63 | 97 | 61 | 91 | 54 | 87 | 50 | 89 | 52 | 91 | 51 | 95 | 49 | 111 | 50 | 90 | 50 | 98 | 53 | 99 | 60 | 111 | 49 | ||
| Cape
Town— Royal Observatory (37) |

| 1888 | 103 | 52 | 99 | 52 | 97 | 52 | 94 | 45 | 75 | 44 | 76 | 44 | 67 | 35 | 80 | 39 | 87 | 44 | 84 | 44 | 82 | 45 | 93 | 50 | 103 | 35 |
| 1889 | 98 | 52 | 90 | 54 | 89 | 51 | 78 | 49 | 82 | 44 | 75 | 37 | 77 | 38 | 80 | 32 | 89 | 38 | 88 | 43 | 82 | 47 | 93 | 49 | 98 | 32 | ||
| 1890 | 92 | 53 | 92 | 50 | 97 | 47 | 91 | 44 | 85 | 41 | 79 | 41 | 71 | 32 | 66 | 38 | 86 | 42 | 88 | 42 | 87 | 44 | 97 | 54 | 97 | 32 | ||
| 1891 | 96 | 56 | 86 | 50 | 92 | 47 | 94 | 44 | 73 | 42 | 78 | 38 | 76 | 37 | 79 | 37 | 81 | 39 | 88 | 45 | 95 | 53 | 85 | 52 | 96 | 37 | ||
| Canada— Toronto (350) |

| 1888 | 41 | −12 | 43 | −16 | 48 | −1 | 76 | 21 | 74 | 33 | 92 | 40 | 87 | 47 | 84 | 47 | 78 | 32 | 62 | 28 | 62 | 14 | 47 | 0 | 92 | −16 |
| 1889 | 46 | −7 | 39 | −11 | 54 | 13 | 67 | 25 | 80 | 30 | 78 | 44 | 88 | 47 | 83 | 45 | 81 | 35 | 61 | 22 | 56 | 16 | 56 | 3 | 88 | −11 | ||
| 1890 | 53 | 6 | 53 | 3 | 53 | 2 | 68 | 23 | 77 | 28 | 86 | 42 | 85 | 47 | 89 | 46 | 79 | 35 | 69 | 29 | 59 | 15 | 41 | −1 | 89 | −1 | ||
| 1891 | 42 | −2 | 49 | 2 | 52 | 5 | 77 | 20 | 78 | 30 | 92 | 42 | 84 | 45 | 90 | 48 | 87 | 50 | 81 | 27 | 58 | 7 | 40 | 2 | 92 | −2 | ||
| Montreal (187) |

| 1888 | 40 | −20 | 39 | −24 | 44 | −3 | 76 | 11 | 80 | 31 | 88 | 46 | 87 | 47 | 86 | 48 | 74 | 33 | 58 | 28 | 68 | 1 | 46 | −10 | 88 | −24 |
| 1889 | 44 | −6 | 39 | −22 | 43 | 7 | 73 | 23 | 88 | 35 | 84 | 45 | 87 | 52 | 81 | 50 | 82 | 37 | 61 | 21 | 55 | 18 | 45 | −7 | 88 | −22 | ||
| 1890 | 52 | −21 | 45 | −9 | 43 | −4 | 66 | 21 | 74 | 28 | 85 | 40 | 88 | 49 | 88 | 47 | 80 | 38 | 71 | 30 | 55 | 9 | 35 | −15 | 88 | −21 | ||
| 1891 | 38 | −15 | 45 | −13 | 49 | −2 | 72 | 29 | 80 | 32 | 90 | 40 | 86 | 47 | 90 | 51 | 83 | 42 | 80 | 24 | 60 | 0 | 52 | −4 | 90 | −15 | ||
| St. John (N.B.) |

| 1888 | 45 | −11 | 42 | −9 | 45 | 2 | 61 | 12 | 69 | 30 | 76 | 42 | 87 | 45 | 79 | 48 | 74 | 34 | 62 | 26 | 53 | 3 | 47 | −3 | 79 | −11 |
| 1889 | 48 | −2 | 42 | −12 | 46 | 7 | 64 | 24 | 71 | 35 | 82 | 45 | 76 | 50 | 75 | 49 | 75 | 34 | 60 | 24 | 55 | 20 | 48 | −2 | 82 | −12 | ||
| 1890 | 49 | −21 | 49 | −5 | 45 | 7 | 61 | 17 | 74 | 34 | 78 | 40 | 79 | 49 | 79 | 49 | 78 | 36 | 72 | 28 | 54 | 15 | 49 | −12 | 79 | −21 | ||
| 1891 | 47 | −1 | 47 | −7 | 48 | … | 61 | 21 | 63 | 36 | 78 | 44 | 75 | 49 | 75 | 50 | 68 | 41 | 60 | 22 | 58 | 7 | 49 | 7 | 78 | −7 | ||
| Halifax (122) |

| 1888 | 48 | −5 | 43 | 1 | 45 | 6 | 57 | 18 | 74 | 27 | 93 | 39 | 87 | 33 | 82 | 45 | 76 | 35 | 65 | 30 | 61 | 10 | 50 | 6 | 93 | −5 |
| 1889 | 49 | 4 | 45 | −8 | 52 | 17 | 63 | 23 | 79 | 34 | 83 | 40 | 82 | 47 | 82 | 47 | 87 | 31 | 64 | 29 | 60 | 23 | 50 | 7 | 87 | −8 | ||
| 1890 | 50 | −10 | 48 | −5 | 48 | 8 | 60 | 18 | 68 | 30 | 78 | 39 | 83 | 47 | 86 | 48 | 77 | 36 | 78 | 32 | 57 | 20 | 50 | −4 | 83 | −10 | ||
| 1891 | 48 | −2 | 48 | −4 | 50 | 7 | 66 | 22 | 73 | 34 | 84 | 36 | 83 | 48 | 85 | 50 | 80 | 40 | 70 | 26 | 60 | 15 | 53 | 13 | 85 | −4 | ||
| Charlottetown, Prince Edward Island (38) |

| 1889 | 44 | 0 | 41 | −14 | 49 | 11 | 64 | 18 | 79 | 30 | 79 | 44 | 79 | 48 | 78 | 40 | 80 | 35 | 68 | 29 | 56 | 21 | 47 | 1 | 80 | −14 |
| 1890 | 46 | −19 | 45 | −4 | 48 | 5 | 58 | 16 | 65 | 31 | 73 | 33 | 81 | 46 | 80 | 49 | 74 | 37 | 69 | 30 | 57 | 17 | 45 | −6 | 81 | −19 | ||
| 1891 | 46 | −4 | 44 | −17 | 46 | 2 | 60 | 19 | 71 | 32 | 77 | 37 | 78 | 48 | 81 | 52 | 73 | 40 | 69 | 29 | 57 | 13 | 47 | 11 | 81 | −17 | ||
| Winnipeg, Manitoba (764) |

| 1888 | 28 | −46 | 37 | −46 | 40 | −26 | 73 | 1 | 78 | 15 | 96 | 21 | 91 | 43 | 97 | 30 | 87 | 23 | 71 | 20 | 47 | 4 | 55 | −14 | 97 | −46 |
| 1889 | 38 | −36 | 40 | −42 | 61 | −14 | 79 | 13 | 81 | 19 | 95 | 33 | 92 | 40 | 96 | 33 | 94 | 29 | 72 | 8 | 52 | −13 | 37 | −26 | 96 | −42 | ||
| 1890 | 26 | −39 | 35 | −36 | 38 | −32 | 69 | 8 | 78 | 17 | 96 | 36 | 90 | 42 | 87 | 33 | 82 | 27 | 77 | 26 | 59 | −1 | 44 | −24 | 96 | −39 | ||
| 1891 | 33 | −30 | 19 | −34 | 50 | −28 | 90 | 3 | 94 | 15 | 84 | 34 | 81 | 36 | 90 | 30 | 85 | 31 | 68 | 19 | 58 | −33 | 40 | −30 | 94 | −34 | ||
| Victoria, British Columbia (10) |

| 1888 | 54 | 8 | 52 | 28 | 58 | 20 | 65 | 31 | 78 | 34 | 72 | 40 | 85 | 37 | 81 | 43 | 79 | 38 | 69 | 31 | 55 | 25 | 59 | 26 | 85 | 8 |
| 1889 | 52 | 24 | 57 | 25 | 64 | 30 | 66 | 32 | 79 | 37 | 80 | 37 | 85 | 40 | 77 | 41 | 73 | 34 | 67 | 36 | 58 | 30 | 51 | 27 | 85 | 24 | ||
| 1890 | 47 | −12 | 49 | 12 | 54 | 29 | 70 | 24 | 71 | 38 | 74 | 38 | 78 | 42 | — | — | — | — | — | — | — | — | — | — | 78 | −12 | ||
| York Factory, North-West Territories (55) |

| 1881 | −8 | −51 | 12 | −38 | 35 | −27 | 37 | −11 | 70 | 4 | 99 | 27 | 100 | 38 | 98 | 33 | 60 | 28 | 40 | 1 | 34 | −32 | 25 | −32 | 100 | −51 |
| 1882 | 0 | −52 | 41 | −49 | — | — | 42 | −18 | 81 | 0 | 95 | 30 | 99 | 46 | 80 | 40 | 73 | 31 | 56 | 14 | 33 | −18 | 15 | −34 | 99 | −52 | ||
| St. John's, Newfoundland (125) |

| 1888 | 41 | −3 | 42 | −3 | 41 | 15 | 50 | 18 | 59 | 25 | 74 | 35 | 76 | 35 | 73 | 41 | 76 | 30 | 67 | 29 | 61 | 9 | 51 | 9 | 76 | −3 |
| 1889 | 50 | −4 | 53 | −12 | 54 | 15 | 71 | 24 | 81 | 28 | 78 | 34 | 83 | 44 | 81 | 39 | 81 | 36 | 69 | 24 | 62 | 17 | 46 | 2 | 83 | −12 | ||
| 1890 | 47 | −19 | 47 | −3 | 55 | 9 | 63 | 8 | 72 | 25 | 73 | 330 | 84 | 45 | 80 | 43 | 75 | 32 | 66 | 26 | 55 | 20 | 49 | 9 | 84 | −19 | ||
| 1891 | 54 | 3 | 56 | −13 | 49 | 3 | 61 | 10 | 70 | 30 | 79 | 32 | 82 | 39 | 83 | 44 | 78 | 33 | 59 | 17 | 70 | 28 | 57 | 14 | 83 | −13 | ||
| Barbados— Joes River (430) |

| 1887 | 80 | 67 | 78 | 66 | 81 | 66 | 82 | 68 | 84 | 68 | 85 | 70 | 83 | 69 | 86 | 70 | 86 | 71 | 88 | 69 | 83 | 69 | 84 | 67 | 88 | 66 |
| 1888 | 80 | 66 | 80 | 66 | 82 | 68 | 83 | 69 | 83 | 70 | 84 | 71 | 86 | 70 | 85 | 68 | 86 | 70 | 83 | 70 | 84 | 69 | 82 | 70 | 86 | 66 | ||
| 1889 | 80 | 70 | 80 | 70 | 82 | 72 | 84 | 73 | 84 | 73 | 85 | 75 | 83 | 72 | 83 | 73 | 83 | 73 | 83 | 73 | 81 | 72 | 79 | 71 | 85 | 70 | ||
| Bahamas— Military Hospital |

| 1887 | 77 | 62 | 80 | 68 | 80 | 67 | 84 | 68 | 85 | 71 | 89 | 72 | 88 | 79 | 88 | 73 | 86 | 73 | 85 | 70 | 80 | 69 | 77 | 68 | 89 | 82 |
| 1888 | 76 | 67 | 78 | 63 | 80 | 66 | 83 | 71 | 85 | 73 | 87 | 73 | 89 | 73 | 90 | 75 | 87 | 77 | 87 | 78 | 83 | 70 | 77 | 62 | 90 | 62 | ||
| 1889 | 78 | 61 | 79 | 66 | 76 | 67 | 86 | 69 | 86 | 73 | 88 | 74 | 90 | 82 | 88 | 72 | 89 | 76 | 85 | 74 | 82 | 71 | 77 | 71 | 90 | 61 | ||
| Jamaica— Kingston (60) |

| 1888 | 91 | 60 | 88 | 61 | 90 | 61 | 93 | 63 | 92 | 69 | 94 | 70 | 95 | 71 | 93 | 69 | 93 | 71 | 94 | 65 | 94 | 64 | 94 | 66 | 95 | 60 |
| 1889 | 92 | 65 | 92 | 63 | 93 | 60 | 93 | 70 | 94 | 71 | 94 | 71 | 94 | 72 | 94 | 69 | 93 | 68 | 94 | 68 | 92 | 67 | 93 | 60 | 94 | 60 | ||
| 1890 | 91 | 62 | 89 | 60 | 89 | 61 | 90 | 65 | 89 | 67 | 92 | 70 | 94 | 69 | 92 | 69 | 91 | 71 | 93 | 70 | 92 | 69 | 89 | 63 | 94 | 60 | ||
| 1891 | 90 | 62 | 90 | 64 | 91 | 63 | 89 | 68 | 91 | 70 | 91 | 72 | 96 | 72 | 97 | 70 | 92 | 70 | 92 | 70 | 90 | 67 | 89 | 64 | 97 | 62 | ||
| Trinidad* (130) |

| 1888 | 84 | 68 | 85 | 66 | 86 | 67 | 87 | 69 | 89 | 69 | 87 | 71 | 88 | 71 | 87 | 71 | 91 | 70 | 88 | 70 | 87 | 70 | 87 | 70 | 91† | 66† |
| 1889 | 88 | 65 | 89 | 68 | 90 | 70 | 91 | 70 | 91 | 72 | 88 | 70 | 86 | 72 | 87 | 71 | 88 | 70 | 89 | 70 | 87 | 69 | 84 | 70 | 87† | 70† | ||
| 1890 | 84 | 68 | 85 | 66 | 86 | 67 | 84 | 70 | 85 | 69 | 85 | 70 | 86 | 68 | 86 | 69 | 89 | 70 | 86 | 70 | 87 | 70 | 85 | 68 | 86† | 69† | ||
| 1891 | 85 | 67 | 85 | 67 | 88 | 68 | 90 | 69 | 91 | 70 | 86 | 72 | 87 | 71 | 89 | 71 | 89 | 71 | 89 | 71 | 88 | 71 | 85 | 70 | 88† | 70† | ||
The rainfall varies much at the different stations, and from year to year. The following shows the rainfall for the last three years:—
| Station. | 1890. | 1891. | 1892. | |||
|---|---|---|---|---|---|---|
| Rainfall. | Number of Days on which Rain fell. | Rainfall. | Number of Days on which Rain ell. | Rainfall. | Number of Days on which Rain fell. | |
| Inches. | Inches. | Inches. | ||||
| Auckland | 46.100 | 176 | 36.040 | 149 | 41.331 | 177 |
| Te Aroha | 64.110 | 129 | 43.270 | 119 | 54.080 | 144 |
| Rotorua | 50.411 | 162 | 48.940 | 132 | 66.230 | 166 |
| Wellington | 45.230 | 165 | 35.125 | 166 | 67.656 | 184 |
| Lincoln | 14.836 | 104 | 20.575 | 98 | 27.883 | 124 |
| Dunedin | 27.984 | 155 | 32.734 | 151 | 47.552 | 160 |
The annual average rainfall at the four principal stations in New Zealand, for the ten years ending December, 1892, was:—
| North Island. | ||
| Auckland. | 38.881 | |
| Wellington | 48.296 | |
| Middle Island. | ||
| Lincoln | 26.190 | |
| Dunedin | 36.863 |
Daily observations have been discontinued at Hokitika, on the west coast of the Middle Island, since 1880; but for the ten years 1871 to 1880 inclusive the annual rainfall there averaged 122.990in., the greatest rainfall for any one of those years having been 154.446in., and the smallest 96.170in.
The greatest rainfall in any twenty-four hours during the year 1892 occurred at Dunedin, 5.400in., on the 8th February.
The observations that have been taken show that the northern part of New Zealand is within the influence of the subtropical winter rainfall, the probability of rainfall in winter in that part of the colony being twice as large as in summer.
In the south, however, the rainfall, though irregular, is distributed more equally over the year. The chief difference to be observed is that on the west coast spring rains prevail, and on the east coast summer rains; while in the middle of the colony the driest season is autumn, and in the south it is winter and spring.
The contrast between the east and west coasts in the matter of rainfall, is as striking as the difference in temperature. Thus, in the North Island, Napier on the east has only half the amount of rain that falls in Taranaki on the west. But the Middle Island, with its longitudinal range of lofty mountains, exhibits this feature in a still more marked manner, for the rainfall on the west is nearly five times that on the east. The excess of precipitation on the coast is clearly illustrated by the distribution of the glaciers on the opposite sides of the range: those on the west slope have an excessive supply of snow, and descend to a line where the mean annual temperature is 50° Fahr., while on the east slope they descend only to the mean annual temperature of 37°. The winter snow-line of the Southern Alps on the east side is 3,000ft., and that on the west side 3,700ft.
Periods of lasting drought are almost unknown in New Zealand, and only in two instances do the records show a whole month at any station without rain.
| Stations. | Rainfall. | Probability of Rain. | Mean Max. in 24 Hours. | ||||||||
|---|---|---|---|---|---|---|---|---|---|---|---|
| Winter. | Spring. | Summer. | Autumn. | Total for Year. | Winter. | Spring. | Summer. | Autumn. | Year. | ||
| North Island— | Percentage. | In. | In. | In. | In. | In. | In. | In. | |||
| Mongonui | 36 | 24 | 23 | 17 | 58.132 | 6.66 | 0.50 | 0.33 | 0.39 | 0.47 | 3.500 |
| Auckland | 32 | 25 | 19 | 24 | 47.008 | 0.61 | 0.52 | 0.33 | 0.41 | 0.47 | 3.358 |
| New Plymouth | 29 | 27 | 20 | 23 | 59.442 | 0.52 | 0.51 | 0.35 | 0.38 | 0.44 | 2.520 |
| Napier | 39 | 15 | 35 | 11 | 36.004 | 0.26 | 0.22 | 0.24 | 0.17 | 0.22 | … |
| Wellington | 29 | 24 | 24 | 22 | 51.542 | 0.51 | 0.43 | 0.37 | 0.40 | 0.43 | 2.610 |
| South Island— | |||||||||||
| Nelson | 27 | 26 | 29 | 17 | 61.599 | 0.27 | 0.25 | 0.22 | 0.18 | 0.23 | 7.189 |
| Hokitika | 24 | 28 | 28 | 20 | 111.653 | 0.52 | 061 | 0.57 | 0.48 | 0.54 | 3.532 |
| Bealey | 22 | 28 | 31 | 18 | 105.340 | 0.53 | 0.61 | 0.56 | 0.47 | 0.54 | 3.512 |
| Christchurch | 31 | 21 | 25 | 23 | 25.536 | 0.36 | 0.33 | 0.28 | 0.24 | 0.30 | 1.622 |
| Dunedin | 23 | 23 | 28 | 26 | 31.682 | 0.51 | 0.55 | 0.58 | 0.54 | 0.54 | 2.079 |
| Invercargill | 26 | 23 | 26 | 26 | 49.732 | 0.47 | 0.47 | 0.40 | 0.49 | 0.46 | 1.130 |
| Stations. | Dec. | Jan. | Feb. | Mar. | April | May. | June | July. | Aug. | Sept. | Oct. | Nov. |
|---|---|---|---|---|---|---|---|---|---|---|---|---|
| North Island– | In. | In. | In. | In. | In. | In. | In. | In. | In. | In. | In. | In. |
| Mongonui | 2.339 | 3.209 | 7.787 | 1.492 | 2.882 | 5.461 | 8.319 | 6.598 | 6.241 | 5.831 | 3.701 | 4.272 |
| Auckland | 3.409 | 2.071 | 3.272 | 3.150 | 3.402 | 4.771 | 5.721 | 5.279 | 4.331 | 4.331 | 3.520 | 3.752 |
| New Plymouth | 4.921 | 3.221 | 3.908 | 2.579 | 3.520 | 7.720 | 5.914 | 6.299 | 5.177 | 5.252 | 5.969 | 4.858 |
| Napier | 5.630 | 3.571 | 3.650 | 1.130 | 1.358 | 1.532 | 3.402 | 3.681 | 6.870 | 2.414 | 1.539 | 1.201 |
| Wellington | 3.999 | 3.882 | 4.453 | 3.780 | 3.280 | 4.540 | 5.212 | 5.658 | 4.299 | 3.941 | 5.000 | 3.500 |
| South Island– | ||||||||||||
| Nelson | 4.319 | 5.358 | 8.331 | 2.063 | 3.221 | 5.177 | 4.441 | 6.319 | 6.233 | 6.319 | 5.000 | 4.815 |
| Hokitika | 12.169 | 8.902 | 9.871 | 6.752 | 8.611 | 6.370 | 8.240 | 9.638 | 9.130 | 5.878 | 13.402 | 12.690 |
| Bealey | 14.087 | 9.681 | 8.902 | 3.921 | 7.433 | 8.079 | 5.019 | 10.378 | 7.799 | 5.811 | 15.501 | 8.733 |
| Christchurch | 1.622 | 2.311 | 2.370 | 1.752 | 1.811 | 2.280 | 3.189 | 2.449 | 2.319 | 1.161 | 2.142 | 2.130 |
| Dunedin | 3.012 | 3.599 | 2.142 | 2.220 | 2.122 | 3.949 | 2.441 | 2.500 | 2.228 | 2.000 | 2.500 | 2.969 |
| Invecargill | 3.622 | 5.279 | 3.921 | 3.980 | 3.571 | 5.401 | 5.019 | 3.441 | 4.390 | 2.661 | 3.929 | 4.520 |
The configuration of the colony—its great length from north to south compared with its breadth, its extent of coast-line, and the division of the two principal parts by Cook Strait—renders it very subject to the influence of sea-breezes. As a consequence, in parts of the country there is at times much motion in the atmosphere, and windy days are prevalent.
Owing to the fact that most atmospheric disturbances pass from west to east, with the centre of the depression to the south of New Zealand, there is a marked prevalence of westerly winds throughout all seasons, but they are much modified by the form of the land. When the centre passes to the north of New Zealand, the result is that the north-east winds impinge on the east coast, bringing rain, followed by cold south-easters, with heavy storms of rain and snow during winter in the south.
The more common westerly winds begin in the north-north-west, with heavy rain on the west coast, and gradually v to south-west, when fair bright weather sets in on that coast; but the same southerly wind, sweeping along the east side of the islands, brings heavy strong weather, locally known as “southerly bursters,” which, from the shape of the coast, reach the region of Cook Strait as south-east storms. All the other winds are either land- or sea-draughts, with light fine weather, or are moderate winds produced by the circulation of the atmosphere round anticyclonic areas of high barometric pressure which are far more persistent in their influence than the fast-moving cyclonic or low-pressure areas.
The number of days on which there were gales or high winds in 1892, at each station, was as follows:—
| Number of Days on which there were Gales or High Winds. | Maximum Velocity of Wind, in Miles, in any 24 Hours. | Date. | |
|---|---|---|---|
| Auckland | 45 | ||
| Te Aroha | 20 | ||
| Rotorua | 0 | ||
| Wellington | 65 | 805 | 25th Oct. |
| Lincoln | 9 | 647 | 8th Sept. |
| Dunedin | 18 | 530 | 12th May. |
Wellington, by reason of its position near the narrowest part of Cook Strait, is peculiarly subject to wind.
Thunderstorms are most frequent where the changes of wind are most suddenly felt, from the moist equatorial currents to the cold polar currents of the south-west. On the west coast they are most frequent in spring, except in the extreme south-west of Otago, where, during winter, thunderstorms are of almost daily occurrence.
Table of Contents
New Zealand is singularly rich in springs of water that hold mineral salts in solution, and these are already noted for their valuable medicinal properties. Some of the acid baths of greatest repute, such as the “Priest's” Bath, at Rotorua, have nothing equal to them in use in any part of the world.
Both hot and cold springs are found, the former being, with few exceptions, confined to the districts of the North Island where volcanic forces have been active since the last Tertiary period, and are not yet altogether dormant. A few thermal springs are found to escape from the Upper Mesozoic rocks, in localities where the source of heat can only be attributed to chemical decomposition of bituminous matters and sulphides; and in a few instances warm waters spring from Paláozoic rock-formations in the Middle Island. The cold mineral springs have a wider distribution, but have only as yet been examined from comparatively few localities.
The mineral waters of New Zealand are classified, from analyses that have been made in the Colonial Laboratory, under the following groups:—
Saline.—Containing chiefly chloride of sodium.
Alkaline.—Containing carbonates and bicarbonates of soda and potash.
Alkaline Siliceous.—Waters containing much silicic acid, but changing rapidly on exposure to the atmosphere, and becoming alkaline.
Hepatic or Sulphurous.—Waters the prominent character of which is the presence of sulphuretted hydrogen and sulphurous acid.
Acid Waters.—In which there is an excess of mineral acids, such as hydrochloric and sulphuric acid.
Mud Baths.—In addition to the clear-water baths, there are what are termed mud baths, in which the mineral waters are mixed with a pasty clay. Their properties vary with the nature, strength, and temperature of the mineral waters, the latter being maintained by steam jets. The best known mud bath is at Sulphur Point, Rotorua. It is an acid bath, and is also rich in sulphuretted hydrogen, one gallon including as much as 10.12 grains of this gas. It has, therefore, a very powerful action on the liver, but is somewhat dangerous, and has to be used with caution.
| Analysis. | Grains per Gallon. |
|---|---|
| Sulphate of soda | 13.32 |
| Sulphate of lime | 4.08 |
| Sulphate of magnesia | 4.86 |
| Sulphate of iron (protoxide) | 1.46 |
| Sulphate of alumina | 15.70 |
| Silica | 13.61 |
| Hydrochloric acid | 5.44 |
| Sulphuric acid | 4.36 |
| 62.83 |
The following is a list of the best known mineral springs, full details concerning which are to be found in the Official Laboratory Reports:—
| No. | Name and Locality. | Temp. Fahr. | Grains per Pint. | Chemical Character of Water. |
|---|---|---|---|---|
| * Destroyed by the eruption of 10th June, 1886. | ||||
| Bay of Islands District. | Deg. | |||
| 1 | Ohaeawai and Pakaraka | 60–116 | 16.8 | Acid, aluminous; deposits mercury |
| Hauraki District. | ||||
| 2 | Waiwera | 110 | 17.7 | Alkaline, saline |
| 3 | Puriri | 60 | 67.1 | Carbonated, alkaline. |
| Bay of Plenty. | ||||
| 4 | White Island Lake | 97–212 | 1850.8 | Strongly acid. |
| 5 | White Island Springs | 210 | 26.1 | Strongly acid. |
| Rotomahana.* | ||||
| 6 | Pink Terrace Geyser | 208 | 19.3 | Sulphurous. |
| 7 | White Terrace Geyser | 210 | 18.0 | Alkaline. |
| Whakarewarewa. | ||||
| 8 | Turikore, or Spirit Bath | 96–120 | 10.9 | Sulphurous. |
| 9 | Koroteoteo, or Oil Bath | 214 | 13.0 | Caustic, alkaline. |
| 10 | Ngatarawa, Gas Pool | 124 | 8.4 | Sulphurous. |
| 11 | Papatangi, Lobster-pot | 110 | 5.7 | Sulphurous. |
| Arikikapakapa. | ||||
| 12 | Mud Bath | 98 | 9.2 | Saline, acidic. |
| 13 | Sulphur Pool | 160 | 6.8 | Acidic. |
| 14 | Sulphur Spring | 73–98 | 10.0 | Acidic. |
| 15 | Sulphur Stream | 80 | 8.5 | Acidic. |
| 16 | Mud Lake | 65 | 6.8 | Acidic. |
| Rotorua. | ||||
| 17 | Tapui te Koutou, Graham's Farm Bath | 90–108 | 9.1 | Alkaline. |
| 18 | Kuirau, Washing Spring | 136–156 | 9.9 | Alkaline, siliceous. |
| 19 | Waihunuhunukuri, Lake House Clear Bath | 130–170 | 7.3 | Alkaline. |
| 20 | Lake House Acid Bath | 150 | 11.4 | Acidic. |
| 21 | Waikite (a), Morrison's Hotel Bath | 120 | 9.4 | Alkaline. |
| 22 | Waikite (b), Scott's Bath | 116 | 9.6 | Alkaline. |
| 23 | Hinemaru, Hughes's Baths | 170 | 16.7 | Acidic. |
| 24 | Te Kauwhanga (a), Cameron's Bath | 105 | 9.9 | Acidic. |
| 25 | Te Kauwhanga (b), Painkiller | 204 | 13.8 | Acidic and hepatic. |
| 26 | Perekari, Sulphur Point Boiling Pool | 130–150 | 7.0 | Acidic. |
| 27 | Mud Bath, Sulphur Point | 120 | 7.8 | Acidic and hepatic. |
| 28 | Hot Pool, Sulphur Point | 200 | 12.1 | Acidic. |
| 29 | Whangapipiro, Madame Rachel's Bath | 170–210 | 14.7 | Alkaline and siliceous |
| 30 | Otamawhata | 144 | 11.4 | Alkaline. |
| 31 | Hospital Lake | 66 | 11.3 | Acidic. |
| 32 | Te Pupunitanga, Priest's Bath | 94–110 | 12.1 | Acidic. |
| 32A | Matatuatonga | 172 | 13.8 | Saline. |
| 32B | Toko, or Postmaster's Bath | 120 | 11.9 | Acidic. |
| 32C | Waikupapapa, or Saddler's Bath | 120 | 7.0 | Acidic. |
| 32C | Ngaruapuia, or Gemini Bath | 108 | 7.8 | Acidic. |
| 32E | Waikirihou, or Vaux's Bath | 112 | 12.8 | Acidic. |
| Rotoiti. | ||||
| 33 | Te Kute, mud lake at Tikitere | 100–212 | 6.1 | Acidic, hepatic. |
| 34 | Te Mimi, hot waterfall, from 30° C. | 90–112 | 3.8 | Acidic. |
| Taupo District. | ||||
| 35 | Rotokawa, Black Water | 192 | 17.8 | Acidic. |
| 36 | Rotokawa, Yellow Water | 152 | 22.0 | Acidic. |
| 37 | Wairakei, Kiriohinekai, or White Water | 112 | 1.8 | Alkaline. |
| 38 | Ruahine, Crow's Nest | 180 | 19.2 | Alkaline. |
| 39 | Ruahine, Witches' Cauldron | 192 | 20.8 | Alkaline. |
| 40 | Ruahine, Ohinekahoro | 195 | 23.0 | Alkaline. |
| 41 | Ruahine, spring on flat near track | 132 | 2.2 | Feebly saline. |
| 42 | Otumahike, Acacia | 136 | 3.9 | Feebly alkaline. |
| 43 | Lofley's Gully, McPherson's | 96 | 1.9 | Feebly alkaline. |
| 44 | Lofley's Gully, cold stream | 76 | 1.3 | Feebly alkaline. |
| 45 | Lofley's Gully, warm stream | 114 | 2.8 | Feebly alkaline. |
| 46 | Lofley's Gully, Sumach | 106 | 3.0 | Feebly alkaline. |
| 47 | Lofley's Gully, Source No. 1 | 106 | 3.0 | Alkaline, siliceous. |
| 48 | Lofley's Gully, Source No. 2 | 136 | 19.0 | Alkaline, saline. |
| 49 | Lofley's Gully, Kokowai | 104 | 2.0 | Feebly saline. |
| 50 | Waipahihi, A.C. Bath No. 1 | 110 | 4.7 | Chlorinated saline. |
| 51 | Waipahihi, A.C. Bath No. 2 | 146 | 5.7 | Saline. |
| 52 | Waipahihi, Tea-tree Spring | 170 | 13.4 | Alkaline, siliceous. |
| 53 | Waipahihi, Source No. 1 | 160 | 10.8 | Alkaline. |
| 54 | Waipahihi, Source No. 2 | 166 | 13.0 | Alkaline. |
| 55 | Waipahihi, Waipahihi Stream | 98 | 8.6 | Saline. |
| 56 | Left bank, Waikato, Waiariki | 125 | 10.8 | Chlorinated saline. |
| Waikato District. | ||||
| 57 | Whangape | 160–200 | 6.0 | Alkaline. |
| 57A | Okoroire | 99–113 | 5.29 | Chlorinated saline. |
| Ruapehu District. | ||||
| 58 | Onetapu, Waikato | 70 | 58.0 | Sulphurous. |
| East Cape District. | ||||
| 59 | Roparoa, Waiapu | Cold | .. | Saline, bituminous. |
| 60 | Manutahi Waiapu | Cold | .. | Saline, bituminous. |
| 61 | Pepoti Waiapu | Cold | .. | Hydrocarbon gas. |
| 62 | Waipaoa, Poverty Bay | Cold | .. | Bituminous. |
| 63 | Waipiro, Waiapu | 144 | .. | Calcareous, bituminous. |
| No. | Name and Locality. | Temp. Fahr. | Grains per Pint. | Chemical Character of Water. |
| Wellington District. | ||||
| 64 | Wallingford | 60 | 10.4 | Acid. |
| 65 | Pahua | Cold | 184.2 | Alkaline. |
| 66 | Burton's Spring | Cold | .. | .. |
| 67 | Akiteo (a) | Cold | 62.4 | Alkaline. |
| 68 | Akiteo (b) | Cold | 4.8 | Sulphurous. |
| South Island. | ||||
| 69 | Hanmer Plain Springs, Amuri | 90–104 | 10.8 | Alkaline. |
| 70 | Sumner Lake Springs | 93 | 2.3 | Saline. |
| 71 | Amberley Spring, Canterbury | Cold | 11.7 | Chalybeate. |
| 72 | Wickliffe Bay Spring, Otago | .. | 34.6 | Salino. |
| 73 | Gibson's Spring, Southland | Cold | 2.3 | Alkaline. |
1. Ohacawai, Auckland.—A group of springs used as baths, 17 miles from Bay of Islands, the waters of which are acidic, depositing sulphur and alum on cooling. Silica is only deposited as a granular sediment. These springs are chiefly interesting from their being accompanied by an escape of mercurial vapour, which deposits cinnabar and metallic mercury. Their medicinal action is tonic and chalybeate, and they have a specific alterative action in skin diseases.
2. Waiwera, on the coast, 30 miles north of Auckland.—A powerful escape of weakly alkaline and saline water, extensively used as baths for rheumatic and dyspeptic complaints; used internally it has also a mild antilithic action. This spring is largely resorted to, and most comfortable accommodation is provided for visitors.
| Grains per Gallon. | |
|---|---|
| Chloride of sodium | 116.715 |
| Chloride of potassium | 0.091 |
| Chloride of lithium | Traces |
| Iodide of magnesium | Traces |
| Sulphate of soda | 0.383 |
| Bicarbonate of soda | 87.513 |
| Bicarbonate of lime | 10.692 |
| Bicarbonate of magnesia | 0.954 |
| Bicarbonate of iron | 0.683 |
| Alumina | Traces |
| Silica | 2.464 |
| 219.495 |
3. Puriri, about ten miles from Grahamstown.—A cold, effervescent water, having valuable properties from the presence of a large percentage of alkaline carbonates. It is bottled both as still and aërated water, and is coming into repute as an antilithic aperient, and would probably be useful in cases of acid dyspepsia and in disorders of the kidney and bladder. In chemical properties it approaches very closely to the Fachingen and Ems waters, of Nassau in Germany.
| Grains per Gallon. | |
|---|---|
| Chloride of sodium | 21.938 |
| Iodide of magnesium | Traces |
| Sulphate of soda | 0.940 |
| Sulphate of potash | 4.938 |
| Carbonate of iron | Traces |
| Bicarbonate of lime | 28.506 |
| Bicarbonate of magnesia | 25.625 |
| Bicarbonate of soda | 452.393 |
| Bicarbonate of lithia | Traces |
| Silica | 2.772 |
| Phosphoric acid | Not determined |
| 537.112 |
4–5. White Island.—A conical island in the Bay of Plenty, formed by the summit of an extinct volcanic mountain rising out of deep water. The crater is occupied by a lake of strong mineral water, which is fed by intermittent geysers and boiling springs surrounding it. All these waters are intensely acid, and deposit sulphate of lime; while the accompanying vapours form irregular deposits of pure sulphur. The first water is too powerful to be used medicinally in its natural state, but might be turned to valuable account in certain chemical manufactures.
6–34 (Rotorua, &c.) are associated geographically as all coming from the famous Rotorua and Rotomahana Districts. They, however, present considerable variety in quality, and may be classed as follows:—
6–17. Alkaline and Siliceous Waters.—These differ from the ordinary alkaline waters in the presence of silicic instead of carbonic acid as the combining agent. They are remarkable from their building extensive mounds and terraces, composed of silica deposited by the cooling water, and involving as it solidifies a certain amount of granular silica, which is held in mechanical suspension; in this manner the wonderful pink and white terraces of Rotomahana and the domes of Whakarewarewa were formed. This class of water invariably contains carbonic-acid gas, and in some cases also sulphuretted hydrogen in large quantity, the oxidation of which leads to the formation of sulphurous and sulphuric acid and the liberation of hydrochloric acid, and by this reaction gives rise to the acidic waters. When used as baths they have an undoubted alterative action, and are very useful in rheumatic affections, especially in gouty constitutions. This is probably due to the specific action of silicates in promoting the discharge of uric acid from the system, as has lately been pointed out by French chemists.
17–34. Acidic Waters.—In the case of these waters the carbonates have been wholly eliminated, and the alkaline salts are formed by a mineral acid, either sulphuric or hydrochloric. In some cases the acid is greatly in excess, forming a bath which has a powerful action upon the liver and upon diseases dependent on the derangement of that important organ. In some the presence of sulphurous and hydro-sulphuric acid in large quantities gives these baths great efficacy in cutaneous diseases.
The following are the analyses of the four chief types of the mineral waters in the Rotorua District:—
32. “Te Pupunitanga,” commonly known as the “Priest's Spring and Bath;” aluminous and strongly acid (reaction acid).
| Grains per Gallon. | ||
|---|---|---|
| Spring (1881). | Bath (1893). | |
| Sulphate of soda | 19.24 | 8.42 |
| Sulphate of potash | Traces | Traces |
| Sulphate of lime | 7.41 | 4.64 |
| Sulphate of magnesia | 3.03 | 1.24 |
| Sulphate of alumina | 21.67 | 11.27 |
| Sulphate of iron | 1.24 | Traces |
| Sulphuric acid | 22.12 | 1.42 |
| Hydrochloric acid | 3.65 | 8.43 |
| Silica | 18.41 | 7.86 |
| 96.77 | 43.28 | |
| Sulphuretted hydrogen | 2.98 | 3.92 |
| Carbonic-acid gas | 2.16 | … |
29. “Whangapipiro,” commonly known as “Madame Rachel's Bath;” saline waters with silicates (reaction alkaline).
| Grains per Gallon. | |
|---|---|
| Chloride of sodium | 69.43 |
| Chloride of potassium | 3.41 |
| Chloride of lithium | Traces |
| Sulphate of soda | 1.53 |
| Silicate of soda | 31.02 |
| Silicate of lime | 4.24 |
| Silicate of magnesia | 1.09 |
| Iron and alumina oxides | 2.41 |
| Silica | 18.21 |
| 131.34 | |
| Carbonic-acid gas | 3.79 |
24. “Te Kauwhanga” (a), commonly known as “Cameron's Bath;” hepatic, feebly saline, with excess of acid (reaction acid).
| Grains per Gallon. | |
|---|---|
| Sulphate of soda | 50.39 |
| Sulphate of potassium | 0.79 |
| Sulphate of calcium | 5.68 |
| Sulphate of magnesia | Traces |
| Sulphate of alumina | 0.29 |
| Silica | 12.64 |
| Hydrochloric acid | 13.62 |
| Iron oxides | 1.29 |
| Sulphuric acid (free) | 5.29 |
| 89.99 | |
| Sulphuretted hydrogen | 8.81 |
| Carbonic-acid gas | 1.96 |
8. “Turikore.” Faintly acid reaction, which turns to alkaline on boiling.
| Grains per Gallon. | |
|---|---|
| Silicate of soda | 16.32 |
| Silicate of lime | 1.61 |
| Silicate of magnesia | 1.14 |
| Silicate of iron | 0.39 |
| Sulphate of soda | 13.47 |
| Chloride of potassium | 1.24 |
| Chloride of sodium | 53.61 |
| Phosphate of alumina | Traces |
| 87.78 |
35–56. With the exception of the first two their general characters are saline and faintly acid. They are reported to be suitable for internal and external use, as alteratives, in scorbutic and tubercular diseases, also in chronic nervous affections and cutaneous eruptions. The presence of iodine in these waters, which was formerly reported, has been disproved by recent analyses of authentic samples.
57. Whangape, Waikato, is a hot alkaline water, having a composition similar to those of Puriri and Waiwera.
57A. Okoroire Hot Springs and Sanatorium: Upper, or No. 2, Bath: Temperature, 113°; flow, 1,300 gallons per hour.
| Grains per Gallon. | |
|---|---|
| Calcium sulphate | 2.77 |
| Magnesium chloride | 0.69 |
| Sodium chloride | 9.48 |
| Sodium carbonate | 17.18 |
| Potassium carbonate | 1.42 |
| Iron oxide | 1.10 |
| Silica and silicates | 9.70 |
| 42.34 |
Lower or Open-air Bath, No. 4: Temperature, 99; flow, 4,100 gallons per hour.
| Grains per Gallon. | |
|---|---|
| Calcium sulphate | 2.42 |
| Calcium carbonate | 1.84 |
| Magnesium carbonate | 1.03 |
| Sodium chloride | 4.34 |
| Alkaline carbonate | 11.41 |
| Iron oxide | 0.70 |
| Silica and silicates | 9.82 |
| 31.56 |
(Analysis by Professor Brown.)
General remarks: Apart from the medicinal value which these springs possess in common with most other alkaline hot springs, they are remarkable for the large flow of water, and for their freedom from any unpleasant odour or deposit. This fact should render the springs specially attractive to persons in good health.
58. Onetapu Desert, at the sources of the Waikato and Wangaehu Rivers. This powerful spring, which issues at the base of Ruapehu, is so strongly charged with sulphates of iron and alumina as to taint the water of the latter river from its source to the sea, a distance of seventy miles. It is only one of the many mineral springs which occur in the still active volcanic district of Tongariro.
59–62. In the East Cape and Poverty Bay District are four—out of some seventeen different springs which have been discovered—that yield hydrocarbons, either in the form of gas or oil, and associated with saline waters. The source of these springs is probably to be found in certain bituminous shales at the base of the cretaceous formation.
63. Waipiro is interesting as being a hot spring in the same district (in which there is no evidence of any volcanic action), and as depositing immense quantities of carbonate of lime in acicular crystals. This lime-deposit is built up in the form of a wall, marking the line of fissure through which the water escapes.
64, 65. Are cold springs in the Wellington District, and belong to the class of saline waters, which are generally feebly acid. Springing from rocks of Lower Secondary formation, they are interesting from the large proportion of iodine and other exceptional elements which they contain. Pahua is the most notable in this respect, and has the following composition:—
| Grains per Gallon. | |
|---|---|
| Chloride of sodium | 1,303.329 |
| Chloride of potassium | 0.501 |
| Chloride of magnesium | 34.960 |
| Chloride of calcium | 120.885 |
| Iodide of magnesium | 0.582 |
| Bromide of magnesium | Traces |
| Sulphate of lime | 3.026 |
| Phosphate of alumina | 0.641 |
| Phosphate of iron | Traces |
| Phosphate of lime | 0.430 |
| Bicarbonate of lime | 6.451 |
| Silica | 1.696 |
| Iodine, free | 1.595 |
| 1,474.096 |
Total quantity of iodine to the gallon (free and combined), 2.177 grains.
66. Burton's, Taipo, in addition to iodine, contains traces of arsenic.
67, 68. Akiteo (a) is a strong saline water containing iodides and bromides, while Akiteo (b) is an aërated chalybeate water, and would be valuable as a tonic, being similar to the springs at Pyrmont, Waldeck, and Recoaro, Venetia. Aërated chalybeate waters of medicinal value are found in many other parts of New Zealand; among these may be mentioned a locality near Whangarei, in the North Island, and Chain Hills, near Dunedin, in the Middle Island.
69. The springs which occur at the Hanmer Plains, Amuri (Middle Island), are alkaline, with a strong escape of sulphuretted hydrogen, and would form useful baths in hepatic and cutaneous diseases.
The water from the springs in question was in 1892 quite clear and colourless. It emitted a very offensive odour, and manifested a strong alkaline reaction after being boiled for a short time. The following are the results obtained by analysis of its fixed salts per gallon. The small quantity of sediment that had formed is excluded from the results:—
| Grains per Gallon. | |
|---|---|
| Chloride of sodium | 62.09 |
| Chloride of potassium | 0.15 |
| Chloride of lithium | Trace |
| Iodide of magnesium | Trace |
| Carbonate of lime | 0.55 |
| Carbonate of magnesia | 1.77 |
| Carbonate of iron | 0.05 |
| Sulphate of soda | 7.48 |
| Carbonate of soda | 2.66 |
| Phosphate of alumina | Traces |
| Silica | 2.63 |
| 77.38 |
The total quantity of carbonic acid was not estimated, owing to the small quantity of water sent. The quantity of sulphuretted hydrogen amounted to 2.19 grains per gallon. The water having been analysed as a mineral water, the organic matter has not been estimated, or tested as to nature.
It will be noticed that iodine occurs in this water, but it is in such small quantity that it can only be found by operating upon it concentrated. The water is hepatic, moderately saline, and should prove useful in diseases of the liver and the skin. The water from these springs was formerly reported on and partially analysed in May, 1867, with very similar results (Hector, “Transactions N.Z. Institute,” Vol. iii., p. 297, 1870).
70. At the distance of a few miles from Sumner Lake the water has a temperature of 93° Fahrenheit, as it gushes from the sandstone rock, but it does not contain sufficient matters in solution to entitle it to rank as a mineral water.
71. Amberley. This was analysed and reported on by Professor Bickerton, of the Canterbury College, as a chalybeate water, but unfit for use on account of the organic matter present. The analysis gave the following quantitative results:—
| Grains per Gallon. | |
|---|---|
| Total dissolved solids | 37.6 |
| Volatile | 8.8 |
| Fixed | 28.8 |
| Carbonate of lime | 3.6 |
| Carbonate of magnesia | 2.2 |
| Chlorine | 10.5 |
| Iron protoxide | 2.3 |
| Free ammonia | 0.069 |
| Albuminoid ammonia | 0.034 |
| Sediment | 165.2 |
72. Wickliffe Bay, Otago. An analysis of this water is given by Professor Black, of Otago University. It appears to be a saline water:—
| Grains per Gallon. | |
|---|---|
| Sulphuric acid (combined) | 39.3 |
| Chlorine | 112.0 |
| Magnesia | 18.3 |
| Lime | 11.5 |
| Alkalies | 83.0 |
| Carbonic acid (combined) | 12.6 |
| 276.7 |
73. Gibson's Spring, Southland, is a water which is stated to be a specific in diarrhœa, and contains a large amount of organic matter, to some astringent in which its medicinal qualities are probably due.
Table of Contents
The geographical position of the North Island of New Zealand will naturally suggest something of the character of its inland climate at an elevation of 1,000ft. Rotorua is some forty miles from the coast. Its elevation is 990ft. above the sea-level. The atmosphere is drier and more bracing than that of the coast—in winter considerably colder, and in summer perhaps somewhat hotter, but of a dry pleasant heat, free from the moist oppressiveness which characterizes the summer heat of Auckland and other coast towns. The mean temperature of spring is 53°, of summer 66°, of autumn 57°, and of winter 45°. The relative moisture of the air for the four seasons (taking complete saturation at 100°) is—for spring, 74°; for summer, 66°; for autumn, 67°; and for winter, 74°. The steam which rises so abundantly and perpetually all over the district no doubt adds considerably to the moisture of the atmosphere. This was clearly shown in the month of June, 1886, when the great eruption of Tarawera took place. The relative moisture for that month was 10° in excess of the average, owing to the immense amount of vapour caused by the eruption. The rainfall for the year is about 50in., and the number of days on which rain falls about 140. Auckland has 18in. less rain, and thirteen more rainy days. The daily range of temperature is greatest in the summer and least in the winter. This condition maintains throughout the whole of New Zealand, and constitutes one of the greatest charms of its climate. No matter how hot a summer's day may be, the nights are invariably cool. The mean daily range of temperature for spring is 21°, for summer 28°, for autumn 23°, and for winter 20°.
These annual means, it must be remembered, are based on observations extending over seven years only, and consequently have only a relative value. For example, the rainfall for the six years ending with the year 1891 averaged 50in. per annum, but in 1892 the rainfall was 67in.; so that for these averages to have an absolute value they must be based on observations extending over a far longer period.
The most agreeable months of the year for an invalid to visit Rotorua are February, March, and April; the least pleasant are August, September, and October; but, as there is ample boarding-accommodation close to the baths, the invalid is virtually independent of the weather. A climate better adapted to the necessities of the class of patients visiting this health-resort could not be desired. They are, as a rule, persons in fairly vigorous health, in whom it is desirable to maintain the normal power of adaptation and resistance to climatic changes. A climate in which the same conditions prevailed for long periods of the year would fail to secure this end; but one in which the various factors of temperature, moisture, light, electricity, wind, and atmospheric pressure are subject to moderate variations, is, in every way, the kind of climate to be desired.
The thermal-springs district of New Zealand comprises an area of upwards of 600,000 acres, or close on 1,000 square miles. The length of the district is some fifty miles, with an average breadth of twenty miles. Its altitude varies from 1,000ft. to 2,000ft. above the sea-level.
The general physical features of this region embrace extensive pumice-plains, intersected in various directions by high ranges of igneous formation, which are relieved here and there by enormous trachytic cones. Forests of extraordinary luxuriance and beauty clothe the mountains and border the extensive plateaux, while hot lakes, boiling geysers, and thermal springs are dotted far and wide over the country. The thermal-springs district, however, as defined on the maps, by no means embraces the whole volcanic and hydrothermal activity of the island. Although the volcanic slopes of Ruapehu and Tongariro bound this region on the south, hot springs are found here and there for fully 250 miles beyond its western boundary—in fact, as far north as the Bay of Islands. Within the district it is no exaggeration to say that hundreds of hot springs exist, to say nothing of mud-volcanoes, solfataras, and fumeroles.
These springs are of the most varied chemical character, and of every degree of temperature from 60° to 212°. Not a twentieth part of them have as yet been submitted to analysis. Those which have been examined in the laboratory of the Geological Survey Department in Wellington are divided by Sir James Hector into five classes: (1) Saline, containing chiefly chloride of sodium; (2) alkaline, containing carbonates and bicarbonates of soda and potash; (3) alkaline-siliccous, containing much silicic acid, but changing rapidly on exposure to the atmosphere, and becoming alkaline; (4) hepatic, or sulphurous, characterized by the presence of sulphuretted hydrogen and sulphurous acid; and (5) acidic, containing an excess of sulphuric or hydrochloric acid, or both. In addition to these we have saline waters, containing iodine, cold acidulous chalybeates, and saline acidulous chalybeates. These, however, are in situations at present inaccessible to the invalid, or, if not out of reach, at least destitute of the conveniences and comforts essential to the sick, but they are no doubt destined in the near future to attain a high medical reputation.
The Government of New Zealand has very wisely chosen the southern shore of Lake Rotorua as the basis of operations for opening-up this wonderful district. Here are grouped together numerous examples of the five classes of springs I have enumerated, and here the Government have fixed their first sanatorium and bathing establishment, to which it is desired specially to direct attention. The sanatorium reserve at Rotorua comprises an area of some 50 acres, bounded on the north and east by the lake, and on the west and south by the Township of Rotorua. Ten years ago this was a howling wilderness, covered with tea-tree scrub, and diversified only by clouds of steam rising from the various hot springs. Here the adventurous invalid of that day had to pitch his tent, and be satisfied with a hole in the ground for a bath; and if the spring he wished to use happened to be too hot for his purpose he probably had to dig the hole for himself, and regulate the supply and temperature of the water to the best of his hydraulic ability. In many instances he immortalised himself by giving his name to the spring—a name still retained. Thus we have “Cameron's Bath,” “McHugh's Bath,” “Mackenzie's Bath,” and “The Priest's Bath.” Other springs have received their names from some real or imaginary quality. Thus we have “Madame Rachel,” “The Pain-killer,” “The Coffee-pot,” and “The Blue Bath.” Now this area of desolation is completely transformed. Walks and drives planted with evergreen trees traverse it from end to end, fountains and flower-gardens delight the eye, and commodious buildings for the accommodation and convenience of invalids are springing up on every side. The principal of these are the Sanatorium Hospital, the medical residence, the Priest's Pavilion, the Rachel Pavilion, the Blue Swimming-bath (to which is attached the sulphur-vapour bath and the electrical department), and Brent's boarding-house.
The hospital, which was opened in 1886, was unfortunately destroyed by fire in November, 1888. A new and far more commodious building has just been erected by the Government. It is designed to accommodate twenty-one patients—twelve males and nine females. The stipulations made by the Government with regard to admission are that the patient shall be able to show that his case is one likely to be benefited by the use of the baths, and that he is unable to pay the usual hotel or boarding-house charges.
The following is a copy of the regulations under which patients are admitted to this institution:—
-
Applications for admission of persons shall be addressed to the Resident Medical Officer of the Sanatorium, Rotorua.
-
No person shall be admitted (unless in accordance with Regulations 5, 6, and 7) except on the recommendation of the Hospital or Charitable Aid Board of the district to which he belongs, or of the Trustees of the benevolent society or hospital (if separate institutions) of the town in which he lives.
-
The charge for maintenance and treatment is 21s. a week.
-
The Board or Trustees, in making such recommendation, shall guarantee the cost of such patient, shall send him or her at their own charge to Rotorua, be responsible for his or her return-passage, and provide a sufficient supply of clothing. They shall also furnish a report on the case by a duly-qualified medical practitioner, in order that it may be seen whether the case is one that is likely to profit by treatment at the Sanatorium.
-
Members of any duly-registered friendly society may be admitted, on the recommendation of the lodge to which they belong, on the same terms as patients recommended by a Hospital or Charitable Aid Board, and Regulations 3 and 4 shall be read as applying to them in all respects: Provided that not more than three of such persons shall be resident at the Sanatorium at any one time, and that all the hospital beds are not required by patients admitted under Regulation 2.
-
When all the beds are not occupied by patients admitted under Regulations 2 and 5, the Resident Medical Officer may, at his discretion, admit persons, being bonâ fide hospital cases, and who have undertaken to pay 30s a week for maintenance and treatment.
-
When all the beds are not occupied by patients admitted under Regulations 2, 5, and 6, persons may be admitted on the following conditions:—
-
That the Resident Medical Officer has certified that each such person is likely to be benefited by treatment at the Sanatorium.
-
That the expenses to and from Rotorua are provided by each such person, together with a sufficient supply of clothing.
-
That not more than four such persons shall be resident at the Sanatorium at one time.
-
-
The stay of each patient is limited to three months, but the Resident Medical Officer can, at his discretion, extend the period to six months.
This means, in brief, that patients sent by the Charitable Aid Boards of the country are to be admitted at all times at one guinea per week; that three beds may be occupied by members of registered friendly societies on the same terms; that not more than four free patients shall be resident at the same time; and that if all the beds are not occupied by the three classes of patients enumerated, the medical officer may, at his discretion, admit suitable cases, paying for themselves, at the rate of 30s. per week. Such patients, if they wish to avoid disappointment, should not leave their homes until they have communicated with the resident medical officer, and been assured by him that their cases are suitable, and that they will be admitted on arrival.
It cannot be too widely known that there is no private accommodation in this institution; whatever the regulations under which the patients are admitted, they are on equal terms; they take their meals together in the same hall; the women have their own sitting-room and dormitory, containing nine beds; and the men have their sitting-room and dormitory, containing twelve beds. Patients are admitted for three months, and if, in the opinion of the medical superintendent, a second period of three months is desirable, it is granted; but in all cases six months is the extreme limit.
The great object of this institution, as at present constituted, is to enable the Charitable Aid Boards of the country to send up for treatment a class of patients who would not otherwise be able to avail themselves of the springs, while at the same time in no way interfering with the private enterprise of hotel and boarding-house proprietors.
Patients who frequent our springs are always anxious to see the analysis of the waters in which they bathe, and are usually under the impression that they absorb into their systems the entire list of salts enumerated. This is an error. The body cannot absorb any salts from an aqueous solution. If the water, or any portion of it, is allowed to dry on the skin, a minute quantity of the constituent solids, of course, remains, which through the friction of the clothing becomes incorporated with the fatty elements of the integument, and is eventually absorbed. After a course of sulphur baths the underclothing is redolent of sulphur for some time after leaving the springs, and silver carried in the pockets becomes blackened, showing that a considerable amount of sulphur has been absorbed in the manner described. The shipwrecked sailor adrift in a boat finds his thirst relieved for a time by saturating his shirt with sea water; if he absorbed the salt his suffering would be only intensified, but the wet shirt by temporarily checking the transpiration and evaporation of moisture from his body affords him relief. The direct influence of hot mineral water used for bathing—apart from the effect of temperature—is twofold, according to its chemical character; it either excites and stimulates the nervous and vascular elements of the skin, as in the case of acid sulphur waters; or it exercises a soothing and emollient effect, as in the case of alkaline siliceous waters. We should never lose sight of the fact that the skin is the most important emunctory of the body; and that, as a means of maintaining its normal functional activity, bathing, well-advised and regulated, is the most efficient agent we can employ; and that in skin diseases especially our cures are brought about not by any absorption of fixed salts contained in the water, but by the prolonged maceration of the cuticle, causing the ready removal of the débris of dead and diseased cells, and their gradual replacement by cells of a more healthy character, due to the employment of a suitable regimen and the influence of a highly vitalising climatic environment.
The following springs are those which have the most valuable properties, and whose therapeutic action is best known:—
-
Te Pupunitanga, or “The Priest's Bath,” at Rotorua, only a few feet from the lake's edge; the water is strongly acidic and aluminous, depositing flocculent sulphur on the bed and sides of the bath; reaction, acid. There are four large public baths or pisciná (each 16ft. by 12ft.), two for each sex, with sixteen comfortable private dressing-rooms attached, and provided with cold fresh-water showers, and hot or tepid douches; also two private baths (each 6ft. by 6ft.) for special cases. It is considered the finest and most curative bath in the southern hemisphere. Analysis (in grains per gallon): Sulphate of soda, 19.24gr.; sulphate of potash, traces; sulphate of lime, 7.41gr.; sulphate of magnesia, 3.03gr.; sulphate of alumina, 21.67gr.; sulphate of iron, 1.24gr.; sulphuric acid, 22.12gr.; hydrochloric acid, 3.65gr.; silica, 18.41gr.—total, 96.77gr.; also, sulphuretted hydrogen, 2.98gr., and carbonic acid gas, 2.16gr. Temperature: From 98° Fahr. to 106° Fahr.; average, 99° Fahr. Special indications: Gout, dyspepsia, sciatica, skin diseases, disorders of the liver, sexual impotence, cold feet, amenorrhœa, dropsy, and all forms of rheumatism.
We have no spring in the district that has obtained a higher reputation, or proved itself more generally useful, than that known as the Priest's Bath. The variation in temperature is due to the rise and fall of the lake and the direction of the wind. When the lake is high and the wind blowing in the direction of the baths the conditions are favourable to a high temperature, and vice versà, the cold water of the lake affording a more efficient barrier to the escape of heat than the open pumice-gravel of which the shore is composed. A patient emerging from his bath looks like a boiled lobster, and I regard this determination of blood to the skin as a most important therapeutic factor: the vascular and nervous apparatus of the skin is powerfully stimulated by it, and internal congestions are relieved. Our alkaline waters, on the other hand, which contain the chlorides and silicates of the alkalies, have a soothing and emollient effect on the skin, and are of great value in eczema, and other cutaneous ailments. The water of the Priest's Spring is brilliantly clear when undisturbed, and pale-green in colour. A faint odour of sulphuretted-hydrogen pervades the vicinity, which gas, together with sulphurous-acid, is copiously evolved. Since the eruption of Tarawera this offensive odour has been much modified, owing, I believe, to an increased evolution of sulphurous-acid gas at that time. Fortunately for the nasal organs and general comfort of the bathers, these gases effect a mutual decomposition, resulting in the formation of sulphur and water, thus—2H2S+SO2 = 3S+2H2O; which means that two parts of sulphuretted hydrogen, combining with one part of sulphurous acid, form three parts of sulphur and two of water. Wherever steam charged with these gases is able to penetrate, sulphur is deposited. This is the origin of all the sulphur in the district. It permeates readily the siliceous-sinter rock, forming beautiful needle-like crystals of sulphur in its interspaces. Sulphur being thus constantly transformed from the gaseous to the solid state in the water of this spring, it is very possible that, coming into contact with the skin in this nascent and impalpable form, its therapeutic power may be considerably enhanced: there can be no doubt about its absorption, for our patients tell us that their underclothing is redolent of sulphur for weeks after returning home. The Priest's Bathing-pavilion is a building 74ft. long by 44ft. wide, having a superficial area of 3,256 square feet. It is divided into male and female departments. Each department comprises two public pisciná, 16ft. by 12ft., with two private baths for special cases, reading-rooms, and comfortable dressing-rooms. Each bath is provided with a cold fresh-water shower, and douches either hot or tepid, thus materially enhancing the hydropathic efficiency of this remarkable water.
-
Whangapipiro, or “Madame Rachel's Bath,” at Rotorua; saline waters of exquisite softness, with silicates, having the power of applying a gloss to the skin, which is due to the large quantity of silicates that they contain; reaction, alkaline. There are two open-air baths (17ft. by 14ft.), one for each sex, and also single baths inside the house. Analysis (in grains per gallon): Chloride of sodium, 69.43gr.; chloride of potassium, 3.41.gr.; chloride of lithium, traces; sulphate of soda, 11.80gr.; silicate of soda, 18.21gr.; silicate of lime, 4.24gr.; silicate of magnesia, 1.09gr.; iron and alumina oxides, 2.41gr.; silica, 5.87gr.—total, 116.46gr. in one gallon; also carbonic acid gas, 3.79gr. Temperature: Formerly 174° Fahr., but rose to 194° Fahr. after eruption in June, 1886. Special indications: Diseases of the skin, especially psoriasis. By internal administration (whereby an increase in the elimination of urea and uric acid is produced) in rheumatism, gout, and certain forms of dyspepsia.
The “Rachel” bathing-pavilion adjoins Te Pupunitanga, or “The Priest's Bath.” Here we have a water diametrically opposite in character to the last described—an alkaline siliceous water, having a temperature at its source of 180°. This source is a cauldron of enormous depth, situated some 200 yards from the bathing-pavilion, and yielding 50,000 gallons daily. We have a simple system of cooling by which the water may be used at any desired temperature. Here also is a separate department for each sex, each containing a public piscina 16ft. square, four private baths, a lounging- or waiting-room kept at a constant temperature of 70° by hot-water pipes, and dressing-rooms. The reaction of the water is alkaline, and it contains a small amount of sulphuretted hydrogen. The delicious sense of bien-être produced by bathing in this water, with the soft satiny feeling it communicates to the skin, must be felt to be appreciated. It is useful in all forms of skin-disease—indeed, in eczema it may be considered specific if continued long enough in conjunction with a suitable regimen. I frequently recommend the internal use of this water. Its taste is not unpleasant, and its action is mildly antilithic. Waters containing silicates are said to be useful in the uric-acid diathesis, and I certainly have found it suit gouty patients admirably.
-
Oruawhata, or “The Blue Bath,” within the Rotorua Hospital grounds, a large reservoir, built of concrete, 36ft. by 20ft., provided with hot- and cold-water douches and showers. This water is of saline character with silicates. Analysis (in grains per gallon): Chloride of sodium, 60.44gr.; chloride of magnesium, 1.04gr.; sulphate of lime, 5.48gr.; silicate of magnesia, 0.32gr.; silicate of soda, 8.38gr.; silicate of iron oxide, 1.42gr.; silica, 14.20gr.—total, 91.28gr. in one gallon. Sulphuretted hydrogen, 5.52gr.; carbonic acid, 2.21gr. Temperature: 140° F. Special indications: Almost identical with the foregoing spring—(Whangapipiro).
The Blue Bath is a warm swimming-bath 62ft. long by 24ft. wide. It is built of stone and concrete, with a smooth surface of Portland cement. Its depth is from 4ft. 6in. to 3ft. It contains about 30,000 gallons of water, maintained at a temperature of 98°. This is the popular pleasure-bath of the Sanatorium, in which our rheumatic invalids are able to take exercise without undue fatigue. It was completed in 1885, and opened by Mr. George Augustus Sala. While excavating this bath the workmen struck upon a remarkable sulphur-cavern, its roof and sides thickly coated with brilliant acicular crystals of sulphur, and at its base a hot-spring yielding steam so strongly impregnated with sulphur-gases as to be quite irrespirable. This we have conducted to the surface, and employ as a sulphur-vapour bath, diluting it as occasion requires with steam of a milder character. In sciatica and all forms of rheumatism this is one of our most popular and efficacious remedies.
-
Cameron's Bath (known as “Laughing-gas Bath”), within the Rotorua Sanatorium Reserve, a quarter-mile from the bath-pavilion, on the shores of Lake Rotorua, at a point called Te Kauwhanga. It is a muddy pool, 30ft. in diameter, with a constant discharge of gas (sulphuretted hydrogen, with sulphurous acid), which, when inhaled, causes faintness and great excitement of the respiratory and vascular functions. The pool has no outflow; the water is a dirty chocolate colour, hepatic, feebly saline, and has a persistent acid reaction and offensive odour. Bathing in the spring itself is to be deprecated. Analysis (in grains per gallon): Sulphate of soda, 44.54gr.; chloride of potassium, 1.67gr.; chloride of sodium, 12.04gr.; chloride of calcium, 5.22gr.; chloride of magnesium, 1.28gr.; chloride of aluminium, 0.62gr.; silica, 9.22gr.; hydrochloride acid, 5.92gr.—total, 80.51gr. in one gallon. Sulphuretted hydrogen, 4.42gr. Temperature: 109° Fahr. to 115° Fahr.
-
The Pain-killer Bath, situated at Te Kauwhanga, resembles the above water (No, 4), but it is a little more saline and hepatic; it is one of the most valuable sulphurous springs in the reserve. The water has a distinct acid reaction, an offensive odour, and deposits a brownish sediment on being boiled. This both has great curative properties, and two baths with sheltered dressing-accommodation have been connected in connection with it. Analysis: Chloride of sodium, 46.42gr.; chloride of potassium, 1.71gr.; chloride of calcium, 2.66gr.; chloride of magnesium, 1.47gr.; chloride of iron and aluminium, 4.22gr.; sulphate of soda, 29.14gr.; hydrochloric acid, 6.84gr.; silica, 18.02gr.—total, 110.48gr. in one gallon. Sulphuretted hydrogen. 4.84gr. Temperature: 204° Fahr.
-
The Coffee Pot, also situated at Te Kauwhanga, a small mud spring, 10ft. in diameter the water is thick, brown, and muddy, covered with an oily slime, in fact, of a most uninviting appearance; it has a persistent acid reaction and an offensive odour; hepatic and feebly saline. Analysis: Silica, 13.86gr.; sulphate of soda, 23.71gr.; chloride of potassium, 0.77gr.; chloride of aluminium, 1.46gr.; chloride of calcium, 2.04gr.; chloride of magnesium, 1.62gr.; chloride of iron, 1.47gr.; hydrochloric acid, 7.66gr.; sulphuric acid, 7.60gr.—total, 60.19gr. in one gallon. Sulphuretted hydrogen, 3.19gr. Temperature: 80° to 100° Fahr. Special indications of the last three baths (Nos. 4, 5, and 6): Chronic rheumatism and gout, chronic rheumatoid arthritis, cutaneous diseases.
Hinemaru (“Stonewall Jackson” or “McHugh's Bath”), situated in the Rotorua Sanatorium Reserve. The water is of a yellowish colour, it is of a saline character, with silicates; reaction, alkaline. Analysis: Chloride of sodium, 93.46gr.; chloride of potassium, 4.69gr.; chloride of lithium, traces; sulphate of soda, 2.76gr.; mono-silicate of soda, 6.41gr.; silicate of lime, 2.89gr.; silicate of magnesia, 1.02gr.; iron and aluminium oxides, 2.10gr.; silica, 8.29gr.—total, 121.62gr. in one gallon. Temperature: From 98° Fahr. to 118° Fahr. Special indications: Cutaneous diseases, rheumatism; if filtered, suitable for internal administration in atonic dyspepsia and the uratic diathesis (dose, one tumbler thrice daily between meals).
At Whakarewarewa, two miles from Rotorua, there are two springs which have a well-merited reputation.
-
Turekore, or the “Spout Bath.”—This water is in great repute among the Maoris for the cure of cutaneous diseases, rheumatism, lumbago, sciatica, and kidney complaints. It is of a sulphurous character, and has a faintly acid reaction, which changes to alkaline on boiling the water. Analysis: Silicate of soda, 16.32gr.; silicate of lime, 1.61gr.; silicate of magnesia, 1.14gr.; silicate of iron, 0.39gr.; sulphate of soda, 13.47gr.; chloride of potassium, 1.24gr.; chloride of sodium, 53.61gr.; phosphate of alumina, traces—total, 87.78gr. in one gallon. Temperature: 96° Fahr. to 120° Fahr. Special indications: Cutaneous diseases, lumbago, chronic rheumatism, local palsy of muscles.
-
Koroteoteo, or the “Oil Bath.”—This water is alkaline and slightly caustic. Analysis: Mono-silicate of soda, 2.08gr.: mono-silicate of lime, 3.16gr.; mono-silicate of magnesia, 0.76gr.; mono-silicate of iron, 0.85gr.; sulphate of soda, 7.49gr.; chloride of potassium, 1.46gr.; chloride of sodium, 66.34gr.; chloride of lithium, traces—total, 104.54gr. in one gallon. Temperature, 212° Fahr. Special indications: Cutaneous diseases.
These springs were analysed some twelve years ago in the laboratory of the Geological Survey Department, but now that we are within a few months of having complete railway communication with Auckland it is most desirable not only that the foregoing springs should be reanalysed, but that others in the vicinity should be examined, in order to meet the demand for increased bathing-accommodation which the railway is certain to create. Every year the number of invalids resorting to these springs is increased. During the last season, from November, 1892, to April, 1893, the accommodation for invalids has been strained to the utmost. What may be the effect of the opening of the railway on the tourist traffic proper is a matter to be dealt with by private enterprise, but that it will enormously increase the invalid traffic there can be no doubt, and this is an important question for the consideration of the Government. Fifteen samples of mineral water are already in the hands of the Government Analyst, and five of these are from recently-discovered springs, of which little is known chemically. They are situated on the edge of the lake, within half a mile of the Priest's and Rachel Baths, and, having an abundant outflow, require only the expenditure of the money necessary for accommodation to make them available to meet our anticipated requirements. They have received the following names: (1) Matuatonga, or “Corlett's Bath;” (2) Waikaupapapapa, or “The Saddler's Bath;” (3) Mahanga, or “The Gemini Baths;” (4) Waiwhakakirihou, or “Vaux's Bath;” (5) Toko, or “The Postmaster's Bath.” The European nomenclature is based on the names of individual residents at Rotorua, who, at their own cost, have made a road to the springs, and established very fair bathing-accommodation, which is already utilised by many of our invalid visitors. Nos. 2, 3, and 5 are acid waters, which will supplement the Priests' Bath in all its therapeutic indications; and Nos. 1 and 4 are alkaline waters, having the Rachel Spring as a congener.
The selection of cases suitable for treatment at Rotorua is a most important matter. I am aware that a strong tendency exists both with physician and patient to try anything as a dernier ressort. It is a serious matter, however, to put a patient to the trouble and expense, and possibly pain, of making a long and weary journey, to rob him of the comforts of home and the society of his friends, without at least some reasonable hope that his labour will not be in vain. And yet this is constantly done. Some six years ago, when I first took up my present position as Superintendent of the Sanatorium at Rotorua, I found that numbers of patients were being sent to the district who ought never to have left their homes. Advanced phthisis, chronic Bright's disease, spinal caries, and psoas abscess were a few of the ailments supposed to be curable by hot water. This state of things, fortunately, has been remedied to a certain extent by a pamphlet I wrote at the request of the Government, giving the medical men of New Zealand a few hints on the selection of cases suitable for treatment at the springs.
The two most important questions to be answered before deciding to send a case to Rotorua are—(1) Has the patient sufficient strength to bear the journey? and (2) is the case one likely to benefit by treatment? With regard to the first question, it must be remembered that the five hours' coaching from Oxford to Rotorua is rather a trying ordeal for an invalid, and will continue to be so until the railway, now in course of construction, is complete. A case otherwise suitable, however, need not be kept away because the journey may occasion considerable fatigue, or even increase of pain, provided there is sufficient vitality to render such inconvenience a mere matter of temporary concern. Nor need the partial or even total loss of the patient's locomotive power prevent his coming. We have many instances on record of patients who on arrival required the aid of crutches, or to be actually carried to the bath, and yet went away enjoying the full use of their limbs. In considering the second question, medical men will not need to be reminded that where profound organic structural change exists very little benefit can be expected, so that considerable discrimination must be exercised in selecting cases of paralysis for treatment. Hot water has no regenerating power that I am aware of where nerve-elements are extensively destroyed. The same may be said of osteo-arthritis or chronic rheumatic arthritis, with structural change and great deformity of the joints. Such cases may improve in general health, gain weight, and lose pain, but there the improvement ends. Our treatment is contra-indicated in phthisis as long as active destructive change is going on in the lungs. Certain chronic poitrinaires, however, pay us periodical visits with advantage.
There is a form of incomplete paraplegia very common amongst old miners: the patient gets about a little with the help of a stick; his walk is shaky and tottering; his general health usually good; often the mind is somewhat crippled—a mild form of dementia; the bowels are generally torpid; there is often dribbling of urine, or, at best, very feeble control of the sphincter; the muscles are not atrophied, and respond normally to both the galvanic and faradic current. I consider such cases incurable. Hot baths are certainly useless. Their mental condition, however, is capable of great improvement by proper discipline and diet, and the bowels and bladder may be kept in a state of perfect comfort by galvanism intelligently applied. As they may enjoy this amount of benefit in any hospital, it is useless to send them to Rotorua. Cases of paraplegia in which the muscles are extensively atrophied, and there is absolutely no response to either galvanism or faradism, are usually hopeless. In hemiplegia, on the other hand, presumably from cerebral embolism or from small hámorrhages, as, for example, from rupture of the miliary aneurisms of Charcot, we have had some excellent results.
Some time ago a man about forty years of age, in a state of delirium tremens, attempted to commit suicide with a pair of scissors. He gave himself four stabs with the pointed blade in the left side of the chest. One wound just touched the lung, and there was some extravasation of air into the cellular tissue In ten days the wounds had healed, and I was about to discharge him, when he was suddenly seized with paralysis. He never lost consciousness, but was unable to articulate, and lost all motor power on the left side. I did not think it wise to commence electrical treatment or hot bathing for the first three weeks. At the end of that time the muscles of the arm and leg were flabby and wasted, and hot sulphur baths, with faradism, were commenced. The muscles regained their normal condition in a marvellously short time; in a fortnight he was able to walk, and at the end of two months could speak quite intelligibly, and use both hand and arm very well.
Primary functional paralysis, in which there is reason to believe that the nerve-centres have undergone no organic change—such paralysis, for example, as may be induced by depressing morbid influences, as malaria, influenza, sexual excesses, mental or physical fatigue, exposure to wet and cold, alcoholism, or hysteria, are likely to benefit by treatment at Rotorua. A lady, aged thirty-six, after a long attack of malarial fever, found herself completely paraplegic. After a time she was able to move on crutches, but had a tendency to fall backwards. Her condition improved up to a certain point, when she remained stationary for some months, Fearing she might be crippled for life, she determined to try the thermal springs of Rotorua, and I received her into my house as a private patient. I found her able to swing herself along on crutches, bearing her weight on the left leg, the right being perfectly powerless. Singularly enough, she could walk on her knees, which seemed to point to the fact that the lesion then existing must be below the spinal origin of the nerves supplying the psoas and iliacus muscles: this, together with the fact that she tried the faradic current at home, and found it injurious, narrowed down the field for electrical treatment very considerably. I chose two large electrodes: the anode was placed on the right sacro-iliac synchondrosis, and the cathode on the calf of the right leg, and a continuous current from ten cells allowed to flow for fifteen minutes daily. In addition to this she had two hot sulphur baths every day. In three weeks she was perfectly well. Another more recent cure is even more remarkable. H.C., a bushman, aged twenty-three, had become completely paraplegic, presumably from exposure to wet and cold. He had been for many months dependant on a Charitable-aid Board, who sent him to Rotorua. For three weeks he was carried to his bath, at the end of which time he was able to stand alone. At the end of five weeks he could walk with two sticks, and ride on horseback. In three months he was as well as ever he had been in his life.
Rheumatism and skin-diseases form fully 75 per cent. of the cases we are called upon to treat, and these usually in a very chronic form. In rheumatism and rheumatic gout we have much success, especially where arthritic degeneration is not too pronounced. Hot acidic sulphur-baths at a temperature not exceeding 104°, or sulphur-vapour up to 115°, taken twice daily for a carefully-regulated time, according to individual tolerance—which we find to vary greatly—forms our routine treatment. These waters redden the skin, and cause some tingling sensation for an hour or two. Occasionally some irritation of the skin occurs, which is readily allayed by a few warm alkaline-showers or douches. In those numerous and well-known cases of chronic hip-rheumatism, initiated frequently by injury, we find nothing so efficacious as the hot douche. The beneficial result is due partly to the quality of the water, and largely to its mechanical action: fortunately, our arrangements are so complete that we are able to vary the temperature and percussive power of the douche at will. We are able to quote several cases of cure even where a considerable amount of fibrous anchylosis has existed. If the rheumatic patient progresses favourably under the bath-treatment alone, neither medicines nor electricity are employed, but if after a few weeks his progress is not satisfactory, we find galvano-faradism a valuable adjunct. Usually thirty cells are put into circuit with a faradic machine, and the double current applied in the labile manner to the parts affected for fifteen minutes daily. We find this answers better than either current alone. In cases of muscular atrophy faradism is had recourse to from the commencement.
Two typical cases of cure, one of uncomplicated and the other of complicated rheumatism, will be sufficient to quote. Dr. MacGregor, the Government Inspector of Hospitals for New Zealand, mentions the following case in connection with our Sanatorium: “A.B., a young man, became affected with rheumatism while serving as a common sailor on the coast, and was reduced to helplessness. He had spent his all without gaming relief. When he had got half-way to Rotorua he found himself at a roadside hotel unable to go further; but a good Samaritan coming along conveyed him in his own carriage to Rotorua, and confided him to the care of Dr. Ginders. In less than a month he was discharged cured.” I think it is only due to the “good Samaritan” to state that his name was Sir Robert Stout, then Premier of New Zealand. The second case is a remarkable one: “C.H., aged forty-nine, an innkeeper; height 5ft. 11in., greatest weight attained 12st. 10lb., present weight 10st. 6lb.; always temperate; family history good; no gout or rheumatism. Got his first attack twenty years ago—sub-acute rheumatism of the feet. Never had venereal disease in any form. The attacks recurred every winter, each being more severe than the last. The ankles, knees, elbows, and hands became affected. For the last nine years he has spent six months of each year in bed. On his arrival at Rotorua his appearance was that of a man of seventy—his hair white, his complexion pale and anámic, his back bent, liver sluggish, bowels torpid, appetite bad, with slight enlargement of knees, elbows, and knuckles. He commenced taking two acid sulphur-baths daily, and during the first month improved wonderfully, when suddenly he got an acute exacerbation of pain, and had to take to his bed, fully impressed that his annual hibernation had commenced; he was relieved, however, after a few days, and was able to leave his bed. Very soon serious costiveness set in; having in vain tried other remedies, as a last resource I tried faradism. All serious symptoms at once disappeared. He rapidly gained strength, resumed his bathing, and, after spending three months with us, considered himself in better condition than he had been for ten years. Very cold weather having set in, I sent him home, in appearance a new man, free from pain, his general health excellent, and with an addition of 7lb. to his weight.
Perhaps there is no class of diseases in which we meet with more uniform success than those affecting the skin. The solid and gaseous constituents of the waters are no doubt important; but I have more confidence in the influence of change and all that it implies in its effect on both mind and body, combined with the prolonged maceration of the cuticle, and the constant exposure of the skin to air and light which frequent bathing entails. General eczema, which may have resisted every form of treatment for years, is generally cured in a period varying from six to thirteen weeks if the patient is willing to submit himself to rigorous medical discipline. The same may be said of psoriasis—at least, as far as its disappearance for a longer or shorter period is concerned. It is rare indeed to see psoriasis completely eradicated. For ringworm and the impetiginous eczema of children the water of the Priest's Spring is a specific. In sycosis epilation is necessary, after which our alkaline waters complete the cure.
Neuralgias, as a rule, do remarkably well. Patients suffering from sciatica are a numerous class with us, most of them presenting a very chronic history. When the disease is not distinctly associated with the gouty or rheumatic diathesis, is not of long standing, and has been caused by exposure to cold, it is very quickly cured. A few baths relieve the pain, and there is rarely any stiffness or weakness remaining. Chronic cases are not so easily dealt with—they require great patience and perseverance on the part of both physician and patient. Our routine treatment consists of hot baths, sulphur vapour, the douche, and galvanism. After six or eight weeks it frequently happens that nothing remains to remind the patient of his old enemy beyond some slight weakness or soreness of the limb, and I usually advise him to try a week's sea-bathing on his way home. In order to accomplish this he should arrive in Rotorua not earlier than September or later than February. We have had some good results in the treatment of cervico-brachial neuralgia. Some time ago a lady who had long suffered from neuralgia of the circumflex nerve came to Rotorua for treatment. She carried her arm in a sling, and dreaded the slightest movement. In spite of her suffering she had attained the terrific weight of 17st. After two weeks' bathing, and the application of a very mild galvanic current, she was able to use her arm, and in a month was completely cured.
There is a strong tendency on the part of patients not to believe in any form of electrical treatment unless the current is almost strong enough to lift them off their feet. The sooner they are disabused of this idea the better. Every week's experience convinces me more fully that for success in the treatment of neuralgias the galvanic current can scarcely be too weak, and in facial neuralgias, and paralysis especially, the greatest caution is requisite.
To enumerate every ailment in which our thermal springs have proved useful would prolong this paper indefinitely. Suffice it to say that in many cases their healing power has been discovered accidentally. Many ladies bathing for rheumatism have found themselves cured of chronic metritis and leucorrhœca, and as a result of such cures have proved fruitful after years of sterility. Congestion of the liver, biliary catarrh with jaundice and háemorrhoids, have been cured by the acid sulphur waters, which also prove useful as a topical application in ozœna and ulcerated throat. This class of water also tends to reduce plethora and corpulency without prostration, insures healthy action of the skin, and relieves torpor of the bowels.
The mention of ulcerated throat reminds me of two most interesting cases which presented themselves recently from the island of New Caledonia. In this island, it appears, chronic laryngitis is common.
The first case was that of a French gentleman engaged in business whose throat ailment was of long standing; he remained with us a few weeks, used the water of the Priest's Spring as a gargle, and as a wet compress to the throat at night, and bathed in the same water twice daily; he left perfectly cured.
The second case was a much more serious one. The patient was a French Roman Catholic priest. He attributed his ailment to excessive use of his voice in preaching, teaching, and singing. He had constant cough, his voice was hoarse and scarcely audible, and there was occasional slight hámorrhage from the laryngeal ulcers. After pursuing the treatment as advised in the foregoing case for four weeks, he left very much improved, but by no means well. To my surprise, in a few weeks after his departure he wrote to our resident engineer, Mr. Malfroy, stating that to his great delight he found himself perfectly cured, and that he could use his voice in preaching and singing as well as he ever did in his life.
During the past eight years my correspondence with patients proposing to come to Rotorua, and with those who have left after a longer or shorter experience of our bath treatment, has been considerable. No fact has struck me more forcibly than this, that patients who have left greatly benefited, but not cured, almost invariably write to say that, after being a short time at home, they realise the benefit they have derived, and in the majority of cases, they find themselves permanently cured.
It appears that whatever it is that our patients take into their systems by absorption or inhalation, and whatever may be the influence of change of climate, change of scene, change of occupation, relaxation, and rest, time is required for assimilation, and the true benefit is only realised some time after their return to their original surroundings.
I am glad to find that this experience is not peculiar to New Zealand, but is quite common with those who frequent the spas of Europe.
There are two questions which are perpetually propounded by visitors to Rotorua. The first is usually put in this way: “How is it that the Government of New Zealand do not advertise these springs? Little or nothing is known of them in Australia, or America, or England (or wherever the questioner happens to hail from). I should not have been here, but that I heard, quite casually, that a friend of mine had been cured here; and if I am cured I shall be able to send you dozens of patients.” My usual reply is: “We believe that good medical work will advertise itself, and your remarks confirm the assertion. It is evident you believe in your own advertising power, and so do we. It will be quite time enough to spend money in advertising when we find that our bathing-accommodation is in excess of the demand made upon it; at present it is barely equal to it. At the same time our resources are practically unlimited. We have one spring in Ohinemutu estimated to discharge not less than a million gallons daily, which means that it is capable of supplying 10,000 baths daily of 100 gallons each. This is at present running to waste. At Whakarewarewa there is a spring almost, if not quite, equal to it. Should the time ever come when these springs are not equal to the demand made upon them we have the Waiotapu Valley to fall back upon, which surely is destined in the future to be the centre of the thermal-springs district of New Zealand. Immense as our resources are at Rotorua, they sink into insignificance when compared with those of the Waiotapu Valley.”
The second question usually takes this form: “How do your springs compare with those of Europe?” This is a much larger and more interesting question. The first fact that strikes the inquirer is this: that cold mineral spas, of high therapeutic value as internal remedies, are abundant in Europe, whereas they are rare; in New Zealand. In the Rotorua district our mineral waters are all hot, and more suitable for bathing than for internal administration. It does not necessarily follow that because a water is hot it is unfit for internal use. The water of our Rachel Spring is an admirable dietetic-water for gouty and dyspeptic patients, used either hot or cold; and a spring has recently been discovered at the head of Lake Roto Ehu containing, in spite of its high temperature, a large amount of carbonic-acid gas, which holds in solution a fair amount of carbonate of iron. After keeping a sample of this water securely bottled for about three weeks, I sent it to a chemical friend for examination. His report was as follows: “On opening the bottle of ‘iron-water’ from Roto Ehu I found a good deal of free carbonic-acid gas, the water effervescing briskly like ordinary soda water; it contained what was equivalent to 172 cubic inches per gallon. Of course this estimate is not to be relied on, as it would only represent a part of the gas contained in the water direct from the spring. There is more iron than I thought would be in it. This most probably exists in the water as ferrous carbonate dissolved in the carbonic acid. It resembles the European water of Pyrmont, with this difference, that it contains more chlorine and silica. As far as I have gone I find the water to contain, in grains per gallon: Chlorine, 11.2; lime (CaO), 12.74; magnesia, 1.177; silica, 10.266; iron (FeO), 1.177—total solids per gallon, 36.560; carbonic acid, 172 cubic inches.” This spring has an enormous outflow, and is destined to be of great value in the future both for external and internal use. The next fact that strikes the inquirer is this: that the thermal springs of the Rotorua district contain a far smaller amount of dissolved salts than those of Europe. The difference amounts to 7 to 1 in favour of Europe. If we take the mean of the total solids in grains per gallon of the nine springs first enumerated, we find that they amount to 96.51gr. only, whereas if we take any nine European springs at haphazard—say, Vichy, Ems, Baden Baden, Marienbad, Seidlitz, Wiesbaden, Saltzbrunnen, Kreuznach, and Leuk—we find that their dissolved constituents amount to 708gr. per gallon.
Fortunately the therapeutic efficacy of a thermal spring is not to be measured by the quantity of fixed salts it may contain. It would be a fortunate thing, of course, if we could discover in our district a cold mineral spring like that of Hunyadi-Janos, in Hungary, of which a wineglassful is an efficient aperient; but we can scarcely expect this in a volcanic region like ours. The so-called “chemically-indifferent springs,” such as Gastein and Wildbad, in Germany, contain absolutely less mineral matter than our ordinary drinking water. Thus, the New River water contains 2 1/2gr. of solid matter to the pint, the East London Company 3gr., and that supplied by the Hampstead Company 4 1/2gr. Yet these waters cause no apparent effect, whilst the springs of Wildbad, with 3 1/2gr. of salt to the pint, and Gastein 2gr., are capable of producing therapeutic results, which seem to be mainly due to the temperature at which they are employed. The chemically-indifferent baths, especially the cooler ones, possess peculiarly sedative effects, not only allaying nervous irritation, but also diminishing vascular excitement, whilst the warmer springs of the same class, being more stimulant, are chiefly used in aggravated cases of chronic rheumatism and rheumatoid arthritis. One important fact has been definitely established by experiment, which is that whatever may be Nature's secret in the preparation of these remedies, it can never be discovered by science or imitated by art. We must be content, therefore, with the empirical knowledge that certain mineral waters produce certain effects.
There are other salient points of difference between our springs and those of Europe. Our waters contain abundance of silica and silicates, and little or no lime, while those of Europe contain abundance of lime, and little or no silica or silicates. Our district appears to be one in which silica takes the place of lime, the latter being almost a chemical curiosity.
Another curious fact is that the hepatic or sulphurous waters, characterized by the presence of sulphuretted hydrogen and free sulphuric acid, as in the case of the Priest's Bath, are abundant here, but absolutely unknown in Europe. The one sole point of similarity—common not only to Europe and New Zealand, but to all thermal springs in the world—is the prevalence of chloride of sodium (common salt) as a leading ingredient.
The Rotorua district enjoys the patronage of three classes of visitors: the tourist, the invalid-tourist, and the invalid proper. The question of common interest to them all is, what have they to do, and what have they to see when they get there? The best thing we can do for the tourist is to place in his hands a local guide-book, and then transfer him to the hands of a local guide. The most delightful trip he can take in fine weather—say from December to March—is to join a party, and do the round of the lakes.
Crossing from the old township of Ohinemutu in a steam-launch, he will first visit the island of Mokoia, in the centre of Lake Rotorua; thence to the beautiful cold spring of Hamarana, one of the most charming picnicking spots in the district; thence through the Ohau Creek into Lake Roto-iti; here he would do well to camp for the night, and spend the following day in exploring the cosy bays and inlets with which the lake abounds, and visiting the hot spring of Manapirua, and the waterfall and hot springs in the neighbourhood of Taheke. Having accomplished this, a short walk of a mile or two will bring him to Lake Roto Ehu; crossing this in a canoe, he will find the hot iron spring already alluded to, and may readily convince himself of the presence of iron in the water by attempting to make tea with it, or using it to dilute his brandy.
Another walk of a mile will disclose to his admiring gaze one of the loveliest lakes in the district, Lake Roto-Ma. The general consensus of opinion is, that this lake is a vision of beauty, which every visitor lingers round as long as possible, and leaves with regret.
This trip discloses to the visitor the Paradise of the district: he will find the Inferno at Tikitere. When George Augustus Sala visited this spot some seven years ago, he called it at once “Hell's Gates.” It is certainly a most weird and awe-inspiring place. The steam rising from its boiling pools and mud-geysers is a never-failing landmark seen from every point of the Rotorua basin. The hydro-thermal action is so powerful at this spot that the visitor feels the earth vibrating under his feet; and yet, in spite of these dismal horrors, invalids—ladies even—will spend weeks here in order to get the benefit of the healing springs, which are justly credited with many most remarkable cures. Tikitere is eleven miles from Rotorua, and the trip may be comfortably made in half a day.
The next point of interest for the tourist is the Wai-o-Tapu Valley, distant from Rotorua some twenty miles. Leaving his hotel after an early breakfast, say at 7 p.m., the visitor may see the chief points of interest in the valley, and return in time for dinner, at 6 p.m., but only to regret the inadequacy of a one-day's visit to fully inform himself of the wonderful resources of this remarkable district.
Perhaps there is no more enjoyable trip for the young and strong than that to Tarawera Mountain, the scene of the eruption on the 10th of June, 1886. A ride of ten miles on horseback brings the visitor to the buried village of Wairoa; thence a voyage by boat some nine miles across Lake Tarawera, lands him at the foot of the mountain. The ascent will occupy an hour and a half, and, having arrived at the summit, he cannot but feel well rewarded for his toil. No verbal description can possibly convey an adequate idea of the scene of devastation and desolation which this standpoint reveals.
The best advice we can give to the invalid tourist is to attend to business first and pleasure afterwards. If he really wishes to derive benefit from the hot springs he must not bathe irregularly on the advice of Dick, Tom, and Harry; taking a long fatiguing journey one day, and possibly three hot baths the next, and then wondering how it is that he feels so limp and exhausted: this kind of thing will only disappoint him, and do no credit to the springs. He may very well spend the first three weeks of his visit in bathing systematically, and filling up his intervals of leisure by visiting places of interest adjacent to his hotel or boarding-house—and they are many, though usually neglected because they are so easy of access.
Not one in twenty of the visitors staying at the Lake or Palace Hotels takes the nearest route across the Pukeroa Recreation Reserve to the Government baths; and yet from this elevation a most magnificent panoramic view of the whole Rotorua basin is obtained—80,000 acres in extent. Standing on the highest point, and looking towards the north, he sees spread out before him the tranquil beauty of Lake Rotorua—20,000 acres of water, with the lofty volcanic island of Mokoia in its centre. The lights and shadows on the surrounding hills, the cloud scenery reflected in the water, the white cliffs to the north and north-east gleaming in the sunlight, the steam column rising from Tikitere, the bluff of Wahanga—the most northerly point of the Tarawera Range—just peering above the intervening hills, and in the foreground the Maori village and the English church on a promontory jutting into the lake, form a picture which would certainly delight the artist, who usually sees when he looks, if not the tourist, who too often looks without seeing. Turning to the south and south-west, I know of no prospect more lovely on a calm summer's evening at sunset. You have the steam columns of Whakarewarewa thrown into relief by the dark background of hills, and through the Hemo Gorge you catch a glimpse of the deep blue Paeroa Ranges in the extreme distance. In the west you have the bold bluff of Paparata, with its sky-line clothed with forest, through which the setting sun throws a flood of crimson light, making it look like a veritable bush on fire. North of west you have the Ngongotaha Mountain, rising 1,600ft. above the level of the lake, from the summit of which may be seen on a clear day the Bay of Plenty with its numerous islands, and inland the snow-capped mountains of Ruapehu and Tongariro.
At Whakarewarewa, only two miles from Rotorua, the visitor will find an epitome of all that the district contains: hotel and bathing-accommodation, geysers, hot springs, boiling pools, mud volcanoes, hot waterfalls, and silicious terrace formation. It will interest the visitor to know that here and at Wairakei exist the only geysers in that British empire on which the sun is said never to set. Geysers are found in the Yellowstone Park District, in Iceland, and in Thibet. Of the latter we know very little, but geologists tell us that, of the geysers of the world, those of the States of Wyoming and Idaho are the oldest, those of New Zealand the next in age, and, strange to say, those of Iceland, with which most of us were first acquainted, the youngest.
It will be seen, therefore, that the invalid tourist has plenty to interest him close at home, without interfering in any way with a profitable use of the numerous hot springs at his disposal.
These two classes of visitors—the tourist and invalid tourist, as regards their accommodation and entertainment—may be safely left to private enterprise; but the third and more numerous and important class—the invalid proper—will soon become a serious consideration for the Government. I do not anticipate that at first the railway will make any great difference in the tourist traffic. Occasional excursion trains in the middle of our season will no doubt strain the existing accommodation, but the law of supply and demand will quickly rectify this; but that the number of invalids resorting to Rotorua will very soon be doubled can scarcely be doubted. What are we to do with them? There is only one answer to the question: additional bathing-accommodation should be proceeded with at once. In the months of February and March this year our baths were overcrowded, and the bath-attendants had, for the first time, to ask for assistance.
The number of visitors to Rotorua for the year ending 31st March, 1893, was 2,560; and the number of baths taken, 17,838. Fifty-eight patients passed through the Government Sanatorium during the same period, twenty-five of whom were cured, twenty-six greatly benefited, and seven unimproved.
With regard to the existing boarding-house and hotel accommodation provided for tourists and invalids, we have, at a distance of one mile from the Sanatorium, three hotels, each possessing valuable thermal springs, with comfortable bath-houses, the use of which is free to visitors staying in the hotels. The tariff varies from 8s. to 10s. per day, but for visitors who wish to remain several weeks a lower tariff may be arranged for. There are four boarding-houses, “Terrace House,” “Tarawera House,” “Mokoia View,” and Brent's “Bathgate House.” The tariff varies from £2 2s. to £1 10s. per week. Brent's “Bathgate House” is within a few yards of the Government baths, and accommodates forty-eight visitors; this house has recently been greatly enlarged and improved, and gives general satisfaction.
The most direct route for visitors from the Australian Colonies is from Sydney to Auckland, and thence by rail to Rotorua. Those who may desire to see something more of the country may take steamer from Melbourne to the Bluff, and from thence on to Wellington, continuing the journey overland to Rotorua—a four days' trip, most enjoyable in fine weather. Patients should be recommended to bring plain, warm clothing, and substantial boots and shoes. Rotorua is essentially a convenient place for the wearing out of old clothes. Frills and furbelows, jewellery and valuable watches had better be left at home, as they are not improved by the sulphurous vapours arising from the springs. The watch par excellence for Rotorua is the nickel-plated “Waterbury.”
Table of Contents
There are within a distance of 120 miles, on the south-west coast of the Middle Island of New Zealand, no less than thirteen deep inlets or sounds, running inland, some of them a distance of twenty miles. These sounds are surrounded by high and precipitous mountains, many rising almost perpendicularly from the water's edge to an elevation of 3,000ft. to 6,700ft. The names of these thirteen deep inlets south to north, are: Preservation and Chalky Inlets (Edwardson Sound); Dusky, Breaksea, Daggs, Doubtful, Thompson, Nancy, Charles, Caswell, George, Bligh, and Milford Sounds.
By far the most majestic and awe-inspiring of these inlets is Milford Sound, the northernmost of the series. Though comparatively inconsiderable in extent, yet, in remarkable features and magnificent scenery, it far surpasses the rest. The mountains by which it is surrounded are the highest on the coast, with the exception of Mount Cook, 120 miles to the north-east. Pembroke Peak, about three miles inland, perpetually snow-capped, rises over its northern side to an elevation of 6,700ft., and Llawrenny Peak, a very remarkable saddle-backed mountain, attains nearly the same elevation on the southern side. But, perhaps, the most striking features are the remarkably-shaped Mitre Peak, rising abruptly to a height of 5,560ft., immediately over the south side of the sound, and a dome-shaped mountain on the opposite shore, nearly bare of vegetation, which, from its peculiar colour, resembles a huge mass of metal. From Anita Bay the sound runs south-east for a mile and a half, when the narrow entrance is reached, barely exceeding a quarter of a mile in width, towering perpendicular cliffs rising on either side, the soundings in mid-channel being sixty fathoms. The sound then trends in an easterly and south-east direction for six miles between stupendous cliffs, the widths varying from one-third to three-quarters of a mile. Near the north shore, where there is a large waterfall, the depth is 214 fathoms. The following is a description given of this sound by the Rev. W. S. Green, a member of the English Alpine Club:—
Vertical cliffs rose for thousands of feet on either hand, and we drove in before a blast so strong as almost to make steaming unnecessary. The surface of the sea would now and then be torn off in sheets, driven along in spindrift, and again all would be calm as glass. Waterfalls, resembling the Staubach, came down the cliffs from far above the clouds, and were blown away into spray while in mid-air by the fury of the storm. Wherever vegetation could get a footing on these immense precipices lovely tree-ferns and darker shrubs grew in profusion, all dripping with moisture, and running up the cliffs in long strips of verdure till lost to our view aloft in the torn white mists. The vivid green of the foliage was the feature of all this wondrous scene which struck me most. Two or three miles up the sound, we steamed close to an immense waterfall which, in one plunge of 300ft., leaped into the sound with a roar like thunder, drowning our voices and sending great gushes of spray over the steamer's deck. The face of another great cliff was so draped with numberless small falls that it seemed to be covered with a veil of silver gauze about 300 yards in width. While passing along here we fired a gun: echo after echo resounded from cliff to cliff, and from invisible crags high over our heads the echo again returned as a voice from the clouds. The mist now showed an inclination to clear off, the rain ceased, and as we entered the inner basin of the sound the forest increased in beauty. The totara pines, draped with festoons of grey lichen, contrasted well with the soft green of the great fern-fronds, and formed a suitable background to the scarlet blossoms of the rata (Metrosideros lucida) which here and there lit up the upper surface of the forest with patches of intense colour. Gleams of sunshine began to dart through the clouds, giving a momentary flash on one of the numerous cascades, and then, passing over forest and cliff, added new beauties of light and shade. When about eight miles from the open sea a booming sound rose higher over the voices of the numerous cascades, growing louder as we advanced, and, rounding a forest-clad point we came upon the grandest of New Zealand waterfalls—the great Bowen Fall. Its first fall is only about 50ft. into a rocky basin, but, leaping from it upwards and outwards in a most wonderful curve, it plunges down with a deafening roar in a single leap of 300ft. The “Te Anau” was allowed to drift up in the eddy caused by the fall, and, being caught by the stream in the midst of drenching clouds of spray, she was spun round as though she were a mere floating twig; then, steaming to a short distance, she stopped again. The weather had now taken up sufficiently for us to see through an opening in the clouds the snow-clad top of Mitre Peak, which rises in one grand precipice of 5,560ft. from the surface of the sound. The glacier on Pembroke Peak showed for a few minutes, and was then lost to view; but what we saw formed the grandest combination of scenery upon which my eyes had ever rested. As these sounds are from 200 to 300 fathoms deep there are but few places in them where a ship could anchor; had we stayed there for the night, we should have made the steamer fast to the trees.
The country about Milford Sound consists of dense forest, and mountains rugged in the extreme. The neighbourhood of all the other sounds is similar—access from overland being most difficult. They belong, it would seem, more to ocean than to land; and the ocean alone gives the right-of-way to their hidden chambers.
In connection with the general subject, a few words may be said of the Fiord County, on the west coast of Otago, and which, as its name implies, is the county of fiords. Its area is 2,101,248 acres. The population is small indeed within this county. The census of 1891 gave the number as 65 men and 6 women; On its coast, and on the contiguous coast of the Wallace and Lake Counties, almost all the possible combinations of the sublime and the beautiful in scenery are to be found. Nature here has set apart her own domain, a sacred grove, where her worshippers can approach and learn from her things that are good. It is well for man to have places, as well as times of rest where he can pause and take breath, and then go back to his daily round of hard work with lifted thought and recruited strength. Nature in this respect has been bountiful to New Zealand. Two noted instances of her beneficence are these fiords in the Middle Island, and the district of the Hot Lakes in the North Island, which is not only a wonderland, but also a sanatorium.
Of late years, during the summer season, the Union Steamship Company has facilitated transit to this otherwise impenetrable and rugged Sounds country by inaugurating special excursions, which have been largely and gladly made use of by tourists from all parts of the world.
Some years ago, Sutherland, a prospector, established for himself a home seven miles up Milford Sound, at a bend of the sound which is known as the Freshwater Basin, where the ever-rushing stream of the Bowen Falls mingles with the otherwise silent and deep waters of the sound. In the course of his ramblings Sutherland discovered an immensely high waterfall, which has now become famous as “The Sutherland Fall.” It is in three leaps, but the total fall is 1,904ft. Thus there is added to the already well-known grandeur of the Sounds this additional charm for those who delight in beholding the wondrous works of Nature. The distance from the place where the steamers anchor in Milford Sound to the waterfall is about fourteen miles—viz., Milford Sound to Lake Ada three miles, then boat up the lake five miles, then track from head of lake to falls six miles. There is a travellers' hut at the head of Lake Ada, where the night can be spent.
The Government is endeavouring to open up communication inland from Milford Sound with the settled districts of Otago by Lake Howden, towards the mouth of the Clinton River. Until recently convict labour was employed in making a coach-road two chains wide; but, after a considerable amount of work had been done by the prisoners, it was decided to abandon the coach-road and make a six-foot bridle-track, and, as the work was not suitable for prison-labour, the prisoners were removed, and the track is now being made by contract.
The Southern Alps of New Zealand extend in one almost unbroken chain along the west side of the Middle Island. In the neighbourhood of the Sounds, and of Lake Te Anau, there are many magnificent peaks, which, though not of great height, are, owing to their southerly position, nearly all crowned with perpetual snow and ice. Going further north, the mountains increase in height, till at Lake Wakatipu, Mount Earnslaw and his satellites are reached, and at Lake Wanaka, Mount Aspiring—which has aptly been termed the New Zealand Matterhorn—nearly 10,000ft. in height. Northward, beyond this, a fine chain of peaks runs as the back-bone of the Middle Island to where Mount Cook, or Aorangi, towers majestic 12,349ft. in air. At Mount Cook the tourist is in the midst of the grandest scenes of the Southern Alps, and here it is that he will see the wonders daily being worked by the Ice King on the grandest scale.
* Mainly from “Aorangi: or, the Heart of the Southern Alps,” by Malcolm Ross, Vice-President, New Zealand Alpine Club.
The scenery of the Southern Alps of New Zealand in many instances excels in beauty and grandeur that of the Alps of Switzerland, while in the former there is far greater variety. Then, again, there is the charm of novelty. Every tourist delights in getting out of the beaten track. In Switzerland this is hardly possible nowadays. In New Zealand, on the other hand, it is easy of accomplishment. In the Swiss Alps there is now hardly a peak unclimbed—one after another having gone down before the indomitable pluck and perseverance of the members of the English Alpine Club. In New Zealand, though several have tried, no one has actually succeeded in making a complete ascent of any of our highest mountains; and there are scores of splendid peaks awaiting the enterprise of the British or Colonial mountaineer, ready to be won. Many of the peaks, and most of the glaciers, are, as yet, unnamed, and there is still in parts of the Middle Island a fine field for exploration and discovery—geographical, geological, and botanical. The wonders of the Southern Alps are only beginning to be known; but the more they are known, the more they are appreciated; and it is safe to predict that in a very few years there will be sight-seekers in large numbers, from all parts of the world, flocking to the Switzerland of Australasia.
In the south, in the region of the West Coast Sounds, there are beautiful lakes, waterfalls, and mountains, while the scenery of the sounds is said to rival that of the fiords of Norway. A great tract of mountainous country lying between these sounds and Lakes Manapouri and Te Anau is still marked on the maps as “Unexplored,” and among these mountain fastnesses discoveries of importance may yet be made. It has long been a popular belief that the unknown country lying behind Lakes Manapouri and Te Anau was inhabited by a tribe of Maoris. Tradition has it that the northern Maoris, under one of their warlike chiefs, drove some of the southern tribes to the shores of Lake Te Anau, where a terrible battle was fought, and it was supposed that the remnant of this tribe had retreated back into the mountains. Many relics of a lost tribe, in the shape of greenstone implements and ornaments (of which Mr. Mitchell, of Manapouri Station, has a unique and interesting collection) have been found on the shores of Manapouri and Te Anau, but the Maoris themselves have evidently gone to that bourne whence no traveller returns.
It is only of recent years that passes have been discovered between the lakes and the sounds, and, although these passes do not lead the traveller beyond the sub-alpine heights, they take him through scenery of the most beautiful and wonderful character—a fitting introduction to the greater marvels of the Ice King's home in the heart of the Southern Alps, at Aorangi, or Mount Cook. Hitherto it was a matter of considerable expense and difficulty to visit this locality. Now all is changed, and from either Dunedin or Christchurch there is only a train-journey of half a day, and two days' coaching (shortly to be reduced to one), while there is excellent accommodation at the end of the journey, at the Hermitage. Taking Timaru as the starting point: by rail from Dunedin, 130 miles; or from Christchurch, 99 1/2 miles, the distances and times usually taken to get to the Hermitage are: Timaru to Fairlie, 37 1/4 miles by rail, 2 3/4 hours; Fairlie to Pukaki, 56 miles by coach, 10 hours; Pukaki to the Hermitage, 40 miles by coach, 8 hours.
At Fairlie, horses and vehicles also may be hired for the excursion.
There is good hotel accommodation at Fairlie, Lakes Tekapo and Pukaki. At Mount Cook, the Hermitage, a large and comfortable hotel, has been erected on a beautiful spot near the Hooker River, close to the Mueller Glacier, and commanding lovely views of the surrounding mountains. Here tourists will be supplied with full information as to the best methods of exploring the wonders of this district.
During the winter months the coach does not run as far as the Hermitage, but to Bourke's Pass, twice, and Pukaki, once weekly from Fairlie Creek.
When the extent and magnitude of railway operations at the present day is considered, it seems hardly credible that but little more than fifty years have elapsed since the inauguration in Great Britain of railway communication, the marvellous development of which has been such a remarkable feature of the progressive Victorian era. It was about the time that the period of excitement known as the “railway mania” was agitating England that affairs in the far-off and then little-known islands of New Zealand were beginning to assume a settled aspect. The Proclamation constituting the infant settlements a separate colony under British sovereignty had been made but a few years previously—indeed, almost concurrently with the opening of the London and Birmingham Railway, one of the first important connections between a manufacturing centre and a seaport.
It was thus impossible for many of the colonial pioneers to have seen a railway, or to have participated in the great social changes which immediately followed on the initiation of this novel mode of transit.
The march of events proceeded so rapidly that by the time later settlements were formed there were among the colonists many who had a keen perception of the advantages that would attend the introduction of railways into the new countries they were helping to found. The progress of settlement was, however, naturally, somewhat slow in those days, and it was not until 1860 that a contract was let for the construction of the first New Zealand railway; although in the neighbouring colonies of New South Wales and Victoria, possessing larger populations, induced by the gold discoveries, railways had been running some years previously, the first turf of the first railway in the Australian Colonies having been turned near Sydney, on the 3rd July, 1850. Ten years later the enterprising settlers of Canterbury, New Zealand, obtained parliamentary sanction for the promotion of a railway to overcome the natural difficulties which stood in the way of communication between Christ-church, the chief town, and Lyttelton, the seaport, and generally to facilitate intercourse between the port and the country. A high range of hills divided the towns, the only means of access at that time being by two difficult roads around its base, and by the Heathcote River, which was obstructed by a shifting sand-bar. The first portion of this line was completed and opened for traffic on the 1st December, 1863; and, until the piercing of the tunnel through the dividing-range was accomplished, traffic was carried on by means of the river and the opened portion of the line as far as Ferrymead Junction. An account of the opening is given in the Illustrated London News of 5th March, 1864, which states that “the ceremony was performed by his Honour the Superintendent, who, with his Executive, and other members of the Government, made the first trip down the line. The event, as may be supposed, was one of no ordinary interest to the province, and drew together a large number of inhabitants. Trains continued to run up and down throughout the day, and afforded gratuitous rides, as well as immense amusement, to crowds of colony-bred young people, to whom a ride in a railway-train was, perhaps, a novelty, as well as to many others who had not enjoyed that mode of conveyance since they emigrated from the Old Country. The day's festivities were crowned with a déjeúner, given by Messrs. George Holmes and Edward Richardson [now Hon. E. Richardson, C.M.G.], the enterprising contractors, to which more than five hundred invited guests sat down. The sturdy Maoris, too, who had laboured as ‘navvies,’ were not forgotten, but were regaled by their employers in good old English style.” The completion of the line to Lyttelton, which was opened on the 1st December, 1867, and the successful accomplishment of the great work of piercing the tunnel, a mile and a half in length, through the dividing-range, was also hailed with great rejoicing. Pending the completion of this work, other lines were being proceeded with inland towards the Canterbury Plains, and other provinces were not slow to follow the example of Canterbury.
In 1863 the Provincial Council of Auckland put in hand the construction of a line between Auckland and Drury, with a branch to Onehunga; and it is interesting to note that this railway was projected in view of the ultimate establishment of a main trunk line to Wellington, although the immediate necessity which gave rise to it appears to have been the want of military transport to the seat of war in the Waikato. Fighting was suspended, however, and the railway was not finished for some years later, after undergoing many vicissitudes. In the same year an Act was passed to authorise the construction of the Bluff Harbour and Invercargill Railway by the Provincial Council of Southland, and this line was finished and opened for traffic on the 5th February, 1867. This line was, at a later date, extended inland to Winton, and many odd stories are told of the primitive style of travelling on this portion, which was little better than a broad-gauge wooden tramway.
Meantime the Province of Marlborough had been making strenuous efforts to obtain railway communication between Picton and the Wairau district; and eventually an Act was passed, in 1865, authorising its promotion by a company, but the undertaking lapsed, and was not revived until the public-works policy was proceeded with.
In view of the probable extension of railway enterprise, the question of what should be the proper gauge for lines constructed in the colony had not been lost sight of; for, as early as 1860, the Government were asked, in connection with the Lyttelton–Christ-church line, then under construction, what steps had been taken to ascertain this important particular. The reply was that, on the recommendation of the late Robert Stephenson, the 5ft. 6in. gauge had been adopted as best suited to the circumstances of the colony. The gauge of 5ft. 3in., known as the Irish gauge, was, however, afterwards approved for the Canterbury lines; and this decision must have been further modified later, for we find that the Auckland–Drury, Dunedin–Clutha, Nelson–Foxhill, and others were originally laid out or projected on the standard English gauge of 4ft. 8 1/2in. Had the construction of railways proceeded piecemeal by the provinces in the fashion it commenced, no doubt the inconvenience and expense now being experienced in Australia would have found their counterparts in this colony; but the inauguration of the public-works policy finally settled the question as far as New Zealand was concerned.
Up to 1870 there were in operation forty-six miles of railway only. In that year, when the colony was feeling the disheartening effects of the Native war, which had just then come to an end, the Colonial Treasurer, Mr. (now Sir Julius) Vogel, promulgated his famous public-works policy, under which some ten millions of pounds were borrowed from the British capitalist and expended in the encouragement of immigration, the construction of railways and roads in all parts of the colony, the extension of telegraphic communication, the supply of water to the goldfields, and the purchase of Native lands. Provision having been made by Parliament for the necessary borrowing powers and administration, the Railways Act of 1870 authorised certain lines to be constructed on specified terms, and surveys of others to be made for consideration by the General Assembly. Of these lines the extension in Canterbury was proceeded with vigorously out of provincial funds. Some of the others had been authorised to be constructed on terms involving a guarantee by the colony of 5 1/2 per cent. interest; the latter were held over, pending negotiations with English capitalists; and, finally, arrangements were made on modified terms with Messrs. Brogden and Sons, the well-known English railway contractors, for the construction of several sections of light narrow-gauge lines, which were designed with a view to the early production of revenue, and at some sacrifice of convenience in travelling and in working. Severe gradients were adopted in preference to expending large sums for flatter lines; and, similarly, curves of sharp radius were allowed in place of easier but more costly routes.
Unfortunately, the inception of the scheme gave rise to so many demands from all parts of the country that considerable variations had to be made in the original proposals of the author, with the result that railway accommodation has in some parts been provided in advance of actual requirements, thus reducing the productiveness of the system as a whole.
The increase of population and the growing settlement of the country has also rendered necessary considerable alterations in the original character of the lines and their equipments, and, in order to keep up with popular demands and increased traffic, continual improvement is going on in the more advanced districts.
In 1876, the abolition of the provinces placed the earlier-constructed railways in the hands of the General Government, and the gauge of the line in Canterbury was assimilated to that of the Government system, now rapidly extending. At the present time the gauge all over the colony is 3ft. 6in., and, although the greater part of the permanent-way was originally laid in 40lb. material, the increase of traffic has since compelled its renewal in heavier metals, and a uniform weight of 53lb. steel rail is now nearly always used in this process.
There are now open for traffic 1,886 miles of railway, the construction of which has cost about £7,812 per mile. This includes the expenditure on the Provincial Government lines, and the purchase-money paid for district railways built by local syndicates and taken over by the Government, also the cost of rolling-stock and equipments. There are in addition 150 miles of private railway in the colony, the principal of which is the Wellington–Manawatu Railway, connecting the capital with the main trunk line through the North Island. The lines under construction by the New Zealand Midland Company, incorporated for the purpose of connecting the east and west coasts of the Middle Island and Nelson, will, when that purpose is accomplished, form no inconsiderable portion of the colonial system.
In spite of many peculiar disadvantages, due chiefly to the physical configuration of the country, the New Zealand railways have realised profits nearly sufficient to cover the total interest payable on the cost of construction—a result which may be considered satisfactory when it is remembered that they were not constructed with that expectation. The average rate of interest earned for the past twelve years is about three per cent. This is sufficiently accounted for by the large mileage of railway in proportion to the population, the location of the latter along the coast-line mainly, the active competition of water-carriage against the railways at many points, the very short distances over which traffic can be carried, the importation by sea of the great proportion of mercantile products which are used by the inhabitants, the extension of the railways inland to mountainous and pastoral districts almost devoid of settlement, which together form a combination of circumstances adverse to the railway system such as probably has no parallel in any other country. The imposition of rates for carriage has also to be largely guided by the peculiar circumstances attending colonial settlement.
The whole railway system of the colony is at present divided into eleven sections, all varying in their characteristics. The Kawakawa and Whangarei Sections, in the extreme north, are short lines, built to coalfields chiefly, but in course of time will no doubt be extended to tap large timber-areas further inland, a class of country for which also the Kaihu Section (17 miles), recently taken over by the Government, was constructed originally by a private company. The Auckland Section forms the northern portion of the North Island Main Trunk Railway, terminating eventually at Wellington, on the shores of Cook Strait, and traversing in its course rich forests of valuable timber and a large area of rich country. By means of its branches, also, the marvellous regions of the Thermal-springs District are brought within easy reach of the traveller for health and excitement. The Napier (114 miles), Taranaki (214 miles), Wellington (92 miles) group of lines serve the southern portion of the North Island, and are well supplied with traffic arising from the frozen-meat industry and timber trade, besides live-stock, and general traffic incidental to the rapid growth of settlement in the grand pastoral country through which the lines run.
In the northern portion of the Middle Island the character of the country has prevented little more than the first link in the chain of through communication being accomplished. On the West Coast, however, the lines and harbour-works constructed for the purpose of developing the vast mineral wealth of that region have been highly successful, and rank among the best-paying portions of the system. During last year 168,000 tons of coal and coke were carried over the Grey mouth Section, and 201,000 tons over the Westport line. In connection with the latter, the Westport Coal Company's incline, between the mine and the railway, deserves special reference as a peculiar and almost unique specimen of engineering work.
It is on the East Coast, however, that the actual working portion of the main trunk line is to be found. The present terminus is Culverden, from whence extension will be made northward. From Culverden to Amberley the country is but sparsely settled; but beyond that point to Christchurch there are numerous small farms and holdings. Around Christchurch in various directions are branch lines, serving districts of more or less importance. The main line proceeds south across the extensive Canterbury Plains, touching at Rakaia, Ashburton, and Timaru, all centres of large agricultural and pastoral districts. Near Oamaru the character of the country changes to undulating limestone-downs of great fertility, and particularly well adapted for the growth of wheat. Approaching Dunedin the line has to pass through some hilly country, involving some heavy cuttings and tunnelling. Between Christchurch and Dunedin a daily express-train is run, doing the distance—230 miles—in nine hours and three-quarters including stoppages.
In the country south and on to Invercargill and the Bluff, the southernmost port in the colony, and, indeed, all along the line from Christchurch, evidences may be seen on every side of industrial enterprise in the shape of meat-preserving and -freezing works, chemical manufactories, dairy factories, coal-mines, sawmills, and timber dépôts, all of which assist in the production of traffic, the development of which is generally regarded as an indication of the colony's progress. Large supplies of brown coal are drawn from the mines in the Canterbury and Otago Districts, and are used for locomotive purposes, in addition to meeting the local requirement for home consumption.
The management of the New Zealand State railways was placed by Parliament a few years ago in the hands of three Commissioners, and freed from party control, although still remaining subject to parliamentary direction. The respective sections are under the control of local District Officers, representing the traffic, locomotive, and maintenance branches, except on the smaller lines, where one officer combines the three charges. At head-quarters the two latter branches are controlled by a Locomotive Superintendent and a Chief Engineer respectively, the traffic branch being directly under the supervision of the Commissioners. The total number of men employed in all ranks is about 4,500.
There are workshops at all the large centres, the principal one being at Addington, near Christchurch, at which, for many years, the building of rolling-stock, and more recently the construction of locomotives, has been successfully carried on.
Prior to 1872, when operations under the public-works policy commenced, there were only 65 miles open for traffic. On the 31st March, 1893, twenty-one years later, there were 1,886, producing a gross annual revenue of £1,181,522; the net revenue being £449,830, equal to a dividend of £3 1s. per cent. on the total cost of all opened lines to same date.
Nearly all the stations are connected by telegraph or telephone, and at many of them the combined duties of a post- and telegraph-office are carried on. As regards signalling, the lines are practically all single-track, and do not require elaborate arrangements in that respect. On portions where extra precaution is necessary, the “Winter” block system is in operation. The “Vacuum” automatic brake is in use in some parts.
The working-expenses of the lines for the year ending the 31st March, 1893, amounted to £732,142, absorbing 61.97 per cent. of the receipts; but, as the cost of improvement in renewing rails, in reconstructing rolling-stock and more permanent structures is borne by working-expenses, they are thus made to appear heavier than they otherwise would do.
The gradual but steady growth of the business of the railways is illustrated by the following table, taken from the latest annual report of the Commissioners:–
| Comparison of Traffic, Revenue, and Expenditure for the Last Fourteen Financial Years. | |||||||||
|---|---|---|---|---|---|---|---|---|---|
| Year. | Miles. | Revenue. | Expenditure. | Expenditure per Cent. of Revenue. | Tonnage. | Parcols, Horses, and Dogs. | Cattle, Sheep, and Pigs. | Passengers. | Season-tickets. |
| £ | £ | No. | No. | No. | No. | ||||
| 1879–80 | 1,172 | 762,573 | 580,010 | 76.06 | 1,108,108 | 180,331 | 285,209 | 2,967,090 | 5,077 |
| 1880–81 | 1,277 | 836,454 | 521,957 | 62.40, | 1,377,783 | 286,865 | 300,704 | 2,849,561 | 6,499 |
| 1881–82 | 1,319 | 892,026 | 523,099 | 58.64 | 1,437,714 | 316,611 | 343,751 | 2,911,477 | 7,207 |
| 1882–83 | 1,358 | 953,347 | 592,821 | 62.18 | 1,564,793 | 341,186 | 477,075 | 3,283,378 | 8,621 |
| 1883–84 | 1,396 | 961,304 | 655,990 | 68.24 | 1,700,040 | 359,896 | 686,287 | 3,272,644 | 9,036 |
| 1884–85 | 1,477 | 1,045,712 | 690,026 | 65.99 | 1,749,856 | 347,425 | 729,528 | 3,232,886 | 8,999 |
| 1885–86 | 1,613 | 1,047,419 | 690,340 | 65.91 | 1,823,767 | 349,428 | 858,662 | 3,362,266 | 10,717 |
| 1886–87 | 1,727 | 998,768 | 699,072 | 69.99 | 1,747,754 | 372,397 | 942,017 | 3,426,403 | 11,821 |
| 1887–88 | 1,758 | 994,843 | 687,328 | 69.09 | 1,735,762 | 399,109 | 940,209 | 3,451,850 | 11,518 |
| 1888–89 | 1,777 | 997,615 | 647,045 | 64.86 | 1,920,431 | 399,056 | 919,392 | 3,132,803 | 11,817 |
| 1889–90 | 1,809 | 1,095,570 | 682,787 | 62.32 | 2,073,955 | 405,838 | 1,068,575 | 3,376,459 | 12,311 |
| 1890–91 | 1,842 | 1,121,701 | 700,703 | 62.47 | 2,086,011 | 413,074 | 1,348,364 | 3,433,629 | 13,881 |
| 1891–92 | 1,869 | 1,115,432 | 706,517 | 63.34 | 2,066,791 | 430,216 | 1,153,501 | 3,555,764 | 16,341 |
| 1892–93 | 1,886 | 1,181,522 | 732,142 | 61.97 | 2,193,330 | 460,383 | 1,393,457 | 3,759,044 | 16,504 |
For the past year the tonnage of the principal products of the colony carried over the railways was: Wool, 96,842 tons; timber and firewood, 257,096 tons; grain, 523,637 tons; minerals, 884,031 tons.
The receipts from passenger traffic were £390,619, including season tickets, £23,025.
The average revenue per mile of railway was £630 14s. 8d., and the average expenditure £390 16s. 10d., equal to 7s. 10 1/2d. and 4s. 10 1/2d. per train-mile respectively.
The cost of maintenance per mile for last year, 1892–93, was £140 3s. 9d.
The total number of miles travelled by trains was 3,002,174; and the statement below shows the traffic ton-mileage and rate of working for the five chief sections of the system for four years:—
| Section. | 1889–90. | 1890–91. | 1891–92. | 1892–93. | ||||
|---|---|---|---|---|---|---|---|---|
| Ton-mil'ge | d. | Ton-mil'ge | d. | Ton-mil'ge | d. | Ton-mil'ge | d. | |
| Auckland | 8,177,770 | 2.16 | 9,228,869 | 1.85 | 9,899,396 | 1.76 | 10,146,797 | 1.80 |
| Napier–Taranaki | 9,517,532 | 2.33 | 10,093,156 | 2.51 | 11,710,544 | 2.15 | 13,205,014 | 2.15 |
| Wellington | 4,516,965 | 2.42 | 5,063,457 | 2.35 | 5,632,828 | 2.11 | 5,816,437 | 2.21 |
| Hurunui–Bluff | 46,789,728 | 2.07 | 53,350,677 | 1.93 | 50,106,636 | 2.00 | 51,699,231 | 2.04 |
| Totals | 69,001,995 | 2.14 | 77,736,159 | 2.02 | 77,349,404 | 2.00 | 80,867,479 | 2.04 |
There are 269 locomotives in use on all lines, of various classes, ranging from the light shunting-engine of 11 tons weight to the larger goods-engines of English and American type, 54 tons in weight. There are also in use several locomotives built in the colony, the principal being those recently constructed in the Addington workshops, and specially designed by the local officers for working over heavy grades at moderate speeds.
Of carriages, first-class, second-class, and composite, there are 491, including several saloon cars of a special design for express and tourist traffic. There are 8,357 waggons in use, a number of these being specially constructed to serve the frozen-meat industry, which forms so large a proportion of the traffic in some districts.
The passenger fares on the New Zealand railways are generally at the rate of 2 1/2d. per mile first-class, and 1 2/3d. per mile second-class; the return fare being calculated at one-third increase on these rates. For suburban and local traffic, however, the rates are much lower; in some cases of commutation tickets being as low as 7/8d. first-class, and 1/2d. second-class, per mile; while excursion and tourist traffic is encouraged by greatly reduced fares during the season for such business.
Compared with the Australian Colonies, which are better circumstanced as regards the absence of competition, and a larger population, especially in suburban areas, the New Zealand railways may be said to fairly hold their own. A table is attached which compares the principal points of interest in the working of the chief colonial lines.
| Comparative Statement of the Mileage open, Capital expended, Expenses, etc., of Railways in Queensland, New South Wales, Victoria, South Australia, and New Zealand. | |||||||||||||
|---|---|---|---|---|---|---|---|---|---|---|---|---|---|
| Railways. | Miles open. | Population (approximately). | Miles of Line open for every 1,000 of Population. | Capital cost. | Cost per Mile open. | Train-miles. | Gross Earnings. | Earnings per Train-mile. | Working-expenses. | Working-expenses per Train-mile. | Percentage of Net Earnings to Cost. | Percentage of Expenses to Revenue. | Year ending |
| £ | £ | £ | d. | £ | d. | ||||||||
| Queensland | 2,320 | 410,330 | 5.65 | 16,046,851 | 6,917 | 3,966,120 | 1,052,536 | 63.69 | 639,502 | 38.70 | 2.57 | 60.76 | 30/6/92 |
| New South Wales | 2,185 | 1,182,000 | 1.85 | 33,312,608 | 15,246 | 8,356,096 | 3,107,296 | 89.25 | 1,914,252 | 54.98 | 3.58 | 61.60 | 30/6/92 |
| Victoria | 2,903 | 1,163,000 | 2.50 | 37,085,309 | 12,775 | 11,807,077 | 3,095,122 | 62.91 | 2,138,139 | 43.45 | 2.58 | 69.08 | 30/6/92 |
| South Australia | 1,660 1/2 | 325,000 | 5.11 | 11,714,434 | 7,054 | 4,178,286 | 1,213,290 | 69.69 | 652,941 | 37.50 | 4.78 | 53.82 | 30/6/92 |
| New Zealand | 1,886 | 698,200 | 2.70 | 14,733,120 | 7,812 | 3,002,174 | 1,181,522 | 94.45 | 732,142 | 58.53 | 3.05 | 61.97 | 31/3/93 |
The question of results cannot, however, be decided by a glance at such figures alone. There are many factors to be taken into consideration when judging of the benefits gained by the country through the construction of its railways. The advancement of settlement, the opening up of new country and increasing its productiveness, the provision of employment for large numbers, the cheapening of transit both for goods and passengers, and many other items, must all be reckoned as value obtained for the expenditure in addition to the mere monetary returns; and, if this is done, the net gain to the colony due to the public-works policy must be generally admitted.
Table of Contents
Harbour Boards are constituted under special Acts of Parliament to regulate the management of harbours, and to make provision for matters connected therewith. The Boards are elective, or partly elective and partly nominated by the Government; they can impose wharfage-dues and other charges on shipping. There are at the present time twenty-one Harbour Boards in the colony, each having special local by-laws in force. Ports where there are no Harbour or River Boards are under direct control of the Government.
The following are the principal harbours and rivers in New Zealand, with the depth of water at entrance and at anchorage, taken from “New Zealand Pilot, 1891,” and other official sources; also the berthage-accommodation and depth of water at quayage, and other particulars of importance:—
There are extensive wharves in this harbour, with commodious goods-sheds erected thereon having storage for about 8,500 tons, quayage, jetties, &c., giving in all about 9,000ft. of berthage for shipping, 3,700ft. of which has from 18ft. to 24ft. depth of water alongside at low water, ordinary spring-tides. The wharves are: Hobson-street Wharf, Queen-street Wharf, Quay-street Wharf, and the Railway Wharf, the berths at the outer eastern and western tees of Queen-street Wharf being capable of accommodating large ocean-going steamers. There are six cranes in all on the main wharves, with power to lift from 3 to 15 tons.
James M. Brigham, Secretary, Auckland Harbour Board; J. J. Burgess, Harbour Master.
The former townships of Grahamstown, Shortland, and Tararu are now amalgamated in the Town of Thames, situated two miles south-eastward of Tararu Point, on the right bank of the entrance to Kauaeranga River. The goods wharf, at the northern end of the town, is about 1,400ft. in length, and has from 9ft. to 10ft. of water alongside at high-water springs. Shortland Wharf is 1 mile southeastward of the goods wharf, on the eastern side of the mouth of the Kauaeranga River. Vessels drawing 5ft. to 6ft. can load alongside this wharf in smooth water. The river above Paeroa, which is 22 miles from the mouth, is only navigable for very small launches and flat punts, on account of the large amount of drainage into the river.
The depth of water on the bar at 4 miles distance from the river-mouth, and in the channel, is 16ft. at high-water springs and 13ft. 6in. at neaps; at low water there is only 4ft. 6in. on the bar. The berthing-space amounts to 1,060ft., viz., at the goods wharf, 500ft.; Shortland Wharf, 400ft.; Kopu Wharf, 40ft.; Kirikiri, 40ft.; Turua, 40ft. The three last-named are timber-jetties, with a berth at the end. There is a solid training-wall and road 1,500ft. long. This wall is in place of the old Grahamstown Wharf mentioned as 1,400ft. long. The berthage-space is now about 350ft. Vessels of 400 tons can be berthed at the river wharves.
Wm. Carpenter, Secretary, Thames Harbour Board; Thomas C. Bayldon, Harbourmaster.
This harbour is 1 mile wide at the entrances, and carries a depth of upwards of 5 fathoms for nearly 1 mile inside. There is a wharf at the head of McGregor Bay with 9ft. to 10ft. alongside it at high-water ordinary springs.
This large inlet, 30 miles south-east of Cape Colville, is 5 miles wide at its entrance, and is the seat of a considerable timber trade. The least depth to be passed over by vessels proceeding to the anchorage in Mangrove River, just within the Heads, is 2 1/4 fathoms at low water.
This is the only harbour on the East Coast between Mercury Bay and Port Nicholson that affords shelter in all winds for vessels of burthen. The least depth to be passed over by a vessel proceeding to the anchorage under Maunganui, or off Maketu Mound, is about 21ft. at low water, and 27ft. at high water.
There are two wharves, with berthage for vessels drawing 16ft. and 12ft. respectively. To approach the wharves the least depth is 9ft. at low water, and 15ft. at high water.
Within the south head of Tolaga Bay is the cove where Captain Cook watered, and beyond is to be seen the remarkable arch in the cliffs which he has described. Several initials are cut on the rock where the artificial well exists, made by his crew.
Is 5 miles in breadth from head to head, and nearly 4 miles in depth. There are two small rivers in the bay—Turanganui and Waipaoa. The first-named is celebrated as the place where Captain Cook first landed in New Zealand. From the untoward circumstances attending his landing and unsuccessful attempts to obtain provisions, he named the bay “Poverty.”
The town of Gisborne is situated on the right bank of the Turanganui River, near the entrance. The extent of harbour-works actually constructed comprise a timber-wharf and viaduct, 1,580ft. long; sea-mole, 1,100ft. (out of 1,900ft. proposed); and a training-wall in lieu of a groin on the west beach (only partly completed). The depth of water in the river varies from 3ft. 9in. to 8ft. 6in. The present (June, 1893) berthage at Kaiti Wharf is 100ft.; at the timber-wharf, on the west side of Turanganui River, 250ft., and at a second wharf recently erected, 100ft.
James Wm. Witty, Secretary, Gisborne Harbour Board.
Nineteen miles westward of Long Point, on the north shore of Hawke's Bay, is the entrance to the River Wairoa, and eleven miles further to the south-westward is the small River Mohaka. Both entrances are difficult; the mouths also shift.
The entrance to the Wairoa River for the past two years (to June, 1893) has been exceptionally good, and open almost continuously during that period for vessels of 5ft. to 6ft. draught. The mouth of the river during that time has remained near the signal-station on the western head. There are now two steamers plying between Napier and the Wairoa, the largest being of 50 tons register. The Mohaka River can be entered by vessels drawing not over 4ft. of water.
J. W. Sargisson, Secretary, Wairoa Harbour Board.
This port is the only harbour deserving the name between Tauranga and Port Nicholson. The entrance is narrow, but inside it expands into a large sheet of water. The depth at entrance at ordinary high-water springs is 14ft. 6in., and at low water 11ft. 6in. The length of quayage is 2,280ft. The depth of water at the wharves is from 8ft. to 13ft. at low-water. There is one crane capable of lifting 15 tons, and good anchorage will be found in the roadstead, where vessels can load and discharge by lighters. A breakwater is in course of construction, and already affords considerable shelter. A western arm is to be constructed, thus making an enclosed harbour of 120 acres in area, with a depth up to 35ft. at low water. This harbour will give accommodation to the largest vessels afloat.
Francis E. Saunders, Secretary, Napier Harbour Board.
This is an excellent harbour, having an area of about 20,000 acres, for the most part sheltered, with good holding ground for anchorage, with depths of from 6 1/2 to 14 fathoms at low water. The main entrance has a clear breadth of not less than 6 cables for a distance of one and a half miles; and the prevailing winds being in the direction of the channel, the entrance is at all times safe and easy.
The wharfage-accommodation is at the city of Wellington, in the western arm of the harbour, and comprises the Queen's, Railway, and Wool Wharves, having a combined berthage of 6,850ft. lineal, with from 12ft. to 30ft. at low water; in addition to which there is 1,000ft. of breastwork berths, having depths at low-water of from 5ft. to 6ft., available for small coastal crafts. The rise and fall of the tide is from 3ft. to 4ft.
The import and transhipping trade is principally carried on at the Queen's Wharf, where ample storage accommodation is provided at each berth. The export trade is principally carried out at the Railway and Wool Wharf, where there are large stores in connection with the railway system, with all facilities for handling wool and hemp.
The Harbour Board act as wharfingers, receiving goods from the vessels, and taking care of them for the consignees or shippers; and, for the purpose of facilitating the cheap handling of cargo, has erected a complete and elaborate system of hydraulic plant, comprising lifting-gear in all the stores and sheds, seven presses for dumping wool and hemp for shipment, and five 2-ton cranes fixed on wharf for loading carts. There are also worked by the same system, to aid in the discharge of cargo from ocean steamers and sailing vessels, movable winches, as well as twelve movable double-powered 2-ton cranes, having variable rakes up to 32ft.; one 10-ton crane, fixed at the outer tee of the Queen's Wharf, having a similar rake, and commanding the hatches of the largest steamers entering the port; and at Jervois Quay a 40-ton derrick-crane at a berth where the depth at low-water is 20ft. The Board have also a large brick bonded-store, where goods may be stored in bond, and a luggage-store where passengers may leave their luggage and obtain a receipt therefor.
A Sailors' Rest (supported by voluntary subscriptions) is provided in one of the Board's buildings.
Wellington, being situated on Cook Strait, has a considerable trade in supplying coal to steamers, a large tonnage of coal being always stored in hulks in the harbour, and vessels calling for coals are exempt from port-charges.
William Ferguson, Treasurer, Wellington Harbour Board; Captain John Holliday, Harbourmaster.
The entrance lies in the depth of the great bight between Cape Terawhiti and Cape Egmont, and about an equal distance from both. The depth on the baris 3ft. to 6ft. at low-water springs, and 9ft. to 12ft. at high water. Vessels drawing 10ft. can load at the town wharf; vessels over 10ft. draught load at the lower anchorage, two miles from the town. The harbour extends from the mouth of the river twenty miles inland. The depth of water varies at high- and low-water springs from 13ft. to 10ft. There are two wharves—the Railway and the Cattle Wharf—aggregating 1,800ft. berthage. The breakwater in course of construction has reached a length of 900ft. from the North Head. Power of Government cranes, 5 tons.
John Notman, Secretary, Wanganui Harbour Board.
The bar of this river has shifted very little since the harbour-works have been in progress. It has a depth of 10ft. to 13ft. at high-water springs, and at neaps 7ft. to 8ft. A rubble and concrete breakwater, 955ft. long and 20ft. wide, has been constructed to keep the channel over the bar straight. The width from the breakwater to the North Spit is 139ft., the depth of water at end of breakwater 17ft., and along it 17ft. The depth of water in the harbour varies from 2ft. to 6ft., and in the river-channel from 6ft. to 15ft., according to tide. There are two wharves—Railway Wharf, 550ft., and Town Wharf, 100ft.; the berthing space being 650ft., at which vessels from 70 to 100 tons burthen, and drawing not more than 8ft. to 10ft. can be accommodated.
Edward Horner, Manager, Patea Harbour Board.
This port and roadstead is 18 miles north-eastward of Cape Egmont. A breakwater has been constructed from a point nearly half a mile north-eastward of the main Sugarloaf. Its present extent is 1,950ft., in a N.E. by N. 1/2 N. direction.
There is a wharf close south-eastward of the breakwater, with berthage 400ft. in length on each side, which is connected with New Plymouth by railway, and has a depth of 12ft. at low water at its outer end, and 8ft. at its inner end. Berthage is on the east side of the wharf only, owing to silting up on the west side at low water.
Clarence Rennell, Secretary, New Plymouth Harbour Board.
This river is 10 miles north-eastward of New Plymouth, and its mouth is about 13 miles to the north-east of the Sugarloaf Island. It is navigable as far as the Railway Wharf, where a bridge crosses, a distance of about three-quarters of a mile from the bar. Length of Railway Quay, 442ft.; depth at quay-side at ordinary spring-tides, high water, 10ft.; low water, 7ft. There is a bar at the entrance to the port, with 12ft. of water at high-water ordinary spring-tides and 9ft. at neap-tides. Two cranes, to lift from 2 to 5 tons each, can be obtained at the Railway Quay. There are two cattle-wharves, which can only be reached by vessels drawing 9ft. or less, and which have 10ft. and 12ft. respectively at high water, and 5ft. and 7ft. at low water. Two training-walls have been constructed to improve the channel. The south-west training-wall is 1,254ft. long, and the north-east training-wall about 700ft. Besides the foregoing there is an open roadstead at the port, where the direct steamers for London load frozen meat and other produce, from large punts specially constructed for the purpose. A small, but powerful, screw-steamer is generally available as a steam-tug for sailing-vessels entering or leaving the river.
J. Cameron, Secretary, Waitara Harbour Board.
This harbour is the most considerable inlet on the west coast south of Manukau Harbour. The south channel is the only one used, being nearly two cables wide, with 17ft. in it at low water; the northern has nearly (1890) closed. When within, and the flats are covered, the harbour presents a considerable expanse of water, 6 miles in length by 4 miles in width. The channel, which for the first mile is between sandbanks, is little more than a cable wide, with 4 and 5 fathoms; the banks have only 2ft. or 3ft. on them, and are distinguished by the stream.
This extensive inlet, immediately opposite to Auckland Harbour, from which it is separated by an isthmus, at its narrowest part of about 6 or 7 miles, and affording water-communication within a short distance of the city, is of considerable importance, as by its means Auckland enjoys rapid communication with Taranaki, Wellington, Nelson, and all the ports on the western coast. The bar of the main channel, a quarter of a mile in breadth, had, in 1890, a least depth in the channel of 21ft. at low-water springs. This channel is, however, seldom used. In the same year there was a depth of 5 fathoms in the south channel, abreast of Heron Spit, gradually shoaling to 2 1/4 fathoms between the inner shoals. Onehunga, the port of entry, is about 6 miles from Auckland, and is connected by an excellent road, and also a railway.
John Robertson, Harbourmaster.
Kaipara Harbour, 40 miles north of Manukau Harbour, is one of the most extensive inlets in New Zealand. The entrance to it, as is the case with all the ports on the west coast of this island, is attended with difficulties, but, when once within, there is perfect security for any number of vessels of the largest size. There is an extent of 700 miles of water-frontage inside.
Five miles within the heads three large rivers branch off in different directions, winding through land abounding with the kauri and other valuable timber. These rivers are navigable for many miles for vessels of moderate tonnage. The Kaipara itself, the southern branch, flows through a valley formed by the hills which bound the coast between Kaipara and Manukau Harbours, and is only separated from an inlet of Auckland Harbour by a distance of about 3 miles.
In December, 1890, the least depth on the line of the leading beacons of Kaipara bar was 5 fathoms at low water. Inside the bar a depth of 6 to 9 fathoms is maintained for 1 3/4 miles, when the water gradually deepens, the channel narrowing to three-quarters of a mile.
At Helensville, the depth alongside the Kauri Timber Company's wharf is 9ft. at low water, 5ft. alongside West Brothers', and 4ft. at Douglas Brothers'.
At Te Kopuru the depth alongside the Kauri Timber Company's wharf is 4ft. to 12ft. at low water; and alongside the same company's wharf at Aratapu the depth is 2ft. to 6ft.
At Dargaville, vessels load alongside the Railway Wharf, where there is a depth of 11ft. at low water, and 22ft. at high water. The railway has been constructed from Dargaville up the Kaihu Valley to assist the kauri-timber trade.
J. C. Smith, Harbourmaster.
Hokianga River is the northernmost port on the West Coast accessible to ships of moderate burthen. It flows in a north-easterly direction for 20 miles between the wooded ranges of Waima and Pungahuru, whose steep sides approach the banks at distances varying from 4 to 10 miles, supplying the main river by large tributaries winding through valleys of great capabilities. The river is navigable, and has few obstructions for a distance of 15 miles from the heads, the depth in the channel varying from 4 to 26 fathoms, mud and sand, and the water is salt to its head. The shoals forming the bar at the river-entrance extend, as formerly, in a north-west and south-east direction for about 2 miles, at the distance of 1 1/2 to 1 3/4 miles from the heads, with two channels, the north channel having a depth of about 12ft. at low water, and the south channel of 10ft. The signal-staff is in communication with the telegraph system of New Zealand (the nearest station being at Omapere, about 2 1/2 miles distant).
George Martin, Harbourmaster.
Is in the south-east corner of Doubtless Bay, distant from Flathead Islet nearly 5 miles. It is 1 1/2 cables wide at the entrance. The depth in the fairway between the heads at low water is 4 fathoms.
The average width of the main branch of this harbour is about one-third of a mile. The most convenient anchorage is in Kaouou Bay, on the western side of the harbour, immediately inside the entrance.
This extensive bay or gulf is comprised between Capes Wiwiki and Brett, is nearly 10 miles wide at its entrance, and is deep enough to take the largest vessel afloat; a peninsula, 3 miles in length, may be said to divide it into two distinct portions. On the western side of the peninsula just mentioned is Kororareka (Port Russell), the principal and best-known anchorage. In the eastern portion of the bay are the numerous islands from which its name is derived.
There is no bar or shallow to be crossed in the Bay of Islands by vessels proceeding to Port Russell, the water shoaling gradually from the entrance to the anchorage. The water-area is about two square miles. The depth of water at the outer end of the Government Wharf at low-water springs is 15 1/2ft.; length of quayage, 300ft.; the depth alongside at ordinary springs is, at high water, 23ft.; and low water, 17ft. There is one hand ballast-crane, capable of discharging 7 tons per hour. In going to Opua coaling-wharf the least depth is about 22ft. at low water, and 31ft. at high-water springs. The length of the Government Wharf is 450ft.; the depth alongside at ordinary springs is, at high water, 24ft.; low water 18ft. There are three steam ballast-cranes, capable of discharging 50 tons per hour.
The least depth to be passed over by vessels proceeding to either Passage Island or Single-tree Point anchorages is 4 1/4 fathoms at low water, and 5 1/2 fathoms at high water. There is a railway wharf, which can be reached by vessels 14ft. draught at high-water springs.
Is a large inlet westward of Kawau Island.* It extends westward for 4 miles, and is about the same length in a north and south direction, with a depth of from 4 to 6 fathoms in almost every part. In its north-west part is the River Matakana, navigable for coasters.
* Kawau Island was for many years and till recently the private property and residence of Sir George Grey, K.C.B., M.H.R., twice a Governor of New Zealand. During his residence here he stocked the island with catley sheep, deer, kangaroos, and various sorts of birds. Every rare plant that will live at Madeira flourishes at Kawau, the climate of which island is similar to that of St. Michael's, in the Azores.
The Port of Lyttelton, which is situate on the north-western side of Banks Peninsula, having an opening to the north-east, is the chief seaport town of the Provincial District of Canterbury. It is 7 miles distant from Christchurch, the capital, and is connected by a line of railway; the Moorhouse tunnel (1 3/4 miles in length) being on this section.
The breakwaters are formed of rubble stone, the outer slopes of which are protected or faced with huge blocks of stone.
The Officer's Point, or eastern breakwater, is some 2,010ft. in length, with a width of 40ft. on top, and having an elevation of 6ft. above high-water spring-tides. The Naval Point breakwater is 1,400ft. in length. The former breakwater has also a timber breastwork built along its inner face for nearly its entire length—known as the Gladstone Pier.
The area of water enclosed within the breakwater is about 107 acres.
The present depth of water inside the breakwaters and at the wharves varies from 20ft. up to 25ft. at low tide. The inner harbour has been deepened by dredging, so that vessels drawing 25ft. may be berthed inside the moles almost at any time of the tide. The rise of tide is about 6 1/2ft. Vessels up to 5,000 tons can now be safely berthed at several of the wharves.
Sets of Mitchell's patent screw-moorings are laid down in the inner harbour, capable of holding vessels up to 3,000 tons.
The berthage-space at the wharves will be: No. 1, Gladstone Pier, 1,740ft.; timber-breastwork, from Gladstone Pier westward to Naval Point, 3,850ft.; Jetties—No. 2, Screw-pile Jetty, 1,030ft.; No. 3, Intermediate, 800ft.; No. 4, Intermediate, 800ft.; No. 5, Intermediate, 800ft.; No. 6, Tunnel-mouth Jetty, 480ft.; Breastwork Jetty, 250ft.; No. 7, Ocean-steamer Jetty, 1,000ft.: making a total of 10,750ft., which would be capable of berthing the following number of vessels, without double-banking: 19 ocean ships and steamers, up to 6,000 tons, when loaded to 26ft. 9in.; 9 intercolonial steamers; 6 schooners, &c. This berthage-space is still capable of very considerable extension by the construction of additional jetties.
A special wharf for ocean-steamers is provided. Its length is over 500ft., and it will accommodate two of the largest steamers visiting the port at the same time. Besides this, two of the other jetties have a depth alongside of about 28ft.
Special berthage-space is provided for men-of-war. Several vessels can be berthed at the moorings inside the breakwaters, without in any way interfering with the ordinary shipping of the port.
The whole of the wharves and jetties in Lyttelton have lines of rails laid down upon them, and are worked by the Railway Department. Extensive shed-accommodation is also provided on the wharves and in the Lyttelton Station-yards.
The Harbour Board have a cool and freezing-chamber (Linde process) near the ocean-steamers' jetty, solely for the accommodation of butter, cheese, meat, &c., prior to shipment. The cool-chamber building is divided into four perfectly separate compartments of 150 tons each, which can be used quite independently of each other, either as a cool chamber, or for freezing purposes, as may be required.
Provision has been made by the Lyttelton Harbour Board for the storage of grain and agricultural produce in Lyttelton at most reasonable rates, namely, 1d. per ton per week, with receiving and delivery charges added. The Board at present have storage-space for 15,000 tons.
C. Hood Williams, Secretary and Treasurer, Lyttelton Harbour Board; Captain J. W. Clark, Harbourmaster.
Penetrates Banks Peninsula in a northerly direction more than 8 miles, its inner part approaching within 4 miles of the head of Pigeon Bay. It is a magnificent port, affording secure and landlocked anchorage to any number of vessels, and is easy of access. The harbour-entrance is nearly a mile in breadth, increasing to a mile and a quarter, which it carries to the anchorage in Pakaeriki Bay, on the eastern shore, nearly 6 miles from the heads, where there is excellent anchorage in 4 fathoms at low water, little more than half a mile off the town.
At the extreme end of the Ninety-mile Beach is a rocky projection, on the northern part of which is the Township of Timaru, the site formerly of an old whaling-station, but now a port of considerable importance for the southern part of the Canterbury District. The breakwater—constructed for the formation of the harbour—commences upwards of one cable eastward of the lighthouse, and runs out N.E. by N. 1,250ft., thence curving to the northward for a further distance of 1,028ft., making a total length of 2,278ft. exclusive of the shore-end. It is 30ft. wide on the top, and is formed principally of concrete blocks, each weighing 30 tons. A rubble wall—north mole—commences from the shore three-quarters of a mile north-westward of the breakwater shore-end, and extends 2,400ft. in an easterly direction to a point 350ft. from the breakwater, and somewhat within its extremity. Latterly, the trade of the port has been entirely carried on under the breakwater, and now the north mole is completed smooth water is assured at all times. Several sets of moorings have been laid down within the breakwater. Dredging is proceeding within the harbour, and the ocean steam-vessels' berth has a depth of 22ft. at low-water springs. The general depth in the harbour is (June, 1893) 12ft. to 23ft. A steam-vessel of 3,720 tons burden was laden here with great rapidity, the wharves being worked by the Railway Department, and having five travelling steam-cranes, their lifting-power being from 2 to 12 tons. The space enclosed has an area of 50 acres. Moody Wharf has berthage-accommodation of 250ft. on each side, with 18ft. at low-water springs; the main wharf, 1,000ft. on one side, with 23ft. at low-water spring-tides.
William James Tennent, Secretary, Timaru Harbour Board; Captain T. N. Clarkson, Harbourmaster.
Formerly, like Timaru, an open roadstead, has been constructed in the first bight northward of Cape Wanbrow, and is the shipping-port of a large grain-producing district in the Middle Island. The breakwater commences a cable north-westward of the principal lighthouse, and runs in a north-by-west direction 1,850ft.; it is 36ft. wide on the top. A mole, 1,700ft. in length, runs in an easterly direction from the shore, commencing half a mile north-westward of the inner end of the breakwater. The mole and breakwater thus enclose a space 60 acres in extent, forming a safe harbour, with an entrance 600ft. in width, the channel and harbour varying from 10ft. to 28ft. in depth. Four wharves—Macandrew (350ft.), Cross (310ft.), Normanby (507ft.), and Sumpter (743ft.)—have, collectively, berthage of 1,910ft. in length, with 8ft. to 20ft. of water at low spring-tides. The railway is connected with all the wharves, and there are five cranes, varying from 1 1/2 to 5 tons each. Moorings have been laid down in the harbour.
Thos. Forrester, Secretary, Oamaru Harbour Board; Wm. Sewell, Harbourmaster.
At the entrance to this harbour there is a mole at the North Head 4,100ft. long, projecting in a north-easterly direction from the low sandbank on the western side of the harbour-entrance. Within the entrance a spacious sheet of water extends to the south-westward for a distance of 11 miles, the area being, approximately, 12,750 acres, and at its head stands the City of Dunedin.
The Town of Port Chalmers is at the head of Koputai Bay, about 6 miles above the bar, where there is good anchorage for large vessels in 5 fathoms.
The depth of water in the lower harbour (Port Chalmers) ranges up to 60ft. at low water, and in the upper harbour (Dunedin) to 20ft. at low water, to which 6ft. 6in. have to be added for high-water springs. The bar at the lower harbour is 24ft., and in the new channel 21ft.; the channel to Port Chalmers is 22ft.: all at low water. In Victoria Channel, at the upper harbour, there is 14ft. at low water, to which 6ft. 6in. should be added for high-water springs. In this (upper) harbour there is a half-tide training-wall 5 miles in length. 14,520ft. of walling has been run round the Board's endowment on the foreshore, 4,661ft. of which have been faced with wharves. The berthage at the six wharves at Dunedin aggregates 5,332ft., and at the three piers at Port Chalmers 2,560ft. There are nine cranes in use, ranging from 1 to 10 tons, and extensive storage-accommodation in commodious sheds at Dunedin.
The wharves at Port Chalmers are worked by the Railway Department.
John L. Gillies, Secretary, Otago Harbour Board; Captain James Macfarlane, Harbourmaster.
Awarua or Bluff Harbour, the first port of call and last of departure of the intercolonial steamers running between Hobart and Melbourne, and Dunedin, Lyttelton and Wellington, is, at high tide, an extensive sheet of water, stretching, in two arms, to the north and east respectively 4 and 5 miles. The available space for anchorage, however, is narrow and confined, and for vessels of large tonnage does not extend much above a mile from the entrance.
Campbelltown, on the northern side of the Bluff Hill, is the port for Southland. It has extensive stores for grain, which is here shipped in large quantities for the Australian Colonies and Europe. There are also two meat-freezing works.
The wharfage accommodation is 2,200ft., and the depth of water alongside the wharves, of which there are three, varies from 24ft. to 14ft. These depths are being gradually increased by dredging operations. Vessels discharge directly into the railway-trucks.
Steam-vessels of moderate size and power can enter or leave Bluff Harbour at all times, irrespective of the tides.
James E. Fox, Secretary, Bluff Harbour Board: Captain N. Macdonald, Harbourmaster.
The New River Harbour is accessible in moderate weather, and has a depth at low water of 14ft., and at high water of 21ft.
The berthing space at Invercargill Jetty is 200ft., at which vessels drawing 9 1/2ft. may be berthed. There is a crane to lift 5 tons, and also a siding connecting with the railway system.
Training-walls have been built for 50 chains on each side of the channel near the jetty.
Invercargill, situated on the east side of the estuary, about 10 miles from the bar, is the principal town in the County of Southland. The Invercargill Borough Council is the Harbour Board.
W. B. Scandrett, Treasurer, New River Harbour Board.
From New River the coast trends in a long sandy beach to the north-west, 15 miles, when it curves round to Howell Point, and forms a bay or bight just within it, having a depth of, say from 10ft. to 40ft. In this bight, at 1 1/2 miles north-west of that point, is Riverton Township, at the entrance of Jacob's River, the bar of which is nearly dry at low water; but vessels of 7ft. or 8ft. draught can enter at high water. There is an area within the harbour of about 1,500 acres, having a depth of from 12ft. to 4ft. at high- and low-water springs. The depth of the channel varies from 5ft. to 16ft. There is a wharf with 180ft. of berthage, and a jetty of 100ft. The depth of water at the wharf is 12ft., and vessels of 120 tons can be berthed.
It is proposed to construct a mole, 1,900ft. in length, at Howell's Point, and to build a large wharf within it for vessels drawing 15ft. to 27ft. water, and also to connect same with Riverton by a railway.
Geo. O. Cassels, Secretary, Riverton Harbour Board.
The only natural harbours along the whole extent of the west coast of the Middle Island—a distance of 500 miles—are those singular and truly remarkable sounds or inlets which penetrate its south-western shores between the parallels of 44° and 46° south latitude. These are thirteen in number. The larger sounds are generally divided into several arms, penetrating the coast in some instances for a distance of 20 miles, with a breadth rarely exceeding a mile, and studded with numerous islets. The smaller sounds generally run in for a distance of from 6 to 8 miles, with a width of about half a mile, and anchorage is seldom to be found except at their inner extremes. The shores, which rise almost perpendicularly from the water's edge, are, in the immediate neighbourhood of the sounds, covered with trees suitable for all purposes, among them the red-pine, which, although heavier and inferior to the kauri of the North Island, is well adapted for masts; and a vessel requiring spars could procure them of any size, up to a sloop-of-war's lower mast, with little difficulty. The most remarkable feature, common to the whole, is the great depth of water. Soundings can rarely be obtained under 80 or 100 fathoms, and frequently at much greater depths; and the shores within a few yards are quite steep. These sounds form the subject of a separate article.
This bay is 55 miles northward of Milford Sound. Although there are other bays in which small craft may lie safely, with the exception of the roadstead under Cape Foulwind, in southerly winds, Jackson's Bay is the northernmost anchorage on the west coast of the Middle Island where shelter can be procured for large vessels.
This river is usually navigable for vessels up to 10ft. draught for a distance of three-quarters of a mile from the entrance, but the bar is constantly shifting its position and varying in depth.
The harbour-works at this port are in an unfinished state; neither of the two training-walls have been carried out as far seaward as was originally intended by the late Sir John Coode. The north wall has been completed to a length of 2,000ft., the south wall to a length of 670ft., and the latter has been well protected by stone. To be of any permanent benefit they should be extended out beyond the line of the sea-beach, say, from 10 chains to 20 chains further to the westward.
The depth of the channel over the bar at high-water ordinary springs varies from 9ft. to 15ft. Spring-tides range from 8ft. to 10ft. The berthing-space at Gibson's Quay amounts to 1,000ft., and the depth of water at the wharf varies from 18ft. to 22ft. at high water.
G. W. Bignell, Secretary and Harbourmaster, Hokitika Harbour Board.
The Mawhera or Grey River flows through an extensive valley, the river trending from its mouth in an easterly direction, about 15 miles, when it divides.
On account of the extensive deposits of coal being worked in and adjacent to the valley, which are connected with Greymouth (the port town) by railway, two extensive breakwaters have been constructed at the mouth of the river to deepen the channel at the entrance, and enable larger steamers than formerly to enter. These, on the recommendation of the late Sir John Coode, have been carried out—the north breakwater 1,100ft., and the south breakwater 3,360ft., into the sea, to confine the river and direct the current square on to the bar. There are also internal training-walls constructed. These works have so far been perfectly successful; they have really done somewhat more than was expected of them. Prior to their initiation there was seldom more than 10ft. of water on the bar, and the channel was tortuous and constantly changing its position; now the channel is straight and permanent, and for the most time the channel has 25 1/2ft. at high-water springs, and 8ft. to 16ft. at low-water springs. The average depth at high-water on the bar during the year 1892 was 18ft. 10in.
The berthing-space is 1,824ft., being 1,032ft. with 12ft. at low-water springs at the upper wharf, and 792ft. at the lower wharf, with 16ft. at low-water springs. Vessels of 1,000 tons can now be berthed at the wharf.
As showing the bearing of the Greymouth Harbour-works on the progress of the colony, it is stated that the output of coal in the Brunner (Grey River) mines for the three years ending December, 1880, averaged 29,840 tons only; whereas the output for the two years ending December, 1892, has averaged 163,979 tons, an increase of 134,139 tons per annum. A large output from the Blackball Mine, situate about 20 miles from the port, will probably commence before the end of the present year. There are six cranes in use; the lifting-power is from 1 1/2 tons to 12 tons.
To facilitate the trade of this port, the towage charge on sailing vessels, with or without cargo, has been reduced to 1s. a ton on the register tonnage in and out.
A powerful steam-tug, the property of the Harbour Board, is at the service of the shipping trading to this port.
Thomas Allen, Secretary, Greymouth Harbour Board; John Connor, Harbourmaster.
The bar-entrance of this river bears E.N.E. distant 6 miles from Cape Foulwind, and E. 3/4 N. from the Northern Steeple. It is one of the largest rivers in New Zealand, and has its source in the Lakes Rotoroa and Rotoiti, 40 miles south-westward of Nelson. In its course to the sea it receives the accession of several smaller streams; its width varies from a quarter to one-third of a mile. Near to this port, also, vast deposits of excellent coal are being successfully hewn.
The general plan of the Westport Harbour-works is much the same as that for Greymouth, but on a larger scale.
The works executed to date consist in the completion of the west and east breakwaters to the points proposed by the late Sir J. Coode. The west breakwater is 4,276ft. long, and the east breakwater is 4,736ft. The west breakwater overlaps the east breakwater by 400ft., and the waterway at the entrance to the breakwaters at low-water spring-tides is 700ft. wide.
The berthages at the merchandise wharf have been dredged, and are now 15ft. deep at low-water springs, for 50ft. in width; outside of this the depth gradually lessens, until 150ft. off the wharf there is 5ft. at low-water springs. The berthages at the coal-staiths have been dredged, and are 18ft. deep at low-water springs for 70ft. in width, and for 200ft. outside of this they are 9ft. deep at low-water springs, to facilitate the swinging of vessels.
The fairway inside the bar has been dredged, and at present exhibits no depth throughout its course shoaler than 20ft. at high-water springs.
The merchandise wharf is 350ft. long, and 10ft. above high-water spring tides.
The coal-staiths are 1,200ft. long, and rise from 20ft. above high-water springs at the up-stream end to 36ft. above the same level at the down-stream end. They are capable of storing 2,000 tons of coal in thirty-six bins, besides which they have nineteen shoots. The lips of the bins and shoots, to which telescopic shoots are fitted, range from 7ft. 9in. to 25ft. 4in. above high-water spring tides. The despatch in coal-loading at the staiths is from 200 tons to 250 tons per hour.
The principal coal-mines are connected by railway with the coal-staiths.
The average depth on the bar at present (June, 1893) is 24ft. at high-water spring-tides, the range of tide being 9ft. 6in. at springs, and 5ft. 6in. at neaps.
The harbour-works at Westport promise to be a complete success. Before these works began, the usual depth of water on the bar was from 9ft. to 14ft., and since the completion of the works the usual depth is from 18ft. to 25ft. These depths are taken at high water, the rise of tide being from 6ft. to 10ft. The internal works for deepening and maintaining the deep water in the berthages and fairway inside the bar consist of half-tide training walls, now under construction, of which 2,850ft. have been completed to date (March, 1893), out of a total length of 9,850ft. provided for under the scheme of works.
Although only in its infancy, the coal trade of Westport is fast assuming large proportions. For the three years ending the 31st December, 1891, the annual output of the mines has averaged 181,200 tons. This progress is mainly due to the success of the harbour-works. The coal trade at Westport is extending very surely, each year's output showing an increase over the previous one. For the year ended 31st December, 1892, the output was 200,969 tons.
Chas. N. Greenland, Secretary, Westport Harbour Board; S. A. Leech, Harbourmaster.
This river, 22 miles north of the Buller River, has a depth of 6ft. to 7ft. at low water within the bar. The wharf and coal-staiths are connected with the coal-mines by a railway three miles in length. The coal-measures of this district are extensive, and the quality good.
Lies at the head of Blind Bay. At a distance of 4 1/2 miles from the entrance commences the long and remarkable boulder-bank, the southern portion of which forms the natural breakwater to the harbour. The least depth to be passed over by vessels entering Nelson Haven is about 6ft. 6in. at low water, and 19ft. at high-water springs. There is good anchorage outside the bar in moderate weather. The berthage accommodation at the Railway Wharf amounts to 1,025ft., and at the Albion Wharf to 422ft. The lifts consist of one sheer-legs, 20 tons; stationary hand-crane, 1 1/2 tons; and a steam-crane on wheels, 3 tons. The draught of water at low-water springs varies at the Railway Wharf from 18ft. to 23ft.; and at the Albion Wharf, 7ft. There is a good fresh-water service at the Railway and Albion Wharves for the use of shipping.
James P. Low, Harbourmaster.
This great inlet, similar in character to Queen Charlotte Sound, extends in a southerly direction about 25 miles, branching off to the eastward and westward into numerous arms and creeks, and embracing no less an extent of coast-line than 250 miles. The depth of water in this sound varies from 45 to 16 fathoms, gradually decreasing towards its head, where it receives two rivers—the Pelorus (Hoiere) and Kaituna—between the mouths of which is situated the Township of Havelock. The Mahakipawa gold-diggings are situated in an arm of the Sound near Havelock.
The entrance to this Sound lies between Capes Koamoru and Jackson, distant from each other little more than 6 miles. The Sound runs in a S.S.W. direction 14 miles to the western entrance of Tory Channel, and then S.W. by W. 1/2 W. for 11 miles to its head, near which is the town of Picton. The depth of water generally varies from 20 to 25 fathoms. It is indented on either side with numerous bays, particularly on the north side, there being ten above Ship Cove. All these bays afford secure anchorage, but the least depth of water to be found in them is 16 fathoms, except at the head of the sound. There is anchorage in 6 and 9 fathoms near the head of the eastern arm, off the town of Picton, which is built on the site formerly occupied by the Maori village of Waitohi. The wharf at Picton has a depth of 25ft. alongside at low water.
Picton is the chief port of Marlborough, and vessels are laden there direct for London with cargoes of wool, grain, flax, and other produce. There are saw-mills in the vicinity, and coal has been found near, but not in sufficient quantities to be worked. Antimony mines are in operation, and there is gold amongst the hills bordering the Sound. Picton is connected with the chief town, Blenheim, by rail, the distance being 18 miles.
G. W. White, Harbourmaster.
Is a good and spacious harbour, accessible in all weathers, and a frequent port of refuge for vessels unable to enter Port Nicholson or to pass through Cook Strait. It lies at the north end of Cloudy Bay, and is 32 miles from the entrance of Port Nicholson.
After winding through the plain of the same name, for a distance of 90 miles, this river falls into Cloudy Bay, 5 1/2 miles from White Bluff, and 9 miles from Port Underwood. It is one of the principal outlets for the produce of the Wairau and surrounding districts. Steamers drawing 5ft. to 6ft. trade regularly from Wellington to Marlboroughtown, 8 miles up the river, and also up the Opawa River, 11 miles, to Blenheim.
This portion of New Zealand, which was first seen by Captain Cook in 1770, and considered by him as part of what is now known as the Middle Island, was, in 1808, discovered to be an island by the master of a merchant-vessel, whose name by common consent it has since retained. It possesses, on its eastern and south-eastern sides, several excellent ports, affording every facility for shipping.
Table of Contents
The following is a schedule of the principal rivers in New Zealand, showing, approximately, the areas of watersheds, the average annual rainfall, and the estimated discharge for each:—
| River. | Area of Watershed in Square Miles. | Average Annual Rainfall. | Estimated Discharge in Cubic Feet per Minute. |
|---|---|---|---|
| Note.—Rivers marked (*) have mountain sources not trapped by lakes, and are therefore subject to exceptional floods. | |||
| North Island. | Inches. | ||
| Waikato | 4,768 | 40 | 839,168 |
| Kaipara | 2,622 | 47 | 545,376 |
| Wanganui | 2,525 | 47 | 525,200 |
| Manawatu* | 2,239 | 65 | 642,593 |
| Thames and Piako | 1,779 | 48 | 377,148 |
| Rangitaiki | 1,633 | 30 | 215,556 |
| Whakatane | 1,014 | 35 | 156,156 |
| Rangitikei | 1,435 | 50 | 315,700 |
| Wairoa* | 1,303 | 45 | 257,994 |
| Mohaka | 1,034 | 45 | 204,732 |
| Ngaruroro* | 843 | 40 | 148,368 |
| Tutaekuri and Esk | 487 | 35 | 73,998 |
| Tukituki | 815 | 35 | 125,510 |
| Mokau | 815 | 60 | 215,445 |
| Patea | 622 | 55 | 151,146 |
| Waipaoa, Poverty Bay* | 602 | 30 | 80,066 |
| Turanganui | 75 | 35 | 11,550 |
| Hokianga | 560 | 50 | 123,760 |
| Waiapu* | 505 | 40 | 88,880 |
| Waitara | 501 | 56 | 123,747 |
| Middle Island. | |||
| Clutha | 8,248 | 30 | 1,088,736 |
| Waitaki | 4,730 | 26 | 539,220 |
| Waiau | 3,079 | 41 | 557,299 |
| Mataura* | 2,378 | 30 | 316,274 |
| Buller* | 2,341 | 95 | 990,879 |
| Taieri | 2,317 | 37 | 379,988 |
| Grey* | 1,572 | 90 | 624,084 |
| Wairau* | 1,562 | 35 | 240,548 |
| Oreti | 1,422 | 40 | 250,272 |
| Waimakariri* | 1,922 | 55 | 345,546 |
| Rakaia* | 1,401 | 50 | 308,220 |
| Rangitata* | 752 | 48 | 159,424 |
| Selwyn (Lake Ellesmere) | 718 | 30 | 94,776 |
| Jacobs | 633 | 40 | 111,408 |
| Haast* | 412 | 125 | 227,424 |
| Kaduka (Martin's Bay) | 283 | 127 | 158,480 |
| Hokitika* | 382 | 120 | 202,460 |
| Oamaru | 23 | 22 | 2,231 |
| Milford Lagoon and Opihi | 888 | 28 | 109,224 |
The Waikato, in the North Island, and the Clutha, in the Middle Island, are the two largest rivers in New Zealand.
The Waikato River takes its rise about the centre of the island, in Tongariro Mountain, and south of Lake Taupo, and has several branches, the principal of which is the Waipa. It has a shifting bar, and is only accessible to small vessels; it is said to be navigable for vessels of 30 tons for 60 or 70 miles, and for a much greater distance for boats. There are 3 1/2 fathoms at low water within the entrance.
The Clutha (Matau) River runs into Molyneux Bay. The old entrance, 4 1/2 miles north-westward of Nugget Point, has silted up, and is nearly dry at low water. The entrance, opened by a flood in 1879, is situated further northward, and is shallow and dangerous. This river is estimated at 220 miles in length, having its source north of the Wanaka Lake, at a height of 974ft. above the sea-level, and calculated to discharge 1,088,736 cubic feet of water per minute. The quantity of water is greater and its temperature lower in summer than winter, this being caused by the melting of the snows on the western ranges of mountains. Several tributaries flow into the Clutha River, the most notable being Pomahaka, Manuherikia, Cardrona, and Kawarau, the latter draining Lake Wakatipu.
Table of Contents
Vessels visiting New Zealand, and requiring docking or repairs, will find ample accommodation at the principal ports of the colony.
There are in New Zealand four graving-docks; two of these are situated in Auckland, one at Lyttelton, and one at Port Chalmers.
The dimensions of the docks at Auckland are as follow:—
| Calliope Dock. | Auckland Dock. | |
|---|---|---|
| Length over all | 525 feet | 312 feet. |
| Length on floor | 500 feet. | 300 feet. |
| Breadth over all | 111 feet. | 65 feet. |
| Breadth on floor | 40 feet. | 42 feet. |
| Breadth at entrance | 80 feet. | 43 feet. |
| Depth of water on sill at high water (ordinary spring tides) | 33 feet. | 13 1/2 feet. |
The graving-dock at Lyttelton also is capable of docking a firstclass ironclad, or any of the large ocean-steamers now running to the colony; its general dimensions are:—
| Length over all | 503 feet. |
| Length on floor | 450 feet. |
| Breadth on floor | 46 feet. |
| Breadth over all | 82 feet. |
| Breadth at entrance | 62 feet. |
| Breadth where ship's bilge would be | 54 feet. |
| Depth of water on sill at high-water springs | 23 feet. |
There is a workshop alongside the dock, and several other places within a short distance of it where repairs and heavy foundry-work can be done.
Alongside the dock is a patent slip, with a cradle 150ft. in length, suitable for vessels of 300 tons.
The docks at Auckland and Lyttelton are the property of the respective Harbour Boards, but that at Port Chalmers is vested in the Otago Dock Trust, a body entirely distinct from the Otago Harbour Board. Vessels of large size can be taken in the Otago Dock, as the following measurements will show:—
| Length over all | 335 feet. |
| Length on the floor | 328 feet. |
| Breadth over all | 68 feet. |
| Breadth on floor | 41 feet. |
| Breadth where ship's bilge would be | 43 feet. |
| Breadth at dock-gates | 50 feet. |
| Depth of water on sill at high-water, ordinary tides | 17 1/2 feet. |
In connection with the Otago Dock there is a large machineshop, steam-hammer, and forge, with all the appliances necessary for performing any work that may be required by vessels visiting the port. An 80-ton sheer-legs has also recently been erected for heavy lifts.
There is also a patent slip, used only for taking up small vessels.
It is proposed to build a new graving-dock at Port Chalmers, to be 500ft. in length, with a depth of 25ft. on the sill.
The Port of Wellington has no dock; but there is a well-equipped patent slip in Evans Bay, on which vessels of 2,000 tons can be safely hauled up. This slip is the property of a private company, and in no way connected with the Harbour Board. The slip is 1,070ft. long, with a cradle 260ft. in length. There is a depth of 32ft. at high water at the outer end of the slip. A dolphin and buoys are laid down for swinging ships in Evans Bay.
The company has convenient workshops, which contain the machinery necessary for effecting all ordinary repairs to vessels using the slip.
The coasts of New Zealand are, considering their extent, fairly well lighted, but there are still many places where lights are wanted. Additions to the existing lights are made from time to time as funds are available.
The lighthouse towers are built of either iron, stone, or timber, the latter material having been selected partly for cheapness and partly from fear of earthquakes; but the use of it for this purpose is now abandoned.
There are twenty-six coastal lights in New Zealand—namely, seven of the first order, thirteen of the second order, three of the third order, and three of smaller orders.
The apparatus used to concentrate the rays of the light are all, with one exception, of the system known as “dioptric,” where the optical agent is wholly glass. The exception is that of Dog Island, a “catadioptric” light, where the optical agents are glass and metallic reflectors.
The forms of the apparatus used are all of the most approved type, and, at the time of their erection, of the latest pattern.
The lamps used are of various kinds; in some of them the oil flows into the wicks by gravity; these are called “fountain” lamps; in others, the oil is supplied by small pumps driven by clockwork; these are known as “mechanical” lamps; whilst in others the oil is forced up by a piston, in which case it is called a “pressure” lamp.
The light itself is produced by the consumption of lighthouse paraffin—a mineral oil distilled from shale—in lamps with burners having concentric wicks, the number of wicks increasing with the power of the apparatus, the maximum number being five, as used in Cuvier Island Lighthouse. The burners are those known as Captain Doty's patent.
The following are the characteristics of the lights used in New Zealand:—
-
The “fixed” light, in which the light is always seen.
-
The “revolving” light, in which the light, at equal periods, gradually comes into view, attains its full power, and disappears.
-
The “flashing” light, showing flashes at short, regular intervals.
There has been no special difficulty in the erection of lighthouses in New Zealand, apart from the difficulty caused by indifferent landings. There are no lighthouses built in the sea, such as the well known Eddystone or Bell Rock. That on The Brothers is the only one that it is considered necessary to keep as a rock-station: that is, the keepers are relieved from time to time, three always being at the station and one on shore.
The cost of the erection of the lighthouses has been about £158,000; the annual consumption of oil is about 17,000gals.; and the cost of maintenance, irrespective of the cost of maintaining the lighthouse steamer, is about £11,000 a year.
The following table shows the names of the lighthouses, indicating also their situation, the order of apparatus, description, period (in seconds), and colour of the lights, and of what material the respective towers are built:—
| Name of Lighthouse. | Order of Apparatus. | Description. | Period of Revolving Light, in. | Colour of Light. | Tower built of | ||
|---|---|---|---|---|---|---|---|
| Dioptric. | Soconds. | ||||||
| Cape Maria van Diemen |

| 1st order | Revolving | 60 | White Red, to show over Columbia Reef |

| Timber. |
| .. | Fixed | .. | |||||
| Moko Hinou | 1st order | Flashing | 10 | White | Stone. | ||
| Tiri-Tiri (Auckland) | 2nd order | Fixed | .. | White, with red arc over Flat Rock | Iron. | ||
| Ponui Passage | 5th order | Fixed | .. | White and red | Timber. | ||
| Cuvier Island | 1st order | Revolving | 30 | White | Iron. | ||
| Portland Island |

| 2nd order | Revolving | 30 | White Red, to show over Bull Rock |

| Timber. |
| .. | Fixed | .. | |||||
| Pencarrow Head | 2nd order | Fixed | .. | White | Iron. | ||
| Cape Egmont | 2nd order | Fixed | .. | White | Iron. | ||
| Manukau Head | 3rd order | Fixed | .. | White | Timber. | ||
| Kaipara Head | 2nd order | Flashing | 10 | White | Timber. | ||
| Brothers (in Cook Strait |

| 2nd order | Flashing | 10 | White Red, to show over Cook Rock |

| Timber. |
| .. | Fixed | .. | |||||
| Cape Campbell | 2nd order | Revolving | 60 | White | Timber. | ||
| Godley Head (Lyttelton) | 2nd order | Fixed | .. | White | Stone. | ||
| Akaroa Head | 2nd order | Flashing | 10 | White | Timber. | ||
| Moeraki | 3rd order | Fixed | .. | White | Timber. | ||
| Taiaroa Head | 3rd order | Fixed | .. | Red | Stone. | ||
| Cape Saunders | 2nd order | Revolving | 60 | White | Timber. | ||
| Nugget Point | 1st order | Fixed | .. | White | Stone. | ||
| Waipapapa Point | 2nd order | Flashing | 10 | White | Timber. | ||
| Dog Island | Catadioptric. 1st order | Revolving | 30 | White | Stone. | ||
| Centre Island | Dioptric. 1st order | Fixed | .. | White, with red arcs over inshore dangers | Timber. | ||
| Puysegur Point | 1st order | Flashing | 10 | White | Timber. | ||
| Cape Foulwind | 2nd order | Revolving | 30 | White | Timber. | ||
| Farewell Spit | 2nd order | Revolving | 60 | White, with red arc over Spit end | Timber. | ||
| Nelson | 4th order | Fixed | .. | White, with red arc to mark limit of anchorage | Iron. | ||
| French Pass | 6th order | Fixed | .. | Red and white with white light on beacon | Iron. | ||
A lighthouse is in course of construction on Stephens Island (Cook Strait). It will be of the first order dioptric, and will show a double flash at intervals of thirty seconds; colour white. It is to be built of iron, and will probably be completed towards the end of this year (1893).
One of the most successful enterprises to which this colony has given birth is the Union Steamship Company of New Zealand (Limited). Its history is a reflex, to a great extent, of the later history of the colony—as the one has grown, the other has expanded. Thirty-three years ago a small paddle-steamer was found sufficient for the requirements of Otago, and continued so until the opening of the Otago goldfields in 1862, when the sudden increase of trade resulting therefrom necessitated the employment of additional tonnage; and, one after another, five steamers were purchased, and connections formed with other ports in the Middle Island. In course of time, as trade grew, it became apparent that a bold step must be taken if it were to be retained in the hands of those under whom it had grown, and this feeling eventuated in the formation, in 1875, of the Union Steamship Company of New Zealand (Limited), with a powerful proprietary and influential board of directors.
The trade of the company was at first confined to the coastal services of the colony, with an occasional extension to Sydney; the intercolonial service being carried on by the fleet of Messrs. McMeckan, Blackwood, and Co., of Melbourne. In 1878, however, the Union Company purchased the steamers and interests of that firm; and in this way the entire intercolonial and the bulk of the New Zealand coastal trade passed into their hands. Energetic steps were taken to develop the intercolonial and coastal trades, and, with a boldness which was at the time considered temerity, orders were sent Home to build several new steamers of the latest design.
The courage of the directors was rewarded by seeing their fleet fully occupied, and, in pursuance of their policy to keep well ahead of the colony's requirements, they continued to order steamer after steamer, each more luxuriously fitted than its predecessor. Every scientific improvement, either in the machinery or the fitting of vessels, was brought into requisition for their construction, so that from the modest beginning already noted, the fleet of the Union Steamship Company has grown to be the largest and most powerful in the Southern Hemisphere.
It is unnecessary to record how, year after year, the fleet and trade of the company have grown to their present dimensions; it need only be stated that at the present time the fleet of the company engaged in regular employment numbers fifty: two steamers, of an aggregate tonnage of 58,000.
The connections of the company have extended with their fleet. In 1885, in conjunction with the Oceanic Steamship Company of San Francisco, they took up the mail-service between the Colonies and America, and have retained it ever since. In 1891 they purchased the plant and business of the Tasmanian Steam Navigation Company, which for many years had carried on the trade between Tasmania and Australia. Besides the New Zealand coastal and the intercolonial services between New Zealand, Tasmania, and Australia, the company run regular services from New Zealand and Australia to the Fijian, Samoan, and other of the South Sea Island groups, and make periodical connection with Calcutta.
The company's interests are so closely interwoven with those of the colony that it is almost regarded as a national institution. It gives employment to a large number of people, and its operations necessitate the circulation of a large sum of money. It employs, afloat and ashore, over 2,600 persons, and expends in wages and other disbursements in the colonies over £800,000 per annum.
At the last annual meeting of shareholders, held on 22nd November, 1892, the Chairman of Directors, referring to the expenditure of the company, stated that £89,000 had been disbursed during the year in provisions, as supplies for passengers and crews. Of this sum £25,646 had been spent on meat alone, the quantity consumed being 2,486,255lb., or an average exceeding 2 1/2lb. per man per day for passengers, officers, and crews. Poultry and game absorbed £5,000; fish, £3,000; vegetables, £5,500; fruit, £5,500. The consumption of eggs was 33,000 dozen, costing £2,000; while 181,160 loaves were consumed, at a cost of £3,700, in addition to the bread baked on board the steamers. In harbour and light dues £32,000 was expended. As showing the extent of its traffic, it may be mentioned that last year the company's steamers carried 148,000 passengers; 485,000 tons of general cargo, and 417,500 tons of coal; and that they steamed 1,816,300 miles, in the course of which they consumed 180,000 tons of coal, of which about one-half was New Zealand.
The directors take a special interest in the welfare of the company's employés. Their crews enjoy peculiar comforts and privileges. A benefit society has been established in the interests of their men afloat, to which the company contributes an annual subsidy; the latter also contributes a considerable proportion of the annual premiums of their officers' life insurances.
Although the progress of the company is largely the result of the prosperity of the colony—and the state of trade of the latter has a barometric effect on the company's operations—it could not have attained and held its present position without wise heads and good judgment to direct its affairs. It has always been fortunate in numbering amongst its directors men who hold leading positions in the commercial community, and whose energy and judgment are mutually recognised. More especially, however, is the pre-eminence of the company due to the conduct of its affairs by the two leading members of the Board—the Hon. George McLean, M.L.C., its Chairman, and Mr. James Mills, M.H.R., the Managing Director of the company since its formation. The name of Mr. John Darling, as designer of the boats and Resident Marine Superintendent in England, as well as one of the London directors, is also closely associated with its history.
The Head Office of the company is in Dunedin, and it possesses thirty branches and agencies throughout the colonies, and an office and local Board in London. Its Inspector is Mr. E. P. Houghton, and Secretary, Mr. T. W. Whitson.
The following are the names of the company's vessels, with their gross registered tonnage: Monowai, 3,433, Mararoa, 2,465; Tekapo, 2,439; Rotokino, 2,004; Tarawera, 2,003; Waihora, 2,003; Talune, 2,000; Hauroto, 1,988; Wakatipu, 1,944; Wairarapa, 1,786; Manapouri, 1,783; Rotomahana, 1,727; Oonah, 1,700; Taieri, 1,668; Te Anau, 1,652; Taviuni, 1,490; Pukaki, 1,443; Corinna, 1,280; Flora, 1,273; Pateena, 1,212; Ovalau, 1,200; Poherua, 1,175; Arawata, 1,098; Ringarooma, 1,096; Upolu, 1,000; Flinders, 948; Penguin, 935; Takapuna, 930; Rotorua, 926; Janet Nicoll, 779; Ohau, 740; Taupo, 737; Rosamond, 721; Wainui, 640; Dingadee, 640; Omapere, 601; Moreton, 581; Mawhera, 554; Grafton, 548; Brunner, 540; Wareatea, 460; Australia, 459; Orowaiti, 453; Kawatiri, 453; Mahinapua, 423; Southern Cross, 263; Oreti, 219; Kanieri, 203; Manawatu, 183; Beautiful Star, 177; Maori, 174; Waihi, 92. Total tonnage, 57,241. The indicated horse-power ranges from 100 to 2,800.
The New Zealand Shipping Company is a colonial enterprise. It was founded at Christchurch, New Zealand, in 1872, with a capital of £100,000. In the following year the capital was increased to £250,000; and it how stands at £800,000 authorised capital, of which £475,048 has been subscribed.
Prior to 1872 the trade to and from the colony was in the hands of two firms; but in that year a combination of merchants and agriculturists in New Zealand formed the company, considering that the time had arrived when their interests demanded the establishment of an independent line. At first the newly-fledged institution had to depend mainly on chartered ships, but gradually they secured a fleet of their own, in which large numbers of passengers were conveyed, and neither pains nor expense were spared to have it thoroughly equipped for safety and comfort. Many of these vessels have been noted for speed; and one of them—the Otaki—made the fastest passage homewards on record, having completed the trip, in 1877, in 69 days from Port Chalmers to the London Docks, or 63 days from land to land.
Between the years 1877 and 1882, inclusive, when the New Zealand Shipping Company was under contract with the New Zealand Government to carry immigrants from the Old Country, their vessels brought out close on 20,000 immigrants and passengers.
During the years 1873–82, the company confined its operations to loading and despatching, from London, of a monthly line of sailing-vessels to each of the principal ports in New Zealand, but in January, 1883, a new departure was made by despatching from London the s.s. British King, 3,559 tons register, being the pioneer of a direct monthly line of steamers. A feeling had been growing in the colony for some time that, for want of a regular direct steam service, a number of desirable immigrants were diverted to Australia whilst merchants and others, who required supplies quickly from England, were often put to great inconvenience through the delay inseparable from transhipment at Melbourne and Sydney. On the other hand, the success of the frozen-meat trade gave the New Zealand colonists the opportunity for the disposal of their beef and mutton, which they so much needed, and increased the desire for rapid steam-service. Accordingly, in 1882, the Colonial Legislature agreed to call for tenders for a monthly service of steamers from England, the voyages each way to be made in 50 days. Pending the decision as to this service, the New Zealand Shipping Company inaugurated a direct steam service by the despatch of the British King, as above-mentioned, which steamer made the passage out to the colony in 49 days, having been detained two days at Capetown for coal.
Foreseeing, however, that a fifty-days' service would not meet the desires of the New Zealand public, the company determined on constructing steamers which would make the passages with regularity under 45 days out and 42 days Home. By such a service they anticipated that the colony might enjoy direct mail communication with the Mother-country; and, at the same time, the shippers of frozen meat would get the quicker passages so desirable for that commodity. They, therefore, contracted with the firm of Messrs. John Elder and Co., Glasgow, for the building of five steamers, all fitted with refrigerating machinery, and chambers capable of carrying 12,000 to 15,000 carcases of mutton, and with accommodation for about 80 first-class, 80 second-class, and 250 third-class passengers. The meat chambers have since been enlarged, and will now carry more than double the above quantities. Several small chambers have also been constructed, which in the season are filled with dairy-produce and fruit, these cool-chambers being kept at a higher degree of temperature than the meat chambers.
To show the great regularity with which these steamers make their passages, the company recently compiled a series of results showing that the five steamers have completed 73 voyages round the world, the longest average passage being—homeward, 40 days 1 hour; and the shortest, 39 days 2 hours; and outward, longest, 43 days 4 hours; shortest, 41 days 20 hours; and all these 73 voyages were performed without any serious casualty or loss of life.
The latest addition to this fine fleet of mail-steamers is the Ruahine, a vessel of 6,127 tons register, specially built to carry a large quantity of frozen meat, dairy-produce, and general cargo, and at the same time fitted for conveying a large number of passengers of all classes. All the arrangements on board are of the most modern type, and calculated to insure the comfort and safety of those who travel by her. Her cabins are unusually large.
The great expansion of trade demanded more accommodation for cargo than was afforded by the mail liners, and the company promptly responded to the colonists' requirements by acquiring three cargo-steamers—the Tekoa, 4,050 tons register, the Otarama, 3,808 tons register, the Waikato, 4,766 tons register, and by chartering other cargo steamers, in addition to the mail-boats, thereby initiating a monthly line of cargo boats.
During the past three years the company has been despatching vessels to the United States, carrying flax and gum, and has now become the principal carrier between that country and New Zealand.
The company's fleet now consists of—
Mail-steamers: Tongariro, 4,163 tons register, carries 27,000 carcases frozen mutton; Aorangi, 4,163 tons, 27,000 carcases; Ruapehu, 4,163 tons, 27,000 carcases; Kaikoura, 4,474 tons, 34,500 carcases; Rimutaka, 4,473 tons, 37,000 carcases; Ruahine, 6,127 tons, 71,000 carcases.
Cargo-steamers: Tekoa, 4,050 tons register, carries 60,000 carcases frozen mutton; Otarama, 3,808 tons, 53,000 carcases; Waikato, 4,766 tons, 46,000.
Sailing-vessels: Mataura, 898 tons register, carries 11,000 carcases frozen mutton; Opawa, 1,131 tons, 11,000 carcases; Turakina, 1,247 tons, 13,000 carcases; Rangitikei, 1,227 tons; Waimea, 871 tons; Waimate, 1,156 tons; Wairoa, 1,057 tons; Hurunui, 1,053 tons; Waitangi, 1,161 tons; Waipa, 1057 tons.
In addition to these the company charters a large number of sailing-vessels for homeward loading.
The number of vessels despatched from the colony during the twelve months ending the 30th June, 1892, was as follows: Mail-boats, 14 steamers; cargo-boats, 8 steamers; sailing-vessels, 56 ships, 9 of which were to the United States.
The company has its head office for Australasia at Christchurch, New Zealand; and the General Manager for the colonies is Mr. Isaac Gibbs. There are branch offices and agents in New Zealand at Lyttelton, Auckland, Wellington, Palmerston North, Dunedin, Napier, Timaru, Ashburton, Rakaia, Oamaru, Invercargill, Gisborne, New Plymouth, Wanganui, Nelson, Blenheim, Greymouth, and Hokitika; also agents at Plymouth, Capetown, Hobart, Melbourne, Sydney, Adelaide, Newcastle, Rio de Janeiro, Madeira, and Teneriffe.
Table of Contents
Early in the sixties, the firm of Shaw-Savill and Co. (then trading under the name of Willis, Gann, and Co.), and some time later, the Albion Company, of Glasgow, established a line from that city to this colony. These two firms subsequently amalgamated under the title of Shaw-Savill and Albion Company, Limited, and now possess a large fleet of magnificent, full-powered steamships trading from New Zealand to London, viâ Rio de Janeiro, Teneriffe, and Plymouth, and outwards viâ Madeira, Cape of Good Hope, and Hobart, on alternate Thursdays, fortnightly with the New Zealand Shipping Company, doing the trip each way in about 42 days.
The mail-steamers, Ionic, 4,753 tons, Tainui, 5,031 tons, Doric, 4,744 tons, Arawa, 5,026 tons, and Coptic, 4,448 tons register, can each carry about 60 saloon and 60 second-class passengers.
Like the sister company (the New Zealand Shipping Company), the Shaw-Savill and Albion Company have greatly aided the growth of the frozen-meat trade by providing first-class steamships fitted with refrigerating-chambers, and thus meeting the requirements of the colony in this respect.
The following table shows the estimated cargo capacities of this company's steamships for the carriage of frozen meat, wool, dairy-produce, &c.:—
| Steamer. | Frozen-meat Capacity. | Wool capacity (Dumped). | Cool-chamber Capacity. |
|---|---|---|---|
| Sheep. | Bales. | Tons Measurement. | |
| Doric | 31,800 | 4,000 | 110 |
| Arawa | 30,500 | 1,800 | 160 |
| Coptic | 30,500 | 3,500 | 100 |
| Ionic | 32,500 | 4,000 | 125 |
| Tainui | 31,150 | 1,800 | 135 |
| Mamari | 41,000 | 3,500 | 360 |
| Matatua | 38,000 | 2,400 | 218 |
| Maori | 32,000 | 2,400 | 147 |
| Rangatira | 45,000 | 5,000 | 230 |
| Pakeha | 45,000 | 5,000 | 200 |
In addition to the mail- and cargo-steamers, the Shaw-Savill and Albion Company has a fleet of thirty-three first-class steel sailing-ships. These vessels are despatched at regular intervals, carrying goods from and to all ports in New Zealand. Occasionally the sailing-ships take a few passengers who may prefer the longer voyage of about three months. Of these sailing-ships, six are fitted up as “freezers” for the carriage of meat, with a capacity of about 10,000 sheep each.
“Wellington to Cape Horn, 4,400 miles; to Rio de Janeiro, 6,750; to Teneriffe, 10,240; to Madeira, 10,445; to Plymouth, 11,655; to Gravesend, 11,946 miles. Gravesend to Plymouth, 291 miles; to Madeira, 1,501; to Teneriffe, 1,706; to Capetown, 6,291; to Hobart, 11,951; to Otago, 13,013; to Lyttelton, 13,203; to Wellington, 13,345 miles.
Table of Contents
| Miles. | |
|---|---|
| Auckland to Onehunga | 8 |
| Auckland to Kaukapakapa | 44 |
| Auckland to Frankton Junction | 85 |
| Auckland to Te Awamutu | 100 |
| Auckland to Te Kuiti | 126 |
| Auckland to Cambridge | 101 |
| Auckland to Lichfield | 145 |
| Auckland to Mercer | 43 |
| Auckland to Te Aroha | 115 |
| Auckland to Helensville | 38 |
| Opua to Kawakawa | 8 |
| Whangarei Wharf to Kamo | 6 |
| Napier to Hastings | 12 |
| Napier to Ormondville | 66 |
| Wellington to Palmerston North | 89 |
| Wellington to Masterton | 71 |
| Wellington to Eketahuna | 93 |
| Wellington to Featherston | 50 |
| Wellington to Foxton | 104 |
| Wellington to Patea | 186 |
| Wellington to Hawera | 204 |
| Wellington to Feilding | 100 |
| Wellington to Wanganui | 151 |
| Wellington to New Plymouth | 251 |
| Wellington to Lower Hutt | 8 |
| Wellington to Longburn Junction | 84 |
| Wellington to Napier | 200 |
| Wellington to Spit | 202 |
| Wanganui to Rangatira | 19 |
| Picton to Blenheim | 18 |
| Nelson to Belgrove | 22 |
| Greymouth to Brunnerton | 8 |
| Greymouth to Reeftor | 52 |
| Westport to Waimangaroa | 10 |
| Westport to Ngakawau | 20 |
| Christchurch to Rangiora | 20 |
| Christchurch to Kaiapoi | 14 |
| Christchurch to Culverden | 69 |
| Christchurch to Oxford (West) | 41 |
| Christchurch to South bridge | 31 |
| Christchurch to Little River | 36 |
| Christchurch to Springfield | 44 |
| Christchurch to Whitecliffs | 42 |
| Christchurch to Methven | 58 |
| Christchurch to Lyttelton | 7 |
| Christchurch to Ashburton | 53 |
| Christchurch to Temuka | 89 |
| Christchurch to Timaru | 100 |
| Christchurch to Oamaru | 152 |
| Christchurch to Dunedin | 230 |
| Ashburton to Springburn | 30 |
| Timaru to Fairlie | 39 |
| Timaru to Waihao Downs | 41 |
| Oamaru to Hakateramea | 43 |
| Oamaru to Tokaraki | 25 |
| Oamaru to Ngapara | 17 |
| Dunedin to Palmerston South | 41 |
| Dunedin to Lawrence | 60 |
| Dunedin to Port Chalmers | 8 |
| Dunedin to Milton | 36 |
| Dunedin to Clinton | 74 |
| Dunedin to Kingston | 174 |
| Dunedin to Invercargill | 139 |
| Dunedin to Dunback | 50 |
| Dunedin to Mosgiel | 10 |
| Dunedin to Outram | 19 |
| Dunedin to Stirling | 50 |
| Dunedin to Kaitangata | 55 |
| Dunedin to Middlemarch | 49 |
| Dunedin to Balclutha | 53 |
| Invercargill to Kingston | 87 |
| Invercargill to Bluff Harbour | 17 |
| Invercargill to Riverton | 26 |
| Invercargill to Orepuki | 43 |
| Invercargill to Clinton | 66 |
| Invercargill to Heriot | 76 |
| Invercargill to Glenham | 33 |
| Invercargill to Mokotua | 13 |
| Riverton to Nightcaps | 31 |
| Lumsden to Gore | 37 |
| Lumsden to Kingston | 38 |
| Lumsden to Invercargill | 50 |
| Miles. | |
|---|---|
|
*Direct. †Viâ French Pass. | |
| Auckland to Russell | 128 |
| Auckland to Tauranga | 133 |
| Auckland to Gisborne | 301 |
| Auckland to Napier | 387 |
| Auckland to Wellington | 564 |
| Wellington to Lyttelton | 175 |
| Port Chalmers to Bluff Harbour | 132 |
| Tauranga to Gisborne | 206 |
| Gisborne to Napier | 86 |
| Napier to Wellington | 203 |
| Lyttelton to Akaroa | 44 |
| Akaroa to Port Chalmers | 159 |
| Lyttelton to Port Chalmers | 190 |
| Manukau Harbour to New Plymouth | 135 |
| New Plymouth to Wanganui | 100 |
| New Plymouth to Nelson | 148 |
| New Plymouth to Wellington* | 172 |
| Wellington to Port Chalmers* | 332 |
| Nelson to Picton† | 85 |
| Picton to Wellington | 53 |
| Nelson to Wellington* | 101 |
| Nelson to Westport | 160 |
| Westport to Greymouth | 63 |
| Greymouth to Hokitika | 20 |
| Nelson to Greymouth* | 208 |
| Miles. | |
|---|---|
| Auckland to Sydney | 1,281 |
| Auckland to Levuka (Fiji) | 1,172 |
| Russell to Sydney | 1,172 |
| Wellington to Sydney | 1,239 |
| Wellington to Melbourne | 1,479 |
| Bluff to Melbourne | 1,200 |
| Bluff to Hobart | 930 |
| Hokitika to Newcastle | 1,085 |
| Greymouth to Melbourne | 1,266 |
The provision made in New Zealand for public instruction is on a liberal scale. The whole cost of primary schools is borne by the State; the instruction imparted in them is wholly secular; and the committee of any school may bring into operation, within its district, certain sections of “The Education Act, 1877,” for the purpose of compelling parents to send their children to school. The primary schools—“public schools” as they are designated in the Act—number 1,302. The average attendance of pupils during the first quarter of 1893 was 101,774. The salaries of teachers at the rates in force at the end of 1892 amounted to £315,447. The number of teachers receiving not less than £400 each was 5; 61 others were in receipt of not less than £300 each; 221 had less than £300, but not less than £200; 1,111 had less than £200, but not less than £100; and 1,942 (including 1,047 pupil-teachers and 160 teachers of sewing) had less than £100 each.
The country is divided into thirteen education districts, over each of which an Education Board presides, and into smaller districts, in each of which a School Committee, elected by the householders, has authority, subject to the general control of the Board. The Board is elected by the School Committees. The Board of an Education District receives and disburses the money-voted by the General Assembly for purposes of primary instruction, and, subject to the condition of consultation with the Committee of the school district, appoints the teachers. The Boards also appoint the inspectors; but the inspectors work under regulations made by the Governor in Council, who also makes the regulations under which the Minister grants certificates to teachers after examination and adequate experience.
The regular income of the Boards consists of a capitation allowance of £3 15s. a year for every unit of average attendance, together with a capitation grant of not more than 1s. 6d. for the maintenance of scholarships tenable in secondary schools, and a grant in aid of inspection. A sum of money (varying considerably from year to year) is always voted to be distributed among the Boards, and expended by them on the erection of school-buildings. The following statement shows the aggregate income and expenditure of the thirteen Boards for the year 1892:—
| Dr. | £ | s. | d. |
|---|---|---|---|
| To Balances, 1st January, 1891 | 65,610 | 4 | 3 |
| Government grants— | |||
| Maintenance | 340,923 | 19 | 1 |
| Buildings | 31,602 | 9 | 4 |
| Reserves revenues | 37,373 | 11 | 9 |
| Local receipts— | |||
| Fees, donations, &c. | 2,391 | 19 | 6 |
| Rents, sales, &c. | 294 | 14 | 2 |
| Interest | 698 | 4 | 4 |
| Refunds, deposits, &c. | 219 | 8 | 2 |
| Total | £479,114 | 10 | 7 |
| Cr. | £ | s. | d. |
|---|---|---|---|
| By Board's administration | 11,017 | 3 | 9 |
| Inspection and examination | 11,685 | 7 | 8 |
| Teachers' salaries and allowances, and training | 316,679 | 1 | 0 |
| Incidental expenses of schools | 32,109 | 3 | 6 |
| Scholarships | 6,465 | 19 | 6 |
| Interest | 286 | 10 | 2 |
| Buildings, sites, plans, &c. | 49,088 | 18 | 4 |
| Refunds and sundries | 683 | 9 | 2 |
| Balances | 51,098 | 17 | 6 |
| Total | £479,114 | 10 | 7 |
The sum of the numbers on the rolls of the several schools at the several dates of examination in 1892 was 120,063. Of this number there were 39,269 in preparatory classes, and 1,359 pupils who had passed the sixth (the highest) standard at the examination in a previous year, leaving 79,435 in the standard classes. Of this last number, 2,801 were absent on examination-day, and 3,178 were exempt from examination on account of short attendance. Of the rest, 63,113 passed (Standard I., 14,652; II., 13,852; III., 12,981; IV., 10,104; V., 7,174; VI., 4,350), and 10,343 failed.*
*Note.—School children not over fifteen years of age, living in a neighbourhood where there is a railway-station but no public school, can obtain free second-class tickets to and from a station in the neighbourhood of the nearest primary school; and all children under fifteen can obtain free tickets to enable them to attend a private school. Also, second-class tickets are issued at 10s. a quarter to children under sixteen, to enable them to go to any school their parents choose.
The secondary schools of the colony are not supported directly by the State, nor are they open to all pupils without charge. Some of these schools have endowments of land, originating in agreements between colonising companies and the early settlers, or in State grants; and some receive aid from School Commissioners, who administer public reserves for education. At the end of 1892 there were twenty-four schools, with an average attendance of 2,129 pupils. The aggregate income of these incorporate schools from school-fees (not including boarding-fees) was £20,766, and from endowments, £26,590.
The University of New Zealand is a corporate body which does not itself maintain a staff of professors or lecturers, but has its functions restricted to the encouragement of learning by the conferring of degrees and certificates of proficiency, and by a liberal system of scholarships. The University has a statutory grant of £3,000 a year from the Treasury, and an income of about £2,000 from the fees paid for examinations and degrees. The Senate of the University was originally nominated by the Governor, but since the graduates have become numerous they meet in Convocation, and, as vacancies occur in the Senate, the Senate and Convocation alternately have the right of election to fill the vacancies. There are three institutions in which most of the undergraduates keep terms and receive instruction: the University of Otago, founded and endowed by the Provincial Government of Otago; Canterbury College, similarly instituted by the Provincial Government of Canterbury; and Auckland University College, established by Act of Parliament since the abolition of provinces, and endowed with a statutory grant of £4,000 a year. The number of students at each of these institutions in 1892 was as follows: Otago University, 213; Canterbury College, 345; Auckland University College, 137. As the result of the examinations at the end of 1892, degrees were conferred as follows: B.A., 35; B.Sc., 4; LL.B., 4; M.B., 4; M.A., 28; D.Sc., 1; LL.D., 1. At the same examinations, 28 gained honours in Arts; 3 gained honours in Science; 98 passed sections of examinations for degrees; 32 passed various examinations for admission to the legal profession; and 378 qualified for matriculation (38 by passing with credit at the junior scholarship examination). The number of graduates by examination is now 373; B.A., 187; B.A. and B.Sc., 4; B.A. and LL.B., 9; B.A. and M.B., 3; B.Sc., 4; M.B., 14; M.A., 126; M.A. and B.Sc., 8; M.A. and LL.B., 9; M.A. and M.B., 1; M.A. and D.Sc., 1; M.A. and LL.D., 1; LL.D., 1; LL.D. and B.A., 1: M.D., 4.
The Department of Education, over which the Minister of Education presides, is charged with the general administration of the public-school system. It has also the direct management of Native schools (with about 2,000 pupils), of industrial schools (with which a boarding-out system is connected), and of an institution for deaf-mutes (conducted on the pure oral system); and it takes an active interest in the instruction of the blind.
The first scientific society in New Zealand was founded in Wellington in 1851, the first President being Sir George Grey, K.C.B., D.C.L. It was named “The New Zealand Society.”
In 1862 a second society was established in Christchurch as the Philosophical Institute of Canterbury, the first President being Mr. Julius von Haast (since Sir Julius von Haast, K.C.M.G., Ph.D.). Much useful work was done by these societies, but they met at very irregular intervals, and the funds collected were inadequate for the proper publication of the papers that were communicated by the members. They therefore languished, owing to their being merely local societies, not having the sympathy of the colony.
The Exhibition held in Dunedin in 1865 brought prominently before the public the advantage of a more general organization for the development of the resources of the colony, and, in 1867, soon after the establishment of a scientific department by the General Government, the New Zealand Institute Act was passed, and its administration was placed under the present Director of the Geological and Natural History Survey (Sir James Hector, K.C.M.G., F.R.S.).
The New Zealand Institute has now been in operation for twenty-five years, which is a sufficient period in the history of a new country to indicate how far the practical results obtained by the working of one of its institutions have fulfilled the anticipations of the original promoters.
The object sought was to foster public interest in the collection and discussion of original observations respecting the resources and natural history of the country. The constitution of the New Zealand Institute was intended to provide for the combination of local efforts by enabling the joint publication of the papers read and discussed before local societies.
The Institute commenced in 1869 with four branch societies and only 258 members, but there are now eight societies affiliated; the number of members had increased to 1,327 in 1881, but has since fallen off to about 800, each of whom pays one guinea a year, which may be considered as a voluntary tax for an educational purpose.
The members now on the roll of the Institute are: Honorary members, 30: Ordinary members—Auckland Institute, 196; Hawke's Bay Philosophical Institute, 108; Wellington Philosophical Society, 150; Philosophical Institute of Canterbury, 65; Nelson Philosophical Society, 35; Westland Institute, 70; Otago Institute, 113; Southland Institute, 72: making a total of 839.
There have now been 1,689 original communications published, in twenty-four volumes, of the Transactions of the Institute, nearly all of which relate directly to the colony, and place on record matters of fact and observation that otherwise might not have been published. Of these papers, 624 are on miscellaneous subjects, chiefly relating to the Ethnology of the aboriginal races, or connected with the Industrial Resources of the colony; 971 are descriptive of the Zoology of New Zealand; 247 refer to its Botany; 113 are on Metallurgy and Chemistry in their relation to the colony; and 244 deal with Geology and Physical Geography. In addition to these papers, which are published at length, abstracts of about 1,010 different communications are given in the Proceedings of the societies. The total number of the communications to the Institute has thus been 3,209. Besides these, a number of popular lectures are given each year under the auspices of the various societies, of which no record is kept. The average size of the annual volume of Transactions and Proceedings is 640 pages, and about 40 plates.
Forty-seven of the most distinguished men in science and literature, who have rendered special service to New Zealand, have been elected honorary members, while there are seventy-five corresponding societies and institutions that exchange their publications with the Institute.
The following table shows the number of public libraries, mechanics' institutes, and other literary and scientific institutions in the colony in April, 1891, in respect of which returns were furnished to the Registrar-General, specifying the number of institutions in each provincial district, the number of members, and the number of volumes:—
| Provincial Districts. | Number of | ||
|---|---|---|---|
| Institutions. | Members. | Volumes. | |
| Auckland | 71 | 2,791 | 73,086 |
| Taranaki | 5 | 348 | 5,378 |
| Hawke's Bay | 21 | 1,314 | 18,710 |
| Wellington | 22 | 1,515 | 31,682 |
| Marlborough | 5 | 234 | 5,868 |
| Nelson | 29 | 1,009 | 28,578 |
| Westland | 6 | 238 | 5,283 |
| Canterbury | 66 | 3,263 | 79,774 |
| Otago | 73 | 3,777 | 82,411 |
| Totals | 298 | 14,489 | 330,770 |
Table of Contents
This department of the Government has been in existence for fully twenty-three years. It possesses the prominent, and, in the history of life insurance institutions, the unique, advantage of being based on the solid principle of State security, payment of all policies being guaranteed by the Government of the colony.
Combined with this inviolable safeguard for its policy-holders, there is the further advantage that its premium rates for life insurance are the lowest in Australasia. There are also other attractive features in the liberal conditions embraced in the assurance policy, and its freedom from numerous other restrictions which in the Old World still continue, more or less, to hamper and narrow the policy contracts of many old-established offices.
The leading characteristic and the chief object of the establishment of this department was to provide the unquestionable security of the State for every policy-holder insured in the office. Prior to the time of its inception, there had been numerous disastrous failures of life offices in Great Britain, as well as in the United States—failures productive of grave and serious losses to thousands of unfortunate families, many of whom were reduced to absolute penury. It was to prevent the possibility of such disasters occurring in New Zealand that the Legislature of the colony, in 1869, passed an enactment, under which this department was established and placed on a commercial footing, and has since enjoyed a marked and successful progress.
Not the least attractive circumstance relating to the Insurance Department is the fact that the favourable climatic conditions of the colony, and its equable temperature, exercise a beneficial influence on the tables of mortality. These tables display a lower death-rate in New Zealand than is shown by any other British colony, or, indeed, by any other country or State in the world. The following figures show the annual death-rate per 1,000 of the population of the Australasian Colonies. These figures are computed for the year 1892:—
| Colony. | Death-rate per 1,000. | |
|---|---|---|
| Victoria | 13.63 | |
| New South Wales | 13.22 | |
| Queensland | 12.66 | |
| South Australia | 11.38 | |
| Western Australia | 16.63 | |
| Tasmania | 13.53 | |
| New Zealand | 10.06 |
The subjoined table shows the growth of the department's business since its establishment up to the close of the last calendar year:—
| Year. | New Business. | Business in Force at End of each Period. | Income (from) | Paid to Policyholders. | Added to Funds. | Accumulated Funds. | |||
|---|---|---|---|---|---|---|---|---|---|
| No. of Policies. | Sum Assured. | No. of Policies. | Sum Assured. | Interest. | Premiums. | ||||
| £ | £ | £ | £ | £ | £ | £ | |||
| 1869–70 | 59 | 30,250 | 59 | 30,250 | .. | 357 | .. | .. | (-)386 |
| 1870–71 | 404 | 176,111 | 454 | 200,611 | .. | 7,151 | .. | (5,499) | 5,113 |
| 1871–72 | 1,357 | 461,310 | 1,689 | 625,421 | 543 | 17,545 | 1,526 | 10,041 | 15,154 |
| 1872–73 | 1,157 | 428,615 | 2,634 | 995,986 | 1,343 | 30,132 | 3,213 | 21,761 | 36,915 |
| 1873–74 | 1,499 | 510,010 | 3,953 | 1,453,496 | 2,332 | 43,379 | 7,033 | 30,321 | 67,236 |
| 1874–75 | 1,374 | 483,223 | 4,989 | 1,836,859 | 4,207 | 64,275 | 14,221 | 42,732 | 109,968 |
| 1875–76 | 1,249 | 481,170 | 6,153 | 2,282,129 | 6,669 | 72,253 | 23,755 | 43,749 | 153,717 |
| 1876–77 | 1,411 | 564,228 | 7,149 | 2,716,907 | 9,133 | 82,852 | 14,438 | 65,677 | 219,394 |
| 1877–78 | 1,994 | 681,109 | 8,711 | 3,251,220 | 12,601 | 98,582 | 21,645 | 73,129 | 292,523 |
| 1878–79 | 2,073 | 687,574 | 10,223 | 3,726,330 | 16,737 | 115,858 | 35,699 | 79,367 | 371,890 |
| 1879–80 | 2,266 | 722,554 | 11,656 | 4,171,504 | 21,098 | 125,076 | 39,088 | 87,446 | 459,336 |
| 1880–81 | 1,790 | 550,351 | 12,411 | 4,352,496 | 26,506 | 130,048 | 39,394 | 97,895 | 557,231 |
| 1881–82 | 2,523 | 702,909 | 13,810 | 4,695,388 | 31,810 | 139,996 | 53,593 | 96,659 | 359,890 |
| Half-year 1882 | 2,547 | 631,279 | 15,892 | 5,176,217 | 17,711 | 77,076 | 27,448 | 50,999 | 704,889 |
| 1883 | 5,113 | 1,039,916 | 19,917 | 5,898,951 | 41,173 | 174,372 | 42,923 | 141,271 | 846,160 |
| 1884 | 3,309 | 800,016 | 21,003 | 6,135,636 | 48,478 | 179,959 | 72,783 | 126,616 | 972,776 |
| 1885 | 4,379 | 859,770 | 23,218 | 6,466,276 | 52,156 | 188,586 | 72,626 | 129,259 | 1,102,035 |
| 1886 | 3,560 | 717,464 | 24,714 | 6,670,741 | 58,205 | 197,324 | 81,660 | 129,899 | 1,231,934 |
| 1887 | 3,124 | 766,952 | 25,439 | 6,831,933 | 66,380 | 201,904 | 125,019 | 96,559 | 1,328,493 |
| 1888 | 2,957 | 785,093 | 26,168 | 7,076,252 | 73,421 | 208,740 | 110,411 | 123,986 | 1,452,479 |
| 1889 | 3,187 | 781,255 | 27,218 | 7,326,129 | 81,386 | 217,308 | 112,102 | 129,969 | 1,582,448 |
| 1890 | 2,761 | 684,242 | 28,102 | 7,544,030 | 89,796 | 223,610 | 103,744 | 132,745 | 1,715,193 |
| 1891 | 2,934 | 699,901 | 29,226 | 7,782,734 | 96,379 | 234,496 | 144,574 | 132,604 | 1,847,797 |
| 1892 | 2,634 | 642,104 | 30,316 | 8,036,220 | 100,638 | 241,965 | 157,408 | 132,500 | 1,980,297 |
| 858,190 | 3,072,844 | 1,304,303 | 1,980,683 | ||||||
The progress shown by the preceding table indicates the popularity of the department, and the general appreciation of the advantages it offers to the people of the colony.
The rates of premiums charged by the Government Insurance Department for whole-life and endowment assurances at the various ages are specified below, the rates being based on age for nearest birthday, which is in itself an advantage to the policy-holder:—
| Age nearest Birthday. | Payable at Death. | Payable at Death or in 25 or 30 years. | |||||||
|---|---|---|---|---|---|---|---|---|---|
| Table I. | Table III. 25. | Table III. 30. | |||||||
| £ | s. | d. | £ | s. | d. | £ | s. | d. | |
| 20 | 1 | 15 | 2 | 3 | 7 | 10 | 2 | 16 | 0 |
| 21 | 1 | 15 | 11 | 3 | 8 | 0 | 2 | 16 | 4 |
| 22 | 1 | 16 | 8 | 3 | 8 | 3 | 2 | 16 | 7 |
| 23 | 1 | 17 | 5 | 3 | 8 | 5 | 2 | 16 | 10 |
| 24 | 1 | 18 | 3 | 3 | 8 | 8 | 2 | 17 | 1 |
| 25 | 1 | 19 | 1 | 3 | 9 | 0 | 2 | 17 | 6 |
| 26 | 2 | 0 | 1 | 3 | 9 | 4 | 2 | 17 | 11 |
| 27 | 2 | 1 | 1 | 3 | 9 | 9 | 2 | 18 | 4 |
| 28 | 2 | 2 | 1 | 3 | 10 | 1 | 2 | 18 | 10 |
| 29 | 2 | 3 | 2 | 3 | 10 | 6 | 2 | 19 | 4 |
| 30 | 2 | 4 | 3 | 3 | 11 | 0 | 2 | 19 | 10 |
| 31 | 2 | 5 | 5 | 3 | 11 | 5 | 3 | 0 | 5 |
| 32 | 2 | 6 | 8 | 3 | 11 | 11 | 3 | 1 | 0 |
| 33 | 2 | 7 | 11 | 3 | 12 | 5 | 3 | 1 | 8 |
| 34 | 2 | 9 | 3 | 3 | 13 | 0 | 3 | 2 | 4 |
| 35 | 2 | 10 | 8 | 3 | 13 | 8 | 3 | 3 | 2 |
| 36 | 2 | 12 | 2 | 3 | 14 | 4 | 3 | 4 | 0 |
| 37 | 2 | 13 | 9 | 3 | 15 | 0 | 3 | 4 | 10 |
| 38 | 2 | 15 | 4 | 3 | 15 | 10 | 3 | 5 | 10 |
| 39 | 2 | 17 | 1 | 3 | 16 | 8 | 3 | 6 | 11 |
| 40 | 2 | 18 | 11 | 3 | 17 | 7 | 3 | 8 | 0 |
| 41 | 3 | 0 | 10 | 3 | 18 | 7 | 3 | 9 | 4 |
| 42 | 3 | 2 | 10 | 3 | 19 | 9 | 3 | 10 | 9 |
| 43 | 3 | 5 | 1 | 4 | 1 | 1 | 3 | 12 | 3 |
| 44 | 3 | 7 | 5 | 4 | 2 | 6 | 3 | 14 | 0 |
| 45 | 3 | 9 | 10 | 4 | 4 | 1 | 3 | 15 | 10 |
| 46 | 3 | 12 | 6 | 4 | 5 | 9 | .. | ||
| 47 | 3 | 15 | 3 | 4 | 7 | 6 | .. | ||
| 48 | 3 | 18 | 1 | 4 | 9 | 6 | .. | ||
| 49 | 4 | 1 | 2 | 4 | 11 | 7 | .. | ||
| 50 | 4 | 4 | 4 | 4 | 13 | 11 | .. | ||
During the last calendar year 2,634 new policies were issued (including 19 annuity contracts), assuring £642,104, and yielding £19,444 of new annual premiums, besides £2,295 received as single premiums, which embrace the payments during the whole term of the contract. The purchase-money for the annuities sold amounted to £8,840, and the total premiums received amounted to £241,965, being an increase on the premium income for the preceding year of £7,469. The total income for the year was £342,617, of which £100,639 consisted of interest on investments, showing in this item an increase on the year of £4,260. Payments for death-claims amounted to £84,366; for endowments and endowment assurances matured, to £23,449, and £20,137 was the sum paid in cash for bonuses surrendered. Surrenders amounted to £23,152, being £5,089 less than in the year preceding. The expenses of management, including commissions and taxes, show a decrease both in total amount and also in relation to the premium income. The reduction for the year is 1 per cent, less than in the previous year, while for the last three years there is a reduction shown of 4 per cent., which is equal to a saving on the present premium income of over £9,000 a year. The accumulated fund has increased during the year by £132,500, and, as the table on page 345 sets forth, amounted at the end of the year to £1,980,297. At the present time (August, 1893) the fund considerably exceeds two millions sterling.
Table of Contents
The Public Trust Office has been established for the purpose of affording at low rates of commission a secure and convenient recourse for persons resident as well abroad as in New Zealand, who may desire to form trusts in the colony, and may be in doubt or difficulty as to the choice of trustees or executors; and for persons also who may be unable or unwilling for various reasons to undertake or continue the administration of the trusts imposed upon them or accepted by them.
The Public Trust Office was constituted by “The Public Trust Office Act, 1872,” and its functions have since been much enlarged by amending Acts, necessary to enable the office to meet the growing requirements of the public and of the business. The Amendment Act of 1891 presents many new and important features. It facilitates the administration of properties placed in the office; authorises a more prompt distribution of the residue of intestate estates; provides absolute security from loss to properties of the funds arising from them which may be invested at the discretion of the Public Trustee in mortgages of real estate within the colony, or in General Government securities of the colony; insures the regular and punctual payment of interest on such funds; and, by rendering practicable a more efficient conduct of the office and of the arrangement of the accounts, has raised the office in the estimation of the public.
The security and fidelity of the administration of the Public Trustee must undoubtedly afford a great attraction to any person who may contemplate the appointment of a trustee. The Public Trust Office is a Government department. The fidelity of its administration is guaranteed by statute; and, by “The Public Trust Office Acts Amendment Act, 1891,” the colony guarantees the integrity of the capital funds of properties placed in the Public Trust Office where there is no direction for the investment of such funds, or where there is no other direction for the investment than generally at the option of the Public Trustee, in General Government securities of New Zealand or in mortgage of real estate within the colony.
The colony also guarantees on such capital funds for investment a common rate of interest, to be determined from time to time by Order in Council, and to be credited quarterly, free of all office charges, to the properties from which the funds arise; and the value of this guarantee will be obvious when it is considered that it is,—
-
The guarantee of the colony against loss from investments in bad or insufficient securities;
-
The guarantee of the colony against loss from delay in the investment of moneys;
-
The guarantee of the colony that the interest determined from time to time by Order in Council shall be regularly and punctually paid, free of all charges of the Public Trust Office.
A person making a will or arranging a trust must always be seriously concerned as to the security of the capital funds; and the larger the capital funds the greater will be the concern for security, and the less for a high rate of interest.
The Public Trustee, in his official capacity, never dies, never leaves the country, and never becomes disqualified or involved in private difficulties, or distrusted. It will thus be evident that by his appointment as trustee, the preparation of the numerous deeds, and the consequent expense, which might become necessary in the case of a private trustee are altogether obviated. These advantages will be readily appreciated by all who have any knowledge of the incidents of trusteeships.
When all the property in an estate has been realised and the money has been transferred to the common fund of the office, the income is paid to beneficiaries free of all commission; but during the progress of administration, while the realisation of the property is taking place, certain moderate fees and percentages are charged. These charges are no more than sufficient for the expense of maintaining the department without loss. It will be found that the charges for the administration of a property by the Public Trustee will compare very favourably with the expense of an administration by any other means.
The legal expenses attending the administration of trusts are minimised by the appointment of the Public Trustee. The office solicitor's advice on all matters of administration is given without charge to the estates.
This is one of the most important branches of the Public Trust Office. A very large number of people die without making provision by will for the administration of their estates. In such cases it is the duty of the Public Trustee to administer estates where relatives are unknown, or are known to reside out of the colony, or where the person entitled by law to administer declines or neglects to apply for letters of administration within due time after death. Very few persons realise the care and responsibility which are inseparable from the administration of an estate, and which no person should assume before considering whether it is not better to allow the estate to be administered by the Public Trustee, who is a responsible officer appointed by the Legislature, and experienced in this class of work. After the assets of an estate are realised and the debts and expenses paid, the Public Trustee, on receiving satisfactory proofs of kinship, distributes the residue in accordance with the law.
The Public Trustee is authorised to administer, without an order of the Court, intestate estates consisting only of personalty of a value not exceeding £250, with the result of expedition and economy in the administration.
To any one desiring to appoint a trustee, or to any present trustee wishing to be relieved of a trust, the Public Trust Office is a satisfactory recourse when the transfer would not result in casting thereon the discredit of a faulty administration for which the office may not be responsible.
Any property can be vested in the Public Trustee upon trusts defined in the deed creating the trust, and the incomes from trusts can be paid as may be desired.
It is gratifying to be able to state that the reputation and benefits of the office are attracting attention in the United Kingdom, and that already several trusts of money belonging to persons resident there have been accepted by the office.
The assets of estates are conserved or realised to the best advantage by the duly appointed agents of the Public Trustee, and under his direction, due regard being paid to all surrounding circumstances and to the provisions of any law will, or trust deed affecting the same.
Wills of living persons, whether under such wills the Public Trustee is or is not appointed executor, may be deposited in the office for safe custody. Testators who may appoint the Public Trustee to be their executor are recommended to secure the advantage of a provisional acceptance of their wills by the Board of the office, thus ascertaining whether the Public Trustee would be likely to accept the trusts of their wills, and obtaining free of charge a careful consideration of any objections.
As executor of a will, the Public Trustee must act alone. The law forbids him to act in conjunction with another person.
The following is a statement of the number and value of estates remaining in the Public Trust Office at the close of the years 1890, 1891,1892:
| Class. | Number of Estates | Value of Estates | ||||||
|---|---|---|---|---|---|---|---|---|
| On Dec. 31, 1890. | On Dec. 31, 1891. | On Dec. 31, 1892. | On December 31, 1890. | On December 31, 1891. | On December 31, 1892. | |||
| £ s. d. | £ s. d. | £ s. d. | ||||||
| Wills and trusts | 288 | 343 | 354 | 418,047 10 0 | 415,160 0 0 | 442,671 7 3 | ||
| Intestate estates | 752 | 794 | 845 | 75,305 0 0 | 83,381 0 0 | 81,650 0 0 | ||
| Real estates | 109 | 114 | 117 | 23,496 10 0 | 24,190 0 0 | 22,705 18 7 | ||
| Lunatic estates | 137 | 181 | 202 | 32,918 10 0 | 34,913 0 0 | 40,380 0 0 | ||
| Native reserves | 99 | 100 | 101 | 340,869 0 0 | 344,692 0 0 | 346,498 18 0 | ||
| West Coast Settlement Reserves | 293 | 293 | 293 | 349,462 0 0 | 350,289 0 0 | 350,853 7 10 | ||
| Totals | 1,678 | 1,825 | 1,912 | 1,240,098 10 0 | 1,252,625 0 0 | 1,284,759 11 8 | ||
The Act which deals with these subjects was passed in 1889, and came into force on the 1st January, 1890. It is in principle and all important matters a reprint of the British Act, the variations being, generally speaking, only such as are required by the circumstances of the colony. It follows, therefore, that, in questions of interpretation of the law, the decisions of the English Courts are taken as a guide in the New Zealand Patent Office and Supreme Court.
The Patent Office is in the Government Buildings, at Wellington. The head of the office is styled “Registrar of Patents, Designs, and Trade-marks,” and all communications should be addressed to that officer.
Fees are payable by preference to the credit of the Public Account at any branch of the Bank of New Zealand, and, when so paid, the bank-receipt must be forwarded with the necessary documents to the Registrar; but, where this mode of payment is inconvenient, drafts or post-office orders will be accepted; cheques cannot be received.
Forms of application for letters patent, or for registration of trade-marks, are supplied gratis.
The office is glad to give inventors and others any information in its power; but it declines the responsibility of making searches, and also of advising on questions of law, or on matters on which the Registrar may have to decide judicially.
Inventors are advised to search for themselves personally, or by their agents, in the Patent Office for New Zealand specifications, and in the Patent Office library in the Museum, in Wellington, for applications lodged out of the colony, to ascertain that their inventions have not been anticipated by others. Copies of specifications filed in Great Britain, Canada, the United States, Australia, &c., may be inspected free in the Patent Office library. As patents are issued in the colony at the risk of the applicants, the importance of such a search is apparent.
Local patent offices are appointed in the principal towns of the colony for the receipt of applications for letters patent.
A “Patent Office Supplement” to the New Zealand Gazette is published fortnightly, and contains notices of applications for patents, and for registration of trade-marks, and a variety of information concerning them. The subscription to this Supplement is 10s. a year.
A patent may be granted to one or more persons, provided that one is the actual inventor, or to the assignee or authorised agent of the inventor. Every application for a patent must be in the form prescribed in the Act, and must be accompanied by a provisional or complete specification in the prescribed form: fee, 10s. If a provisional specification is lodged with the application, a complete specification must be deposited within nine months; fee, 10s. Copies of the complete specification and of drawings, if any, are required. The acceptance of the complete specification is gazetted, and any person may, within two months of the date of the Gazette, give notice in duplicate of opposition, stating the grounds of the objection. The Registrar will then fix a day for hearing the case, and decide thereon. He has power to examine witnesses on oath, and to make such orders as to costs as he may think fit. Fifteen months from the date of the acceptance of the application is allowed for payment of a further fee of £2 and the issue of the patent. The Registrar may grant an extension of time on good cause being shown and on payment of extra fees. The term of a patent is fourteen years, subject to payment of £5 within four years, and £10 within seven years. A specification may be amended under certain conditions, but no substantial alteration or enlargement can be allowed. The Governor may order a patentee to grant licenses on terms, but there is no provision for compulsory working. A patent may be revoked by the Supreme Court.
Designs may be registered on application in the prescribed form, with drawings or other representations, and are then copyright.
Applications for registration of trade-marks are to be made in the prescribed form, and accompanied by four representations of the mark; fee, 5s. Certain essential particulars are required in a trademark, which is to be registered for particular goods or a class of goods. Every application for registration of a trade-mark is gazetted, and within two months any person may give notice in duplicate of objections. The applicant may send to the Registrar a counter-statement in duplicate. The Registrar will then hear both sides and decide the case.
An address for service in the colony must be given with all applications and objections.
Appeal may be made to the Supreme Court in Wellington against decisions of the Registrar. The Registrar has power to correct clerical errors.
Assignments and licenses must be registered in the Patent Office. The colony has joined the International Convention, and has thus secured seven months' priority of right for patents, and four for trade-marks. A similar arrangement has also been made between Victoria and New Zealand. Patents and trade-marks are open to inspection, but designs are not, while the copyright exists.
Only persons registered as patent agents are allowed to so style themselves. Any person representing an article to be patented when no patent for it has been granted in the colony, or falsely describing a design or trade-mark to be registered, is liable to a penalty of £50. Other offences against the Act are punishable by fine or imprisonment.
A careful perusal of the Act and regulations is advised, as otherwise unnecessary delay and expense may be incurred.
It is believed that in proportion to its population there are more applications for patents in New Zealand than in any other country or colony in the world. In 1892 there were 606 applications, and the total number up to the end of that year was 5,973.
An annual report is published by the Registrar.
There are 69 fire-brigades in the colony, having a total strength of 223 officers and 1,195 men. With the exception of 11, these brigades have formed themselves into a union, under the name of the “United Fire Brigades' Association of New Zealand.” The fourteenth annual meeting of the Union was held in Wanganui, on the 22nd and 23rd March, 1893. The report stated that during the year three brigades had joined the Association, making the total number 58. The Accident Assurance Society in connection with the association had been registered under the Friendly Societies Act. The society provides for an allowance of 30s. per week if a member be incapacitated from following his usual employment by accident whilst on duty as a fireman; and, if totally disabled or killed, a sum of £50 is assured.
The New Zealand “Friendly Societies Act, 1882,” is, with a few slight alterations, copied from the English Act of 1875. That Act was drawn on the principle recommended by the Royal Commission presided over by Sir Stafford Northcote—namely, that the State should legislate for the protection of the rights of members of registered societies only, registration being optional, and that the responsibility of solvency should rest with the societies themselves.
There are in New Zealand few societies which have not availed themselves of the facilities and privileges conferred by registration.
Inadequate rates of contribution were originally adopted by many societies. In some instances the rates have been raised, and the financial position correspondingly improved; in others there has been exhibited persistent disregard of advice and warning. This is the principal cause of deficiency. Other causes are excessive sickness, losses through unprofitable investments (chiefly in buildings), and negligence in regard to investment of funds.
From the compilation of New Zealand friendly society statistics, it is found that the rates of sickness and mortality differ widely from other experience. The mortality, in common with the mortality of the whole population, is conspicuously light. On the other hand, the average total sickness greatly exceeds the expectation as based on English rates.
In the Statistical Information will be found particulars as to the number of lodges and members in New Zealand.
Table of Contents
Prior to the abolition of the provinces the hospitals of the colony were supported mainly out of provincial revenues. Subsequently thereto, the expenditure for hospitals became to a large extent a charge on the revenue of counties and municipal corporations, until October, 1885, when “The Hospitals and Charitable Institutions Act, 1885,” passed by the General Assembly, came into operation.
The portion of the colony included within the three principal islands—the North, Middle, and Stewart Islands—was by the above Act divided into twenty-eight hospital districts, each consisting of one or more counties with the interior boroughs, to be presided over by elected Boards, designated “Hospital and Charitable-aid Boards.”
The revenues of these boards accrue from the following sources:—
-
Rents and profits of land and endowments vested in the Board, or set apart for the benefit of particular institutions;
-
Voluntary contributions;
-
Grants from contributory local authorities; and
-
Subsidies from the Consolidated Fund (these being at the rate of 10s. for every £1 of bequests, but in no case exceeding £500 in respect of any one bequest; £1 4s. for every £1 of voluntary contributions; and £1 for every £1 received from any local authority).
The contributory local authorities—being the County and Borough Councils, and Boards of road and town districts where the Counties Act is not in operation—are empowered by the Act to raise, by special rates, the amounts assessed by the Hospital District Boards, as the proportionate contributions for the purpose of the Hospital and Charitable-aid Fund.
The District Boards undertake the general management and control of those hospitals that are not incorporated in terms of the Act, and are required to contribute to the support of the incorporated hospitals. Incorporated hospitals are those having not less than one hundred subscribers who contribute not less than £100 annually to the institution by amounts of not less than 5s., and which have been declared by the Governor in Council, after receipt by him of a duly signed petition, to be a body politic and corporate, governed by trustees.
There are 38 hospitals in the colony, of which 25 are incorporated institutions, and 13 are directly managed and controlled by District Boards. In 1892 these hospitals afforded accommodation for 972 male and 430 female patients, a total of 1,402. The number of cubic feet of space included within the walls of all the sleeping wards was 1,843,974, which gave an average of 1,315 cubic feet to each bed. 5,385 males and 2,202 females were admitted as patients during the year 1892, and 545 male and 184 female patients were inmates at the end of the year. The total number of indoor patients during the year was 8,328, viz., 5,948 males and 2,380 females.
The various benevolent asylums and charitable institutions are placed on a similar footing to the hospitals. The Boards of hospital districts are constituted Hospital and Charitable-aid Boards; but, for the purpose of distributing charitable aid only, some of the hospital districts have been united into larger districts, so that, although there are 28 Boards for hospital purposes, there are only 21 for charitable-aid purposes.
Returns were received in 1892 from 14 benevolent asylums (not including orphanages), established for the support of certain indigent persons. These have accommodation for 522 males and 297 females. The number of inmates in these institutions at the end of 1892 was 680, of whom 472 were males and 208 were females. Outdoor relief was given by five of these institutions to 3,674 persons, including 2,226 children.
There are six orphan asylums in the colony; two are maintained by District Hospital Boards, one by the Church of England authorities, and three by clergy of the Roman Catholic Church; four of these receive, at the charge of the State, orphan, destitute, and other children that may be committed to them by a Resident Magistrate.
Exclusive of the children so committed, 7 male and 39 female orphans were received during the year 1892, and 50 male and 117 female orphans remained as inmates at the end of the year.
The orphanages that receive committed children are, for that purpose, constituted “industrial schools.” The particulars of the committed children will be found included with those of the committed children attending the Government industrial schools.
There are seven public lunatic asylums in the colony (one being, however, only an auxiliary institution to the district asylum), maintained wholly or in part out of the public revenue. There is also one private asylum, licensed by the Governor for the reception of lunatics. There were, at the end of 1892, 1,154 male and 763 female patients belonging to these asylums. Of these, 1,007 males and 659 females were supposed to be incurable, 20 males and 24 females were out on trial, and 127 males and 80 females were supposed to be curable. 115 male and 95 female patients were discharged during the year.
The following shows the proportion of insane—or, rather, of inmates of lunatic asylums—to the population (exclusive in each case of Maoris) at the end of the years stated:—
| 1884, 1 insane person to every | 393 of population. |
| 1885, 1 insane person to every | 382 of population. |
| 1886, 1 insane person to every | 370 of population. |
| 1887, 1 insane person to every | 360 of population. |
| 1888, 1 insane person to every | 365 of population. |
| 1889, 1 insane person to every | 349 of population. |
| 1890, 1 insane person to every | 348 of population. |
| 1891, 1 insane person to every | 343 of population. |
| 1892, 1 insane person to every | 339 of population. |
It must not be overlooked that the proportions are increased by the admission into the asylums of inebriates, idiots, and others, who should not properly be there.
There are four industrial schools maintained by the Government, end. one maintained wholly by the local authorities. In addition, three orphanages under the control of the Roman Catholic clergy have been constituted industrial schools for the reception of children committed under the Industrial Schools Act. The Government pays a contribution of 1s. a day for each child committed to these institutions. 237 children of both sexes were committed to these schools in 1892—namely, 135 boys and 102 girls.
The following shows the number of children committed to the industrial schools in each year since 1886:—
| In 1886 | 238 children were committed. |
| 1887 | 224 children were committed. |
| 1883 | 190 children were committed. |
| 1889 | 169 children were committed. |
| 1890 | 158 children were committed. |
| 1891 | 184 children were committed. |
| 1892 | 237 children were committed. |
The number of committed children belonging to these schools at the end of 1892 was 1,489—namely, 819 boys and 670 girls. Of these, 527 were actually in the schools, 419 were boarded out, 391 were at service, 117 were with friends, and the others were variously accounted for.
Of those admitted during the year, 35—namely, 31 boys and 4 girls—had been guilty of punishable offences.
Ten children (9 boys and 1 girl) were transferred to the Costley Training Institution of Auckland in 1892. This institution was established and is maintained out of funds bequeathed for such purpose chiefly by the generosity of one individual, and has for its objects the selection of a certain number of boys and girls of ages fit to be apprenticed, being inmates of the schools established under “The Industrial Schools Act, 1882,” in or near the City of Auckland, the boys to be apprenticed to suitable trades and maintained at aforesaid institution until they are fit to be left to their own control, and the girls to be provided with domestic service or other suitable employment.
There were 36 inmates of the institution at the end of 1892—namely, 26 boys, of ages varying from 13 to 19, and 10 girls. All the boys were either learning a useful trade, or held situations in offices or other positions of respectability. The girls were all either in service or boarded out with respectable families.
Table of Contents
Possessed of great intelligence, susceptible of civilisation, and owners of an immense area of land, the Native people form an important element in the New Zealand population.
Now that the Maori wars are over, the Natives have turned their attention to peaceful pursuits; and, had it not been for the baneful effects of war, their social condition might have advanced far beyond the stage it has at present reached. Loss of life in the field, death from disease, the privations incident to war-time, and the disturbances in their ordinary occupations, perceptibly diminished their numbers and checked for years the progress they were making in civilisation.
According to the census of 1891, the total Maori population amounted to 41,993 persons, of whom 22,861 were males and 19,132 females. In 1886 the population was returned as 41,969 persons—males 22,840, females 19,129. As more than 100 Maoris lost their lives in the Tarawera eruption, which took place subsequently to the census of 1886, it would seem that the Maori population is not on the decline. Included in these numbers are the half-castes living as members of Maori tribes.
The North Island had in 1891 a Maori population of 39,535 persons. The Middle Island had only 1,883, and Stewart Island 136. The Native population of the Chatham Islands was 188 persons, 40 of whom were Morioris. 251 Maori women were found to be wives of European husbands.
Of the half-caste population some are living as members of Maori tribes and others amongst and as Europeans. The numbers were as under for two censuses:—
| Census. | Half-castes living as Members of Maori Tribes. | Half-castes living as Europeans. | Total half-caste Population. |
|---|---|---|---|
| Persons. | Persons. | Persons. | |
| 1891 | 2,681 | 2,184 | 4,865 |
| 1886 | 2,254 | 1,958 | 4,212 |
For the whole colony the proportionate strength of the two races is 1 Maori to about 15 Europeans. Omitting from the calculation the 251 Maori wives married to European husbands, it is found that in the North Island the proportion of Maoris is 1 to every 7 Europeans, in the Middle Island 1 to 183, in Stewart Island 1 to 1.5, and in the Chatham Islands 1 to 1.4; the percentage of each race to the total population being,—
| European. | Maori. | |
|---|---|---|
| Per Cent. | Per Cent. | |
| North Island | 87.68 | 12.32 |
| Middle Island | 99.46 | 0.54 |
| Stewart Island | 59.76 | 40.24 |
| Chatham Islands | 59.04 | 40.96 |
| Colony | 93.72 | 6.28 |
At the census of 1891, the enumerators were directed to report to the Native Department on the general health of the Maoris, with any other information bearing on the population question deemed to be important. Inquiry into increase or decrease in different localities seemed to show that Natives move from one place to another frequently, and often depart from their usual place of abode for the purpose of gum-digging, thus swelling for a while the population of one locality at the expense of another.
As to health, the enumerator for the districts north of Auckland reported that during the last five years there had been no great mortality amongst the Natives, and that the deaths had “principally occurred from old age or pulmonary complaints.” Three cases of Maori leprosy were met with, which appeared to be of recent origin. The enumerator for the country around Auckland, Waikato, &c., stated there was no epidemic sickness amongst the Natives when the census was being taken. The ailments noticed were pulmonary diseases, rheumatism, and almost universal hakihaki among the children.
Around Tauranga the general health was found to be fairly good, without serious epidemics. The mortality did not appear to be excessive, taking into consideration the irregular and careless mode of life. One case is noticed of supposed leprosy near Rotorua. The disease is termed ngerengere by the Natives.
In the Counties of Cook and Waiapu the general health is reported good, the Maoris not being given to drinking, and being much more industrious than formerly. For Hawke's Bay also the report was favourable.
For Wairarapa and the country around Wellington the diseases observed were those of the respiratory organs; and it is stated that when once the Natives are attacked they soon succumb, from which it would appear that their constitution is not so vigorous as in the past, when they lived on high ground instead of in low-lying places, often very wet. Around Wanganui their health is stated to be fairly good; but the enumerator at New Plymouth reported that the Natives in his district are, in his opinion, decreasing steadily in number through excessive mortality and paucity of births: probably not more than one in three Maori children living to maturity.
In reports on previous censuses it is stated that the tendency to racial decrease, which is indicated by the low proportion of the number under 15 years of age to the whole population, is attributable to the following causes: An excessive infantile mortality, owing to improper food, exposure, want of ordinary care and cleanliness; the fact that the constitutions of the parents are often undermined; the practice of placing their sick in the hands of the Native doctor (tohunga), instead of applying to the medical officer of the district; the sterility induced by widespread immorality among quite young females before marriage; the partial adoption of European habits and costume, and the continual reversion to the habits and costume of barbarism with a system rendered more susceptible to external influences, especially those of a humid and changeable climate, and more liable therefore to the attacks of disease, especially such as affect the respiratory organs; and, to a certain extent, the continual introtribal marriages, resulting in diminished fruitfulness and enfeebled constitutions.
The Natives are rich in land. It is estimated that they own more than ten millions of acres. In this area there are valuable lands, but allowance must be made for mountain-ranges and portions where the soil is poor. The following figures will show that the Natives are utilising their lands, although not to the extent that might be wished. According to the census of 1891, they had, in crop and grass, 75,833 acres: of which 11,203 acres were in wheat, 5,599 acres in maize, 16,093 acres in potatoes, 16,220 acres in other crops, and 26,718 acres in sown grasses. They also owned 262,763 sheep, 42,912 cattle, 86,259 pigs, besides horses, of which no account has been taken.
The Maoris take no small interest in education, and the aptitude for learning shown by their children at the schools provided for them is most marked. For many years the Government has maintained schools in Native districts, and solid work has been done in giving the children an English education. In December, 1892, the number on the rolls of the ordinary Native schools, public schools, and boarding-schools was 3,749. At the same date the number of Native village schools was 67, and of boarding-schools 4. The public schools at which Native children attended were 229. The Native schools are inspected periodically by the Government Inspector, and the day on which this official makes his inspection is one of no small interest and excitement to the youthful Maori.
The Natives are represented in Parliament. There are four constituencies, each sending a member of the Native race to the House of Representatives. At present one of these representatives, who is a half-caste, is a member of the Executive Council. There are also two Maoris in the Legislative Council. The Native members take a keen and intelligent interest in all questions affecting their people, and are well able to hold their own on the floor of the House.
The following table shows, with the population at the census, the large proportional number of votes recorded at the election in October, 1890, of Native members for the House of Representatives, under the Maori Representation Acts of 1867, 1872, and 1876:—
| Electoral Districts. | Maori Population. Census, 1891. | Number of Votes recorded. |
|---|---|---|
| *Being 22,861 males and 19,132 females (including 251 wives of European husbands). | ||
| North Island— | ||
| Northern Maori | 8,970 | 1,649 |
| Eastern Maori | 14,440 | 3,131 |
| Western Maori | 16,365 | 1,916 |
| Middle Island— | ||
| Southern Maori | 2,218 | 390 |
| Totals | 41,993* | 7,086 |
The institution, above all others, in which the Natives take a lively interest is the Native Land Court. This tribunal was established in 1865, for the purpose of giving them legal titles to their lands, and has been in existence ever since. The Natives bring their claims before the Court, and, upon evidence brought before it, judgment is given in accordance with the customs of Native land-tenure. Large and valuable blocks are constantly being passed through the Court, and at times the claims of the contending parties are keenly contested. In some cases when the blocks are very valuable the attention of the Court is occupied for many weeks. The Court consists of the Chief Judge and a staff of Judges, Native Assessors, Registrars, Clerks, and Interpreters. The Assessors sit on the bench with the Judges. As might be expected, great difficulties have been experienced in dealing with lands belonging to a people emerging from the conditions of life to which the Maoris have been accustomed, and a great deal of legislation on the subject has been the result. Probably in no country in the world is there a tribunal like the Native Land Court of New Zealand, and, all things considered, the amount of work it has done has been very considerable.
The Minister of Justice is now charged with Native affairs, and the Native Department has been merged in the Department of Justice, which is under his control. The Native Land Court is part of this department, but the Minister does not interfere with its judicial functions.
The Department of Justice is the medium by which the Maoris communicate with the Government on matters relating to their lands, land-disputes, roads, surveys, and other subjects in which they are interested. The Natives are good letter-writers, and do not fail—as the officers of the department well know—to keep up a constant correspondence with the Government. It is considered that, as so many Natives have been taught English in the schools, the time has come when they may be expected to correspond in English, and in many cases replies to their letters are no longer written in Maori but in English. It is a curious fact that many Maoris who can speak English fluently will plead inability to do so if an interpreter be available. The Justice Department also disburses annually the sum of £7,000 set apart by the Constitution Act for Native purposes. The amount is mainly spent in pensions to Natives for valuable services rendered to the Crown, and in providing medical and charitable aid to indigent Natives.
The Native question now has lost much of the importance it once possessed. The days of Maori disturbances are happily past, and the whistle of the railway-engine may now be heard in places where the Maoris once fought with us. Flocks of sheep belonging to Natives may now be seen passing along roads in neighbourhoods formerly the hotbeds of disaffection.
| Principal Tribe. | Numbers under and over 15 years. | Total Population. | |||||
|---|---|---|---|---|---|---|---|
| Under 15. | Over 15. | ||||||
|
* Including 119 males and 118 females; ages not specified. † Including 1 male and 1 female; ages not specified. ‡ Including 120 males and 119 females; ages not specified. | |||||||
| Male. | Female. | Male. | Female. | Male. | Female. | Persons. | |
| Arawa | 678 | 564 | 1,369 | 1,102 | 2,047 | 1,666 | 3,713 |
| Muaupoko | 6 | 2 | 45 | 36 | 51 | 38 | 89 |
| Ngatiporou | 628 | 581 | 1,348 | 1,138 | 1,976 | 1,719 | 3,695 |
| Ngatikakungunu | 938 | 796 | 1,963 | 1,497 | 2,901 | 2,293 | 5,194 |
| Ngaiterangi | 235 | 192 | 505 | 384 | 740 | 576 | 1,316 |
| Ngapuhi | 1,357 | 1,205 | 2,095 | 1,657 | 3,452 | 2,862 | 6,314 |
| Ngatimaniapoto | 284 | 256 | 527 | 464 | 811 | 720 | 1,531 |
| Ngatimaru | 203 | 188 | 542 | 416 | 745 | 604 | 1,349 |
| Ngatiawa | 326 | 280 | 806 | 615 | 1,132 | 895 | 2,027 |
| Ngatiraukawa | 291 | 248 | 576 | 484 | 867 | 732 | 1,599 |
| Ngatiruanui | 107 | 67 | 373 | 288 | 480 | 355 | 835 |
| Ngatiwhatua | 72 | 65 | 195 | 139 | 267 | 204 | 471 |
| Rangitane | 14 | 14 | 43 | 27 | 57 | 41 | 9.3 |
| Rarawa | 414 | 382 | 701 | 526 | 1,115 | 908 | 2,023 |
| Taranaki | 91 | 65 | 260 | 193 | 351 | 258 | 609 |
| Urewera | 204 | 245 | 418 | 344 | 622 | 589 | 1,211 |
| Waikato | 665 | 636 | 1,502 | 1,120 | 2,167 | 1,756 | 3,923 |
| Whanau-a-Apanui | 142 | 108 | 225 | 221 | 367 | 329 | 696 |
| Whanganui | 310 | 224 | 676 | 537 | 986 | 761 | 1,747 |
| Whakatohea | 101 | 99 | 179 | 167 | 280 | 266 | 546 |
| Unspecified | 40 | 26 | 87 | 53 | 246 | 197 | 443* |
| Others | 17 | 12 | 48 | 29 | 65 | 41 | 106 |
| Population. | |||||||
| North Island | 7,123 | 6,255 | 14,483 | 11,437 | 21,725 | 17,810 | 39,535* |
| Middle Island | 374 | 366 | 598 | 543 | 973 | 910 | 1,883† |
| Stewart Island | 31 | 34 | 41 | 30 | 72 | 64 | 136 |
| Chatham Island: | |||||||
| Maoris | 32 | 40 | 43 | 43 | 65 | 83 | 148 |
| Morioris | 4 | 2 | 22 | 12 | 26 | 14 | 40 |
Maori wives living  with European with European husbands | .. | .. | .. | 251 | .. | 251 | 251 |
| Totals | 7,554 | 6,697 | 15,187 | 12,316 | 22,861 | 19,132 | 41,993‡ |
It has been stated that the comparison of the numbers of Maoris returned in 1891 and 1886 leads to the conclusion that the population is about stationary. But the males under 15 years by the above table were in the proportion of 33.04 to every 100 of the male population, and the similar proportion among the females was 35.00 per cent. In the European portion of the population the proportions were: Males under 15 years 38.08 per cent., and the females under 15 years 42.20 per cent., of the totals of the respective sexes. The variation in the proportions for the two races would seem to indicate that a low birth-rate or a high juvenile mortality obtains among the Maoris.
Table of Contents
Table of Contents
The Crown lands are administered, under the authority of “The Land Act, 1892,” by the Hon. the Minister of Lands at Wellington. For convenience the colony is divided into ten land districts, each being under the local direction of a Commissioner and a Land Board. The Commissioner's office is known as the principal land office, and in some of the larger districts there are one or more sub-offices. It is with these land offices the selector has to transact all business, from the first consultation of the maps, the subsequent selection of the land, to the final receipt of the Crown title.
The names of the land districts and of the towns where each principal office is situated are, beginning with the most northerly and taking them geographically, as under:—
| Land District. | Town where Principal Land Office is situated. |
|---|---|
| Auckland | Auckland. |
| Taranaki | New Plymouth. |
| Hawke's Bay | Napier. |
| Wellington | Wellington. |
| Nelson | Nelson. |
| Marlborough | Blenheim. |
| Canterbury | Christchurch. |
| Otago | Dunedin. |
| Southland | Invercargill. |
| Westland | Hokitika. |
Crown lands are divided into three classes:—
-
Town and village lands, the upset prices of which are respectively not less than £20 and £3 per acre; such lands are sold by auction:
-
Suburban lands, the upset price of which may not be less than £2 an acre; these lands are also sold at auction:
-
Rural lands, which may be disposed of at not less than £1 per acre for first-class, and 5s. an acre for second-class lands; such lands may be sold or leased by auction, or sold or leased on application.
No rural section may be larger than 640 acres in extent if first-class land, or 2,000 acres if second-class land, whether offered by auction or application. No person can select more than 640 acres of first- or 2,000 acres of second-class land, including therein any land which he then holds. Pastoral runs are limited to what will carry 20,000 sheep or 4,000 cattle. No person can select more than one run.
Crown lands may be acquired as follows:—
-
By auction, after survey, in which case one-fifth of the price is paid down at the time of sale, the balance within thirty days:
-
By application, after the lands have been notified as open for selection, in which case the applicant fills up a form (to be obtained at any of the Land Offices) and makes the declaration and deposit required by the particular system he wishes to select under.
All applications, whether for surveyed or unsurveyed lands, are deemed to be simultaneous if made on the same day, and, if there be more than one applicant for the same land, the right of selection is determined by ballot.
Lands thrown open for application may be either surveyed or unsurveyed, and those not selected the first day remain open.
Lands for selection are notified as open for application on and after a stated day, and, at the option of the applicant, may be obtained on any of the three following tenures:—
(a.) Cash; (b.) Occupation with the right of purchase; (c.) Lease in perpetuity.
If the land is surveyed, one-fifth of the price is to be paid down at the time of application, and the balance within thirty days; or if the land is not completely surveyed the survey-fee is paid on application, and goes towards the purchase of the land; the balance must be paid within thirty days of notice that the survey is completed.
A certificate of occupation will issue to the purchaser on final payment, which will be exchanged for a Crown title so soon as the Board is satisfied that the improvements mentioned hereafter have been completed.
Lands selected on this tenure are held under a license for twenty-five years. At any time subsequent to the first ten years, and after having resided and made the improvements hereafter described, the licensee can, on payment of the upset price of the land, acquire the freehold. If the land be not purchased the license may be exchanged for a lease in perpetuity.
The rent is 5 per cent. on the cash price of the land; a half-year's rent has to be paid in with the application, if surveyed land, which represents the half-year's rent due in advance on the 1st day of January or July following the selection. If the land is unsurveyed, the cost of survey is to be deposited, which is credited to the selector as so much rent paid in advance, counted from the 1st day of January or July following thirty days' notice of the completion of survey.
Residence and improvement of the land are compulsory, as hereafter described.
Lands selected on this tenure are leased for 999 years, subject to the conditions of residence and improvements hereafter described. The rental is 4 per cent. on the cash price of the land, and applications are dealt with in the same way as under the previous tenure (b), but there is at no time a right of purchase.
Two or more persons may make a joint application to hold as tenants in common under either of the two last-named tenures.
Under the two last-mentioned tenures, the conditions as to residence and improvements are:
Residence—
-
Must commence on bush or swamp lands within four years, and in open or partly open land within one year, from the date of selection;
-
Must be continuous for six years on bush or swamp land, and for seven years on open or partly open land, on lands occupied with a right of purchase;
-
Must be continuous for a term of ten years on lease-in-perpetuity lands.
The Board has power to dispense with residence in certain cases, such as where the selector is residing on adjacent lands, or is a youth or unmarried woman living with parents, and in a few other cases.
Residence implies the erection of a habitable house to be approved of by the Board.
Improvements which must be made are as follows:—
-
Cash-tenure lands must be improved within seven years to an amount of £1 an acre for first-class land, and 10s. an acre for second-class land.
-
Lands held on lease with right of purchase, or on lease in perpetuity, must be improved to an amount equal to 10 per cent. of the value of the land, within one year from the date of the license or lease; within two years must be improved to the amount of another 10 per cent.; within six years must be improved to the value of another 10 per cent., making 30 per cent. in all within the six years. In addition to the above, the land must be further improved to an amount of £1 an acre for firstclass land, and on second-class land to an amount equal to the net price of the land, but not more than 10s. an acre.
Improvements may consist of reclamation from swamps, clearing of bush, cultivation, planting with trees, or hedges, cultivation of gardens, fencing, draining, making roads, wells, water-tanks, water-races, sheep-dips, embankments or protective-works, or in any way improving the character or fertility of the soil; or the erection of any building, &c.; and cultivation implies the clearing of land for cropping, or clearing and ploughing for laying down with artificial grasses, &c.
Under the existing regulations any number of persons, not less than twelve, may apply for a block of land of not less than 1,000 acres or more than 11,000 acres in extent, but the number of members must be such that there shall be one for every two hundred acres in the block, and no one can hold more than 320 acres, except in swamp lands, when the area may be 500 acres.
The capital value of lands within a special settlement is fixed after survey by special valuation, but may not be less than 10s. an acre; the rental is not less than 4 per cent. on the capital value, and the tenure is a lease in perpetuity.
Residence, occupation, and improvements are generally the same as already described, and applications have to be made in manner prescribed by regulations.
Applicants should apply to a Commissioner for a copy of the regulations, as they are liable to alteration at any time.
Village settlements are disposed of under regulations made from time to time by the Governor, but the main features are as follows:—
Such settlements may be divided into,—
-
Village allotments not exceeding one acre each, which are disposed of either by auction among the applicants, or by application as already described, with option of tenure, the cash price being not less than £3 per allotment:
-
Homestead allotments not exceeding 100 acres each, which are leased in perpetuity at a 4-per-cent. rental on a capital value of not less than 10s. per acre.
Residence, improvements, and applications are the same as already described. The leases are exempt from liability to be seized or sold for debt or bankruptcy.
The Governor is empowered in certain cases, and under regulation, to advance small sums for the purpose of enabling selectors to profitably occupy their allotments.
Small grazing-runs are divided into two classes: first-class, which do not exceed 5,000 acres; second-class, which do not exceed 20,000 acres in area. The rental in both cases is not less than 2 1/2 per cent. on the capital value per acre, but such capital value cannot be less than 5s. per acre. Small grazing-runs are leased for terms of twenty-one years, with right of renewal for other twenty-one years, at a rent of 2 1/2 per cent. on the then value of the land. The runs are declared open for selection, and applications and declarations on the forms provided have to be filled in and left at the Land Office, together with the deposit of one half-year's rent, which represents that due on the 1st day of March or September following the selection.
No holder of a pastoral run, and no holder of freehold or leasehold land of any kind whatever over 1,000 acres in area exclusive of the area of the small grazing run applied for, may be a selector under this system, and only one small grazing run can be held by any one person.
The lease entitles the holder to the grazing rights, and to the cultivation of any part of the run, and to the reservation of 150 acres round his homestead through which no road may be taken; but the runs are subject to the mining laws.
Residence is compulsory, if bush or swamp land, within three years; if open, within one year; and must be continuous to the end of the term, but may in a few cases be relaxed. Improvements necessary are as follows: Within the first year, to the amount of one year's rent; within the second year, to another year's rent; and, within six years, equal to the value of two other years' rent: making in all a sum equal to four year's rental, which must be expended within six years. In addition to these improvements, bush-covered first-class runs must be improved to an amount of 10s. an acre, and second-class bush-clad runs to an amount of 5s. an acre.
These runs may be divided, after three year's compliance with the conditions, amongst the members of the selector's family.
Pastoral country is let by auction for varying terms not exceeding twenty-one years; and, excepting in extraordinary circumstances, runs must not be of a greater extent than would carry 20,000 sheep or 4,000 head of cattle. Runs are classified from time to time by special Commissioners into: (1) Pastoral lands, which are only suitable for depasturing more than 5,000 sheep; (2) Pastoral-agricultural lands suitable for subdivision into areas of under 5,000 acres, which may be either let as pastoral runs, generally for short terms, or cut up for settlement in some other form. Leases of pastoral lands may not be resumed; leases of pastoral-agricultural lands may be resumed at any time after twelve months' notice without compensation.
No one can hold more than one run, but in case of any one holding a run of a carrying-capacity less than 10,000 sheep, he may take up additional country up to that limit.
Runs are offered at auction from time to time, and half a year's rent has to be paid down at the time of sale, which represents that due in advance on the first day of March or September following the sale, and the purchaser has to make the declaration required by the Act. All leases begin on the first day of March, and they entitle the holder to the grazing rights, but not to the soil, timber, or minerals; and the lease terminates over any part of the run which may be leased for some other purpose, purchased, or reserved. The tenant has to prevent the burning of timber or bush, in open country to prevent the growth of gorse, broom, or sweet-briar, and to destroy the rabbits on his run. With the consent of the Land Board, the interest in a run may be transferred or mortgaged, but power of sale under a mortgage must be exercised within two years.
In case it is determined again to lease any run on expiry of the lease, the new lease must be offered by auction twelve months before the end of the term, and if, on leasing, it shall be purchased by some one other than the previous lessee, valuation for improvements, to be made by an appraiser, shall be paid by the incoming tenant, but to a value not greater than three times the annual rent—excepting in the case of a rabbit-proof fence, which is to be valued separately. If the run is not again leased, the value of rabbit-proof fencing is paid by the Crown, but the tenant has no claim against the Crown beyond the value of the rabbit-proof fence; he may, however, within three months of sale, remove fences, buildings, &c. Runs may also be divided with the approval of the Board.
The following is the scale of charges for surveys of unsurveyed lands:—
-
Not exceeding 30 acres, £6.
-
Exceeding 30 and up to 50 acres, 3s. 6d. per acre, but not less than £6.
-
Exceeding 50 and up to 100 acres, 3s. per acre, but not less than £8 15s.
-
Exceeding 100 and up to 200 acres, 2s. 6d. per acre, but not less than £15.
-
Exceeding 200 and up to 300 acres, 2s. per acre, but not less than £25.
-
Exceeding 300 and up to 500 acres, 1s. 8d. per acre, but not less than £30.
-
Exceeding 500 and up to 1,000 acres, 1s. 4d. per acre, but not less than £41 10s.
-
Exceeding 1,000 and up to 2,000 acres, 1s. per acre, but not less than £66 10s.
For the survey of any area of rural land, being open land, the scale of charges shall be two-thirds the foregoing rates.
Table of Contents
The Auckland Land District covers about four and a half degrees of latitude, extending from 34° 30′ to 39° S., its greatest length being about 365 miles, from the North Cape to the 39° parallel, south of Lake Taupo, whilst its greatest width is about 180 miles. Indented as it is on nearly every side by harbours and arms of the sea, and with a mean width between the Pacific Ocean and Tasman Sea, north of the Isthmus of Auckland, of a little over forty miles, the range of temperature is not great, and the frosts little worth mentioning, at any rate north of 37° of latitude. The thermometer seldom registers above 80° in the shade in the middle of summer, whilst the heat is always tempered by a cool breeze, bringing the mean summer temperature to under 70° in the shade. The minimum register is seldom below 40° for the district north of Auckland; south of that city, sharp white frosts occur very frequently, more especially beyond 38° of latitude, and snow lies upon the summits of some of the highest hills or mountains in winter.
This land district may be said to have no real mountains, as the most prominent peaks of the several scattered ranges or hills seldom exceed 3,000ft. in height above the sea-level, an altitude just enough—south of 38°—to clothe the last 1,000ft. with snow in the depth of winter. North of Hokianga and the Bay of Islands there is one well-defined range of hills rising to a height of 2,463ft.; whilst south of these places, and extending to the Wairoa River on one side and the Whangarei Harbour upon the other, the country is all more or less broken into ranges from 1,000ft. to 2,000ft. in height, with valleys between. The next really well developed main range lies within the Coromandel and Thames Peninsula. With a length of over 150 miles, it has an average height of over 2,800ft., commencing with Moehau, or Cape Colville, 2,800ft.; next, Te Aroha, a peak of 3,176ft.; and ending at Weraiti, with a height of 2,527ft. There are two other well-defined ranges—namely, Tawairoa and Hauturu—lying between the west coast and the Waipa basin, with the highest peak at Pirongia, which rises to a height of 3,156ft., and is often snow-capped. There are other ranges forming the watershed between the Waikato and Waipa Rivers, and also that of the streams running into the western side of Lake Taupo, their highest peak is Pureora, rising to 3,793ft. The eastern side of the land district is occupied by a very broken, forest-clad country known as the Urewera Country, the average height of which is about 2,500ft. It is practically unexplored, and, being still in the hands of the Natives, is as yet not available for settlement. To the east of Lake Taupo lie the Kaimanawa Ranges, of about 4,500ft., and generally open on the ridges, with valleys clothed in beech-forests. The whole of the Auckland Land District is indented on both coasts with numerous harbours and arms of the sea, forming a cheap and easy means of access. Of rivers, properly so called, there are only two of any great length, namely, the Wairoa and Waikato. The first empties itself into the Kaipara Harbour, a large arm, or rather succession of arms, of the sea, giving hundreds of miles of inland water-carriage to all parts of the Counties of Hobson, Otomatea, Rodney, and Waitemata. This river is navigable from its mouth to its junction with its tributaries Wairua and Mangakahia, a distance of ninety-one miles from the sea, and for forty miles it is navigable for ships of large burden. The River Waikato has a course of 200 miles, measured from its source in the Ruapehu Mountain through Lake Taupo to the sea on the west coast. It is navigable for river-steamers for seventy-five miles from its mouth. Another river—the Thames or Waihou—though of no great length, affords a valuable means of inland water-carriage, and is navigable for steamers for forty miles from its mouth. Generally speaking, every part of the district has an abundant water-supply, only lessened sometimes for a short time at the end of a very dry summer.
Of plains proper this district has only the stretch of country called Kaingaroa, extending from the eastern side of Lake Taupo towards the Bay of Plenty, all more or less of a pumice formation; the valley of the Thames, which is generally level, the quality of the soil varying very much in different parts; and the Central Waikato basin, which carries a large population. Here and there in the North there are level plateaux of volcanic soil, more or less densely wooded, and along the main rivers there are stretches of level country, but there are no large plains of alluvial soil such as the South Island can show.
Of these which add so much to the scenery of the country, this district possesses a fair share, there being eight principal lakes, with some twenty or more smaller ones. To the north of Auckland, in the Bay of Islands district, there is only one lake of any size, called Omapere, three miles by two miles, an old crater; and all the other lakes of any size are situated south of Auckland, namely, Lakes Waikari and Whangape, the first six miles and a half long by three miles across, and the second five miles by one mile. These lakes are generally covered with numerous wild swans and ducks, and, being both connected with the Waikato River by navigable creeks, form a convenient waterway for transport of goods to settlers living around their shores. All the remaining lakes of large size are within the watershed of the thermal springs district, and are mostly of seven to eight miles long, and from three to six miles wide, except Lake Taupo, the queen of the North Island lakes, which is twenty-five miles long and eighteen miles broad, with a depth of 500ft. The scenery around its western shores is of the most romantic description.
The greater part of the Auckland Land District has been covered in the past with dense forests, which are now fast disappearing under the axe of the settler, and being transformed into rich pasture-land. As a matter of fact, the only really good Crown lands fit for settlement in the North are all covered with forest, and must be cleared and sown before any returns can follow. The area of forest-land in the Auckland District at the present time is about 1,800,000 acres north of Auckland, and 3,420,000 acres south of it. The forests contain a mixture of trees of all kinds, from the giant kauri to scrubby tea-tree or manuka, but all the bush is useful for building, fencing, and household purposes, or to convert into charcoal for sale. Of the giant kauri (the most valuable tree in New Zealand) vast quantities are being yearly cut and exported, or used for home consumption—to the value of about £400,000 per annum. To give some idea of the size of these trees, and the amount of timber contained in them, it is estimated that upon the Crown land to the north of Auckland, in the Counties of Hokianga, Hobson, Bay of Islands, and Whangarei, there is still remaining 498,000,000ft., of a value, as it stands, of £1,294,000.
With respect to the soils of Auckland, nowhere in New Zealand within such short distances is there such a diversity in the quality—a distance of half a mile often makes all the difference between rich alluvial and barren pipe-clay. To the north of the Bay of Islands and Hokianga the lands are chiefly clay and sandstone, with here and there a volcanic area intervening. In the Hokianga County, and in and about the valley of Mangonuiowae River, there is some of the richest alluvial soil in the district; and, taking the whole Crown land remaining to the north of a line between the Hokianga and Bay of Islands Harbours, the really available good land fit for settlement would be about 40,000 acres. There are large areas outside of this which will carry good grass and feed one or two sheep to the acre, after clearing and laying down in grass, and also land highly suitable for fruit-growing. South of Hokianga, and between that place and the Wairoa River, the soil is, generally speaking, very good, being both volcanic and alluvial. Here the Crown has probably 200,000 acres of such land fit for settlement. Immediately south of the Bay of Islands, and extending from there to Whangarei, the soil is, generally speaking, clay lying upon sandstone or marl, with alluvial flats in the bottoms of the valleys; but these are, as a rule, very narrow. Within the Puhipuhi State Forest there is an area, say, of 16,000 acres, more or less volcanic soil, over a large portion of which a fire has run; having been surface-sown with grass, it is now carrying most luxuriant pasture. Approaching Whangarei, at Hikurangi, the limestone crops out, overlying coal-deposits, and around Whangarei itself the soil becomes a rich volcanic, in a high state of cultivation. South of Whangarei Harbour, and from there to Auckland, the Crown lands generally are of a broken character, with soil varying from alluvial swamps—as in the case of the Tokatoka Swamp of 16,000 acres—to the limestone areas round Maungaturoto, the sandstone and clay lands of Rodney County, and the poorer clay-lands immediately north of the City of Auckland, which have, however, proved eminently suitable for fruit growing.
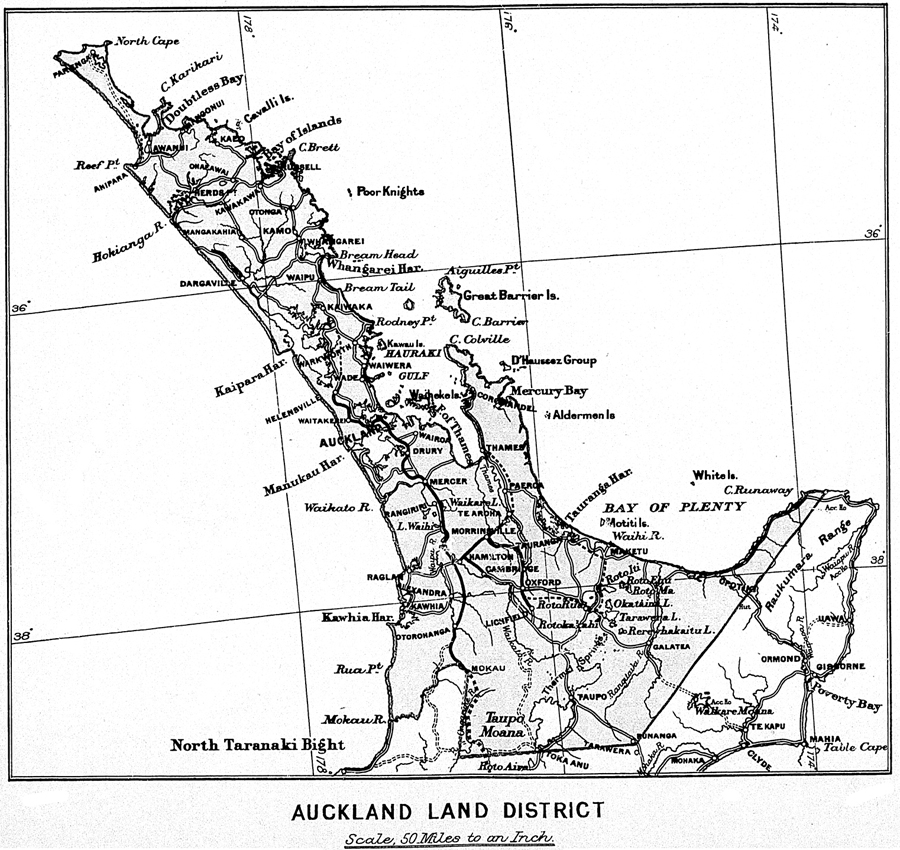
For about 200 miles south of Auckland the land (with the exception of the Cape Colville Ranges) is, generally speaking, far less broken, and gradually opens out into large tracts of level country in the Waikato and Waipa basins. Immediately south of Auckland the land is rich volcanic until it is gradually superseded by the prevailing clays; the greater portion of Manukau County, for thirty miles south of Auckland, may be classed as pastoral, and under cultivation as such. The Crown areas available for settlement—say, 16,000 acres—are chiefly in the Otau Parish, varying from volcanic clay to ordinary clay land, forest-clad and well adapted for pastoral purposes. In the Counties of Waikato, Raglan, Waipa, Piako, West Taupo, and Kawhia, we have a still greater diversity of soils, whilst on the right hand (Raglan County) there are large areas of rich limestone country, broken, but with rich black soil, and carrying most luxuriant grass. The lower Waikato County consists of clay soil and extensive swamps almost undrainable, but at a distance of eighty miles from Auckland is reached the flat and undulating country, lying chiefly within the Waikato and Waipa basins, and within the valleys of the Piako and Waihou Rivers, formed mainly of alluvial deposits of rhyolite sands brought down from the volcanic districts. In the Kawhia County there are some 300,000 acres of excellent limestone land, a large portion of which is heavily timbered, with numerous warm valleys. The greater portion of this land is now being acquired by the Government from the Native owners. Beyond this there is a large stretch of country consisting alternately of open valleys and forest-clad hills, a fair proportion of which is good land, both pastoral and agricultural. The County of Coromandel, with portions of Thames and Ohinemuri Counties, is chiefly devoted to the mining industry. The soil is nearly all clay, the land very broken, but will be suitable for pastoral purposes when cleared of the dense forest that now covers it. The western portion, however, of the Thames and Ohinemuri Counties contain large areas of alluvial and swamp lands, in the hands of the Crown, but through want of drainage not yet available for settlement.
In the County of Tauranga, the clay lands extend from Te Aroha Mountain to Katikati Entrance, changing, near Tauranga, to sandstone and black pumice soil of rich character, which improves towards Te Puke and Maketu, where the land is all good and more or less volcanic. In Whakatane County there are very extensive swamps, a good deal of which is drainable, and back from the coast seven miles or so are large areas of Crown lands, broken and forest-covered, open for settlement. The soil is chiefly clay or light loam, with alluvial flats in the valleys, and all well watered. This description of country extends to the boundary of the land district. The coastal lands are nearly all alluvial flats, and in a high state of cultivation, and the settlers well-to-do.
Briefly to set forth the capabilities and suitabilities of the Crown lands in the district, it will suffice to say that north of the Bay of Islands and Hokianga the land is chiefly suitable for two classes of persons. The gumdigger has the range over large areas of Crown lands upon paying a small fee, and his earnings average from 10s. to 6s. a day. In and around Hokianga, with its harbour- and tidal-waters covering some 250 miles of water-frontage, almost anything can be grown, from the tropical banana to the more prosaic potato, whilst oranges and lemons flourish side by side with all kinds of apples, pears, and plums. Wheat does fairly well, and maize gives a return of 50 to 60 bushels an acre. Sheep also do well, and most of the lands, when properly grassed with artificial grasses, will carry two or three sheep to an acre; but ordinary rough-grassed lands only one and a half to two sheep per acre. The clearing of forest-lands, ring-fencing and grassing them, will cost about £3 to £3 10s. per acre. The same remarks apply to the Bay of Islands and Whangarei, and right down to Auckland. Round about Whangarei district, and under similar conditions of culture, the average return per acre for good agricultural or pastoral lands would be fully 12s. per acre per annum. South of Auckland, throughout the Waikato, Piako, Waipa, Raglan Counties, and thence south to the district boundaries, the land is both agricultural and pastoral. All the cereals do well, wheat averaging 27 to 30 and up to 40 bushels per acre, and oats 30 bushels per acre. Potatoes average from 5 to 7 tons per acre. Dairy farming is carried on, yielding (upon well cultivated farms) a net profit of 15s. to 20s. an acre per annum. Whilst sheep-farming yields a profit of from 5s. to 7s. 6d. a sheep per annum, on very large estates, with greater losses from disease, £c., the average return would be 4s. per sheep. The cost of clearing fern and scrub is generally from 7s. to 10s. an acre, and laying down fern-land by surface-sowing and harrowing is generally about 17s. an acre.
The seaward counties of Tauranga and Whakatane are both agricultural and pastoral, growing wheat and maize alike to great perfection. In fact, the County of Whakatane, upon its alluvial shores and uplands, grows the greater portion of the maize produced in the district, and from the ports of Whakatane and Opotiki in one year have been exported some 34,000 sacks. In these counties the average yield of wheat has been from 22 to 25 bushels per acre, oats about 29 bushels per acre, and maize 45 to 60 bushels per acre. It is quite possible within this district to select land early in the winter, fell and burn off by the ensuing summer, sow in seed in the autumn, and put on stock within twelve months from selection.
The rainfall during the year averages about 39in., the greater portion of which, as a rule, falls between the 1st of May and 1st of November, or during the winter and spring months. Owing to the constant changes of wind, induced by the configuration of the coast-line, the narrow distance between the two coasts, and the influence, greater or less, of the trade-winds on the coast, it is quite common for some neighbourhoods to have double the rainfall of others, even though separated only by a distance of twenty miles. Droughts of more than a couple of months are practically unknown, and grass is always abundant.
One of the chief means whereby the great healthiness of the climate is maintained is the constant presence of fine breezes, blowing both summer and winter, the prevailing winds being north-east and south-west, and very seldom passing into really heavy gales. In the middle of summer, the sea-breeze during the day and the land-breeze at night are almost unvarying.
The City of Auckland is situated in a narrow neck of land on the southern side of the Waitemata Harbour, between the eastern and western coasts of New Zealand, and has one of the best harbours in the colony. From the sea and neighbouring hills the city and surrounding country present a beautiful view, especially from Mount Eden, the top of which can be reached by driving. Clusters of houses cover hill and vale. Facing the town are the green headlands and suburban boroughs of the North Shore, and the remarkable peak of Rangitoto; inland are seen many other extinct volcanoes covered with cultivation, while at sea the spacious Gulf of Hauraki or Thames is studded with islets. The suburbs of Birkenhead, Northcote, Devonport, Newmarket, Newton, Parnell, Arch Hill, Eden Terrace, Epsom, Mount Albert, Mount Eden, Mount Roskill, One-tree Hill, Point Chevalier, and Remuera surround the city. Many have fine suburban residences with gardens and shrubberies. The city is unrivalled for its commercial position; it has at its door water-communication from both sides of the Island, and to the north the Kaipara and Wairoa Rivers (connected by rail with Auckland) leading almost to the Bay of Islands, and to the south the Waikato and Thames Rivers leading into the heart of the Island, give it excellent natural facilities for inland communication. The population of the city in 1891, with that of the suburbs, amounted to 51,287 persons. The city is well supplied with gas and water, and amongst public buildings may be noticed Government House, the new Government Offices, Post and Telegraph Offices, Supreme Court, £c. There is a Free Public Library and Art Gallery, and a good Museum, which contains probably the best Maori collection in the world. The Auckland University College is affiliated to the New Zealand University. Amongst public buildings the Victoria Arcade, the Exchange, Harbour Board Offices, hotels and clubs, with many commercial buildings, compare favourably with those in other parts of the colony. There are admirable recreation-grounds, including the Government Domain of about 180 acres, with the Botanic Garden and the Albert Park in the centre of the city. There is a tramway system extending through the suburbs. Auckland has numerous industries, including, amongst others, shipbuilding, sugar-refining, timber-converting, sash-and-door, and numerous other manufactories; rope-and-twine, pottery, brick-and-tile, varnish, printing-offices, £c. A description of the Waitemata Harbour will be found in the special article on Ports and Harbours, p. 310, and the Calliope Dock is also described in detail in p. 328.
Auckland and suburbs, with its 51,000 persons, is the centre from which all railway-, road-, and steamer-communication radiates. From it, by rail, all the Crown lands south of Auckland are reached, while the Kaipara Railway connects it with the country north of Helensville. All lands to the north and along the Bay of Plenty coasts are reached from its wharves by the Northern Company's steamers. The chief centres to the north are,—
Warkworth, on the East Coast, forty miles from Auckland, with communication by coach and steamer nearly every day. It is a thriving township, with post- and telegraph-office, public halls, hotels, £c., and is the starting point for the Tauhoa and Pakiri Crown lands. It is also the site of important hydraulic lime-and-cement works. A good deal of agricultural and pastoral farming is carried on in its neighbourhood.
A still more important centre on the West Coast is Helensville, on the Kaipara Harbour, reached by rail from Auckland, and distant thirty-six miles. It has all the conveniences required by travellers in the shape of good hotels, stores, £c., and is the starting-point of the river-steamers running to all places in the Otamatea and Hobson Counties. It is also one of the main centres for sawmilling, and for the export of balk timber by large vessels to other colonies, and has several flax-mills in operation.
Whangarei, on the East Coast, is distant seventy-five miles from Auckland, with which it has steam communication twice a week. The town is a very thriving and important place, having a population approaching 1,000, and is the centre of a large and well-cultivated agricultural and pastoral district. In the neighbourhood is also a large coal-bearing and gum-producing district, while the export of oranges and lemons, which thrive magnificently on the rich volcanic soil, is developing. From here a coach runs weekly to Kawakawa upon the arrival of the Northern Company's steamer, and from it, by carriage or horse, all lands can be reached within a radius of thirty to forty miles.
Dargaville, on the Wairoa Rivet, is a town of about 500 inhabitants, with all conveniences for travellers. It is reached by rail and steamer from Auckland three times a week. Dargaville is the starting-point of the Kaihu Valley Railway, which is open for traffic for twenty miles from the town; and from the terminus of the railway all the Crown lands are reached, even so far north as Hokianga. The town is also the centre of a very large timber export. There are only two townships of any importance north of Dargaville—Port Rawene, or Hokianga, and Kohukohu, about four miles further up. Both have post- and telegraph-stations, and comfortable hotels, with fortnightly steam-communication from Auckland.
Kawakawa, at the head of the tidal portion of the river of the same name, is connected by a short railway-line with Opua, which is the calling-place of steamers from Auckland. Kawakawa possesses good accommodation for travellers, and a branch of the Bank of New Zealand. From it coaches run weekly to Hokianga and Whangarei. It is the centre of a coal and gum industry, and port of export for these products. The old town of Russell is situated further down the bay, and has good accommodation for travellers, besides having post-and telegraph-office, also a branch of the Bank of New Zealand. Whangaroa and Mangonui are reached weekly by the Northern Company's steamers. Whangaroa is famed for its exquisite scenery, and is the centre of a large timber- and gum export trade. Mangonui is the starting-point and centre from which all the Crown lands in the Mangonui County are reached, by vehicle or horse, and from it also the steamer “Staffa” runs to Awanui and ports beyond, in connection with the weekly steamer from Auckland.
South of Auckland, along the Waikato Railway there are numerous townships of more or less importance, but no starting-point for Crown lands, until Mercer is reached at forty-three miles. It is situated at the borders of what is known as the Waikato Country, upon the Waikato River, which is tidal up to this point. Mercer is the centre of a large flax industry, and has post- and telegraph - office and other conveniences. At sixty-five miles from Auckland by rail is Huntly, also on the Waikato River, a flourishing township, with a very large output of valuable coal. It has also pottery, brick-, and tile-works. On the opposite side of the Waikato River, large areas of Crown lands are being brought into cultivation, and are carrying many sheep and cattle. The next town is Ngaruawahia, or Newcastle, seventy-four miles from Auckland, situated at the junction of the Waikato and Waipa Rivers, with hotels, bank, post- and telegraph-office, It is a centre from which portions of Crown lands in Raglan County are reached, and also from it river-steamers run north and south to the various settlements. Ngaruawahia has a flourishing creamery, a brewery, and a coopering establishment. At eighty-four miles from Auckland the train reaches Frankton Junction, where the line branches off to Hamilton, Te Aroha, and Oxford, the main line going to Te Awamutu, ninety-nine miles from Auckland. The latter is a thriving town, but to reach available lands for future settlement the traveller passes on by rail to Otorohanga and Te Kuiti, fifteen and twenty miles further on respectively, at both of which places there are accommodation-houses, forming convenient centres for visiting the fertile limestone undulating lands in the vicinity. Hamilton is a busy, flourishing town, situated on. both sides of the Waikato River, with a population of about 1,300 persons, and is the centre of a large agricultural and pastoral district. It possesses a creamery, flax-mill, brewery, and two soap-factories, besides other local industries. Cambridge comes next, about thirteen miles by road and fifteen miles by rail from Hamilton, with a population of about 900, and is the head-quarters of the Farmers' Club. It is surrounded with a good agricultural and pastoral district, and is a busy, thriving township. Between Hamilton and Cambridge, and in the district around, there are numerous creameries, cheese- and butter-factories; wine- and cider-making is also successfully pursued, and there are several apiaries from which large quantities of honey are produced, There are three flour-mills in the district, one at Cambridge, one at Hamilton, and the third at the terminus of one of the before-mentioned branch lines. Te Aroha is 116 miles from Auckland—a quiet township, celebrated for its thermal springs and good hotels; and, being situated upon the Waihou or Thames River, is also reached by steamer by the way of the Thames.
The towns at the Thames and Coromandel are essentially mining townships. The first is situated thirty-eight miles from Auckland, by steamer, on the Frith of Thames and at the mouth of the Waihou River: it has a population of about 5,000 persons. There is daily steam communication with Auckland, and connection with Paeroa and Te Aroha by a railway now in course of construction. Coromandel is about thirty-five miles from Auckland, with which it has constant communication by steamer; it is another mining centre, situated at the head of the picturesque harbour of the same name. Tauranga, with a population of about 1,100, is situated on the harbour of that name on the Bay of Plenty, and is reached by coach from the Thames, and from Rotorua; it has also constant communication by the steamers with Auckland, and with Matata, Whakatane, and Opotiki. From the fact of its harbour being the only one on the East Coast capable of receiving large vessels, it is bound to be of importance in the future. Tauranga has a new and well-appointed flour-mill upon the Waimapu River, also a chemical and sulphuric-acid and a cheese factory.
Opotiki, the second town of importance, is situated about sixty-five miles by steam and road from Tauranga. It has weekly steam communication with Auckland: and also with Gisborne by a bridle-road. It is the head-quarters of the maize-producing district, and has rich alluvial lands, from which good returns are obtained, It is a good starting-point from which large blocks of Crown lands suitable for pastoral purposes may be reached. The township of Rotorua is situated on the shores of Rotorua lake, at a distance of 172 miles from Auckland. The railway now in course of construction will probably be open next year, when travellers can reach it from Auckland in one day. It is the chief township in the hot-lakes district, and has also a large area of fairly good Crown land near, adapted for pastoral purposes, and considerable quantities of sulphur are obtained from its neighbourhood.
In the Mangonui County the Crown possesses 31,460 acres of fairly good forest-lands, fairly accessible.
In the Bay of Islands County there are only about 25,000 acres of available Crown land, both forest and open, but the Natives still own about 156,000 acres, chiefly forest-land, except about Kaikohe, where it is open and rich volcanic land, most of it broken, but fit for settlement.
In Hokianga County there are some 209,000 acres of available Crown land, of good quality, nearly all covered with forest; and fit for immediate settlement. The Natives still own some 127,000 acres, nearly all good land, and fit for settlement.
In Whangarei County there are only about 20,000 acres of available Crown land, mostly broken and forest-clad. The Natives still retain some 54,000 acres of land, some of it being very rich.
In the Otamatea County the Crown retains only about 18,000 acres, a good deal of this being alluvial swamp, and well worth draining. The Natives still own about 20,000 acres, but not much of it is fit for settlement.
In the Rodney and Waitemata Counties about 25,000 acres of Crown lands are left, most of it fit only for pastoral or fruit-growing purposes. The Natives still own about 14,000 acres in these two counties, some of it very good land.
In the Manukau County the Crown owns some 18,000 acres of broken forest land, fit for pastoral purposes. The Natives still own about 15,000 acres, a portion of which is fairly good.
In the Waikato and Raglan Counties the Crown lands amount to about 23,000 acres, all fairly good land, mostly forest, and easy of access In Raglan County the Natives still own the freehold of 150,000 acres, all good land but difficult to secure.
In the Coromandel, Thames, and Ohinemuri Counties there are about 50,000 acres of available Crown lands. In the last two counties a good deal of the land is swampy, and requires draining before being available. The Natives still own 60,000 acres, much of which is very good.
In Tauranga, Whakatane, and Rotorua Counties the Crown owns 70,000 acres, nearly all forest-clad and generally broken, but in the last-named county the Natives retain a very large area, the greater part too broken and too much covered with pumice or volcanic ash to be fit for settlement.
In the Kawhia and West Taupo Counties the Crown is acquiring from the Natives large areas of very good land, all fit for settlement and easy of access. About 300,000 acres are really first-class land, and about 1,000,000 acres fairly good land, all suitable for pastoral purposes, and accessible from the Main Trunk Railway-line.
Table of Contents
The Taranaki Land District is situated on the western side of the North Island of New Zealand, at about its widest part, and may be said to be the most compact and fertile district of the colony, for, with the exception of the upper half of Mount Egmont, and of the ranges ajoining, which absorb about 36,000 acres, the whole of the area—minus what is taken up by the rivers, streams, and lakes—is suitable for settlement, and certainly two-thirds of the district is good land. The gross area of the district is 2,430,000 acres.
Of mountains, the principal one is the beautiful volcanic cone from which the district takes its name, Taranaki, otherwise called Mount Egmont, which has an altitude of 8,260ft. This mountain is the centre of distribution for a radius of twenty miles of the volcanic formation known as the “drift,” which covers the volcanic rocks below an altitude of 3,000ft. Hummocks composed of trachyte boulders and cement crop up here and there and make excellent metal-quarries.
Beyond the volcanic formation, that is, from about Urenui on the north and Hawera on the south, the country is generally broken, and the formation is known as papa, a calcareous blue clay, capped in many places by shelly limestone.
The northern portion, between the Tongaporutu and the Mokau Rivers, contains also limestone, greensands, and coal outcrops. At Pauirau, a small tributary of the Mokau, about thirty miles from the sea, there is an isolated patch of volcanic agglomerate and tufas, which formation obtains also at the northeastern corner of the district.
Eastward of the base of Mount Egmont there are few, if any, mountains worthy of the name, although there are many ranges varying in height from 1,000ft. to 1,500ft. above sea-level, and in a few instances—such as the Mate-mateonga and Waiaria Ranges—they run up to 2,500ft.
The principal river is the Wanganui, which bounds the district on the east between Taumarunui and Pipiriki, a distance of about ninety miles. Its average width is about three chains. For nearly the whole distance it is shut in by high precipitous hills, and in many places by perpendicular walls of rock, very grand and beautiful to look at but somewhat impairing the usefulness of the river as a highway, rendering the land difficult of access from the water or vice versâ. The scenery is very grand and beautiful. There are numerous rapids but few of them are dangerous to skilful canoeists. A steamer runs regularly from Wanganui to Pipiriki, a distance of fifty miles. The principal tributaries of the Wanganui on the Taranaki side are the Ongaruhe, Ohura, and Tangarakau Rivers.
The next river in size is the Mokau, bounding the district on the north. It is navigable for small steamers, of 20 tons or 30 tons, as far as the coal mines, about twenty miles from its mouth; and for canoes as far as Torotoro, twenty-six miles further up. Several outcrops of coal are found on its banks, and, as limestone is also present, the river is likely to become the most important waterway of the district. The scenery on either side, although on not quite so grand a scale as that of the Wanganui, is very beautiful.
The other large rivers are the Waitara and Patea. The former has its source about midway between the coast and the Wanganui River, in an easterly direction from Pukearuhe, between New Plymouth and the Mokau. 1t is about a hundred miles in length, and runs out at the Town of Waitara, about ten miles north-east from New Plymouth. There is a bar at the mouth, but steamers of 300 tons can enter safely in calm weather, and, although there are numerous rapids on its course, it is navigable for canoes for about ninety miles.
The Patea River rises in Mount Egmont, and, after traversing a tortuous course of about 110 miles, runs out at the extreme southern end of the province. It has a bar-harbour, with a depth of 13ft. to 14ft. at spring tides. Steamers of from 40 tons to 50 tons trade regularly to the town of Patea, which is built a mile or so north of the mouth. The Patea is navigable for canoes for fifty miles.
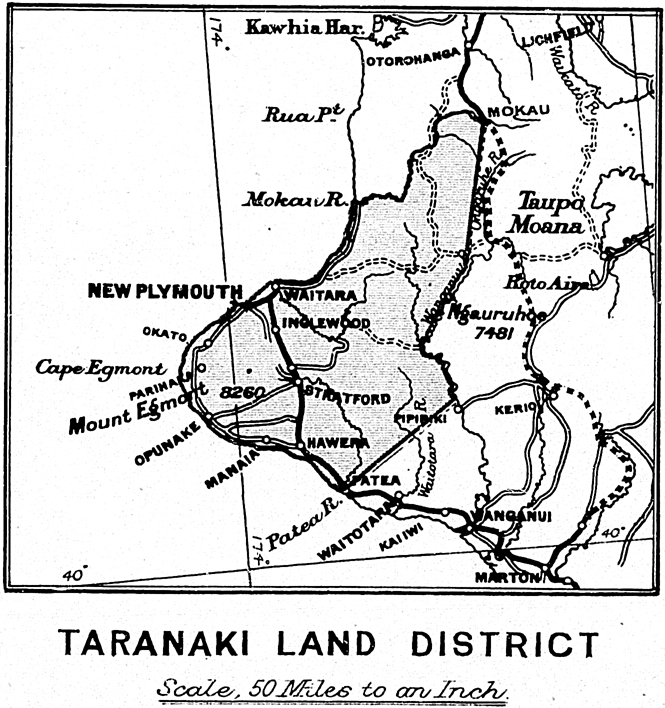
Besides these rivers there are many smaller ones, and streams innumerable—in fact, no district in the world could be better watered, and at the same time so secure from disastrous floods. It is estimated that between the Mokau and the Patea there are no fewer than eighty-five named streams emptying themselves into the Tasman Sea, fully sixty of which flow from Mount Egmont.
The only absolutely level country is the Ngaere Swamp, which is open land, 4,500 acres in area, and situated in the Ngaere Block (Native land), close to Eltham.
There are no plains, properly so called, in the district, although the stretch of very fertile country lying between the Waingongoro and Otakeho rivers is known as the Waimate Plains, and comprises an area of about 25,000 acres. Of this area 13,500 acres have been disposed of, and the remainder, 11,500 acres, has been handed back to the Natives as a reserve.
There are no lakes worthy of the name. The largest sheet of water is Lake Rotokare, situate about twelve miles from Eltham; it is about half a mile in length with an average width of six chains. There are also a few small lakes at the southern end of the district inland from Waverley.
The whole of the district, with the exception of a fringe of open country along the coast from Pukearuhe to Patea, averaging three miles in width and containing about 250,000 acres, and some valleys at the north-eastern corner of the district, about 150,000 acres in extent, was originally covered with heavy forest. Estimating the area already cleared for settlement at 170,000 acres, it will be seen that there still remain about 1,850,000 acres under bush.
The larger timber is chiefly rata, rimu, matai, tawa, kahikatea, kohekohe, pukatea, rewarewa, hinau, with a few totara scattered here and there. Among the smaller trees may be mentioned the kotukutuku or fuchsia, karaka, and mahoe.
As regards the timber industry, there are altogether eleven sawmills, and the total quantity cut last year (1892) was 8,000,000ft., chiefly rimu (red pine), kahikatea (white pine), and matai (black pine).
An area of 72,565 acres, measuring six miles on every side from the summit of Mount Egmont, has been set apart as a forest-reserve. At about two miles within the reserve the forest begins to get stunted; and at three miles it gives place to low wiry scrub, which ceases at four miles, or an elevation of about 4,000ft. At 5,000ft. the moss ends; beyond this point to the summit the mountain is composed of loose scoriæ and lava.
A commodious mountain-house has been built at an elevation of 3,000ft. on the northern face of the mountain, at a distance of nineteen miles from New Plymouth by the Junction and Egmont Roads. Fifteen miles can be driven over, and the remaining four ridden. In fine weather, when the snow is off, the mountain can be ascended without risk, by several routes.
The volcanic soil, the boundaries of which have been already described, varies a good deal in quality. The best is believed to be on the south side of the mountain—between Stratford, Hawera, and Opunake, but not less than two or three miles from the forest-reserve boundary. It is believed that the country now being opened to the north and east of the volcanic deposit—that is, the papa and limestone formation—will, from the presence of lime, be much richer and more lasting as pasture-land than that around the mountain. The carrying-capacity of the land is, on an average, three sheep to the acre.
Taranaki is essentially a grazing and dairying district, its chief product being butter—of which, during the year 1891, there were 1,727 tons exported: valued at £145,068. There are at least twenty dairy-factories scattered over the district.
Agriculture has not hitherto been carried on largely. The total area under grain-crops this year (1893) was 5,641 acres; under green and other crops, 7,316 acres; while the total area under all kinds of crops, including sown grasses, was 381,588 acres.
The average yield of different grain-crops, in bushels, per acre, was last season:—Wheat, 26; oats, 37; maize, 21; barley, 28.
The only mining going on at present is at the Mokau coal-mines, situate as already remarked, about twenty-four miles up the Mokau River. The output for last year (1892) was 1,150 tons, as against 3,713 in 1891. The coal is sold at New Plymouth, at 30s. per ton, for domestic purposes, for which, when mixed with coke, it answers very well.
Ironsand is found in great abundance on the seashore from Mokau to Patea, a distance of 130 miles. It produces, when smelted, from 50 to 60 per cent. of iron of the finest quality. The first attempt to smelt this sand was made in 1848, and several trials have been made since, but the heavy cost of production and the absence of capital and modern appliances, have, so far, retarded the industry.
The climate of Taranaki is remarkably healthy, without any extremes of temperature.
Below is given a table of mean temperatures for the ten years ending December, 1874:—
| Jan. | Feb. | Mar. | April. | May. | June. | July. | Aug. | Sept. | Oct. | Nov. | Dec. |
|---|---|---|---|---|---|---|---|---|---|---|---|
| 64.4 | 65.1. | 61.1 | 57.5 | 53.8 | 50 | 49.3 | 49.3 | 52.9 | 55.8 | 59.1 | 63.1 |
From which it will be seen that the greatest difference was 15.8.
The average rainfall at New Plymouth is about 60in. for twelve months, or an average of 5in. per month. But it varies considerably with locality; for instance, at Waipuku, on the highest point of the railway, about east from Mount Egmont, the annual rainfall is 10ft.
The principal town of the district is New Plymouth (population about 3,500), situate on the seashore, about two miles from, and to the north-east of, the picturesque rocky islets known as the Sugar Loaves. The general appearance of the town is very attractive, and it abounds in neatly-kept gardens. The Recreation Grounds, from which a good view of Mount Egmont is obtained, form a favourite resort.
New Plymouth is 258 miles by rail from Wellington, the railway running in a northerly direction through the district from Patea to Sentry Hill, where it turns at right-angles westward for about eight miles to New Plymouth. From Sentry Hill there is a branch line to Waitara two miles distant.
The Port of New Plymouth is situated at the Sugar Loaves, as already stated, two miles from the town. Protection for shipping is provided by a concrete mole or breakwater running in a north-east direction for a distance of 1,900ft. Under the lee of this there is wharf-accommodation provided for the coastal trade. Steamers of 500 tons can be berthed here in almost all weathers. The wharf is connected with New Plymouth by both rail and road. The breakwater was built at a cost of £200,000, borrowed under security of one-fourth of the land-revenue of the Provincial District of Taranaki, and the right to levy a rate over certain lands. The present rate levied is 3/4d. in the pound on the capital value.
Manufactures in New Plymouth are represented by a sash-and-door factory, a boat-, a butter-keg-, and three coach-factories. There are also an iron-foundry, tannery, and a flour- and bone-mill. The town has both water and gas laid on.
Hawera, the next largest town, is situate on the eastern edge of the Waimate Plains. The population is about 1,300. The Wellington-New Plymouth railway runs close to it and it is distant about forty-eight miles by rail from New Plymouth. Hawera is surrounded by a first-class grazing country.
The Town of Patea is situated on the coast, at the extreme southern end of the district, and has a population of about 700. There is a splendid grazing district inland, with a large area of land yet to be opened up. The principal industry is the canning, freezing, and boiling-down of meat. A dumping-plant has been erected lately by the Harbour Board; and last year (1892) 4,672 bales of wool were shipped. Corn, grass-seed, tallow, £c., are also largely exported.
Stratford, a comparatively young town, about midway between Patea and New Plymouth, is making rapid strides. It is about 1,000ft. above sea-level, and has a bracing though somewhat moist climate. The main road to Auckland—known as the Stratford–Mangaroa Road—starts here. It has been formed as a cart-road for twenty-one miles, and the remaining distance is in course of construction. If the work is continued, communication with Auckland should be opened up in about two years' time.
The Town of Waitara is situated at the mouth of the river, and about ten miles north-east from New Plymouth. The population is about 500. The chief industry is the freezing of meat, which is carried on by the Mount Egmont Freezing Company. The works are fitted with all modern requirements, and are capable of dealing with 400 sheep or thirty bullocks daily. The company has been in operation since August, 1890, and has exported in two years and a half ending March, 1893, 32,000 quarters of beef = 5,378,780lb.; 20,500 sheep = 1,161,848lb.; 4,050 lambs = 178,304lb: total, 6,718,932lb.
Besides the above, nearly 7,000 boxes of butter, 3,000 bales of wool, and large quantities of cheese and other produce have been exported. The steamers of the New Zealand Shipping Company and the Shaw-Savill and Albion Company call at Waitara every month, and the frozen meat is conveyed to the steamers in large barges specially insulated with charcoal and supplied with cold-air connections from the main engines. These barges can carry from 1,200 to 1,500 frozen sheep each.
The only other towns of importance are Inglewood, Opunake, and Manaia.
The chief means of communication is the railway from Wellington, which traverses the district between Patea and New Plymouth—a distance of sixty-six miles. Trains run every day between New Plymouth and Palmerston North—174 miles—and on Tuesdays and Fridays there are through - trains between New Plymouth and Wellington—258 miles. The Main North Road runs from New Plymouth, passing through the towns of Waitara and Urenui; it is formed as a cart-road as far as Pukearuhe, a distance of thirty miles. From here a horse-track connects with the Mokau and Awakino Rivers, and from Awakino there is a track to Te Kuiti, in the Auckland Province. About midway between New Plymouth and Waitara on the above road, the Mountain Road diverges and runs almost due south, and chiefly along the railway, for a distance of forty miles, connecting with the Main South Road at the Town of Hawera. This is at present the principal road in the district, tapping, as it does, large numbers of district roads, and passing through the towns of Inglewood, Midhirst, Stratford, Eltham, and Normanby.
The East Road branches from the Mountain Road at Stratford, and is formed for a distance of twenty-one miles; it is being extended into the interior so as eventually to connect with Auckland, and will open up a large area of fertile country.
The Main South Road from New Plymouth follows the trend of the coast to the south, and was at one time the coach-road to Wellington. It passes through the villages of Omata, Oakura, Okato, Rahotu, Otakeho, Manutahi South, and Kakaramea and the towns of Opunake, Manaia, Hawera, and Patea.
The Junction Road runs south-east from New Plymouth, and crosses the Mountain Road at Inglewood. It is formed and partly metalled for twenty miles beyond this point. Eventually it will connect with the East Road at a distance of thirty miles from Stratford. This road bisects a number of district roads; hence its name.
The Opunake Road runs from Stratford to Opunake, twenty-six miles, skirting the southern base of Mount Egmont. It is formed and metalled for twelve miles from Stratford and seven miles from Opunake; the remainder is open for horse-traffic only.
The Eltham Road runs from Eltham to Opunake, twenty-five miles, connecting with the Opunake Road at Punehu, seven miles from Opunake. This is formed throughout and partly gravelled.
The other main roads in course of construction are the Mimi Road, branching from the Main North Road at the Mimi; the Motukawa Road, diverging from the Junction Road near Tarata; the Anderson Road, leaving the Mountain Road near Eltham; and the Waitotara Valley Road, starting from the Main South Road at Waitotara Township.
| Acres. | |
|---|---|
| Crown lands available for settlement | 400,000 |
| Taumatamahoe, Whitianga, and Maraekowhai
Blocks, Native lands being acquired | 234,000 |
| Native lands undealt with | 630,000 |
| 1,264,000 | |
Of the above about 150,000 acres are open valleys and hills in the north-east corner of the district; a good deal of it more or less pumice-land, but still suitable for grazing. From the rest we may subtract perhaps 10,000 acres for area absorbed by rivers, gorges, £c., and there remains 1,104,000 acres of forestland yet to be dealt with. Of this area, perhaps 50,000 acres, made up of strips of flats and terraces, may be suitable for agriculture, while the balance–1,154,000 acres—will be good pastoral land.
It may be said, in conclusion, that there is every sign of genuine prosperity within the district, which has advanced rapidly during the last three or four years, and will, no doubt, continue to do so.
Table of Contents
The Land District of Hawke's Bay comprises the portion of the east coast of the North Island from Cape Turnagain northwards to Lottin Point, about thirty miles beyond the East Cape, and embraces an area of 6,063,000 acres. Its western limit is defined by the Ruahine, Kaweka, Ahimanawa, Raukumara, and other high ranges that form the water-shed between the rivers flowing through it to the sea and those that flow in the opposite direction to the West Coast and the Bay of Plenty. The Ruahine Range extends northwards from the Manawatu Gorge for about sixty miles to the Ngaruroro River, its altitude varying from 3,000ft. to 6,000ft., and the summit, for a considerable length, is snow-clad during winter months. The Kaweka is a shorter range, of an altitude of 5,650ft., very rugged and steep, also covered with winter snows. From these ranges, which fall abruptly on the Hawke's Bay side, the land slopes gradually to the sea, forming in some parts fine rolling hills—the essence of a sheep-country—and in others extensive plains, with comparatively little of what may be called poor land.
It is this part of the district that contains the largest portion of the population, and, from the extent of arable land it possesses, it is likely in the future to be thickly peopled. At the last census (1891) the holdings in this part embraced 2,300,000 acres, carrying 2,519,534 sheep and 52,060 cattle, and the population, inclusive of towns and villages, was 27,593.
Napier, the chief town, is situated on the peninsula known as Scinde Island, which is joined to the mainland by a narrow shingle-bank of several miles in length. It is a busy town with a population of about 8,500. The shipping trade—which is especially active during the wool and frozen-meat seasons, as the large exports show—is carried on a short distance from the town, at Port Ahuriri; but will, before long, in a large measure be transferred to the fine breakwater which is now advancing towards completion.
The country to the south is tapped by a railway running from Napier to Palmerston North, passing through several towns and villages, the principal being Hastings, a rising place of 2,500 inhabitants, Waipawa, Waipukurau, Dannevirke, and, finally, Woodville, situated near the Manawatu Gorge, and distant ninety eight miles from Napier. It is at this end of the district that the Crown has in the last few years successfully planted settlements, and, in place of the dense continuous forest known as the Seventy-mile Bush of earlier days, there are now prosperous townships with various thriving industries established.
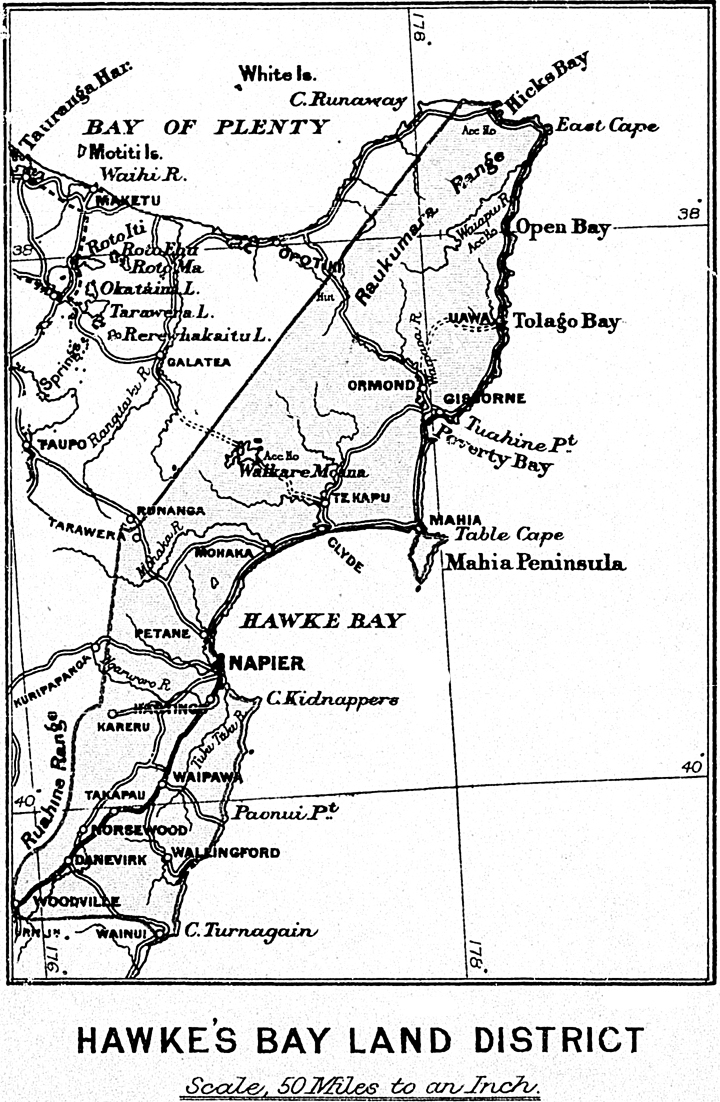
The only main road going northward from Napier is the coach route to Taupo, which, soon after leaving the fertile Petane Valley, traverses poor country, and, twenty-five miles out, enters the light pumice soil.
Next in order northwards from Napier is the Wairoa County. Though there is here a fair extent of good agricultural land it is essentially a pastoral country. A considerable area has, in late years, been occupied as sheep-runs, while some 17,000 acres at the Mahia end has been taken up in moderate-sized holdings under the perpetual-lease system. The county town is Clyde, a picturesque place situated on the Wairoa River, which is navigable for vessels of light draught as far as Frasertown. Owing to there being no road from Napier fit for vehicles, the whole traffic has to be done by small steamers.
The Wairoa Valley and adjacent country is noted for its grain and fruit-producing qualities. Lake Waikaremoana, so famous for its magnificent scenery, is about thirty-five miles distant, the road to it for about twenty-five miles can be driven over, the remainder of the journey must be done on horseback. The lake is about eleven miles in length, with a breadth of eight miles. It is surrounded by precipitous mountain-ranges, wooded to the water's edge, and, for natural beauty, can hardly be surpassed.
A road runs northward from Clyde through more or less improved land, passing through the village of Tiniroto, and on to Gisborne, a distance of seventy-five miles. For a considerable length it runs over very hilly country, and, as it has not been gravelled, wheeled traffic between the two towns is suspended during the winter months.
Gisborne, the trade centre of what is known as the Poverty Bay District, is a prosperous town of about 2,500 inhabitants, rapidly increasing in size and importance, owing to the large quantity of unimproved land in the Cook County which is becoming settled and made productive.
At the date of the last census there were nearly half a million sheep in the county, and since then much fresh land has been broken in, and the stock largely increased in number.
The plain behind Gisborne, of about sixty-five square miles in extent, which has been settled for many years is very fertile, well cultivated, and bears a large population. Apart from this, the land in the Cook County is for the most part fine rolling country, mixed with rough ranges, with varying classes of soil, and is best adapted for sheep-farming.
Communication between Gisborne and Opotiki, in the Bay of Plenty, is carried on by a road, which has been formed for fifty miles, to the edge of the Motio Forest, in the neighbourhood of which Crown lands are open for selection; from there onwards the travelling has to be done on horseback.
The Waiapu County, so far as settlement goes, may be said to be in its infancy. The bulk of the land is still in the hands of the Natives, and much of it has not yet come before the Native Land Court for investigation of title. There is here a large extent of good country, both agricultural and pastoral, chiefly the latter, and doubtless the county has a great future before it. Formed roads for wheeled traffic are few in number and not continuous, but small steamers trade regularly along the coast, calling in at Waipiro, Tuparoa, and Awanui, Kawakawa and other small bays.
The Hawke's Bay Land District is pre-eminently a sheep-grazing country. The aggregate of the holdings at the date of last census was 3,802,064 acres, and notwithstanding that a considerable amount is unused, or forest country—and therefore unproductive—while other parts are made use of for tillage only, it was at that time carrying 3,537,221 sheep, besides 75,693 cattle. The value of the wool exported during the twelve months ending 30th June, 1892, was considerably over a million pounds sterling, that shipped from Napier alone representing £935,500.
Freezing-works have been established at Woodville, Waipukurau, Tomoana, Napier, and Gisborne, and the export of frozen meat from the port of Napier alone during the same period was of a value of £195,639, while further shipments were made from Gisborne. This industry gives employment to a large number of persons, both directly to those engaged in breeding, shearing, freezing, and shipping, and indirectly to those who labour at bush felling, grass-seed sowing, fencing, and otherwise opening-up new country. Nor must the cutting of the immense amount of firewood consumed at the works be forgotten. All this benefits the settler with limited means, by providing him with funds to improve his holding, and to this is due, in a great measure, the general prosperity in the settlements.
Agriculture is not carried on to the extent it might be with so much land suitable for root- and grain-crops. No doubt this is due to the profits made in sheep-farming. It is chiefly confined to the Heretaunga Plains and the flat lands near Gisborne. The soil is favourable to root-crops; potatoes range from 12 to 15 tons to the acre, and in some instances exceed this amount. Only a moderate quantity of grain is grown, barley, for which the soil seems well adapted, returning from 20 to 60 bushels to the acre, and those of a good sample.
Settlers are now turning their attention to dairying, and lately factories have been established in the bush-districts, at Norsewood, Maharahara, and Woodville, whilst several others are in contemplation. At the last-mentioned town a cheese-factory has been in existence for some years which turns out an excellent article much sought after in other parts of the colony.
The Timber industry is extensive, numerous saw-mills being in full work in different parts of the district. In the forest between Takapau and Woodville there are twelve, with an estimated yearly output of 10,000,000ft. This tract of forest is the one most utilised for milling purposes, and will yield a plentiful supply for a long time to come, notwithstanding that for years past a large amount of totara timber has been taken out of it to send to other parts of the colony. Further north there is no totara in any quantity, though rimu, white pine, and other milling timbers are to be found scattered throughout the forests, and in the Poverty Bay district puriri is found in considerable quantities.
Other industries, such as fellmongery, soap-works, boot-, coach-, and sash- and door factories, £c. are established in the principal towns.
The climate is generally of a mild character, and though hot along the coastlands in the height of summer, it is, owing to the dryness of the atmosphere, not so relaxing as that of parts of the Island farther north. The rain-fall is light, excepting in the bush districts and high inland country.
Napier itself is recommended by many medical men as a resort for individuals suffering from pulmonary complaints, chiefly on account of the mildness of its winter season.
The land held by tenants of the Crown under the various systems of tenure amounts to 473,544 acres, and there remains about the same quantity to be disposed of. The remainder is for the most part suitable for pastoral purposes only, any fit for agriculture lying in small isolated spots, widely scattered, and such as could not be selected independently of the surrounding inferior land. This, with little exception, is broken forest country, fitted more for sheep than cattle, and having an average carrying capacity, when cleared, of one sheep to the acre, though the best of it might possibly graze from two to three. One block of 4,000 acres now open for selection near Pohui is hilly, with limestone formation in parts; another of 8,000 acres at Nuhaka North is high country with light soil. There is another and larger block in the Motu District, near the horse-track from Gisborne to Opotiki, and about fifty miles from the former town, also hilly forest country, but, notwithstanding its height above sea-level, well adapted for grazing. There are about 400,000 acres of Crown lands not yet thrown open for selection, partly lying in the Hangaroa and Motu Districts, Wairoa County, and partly back country in the Waiapu County. The bulk of this is forest-clad and very rough, though the soil is fair.
Of the Native lands in this district, a very considerable portion has been leased to Europeans, but there still remains in the hands of the Maoris a valuable estate, comprising both agricultural and pastoral country, and including some 800,000 acres of excellent land that has not yet come before the Native Land Court for investigation of title. This land lies for the most part in the Waiapu County, in the direction of the East Cape.
Table of Contents
The Wellington Land District is bounded on the north by the districts of Auckland and Hawke's Bay, on the west by that of Taranaki, on the east by the sea, and on the south and south-west by Cook Strait. The area contained within these limits is about 6,000,000 acres. It lies between the parallels of 39° and 41° 30′ South latitude; its greatest length north and south is about 180 miles, and its mean width east and west about sixty miles.
The district is divided into two well-defined parts by a mountain range, which forms part of the backbone of the North Island. At its northern end this range—there known by the name of Ruahine, and averaging a height of about 4,000ft.—divides Wellington from Hawke's Bay, but after passing the point where it is intersected by the Manawatu River, flowing from cast to west right through it, the range takes the name of Tararua for many miles, until at about forty miles from its termination on the shores of Cook Strait, it divides into two main ranges, known respectively under the general names of Rimutaka and Tararua, both ranges averaging from 2,500ft. to 3,500ft. in height, the highest point being Mitre Peak, 5,154ft. Parallel to the main range, and divided from it by the Wairarapa Plain and the undulating country to the north, are a series of ranges at a few miles inland from the East Coast, known as the Puketoi, Taipo, Maungaraki, and Haurangi Ranges. Lying on the northern border of the district are the Kaimanawa Ranges, an offshoot from the Ruahine, which are generally open and grass-covered, rising to a mean height of about 4,500ft. Westward from the latter mountains, and divided from them by a deep, broad valley, in which low the Waikato and Wangaehu Rivers, is the volcanic chain of mountains in which are situated Ruapehu (8,878ft.) and Ngauruhoe, an active volcano, 7,515ft. high. The long, sweeping curve of Cook Strait, forming the south-western limit of the district, from the Patea River to within twenty miles of Wellington, is bordered by a comparatively level and undulating country, now nearly all under cultivation, which has an average width of about fifteen miles. This country is one of the finest parts of the colony, and is celebrated for its stock-raising capabilities. It was originally in a great measure an open country, though the southern part, where the plain is narrowed in between the sea and the Tararua Range, has a good deal of forest on it, which is fast disappearing under the axe of the settler.
Inland of this coastal plain, at varying distances from the sea, the country gradually rises to a mean height of about 1,500ft. to 1,800ft., and becomes a good deal broken in character. It was originally almost entirely forest-clad. It is much cut up by rivers and streams flowing from the interior to the sea, the principal of which are, commencing from the north: the Waitotara, the Whanganui, the Whangaehu, the Rangitikei, the Oroua, the Pohangina, and the Manawatu, which, after leaving the gorge in the Ruahine Ranges, runs through a plain country to its mouth in Cook Strait. All of this broken country is composed of papa, or marly formation, which takes grass excellently, and promises in the near future to be a large sheep-carrying district.
At about fifteen miles south of the volcanic peaks of Ruapehu Mountain the papa country terminates in a fairly well-marked escarpment, giving place to a more level and undulating country formed of volcanic matter, the greater portion of which is forest-clad, though on the south-east, east, and west sides of that mountain there are open grassy plains, of no great fertility, but yet suited to pastoral pursuits.
To the eastward of the main range formed by the Rimutaka and Tararua Ranges is the great depression known in its southern end as the Wairarapa Plains, which gradually rises northwards from the lake of that name into wooded, somewhat broken country, of no great height, at a distance of some forty-five miles from the sea. From here the country falls again slightly to the Upper Manawatu River, the depression in this part being marked by the extensive flats in the neighbourhood of Pahiatua, and by the shallow valleys of the Mangahao, Mangatainoko, and Tiraumea Rivers and their branches. For thirty miles from the sea this great valley is mostly open, with patches of forest here and there, but becomes more plentifully supplied with wood at the base of the Rimutaka and Tararua Ranges. The quality of the soil varies from light and stony on the Wairarapa Plains proper, to rich papa country as the northern end is approached. The southern end of this country, the whole of which is (or was) forest-clad, is watered by the Ruamahanga River and its tributaries. Generally the district is a pastoral one, though agriculture is also pursued successfully. The neighbourhood of the Puketoi Ranges is in many places composed of limestone, and promises in the future to become a very rich pastoral district, such as will carry a considerable population. In the forks formed by the Tararua and Rimutaka Ranges the Hutt River takes its rise, and runs in a southerly direction through an undulating or level country, finally falling into Port Nicholson. The valley contains some very fine land, generally held in small holdings. The slopes of the bounding ranges are everywhere clothed in forests.
The Wellington District is essentially a forest district, for out of the six million acres contained within its borders, 3,400,000 are still under forest. Settlers must therefore look forward to having to make their farms by felling and burning the bush before grass can be sown, and, as it takes from ten to fifteen years before the plough can be used in bush land, the principal industry must be for many years of a pastoral character, for which purpose the climate and soil are admirably adapted. It is generally calculated that the cost of felling and burning ordinary bush varies from 25s. to 35s. an acre. To this must be added about 20s. for seed and fencing. It is no uncommon thing for a return to be received at from twelve to eighteen months after felling. The usual practice is to put sheep on to the new lands soon after the grass has obtained a good hold. The process of improving the lands by the gradual “logging up” and burning of the fallen tree-trunks is a long one, but the result pays, and in the end fine pasture lands are obtained on the hills, and agricultural lands on the flats.
It may be said that the Wellington Land District contains within its borders the greatest amount of good land in the North Island, very little of it except the mountain tops being unfitted for use, while some of it is of very superior quality, suited for the growth of productions of every temperate clime.
The district is well provided with means of communication, both by sea and by land. Leaving out of account the interprovincial coastal trade, which centres in Wellington, the capital of the colony, there are lines of steamers running along both coasts northwards, calling at the smaller ports, more especially in the wool season.
In the matter of railways, the completion of the line now forming from Eketahuna in the Wairarapa Valley to Woodville on the Napier–Palmerston line, will make this district very easy of access from its chief port, Wellington. Starting from that city, the line runs up the Hutt Valley, over the Rimutaka Ranges into the Wairarapa Valley, passing several flourishing townships on the way, and terminating at present at Eketahuna, a distance of 93 miles. On the west coast, a line of railway departing from the same city crosses the lower end of the Tararua Ranges, and from their western bases runs through a fertile and populated country to Patea, on the north-western border, 192 miles from Wellington, and beyond that place to New Plymouth. At Palmerston, a branch line from the above, after passing through the Manawatu Gorge, traverses the greater part of Hawke's Bay, terminating at the Town of Napier. Near Marton another line of railway branches off from the same line, and turns inland towards the northern end of the district. About 19 miles of this have been formed, and its further extension is still in progress. This line will eventually tap the large area of available lands on the northern border of the district. The total mileage of railways open in the Wellington District on the 31st March, 1893, was about 340 miles.
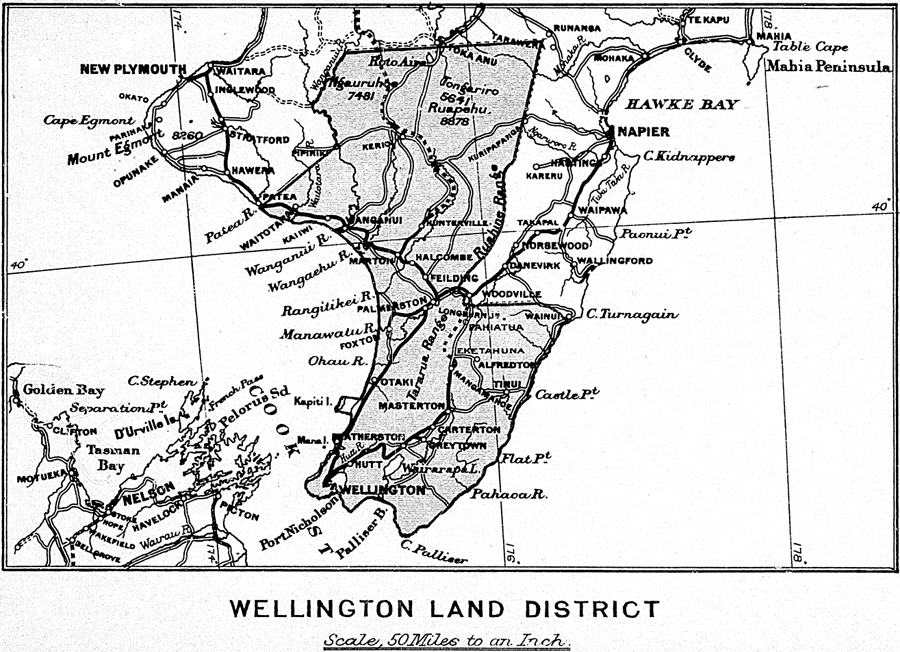
Connected with the railways are innumerable roads, many of these first-class ones, serving to give access to the remoter settlements and unoccupied Crown land. One main line of road is now nearly completed, which, leaving Hunterville on the Main Trunk Railway, runs northwards the whole length of the district, and effects a junction with the Auckland roads; this line will be much used in the near future as a route for both settlers and tourists visiting the interior lakes and mountains. Another main road is also under construction, and will be open for traffic in the summer of 1893, which, starting from Napier in an easterly direction, passes over the Ruahine Mountains, and, after traversing the undulating and level country round the foot of Ruapehu Mountain, eventually strikes the Whanganui River at Pipiriki, a distance of fifty miles from the mouth.
Inland water communication is confined to the Whanganui River, up which a little steamer runs once a week from Wanganui to Pipiriki. Beyond that point the river is navigable for canoes to Taumaranui, in the Auckland District. The scenery on the river is very fine, and along its banks a reservation of a mile in width has been made, to preserve the native forests from destruction, and so retain for ever the beauty of this noble stream. Steamers proceed up the Manawatu River for a few miles to the Town of Foxton, which is connected with the railway system of this district. The Patea and Waitotara Rivers are also both navigable for canoes for some distance from their mouths, and the former is entered by small steamers.
On most of the main roads connecting with the railways coaches are running, conveying passengers and mails to the more distant settlements, while all the principal towns are connected with the rest of the world by telegraph or telephone communication. Public schools are found in every part of the district wherever a few families are congregated together.
Wellington is at present a wool and meat-producing district, as is proved by the large area under grass in 1893—viz., 1,843,420 acres; but in addition a considerable amount of grain, flax, timber, butter, and cheese is turned out each year. The meat-freezing industry has been greatly developed the last few years, and is likely to extend, from the simple reason that most of the new country under process of settlement will be suitable only for pastoral pursuits for many years to come. There are freezing-works at Wellington, Wanganui, and Long-burn. The price of sheep has increased enormously since meet-freezing began; the trade has therefore been very far-reaching in the benefits it has conferred on the country settlers. The country round Wanganui, Waitotara, and Patea, in the north-western part of the district, is celebrated for the quantity and excellence of the cattle raised there, and exports largely to other parts of the colony. The following figures will show the average return per acre of grain, &c., for the year 1893: Wheat, 22.04 bushels; oats, 31.54 bushels; barley, 26.47 bushels; hay, 1.59 tons; potatoes, 7.09 tons. The flax-industry is a considerable one, the Town of Foxton and its neighbourhood producing the greatest quantities. Sawmills are to be found all over the district where the means of communication allow of it, the timbers cut being principally totara and red-pine, both of which are largely used in house-construction and other works. Many of the native woods are very beautiful, but at present are utilised only to a small extent. The soil and climate are well adapted for the production of butter and cheese, and hence we find creameries and butter-factories increasing in number very considerably each year, and the export constantly augmenting.
The coasts of Wellington are not so well supplied in this respect as are some other parts of the colony; but what is lost in number is made up in a great measure by the excellence of its principal one—Port Nicholson—which, from the position it occupies, at the meeting-point, as it were, of the coastal traffic of both islands, and from its sheltered position and depth of water, may be considered one of the most convenient harbours in the world. The Whanganui River, which has been considerably improved by artificial means, is the second port in the district, and has a considerable trade carried on by coastal steamers. Patea and Manawatu Rivers are also used by the coastal steamers, whilst several other places along the shore afford shelter and stopping-places, according to the direction of the wind. The extension of railways along both coasts has, in a large measure, done away with the inconveniences arising from want of harbours.
The capital of the colony—Wellington—is situated in the south-west angle of Port Nicholson, on Lambton Harbour. The wharfage-accommodation here is inferior to none in the colony, and the wharves present always a busy scene of life with the numerous steamers and sailing-vessels continuously discharging or taking in passengers and cargoes. From two to four ocean-going steamers are not infrequently seen alongside, loading with wool, frozen meat, and other products, for conveyance to Europe. The port possesses a patent slip at Evans' Bay, within a short distance of the city. Founded in 1840 by the New Zealand Company, the city occupies the flats skirting the original shoreline, long since obliterated by the reclamation of the foreshore, which is now mostly covered with fine buildings. Rising directly from the old shore-line is a range of hills, the lower parts of which are all built over. The presence of hilly country round the harbour—some of which is still wooded—adds greatly to its beauty, and gives it the appearance of a lake. The population of the city in 1891 was 31,021. Being the seat of Government, it contains the residence of the Governor and the head-quarters of the Government departments, which are located in what is said to be the largest wooden building in the southern hemisphere. There are several noticeable public buildings, amongst which must be enumerated the General Post Office, the Government Life Insurance Offices, Public Library, School of Art, and Harbour Board Office. The city is lighted by electricity, and its streets are well kept and clean, whilst an excellent supply of water is obtained from the Wainui-o-mata River, on the other side of the harbour. The principal industries consist of iron- and brass-foundries, factories, sawmills, soap-and-candle works, boot-factories, aerated water, meat-freezing works, railway workshops, coach-building, woollen factories, rope-and-twine works, sash-and-door factories, brick-, tile-, and pottery-works, besides innumerable other smaller works of various kinds. The city is increasing with rapid strides; its excellent position, together with the fine back-country, places it in the front rank of New Zealand towns.
Wanganui, situated near the mouth of the river of that name, is the oldest town in the district next to Wellington, from which it is distant 151 miles by rail (the distance by sea being only 100 miles). It is the centre of an excellent farming district, and has a considerable trade and several manufactories. Near the mouth of the river are some extensive freezing-works, the meat from which is conveyed by lighters to the large English steamers lying off the mouth of the river. The town is lighted with gas, and has a good water-supply. Not far from it are some extensive railway workshops. Altogether, it is a thriving place, with a population, in 1891, of 5,011.
Palmerston is an inland town at the junction of the Wellington–New Plymouth and the Palmerston–Napier Railways. It is situated on a fine plain in the midst of a most excellent farming district, which extends for many miles in all directions. It is 88 miles from Wellington, and 110 miles from Napier. It is lighted with gas, and is well equipped with all requirements for a town of its size, and is increasing at a rapid rate. Its population was, in 1891, 4,303.
Masterton is situated at the head of the Wairarapa Valley, on the Wellington–Eketahuna Railway, sixty-seven miles from the capital. It is the centre of an agricultural and pastoral district, and contained a population of 3,114 in 1891. It is lit by gas, and has several industries, such as fellmongery, rope-making, flaxmills, coach-factory, &c., and, in addition, has some excellent fish-breeding ponds, from which many of the rivers in the colony have been supplied with trout.
Greytown North is situated on the same line of railway, near the middle of the Wairarapa Valley, fifty-three miles from Wellington. The chief industries are sawmills, coach-factory, &c. The population in 1891 was 1,141. A few miles further north is the town of Carterton, where are to be found timber-mills, cheese-factory, &c., and a population of over 1,100 persons. Featherston is also in the valley, near the head of the Wairarapa Lake, and is fifty miles by rail from Wellington.
On the west coast of the district are the following townships: Feilding, distant 104 miles from Wellington by rail, with a population of 1,583; the centre of a very fine district, and the outlet of a large inland district, fast becoming settled: Marton, 123 miles by rail from Wellington, with a population of 976; also the centre of a very fine district, and near where the Main Trunk Line of railway turns off to the north: Halcombe, 112 miles distant from Wellington; besides many smaller towns, such as Foxton, Bulls, Ashurst, Hunterville, &c., all situated in thriving agricultural and pastoral districts.
The climate of Wellington District is healthy and mild, the mean annual temperature (in the city) being 54.8, whilst the mean rainfall is 48.3in. per annum. The rainfall differs, however, according to locality. In the interior and near the ranges it is much greater. The top of Ruapehu Mountain is covered with perpetual snow, which lies also on the tops of Kaimanawa, Ruahine, and Tararua in the winter. Frosts also are heavy in the interior. The area of lands still left in the hands of the Crown to be dealt with in the Wellington District is about 596,000 acres—exclusive of hill-tops, lakes, &c., which cover an area of about 64,000 acres. Lands still in the hands of the Natives amount to about 340,000 acres, much of which is of good quality.
The Marlborough District, occupying the north-east corner of the Middle Island, and containing 2,560,000 acres of land, is most advantageously situated for trade; the principal port, Picton, one of the best harbours in the colony, being only fifty-three miles by sea from Wellington. The district throughout is mountainous, but none even of the highest peaks are covered with perpetual snow, though Tapuaenuka, on the East Coast, attains an elevation of 9,462ft., or 1,192ft. higher than Mount Egmont.
In the northern part of the district, bounded by Cook Strait, numerous deep fiords and bays run far into the land. The principal inlets are Queen Charlotte Sound, with the Town of Picton at its head, and Pelorus Sound, on which Havelock is situated. Four considerable rivers—the Wairau, Awatere, Clarence, and Conway—rise near the western boundary of the district; the two former, running east and north, fall into Cook Strait; the latter, taking a southerly and easterly course, discharge into the sea on the eastern side of the Island. These rivers water large and fertile valleys, but none can be entered by vessels except the Wairau, which is navigable for small steamers for about ten miles from its mouth. In the northwestern portion of the district metamorphic schists, similar to the rocks on the Westland and Otago goldfields, occupy a small area, and rise into hills from 2,000ft. to 4,000ft. elevation, amongst which the Wakamarina, Wairau Valley, and Mahakipawa Goldfields, and the Endeavour Inlet Antimony-mine are situated. Coal has been discovered in the neighbourhood of Picton and in the Clarence Valley, but none has been as yet successfully worked within the district. A narrow belt of white tertiary limestone, suitable for building purposes, extends with small interruptions from Cape Campbell to the boundary of the Canterbury Provincial District.
The Marlborough land may be divided into three classes: open land, generally covered with associated grasses, forest-land, and intermediate, or land partly forest partly covered with scrub, fern, or other rank vegetation. This original condition of the soil naturally gave rise to a localisation of industries, and a very unequal distribution of the population. Thus the open country was taken up for pastoral purposes; in the forest country the timber industry developed, and the intermediate land passed into the hands of agriculturists. Though agriculture is now extending into the pastoral and forest country, and considerable areas of forest-land have been cleared and laid down in grass, the portions of the district characterized by the respective industries are still well defined.
The Wairau Plain, containing about 65,000 acres, on which stands Blenheim, the capital of Marlborough, is the principal block of agricultural land within the district. The soil, generally good, is on the lower or seaward side of the plain extremely fertile, especially near Blenheim, which is surrounded by numerous fine gardens, well sheltered with trees. The average yield of wheat (for the plain) is about 25 bushels per acre; of oats and barley 35, of peas 30, and of potatoes 6 tons per acre. Hops have been successfully grown for many years in the neighbourhood of the town, but owing to the high price of labour their cultivation has not extended. Eighteen miles of railway connect Blenheim with Picton, where vessels load for London and other foreign parts. Besides this it has direct communication with Wellington, the Opawa, a branch of the Wairau River, being navigable by steamers of light draught to where the town is situated. The plain, traversed in all directions by good macadamised roads, and dotted over with numerous homesteads standing amidst well cultivated fields, and surrounded with trees, has already an Old-world appearance. More than half the population of the Marlborough Land District—12,782 according to the last census—is centred in the town of Blenheim, and on the Wairau Plain.
The second agricultural centre is in the neighbourhood of Kaikoura; the land, extending along the base of Mount Fyffe, between the Kohai and Hapuku Rivers—about 13,000 acres in extent—is held in small or moderate-sized farms. The soil is good, the block known as “The Swamp,” between Mount Fyffe and the Peninsula, being particularly rich. Kaikoura has direct steamer-communication with Wellington and Lyttelton, and receives a weekly mail, carried by coach from Blenheim. The population of the town and suburban riding is 1,060, the remainder of the county containing only 400.
About 1,700,000 acres of the Marlborough Land District is at present devoted to keeping sheep. In this is included 900,000 acres of Crown land, held under leases that expire for the most part in 1896. The leaseholds in the northern part of the district contain a large extent of scrub- and fern-covered country, now producing little or no food for sheep, but capable of improvement. The total number of sheep depastured is 821,000, distributed as follows amongst the counties into which the land district is divided: Marlborough County, 542,000; Kaikoura County, 193,000; Sounds County, 86,000. On the natural pasture of the open country merino sheep are almost exclusively kept, the land carrying from half to one sheep per acre. In the forest country, on sown grass, the land keeps from two to four crossbred sheep per acre.
The direct exportation of frozen meat from Picton to London commenced in 1892, when 16,433 carcases were shipped. This year, 1893, the quantity will be nearly double; a large number of sheep having been driven overland from Nelson, viâ the Pelorus Valley. Much of the open land near the coast is well adapted for agriculture, and must eventually be brought under crop, but at present, owing to the sudden rise in the value of sheep, the tendency is in an opposite direction. On many of the small farms near Kaikoura mutton is now raised where corn was formerly grown. Though this land was originally destitute of trees, it grows several foreign species well. On many of the runs plantations are beginning to relieve the monotony of the grass-country.
A railway is now in course of construction from Blenheim to the Awatere Valley. When it is completed the low tableland between the Ure and Awatere Rivers—about 200 square miles in extent—will be almost an extension of the Wairau Plain.
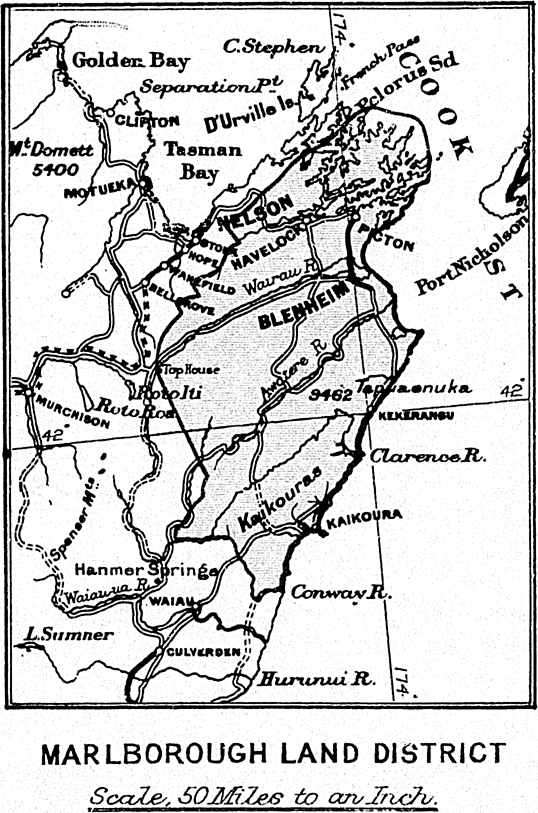
The portion of Marlborough north-west of the Wairau River, extending to the boundary of the Nelson Land District, and including the County of Sounds, in all about 280,000 acres, was originally covered with dense forest. In the valleys, and on the lower hill-slopes, rimu, kahikatea, matai, totara, miro, and tawa were the principal forest-trees. The higher portions of the hills and steep spurs were clothed with the various species and varieties of birch (beech), to which, along the shores of the Sound, were added pukatea and kohekohe, locally called cedar. During the last thirty-three years sawmills have been at work in various parts of this district. Thirty-two mills have been erected and worked for longer or shorter periods. Havelock, on the Pelorus Sound, is the present head-quarters of the timber trade. Five sawmills are at present working: two in the Pelorus Sound, cutting railway-sleepers; one in the Onamalutu Valley; and one in the Kaituna Valley, cutting for the local market; and one at the mouth of the Pelorus River, cutting for export. The hills along the shores of the Sound will for many years furnish birch sleepers; there are other timbers left in places, but nowhere sufficient to justify the erection of a mill, unless pukatea wood, hitherto neglected, could be utilised. It is a light tough timber, well adapted for packing-cases. The quantity of pine-timber remaining in the Kaituna and Onamalutu is small, but there is a good supply of birch and other wood suitable for fencing and firewood. On these valleys the Wairau Plain is mostly dependent. Messrs. Brownlee and Co's mill, at the mouth of the Pelorus River, is now the only mill working regularly throughout the year. The present output is 3,640,000 superficial feet per annum, but the machinery is capable of producing 5,000,000ft. annually, working eight hours per diem. The Pelorus Valley, with its tributaries the Rai and Wakamarina, still contains about 200,000,000ft. of convertible timbers, exclusive of the birch, of which there is a large amount of the best quality on the hills and terraces. The value of the sawn timber produced in 1892 on the company's wharf was £11,000.
Settlers following in the wake of the sawmills have already converted much of the land worked over into grazing-farms. The land is of three descriptions: alluvial flats, terraces, and hillsides. On the flats, confined to the larger valleys, the soil is rich, producing heavy crops of oats, hay, beans, and potatoes wherever it has been brought into cultivation. The terrace-land varies much in quality, but generally grows good grass, as do also the hills on which tawa formerly grew; the birch country being very barren. On the small bush-farms, cattle-grazing is the chief pursuit; out of over 7,000 head kept in Marlborough, 4;000 belong to the forest country. Along the shores of the Sounds large areas of hill-land have been taken up on lease, and are now being cleared and laid down in grass expressly for keeping sheep; but generally throughout the forest country the holdings are small or moderate-sized; hence it is—alter the Wairau Plain—the most populous portion of the district.
A steamer runs fortnightly between Havelock and Wellington, delivering mails at Ketu Bay, Maud Island, Homewood, and Maori Bay, in the Pelorus Sound. The Sound also receives a weekly mail from Picton, which is conveyed by steamer to Torea, in Queen Charlotte's Sound, and thence overland and by boat to Kenepuru and Manaroa. Between Picton and Havelock there is a bi-weekly service, viâ Cullensville, on the Mahakipawa Goldfields; and a coach runs on alternate days from Blenheim to Nelson, and from Nelson to Blenheim, delivering mails en route at Canvastown in the Pelorus Valley, at Havelock, at two offices in the Kaituna Valley, and at Renwicktown on the Wairau Plain.
In the neighbourhood of Kaikoura, along the base of Mount Fyffe, and in the Hapuku Valley, there is another small block of forest-land, in which three small sawmills have been erected. One is now working in the Hapuku, cutting for the local market. The quantity of timber suitable for sawmill purposes in the block is very limited, but it will furnish the neighbouring country with firewood and fencing for many years.
The original distribution of the open and forest lands of Marlborough was entirely due to climatic causes. At Cape Campbell, one of the barest places in the district, the annual rainfall is only 23.25in.; in the Pelorus Valley, the centre of the forest country, it is over 65in. This difference between the climates of the north-western and south-eastern portions of the district explains why the artificial-pasture land, when compared with the natural pasture, supports such a large amount of stock. Winter and spring are the wettest seasons, hence the dry climate is not unfavourable for agriculture. Wherever the soil is suitable, crops sown in winter and harvested in early summer can be successfully grown. Everywhere near the coast the range of temperature, considering the latitude, is very small. The thermometer seldom falls below 30°, or rises above 78°. Along the shores of the Sound the mildness of the winter, owing to the curious distribution of land and water, allows lemons, oranges, passion-fruit, figs, and other sub-tropical fruits to be grown in favourable situations. On the lower hills and terraces of the forest country the chestnut (Castanea vulgaris) grows rapidly, and commences to bear fruit in five or six years. A few trees planted in the Pelorus Valley about twenty years ago are now yielding annually about 2cwt. of nuts a tree. In all parts of the low country the common English fruit-trees—apple, plum, pear, cherry, £c.—yield abundantly; the fruit, owing to the clearness of the atmosphere, being of excellent quality. In the high country, where snow falls occasionally during winter, the red, white, and black currants can be produced in such quantities that, with little labour, they might become an article of export to the warmer parts of Australia.
Flaxmills have been at work in Marlborough since 1869, but the industry has up to the present time been very unsteady, the number of mills varying with the fluctuations of the market. Thirteen mills, running fourteen strippers, are now working. Of these, ten are in the Wairau Valley and on the plain, one in the Pelorus Valley, one on the East Coast, near the Ure River, and one in the Kaikoura Swamp.
In connection with one of the mills a rope-factory has been established, in which binder-twine, made of short flax or tow, is the main product. At Springlands, near Blenheim, there is another twine-factory, the produce finding a market on the surrounding farms.
Around the whole of the Marlborough coast, from the mouth of the Conway to near the French Pass, the sea abounds in fish. Within the Sounds, and amongst the islands of Cook Strait, hapuku, schnapper, moki, barracouta, haturi, kahawai, and rock-cod are extremely plentiful. Immense shoals of the southern herring (Clupea sagax) and of anchovies (Engraulis encrasiclus) frequent the inlets at certain seasons of the year, and quantities of fresh fish are exported thence to various places within the colony. As steamers arrive at and leave Picton daily, shipments can be made without delay to all parts.
A small quantity of oysters, mostly procured in Queen Charlotte Sound, is annually exported from Picton. With culture, the supply might be almost indefinitely increased, many of the sheltered bays in both Sounds being well adapted for the purpose. What is now being done along the Marlborough coast is a mere trifle compared with what might be accomplished if capital and knowledge were brought to bear on the fishing industry.
Two meat-preserving factories have been at work in Blenheim since 1886, tinning rabbits, mutton, and vegetables for exportation.
In Picton and Blenheim there are large malting establishments, also producing for export, as the excellent quality of the barley grown on the Wairau Plain insures a ready market.
Flour, the product of the Wairau mills, is shipped from Picton to other parts of the colony, the Marlborough District producing annually a surplus of all the most important articles of food.
Table of Contents
The Nelson District comprises the north and north-western portion of the Middle Island, the greater part being high and mountainous, and on the western and inland ranges covered with dense forest to the bush-limit, reaching from 4,000ft. to 4,500it. Cape Farewell, the northernmost point, is situate at the western entrance of Cook Strait, on the south side of which lie Golden or Massacre Bay, and Tasman, more commonly called Blind Bay, with a depth of fifty four miles from its entrance. The town of Nelson is built at the head of this bay. The former bay derives its name from the massacre of a boat's crew belonging to Tasman, who visited it on the occasion of his discovery of New Zealand in 1642. From Separation Point, on the western side of Blind Bay, a range of mountains from 3,000ft. to 4,000ft. in elevation extends southward to Mount Murchison. It consists of a granitic formation, with slates, limestone, and sandstone belts. From Pelorus Sound, on the east, commences another range—a portion of which is serpentine, forming a mineral belt immediately south of Nelson City. It reaches an elevation of 6,000ft., and runs in a south-westerly direction to the St. Arnaud Range, terminating in the Spencer Mountains, a large central mass attaining a height of 8,000ft. above the sea-level. To the westward of the Spencer Ranges and those on the further side of Blind Bay are the Brunner, Lyell, Marine, and Tasman Mountains, from 5,000ft. to 6,500ft. in height. Still further westward along the coast are the Paparoa, Buckland Peaks, and Papahaua Mountains, about 4,500ft. at their highest eievation, and the Whakamara Range, extending from Rocks Point to Cape Farewell. There are also a number of isolated mountain-masses here and there through the district.
The inland Spencer Mountains are the source of the principal rivers of the district south of the Buller River, and are thus described by Sir Julius von Haast: “On the southern slopes of this wild alpine-stack we find the principal sources of the Grey, or Pohaturoha; on its north-east side the sources of the Wairau; on its eastern side those of the Acheron and Clarence; and in the deep recesses of these snow-clad giants those of the Waiau-ua, or Dillon: so we may say that, with the exception of the Takaka and Aorere, which fall into Massacre Bay, the Wangapeka and Motueka, which run into Blind Bay, the Karamea and smaller streams which reach the sea on the West Coast to the north of the Buller River, all the rivers of any size in the northern part of this Island take their rise in this magnificent chain.”
The Buller River derives its source at a point about sixty miles south-west from Nelson, where it flows out of the beautiful alpine-lake Rotoiti, 1,800ft. above sea-level, lying at the foot of the lofty St. Arnaud Range, the peaks of which are 6,000ft. in height. This river breaks through the massive mountain-chains of the interior in a transverse or easterly direction, forming, where it receives no tributaries, a succession of magnificent rocky gorges, and finally discharges its waters into the ocean on the West Coast.
The Grey River, also discharging it waters on the West Coast, takes its rise out of Lake Christabel, near the western flank of the Spencer Range. It has a very large basin, and numerous tributaries, of which the Ahaura is the chief.
The rivers on the eastern side, named above as taking their rise in this district, flow through mountain-ranges and open valleys utilised as pastoral lands, with the exception of certain plains hereinafter described.
The lakes of the district are alpine in character, surrounded by grand mountain- and bush-scenery. Rotoroa, lying south-east of Mount Murchison; Matiri, to the west of the Owen Range, 980ft. above the sea; Lakes Tennyson, 3,614ft., and Guyon, 2,658ft., on the eastern flank of the Spencer Mountains; Lake Christabel, on their western flank; Lake Hochstetter and Lake Sumner, the latter 1,725ft., lying under Mount Emerson, 6,000ft. above sea-level.
The plains of this district are limited in extent, the principal being the Amuri, in the valleys of the Hurunui and Waiau-ua, in the centre of which rises a partly isolated mass of hills called the Percival Ranges, the highest peak of which is Mount Percival, 5,335ft. These plains, being well covered with native tussock-grass, were either purchased or taken up with pre-emptive rights as pastoral land very soon after the commencement of the settlement. The Waimea Plains, near Nelson, with the Lower Motueka, Riwaka, and Takaka Valley lands, formed part of the original settlement of the New Zealand Company, and are occupied mostly by small settlers. Inland are the Tirumea Plains, 1,100ft. above sea-level, and the Maruia, 1,300ft. These are, together, about 20,000 acres in extent. They are surrounded by high mountains heavily timbered, and the land is only of second-rate quality. On the West Coast the level lands are Totara Flat and Ikamatua Plains, in the Grey Valley; Mawhera-iti and Inangahua Valleys, lying on the eastern flanks of the Paparoha coastal range. There are also open pakihis at Addison's Flat, on the south side of the Buller, and low swampy lands on the north side, which form the delta of that river; northward are the lands forming the special settlement at the mouth of the Karamea, which are heavily timbered.
The area of the district is estimated at about 7,000,000 acres, of which the area of open land under 2,000ft. in altitude is, approximately, 1,835,000 acres; the area of forest-land under 2,000ft., about 1,745,000 acres; open land over 2,000ft., about 1,470,000 acres, including summits. The forest-lands may be approximately estimated at 3,290,000 acres, including good forest, mountain-forest timber, patches in gullies, £c. Of this area about 1,000,000 acres would, probably, be the utmost available for clearing. The timber on the western side consists of red- and white-pine, matai (or black-pine), totara, kawhaka (or cedar), rata, and occasional silver-pine, besides black- and red-birch (Fagus fusca). These varieties are also found, but in smaller areas, on the eastern side; birch preponderating. A large amount of timber is used in the mining industry for props and planking, and throughout the districts generally for shingles, fencing, firewood, sleepers, £c. There are thirty-four sawmills at work, with an output of about 8,000,000 superficial feet per annum.
Nelson has little land suitable for agriculture, and most of that little has been already taken up. Excellent barley is grown on the Waimea Plains, a small quantity of which is exported. Oats and chaff are sent in large amounts to the West Coast and elsewhere. Hops also form one of the chief exports. Wheat, maize, rye, and root-crops of most varieties are grown, and fruit is plentiful. The weekly wage of a farm-labourer is 20s. with board; without board he would receive 6s. a day. Ploughmen can get 25s. per week with board; without, 7s. 6d. a day.
The total area of pastoral ands held under the Crown by 331 tenants on the 31st March, 1893, amounted to 799,958 acres. By the last census-returns of April, 1891, there were 30,717 cattle and 898,738 sheep in the district. As the agricultural land is limited, settlers are turning their attention to the timbered mountain-slopes for grazing purposes. These, when the timber is felled and burnt, and the soil sown with suitable grass, will, after three to four years, carry about two sheep to an acre on fair soil, and more on the limestone soils. The cost of felling and burning green timber is from 15s. to 20s. per acre; cost of mixed grass-seeds and sowing, about 15s. per acre; and a good paling-fence on ordinary bush-lands with double No. 8 wires at top and bottom, with 1/2in. palings and 7in. posts sunk 2ft. in the ground, could be erected at about 12s. per chain.

The western side of the Nelson District was a terra incognita till about the year 1863, the date of the discovery of gold. Miners flocked in at first from the other goldfields in New Zealand, then from Australia, California, and other parts of the world, until in 1865 the whole coast-line was peopled from Broken River in the north to Jackson's Bay in the south. Mining, at first altogether alluvial, developed into quartz-reefing, and hydraulic-sluicing of large areas. The agricultural lands in the Grey and Inangahua Valleys were taken up and cultivated, and, as mining became a more settled industry, the miners occupied and tilled the non-auriferous alluvial flats in the many valleys. Hence at the present time a number of homesteads are scattered throughout the district.
Reefton and its neighbourhood forms one of the chief quartz-mining districts in New Zealand; and the West Coast, including Westland, contributes about 45 per cent, of the total amount raised in the colony. The oldest alluvial field is at Collingwood. Minerals other than gold found in the district are: silver, copper, chrome, antimony, manganese and hæmatite ores, besides various other minerals. Extensive deposits of coal are found on the West Coast, within the areas of the Grey and Buller Coalfields Reserves. Coal is also found in Collingwood in Blind Bay, in West Wanganui Inlet; and there are numerous smaller areas of coal-bearing strata here and there throughout the district. The output from the mines at work within the district during the year ending 31st December, 1892, was 378,582 tons. Copper-ore is found in a serpentine rock formation near Nelson, but the companies which have worked the ore have not hitherto been successful—the last one “The Champion,” failing from want of sufficient capital. Deposits of chrome-ore are also found here. Silver-ore has been worked in the Collingwood district; and at Parapara, in Blind Bay, the Onehunga Iron Company are starting to work the extensive deposits of hæmatite iron-ore, which are found combined with limestone and coal in the immediate neighbourhood. There is also a small industry in flax. It will be readily gathered from the above brief description that mining is the chief industry of the Nelson District.
The chief town is Nelson, situated at the head of Blind Bay, and surrounded on all sides, except the north, by mountains reaching an elevation of 3,500ft. With a mean temperature of 54° 8′ Fahr., and in the latitude of 41° 16′ S., it possesses a climate almost unequalled for its beneficial effects on invalids suffering from pulmonary diseases. There are many picturesque spots in the suburbs, and the town itself, with its cleanly-looking buildings and well-kept gardens, is one of the most charming spots in New Zealand. There is an old-established Boys' College and a High School for Girls, besides Government and other schools. The Anglican Pro-Cathedral, situated on the summit of a central hill, memorable as having been the site of fortifications erected in the early days of the settlement for defence against an expected attack of the Natives, is a striking feature. The Roman Catholic Church, Convent, and school-buildings cover a large extent of ground. There is also at Stoke, a small village three miles from Nelson, a central Catholic Orphanage, surrounded by grounds of considerable area. There is a good supply of excellent water from a reservoir in the hills at the back of the town, and the streets are well lighted with gas. The several Government departments are housed in one commodious building, containing a large hall used for Supreme Court sittings and other public purposes. Nelson has a small natural harbour, formed by a boulder-bank running eight miles parallel to the shore, deep enough at high tide to admit vessels up to 1,000 tons burden. It is a port of call for the Union Steamship Company's intercoastal steamers, and has a small local fleet plying between the West Coast, Blind Bay, Picton, and Wellington. The town is reached inland from the eastward by a good main road from Marlborough. A railway-line has been constructed up country to the southward for thirty miles, passing through the farming villages of Stoke, Richmond, Brightwater, Wakefield, Foxhill, and Belgrove. Leaving Nelson for the West Coast by a good main road, the traveller starts from the Belgrove station on one of Cobb and Co.'s coaches, passes over Spooner's Range, the Clarke and Hope River saddles, and enters the Buller Valley at the junction of the Hope, about sixty-seven miles from town. He then passes through a succession of views of mountain-gorge scenery, and, after traversing a gorge of seventeen miles in length, arrives at the Lyell, 107 miles from his starting-point. This is an Alpine township, in a small quartz-mining neighbourhood. Here is a noble cast-iron-girder bridge, spanning a rocky gorge of the Buller, and springing boldly from a bluff on the northern side. At 116 miles the junction of the Inangahua with the Buller is reached, the main road continuing to Reefton, with a branch road twenty-eight miles to Westport, which for twenty miles passes through the grandest river-gorge scenery in New Zealand.
Westport is the town next in importance to Nelson, situated at the mouth of the Buller River; the harbour being sheltered from southerly gales by Cape Foulwind and its outlying rocks. This port is accessible in nearly all weathers, and a large sum has been spent on a system of harbour-works, designed by the late Sir John Coode. This harbour is the shipping-port for the coal-mines lying between it and the Mokihinui River to the north. The character of this coal for steam purposes stands almost unrivalled. The long line of coal-staiths on the northern bank of the river, with a fleet of steam-colliers loading alongside, does not fail at once to impress a visitor with a sense of the importance of the trade. Though much has already been done, yet the industry, from the extent of the coal-bearing strata, is capable of much larger expansion when the necessary capital can be found. The Westport–Ngakawau Railway to Mokihinui, connected with the mines by the company's line, conveys the coal to the port. Nine miles from Westport is Waimangaroa, at the foot of the Mount Rochfort plateau, on which is situated Denniston—both coal-mining villages. The latter, built at an elevation of 1,960ft., is said to be the highest township in New Zealand. On a clear day it is well worthy of a visit, for the sake of enjoying the magnificent panoramic view of the Southern Alps, which reach their highest point in Mount Cook, 12,349ft. high, about 100 miles south. South of Westport are the alluvial gold-mining centres of Addison's Flat, Cronadon, Nine-mile Beach, and Charleston.
From the Inangahua Junction, the main road continues southwards through the Inangahua Valley to Reefton, 136 miles from Nelson, passing through cultivated lands, which are being gradually won from the heavy bush. With the latter port it is now connected by rail through the Midland Railway Company's extension of the Grey-Brunner Government line, and from thence it is for the most part supplied. About two miles inland from Reefton is located Black's Point mining township, with several batteries at work in and about the place, a visit to which is generally paid by tourists wishing to see something of the gold-mining industry. Reefton was the first town in New Zealand to be lighted by electricity. Good hotels are found both here and in Westport for the accommodation of travellers. Every one of the larger Coast towns is provided with a hospital, which receives a Government grant-in-aid. Other small mining townships are—Boatman's, Capleston, Antonio's, Noble's, Orwell Creek, Hatters', Nelson Creek, and Twelve-mile.
Leaving Reefton by rail, and passing into the Grey Valley through a short tunnel and bridge over the Grey River, Totara Flat is reached, nineteen miles from Reefton, where there is a considerable area under cultivation. Seven miles farther on is the decayed mining township of Ahaura. Small townships are springing up along the railway-line, and several large sawmills are working.
At the Grey River Gorge, eight miles from Greymouth, we enter the township of Brunnerton. This place is the oldest centre of coal-mining in this district. Owing to the effect of the coal-smoke from the coke-ovens on the surrounding cliffs and bush, and the appearance of the numerous miners' cottages nestling on the mountain-slopes, it has the look of a veritable “Black Country,” such as may be seen in some coal-districts in England.
The Midland Railway Company have selected, under the terms of their contract, the coal-area contained in the Black Ball Reserves, subject to existing rights. These are about four miles inland from Brunnerton, and will shortly be worked. As they are situate on the side of the Grey River opposite to the company's constructed railway, a branch line with a heavy bridge is necessary to connect the two. At present an aërial tramway serves that purpose. Several large sawmills are at work between this place and Greymouth, which we reach at a distance of 180 miles from Nelson, the centre of the Grey River from the junction of the Arnold being the southern boundary of the district at this part. The Midland Railway Company's contract line, to connect with Canterbury over Arthur's Pass in the Otira Gorge, has been constructed on the Westland side of the Arnold River to Lake Brunner, the eastern shores of which it skirts for some distance, and from thence to the Teremakau River. An attempt is being made by the Midland Company to utilise the valuable timber growing in this part of the district, and to create an export trade to Australia; but at present, owing to various causes, it does not appear to be in a flourishing condition.
The town of Greymouth is situated on the south bank of the Grey River, in the Westland District, and is the shipping-port for the products of the coal-basin included within the area of the Grey Coalfields Reserve, the larger portion of which lies on the north bank of the river in the Nelson District.
The small town of Cobden is situate opposite the town of Greymouth, and is connected with it by a substantial bridge.
Situate on the coast, fifty miles north of Westport, is the Karamea Special Settlement, principally settled from the Nelson and Motueka Valley districts. This part of the district contains some excellent but heavily-timbered land, and is reached from Westport by a good road, connecting with the Westport–Nga-kawau Railway at the Mokihinui River. A bridle-track, also, connecting with Collingwood and Golden Bay, is nearly completed by the Government. This track passes along the coast northwards, thence up the Heaphy Valley to the Golden Downs, and down the Aorere Valley to Golden Bay. Here again is another coal-basin, which, though of inferior value to the older deposits on the western side, is likely to become of importance, having at the present time one mine in full work. At the Parapara Creek, about five miles south of Collingwood, extensive deposits of hæmatite-ore are found. These are now in the hands of the Onehunga Iron Company, which possesses also works in Auckland for reducing iron-sand. The company are making preparations for reducing the ore, the surrounding conditions being favourable, as both limestone and coal are abundant in the locality. Another coal-basin exists at West Wanganui and Pakawau.
In the Aorere Valley, of which Collingwood is the port, alluvial mining is still found to be payable, and the country contains some valuable timber in the upper part not yet utilised. Nineteen miles south, in Blind Bay, lies the small port of Waitapu, from which a considerable amount of sawn timber is exported, drawn from the Takaka Valley, and brought down by a steam tramway from the upper mills. From the head of this valley the main road is carried over a pass in the Pikikirunga Range, 3,476ft. high, through the villages of East and West Takaka, Riwaka, Motueka, and Moutere to the township of Richmond, eight miles from Nelson. Inland are also situated the villages of Ngatimoti, Dovedale, Tadmor, and Sherry, each the centre of a number of small farms, and all connected by fairly-constructed dray-roads.
An inland road, partly bridle-track and partly dray-road, has been constructed from Nelson to Canterbury, by way of Tophouse, Wairau Gorge, Tarndale, Clarence Valley, Jollies' Pass, and the Waiau Plains. On the Hanmer, a branch of the Waiau-ua, is a Government Sanatorium, at an elevation of 1,000ft. above sea-level, and situate among hills 6,000ft. high. Here there are hot mineral springs, much visited by persons suffering from rheumatism and skin-diseases. It is reached by coach and rail from Christchurch in ten hours. The main trunk railway line is constructed to Culverden, twelve miles north of the Hurunui, the southern boundary of the district. From Culverden a good coach-road passes through Rotherham and Waiau-ua to the East Coast at Kaikoura, connecting with Blenheim and Nelson.
About 4,000,000 acres of land in the southern part of the district has been set apart as an area of selection for the Midland Railway Company, according to the terms of their contract, but as yet a very small area has been dealt with.
About 3,000,000 of acres of Crown lands still remain in the northern part of this district to be dealt with; it consists principally of high bush-country, with occasional patches of good valley lands, the greater part being classed as second-class lands. Of these, the area open for selection to date consists of 41,380 acres of surveyed lands, and 212,213 acres unsurveyed lands, of which the location, nature of soil, &c., have been briefly described in the foregoing pages.
Table of Contents
The main range (Southern Alps), forming the back-bone of the Middle Island, extends along the eastern boundary of Westland from Harper's Saddle (Hurunui Pass) on the north, to Mount Aspiring in the south, and at distances varying from fifteen to over forty-two miles from the sea-coast. On this range are many peaks ranging in altitude from 4,000ft. to 12,349ft., the latter being the height of the magnificent snow-clad dome of Aorangi or Mount Cook; while there are at least six others, between Elie de Beaumont and Mount Sefton, reaching an altitude of over 10,000ft., with Mount Aspiring close up at 9,960ft. above sea-level. From the main range descend immense snowfields and glaciers in profusion, and from these the principal rivers take their rise, running, with the exception of the Waiatoto and Arawata (which flow north and west) in a generally south-westerly direction to the sea. These glaciers are most interesting and beautiful, and the terminal faces of some of them extend down to a very low altitude, notably those of the Fox and Franz Joseph, which are only some 600ft. or 700ft. above sea-level, and can be approached on horseback without any danger.
These are numerous, swift, and strong, but of no great length. The principal ones, beginning in the north, are: The Grey, Arnold, Teremakau, Arahura, Hokitika, Mikonui, Waitaha, Wanganui, Poerua (Little Wanganui), Wataroa, Waitangi, Taona, Okarito, Waiho, Cook's, Karangarua, Makawiho, Mahitahi, Paringa, Moeraki, Haast, Okuru, Turnbull, Waiatoto, Arawata, Cascade, Gorge, and Awarua, besides many other smaller ones. Most of them are seldom fordable on horseback unless in winter time, which is consequently the best season for travelling; being nearly all snow-fed, they come down in raging torrents in the spring and early summer months.
The lakes are also numerous, although none are of any great area, but most of them very pretty: The largest are, Lake Brunner, six miles by three miles and a half; Kanieri, five miles by one mile and a half; Okarito, six miles by one mile and a quarter; Mapourika, three miles by one mile and a half; Mahinapua, Ianthe, Rotokino, Wanapo, Saltwater Lagoon, Paringa, Moeraki, and Ellery. Some are very deep, their bottoms being hundreds of feet below sea-level.
The soils on the low-lying lands are pretty much the same throughout West-land, and vary from gravel to fine sandy loam and stiff clay. There is usually a fringe, varying in width from a quarter of a mile to three miles, along each bank of the streams, on which the land is fairly good silt and loam, with timber ranging from light scrub to heavy bush. Towards the foot of the range or terrace, the ground is more swampy, with stiff subsoil of clay, or cemented sand and gravel. On the terraces the soil is, as a rule, poor and thin, with a hard bottom. Numbers of pakihis, or open lands (mostly of a peaty nature), and also swamps, many of the latter of considerable area and good quality, are scattered about, but as yet no attempt has been made to reclaim any of them. No doubt some capital is necessary to begin with, for, although free from bush, a considerable amount of drain-cutting would be necessary in a moist climate like this to insure the surface remaining dry; still the land is good, and will some day repay the labour of reclamation, as each acre so redeemed would be worth a dozen on the terraces. The good farming land in Westland is very limited in area, but grass grows well throughout.
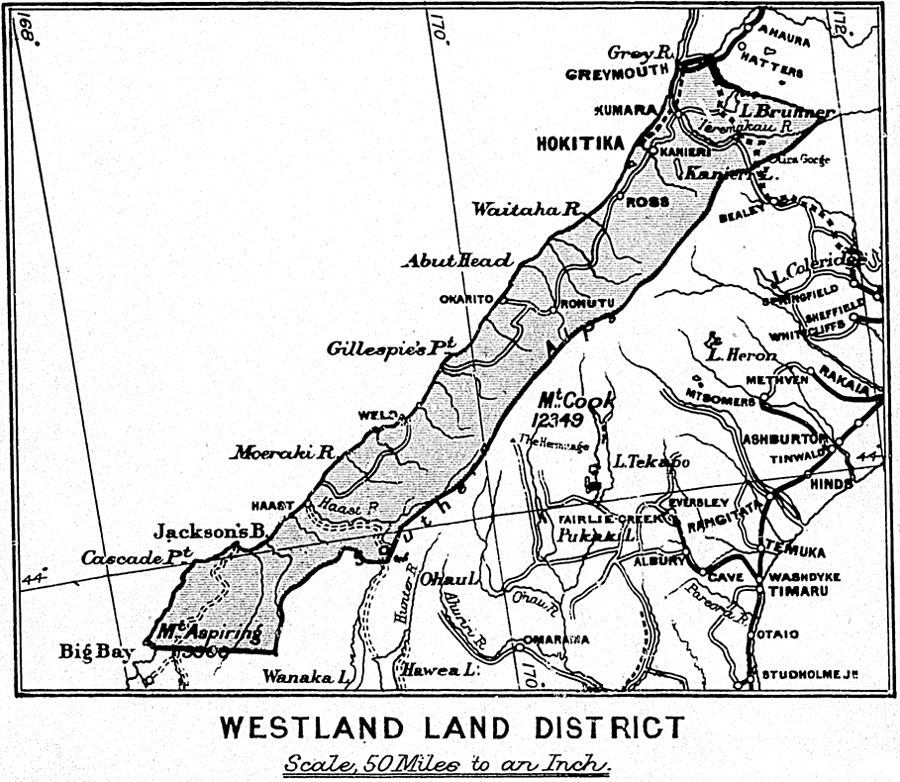
The total area of forests amounts to 2,394,951 acres, of which 903,785 acres are at an altitude of over 2,000ft. above sea-level, and 1,491,166 acres under that altitude. The supply of timber is practically inexhaustible, and the principal drawbacks to the extension of the saw-milling and timber industry appear to be the length of carriage before reaching a shipping port; the want of frequent and regular communication with such ports as we have south of Hokitiki (unfortunately mostly bar harbours); the lack of railways, tramways, or good dray roads to open up the virgin bush inland; and last, but not least, want of capital and energy to push trade.
From the Grey River southward along the coast, and for a few miles inland, the most valuable and durable timber we have, silver-pine, is to be found, generally in belts fringing the margins of swamps and pakihis. There is also a large supply of good furniture timber, and along the mountain sides a number of twisted, gnarled, and knotted trees, that would show a most beautiful grain, and be valuable for veneering and similar purposes. The timber industry, next to minerals, is the most valuable asset of this district.
The harbours and ports of Westland are the following:—
Greymouth: Twenty-four miles north-east of Hokitika. Extensive harbour works have been carried out, a breakwater or sea-wall extends some 3,360ft. seaward from mouth of river on south side, and on the north side to 1,100ft., with internal half-tide training-walls, the result being an average depth of water on the bar of from 18 1/2ft. to 26 1/2ft. at high-water spring tides, and of from 8ft. to 16ft. at low-water springs. Vessels of 1,000 tons can now come alongside the wharf, where there is berthage accommodation of 1,824ft., with a minimum depth of from 12ft. to 16ft. at low water.
The principal exports are gold, coal, coke, and timber; and these for the financial year ended 31st March, 1893, were as follows: Gold, 62,992., valued at £251,968 sterling; coal, 153,000 tons; coke, 3,270 tons; timber, 2,095,839 superficial feet. The number of vessels using the port during the same period were: 642 steamers, tonnage 137,359; sailing vessels, 31, tonnage, 2,601; or a gross tonnage of 139,960 for the year.
The train runs down the wharf, and the coal-trucks (specially made for the purpose) are lifted and emptied into the vessel's hold by means of powerful cranes, of which there are six, with capacities of from 1 1/2 tons to 12 tons, so that every encouragement is given to quick despatch.
Hokitika: Two training-walls have been constructed, the one on the north side being about 2,000ft. long, while that on the south is 670ft. The bar is one of shifting sand, and the depth at high water varies from 9ft. to 15ft., while inside the depth is from 6ft. to 22ft. for three-quarters of a mile up from entrance. The port is usually safe for vessels drawing 8ft. to 10ft. of water, for ten months out of the twelve. The berthage space amounts to 1,000ft., with from 18ft. to 22ft. of water. The exports for the financial year ended 31st March, 1893, were: Gold, 25,924oz., valued at £98,707; timber, 279,641 superficial feet, only 100,000ft. of which was scantling or boards, the remainder being in the form of silver-pine railway-sleepers. The number of vessels using the port for same period, 192; gross tonnage, 14,660.
Okarito, fifty-five miles south-west of Hokitika: A bar entrance, and not always open, being occasionally completely blocked by high sand-bank thrown up by heavy seas. When open the entrance is good, with a maximum depth of 10ft. There is a small jetty some half-mile up from entrance.
Bruce Bay, ninety-five miles south-west of Hokitika: An open roadstead, well sheltered from south and south-westerly winds by Herataniwha Point, which projects fully a mile in a northerly direction. Good anchorage, in 18ft. of water, opposite the Green Rock, which stands up out of the water. Good boat landing with above winds.
Paringa River, 104 miles south-west of Hokitika: Open roadstead. Vessels coming in or out should give Hauata Reef (off the north head) a wide berth. There is also a sunken reef, awash at low water, in middle of bay, and a dangerous sunken rock just off the south head, two or three chains away, facing a small sandy bay, and right abreast of the Trig. station. Vessels lie inside and a little to the northward of this rock, about a quarter of a mile from shore, and quite safe with southerly winds.
Haast River, 118 miles south-west of Hokitika: A constantly shifting bar at entrance, being nearly opposite and a little to southward of the Alhambra Rock, which stands well out of water, and vessels entering can go on either side with safety. Average depth on bar, from 6ft. to 8ft.
Okuru and Turnbull Rivers, 138 miles south-west of Hokitika: These rivers join just inside the entrance. Good, straight channel; average depth, 8ft. to 10ft. The Open Bay Islands lie just opposite the entrance, bearing a trifle west of north and about three miles off. A dangerous reef lies about two miles and a-half from south-west point of the smaller island, and immediately to northwest side of a line drawn from the last-named point to extreme end of Jackson's Head.
Jackson's Bay, 153 miles south-west of Hokitika: Good shelter and anchorage, open only to north-east, with 12ft. of water to within a few chains of shore. Jackson's Head runs out about one mile and a-half in a north-easterly direction from southern end of bay. This is the only ocean harbour on the coast above Milford Sound, and could be converted into a first-class port at comparatively small cost. No doubt Jackson's Bay will eventually form a great coal port, as the recent discovery of a practicable pass through the main range, viâ, the Waiatoto and Axius Rivers, will make it in the not distant future the natural outlet for the Lake Wanaka country.
Cascade River, 169 miles south-west of Hokitika: Bar entrance; but once in, the river is navigable for five miles. No steamer has yet been in, but there is no apparent difficulty in the way. Depth of water said to be 8ft. to 10ft. at entrance.
Big, or Awarua Bay, 200 miles south-west of Hokitika: At extreme southwest corner of Westland. An open roadstead, with good anchorage in fine weather, sheltered from east and south-west winds; 24ft. of water on south side anchorage and 30ft. on north side, just opposite Crayfish Rock, in a spot sheltered from northerly winds.
The district is fairly provided with roads and horse-tracks, most of which, however, run in a direction parallel to the sea-coast. Of the former there are over 290 miles; of the latter, 376 miles; while of completed railways there are forty-five miles.
Brunnerton, a borough of 2,231 inhabitants, is a coal-mining centre. Coke and fireclay bricks are also manufactured. Railway communication with Grey-mouth Port, with Reefton, and Lake Brunner.
Greymouth Borough: Population, 3,787; shipping port for Grey Valley (see Ports and Harbours); railway communication with Reefton, also Hokitika; railway workshops, foundry, quarries. The principal business portion of town is built on Native lands, rents being paid to Public Trustee, who distributes same to Natives entitled thereto.
Kumara; Borough of 1,176 inhabitants. This is a brisk little mining town, and is probably the largest hydraulic sluicing mining centre in New Zealand. It has two suburbs—Dillmanstown and Larrikin's—with populations of 479 and 242 respectively.
Hokitika: Borough of 2,178 inhabitants. This is a pretty little town, the political capital of Westland, the port for shipping and centre of supply for a number of little townships, and for the whole district south of Teremakau.
Ross: Borough, 822 of a population; a clean and neat little town, the centre of a considerable mining district, with a few good sluicing-claims on a large scale.
In addition to the above, there are several smaller mining centres, such as Stafford, Kanieri, Woodstock, Rimu, Blue Spur, Okarito, and Gillespies.
The District of Westland contains the greatest area of alluvial auriferous ground on the West Coast. According to the Mines Report for 1892, the number of miners employed is given as 1,525; and 25,775oz. of gold, valued at £103,135, is stated to be the return for their work.
All the Westland rivers carry more or less gold, but the two great golden rivers are the Arahura and Waiho, the bars and ripples in which appear to be replenished with fresh deposits of gold after each flood. Standing on the summit of Mount Turiwhate, the ancient beds of the Arahura can easily be traced northward to the Kumara, and southward to the Rimu diggings. Similarly, the Waiho has in olden times flowed northward, and down the course of the Okarito River, also southward to the Omoeroa River, the lateral terraces in both directions being well defined and gold-bearing.
There are three leading deposits of gold in Westland: first, what may be called riverine leads, running generally westward; second, beach leads, consisting of those along present coast-line, and others running parallel thereto at distances varying from one-quarter to three miles inland, and at levels from a few feet below, to a couple of hundred feet above sea-level; third, extensive masses of auriferous gravel, &c., occuring in large isolated patches, as at Big Dam Hill, Humphrey's Gully, Mount Greenland, and Bald Hill, north of the Haast. These drifts have all one notable peculiarity—viz., that they invariably coat the seaward faces of the hills, and neither gold nor drift is found on the inland slopes. Gold-bearing fans from Mount Greenland have been found at different levels on Ross Flat, having probably been deposited in deep water by successive landslides.
Large hydraulic-sluicing operations are successfully carried on in various portions of the northern district, and these will doubtless be extended to many other localities. The tapping of the Arahura River by the Humphries Gully Sluicing Company will, when completed, enable the miners of Blue Spur, Kanieri, and Rimu to obtain a permanent supply of water, and command a large area of auriferous country at present unworkable from want of water at a sufficient altitude. Numerous and costly experiments have been made with dredges of different types in the endeavour to work economically the auriferous sands which lie along the sea-beaches for a distance of over 140 miles; but none has proved a success as yet. A considerable number of miners (blacksanders) work on some of these beaches, and seem to make a fair living, many of them having been so employed in one locality over twenty years. Gold-bearing quartz has been found throughout the district, the most notable finds being at Taipo Range, Browning's Pass, and Cedar Creek; but, as yet, no systematic development of them has taken place. Silver-ores have been found, notably at Mount Rangitoto; but the main lode has not yet been discovered, although systematic search is still going on. Copper has also been found extensively, notably at Browning's Pass, and on the western slopes of the Matakitaki Range, where good coal and limestone are also at hand.
The pastoral lands amount to 2,002,577 acres, of which 1,898,776 acres are covered with forest, and 103,801 acres are open lands, the latter being for the most part the mountain-slopes above the timber-line. Hitherto (speaking generally) only cattle have been grazed; usually on the open river-beds and adjoining forest-lands. The settlers are only now beginning to see the value of the mountain-slopes as a summer run for sheep, and to introduce the latter animals in numbers. For several years past the rabbits have crossed the dividing range at different points into the upper valleys of some of the south Westland rivers, making their way for a few miles downward before returning—which they generally do. The common opinion seems to be that the climate and ground are both too moist for them ever to spread much.
The agricultural lands comprise 355,981 acres, of which 332,715 are forest and 23,266 acres are open lands, consisting principally of river-flat and swamplands. There is but little real farming done in the district, and only such grain is sown as is necessary to provide feed for stock. Most of the grain is therefore cut before maturing, either as green food or for hay and chaff, a considerable amount of which, together with nearly all the oats consumed, is still imported from Nelson or Canterbury. Comparatively few turnips and mangolds are grown, although they will grow freely, most of the farmers devoting their attention to growing grass, dairying, and fattening cattle, for which the district is well suited.
Of Crown lands available, there still remain 2,359,000 acres, of which the above remarks hold good as regards description and quality. The Native lands in Westland are virtually freeholds, and most of them already Crown-granted.
Very erroneous ideas of the Westland climate appear to exist in other districts, the general impression being that it is raining nearly all the year round. Such, however, is far from being the case, the average climate being simply delightful, and very even; no extremes, and very little cold wind. It is freely asserted that the climate is very much better now than in the early days of settlement on the Coast. We have no available authentic meteorological records since 1880, but for the fifteen years previous to that date they were regularly kept, and show an average rainfall of 119in. per annum, with an average of 202 wet days. The mean barometric reading over the same period was 29.944, and the mean temperature 53.61.
Table of Contents
The Land District of Canterbury comprises the central portion of the Middle Island, and is bounded towards the north by the Hurunui River, with an extension northward to the Waiau-ua River for about twelve miles from the sea; towards the westward by the summit of the Southern Alps to Mount Aspiring; thence towards the south by a right line, and by the Ohau and Waitaki Rivers to the sea; and towards the east by the South Pacific Ocean. It lies between south latitudes 42° 45′ and 44° 55′, and east longitudes 168° 50′ and 173° 20′. The general extension of the district is north-east, for a distance of about 190 miles; the breadth east and west, from the summit of the Alps to the sea, averaging seventy miles. The sea-board has a length of about 240 miles, consisting generally of low-lying beaches, broken by the projection eastward of Banks Peninsula, which contains the only large natural harbours. That portion of the district which fronts the ocean between the Ashley and Opihi Rivers consists of a plain of about 2,500,000 acres; north and south of those limits the plain is interspersed with undulating and hilly country.
This great plain extends westward, rising and merging into downs and hills, which again extend westward, and connect with the Southern Alps and the offshoots therefrom. The exceptions are the Mackenzie Plains, the small plain near Clent Hills, and Lake Heron. Banks Peninsula, which has an area of about 250,000 acres, consists of an aggregation of ridges and hills, deeply intersected by basins and gullies, the result of volcanic action.
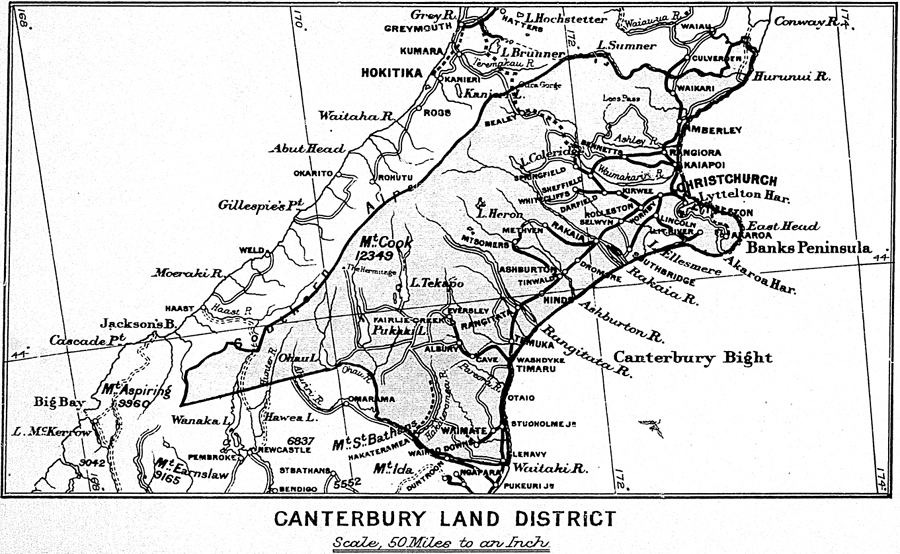
The Alps, which form the backbone of the island, constitute a continuous chain of mountains, with a succession of magnificent peaks, attaining their culminating point in Mount Cook, or Aorangi, 12,349ft. above sea-level; there are, besides, numerous peaks, ranging in altitude between 7,000ft. and 10,000ft. Offshoots, extending to great distances eastward and south-eastward from the main range, attain elevations of 6,000ft to 9,000ft. On these mountain-ranges are numerous and extensive glaciers, from which emanates the river-system of the district, comprising the Hurunui, about 85 miles in length; Waimakariri, 90 miles; Rakaia, 85 miles; Ashburton, 64 miles; Rangitata, 74 miles; the Waitaki and its main feeders, 140 miles. These rivers rush down from the mountain-gorges, through the intervening ranges and hills, and traverse the plains to the sea. The channels on the plains are shallow, and extend in some instances over a mile in width.
Associated with these rivers is a portion of the lake-system of the Middle Island—Lake Sumner being connected with the Hurunui, Lakes Coleridge and Heron with the Rakaia; and the Mackenzie-country lakes—Tekapo Pukaki, and Ohau—with the Waitaki. Another important lake is that known as Lake Elles-mere—west of Banks Peninsula; it is separated from the ocean by a narrow shingle-spit only 5 chains across at one point, through which, at certain seasons, it passes by a channel to the sea.
Canterbury, with its diversity of scenery, comprising mountains, hills and plains, glaciers, rivers and lakes, presents great attractions to the tourist and ordinary sight-seer or health-seeker. Mount Cook, the Mackenzie-country lakes, and the Otira Gorge (Westland) are world renowned; Akaroa, and many other places, are famed for their beauty. There are scores of unscaled snowy peaks and glaciers; countless scenes of grandeur and beauty to reward the intrepid climber or traveller.
The climate of Canterbury is well suited to Europeans: it resembles that of Great Britain, but on the Plains it is far more equable. Observations at Lincoln (14 miles from Christchurch) for 1892 show the temperature in the shade to have reached a maximum of 86° Fahr., and fallen as low as 27°; the mean being 53.8°, and extreme range 59°. Snowfalls are very light on the plains, but in the high uplands the climate is much colder and more severe, snowfalls being common and skating possible. The rainfall at Lincoln varies much from year to year, and is very limited in some years: it was 13.54in. in 1878, and 32.31in. in 1875; the mean for ten years was 26.691in. per annum. The changes of weather and temperature are sudden, calms and gales, rain and sunshine, heat and cold alternating. The prevailing winds are north-east, southwest, and north-west; the latter a hot wind. The winter frosts are sharp at night; the summer heat at times is great. Nevertheless, the climate as a whole is splendidly healthy and bracing, and most enjoyable.
The area of the Canterbury Land District is 8,778,027 acres, of which the estimated area of forest-land is 492,130 acres. The principal areas of forest-lands are found in Banks Peninsula and in the Mount Peel and Waimate districts, where the timber consists chiefly of rimu, totara, and matai; at the sources of the Ashley, Waimakariri, Rakaia, Hopkins, and Hunter Rivers, at Lake Wanaka and near Springfield and Alford Forest, the timber in these localities being principally native beech; in Oxford Forest the native beech is interspersed with rimu, totara, matai, &c.
The lands of Canterbury are classed as follows: First class, 1,840,681 acres; second class, 4,707,173 acres; third class (barren lands and lands of small value), 2,230,173acres: total, 8,778,027 acres.
| The disposition of the lands is as under:— | No. of Holders. | Acres. |
|---|---|---|
| 1. Crown lands alienated to date | .. | 3,263,454 |
| 2. Lands held on deferred payments | 145 | 26,243 |
| 3. Lands held on perpetual lease | 339 | 80,819 |
| 4. Lands held as leases in perpetuity | 7 | 3,402 |
| 5. Lands held under the system of occupation with right of purchase | 2 | 185 |
| 6. Lands held under the system of village-homestead special settlement | 180 | 5,637 |
| 7. Lands held under the system of special-settlement associations | 32 | 3,023 |
| 8. Lands held under the system of small grazing-runs | 34 | 82,380 |
| 9. Crown lands held under pastoral licenses, including a small area of barren lands | 135 | 2,961,386 |
| 10. Reserves held under license | 200 | 96,816 |
| 11. Crown lands reserved for various purposes | .. | 339,050 |
| 12. Endowment lands (Canterbury College, &c.) | .. | 252,094 |
| 13. Crown lands open for selection | .. | 33,750 |
| 14. Crown lands being prepared for selection | .. | 112,698 |
| 15. Lands held by aboriginal natives | .. | 13,340 |
| 16. Balance of barren country | .. | 1,503,750 |
| Total | 8,778,027 | |
In explanation, it may be noted that No. 1 comprises the freehold lands. Nos. 2, 3, and 5 carry the right of acquiring the freehold, which is not the case with Nos. 4, 6, 7, 8, 9, and 10. No. 12 comprises lands which will probably be opened for sale at a future date. The Crown lands proper are: 13. Open for sale or selection (Vide “Land Guide”), 33,750 acres; 14. Being surveyed and prepared for sale or selection, 112,698 acres.
In no part of New Zealand are the means of communication better than in Canterbury. The natural facilities of the country have been abundantly supplemented by railways and roads. Lyttelton, the chief port, is connected by rail with Christchurch, the heart and centre of the whole district. From Christ-church extends the main line northwards to Culverden, which strikes the Hurunui River at 57 miles; southward the main trunk line runs to Waitaki, 138 3/4 miles. These lines tap and serve the whole coastal district, and the lands which are contiguous on the western side. As feeders to these trunk lines, seven branch lines have been constructed westward, and two lines south-eastward; the former, in most instances, extending to the foot of the hills.
Combined with the railway-system is a complete network of main, district, and subsidiary roads, which extend their ramifications into all parts of Canterbury, providing highways for the transport of the productions of the country, and answering all the requirements of the settlers and travellers. The total mileage of railways is 455 miles, and the roads probably exceed 10,000 miles in the aggregate. The completion of this splendid system is due, in great measure, to the foresight of the original settlers, the Provincial Government, and the railway and public-works policy of Sir Julius Vogel.
According to Sir James Hector, the main western ranges are composed of Upper Palæozoic rocks, having at their base extensive plains of Tertiary fluviatile formation, with occasional protruding ridges of Upper Mesozoic, forming low mountain-ranges subordinate to the main axis. Banks Peninsula consists of basic volcanic rocks.
The Southern Alps and adjacent mountainous country, owing to their great altitude are, subject to disintegration, and comprise generally rocky barren wastes.
The lower ranges and hills, the high tablelands, and the light stony portions of the plain constitute the pastoral areas.
In the northern and southern districts and in the great central plain are situated the agricultural areas. This latter class of land comprises rich alluvial tracts about Cheviot, Rangiora, Kaiapoi, Lincoln, Ellesmere, Longbeach, Temuka, and Waimate, and the splendid plain- and down-lands which extend from Cheviot to the Waitaki.
Banks Peninsula, where the soil is of a rich volcanic nature, though exceedingly hilly, has alluvial areas in the valleys and about the bays.
The mountainous and hilly regions, and the high upland country in the western and northern part of Canterbury, excluding the high barren wastes, are covered by indigenous grasses, with an admixture of English forage plants where the character of the soil and other circumstances are favourable.
The pasturage, which is very suitable for sheep-farming, is taken full advantage of by the pastoral tenants of the Crown, and to some extent by freeholders. The light stony portions of the plains likewise comprise native pastures, which are also very suitable for merino sheep.
The lower hills, downs, and better class of plain-country have been extensively cultivated, and have proved admirably adapted for the production of cereals and for pasturage for cattle and sheep.
The chief crops grown are wheat, oats, barley, turnips, rape, and grass-seed; while amongst other crops produced are maize, rye, and beans.
Of the cereals, wheat is the most extensively grown, and has been for many years a large item of export. The Canterbury Plains, which comprise about 3,000,000 acres, extending over 150 miles from north to south, constitute the main wheat-producing area of the colony.
In 1893 the area under crop was 270,780 acres; the yield, 5,672,238 bushels, or 20.95 bushels per acre, equal to about two-thirds of the whole yield for the colony.
Oats also are very successfully grown, the figures for the same period being 112,894 acres, yielding 2,968,807 bushels; average, 26.30 bushels per acre, or nearly one-third of total yield for colony.
Barley of superior quality is also produced, the figures being 9,569 acres, 248,422 bushels; average per acre, 25.96 bushels, or over one-third of total yield. Grass-seeds are abundantly grown. Cocksfoot is produced chiefly on the splendid Banks Peninsula country, and rye throughout the land district. The yield in 1893 was, cocksfoot, 243,992 bushels of 12lb.; and ryegrass, 145,751 bushels of 20lb.: the proportion of each to the total yield for the colony being respectively about one-half and one-third.
Hay was grown on 17,097 acres.
Potatoes, which yield crops of excellent quality, were grown in 1893 on 4,996 acres, the yield being 31,584 tons, or 6.32 tons per acre; nearly one-third of the yield for the colony. Turnips and rape were grown on 127,574 acres, being about one-third of the total yield for the colony. The combined area of other crops grown, including rye, peas, beans, mangolds, beet, carrots, and onions, was 11,386 acres. The area of oats for green fodder and hay was 42,179 acres. The area ploughed and laid down in English grasses was 1,242,663 acres. Surface-sown lands comprised 333,013 acres. For the same year, 1893, the total area under crop was 579,378 acres, and the area broken up but not in crop, 50,708 acres.
The large extent and splendid capabilities of the Canterbury pastoral and agricultural areas provide pasture and fodder for a large number of sheep, cattle, horses, and other stock. Of late years the value of the plains has been much enhanced and the carrying-capacity thereof greatly increased by the water-race system, which supplies water throughout the length and breadth of the dry areas, and enables the country to be occupied in smaller holdings than would otherwise be possible. The number of stock in April, 1891, was as follows: Horses, including 6,754 brood mares, 47,567; mules and asses, 97; cattle, including calves, and including 34,922 breeding-cows, of which 31,250 were milch cows, 81,772; sheep, excluding lambs, and including 1,693,339 breeding-ewes, 4,307,732; goats, 397; pigs, 75,984; poultry, 404,355.
The district has a well-deserved reputation for the classes and splendid quality of its sheep. On the mountains and higher lands the merino still reigns supreme; but on the richer low-lying ranges, hills, and plains the prevailing types are crosses between the merino and Leicester, Lincoln, Romney Marsh, and other breeds. In proof of the superior character of the flocks, pasturage, and climatic conditions in the Middle Island, the following percentages of lambing returns are quoted—these are “fair average returns, but much higher might have been exhibited”: Mountain native pasture—pure merino, 75.36; pure merino and Border Leicester, 88.94: English-grass pasture—crossbred and Border Leicester, 80.8; half-bred Border Leicester, 82.79; Border Leicester, 90.77; Lincoln, 88.08; Romney Marsh, 111.46; English Leicester, 93.34; Shropshire, 97.41; Southdowns, 96.87. It must be borne in mind that the flocks and herds are supported by the natural and artificial pastures without housing.
Owing to the development of the frozen-meat trade a great impetus has been given to sheep-breeding. The bulk of the frozen meat exported from the colony is supplied by this district, and its meat commands the highest price in the London markets. In the year 1890 the number of carcases frozen was 640,723, of the value of £369,574, being over one-third of the total output of the colony in this line. 197,037lb. of beef, valued at £2,052, and 554,593lb. of preserved meat, valued at £12,622, were also produced. Other productions during 1890 were as under: Tallow, 1,521 tons, value £33,254; bonedust, 668 tons, value £3,674; neatsfoot- and trotter-oil, 3,162 gallons, value £530; bones, hoofs, horns, &c., 479 tons, value £1,900.
In the year 1892 there were shipped at Lyttelton 63,758 bales of wool produced in the Canterbury District. The staple of the New Zealand wool, especially the long-wool and crossbred, is remarkable for its freedom from breaks and other imperfections. The average clips are approximately as follows: Merino, 4lb. to 7lb.; quarter-breds, 8 1/2lb.; half-breds, 7 1/2lb.; three-quarters, 8 1/2lb.; Leicesters, 10 1/2lb.; Lincoln, 11lb. From special flocks clips up to 25lb. to 30lb. are obtained.
The capabilities of a large area of the district, including Banks Peninsula and the rich tracts of country previously specified, for dairy-farming cannot be overestimated. The pasturage and climatic conditions are favourable, and a great increase in the production of butter and cheese may be anticipated, particularly as housing and hand-feeding are in some districts not necessary. The Government are encouraging the development of the industry by every means; and increased activity is displayed in the establishment of a central butter-factory associated with creameries in the various districts. A central co-operative dairy factory has been established at Addington, served by five creameries, situate at Marshlands, Halswell, Springston, Doyleston, and Oxford, and other creameries will be established wherever the circumstances warrant their erection. There are very complete dairy factories at Taitapu, Sefton, Temuka, and Southbrook. In 1890 the production of butter amounted to 2,268,758lb., and of cheese, 1,313,027lb.
In connection with the foregoing it is worthy of note that in 1891 the agricultural machines in use in Canterbury were as follows: Threshing, steam-power, 243; threshing, water-power, 6; threshing, horse-power, 23; reaping, 3,565; steam-ploughs, 37; steam-harrows, 17.
The sawmilling industry finds its development chiefly in the Oxford, Little River, Mount Somers, and Waimate districts. The number of mills in Canterbury in 1890 was twenty, employing 250 hands, the horse-power being 281. The output was 3,978,146ft., valued at £16,049. The timber comprises birch, totara, red-and white-pine. The former is used chiefly for sleepers and fencing, the totara and pines for building purposes. Including the work done by the planing- and moulding-mills, the value of all the manufactories under this head was £41,447.
New Zealand hemp, a splendid natural product of the soil, grows from 5ft. to 10ft. high, and consists of bunches of shoots or leaves in clusters of about fifty. It grows readily, is capable of extensive cultivation, and its treatment would form a remunerative industry should the price in the Home markets prove as favourable as at former periods. The drying and preparation of this plant gave employment to 16 mills and 313 hands; the aggregate horse-power of the engines was 222; 15,409 tons of raw material turned out 2,125 tons of fibre, valued at £36,960.
The district is eminently adapted for the growth of a large variety of fruits, especially all those which flourish in Great Britain. Attention has recently been directed to landing supplies of fruit in London; the attempts so far have proved satisfactory, and point to the possibility of a large trade being established.
Brown coal is found at Malvern Hills, Homebush, Whitecliffs, Springfield, Mount Somers, near Albury, and various other places. Lignite is commonly distributed. The output for 1891 was 16,263 tons, being a total of 279,770 tons up to December, 1891. In 1891 there were eight collieries, employing 37 hands and using engines of 36-horse power in all.
The building-stones of Canterbury comprise some excellent varieties. The Halswell quarries produce an exceedingly hard and close-grained stone of a dull leaden-grey colour. Granular trachytes are obtained from Governor's Bay, Lyttelton; porphyrites at Malvern Hills; good limestone at Malvern Hills, Waikari, Mount Somers, and various other places; bluestone rock is found at Timaru suitable for millstones. There is abundance of limestone in North Canterbury, Mount Somers, Castle Hill, and various other parts, which is well adapted for production of lime.
Deep-sea fishing is carried on to a limited extent from Lyttelton, whilst the rivers and lakes afford splendid sport, owing to the abundance of trout, which thrive amazingly therein. Lake Ellesmere and the estuaries supply Christ-church with excellent flounders. In 1891 there were 81 persons engaged in this business, using 550 nets and 67 boats of a total of 108 tons.
The total number of manufactories in Canterbury in 1891 was 386, employing 4,197 males and 465 females, their annual wages respectively being £328,812 and £16,965; the number of engines 391, of 4,677 horse-power.
The total value of manufactures for 1890 was £2,061,921, and the value of land, machinery, and buildings was £1,099,444. Included in the above were 16 printing, 12 agricultural-implement, 32 coach-building and painting, 25 fell-mongering, tanning, currying, and wool-scouring establishments, 4 ship- and boat-building works, 7 sail- and oilskin-factories, 2 woollen-mills, 2 clothing-, 10 boot-and-shoe factories, 3 rope-and-twine works, 16 flax-mills, 6 boiling-down, meat-preserving, and freezing works, 4 cheese- and butter-factories, 40 grain-mills, 1 fruit and jam-making works, 19 breweries, 5 malt-houses, 21 acrated waters and cordial works, 1 sauce- and pickle-making factory, 4 soap- and candle-works, 20 sawmills and sash-and-door factories, 4 gasworks, 18 brick, tile, and pottery manufactories, 11 iron- and brass-foundries, and 6 collieries.
Since the above date the following industries have been started: Bicycle, cooking-range, chaff-cutting, and hat-factories.
The principal amongst the above manufactories are the following: Kaiapoi Woollen Mills end Clothing Factory; Belfast, Islington, and South Canterbury Meat-freezing Companies; Aulsebrook and Co.'s Biscuit Factory; Moir and Co.'s Flour-mills; Zealandia and Premier Boot-factories; Whitcombe and Tombs' Printing, Book-binding, and Engraving Works; Atlas and Canterbury Foundries; T. and D. Duncan's, and Booth and Macdonald's Agricultural-implement Works.
From the above statistics it will be gathered that the manufacturing industries of Canterbury, though comparatively in their infancy, are of considerable magnitude. There is a wide scope for their development, which will surely follow with growth of population and under the fostering care of the Government.
As an indication of the advancement of the district, it may be noted that there were in 1891 66 public libraries, mechanics' institutes, and scientific institutions, with a membership of 3,263; and 256 churches or chapels, attended by 41,771 persons.
Primary Schools.—The district is divided into two, termed North and South Canterbury, each presided over by an Educational Board. Under their control schools have been established throughout the whole country, wherever population warrants their erection. The number of schools in 1891 was 228, attended by 14,074 boys and 13,315 girls.
Some of the school-buildings are large and handsomely built, the chief being the Normal School, Christchurch; East and West Christchurch; Sydenham; and in the towns of Lyttelton, Rangiora, Kaiapoi, Ashburton, Temuka, Timaru, and Waimate.
For the further education of the children ample provision has been made by the establishment of secondary schools. The principal schools of this class include the Boys' and Girls' High Schools at Christchurch, Rangiora, Ashburton Timaru, and Waimate.
For more advanced students Canterbury College, Christchurch, is available. This institution was founded and endowed by the Provincial Government in 1873. It is presided over by a Board of Governors. The professional staff consists of five professors and other lecturers. In 1891–92 the number of students attending lectures was 349.
There are numerous private schools, independent of the State, the chief amongst them being Christ's College, Christchurch, connected with the Church of England. The Roman Catholics support schools of their own in Christchurch, Lyttelton, Timaru, Addington, Papanui, and Halswell. There are besides some excellent boarding- and day-schools in Christchurch for boys and girls.
Canterbury has the advantage of possessing numerous and flourishing institutions. The principal include: the School of Art, Christchurch, established by the College Governors in 1882; the Art Gallery, which owes its origin to the Art Society, the site being the gift of the Government. The School of Agriculture, Lincoln, also founded by the College Governors, is surrounded by 660 acres of land. The commodious buildings, which cost over £20,000, provide accommodation for the Director and teaching-staff, and for forty-five students. The fees are on a low scale. The farm-buildings are complete, and include a well-equipped dairy. Instruction is given in agriculture, chemistry, botany, medics, physics, surveying, £c.
The Public Library, Christchurch, under control of the College Governors, contains reading-rooms, a circulating library of over 12–000 books, and a reference library of over 2,000 volumes. Numbers of magazines and newspapers are provided.
The Museum, Christchurch, incorporated with Canterbury College, consists of a handsome pile of stone buildings, the collection of 150,000 specimens being one of the best in Australasia. This institution owes its origin and success to the foresight, skill, and energy of the late Sir Julius von Haast and the munificence of the Provincial Government.
The Canterbury Agricultural and Pastoral Association takes foremost place among kindred bodies. The Canterbury Caledonian Society. The Philosophical Society, established in Christchurch in 1862.
The philanthropic institutions embrace the Christchurch, Akaroa, Ashburton, Timaru, and Waimate Hospitals; the Sunnyside Asylum for the insane; the Memorial Home for the aged at Woolston; the City Mission and Destitute Men's Home, Christchurch; the Deaf-and-dumb Asylum at Sumner; the Orphanage, Lyttelton; and the Industrial School at Burnham, celebrated for its boys' excellent brass band.
Sport is represented by the Canterbury Jockey Club, which owns the celebrated Riccarton racecourse and grounds of 300 acres in extent. Cricket is represented by several clubs, which have splendid grounds in Lancaster and Hagley Parks; and numerous race and cricket clubs throughout Canterbury. Football, swimming, and boating likewise number a multitude of devotees amongst the various clubs.
Christchurch, the capital city of the Canterbury District, is situated on the plains. It is practically level, laid out in rectangular form, two miles by one mile and a quarter, and is intersected by a diagonal street. The streets are 66ft. in width. There are numerous open spaces, including the Cathedral Square in the centre, besides Cranmer and Latimer Squares. The Avon, a beautiful stream, intersects the city, presenting from all points charming vistas. The city is surprisingly English in its appearance, architecture, and surroundings. The central portion has a handsome well-built appearance, due to the noble Cathedral, fine Government Offices, palatial Morton's Buildings, and other fine structures, which have been erected round the Square and on the streets radiating therefrom. Other portions of the city present a striking effect, due to the presence of such buildings as the Provincial Council Chambers and Government Offices, Canterbury College, Museum, High Schools, Normal and other public schools, City Council Chambers, clubs, banks, insurance and other commercial institutions, and numerous places of public worship. The whole is admirably set off by Hagley Park, 400 acres in extent, the Domain and Botanical Gardens, 79 acres, Lancaster Park, the town belts, and other public and private gardens and plantations. The suburbs comprise a large number of handsome houses and beautifully kept grounds.
The city is surrounded by the populous boroughs and districts of Sydenham, St. Albans, Linwood, Papanui, Woolston, £c. The population of the city was at the last census 16,223, in 3,318 houses; including the adjacent boroughs and other suburbs the population amounts to 47,846. Tramways connect the city with Sumner, eight miles and New Brighton, six miles, both seaside resorts; also with Papanui, three miles, and the railway-station; also Addington and Sydenham. The city has been drained at considerable expense, the sewage being conveyed three miles and discharged on the sand-wastes near the sea. A pure and copious water-supply has been provided by nature, and is obtained by artesian wells. The affairs of the municipality are controlled by the City Council, presided over by the Mayor. Christchurch is the centre of trade and commerce for the North Canterbury agricultural and pastoral country, and the head quarters of many manufacturing industries, including carriage-, boot- and clothing-factories, flourmills, breweries, meat-preserving and freezing, biscuit, planing and moulding, bicycle, and other works.
There are extensive and splendidly equipped show-grounds at Addington.
Recreation and amusement are provided for by the Theatre Royal and various public halls, the famous Riccarton racecourse, the numerous cricket and football grounds. The Avon and Heathcote estuary meet the requirements of boating men.
Christchurch is connected with the outside world by Port Lyttelton, seven miles distant. The railway-tunnel of 15/8 miles in length, through the Port Hills, is on this line. Christchurch is not only the centre of the splendid Canterbury Plains, but it also is one of the chief railway centres of the colony. Addington railway-workshops are extensive and fully equipped.
Lyttelton, the chief port of the district, is situated on the northern shores of the inlet of that name, sometimes called Port Cooper. The surrounding country consists of high precipitous hills, which separate the harbour from Christchurch and the plains; but by the construction of the railway and tunnel the natural difficulties have been overcome, with the result that the whole of the imports and exports of northern and central Canterbury pass through Lyttelton. The origination and accomplishment of this great engineering work is due to the late William Sefton Moorhouse, the then Superintendent of the province. The natural facilities of the port have been enhanced by reclamation and harbour-works, which include two breakwaters, 2,010ft. and 1,400ft. in length respectively, extending from Officer and Naval Points, enclosing about 107 acres; long lengths of wharf-accommodation, 10,041ft.; a patent slip for ships up to 400 tons, and a splendid graving-dock 450ft. long, width on top and bottom 82ft. and 46ft. respectively, the entrance being 62ft. wide, well equipped with machinery and all requisites for repairs. Ships drawing up to 25ft. can berth alongside the spacious wharves and vast sheds. The railway electric-light machinery, and appliances are available throughout, which render loading and unloading practicable both by day and night. The town nestles on the steep side of the range, the streets being generally steep, flanked by solid stone buildings; and a background of green spurs and bold rocky faces gives to the whole a charming and picturesque appearance. The chief buildings are the Government Offices, Bank of New Zealand, and Union Bank of Australia, public school, gaol, £c. The water-supply is obtained from artesian wells on the Christchurch side of the hills. It is connected with Christchurch by a bridle-track over the range, and by a carriage-road viá Sumner. The harbour is well defended by fortifications and batteries on Ripa Island and the mainland. The population in 1891 was 4,087, with 790 houses.
Timaru, the third town in importance, is situated on the coast and railway line between Christchurch (100 miles) and Dunedin (131 miles). It has a well-constructed artificial harbour, which constitutes the port for the agricultural and pastoral districts of Geraldine, Timaru, and Waimate. The harbour is enclosed by a breakwater built of blocks of concrete; a rubble wall—North Mole—commences from the shore three-quarters of a mile away to the north, and extends easterly from the breakwater. Sets of moorings have been laid down. Dredging within the harbour is carried on: the ocean steamers' berth has a depth of 22ft. at low - water springs; the general depth of water is 20ft. to 26ft. A steam - vessel of 3,720 tons burden has been laden there. The Railway Department has travelling - cranes with lifting-power from 2 tons to 12 tons. The enclosed space is 50 acres. There is good berthage - accommodation, that at the main wharf being 1,000ft. long, with 23ft. at low-water springs. The town is picturesquely situated on the rolling hills overlooking the sea. The streets are irregular, but the public and commercial buildings, churches, and private houses are generally well and handsomely built of stone. The chief buildings are—Theatre, Town Hall, Hospital, Convent, Oddfellows', Foresters', and Garrison Halls, Government Buildings, Anglican Church, banks, and insurance offices, the High and public schools. The chief industries are—Frozen-meat works, two sawmills, three flour-mills, wool-scouring works, two wool-dumping, brick-making, cooperage, implement-, carriages-, door-and-sash works, boot-and-shoe, and woollen-factory. The town has a good high-pressure water-supply, and is connected by well-constructed roads with the surrounding districts, and by rail with Fairlie Creek, the route to the Mackenzie Country and Mount Cook. The population in 1891 was 3,663, with 738 houses.
The other principal towns in Canterbury are—Waikari, the centre for the extreme North Canterbury pastoral district; Amberley, population 470, distant thirty-five miles on Canterbury railway-line, is a farming and pastoral centre; Rangiora, population 1,783, with 367 houses, twenty miles from Christchurch by northern line of railway, is situated in the centre of a fine farming district, and possesses manufactories including seven flaxmills, flourmill, and brewery. The town and surrounding district are much benefited by plantations.
Kaiapoi, on the Waimakariri, population 1,371, about fourteen miles from Christchurch by the northern railway-line, lies in a rich agricultural district, rendered pleasing and attractive by the extent and variety of plantations and gardens. There are factories and various other works, including ham- and bacon-works, sawmills, brewery, and agricultural-implement works. Here also is the famed Kaiapoi Woollen-mill, which employs 600 hands when in full work. The town comprises some fine structures, including banks, churches, schools, and commercial buildings. The Waimakariri is navigable for small vessels to the centre of the town.
Ashburton, the newest of the towns, has a population of 1,900, with 341 houses, and is fifty-three miles from Christchurch on the southern trunk line. It is a well-built town, with extensive and beautiful recreation-grounds and gardens. The chief buildings are banks (four), Convent, Hospital, Old Man's Home, several churches, High School, public schools, halls, £c. It owes its existence to the settlement of the plains, the surrounding district being well adapted for farming. There are two breweries, a cordial-factory, three flour-mills, gasworks, ironworks, woollen-mill, brickworks, £c.
Geraldine, population 794, is situated on the Waihi River, four miles from Orari Railway-station, about eighty-six miles south-west from Christchurch. It is a neat and pretty town, in a first-class farming district, and has a beautiful park of native forest-trees.
Temuka, population 1,309, eighty-eight miles from Christchurch, on the southern railway line, is a well-built town, in the midst of a fine agricultural district. It possesses three flour-mills, a butter- and cheese-factory, brewery, foundry, fellmongery, and paper-mill. The Roman Catholic Church is a handsome building.
Waimate, population 1,379, is situated on the Waihao Forks Railway, about four miles from Studholme Junction, about 111 miles from both Christchurch and Dunedin. This town is the centre of an extensive back-country, and of a splendid agricultural area. It owes its origin to the sawmill industry of the Waimate bush. It has a fine public school, County Council Office, Hospital, and several well-built stores and banks, halls, and a handsome Courthouse. Industries: sawmills, flour-mills, £c.
Akaroa, situated on the noble harbour of that name, was founded in 1840, in the first instance by the French. It is a quiet, picturesque little place, much patronised by the Christchurch residents and others as a summer resort and watering-place. It was here that Captain Stanley hoisted the British flag on 11th August, 1840, when he took possession of the Middle Island on behalf of the Crown, forestalling the French by a few hours only.
Table of Contents
The Otago Land District lies between the 44th and 47th parallels of south latitude, and is bounded on the north by the Canterbury Land District; on the south-east and south by the ocean; on the west and south by the Waikawa, Mokoreta, Slopedown, Waikaka, Chatton, Wendon, Wakaia, Gap, Rockyside, and Kingston Survey Districts, the western and southern shores of Lake Waka-tipu, the Mid-Wakatipu, Mavora, Swinton, Eglinton, Arran, and Doon Survey Districts and a straight line from the north-east corner of the last-mentioned district to the nearest arm of George Sound, and by George Sound to the ocean; and on the north-west by the ocean to Big Bay.
The Otago Land District measures about 160 miles from Milford Sound on the west coast to Waikouaiti Bay on the east coast, and the same distance from north to south. Its area is 8,893,900 acres.
The country generally is mountainous, the highest land being to the northwest, and culminating in Mount Aspiring, 9,960ft. above the level of the sea.
The West Coast mountains are remarkably rugged and grand; and of the thirteen sounds that pierce this coast, three of them are within the limits of the Otago Land District, the remaining ten being on the west coast of the Southland Land District. These three are Milford Sound, Bligh Sound, and George Sound. Milford Sound, though only eight miles in length, contains some of the grandest scenery in the world; and fourteen miles inland from its head is the great Sutherland Waterfall, 1,904ft. high, possibly the highest waterfall known. Bligh Sound is smaller than Milford, and not nearly so interesting; but George Sound is larger, and very picturesque.
A rough tourist track has been opened from the head of Te Anau Lake to Milford Sound, and a practicable route has also been discovered from the northwest arm of the middle fiord of Te Anau Lake to the head of George Sound.
For nearly one hundred miles inland from the West Coast the country is very mountainous, but at a distance of sixty or seventy miles from the southeast coast-line it begins to get gradually lower, taking the form of rolling hills and downs along the sea-coast.
The largest rivers are the Clutha and the Waitaki; the former drains Lakes Wakatipu, Wanaka, and Hawea; the latter, Lakes Ohau, Pukaki, and Tekapo; the three last-mentioned lakes being in the Canterbury District. The largest lake in the Middle Island is Te Anau, lying chiefly in the Southland District. The dimensions of these lakes are as follows:—
| Lakes | Length in miles. | General breadth in miles. | Area in square miles. | Height above sea-level in feet |
|---|---|---|---|---|
| Te Anau | 38 | 1 to 6 | 132 | 694 |
| Wakatipu | 50 | 1 to 31/2 | 114 | 1,069 |
| Wanaka | 29 | 1 to 3 | 75 | 928 |
| Hawea | 19 | 3 | 48 | 1,062 |
| Ohau | 11 | 1 to 3 | 23 | 1,720 |
| Pukaki | 11 | 21/2 to 5 | 31 | 1,588 |
| Tekapo | 15 | 1 to 31/2 | 321/2 | 2,325 |
These lakes are situated in mountainous country; they are of glacial origin, and all very deep.
The Clutha River is the largest in New Zealand, and is estimated to discharge over 1,000,000 cubic feet per minute. It has a rapid current, but is navigable for a small steamer for a distance of forty miles from its mouth. The Waitaki is not a navigable river. For some seventeen miles from its mouth the Taieri River is affected by the tides, which run up one branch into Waihola Lake, and the other branch as far as Greytown.
There are some considerable areas of tolerably level land in the interior, the largest being the Maniototo Plains, and the Idaburn, Manuherikia, and Upper Clutha Valleys. Their dimensions are approximately as follows: Maniototo Plains, length, twenty-eight miles; average breadth, ten miles; Idaburn Valley, twenty-five miles by four miles; Manuherikia Valley, thirty-five miles by four miles; Upper Clutha Valley, thirty-three miles by five miles.
The Taieri Plain, nearer the coast, is about the same size as the Idaburn Valley, and is very fertile. The other lesser plains are the Waitaki in the North, the Tokomairiro, the Strath-Taieri, the Tapanui, and the fertile Inch-Clutha, lying between the two branches of the Clutha River, and consisting entirely of alluvial deposit. There is also a good deal of low country, consisting chiefly of rolling downs, on the south-west side of the Clutha near the sea.
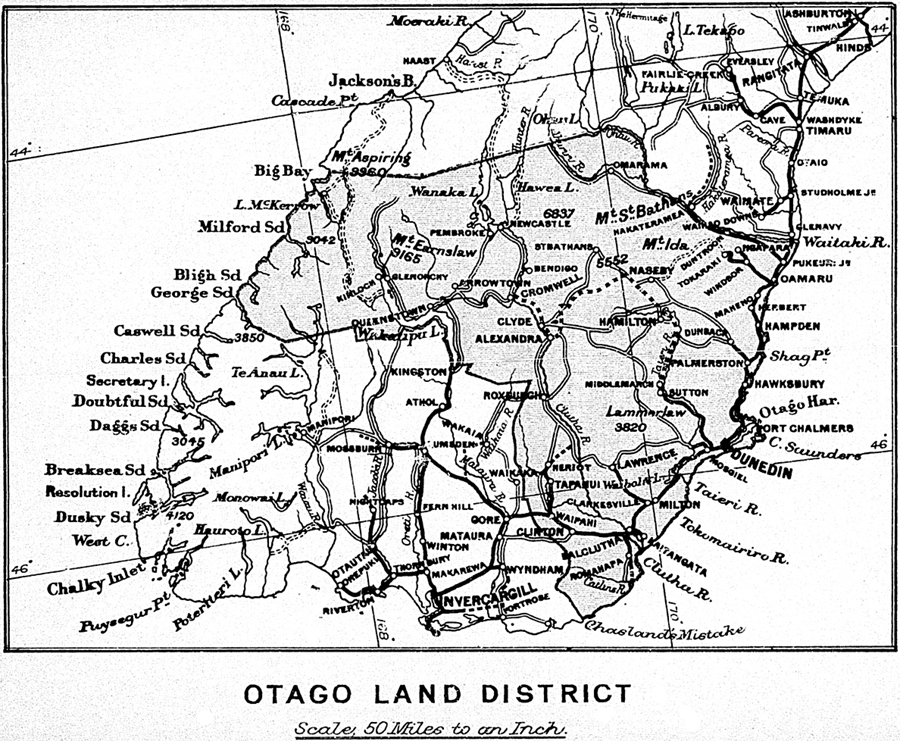
The forest land lies chiefly along the sea-coast; the largest area of bush being Tautuku Forest, about forty miles in length and fifteen miles in breadth. The western part of this forest is in the Southland District. The other principal forest-areas are in the following localities, viz.—north of Dunedin, east of the Tapanui mountains, in the Upper Valley of the Wakaia River, and also towards the north-west coast.
The forests of Otago contain a large variety of useful timber, both hard and soft wood; some being useful for building purposes, while other varieties are greatly prized for cabinet work, being highly ornamental.
Building stones of good quality are found in various localises throughout Otago. The Port Chalmers quarries afford an inexhaustible supply of bluestone, a basaltic stone of great hardness and durability. A hard freestone of excellent quality is found at Waikawa, where there is a large hill of it close to the water's edge. Blocks of very great size can be obtained. A soft white building stone—the well-known Oamaru limestone—is found in large quantities along the railway-line near Oamaru, from whence it is exported in considerable quantities to other parts of New Zealand, and to the neighbouring colonies. A similar kind of stone is found at Otekaike, about two miles from the railway-station, and it may be interesting to note that during the last two years about 3,000 tons of stone have been sent from the Otekaike quarries to form the facings of the Melbourne fish-market.
No first-class coals have yet been discovered in Otago suitable for steamships making long voyages, but very excellent brown coal exists in various neighbourhoods, large quantities of which are used on the railways. There are nearly one hundred coal-mines in operation in Otago in thirty-seven different places which furnish very good fuel for household and domestic purposes. Beds of lignite are also found in numerous localities, chiefly round the margins of the old lake-basins, and along the courses of the older river-valleys.
Limestone is found in the following places: Oamaru, Otekaike, Otepopo, Waihemo, Maniototo Plains, Waikouaiti, Lower Harbour, Peninsula, Waihola, Millburn, and Wakatipu.
The Millburn Lime and Cement Company burn large quantities of lime at their Millburn works, from whence it is sent to all parts of Otago, for building purposes, gasworks, £c. It is also largely used for agricultural purposes, and the fertility of the Tokomairiro Plain has been greatly increased during late years by its application to the soil. Extensive cement-works belonging to the same company have been in operation for some years on the reclaimed land, in Otago Harbour, near Dunedin. The cement manufactured at these works is considered fully equal, if not superior, to the best imported, and is largely used in building and other constructive works.
The climate of Otago varies greatly in different localities, and sometimes a distance of a few miles only separates districts very dissimilar in this respect. A large area in the interior of Otago has what may be called a dry climate. This area includes the Maniototo Plains, the Idaburn and Manuherikia valleys, and extends to Lakes Wakatipu, Wanaka, Hawea and Ohau on the west and north, and to the Waitaki River on the north-east. From Oamaru the direction would probably be across country to the Lammerlaw Ranges, and from there to Mount Benger and the southern end of Lake Wakatipu. This part of the country is well adapted for sheep of all kinds, especially merinoes. Some of the sheep-stations in the hilly country are capable of carrying 20,000 sheep. The Wolseley sheep-shearing machines have been introduced on about ten stations; the number of machines in each woolshed varying generally from ten to fifteen, though there is one shed at Benmore, near Lake Ohau, where there are twenty-eight machines driven by a turbine.
There are some fine fruit-growing districts in the valley of the Clutha, from below Roxburgh right up to Lake Wanaka. At Roxburgh and other places the summers are warm and dry and favourable to ripening the ordinary fruits. Apricots, peaches, &c., come to maturity fully a month before they do at Dunedin, and grapes will ripen in the open air in favourable spots.
Cereal crops of all kinds do well in the interior, although they sometimes suffer from want of rain.
In marked contrast to this is the West Coast district, which may be described as having a wet climate. Not that the number of wet days in the year is very great, but it is subject to very heavy rains from the northwest, the fall, generally exceeding 100in. per annum. But, although wet, the climate is mild, and the vegetation is consequently luxuriant. The only inhabitants of this part of the country are Mr. and Mrs. Sutherland, who keep a house of accommodation for tourists at the head of Milford Sound. There are very few visitors to the Sounds during winter, but in summer the tourist traffic is considerable. Towards the south-east and south coasts of the district the climate is moist, being somewhat similar to that of Dunedin, where the average rainfall is 35in., distributed over 163 days in the year.
There are about 3,000,000 sheep in Otago, of which rather more than half are merinoes. On an average, about one-third of the flocks consist of breeding ewes. The value of the Otago wool-clip is about £700,000.
There are two freezing establishments in Otago, namely, at Oamaru and at Burnside. They both belong to the New Zealand Refrigerating Company. At Oamaru there are two Bell-Colman machines. The capacity of the smaller one is 60,000 cubic feet of cold air per hour; and the larger one can supply 90,000 cubic feet per hour. The smaller machine is driven by water, obtained from the Oamaru town supply. The larger one is driven by steam. They can freeze 800 sheep per day, and they have storage-room for 20,000 carcases. At Burnside there are two Haslam machines, both driven by steam. One can supply 40,000 cubic feet of cold air per hour, and the other 60,000. The Burnside works can freeze 500 sheep per day, and have storage-room for 14,000 carcases.
There are four woollen-mills in operation in Otago, employing upwards of 600 hands. The amount paid in wages is about £46,000 per annum, and the machinery is 610 horse-power. £67,000 worth of wool is used per annum, and the turnout of manufactured goods exceeds £150,000 yearly. It will thus be seen that, taking each item as given above, the extent of the woollen industry in Otago exceeds that of all the other districts in New Zealand taken together.
In clothing-factories, also, Otago takes the lead, having five factories, employing 664 hands, whose wages amount to £27,000 per annum.
There are about twenty flax-mills in different parts of the district, employing nearly 400 hands, paying wages amounting to £8,000 yearly, and turning out £16,000 worth of manufactured material per annum.
Otago takes also the first position as regards cheese-and-butter factories and creameries, whether in respect of the number of hands employed, wages paid, or the value of the annual output, which amounts to about £60,000. There are twenty-six factories at present, and new factories are being started at short intervals.
The average yield per acre of the various crops in February, 1893, was as follows: Wheat, 26 bushels; oats, 33; barley, 29; rye, 16; peas, 20; beans, 41; hay, 2 tons; potatoes, 5 tons.
Otago produces about one-third of all the gold produced in New Zealand the annual output being about 100,000oz., value £400,000, giving employment to between 4,000 and 5,000 miners, of whom about 30 per cent are Chinese. Gold is found very generally distributed throughout Otago, except in the southern portion of the district. The chief localities are: Clutha Valley, Tuapeka, Shotover, Cardrona, Tinkers', St. Bathan's, Mount Ida, Nevis, Bannockburn, and Maerewhenua.
The following are the chief towns of Otago, with their population, including all towns having a population of 1,000 and upwards: Dunedin and suburbs, 46,000; Oamaru, 5,600; Port Chalmers, 2,000; Mosgiel, 1,300; Milton, 1,100; Kaitangata, 1,100; Lawrence, 1,000.
Dunedin, the capital city of Otago, is situated at the head of Otago Harbour, which is divided into two parts—the upper and lower. The lower harbour is six miles long from Taiaroa Heads to Port Chalmers. From Port Chalmers to Dunedin, the upper harbour, is seven miles in length. Dunedin and Port Chalmers are also connected by railway.
Although the hills surrounding Dunedin are rather tame in character and outline, the city itself is picturesquely situated. The business part of it is on level land near the harbour, and the residences occupy the sloping hills which rise on the west side of the city. The city proper is about two miles and a half long by seven-eighths of a mile wide, and is surrounded on the land-side by what is called the Town Belt. This reserve averages one-fifth of a mile in width, and comprises 500 acres, a great part of which is virgin forest. A pretty road, called the Queen's Drive, has been laid out through the Belt from end to end, from which many fine views of the town and harbour can be obtained.
It is thirteen miles down the harbour to the Heads in a north-easterly direction, but the Ocean Beach, lying to the south-east, is only two miles from the centre of the city, and the favourite sea-side resort—St. Clair—is about three miles. Trams run to both these places at frequent intervals. The city is also connected with the suburban boroughs, lying on the hills overlooking the town, by excellent cable-tramways. The Botanical Gardens to the north of the city are well laid out, the native bush contrasting with the cultivated parts. The Reservoir also, which is within easy walking distance, and the drive to Blueskin Bay, have many beauties.
Dunedin is well supplied with schools, there being six large schools in the city proper, and seven more in the suburbs.
There is also in Dunedin a training-college for teachers. The number of students in training is thirty-five males and thirty-seven females. The students devote every fifth week during the session to practice in teaching and management of classes in the ten associated schools of the city and suburbs.
The School of Art is attended by 404 students of whom 161 are artisans and other pupils who attend the evening classes only.
The Otago Boys' High School stands on a commanding eminence overlooking the city and harbour. The school was established in August, 1863, in the building in Dowling Street which is now the Girls' High School. The present handsome stone building was opened in February, 1885. The teaching staff numbers twelve, and the attendance is 210. The Otago Girls' High School was opened on the 6th February, 1871, with a roll of seventy-eight pupils, and by the end of the quarter there were 102 in attendance. The present attendance is 165, with a teaching staff of thirteen. Otago holds the proud distinction of having established the first Girls' High School in the Australasian Colonies. Among the earnest band of workers who laboured to establish this first High School for girls, the name of Miss Dalrymple will ever be held in grateful remembrance by the people of Otago.
The Otago University was founded in 1869, and opened in 1871. It is well housed in a handsome pile of buildings in the domestic Gothic style, somewhat sombre, from being built of basalt; and it forms a conspicuous object at the north end of the town. The University contains faculties of arts and science, medicine, and law, and a school of mines. There are at present twenty-seven professors and lecturers on the teaching staff; and the number of undergraduates keeping terms is 213—namely, 177 male and 36 female students. The University Library contains over 5,000 specially selected volumes. It is open to the public, under certain conditions, as a reference-library. The Chemical and Physical Laboratories are well fitted up and furnished with all necessary instruments and appliances. There are six scholarships tenable at the University, ranging in value from £15 to £40 per annum. One important educational institution is the Technical Classes Association. This was established in 1889 and has proved highly successful. The classes are held in the winter months, from April to September inclusive, and last year there were 364 students enrolled. There is an efficient staff of teachers, and the fees charged are 7s. 6d. for each class per quarter, except for drawing and cookery, the fees for which are 10s. 6d. per quarter.
The Dunedin Athenæum and Mechanics' Institute possesses a fine library of over 16,000 volumes. It has also two commodious reading-rooms well supplied with newspapers and magazines, of which a total of over 200 are regularly received. The average number of subscribers for last year was 1,021.
Public Buildings.—There are some fine specimens of architecture in Dunedin, the buildings for the most part having an aspect of permanence and solidity. Some of the churches are very handsome, and St. Joseph's Cathedral (Roman Catholic) has a particularly imposing appearance. Up to the present time it has cost over £22,000, but is not yet nearly complete. The First Church, and Knox Church, both Presbyterian, are both handsome structures. The Cargill Monument, which was erected to the memory of the late Captain Cargill, the founder of the Otago settlement, stands in the Triangle between the Customhouse and the Bank of New Zealand. It is an ornate specimen of early decorated Gothic architecture.
The Museum, of which the Professor of Biology is Curator, is under the control of the University Council. It is situated in King Street, about five minutes walk from the University. Up to the present time only the centre portion of the original design has been erected.
Dunedin is defended by three batteries on the Ocean Beach, to the southeast of the town. Of these the Central Battery is the most powerful. Port Chalmers and the entrance to the harbour are also defended by several batteries placed on Taiaroa Heads, and also by a system of submarine mines.
For a description of the accommodation for shipping at Dunedin, Port Chalmers, and Oamaru Harbours, see “Ports and Harbours,” page 320 ante. The Port Chalmers Graving-dock is described in the article on page 329.
There is not space to give in detail particulars of the various local industries throughout Otago, but a few, amongst others, may be noticed. Besides the woollen-mills, clothing-factories, meat-freezing works, and dairy-factories before mentioned, there are three bone-mills and artificial-manure manufactories, where substances that might otherwise go to waste, or pollute the air and water, are turned to profitable account and made to increase the fertility of the soil. There are six lime and cement works, the chief of which, those at Dunedin, have already been mentioned. There are thirty-three brick, tile, and pottery manufactories, the most extensive pottery-works being at Milton, where all kinds of useful household crockery ware are made. Seventeen agricultural-implement factories are in operation in Otago, and turn out annually a large supply. And lastly, there is a piano manufactory in Dunedin which has been in operation for the last eight years. During that period 160 pianos have been manufactured and 150 sold. The types manufactured are cottage-pianos and upright grands, at prices ranging from thirty to sixty guineas. The present output is from twenty-five to thirty pianos per annum.
The principal lines are as follows: (1.) The main trunk line from Dunedin to Christchurch, with branches from Oamaru to Hakateramea, and Oamaru to Ngapara and Tokoraki; also, Palmerston to Dunback. (2.) The main trunk line, Dunedin to Invercargill, with branches, Milton to Lawrence, Balclutha to Glenomaru, and Waipahi to Heriot. (3.) The Otago Central, from Wingatui to Middlemarch.
The total population of Otago Land District at date of last census, 5th April, 1891, was 117,638.
Area of Otago Land District: Open land below 2,000ft., 5,252 square miles; forest-land below 2,000ft., 1,919 square miles; open land above 2,000ft., 6,480 square miles; forest-land above 2,000ft., 419 square miles; area of lakes, &c., 275 square miles: total, 14,345 square miles.
Land-tenures in the Otago Land District on the 1st March, 1893: Total area made freehold, 2,027,673 acres; reserves and endowments Crown-granted, &c., 587,732 acres; total area under lease or license, including small grazing runs but not pastoral licenses, 665,805 acres; total area held under pastoral license, 4,161,708 acres; total unoccupied Crown lands, 1,561,882 acres; lakes, and Clutha and Taieri Rivers, 176,000 acres: total area of district, 9,180,800 acres = 14,345 square miles.
Of the 1,561,882 acres of unoccupied Crown lands there are: Open for selection, 68,000 acres; in course of being thrown open, 242,000 acres; open for pastoral license, 69,262 acres; Tautuku Forest, unsurveyed, 128,000 acres; other bush-lands and North-western District, 1,054,620 acres: total, 1,561,882 acres.
Total area under cultivation at last census, 5th April, 1891: Sown grasses on unploughed land, 135,933 acres; sown grasses on ploughed land, 685,589 acres; land broken up but not cropped, 33,448 acres; land under crop, 299,334 acres; land in gardens, 1,384 acres; land in orchard, 1,307 acres; land in plantation, 2,466 acres; area of boroughs (more or less cultivated), 27,202 acres: total, 1,286,663 acres = 1,854 square miles.
Table of Contents
The most striking characteristics of this district are its numerous and well-defined rivers and valleys, the latter often widening out to such an extent as to form very extensive plains. Commencing with the eastern side, the Mataura, Oreti (or New River), Aparaima (or Jacob's River), and Waiau are the most prominent illustrations of this: but these rivers by no means exhaust the list, as they all have numerous tributaries, which exhibit the same features on a smaller scale.
Speaking generally, the watersheds of these rivers do not attain any great height until followed far inland, and near the great lakes to be presently noticed. From what has been said above it follows that the extensive plains and valleys referred to are of alluvial formation, in many places of very rich and fertile quality, and capable of raising crops of every known product, subject, of course, to climatic limitations. Generally these plains and valleys rise from the river-levels in a very gradual slope, sometimes into a series of terraces from 10ft. to 50ft. in height, and sometimes into undulating hills, intersected at frequent intervals by lateral gullies, affording natural drainage and an abundant supply of water.
The indigenous growth on these hills consists of tussock and other grasses, fern, flax, &c., and even in this unimproved condition affords excellent grazing for sheep.
Near the large lakes, such as Wakatipu, Te Anau, Manapouri, Hauroto, and others, and between these and the West Coast, the country becomes very high, often reaching the elevations of 5,000ft. and 6,000ft., with very steep and rugged spurs and ravines, these in most cases being covered with a dense growth of timber, principally of the birch or beech tribe, for two-thirds of their height: the tops, however, often carry tussock and other herbage, affording admirable pasture for sheep in summer; but stock have to be removed from April to October, between which periods this country is generally covered with snow.
Southland does not contain so much forest as most of the North Island districts, nevertheless there is a very considerable quantity in the eastern, southern, and western parts, and a large export trade is done in the different kinds of pines and other timbers used for building, engineering, and furniture purposes, &c.
From what has been said of the river systems it will be evident that the country is well supplied with water, although none of the rivers can be used for purposes of internal communication; but the plains are traversed by railways for considerable distances from the principal towns, and where the railways end communication is continued by roads of a generally superior kind, so that there is probably no part of the colony so well off for means of transit.
Having already touched on the character of the soil, it only remains to say that the plains, terraces, and lower hills are well adapted for raising wheat, oats, and other cereals, turnips, mangolds, beets, and the various other crops common to temperate climates. Wheat is not so extensively grown as it might be, for the reason, probably, that the pastoral branches of farming receive more attention than the agricultural, and wheat is not required for these; whereas oats are extensively grown to feed sheep in the form of chaff; turnips also are much cultivated for winter food. Where wheat is grown the yields are very satisfactory, ranging from 40 to 60 bushels per acre, while oats frequently give 80 bushels.
Dairy - farming is becoming a very important industry, and is rapidly expanding under the impetus it has received through improved appliances and the favourable state of the Home markets. There are a number of cheese- and butter-factories, and one for preserving milk on the Swiss system. One firm makes Stilton cheese, which is considered to be equal to that of the same kind in England.
But by far the most important industries are those connected with the rearing and export of sheep and wool. Some years ago this kind of farming received a severe check on account of the inroads of wild rabbits, which for a time increased beyond all precedent; but owing to the repressive measures adopted there has been a marked abatement of the pest even on high and back country, and thus it has come to pass that country which a few years ago was absolutely denuded of vegetation now shows unmistakable signs of recovery. The hill-country, although it does not carry a large proportion of stock to area, is eminently healthy. The average carrying-capacity over the whole district would probably be under one sheep to the acre. Until within the last few years most of the runs were stocked with merino sheep, but, owing to the decline in price of that class of wool, and to the carcase not being acceptable to the European market, these sheep have, generally speaking, been replaced by Leicesters, Lincolns, Romney Marsh, Cheviot, and cross-breds of various kinds, better suited to the existing conditions. Very extensive establishments for slaughtering and freezing sheep are in operation. The latest of these, erected near the Bluff Harbour, is considered to be the most complete in the colony, being provided with all possible labour-saving machinery and appliances for working up the by-products into articles of commerce.
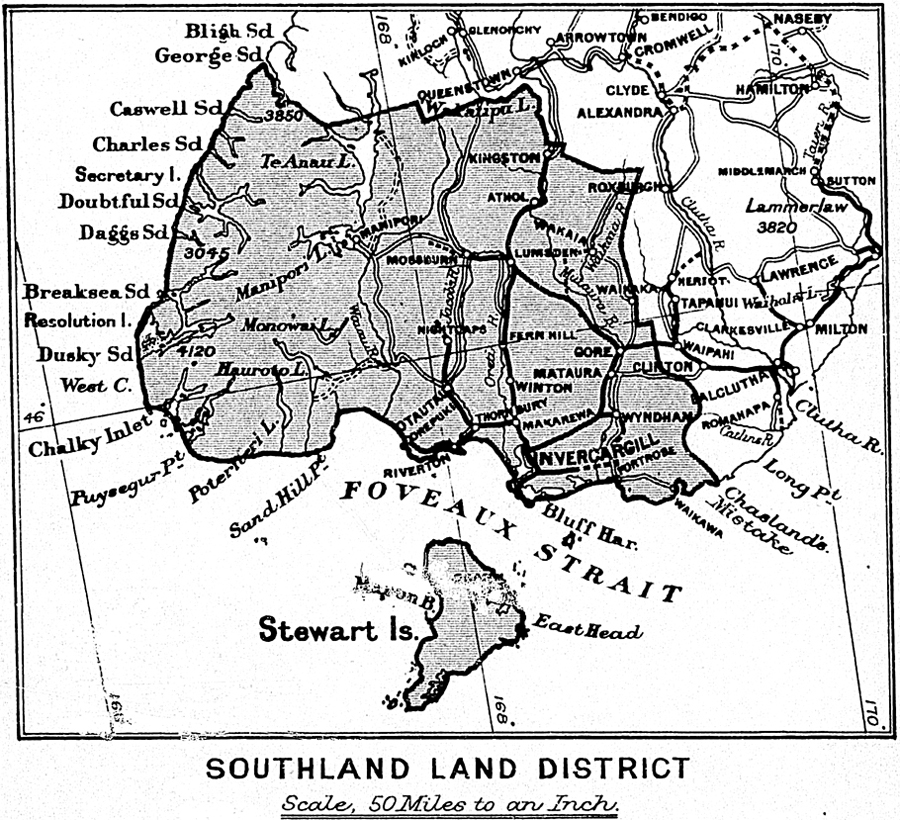
There are extensive seams of coal and lignite distributed over the district, and many of these have large annual outputs. Peat is also found in some of the up-country parts, and is used for fuel where wood and coal are scarce. Gold is found all over the district, and a large number of persons are engaged in obtaining it either by sluicing or dredging. A considerable amount of capital has been invested in beach-dredges worked by steam. Quite lately auriferous reefs, reported to be of great richness, have been discovered at Wilson's River, near Preservation Inlet.
Salt-water fish abound in great quantities in the waters surrounding Stewart Island, and oysters are found on banks between that island and the Bluff. All the large rivers, and many of the tributaries, are well stocked with trout, and one river—the Aparaima—had salmon-spawn put into it some years ago.
The small English fruits, such as gooseberries, currants, raspberries, strawberries, &c., grow in great profusion, as do also apples. The stone-fruits are not so common, although peaches, nectarines, apricots, &c., do well when trained against nursery-walls in favourable aspects.
The climate is bracing in winter, and warm and genial in spring and summer. The old residents state that there is a marked decrease in the rainfall within the last decade. No regular observations have been recorded for the last few years, but it is believed that the average annual rainfall is about 30in. It may, however, be observed that more rain falls near the coast than inland, and also that the rainfall is more evenly distributed throughout the year than is the case in the northern part of the colony. The temperature varies from 40° in winter to 70° in summer.
Invercargill, the chief town, was originally well laid out with wide streets, and liberal reserves in the town belts for recreation purposes. The Corporation exercises a paternal care in providing water, gas, and in disposing of sewage, &c., for the citizens, and the streets are well lighted, paved, and maintained. Artesian water is pumped to the top of a handsome brick tower—which, by the way, is a very conspicuous landmark—and stored there in a tank, from which most of the houses within the town boundaries are supplied. The population, including suburbs, is nearly 10,000. All religious denominations are represented. There are rope-and-twine, carriage-, and implement-factories, flour-and saw-mills, fellmongeries, brick- and pottery-works, iron-foundries, and various other industries. Exceptionally good beer is brewed here, and there are three first-class hotels. The Government Buildings, lately enlarged, and now rapidly approaching completion, are on a scale not often seen in a town of the same size. Although the Bluff is the principal port, Invercargill is provided with a second harbour for smaller vessels, in the New River Estuary, where there is a jetty with appliances for handling and receiving goods within the town boundaries.
The Bluff Harbour, which is connected by rail with Invercargill, does a very large shipping business, and derives additional importance as being the first and last port of call for steamers trading with Victoria and Tasmania.
Next in size to Invercargill is the town of Gore, situated on the Mataura River, and at the junction of the trunk railway with the Waimea Plains Railway. Owing to this fact, and to the town being surrounded with good agricultural land, Gore is rapidly growing in size and importance.
Riverton is a pretty little town, about twenty-five miles from Invercargill, with which it is connected by rail, and is situated on the estuary of Aparaima or Jacobs River. This is the oldest settlement in Southland, and was a great resort for whalers in former years. The harbour is available for coasting-vessels, but the principal carrying-trade is done by rail. There are several sawmills in the neighbourhood.
The town of Winton is on the Invercargill–Kingston Railway, about twenty miles distant from the latter, and is the centre for a good farming, sawmilling, and coal-mining district.
Lumsden is the junction of the Kingston and Waimea Plains lines. Coaches starting from this place take passengers and mails to the Lake country.
East of Invercargill is Fortrose, on the estuary of Mataura River, which is available for coasting-steamers. This place is surrounded by an exceptionally fertile agricultural and pastoral country.
About midway between Fortrose and Catlin's River is Waikawa, a newly-settled district with a first-class harbour for coasters, and a very large area of Crown land around it available for settlement. Steamers trading with Dunedin and Invercargill call here and at Fortrose at regular intervals.
There remains for disposal a very large area of Crown land, probably more than 500,000 acres, but this can only be estimated roughly, because much of the district west of Waiau River is practically unexplored. It is true that most of this is forest-land, but it is beginning to be recognised here, as in the North Island, that when this is once cleared and laid down with grass it is distinctly superior to most of the open land for purposes of grazing; and grazing is and will long remain the principal industry of the country. The land referred to is chiefly situated around Waikawa Harbour, along the Waikawa-Catlin's Road, between the Jacob's and Waiau Rivers, and to the west of the Waiau. Stewart Island also contains a wide extent of Crown lands, mostly forest-clad. There are also considerable areas of open hilly country carrying natural grasses still in the hands of Government. These are scattered over various parts of the district, but are rapidly being taken up.
Table of Contents
In 1891, an Act was passed for the assessment of land and income, and the new system took the place of that under which the property-tax was levied. The land-tax and income-tax, generally-spoken of as one system, are really distinct, although dealt with under the same assessment and tax Acts.
By far the most important branch of the dual system is the land tax, and from it a revenue of—in round numbers—£300,000 is derived. A mortgagee is treated as a part owner of land to this extent, that for the ordinary land-tax an owner is allowed to deduct from the value of his land the amount of any money owing by him which is secured by a duly-registered mortgage; and the mortgagee has to return the amount owing to him on registered mortgage, and is assessed thereon subject to certain deductions. A person owning land and holding mortgages is assessed on both as land, and from the assessment there is deducted any money owing by him on registered mortgage. There is a provision for assessing a mortgage at its value to the mortgagee, and this applies in cases in which the value of the security does not equal the mortgage-debt. By allowing an owner to deduct his mortgage, and assessing the mortgagee with it, the whole value of land, subject to the deductions and exemptions allowed by law, is assessed for land-tax. The same principle applies to land and mortgages of companies, excepting that mortgages held by banks are exempt from land-tax, and the interest derived by banks from mortgages is assessed with other profits for income-tax.
Each landowner is entitled to a deduction in his assessment of the value of all improvements on his property or properties up to a total of £3,000 on the whole. Thus, an owner having improvements worth £1,500 would be entitled to deduct that amount, and an owner having improvements worth £4,500 would be entitled to deduct £3,000. The deduction of mortgages and of improvements up to a value of £3,000 renders very many owners exempt from land-tax, the total number of land-tax payers being 12,557, out of a total of 91,501 owners of land in the colony. The allowance of a special exemption also reduces the number of taxpayers. An owner whose land and mortgages, after the deduction of mortgages owing by him and of improvements up to a value of £3,000, does not exceed £1,500, is allowed a deduction by way of exemption of £500; and this amount gradually diminishes until it vanishes, when an owner's assessed value, less deductions, reaches £2,500.
In addition to the ordinary land-tax, a graduated tax is levied, and for this all improvements are deducted; but an owner is not allowed to make any deduction for mortgages owing by him, and he has not to include in his return any mortgages owing to him. This tax is not imposed on any owner the value of whose land less the improvements thereon does not exceed £5,000, and the lowest rate imposed is one-eighth of a penny in the pound. The rate gradually rises until it reaches a penny and six-eighths in the pound on an unimproved value of £210,000 or more. There is a provision for levying 20 per cent. additional graduated tax in the case of owners who have been absent from or resident out of the colony for a period of three years or over, prior to the passing of the yearly tax Act. The yield of the graduated tax may be set down in round figures at £70,000, and the absentee tax forms a very small part indeed of this total, viz., £668. When land belongs to two or more persons, and one partner resides in the colony, the absentee tax is not levied, and it does not apply to companies.
Under the existing law, the value of land and improvements thereon is ascertained by an assessment made by assessors, who value the whole of the land in the colony. Owners make returns of their lands, and have ample opportunities given to them to object to the departmental values; and any objections which are not allowed by the Commissioner are referred to a Board of Review sitting in open Court, who hear evidence, and decide the value. The reviewers are chosen from residents in the district in which the lands are situated, and their decision is final, and cannot be appealed from.
If, after the sitting of a Board of Review, an owner should not be satisfied with the value at which a property was assessed, he can call on the Commissioner to either reduce the assessed value of the property to the sum at which he, as owner, returned it, or to purchase the property at the sum so returned by such owner. Under this provision the Cheviot Estate, formerly the property of the late Hon. William Robinson, was purchased by the Government on the recommendation of the Commissioner, who refused to reduce the assessed value, £304,826. The trustees for the owners demanded a reduction to £260,220, the amount at which they entered it in their return. The estate contains 84,222 acres of land, and is situated in the south-eastern portion of the Nelson Provincial District, and immediately to the north of the Canterbury Provincial District. The price paid was £260,220, the value returned by the owners, who had objected to the Commissioner's value and had brought the matter before the Board of Review, by whom the Commissioner's value was sustained. The property is now vested in the Crown, and is being surveyed for subdivision.
Another provision enables the Commissioner to call upon an owner to agree to what the Commissioner may consider the actual value of a property, and, should the owner not so agree, the Commissioner may, with the approval of the Governor in Council, purchase the property at the value entered in the owner's return, with 10 per cent. added thereto.
In considering the income-tax, it must be remembered that many incomes are declared to be exempt from this tax. As land and mortgages are reached by the land-tax, all incomes from mortgages, and from rents, and from the use or produce of land derived by the owner or occupier, are exempt from income-tax. This most materially reduces the number of income-tax payers, and, as all companies pay on their incomes, shareholders do not include in their returns of income dividends received by them. An exemption of £300 is allowed to each person, and this is deducted from all taxable incomes. Consequently the number of taxpayers, and the revenue from the tax, are both very greatly lessened by this exemption.
It has been found that those who have a net income of £300, when all incomes derived from mortgages and rents, and from the use or produce of land derived by the owner or occupier, are omitted, bear a very small proportion to the total of those earning incomes. In comparing the results of the New Zealand income-tax with any other system, the large number of incomes that are not subject to it must be borne in mind. The year ending the 31st March, 1893, was the first for which income-tax was collected, and the immense amount of work attending the assessment for land-tax delayed the business of dealing with the income-tax. Since the end of March a great deal has been done in scrutinising returns of income, and investigations made have resulted in many additions to returns. It can hardly be supposed that no instances of making wilfully false returns will occur. Such cases are found wherever there is an income-tax. Objections to the assessment of income are heard by a Resident Magistrate sitting as a Board of Review, and the proceedings are private.
Summarising results, it may be stated—using round figures—that the land-tax yields £300,000, including £70,000 for graduated tax, and the income-tax yields £70,000, making a total of £370,000. The expenditure for a triennial period may be set down as £23,000 for each of two years, and £7,000 for the third year, making a total of £53,000. The revenue for the three years would at present rates be £1,110,000.
The rates of tax for 1892–93 were: ordinary land-tax, 1d. in the pound, and the graduated tax commenced at one-eighth of a penny in the pound on the unimproved value, and rose to 1 6/8d. where the unimproved value of the land of an owner was £210,000, or exceeded that sum. The rate of income-tax was 6d. in the pound on the first taxable £1,000, i.e., after deducting the £300 exemption; and 1s. in the pound on taxable incomes over £1,000. That is, a person having an income of £1,900 would be thus taxed: £300 would be exempt; £1,000 would pay 6d. in the pound; and the remaining £600, 1s. in the pound; making a total of £55 a year. The tax on an income of £400 would be, at 6d. on £100, equal to £2 10s.
The administration of the Land and Income Assessment Act is vested in the Commissioner of Taxes, but the appointments of officers, assessors, and reviewers are made by the Governor—that is, on the recommendation of the Colonial Treasurer, as the Ministerial head of the department. The Commissioner of Taxes is not in the exercise of his statutory duties subject to the Ministerial head of the department; and the assessment for income-tax, and all matters connected therewith, are entirely confidential. There is no secrecy as to the assessment of land, and in the work of administration land-tax and income-tax matters are kept distinct as much as possible.
Land and Income-tax Department, Wellington, 30th May, 1893.
By the passing of “The Land and Income Assessment Acts Amendment Act, 1893," various amendments were made in the land-tax system. The most important is that which exempts from liability to land-tax the value of all improvements on land, instead of deducting improvements up to the value of £3,000 only. This amendment will decrease the revenue from the land-tax by about £37,000; and to compensate for this, in some degree, the scale of graduated tax has been increased, so that the highest rate is twopence in the pound instead of one penny and six-eighths in the pound. It is estimated this increase will result in additional revenue to the amount of £18,000, thus leaving the net loss of revenue at about £19,000. The larger part of the increased graduated will be paid by those owners who derive advantage from the exemption of all improvements; but in cases where the improvements made on a large property are small by comparison with the value of the land, an owner will have to pay more tax on his land than he did for the year 1892–93. The revised schedule of rates of graduated tax is published herewith:—
Where the value is £5,000, and is less than £10,000: One-eighth of a penny in the pound sterling.
Where the value is £10,000, and is less than £15,000: Two-eighths of a penny in the pound sterling.
Where the value is £15,000, and is less than £20,000: Three-eighths of a penny in the pound sterling.
Where the value is £20,000, and is less than £25,000: Four-eighths of a penny in the pound sterling.
Where the value is £25,000, and is less than £30,000: Five-eighths of a penny in the pound sterling.
Where the value is £30,000, and is less than £40,000: Six-eighths of a penny in the pound sterling.
Where the value is £40,000, and is less than £50,000: Seven-eighths of a penny in the pound sterling.
Where the value is £50,000, and is less than £70,000: One penny in the pound sterling.
Where the value is £70,000, and is less than £90,000: One penny and one-eighth of a penny in the pound sterling.
Where the value is £90,000, and is less than £110,000: One penny and two eighth of a penny in the pound sterling.
Where the value is £110,000, and is less than £130,000: One penny and three-eighths of a penny in the pound sterling.
Where the value is £130,000, and is less than £150,000: One penny and four-eighths of a penny in the pound sterling.
Where the value is £150,000, and is less than £170,000: One penny and five-eighths of a penny in the pound sterling.
Where the value is £170,000, and is less than £190,000: One penny and six eighths of a penny in the pound sterling.
Where the value is £190,000, and is less than £210,000: One penny and seven eighths of a penny in the pound sterling.
Where the value is £210,000, or exceeds that sum: Two-pence in the pound sterling.
It is not intended, in future, to have a triennial valuation of land, and rolls for local rating purposes will not be supplied by the Commissioner of Taxes. The valuations will be made by local bodies. Next session of Parliament a measure will be introduced for abolishing the triennial valuation of land by the Commissioner, and a system will be provided for having a readjustment of values when necessary; but as the value of land, less improvements thereon, is not subject to such frequent variations as the value plus improvements, it is not expected that such adjustments will be frequent. By having skilled land-valuers permanently engaged by the department, stationed in the more important districts in the colony, an efficient means will be provided for having any necessary alterations in land-values secured. The number of such permanent officers has not yet been determined, but probably there will be two for each island. In order to indicate the extent of work imposed in making a general triennial valuation of the colony, it will be sufficient to state that, in making the assessment for 1891, there were 230 land-assessors employed, and, at one time, 82 extra clerks; the total cost of the assessment, without including the salaries of permanent officers, being over £33,000. It will thus be seen that, by doing without the triennial assessment, a very large saving of expenditure by the State will be effected. The cost of valuations will be thrown upon the local bodies, and in country districts they will be made by the counties, rolls being supplied by the counties to the Road Boards. As nearly all boroughs now make their own valuations the alteration will affect very few boroughs. The rolls of Harbour, Drainage, River conservation, and other District Boards will be compiled from the county rolls, instead of being supplied by the Commissioner of Taxes.
The most important amendment made as regards income-tax is a provision that for assessment for this tax the income of a bank doing business in the colony shall not be deemed to be less than £10,000, which, at a shilling in the pound, will fix the minimum of income tax to be paid by a bank at £500 a year.
Some of the amendments grant concessions to income-tax payers, but none seriously affect the revenue. It is provided that pensions drawn by residents in the colony shall be exempt from income-tax when such a tax has already been paid on them in the country from which they are derived. There are resident in the colony a very considerable number of officers drawing Imperial pensions, and they will be relieved from the payment of income-tax in the colony.
One amendment provides that companies borrowing money on debentures shall not be allowed to deduct from interest payable to debenture-holders tax paid by the company as agent for such debenture-holders. Under the former Acts a company was allowed to deduct from interest payable to the debenture-holders tax paid by the company as agent for the debenture-holders. This provision was taken advantage of by one or two companies only, and its repeal was considered advisable.
It is estimated that the revenue from the land- and income-tax systems, as modified, will be somewhat in excess of £350,000 a year.
Land and Income-Tax Office, Wellington, 15th September, 1893.
The attached table gives a classification of land- and income-tax payers by occupation or designation, and of companies according to the business they carry on. Results are contrasted with those of the last assessment for property-tax in 1888, which were published in 1889.
Under both systems the largest contributions were by graziers, sheep farmers, farmers, dairymen, £c.—that is, by owners of country lands—the total for land- and income-tax being £89,341, and for property-tax £81,544. The number of the property-tax payers was 8,611. The number of land-tax payers is 4,760, who are assessed for ordinary land-tax £60,203; 766 are assessed for graduated land-tax £28,015; and 97 are assessed for income-tax £1,123. In considering these and other results it should be remembered that some who pay graduated tax do not pay land-tax, but it may be taken to be the rule that the land-tax payers include those who pay graduated tax, and the number of the latter is therefore omitted in these comparisons. Further, some of those who pay land-tax also pay income tax. Land companies (15) were assessed for property-tax £12,049; and land companies (19) were assessed for land-tax £16,579, and graduated tax £15,232, making up, with income-tax £396, a total of £32,207, which shows an increase of £20,158 in the present as compared with the late system. Loan companies contribute £30,923 for land- and income-tax as against £38,147 property-tax; life insurance companies, £11,790, as against £11,749; fire and marine insurance companies, £8,279, as against £6,652; banks pay £10,184, as against £14,244; mercantile companies, £16,302, as against £9,384; manufacturing companies, £7,549, as against £3,784; manufacturing and mercantile, £5,622, as against £5,807; coal-mining £1,425, as against £1,498; gold-mining (23), £2,735, as against (113) £2,545; building societies, which were not assessed for property-tax, pay £1,987; church property corporations and trusts, £2,736, as against £2,046.
In amounts paid by persons, the table shows that, as a rule, the totals contributed in the various classes under the two systems do not differ very materially, excepting in the class including “working storemen, mechanics, labourers, shepherds, miners, sailors, £c.”: 2,242 paid property-tax, £4,053; and 249 paid land- and income-tax, £543.
| Classification of Taxpayers according to Occupation. | |||||||||
|---|---|---|---|---|---|---|---|---|---|
| Designation. | Land-and Income tax Payers, 1892–93. | Property-tax, 1889. | |||||||
| Number of Taxpayers. | Land tax. | Number of Taxpayers. | Graduated Land tax. | Number of Taxpayers. | Income tax. | Total Tax. | Number of Taxpayers. | Tax. | |
| £ | £ | £ | £ | £ | |||||
| Professional: clergymen, lawyers, doctors, authors, editors, engineers, surveyors, and architects | 449 | 6,612 | 42 | 755 | 652 | 6,153 | 13,520 | 1,155 | 11,677 |
| Civil servants, officers of local bodies, teachers, &c. | 173 | 773 | 5 | 10 | 391 | 1,498 | 2,281 | 547 | 2,216 |
| Retired professional men, merchants, and others | 154 | 6,610 | 45 | 1,660 | 89 | 692 | 8,962 | 342 | 12,808 |
| Merchants, importers, warehousemen, contractors, &c.—firms | 92 | 2,693 | 22 | 243 | 111 | 8,383 | 11,229 | 336 | 10,326 |
| Merchants, importers, warehousemen, contractors, &c.—persons | 300 | 5,770 | 56 | 1,306 | 127 | 2,010 | 9,086 | 667 | 9,658 |
| Tradesmen, wholesale and retail shopkeepers, storekeepers, carriers, &c. | 1,251 | 6,182 | 41 | 204 | 558 | 5,592 | 11,978 | 3,156 | 14,721 |
| Working storemen, mechanics, labourers, shepherds, miners, sailors, &c. | 220 | 474 | 2 | 7 | 29 | 62 | 543 | 2,242 | 4,053 |
| Manufacturers, brewers, millers, founders, sawmillers, shipbuilders, &c. | 170 | 1,697 | 19 | 175 | 139 | 2,280 | 4,152 | 525 | 5,046 |
| Graziers, sheepfarmers, farmers, dairymen, &c. | 4,760 | 60,203 | 766 | 28,015 | 97 | 1,123 | 89,341 | 8,611 | 81,544 |
| Land, commission, or general agents, auctioneers, accountants, brokers, commercial and other managers, clerks, bookkeepers, master-mariners | 397 | 4,220 | 35 | 323 | 914 | 6,112 | 10,655 | 1,858 | 13,675 |
| Widows, wives'trustees, spinsters | 1,837 | 13,574 | 57 | 689 | 58 | 483 | 14,746 | 3,760 | 22,274 |
| Other trust estates and estates of deceased persons | 1,522 | 33,455 | 210 | 6,738 | 26 | 362 | 40,555 | 1,492 | 32,287 |
| Absentees | 784 | 21,053 | 114 | 4,109 | 20 | 139 | 25,301 | 1,150 | 25,977 |
| Companies— | |||||||||
| Banks | 6 | 4,596 | 6 | 2,512 | 4 | 3,076 | 10,184 | 6 | 14,244 |
| Life insurance | 6 | 6,771 | 6 | 446 | 8 | 4,573 | 11,799 | 10 | 11,749 |
| Loan | 30 | 26,567 | 14 | 2,700 | 15 | 1,656 | 30,923 | 36 | 38,147 |
| Land | 19 | 16,579 | 13 | 15,232 | 3 | 396 | 32,207 | 15 | 12,049 |
| Mercantile | 36 | 4,850 | 9 | 492 | 84 | 10,960 | 16,302 | 101 | 9,384 |
| Manufacturing | 23 | 1,832 | 8 | 463 | 44 | 5,254 | 7,549 | 58 | 3,784 |
| Manufacturing and mercantile | 15 | 1,495 | 5 | 791 | 21 | 3,336 | 5,622 | 28 | 5,807 |
| Mining (coal) | 6 | 92 | 2 | 8 | 7 | 1,325 | 1,425 | 10 | 1,498 |
| Mining (gold) | ... | ... | ... | 23 | 2,735 | 2,735 | 113 | 2,545 | |
| Fire and marine insurance | 9 | 2,631 | 3 | 221 | 28 | 5,427 | 8,279 | 33 | 6,652 |
| Building societies | 37 | 1,968 | 1 | 19 | ... | ... | 1,987 | ... | ... |
| Church property— | |||||||||
| Corporations and trusts | 64 | 1,974 | 10 | 762 | ... | ... | 2,736 | 76 | 2,046 |
| Totals | 12,360 | 232,581 | 1,491 | 67,880 | 3,448 | 73,627 | 374,088 | 26,327 | 354,167 |
The following extracts are given from a report on the general valuation of land under “The Land and Income Assessment Act, 1891,” presented to Parliament in 1892. Special attention is drawn to the remarks on the land-values and increased settlement.
The definitions of the words “land” and “improvements” in the meaning of the above-mentioned Act are as follow:—
“Land” means and includes all land tenements, buildings, and hereditaments, whether corporeal or incorporeal, and also includes all chattel interests in land.
“Improvements” include houses and buildings, fencing, planting, draining of land, clearing from timber, scrub, or fern, laying down in grass or pasture, and any other improvements whatsoever the benefit of which is unexhausted at the time of valuation.
A general assessment is an undertaking of very considerable magnitude, for all land in the colony has to be valued, whether occupied or unoccupied, whether belonging to companies, or persons, or local bodies, to Natives, or the Crown.
Much interesting information as to the colony as a whole and its various parts may be extracted from an examination of the results of a general land-valuation. The two natural divisions of New Zealand may be taken first, and the figures for two assessments are—
| 1888. | 1891. | Increase. | |
|---|---|---|---|
| North Island | £49,607,873 | £57,441,115 | £7,833,242 |
| Middle Island | 61,529,841 | 64,783,914 | 3,254,073 |
| Totals | £111,137,714 | £122,225,029 | £11,087,315 |
Comparing the total valuation of 1888 with 1891, there is an increase of £11,000,000, a result that is highly satisfactory, and will no doubt be a surprise to many persons, even to those who take an interest in watching affairs that have a more or less direct bearing on land-values and increased settlement. Of this large additional value, the North Island claims nearly £8,000,000, the increase in the counties being £6,500,000, and in the boroughs £1,300,000. In the Middle Island the increase is £3,000,000, and it may be said that the whole is in the counties, the boroughs showing an increase of £300,000 only. The value of the boroughs in each Island is about the same, being £18,184,297 in the North Island, and £18,222,565 in the Middle. The North Island counties reach a total of £39,256,818, and those in the Middle £46,561,349. It appears probable that by November, 1894, the North Island will have reached a total land-value nearly equal to the Middle, for there is every indication that settlement will continue to proceed much more rapidly than in the Middle Island, and there is a great deal of land that is likely to be improved during the next two years, in addition to a large area that has been taken in hand since last November. As an instance of progress Oroua County may be cited, for its value rose in three years from £1,397,753 in 1888 to £2,268,854 in 1891.
In considering the results of this assessment, it should be remembered that it has been made at a time when in no part of the colony did any excitement in land-dealing exist, and there was nothing like a boom, if one or two small local districts are excepted. In many parts of the colony there has been a great deal of improving done, and on the whole there has been in the districts which show the greatest increase a steady and bonâ fide demand for good to fair land. It will be seen that very few portions of the Auckland Provincial District show an increased value, but in several counties in the southern part of the North Island there has been a most marked increase in the total assessed value. It has been asserted—it always is—that values have been placed at too high a figure by assessors; but this is not the case, and the higher total must be ascribed—firstly, to the increased extent of improved land, and to a generally firmer feeling in the land-market; and, secondly, to many larger properties having been raised to their fair market value.
In the North Island the counties rank thus as to total value: Hawke's Bay, £3,673,889; Oroua, £2,268,854; Waipawa, £2,179,312; Eden, £2,002,677; Cook, £1,885,856; Wairarapa South, £1,872,035; Patangata, £1,863,936; Wairarapa North, £1,831,209; Rangitikei, £1,475,473; Manukau, £1,385,330; Hawera, £1,247,436; Wanganui, £1,176,106; and Hutt, £1,030,745, all the others having a total value of less than £1,000,000. Whangaroa, with a value of £63,825, stands at the bottom of the list.
The North Island counties may be classed into four groups: Auckland Provincial District, excepting Waiapu and Cook Counties; East Coast, from Waiapu County to Waipawa; and West Coast, from Clifton to Horowhenua; in each of which the total value is about £11,000,000; and then, from Pahiatua to the Hutt, there is a total value of something over £5,000,000. These figures exclude boroughs.
Selwyn still has the honour of being the richest county in the colony, its value being £7,446,756, and with its neighbour, Ashley—£3,801,341—(the second in the colony), makes £11,248,097, nearly equal to the value of all the Auckland counties. Next in the Middle Island to Ashley comes Southland, with a value of £3,739,513; then Ashburton, £3,630,383; Geraldine, £3,257,696; Waitaki, £2,709,379; Waimate, £2,462,433; Marlborough, £1,837,632; Wallace, £1,364,016; Taieri, £1,330,718; Waimea, £1,196,226; Clutha, £1,151,046; Akaroa, £1,169,379; and Westland, £1,048,156: the remaining counties having a value of less than £1,000,000, Sounds—£171,095—being the lowest. Stewart Island has a value of £85,021, and in the tables is included in the Middle Island.
The total improved value of all the counties in Canterbury is £22,504,009, and of those in Otago and Southland, £15,333,847, the Canterbury counties having increased nearly £2,000,000 since 1888, and the Otago and Southland counties nearly £1,000,000.
Some of the road districts in the Middle Island reach a very high total—Levels, £1,539,999, being the highest, and next are Ellesmere, £1,227,768, and Waipara, £1,187,535. In the North Island, Featherston Road District has a value of £1,138,953. There is a wide margin between these totals and £6,031, the total of landed properties in the Upper Hurford Road District, Taranaki County. Small road districts are very numerous in the North Island, and particularly so in several Auckland counties and in Taranaki County.
In Eden, Manukau, and Peninsula Counties the value of the improvements is higher than that of the unimproved land; and in Hutt County the value of improvements nearly reaches that of the land. Selwyn County has improvements assessed at £2,549,817; Southland, at £1,292,111; Hawke's Bay, at £1,115,306; and Eden, at £1,010,269. The following counties have improvements assessed at nearly one million: Oroua, £970,437; Geraldine, £941,513; Ashburton, £938,917; Waipawa, £931,930; and Ashley, £927,930.
The results of the assessments for the four largest boroughs or cities are—
| Improved | Improve- | Unimproved | |
|---|---|---|---|
| Value. | ments. | Value. | |
| £ | £ | £ | |
| Auckland | 4,934,288 | 2,453,472 | 2,471,496 |
| Wellington | 5,865,778 | 2,432,749 | 3,440,182 |
| Christchurch | 3,403,566 | 1,527,626 | 1,820,770 |
| Dunedin | 4,193,422 | 2,069,905 | 2,124,467 |
In considering these figures it must be remembered that Wellington has no populous and valuable boroughs close to it, as the other cities have.
The second-class boroughs in the colony rank thus for improved value: Napier, £1,275,853; Invercargill, £959,140; Nelson, £942,370; Lyttelton, £851,730; Sydenham, £821,060; Oamaru, £612,571; Wanganui, £543,403; St. Albans, £524,822; Palmerston North, £489,618; Caversham, £466,074; Timaru, £442,830; and Devonport, £407,333. Patea, with £43,378, has a less value than any other borough in the North Island; while Alexandra, £13,578, and Hampden, £13,195, have the lowest value in the Middle.
The following are the results of the assessment under “The Land and Income Assessment Act, 1891,” made as at 1st November, 1891, distinguishing the value of improvements from the unimproved value:—
| Counties or Boroughs. | Actual Value, including Improvements. | Value of Improvements. | Unimproved Value. |
|---|---|---|---|
| £ | £ | ||
| Counties | 85,818,167 | 27,922,735 | 57,880,233 |
| Boroughs | 36,406,862 | 18,442,562 | 17,907,662 |
| Totals | 122,225,029 | 46,365,297 | 75,787,895 |
The following comparative table shows the improved value of land in the different counties, according to the returns made at the assessments of 1888 and 1891:—
| County. | 1888. | 1891. |
|---|---|---|
|
* Included in Cook County. * Included in Clifton, Taranaki, Hawera, and Patea Counties. | ||
| £ | £ | |
| Mongonui | 180,489 | 196,158 |
| Whangaroa | 71,810 | 63,825 |
| Bay of Islands | 349,441 | 365,069 |
| Hokianga | 504,663 | 422,365 |
| Whangarei | 536,657 | 523,420 |
| Hobson | 284,362 | 325,974 |
| Otamatra | 249,250 | 258,496 |
| Rodney | 273,640 | 293,235 |
| Waitemata | 656,300 | 032,012 |
| Eden | 2,174,570 | 2,002,677 |
| Manukau | 1,339,646 | 1,385,330 |
| Coromandel | 192,882 | 217,120 |
| Thames | 238,533 | 253,013 |
| Ohinemuri | 193,319 | 204,704 |
| Raglan | 267,678 | 357,941 |
| Waikato | 633,571 | 682,774 |
| Piako | 753,700 | 689,384 |
| Waipa | 490,626 | 464,086 |
| Tauranga | 250,966 | 282,723 |
| Rotorua | 119,979 | 168,371 |
| Whakatane | 516,184 | 663,785 |
| East Taupo | 301,781 | 301,681 |
| West Taupo | 208,799 | 235,997 |
| Kawhia | 41,232 | 354,269 |
| Islands— | ||
| Great Barrier, &c. | 54,409 | 55,284 |
| Waiheke, &c. | 63,288 | 71,343 |
| Waiapu | * | 472,548 |
| Cook | 1,762,045 | 1,885,856 |
| Wairoa | 793,898 | 1,101,072 |
| Hawke's Bay | 3,182,295 | 3,673,889 |
| Waipawa | 1,644,874 | 2,179,812 |
| Patangata | 1,474,757 | 1,863,936 |
| Clifton | 393,138 | 441,325 |
| Taranaki | 918,098 | 969,579 |
| Stratford | * | 560,345 |
| Hawera | 986,150 | 1,247,436 |
| Patea | 681,345 | 823,675 |
| Waitotara | 597,036 | 731,668 |
| Wanganui | 955,468 | 1,176,106 |
| Rangitikei | 1,082,922 | 1,475,473 |
| Oroua | 1,397,753 | 2,268,854 |
| Manawatu | 536,996 | 810,171 |
| Horowhenua | 569,274 | 858,648 |
| Pahiatua | 334,562 | 511,400 |
| Wairarapa North | 1,540,345 | 1,831,209 |
| Wairarapa South | 1,537,761 | 1,872,035 |
| Hutt | 1,349,510 | 1,030,745 |
| Collingwood | 279,864 | 323,910 |
| Buller | 670,788 | 651,129 |
| Inangahua | 895,519 | 874,948 |
| Grey | 499,593 | 861,890 |
| Westland | 1,309,797 | 1,048,156 |
| Waimea | 1,194,006 | 1,196,226 |
| Sounds | 136,906 | 171,095 |
| Marlborough | 1,716,044 | 1,837,632 |
| Kaikoura | 349,932 | 350,521 |
| Cheviot | 466,912 | 486,765 |
| Amuri | 791,781 | 921,221 |
| Ashley | 3,436,251 | 3,801,341 |
| Selwyn | 7,021,548 | 7,446,756 |
| Akaroa | 1,005,291 | 1,169,379 |
| Ashburton | 3,174,931 | 3,630,383 |
| Geraldine | 3,094,079 | 3,257,696 |
| Mackenzie | 749,974 | 736,021 |
| Waimate | 2,278,351 | 2,462,433 |
| Waitaki | 2,404,762 | 2,709,379 |
| Vincent | 873,259 | 791,595 |
| Maniototo | 689,286 | 449,650 |
| Waihemo | 421,313 | 417,887 |
| Waikouaiti | 619,522 | 602,015 |
| Taieri | 1,299,370 | 1,330,718 |
| Peninsula | 405,897 | 414,146 |
| Tuapeka | 897,650 | 938,701 |
| Bruce | 889,245 | 957,438 |
| Clutha | 1,032,686 | 1,151,046 |
| Lake | 449,132 | 382,722 |
| Southland | 3,257,610 | 3,739,513 |
| Wallace | 1,237,825 | 1,364,016 |
| Fiord | .. | .. |
| Stewart Island | 39,451 | 85,021 |
| Total Counties | 76,340,577 | 85,818,167 |
Another table is added to show the actual value of land including improvements, value of improvements, and the unimproved value in the different boroughs of the colony, according to the returns made at the assessment in November, 1891:—
| Borough. | Actual Value, including Improvements. | Value of Improvements. | Unimproved Value. |
|---|---|---|---|
| £ | £ | £ | |
| Birkenhead | 77,532 | 35,199 | 42,333 |
| Devonport | 407,333 | 244,155 | 163,468 |
| Auckland | 4,934,288 | 2,453,472 | 2,471,496 |
| Parnell | 366,098 | 227,173 | 138,775 |
| Newmarket | 182,353 | 100,026 | 82,327 |
| Newton | 222,355 | 86,748 | 135,607 |
| Onehunga | 250,634 | 139,008 | 111,406 |
| Thames | 227,171 | 150,624 | 76,547 |
| Tauranga | 63,026 | 37,873 | 25,153 |
| Hamilton | 90,142 | 45,558 | 44,584 |
| Cambridge | 70,279 | 44,758 | 25,521 |
| Gisborne | 317,989 | 169,478 | 148,511 |
| Napier | 1,275,853 | 608,696 | 667,157 |
| Hastings | 372,458 | 141,866 | 230,592 |
| Woodville | 102,226 | 44,374 | 57,852 |
| New Plymouth | 341,117 | 175,496 | 165,621 |
| Hawera | 84,834 | 46,920 | 37,914 |
| Patea | 43,378 | 31,323 | 12,055 |
| Wanganui | 543,403 | 253,082 | 290,321 |
| Marton | 83,915 | 50,179 | 33,736 |
| Feilding | 146,884 | 78,635 | 68,199 |
| Palmerston North | 489,618 | 179,325 | 310,293 |
| Foxton | 85,743 | 45,988 | 39,755 |
| Masterton | 356,860 | 196,999 | 159,861 |
| Carterton | 88,650 | 57,335 | 31,315 |
| Greytown | 115,649 | 81,554 | 34,095 |
| Lower Hutt | 244,075 | 84,897 | 159,178 |
| Petone | 268,358 | 125,817 | 145,221 |
| Onslow | 144,053 | 73,250 | 70,803 |
| Karori | 118,728 | 44,133 | 74,595 |
| Wellington | 5,865,778 | 2,432,749 | 3,440,182 |
| Melrose | 203,517 | 74,088 | 129,429 |
| Picton | 83,195 | 47,006 | 41,189 |
| Nelson | 942,370 | 552,463 | 389,397 |
| Richmond | 84,285 | 40,910 | 43,375 |
| Blenheim | 378,943 | 211,302 | 167,481 |
| Westport | 166,987 | 109,205 | 57,782 |
| Greymouth | 299,077 | 184,514 | 114,543 |
| Brunner | 115,892 | 99,726 | 16,166 |
| Kumara | 33,565 | 26,620 | 6,945 |
| Hokitika | 102,708 | 84,654 | 18,054 |
| Ross | 16,961 | 11,711 | 5,250 |
| Rangiora | 158,017 | 86,856 | 71,161 |
| Kaiapoi | 134,055 | 87,032 | 47,023 |
| St. Albans | 524,822 | 239,634 | 284,938 |
| Christchurch | 3,403,566 | 1,527,626 | 1,820,770 |
| Sydenham | 821,060 | 487,184 | 333,876 |
| Sumner | 102,145 | 41,899 | 60,246 |
| Lyttelton | 851,730 | 701,240 | 150,490 |
| Akaroa | 49,407 | 29,779 | 19,628 |
| Ashburton | 223,091 | 132,358 | 90,733 |
| Timaru | 442,830 | 290,369 | 151,661 |
| Waimate | 75,399 | 56,640 | 18,759 |
| Oamaru | 612,571 | 333,458 | 279,113 |
| Hampden | 13,195 | 7,966 | 5,229 |
| Palmerston | 51,182 | 34,411 | 16,771 |
| Hawkesbury | 45,716 | 25,893 | 19,823 |
| Port Chalmers | 200,043 | 139,097 | 60,946 |
| West Harbour | 137,015 | 68,775 | 68,240 |
| North-east Valley | 276,835 | 146,564 | 130,271 |
| Maori Hill | 142,890 | 75,542 | 67,348 |
| Roslyn | 360,962 | 191,352 | 169,610 |
| Mornington | 284,875 | 159,461 | 125,414 |
| Dunedin | 4,193,422 | 2,069,905 | 2,124,467 |
| Caversham | 466,074 | 248,916 | 217,158 |
| South Dunedin | 223,534 | 140,925 | 82,609 |
| St. Kilda | 118,477 | 41,635 | 76,842 |
| Green Island | 36,962 | 23,377 | 13,585 |
| Mosgiel | 122,625 | 69,184 | 53,441 |
| Naseby | 24,186 | 21,746 | 2,440 |
| Cromwell | 22,168 | 17,510 | 4,658 |
| Alexandra | 13,578 | 10,623 | 2,955 |
| Roxburgh | 20,123 | 16,956 | 3,167 |
| Lawrence | 79,066 | 60,482 | 18,584 |
| Tapanui | 16,155 | 13,580 | 2,575 |
| Milton | 70,207 | 62,195 | 14,012 |
| Balclutha | 53,210 | 38,663 | 14,547 |
| Kaitangata | 54,976 | 33,843 | 21,133 |
| Arrowtown | 24,586 | 19,574 | 5,012 |
| Queenstown | 65,153 | 51,629 | 13,524 |
| Gore | 142,708 | 76,537 | 66,171 |
| Winton | 20,195 | 12,230 | 7,965 |
| Gladstone | 26,541 | 12,716 | 13,825 |
| Avenal | 15,269 | 8,582 | 6,687 |
| North Invercargill | 28,293 | 12,653 | 15,640 |
| East Invercargill | 42,996 | 24,611 | 18,385 |
| Invercargill | 959,140 | 440,200 | 517,879 |
| South Invercargill | 79,526 | 36,713 | 42,813 |
| Riverton | 59,626 | 37,602 | 22,024 |
| Campbelltown | 97,380 | 47,950 | 49,430 |
| Totals | 36,406,862 | 18,442,562 | 17,907,662 |
- Accumulation, 115
- Acres of Land under Crop, 121, 178–181
- Administration of Land Laws, &c., 363
- Agencies, Government Life Insurance, 46
- Agents for the Colonies, Crown, 24
- Agents-General in London, 24
- Ages at Death, 81
- Agricultural and Live-stock Department, 46
- Statistics, 119–127, 177–181
- Agriculture, 159–166
- Advice to Dairy-factory Owners, 171
- Artificial Manures, 176
- Average Clips, 167
- Butter-factory, Cost of Equipment, 170
- Butter, New Zealand, 171
- Cattle, 168
- Cereals, 161
- Cross-breeding of Sheep, The, 187
- Cost of Working a Farm in New Zealand, 166
- Dairy Industry, The, 169
- Stock, 168
- Fruit Industry, 173
- Horse-breeding, 168
- In Middle Island, 160
- In North Island, 159
- Lambing Returns—Averages, 185
- Progress of, 161
- Root-crops, 162
- Scab, New Zealand free from, 171
- Seeds, 164
- Seed-sowing commences, 162
- Sires bred in New Zealand, 172
- Statistics, 177–181
- Stock, 166
- Ahuriri (Napier) Harbour, 312
- Akaroa Harbour, 319
- Alcoholic Liquors in Ten Years, Consumption of, 92
- Aliens Naturalised in 1892, 76
- Alps, The Southern, 299
- Animals and Produce, 127
- Annual Meetings and Officers of Religious Bodies, 33
- Antimonial Silver-ores, 250
- Antimony, 238,251
- Apprehensions and Summonses, 140
- Arbor Day, Tree-planting, 174
- Archbishop, Roman Catholic, 33
- Area of New Zealand, 7
- Of North, Middle, Stewart, Chatham, and other Islands, 7
- Of United Kingdom compared with New Zealand, 7
- Of Watersheds of Principal Rivers, in Square Miles, 327
- Areas of Australasian Colonies, 7
- Compared with European Countries, 7
- Arms, Ordnance, &c., 49
- Arrests for Drunkenness, 141
- Arrivals and Departures, 69–72
- Chinese, 69, 70
- Artificial Manures, 176
- Artillery, Naval and Field, 49
- Assaults, 141
- Assembly—
- General, 25
- Presbyterian Church of New Zealand, 33
- Of Otago and Southland, 33
- United Methodist Free Churches, 34
- Assignees in Bankruptcy, Official, 39
- Asylums, Benevolent, 354
- Lunatic, 355
- Inspector of, 43
- Superintendents of, 43
- Orphan, 355
- Attorney-General, 38
- Auckland Docks, 328
- Harbour, 310
- Auckland Land District—Introductory, Physical Features, Plains, Lakes, Forests, Soils; Rainfall, Winds, Chief Towns, Crown or Native Lands available for Future Settlement, 369–375
- Audit Office, 37
- Travelling Inspectors, 37
- Auditor-General, 37
- Australasian Statistics, (Broadsheet).
- Australian Colonies, Area of the, 6
- Population of the, 61
- Awarua (Bluff) Harbour, 321
- Bankruptcy, 138
- Official Assignees in, 39, 47
- Transactions in 1891, 138
- Banks of Issue—
- Advances and Discounts, 115
- Assets and Liabilities, 115
- Deposits, 115
- In all Classes of Banks—Average per Head, 116
- Notes in Circulation, &c., 116
- Post-office Savings, 116
- Deposits, Withdrawals, Open Accounts, Amounts to Credit, 116
- Private Savings, 116
- Deposits, Withdrawals, 116
- Barley, Acres in, 121, 178
- Yield in Bushels, 122, 178
- Export of, 96
- Bay of Islands, 317
- Beach and River Gold-workings, Remarks on, 255
- Beer, Consumption of, per Head, 92
- Benevolent Asylums and Charitable Institutions, 354
- Bible Christians, 34
- Birthplaces of Population, 61
- Birth-rates per 1,000 of Population in Australasian Colonies, 74
- Decline of in New Zealand, 73
- Births, 73
- Decrease, Gradual, 73
- Excess of, over Deaths, for Ten Years, 76
- Illegitimate, 74
- In Australasian Capitals, 80
- In Australasian Colonies, Proportion of Illegitimate, 74
- Legitimate, 75
- To Marriages, Proportion of, 75
- Bishops, Church of England, 32
- Roman Catholic, 33
- Bluff Harbour, 321
- Board of Examiners under “The Coal-mines Act, 1891”, 44
- Board of Examiners under “The Mining Act, 1891”, 44
- Boards, Waste Lands, Members of, 45
- Of Education, 42
- Bonedust, Output of, 198
- Bones, Horns, Hoofs, &c., 198
- Boroughs, Expenditure of, 157
- In Colony, 66
- Auckland, with suburbs, 67, 372
- Christchurch with suburbs, 67, 407
- Dunedin with suburbs, 67, 413
- Wellington with suburbs, 67, 386
- Indebtedness of, 157
- Principal, Population of, 67
- Revenue of, 157
- Value of Rateable Property, 157
- Boundaries and Area of the Colony, 5
- Bowen Fall, The, 299
- Breadstuffs in Various Countries and Colonies, Consumption of, 125
- Brigades, Fire, 352
- Building Societies, 116
- Amounts deposited with, 117
- Income, Assets, Liabilities, Reserve Funds, 117
- Buller River (Kawatiri), 324
- Butter and Cheese, 129, 199
- Annual Production of, 129
- Export to United Kingdom, Eight Years, 96
- Industry, 199
- Cadet Corps, 49
- Campbelltown, 321
- Cancer, Deaths from, 87
- Canterbury Land District—Boundaries and Physical Features, Scenery, Climate; Area, Nature, and Disposition of Lands; Internal Communication; Geological Formation; Soils; Pasturage and Crops, Root-crops; Stock, Wool, Butter and Cheese, Timber, Phormium tenax, Fruit; Coal, Building-stones; Fisheries, Manufactories; Educational and other Institutions; Towns, 400
- Capitation to Efficient Volunteers and Cadets, 50
- Catholic Church, Roman, 33
- Cattle, 127
- In Provincial Districts, Number of, 181
- Causes of Death, 82
- Phthisis, 86
- Ages and Length of Residence in Colony of Persons dying from, 87
- Deaths from, increased by Introduction of Phthisical Persons, 86
- Table showing the Percentage of Deaths from each, 83
- Cavalry Volunteers, 48
- Cereals, 161
- Chapels, Churches and, 34
- Charitable Institutions, Benevolent Asylums and, 354
- Cheese, 129
- Cheese and Butter, Export of, 96, 204
- Factories, Number of, 133, 199
- Chief Postmasters, 41
- Children to a Marriage, Number of, 75, 76
- Chinese—
- Immigration and Emigration of, 69, 70
- Poll-tax on, 70
- Christians, Bible, 34
- Chrome, 238, 254
- Church, Baptist Union, 34
- Hebrew, 34, 61
- Of England, 33, 61
- Of England Bishops, 32
- Of New Zealand, Presbyterian, 33, 61
- Of Otago and Southland, Presbyterian, 33
- Primitive Methodist, 34
- Roman Catholic, 33, 61
- United Methodist Free, 34
- Wesleyan Methodist, 33, 61
- Churches and Chapels, Number of, 35
- In Provincial Districts, 36
- Cinnabar, 239
- Cities (see Boroughs), 66
- Civil Cases, 138
- Civil Establishment at Seat of Government, 37
- Classification of Lands, &c., 363
- Clerks of District Courts, 39
- Resident Magistrates', 39
- Warden's Courts, 39
- Climate, Temperature, Rainfall, &c., 257–265
- Comparison between East and West Coast Climates, 258
- Meteorological Observations, 257
- Rainfall, 263
- Temperature, 257
- In New Zealand, Australia, and other British possessions, 260–262
- Thunderstorms, 265
- Winds, 264
- Clothing, Imported, 91
- Coal, Description of, in New Zealand, 240–243
- Export of, 93
- Found in Colony, Composition of, 243
- Import of, 91
- Output of, 241, 242
- Coast-waiters, Officers in Charge of Ports, 41
- Colleges and Universities, 149, 341
- Colonial Office, The, 24
- Secretary's Department, 37
- Treasurer's Department, 37
- Colonies, Crown Agents for the, 24
- Area of the Australian, 6
- Colonisation of New Zealand, 4
- Colony, Boundaries and Area of the, 5
- Crown Agents for the, 24
- Commissioner, Government Life Insurance, 46
- New Zealand Police Force, 44
- Of Telegraphs, 40
- Commissioners, Railway, 43
- School, 42
- Congregational Union, Annual Meetings of, 34
- Conjugal Condition of the People, 63
- Constitution and Government, 14
- Consuls, Foreign, facing page 1, 23
- Convictions, 141
- Cook Strait, 10
- Copper, 237, 252
- Corned Beef, Output of and Value, 198
- Coromandel Harbour, 311
- Cost of Working a Farm in New Zealand, 166
- Costley Training Institution, Auckland, 356
- Council, Executive, 1843–56, 19
- Council, Executive, 1893, 25
- Legislative, Roll of Members of the, 26
- Successive Speakers of the Legislative, 22
- Counties, 64,157
- Court Judges, District, 38
- Court Judges, Supreme, 38
- Courts, Bankruptcy, 138
- Civil Cases, Supreme and District, 138
- Clerks of District and Resident Magistrates', 39
- Divorce and Separation, 139
- Native Land, 360
- Recorders of, 39
- Registrars of Supreme, 38
- Resident Magistrates', Civil Cases, 138
- Charges for Offences before, 140
- Committals, 140
- Summary Convictions before, 140
- Supreme and District, Convictions, 141
- Crime, Law and, 138
- Criminal Cases, 140
- Crown Agents for the Colonies, 24
- Lands, Alienated, 118
- Mode of Acquiring, 364
- Crown Lands of New Zealand (See Land).
- Crown Law Officers, 38
- Prosecutors, 38
- Solicitors, 38
- Cultivation, Barley, 125
- Extent of Land in, 121
- Holdings over 1 acre, occupied, 122
- To every 100 Adult Males, 122
- Hops, 126
- Land in Sown Grasses in Australasian Colonies, 126
- Under Grain-crops in Provincial Districts, 121
- Oats, 125
- In Australian Colonies, 125
- Orchards, 126
- Potatoes, 126
- Tobacco, 126
- Turnips, 126
- Wheat, 122
- In Australian Colonies, 123
- Customs, Department of Trade and, 41
- Collectors of, 41
- Duties, Revenue from, 104
- Dairy Factory Companies, 133, 135, 170
- Farming, 169
- Industry, 169, 199–204
- Produce, Export of, 96, 204
- In Census Years 1881, 1886, 1891, 129
- Stock, 168
- Dargaville, 316
- Deaf-mutes, Institution for, 43
- Death, Average Age at, 81
- Causes of, 82–89
- Death-rate, 1883–92, in various Countries and Colonies, 78
- In Four Principal Cities, 79
- In Principal Cities of Australia, 79
- Deaths, 77–89
- Inquests, 148
- Of Infants, 81
- Of Infants to every 100 Births, 82
- Violent, 89
- Debt, General Government, 108
- Of Local Bodies, 153
- Deeds, Registrar-General of Lands and, 42
- District Registrars of Land and, 42
- Defence Department, 44
- Defences, Military and Naval, 48–50
- Administration, 50
- Artillery—Permanent Militia, 48
- Cadet Corps—Volunteers, 49
- Capitation, 50
- Cavalry—Volunteers, 48
- Engineers—Volunteers, 49
- Enrolment, &c., 50
- Expenditure and Maintenance, 50
- Field Artillery—Volunteers, 49
- Instructors, 50
- Militia and Volunteer Districts, 48
- Mounted Rifles—Volunteers, 48
- Naval Artillery—Volunteers, 49
- Ordnance, Arms, &c., 49
- Rifle Corps—Volunteers, 49
- Torpedo Corps—Permanent Militia, 48
- Deferred-payment System, Land taken up on, 118
- Denominations, Religious, 34, 61
- Departures, Arrivals and, 69–72
- Designs, and Trade-marks, Patents, 350
- Diarrhœal Diseases, Deaths from, 85
- Digest of Land Laws, 363–368
- Diphtheria, Deaths from, 85
- Discovery and Early Settlement, 2
- Of Gold in New Zealand, 233, 236
- Distances by Rail and Sea, Table of, 338
- Homewards and Outwards, 338
- District-Courts, Judges, 38
- Clerks, 39
- Land Registrars, 42
- Divorce and Separation, 139
- Docks, Graving and Patent Slips, 328
- Drainage Board, Revenue, 158
- Early Settlement, Discovery and, 2
- Ecclesiastical, 32
- Education (see Public Instruction, also Schools), 62, 148–152, 339–341
- Board Secretaries, 42
- Department, 42, 341
- Minister of, 42
- Of the People, Degree of, 62
- Reserves, Administrators of, 42
- Universities and Colleges, 149
- University, New Zealand, 341
- Education Boards, Income and Expenditure of, 340
- Egmont, Mount, 9
- Elections, Dates of last General, 32
- “Electoral Act, 1893," extends Franchise to Women, facing page 1
- Electoral Districts, &c.—
- Actual Population of, 30
- Middle Island, 31
- Nominal Population of, 30
- North Island, 30
- Electorates, 28, 30
- Electric Telegraph, 101, 103
- Emigration (see Immigration and Emigration).
- Engineers, Volunteers, 49
- Enrolment of Permanent Militia, 50
- Estates, Intestate, 348
- European Population of Colony, 60
- Examiners of Titles, 42
- Examiners—
- Under “The Coal-mines Act, 1891,” Board of, 44
- Under “The Mining Act, 1891,” Board of, 44
- Executive Council, 1843–56, 19
- 1893, facing page 1, 25
- Expenditure—
- Charges of Public Debt, 104
- General Government, 104
- Local Bodies, 156, 157
- On Education, 104
- On Railways, 113
- On Reproductive Public Works, 110
- Out of Loan by General Government on certain Public Works, 105
- Exports, Imports and, 90–101
- From United Kingdom to various Countries and Colonies, 101
- Butter and Cheese to United Kingdom, for Ten Years, 96
- Coal, 93
- Frozen Meat, 94, 197
- Value, Eleven Years, 197
- Gold, 93
- Grain, 96
- Other New Zealand Produce, 93
- Phormium, 97
- Re-exports, exclusive of Specie, 94
- Of New South Wales compared with New Zealand, 94
- To United States, 99
- Value of, from different Ports, 97
- Principal Articles of New Zealand Produce, 93
- Wool, Ten Years, 93
- Factories, 131
- Farmers, Prospects of Small, 176
- Farming, Dairy, 168–171, 199–204
- Sheep, 166, 171, 182–190
- Farm in New Zealand, Cost of Working, 166
- Features of the Middle Island, Physical, 10
- Of the North Island, 8
- Finance, Accumulation, and Production, 104
- Fire Brigades, 352
- Fire Inquests, 148
- Fish and Fisheries, 230
- Persons employed in Fishing, Number of, 231
- Variety of Species, 230
- Flax, Export of, 97, 216
- Preparation, &c., 215
- Flocks of Sheep, Number and Size of, 95
- Foreigners Naturalised during last Twelve Years, Number of, 77
- Foreign Consuls
- Facing page 1, 23
- Forest-trees and Timber Industry, 204–214
- Export Trade, Value of, 213
- Forest Timbers, Description of, 204, 211
- Fungus, New Zealand, 213
- Strength of New Zealand Timbers, 212
- Experiments to Test, 212
- Timber Industry and Produce for Year 1890, 213, 214
- Forestry in America, 175
- Foveaux Strait, 13
- Franchise
- Facing page 1, 16
- Freezing Establishments in the Colony, Number of, 197
- Friendly Societies, 352
- Lodges, &c., Assets, Receipts of Sick and Funeral Funds, Expenditure, Sick Pay, Management Expenses, 117
- Registry Office, 37
- Frauds Prevention Act, Trust Commissioners under Native Lands, 39
- Frozen Meat in various Provincial Districts, Quantities and Values of, 197
- Meat, Value of Export for Eleven Years, 197
- Meat Industry, 190–198
- Bonedust, Quantity and Value of Output, 198
- Bones, Horns, Hoofs, &c., Output of, 198
- Corned Beef, Output and Value, 198
- History of, 191
- Frozen Sheep, Output, 197
- Development of the Trade, 195
- Large Increase in Numbers of Sheep, 190
- Neatsfoot- and Trotter-oil, Quantities and Values, 198
- Preserved Meats, Quantities and Values, 197
- Provincial Districts, Total Value of Produce in, 198
- Tallow, Output of, 198
- Works and Hands Employed, Number of, 198
- Fruit Industry, The, 173
- Fungus, New Zealand, 213
- Gaolers, 40
- Gaols, Prisoners in, 142
- General Assembly, The, 25
- Geological Survey, Museum, and Observatories, 44
- Glaciers in Middle Island, 11
- Gold, Coal, and other Minerals, 233–256
- Antimony, 238, 251
- Chrome, 238, 254
- Gold, Coal, and other Minerals—
- Cinnabar, 239
- Coal, 240
- Composition of, 243
- Output of, 241, 242
- Copper, 237, 252
- Discovery of Gold in New Zealand, 233–236
- Gold Exported, 93, 236
- Gold Produced, 236
- Hints to Prospectors for, 245–256
- Iron, 239
- Lead, 239, 253
- Manganese, 238, 253
- Mineral Oils, 240
- Minerals Exported, 93
- Mining generally, 244
- Scheelite, 244, 255
- Silver, 237, 249
- Stones, Precious, 244
- Tin, 240, 250
- Governing Bodies, Local, 152
- Government Life Insurance Department, New Zealand, 46, 344
- Annual Premiums for £100, 346
- Chief Object, 344
- New Business for the Year 1892, 346
- Low Mortality in New Zealand, 344
- Progress of Business for Twenty-three Years, 345
- Government Printer, 37
- Government, the seat of, 16
- Governor of New Zealand, 25
- Governors, Successive, 17
- Grain Exported, 96
- Grown in each Provincial District (See also Cultivation.), 122
- Grazing-runs, Small, 367
- Grass Lands, Acres of, 121, 180, 181
- Grass-seeds, Cocksfoot and Rye-grass, 179
- Graving Docks and Patent Slips, 328
- Auckland Docks, 328
- Lyttelton Dock and Patent Slip, 328
- Port Chalmers Dock, 329
- Wellington Patent Slip, 329
- Grey River, 323
- Gum, Kauri, 216
- Harbour Board Managers, Treasurers, or Secretaries—
- Auckland, 310; Bluff, 321; Gisborne, 312; Greymouth, 324; Hokitika, 323; Lyttelton, 319; Napier, 313; New Plymouth, 314; Oamaru, 320; Otago, 321; Patea, 314; Thames, 311; Timaru, 320; Wairoa, and Mohaka, 312; Waitara, 315; Wellington, 314; Westport, 325
- Harbour Boards Revenue, 157
- Defence, Chief Engineer, 44
- Harbourmasters, 41
- Auckland, 310; Bluff, 321; Greymouth, 324; Hokianga, 316; Hokitika, 323; Kaipara, 316; Lyttelton, 319; Manukau, 315; Nelson, 325; Oamaru, 320; Otago, 321; Queen Charlotte Sound, 326; Thames, 311; Timaru, 320; Wellington, 314; Westport, 325
- Harbours—
- Middle Island, 318
- North Island, 310
- Hawke's Bay Land District—General Description; Pastoral Industries: Agricultural Pursuits; Dairying; Timber Industry; Climate; Crown Lands; Native Lands, 380
- Hay, Acres in, 121, 180, 181
- Hebrew Ministers, 34
- Hemp, New Zealand (Phormium tenax), 215
- Hints to Prospectors for Gold and other Minerals, 245–256
- Antimonial Silver-ores, 250
- Antimony, 251
- Chrome, 254
- Copper, 252
- Gold, 248
- Lead, 253
- Manganese, 253
- Nickel, 254
- Platinum, 250
- Scheelite, 255
- Silver, 249
- Tin, 250
- Zinc, 254
- Hokianga River, 316
- Hokitika River, 322
- Honours held by Colonists
- Facing page 1
- Hops cultivated, 126
- Horse-breeding, 168
- Horses in New Zealand, Number of, 127
- Hospitals—, 353
- Accommodation and Indoor Patients, 354
- General Management, 354
- Number of Districts, 353
- Outdoor Relief, 354
- Revenues of Boards, how raised, 353
- Hot Springs (see Mineral Waters of New Zealand), 265–296
- House of Representatives, 15, 27
- Roll of Members of the, 28
- Speakers of the, 22
- Illegitimate Births in Australasian Colonies, 74
- Immigration and Emigration, 69–72
- Assisted and Unassisted Immigrants (Ten Years), 69
- Each Australian Colony, 72
- Of Chinese, 70
- From United Kingdom, Australian Colonies, and other Places, 70
- Gain by net Immigration from United Kingdom in Ten Years, 71
- Nominating Immigrants discontinued, 69
- Poll tax on Chinese, 70
- Minister of Lands and, 44
- Imports and Exports, 90–101
- For Ten Years, 90
- Imports—
- Beer, Spirits, and Wine, Consumption of, 92
- Clothing, &c., 91
- Coal, 91
- From Different Countries, 1892, Values of, 92
- United Kingdom to Australasia, 100
- United States, Ten Years, 99
- Imports—
- Per Head of Population, Ten Years, 98
- Principal Articles, in Groups, 1892, 91
- Spirits, 91
- Sugar and Tea, Imports of, 91
- Consumption of, per Head of Population, 91
- Tobacco, Consumption of, 92
- To each Provincial District, 93
- Value of, inclusive and exclusive of Specie, for Ten Years, 90
- Per Head of Population, Australasian Colonies, 100
- Wine, 91
- Improvements on Crown Lands, Conditions as to, 365
- Income-tax Department, 37
- Income-tax Levied, 107
- Income-tax (Addendum), 419
- Increased Value of Land with Improvements, 427
- Indebtedness of the Australasian Colonies, 108
- Of Local Bodies, 153–156
- For Twelve Years, 153
- To Persons outside Colony, 154
- Industrial Schools, 152, 356
- Managers, 43
- Industries, various, 131, 137
- In Provincial Districts, 135
- Comparisons with Victoria and New South Wales, 136
- Influenza, Deaths from, 84
- Inquests, Death, 148
- Fire, 148
- Inspector of Lunatic Asylums, 43
- Inspectors, Police Department, 44
- Inspectors of Factories, 40
- Mines, 44
- Stock, 46
- Institute, New Zealand, 44, 342
- Institutes, Public Libraries, and Mechanics', 343
- Instruction, Public, 339–341
- Instructors, Military and Naval, 50
- Insurance Department, Government Life, 46, 344–347
- Intestate Estates, 47, 348
- Introduction of Trout to New Zealand, 230
- Introductory; Official; Statistical, 1–17
- Area of the Australasian Colonies, 6
- Colony of New Zealand, 7
- Boundaries and Area of New Zealand, 5
- Colonisation, 4
- Constitution, 14
- Cook Strait, 10
- Discovery and Early Settlement, 2
- Foveaux Strait, 13
- Glaciers in Middle Island, 11
- Government, 15
- Outlying Islands of New Zealand, 13
- Physical Features of the Middle Island, 10
- North Island, 8
- Public Works, 17
- Seat of Government, 16
- Invercargill (New River) Harbour, 321
- Iron, 239
- Machinery, &c., imported, 91
- Islands, Description of the—
- Antipodes, 6
- Auckland, 6, 14
- Bounty, 6
- Campbell, 6
- Chatham, 6, 13
- Kermadec, 6, 13
- Middle, 6, 10, 13
- North, 5, 8, 10
- Stewart, 6, 13
- Jackson's Bay, 322
- Jacob's River, Riverton, 321
- Joint-Stock Companies, Registrar of, 42
- Assistant Registrars of, 42
- Judicial, 38, 47
- Justice Department, 38
- Kaipara Harbour, 315
- Kauri-gum, 216
- Quantities and Values exported, 97, 218
- Where found and Method of Searching for it, 217
- Kawatira (Buller) River, 324
- Kawau Bay, 317
- Kawhia Harbour, 315
- Kororareka Bay (Port Russell), 317
- Labour—
- Department, 40
- In New Zealand, 218–229
- Prices of Provisions, Live-stock, &c., 223, 229
- Various Industries, 220, 223
- Wages, Average Rates of, 224–227
- Minister of, 40
- Lakes, 10, 12
- Lambing Averages, 185
- Land—
- Alienated from Foundation of Colony, 118
- And Income Tax, 419–422
- And Income-tax Department, 37
- Boards, Members of Wasta, 45
- Disposed of without Sale, 118
- Fit for Agriculture and Pasture, 8, 13
- Held as Pastoral Runs, 119
- Revenue from, 119
- Held as Small Grazing-runs, 119
- Increased Value of, with Improvements, 427
- Laws, Digest of the, 363–368
- On Perpetual Lease, Lease in Perpetuity, and Occupation with Right of Purchase, 118–119
- Purchase Branch, 45
- Registrars, and Registrars of Deeds, District, 42
- Revenue from, 104
- Sold on Deferred Payments, 118
- Sold for Cash, 118
- Tax, 106, 419
- Graduated, 106, 419
- Transfer Department, and Deeds Registry, 42
- Village Settlements, sold on Deferred Payments and for Cash, 119
- Land Districts in the Colony, Description of, 369–418
- Auckland, 369; Canterbury, 400; Hawke's Bay, 380; Marlborough, 387; Nelson, 391; Otago, 409; Southland, 415; Taranaki, 376; Wellington, 383; Westland, 396.
- Land Laws, Digest of, 363, 368
- Administration, 363
- Classification of Lands, &c., 363
- Grazing-runs, small, 367
- Improvements, Residence, and, 365
- Land Districts and Principal Land Offices, 363
- Mode of Acquiring Crown Lands, 364
- Optional System of Selection, 364
- Cash Tenure, 364
- Leases in Perpetuity, 365
- Occupation with Right of Purchase, 364
- Pastoral Runs, 367
- Residence and Improvements, 365
- Special-settlement Associations, 366
- Survey Charges on Unsurveyed Lands, 368
- Village Settlements, 366
- Land Offices, Principal, 363
- Land Tax, 106, 419
- Lands—
- And Deeds, Registrar-General of, 42
- And Immigration, Minister of, 44
- And Survey Departments, 44
- Survey Charges on Unsurveyed, 368
- Land-values and Increased Settlement—
- General Valuation, 427
- Results of Assessments, 1888 and 1891, 429
- Total Valuations in Boroughs, 431
- Law and Crime, 138
- Law Office, Crown, 38
- Lead, 239
- Hints to Prospectors for, 253
- Legislative Council, 25
- Members of the, 15
- Roll of Members of, 26
- Legitimate Births to Marriages, Number of, 75
- Letters delivered and posted, 101
- Libraries and Mechanics’ Institutes, Public, 343
- Life Insurance Department, Government, 46, 344
- Agencies, 46
- Annual Premiums for £100, 346
- Commissioner, 46
- Death-rates, 344
- New Business for the Year 1892–346
- Progress of Business for Twenty-three Years, 345
- Lighthouses, Names and Number of, where situate, Colour, Order, &c., 330, 332
- List, Official, 37–47
- Live-stock, 127
- Average Prices of, 228, 229
- Department, Agricultural and, 46
- Live-stock, Export of, 94
- In Australasian Colonies, 128
- In the World, 239
- Inspectors, 46
- Loans—
- General Government (see Public Debt), 108
- Of Local Bodies, Outstanding, at various Rates of Interest, 153, 154
- Local Bodies—
- Expenditure of, 156
- Indebtedness, 153, 154
- Twelve Years, 153
- Outstanding Loans at various Rates of interest, 154
- Property in, 157, 158
- Rates collected in Twelve Years, 153
- Revenue and Expenditure of—
- Boroughs, 157
- Counties, 157
- Drainage Board, 158
- Harbour Boards, 158
- River Boards, 158
- Road Boards, 158
- Town Boards, 157
- Lunatic Asylums, 355
- Inspector of, 43
- Superintendents of, 43
- Lyttelton, Port of, 318
- Magistrates, Resident, 38
- Courts, Clerks of, 39
- Mail-services between England and New Zealand, Cost of, 103
- Managers of Water-races, 44
- Manganese, 238
- Hints to Prospectors for, 253
- Mangonui Harbour, 317
- Manufactories, & 131, 137
- Manufactures, Value of, 135
- Manukau Harbour, 315
- Manures, Artificial, 176
- Maori Electoral Districts and Population, 32
- Maoris, The, 357
- Ages of, 361
- Charged with Offences, 142
- Children attending Schools, 151
- Contribute towards Revenue, 107
- Education, 359
- Electoral Districts and Yates recorded, 359, 360
- Lands, 359
- Native Affairs, 360
- Land Court, 360
- Numbers and Condition as at present, 357–362
- Population, 60, 357
- Representation, 15, 359
- Tribes, Numbers of the Principal, 361
- Marine Department, 41
- Minister of, 41
- Marriage, Proportion of Births to every, 75
- Decrees for Dissolution of, 139
- Petitions for Dissolution of, 139
- Rates in New Zealand and Australian Colonies, Broadsheet
- Marriages, 75, Broadsheet
- Marlborough Land District—Rivers and Inlets, Goldfields, Lands; Wairau Plain; Sheep; Export of Frozen Meat; Forests and Timbers; Flax-mills, 387
- Measles, Deaths from, 84
- Meat, Export of Frozen, 93, 197
- Industry, Frozen, 190–198
- Meat, Frozen—
- Quantities and Values in Provincial Districts, 197
- Total Export of, 95
- Mechanics’ Institutes, Public Libraries and, 343
- Members of Waste Land Boards, 45
- House of Representatives, Roll of, 28
- Legislative Council, Roll of, 26
- Mercury Bay, 311
- Meteorological Observations, 357
- Methodists, 33, 34, 61, 62
- Middle Island, Physical Features of, 10
- Ports, Harbours, &c., 310–326
- Miles of Railway open for Traffic, 304
- Milford Sound, 297
- Military and Naval Defences, 48
- Militia Officers, Permanent and Volunteer, 44
- Mills, 133
- Mineral Oils, 240
- Mineral Waters of New Zealand (see Thermal Springs District), 265–296
- Minerals, Gold, Coal, and other, 233–256
- Mines Department, 43
- Inspectors of, 44
- Minister of, 43
- Mining, 130
- Registrars, 39
- Remarks, 244
- Ministers, Cabinet, facing page 1, 25
- Number of Officiating, under Marriage Act, 35
- Ministries, Successive, 21
- Mitre Peak, 297
- Mohaka River, 312
- Mokihinui River, 325
- Money-orders, 102
- Mortality with Rise or Fall of Temperature, 85
- Mountains, 9, 11
- Mount Cook, 11
- Egmont, 9
- Ruapehu, 9
- Tongariro, 9
- Mounted Rifles—Volunteers, 48
- Museum and Observatories, Geological Survey, 44
- Napier (or Ahuriri) Harbour, 312
- Native Land Court, 39, 48, 360
- Recorders of the, 39
- Land Frauds Prevention Act, Trust Commissioners under, 39
- Naturalisation, 76
- Neatsfoot and Trotter Oil, 198
- Nelson Haven, 325
- Nelson Land District—General Description: Rivers, Lakes, Plains, Forest; Agricultural, Pastoral, Mining; Towns; Midland Railway, 391
- New Plymouth, 314
- New River Harbour, Invercargill, 321
- Newspapers, 54
- New Zealand, 1
- Abolition of Provincial Governments in, 15
- Area of, Boundaries and, 5
- Arrival of Missionaries in, 3
- Captain Cook's Visits to, 3
- Colonisation of, 4
- Colony divided into Six Provinces, 15
- Company, 4
- County Government in, 15
- Discovery and Early Settlement of, 2
- General Assembly of, 25
- Government Life Insurance Department, 344
- Governor of, 25
- Governors of, Successive, 17
- Institute, 44, 342
- Labour in, 218–227
- Lieutenant Hanson's Visit to, 3
- Made a Separate Colony, 5
- Middle Island of, Physical Features of the, 10
- Newspapers, 54
- North Island of, Physical Features of the, 8
- Permanent Militia, 48
- Police Force, 44
- Premiers of, 22
- Provincial Governments abolished in, 15
- Representative Government granted in, 15
- Settlement at Port Nicholson, 4
- Canterbury, 5
- Nelson, 5
- New Plymouth, 5
- Otago, 5
- Shipping Company, The, 334
- Sovereignty of Queen proclaimed, 5
- Surville, and Marion du Fresne's Visits, 3
- Tasman's Visit, 2
- Treaty of Waitangi, 5
- University of, 149, 341
- Nickel, Hints to Prospectors for, 254
- Oamaru Harbour, 320
- Oat-crop of Australasian Colonies, 125
- Oats, Barley, Potatoes, and Wheat, Yield of, 178, 179
- Oats, Cultivation of, 121
- Export of, 96
- For Fodder and Hay, Acres under, 180
- Observatories, Geological Survey, and Museum, 44
- Offences, 143
- Charges for, before Resident Magistrates’ Courts, 140
- Committals for, 140
- Convictions for, 141
- Maoris charged with, 140
- Convicted before Supreme and District Courts, 140
- Summarily convicted, 140
- Officers in Charge of Telegraph-offices, 41
- Of Religious Bodies, 33
- Office, The Colonial, 24
- Official Assignees in Bankruptcy, 39
- Official List, 37–47
- Officiating Ministers, Number of, 35
- Oils, Mineral, 240
- Optional System of Selecting Crown Lands, 364
- Orchards, 126
- Orphan Asylums, 355
- Otago Harbour, 320
- Otago Land District—Boundaries and Area; Physical Description; Rivers and Lakes, Plains, Forests; Building-stones, Coal, Limestone; Climate; Fruit, Cereals; West Coast; Sheep; Freezing Establishments, Woollen-mills, Clothing-factories, Flax-mills, Dairy-factories; Agricultural Products; Gold Production; Chief Towns; Defences; Local Industries; Railways; Statistical, 409
- Outlying Islands of New Zealand, 13
- Parliament,—
- Members of, 26
- Parliaments, Successive, 20
- Passenger Fares and Traffic, Railway, 307, 308
- Pastoral Leases—
- Operations under, 119
- Receipts from, 119
- Pastoral Runs, 367
- Patea Harbour, 314
- Patent Office, 38
- Patents, Designs, and Trade-marks, 350, 352
- Patent Slips and Graving-docks, 328
- Patiti Point, Port Timaru, 319
- Pelorus Sound, 325
- Pensions, Annual, 51
- Permanent Militia, 48
- Perpetual Lease System, 118
- Perpetuity, Leaseholds in, 119, 365
- Phormium tenax (New Zealand Hemp), 215
- Export of, 97, 216
- Its Preparation and Dressing, 215
- Mills, 133
- Phthisis, Death-rates from, 86
- Deaths from (1892), 87
- Physical Features of the Middle Island, 10
- North Island, 8
- Picton, 326
- Pigs, 127, 172
- Market for inferior Grain, 172
- Prospects of Pork Trade, 172
- Raising young Stock, 173
- Platinum, Hints to Prospectors for, 250
- Police Department, 44
- Force, New Zealand, 44
- Population of New Zealand, 59
- Arrivals and Departures, 69–72
- From and to United Kingdom, 71
- Of Chinese, 70
- Birthplaces of, 62
- Chinese, 59
- Conjugal Condition of, 63
- Degree of Education of, 62
- European, 60
- Increase of, 67
- In different Islands, 60
- In Principal Towns and Suburbs, 67
- In Provincial Districts, 63
- Maori, 60
- Middle Island Electoral Districts, 31
- North Island Electoral Districts, 30
- Of Australasian Colonies, 61
- Of Boroughs, 65
- Of Counties, 64
- Of Electoral Districts, 30
- Rural, 30
- Town, 30
- Of Provincial Districts, 63
- Proportions of the Sexes in New Zealand and Australian Colonies, 63
- Religious Denominations, 61
- Pork packing (new industry), 172
- Port Lyttelton, 318
- Nicholson Harbour, 313
- Timaru (Patiti Point), 319
- Underwood, 326
- Ports, Officers in Charge of, 41
- And Harbours, 310–326
- Middle Island, 318
- North Island, 310
- Post Offices, 101
- Post Office and Telegraph Department, 40
- Average Number of Days within which Mails delivered, 103
- Books and Parcels, 102
- General, 40
- Increase of Correspondence, 101
- Letters posted, per Head of Population, 102
- Mail-services, England and New Zealand, Cost of, 103
- Money-orders, 102
- Newspapers, 101
- Post-cards, 101
- Savings-banks, 116
- Postmaster-General and Commissioner of Telegraphs, 40
- Postmasters, Chief, 41
- Potatoes, Cultivation of, 121, 122, 126
- Export of, 94
- Yield of, 179
- Poverty Bay, 312
- Precious Stones, 244
- Premiers of Successive Ministries, 22
- Premier's Office, 37
- Presbyterian Church of New Zealand, 33
- Otago and Southland, 33
- Preservation Inlet, 297
- Preserved Meats in various Provincial Districts, Quantities and Values of, 197
- Prices of Provisions, Live-stock, &c., 228, 229
- Primitive Methodist Annual Conference, 34
- Printer, Government, 37
- Printing and Stationery Department, 37
- Prisoners—
- Ages of Distinct, Convicted, 146
- Birthplaces of, 146
- Convicted, Number of, 146
- Distinct Convicted, 1891, Classified, 144
- New Zealand-born Convicted, 147
- Offences, during Six Years, 143
- Religious Denominations of, 144, 145
- Prisons Department, 40
- Private Property, 1892, Value of, 112
- Private Wealth, 110
- Probation Act, First Offenders treated under, 145
- Produce, Agricultural, Pastoral, and Dairy, 121–129
- Average Prices of, 228, 229
- Mining, 130
- Property, 1892, Private, 112
- Property-tax, Repealed, 106
- Proportions of the Sexes, 63
- Prosecutors, Crown, 38
- Prospectors for Gold and other Minerals, Hints to, 245–256
- Prospects of Small-farmers, 176
- Provisions, Live-stock, &c., Prices of, 228
- Public Debt, 108
- Annual Charge, 108
- Net Indebtedness, 108
- Of Australasian Colonies, 108
- Old Provincial Loans, 109
- Sinking Fund accrued, Amount of, 108
- Public Instruction, 339–341
- Administration, 341
- Average Attendance at Schools, 339
- Number of Districts, 339
- On Rolls at dates of Examination, 340
- Secondary Schools, 341
- University of New Zealand, 341
- Public Trustee, 47
- Public Trust Office, 347
- Assets of Estates, 349
- Charges, 348
- Constitution and Objects, 347
- Intestate Estates, 348
- Officers, 47
- Security, 347
- Wills and Trusts, 349
- Public Works, 17
- Department, 40
- District Offices, 40
- Expenditure on, 110
- Minister for, 40
- Queen Charlotte Sound, 326
- Rail and Sea, Table of Distances by, 338
- Railway Commissioners, 43
- Department, 43
- Railways, 113
- Australasian Colonies, Miles of, in, 115
- Comparative Statement of Mileage open in Australasian Colonies, 309
- Comparison of Traffic, Revenue, and Expenditure for Fourteen Years, 307
- Cost of Maintenance, 308
- Government, Goods and Live-stock carried, 114
- Length and Cost, 113
- Particulars of Revenue from, 114
- Passengers, 114
- Profit on Working, 113
- Revenue and Expenditure, 113
- Train-miles, 114
- In New Zealand: Their History and Progress, 301–310
- Management, 306
- Miles of Railway open for Traffic, 304
- Passenger Fares, 308
- Traffic, 307, 308
- Private, 114
- Cost of Construction, Revenue, and Working, 114
- Traffic, Revenue, and Expenditure for Thirteen Years, 307
- Working Expenses, 307
- Rainfall, 263
- Review of Proportions, 264
- Totals of Monthly, 264
- Rape and Turnips, Acres under, 126, 180
- Ratable Properties in Boroughs, 157
- Outlying Districts, 157
- In Road Districts, 158
- Town Districts, 157
- Rates collected by Local Bodies, Twelve Years, 153
- Of Wages, Average, 224–227
- Receipts and Expenditure of Local Bodies, 156
- Receivers of Gold Revenue, 39
- Registrar-General, 37
- Of Lands and Deeds, 42
- Registrar of Joint-stock Companies, 42
- Assistant, 42
- Registrars, Mining, 30
- Supreme Court, 38
- Registry Office, Friendly Societies, 37
- Religious Denominations, 34
- Bodies, Annual Meetings and Officers of, 33
- Religions and Birthplaces of Population, 61
- Representation and Electoral Districts, 30
- Electorates reduced in number, 15
- European, 15
- Maori, 16
- Residence and Improvements on Crown Lands, 365
- Resident Magistrates, 38, 47
- Resident Magistrates’ Courts, Clerks of, 39
- Civil Cases, 138
- Revenue—
- From Government Railways, 104
- From Land- and Income-tax, 106, 107, 424
- From Property-tax, 104
- General Government (Ordinary and Territorial), 104
- Local Government, 152
- Of Boroughs, 157
- Of Counties, 157
- Of Drainage Board, 158
- Of Harbour Boards, 158
- Of River Boards, 158
- Of Road Boards, 158
- Of Town Boards, 157
- Territorial, 104
- Rifle Corps—Volunteer, 49
- River Boards, Revenue, 158
- Rivers, 8, 13
- In North and Middle Islands, Area of Basin and Estimated Discharge, 327
- Riverton, Jacob's River, 321
- Road Boards, Revenue, 158
- Roll of Members of the House of Representatives, 28
- Legislative Council, 26
- Roman Catholic Archbishop, 33
- Bishops, 33
- Suffragan Dioceses, 33
- Roman Catholics, Number of, 61
- Root-crops, 162
- Rotorua Sanatorium, 278
- Ruapehu Mountain, 9
- Rural Population of Electoral Districts, 30
- Russell, Port, 317
- Salmon-trout, Introduction of, 231
- Sanatorium, Rotorua, 278
- Savings-Banks, Post Office, 116
- Private, 116
- Scarlet Fever and Scarlatina, 84
- Scheelite, 244
- Hints to Prospectors for, 255
- School Commissioners, Secretaries to, 42
- Schools, Industrial, 356
- Managers, 43
- Native, 151, 341
- Primary or Public, 148, 339
- Attendance at, 339
- Teachers at, 339
- Private, 148, 149
- Secondary, 149, 341
- Seat of Government, 16
- Civil Establishment at, 37
- Secretary's Department, Colonial, 37
- Secretaries, Education Boards, 42
- Settlement, Discovery and Early, 2
- Sexes, Conjugal Condition of the, 63
- Proportions of the, 63
- Shaw-Savill and Albion Company, 337
- Sheep, 127
- Cross-breeding of, 187
- In Colony, Increase in Number of, 95, 190
- Number and Size of Flocks, 95
- Sires bred in New Zealand, 172
- Sheep-farming, 182
- Sheriffs, 38
- Shipping, 89
- Coastwise, Vessels and Tonnage, 90
- Inwards and Outwards, Ten Years, 90
- New Zealand Shipping Company, 334
- Shaw-Savill and Albion Company (Limited), 337
- Union Steamship Company of New Zealand (Limited), 332
- Silver, 237
- Hints to Prospectors for, 249
- Sinking Fund (see Public Debt), 108
- Sitting-days of House of Representatives, 28
- Legislative Council, 26
- Slips, Patent, 328
- Solicitors, Crown, 38
- Sound, Pelorus, 325
- Queen Charlotte, 326
- Sounds, West Coast (Middle Island), 11, 297, 322
- Southern Alps, The, 299
- Southland Land District—Physical Features; Agriculture, Dairy-farming, Sheep-farming; Coal, Fish, Fruit; Climate; Towns; Crown Lands for Disposal, 415
- Sown Grasses, Extent of, 121, 126
- New Zealand, compared with Australia, 126
- Speaker of House of Representatives, 28
- Legislative Council, 26
- Speakers of the House of Representatives, Successive, 22
- Legislative Council, Successive, 22
- Special-settlement Associations, 366
- Spirits, Consumption per Head, Ten Years, 92
- Springs, The Thermal, 265–296
- Stamp Department, 42
- Stamps, Deputy-Commissioners of, 42
- Stationery Department, Printing and, 37
- Statistical Information, 59–158
- Statistics, Broadsheets
- Stewart Island, 6, 326
- Stock in New Zealand, 128, 166, 181
- Inspectors of, 46
- Stones, Precious, 244
- Successive Governors, 17
- Ministries, 21
- Premiers, 22
- Sugar, Consumption of, 91
- Supreme Court, Civil Cases, 138
- Judges, 38
- Registrars, 38
- Sheriffs, 38
- Survey Charges on Unsurveyed Lands, 368
- Sutherland Waterfall, The, 299
- Table of Distances by Rail and Sea, 338
- Tallow, Quantities and Value of, 198
- Taranaki Land District—Fertility; Mount Egmont; Rivers, Waimate Plains, Forest-lands, Volcanic Soil; Dairying; Mining; Climate; Chief Towns; Roads and Railways; Lands for Settlement, 376
- Tauranga Harbour, 311
- Taxation by General Government, 106
- Incidence of Land- and Income-tax, 425
- Income-tax, 106, 419
- Land-tax (ordinary), 106, 419
- Graduated, 107, 423
- Per Head in New Zealand, for Eleven Years, excluding Maoris, 107
- In Australasian Colonies, 107
- Rate of, per Head, including Maoris, 107
- Tax, Land and Income, 106, 107, 419, 432
- Tea, Consumption of, 91
- Telegraph Department, Post Office and, 40
- Telegraph-offices, Officers in Charge of, 41
- Telegraphs, Commissioner of, 40
- Inspectors of, 40
- Temperature, 257
- Comparative, of New Zealand, 259
- Daily Range of, 259
- Highest and Lowest in Shade, in New Zealand, the Australian Colonies and other British Possessions during Successive Years, 260–263
- Thames Harbour, 311
- Thermal-springs District, and Sanatorium at Rotorua, 265–293
- Accommodation at Rotorua, 296
- Analysis and Action of the Waters, 280
- Area of Thermal-springs District, 277
- Benefits realised, Permanent, 290
- Climate of Rotorua, 276
- Comparison of Rotorua Springs with those of Europe, 291
- Cures in Severe Rheumatism, 288
- Hospital, The, 278
- Mineral Waters, Curative Effects of, 290
- Varieties of, 277
- Names of the Principal Baths, 278
- Neuralgia, 289
- Paralysis, Cases of, 286
- Patients and Visitors, 295
- Paraplegia Cured, 287
- Physical Features of Region, 277
- Properties of the principal Bath Springs, 280
- Regulations and Tariff, 278
- Remarkably Successful Case, 286
- Resources, Magnitude of, 291
- Rheumatism and Skin Diseases, 287
- Rotorua Basin and its Surroundings, 294
- Routes from Australian Colonies, 296
- Skin Disease, Great Success in, 289
- Tarawera, 294
- Treatment, Cases Suitable for, 285
- Whakarewarewa, 295
- Baths, 284
- Thunderstorms, 265
- Timaru, Port, 319
- Timber exported, 93
- Industry, Forest-trees and, 204–214
- Timber of Pinus insignis suitable for Butter-boxes, 175
- Timbers, Strength of New Zealand, 212
- Quantities and Values of Exports of, 213
- Tin, 240
- Hints to Prospectors for, 250
- Titles, Examiners of, 42
- Tobacco, Consumption of, 92
- Cultivation of, 126
- Tolaga Bay, 312
- Tongariro Mountain, 9
- Town Districts (see Local Bodies), 152
- Population of Electoral Districts, 30
- Towns, Principal, and Suburbs (see also Descriptions of Land Districts), 66–67
- Trade and Customs, Commissioner of, 41
- Department, 41
- Trade and Interchange, 89–101
- Importance of Australasian Colonies as Markets for Great Britain, 101
- New Zealand, Total Value of External, 97
- Per Head, Population, Ten Years, 98
- With Atlantic and Pacific Ports of United States, Ten Years, 99
- With Australia, 98
- With India, 99
- With United Kingdom, 98
- Of Australasian Colonies, Value of, per Head, 100
- Of Australasian Colonies with United Kingdom, (See Imports)., (See Exports)., 100
- Shipping (see shipping).
- Trade-marks, Patents, and Designs, 350
- Treasurer's Department, Colonial, 37
- Trees, Timber and Forest, 204
- Tree-planting—Arbor Day, 174
- Trout to New Zealand, Introduction of, 231
- Fish-hatcheries, Number established, 232
- Fishing, Record of Day's, 232
- Habit of Trout, 232
- Trust Commissioners under Native Lands Frauds Prevention Act, 39
- Trustee, Public, 47
- Trust Office, Public, 47, 347
- Trusts and Wills, 349
- Turanga (Poverty Bay), 312
- Turnips and Rape, 126, 180
- Typhoid Fever, Deaths from, 86
- Underwood, Port, 326
- Union Steamship Company of New Zealand, 332
- United Methodist Free Church, Annual Meetings of the, 34
- United States, Trade with, 99
- Universities and Colleges, 149
- University of New Zealand, 149, 341
- Unsurveyed Lands, Survey Charges on, 368
- Vaccinations, Proportions of Successful, 84
- Value of Land, Increased, 427
- Value of Produce exported, 93
- Vessels (see Shipping), 89
- Village Settlements, 366
- Violent Deaths, 89
- Vital Statistics, 73–89
- Volunteers, 48, 49
- Wages, Average Rates of, 224–227
- Waihau (Coromandel) Harbour, 311
- Wairau River, 326
- Wairoa and Mohaka Rivers, 312
- Waitara River, 314
- Wanganui River, 314
- Wardens’ Courts, Clerks of, 39
- Water-races, Managers of, 44
- Wealth, Private, 110
- Calculated from Probate Returns, 111
- Of Australasian Colonies, 113
- Of Principal Countries, 113
- Of United Kingdom, 113
- Understated, 111
- Weather Reporter (Marine), 41
- Wellington Land District, 383
- (Port Nicholson) Harbour, 313
- Wellington-Manawatu Railway, 114
- Wesleyan Methodist Church, 33
- West Coast Sounds, The, 297, 322
- Westport Harbour (Buller River), 324
- Whangarei Harbour, 317
- Whangaroa Harbour and Bay, 317
- Wheat, Amount annually retained in Colony, 123
- Consumption of, in New Zealand, 124
- Annual Average, Principal Countries, 125
- Crops of Australasian Colonies, 123
- Cultivation, 121
- Export in 1892, 96
- Oats, Barley, and Potatoes, Yield of, 178, 179
- White Island, 270
- Whooping-cough, Deaths from, 84
- Wills and Trusts, 349
- Winds, 264
- Maximum Velocity in Miles, 265
- Wine, Consumption of, per Head for Ten Years, 92
- Women's franchise, facing page 1
- Wool, exported, 93–95
- Increase in Production of, Ten Years, 95
- Used at Local Mills, 95
- Woollen Manufactures, Exported, 94
- Mills, Number of, 133
- Works, Public, 17
- Expenditure on, 105, 110
- Zinc, Hints to Prospectors for, 254
| Year. | Population of European Descent (excluding the Military and their Families.)* | Trade. | Revenue and Expenditure. | |||||||
|---|---|---|---|---|---|---|---|---|---|---|
| Imports. | Exports. | Revenue from Customs. | Revenue from Land Sales and Crown Lands. | Revenue from Post Office, Fees, Fines, Licenses, and other Incidental Sources. | Total Revenue from Previous Sources. | Parliamentary Grant, or Receipts in aid of Revenue. | Appropriations from the Commissariat Chest for Military and Naval Expenditure.† | Total Expenditure. | ||
|
* The Maori population was estimated at 56,400 persons in the year 1853. † The data are drawn from several official sources, and the information is only approximate. ‡ Raised by debentures at different issues. | ||||||||||
| Persons. | £ | £ | £ | £ | £ | £ | £ | £ | £ | |
| 1840 | 2,050 | .. | .. | 926 | .. | .. | 926 | .. | .. | 926 |
| 1841 | 5,000 | 85,062 | 10,836 | 6,407 | 28,540 | 2,443 | 37,390 | 43,347 | 804 | 81,541 |
| 1842 | 10,992 | 166,783 | 18,670 | 18,568 | 11,723 | 2,298 | 32,589 | 17,494 | 1,426 | 51,509 |
| 1843 | 11,848 | 191,207 | 53,945 | 16,241 | 1,613 | 3,544 | 21,398 | 9,562 | 8,093 | 39,053 |
| 1844 | 12,447 | 111,619 | 49,647 | 11,099 | 405 | 2,445 | 13,949 | 30,815‡ | 9,782 | 54,546 |
| 1845 | 12,774 | 116,980 | 76,911 | 8,899 | 155 | 3,845 | 12,899 | .. | 200,000 | 212,899 |
| 1846 | 13,274 | 155,478 | 82,656 | 21,319 | 615 | 4,711 | 26,645 | 35,673‡ | 190,000 | 252,318 |
| 1847 | 14,477 | 202,355 | 45,485 | 36,472 | 835 | 5,958 | 43,265 | 37,752 | 153,038 | 234,055 |
| 1848 | 17,166 | 233,844 | 44,215 | 38,366 | 3,337 | 5,779 | 47,482 | 36,000 | 155,653 | 239,135 |
| 1849 | 19,543 | 254,679 | 133,662 | 41,931 | 3,600 | 4,877 | 50,408 | 20,000 | 151,455 | 221,863 |
| 1850 | 22,108 | .. | .. | 43,612 | 8,559 | 7,127 | 52,298 | 41,730 | 131,100 | 232,128 |
| 1851 | 26,707 | .. | .. | 49,208 | 12,261 | 5,580 | 67,049 | 20,000 | 110,600 | 197,649 |
| 1852 | 27,633 | .. | .. | 50,527 | 14,281 | 10,956 | 75,764 | 10,000 | 91,600 | 177,364 |
The following are particulars respecting the European population, their cultivations, and live stock for the year 1851:—
Religious Denominations.—Church of England, 14,179 persons; Presbyterians, 4,124; Wesleyans, 2,529; Primitive Methodists, 226; Independents, 333; Baptists, 400; Unitarians, 74; Lutherans, 186; Quakers, 8; Protestants not specifically defined, 614; Roman Catholics, 3,473; Jews, 65; refused to state, 496.
Education.—Could not read, 7,818 persons; read only, 4,353; read and write, 14,536.
Land in Cultivation.—Acres—in wheat, 5,514; barley, 1,329; oats, 2,324; maize, 259; potatoes, 2,256; grass, 15,589; gardens or orchard, 1,189; other crops, 679: total under crop, 29,140. Acres fenced, 40,625.
Live Stock.—Horses, 2,890; mules and asses, 60; cattle, 34,787; sheep, 233,043; goats, 12,121; pigs, 16,214.
[The above table is compiled from information given in Dr. Thomson's work on New Zealand, which is stated by Sir George Grey to have been supplied from official sources when he was Governor.]
STATISTICAL SUMMARY OF THE COLONY OF NEW ZEALAND
FROM 1853 TO 1892 INCLUSIVE.
(For
Summary, Years 1840 to 1852, see back.)
| Australasian Statistics for the Year 1892. | ||||||||||||||||
|---|---|---|---|---|---|---|---|---|---|---|---|---|---|---|---|---|
| Colonies. | Population.* | Births. | Deaths. | Marriages. | Arrivals. | Departures. | ||||||||||
| On 31st December. | Mean for year. | Number. | Proportion to every 1,000 of Population. | Number. | Proportion to every 1,000 of Population. | Number. | Proportion to every 1,000 of Population. | Males. | Females. | Total. | Males. | Females. | Total. | |||
| Males. | Females. | Total | ||||||||||||||
| Queensland | 237,965 | 183,332 | 421,297 | 415,813 | 14,903 | 35.84 | 5,266 | 12.66 | 2,774 | 6.67 | 10,211 | 4,435 | 14,646 | 9,393 | 4,171 | 13,564 |
| Now South Wales | 646,378 | 550,672 | 1,197,050 | 1,181,175 | 40,646 | 34.41 | 15,611 | 13.22 | 8,001 | 6.77 | 41,570 | 20,027 | 62,197 | 35,506 | 17,181 | 58,687 |
| Victoria | 607,795 | 559,579 | 1,167,374 | 1,162,526 | 37,829 | 32.54 | 15,849 | 13.63 | 7,735 | 6.65 | 42,849 | 20,102 | 62,951 | 46,718 | 22,496 | 69,214 |
| South Australia§ | 171,476 | 160,245 | 331,721 | 325,284 | 10,544 | 32.41 | 3,711 | 11.41 | 2,119 | 6.51 | 41,895 | 15,688 | 57,583 | 38,178 | 14,499 | 52,677 |
| Western Australia | 36,095 | 22,579 | 58,674 | 56,531 | 1,848 | 32.69 | 931 | 16.47 | 412 | 7.29 | 5,828 | 1,612 | 7,440 | 2,299 | 669 | 2,968 |
| Tasmania | 82,009 | 71,135 | 153,144 | 152,881 | 4,965 | 32.48 | 2,069 | 13.53 | 995 | 6.51 | 16,849 | 6,895 | 23,744 | 15,049 | 8,358 | 24,407 |
| New Zealand | †345,146 | †305,287 | †650,433 | 642,215 | 17,876 | 27.83 | 6,459 | 10.06 | 4,002 | 6.23 | 13,131 | 5,991 | 18,123 | 8,466 | 4,695 | 13,164 |
| Colonies. | Trade. | Live-stock. | |||||||||||||||||||
|---|---|---|---|---|---|---|---|---|---|---|---|---|---|---|---|---|---|---|---|---|---|
| Value of Imports from | Value of Imports per Head of Mean Population. | Value of Exports to | Value of Exports per Head of Mean Population. | Value of Exports the Produce and Manufacture of the Colony. | Horses. | Cattle. | Sheep. | Pigs. | |||||||||||||
| United Kingdom. | Australian Colonies. | Other British Possessions. | Foreign States. | Total. | United Kingdom. | Australian Colonies. | Other British Possessions. | Foreign States. | Total. | ||||||||||||
| £ | £ | £ | £ | £ | £ | s. | d. | £ | £ | £ | £ | £ | £ | s. | d. | £ | No. | No. | No. | No. | |
| Queensland | ‡ | ‡ | ‡ | ‡ | 4,248,441 | 10 | 4 | 4 | ‡ | ‡ | ‡ | ‡ | 8,578,071 | 20 | 12 | 7 | ‡ | |399,364 | |6,192,759 | |20,289,633 | |122,672 |
| New South Wales | 8,883,983 | 9,201,193 | 577,707 | 2,113,643 | 20,776,526 | 17 | 11 | 9 | 7,653,915 | 8,917,677 | 481,553 | 4,919,102 | 21,972,247 | 18 | 12 | 1 | 17,707,102 | 481,416 | 2,147,074 | 58,080,114 | 249,522 |
| Victoria | ‡ | ‡ | ‡ | ‡ | 17,159,613 | 14 | 15 | 2 | ‡ | ‡ | ‡ | ‡ | 14,214,546 | 12 | 4 | 6 | ‡ | |440,696 | |1,812,104 | |12,928,148 | |286,780 |
| South Australia§ | 2,372,185 | 4,052,896 | 219,405 | 750,692 | 7,395,178 | 22 | 14 | 8 | 3,167,298 | 3,610,852 | 716,629 | 324,760 | 7,819,539 | 24 | 0 | 9 | 3,232,259 | 186,726 | 411,793 | 7,152,047 | 61,180 |
| Western Australia | 592,496 | 679,752 | 77,258 | 41,603 | 1,391,109 | 24 | 13 | 8 | 395,700 | 314,272 | 157,203 | 14,973 | 882,148 | 15 | 12 | 1 | 870,814 | 44,973 | 162,886 | 1,685,500 | 24,417 |
| Tasmania | 541,619 | 935,428 | 1,278 | 18,836 | 1,497,161 | 9 | 15 | 10 | 315,836 | 1,031,093 | 36 | ... | 1,346,965 | 8 | 16 | 2 | 1,330,144 | 31,976 | 170,085 | 1,623,338 | 59,267 |
| New Zealand | 4,767,369 | 1,112,099 | 445,208 | 618,380 | 6,943,056 | 10 | 16 | 3 | 7,483,618 | 1,367,314 | 59,803 | 624,116 | 9,534,851 | 14 | 16 | 11 | 9,365,868 | ¶211,040 | 851,351 | **19,357,736 | ¶222,553 |
| Colonies. | Agriculture, 1892–93. | ||||||||||||||||||||||
|---|---|---|---|---|---|---|---|---|---|---|---|---|---|---|---|---|---|---|---|---|---|---|---|
| No. of Cultivated Holdings over One Acre in Extent. | Acreage of Land in Crop. | Acreage of Land broken up but not under Crop. | Acreage of Land in Sown Grasses. | Total Acreage of Land in Cultivation. | Principal Crops. | ||||||||||||||||||
| In Wheat. | In Oats. | In Barley. | In Maize. | In Hay. | In Potatoes. | ||||||||||||||||||
| Land. | Produce. | Yield per Acre. | Land. | Produce. | Yield per Acre. | Land. | Produce. | Yield per Acre. | Land. | Produce. | Yield per Acre. | Land. | Produce. | Yield per Acre. | Land. | Produce. | Yield per Acre. | ||||||
| No. | Acres. | Acres. | Acres. | Acres. | Acres. | Bushels. | Bshls. | Acres. | Bushels. | Bshls. | Acres. | Bshls. | Bshls. | Acres. | Bushels. | Bshls. | Acres. | Tons. | Tons. | Acres. | Tons. | Tons | |
|
* The aboriginal population of Victoria and New South Wales is included in the numbers given in the table. It was estimated at the time of the census (1891) that there were 565 aborigines in Victoria and 8,280 in New South Wales. Aborigines are excluded from the populations of the under-mentioned colonies, for which the census returns gave the following estimates of the native population: In Queensland, 20,585 persons for 1881; in South Australia, 23,789 persons (of whom 20,655 ware in the Northern Territory) for 1891. † Exclusive of 41,993 Maoris (22,861 males and 19,132 females). ‡ No information. § Exclusive of Northern Territory. | Figures for 1891–92. ¶ Figures taken from census returns of 1891. ** Approximate number on 30th April, 1893. | |||||||||||||||||||||||
| Queensland| | ‡ | 242,629 | 15,375 | 20,921 | 278,925 | 19,306 | 392,309 | 20.32 | 715 | 16,669 | 23.31 | 739 | 21,302 | 28.83 | 101,598 | 3,077,915 | 30.30 | 30,655 | 58,842 | 1.92 | 9,173 | 25,018 | 2.73 |
| New South Wales | 53,534 | 1,010,727 | ‡ | 361,280 | 1,372,007 | 452,921 | 6,817,457 | 15.05 | 20,890 | 431,603 | 20.66 | 4,618 | 91,801 | 19.88 | 167,549 | 5,037,256 | 30.06 | 214,468 | 303,288 | 1.41 | 18,502 | 51,505 | 2.78 |
| Victoria | 35,223 | 2,241,812 | 495,189 | 223,114 | 2,970,115 | 1,342,504 | 14,814,645 | 11.04 | 177,645 | 4,574,816 | 25.75 | 37,533 | 774,207 | 20.63 | 6,667 | 373,183 | 55.97 | 512,648 | 740,049 | 1.44 | 40,594 | 142,623 | 3.51 |
| South Australia § | 20,355 | 2,037,653 | 567,878 | 20,210 | 2,625,741 | 1,520,580 | 9,240,108 | 6.08 | 15,745 | 166,489 | 10.57 | 13,285 | 175,468 | 13.21 | ... | ... | ... | 434,116 | 389,277 | 0.90 | 6,014 | 20,057 | 3.33 |
| Western Australia | ‡ | 79,603 | 81,562 | ‡ | 161,465 | 35,060 | 429,497 | 12.25 | 1,694 | 29,645 | 17.50 | 3,665 | 56,823 | 15.50 | 33 | 775 | 23.48 | 35,123 | 43,904 | 1.25 | 528 | 1,586 | 3.00 |
| Tasmania | ‡ | 179,396 | 165,136 | 217,905 | 562,437 | 58,897 | 10,018,550 | 17.29 | 22,976 | 631,746 | 27.50 | 3,929 | 80,205 | 20.43 | ... | ... | ... | 46,070 | 53,544 | 1.16 | 16,535 | 60,245 | 3.64 |
| New Zealand | 42,768 | 1,29,446 | 154,254 | 8,262,045 | 9,713,745 | 381,245 | 8,378,267 | 21.98 | 326,531 | 9,893,989 | 30.30 | 24,906 | 654,231 | 26.27 | 4,491 | 171,661 | 38.22 | 61,811 | 93,293 | 1.51 | 18,338 | 104,173 | 5.68 |
| Year. | Population (exclusive of Maoris) | Births. | Deaths. | Marriages. | Immigration, excess over Emigration. | Crown Lands.* | Occupied and Cultivated Holdings over One Acre in extent. | |||||||
|---|---|---|---|---|---|---|---|---|---|---|---|---|---|---|
| Males. | Females. | Totals. | Waste Lands sold for Cash in each Year. | Cash realised. | Lands finally alienated under the Deferred-payment System. | Free Grants.* | Let on Perpetual Lease. | |||||||
| Land taken up. | In Occupation on December 31. | |||||||||||||
| Acres. | £ | Acres. | Acres. | Acres. | Acres. | Number. | ||||||||
| 1853 | .. | .. | .. | .. | .. | .. | 1,091 | .. | .. | .. | .. | .. | .. | .. |
| 1854 | 17,914 | 14,640 | 32,554 | .. | .. | .. | 2,057 | .. | .. | .. | .. | .. | .. | |
| 1855 | 20,781 | 16,411 | 37,192 | 1,460 | 470 | 406 | 3,937 | .. | .. | .. | .. | .. | .. | .. |
| 1856 | 25,356 | 20,184 | 45,540 | 1,722 | 406 | 404 | 2,525 | 51,972 | 33,156 | .. | 14 | .. | .. | .. |
| 1857 | 27,606 | 22,196 | 49,802 | 1,966 | 434 | 478 | 3,042 | 141,159 | 79,060 | .. | 6,169 | .. | .. | .. |
| 1858 | 33,679 | 25,734 | 59,413 | 2,272 | 582 | 534 | 6,130 | 239,128 | 150,839 | .. | 6,277 | .. | .. | .. |
| 1859 | 41,107 | 30,486 | 71,593 | 2,647 | 704 | 603 | 8,637 | 477,021 | 222,885 | .. | 45,730 | .. | .. | .. |
| 1860 | 45,394 | 34,317 | 79,711 | 3,146 | 1,092 | 690 | 6,064 | 424,254 | 204,113 | .. | 47,616 | .. | .. | .. |
| 1861 | 61,062 | 37,959 | 99,021 | 3,441 | 1,109 | 878 | 16,222 | 449,358 | 235,365 | .. | 18,834 | .. | .. | .. |
| 1862 | 79,680 | 46,132 | 125,812 | 4,064 | 1,231 | 1,091 | 20,991 | 658,337 | 536,657 | .. | 40,335 | .. | .. | .. |
| 1863 | 105,978 | 58,070 | 164,048 | 5,115 | 1,983 | 1,485 | 35,120 | 529,437 | 380,998 | .. | 66,853 | .. | .. | .. |
| 1864 | 106,580 | 65,573 | 172,158 | 6,501 | 2,921 | 1,878 | 8,527 | 691,174 | 595,858 | .. | 47,198 | .. | .. | .. |
| 1865 | 117,376 | 73,231 | 190,607 | 7,490 | 2,757 | 1,908 | 12,309 | 503,112 | 341,094 | .. | 62,681 | .. | .. | .. |
| 1866 | 125,080 | 79,034 | 204,114 | 8,466 | 2,540 | 2,038 | 7,599 | 603,406 | 528,028 | .. | 55,975 | .. | .. | .. |
| 1867 | 131,929 | 86,739 | 218,668 | 8,918 | 2,702 | 2,050 | 4,859 | 288,917 | 287,416 | .. | 76,743 | .. | .. | .. |
| 1868 | 134,621 | 91,997 | 226,618 | 9,391 | 2,662 | 2,085 | 860 | 199,309 | 102,065 | .. | 42,205 | .. | .. | 11,932 |
| 1869 | 140,112 | 97,137 | 237,249 | 9,718 | 2,721 | 1,931 | 3,641 | 112,211 | 115,941 | .. | 145,449 | .. | .. | 13,476 |
| 1870 | 145,732 | 102,668 | 248,400 | 10,277 | 2,703 | 1,851 | 3,577 | 76,766 | 88,419 | .. | 37,256 | .. | .. | 10,211 |
| 1871 | 156,431 | 110,555 | 266,986 | 10,592 | 2,642 | 1,864 | 4,786 | 92,642 | 110,973 | .. | 123,796 | .. | .. | 14,874 |
| 1872 | 162,404 | 117,156 | 279,560 | 10,795 | 3,194 | 1,873 | 4,973 | 338,516 | 389,107 | .. | 183,673 | .. | .. | 15,304 |
| 1873 | 170,406 | 125,540 | 295,496 | 11,222 | 3,64 | 2,276 | 8,811 | 790,245 | 980,758 | .. | 484,541 | .. | .. | 15,883 |
| 1874 | 194,349 | 147,511 | 341,860 | 12,844 | 4,161 | 2,828 | 38,106 | 648,800 | 860,471 | .. | 238,581 | .. | .. | 16,092 |
| 1875 | 213,294 | 162,562 | 375,856 | 14,438 | 5,712 | 3,209 | 25,270 | 318,682 | 448,697 | .. | 486,335 | .. | .. | 17,250 |
| 1876 | 225,580 | 173,495 | 399,075 | 16,168 | 4,904 | 3,196 | 11,955 | 497,416 | 846,831 | .. | 31,145 | .. | .. | 18,750 |
| 1877 | 227,681 | 180,937 | 408,618 | 16,856 | 4,685 | 3,114 | 6,376 | 777,862 | 1,314,480 | 40,314 | .. | .. | 20,519 | |
| 1878 | 240,627 | 191,892 | 432,519 | 17,770 | 4,645 | 3,377 | 10,502 | 642,667 | 1,252,993 | } 79,324 | 54,861 | .. | .. | 21,048 |
| 1879 | 257,894 | 205,835 | 463,729 | 18,070 | 5,583 | 3,352 | 18,723 | 79,575 | 146,733 | 37,953 | .. | .. | 23,129 | |
| 1880 | 268,364 | 216,500 | 484,864 | 19,341 | 5,347 | 3,181 | 7,231 | 131,798 | 184,488 | 18,978 | 41,972 | .. | .. | 24,147 |
| 1881 | 274,986 | 225,924 | 500,910 | 18,732 | 5,491 | 3,277 | 1,616 | 235,815 | 351,430 | 39,494 | 530,650 | .. | .. | 26,298 |
| 1882 | 283,303 | 234,404 | 517,707 | 19,009 | 5,701 | 3,600 | 3,489 | 138,512 | 209,004 | 27,487 | 122,100 | .. | .. | 27,352 |
| 1883 | 294,665 | 246,212 | 540,077 | 19,202 | 6,061 | 3,612 | 10,029 | 113,500 | 141,251 | 24,229 | 228,698 | 26,786 | 26,364 | 28,587 |
| 1884 | 306,667 | 257,637 | 564,304 | 19,846 | 5,740 | 3,800 | 9,321 | 96,267 | 124,928 | 40,023 | 121,611 | 20,975 | 41,561 | 29,814 |
| 1885 | 312,125 | 263,101 | 575,226 | 19,693 | 6,081 | 3,813 | 4,504 | 49,613 | 84,282 | 34,637 | 456,080 | 24,441 | 51,367 | 31,763 |
| 1886 | 317,646 | 271,740 | 589,386 | 19,299 | 6,135 | 3,88 | 1,064 | 39,964 | 43,836 | 29,292 | 185,764 | 46,367 | 93,868 | 33,332 |
| 1887 | 324,558 | 278,803 | 603,361 | 19,135 | 6,137 | 3,563 | 977 | 21,154 | 25,330 | 18,496 | 316,488 | 64,595 | 150,218 | 34,743 |
| 1888 | 324,948 | 282,432 | 607,380 | 18,902 | 5,708 | 3,617 | -9,175 Dec. | 64,898 | 52,379 | 23,630 | 142,351 | 178,138 | 312,495 | 35,747 |
| 1889 | 328,588 | 287,464 | 616,052‡ | 18457 | 5,772 | 3,632 | 214 | 42,617 | 4,950 | 24,773 | 60,708 | 242,790 | 544,914 | 38,178 |
| 1890 | 332,557 | 292,951 | 625,508‡ | 18,278 | 5,994 | 3,797 | -1,782 Dec. | 98,479 | 108,959 | 46,808 | 135,763 | 271,736 | 798,571 | 38,083 |
| 1891 | 336,174 | 297,884 | 634,058 | 18,273 | 6,518 | 3,805 | -3,198 Dec. | 56,060 | 53,568 | 52,021 | 209,432 | 273,087 | 1,019,405 | 41,224 |
| 1892 | 345,146 | 305,287 | 650,433 | 17,876 | 6,459 | 4,002 | 4,958 | 33,659 | 34,156 | 41,726 | 243,008 | 196,075** | 1,188,071 | 42,768 |
| Land (including Sown Grasses) under Cultivation. | Live Stock.† | Postal. | Electric Telegraph. | Miles of Railway. | |||||||||||
|---|---|---|---|---|---|---|---|---|---|---|---|---|---|---|---|
| Horses. | Horned Cattle. | Sheep. | Pis. | Letters (received and despatched). | Newspapers (received and despatched). | Postal. Revenue. | Number of Money Orders issued. | Amount of Money Orders issued. | Miles of Line. | Number of Messages. | Cash and Cash Values. | Open for Traffic. | Under Construction. | Railway Receipts. | |
|
* The waste or Crown lands sold or granted in each year prior to 1856 cannot be accurately stated. The total gross quantity of land disposed of by Crown grants up to the end of 1892, including lands sold and lands disposed of without sale, was 20,364,208 statute acres. The figures under the head “Free Grants" represent in each year the total quantity of free grants to immigrants and naval and military settlers grants for public purposes and Native reserves and old land claims; also, from the year 1872, grants to Natives under the provisions of the Native Land Acts. † This information is given only for the years in which a census of the colony was taken. ‡ Corrected by means of results of census taken in April, 1891. The population of the colony (other than Maoris) according to the census of 5th April, 1891, was 626,658 persons at that date; the Maori population was 41,993. § Excluding those owned by Maoris. | Including those owned by Maoris. ¶ Government Railways; there are, besides, 150 miles of private lines. ** There were in addition 13,170 acres taken up in 1892 under the new system of “occupation with right of purchase," and 17,984 acres on “lease in perpetuity.” | |||||||||||||||
| Acres. | Number. | Number. | £ | Number. | £ | £ | £ | ||||||||
| .. | .. | .. | .. | 119,039 | 177,583 | .. | .. | .. | .. | .. | .. | .. | .. | .. | |
| .. | .. | .. | .. | .. | 138,492 | 201,391 | .. | .. | .. | .. | .. | .. | .. | .. | .. |
| .. | .. | .. | .. | .. | 171,407 | 238,522 | .. | .. | .. | .. | .. | .. | .. | .. | .. |
| .. | .. | .. | .. | .. | 196,760 | 271,254 | .. | .. | .. | .. | .. | .. | .. | .. | .. |
| 121,648 | .. | .. | .. | .. | 337,721 | 498,163 | .. | .. | .. | .. | .. | .. | .. | .. | .. |
| 141,007 | 14,912 | 137,204 | 1,523,324 | 40,734 | 482,856 | 684,348 | 6,024 | .. | .. | .. | .. | .. | .. | .. | .. |
| 156,940 | .. | .. | .. | .. | 707,870 | 839,385 | 7,812 | .. | .. | .. | .. | .. | .. | .. | .. |
| .. | .. | .. | .. | .. | 890,369 | 1,029,356 | 10,068 | .. | .. | .. | .. | .. | .. | .. | .. |
| 226,621 | 28,275 | 193,285 | 2,761,583 | 43,270 | 1,236,768 | 1,428,351 | 14,108 | .. | .. | .. | .. | .. | .. | .. | .. |
| .. | .. | .. | .. | .. | 2,122,232 | 2,064,123 | 22,710 | 1,410 | 6,590 | .. | .. | .. | .. | .. | .. |
| .. | .. | .. | .. | .. | 3,403,248 | 3,397,669 | 32,329 | 11,586 | 55,703 | .. | .. | .. | .. | .. | |
| 382,655 | 49,409 | 249,760 | 4,937,273 | 61,276 | 4,151,142 | 4,306,017 | 39,302 | 16,591 | 78,556 | .. | .. | .. | .. | .. | .. |
| .. | .. | .. | .. | .. | 4,443,473 | 4,206,992 | 46,475 | 17,236 | 78,576 | .. | .. | .. | .. | .. | .. |
| .. | .. | .. | .. | .. | 4,758,644 | 4,373,039 | 49,598 | 22,710 | 108,779 | 699 | 48,231 | 9,114 | .. | .. | .. |
| 676,909 | 65,715 | 312,835 | 8,418,579 | 115,104 | 4,811,240 | 3,060,888 | 55,331 | 24,473 | 115,610 | 714 | 87,436 | 14,29 | .. | .. | .. |
| 783,435 | .. | .. | .. | .. | 4,977,199 | 3,283,615 | 57,107 | 25,854 | 118,211 | 1,471 | 134,647 | 26,224 | .. | .. | .. |
| 997,477 | .. | .. | .. | .. | 5,016,595 | 3,563,147 | 58,007 | 28,427 | 127,218 | 1,611 | 1,73,746 | 32,649 | .. | .. | .. |
| 1,140,279 | .. | .. | .. | .. | 5,645,879 | 3,889,662 | 55,780 | 31,864 | 140,454 | 1,887 | 238,195 | 27,422 | .. | .. | .. |
| 1,226,222 | 81,028 | 436,592 | 9,700,629 | 151,460 | 6,01,697 | 4,179,784 | 70,249 | 36,291 | 157,397 | 2,015 | 369,085 | 37,203 | .. | .. | .. |
| 1,416,933 | .. | .. | .. | .. | 6,958,543 | 4,411,091 | 94,733 | 44,660 | 191,009 | 2,312 | 491,205 | 44,669 | .. | .. | .. |
| 1,651,712 | .. | .. | .. | .. | 7,915,985 | 5,269,195 | 94,706 | 52,351 | 219,258 | 2,389 | 637,941 | 55,195 | 145 | 434 | .. |
| 1,943,653 | 99,261 | 494,113 | 11,674,863 | 123,741 | 9,058,456 | 6,306,692 | 104,371 | 62,712 | 263,164 | 2,632 | 844,301 | 62,322 | 209 | 621 | 21,198 |
| 2,377,402 | .. | .. | .. | .. | 10,427,851 | 6,811,277 | 122,496 | 73,027 | 293,481 | 3,156 | 993,323 | 74,420 | 542 | 464 | 72,073 |
| 2,940,711 | .. | .. | .. | .. | 11,770,737 | 7,962,748 | 129,263 | 80,255 | 310,268 | 3,170 | 1,100,599 | 80,841 | 718 | 427 | 469,051 |
| 3,523,277 | .. | .. | .. | .. | 13,054,870 | 8,066,311 | 143,600 | 90,672 | 334,973 | 3,307 | 1,182,955 | 85,589 | 1,052 | 251 | 569,898 |
| 3,982,866 | 137,768 | 578,430 | 13,069,338 | 207,337 | 15,524,761 | 9,410,366 | 158,998 | 101,017 | 368,255 | 3,434 | 1,260,324 | 92,433 | 1,089 | 142 | 758,096 |
| 4,506,889 | .. | .. | .. | .. | 20,957,818 | 10,057,944 | 141,448 | 117,999 | 428,673 | 3,512 | 1,448,943 | 112,351 | 1,171 | 284 | 762,572 |
| 4,768,192 | .. | .. | .. | .. | 22,824,468 | 10,272,917 | 149,517 | 135,648 | 465,405 | 3,758 | 1,304,712 | 100,023 | 1,288 | 192 | 836,077 |
| 5,189,104 | 161,736 | 698,637 | 12,985,085 | 200,083 | 25,557,931 | 12,248,043 | 156,579 | 135,556 | 452,182 | 3,824 | 1,438,772 | 101,566 | 1,333 | 187 | 892,026 |
| 5,651,255 | .. | .. | .. | .. | 30,525,579 | 13,313,099 | 168,325 | 148,162 | 499,368 | 3,974 | 1,570,189 | 102,378 | 1,371 | 171 | 953,347 |
| 6,072,949 | .. | .. | .. | .. | 33,588,408 | 13,030,563 | 172,665 | 172,556 | 541,133 | 4,074 | 1,599,400 | 102,958 | 1,404 | 224 | 961,304 |
| 6,550,399 | .. | .. | .. | .. | 35,257,846 | 14,093,742 | 188,772 | 186,052 | 572,666 | 4,264 | 1,654,305 | 101,482 | 1,479 | 158 | 1,045,712 |
| 6,668,920 | .. | .. | .. | .. | 35,829,855 | 14,233,878 | 197,456 | 188,622 | 581,395 | 4,463 | 1,774,273 | 112,778 | 1,613 | 179 | 1,047,418 |
| 6,845,177 | 187,382 | 853,358 | 16,564,595 | 277,901 | 38,084,592 | 14,324,047 | 206,029 | 155,680 | 547,755 | 4,546 | 1,836,266 | 115,666 | 1,721 | 71 | 998,768 |
| 7,284,752 | .. | .. | .. | .. | 39,377,774 | 15,381,323 | 213,355 | 159,579 | 555,744 | 4,646 | 1,835,394 | 116,211 | 1,753 | 169 | 994,843 |
| 7,670,167 | .. | .. | .. | .. | 40,398,020 | 16,202,849 | 212,247 | 162,387 | 555,996 | 4,790 | 1,765,860 | 104,116 | 1,777 | 163 | 997,615 |
| 8,015,426 | .. | .. | .. | .. | 42,301,233 | 16,721,016 | 222,978 | 172,076 | 589,545 | 4,874 | 1,802,987 | 106,462 | 1,809 | 176 | 1,095,569 |
| 8,462,495 | .. | .. | .. | .. | 43,917,200 | 17,912,734 | 229,867 | 176,427 | 602,077 | 5,060 | 1,961,161 | 110,697 | 1,842 | 132 | 1,121,701 |
| 8,893,225 | 211,040§ | 831,831| | 18,128,186| | 308,812| | 47,612,864 | 18,501,912 | 245,395 | 195,239 | 651,990 | 5,349 | 1,968,264 | 117,634 | 1,869 | 170 | 1,115,432 |
| 9,713,745 | .. | .. | .. | .. | 50,610,742 | 18,557,565 | 214,002 | 199,438 | 694,847 | 5,479 | 1,904,143 | 105,384 | 1,886¶ | 188 | 1,181,521 |
| Year. | Shipping. | Exports (the Produce of New Zealand). | Exports (the Produce of New Zealand). | |||||||||||||||||
|---|---|---|---|---|---|---|---|---|---|---|---|---|---|---|---|---|---|---|---|---|
| Inwards. | Outwards. | Registered Vessels belonging to the Colony. | Wool. | Grain. | Frozen Meat. | Flax (Phormium). | Gold. | Gum (Kauri). | Provisions, Tallow, Timber, &c. | |||||||||||
| Number of Vessels. | Tonnage. | Number of Vessels. | Tonnage. | Number of Vessels. | Gross Tonnage. | Quantity. | Value. | Quantity. | Value. | Quantity. | Value. | Quantity. | Value. | Quantity | Value. | Quantity. | Value. | Value. | Total Value. | |
| lb. | £ | Bushels. | £ | cwt. | £ | Tons. | £ | Oz. | £ | Tons. | £ | £ | £ | |||||||
| 1853 | 238 | 65,505 | 229 | 62,891 | .. | .. | 1,071,340 | 66,507 | 59,959 | 19,042 | .. | .. | 46 | 1,046 | .. | .. | 829 | 15,971 | 200,706 | 303,282 |
| 1854 | 293 | 74,831 | 293 | 76,718 | .. | .. | 1,254,416 | 70,103 | 94,600 | 41,019 | .. | .. | 48 | 1,563 | .. | .. | 1,660 | 28,864 | 179,341 | 320,890 |
| 1855 | 378 | 88,614 | 341 | 79,825 | .. | .. | 1,772,344 | 93,104 | 150,352 | 82,302 | .. | .. | 150 | 4,674 | .. | .. | 355 | 4,514 | 181,273 | 365,867 |
| 1856 | 326 | 85,748 | 323 | 82,991 | .. | .. | 2,559,618 | 146,070 | 66,150 | 24,132 | .. | .. | 22 | 552 | .. | .. | 1,440 | 18,591 | 129,088 | 318,433 |
| 1857 | 289 | 78,309 | 283 | 76,524 | 186 | 6,662 | 2,648,716 | 176,579 | 81,757 | 29,676 | .. | .. | 38 | 710 | 10,436 | 40,442 | 2,521 | 35,250 | 86,737 | 369,394 |
| 1858 | 339 | 90,118 | 322 | 82,293 | 189 | 6,852 | 3,810,372 | 254,022 | 71,403 | 20,680 | .. | .. | 64 | 1,516 | 13,533 | 52,443 | 1,810 | 20,036 | 85,252 | 433,949 |
| 1859 | 438 | 136,580 | 398 | 120,392 | 213 | 7,883 | 5,096,751 | 339,779 | 118,740 | 39,016 | .. | .. | 77 | 1,593 | 7,336 | 28,427 | 2,010 | 20,776 | 91,717 | 521,308 |
| 1860 | 398 | 140,276 | 398 | 140,293 | 238 | 8,527 | 6,665,880 | 444,392 | 55,683 | 13,112 | .. | .. | 61 | 1,240 | 4,538 | 17,585 | 1,046 | 9,851 | 62,953 | 549,133 |
| 1861 | 596 | 197,986 | 546 | 205,350 | 252 | 9,144 | 7,855,920 | 523,728 | 8,118 | 2,518 | .. | .. | 2 | 43 | 194,234 | 752,657 | 856 | 9,888 | 50,407 | 1,339,241 |
| 1862 | 813 | 301,365 | 783 | 288,647 | 287 | 10,825 | 9,839,265 | 674,226 | ,602 | 1,821 | .. | .. | 13 | 161 | 410,862 | 1,591,389 | 1,103 | 11,107 | 79,216 | 2,358,020 |
| 1863 | 1,154 | 419,935 | 1,094 | 394,665 | 343 | 15,189 | 12,585,980 | 830,495 | 3,238 | 1,160 | .. | .. | 13 | 251 | 628,450 | 2,431,723 | 1,400 | 27,027 | 52,235 | 3,342,891 |
| 1864 | 1,117 | 426,004 | 1,089 | 433,253 | 423 | 22,573 | 16,691,666 | 1,070,997 | 3,580 | 722 | .. | .. | 7 | 170 | 480,71 | 1,857,847 | 2,228 | 60,590 | 60,308 | 3,050,634 |
| 1865 | 862 | 295,625 | 783 | 283,020 | 466 | 24,484 | 19,180,500 | 1,141,761 | 25,447 | 6,076 | .. | .. | 3 | 75 | 574,574 | 2,226,474 | 1,867 | 46,060 | 82,975 | 3,503,421 |
| 1866 | 1,019 | 330,303 | 986 | 306,97 | 493 | 26,787 | 22,810,776 | 1,354,152 | 32,610 | 7,297 | .. | .. | 45 | 996 | 735,376 | 2,844,517 | 2,535 | 70,572 | 118,556 | 4,396,100 |
| 1867 | 944 | 309,568 | 950 | 308,169 | 366 | 23,240 | 27,152,966 | 1,580,608 | 158,812 | 26,986 | .. | .. | 126 | 4,256 | 686,753 | 2,700,275 | 2,685 | 77,491 | 89,848 | 4,479,464 |
| 1868 | 851 | 277,105 | 873 | 287,710 | 372 | 24,539 | 28,875,163 | 1,516,548 | 633,676 | 114,468 | .. | .. | 534 | 8,137 | 637,474 | 2,504,326 | 2,690 | 72,493 | 52,790 | 4,268,762 |
| 1869 | 764 | 250,731 | 771 | 247,764 | 381 | 25,990 | 27,765,636 | 1,371,230 | 520,556 | 96,441 | .. | .. | 2,028 | 45,245 | 614,281 | 2,362,995 | 2,850 | 111,307 | 102,916 | 4,090,134 |
| 1870 | 756 | 273,151 | 766 | 265,407 | 384 | 26,743 | 37,039,763 | 1,703,944 | 854,897 | 141,135 | .. | .. | 5,471 | 132,578 | 544,880 | 2,157,585 | 4,391 | 175,074 | 234,366 | 4,544,682 |
| 1871 | 729 | 274,643 | 709 | 265,618 | 371 | 27,107 | 37,793,734 | 1,606,144 | 1,032,902 | 164,087 | .. | .. | 4,248 | 90,611 | 730,029 | 2,787,520 | 5,054 | 167,958 | 354,784 | 5,171,104 |
| 1872 | 775 | 300,302 | 743 | 285,366 | 364 | 23,963 | 41,886,997 | 2,537,919 | 1,058,480 | 178,886 | .. | .. | 3,985 | 99,405 | 445,370 | 1,730,992 | 4,811 | 154,167 | 405,817 | 5,107,186 |
| 1873 | 739 | 289,297 | 704 | 281,847 | 411 | 30,035 | 41,535,185 | 2,702,471 | 587,881 | 136,382 | .. | .. | 6,454 | 143,799 | 505,337 | 1,987,425 | 2,833 | 85,816 | 422,077 | 5,477,970 |
| 1874 | 856 | 399,296 | 822 | 385,533 | 471 | 38,935 | 46,848,735 | 2,834,695 | 1,162,782 | 291,103 | .. | .. | 2,038 | 37,690 | 376,388 | 1,505,331 | 2,568 | 79,986 | 403,338 | 5,152,143 |
| 1875 | 926 | 416,727 | 940 | 417,820 | 502 | 42,025 | 54,401,540 | 3,398,155 | 1,276,927 | 231,417 | .. | .. | 639 | 11,742 | 355,322 | 1,407,770 | 3,230 | 138,523 | 288,237 | 5,475,844 |
| 1876 | 878 | 393,180 | 866 | 393,334 | 538 | 44,401 | 59,853,454 | 3,395,816 | 2,172,098 | 337,878 | .. | .. | 897 | 18,285 | 318,367 | 1,268,559 | 2,888 | 109,234 | 359,129 | 5,488,901 |
| 1877 | 812 | 388,568 | 848 | 400,609 | 533 | 42,479 | 64,481,324 | 3,658,938 | 1,323,910 | 276,452 | .. | .. | 1,053 | 18,826 | 366,955 | 1,476,312 | 3,632 | 118,348 | 509,841 | 6,078,484 |
| 1878 | 926 | 456,490 | 886 | 428,493 | 541 | 46,965 | 59,270,256 | 3,292,807 | 2,112,214 | 508,767 | .. | .. | 622 | 10,666 | 311,437 | 1,244,190 | 3,445 | 132,975 | 595,214 | 5,780,508 |
| 1879 | 894 | 473,940 | 908 | 475,752 | 563 | 64,457 | 62,220,810 | 3,126,439 | 3,470,344 | 660,557 | .. | .. | 445 | 7,874 | 284,100 | 1,134,641 | 3,228 | 147,535 | 486,409 | 5,563,455 |
| 1880 | 730 | 395,675 | 786 | 424,041 | 559 | 66,316 | 66,860,150 | 3,169,300 | 5,540,445 | 898,997 | .. | .. | 894 | 15,617 | 303,215 | 1,220,263 | 4,725 | 242,817 | 555,306 | 6,102,400 |
| 1881 | 765 | 420,134 | 762 | 413,487 | 572 | 72,387 | 59,415,940 | 2,909,760 | 5,815,960 | 986,072 | .. | .. | 1,308 | 26,285 | 250,683 | 996,867 | 5,460 | 253,778 | 589,488 | 5,762,250 |
| 1882 | 795 | 461,285 | 769 | 438,551 | 584 | 76,196 | 65,322,707 | 3,118,554 | 4,310,984 | 907,961 | 15,244 | 19,339 | 2,040 | 41,955 | 230,893 | 921,664 | 5,533 | 260,369 | 983,508 | 6,253,350 |
| 1883 | 805 | 494,926 | 851 | 507,565 | 579 | 84,903 | 68,149,430 | 3,014,211 | 6,723,303 | 1,286,724 | 87,975 | 118,328 | 2,013 | 36,761 | 222,899 | 892,445 | 6,518 | 336,606 | 1,170,169 | 6,855,244 |
| 1884 | 852 | 529,188 | 872 | 534,242 | 583 | 92,696 | 81,139,028 | 3,267,527 | 5,361,167 | 743,807 | 254,069 | 345,090 | 1,525 | 23,475 | 246,392 | 988,953 | 6,393 | 342,151 | 1,231,483 | 6,942,486 |
| 1885 | 786 | 519,700 | 780 | 513,000 | 597 | 95,887 | 86,507,431 | 3,205,275 | 4,478,264 | 496,371 | 296,473 | 373,857 | 1,063 | 16,316 | 222,732 | 890,056 | 5,876 | 299,762 | 1,310,274 | 6,591,911 |
| 1886 | 725 | 502,572 | 707 | 488,331 | 571 | 94,196 | 90,853,744 | 3,072,971 | 3,441,803 | 449,415 | 346,055 | 427,193 | 1,1 | 15,922 | 235,578 | 939,648 | 4,920 | 257,653 | 1,223,880 | 6,386,682 |
| 1887 | 653 | 489,754 | 675 | 493,583 | 557 | 94,027 | 88,824,382 | 3,321,074 | 3,987,189 | 419,525 | 402,107 | 455,870 | 1,570 | 25,094 | 187,938 | 747,878 | 6,790 | 362,434 | 1,219,206 | 6,551,081 |
| 1888 | 683 | 526,435 | 701 | 531,478 | 524 | 86,132 | 83,225,733 | 3,115,008 | 4,997,587 | 653,311 | 552,298 | 628,800 | 4,042 | 75,269 | 229,608 | 914,309 | 8,482 | 380,933 | 1,487,498 | 7,255,128 |
| 1889 | 781 | 602,634 | 762 | 593,252 | 520 | 87,411 | 102,227,354 | 3,976,375 | 6,027,201 | 970,695 | 656,822 | 783,374 | 17,084 | 361,182 | 197,492 | 785,490 | 7,519 | 329,590 | 1,835,302 | 9,044,607 |
| 1890 | 744 | 662,769 | 745 | 649,705 | 521 | 98,907 | 102,817,077 | 4,150,599 | 7,999,139 | 1,074,354 | 898,894 | 1,087,617 | 21,158 | 381,789 | 187,641 | 751,360 | 7,438 | 378,563 | 1,604,479 | 9,428,761 |
| 1891 | 737 | 618,515 | 744 | 625,807 | 521 | 102,068 | 106,187,114 | 4,129,686 | 5,877,059 | 676,338 | 1,000,307 | 1,194,724 | 15,809 | 281,514 | 251,161 | 1,007,172 | 8,388 | 437,056 | 1,673,604 | 9,400,094 |
| 1892 | 686 | 675,223 | 689 | 656,100 | 491 | 101,156 | 118,180,912 | 4,313,307 | 6,625,525 | 816,272 | 869,600 | 1,033,377 | 12,793 | 214,542 | 237,393 | 951,963 | 8,705 | 517,678 | 1,518,729 | 9,365,868 |
| Imports. | Coal-mines Output from. | Revenue. | Expenditure. | Public Debt (Debentures and Stock in Circulation). | Debt of Local Bodies. | Banks. (Average of Four Quarters.) | Savings Banks.* | Friendly Societies registered. | Schools and Scholars.† | Convictions in Superior Courts after Commitment. | ||||||||||
|---|---|---|---|---|---|---|---|---|---|---|---|---|---|---|---|---|---|---|---|---|
| Primary Schools. | Private Schools. | |||||||||||||||||||
| Total Value. | Ordinary. | Territorial. | Total for Year. | Out of Revenue. | Out of Loan. | Deposits. | Assets. | Liabilities. | Number of Depositors. | Balance to credit on 31st Dec. | No. of Lodges, &c. | No. of Members. | Schools. | Scholars. | Schools. | Scholars. | ||||
|
* Post Office Savings Banks were first opened in 1867. † Statistics of schools and scholars not being complete for years prior to 1874. no figures are entered. ‡ Exclusive of charges for sinking fund met by debentures issued to an equivalent amount. § Approximate. | There was an accrued sinking fund amounting to £1,037,557 in December, 1892, leaving a net indebtedness of £38,154,962. ¶ In addition to these there were in December, 1892, 2, 133 children attending the Native schools, nearly all of which are maintained by Government, 69 at industrial schools and orphanages, and 2,262 scholars at high schools. | ||||||||||||||||||||
| £ | Tons. | £ | £ | £ | £ | £ | £ | £ | £ | £ | £ | £ | ||||||||
| 597,827 | Prior to 1878, 703,413. | 83,069 | 66,751 | 149,820 | .. | .. | .. | .. | .. | .. | .. | .. | .. | .. | .. | .. | .. | .. | .. | 13 |
| 891,201 | 111,214 | 180,826 | 292,040 | .. | .. | .. | .. | .. | .. | .. | .. | .. | .. | .. | .. | .. | .. | .. | 21 | |
| 813,460 | 113,596 | 62,300 | 175,896 | .. | .. | .. | .. | .. | .. | .. | .. | .. | .. | .. | .. | .. | .. | .. | 31 | |
| 710,868 | 112,152 | 76,177 | 88,329 | .. | .. | .. | .. | .. | .. | .. | .. | .. | .. | .. | .. | .. | .. | .. | 28 | |
| 992,994 | 157,064 | 91,193 | 248,257 | .. | .. | .. | .. | 343,316 | 419,860 | 432,494 | .. | .. | .. | .. | .. | .. | .. | .. | 27 | |
| 1,141,273 | 179,856 | 161,799 | 341,655 | .. | .. | .. | .. | 448,078 | 705,738 | 616,769 | 715 | 7,862 | .. | .. | .. | .. | .. | .. | 62 | |
| 1,551,030 | 217,767 | 241,882 | 459,649 | .. | .. | .. | .. | 541,213 | 1,003,584 | 678,474 | 802 | 7,996 | .. | .. | .. | .. | .. | .. | 70 | |
| 1,548,333 | 248,978 | 215,760 | 464,739 | .. | .. | .. | .. | 644,521 | 992,082 | 801,588 | 1,104 | 12,450 | .. | .. | .. | .. | .. | .. | 91 | |
| 2,493,811 | 344,110 | 347,354 | 691,464 | .. | .. | .. | .. | 882,754 | 1,235,952 | 1,097,162 | 1,144 | 22,921 | .. | .. | .. | .. | .. | .. | 100 | |
| 4,626,082 | 579,179 | 606,830 | 1,186,009 | .. | .. | 836,000 | .. | 1,596,446 | 2,691,117 | 2,092,497 | 1,496 | 29,768 | .. | .. | .. | .. | .. | .. | 145 | |
| 7,024,674 | 856,432 | 524,409 | 1,380,836 | .. | .. | 1,289,750 | .. | 2,092,090 | 4,028,766 | 2,962,585 | 2,371 | 44,117 | .. | .. | .. | .. | .. | .. | 234 | |
| 7,000,655 | 894,071 | 714,770 | 1,608,841 | .. | .. | 2,219,450 | .. | 2,480,303 | 5,063,458 | 3,343,172 | 4,669 | 94,248 | .. | .. | .. | .. | .. | .. | 262 | |
| 5,594,977 | 1,025,782 | 500,045 | 1,525,827 | .. | .. | 4,368,681 | .. | 2,638,414 | 5,455,289 | 3,522,146 | 4,304 | 87,400 | .. | .. | .. | .. | .. | .. | 332 | |
| 5,894,863 | 1,202,282 | 776,429 | 1,978,711 | .. | .. | 5,435,728 | .. | 3,097,473 | 5,891,532 | 4,010,110 | 4,513 | 91,863 | .. | .. | .. | .. | .. | .. | 277 | |
| 5,344,607 | 1,302,425 | 561,730 | 1,864,155 | .. | .. | 5,781,193 | .. | 2,904,594 | 5,947,160 | 3,737,695 | 6,579 | 156,855 | .. | .. | .. | .. | .. | .. | 240 | |
| 4,985,748 | 1,195,512 | 425,323 | 1,620,835 | .. | .. | 7,182,743 | .. | 3,102,727 | 5,734,745 | 3,838,220 | 8,121 | 243,615 | .. | .. | .. | .. | .. | .. | 248 | |
| 1,976,126 | 1,072,925 | 382,070 | 1,454,995 | .. | .. | 7,360,616 | .. | 3,174,831 | 6,231,416 | 3,863,006 | 10,103 | 320,383 | .. | .. | .. | .. | .. | .. | 277 | |
| 4,639,015 | 1,057,050 | 327,589 | 1,384,639 | .. | .. | 7,841,891 | .. | 3,127,769 | 6,315,354 | 3,819,670 | 12,137 | 388,804 | .. | .. | .. | .. | .. | .. | 231 | |
| 4,639,015 | 1,057,050 | 327,589 | 1,384,639 | .. | .. | 7,841,891 | .. | 3,127,769 | 6,315,354 | 3,819,670 | 12,137 | 388,804 | .. | .. | .. | .. | .. | .. | 231 | |
| 4,078,193 | 964,417 | 377,699 | 1,342,116 | .. | .. | 8,900,991 | .. | 3,334,672 | 5,871,888 | 3,988,400 | 14,275 | 454,966 | .. | .. | .. | .. | .. | .. | 180 | |
| 5,142,951 | 1,056,044 | 618,772 | 1,674,816 | .. | .. | 9,985,386 | .. | 3,919,838 | 5,429,747 | 4,628,819 | 17,289 | 597,002 | .. | .. | .. | .. | .. | .. | 190 | |
| 6,464,687 | 1,510,600 | 1,265,788 | 2,776,388 | .. | .. | 10,913,936 | .. | 4,713,806 | 7,267,720 | 5,538,030 | 21,807 | 812,144 | .. | .. | .. | .. | .. | .. | 189 | |
| 8,121,812 | 1,917,712 | 1,150,900 | 3,068,612 | 2,960,710 | 2,725,893 | 13,366,936 | .. | 5,564,434 | 9,954,216 | 6,490,504 | 27,215 | 943,753 | .. | .. | 544 | 38,215 | 188 | 8,237 | 194 | |
| 8,029,172 | 2,125,206 | 688,722 | 2,813,9928 | 3,431,972 | 3,107,867 | 17,400,031 | .. | 5,967,205 | 10,087,178 | 6,987,318 | 30,310 | 897,326 | .. | .. | 599 | 45,562 | 182 | 7,316 | 257 | |
| 6,905,171 | 2,430,672 | 1,149,622 | 3,580,294 | 4,305,337 | 2,066,104 | 18,678,111 | .. | 6,238,471 | 11,776,070 | 7,221,399 | 32,577 | 905,146 | .. | .. | 680 | 51,964 | 244 | 9,357 | 249 | |
| 6,973,418 | 2,340,841 | 1,575,182 | 3,916,023 | 3,822,425 | 1,827,904 | 20,691,111 | .. | 7,185,106 | 12,992,104 | 8,152,230 | 35,709 | 964,430 | 89 | 8,560 | 730 | 56,239 | 252 | 9,992 | 250 | |
| 8,755,663 | 162,218 | 2,658,708 | 1,509,181 | 4,167,889 | 4,365,275 | 1,287,869 | 22,608,311 | .. | 8,960,369 | 15,393,630 | 10,031,009 | 39,926 | 1,043,204 | 88 | 8,828 | 748 | 65,040 | 236 | 9,206 | 292 |
| 8,374,585 | 231,218 | 2,816,244 | 18,661 | 3,134,905 | 3,845,035 | 1,973,239 | 23,958,311 | .. | 8,020,073 | 16,054,295 | 9,057,463 | 42,679 | 990,337 | 110 | 9,759 | 817 | 75,556 | 257 | 10,234 | 296 |
| 6,162,011 | 299,923 | 2,895,128 | 389,914 | 3,285,042 | 4,019,850 | 2,228,990 | 28,583,231 | .. | 8,538,935 | 14,220,275 | 9,550,177 | 47,462 | 1,148,992 | 138 | 13,165 | 836 | 82,401 | 278 | 11,238 | 330 |
| 7,457,045 | 337,262 | 3,206,554 | 550,939 | 3,757,493 | 3,675,797 | 1,069,927 | 29,659,111 | 3,039,807 | 9,069,377 | 14,863,645 | 10,083,188 | 61,054 | 1,549,515 | 179 | 14,484 | 869 | 83,560 | 266 | 9,987 | 270 |
| 8,609,270 | 378,272 | 3,408,351 | 508,809 | 3,917,160 | 3,824,735 | 821,976 | 30,235,711 | 3,277,584 | 8,945,346 | 17,162,234 | 10,015,273 | 68,358 | 1,832,047 | 272 | 18,634 | 911 | 87,179 | 262 | 10,002 | 265 |
| 7,974,038 | 421,764 | 3,470,191 | 401,076 | 3,871,267 | 3,924,005 | 1,191,784 | 31,385,411 | 3,540,046 | 8,659,477 | 17,794,761 | 9,706,700 | 73,546 | 1,784,631 | 315 | 21,882 | 943 | 92,476 | 257 | 11,2555 | 258 |
| 7,663,888 | 480,831 | 3,280,115 | 427,373 | 3,707,488 | 3,853,618† | 1,565,748 | 32,860,982 | 3,962,330 | 9,643,214 | 18,442,139 | 10,691,599 | 79,514 | 1,926,759 | 323 | 23,107 | 987 | 97,238 | 265 | 12,203 | 287 |
| 7,479,921 | 511,063 | 3,464,252 | 395,744 | 3,859,996 | 4,045,901† | 1,178,884 | 35,790,422 | 4,313,223 | 10,083,296 | 18,811,567 | 11,130,244 | 85,769 | 2,142,560 | 334 | 23,500§ | 1,021 | 102,407 | 280 | 11,989 | 266 |
| 6,759,013 | 534,353 | 3,349,891 | 338,125 | 3,688,016 | 4,170,465† | 1,583,723 | 37,587,776 | 4,943,270 | 10,579,711 | 19,041,827 | 11,603,194 | 91,296 | 2,133,861 | 358 | 25,000§ | 1,054 | 106,328 | 288 | 12,497 | 286 |
| 6,245,515 | 558,620 | 3,141,573 | 321,922 | 3,463,495 | 3,954,290† | 1,572,786 | 38,225,537 | 5,620,747 | 11,031,614 | 18,799,847 | 11,995,495 | 97,496 | 2,407,776 | 372 | 25,300§ | 1,093 | 110,919 | 299 | 13,417 | 347 |
| 5,941,900 | 613,895 | 3,779,581 | 330,234 | 4,109,815 | 3,962,912† | 824,880 | 38,325,550 | 5,812,803 | 11,155,778 | 18,709,444 | 12,108,353 | 103,046 | 2,691,693 | 372 | 25,500§ | 1,128 | 112,685 | 299 | 13,893 | 308 |
| 6,308,863 | 586,445 | 3,635,768 | 356,151 | 3,991,919 | 3,981,721† | 515,058 | 38,483,250 | 5,892,050 | 11,528,424 | 17,652,915 | 12,486,717 | 110,566 | 2,858,644 | 387 | 26,200§ | 1,155 | 115,456 | 293 | 13,516 | 276 |
| 6,260,525 | 637,397 | 3,843,862 | 364,166 | 4,208,028 | 4,081,566† | 398,817 | 38,802,350 | 5,978,059 | 12,368,610 | 17,735,259 | 13,356,598 | 118,344 | 3,137,023 | 387 | 26,700§ | 1,200 | 117,912 | 298 | 13,626 | 270 |
| 6,503,849 | 668,794 | 3,804,307 | 341,923 | 4,146,230 | 4,135,543† | 518,348 | 38,844,914 | 6,042,693 | 12,796,098 | 16,814,518 | 13,820,458 | 126,886 | 3,406,949 | 390 | 28,000§ | 1,255 | 119,523 | 281 | 14,142 | 283 |
| 6,943,056 | 673,315 | 4,039,401 | 349,850 | 4,389,251 | 4,044,690† | 488,782 | 39,192,519| | 6,081,934 | 13,587,061 | 17,558,168 | 14,623,335 | 135,827 | 3,580,544 | 400 | 28,250§ | 1,302 | 122,620¶ | 272 | 14,208 | 239 |