
Table of Contents
THIS volume gives in condensed form, with comments, the principal results of the New Zealand population census of 1916. Detailed results have already been published in twelve parts and five appendices, as under:—
Population May, 1918.
Ages July, 1918.
Birthplaces and Length of Residence in New Zealand Sept., 1918.
Religions Aug., 1918.
Education Nov., 1918.
Infirmity Nov., 1918.
Conjugal Condition Nov., 1918.
Fertility Sept. 1919.
Occupations May, 1919.
Aliens Feb., 1919.
Dwellings June, 1919.
Households: June, 1920.
Appendices: (a.) Maori Census May, 1918. May, 1918.
(b.) Census of Cook and other Pacific Islands May, 1918.
(c.) Libraries and Religious Denominations May, 1918.
(d.) Industrial Manufacture May, 1918.
(e.) Poultry and Bees Oct., 1918.
The form in which the matter was presented in prior reports has been almost entirely recast, and the present volume will be found to contain an immense amount of new matter, of which some of the most interesting features are the historical sketch of New Zealand census-takings, given in Chapter I, the investigations into conjugal condition and fecundity, in Chapters IX and X, and the examination of the results of inquiries into dwellings and households, in Chapters XIII and XIV.
The Report has been considerably delayed by the very great pressure of work in this Office arising out of the administration of the Military Service Act, and by congestion of work in the Government Printing Office when it was ready for printing.
MALCOLM FRASER,
Government Statistician.
Census and Statistics Office,
Wellington, 7th October, 1920.
Table of Contents
Table of Contents
THE history of the census in New Zealand dates back to the days prior to the establishment of responsible government—indeed, some crude form of census-taking appears to have been brought into operation in the early “forties,” shortly after the proclamation of British sovereignty over the Islands of New Zealand.
The volumes of statistics of New Zealand covering each year from 1841 to 1852, prepared (in triplicate) in manuscript on forms with printed headings, contain for each year from 1842 onwards statements of population (male and female separately) for each of the settlements of New Zealand. These appear to have been compiled in each settlement by the local Resident Magistrate, and it would appear that it was the custom to take a complete count of the population in the settlements themselves, which in those days were few in number and circumscribed in area. The population is seldom given in round numbers, and, where it is, an explanation is added—as in the case of Nelson in 1842, where an estimate of 2,500 is given, with a footnote to the effect that actual figures were unobtainable on account of the Resident Magistrate having been killed by Maoris. There seems to be little doubt that these early annual enumerations are entitled to rank as censuses, but most of them are palpably incomplete in that they cover only the definite settlements and apparently do not include settlers, whalers, . &c, at remote places.
What is usually regarded as the first general census of New Zealand took place in December, 1851, under the provisions of the Census Ordinance, 1851 (No. VIII of Session XI). This census, besides being the first taken by law, was more comprehensive than earlier enumerations in that information was collected not only as to sexes of the population, but also as to age and degree of education of each person. Information was also obtained concerning numbers of scholars at day and Sabbath schools, as well as regarding live-stock and crops.
Censuses should have been taken in 1854 and 1857, but for some unexplained reason the requirements of the Ordinance do not appear to have been complied with in all the provinces into which New Zealand had then been divided. A question asked on the point during the first session of Parliament (in 1854) elicited the information that censuses had been taken in Wellington, Canterbury, and Nelson in 1854, but had been accidentally overlooked in Auckland, while the Government appeared to be in doubt as to the position elsewhere. Auckland, New Plymouth (now Taranaki), Wellington, and Canterbury Provinces all took censuses for March, 1857, and Otago either took a census or was otherwise able to supply complete figures as to numbers and sexes for December, 1857. Wellington took another census for March, 1858.
Judging from remarks made in the House and in official documents, the position was not regarded as at all satisfactory, and steps were taken in 1858 to place the census-taking on a proper footing by the passing of the Census Act of that year, which will be referred to later on. A census of the whole country was taken in 1858, the forerunner of a long series of censuses which have followed at intervals of three, four, or five years. The list of dates of all general censuses from 1851 onwards is as follows:—
— December, 1851.
— December, 1858.
16 December, 1861.
1 December, 1864.
19 December, 1867.
27 February, 1871.
1 March, 1874.
3 March, 1878.
3 April, 1881.
28 March, 1886.
5 April, 1891.
12 April, 1896.
31 March, 1901.
29 April, 1906.
2 April, 1911.
15 October, 1916
Before proceeding to a discussion of the various general censuses taken in New Zealand it may be well to refer briefly to such censuses as were confined to the area of particular provinces.
Provincial Responsible Governments date from 1853. The Provincial Governments of Auckland, Taranaki (or New Plymouth), Wellington, Nelson, and Canterbury each passed Census Ordinances in 1854 or 1855 providing for the taking of provincial censuses at varying dates and in varying manners. Otago apparently passed no individual Census Act, but authorized its Superintendent to act under the New Zealand Act of 1851. Hawke's Bay, Marlborough, Westland, and Southland had no existence then. Southland, although established only about 1860, passed a Census Act, and took at least two or three censuses under it.
Most of the provinces ceased taking separate censuses after the second New Zealand general census of 1858. Otago and Southland continued for a short time taking independent censuses in addition to the New Zealand one.
In at least some of the provinces census-taking was well established before the passing of the provincial Ordinances—for example, Nelson, Taranaki, and Canterbury—but as no official gazettes or journals seem to have existed then details cannot be traced.
The actual term “census” does not seem to have been always in general use. For example, in Otago for several years the word “statistics” was employed to refer to a census fairly detailed and complete.
There are also very many returns which from their nature suggest that they must have been the result of a census. These are chiefly by Resident Magistrates and officers in charge of armed police. In answer to a question put to him in the House as to why a census had not been taken in all the provinces in 1854, we have the Hon. Mr. Bartley claiming that the blue-books, prepared annually, contain almost “as much information as a census affords” and an examination of these early records reveals that the collection and preparation of some of the figures for these must have partaken very much of the nature of a census.
There does not seem to have been any uniformity in system or in dates. Even each province (with the praiseworthy exception of Otago) did not take its own censuses in successive years at anything like corresponding dates. So much was this the case that an attempt was made in 1856 to reconcile these various methods.
Resident Magistrates, as a rule, were the Enumerators, or, as known generally till about 1858, “Collectors.”
In one case, that of Nelson in 1856, tenders were called for the depositing and collection of schedules. It is of interest to quote this document:—
Table of Contents
Tenders will be received at this office till Saturday next, the 13th instant, from persons willing to undertake the duty of leaving the census schedules with the several householders in the undermentioned districts, and calling for the same when filled up in accordance with the provisions of the Census Ordinance, Session II, No. 1.
For further particulars apply at this office.
John Poynter,
Resident Magistrate.
Up to the census of 1891, enactments of the General Government dealing with the census were almost as frequent as the censuses themselves. The gap of seven years between the passing of the Census Ordinance, 1851, and the Census Act, 1858, was punctuated by various provincial Census Ordinances somewhat on the lines of the general Ordinance of 1851. The Act of 1858 was amended in 1860, 1867, 1870, 1873, and 1876, and with its amendments was repealed in 1877 by the Census Act of that year, which consolidated and extended the law relating to census-taking.
The Act of 1877 was amended in 1880 and again in 1890, after which the law remained unaltered until 1908, in which year it was consolidated in the Statistics Act, 1908, as part of the general consolidation of statutes. The Statistics Act, 1908, was replaced two years later by the Census and Statistics Act, 1910, which was amended slightly in 1915 by the Census and Statistics Amendment Act of that year.
AN ORDINANCE for taking a Census of the Colony of New Zealand. (15th July, 1851.)
WHEREAS it is expedient that authentic statistical information of the Colony of New Zealand be periodically obtained:
Be it therefore enacted by His Excellency the Governor-in-Chief of New Zealand, with the advice and consent of the Legislative Council thereof, as follows:—
1. That a census of the number and condition of the population of the Islands of New Zealand shall be taken in the first, fourth, and seventh years of every decade of years, on the days and in the manner hereinafter declared.
2. That the first decade shall be deemed to commence with the year of the passing there of.
3. That the Governor-in-Chief shall appoint persons to collect the information required by this Ordinance, and may cause an allowance to be made to any such person at a rate not exceeding ten shillings per day,
4. That in each of the years hereinbefore particularized the senior Resident Magistrate in every settlement in the said Islands, or, where there is no Resident Magistrate, some fit person to be appointed by His Excellency the Governor-in-Chief, shall, on or before the first day of March, cause notices to be affixed on the several churches, chapels, Courthouses, and police-stations, and in such other conspicuous places as he shall deem proper within such district as shall be to him assigned for that purpose by His Excellency the Governor-in-Chief, requiring every householder to be prepared on the 31st day of March, or as soon thereafter as he may be called upon so to do by a Collector appointed as aforesaid, to give all such information as is required by the Schedule hereunto annexed.
5. That the said Collectors shall, on or before the twenty-fifth day of March in each of the years hereinbefore particularized, leave at every house within the districts assigned to them respectively a schedule, being a blank copy of the Schedule to this Ordinance annexed; and every householder able to write shall, on the thirty-first day of March, furnish in writing the information required by the said schedule, by filling up the same and subscribing his name at the foot thereof, and shall deliver the same when called for to one of the said Collectors.
6. That each Collector shall, as soon after the thirty-first day of March as practicable, call at every house in his district to collect the schedules, and is hereby authorized to put such questions as may be indispensable to the complete filling up thereof to any householder who, from inability to write, shall not have duly filled up the same, and the Collector shall thereupon fill it up himself with the information so supplied.
7. That every householder who shall wilfully refuse or without lawful excuse neglect to fill up the said schedule to the best of his knowledge or belief, or to sign and deliver the same, or shall make, sign, or deliver, or cause to be made, signed, or delivered, any false return of any of the matters specified in the said schedule) or who shall refuse to answer or wilfully give a false answer to such questions as aforesaid, shall for every such refusal or wilfully false answer forfeit a sum not exceeding five pounds nor less than twenty shillings.
8. Provided always that with respect to the present year the census shall be taken on the first day of November, the notices given on or before the first day of October, the schedules left on or before the twenty-fifth day of October, and filled up by the householder on the first day of November, and called for and filled up, when requisite, by the Collector as soon after that day as practicable, all in manner aforesaid.
9. The Ordinance shall come into operation on the first day of August, one thousand eight hundred and fifty-one.
The neglect of certain provincial authorities to take the censuses of 1854 and 1857, combined with the departure from the set date in other cases and the consequent inability to arrive at a definite population total for the whole country for any specific date, led to the passing of the Census Act, 1858, which repealed and largely re-enacted the Ordinance of 1851. The Act provided for Enumerators and Sub-Enumerators instead of the former Resident Magistrates and Collectors, and imposed on the Colonial Secretary the duty of compiling and publishing statistical tables embodying the information collected. Maoris were specifically excluded from the operation of the Act, except in so far as the Governor might direct. The census month was altered from March to December, and it was definitely contemplated that the census should be a triennial institution. Penalties were provided for default, alteration, or omission on the part of Enumerators and Sub-Enumerators, and for the neglect or refusal of a householder to supply information, giving false answers, or offering obstruction to any one engaged in carrying out the provisions of the Act.
The Act of 1858 made masters of gaols and asylums Sub-Enumerators, but by the amendment of 1860 such persons were now deemed to be occupiers of premises, and, as such, responsible for furnishing returns for their respective establishments. This amendment also empowered the Governor in Council to depart from the month of December laid down in the Act.
The amendment of 1867 added agricultural and pastoral statistics and statistics of various industries to the particulars to be ascertained at each census, and provided also for the annual collection of agricultural and pastoral statistics.
It also provided for the taking at the next census of an account of the gross value of the property of inhabitants of the colony (excluding Natives and half-castes), although the exact manner of taking the return was not prescribed. It is of interest to mention that such information has not been collected by means of a census to this day.
The amending Acts of 1870 and 1873 merely gave authority for the taking of a census in the early months of the year following that in which it would normally have been taken according to the triennial plan, and the amending Act of 1876 provided that the census which in the normal sequence should have been taken in 1876 need not be taken until 1881. The amending Act of 1870 also asked for certain additional particulars not previously collected, and permitted any person to refuse to supply information as to his religious faith.
Meanwhile, however, the Act of 1877 was passed repealing all previous enactments dealing with the census. This Act provided for the taking of a census in 1878, in 1881, and every fifth year thereafter. Penalties were provided for refusal or neglect to fill up forms by individuals, or for failure, neglect of duty, false declaration, or divulging of information by Enumerators or Sub-Enumerators. Like the 1870 amending Act, it was mainly a consolidation of previous enactments. However, it permitted the omission, from conscientious scruples, by any person of a statement as to the religious denomination to which he belonged. The proof of such conscientious scruple was to be the filling-up of the column set apart for that purpose with the word “Object.”
The system of compilation in the Registrar-General's Office in Wellington instead of by the Enumerators in each province—a system which had actually been adopted in connection with the census of 1874—was also legalized and made mandatory by the 1877 Act.
Minor amendments were passed in 1880 and in 1890 dealing -with the date on which the census was to be taken during particular years, mainly with a view to synchronizing the New Zealand census with that of the United Kingdom. The 1890 Act also effected slight alterations in the census schedule, referred to in detail below.
The Act of 1908 was, as already mentioned, merely a consolidation. This was, however, destined, to be shortly repealed by the Census and Statistics Act, 1910, which was slightly amended in 1915, the most important innovation in the amending Act being the separation of the offices of Registrar-General and Government Statistician, involving the creation of a separate Census and Statistics Office. It is under the Act of 1910 that the 1911 and 1916 censuses were taken. The portion of this Act and schedules thereto relating to the population census is here quoted in full as amended by the Act of 1915.
AN ACT relating to the Census and Statistics of New Zealand. (3rd December, 1910.)
BE IT ENACTED by the General Assembly of New Zealand in Parliament assembled, and by the authority of the same, as follows:—
1. This Act may be cited as the Census and Statistics Act, 1910.
2. In this Act, if not inconsistent with the context,—
“Dwelling” means a building, erection, or tenement, whether permanent or temporary, which, is wholly or partly used for the purpose of human habitation, and includes every ship or vessel in any port or harbour of New Zealand:
“Factory” means a factory within the meaning of the Factories Act, 1908:
“Native” means a person belonging to the aboriginal rate of New Zealand, and includes a half-caste and a person intermediate in blood between half-caste and persons of pure descent from that race: “Minister” means the Minister of Internal Affairs:
“Occupier or person in charge” includes every master, keeper, chief officer, or other person in actual charge of any gaol, prison, hospital, mental hospital, or other public or charitable institution:
“Prescribed” means prescribed by this Act or by regulations made under this Act.
3. For the purpose of this Act the Governor may appoint an officer to be called the Government Statistician (hereinafter referred to as the Statistician).
4. A census shall be taken in the year nineteen hundred and eleven, and in every fifth year thereafter, of the number and condition of persons, and of the live-stock, and of the land in cultivation within New Zealand, and of other particulars relating thereto. The census shall be taken on the day appointed for that purpose by Proclamation.
5. It shall be the duty of the Statistician, subject to the directions of the Minister, to prepare and issue forms and instructions, and to take all necessary steps for the taking of the census.
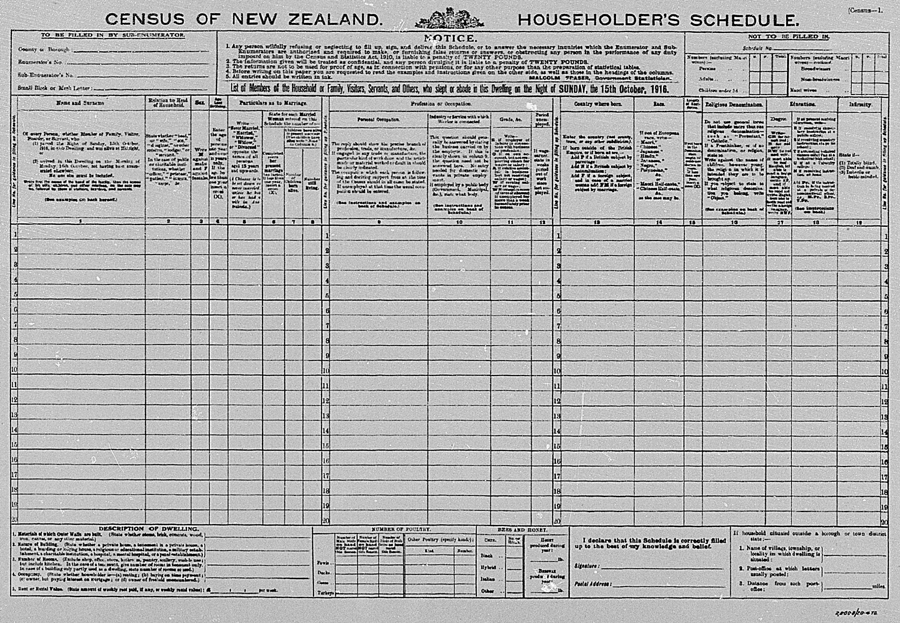
6. For the purpose of taking the census a form to be called the “Householder’s Schedule” shall be prepared, on which shall be entered particulars) as to the matters referred to in the First Schedule to this Act.
7. For the taking of such census the Governor may from time to time appoint and remove Enumerators, and define the districts for which they shall respectively act. and determine the number of Sub-Enumerators to be appointed by such Enumerators respectively.
8. Subject in each case to the approval of the Governor, every Enumerator shall appoint and may remove Sub-Enumerators for his district, and assign subdistricts to such Sub-Enumerators.
9. Every Sub-Enumerator shall, within fourteen days immediately preceding that fixed for taking the census, leave at every dwelling within his subdistrict one of the forms prepared as aforesaid, or, where such dwelling is let in different stories or apartments and occupied distinctly by different persons or families, a separate form for the occupier or person in charge of each such story or apartment.
10. Every occupier or person in charge of such dwelling, story, or apartment shall fill up and supply in the said form, to the best of his knowledge and belief, the matters and particulars required by the said form and any instructions accompanying the same, and shall sign the said form with his name, and deliver or cause to be delivered the said form so filled up and signed to the Sub-Enumerator authorized to receive the same.
11. Every Sub-Enumerator shall, on the day next following that fixed for taking the census as aforesaid, or as soon thereafter as practicable, demand and receive the said form at every dwelling, story, or apartment as aforesaid within his subdistrict, and shall satisfy himself, by inquiries from the occupier or person in charge of the same, or from persons in or near the same, that such form is fully, truly, and correctly filled up; or, if not so, either in the whole or any particular, shall himself, according to the best information which he is able to obtain, fill up the said form or make the same complete and correct, and in such case shall then and there sign the said form with his own name.
12. (1.) Every Sub-Enumerator shall, within seven days after all the forms within his subdistrict have been completed and received by him, deliver or transmit them, and all other forms required to be filled in by him according to instructions issued by the Statistician, to the Enumerator of his district, together with a declaration in the form numbered (1) in the Second Schedule hereto or to the effect thereof, made and subscribed by himself either before the Enumerator or before some Justice, and the said Enumerator or Justice is hereby respectively authorized to take such declaration accordingly.
(2.) If the declaration is made before a Justice, such Justice is hereby required to ascertain that the forms referred to in the declaration are securely made up in a packet for transmission to the Enumerator, and he shall seal the same and notify thereon that it is the packet referred to in the declaration made before him, and such declaration and packet shall thereupon be transmitted to the Enumerator.
(3.) The Enumerator shall, in the case of any defect or deficiency in any form so delivered, require the Sub-Enumerator delivering the same to make further inquiries, and to correct such defect or supply such deficiency at his own cost.
13. Every Enumerator shall, within twenty-one days after receipt from the Sub-Enumerators of all such forms, make out therefrom returns containing such particulars as are required of him by the Statistician, and shall sign and transmit the same to the Statistician, together with all the. forms and deck rations aforesaid as received from the several Sub-Enumerators, and together also with a declaration in the form numbered (2) in the Second Schedule hereto or to the effect thereof, made and subscribed by himself before some Justice, who is hereby authorized and required to take the same.
14. On receipt from the Enumerators of all returns and of all forms required to be filled up as before provided, the Statistician shall examine the same and cause any defect or inaccuracy therein to be supplied or corrected as far as possible, and shall, with all convenient speed, prepare abstracts therefrom, and such abstracts shall be printed and laid before Parliament.
15. If any occupier or person in charge of any dwelling, story, or apartment as aforesaid refuses or wilfully neglects to fill up, to the best of his knowledge or belief, the form or forms so left at his dwelling, story, or apartment, or to sign and deliver the same, or refuses or wilfully neglects to answer or answers untruly any inquiry made by a Sub-Enumerator, or wilfully makes, signs, or delivers, or causes to be made, signed, or delivered, any false return or statement of any particular in such form or forms, or obstructs any person in the performance of any duty under this Act, the person so offending shall be liable to a fine not exceeding twenty pounds:
Provided that such fine shall not be enforced against any person who from conscientious scruples omits to state the religious denomination or sect to which he belongs; and the proof of such conscientious scruple shall be the. filling-up of the column set apart for that purpose with the word “Object.”
16. If any Sub-Enumerator fails to return to the Enumerator of his district any of the forms received by him, or wilfully signs or delivers any untrue form, or alters any form except as provided by this Act, or otherwise wilfully violates any provision of this Act, he shall be liable to a fine not exceeding fifty pounds.
17. If any Enumerator or Sub-Enumerator makes and subscribes a false declaration under this Act before any Enumerator or Justice he shall be deemed guilty of perjury.
18. If any person accepts the office of Enumerator or Sub-Enumerator under this Act and afterwards, without lawful excuse from sickness or unavoidable accident, neglects or refuses to perform any duty required by this Act to be done or performed by him he shall be liable to a fine not exceeding fifty pounds.
19. If any Enumerator, Sub-Enumerator, or clerk divulges or makes use of any information required by this Act to be given, or the contents of any form required by this Act to be filled up, except for the purposes required by this Act, he shall be liable to a fine not exceeding twenty pounds.
Table of Contents
THE number and description of houses or buildings.
The names and surnames of the people.
Their relation to heads of households—as wife, son, daughter, or other relative, visitor, lodger, or servant.
Their condition—as married or single, widower or widow, or divorced.
Date of marriage and number of children born to the existing marriage.
Their sex and age.
Their present rank, profession, or usual occupation.
Whether employer of labour; in business on his own account but not employing paid labour; relative assisting in business but not receiving salary or wages; earning salary or wages; or unemployed.
Their extraction and place of birth.
Length of residence in New Zealand, if not born therein.
Their religious denomination.
Whether British subjects or aliens.
Whether suffering from sickness, accident, or infirmity.
And other prescribed matters.
Table of Contents
I, a Sub-Enumerator appointed under the Census and Statistics Act, 1910, do solemnly declare that the forms numbered from to inclusive, contained in the packet to which this declaration is attached, are all the forms under the said Act which have been completed and received by me within the subdistrict to which I was appointed, and that the whole contents of all the said forms are true to the best of my knowledge, information, and belief. And I further declare that I have distributed all necessary forms at every dwelling, story, and apartment as required by section nine of the said Act, and that I have collected, within the time specified in the said Act, all the forms so distributed.
[Signature of Sub-Enumerator.]
Made and subscribed before me at, this day of, 19.
, Enumerator [or Justice of the Peace].
I, an Enumerator appointed for the district of, under the Census and Statistics Act, 1910, do solemnly declare that the packet addressed to the Government Statistician, to which this declaration is attached, contains all the forms and declarations transmitted to me by the [State here the number of Sub-Enumerators for his district] Sub-Enumerators appointed by me, and also one collective return made out by me from the said forms; and that such collective return is correctly and truly made to the best of my knowledge, information, and belief.
[Signature of Enumerator.]
Made and subscribed before me at, this day of, 19.
, Justice of the Peace.
The history of the census in New Zealand reveals a steady widening in the ambit of the inquiries involved in so far as they relate to population characteristics. The gradual tendency in this direction is indicated by the progressive changes revealed by the successive census enactments already referred to.
Copies of the schedules used in connection with the census prior to 1858 cannot be traced, but the early census-takings appear to have been very little more than mere enumerations of population. The census of 1851 obtained details of sex, age, and degree of education, live-stock and crops being also enumerated. It was not, however, until the passing of the Census Act, 1858, that anything like a comprehensive inquiry into the domestic and social condition of the people was instituted.
The remarks of Mr. Stafford (who seems to have been in advance of most of his contemporaries in appreciating the desirability of the existence of accurate statistical information) in moving leave to introduce the Census Bill of 1858 are worth quoting:—
“It is highly desirable that a perfect picture of the moral, social, and commercial position of the colony should be obtained. The importance of this matter is now beginning to be recognized by every civilized State, so that an eminent historian has truly said, that government is now a government of statistics; while in bygone ages Governments were content to legislate on mere hypothetical knowledge in this direction, a course which has led to many serious errors.”
The chief innovations as regards the scope of the census introduced by the Act of 1858 were in respect of enumeration of live-stock and land in cultivation, including the number of acres under various crops and the total area fenced. The Act was not to apply to Natives except in so far as the Governor in Council should direct to the contrary.
The population portion of the census was to embrace the domestic and social condition of the people, including the number and description of the houses, relationship of occupants to heads of households, conjugal condition, age, sex, occupation, extraction and place of birth, religion, date of entering colony, whether British subject or alien, ability to read and write, and schooling (distinguishing Government, public, and private schools, and day and Sunday schools). Details were also collected in connection with places of worship, hospitals, dispensaries, and other charitable institutions, savings-banks, friendly and building societies, literary and scientific societies, and manufactories and works.
To these the collection of agricultural and pastoral statistics was added by the amending Act of 1867, stocks of grain on hand at the date of census being added in 1870, and stocks of flour in 1877.
The Act of 1877 made little alteration in the scope of the census except that it required details to be furnished as to persons suffering from sickness, accident, or infirmity.
By 1890 the modern distinction between census proper and statistics had emerged, and by the amending Act of that year the question as to the amount of land fenced was omitted from the census, as were the details in respect of stocks of grain and flour on hand as at the date of the census. These statistics were from that date collected not through the medium of the census, but through the instrumentality of the Agriculture Department.
The chief innovations in connection with the census introduced by the 1910 Act were in respect of the inclusion of details as to duration and issue of marriage and grade of occupation, and' authority was granted for the inclusion of other details to be prescribed from time to time.
It has already been mentioned that there has been a gradual movement in the direction of limiting the scope of the census to a population inquiry entirely, and to treat the collection of statistical information other than concerning the population as quite apart from the census. In this connection it may be pointed out that until recently along with the population census were taken censuses of industrial manufacture and agricultural and pastoral production. These inquiries are now conducted annually as part of the general routine work of the Census and Statistics Office, so that at present the only extraneous matter taken in conjunction with the population census is an inquiry as to churches, chapels, and other places of worship, and libraries; in addition the census schedule is still regarded as the best medium for obtaining information as to poultry and bees. On the other hand, while formerly the population census dealt entirely with individuals, recently its scope has been extended to cover the family or household, its composition and its home.
A copy of the schedule used in connection with the 1916 census is reproduced.
It has always been the practice in New Zealand to enumerate the de facto and not the de jure population—that is, to enumerate with each locality the persons actually residing there at the date of the census, not those habitually residing there.
In the early censuses, before the abolition of the provinces, appointments of Enumerators for the several provinces appear to have been made by the Governor, on the recommendation of the respective Superintendents, who were requested to nominate the persons most competent in their judgment to discharge the duties satisfactorily. Sub-Enumerators were selected by the Enumerators, so that the machinery for the collection of the census in each province was virtually organized by its own Provincial Government.
In connection with the census of 1878 the size of the Enumerators' districts was reduced. For the provinces were substituted for this purpose twenty-five Enumerators' districts. It was claimed at the time that “while the total remuneration for Enumerators was somewhat larger, there was a saving in the cost of clerical labour by Enumerators, and the local cost of collecting by Sub-Enumerators could be more closely watched and kept within reasonable bounds.” As a result of this innovation the expense of the census per head of population was reduced from 7d. in 1874 to 5¾d. in 1878.
The census of 1916 witnessed an important innovation in respect of the mode of distribution and collection of the census schedules, resulting in a considerable saving of expense. This was the substitution of the machinery of the Post Office for the old system of special Enumerators.
Postmasters acted as Enumerators, while specially selected letter-carriers performed the functions of Sub-Enumerators. In the few cases where no letter-carriers were available the Enumerator made arrangements with some outside person for the collection.
Not only was the work performed more economically (the cost of collection was approximately £20,600 in 1911 and £17,500 in 1916), but the schedules were in much better condition than at any previous census, the proportion of incomplete entries being infinitesimal, and the necessity for queries being reduced to practically nil.
A point in connection with the 1916 census was the increase in the number of Enumerators’ districts—ninety-five, as compared with fifty-nine in 1911—and it is probable that the consequential reduction in the average size of the districts made for increased efficiency.
Briefly, the system of census-collection, which has not altered except in only minor details during the past forty years, is as follows:—
Each Enumerator is supplied with two maps of his district, and instructed to mark on them his proposed subdistricts (for each of which a Sub-Enumerator is appointed), and to send one of them to the Government Statistician for approval, keeping the other by him for his own use.
The maps returned by the Enumerators are forwarded, on the divisions being found satisfactory, to the Lands Department, where smaller maps are prepared from them, one for each Sub-Enumerator.
On the maps are coloured lines defining the boundaries of all local-governing districts, such as counties, ridings, road districts, boroughs, and town districts. Boundaries of provincial districts, electoral districts, and goldfields are also indicated.
The Sub-Enumerator’s principal duty is to deliver a household schedule at every dwelling in his subdistrict before census night, and to collect it as soon as possible thereafter. He is required to keep in a book provided for the purpose a note of all schedules delivered and collected, with particulars of the number of persons, distinguishing the two sexes, returned on each schedule.
On the Sub-Enumerators’ maps the whole territory is cut into very small blocks by means of dotted red lines. On the map, which is fixed inside his collecting-book, the Sub-Enumerator enters the number of people residing in each block, this being done primarily for the information of the Representation Commissioners, who are charged with the preparation of new electoral districts based on the population disclosed by each census enumeration.
The Enumerator’s duties consist in making all general arrangements for his district, and in keeping a close supervision over his Sub-Enumerators during the course of the distribution and collection of the schedules. To enable the Enumerator to keep himself better informed of the progress of the work, a Sub-Enumerator’s daily report form, showing clearly the actual stage reached at the end of each day, was introduced in connection with the 1916 census. As the collected schedules come to hand, after check by the Sub-Enumerator, they are again closely scrutinized by the Enumerator, and, if necessary, returned for collection or completion before despatch to Wellington, where the work of compilation is carried out.
Beyond the statutory provisions already referred to, little information is available as to the method of compilation employed in connection with the earlier census-takings. It is interesting, however, to note in the Registrar-General’s report on the census of 1858 “that in several instances the numbers given by the Enumerators, while generally correct in the totals-—and, indeed, in all that could be regarded as practically important—were found on more minute analysis to contain minor discrepancies in figures which in perfectly accurate compilations must have exactly agreed. These were probably to be attributed partly to different modes of compilation, partly to the unavoidable employment in some cases of persons previously unpractised in the work, and (perhaps chiefly) to the defective and irregular manner in which the columns in the original census form were filled in by many of the householders.” He proceeds to point out that “if paper ruled in faint lines as well as otherwise suitable for the census forms could have been obtained in the colony at the time in sufficient quantity, it would have prevented much of the perplexity experienced in the attempt to follow out through the various columns the particulars properly relating to each individual.” The discrepancies were as far as possible corrected, and the Registrar-General claimed that the returns “as a whole and for all practical purposes could be fully relied on, especially as the 1858 census was the first taken through the colony simultaneously and on a uniform plan, instead of, as heretofore, enumerations being made in the several provinces at different times, and not always embracing the same branches of information.”
The census of 1851 applied to the “settlements” of New Zealand, while in subsequent enumerations the division into provinces was adopted. Although the geographical boundaries of the latter extended beyond the less-defined limits of the former, yet the Registrar-General claimed in his report on the 1861 census that the difference, in so far as the European population was concerned, was not so great as materially to affect the validity of comparisons.
The 1858 census showed details for no geographical divisions smaller than provinces, but in connection with the 1861 and subsequent census-takings arrangements were made to obtain the required information for each electoral district as well.
Little innovation in the machinery of the census compilation appears to have been made between 1861 and 1874, in which latter year we find that alterations were made in the body of the household schedule that enabled the information given to be compiled in such a form that the results were more comparable with those of other countries. At the same time, instead of returns being made out for each province by the local Enumerator—a practice which precluded the compilation from being done so extensively or uniformly as was possible under one system of management—the whole of the results were compiled in the Registrar-General’s Office at Wellington. As a result of this change of system the cost of the census was reduced from 9d. to 7d. per head of population as compared with the preceding census, and was actually £1,260 less than the amount (£10,000) voted for the purpose, despite the fact that the population had increased roughly one-sixth and “the price of labour” had risen in the interim.
It is interesting to notice that the practice of central compilation was not legalized till the Act of 1877.
Up to and including the census of 1886 the tabulation of the results was done direct from the schedules without any intervening card system. The system appears to have been perfectly satisfactory for the compilation of simple tables, but with the increase in population and the growing need for tables showing two or more factors in conjunction—e.g., birthplace and age—it became necessary to transcribe the details concerning each individual on to a separate card for convenience in sorting. This innovation was effected in connection with the census of 1891, and has since then been the practice.
A feature of the compilation of the “Results of the 1916 Census “was the employment of female clerks for the bulk of the work, a departure which was necessitated by war conditions, and which was found to work well enough in practice.
The clerical staff was taken on by degrees, and as the household schedules arrived at the Census and Statistics Office the work of compilation was proceeded with.
All persons employed on census are required to make formal declaration not to divulge any information coining under their notice during the course of their duties.
The results of the census of 1916 have been published in twelve parts and five appendices, as follows:—
Part I—Population.
Part II—Ages.
Part III—Birthplace and Length of Residence.
Part IV—Religions.
Part V—Education.
Part VI—Infirmity.
Part VII—Conjugal Condition.
Part VIII—Fertility.
Part IX—Occupations and Unemployment.
Part X—Race Aliens.
Part XI—Dwellings.
Part XII—Households.
Appendix A—Maori Census.
Appendix B—Census of Cook and other Annexed Pacific Islands.
Appendix C—Libraries and Religious Denominations.
Appendix D—Census of Industrial Manufacture.
Appendix E—Poultry and Bees.
The tables, as compared with those of previous censuses, have been revised and considerably enlarged.
The earlier Acts expressly excluded Maoris from the ambit of the census except in so far as the Governor should direct to the contrary.
Various local enumerations of Maoris appear, however, to have taken place, tables occurring in several of the provincial records, notably Otago and Wellington, and there is in the “Results of the Census of 1858” a table showing the Native population of New Zealand as ascertained from a census taken between September, 1851, and September, 1858. No subsequent enumeration appears to have been made for a number of years, though the results of the census-takings of 1867 and 1871 contain estimates of the aboriginal population supplied by the Native Department.
The “Report on the 1874 Census” states: “Although a census of the Maori population was not taken at the same time and in the same manner as the census for the rest of the population, yet perhaps the most accurate enumeration of the Maori population ever yet obtained was made immediately after the taking of the census by the various officers in charge of the Native districts throughout the colony.” Similar information, showing simply the numbers in each hapu, and distinguishing sexes and whether over or under fifteen years of age, was taken out in connection with the 1878 census.
In 1881 a more ambitious attempt at a Native census was made, but difficulties were many, and the results could not be considered too satisfactory. In some parts no access was permitted to those desiring information, and there was evidence of a growing suspicion on the part of the Natives towards the enumeration. Difficulty was also experienced on account of the nomadic habits of portion of the tribes, some officers enumerating the de facto population and some the de jure.
In connection with the 1886 and subsequent census-takings books were supplied to the officers of the Native Department in each district, providing for collection of details as to numbers, sexes, ages, principal tribes, and county of residence. Particulars as to land under cultivation, live-stock, &c, were later included. In no case was it found possible to effect an enumeration of the Natives on one particular night. The enumeration was, however, carried out as quickly and thoroughly as possible.
In 1916 a new departure was made in connection with the enumeration of Maoris. Of the Maori population of 49,776, fewer than 1,900 reside in the South Island, and the cost of a separate enumeration had been found to be out of all proportion to the numbers dealt with. The few distinctly Maori settlements in the South Island are all in close proximity to European settlements, and very few of the South Island Maoris are incapable of speaking and reading English. It was decided, therefore, to enumerate the Maoris in that Island in connection with the enumeration of the European population, the same schedules being used and the work done by the same Enumerators and Sub-Enumerators as for the European population. The result was entirely satisfactory. The North Island Maori census, however, was taken on the same lines as in previous years.
Table of Contents
For general statistical purposes it is usual to exclude from the population of New Zealand the Maoris and the residents (European and Native) of the Cook and other Pacific islands annexed in 1901, and in this report it will be understood that unless the contrary is stated all figures given are exclusive of these divisions of the population, which are dealt with in special sections at the end of the report.
At the census taken for the night of the 15th October, 1916, the population, excluding Maoris, of the Dominion proper was 1,099,449. The census of the Maori population taken at the same time showed the number of the Native race to be 49,776, including 3,529 half-castes living as Maoris, as well as 5 persons returned as belonging to the now practically extinct Moriori race. The population of the Cook and other annexed islands at the same date was 12,797. A summary of the total population is as follows:—
| Males. | Females. | Total. | |
|---|---|---|---|
* Includes 3,529 half-castes living as Maoris. † Includes 112 soldiers in camp in New Zealand. | |||
| Population of the Dominion (excluding Maoris and residents of Cook and other Pacific islands) | 551,775 | 547,674 | 1,099,449 |
| Maori population* | 25,931 | 23,840 | 49,771 |
| Morioris at Chatham Islands | 2 | 3 | 5 |
| Population of Cook and other annexed Pacific islands† | 6,553 | 6,244 | 12,797 |
| Totals | 584,261 | 577,761 | 1,162,022 |
The census of 1916 was abnormal in that there were at that time some 43,000 soldiers absent from the Dominion on service abroad with the Expeditionary Force. The effect of the absence of so decided a proportion of the younger adult males will be noticed in the statistical comparisons made with former censuses throughout this report.
Between the dates of the last two censuses, that of 1911 and that of 1916, roughly five years and a half elapsed. Most countries take censuses at intervals of ten years. In Denmark, France, Germany, and New Zealand it has, however, been the practice to use the shorter interval of five years, and an agitation has for some time been afoot in the United Kingdom and elsewhere for the shorter interval to be adopted. The chief argument in favour of the quinquennial period is probably the increased accuracy with which intercensal estimates of population can be made. Such estimates are used as a basis for calculating birth and death rates, and the various per capita rates used to show alterations in the volume of trade, amount of indebtedness, taxation, &c. In all such computations, in the interval between two successive censuses it is clearly essential to interpolate values for intermediate periods, and, although the error in such interpolation may be small as regards the whole of a country, the value of such an estimate as a basis of local population, and therefore for electoral and allied purposes, must always remain somewhat problematical. This is especially the case in rapidly developing countries such as New Zealand, where changes in industrial conditions produce rapid alterations of the centre of gravity of population. The sole reason why other countries have refrained from more frequent census enumerations appears to be on the score of expense.
During the whole of an intercensal period therefore it is desirable to estimate the total population, and there are various methods which have been adopted to this end, such as calculations on the basis of an arithmetic (or, better, a geometric) progression. In New Zealand, however, the more accurate method of making quarterly intercensal estimates from the records of births, deaths, and migration has been adopted, with admirable results, as will be seen from the following table showing the estimated population as at 30th September, 1916, and at 31st March in each of the preceding seven census years, compared with the population as ascertained by the census in the same years. The comparatively large difference in 1916 is due in part to the difficulty experienced in keeping a reliable record of arrivals and departures since the outbreak of the war.
| Year. | Estimated Population, 31st March. | Census Population. | Difference. |
|---|---|---|---|
| * 30th September. | |||
| 1881 | 488,649 | 489,933 | 1,284 |
| 1886 | 585,844 | 578,482 | 7,362 |
| 1891 | 631,898 | 626,658 | 5,240 |
| 1896 | 701,383 | 703,360 | 1,977 |
| 1901 | 775,123 | 772,719 | 2,404 |
| 1906 | 889,971 | 888,578 | 1,393 |
| 1911 | 1,006,761 | 1,008,468 | 1,707 |
| 1916 | 1,092,502* | 1,099,449 | 6,947 |
The migration returns are compiled from the records of the Customs Department, and the departures from the Dominion are checked by special returns furnished by the pursers of passenger-steamers, so that where persons who did not book their passages have been omitted the necessary additions can be made. The pursers' returns also serve to prevent the occasional omission of the full number of persons leaving by any one vessel, which sometimes happened prior to the introduction of this check.
The system of registration of births in force in New Zealand is one of the best in the world, and, apart from the compulsory provisions of the law, the people appear to appreciate the advantages of having their children's births duly registered. A few births are overlooked either from inadvertent omission or, in certain obvious cases, from a desire to avoid publicity. This is evidenced from the fact that every year a few of the births registered under the provisions of the Legitimation Act are found not to have been previously registered as illegitimate. Another proof that all births are not registered at the proper time is afforded by the registrations effected under the various Extension Acts passed from time to time to provide for the registration of births after the lapse of the statutory limit of two years. But most of these births date back many years, and the advantage taken of the provisions of the Extension Acts is in the main merely proof of the public's appreciation of the desirability of registration being effected. Probably unregistered births do not exceed 100 annually.
Notwithstanding the “suspicions of defective counting” suggested in his “Principles” by the eminent American economist, Professor Taussig, in lightly passing over New Zealand's remarkably low death-rate, the system of registration of deaths in the Dominion makes it almost impossible for any death (other than odd cases of drowning, &c, where the death is not witnessed and the body not found) remaining unregistered. The duty of registration is imposed on the undertaker, and in the remote event of that individual overlooking the requirements there is a formidable array of checks in the form of notifications by police and certificates from medical men, Coroners, and clergymen, not to mention inquiries for proof of death which sooner or later arise from insurance companies, lawyers, &c.
The “missed” deaths are therefore practically nil, and even allowing the limit of 100 unregistered births per annum it is evident that only a small portion of the slight discrepancy between census and estimated population is thus accounted for.
Nevertheless it is probable that it is in the registration of births and deaths that one of the causes of the discrepancy lies, and this owing to the simple fact that the births and deaths taken for a quarter are of necessity those registered, and not those occurring, during the quarter. It is probable that on the average three or four weeks elapse between birth and registration, and several days between death and registration. Each quarter's registrations thus include a proportion of births and deaths which occurred in the preceding quarter, and in the census enumeration are included children whose births are not registered, while deceased persons not yet registered as such are excluded. The registrations for the next quarter, of course, include these, and though by next census they will be offset by the corresponding non-registrations at that time, which by the law of averages will not in the ordinary course of events differ materially, it is quite possible for exceptional circumstances to exert a disturbing influence. Moreover, in an interval of five years the number of births or deaths in a quarter, and consequently the number unregistered at the end of the quarter, may alter considerably.
Other sources tending to discrepancies between the census and estimated populations are, of course, the enumeration itself (which can never be perfect), and inaccuracies in the recording of arrivals and departures, while the taking of the census on any night except that between the end of one quarter and the beginning of the next is a factor in a country of increasing population. Then, the following points should not be overlooked: Officers and crews of vessels in port on census night are included in the population of New Zealand, and no record of arrivals and departures is furnished by pursers and others for such people in the same way as for ordinary passengers. This means that if at the date of the census there were many vessels in New Zealand waters the actual population at a subsequent date might, from this cause alone, differ in a comparatively material degree from that estimated. That the difference between one census and another in regard to this item is not a negligible one will be seen from the fact that while on census night, 1911, 4,865 persons were returned as being on shipboard, the 1916 figures were only 3,085. This difference is in part explainable on grounds which will appear later.
As regards accuracy, however, the New Zealand figures compare more than favourably with those of Australia and other countries. In the last Australian census (1911) a discrepancy of 70,000 between the actual census return and the estimate based on registrations and migrations emerged, while the corresponding error in New Zealand was only 1,707.
Towards the latter end of 1914 there was instituted a system whereby inter-Island migration was kept tally of by means of returns furnished monthly through the agency of Collectors of Customs. To what extent an accurate estimate of the population of each Island during intercensal periods can be made will not be apparent until the next census, but it can scarcely be anticipated that the result will be quite as gratifying as in the case of the estimate of the total population of the Dominion. Larger numbers, involving increased risks of error, are being dealt with than in the case of oversea returns, and there is more chance of inaccuracy arising from the non-recording of passengers travelling by private yachts and launches -from Island to Island, and from the overlooking of passengers when at most twelve or thirteen hours (and usually by night) are spent on shipboard.
The increase of population at successive census periods has been—
| Date of Enumeration. | Population. | Numerical Increase. | Percentage Increase. |
|---|---|---|---|
| December, 1858 | 59,413 | ||
| December, 1861 | 99,021 | 39,608 | 66.67 |
| December, 1864 | 172,158 | 73,137 | 73.86 |
| December, 1867 | 218,668 | 46,510 | 27.01 |
| February, 1871 | 256,393 | 37,725 | 17.25 |
| March, 1874 | 299,514 | 43,121 | 16.82 |
| March, 1878 | 414,412 | 114,898 | 38.36 |
| April, 1881 | 489,933 | 75,521 | 18.07 |
| March, 1886 | 578,482 | 88,549 | 18.07 |
| April, 1891 | 626,658 | 48,176 | 8.33 |
| April, 1896 | 703,360 | 76,702 | 12.24 |
| March, 1901 | 772,719 | 69,359 | 9.86 |
| April, 1906 | 888,578 | 115,859 | 14.99 |
| April, 1911 | 1,008,468 | 119,890 | 13.49 |
| October, 1916 | 1,099,449 | 90,981 | 9.02 |
The population of New Zealand has shown a continuous though not a regular increase in each year since 1855, the first year in which accurate records of births and deaths were obtained and used in conjunction With the returns of immigration and emigration. The greatest increase in any year was in 1874, when 32,118 assisted immigrants were brought into the country in accordance with the immigration and public-works policy of the Government. The next greatest increase of population was in 1863, following the discovery of gold in Otago. The accompanying logarithmic diagram gives a good indication of the progress of population in the Dominion, and is further interesting as showing the gradual tendency towards an equalization of the sexes. The loss of men in the years 1914–16 due to the departure of troops has actually brought the estimated female population at 31st December, 1916, slightly ahead of the male.
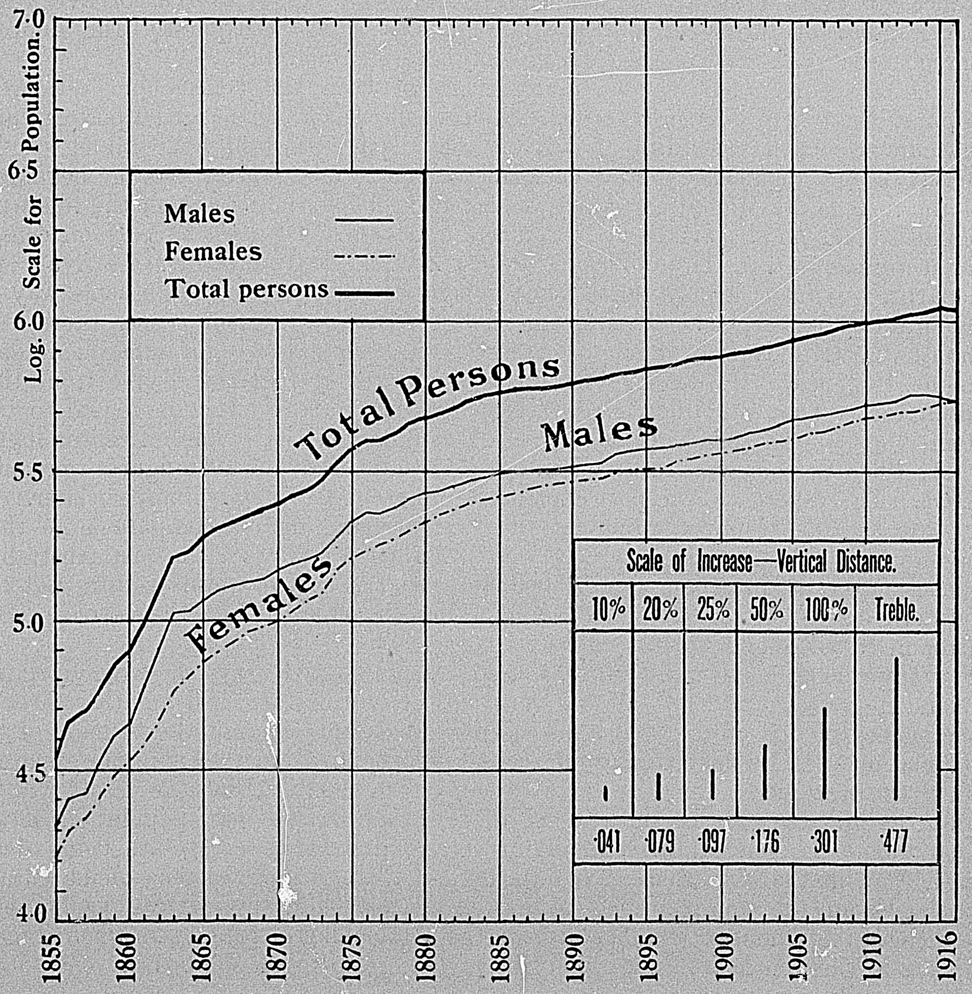
The smallness of the increase in 1914 and 1915, and the actual decrease in 1916, are due in great part to the war, immigration being considerably restricted, while the emigration figures were swelled by the departure of troops for the front.
The principal natural divisions in New Zealand are the North, South, and Stewart Islands. These contain nearly the whole population of European descent, the Cook and other annexed islands being inhabited almost solely by coloured Natives.
In 1858 the North Island had a larger population than the South, this position being reversed at the succeeding enumerations until 1901, in which year the North Island was found to have slightly the larger total, a position which it has since considerably improved upon. The Maori war which broke out in 1860 retarded settlement in the North, while a large area of land reserved for the Maoris was until quite recently a serious hindrance to the development of this portion of the Dominion. The construction of railways, roads, and bridges is now giving access to larger areas of new lands, which are being offered for selection in blocks intended for close settlement, and are quickly occupied. The South Island was practically free from Maori troubles, and settlement was more rapid, though much of the land was disposed of in large areas. The discovery of gold in Otago in 1861 and on the West Coast in 1864 attracted to these localities considerable numbers of miners.
In 1870 a policy of vigorous construction of railways and other developmental public works and of assistance to immigrants was inaugurated, resulting in a large increase to the population, including nearly 90,000 Government immigrants introduced between 1873 and 1879.
The population of the two Islands at successive censuses is given in the table following, together with the percentage that each Island bears to the total:—
Population of the North and South Islands, 1858–1916.
| Census Year. | Population (excluding Maoris). | Proportions per Cent. | |||
|---|---|---|---|---|---|
| North Island. | South Island.* | Total. | North Island. | South Island.* | |
| * Including Stewart Island and Chatham Islands. | |||||
| 1858 | 34,094 | 25,319 | 59,413 | 57.38 | 42.62 |
| 1861 | 41,64l | 57,380 | 99,021 | 42.05 | 57.95 |
| 1864 | 65,263 | 106,895 | 172,158 | 37.91 | 6209 |
| 1867 | 79,913 | 138,755 | 218,668 | 36.55 | 63.45 |
| 1871 | 96,875 | 159,518 | 256,393 | 37.78 | 62.22 |
| 1874 | 111,934 | 187,580 | 299,514 | 37.37 | 62.63 |
| 1878 | 158,208 | 256,204 | 414,412 | 38.18 | 61.82 |
| 1881 | 193,047 | 296,886 | 489,933 | 39.40 | 60.60 |
| 1886 | 250,482 | 328,000 | 578,482 . | 43.30 | 56.70 |
| 1891 | 281,474 | 345,184 | 626,658 | 44.92 | 55.08 |
| 1896 | 340,638 | 362,722 | 703,360 | 48.43 | 51.57 |
| 1901 | 390,579 | 382,140 | 772,719 | 50.54 | 49.45 |
| 1906 | 476,737 | 411,841 | 888,578 | 53.65 | 46.35 |
| 1911 | 563,733 | 444,735 | 1,008,468 | 55.90 | 44.10 |
| 1916 | 651,072 | 448,377 | 1,099,449 | 59.22 | 40.78 |
The figures for 1916 are not quite fair to the South Island. All the military and internment camps were in the North Island, and many of the soldiers, &c, in these on census night belonged to the South Island. The presence of the camps in the North Island had the further effect of temporarily attracting people from the other Island for business purposes, or to be near soldier friends and relatives. The troops abroad on census night (42,666 in number) may be regarded as having come from the two Islands in proportions approximately relative to population.
The populations of the various provincial of the 15th October, 1916, are as follows:—
| Provincial Districts. | Males. | Females. | Totals. |
|---|---|---|---|
| Auckland | 155,298 | 153,468 | 308,766 |
| Taranaki | 28,775 | 27,150 | 55,925 |
| Hawke's Bay | 27,194 | 27,073 | 54,267 |
| Wellington | 119,572 | 112,542 | 232,114 |
| Marlborough | 8,506 | 8,102 | 16,608 |
| Nelson | 22,415 | 20,836 | 43,251 |
| Westland | 8,088 | 7,414 | 15,502 |
| Canterbury | 88,085 | 93,784 | 181,869 |
| Otago— | |||
| Otago Portion | 63,546 | 67,972 | 131,518 |
| Southland Portion | 30,296 | 29,333 | 59,629 |
| Totals for the Dominion | 551,775 | 547,674 | 1,099,449 |
The following table shows for successive census-takings since 1880 the percentage the population of each province has borne to the total population of New Zealand:—
| Year. | Auckland. | Taranaki. | Hawke's Bay | Wellington. | Marlborough | Nelson. | Westland. | Canterbury. | Otago | Southland. | Total. |
|---|---|---|---|---|---|---|---|---|---|---|---|
| 1881 | 20.29 | 3.03 | 3.54 | 12.54 | 1.89 | 5.33 | 3.06 | 22.95 | 21.94 | 5.43 | 100.00 |
| 1886 | 22.54 | 3.11 | 4.25 | 13.40 | 1.92 | 5.22 | 2.75 | 21.02 | 19.66 | 6.13 | 100.00 |
| 1891 | 21.25 | 3.52 | 4.55 | 15.59 | 2.01 | 5.55 | 2.54 | 20.53 | 18.52 | 5.9l | 100.00 |
| 1896 | 21.81 | 4.43 | 4.84 | 17.32 | 1.77 | 5.08 | 2.06 | 19.35 | 17.06 | 6.25 | 100.00 |
| 1901 | 22.77 | 4.90 | 4.58 | 18.29 | 1.72 | 4.91 | 1.88 | 18.54 | 16.22 | 6.19 | 100.00 |
| 1906 | 23.77 | 4.88 | 4.75 | 20.24 | 1.62 | 4.79 | 1.65 | 17.93 | 14.39 | 5.98 | 100.00 |
| 1911 | 26.23 | 5.11 | 4.81 | 19.74 | 1.59 | 4.81 | 1.56 | 17.20 | 13.13 | 5.82 | 100.00 |
| 1916 | 28.29 | 5.11 | 4.98 | 20.52 | 1.49 | 4.40 | 1.29 | 16.39 | 12.08 | 5.45 | 100.00 |
With the solitary exception of Southland, it will be seen that each southern province has suffered during the period in respect of the proportion that its population has borne to the total, while without exception the northern provinces have gained.
The following table shows the distribution of the population at each quinquennial census since 1881 in (1) counties and (2) boroughs (which term, unless this presumption is negatived by the context, is hereinafter used as being inclusive of cities):—
| Census Year. | Counties. | Boroughs. | Percentage. | ||
|---|---|---|---|---|---|
| Counties. | Boroughs. | Shipboard, &c | |||
| 1881 | 291,238 | 327,328 | 59.44 | 39.80 | 0.76 |
| 1886 | 352,097 | 270,343 | 56.58 | 42.46 | 0.96 |
| 1891 | 352,097 | 307,294 | 56.18 | 43.14 | 0.68 |
| 1896 | 391,735 | 307,294 | 55.69 | 43.69 | 0.62 |
| 1901 | 417,596 | 350,202 | 54.01 | 45.32 | 0.64 |
| 1906 | 458,797 | 424,614 | 51.63 | 47.79 | 0.58 |
| 1911 | 496,779 | 505,598 | 19.26 | 50.14 | 0.60 |
| 1916 | 501,259 | 585,306 | 45.59 | 53.24 | 1.17 |
The counties contain what is understood to be the rural population, but this is not strictly correct, as some of the towns not municipalized and forming parts of counties have considerable populations. On the other hand, the population of a few of the smaller boroughs should strictly be classed as rural.
A progressive increase will be noted in the proportions of the population living in the boroughs, an increase which many would be inclined to view with alarm when it is considered that New Zealand is, after all, a primary producing and not a manufacturing country. As compared with Australia, however, the rural exodus is not marked, as is shown by the fact that as at 31st December, 1915, 48.24 per cent, of the population of Victoria, 40.83 per cent, of New South Wales, 46.63 per cent, of South Australia, and 38.36 per cent, of Western Australia were to be found in the capitals alone, while 40.06 per cent, of the population of the Commonwealth resided in the six capital cities. The 1916 census figures for the New Zealand metropolitan areas are—
| Population. | Proportion to Whole. | |
|---|---|---|
| Auckland | 133,712 | 12.17 |
| Wellington. | 95,235 | 8.66 |
| Christchurch | 92,733 | 8.43 |
| Dunedin | 68,716 | 6.16 |
| Total | 390,396 | 35.42 |
Table of Contents
A list of counties and their population (exclusive of interior boroughs) as at the census of 1916 is given:—
| County. | Population. |
|---|---|
| Akaroa | 1,982 |
| Akitio | 1,416 |
| Amuri | 1,836 |
| Ashburton | 13,136 |
| Ashley | 728 |
| Awakino | 702 |
| Awatere | 1,542 |
| Bay of Islands | 3,600 |
| Bruce | 4,763 |
| Buller | 5,773 |
| Castlepoint | 621 |
| Chatham Islands | 219 |
| Cheviot | 1,224 |
| Clifton | 2,156 |
| Clutha | 6,901 |
| Collingwood | 1,253 |
| Cook | 8,145 |
| Coromandel | 2,256 |
| Dannevirke | 4,538 |
| East Taupo | 515 |
| Eden | 18,204 |
| Egmont | 3,264 |
| Eketahuna | 2,312 |
| Ellesmere | 3,441 |
| Eltham | 3,393 |
| Eyre | 1,806 |
| Featherston | 5,119 |
| Fiord | 17 |
| Franklin | 9,397 |
| Geraldine | 5,194 |
| Great Barrier | 245 |
| Grey | 5,510 |
| Halswell | 1,628 |
| Hawera | 4,599 |
| Hawke's Bay | 11,467 |
| Heathcote | 4,212 |
| Hobson | 4,217 |
| Hokianga | 3,596 |
| Horowhenua | 6,926 |
| Hutt | 6,397 |
| Inangahua | 4,130 |
| Kaikoura | 1,906 |
| Kairanga | 4,124 |
| Kaitieke | 3,597 |
| Kawhia | 991 |
| Kiwitea | 2,585 |
| Kowai | 1,914 |
| Lake | 1,749 |
| Levels | 5,100 |
| Mackenzie | 2,868 |
| Makara | 3,862 |
| Malvern | 2,757 |
| Manawatu | 4,521 |
| Maniototo | 2,527 |
| Manukau | 6,799 |
| Marlborough | 6,915 |
| Masterton | 3,746 |
| Matamata | 3,903 |
| Mauriceville | 771 |
| Mongonui | 3,562 |
| Mount Herbert | 405 |
| Murchison | 1,251 |
| Ohinemuri | 4,661 |
| Ohura | 2,382 |
| Opotiki | 1,881 |
| Oroua | 3,304 |
| Otamatea | 3,647 |
| Oxford | 1,756 |
| Pahiatua | 3,110 |
| Paparua | 4,716 |
| Patangata | 2,080 |
| Patea | 3,759 |
| Peninsula | 1,793 |
| Piako | 5,013 |
| Pohangina | 1,581 |
| Raglan | 4,027 |
| Rangiora | 2,747 |
| Rangitikei | 8,953 |
| Rodney | 4,043 |
| Rotorua | 1,400 |
| Selwyn | 1,423 |
| Sounds | 1,201 |
| Southland | 25,661 |
| Springs | 1,785 |
| Stewart Island | 349 |
| Stratford | 5,152 |
| Taieri | 5,662 |
| Takaka | 1,858 |
| Taranaki | 7,100 |
| Tauranga | 3,947 |
| Tawera | 847 |
| Thames | 4,690 |
| Tuapeka | 5,123 |
| Vincent | 3,930 |
| Waiapu | 2,075 |
| Waihemo | 1,446 |
| Waikato | 8,099 |
| Waikohu | 3,013 |
| Waikouaiti | 4,094 |
| Waimairi | 11,914 |
| Waimarino | 3,502 |
| Waimate | 6,984 |
| Waimate West | 2,635 |
| Waimea | 9,334 |
| Waipa | 6,864 |
| Waipara | 2,058 |
| Waipawa | 3,084 |
| Waipukurau | 667 |
| Wairarapa South | 2,744 |
| Wairewa | 1,036 |
| Wairoa | 2,332 |
| Waitaki | 9,694 |
| Waitemata | 9,354 |
| Waitomo | 5,181 |
| Waitotara | 5,842 |
| Wallace | 9,432 |
| Wanganui | 3,397 |
| Weber | 420 |
| Westland | 4,087 |
| West Taupo | 2,351 |
| Whakatane | 2,954 |
| Whangamomona | 1,387 |
| Whangarei | 8,870 |
| Whangaroa | 776 |
| Woodville | 1,819 |
Table of Contents
Prior to the year 1900 there was no statutory limitation to the number of inhabitants necessary to constitute a borough, and consequently many small centres, the residents being mainly engaged in rural occupations, became municipalities. The Municipal Corporations Act now imposes a limit as to area, and provides that no new borough may be constituted unless the proposed area contains at least 1,000 inhabitants.
The name of each borough, with the number of inhabitants as at the census of 1916, is given in the next table:—
| Borough. | Population. |
|---|---|
| * Town constituted under special Act. | |
| Akaroa | 540 |
| Alexandra | 679 |
| Arrowtown | 307 |
| Ashburton | 2,808 |
| Auckland (City) | 64,951 |
| Balclutha | 1,409 |
| Birkenhead | 2,116 |
| Blenheim | 3,822 |
| Brunner | 598 |
| Cambridge | 1,507 |
| Campbelltown | 1,823 |
| Carterton | 1,614 |
| Christchurch (City) | 54,925 |
| Cromwell | 549 |
| Dannevirke | 3,336 |
| Dargaville | 1,776 |
| Devonport | 7,613 |
| Dunedin (City) | 55,256 |
| Eastbourne | 952 |
| Eketahuna | 754 |
| Eltham | 1,711 |
| Feilding | 3,438 |
| Foxton | 1,772 |
| Frankton | 1,861 |
| Geraldine | 869 |
| Gisborne | 9,174 |
| Gore | 3,551 |
| Green Island | 1,841 |
| Greymouth | 4,863 |
| Greytown | 1,186 |
| Hamilton | 5,677 |
| Hampden | 364 |
| Hastings | 7,918 |
| Hawera | 3,375 |
| Hokitika | 2,091 |
| Inglewood | 1,199 |
| Invercargill | 14,154 |
| Invercargill South | 1,712 |
| Kaiapoi | 1,560 |
| Kaitangata | 1,681 |
| Karori | 1,647 |
| Kumara | 623 |
| Lawrence | 837 |
| Levin | 1,630 |
| Lower Hutt | 4,893 |
| Lyttelton | 3,766 |
| Marton | 1,650 |
| Masterton | 5,894 |
| Mataura | 1,129 |
| Milton | 1,317 |
| Miramar | 2,158 |
| Mosgiel | 1,719 |
| Motueka | 1,475 |
| Mount Albert | 9,654 |
| Mount Eden | 12,555 |
| Napier | 12,704 |
| Naseby | 276 |
| Nelson (City) | 8,774 |
| New Brighton | 2,310 |
| Newmarket | 2,863 |
| New Plymouth | 8,704 |
| North cote | 1,651 |
| Oamaru | 5,140 |
| Ohakune | 1,371 |
| Onehunga | 5,913 |
| Onslow | 2,191 |
| Opotiki | 1,073 |
| Otahuhu | 2,328 |
| Paeroa | 1,376 |
| Pahiatua | 1,300 |
| Palmerston | 752 |
| Palmerston North | 12,829 |
| Patea | 1,010 |
| Petone | 7,115 |
| Picton | 1,121 |
| Port Chalmers | 2,615 |
| Pukekohe | 1,533 |
| Queenstown | 657 |
| Rangiora | 1,808 |
| Riccarton | 2,890 |
| Richmond | 872 |
| Riverton | 837 |
| Ross | 491 |
| Rotorua* | 2,845 |
| Roxburgh | 449 |
| Runanga | 1,411 |
| Spreydon | 4,289 |
| St. Kilda | 5,520 |
| Stratford | 2,713 |
| Sumner | 2,287 |
| Taihape | 1,927 |
| Takapuna | 2,756 |
| Tapanui | 322 |
| Taumarunui | 1,875 |
| Tauranga | 1,685 |
| Te Aroha | 1,452 |
| Te Awamutu | 1,064 |
| Te Kuiti | 1,982 |
| Temuka | 1,633 |
| Thames | 3,273 |
| Timaru | 12,238 |
| Waihi | 4,774 |
| Waikouaiti | 611 |
| Waimate | 1,867 |
| Waipawa | 1,100 |
| Waipukurau | 1,167 |
| Wairoa | 1,530 |
| Waitara | 1,422 |
| Wanganui | 14,380 |
| Wellington (City) | 73,305 |
| West Harbour | 1,631 |
| Westport | 4,067 |
| Whangarei | 3,294 |
| Winton | 586 |
| Woodville | 1,078 |
| Woolston | 3,990 |
Table of Contents
For various purposes (vital statistics. &c.) metropolitan areas have been created at each of the four chief centres, and suburban areas at nine of the more important secondary centres. Each area includes, in addition to the central borough and suburban boroughs, a considerable non-municipalized area adjacent to and contingent on the centre.
An objection to the old system of publishing statistics for the municipal areas only was that these were constantly being extended or otherwise altered, and no proper comparison could be made between one period and. another, and no satisfactory record kept of the social condition and progress of the community. The creation of fairly extensive areas fixed for a long period will remove these disabilities.
Population figures as at the census of 1916 are as follows:—
| Population. | |
|---|---|
| Auckland | |
| Auckland City | 64,951 |
| Birkenhead Borough | 2,116 |
| Northcote Borough | 1,651 |
| Takapuna Borough | 2,756 |
| Devonport Borough | 7,613 |
| Newmarket Borough | 2,863 |
| Mount Eden Borough | 12,555 |
| Mount Albert Borough | 9,654 |
| Onehunga Borough | 5,913 |
| Otahuhu Borough | 2,328 |
| New Lynn Town District | 1,041 |
| Ellerslie Town District | 1,363 |
| Remainder of metropolitan area | 18,908 |
| Total | 133,712 |
| Wellington. | |
| Wellington City | 73,305 |
| Miramar Borough | 2,158 |
| Karori Borough | 1,647 |
| Onslow Borough | 2,191 |
| Petone Borough | 7,115 |
| Lower Hutt Borough | 4,893 |
| Eastbourne Borough | 952 |
| Johnsonville Town District | 886 |
| Remainder of metropolitan area | 2,088 |
| Total | 95,235 |
| Christchurch. | |
| Christchurch City | 54,925 |
| Riccarton Borough | 2,890 |
| Spreydon Borough | 4,289 |
| Woolston Borough | 3,990 |
| New Brighton Borough | 2,310 |
| Sumner Borough | 2,287 |
| Lyttelton Borough | 3,766 |
| Remainder of metropolitan area | 18,276 |
| Total | 92,733 |
| Dunedin. | |
| Dunedin City | 55,256 |
| St. Kilda Borough | 5,520 |
| Green Island Borough | 1,841 |
| West Harbour Borough | 1,631 |
| Port Chalmers Borough | 2,615 |
| Remainder of metropolitan area | 1,853 |
| Total | 68,716 |
| Population | |
|---|---|
| Gisborne. | |
| Gisborne Borough | 9,174 |
| Mangapapa Town District | 1,140 |
| Remainder of suburban area | 2,346 |
| Total | 12,660 |
| Napier. | |
| Napier Borough | 12,704 |
| Taradale Town District | 1,012 |
| Remainder of suburban area | 1,415 |
| Total | 15,131 |
| New Plymouth. | |
| New Plymouth Borough | 8,704 |
| Remainder of suburban area | 1,091 |
| Total | 9,795 |
| Wanganui. | |
| Wanganui Borough | 14,380 |
| Gonville Town District | 2,693 |
| Castlecliff Town District | 734 |
| Remainder of suburban area | 1,710 |
| Total | 19,517 |
| Palmerston North. | |
| Palmerston North Borough | 12,829 |
| Remainder of suburban area | 1,177 |
| Total | 14,006 |
| Nelson. | |
| Nelson City | 8,774 |
| Remainder of suburban area | 1,188 |
| Total | 9,962 |
| Grey Valley Boroughs. | |
| Greymouth Borough | 4,863 |
| Runanga Borough | 1,411 |
| Brunner Borough | 598 |
| Remainder of suburban area | 1,501 |
| Total | 8,373 |
| Timaru. | |
| Timaru Borough | 12,238 |
| Remainder of suburban area | 1,478 |
| Total | 13,716 |
| Invercargill. | |
| Invercargill Borough | 14,154 |
| South Invercargill Borough | 1,712 |
| Remainder of suburban area | 1,996 |
| Total | 17,862 |
Table of Contents
The several stages in the growth of a New Zealand town may be marked thus: The village, taxed by the parent county, and dependent upon the latter for all public works; then the legally constituted town district, still subordinate to the county in some matters, its affairs administered by a Board presided over by a Chairman. When its population exceeds 500 the town district may become independent of the county and control the whole of its revenues. When the population reaches 1,000 full municipal powers may be obtained, with the dignity of à Council presided over by a Mayor; and finally, if the number of inhabitants should reach 2O.000 or over, the title of “city” may be assumed, although the constitution remains unaltered. The name of each town district and its population at the census of 1916 are as follows:—
| Town District. | Population. |
|---|---|
| Bull's | 483 |
| Castlecliff. | 734 |
| Ellerslie | 1,363 |
| Featherston | 1,159 |
| Gonville | 2,693 |
| Hampstead | 1,579 |
| Havelock North | 870 |
| Helensville | 775 |
| Hunterville | 555 |
| Huntly | 1,535 |
| Johnsonville | 886 |
| Lumsden | 530 |
| Manaia | 606 |
| Mangapapa | 1,140 |
| Mangaweka | 390 |
| Manunui | 813 |
| Martin borough | 725 |
| Morrinsville | 934 |
| New Lynn | 1,041 |
| Ngaruawahia | 755 |
| Otaki | 806 |
| Otautau | 696 |
| Papakura | 641 |
| Pleasant Point | 482 |
| Raetihi | 508 |
| Rangataua | 410 |
| Taradale | 1,012 |
| Te Puke | 565 |
| Tinwald | 1,075 |
| Upper Hutt | 1,399 |
| Waiuku | 641 |
| Warkworth | 624 |
| Waverley | 623 |
| Whakatane | 900 |
| Wyndham | 647 |
| Town District. | Population. |
|---|---|
| Amberley | 325 |
| Clinton | 413 |
| Edendale | 363 |
| Halcombe | 282 |
| Havelock | 290 |
| Kamo | 363 |
| Kaponga | 397 |
| Kawakawa | 327 |
| Kihikihi | 277 |
| Kohukohu | 403 |
| Leamington | 438 |
| Lethbridge | 234 |
| Manurewa | 430 |
| Mercer | 329 |
| Normanby | 368 |
| Norsewood | 213 |
| Ohaupo | 259 |
| Onerahi | 325 |
| Opunake | 459 |
| Ormondville | 317 |
| Otane | 333 |
| Otorohanga | 367 |
| Outram | 348 |
| Raglan | 217 |
| Rongotea | 267 |
| Southbridge | 369 |
| Takaka | 370 |
| Tuakau | 390 |
No fewer than ten of the “independent” town districts have sufficient population to enable them to be constituted boroughs, while on the other hand the census has disclosed four as having fallen below the 500 mark. None of the town districts still under county jurisdiction had at the date of the census a population of over. 500.
In a country such as New Zealand, which is still largely in the development stage, villages and townships occupy a comparatively much more important position than is the case in older countries. Steps are taken at each census to compile accurate statements of population for such centres, and, though difficulty is experienced in many cases on account of the scattered nature of settlements, the following figures of population of small centres are sufficiently reliable to give a fair idea of the relative importance of the various places from a population point of view. Only townships with 100 or more inhabitants have been included.
| Centre. | County in which situated. | Population |
|---|---|---|
| * Including Mental Hospital | ||
| Abbotsford | Taieri | 145 |
| Adamsville | Masterton | 195 |
| Addington | Waimairi | 284 |
| Addison's | Buller | 104 |
| Ahaura | Grey | 167 |
| Akaaka | Franklin | 202 |
| Akatarawa | Hutt | 136 |
| Akitio | Akitio | 133 |
| Albany | Waitemata | 240 |
| Albury | Mackenzie | 282 |
| Alford Forest | Ashburton | 262 |
| Alfredton | Eketahuna | 240 |
| Alfriston | Manukau | 192 |
| Allandale | Mackenzie | 103 |
| Allanton | Taieri | 216 |
| Allenton | Ashburton | 1,113 |
| Alma | Waitaki | 180 |
| Alton | Patea | 331 |
| Anama | Ashburton | 121 |
| Annan | Amuri | 141 |
| Annat | Malvern | 178 |
| Aokautere | Kairanga | 200 |
| Aongatete | Tauranga | 104 |
| Aorangi | Oroua | 122 |
| Aoroa | Hobson | 282 |
| Aparima | Wallace | 231 |
| Apiti | Pohangina | 449 |
| Appleby | Waimea | 275 |
| Arahura | Westland | 119 |
| Aramoho | Waitotara | 146 |
| Aranga | Hokianga | 136 |
| Arapohue | Hobson | 182 |
| Ararata | Hawera | 155 |
| Ararimu | Franklin | 120 |
| Aratapu | Hobson | 384 |
| Aratoro | Waitomo | 109 |
| Ardgowan | Waitaki | 367 |
| Ardmore | Manukau | 199 |
| Argyll | Waipawa | 228 |
| Aria | Waitomo | 225 |
| Arthur's Pass | Tawera | 222 |
| Arundel | Geraldine | 103 |
| Ashhurst | Oroua | 498 |
| Ashley | Ashley | 304 |
| Ashley- Clinton | Waipawa | 135 |
| Atawhai | Waimea | 123 |
| Athol | Southland | 182 |
| Auckland Hospital | Edon | 594 |
| Auroa | Waimate West | 371 |
| Avondale | Edon | *2,670 |
| Avonside | Heathcote | 585 |
| Awahuri | Manawatu | 401 |
| Awakeri | Whakatane | 105 |
| Awamangu | Bruce | 117 |
| Awamoa | Waitaki | 176 |
| Awamoko | Waitaki | 176 |
| Awanui | Mongonui | 187 |
| Awatoto | Hawke's Bay | 261 |
| Awatuna | Egmont | 228 |
| Awhitu | Franklin | 153 |
| Aylesbury | Malvern | 106 |
| Bainham | Collingwood | 165 |
| Balcairn | Kowai | 202 |
| Balclutha North | Bruce | 208 |
| Balfour | Southland | 449 |
| Ballance | Pahiatua | 211 |
| Bannookburn | Vincent | 146 |
| Barry's Bay | Akaroa | 105 |
| Bayswater | Wallace | 102 |
| Beaconsfield | Kiwitea | 253 |
| Beaumont | Tuapeka | 245 |
| Belfast | Waimairi | 1,057 |
| Belfield | Geraldine | 100 |
| Belgrove | Waimea | 184 |
| Bell Block | Taranaki | 263 |
| Belmont | Hutt | 201 |
| Belvedere | Wairarapa South | 235 |
| Benhar | Bruce | 172 |
| Bennett's | Oxford | 197 |
| Berwick | Taieri | 192 |
| Bexley | Heathcote | 415 |
| Bideford | Masterton | 140 |
| Birchfield | Buller | 132 |
| Birchwood | Wallace | 217 |
| Blackball | Grey | 863 |
| Black's Point | Inangahua | 239 |
| Blackwater | Inangahua | 108 |
| Blue Cliffs | Waimate | 132 |
| Blue Spur | Tuapeka | 100 |
| Bombay | Franklin | 394 |
| Bonny Glen | Rangitikei | 149 |
| Braigh | Whangarei | 105 |
| Brighton | Taieri | 245 |
| Brightwater | Waimea | 499 |
| Broadwood | Hokianga | 164 |
| Bromley | Heathcote | 823 |
| Brookside | Ellesmere | 220 |
| Brown's | Southland | 264 |
| Brunswick | Waitotara | 198 |
| Bruntwood | Waikato | 155 |
| Brydone | Southland | 203 |
| Buckland | Franklin | 444 |
| Bunnythorpe | Kairanga | 614 |
| Burke's Pass | Mackenzie | 109 |
| Burnett'8 Face | Buller | 526 |
| Burnham | Paparua | 331 |
| Burwood | Waimairi | 665 |
| Cabbage Bay | Coromandel | 160 |
| Calico Lino | Rangitikei | 176 |
| Cambrian | Maniototo | 110 |
| Cameron's | Grey | 120 |
| Cannington | Waimate | 125 |
| Canvastown | Marlborough | 262 |
| Cape Foulwind | Buller | 187 |
| Cape Runaway | Waiapu | 101 |
| Capleston | Inangahua | 121 |
| Cardiff | Stratford | 316 |
| Cardrona | Lake | 111 |
| Carew | Ashburton | 154 |
| Carrington | Wairarapa South | 130 |
| Cashmere | Heathcote | 970 |
| Cave | Levels | 187 |
| Chamberlain | Mackenzie | 132 |
| Charlton | Southland | 317 |
| Chatton | Southland | 116 |
| Cheltenham | Oroua | 119 |
| Chertsey | Ashburton | 365 |
| Cheviot | Cheviot | 192 |
| Chiselhurst | Eltham | 100 |
| Christchurch Hospital | Waimairi | 354 |
| Churchill | Raglan | 102 |
| Clandeboye | Geraldine | 304 |
| Clarendon | Bruce | 122 |
| Clareville | Wairarapa South | 339 |
| Clarks ville | Bruce | 130 |
| Clarkville | Eyre | 204 |
| Claudelands | Waikato | 277 |
| Clevedon | Manukau | 539 |
| Clifden | Wallace | 163 |
| Clifton | Takaka | 105 |
| Clive | Hawke's Bay | 572 |
| Clyde | Vincent | 370 |
| Clydevale | Clutha | 238 |
| Coal Creek | Tuapeka | 179 |
| Coalgate | Malvern | 197 |
| Cobden | Grey | 1,016 |
| Colac Bay | Wallace | 178 |
| Collingwood | Collingwood | 213 |
| Collingwood | Southland | 296 |
| Colyton | Pohangina | 109 |
| Conical Hill | Clutha | 105 |
| Coromandel | Coromandel | 677 |
| Crofton | Rangitikei | 156 |
| Cronadun | Inangahua | 154 |
| Crookston | Tuapeka | 202 |
| Cross Creek | Featherston | 110 |
| Croydon Bush | Southland | 186 |
| Crushington | Inangahua | 122 |
| Culverden | Amuri | 246 |
| Cust | Rangiora | 387 |
| Dairy Flat | Waitemata | 106 |
| Dalefield | Wairarapa South | 225 |
| Dallington | Waimairi | 270 |
| Darfield | Malvern | 316 |
| Day's Bay | Hutt | 308 |
| Deep Creek | Marlborough | 397 |
| Denniston | Grey | 702 |
| Dillmanstown | Westland | 143 |
| Dipton | Southland | 486 |
| Domett | Cheviot | 166 |
| Dorie | Ashburton | 134 |
| Douglas | Stratford | 181 |
| Douglas | Waimate | 119 |
| Dovedale | Waimea | 115 |
| Doyleston | Ellesmere | 403 |
| Driving Creek | Coromandel | 169 |
| Drummond | Wallace | 443 |
| Drury | Franklin | 391 |
| Dunback | Waihemo | 345 |
| Dunsandel | Ellesmere | 443 |
| Duntroon | Waitaki | 353 |
| Durham Road | Taranaki | 244 |
| Duvauchelle's Bay | Akaroa | 183 |
| Dyerville | Featherston | 148 |
| Ealing | Ashburton | 129 |
| Earnscleugh | Vincent | 306 |
| East Tamaki | Manukau | 340 |
| Egmont Village | Taranaki | 211 |
| Eiffelton | Ashburton | 186 |
| Elgin | Ashburton | 118 |
| Ellesmere | Springs | 179 |
| Elsthorpe | Patangata | 157 |
| Elston | Ohinemuri | 105 |
| Enfield | Waitaki | 289 |
| Epsom | Eden | 3,168 |
| Epuni Hamlet | Hutt | 227 |
| Eskdale | Hawke's Bay | 132 |
| Esk Valley | Waimate | 105 |
| Ettrick | Tuapeka | 153 |
| Eureka | Waikato | 248 |
| Evans Bay | Tuapeka | 158 |
| Eveline | Waitaki | 295 |
| Eyreton | Eyre | 140 |
| Fairfax | Wallace | 154 |
| Fairfield | Horowhenua | 162 |
| Fairfield | Ashburton | 210 |
| Fairfield | Taieri | 261 |
| Fairhall Valley | Marlborough | 112 |
| Fairlie | Mackenzie | 640 |
| Fair view | Levels | 151 |
| Farndon | Hawke's Bay | 136 |
| Farnham | Marlborough | 145 |
| Favona | Manukau | 143 |
| Fencourt | Waikato | 303 |
| Fendalton | Waimairi | 1,796 |
| Fernside | Rangiora | 315 |
| Five Rivers | Southland | 125 |
| Flat Creek | Marlborough | 143 |
| Fordell | Wanganui | 315 |
| Fortification | Southland | 132 |
| Fortrose | Southland | 190 |
| Foxhill | Waimea | 164 |
| Frankton | Waipa | 172 |
| Frasertown | Wairoa | 318 |
| Gabriel's Gully | Tuapeka | 104 |
| Galloway | Vincent | 121 |
| Gap | Southland | 101 |
| Gapes Valley | Geraldine | 144 |
| Garston | Lake | 133 |
| Gate Pa | Tauranga | 111 |
| Gebbie's Valley | Wairewa | 122 |
| Georgetown | Waitaki | 193 |
| Gimmerburn | Maniototo | 134 |
| Gladstone | Wairarapa South | 194 |
| Glenavy | Waimate | 206 |
| Glenbrook | Franklin | 131 |
| Glenfield | Waitemata | 501 |
| Glenham | Southland | 238 |
| Gleniti | Levels | 361 |
| Glenkenich | Clutha | 216 |
| Glen Massey | Raglan | 346 |
| Glen Murray | Raglan | 117 |
| Glenomaru | Clutha | 149 |
| Glenorchy | Lake | 150 |
| Glen Oroua | Manawatu | 200 |
| Glenroy | Selwyn | 170 |
| Glentui | Oxford | 113 |
| Glentunnel | Malvern | 261 |
| Globe Hill | Inangahua | 197 |
| Goodwood | Waihemo | 260 |
| Gordon | Piako | 108 |
| Gordonton | Waikato | 321 |
| Gorge Road | Southland | 206 |
| Granity | Buller | 667 |
| Grassmere | Awatere | 118 |
| Grassmere | Southland | 161 |
| Greatford | Rangitikei | 191 |
| Green Bay | Eden | 110 |
| Greendale | Malvern | 267 |
| Greenhills | Southland | 165 |
| Green Lane | Eden | 648 |
| Greenmeadows | Hawke's Bay | 646 |
| Greenpark | Springs | 308 |
| Greenstreet | Ashburton | 141 |
| Green vale | Southland | 211 |
| Greenwood's Corner | Eden | 151 |
| Greerton | Tauranga | 102 |
| Grove Bush | Southland | 146 |
| Grovetown | Marlborough | 376 |
| Gummie's Bush | Wallace | 159 |
| Hairini | Waipa | 141 |
| Hakataramea | Waimate | 203 |
| Hakataramea Valley | Waimate | 123 |
| Half-moon Bay | Stewart Island | 209 |
| Halkett | Malvern | 146 |
| Halswell | Halswell | 1,096 |
| Hamua | Eketahuna | 192 |
| Hangatiki | Waitomo | 161 |
| Hanmer | Amuri | 167 |
| Hapuka | Kaikoura | 103 |
| Harewood | Waimairi | 402 |
| Harihari | Westland | 103 |
| Harrisville | Franklin | 174 |
| Hastwell | Mauriceville | 119 |
| Hatuma | Waipukurau | 336 |
| Haumoana | Hawke's Bay | 208 |
| Hautapu | Waikato | 145 |
| Hautere | Horowhenua | 152 |
| Hawarden | Waipara | 259 |
| Hawea Flat | Vincent | 216 |
| Hawtrey | Makara | 100 |
| Heathcote Valley | Heathcote | 618 |
| Hector | Buller | 190 |
| Heddon Bush | Wallace | 239 |
| Hedgehope | Southland | 227 |
| Hekeia | Wallace | 111 |
| Helensbrook | Bruce | 146 |
| Henderson | Waitemata | 874 |
| Henley | Taieri | 110 |
| Herbert | Waitaki | 461 |
| Herbertville | Patangata | 105 |
| Herekino | Hokianga | 283 |
| Heropuru | Whakatane | 103 |
| Heriot | Tuapeka | 331 |
| Herriesville | Piako | 239 |
| Hexton | Cook | 115 |
| Highbank | Ashburton | 313 |
| Highcliff | Peninsula | 178 |
| Hihitahi | Wanganui | 279 |
| Hikimutu | Kaitieke | 100 |
| Hikuai | Thames | 107 |
| Hikutaia | Ohinemuri | 374 |
| Hilderthorpe | Waitaki | 105 |
| Hillend | Bruce | 151 |
| Hillmorton | Waimairi | 358 |
| Hillsborough | Eden | 264 |
| Hillsborough | Taranaki | 144 |
| Hillsborough | Heathcote | 265 |
| Hillside | Waikato | 149 |
| Hilton | Geraldine | 186 |
| Himatangi | Manawatu | 122 |
| Hinakura | Featherston | 117 |
| Hinds | Ashburton | 379 |
| Hinuera | Matamata | 206 |
| Hoanga | Hobson | 153 |
| Hobsonville | Waitemata | 207 |
| Hokonui | Southland | 175 |
| Honikiwi | Waitomo | 104 |
| Hook | Waimate | 342 |
| Hope | Waimea | 387 |
| Horehore | Hobson | 105 |
| Hornby | Paparua | 568 |
| Horokiwi Valley | Hutt | 112 |
| Horopito | Waimarino | 380 |
| Hororata | Selwyn | 432 |
| Horotiu | Waipa | 313 |
| Horrelville | Eyre | 120 |
| Horsham Downs | Waikato | 143 |
| Hoteo | Rodney | 136 |
| Houipapa | Clutha | 159 |
| Howick | Manukau | 483 |
| Huatoki | Taranaki | 178 |
| Huinga | Stratford | 124 |
| Huirangi | Taranaki | 222 |
| Huiroa | Stratford | 203 |
| Hukanui | Eketahuna | 261 |
| Hukarere | Inangahua | 115 |
| Hukatere | Otamatea | 120 |
| Hukerenui | Whangarei | 309 |
| Humphrey's Gully | Westland | 105 |
| Hunter | Waimate | 255 |
| Hunua | Franklin | 206 |
| Hurimoana | Whangamomona | 113 |
| Hurleyville | Patea | 192 |
| Hyde | Maniototo | 156 |
| Ida Valley | Maniototo | 131 |
| Ihaia | Egmont | 111 |
| Ihakara | Horowhenua | 138 |
| Ihumata | Manukau | 105 |
| Ihuraua | Mauriceville | 134 |
| Ikamatua | Inangahua | 109 |
| Inaha | Hawera | 293 |
| Inangahua Junction | Inangahua | 120 |
| Incholme | Waitaki | 103 |
| Irwell | Ellesmere | 259 |
| Isla Bush | Wallace | 139 |
| Islington | Paparua | 266 |
| Janefield | Taieri | 112 |
| Judgeford | Hutt | 101 |
| Kaeo | Whangaroa | 180 |
| Kahuika | Clutha | 102 |
| Kahukura | Waiapu | 139 |
| Kaihu | Hobson | 238 |
| Kai Iwi | Waitotara | 258 |
| Kaikohe | Bay of Islands | 356 |
| Kaikoura | Kaikoura | 410 |
| Kaimata | Taranaki | 360 |
| Kainui | Awatere | 103 |
| Kaipaki | Waipa | 177 |
| Kaipara Flats | Rodney | 123 |
| Kairanga | Kairanga | 406 |
| Kaitaia | Mongonui | 519 |
| Kaitawa | Pahiatua | 161 |
| Kaiti | Cook | 723 |
| Kaituna | Marlborough | 103 |
| Kaituna Valley | Wairewa | 140 |
| Kaiwaka | Otamatea | 148 |
| Kakahi | Kaitieke | 510 |
| Kakahu | Geraldine | 156 |
| Kakanui | Waitaki | 233 |
| Kakaramea | Patea | 262 |
| Kanieri | Westland | 219 |
| Kapuka | Southland | 134 |
| Kapuni | Waimate West | 460 |
| Karaka | Franklin | 253 |
| Karamea | Buller | 240 |
| Karamu | Raglan | 173 |
| Karangahake | Ohinemuri | 790 |
| Kariotahi | Franklin | 108 |
| Karopiro | Matamata | 132 |
| Katea | Clutha | 101 |
| Katikati | Tauranga | 261 |
| Kauaeranga Valley | Thames | 137 |
| Kaukapakapa | Waitemata | 399 |
| Kaupokonui | Waimate West | 461 |
| Kaurihohore | Whangarei | 120 |
| Kauroo Hill | Waitaki | 129 |
| Kauwhata | Kairanga | 148 |
| Kawhatau | Kiwitea | 137 |
| Kelso | Tuapeka | 165 |
| Kennington | Southland | 378 |
| Kerikeri | Bay of Islands | 102 |
| Kerrytown | Levels | 118 |
| Kia Ora | Waitaki | 128 |
| Killinchy | Ellesmere | 220 |
| Kimbell | Mackenzie | 128 |
| Kimberley | Malvern | 143 |
| Kimihia | Waikato | 375 |
| Kingsdown | Levels | 189 |
| Kiokio | Waitomo | 199 |
| Kirikopuni | Hobson | 107 |
| Kiripaka | Whangarei | 207 |
| Kiritaki | Woodville | 188 |
| Kirwee | Malvern | 289 |
| Kiwitahi | Piako | 139 |
| Knapdale | Southland | 157 |
| Kohekohe | Franklin | 113 |
| Kohi | Patea | 137 |
| Kohimarama | Eden | 225 |
| Kohinui | Pahiatua | 179 |
| Kohuratahi | Whangamomona | 255 |
| Koiterangi | Westland | 175 |
| Kokatahi | Westland | 184 |
| Komakorau | Waikato | 135 |
| Komata | Ohinemuri | 158 |
| Konini | Pahiatua | 261 |
| Kopu | Thames | 125 |
| Kopuaranga | Masterton | 121 |
| Koputaroa | Horowhenua | 199 |
| Korakonui | West Taupo | 106 |
| Korere | Waimea | 132 |
| Korito | Taranaki | 157 |
| Koromatua | Waipa | 149 |
| Kotuku | Grey | 101 |
| Koutu | Hokianga | 100 |
| Kuaotunu | Coromandel | 122 |
| Kumeroa | Woodville | 125 |
| Kumeu | Waitemata | 128 |
| Kurow | Waitaki | 340 |
| Kururau | Ohura | 111 |
| Kyeburn | Maniototo | 151 |
| Ladbrook's | Paparua | 253 |
| Lakeside | Ellesmere | 271 |
| Lansdowne | Masterton | 734 |
| Lauder | Vincent | 176 |
| Lauriston | Ashburton | 162 |
| Leeston | Ellesmere | 762 |
| Leigh | Rodney | 119 |
| Leithfield | Kowai | 170 |
| Lepperton | Taranaki | 291 |
| Levels | Levels | 252 |
| Limehills | Southland | 382 |
| Limestone Island | Whangarei | 138 |
| Lincoln | Springs | 520 |
| Lindsay | Waipawa | 229 |
| Linton | Kairanga | 460 |
| Lismore | Ashburton | 145 |
| Little Akaloa | Akaroa | 140 |
| Little River | Wairewa | 161 |
| Livingstone | Waitaki | 186 |
| Loburn | Ashley | 185 |
| Lochiel | Southland | 326 |
| Longbeach | Ashburton | 113 |
| Longburn | Kairanga | 602 |
| Longbush | Southland | 251 |
| Longridge | Southland | 205 |
| Lome | Southland | 175 |
| Lovell's Flat | Bruce | 227 |
| Lowburn Ferry | Vincent | 236 |
| Lowcliffe | Ashburton | 158 |
| Lowgarth | Stratford | 216 |
| Lyndhurst | Ashburton | 178 |
| Lyndon | Amuri | 173 |
| Mabel Bush | Southland | 203 |
| Macandrew Bay | Peninsula | 103 |
| Mackaytown | Ohinemuri | 209 |
| Mackenzie | Cheviot | 175 |
| McNab | Southland | 112 |
| Macrae's | Waihemo | 125 |
| Maerewhenua | Waitaki | 106 |
| Mahakipawa | Marlborough | 119 |
| Maheno | Waitaki | 424 |
| Mahoe | Stratford | 198 |
| Mahoenui | Awakino | 112 |
| Mahurangi | Rodney | 108 |
| Maitland | Southland | 145 |
| Makara | Makara | 170 |
| Makaraka | Cook | 280 |
| Makaretu | Waipawa | 268 |
| Makarewa | Southland | 591 |
| Makauri | Cook | 184 |
| Makikihi | Waimate | 346 |
| Makino | Oroua | 163 |
| Makirikiri | Wanganui | 294 |
| Mangamaire | Pahiatua | 138 |
| Makotuku | Dannevirke | 230 |
| Makuri | Pahiatua | 187 |
| Mamaku | Rotorua | 486 |
| Manakau | Horowhenua | 455 |
| Manawapou | Hawera | 222 |
| Manawaru | Piako | 363 |
| Mandeville | Southland | 164 |
| Mangaiti | Ohinemuri | 159 |
| Mangamahu | Wanganui | 164 |
| Mangamaire | Pahiatua | 154 |
| Mangamutu | Pahiatua | 116 |
| Mangaonoho | Rangitikei | 153 |
| Mangapai | Whangarei | 248 |
| Mangapehi | Waitomo | 277 |
| Mangapiko | Waipa | 141 |
| Mangaramarama | Pahiatua | 137 |
| Mangarawa | Woodville | 108 |
| Mangatainoka | Pahiatua | 454 |
| Mangateretere | Hawke's Bay | 207 |
| Mangatete | Mongonui | 113 |
| Mangatoki | Eltham | 408 |
| Mangatoro | Dannevirke | 123 |
| Mangawai | Otamatea | 109 |
| Mangawhata | Manawatu | 113 |
| Mangawhero Valley' | Matamata | 101 |
| Manger© | Manukau | 673 |
| Mangere Bridge | Manukau | 285 |
| Mangonui | Mongonui | 230 |
| Mangorei | Taranaki | 263 |
| Manuherikia | Vincent | 147 |
| Manutahi | Patea | 262 |
| Manutuke' | Cook | 316 |
| Mapiu | Waitomo | 171 |
| Maraekakaho | Hawke's Bay | 236 |
| Maraetotara | Hawke's Bay | 116 |
| Marakopa' | Awakino | 105 |
| Mareretu | Otamatea | 123 |
| Marotiri | Manawatu | 101 |
| Marshland | Waimairi | 669 |
| Marshlands | Marlborough | 112 |
| Marton Junction | Rangitikei | 544 |
| Marua | Whangarei | 170 |
| Mata | Eltham | 124 |
| Matahiwi | Masterton | 106 |
| Matahuru | Waikato | 164 |
| Matakana | Rodney | 352 |
| Manuherikia | Vincent | 159 |
| Matakitaki | Murchison | 152 |
| Matakohe | Otamatea | 197 |
| Matamata | Matamata | 958 |
| Matamau | Dannevirke | 283 |
| Matangi | Waikato | 199 |
| Matapu | Eltham | 375 |
| Matarawa | Wairarapa South | 160 |
| Mataroa | Rangitikei | 385 |
| Matata | Whakatane | 183 |
| Matatoki | Thames | 127 |
| Mataura Island | Southland | 304 |
| Matawai | Waikohu | 498 |
| Matawhero | Cook | 253 |
| Matiere | Ohura | 271 |
| Matuku | Wallace | 113 |
| Mauku | Franklin | 283 |
| Maungakaramea | Whangarei | 280 |
| Maungakawa | Piako | 110 |
| Maungatapere | Whangarei | 215 |
| Maungatautari | Matamata | 101 |
| Maungatawhiri | Franklin | 150 |
| Maungatua | Taieri | 210 |
| Maungaturoto | Otamatea | 194 |
| Maunu | Whangarei | 392 |
| Mauriceville | Mauriceville | 343 |
| Ma-waro | Mackenzie | 128 |
| Maxwelltown | Waitotara | 234 |
| Mayfield | Ashburton | 297 |
| Meadowbank | Waitaki | 110 |
| Medbury | Waipara | 105 |
| Meeanee | Hawke's Bay | 152 |
| Menzies Ferry | Southland | 232 |
| Meremere | Hawera | 330 |
| Merton | Waikouaiti | 152 |
| Methven | Ashburton | 760 |
| Middlemarch | Taieri | 338 |
| Midhirst | Stratford | 711 |
| Milburn | Bruce | 216 |
| Miller's Flat | Tuapeka | 365 |
| Millerton | Buller | 843 |
| Miro | Taranaki | 185 |
| Mitcham | Ashburton | 169 |
| Moa Creek | Vincent | 189 |
| Moa Flat | Tuapeka | 160 |
| Moawhango | Rangitikei | 120 |
| Moeraki | Waitaki | 133 |
| Mohaka | Wairoa | 133 |
| Mokai | East Taupo | 199 |
| Mokau | Awakino | 171 |
| Mokauiti | Waitomo | 217 |
| Mokoia | Hawera | 111 |
| Mokoreta | Southland | 131 |
| Mokotua | Southland | 148 |
| Momona | Taieri | 216 |
| Monavale | Waipa | 172 |
| Moneymore | Bruce | 150 |
| Morley | Wallace | 168 |
| Morrison's Bush | Featherston | 162 |
| Morton Mains | Southland | 290 |
| Morven | Waimate | 546 |
| Mosgiel Junction | Taieri | 225 |
| Mossburn | Taieri | 123 |
| Mossburn | Wallace | 180 |
| Mosstown | Waitotara | 229 |
| Motu | Waikohu | 184 |
| Motuhora | Opotiki | 106 |
| Motukaraka | Hokianga | 119 |
| Motukarara | Springs | 125 |
| Motumaoho | Piako | 215 |
| Motunau | Waipara | 105 |
| Motunui | Clifton | 107 |
| Motupipi | Takaka | 210 |
| Mount Albert | Eden | 226 |
| Mount Roskill | Eden | 136 |
| Mount St. John | Eden | 1,107 |
| Mount Smart | Eden | 156 |
| Mount Somers | Ashburton | 277 |
| Mount Wellington | Edon | 212 |
| Moutere | Waimea | 325 |
| Moutoa | Manawatu | 216 |
| Murchison | Murchison | 318 |
| Muriwai | Cook | 157 |
| Myross Bush | Southland | 189 |
| Nainai | Hutt. | 319 |
| Naumai | Otamatea | 232 |
| Nelson Creek | Grey | 163 |
| Netherton | Ohinemuri | 360 |
| Neudorf | Waimea | 178 |
| Nevis | Vincent | 132 |
| Newborough | Waitaki | 187 |
| Newbury | Kairanga | 261 |
| Newlands | Makara | 135 |
| Newman | Eketahuna | 193 |
| Newstead | Waikato | 152 |
| Ngaawapurua | Woodville | 122 |
| Ngaere | Stratford | 348 |
| Ngahauranga | Makara | 219 |
| Ngahere | Grey | 233 |
| Ngakawau | Buller | 157 |
| Ngamatea | Wanganui | 123 |
| Ngamoko | Dannivirke | 110 |
| Ngapara | Waitaki | 285 |
| Ngarua | Piako | 186 |
| Ngataki | Mongonui | 140 |
| Ngatapa | Cook | 322 |
| Ngatea | Thames | 159 |
| Ngatimoti | Waimea | 152 |
| Ngongotaha | Rotorua | 305 |
| Ngutuwera | Patea | 111 |
| Nightcaps | Wallace | 439 |
| Nihotapu | Waitemata | 101 |
| Nireaha | Ekotahuna | 323 |
| Nokomai | Southland | 114 |
| Nolantown | Hawera | 364 |
| Normandale | Hutt | 111 |
| North Loburn | Ashley | 145 |
| Norton Road | Waipa | 110 |
| Norton's Reserve | Waimate | 114 |
| No. 2 Line | Wanganui | 113 |
| Nuhaka | Wairoa | 150 |
| Nydia Bay | Sounds | 110 |
| Oakura | Taranaki | 206 |
| Oaonui | Egmont | 377 |
| Oeo | Egmont | 204 |
| Ohaeawai | Bay of Islands | 133 |
| Ohakea | Manawatu | 103 |
| Ohangai | Hawera | 121 |
| Ohape | Geraldine | 154 |
| Ohariu | Makara | 227 |
| Ohau | Horowhenua | 251 |
| Ohinewai | Waikato | 293 |
| Ohingaiti | Rangitikei | 309 |
| Ohoka | Eyre | 263 |
| Ohura | Ohura | 205 |
| Oio | Kaitieke | 102 |
| Okahu | Hobson | 108 |
| Okahukura | Ohura | 281 |
| Okaiawa | Hawera | 301 |
| Okaihau | Bay of Islands | 131 |
| Okain's Bay | Akaroa | 281 |
| Okate | Taranaki | 456 |
| Okau | Clifton | 110 |
| Okauia | Matamata | 121 |
| Okoia | Wanganui | 273 |
| Okoroire | Matamata | 265 |
| Okuramio | Marlborough | 167 |
| Omaka | Marlborough | 126 |
| Omakau | Vincent | 179 |
| Omanawa | Tauranga | 123 |
| Omata | Taranaki | 235 |
| Omihi | Waipara | 202 |
| Onetea | Hobson | 109 |
| One Tree Hill | Eden | 924 |
| Onewhero | Raglan | 285 |
| Ongaonga | Waipawa | 330 |
| Ongarue | Ohura | 141 |
| Opaki | Masterton' | 148 |
| Oparau | Kawhia | 110 |
| Oparure | Waitomo | 187 |
| Ophir | Vincent | 110 |
| Opouriao | Whakatane | 250 |
| Opouri Valley | Marlborough | 121 |
| Opua | Bay of Islands | 103 |
| Opuatia | Raglan | 110 |
| Orakipaoa | Geraldine | 116 |
| Orari | Geraldine | 256 |
| Oratia | Waitemata | 193 |
| Orawia | Wallace | 255 |
| Orepuki | Wallace | 746 |
| Oreti | Southland | 174 |
| Orini | Waikato | 198 |
| Ormond | Cook | 523 |
| Orongo | Thames | 108 |
| Oropi | Tauranga | 172 |
| Oroua Downs | Manawatu | 136 |
| Otaika | Whangarei | 316 |
| Otaio | Waimate | 222 |
| Otakeho | Waimate West | 324 |
| Otama | Southland | 123 |
| Otapiri | Southland | 138 |
| Otara | Opotiki | 214 |
| Otara | Southland | 286 |
| Otatara | Southland | 191 |
| Otaua | Franklin | 346 |
| Otauwhao | Waipawa | 213 |
| Otekaike | Waitaki | 308 |
| Otewa | Waitomo | 1ll |
| Otiake | Waitaki | 130 |
| Otipua | Levels | 164 |
| Otira | Westland | 462 |
| Otokia | Taieri | 301 |
| Otoko | Waikohu | 172 |
| Otumoetai | Tauranga | 128 |
| Oturehua | Maniototo | 167 |
| Oturoa | Rotorua | 136 |
| Ouruhia | Waimairi | 190 |
| Overdale | Ashburton | 124 |
| Owaka | Clutha | 576 |
| Owhango | Kaitieke | 667 |
| Oxford | Oxford | 989 |
| Paekakariki | Hutt | 382 |
| Paemako | Waitomo | 110 |
| Paengaroa | Tauranga | 238 |
| Paerata | Franklin | 146 |
| Pahia | Wallace | 212 |
| Pakihikura | Kiwitea | 104 |
| Pakipaki | Hawke's Bay | 200 |
| Pakowhai | Hawke's Bay | 236 |
| Pakuranga | Manukau | 249 |
| Pangatotara | Waimea | 162 |
| Panmure | Eden | 400 |
| Papakaio | Waitaki | 232 |
| Papamoa | Tauranga | 210 |
| Papanui | Waimairi | 2,844 |
| Paparangi | Makara | 123 |
| Paparata | Franklin | 158 |
| Paparoa | Otamatea | 331 |
| Papatawa | Woodville | 147 |
| Papatoitoi | Manukau | 1,062 |
| Papatotara | Wallace | 145 |
| Parakai | Waimarino | 195 |
| Parapara | Waimarino | 146 |
| Paraparaumu | Hutt | 356 |
| Parawai | Thames | 604 |
| Paremata | Hutt | 115 |
| Pareora | Levels | 330 |
| Parkvale | Wairarapa South | 276 |
| Parnassus | Cheviot | 108 |
| Paroa | Grey | 116 |
| Parua Bay | Whangarei | 127 |
| Patearoa | Maniototo | 228 |
| Paterangi | Waipa | 221 |
| Patetere | Matamata | 111 |
| Patoka | Hawke's Bay | 133 |
| Patumahoe | Franklin | 328 |
| Patutahi | Cook | 649 |
| Pelorus Valley | Marlborough | 66 |
| Pemberton | Kiwitea | 64 |
| Pembroke | Lake | 113 |
| Pembroke Road | Stratford | 106 |
| Peninsula | Kaikoura | 134 |
| Penrose | Eden | 307 |
| Peria | Mongonui | 133 |
| Petane | Hawke's Bay | 271 |
| Piha | Waitemata | 137 |
| Pihama | Egmont | 328 |
| Pine Bush | Southland | 141 |
| Piopio | Waitomo | 311 |
| Pipiriki | Waimarino | 334 |
| Pipiroa | Thames | 121 |
| Piriaka | Kaitieke | 270 |
| Pirinoa | Featherston | 225 |
| Piripiri | Dannevirke | 201 |
| Pirongia | Waipa | 182 |
| Pirongia West | Kawhia | 122 |
| Pleasant Valley | Geraldine | 209 |
| Plimmerton | Hutt | 247 |
| Pohangina | Pohangina | 249 |
| Pohangina Valley | Oroua | 233 |
| Pohokura | Whangamomona | 145 |
| Point Chevalier | Eden | 556 |
| Pokeno | Franklin | 362 |
| Pongakawa | Tauranga | 150 |
| Pongara | Akitio | 487 |
| Poolburn | Vincent | 103 |
| Porangahau | Patangata | 405 |
| Porewa | Rangitikei | 140 |
| Porirua | Makara | *1,399 |
| Port Albert | Rodney | 266 |
| Portland | Whangarei | 204 |
| Portobello | Peninsula | 188 |
| Poukawa | Hawke's Bay | 195 |
| Pourakino | Wallace | 103 |
| Prebbleton | Paparua | 484 |
| Puaha | Wairewa | 176 |
| Puerua | Clutha | 110 |
| Puha | Waikohu | 205 |
| Puhoi | Rodney | 274 |
| Pukahu | Hawke's Bay | 169 |
| Pukehinau | Akitio | 111 |
| Pukehou | Waipawa | 100 |
| Pukehuia | Hobson | 161 |
| Pukekohe East | Franklin | 229 |
| Pukekohe Hill | Franklin | 121 |
| Pukekohe | Waipa | 173 |
| Pukemiro | Raglan | 223 |
| Pukengahu | Stratford | 127 |
| Pukenui | Mongonui | 123 |
| Pukerau | Southland | 313 |
| Pukerimu | Waipa | 161 |
| Pukeroro | Waikato | 102 |
| Puketapu | Hawke's Bay | 173 |
| Puketitiri | Hawke's Bay | 143 |
| Puketurua | Matamata | 104 |
| Pukeuri | Waitaki | 227 |
| Pungapunga | West Taupo | 216 |
| Pungarehu | Egmont | 210 |
| Puni | Franklin | 293 |
| Puuiho | Taranaki | 147 |
| Puponga | Collingwood | 157 |
| Purakanui | Waikouaiti | 134 |
| Purekireki | Clutha | 104 |
| Puriri | Thames | 278 |
| Putaruru | Matamata | 308 |
| Putiki | Wanganui | 203 |
| Rahotu | Egmont | 318 |
| Rakaia | Ashburton | 536 |
| Rakaia Gorge | Ashburton | 104 |
| Rakaunui | Akitio | 121 |
| Rakauroa | Waikohu | 145 |
| Ramarama | Franklin | 252 |
| Ranfurly | Maniototo | 346 |
| Rangiahua | Hokianga | 119 |
| Rangiotu | Manawatu | 313 |
| Rangiriri | Waikato | 113 |
| Rangitata | Geraldine | 139 |
| Rangitata Island | Geraldine | 100 |
| Rangitikei Line | Kairanga | 132 |
| Rangitikei River Bank | Manawatu | 107 |
| Rangitumau | Masterton | 134 |
| Rangiwahia | Kiwitea | 216 |
| Rapaura | Marlborough | 168 |
| Rata | Rangitikei | 100 |
| Ratanui | Clutha | 167 |
| Ratapiko | Taranaki | 133 |
| Raumai | Pohangina | 315 |
| Raumati | Dannevirke | 124 |
| Raupo | Otamatea | 138 |
| Raurimu | Kaitieke | 631 |
| Rawene | Hokianga | 327 |
| Rawhitiroa | Eltham | 181 |
| Redcliffe | Waimato | 200 |
| Redhill | Hobson | 151 |
| Redwoodtown | Marlborough | 282 |
| Reefton | Inangahua | 1,623 |
| Reidston | Waitaki | 117 |
| Reikorangi | Hutt | 114 |
| Renwicktown | Marlborough | 350 |
| Rewanui | Grey | 152 |
| Richmond | Waitaki | 111 |
| Richmond Grove | Southland | 207 |
| Rimu | Westland | 288 |
| Rimu | Southland | 115 |
| Rissington | Hawke's Bay | 136 |
| Riverhead | Waitemata | 336 |
| Riverlea | Eltham | 109 |
| Riversdale | Southland | 320 |
| Riverside | Taieri | 106 |
| Riwaka | Waimea | 716 |
| Rockville | Collingwood | 175 |
| Rolleston | Paparua | 206 |
| Romahapa | Clutha | 208 |
| Rongokokako | Eketahuna | 145 |
| Rongomai | Eketahuna | 152 |
| Rosebank | Eden | 435 |
| Rosebank | Clutha | 219 |
| Rotherham | Amuri | 248 |
| Roto-o-rangi | West Taupo | 128 |
| Rotorangi | Waipa | 146 |
| Rototuna | Waikato | 193 |
| Round Hill | Wallace | 155 |
| Ruakaka | Whangarei | 207 |
| Ruakaka | Ohinemuri | 118 |
| Ruakapuka | Geraldine | 179 |
| Ruakituri | Wairoa | 128 |
| Ruakoa | Dannevirke | 169 |
| Ruakura | Waikato | 152 |
| Ruapuna | Ashburton | 136 |
| Ruatangata | Whangarei | 170 |
| Ruatapu | Westland | 206 |
| Ruawai | Otamatea | 306 |
| Ruawhata | Pahiatua | 120 |
| Rukuhia | Waipa | 258 |
| Runciman | Franklin | 101 |
| Ruru | Grey | 125 |
| Russell | Bay of Islands | 220 |
| Russell's Flat | Tawera | 108 |
| Ryal Bush | Southland | 289 |
| Saddle Hill | Taieri | 108 |
| St. Andrew's | Waimate | 541 |
| St. Bathan's | Maniototo | 161 |
| St. Heliers | Eden | 507 |
| St. Martin's | Heathcote | 360 |
| Sandon Block | Kiwitea | 109 |
| Sandymount | Peninsula | 101 |
| Sanson | Manawatu | 391 |
| Sawyer's Bay | Waikouaiti | 536 |
| Scarborough | Pahiatua | 158 |
| Scargill | Waipara | 163 |
| Scott's Ferry | Rangitikei | 165 |
| Scott's Gap | Wallace | 127 |
| Seacliff | Waikouaiti | *1,253 |
| Seadown | Levels | 334 |
| Seatoun | Peninsula | 159 |
| Seaward Downs | Southland | 274 |
| Seddon | Awatere | 208 |
| Seddonville | Buller | 187 |
| Sefton | Kowai | 253 |
| Selwyn | Ellesmere | 105 |
| Sentry Hill | Taranaki | 114 |
| Shag Point | Waihemo | 111 |
| Shannon | Horowhenua | 560 |
| Sheffield | Malvern | 201 |
| Sherwood Downs | Mackenzie | 163 |
| Shirley | Waimairi | 338 |
| Shortland | Thames | 899 |
| Silverdale | Waitemata | 252 |
| Silverstream | Hutt | 110 |
| Sockburn | Paparua | 512 |
| Solway | Masterton | 180 |
| South Beach | Grey | 158 |
| Southbrook | Rangiora | 346 |
| Southburn | Waimate | 130 |
| South Hillend | Wallace | 111 |
| South Rakaia | Ashburton | 162 |
| Spar Bush | Southland | 149 |
| Spotswood | Taranaki | 173 |
| Spotswood | Cheviot | 150 |
| Spreadeagle | Ashburton | 109 |
| Springbank | Rangiora | 120 |
| Springburn | Ashburton | 101 |
| Spring Greek | Marlborough | 191 |
| Springfield | Ashburton | 189 |
| Springfield | Tawera | 308 |
| Spring Grove | Waimea | 254 |
| Springlands | Marlborough | 699 |
| Springston | Springs | 259 |
| Springston South | Springs | 393 |
| Springvale | Waitotara | 158 |
| Stafford | Westland | 104 |
| Stanley Brook | Waimea | 129 |
| Stanway | Oroua | 175 |
| Starborough | Awatere | 187 |
| Staveley | Ashburton | 158 |
| Stirling | Bruce | 564 |
| Stockton | Buller | 101 |
| Stoke | Waimea | 727 |
| Strathmore | Whangamomona | 113 |
| Streamlands | Rodney | 108 |
| Studholme Junction | Waimate | 285 |
| Styx | Waimairi | 328 |
| Sunnyside | Waimairi | *765 |
| Sutherland's | Levels | 254 |
| Sutton | Taieri | 114 |
| Swannanoa | Eyre | 146 |
| Swanson | Waitemata | 263 |
| Tadmor | Waimea | 206 |
| Tahaia | Waitomo | 102 |
| Tahakopa | Clutha | 186 |
| Tahatika | Clutha | 132 |
| Tahora | Whangamomona | 182 |
| Tahoraite | Dannevirke | 157 |
| Tahuna | Ohinemuri | 205 |
| Tahunanui | Waimea | 298 |
| Tahora | Cook | 123 |
| Taieri East | Taieri | 261 |
| Taieri North | Taieri | 269 |
| Taikorea | Manawatu | 207 |
| Tairua | Thames | 112 |
| Taita | Hutt | 355 |
| Tai Tapu | Halswell | 466 |
| Takahu | Mongonui | 126 |
| Takaiwhata | Waikato | 129 |
| Takaka East | Takaka | 130 |
| Takamatua | Akaroa | 119 |
| Takapau | Waipawa | 442 |
| Tamahere | Waikato | 222 |
| Tamaki West | Eden | 132 |
| Tamumu | Patangata | 136 |
| Taneatua | Whakatane | 388 |
| Tangihua | Whangarei | 112 |
| Tangiteroria | Hobson | 107 |
| Tangowahine | Hobson | 148 |
| Taonui | Oroua | 265 |
| Taoroa | Rangitikei | 114 |
| Tarangaturi | Southland | 105 |
| Tarata | Clifton | 190 |
| Taratahi | Wairarapa South | 290 |
| Tariki | Taranaki | 505 |
| Taringamotu | West Taupo | 167 |
| Tarras | Vincent | 127 |
| Taruheru | Cook | 218 |
| Tarurutangi | Taranaki | 198 |
| Tasman | Waimea | 184 |
| Tataraimaka | Taranaki | 193 |
| Tatarariki | Hobson | 235 |
| Tataunui | Piako | 166 |
| Taueru | Masterton | 142 |
| Tauhei | Piako | 243 |
| Tauherenikau | Featherston | 178 |
| Tauhoa | Rodney | 148 |
| Taupiri | Waikato | 358 |
| Taupo | East Taupo | 103 |
| Tautari | West Taupo | 182 |
| Tauwhare | Waikato | 257 |
| Tawa Flat | Makara | 191 |
| Tawai | Waimate | 129 |
| Tawaka | Featherston | 272 |
| Tawanui | Clutha | 105 |
| Tawhiti | Hawera | 109 |
| Tayforth | Waitotara | 212 |
| Te Araroa | Waiapu | 280 |
| Te Atatu | Waitemata | 179 |
| To Hana | Rodney | 107 |
| Te Hirau | Raglan | 137 |
| To Horo | Horowhenua | 256 |
| Te Houka | Clutha | 124 |
| Te Kapo | Mackenzie | 119 |
| Te Karaka | Waikohu | 467 |
| Te Kawa | West Taupo | 135 |
| Te Kinga | Grey | 142 |
| Te Kiri | Egmont | 292 |
| Te Kopuru | Hobson | 637 |
| To Kowhai | Waipa | 289 |
| To Mapara | Waitomo | 201 |
| Te Mata | Raglan | 235 |
| Te Mata | Hawke's Bay | 334 |
| Te Mawhai | West Taupo | 120 |
| Templeton | Paparua | 658 |
| Tengawai | Mackenzie | 157 |
| Te Oreore | Masterton | 175 |
| Te Papakuhu | Dannevirke | 189 |
| Te Poliue | Hawke's Bay | 206 |
| Te Poi | Matamata | 152 |
| Terakohe | Takaka | 127 |
| Te Rapa | Waipa | 255 |
| Te Rehunga | Dannevirke | 406 |
| Te Rore | Waipa | 128 |
| Te Roti | Eltham | 273 |
| Te Tua | Wallace | 199 |
| Te Waewae | Wallace | 106 |
| The Mount | Tauranga | 142 |
| The Peaks | Waipara | 117 |
| Thornbury | Wallace | 304 |
| Three Kings | Eden | 258 |
| Tihaka | Wallace | 109 |
| Tikokino | Waipawa | 289 |
| Tikorangi | Clifton | 288 |
| Timatanga | Marlborough | 115 |
| Tiniroto | Cook | 171 |
| Tinui | Castlepoint | 191 |
| Tirau | Matamata | 235 |
| Tiriraukawa | Rangitikei | 126 |
| Tisbury | Southland | 155 |
| Titirangi | Waitemata | 203 |
| Titoki | Whangarei | 110 |
| Ti-tree Point | Weber | 103 |
| Tokanui | West Taupo | *259 |
| Tokanui | Southland | 177 |
| Tokaora | Hawera | 110 |
| Tokarahi | Waitaki | 247 |
| Tokatoka | Otamatea | 106 |
| Toko | Stratford | 525 |
| Tokoiti | Bruce | 217 |
| Tokomaru | Horowhenua | 599 |
| Tokomaru Bay | Waiapu | 806 |
| Tolaga Bay | Cook | 381 |
| Tongaporutu | Clifton | 146 |
| Totara | Whangaroa | 133 |
| Totara | Waitaki | 268 |
| Totara Flat | Grey | 115 |
| Totara Valley | Levels | 176 |
| Towai | Bay of Islands | 132 |
| Trentham | Hutt | 592 |
| Tuamarina | Marlborough | 296 |
| Tuapaki | Waitemata | 203 |
| Tuapeka Flat | Tuapeka | 114 |
| Tuapeka Mount | Tuapeka | 121 |
| Tuapeka West | Tuapeka | 150 |
| Tuatapere | Wallace | 401 |
| Tuparoa | Waiapu | 130 |
| Turakina | Rangitikei | 100 |
| Turakina Valley | Rangitikei | 257 |
| Turangarere | Wanganui | 168 |
| Turua | Thames | 187 |
| Tussock Creek | Southland | 139 |
| Tutaenui | Rangitikei | 161 |
| Tutaenui, Upper | Rangitikei | 214 |
| Tuturau | Southland | 349 |
| Twyford | Hawke's Bay | 162 |
| Tycho | Levels | 110 |
| Umukuri | Waimea | 289 |
| Umutaoroa | Dannevirke | 201 |
| Umutoi | Pohangina | 114 |
| Upper Plain | Masterton | 327 |
| Upper Spring Creek | Marlborough | 107 |
| Urenui | Clifton | 364 |
| Uruti | Clifton | 246 |
| Utiku | Rangitikei | 586 |
| Utuwai | Pohangina. | 112 |
| Victoria Valley | Mongonui | 172 |
| View Hill | Oxford | 141 |
| Waddington | Malvern | 251 |
| Waerenga | Waikato | 179 |
| Waerengaahika | Cook | 263 |
| Waharoa | Matamata | 258 |
| Waianakarua | Waitaki | 103 |
| Waianiwa | Southland | 304 |
| Waiareka | Waitaki | 136 |
| Waiau | Franklin | 180 |
| Waiau | Amuri | 244 |
| Waihakeke | Wairarapa South | 148 |
| Waihaorunga | Waimato | 157 |
| Waiharara | Mongonui | 107 |
| Waihi Plains | Ohinemuri | 169 |
| Waihoanga | Horowhenua | 120 |
| Waihola | Bruce | 222 |
| Waihopo | Mongonui | 270 |
| Waihou | Piako | 598 |
| Wai-iti | Waimea | 144 |
| Waikaia | Southland | 301 |
| Waikaka | Southland | 235 |
| Waikaka Valley | Southland | 309 |
| Waikanae | Horowhenua | 274 |
| Waikari | Waipara | 438 |
| Waikawa | Southland | 154 |
| Waikeria | West Taupo | 106 |
| Waikiekie | Whangarei | 190 |
| Waikino | Ohinemuri | 779 |
| Waikiwi | Southland | 583 |
| Waikohu | Waikohu | 155 |
| Waikoikoi | Clutha | 220 |
| Waikuku | Rangiora | 205 |
| Waikumete | Waitemata | 441 |
| Waimahaka | Southland | 159 |
| Waimamaku | Hokianga | 174 |
| Waimana | Whakatane | 225 |
| Waimangaroa | Buller | 287 |
| Waimata | Cook | 222 |
| Waimataitai | Levels | 253 |
| Waimate North | Bay of Islands | 127 |
| Waimatua | Southland | 103 |
| Waimatuku | Wallace | 235 |
| Waimauku | Waitemata | 217 |
| Waimumu | Southland | 228 |
| Waingake | Cook | 133 |
| Waingaro | Raglan | 138 |
| Wainui | Akaroa | 133 |
| Wainuiomata | Hutt | 169 |
| Waioeka | Opotiki | 221 |
| Waiongona | Taranaki | 213 |
| Waiorongomai | Piako | 224 |
| Waiotahi | Opotiki | 139 |
| Waipahi | Clutha | 186 |
| Waipaoa | Waikohu | 235 |
| Waipara | Waipara | 176 |
| Waipiata | Maniototo | 156 |
| Waipipi | Franklin | 257 |
| Waipiro Bay | Waiapu | 197 |
| Waipu | Whangarei | 328 |
| Waipuku | Stratford | 154 |
| Wairau | Marlborough | 112 |
| Wairau Valley | Marlborough | 182 |
| Wairere | Otamatea | 190 |
| Wairio | Wallace | 279 |
| Wairuna | Clutha | 193 |
| Wairuna | Tuapeka | 378 |
| Waitahuna West | Bruce | 151 |
| Waitakerei | Waitemata | 182 |
| Waitaki South | Waitaki | 108 |
| Waitapu | Kiwitea | 194 |
| Waitapu | Takaka | 128 |
| Waitati | Waikouaiti | 550 |
| Waitekauri | Waitomo | 105 |
| Waiterimu | Waikato | 105 |
| Waitoa | Piako | 454 |
| Waitohi | Geraldine | 236 |
| Waitihu | Horowhenua | 104 |
| Waitotara | Pa tea | 281 |
| Waituhi | West Taupo | 169 |
| Waituna | Waimate | 177 |
| Waituna | Southland | 118 |
| Waiuta | Inangahua | 511 |
| Waiwera | Waitemata | 213 |
| Waiwera South | Clutha | 304 |
| Wakanui | Ashburton | 179 |
| Wakapuaka | Waimea | 150 |
| Wakarara | Waipawa | 124 |
| Wakari | Taieri | 126 |
| Wakefield | Waimea | 776 |
| Wallacetown | Southland | 270 |
| Wallingford | Patangata | 137 |
| Walton | Piako | 320 |
| Wangaehu | Rangitikei | 222 |
| Wangaehu | Masterton | 100 |
| Wanstead | Patangata | 175 |
| Ward | Awatere | 277 |
| Warea | Egmont | 292 |
| Warepa | Clutha | 221 |
| Warrington | Waikouaiti | 203 |
| Washdyke | Levels | 417 |
| Wataroa | Westland | 124 |
| Watershed Road | Oroua | 111 |
| Waterton | Ashburton | 124 |
| Watlington | Levels | 199 |
| Weber | Weber | 207 |
| Wedderburn | Maniototo | 119 |
| Weedon's | Panama | 176 |
| Wellsford | Rodney | 153 |
| Wendon | Southland | 445 |
| Wendonside | Southland | 246 |
| Weraroa | Horowhenua | 640 |
| Westerfield | Ashburton | 236 |
| Western Springs | Eden | 152 |
| Westmere | Waitotara | 317 |
| West Melton | Paparua | 186 |
| Weston | Waitaki | 252 |
| West Plains | Southland | 309 |
| Westshore | Hawke's Bay | 490 |
| Whakamara | Hawera | 130 |
| Whakapara | Whangarei | 153 |
| Whakapirau | Otamatea | 143 |
| Whakaronga | Kairanga | 273 |
| Whakatu | Hawke's Bay | 111 |
| Whangamomona | Whangamomona | 284 |
| Whangarata | Franklin | 169 |
| Whangaripo | Rodney | 148 |
| Whangaroa | Whangaroa | 103 |
| Wharehuia | Stratford | 316 |
| Wharekopae | Waikohu | 108 |
| Wharepoha | Thames | 241 |
| Whatatutu | Waikohu | 222 |
| Whataupoko | Cook | 832 |
| Whatawhata | Waipa | 278 |
| Whenuakura | Patea | 430 |
| Whetukura | Dannevirke | 167 |
| Whitecliffs | Malvern | 183 |
| Whiteman's Valley | Hutt | 127 |
| Whitford | Manukau | 265 |
| Whitianga | Coromandel | 446 |
| Wild Bush | Wallace | 150 |
| Willowbridge | Waimate | 276 |
| Willowby | Ashburton | 200 |
| Wimbledon | Weber | 114 |
| Winchester | Geraldine | 342 |
| Winchmore | Ashburton | 231 |
| Windsor | Waitaki | 267 |
| Wingatui | Taieri | 184 |
| Wiri | Manukau | 155 |
| Woodbury | Geraldine | 356 |
| Woodend | Rangiora | 429 |
| Woodend | Southland | 198 |
| Woodgrove | Waipara | 222 |
| Woodhill | Waitemata | 103 |
| Woodlands | Southland | 432 |
| Woodside | Taieri | 175 |
| Woodstock | Westland | 154 |
| Wrey's Bush | Wallace | 193 |
| Wright's Bush | Southland | 127 |
| Wyfie's Crossing | Taieri | 129 |
| Yaldhurst | Paparua | 278 |
The fact that on Sunday night travelling is at a minimum has been one of the factors in determining that night as the occasion most suitable for the taking of a census. The number of persons on shipboard within territorial waters on census night was 3,085—viz., 2,923 males and 162 females. This shows a decrease of 1,780 on the 1911 figures, partly due, no doubt, to the fact that the 1911 figures included passengers and crews on the weekly intercolonial service (since discontinued) leaving Dunedin for Bluff on Sunday evenings. The 1916 figures include 378 passengers travelling by night on the North Island Main Trunk Railway, the only railway route on which passenger-trains were running at midnight between census Sunday and Monday.
Adjacent to the main Islands are many smaller islands, some of which are of considerable area, and are under cultivation; others are but islets used as sites for lighthouses, while others again are barren and unfitted for human habitation. The Chatham Islands and Great Barrier Island have been constituted counties, and their populations are shown in the list of counties already given. The name and population of each of the inhabited islands as at the census of 1916 are shown in the following table —
| Island. | Population. |
|---|---|
| * Excluding internment camp. | |
| Mokohinau | 8 |
| Kawau | 23 |
| Motuketekete | 2 |
| Moturekareka | 1 |
| Little Barrier | 3 |
| Motuhora | 5 |
| Waiheke to Pakihi | 2 |
| Ponui | 21 |
| Rakino | 6 |
| Motutapu | 20 |
| Motuihi* | 6 |
| Rangitoto | 6 |
| Brown's | 5 |
| Rotoroa | 125 |
| Pakatoa | 43 |
| Tiritiri | 13 |
| Slipper | 2 |
| Cuvier | 7 |
| Mercury | 4 |
| Matakana | 7 |
| Motiti | 6 |
| Somes* | 7 |
| Mana | 1 |
| Kapiti | 3 |
| The Brothers | 3 |
| D'Urville | 87 |
| Stephen | 11 |
| Quarantine | 56 |
| Dog | 12 |
| Centre | 9 |
| Total | 697 |
Since 1901 the boundaries of New Zealand have been extended to include the Cook and certain other Pacific islands, the population of which, as before stated, is dealt with separately at the end of this report.
The densities of population per Islands and per provincial districts at successive census-takings are appended.
| Census Year. | Number of Persons to a Square Mile.* | ||
|---|---|---|---|
| North Island. | South Island. | Both Islands. | |
| * Excluding Maoris. | |||
| 1861 | 0.94 | 0.97 | 0.96 |
| 1871 | 2.20 | 2.70 | 2.39 |
| 1881 | 4.37 | 5.02 | 4.74 |
| 1891 | 6.38 | 5.84 | 6.07 |
| 1901 | 8.85 | 6.46 | 7.48 |
| 1906 | 10.80 | 6.96 | 8.60 |
| 1911 | 12.77 | 7.52 | 9.76 |
| 1916 | 14.75 | 7.58 | 10.64 |
| Provincial District. | Area in Square | Persons to a Square Mile (excluding Maoris). | |||||||
|---|---|---|---|---|---|---|---|---|---|
| 1881. | 1886. | 1891. | 1896. | 1901. | 1906. | 1911. | 1916. | ||
| Auckland | 25,364 | 3.92 | 5.14 | 5.25 | 6.05 | 6.94 | 8.33 | 10.43 | 12.17 |
| Taranaki | 3,732 | 3.98 | 4.82 | 5.91 | 8.35 | 10.14 | 11.63 | 13.82 | 14.99 |
| Hawke's Bay | 4,241 | 4.10 | 5.79 | 6.72 | 8.03 | 8.35 | 9.96 | 11.45 | 12.80 |
| Wellington | 10,807 | 5.68 | 7.17 | 9.04 | 11.28 | 13.08 | 16.64 | 18.42 | 21.48 |
| Marlborough | 4,225 | 2.20 | 2.63 | 3.02 | 2.95 | 3.15 | 3.40 | 3.78 | 3.93 |
| Nelson | 10,875 | 2.40 | 2.78 | 3.20 | 3.29 | 3.49 | 3.91 | 4.46 | 3.98 |
| Westland | 4,881 | 3.08 | 3.26 | 3.25 | 2.96 | 2.97 | 3.01 | 3.22 | 3.18 |
| Canterbury | 13,858 | 8.11 | 8.77 | 9.28 | 9.82 | 10.34 | 11.50 | 12.52 | 13.12 |
| Otago— | |||||||||
| Otago portion | 13,957 | 7.70 | 8.15 | 8.32 | 8.60 | 8.98 | 9.16 | 9.52 | 9.42 |
| Southland portion | 11,358 | 2.34 | 3.12 | 3.26 | 3.87 | 4.21 | 4.67 | 5.17 | 5.25 |
| Totals | 103,298 | 4.74 | 5.60 | 6.07 | 6.81 | 7.48 | 8.60 | 9.76 | 10.64 |
NOTE.—Certain uninhabited outlaying islands (area, 283 square miles) are not included for the purpose of this table.
The Number of persons per square mile in each country at the census of October, 1916, was as follows —
| County. | Parsons per Square Mile. |
|---|---|
| Mongonui | 4.07 |
| Whangaroa | 3.88 |
| Hokianga | 3.85 |
| Bay of Islands | 4.25 |
| Whangarei | 13.61 |
| Hobson | 9.57 |
| Otamatea | 8.23 |
| Rodney | 8.20 |
| Waitemata | 37.29 |
| Eden | 3,804.67 |
| Great Barrier | 2.27 |
| Manukau | 46.33 |
| Franklin | 17.63 |
| Raglan | 4.71 |
| Waikato | 24.93 |
| Waipa | 34.47 |
| Kawhia | 2.82 |
| Awakino | 1.69 |
| Waitomo | 6.42 |
| Ohura | 4.52 |
| West Taupo | 2.94 |
| Matamata | 4.14 |
| Piako | 16.00 |
| Ohinemuri | 21.75 |
| Thames | 15.99 |
| Coromandel | 5.13 |
| Tauranga | 8.65 |
| Rotorua | 4.27 |
| East Taupo | 0.21 |
| Whakatane | 1.91 |
| Opotiki | 1.96 |
| Waiapu | 1.88 |
| Waikohu | 3.36 |
| Cook | 16.01 |
| Wairoa | 2.90 |
| Hawke's Bay | 16.17 |
| Waipawa | 9.51 |
| Waipukurau | 21.58 |
| Patangata | 2.90 |
| Dannevirke | 19.02 |
| Woodville | 18.81 |
| Weber | 3.89 |
| Clifton | 3.51 |
| Taranaki | 47.73 |
| Egmont | 16.57 |
| Stratford | 20.12 |
| Whangamomona | 3.67 |
| Eltham | 25.39 |
| Waimate West | 35.13 |
| Hawera | 40.89 |
| Patea | 7.62 |
| Waitotara | 45.24 |
| Kaitieke | 6.10 |
| Waimarino | 5.24 |
| Wanganui | 5.42 |
| Rangitikei | 10.95 |
| Kiwitea | 7.69 |
| Pohangina | 5.36 |
| Oroua | 31.65 |
| Manawatu | 23.57 |
| Horowhenua | 17.15 |
| Kairanga | 89.23 |
| Pahiatua | 14.65 |
| Akitio | 4.34 |
| Eketahuna | 9.46 |
| Mauriceville | 5.67 |
| Masterton | 16.45 |
| Castlepoint | 2.60 |
| Wairarapa South | 9.64 |
| Featherston | 6.56 |
| Hutt | 41.99 |
| Makara | 823.40 |
| Sounds | 2.54 |
| Marlborough | 6.14 |
| Awatere | 1.22 |
| Kaikoura | 2.71 |
| Waimea | 12.31 |
| Takaka | 4.09 |
| Collingwood | 1.74 |
| Buller | 5.41 |
| Murchison | 0.76 |
| Inangahua | 5.57 |
| Grey | 8.53 |
| Westland | 1.65 |
| Amuri | 0.78 |
| Cheviot | 3.80 |
| Waipara | 2.28 |
| Kowai | 11.96 |
| Ashley | 2.34 |
| Rangiora | 47.95 |
| Eyre | 19.23 |
| Oxford | 5.42 |
| Tawera | 0.91 |
| Malvern | 11.12 |
| Paparua | 34.68 |
| Waimairi | 200.05 |
| Heathcote | 3,404.29 |
| Halswell | 140.88 |
| Mount Herbert | 6.86 |
| Akaroa | 15.47 |
| Chatham Islands | 0.58 |
| Wairewa | 16.28 |
| Springs | 20.06 |
| Ellesmere | 18.80 |
| Selwyn | 1.46 |
| Ashburton | 6.27 |
| Geraldine | 8.11 |
| Levels | 63.51 |
| Mackenzie | 1.13 |
| Waimate | 6.59 |
| Waitaki | 6.51 |
| Waihemo | 6.54 |
| Waikouaiti | 28.15 |
| Peninsula | 48.46 |
| Taieri | 75.27 |
| Bruce | 15.43 |
| Clutha | 8.78 |
| Tuapeka | 4.93 |
| Maniototo | 2.26 |
| Vincent | 1.92 |
| Lake | 0.73 |
| Southland | 12.95 |
| Wallace | 2.78 |
| Fiord | 0.01 |
| Stewart Island | 0.52 |
The following map illustrates the number of people per square mile in each county at the date of the census. The population figures used in the compilation are inclusive of interior boroughs, but exclusive of persons on shipboard.
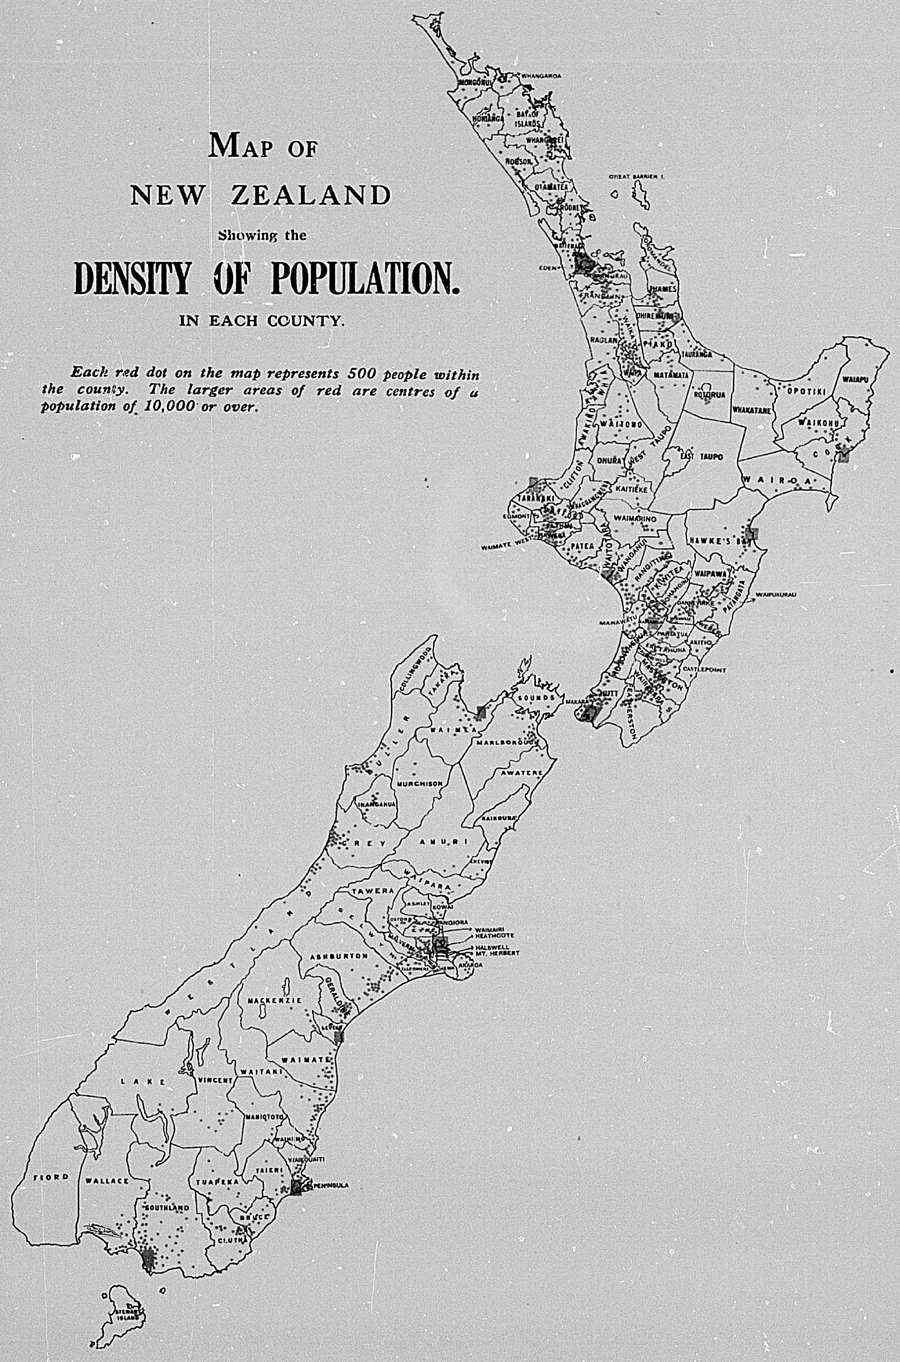
Table of Contents
In respect of the relative proportions of the sexes in the population, New Zealand has since the first settlement of the Islands differed materially from the older countries of the world. Although in the latter the composition of the populations has been no doubt to some extent affected by emigration, yet, in general, natural increase would appear to be the main determining factor, the numbers of males and females being in most of these countries approximately equal, with a more or less marked tendency, however, for the females slightly to exceed the males. The excess of females in such older countries arises from a variety of causes, amongst which the most potent are probably (a) higher rate of mortality amongst males, (b) the fact that males tend to emigrate to a greater extent than females.
Very different is the case with newer countries such as New Zealand, where the rule is (in the early years of colonization especially) for the male population to outnumber the female.
The following table is interesting as showing the early excess of males and the gradual equalization of the sexes in New Zealand, the number of females to 1,000 males having risen from 622 in 1861 to 903 in 1901. The proportion was slightly lower in 1906 and 1911, but rose to 993 in 1916, mainly on account of the absence of so many men at the war.
| Census Year. | Males. | Females. | Females to 1,000 Males |
|---|---|---|---|
| 1861 | 61,062 | 37,959 | 622 |
| 1871 | 150,356 | 106,037 | 705 |
| 1881 | 269,605 | 220,328 | 817 |
| 1891 | 332,877 | 293,781 | 883 |
| 1901 | 405,992 | 366,727 | 903 |
| 1906 | 471,008 | 417,570 | 887 |
| 1911 | 531,910 | 476,558 | 896 |
| 1916 | 551,775 | 547,674 | 993 |
The preponderance of males in the early years of New Zealand was doubtless due to the fact that the difficulties of pioneering and the remoteness of the country from Europe were such as to deter female immigration to a greater extent than male. This was accentuated by the character of the early industries. Gold-mining and coal-mining would attract large numbers of men but few women. The low female figures for the mining province of Westland as shown by a succeeding table are a striking proof of this. The effect of this early preponderance of males no doubt still exists, but in an ever-diminishing degree, its gradual elimination being effected by the dying-off of the earlier settlers.
Of the two sources from which the Dominion's population has been recruited— viz., migration and natural increase— the effect of the former has hitherto been to give in the aggregate a considerable preponderance of males, and of the latter to give a regular preponderance of females. Between 1860 and 1916 the gain of males by migration totalled 92,000 more than that of females. This excess was only partly offset numerically by a female surplus of 33,000 in the figures of natural increase, but the net excess of some 80,000 males is not nearly sufficient to maintain the former high ratio of males to females in the population.
The following figures of births, deaths, and natural increase in each year since compulsory registration was instituted show, with one exception, a very steady excess of males over females in the birth-registrations. The male excess in the deaths is, however, considerably greater, so that, with the exception of 1856, each year shows a larger gain of females than of males by natural increase.
| Year. | Births. | Deaths. | Natural Increase. | ||||||
|---|---|---|---|---|---|---|---|---|---|
| Males. | Females. | Male Excess. | Males. | Females. | Male Excess. | Males. | Females. | Excess of Females over Males. | |
| 1855 | 766 | 694 | 72 | 304 | 166 | 138 | 462 | 528 | 66 |
| 1856 | 904 | 818 | 86 | 236 | 170 | 66 | 668 | 648 | −20 |
| 1857 | 1,005 | 961 | 44 | 266 | 168 | 98 | 739 | 793 | 54 |
| 1858 | 1,185 | 1,087 | 98 | 342 | 240 | 102 | 843 | 847 | 4 |
| 1859 | 1,394 | 1,253 | 141 | 433 | 271 | 162 | 961 | 982 | 21 |
| 1860 | 1,566 | 1,580 | −14 | 630 | 462 | 168 | 936 | 1,118 | 182 |
| 1861 | 1,752 | 1,689 | 63 | 632 | 477 | 155 | 1,120 | 1,212 | 92 |
| 1862 | 2,090 | 1,974 | 116 | 773 | 458 | 315 | 1,317 | 1,516 | 199 |
| 1863 | 2,641 | 2,474 | 167 | 1,218 | 765 | 453 | 1,423 | 1,709 | 286 |
| 1864 | 3,334 | 3,167 | 167 | 1,758 | 1,163 | 595 | 5,576 | 2,004 | 428 |
| 1865 | 3,847 | 3,643 | 204 | 1,658 | 1,099 | 559 | 2,189 | 2,544 | 355 |
| 1866 | 4,284 | 4,182 | 102 | 1,567 | 973 | 594 | 2,717 | 3,209 | 492 |
| 1867 | 4,595 | 4,323 | 272 | 1,621 | 1,081 | 540 | 2,974 | 3,242 | 268 |
| 1868 | 4,766 | 4,625 | 141 | 1,631 | 1,031 | 600 | 3,135 | 3,594 | 459 |
| 1869 | 4,875 | 4,843 | 32 | 1,683 | 1,038 | 645 | 3,192 | 3,805 | 613 |
| 1870 | 5,240 | 5,037 | 203 | 1,595 | 1,108 | 487 | 3,645 | 3,929 | 284 |
| 1871 | 5,410 | 5,182 | 228 | 1,635 | 1,007 | 628 | 3,775 | 4,175 | 400 |
| 1872 | 5,510 | 5,285 | 225 | 1,897 | 1,295 | 602 | 3,613 | 3,990 | 377 |
| 1873 | 5,707 | 5,515 | 192 | 2,068 | 1,578 | 490 | 3,639 | 3,937 | 298 |
| 1874 | 6,634 | 6,210 | 424 | 2,366 | 1,795 | 571 | 4,268 | 4,415 | 147 |
| 1875 | 7,490 | 6,948 | 542 | 3,376 | 2,336 | 1,040 | 4,114 | 4,612 | 498 |
| 1876 | 8,320 | 7,848 | 472 | 2,881 | 2,023 | 858 | 5,439 | 5,825 | 386 |
| 1877 | 8,617 | 8,239 | 378 | 2,802 | 1,883 | 919 | 5,815 | 6,356 | 541 |
| 1878 | 8,954 | 8,816 | 138 | 2,719 | 1,926 | 793 | 6,235 | 6,890 | 655 |
| 1879 | 9,294 | 8,776 | 518 | 3,362 | 2,221 | 1,141 | 5,932 | 6,555 | 623 |
| 1880 | 9,893 | 9,448 | 445 | 3,171 | 2,266 | 905 | 6,722 | 7,182 | 460 |
| 1881 | 9,590 | 9,142 | 448 | 3,247 | 2,244 | 1,003 | 6,343 | 6,898 | 555 |
| 1882 | 9,712 | 9,297 | 415 | 3,355 | 2,346 | 1,009 | 6,357 | 6,951 | 594 |
| 1883 | 9,843 | 9,359 | 484 | 3,469 | 2,592 | 877 | 6,374 | 6,767 | 393 |
| 1884 | 10,131 | 9,715 | 416 | 3,301 | 2,439 | 862 | 6,830 | 7,276 | 446 |
| 1885 | 10,020 | 9,673 | 347 | 3,562 | 2,519 | 1,043 | 6,458 | 7,154 | 696 |
| 1886 | 9,872 | 9,427 | 445 | 3,516 | 2,619 | 897 | 6,356 | 6,808 | 452 |
| 1887 | 9,725 | 9,410 | 315 | 3,603 | 2,534 | 1,069 | 6,122 | 6,876 | 754 |
| 1888 | 9,641 | 9,261 | 380 | 3,315 | 2,393 | 922 | 6,326 | 6,868 | 542 |
| 1889 | 9,514 | 8,943 | 571 | 3,356 | 2,416 | 940 | 6,158 | 6,527 | 369 |
| 1890 | 9,293 | 8,985 | 308 | 3,474 | 2,520 | 954 | 5,819 | 6,465 | 646 |
| 1891 | 9,377 | 8,896 | 481 | 3,787 | 2,731 | 1,056 | 5,590 | 6,165 | 575 |
| 1892 | 9,101 | 8,775 | 326 | 3,791 | 2,668 | 1,123 | 5,310 | 6,107 | 797 |
| 1893 | 9,310 | 8,877 | 433 | 3,943 | 2,824 | 1,119 | 5,367 | 6,053 | 686 |
| 1894 | 9,472 | 9,056 | 416 | 4,011 | 2,907 | 1,104 | 5,461 | 6,149 | 688 |
| 1895 | 9,493 | 9,053 | 440 | 3,966 | 2,897 | 1,069 | 5,527 | 6,156 | 629 |
| 1896 | 9,511 | 9,101 | 410 | 3,776 | 2,656 | 1,120 | 5,735 | 6,445 | 710 |
| 1897 | 9,600 | 9,137 | 463 | 3,787 | 2,808 | 979 | 5,813 | 6,329 | 516 |
| 1898 | 9,615 | 9,340 | 275 | 4,280 | 2,964 | 1,316 | 5,335 | 6,376 | 1,041 |
| 1899 | 9,724 | 9,111 | 613 | 4,464 | 3,216 | 1,248 | 5,260 | 5,895 | 635 |
| 1900 | 10,107 | 9,439 | 668 | 4,153 | 3,047 | 1,106 | 5,954 | 6,392 | 438 |
| 1901 | 10,471 | 10,020 | 451 | 4,418 | 3,216 | 1,202 | 6,053 | 6,804 | 751 |
| 1902 | 10,653 | 10,002 | 651 | 4,890 | 3,485 | 1,405 | 5,763 | 6,517 | 754 |
| 1903 | 11,217 | 10,612 | 605 | 4,947 | 3,581 | 1,366 | 6,270 | 7,031 | 761 |
| 1904 | 11,762 | 11,004 | 758 | 4,753 | 3,334 | 1,419 | 7,009 | 7,670 | 661 |
| 1905 | 12,109 | 11,573 | 536 | 4,689 | 3,372 | 1,317 | 7,420 | 8,201 | 781 |
| 1906 | 12,397 | 11,855 | 542 | 4,935 | 3,404 | 1,531 | 7,462 | 8,451 | 989 |
| 1907 | 12,835 | 12,259 | 576 | 5,755 | 4,311 | 1,444 | 7,080 | 7,948 | 868 |
| 1908 | 13,369 | 12,571 | 798 | 5,324 | 3,719 | 1,605 | 8,045 | 8,852 | 807 |
| 1909 | 13,502 | 13,022 | 480 | 5,246 | 3,713 | 1,533 | 8,256 | 9,309 | 1,053 |
| 1910 | 13,442 | 12,542 | 900 | 5,604 | 4,035 | 1,569 | 7,838 | 8,507 | 669 |
| 1911 | 13,532 | 12,822 | 710 | 5,595 | 3,939 | 1,656 | 7,937 | 8,883 | 946 |
| 1912 | 13,996 | 13,512 | 484 | 5,374 | 3,840 | 1,534 | 8,622 | 9,672 | 1,050 |
| 1913 | 14,433 | 13,502 | 931 | 5,867 | 4,252 | 1,615 | 8,566 | 9,250 | 684 |
| 1914 | 14,535 | 13,803 | 732 | 5,986 | 4,162 | 1,824 | 8,549 | 9,641 | 1,092 |
| 1915 | 14,415 | 13,435 | 980 | 5,766 | 4,199 | 1,567 | 8,649 | 9,236 | 587 |
| 1916 | 14,669 | 13,840 | 829 | 6,146 | 4,450 | 1,696 | 8,523 | 9,390 | 867 |
Table of Contents
The figures of immigration and emigration naturally do not move so smoothly and regularly as those of natural increase either as a whole or as between the two sexes. Some of the earlier years show a huge excess of males in the migration gain, but as early as 1864 a female excess was recorded, due probably to the departure from the country of many men who had been attracted to the gold-fields. The figures have fluctuated considerably since, but the general effect has been to give an excess of males. A statement is appended showing the movement since 1859:—
| Year. | Arrivals. | Departures. | Excess of Arrivals over Departures. | Excess of Males over Females in Net Migration Gain. | |||
|---|---|---|---|---|---|---|---|
| Males. | Females. | Males. | Females. | Males. | Females. | ||
| 1859 | 15,244 | 5,944 | 8,777 | 2,173 | 6,467 | 3,771 | 2,696 |
| 1860 | 5,460 | 3,475 | 2,149 | 722 | 3,311 | 2,753 | 558 |
| 1861 | 19,896 | 2,443 | 5,687 | 430 | 14,209 | 2,013 | 12,196 |
| 1862 | 27,005 | 7,285 | 12,695 | 604 | 14,310 | 6,681 | 7,629 |
| 1863 | 34,516 | 11,214 | 9,654 | 956 | 24,862 | 10,258 | 14,604 |
| 1864 | 12,882 | 8,049 | 10,879 | 1,525 | 2,003 | 6,524 | −4,521 |
| 1865 | 13,227 | 5,689 | 5,326 | 1,281 | 7,901 | 4,408 | 3,493 |
| 1866 | 10,979 | 3,914 | 5,992 | 1,302 | 4,987 | 2,612 | 2,375 |
| 1867 | 7,581 | 3,545 | 5,075 | 1,192 | 2,506 | 2,353 | 153 |
| 1868 | 6,045 | 2,678 | 6,647 | 1,216 | −602 | 1,462 | −2,064 |
| 1869 | 6,302 | 2,601 | 4,001 | 1,261 | 2,301 | 1,340 | 961 |
| 1870 | 6,178 | 2,946 | 4,203 | 1,344 | 1,975 | 1,602 | 373 |
| 1871 | 7,526 | 2,557 | 4,041 | 1,256 | 3,485 | 1,301 | 2,184 |
| 1872 | 6,775 | 3,950 | 4,417 | 1,335 | 2,358 | 2,615 | −257 |
| 1873 | 7,871 | 5,701 | 3,507 | 1,254 | 4,364 | 4,447 | 83 |
| 1874 | 25,830 | 18,135 | 4,367 | 1,492 | 21,463 | 16,643 | 4,820 |
| 1875 | 19,558 | 12,179 | 4,727 | 1,740 | 14,831 | 10,439 | 4,392 |
| 1876 | 11,524 | 6,890 | 4,677 | 1,782 | 6,847 | 5,108 | 1,739 |
| 1877 | 8,104 | 4,883 | 4,696 | 1,915 | 3,408 | 2,968 | 440 |
| 1878 | 10,671 | 5,592 | 4,138 | 1,623 | 6,533 | 3,969 | 2,564 |
| 1879 | 15,186 | 8,771 | 3,852 | 1,382 | 11,334 | 7,389 | 3,945 |
| 1880 | 9,564 | 5,590 | 5,816 | 2,107 | 3,748 | 3,483 | 265 |
| 1881 | 6,643 | 3,045 | 5,705 | 2,367 | 938 | 678 | 260 |
| 1882 | 7,042 | 3,903 | 5,082 | 2,374 | 1,960 | 1,529 | 431 |
| 1883 | 11,218 | 7,997 | 6,230 | 2,956 | 4,988 | 5,041 | −53 |
| 1884 | 12,475 | 7,546 | 7,303 | 3,397 | 5,172 | 4,149 | 1,023 |
| 1885 | 10,766 | 5,433 | 7,866 | 3,829 | 2,900 | 1,604 | 1,296 |
| 1886 | 11,068 | 5,033 | 10,442 | 4,595 | 626 | 438 | 188 |
| 1887 | 9,224 | 4,465 | 8,434 | 4,278 | 790 | 187 | 603 |
| 1888 | 9,112 | 4,494 | 15,048 | 7,733 | −5,936 | −3,239 | −2,697 |
| 1889 | 10,158 | 5,234 | 9,493 | 5,685 | 665 | −451 | 1,116 |
| 1890 | 9,753 | 5,275 | 10,809 | 6,001 | −1,056 | −726 | −330 |
| 1891 | 9,427 | 5,004 | 11,396 | 6,233 | −1,969 | −1,229 | −740 |
| 1892 | 12,131 | 5,991 | 8,469 | 4,695 | 3,652 | 1,296 | 2,366 |
| 1893 | 17,385 | 8,750 | 10,263 | 5,460 | 7,122 | 3,290 | 3,832 |
| 1894 | 16,375 | 8,862 | 15,708 | 7,276 | 667 | 1,586 | −919 |
| 1895 | 14,181 | 7,681 | 13,746 | 7,221 | 435 | 460 | −25 |
| 1896 | 11,145 | 6,091 | 10,032 | 5,732 | 1,113 | 359 | 754 |
| 1897 | 12,153 | 6,439 | 10,250 | 5,590 | 1,903 | 849 | 1,054 |
| 1898 | 12,524 | 6,331 | 10,438 | 5,721 | 2,086 | 610 | 1,476 |
| 1899 | 11,862 | 6,644 | 10,567 | 6,052 | 1,295 | 592 | 703 |
| 1900 | 11,966 | 6,108 | 11,043 | 5,200 | 923 | 908 | 15 |
| 1901 | 16,968 | 8,118 | 12,426 | 6,138 | 4,542 | 1,980 | 2,562 |
| 1902 | 21,522 | 8,771 | 15,600 | 6,701 | 5,922 | 2,070 | 3,852 |
| 1903 | 20,479 | 10,404 | 12,983 | 6,625 | 7,496 | 3,779 | 3,717 |
| 1904 | 21,980 | 10,652 | 14,671 | 7,606 | 7,309 | 3,046 | 4,263 |
| 1905 | 21,344 | 11,341 | 15,390 | 7,993 | 5,954 | 3,348 | 2,606 |
| 1906 | 25,607 | 13,626 | 17,211 | 9,174 | 8,396 | 4,452 | 3,944 |
| 1907 | 23,228 | 12,880 | 19,310 | 11,068 | 3,918 | 1,812 | 2,106 |
| 1908 | 29,342 | 15,628 | 19,707 | 11,002 | 9,635 | 4,626 | 5,009 |
| 1909 | 24,065 | 14,585 | 22,244 | 11,687 | 1,821 | 2,898 | −1,077 |
| 1910 | 22,135 | 13,634 | 20,451 | 11,910 | 1,684 | 1,724 | −40 |
| 1911 | 25,333 | 16,056 | 23,539 | 13,650 | 1,794 | 2,406 | −612 |
| 1912 | 26,775 | 17,885 | 21,914 | 13,819 | 4,861 | 4,066 | 795 |
| 1913 | 25,891 | 18,697 | 18,560 | 11,809 | 7,331 | 6,888 | 443 |
| 1914 | 22,526 | 15,120 | 20,025 | 12,481 | 2,501 | 2,639 | −138 |
| 1915 | 14,487 | 11,064 | 13,318 | 9,158 | 1,169 | 1,906 | −737 |
| 1916 | 11,959 | 9,840 | 11,932 | 9,231 | 27 | 609 | −582 |
The net migration gain has contained an excess of females only in exceptional years— viz.,1864, 1868, 1872, 1883, 1888, the early “nineties,” 1909–11, and since 1914. It is to be noted that the excess of females for the last three years covered by the table is in no way accountable for by departures of troops, these being expressly disregarded in making up the migration figures, but is due partly to the restrictions imposed on males in the United Kingdom and other British possessions in regard to departure overseas, and partly also to the fact that a considerable number of men, other than members of the Expeditionary Force, travelled to the United Kingdom for service (military, naval, or other) in connection with the war.
Taking the figures by decennial periods it will be noted that males have exceeded females in migration gain as follows:—
| 1859–1870 | 38,453 |
| 1871–1880 | 20,175 |
| 1881–1890 | 1,837 |
| 1891–1900 | 8,516 |
| 1901–1910 | 26,942 |
| 1911–1916 | −831 |
The depression of trade during the late “eighties” and early “nineties” is reflected in the figures for the corresponding decades.
Table of Contents
Details as to the sex composition of the community by Islands and provinces as revealed by the 1916 census are given in the following tables. Another table shows the sex composition of the population of the various metropolitan and suburban areas, &c.
| Year. | North Island. | South Island. | Total. |
|---|---|---|---|
| * Excludes military and internment camps. If these be included the figure will be 99.26. | |||
| 1881 | 83.78 | 80.41 | 81.72 |
| 1886 | 84.59 | 85.31 | 85.28 |
| 1891 | 87.92 | 88.52 | 88.26 |
| 1896 | 88.10 | 90.58 | 89.31 |
| 1901 | 89.04 | 91.66 | 90.33 |
| 1906 | 86.91 | 90.71 | 88.66 |
| 1911 | 87.7l | 91.51 | 89.59 |
| 1916 | 99.40 | 102.94 | 100.84* |
The break shown for both Islands in 1901 in the continuity of the changes in the sex composition of the community is probably to be accounted for by the absence on service in South Africa of a percentage of the male population. The effect of the absence of a much greater percentage in 1916 is clearly shown in the tremendous alterations in that year as compared with 1911.
| Provincial District. | Census Year. | |||||||
|---|---|---|---|---|---|---|---|---|
| 1881. | 1880. | 1891. | 1896. | 1901. | 1906. | 1911. | 1916.* | |
| *Excludes military and internment camps. If these be included the females to 100 males in the Dominion will be 99.26. | ||||||||
| Auckland | 83.79 | 84.72 | 90.52 | 89.10 | 89.29 | 88.03 | 86.68 | 98.69 |
| Taranaki | 74.45 | 87.96 | 87.68 | 84.47 | 84.04 | 86.80 | 85.60 | 94.61 |
| Hawke's Bay | 79.04 | 76.87 | 81.06 | 85.02 | 87.83 | 84.91 | 88.39 | 99.56 |
| Wellington | 87.58 | 86.16 | 86.59 | 88.67 | 90.42 | 86.11 | 89.71 | 101.20 |
| Marlborough | 77.18 | 78.57 | 80.61 | 86.20 | 86.36 | 81.07 | 82.79 | 95.18 |
| Nelson | 76.18 | 78.94 | 78.78 | 82.61 | 83.99 | 81.82 | 79.69 | 91.18 |
| Westland | 65.40 | 69.69 | 71.66 | 78.50 | 78.94 | 78.91 | 80.23 | 92.11 |
| Canterbury | 85.15 | 92.41 | 94.22 | 94.90 | 96.29 | 93.73 | 95.93 | 107.23 |
| Otago— | ||||||||
| Otago portion | 81.59 | 86.24 | 90.70 | 93.16 | 94.16 | 95.84 | 97.63 | 106.88 |
| Southland portion | 71.61 | 79.19 | 83.21 | 83.29 | 83.57 | 83.83 | 85.06 | 96.95 |
| Whole Dominion | 81.72 | 85.28 | 88.26 | 89.31 | 90.33 | 88.66 | 89.59 | 100.84* |
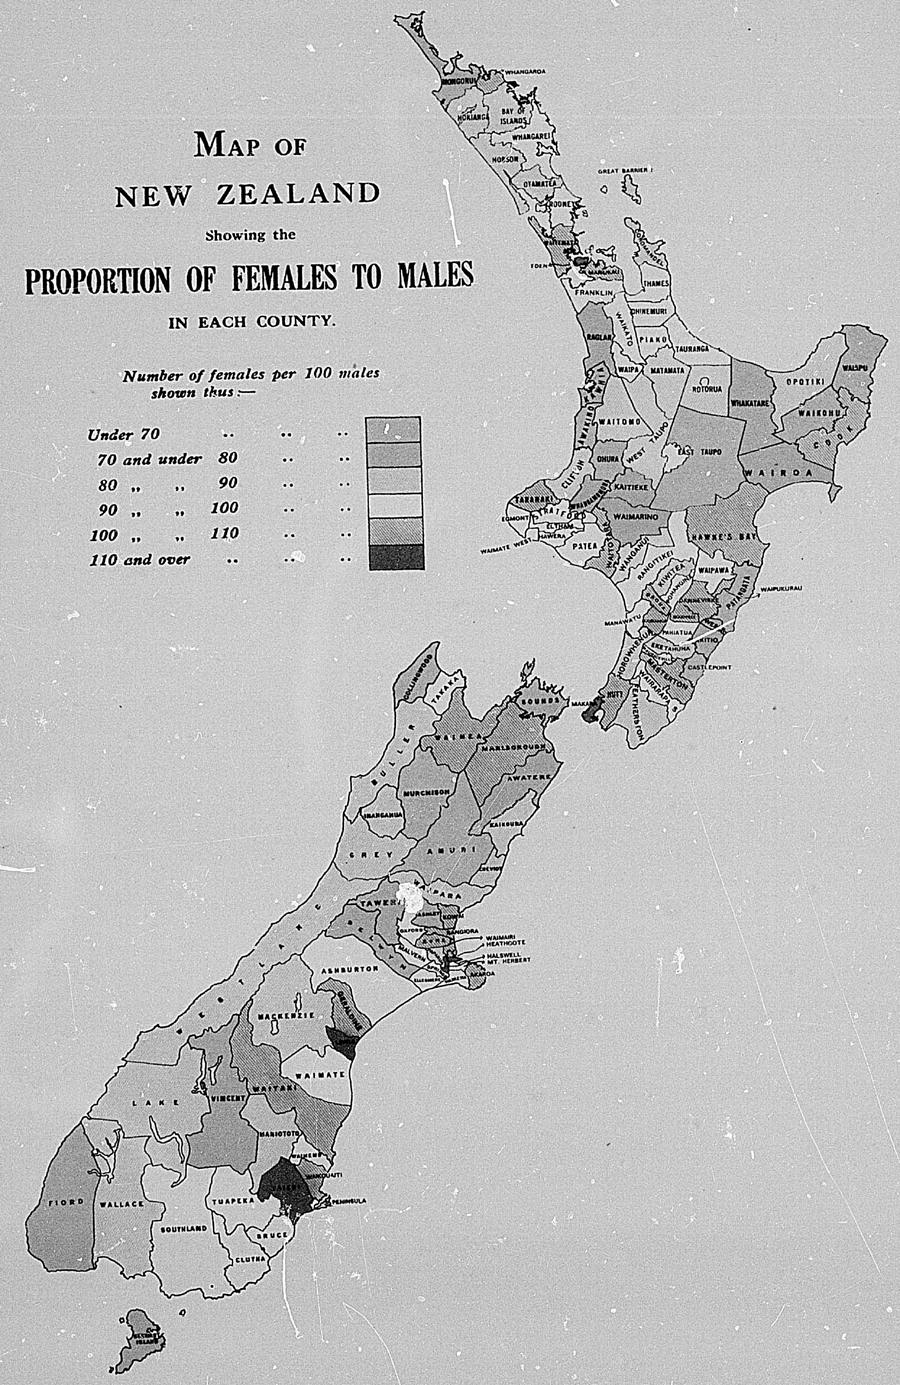
It will be noted that in 1916 for the first time there have been mere females than males in any province, and this state of affairs existed in Canterbury, Otago, and Wellington. In 1916, as in 1911, the proportion of females to total population was lowest in Nelson and Westland, the old mining conditions still leaving their mark on the sex composition of these provincial districts.
The following figures are also of interest:—
| Metropolitan areas— | Females to 100 Males. |
|---|---|
| Auckland | 115.28 |
| Wellington | 112.08 |
| Christchurch | 117.98 |
| Dunedin | 120.44 |
| Total metropolitan areas | 115.95 |
| Suburban areas— | |
| Gisborne | 107.50 |
| Napier | 111.91 |
| New Plymouth | 110.19 |
| Wanganui | 111.36 |
| Palmerston North | 112.56 |
| Nelson | 118.60 |
| Grey Valley boroughs | 101.90 |
| Timaru | 120.09 |
| Invercargill | 114.35 |
| Total suburban areas | 112.34 |
| Total metropolitan and suburban areas | 115.08 |
| Total boroughs | 114.45 |
| Total outside boroughs | 84.39 |
| Total New Zealand | 99.26 |
It will be at once apparent that the tendency is for females to congregate in the towns and cities, while males are in excess in the country. The highest proportion of females is to be found in Dunedin among the metropolitan, and in Nelson and Timaru among the suburban areas; and the lowest among metropolitan areas is Wellington, and among suburban areas Grey Valley boroughs. The metropolitan areas have in general a somewhat higher proportion of females than the suburban areas. In none of the thirteen areas of close settlement do the males exceed the females. Except in Westland (where the conditions under which the province was settled were rather different), the proportionate excess of females is uniformly greater in the South Island.
The accompanying map indicates the proportion of females to 100 males in each county (with interior boroughs), excluding persons on shipboard.
It will again be at once noted that the proportion of females is highest in the neighbourhood of cities, and in general is lowest in the more remote and inaccessible counties. Thus the highest proportion is to be found in Halswell County, including as it does part of Christchurch metropolitan area, and the next highest in Taieri County, which includes practically the whole of Dunedin City and suburbs, while Heathcote, including Christchurch and most of its suburban boroughs, is a very close third. The lowest proportions are to be found in Awakino, Fiord, Waiapu, and Chatham Islands, in that order, all of them remote and scantily populated regions. Indeed, it is a remarkable fact that in the five counties which have the lowest densities of population-Stewart Island, Fiord, East Taupo, Chatham Islands, and Lake-the proportions of females to 100 males is nowhere higher than 84, and in only two cases (Stewart Island and Lake) exceeds 60. It is noteworthy, moreover, that the comparatively high proportion in these two counties can be accounted for on the ground that each contains a town that is a holiday resort and is more or less easy of access from Invercargill. In the four counties, on the other hand, in which the density of population is greatest (Eden*, Heathcote†, Makara‡, and Waimairi§) the proportion of females to 100 males nowhere falls below 109.
* Including Auckland City and certain suburbs.
† Including Christchurch City and certain suburbs.
‡ Including Wellington City and certain suburbs.
§ Including certain suburbs of Christchurch.
Table of Contents
The causes which in early years operated to effect an excess of males in the population of New Zealand were at the same time equally effective in rendering the age-distribution different in a marked degree from that of older countries. The majority of the immigrants were in the prime of life, and as the New Zealand birthrate was formerly a fairly high one, the natural result was a population in which young and middle-aged persons predominated. In process of time, however, the age-distribution of New Zealand has fallen more and more into accord with that prevailing in older countries, and now, except in showing a lower proportion at old ages and a slightly higher one at young ages, fails to differ essentially there from.
The following table, compiled from the census household schedules, affords an indication of the manner in which age-distribution has varied during the last fifty years. The percentages have been calculated on the totals of specified ages.
Age-groups.—Percentages at Successive Censuses, by Sexes.
| Census. | Proportions per Cent, in each Age-group. | ||||||||
|---|---|---|---|---|---|---|---|---|---|
| Under 5 Years. | 5 and under 10. | 10 and under 15. | 15 and under 21. | 21 and under 40 | 40 and under 55. | 55 and under 65. | 65 and over. | Total. | |
| December, 1867— | |||||||||
| Males | 14.48 | 9.54 | 6.77 | 6.69 | 48.49 | 10.95 | 2.22 | 0.86 | 100.00 |
| Females | 21.26 | 14.06 | 9.50 | 10.04 | 33.77 | 8.36 | 2.14 | 0.85 | 100.00 |
| Both sexes | 17.18 | 11.34 | 7.86 | 8.02 | 42.64 | 9.92 | 2.18 | 0.86 | 100.00 |
| February, 1871. | |||||||||
| Males | 15.56 | 10.94 | 7.59 | 6.75 | 43.02 | 12.49 | 2.54 | 1.11 | 100.00 |
| Females | 21.90 | 15.31 | 10.12 | 9.48 | 31.26 | 8.58 | 2.31 | 1.04 | 100.00 |
| Both sexes | 18.19 | 12.75 | 8.64 | 7.88 | 38.15 | 10.87 | 2.44 | 1.08 | 100.00 |
| March, 1874. | |||||||||
| Males. | 15.31 | 12.78 | 8.58 | 7.83 | 36.29 | 15.11 | 2.83 | 1.27 | 100.00 |
| Females | 20.07 | 16.75 | 11.07 | 10.07 | 29.01 | 9.46 | 2.42 | 1.15 | 100.00 |
| Both sexes | 17.36 | 14.49 | 9.65 | 8.79 | 33.16 | 12.68 | 2.65 | 1.22 | 100.00 |
| March, 1878. | |||||||||
| Males | 15.41 | 12.99 | 10.05 | 8.74 | 32.99 | 15.51 | 2.96 | 1.35 | 100.00 |
| Females | 18.77 | 16.26 | 12.34 | 11.04 | 28.07 | 9.95 | 2.35 | 1.22 | 100.00 |
| Both sexes | 16.90 | 14.44 | 11.07 | 9.76 | 30.81 | 13.04 | 2.69 | 1.29 | 100.00 |
| April, 1881. | |||||||||
| Males | 15.50 | 12.78 | 10.74 | 9.39 | 30.65 | 16.24 | 3.22 | 1.48 | 100.00 |
| Females | 18.49 | 15.28 | 13.06 | 11.70 | 27.01 | 10.63 | 2.50 | 1.33 | 100.00 |
| Both sexes | 16.84 | 13.90 | 11.79 | 10.43 | 29.02 | 13.71 | 2.90 | 1.41 | 100.00 |
| March, 1886. | |||||||||
| Males | 14.12 | 13.70 | 10.97 | 11.05 | 27.71 | 16.37 | 4.15, | 1.93 | 100.00 |
| Females | 16.18 | 15.73 | 12.54 | 13.27 | 26.14 | 11.62 | 2.85 | 1.87 | 100.00 |
| Both sexes | 15.07 | 14.63 | 11.69 | 12.08 | 26.99 | 14.18 | 3.55 | 1.81 | 100.00 |
| April, 1891. | |||||||||
| Males | 12.72 | 13.09 | 12.27 | 11.61 | 26.67 | 5.52 | 5.61 | 2.51 | 100.00 |
| Females | 13.95 | 14.51 | 13.74 | 13.37 | 26.78 | 11.99 | 3.62 | 2.04 | 100.00 |
| Both sexes | 13.30 | 13.76 | 12.96 | 12.44 | 26.72 | 13.86 | 4.67 | 2.29 | 100.00 |
| April, 1896. | |||||||||
| Males | 11.45 | 11.75 | 11.61 | 12.91 | 27.94 | 14.30 | 6.67 | 3.37 | 100.00 |
| Females | 12.42 | 12.80 | 12.79 | 14.38 | 28.84 | 11.79 | 4.49 | 2.49 | 100.00 |
| Both sexes | 11.91 | 12.25 | 12.17 | 13.61 | 28.36 | 13.11 | 5.64 | 2.95 | 100.00 |
| March, 1901. | |||||||||
| Males | 10.93 | 10.68 | 10.62 | 12.59 | 30.06 | 13.84 | 6.54 | 4.74 | 100.00 |
| Females | 11.59 | 11.57 | 11.49 | 13.90 | 31.41 | 11.82 | 4.91 | 3.31 | 100.00 |
| Both sexes | 11.24 | 11.10 | 11.04 | 13.21 | 30.70 | 12.88 | 5.77 | 4.06 | 100.00 |
| April 1906. | |||||||||
| Males | 11.16 | 9.74 | 9.31 | 11.34 | 33.94 | 13.65 | 5.62 | 5.24 | 100.00 |
| Females | 12.04 | 10.65 | 10.28 | 12.36 | 33.57 | 12.34 | 4.89 | 3.87 | 100.00 |
| Both sexes | 11.57 | 10.17 | 9.77 | 11.82 | 33.76 | 13.03 | 5.28 | 4.60 | 100.00 |
| April, 1911. | |||||||||
| Males | 11.30 | 10.14 | 8.74 | 10.10 | 34.72 | 14.25 | 5.56 | 5.19 | 100.00 |
| Females | 12.16 | 10.96 | 9.45 | 11.01 | 33.83 | 13.56 | 4.80 | 4.23 | 100.00 |
| Both sexes | 11.70 | 10.53 | 9.08 | 10.53 | 34.30 | 13.92 | 5.20 | 4.74 | 100.00 |
| October, 1916. | |||||||||
| Males | 12.22 | 11.31 | 10.08 | 9.37 | 28.33 | 17.02 | 6.32 | 5.35 | 100.00 |
| Females | 11.83 | 11.05 | 9.81 | 10.19 | 32.48 | 15.12 | 5.16 | 4.36 | 100.00 |
| Both sexes | 12.02 | 11.18 | 9.95 | 9.78 | 30.40 | 16.07 | 5.74 | 4.86 | 100.00 |
The declining proportions at the earlier ages may be ascribed to a falling birthrate, while the increase at the higher ages is due to the now advanced age of the then young adult immigrants introduced during the early stages of settlement. These form the greater portion of the groups 60 years and over, which numbered 82,087 persons in 1916, of whom only 7,583 were New-Zealand-born. The latter element in the population is assuming larger proportions each year, while the influence exerted on the age-constitution by the numbers recruited from abroad is gradually waning.
The proportion of the population represented by the two sexes is indicated by the table above, and may be supplemented by the following one:—
Age.groups.—Numbers at Successive Censuses, by Sexes.
| Age-groups. | Number. | |||||||
|---|---|---|---|---|---|---|---|---|
| Census, 1886. | Census, 1396. | Census, 1906. | Census, 1916. | |||||
| Males. | Females. | Males. | Females. | Males. | Females. | Males. | Females. | |
| Under 5 years | 43,820 | 43,008 | 42,448 | 41,211 | 52,499 | 50,246 | 67,320 | 64,735 |
| 5 years and under 10 years | 42,524 | 41,791 | 43,561 | 42,464 | 45,826 | 44,462 | 62,340 | 60,478 |
| 10 years and under 15 years | 34,065 | 33,320 | 43,044 | 42,423 | 43,834 | 42,924 | 55,532 | 53,693 |
| 15 years and under 20 years | 29,070 | 29,819 | 40,364 | 40,370 | 44,242 | 42,875 | 45,012 | 46,392 |
| 20 years and under 25 years | 24,650 | 24,514 | 34,264 | 34,452 | 49,370 | 45,238 | 30,419 | 46,759 |
| 25 years and under 30 years | 24,452 | 19,956 | 30,605 | 28,990 | 49,308 | 43,140 | 40,018 | 48,557 |
| 30 years and under 35 years | 22,591 | 16,128 | 23,747 | 21,466 | 37,798 | 32,621 | 46,166 | 47,415 |
| 35 years and under 40 years | 19,574 | 14,319 | 22,506 | 18,081 | 32,329 | 27,794 | 46,138 | 44,311 |
| 40 years and under 45 years | 19,287 | 13,154 | 19,999 | 14,855 | 24,451 | 20,930 | 36,758 | 33,866 |
| 45 years and under 50 years | 18,004 | 10,323 | 16,830 | 12,725 | 21,424 | 17,003 | 32,993 | 27,745 |
| 50 years and under 55 years | 13,539 | 7,414 | 16,203 | 11,523 | 18,336 | 13,563 | 24,027 | 21,083 |
| 55 years and under 60 years | 7,878 | 4,406 | 14,252 | 8,597 | 13,984 | 10,958 | 18,707 | 15,632 |
| 60 years and under 65 years | 4,979 | 3,173 | 10,504 | 6,278 | 12,452 | 9,442 | 16,115 | 12,576 |
| 65 years and under 70 years | 3,050 | 2,127 | 6,459 | 3,781 | 11,524 | 7,599 | 11,204 | 9,592 |
| 70 years and under 75 years | 1,574 | 1,238 | 3,219 | 2,205 | 7,567 | 4,616 | 8,319 | 6,855 |
| 75 years and under 80 years | 854 | 675 | 1,843 | 1,388 | 3,698 | 2,373 | 6,037 | 4,510 |
| 80 and over | 525 | 390 | 982 | 879 | 1,865 | 1,546 | 3,979 | 2,900 |
| Unspecified minors | 54 | 76 | 26 | 18 | 35 | 28 | 54 | 60 |
| Unspecified adults | 1,731 | 430 | 559 | 239 | 466 | 212 | 637 | 515 |
A calculation of the proportion per cent, at each age-group to the total of males and females shows the effect of a declining birth-rate on the ages under 15, the proportion of males at these ages being 30.19 per cent, in 1911 against 34.81 per cent, in 1896, and of females 32.58 per cent, against 38.02 per cent, respectively.
When the proportions for 1916 are considered, however, it will be seen that the figures in all age-groups for the male portion of the population have been materially affected by the withdrawal of men between the ages of 20 and 45 for service overseas. The percentages for males in 1916 can therefore be compared with figures in previous census years only after allowance has been made for the abnormal age-distribution resulting from the departure of troops. Thus, scrutiny shows that the proportion of males under 15 to the total male population in 1916 was 33.61, an increase of 3.42 over the 1911 figures. The similar figures for females for 1916 were 32.70 per cent., an increase of only 0.12 over the percentage in 1911. Likewise of the males, those 15.24 years formed 20.13 per cent, of the total in 1896, and only 13.69 per cent, in 1916. At the ages 15.64 the proportions were 61.82 per cent, and 61.03 per cent, in 1896 and 1916 respectively. From 65 years upwards the proportions increased from 3.37 per cent, to 5.36 per cent, during the period under review.
An interesting view of the distribution of the Dominion's population, and of the alterations in the proportions at different stages, is afforded by a classification according to the following usually accepted natural age-groups:—
Infancy—Ages 0 and 1.
Childhood—Ages 2–13
Adolescence—Ages 14–20
Early adult life—Ages 21–44(inclusive).
Maturity—Ages 45–64
Advanced age —Ages 65 and over.
Distribution of Population at Successive Censuses, by Sexes, according to Natural Age-groups. *
| Age last Birthday. | Period of Life. | Census, 1881. | Census, 1886. | Census, 1891. | Census, 1896. | Census, 1901. | Census, 1906. | Census, 1911. | Census, 1916. | ||||||||
|---|---|---|---|---|---|---|---|---|---|---|---|---|---|---|---|---|---|
| Number. | Percentage | Number. | Percentage | Number. | Percentage | Number. | Percentage | Number. | Percentage | Number. | Percentage | Number. | Percentage | Number. | Percentage | ||
| * Exclusive of persons with ages unspecified, | |||||||||||||||||
| Males. | |||||||||||||||||
| 0–1 | Infancy | 16,693 | 6.21 | 17,063 | 5.50 | 15,922 | 4.79 | 16,428 | 4.43 | 17,761 | 4.38 | 21,728 | 4.62 | 24,207 | 4.56 | 26,484 | 4.81 |
| 2–13 | Childhood | 82,698 | 30.79 | 96,800 | 31.18 | 102,701 | 30.92 | 104,211 | 28.10 | 104,228 | 25.70 | 111,569 | 23.71 | 126,908 | 23.90 | 148,443 | 26.93 |
| 14–20 | Adolescence | 30,650 | 11.41 | 40,855 | 13.16 | 46,462 | 13.99 | 56,287 | 15.18 | 59,764 | 14.73 | 62,222 | 13.22 | 62,778 | 11.82 | 61,885 | 11.23 |
| 21.44 | Early adult life | 102,448 | 38.14 | 105,315 | 33.93 | 106,332 | 32.01 | 123,612 | 33.33 | 143,528 | 35.39 | 184,138 | 39.14 | 215,597 | 40.60 | 192,891 | 35.00 |
| 45–64 | Maturity | 32,139 | 11.98 | 44,400 | 14.30 | 52,428 | 15.78 | 57,789 | 15.59 | 61,061 | 15.06 | 66,196 | 14.07 | 74,006 | 13.93 | 91,842 | 16.67 |
| 65 and over | Advanced age | 3,957 | 1.47 | 6,003 | 1.93 | 8,336 | 2.51 | 12,503 | 3.37 | 19,218 | 4.74 | 24,654 | 5.24 | 27,573 | 5.19 | 29,539 | 5.36 |
| Totals | .. | 268,635 | 100.00 | 310,436 | 100.00 | 332,181 | 100.00 | 370,830 | 100.00 | 405,560 | 100.00 | 470,507 | 100.00 | 531,069 | 1100.00 | 551,084 | 100.00 |
| Females, | |||||||||||||||||
| 0–1 | Infancy | 16,149 | 7.34 | 16,905 | 6.36 | 15,352 | 5.23 | 15,834 | 4.77 | 16,602 | 4.53 | 20,539 | 4.92 | 22,933 | 4.82 | 25,128 | 4.59 |
| 2–13 | Childhood | 76,204 | 34.64 | 94,873 | 35.70 | 100,728 | 34.32 | 101,990 | 30.75 | 102,069 | 27.85 | 108,437 | 25.98 | 123,247 | 25.89 | 143,914 | 26.30 |
| 14–20 | Adolescence | 36,380 | 16.54 | 41,613 | 15.66 | 47,011 | 16.02 | 55,985 | 16.88 | 59,299 | 16.18 | 60,241 | 14.44 | 61,302 | 12.88 | 65,610 | 11.99 |
| 21–44 | Early adult life | 70,421 | 32.01 | 82,618 | 31.09 | 92,040 | 31.36 | 110,503 | 33.32 | 132,446 | 36.13 | 161,013 | 38.58 | 188,321 | 39.56 | 211,554 | 38.67 |
| 45–64 | Maturity | 17,874 | 8.13 | 25,316 | 9.53 | 32,372 | 11.02 | 39,123 | 11.79 | 43,968 | 12.10 | 50,966 | 12.21 | 60,103 | 12.62 | 77,036 | 14.08 |
| 65 and over | Advanced age | 2,938 | 1.34 | 4,430 | 1.66 | 6,006 | 2.05 | 8,253 | 2.49 | 12,135 | 3.31 | 16,134 | 3.87 | 20,127 | 4.23 | 23,857 | 3.87 |
| Totals | .. | 219,966 | 100.00 | 265,755 | 100.00 | 293,509 | 100.00 | 331,688 | 100.00 | 366,519 | 100.00 | 417,330 | 100.00 | 476,033 | 100.00 | 547,099 | 100.00 |
| Total Population, | |||||||||||||||||
| 0–1 | Infancy | 32,842 | 6.72 | 33,968 | 5.90 | 31,274 | 5.00 | 32,262 | 4.59 | 34,363 | 4.45 | 42,267 | 4.76 | 47,140 | 4.68 | 51,612 | 4.70 |
| 2–13 | Childhood | 164,250 | 33.62 | 191,673 | 33.27 | 203,429 | 32.51 | 206,201 | 29.35 | 206,297 | 26.73 | 220,006 | 24.78 | 250,155 | 24.84 | 292,357 | 26.62 |
| 14–20 | Adolescence | 61,682 | 12.62 | 82,468 | 14.31 | 93,473 | 14.94 | 112,272 | 15.99 | 119,063 | 15.42 | 122,463 | 13.79 | 124,080 | 12.31 | 127,495 | 11.61 |
| 21–44 | Early adult life | 172,869 | 35.38 | 187,933 | 32.61 | 198,372 | 31.70 | 234,115 | 33.33 | 275,974 | 35.74 | 345,151 | 38.88 | 403,918 | 40.10 | 404,445 | 36.82 |
| 45–64 | Maturity | 50,063 | ]0.25 | 69,716 | 12.10 | 84,800 | 13.56 | 96,912 | 13.78 | 105,029 | 13.60 | 117,162 | 13.20 | 134,109 | 13.32 | 168,878 | 15.38 |
| 65 and over | Advanced age | 6,895 | 1.41 | 10,433 | 1.81 | 14,342 | 2.29 | 20,756 | 2.96 | 31,353 | 4.06 | 40,788 | 4.59 | 47,700 | 4.75 | 53,396 | 4.86 |
| Totals | .. | 488,601 | 100.00 | 576,191 | 100.00 | 625,690 | 100.00 | 702,518 | 100.00 | 772,079 | 100.00 | 887,837 | 100.00 | 1,007,102 | 100.00 | 1,098,183 | 100.00 |
DISTRIBUTION OF POPULATION AT SUCCESSIVE CENSUSES, BY SEXES, ACCORDING TO NATURAL AGE.GROUPS,
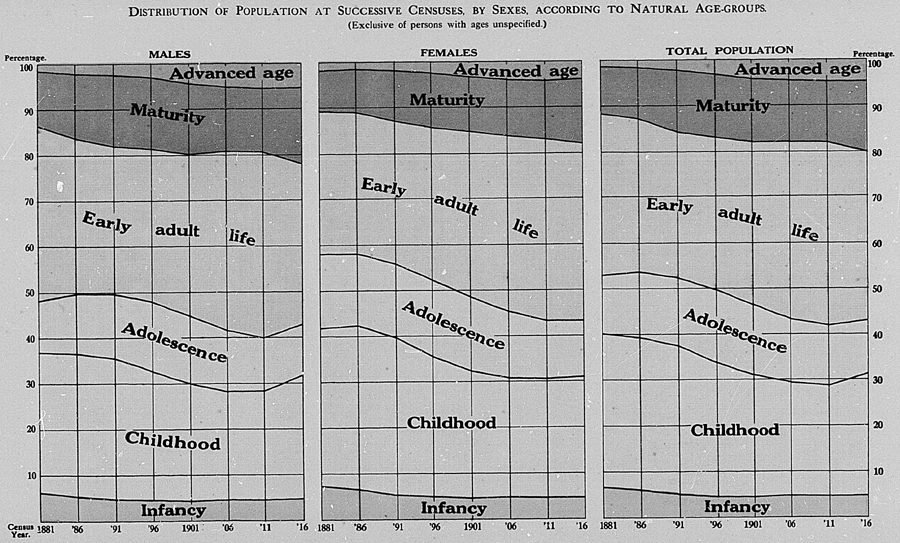
An examination of the foregoing tables reveals several very interesting features, It wall be noted that at all census-takings the proportion of population in the advanced-age group to the whole population is considerably higher in the case of males than that of females, As, however, practically the whole of the population 65 and over has been born abroad, this fact is easily accounted for when one remembers that emigration to a new country is a considerably more attractive proposition to a man than it is to a woman,
The diminished birth-rate is reflected by the gradual decline in the proportion of child and infant population to the total,
The 1916 census is the first to reveal a larger proportion of infants and children in the case of the male population than in that of the female, Uniformly in all other census-takings have males younger than the period of early adult life formed a smaller proportion of the total male population than the corresponding proportion in the case of female population, The variation in 1916 is accounted for by the large proportion of the male population in late adolescence and early adult life absent abroad on war service, leaving a relatively high proportion of males at all ages other than that from 21–44, and to a less extent 14–20,
The above consideration is even more fully brought out by the appended classification on the basis of liability for service under the Military Service Act,
The following classification might be adopted:—
Under age—Age 0–18 (inclusive),
Eligible to volunteer but not liable to compulsory service—
Age 19, Liable to compulsory service—Age 20–45 (inclusive),
Over age—Age 46 and over,
Distribution of Male Population at Successive Censuses according to present Military Basis (excluding those with Ages unspecified),
| Age last Birthday. | Census, 1896. | Census, 1901. | Census, 1906. | Census, 1911. | Census, 1916. | |||||
|---|---|---|---|---|---|---|---|---|---|---|
| Number. | Percentage of Total Male Population. | Number. | Percentage of Total Male Population. | Number. | Percentage of Total Male Population. | Number. | Percentage of Total Male Population. | Number. | Percentage of Total Male Population. | |
| 0–18 | 161,615 | 43.55 | 164,752 | 40.62 | 177,007 | 37.62 | 195,841 | 36.88 | 222,654 | 40.40 |
| 19 | 7,902 | 2.13 | 8,442 | 2.08 | 9,394 | 2.00 | 9,197 | 1.73 | 7,550 | 1.37 |
| 20–45 | 135,572 | 36.56 | 156,795 | 38.66 | 198,511 | 42.19 | 230,525 | 43.41 | 206,401 | 37.45 |
| 46 and over | 65,841 | 17.76 | 75,571 | 18.64 | 85,592 | 18.19 | 95,506 | 17.98 | 114,479 | 20.78 |
| Totals | 370,330 | 100.00 | 405,560 | 100.00 | 470,507 | 100.00 | 531,069 | 100.00 | 551,084 | 100.00 |
The effects of the war are very marked, At the 1911 census 1.73 per cent, of the total male population was at age 19, and 43.41 per cent, at ages 20–45, The war drained the young manhood of the country so as to reduce the corresponding figures for 1916 to 1.37 per cent, and 37.45 per cent, respectively, The reduced proportions at these ages in 1916 are reflected by increased proportions at non-military ages, under 19 and 46 and over, It will be noted that the effect of the comparatively high birth-rate ruling in New Zealand in its earlier years and its recent falling-off is reflected in the increase of the male proportion of the population at military age in successive census-takings up to 1911, and the corresponding fall in those under age, The high percentage reached in 1911 for males at military age (43.41 per cent, of the whole population) will probably never be realized again unless there is a substantial increase in the birth-rate or an influx of early adult male immigrants, It is thus noteworthy that the Great European War made its appeal to the New Zealand manhood at the very period when the proportion of males at military age to the total male population was at a maximum,
The Defence Act, 1909, with its amendments, suggests a different arrangement of the male population, Under this Act males are classified as under, although there is a certain amount of fluidity as to the ages of passing in and out of the different training groups, due to the special circumstances allowed for in the Act, The age-groups for military training are as under:—
Under age—Under 14,
Liable to serve in the Senior Cadets—14 and under 18,
Liable to serve in the Territorials—18 and under 25,
Liable to serve in the Reserve—25 and under 30,
Over age—30 and over,
A classification on this basis is appended,
Distribution of Male Population at Successive Censuses according to present Defence Act Basis (excluding those with Ages unspecified),
| Age-group. | Age last Birthday, | Census, 1891. | Census, 1890. | Census, 1901. | |||
|---|---|---|---|---|---|---|---|
| Number. | Percentage of Total Male Population. | Number. | Percentage of Total Male Population. | Number. | Percentage of Total Male Population. | ||
| Under age | 0–13 | 118,623 | 35.71 | 120,639 | 32.53 | 121,989 | 30.08 |
| Senior Cadets | 14–17 | 28,116 | 8.47 | 32,828 | 8.85 | 34,227 | 8.44 |
| Territorials | 18–24 | 40,685 | 12.25 | 50,214 | 13.54 | 58,174 | 14.34 |
| Reserve | 25–29 | 23,704 | 7.13 | 30,605 | 8.25 | 35,307 | 8.71 |
| Over age | 30 and over | 121,053 | 36.44 | 136,544 | 36.83 | 155,863 | 38.43 |
| Totals | .. | 332,181 | 100.00 | 370,830 | 100.00 | 405,560 | 100.00 |
| Age-group. | A last Birthday. | Census, 1906. | Census, 1911. | Census, 1910. | |||
|---|---|---|---|---|---|---|---|
| Number. | Percentage of Total Male Population. | Number. | Percentage of Total Male Population. | Number. | Percentage of Total Male Population. | ||
| Under age | 0–13 | 133,297 | 28.33 | 151,115 | 28.46 | 174,927 | 31.74 |
| Senior Cadets | 14–17 | 34,561 | 7.35 | 35,698 | 6.72 | 39,029 | 7.08 |
| Territorials | 18–24 | 67,913 | 14.43 | 67,917 | 12.79 | 46,667 | 8.47. |
| Reserve | 25–29 | 49,308 | 10.48 | 54,694 | 10.30 | 40,018 | 7.26 |
| Over age | 30 and over | 185,428 | 39.41 | 221,645 | 41.73 | 250,443 | 45.45 |
| Totals | .. | 470,507 | 100.00 | 531,069 | 100.00 | 551,084 | 100.00 |
The main feature of interest in this table is again the marked evidence of response to the Empire's call, as manifested by the falling-off shown by the 1916 census in the proportions of population liable to service other than in the Senior Cadets,
Just as national prosperity is largely dependent on the effective male population, so in the case of female population it is necessary to examine the data available as to the possibilities of recruiting the national strength, A convenient division of the female population is therefore according to age into the following groups:—
Ante-reproductive—Ages 0–14 (inclusive),
Reproductive—Ages 15–44 (inclusive),
Post-reproductive—Ages 45 and upwards,
It is true that the limits of these groups are not so sharply defined in reality as the above age-classification would suggest, cases of reproduction being not infrequent beyond 44, and being not even Unknown beyond 50; so also cases have been known of girls becoming mothers before the age of 15, The numbers of these exceptional cases are, however, negligible in proportion to the total births,
The effect of the declining birth-rate is here abundantly manifest, the proportion of reproductive females rising to a maximum in 1906, and thereafter falling, the 1906 maximum being still reflected by a continual increase of the proportion of post-reproductives, which has doubled itself since 1881, In the course of some ten or twenty years this group may, in the absence of any pronounced future alteration in the birth-rate or any marked migration of early adult females, be expected to reach its maximum in turn, It is a significant fact that, while the proportions of marriageable males have been notably reduced by unnatural war conditions, more or less natural features have operated at the same time to reduce the proportion of marriageable females, and there is no prospect of their ranks being adequately recruited from a younger immature generation, the proportion of which is itself declining, having been 46.83 per cent, of the total female population in 1881, and only 32.70 per cent, in 1916,
Distribution of Female Population at Successive Censuses according to Reproductivity (excluding those with Ages unspecified),
| Age-group. | A last Birthday. | Census, 1881. | Census, 1886. | Census, 1891. | Census, 1896. | ||||
|---|---|---|---|---|---|---|---|---|---|
| Number. | Percentage of Total Female Population. | Number. | Percentage of Total Female Population. | Number. | Percentage of Total Female Population. | Number. | Percentage of Total Female Population. | ||
| Ante-reproductive | 0–14 | 103,010 | 46.83 | 118,119 | 44.45 | 123,860 | 42.20 | 126,098 | 38.02 |
| Reproductive | 15–44 | 96,144 | 43.71 | 117,890 | 44.36 | 131,271 | 44.72 | 158,214 | 47.70 |
| Post-reproductive | 45 and upwards | 20,812 | 9.46 | 29,746 | 1149 | 38,378 | 13.08 | 47,376 | 14.28 |
| Totals | .. | 219,966 | 100.00 | 265,755 | 100.00 | 293,509 | 100.00 | 331,688 | 100.00 |
| Age-group. | A last Birthday. | Census, 1901. | Census, 1906. | Census, 1911. | Census, 1916. | ||||
|---|---|---|---|---|---|---|---|---|---|
| Number. | Percentage of Total Female Population. | Number. | Percentage of Total Female Population. | Number. | Percentage of Total Female Population. | Number. | Percentage of Total Female Population. | ||
| Ante-reproductive | 0–13 | 127,029 | 34.66 | 137,632 | 32.98 | 155,089 | 32.58 | 178,906 | 32.70 |
| Reproductive | 15–44 | 183,387 | 50.03 | 212,598 | 50.94 | 240,714 | 50.56 | 267,300 | 48.86 |
| Post-reproductive | 45 and upwards | 56,103 | 15.31 | 67,100 | 16.08 | 80,230 | 16.86 | 100,893 | 18.44 |
| Totals | .. | 366,519 | 100.00 | 417,330 | 100.00 | 476,033 | 100.00 | 547,099 | 100.00 |
Further light is thrown on the ever-increasing older age-constitution of the population by an investigation into the mean age of persons whose ages were specified at different census-takings, In this connection it is worth noting that, as the census figures merely give ages last birthday, it is not possible to calculate with absolute accuracy the mean age of the population at the date of census, results being liable to error beyond the first place of decimals, on account of the fact that the formula employed in the calculation is derived on the assumption that the total population is at census-day on the average exactly half-way between two birthdays, This assumption is no doubt a close approximation to fact, but figures are available which go to show that births are not constant in number throughout the year, but vary somewhat from season to season, A word of warning is appropriate to the effect that the figures thus given are very different from what actuaries designate “the expectation of life at age 0,” except for a hypothetical community where the rate of mortality over each age-group is constant for a long period, a state of affairs from which observed facts normally diverge considerably,
The mean age of the population has been at successive census-takings:—
| Census, | For Males, | For Females, | For Both Sexes, |
|---|---|---|---|
| 1896 | 26.27 | 23.83; | 25.12 |
| 1901 | 27.25 | 25.06 | 26.21 |
| 1906 | 27.72 | 25.91 | 26.87 |
| 1911 | 28.04 | 26.57 | 27.35 |
| 1916 | 28.50 . | 27.31 | 27.84 |
It will be noted that the average male is older than the average female, probably because of the influence of immigration being stronger in the case of males than in that of females, Persons arriving in the country are for the most part adults, or at least adolescents, with a corresponding ultimate effect of raising the mean age of the population,
The increase in the mean age of the community during even the short period under review is probably due to the diminished birth-rate that has prevailed of late years; so that, while members of the large families of the early settlers (now fully grown up) are ever tending to shift upwards the position of the mean, the proportions of the community at the early age-groups are diminishing, thus accentuating the movement of the mean,
For the sake of convenience, age-groups are adopted in this section on a slightly different model from, but roughly approximating to, the natural age-groups previously referred to,
The first table shows the percentage age-distribution of the population by provinces and Islands at the 1916 census:—
| Provincial District. | Ages 0–19. | Ages 20–44. | Ages 45–64. | Ages 65 and over. | Total. |
|---|---|---|---|---|---|
| Auckland | 41.88 | 38.09 | 15.55 | 4.48 | 100.00 |
| Taranaki | 46.19 | 36.59 | 13.42 | 3.80 | 100.00 |
| Hawke's Bay | 42.21 | 38.23 | 15.14 | 4.42 | 100.00 |
| Wellington | 40.71 | 40.13 | 15.21 | 3.95 | 100.00 |
| Totals, North Island | 41.87 | 38.69 | 15.21 | 4.23 | 100.00 |
| Marlborough | 43.92 | 35.75 | 15.51 | 4.82 | 100.00 |
| Nelson | 43.29 | 36.44 | 15.13 | 5.14 | 100.00 |
| Westland | 41.79 | 36.08 | 1406 | 8.07 | 100.00 |
| Canterbury | 40.76 | 37.55 | 15.91 | 5.78 | 100.00 |
| otago | 40.27 | 36.36 | 16.74 | 6.63 | 100.00 |
| Southland | 45.34 | 35.22 | 14.67 | 4.77 | 100.00 |
| Totals, South Island | 41.64 | 36.66 | 15.84 | 5.86 | 100.00 |
| Military and internment camps | 3.98 | 91.78 | 4.18 | 0.06 | 100.00 |
| Grand totals | 41.48 | 38.28 | 15.38 | 4.86 | 100.00 |
The more recent development of the North Island is reflected by the fact that the age-constitution of the South Island as a whole is older than that of the North, Wellington in particular would appear to have recently exerted an attraction for persons in early adult life, while the proportion of people of advanced age is highest in Westland, Otago, and Canterbury in that order, all of which three provincial districts (and especially Westland, in which the proportion is highest of all) were early settled, and have of late years attracted but few new settlers as compared with the northern districts, Persons who have not yet reached maturity are in highest proportion in Taranaki and Southland, suggesting a higher birth-rate in these districts,
For many purposes it is useful and interesting to estimate the proportions of people at different ages resident in the towns and in the country, For this purpose two methods suggest themselves, one being to compare straight out the borough age-constitution with the age-constitution outside such areas, Another method would be to take the metropolitan and suburban areas created for statistical purposes at each of the four main centres and at nine of the more important secondary centres, each of which areas includes considerable non-municipalized areas adjacent or contingent to such centres; the age-constitution of these areas would then be ascertained and compared with that outside them,
Table showing the Relative Proportions of Urban and Non-urban Population at Different Age-groups, Census, 1916,
| Age-group, | Borough and City Population, | Population outside Boroughs and Cities, | Total, |
|---|---|---|---|
| 0–19 | 51.40 | 48.60 | 100.00 |
| 20–44 | 54.61 | 45.39 | 100.00 |
| 54–64 | 55.19 | 44.81 | 100.00 |
| 65 and over | 57.49 | 42.81 | 100.00 |
| Totals | 53.51 | 46.49 | 100.00 |
Table showing the Relative Proportions of Population at Different Age-groups living within and without the Metropolitan and Suburban Areas, Census, 1916,
| Age-group, | Percentage of Population at each Age-group living in Metropolitan and Suburban Areas, | Percentage of, Population resident elsewhere, | Total, |
|---|---|---|---|
| 0–4 | 42.74 | 57.26 | 100.00 |
| 5–9 | 43.42 | 56.58 | 100.00 |
| 10–14 | 45.20 | 54.80 | 100.00 |
| 15–19 | 46.94 | 53.06 | 100.00 |
| 20–24 | 47.45 | 52.55 | 100.00 |
| 25–29 | 47.92 | 52.08 | 100.00 |
| 30–34 | 48.24 | 51.76 | 100.00 |
| 35–39 | 47.73 | 52.27 | 100.00 |
| 40–44 | 48.22 | 51.78 | 100.00 |
| 45–49 | 4844 | 51.86 | 100.00 |
| 50–54 | 49.19 | 50.81 | 100.00 |
| 55–59 | 49.91 | 50.09 | 100.00 |
| 60–64 | 50.45 | 49.55 | 100.00 |
| 65–69 | 50.35 | 49.65 | 100.00 |
| 70–74 | 50.00 | 50.00 | 100.00 |
| 75–79 | 50.32 | 49.68 | 100.00 |
| 80–89 | 51.13 | ¿3.87 | 100.00 |
| 90–99 | 54.44 | 45.56 | 100.00 |
| 100 and over | 50.00 | 50.00 | 100.00 |
| Totals | 46.52 | 53.48 | 100.00 |
From a consideration of the last table above it will be abundantly clear that the proportion of people resident outside the metropolitan and suburban areas to the total population is highest for children under 5, and shows an irregular but gradual fall, definitely dropping below the 50-per-cent, mark at ages 60 to 64, until we note that of the 360 nonagenarians in the Dominion only 164 were resident outside the areas of closer settlement, In the case of the twelve centenarians the odds were, however, even, It would appear from this that the country population is more prolific than that of the towns; also (in the absence of definite evidence of a higher death-rate in the country than in the town) that there is a tendency for persons of advancing years to congregate in the larger centres,
Table of Contents
Of the total population (1,099,449 persons) in 1916 only 1,608 did not have their birthplaces returned on the census schedules. Of the remaining 1,097,841 the number of New-Zealand-born was 794,139, comprising 72.34 per cent, of the whole. As might be expected in a young country peopled originally from overseas, the proportion of New-Zealand-born to the whole population has shown a steady increase. The percentages of New-Zealand-born to the total population have been for successive census-takings—
| Year. | Percentage. |
|---|---|
| 1886 | 51.89 |
| 1891 | 58.61 |
| 1896 | 62.85 |
| 1901 | 66.83 |
| 1906 | 68.26 |
| 1911 | 69.74 |
| 1916 | 72.34 |
Table of Contents
In view of the fact that the 1916 census was taken during the war period this aspect of the census was of special importance. The figures show that of the total population of specified birthplace (1,097,841), 1,077,808, or 98.17 per cent., were born on British soil, 1.70 per cent, on foreign soil, and 0.13 per cent, at sea.
The table following shows the birthplaces of the population, exclusive of Maoris, for 1916 and four preceding census years. The total number of British-born has increased during the period by 58 per cent., while the number of foreign-born has slightly decreased. Persons born in New Zealand have increased by 80 per cent. The Commonwealth of Australia is represented by 45,585 persons, a large increase since 1896. Against this there were 31,868 persons, natives of New Zealand, residing in the Commonwealth in 1911, as compared with 25,788 in 1901. Persons born in the United Kingdom numbered 218,834 in 1891 and 232,525 in 1916.
| Birthplace. | Number as at Census of — | ||||
|---|---|---|---|---|---|
| 1896. | 1901. | 1906. | 1911. | 1916. | |
| Persons. | Persons. | Persons. | Persons. | Persons. | |
| New Zealand | 441,661 | 516,106 | 606,247 | 702,779 | 794,139 |
| Commonwealth of Australia | 21,631 | 26,991 | 47,256 | 50,029 | 45,585 |
| England | 116,541 | 111,964 | 116,560 | 133,811 | 140,997 |
| Wales | 2,148 | 1,765 | 2,144 | 2,206 | 2,197 |
| Scotland | 50,435 | 47,858 | 47,767 | 51,709 | 51,951 |
| Ireland | 46,037 | 43,524 | 42,460 | 40,958 | 37,380 |
| Other British possessions | 3,901 | 4,273 | 4,560 | 5,234 | 5,559 |
| Total British | 682,354 | 752,481 | 866,994 | 986,726 | 1,077,808 |
| Austria-Hungary | 881 | 1,874 | 2,212 | 2,131 | 2,365 |
| German Empire | 4,595 | 4,217 | 4,174 | 4,015 | 2,999 |
| Denmark | 2,125 | 2,120 | 2,277 | 2,262 | 2,244 |
| Chinese Empire | 3,719 | 2,902 | 2,602 | 2,611 | 2,041 |
| Other foreign countries | 7,760 | 7,480 | 8,602 | 8,552 | 9,007 |
| Total foreign | 19,080 | 18,593 | 19,867 | 19,571 | 18,656 |
| At sea | 1,322 | 1,203 | 1,245 | 1,392 | 1,377 |
| Not stated | 604 | 442 | 472 | 779 | 1,608 |
| Totals | 703,360 | 772,719 | 888,578 | 1,008,468 | 1,099,449 |
The next table shows the proportionate strength of the different birthplaces represented in the Dominion:—
| Birthplace. | Number as at Census of — | ||||
|---|---|---|---|---|---|
| 1896. | 1901. | 1906. | 1911. | 1916. | |
| Per Cent. | Per Cent. | Per Cent. | Per Cent. | Per Cent. | |
| New Zealand | 62.85 | 66.83 | 68.26 | 69.74 | 72.34 |
| Commonwealth of Australia | 3.08 | 3.49 | 5.32 | 4.97 | 4.15 |
| England | 16.58 | 14.50 | 13.30 | 13.28 | 12.84 |
| Wales | 0.31 | 0.22 | 0.24 | 0.22 | 0.20 |
| Scotland | 7.18 | 6.20 | 5.38 | 5.13 | 4.73 |
| Ireland | 6.55 | 5.64 | 4.78 | 4.06 | 3.40 |
| Other British possessions | 0.55 | 0.55 | 0.51 | 0.52 | 0.51 |
| Total British | 97.10 | 97.43 | 97.62 | 97.92 | 98.17 |
| Austria-Hungary | 0.13 | 0.24 | 0.25 | 0.21 | 0.22 |
| German Empire | 0.65 | 0.55 | 0.47 | 0.40 | 0.27 |
| Denmark | 0.30 | 0.27 | 0.26 | 0.22 | 0.20 |
| Chinese Empire | 0.53 | 0.38 | 0.29 | 0.26 | 0.19 |
| Other foreign countries | 1.10 | 0.97 | 0.97 | 0.85 | 0.82 |
| Total foreign | 2.71 | 2.41 | 2.24 | 1.94 | 1.70 |
| At sea | 0.19 | 0.16 | 0.14 | 0.14 | 0.13 |
| 100.00 | 100.00 | 100.00 | 100.00 | 100.00 | |
The notable feature of the tables is the decline in the numbers of persons set down as being of German birth, showing a fall from 4,015 in 1911 to 2,999 in 1916. Chinese also fell from 2,611 to 2,041. The fall in Germans is so great as to suggest deliberate misrepresentation in the census schedules consequent on the waning prestige of that nation in the Dominion.
While British-born females slightly exceeded British-born males, it is worth noting that there were roughly three times as many foreign-born males as females, a phenomenon which is no doubt accountable for by the fact that the inducement to settle in foreign parts is such as to operate very much more strongly in the case of males than in that of females. So, while 4^644 females were born in foreign countries, the corresponding figure for males was as high as 14,012. The discrepancy between the sexes was particularly marked in the case of Chinese, the figures being—females 78, males 1,963.
Table of Contents
Birthplace and allegiance do not necessarily correspond. Accordingly, a table has been drawn up showing the numbers and relative proportions of British and foreign subjects at the 1916 census. It will be noted that whereas 1.70 per cent, of the population were born in foreign parts, almost exactly half of these considered themselves British subjects by parentage, by naturalization, or by birth. The highest percentage of persons owning allegiance to the British flag was to be found in Southland, the lowest in Westland.
| Provincial District. | Total of all Nationalities. | Total British-born Subjects.* | Total Naturalized British Subjects. | Total British Subjects. | Total Foreign Subjects. | In every 100 Persons: Proportion of | |
|---|---|---|---|---|---|---|---|
| British Subjects. | Foreign Subjects. | ||||||
| * Includes all persons born in British possessions, British subjects born abroad, and persons with British names who wore born at sea or whose birthplaces were not specified. | |||||||
| Auckland | 308,524 | 302,266 | 2,696 | 304,962 | 3,562 | 98.85 | 1.15 |
| Taranaki | 55,780 | 54,633 | 627 | 55,260 | 520 | 99.07 | 0.93 |
| Hawke's Bay | 54,267 | 53,118 | 698 | 53,816 | 451 | 99.17 | 0.83 |
| Wellington | 223,777 | 219,282 | 2,099 | 221,381 | 2,396 | 98.93 | 1.07 |
| Marlborough | 16,290 | 16,134 | 55 | 16,189 | 101 | 99.38 | 0.62 |
| Nelson | 48,040 | 47,458 | 231 | 47,689 | 351 | 99.27 | 0.73 |
| Westland | 14,091 | 13,636 | 179 | 13,815 | 276 | 98.04 | 1.96 |
| Canterbury | 178,809 | 177,425 | 626 | 178,051 | 758 | 99.58 | 0.42 |
| Otago | 131,800 | 130,621 | 506 | 131,127 | 673 | 99.49 | 0.51 |
| Southland | 59,347 | 58,907 | 223 | 59,130 | 217 | 99.63 | 0.37 |
| Military and internment camps | 8,724 | 8,349 | 40 | 8,389 | 335 | 96.16 | 3.84 |
| Total population of Dominion | 1,099,449 | 1,081,829 | 7,980 | 1,089,809 | 9,640 | 99.12 | 0.88 |
Table of Contents
From the table given below it will be noted that the number of persons born locally falls rapidly as the more advanced ages are reached. At ages from 55 upwards it is found that the number of persons born in New Zealand falls short in an increasing degree of that, of persons born in the United Kingdom. This is to be expected when we consider the circumstances under which the country was colonized. Moreover, families comprising young children are not likely to migrate to the same extent as adult men and women without ties. The result is that the number of children born abroad is an exceedingly small proportion of the total, representing only 1.67 per cent, of those under 5, a percentage which increases gradually with age, until at ages 95 and over the 100-per-cent. mark is reached.
| Birthplace. | Under 5 | 5 and under 10 | 10 and under 15 | 15 and under 20 | 20 and Under 25 | 25 and under 30 | 30 and under 35 | 35 and under 40 | 40 and under 45 | 45 and under 50 | 50 and under 55 | 55 and under 60 |
|---|---|---|---|---|---|---|---|---|---|---|---|---|
| BRITISH COUNTRIES. | ||||||||||||
| New Zealand | 129,850 | 115,834 | 99,146 | 81,201 | 64,310 | 67,424 | 67,338 | 61,281 | 41,803 | 31,747 | 18,034 | 8,015 |
| Australia | 815 | 1,250 | 2,202 | 2,847 | 3,904 | 5,487 | 5,582 | 5,574 | 4,100 | 3,775 | 3,478 | 3,325 |
| England | 651 | 3,396 | 4,913 | 4,474 | 4,623 | 8,775 | 12,241 | 14,001 | 14,542 | 14,664 | 12,386 | 11,234 |
| Wales | 14 | 58 | 74 | 07 | 63 | 152 | 210 | 245 | 233 | 219 | 184 | 181 |
| Scotland | 207 | 1,220 | 1,633 | 1,522 | 1,666 | 2,921 | 3,935 | 4,579 | 4,475 | 4,365 | 4,366 | 4,667 |
| Ireland | 41 | 238 | 331 | 396 | 928 | 1,696 | 1,941 | 2,434 | 2,830 | 3,599 | 4,284 | 4,896 |
| India | 17 | 39 | 42 | 46 | 82 | 133 | 121 | 120 | 108 | 122 | 117 | 121 |
| Ceylon | .. | 2 | 2 | 3 | 2 | 3 | 8 | 7 | 15 | 12 | 12 | 11 |
| British South Africa | 44 | 143 | 275 | 100 | 59 | 63 | 118 | 75 | 41 | 37 | 122 | 66 |
| Canada | 49 | 84 | 38 | 32 | 60 | 54 | 70 | 74 | 87 | 85 | 127 | 178 |
| British West Indies | .. | .. | .. | 1 | 9 | 16 | 17 | 14 | 17 | 26 | 22 | 15 |
| Fiji | 26 | 35 | 71 | 65 | 56 | 37 | 39 | 33 | 27 | 14 | 5 | 4 |
| Other British Pacific islands | 18 | 49 | 66 | 75 | 59 | 68 | 58 | 29 | 25 | 17 | 14 | 10 |
| Other British possessions | 7 | 21 | 12 | 10 | 14 | 11 | 24 | 32 | 27 | 33 | 23 | 22 |
| Total British | 131,739 | 122,369 | 108,805 | 90,845 | 75,835 | 86,840 | 91,702 | 88,498 | 68,330 | 58,715 | 43,174 | 32,745 |
| FOREIUN COUNTRIES. | ||||||||||||
| Europe — | ||||||||||||
| Austria-Hungary | 4 | 6 | 9 | 145 | 479 | 451 | 344 | 263 | 178 | 128 | 106 | 59 |
| Belgium | 1 | 2 | 2 | .. | 9 | 8 | 23 | 24 | 19 | 16 | 12 | 7 |
| Denmark | 3 | 16 | 22 | 23 | 75 | 130 | 143 | 171 | 209 | 289 | 249 | 194 |
| France | 1 | 2 | 3 | 4 | 14 | 22 | 29 | 43 | 47 | 58 | 49 | 59 |
| Germany | 5 | 8 | 18 | 19 | 81 | 127 | 179 | 227 | 336 | 348 | 318 | 262 |
| Greece | .. | .. | .. | 5 | 23 | 18 | 23 | 23 | 7 | 4 | 8 | 7 |
| Italy | 2 | 8 | 11 | 15 | 48 | 62 | 64 | 54 | 64 | 54 | 30 | 31 |
| Netherlands | .. | 1 | .. | .. | 3 | 16 | 9 | 16 | 13 | 11 | 11 | 7 |
| Norway | 1 | 1 | 4 | 12 | 51 | 70 | 86 | 90 | 98 | 145 | 152 | 122 |
| Portugal | .. | .. | .. | .. | 2 | .. | 1 | 3 | 1 | 5 | 15 | 11 |
| Russia | 2 | 6 | 11 | 28 | 70 | 132 | 120 | 134 | 149 | 141 | 122 | 81 |
| Spain | 1 | 1 | 1 | 4 | 5 | 6 | 1 | 7 | 4 | 6 | 5 | 3 |
| Sweden | .. | 3 | 1 | 6 | 32 | 74 | 113 | 127 | 119 | 142 | 142 | 162 |
| Switzerland | 2 | 9 | 8 | 10 | 51 | 93 | 122 | 73 | 75 | 45 | 45 | 34 |
| Others | .. | .. | 3 | 10 | 17 | 17 | 17 | 15 | 17 | 11 | 9 | 5 |
| Asia— | ||||||||||||
| China | 6 | 7 | 13 | 16 | 40 | 120 | 219 | 161 | 222 | 214 | 214 | 216 |
| Japan | .. | 2 | 4 | 2 | 16 | 12 | 14 | 10 | 5 | 2 | 3 | .. |
| Java | .. | .. | .. | 1 | .. | .. | .. | .. | .. | .. | .. | 1 |
| Syria | 2 | 7 | 14 | 12 | 26 | 58 | 41 | 64 | 49 | 36 | 29 | 25 |
| Others | 1 | .. | 3 | 1 | 4 | 4 | 1 | 4 | 3 | 2 | 4 | 5 |
| Africa— | ||||||||||||
| Egypt | 1 | .. | .. | .. | 1 | 3 | 2 | 3 | 2 | 5 | 1 | .. |
| Others. | 1 | .. | 15 | 4 | 2 | 4 | 3 | 4 | 2 | 4 | 12 | 8 |
| America— | ||||||||||||
| Argentina | 1 | 5 | 6 | 1 | 3 | 5 | 3 | 1 | 6 | 2 | 1 | 1 |
| Brazil | .. | 1 | 1 | 1 | 1 | .. | 3 | 2 | 5 | 1 | 2 | .. |
| Chile | 1 | 5 | 2 | 3 | 5 | 1 | 1 | 2 | 2 | 1 | 4 | 2 |
| Mexico | .. | .. | .. | .. | .. | 1 | 2 | .. | .. | .. | .. | 1 |
| Peru | .. | 1 | .. | .. | .. | .. | 2 | .. | .. | .. | .. | 1 |
| United States | 38 | 72 | 59 | 65 | 150 | 155 | 133 | 176 | 226 | 172 | 113 | 117 |
| Uruguay | 1 | .. | .. | .. | .. | 1 | .. | 1 | 1 | .. | ||
| Others | .. | 3 | 4 | 8 | 5 | 8 | 3 | 14 | 11 | 6 | 3 | |
| Polynesia— | ||||||||||||
| French possessions | 2 | 7 | 3 | 6 | 5 | 7 | 5 | 2 | 4 | 9 | 7 | .. |
| German possessions | .. | .. | 1 | l | 1 | .. | .. | 1 | 1 | .. | 1 | |
| United States possessions | 1 | .. | 1 | .. | 1 | .. | 1 | .. | 1 | .. | 1 | .. |
| Others | .. | 2 | .. | 1 | .. | 2 | .. | .. | .. | .. | .. | |
| Total foreign | 76 | 175 | 219 | 409 | 1,220 | 1,607 | 1,707 | 1,715 | 1,876 | 1,862 | 1,671 | 1,424 |
| At sea | 16 | 14 | 8 | 7 | 14 | 27 | 71 | 163 | 339 | 113 | 216 | 139 |
| Unspecified | 224 | 260 | 193 | 143 | 109 | 101 | 101 | 73 | 79 | 48 | 49 | 31 |
| Totals | 132,055 | 122,818 | 109,225 | 91,404 | 77,178 | 88,575 | 93,581 | 90,449 | 70,624 | 60,738 | 45,110 | 34,339 |
Birthplace, by Ages, Census, 1916. continued.
| Birthplace. | 60 and Under 65 | 65 and under 70 | 70 and under 75 | 75 and Under 80. | 80 and under 85 | 85 and under 90 | 90 and under 95 | 95 and under 100 | 100 and over | Unspecified. | Totals | |
|---|---|---|---|---|---|---|---|---|---|---|---|---|
| Adults | Minor | |||||||||||
| BRITISH COUNTRIES. | ||||||||||||
| New Zealand | 4,051 | 2,138 | 1,118 | 210 | 43 | 21 | 2 | .. | .. | 482 | 91 | 794,139 |
| Australia | 1,699 | 721 | 462 | 208 | 42 | 17 | 8 | 1 | 1 | 82 | 5 | 45,585 |
| England | 11,277 | 9,255 | 6,500 | 4,722 | 2,168 | 744 | 154 | 23 | 3 | 243 | 8 | 140,997 |
| Wales | 178 | 105 | 90 | 67 | 42 | 10 | .. | .. | .. | 5 | .. | 2,197 |
| Scotland | 4,894 | 3,891 | 3,219 | 2,581 | 1,217 | 411 | 83 | 10 | 4 | 85 | .. | 51,951 |
| Ireland | 4,601 | 3,097 | 2,653 | 1,998 | 984 | 287 | 43 | 13 | 3 | 87 | .. | 37,380 |
| India | 92 | 90 | 53 | 31 | 15 | 6 | .. | .. | .. | 4 | .. | 1,359 |
| Ceylon | 7 | 5 | 3 | 1 | 1 | 1 | .. | .. | .. | .. | .. | 95 |
| British South Africa | 33 | 17 | 12 | 3 | 1 | 1 | 2 | .. | .. | .. | .. | 1,218 |
| Canada | 144 | 129 | 99 | 67 | 40 | 21 | 1 | 1 | .. | 3 | .. | 1,443 |
| British West Indies | 17 | 18 | 16 | 6 | 3 | 4 | .. | .. | .. | 2 | .. | 203 |
| Fiji | 3 | .. | 2 | .. | .. | .. | .. | .. | .. | 1 | .. | 418 |
| Other British Pacific islands | 6 | 10 | 8 | 2 | 1 | 1 | .. | .. | .. | .. | .. | 516 |
| Other British possessions | 32 | 9 | 15 | 10 | 1 | 1 | 2 | .. | .. | 1 | .. | 307 |
| Total British | 27,034 | 19,485 | 14,250 | 9,906 | 4,558 | 1,525 | 295 | 48 | 11 | 995 | 104 | 1,077,808 |
| FOREIGN COUNTRIES. | ||||||||||||
| Europe— | ||||||||||||
| Austria-Hungary | 63 | 46 | 27 | 28 | 11 | 5 | .. | 1 | .. | 12 | .. | 2,365 |
| Belgium | 7 | 12 | 5 | 3 | 2 | 1 | .. | .. | .. | 1 | .. | 154 |
| Denmark | 250 | 182 | 135 | 100 | 35 | 8 | 1 | .. | .. | 3 | .. | 2,244 |
| France | 54 | 46 | 52 | 22 | 16 | 7 | 2 | .. | .. | 2 | .. | 532 |
| Germany | 256 | 284 | 219 | 177 | 92 | 30 | 3 | 1 | .. | 9 | .. | 2,999 |
| Greece | 10 | 9 | 11 | 3 | 1 | 2 | .. | .. | .. | 2 | .. | 156 |
| Italy | 38 | 32 | 24 | 18 | 12 | 4 | .. | .. | .. | .. | .. | 571 |
| Netherlands | 10 | 14 | 9 | 7 | 5 | 2 | .. | .. | .. | .. | .. | 134 |
| Norway | 128 | 95 | 76 | 55 | 31 | 11 | 1 | 2 | .. | 2 | .. | 1,233 |
| Portugal | 11 | 15 | 9 | 7 | 4 | 1 | .. | .. | .. | .. | .. | 35 |
| Russia | 77 | 68 | 53 | 22 | 16 | 5 | 2 | .. | .. | 3 | .. | 1,242 |
| Spain | 6 | 5 | 2 | 2 | 3 | .. | .. | .. | .. | 1 | .. | 63 |
| Sweden | 159 | 129 | 86 | 51 | 26 | 10 | .. | 2 | .. | 7 | .. | 1,391 |
| Switzerland | 33 | 16 | 18 | 18 | 10 | 1 | 1 | .. | .. | .. | .. | 670 |
| Others | 5 | 7 | 3 | 1 | 4 | 1 | .. | .. | .. | .. | .. | 142 |
| Asia— | ||||||||||||
| China | 249 | 176 | 87 | 38 | 14 | 6 | .. | 1 | .. | 21 | 1 | 2,041 |
| Japan | 1 | .. | .. | .. | .. | .. | .. | .. | .. | .. | .. | 71 |
| Java | 1 | 2 | .. | .. | .. | .. | .. | .. | .. | .. | .. | 5 |
| Syria | 7 | 10 | 5 | 2 | 3 | 1 | .. | .. | .. | 1 | .. | 392 |
| Others | 5 | 4 | 2 | .. | 1 | 1 | .. | .. | .. | .. | .. | 45 |
| Africa— | ||||||||||||
| Egypt | .. | .. | 1 | .. | .. | .. | .. | .. | .. | 1 | .. | 20 |
| Others | 1 | 3 | 1 | 1 | 1 | .. | .. | .. | .. | .. | .. | 65 |
| America— | ||||||||||||
| Argentina | .. | .. | .. | .. | .. | .. | .. | .. | .. | .. | .. | 35 |
| Brazil | .. | 2 | 2 | .. | .. | .. | .. | .. | .. | .. | .. | 21 |
| Chile | 1 | 2 | 3 | 1 | .. | .. | .. | .. | .. | .. | .. | 36 |
| Mexico | 1 | 2 | 1 | 1 | .. | .. | .. | .. | .. | .. | .. | 9 |
| Peru | .. | .. | .. | .. | .. | .. | .. | .. | .. | .. | .. | 4 |
| United States | 122 | 58 | 39 | 38 | 16 | 6 | .. | .. | .. | 6 | .. | 1,761 |
| Uruguay | .. | .. | .. | .. | .. | .. | .. | .. | .. | .. | .. | 4 |
| Others | 6 | .. | .. | .. | .. | .. | .. | .. | .. | .. | .. | 82 |
| Polynesia— | ||||||||||||
| French possessions | 2 | 4 | 1 | .. | 1 | .. | .. | .. | .. | .. | .. | 65 |
| German possessions | .. | .. | .. | .. | .. | .. | .. | .. | .. | .. | .. | 6 |
| United States possessions | .. | .. | .. | .. | .. | .. | .. | .. | .. | .. | .. | 6 |
| Others | 2 | .. | .. | .. | .. | .. | .. | .. | .. | .. | .. | 7 |
| Total foreign | 1,511 | 1,223 | 871 | 595 | 304 | 102 | 10 | 7 | .. | 71 | 1 | 18,656 |
| At sea | 112 | 61 | 38 | 29 | 7 | 2 | .. | .. | 1 | .. | .. | 1,377 |
| Unspecified | 34 | 27 | 15 | 17 | 9 | .. | .. | .. | .. | 86 | 9 | 1,608 |
| Totals | 28,691 | 20,796 | 15,174 | 10,547 | 4,873 | 1,629 | 305 | 55 | 12 | 1,152 | 114 | 1,099,449 |
It is interesting to note that the number of persons born in England was at a maximum at the 45–49 age-group. For persons of Scottish and Irish birth the maxima were considerably higher—viz., 60.64 and 55.59 respectively. The explanation of these phenomena is to be found in the fact that various parts of New Zealand were colonized at different times from different parts of the Mother-country, and may also partly lie in a difference of age-constitution between immigrants from the several parts of the Old Land. For persons of Australian birth the maximum was at the 30–34 age-group.
Table of Contents
The distribution of the British- and foreign-born population over the various provincial districts is next shown.
| Birthplace. | Auckland. | Taranaki. | Hawke's Bay. | Wellington. | Marlborough. | Nelson. | Westland. | Canterbury. | Otago. | Southland. | Milltary and Internment Camps. | Totals |
|---|---|---|---|---|---|---|---|---|---|---|---|---|
| BRITISH COUNTRIES. | ||||||||||||
| New Zealand | 214,882 | 42,352 | 38,675 | 157,931 | 13,062 | 35,844 | 10,386 | 131,123 | 97,650 | 46,233 | 6,001 | 794,139 |
| Australia | 14,451 | 1,924 | 1,837 | 10,757 | 468 | 2,352 | 766 | 5,525 | 4,884 | 2,114 | 507 | 45,585 |
| England | 46,665 | 6,740 | 7,865 | 32,535 | 1,602 | 5,269 | 1,104 | 24,606 | 9,885 | 3,591 | 1,135 | 140,995 |
| Wales | 748 | 131 | 58 | 530 | 24 | 128 | 29 | 333 | 138 | 57 | 21 | 2,197 |
| Scotland | 11,213 | 1,475 | 2,254 | 8,998 | 406 | 2,227 | 452 | 7,308 | 12,717 | 4,515 | 386 | 51,951 |
| Ireland | 10,154 | 1,550 | 1,989 | 0,633 | 477 | 1,296 | 790 | 7,511 | 4,573 | 2,192 | 215 | 37,380 |
| India | 569 | 69 | 56 | 282 | 18 | 58 | 5 | 148 | 118 | 18 | 18 | 1,359 |
| Ceylon | 40 | .. | 4 | 17 | .. | 4 | .. | 20 | 7 | 1 | 2 | 95 |
| British South Africa | 508 | 56 | 90 | 294 | 10 | 43 | 9 | 115 | 66 | 21 | 6 | 1,218 |
| Canada | 753 | 64 | 64 | 248 | 14 | 43 | 14 | 113 | 85 | 32 | 13 | 1,443 |
| British West Indies | 78 | 9 | 12 | 57 | 4 | 5 | 1 | 17 | 17 | 2 | 1 | 203 |
| Fiji | 326 | 13 | 5 | 41 | .. | 2 | .. | 11 | 7 | 1 | 12 | 418 |
| Other British Pacific islands | 425 | 3 | 12 | 37 | 1 | 7 | 1 | 12 | 11 | 2 | 5 | 516 |
| Other British possessions | 124 | 11 | 14 | 82 | 6 | 2 | 5 | 33 | 22 | 6 | 2 | 307 |
| Total British countries | 300,936 | 54,397 | 52,935 | 218,442 | 16,092 | 47,280 | 13,562 | 176,875 | 130,180 | 58,785 | 8,324 | 1,077,808 |
| FOREIGN COUNTRIES. | ||||||||||||
| Europe— | ||||||||||||
| Austria-Hungary | 2,008 | 63 | 16 | 97 | 3 | 22 | 24 | 59 | 18 | 20 | 35 | 2,365 |
| Belgium | 82 | 5 | 3 | 22 | 2 | 8 | 1 | 17 | 11 | 1 | 2 | 154 |
| Denmark | 506 | 153 | 300 | 850 | 28 | 49 | 29 | 173 | 94 | 50 | 6 | 2,244 |
| France | 190 | 17 | 26 | 120 | 6 | 21 | 10 | 78 | 47 | 13 | 4 | 532 |
| Germany | 651 | 228 | 112 | 783 | 33 | 115 | 99 | 352 | 200 | 137 | 289 | 2,999 |
| Greece | 47 | .. | 12 | 78 | 3 | 1 | 2 | 13 | .. | .. | .. | 156 |
| Italy | 144 | 16 | 24 | 214 | 6 | 50 | 21 | 49 | 37 | 6 | 4 | 571 |
| Netherlands | 57 | 5 | 2 | 32 | 1 | 5 | .. | 20 | 12 | .. | .. | 134 |
| Norway | 344 | 56 | 224 | 350 | 8 | 40 | 13 | 88 | 70 | 30 | 4 | 1,233 |
| Portugal | 53 | 6 | .. | 7 | 1 | 2 | 1 | 5 | 7 | 1 | 2 | 85 |
| Russia | 428 | 106 | 66 | 335 | 5 | 39 | 24 | 110 | 91 | 29 | 9 | 1,242 |
| Spain | 12 | 4 | 5 | 16 | .. | 4 | 1 | 14 | 6 | 1 | .. | 63 |
| Sweden | 398 | 55 | 136 | 444 | 13 | 80 | 41 | 99 | 91 | 27 | 7 | 1,391 |
| Switzerland | 170 | 326 | 15 | 86 | 1 | 16 | 16 | 17 | 16 | 5 | 2 | 670 |
| Others | 76 | 5 | 5 | 25 | 4 | 3 | 2 | 10 | 6 | 2 | 4 | 142 |
| Asia— | ||||||||||||
| China | 441 | 48 | 135 | 690 | 15 | 78 | 124 | 116 | 318 | 76 | .. | 2,041 |
| Japan | 11 | .. | 2 | 6 | .. | 4 | .. | 4 | 44 | .. | .. | 71 |
| Java | 1 | .. | .. | 2 | .. | .. | .. | .. | 2 | .. | .. | 5 |
| Syria | 111 | 20 | 17 | 107 | 9 | 15 | 8 | 30 | 66 | 8 | 1 | 392 |
| Others | 16 | .. | 2 | 18 | .. | 1 | .. | 2 | 5 | .. | 1 | 45 |
| Africa— | ||||||||||||
| Egypt | 5 | .. | 2 | 6 | .. | .. | .. | 2 | 3 | .. | 2 | 20 |
| Others | 33 | 1 | 3 | 9 | .. | 1 | 3 | 10 | 4 | 1 | .. | 65 |
| America— | ||||||||||||
| Argentina | 10 | 3 | .. | 9 | 2 | .. | .. | 3 | 2 | 5 | 1 | 35 |
| Brazil | 6 | 1 | .. | 1 | .. | .. | .. | 10 | 1 | .. | 1 | 21 |
| Chile | 10 | 1 | 1 | 8 | 1 | 1 | .. | 3 | 5 | 5 | 1 | 36 |
| Mexico | 5 | .. | 2 | .. | .. | .. | .. | 1 | 1 | .. | .. | 9 |
| Peru | 1 | .. | .. | 1 | .. | .. | .. | 2 | .. | .. | .. | 4 |
| United States | 726 | 80 | 89 | 375 | 16 | 56 | 10 | 225 | 123 | 54 | 7 | 1,761 |
| Uruguay | 1 | .. | .. | 2 | .. | .. | .. | 1 | .. | .. | .. | 4 |
| Others | 42 | 4 | 2 | 14 | 1 | 2 | .. | 10 | 6 | 1 | .. | 82 |
| Polynesia— | ||||||||||||
| French possessions | 42 | 2 | 1 | 11 | .. | 1 | .. | 1 | 4 | 2 | 1 | 65 |
| German possessions | 3 | .. | 2 | .. | .. | .. | .. | .. | 1 | .. | .. | 6 |
| United States possessions | 5 | .. | .. | .. | .. | .. | .. | .. | 1 | .. | .. | 6 |
| Others | 3 | .. | 1 | 2 | .. | .. | .. | .. | .. | .. | 1 | 7 |
| Total foreign countries | 6,638 | 1,205 | 1,211 | 4,720 | 158 | 614 | 429 | 1,525: | 1,297 | 475 | 384 | 18,656 |
| At sea | 416 | 82 | 52 | 265 | 24 | 42 | 18 | 225 | 174 | 74 | 5 | 1,377 |
| Total for specified birthplaces | 307,990 | 55,684 | 54,198 | 223,427 | 16,274 | 47,936 | 14,009 | 178,625 | .131,651 | 59,334 | 8,713 | 1,097,841 |
| Unspecified | 534 | 96 | 69 | 350 | 16 | 104 | 82 | 184 | 149 | 13 | 11 | 1,608 |
| Total population | 308,524 | 55,780 | 54,267 | 223,777 | 16,290 | 48,040 | 14,091 | 178,809 | 31,800 | 59,347 | 8,724 | 1,099,449 |
It will be apparent from the table that persons of foreign birth were considerably more numerous in the northern provinces than in the southern. This is probably an outcome of the fact that in the majority of cases North Island ports are the first reached by vessels from overseas. Thus, while there were 5,319 males and 1,319 females born in foreign countries returned in Auckland Province, and 3,382 males and 1,338 females in Wellington, making totals of 6,638 Auckland and 4,720 Wellington, there were but 6,914 persons born on foreign soil in all the remaining provincial districts. Besides these there were 383 males and 1 female of foreign birth in military and internment camps.
A closer analysis shows that of the 6,638 persons of foreign birth in Auckland 2,008 were of Austrian birth (mostly Dalmatian gum-diggers), while there were only 358 other persons of Austrian birth in the Dominion outside this province. Of 1,761 persons born in the United States of America, moreover, 726 were in the Auckland District. In the case of Wellington Province the only outstanding feature is the relatively high number of Chinese, 690 being found here out of a Dominion total of 2,041.
The percentage of persons of foreign birth to the total population in the different provincial districts is shown in the appended table:—
| Provincial District. | Foreign Element in Male Population. | Foreign Element in Female Population. | Foreign Element in Population of both Sexes. |
|---|---|---|---|
| Per Cent. | Per Cent. | Per Cent. | |
| Auckland | 3.65 | 0.86 | 2.16 |
| Taranaki | 2.79 | 1.50 | 2.16 |
| Hawke's Bay | 2.91 | 149 | 2.23 |
| Wellington | 3.05 | 1.19 | 2.11 |
| Marlborough | 1.33 | 0.59 | 0.97 |
| Nelson | 2.00 | 0.49 | 1.28 |
| Westland | 4.86 | 1.09 | 3.06 |
| Canterbury | 1.16 | 0.57 | 0.85 |
| Otago | 1.57 | 0.44 | 0.99 |
| Southland | 1.17 | 0.42 | 0.80 |
| Military and internment camps | 4.41 | 5.00 | 4.41 |
| Total | 2.54 | 0.85 | 1.70 |
It will be noted throughout that the foreign element in the population was smaller among females than among males, for reasons mentioned above. Taking the total population, it is noted that the foreign element was highest in Westland (3.06 per cent.) and lowest in Southland and Canterbury (0.80 per cent, and 0.80 per cent, respectively). The foreign element in the male population was again highest in Westland (4.86 per cent.) and lowest in Canterbury and Southland (1.16 per cent, and 1.17 per cent, respectively). With females, however, it was otherwise. The highest percentage was in Taranaki (1.50 per cent.) and in Hawke's Bay (1.49 per cent.), the lowest in Southland (0.42 per cent.) and Otago (0.44 per cent.).
Persons of Scottish birth were in excess of those of English only in Otago and Southland, which regions were, of course, originally settled from the “land of heather.” Persons of Irish birth were in excess of Scottish in Taranaki, Marlborough, Westland, and Canterbury. The numbers of persons of Scottish, Australian, and Irish birth may be described as roughly equal, being in each case approximately one-third of the number of persons of English birth and one-sixteenth of the number of New-Zealand-born.
The accompanying table is of interest as showing the birthplaces of the rural and town populations. It will be noted that persons of British (other than New Zealand) birth tend to congregate in the towns, while the New-Zealand- and foreign-born seem to be attracted to the country. In particular, New-Zealanders by birth seem to be found in the rural districts; and this fact, though by no means conclusive, is possibly additional confirmation of the indications already referred to that the country population is more prolific than the town.
| — | Foreign-born. | New-Zealand-born. | Other British-born. | Born at Sea. | Total specified. |
|---|---|---|---|---|---|
| Number. | |||||
| Boroughs | 8,931 | 411,749 | 166,213 | 747 | 587,640 |
| Counties | 9,725 | 382,390 | 117,456 | 630 | 510,201 |
| Totals | 18,656 | 794,139 | 283,669 | 1,377 | 1,097,841 |
| Percentages. | |||||
| Boroughs | 1.52 | 70.07 | 28.28 | 0.13 | 100.00 |
| Counties | 1.91 | 74.95 | 23.02 | 0.12 | 100.00 |
| Totals | 1.70 | 72.34 | 25.84 | 0.12 | 100.00 |
Table of Contents
Probably the chief reason for attaching importance to an investigation into the length of residence of persons born out of New Zealand is to be found in the Pensions Act, 1913, section 8, which provides that persons otherwise entitled are not in general eligible to receive old-age pensions unless they have resided continuously in New Zealand for at least twenty-five years preceding the date on which they establish their claim to a pension.
The following table is instructive, but the manner in which frequencies cluster about multiples of five shows that in many cases persons who have been resident in the country many years are apt to state, not the exact number of years of residence, but merely an approximation thereto. For purposes of exact comparison, then, it is of little value, but it may be taken as being approximately correct. This contention is borne out by the large numbers shown in 1911 as having been between 35 and 37, and in 1916 between 40 and 42 years, in the country, showing a year of arrival about 1874 to 1876, synchronous with the immigration boom of that period.
| Length of Residence, in Years. | 1911 Census | 1916 Census | ||||
|---|---|---|---|---|---|---|
| Males. | Females. | Total. | Males. | Females. | Total | |
| Under 5 | 38,936 | 24,232 | 63,168 | 23,762 | 22,804 | 46,566 |
| 5 | 6,460 | 3,551 | 10,011 | 6,021 | 5,009 | 11,030 |
| 6 | 5,345 | 2,992 | 8,267 | 5,017 | 4,143 | 9,160 |
| 7 | 4,898 | 2,640 | 7,538 | 4,874 | 4,210 | 9,084 |
| 8 | 4,720 | 2,430 | 7,150 | 6,197 | 4,507 | 10,704 |
| 9 | 3,423 | 1,583 | 5,006 | 4,738 | 3,347 | 8,085 |
| 10 | 4,065 | 1,801 | 5,866 | 6,512 | 3,961 | 10,473 |
| 11 | 1,973 | 988 | 2,961 | 3,513 | 2,398 | 5,911 |
| 12 | 2,127 | 1,019 | 3,146 | 4,395 | 2,724 | 7,119 |
| 13 | 1,546 | 957 | 2,503 | 3,027 | 1,918 | 4,945 |
| 14 | 1,731 | 1,046 | 2,777 | 3,690 | 1,977 | 5,667 |
| 15 | 1,708 | 1,097 | 2,805 | 3,029 | 1,624 | 4,653 |
| 16 | 1,733 | 1,159 | 2,892 | 2,482 | 1,286 | 3,768 |
| 17 | 1,923 | 1,394 | 3,317 | 1,329 | 787 | 2,116 |
| 18 | 2,031 | 1,352 | 3,383 | 1,434 | 930 | 2,364 |
| 19 | 1,218 | 838 | 2,056 | 1,086 | 766 | 1,852 |
| 20 | 2,527 | 1,548 | 4,075 | 2,636 | 1,738 | 4,374 |
| 21 | 1,140 | 735 | 1,875 | 1,074 | 824 | 1,898 |
| 22 | 1,194 | 812 | 2,006 | 1,563 | 1,192 | 2,755 |
| 23 | 1,356 | 1,148 | 2,504 | 1,527 | 1,246 | 2,733 |
| 24 | 1,725 | 1,380 | 3,105 | 1,219 | 921 | 2,140 |
| 25 | 2,844 | 2,078 | 4,922 | 1,790 | 1,171 | 2,961 |
| 26 | 2,362 | 2,083 | 4,445 | 1,230 | 840 | 2,070 |
| 27 | 3,013 | 2,891 | 5,904 | 972 | 757 | 1,729 |
| 28 | 2,947 | 2,335 | 4,832 | 1,130 | 973 | 2,103 |
| 29 | 1,655 | 1,371 | 3,026 | 1,169 | 943 | 2,112 |
| 30 | 5,024 | 4,152 | 9,176 | 3,840 | 3,132 | 6,972 |
| 31 | 3,545 | 2,764 | 6,309 | 1,494 | 1,280 | 2,774 |
| 32 | 3,808 | 2,893 | 6,701 | 2,474 | 2,636 | 4,837 |
| 33 | 2,860 | 2,421 | 5,281 | 2,358 | 2,219 | 4,577 |
| 34 | 3,071 | 2,692 | 5,763 | 1,874 | 1,590 | 3,464 |
| 35 | 5,122 | 4,335 | 9,457 | 2,646 | 2,264 | 4,910 |
| 36 | 6,491 | 5,624 | 12,115 | 3,301 | 2,773 | 6,074 |
| 37 | 5,078 | 4,347 | 9,425 | 3,128 | 2,515 | 5,643 |
| 38 | 2,676 | 2,364 | 5,040 | 2,640 | 2,260 | 4,900 |
| 39 | 1,512 | 1,258 | 2,770 | 1,988 | 1,801 | 3,789 |
| 40 | 3,293 | 2,611 | 5,904 | 6,182 | 5,404 | 11,586 |
| 41 | 981 | 696 | 1,677 | 3,732 | 3,176 | 6,908 |
| 42 | 1,215 | 946 | 2,161 | 5,718 | 4,875 | 10,593 |
| 43 | 1,198 | 988 | 2,186 | 2,679 | 2,358 | 5,037 |
| 44 | 1,240 | 1,175 | 2,415 | 1,808 | 1,520 | 3,328 |
| 45 | 2,508 | 1,970 | 4,478 | 1,725 | 1,480 | 3,205 |
| 46 and over | 20,408 | 15,220 | 35,628 | 20,862 | 17,558 | 38,420 |
| Unspecified | 5,544 | 4,119 | 9,663 | 5,501 | 4,380 | 9,881 |
| Total | 179,724 | 125,965 | 305,689 | 169,366 | 135,944 | 305,310 |
The figures, while showing a fairly constant total, yet disclose a falling-of in the total number of males of other than New Zealand birth and an increase in the corresponding number of females. The first phenomenon is doubtless due to the fact that the early settlers were mostly men, and by 1916 many of them had reached advanced years. Thus the males born abroad, being in the aggregate of an older age-constitution than females born abroad, were subject to a higher death-rate, and the falling-off during the second decade of the century in the net arrivals already referred to in this report is reflected by the marked fall in the number of persons who have resided in the country six years and under.
Of considerably more interest from the pension point of view is the next table.
| Ages. | Totals at each Age. | Length of Residence, in Years. | ||||||||||
|---|---|---|---|---|---|---|---|---|---|---|---|---|
| 16 | 17. | 18. | 19. | 20. | 21. | 22. | 23. | 24. | 25 Years and over. | |||
| 55 | Males | 3,360 | 21 | 27 | 19 | 24 | 49 | 20 | 25 | 17 | 29 | 3,129 |
| Females | 2,472 | 12 | 15 | 20 | 14 | 19 | 5 | 16 | 14 | 27 | 2,330 | |
| 56 | Males | 3,223 | 15 | 23 | 25 | 22 | 37 | 17 | 14 | 17 | 45 | 3,008 |
| Females | 2,411 | 10 | 17 | 10 | 7 | 16 | 12 | 16 | 16 | 19 | 2,288 | |
| 57 | Males | 2,908 | 11 | 22 | 20 | 9 | 22 | 9 | 11 | 15 | 19 | 2,770 |
| Females | 2,094 | 15 | 18 | 16 | 7 | 9 | 4 | 10 | 18 | 19 | 1,978 | |
| 58 | Males | 2,891 | 14 | 10 | 34 | 8 | 24 | 10 | 21 | 13 | 21 | 2,736 |
| Females | 2,291 | 3 | 12 | 15 | 10 | 21 | 8 | 15 | 14 | 21 | 2,172 | |
| 59 | Males | 2,515 | 14 | 17 | 20 | 18 | 23 | 19 | 6 | 8 | 12 | 2,378 |
| Females | 1,971 | 7 | 15 | 15 | 8 | 17 | 7 | 2 | 11 | 13 | 1,876 | |
| 60 | Males | 3,083 | 13 | 17 | 16 | 10 | 45 | 14 | 14 | 16 | 14 | 2,924 |
| Females | 2,541 | 9 | 14 | 14 | 7 | 15 | 8 | 9 | 16 | 16 | 2,433 | |
| 61 | Males | 2,026 | 8 | 7 | 14 | 8 | 17 | 11 | 9 | 14 | 17 | 1,921 |
| Females | 1,488 | 3 | 5 | 4 | 4 | 11 | 8 | 10 | 10 | 13 | 1,420 | |
| 62 | Males | 2,301 | 12 | 13 | 10 | 7 | 11 | 7 | 10 | 14 | 16 | 2,201 |
| Females | 1,815 | 5 | 8 | 6 | 8 | 8 | 6 | 5 | 17 | 7 | 1,745 | |
| 63 | Males | 2,157 | 5 | 7 | 8 | 3 | 9 | 10 | 7 | 10 | 13 | 2,085 |
| Females | 1,745 | 6 | 6 | 7 | 5 | 12 | 5 | 6 | 11 | 7 | 1,680 | |
| 64 | Males | 2,131 | 7 | 6 | 6 | 3 | 10 | 3 | 5 | 8 | 21 | 2,062 |
| Females | 1,693 | 8 | 3 | 2 | 6 | 3 | 4 | 6 | 10 | 24 | 1,627 | |
| 65 and upward. | Males | 25,027 | 43 | 46 | 65 | 38 | 103 | 47 | 48 | 62 | 94 | 24,481 |
| Females | 18,035 | 43 | 52 | 39 | 41 | 85 | 46 | 46 | 76 | 98 | 17,509 | |
| Males | 51,622 | 103 | 195 | 337 | -150 | 350 | 167 | 170 | 194 | 301 | 49,695 | |
| Females | 38,556 | 121 | 165 | 148 | 117 | 216 | 113 | 141 | 213 | 264 | 37,058 | |
| Totals | 90,178 | 284 | 360 | 385 | 267 | 566 | 280 | 311 | 407 | 565 | 86,753 | |
| Ages. | Totals at each Age. | Length of Residence, in Years. | ||||||||||
|---|---|---|---|---|---|---|---|---|---|---|---|---|
| 16. | 17. | 18. | 19. | 20. | 21. | 22. | 23. | 24. | 25 Years and over. | |||
| 55 | Males | 2,425 | 30 | 20 | 20 | 17 | 43 | 21 | 37 | 26 | 20 | 2,191 |
| Females | 2,020 | 16 | 9 | 13 | 13 | 24 | 20 | 17 | 24 | 21 | 1,863 | |
| 56 | Males | 2,812 | 39 | 17 | 29 | 19 | 45 | 22 | 46 | 34 | 28 | 2,533 |
| Females | 2,285 | 12 | 12 | 14 | 9 | 17 | 10 | 26 | 22 | 17 | 2,140 | |
| 57 | Males | 2,336 | 21 | 18 | 13 | 17 | 47 | 20 | 28 | 25 | 17 | 2,130 |
| Females | 1,884 | 12 | 9 | 13 | 6 | 18 | 15 | 11 | 18 | 17 | 1,765 | |
| 58 | Males | 2,661 | 28 | 10 | 19 | 17 | 43 | 15 | 22 | 21 | 16 | 2,470 |
| Females | 2,032 | 12 | 14 | 15 | 5 | 19 | 10 | 17 | 21 | 15 | 1,904 | |
| 59 | Males | 2,426 | 11 | 13 | 19 | 17 | 39 | 14 | 19 | 21 | 23 | 2,250 |
| Females | 1,924 | 9 | 8 | 13 | 6 | 23 | 10 | 17 | 20 | 8 | 1,810 | |
| 60 | Males | 3,187 | 26 | 16 | 20 | 8 | 45 | 20 | 22 | 31 | 21 | 2,978 |
| Females | 2,527 | 13 | 10 | 11 | 11 | 22 | 11 | 18 | 19 | 15 | 2,397 | |
| 61 | Males | 2,264 | 16 | 11 | 8 | 14 | 25 | 11 | 16 | 24 | 7 | 2,132 |
| Females | 1,576 | 7 | 7 | 5 | 3 | 14 | 9 | 10 | 14 | 7 | 1,500 | |
| 62 | Males | 2,608 | 12 | 10 | 15 | 8 | 28 | 12 | 20 | 22 | 14 | 2,467 |
| Females | 1,833 | 9 | 5 | 6 | 5 | 12 | 5 | 9 | 9 | 9 | 1,764 | |
| 63 | Males | 2,444 | 9 | 5 | 7 | 5 | 24 | 10 | 15 | 17 | 8 | 2,344 |
| Females | 1,839 | 5 | 6 | 1 | 10 | 8 | 8 | 10 | 10 | 11 | 1,770 | |
| 64 | Males | 2,298 | 11 | 7 | 6 | 7 | 23 | 5 | 12 | 15 | 14 | 2,198 |
| Females | 1,801 | 7 | 6 | 8 | 4 | 9 | 9 | 11 | 14 | 8 | 1,725 | |
| 65 and upwards | Males | 26,662 | 71 | 45 | 45 | 34 | 128 | 55 | 78 | 101 | 62 | 26,043 |
| Females | 20,940 | 51 | 37 | 49 | 37 | 99 | 48 | 74 | 98 | 59 | 20,388 | |
| Males. | 52,123 | 274 | 172 | 201 | 163 | 490 | 205 | 315 | 337 | 230 | 49,736 | |
| Females | 40,661 | 153 | 123 | 148 | 109 | 265 | 161 | 220 | 269 | 187 | 39,026 | |
| Totals | 92,784 | 427 | 295 | 349 | 272 | 755 | 366 | 535 | 606 | 417 | 88,762 | |
The figures show an increase in the numbers of persons born abroad who are actually prima facie eligible for old-age pensions, but suggest that a falling-of in such numbers is imminent. While this is true of persons born abroad, it is by no means true of New-Zealand-born, and for the purpose of computing the total population actually prima facie eligible for pensions the figures given above should be combined with those of the New-Zealand-born at similar ages, the whole giving a fairly accurate conspectus of the position, it being remembered that the age-requirements are, in the absence of special circumstances, 60 for females and 65 for males. The combined figures show an increase since last census in the total population prima facie eligible, with no prospect of any early diminution, but (if anything) the reverse.
| Ages. | 1911. | 1910. | |||||
|---|---|---|---|---|---|---|---|
| Born outside New Zealand but with 25 Years' Residence (or over). | New-Zealand-born. | Total. | Born outside New Zealand but with 25 Years' Residence (or over). | New-Zealand-born. | Total. | ||
| 55 | Males | 3,129 | 544 | 3,673 | 2,191 | 1,061 | 3,252 |
| Females | 2,330 | 501 | 2,831 | 1,863 | 997 | 2,860 | |
| 56 | Males | 3,008 | 482 | 3,490 | 2,533 | 986 | 3,519 |
| Females | 2,288 | 396 | 2,684 | 2,140 | 1,012 | 3,152 | |
| 57 | Males | 2,770 | 395 | 3,165 | 2,130 | 736 | 2,866 |
| Females | 1,978 | 368 | 2,346 | 1,765 | 696 | 2,461 | |
| 58 | Males | 2,736 | 378 | 3,114 | 2,470 | 706 | 3,176 |
| Females | 2,172 | 380 | 2,552 | 1,904 | 679 | 2,583 | |
| 59 | Males | 2,378 | 287 | 2,665 | 2,250 | 589 | 2,839 |
| Females | 1,876 | 277 | 2,153 | 1,810 | 553 | 2,363 | |
| 60 | Males | 2,924 | 313 | 3,237 | 2,978 | 609 | 3,587 |
| Females | 2,433 | 352 | 2,785 | 2,397 | 587 | 2,984 | |
| 61 | Males | 1,921 | 196 | 2,117 | 2,132 | 373 | 2,505 |
| Females | 1,420 | 180 | 1,600 | 1,500 | 354 | 1,854 | |
| 62 | Males | 2,201 | 250 | 2,451 | 2,467 | 416 | 2,883 |
| Females | 1,745 | 222 | 1,967 | 1,764 | 335 | 2,099 | |
| 63 | Males | 2,085 | 204 | 2,289 | 2,344 | 352 | 2,696 |
| Females | 1,680 | 195 | 1,875 | 1,770 | 373 | 2,143 | |
| 64 | Males | 2,062 | 185 | 2,247 | 2,198 | 327 | 2,525 |
| Females | 1,627 | 188 | 1,815 | 1,725 | 325 | 2,050 | |
| 65 and upward | Males | 24,481 | 785 | 25,266 | 26,043 | 1,766 | 27,809 |
| Females | 17,509 | 792 | 18,301 | 20,388 | 1,766 | 22,154 | |
| Males | 49,695 | 4,019 | 53,714 | 49,736 | 7,921 | 57,657 | |
| Females | 37,058 | 3,851 | 40,909 | 39,026 | 7,677 | 46,703 | |
| Totals | 86,753 | 7,870 | 94,623 | 88,762 | 15,598 | 104,360 | |
Table of Contents
On a perusal of the portion of the census results relating to religion the remarkable variety of sects that appears to exist cannot fail to strike one. A close examination reveals that although the majority of persons were returned as belonging to one of the more or less generally recognized sects, there was a notable minority who from either conviction, ignorance, or motives of ill-judged humour expressed themselves as belonging to various obscure cults. The word “religion” is, of course, a difficult one to state the connotation of, and in several cases persons have returned themselves as attending a particular place of worship instead of mentioning the name of the religious body controlling such place (e.g., “Gospel Hall,” “City Mission “). Others (no doubt mostly adherents of no definite religious body) adopted the line of least resistance by describing their views. Fifty-two persons were returned as of religion unknown, seven uncertain, and two undecided. Others again filled in this portion of the census paper by endeavouring to designate the ethical or philosophic system with which they sympathized (e.g., “Universal Hedonist,” “Monist,” “Transcendentalist,” “Positivist,” “Determinist,” and a host of others). Six proclaimed themselves as heathens, and four as infidels. Others again expressed themselves so vaguely as to baffle classification (e.g., “Pilgrim,” “Seeker after Truth,” “Believer in God,” “Christian Doctrine”)
With this variety it will be evident that the task of classifying the people according to religious belief was among the outstanding difficulties arising out of the census, and in many cases the classification cannot claim to absolute accuracy in regard to whether Christian or non-Christian, &c. This difficulty is further increased by the fact that this portion of the census schedule is the only one where a person has the legal right to refuse to answer the questions asked, this being expressly provided for in section 15 of the Census and Statistics Act, 1910. The number of persons availing themselves of this privilege shows a remarkable decline, having been 35,905 in 1911 and only 25,577 in 1916. Further details are supplied in the ensuing table.
As, however, the proportion of cases where there was difficulty in classification was really only a small one as compared with the total, the figures published may be taken as being for all intents and purposes a substantially accurate statement of the religions of the people. The broad heads usually accepted as a basis of classification are as follows:—
| I. | Christian |
| IV. | No religion |
| II. | Non-Christian |
| V. | Object to state |
| III. | Indefinite. |
| VI. | Unclassified |
The first four of these are subdivided into the different denominations and sects comprised under the respective heads.
Table of Contents
There is no State Church in New Zealand, nor is financial assistance given by the State to any religious denomination. Among the first colonists settlements were formed composed entirely of the adherents of certain religious bodies, but, as facilities for communication increased, this exclusiveness rapidly gave place to a spirit of tolerance, and no serious attempt was made to preserve the distinctive religious character of these communities. In Otago, where the Free Church of Scotland founded a settlement, adherents to the Presbyterian Church, mostly descendants of the original stock, form 47 per cent. of the population of that portion of the Dominion; while in Canterbury, which was originally settled by the United Church of England and Ireland, adherents to the Church of England constituted 46 per cent. of the population of the provincial district at the census of 1916.
The Church of England had the largest number of adherents, and, according to returns collected in 1916, had 645 churches, besides using 497 other buildings for Divine worship. The Presbyterian Church, the next in strength, had 519 churches, with the use of 551 buildings as temporary places of worship. Roman Catholics occupied third place in point of numbers, and possessed 336 churches, while using 106 other buildings. Methodists had 416 churches, and used 274 other buildings wherein to hold service.
The total number of churches and chapels belonging to all denominations and sects was 2,091, besides which 870 schoolhouses and 886 dwellings or public buildings were made use of as places of worship or for meetings. These churches and buildings were sufficient for the accommodation of 493,260 persons, or 45 per cent. of the total number of adherents and members.
The number belonging to each of the principal denominations is shown, for five census periods, in the next table.
| Denomination. | April, 1896. | March, 1901. | April, 1900. | April, 1911. | October, 1916. | |||||
|---|---|---|---|---|---|---|---|---|---|---|
| Number | Proportion per Cent. | Number | Proportion per Cent. | Number | Proportion per Cent. | Number | Proportion per Cent, | Number | Proportion per Cent. | |
| *Including those shown as belonging to “no denomination.” | ||||||||||
| Church of England | 281,166 | 40.97 | 314,024 | 41.97 | 366,828 | 42.54 | 411,671 | 42.43 | 459,021 | 42.90 |
| Presbyterians | 159,952 | 23.31 | 176,503 | 2342 | 203,597 | 23.61 | 234,662 | 24.19 | 260,659 | 24.36 |
| Methodists | 73,367 | 10.69 | 83,802 | 11.12 | 89,038 | 10.32 | 94,827 | 9.77 | 106,024 | 9.91 |
| Baptists | 16,037 | 2.34 | 16,035 | 2.13 | 17,747 | 2.06 | 20,042 | 2.07 | 20,872 | 1.95 |
| Congregationalists | 6,777 | 0.99 | 6,699 | 0.89 | 7,360 | 0.85 | 8,756 | 0.90 | 8,221 | 0.77 |
| Lutherans | 5,538 | 0.81 | 4,833 | 0.64 | 4,856 | 0.56 | 4,477 | 0.46 | 3,530 | 0.33 |
| Salvation Army | 10,532 | 1.53 | 7,999 | 1.06 | 8,389 | 0.97 | 9,707 | 1.00 | 10,004 | 0.94 |
| Brethren | 5,035 | 0.73 | 7,484 | 0.99 | 7,901 | 0.92 | 7,865 | 0.81 | 9,758 | 0.91 |
| Church of Christ | 5,859 | 0.85 | 6,105 | 0.81 | 7,061 | 0.82 | 9,187 | 0.95 | 9,249 | 0.86 |
| Unitarians | 375 | 0.05 | 468 | 0.06 | 789 | 009 | 1,316 | 0.14 | 1,402 | 0.13 |
| Society of Friends | 321 | 0.05 | 313 | 0.04 | 334 | 0.04 | 412 | 0.04 | 431 | 0.04 |
| Roman; Catholics and Catholics undefined | 98,804 | 14.40 | 109,822 | 14.58 | 126,995 | 14.73 | 140,523 | 14.49 | 151,605 | 14.17 |
| Other Christians | 6,595 | 0.96 | 5,314 | 0.71 | 5,698 | 0.66 | 6,509 | 0.67 | 7,703 | 0.72 |
| Hebrews | 1,549 | 0.23 | 1,611 | 0.21 | 1,867 | 0.22 | 2,128 | 0.22 | 2,341 | 0.22 |
| Other specified religions* | 12,489 | 1.82 | 11,421 | 1.52 | 12,200 | 1.41 | 12,536 | 1.29 | 14,817 | 1.39 |
| No religion | 1,875 | 0.27 | 1,109 | 0.15 | 1,709 | 0.20 | 5,529 | 0.57 | 4,311 | 0.40 |
| Totals, specified religions* | 686,271 | 100.00 | 753,542 | 100.00 | 862,369 | 100.00 | 970,147 | 100.00 | 1,069,948 | 100.00 |
| Object to state | 15,967 | .. | 18,295 | .. | 24,325 | .. | 35,905 | .. | 25,577 | .. |
| Unspecified | 1,122 | .. | o882 | .. | 1,884 | .. | 2,416 | .. | 3,924 | .. |
| Grand totals | 703,360 | .. | 772,719 | .. | 888,578 | .. | 1,008,468 | .. | 1,099,449 | .. |
Members of Christian denominations formed 95.71 per cent. of those who made answer to the inquiry at the last census; non-Christian sects were 0.44 per cent.; and those who described themselves as of no religion 0.39 per cent.; whilst “indefinite” religions constituted 1.12 per cent.
It will be noted that the religious composition of the community, in so far as the larger denominations are concerned, has remained remarkably uniform over successive census periods. The only marked differences emerge in the cases of the smaller bodies, where fairly notable declines have occurred in the proportions of Congregationalists and Lutherans to the total population. Brethren and Unitarians show fairly large proportionate increases over the period under review.
Table of Contents
The following table is instructive:—
| Religious Denominations. | Numbers. | Proportions per Cent. | Proportion of the Sexes in every 100 Persons. | |||||
|---|---|---|---|---|---|---|---|---|
| Males. | Females. | Total. | Males. | Females. | Total. | Males. | Females. | |
| Christians— | ||||||||
| Church of England | 229,399 | 229,622 | 459,021 | 42.97 | 42.84 | 42.90 | 49.98 | 50.02 |
| Presbyterian | 130,387 | 130,272 | 260,659 | 24.42 | 24.30 | 24.36 | 50.02 | 49.98 |
| Methodist | 50,601 | 55,423 | 106,024 | 9.48 | 10.34 | 9.91 | 47.73 | 52.27 |
| Baptist | 9,588 | 11,284 | 20,872 | 1.80 | 2.11 | 1.95 | 45.94 | 54.06 |
| Congregational | 3,750 | 4,471 | 8,221 | 0.70 | 0.83 | 0.77 | 45.61 | 54.39 |
| Lutheran | 2,310 | 1,220 | 3,530 | 0.43 | 0.23 | 0.33 | 65.44 | 34.56 |
| Church of Christ | 4,254 | 4,995 | 9,249 | 0.80 | 0.93 | 0.86 | 45.99 | 54.01 |
| Salvation Army | 4,622 | 5,382 | 10,004 | 0.87 | 1.00 | 0.94 | 46.20 | 53.80 |
| Seventh-day Adventist | 601 | 933 | 1,534 | 011 | 0.17 | 0.14 | 39.18 | 60.82 |
| Unitarian | 745 | 657 | 1,402 | 0.14 | 0.12 | 0.13 | 53.14 | 46.86 |
| Protestant (undefined) | 1,348 | 890 | 2,238 | 0.25 | 0.17 | 0.21 | 60.23 | 39.77 |
| Roman Catholic | 74,086 | 75,120 | 149,206 | 13.88 | 14.01 | 13.95 | 49.65 | 50.35 |
| Greek Catholic | 182 | 65 | 247 | 0.03 | 0.01 | 0.02 | 73.68 | 26.32 |
| Catholic (undefined) | 1,310 | 1,089 | 2,399 | 0.24 | 0.20 | 0.22 | 54.61 | 45.39 |
| Other Christians | 6,433 | 7,440 | 13,873 | 1.20 | 1.39 | 1.30 | 46.37 | 53.63 |
| Non-Christians— | ||||||||
| Hebrew | 1,196 | 1,145 | 2,341 | 0.22 | 0.21 | 0.22 | 51.09 | 48.91 |
| Mohammedan | 41 | 6 | 47 | 0.01 | 0.00 | 0.00 | 87.23 | 12.77 |
| Buddhist, Confucian | 1,433 | 38 | 1,471 | 0.27 | 0.01 | 0.14 | 97.42 | 2.58 |
| Other | 494 | 460 | 954 | 0.09 | 0.09 | 0.09 | 51.78 | 48.22 |
| Indefinite— | ||||||||
| Agnostic | 515 | 137 | 652 | 0.10 | 0.03 | 0.06 | 78.99 | 21.01 |
| Freethinker | 3,394 | 1,052 | 4,446 | 0.64 | 0.20 | 0.42 | 76.34 | 23.66 |
| Rationalist | 382 | 237 | 619 | 0.07 | 0.05 | 0.06 | 61.71 | 38.29 |
| Spiritualist | 592 | 703 | 1,295 | 0.11 | 0.13 | 0.12 | 45.71 | 54.29 |
| No denomination | 2,991 | 2,032 | 5,023 | 0.56 | 0.38 | 0.47 | 59.55 | 40.45 |
| Other | 196 | 114 | 310 | 0.04 | 0.02 | 0.03 | 63.23 | 36.77 |
| No Religion— | ||||||||
| No religion | 2,962 | 1,222 | 4,184 | 0.55 | 0.23 | 0.39 | 70.79 | 29.21 |
| Atheist | 95 | 20 | 115 | 0.02 | .. | 0.01 | 82.61 | 17.39 |
| Other | 9 | 3 | 12 | .. | .. | .. | 75.00 | 25.00 |
| Totals for specified religions | 533,916 | 536,032 | 1,069,948 | 100.00 | 100.00 | 100.00 | 49.90 | 50.10 |
| Object to state | 15,606 | 9,971 | 25,577 | .. | .. | .. | 61.02 | 38.98 |
| Unspecified | 2,253 | 1,671 | 3,924 | .. | .. | .. | 57.42 | 42.58 |
| Grand totals | 551,775 | 547,674 | 1,099,449 | .. | .. | .. | 50.19 | 49.81 |
It will be noted that males exceeded females in the following of the religious bodies mentioned, the excess being that percentage of the total numbers belonging to each body which is shown after each:—
| Greek Catholic | (47.36). |
| Lutheran | (30.88). |
| Unitarian | (6.28). |
| Presbyterian | (0.04). |
The very causes that have operated to bring about the preponderance of males in the foreign element of the population have operated in the first two cases above; the same remark also applies to the figures shown above for Confucians and Mohammedans.
Females, on the other hand, exceeded males in the following cases:—
| Seventh-day Adventist | (21.64). |
| Congregational | (8.78). |
| Baptist | (8.12). |
| Church of Christ | (8.02). |
| Salvation Army | (7.60). |
| Methodist | (4.54). |
| Roman Catholic | (0.70). |
| Church of England | (0.04). |
In the cases of Spiritualists, also, females were in a slight majority; but males were in a large majority amongst persons of no religion, atheists, those who objected to state, and other residue generally.
It is worth noting that in the two most numerous religious bodies (Church of England and Presbyterian) the proportion of males to females belonging to the same religion is most nearly equal. The percentage of males in the total population has already been shown to be 49.12; the respective percentages for the Church of England and the Presbyterian Church are 49.98 and 50.02.
Table of Contents
The following table shows at different age-groups the proportions of each denomination to the total population specified as to religion. It will be noted that in general, especially for the forms of religion most represented, the religious constitution of the community by age-groups is fairly constant. The ranks of those belonging to non-Christian religions are mainly recruited by overseas immigration; hence the low percentage at early age-groups. Indefiniteness in religious profession is, moreover, a phenomenon appearing usually in adult life, children being rarely so classified; so also with atheism, &c., all of which religions are at a maximum between 30 and 60. All these factors have tended to effect a gradual diminution as one goes from younger to older age-groups in the proportion of the population asserted to be Christians. Of the Christian religions constituting 1 per cent of the population or over the only ones showing in any degree worth mentioning a preponderance of children are the Church of England and Roman Catholic, and even here the difference is by no means marked. Baptists, on the other hand, show a slightly lower proportion at the earliest age-groups than is usual.
| Religion. | Under 5. | 5 and under 10. | 10 and under 15. | 15 and under 20. | 20 and under 25. | 25 and under 30. | 30 and under 35. | 35 and under 40. | 40 and under 45. | 45 and under 50. | 50 and under 55. | 55 and under 60. | 60 and over. | Total. |
|---|---|---|---|---|---|---|---|---|---|---|---|---|---|---|
| Christian— | ||||||||||||||
| Church of England | 43.73 | 43.17 | 42.90 | 42.45 | 42.54 | 43.08 | 43.96 | 43.71 | 43.00 | 42.74 | 42.49 | 42.08 | 40.23 | 42.90 |
| Presbyterian | 24.37 | 24.18 | 24.09 | 24.61 | 23.83 | 23.52 | 23.82 | 24.52 | 24.99 | 25.46 | 25.12 | 23.57 | 25.17 | 24.36 |
| Methodist | 10.02 | 10. 50 | 11.00 | 10.68 | 9.67 | 9.27 | 9.28 | 9.52 | 9.52 | 9.27 | 9.32 | 9.58 | 9.88 | 9.91 |
| Baptist | 1.68 | 1.91 | 2.10 | 2.03 | 1.79 | 1.72 | 1.84 | 1.86 | 2.14 | 2.00 | 2.20 | 2.03 | 2.38 | 1.95 |
| Congregational | 0.58 | 0.66 | 0.65 | 0.68 | 0.70 | 0.75 | 0.78 | 0.76 | 0.86 | 0.91 | 1.01 | 1.14 | 1.07 | 0.77 |
| Lutheran | 0.17 | 0.19 | 0.23 | 0.23 | 0.31 | 0.30 | 0.34 | 0.30 | 0.36 | 0.34 | 0.45 | 0.58 | 0.89 | 0.33 |
| Church of Christ | 0.88 | 0.90 | 0.98 | 0.94 | 0.87 | 0.86 | 0.79 | 0.78 | 0.74 | 0.71 | 0.87 | 0.81 | 0.96 | 0.86 |
| Salvation Army | 0.97 | 1.11 | 1.23 | 1.00 | 0.83 | 0.70 | 0.69 | 0.80 | 0.94 | 0.91 | 0.91 | 0.88 | 0.98 | 0.94 |
| Seventh-day Adventist | 0.13 | 0.15 | 0.16 | 0.13 | 0.13 | 0.13 | 0.13 | 0.13 | 0.13 | 0.16 | 0.15 | 0.18 | 0.16 | 0.14 |
| Unitarian | 0.09 | 0.10 | 0.08 | 0.09 | 0.11 | 0.11 | 0.13 | 0.16 | 0.13 | 0.20 | 0.21 | 0.20 | 0.23 | 0.13 |
| Protestant (undefined) | 0.15 | 0.15 | 0.16 | 0.18 | 0.24 | 0.24 | 0.25 | 0.23 | 0.21 | 0.27 | 0.21 | 0.31 | 0.24 | 0.21 |
| Roman Catholic | 14.67 | 14.37 | 13.70 | 14.04 | 15.67 | 15.50 | 13.86 | 13.15 | 12.67 | 12.61 | 12.44 | 13.63 | 13.01 | 13.95 |
| Greek Catholic | 0.01 | 0.01 | 0.01 | 0.02 | 0.03 | 0.04 | 0.04 | 0.03 | 0.02 | 0.02 | 0.01 | 0.02 | 0.02 | 0.02 |
| Catholic (undefined) | 0.11 | 0.19 | 0.17 | 0.23 | 0.28 | 0.31 | 0.27 | 0.21 | 0.21 | 0.22 | 0.23 | 0.22 | 0.22 | 0.22 |
| Other | 1.16 | 1.27 | 1.33 | 1.28 | 1.22 | 1.11 | 1.11 | 1.21 | 1.34 | 1.31 | 1.55 | 1.66 | 1.77 | 1.30 |
| Total Christians | 98.82 | 98.90 | 98.87 | 98.69 | 98.22 | 97.64 | 97.29 | 97.40 | 97.26 | 97.14 | 97.05 | 96.89 | 97.21 | 97.99 |
| Non-Christian— | ||||||||||||||
| Hebrew | 0.19 | 0.17 | 0.20 | 0.21 | 0.23 | 0.24 | 0.23 | 0.23 | 0.28 | 0.24 | 0.30 | 0.31 | 0.20 | 0.22 |
| Confucian | 0.01 | 0.01 | 0.00 | 0.01 | 0.04 | 0.08 | 0.15 | 0.12 | 0.20 | 0.23 | 0.33 | 0.51 | 0.51 | 0.13 |
| Mohammedan | 0.00 | 0.00 | 0.00 | 0.00 | 0.01 | 0.01 | 0.01 | 0.01 | 0.01 | 0.00 | 0.01 | 0.00 | 0.00 | 0.00 |
| Buddhist | 0.00 | 0.00 | 0.00 | O.00 | 0.02 | 0.01 | 0.01 | 0.00 | 0.00 | 0.01 | 0.00 | 0.00 | 0.02 | 0.01 |
| Other | 0.05 | 0.07 | 0.05 | 0.05 | 0.08 | 0.12 | 0.11 | 0.12 | 0.11 | 0.13 | 0.15 | 0.12 | O.10 | 0.09 |
| Total non -Christians | 0.25 | 0.25 | 0.25 | 0.27 | 0.38 | 0.46 | 0.51 | 0.48 | 0.60 | 0.62 | 0.79 | 0.93 | 0.83 | 0.45 |
| Indefinite— | ||||||||||||||
| Agnostic | 0.02 | 0.02 | 0.02 | 0.02 | 0.04 | 0.07 | 0.09 | 0.09 | 0.10 | 0.12 | 0.12 | 0.12 | 0.11 | 0.06 |
| Freethinker | 0.18 | 0.14 | 0.13 | 0.19 | 0.46 | 0.70 | 0.75 | 0.63 | 0.60 | 0.52 | 0.48 | 0.53 | 0.56 | 0.42 |
| Rationalist | 0.04 | 0.05 | 0.05 | 0.03 | 0.04 | 0.04 | 0.06 | 0.07 | 0.08 | 0.08 | 0.08 | 0.08 | 0.08 | 0.06 |
| Spiritualist | 0.07 | 0.07 | 0.08 | 0.12 | 0.11 | 0.08 | 0.09 | 0.13 | 0.15 | 0.19 | 0.22 | 0.26 | 0.22 | 0.12 |
| No denomination | 0.33 | 0.31 | 0.37 | 0.41 | 0.43 | 0.45 | 0.57 | 0.58 | 0.64 | 0.67 | 0.64 | 0.62 | 0.49 | 0.47 |
| Other | 0.02 | 0.02 | 0.02 | 0.02 | 0.01 | 0.04 | 0.03 | 0.03 | 0.03 | 0.05 | 0.05 | 0.04 | 0.04 | 0.03 |
| Total indefinite | 0.67 | 0.62 | 0.67 | 0.79 | 1.09 | 1.38 | 1.59 | 1.54 | 1.60 | 1.63 | 1.61 | 1.65 | 1.50 | 1.16 |
| No religion | 0.25 | 0.23 | 0.20 | 0.24 | 0.30 | 0.49 | 0.60 | 0.56 | 0.53 | 0.60 | 0.52 | 0.52 | 0.45 | 0.39 |
| Atheist | 0.01 | 0.00 | 0.00 | 0.01 | 0.01 | 0.02 | 0.01 | 0.02 | 0.01 | 0.01 | 0.01 | 0.01 | 0.01 | 0.01 |
| Other | 0.00 | 0.00 | 0.00 | 0.00 | 0.00 | 0.00 | 0.00 | 0.00 | 0.00 | 0.00 | 0.02 | 0.00 | 0.00 | 0.00 |
| Total no religion | 0.26 | 0.23 | 0.21 | 0.25 | 0.31 | 0.52 | 0.61 | 0.58 | 0.54 | 0.61 | 0.55 | 0.53 | 0.46 | 0.40 |
| Grand total | 100.00 | 100.00 | 100.00 | 100.00 | 100.00 | 100.00 | 100.00 | 100.00 | 100.00 | 100.00 | 100.00 | 100.00 | 100.00 | 100.00 |
The following tables show in an interesting manner the distribution of religions by provincial districts. This table has been compiled from the borough and county returns, and as in a few cases boroughs and counties are not exactly conterminous with provincial districts the figures are not absolutely accurate, although the error thus creeping in is to all intents and purposes so small as to be- quite negligible.
Distribution of Persons belonging to different Denominations among the various Provincial Districts, Census, 1916.
| Religion. | Auckland. | Hawke's Bay. | Taranaki. | Wellington. | Marlborough. | Nelson. | West-land. | Canterbury. | Otago. | Southland. | Total. |
|---|---|---|---|---|---|---|---|---|---|---|---|
| Christians— | |||||||||||
| Church of England | 31.24 | 5.55 | 5.51 | 22.30 | 1.86 | 4.16 | 1.66 | 17.96 | 6.88 | 2.88 | 100.00 |
| Presbyterian | 21.45 | 4.84 | 3.51 | 15.74 | 1.01 | 2.54 | 1.34 | 14.65 | 23.77 | 11.13 | 100.00 |
| Methodist | 28.23 | 4.01 | 7.43 | 20.57 | 1.55 | 4.02 | 1.24 | 19.95 | 8.66 | 4.33 | 100.00 |
| Baptist | 31.71 | 3.90 | 2.50 | 17.44 | 0.34 | 4.16 | 0.25 | 17.01 | 20.08 | 2.60 | 100.00 |
| Congregational | 36.29 | 5.18 | 1.15 | 19.23 | 0.33 | 3.32 | 0.24 | 14.48 | 17.51 | 2.20 | 100.00 |
| Lutheran | 14.25 | 16.42 | 3.80 | 47.00 | 0.90 | 9.40 | 1.87 | 3.77 | 1.75 | 0.84 | 100.00 |
| Church of Christ | 36.98 | 1.37 | 1.23 | 17.17 | 0.39 | 9.82 | 0.56 | 7.75 | 18.30 | 6.43 | 100.00 |
| Salvation Army | 23.35 | 5.22 | 6.17 | 24.82 | 1.39 | 3.37 | 0.89 | 18.24 | 11.66 | 4.89 | 100.00 |
| Seventh-day Adventist | 38.51 | 8.62 | 5.22 | 22.85 | 0.52 | 2.87 | 0.39 | 16.97 | 1.83 | 2.22 | 100.00 |
| Unitarian | 42.86 | 3.09 | 2.66 | 28.71 | 0.22 | 1.94 | .. | 16.22 | 3.73 | 0.57 | 100.00 |
| Protestant (undefined) | 24.65 | 1.50 | 1.00 | 22.92 | 2.14 | 10.96 | 6.87 | 18.37 | 8.00 | 3.59 | 100.00 |
| Roman Catholic | 29.05 | 4.90 | 5.24 | 20.68 | 1.92 | 3.89 | 3.78 | 14.51 | 10.35 | 5.68 | 100.00 |
| Greek Catholic | 38.84 | 3.72 | 0.83 | 21.49 | 0.83 | 2.07 | 3.30 | 4.13 | 24.38 | 0.41 | 100.00 |
| Catholic (undefined) | 30.62 | 2.14 | 0.92 | 16.50 | 3.53 | 5.04 | 14.66 | 15.92 | 6.76 | 3.91 | 100.00 |
| Other | 28.49 | 5.88 | 4.54 | 23.97 | 0.61 | 5.32 | 0.83 | 14.00 | 10.63 | 5.72 | 100.00 |
| Total Christians | 28.13 | 5.10 | 5.00 | 20.22 | 1.54 | 3.78 | 1.80 | 16.60 | 12.28 | 5.55 | 100.00 |
| Non-Christians— | |||||||||||
| Hebrew | 37.39 | 2.63 | 1.55 | 37.69 | .. | 1.04 | 0.43 | 7.86 | 11.14 | 0.26 | 100.00 |
| Confucian | 22.06 | 3.20 | 1.64 | 41.78 | 0.43 | 3.13 | 8.68 | 3.06 | 2.17 | 3.84 | 100.00 |
| Mohammedan | 34.78 | 15.22 | 2.17 | 28.26 | .. | .. | .. | 15.22 | 4.35 | .. | 100.00 |
| Buddhist | 6.25 | 3.13 | .. | 4.69 | .. | 1.56 | .. | .. | 84.37 | .. | 100.00 |
| Other. | 52.32 | 10.21 | 3.68 | 17.89 | 0.32 | 1.16 | 0.42 | 6.84 | 6.42 | 0.74 | 100.00 |
| Total non-christians | 35.41 | 4.43 | 1.99 | 34.43 | 0.19 | 1.67 | 2.85 | 6.21 | 11.42 | 1.40 | 100.00 |
| Indefinite— | |||||||||||
| Agnostic | 34.37 | 3.13 | 4.53 | 29.22 | 0.94 | 3.75 | 4.69 | 11.41 | 6.87 | 1.09 | 100.00 |
| Freethinker | 40.40 | 4.57 | 4.01 | 23.49 | 0.82 | 5.03 | 2.18 | 10.99 | 6.10 | 2.41 | 100.00 |
| Rationalist | 28.71 | 2.61 | 1.47 | 14.03 | 1.47 | 2.28 | 4.57 | 36.87 | 3.42 | 4.57 | 100.00 |
| Spiritualist | 32.92 | 7.59 | 2.79 | 25.25 | 1.24 | 2.17 | 0.23 | 17.90 | 8.05 | 1.86 | 100.00 |
| No denomination | 42.84 | 4.00 | 3.28 | 17.82 | 0.56 | 4.14 | 0.88 | 11.19 | 11.63 | 3.86 | 100.00 |
| Other | 39.61 | 1.62 | 2.60 | 17.53 | 0.65 | 5.84 | 0.00 | 19.16 | 9.42 | 3.57 | 100.00 |
| Total indefinite | 39.69 | 4.41 | 3.44 | 21.04 | 0.71 | 4.17 | 1.65 | 13.32 | 8.56 | 3.01 | 100.00 |
| No religion | 33.49 | 4.71 | 4.85 | 24.01 | 1.10 | 3.91 | 3.72 | 14.86 | 6.19 | 3.15 | 100.00 |
| Atheist | 26.55 | 12.39 | 7.08 | 22.12 | 0.88 | 11.50 | 3.54 | 14.16 | 0.88 | 0.88 | 100.00 |
| Other | 33.33 | 8.33 | .. | 16.67 | .. | .. | .. | .. | 41.67 | .. | 100.00 |
| Total no religion | 35.10 | 4.64 | 4.81 | 21.85 | 1.07 | 6.21 | 2.03 | 12.87 | 7.76 | 3.66 | 100.00 |
| Total | 28.29 | 4.98 | 5.11 | 20.52 | 1.49 | 4.40 | 1.29 | 16.39 | 12.08 | 5.45 | 100.00 |
Some of the features of the table are referred to below. In each case the percentage which the number of people in the province belonging to the religion in question bears to the total Dominion population belonging to that religion is set opposite the name of each religion as it is mentioned.
Of the Christian religions that have the largest proportion of their total adherents in the Auckland Provincial District, the following are the outstanding examples:—
| Unitarian | 45.97 per cent. |
| Greek Catholic | 40.00 per cent. |
| Seventh-day Adventist | 38.37 per cent. |
Those will the smallest proportion in this province are the—
| Lutheran | 14.25 per cent. |
| Presbyterian | 21.45 per cent. |
| Salvation Army | 23.35 per cent. |
The outstanding feature of the Hawke's Bay figures are the relatively large proportions of Lutherans (16.42 per cent.) and the Seventh-day Adventists (8.62 per cent.).
In Taranaki, Methodists (7.43 per cent.) and the Salvation Army (6.17 per cent.) make the best relative showing.
In Wellington Province are to be found 47.00 of all the Lutherans in New Zealand, persons of this faith being very strong relatively in the lower Manawatu district.
In Marlborough, Roman Catholics (together with Catholics, undefined) would appear to be relatively strong.
The outstanding religions in Nelson are—
| Protestant (undefined) | 10.96 per cent. |
| Church of Christ | 9.82 per cent. |
| Lutheran | 9.40 per cent. |
In Westland the outstanding feature is the number of Catholics (undefined)— viz., 14.66 per cent.—the only other head possessing over 4 per cent. in this province being Protestants (undefined), with 6.87 per cent. These two indefinite descriptions are denounced in instructions printed on the census household schedules. Such terms when used are, of course, so vague and shadowy as to baffle detailed classification, though there exists a reasonable presumption that persons returning themselves as Catholics are for the most part Roman Catholics.
In Canterbury the following are outstandingly high:—
| Methodist | 19.95 per cent. |
| Protestant (undefined) | 18.37 per cent. |
The following are outstandingly low:—
| Lutheran | 3.77 per cent. |
| Greek Catholic | 4.13 per cent. |
Although in 1916 the number of members of the Church of England was but 17.96 per cent. of the total members of this communion in the Dominion, 46 per cent. of the province was returned as belonging to this body. In Otago the following are outstandingly high:—
| Greek Catholic | 24.38 per cent. |
| Presbyterian | 23.77 per cent. |
| Baptist | 20.08 per cent. |
Although the above percentage of the total Presbyterians in the Dominion was in 1916 in Otago, it is worth noting that 47 per cent. of the total population of this province belonged to that Church. The following are outstandingly low:—
| Lutheran | 1.75 per cent. |
| Seventh-day Adventist | 1.83 per cent. |
| Unitarian | 3.73 per cent. |
In Southland Presbyterianism stands out conspicuously:—
| Presbyterian | 11.13 per cent. |
| Church of Christ | 6.43 per cent. |
The lowest here is Greek Catholic (0.41 per cent.), with Unitarian (0.57 per cent.) a close second.
Of non-Christians, Confucians were strong in -Wellington, 41.78 per cent. of the Dominion total residing here. 37.69 per cent. of the Hebrews were also to be found in this provincial district. Moreover, 8.68 per cent. of the Dominion's Confucians were in Westland, a high figure for a province with so small a population. It is notable that 84.37 per cent. of the Dominion's Buddhists were returned in Otago. An examination of the detailed returns, however, reveals the fact that this was almost entirely due to the presence in Otago Harbour on census night of an overseas vessel largely manned by race aliens; and it is not impossible that shipping considerations have also affected conditions in other centres, though not to the same noticeable extent. It should be mentioned that as a whole non-Christians were very largely confined to the North Island, roughly three-quarters of them being returned there.
Of indefinite religions Canterbury would appear to be a stronghold of rationalism, 36.87 per cent., of the Rationalists in the Dominion living here. Rationalism is the only indefinite religion that is outstanding in any way in any province.
The number of names on the list of officiating ministers under the Marriage Act was in June, 1916, 1,567, and the denominations to which they belonged are shown hereunder:—
| Denomination. | No. |
|---|---|
| Specified in statute— | |
| Church of England | 455 |
| Presbyterian Church of New Zealand | 359 |
| Methodist Church of New Zealand | 266 |
| Roman Catholic Church | 251 |
| Congregational Independents | 35 |
| Baptists | 51 |
| Lutheran Church | 7 |
| Hebrew Congregations | 5 |
| Not specified in statute— | |
| Church of Christ | 29 |
| Salvation Army | 62 |
| Not specified in statue— | |
| Catholic Apostolic Church | 4 |
| Unitarians | 2 |
| Brethren | 2 |
| Seventh-day Adventists | 5 |
| Free Methodist Church of New Zealand | 1 |
| Latter-day Saints | 3 |
| Church of the Seven Rules of Jehovah | 10 |
| Ringatu Church | 10 |
| Others | 10 |
| Total | 1,567 |
It is of interest to work out the numbers of adherents per minister for each of the chief denominations. The following are the results for the last four census-takings:—
| Denomination. | 1901. | 1906. | 1911. | 1916. |
|---|---|---|---|---|
| Church of England | 993 | 1,075 | 1,006 | 1,009 |
| Presbyterian | 856 | 775 | 747 | 726 |
| Methodist | 441 | 511 | 451 | 398 |
| Roman Catholic | 717 | 647 | 644 | 604 |
| Congregational | 372 | 364 | 285 | 234 |
| Baptist | 667 | 507 | 477 | 409 |
| Lutheran | 537 | 485 | 447 | 504 |
| Hebrew | 268 | 311 | 354 | 468 |
| Church of Christ | 436 | 441 | 328 | 318 |
| Salvation Army | 799 | 441 | 359 | 161 |
| Unitarian | 468 | 789 | 438 | 701 |
It will be noted that the tendency has for the most part been towards a reduction in the number of adherents per minister, the exceptions being the Church of England, Hebrew, and Unitarian faiths.
The statistics relating to places of worship were compiled from returns supplied by responsible officers of congregations throughout the Dominion. It is by no means improbable that the figures relating to attendance at service and the like may have been made up in different ways by different denominations, but the general view of the position gives useful and probably accurate enough information.
The following table furnishes an interesting comparison of the total number of buildings used as places of worship as returned in the last two census-takings:—
| Denomination. | 1911. | 1916. |
|---|---|---|
| Church of England | 796 | 1,142 |
| Presbyterian | 709 | 1,070 |
| Roman Catholic | 358 | 442 |
| Catholic Apostolic | 5 | 6 |
| Greek Orthodox | 1 | 1 |
| Methodists | 583 | 690 |
| Baptists | 55 | 66 |
| Congregational | 32 | 31 |
| Brethren | 68 | 125 |
| Church of Christ | 44 | 53 |
| Lutheran | 11 | 14 |
| Society of Friends | 1 | 2 |
| Christadelphians | 3 | 7 |
| Seventh-day Adventists | 8 | 14 |
| Unitarian | 3 | 3 |
| Salvation Army | 79 | 107 |
| Hebrew | 5 | 4 |
| Church of God | 1 | 1 |
| Spiritualist | 2 | 7 |
| Mormons | 3 | 7 |
| Theosophists | 1 | 5 |
| Undenominational | 91 | 50 |
| Totals | 2,859 | 3,847 |
It will be noted that there has been a general all-round increase in places of worship, an increase least marked in the cases of churches and chapels themselves, the total figures being—
| Class of Building. | 1911. | 1916. |
|---|---|---|
| Churches and chapels | 1,976 | 2,091 |
| Schoolhouses | 491 | 870 |
| Dwellinghouses and public buildings | 392 | 886 |
| Totals | 2,859 | 3,847 |
Fuller details for 1916 are appended:—
| Religious Denomination. | Class of Building. | Materials of which Outer Walls are built. | Total Places of Worship. | |||||||
|---|---|---|---|---|---|---|---|---|---|---|
| Churches and Chapels. | Public Schools. | Halls and Theatres. | Private Dwelling-houses. | Wood. | Stone. | Brick. | Iron. | Other. | ||
| Church of England | 645 | 273 | 169 | 55 | 1,031 | 30 | 33 | 25 | 23 | 1,142 |
| Presbyterian | 519 | 370 | 141 | 40 | 960 | 38 | 50 | 15 | 7 | 1,070 |
| Roman Catholic | 336 | 37 | 44 | 25 | 377 | 24 | 33 | 1 | 7 | 442 |
| Catholic Apostolic | 3 | 2 | 1 | .. | 6 | .. | .. | .. | .. | 6 |
| Greek Orthodox | 1 | .. | .. | .. | 1 | .. | .. | .. | .. | 1 |
| Methodist | 416 | 156 | 87 | 31 | 635 | 11 | 36 | 3 | 5 | 690 |
| Baptist | 51 | 4 | 7 | 4 | 56 | 1 | 8 | .. | 1 | 66 |
| Congregational | 27 | 2 | 2 | .. | 25 | 1 | 4 | .. | 1 | 31 |
| Brethren | .. | 6 | 113 | 6 | 109 | 1 | 11 | 2 | 2 | 125 |
| Church of Christ | 41 | .. | 11 | 1 | 46 | 1 | 6 | .. | .. | 53 |
| Lutheran | 12 | 2 | .. | .. | 14 | .. | .. | .. | .. | 14 |
| Society of Friends | 2 | .. | .. | .. | .. | .. | 2 | .. | .. | 2 |
| Christadelphians | .. | .. | 6 | 1 | 1 | .. | 4 | .. | 2 | 7 |
| Seventh-day Adventist | 10 | 2 | 1 | 1 | 11 | .. | 1 | .. | 2 | 14 |
| Unitarian | 2 | .. | 1 | .. | 1 | .. | 2 | .. | .. | 3 |
| Salvation Army | 5 | 11 | 86 | 5 | 89 | 2 | 15 | .. | .. | 107 |
| Hebrew | 4 | .. | .. | .. | 1 | 1 | 1 | .. | 1 | 4 |
| Church of God | 1 | .. | .. | .. | 1 | .. | .. | .. | .. | 1 |
| Spiritualist | 2 | .. | 5 | .. | 4 | .. | 3 | .. | .. | 7 |
| Mormon | 6 | .. | .. | 1 | 5 | .. | 2 | .. | .. | 7 |
| Theosophist | .. | .. | 2 | 3 | .. | .. | 3 | 2 | .. | 5 |
| Undenominational | 8 | 5 | 29 | 8 | 38 | .. | 11 | 1 | .. | 50 |
| Totals | 2,091 | 870 | 705 | 181 | 3,411 | 110 | 225 | 50 | 61 | 3,847 |
In respect of accommodation for worshippers and the numbers of persons attending service, figures for 1911 and 1916 are appended. It will be noted that while for the whole Dominion in 1916 accommodation existed for 45 per cent. of the adherents, this proportion was spread over the different denominations in a far from uniform manner.
| Religious Denomination. | Number of People for whom Accommodation. | Average Seating-capacity of Places of Worship. | Percentage of Accommodation to Number of Adherents. | |||
|---|---|---|---|---|---|---|
| 1911. | 1916. | 1911. | 1916. | 1911. | 1916. | |
| Church of England | 99,944 | 125,330 | 126 | 110 | 24.28 | 27.30 |
| Presbyterian | 98,779 | 125,375 | 139 | 117 | 42.10 | 48.10 |
| Roman Catholic | 67,873 | 71,847 | 190 | 163 | 48.77 | 48.11 |
| Catholic Apostolic | 1,115 | 760 | 223 | 127 | 331.85 | 222.87 |
| Greek Orthodox | 85 | 60 | 85 | 60 | 32.08 | 24.29 |
| Methodist | 86,328 | 87,295 | 148 | 126 | 91.04 | 82.34 |
| Baptist | 11,675 | 13,190 | 212 | 200 | 58.25 | 63.19 |
| Congregational | 8,360 | 7,800 | 261 | 252 | 95.48 | 94.88 |
| Brethren | 10,415 | 16,110 | 153 | 129 | 132.42 | 165.10 |
| Church of Christ | 8,732 | 8,734 | 199 | 165 | 95.05 | 94.43 |
| Lutheran | 1,360 | 1,395 | 124 | 100 | 30.38 | 39.52 |
| Society of Friends | 60 | 200 | 60 | 100 | 14.56 | 46.40 |
| Christadelphian | 284 | 925 | 95 | 132 | 27.63 | 80.43 |
| Seventh-day Adventist | 1,305 | 1,648 | 163 | 118 | 117.25 | 107.43 |
| Unitarian | 650 | 800 | 217 | 267 | 49.39 | 57.06 |
| Salvation Army | 20,392 | 21,328 | 258 | 199 | 210.08 | 213.19 |
| Hebrew | 986 | 1,340 | 197 | 335 | 46.33 | 57.24 |
| Church of God | 70 | 80 | 70 | 80 | 42.42 | 55.17 |
| Spiritualist | 500 | 1,690 | 250 | 241 | 41.77 | 130.50 |
| Mormon | 350 | 950 | 117 | 136 | 95.89 | 301.59 |
| Theosophist | 70 | 431 | 70 | 86 | 14.03 | 51.93 |
| Undenominational | 9,726 | 5,972 | 107 | 119 | 105.98 | 108.89 |
| Totals | 429,059 | 493,260 | 150 | 128 | 44.23 | 46.10 |
It is noted that the percentage of accommodation to the adherents was in 1916 highest for Mormons (301.59 per cent.), Catholic Apostolic (222.87 per cent.), Salvation Army (213.19 per cent.), and Brethren (165.10 per cent.). In these cases alone and in those of Spiritualists, Undenominationalists, and Seventh-day Adventists did the accommodation exceed the number of adherents. The percentage was lowest for Greek Orthodox (24.29 per cent.) and Church of England (27.30 per cent.). Except in the cases of some of the smaller denominations there is no marked difference between the 1911 and 1916 figures.
| Religious Denomination. | Number of Persons attending Service. | Percentage of Persons attending Service to Accommodation. | ||
|---|---|---|---|---|
| 1911. | 1916. | 1911. | 1916. | |
| Church of England | 53,258 | 54,964 | 53.30 | 43.06 |
| Presbyterian | 55,256 | 60,781 | 55.94 | 48.48 |
| Roman Catholic | 48,146 | 53,907 | 70.94 | 75.03 |
| Catholic Apostolic | 566 | 195 | 50.76 | 25.66 |
| Greek Orthodox | 45 | 40 | 52.94 | G6.67 |
| Methodist | 46,093 | 41,968 | 53.40 | 48.08 |
| Baptist | 6,032 | 6,034 | 51.67 | 45.75 |
| Congregational | 4,235 | 3,257 | 50.66 | 41.76 |
| Brethren | 3,563 | 6,119 | 34.21 | 37.98 |
| Church of Christ | 3,745 | 3,131 | 42.90 | 35.85 |
| Lutheran | 728 | 564 | 53.53 | 40.43 |
| Society of Friends | 20 | 44 | 33.33 | 22.00 |
| Christadelphian | 47 | 163 | 16.55 | 17.62 |
| Seventh-day Adventist | 240 | 613 | 18.39 | 37.20 |
| Unitarian | 470 | 150 | 72.31 | 18.75 |
| Salvation Army | 8,143 | 6,991 | 39.93 | 32.78 |
| Hebrew | 360 | 390 | 36.51 | 29.10 |
| Church of God | 50 | 80 | 71.43 | 100.00 |
| Spiritualist | 325 | 525 | 65.00 | 31.07 |
| Mormon | 150 | 355 | 42.86 | 37.37 |
| Theosophist | 50 | 226 | 71.43 | 52.42 |
| Undenominational | 3,472 | 2,527 | 35.70 | 42.31 |
| Totals | 234,994 | 243,024 | 54.76 | 49.26 |
It is worth nothing with regard to the latter table that in 1916 the number of persons usually present at the largest-attended service of the day was supplied; in 1911 in many cases there is reason to believe the figures was supplied for the total number of persons attending service at any time during the day. A conclusion, therefore from the foregoing figures that church attendance has fallen off would be invalid except possibly in such an obvious case as that of Westland, as shown in a subsequent table.
The following table, showing the service at which the larger number usually attends (also the Sunday-school roll), is of interest:—
| Religions Denomination. | Service at which Largest Number usually attends. | Sunday School | ||||||
|---|---|---|---|---|---|---|---|---|
| Teachers. | Scholars. | |||||||
| Morning. | Afternoon. | Evening. | Not stated. | Males. | Females. | Males. | Females. | |
| Church of England | 248 | 355 | 484 | 55 | 755 | 2,830 | 18,819 | 22,406 |
| Presbyterian | 298 | 427 | 317 | 28 | 1,201 | 2,637 | 17,138 | 20,003 |
| Roman Catholic | 412 | .. | 7 | 23 | 146 | 466 | 5,492 | 6,742 |
| Catholic Apostolic | 3 | 1 | 2 | .. | .. | .. | .. | .. |
| Greek Orthodox | 1 | .. | .. | .. | .. | .. | .. | .. |
| Methodist | 148 | 238 | 295 | 9 | 1,131 | 1,733 | 12,235 | 14,684 |
| Baptist | 19 | 9 | 38 | .. | 284 | 423 | 2,418 | 3,010 |
| Congregational | 10 | 3 | 18 | .. | 114 | 217 | 1,170 | 1,446 |
| Brethren | 57 | 6 | 60 | 2 | 202 | 188 | 1,683 | 1,830 |
| Church of Christ | 5 | 3 | 25 | .. | 142 | 198 | 1,401 | 1,616 |
| Lutheran | 9 | 3 | 1 | .. | 11 | 7 | 93 | 100 |
| Society of Friends | 2 | .. | .. | .. | .. | .. | .. | .. |
| Christadelphian | 3 | .. | 4 | .. | 11 | 1 | 36 | 29 |
| Seventh-day Adventist | 11 | 2 | 1 | .. | 28 | 40 | 155 | 315 |
| Unitarian | .. | .. | 3 | .. | 6 | 10 | 70 | 70 |
| Salvation Army | 6 | 11 | 90 | .. | 138 | 381 | 2,283 | 2,503 |
| Hebrew | 3 | .. | 1 | .. | 9 | .. | 79 | 72 |
| Church of God | .. | .. | 1 | .. | 2 | 2 | 12 | 10 |
| Spiritualist | 1 | .. | 6 | .. | 5 | 0 | 44 | 53 |
| Mormon | .. | 5 | 2 | .. | 20 | 38 | 232 | 218 |
| Theosophist | .. | 1 | 4 | .. | 4 | 7 | 42 | 45 |
| Undenominational | 9 | 12 | 27 | 2 | 51 | 68 | 463 | 643 |
| Totals | 1,265 | 1,076 | 1,386 | 120 | 4,260 | 9,232 | 63,865 | 75,795 |
The following table purports to show by provincial district the total number of buildings used as places of worship as returned in the last two censuses:—
| Provincial District. | 1911. | 1916. |
|---|---|---|
| Auckland | 739 | 1,067 |
| Taranaki | 130 | 218 |
| Hawke's Bay | 150 | 196 |
| Wellington | 513 | 624 |
| Marlborough | 44 | 102 |
| Nelson | 171 | 212 |
| Westland | 59 | 90 |
| Canterbury | 446 | 592 |
| Otago— | ||
| Otago portion | 437 | 501 |
| Southland portion | 170 | 245 |
| Totals | 2,859 | 3,847 |
In respect of accommodation for worshippers and the numbers of persons attending service the following figures by provincial districts for 1911 and 1916 axe appended:—
| Provincial District. | Number of Persons for whom Accommodation. | Average Seating-capacity of Places of Worship. | ||
|---|---|---|---|---|
| 1911. | 1910. | 1911. | 1916. | |
| Auckland | 103,422 | 131,395 | 139 | 123 |
| Taranaki | 17,422 | 25,453 | 134 | 117 |
| Hawke's Bay | 20,276 | 24,274 | 135 | 124 |
| Wellington | 77,554 | 83,245 | 151 | 133 |
| Marlborough | 6,431 | 8,662 | 146 | 86 |
| Nelson | 20,895 | 22,409 | 122 | 106 |
| Westland | 7,255 | 11,982 | 123 | 133 |
| Canterbury | 72,427 | 84,638 | 163 | 143 |
| Otago— | ||||
| Otago portion | 79,575 | 72,348 | 182 | 144 |
| Southland portion | 23,802 | 28,854 | 140 | 118 |
| Totals | 429,059 | 493,260 | 150 | 128 |
In number of places of worship all provinces show an increase, the percentage of increase being highest in Marlborough, where places of worship returned at the census have more than doubled; and lowest in Otago, where the increase was less than 15 per cent. Evidently, however, the increase represents for the most part buildings of small seating-capacity, as in Westland Province alone has the average seating-capacity of places of worship increased, and even here only by a very small fraction.
| Provincial District. | Number of Persons usually Present at Largest-attended Service of Day. | Percentages of Persons attending Service to Accommodation. | ||
|---|---|---|---|---|
| 1911.* | 1916. | 1911. | 1916. | |
| *See “Placed of Worship, by Denomination” | ||||
| Auckland | 55,883 | 60,474 | 54.03 | 46.02 |
| Hawke's Bay | 11,666 | 12,553 | 58.60 | 51.71 |
| Taranaki | 10,208 | 11,606 | 58.60 | 45.60 |
| Wellington | 42,706 | 38,953 | 55.06 | 46.80 |
| Marlborough | 3,697 | 4,759 | 57.48 | 54.94 |
| Nelson | 10,673 | 10,802 | 51.07 | 28.20 |
| Westland | 5,057 | 4,460 | 69.70 | 37.22 |
| Canterbury | 40,460 | 46,908 | 55.86 | 55.42 |
| Otago | 40,740 | 37,358 | 51.20 | 51.64 |
| Southland | 13,904 | 15,151 | 58.41 | 52.51 |
| Totals | 234,994 | 243,024 | 54.77 | 49.27 |
The following figures, showing by provincial districts (1) the services at which the largest number usually attends, (2) the Sunday-school membership, are also of interest:—
| Provincial District. | Service at which Largest Number usually attends. | Sunday School. | ||||||
|---|---|---|---|---|---|---|---|---|
| Teachers. | Scholars. | |||||||
| Morning. | Afternoon. | Evening. | Not stated. | Males. | Females. | Males. | Female | |
| Auckland | 402 | 286 | 364 | 15 | 1,103 | 2,243 | 15,947 | 19,407 |
| Hawke's Bay | 58 | 69 | 63 | 6 | 167 | 384 | 2,963 | 3,752 |
| Taranaki | 63 | 72 | 74 | 9 | 152 | 403 | 2,728 | 3,411 |
| Wellington | 198 | 161 | 233 | 32 | 835 | 1,675 | 12,295 | 14,544 |
| Marlborough | 37 | 32 | 32 | 1 | 43 | 135 | 979 | 985 |
| Nelson | 72 | 41 | 93 | 6 | 205 | 457 | 3,243 | 3,674 |
| Westland | 33 | 14 | 40 | 3 | 43 | 119 | 929 | 1,152 |
| Canterbury | 192 | 174 | 202 | 24 | 767 | 1,812 | 11,738 | 13,736 |
| Otago | 139 | 142 | 210 | 10 | 718 | 1,509 | 9,531 | 10,805 |
| Southland | 71 | 85 | 75 | 14 | 227 | 495 | 3,812 | 4,329 |
| Totals | 1,265 | 1,076 | 1,386 | 120 | 4,260 | 9,232 | 63,865 | 75,795 |
Table of Contents
Table of Contents
Of the 1,099,449 persons returned on the 1916 census schedules only 1,213 cases occurred of failure to state the degree of education attained. Of those whose degree of education was stated it was found that 83.53 per cent. were able to read and write, 0.68 per cent. could read only, while 15.79 per cent. could neither read nor write.
The proportion able to read and write has fallen slightly as compared with figures compiled from the 1911 census returns. This small decrease is probably due to the disturbance of the normal proportions of the population brought about by the absence with the Forces of a number of men between twenty and forty-five years of age.
Over a longer period, however, there has been a considerable increase in the proportion of the population able both to read and write. This improvement, however, is not entirely due to improved educational facilities, but has to some extent been caused by the decreased birth-rate and the consequent decreased proportion of children under five years of age. The figures for successive census years are as follows:—
Education.—Proportions per Cent. at Successive Censuses.—Total Population.
| Census. | Males. | Females. | Both Sexes. | ||||||
|---|---|---|---|---|---|---|---|---|---|
| Read and Write. | Read only. | Cannot Read. | Read and Write. | Read only. | Cannot Read. | Read and Write. | Read only. | Cannot Read. | |
| Per Cent. | Per Cent, | Per Cent. | Per Cent. | Per Cent. | Per Cent. | Per Cent. | Per Cent. | Per Cent. | |
| December, 1858 | 66.86 | 9.59 | 23.55 | 59.13 | 13.53 | 27.34 | 63.51 | 11.30 | 25.19 |
| December, 1861 | 73.45 | 7.12 | 19.43 | 61.36 | 11.89 | 26.75 | 68.67 | 9.01 | 22.32 |
| December, 1864 | 77.27 | 5.64 | 17.09 | 65.27 | 9.65 | 25.08 | 72.07 | 7.17 | 20.13 |
| December, 1867 | 75.62 | 5.95 | 18.43 | 64.86 | 9.24 | 25.90 | 71.35 | 7.25 | 21.40 |
| February, 1871 | 73.10 | 6.36 | 20.54 | 63.75 | 9.10 | 27.15 | 69.20 | 7.50 | 23.30 |
| March, 1874 | 71.40 | 6.96 | 21.64 | 63.94 | 9.56 | 26.50 | 68.15 | 8.09 | 23.76 |
| March, 1878 | 72.11 | 5.91 | 21.98 | 66.33 | 7.80 | 25.87 | 69.52 | 6.76 | 23.72 |
| April, 1881 | 73.31 | 5.01 | 21.68 | 68.94 | 6.39 | 24.67 | 71.32 | 5.63 | 23.05 |
| March, 1886 | 75.40 | 4.36 | 20.24 | 72.41 | 5.31 | 22.28 | 74.01 | 4.80 | 21.19 |
| April, 1891 | 77.97 | 3.74 | 18.29 | 76.48 | 4.24 | 19.28 | 77.27 | 3.97 | 18.76 |
| April, 1896 | 81.06 | 2.71 | 16.23 | 80.09 | 3.08 | 16.83 | 80.60 | 2.89 | 16.51 |
| March, 1901 | 83.08 | 1.81 | 15.11 | 82.44 | 2.10 | 15.46 | 82.78 | 1.95 | 15.27 |
| April, 1906 | 84.03 | 1.48 | 14.49 | 82.91 | 173 | 15.36 | 83.50 | 1.60 | 14.90 |
| April, 1911 | 84.30 | 0.78 | 14.92 | 83.20 | 0.95 | 15.85 | 83.78 | 0.86 | 15.36 |
| October, 1916 | 83.06 | 0.70 | 16.24 | 84.00 | 0.67 | 15.33 | 83.53 | 0.68 | 15.79 |
| NOTE.—Chinese are excluded prior to 1916. | |||||||||
Education.—Proportions per Cent. at Successive Censuses.—Population over Five Years of Age.
| Census. | Males. | Females. | Both Sexes. | ||||||
|---|---|---|---|---|---|---|---|---|---|
| Read and Write. | Read only. | Cannot Read. | Read and Write. | Read only. | Cannot Read. | Read and Write. | Read only. | Cannot Read. | |
| Per Cent. | Per Cent, | Per Cent. | Per Cent. | Per Cent. | Per Cent. | Per Cent. | Per Cent. | Per Cent. | |
| March, 1874 | 84.84 | 7.84 | 7.32 | 80.12 | 11.37 | 8.51 | 82.85 | 9.33 | 7.82 |
| March, 1878 | 85.58 | 6.74 | 7.68 | 81.73 | 9.25 | 9.02 | 83.89 | 7.84 | 8.27 |
| April, 1881 | 87.08 | 5.71 | 7.21 | 84.61 | 7.48 | 7.91 | 85.98 | 6.50 | 7.52 |
| March, 1886 | 88.05 | 4.95 | 7.00 | 86.43 | 6.17 | 7.40 | 87.30 | 5.51 | 7.19 |
| April, 1891 | 89.56 | 4.18 | 6.26 | 88.92 | 4.79 | 6.29 | 89.26 | 4.47 | 6.27 |
| April, 1896 | 91.69 | 3.00 | 5.31 | 91.49 | 3.42 | 5.09 | 91.59 | 3.20 | 5.21 |
| March, 1901 | 93.42 | 1.99 | 4.59 | 93.32 | 2.32 | 4.36 | 93.37 | 2.15 | 4.48 |
| April, 1906 | 94.67 | 1.63 | 3.70 | 94.28 | 1.91 | 3.81 | 94.48 | 1.76 | 3.76 |
| April, 1911 | 93.89 | 0.88 | 5.23 | 94.50 | 0.78 | 4.72 | 94.20 | 0.83 | 4.97 |
| October, 1916 | 94.73 | 0.79 | 4.48 | 95.38 | 0.76 | 3.86 | 95.06 | 0.77 | 4.17 |
| NOTE.—Chinese are excluded prior to 1916. | |||||||||
The following table shows for various age-groups in 1916 the percentages under the three headings:—
| Age-group (in Years). | Read and Write. | Read only. | Cannot Read. |
|---|---|---|---|
| Under 5 | .. | .. | 100.00 |
| 5 and under 10 | 71.32 | 2.62 | 26.06 |
| 10 and under 15 | 99.57 | 0.09 | 0.34 |
| 15 and under 20 | 99.63 | 0.07 | 0.30 |
| 20 and under 25 | 99.47 | 0.16 | 0.37 |
| 25 and under 30 | 99.42 | 0.18 | 0.40 |
| 30 and under 35 | 99.38 | 0.18 | 0.44 |
| 35 and under 40 | 99.16 | 0.20 | 0.64 |
| 40 and under 45 | 98.99 | 0.28 | 0.73 |
| 45 and under 50 | 98.66 | 0.33 | 1.01 |
| 50 and under 55 | 97.91 | 0.64 | 1.45 |
| 55 and under 60 | 96.53 | 1.13 | 2.34 |
| 60 and under 65 | 94.99 | 1.83 | 3.18 |
| 65 and under 70 | 93.11 | 2.70 | 4.19 |
| 70 and under 75 | 91.38 | 3.54 | 5.08 |
| 75 and under 80. | 90.45 | 4.22 | 5.33 |
| 80 and upwards | 86.26 | 6.00 | 7.74 |
Even after allowance is made for the infirmities of old people, it will be seen from the above figures that the persons of the younger generation are much less illiterate than persons of advanced ages.
The following table will also be found instructive:—
Education, by Age-groups, Census, 1916.
| Age last Birthday. | English Language. | Foreign Language. | Cannot Read. | Not stated. | Total. | ||
|---|---|---|---|---|---|---|---|
| Read and Write. | Read only. | Read and Write. | Read only. | ||||
| Under 5 | 132,055 | .. | 132,055 | ||||
| 5–9 | 86,187 | 3,162 | 2 | .. | 31,491 | 1,976 | 122,818 |
| 10–14 | 108,093 | 94 | 4 | .. | 374 | 660 | 109,225 |
| 15–19 | 90,538 | 38 | 106 | 21 | 277 | 424 | 91,404 |
| 20–24 | 75,862 | 53 | 438 | 62 | 286 | 477 | 77,178 |
| 25–29 | 86,973 | 91 | 483 | 60 | 354 | 614 | 88,575 |
| 30–34 | 91,836 | 106 | 450 | 61 | 403 | 725 | 93,581 |
| 35–39 | 88,530 | 132 | 315 | 48 | 573 | 851 | 90,449 |
| 40–44 | 68,869 | 146 | 309 | 51 | 511 | 738 | 70,624 |
| 45–49 | 58,887 | 162 | 261 | 37 | 603 | 778 | 60,738 |
| 50–54 | 48,437 | 237 | 226 | 50 | 645 | 515 | 45,110 |
| 55–59 | 32,435 | 337 | 215 | 44 | 792 | 516 | 34,339 |
| 60–64 | 26,584 | 458 | 230 | 58 | 899 | 462 | 28,691 |
| 65–69 | 18,795 | 511 | 201 | 41 | 855 | 393 | 20,796 |
| 70–74 | 13,461 | 490 | 132 | 37 | 747 | 307 | 15,174 |
| 75–79 | 9,295 | 405 | 83 | 33 | 555 | 176 | 10,547 |
| 80–84 | 4,122 | 245 | 38 | 21 | 347 | 105 | 4,878 |
| 85–89 | 1,344 | 97 | 12 | 12 | 128 | 36 | 1,629 |
| 90–94 | 243 | 19 | 2 | 1 | 36 | 4 | 305 |
| 95–99 | 37 | 8 | 1 | .. | 9 | .. | 55 |
| 100 and over | 9 | 1 | .. | .. | 1 | 1 | 12 |
| Unspecified Adults | 978 | 10 | 25 | .. | 48 | 91 | 1,152 |
| Unspecified Minors | 60 | .. | .. | .. | 48 | 6 | 114 |
| Totals | 906,585 | 6,802 | 3,533 | 637 | 172,037 | 9,855 | 1,099,449 |
Of the population between the ages of 5 and 10 there were 31,491, or 25.64 per cent., unable to read, the percentage falling to 0.34 at the 10–15 age-group, and to 0.30 at the 15–20 age-group. Above 20 the percentage was 1.20.
The birthplaces of those able to read (or read and write) a foreign language only are of interest. The 4,170 persons concerned, representing roughly 0.4 per cent. of the total population, comprised 1,041 persons born in Austria-Hungary, 341 in Germany, 1,382 in China, and 1,406 born in other countries, or 24.96. 8.18, 33.14, and 33.72 per cent. respectively of the total persons in the Dominion born in those countries.
Of these, easily the highest percentage among metropolitan and suburban areas was in Palmerston North, where 2.57 per cent, of the male population 15 years of age and over were unable to read English, but able to read a foreign language. Apparently the element of foreign descent following the Lutheran form of worship mainly accounts for this. Amongst metropolitan areas Wellington stood highest (1.41 per cent.). The generally high percentage in the larger centres was no doubt in many cases due to the presence in port of oversea vessels.
The county containing the largest number and percentage of persons able to read (or read and write) a foreign language only was Hobson, where, of a total population of 3,622 aged 5 years and over, 253, or 7 per cent., were in this position. Other North Auckland counties also show a higher percentage than the average, due to this district being the New Zealand habitat of Dalmatian gum-diggers.
The following table is of interest:—
Education, by Provincial Districts.—Proportions per Cent. at Successive Censuses.
| Census. | Provincial Districts. | Totals. | |||||||||
|---|---|---|---|---|---|---|---|---|---|---|---|
| Auckland | Taranaki | Hawke's Bay | Wellington | Marlborough | Nelson | Westland | Canterbury | Otago | Southland | ||
| * Based on figures for specified ages only. | |||||||||||
| Per Cent. | Per Cent, | Per Cent. | Per Cent. | Per Cent. | Per Cent. | Per Cent. | Per Cent. | Per Cent. | Per Cent. | ||
| March, 1878— | |||||||||||
| Read and write | 69.59 | 67.19 | 68.77 | 69.19 | 67.07 | 71.48 | 70.71 | 69.34 | 69.63 | Included in Otago. | 69.52 |
| Read only | 7.59 | 6.46 | 6.70 | 5.58 | 6.78 | 6.91 | 6.79 | 6.12 | 7.07 | 6.76 | |
| Cannot read | 22.82 | 26.35 | 24.53 | 24.95 | 26.15 | 21.61 | 22.50 | 24.54 | 23.30 | 23.72 | |
| April, 1881— | |||||||||||
| Read and write | 72.48 | 70.27 | 69.62 | 70.03 | 67.85 | 72.92 | 74.29 | 70.44 | 71.75 | 71.32 | |
| Read only | 5.70 | 5.04 | 5.18 | 5.13 | 5.53 | 6.12 | 5.32 | 5.61 | 5.92 | 5.63 | |
| Cannot read | 21.82 | 24.69 | 25.20 | 24.84 | 26.62 | 20.96 | 20.39 | 23.95 | 22.33 | 23.05 | |
| March, 1886— | |||||||||||
| Read and write | 74.88 | 69.54 | 73.07 | 72.67 | 71.98 | 75.39 | 77.43 | 73.50 | 74.59 | 74.01 | |
| Read only | 4.83 | 4.94 | 3.78 | 4.46 | 4.08 | 5.05 | 4.30 | 4.76 | 5.21 | 4.80 | |
| Cannot read | 20.29 | 25.52 | 23.15 | 22.87 | 23.94 | 19.56 | 18.27 | 21.74 | 20.20 | 21.19 | |
| April, 1891*— | |||||||||||
| Read and write | 76.95 | 73.68 | 74.98 | 76.69 | 73.58 | 78.18 | 79.79 | 77.72 | 78.29 | 77.25 | |
| Read only | 4.19 | 3.61 | 3.22 | 3.52 | 3.74 | 3.78 | 3.94 | 3.88 | 4.41 | 3.98 | |
| Cannot read | 18.86 | 22.71 | 21.80 | 19.79 | 22.68 | 18.04 | 16.27 | 18.40 | 17.30 | 18.77 | |
| April, 1896*— | |||||||||||
| Read and write | 79.83 | 77.91 | 79.26 | 79.94 | 77.81 | 80.97 | 83.71 | 81.71 | 81.50 | 80.59 | |
| Read only | 3.08; | 2.37 | 2.57 | 2.52 | 2.67 | 2.77 | 2.98 | 2.76 | 3.30 | 2.89 | |
| Cannot read | 17.09 | 19.72 | 18.17 | 17.54 | 19.52 | 16.26 | 13.31 | 15.53 | 15.20 | 16.52 | |
| March, 1901*— | |||||||||||
| Read and write | 82.02 | 80.55 | 81.25 | 82.18 | 80.08 | 83.29 | 84.04 | 83.87 | 83.90 | 82.77 | |
| Read only | 2.12 | 1.70 | 1.76 | 1.67 | 2.10 | 1.98 | 2.00 | 1.88 | 2.10 | 1.94 | |
| Cannot read | 15.86 | 17.75 | 16.99 | 16.15 | 17.82 | 14.73 | 13.96 | 14.25 | 14.00 | 15.29 | |
| April, 1906*— | |||||||||||
| Read and write | 82.90 | 81.05 | 82.74 | 83.40 | 82.71 | 83.40 | 79.78 | 84.28 | 84.33 | 83.50 | |
| Read only | 1.95 | 1.51 | 1.18 | 1.44 | 1.58 | 1.60 | 2.43 | 1.44 | 1.53 | 1.60 | |
| Cannot read | 15.15 | 17.44 | 16.08 | 15.16 | 15.71 | 15.00 | 17.79 | 14.28 | 14.14 | 14.90 | |
| April, 1911*— | |||||||||||
| Read and write* | 83.81 | 81.81 | 83.25 | 83.38 | 82.15 | 83.72 | 84.33 | 84.50 | 85.07 | 82.40 | 83.77 |
| Read only | 0.84 | 0.73 | 0.74 | 0.78 | 0.78 | 1.01 | 1.11 | 0.81 | 1.03 | 0.98 | 0.86 |
| Cannot read | 15.35 | 17.46 | 16.01 | 15.84 | 17.07 | 15.27 | 14.56 | 14.69 | 13.90 | 16.62 | 15.37 |
| October, 1916— | |||||||||||
| Read and write | 82.88 | 80.90 | 83.03 | 83.41 | 81.69 | 83.27 | 83.05 | 84.18 | 85.46 | 82.40 | 83.40 |
| Read only | 0.70 | 0.60 | 0.58 | 0.62 | 0.59 | 0.71 | 1.31 | 0.74 | 0.70 | 0.73 | 0.69 |
| Cannot read | 16.42 | 18.50 | 16.39 | 15.97 | 17.72 | 16.02 | 15.61 | 15.08 | 13.84 | 16.87 | 15.91 |
It will be noticed that Otago had the most satisfactory percentage, with Canterbury a close second. The least satisfactory was Taranaki. The differences between provinces have, however, never been marked, but it is still true to state that all have not shared to the same extent in the increase of the proportion of the population able to read and write, the South Island generally showing better results than the North, but this is merely a reflex of the older age-constitution there, as will be seen from the following table, which shows the information for persons aged 15 and over only, and really gives a better comparison:—
Education, by Provincial Districts.—Proportions per Cent. among Population 15 Years and over, Census, 1916.
| Provincial District. | Males. | Females. | ||||||||
|---|---|---|---|---|---|---|---|---|---|---|
| English Language. | Foreign Language only. | Cannot Read | English Language. | Foreign Language only. | Cannot Read | |||||
| Read and Write. | Read only. | Read and Write. | Read only. | Read and Write. | Read only. | Read and Write. | Read only. | |||
| Auckland | 96.87 | 0.43 | 1.32 | 0.17 | 1.21 | 98.53 | 0.48 | 0.14 | 0.02 | 0.83 |
| Taranaki | 97.10 | 0.45 | 0.89 | 0.11 | 1.45 | 98.14 | 0.44 | 0.45 | 0.09 | 0.88 |
| Hawke's Bay | 97.66 | 0.33 | 0.72 | 0.12 | 1.17 | 98.53 | 0.44 | 0.18 | 0.05 | 0.80 |
| Wellington | 97.27 | 0.40 | 0.86 | 0.25 | 1.22 | 98.50 | 0.43 | 0.21 | 0.07 | 0.79 |
| Marlborough | 97.72 | 0.58 | 0.22 | 0.06 | 1.42 | 98.15 | 0.56 | 0.07 | 0.05 | 1.17 |
| Nelson | 97.32 | 0.46 | 0.57 | 0.09 | 1.56 | 98.32 | 0.56 | 0.09 | 0.02 | 1.01 |
| Westland | 94.32 | 0.95 | 2.14 | 0.29 | 2.30 | 97.37 | 0.92 | 0.21 | 0.12 | 1.38 |
| Canterbury | 97.58 | 0.50 | 0.20 | 0.05 | 1.67 | 98.19 | 0.70 | 0.06 | 0.02 | 1.03 |
| Otago | 97.70 | 0.46 | 0.62 | 0.09 | 1.13 | 98.44 | 0.60 | 0.05 | 0.02 | 0.89 |
| Southland | 97.43 | 0.45 | 0.38 | 0.06 | 1.68 | 98.29 | 0.53 | 0.08 | .. | 1.10 |
| Military and internment camps | 98.20 | 0.10 | 1.49 | 0.04 | 0.17 | 95.00 | 5.00 | .. | .. | .. |
| Totals | 97.27 | 0.44 | 0.83 | 0.14 | 1.32 | 98.40 | 0.53 | 0.14 | 0.04 | 0.89 |
A similar table to the above is next given for metropolitan and suburban areas, and for the rest of the Dominion:—
Education, by Metropolitan and Suburban Areas.— Proportions Per Cent. among Population 15 Years and over, Census, 1916.
| Metropolitan or Suburban Area | Males. | Females. | ||||||||
|---|---|---|---|---|---|---|---|---|---|---|
| English Language. | Foreign Language only. | Cannot Read | English Language. | Foreign Language only. | Cannot Read | |||||
| Read and Write. | Read only. | Read and Write. | Read only. | Read and Write. | Read only. | Read and Write. | Read only. | |||
| Metropolitan Areas. | ||||||||||
| Auckland | 97.79 | 0.39 | 0.80 | 0.06 | 0.96 | 98.61 | 0.51 | 0.12 | 0.01 | 0.75 |
| Wellington | 97.45 | 0.33 | 0.96 | 0.45 | 0.81 | 98.68 | 0.40 | 0.12 | 0.04 | 0.76 |
| Christchurch | 97.82 | 0.46 | 0.26 | 0.05 | 1.41 | 98.22 | 0.72 | 0.06 | 0.02 | 0.98 |
| Dunedin | 97.67 | 0.54 | 0.75 | 0.10 | 0.94 | 98.49 | 0.58 | 0.07 | 0.02 | 0.84 |
| Suburban Areas. | ||||||||||
| Gisborne | 98.27 | 0.29 | 0.39 | 0.05 | 1.00 | 98.87 | 0.40 | 0.07 | .. | 0.66 |
| Napier | 97.59 | 0.20 | 1.27 | 0.07 | 0.87 | 98.80 | 0.37 | 0.16 | 0.04 | 0.63 |
| New Plymouth | 97.64 | 0.43 | 0.56 | 0.07 | 1.30 | 98.20 | 0.42 | 0.27 | 0.06 | 1.05 |
| Wanganui | 97.05 | 0.39 | 0.63 | 0.05 | 1.88 | 98.80 | 0.41 | 0.15 | 0.03 | 0.61 |
| Palmerston North | 96.01 | 0.33 | 2.40 | 0.17 | 1.09 | 97.85 | 0.52 | 0.52 | 0.18 | 0.93 |
| Nelson | 97.07 | 0.31 | 0.72 | 0.04 | 1.86 | 98.37 | 0.47 | 0.10 | 0.09 | 0.97 |
| Grey Valley Boroughs | 96.40 | 0.85 | 0.97 | 0.30 | 1.48 | 97.90 | 0.90 | 0.12 | 0.07 | 1.01 |
| Timaru | 98.14 | 0.30 | 0.33 | .. | 1.23 | 98.52 | 0.55 | .. | .. | 0.93 |
| Invercargill | 97.95 | 0.35 | 0.30 | 0.05 | 1.35 | 98.29 | 0.58 | 0.01 | .. | 1.12 |
| Totals | 97.62 | 0.40 | 0.74 | 0.15 | 1.09 | 98.50 | 0.53 | 0.11 | 0.03 | 0.83 |
| Remainder of Dominion | 97.00 | 0.46 | 0.91 | 0.14 | 1.49 | 98.29 | 0.53 | 0.16 | 0.05 | 0.97 |
| Grand total for Dominion | 97.27 | 0.44 | 0.83 | 0.14 | 1.32 | 98.40 | 0.53 | 0.14 | 0.04 | 0.89 |
This table reveals several interesting features. It will be observed that the proportion of those unable to read to the total population was higher for males than for females in all areas. The proportion of those unable to read was higher in the districts outside the thirteen centres of population than in the average of those centres, due no doubt to the better facilities existing for education in the towns.
In the table on the opposite page will be found a classification of persons shown on the 1916 census schedule as receiving education.
Schooling, by Ages, Census, 1916.
| Nature of Schooling. | Age last Birthday. | Total. | |||||||||||||
|---|---|---|---|---|---|---|---|---|---|---|---|---|---|---|---|
| Under 5 | 5 | 6 | 7 | 8 | 9 | 10 | 11 | 12 | 13 | 14 | 15 and under 21. | Unspecified Minors. | 21 and over. | ||
| Receiving education at— | Males | ||||||||||||||
| University College | .. | .. | .. | .. | .. | .. | .. | .. | .. | .. | .. | 490 | .. | 406 | 896 |
| Secondary school—Public | 2 | 48 | 114 | 145 | 174 | 200 | 243 | 296 | 490 | 979 | 1,776 | 3,293 | 3 | 27 | 7,790 |
| Secondary school— Private | 1 | 6 | 10 | 15 | 30 | 15 | 27 | 39 | 67 | 129 | 205 | 751 | .. | 37 | 1,332 |
| Technical school—Public | .. | 1 | .. | 4 | 4 | 4 | 12 | 12 | 43 | 135 | 411 | 2,249 | 1 | 260 | 3,136 |
| Technical school— Private | .. | .. | .. | .. | .. | .. | .. | .. | 3 | 4 | 9 | 78 | .. | 55 | 149 |
| Primary school—Public | 374 | 6,241 | 9,819 | 10,699 | 10,795 | 10,434 | 10,281 | 9,959 | 9,750 | 8,093 | 4,441 | 1,661 | 14 | 31 | 92,592 |
| Primary school— Private | 152 | 570 | 798 | 863 | 799 | 745 | 724 | 735 | 668 | 550 | 359 | 233 | 2 | 10 | 7,208 |
| Home | 206 | 329 | 326 | 202 | 131 | 107 | 62 | 63 | 53 | 65 | 53 | 210 | .. | 109 | 1,916 |
| “Scholar,” but class of school not stated | 78 | 301 | 385 | 382 | 346 | 343 | 344 | 355 | 342 | 310 | 250 | 144 | 2 | 4 | 3,586 |
| Totals | 813 | 7,496 | 11,452 | 12,310 | 12,279 | 11,848 | 11,693 | 11,459 | 11,416 | 10,265 | 7,504 | 9,109 | 22 | 939 | 118,605 |
| Receiving education at— | Males | ||||||||||||||
| University College | .. | .. | .. | .. | .. | .. | .. | .. | .. | .. | .. | 386 | 1 | 242 | 629 |
| Secondary school—Public | .. | 43 | 86 | 144 | 124 | 165 | 224 | 306 | 426 | 881 | 1,550 | 3,222 | 1 | 7 | 7,179 |
| Secondary school—Private | .. | 8 | 25 | 20 | 21 | 42 | 39 | 58 | 110 | 199 | 266 | 1,180 | .. | 13 | 1,981 |
| Technical school—Public | .. | .. | 1 | 3 | 1 | 2 | 2 | 5 | 39 | 111 | 327 | 2,141 | .. | 199 | 2,831 |
| Technical school— Private | .. | .. | .. | .. | .. | .. | .. | 1 | 6 | 10 | 23 | 224 | .. | 34 | 298 |
| Primary school—Public | 334 | 5,573 | 8,953 | 10,332 | 10,179 | 9,716 | 9 775 | 9,233 | 9,094 | 7,497 | 3,986 | 1,530 | 12 | 18 | 86,232 |
| Primary school— Private | 129 | 524 | 836 | 1,076 | 1,066 | 1,016 | 998 | 973 | 857 | 826 | 572 | 725 | 2 | 7 | 9,657 |
| Home | 256 | 388 | 107 | 291 | 194 | 155 | 123 | 117 | 95 | 93 | 99 | 175 | .. | 9 | 2,402 |
| “Scholar,” but class of school not stated | 90 | 280 | 396 | 383 | 384 | 352 | 345 | 330 | 321 | 313 | 302 | 209 | 1 | 1 | 3,707 |
| Totals | 809 | 6,816 | 10,754 | 13,249 | 11,969 | 11,448 | 11,506 | 11,023 | 10,948 | 9,930 | 7,125 | 9,792 | 17 | 530 | 114,916 |
| Receiving education at— | Both Sexes. | ||||||||||||||
| University College | .. | .. | .. | .. | .. | .. | .. | .. | .. | .. | l | 876 | 1 | 648 | 1,525 |
| Secondary school—Public | 2 | 91 | 200 | 289 | 298 | 365 | 467 | 602 | 916 | 1,860 | 3,326 | 6,515 | 4 | 34 | 14,969 |
| Secondary school— Private | 1 | 14 | 35 | 35 | 51 | 57 | 66 | 97 | 177 | 328 | 471 | 1,931 | .. | 50 | 3,313 |
| Technical school—Public | .. | 1 | 1 | 7 | 5 | 6 | 14 | 17 | 82 | 246 | 738 | 4,390 | 1 | 459 | 5,967 |
| Technical school— Private | .. | .. | .. | .. | .. | .. | .. | 1 | 9 | 14 | 32 | 302 | .. | 89 | 447 |
| Primary school—Public | 708 | 11,814 | 18,772 | 21,031 | 20,974 | 20,150 | 20,056 | 19,192 | 18,844 | 15,590 | 8,427 | 3,191 | 26 | 49 | 178,824 |
| Primary school— Private | 281 | 1,094 | 1,684 | 1,939 | 1,865 | 1,761 | 1,722 | 1,708 | 1,525 | 1,376 | 931 | 958 | 4 | 17 | 16,865 |
| Home | 462 | 717 | 733 | 493 | 325 | 262 | 185 | 180 | 148 | 158 | 152 | 385 | .. | 118 | 4,318 |
| “Scholar,” but class of school not stated | 168 | 581 | 781 | 765 | 730 | 695 | 689 | 685 | 663 | 623 | 552 | 353 | 3 | 5 | 7,293 |
| Totals | 1,622 | 14,312 | 22,206 | 24,559 | 24,248 | 23,296 | 23,199 | 22,482 | 22,364 | 20,195 | 14,629 | 18,901 | 39 | 1,469 | 233,521 |
An historical survey of results by provincial districts is also given.
Schooling, by Provincial Districts, at Successive Censuses.
| Provincial District. | At State Primary Schools. | At Secondary or Private Schools.* | Being taught at Home. | ||||||
|---|---|---|---|---|---|---|---|---|---|
| Males. | Females | Total. | Males. | Females. | Total. | Males. | Females. | Total. | |
* Including universities and secondary schools in 1911 and 1916. † Including Southland in 1896, 1901, and 1906. | |||||||||
| Auckland— | |||||||||
| April, 1896 | 14,339 | 13,789 | 28,128 | 1,705 | 2,169 | 3,874 | 798 | 971 | 1,769 |
| Mar., 1901 | 15,523 | 14,557 | 30,080 | 2,002 | 2,512 | 4,514 | 635 | 769 | 1,404 |
| April, 1906 | 17,028 | 15,683 | 32,711 | 2,477 | 2,961 | 5,438 | 583 | 721 | 1,304 |
| April, 1911 | 21,246 | 19,950 | 41,196 | 4,206 | 4,043 | 8,249 | 653 | 796 | 1,449 |
| Oct., 1916 | 26,217 | 24,739 | 50,956 | 6,532 | 6,903 | 13,435 | 655 | 785 | 1,440 |
| Taranaki— | |||||||||
| April, 1896 | 3,150 | 2,846 | 5,996 | 161 | 291 | 452 | 149 | 172 | 321 |
| Mar., 1901 | 3,571 | 3,285 | 6,856 | 201 | 355 | 556 | 118 | 144 | 262 |
| April, 1906 | 3,787 | 3,435 | 7,222 | 499 | 609 | 1,108 | 111 | 150 | 261 |
| April, 1911 | 4,490 | 4,094 | 8,584 | 722 | 805 | 1,527 | 148 | 190 | 338 |
| Oct., 1916 | 5,177 | 4,758 | 9,935 | 1,150 | 1,226 | 2,376 | 134 | 158 | 292 |
| Hawke's Bay— | |||||||||
| April, 1896 | 3,152 | 2,892 | 6,044 | 461 | 522 | 983 | 173 | 213 | 386 |
| Mar., 1901 | 3,253 | 3,023 | 6,276 | 546 | 625 | 1,171 | 125 | 180 | 305 |
| April, 1906 | 3,455 | 3,208 | 6,663 | 591 | 702 | 1,293 | 121 | 182 | 303 |
| April, 1911 | 3,751 | 3,535 | 7,286 | 811 | 937 | 1,748 | 118 | 174 | 292 |
| Oct., 1916 | 4,477 | 4,233 | 8,710 | 1,221 | 1,404 | 2,625 | 132 | 144 | 276 |
| Wellington— | |||||||||
| April, 1896 | 11,143 | 10,592 | 21,735 | 1,506 | 1,836 | 3,342 | 536 | 743 | 1,279 |
| Mar., 1901 | 12,040 | 11,497 | 23,537 | 1,724 | 2,059 | 3,783 | 466 | 636 | 1,102 |
| April, 1906 | 13,503 | 12,473 | 25,976 | 2,530 | 2,988 | 5,518 | 444 | 522 | 966 |
| April, 1911 | 15,286 | 13,115 | 28,401 | 3,842 | 4,574 | 8,416 | 430 | 611 | 1,041 |
| Oct., 1916 | 17,779 | 16,180 | 33,959 | 5,346 | 5,938 | 11,284 | 396 | 505 | 901 |
| Marlborough— | |||||||||
| April, 1896 | 1,276 | 1,182 | 2,458 | 114 | 154 | 268 | 91 | 100 | 191 |
| Mar., 1901 | 1,234 | 1,151 | 2,385 | 172 | 207 | 379 | 65 | 63 | 128 |
| April, 1906 | 1,156 | 1,081 | 2,237 | 180 | 224 | 404 | 43 | 80 | 123 |
| April, 1911 | 1,212 | 1,124 | 2,336 | 228 | 255 | 483 | 59 | 78 | 137 |
| Oct., 1916 | 1,393 | 1,203 | 2,596 | 316 | 359 | 675 | 51 | 68 | 119 |
| Nelson— | |||||||||
| April, 1896 | 3,521 | 3,326 | 6,847 | 542 | 499 | 1,041 | 144 | 173 | 317 |
| Mar., 1901 | 3,507 | 3,314 | 6,821 | 522 | 575 | 1,097 | 106 | 119 | 225 |
| April, 1906 | 3,490 | 3,215 | 6,705 | 609 | 629 | 1,238 | 117 | 147 | 264 |
| April, 1911 | 4,051 | 3,485 | 7,536 | 588 | 783 | 1,371 | 102 | 160 | 262 |
| Oct., 1916 | 4,297 | 3,878 | 8,175 | 1,125 | 1,204 | 2,329 | 120 | 150 | 270 |
| Westland— | |||||||||
| April, 1896 | 1,316 | 1,297 | 2,613 | 233 | 257 | 490 | 24 | 34 | 58 |
| Mar., 1901 | 1,032 | 1,073 | 2,105 | 281 | 349 | 630 | 16 | 12 | 28 |
| April, 1906 | 877 | 904 | 1,781 | 296 | 362 | 658 | 18 | 20 | 38 |
| April, 1911 | 1,071 | 1,009 | 2,080 | 309 | 352 | 661 | 24 | 21 | 45 |
| Oct., 1916 | 1,084 | 1,083 | 2,167 | 466 | 531 | 997 | 17 | 18 | 35 |
| Canterbury— | |||||||||
| April, 1896 | 13,997 | 13,011 | 27,008 | 1,883 | 2,053 | 3,936 | 392 | 530 | 922 |
| Mar., 1901 | 12,873 | 12,004 | 24,877 | 1,886 | 2,053 | 3,939 | 339 | 473 | 812 |
| April, 1906 | 12,375 | 11,642 | 24,017 | 2,190 | 2,419 | 4,609 | 285 | 405 | 690 |
| April, 1911 | 13,695 | 12,711 | 26,406 | 2,779 | 2,998 | 5,777 | 265 | 457 | 722 |
| Oct., 1916 | 14,981 | 14,055 | 29,036 | 4,078 | 4,508 | 8,586 | 165 | 311 | 476 |
| Otago †— | |||||||||
| April, 1896 | 16,812 | 15,723 | 32,535 | 1,541 | 1,673 | 3,214 | 449 | 660 | 1,109 |
| Mar., 1901 | 15,327 | 14,647 | 29,974 | 1,660 | 2,108 | 3,768 | 345 | 444 | 789 |
| April, 1,906 | 14,661 | 13,961 | 28,622 | 2,076 | 2,344 | 4,420 | 309 | 333 | 642 |
| April, 1911 | 10,570 | 9,942 | 20,512 | 2,119 | 2,016 | 4,135 | 147 | 178 | 325 |
| Oct., 1916 | 11,410 | 10,649 | 22,059 | 2,901 | 3,037 | 5,938 | 174 | 182 | 356 |
| Southland— | |||||||||
| April, 1911 | 5,174 | 4,641 | 9,815 | 501 | 597 | 1,098 | 106 | 123 | 229 |
| Oct., 1916 | 5,777 | 5,454 | 11,231 | 962 | 1,172 | 2,134 | 72 | 81 | 153 |
| Totals. | |||||||||
| April, 1896 | 68,706 | 64,658 | 133,364 | 8,146 | 9,454 | 17,600 | 2,756 | 3,596 | 6,352 |
| Mar., 1901 | 68,306 | 64,551 | 132,911 | 8,994 | 10,843 | 19,837 | 2,215 | 2,840 | 5,055 |
| April, 1906 | 70,332 | 65,602 | 135,934 | 11,448 | 13,238 | 24,686 | 2,031 | 2,560 | 4,591 |
| April, 1911 | 80,546 | 73,606 | 154,152 | 16,105 | 17,360 | 33,465 | 2,057 | 2,791 | 4,848 |
| Oct., 1916 | 92,592 | 80,232 | 178,824 | 24,097 | 26,282 | 50,379 | 1,916 | 2,402 | 4,318 |
An examination of the two foregoing tables reveals some striking features, of which perhaps the most interesting is the evidence that sending children to private schools or keeping them for instruction at home are practices which operate to a greater extent in the case of girls than of boys. This is clear from the fact that in nearly all cases males receiving instruction at State schools exceeded females, whereas in all other cases females exceeded males. That this is the case is further borne out by the statistics collected directly in connection with educational establishments and quoted in the table below.
This table gives, for the twenty years ended with 1916, the number of private schools and of European scholars attending them, the number of Roman Catholic schools and pupils being also shown separately, these figures being compiled from annual returns supplied by the schools themselves:—
| Year | Number of Private Schools. | Pupils | Included in Previous Numbers. | |||
|---|---|---|---|---|---|---|
| Boys. | Girls. | Total | Roman Catholic Schools. | Pupils at Roman Catholic Schools. | ||
| 1897 | 278 | 5,974 | 8,473 | 1,14,447 | 120 | 642 |
| 1898 | 294 | 6,043 | 8,739 | 14,782 | 124 | 10,175 |
| 1899 | 307 | 6,219 | 9,076 | 15,295 | 133 | 10,526 |
| 1900 | 304 | 6,152 | 9,403 | 15,555 | 132 | 10,687 |
| 1901 | 309 | 6,244 | 9,100 | 15,344 | 129 | 10,448 |
| 1902 | 297 | 6,451 | 9,173 | 15,624 | 139 | 10,802 |
| 1903 | 288 | 6,405 | 9,204 | 15,609 | 139 | 10,812 |
| 1904 | 295 | 6,785 | 9,593 | 16,378 | 149 | 11,373 |
| 1905 | 291 | 6,837 | 9,802 | 16,639 | 146 | 11,738 |
| 1906 | 308 | 7,026 | 10,105 | 17,131 | 154 | 11,948 |
| 1907 | 302 | 7,510 | 10,578 | 18,088 | 152 | 12,650 |
| 1908 | 307 | 7,653 | 10,714 | 18,367 | 149 | 12,538 |
| 1909 | 306 | 7,597 | 10,333 | 17,930 | 150 | 12,611 |
| 1910 | 318 | 8,036 | 10,945 | 18,981 | 156 | 13,161 |
| 1911 | 326 | 8,310 | 11,558 | 19,868 | 158 | 13,941 |
| 1912 | 310 | 8,801 | 11,437 | 20,238 | 156 | 14,476 |
| 1913 | 304 | 9,146 | 11,969 | 21,115 | 155 | 14°837 |
| 1914 | 321 | 9,641 | 12,439 | 22,080 | 180 | 16,471 |
| 1915 | 310 | 9,555 | 12,784 | 22,339 | 172 | 15,892 |
| 1916 | 305 | 9,791 | 13,621 | 23,412 | 170 | 17,266 |
It will be noted from the above two tables that the tendency to educate children at home is a decreasing one, due no doubt to improved educational facilities in the country. There is, however, an increasing tendency to have children educated in private and denominational schools.
Of those children who were receiving education at the date of the Census, the maximum percentage of any age attending State primary schools was 86.49 at age 8, while the maximum for private primary schools was 17.33 at ages under 5, The maximum percentage receiving education at home was (as might be expected) also at this age.
Figures relating to metropolitan and suburban areas for the census of 1916 are appended. The highest percentage attending university colleges was to be found in Dunedin, due possibly to the more varied and comprehensive nature of the curricula at that centre. The number of males taking university courses was, in all cases but Christchurch, considerably in excess of the number of females. The number of males attending private secondary schools was low in Wellington, and exceptionally so in Dunedin. In Christchurch the number of males receiving education at home was exceptionally low. In most other respects the figures were largely uniform.
Schooling, by Metropolitan and Suburban Areas, Census, 1916.
| Metropolitan or Suburban Area. | University College. | Secondary School (Public). | Secondary School (Private). | Technical School (Public). | Technical School (Private). | ||||||||||
|---|---|---|---|---|---|---|---|---|---|---|---|---|---|---|---|
| Males. | Females. | Total | Males. | Females. | Total. | Males. | Females. | Total. | Males. | Females. | Total | Males. | Females. | Total. | |
| Metropolitan areas— | |||||||||||||||
| Auckland | 210 | 131 | 341 | 1,265 | 972 | 2,237 | 369 | 402 | 771 | 599 | 385 | 984 | 39 | 86 | 125 |
| Wellington | 145 | 132 | 277 | 650 | 750 | 1,400 | 161 | 247 | 408 | 431 | 278 | 709 | 38 | 42 | 80 |
| Christchurch | 136 | 146 | 281 | 703 | 681 | 1,384 | 229 | 256 | 485 | 362 | 249 | 611 | 26 | 62 | 88 |
| Dunedin | 291 | 175 | 466 | 572 | 441 | 1,013 | 65 | 201 | 266 | 314 | 224 | 538 | 8 | 35 | 43 |
| Suburban areas— | |||||||||||||||
| Gisborne | 1 | 1 | 2 | 110 | 99 | 209 | 9 | 13 | 22 | 22 | 25 | 47 | 4 | 4 | |
| Napier | 28 | 28 | 165 | 149 | 314 | 11 | 34 | 45 | 104 | 103 | 207 | 1 | 1 | 2 | |
| New Plymouth | 1 | 1 | 2 | 173 | 105 | 278 | 3 | 38 | 41 | 59 | 81 | 140 | 1 | 3 | 4 |
| Wanganui | 2 | 1 | 3 | 165 | 266 | 431 | 204 | 57 | 261 | 150 | 121 | 271 | 2 | .. | 2 |
| Palmerston North | .. | .. | .. | 127 | 90 | 217 | 14 | 40 | 54 | 63 | 96 | 159 | 4 | .. | 8 |
| Nelson | 2 | 2 | 4 | 168 | 151 | 319 | 1 | 14 | 15 | 45 | 54 | 99 | 2 | 1 | 3 |
| Grey Valley | 1 | .. | 1 | 50 | 73 | 123 | 27 | 35 | 62 | 12 | 15 | 27 | .. | .. | .. |
| Timaru | .. | 1 | 1 | 150 | 101 | 251 | 7 | 85 | 92 | 47 | 45 | 92 | 1 | 14 | 15 |
| Invercargill | 3 | 2 | 5 | 183 | 232 | 415 | 10 | 27 | 37 | 71 | 98 | 169 | 2 | 1 | 3 |
| 819 | 592 | 1,411 | 4,481 | 4,110 | 8,591 | 1,110 | 1,449 | 1 2,559 | 2,279 | 1,774 | 4,053 | 124 | 253 | 377 | |
| Remainder of Dominion | 77 | 37 | 114 | 3,309 | 3,069 | 6,378 | 222 | 532 | 754 | 857 | 1,057 | 1,914 | 25 | 45 | 70 |
| Totals for Dominion | 896 | 629 | 1,525 | 7,790 | 7,179 | 14,969 | 1,332 | 1,981 | 3,313 | 3,136 | 2,831 | 5,967 | 149 | 298 | 447 |
| Metropolitan or Suburban Area. | Primary School (Public). | Primary School (Private). | Home. | “Scholar,” but Class of School not stated. | ||||||||
|---|---|---|---|---|---|---|---|---|---|---|---|---|
| Males. | Females. | Total | Males. | Females. | Total. | Males. | Females. | Total. | Males. | Females. | Total | |
| Metropolitan areas— | ||||||||||||
| Auckland | 10,391 | 9,880 | 20,271 | 1,101 | 1,573 | 2,604 | 156 | 178 | 334 | 288 | 353 | 641 |
| Wellington | 6,494 | 5,910 | 12,404 | 853 | 1,184 | 2,037 | 142 | 156 | 298 | 398 | 394 | 792 |
| Christchurch | 7,234 | 6,888 | 14,122 | 805 | 1,053 | 1,858 | 37 | 104 | 141 | 401 | 428 | 829 |
| Dunedin | 5,720 | 5,284 | 11,004 | 457 | 773 | 1,230 | 83 | 52 | 135 | 180 | 178 | 358 |
| Suburban areas— | ||||||||||||
| Gisborne | 1,055 | 923 | 1,978 | 81 | 164 | 245 | 19 | 26 | 45 | 47 | 74 | 121 |
| Napier | 1,164 | 1,038 | 2,202 | 155 | 251 | 406 | 19 | 24 | 43 | 34 | 33 | 67 |
| New Plymouth | 841 | 730 | 1,571 | 50 | 103 | 153 | 21 | 12 | 33 | 21 | 14 | 35 |
| Wanganui | 1,626 | 1,465 | 3,091 | 273 | 308 | 581 | 19 | 28 | 47 | 28 | 29 | 57 |
| Palmerston North | 1,161 | 1,133 | 2,294 | 146 | 173 | 319 | 6 | 11 | 17 | 21 | 24 | 45 |
| Nelson | 861 | 728 | 1,589 | 101 | 153 | 254 | 8 | 25 | 33 | 23 | 18 | 41 |
| Grey Valley | 617 | 625 | 1,242 | 216 | 241 | 457 | 7 | 8 | 15 | 62 | 50 | 112 |
| Timaru | 1,187 | 1,120 | 2,307 | 159 | 166 | 325 | 12 | 20 | 32 | 15 | 20 | 35 |
| Invercargill | 1,649 | 1,455 | 3,104 | 112 | 160 | 272 | 6 | 12 | 18 | 52 | 61 | 113 |
| 40,000 | 37,179 | 77,179 | 4,509 | 6,302 | 10,811 | 535 | 656 | 1,191 | 1,570 | 1,676 | 3,246 | |
| Remainder of Dominion | 52,592 | 49,053 | 101,645 | 2,699 | 3,355 | 6,054 | 1,381 | 1,746 | 3,127 | 2,016 | 2,031 | 4,047 |
| Totals for Dominion | 92,592 | 86,232 | 178,824 | 7,208 | 9,657 | 16,865 | 1,916 | 2,402 | 4,318 | 3,586 | 3,707 | 7,293 |
Table of Contents
Table of Contents
At census-takings prior to 1911 information was required as to “sickness” and “accident” as well as infirmity. In 1911 and 1916, however, details were collected of the following types of infirmity alone:—
Deaf-mutism—i.e., existence of deafness and dumbness in conjunction.
Blindness.
Feeble-mindedness.
In addition the returns supplied by mental-hospital authorities gave particulars of lunacy.
Of the total population, 6,359 persons, or 5.78 per 1,000, were suffering from one or other of the above infirmities, of whom 206 were deaf-mutes, 566 blind, 4,275 lunatics, and 1,312 feeble-minded. In 1911 there were 5,301 persons returned as infirm, being 5.26 per 1,000. The figures for the respective classes of infirmity were in that year 301, 482, 3,741, and 777. It will be apparent that deaf-mutes alone show a decrease, the direct and indirect effects of the war being doubtless at the bottom of the general increase during the quinquennium. A point that should be borne in mind in connection with the statistics of infirmity is that there was no definite question to be answered in this respect, the instruction merely being that if a person were a deaf-mute, blind, or feeble-minded, this fact should be entered in a column provided. It is possible that in a number of cases the information might have been omitted, inadvertently or otherwise, on this account.
The following table shows the proportion of infirm per 10,000 of population by age-groups and sexes:—
| Age, in Years. | Males. | Females. | Both Sexes. | |||||||||
|---|---|---|---|---|---|---|---|---|---|---|---|---|
| Deaf and Dumb. | Blind. | Lunatic | Feeble-Minded. | Deaf and Dumb. | Blind. | Lunatic | Feeble-Minded. | Deaf and Dumb. | Blind. | Lunatic | Feeble-Minded. | |
| Under 5 | 0.15 | 0.59 | .. | 2.23 | 0.93 | .. | 0.31 | 1.85 | 0.53 | 0.30 | 0.15 | 2.05 |
| 5 and under 10 | 1.12 | 1.12 | 0.64 | 9.79 | 1.16 | 1.32 | 0.83 | 7.44 | 1.14 | 1.22 | 0.73 | 8.63 |
| 10 and under 15 | 1.62 | 1.08 | 2.34 | 15.67 | 0.56 | 2.23 | 2.23 | 11.18 | 1.09 | 1.65 | 2.29 | 13.46 |
| 15 and under 20 | 1.78 | 2.66 | 6.00 | 26.44 | 1.51 | 1.72 | 5.60 | 15.96 | 1.64 | 2.19 | 5.80 | 21.11 |
| 20 and under 25 | 3.94 | 3.62 | 25.64 | 27.93 | 2.14 | 1.50 | 15.18 | 11.55 | 2.85 | 2.33 | 19.31 | 18.01 |
| 25 and under 30 | 4.50 | 4.00 | 36.48 | 19.74 | 2.47 | 1.23 | 21.83 | 10.30 | 3.39 | 2.48 | 28.46 | 14.56 |
| 30 and under 35 | 2.82 | 3.46 | 53.50 | 12.78 | 1.69 | 1.27 | 28.89 | 9.28 | 2.24 | 2.35 | 41.04 | 11.01 |
| 35 and under 40 | 3.03 | 3.90 | 65.68 | 10.84 | 1.80 | 2.26 | 44.01 | 9.70 | 2.43 | 3.10 | 55.06 | 10.28 |
| 40 and under 45 | 2.18 | 2.72 | 81.61 | 11.97 | 0.89 | 2.07 | 56.10 | 8.27 | 1.56 | 2.41 | 69.13 | 10.19 |
| 45 and under 50 | 2.42 | 3.94 | 88.81 | 9.09 | 2.16 | 2.52 | 76.77 | 6.49 | 2.30 | 3.29 | 83.32 | 7.90 |
| 50 and under 55 | 2.91 | 5.00 | 93.64 | 9.57 | 2.85 | 2.37 | 96.76 | 9.96 | 2.88 | 3.77 | 95.11 | 9.75 |
| 55 and under 60 | 2.14 | 14.43 | 124.02 | 7.48 | 3.20 | 10.23 | 115.79 | 7.04 | 2.62 | 12.52 | 120.27 | 7.28 |
| 60 and under 65 | 1.86 | 11.17 | 125.35 | 11.17 | 1.59 | 13.52 | 114.50 | 12.72 | 1.74 | 12.20 | 120.60 | 11.85 |
| 65 and under 70 | 0.89 | 11.60 | 141.02 | 16.96 | 2.09 | 20.85 | 103.21 | 12.51 | 1.44 | 15.87 | 123.58 | 14.91 |
| 70 and under 75 | 1.20 | 43.27 | 126.22 | 16.83 | 5.84 | 29.18 | 96.28 | 30.63 | 3.30 | 36.90 | 112.69 | 23.07 |
| 75 and under 80 | .. | 56.32 | 152.40 | 21.53 | 2.22 | 88.69 | 128.61 | 37.69 | 0.95 | 70.16 | 142.22 | 28.44 |
| 80 and under 85 | 6.92 | 134.90 | 117.61 | 55.34 | .. | 125.82 | 135.88 | 60.39 | 4.10 | 131.20 | 125.05 | 57.40 |
| 85 and under 90 | .. | 218.57 | 142.08 | 120.22 | .. | 294.11 | 14006 | 98.04 | .. | 251.69 | 141.19 | 110.50 |
| 90 and over | .. | 578.03 | 115.62 | 57.80 | .. | 301.51 | .. | .. | .. | 430.11 | 53.76 | 26.88 |
| Totals, 1916 | 2.10 | 5.87 | 45.51 | 13.81 | 1.64 | 4.42 | 32.21 | 10.04 | 1.87 | 5.15 | 38.89 | 11.93 |
| Totals, 1911 | 2.90 | 5.25 | 41.26 | 7.95 | 3.08 | 4.26 | 32.44 | 7.43 | 2.98 | 4.78 | 37.10 | 7.70 |
One of the most marked features of the table is the general increase of infirmity with age, a result which naturally would be expected. The very low percentages at the earliest quinquennial groups may be accounted for partly by a natural tendency on the. part of parents to hope for eventual recovery where evidence of infirmity has actually emerged, and also partly by the fact that the existence of infirmity is not always apparent in the earliest years of infancy. In all cases except deaf-mutism the increase in infirmity with age is marked. The comparatively even frequency distribution over age-groups of this particular form of infirmity suggests that it is for the most part at least congenital, whilst the other forms are, on the other hand, with the possible exception of feeble-mindedness, for the most part acquired.
Infirmity is considerably higher amongst males than amongst females, especially as age advances. This is doubtless due to the fact that the more strenuous occupations of males are normally such as to render them much more liable to acquired as opposed to congenital infirmity. That this is the explanation is borne out by the very low percentage of infirm males at the earliest age-group, being somewhat smaller, in fact, than that for females at the same group. What is more remarkable, however, is that the excess of males is more or less evenly distributed over the different classified heads of infirmity.
DEAF-MUTISM.
The following table shows the progressive changes in the proportion per 10,000 of population suffering from this infirmity:—
| Census. | Males. | Females. |
|---|---|---|
| 1874 | 2.05 | 1.71 |
| 1878 | 2.25 | 2.18 |
| 1881 | 2.23 | 2.45 |
| 1886 | 2.37 | 2.22 |
| 1891 | 2.80 | 2.49 |
| 1896 | 2.99 | 2.71 |
| 1901 | 3.28 | 2.51 |
| 1906 | 3.29 | 2.73 |
| 1911 | 2.89 | 3.08 |
| 1916 | 2.10 | 1.64 |
This form of infirmity would appear to have reached a maximum in the first decennium of the present century, and to be now on the decrease. Of 206 persons suffering from this infirmity 160, or 78 percent-, were born in New Zealand.
There appears to be no definite age-group at which this infirmity is at a maximum. The total number of cases is fortunately so small that few inferences of any validity may be drawn. Provided, however, that the proportion of children born deaf is fairly constant, that the death-rate is not appreciably higher for them than for the rest of the community, and that migration is for them at a minimum, the above general results are ones that might be expected from a class of infirmity whose origin is congenital.
The following table shows the occupations (past or present) of all deaf-mutes whose occupations were specified in the 1916 census returns:—
| Occupations. | Males. | Females. |
|---|---|---|
| Hospital assistant | .. | 1 |
| Draughtsman | 2 | .. |
| Boardinghouse assistant | .. | 2 |
| Domestic servant | .. | 3 |
| Groom | 1 | .. |
| Gardener | 3 | .. |
| Caretaker in Education Department | 1 | .. |
| Hairdresser | 1 | .. |
| Laundryman | 1 | .. |
| Labourer in coal-yard | 1 | .. |
| General storekeeper | 1 | .. |
| Printer's machinist | 1 | .. |
| Picture-framer | 1 | .. |
| Coachbuilder | 1 | .. |
| Saddler | 2 | .. |
| Cabinetmaker | 1 | .. |
| Sawmill worker | 3 | .. |
| Tailor | 5 | .. |
| Tailoress | .. | 1 |
| Dressmaker | .. | 2 |
| Bootmaker | 2 | .. |
| Assistant in biscuit-factory | 1 | .. |
| Confectionery-maker | 1 | .. |
| Tanner | 1 | .. |
| Fencer | 2 | .. |
| Ironworker | 1 | .. |
| Carpenter | 4 | .. |
| Builder's labourer | 2 | .. |
| General labourer | 4 | .. |
| Farmer | 2 | .. |
| Farm labourer | 9 | .. |
| Assistant fruitgrower | 1 | .. |
| Gardener | 2 | .. |
| Sheep-farmer | 2 | .. |
| Cook on sheep-station | 1 | .. |
| Assistant on sheep-farm | 3 | .. |
| Dairy-farmer | 7 | .. |
| Assistant on dairy farm | 5 | .. |
| Wool-classer | 1 | .. |
| Quarryman | 1 | .. |
| Pensioner | .. | 1 |
| Independent means | 1 | 1 |
| Domestic duties | 2 | 49 |
| Scholar | .. | 1 |
| Child unable to read or write | 15 | 15 |
| Dependent | 8 | 8 |
| Hospital patient | 2 | .. |
| In receipt of charitable aid | 1 | 3 |
| Inmate of special school | 1 | .. |
| Inmate of reformatory | .. | 2 |
| Occupation not stated | 10 | 1 |
| Totals | 116 | 90 |
The following table shows the progressive changes in the proportion per 10,000 of population afflicted with this infirmity:—
| Census. | Males. | Females. | Total. |
|---|---|---|---|
| 1874 | 2.45 | 2.18 | 2.34 |
| 1878 | 2.42 | 2.73 | 2.56 |
| 1881 | 2.93 | 2.68 | 2.82 |
| 1886 | 3.65 | 2.70 | 3.22 |
| 1891 | 4.91 | 3.74 | 4.37 |
| 1896 | 5.69 | 4.01 | 4.90 |
| 1901 | 7.32 | 4.26 | 5.87 |
| 1906 | 6.11 | 3.98 | 5.11 |
| 1911 | 5.25 | 4.26 | 4.78 |
| 1916 | 5.87 | 4.42 | 5.15 |
From the foregoing it will be seen that this infirmity reached a maximum in 1901, and that since 1911 the proportion has again risen. The fact that this rise is much more marked in the case of males than in that of females suggests that the asperities of war have had some effect on the figures. This is partly borne out by the following table showing the figures for age-groups corresponding roughly to military age:—
| Age last Birthday. | Number of the blind | |||
|---|---|---|---|---|
| census, 1911. | census, 1916. | |||
| Males. | Females. | Males. | Females. | |
| 20.24 | 9 | 6 | 11 | 7 |
| 25.29 | 14 | 5 | 16 | 6 |
| 30.34 | 9 | 10 | 16 | 6 |
| 35.39 | 8 | 8 | 18 | 10 |
| 40.44 | 12 | 7 | 10 | 7 |
Direct effects of war cannot, however, be the sole cause, for there has been a marked increase at ages 80 and over, as follows:—
| Census | Males | Females |
|---|---|---|
| 1911 | 30 | 30 |
| 1916 | 71 | 53 |
Of 566 persons suffering from this infirmity only 194, or 35 percent., were born in New Zealand. Most persons shown as blind who were born abroad have no doubt acquired their infirmity after settling in New Zealand. Deaf-mutism is apparently, however, usually congential, being rarely acquired, and is moreover an infirmity which proves a formidable obstacle to travel. Hence the difference in the proportions of New-Zealand-born in the two cases.
The following figures are appended as showing the occupations (past or present) of all persons afflicted with blindness for whom an occupation was specified:—
| Occupations. | Males | Females |
|---|---|---|
| Member of Legislative Council | 1 | .. |
| Masseur | 1 | 2 |
| Teacher in Institute for Blind | 1 | 3 |
| Sculptor | 1 | .. |
| Organist | 1 | .. |
| Street musician | 10 | .. |
| Boardinghouse-keeper | 2 | .. |
| Capitalist | 4 | 2 |
| Insurance agent | 1 | .. |
| House-proprietor | 3 | .. |
| Dairyman | 1 | .. |
| Grocer | 1 | .. |
| Tea-merchant | 1 | .. |
| Tobacconist | 1 | .. |
| Horsebreaker | 1 | .. |
| Storekeeper | 1 | .. |
| Hawker | 1 | .. |
| Master mariner | 2 | .. |
| Piano-tuner | 14 | .. |
| Basketmaker | 11 | .. |
| Boxmaker | 1 | .. |
| Knitting machinist | 1 | 1 |
| Bootmaker | 2 | .. |
| Matmaker | 4 | .. |
| Baker | 1 | .. |
| Brickmaker | 1 | .. |
| Engineer in foundry | 1 | .. |
| Ironmoulder | 2 | .. |
| Electric linesman | 1 | .. |
| Carpenter | 2 | .. |
| Painter | 1 | .. |
| Public Works labourer | 1 | .. |
| General labourer | 3 | .. |
| Agricultural farmer | 8 | .. |
| Market-gardener | 1 | .. |
| Fruitgrower | 1 | .. |
| Sheep-farmer | 7 | .. |
| Shepherd | 1 | .. |
| Poultry-farmer | 1 | .. |
| Dairy-farmer | 14 | 2 |
| Alluvial-gold miner | 1 | .. |
| Pensioner | 18 | 5 |
| Annuitant | 3 | 5 |
| Of independent means | 29 | 6 |
| Domestic duties | .. | 86 |
| Scholar | 16 | 18 |
| University student | 1 | .. |
| Child unable to read or write | 7 | 7 |
| Dependent | 30 | 33 |
| Invalid | 1 | .. |
| Hospital patient | 10 | 3 |
| In receipt of charitable aid | 30 | 18 |
| Inmate of Institute for Blind | 26 | 12 |
| Prisoner | 1 | .. |
| Inmate of reformatory | .. | 1 |
| Occupation not stated | 38 | 38 |
| Totals | 324 | 242 |
As regards this form of infirmity it was assumed that all cases of lunacy were confined in mental hospitals. Accordingly no direct question was asked in the census schedule as to lunacy, but particulars were specially obtained at the date of census from mental hospitals. In this way errors arising from reluctance to record, or from misplaced humour, were largely if not wholly eliminated.
The following table is of interest as manifesting the remarkable increase in this form of infirmity:—
| Census | Per 10,000 of Population | ||
|---|---|---|---|
| Males. | Females. | Total. | |
| 1874 | 23.28 | 15.48 | 19.93 |
| 1878 | 25.07 | 15.54 | 20.85 |
| 1881 | 27.30 | 17.43 | 22.86 |
| 1886 | 31.03 | 21.18 | 26.50 |
| 1891 | 31.28 | 23.92 | 27.82 |
| 1896 | 35.70 | 26.02 | 31.13 |
| 1901 | 39.23 | 29.19 | 34.47 |
| 1906 | 39.64 | 30.63 | 35.40 |
| 1911 | 41.27 | 32.44 | 37.10 |
| 1916 | 45.51 | 32.21 | 38.89 |
Between 1911 and 1916 there was a slight fall in the proportion of female lunacy, but it was far otherwise with males. Here again war anxieties, &c. possibly operated as a contributing factor, but the following table seems to suggest that the direct effects of the war have not been marked:—
| Age-groups. | Census, 1911. | Census, 1916 | ||
|---|---|---|---|---|
| Males. | Females. | Males. | Females. | |
| 20.24 | 77 | 73 | 78 | 71 |
| 25.29 | 149 | 106 | 146 | 106 |
| 30.34 | 217 | 142 | 247 | 137 |
| 35.39 | 226 | 156 | 303 | 195 |
| 40.44 | 259 | 166 | 300 | 190 |
Of 4,275 persons thus afflicted, 1,912, or 45 percent., were New-Zealand-born, which proportion is just below that borne by the New-Zealand-born population to the total population.
Where feeble-mindedness begins and full possession of one's faculties ends is difficult to define, and for this reason figures as to this form of infirmity are of value only as an index, and it has not been considered worth while carrying an investigation into these results very far.
It is worth noting, however, that of 1,312 persons so set down, 1,003, or 77 percent., were born in New Zealand. The high percentage as compared with lunacy is probably accounted for by the fact that feeble-mindedness (as suggested by the first table in this section of the Report) is probably more often congenital than lunacy. Few persons with a tendency to feeble-mindedness will migrate; whereas many persons set down in the census as being lunatics had migrated to New Zealand before the affection developed.
Both the 1911 and 1916 census-takings point to two maxima for this class of infirmity, one about age 15 and one at advanced age. Feeble-mindedness is no doubt a phenomenon which, even though congenital, does not always manifest itself at the earliest ages; moreover, with advancing years in many cases the mental faculties decay. In these two facts the explanation of the two maxima probably lies.
Table of Contents
In Section IV of this report an investigation was instituted into the numbers of women of reproductive age, and some index was thereby secured to the potentialities of the community from the reproductive^ point of view. It must be remembered, however, that these potentialities do not depend solely on this factor already investigated, but are probably even more profoundly a function of a factor which is itself largely a function of social and economic conditions, sometimes termed the “nuptial ratio,” or the ratio of the married to the unmarried in the population. There is, moreover, still another factor on which light must be shed in investigating this problem—viz., fecundity, or the measure of probability that a female will reproduce within a certain time. This latter factor, which depends on what are in part social, in part physiological, and in part economic considerations, will form the subject of a subsequent section of the report. With the nuptial ratio and with allied considerations mainly of a sociological bearing we are principally concerned in this section.
A strictly dichotomous division of the population into married and unmarried is unfortunately not possible, for there is always a small but far from negligible residuum in the shape of the widowed and divorced. As, however, the conception of the nuptial ratio owes its importance primarily to its bearing on the reproductive problem, it is usual to include for practical purposes this residuum under the “unmarried “head, its potentialities from the reproductive point of view being in effect equal to those of the never married.
In the census statistics relating to conjugal condition the terms “married,” “widowed,” “divorced,” &c, refer to the marital status of the persons enumerated as at the date of the census. Accordingly, a person who had been widowed or divorced but had before the date of the census remarried would be returned as “married."
Of 551,775 males at the census of 1916, 332,359 were returned as never married, 201,967 as husbands, 15,454 as widowers, and 760 as divorced, while 1,235 were unspecified as to conjugal condition. These figures show 60.37 per cent, of males never to have been married, while 36.69 per cent, were returned as husbands, 2.81 per cent, as widowers, and 0.13 per cent, as divorced; or, eliminating all males under 21 years, 30.52 per cent, never married, 64.31 per cent, husbands, 4.93 per cent, widowers, and 0.24 per cent, divorced.
Of 547.647 females, 310,079 were returned as never married, 205,896 as wives, 30,423 as widows, 613 as divorced, while 663 were unspecified as to conjugal condition. These figures show 56.69 per cent, of females never to have been married, while 37.64 per cent, were returned as wives, 5.56 per cent, as widowed, and 0.11 per cent, as divorced; or, eliminating all females under 21 years, 24.91 per cent, never married, 65.16 per cent, wives, 9.74 per cent, widows, and 0.19 per cent, divorced.
The following table shows the nuptial ratios (i.e., ratio of married to not married) calculated for the last ten census-takings, the divorced and widowed being treated as single:—
| Census. | Total Population. | Population, Twenty-one Years of Age and over. | ||||
|---|---|---|---|---|---|---|
| Males. | Females. | Total. | Males. | Females. | Total. | |
| March, 1874 | 0.362 | 0.532 | 0.430 | 0.918 | 3.907 | 14.63 |
| March, 1878 | 0.380 | 0.522 | 0.439 | 1.071 | 3.806 | 1.661 |
| April, 1881 | 0.374 | 0.493 | 0.425 | 1.111 | 3.333 | 1.650 |
| March, 1886 | 0.374 | 0.465 | 0.414 | 1.181 | 2.704 | 1.635 |
| April, 1891 | 0.376 | 0.448 | 0.408 | 1.180 | 2.157 | 1.522 |
| April, 1896 | 0.383 | 0.451 | 0.414 | 1.124 | 1.800 | 1.382 |
| March, 1901 | 0.414 | 0.474 | 0.441 | 1.127 | 1.606 | 1.323 |
| April, 1906 | 0.441 | 0.520 | 0.477 | 1.099 | 1.615 | 1.305 |
| April, 1911 | 0.483 | 0.562 | 0.518 | 1.189 | 1.703 | 1.398 |
| October, 1916 | 0.579 | 0.586 | 0.582 | 1.802 | 1.870 | 1.836 |
For its practical bearing on the reproductive problem the second half of the table is clearly the more valuable.
In 1874 we find that of the females 21 and over the married were nearly four times as numerous as the single, a ratio which showed a rapid decline till 1896 and which has remained approximately stationary ever since, but with a slight tendency to rise since 1906. The explanation is simple: The majority of females in New Zealand in 1874 were women who had come to the country with or in order to join their husbands. Few unmarried women would, on the other hand, migrate except for the purpose of marrying men who had preceded them to prepare a home for them. The immigrants being persons in the prime of life, there would also be few widows. For males, on the other hand, the position was very different. Difficulties of colonization in distant lands were such as to deter married men rather than single. Thus the majority of men coming into the country would be single.
During the subsequent forty years conditions changed. Children were born to the early settlers and grew up to manhood and womanhood; the country entered upon years of prosperity and became a more attractive place for women to enter. The settlers who had entered the country in the prime of life reached old age, with the result that widowhood increased. Conditions no longer operated to make the number of unmarried women in the country small. With males, on the other hand, it was otherwise. The country had been opened up and had become a more suitable place than before for married men to make their homes in; moreover, the children of the early settlers had grown up and married amongst themselves. Under such circumstances the proportion of married men would increase.
So, while in 1874 there was a marked disproportion in the nuptial ratios for the sexes, by 1911 the disproportion had been largely eliminated, so that, with the withdrawal of a fair proportion of the unmarried and but a small proportion of the married men for war purposes in 1916, the nuptial ratios for the two sexes attained approximate equality, rising suddenly from 1.189 for males in 1911 to 1.802 in 1916. On this rise, and on the corresponding rise in females from 1.703 in 1911 to 1.870 in 1916, further interesting light is thrown by the following table:—
| Year. | Total Number of Marriages registered. | Marriage-rate. | |
|---|---|---|---|
| Per 1000 of Population. | Compared with Rate in 1882–80 taken as 100. | ||
| 1911 | 8,825 | 8.70 | 130 |
| 1912 | 9,149 | 8.81 | 132 |
| 1913 | 8,813 | 8.25 | 124 |
| 1914 | 9,280 | 8.51 | 127 |
| 1915 | 10,028 | 9.12 | 137 |
| 1916 | 8,213 | 7.47 | 112 |
The large number of marriages in 1915 included many that in the ordinary course of events would have been celebrated in 1916, but were hastened by the operation of the National Registration Act, and the desire of many men to be shown in the register as married men and to obtain certain anticipated advantages or escape certain obligations. The year 1916 was robbed of these “hastened” marriages, and the rate for 1916 was still further adversely affected by the introduction of a system of compulsory military service, which took into account only marriages solemnized before May, 1915. Again, the constantly lessening proportion of men of marriageable age in the country has had a further effect on the marriage-rate for 1916.
Clearly the varying age-constitution of the community has had a marked effect on the figure which represents the nuptial ratio at different periods. Some of the implications of this proposition have already been referred to—viz., the increase of widowhood as the early settlers grew old. Thus it is a remarkable fact that while for the total female population the nuptial ratio shows a net increase from 1874 to 1916, for the female population above 20 it has shown a marked net fall. This phenomenon is largely if not wholly due to the varying proportion of the total female population from time to time at ages 0.20. While the birth-rate was highest, and in ever-lessening degree for twenty-one years thereafter, we should expect to find a particularly large proportion of the population under 21, and there fore a low nuptial ratio for the whole population, provided no serious fluctuation in immigration occurred. The nuptial ratio was actually at a minimum in 1891, and in this connection the following table is of interest, showing as it does the birthrate for successive quinquennia since 1871;—
| Period. | Births per 1,000. |
| 1871–1875 | 39.88 |
| 1876–1880 | 41.21 |
| 1881–1885 | 36.36 |
| 1886–1890 | 31.15 |
| 1891–1805 | 27.68 |
| 1896–1900 | 25.75 |
| 1901–1905 | 26.60 |
| 1906–1910 | 27.06 |
| 1911–1915 | 25.98 |
The following tables are of interest:—
Conjugal Condition at Successive Censuses.—Numbers.
| Census. | Males. | Females. | ||||||||||
|---|---|---|---|---|---|---|---|---|---|---|---|---|
| Never Married. | Married. | Widowed. | Divorced. | Not stated. | Totals. | Never Married. | Married. | Widowed. | Divorced. | Not stated. | Totals. | |
| * At these censuses divorced persons were included among “never married.” | ||||||||||||
| WHOLE POPULATION. | ||||||||||||
| March, 1874 | 121,870 | 45,362 | 3,272 | * | 477 | 170,981 | 79,888 | 44,020 | 3,990; | * | 29 | 128,533 |
| March, 1878 | 162,740 | 63,495 | 4,177 | * | 580 | 230,998 | 114,740 | 62,914 | 5,672! | * | 88 | 183,414 |
| April, 1881 | 190,864 | 73,331 | 4,965 | * | 445 | 269,005 | 140,190 | 72,807 | 7,290; | * | 35 | 220,328 |
| March, 1880 | 219,838 | 84,656 | 6,253 | * | 1,474 | 312,221 | 171,866 | 84,409 | 9,704! | * | 162 | 226,261 |
| April, 1891 | 233,787 | 90,550 | 7,790 | * | 750 | 332,877 | 190,009 | 90,877 | 12,0981 | * | 137 | 293,781 |
| April, 1896 | 258,071 | 102,824 | 9,362 | 87 | 471 | 371,415 | 213,548 | 103,204 | 15,048 | 50 | 95 | 331,945 |
| March, 1901 | 275,009 | 118,536 | 10,666 | 255 | 920 | 405,992 | 230,375 | 117,839 | 17,902 | 149 | 462 | 300,727 |
| April, 1906 | 313,164 | 143,983 | 12,035 | 351 | 875 | 471,008 | 252,428 | 142,891 | 21,050 | 256 | 345 | 417,570 |
| April, 1911 | 343,438 | 172,228 | 14,209 | 575 | 1,400 | 531,910 | 278,405 | 171,283 | 25,797 | 411 | 662 | 476,558 |
| October, 1916 | 332,359 | 201,907 | 15,454 | 760 | 1,235 | 551,775 | 310,079 | 205,890 | 30,423 | 613 | 663 | 547,074 |
| Adult Population, | ||||||||||||
| March, 1874 | 46,052 | 45,300 | 3,271 | * | 473 | 95,096 | 7,065 | 43,029 | 3,983 | * | 29 | 54,106 |
| March, 1878 | 54,487 | 03,395 | 4,172 | * | 586 | 122,640 | 10,248 | 60,540 | 5,658 | * | 88 | 76,534 |
| April, 1881 | 60,933 | 73,234 | 4,902 | * | 435 | 139,564 | 13,850 | 70,432 | 7,278 | * | 34 | 91,595 |
| March, 1886 | 65,298 | 84,521 | 6,250 | * | 1,434 | 157,503 | 20,683 | 52,288 | 9,748 | * | 146 | 112,865 |
| April, 1891 | 68,828 | 90,443 | 7,788 | * | 733 | 167,792 | 29,207 | 89,211 | 12,089 | * | 123 | 130,690 |
| April, 1896 | 81,896 | 102,686 | 9,360 | 87 | 460 | 194,489 | 41,349 | 101,604 | 15,041 | 50 | 92 | 158,136 |
| March, 1901 | 94,047 | 118,394 | 10,005 | 255 | 878 | 224,239 | 54,210 | 116,099 | 17,896 | 149 | 403 | 188,757 |
| April, 1906 | 117,854 | 143,793 | 12,033 | 351 | 858 | 275,489 | 65,281 | 140,854 | 21,643 | 255 | 320 | 228,353 |
| April, 1911 | 129,792 | 172,070 | 14,208 | 575 | 1,312 | 318,017 | 73,108 | 169,204 | 25,789 | 411 | 504 | 269,070 |
| October, 1910 | 95,754 | 201,778 | 15,452 | 760 | 1,219 | 314,963 | 77,817 | 203,555 | 30,412 | 610 | 628 | 313,022 |
Conjugal Condition at Successive Censuses,—Percentages,
| Census. | Males. | Females. | Both Sexes. | |||||||||
|---|---|---|---|---|---|---|---|---|---|---|---|---|
| Never Married. | Married. | Widowed. | Divorced. | Never Married. | Married. | Widowed. | Divorced. | Never Married. | Married. | Widowed. | Divorced. | |
| * At these censuses divorced persons were included among “never married.” | ||||||||||||
| WHOLE POPULATION. | ||||||||||||
| March, 1874 | 71.48 | 26.00 | 1.92 | * | 62.17 | 34.73 | 3.10 | * | 67.48 | 30.09 | 2.43 | .. |
| March, 1878 | 70.63 | 27.56 | 1.81 | * | 62.59 | 34.32 | 3.09 | * | 67.07 | 30.55 | 2.38 | .. |
| April, 1881 | 70.92 | 27.24 | 1.84 | * | 63.64 | 33.05 | 3.31 | * | 67.64 | 29.85 | 2.51 | .. |
| March, 1886 | 70.75 | 27.24 | 2.01 | * | 64.59 | 31.74 | 3.67 | * | 67.90 | 2932 | 2.78 | .. |
| April, 1891 | 70.39 | 27.26 | 2.35 | * | 64.93 | 30.95 | 4.12 | * | 67.83 | 28.99 | 3.18 | .. |
| April, 1896 | 69.74 | 27.72 | 2.52 | 0.02 | 64.35 | 31.10 | 4.53 | 0.02 | 67.19 | 29.32 | 3.47 | 0.02 |
| March, 1901 | 63 | 29.26 | 2.63 | 0.06 | 62.90 | 32.17 | 4.89 | 0.04 | 65.60 | 30.65 | 3.70 | 0.05 |
| April, 1906 | 66 | 30.63 | 2.69 | 0.07 | 60.50 | 34.25 | 5.19 | 0.06 | 63.74 | 32.33 | 3.86 | 0.07 |
| April, 1911 | 64.74 | 32.46 | 2.69 | 0.11 | 58.50 | 35.99 1 | 5.42 | 0.09 | 61.79 | 34.13 | 3.98 | 0.10 |
| October, 1916 | 60.37 | 36.69 | 2.81 | 0.13 | 56.69 | 37.64 1 | 5.56 | 0.11 | 58.54 | 37.16 | 4.18 | 0.12 |
| Adult Population. | ||||||||||||
| March, 1874 | 48.67 | 47.87 | 3.46 | * | 13.06 | 79.57 | 7.37 | * | 35.72 | 59.40 | 4.88 | .. |
| March, 1878 | 44.64 | 51.94 | 3.42 | * | 13.41 | 79.19 | 7.40 | * | 32.61 | 81.44. | 4.95 | .. |
| April, 1881 | 43.79 | 52.64 | 3.57 | * | 15.13 | 76.92 | 7.95 | * | 32.43 | 62.27 | 5.30 | .. |
| March, 1886 | 41.84 | 54.16 | 4.00 | * | 18.35 | 73.00 | 8.65 | * | 31.99 | 62.06 | 5.95 | .. |
| April, 1891 | 41.20 | 54.14 | 4.66 | * | 22.42 | 68.32 | 9.26 | * | 32.96 | 60.36 | 6.68 | .. |
| April, 1896 | 42.21 | 52.92 | 4.83 | 0.04 | 26.16 | 64.29 | 9.52 | 0.03 | 35.00 | 58.03 | 6.93 | 0.04 |
| March, 1901 | 42.11 | 53.00 | 4.78 | 0.11 | 28.78 | 61.64 | 9.50 | 0.08 | 36.01 | 56.95 | 6.94 | 0.10 |
| April, 1906 | 42.91 | 52.36 | 4.60 | 0.13 | 28.63 | 61.77 | 9.49 | 0.11 | 30.43 | 56.63 | 6.82 | 0.12 |
| April, 1911 | 40.99 | 54.33 | 4.50 | 0.18 | 27.23 | 63.02 | 9.60 | 0.15 | 34.67 | 58.32 | 6.84 | 0.17 |
| October, 1916 | 30.52 | 64.31 | 4.93 | 0.24 | 24.91 | 65.16 | 9.74 | 0.19 | 27.72 | 64.74 | 7.32 | 0.22 |
It will be noted that there has been a general increase in the proportion of the population married, widowed, and divorced, and a corresponding decrease in the proportion never married, The proportion of married females 21 years of age and over to the total female population of those ages, however, decreased to 1901, after which it has again risen, The reason has already been casually referred to, but may conveniently be here stated more fully, In the early days of the colony few women migrated to New Zealand except those who came out with their husbands, The New-Zealand-born females bad not as yet, save in exceptional cases, reached adult age, Moreover, the marriage age for females was in those days considerably lower than it has been in recent years,
In course of time these early settlers grew old and gradually died one by one, the natural outcome being an increase in widowhood, In 1916, as will be seen from the next table following, from ages 85 onwards in the case of males, and 70 onwards in that of females, widowers and widows respectively exceeded the married,
While in 1874 widows but slightly exceeded widowers in number, by 1916 the number of widows had become double that of widowers, Evidently remarriage is commoner among widowers than amongst widows, This is probably, however, not the whole explanation of the present excess of widows, The male death-rate is higher than that for females, Moreover, men usually marry later in life than women, Accordingly the marriage relation is more often broken by the death of the husband than by that of the wife, There is thus seen to be a close correlation between an excess of single men over single women and an excess of widows over widowers,
Conjugal Condition, by Quinquennial Age-groups, Census, 1916,
| Age-groups. | Males. | Female. | ||||||||||
|---|---|---|---|---|---|---|---|---|---|---|---|---|
| Never Married. | Married. | Widowed. | Divorced. | Not stated. | Totals. | Never Married. | Married. | Widowed. | Divorced. | Not stated. | Totals. | |
| Under 15 years | 185,192 | .. | .. | .. | .. | 185,192 | 178,906 | .. | .. | .. | .. | 178,906 |
| 15 and under 20 | 44,952 | 60 | .. | .. | .. | 45,012 | 45,327 | 1,060 | 4 | 1 | .. | 46,392 |
| 20 and under 21 | 0,461 | 129 | 2 | .. | 10 | 6,608 | 8,029 | 1,281 | 7 | 2 | 35 | 9,354 |
| 21 and under 25 | 19,850 | 3,781 | 16 | 1 | 103 | 23,811 | 24,649 | 12,490 | 105 | 11 | 150 | 37,405 |
| 25 and under 30 | 20,588 | 19,039 | 174 | 20 | 191 | 40,018 | 18,263 | 29,723 | 377 | 55 | 139 | 48,557 |
| 30 and under 35 | 14,730 | 30,742 | 454 | 71 | 109 | 46,166 | 10,859 | 35,648 | 728 | 100 | 80 | 47,415 |
| 35 and under 40 | 10,862 | 34,314 | 752 | 91 | 119 | 46,138 | 8,266 | 34,587 | 1,270 | 123 | 65 | 44,311 |
| 40 and under 45 | 7,418 | 28,207 | 906 | 117 | 110 | 36,758 | 5,519 | 26,533 | 1,655 | 111 | 48 | 33,806 |
| 45 and under 50 | 6,543 | 25,006 | 1,203 | 143 | 98 | 32,993 | 4,076 | 21,230 | 2,330 | 74 | 35 | 27,745 |
| 50 and under 55 | 4,441 | 18,172 | 1,259 | 90 | 59 | 24,027 | 2,545 | 15,444 | 3,000 | 71 | 23 | 21,083 |
| 55 and under 60 | 3,157 | 13,937 | 1,470 | 83 | 60 | 18,707 | 1,439 | 10,670 | 3,470 | 34 | 13 | 15,632 |
| 60 and under 65 | 2,855 | 11,357 | 1,804 | 52 | 47 | 18,115 | 866 | 7,502 | 4,114 | 19 | 15 | 12,576 |
| 65 and under 70 | 1,877 | 7,448 | 1,802 | 37 | 40 | 11,204 | 553 | 4,798 | 4,221 | 6 | 14 | 9,592 |
| 70 and under 75 | 1,435 | 4,845 | 1,987 | 19 | 33 | 8,319 | 305 | 2,084 | 3,857 | 2 | 7 | 6,855 |
| 75 and under 80 | 1,002 | 3,146 | 1,854 | 13 | 22 | 6,037 | 189 | 1,359 | 2,951 | 2 | 9 | 4,510 |
| 80 and under 85 | 479 | 1,211 | 1,179 | 7 | 15 | 2,891 | 91 | 401 | 1,488 | 1 | 6 | 1,987 |
| 85 and under 90 | 168 | 298 | 441 | 1 | 7 | 915 | 34 | 95 | 583 | .. | 2 | 714 |
| 90 and under 95 | 10 | 40 | 86 | .. | 3 | 145 | 8 | 20 | 131 | .. | 1 | 160 |
| 95 and under 100 | 5 | 5 | 11 | .. | 1 | 22 | 1 | 3 | 29 | .. | .. | 33 |
| 100 and over | 3 | .. | 3 | .. | .. | 6 | .. | 1 | 5 | .. | .. | 6 |
| Adults (unspecified) | 273 | 230 | 51 | 3 | 80 | 637 | 98 | 299 | 98 | 1 | 19 | 515 |
| Minors (unspecified) | 52 | .. | .. | .. | 2 | 54 | 56 | 2 | .. | .. | 2 | 60 |
| Totals | 332,359 | 201,967 | 15,454 | 760 | 1,235 | 551,775 | 310,079 | 205,896 | 30,423 | 613 | 663 | 547,674 |
Bachelors in 1916 predominated in all age-groups under 25, In the 25–29 age-groups bachelors exceeded married males, but by a very slight margin indeed, At ages 21–24 spinsters exceeded married females, being in the proportion of nearly two to one, In the age-group 25–29 the proportions were nearly reversed Of 332,034 never-married males of specified ages, 101,890 were 20 years of age and over, while of 309,925 never-married females of specified ages 85,692 were 20 years of age and over, It will be seen, then, that never-married males are considerably in excess of never-married females at what might be considered the marriageable ages, Registrations, however, show that many women, but few men, are married at ages 15–19, Accordingly the following table has been drawn up, showing the number of bachelors aged 20 years and upwards to every 100 of spinsters aged 15 and upwards:—
| Census Year | Number, |
|---|---|
| * Including divorced, who in census-takings prior to 1890 were returned as “single,” | |
| 1874 | 238* |
| 1878 | 191* |
| 1881 | 162* |
| 1886 | 123* |
| 1891 | 105* |
| 1896 | 98 |
| 1901 | 96 |
| 1906 | 108 |
| 1911 | 110 |
| 1916 | 77 |
The high figures for early years are the natural corollary of the conditions under which early colonization proceeded, while the sudden drop for 1916 is, of course, a direct outcome of war conditions,
Further details as to the geographical distribution of bachelors and spinsters in 1916 will be found on pages 85 to 88 of the report,
The number of husbands in 1916 was 201,967, and of wives 205,896, giving an excess of waves over husbands of 3,929, This is unusual, and is doubtless the outcome of war conditions, In former census-takings the result has usually been the other way, owing to the arrival from abroad of married men who do not send for their wives until they have become settled in this country, The following figures show the differences at the last ten census-takings:—
| Census | Excess of Husbands over Wives, |
|---|---|
| 1874 | 736 |
| 1878 | 581 |
| 1881 | 524 |
| 1886 | 187 |
| 1891 | —327 |
| 1896 | —380 |
| 1901 | 697 |
| 1906 | 1,092 |
| 1911 | 945 |
| 1916 | —3,929 |
The anomalous position of 1891 and 1896 is doubtless due to the general depression prevailing at that time, resulting in the application to New Zealand in her turn of the rule that married men leaving for another, country depart before their wives in order to make a home for them,
The following table is of interest as reflecting the gradual rise in the marriage age for females:—
Percentage at Successive Censuses of Married Women at Different Age-groups to Total Married Women aged 15 and under 45,
| Ages, | 1878, | 1881, | 1886, | 1891, | 1896, | 1901, | 1906, | 1911, | 1916, |
|---|---|---|---|---|---|---|---|---|---|
| Under 20 years | 2.45 | 2.16 | 1.81 | 1.19 | 1.12 | 0.98 | 0.94 | 0.81 | 0.75 |
| 20 and under 35 years | 61.90 | 60.53 | 60.03 | 60.12 | 59.57 | 59.94 | 60.29 | 59.98 | 56.00 |
| 35 and under 45 years | 35.65 | 37.31 | 38.16 | 38.89 | 39.31 | 39.08 | 38.77 | 39.21 | 43.25 |
| 100.00 | 100.00 | 100.00 | 100.00 | 100.00 | 100.00 | 100.00 | 100.00 | 100.00 |
Figures compiled from actual marriage records show that the average age at marriage is steadily rising,
Further details as to the geographical distribution of married women in 1916 will be found on pages 86 to 88 of the report,
Figures relating to divorce are of value on account of the light they throw on the operation of conditions inimical to social stability, For their understanding a brief résumé of the history of divorce law in New Zealand is essential,
So far back as 1807 a Divorce and Matrimonial Causes Act was passed in New Zealand, Under this Act a husband might obtain a divorce on the grounds of adultery, but adultery alone was insufficient grounds for a wife to obtain a divorce from her husband, The actual grounds for divorce in cases where the husband was respondent must be—Incestuous adultery, or bigamy with adultery, or rape, &c, or adultery coupled with such cruelty as would otherwise have entitled the wife to a decree for a divorce mensa et thoro under English law, or adultery coupled with desertion without reasonable excuse for two years or upwards, A decree for judicial separation might be obtained by either husband or wife on the grounds of adultery, or of cruelty, or of desertion without cause for a period of two years, The law as to judicial separation still holds,
The divorce law was revised in 1898, An Act passed in that year placed persons of either sex practically on an equality as regards petitions for dissolution of marriage; the same grounds, in substance, for a decree of divorce applying to man or woman, The grounds for divorce were altered as under: Adultery, on either side; wilful desertion continuously during five years or more; habitual drunkenness during four years and upwards on the part of husband, along with failing to support wife, or habitual cruelty; or habitual drunkenness for a like period and neglect, with unfitness to discharge her household duties, on the part of the wife; conviction, with sentence of imprisonment or penal servitude for seven years or upwards, for attempting to take life of petitioner, or of any child of the petitioner or respondent,
By section 17 of the 1898 Act it was in addition provided that non-compliance with a decree for restitution of conjugal rights should give an immediate right to a decree for dissolution,
The Acts of 1867 and 1898 were consolidated in 1904, An amendment was passed by the Legislature in 1907, and after having been reserved for the Royal assent became law on the 9th May, 1908, By this Act failure to comply with a decree for restitution of conjugal rights ceased (save for one technical exception which is no longer of practical importance) to be a ground for divorce proceedings, On the other hand, the following grounds were added, viz,—That the respondent has been convicted of the murder of a child of the petitioner or respondent; that the respondent is a lunatic or person of unsound mind, and has been confined as such in any asylum or other institution or house in accordance with the provisions of the Lunatics Act for a period or periods not less in the aggregate than ten years within twelve years immediately preceding the filing of the petition, and that the respondent is unlikely to recover from such lunacy or unsoundness of mind,
All enactments of the General Assembly of New Zealand relating to divorce, judicial separation, restitution of conjugal rights, and summary separation, prior to 1908, were consolidated in that year, and re-enacted under the title of the Divorce and Matrimonial Causes Act, 1908,
The Divorce and Matrimonial Causes Amendment Act, 1912, amended the main Act in various respects, In particular, section 2 reduced the period of detention in a mental hospital necessary to constitute a ground of divorce to seven years within the ten immediately preceding the filing of the petition, Section 3 laid down that divorced persons may remarry at any time after the making of a decree absolute for the dissolution of a prior marriage, and section 4 declared that no appeal shall lie from such a decree absolute, Section 5 made valid any marriage already celebrated after the making of a decree absolute but before the expiration of the time limited for an appeal therefrom.
By an amendment to the Act passed in 1913 the respondent is empowered to apply for the order making the decree absolute, Section 6 of this Amendment Act provides that a husband who, while separated from his wife by mutual consent or judicial decree, habitually and without cause leaves her without reasonable maintenance, shall for the purposes of the main Act (relating to grounds of divorce) be deemed to have deserted her wilfully and without just cause or reasonable excuse, and to have left her so deserted,
The Act of 1898 operated in the direction of increasing the number of cases in which the machinery of the Supreme Court in its divorce jurisdiction was resorted to, and after this date disobedience of an order for restitution of conjugal rights came to be relied upon more and more as a ground for divorce, until this ground of obtaining a dissolution of marriage ceased to be available on the passing of the Act of 1907, It is obvious that with the various changes the divorce law has undergone comparisons over back years would form no basis for valid conclusions as to variations in the ethical standards of the community from time to time, They are of very considerable interest, however, as showing the effects of changes in the law,
In selecting a basis of comparison between the numbers of divorced at different times or in different geographical areas, certain difficulties emerge as to what denominator will best serve our purpose, Clearly it is only the population which has at some time or other entered the married state (i.e., the sum total of those returned in the census as married, divorced, and widowed) which forms a true basis of comparison, inasmuch as the proportion in the total population that has been married (and as a simple corollary the proportion in the total population to which the divorce process is or has been open) varies from place to place and time to time, For convenience, however, both this denominator and also that represented by the total population (irrespective of whether every married or not) have been taken in estimating the proportions of divorced,
The earliest figures available relating to the number of divorces are for the 1896 census, The marked difference between the numbers as shown in this census and those revealed by thejl901 census is no doubt almost wholly attributable to the changes effected during 1898 in the law,
The resulting figures are here quoted:—
Numbers and Proportions of Divorced Persons at Successive Censuses,
| Census, | Males. | Females. | Total. | ||||||
|---|---|---|---|---|---|---|---|---|---|
| Number, | Proportion to Total Population, | Proportion to Total Population, married, divorced, and widowed, | Number, | Proportion to Total Population, | Proportion to Total Population married, divorced, and widowed, | Number, | Proportion to Total Population, | Proportion to Total Population, married, divorced, and widowed, | |
| WHOLE POPULATION. | |||||||||
| 1896 | 87 | 0023 | 0.077 | 50 | 0.015 | 0.042 | 137 | 0.019 | 0.059 |
| 1901 | 255 | 0.062 | 0.196 | 149 | 0.040 | 0.109 | 404 | 0.052 | 0.152 |
| 1906 | 351 | 0.074 | 0.223 | 256 | 0.061 | 0.155 | 607 | 0.068 | 0.188 |
| 1911 | 575 | 0.108 | 0.307 | 411 | 0.086 | 0.208 | 986 | 0.098 | 0.256 |
| 1916 | 760 | 0.138 | 0.348 | 613 | 0.112 | 0.258 | 1,373 | 0.125 | 0.301 |
| ADULT POPULATION. | |||||||||
| 1896 | 87 | 0.044 | 0.077 | 50 | 0.031 | 0.042 | 137 | 0.038 | 0.059 |
| 1901 | 255 | 0.114 | 0.197 | 149 | 0.079 | 0.111 | 404 | 0.098 | 0.153 |
| 1906 | 351 | 0.128 | 0.223 | 255 | 0.111 | 0.156 | 606 | 0.119 | 0.189 |
| 1911 | 575 | 0.181 | 0.307 | 411 | 0.153 | 0.210 | 986 | 0.167 | 0.257 |
| 1916 | 760 | 0.242 | 0.348 | 610 | 0.195 | 0.260 | 1,370 | 0.219 | 0.302 |
It will be noted that the proportion of divorced in the adult community has doubled itself since 1901, while it has quintupled itself since 1896,
An analysis of the 1916 census figures reveals that for the married the maxima were at an age representing mature life, after which death tends to increase the widowed class at the expense of the married, The number of divorced is, however, unaffected by the death, of the former husband or wife, but is affected by remarriage (the prospect of which is also, no doubt, in some cases responsible in the first place for the divorce), Contrary, then, to what is the case with the married, we find that divorced persons were at a maximum at a comparatively advanced age— viz 70–74 for males and 65–69 for females,
The following figures are of interest on account of the light they shed on the geographical distribution of the divorced element in the community:—
| Where resident. | Percentage of Divorced. | |
|---|---|---|
| To Total Population. | To Total Population, married, divorced, and widowed. | |
| Provincial Districts. | ||
| Auckland | 0.144 | 0.344 |
| Taranaki | 0.095 | 0.238 |
| Hawke's Bay | 0.121 | 0.281 |
| Wellington | 0.180 | 0.423 |
| Marlborough | 0.122 | 0.305 |
| Nelson | 0.102 | 0.249 |
| Westland | 0.127 | 0.334 |
| Canterbury | 0.088 | 0.209 |
| Otago | 0.081 | 0.199 |
| Southland | 0.053 | 0.139 |
| Whole Dominion | 0.125 | 0.301 |
| Metropolitan Areas, | ||
| Auckland | 0.168 | 0.384 |
| Wellington | 0.225 | 0.508 |
| Christchurch | 0.128 | 0.292 |
| Dunedin | 0.098 | 0.232 |
The figures are rather striking, Otago and Southland have a particularly low percentage of divorced, and Canterbury is not far behind, Wellington is easily first, the proportion here being more than three times that in Southland, Auckland has the second-highest proportion, with Westland a close third, Among metropolitan areas Wellington stands abnormally high, the proportion here being well, in excess of twice that in Dunedin, Auckland stands second, and Christchurch third,
The following table shows the number of divorced by town and country population:—
| Whore resident. | Males. | Females. | Total. |
| Counties | 343 | 154 | 497 |
| Boroughs | 417 | 459 | 876 |
| Totals | 760 | 613 | 1,373 |
Although the proportion of the total population in the boroughs to the total population, borough and county, was 50 per, cent, and 57 per cent, for males and females respectively, the corresponding figures for the divorced population were 55 per cent, and 75 per cent, respectively, We*see at once that the divorced tend to congregate in the boroughs, a tendency especially marked in the case of females,
The following figures show for each metropolitan area the number of males 20 and upwards who might be considered marriageable (i.e., those widowed, divorced, and never married), and also the number of females 15 and upwards who might be considered marriageable (i.e., those widowed, divorced, and never married):—
| Metropolitan Area. | Males. | Females. | Males to 100 Females. |
|---|---|---|---|
| Auckland | 12,090 | 23,997 | 50 |
| Wellington | 9,572 | 16,625 | 57 |
| Christchurch | 7,440 | 17,238 | 43 |
| Dunedin | 5,933 | 14,186 | 42 |
| Total for metropolitan areas | 35,035 | 72,046 | 40 |
The ratio of marriageable males to marriageable females furnishes a fairly reliable direct index to the marriage prospects of the women, and an inverse index to the prospects of the men, in the community, and is therefore of considerable social importance, It will be noted that the ratio of marriageable males to females was highest in Wellington, this probably being due to the fact that that city offers more powerful attractions for men on account of its geographical position and its status as the seat of Government, The additional prospects offered in the North Island to young men probably also account for the fact that Auckland stands somewhat higher than the average for the four metropolitan areas,
Of considerable interest, and of more immediate bearing on the reproductive potentialities of the community, is the following table, which shows the percentage of married women to the total for whom the conjugal condition and age were stated at ages 15–44 on the last birthday preceding the census, This ratio is for practical purposes sometimes more useful than the nuptial ratio already discussed. It is worth remembering that the nuptial ratio can be easily calculated from it on the basis of the mathematical property whereby its reciprocal is equal to the reciprocal of the nuptial ratio increased by unity, This table reveals the fact that the proportion of such married women to the total was highest outside the metropolitan areas, The cities offer greater opportunities for, employment of single women: hence, no doubt, this result, Of the metropolitan areas themselves it is worth mentioning that the proportion of married women to the total was lowest in the South Island, especially Dunedin, and highest in Wellington, The migration of young men from the South to the North has doubtless militated against rosy marriage prospects for southern girls, and, in addition to t” is circumstance, at the date of the 1916 census the presence of the camps in the vicinity of Wellington was doubtless not without its effect in attracting to the capital city the wives of men about to proceed on active service,
Proportion of Wives amongst Females 15–44, Census, 1916,
| Metropolitan Area. | Number Married. | Total specified. | Percentage of Married to Total. |
|---|---|---|---|
| Auckland | 18,133 | 36,032 | 50.32 |
| Wellington | 14,024 | 27,115 | 51.72 |
| Christchurch | 12,160 | 25,022 | 48.59 |
| Dunedin | 8,202 | 18,687 | 43.89 |
| Total, metropolitan areas | 52,519 | 106,856 | 49.14 |
| Rest of Dominion | 88,803 | 159,927 | 55.52 |
| Total, Dominion | 141,322 | 266,783 | 52.97 |
The following figures show the number of marriageable males and females as above defined returned in each provincial district at the 1916 census, together with the number of marriageable males per 100 marriageable females:—
| Provincial District, | Males, | Females, | Males to 100 Females, |
|---|---|---|---|
| Auckland | 32,057 | 43,404 | 73 |
| Taranaki | 5,276 | 6,736 | 77 |
| Hawke's Bay | 5,469 | 7,584 | 72 |
| Wellington | 22,683 | 32,744 | 69 |
| Marlborough | 1,729 | 2,150 | 80 |
| Nelson | 5,458 | 5,929 | 92 |
| Westland | 2,084 | 2,023 | 103 |
| Canterbury | 16,612 | 29,501 | 56 |
| Otago | 13,867 | 23,616 | 58 |
| Southland | 6,205 | 8,252 | 75 |
| Totals | 111,440 | 161,939 | 69 |
It should be mentioned that although Westland shows the highest proportion of marriageable males to females, the phenomenon is in part illusory, forasmuch as there is a large proportion in this district of males who are of advanced years and hence unlikely actually to marry, The low rates in Canterbury and Otago are due to a cause already referred to—namely, the greater mobility of males combined with the marked northward migratory tendency,
An earlier portion of this section of the report revealed the interesting fact that the proportion of married women to the total population at ages 15 and over was highest outside the metropolitan areas, It has been computed that the number of marriageable males as above defined per 100 marriageable females is 103 for the counties and 49 for the boroughs, An investigation on page 35 of this report has revealed that women tend to congregate in the towns, while the country districts are, remarkable for the paucity of single women they reveal, Comparatively speaking, on the other hand, males tend to congregate in the country, there being more than twice as many marriageable males per 100 marriageable females in the counties proper as there were within the precincts of the cities and boroughs,
The numbers and proportions of married women to the total female population of ages 15–44 for whom conjugal condition was specified is shown in the following table, borough and county population being treated separately,:—
| Where Resident, | Number of Wives, | Total specified, | Percentage of Wives to Total specified, |
|---|---|---|---|
| * Excluding population of adjacent islands, express trains, and military and internment camps, | |||
| Boroughs | 79,301 | 157,506 | 50 |
| Counties | 61,895 | 109,066 | 57 |
| Totals | 141,196* | 266,572* | 53 |
It will be noted that the percentage of women married is highest in the country, and that the average for the boroughs is very approximately equal to that for the metropolitan areas, although it is considerably higher than the percentage for Dunedin and for Christchurch,
Figures have been worked out showing the number of marriageable males per 100 females for each county (inclusive of interior boroughs), As might have been expected, the greatest marriage prospects for females (and, of course, the smallest for males) prevail in certain of what might be styled essentially country districts, The following are outstandingly high:—
| Awakino* | 426 |
| Oliura* | 345 |
| Waiapu* | 335 |
| Murchison* | 318 |
| Castlepoint* | 316 |
| Easttaupo* | 264 |
| Whangamomona | 264 |
| Kaitieke | 248 |
The lowest ratios are to be found in counties containing cities or larger boroughs, especially such as are suburban to cities:—
| Halswell (including Spreydon Borough, suburban to Christchurch)† | 37 |
| Heathcote (including Christchurch city and four suburban boroughs)† | 42 |
| Levels (including Timaru Borough)† | 43 |
| Taieri (including Dunedin City and three suburban boroughs)† | 43 |
| Waimairi (including Riccarton Borough, suburban to Christchurch) | 49 |
| Waimea (including Nelson City and Richmond and Motueka Boroughs) | 50 |
| Akaroa (including Akaroa Borough) | 50 |
| Eden (including Auckland City and four suburban boroughs)† | 51 |
| Waitotara (including Wanganui Borough) | 51 |
It is noteworthy that, especially as regards the counties, including city areas, the marriage possibilities depend very largely on the sex-distribution, Thus, in the first list above, those counties marked with an asterisk are amongst the ten counties in which there are fewer than 70 females to every 100 males,
On the other hand, in the second list those counties marked with a dagger are amongst the six counties where there are 110 or more females to every 100 males, The correspondence, it will be seen, is fairly close but by no means absolute, the nuptial ratio varying fairly extensively from county to county,
The accompanying map illustrates the position fully, different shadings being provided according to the number of marriageable males per 100 marriageable females in each county inclusive of interior boroughs,
The proportion of wives amongst the female population aged 15–44 has been worked out for each county, inclusive of interior boroughs, Viewing the matter broadly, it will again be apparent that the proportion of women married is highest in the country districts, and lowest in those counties which include cities and larger boroughs,
The highest percentages are as follows:—
| Ohura* | 78.00 |
| Kaitieke* | 77.48 |
| Stewart Island | 74.57 |
| Waimarino | 73.73 |
| Whangamomona* | 73.62 |
| Murchison* | 71.17 |
| Awakino* | 71.07 |
Of these, those marked with an asterisk are also amongst the eight counties which stood highest as regards the number of marriageable males per 100 marriageable females, The resemblance is again a somewhat striking one,
The lowest percentages, on the other hand, neglecting the case of Fiord, which contained only five females on census night, are:—
| Taieri (including Dunedin City and three suburban boroughs)* | 43.59 |
| Mount Herbert | 45.71 |
| Waimairi (including Riccarton Borough, suburban to Christchurch)* | 46.77 |
| Waikouaiti (including Waikouaiti Borough and two other boroughs suburban to Dunedin) | 46.87 |
| Waitaki (including Oamaru and Hampden Boroughs) | 47.15 |
| Levels (including Timaru Borough)* | 47.18 |
| Heathcote (including Christchurch City and four suburban boroughs)* | 48.60 |
| Eden (including Auckland City and four suburban boroughs)* | 49.49 |
| Halswell (including Spreydon Borough: suburban to Christchurch)* | 49.62 |
Again, asterisks appear against the names of such counties as were included in the list of those nine which possess the lowest ratio of marriageable males to 100 marriageable females, It will be observed that in each of these lists are included the greater part of three of the four metropolitan areas, Wellington being in each case conspicuous by its complete absence, The circumstances which have operated to effect Wellington's exclusion have already been adverted to.
A second map is given opposite, showing for each county (with interior boroughs) the proportion of wives in the total female population returned in the 1916 census as being of ages 15.44,
Table of Contents
Section IX of this report should have shed some light on the reproductive potentialities of the community in so far as they are dependent on the number of adults, their age, and their conjugal condition. The present section carries the matter further, dealing as it does with the actual fertility and fecundity of the population. The distinction between the usage of these two terms is a somewhat fluid one, but sometimes the former is confined to a connotation antonymous to “sterility”— one, that is, pointing to the difference between producing and non-producing— while to the latter term is ascribed a quantitative rather than a qualitative significance, pointing to the actual numbers of offspring.
It is clear that no data are or can at present be made available such that they will indicate physiological fecundity, defining that term provisionally as the actual maximum possibilities of reproduction were that process to be conditioned by physiological conditions alone. The word “provisionally” is introduced advisedly, for in every case the age and physiological characteristics of the associated male are not without influence on this function. Ideally, physiological fecundity, could figures for it be obtained, would be of considerable value not only from the light it would shed on the objective factor of reproductive potentialities, but also subjectively as a measure of the urgency of the reproductive impulse. Physiological fecundity is, however, under our modern civilization probably rarely, if ever, in accord with actual fecundity; there are always in operation powerful checks on the realization of physiological fecundity—economic, ethical, or psychological in their operation—which, as Malthus long since pointed out, may take the alternative forms of “moral restraint” and “vice.”
Physiological fecundity is therefore, under modern conditions, somewhat of an abstraction, though its theoretic importance is undoubted. Actual fecundity it is alone possible to measure, and the data are fairly accurate and complete.
As an index to the reproductive efficiency of a population, however, the use of the conception of actual fecundity is attended by certain practical difficulties, some of which have been already referred to. Some are involved in the very definition of “reproductive efficiency.” Should one take account merely of the numbers of children born, or should some account also be taken of their health and strength? Clearly an accurate investigation should not neglect the latter, for such factors as the number of previous confinements, age, &c, of the mothers are not without their influence on the quality of the offspring. Unfortunately, statistics are not well adapted for dealing with qualitative matters, their realm being the quantitative, and no data are available for infantile mortality in conjunction with the age of the mother and other factors. The only data available relate to the numbers born and surviving as at the date of the census.
Probably the most satisfactory all-round index of reproductive efficiency in its quantitative aspect is the average frequency of maternity for married women in each age-group. If this is suitably weighted and combined with a similar frequency deduced for the unmarried a still more suitable measure of reproductive efficiency may be arrived at.
It is here, that the importance in this connection of the investigation carried out in the preceding section into the conjugal condition of the community becomes evident. That investigation has revealed the numbers of married and unmarried at various age-groups. The actual figures of birth-registrations (distinguishing legitimate and illegitimate) classified on the basis of mothers' age-groups and taken in conjunction with the numbers of married women and unmarried women respectively belonging to the same age-groups yield the legitimate maternity rates per 100 married women and the illegitimate maternity rates per 100 unmarried women for each group. It is true that illegitimate children are not always the offspring of single, widowed, or divorced women, but the approximation to fact is fairly close. It is also of interest to compute for each age-group the birth-rate per 100 women irrespective of conjugal condition. Data for preceding years are not available, but it is hoped that the present investigation will form a basis for future tracings of changes in reproductive efficiency. Moreover, for more accurate theoretical investigations on a comparative basis, forasmuch as the legitimate and illegitimate birth-rates are normally widely disparate, and as, further, the conjugal constitution of the female population in each age-group must necessarily vary from census to census, it will be desirable to standardize future populations on the basis of the age and marital constitution of the 1916 female population. This done, a measure of reproductive efficiency strictly adapted for comparative purposes will be at hand, for it is when, and only when, the fecundity of an existing population is attributed to a “standard” population of constant age and conjugal constitution that we are in a position to arrive at a definite comparative measure of the average fecundity of the average woman in each age-group and in each conjugal condition over different periods of time. Each such measure of reproductive efficiency might be termed a “fecundity index.” The fecundity index, it should be noted, is purely a quantitative conception and (unlike reproductive efficiency) has no qualitative implication.
In actual practice in computing the fecundity index it is desirable to select not one year but to average a series of years. In this way any chance anomalies occurring during any one year in the births are practically eliminated, and, except for the age-groups, &c, least represented, the results will not be appreciably vitiated by paucity of instances. It is for this latter reason, too, that quinquennial age-groups and not single years require to be selected. Accordingly, in computing the fecundity index for 1916, the 1916 births alone have not been taken, but an average has been struck for this year in conjunction with the year immediately preceding and the year immediately following it. A still wider choice of years would have been desirable, but the data are not available.
The following table is the result:—
Fecundity Index for (a) Legitimate Births, (b) Illegitimate Births, (c) all Birth, by Quinquennial Age-groups of Women. (Average for Years 1915–17.)
| Age-group. | Number of Married Women in Age-group. | Number of Children born alive per Year to Married Women in Age-group (Average of 1915–17). | Number of Unmarried Women in Age-group (Widowed, Divorced, and Never Married). | Number of Illegitimate Children born alive per Year to Women in Age-group (Average of 1915–17). | Percentage of Number of Legitimate Children born alive per Year to Women in Age-group, to Total Number of Married Women in same Age-group. | Percentage of Number of Illegitimate Children born alive per Year to Women in Age- group, to Total Number of Unmarried (i.e., Widowed, Divorced, and Never Married) Women in same Age-group. | Percentage of Number of Children born alive per Year to Women in Age-group, to Total Number of Women in same Age-group. |
|---|---|---|---|---|---|---|---|
| Under 15 | .. | .. | 178,906 | 3 | .. | .. | .. |
| 15–19 | 1,060 | 552 | 45,332 | 284 | 52.07 | 0.62 | 1.80 |
| 20–24 | 13,771 | 5,083 | 32,803 | 434 | 36.91 | 1.32 | 11.84 |
| 25–29 | 29,723 | 8,196 | 18,695 | 216 | 27.57 | 1.16 | 17.37 |
| 30–34 | 35,648 | 7,031 | 11,687 | 110 | 19.72 | 0.94 | 15.08 |
| 35–39 | 34,587 | 4,566 | 9,659 | 73 | 13.20 | 0.75 | 10.48 |
| 40–44 | 26,533 | 1,471 | 7,285 | 25 | 5.54 | 0.34 | 4.42 |
| 45–49 | 21,230 | 146 | 6,480 | 1 | 0.68 | 0.01 | 0.53 |
| 50 and over | 43,043 | 1 | 30,015 | .. | .. | .. | .. |
| Total specified | 205,595 | 27,046 | 340,862 | 1,146 | 13.15 | 0.33 | 5.15 |
It will be noted that for married women the maximum fecundity is at ages 15–19, for single women at ages 20–24, and for the total population at ages 25–29. For each of the three groups of women the maximum fecundity is reached by a rather sudden leap, and fecundity falls more gradually with advancing age. The early maxima may or may not be due in part to physiological causes, but are no doubt largely due to the fact the birth figures reveal that first births in a large majority of cases occur within the first eighteen months of marriage, and it is in these earlier age-groups that the popular marriage age for females lies. A subsequent investigation throws some light on this matter. It will be noted that the fecundity index for illegitimate births falls with advancing years and increased discretion.
It is not impossible that while the actual “powerful checks” mentioned by Malthus are operating in a uniform manner over a given period of time to effect a difference between the physiological and actual fecundity, even where due allowance has been made for the varying age and the conjugal constitution of the female population, differences may creep in (quite apart from any change in absolute physiological fecundity itself) from one or more of the following modifying circumstances: (1) The ages and physiological characteristics of the associated males; (2) the number of previous pregnancies of the women. It is not seriously advanced that this list is exhaustive, but it is claimed that it includes the most powerful modifying influences. For example, the age at which child-bearing initiated is probably not without its influence.
The remaining portion of this section of the report will be largely devoted towards an investigation of the effects of these disturbing factors.
The following table furnishes a summary of particulars in regard to the relative ages of husbands and wives for the more important quinquennial age-groups:—
Relative Ages of Husbands and Wives, Census, 1916.
| Ages of Husbands last Birthday. | Ages of Wives last Birthday. | ||||||||||||
|---|---|---|---|---|---|---|---|---|---|---|---|---|---|
| Under 20. | 20–21. | 25–29. | 30–34. | 35–30. | 40–44. | 45–49. | 50–54. | 55–59. | 60–64. | 65 and over. | Unspecified | Totals. | |
| Under 20 | 16 | 17 | 3 | .. | .. | .. | .. | .. | .. | .. | .. | .. | 36 |
| 20–24 | 323 | 2,107 | 702 | 101 | 18 | l | 8 | 1 | .. | .. | .. | 1 | 3,262 |
| 25–29 | 292 | 5,341 | 8,230 | 2,101 | 330 | 40 | 9 | 5 | .. | .. | .. | 16 | 16,364 |
| 30–34 | 70 | 2,670 | 9,812 | 11,364 | 2,645 | 402 | 67 | 24 | 4 | .. | .. | 13 | 27,071 |
| 35–39 | 21 | 752 | 4,469 | 10,712 | 11,644 | 2,199 | 349 | 62 | 11 | 3 | .. | 21 | 30,243 |
| 40–44 | 6 | 181 | 1,234 | 4,344 | 9,038 | 8,130 | 1,585 | 258 | 44 | 6 | 7 | 15 | 24,848 |
| 45–49 | 4 | 66 | 427 | 1,514 | 4,446 | 7,378 | 6,550 | 1,068 | 165 | 35 | 13 | 10 | 21,676 |
| 50–54 | .. | 15 | 74 | 455 | 1,295 | 3,160 | 5,415 | 4,253 | 671 | 120 | 24 | 9 | 15,491 |
| 55–59 | .. | 7 | 26 | 139 | 438 | 1,065 | 2,580 | 3,821 | 2,911 | 521 | 102 | 7 | 11,617 |
| 60–64 | 1 | 3 | 15 | 46 | 187 | 419 | 980 | 2,204 | 2,865 | 2,231 | 478 | 3 | 9,432 |
| 65 and over. | .. | .. | 3 | 31 | 79 | 237 | 526 | 1,124 | 2,153 | 3,214 | 6,406 | 8 | 13,841 |
| Unspecified. | 327 | 2,612 | 4,728 | 4,841 | 4,467 | 3,502 | 3,161 | 2,624 | 1,852 | 1,432 | 2,271 | 198 | 32,015 |
| Totals | 1,060 | 13,771 | 29,723 | 35,648 | 34,587 | 26,533 | 21,230 | 15,444 | 10,676 | 7,562 | 9,301 | 301 | 205,896 |
It is interesting to trace the position of the modal, or popular, age for couples from age-group to age-group. In so doing we must disregard those groups which are not exact quinquennial periods—viz., “under 20,” and “65 and over.” It will be at once seen that for all age-groups up to the 35–39 group the modal state of affairs is for both spouses to belong to the same age-group. Thereafter the modal circumstances are for the husband to belong to an older age-group than the wife, thus reflecting the custom prevalent twenty years back, whereby women married very much younger than they do nowadays, while the average age of the bridegroom probably did not differ very materially from that which prevails at present.
From such a table as the foregoing it is not feasible to pronounce absolutely as to the proportion of all husbands who are older than their wives, for if we take those husbands whose age last birthday was the same as that of their wives' last birthday one or other of the spouses may be the senior. A reduction of the size of the age-groups will have the effect of materially reducing the proportion of such doubtful cases.
The married population classified by single-year age-groups has accordingly been taken. The resulting tables are too large for insertion in such a report as this, and are therefore here summarized by quinquennial groups.
Wives‘ Age in relation of their Husbands, Census, 1916.
| Age of Husband. | Husbands whose Wives were of— | Total Husbands. | |||||
|---|---|---|---|---|---|---|---|
| A Lower Age. | The Same Age. | A Higher Age. | |||||
| Number | Percentage to Total Husbands in Age-group. | Number. | Percentage to Total Husbands in Age-group. | Number. | Percentage to Total Husbands in Age-group. | ||
| Under 20 | .. | .. | 16 | 44.4 | 20 | 55.6 | 36 |
| 20–24 | 1,581 | 48.5 | 530 | 16.2 | 1,150 | 35.3 | 3,261 |
| 25–29 | 9,918 | 60.7 | 2,113 | 12.9 | 4,317 | 26.4 | 16,348 |
| 30–34 | 18,190 | 67.2 | 3,098 | 11.5 | 5,770 | 21.3 | 27,058 |
| 35–39 | 21,696 | 71.8 | 3,197 | 10.6 | 5,329 | 17.6 | 30,222 |
| 40–44 | 18,819 | 75.8 | 2,222 | 8.9 | 3,792 | 15.3 | 24,833 |
| 45–49 | 17,170 | 79.3 | 1,765 | 8.1 | 2,731 | 12.6 | 21,666 |
| 50–54 | 12,636 | 81.6 | 1,150 | 74 | 1,696 | 11.0 | 15,482 |
| 55–59 | 9,591 | 82.6 | 778 | 6.7 | 1,241 | 10.7 | 11,610 |
| 60–64 | 7,898 | 83.8 | 568 | 6.0 | 963 | 10.2 | 9,429 |
| 65 and over | 8,045 | 58.2 | 5,638 | 40.7 | 150 | 1.1 | 13,833 |
| Totals (excluding unspecified) | 125,544 | 72.3 | 21,075 | 12.1 | 27,159 | 15.6 | 173,778 |
Husbands‘ Age in relation those of their wives, census, 1916.
| Age of Wife. | Wives whose Wives were of— | Total Wives. | |||||
|---|---|---|---|---|---|---|---|
| A Lower Age. | The Same Age. | A Higher Age. | |||||
| Number | Percentage to Total Wives in Age-group. | Number. | Percentage to Total Wives in Age-group. | Number. | Percentage to Total Wives in Age-group. | ||
| Under 20 | .. | .. | 16 | 2.2 | 717 | 97.8 | 733 |
| 20–24 | 336 | 3.0 | 530 | 4.8 | 10,293 | 92.2 | 11,159 |
| 25–29 | 2,537 | 10.1 | 2,113 | 8.5 | 20,345 | 81.4 | 24,995 |
| 30–34 | 4,830 | 15.7 | 3,098 | 10.0 | 22,879 | 74.3 | 30,807 |
| 35–39 | 5,698 | 18.9 | 3,197 | 10.6 | 21,225 | 70.5 | 30,120 |
| 40–44 | 4,534 | 19.7 | 2,222 | 9.6 | 16,275 | 70.7 | 23,031 |
| 45–49 | 3,468 | 19.2 | 1,765 | 9.8 | 12,836 | 71.0 | 18,069 |
| 50–54 | 2,299 | 18.0 | 1,150 | 9.0 | 9,371 | 73.0 | 12,820 |
| 55–59 | 1,513 | 17.2 | 778 | 8.8 | 6,533 | 74.0 | 8,824 |
| 60–64 | 1,170 | 19.1 | 568 | 9.3 | 4,392 | 71.6 | 6,130 |
| 65 and over | 774 | 10.9 | 5,638 | 79.5 | 678 | 9.6 | 7,090 |
| Totals (excluding unspecified) | 27,159 | 15.6 | 21,075 | 12.1 | 125,544 | 72.3 | 173,778 |
It is at once patent that for the majority of married couples the husband is the older of the two spouses. An item of special interest in the tables is a state of affairs which might have been expected a priori—viz., the continuous increase with age in the percentage of persons whose; spouses belong to lower age-groups than themselves, and the corresponding decrease in the percentage of persons whose spouses belong to higher age-groups. With an increase in age no general tendencies of any cogency emerge as regards the percentage of persons whose spouses belong to the same age-group as themselves, except that the proportion of husbands whose wives were of the same age last birthday as themselves appears to decrease with age, being 44.4 per cent, of the husbands under 20, and but 6 per cent, of those 60.64.
On viewing the matter broadly it will probably be seen to be not far wide of the mark to assume that the relative seniority disclosed by the cases where spouses were of different ages at the birthday preceding the census also prevails where they were of the same age. Granted that this assumption is in approximate correspondence with actual fact, we may assume that of 21,075 husbands who belonged to the same age-group as their wives 17,334 were older and 3,741 younger than their wives. On this basis it would appear that at the date of the census 82.25 per cent, of the husbands were older and 17.75 per cent, younger than their wives. By reducing the size of the age-groups as we have done, the effect of an error arising from this source is largely eliminated, only 12.1 per cent, of the cases being liable to such error.
Further light is shed on this matter by the accompanying tables, showing for persons at different representative age-groups the average ages of their spouses. Time and space do not permit of a computation of these details for all ages. Representative ages alone have been carefully selected as stub items for the table, and all ages have been considered in calculating the figures shown under the various captions. The fact that in the census persons in doubt as to their age usually return themselves in numbers which are exact multiples of 5 suggests the desirability of choosing some other ages than these as our representative ones, and accordingly the ages selected are those which exceed by 2 the exact multiples of 5—viz., 22, 27, 32, and so on. It should be remarked that if 22 is selected as the age last birthday the average age in years of persons in this class at the date of census is approximately 22£.
On the basis of actual registration figures it has been calculated that the average age of husbands returned in the census of 1916 as under 20 was 19.4 years, and of the wives 19.1. This calculation disregards migration and deaths and possibilities of misrepresentation of age. It proceeds on the assumption that on a given date all persons are, on the average, half-way between two birthdays. Since marriages are a phenomenon which at the early age-groups increase rapidly with age, the effect of this assumption would for all birthdays prior to the twenty-first (with the advent of which the added legal status whereby parental consent is no longer essential to the validity of the marriage contract no doubt gives an immediate impetus to marriage) beyond doubt be to give an age slightly younger than what must actually have been the age of brides and grooms at marriage, were not this source of error largely (if not wholly) counteracted by the existence of an inducement for certain youthful marriage aspirants to overstate their ages so as to appear to possess full contractual capacity in the eyes of the law.
It has also been assumed in calculating the figures to be inserted under the various captions of the table that all persons returned as being 66 and over were actually, on the average, 70 years of age, but no stub item is provided for persons belonging to that group.
Details are appended:—
Average Difference of Age between Husbands and Wives at Representative Ages, Census, 1916.
| Estimated Average Age in Years. | Average Age of Wives whose Husbands were of Age specified. | Average Excess of Age of Husband of Age specified over that of his Wife. | Average Age of Husbands whose Wives were of Age specified. | Average Deficiency of Age of Wife of Age specified from that of her Husband. |
|---|---|---|---|---|
| 19–1 | .. | .. | 26.2 | 7.1 |
| 19–4 | 21.3 | —1.9 | .. | .. |
| 22.5 | 22.8 | —0.3 | 28.5 | 6.0 |
| 27.5 | 26.3 | 1.2 | 32.1 | 4.6 |
| 32.5 | 30.2 | 2.3 | 36.5 | 4.0 |
| 37.5 | 34.4 | 3.1 | 41.1 | 3.6 |
| 42.5 | 38.5 | 4.0 | 46.1 | 3.6 |
| 47.5 | 42.7 | 4.8 | 51.2 | 3.7 |
| 52.5 | 47.1 | 5.4 | 56.7 | 4.2 |
| 57.5 | 51.9 | 5.6 | 61.5 | 4.0 |
| 62.5 | 56.1 | 6.4 | 65.9 | 3.4 |
It will be noted that the two portions of the table, as might have been expected from the non-homogeneous character of the groupings, and the representative character of the ages selected, yield somewhat different results. However, the figures for all ages in the two tables indicate broadly that on the average the ages of husbands exceeded those of their wives by 3.9 years.
The portion of the foregoing table showing the average differences in age between spouses is also of interest in this connection. Again, apart from the inevitable inaccuracies in statements of age in a proportion of cases, it should be noted that the figures, inasmuch as they depend on the assumption that the average age in years of persons whose age last birthday was shown as (say) 27 years is 27½, can claim close approximation to, but not absolute agreement with, actual fact.
So many more women than men marry under 20 that it may seem at first paralogistic to state that for husbands at the two earliest representative ages the wife’s age is on the average in excess of that of the husband. The explanation is that the majority of persons, male as well as female, who marry from the lowest age-groups throw in their lot with persons in a higher age-group than themselves— a fact which is clearly shown by the two tables which precede that last given.
It will be noted that, in general, with increasing age of the husband the discrepancies in age of the two spouses increase, but with increasing age of the wife the tendency is the other way. While there was one husband of age 62 with a wife under 20, there was no similar case of a wife of age 62 with a young husband. It is such circumstances as this which account for the fact that the average discrepancy at high ages is smaller using the wife’s age as argument than where using the husband’s.
Now for the bearing of the factor here investigated on the fecundity index. The following table shows the, percentage of legitimate children born per year (the average of 1915,1916, and 1917 being again taken for this purpose) according to the relative ages of the parents, and is compiled from a conjunction of the census figures quoted above with the actual figures of birth-registrations:—
Relative Ages of Spouses.—Children born Annually per 100 Couples in each Conjunction. (Average for Years 1915–17.)
| Age of Mother. | Age of Father. | ||||||||||
|---|---|---|---|---|---|---|---|---|---|---|---|
| Under 20 | 21–24. | 25–29. | 30–34. | 35–39. | 40–44. | 45–49. | 60–54. | 55–64. | 65 and over. | Total. | |
| ‡ Only 21 couples belonged to this conjunction. | |||||||||||
| Under 20 | 97.3 | 78.3 | 67.7 | 76.2 | 84.1‡ | 72.2† | 33.3* | .. | 33.3* | .. | 52.1 |
| 20–24 | 67.1 | 52.0 | 45.0 | 41.8 | 44.1 | 45.7 | 38.9 | 444.4† | 40.3† | .. | 36.9 |
| 25–29 | 20.5* | 39.3 | 36.1 | 31.5 | 30.2 | 28.7 | 27.1 | 32.9 | 26.8 | 88.9* | 27.6 |
| 30–34 | 16.7* | 27.9 | 30.8 | 24.2 | 21.5 | 20.7 | 18.5 | 18.7 | 18.5 | 17.2† | 19.7 |
| 35–39 | .. | 19.6* | 26.7 | 19.7 | 15.8 | 14.2 | 13.3 | 12.8 | 10.8 | 8.9 | 13.2 |
| 40–44 | .. | 66.7* | 20.0 | 13.6 | 8.7 | 6.9 | 5.6 | 5.2 | 4.6 | 2.l† | 5.5 |
| 45–49 | .. | .. | .. | 2.5* | l.7† | 1.2 | 1.0 | 0.6 | 0.5 | 0.4* | 0.7 |
| 50 and over | .. | .. | .. | .. | .. | .. | .. | .. | .. | .. | .. |
| Totals | 71.7 | 50.6 | 38.6 | 28.1 | 20.0 | 12.9 | 6.9 | 3.1 | 1.0 | 0.1 | 13.1 |
| NOTE.—In all cases where a dagger note appears there were, during the three years under review, 20 or fewer, but more than 10, children born to couples belonging to the conjunction concerned, and where an asterisk appears 10 or fewer. These instances should be more or less discounted in forming conclusions. | |||||||||||
It will be abundantly clear that we must disregard those instances where the number of children born to couples belonging to any particular conjunction is small, for the effect of any one birth on the total will in such cases be unduly large, and there is not available a series of data extending over a sufficiently large number of years for the effects of chance synchronizings of births over a short period of time within any particular conjunction to be eliminated. Accordingly all cases where there were twenty or fewer births to couples within any one conjunction have been indicated in the foregoing table. These cases have been largely disregarded in the examination of the table. When this is done, order at once emerges out of comparative chaos, and it will be seen that for females the decrease in fecundity with advancing age is uninterrupted. It is also true, but in rather a less uniform degree, o that the fecundity of the female decreases with the age of the associated male.
To what extent this regular variation in actual fecundity with age is other than physiological in its operation it is not at present for the statistician to pronounce.
The following table shows the total number of issue born in relation to the ages of married women. A second table is subjoined showing the corresponding numbers not only born but actually surviving at the date of the 1916 census.
| Age of Mother and Issue born (as at Date of 1916 Census) | |||||||||||||||||||
|---|---|---|---|---|---|---|---|---|---|---|---|---|---|---|---|---|---|---|---|
| Age. | Number of Married Women for whom specified. | Number of Married Women to whom the Number of Children stated at Head of Column had been born. | Total Issue born. | ||||||||||||||||
| Not stated. | 0. | 1. | 2. | 3. | 4. | 5. | 6. | 7. | s. | 9. | 10. | 11. | 12. | 13. | 14. | 15 and over. | |||
| Under 20 | 1,060 | 3 | 544 | 448 | 62 | 3 | .. | .. | .. | .. | .. | .. | .. | .. | .. | .. | .. | .. | 581 |
| 20–24 | 13,771 | 72 | 4,436 | 5,214 | 2,756 | 970 | 263 | 48 | 9 | 3 | .. | .. | .. | .. | .. | .. | .. | .. | 15,003 |
| 25–29 | 29,723 | 143 | 6,356 | 8,526 | 7,194 | 4,139 | 2,055 | 865 | 313 | 103 | 20 | 6 | 2 | 1 | .. | .. | .. | .. | 50,720 |
| 30–34 | 35,648 | 171 | 5,419 | 6,976 | 8,258 | 6,172 | 3,894 | 2,337 | 1,295 | 612 | 311 | 129 | 43 | 23 | 5 | 1 | 1 | 1 | 85,760 |
| 35–39 | 34,587 | 184 | 4,707 | 4,725 | 6,499 | 5,874 | 4,507 | 3,031 | 2,043 | 1,266 | 864 | 454 | 243 | 110 | 41 | 19 | 9 | 11 | 105,318 |
| 40–44 | 26,533 | 157 | 3,690 | 2,974 | 3,874 | 4,006 | 3,457 | 2,624 | 1,886 | 1,384 | 940 | 595 | 397 | 237 | 153 | 91 | 42 | 26 | 94,172 |
| 45–49 | 21,230 | 202 | 2,860 | 2,014 | 2,630 | 2,839 | 2,641 | 2,060 | 1,662 | 1,370 | 972 | 655 | 484 | 340 | 230 | 138 | 70 | 63 | 85,006 |
| 50–54 | 15,444 | 176 | 2,094 | 1,104 | 1,469 | 1,580 | 1,770 | 1,625 | 1,376 | 1,137 | 910 | 695 | 546 | 357 | 249 | 162 | 105 | 89 | 71,097 |
| 55–59 | 10,676 | 166 | 1,260 | 620 | 753 | 944 | 1,064 | 1,045 | 968 | 885 | 778 | 671 | 544 | 366 | 264 | 168 | 92 | 88 | 56,198 |
| 60–64 | 7,562 | 127 | 928 | 371 | 410 | 508 | 597 | 647 | 682 | 642 | 647 | 566 | 482 | 360 | 263 | 157 | 99 | 76 | 43,776 |
| 65 and over | 9,361 | 100 | 1,855 | 351 | 357 | 491 | 558 | 656 | 794 | 779 | 817 | 763 | 590 | 435 | 356 | 213 | 115 | 131 | 53,089 |
| Unspecified | 301 | 32 | 67 | 39 | 38 | 33 | 16 | 16 | 20 | 9 | 11 | 2 | 10 | 4 | 1 | 2 | 1 | .. | 843 |
| Totals | 205,896 | 1,533 | 34,216 | 33,362 | 34,300 | 27,559 | 20,822 | 14,954 | 11,048 | 8,190 | 6,270 | 4,536 | 3,341 | 2,233 | 1,562 | 951 | 534 | 485 | 661,563. |
| Age of Mother and Issue born (as at Date of 1916 Census) | |||||||||||||||||||
|---|---|---|---|---|---|---|---|---|---|---|---|---|---|---|---|---|---|---|---|
| Age. | Number of Married Women for whom specified. | Cases in which the Number of Issue living was— | Total Issue living. | ||||||||||||||||
| 0. | 1. | 2. | 3. | 4. | 5. | 6. | 7. | 8. | 9. | 10. | 11. | 12. | 13. | 14. | 15. | 16 and over. | |||
| Under 20 | 1,057 | 565 | 433 | 57 | 2 | .. | .. | .. | .. | .. | .. | .. | .. | .. | .. | .. | .. | .. | 553 |
| 20–24 | 13,692 | 4,661 | 5,309 | 2,622 | 855 | 216 | 25 | 2 | 2 | .. | .. | .. | .. | .. | .. | .. | .. | .. | 14,133 |
| 25–29 | 29,574 | 6,676 | 8,939 | 7,199 | 3,975 | 1,802 | 699 | 219 | 51 | 10 | 3 | 1 | .. | .. | .. | .. | .. | .. | 47,753 |
| 30–34 | 35,406 | 5,756 | 7,470 | 8,582 | 6,085 | 3,724 | 2,068 | 1,035 | 467 | 178 | 76 | 10 | 14 | 1 | .. | .. | .. | .. | 79,978 |
| 35–39 | 34,407 | 5,034 | 5,227 | 6,936 | 6,047 | 4,335 | 2,826 | 1,792 | 1,065 | 641 | 290 | 134 | 48 | 14 | 11 | 6 | 1 | .. | 96,933 |
| 40–44 | 26,362 | 3,868 | 3,391 | 4,353 | 4,171 | 3,454 | 2,433 | 1,742 | 1,154 | 795 | 445 | 279 | 133 | 82 | 42 | 12 | 4 | 4 | 85,561 |
| 45–49 | 21,007 | 3,047 | 2,406 | 2,993 | 3,089 | 2,632 | 2,080 | 1,551 | 1,150 | 780 | 495 | 355 | 200 | 133 | 61 | 24 | 4 | 7 | 75,286 |
| 50–54 | 15,235 | 2,222 | 1,354 | 1,741 | 1,861 | 1,940 | 1,668 | 1,299 | 1,013 | 758 | 553 | 381 | 197 | 127 | 60 | 39 | 15 | 7 | 61,610 |
| 55–59 | 10,482 | 1,351 | 764 | 993 | 1,189 | 1,217 | 1,116 | 1,036 | 880 | 668 | 474 | 362 | 223 | 110 | 52 | 30 | 10 | 7 | 47,505 |
| 60–64 | 7,434 | 991 | 491 | 578 | 673 | 771 | 788 | 748 | 693 | 606 | 431 | 300 | 186 | 106 | 46 | 21 | 5 | .. | 36,041 |
| 65 and over | 9,248 | 1,938 | 496 | 547 | 783 | 826 | 925 | 998 | 809 | 701 | 509 | 330 | 210 | 100 | 42 | 20 | 7 | 7 | 41,566 |
| Unspecified | 267 | 74 | 44 | 40 | 24 | 25 | 20 | 16 | 6 | 2 | 5 | 8 | 2 | 1 | .. | .. | .. | .. | 709 |
| Totals | 204,231 | 36,183 | 36,324 | 36,641 | 28,754 | 20,942 | 14,648 | 10,438 | 7,290 | 5,139 | 3,281 | 2,160 | 1,213 | 674 | 314 | 152 | 46 | 32 | 587,628 |
It will be noted that in the case of both tables the modal (or popular) number of issue for the total population is two, but there is no great difference between the numbers of married women who have no children and only one or two. The number of women who had more children than two falls gradually with an increase in the number of issue. With different age-groups, however, it is otherwise. For married women under 20 the popular number of issue is none, for married women 20–29 one, for married women 30–39 two, for married women 40–44 three born and. two living, and for married women 44–49 three. Such is what might have been expected, since it is a generally recognized fact that reproduction is spread fairly uniformly over the years 15–44, and even later. What at first sight may seem somewhat extraordinary, however, is that the number of previous issue increases with age after reproduction has clearly ceased, until we find that the popular number of issue for women at ages 50–59 is four; at 60–64, six born, five living; and at 65 and over, eight born, six living. This is, however, merely the outcome of the perfectly well-known fact that in the early days of New Zealand large families were the rule and not the exception.
The bearing of these figures on reproductive efficiency must now engage our attention. It is probable that fecundity depends not so much on number of previous issue as of previous pregnancies; unfortunately, however, from the nature of the case, details of the former are alone available for the statistician. The accompanying table shows the percentage that the number of cases of wives to whom the specified number of previous children had been born as at the date of census and to whom children are born annually bears to the total number of cases of wives to whom that number of previous children had been born. In computing these figures the average of the years 1915–17 has again been taken, and an asterisk has been placed in all columns where there were fewer than seven children born annually on the average during the three years, and a dagger note where more than seven and fewer than twenty. As already indicated, results yielded, where there is a paucity of instances, are subject to a high relative error; in such cases fortuitous coincidences have a disproportionate influence on the values of the ratios deduced.
Ages and Previous Issue of Wives.—Children born Annually per 100 Wives in each Conjunction. (Average for Years 1915–17.)
| Ages. | Number of Previous Issue. | ||||||||||||||||
|---|---|---|---|---|---|---|---|---|---|---|---|---|---|---|---|---|---|
| 0. | 1. | 2. | 3. | 4. | 5. | 8. | 7. | 8. | 9 | 10. | 11. | 12. | 13. | 14. | 15 and over. | Total. | |
| Under 20 | 84.3 | 18.5 | 13.4† | * | .. | .. | .. | .. | .. | .. | .. | .. | .. | .. | .. | .. | 52.1 |
| 20–24 | 61.3 | 28.7 | 21.9 | 18.4 | 14.3 | 15.3† | * | * | .. | .. | .. | .. | .. | .. | .. | .. | 36.9 |
| 25–29 | 39.9 | 27.3 | 22.6 | 21.5 | 21.4 | 22.0 | 22.4 | 23.3 | 38.3† | * | * | * | .. | .. | .. | .. | 27.6 |
| 30–34 | 20.9 | 20.9 | 17.6 | 17.4 | 19.9 | 21.3 | 22.1 | 24.3 | 21.0 | 23.8 | 31.8† | * | * | * | * | .. | 19.7 |
| 35–39 | 9.4 | 12.6 | 10.8 | 11.7 | 12.8 | 16.1 | 17.7 | 21.9 | 18.4 | 21.9 | 22.5 | 22.4 | 38.2† | * | * | * | 13.2 |
| 40–44 | 2.4 | 3.7 | 4.0 | 4.2 | 4.8 | 6.2 | 8.1 | 9.2 | 10.7 | 13.1 | 13.4 | 16.3 | 10.3 | 17.6† | * | * | 5.5 |
| 45–49 | † | * | 0.3† | 0.4† | 0.4† | 0.7† | 0.7† | 0.8† | 1.1† | 2.4† | 2.6† | 3.4† | * | * | * | * | 0.7 |
| 50 and over | .. | .. | .. | .. | .. | .. | .. | .. | .. | .. | .. | .. | .. | .. | .. | .. | .. |
| Totals | 21.6 | 18.2 | 13.3 | 10.9 | 9.6 | 9.1 | 8.0 | 7.2 | 5.5 | 5.0 | 4.1 | 3.5 | 3.0 | 2.0 | 1.7† | * | 13.1 |
The table is, of course, of very different construction from the two which immediately precede it. This table (like that previously quoted in connection with the bearing of the ages of the parents on the fecundity index) relates to reproductivity as evidencing itself during the three years nearest that of the census—that is, it views reproductivity dynamically; the two preceding tables, on the other hand, regard the effects of past reproduction, viewing the matter in cross-section, as it were, or statically. Thus any changes in actual fecundity that have taken place in the past will have no effect on the figures exhibited in this table, but the results of such changes will, as already indicated, have profoundly affected those in the tables immediately preceding it.
The resulting figures are striking: 84.3 per cent. of the married women under 20 who have had no previous children born to them have issue per year. This proportion falls gradually for women with no previous issue in proceeding from lower to higher age-groups. So also in each age-group the highest percentages of births occur amongst those women who have had no previous issue, and these percentages fall with an increase in the number of previous issue, at first rapidly and then more slowly towards a minimum. As might be expected, as we go from lower to higher age-groups the position of this minimum recedes until eventually it vanishes, and for age-groups 40 and upwards the wives who have had no previous “issue have a very low birth-rate. This is what is to be expected. Child-bearing normally begins early in married life, and the majority of marriages occur in the earlier age-groups. What is perhaps more strange is the fact that if a certain number of children have been born to a woman she appears, on the average, to begin to have children more frequently thereafter. The number of previous issue which forms the turning-point varies from age-group to age-group, and corresponds to the minimum above referred to.
The following figures are of interest as shaving the average issue born and the average issue surviving as at the dates of the 1911 and 1916. census-takings for married women at different age-groups. As might have been expected, the figures show a fairly general increase with age.
Average Number of Children to Married Women of Specified Ages (as at Dates of 1911 and 1916 Census).
| Ago of Married Women. | Counting all Married Women. | Counting Married Women with Children only. | ||||||||||
|---|---|---|---|---|---|---|---|---|---|---|---|---|
| 1911. | 1916. | 1911. | 1916. | |||||||||
| Born. | Living. | Dead. | Born. | Living. | Dead. | Born. | Living. | Dead. | Born. | Living. | Dead. | |
| 15–19 | 0.669 | 0.615 | 0.054 | 0.548 | 0.522 | 0.026 | 1.189 | 1.094 | 0.095 | 1.133 | 1.078 | 0.055 |
| 20 | 0.815 | 0.765 | 0.050 | 0.821 | 0.780 | 0.041 | 1.306 | 1.227 | 0.079 | 1.325 | 1.258 | 0.067 |
| 21 | 0.930 | 0.841 | 0.089 | 0.911 | 0.856 | 0.055 | 1.488 | 1.345 | 0.143 | 1.472 | 1.383 | 0.089 |
| 22 | 1.010 | 0.939 | 0.071 | 1.022 | 0.963 | 0.059 | 1.544 | 1.435 | 0.109 | 1.532 | 1.444 | 0.088 |
| 23 | 1–194 | 1.102 | 0.092 | 1.137 | 1.068 | 0.069 | 1.676 | 1.547 | 0.129 | 1.664 | 1.563 | 0.101 |
| 24 | 1 1–311 | 1.202 | 0.109 | 1.252 | 1.181 | 0.071 | 1.836 | 1.682 | 0.154 | 1.771 | 1.671 | 0.100 |
| 25 | 1.445 | 1.333 | 0.112 | 1.392 | 1.308 | 0.084 | 1.973 | 1.319 | 0.154 | 1.877 | 1.763 | 0.114 |
| 26 | 1.610 | 1.488 | 0.122 | 1.535 | 1.452 | 0.083 | 2.116 | 1.955 | 0.161 | 2.032 | 1.922 | 0.110 |
| 27 | 1.756 | 1.605 | 0.151 | 1.676 | 1.579 | 0.097 | 2.245 | 2.052 | 0.193 | 2.136 | 2.012 | 0.124 |
| 28 | 1.839 | 1.684 | 0.155 | 1.834 | 1.729 | 0.105 | 2.345 | 2.148 | 0.197 | 2.279 | 2.148 | 0.131 |
| 29 | 2.039 | 1.871 | 0.168 | 1.975 | 1.853 | 0.122 | 2.537 | 2.328 | 0.209 | 2.452 | 2.301 | 0.151 |
| 30 | 2.194 | 2.009 | 0.185 | 2.082 | 1.954 | 0.128 | 2.694 | 2.466 | 0.228 | 2.550 | 2.394 | 0.156 |
| 31 | 2.361 | 2.162 | 0.199 | 2.275 | 2.133 | 0.142 | 2.834 | 2.595 | 0.239 | 2.717 | 2.548 | 0.169 |
| 32 | 2.519 | 2.287 | 0.232 | 2.432 | 2.264 | 0.168 | 2.987 | 2.712 | 0.275 | 2.853 | 2.656 | 0.197 |
| 33 | 2.718 | 2.463 | 0.255 | 2.566 | 2.391 | 0.175 | 3.204 | 2.904 | 0.300 | 3.021 | 2.815 | 0.206 |
| 34 | 2.845 | 2.571 | 0.274 | 2.685 | 2.485 | 0.200 | 3.359 | 3.035 | 0.324 | 3.118 | 2.886 | 0.232 |
| 35 | 3.028 | 2.739 | 0.289 | 2.749 | 2.538 | 0.211 | 3.547 | 3.208 | 0.339 | 3.250 | 3.000 | 0.250 |
| 36 | 3.161 | 2.849 | 0.312 | 2.916 | 2.704 | 0.212 | 3.090 | 3.326 | 0.364 | 3.405 | 3.158 | 0.247 |
| 37 | 3–354 | 3.007 | 0.347 | 3.116 | 2.869 | 0.247 | 3.897 | 3.494 | 0.403 | 3.585 | 3.301 | 0.284 |
| 38 | 3.467 | 3.108 | 0.359 | 3.180 | 2.922 | 0.257 | 4.055 | 3.626 | 0.419 | 3.693 | 3.394 | 0.299 |
| 39 | 3.633 | 3.242 | 0.391 | 3.315 | 3.021 | 0.294 | 4.228 | 3.772 | 0.456 | 3.847 | 3.506 | 0.341 |
| 40–44 | 1.053 | 3.590 | 0.463 | 3.549 | 3.225 | 0.324 | 4.702 | 4.166 | 0.536 | 4.151 | 3.771 | 0.380 |
| 45–49 | 4.805 | 4.180 | 0.625 | 4.004 | 3.546 | 0.458 | 5.607 | 4.878 | 0.729 | 4.679 | 4.144 | 0.535 |
| 50 and over | 5.769 | 4.725 | 1.044 | 5.208 | 4.338 | 0.870 | 6.871 | 5.628 | 1.243 | 6.169 | 5.139 | 1.030 |
| Unspecified | 3.089 | 2.647 | 0.442 | 2.801 | 2.356 | 0.445 | 4.332 | 3.712 | 0.620 | 4.173 | 3.510 | 0.663 |
| Totals | 3.480 | 3.024 | 0.456 | 3.213 | 2.854 | 0.359 | 4.233 | 3.679 | 0.554 | 3.888 | 3.454 | 0.434 |
The figures. reveal a considerable difference between the two years; The average number of children now dead who had been born to married women at the various age-groups shows a fall at all ages, and especially for women 15–19 last birthday. The gradual increase with age is what we might expect when it is remembered that by the time many- mothers have reached 45 some of their children have been born many years.
Like vise, the number of children living at the date of the census shows a fall, but not nearly so large a one proportionately. This suggests a diminished birthrate, a fact which is borne out by the consideration that although child-bearing has completely ceased by 50, yet the average issue that had been born to women 50 and over was in 1911 1,264, and in 1916 1,490, in excess of that at the next lower age-group. The increase in 1916 suggests that the fall in fecundity for the older married women has within the last twenty-odd years considerably increased in rate. For the younger married women fecundity has not appreciably diminished during the period under review.
Combining these we see that there has been a diminution in the birth-rate and a more than proportionate diminution in the death-rate. This is, of course, merely confirmation of what is a statistical commonplace—viz., that there is normally a fairly close correlation between birth and mortality (especially infantile mortality) rates.
The actual number of cases where no children had been born rises to age 25–29, and falls thereafter, though not so rapidly as the frequency of cases of other numbers of issue. Accordingly, about age 44 the number of cases where no children had been born actually exceeds the frequency of cases for any other numbers of issue. In the foregoing discussion, however, these cases of no issue have been disregarded, bearing as they do on fertility (and its opposite) rather than on fecundity.
The rise with age to the 25–29 group in the number of cases where no issue had been born is entirely on account of the fact that at the earlier age-groups the number of married women is comparatively small. While the number rises, however, the proportion of married women with no issue to the total number of married women falls continually to ages 55–59, as shown below. The slight rise thereafter is probably due to the increasing proportion of late marriages as we proceed towards higher age-groups. Following are the figures for the 1916 census:—
| Ago-group. | Number of Married Women specified as to Issue born and Age. | Number with no Children. | Percentage of Number with no Issue to Total specified. |
|---|---|---|---|
| Under 20 | 1,057 | 544 | 51.46 |
| 20.24 | 13,699 | 4,436 | 32.38 |
| 25.29 | 29,580 | 6,356 | 21.48 |
| 30.34 | 35,477 | 5,419 | 15.27 |
| 35.39 | 34,403 | 4,707 | 13.68 |
| 40.44 | 26,376 | 3,690 | 14.99 |
| 45.49 | 21,028 | 2,860 | 13.60 |
| 50.54 | 15,268 | 2,094 | 13.71 |
| 55.59 | 10,510 | 1,260 | 11.99 |
| 60.64 | 7,435 | 928 | 12.48 |
| 65 and over | 9,261 | 1,855 | 20.03 |
| Totals | 204,094 | 34,149 | 16.73 |
The table given on page 99 shows for the last two census-takings the numbers and percentages of married women, classified according to duration of marriage, with and without children. Just as there exists between actual and physiological fecundity a disparity due to various causes, so there exists between childlessness and sterility a similar disparity. Although information as to sterility (which, of course, may be regarded alternatively as negative fertility or zero fecundity) is of vast importance theoretically, no direct data are available. The figures given in this table relate to childlessness, and the degree to which that phenomenon approximates to actual sterility cannot here be pronounced upon.
A second table, on page 100, shows for the last two census-takings the average issue to marriages classified according to duration. Issue living and dead are distinguished.
Numbers and Percentages of Married Women with and without Children born, according to Duration of Marriage (as at Dates of 1911 and 1916 Census).
| Duration of Marriage, in Complete Years. | Married Women without Children born. | Married Women with Children born. | ||||||
|---|---|---|---|---|---|---|---|---|
| 1911. | 1916. | 1911. | 1916. | |||||
| Number. | Proportion per Cent. | Number. | Proportion per Cent. | Number. | Proportion per Cent. | Number. | Proportion per Cent. | |
| Under 1 | 5,110 | 86.58 | 7,687 | 87.12 | 792 | 13.42 | 1,136 | 12.88 |
| 1 | 3,678 | 49.96 | 3,525 | 46.33 | 3,684 | 50.04 | 4,084 | 53.67 |
| 2 | 2,349 | 28.28 | 2,687 | 30.90 | 5,956 | 71.72 | 6,008 | 69.10 |
| 3 | 1,815 | 22.30 | 2,078 | 23.34 | 6,324 | 77.70 | 6,825 | 76.66 |
| 4 | 1,456 | 18.22 | 1,757 | 19.67 | 6,536 | 81.78 | 7,175 | 80.33 |
| 5 | 1,184 | 16.07 | 1,535 | 17.99 | 6,184 | 83.93 | 6,999 | 82.01 |
| 6 | 1,033 | 14.66 | 1,294 | 1601 | 6,014 | 85.34 | 6,789 | 83.99 |
| 7 | 985 | 14.32 | 1,130 | 14.93 | 5,893 | 85.68 | 6,438 | 85.07 |
| 8 | 808 | 12.58 | 1,167 | 14.46 | 5,615 | 87.42 | 6,901 | 85.54 |
| 9 | 703 | 11.83 | 1,027 | 13.65 | 5,237 | 88.17 | 6,498 | 86.35 |
| 10 | 893 | 13.79 | 1,072 | 13.43 | 5,582 | 86.21 | 6,910 | 86.57 |
| 11 | 582 | 10.87 | 812 | 12.43 | 4,772 | 89.13 | 5,720 | 87.57 |
| 12 | 547 | 10.91 | 845 | 12.16 | 4,467 | 89.09 | 6,103 | 87.84 |
| 13 | 450 | 9.84 | 674 | 10.74 | 4,121 | 90.16 | 5,604 | 89.26 |
| 14 | 494 | 10.91 | 692 | 11.51 | 4,035 | 89.09 | 5,318 | 88.49 |
| 15 | 447 | 11.12 | 706 | 11.98 | 3,573 | 88.88 | 5,189 | 88.02 |
| 16 | 396 | 10.64 | 627 | 11.15 | 3,325 | 89.36 | 4,996 | 88.85 |
| 17 | 333 | 9.11 | 487 | 10.12 | 3,322 | 90.89 | 4,323 | 89.88 |
| 18 | 319 | 9.12 | 437 | 9.68 | 3,180 | 90.88 | 4,076 | 90.32 |
| 19 | 260 | 8.12 | 362 | 8.73 | 2,943 | 91.88 | 3,783 | 91.27 |
| 20 | 403 | 10.90 | 504 | 10.87 | 3,295 | 89.10 | 4,133 | 89.13 |
| 21 | 229 | 8.38 | 285 | 8.84 | 2,503 | 91.62 | 2,939 | 91.16 |
| 22 | 223 | 7.86 | 299 | 9.02 | 2,614 | 92.14 | 3,016 | 90.98 |
| 23 | 217 | 7.91 | 276 | 8.19 | 2,526 | 92.09 | 3,094 | 91.81 |
| 24 | 221 | 8.50 | 275 | 8.66 | 2,378 | 91.50 | 2,899 | 91.34 |
| 25 | 246 | 9.04 | 294 | 8.93 | 2,475 | 90.96 | 2,995 | 91.06 |
| 20 | 183 | 7.38 | 229 | 8.17 | 2,297 | 92.62 | 2,573 | 91.83 |
| 27 | 202 | 8.71 | 196 | 7.88 | 2,117 | 91.29 | 2,292 | 92.12 |
| 28 | 171 | 7.35 | 192 | 7.49 | 2,155 | 92.65 | 2,371 | 92.51 |
| 29 | 148 | 7.59 | 132 | 6.07 | 1,803 | 92.41 | 2,043 | 93.93 |
| 30 | 219 | 9.06 | 254 | 9.28 | 2,198 | 90.94 | 2,482 | 90.72 |
| 31 | 115 | 7.08 | 146 | 7.32 | 1,509 | 92.92 | 1,849 | 92.68 |
| 32 | 137 | 7.16 | 143 | 6.94 | 1,777 | 92.84 | 1,918 | 93.06 |
| 33 | 141 | 8.09 | 130 | 6.61 | 1,601 | 91.91 | 1,837 | 93.39 |
| 34 | 99 | 6.18 | 113 | 6.03 | 1,504 | 93.82 | 1,760 | 93.97 |
| 35 | 137 | 7.89 | 113 | 6.57 | 1,599 | 92.11 | 1,606 | 93.43 |
| 36 | 120 | 7.12 | 89 | 5.33 | 1,565 | 92.88 | 1,580 | 94.67 |
| 37 | 111 | 7.80 | 73 | 5.18 | 1,312 | 92.20 | 1,336 | 94.82 |
| 38 | 88 | 6.98 | 80 | 5.52 | 1,173 | 93.02 | 1,368 | 94.48 |
| 39 | 57 | 5.55 | 69 | 5.74 | 969 | 94.45 | 1,133 | 94.26 |
| 40 | 130 | 9.06 | 139 | 8.07 | 1,305 | 90.94 | 1,583 | 91.93 |
| 41 | 58 | 6.90 | 65 | 6.14 | 782 | 93.10 | 993 | 93.86 |
| 42 | 43 | 5.22 | 48 | 4.38 | 780 | 94.78 | 1,047 | 95.62 |
| 43 | 57 | 7.55 | 53 | 5.57 | 698 | 92.45 | 898 | 94.43 |
| 44 | 53 | 7.89 | 42 | 5.92 | 619 | 9241 | 668 | 94.08 |
| 45 | 65 | 7.96 | 52 | 7.22 | 751 | 92.04 | 668 | 92.78 |
| 46 | 40 | 6.83 | 40 | 6.23 | 546 | 93.17 | 602 | 93.77 |
| 47 | 44 | 7.35 | 21 | 4.21 | 555 | 92.65 | 478 | 95.79 |
| 48 | 29 | 5.85 | 29 | 5.80 | 467 | 94.15 | 471 | 94.20 |
| 49 | 25 | 6.27 | 30 | 7.61 | 374 | 93.73 | 364 | 92.39 |
| 50 | 29 | 6.64 | 38 | 7.17 | 408 | 93.36 | 492 | 92.83 |
| 51 | 18 | 8.14 | 25 | 8.96 | 203 | 91.86 | 254 | 91.04 |
| 52 | 21 | 9.05 | 16 | 5.32 | 211 | 90.95 | 285 | 94.68 |
| 53 | 8 | 4.76 | 27 | 11.59 | 160 | 95.24 | 206 | 88.41 |
| 54 | 7 | 5.00 | 11 | 5.85 | 133 | 95.00 | 177 | 94.15 |
| 55 | 3 | 2.83 | 7 | 5.69 | 103 | 97.17 | 116 | 94.31 |
| 56 and over | 26 | 8.05 | 46 | 8.88 | 297 | 91.95 | 472 | 91.12 |
| Unspecified | 2,526 | 63.13 | 1,001 | 31.52 | 1,475 | 36.87 | 2,175 | 68.48 |
| Totals | 30,491 | 17.80 | 36,183 | 17.72 | 140,792 | 82.20 | 168,048 | 82.28 |
Average Number of Children to Marriages according to Duration (as at Dates of 1911 and 1910 Census).
| Duration of Marriage, in Complete Years. | Counting all Married Women. | Counting Married Women with Children only. | ||||||||||
|---|---|---|---|---|---|---|---|---|---|---|---|---|
| 1911. | 1916. | 1911. | 1916. | |||||||||
| Born. | Living. | Dead. | Born. | Living. | Dead. | Born. | Living. | Dead. | Born. | Living. | Dead. | |
| Under 1 | 0.137 | 0.130 | 0.007 | 0.138 | 0.133 | 0.005 | 1.021 | 0.967 | 0.054 | 1.034 | 0.997 | 0.037 |
| 1 | 0.521 | 0.490 | 0.031 | 0.576 | 0.553 | 0.023 | 1.042 | 0.980 | 0.062 | 1.044 | 1.002 | 0.042 |
| 2 | 0.876 | 0.820 | 0.056 | 0.896 | 0.852 | 0.044 | 1.250 | 1.170 | 0.080 | 1.264 | 1.202 | 0.062 |
| 3 | 1.227 | 1.145 | 0.082 | 1.215 | 1.153 | 0.062 | 1.579 | 1.474 | 0.105 | 1.566 | 1.486 | 0.080 |
| 4 | 1.544 | 1.425 | 0.119 | 1.495 | 1.417 | 0.078 | 1.888 | 1.743 | 0.145 | 1.845 | 1.749 | 0.096 |
| 5 | 1.821 | 1.678 | 0.143 | 1.742 | 1.646 | 0.096 | 2.169 | 1.999 | 0.170 | 2.106 | 1.980 | 0.116 |
| 6 | 2.078 | 1.909 | 0.169 | 1.985 | 1.878 | 0.107 | 2.435 | 2.237 | 0.198 | 2.353 | 2.226 | 0.127 |
| 7 | 2.317 | 2.133 | 0.184 | 2.207 | 2.078 | 0.129 | 2.704 | 2.489 | 0.215 | 2.581 | 2.430 | 0.451 |
| 8 | 2.556 | 2.328 | 0.228 | 2.375 | 2.234 | 0.141 | 2.923 | 2.663 | 0.260 | 2.771 | 2.607 | 0.164 |
| 9 | 2.818 | 2.569 | 0.249 | 2.575 | 2.399 | 0.176 | 3.197 | 2.914 | 0.283 | 2.972 | 2.769 | 0.203 |
| 10 | 2.874 | 2.590 | 0.284 | 2.725 | 2.525 | 0.200 | 3.334 | 3.001 | 0.330 | 3.136 | 2.906 | 0.230 |
| 11 | 3.227 | 2.910 | 0.317 | 2.898 | 2.707 | 0.191 | 3.620 | 3.264 | 0.356 | 3.300 | 3.082 | 0.218 |
| 12 | 3.285 | 2.966 | 0.319 | 3.054 | 2.832 | 0.222 | 3.687 | 3.329 | 0.358 | 3.466 | 3.214 | 0.252 |
| 13 | 3.577 | 3.209 | 0.368 | 3.256 | 3.015 | 0.241 | 3.967 | 3.559 | 0.408 | 3.615 | 3.375 | 0.270 |
| 14 | 3.635 | 3.259 | 0.376 | 3.314 | 3.058 | 0.286 | 4.080 | 3.658 | 0.422 | 3.763 | 3.441 | 0.322 |
| 15 | 3.813 | 3.385 | 0.428 | 3.506 | 3.201 | 0.305 | 4.290 | 3.809 | 0.481 | 3.972 | 3.627 | 0.345 |
| 16 | 3.963 | 3.543 | 0.420 | 3.592 | 3.268 | 0.324 | 4.435 | 3.965 | 0.470 | 4.040 | 3.676 | 0.364 |
| 17 | 4.121 | 3.673 | 0.448 | 3.824 | 3.482 | 0.342 | 4.535 | 4.041 | 0.494 | 4.243 | 3.864 | 0.379 |
| 18 | 4.305 | 3.831 | 0.474 | 3.891 | 3.546 | 0.345 | 4.737 | 4.215 | 0.522 | 4.305 | 3.923 | 0.382 |
| 19 | 4.482 | 3.977 | 0.505 | 4.029 | 3.655 | 0.374 | 4.893 | 4.341 | 0.552 | 4.418 | 4.008 | 0.410 |
| 20 | 4.589 | 4.038 | 0.551 | 4.029 | 3.606 | 0.423 | 5.150 | 4.532 | 0.618 | 4.520 | 4.045 | 0.475 |
| 21 | 4.755 | 4.199 | 0.556 | 4.266 | 3.834 | 0.432 | 5.190 | 4.583 | 0.607 | 4.669 | 4.196 | 0.473 |
| 22 | 5.012 | 4.104 | 0.608 | 4.385 | 3.919 | 0.466 | 5.439 | 4.779 | 0.660 | 4.788 | 4.279 | 0.509 |
| 23 | 5.234 | 4.552 | 0.682 | 4.462 | 3.982 | 0.480 | 5.683 | 4.943 | 0.740 | 4.855 | 4.333 | 0.022 |
| 24 | 5.174 | 4.491 | 0.683 | 4.614 | 4.095 | 0.519 | 5.655 | 4.908 | 0.747 | 5.033 | 4.467 | 0.566 |
| 25 | 5.237 | 4.552 | 0.685 | 4.668 | 4.099 | 0.569 | 5.757 | 5.004 | 0.753 | 5.109 | 4.486 | 0.623 |
| 26 | 5.593 | 4.842 | 0.751 | 4.788 | 4.191 | 0.597 | 6.038 | 5.227 | 0.811 | 5.194 | 4.547 | 0.647 |
| 27 | 5.561 | 4.800 | 0.761 | 5.030 | 4.395 | 0.635 | 6.091 | 5.257 | 0.834 | 5.446 | 4.758 | 0.688 |
| 28 | 5.816 | 4.985 | 0.831 | 5.137 | 4.447 | 0.690 | 6.277 | 5.380 | 0.897 | 5.535 | 4.791 | 0.744 |
| 29 | 6.018 | 5.193 | 0.825 | 5.340 | 4.610 | 0.730 | 6.512 | 5.619 | 0.893 | 5.677 | 4.901 | 0.776 |
| 30 | 6.012 | 5.118 | 0.894 | 5.125 | 4.395 | 0.730 | 6.610 | 5.627 | 0.983 | 5.651 | 4.846 | 0.805 |
| 31 | 6.414 | 5.414 | 1.000 | 5.639 | 4.844 | 0.795 | 6.903 | 5.827 | 1.076 | 6.071 | 5.215 | 0.856 |
| 32 | 6.484 | 5.531 | 0.953 | 5.630 | 4.850 | 0.780 | 6.983 | 5.957 | 1.026 | 6.096 | 5.251 | 0.845 |
| 33 | 6.618 | 5.586 | 1.032 | 5.763 | 4.905 | 0.858 | 7.201 | 6.078 | 1.123 | 6.181 | 5.261 | 0.920 |
| 34 | 6.832 | 5.711 | 1.121 | 5.952 | 5.021 | 0.931 | 7.282 | 6.087 | 1.195 | 6.365 | 5.369 | 0.996 |
| 35 | 6.754 | 5.559 | 1.195 | 6.055 | 5.120 | 0.935 | 7.333 | 6.035 | 1.298 | 6.467 | 5.468 | 0.999 |
| 36 | 6.936 | 5.692 | 1.244 | 6.372 | 5.348 | 1.024 | 7.467 | 6.128 | 1.339 | 6.715 | 5.636 | 1.079 |
| 37 | 7.155 | 5.923 | 1.232 | 6.428 | 5.385 | 1.043 | 7.760 | 6.424 | 1.336 | 6.777 | 5.677 | 1.100 |
| 38 | 7.174 | 5.805 | 1.369 | 6.590 | 5.534 | 1.056 | 7.712 | 6.240 | 1.472 | 6.948 | 5.835 | 1.113 |
| 39 | 7.362 | 5.875 | 1.487 | 6.847 | 5.708 | 1.139 | 7.794 | 6.220 | 1.574 | 7.254 | 6.047 | 1.207 |
| 40 | 6.931 | 5.497 | 1.434 | 6.625 | 5.473 | 1.152 | 7.621 | 6.044 | 1.577 | 7.227 | 5.971 | 1.256 |
| 41 | 7.737 | 6.182 | 1.555 | 7.206 | 5.937 | 1.269 | 8.310 | 6.640 | 1.670 | 7.652 | 6.305 | 1.347 |
| 42 | 7.725 | 6.235 | 1.490 | 7.455 | 5.977 | 1.478 | 3.151 | 6.578 | 1.573 | 7.808 | 6.260 | 1.548 |
| 43 | 7.673 | 6.167 | 1.506 | 7.448 | 6.000 | 1.448 | 8.299 | 6.670 | 1.629 | 7.894 | 6.359 | 1.535 |
| 44 | 7.604 | 6.009 | 1.595 | 7.142 | 5.687 | 1.455 | 8.255 | 6.523 | 1.732 | 7.553 | 6.015 | 1.538 |
| 45 | 7.583 | 5.841 | 1.742 | 7.183 | 5.706 | 1.477 | 8.239 | 6.346 | 1.893 | 7.727 | 6.138 | 1.589 |
| 46 | 7.568 | 5.725 | 1.843 | 7–513 | 5.960 | 1.553 | 8.122 | 6.144 | 1.978 | 7.982 | 6.332 | 1.650 |
| 47 | 8.067 | 6.214 | 1.853 | 7–846 | 6.265 | 1.581 | 8.706 | 6.706 | 2.000 | 8.190 | 6.540 | 1.650 |
| 48 | 8.252 | 7.548 | 0.704 | 7.861 | 6.233 | 1.628 | 8.764 | 8.017 | 0.747 | 8.307 | 6.587 | 1.720 |
| 49 | 8.321 | 6.198 | 4.123 | 8–058 | 6.302 | 1.756 | 8.877 | 6.612 | 2.265 | 8.628 | 6.747 | 1.881 |
| 50 | 7.659 | 5.835 | 1.794 | 7–475 | 5.747 | 1.728 | 8.203 | 6.282 | 1.921 | 8.093 | 6.222 | 1.871 |
| 51 | 8.072 | 5.859 | 2.213 | 7.799 | 5.971 | 1.828 | 6.788 | 6.379 | 2.409 | 8.500 | 6.508 | 1.992 |
| 52 | 7.866 | 5.758 | 2.108 | 8–099 | 6.033 | 2.066 | 8.649 | 6.332 | 2.317 | 8.549 | 6.368 | 2.181 |
| 53 | 8.345 | 6.425 | 2.220 | 7.691 | 5.733 | 1.958 | 8–762 | 6.431 | 2.331 | 8.602 | 6.412 | 2.190 |
| 54 | 8.850 | 6.321 | 2.529 | 7–974 | 6.032 | 1.954 | 9.315 | 6.654 | 2.661 | 8.466 | 6.404 | 2.062 |
| 55 | 8.651 | 6.028 | 2.623 | 7.577 | 5.537 | 2.040 | 8.903 | 6.204 | 2.699 | 8.034 | 5.870 | 2.164 |
| 56 and over | 8.111 | 5.622 | 2.489 | 8–174 | 5.904 | 2.170 | 8.821 | 6.114 | 2.707 | 8.834 | 6.381 | 2.453 |
| Unspecified | 1.683 | 1.438 | 0.245 | 2–824 | 2.400 | 0.424 | 4.565 | 3.900 | 0.665 | 4.333 | 3.682 | 0.651 |
| Totals | 3.480 | 3.024 | 0.456 | 3–213 | 2.854 | 0.359 | 4.233 | 3.679 | 0.554 | 3.888 | 3.454 | 0.434 |
The total figures given in the table on page 99 show but slight differences between the two census years. While in 1911 17.80 per cent. of the married women were returned as childless, in 1916 the percentage was 17.72. For individual durations of marriage differences are more marked.
It will be noted that of women married less than a year only 12.88 per cent. had children, a proportion which increases rapidly for each year of marriage, being 53.67 per cent. for those married one complete year at the date of census, 69.10 per cent for two years, 76.66 for three years, and so on. Reproduction rarely takes place after the thirtieth year of marriage. It may appear surprising, then, that while the percentage of married women with children is in the vicinity of 92.5 for thirty complete years of marriage and thereabouts, for forty years and over it is more in the vicinity of 94.
Two explanations of this phenomenon may be vouchsafed, neither of which is capable (with the data available) of deductive verification. One is that childlessness is on the increase, whether this be due to physiological or prudential considerations: this explanation is to a certain extent borne out by the increase shown by the 1916 figures over those for 1911 as regards the proportions of childless marriages of durations ranging from three to nine complete years. The other explanation is that women who have had children tend to survive into old age to a greater extent than those who are childless. No data on this subject are available as regards New Zealand, but investigations in the United States and elsewhere have fully established that having borne children is conducive to longevity among women.
Whatever doubts there may be as to whether voluntary childlessness is or is not increasing, the table given on page 100 leaves no doubt as to the fact that the average size of families is on the wane.
While in 1911 3.48 children had on the average been born to each married woman, the ratio fell to 3.21 in 1916; so also, while in 1911 each married woman had on the average 3.02 children living, this ratio fell to 2.85 in 1916. If instead of considering all married women we consider only those with children the fall becomes even more striking. While in 1911 4.23 children had on the average been born to each married woman who was not childless, the corresponding figure for 1916 was 3.89; so also, while in 1911 each married woman (excluding childless women) had on the average 3.68 children living, the corresponding figure for 1916 was 3.45.
Child-bearing in practically every marriage has ceased by the thirtieth year of married life., Yet we find that in 1911 the average issue born to women who had been married thirty complete years was 6.01, and in 1916 5.12. For women married fifty complete years the corresponding figures were 7.66 and 7.48.
The increase in the number of children born with increased duration of marriage must be due to one or the other of two causes: (a) Decrease in the average size of families; (b) greater longevity of mothers of larger families than of mothers of smaller ones. The truth of the former proposition is already established independently; data are not at present available to enable a pronouncement to be made on the truth or otherwise of the latter proposition.
It is worth noting that the diminution in the average number of issue in 1916 as compared with 1911 is pretty generally distributed amongst the various durations of marriage, but is greatest for durations thirteen to forty-five years, especially the middle range of this group. At durations under three complete years the average issue to married women was actually greater in 1916 than it was in 1911. There would thus appear to be no diminution in the average number of issue during the first years of marriage, but diminution appears to be an undoubted phenomenon of later married life. The increase in the average size of families for short durations is not easy to account for, but may probably be attributable in part to war conditions hastening the advent of the first-born. A striking fact in this connection is that although the average number born has increased since 1911, the average number dead has fallen in a marked degree. This evidence of decreased infantile mortality in a country where it has long been at a minimum is matter for congratulation.
Of considerable interest from the point of view of reproductive efficiency is the attached table. Owing to paucity of instances most of the cases where the number of previous issue born is large are of little value. All cases where fewer than twenty children were born to a conjunction during the triennium are star noted.
Previous Issue and Duration of Marriage.—Children born Annually per 100 Couples belonging to each Conjunction. (Average for Years 1915–17.)
| Duration of Marriage, in Complete Years. | Number of Previous Issue born. | Totals | ||||||||||||||||
|---|---|---|---|---|---|---|---|---|---|---|---|---|---|---|---|---|---|---|
| 0. | 1. | 2. | 3. | 4. | 5. | 6. | 7. | 8. | 9. | 10. | 11. | 12. | 13. | 14. | 15. | 16 and over. | ||
| Under 1 | 47.4 | 1.4 | 1.8* | .. | .. | .. | .. | .. | .. | .. | .. | .. | .. | .. | .. | .. | .. | 29.9 |
| 1 | 68.3 | 18.5 | 8.1 | 6.7* | .. | .. | .. | .. | .. | .. | .. | .. | .. | .. | .. | .. | .. | 66.7 |
| 2 | 28.5 | 42.1 | 13.0 | 10.0 | 4.2* | .. | .. | .. | .. | .. | .. | .. | .. | .. | .. | .. | .. | 36.6 |
| 3 | 17.3 | 35.6 | 24.7 | 12.7 | 11.5* | .. | .. | .. | .. | .. | .. | .. | .. | .. | .. | .. | .. | 21.9 |
| 4 | 11.0 | 28.2 | 28.7 | 20.1 | 12.9 | 11.1* | .. | 16.7* | .. | .. | .. | .. | .. | .. | .. | .. | .. | 15.9 |
| 5 | 7.4 | 22.3 | 25.4 | 23.8 | 19.3 | 12.0 | 8.3* | 10.7* | .. | .. | .. | .. | .. | .. | .. | .. | .. | 11.9 |
| 6 | 5.4 | 18.0 | 21.3 | 25.8 | 21.2 | 22.2 | 18.7* | 10.0* | .. | .. | .. | .. | .. | .. | .. | .. | .. | 9.7 |
| 4 | 4.8 | 14.4 | 19.0 | 22.3 | 26.9 | 23.1 | 19.7 | 16.7* | .. | .. | .. | .. | .. | .. | .. | .. | .. | 8.2 |
| 8 | 31 | 10.2 | 14.6 | 18.5 | 23.5 | 23.8 | 23.3 | 18.5* | 20.6* | .. | .. | .. | .. | .. | .. | .. | .. | 6.4 |
| 9 | 2.6 | 8.5 | 12.0 | 17.3 | 22.4 | 22.5 | 24.7 | 25.4 | 20.5* | 10.7* | .. | .. | .. | .. | .. | .. | .. | 5.6 |
| 10 | 1.9 | 5.7 | 9.7 | 13.1 | 10.4 | 26.0 | 21.4 | 27.5 | 19.5 | 4.4* | 22.2* | .. | 33.3* | .. | .. | .. | .. | 4.5 |
| 11 | 1.8 | 5.1 | 8.8 | 11.6 | 15.6 | 21.9 | 23.5 | 31.4 | 30.4 | 29.4* | 100.0* | .. | .. | .. | .. | .. | .. | 4.2 |
| 12 | 1.2 | 39 | 5.8 | 9.7 | 13.4 | 18.7 | 24.2 | 21.8 | 23.4 | 50.0 | 22.2* | 44.4* | .. | .. | .. | .. | .. | 3.5 |
| 13 | 1.5 | 2.6 | 4.9 | 8.2 | 10.1 | 16.4 | 21.0 | 20.1 | 23.9 | 24.7 | 42.0 | 7.4* | 33.3* | 33.3* | .. | .. | .. | 3.0 |
| 14 | 0.9* | 2.4 | 3.9 | 6.0 | 10.0 | 13.9 | 17.1 | 20.9 | 21.6 | 28.8 | 34.7 | 15.2* | 16.7* | .. | .. | .. | .. | 2.7 |
| 15 | 0.5* | 1.3 | 3.3 | 5.1 | 7.4 | 9.5 | 15.0 | 19.1 | 21.7 | 20.6 | 23.5 | 27.8* | 14.3* | .. | .. | .. | .. | 2.1 |
| 16 | 0.7* | 1.0* | 2.8 | 3.4 | 0.0 | 9.7 | 11.0 | 10.0 | 20.4 | 19.9 | 23.0 | 21.0* | 44.4* | 6.3* | .. | .. | .. | 1.8 |
| 17 | 0.0* | 1.4* | 2.2 | 2.9 | 5.4 | 7.1 | 11.0 | 16.2 | 18.5 | 21.8 | 17.4 | 21.9 | 23.1* | 33.3* | .. | 33.3* | .. | 1.7 |
| 18 | 0.5* | 0.7* | 1.6 | 2.2 | 3.0 | 6.2 | 8.5 | 12.7 | 15.2 | 16.7 | 21.0 | 26.0 | 33.3* | 50.0* | 50.0* | .. | .. | 1.3 |
| 19 | 0.6* | 0.4* | 1.1* | 2.0 | 2.6 | 4.7 | 7.7 | 104 | 9.3 | 17.7 | 23.7 | 21.4 | 29.2* | 15.2* | 33.3* | .. | .. | 11 |
| 20 | 0.2* | 0.3* | 0.3* | 1.0* | 1.7 | 2.9 | 2.9 | 6.0 | 5.9 | 13.8 | 16.2 | 18.8 | 33.3 | 21.4* | 133.3* | 33.3* | .. | 0.7 |
| 21 | .. | 0.5* | 0.5* | 0.9* | 1.4 | 2.7 | 4.4 | 5.0 | 7.3 | 14.9 | 14.8 | 10.3 | 13.3* | 12.5* | .. | 100.0* | .. | 0.7 |
| 22 | 0.3* | .. | .. | 0.8* | 0.5* | 1.0* | 2.8 | 3.0 | 5.1 | 9.2 | 12.8 | 11.4 | 15.6* | 18.5* | 12.5* | 11.1* | 33.3* | 0.5 |
| 23 | 0.1* | .. | 0.3* | 0.2* | 0.7* | 1.3* | 1.7* | 2.4* | 2.7* | 5.9 | 6.8* | 10.0 | 12.7* | 22.2* | 8.3* | 11.1* | .. | 0.4 |
| 24 | .. | .. | 0.3* | .. | 0.2* | 0.4* | 1.1* | 0.9* | 1.8* | 2.9* | 5.0* | 8.8* | 9.4* | 9.7* | 8.3* | .. | 13.3* | 0.2 |
| 25–29 | .. | 0.1* | 0.1* | .. | 0.1* | 0.2* | 0.2* | 0.3* | 0.0* | 0.8* | 1.1* | 2.4 | 3.1* | 3.4* | 5.2* | 6.4* | 4.2* | 0.1 |
| 30 and over | .. | .. | .. | .. | .. | .. | .. | .. | .. | .. | .. | .. | .. | .. | .. | .. | .. | .. |
| Totals | 21.6 | 18.2 | 13.3 | 10.9 | 9.6 | 9.1 | 8.0 | 7.2 | 5.5 | 5.0 | 4.1 | 3.5 | 3.0 | 2.6 | 1.7 | 1.7* | 2.1* | 13.1 |
It will be noted that 47.41 per cent. of the marriages that have lasted less than a year have children born to them during the year, while 68.34 per cent, of those remaining childless at the end of the first year have children born to them during the next ensuing year, and 28.52 per cent, of those remaining childless at the end of the second year have children born to them during the third year. Thereafter the proportion of hitherto childless marriages remaining to which children are born falls fairly rapidly. This merely confirms the well-recognized fact that, except in the case of large families, one or more children are usually born (if at all) during the earlier years of marriage. The popular or modal duration of marriage before the second child is born is not one complete year but two, and the modal, duration before the third is born is four years. Before the remaining children are born the modal period of married life that elapses is as follows:—
| Popular Duration of Married Life, in Complete Years. | Before Birth of Child hi Numerical Sequence as indicated below. |
|---|---|
| 6 | 4 |
| 7 | 5 |
| 8 | 6 |
| 9 | 7 |
| 11 | 8 |
| 11 | 9 |
| 12 | 10 |
| 13 | 11 |
It will at once be seen that actual fecundity for all durations of marriage is at a maximum when the first child is born, and falls there from rapidly at first, but slowly after the birth of the fourth child. As duration of marriage increases, fecundity appears to be greatest amongst those couples who have already had a considerable number of children, this number being higher with an increased duration of marriage. This shows that, apart from those cases where child-bearing ceases altogether—and they are by no means few—the tendency is, when once a fairly large family is borne, for it to be increased.
Actual fecundity is also at a maximum for all numbers of previous issues when marriage has lasted one complete year. With increasing duration it falls very considerably. Whether the same law holds of physiological fecundity, it would be difficult to pronounce upon.
In the light of the preceding portions of this discussion the attached table, drawn up from the 1916 census returns, showing the average issue that has been born to all married women of specified ages whose existing marriages had lasted the specified numbers of complete years, is of interest. As heretofore, a paucity of instances is designated by an asterisk, which appears wherever twenty or fewer married women belonged to a particular conjunction at the date of census; such cases should again be discounted hi drawing conclusions.
Average Issue born (by Ages and Duration of Marriage) to Married Women specified (as at Date of 1916 Census).
A feature of the table is the clear evidence it affords of the decrease with age in actual fecundity, in almost every case the average issue for a given duration of marriage being considerably smaller for married women in the higher age-groups than for those in the lower.
On general grounds it is to be expected that the average number of total issue to women of a given age will rise with an increase in the duration of marriage. As, however, actual fecundity decreases with age, there may be expected to be an appreciable fall in the rate of this rise as the duration of marriage increases, especially when it is remembered that the secular fall in the birth-rate has been almost (if not wholly) confined to other than the earliest years of married life, a fact which has been established in an earlier portion of this section of the report.
Accordingly, on referring to the table, one is far from surprised to note the rate of increase in the average number of issue that had been born to married women decreases for those in the younger age-groups with an increase in the duration of marriage. With the older married women one would expect it to be otherwise, and that expectation is not disappointed. Most have been married many years, during which period the secular fall in actual fecundity has been marked, and much of their married life was spread over a period when the birth-rate was considerably higher than it is now.
For older women, then, with an increase in the duration of marriage the average issue is seen to increase more than proportionately, thus reflecting the higher rate of actual fecundity formerly prevalent. This explanation of the matter is confirmed by consideration of a further characteristic of the table. Reproduction normally ceases after forty-five years of life and thirty years, or thereabouts, of marriage. Accordingly, the fact that the table reveals an average issue increasing considerably beyond these limiting periods is clearly another result of the continuous diminution in birth-rates, the assumption that parents of large families survive longer than those of small ones being set aside provisionally as unproven.
A similar table to that immediately preceding is now offered, average issue born and still surviving at the date of the 1916 census-taking here being quoted in lieu of the average issue born irrespective of whether surviving at the date of census or not. The general features of this table will be seen to resemble closely those which have already been discussed in connection with that last quoted. An asterisk has again been inserted to indicate cases wherever twenty or fewer married women belonged to a particular conjunction as at the date of the census.
Average Issue living, (by Ages and Duration of Marriage) born to Married Women (as at Date of 1916 Census).
| Duration of Marriage, in Complete Years. | Ages of Wives. | ||||||||
|---|---|---|---|---|---|---|---|---|---|
| Under 20. | 20–24. | 25–29. | 30–34. | 35–39. | 40–14. | 45–49. | 50 and over. | Totals. | |
| Under 1 | 0.233 | 0.168 | 0.113 | 0.079 | 0.095 | 0.075 | 0.019 | 0.066 | 0.133 |
| 1 | 0.749 | 0.640 | 0.554 | 0.496 | 0.347 | 0.236 | 0.111 | 0.022 | 0.557 |
| 2 | 1.146 | 1.037 | 0.877 | 0.772 | 0.650 | 0.284 | 0.137 | 0.102 | 0.858 |
| 3 | 1.421 | 1.421 | 1.225 | 1.060 | 0.908 | 0.620 | 0.193 | 0.198 | 1.163 |
| 4 | 1.222* | 1.795 | 1.540 | 1.347 | 1.114 | 0.768 | 0.322 | 0.261 | 1.427 |
| 5 | .. | 2.094 | 1.826 | 1.632 | 1.379 | 0.987 | 0.545 | 0.359 | 1.658 |
| 6 | .. | 2.406 | 2.174 | 1.842 | 1.647 | 1.232 | 0.754 | 0.329 | 1.893 |
| 7 | .. | 2.736 | 2.408 | 2.093 | 1.985 | 1.441 | 0.862 | 0.387 | 2.089 |
| 8 | .. | 2.635 | 2.660 | 2.343 | 2.035 | 1.680 | 1.009 | 0.364 | 2.248 |
| 9 | .. | 3.000 | 2.913 | 2.559 | 2.279 | 1.907 | 1.075 | 0.409 | 2.414 |
| 10 | .. | 1.400* | 3.224 | 2.782 | 2.444 | 1.967 | 1.339 | 0.622 | 2.544 |
| 11 | .. | 4.000* | 3.469 | 3.026 | 2.640 | 2.368 | 1.438 | 0.500 | 2.719 |
| 12 | .. | .. | 3.547 | 3.326 | 2.823 | 2.436 | 1.715 | 0.796 | 2.850 |
| 13 | .. | .. | 3.847 | 3.573 | 3.084 | 2.681 | 2.175 | 1.041 | 3.033 |
| 14 | .. | .. | 3.813* | 3.759 | 3.225 | 2.823 | 2.193 | 0.957 | 3.078 |
| 15 | .. | .. | 3.800* | 4.065 | 3.582 | 2.942 | 2.288 | 1.037 | 3.226 |
| 16 | .. | .. | .. | 4.190 | 3.742 | 3.086 | 2.502 | 1.355 | 3.293 |
| 17 | .. | .. | .. | 4.466 | 4.071 | 3.451 | 2.700 | 1.457 | 3.496 |
| 18 | .. | .. | .. | 4.708 | 4.191 | 3.645 | 2.904 | 1.800 | 3.581 |
| 19 | .. | .. | .. | 4.810 | 4.562 | 3.836 | 3.097 | 1.783 | 3.680 |
| 20 | .. | .. | .. | 9.200* | 4.833 | 3.937 | 3.180 | 1.967 | 3.641 |
| 21 | .. | .. | .. | .. | 4.735 | 4.414 | 3.515 | 2.450 | 3.855 |
| 22 | .. | .. | .. | .. | 5.468 | 4.521 | 3.609 | 2.736 | 3.944 |
| 23 | .. | .. | .. | .. | 4.582 | 4.848 | 3.779 | 2.939 | 4.011 |
| 24 | .. | .. | .. | .. | 5.500 | 5.031 | 4.093 | 3.098 | 4.129 |
| 25 | .. | .. | .. | .. | 4.429* | 5.314 | 4.337 | 3.166 | 4.135 |
| 26 | .. | .. | .. | .. | .. | 5.281 | 4.602 | 3.409 | 4.222 |
| 27 | .. | .. | .. | .. | .. | 5.769 | 5.022 | 3.661 | 4.418 |
| 28 | .. | .. | .. | .. | .. | 6.318 | 5.158 | 3.809 | 4.485 |
| 29 | .. | .. | .. | .. | .. | 6.923* | 5.604 | 4.131 | 4.644 |
| 30 | .. | .. | .. | .. | .. | 5.333* | 5.517 | 4.106 | 4.453 |
| 31–39 | .. | .. | .. | .. | .. | .. | 6.283 | 5.106 | 5.142 |
| 40–49 | .. | .. | .. | .. | .. | .. | .. | 5.867 | 5.867 |
| 50 and over | .. | .. | .. | .. | .. | .. | .. | 5.872 | 5.872 |
| Totals specified | 0.523 | 0.954 | 1.606 | 2.244 | 2.803 | 3.225 | 3.546 | 4.338 | 2.855 |
It has already been pointed out that statistics are in. general concerned with the quantitative, and are as a rule of no great service for qualitative purposes. They are, however, of considerable value in shedding light on matters which are capable of being qualitatively designated by some important characteristic capable of quantitative treatment.
So far, mere numbers have been quoted in dealing with reproductive efficiency, but it is patent that quality of offspring is of no inconsiderable importance. Statistics of the numbers that die within a fixed period will be of special value as an index to the quality of offspring. With this consideration in view the following table has been drawn up from the figures quoted in the last two.
When fewer than 2,000 children had been born to a conjunction an asterisk appears, but where every than 1,500 a dagger note. These cases should be more or less discounted in examining the table.
Number of Issue dead to 1,000 born (by Ages of Mothers and Duration of Marriage), as at Date of 1916 Census. ml
| Duration of Marriage, in Years. | Ages of Mothers. | |||||||
|---|---|---|---|---|---|---|---|---|
| 20–24. | 25–29. | 30–34. | 35–39. | 40–44. | 45–49. | 50 and over. | Totals. | |
| Under 1 | 51† | 17† | .. | .. | .. | .. | .. | 36† |
| 1 | 55* | 38* | 27† | .. | .. | .. | .. | 38 |
| 2 | 501 | 47 | 45† | 56† | .. | .. | .. | 49 |
| 3 | 57 | 47 | 44 | 57† | .. | .. | .. | 50 |
| 4 | 56 | 46 | 49 | 59† | .. | .. | .. | 51 |
| 5 | 64* | 53 | 51 | 50* | 90† | .. | .. | 55 |
| 6 | 75† | 53 | 47 | 54 | 69† | .. | .. | 54 |
| 7 | 70† | 59 | 52 | 62 | 75† | .. | .. | 59 |
| 8 | .. | 66 | 53 | 54 | 71† | .. | .. | 59 |
| 9 | .. | 78 | 64 | 64 | 72† | .. | .. | 67 |
| 10 | .. | 82 | 73 | 68 | 76* | 72† | .. | 73 |
| 11 | .. | 79* | 67 | 59 | 64 | 102† | .. | 67 |
| 12 | .. | 82† | 74 | 71 | 73 | 75† | .. | 72 |
| 13 | .. | 98† | 85 | 69 | 67 | 69† | .. | 73 |
| 14 | .. | .. | 94 | 81 | 87 | 79† | .. | 85 |
| 15 | .. | .. | 102 | 81 | 81 | 105† | 129 | 87 |
| 16 | .. | .. | 105* | 91 | 84 | 86* | 111† | 88 |
| 17 | .. | .. | 105† | 94* | 81 | 94 | 95† | 90 |
| 18 | .. | .. | .. | 99 | 81 | 85 | 85† | 88 |
| 19 | .. | .. | .. | 93 | 92 | 92 | 108† | 92 |
| 20 | .. | .. | .. | 116 | 103 | 97 | 114† | 103 |
| 21 | .. | .. | .. | 116† | 95 | 100 | 139† | 101 |
| 22 | .. | .. | .. | 107† | 110 | 104 | 107 | 106 |
| 23 | .. | .. | .. | 128† | 104 | 111 | 104 | 107 |
| 24 | .. | .. | .. | .. | 112 | 107 | 128 | 111 |
| 25 | .. | .. | .. | .. | 115 | 125 | 120 | 120 |
| 26 | .. | .. | .. | .. | 119* | 125 | 134 | 124 |
| 27 | .. | .. | .. | .. | 136† | 135 | 113 | 125 |
| 28 | .. | .. | .. | .. | 117† | 131 | 139 | 134 |
| 29 | .. | .. | .. | .. | .. | 134 | 139 | 136 |
| 30 | .. | .. | .. | .. | .. | 138 | 143 | 142 |
| 31–39 | .. | .. | .. | .. | .. | 137 | 154 | 154 |
| 40–49 | .. | .. | .. | .. | .. | .. | 129 | 129 |
| 50 and over | .. | .. | .. | .. | .. | .. | 252 | 252 |
| Totals | 129 | 64 | 72 | 84 | 97 | 124 | 178 | 118 |
Figures in this table are (it should be remembered) comparable horizontally, but not vertically, since different durations of marriage mean that the children of these marriages concerned are exposed to different risks of death, and such risks vary considerably in degree with the ages of the issue concerned.
The table seems to show that the proportion of issue that had died was at a minimum somewhere in the vicinity of the 30–34 group for the shorter durations of marriage, and for a somewhat later group for longer durations. Towards these minima the proportions*fall gradually from the younger and older age-groups. It would appear from this, then, that the issue of women nearing the limiting period of reproductivity are more likely to die than those of other women; also that the children of young mothers are subject to a high death-rate. While these results emerge in an investigation of the deaths of issue of women by age-groups, it may be that it is not the age of the mother itself but some factor that varies closely in accordance with her age that really accounts for the results shown. For example, an equally admissible explanation of the facts recorded is that the first-born is subject to a high degree of risk of death; also that as a family increases in size beyond a certain minimum the risk of death again increases. No data as yet exist in New Zealand v, hereby an investigation into the respective claims of the two theories can be effected, but investigations in other countries have certainly fully established that large families are subject to a higher death-rate than small ones, although no finality appears yet to have been reached abroad as to the “alleged handicap of the first-born,” or the effect of the mother's age of itself, unmodified by other qualifying circumstances, on the quality of the offspring.
Table of Contents
Table of Contents
The classification of occupations used at the more recent census-takings was again followed in 1916, each person being placed in one of eight classes. The full description of the arrangement of occupations in these eight classes is as follows:—
Section A—Breadwinners:—
Professional.—Embracing all persons, not otherwise classed, mainly engaged in the government and defence of the country and in satisfying the moral, intellectual, and social wants of its inhabitants.
Domestic.—Embracing all persons engaged in the supply of board and lodging and in rendering personal services for which remuneration is usually paid.
Commercial.—Embracing all persons directly connected with the hire, sale, transfer, distribution, storage, and security of property and materials.
Transport and communication.—Embracing all persons engaged in the transport of persons or goods or in; effecting communications.
Industrial.—Embracing all persons, not otherwise classed, who are principally engaged in various works of utility or in specialities connected with the manufacture, construction, modification, or alteration of materials so as to render them more available for the various uses of man, but excluding, so far as possible, all who are mainly or solely engaged in the service of commercial interchange.
Agricultural, pastoral, mineral, and other primary producers.—Embracing all persons mainly engaged in the cultivation or acquisition of food products and in obtaining other raw materials from natural sources.
Indefinite.—Embracing all persons who derive incomes from services rendered, but the direction of which services cannot be exactly determined.
Section B—Dependents: Non-Breadwinners:—
Dependents.—Embracing all persons dependent upon relatives or natural guardians, including wives, children, and others not otherwise engaged in pursuits for which remuneration is paid, and all persons dependent upon private charity or whose support is a burden on the public revenue.
The old classification of Dr. Fan, in use prior to 1891, purported to divide the population so as to distinguish the commercial from the industrial class; but in allotting the various occupations to the different classes the principle adopted was that of grouping all workers and dealers in. different matters together, according to the material dealt in or worked upon, and placing the whole in the industrial class. Thus, the dealers, who are really commercial, went to swell the number of the industrial at the expense of the commercial class. General labourers were cast out of the industrial into the indefinite class, merely because the material on which they worked was not stated, &c. The classification used in 1891 and 1896, while preserving Fair's professional class nearly intact, among other changes effected, transfers a large number of women and children from the domestic to the dependent class, and completes the commercial class by including “trade” among the agorici of Farr. The industrial class now consists of part of what was assigned to it by Farr, but includes general labourers. Miners and other primary producers are placed with the agricultural and pastoral class, as being engaged in obtaining raw materials from natural sources. The indefinite class is greatly reduced in number, and the class styled “dependent” introduced. “Employers” are distinguished from “employed” —a division which was first attempted in New Zealand at the suggestion of Mr. E. J. von Dadelszen on the occasion of the census of 1886, and which has been continued ever since. The importance of affording the means of distinguishing persons in business from wage-earners is obvious, besides being absolutely essential to an improved classification of occupations.
It should be noted that the figures given under the heading “Officer of Government Department” (Order I, Sub-order 1), and included in the total for Class I, Professional, do not represent the full number employed by the Government, the principle adopted having been to complete other groups where the scheme of classification required it, rather than to show the total number paid by Government. Thus, Postal and Telegraph officers are classified under “Transport and Communication,” in Class IV. Railway employees are similarly dealt with. The full statement of persons paid by Government but not included in Order I would comprise some or all of the following: Persons connected with charitable or benevolent institutions, hospitals, museums, education, insurance, railways, harbours, lighthouses, post and telegraph, and mines; also civil engineers, electricians, surveyors, and assistants, architects and draughtsmen, printers and binders in the Government Printing Office, and artisans in Government Railway Workshops.
The numbers under “Commercial” and “Industrial” include all persons whose occupations were sufficiently defined to enable them to be classified in connection with the business or industry in which they are engaged. Some, however, chiefly those whose employment was of a nature of unskilled clerical assistance, while entering “clerk” under the heading “Occupation,” did not state in what trade or industry they were employed. These, of course, could, not be allotted to any special industry. Those engaged as agents or assistants in any occupation belonging to Classes III to VII have been, generally speaking, included with the principals. All persons returned as both manufacturers and dealers or sellers have been classed as makers only, under Class V. Persons out of employment are included under their ordinary or former occupations. Inmates of mental hospitals, industrial schools, and refuges, together with all persons in gaols, have been classed not according to their ordinary occupations, but in Class VIII as part of the dependent population.
The difficulty of tabulating the occupations of the people shown in the census was certainly lessened by the introduction of the card system, but this could not eliminate an unsatisfactoriness in the work on account of the different ways in which people returned themselves when their occupations were virtually the same, and of the number of instances in which unskilled labour was not defined as having to do with the industry on which it was temporarily employed. These causes have in the past prevented the published results from being what they might have been, even with perfect care in the compilation work. One man might be a “carter at brewery,” and return himself accordingly. Another omitted the words “at brewery,” and thus the total number of persons employed in the brewing business was deficient. As instances of these irregularities occurred continually, it came about that the industrial statistics brought out by the census often differed materially as to “hands employed” from the results brought out under the head of “Occupation” in regard to labourers and others attached to various industries.
For such reasons as have already emerged the section of the census investigation dealing with occupations was, with the somewhat doubtful exception of “religions,” the most complex, and from the point of view of accuracy of data certainly the least satisfactory, of all the investigations coming within the ambit of the census. In one respect, however, an innovation calculated to lead to greater accuracy has been introduced in the 1916 census schedule, whereby information is required as to the industry or service with which a person is connected. In this way it can now be more readily and accurately ascertained than heretofore for each industry or service just how many persons are employed therein or in connection therewith. Thus, formerly a person who returned himself merely as “Government employee” would have been classified under the first head,” Professional,” for want of further information. If now, however, he states that he is employed in the Railway Department it will be possible to say definitely that he should be shown as connected not with General Government but with Transport. For obvious reasons, therefore, all comparisons as regards class of occupation between 1916 and other census years should be made cautiously.
As indicated above, the first broad basis of classification is to divide the whole population into the two sections, breadwinners and dependents. The dependent population would consist principally of wives, relatives, and others employed in household duties without remuneration, children, persons supported by charity, and the like.
The following figures exhibit the classification of the population on this basis at successive census-takings:—
| — | 1901. | 1906. | 1911. | 1916. | ||||||||
|---|---|---|---|---|---|---|---|---|---|---|---|---|
| Males. | Females. | Totals. | Males. | Females. | Totals. | Males. | Females. | Totals. | Males. | Females. | Totals. | |
| Breadwinners | 274,559 | 65,671 | 340,230 | 323,841 | 75,244 | 399,085 | 363,856 | 90,261 | 454,117 | 355,049 | 100,255 | 455,304 |
| Dependents or non-breadwinners | 131,164 | 300,985 | 432,149 | 146,947 | 342,313 | 489,260 | 167,823 | 386,228 | 554,051 | 196,600 | 447,415 | 644,015 |
| Not indicated | 269 | 71 | 340 | 220 | 13 | 233 | 231 | 69 | 300 | 126 | 4 | 130 |
| Totals | 405,992 | 366,727 | 772,719 | 471,008 | 417,570 | 888,578 | 531,910 | 476,558 | 1,008,468 | 551,775 | 547,674 | 1,099,449 |
| — | 1901. | 1906. | 1911. | 1916. | ||||||||
|---|---|---|---|---|---|---|---|---|---|---|---|---|
| Males. | Females. | Totals. | Males. | Females. | Totals. | Males. | Females. | Totals. | Males. | Females. | Totals. | |
| Breadwinners | 67.63 | 17.91 | 44.03 | 68.75 | 18.02 | 44.91 | 68.41 | 18.94 | 45.03 | 64.35 | 18.30 | 41.41 |
| Dependents or non-breadwinners | 32.31 | 82.07 | 55.93 | 31.20 | 81.98 | 55.06 | 31.55 | 81.05 | 54.94 | 35.63 | 81.70 | 58.58 |
| Not indicated | 0.06 | 0.02 | 0.04 | 0.05 | .. | 0.03 | 0.04 | 0.01 | 0.03 | 0.02 | .. | 0.01 |
| Totals | 100.00 | 100.00 | 100.00 | 100.00 | 100.00 | 100.00 | 100.00 | 100.00 | 100.00 | 100.00 | 100.00 | 100.00 |
It will be noted that in 1916 the male bread winners were nearly twice as numerous as the male dependents. Roughly, five-sixths of the females were returned as dependents, and among these divorced women and women whose conjugal condition was not specified alone showed a majority of breadwinners, the exact figures being—
| — | Never married. | Married. | Widowed. | Divorced. | Not stated. | Totals. |
|---|---|---|---|---|---|---|
| Breadwinners | 78,553 | 12,645 | 8,318 | 329 | 410 | 100,255 |
| Dependents | 231,522 | 193,251 | 22,105 | 284 | 253 | 147,415 |
| Totals | 310,075 | 205,896 | 30,423 | 613 | 663 | 547,670 |
The percentage of breadwinners amongst widows was also comparatively high.
As previously indicated, breadwinners are in turn divided into seven classes. Following are details showing the numbers and proportions of breadwinners in each class at all census-takings from 1901 onwards:—
Numbers of Breadwinners according to Class of Occupation (Males separately) at Successive Census-takings.
| — | 1901. | 1906. | 1911. | 1916. | ||||||||
|---|---|---|---|---|---|---|---|---|---|---|---|---|
| Males. | Females. | Totals. | Males. | Females. | Totals. | Males. | Females. | Totals. | Males. | Females. | Totals. | |
| I. Professional | 14,549 | 8,960 | 23,509 | 16,578 | 10,520 | 27,098 | 19,796 | 12,920 | 32,716 | 24,797 | 17,304 | 42,101 |
| II. Domestic | 6,542 | 27,852 | 34,394 | 9,593 | 30,210 | 39,803 | 10,891 | 33,376 | 44,267 | 10,119 | 31,796 | 41,915 |
| III. Commercial | 34,409 | 5,528 | 39,937 | 43,339 | 8,629 | 51,968 | 52,994 | 12,768 | 65,762 | 49,490 | 16,714 | 66,204 |
| IV. Transport | 21,265 | 485 | 21,750 | 27,637 | 749 | 28,386 | 35,212 | 1,221 | 36,433 | 40,253 | 2,269 | 42,522 |
| V. Industrial | 84,874 | 16,310 | 101,184 | 105,768 | 18,487 | 124,255 | 113,684 | 19,871 | 133,555 | 97,045 | 19,874 | 116,919 |
| VI. Primary producers | 108,007 | 3,914 | 111,921 | 114,906 | 3,467 | 118,273 | 123,099 | 7,482 | 130,581 | 122,814 | 9,685 | 132,499 |
| VII. Indefinite | 4,913 | 2,622 | 7,535 | 6,020 | 3,182 | 9,202 | 8,180, | 2,623 | 10,803 | 10,531 | 2,613 | 13,144 |
| Total breadwinners. | 274,559 | 65,071 | 340,230 | 323,841 | 75,244 | 399,085 | 363,856 | 90,261 | 454,117 | 355,049 | 100,255 | 455,304 |
Proportions of Breadwinners (Males and Females separately) belonging to each Class of Occupation, at Successive Census-takings.
| — | 1901. | 1906. | 1911. | 1916. | ||||||||
|---|---|---|---|---|---|---|---|---|---|---|---|---|
| Males. | Females. | Totals. | Males. | Females. | Totals. | Males. | Females. | Totals. | Males. | Females. | Totals. | |
| I. Professional | 5.30 | 13.04 | 6.91 | 5.12 | 13.98 | 6.79 | 5.44 | 14.31 | 7.20 | 6.98 | 17.26 | 9.25 |
| II. Domestic | 2.38 | 42.41 | 10.11 | 2.96 | 40.15 | 9.97 | 2.99 | 36.98 | 9.75 | 2.86 | 31.71 | 9.21 |
| III. Commercial | 12.53 | 8.42 | 11.74 | 13.38 | 11.47 | 13.02 | 14.57 | 14.15 | 14.49 | 13.94 | 16.67 | 14.54 |
| IV. Transport. | 7.74 | 0.74 | 0.39 | 8.53 | 0.99 | 7.11 | 9.68 | 1.35 | 8.02 | 11.33 | 2.26 | 9.33 |
| V. Industrial | 30.91 | 24.84 | 29.74 | 32.66 | 24.57 | 31.13 | 31.24 | 22.01 | 29.41 | 27.33 | 19.83 | 25.68 |
| VI. Primary producers | 39.35 | 5.96 | 32.90 | 35.49 | 4.61 | 29.67 | 33.83 | 8.29 | 28.75 | 34.59 | 9.66 | 29.10 |
| VII. Indefinite. | 1.79 | 3.99 | 2.21 | 1.86 | 4.23 | 2.31 | 2.25 | 2.91 | 2.38 | 2.97 | 2.61 | 2.89 |
| Total breadwinners | 100.00 | 100.00 | 100.00 | 100.00 | 100.00 | 100.00 | 100.00 | 100.00 | 100.00 | 100.00 | 100.00 | 100.00 |
Increases will be noted in the proportions of the population engaged in professional, commercial, and transport pursuits, the augmentation of the proportion being particularly marked amongst females. Decreases are noted in connection with industrial pursuits and those connected with the primary extractive industries, although in the latter case there has been an increased proportion of women engaged.
Of the total population of both sexes in 1916 the highest proportion was to be found in the class of dependents or non-breadwinners, being 35.64 and 81.69 per cent, of the total population for males and females respectively. The next highest percentages were engaged in the primary industries—viz., 22.26 and 1.77 of the total population respectively; while still the next in order was transport—7.30 and 0.42 respectively.
The total population of both sexes was in 1916 distributed among the eight classes as follows:—
| Class. | Percentage of Total Male Population in each Class. | Percentage of Total Female Population in each Class. | Percentage of Total Population in each Class. |
|---|---|---|---|
| Professional | 4.50 | 3.16 | 3.83 |
| Domestic | 1.83 | 5.81 | 3.81 |
| Commercial | 8.97 | 3.05 | 6.02 |
| Transport and communication | 7.30 | 0.42 | 3.87 |
| Industrial | 17.59 | 3.62 | 10.64 |
| Primary | 22.26 | 1.77 | 12.05 |
| Indefinite | 1.91 | 0.48 | 1.20 |
| Dependent | 35.64 | 81.69 | 58.58 |
| Totals | 100.00 | 100.00 | 100.00 |
Female dependents (as above mentioned) include a sprinkling of all kinds of conjugal conditions, but male dependents are almost entirely confined to the “never married “class. The exact figures are now quoted.
Males.—Classes of Occupation, by Conjugal Condition, Census, 1916.
| Class. | Never married. | Married. | Widowed. | Divorced. | Not stated. | Totals. |
|---|---|---|---|---|---|---|
| Professional | 9,580 | 14,448 | 613 | 63 | 93 | 24,797 |
| Domestic | 3,781 | 5,597 | 665 | 29 | 47 | 10,119 |
| Commercial | 17,739 | 29,889 | 1,626 | 73 | 163 | 49,490 |
| Transport and communication | 15,398 | 23,579 | 1,088 | 89 | 99 | 40,253 |
| Industrial | 34,603 | 58,569 | 3,372 | 246 | 255 | 97,045 |
| Primary | 56,409 | 61,644 | 4,133 | 193 | 435 | 122,814 |
| Indefinite | 1,597 | 6,209 | 2,668 | 22 | 35 | 10,531 |
| Dependent | 193,171 | 1,993 | 1,287 | 45 | 104 | 196,600 |
| Totals | 332,278 | 201,928 | 15,152 | 760 | 1,231 | 551,649 |
These figures yield the highest nuptial ratios—i.e., the ratio of the married to the unmarried (including never married, widowed, and divorced)—for the commercial and industrial classes, with the indefinites and professionals not far behind. The lowest nuptial ratio amongst the breadwinners is that in the primary extractive industries. These conclusions must not, however, be relied upon as establishing any definite fact concerning the bearing of occupation on marriage, for it should be remembered that the differences revealed are largely due to the different age-constitutions of the portions of the population belonging to each class, and the foregoing table should accordingly be read in the light of that on page 113.
Details of the distribution of occupations amongst the population (according to sex) in each provincial district have been compiled and are quoted on page 111.
A number of interesting features emerge amongst males. The professional class is most highly represented in Wellington Province, due no doubt to the situation there of the seat of Government. Auckland, Hawke's Bay, and Otago all have a high percentage of the total population belonging to this class, while low percentages occur in Nelson and Southland. The high percentage of the female population of Westland belonging to this class is a notable feature.
Transport claims the highest proportion of the male population in Wellington, Westland, Auckland, and Otago, in that order.
As might have been expected, the industrial and commercial classes are most prominent in the four provincial districts containing the four chief centres. The position with regard to the primary extractive industries is, on the other hand, almost exactly the. reverse.
| Occupations of Males—Classes, by Provincial Districts, Census, 1916. | ||||||||||||
|---|---|---|---|---|---|---|---|---|---|---|---|---|
| Class. | Auckland. | Taranaki. | Hawke's Bay. | Wellington. | Marlborough. | Nelson. | West land. | Canterbury. | Otago. | Southland. | Military and Internment Camps. | Totals. |
| SECTION A.—BREADWINNERS. | ||||||||||||
| I. Professional | 4.45 | 3.21 | 4.40 | 5.92 | 3.04 | 2.92 | 3.65 | 3.97 | 4.39 | 2.98 | 9.74 | 1.49 |
| II. Domestic | 1.86 | 1.24 | 2.21 | 2.25 | 1.53 | 1.47 | 2.47 | 1.91 | 1.41 | 1.01 | 2.85 | 1.83 |
| III. Commercial | 9.04 | 6.19 | 8.76 | 9.89 | 6.25 | 5.26 | 6.54 | 9.82 | 9.44 | 7.18 | 15.41 | 8.97 |
| IV. Transport and communication | 7.26 | 4.41 | 6.51 | 9.83 | 4.58 | 5.96 | 9.41 | 6.13 | 7.16 | 5.13 | 12.32 | 7.29 |
| V. Industrial | 17.68 | 14.87 | 16.27 | 19.05 | 14.43 | 11.63 | 9.90 | 18.18 | 17.63 | 15.26 | 29.25 | 17.59 |
| VI. Agricultural, pastoral, mineral, and other primary producers | 21.81 | 31.11 | 24.28 | 16.28 | 32.16 | 34.66 | 17.15 | 21.09 | 21.01 | 28.31 | 30.23 | 22.26 |
| VII. Indefinite | 1.81 | 1.39 | 1.43 | 1.40 | 1.62 | 1.79 | 2.89 | 2.57 | 2.83 | 1.85 | 0.07 | 1.92 |
| SECTION B.—DEPENDENTS: NON— BREADWINNERS. | ||||||||||||
| VIII. Dependents | 36.09 | 37.58 | 36.14 | 35.38 | 36.39 | 36.31 | 37.99 | 36.33 | 36.13 | 37.85 | 0.13 | 35.65 |
| 100.00 | 100.00 | 100.00 | 100.00 | 100.00 | 100.00 | 100.00 | 100.00 | 100.00 | 100.00 | 100.00 | 100.00 | |
| Occupations of Males—Classes, by Provincial Districts, Census, 1916. | ||||||||||||
|---|---|---|---|---|---|---|---|---|---|---|---|---|
| Class. | Auckland. | Taranaki. | Hawke's Bay. | Wellington. | Marlborough. | Nelson. | West land. | Canterbury. | Otago. | Southland. | Military and Internment Camps. | Totals. |
| SECTION A.—BREADWINNERS. | ||||||||||||
| I. Professional | 3.03 | 2.76 | 3.36 | 3.62 | 2.94 | 3.01 | 4.25 | 3.13 | 3.09 | 2.41 | 90.00 | 3.16 |
| II. Domestic | 5.30 | 4.85 | 6.50 | 6.53 | 6.02 | 5.39 | 5.73 | 6.05 | 5.71 | 5.65 | .. | 5.81 |
| III. Commercial | 3.19 | 1.87 | 2.70 | 3.54 | 1.72 | 2.55 | 2.72 | 3.06 | 3.12 | 2.47 | .. | 3.05 |
| IV. Transport and communication | 0.42 | 0.32 | 0.43 | 0.50 | 0.44 | 0.42 | 0.43 | 0.35 | 0.41 | 0.29 | .. | 0.42 |
| V. Industrial | 3.38 | I .36 | 2.21 | 3.74 | 1.42 | 1.70 | 2.04 | 4.69 | 5.66 | 2.29 | .. | 3.62 |
| VI. Agricultural, pastoral, mineral, and other primary producers | 1.86 | 5.50 | 1.63 | 1.27 | 2.24 | 1.43 | 1.27 | 1.18 | 1.27 | 3.18 | .. | 1.77 |
| VII. Indefinite | 0.41 | 0.32 | 0.33 | 0.43 | 0.49 | 0.94 | 0.59 | 0.67 | 0.46 | 0.32 | .. | 0.48 |
| SECTION B.—DEPENDENTS: NON— BREADWINNERS. | ||||||||||||
| VIII. Dependents | 82.41 | 83.02 | 82.78 | 80.37 | 84.73 | 84.56 | 82.97 | 80.87 | 80.28 | 83.39 | 10.00 | 81.69 |
| 100.00 | 100.00 | 100.00 | 100.00 | 100.00 | 100.00 | 100.00 | 100.00 | 100.00 | 100.00 | 100.00 | 100.00 | |
The distribution of classes amongst the metropolitan areas now claims attention. The following tables shed some measure of light on this matter:—
| Occupations of Males.—Proportions, by Metropolitan Areas, Census, 1916. | ||||||
|---|---|---|---|---|---|---|
| Class. | Auckland. | Wellington. | Christ-church. | Dunedin. | Remainder of Dominion. | Totals. |
| SECTION A. BREADWINNERS. | ||||||
| I. Professional | 5.99 | 8.94 | 5.20 | 5.18 | 3.55 | 4.49 |
| II. Domestic | 2.44 | 2.81 | 2.56 | 1.83 | 1.53 | 1.83 |
| III. Commercial | 14.10 | 14.11 | 13.70 | 13.79 | 6.50 | 8.97 |
| IV. Transport and communication | 11.08 | 15.73 | 8.56 | 9.99 | 5.23 | 7.29 |
| V. Industrial | 22.89 | 21.52 | 24.63 | 22.09 | 14.99 | 17.59 |
| VI. Agricultural, pastoral, mineral, and other primary producers | 4.06 | 2.73 | 5.39 | 3.34 | 31.34 | 22.26 |
| VII. Indefinite | 2.56 | 1.52 | 2.97 | 3.09 | 1.62 | 1.92 |
| SECTION B.-DEPENDENTS : NON-BREADWINNERS. | ||||||
| VIII. Dependents | 36.88 | 32.64 | 36.99 | 40.69 | 35.24 | 35.65 |
| 100.00 | 100.00 | 100.00 | 100.00 | 100.00 | 100.00 | |
| Occupations of Females.—Proportions, by Metropolitan Areas, Census, 1916. | ||||||
|---|---|---|---|---|---|---|
| Class. | Auckland. | Wellington. | Christchurch. | Dunedin. | Remainder of Dominion. | Totals. |
| SECTION A.—BREADWINNERS. | ||||||
| I. Professional | 3.50 | 4.50 | 3.76 | 3.53 | 2.76 | 3.16 |
| II. Domestic | 5.37 | 6.83 | 5.19 | 5.63 | 5.86 | 5.81 |
| III. Commercial | 4.61 | 5.06 | 4.12 | 4.23 | 2.13 | 3.05 |
| IV. Transport and communication | 0.41 | 0.64 | 0.41 | 0.46 | 0.38 | 0.42 |
| V. Industrial | 5.78 | 6.04 | 6.48 | 8.11 | 1.89 | 3.62 |
| VI. Agricultural, pastoral, mineral, and other primary producers | 0.12 | 0.11 | 0.17 | 0.09 | 2.79 | 1.77 |
| VII. Indefinite | 0.59 | 0.38 | 0.89 | 0.46 | 0.41 | 0.48 |
| SECTION B.—DEPENDENTS : NON-BREADWINNERS. | ||||||
| VIII. Dependents | 79.62 | 76.44 | 78.98 | 77.49 | 83.78 | 81.69 |
| 100.00 | 100.00 | 100.00 | 100.00 | 100.00 | 100.00 | |
When it is remembered that Wellington not only is the seat of Government but. had also the large military camps in close proximity, the high percentage of males engaged in professional work, which class, of course, embraces persons engaged in government and defence, returned for this metropolitan area in the 1916 census requires no word of explanation. As might be expected, the proportion of the population engaged in such work outside the four metropolitan areas is comparatively quite small. Persons engaged in transport, commerce, and industrial pursuits also form a large proportion of the population in the vicinity of the cities, and but a small one elsewhere; while the primary industries claim practically one-third of the male population outside the metropolitan areas, and only about one-thirtieth within them. With regard to these industries, the four chief centres differ considerably amongst themselves, nor are the reasons underlying the differences easy to fasten upon. Christchurch would appear to be the chief city from the industrial point of view and from that of the primary industries, but the least important from the commercial point of view. Wellington is prominent in connection with transport and communication, partly, no doubt, on account of its importance as a port, and partly from the fact that it is the headquarters of the Railway and Post and Telegraph Departments.
A notable feature is the large proportion of women in Wellington who are breadwinners, and the corresponding low proportion of dependents. The better opportunities afforded by the cities for employment for women also account for the relatively high percentage of women outside the metropolitan areas returned as dependents.
Two tables are now given, one for males and the other for females, showing by age-groups the numbers belonging to each class of occupation.
| Class. | Under 15. | 15 and under 20. | 20 and under 25. | 25 and under 45 | 45 and under 65 | 65 and over. | Not stated. | Total Males. |
|---|---|---|---|---|---|---|---|---|
| SECTION A.—BREADWINNERS. | ||||||||
| I. Professional | 135 | 2,458 | 3,266 | 12,100 | 5,881 | 924 | 33 | 24,797 |
| II. Domestic | 56 | 435 | 592 | 4,622 | 3,379 | 1,025 | 10 | 10,119 |
| III. Commercial | 742 | 6,242 | 4,030 | 23,311 | 11,985 | 3,117 | 63 | 49,490 |
| IV. Transport and communication | 375 | 5,167 | 3,664 | 21,953 | 8,307 | 736 | 51 | 40,253 |
| V. Industrial | 692 | 9,055 | 7,807 | 49,890 | 24,999 | 4,418 | 184 | 97,045 |
| VI. Agricultural, pastoral, mineral, and other primary producers | 1,854 | 14,694 | 10,314 | 54,406 | 33,053 | 8,297 | 196 | 122,814 |
| VII. Indefinite | .. | 2 | 28 | 212 | 1,996 | 8,274 | 19 | 10,531 |
| SECTION B.—DEPENDENTS : NON-BREADWINNERS. | ||||||||
| VIII. Dependents | 181,338 | 6,951 | 695 | 2,536 | 2,204 | 2,744 | 132 | 196,600 |
| Totals specified | 185,192 | 45,004 | 30,396 | 169,030 | 91,804 | 29,535 | 688 | 551,649 |
| Occupations not stated | .. | 8 | 23 | 50 | 38 | 4 | 3 | 126 |
| Grand totals | 185,192 | 45,012 | 30,419 | 169,080 | 91,842 | 29,539 | 691 | 551,775 |
| Class. | Under 15. | 15 and under 20. | 20 and under 25. | 25 and under 45 | 45 and under 65 | 65 and over. | Not stated. | Total Males. |
|---|---|---|---|---|---|---|---|---|
| SECTION A.—BREADWINNERS. | ||||||||
| I. Professional | 24 | 2,292 | 4,098 | 8,006 | 2,601 | 269 | 14 | 17,304 |
| I. Professional | 465 | 6,432 | 7,136 | 12,948 | 4,333 | 424 | 58 | 31;796 |
| II. Domestic | 203 | 4,700 | 4,456 | 5,365 | 1,415 | 564 | 11 | 16,714 |
| III. Commercial | 12 | 574 | 618 | 839 | 214 | 12 | .. | 2,269 |
| V. Industrial. | 464 | 6,520 | 5,144 | 6,463 | 1,178 | 87 | 18 | 19,874 |
| VI. Agricultural, pastoral, mineral, and other primary producers | 410 | 2,429 | 1,519 | 2,872 | 1,947 | 496 | 12 | 9,685 |
| VII. Indefinite | .. | 6 | 23 | 209 | 680 | 1,687 | 8 | 2,613 |
| SECTION B.—DEPENDENTS : NON-BREADWINNERS. | ||||||||
| VIII. Dependents | 177,328 | 23,439 | 23,761 | 137,447 | 64,668 | 20,318 | 454 | 447,415 |
| Totals specified | 178,906 | 46,392 | 46,755 | 174,149 | 77,036 | 23,857 | 575 | 547,670 |
| Occupations not stated | .. | .. | 4 | .. | .. | .. | .. | 4 |
| Grand totals | 178,906 | 46,392 | 46,759 | 174,149 | 77,036 | 23,857 | 575 | 547,674 |
The following two tables, showing for males and females respectively the proportion of the population at each age-group belonging to each class of occupation, are probably more illuminative:—
| Class. | Under 15. | 15 and under 20. | 20 and under 25. | 25 and under 45 | 45 and under 65 | 65. over. | Not stated. | Total Males |
|---|---|---|---|---|---|---|---|---|
| SECTION A.—BREADWINNERS. | ||||||||
| I. Professional | 0.07 | 5.46 | 10.74 | 7.16 | 6.41 | 3.13 | 4.80 | 4.50 |
| 11. Domestic | 0.03 | 0.97 | 1.95 | 2.73 | 3.68 | 3.47 | 1.45 | 1.83 |
| III. Commercial | 0.40 | 13.87 | 13.26 | 13.79 | 13.06 | 10.55 | 9.16 | 8.97 |
| IV. Transport and communication | 0.20 | 11.48 | 12.05 | 12.99 | 9.05 | 2.49 | 7.41 | 7.30 |
| V. Industrial | 0.38 | 20.12 | 25.69 | 29.51 | 27.23 | 14.96 | 26.74 | 17.59 |
| VI. Agricultural, pastoral, mineral, and other primary producers | 1.00 | 32.65 | 33.93 | 32.19 | 36.00 | 28.10 | 28.49 | 22.26 |
| VII. Indefinite | .. | .. | 0.09 | 0.13 | 2.17 | 28.01 | 2.76 | 1.91 |
| SECTION B.-DEPENDENTS : ON-BREADWINNERS. | ||||||||
| VIII. Dependents | 97.92 | 15.45 | 2.29 | 1.50 | 2.40 | 9.29 | 19.19 | 35.64 |
| All classes | 100.00 | 100.00 | 100.00 | 100.00 | 100.00 | 100.00 | 100.00 | 100.00 |
| Class. | Under 15. | 15 and under 20. | 20 and under 25. | 25 and under 45 | 45 and under 65 | 65. over. | Not stated. | Total Males |
|---|---|---|---|---|---|---|---|---|
| SECTION A.—BREADWINNERS. | ||||||||
| I. Professional | 0.02 | 4.94 | 8.77 | 4.60 | 3.38 | 1.13 | 2.43 | 3.16 |
| 11. Domestic | 0.26 | 13.87 | 15.27 | 7.44 | 5.62 | 1.78 | 10.09 | 5.81 |
| III. Commercial | 0.11 | 10.13 | 9.53 | 3.08 | 1.84 | 2.36 | 1.92 | 3.05 |
| IV. Transport and communication | .. | 1.24 | 1.32 | 0.48 | 0.28 | 0.05 | .. | 0.42 |
| V. Industrial | 0.26 | 14.06 | 11.00 | 3.71 | 1.52 | 0.36 | 3.13 | 3.62 |
| VI. Agricultural, pastoral, mineral, and other primary producers | 0.23 | 5.24 | 3.25 | 1.65 | 2.53 | 2.08 | 2.09 | 1.77 |
| VII. Indefinite | .. | .. | 0.04 | 0.12 | 0.88 | 7.07 | 1.39 | 0.48 |
| SECTION B.-DEPENDENTS : ON-BREADWINNERS. | ||||||||
| VIII. Dependents | 99.12 | 50.52 | 50.82 | 78.92 | 83.95 | 85.17 | 78.95 | 81.69 |
| All classes | 100.00 | 100.00 | 100.00 | 100.00 | 100.00 | 100.00 | 100.00 | 100.00 |
Of great social importance are the figures dealing with the employment of young persons. The census shows that of persons under 15 years of age 97.16 per cent, of the males and 98.47 per cent, of the females were dependent on natural guardians, and 0.76 per cent, of the males and 0.65 per cent, of the females on the State.
A higher proportion of children under 15 were employed in the primary industries than in any other; 1 per cent, of the males and 0.23 per cent, of the females under 15 were so employed. The next highest percentage is for males (0.20 per cent.) engaged in transport and communication, and for females (0.26 per cent.) engaged in the supply of board, lodging, and other personal services for remuneration.
An interesting feature of this table is the relatively small change among males through important ranges of age exhibited by several of the classes, especially commercial, industrial, and primary.
The figures for those 65 and over suggest that either retirement or death occurs earliest in the professional, transport, and industrial classes. As age advances there is an increase in the proportion of males employed in domestic duties, while the proportion of males classed as indefinite, no doubt largely made up of the retired, shows a similar tendency. For females the table shows clearly the effects of the marriage-market. Dependents are at a minimum from 15.20, and thereafter increase regularly, the explanation being that on marriage a woman who while single has been engaged in some description or other of gainful occupation is for census purposes automatically removed from one of the breadwinning classes into the dependent class.
The maxima for each class are as follows:—
| Male. | Female. | |
|---|---|---|
| Professional | 20–21 | 20–24 |
| Domestic | 45–64 | 20–24 |
| Commercial | 25–44 | 15–19 |
| Transport and communication | 25–44 | 20–24 |
| Industrial | 25–44 | 15–19 |
| Primary | 45–64 | 15–19 |
| Indefinite | 65 and over | 65 and over |
| Dependent | Under 15 | Under 15 |
The cautious reader will not interpret the above table as establishing a proposition to the effect that females in the commercial, industrial, and primary industries marry earlier than those in the others. The phenomenon may be and probably is partly accounted for by the fact that of the others the professional class at least requires a more lengthy period of training; moreover, there are some forms of occupation connected with transport and communication into which entry for women is barred until a fairly high age is reached, whereas a minimum age qualification is not to the same extent required in the classes showing earlier maxima.
The occupations, as above indicated, are divided into eight general classes, which are subdivided into twenty-seven orders, with one additional order covering persons whose occupations are not indicated. The orders are again subdivided into 112 sub-orders, which are still further subdivided into 627 groups. These latter may be taken as representing the specific occupations of the people.
A table is given showing the percentages of the total population, males and females being separated, engaged in each order of occupation at the last four census-takings.
| Class. | Order | Definition of order. | Years 1901. | Years 1906. | Years 1911. | Years 1916. | ||||
|---|---|---|---|---|---|---|---|---|---|---|
| Male. | Female. | Male. | Female. | Male. | Female. | Male. | Female. | |||
| I | 1 | Persons engaged in government;, defence, law, and protection (not otherwise classed) | 1.19 | 0.04 | 1.04 | 0.06 | 1.15 | 0.10 | 1.90 | 0.33 |
| 2 | Persons ministering to religion, charity, health, education, art, and science | 2.40 | 2.41 | 2.49 | 2.46 | 2.57 | 2.61 | 2.59 | 2.83 | |
| II | 3 | Persons engaged in the supply of board and lodging and in rendering personal service for which remuneration is usually paid | 1.61 | 7.60 | 2.04 | 7.24 | 2.05 | 7.00 | 1.84 | 5.80 |
| III | 4 | Persons who perform offices in connection with the exchange, valuation, insurance, lease, loan, or custody of money, houses, land, or property rights | 1.24 | 0.16 | 1.35 | 0.21 | 2.63 | 0.26 | 1.52 | 0.37 |
| 5 | Persons dealing in art and mechanic productions in which matters of various kinds are employed in combination | 0.48 | 0.01) | 0.58 | 0.12 | 0.70 | 0.19 | 0.87 | 0.28 | |
| 6 | Persons engaged in the sale, hire, or exchange of textile fabrics and dress and of fibrous materials | 1.03 | 0.38 | l.19 | 0.58 | 1.26 | 0.69 | 1.24 | 0.95 | |
| 7 | Persons engaged in dealing in food, drink, narcotics, and stimulants | 2.10 | 0.24 | 2.31 | 0.28 | 2.34 | 0.34 | 2.07 | 0.52 | |
| 8 | Persons engaged in dealing in and treating animals, and dealing in animal and vegetable substances, excluding dealers in food | 0.64 | 0.01 | 0.60 | 0.02 | 0.77 | 0.03 | 0.84 | 0.OC | |
| 9 | Persons engaged in dealing in minerals or other substances mainly used for fuel and light | 0.18 | .. | 0.22 | 0.01 | 0.21 | 0.01 | 0.23 | 0.02 | |
| 10 | Persons engaged in dealing in minerals other than for fuel and light | 0.37 | 0.01 | 0.39 | 0.02 | 0.45 | 0.03 | 0.47 | 0.07 | |
| 11 | Persons engaged as general dealers or in mercantile pursuits not elsewhere classed | 2.21 | 0.61 | 2.40 | 0.85 | 2.44 | 1.13 | 1.68 | 0.79 | |
| 12 | Persons engaged as speculators on chanceevents | 0.01 | .. | 0.01 | .. | .. | .. | .. | .. | |
| 13 | Persons engaged in storage | 0.21 | .. | 0.14 | .. | 0.17 | .. | 0.03 | .. | |
| IV | 14 | Persons engaged in the transport of passengers or goods or in effecting communications | 5.24 | 0.13 | 5.87 | 0.18 | 6.62 | 0.26 | 7.30 | 0.42 |
| V | 15 | Persons engaged in connection with the manufacture of, or in other processes relating to, art and mechanic productions in which materials of various kinds are employed in combination | 4.56 | 0.26 | 4.82 | 0.31 | 0.32 | 4.41 | 0.33 | |
| 16 | Persons engaged in connection with the manufacture of, or in repairs, cleansing, or in other processes relating to, textile fabrics, dress, and fibrous materials | 2.01 | 3.88 | 2.22 | 3.76 | 1.74 | 3.54 | 1.73 | 2.90 | |
| 17 | Persons engaged in connection with the manufacture of, or in other processes relating to, food, drink, narcotics, and stimulants | 1.80 | 0.10 | 1.84 | 0.11 | 2.05 | 0.12 | 2.56 | 0.23 | |
| 18 | Persons (not otherwise classed) engaged in connection with manufactures or other processes connected with animal and vegetable substances | 0.60 | .. | 0.45 | 0.01 | 0.46 | 0.01 | 0.38 | 0.02 | |
| 19 | Persons engaged in the alteration, modification, or manufacture, or in other processes relating to metals or mineral matters | 2.04 | .. | 1.98 | 0.01 | 1.82 | 0.01 | 1.47 | 0.04 | |
| 20 | Persons engaged in the production of fuel, light, and other forms of energy | 0.14 | .. | 0.25 | .. | 0.33 | 0.01 | 0.48 | 0.02 | |
| 21 | Persons engaged in the construction or repair of buildings, roads, railways, canals, docks, earthworks, &c, or in operations the nature of which is undefined | 5.64 | 6.73 | 0.01 | 6.94 | 0.01 | 4.93 | 0.02 | ||
| 22 | Persons engaged in the disposal of the dead or of refuse | 0.05 | .. | 0.05 | .. | 0.06 | .. | 0.07 | .. | |
| 23 | Industrial and other active workers imperfectly defined | 4.0f | 0.20 | 4.13 | 0.21 | 3.15 | 0.15 | 1.56 | 0.0G | |
| VI | 24 | Persons directly engaged in the cultivation of land, in breeding and rearing animals, or in obtaining raw products from natural sources | 26.62 | 1.07 | 24.41 | 0.83 | 23.15 | 1.57 | 22.26 | 1.77 |
| VII | 25 | Persons whose occupations are undefined or unknown, embracing those who derive incomes from sources which cannot be directly related to any other class. | 1.21 | 0.72 | 1.28 | 0.76 | 1.54 | 0.55 | 1.92 | 0.48 |
| VIII | 26 | Persons dependent upon natural guardians | 31.53 | 81.47 | 30.01 | 81.1C | 30.42 | 80.07 | 34.23 | 80.75 |
| 27 | Persons dependent upon the State or upon public or private support | |||||||||
| Totals specified | 100.00 | 100.00 | 100.00 | 100.00 | 100.00 | 100.00 | 100.00 | 100.00 | ||
More detailed information relating to the 1916 census is now supplied, together with a general comparison extending hack as far as the census of 1901.
Table of Contents
(1.90 per cent, of total male population; 0.33 per cent, of total female population; 1.11 per cent, of total population, both sexes.)
| Occupations, in Sub-orders. | Males. | Females. | Totals, both Sexes. | ||||||||||
|---|---|---|---|---|---|---|---|---|---|---|---|---|---|
| Under 20. | 20–44. | 45–64. | 65 and over. | Not stated. | Totals. | Under 20. | 20–44. | 45–64. | 65 and over. | Not stated. | Totals. | ||
| 1. Officers of General Government (not Otherwise classed) | 474 | 1,147 | 565 | 53 | .. | 2,239 | 72 | 325 | 19 | .. | .. | 416 | 2,655 |
| 2. Officers of local government | 89 | 459 | 361 | 86 | .. | 995 | 36 | 89 | 2 | .. | .. | 127 | 1,122 |
| 3. Persons ministering to defence | 317 | 3,401 | 311 | 6 | 10 | 4,045 | 11 | 87 | 1 | .. | .. | 99 | 4,144 |
| 4. Persons ministering to law and order | 338 | 2,011 | 770 | 98 | 2 | 3,219 | 428 | 708 | 26 | .. | 2 | 1,164 | 4,383 |
| Totals, Order 1, 1916 | 1,218 | 7,018 | 2,007 | 243 | 12 | 10,498 | 547 | 1,209 | o48 | .. | 2 | 1,806 | 12,304 |
| Totals, Order 1, 1911 | 714 | 3,743 | 1,459 | 204 | 3 | 6,123 | 101 | 305 | 21 | 2 | .. | 489 | 6,612 |
| Totals, Order 1, 1906 | 493 | 2,922 | 1,2.10 | 221 | 3 | 4,879 | 48 | 191 | 11 | 1 | .. | 251 | 5,130 |
| Totals, Order 1, 1901 | 414 | 3,058 | 1,140 | 197 | 4 | 4,813 | 32 | 78 | 16 | 3 | .. | 129 | 4,942 |
The first sub-order consists of persons occupied in connection with government whom it was not necessary or desirable to allot to other classes in carrying out the principle of classification. Hence the total number does not by any means represent the full number of persons employed by the Government, but is merely the residuum left after the completion of other groups—e.g., that of transport and communication, to which are credited employees in the Government Railways and the Post Office. The same remarks are applicable but to a lesser extent to the oases of the officials of local governing bodies.
The question may be raised, Why has the full number of persons employed by the Government not been shown? The answer to this is, of course, that the classification is not designed to show any such result, nor is the census the proper source from which to look for such information. In describing occupations householders constantly omit the word “Government,” and accordingly no census figures for Government employees could compare in point of accuracy with returns compiled from departmental sources.
Since last census the proportion of the female population belonging to this group has more than trebled itself.
| Occupations, in Sub-orders. | Males. | Females. | Totals, both Sexes. | ||||||||||
|---|---|---|---|---|---|---|---|---|---|---|---|---|---|
| Under 20. | 20–44. | 45–64. | 65 and over. | Not stated. | Totals. | Under 20. | 20–44. | 45–64. | 65 and over. | Not stated. | Totals. | ||
| 1. Persons ministering to religion | 17 | 954 | 624 | 159 | 2 | 1,756 | 14 | 356 296 | 114 | 9 | .. | 493 | 2,249 |
| 2. Persons ministering to charity (exclusive of hospitals) | 5 | 31 | 39 | 10 | .. | 85 | 28 | 296 | 116 | 9 | .. | 449 | 534 |
| 3. Persons ministering to health | 386 | 2,199 | 840 | 123 | 10 | 3,558 | 314 | 3,845 | 1,174 | 170 | 8 | 5,511 | 9,069 |
| 4. Persons connected with literature.. | 28 | 301 | 219 | 61 | 1 | 610 | 8 | 25 | 13 | 5 | .. | 51 | 661 |
| 5. Persons connected with science | 4 | 40 | 29 | 4 | .. | 77 | .. | 1 | .. | .. | .. | 1 | 78 |
| 6. Persons engaged in civil and mechanical engineering and surveying | 313 | 1,274 | 517 | 130 | 2 | 2,236 | 31 | 40 | 1 | .. | .. | 72 | 2,308 |
| 7. Persons connected with education | 281 | 1,744 | 765 | 62 | 2 | 2,854 | 1,078 | 4,750 | 837 | 40 | 4 | 6,709 | 9,563 |
| 8. Persons connected with fine arts. | 36 | 308 | 221 | 41 | .. | 606 | 95 | 316 | 48 | 6 | .. | 465 | 1,071 |
| 9. Persons connected with music | 11 | 215 | 154 | 30 | .. | 410 | 126 | 1,026 | 236 | 30 | .. | 1,418 | 1,828 |
| 10. Perseus connected with amusements | 294 | 1,282 | 466 | 61 | 4 | 2,107 | 75 | 240 | 14 | .. | .. | 329 | 2,436 |
| Totals, Order 2, 1916 | 1,375 | 8,348 | 3,874 | 681 | 21 | 14,299 | 1,769 | 10,895 | 2,553 | 269 | 12 | 15,498 | 29,779 |
| Totals, Order 2, 1911 | 1,215 | 8,714 | 3,064 | 607 | 73 | 13,673 | 1,392 | 8,934 | 1,830 | 256 | 19 | 12,431 | 26,104 |
| Totals, Order 2, 1906 | 1,016 | 7,420 | 2,645 | 604 | 14 | 11,699 | 1,058 | 7,372 | 1,603 | 223 | 13 | 10,269 | 21,968 |
| Totals, Order 2, 1901 | 952 | 6,015 | 2,254 | 499 | 16 | 9,736 | 1,120 | 6,200 | 1,286 | 218 | 7 | 8,831 | 18,567 |
Some of the more important specific occupations comprised in this order are clergymen, medical practitioners and students, dentists, chemists, hospital attendants, veterinary surgeons, midwives, journalists, architects, engineers, surveyors, teachers, photographers, musicians, theatre employees, jockeys, billiard-saloon proprietors and employees, and a host of others. There has been a steady and regular increase in the proportion of the population belonging to this order, especially among females.
Table of Contents
(1.84 per cent, of total male population; 5.80 per cent, of total female population; 3.81 per cent, of total population, both sexes.)
| Occupations, in Sub-orders. | Males. | Females. | Totals, both Sexes. | ||||||||||
|---|---|---|---|---|---|---|---|---|---|---|---|---|---|
| Under 20. | 20–44. | 45–64. | 65 and over. | Not stated. | Totals. | Under 20. | 20–44. | 45–64. | 65 and over. | Not stated. | Totals. | ||
| 1. Persons engaged in the supply of board and lodging | 143 | 2,964 | 1,636 | 268 | 4 | 5,015 | 1,387 | 6,088 | 1,421 | 153 | 22 | 9,071 | 14,086 |
| 2. Persons engaged in domestic service and attendance | 348 | 2,250 | 1,743 | 757 | 6 | 5,104 | 5,510 | 13,996 | 2,912 | 271 | 36 | 22,725 | 27,829 |
| Totals, Order 3, 1916 | 491 | 5,214 | 3,379 | 1,025 | 10 | 10,119 | 6,897 | 20,084 | 4,333 | 424 | 58 | 31,796 | 41,915 |
| Totals, Older 3, 1911. | 846 | 6,597 | 2,645 | 775 | 28 | 10,891 | 7,260 | 21,579 | 4,016 | 460 | 6l | 33,376 | 44,267 |
| Totals, Order 3, 1906 | 1,015 | 5,590 | 2,305 | 666 | 17 | 9,593 | 8,272 | 18,722 | 2,801 | 383 | 32 | 30,210 | 39,803 |
| Totals, Order 3, 1901 | 843 | 3,686 | 1,629 | 377 | 7 | 6,542 | 8,966 | 16,372 | 2,183 | 303 | 28 | 27,852 | 34,394 |
The proportion of the total population returned as belonging to this class has fallen considerably since 1911. In that year 2.05 per cent, of the male and 7.00 per cent, of the female population were so engaged, while in 1916 the figures were 1.84 and 5.80 per cent, respectively. The figures for 1901 and 1906 were 1.61 and 7.60 and 2.04 and 7.24 respectively.
The total number of persons engaged in or connected with the sale or manufacture of wine, beer, spirits, cordials, &c, is estimated to have been as under:—
| Census Year. | Male. | Female. | Total |
|---|---|---|---|
| 1901 | 4,551 | 3,820 | 8,371 |
| 1906 | 4,917 | 4,192 | 9,109 |
| 1911 | 6,025 | 4,591 | 30,616 |
| 1916 | 5,784 | 3,927 | 9,711 |
The 1916 figures include 1,134 male and 628 female hotelkeepers, 2,262 male and 3,156 female hotel servants, 618 cellarmen and carters, &c
Table of Contents
(1.52 per cent, of total male population; 0.37 per cent, of total female population; 0.94 per cent, of total population, both sexes.)
| Occupations, in Sub-orders. | Males. | Females. | Totals, both Sexes. | ||||||||||
|---|---|---|---|---|---|---|---|---|---|---|---|---|---|
| Under 20. | 20–44. | 45–64. | 65 and over. | Not stated. | Totals. | Under 20. | 20–44. | 45–64. | 65 and over. | Not stated. | Totals. | ||
| 1. Persons engaged in banking and finance | 637 | 1,316 | 805 | 525 | 6 | 3,289 | 70 | 387 | 99 | 128 | .. | 684 | 3,973 |
| 2. Persons engaged in insurance and valuation | 381 | 1,395 | 621 | 65 | 3 | 2,465 | 185 | 293 | 9 | 1 | .. | 488 | 2,953 |
| 3. Persons dealing in land and household property | 42 | 620 | 958 | 1,002 | 1 | 2,623 | 138 | 187 | 221 | 281 | .. | 827 | 3,450 |
| 4. Persona dealing in property rights (not otherwise classed) | .. | 8 | 3 | 5 | .. | 16 | 3 | 3 | .. | .. | .. | 6 | 22 |
| Totals, Order 4, 1916 | 1,060 | 3,339 | 2,387 | 1,597 | 10 | 8,393 | 396 | 870 | 329 | 410 | .. | 2,005 | 10,398 |
| Totals, Order 4, 1911 | 859 | 3,863 | 2,205 | 1,747 | 13 | 8,687 | 113 | 326 | 415 | 397 | 2 | 1,253 | 9,940 |
| Totals, Order 4, 1906 | 703 | 3,036 | 1,590 | 1,037 | 4 | 6,370 | 48 | 168 | 316 | 329 | 2 | 863 | 7,233 |
| Totals, Order 4, 1901 | 608 | 2,437 | 1,313 | 684 | 4 | 5,046 | 15 | 134 | 259 | 177 | .. | 585 | 5,631 |
The principal specific occupations comprised under this head are bank and insurance officials, financiers, auctioneers, house and land agents and owners, &c.
(0.87 per cent. of total male population; 0.28 per cent. of total female population; 0.57 per cent. of total population, both sexes.)
| Occupations, in Sub-orders. | Males. | Females. | Totals, both Sexes. | ||||||||||
|---|---|---|---|---|---|---|---|---|---|---|---|---|---|
| Under 20. | 20–44. | 45–64. | 65 and over. | Not stated. | Totals. | Under 20. | 20–44. | 45–64. | 65 and over. | Not stated. | Totals. | ||
| 1. Persons dealing in books, publications, and advertising | 170 | 431 | 292 | 72 | .. | 965 | 99 | 199 | 34 | 2 | .. | 334 | 1,299 |
| 2. Persons dealing in musical instruments | 32 | 140 | 66 | 7 | .. | 245 | 31 | 85 | 2 | .. | .. | 118 | 363 |
| 3. Persons dealing in prints, pictures, and art materials | 13 | 79 | 32 | 1 | .. | 125 | 11 | 26 | 3 | .. | 1 | 41 | 166 |
| 4. Persons dealing in ornaments, minor art products, and small wares | 21 | 149 | 73 | 9 | .. | 252 | 81 | 187 | 39 | 5 | .. | 312 | 564 |
| 5. Persons dealing in equipment for sports and games | 2 | 12 | 1 | l | .. | 16 | .. | 1 | .. | .. | .. | 1 | 17 |
| 6. Persons dealing in designs, medals, type, and dies | .. | 1 | 1 | 1 | .. | 3 | .. | 1 | .. | .. | .. | 1 | 4 |
| 7. Persons dealing in watches, clocks, jewellery, plated ware, and scientific instruments | 29 | 195 | 79 | 11 | .. | 314 | 21 | 41 | 3 | .. | .. | 65 | 379 |
| 8. Persons dealing in surgical instruments and appliances | 3 | 21 | 1 | .. | .. | 25 | .. | 4 | .. | .. | .. | 4 | 29 |
| 9. Persons dealing in arms and explosives | .. | 6 | 3 | 1 | .. | 10 | 3 | 1 | .. | .. | .. | 4 | 14 |
| 10. Persons dealing in machines, tools, and implements | 30 | 430 | 174 | 13 | .. | 647 | 32 | 45 | 2 | .. | .. | 79 | 726 |
| 11. Persons dealing in carriages and vehicles | 94 | 416 | 105 | 5 | .. | 620 | 28 | 57 | 1 | .. | .. | 86 | 706 |
| 12. Persons dealing in harness, saddlery, and leatherware | 15 | 107 | 47 | 2 | .. | 171 | 3 | 5 | 1 | .. | .. | 9 | 180 |
| 13. Persons dealing in ships, boats, and marine stores | 7 | 72 | 6 | 9 | .. | 94 | 3 | 2 | .. | .. | .. | 5 | 99 |
| 14. Persons dealing in building-materials and house-fittings | 27 | 204 | 61 | 7 | .. | 299 | 11 | 24 | 2 | 1 | .. | 38 | 337 |
| 15. Persons dealing in furniture | 47 | 244 | 101 | 16 | .. | 408 | 30 | 73 | 8 | .. | .. | 111 | 519 |
| 16. Persons dealing in chemicals and by-products | 23 | 13l | 51 | 2 | 207 | 15 | 32 | 3 | 2 | .. | .. | 50 | 257 |
| 17. Persons dealing in paper and paper-makers' materials | 50 | 209 | 95 | 15 | .. | 375 | 58 | 164 | 20 | 6 | 2 | 250 | 625 |
| Totals, Order 5, 1910 | 509 | 2,847 | 1,188 | 172 | .. | 4,776 | 426 | 947 | 118 | 14 | 3 | 1,508 | 6,284 |
| Totals, 0rder5, 1911 | 559 | 2,360 | 685 | 115 | 106 | 9 | 3,728 | 249 | 574 | 77 | 7 | 908 | 4,636 |
| Totals, Order 5, 1900 | 490 | 1,656 | 470 | 106 | 2 | 2,730 | 127 | 289 | 62 | 7 | .. | 485 | 3,215 |
| Totals, Order 5, 1901 | 424 | 1,077 | 361 | 93 | 1 | 1,956 | 85 | 200 | 43 | 6 | .. | 334 | 2,290 |
Table of Contents
These, it must be remembered, are dealers only, not makers. The exclusion of the latter, and compliance with the rule of grouping persons stated to be both manufacturers and dealers as makers under Class V, leaves some fairly small numbers (such as watch and clock dealers, 379) in Sub-order 7, while the watch and clock makers number 438 in Class V.
(1.24 per cent, of total male population; 0.95 per cent, of total female population; 1.10 per cent, of total population, both sexes.)
| Occupations, in Sub-orders. | Males. | Females. | Totals, both Sexes. | ||||||||||
|---|---|---|---|---|---|---|---|---|---|---|---|---|---|
| Under 20. | 20–44. | 45–64. | 65 and over. | Not stated. | Totals. | Under 20. | 20–44. | 45–64. | 65 and over. | Not stated. | Totals. | ||
| 1. Persons engaged in the sale, hire, or exchange of textile fabrics | 1,261 | 3,049 | 1,077 | 133 | 6 | 5,526 | 1,571 | 2,829 | 199 | 20 | 1 | 4,620 | 10,146 |
| 2. Persons engaged in the sale, hire, or exchange of dress | 160 | 805 | 330 | 38 | 3 | 1,330 | 160 | 383 | 47 | 6 | 1 | 597 | 1,933 |
| 3. Persons engaged in the sale, hire, or exchange of fibrous materials | 1 | 4 | 2 | 2 | .. | 9 | .. | .. | .. | .. | .. | .. | 9 |
| Totals, Order 6, 1916 | 1,422 | 3,858 | 1,409 | 173 | 9 | 6,871 | 1,731 | 3,212 | 246 | 20 | 2 | 5,217 | 12,088 |
| Totals, Order 6, 1911 | 1,492 | 4,075 | 967 | 146 | 8 | 6,688 | 1,003 | 2,066 | 158 | 16 | 4 | 3,307 | 9,095 |
| Totals, Order 6, 1906 | 1,411 | 3,335 | 751 | 106 | 2 | 5,605 | 737 | 1,448 | 132 | 11 | .. | 2,328 | 7,933 |
| Totals, Order 6, 1901 | 1,049 | 2,435 | 627 | 61 | 3 | 4,175 | 424 | 863 | 82 | .. | .. | 1,376 | 5,551 |
Some of the more important specific occupations comprised under this head are drapers, wholesale soft-goods merchants, and boot and shoe dealers. This class appears to have increased markedly during the period under review, but the increase is probably mainly fictitious, resulting from the more specific nature of the information required under the heading “Occupation” in the 1916 census, whereby persons who for want of more definite information were formerly classified as general dealers,” have now been definitely allocated to one or other of the classes of dealers in a specific kind of commodity.
(2.07 per cent, of total male population; 0.52 per cent, of total female population; 1.30 per cent, of total population, both sexes.)
| Occupations, in Sub-orders. | Males. | Females. | Totals, both Sexes. | ||||||||||
|---|---|---|---|---|---|---|---|---|---|---|---|---|---|
| Under 20. | 20–44. | 45–64. | 65 and over. | Not stated. | Totals. | Under 20. | 20–44. | 45–64. | 65 and over. | Not stated. | Totals. | ||
| 1. Persons engaged in dealing in animal food | 624 | 3,102 | 1,052 | 153 6 | 4,937 | 119 | 299 | 49 | 7 | .. | 474 | 5,411 | |
| 2. Persons engaged in dealing in vegetable food | 193 | 1,427 | 689 | 110 | 7 | 2,426 | 337 | 977 | 226 | 34 | 2 | 1,576 | 4,002 |
| 3. Persons engaged in dealing in groceries, drinks, narcotics, and stimulants | 750 | 2,460 | 779 | 109 | 6 | 4,104 | 236 | 442 | 102 | 19 | .. | 799 | 4,903 |
| Totals. Order 7, 1910 | 1,567 | 6,989 | 2,520 | 372 | 19 | 11,467 | 692 | 1,718 | 377 | 60 | 2 | 2,849 | 14,316 |
| Totals, Order 7, 19ll | 1,915 | 8,228 | 3,931 | 334 | 21 | 12,429 | 404 | 932 | 224 | 35 | 4 | 1,599 | 14,028 |
| Totals, Order 7, 1906 | 1,904 | 6,935 | 1,728 | 315 | 11 | 10,893 | 238 | 694 | 210 | 32 | .. | 1,174 | 12,067 |
| Totals, Order 7, 1901 | 1,817 | 4,951 | 1,491 | 256 | 6 | 8,521 | 151 | 473 | 224 | 30 | .. | 878 | 9,399 |
The principal specific occupations comprised in this order are milk-vendors, butchers, fishmongers, flour and grain merchants, confectioners, pastry-dealers, greengrocers and. fruiterers, and grocers. The number of females belonging to this order appears to have increased considerably since 1901, but much of this increase probably is, as in the case of Order 6, of a fictitious character.
(0.84 per cent, of total male population; 0.06 per cent, of total female population; 0.45 per cent, of total population, both sexes.)
| Occupations, in Sub-orders. | Males. | Females. | Totals, both Sexes. | ||||||||||
|---|---|---|---|---|---|---|---|---|---|---|---|---|---|
| Under 20. | 20–44. | 45–64. | 65 and over. | Not stated. | Totals. | Under 20. | 20–44. | 45–64. | 65 and over. | Not stated. | Totals. | ||
| 1. Persons dealing in and treating living animals | 152 | 1,135 | 414 | 55 | 1 | 1,757 | 10 | 24 | .. | .. | .. | 34 | 1,791 |
| 2. Persons dealing in manures and animal waste products | .. | 13 | 4 | .. | .. | 17 | .. | .. | .. | .. | .. | .. | 17 |
| 3. Persons dealing in leather, raw materials, and manufactures | 11 | 93 | 40 | 13 | .. | 157 | 8 | 10 | .. | .. | .. | 34 | 1,791 |
| 4. Persons dealing in wool and other animal matters | 46 | 327 | 150 | 18 | .. | 541 | 8 | 19 | 1 | .. | .. | 28 | 569 |
| 5. Persons dealing in seeds, plants, and fodder | 113 | 525 | 179 | 22 | 2 | 841 | 57 | 131 | 4 | 2 | .. | 194 | 1,035 |
| 6. Persons dealing in other vegetable matters (not included elsewhere) | 97 | 778 | 391 | 54 | 2 | 1,322 | 26 | 45 | 1 | .. | .. | 72 | 1,394 |
| Totals, Order 8, 1916 | 419 | 2,871 | 1,178 | 162 | 5 | 4,035 | 109 | 229 | 6 | 2 | .. | 346 | 4,981 |
| Totals, Orders, 1911 | 300 | 2,842 | 795 | 135 | 4 | 4,076 | 32 | 84 | 6 | 2 | .. | 124 | 4,200 |
| Totals, Order 8, 1906 | 242 | 1,928 | 571 | 105 | 1 | 2,847 | 29 | 62 | 7 | .. | .. | 98 | 2,945 |
| Totals, Order 8, 1901 | 354 | 1,665 | 497 | 70 | 6 | 2,592 | 15 | 34 | 6 | .. | .. | 55 | 2,647 |
The principal specific occupations comprised in this order are live-stock dealers, stock and£station agents, horse-breakers and animal-trainers, wool brokers and merchants, seed and produce merchants, and timber-merchants. The number of persons employed, especially females, has increased notably since 1901. Here again some of the increase is probably of a fictitious nature.
(0.23 per cent, of total male population; 0.02 per cent, of total female population; 0.13 per cent, of total population, both sexes.)
| Occupations, in Sub-orders. | Males. | Females. | Totals, both Sexes. | ||||||||||
|---|---|---|---|---|---|---|---|---|---|---|---|---|---|
| Under 20. | 20–44. | 45–64. | 65 and over. | Not stated. | Totals. | Under 20. | 20–44. | 45–64. | 65 and over. | Not stated. | Totals. | ||
| 1. Persons engaged in dealing in coal, &c, for fuel and light | 71 | 817 | 349 | 51 | 2 | 1,290 | 37 | 63 | 5 | 2 | .. | 107 | 1,397 |
| Totals, Order 9, 1916 | 71 | 817 | 349 | 51 | 2 | 1,290 | 37 | 63 | 5 | 2 | .. | 107 | 1,397 |
| Totals, Order 9, 1911 | 74 | 768 | 235 | 48 | 2 | 1,127 | 23 | 19 | 3 | .. | .. | 45 | 1,172 |
| Totals, Order 9, 1906 | 64 | 714 | 209 | 43 | 2 | 1,032 | 9 | 13 | 7 | 1 | .. | 30 | 1,062 |
| Totals, Order 9, 1901 | 81 | 443 | 195 | 28 | 1 | 748 | 3 | 7 | l | .. | .. | 11 | 759 |
Of 1,397 persons belonging to this order in 1916, 1,281 were coal-merchants or employees thereof.
(047 per cent, of total male population; 0.07 per cent, of total female population; 0.27 per cent, of total population, both sexes.)
| Occupations, in Sub-orders. | Males. | Females. | Totals, both Sexes. | ||||||||||
|---|---|---|---|---|---|---|---|---|---|---|---|---|---|
| Under 20. | 20–44. | 45–64. | 65 and over. | Not stated. | Totals. | Under 20. | 20–44. | 45–64. | 65 and over. | Not stated. | Totals. | ||
| 1. Persons dealing in stone, clay, earthenware, glass | 15 | 92 | 50 | 3 | .. | 160 | 21 | 58 | 5 | 1 | .. | 85 | 245 |
| 2. Persons dealing in gold, silver, and precious stones | 1 | 3 | .. | .. | .. | 4 | .. | .. | .. | .. | .. | .. | 4 |
| 3. Persons dealing in metals other than gold and silver | 474 | 1,452 | 464 | 57 | 1 | 2,448 | 91 | 177 | 2 | .. | .. | 276 | 2,718 |
| Totals, Order 10, 1916 | 490 | 1,547 | 514 | 60 | l | 2,612 | 112 | 235 | 7 | 1 | .. | 355 | 2,967 |
| Totals, Order 10, 1911 | 540 | 1,511 | 333 | 43 | 1 | 2,388 | 36 | 104 | 3 | 2 | .. | 45 | 2,533 |
| Totals, Order 10, 1906 | 442 | 1,122 | 233 | 37 | 2 | 1,836 | 21 | .. | 5 | .. | .. | 85 | 1,921 |
| Totals, Order 10, 1901 | 355 | 933 | 203 | 27 | 1 | 1,519 | 10 | 2 | 3 | l | .. | 38 | 1,557 |
The vast majority of the persons comprised in this order are connected with the ironmongery business or the hardware trade.
Again a notable feature is the increase in the number of females employed, an increase which is probably partly the result of war conditions and partly to be accounted for on similar grounds to those mentioned in connection with Order 6.
(1.68 per cent. of total male population; 0.79 per cont. of total female population; 1.24 per cent, of total population, both sexes.)
| Occupations, in Sub-orders. | Males. | Females. | Totals, both Sexes. | ||||||||||
|---|---|---|---|---|---|---|---|---|---|---|---|---|---|
| Under 20. | 20–44. | 45–64. | 65 and over. | Not stated. | Totals. | Under 20. | 20–44. | 45–64. | 65 and over. | Not stated. | Totals. | ||
| 1. Persons engaged as merchants and dealers (undefined) | 1,036 | 3,800 | 1,702 | 363 | 14 | 6,975 | 766 | 1,375 | 279 | 40 | 2 | 2,462 | 9,437 |
| 2. Persons engaged in other mercantile pursuits (undefined) | 336 | 1,163 | 634 | 163 | 3 | 2,299 | 63l | 1,172 | 48 | 9 | 2 | 1,862 | 4,161 |
| Totals, Order 11, 1916 | 1,372 | 4,963 | 2,396 | 526 | 17 | 9,274 | 1,397 | 2,547 | 327 | 49 | 4 | 4,324 | 13,598 |
| Totals, Order 11, 1911 | 2,094 | 7,581 | 2,617 | 652 | 25 | 12,969 | 1,717 | 3,211 | 385 | 60 | 13 | 5,386 | 18,355 |
| Totals, Order 11, 1906. | 1,765 | 6,539 | 2,436 | 558 | 18 | 11,316 | 1,060 | 2,155 | 279 | 63 | 3 | 3,560 | 14,876 |
| Totals, Order 11, 1901 | 1,667 | 4,832 | 2,024 | 415 | 10 | 8,948 | 629 | 1,279 | 275 | 60 | .. | 2,243 | 11,191 |
This order includes storekeepers, shopkeepers, merchants, importers, brokers, agents, clerks, accountants, commercial travellers (undefined). The numbers do not appear to have increased much during the period under review, but it should be remembered that this is almost wholly to be accounted for by the more specific nature of the information asked for in the 1916 census schedule, with a corresponding, reduction in the number of general dealers undefined.
| Occupations, in Sub-orders. | Males. | Females. | Totals, both Sexes. | ||||||||||
|---|---|---|---|---|---|---|---|---|---|---|---|---|---|
| Under 20. | 20–44. | 45–64. | 65 and over. | Not stated. | Totals. | Under 20. | 20–44. | 45–64. | 65 and over. | Not stated. | Totals. | ||
| 1. Persons engaged in speculating on events | 1 | 10 | 3 | .. | .. | 14 | .. | .. | .. | .. | .. | .. | 14 |
| Totals, Order 12,1916 | 1 | 10 | 3 | .. | .. | 14 | .. | .. | .. | .. | .. | .. | 14 |
| Totals, Order 12,1911 | .. | 3 | 4 | .. | .. | 7 | .. | .. | .. | .. | .. | .. | 7 |
| Totals, Order 12.. 1906 | .. | 44 | 11 | 3 | .. | 58 | .. | .. | .. | .. | .. | .. | 58 |
| Totals, Order 12, 1901 | 3 | 32 | 6 | .. | .. | 41 | .. | 2 | 1 | .. | .. | 3 | 44 |
Table of Contents
(0.03 per cent, of total male population; 0.01 per cent, of total population, both sexes.)
| Occupations, in Sub-orders. | Males. | Females. | Totals, both Sexes. | ||||||||||
|---|---|---|---|---|---|---|---|---|---|---|---|---|---|
| Under 20. | 20–44. | 45–64. | 65 and over. | Not stated. | Totals. | Under 20. | 20–44. | 45–64. | 65 and over. | Not stated. | Totals. | ||
| 1. Persons engaged in storage | 13 | 100 | 41 | 4 | .. | 158 | 3 | .. | .. | .. | .. | 3 | 161 |
| Totals, Order 13,1910 | 13 | 100 | 41 | 4 | .. | 158 | 3 | .. | .. | .. | .. | 3 | 161 |
| Totals, Order 13, 1911 | 101 | 571 | 194 | 28 | 1 | 895 | 1 | .. | .. | .. | .. | 1 | 896 |
| Totals, Order 13, 1906 | 61 | 434 | 129 | 27 | 1 | 652 | 3 | 3 | .. | .. | .. | 6 | 658 |
| Totals, Order 13,1901 | 136 | 501 | 207 | 18 | 1 | 863 | 1 | 4 | .. | .. | .. | 5 | 868 |
The numbers comprised in this order show a marked fall in 1916 as compared with prior census years, a result due to the more correct classification obtained by asking for information as to industry in addition to personal occupation. There is reason to believe that the numbers in this order prior to 1916 were overstated on account of the incorrect inclusion of many employees of country retail “stores.”
Table of Contents
(7.30 per cent. of total male population; 0.42 per cent. of total female population; 3.87 per cent. of total population, both sexes.)
| Occupations, in Sub-orders. | Males. | Females. | Totals, both Sexes. | ||||||||||
|---|---|---|---|---|---|---|---|---|---|---|---|---|---|
| Under 20. | 20–44. | 45–64. | 65 and over. | Not stated. | Totals. | Under 20. | 20–44. | 45–64. | 65 and over. | Not stated. | Totals. | ||
| 1. Persons engaged on railways (not construction) | 1,323 | 7,595 | 1,926 | 70 | 11 | 10,925 | .. | 8 | 8 | .. | .. | 16 | 10,941 |
| 2. Persons engaged on roads | 770 | 7,168 | 2,144 | 226 | 15 | 10,323 | 74 | 138 | 10 | 2 | .. | 224 | 10,547 |
| 3. Persons engaged on seas and rivers | 819 | 7,724 | 3,512 | 384 | 23 | 12,462 | 32 | 134 | 27 | 1 | .. | 164 | 12,656 |
| 4. Persons engaged on postal services.. | 2,501 | 3,117 | 715 | 55 | 2 | 6,390 | 478 | 1,177 | 169 | 9 | .. | 1,833 | 8,223 |
| 5. Persons engaged on telegraph and telephone services | 2,501 | 3,117 | 715 | 55 | 2 | 6,390 | 478 | 1,177 | 169 | 9 | .. | 1,833 | 8,223 |
| 6. Persons engaged in delivery of documents, parcels, and messages by hand | 129 | 13 | 10 | 1 | .. | 153 | 2 | .. | .. | .. | .. | 2 | 155 |
| Totals, Order 14, 1916 | 5,542 | 25,617 | 8,307 | 736 | 51 | 40,253 | 586 | 1,457 | 214 | 12 | .. | 2,269 | 42,522 |
| Totals, Order 14, 1911 | 3,783 | 24,588 | 6,042 | 735 | 64 | 35,212 | 226 | 881 | 100 | 13 | 1 | 1,221 | 36,433 |
| Totals, Order 14,1906 | 3,372 | 18,629 | 4,927 | 680 | 29 | 27,637 | 105 | 563 | 69 | 11 | 1 | 749 | 28,386 |
| Totals, Order 14, 1901 | 2,967 | 13,314 | 4,325 | 625 | 34 | 21,266 | 60 | 358 | 55 | 11 | 1 | 485 | 21,750 |
The principal specific occupations comprised under this head are railway and tramway employees, carriers and carters (not otherwise classified), livery and stable keepers and employees, lighthouse-keepers; shipping agents, clerks, and employees; wharf labourers, postal and telegraphic and telephone officers, and the like.
The numbers comprised in the order (especially females) show a vast increase during the period under review.
Table of Contents
In Sub-class B of the commercial class all persons engaged in dealing were included; the makers or manufacturers have now to be considered.
(4.41 per cent, of total male population; 0.33 per cent, of total female population; 2.38 per cent, of total population, both sexes.)
| Occupations, in Sub-orders. | Males. | Females. | Totals, both Sexes. | ||||||||||
|---|---|---|---|---|---|---|---|---|---|---|---|---|---|
| Under 20. | 20–44. | 45–64. | 65 and over. | Not stated. | Totals. | Under 20. | 20–44. | 45–64. | 65 and over. | Not stated. | Totals. | ||
| 1. Persons engaged in connection with the manufacture of books and publications | 671 | 1,961 | 786 | 93 | 4 | 3,515 | 457 | 483 | 14 | 1 | .. | 955 | 4,470 |
| 2. Persons engaged in connection with the manufacture of musical instruments | 12 | 124 | 65 | 13 | 2 | 216 | 3 | .. | .. | .. | .. | 3 | 219 |
| 3. Persons engaged in connection with the manufacture of prints, pictures, and art materials | 34 | 169 | 69 | 13 | .. | 285 | 2 | 10 | .. | .. | .. | 12 | 297 |
| 4. Persons manufacturing ornaments, minor art products, and small wares | 59 | 181 | 67 | 24 | 1 | 332 | 52 | 70 | 10 | .. | .. | 132 | 464 |
| 5. Persons manufacturing equipment for sports and games | 3 | 22 | 5 | 3 | .. | 33 | 1 | 8 | .. | .. | .. | 9 | 42 |
| 6. Persons manufacturing designs, medals, type, and dies | 11 | 28 | 12 | 5 | .. | 56 | 4 | 3 | .. | .. | .. | 7 | 63 |
| 7. Persons manufacturing watches, clocks, and scientific instruments | 35 | 234 | 129 | 22 | 1 | 421 | 6 | 9 | 2 | .. | .. | 17 | 438 |
| 8. Persons manufacturing surgical instruments and appliances | 1 | 5 | 3 | 2 | .. | 11 | .. | .. | 1 | .. | .. | 1 | 12 |
| 9. Persons manufacturing arms, ammunition, and explosives | 9 | 38 | 18 | 9 | .. | 74 | 68 | 48 | 4 | .. | .. | 120 | 194 |
| 10. Persons manufacturing engines, tools, and implements | 304 | 1,288 | 492 | 86 | 7 | 2,177 | 9 | 18 | 1 | .. | .. | 28 | 2,205 |
| 11. Persons manufacturing carriages and vehicles | 709 | 3,136 | 1,097 | 89 | 6 | 5,037 | 15 | 16 | .. | 1 | .. | 32 | 5,069 |
| 12. Persons manufacturing harness, saddlery, and leatherware | 127 | 557 | 311 | 58 | 1 | 1,054 | 27 | 39 | 4 | .. | .. | 70 | 1,124 |
| 13. Persons manufacturing ships, boats, and their equipment | 59 | 378 | 209 | 91 | .. | 737 | 9 | 11 | 3 | .. | .. | 23 | 760 |
| 14. Persons manufacturing furniture. | 467 | 1,546 | 457 | 82 | 2 | 2,554 | 37 | 103 | 8 | 3 | .. | 151 | 2,705 |
| 15. Parsons manufacturing building-material | 681 | 4,724 | 1,820 | 219 | 15 | 7,459 | 47 | 56 | 3 | .. | .. | 106 | 7,565 |
| 16. Persons manufacturing chemicals and by-products | 23 | 200 | 129 | 13 | 1 | 366 | 65 | 77 | 6 | .. | .. | 148 | 514 |
| Totals, Order 15, 1916 | 3,205 | 14,591 | 5,669 | 822 | 40 | 24,327 | 802 | 951 | 56 | 5 | .. | 1814 | 26,141 |
| Totals, Order 15, 1911 | 2,986 | 14,621 | 3,606 | 721 | 34 | 21,868 | 265 | 348 | 29 | 5 | 1 | 643 | 22,516 |
| Totals, Order 15, 1906 | 3,139 | 12,296 | 3,090 | 698 | 14 | 19,237 | 258 | 273 | 17 | 4 | .. | 552 | 19,786 |
| Totals, Order 15, 1901 | 3,892 | 10,905 | 3,109 | 561 | 12 | 18,479 | 525 | 395 | 21 | 4 | 1 | 946 | 19,425 |
This order comprises persons, engaged in connection with printing, fitters and mechanical engineers, saddlery and harness makers, shipwrights and builders, cabinetmakers, sawmillers, joiners, &c. The proportion of the population classed with this order has not varied greatly during the period under review. The latest census, however, shows a considerable increase in the number of females engaged in these occupations, especially printing.
(1.73 per cent. of total male population; 2.90 per cent. of total female population; 2.31 per cent. of total population, both sexes.)
| Occupations, in Sub-orders. | Males. | Females. | Totals, both Sexes. | ||||||||||
|---|---|---|---|---|---|---|---|---|---|---|---|---|---|
| Under 20. | 20–44. | 45–64. | 65 and over. | Not stated. | Totals. | Under 20. | 20–44. | 45–64. | 65 and over. | Not stated. | Totals. | ||
| 1. Persons manufacturing, repairing, cleansing, fee, textile fabrics | 138 | 563 | 265 | 30 | 3 | 999 | 545 | 684 | 35 | 2 | 4 | 1,270 | 2,269 |
| 2. Persons manufacturing dress | 494 | 3,372 | 3,789 | 330 | 13 | 5,998 | 4,641 | 8,817 | 976 | 69 | 12 | 14,515 | 20,513 |
| 3. Persons manufacturing fibrous materials | 237 | 1,788 | 491 | 44 | 3 | 2,563 | 37 | 64 | 5 | .. | .. | 106 | 2,669 |
| Totals, Order 16, 1916 | 869 | 5,723 | 2,545 | 404 | 19 | 9,560 | 5,223 | 9,565 | 1,016 | 7l | 16 | 15,891 | 25,451 |
| Totals, Order 16. 1911 | 1,010 | 6,040 | 1,730 | 463 | 6 | 9,249 | 5,743 | 10,302 | 723 | 89 | 11 | 16,868 | 26,117 |
| Totals, Order 16, 1906 | 1,446 | 6,896 | 1,611 | 483 | 12 | 10,448 | 5,426 | 9,594 | 586 | 94 | 9 | 15,709 | 26,157 |
| Totals, Order 16, 1901 | 1,530 | 4,824 | 1,384 | 433 | 2 | 8,173 | 5,334 | 8,253 | 548 | 87 | 15 | 14,237 | 22,410 |
The principal specific occupations falling within this order are woollen-manufacturers, clothing-manufacturers, tailors, dressmakers, bootmakers, and flax-millers.
(2.56 per cent, of total male population; 0.23 per cent, of total female population; 1.40 per cent, of total population, both sexes.)
| Occupations, in Sub-orders. | Males. | Females. | Totals, both Sexes. | ||||||||||
|---|---|---|---|---|---|---|---|---|---|---|---|---|---|
| Under 20. | 20–44. | 45–64. | 65 and over. | Not stated. | Totals. | Under 20. | 20–44. | 45–64. | 65 and over. | Not stated. | Totals. | ||
| 1. Persons manufacturing animal food | 790 | 5,152 | 1,553 | 116 | 8 | 7,619 | 86 | 126 | 3 | .. | .. | 215 | 7,834 |
| 2. Persons manufacturing vegetable food | 691 | 2,796 | 965 | 116 | 8 | 4,576 | 448 | 439 | 47 | 5 | 2 | 941 | 5,517 |
| 3 Persons manufacturing groceries, drinks, narcotics, and stimulants | 151 | 1,169 | 485 | 95 | 1 | 1,901 | 48 | 58 | 12 | 2 | .. | 120 | 2,021 |
| Totals, Order 17, 1916 | 1,632 | 9,117 | 3,003 | 327 | 17 | 14,096 | 582 | 623 | 62 | 7 | 2 | 1,276 | 15,372 |
| Totals, Order 17, 1911 | 1,296 | 7,715 | 1,612 | 279 | 16 | 10,918 | 265 | 296 | 19 | 6 | 1 | 587 | 11,505 |
| Totals, Order 17, 1906 | 1,327 | 5,841 | 1,289 | 221 | 6 | 8,684 | 236 | 212 | 21 | 3 | .. | 472 | 9,156 |
| Totals, Order 17, 1901 | 1,314 | 4,619 | 1,162 | 203 | 4 | 7,302 | 196 | 135 | 25 | 1 | .. | 357 | 7,659 |
Slaughtermen, ham and bacon curers, cheese and butter makers, animal-food refrigerators, bakers, millers, brewers, and cordial-manufacturers constitute the principal specific occupations comprised in this order.
(0.38 per cent, of total male population; 0.02 per cent, of total female population; 0.20 per cent, of total population, both sexes.)
| Occupations, in Sub-orders. | Males. | Females. | Totals, both Sexes. | ||||||||||
|---|---|---|---|---|---|---|---|---|---|---|---|---|---|
| Under 20. | 20–44. | 45–64. | 65 andover. | Not stated. | Totals. | Under 20. | 20–44. | 45–64. | 65 andover. | Not stated. | Totals. | ||
| 1. Persons working in animal matter | 118 | 743 | 376 | 55 | .. | 1,292 | 32 | 17 | 5 | .. | .. | 54 | 1,346 |
| 2. Persons working in wood (not elsewhere classed) | 31 | 237 | 119 | 26 | .. | 413 | 4 | 4 | .. | .. | .. | 8 | 421 |
| 3. Persons working in vegetable produce for fodder | 21 | 201 | 54 | 4 | 1 | 281 | 1 | 2 | .. | .. | .. | 3 | 284 |
| 4. Persons manufacturing paper. | 11 | 62 | 44 | 7 | .. | 124 | 21 | 15 | .. | .. | .. | 36 | 160 |
| Totals, Order 18, 1916 | 181 | 1,243 | 593 | 92 | 1 | 2,110 | 58 | 38 | 5 | .. | .. | 101 | 2,211 |
| Totals, Order 18, 1911 | 213 | 1,635 | 481 | 83 | 4 | 2,416 | 33 | 15 | .. | .. | .. | 48 | 2,464 |
| Totals, Order 18, 1906 | 237 | 1,390 | 398 | 69 | 4 | 2,098 | 26 | 14 | .. | .. | .. | 40 | 2,138 |
| Totals, Order 18, 1901 | 454 | 1,504 | 412 | 59 | 2 | 2,431 | 13 | 4 | .. | 1 | .. | 18 | 2,449 |
Besides tanners and fellmongers, there is no specific occupation of any importance comprised in this order. The proportion of the total population engaged in such occupations will be seen to have fallen since 1901.
(1.47 per cent. of total male population; 0.04 per cent. of total female population; 0.76 per cent. of total population, both sexes.)
| Occupations, in Sub-orders. | Males. | Females. | Totals, both Sexes. | ||||||||||
|---|---|---|---|---|---|---|---|---|---|---|---|---|---|
| Under 20. | 20–44. | 45–64. | 65 and over. | Not stated. | Totals. | Under 20. | 20–44. | 45–64. | 65 and over. | Not stated. | Totals. | ||
| 1. Persons engaged in manufactures and processes relating to stone, clay, earthenware, glass, and minerals | 108 | 1,210 | 548 | 74 | 5 | 1,945 | 11 | 10 | 3 | .. | .. | 24 | 1,909 |
| 2. Persons engaged in manufactures relating to gold, silver, and precious stones | 83 | 330 | 101 | 8 | .. | 522 | 33 | 84 | 7 | 1 | .. | 125 | 647 |
| 3. Persons engaged in manufactures relating to metals other than gold and silver | 857 | 3,327 | 1,219 | 221 | 11 | 5,035 | 36 | 27 | 3 | 1 | .. | 67 | 5,702 |
| Totals, Order 19, 1916 | 1,048 | 4,807 | 1,808 | 303 | 10 | 8,102 | 80 | 121 | 13 | 2 | .. | 210 | 8,318 |
| Totals, Order 19, 1911 | 2,510 | 6,355 | 1,510 | 277 | 13 | 9,071 | 27 | 34 | 3 | .. | .. | 64 | 9,735 |
| Totals, Order 19, 1908 | 1,757 | 5,907 | 1,343 | 283 | 10 | 9,300 | 21 | 33 | 2 | 1 | .. | 57 | 9,357 |
| Totals, Order 19, 1901 | 2,045 | 4,701 | 1,225 | 241 | 8 | 8,280 | 5 | 6 | 2 | .. | .. | 13 | 8,293 |
The principal specific occupations belonging to this order are those of brickmakers, cement-manufacturers, jewellers, tinsmiths, ironworkers, and blacksmiths.
(0.48 per cent, of total male population; 0.02 per cent, of total female population; 0.25 per cent, of total population, both sexes.)
| Occupations, in Sub-orders. | Males. | Females. | Totals, both Sexes. | ||||||||||
|---|---|---|---|---|---|---|---|---|---|---|---|---|---|
| Under 20. | 20–44. | 45–64. | 65 and over. | Not stated. | Totals. | Under 20. | 20–44. | 45–64. | 65 and over. | Not stated. | Totals. | ||
| 1. Persons engaged in the conversion of coal, &c, to purposes of beat, light, &c. | 371 | 1,091 | 519 | 48 | 7 | 2,630 | 26 | 78 | 4 | .. | .. | 108 | 2,744 |
| Totals, Order 20, 1916 | 371 | 1,091 | 519 | 48 | 7 | 2,636 | 26 | 78 | 4 | .. | .. | 108 | 2,744 |
| Totals, Order 20, 1911 | 228 | 1,242 | 259 | 27 | 4 | 1,700 | 12 | 19 | .. | .. | .. | 31 | 1,791 |
| Totals, Order 20, 1906 | 152 | 834 | 183 | 19 | .. | 1,188 | 3 | 6 | .. | .. | .. | 9 | 1,197 |
| Totals, Order 20, 1901 | 63 | 354 | 139 | 24 | .. | 580 | 3 | .. | .. | .. | .. | 3 | 583 |
This order includes both electricians and gasworks and electrical works employees. A marked increase will be noted, concomitant with the great development of electric power during the past 15-odd years.
(4.93per cent, of total male population; 0.02 per cent, of total female population; 2.49per cent, of total population, both sexes.)
| Occupations, in Sub-orders. | Males. | Females. | Totals, both Sexes. | ||||||||||
|---|---|---|---|---|---|---|---|---|---|---|---|---|---|
| Under 20. | 20–44. | 45–64. | 65 and over. | Not stated. | Totals. | Under 20. | 20–44. | 45–64. | 65 and over. | Not stated. | Totals. | ||
| 1. Persons engaged in making or repairing houses and buildings | 1,378 | 11,666 | 4,708 | 1,088 | 27 | 18,867 | 60 | 58 | 4 | .. | .. | 122 | 18,989 |
| 2. Persons engaged in making or repairing roads, railways, bridges, &c. | 153 | 4,434 | 3,318 | 397 | 28 | 8,330 | .. | .. | .. | .. | .. | .. | 8,330 |
| Totals, Order 21, 1916 | 1,531 | 16,100 | 8,026 | 1,485 | 55 | 27,197 | 60 | 58 | 4 | .. | .. | 122 | 27,319 |
| Totals, Order 21, 1911 | 3,078 | 24,294 | 7,740 | 1,734 | 72 | 36,918 | 15 | 41 | 5 | .. | .. | 61 | 36,979 |
| Totals, Order 21, 1906 | 3,749 | 19,568 | 0,710 | 1,040 | 16 | 31,683 | 13 | 18 | 1 | .. | .. | 32 | 31,715 |
| Totals, Order 21, 1901. | 2,995 | 12,052 | 5,945 | 1,260 | 27 | 22,879 | 5 | 5 | 3 | .. | .. | 13 | 22,892 |
Builders, contractors, bricklayers, carpenters, painters, paperhangers, glaziers, plumbers, plasterers, gasfitters, navvies, labourers, drainers, asphalters, and a few minor allied occupations are all comprised in this order.
(0.07 per cent, of total male population; 0.03 per cent, of total population, both sexes.)
| Occupations, in Sub-orders. | Males. | Females. | Totals, both Sexes. | ||||||||||
|---|---|---|---|---|---|---|---|---|---|---|---|---|---|
| Under 20. | 20–44. | 45–64. | 65 and over. | Not stated. | Totals. | Under 20. | 20–44. | 45–64. | 65 and over. | Not stated. | Totals. | ||
| 1. Engaged in the disposal of the dead.. | 4 | 69 | 77 | 23 | .. | 173 | 1 | 1 | 1 | .. | .. | 3 | 176 |
| 2. Engaged in the disposal of refuse. &c. | 4 | 108 | 70 | 22 | 1 | 205 | .. | .. | .. | .. | .. | .. | 205 |
| Totals, Order 22, 1916 | 8 | 177 | 147 | 45 | 1 | 378 | 1 | 1 | 1 | .. | .. | 3 | 381 |
| Totals Order 22, 1911 | 6 | 144 | 102 | 55 | .. | 307 | .. | .. | 1 | .. | .. | .. | 308 |
| Totals, Order 22, 1906 | 14 | 98 | 96 | 38 | .. | 246 | .. | 2 | 1 | .. | .. | 3 | 249 |
| Totals, Order 22, 1901 | 11 | 71 | 79 | 20 | .. | 181 | 2 | .. | .. | .. | .. | 2 | 183 |
(1.56 per cent, of total male population; 0.06 per cent, of total female population; 0.81 per cent, of total population, both sexes.)
| Occupations, in Sub-orders. | Males. | Females. | Totals, both Sexes. | ||||||||||
|---|---|---|---|---|---|---|---|---|---|---|---|---|---|
| Under 20. | 20–44. | 45–64. | 65 and over. | Not stated. | Totals. | Under 20. | 20–44. | 45–64. | 65 and over. | Not stated. | Totals. | ||
| Industrial workers imperfectly defined | 902 | 4,188 | 2,629 | 892 | 28 | 8,639 | 152 | 172 | 17 | 2 | .. | 343 | 8,982 |
| Totals, Order 23, 1916 | 902 | 4,188 | 2,629 | 892 | 28 | 8,639 | 152 | 172 | 17 | 2 | .. | 343 | 8,982 |
| Totals, Order 23,1911 | 1,621 | 10,405 | 3,564 | 1,110 | 41 | 16,741 | 320 | 374 | 9 | t | .. | 704 | 17,445 |
| Totals, Order 23, 1906 | 2,115 | 12,041 | 3,943 | 1,294 | 38 | 19,431 | 406 | 460 | 7 | 2 | .. | 875 | 20,306 |
| Totals, Order 23, 1901 | 2,295 | 9,331 | 3,727 | 1,195 | 21 | 16,569 | 308 | 404 | 7 | 2 | .. | 721 | 17,290 |
This order includes engineers, engine-drivers, stokers, and labourers undefined. The marked fall is probably wholly a fictitious one, due to the more specific nature, in 1916, of the information required in connection with occupations, whereby the numbers of industrial workers imperfectly defined were greatly diminished, while the numbers of specifically defined industrial workers were correspondingly augmented.
Table of Contents
(22.20 per cent, of total male population; 1.77 per cent, of total female population; 12.05 per cent. of total population, both sexes.)
| Occupations, in Sub-orders. | Males. | Females. | Totals, both Sexes. | ||||||||||
|---|---|---|---|---|---|---|---|---|---|---|---|---|---|
| Under 20. | 20–44. | 45–64. | 65 and over. | Not stated. | Totals. | Under 20. | 20–44. | 45–64. | 65 and over. | Not stated. | Totals. | ||
| 1. Persons directly engaged in agricultural pursuits | 3,966 | 17,349 | 9,335 | 2,905 | 58 | 33,613 | 321 | 538 | 354 | 153 | .. | 1,366 | 34,979 |
| 2. Persons directly engaged in pastoral pursuits | 11,684 | 38,210 | 19,722 | 4,433 | 86 | 74,135 | 1,514 | 3,837 | 1,589 | 343 | 12 | 8,295 | 82,430 |
| 3. Persons engaged in rabbiting, bee-keeping, &c. | 51 | 272 | 161 | 29 | 2 | 515 | 2 | 9 | 4 | .. | .. | 15 | 530 |
| 4. Persons directly engaged in fisheries, &c. | 61 | 536 | 259 | 64 | 2 | 922 | .. | 2 | .. | .. | .. | 2 | 924 |
| 5. Persons directly engaged in forestry or the acquisition of raw products yielded by natural vegetation | 123 | 1,527 | 459 | 43 | 4 | 2,156 | .. | 4 | .. | .. | .. | 4 | 2,160 |
| 6. Persons engaged in the conservancy of water | 7 | 174 | 133 | 18 | .. | 332 | .. | .. | .. | .. | .. | .. | 332 |
| 7. Persons engaged in mines, quarries, &c. | 656 | 6,652 | 2,984 | 805 | 44 | 11,141 | 2 | 1 | .. | .. | .. | 3 | 11,144 |
| Totals, Order 24, 1916 | 16,548 | 64,720 | 33,053 | 8,297 | 196 | 122,814 | 2,839 | 4,391 | 1,947 | 496 | 12 | 9,685 | 132,499 |
| Totals, Order 24, 1911 | 16,758 | 70,687 | 26,589 | 8,852 | 213 | 123,099 | 2,288 | 3,103 | 1,616 | 467 | 8 | 7,482 | 130,581 |
| Totals, Order 24, 1906 | 17,164 | 62,964 | 25,319 | 9,298 | 164 | 114,906 | 907 | 1,163 | 1,050 | 345 | 2 | 3,467 | 118,373 |
| Totals, Older 24, 1901 | 18,605 | 55,701 | 25,532 | 8,014 | 155 | 108,007 | 1,336 | 1,220 | 1,082 | 273 | 3 | 3,914 | 111,921 |
The foregoing table attempts to separate persons engaged in agricultural from those engaged in pastoral pursuits. It should be remembered, however, that there is a large class of general farmers who are partly engaged in pastoral and partly in agricultural farming. The figures seem to show a marked fall during the period under review in the numbers of agricultural, and a marked increase in the numbers of pastoral farmers. To what extent this may be due to differences of classification of the fairly numerous classes of general farmers it would be difficult to pronounce upon, but it is clear, on a reference to the export figures for primary produce, that there has actually been some falling-off in exports of agricultural produce with a more than corresponding increase in exports of pastoral produce, and this seems to suggest that pastoral have considerably supplanted agricultural pursuits during the period under review, though whether or not to the extent suggested by the following census figures showing the numbers of persons engaged in each of the two principal forms of farming it would be difficult to say:—
| Census. | Agricultural. | Pastoral. |
| 1901 | 67,812 | 21,410 |
| 1906 | 69,557 | 27,400 |
| 1911 | 54,738 | 55,287 |
| 1916 | 34,979 | 82,430 |
It would be rash to pronounce dogmatically on the cause of this apparent fall in the proportion of the population engaged in agriculture, but it may be safely affirmed that some or all of the following circumstances have not been without their influence:—
(1.) Increased efficiency in this element of the population, either as a result of improved personal knowledge and efficiency or of better farm equipment, thus necessitating fewer people to do a fixed amount of work.
(2.) Specialization, whereby this element in the population undertakes a smaller variety of tasks than before. It is a well-known fact that whereas in the past the farmer has combined in himself the functions of baker, butter-manufacturer, and what-not, these functions are now gradually but surely being relegated to specialists.
(3.) Improved transport facilities, whereby farmers perform a smaller amount than heretofore of the hauling of farm-produce to market.
(4.) The greater “net advantages “in the shape of better conditions and higher profits offered by pastoral pursuits.
In view of the fact that New Zealand is primarily a producing country the following figures are worth noting. The figures give the actual numbers engaged in agricultural and pastoral and in mining pursuits.
| Agricultural and pastoral pursuits:— | 1901. | 1906. | 1911. | 1916. |
|---|---|---|---|---|
| Males | 85,323 | 93,504 | 102,574 | 107,748 |
| Females | 3,899 | 3,453 | 7,451 | 9,661 |
| Total | 89,222 | 96,957 | 110,025 | 117,409 |
| Mining:— | ||||
| Males | 17,808 | 15,956 | 14,767 | 11,141 |
| Females | 8 | 8 | 8 | 3 |
| Total | 17,816 | 15,964 | 14,775 | 11,144 |
War conditions account for an increase in the numbers and proportions of females engaged in this class, and no doubt partly account for the fall amongst male?. There seems, however, to be a decided tendency for the proportion of the total population directly employed in the primary industries to fall off, and (as already indicated in an earlier section of this report) this tendency appears to be concomitant with that towards urban aggregation. The following table shows for the last four census-takings the percentage of the total male population engaged in primary industries:—
| 1901 | 26.60 per cent. |
| 1906 | 24.41 per cent. |
| 1911 | 23.14 per cent. |
| 1916 | 22.26 per cent. |
(1.92 per cent, of total male population; 0.48 per cent, of total female population; 1.20 per cent, of total population, both sexes.)
| Occupations, in Sub-orders. | Males. | Females. | Totals, both Sexes. | ||||||||||
|---|---|---|---|---|---|---|---|---|---|---|---|---|---|
| Under 20. | 20–44. | 45–64. | 65 and over. | Not stated. | Totals. | Under 20. | 20–44. | 45–64. | 65 and over. | Not stated. | Totals. | ||
| 1. Persons of independent means, having no specific occupation or undefined | 2 | 240 | 1,996 | 8,274 | 19 | 10,531 | 6 | 232 | 680 | 1,687 | 8 | 2,613 | 13,144 |
| Totals, Order 25, 1910 | 2 | 240 | 1,996 | 8,274 | 19 | 10,53l | 6 | 232 | 680 | 1,687 | 8 | 2,613 | 13,144 |
| Totals, Order 25,1911 | 2 | 451 | 1,384 | 6,309 | 34 | 8,180 | 14 | 380 | 660 | 1,555 | 8 | 2,623 | 10,803 |
| Totals, Order 25, 1906 | 9 | 462 | 1,010 | 4,524 | 15 | 6,020 | 27 | 504 | 714 | 1,875 | 2 | 3,182 | 9,202 |
| Totals, Order 25, 1901 | 84 | 882 | 1,001 | 2,931 | 15 | 4,913 | 49 | 744 | 677 | 1,145 | 7 | 2,622 | 7,535 |
Table of Contents
(34.23 per cent, of total male population; 80.75 per cent, of total female population; 57.42 per cent. of total population, both sexes.)
| Occupations, in Sub-orders. | Males. | Females. | Totals, both Sexes. | ||||||||||
|---|---|---|---|---|---|---|---|---|---|---|---|---|---|
| Under 20. | 20–44. | 45–64. | 65 and over. | Not stated. | Totals. | Under 20. | 20–44. | 45–64. | 65 and over. | Not stated. | Totals. | ||
| 1. Persons performing domestic duties for which remuneration is not paid | 93 | 65 | 39 | 35 | 5 | 237 | 16,940 | 158,742 | 63,217 | 18,378 | 369 | 257,652 | 257,889 |
| 2. Dependent scholars and students | 112,553 | 104 | .. | .. | 14 | 112,731 | 110,709 | 334 | .. | .. | 27 | 111,070 | 223,801 |
| 3. Dependent relatives and others not performing domestic duties | 73,781 | 519 | 342 | 1,119 | 68 | 75,829 | 71,537 | 397 | 339 | 1,208 | 33 | 73,514 | 149,343 |
| Totals, Order 20,1916. | 186,427 | 748 | 381 | 1,154 | 87 | 188,797 | 199,192 | 159,473 | 63,556 | 19,586 | 429 | 442,230 | 631,033 |
| Totals, Order 20, 1911. | 159,894 | 957 | 198 | 602 | 63 | 161,720 | 175,218 | 140,989 | 48,852 | 16,085 | 365 | 381,509 | 543,229 |
| Totals, Order 26, 1906 | 140,546 | 510 | 78 | 98 | 47 | 141,279 | 160,143 | 124,071 | 42,335 | 12,315 | 154 | 339,018 | 480,297 |
| Totals, Order 26,1901 | 127,081 | 130 | 14 | 69 | 22 | 127,916 | 149,503 | 103,035 | 36,536 | 9,540 | 113 | 298,727 | 426,643 |
Persons belonging to this and to the order following have already been referred to in some detail in an earlier portion of this section of the report.
(1.42 per cent, of total male population; 0.94 per cent, of total female population; 1.19 per cent, of total population, both sexes.)
| Occupations, in Sub-orders. | Males. | Females. | Totals, both Sexes. | ||||||||||
|---|---|---|---|---|---|---|---|---|---|---|---|---|---|
| Under 20. | 20–44. | 45–64. | 65 and over. | Not stated. | Totals. | Under 20. | 20–44. | 45–64. | 65 and over. | Not stated. | Totals. | ||
| 1. Persons supported by voluntary and State contributions | 1,152 | 1,890 | 1,569 | 1,545 | 42 | 6,204 | 1,303 | 1,517 | 1,039 | 706 | 24 | 4,589 | 10,793 |
| 2. Criminal class (under legal detention) | 710 | 587 | 254 | 45 | 3 | 1,599 | 272 | 218 | 73 | 26 | 1 | 590 | 2,189 |
| Totals, Order 27, 1910. | 1,862 | 2,483 | 1,823 | 1,590 | 45 | 7,803 | 1,575 | 1,735 | 1,112 | 732 | 25 | 5,179 | 12,982 |
| Totals, Order 27, 1911. | 1,259 | 2,039 | 1,392 | 1,359 | 54 | 6,103 | 1,607 | 1,647 | 915 | 632 | 18 | 4,719 | 10,822 |
| Totals, Order 27, 1906. | 1,008 | 1,896 | 1,348 | 1,406 | 10 | 5,668 | 885 | 1,241 | 726 | 434 | 9 | 3,295 | 8,963 |
| Totals, Order 27, 1901 | 555 | 869 | 1,012 | 802 | 10 | 3,248 | 597 | 777 | 623 | 254 | 7 | 2,258 | 5,506 |
A cross-division to that just discussed has also been adopted whereby the grades of occupations of the people are shown; that is, the population is divided into different grades according as one or other of the following terms is applicable:—
E. Employer of labour.
0. In business on own account, but not employing others.
A. Relative assisting, but not receiving wages.
W. Working for wages or salary. W.N. Wage-earner unemployed.
N.A. Classification not applicable (as in the case of a minister of religion).
N.S. Not started or not indicated.
Four tables are first quoted as being of interest in this connection, the first two taking the total population belonging to each grade and showing the percentage in each case belonging to each class, the second two taking the total population belonging to each class and showing the percentage in each case belonging to each grade.
| Glass. | Males. | |||||||
|---|---|---|---|---|---|---|---|---|
| E. | O | A. | W. | W.N. | N.A. | NS | Total Males. | |
| SECTION A.—BREADWINNERS. | ||||||||
| I. Professional | 5.21 | 3.85 | 0.34 | 8.65 | 5.17 | 5.11 | 7.24 | 6.98 |
| II. Domestic | 3.84 | 2.40 | 1.03 | 3.03 | 4.85 | .. | 0.53 | 2.86 |
| III. Commercial | 16.58 | 11.22 | 3.18 | 14.72 | 12.57 | 15.99 | 7.67 | 13.94 |
| IV. Transport. | 2.63 | 4.24 | 0.60 | 16.27 | 10.52 | 0.37 | 2.29 | 11.33 |
| V. Industrial | 21.94 | 13.20 | 2.61 | 34.76 | 44.04 | 0.08 | 13.89 | 27.33 |
| VI. Agricultural, pastoral, mineral, and other primary producers | 49.80 | 65.09 | 92.24 | 22.57 | 22.85 | 0.04 | 68.38 | 34.59 |
| VII. Indefinite | .. | .. | .. | .. | .. | 78.41 | .. | 2.97 |
| Totals | 100.00 | 100.00 | 100.00 | 100.00 | 100.00 | 100.00 | 100.00 | 100.00 |
| Glass. | Males. | |||||||
|---|---|---|---|---|---|---|---|---|
| E. | O | A. | W. | W.N. | N.A. | NS | Total Males. | |
| SECTION A.—BREADWINNERS. | ||||||||
| I. Professional | 7.49 | 27.70 | 1.11 | 17.43 | 18.08 | 28.75 | 24.17 | 17.26 |
| II. Domestic | 28.19 | 14.47 | 14.09 | 37.61 | 41.44 | 1.96 | 23.42 | 31.71 |
| III. Commercial | 14.72 | 16.22 | 9.49 | 17.69 | 19.90 | 15.20 | 12.62 | 16.67 |
| IV. Transport. | 0.53 | 0.05 | 0.41 | 2.96 | 1.21 | .. | 0.11 | 2.26 |
| V. Industrial | 18.07 | 25.10 | 2.05 | 22.62 | 19.20 | 0.24 | 21.71 | 19.83 |
| VI. Agricultural, pastoral, mineral, and other primary producers | 31.00 | 16.46 | 72.85 | 1.69 | 0.17 | 1.64 | 17.97 | 9.66 |
| VII. Indefinite | .. | .. | .. | .. | .. | 52.21 | .. | 2.61 |
| Totals | 100.00 | 100.00 | 100.00 | 100.00 | 100.00 | 100.00 | 100.00 | 100.00 |
| Glass. | Males. | |||||||
|---|---|---|---|---|---|---|---|---|
| E. | O | A. | W. | W.N. | N.A. | NS | Total Males. | |
| SECTION A.—BREADWINNERS. | ||||||||
| I. Professional | 9.07 | 8.67 | 0.16 | 77.00 | 1.24 | 2.77 | 1.09 | 100.00 |
| II. Domestic | 16.42 | 13.19 | 1.24 | 66.11 | 2.84 | .. | 0.20 | 100.00 |
| III. Commercial | 14.48 | 12.64 | 0.79 | 65.67 | 1.50 | 4.34 | 0.58 | 100.00 |
| IV. Transport | 2.82 | 5.87 | 0.18 | 89.24 | 1.55 | 0.13 | 0.21 | 100.00 |
| V. Industrial | 9.77 | 7.58 | 0.33 | 79.09 | 2.69 | 0.01 | 0.53 | 100.00 |
| VI. Agricultural, pastoral, mineral, and other primary producers | 17.55 | 29.56 | 9.16 | 40.57 | 1.10 | .. | 2.06 | 100.00 |
| VII. Indefinite | .. | .. | .. | .. | .. | 100.00 | .. | 100.00 |
| All classes | 12.18 | 15.71 | 3.43 | 62.18 | 1.67 | 3.78 | 1.05 | 100.00 |
| Glass. | Males. | |||||||
|---|---|---|---|---|---|---|---|---|
| E. | O | A. | W. | W.N. | N.A. | NS | Total Males. | |
| SECTION A.—BREADWINNERS. | ||||||||
| I. Professional | 1.14 | 12.65 | 0.53 | 74.85 | 1.21 | 8.32 | 1.30 | 100.00 |
| II. Domestic | 2.33 | 3.59 | 3.68 | 87.86 | 1.50 | 0.30 | 0.68 | 100.00 |
| III. Commercial | 2.31 | 7.67 | 4.72 | 78.65 | 1.38 | 4.56 | 0.71 | 100.00 |
| IV. Transport | 0.62 | 0.18 | 1.49 | 97.05 | 0.62 | .. | 0.01 | 100.00 |
| V. Industrial | 2.39 | 9.98 | 0.86 | 84.57 | 1.12 | 0.06 | 1.02 | 100.00 |
| VI. Agricultural, pastoral, mineral, and other primary producers | 8.41 | 13.44 | 62.61 | 12.94 | 0.20 | 0.84 | 1.74 | 100.00 |
| VII. Indefinite | .. | .. | .. | .. | .. | 100.00 | .. | 100.00 |
| All classes | 2.62 | 7.89 | 8.30 | 74.11 | 1.16 | 4.99 | 0.93 | l00.00 |
It will be noted that for males the proportion of employers to the total in the various classes was lowest in transport and highest in the primary extractive industries. The same remarks are true of those in business on their own account and not employing others. The large proportion of those belonging to the employing, working on own account, and relatives assisting grades to be found in the class of primary producers throws a striking light on the special nature of these industries, which (in direct contrast to the other classes of occupations) tend to remain in the hands of individuals, and to be worked on a small scale by themselves and their families. These features of the tables are merely confirmation of the already well recognized fact that the process of industrial evolution known as the “division of labour” has proceeded furthest in transport and least in the primary industries, which are, from their essential nature, less capable of being specialized. Wage earners unemployed formed 2.84 per cent, of the persons whose usual employment was domestic, and 2.69 per cent, of those whose usual employment was industrial. The smallest percentage of unemployed was to be found in the primary industries (1.10). These results do not differ materially from those disclosed by the 1911 census.
On closely referring to the second pair of the series of tables it will be noted that although the above conclusions are substantially borne out, yet it must not be supposed that the majority of males engaged in the primary industries are employers. True, in this class the percentage of employers is higher, and that of wage earners is lower, than in any other; yet, while 17.55 per cent, of the class are employers, as many as 4057 per cent, are wage earners. A relatively large proportion of the domestic and commercial classes will from this table be seen also to belong to the employing, and a relatively small proportion to the wage earning, grade.
For females approximately similar results emerge. With regard to the relative distribution of male members of the different grades throughout the different classes of employment, it is found that the highest percentage of the employing grade was engaged in the primary industries (49.80 per cent.), while the lowest percentage was in transport (4.24 per cent.). Of those working on their own account the highest percentage was again in the primary industries (65.09 per cent.), while the lowest was this time in domestic (2.40 per cent.). For females the highest figure for the employing grade was 31 per cent, in the primary industries, and in the “on own account” grade 27.70 per cent, in the professional. The lowest figures were, for the employing grade, 0.53 per cent, in transport, and for those working on their own account 0.05 per cent, were in the same class.
Of the unemployed males 44.04 per cent, were of the industrial class and 4.85 per cent, of the domestic, these figures being the highest and lowest respectively; for females the highest percentage was 41.44 in the domestic class, and the lowest 0.17 per cent, in the primary industries.
The following tables are of interest:—
| Year. | Employers. | In Business on own account, but not employing other Persons. | Working for Wages or Salary. | Wage-earners unemployed. | Relatives assisting but not receiving Wages, and others undescribed. | Total |
|---|---|---|---|---|---|---|
| MALES. | ||||||
| 1901 | 12,39 | 17.23 | 60.62 | 3.08 | 6.68 | 100.00 |
| 1906 | 12.81 | 14.49 | 62.99 | 2.53 | 7.18 | 100.00 |
| 1911 | 12.07 | 15.58 | 63.67 | 1.97 | 6.71 | 100.00 |
| 1916 | 12.18 | 15.71 | 62.18 | 1.67 | 8.26 | 100.00 |
| FEMALES. | ||||||
| 1901 | 3.06 | 13.32 | 73.23 | 2.07 | 8.32 | 100.00 |
| 1906 | 3.10 | 10.54 | 73.75 | 1.82 | 10.79 | 100.00 |
| 1911 | 3.07 | 10.70 | 71.20 | 1.33 | 13.70 | 100.00 |
| 1913 | 2.62 | 7.89 | 74.11 | 1.16 | 14.22 | 100.00 |
It will be noted that there has been a progressive decrease in the proportions of the population returned as belonging to the class of employers and those in business on their own account, together with wage-earners unemployed, and a corresponding increase amongst workers for wages or salary and relatives assisting. Females show the same tendencies, except that the changes are more marked.
An interesting comparison as between borough and county population on the basis of grades of occupation is now offered. It will be noted that employers, persons working on their own account (mostly small farmers, no doubt), and relatives assisting predominate in the country, and the other classes in the towns, with the exception that females working on their own account are rather more prevalent in the towns than in the country.
The first table in the series states the actual number of persons (a) living in boroughs and cities, (b) living in counties (exclusive of interior boroughs and cities), belonging to each grade, males and females being shown separately.
| — | E | O. | A. | W. | W.N. | N.A. | N.S. | Totals. |
|---|---|---|---|---|---|---|---|---|
| MALES. | ||||||||
| Totals for boroughs | 17,134 | 16,043 | 782 | 127,684 | 4,112 | 108,768 | 1,236 | 275,759 |
| Totals for counties | 26,122 | 39,712 | 11,405 | 93,099 | 1,808 | 101,390 | 2,480 | 276,016 |
| Grand totals | 43,256 | 55,755 | 12,187 | 220,783 | 5,920 | 210,158 | 3,716 | 551,775 |
| FEMALES. | ||||||||
| Totals for boroughs | 1,501 | 5,271 | 1,813 | 52,717 | 864 | 249,705 | 645 | 312,516 |
| Totals for counties | 1,128 | 2,633 | 6,511 | 21,585 | 292 | 202,719 | 290 | 235,158 |
| Grand totals | 2,629 | 7,904 | 8,324 | 74,302 | 1,156 | 452,424 | 935 | 547,674 |
The next tables take «as their basis the total population belonging to each grade, and the proportion of these totals to be found (a) in the boroughs and cities, (b) in the counties (exclusive of interior boroughs and cities), is then shown.
| — | E | O. | A. | W. | W.N. | N.A. | N.S. | Totals. |
|---|---|---|---|---|---|---|---|---|
| MALES. | ||||||||
| Totals for boroughs | 39.61 | 28.77 | 6.42 | 57.83 | 69.46 | 51.76 | 33.26 | 49.98 |
| Totals for counties | 60.39 | 71.23 | 93.58 | 42.17 | 30.54 | 48.24 | 66.74 | 50.02 |
| Grand totals | 100.00 | 100.00 | 100.00 | 100.00 | 100.00 | 100.00 | 100.00 | 100.00 |
| FEMALES. | ||||||||
| Totals for boroughs | 57.09 | 66.69 | 21.78 | 70.95 | 74.74 | 55.19 | 68.98 | 57.06 |
| Totals for counties | 42.91 | 33.31 | 78.22 | 29.05 | 25.26 | 44.81 | 31.02 | 42.94 |
| Grand totals | 100.00 | 100.00 | 100.00 | 100.00 | 100.00 | 100.00 | 100.00 | 100.00 |
The counties are the home of small-scale industries, the boroughs of large; hence the comparative paucity of employers and persons working on their own account and the superfluity of wage-earners in the boroughs. So numerous are the opportunities for outside employment in the towns that the younger members of the families who, if living in the country, would doubtless assist their parents in the home or on the farm, here seek employment elsewhere. The effect of this is that the proportion of relatives assisting at home is high in the counties and low in the boroughs.
The final tables in the series take as their basis (a) the total borough population, and (b) the total county population (excluding population of interior boroughs, &c). The proportion belonging to each grade is shown. The results revealed resemble closely those of the preceding tables.
| — | E | O. | A. | W. | W.N. | N.A. | N.S. | Totals. |
|---|---|---|---|---|---|---|---|---|
| MALES. | ||||||||
| Totals for boroughs | 6.21 | 5.82 | 0.28 | 46.31 | 1.49 | 39.44 | 0.45 | 100.00 |
| Totals for counties | 9.46 | 14.39 | 4.13 | 33.73 | 0.66 | 36.73 | 0.90 | 100.00 |
| Grand totals | 7.84 | 10.11 | 2.21 | 40.01 | 1.07 | 38.09 | 0.67 | 100.00 |
| FEMALES. | ||||||||
| Totals for boroughs | 0.48 | 1.69 | 0.58 | 16.87 | 0.27 | 79.90 | 0.21 | 100.00 |
| Totals for counties | 0.48 | 1.12 | 2.77 | 9.18 | 0.12 | 86.21 | 0.12 | 100.00 |
| Grand totals | 0.48 | 1.44 | 1.52 | 13.57 | 0.21 | 82.61 | 0.17 | 100.00 |
A classification of the data in respect of the grades of occupation by age-groups furnishes the following results:—
| Grade. | Under 15. | 15 and under 20. | 20 and under 25. | 25 and under 45. | 45 and under 65. | 65 and over | Not stated. | Totals. |
|---|---|---|---|---|---|---|---|---|
| MALES. | ||||||||
| E | .. | 0.23 | 2.98 | 14.02 | 16.99 | 9.79 | 6.08 | 7.84 |
| O | .. | 1.07 | 6.80 | 15.61 | 22.20 | 21.30 | 17.66 | 10.11 |
| A | 0.57 | 12.59 | 7.44 | 1.42 | 0.54 | 1.01 | 0.87 | 2.21 |
| W | 1.47 | 69.07 | 77.13 | 64.80 | 51.43 | 21.58 | 48.33 | 40.01 |
| W.N | 0.01 | 0.74 | 1.78 | 1.36 | 2.04 | 2.90 | 1.30 | 1.07 |
| N.A | 97.93 | 15.73 | 2.94 | 1.90 | 5.59 | 41.73 | 22.87 | 38.09 |
| N.S | 0.02 | 0.57 | 0.93 | 0.89 | 1.21 | 1.69 | 2.89 | 0.67 |
| Totals | 100.00 | 100.00 | 100.00 | 100.00 | 100.00 | 100.00 | 100.00 | 100.00 |
| FEMALES. | ||||||||
| E | .. | 0.01 | 0.11 | 0.65 | 1.46 | 1.27 | 0.87 | 0.48 |
| O | 0.01 | 0.41 | 1.34 | 2.01 | 3.85 | 2.45 | 3.48 | 1.44 |
| A | 0.23 | 5.21 | 3.14 | 1.65 | 1.36 | 0.40 | 2.26 | 1.52 |
| W | 0.63 | 42.85 | 43.16 | 15.65 | 7.02 | 1.59 | 12.52 | 13.57 |
| W.N | .. | 0.46 | 0.64 | 0.28 | 0.17 | 0.08 | .. | 0.21 |
| N.A | 99.12 | 50.76 | 51.32 | 79.55 | 85.84 | 93.98 | 80.52 | 82.61 |
| N.S | 0.01 | 0.3O | 0.29 | 0.21 | 0.30 | 0.23 | 0.35 | 0.17 |
| Totals | 100.00 | 100.00 | 100.00 | 100.00 | 100.00 | 100.00 | 100.00 | 100.00 |
| Grade. | Under 15. | 15 and under 20. | 20 and under 25. | 25 and under 45. | 45 and under 65. | 65 and over | Totals. |
|---|---|---|---|---|---|---|---|
| MALES. | |||||||
| E | 0.002 | 0.241 | 2.099 | 54.860 | 36.106 | 6.692 | 100.000 |
| O | 0.004 | 0.863 | 3.717 | 47.450 | 36.658 | 11.308 | 100.000 |
| A. | 8.727 | 46.531 | 18.570 | 19.637 | 4.080 | 2.455 | 100.000 |
| W | 1.236 | 14.103 | 10.643 | 49.701 | 21.426 | 2.891 | 100.000 |
| W.N | 0.203 | 5.651 | 9.152 | 38.809 | 31.670 | 14.515 | 100.000 |
| N.A. | 86.360 | 3.371 | 0.426 | 1.530 | 2.443 | 5.870 | 100.000 |
| N.S. | 0.947 | 6.899 | 7.684 | 40.882 | 30.060 | 13.528 | 100.000 |
| All grades | 33.605 | 8.168 | 5.520 | 30.681 | 16.666 | 5.360 | 100.000 |
| FEMALES. | |||||||
| E | .. | 0.229 | 2.020 | 43.407 | 42.835 | 11.509 | 100.000 |
| 0 | 0.165 | 2.410 | 7.965 | 44.457 | 37.583 | 7.420 | 100.000 |
| A. | 4.994 | 29.082 | 17.663 | 34.460 | 12.646 | 1.155 | 100.000 |
| W | 1.522 | 26.779 | 27.190 | 36.718 | 7.280 | 0.511 | 100.000 |
| W.N | 0.086 | 18.599 | 25.865 | 42.474 | 11.332 | 1.644 | 100.000 |
| N.A | 39.237 | 5.210 | 5.309 | 30.651 | 14.632 | 4.961 | 100.000 |
| N.S | 1.179 | 14.791 | 14.255 | 38.800 | 25.080 | 5.895 | 100.000 |
| All grades | 32.701 | 8.480 | 8.547 | 31.830 | 14.081 | 4.361 | 100.000 |
It might be expected that as a rule the majority of persons who eventually become employers do so when they have attained at least the thirtieth, if not the fortieth, year, and that they tend to retire early. A similar phenomenon might be looked for as regards those working on their own account. These expectations are fully borne put in the above tables, for it will be at once seen that these grades reach a maximum in mature life.
Relatives assisting reach a maximum at the 15.19 group, after which most boys and some girls usually commence work elsewhere, while many girls, no doubt; are kept at home to assist (especially, the figures suggest, as regards the supplying of board and lodging) until a more congenial opening offers in the marriage-market.
In this connection it might be of interest to submit to review the figures dealing with grades of occupations in relation to conjugal conditions, which are now quoted.
| Grade. | Conjugal Condition. | |||||
|---|---|---|---|---|---|---|
| Never Married. | Married. | Widowed. | Divorced. | Not stated. | Totals. | |
| MALES. | ||||||
| E. | 7,068 | 34,614 | 1,449 | 71 | 54 | 43,256 |
| 0. | 13,516 | 39,425 | 2,568 | 117 | 129 | 55,755 |
| A. | 11,252 | 727 | 173 | 4 | 31 | 12,187 |
| W. | 100,892 | 112,302 | 6,316 | 459 | 814 | 220,783 |
| W.N. | 2,585 | 2,908 | 379 | 25 | 23 | 5,920 |
| N.A. | 195,624 | 9,945 | 4,364 | 73 | 152 | 210,158 |
| N.S, | 1,422 | 2,046 | 205 | 11 | 32 | 3,716 |
| Totals | 332,359 | 201,967 | 15,454 | 760 | 1,235 | 551,775 |
| FEMALES. | ||||||
| E. | 783 | 803 | 1,020 | 21 | 2 | 2,629 |
| 0. | 3,646 | 2,162 | 2,016 | 51 | 29 | 7,904 |
| A. | 5,393 | 2,784 | 122 | 1 | 24 | 8,321 |
| W. | 65,101 | 5,772 | 2,886 | 229 | 314 | 74,302 |
| W.N. | 975 | 90 | 76 | 8 | 7 | 1,156 |
| N.A. | 233,617 | 194,061 | 24,181 | 299 | 266 | 452,424 |
| N.S. | 564 | 224 | 122 | 4 | 21 | 935 |
| Totals | 310,079 | 205,896 | 30,423 | 613 | 663 | 547,674 |
| BOTH SEXES. | ||||||
| E. | 7,851 | 35,417 | 2,469 | 92 | 56 | 45,885 |
| 0. | 17,162 | 41,587 | 4,584 | 168 | 158 | 63,659 |
| A. | 16,645 | 3,511 | 295 | 5 | 55 | 20,511 |
| W. | 165,993 | 118,074 | 9,202 | 688 | 1,128 | 295,085 |
| W.N. | 3,560 | 2,998 | 455 | 33 | 30 | 7,076 |
| N.A. | 429,241 | 204,006 | 28,545 | 372 | 418 | 662,582 |
| N.S. | 1,986 | 2,270 | 327 | 15 | 53 | 4,651 |
| Totals | 642,438 | 407,863 | 45,877 | 1,373 | 1,898 | 1,099,449 |
It will be observed that for females the proportion of employers is lowest (as might be expected) amongst the never-married and also among persons whose conjugal condition was not stated, higher amongst the married, and highest amongst women who were widowed or divorced. The same remarks apply to persons working on their own account, except that amongst married women the proportion belonging to this grade is even lower than among the never-married. Relatives assisting form a comparatively large proportion amongst women never married and those whose conjugal condition was not specified, especially the latter, and a comparatively low proportion among the widowed and the divorced. Roughly, one-eleventh of the widows were wage-earners, as against one-half of those whose conjugal condition was not stated, one-third of the divorced, one-fifth of the never-married, and one-thirty-fifth of the married women. The grades of five-sixths of the women in the population were set down as “not applicable” ; all dependents (including married women living with their husbands) would, of course, be so shown.
The figures relating to the employment of women, especially as wage-earners, and especially married women and widows with children, are of vast social importance, and it is a pity that no figures exist for past census years on the basis of which light might be thrown on the question of whether the tendency in this respect is progressive or retrograde; also on the question of the extent to which conditions as regards the employment of women have been altered by the war.
Amongst males a fairly large proportion of those whose grade was set down as “not applicable” would consist of the younger people who were still dependents at the date of the census. After eliminating all those whose conjugal condition was not specified, tables have been compiled showing (a) the proportion of the total males in each grade who are in each of the different conjugal conditions; (b) the proportion of the total males in each of the different conjugal conditions who are in each grade. These tables are now quoted.
| Grade. | Conjugal Condition. | ||||
|---|---|---|---|---|---|
| Never Married. | Married. | Widowed. | Divorced. | Totals. | |
| E | 16.361 | 80.121 | 3.354 | 0.164 | 100.000 |
| 0 | 24.298 | 70.875 | 4.616 | 0.211 | 100.000 |
| A | 92.563 | 5.981 | 1.423 | 0.033 | 100.000 |
| W | 45.866 | 51.054 | 2.871 | 0.209 | 100.000 |
| W.N. | 43.836 | 49.313 | 6.427 | 0.424 | 100.000 |
| N.A | 93.152 | 4.735 | 2.078 | 0.035 | 100.000 |
| N.S | 38.599 | 55.537 | 5.565 | 0.299 | 100.000 |
| All grades | 60.370 | 36.685 | 2.807 | 0.138 | 100.000 |
| Grade. | Conjugal Condition. | ||||
|---|---|---|---|---|---|
| Never Married. | Married. | Widowed. | Divorced. | Totals. | |
| B | 2,127 | 17,138 | 9,376 | 9,342 | 7,847 |
| 0 | 4,067 | 19,521 | 16,617 | 15,395 | 10,104 |
| A | 3,385 | 0,36O | 1,120 | 0,526 | 2,208 |
| w | 30,356 | 55,604 | 40,870 | 60,395 | 39,955 |
| W.N. | 0,778 | 1,440 | 2,452 | 3,290 | 1,071 |
| N.A | 58,859 | 4,924 | 28,239 | 9,605 | 38,146 |
| N.S | 0,428 | 1,013 | 1,326 | 1,447 | 0,669 |
| Totals | 100,000 | 100,000 | 100,000 | 100,000 | 100,000 |
It will be at once seen that the proportion of the married is highest in the employing grade, and next highest amongst those working on their own account. It is lowest among relatives assisting and amongst those to whose occupation the classification by grades is inapplicable. The proportion of widowers and the divorced is highest among wage-earners unemployed, while the proportion of never-married is highest among those to whose occupation the classification by grades is not applicable (mainly dependents, no doubt), and among relatives assisting.
On turning to the second table it is seen that the proportion of employers and of those working on their own account is lowest among those never married and highest among those married. The proportion of relatives assisting is highest among those never married, and of wage-earners amongst those divorced, with married persons a close second. The proportion of wage-earners unemployed is highest among the divorced.
The majority of the above results will be seen to follow closely on the circumstances determining the different age-constitutions of the grades and the conjugal conditions.
Unemployed males in October, 1916, numbered 5,919, or 1.67 per cent, of the male breadwinners, compared with 1.97 in April, 1911, and 2.53 in April, 1906. Females out of employment totalled 1,15,6, or 1;16 per cent, of the female breadwinners.
Details of the numbers of unemployed of both sexes are now briefly summarized by age-groups.
| Length of Unemployment. | Under 20 Years. | 20 and under 25 Years. | 25 and under35 Years. | 35 and under45 Years. | 45 and under55 Years. | 55 and under65 Years. | 05 Years and over. | Not stated. | Total. |
|---|---|---|---|---|---|---|---|---|---|
| Under 2 weeks | 49 | 58 | 119 | 102 | 65 | 35 | 13 | 2 | 443 |
| 2 weeks and under 4 | 148 | 195 | 332 | 282 | 241 | 146 | 87 | 3 | 1,434 |
| 4 weeks and under 8 | 135 | 172 | 299 | 259 | 213 | 128 | 108 | .. | 1,314 |
| 8 weeks and under 16 | 78 | 121 | 229 | 205 | 163 | 160 | 138 | .. | 1,094 |
| 16 weeks and under 26 | 29 | 56 | 82 | 82 | 72 | 79 | 59 | .. | 459 |
| 26 weeks and under 52 | 22 | 53 | 102 | 77 | 89 | 109 | 109 | 1 | 562 |
| Over 1 year | 6 | 27 | 59 | 69 | 76 | 89 | 114 | .. | 440 |
| Not stated | 89 | 189 | 289 | 204 | 155 | 168 | 233 | 2 | 1,329 |
| Totals | 556 | 871 | 1,511 | 1,280 | 1,074 | 914 | 861 | 8 | 7,075 |
It is substantially true that the ranks of the unemployed are recruited from amongst those persons who normally rank as salary- and wage-earners. For this reason it is sufficiently accurate to compile rates of unemployment from a comparison of the numbers of persons actually unemployed with the, total obtained by adding the numbers unemployed to the number of those who are earning wages and salary. The second term of the comparison represents the number subject to the risk of unemployment, and with this as divisor and the number of unemployed as dividend, the quotient multiplied by 100 so as to be expressed as a percentage is what might be termed the “unemployment rate.”
It will be noted from the table on page 137 that the unemployment rate tends to increase with age. Males only are considered, and in view of the greater social importance of male than female unemployment it has been deemed desirable to treat the matter in greater detail than in the last table.
An example from the table is perhaps necessary in order to bring out the significance thereof. To take the first figure, 0.109: This means that, of all the wage-earners under 15 employed and unemployed who were returned in the census, 0.109 per cent. had been unemployed one but less than two complete weeks. Continuing, we see that 0.073 per cent. had been unemployed two weeks but less than three, and so on. Finally, we note that 0.471 per cent, of males under 15 of the wage-earning grade were unemployed altogether, while, continuing along the last line horizontally, it is observed that this proportion becomes higher and higher as the age becomes greater. The increase is not absolutely regular, but approximates more or less closely to uniformity. It is also noteworthy that the majority of persons unemployed have been in that condition at the most from two to four weeks. The proportion of persons unemployed for longer periods falls gradually with an increase in the length of the period.
A second table on page 138 shows similar figures, distinguishing classes of occupation in lieu of ages. Similar features with regard to the length of unemployment emerge as in connection with the prior table. It will also be noted that the unemployment rate is lowest for the professional class and for those engaged in transport, while it is highest in domestic occupations, and above the average also in industrial and primary extractive pursuits in that order. Unemployment in the last-named occupation is, however, clearly a seasonal phenomenon—e.g., shearing and harvesting operations attract a large number of workers in the summer months, for the rate in this occupation is much lower for longer durations than in the commercial class, although the latter class has a considerably lower unemployment rate in the aggregate.
| Length of Unemployment in Complete Weeks. | Under 15. | 15 and under 20. | 20 and under 21. | 21 and under 25. | 25 and under 30. | 30 and under 35. | 35 and under 40. | 40 and under 45. | 45 and under 50. | 50 and under 55. | 55 and under 60. | 60 and under 65. | 65 and under 70. | 70 and under 75. | 75 and over. | Unspecified. | Totals. |
|---|---|---|---|---|---|---|---|---|---|---|---|---|---|---|---|---|---|
| 1 | 0.109 | 0.111 | 0.075 | 0.199 | 0.193 | 0.158 | 0.192 | 0.145 | 0.187 | 0.160 | 0.144 | 0.255 | 0.170 | 0.242 | 0.173 | 0.583 | 0.166 |
| 2 | 0.073 | 0.204 | 0.261 | 0.332 | 0.322 | 0.248 | 0.287 | 0.277 | 0.410 | 0.434 | 0.410 | 0.523 | 0.656 | 0.613 | 0.605 | 0.291 | 0.317 |
| 3. | 0.073 | 0.102 | 0.206 | 0.247 | 0.177 | 0.138 | 0.209 | 0.250 | 0.293 | 0.259 | 0.307 | 0.403 | 0.510 | 0.664 | 0.345 | 0.583 | 0.217 |
| 4. | 0.036 | 0.127 | 0.149 | 0.209 | 0.210 | 0.164 | 0.182 | 0.245 | 0.282 | 0.266 | 0.205 | 0.349 | 0.608 | 0.523 | 0.432 | .. | 0.213 |
| 5 | 0.036 | 0.044 | 0.037 | 0.043 | 0.051 | 0.064 | 0.054 | 0.091 | 0.117 | 0.137 | 0.164 | 0.094 | 0.243 | 0.153 | 0.345 | .. | 0.078 |
| 6 | 0.036 | 0.054 | 0.093 | 0.160 | 0.108 | 0.129 | 0.113 | 0.154 | 0.170 | 0.229 | 0.154 | 0.309 | 0.559 | 0.459 | 0.605 | .. | 0.146 |
| 7. | .. | 0.009 | 0.037 | 0.016 | 0.047 | 0.023 | 0.034 | 0.032 | 0.026 | 0.061 | 0.051 | 0.080 | 0.049 | 0.102 | 0.259 | .. | 0.034 |
| 8. | 0.036 | 0.029 | 0.056 | 0.113 | 0.088 | 0.087 | 0.123 | 0.091 | 0.123 | 0.167 | 0.216 | 0.335 | 0.462 | 0.459 | 0.259 | .. | 0.117 |
| 9 | .. | 0.016 | 0.019 | 0.016 | 0.020 | 0.019 | 0.024 | 0.018 | 0.016 | 0.030 | 0.031 | 0.094 | 0.122 | 0.102 | 0.087 | .. | 0024 |
| 10 | .. | 0.029 | 0.019 | 0.064 | 0.050 | 0.051 | 0.048 | 0.049 | 0.075 | 0.068 | 0.133 | 0.148 | 0.267 | 0.153 | 0.432 | .. | 0.064 |
| 11 to 15 | 0.036 | 0.060 | 0.056 | 0.150 | 0.169 | 0.109 | 0.137 | 0.218 | 0.245 | 0.213 | 0.307 | 0.577 | 1.289 | 1.021 | 0.605 | .. | 0.199 |
| 16 to 20 | .. | 0.038 | 0.093 | 0.118 | 0.081 | 0.042 | 0.082 | 0.050 | 0.133 | 0.182 | 0.226 | 0.281 | 0.510 | 0.561 | 0.345 | .. | 0.106 |
| 21 to 25 | .. | 0.016 | 0.019 | 0.016 | 0.051 | 0.039 | 0.065 | 0.049 | 0.032 | 0.084 | 0.123 | 0.228 | 0.340 | 0.255 | 0.259 | .. | 0.059 |
| 26 to 30 | .. | 0.013 | 0.037 | 0.032 | 0.034 | 0.032 | 0.027 | 0.045 | 0.064 | 0.145 | 0.216 | 0.242 | 0.364 | 0.204 | 0.605 | .. | 00.64 |
| 31 to 35 | .. | 0.006 | 0.037 | 0.021 | 0.010 | 0.013 | 0.024 | 0.018 | 0.032 | 0.039 | 0.051 | 0.067 | 0.146 | 0.255 | 0.087 | .. | 0.026 |
| 36 to 40 | .. | 0.013 | .. | 0.011 | 0.014 | 0.023 | 0.017 | 0.023 | 0.059 | 0.068 | 0.062 | 0.134 | 0.291 | 0.561 | 0.259 | .. | 0.039 |
| 41 to 52 | .. | 0.016 | .. | 0.059 | 0.034 | 0.042 | 0.041 | 0.036 | 0.069 | 0.076 | 0.216 | 0.241 | 0.462 | 0.664 | 0.949 | 0.291 | 0.073 |
| 53 and over | .. | 0.013 | 0.075 | 0.107 | 0.061 | 0.090 | 0.092 | 0.169 | 0.224 | 0.229 | 0.318 | 0.724 | 1.362 | 1.327 | 2.677 | .. | 0.180 |
| Not stated | 0.036 | 0.150 | 0.729 | 0.548 | 0.393 | 0.345 | 0.339 | 0.333 | 0.410 | 0.449 | 0.789 | 1.113 | 2.066 | 3.318 | 6.562 | 0.583 | 0.489 |
| Total, all cases | 0.471 | 1.050 | 1.998 | 2.461 | 2.113 | 1.816 | 2.090 | 2.293 | 2.9X7 | 3.296 | 4.123 | 6.197 | 10.476 | 11.638 | 15.890 | 2.331 | 2.611 |
| Length of Unemployment in Complete Weeks. | Professional. | Domestic. | Commercial. | Transport. | Industrial. | Primary. | Totals. |
|---|---|---|---|---|---|---|---|
| 1 | 0.062 | 0.315 | 0.099 | 0.164 | 0.204 | 0.178 | 0.166 |
| 2 | 0.149 | 0.416 | 0.214 | 0.246 | 0.408 | 0.344 | 0.317 |
| 3 | 0.077 | 0.358 | 0.174 | 0.109 | 0.303 | 0.223 | 0.217 |
| 4 | 0.077 | 0.272 | 0.189 | 0.129 | 0.257 | 0.364 | 0.213 |
| 5 | 0.046 | 0.143 | 0.051 | 0.052 | 0.104 | 0.074 | 0.078 |
| 6 | 0.088 | 0.201 | 0.135 | 0.082 | 0.195 | 0.137 | 0.146 |
| 7 | 0.006 | 0.073 | 0.021 | 0.022 | 0.054 | 0.020 | 0.034 |
| 8 | 0.057 | 0.201 | 0.108 | 0.057 | 0.151 | 0.123 | 0.117 |
| 9 | 0.015 | 0.014 | 0.009 | 0.022 | 0.043 | 0.016 | 0.024 |
| 10 | 0.046 | 0.057 | 0.076 | 0.041 | 0.091 | 0.037 | 0.064 |
| 11 to 15 | 0.118 | 0.272 | 0.177 | 0.101 | 0.257 | 0.207 | 0.199 |
| 16 to 20 | 0.072 | 0.229 | 0.099 | 0.063 | 0.137 | 0.088 | 0.106 |
| 21 to 25 | 0.052 | 0.072 | 0.078 | 0.022 | 0.078 | 0.045 | 0.059 |
| 26 to 30 | 0.046 | 0.100 | 0.054 | 0.036 | 0.083 | 0.064 | 0.064 |
| 31 to 35 | 0.026 | 0.042 | 0.040 | 0.016 | 0.032 | 0.014 | 0.026 |
| 36 to 40 | 0.015 | 0.042 | 0.051 | 0.029 | 0.050 | 0.031 | 0.039 |
| 41 to 52 | 0.026 | 0.143 | 0.057 | 0.041 | 0.092 | 0.084 | C.073 |
| 53 and over | 0.128 | 0.344 | 0.175 | 0.123 | 0.222 | 0.155 | 0.180 |
| Not stated | 0.474 | 0.817 | 0.430 | 0.347 | 0.524 | 0.532 | 0.489 |
| Totals | 1.580 | 4.111 | 2.237 | 1.702 | 3.285 | 2.641 | 2.611 |
The actual vocations in which persons of both sexes out of employment at the date of the census were ordinarily engaged were as under:—
| Persons engaged in— | No. |
|---|---|
| Government, defence, law, &c. | 139 |
| Religion, health, education, &c. | 377 |
| Supplying board and lodging | 255 |
| Domestic service and attendance | 511 |
| Dealing in textile fabrics, &c. | 160 |
| Dealing in food, drinks, &c. | 225 |
| General merchants and dealers | 331 |
| Traffic on seas and rivers | 408 |
| Art and mechanic productions | 432 |
| Working in food, drinks, &c. | 404 |
| Working in metals | 151 |
| Road and building construction | 741 |
| Agricultural pursuits | 470 |
| Pastoral pursuits | 492 |
| Mining and quarrying | 317 |
| Other occupations. | 1,329 |
| Total | 7,075 |
Table of Contents
Table of Contents
It has already been explained in Section II of this report that figures quoted throughout, except where this presumption is expressly negatived, relate to the population exclusive of Maoris and of residents of the Cook and other Pacific islands.
It will be at once recognized that the figures given in the preceding sections include, however, a fair proportion of “race aliens,” who, for statistical purposes, may be defined as persons of other than European descent. In considering this definition the distinction in meaning between “descent” and “birth” should be borne in mind. An investigation into the birthplaces of the population will be found in Section V hereof.
The special inquiry into the matter of race aliens in the 1916 census is an innovation, and accordingly data are not available (excepting in a few instances) for comparisons to be made extending over a series of years. It may be mentioned, however, in this connection that immigrants who are race aliens are required to pass an education test before admission into the Dominion. Poll-taxes on aliens entering the country have, moreover, been in operation in certain cases as far back as 1881. As the sequel will show, there is reason to believe that these measures had considerable effect in keeping down the numbers of race aliens.
The portion of the schedules dealing with race aliens is or of the two places in the whole census inquiry where a categorical answer was not required to a query. The instructions did not require “Yes” or “No” to be answered to the question whether a race alien or not, but merely required that if a person was a race alien he or she should be designated by the name of the race applicable. This defect may have resulted in a partial understatement of the number of race aliens, but a consideration of the figures relating to Chinese (which have existed for a number of years) suggests that any such understatement was probably not large.
Maoris are separately treated in Section XV of this report, as are also half-castes living both after the Maori and after the European fashion. The former portion of the Maori half-castes were enumerated along with the Maoris, but the latter portion were treated as race aliens and enumerated with them. In this discussion relating to race aliens details as to Maoris living as Europeans are, however, expressly excluded for two reasons:—
The term “alien” as applied to them is, for historical reasons, a misnomer, though convenient for certain purposes.
The fact that the main source from which Maori half-castes are recruited is “natural increase,” or the excess of births over deaths, distinguishes them rather sharply from race aliens proper, whose main source of recruiting is migration.
The characteristics of the Maori half-caste population differ on this account from those of other half-castes in several important respects.
At the 1916 census there were 3,704 race aliens, only 447, or 14 per cent., of whom were females. The great preponderance of males is wholly due to the fact of the greater inertia of females as regards migration, especially to lands inhabited by people enjoying social customs very different from their own.
The races chiefly represented amongst the race aliens were Chinese, Syrians, Hindus, Negroes, Japanese, and Fijians, in that order. No other race had more than eighteen representatives (of the full and half blood combined) in the Dominion.
Details are appended.
Race Aliens.—General Summary, Census, 1916.
| Full Blood. | Half-caste. | Totals. | |||||||
|---|---|---|---|---|---|---|---|---|---|
| Race. | Males. | Females. | Both Sexes. | Males. | Females. | Both Sexes. | Males. | Females. | Both Sexes. |
| Chinese | 1,933 | 79 | 2,012 | 84 | 51 | 135 | 2,017 | 130 | 2,147 |
| Japanese | 52 | .. | 52 | 3 | 4 | 7 | 55 | 4 | 59 |
| Siamese | 1 | .. | 1 | .. | .. | .. | 1 | .. | 1 |
| Siamese | 6 | .. | 6 | 4 | 2 | 6 | 10 | 2 | 12 |
| Hindus | 160 | 5 | 165 | 7 | 9 | 16 | 167 | 14 | 181 |
| Afghans | 2 | .. | 2 | .. | .. | .. | 2 | .. | 2 |
| Persians | 2 | .. | 2 | .. | .. | .. | 2 | .. | 2 |
| Asiatic Turks | .. | 1 | 1 | .. | .. | .. | .. | 1 | 1 |
| Asiatic Jews | 3 | 2 | 5 | .. | .. | .. | 3 | 2 | 5 |
| Syrians | 262 | 186 | 448 | 5 | 6 | 11 | 267 | 192 | 459 |
| Arabs | 10 | .. | 10 | .. | .. | .. | 10 | .. | 10 |
| Egyptians | 2 | .. | 2 | .. | .. | .. | 2 | .. | 2 |
| Abyssinians | 1 | .. | 1 | 2 | 1 | 3 | 3 | 1 | 4 |
| Negroes | 49 | 2 | 51 | 30 | 14 | 44 | 79 | 16 | 95 |
| American Indians | .. | .. | .. | 1 | .. | 1 | 1 | .. | 1 |
| Australian Aborigines | 1 | .. | 1 | 3 | 1 | 4 | 4 | 1 | 5 |
| Melanesians | 16 | .. | 16 | .. | 2 | 2 | 16 | 2 | 18 |
| Polynesians— | |||||||||
| Fijians | 15 | 8 | 23 | 14 | 12 | 26 | 29 | 20 | 49 |
| Others and undefined | 46 | 13 | 59 | 43 | 49 | 92 | 89 | 62 | 151 |
| Totals | 2,561 | 296 | 2,857 | 196 | 151 | 347 | 2,757 | 447 | 3,204 |
The following tables show the number of all race aliens, full-blood and half-caste, in each provincial district; also the proportions borne by such to the total population exclusive of Maoris.
Race Aliens.—Numbers, by Provincial Districts, Census, 1916.
| Race. | Provincial District. | ||||||||||||||||||||||||
|---|---|---|---|---|---|---|---|---|---|---|---|---|---|---|---|---|---|---|---|---|---|---|---|---|---|
| Auckland. | Taranaki. | Hawke's Bay. | Wellington. | Marlborough. | Nelson. | Westland. | Canterbury. | Otago. | Southland. | Military and Internment Camps. | Totals. | ||||||||||||||
| Full Blood. | Half-caste. | Full Blood. | Half-caste. | Full Blood. | Half-caste. | Full Blood. | Half-caste. | Full Blood. | Half-caste. | Full Blood. | Half-caste. | Full Blood. | Half-caste. | Full Blood. | Half-caste. | Full Blood. | Half-caste. | Full Blood. | Half-caste. | Full Blood | Half-caste. | Full Blood. | Half-Caste. | Totals. | |
| MALES. | |||||||||||||||||||||||||
| Chinese | 414 | 14 | 44 | 12 | 132 | .. | 660 | 18 | 16 | .. | 71 | 4 | 119 | 3 | 103 | 5 | 298 | 21 | 76 | 6 | .. | 1 | 1,933 | 84 | 2,017 |
| Japanese | 5 | 2 | .. | .. | .. | .. | 1 | .. | .. | .. | 3 | .. | .. | .. | 1 | 1 | 42 | .. | .. | .. | .. | .. | 52 | 3 | 55 |
| Siamese | .. | .. | .. | .. | .. | .. | 1 | .. | .. | .. | .. | .. | .. | .. | .. | .. | .. | .. | .. | .. | .. | .. | 1 | .. | 1 |
| Cingalese | 2 | 1 | 1 | .. | .. | .. | .. | .. | .. | 1 | .. | 1 | .. | .. | 1 | 1 | .. | .. | 1 | .. | 1 | .. | 6 | 4 | 10 |
| Hindus | 115 | 2 | 3 | .. | 2 | .. | 25 | 1 | 1 | .. | 3 | 1 | .. | .. | 8 | 1 | 2 | 1 | .. | .. | 1 | 1 | 160 | 7 | 167 |
| Afghans | .. | .. | .. | .. | .. | .. | 2 | .. | .. | .. | .. | .. | .. | .. | .. | .. | .. | .. | .. | .. | .. | .. | 2 | .. | 2 |
| Persians | 2 | .. | .. | .. | .. | .. | .. | .. | .. | .. | .. | .. | .. | .. | .. | .. | .. | .. | .. | .. | .. | .. | 2 | .. | 2 |
| Asiatic Jews | 1 | .. | .. | .. | .. | .. | 2 | .. | .. | .. | .. | .. | .. | .. | .. | .. | .. | .. | .. | .. | .. | .. | 3 | .. | 3 |
| Syrians | 69 | 5 | 18 | .. | 11 | .. | 69 | .. | 4 | .. | 12 | .. | 5 | .. | 20 | .. | 47 | .. | 7 | .. | .. | .. | 262 | 5 | 267 |
| Arabs | 2 | .. | .. | .. | .. | .. | 8 | .. | .. | .. | .. | .. | .. | .. | .. | .. | .. | .. | .. | .. | .. | .. | 10 | .. | 10 |
| Egyptians. | .. | .. | .. | .. | .. | .. | 2 | .. | .. | .. | .. | .. | .. | .. | .. | .. | .. | .. | .. | .. | .. | .. | 2 | .. | 2 |
| Abyssinians | 1 | 2 | .. | .. | .. | .. | .. | .. | .. | .. | .. | .. | .. | .. | .. | .. | .. | .. | .. | .. | .. | .. | 1 | 2 | 3 |
| Negroes | 19 | 12 | 2 | 2 | 3 | 1 | 16 | 9 | .. | .. | .. | 1 | .. | 1 | 3 | 3 | 4 | 1 | 2 | .. | .. | .. | 49 | 30 | 79 |
| American Indians | .. | 1 | .. | .. | .. | .. | .. | .. | .. | .. | . | .. | .. | .. | .. | .. | .. | .. | .. | .. | .. | .. | .. | 1 | 1 |
| Australian Aborigines | .. | 1 | 1 | .. | .. | .. | .. | .. | .. | .. | .. | .. | .. | .. | .. | 2 | .. | .. | .. | .. | .. | .. | 1 | 3 | 4 |
| Melanesians | 16 | .. | .. | .. | .. | .. | .. | .. | .. | .. | .. | .. | .. | .. | .. | .. | .. | .. | .. | .. | .. | .. | 16 | .. | 16 |
| Polynesians— | |||||||||||||||||||||||||
| Fijians. | 8 | 10 | 1 | .. | .. | .. | 2 | 1 | .. | .. | .. | .. | .. | .. | .. | .. | 2 | .. | .. | .. | 2 | 3 | 15 | 14 | 29 |
| Others and undefined | 39 | 36 | 1 | .. | .. | 1 | 3 | 2 | .. | .. | .. | 3 | .. | .. | 1 | .. | 1 | .. | .. | .. | 1 | 1 | 46 | 43 | 89 |
| Totals | 693 | 86 | 71 | 14 | 148 | 2 | 791 | 31 | 21 | 1 | 89 | 10 | 124 | 4 | 137 | 13 | 396 | 23 | 86 | 6 | 5 | 6 | 2,561 | 196 | 2,757 |
| FEMALES. | |||||||||||||||||||||||||
| Chinese | 23 | 9 | 3 | 9 | 7 | .. | 37 | 12 | 4 | .. | 1 | 1 | .. | 4 | 1 | 3 | 3 | 10 | .. | 3 | .. | .. | 79 | 51 | 130 |
| Japanese | .. | 2 | .. | .. | .. | .. | .. | .. | .. | .. | .. | .. | .. | .. | .. | .. | .. | .. | .. | 2 | .. | .. | .. | 4 | 4 |
| Cingalese | .. | 1 | .. | .. | .. | .. | .. | .. | .. | .. | .. | 1 | .. | .. | .. | .. | .. | .. | .. | .. | .. | .. | .. | 2 | 2 |
| Hindus | 3 | 2 | .. | .. | .. | 1 | .. | 1 | .. | .. | 1 | .. | .. | 1 | .. | 2 | 1 | 2 | .. | .. | .. | .. | 5 | 9 | 14 |
| Asiatic Turks | 1 | .. | .. | .. | .. | .. | .. | .. | .. | .. | .. | .. | .. | .. | .. | .. | .. | .. | .. | .. | .. | .. | 1 | .. | 1 |
| Asiatic Jews | 1 | .. | .. | .. | .. | .. | 1 | .. | .. | .. | .. | .. | .. | .. | .. | .. | .. | .. | .. | .. | .. | .. | 2 | .. | 2 |
| Syrians | 55 | 3 | 7 | 2 | 9 | .. | 44 | 1 | 4 | .. | 2 | .. | 5 | .. | 21 | .. | 38 | .. | 1 | .. | .. | .. | 186 | 6 | 192 |
| Abyssinians | .. | 1 | .. | .. | .. | .. | .. | .. | .. | .. | .. | .. | .. | .. | .. | .. | .. | .. | .. | .. | .. | .. | .. | 1 | 1 |
| Negroes | 2 | 8 | .. | .. | .. | .. | .. | 6 | .. | .. | .. | .. | .. | .. | .. | .. | .. | .. | .. | .. | .. | .. | 2 | 14 | 16 |
| Australian Aborigines | .. | .. | .. | .. | .. | 1 | .. | .. | .. | .. | .. | .. | .. | .. | .. | .. | .. | .. | .. | .. | .. | .. | .. | 1 | 1 |
| Melanesians | .. | .. | .. | .. | .. | .. | .. | 1 | .. | .. | .. | 1 | .. | .. | .. | .. | .. | .. | .. | .. | .. | .. | .. | 2 | 2 |
| Polynesians— | |||||||||||||||||||||||||
| Fijians | 7 | 12 | .. | .. | .. | .. | .. | .. | .. | .. | .. | .. | .. | .. | .. | .. | 1 | .. | .. | .. | .. | .. | 8 | 12 | 20 |
| Others and undefined | 8 | 40 | .. | .. | .. | 2 | 2 | 2 | .. | .. | 2 | 5 | .. | .. | 1 | .. | .. | .. | .. | .. | .. | .. | 13 | 49 | 62 |
| Totals | 100 | 78 | 10 | 11 | 16 | 4 | 84 | 23 | 8 | .. | 6 | 8 | 5 | 5 | 23 | 5 | 43 | 12 | 1 | 5 | .. | .. | 296 | 151 | 447 |
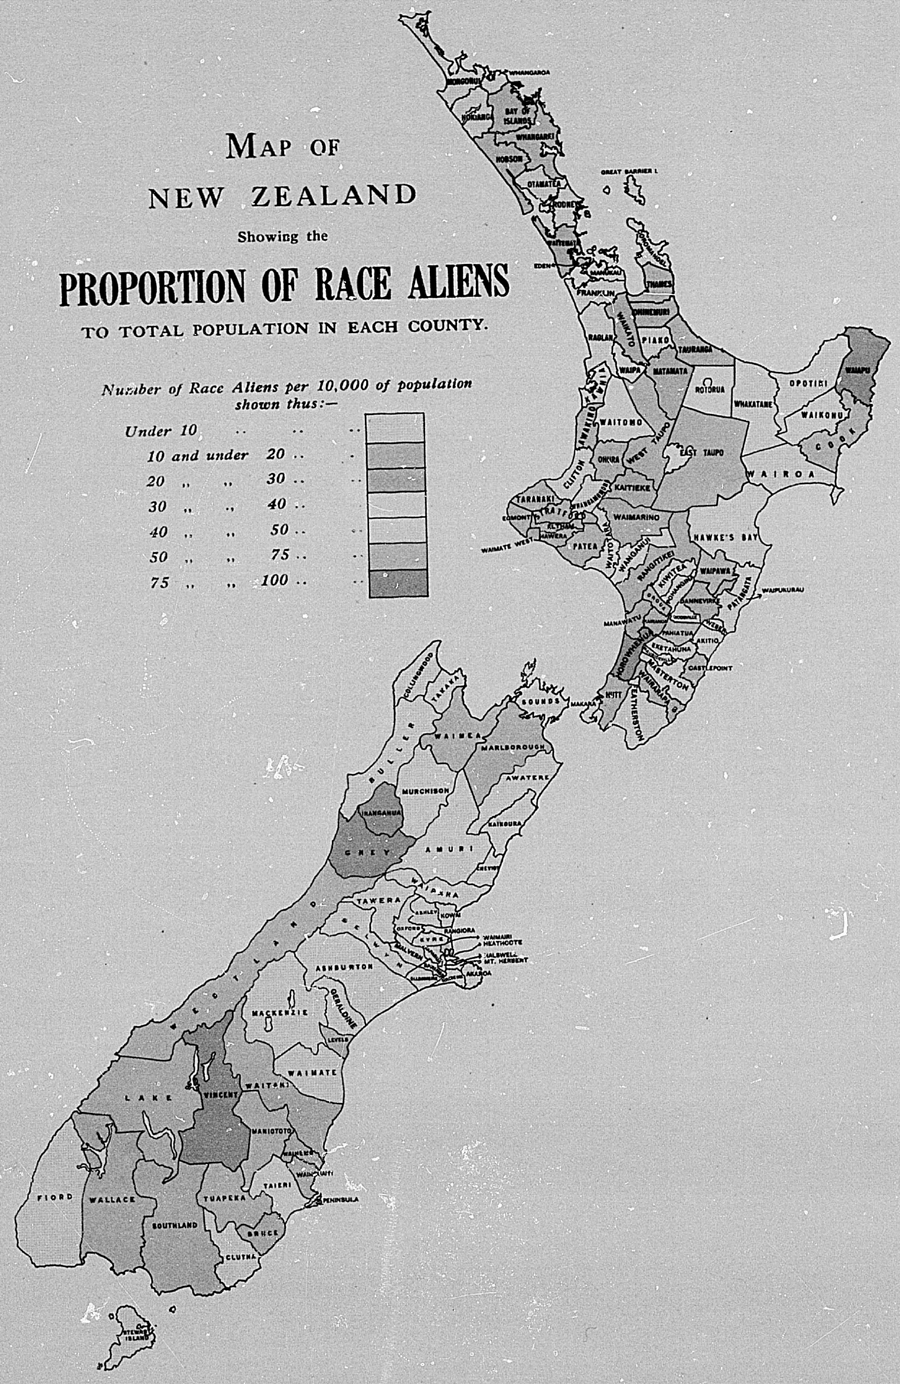
Race Aliens.—Numbers and Proportions per 10,000 of Population, by Provincial Districts, Census, 1916.
| Provincial District. | Males. | Females. | Totals. | Proportion of Race Aliens to 10,000 of Population |
|---|---|---|---|---|
| Auckland | 779 | 178 | 957 | 31 |
| Taranaki | 85 | 21 | 106 | 19 |
| Hawke's Bay | 150 | 20 | 170 | 31 |
| Wellington | 822 | 107 | 929 | 42 |
| Marlborough | 22 | 8 | 30 | 18 |
| Nelson | 99 | 14 | 113 | 23 |
| Westland | 128 | 10 | 138 | 98 |
| Canterbury | 150 | 28 | 178 | 10 |
| Otago | 419 | 55 | 474 | 36 |
| Southland | 92 | 6 | 98 | 17 |
| Military and internment camps | 11 | .. | 11 | 13 |
| Totals | 2,757 | 447 | 3,204 | 29 |
Canterbury is conspicuously low, having had only ten race aliens to 10,000 of population. The high figure in Westland is accounted for by the attraction of the goldfields for the Chinese in days before immigrational restrictions operated. The high figures in Wellington and Otago are due to the relatively large numbers of Chinese in Wellington and Dunedin. Wellington and Auckland are high, too, by reason of the fact that their principal cities are usually the first ports of call for foreign-trading vessels; while Otago figures are further swollen by the presence in harbour at Port Chalmers on census night of an overseas vessel largely manned by an alien crew.
The accompanying map illustrates the proportions of race aliens to the total population in each county (inclusive of interior boroughs).
The twelve counties which contained the highest percentages of race aliens to the total population were the following:—
| Per Cent. | |
|---|---|
| Inangahua | 0.99 |
| Horowhenua | 0.95 |
| Waiapu | 0.92 |
| Grey | 0.91 |
| Vincent | 0.87 |
| Westland | 0.74 |
| West Taupo | 0.69 |
| Kairanga | 0.67 |
| Waikouaiti | 0.66 |
| Tuapeka | 0.65 |
| Lake | 0.59 |
| East Taupo | 0.58 |
The high percentages in Inangahua and Horowhenua (the latter including Levin Borough) were due to the numbers of Chinese there resident. Strangely enough, there were no Chinese in Waiapu, the county which stands next, its percentage being swollen by the fewness of inhabitants generally (excepting Maoris), and by the presence of a medley of aliens, mainly Japanese, Syrians, and Hindus. Chinese, again, mainly accounted for the high percentages in Grey, Vincent. Westland, Tuapeka, and Lake, all of which, like Inangahua, are old-time gold-mining districts. Indeed, the high percentage is due to the prevalence of persons of this race in all the remaining cases except West Taupo, where Chinese and Hindus are both present, and East Taupo, where three Syrians are sufficient to produce the rate shown above.
There were, on the other hand, a considerable number of counties in which the number of race aliens was nil.
The following table is instructive. It will be at once apparent that, great as is the tendency for race aliens of the full blood to congregate in the towns, this tendency is even greater in the case of those of the half-blood. Females especially; both full and half blood, greatly preponderate in the towns.
Race Aliens.—Town and Country Population, Census, 1916.
| Race. | Boroughs. | Counties (excluding Interior Boroughs). | Totals. | |||||||||
|---|---|---|---|---|---|---|---|---|---|---|---|---|
| Full Blood. | Half-caste. | Full Blood. | Half-caste. | Full Blood. | Half-caste. | |||||||
| Males. | Females. | Males. | Females. | Males. | Females. | Males. | Females. | Males. | Females. | Males. | Females. | |
| Chinese | 1,178 | 73 | 60 | 37 | 755 | 6 | 24 | 14 | 1,933 | 79 | 84 | 51 |
| Hindus | 82 | 4 | 3 | 8 | 78 | 1 | 4 | 1 | 160 | 5 | 7 | 9 |
| Japanese | 45 | .. | 2 | 4 | 7 | .. | 1 | .. | 52 | .. | 3 | 4 |
| Syrians | 187 | 150 | 5 | 6 | 75 | 36 | .. | .. | 262 | 186 | 5 | 6 |
| Other Asiatics | 9 | 3 | 3 | 1 | 5 | .. | 1 | 1 | 14 | 3 | 4 | 2 |
| Negroes | 27 | 2 | 20 | 10 | 22 | .. | 10 | 4 | 49 | 2 | 30 | 14 |
| Other Africans | 12 | .. | 2 | 1 | 1 | .. | .. | .. | 13 | .. | 2 | 1 |
| Polynesians and Melanesians | 55 | 15 | 38 | 47 | 22 | 6 | 19 | 16 | 77 | 21 | 57 | 63 |
| Others | 1 | .. | .. | 1 | .. | .. | 4 | .. | 1 | .. | 4 | 1 |
| Totals. | 1,596 | 247 | 133 | 115 | 965 | 49 | 63 | 36 | 2,561 | 296 | 196 | 151 |
In this connection the following table is of interest:—
Ages of Race Aliens of Full Blood, Census, 1916.
| Ages. | Chinese. | Hindus. | Syrians. | Others. | Totals. | |||||
|---|---|---|---|---|---|---|---|---|---|---|
| Males. | Females. | Males. | Females. | Males. | Females. | Males. | Females. | Males. | Females. | |
| Under 5 years | 16 | 13 | .. | 2 | 15 | 21 | 1 | 2 | 32 | 38 |
| 5 and under 10 | 12 | 15 | 2 | .. | 22 | 13 | 4 | 1 | 40 | 29 |
| 10 and under 15 | 11 | 5 | 1 | .. | 13 | 19 | 3 | 1 | 28 | 25 |
| 15 and under 20 | 11 | .. | 7 | .. | 14 | 20 | 13 | 6 | 45 | 26 |
| 20 and under 25 | 32 | 8 | 34 | 2 | 19 | 11 | 35 | 1 | 120 | 22 |
| 25 and under 30 | 106 | 15 | 53 | .. | 26 | 19 | 40 | .. | 225 | 34 |
| 30 and under 35 | 207 | 10 | 23 | .. | 22 | 18 | 26 | 3 | 278 | 31 |
| 35 and under 40 | 148 | 5 | 13 | .. | 33 | 24 | 21 | 2 | 215 | 31 |
| 40 and under 45 | 211 | 6 | 6 | 1 | 30 | 10 | 16 | 2 | 263 | 19 |
| 45 and under 50 | 203 | 1 | 6 | .. | 24 | 7 | 13 | 5 | 246 | 13 |
| 50 and under 55 | 204 | .. | 6 | .. | 17 | 5 | 12 | 1 | 239 | 6 |
| 55 and under 60 | 209 | 1 | 2 | .. | 15 | 7 | 5 | 1 | 231 | 9 |
| 60 and under 65 | 234 | .. | .. | .. | 5 | 2 | 7 | 1 | 246 | 3 |
| 65 and under 70 | 169 | .. | 3 | .. | 3 | 6 | 2 | .. | 177 | 6 |
| 70 and under 75 | 83 | .. | .. | .. | 2 | 2 | 5 | .. | 90 | 2 |
| 75 and under 80 | 36 | .. | 1 | .. | 1 | .. | 1 | .. | 39 | .. |
| 80 and under 85 | 13 | .. | .. | .. | .. | 2 | 1 | .. | 14 | 2 |
| 85 and under 90 | 6 | .. | .. | .. | 1 | .. | 1 | .. | 8 | .. |
| 90 and under 95 | .. | .. | .. | .. | .. | .. | .. | .. | .. | .. |
| 95 and under 100 | 1 | .. | .. | .. | .. | .. | .. | .. | 1 | .. |
| Unspecified (adults) | 21 | .. | 3 | .. | .. | .. | .. | .. | 24 | .. |
| Totals | 1,933 | 79 | 160 | 5 | 262 | 186 | 206 | 26 | 2,561 | 296 |
Of 2,561 male and 296 female race aliens of the full blood only 100 males and 92 females were under 15 years of age at the date of the census. The small numbers at the earlier age-groups are what might be expected in the case of a section of the population recruited almost wholly from overseas. The close correspondence in the numbers of the two sexes at the earlier age-groups and the wide divergence elsewhere suggests that practically all the race aliens under 15 have been born locally.
To the generalization that race aliens are few at the earlier age-groups the Syrian race is a notable exception. While of all race aliens of the full blood Syrians constitute but 15 per cent., of all race aliens under 15 of the full blood they constitute as much as 53 per cent. This fact should be regarded in conjunction with the fact that, while amongst aliens of the full blood Syrian males 15 and over number 9 per cent. of the total male population of those ages, the corresponding figure for females is 65 per cent. There is considerable evidence, then, that persons of this race, most of whom immigrated many years ago, bringing with them their wives, have come to the Dominion with the fixed intention of making this country their home. The close correspondence in numbers between the two sexes at early age-groups shows that these people are now rearing their families in the land of their adoption. In the case of other alien races, notably perhaps the Chinese, on the other hand, New Zealand appears to have been regarded more as a temporary home than anything else.
A similar table relating to half-castes is also given:—
Ages of Half-caste Race Aliens, Census, 1916.
| Ages. | Chinese. | Hindus. | Syrians. | Others. | Totals. | |||||
|---|---|---|---|---|---|---|---|---|---|---|
| Males. | Females. | Males. | Females. | Males. | Females. | Males. | Females. | Males. | Females. | |
| Under 5 years | 8 | 5 | .. | .. | 1 | .. | 5 | 7 | 14 | 12 |
| 5 and under 10 | 8 | 6 | .. | .. | .. | 2 | 12 | 13 | 20 | 21 |
| 10 and under 15 | 9 | 8 | 1 | .. | 2 | 1 | 12 | 22 | 24 | 31 |
| 15 and under 20 | 8 | 9 | 2 | 3 | 2 | 1 | 17 | 14 | 29 | 27 |
| 20 and under 25 | 12 | 5 | 1 | 3 | .. | .. | 13 | 9 | 26 | 17 |
| 25 and under 30 | 2 | 7 | 1 | .. | .. | 1 | 9 | 6 | 12 | 14 |
| 30 and under 35 | 10 | 1 | .. | .. | .. | .. | 3 | 4 | 13 | 5 |
| 35 and under 40 | 7 | 7 | 1 | 2 | .. | .. | 13 | 2 | 21 | 11 |
| 40 and under 45 | 11 | 2 | .. | .. | .. | .. | 3 | 3 | 14 | 5 |
| 45 and under 50 | 3 | .. | 1 | .. | .. | .. | 8 | 2 | 12 | 9 |
| 50 and under 55 | 2 | 1 | .. | 1 | .. | 1 | 1 | 2 | 3 | 5 |
| 55 and under 60 | 1 | .. | .. | .. | .. | .. | 1 | .. | 2 | 1 |
| 60 and under 65 | 2 | .. | .. | .. | .. | .. | .. | 1 | 2 | .. |
| 65 and under 70 | 1 | .. | .. | .. | .. | .. | 1 | .. | 2 | .. |
| 70 and under 75 | .. | .. | .. | .. | .. | .. | .. | .. | .. | .. |
| 75 and under 80 | .. | .. | .. | .. | .. | .. | 1 | .. | 1 | .. |
| 80 and under 85 | .. | .. | .. | .. | .. | .. | 1 | .. | 1 | .. |
| 85 and under 90 | .. | .. | .. | .. | .. | .. | .. | .. | .. | .. |
| 90 and under 95 | .. | .. | .. | .. | .. | .. | .. | .. | .. | .. |
| 95 and under 100 | .. | .. | .. | .. | .. | .. | .. | .. | .. | .. |
| Unspecified (adults) | .. | .. | .. | .. | .. | .. | .. | .. | .. | .. |
| Totals | 84 | 51 | 7 | 9 | 5 | 6 | 100 | 85 | 196 | 151 |
With regard to half-caste race aliens, the figures are clearly rather different. Of 196 males and 151 females, it is probable from the more or less close correspondence in numbers as between the sexes that the majority have been born locally. This is further borne out by the fact that 58 males and 64 females were under 15, which is an exceedingly high proportion when compared with the corresponding figure relating to those of the full blood.
Section VI of this report has referred to the fact that race aliens largely account for the instances of the less represented religions. The following are the religions most frequently represented:—
| Religion, | Males. | Females. | Totals. | |||
|---|---|---|---|---|---|---|
| Full. | Half. | Full. | Half. | Full. | Half. | |
| Confucian | 1,314 | 4 | 22 | 2 | 1,336 | 6 |
| Buddhist | 58 | .. | .. | .. | 58 | .. |
| Church of England | 204 | 89 | 44 | 77 | 248 | 166 |
| Roman Catholic | 234 | 34 | 142 | 31 | 376 | 65 |
| Presbyterian | 59 | 22 | 14 | 10 | 73 | 32 |
| Methodist | 27 | 15 | 12 | 15 | 39 | 30 |
| Baptist | 46 | 5 | 6 | 2 | 52 | 7 |
Of 1,933 male Chinese of the full blood, 114 were Church of England, 48 Presbyterians, 46 Baptists, and 12 Roman Catholics, while 104 were returned as of “no religion.” and 182 “objected to state,” the remainder being variously distributed over a number of different forms of religion. Of 84 half-blood male Chinese no fewer than 72 were returned as Christians. The principal forms of religion represented were: Church of England of England).
It is substantially true that persons of the half-blood have tended to adopt a Christian religion rather than that of their alien parent. Converts to the Christian religion among race aliens of the full blood are, however, comparatively few.
The following figures are instructive:—
Race Aliens.—Degree of Education, Census, 1916.
| Race. | English Language: Read and Write. | English language: Read only. | Foreign Language only: Read and Write. | Foreign Language only: Read only, | Cannot Road. | Not stated. | Totals. | ||||||||
|---|---|---|---|---|---|---|---|---|---|---|---|---|---|---|---|
| Full Blood. | Half-caste. | Full Blood. | Half-caste. | Full Blood. | Half-caste. | Full Blood. | Half-caste. | Full Blood. | Half-caste. | Full Blood | Half-caste. | Full Blood. | Half-Caste. | Totals. | |
| MALES. | |||||||||||||||
| Chinese | 267 | 68 | 11 | .. | 1,098 | 2 | 216 | .. | 286 | 14 | 55 | .. | 1,933 | 84 | 2,017 |
| Japanese | 20 | 3 | .. | .. | 32 | .. | .. | .. | .. | .. | .. | .. | 52 | 3 | 55 |
| Siamese | .. | .. | .. | .. | .. | .. | .. | .. | .. | .. | 1 | .. | 1 | .. | 1 |
| Cingalese | 4 | 3 | .. | .. | 2 | .. | .. | .. | .. | 1 | .. | .. | 6 | 4 | 10 |
| Hindus | 87 | 7 | .. | .. | 35 | .. | 18 | .. | 19 | .. | 1 | .. | 160 | 7 | 167 |
| Afghans | 1 | .. | .. | .. | .. | .. | 1 | .. | .. | .. | .. | .. | 2 | .. | 2 |
| Persians | 1 | .. | .. | .. | 1 | .. | .. | .. | .. | .. | .. | .. | 2 | .. | 2 |
| Asiatic Jews | 3 | .. | .. | .. | .. | .. | .. | .. | .. | .. | .. | .. | 3 | .. | 3 |
| Syrians | 127 | 4 | 7 | .. | 51 | .. | 13 | .. | 61 | 1 | 3 | .. | 262 | 5 | 267 |
| Arabs | .. | .. | .. | .. | 6 | .. | .. | .. | 4 | .. | .. | .. | 10 | .. | 10 |
| Egyptians | 2 | .. | .. | .. | .. | .. | .. | .. | .. | .. | .. | .. | 2 | .. | 2 |
| Abyssinians | 1 | 2 | .. | .. | .. | .. | .. | .. | .. | .. | .. | .. | 1 | 2 | 3 |
| Negroes | 37 | 26 | 3 | .. | 1 | .. | .. | .. | 4 | 4 | 4 | .. | 49 | 30 | 79 |
| American Indians | .. | .. | .. | 1 | .. | .. | .. | .. | .. | .. | .. | .. | .. | 1 | 1 |
| Australian Aborigines | 1 | 2 | .. | .. | .. | .. | .. | .. | .. | 1 | .. | .. | 1 | 3 | 4 |
| Melanesians | 1 | .. | .. | .. | 8 | .. | .. | .. | 6 | .. | 1 | .. | 16 | .. | 16 |
| Polynesians— | |||||||||||||||
| Fijians | 11 | 13 | .. | .. | 1 | .. | 1 | .. | 2 | 1 | .. | .. | 15 | 14 | 29 |
| Others and undefined | 30 | 37 | .. | .. | 12 | .. | 1 | .. | 3 | 6 | .. | .. | 40 | 43 | 89 |
| Totals | 593 | 165 | 21 | 1 | 1,247 | 2 | 250 | .. | 385 | 28 | 65 | .. | 2,561 | 196 | 2,757 |
| FEMALES. | |||||||||||||||
| Chinese | 20 | 46 | 2 | .. | 25 | .. | 8 | .. | 23 | 5 | 1 | .. | 79 | 51 | 130 |
| Japanese | .. | 4 | .. | .. | .. | .. | .. | .. | .. | .. | .. | .. | .. | 4 | 4 |
| Cingalese | .. | 1 | .. | .. | .. | .. | .. | .. | .. | 1 | .. | .. | .. | 2 | 2 |
| Hindus | 2 | 9 | 1 | .. | .. | .. | .. | .. | 2 | .. | .. | .. | 5 | 9 | 14 |
| Asiatic Turks | 1 | .. | .. | .. | .. | .. | .. | .. | .. | .. | .. | .. | 1 | .. | 1 |
| Asiatic Jews | 1 | .. | .. | .. | .. | .. | 1 | .. | .. | .. | .. | .. | 2 | .. | 2 |
| Syrians | 69 | 3 | 3 | 1 | 25 | .. | 14 | .. | 67 | 2 | 8 | .. | 186 | 6 | 192 |
| Abyssinians | .. | 1 | .. | .. | .. | .. | .. | .. | .. | .. | .. | .. | .. | 1 | 1 |
| Negroes | 2 | 7 | .. | 1 | .. | .. | .. | .. | .. | 6 | .. | .. | 2 | 14 | 16 |
| Australian Aborigines | .. | 1 | .. | .. | .. | .. | .. | .. | .. | .. | .. | .. | .. | 1 | 1 |
| Melanesians | .. | 2 | .. | .. | .. | .. | .. | .. | .. | .. | .. | .. | .. | 2 | 2 |
| Polynesians— | |||||||||||||||
| Fijians | 5 | 12 | .. | .. | .. | .. | .. | .. | 3 | .. | .. | .. | 8 | 12 | 20 |
| Others and undefined | 9 | 44 | .. | .. | 1 | .. | .. | .. | 3 | 4 | .. | 1 | 13 | 49 | 62 |
| Totals | 109 | 130 | 6 | 2 | 51 | .. | 23 | .. | 98 | 18 | 9 | 1 | 296 | 151 | 447 |
The high standard of education attained by the Japanese as compared with Chinese and Syrians especially deserves comment. Of 59 Japanese in the country at the date of the census 27 could read and write English, while all the rest could read and write a foreign language only.
As might be expected, race aliens of the half-blood who cannot read and write English are comparatively rare, though the reverse holds in the case of those of the full blood. Females of the full, blood appear to have reached a considerably higher standard of education than the corresponding males.
A noticeable feature of the following table is the high proportion of Chinese males shown as never married, and this despite their relatively high age-constitution. The explanation is probably that the Chinese arrivals in the country are almost entirely young men who, not having married in China, find very few marriageable Chinese women in the Dominion. This tends to swell the proportion of those never married, who number nearly 80 per cent. of the males of the full blood, but only 66 per cent. of those of half-blood. Full figures are as follows:—
Race Aliens.—Conjugal Condition, Census, 1916.
| Race | Never Married. | Married. | Widowed. | Divorced. | Not stated. | Totals. | |||||||
|---|---|---|---|---|---|---|---|---|---|---|---|---|---|
| Full Blood. | Half-caste. | Full Blood. | Half-caste. | Full Blood. | Half-caste. | Full Blood. | Half-caste. | Full Blood | Half-caste. | Full Blood. | Half-Caste. | Totals. | |
| MALES | |||||||||||||
| Chinese | 1,747 | 57 | 123 | 26 | 17 | 1 | .. | .. | 46 | .. | 1,933 | 84 | 2,017 |
| Japanese | 35 | 2 | 17 | 1 | .. | .. | .. | .. | .. | .. | 52 | 3 | 55 |
| Siamese | 1 | .. | .. | .. | .. | .. | .. | .. | .. | .. | 1 | .. | 1 |
| Cingalese | 3 | 3 | 3 | 1 | .. | .. | .. | .. | .. | .. | 6 | 4 | 10 |
| Hindus | 54 | 5 | 103 | 2 | 2 | .. | .. | .. | 1 | .. | 160 | 7 | 167 |
| Afghans | .. | .. | 2 | .. | .. | .. | .. | .. | .. | .. | 2 | .. | 2 |
| Persians | .. | .. | 2 | .. | .. | .. | .. | .. | .. | .. | 2 | .. | 2 |
| Asiatic Jews | 2 | .. | 1 | .. | .. | .. | .. | .. | .. | .. | 3 | .. | 3 |
| Syrians | 115 | 5 | 137 | .. | 4 | .. | .. | .. | 6 | .. | 262 | 5 | 267 |
| Arabs | 10 | .. | .. | .. | .. | .. | .. | .. | .. | .. | 10 | .. | 10 |
| Egyptians | 1 | .. | 1 | .. | .. | .. | .. | .. | .. | .. | 2 | .. | 2 |
| Abyssinians | .. | 2 | 1 | .. | .. | .. | .. | .. | .. | .. | 1 | 2 | 3 |
| Negroes | 24 | 19 | 16 | 9 | 5 | 2 | 3 | .. | 1 | .. | 49 | 30 | 79 |
| American Indians | .. | .. | .. | 1 | .. | .. | .. | .. | .. | .. | .. | 1 | 1 |
| Australian Aborigines | 1 | 2 | .. | 1 | .. | .. | .. | .. | .. | .. | 1 | 3 | 4 |
| Melanesians | 13 | .. | 2 | .. | 1 | .. | .. | .. | .. | .. | 16 | .. | 16 |
| Polynesians— | |||||||||||||
| Fijians | 9 | 13 | 6 | 1 | .. | .. | .. | .. | .. | .. | 15 | 14 | 29 |
| Others and undefined | 32 | 35 | 11 | 7 | 2 | .. | .. | .. | 1 | 1 | 46 | 43 | 89 |
| Totals | 2,047 | 143 | 425 | 49 | 31 | 3 | 3 | .. | 55 | 1 | 2,561 | 196 | 2,757 |
| FEMALES. | |||||||||||||
| Chinese | 38 | 36 | 41 | 13 | .. | 2 | .. | .. | .. | .. | 79 | 51 | 130 |
| Japanese | .. | 2 | .. | 1 | .. | 1 | .. | .. | .. | .. | .. | 4 | 4 |
| Cingalese | .. | 2 | .. | .. | .. | .. | .. | .. | .. | .. | .. | 2 | 2 |
| Hindus | 3 | 6 | 1 | 3 | 1 | .. | .. | .. | .. | .. | 5 | 9 | 14 |
| Asiatic Turks | .. | .. | 1 | .. | .. | .. | .. | .. | .. | .. | 1 | .. | 1 |
| Asiatic Jews | 1 | .. | 1 | .. | .. | .. | .. | .. | .. | .. | 2 | .. | 2 |
| Syrians | 85 | 4 | 82 | 2 | 18 | .. | 1 | .. | .. | .. | 186 | 6 | 192 |
| Abyssinians | .. | 1 | .. | .. | .. | .. | .. | .. | .. | .. | .. | 1 | 1 |
| Negroes | 1 | 10 | 1 | 3 | .. | 1 | .. | .. | .. | .. | 2 | 14 | 16 |
| Australian Aborigines | .. | 1 | .. | .. | .. | .. | .. | .. | .. | .. | .. | 1 | 1 |
| Melanesians | .. | 1 | .. | .. | .. | 1 | .. | .. | .. | .. | .. | 2 | 2 |
| Polynesians— | |||||||||||||
| Fijians | 8 | 10 | .. | 2 | .. | .. | .. | .. | .. | .. | 8 | 12 | 20 |
| Others and undefined | 4 | 41 | 7 | 7 | 2 | 1 | .. | .. | .. | .. | 13 | 49 | 62 |
| Totals | 140 | 114 | 134 | 31 | 21 | 6 | 1 | .. | .. | .. | 296 | 151 | 447 |
It will be noted that the proportion never married is much lower for females than for males. This is due to the fact that while males, especially those who are unmarried, migrate comparatively freely females who are race aliens are not likely to become immigrants unless accompanying their husbands or families.
The following table shows the grades of occupations of race aliens as at the 1916 census:—
Race Aliens.—Grade of Occupation, Census, 1916.
| Race. | Employer. | Working on own Account. | Relative assisting. | Wage-earner. | Wage-earner unemployed. | Not applicable. | Not stated. | Totals. | |||||||||
|---|---|---|---|---|---|---|---|---|---|---|---|---|---|---|---|---|---|
| Full Blood. | Half-caste. | Full Blood. | Half-caste. | Full Blood. | Half-caste. | Full Blood. | Half-caste. | Full Blood | Half-caste. | Full Blood. | Half-Caste. | Full Blood | Half-caste. | Full Blood. | Half-Caste. | Totals. | |
| MALES. | |||||||||||||||||
| Chinese | 223 | 5 | 796 | 11 | 37 | .. | 749 | 40 | 14 | .. | 108 | 28 | 6 | .. | 1,933 | 84 | 2,017 |
| Japanese | .. | .. | 3 | 1 | .. | .. | 49 | 2 | .. | .. | .. | .. | .. | .. | 52 | 3 | 55 |
| Siamese | .. | .. | .. | .. | .. | .. | .. | .. | .. | .. | 1 | .. | .. | .. | 1 | .. | 1 |
| Cingalese | 1 | .. | 2 | .. | .. | .. | 2 | 1 | .. | .. | 1 | 3 | .. | .. | 6 | 4 | 10 |
| Hindus | 6 | .. | 48 | 1 | 4 | .. | 95 | 4 | .. | .. | 7 | 2 | .. | .. | 160 | 7 | 167 |
| Afghans | .. | .. | .. | .. | .. | .. | 2 | .. | .. | .. | .. | .. | .. | .. | 2 | .. | 2 |
| Persians | .. | .. | 1 | .. | .. | .. | 1 | .. | .. | .. | .. | .. | .. | .. | 2 | .. | 2 |
| Asiatic Jews | .. | .. | 1 | .. | .. | .. | 1 | .. | .. | .. | 1 | .. | .. | .. | 3 | .. | 3 |
| Syrians | 26 | .. | 113 | .. | 5 | .. | 50 | 2 | .. | .. | 66 | 3 | 2 | .. | 262 | 5 | 267 |
| Arabs | .. | .. | .. | .. | .. | .. | 9 | .. | .. | .. | 1 | .. | .. | .. | 10 | .. | 10 |
| Egyptians | 1 | .. | 1 | .. | .. | .. | .. | .. | .. | .. | .. | .. | .. | .. | 2 | .. | 2 |
| Abyssinians | 1 | .. | .. | .. | .. | .. | .. | 1 | .. | .. | .. | 1 | .. | .. | 1 | 2 | 3 |
| Negroes | 1 | 2 | 5 | .. | .. | .. | 33 | 16 | .. | .. | 9 | 12 | 1 | .. | 49 | 30 | 79 |
| American Indians | .. | .. | .. | 1 | .. | .. | .. | .. | .. | .. | .. | .. | .. | .. | .. | 1 | 1 |
| Australian Aborigines | .. | .. | .. | .. | .. | .. | .. | 3 | .. | .. | 1 | .. | .. | .. | 1 | 3 | 4 |
| Melanesians | .. | .. | .. | .. | .. | .. | 16 | .. | .. | .. | .. | .. | .. | .. | 16 | .. | 16 |
| Polynesians— | |||||||||||||||||
| Fijians | 4 | 2 | 2 | .. | .. | .. | 6 | 8 | .. | .. | 3 | 4 | .. | .. | 15 | 14 | 29 |
| Others and undefined | 3 | .. | 2 | 1 | .. | .. | 36 | 23 | .. | .. | 5 | 19 | .. | .. | 46 | 43 | 89 |
| Totals | 266 | 9 | 974 | 15 | 46 | .. | 1,049 | 100 | 14 | .. | 203 | 72 | 9 | .. | 2,561 | 196 | 2,757 |
| FEMALES. | |||||||||||||||||
| Chinese | .. | .. | 1 | 1 | 2 | 1 | 2 | 12 | .. | .. | 74 | 37 | .. | .. | 79 | 51 | 130 |
| Japanese | .. | .. | .. | .. | .. | .. | .. | .. | .. | .. | .. | 4 | .. | .. | .. | 4 | 4 |
| Cingalese | .. | .. | .. | .. | .. | .. | .. | .. | .. | .. | .. | 2 | .. | .. | .. | 2 | 2 |
| Hindus | .. | .. | .. | .. | .. | .. | 2 | 4 | .. | .. | 3 | 5 | .. | .. | 5 | 9 | 14 |
| Asiatic Turks | .. | .. | .. | .. | .. | .. | .. | .. | .. | .. | 1 | .. | .. | .. | 1 | .. | 1 |
| Asiatic Jews | .. | .. | .. | .. | .. | .. | .. | .. | .. | .. | 2 | .. | .. | .. | 2 | .. | 2 |
| Syrians | 2 | .. | 13 | .. | 4 | .. | 10 | .. | .. | .. | 156 | 6 | 1 | .. | 186 | 6 | 192 |
| Abyssinians | .. | .. | .. | .. | .. | .. | .. | .. | .. | .. | .. | 1 | .. | .. | .. | 1 | 1 |
| Negroes | .. | .. | .. | .. | .. | .. | .. | .. | .. | .. | 2 | 14 | .. | .. | 2 | 14 | 16 |
| Australian Aborigines | .. | .. | .. | .. | .. | .. | .. | 1 | .. | .. | .. | .. | .. | .. | .. | 1 | 1 |
| Melanesians | .. | .. | .. | .. | .. | .. | .. | 2 | .. | .. | .. | .. | .. | .. | .. | 2 | 2 |
| Polynesians— | |||||||||||||||||
| Fijians | .. | .. | .. | .. | .. | .. | 2 | 6 | .. | .. | 6 | 6 | .. | .. | 8 | 12 | 20 |
| Others and undefined | .. | .. | .. | 1 | .. | .. | 1 | 5 | .. | .. | 12 | 43 | .. | .. | 13 | 49 | 62 |
| Totals | 2 | .. | 14 | 2 | 6 | 1 | 17 | 30 | .. | .. | 256 | 118 | 1 | .. | 296 | 151 | 447 |
With regard to the classes of occupations of males it is worth noting that of 2,017 Chinese 860 were engaged in agricultural pursuits, 358 in dealing in food, &c, 284 in domestic service, and 130 in mining and quarrying.
Of 167 Hindus 38 were engaged in dealing in food, &c, 26 in pastoral and 24 in agricultural pursuits.
Of 55 Japanese 43 were engaged in traffic on seas and rivers (39 of them on shipboard at Port Chalmers).
Of 267 Syrians 56 were general merchants and 37 dealers in textiles, &c, while 58 were dependents.
Of 79 Negroes 19 were engaged on vessels.
Full details with regard to the Chinese, Hindus, Syrians, and other aliens will be found in the following table:—
Race Aliens.—Occupations, Census, 1916.
| Occupation. | Chinese. | Hindus. | Syrians. | Others. | Totals. | ||||||
|---|---|---|---|---|---|---|---|---|---|---|---|
| Full Blood. | Half-caste. | Full Blood. | Half-caste. | Full Blood. | Half-caste. | Full Blood | Half-caste. | Full Blood. | Half-Caste. | Totals. | |
| MALES. | |||||||||||
| Engaged in government, defence, law, &c. | 1 | 1 | .. | .. | .. | .. | 5 | 2 | 6 | 3 | 9 |
| Ministering to religion, charity, health, education, &c. | 10 | 2 | 1 | .. | 2 | .. | 2 | 2 | 15 | 4 | 19 |
| Engaged in supplying board and lodging | 85 | 3 | 12 | .. | 2 | .. | 17 | 2 | 116 | 5 | 121 |
| Engaged in domestic service and attendance | 282 | 2 | 8 | .. | 4 | .. | 9 | .. | 303 | 2 | 305 |
| Dealing in property and finance | 1 | .. | 1 | .. | .. | .. | 6 | .. | 8 | .. | 8 |
| Dealing in art and mechanic productions | 2 | .. | 4 | .. | 19 | .. | .. | 1 | 25 | 1 | 26 |
| Dealing in textile fabrics, dress and fibrous materials | 5 | .. | 1 | .. | 37 | .. | 2 | 2 | 45 | 2 | 47 |
| Dealing in food, drinks, narcotics, and stimulants | 354 | 4 | 38 | .. | 15 | .. | 2 | 4 | 409 | 8 | 417 |
| Dealing in animals, animal and vegetable substances (n.e.i,) | 3 | .. | 3 | .. | 6 | .. | .. | .. | 12 | .. | 12 |
| Dealing in fuel and light | .. | .. | .. | .. | .. | .. | 1 | .. | 1 | .. | 1 |
| Dealing in metals and other minerals | .. | .. | 1 | .. | 1 | .. | ... | 1 | .. | 1 | 3 |
| General and undefined merchants and dealers | 33 | .. | 5 | .. | 56 | .. | 2 | 3 | .. | 3 | 99 |
| Engaged in railway traffic | 1 | .. | .. | .. | .. | .. | .. | 1 | 1 | 1 | 2 |
| Engaged in traffic on roads | .. | 2 | .. | .. | 1 | .. | .. | 2 | 1 | 4 | 5 |
| Engaged in traffic on seas and rivers | .. | 1 | .. | 2 | 5 | .. | 93 | 7 | 98 | 10 | 108 |
| Engaged in postal, telegraph, and telephone services | .. | .. | .. | .. | .. | 1 | .. | .. | .. | 1 | 1 |
| Working in art and mechanic productions | 1 | 3 | 2 | .. | 6 | .. | 3 | 8 | 12 | 11 | 23 |
| Working in textile fabrics, dress and fibrous materials | 3 | 5 | 5 | .. | 11 | .. | 2 | 2 | 21 | 7 | 28 |
| Working in food, drinks, narcotics, and stimulants | 3 | 5 | 6 | .. | 2 | .. | 3 | 1 | 14 | 6 | 20 |
| Working in animal and vegetable substances (n.e.i) | 1 | .. | .. | .. | .. | .. | .. | .. | 1 | .. | 1 |
| Working in metals and other minerals | .. | 2 | 9 | .. | 3 | .. | 3 | 2 | 15 | 4 | 19 |
| Working in fuel, light, and other forms of energy.. | .. | 3 | .. | .. | .. | .. | 1 | .. | 1 | 3 | 4 |
| Engaged in construction of buildings, roads, railways, &c. | 1 | 2 | 1 | .. | 5 | 1 | 8 | 3 | 15 | 6 | 21 |
| Engaged in disposal of the dead or of refuse | .. | 1 | 4 | .. | .. | .. | 1 | .. | 5 | 1 | 6 |
| Engaged in undefined industrial pursuits | 30 | .. | 3 | .. | 6 | .. | 6 | 5 | 45 | 5 | 50 |
| Engaged in agricultural pursuits | 849 | 11 | 23 | 1 | 8 | .. | 1 | 3 | 881 | 15 | 896 |
| Engaged in pastoral pursuits | 16 | 5 | 24 | 2 | 6 | .. | 12 | 11 | 58 | 18 | 76 |
| Engaged in capture of wild animals and their produce | 3 | .. | .. | .. | .. | .. | .. | .. | 3 | .. | 3 |
| Engaged in fisheries | 11 | .. | .. | .. | .. | .. | 1 | 1 | 12 | 1 | 13 |
| Engaged in forestry | .. | .. | .. | .. | .. | .. | 1 | .. | 1 | .. | 1 |
| Engaged in water conservation and supply | 6 | .. | .. | .. | .. | .. | .. | .. | 6 | .. | 6 |
| Engaged in mining and quarrying | 126 | 4 | 2 | .. | 1 | .. | 3 | .. | 132 | 4 | 136 |
| Independent | 13 | .. | .. | .. | 4 | .. | 2 | 1 | 19 | 1 | 20 |
| Dependent on natural guardians | 50 | 27 | 4 | 2 | 55 | 3 | 8 | 34 | 117 | 66 | 183 |
| Supported by voluntary or State contributions | 36 | .. | 2 | .. | 4 | .. | 6 | .. | 48 | .. | 48 |
| Criminal class (under legal detention) | 7 | 1 | 1 | .. | 3 | .. | 6 | 2 | 17 | 3 | 20 |
| Totals | 1,933 | 84 | 160 | 7 | 262 | 5 | 206 | 100 | 2,561 | 196 | 2,757 |
| FEMALES. | |||||||||||
| Engaged in government, defence, law, &c. | .. | 1 | .. | .. | .. | .. | .. | .. | .. | 1 | 1 |
| Ministering to religion, charity, health, education, &c. | .. | 1 | .. | .. | .. | .. | .. | 9 | .. | 3 | 3 |
| Engaged in supplying board and lodging | .. | 2 | .. | .. | 3 | .. | .. | 1 | 3 | 3 | 6 |
| Engaged in domestic service and attendance | 2 | 4 | 1 | 4 | 2 | .. | 1 | 8 | 6 | 16 | 22 |
| Dealing in property and finance | .. | .. | .. | .. | .. | .. | .. | .. | .. | .. | .. |
| Dealing in art and mechanic productions | .. | .. | .. | .. | 2 | .. | .. | .. | 2 | .. | 2 |
| Dealing in textile fabrics, dress and fibrous materials | .. | .. | .. | .. | 4 | .. | .. | .. | 4 | .. | 4 |
| Dealing in food, drinks, narcotics, and stimulants | 1 | 3 | .. | .. | 3 | .. | .. | 2 | 4 | 5 | 9 |
| Dealing in animals, animal and vegetable substances (n.e.i.) | .. | .. | .. | .. | .. | .. | 1 | .. | 1 | .. | 1 |
| General and undefined merchants and dealers | 1 | 1 | .. | .. | 3 | .. | .. | .. | 4 | 1 | 5 |
| Engaged in postal, telegraph, and telephone services | .. | .. | .. | .. | .. | .. | .. | .. | .. | .. | .. |
| Working in art and mechanic productions | .. | 1 | 1 | .. | .. | .. | .. | .. | 1 | 1 | 2 |
| Working in textile fabrics, dress and fibrous materials | 1 | 1 | .. | .. | 13 | .. | .. | 3 | 14 | 4 | 18 |
| Working in food, drinks, narcotics, and stimulants | .. | .. | .. | .. | .. | .. | 1 | .. | 1 | .. | 1 |
| Engaged in undefined industrial pursuits | .. | .. | .. | .. | .. | .. | .. | .. | .. | .. | .. |
| Engaged in agricultural pursuits | .. | .. | .. | .. | .. | .. | .. | .. | .. | .. | .. |
| Engaged in pastoral pursuits | .. | .. | .. | .. | .. | .. | .. | .. | .. | .. | .. |
| Engaged in forestry | .. | .. | .. | .. | .. | .. | .. | .. | .. | .. | .. |
| Independent | .. | .. | .. | .. | .. | .. | 1 | .. | 1 | .. | 1 |
| Dependent on natural guardians | 74 | 35 | 3 | 5 | 152 | 6 | 22 | 62 | 251 | 108 | 359 |
| Supported by voluntary or State contributions. | .. | 2 | .. | .. | 4 | .. | .. | 7 | 4 | 9 | 13 |
| Criminal class (under legal detention) | .. | .. | .. | .. | .. | .. | .. | .. | .. | .. | .. |
| Totals | 79 | 51 | 5 | 9 | 186 | 6 | 26 | 84 | 296 | 151 | 447 |
In view of the public interest displayed in the matter the two most prominent classes of race aliens in the Dominion are separately treated.
Of the race aliens arriving in New Zealand a large proportion are Chinese, and in connection with this race complete census figures exist for a considerable range of years, details of which are appended:—
| Year. | Males. | Females. | Totals. |
|---|---|---|---|
| 1874 | 4,814 | 2 | 4,816 |
| 1878 | 4,424 | 9 | 4,433 |
| 1881 | 4,995 | 9 | 5,004 |
| 1886 | 4,527 | 15 | 4,542 |
| 1891 | 4,373 | 18 | 4,391 |
| 1896 | 3,685 | 26 | 3,711 |
| 1901 | 2,825 | 32 | 2,857 |
| 1906 | 2,515 | 55 | 2,570 |
| 1911 | 2,542 | 88 | 2,630 |
| 1916 | 2,017 | 130 | 2,147 |
At the census of 1881, the year in which taxation was first imposed on Chinese landing in New Zealand, the Chinese population numbered 5,004 persons, which fell to 4,542 in 1884, and further to 3,711 in 1896. During the period 1881–96 the poll-tax was £10 per head, and this seemed sufficient for the purpose of preventing a large influx of the Chinese. During the years 1894 and 1895, however, the arrivals shown by the Customs returns were found to be somewhat greater than the departures, and in 1896 an Act was passed raising the poll-tax on Chinese immigrants to £100 per head, and limiting the number of Chinese passengers that may be carried by vessels to New Zealand to one for every 200 tons burthen. According to the census of 1901 the Chinese population was 2,857, and in 1906 it was 2,570, while at the census of 1911 the total was 2,630, of whom 88 were females. The decrease still continues, deaths exceeding births, and the departures usually being more than the arrivals, though the records for 1916 showed a substantial excess of immigration over emigration.
It is an interesting fact that, although the number of Chinese has on the whole decreased during the period under review, there has been a marked tendency for the number of Chinese women to increase. Thus, while in 1874 there were but 2 Chinese females in the country, the number by 1916 had reached 130. Some of these no doubt had been born in New Zealand. The figures relating to the birthplaces reveal that 78 women in the Dominion had been born in China, but there is no reason to suppose that all these were of the Chinese race.
The distribution of Chinese amongst the provinces was shown in detail in the general table quoted above, and is here summarized:—
| Provincial District. | Full Blood. | Half Blood. | Totals. |
|---|---|---|---|
| Auckland | 437 | 23 | 460 |
| Taranaki | 47 | 21 | 68 |
| Hawke's Bay | 139 | .. | 139 |
| Wellington | 697 | 30 | 727 |
| Marlborough | 20 | .. | 20 |
| Nelson | 72 | 5 | 77 |
| Westland | 119 | 7 | 126 |
| Canterbury | 104 | 8 | 112 |
| Otago | 301 | 31 | 332 |
| Southland | 76 | 9 | 85 |
| Military and internment camps | .. | 1 | 1 |
| Totals | 2,012 | 135 | 2,147 |
Wellington, Auckland, and Otago, in that order, have the largest numbers, but, as already indicated, proportionately to the total population, Chinese are most numerous in Westland. It is worth noting that of 79 full-blood and 51 half-caste Chinese women, 23 full-blood and 9 half-caste were in Auckland, and 37 full-blood and 12 half-caste in Wellington. Despite the large numbers of Chinese in Otago, there were only 3 women of the full- and 10 of the half-blood in that province. Hawke's Bay accounted for 7 full-blood Chinese women.
The other class of race alien besides Chinese who were deemed worthy of a separate discussion is the Hindu race. The following table was specially compiled from the census schedules for this purpose:—
Table showing the Number of Hindus in New Zealand classified according to Length of Residence in the Dominion, Census, 1916.
| Length of Residence, in Years | Full-blooded. | Half-castes. | ||||
|---|---|---|---|---|---|---|
| Males. | Females. | Totals. | Males. | Females. | Totals. | |
| Under 1 | 31 | .. | 31 | 1 | .. | 1 |
| 1 and under 2 | 3 | .. | 3 | .. | 2 | 2 |
| 2 and under 3 | 16 | 1 | 17 | 2 | 1 | 3 |
| 3 and under 4 | 42 | .. | 42 | .. | 1 | 1 |
| 4 and under 5 | 21 | 1 | 22 | .. | .. | .. |
| 5 and under 6 | 7 | .. | 7 | 1 | .. | 1 |
| 6 and under 7 | .. | .. | .. | .. | .. | .. |
| 7 and under 8 | 2 | .. | 2 | 1 | .. | 1 |
| 8 and under 9 | 1 | .. | 1 | .. | .. | .. |
| 9 and under 10 | 1 | .. | 1 | 1 | .. | 1 |
| 10 and under 15 | 4 | .. | 4 | .. | .. | .. |
| 15 and under 20. | 3 | 1 | 4 | .. | .. | .. |
| 20 and under 30 | 8 | .. | 8 | .. | .. | .. |
| 30 and under 40 | 3 | .. | 3 | .. | .. | .. |
| 40 and under 50 | 3 | .. | 3 | .. | .. | .. |
| 50 and over | .. | .. | .. | .. | .. | .. |
| Not stated | 11 | .. | 11 | .. | 2 | 2 |
| Born in New Zealand | 4 | 2 | 6 | 1 | 3 | 4 |
| Totals | 160 | 5 | 165 | 7 | 9 | 16 |
It will be noted that of 145 full-blooded male Hindus born abroad whose length of residence is known, 113 had been under five years in the country; and of 6 half-caste males 3 had been under three years in the country, 4 under six, 5 under eight, and all under ten. These figures clearly show the increase in the number of persons of this race in the Dominion. It will also be noted that 6 full-blood and 4 half-caste Hindus have been born in the country.
The table affords good evidence that until recent years at least a large proportion of the Hindu arrivals in the country merely stayed here a few weeks in transit to or from the Pacific islands. A comparison of the arrivals of Hindus during each of the ten years ended 1916 with the approximate year of arrival of those included in the above table gives the following results:—
| Year. | Arrivals during Year. | Number in Dominion in 1916 who arrived in same Year. |
|---|---|---|
| 1907 | 20 | 2 |
| 1908 | 24 | 1 |
| 1909 | 157 | 3 |
| 1910 | 80 | 0 |
| 1911 | 190 | 8 |
| 1912 | 325 | 22 |
| 1913 | 133 | 43 |
| 1914 | 257 | 20 |
| 1915 | 13 | 5 |
| 1916 | 92 | 32 |
Table of Contents
Dwellings may be classified in various ways, of which the following are adopted in the census:—
According to the nature of the dwellings, &c, or the purpose for which used—i.e., whether private dwelling, tenement in private dwelling, hotel, boardinghouse, &c,.
Whether inhabited, uninhabited, or in course of erection.
According to the materials of which outer walls are built.
According to the nature of the occupancy.
According to the number of rooms and occupants.
It should be noted that the majority of the census figures taken out relate only to inhabited private dwellings and tenements. Details are, however, by way of exception, supplied in the case of uninhabited private dwellings and tenements, and also those in course of erection, in connection with the materials of which outer walls are built. Again, details as to the number of rooms and occupants are also supplied in connection with all dwellings, whether private dwellings or tenements or not.
Dwellings occupied exclusively by Maoris are not included in this investigation.
Dwellings, &c, classified according to the Nature or Purpose for which used.
The following table gives the above details by provincial districts:—
TABLE SHOWING FOR EACH PROVINCIAL DISTRICT IN NEW ZEALAND THE NUMBER OF INHABITED DWELLINGS, ETC. (EXCLUSIVE OF THOSE OCCUPIED ONLY BY MAORIS), CLASSIFIED ACCORDING TO NATURE OF DWELLINGS, ETC., AS AT THE CENSUS OF OCTOBER, 1916.
| Provincial District. | Private Dwelling. | Tenement in Private Dwelling. | Hotel. | Boarding-house. | Religious Institution. | Educational Institution. | Charitable Institution. | Hospital or Mental Hospital. | Prison. | Military Establishment. | Other. | Totals. |
|---|---|---|---|---|---|---|---|---|---|---|---|---|
| Auckland | 64,791 | 2,561 | 276 | 958 | 32 | 39 | 26 | 78 | 7 | 14 | 14 | 68,796 |
| Taranaki | 11,520 | 351 | 52 | 103 | 8 | 5 | 2 | 14 | 1 | .. | 2 | 12,058 |
| Hawke's Bay | 11,218 | 294 | 69 | 123 | 4 | 13 | 4 | 10 | 1 | .. | 3 | 11,739 |
| Wellington | 44,515 | 2,579 | 169 | 866 | 19 | 32 | 22 | 59 | 7 | 10 | 22 | 48,300 |
| Marlborough | 3,450 | 97 | 29 | 35 | 3 | .. | .. | 8 | 1 | 1 | .. | 3,624 |
| Nelson | 10,407 | 250 | 131 | 128 | 2 | 3 | 6 | 22 | .. | 3 | 2 | 10,954 |
| Westland | 3,357 | 99 | 99 | 39 | 5 | 1 | 1 | 7 | 1 | .. | 2 | 3,611 |
| Canterbury | 38,992 | 1,071 | 17,1 | 341 | 18 | 35 | 20 | 41 | 4 | 4 | 9 | 40,706 |
| Otago | 28,408 | 885 | 170 | 324 | 17 | 18 | 12 | 38 | 2 | 7 | 12 | 29,893 |
| Southland | 12,765 | 456 | 54 | 32 | 10 | 1 | 2 | 21 | 3 | 1 | .. | 13,405 |
| Totals | 229,423 | 8,643 | 1,220 | 3,000 | 118 | 147 | 95 | 298 | 27 | 40 | 66 | 243,086 |
A second table gives the same information according to the percentage of the total inhabited dwellings in each provincial district belonging to each class.
PERCENTAGE OF EACH CLASS OF DWELLING TO TOTAL INHABITED DWELLING IN PROVINCIAL DISTRICTS, CENSUS, 1916.
| Provincial District. | Private Dwelling. | Tenement in Private Dwelling. | Hotel | Boarding-house. | Religious Institution. | Educational Institution. | Charitable Institution. | Hospital or Mental Hospital. | Prison. | Military Establishment. | Other. | Totals. |
|---|---|---|---|---|---|---|---|---|---|---|---|---|
| Auckland | 94.18 | 3.72 | 0.40 | 1.39 | 0.05 | 0.06 | 0.04 | 0.11 | 0.01 | 0.02 | 0.02 | 100.00 |
| Taranaki | 95.54 | 2.91 | 0.43 | 0.85 | 0.07 | 0.04 | 0.02 | 0.11 | 0.01 | .. | 0.02 | 100.00 |
| Hawke's Bay | 95.56 | 2.50 | 0.59 | 1.05 | 0.03 | 0.11 | 0.03 | 0.09 | 0.01 | .. | 0.03 | 100.00 |
| Wellington | 92.16 | 5.34 | 0.35 | 1.79 | 0.04 | 0.07 | 0.05 | 0.12 | 0.01 | 0.02 | 0.05 | 100.00 |
| Marlborough | 95.20 | 2.68 | 0.80 | 0.96 | 0.08 | .. | .. | 0.22 | 0.03 | 0.03 | .. | 100.00 |
| Nelson | 95.01 | 2.28 | 1.19 | 1.17 | 0.02 | 0.03 | 0.05 | 0.20 | .. | 0.03 | 0.02 | 100.00 |
| Westland | 92.97 | 2.74 | 2.74 | 1.08 | 0.14 | 0.03 | 0.03 | 0.19 | 0.03 | .. | 0.05 | 100.00 |
| Canterbury | 95.79 | 2.63 | 0.42 | 0.84 | 0.04 | 0.09 | 0.05 | 0.10 | 0.01 | 0.01 | 0.02 | 100.00 |
| Otago | 95.03 | 2.96 | 0.57 | 1.08 | 0.06 | 0.06 | 0.04 | 0.13 | 0.01 | 0.02 | 0.04 | 100.00 |
| Southland | 95.22 | 3.40 | 0.40 | 0.69 | 0.08 | 0.01 | 0.01 | 0.16 | 0.02 | 0.01 | .. | 100.00 |
| Totals | 94.38 | 3.55 | 0.50 | 1.24 | 0.05 | 0.06 | 0.04 | 0.12 | 0.01 | 0.02 | 0.03 | 100.00 |
Private dwellings form only 92.10 percent, of the total inhabited dwellings in Wellington Province, Westland also being low. Canterbury has the highest percentage of private dwellings—viz., 95.79 of the total. Tenements in private dwellings form 5.34 percent, of the total inhabited dwellings in Wellington Province and 3.72 in Auckland, but only 2.28 percent, in Nelson. Boardinghouses, again, are most numerous in Wellington (1.79 per cent.), with Auckland again a fairly close second (1.39 per cent.), and are least in Southland (0.69 per cent.).
Religious institutions form 0.14 percent, of the total in Westland, but only 0.02 percent, in Nelson, while educational establishments form 0.11 percent, of the total in Hawke’s Bay and 0.01 percent, in Southland.
Hotels form 2.74 percent, of the total in Westland, as against only 0.35 percent, in Wellington and 0.40 percent, in Auckland and Southland.
Dwellings classified according as Inhabited, Uninhabited, or in Course of Erection.
The succeeding statement gives the number of dwellings falling under each of the above classes for the past six census-takings:—
| Year. | Inhabited Dwellings | Uninhabited Dwellings. | Proportion of Dwellings of Two Foregoing Classes per 100 of Population.* | Number of Dwelling-houses in Course of Erection. |
|---|---|---|---|---|
* The population on shipboard is excluded from the numbers used. † Private dwellings and tenements only. | ||||
| 1891 | 123,851 | 9,558 | 21.40 | 425 |
| 1896 | 141,339 | 8,006 | 21.34 | 577 |
| 1901 | 158,898 | 10,930 | 22.07 | 865 |
| 1906 | 184,457 | 11,279 | 22.13 | 1,267 |
| 1911 | 215,425 | 15,234 | 22.52 | 1,508 |
| 1916† | 238,066 | 19,640 | 23.51 | 685 |
The implications of the figures above quoted are fully discussed in the sequel.
The percentage that the number of uninhabited dwellings bears to the total number of dwellings built might be considered a good criterion of the prosperity of a place (since all available house-room is likely to be taken up if the prospects offered by a locality are rosy) were it not for the complications introduced by the fact that summer residences are likely to be unfrequented at the date of the census. It is a notable fact that the highest percentages of uninhabited dwellings to the total built are to be found in New Brighton (32.31), Sumner (31.20), and East-bourne (29.94), with Takapuna sixth (19.62). None of these could be classed as decadent boroughs, the high percentages being solely accounted for by the fact of their popularity as holiday resorts. It is otherwise with the fourth, Brunner (22.46), and the eighth, Kumara (16.47), which are decayed mining towns. Similar high percentages are to be found in the former mining centres of Central Otago, especially Lawrence, Naseby, Cromwell, and Arrowtown. Indeed, there is practically none of the South Island mining boroughs which may be said to have a high prosperity index, basing that attribute on the proportion of uninhabited dwellings. The fifth town on the list is Waikouaiti (20.54), and the seventh Hampden (18.10). Their presence here is accounted for partly by the fact that they are of some popularity as holiday resorts, and also by the fact of the rapidly falling state of the population as revealed by successive census-takings in the former case, and its practically stationary state in the latter.
The percentage was, in general, higher in the country districts than in the boroughs, the figures being—
| Countries. | Boroughs. | Total. | |
|---|---|---|---|
| Inhabited | 111,938 | 126,812 | 238,066 |
| Uninhabited | 11,938 | 7,702 | 19,640 |
| Totals | 123,192 | 134,514 | 257,706 |
The 1911 census yielded a somewhat similar result.
A better criterion of prosperity would be in normal times the number of buildings in course of erection. The relative inactivity of the building trade during the war period, however, renders such figures for the 1916 census of little value for such a purpose. The number of houses in course of erection at that census was but 685, a decrease of 823 as compared with the census of 1911.
Full details for census-takings from 1891 onwards are—
| 1891 | 425 |
| 1896 | 577 |
| 1901 | 865 |
| 1906 | 1,267 |
| 1911 | 1,508 |
| 1916 | 685 |
Of the 685 in 1916, 466 were in boroughs and 219 in counties, as against 901 and 607 respectively in 1911. No fewer than 315 of those in towns belonged to the four chief centres and their suburban boroughs. Details in this connection are appended for the census-takings of 1911 and 1916:—
| Centre.* | 1911. | 1916. |
|---|---|---|
| * Not metropolitan areas. | ||
| Auckland and suburban towns | 174 | 133 |
| Wellington and suburban towns | 93 | 89 |
| Christchurch and suburban towns | 134 | 62 |
| Dunedin and suburban towns | 100 | 31 |
| 501 | 315 | |
The falling-off is no doubt mainly attributable to war conditions, as referred to in greater detail elsewhere in this section of the report. While in 1911 Auckland was somewhat in excess of the other three centres (which were approximately equal, with Wellington showing apparently less activity than either Christchurch or Dunedin), we find in 1916 that Auckland retains its former position, while Wellington (which now takes second place in. this respect) has practically as many houses in course of erection as the remaining two centres together, and Christchurch has exactly double the number of Dunedin.
Table of Contents
This term is defined so as to exclude dwellings, &c, occupied only by Maoris.
The total number of inhabited dwellings, &c, has been at successive census-takings—
| 1874 | 61,356 |
| 1878 | 82,588 |
| 1881 | 95,750 |
| 1886 | 111,971 |
| 1891 | 123,851 |
| 1896 | 141,339 |
| 1901 | 158,898 |
| 1906 | 184,457 |
| 1911 | 215,425 |
| 1916 | 243,086 |
Of the 243,086 dwellings, &c, in 1916, 229,423 were private dwellings and 8,643 tenements in private dwellings. The nature of dwellings was not specified in previous census-takings.
The considerations leading to a decision as to the materials of which the outer-walls of private dwellings and tenements shall be built may be broadly classified on a twofold basis—viz., as objective and subjective. The objective considerations arise from the geological constitution of the soil—e.g., whether building-stone or clay suitable for brickmaking is available—this factor operating either alone or in conjunction with factors of a climatological character, such as whether or not the amount of precipitation combined with other climatic conditions is conducive to the growth of forests yielding suitable building-timber, The subjective considerations depend not on the kindliness or niggardliness of nature, but arise from the prudential considerations affecting the minds of would-be builders; they have regard not to the facility with which building-materials are obtainable, but to the extent to which such materials commend themselves on the score of permanent suitability for the purpose to which they are to be put. Thus inhabitants of Wellington, where the tendency to earthquakes was in clays gone by proverbial, have a marked penchant for wooden homes, merely on grounds of safety and expediency; while within a certain distance of the centres of metropolitan areas the municipal authorities have for some time past in certain cases prohibited the erection of wooden houses on account of the increased danger from fire and consequent loss of property which experience has shown to be a concomitant of the use for building purposes of such an inflammable material as wood.
In the accompanying series of tables the effects of the operating factors just discussed will be abundantly manifest. The figures given relate to inhabited private dwellings and tenements only. Uninhabited private dwellings and tenements and those in course of erection are included in the second set of tables.
INHABITED PRIVATE DWELLINGS AND TENEMENTS.—MATERIALS OK WHICH OUTER WALLS ARE BUILT (ALL SPECIFIED CASES), CENSUS, 1916.
| Inhabited Dwellings in | Stone. | Brick. | Concrete. | Wood. | Iron. | Canvas. | Other. | Totals. |
|---|---|---|---|---|---|---|---|---|
| Numbers. | ||||||||
| Metropolitan areas— | ||||||||
| Auckland | 63 | 1,062 | 388 | 26,550 | 57 | 6 | 107 | 28,261 |
| Wellington | 10 | 539 | 152 | 18,515 | 241 | 3 | 85 | 19,647 |
| Christchurch | 54 | 968 | 145 | 18,665 | 52 | 4 | 245 | 20,225 |
| Dunedin | 164 | 1,940 | 120 | 12,487 | 5 | 1 | 201 | 14,929 |
| Suburban areas | 64 | 1,055 | 276 | 23,253 | 138 | 17 | 234 | 25,067 |
| Remainder of Dominion | 929 | 1,493 | 604 | 120,041 | 3,006 | 2,360 | 1,179 | 129,935 |
| Totals | 1,284 | 7,057 | 1,685 | 219,511 | 3,499 | 2,391 | 2,051 | 238,066 |
| Percentages. | ||||||||
| Metropolitan areas— | ||||||||
| Auckland | 0.22 | 3.76 | 1.37 | 94.05 | 0.20 | 0.02 | 0.38 | 100.00 |
| Wellington | 0.05 | 2.77 | 0.77 | 94.74 | 1.23 | 0.01 | 0.43 | 100.00 |
| Christchurch | 0.27 | 4.80 | 0.72 | 92.71 | 0.26 | 0.02 | 1.22 | 100.00 |
| Dunedin | 1.10 | 13.01 | 0.80 | 83.70 | 0.03 | 0.01 | 1.35 | 100.00 |
| Suburban areas | 0.26 | 4.21 | 1.10 | 92.88 | 0.55 | 0.07 | 0.93 | 100.00 |
| Remainder of Dominion | 0.72 | 1.15 | 0.46 | 92.63 | 2.31 | 1.82 | 0.91 | 100.00 |
| Totals | 0.54 | 2.97 | 0.71 | 92.45 | 1.47 | 1.00 | 0.86 | 100.00 |
Another set of tables is appended, showing a comparison between the boroughs and counties (exclusive of interior boroughs). Inhabited private dwellings and tenements, and those uninhabited or in course of erection, are accorded separate treatment.
PRIVATE DWELLINGS AND TENEMENTS. — MATERIALS OF WHICH OUTER WALLS ARE BUILT (ALL SPECIFIED CASES), CENSUS, 1916.
| Materials. | Inhabited. | Uninhabited. | In Course of Erection. | ||||||
|---|---|---|---|---|---|---|---|---|---|
| Counties. | Boroughs. | Totals. | Counties. | Boroughs. | Totals. | Counties. | Boroughs. | Totals. | |
| Numbers. | |||||||||
| Stone | 674 | 610 | 1,284 | 191 | 617 | 808 | 14 | 45 | 59 |
| Brick | 1,219 | 5,838 | 7,057 | 191 | 617 | 808 | 14 | 45 | 59 |
| Concrete | 572 | 1,113 | 1,685 | ||||||
| Wood | 102,342 | 117,169 | 219,511 | 10,827 | 6,523 | 17,350 | 175 | 394 | 569 |
| Iron | 2,729 | 770 | 3,499 | ||||||
| Canvas | 2,325 | 66 | 2,391 | 331 | 50 | 381 | 3 | 7 | 10 |
| Other | 1,053 | 998 | 2,051 | ||||||
| Totals | 110,914 | 126,564 | 237,478 | 11,349 | 7,190 | 18,539 | 192 | 446 | 638 |
| Percentages. | |||||||||
| Stone | 0.61 | 0.48 | 0.54 | ||||||
| Brick | 1.10 | 4.61 | 2.97 | 1.68 | 8.58 | 4.36 | 7.29 | 10.09 | 9.25 |
| Concrete | 0.52 | 0.88 | 0.71 | ||||||
| Wood | 92.27 | 92.58 | 92.44 | 95.40 | 90.72 | 93.9 | 91.15 | 88.34 | 89.18 |
| Iron | 2.46 | 0.61 | 1.47 | ||||||
| Canvas | 2.09 | 0.05 | 1.01 | 2.92 | 0.70 | 2.05 | 1.56 | 1.57 | 1.57 |
| Other | 0.95 | 0.79 | 0.86 | ||||||
| Totals | 100.00 | 100.00 | 100.00 | 100.00 | 100.00 | 100.00 | 100.00 | 100.00 | 100.00 |
The figures relating to inhabited private dwellings and tenements fully substantiate the conclusion suggested by the preceding tables—viz., that canvas, stone, and iron are more popular materials in the country than in the towns, while the converse is true of brick and concrete.
It will be noted that a larger proportion of the buildings in course of erection were in stone, brick, or concrete, and a correspondingly smaller proportion in wood or iron, than was the case with buildings already erected.
Of the metropolitan areas Dunedin has easily the largest percentage of inhabited private dwellings and tenements in stone (1.10 per cent.), while Wellington has but 0.05 per cent. The percentage for the suburban areas is 0.26 per cent., for the rest of the Dominion 0.72 per cent., and for the whole Dominion 0.54 per cent. Stone houses are thus seen to predominate in the country, a fact on which further light is shed by the second set of tables quoted. It is worth noting, however, that had Oamaru been included amongst the suburban areas the position would have been somewhat altered, inasmuch as in that borough, out of a total of 1,145 houses specified, as many as 175 were of stone, while there were but 2 of brick, 9 of concrete, 939 of wood, 1 of iron, and 19 of other materials. Roughly, 15 percent, of the houses in Oamaru are accordingly built of stone, a fact directly due to the occurrence in the vicinity of the town of the famous “Oamaru stone,” a variety of limestone eminently suited for building purposes. The anomalous position of Oamaru finds a counterpart in the adjacent counties. In Waitaki, the nearest, of 2,092 inhabited private dwellings and tenements specified, 155, or roughly 7½ per cent., are of stone, while the next adjoining county to the south, Waihemo, has practically the same percentage, although it would be inaccurate to suggest that in the case of its latter county more than a small proportion of the houses are actually in Oamaru stone. These counties stand fourth and third respectively in the Dominion as regards the percentage of stone houses, the gold-fields counties of Vincent and Lake holding first and second places with 12. and 10. percent, respectively.
High as Oamaru stands, its record is easily eclipsed by two of the old mining boroughs of Central Otago, Roxburgh and Arrowtown, with roughly 33 percent, and 25 percent, respectively of the inhabited private dwellings and tenements built of stone. Cromwell and Alexandra are not far behind with 11 percent, and 8 percent, respectively. These four boroughs, however, have declined since the day of the gold rushes, and, though their municipal constitution remains, their population is at the present day, in each case, very much less than that minimum which is now by statute a condition precedent to the granting of autonomy as a borough. Their inclusion as boroughs is an historical accident, for their modern characteristics are not so much those of towns as of rural areas, the prevailing conditions being not in any material way dissimilar horn those of the surrounding counties of Tuapeka and Lake respectively in the case of the first two, and Vincent in that of the last two, in all of which instances a deficient rainfall has operated to bring about steppe conditions involving complete absence of timber. Moreover, in these parts settlement took place long before the inauguration of Sir Julius Vogel’s public-works policy of the “seventies,” whereby means of transport were provided to the country districts, and has proceeded little, if any, since the appearance of these better means of communication.
As was the case with stone, brick inhabited dwellings and tenements predominate in Dunedin, where 13.01 percent, of the total were of this material, as against 2.77 percent, in Wellington and 1.15 percent, in the portions of the Dominion lying outside metropolitan and suburban areas. This material is therefore clearly more popular in towns than in the country, a fact which is perhaps more clearly brought out by the second set of tables.
It is interesting to note that of 1,219 brick inhabited private dwellings and tenements in the counties of the Dominion only 281 were in the North Island, while of 5,838 in the boroughs only 1,903 were in that Island. It is natural, therefore, to look for the highest percentages in South Island boroughs and counties, rind one finds that of the counties Maniototo has 31 percent, and Vincent 12 percent, of its houses in brick, while of the boroughs the following exceed Dunedin’s figures: Naseby (25½ per cent.), Lawrence (22½ per cent.), Alexandra (17 per cent.); Invercargill Borough, with 11½ per cent., being not far behind. Several of the Canterbury boroughs and counties show also fairly high figures.
Of the metropolitan areas Auckland has the highest percentage of its inhabited private dwellings and tenements in concrete—viz., 1.37 per cent. Suburban areas as a whole are not far behind, with 1.10 per cent.—Timaru, Napier, and Invercargill, in that order, all yielding high figures; while the portions of the Dominion lying outside the metropolitan and suburban areas have in the aggregate as low a figure as 0.46 per cent.
Wellington has as many as 94.74 percent, of its inhabited private dwellings and tenements in wood, as against 83.70 in Dunedin—the latter figure being very much lower than that for the suburban areas combined (92.88 per cent.), as well as that for the country districts (92.63 per cent.).
Iron predominates in the country, 2.31 percent, of the inhabited private dwellings and tenements outside the metropolitan and suburban areas being built of this material. The same remarks are true of canvas, 1.82 percent, of the inhabited private dwellings and tenements in the country being built of this material. As many as 1.23 percent, of the inhabited private dwellings and tenements in Wellington are of iron, as against only 0.03 percent, in Dunedin.
The following table is of interest:—
TABLE SHOWING THE NATURE OF OCCUPANCY OF INHABITED PRIVATE DWELLINGS AND TENEMENTS (EXCLUDING THOSE OCCUPIED ONLY BY MAORIS), CLASSIFIED ACCORDING TO NUMBER OF ROOMS, AS AT THE CENSUS OF OCTOBER, 1916.
| Number of Rooms. | Classification of Head of Household in regard to Occupancy. | Totals. | ||||
|---|---|---|---|---|---|---|
| Renting. | Buying on Time Payment. | Owner, but paying Interest I on Mortgage. | Owner of Freehold Unencumbered. | Not stated. | ||
| 1 | 5,608 | 56 | 489 | 2,070 | 1,510 | 9,731 |
| 2 | 5,521 | 228 | 1,122 | 2,229 | 477 | 9,577 |
| 3 | 7,182 | 405 | 1,629 | 2,249 | 230 | 11,695 |
| 4 | 28,594 | 3,129 | 9,316 | 9,654 | 703 | 51,396 |
| 5 | 27,512 | 4,593 | 15,302 | 12,139 | 651 | 60,197 |
| 6 | 20,588 | 2,494 | 14,413 | 13,370 | 484 | 51,349 |
| 7 | 7,624 | 674 | 6,674 | 7,028 | 271 | 22,271 |
| 8 | 3,210 | 241 | 3,257 | 4,077 | 141 | 10,926 |
| 9 | 1,398 | 61 | 1,169 | 1,400 | 38 | 4,066 |
| 10 | 685 | 38 | 829 | 1,185 | 40 | 2,777 |
| 11 | 218 | 13 | 293 | 458 | 17 | 999 |
| 12 | 185 | 2 | 238 | 330 | 12 | 767 |
| 13 | 70 | 1 | 83 | 150 | 9 | 313 |
| 14 | 64 | 3 | 63 | 132 | 5 | 267 |
| 15 | 25 | 1 | 32 | 56 | 2 | 116 |
| 16 | 33 | 1 | 22 | 66 | 4 | 126 |
| 17 | 11 | 1 | 13 | 27 | 3 | 55 |
| 18 | 10 | 1 | 13 | 23 | 3 | 50 |
| 19 | 4 | .. | 5 | 7 | 1 | 17 |
| 20 and over | 31 | .. | 13 | 57 | 3 | 104 |
| Not stated | 345 | 21 | 87 | 153 | 661 | 1,267 |
| Totals | 108,916 | 11,963 | 55,062 | 56,860 | 5,265 | 238,066 |
It will be noted that the popular number of rooms is four for rented houses, five for those being purchased on time payment and for those owned subject to mortgage, while it is six for inhabited dwellings owned in fee-simple unencumbered.
The following tables are also of interest in this connection:—
METROPOLITAN AND SUBURBAN AREAS.— NATURE OF OCCUPANCY OF PRIVATE DWELLINGS AND TENEMENTS, CENSUS, 1916.
| —— | Renting. | Buying on Time Payment. | Owner, but paying Interest on Mortgage. | Owner of Freehold Unencumbered. | Not stated. | Totals. |
|---|---|---|---|---|---|---|
| Numbers. | ||||||
| Metropolitan areas- | ||||||
| Auckland | 15,155 | 1,581 | 5,353 | 5,055 | 117 | 28,261 |
| Wellington | 12,702 | 882 | 3,705 | 2,089 | 269 | 19,647 |
| Christchurch | 9,269 | 1,780 | 4,657 | 1,223 | 296 | 20,225 |
| Dunedin | 7,460 | 906 | 2,873 | 3,636 | 54 | 14,929 |
| Suburban areas- | ||||||
| Gisborne | 1,499 | 141 | 697 | 350 | 15 | 2,702 |
| Napier | 1,712 | 283 | 554 | 567 | 15 | 3,131 |
| New Plymouth | 1,098 | 103 | 532 | 474 | 3 | 2,210 |
| Wanganui | 2,212 | 410 | 831 | 665 | 14 | 4,132 |
| Palmerston North | 1,540 | 155 | 695 | 473 | 13 | 2,976 |
| Nelson | 755 | 163 | 355 | 545 | 16 | 1,834 |
| Grey Valley | 526 | 102 | 158 | 364 | 22 | 1,172 |
| Timaru | 1,297 | 247 | 702 | 666 | 16 | 2,928 |
| Invercargill | 1,547 | 505 | 894 | 1,027 | 8 | 3,982 |
| Totals, metropolitan and suburban areas | 56,872 | 7,259 | 23,006 | 20,134 | 858 | 108,129 |
| Totals, rest of Dominion | 52,044 | 4,704 | 32,056 | 36,726 | 4,407 | 129,937 |
| Totals, Dominion | 108,916 | 11,963 | 55,062 | 56,860 | 5,265 | 238,066 |
| Proportions. | ||||||
| Metropolitan areas- | ||||||
| Auckland | 53.62 | 5.60 | 22.48 | 17.89 | 0.41 | 100.00 |
| Wellington | 64.65 | 4.49 | 18.86 | 10.63 | 1.37 | 100.00 |
| Christchurch | 45.83 | 8.80 | 23.03 | 20.88 | 1.46 | 100.00 |
| Dunedin | 49.97 | 6.07 | 19.24 | 24.36 | 0.36 | 100.00 |
| Suburban areas— | ||||||
| Gisborne | 55.48 | 5.22 | 25.80 | 12.95 | 0.55 | 100.00 |
| Napier | 54.68 | 9.01 | 17.69 | 18.11 | 0.48 | 100.00 |
| New Plymouth | 49.68 | 4.66 | 24.07 | 21.45 | 0.14 | 100.00 |
| Wanganui | 53.53 | 9.92 | 20.11 | 16.10 | 0.34 | 100.00 |
| Palmerston North | 55.11 | 5.21 | 23.35 | 15.89 | 0.44 | 100.00 |
| Nelson | 41.17 | 8.89 | 19.36 | 29.71 | 0.87 | 100.00 |
| Grey Valley | 44.88 | 8.70 | 13.48 | 31.06 | 1.88 | 100.00 |
| Timaru | 44.29 | 8.44 | 23.97 | 22.75 | 0.55 | 100.00 |
| Invercargill | 38.85 | 12.71 | 22.45 | 25.79 | 0.20 | 100.00 |
| Totals, metropolitan and suburban areas | 52.60 | 6.71 | 21.28 | 18.62 | 0.79 | 100.00 |
| Totals, rest of Dominion | 40.05 | 3.62 | 24.67 | 28.27 | 3.39 | 100.00 |
| Totals, Dominion | 45.75 | 5.03 | 23.13 | 23.88 | 2.21 | 100.00 |
PRIVATE DWELLINGS AND TENEMENTS IN COUNTIES AND BOROUGHS.— NATURE OF OCCUPANCY, CENSUS, 1916.
| — | Renting. | Buying on time Payment. | Owner, but paying Interest on Mortgage. | Owner of Freehold Unencumbered. | Not stated. | Totals. |
|---|---|---|---|---|---|---|
| Numbers. | ||||||
| Counties | 42,182 | 3,739 | 29,523 | 31,502 | 4,308 | 111,254 |
| Boroughs | 66,734 | 8,224 | 25,539 | 25,358 | 957 | 126,812 |
| Totals | 108,916 | 11,963 | 55,062 | 56,860 | 5,265 | 238,066 |
| Proportions. | ||||||
| Counties | 37.91 | 3.36 | 26.54 | 28.32 | 3.87 | 100.00 |
| Boroughs | 52.62 | 6.49 | 20.14 | 20.00 | 0.75 | 100.00 |
| Totals | 45.75 | 5.03 | 23.13 | 23.88 | 2.21 | 100.00 |
It will be observed that, roughly, half the homes in the cities are rented, though this proportion is exceeded in Wellington (64.05 per cent.) and Auckland (53.62 per cent.), and also in Gisborne (55.48 per cent.), Napier (54.68 per cent.), Palmerston North (55.11 per cent.), and Wanganui (53.53 per cent.). The high percentage in Wellington is probably due to the moving nature of the population of that city. In most cases Wellington is regarded merely as a temporary abiding-place, and there has not been the same inducement; as elsewhere, to own one's own home. In Christchurch 8.80 per cent. of the inhabited dwellings are being purchased on time payment, and this percentage is exceeded in Invercargill (12.71 per cent.), Wanganui (9.92 per cent.), Napier (9.04 per cent.), and Nelson (8.89 per cent.). The percentage for the whole Dominion is 5.03, which exceeds that in Wellington (4.49 per cent.) and New Plymouth (4.66 per cent.) alone of all the metropolitan and suburban areas.
Throughout the whole Dominion 23.13 per cent. of the inhabited houses were owned by the occupants subject to a mortgage. In most of the metropolitan and suburban areas the percentage was, however, lower than for the whole Dominion, the exceptions being Gisborne (25.80 per cent.), New Plymouth (24.07 per cent.), Timaru (23.97 per cent.), and Palmerston North (23.35 per cent.). Occupants owning the freehold unencumbered occurred in 23.88 per cent. of all the cases in the Dominion. In the metropolitan and suburban areas the proportion was usually much lower, the exceptions being Dunedin (24.36 per cent.), Grey Valley (31.06 per cent.). Nelson (29.71 per cent.), and Invercargill (25.79 per cent.).
From the tables showing the corresponding figures for the boroughs and the counties (exclusive of interior boroughs) it will again be noted that the tendency is in the country for the occupant to own the freehold, either subject to a mortgage or unencumbered, while in the towns the tendency is for the occupant to rent the home or to be buying it according to some form or other of the hire-purchase system.
Table of Contents
Very interesting are the figures in the next table. These set out the mean rental values of the principal sizes of private dwellings in the four metropolitan areas. Metropolitan areas, which are of recent constitution, cannot be given for 1911; but the averages for the cities at that date afford reasonable comparison. It should be mentioned that a small number of houses were returned as being occupied either rent-free or at a nominal rental. The suggestion is that in most cases these houses were the property of the State or municipal or other bodies, and given to the tenants in lieu of a monetary allowance which would otherwise be payable.
Average Rails in the Four Centres, Census, 1916.
| House of | Auckland. | Wellington. | Christchurch. | Dunedin. | ||||||||||||
|---|---|---|---|---|---|---|---|---|---|---|---|---|---|---|---|---|
| 1910.* | 1911.† | 1916.* | 1911.† | 1916.* | 1911.† | 1916.* | 1911.† | |||||||||
* Metropolitan area. † City. | ||||||||||||||||
| s. | d. | s. | d. | s. | d. | s. | d. | s. | d. | s. | d. | s. | d. | s. | d. | |
| Four rooms | 12 | 10 | 10 | 10 | 16 | 1 | 14 | 4 | 12 | 5 | 10 | 6 | 11 | 6 | 10 | 6 |
| Five rooms | 16 | 4 | 13 | 5 | 19 | 2 | 17 | 2 | 15 | 7 | 13 | 3 | 14 | 6 | 13 | 1 |
| Six rooms | 18 | 8 | 16 | 3 | 22 | 9 | 22 | 0 | 18 | 0 | 15 | 5 | 16 | 5 | 15 | 11 |
| Seven rooms | 22 | 8 | 18 | 11 | 28 | 1 | 25 | 1 | 21 | 6 | 18 | 10 | 20 | 6 | 19 | 1 |
| All houses | 16 | 2 | .. | .. | 19 | 7 | .. | .. | 14 | 4 | .. | .. | 13 | 6 | .. | .. |
A general and very considerable rise is apparent, more especially in the northern cities. Many reasons are ascribed for this increase—amongst others, the decreased purchasing-power of money and the higher (consequently more costly) standard of appearance and fittings required in the more recent house. The more rapid expansion of the North Island and the resulting demands for habitations explain partly the difference between North and South.
Concomitantly with the increase in population there has been an increase in the number of dwellings, &c, per square mile. The following table shows the movements side by side, and relates to all dwellings (not merely private dwellings and tenements):—
| Year. | Number of Inhabited Dwellings per Square Mile. | Number of Persons per Square Mile. | Number of Persons per Inhabited Dwelling. |
|---|---|---|---|
| 1861 | 0.214 | 0.944 | 4.42 |
| 1864 | 0.362 | 1.641 | 4.53 |
| 1867 | 0.517 | 2.094 | 4.05 |
| 1871 | 0.548 | 2.456 | 4.48 |
| 1874 | 0.588 | 2.869 | 4.88 |
| 1878 | 0.791 | 3.969 | 5.02 |
| 1881 | 0.917 | 4.693 | 5.12 |
| 1886 | 1.076 | 5.561 | 5.17 |
| 1891 | 1.191 | 6.024 | 5.06 |
| 1896 | 1.358 | 6.760 | 4.98 |
| 1901 | 1.527 | 7.427 | 4.86 |
| 1906 | 1.773 | 8.541 | 4.82 |
| 1911 | 2.070 | 9.690 | 4.68 |
| 1916 | 2.344 | 10.644 | 4.52 |
It will be noted that the movement has not always proceeded with a uniform rapidity. This fact is clearly brought out by the following graph:—
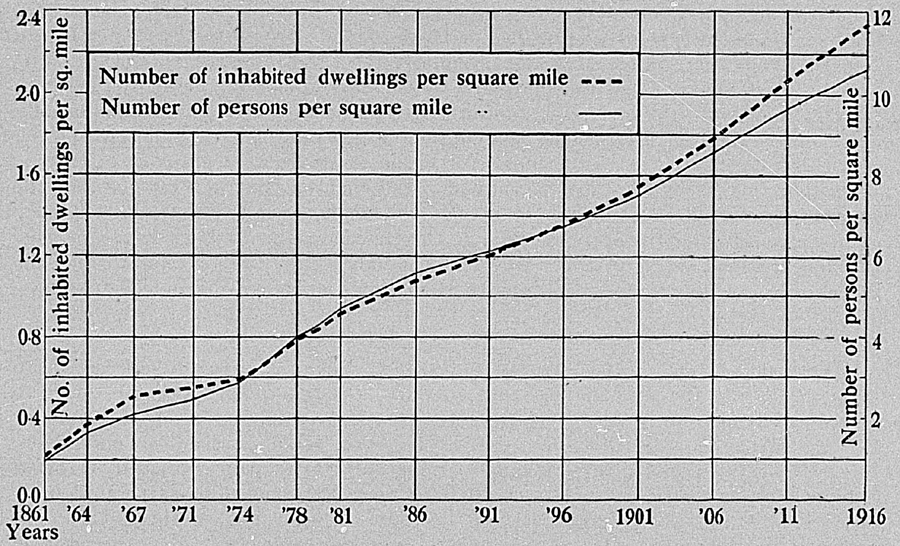
It would appear that the number of persons per inhabited dwelling rose more or less gradually to a maximum in 1886, after which date it has fallen slowly but without a break. The recent tendency is probably an outcome partly of the gradually diminishing size of families and partly of an improved standard of living, two factors which are themselves mutually interactive.
The number of persons per inhabited dwelling has been for each province at successive census-takings—
| Provincial District. | Persons to an Inhabited Dwelling (including Tents). | ||||||||
|---|---|---|---|---|---|---|---|---|---|
| 1878. | 1881. | 1886. | 1891. | 1896. | 1901. | 1906. | 1911. | 1916. | |
| Auckland | 5.01 | 5.12 | 5.15 | 4.85 | 4.84 | 4.76 | 4.32 | 4.76 | 4.49 |
| Taranaki | 5.03 | 5.06 | 5.13 | 5.23 | 5.07 | 4.90 | 4.85 | 4.69 | 4.63 |
| Hawke's Bay | 5.26 | 5.37 | 5.36 | 5.35 | 5.10 | 4.99 | 4.97 | 4.83 | 4.62 |
| Wellington | 5.42 | 5.33 | 5.46 | 5.22 | 5.17 | 5.12 | 5.06 | 4.82 | 4.63 |
| Marlborough | 5.15 | 5.18 | 5.26 | 5.25 | 5.24 | 5.06 | 4.81 | 4.64 | 4.50 |
| Nelson | 4.35 | 4.37 | 4.56 | 4.52 | 4.49 | 4.46 | 4.36 | 4.29 | 4.39 |
| Westland | 3.39 | 3.45 | 3.66 | 3.88 | 3.79 | 3.93 | 4.08 | 4.18 | 3.90 |
| Canterbury | 5.45 | 5.51 | 5.50 | 5.44 | 5.36 | 5.02 | 4.88 | 4.69 | 4.39 |
| Otago— | |||||||||
| Otago portion | 5.03 | 5.15 | 5.10 | 4.99 | 4.86 | 4.73 | 4.64 | 4.49 | 4.41 |
| Southland portion | 4.95 | 5.01 | 5.15 | 5.05 | 4.93 | 4.89 | 4.77 | 4.65 | 4.43 |
| Totals | 5.02 | 5.12 | 5.17 | 5.06 | 4.98 | 4.86 | 4.82 | 4.68 | 4.52 |
The comparatively stationary stage of the population in Westland no doubt accounts for the low 1916 figure there, while the rapid increase of population in the northern provinces, coupled with the practically stationary state of the building trade, accounts for their relatively high showing.
The accommodation in the dwellings of the people has improved greatly with time. In this connection the following table is of interest:—
| Year. | Number of Dwellings, &c, containing | ||||
|---|---|---|---|---|---|
| One Room. | Two Rooms. | Three or Four Rooms. | Five or Six Rooms. | Seven or more Rooms. | |
| 1891 | 11,528 | 11,030 | 41,934 | 32,868 | 24,968 |
| 1896 | 12,378 | 11,450 | 42,711 | 41,290 | 32,585 |
| 1901 | 13,263 | 10,462 | 45,499 | 52,585 | 36,542 |
| 1906 | 12,558 | 9,651 | 47,098 | 68,390 | 45,185 |
| 1911 | 12,281 | 9,954 | 54,770 | 89,275 | 46,814 |
| 1916 | 9,739 | 9,584 | 63,192 | 112,042 | 47,171 |
| Increase (+) or Decrease (−). | |||||
| 1891 to 1896 | +850 | +420 | +777 | +8,422 | +7,617 |
| 1896 to 1901 | +885 | −988 | +2,788 | +11,295 | +3,957 |
| 1901 to 1906 | −705 | −811 | +1,599 | +15,805 | +8,643 |
| 1906 to 1911 | −277 | +303 | +7,672 | +20,885 | +1,629 |
| 1911 to 1916 | −2,512 | −370 | +8,422 | +22,767 | +357 |
A remarkable increase will be noted in the number of houses containing from three to six rooms. During the whole period reviewed there has been, on the other hand, an almost continuous fall in the number of inhabited dwellings containing fewer than three rooms.
Next a series of tables is given showing by metropolitan and suburban areas the average number of occupants to each private dwelling or tenement according to the number of rooms.
AVERAGE NUMBER OF OCCUPANTS TO EACH PRIVATE DWELLING OR TENEMENT, CENSUS, 1916.
| Number of Rooms. | Total of Metropolitan and Suburban Areas. | Total of Remainder of Dominion. | Total Dominion. |
|---|---|---|---|
| 1 | 1.47 | 1.43 | 1.43 |
| 2 | 2.10 | 2.24 | 2.21 |
| 3 | 2.97 | 3.29 | 3.16 |
| 4 | 3.74 | 3.96 | 3.87 |
| 5 | 4.24 | 4.55 | 4.39 |
| 6 | 4.63 | 4.93 | 4.78 |
| 7 | 4.98 | 5.26 | 5.13 |
| 8 | 5.13 | 5.51 | 5.34 |
| 9 | 5.36 | 5.80 | 5.57 |
| 10 | 5.29 | 5.89 | 5.61 |
| 11 | 5.51 | 5.99 | 5.75 |
| 12 | 5.75 | 6.13 | 5.94 |
| 13 | 5.79 | 6.36 | 6.08 |
| 14 | 6.07 | 6.70 | 6.42 |
| 15 | 6.79 | 7.34 | 7.09 |
| 16 | 7.11 | 7.14 | 7.13 |
| 17 | 5.65 | 7.80 | 7.27 |
| 18 | 7.53 | 7.57 | 7.56 |
| 19 | 7.13 | 4.67 | 5.82 |
| 20 and over | 7.11 | 9.24 | 8.48 |
| Not stated | 3.38 | 3.10 | 3.18 |
| Totals | 4.26 | 4.25 | 4.25 |
METROPOLITAN AREAS.— AVERAGE NUMBER OF OCCUPANTS TO EACH PRIVATE DWELLING OR TENEMENT, CENSUS, 1916.
| Number of Rooms. | Metropolitan Areas. | ||||
|---|---|---|---|---|---|
| Auckland. | Wellington. | Christchurch. | Dunedin. | Totals. | |
| 1 | 1.44 | 1.86 | 1.21 | 1.25 | 1.55 |
| 2 | 2.30 | 2.35 | 1.91 | 1.69 | 2.15 |
| 3 | 2.96 | 3.16 | 2.82 | 2.83 | 2.98 |
| 4 | 3.71 | 3.79 | 3.59 | 3.79 | 3.71 |
| 5 | 4.19 | 4.35 | 4.14 | 4.27 | 4.23 |
| 6 | 4.61 | 4.73 | 4.57 | 4.57 | 4.62 |
| 7 | 5.00 | 5.11 | 4.89 | 4.87 | 4.98 |
| 8 | 5.21 | 5.09 | 5.12 | 4.90 | 5.11 |
| 9 | 5.28 | 5.77 | 5.41 | 5.25 | 5.41 |
| 10 | 5.29 | 5.56 | 5.19 | 5.12 | 5.31 |
| 11 | 5.46 | 5.76 | 5.65 | 5.69 | 5.61 |
| 12 | 6.12 | 5.49 | 5.70 | 5.07 | 5.67 |
| 13 | 5.61 | 5.45 | 6.13 | 6.33 | 5.80 |
| 14 | 6.31 | 6.09 | 6.00 | 5.53 | 6.04 |
| 15 | 7.17 | 7.10 | 6.00 | 7.00 | 6.88 |
| 16 | 9.00 | 8.08 | 6.13 | 5.20 | 7.22 |
| 17 | 4.50 | 600 | 6.40 | 6.00 | 5.91 |
| 18 | 9.80 | .. | 8.00 | 5.67 | 8.22 |
| 19 | 7.50 | 8.00 | 8.00 | .. | 7.86 |
| 20 and over | 7.17 | 7.57 | 8.00 | 5.86 | 7.23 |
| Not stated | 3.38 | 3.21 | 3.72 | 3.20 | 3.41 |
| Totals | 4.31 | 4.31 | 4.13 | 4.19 | 4.25 |
SUBURBAN AREAS.—AVERAGE NUMBER of OCCUPANTS to EACH PRIVATE DWELLING or TENEMENT, CENSUS, 1916.
| Number of Rooms. | Suburban Areas. | |||||||||
|---|---|---|---|---|---|---|---|---|---|---|
| Gisborne. | Napier. | New Plymouth. | Wanganui. | Palmerston North. | Nelson. | Grey Valley. | Timaru. | Invercargill | Totals. | |
| 1 | 1.26 | 1.42 | 1.30 | 1.33 | 1.45 | 1.05 | 1.16 | 1.35 | 1.30 | 1.32 |
| 2 | 2.18 | 2.28 | 2.22 | 2.00 | 2.02 | 1.32 | 1.51 | 1.86 | 1.58 | 1.97 |
| 3 | 2.75 | 3.30 | 2.79 | 2.95 | 2.76 | 2.11 | 2.50 | 3.16 | 2.94 | 2.94 |
| 4 | 4.65 | 3.99 | 3.52 | 3.69 | 3.62 | 3.37 | 3.42 | 3.93 | 3.76 | 3.86 |
| 5 | 4.31 | 4.31 | 4.16 | 4.36 | 4.29 | 3.81 | 4.34 | 4.41 | 4.26 | 4.28 |
| 6 | 4.88 | 4.53 | 4.92 | 4.65 | 4.72 | 3.97 | 4.67 | 4.63 | 4.74 | 4.66 |
| 7 | 5.24 | 4.78 | 4.95 | 4.82 | 5.28 | 4.49 | 5.21 | 5.11 | 5.08 | 4.98 |
| 8 | 541 | 5.17 | 4.77 | 5.26 | 6.10 | 4.29 | 4.69 | 5.17 | 5.27 | 5.20 |
| 9 | 4.92 | 5.38 | 5.51 | 5.62 | 4.48 | 4.85 | 5.92 | 4.90 | 5.42 | 5.19 |
| 10 | 5.56 | 5.47 | 5.04 | 4.71 | 6.V2 | 4.54 | 4.64 | 5.20 | 5.27 | 5.21 |
| 11 | 5.91 | 4.71 | 5.78 | 5.59 | 4.70 | 4.45 | 4.33 | 5.64 | 4.92 | 5.13 |
| 12 | 5.22 | 5.88 | 6.00 | 7.00 | 5.43 | 6.07 | .. | 5.20 | 0.14 | 6.00 |
| 13 | .. | 7.00 | .. | 7.00 | 5.00 | 5.09 | .. | 4.17 | 6.71 | 5.75 |
| 14 | 6.67 | 4.00 | .. | 6.67 | 6.50 | 5.00 | 9.00 | 3.00 | 8.00 | 6.14 |
| 15 | 8.50 | .. | 5.00 | 6.00 | 6.50 | 7.50 | 4.00 | 6.00 | 6.50 | 6.61 |
| 16 | 5.00 | .. | .. | .. | 7.00 | 7.00 | 7.00 | .. | .. | 6.20 |
| 17 | 3.00 | 8.00 | .. | .. | 4.50 | .. | 5.00 | .. | .. | 5.00 |
| 18 | 9.00 | 7.00 | .. | 6.50 | 6.00 | .. | .. | 4.00 | .. | 6.50 |
| 19 | .. | .. | .. | .. | 2.00 | .. | .. | .. | .. | 2.00 |
| 20 and over | 5.00 | 7.00 | .. | .. | 10.10 | .. | .. | .. | .. | 6.57 |
| Not stated | 5.00 | 4.75 | 4.50 | 1.57 | 3.80 | 5.00 | 2.56 | 2.50 | 4.00 | 3.15 |
| Totals | 4.50 | 4.24 | 4.28 | 4.32 | 4.28 | 3.90 | 4.31 | 4.31 | 4.35 | 4.29 |
Among suburban areas Nelson is seen to have easily the fewest occupants per inhabited dwelling, while the highest figure is that for Gisborne. Although the average for suburban areas is slightly higher than that for the whole Dominion, the average for the metropolitan areas and that for the areas outside the suburban and metropolitan areas are practically identical with that for the whole Dominion. Among metropolitan areas it is again noteworthy that the average is highest in those cases—viz., Wellington and Auckland—in which the population has increased most rapidly. This would appear to establish an empirical law to the effect that changes in the number of dwellings lag behind changes in population, a state of affairs which indeed might have been expected a priori, since people seem to build when a need has arisen rather than in anticipation of needs. Thus it is a remarkable fact that although the Wellington metropolitan area exceeds considerably the Christchurch area in population, the converse holds as regards numbers of inhabited dwellings, a state of affairs reminiscent of the day not far back when Christchurch was in point of numbers the second city in the Dominion. Possibly it may be, too, that the increase of the population in the case of Wellington has been so rapid that building operations have not been able to keep pace with it from shortage either of labour or of materials—though there is little positive evidence in support of this suggestion. More weight attaches to the consideration that during the war period persons have from prudential motives, in anticipation of lower prices after the cessation of hostilities, refrained from building. (See hereon “Dwellings in Course of Erection” below.)
Taking the counties (including interior boroughs), the highest percentages of occupants per inhabited dwellings were in Castlepoint (5.15), Pohangina (5.06), Sounds (4.89), and Stratford (4.80). The lowest, on the other hand, were in Stewart Island (3.07) and Fiord (2.60). The low percentage in Stewart Island will, of course, be a direct outcome of the fact that this island is largely a holiday resort, and, except in the summer, has few or no visitors. The accompanying map illustrates the matter further.
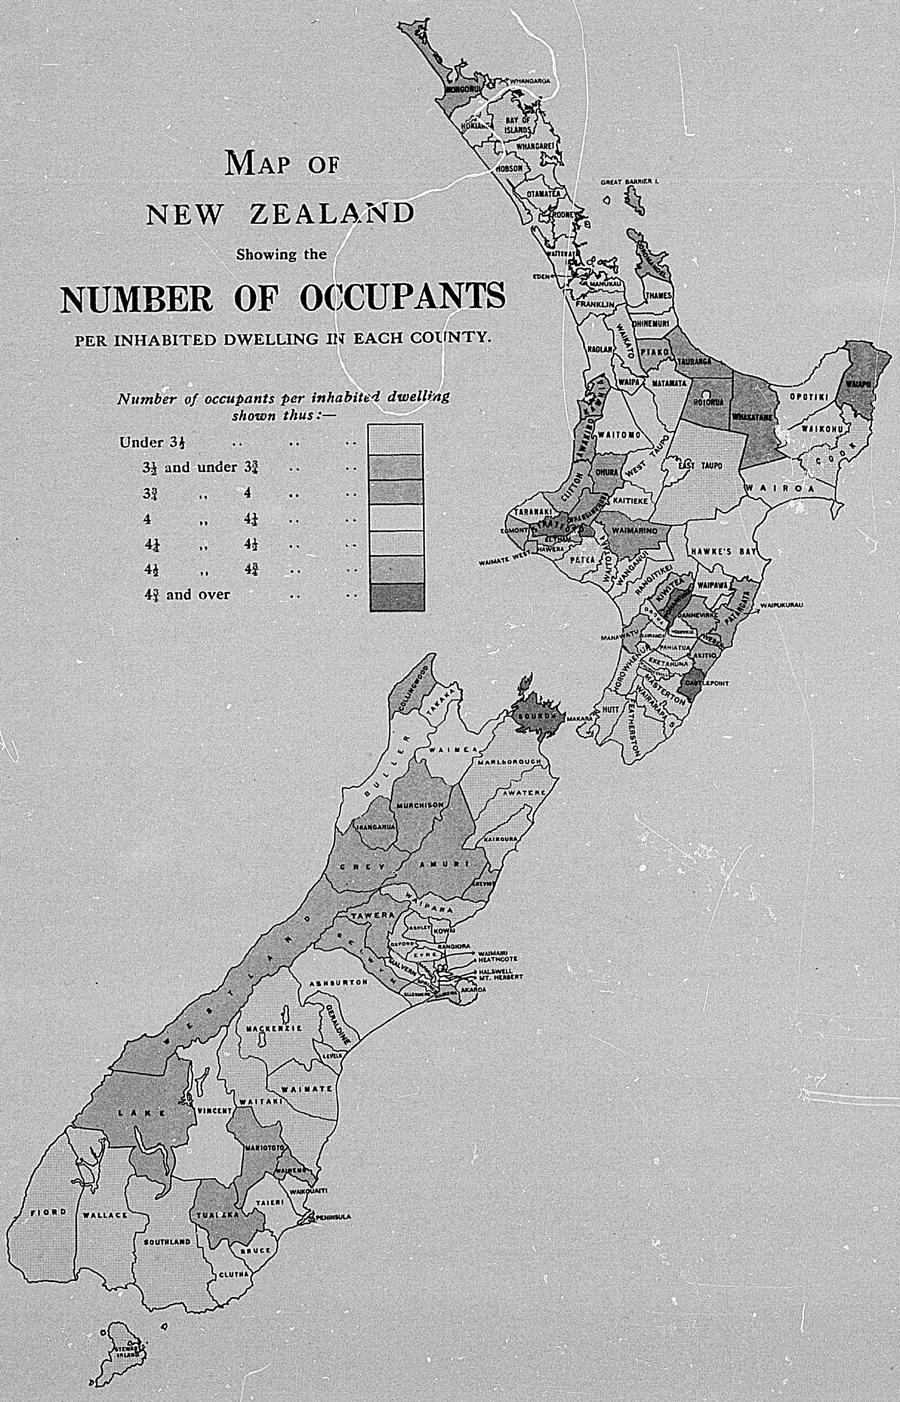
Fuller details for the 1916 census are now quoted. One table shows the nature of dwellings, &c,., according to the number of rooms.
INHABITED DWELLINGS, etc.—NATURE, by NUMBER of ROOMS, CENSUS, 1916.
| Number of Rooms. | Private Dwelling. | Tenement in Private Dwelling. | Hotel. | Boarding-house. | Religious Institution. | Educational Institution. | Charitable Institution. | Hospital or Mental Hospital. | Prison. | Military Establishment. | Other. | Totals. |
|---|---|---|---|---|---|---|---|---|---|---|---|---|
| 1 | 8,047 | 784 | .. | .. | .. | 1 | .. | .. | .. | 5 | 2 | 9,739 |
| 2 | 8,382 | 1,195 | .. | .. | 1 | 2 | .. | .. | 1 | .. | 3 | 9,584 |
| 3 | 10,568 | 1,127 | .. | 23 | .. | .. | .. | 1 | .. | 6 | 2 | 11,727 |
| 4 | 49,107 | 2,289 | .. | 61 | 2 | 1 | .. | 3 | .. | 2 | .. | 51,465 |
| 5 | 58,560 | 1,637 | 1 | 106 | 4 | 3 | 2 | 13 | 2 | 4 | 3 | 60,335 |
| 6 | 50,327 | 1,022 | 2 | 313 | 8 | 10 | 1 | 18 | 1 | 1 | 4 | 51,707 |
| 7 | 21,933 | 338 | 8 | 426 | 9 | 3 | 1 | 22 | 1 | 1 | 3 | 22,745 |
| 8 | 10,808 | 118 | 11 | 358 | 16 | 3 | 2 | 25 | 1 | .. | 5 | 11,347 |
| 9 | 4,023 | 43 | 21 | 278 | 8 | 6 | 7 | 26 | .. | 1 | 5 | 4,418 |
| 10 | 2,777 | .. | 29 | 241 | 6 | 5 | 7 | 20 | .. | .. | 1 | 3,086 |
| 11 | 999 | .. | 33 | 138 | 12 | 5 | 5 | 16 | .. | 2 | .. | 1,210 |
| 12 | 767 | .. | 63 | 142 | 11 | 6 | 7 | 17 | .. | .. | 1 | 1,014 |
| 13 | 313 | .. | 56 | 74 | 1 | 3 | 2 | 9 | .. | .. | 2 | 460 |
| 14 | 267 | .. | 60 | 92 | 3 | 7 | 4 | 14 | .. | .. | 3 | 450 |
| 15 | 116 | .. | 57 | 72 | 6 | 2 | 4 | 9 | .. | .. | .. | 266 |
| 16 | 126 | .. | 63 | 82 | 2 | 1 | 4 | 7 | 1 | .. | .. | 286 |
| 17 | 55 | .. | 55 | 58 | 2 | 5 | 3 | 5 | .. | .. | 1 | 184 |
| 18 | 50 | .. | 68 | 60 | 5 | 5 | 5 | 3 | .. | 1 | 1 | 198 |
| 19 | 17 | .. | 42 | 30 | 1 | 2 | 1 | 4 | .. | .. | .. | 97 |
| 20 and over | 104 | .. | 643 | 430 | 20 | 73 | 37 | 66 | 9 | 2 | 26 | 1,410 |
| Not stated | 1,177 | 90 | 8 | 25 | 1 | 4 | 3 | 20 | 11 | 15 | 4 | 1,358 |
| Totals | 229,423 | 8,643 | 1,220 | 3,009 | 118 | 147 | 95 | 298 | 27 | 40 | 66 | 243,086 |
It will be observed that five is the predominant number of rooms for private dwellings and four for tenements, while the number is considerably higher for such establishments as hotels, boardinghouses, religious and educational institutions, and so on. For private dwellings and tenements the average number of rooms was 5–16.
A further table shows the nature of dwellings, &c,., according to the number of occupants:—
INHABITED DWELLINGS, etc.—NATURE, by NUMBER of OCCUPANTS, CENSUS, 1916.
| Number of Occupants. | Private Dwelling. | Tenement in Private Dwelling. | Hotel. | Boarding-house. | Religious Institution. | Educational Institution. | Charitable Institution. | Hospital or Mental Hospital. | Prison. | Military Establishment. | Other. | Totals. |
|---|---|---|---|---|---|---|---|---|---|---|---|---|
| 1 | 21,035 | 1,024 | 2 | 27 | 3 | 5 | 1 | 3 | 1 | 3 | 6 | 22,110 |
| 2 | 33,754 | 1,781 | 13 | 79 | 7 | 1 | .. | 12 | .. | 3 | 6 | 35,656 |
| 3 | 39,994 | 1,753 | 40 | 123 | 5 | 4 | 1 | 6 | .. | 2 | 2 | 41,930 |
| 4 | 40,682 | 1,456 | 70 | 180 | 17 | 13 | .. | 18 | 1 | 2 | 4 | 42,443 |
| 5 | 33,861 | 1,012 | 77 | 259 | 16 | 7 | 1 | 12 | .. | 4 | 4 | 35,253 |
| 6 | 24,112 | 700 | 99 | 296 | 7 | 4 | 1 | 19 | 2 | 3 | 3 | 25,246 |
| 7 | 15,421 | 416 | 82 | 300 | 7 | 5 | 1 | 25 | 2 | 2 | 3 | 16,264 |
| 8 | 9,464 | 238 | 80 | 251 | 5 | 2 | 2 | 12 | 1 | .. | 3 | 10,058 |
| 9 | 5,293 | 124 | 94 | 238 | 4 | 2 | 2 | 14 | .. | 3 | 1 | 5,775 |
| 10 | 3,015 | 66 | 81 | 200 | 2 | 2 | 3 | 24 | 2 | 1 | 2 | 3,398 |
| 11 | 1,438 | 36 | 77 | 164 | 7 | 1 | .. | 14 | .. | .. | 1 | 1,738 |
| 12 | 701 | 17 | 61 | 135 | 1 | 9 | 2 | 6 | 1 | 1 | 3 | 937 |
| 13 | 304 | 13 | 48 | 119 | 2 | 4 | 1 | 6 | .. | .. | 1 | 498 |
| 14 | 149 | 4 | 54 | 89 | 3 | 2 | .. | 7 | .. | 3 | 2 | 313 |
| 15 | 83 | 2 | 27 | 79 | 4 | 1 | 1 | 10 | .. | 1 | 3 | 211 |
| 16 | 50 | 1 | 35 | 68 | 3 | 5 | 3 | 10 | .. | 1 | .. | 176 |
| 17 | 20 | .. | 31 | 60 | 1 | 4 | 2 | 11 | 1 | .. | 1 | 131 |
| 18 | 13 | .. | 23 | 51 | 1 | I | 2 | 4 | .. | 1 | 3 | 99 |
| 19 | 9 | .. | 23 | 32 | .. | 4 | .. | 2 | .. | .. | .. | 70 |
| 20 and under 30 | 25 | .. | 123 | 164 | 4 | 18 | 22 | 22 | 3 | 2 | 6 | 389 |
| 30 and under 40 | .. | .. | 39 | 53 | 2 | 14 | 19 | 14 | 2 | 2 | 4 | 149 |
| 40 and under 50 | .. | .. | 20 | 20 | 5 | 6 | 4 | 10 | 4 | 4 | .. | 77 |
| 50 and under 75 | .. | .. | 10 | 16 | 5 | 16 | 12 | 14 | 3 | .. | .. | 76 |
| 75 and under 100 | .. | .. | 8 | 4 | 2 | 5 | 5 | 5 | 3 | 1 | 3 | 36 |
| 100 and under 150 | .. | .. | 2 | 2 | 4 | 7 | 6 | 6 | .. | .. | .. | 27 |
| 150 and under 200 | .. | .. | 1 | .. | 1 | .. | .. | 1 | .. | .. | 1 | 4 |
| 200 and under 250 | .. | .. | .. | .. | .. | 5 | 2 | 4 | 1 | 1 | .. | 13 |
| 250 and over | .. | .. | .. | .. | .. | .. | 2 | 7 | .. | .. | .. | 9 |
| Totals | 229,423 | 8,643 | 1,220 | 3,009 | 118 | 147 | 95 | 298 | 27 | 40 | 66 | 243,086 |
The popular number for private dwellings is four, as compared with two for tenements and as many as seven for boardinghouses. The frequency distributions will be seen from the table to be remarkably symmetrical.
The foregoing tables and remarks apply to all inhabited dwellings, whatever their nature. The following have reference to private dwellings and tenements only.
Although, as pointed out above, five is the popular number of rooms for private dwellings throughout the Dominion, it by no means follows that this is true of any one section of the Dominion. In particular, it is worth pointing out that in the counties (exclusive of interior boroughs) the number is but four, thus showing that houses have, on the whole, more rooms in the towns than in the country, though it should not be overlooked that a large number of rooms does not of necessity connote a large house, and indeed it is probable that the average room in the country may be larger than its counterpart in the town. Further light is shed on this matter by the accompanying table and diagram:—
NUMBER of PRIVATE DWELLINGS or TENEMENTS with OCCUPANTS as under, CENSUS, 1916.
| Number of Rooms. | Totals for Counties. | Totals for Boroughs. | Grand Totals for Dominion. |
|---|---|---|---|
| 1 | 7,941 | 1,790 | 9,731 |
| 2 | 6,365 | 3,212 | 9,577 |
| 3 | 6,285 | 5,410 | 11,695 |
| 4 | 24,753 | 26,643 | 51,396 |
| 5 | 24,292 | 35,905 | 60,197 |
| 6 | 20,775 | 30,574 | 51,349 |
| 7 | 10,008 | 12,263 | 22,271 |
| 8 | 5,313 | 5,613 | 10,926 |
| 9 | 1,860 | 2,206 | 4,066 |
| 10 or over | 2,784 | 2,807 | 5,591 |
| Not stated | 878 | 389 | 1,267 |
| Total dwellings | 111,254 | 126,812 | 238,066 |
| Total occupants | 476,687 | 536,007 | 1,012,694 |
| Average occupants | 4.28 | 4.23 | 4.25 |
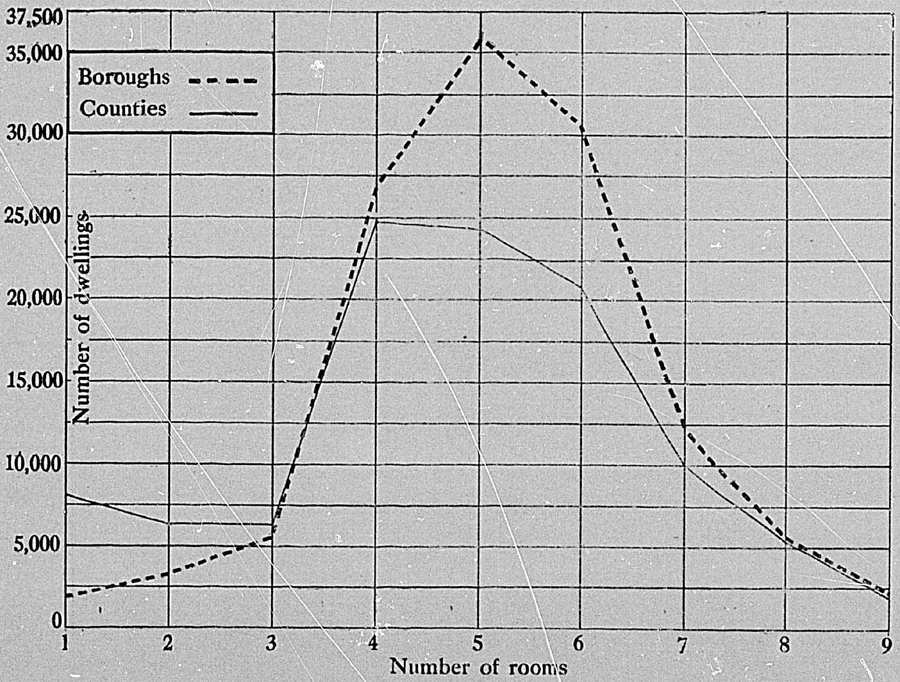
Similarly, although four is the popular number of occupants for private dwellings for the Dominion, three is the popular number for the boroughs and cities, reflecting the tendency, no doubt towards smaller families in the towns. Another table and graph illustrate this:—
NUMBER OF PRIVATE DWELLING OR TENEMENTS WITH OCCUPATION AS UNDER, CENSUS, 1916.
| Number of Occupants. | Totals for Counties. | Totals for Boroughs. | Grand Totals for Dominion. |
|---|---|---|---|
| 1 | 14,225 | 7,834 | 22,059 |
| 2 | 15,613 | 19,922 | 35,535 |
| 3 | 16,953 | 24,794 | 41,747 |
| 4 | 18,132 | 24,006 | 42,138 |
| 5 | 15,194 | 19,679 | 34,873 |
| 6 | 11,660 | 13,152 | 24,812 |
| 7 | 7,820 | 8,017 | 15,837 |
| 8 | 5,085 | 4,617 | 9,702 |
| 9 | 3,007 | 2,410 | 5,417 |
| 10 | 1,808 | 1,273 | 3,081 |
| 11 | 876 | 598 | 1,474 |
| 12 | 427 | 291 | 718 |
| 13 | 201 | 116 | 317 |
| 14 | 102 | 51 | 153 |
| 15 | 56 | 29 | 85 |
| 16 | 40 | 11 | 51 |
| 17 | 14 | 6 | 20 |
| 18 | 11 | 2 | 13 |
| 19 | 8 | 1 | 9 |
| 20 and over | 22 | 3 | 25 |
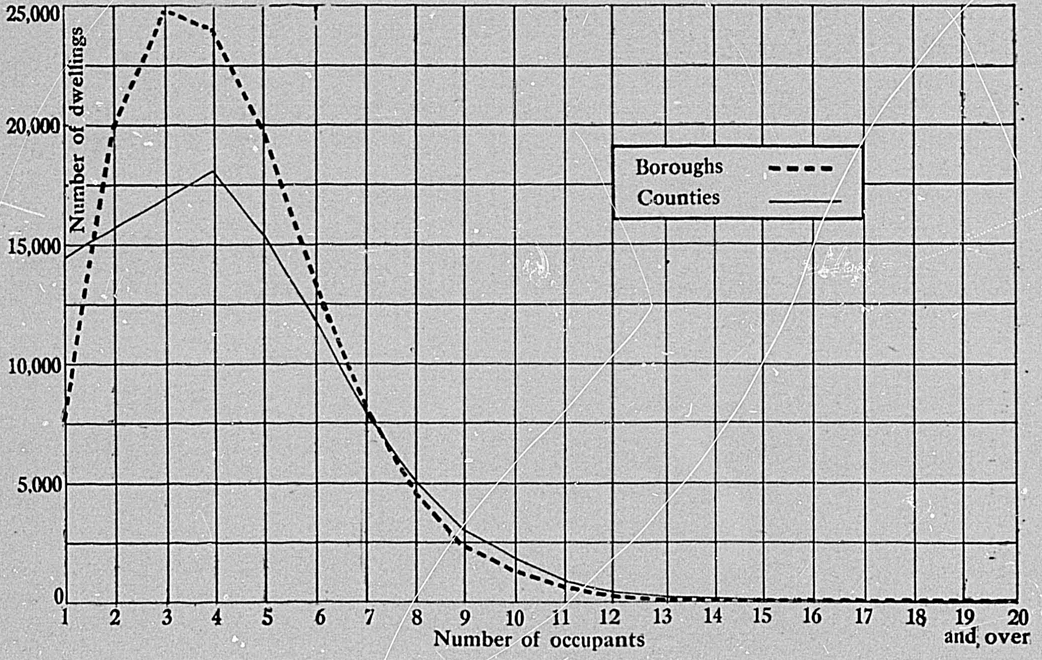
The two tables last quoted viewed together might be regarded as striking evidence of the very much higher standard of living prevailing in the towns as compared with that prevailing in the country districts of New Zealand.
A building may in general be said to be overcrowded if the number of its inhabitants and the manner of their disposal about that building is such, as to challenge health and decency. Overcrowding in this sense cannot in practice be statistically investigated, and it is accordingly usually assumed that all dwellings having two or more persons per room are overcrowded, an assumption which, while its shortcomings are fully realized, has earned wide approval in statistical circles.
In the first instance it must be noted that this assumption has no regard to the size of the rooms, or to the ages and sexes of the occupants, or, again, to the means of ventilation and other considerations of hygiene, all of which have an important bearing on health and morals. It is reasonable, however, in the absence of any evidence that the contrary is indeed the case, to assume that cases where the size of the room is sufficiently great to negative overcrowding are not relatively more numerous in one city than in another; so also with cases where, although there are fewer than two persons to a room, the rooms are so small or so few that overcrowding actually does exist. The error introduced by this latter assumption is probably in most cases so small as to be practically negligible.
Whether the drawing of the line at “two persons per
room” gives the best measure of overcrowding is one that is open to more
argument, and it should be realized then that the figures
are of comparatively little value taken absolutely; in other words, inasmuch as our
definition of overcrowding is a somewhat arbitrary one, it would be largely illicit
to contend on the basis of the figures shortly to be quoted that  per cent. of the homes in Dunedin were overcrowded. Some weight
would, however, attach to a comparison between Dunedin and Wellington whereby it was
asserted that cases of overcrowding were relatively more frequent in the former,
inasmuch as while
per cent. of the homes in Dunedin were overcrowded. Some weight
would, however, attach to a comparison between Dunedin and Wellington whereby it was
asserted that cases of overcrowding were relatively more frequent in the former,
inasmuch as while per cent. of the houses in the former case have two persons to
a room, the corresponding figure in the latter case is but although it must not be
overlooked that such figures are not quite conclusive, as it may be that the average
size of a room in Dunedin houses is greater than in Wellington.
per cent. of the houses in the former case have two persons to
a room, the corresponding figure in the latter case is but although it must not be
overlooked that such figures are not quite conclusive, as it may be that the average
size of a room in Dunedin houses is greater than in Wellington.
The table now quoted has been specially drawn up showing for all private dwellings and tenements in each metropolitan area, for a given number of persons per room, the number of persons affected and the number of cases involved. From the former is compiled the percentage of the total population living fewer than half a person to a room, more than half but less than one, and so on, and the results of this latter investigation are embodied in a separate table.
Table showing for all Private Houses and Tenements in each Metropolitan Area the Number of Persons to a Room at the Census of October, 1916.
| Number of Persons to a Room. | Auckland Metropolitan Area. | Wellington Metropolitan Area. | Christchurch Metropolitan Area. | Dunedin Metropolitan Area. | ||||
|---|---|---|---|---|---|---|---|---|
| Number of Cases. | Number of Persons. | Number of Cases. | Number of Persons. | Number of Cases. | Number of Persons. | Number of Cases. | Number of Persons. | |
| Under ½ | 4,743 | 10,198 | 2,774 | 6,044 | 3,417 | 7,049 | 2,591 | 5,367 |
| ½ and under ½ | 13,523 | 52,341 | 8,893 | 33,597 | 9,551 | 34,120 | 6,860 | 25,035 |
| ½ and under ½ | 7,861 | 44,039 | 6,030 | 32,272 | 5,709 | 31,092 | 4,224 | 22,778 |
| 1½ and under 2½ | 1,637 | 11,736 | 1,360 | 9,064 | 1,155 | 8,477 | 922 | 6,684 |
| 2 and under 2½ | 324 | 2,671 | 323 | 2,477 | 243 | 2,081 | 272 | 2,236 |
| 2½ and under 3 | 61 | 483 | 47 | 382 | 36 | 342 | 38 | 343 |
| 3 and under 3½ | 36 | 166 | 65 | 229 | 8 | 51 | 7 | 52 |
| 3½ and under 4 | 1 | 7 | .. | .. | .. | .. | 1 | 11 |
| 4 and over | 9 | 46 | 21 | 99 | 4 | 30 | 4 | 16 |
| Totals where number of rooms stated | 28,198 | 121,687 | 19,513 | 84,164 | 20,123 | 83,242 | 14,919 | 62,522 |
| Totals where number of rooms not stated | 63 | 213 | 134 | 430 | 102 | 379 | 10 | 32 |
| Grand totals | 28,261 | 1215900 | 19,647 | 84,594 | 20,225 | 83,621 | 14,929 | 62,554 |
Table showing for each Number of Persons per Room the Percentage of Persons 80 living to Total Population of each Metropolitan Area, Census, 1916.
| Number of Persons to a Room. | Metropolitan Area. | |||
|---|---|---|---|---|
| Auckland. | Wellington. | Christchurch. | Dunedin. | |
| Under ½ | 8.38 | 7.18 | 8.47 | 8.58 |
| ½ and under 1 | 43.01 | 39.92 | 40.99 | 40.04 |
| 1 and under 1½ | 36.19 | 38.34 | 37.35 | 36.43 |
| 1½ and under 2 | 9.64 | 10.77 | 10.18 | 10.69 |
| 2 and under 2½ | 2.19 | 2.94 | 2.50 | 3.58 |
| 2½ and under 3 | 0.40 | 0.45 | 0.41 | 0.55 |
| 3 and under 3½ | 0.14 | 0.28 | 0.06 | 0.08 |
| 3½ and under 4 | 0.01 | .. | .. | 0.02 |
| 4 and over | 0.04 | 0.12 | 0.04 | 0.03 |
| Totals | 100.00 | 100.00 | 100.00 | 100.00 |
Taking the first lines for Auckland metropolitan area, the figures show that out of a total of 28,198 households, in 4,743 cases the number of rooms in the house was more than twice the number of occupants, giving at least two rooms per occupant. The 10,198 persons living under these conditions represented 8.38 per cent. of the total population (excluding those living in hotels, hospitals, &c,.). The corresponding percentages for Wellington, Christchurch, and Dunedin were 7.18, 8.47, and 8.58 respectively.
If the first four lines in each table be considered, it will be seen
that households with less than two persons to the room represented 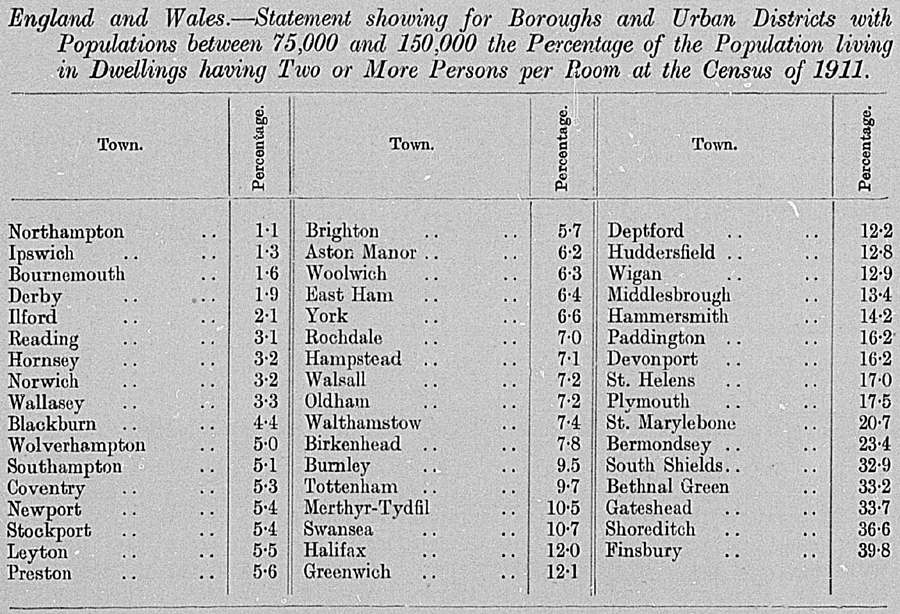 per cent. of the total population in Auckland, per cent. in
Wellington, 97 per cent. in Christchurch, and per cent. in Dunedin; the balances of
per cent., per cent., 3 per cent., and per cent. representing the proportion of the
total in the respective metropolitan areas living in houses whose occupants averaged
two or more per room.
per cent. of the total population in Auckland, per cent. in
Wellington, 97 per cent. in Christchurch, and per cent. in Dunedin; the balances of
per cent., per cent., 3 per cent., and per cent. representing the proportion of the
total in the respective metropolitan areas living in houses whose occupants averaged
two or more per room.
These figures compare very favourably with those for England and Wales, where, at the census of 1911, 9.1 per cent, of the total population, (town and country) were living in houses having more than two persons per room (not including cases where the proportion was exactly two). The corresponding figure for Scotland was as high as 43.6 per cent.
If the figures for our metropolitan areas are worked on the same basis as in England and Scotland—i.e., not including cases where the number of persons to a room was exactly two—the percentages are reduced to—Auckland, 1.23; Wellington, 1.69; Christchurch, 1.47; Dunedin, 1.86.
There follows a table showing for all English boroughs and urban districts with populations of between 75,000 and 150,000 (i.e., of approximately the same size as our metropolitan areas) the percentage of population living in dwellings which at the census of 1911 averaged one room to two or more occupants. Dunedin, which has the highest figure of the four New Zealand towns, still shows better conditions than all but three (or at most four) of the English towns of about the same size.
England and Wales.—Statement showing for Boroughs and Urban Districts with Population between 75,000 and 150,000 the Percentage of the Population living in Dwellings having Two or More Persons per Room at the Census of 1911.
| Town. | Percentage. |
|---|---|
| Northampton | 1.1 |
| Ipswich | 1.3 |
| Bournemouth | 1.6 |
| Derby | 1.9 |
| Ilford | 2.1 |
| Reading | 3.1 |
| Hornsey | 3.2 |
| Norwich | 3.2 |
| Wallasey | 3.3 |
| Blackburn | 44 |
| Wolverhampton | 5.0 |
| Southampton | 5.1 |
| Coventry | 5.3 |
| Newport | 54 |
| Stockport | 54 |
| Leyton | 5.5 |
| Preston | 5.6 |
| Brighton | 5.7 |
| Aston Manor | 6.2 |
| Woolwich | 6.3 |
| East Ham | 64 |
| York | 6.6 |
| Rochdale | 7.0 |
| Hampstead Walsall | 7.1 |
| 7.2 | |
| Oldham | 7.2 |
| Walthamstow | 74 |
| Birkenhead | 7.8 |
| Burnley | 9.5 |
| Tottenham | 9.7 |
| Merthyr-Tydfil | 10.5 |
| Swansea | 10.7 |
| Halifax | 12.0 |
| Greenwich | 12.1 |
| Deptford | 12.2 |
| Huddersfield | 12.8 |
| Wigan | 12.9 |
| Middlesbrough | 134 |
| Hammersmith | 14.2 |
| Paddington | 16.2 |
| Devonport | 16.2 |
| St. Helens | 17.0 |
| Plymouth | 17.5 |
| St. Marylebone | 20.7 |
| Bermondsey | 234 |
| South Shields | 32.9 |
| Bethnal Green | 33.2 |
| Gateshead | 33.7 |
| Shoreditch | 36.6 |
| Finsbury | 39.8 |
The next section of the Census Report, dealing with households, will be found to throw further light on the occupants of dwellings in New Zealand.
Table of Contents
Table of Contents
Before proceeding further, the distinction drawn for census purposes between a “family” and a “household” requires to be explicated. The former term is commonly confined in its application to husband, wife, and their common issue, whether living together in one dwelling or scattered; while the latter term refers to all persons living together under the same roof, whether related to the head of the house or not, and excludes all members of a family as above defined who were not at the date of the census living “at home.”
A considerable mass of minute information dealing with the constitution of households has been tabulated for the first time in connection with the 1916 census, and is to be found in the last of the twelve parts of the volume containing the detailed results of the census of that year. Unfortunately the material is somewhat, too detailed to be easily capable of general treatment in a report such as this, and accordingly only some of the more interesting and important general results can here be mentioned.
Much information under the above head has already been disclosed in Section XIII of this report. A further table is now quoted summarizing the information relating to occupants by metropolitan and suburban districts:—
Table showing the Number of Occupants of all Inhabited Private Dwellings and Tenements in each Metropolitan and Suburban Area and the Remainder of the Dominion, classified according to the Number in the Household, as at the Census of October, 1916.
| Metropolitan or Suburban Area. | Cases in which the Number of Persons in the Household was | Totals. | ||||||||||
|---|---|---|---|---|---|---|---|---|---|---|---|---|
| 1. | 2. | 3. | 4. | 5. | 6. | 7. | 8. | 9. | 10. | More than 10. | ||
| Metropolitan areas— | ||||||||||||
| Auckland | 1,296 | 4,250 | 5,684 | 5,490 | 4,481 | 3,041 | 1,808 | 1,112 | 567 | 305 | 227 | 28,261 |
| Wellington | 854 | 3,025 | 3,893 | 3,968 | 3,096 | 2,060 | 1,252 | 747 | 346 | 214 | 192 | 19,647 |
| Christchurch | 1,031 | 3,460 | 4,254 | 4,029 | 2,989 | 1,996 | 1,169 | 636 | 309 | 186 | 166 | 20,225 |
| Dunedin | 922 | 2,462 | 2,914 | 2,823 | 2,234 | 1,599 | 918 | 506 | 288 | 147 | 116 | 14,929 |
| Suburban areas— | ||||||||||||
| Gisborne | 147 | 307 | 453 | 542 | 476 | 352 | 201 | 117 | 61 | 24 | 22 | 2,702 |
| Napier | 170 | 482 | 611 | 655 | 468 | 320 | 192 | 117 | 64 | 30 | 22 | 3,131 |
| New Plymouth | 158 | 340 | 378 | 388 | 383 | 255 | 131 | 95 | 47 | 16 | 19 | 2,210 |
| Wanganui | 225 | 599 | 814 | 812 | 635 | 441 | 271 | 158 | 98 | 35 | 44 | 4,132 |
| Palmerston North | 193 | 464 | 587 | 520 | 427 | 335 | 216 | 112 | 57 | 41 | 24 | 2,976 |
| Nelson | 167 | 341 | 370 | 344 | 236 | 169 | 104 | 61 | 26 | 7 | 9 | 1,834 |
| Grey Valley Boroughs | 96 | 188 | 204 | 191 | 164 | 135 | 91 | 50 | 24 | 13 | 16 | 1,172 |
| Timaru | 172 | 431 | 589 | 520 | 468 | 327 | 194 | 103 | 60 | 29 | 35 | 2,928 |
| Invercargill | 268 | 571 | 719 | 775 | 619 | 388 | 287 | 165 | 83 | 63 | 44 | 3,982 |
| Totals, metropolitan and suburban areas | 5,699 | 16,920 | 21,470 | 21,057 | 16,676 | 11,418 | 6,834 | 3,979 | 2,030 | 1,110 | 936 | 108,129 |
| Remainder of Dominion | 16,360 | 18,615 | 20,277 | 21,081 | 18,197 | 13,394 | 9,003 | 5,723 | 3,387 | 1,971 | 1,929 | 129,937 |
| Grand totals | 22,059 | 35,535 | 41,747 | 42,138 | 34,873 | 24,812 | 15,837 | 9,702 | 5,417 | 3,081 | 2,865 | 238,066 |
It is interesting to note that although Christchurch possessed in the aggregate more inhabited private dwellings and tenements than Wellington, yet of each number of occupants in excess of four more instances occurred in the case of the latter suburban area than in that of the former. The tendency is thus towards larger households in Wellington, and the figures relating to Auckland appear to reveal a similar tendency.
Among suburban areas the tendency towards large households appears to be greatest in the Grey Valley boroughs, with Timaru, Invercargill, and Wanganui not far behind. In Nelson the tendency towards small households would appear to be most marked.
Outside the thirteen centres, cases where there are three occupants are fewer than within them, but either with an increase in the number of occupants or with a fall the country areas in each case show an excess over the town, and this excess increases rapidly the more the turning-point (three occupants) is receded from.
It is interesting to note that while there were 18,154 households containing one male and no female, there were only 3,905 containing one female and no male. Altogether 13,276 households contained no male, and 26,573 no female. The most popular arrangement was one male and one female to a household, there being 24,894 cases of this conjunction. The next most popular arrangement was one male and two females (20,912 cases), and still the next most favoured two males and two females (19,847 cases).
There were 22,068 households containing no adult female and one adult male, as against 12,475 containing one adult female and no adult male. Altogether 23,132 households contained no adult male, and 29,487 no adult female. Out of a total of 238,066 households as many as 115,145 contained but one adult male and one adult female.
The popular number of adults in a household, both for the whole Dominion and for each of the metropolitan and suburban areas, was two. There were 982 households containing no adults. Of these 554 contained only one occupant, 213 only two, and 79 only three. There were 21,505 households which contained only one person, and that an adult.
There were 100,503 households containing no children under 14. There were, moreover, 23,595 containing one female under 14 and no male of that age, as against 23,895 containing one male under 14 and no such female. Two households contained more than ten male children and no female children, 1 contained more than ten male children and four female children, and 1 contained nine female children and four male children.
There were 70 households containing only one person, and that a child under 14>; there were 3 containing only two persons, and those both children under 14; while 5 contained only three persons, all of whom were children under 14.
There were 770 cases where there were no adults and no children under 14— i.e., 770 cases where all the occupants were aged 14 and under 21.
Childless households (i.e., households containing no persons under 14) numbered 11,772 in Auckland, 8,095 in Wellington, 8,980 in Christchurch, and 0,872 in Dunedin. On the other hand, there were in Auckland 24, in Wellington 21, in Christchurch 20, and in Dunedin 9 households which contained no adults. The suburban areas show even more variation, and the high figures for Invercargill in this connection are especially hard to account for.
| Number of Cases of Childless Households. | number of cases of Households containing no Adult. | |
|---|---|---|
| Gisborne | 863 | 4 |
| Napier | 1,236 | 2 |
| New Plymouth | 872 | 4 |
| Wanganui | 1,582 | 11 |
| Palmerston north | 1,172 | 1 |
| Nelson | 869 | 3 |
| Grey Valley Boroughs | 471 | 6 |
| Timaru | 1,189 | 5 |
| Invercargill | 1,585 | 17 |
| The following figures are of interest:— | ||
| Total metropolitan and suburban areas | 45,558 | 127 |
| Rest of Dominion | 54,945 | 855 |
| Whole Dominion | 100,503 | 982 |
A glance reveals for the country districts a relatively large number of households containing no adult.
In each geographical division there were more households with no children than with any other number. Disregarding childless households, one was the next most favoured number of children, except in Gisborne suburban area, where it was two.
In 32,948 cases all the occupants were breadwinners, distributed as follows:—
| Number of Occupants. | Total Number of Households with Foregoing Number of Occupants. | Number of Cases where all Occupants were Breadwinners. |
|---|---|---|
| 1 | 22,059 | 19,462 |
| 2 | 35,535 | 7,960 |
| 3 | 41,747 | 2,977 |
| 4 | 42,138 | 1,278 |
| 5 | 34,873 | 591 |
| 6 | 24,812 | 273 |
| 7 | 15,837 | 147 |
| 8 | 9,702 | 82 |
| 9 | 5,417 | 55 |
| 10 | 3,081 | 32 |
| More than 10 | 2,865 | 91 |
| 238,066 | 32,948 |
In 10,303 households there were no breadwinners, as follows:—
| Number of Occupants | Total Number of Households with Foregoing Number of Occupants | Number of Cases where no Occupants were Breadwinners. |
|---|---|---|
| 1 | 22,059 | 2,597 |
| 2 | 35,535 | 2,662 |
| 3 | 41,747 | 1,761 |
| 4 | 42,138 | 1,250 |
| 5 | 34,873 | 831 |
| 6 | 24,812 | 488 |
| 7 | 15,837 | 254 |
| 8 | 9,702 | 375 |
| 9 | 5,417 | 43 |
| 10 | 3,081 | 16 |
| More than 10 | 2,865 | 26 |
| 238,066 | 10,303 |
There were 127,858 cases where there was only one breadwinner, and in 303 of these there were more than ten occupants. Of the 127,858 cases, 6,442 households contained one female and no male breadwinner, as against 121,416 containing no female and one male breadwinner. Altogether 20,378 households contained no male breadwinner, and 176,424 no female breadwinner.
Details by geographical divisions are appended:—
| Metropolitan or Suburban Area. | Number of Cases where the Household contained | Total Cases. | ||
|---|---|---|---|---|
| No Breadwinner. | No Non-breadwinner. | Only One Breadwinner. | ||
| Metropolitan areas— | ||||
| Auckland | 1,605 | 1,795 | 14,416 | 28,261 |
| Wellington | 972 | 1,460 | 9,687 | 19,647 |
| Christchurch | 932 | 1,401 | 10,876 | 20,225 |
| Dunedin | 913 | 1,128 | 6,827 | 14,929 |
| Suburban areas— | ||||
| Gisborne | 131 | 228 | 1,483 | 2,702 |
| Napier | 177 | 244 | 1,733 | 3,131 |
| New Plymouth | 151 | 195 | 1,178 | 2,210 |
| Wanganui | 236 | 331 | 2,299 | 4,132 |
| Palmerston North | 114 | 297 | 1,636 | 2,976 |
| Nelson | 59 | 295 | 1,001 | 1,834 |
| Grey Valley Boroughs | 80 | 135 | 637 | 1,172 |
| Timaru | 171 | 209 | 1,615 | 2,928 |
| Invercargill | 240 | 329 | 2,147 | 3,982 |
| Totals, metropolitan and suburban areas | 5,781 | 8,047 | 55,535 | 108,129 |
| Remainder of Dominion | 4,522 | 24,901 | 72,323 | 129,937 |
| Grand totals | 10,303 | 32,948 | 127,858 | 238,066 |
Why Auckland should contain so many cases of there being no breadwinner in the house it is difficult to divine. The small number of such cases in Wellington is also a notable feature.
The first column in the census schedule required the full names of the persons returned. In column 2 the person filling in the schedule was asked to state whether “head,” or “wife,” “son,” “daughter,” or other relative, “lodger,” or “servant,” &c. In other words, the relationship of each inhabitant of the dwelling to the head thereof was required to be stated.
It is interesting to note that of 238,066 heads of households on census night 204,373, or roughly 8G per cent., were males. Detailed figures showing the percentage for each metropolitan and suburban area and for the rest of the Dominion are appended:—
Households.—Sex of Head, Census, 1916.
| Metropolitan or Suburban Area. | Males. | Females. | Totals. |
|---|---|---|---|
| Metropolitan areas— | |||
| Auckland | 80.40 | 19.60 | 100.00 |
| Wellington | 83.17 | 16.83 | 100.00 |
| Christchurch | 81.48 | 18.52 | 100.00 |
| Dunedin | 78.05 | 21.95 | 100.00 |
| Suburban areas— | |||
| Gisborne | 84.94 | 15.06 | 100.00 |
| Napier | 81.57 | 18.43 | 100.00 |
| New Plymouth | 82.90 | 17.10 | 100.00 |
| Wanganui | 82.94 | 17.06 | 100.00 |
| Palmerston North | 83.40 | 16.60 | 100.00 |
| Nelson | 77.43 | 22.57 | 100.00 |
| Grey Valley Boroughs | 79.61 | 20.39 | 100.00 |
| Timaru | 81.97 | 18.03 | 100.00 |
| Invercargill | 81.09 | 18.91 | 100.00 |
| Totals, metropolitan and suburban areas | 81.17 | 18.83 | 100.00 |
| Remainder of Dominion | 89.74 | 10.26 | 100.00 |
| Grand totals | 85.85 | 14.15 | 100.00 |
High percentages of male heads will be noted in Gisborne, Palmerston North, and Wellington, and of female heads in Nelson and Dunedin.
Another table takes the sexes separately, and shows for each geographical division the proportions of the total heads belonging to each of the conjugal conditions. We should naturally expect that the majority of male heads would be married, but that amongst females widows should be rather more frequent than widowers among males. The following tables reveal some interesting results in this connection:—
Percentage of Heads of Households belonging to each Conjugal Condition, by Metropolitan and Suburban Areas, Census, 1916.
| Metropolitan or Suburban Area. | Never Married. | Married. | Widowed. | Divorced. | Totals. |
|---|---|---|---|---|---|
| MALE HEADS. | |||||
| Metropolitan areas— | |||||
| Auckland | 3.84 | 92.76 | 3.26 | 0.14 | 100.00 |
| Wellington | 4.40 | 92.49 | 2.97 | 0.14 | 100.00 |
| Christchurch | 3.29 | 92.41 | 4.19 | 0.11 | 100.00 |
| Dunedin | 4.18 | 90.70 | 5.01 | 0.11 | 100.00 |
| Suburban areas— | |||||
| Gisborne. | 5.52 | 91.45 | 2.85 | 0.18 | 100.00 |
| Napier | 5.22 | 91.40 | 3.22 | 0.16 | 100.00 |
| New Plymouth | 5.26 | 90.20 | 4.43 | 0.11 | 100.00 |
| Wanganui | 4.73 | 91.73 | 3.42 | 0.12 | 100.00 |
| Palmerston North | 5.04 | 92.01 | 2.95 | .. | 100.00 |
| Nelson | 3.94 | 91.34 | 4.58 | 0.14 | 100.00 |
| Grey Valley Boroughs | 9.58 | 85.85 | 4.57 | .. | 100.00 |
| Timaru | 3.97 | 92.56 | 3.38 | 0.09 | 100.00 |
| Invercargill | 5.34 | 89.82 | 4.65 | 0.19 | 100.00 |
| Totals, metropolitan and suburban areas | 4.19 | 91.98 | 3.71 | 0.12 | 100.00 |
| Remainder of Dominion | 14.82 | 80.82 | 4.19 | 0.17 | 100.00 |
| Grand totals | 10.26 | 85.61 | 3.98 | 0.15 | 100.00 |
Percentage of Heads of Households belonging to each Conjugal Condition, &c.—ctd.
| Metropolitan or Suburban Area. | Never Married. | Married | Widowed. | Divorced. | Totals. |
|---|---|---|---|---|---|
| FEMALE HEADS. | |||||
| Metropolitan areas— | |||||
| Auckland | 11.49 | 40.14 | 47.48 | 0.89 | 100.00 |
| Wellington | 11.56 | 42.50 | 44.51 | 1.43 | 100.00 |
| Christchurch | 12.51 | 34.04 | 52.86 | 0.59 | 100.00 |
| Dunedin | 14.06 | 29.91 | 55.57 | 0.46 | 100.00 |
| Suburban areas— | |||||
| Gisborne | 12.59 | 50.87 | 35.80 | 0.74 | 100.00 |
| Napier | 12.87 | 37.04 | 49.39 | 0.70 | 100.00 |
| New Plymouth | 19.58 | 30.16 | 49.47 | 0.79 | 100.00 |
| Wanganui | 13.09 | 41.96 | 44.24 | 0.71 | 100.00 |
| Palmerston North | 11.63 | 44.28 | 42.86 | 1.23 | 100.00 |
| Nelson | 18.81 | 27.23 | 52.97 | 0.99 | 100.00 |
| Grey Valley Boroughs | 8.09 | 36.17 | 55.74 | .. | 100.00 |
| Timaru | 14.45 | 35.07 | 50.10 | 0.38 | 100.00 |
| Invercargill | 12.30 | 34.49 | 52.81 | 0.40 | 100.00 |
| Totals, metropolitan and suburban areas | 12.59 | 37.21 | 49.39 | 0.81 | 100.00 |
| Remainder of Dominion | 11.31 | 36.14 | 52.11 | 0.44 | 100.00 |
| Grand totals | 12.08 | 36.79 | 50.47 | 0.66 | 100.00 |
The country districts, and in a lesser degree the Grey Valley boroughs suburban area, show a high percentage of never-married male heads (14.82 and 9.58 respectively) and a correspondingly low percentage of married ones. The lowest percentage of male heads who have never been married is in Christchurch (3.29). Wellington is highest among metropolitan areas (4.40 per cent.), but this figure is exceeded by all the suburban areas except Nelson (3.94 per cent.) and Timaru (3.97 per cent.). The highest percentage of widowed male heads is in Dunedin (5.01), with Invercargill second on the list (4.65). The lowest percentages are in Gisborne (2.85), Palmerston North (2.95), and Wellington (2.97). Invercargill (0.19 per cent.), Gisborne (0.18 per cent.), and the country districts (0.17 per cent.) show the lowest figures for divorced male heads.
The figures for females differ from the male figures greatly. The percentage of never-married among female heads exceeds the corresponding male figure except in the Grey Valley boroughs suburban area and the “remainder of the Dominion.” In all cases the percentage of heads who are married is markedly lower among females than among males, the reverse being true of widowed and divorced heads. A particularly large percentage of female heads in Wellington are divorced (1.43 percent, of the female heads), nor is Palmerston North far behind (1.23 per cent.).
In this connection the following table is now quoted:—
Percentage of Heads of Households belonging to each Conjugal Condition, by Age-Groups, Census, 1916.
| Age of Head of Household. | Never Married. | Married. | Widowed. | Divorced. | Totals. |
|---|---|---|---|---|---|
| MALE HEADS. | |||||
| Under 20 | 97.17 | 2.83 | .. | .. | 100.00 |
| 20 and under 21 | 76.47 | 23.53 | .. | .. | 100.00 |
| 21 and under 25 | 35.08 | 64.80 | 0.12 | .. | 100.00 |
| 25 and under 30 | 14.66 | 85.09 | 0.23 | 0.02 | 100.00 |
| 30 and under 35 | 9.19 | 90.28 | 0.50 | 0.03 | 100.00 |
| 35 and under 40 | 7.32 | 91.64 | 0.94 | 0.10 | 100.00 |
| 40 and under 45 | 7.40 | 90.76 | 1.71 | 0.13 | 100.00 |
| 45 and under 50 | 8.57 | 88.51 | 2.70 | 0.22 | 100.00 |
| 50 and under 55 | 8.79 | 87.03 | 3.93 | 0.25 | 100.00 |
| 55 and under 60 | 9.01 | 84.80 | 5.86 | 0.33 | 100.00 |
| 60 and under 65 | 9.63 | 81.36 | 8.78 | 0.23 | 100.00 |
| 65 and under 70 | 9.86 | 77.81 | 12.09 | 0.24 | 100.00 |
| 70 and under 75 | 11.36 | 69.97 | 18.44 | 0.23 | 100.00 |
| 75 and under 80 | 11.61 | 66.02 | 22.30 | 0.07 | 100.00 |
| 80 and under 85 | 11.85 | 55.58 | 32.40 | 0.17 | 100.00 |
| 85 and under 90 | 11.32 | 51.96 | 36.32 | 0.40 | 100.00 |
| 90 and under 95 | 4.94 | 48.15 | 46.91 | .. | 100.00 |
| 95 and under 100 | 16.66 | 41.67 | 41.67 | .. | 100.00 |
| 100 and over | 100.00 | .. | .. | .. | 100.00 |
| Totals | 10.22 | 85.66 | 3.97 | 0.15 | 100.00 |
Percentage of Heads of Households belonging to each Conjugal Condition,&c.—ctd.
| Age of Head of Household. | Never Married. | Married | Widowed, | Divorced. | Totals. |
|---|---|---|---|---|---|
| FEMALE HEADS. | |||||
| Under 20 | 90.58 | 9.42 | .. | .. | 100.00 |
| 20 and under 21 | 75.00 | 23.75 | 1.25 | .. | 100.00 |
| 21 and under 25 | 45.58 | 51.24 | 2.83 | 0.35 | 100.00 |
| 25 and under 30 | 25.76 | 67.04 | 6.75 | 0.45 | 100.00 |
| 30 and under 35 | 15.06 | 71.31 | 12.79 | 0.84 | 100.00 |
| 35 and under 40 | 15.05 | 63.45 | 20.44 | 1.06 | 100.00 |
| 40 and under 45 | 14.73 | 54.40 | 29.28 | 1.59 | 100.00 |
| 45 and under 50 | 14.10 | 45.97 | 38.99 | 0.94 | 100.00 |
| 50 and under 55 | 12.92 | 35.58 | 50.60 | 0.90 | 100.00 |
| 55 and under 60 | 9.19 | 26.61 | 63.68 | 0.52 | 100.00 |
| 60 and under 65 | 6.63 | 19.50 | 73.59 | 0.28 | 100.00 |
| 65 and under 70 | 5.05 | 13.36 | 81.46 | 0.13 | 100.00 |
| 70 and under 75 | 3.72 | 8.54 | 87.70 | 0.04 | 100.00 |
| 75 and under 80 | 2.60 | 6.49 | 90.85 | 0.06 | 100.00 |
| 80 and under 85 | 4.51 | 7.12 | 88.37 | .. | 100.00 |
| 85 and under 90 | 2.34 | 5.14 | 92.52 | .. | 100.00 |
| 90 and under 95 | .. | 4.08 | 95.92 | .. | 100.00 |
| 95 and under 100 | .. | .. | 100.00 | .. | 100.00 |
| 100 and over | .. | 100.00 | .. | .. | 100.00 |
| Totals | 12.09 | 36.82 | 50.43 | 0.66 | 100.00 |
As might be expected, the percentage of total male heads at each age-group who are never married is high for the early age-groups, and falls gradually until it reaches a minimum about 35.39. The percentage of married heads changes inversely to that of the never-married, while, as might be expected, the percentage of widowed increases gradually with age. The percentage of divorced is at a maximum at 55.59. In the high age-groups occasional anomalies emerge owing to paucity of instances.
The most popular age for never-married male heads is 30.34 (2,679 cases), for married male heads 35.39 (30,014 cases), for widowed male heads 70.74 (1,109 cases), for divorced male heads 45–49 (55 oases), and for all male heads 35.39 (32,923 cases). Male heads under 20 comprise 926 never-married, 27 married, none widowed or divorced, and 12 not stated. The earliest age-group at which a divorced male head appears is 25.29, and there were 3 such cases. At 21.24 there were 5 widowed male heads, as compared with 1,413 never-married and 2,610 married. At 20 there were 24 never-married heads and 68 married,
The table relating to female heads is somewhat similar. “Never-married” form a high percentage of all female heads at early age-groups, but the fall with increase in age is practically continuous. The percentage of “married” female heads reaches a maximum more early than is the case of males—viz., at 30.34 instead of 35.39. The percentage of divorced is at a maximum at 40.44, and of the widowed at 95.99.
The most popular age for never-married female heads is 45.49 (523 cases), for married female heads 35.39 (2,036. cases), for widowed female heads 65.69 (2,421 cases), for divorced female heads 40.44 (54 cases), and for all female heads 45.49 (3,726 cases). The later figure for all female heads than for all male heads is on account of the fact that the most potent factor causing women to become heads of households is widowhood, which from the nature of the case cannot be at a maximum at early age-groups. Death of the widows, however, after 65.69 operates to reduce their numbers more rapidly than they are recruited by the predeceasing of husbands.
Female heads under 20 include 125 never-married, 13 married, and 3 whose conjugal condition was not stated. Those 20 years of age included 60 never-married, 19 married, 1 widowed. The earliest age at which a divorced female head appears is 21.24 (2 cases). At that group there were 258 never-married, 290 married, and 16 widowed heads. The female figures bear on the face of them the mark of the operation of war conditions and the ravages wrought thereby.
Table of Contents
Table of Contents
For the census of 1916 a new departure was taken as regards the Maori population of the South Island, which was on this occasion enumerated along with the European population, the enumeration being conducted by the European Sub-Enumerators, and on the same schedule (printed in English only) as was used for Europeans. In the North Island the enumeration of the Maoris was conducted on the same lines as at previous censuses—viz., by officers of the Native Department, who ascertained and entered in a register particulars as to name, age, sex, residence, and trade or occupation of each Maori and each half-caste living as a Maori. Half-castes living as Europeans were enumerated with the European population.
The following table shows the numbers of Maori and half-caste population living as Maoris at successive census-takings:—
| 1874 | 45,470 |
| 1878 | 43,595 |
| 1881 | 44,097 |
| 1886 | 41,969 |
| 1892 | 41,993 |
| 1896 | 39,854 |
| 1901 | 43,143 |
| 1906 | 47,731 |
| 1911 | 49,844 |
| 1916 | 49,776 |
Fuller details for the more recent census-takings are appended.
Table showing for each Census since 1891 the Maori Population (including Half cases living as Maoris) in the North and South Islands and in the Dominion.
(Note,—Stewart Island and Chatham Islands are included with the South Island.)
| Census Year. | North Island. | Smith Inland. | New Zealand. | ||||||
|---|---|---|---|---|---|---|---|---|---|
| Males. | Females. | Both Sexes. | Males. | Females. | Both Sexes. | Males. | Females.* | Both Sexes.* | |
| * Including Maori wives of Europeans—not shown by Island.†These are half-castes living as Maoris. The half-castes living as Europeans are included in the European population. | |||||||||
| 1891 | 21,725 | 17,810 | 39,535 | 1,136 | 1,071 | 2,207 | 22,861 | 19,132 | 41,993 |
| 1896 | 20,343 | 16,759 | 1 37,102 | 1,330 | 1,193 | 2,523 | 21,673 | 18,181 | 39,854 |
| 1901 | 21,923 | 18,784 | 40,707 | 1,197 | 1,043 | 2,240 | 23,120 | 20,023 | 43,143 |
| 1906 | 24,161 | 20,801 | 44,962 | 1,377 | 1,181 | 2,558 | 25,538 | 22,193 | 47,731 |
| 1911 | 24,935 | 21,697 | 46,632 | 1,540 | 1,423 | 2,963 | 26,475 | 23,369 | 49,844 |
| 1916 | 24,991 | 22,554 | 47,545 | 942 | 910 | 1,852 | 25,933 | 23,843 | 49,776 |
| Half-castes (included above).† | |||||||||
| 1891 | 1,125 | 872 | 1,997 | 344 | 340 | 684 | 1,469 | 1,212 | 2,681 |
| 1896 | 1,395 | 1,082 | 2,477 | 549 | 477 | 1,026 | 1,944 | 1,559 | 3,503 |
| 1901 | 1,379 | 1,138 | 2,517 | 315 | 301 | 616 | 1,694 | 1,439 | 3,133 |
| 1906 | 1,657 | 1,328 | 2,985 | 494 | 459 | 953 | 2,151 | 1,787 | 3,938 |
| 1911 | 1,760 | 1,391 | 3,151 | 531 | 499 | 1,030 | 2,291 | 1,890 | 4,181 |
| 1916 | 1,677 | 1,358 | 3,035 | 237 | 257 | 494 | 1,914 | 1,615 | 3,529 |
The fluctuations exhibited in the tables cannot be regarded as normal, and inferences drawn from the figures must be regarded to a large degree as conjectural. In particular, the large decrease of 1896 is probably due to non-inclusion of a number of Natives either by accident or through refusals to give proper information to the Sub-Enumerators.1
The percentages of Maoris and half-castes living as Maoris to the total population has been at successive census-takings—
| Year. | Percentage. |
|---|---|
| 1874 | 11.74 |
| 1878 | 9.16 |
| 1881 | 8.09 |
| 1886 | 6.65 |
| 1891 | 6.21 |
| 1896 | 5.29 |
| 1901 | 5.19 |
| 1906 | 4.99 |
| 1911 | 4.64 |
| 1916 | 4.33 |
Although the Maori population has increased absolutely, relatively to the rest of the population it has declined. The fact is that this table should be read in the light of the consideration that while the numbers of the Maoris are in general a function almost wholly of natural increase alone— i.e., the excess of births over deaths—those of the rest of the population have been profoundly affected by the excess of inwards migration, which has at nearly every period of the country's history been high.
The proportions of the Maori population under and over 15 years of age are now given for the last six census-takings:—
Proportions of Total Maoris at Different Age-groups.
| Census. | Males. | Females. | ||
|---|---|---|---|---|
| Under 15. | Over 15. | Under 16. | Over 15. | |
| 1891 | 33.22 | 66.78 | 35.22 | 64.78 |
| 1896 | 35.28 | 64.72 | 36.82 | 63.18 |
| 1901 | 35.75 | 64.25 | 37.89 | 62.11 |
| 1906 | 38.26 | 61.74 | 39.20 | 60.80 |
| 1911 | 39.10 | 60.90 | 40.97 | 59.03 |
| 1916 | 41.35 | 58.65 | 41.43 | 58.57 |
The tendency is clearly towards an increase in the proportions at earlier ages. The following table as at the census of 1916 is of interest:—
| Census. | Males. | Females. | ||
|---|---|---|---|---|
| Under 15. | Over 15. | Under 16. | Over 15. | |
| Maoris | 41.35 | 58.65 | 41.43 | 58.57 |
| Population excluding Maoris | 33.61 | 66.39 | 32.69 | 67.31 |
The discrepancy is probably almost entirely accounted for by the fact that in the case of the Europeans the proportions of the people under 15 years are kept down by the net immigration, which affects mainly grown-ups.
The half-caste population consists of those who live as members of Maori tribes together with others living with and counted as Europeans in the census. It has proved a matter of some difficulty to ascertain . the number of half-castes living as Maoris. There has been no definite rule to guide collectors in deciding when a half-caste should be classified as living as a Maori; indeed, it must be said that all the half-castes and most of the Maoris in the South Island have separate homes and holdings of land, and have otherwise adopted European habits. Adding the numbers of the half-castes living as Maoris to those living as Europeans, we have. for the last six census-takings—
| Census. | Half-castes living as Members of Maori Tribes. | Half-castes living as Europeans. | Total Half-castes. |
|---|---|---|---|
| 1891 | 2,681 | 2,184 | 4,865 |
| 1896 | 3,503 | 2,259 | 5,762 |
| 1901 | 3,133 | 2,407 | 5,540 |
| 1906 | 3,938 | 2,578 | 6,516 |
| 1911 | 4,181 | 2,879 | 7,060 |
| 1916 | 3,529 | 3,221 | 6,750 |
As might be expected, the total half-caste population is apparently on the increase, the small fall for 1916 being doubtless accountable for by war conditions.
Full details under the various heads of inquiry are not available for those half-caste Maoris who live after the Native fashion. Such details have, however, been collected for half-castes living as Europeans, and particulars are here summarized for the 1,513 males and the 1,708 females concerned.
The distribution by provincial districts is as follows:—
| Provincial District. | Males. | Females. | Total. |
|---|---|---|---|
| Auckland | 915 | 1,047 | 1,962 |
| Taranaki | 49 | 55 | 104 |
| Hawke's Bay | 51 | 104 | 155 |
| Wellington | 210 | 186 | 396 |
| Marlborough | 27 | 21 | 48 |
| Nelson | 18 | 24 | 42 |
| Westland | 6 | 11 | 17 |
| Canterbury | 64 | 78 | 142 |
| Otago | 46 | 69 | 115 |
| Southland | 111 | 113 | 224 |
| Military and internment camps | 16 | 16 | |
| Totals | 1,513 | 1,708 | 3,221 |
The concentration in the North Island provinces corresponds fairly closely with that of Maoris of the full blood, but is, as might be expected, rather less marked.
Half-castes are more likely to appear after the two races have been living side by side for a considerable number of years. Hence it is not surprising to find that half-castes living as Europeans are mostly to be found amongst the earlier age-groups. Details are appended.
| Age-group. | Males. | Females. | Total. |
|---|---|---|---|
| Under 5 | 210 | 241 | 451 |
| 5 and under 10 | 179 | 220 | 399 |
| 10 and under 15 | 179 | 227 | 406 |
| 15 and under 20 | 177 | 233 | no |
| 20 and under 25 | 120 | 142 | 262 |
| 25 and under 30 | 131 | 131 | 262 |
| 30 and under 35 | 106 | 121 | 227 |
| 35 and under 40 | 103 | 88 | 191 |
| 10 and under 45 | 69 | 81 | 150 |
| 45 and under 50 | 62 | 37 | 99 |
| 50 and under 55 | 40 | 54 | 94 |
| 55 and under 60 | 37 | 24 | 61 |
| 55 and under 65 | 33 | 37 | 70 |
| 65 and under 70 | 29 | 30 | 59 |
| 70 and under 75 | 20 | 22 | 42 |
| 75 and under 80 | 13 | 13 | 26 |
| 80 and under 85 | 3 | 2 | 5 |
| 85 and under 90 | 1 | 3 | 4 |
| 90 and under 95 | .. | 2 | 2 |
| Unspecified (adult) | 1 | .. | 1 |
| Totals | 1,613 | 1,708 | 3,221 |
The irregularity of the male figures in the vicinity of the ages 20–40 is probably a reflection of the large response of Maoris and half-castes to the Empire's call.
It is interesting to note the religions of Maori half-castes living as Europeans.
| Males | Females | Total. | |
|---|---|---|---|
| Church of England | 975 | 1,157 | 2,032 |
| Presbyterian | 74 | 99 | 173 |
| Methodist | 79 | 77 | 156 |
| Roman Catholic | 244 | 251 | 495 |
| Church of Jesus Christ of Latter-day Saints | 18 | 11 | 29 |
| Other Christian | 38 | 42 | 80 |
| Non-Christian | 1 | 1 | 2 |
| Indefinite | 10 | 13 | 23 |
| No religion and atheist | 15 | 14 | 29 |
| Object to state | 42 | 29 | 71 |
| Unspecified | 17 | 14 | 31 |
| Totals | 1,513 | 1,708 | 3,221 |
The large proportion shown as Church of England is an interesting feature.
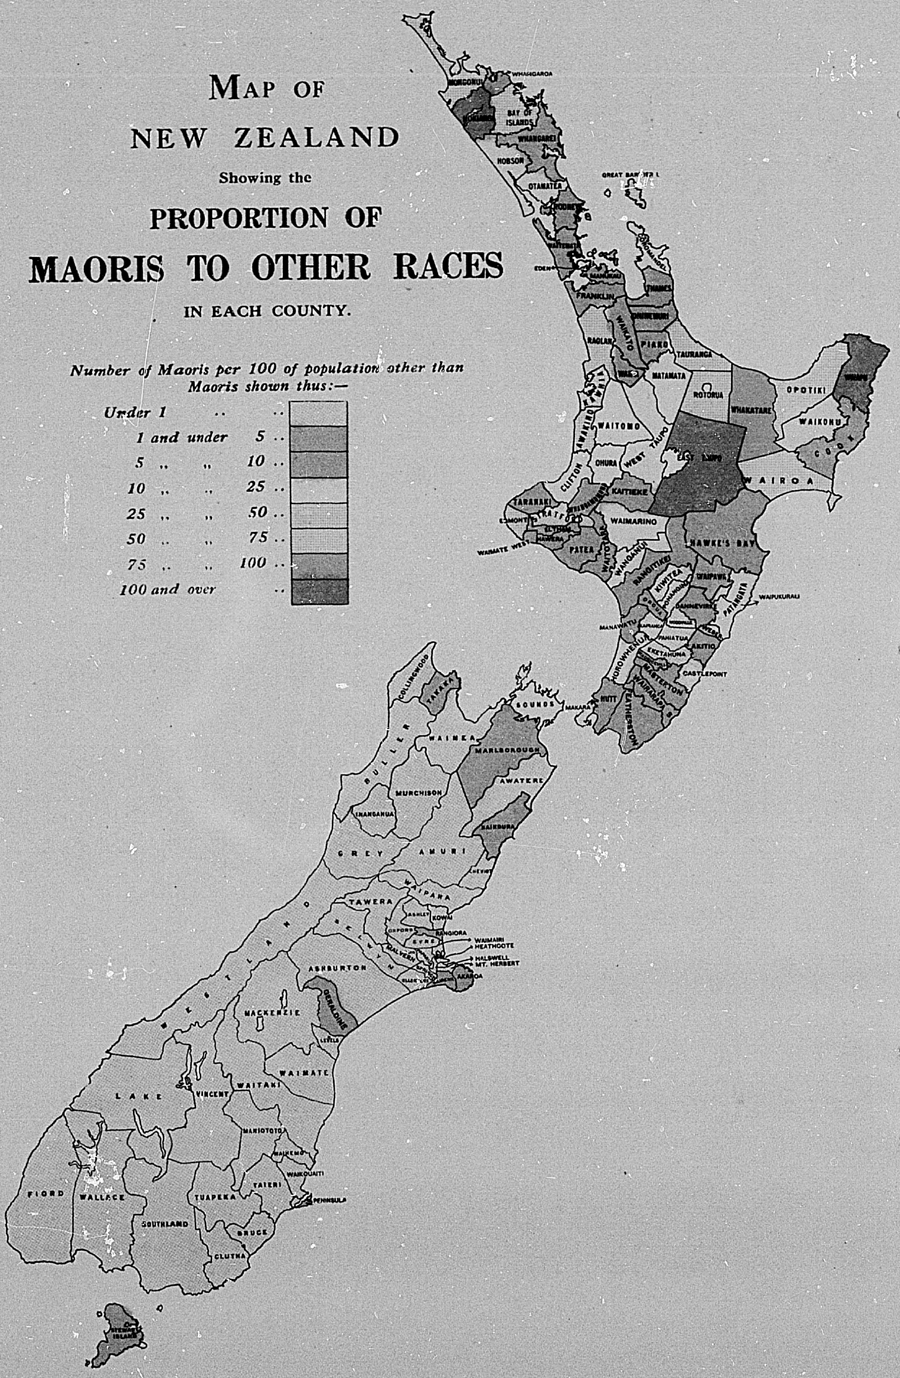
The following are details as to the degrees of education attained, and when the young age-constitution of the half-castes is remembered must be considered highly satisfactory:-
| Males. | Females. | Total. | |
|---|---|---|---|
| English language—Read and write | 1,116 | 1,263 | 2,379 |
| English language—Read only | 27 | 26 | 53 |
| Foreign language only-Read only | 1 | .. | 1 |
| Cannot read | 355 | 402 | 757 |
| Not stated | 14 | 17 | 31 |
| Totals | 1,513 | 1,708 | 3,221 |
When the young age-constitution of the Maori half-castes living as Europeans is borne in mind the small number of this element in the population who have been married does not appear in any way striking. The following classifies this element of the population on the conjugal-condition basis —
| Males. | Females. | Total. | |
|---|---|---|---|
| Never married | 969 | 1,056 | 2,025 |
| Married | 484 | 542 | 1,026 |
| Widowed | 54 | 105 | 159 |
| Divorced | 3 | 2 | 5 |
| Not stated | 3 | 3 | 6 |
| Totals | 1,513 | 1,708 | 3,221 |
The following figures show the grades of occupations—
| Males. | Females. | Total. | |
|---|---|---|---|
| Employer | 73 | 9 | 82 |
| Working on own account | 168 | 29 | 197 |
| Relative assisting | 53 | 26 | 79 |
| Wage-earner | 586 | 200 | 786 |
| Wage-earner unemployed | 2 | 4 | 6 |
| Not applicable | 618 | 1,439 | 2,057 |
| Not stated | 13 | 1 | 14 |
| Totals | 1,513 | 1,708 | 3,221 |
The chief occupations represented amongst males are the following —
| Dependents | 566 |
| Pastoral | 314 |
| Agricultural | 84 |
| Forestry | 62 |
| Traffic on seas and rivers | 55 |
| Working in art and mechanic production | 49 |
No other occupations claimed as many as 40 adherents amongst Maori half-castes living as Europeans.
Except for a few isolated counties in the South Island, Maoris are practically confined to North Island counties, in three of which (Hokianga, East Taupo, and Waiapu) and in the Chatham Islands they actually exceed in numbers the rest of the population. In East Taupo Maoris exceed the rest of the population by more than two to one.
The accompanying map, showing the rates of Maoris to the rest of the population in each county, renders further reference superfluous.
Table of Contents
In pursuance of resolutions passed by the House of Representatives in September and October, 1900, certain islands in the Pacific became annexed to New Zealand. These were Rarotonga, Mangaia, Mauke, Atiu, Aitutaki, Mitiaro, Hervey Islands, Palmerston, Niue, Danger, Rakahanga, Manihiki, Penrhyn, and Suwarrow; while Takutea and Nassau, not mentioned in the resolutions, also lie With in the boundary-lines prescribed by the Imperial Order in Council and the New Zealand Proclamation dealing with the annexation.
A short geographical description of the Cook and other annexed Pacific Islands, as they are usually called, is now given.
Aitutaki presents a most fruitful appearance, its shores being bordered by flat land on which are innumerable coconut and other trees, the higher ground being beautifully interspersed with lawns. It is eighteen miles in circuit.
At in resembles Mangaia in appearance and extent. It is a mere bank of coral 10 ft. or 12 ft. high, steep and rugged, except where there are small sandy beaches and some clefts, where the ascent is gradual.
Mangaia, the south-easternmost of the Cook Group, is of volcanic origin and about thirty miles in circumference. The productions, which are numerous and cheap, are obtained by assiduous labour.
Manihiki, lying about 400 miles eastward of Danger Island, is an atoll, about thirty miles in circumference, valuable from the extent of the coconut groves. The interior lagoon contains a vast deposit of pearl-shell.
Manuae, or Hervey Islands: This group consists of two islands surrounded by a reef, which is about 10½ miles in circumference.
Mauke, or Parry Island, is a low-lying island; it is about two miles in diameter, well wooded, and inhabited.
Mitiaro is a low-lying island, from three to four miles long and one mile wide.
Niue, or Savage Island, lying east of the Friendly Islands, is a coral island thirty-six miles in circumference, rising to a height of 200 ft. It has the usual tropical productions.
Palmerston Island, lying about 500 miles east of Niue and about 220 from the nearest island of the Cook Group (Aitutaki), is remarkable as the “San Pablo” of Magellan, the first island discovered in the South Sea. It has no harbour. The soil is fairly fertile, and there is some good hardwood timber.
Penrhyn Island (Tongareva) lies about 300 miles north-east of Manihiki. It is one of the most famous pearl-islands in the Pacific, and there is a splendid harbour, a lagoon with two entrances, fit for ships of any size.
Danger Island (Pukapuka): Next to the 10th parallel, but rather north of the latitude of the Navigators, and east of them is a number of small atolls. Of these, the nearest to the Samoan Group — about 500 miles — is Danger Island, bearing north-west of Suwarrow about 250 miles.
Rakahanga is an atoll, three miles in length and of equal breadth.
Rarotonga: A magnificent island, rising to a height of 3,000 ft., clothed to the tops of the mountains with splendid vegetation. It has abundant streams, considerable tracts of sloping land, and rich alluvial valleys.” The two harbours are poor.
Suwarrow Island has one of the best harbours in the Pacific. It lies about 500 miles east of Apia, the capital of German Samoa (now in British possession). It is a coral atoll, of a triangular form, fifty miles in circumference, the reef having an average width of half a mile across, enclosing a land-locked lagoon twelve miles by eight, which forms an excellent harbour. The entrance is half a mile wide, and the accommodation permits of ships riding in safety in all weathers, with depths of from three to thirty fathoms. It is out of the track of hurricanes, but capable by its fertility of supporting a small population. As a depot for the collection of trade from the various islands it should in time be very valuable.
Table of Contents
AS mentioned above, the islands were annexed in 1901; consequently census figures are available only for the years 1906, 1911, and 1916. A summary is appended.
Cook and oilier Pacific Islands.—Table showing the Numbers of Whites and Natives in each Island of the Group at Successive Censuses.
| Islands. | 1906 | 1911, | 1916. | ||||||
|---|---|---|---|---|---|---|---|---|---|
| Whites and Half-castes living as Whites. | Natives and Half-castes living as Natives. | Totals. | Whites and Half-castes living as Whites. | Natives and Half-castes living as Natives. | Totals. | Whites and Half-castes living as Whites. | Natives and Half-castes living as Natives. | Totals. | |
* Or Hervey Wand. † Or Parry Island. ‡ Or Savage Island. § Or Tongarevn Island. ΙΙ Or Danger Island. | |||||||||
| Aitutaki | 8 | 1,154 | 1,162 | 16 | 1,221 | 1,237 | 25 | 1,277 | 1,302 |
| Atiu | 4 | 914 | 918 | 2 | 810 | 812 | 2 | 757 | 759 |
| Mangaia | 8 | 1,523 | 1,531 | 5 | 1,466 | 1,471 | 10 | 1,235 | 1,245 |
| Manihiki | 2 | 519 | 521 | 4 | 440 | 444 | 3 | 490 | 493 |
| Manuae* | .. | .. | .. | .. | .. | .. | .. | 23 | 23 |
| Mauke† | 2 | 444 | 446 | 10 | 447 | 457 | 14 | 476 | 490 |
| Mitiaro | 2 | 208 | 210 | 1 | 198 | 199 | 2 | 235 | 237 |
| Niue‡ | 21 | 3,801 | 3,822 | 52 | 3,891 | 3,943 | 11 | 3,839 | 3,880 |
| Palmerston | .. | 82 | 82 | .. | 107 | 107 | .. | 90 | 90 |
| Penrhyn§ | 6 | 414 | 420 | 3 | 332 | 335 | 7 | 319 | 326 |
| Pukapuka║ | .. | 435 | 435 | .. | 490 | 490 | .. | 474 | 474 |
| Rakahanga | 1 | 351 | 352 | .. | 315 | 315 | 1 | 294 | 295 |
| Rarotonga | 107 | 2,334 | 2,441 | 139 | 2,602 | 2,759 | 211 | 2,853 | 3,064 |
| Suwarrow | .. | .. | .. | .. | .. | .. | 1 | 6 | 7 |
| Totals | 161 | 12,179 | 12,340 | 232 | 12,366 | 12,598 | 317 | 12,368 | 12,685 |
It will be noted that there has been a marked tendency for the number of whites and half-castes living as whites to increase, although the Native population has remained practically stationary. At the date of census there were 112 Natives of these islands in camp in New Zealand, and this fact partially accounts for the slight falling-oft* in the Native population as revealed by the 1916 census. Aitutaki, ])Mauke, Niue, and Rarotonga all show fairly large relative increases in white population. A subsequent portion of this section of the report throws some further light on the changes in Native population.
Fuller details for 1916 are appended.
Table showing the Population (Native and other) of each Inhabited Island, at the Census of October, 1916.
| Island. | Native Population. | British- and Foreign-born Population. | Totals. | ||||||
|---|---|---|---|---|---|---|---|---|---|
| Males. | Females. | Both Sexes. | Males. | Females* | Both Sexes.* | Males. | Females. | Both Sexes. | |
| * Including 15 Native Women married to and living as europeans | |||||||||
| Aitutaki | 662 | 615 | 1,277 | 12 | 13 | 25 | 674 | 628 | 1,302 |
| Atiu | 387 | 370 | 757 | 2 | .. | 2 | 389 | 370 | 759 |
| Mangaia | 602 | 633 | 1,235 | 7 | 3 | 10 | 609 | 636 | 1,245 |
| Manihiki | 258 | 232 | 490 | 3 | .. | 3 | 261 | 232 | 493 |
| Manuae. or Hervey | 15 | 8 | 23 | .. | .. | .. | 15 | 8 | 23 |
| Mauke | 247 | 229 | 476 | 10 | 4 | 14 | 257 | 233 | 490 |
| Mitiaro | 110 | 125 | 235 | 1 | 1 | 2 | 1ll | 126 | 237 |
| Niue | 1,804 | 2,035 | 3,839 | 24 | 17 | 41 | 1,828 | 2,052 | 3,880 |
| Palmerston | 53 | 37 | 90 | .. | .. | .. | 53 | 37 | 90 |
| Penrhyn | 152 | 167 | 319 | 5 | 2 | 7 | 157 | 169 | 326 |
| Pukapuka | 278 | 196 | 474 | .. | .. | 278 | 196 | 474 | |
| Rakahanga | 150 | 144 | 294 | 1 | .. | 1 | 151 | 144 | 295 |
| Rarotonga | 1,545 | 1,308 | 2,853 | 105 | 106 | 211 | 1,650 | 1,414 | 3,064 |
| Suwarrow | 6 | .. | 6 | 1 | .. | 1 | 7 | .. | 7 |
| Totals | 6,269 | 6,099 | 12,368 | 171 | 146 | 317 | 6,440 | 6,245 | 12,685 |
In connection with the last table an interesting point arises which merits more than merely passing mention.
There are in general two modes of referring population to locality. One mode regards domicil, which is defined by reference to the place a person habitually resides in and intends to be his “home.” This mode is of outstanding importance in jurisprudence, and the population computed on this basis is accordingly known as the population de jure. The term is opposed to the population de facto, which regards the number of persons actually present in a locality at the time, whether strangers or habitual residents.
The latter mode commends itself on the grounds of its simplicity, and is that which is usually adopted. Some countries, however, attempt an estimate of the population de jure as well.. inasmuch as an enumeration of population de facto is liable to the objection that health and pleasure resorts may have their population unduly inflated at certain seasons at the expense of the districts whence their visitors have come. The force of the objection is, however, in practice usually minimized by the selection of a date for the census enumeration when displacement is at a minimum. Care has always been taken in New Zealand to avoid synchronizing a census enumeration with such functions as public holidays and agricultural and pastoral shows; and for a similar reason the height of summer, when holiday-makers are many, is also avoided.
Now, it is obvious that if all countries adopt the de facto method, then an accurate estimate of the world’s population at a given date may be arrived at by the simple process of interpolation (in order to secure uniformity of date) and summation. On the other hand, owing to the haziness of the conception of domicil, there is not the same guarantee of accuracy with the de jure method. A word of caution is, however, necessary. It is said above that the world’s population at a given date may be arrived at by a simple summation; but this is subject to the condition that enumerations of the population are universal. There are certain islets in the Pacific, commonly known as the Guano Islands, which are repeatedly visited for purposes of gain by inhabitants from Niue Island. These islands do not come within, the scope of any census scheme, and accordingly it has been deemed fitting to make some attempt to enumerate absentees from Niue and the other Cook Islands on such expeditions. In other words, what might be called a population de jure as well as a population de facto has been enumerated for these islands. The number of absentees at successive census-takings and the de jure population so defined have been—
| Absentees. | De Jure Population. | |
|---|---|---|
| 1906 | 776 | 13,116 |
| 1911 | 513 | 13,111 |
| 1916 | 414 | 13,211 |
The 1916 de jure population includes in addition 112 Natives of the Cook Islands in camp in New Zealand at the date of census. These were not included in the general totals, for the Dominion proper.
It should not be overlooked that, although the above figures have been said to relate to population de jure, a better term would have been quasi de jure, inasmuch as no allowance has been made for absentees in Australia, New Zealand, and other countries, or for visitors therefrom.
British-born and Foreign Population of Islands (excluding Niue).
The following table relating to birthplaces is of interest:—
| Island. | Birthplace. | |||||||||||||||||||||||||||
|---|---|---|---|---|---|---|---|---|---|---|---|---|---|---|---|---|---|---|---|---|---|---|---|---|---|---|---|---|
| Aitutaki. | Australia. | United Kingdom. | Canada. | Cook Islands (undefined). | Denmark. | France. | Germany. | Holland. | Mangaia. | Mauke. | New Zealand. | Norway. | Paumotu. | Penrhyn. | Pitcairn Island. | Raiatea. | Rakahanga. | Rarotonga. | Samoa. | South Africa. | Sweden. | Tahiti | Tasmania. | Tonga | United States of America. | Not stated. | Totals. | |
| * Inclusive of 11 Native Women Married To And living As Europeans. | ||||||||||||||||||||||||||||
| Aitutaki | 10 | .. | 1 | 1 | .. | .. | 1 | .. | .. | .. | .. | 2 | 1 | .. | .. | .. | .. | 1 | 2 | .. | .. | .. | 5 | .. | .. | 1 | .. | 25 |
| Atiu | .. | .. | 1 | .. | .. | .. | .. | .. | 1 | .. | .. | .. | .. | .. | .. | .. | .. | .. | .. | .. | .. | .. | .. | .. | .. | .. | .. | 2 |
| Mangaia | .. | 1 | 3 | .. | 5 | .. | .. | .. | .. | 1 | .. | .. | .. | .. | .. | .. | .. | .. | .. | .. | .. | .. | .. | .. | .. | .. | .. | 10 |
| Manihiki | .. | .. | .. | .. | .. | .. | 1 | .. | l | .. | .. | .. | .. | .. | .. | .. | .. | .. | .. | .. | .. | .. | .. | .. | .. | 1 | .. | 3 |
| Mauke | .. | .. | 3 | .. | .. | .. | 1 | 2 | .. | .. | 1 | 1 | .. | .. | .. | .. | .. | .. | .. | .. | 1 | .. | 1 | .. | .. | 2 | 2 | 14 |
| Mitiaro | .. | .. | .. | .. | 1 | 1 | .. | .. | .. | .. | .. | .. | .. | .. | .. | .. | .. | .. | .. | .. | .. | .. | .. | .. | .. | .. | .. | 2 |
| Penrhyn | .. | 1 | 4 | .. | .. | .. | .. | .. | .. | .. | .. | .. | .. | .. | 1 | .. | .. | .. | .. | .. | .. | .. | 1 | .. | .. | .. | .. | 7 |
| Rakahanga | .. | .. | 1 | .. | .. | .. | .. | .. | .. | .. | .. | .. | .. | .. | .. | .. | .. | .. | .. | .. | .. | .. | .. | .. | .. | .. | .. | 1 |
| Rarotonga | .. | 4 | 58 | .. | 9 | .. | 4 | 3 | 2 | 1 | .. | 46 | 1 | 1 | 1 | 1 | 2 | .. | 45 | 1 | .. | 2 | 8 | 1 | 5 | 9 | 7 | 211 |
| Suwarrow | .. | .. | 1 | .. | .. | .. | .. | .. | .. | .. | .. | .. | .. | .. | .. | .. | .. | .. | .. | .. | .. | .. | .. | .. | .. | .. | .. | 1 |
| Totals | 10 | 6 | 72 | 1 | 15 | 1 | 7 | 5 | 4 | 2 | 1 | 49 | 2 | 1 | 2 | 1 | 2 | 1 | 47 | 1 | 1 | 2 | 15 | 1 | 5 | 13 | 9 | 270* |
The majority of the inhabitants of this class have been born in the United Kingdom, while New Zealand and Rarotonga come next in numbers in that order. This is a characteristic which appears to have remained practically constant since the islands were annexed in 1901, though for the 1906 and 1911 census-takings the data are not quite complete.
The following table gives information re the sex-distribution of this section of the population. As might be expected from the nature of the islands, males predominate hi the adult population. The large proportion of this section of the population under 16 is notable.
| Island. | Sexes and Ages. | ||||
|---|---|---|---|---|---|
| Under 16 Years. | 16 Years and over. | Totals. | |||
| * Inclusive of 11 Native women married to and living as Europeans. | |||||
| M. | F. | M. | F | ||
| Aitutaki | 4 | 10 | 8 | 3 | 25 |
| Atiu | .. | .. | 2 | .. | 2 |
| Mangaia | 3 | 1 | 4 | 2 | 10 |
| Manihiki | .. | .. | 3 | .. | 3 |
| Mauke | 4 | 1 | 6 | 3 | 14 |
| Mitiaro | .. | .. | 1 | 1 | 2 |
| Penrhyn | .. | 1 | 5 | 1 | 7 |
| Rakahanga | .. | .. | 1 | .. | 1 |
| Rarotonga | 29 | 46 | 76 | 60 | 211 |
| Suwarrow | .. | .. | 1 | .. | 1 |
| Totals | 40 | 59 | 107 | 70 | 276* |
Another table supplies data as to the religions:—
| Island. | Religious Denomination. | ||||||||||||||||||
|---|---|---|---|---|---|---|---|---|---|---|---|---|---|---|---|---|---|---|---|
| Baptist. | Church of England. | Congregational. | Freethinkers. | Jewish. | Lutheran. | Methodist. | Presbyterian. | Protestant. | Roman Catholic. | Salvation Army. | Seventh-day Adventists. | Unitarian | Wesleyan. | NO Denomination. | No Religion. | Object. | Not stated. | Totals. | |
| * Inclusive of 11 Native women married to and living as Europeans. | |||||||||||||||||||
| Aitutaki | .. | 9 | 1 | .. | .. | .. | .. | .. | .. | 2 | .. | 1 | 1 | .. | .. | .. | .. | 11 | 25 |
| Atiu | .. | .. | .. | .. | .. | .. | .. | 1 | .. | 1 | .. | .. | .. | .. | .. | .. | .. | .. | 2 |
| Mangaia | .. | .. | 6 | .. | .. | .. | .. | .. | .. | .. | .. | .. | .. | .. | .. | 3 | 1 | .. | 10 |
| Manihiki | .. | .. | .. | .. | .. | .. | .. | .. | .. | 3 | .. | .. | .. | .. | .. | .. | .. | .. | 3 |
| Mauke | .. | 4 | .. | .. | .. | .. | .. | 4 | 3 | 1 | .. | 2 | .. | .. | .. | .. | .. | .. | 14 |
| Mitiaro | .. | .. | .. | .. | .. | 1 | 1 | .. | .. | .. | .. | .. | .. | .. | .. | .. | .. | .. | 2 |
| Penrhyn | l | .. | 2 | 1 | .. | .. | .. | 2 | .. | .. | .. | .. | .. | .. | .. | .. | 1 | .. | 7 |
| Rakahanga | .. | .. | .. | .. | .. | .. | .. | .. | .. | .. | .. | 1 | .. | .. | .. | .. | .. | .. | 1 |
| Rarotonga | l | 77 | 40 | 4 | 1 | 2 | 7 | 12 | .. | 27 | 1 | 4 | 4 | 2 | 3 | 13 | 4 | 3 | 211 |
| Suwarrow | .. | 1 | .. | .. | .. | .. | .. | .. | .. | .. | .. | .. | .. | .. | .. | .. | .. | .. | 1 |
| Totals | 2 | 91 | 55 | 5 | 1 | 3 | 8 | 10 | 3 | 34 | 1 | 7 | 5 | 2 | 3 | 17 | 6 | 11 | 270* |
Even when regard is had the young age-constitution of this section of the population of the island the comparatively low standard of education as exhibited in the following table is notable:—
| Island. | Degree of Education. | |||
|---|---|---|---|---|
| Read and Write. | Cannot Read. | Not stated. | Totals. | |
| * Inclusive of 11 Native women married to and living as Europeans. | ||||
| Aitutaki | 17 | 8 | .. | 25 |
| Atiu | 2 | .. | .. | 2 |
| Mangaia | 6 | 3 | 1 | 10 |
| Manihiki | 3 | .. | .. | 3 |
| Mauke | 11 | 3 | .. | 14 |
| Mitiaro | 1 | .. | 1 | 2 |
| Penrhyn | 7 | .. | .. | 7 |
| Rakahanga | 1 | .. | .. | 1 |
| Rarotonga | 151 | 44 | 16 | 211 |
| Suwarrow | 1 | .. | .. | 1 |
| Totals | 200 | 58 | 18 | 276* |
Native Population of Islands (excluding Nine).
The following table is of value from the indication it affords of the degree of migration on the part of the Natives that has taken place between the various islands comprised in the Group, exclusive of Niue:—
| Birthplace. | Number in all Islands. | Number of Residents in, Island of birth (included in preceding Column). | Total Population of each Island of Group. |
|---|---|---|---|
| Aitutaki | 1,210 | 1,112 | 1,277 |
| Atiu | 888 | 681 | 757 |
| Mangaia | 1,657 | 1,171 | 1,235 |
| Manihiki | 442 | 301 | 490 |
| Manuae (Hervey) | 1 | .. | 23 |
| Mauke | 466 | 404 | 476 |
| Mitiaro | 224 | 195 | 235 |
| Palmerston | 104 | 76 | 90 |
| Penrhyn | 348 | 270 | 319 |
| Pukapuka | 529 | 471 | 474 |
| Rakahanga | 295 | 217 | 294 |
| Rarotonga | 1,838 | 1,721 | 2,853 |
| Suwarrow | 3 | .. | 6 |
In the above table the first column of figures shows the total Native population comprised in the total population of the islands that had been born in each island of the Group; the next column shows the number who at the date of census were actually residents of the same island as they were born in; while the last column shows the total Natives (irrespective of birthplace) in each island at the date of census.
It will be noted that Rarotonga seems to have attracted the most immigrants, a state of affairs which is easily accounted for when it is remembered that this island is the chief port of call in the Group for ocean-going vessels. A larger proportion of the population born in this island appears to have remained there than is the case with most of the other islands. An examination of the table reveals that inter-island migration has in most other cases been considerable.
In addition to the foregoing, the inhabitants of the islands comprised within the ambit of the census included 28 Natives born in Niue, 4 in New Zealand, 62 in Raiatea, 45 in Ruruta, 25 in Fanning Island, 19 in Samoa, 190 in Tahiti, and a number of others.
The following table shows the age-distribution of the Native population, males and females being separated:—
| Island. | Under 5. | 5 and under 10. | 10 and under 15 | 15 and under 20 | 20 and under 25 | 25 and under 30 | 30 and under 35 | 35 and under 40 | 40 and under 45 | 45 and under 50 | 50 and under 55 | 55 and under 60 | 60 and under 65 | 65 and under 70 | 70 and over | Unspecified. | Totals. |
|---|---|---|---|---|---|---|---|---|---|---|---|---|---|---|---|---|---|
| * Labourers Temporarily Employed On This Island. | |||||||||||||||||
| Aitutaki | 107 | 92 | 79 | 48 | 45 | 47 | 43 | 56 | 34 | 33 | 20 | 22 | 17 | 10 | 9 | .. | 662 |
| Atiu | 68 | 62 | 39 | 24 | 15 | 21 | 22 | 46 | 22 | 27 | 16 | 4 | 15 | 3 | 3 | .. | 387 |
| Mangaia | 104 | 101 | 66 | 49 | 35 | 32 | 22 | 27 | 28 | 30 | 30 | 28 | 13 | 23 | 14 | .. | 602 |
| Manihiki | 24 | 30 | 30 | 15 | 18 | 14 | 18 | 20 | 23 | 53 | 5 | 4 | 2 | 1 | 1 | .. | 258 |
| Manuae or Hervey | .. | .. | .. | .. | .. | .. | .. | .. | 15 | .. | .. | .. | .. | .. | .. | .. | *15 |
| Mauke | 35 | 34 | 30 | 29 | 19 | 19 | 11 | 15 | 10 | 8 | 5 | 10 | 11 | 4 | 7 | .. | 247 |
| Mitiaro | 24 | 18 | 10 | 11 | 4 | 8 | 9 | 5 | 3 | 2 | 2 | 4 | 5 | 3 | 2 | .. | 110 |
| Palmerston | 17 | 12 | 3 | 4 | 4 | 4 | 3 | 2 | .. | 1 | 3 | .. | .. | .. | .. | .. | 53 |
| Penrhyn | 17 | 19 | 9 | 12 | 12 | 10 | 17 | 13 | 6 | 33 | .. | 2 | 1 | 1 | .. | .. | 152 |
| Pukapuka | 67 | 41 | 17 | 3 | 18 | 24 | 52 | 3 | 20 | .. | 10 | .. | 19 | 1 | 3 | .. | 278 |
| Rakahanga | 21 | 20 | 18 | 15 | 11 | 4 | 10 | 6 | 11 | 27 | 2 | 2 | 1 | 2 | .. | .. | 150 |
| Rarotonga | 162 | 160 | 153 | 135 | 122 | 205 | 137 | 117 | 100 | 73 | 59 | 47 | 29 | 18 | 25 | 3 | 1,545 |
| Suwarrow | .. | .. | .. | .. | 1 | .. | 3 | .. | 1 | .. | .. | 1 | .. | .. | .. | .. | *6 |
| Totals | 646 | 589 | 453 | 345 | 304 | 388 | 347 | 310 | 273 | 287 | 152 | 124 | 113 | 66 | 64 | 3 | 4,465 |
| Island. | Under 5. | 5 and under 10. | 10 and under 15 | 15 and under 20 | 20 and under 25 | 25 and under 30 | 30 and under 35 | 35 and under 40 | 40 and under 45 | 45 and under 50 | 50 and under 55 | 55 and under 60 | 60 and under 65 | 65 and under 70 | 70 and over | Unspecified. | Totals. |
|---|---|---|---|---|---|---|---|---|---|---|---|---|---|---|---|---|---|
| * Labourers Temporarily Employed On This Island. | |||||||||||||||||
| Aitutaki | 83 | 91 | 61 | 72 | 55 | 51 | 50 | 50 | 27 | 26 | 20 | 5 | 12 | 5 | 6 | 1 | 615 |
| Atiu | 64 | 53 | 27 | 19 | 32 | 32 | 35 | 38 | 30 | 9 | 18 | 4 | 6 | 1 | 2 | .. | 370 |
| Mangaia | 74 | 80 | 81 | 54 | 59 | 39 | 30 | 27 | 33 | 34 | 44 | 29 | 17 | 20 | 12 | .. | 633 |
| Manihiki | 20 | 25 | 29 | 27 | 21 | 15 | 9 | 11 | 23 | 46 | 2 | 1 | 2 | 1 | .. | .. | 232 |
| Manuae or Hervey | .. | .. | .. | .. | .. | .. | .. | .. | 8 | .. | .. | .. | .. | .. | .. | .. | *8 |
| Mauke | 32 | 31 | 33 | 33 | 19 | 13 | 15 | 8 | 13 | 5 | 7 | 4 | 6 | 3 | 7 | .. | 229 |
| Mitiaro | 14 | 15 | 20 | 17 | 10 | 12 | 8 | 6 | 4 | 2 | 3 | 2 | 5 | 4 | 3 | .. | 125 |
| Palmerston | 5 | 4 | 4 | 5 | 6 | 3 | 6 | 1 | .. | 1 | 2 | .. | .. | .. | .. | .. | 37 |
| Penrhyn | 18 | 17 | 18 | 18 | 9 | 21 | 11 | 11 | 4 | 39 | .. | 1 | .. | .. | .. | .. | 167 |
| Pukapuka | 44 | 27 | a | 3 | 19 | 17 | 41 | 6 | 17 | .. | 10 | .. | 4 | .. | 3 | .. | 196 |
| Rakahanga | 18 | 13 | 11 | 17 | 13 | 6 | 8 | 6 | 15 | 32 | 3 | .. | .. | .. | .. | .. | 144 |
| Rarotonga | 165 | 167 | 134 | 132 | 124 | 154 | 95 | 94 | 91 | 51 | 46 | 15 | 22 | 8 | 9 | 1 | 1,308 |
| Suwarrow | .. | .. | .. | .. | .. | .. | .. | .. | .. | .. | .. | .. | .. | .. | .. | .. | .. |
| Totals | 537 | 523 | 423 | 397 | 367 | 363 | 308 | 258 | 265 | 245 | 155 | 63 | 74 | 42 | 42 | 2 | 4,064 |
As regards religions, the large proportion of congregationalists may be directly attributed to the missionary zeal of that body in these parts.
| Island. | Religious Denomination. | |||||||||||
|---|---|---|---|---|---|---|---|---|---|---|---|---|
| Church of England. | Confusion. | Congregation-alists. | London Missionary Society. | Methodists of Australasia. | Presbyterian. | Protestants. | Roman Catholic. | Seventh-day Adventists | Object. | Not stated. | Totals. | |
| Aitutaki | .. | .. | 1,193 | 13 | .. | .. | .. | 15 | 24 | .. | 32 | 1,277 |
| Atiu | .. | 1 | 737 | .. | .. | .. | .. | 18 | .. | .. | 1 | 757 |
| Mangaia | .. | .. | 6 | 1,229 | .. | .. | .. | .. | .. | .. | .. | 1,235 |
| Manihiki | .. | .. | 451 | .. | .. | .. | .. | 36 | .. | .. | 3 | 490 |
| Manuae or Hervey | .. | .. | 13 | 1 | .. | .. | .. | 3 | 5 | .. | 1 | 23 |
| Mauko | .. | .. | 376 | .. | .. | .. | 3 | 92 | 2 | .. | 3 | 476 |
| Mitiaro | .. | .. | .. | .. | 235 | .. | .. | .. | .. | .. | .. | 235 |
| Palmerston | .. | .. | 90 | .. | .. | .. | .. | .. | .. | .. | .. | 90 |
| Penrhyn | .. | .. | 318 | .. | .. | .. | .. | 1 | .. | .. | .. | 319 |
| Pukapuka | .. | .. | 474 | .. | .. | .. | .. | .. | .. | .. | .. | 474 |
| Rakahanga | .. | .. | 287 | .. | .. | .. | .. | 1 | .. | .. | 6 | 294 |
| Rarotonga | 3 | .. | 2,765 | 5 | .. | 1 | .. | 55 | 19 | 2 | 3 | 2,853 |
| Suwarrow | .. | .. | 6 | .. | .. | .. | .. | .. | .. | .. | .. | 6 |
| Totals | 3 | 1 | 6,716 | 1,248 | 235 | 1 | 4 | 220 | 50 | 2 | 49 | 8,529 |
A comparatively high standard of education for a Native community will be observed.
| Island. | Degree of Education. | Attending School. | ||||||||||||||
|---|---|---|---|---|---|---|---|---|---|---|---|---|---|---|---|---|
| Read Native. | Read and write Native. | Read English. | Read and write English. | Not stated. | Totals. | Aorangi. | Araura. | London Missionary Society. | Rakahanga. | Roman Catholic. | Takitumu | Tauhunu. | Tautu Native School. | Tukao. | Totals. | |
| Aitutaka | 12 | 582 | 74 | 155 | 454 | 1,277 | .. | 263 | .. | .. | 1 | .. | .. | 2 | .. | 266 |
| Atiu | 73 | 351 | 1 | 2 | 325 | 757 | .. | .. | 80 | .. | 44 | .. | .. | .. | .. | 124 |
| Mangaia | 2 | 555 | .. | 2 676 | 1,235 | .. | .. | 196 | .. | .. | .. | .. | .. | .. | 196 | |
| Manihiki | 4 | 360 | 4 | 5 | 117 | 490 | .. | .. | .. | .. | .. | .. | 67 | .. | 33 | 100 |
| Manuae or Hervoy | .. | 22 | .. | .. | 1 | 23 | .. | .. | .. | .. | .. | .. | .. | .. | .. | .. |
| Mauke | 71 | 117 | 1 | 6 | 251 | 476 | .. | .. | 60 | .. | 52 | .. | .. | .. | .. | 112 |
| Mitiaro | 22 | 138 | .. | .. | 75 | 235 | .. | .. | 42 | .. | 1 | .. | .. | .. | .. | 12 |
| Palmerston | 3 | 29 | .. | 21 | 37 | 90 | .. | .. | 6 | .. | .. | .. | .. | .. | .. | 6 |
| Penrhyn | 32 | 191 | .. | 2 | 94 | 319 | .. | .. | 75 | .. | .. | .. | .. | .. | .. | 75 |
| Pukapuka | 20 | 277 | .. | 2 | 175 | 474 | .. | .. | 50 | .. | .. | .. | .. | .. | .. | 50 |
| Rakahanga | 3 | 190 | 1 | 7 | 93 | 294 | .. | .. | .. | 65 | .. | .. | .. | .. | .. | 65 |
| Rarotonga | 42 | 1,806 | 2 | 116 | 887 | 2,853 | 124 | .. | 79 | .. | 50 | 151 | .. | .. | .. | 404 |
| Suwarrow | 4 | 2 | .. | .. | .. | 6 | .. | .. | .. | .. | .. | .. | .. | .. | .. | .. |
| Totals | 293 | 4,650 | 83 | 318 | 3,185 | 8,529 | 124 | 263 | 588 | 65 | 147 | 151 | 67 | 2 | 33 | 1,410 |
Native population of Island of Niue.
Details with regard to Niue Island were separately tabulated. The following table shows the age-distribution of the Native population of the island:—
| Males. | Females. | Total. | |
|---|---|---|---|
| Under 5 | 198 | 175 | 373 |
| 5 and under 15 | 398 | 346 | 744 |
| 15 and under 45 | 794 | 1,098 | 1,892 |
| 45 and over | 438 | 433 | 871 |
| Totals | 1,828 | 2,052 | 3,880 |
The degree of education was as follows:—
| Read Native | 429 |
| Read and write Native | 2,011 |
| Read English | 13 |
| Read and write English | 72 |
| Not stated | 1,355 |
| 3,880 |
There were also at the date of census 110 receiving education in the Government school, Tufukia; 100 at the London Missionary Society’s school, Alogi; 15 at the same body’s theological college; 58 at the teachers’ school; and 58 at village schools.
In connection with the above a table is appended
Table Showing the Numbers of Live-Stock and Coconut-Palms in the Cook and other annexed Pacific Islands (Exclusive of Niue) at the Census of October, 1916
| Island. | Live-stock. | Coconut-palms. | ||||||
|---|---|---|---|---|---|---|---|---|
| Cows. | Goats. | Horses. | Pigs. | Poultry. | Not tearing. | Bearing. | Total. | |
* Not Shown Separately † Not Obtained ‡ No Permanent Residents § Incomplete | ||||||||
| Aitutaki | 11 | 9 | 15 | 961 | 3,360 | 53,989 | 583,046 | 637,035 |
| Atiu | .. | .. | 117 | 608 | .. | * | * | 129,030 |
| Mangaia | 1 | .. | 291 | 683 | .. | 41,462 | 66,114 | 107,576 |
| Manihiki | .. | .. | .. | 265 | 727 | † | † | † |
| Manuae or Hervey‡ | .. | .. | .. | .. | .. | .. | .. | .. |
| Mauke | .. | 25 | 82 | 202 | 87 | 11,193 | 51,800 | 62,993 |
| Mitiaro | .. | .. | 12 | 156 | .. | 3,510 | 8,490 | 12,000 |
| Palmerston | .. | .. | .. | 20 | 200 | * | * | 30,000 |
| Penrhyn | .. | .. | .. | 217 | 397 | 26,720 | 63,990 | 90,710 |
| Pukapuka | .. | .. | .. | 50 | 500 | † | † | † |
| Rakahanga | .. | .. | .. | 123 | 692 | † | † | † |
| Rarotonga | 28 | .. | 598 | 561 | 109 | 8,8708 | 18,700 | 27,570 |
| Suwarrow‡ | .. | .. | .. | .. | .. | .. | .. | .. |
| Totals | 40 | 34 | 1,118 | 3,846 | 6,072 | 145,744§ | 792,140§ | 1,096,914§ |
Figures relating to Niue are not included in this table. There were in that island at the date of census 227 horses, 467 pigs, 116 dogs, and 4,981 poultry. There were, in addition, estimated to be 201,138 coconut-palms not bearing and 241,384 bearing.
There is, unfortunately, reason to believe that the live-stock totals (except in the case of Niue) are considerably short of the actual numbers, and that a similar remark applies to the estimates of coconut-palms. In some instances no number of coconut-palms is entered at all. Individual ownership among the Natives is practically unknown at present, so that few Natives knew the number of palm-trees they owned, and even if they did were most unwilling to supply the information, owing to the prevalence of an unfortunate rumour that the census inquiry was intended to be the basis of a scheme of taxation, or that in the alternative the inquiry was being instituted for some other ulterior motive.