
Table of Contents
Table of Contents
Registrar-General’s Office, Wellington, 12th December, 1892.
SIR,—
I have the honour to submit to you the following report on the results of the census of last year:—
The census was taken in New Zealand for the night of Sunday, the 5th April, 1891, the same date as that fixed for the census of the United Kingdom and the greater part of the British dominions. The interval between the above date and that of the previous census taken on the 28th March, 1886, was five years and eight days.
To meet the demand for information, tables showing the population in the various divisions of the colony were presented to Parliament in June and August of 1891, and summary-tables of the results under the different heads were gazetted from time to time. All the information, excepting that relating to occupations and sickness, had been made public by the 25th February of this year through the medium of the Gazette. The complete portions of the census volume were issued on the following dates during the present year: Part I., 25th February . Parts II. and III., 31st March; Parts IV., V., and VI., 9th May; Appendices A and B, 27th May; Parts VII. and VIII., and Appendix C, 5th December.
For the purposes of the census 24 Enumerators' districts were constituted, for each of which an officer was appointed whose duty it was to divide Ms district into subdistricts and select suitable persons for Sub-Enumerators to distribute and collect the household schedules, each Sub-Enumerator taking a separate subdistrict. The number of Sub-Enumerators was 708.
Maps in duplicate on a large scale were sent to the Enumerators, who were required, to mark thereon the boundaries of their subdistricts, and return one to the Registrar-General. These maps were inspected, and in cases where the division was not sufficiently small alterations were required to be made.
The best method of subdivision, at least in and about towns, is to have subdistricts of such a size that the household schedules can be distributed by each Sub-Enumerator in one day and collected in two or three. However practicable this may be in a densely-populated country like England, it is found quite impossible to carry out in this colony. Competent men cannot be obtained to act as Sub-Enumerators for a work of so short duration even in towns; and in the country districts, where the population is sparse and much scattered, the difficulty is considerably increased. It is necessary to enlarge the size of subdistricts in the country very greatly, allowing fully a fortnight for the work of collecting the schedules alone.
After the division into subdistricts had been approved, the written descriptions of boundaries were sent from the Registrar-General’s Office to the Surveyor-General, so that a map of each subdistrict might be prepared to be inserted in the Sub-Enumerators' books. These maps were coloured to show all important territorial divisions, such as provincial districts, counties, ridings, road and town districts, besides electoral districts. By means of these maps the Sub-Enumerators were able to post up their books so as to group together the household schedules belonging to these territorial divisions.
Full instructions were printed for Enumerators and Sub-Enumerators; these, with supplies of household schedules, Sub-Enumerators' books, and certain special forms for returns of manufactories, places of public worship, &c., besides the agricultural statistics which were taken with the census, were supplied from the Registrar-General’s Office.
When the household schedules with the Sub-Enumerators' books came into the hands of the Enumerators, after the Sub-Enumerators had completed their work, it became the duty of the Enumerators to examine the schedules to see that they were properly filled up. If any deficiencies were discovered the Sub-Enumerators were called upon to have all defects put right. A preliminary return of dwellings and population was then compiled from the totals shown in the Sub-Enumerators' books by the various Enumerators, and sent with forms and schedules to the Registrar-General.
It was not until nearly the end of June that the whole of the household schedules were received in the Registrar-General’s Office from Enumerators, owing to the time required in the collection of the schedules and the examination and subsequent correction of errors. Nearly three months elapsed before the work of compilation was fully organized and developed.
When the household schedules are received at the head office they are sorted into the territorial divisions and localities for which information is to be given, and the number of persons in each schedule is marked thereon, showing sexes. The first tabulation is then begun. It consists of tabulating from the schedules on to large forms the particulars of the people according to sex, the number of dwelling-houses of each class of material, and also the number of rooms. Besides the persons and dwellings, the number of occupied holdings of land with the livestock are also tabulated at this stage of the proceedings. The work on each sheet has to be checked, and the totals of sheets summarised according to small localities. The totals for smaller divisions are then grouped into the larger divisions, of which they form parts, and the process of building up is continued until the last line represents the final total for the colony.
The above is known by the name of the first tabulation. The result exhibits the exact number of the people in every division of the colony according to sex, with the description and size of dwellings, and includes the results of the census as to occupied lands and live-stock; but it does not deal with the particulars respecting the population, such as age, religion, birthplace, occupation, health, conjugal condition, and education. These are left to be dealt with in what is termed the second tabulation by means of “ the card-system,” a description of which will be given further on.
The results of the first compilation were published in the New Zealand Gazette on the following dates:—
| Population in counties, boroughs, &c. | 19th Aug., 1891. |
| Land and stock | 7th Oct., 1891. |
| Dwellings | 16th Oct., 1891. |
Having by means of the first tabulation determined the exact population of the colony, the Registrar-General was in a position to comply with the requirements of “The Representation Act, 1887” under which he is required to report the results of the census as early as possible to the Commissioners appointed to divide the colony into new electoral districts for the apportionment of the European representation of the people in the House of Representatives.
A return showing the exact population of the colony and of each of the electoral districts as then existing was prepared, and presented to the Commissioners on the 25th September, 1891. To enable the Commissioners to divide the colony afresh into 62 new districts for 70 members, according to the provisions of the Representation Act Amendment Acts of 1887 and 1889, the area of each Sub-Enumerator’s district was marked off on his map into small blocks, and Sub-Enumerators were instructed to indicate on each block the population thereof. By means of these maps the Surveyor-General was enabled to prepare a series of large maps of the colony, showing the population in a vast number of small divisions, thus affording the means of defining the 62 new districts on a population basis of one member to each district (excepting in the case of the amalgamated city constituencies, of which there are 4—Auckland, Wellington, Christchurch, and Dunedin—with 3 members each), making 70 European members altogether, representing 62 constituencies, for purposes of European representation.
It may be interesting to state here that the method laid down in “The Representation Act Amendment Act, 1889,” for computing for the purposes of that Act the population of the colony, is to add 28 percent. to the population not contained in any city, borough, or town district having a population of over 2,000 persons. The total population of the colony (other than Maoris), with the addition aforesaid, having been ascertained, was then divided by the number of members (70), and the quotient thus obtained formed the quota. The four city electoral districts were so defined as to extent that the population should be three times the quota. Inasmuch as it would be impossible to divide the country into a given number of districts all having exactly the given quota of population, the law permits the Commissioners to make an allowance of 750 persons by way of addition, to or deduction from the population of rural districts, and 100 persons in case of city electorates; and due consideration is given to community of interest, facilities of communication, and topographical features, as far as possible, in forming the districts. A table is given further on showing the new districts, with the actual population of each, and the nominal population—that is, with 28 percent, added to the rural portion.
To return to the census compilation: For the subsequent processes a radically-different method of compilation is used. At a Conference of statisticians held at Hobart for the purpose of considering what methods should be adopted to secure uniformity in the census results, so as to admit of comparisons between the published figures for the various Australasian Colonies, it was generally held that “the card-system” would be the best to adopt—that is, to transcribe the particulars respecting each person from the schedule on to a prepared card, the cards to be subsequently sorted according to the nature of the information required and the combinations to be effected, and the results brought out on sheets.
The adoption of the card-system became especially necessary in view of the request of the Secretary of State for the Colonies that the occupations of the people should be shown according to seven age-periods, involving several combinations that would have very largely added to the labour, if attempted, under the method of tabulating direct from the household schedules on to large sheets. Besides this, the adoption of a new classification of occupations in conformity with the resolutions of the Census Conference was found, owing to its increased length, an additional reason for the use of cards.
A card-system is now used for all statistics where many and lengthy combinations are required. In vital statistics, for instance, the deaths are classed according to description of disease in groups of age-periods, and cards have been in use in New Zealand for this purpose since the year 1873. Indeed, the death cards are made to answer yet another purpose; for, by taking out the names of the deceased persons, besides the ages and causes of death, they afford the means of obtaining (after sorting alphabetically) the general index of entries in the death-registers required for purposes of searches made when certified copies of entries are called for.
To avoid the very serious loss of time that would be involved by writing out full particulars of each person, specially-designed cards were prepared that admitted of the bulk of the information being given by pencilling lines across the divisions shown thereon. The following is the form of card used, the cards for males being printed in black ink, and those for females in red. To further avoid all unnecessary writing, the probable number of cards required for each county or borough was estimated, and the names printed thereon. Definite abbreviations were adopted, words only being written for which no provision could be made.
FORM OF CENSUS CARD.
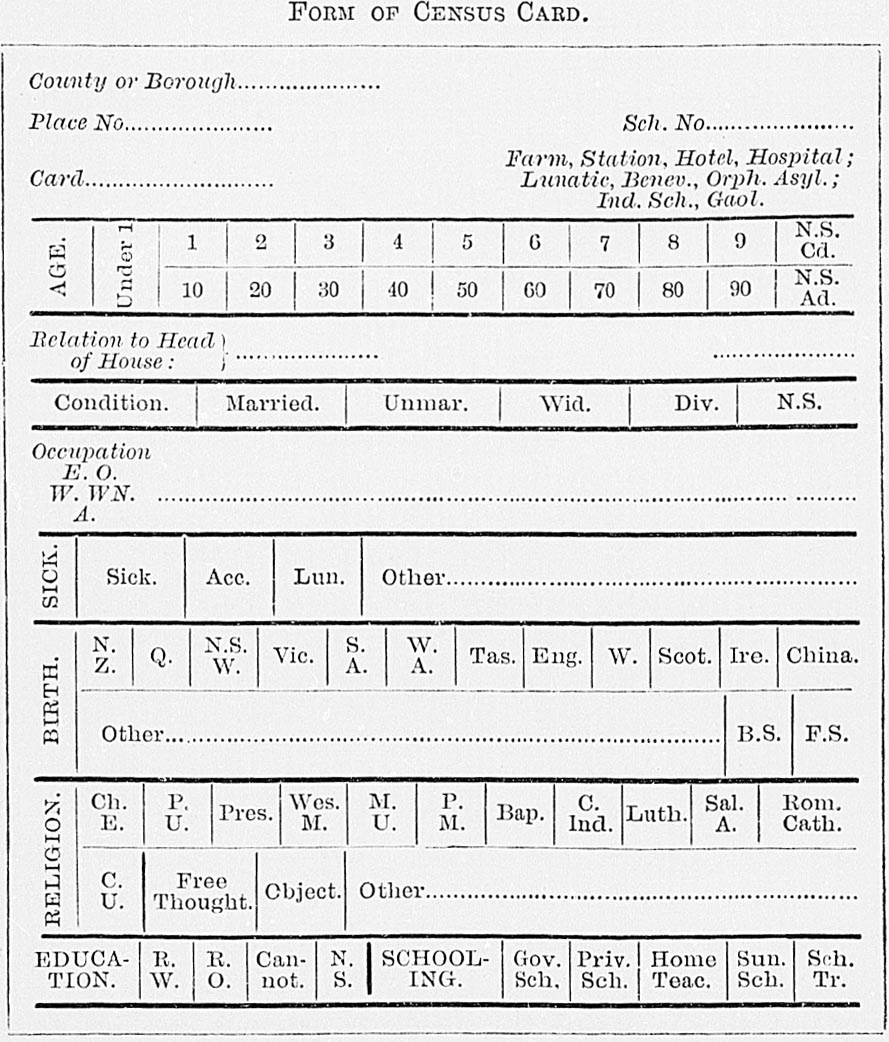
These cards, of which there were over six hundred and thirty thousand, were machine-numbered with consecutive numbers for each county and borough.
To prevent the necessity for disturbance of the county and borough cards, and to avoid the labour of searching out cards for preparing tables relating to minor subjects, such as the Chinese, and matters like sickness, &c, a system of duplicate cards was made use of. These duplicate cards were filled up at the time the original card was written, but kept apart to be used for their special purpose. The trouble of filling up a duplicate card is slight, but to search for and extract cards having special information on them from out of the mass of the census would cause great trouble and lead to confusion.
The price paid for filling up the cards was 2s. 8d. per 100 for those printed in black, representing males, and 2s. 6d. per 100 for those in red, representing females. As the work of the first tabulation narrowed to a close, one by one the clerks were struck off daily pay and. employed at the piecework rates on the business of filling up the cards—excepting some to whom was intrusted the process of checking the entries on the cards by comparison with the schedules, and who retained their day-pay (10s.), but were allowed overtime piecework limited in amount, so as to yield about 5s. per day in addition. It was estimated that the clerks receiving piecework only would earn, on an average, at the rate of 15s. per day.
The cards were all written by the 3rd of December, 1891, and the checking terminated about the end of the same month. The piecework system is liked by clerks who are rapid and accurate in execution, but is the dread of those who are not quick at extracting from the often badly-written matter in the household schedule the different items of information.
To ensure accuracy, the errors made in copying from the schedules were noted by the checkers, and the lists handed to a taxing officer, who compared the cards with the entries in the schedules, and decided on what errors fines were fairly chargeable. The fine was by way of deduction of a given number of cards from the total charged for in any account.
The card system is evidently the best for purposes of compilation, admitting as it does of infinite combinations of results being brought out, but it would seem that the method of indicating the particulars of information by a pencilled stroke can be improved upon by the plan of punched holes. When holes are punched the sorting of any pack of cards can be checked by merely holding them up to the light, or by running a bodkin through the holes, to test if there be any impediment owing to a wrongly-sorted card getting in . whereas with cards merely pencil-marked it becomes necessary to look through the sorted cards before they are finally removed from the sorting-boxes, which takes time. Nevertheless, for a small population the card used in New Zealand answered very well.
The results of the sorted cards for the various counties and boroughs were noted roughly on ruled forms with printed headings, which when filled up were passed to special clerks, who compiled from them the office summaries and the tables for the printer, with their comparisons and percentage calculations.
Separate compilations and summaries were made of the various industrial returns collected by the Enumerators from all parts of the colony, and of the returns of places of worship, land and building societies, literary and scientific institutes, &c.
Besides the European census, the Maori census was also compiled. The bare numbers had been previously stated by the Native Department to the Native Minister, and made public. But the final compilation from the books supplied to Sub-Enumerators, in which the numbers, sexes, ages, principal tribes, and counties in which they resided are all stated, was made in the office of the Registrar-General.
The magnitude of the work of compiling a census, and the length of time required therefor, are not realised by those not conversant with the details. An enormous number of entries have not only to be made but examined and checked, which necessarily makes the work one that involves a very considerable time for its proper performance. The maximum number of clerks employed on the New Zealand census of 1891 was 35. The disturbance of the ordinary work of the department was very great, on account of the necessity for the supervision of so many extra clerks.
Great misunderstanding appears to exist as to the length of time taken in New Zealand for the work of compilation as compared with other colonies. When Part VII. of the census volume, containing the full detailed tables relating to occupations, made its appearance on the 5th of the current month (December), the delay was at once made a subject of remark, although the summarised results had been published months before. Nevertheless, the full occupation tables had not been received here at that date for any of the Australian Colonies, except Queensland and Tasmania, and the populations of these are not nearly so large as that of New Zealand.
Even when the preparation of the exhaustive and elaborate tables that are required in respect of occupations is done, the work of printing is heavy, and had on this occasion to give way for a while to other more urgent orders which the Government Printer was called upon to execute.
The cost of taking and compiling the census was as under:—
| European census— | £ | s. | d. |
|---|---|---|---|
| Enumerators | 746 | 0 | 7 |
| Sub-Enumerators | 8,524 | 19 | 2 |
| Maps and sundries | 483 | 8 | 0 |
| Total | 9,734 | 7 | 9 |
| Maori census | 788 | 15 | 10 |
| Total collection | 10,523 | 3 | 7 |
| Compilation and sundries in central office | 5,608 | 1 | 3 |
| Grand total cost of census, exclusive of printing | £16,131 | 4 | 10 |
The cost of the European census was at the rate of 5.8d. per head, being exactly the same proportion as at the census of 1886. In 1881 the cost was 5.6d. per head, but on that occasion only £50 6s. was paid by the department for maps and sundries, which became in 1886 a charge of £150 17s. Id., a difference equal to 0.2d. per head, the apparent additional cost being caused by a change of system in the Surveyor-General’s Department in making claims against other departments for repayment of the value of work done for them.
Table of Contents
THE population of the colony (exclusive of Maoris), as returned in the census schedules for the night of the 5th April, 1891, amounted to 626,658 persons, of whom 4,444 persons were Chinese, and 2,184 half-castes living amongst and as Europeans.
A census of the Maori population was taken during February of 1891, and the ascertained Native population was found to be 41,993 persons, including 2,681 half-castes living as Maoris. 251 Maori women were returned as married to European husbands. The complete population of the colony, specifying the numbers of the sexes, amounts to 668,651 persons, and is exhibited in the following statement:—
| Persons. | Males. | Females. | |
|---|---|---|---|
| * Not including 1,134 persons, officers and crews of six British men-of-war, and 365 persons, officers and crew of the Austrian war-ship s.s. “Saida.” | |||
| Population (exclusive of persons of the aboriginal native race, of mixed European and Native blood, and Chinese) | 620,030 | 327,329 | 292,701 |
| Half-castes and persons of mixed race living as and among Europeans | 2,184 | 1,122 | 1,062 |
| Chinese | 4,444 | 4,426 | 18 |
| Aboriginal natives (including 251 Maori wives of Europeans) | 39,312 | 21,392 | 17,920 |
| Half-castes and persons of mixed race living among and as members of Maori tribes | 2,681 | 1,469 | 1,212 |
| Total population | *668,651 | 355,738 | 312,913 |
The total half-caste or mixed European and Native population was 4,865 persons. The number of half-castes living among Europeans increased since 1886 by 227, or at the rate of 11.6 per cent. In that year the number of Maori wives of Europeans was 201; in 1891 it was 251. The Australasian Colonies as a whole contained at the census of 1891 a population amounting to 3,851,888 persons (exclusive of the Australian aborigines of Queensland, and South and Western Australia, but including New Zealand Maoris).
| Persons. | Males. | Females. | |
|---|---|---|---|
| * Includes 9,428 Polynesians. | |||
| Queensland | *393,718 | 223,779 | 169,939 |
| New South Wales | 1,132,234 | 612,562 | 519,672 |
| Victoria | 1,140,405 | 598,414 | 541,991 |
| South Australia | 320,431 | 166,801 | 153,630 |
| Western Australia | 49,782 | 29,807 | 19,975 |
| Tasmania | 146,667 | 77,560 | 69,107 |
| New Zealand | 668,651 | 355,738 | 312,913 |
| Total Australasian Colonies | 3,851,888 | 2,064,661 | 1,787,227 |
Comparison of the census results for 1881 and 1891 shows the rate of increase of population per cent. to have been: Queensland, 84.38; New South Wales, 50.67; Victoria, 32.24; South Australia, 14.49; Western Australia, 67.57; Tasmania, 26.76; New Zealand, including Maoris 25.21, excluding Maoris 27.94.
In this and the succeeding parts of this report, Nos. I. to VIII., the number of the population of New Zealand exclusive of the Maoris will be dealt with, leaving the Native population for consideration in the remarks on Appendix C of the census volume.
The population (excluding Maoris), consisting of 626,658 persons, shows an increase of only 48,176, or at the rate of 8.33 per cent., on the number returned at the census of March, 1886. This is equal to an average annual rate of 1.66 per cent, increase during the past five years. The rate of increase for the quinquennium previous to March, 1886, was 18.07 per cent., being an average rate of 3.61 per annum.
The returns for 1886 had shown that over 7,000 persons whose departures had not been recorded left the colony since the census of 1881 was taken. A similar result was found on comparing the results of the census of 1891 with that of 1886, the ascertained population proving to be about 5,000 persons less than the estimate. This was unsatisfactory, for the best efforts had been made to obtain correct statements of arrivals and departures, which were believed to have been fairly successful, and it is considered certain that the natural increase is correctly ascertained, very few births escaping registration. As New Zealand can only be reached, by sea, it might be reasonably supposed that the number of persons who arrive and depart could be ascertained with perfect accuracy; and, indeed, the arrivals are probably correct, but many persons leave the colony for Australia without booking their passages, paying their fares on board after leaving port instead. In such cases there is no record here of such departures.
To meet the difficulty, arrangements were made by which the purser of each intercolonial steamer belonging to the Union Steamship Company was required, on his return to New Zealand, to post to the Registrar-General a statement of the number of passengers outwards who were on board such steamer on her previous voyage from the colony. Notwithstanding this, there was found to have been considerable unascertained emigration, which can only be accounted for in two ways: first, that a larger number left by a line of steamers for which the pursers render no other returns than are shown by the Customs emigration officer; and, second, that during a period of cheap fares to Australia and strong competition between rival companies, many steamers carried more passengers than should have been taken, and of which excessive number no return was made.
Between the 28th March, 1886, and 5th April, 1891, the number of births registered amounted to 93,855, and the deaths to 29,733, giving a natural increase to the population between these dates of 64,122 persons. Adding this number to the population at the census of 1886 gives a total of 642,604 persons, which number would have represented the population (exclusive of Maoris) on the night of the 5th April, 1891, had there been neither arrivals in nor departures from the colony during the previous five years—depending entirely on the natural increase. But the number enumerated only amounted to 626,658 persons, showing a loss by excess of departures over arrivals during the quinquennium of no less than 15,946 persons. At the previous quinquennium the natural increase was not only retained, but the colony added to its population 21,344 persons from over sea, being the excess of immigration over emigration. When it is remembered that the expenditure on public works for New Zealand was curtailed in the period 1886 to 1891, and that while the reduction was in progress there was a large expenditure of loan-money in the Australian Colonies going on, the reason for the outgo of population from here becomes apparent.
The population of the principal divisions of the colony in March, 1891, was—
| Persons. | Males. | Females. | |
|---|---|---|---|
| North Island and adjacent islets (exclusive of Maoris) | 281,455 | 149,767 | 131,688 |
| Middle Island and adjacent islets (exclusive of Maoris) | 344,711 | 182,835 | 161,876 |
| Stewart Island | 202 | 115 | 87 |
| Chatham Islands (exclusive of Natives) | 271 | 149 | 122 |
| Kermadec Islands | 19 | 11 | 8 |
| Total for the colony (exclusive of Maoris) | 626,658 | 332,877 | 293,781 |
During the interval between March, 1886, and April, 1891, the increase of population in the North Island was far in excess of that in the Middle Island. The figures are: North Island, 1886, 250,482 persons, against 281,455 in 1891, a difference of 30,973, or at the rate of 12.36 per cent.; Middle Island, 1886, 327,592 persons, against 344,711 in 1891, a difference of only 17,119, or 5.22 per cent. The European population of Stewart Island did not increase, but that of the Chatham Islands rose from 199 to 271 persons. The Kermadec Islands appear for the first time in 1891 as part of New Zealand, with a population of 19 persons.
Table of Contents
The following table gives the number of males and females in each provincial district in 1886 and 1891, and also for the Chatham and Kermadec Islands:—
| March, 1886. | April, 1891. | |||||
|---|---|---|---|---|---|---|
| Provincial Districts. | Persons. | Males. | Females. | Persons. | Males. | Females. |
| Auckland | 130,379 | 70,582 | 59,797 | 133,159 | 69,891 | 63,268 |
| Taranaki | 17,999 | 9,576 | 8,423 | 22,065 | 11,757 | 10,308 |
| Hawke's Bay | 24,568 | 13,890 | 10,678 | 28,506 | 15,744 | 12,762 |
| Wellington | 77,536 | 41,650 | 35,886 | 97,725 | 52,375 | 45,350 |
| Marlborough | 11,113 | 6,223 | 4,890 | 12,767 | 7,069 | 5,698 |
| Nelson | 30,203 | 16,878 | 13,325 | 34,770 | 19,448 | 15,322 |
| Westland | 15,931 | 9,388 | 6,543 | 15,887 | 9,255 | 6,632 |
| Canterbury | 121,400 | 63,094 | 58,306 | 128,392 | 66,105 | 62,287 |
| Otago | 149,154 | 80,834 | 68,320 | 153,097 | 81,073 | 72,024 |
| Chatham Islands | 199 | 106 | 93 | 271 | 149 | 122 |
| Kermadec Islands | .. | .. | .. | 19 | 11 | 8 |
| Totals | 578,482 | 312,221 | 266,261 | 626,658 | 332,877 | 293,781 |
The numbers given, as before stated, include persons of mixed European and Native blood who are residing among and living as Europeans, but not Maoris or persons of mixed race living as members of Native tribes.
Of the total increase in the period 1886–91, more than one-fourth (26.04 per cent.) occurred in the Wellington Provincial District. Next to Wellington, the largest increase was in Taranaki (22.59 per cent.), and Hawke's Bay came next with 16.03 per cent, of increase. The Otago population only increased 2.64 per cent., and Westland had an actual decrease of 0.28 per cent. While the Provincial District of Auckland only put on 2.13 per cent, to the number of people, the three other provincial districts of the North Island had the largest increases of all. The increase in Marlborough was at the rate of 14.88 per cent., in Nelson 15.12 per cent., and in Canterbury 5.76 per cent.
The following is a statement of the numerical and centesimal increase or decrease in each provincial district, according to the returns of 1886 and 1891:—
| 1881 to 1886. | 1886 to 1891. | |||||
|---|---|---|---|---|---|---|
| Numerical. | Percentage. | Numerical. | Percentage. | |||
| Auckland | (Increase) | 30,928 | 31.10 | (Increase) | 2,780 | 2.13 |
| Taranaki | (Increase) | 3,141 | 21.14 | (Increase) | 4,066 | 22.59 |
| Wellington | (Increase) | 16,165 | 26.34 | (Increase) | 20,189 | 26.04 |
| Hawke's Bay | (Increase) | 7,201 | 41.46 | (Increase) | 3,938 | 16.03 |
| Marlborough | (Increase) | 1,813 | 19.49 | (Increase) | 1,654 | 14.88 |
| Nelson | (Increase) | 4,128 | 15.83 | (Increase) | 4,567 | 15.12 |
| Westland | (Increase) | 921 | 6.13 | (Decrease) | −44 | −0.28 |
| Canterbury | (Increase) | 9,218 | 8.21 | (Increase) | 6,992 | 5.76 |
| Otago | (Increase) | 15,077 | 11.24 | (Increase) | 3,943 | 2.64 |
In the report on the census of 1886 the Registrar-General remarked on the untrustworthiness of any calculations of future increases of population extending over a lengthened period, owing (1) to the fact of the population not having assumed a normal character as to ages and surrounding conditions that might give some stability to the birth- and death-rates, and (2) to the uncertainty as to the annual amount of immigration or emigration. This has been strikingly borne out by the results of the past quinquennium, for, whereas on the basis of previous experience an increase might have been calculated upon equivalent to the excess of births over deaths, plus a certain estimated excess of immigration over emigration, the actual increase was equivalent only to about three-fourths of the excess in number of births over deaths.
The movement among the male portion of the population has been greater and more irregular than that among the female, a result that might have been expected, especially as the number of males is 39,096 in excess of that of the females. No absolute decrease in females will be found, though in Westland the numbers for 1886 and 1891 are almost equal.
A process of equalisation of the relative numbers of the sexes is going on. In 1871 there were 70.52 females to every 100 males; in 1881 the ratio was 81.72; in 1886, 85.28; and in 1891, 88.26 percent. The proportions are based on the numbers, excluding Maoris, but including Chinese. The number of males enumerated in 1891 was 332,877, of whom 4,426 were Chinese; the number of females was 293,781, of whom 18 were Chinese, giving a proportion, excluding the Chinese, of 89.44 females to every 100 males. The proportions (including Chinese) varied greatly in different parts of the colony—from 94.22 females to 100 males in Canterbury to 71.66 in Westland. The following shows the proportions of females to every 100 males in each of the provincial districts in 1886 and 1891, also the centesimal increase or decrease in the number of each sex during the intervening period:—
| Females to 100 Males. | Centesimal Incr. or Decr., 1886 to 1891. | |||
|---|---|---|---|---|
| Provincial Districts. | 1886. | 1891. | Males. | Females. |
| Auckland | 84.72 | 90.52 | −0.98 | 5.80 |
| Taranaki | 87.96 | 87.68 | 22.78 | 22.38 |
| Hawke's Bay | 76.87 | 81.06 | 13.35 | 19.52 |
| Wellington | 86.16 | 86.59 | 25.75 | 26.37 |
| Marlborough | 78.57 | 80.61 | 13.59 | 16.52 |
| Nelson | 78.94 | 78.78 | 15.23 | 14.99 |
| Westland | 69.69 | 71.66 | −1.42 | 1.36 |
| Canterbury | 92.41 | 94.22 | 4.77 | 6.83 |
| Otago | 84.52 | 88.84 | 0.30 | 5.42 |
In the period 1881 to 1886 the Provincial Districts of Taranaki, Westland, Canterbury, and Otago suffered a loss of male population by which the Districts of Wellington and Hawke's Bay profited. These losses were not absolute but only relative, the male population having been actually greater in 1886 than in 1881, but less than it should have been considering the excess of births over deaths in each district. The loss was in fact equivalent to a portion of the natural increase during the above-named period. In the period 1886 to 1891 the Districts of Westland, Canterbury, and Otago have each again experienced a loss of male population, which in the case of West-land has been absolute, and in Otago nearly so. In the same period Auckland has experienced an absolute loss, having fewer males by 691 in the year 1891 than in 1886.
New Zealand is by “The Comities Act, 1876,” divided into counties and boroughs, excepting certain outlying islands, which are not within the county boundaries. It is provided by the above-mentioned. Act that boroughs shall not be included in counties. In April, 1891, the number of the counties was 78. Of these, the North Island had 45, with a county population amounting altogether to 155,057 persons. The Middle Island had 32 counties, the population being 196,838 persons. Stewart Island constitutes a county in itself, with a population of 202 persons. The names and populations of the various counties in the colony were as under at the date of the enumeration:—
| Counties. | Persons. | M. | F. |
|---|---|---|---|
| Mongonui | 1,389 | 788 | 601 |
| Whangaroa | 878 | 487 | 391 |
| Hokianga | 1,494 | 871 | 623 |
| Bay of Islands | 2,562 | 1,437 | 1,125 |
| Hobson | 3,298 | 2,154 | 1,144 |
| Whangarei | 6,120 | 3,456 | 2,664 |
| Otamatea | 2,054 | 1,190 | 864 |
| Rodney | 3,170 | 1,681 | 1,489 |
| Waitemata | 6,184 | 3,492 | 2,692 |
| Eden | 13,782 | 6,791 | 6,991 |
| Manukau | 11,925 | 6,111 | 5,814 |
| Coromandel | 2,846 | 1,694 | 1,152 |
| Thames | 4,340 | 2,353 | 1,987 |
| Ohinemuri | 1,516 | 982 | 534 |
| Piako | 2,517 | 1,428 | 1,089 |
| Waikato | 2,738 | 1,473 | 1,265 |
| Waipa | 3,395 | 1,761 | 1,634 |
| Raglan | 1,090 | 654 | 436 |
| Kawhia | 308 | 196 | 112 |
| West Taupo | 119 | 91 | 28 |
| East Taupo | 152 | 100 | 52 |
| Rotorua | 418 | 253 | 165 |
| Tauranga | 1,393 | 783 | 610 |
| Whakatane | 1,524 | 846 | 678 |
| Waiapu | 379 | 256 | 123 |
| Cook | 3,945 | 2,239 | 1,706 |
| Clifton | 908 | 523 | 385 |
| Taranaki | 7,905 | 4,237 | 3,668 |
| Stratford | 2,521 | 1,416 | 1,105 |
| Hawera | 4,347 | 2,448 | 1,899 |
| Patea | 2,608 | 1,484 | 1,124 |
| Waitotara | 2,255 | 1,289 | 966 |
| Wanganui | 2,281 | 1,297 | 984 |
| Rangitikei | 4,438 | 2,559 | 1,879 |
| Oroua | 7,418 | 4,160 | 3,258 |
| Manawatu | 2,725 | 1,594 | 1,131 |
| Horowhenua | 2,289 | 1,495 | 794 |
| Wairoa | 1,246 | 756 | 490 |
| Hawke's Bay | 6,028 | 3,571 | 2,457 |
| Waipawa | 7,906 | 4,432 | 3,474 |
| Patangata | 2,044 | 1,378 | 666 |
| Pahiatua | 2,365 | 1,414 | 951 |
| Wairarapa N. | 5,143 | 3,092 | 2,051 |
| Wairarapa S. | 4,980 | 2,863 | 2,117 |
| Hutt | 6,114 | 3,242 | 2,872 |
| Sounds | 720 | 426 | 294 |
| Marlborough | 6,520 | 3,827 | 2,693 |
| Kaikoura | 1,460 | 817 | 643 |
| Collingwood | 2,103 | 1,174 | 929 |
| Waimea | 8,942 | 4,740 | 4,202 |
| Buller | 4,659 | 2,823 | 1,836 |
| Inangahua | 4,648 | 2,892 | 1,756 |
| Grey | 4,330 | 2,950 | 1,380 |
| Westland | 5,031 | 3,191 | 1,840 |
| Amuri | 967 | 679 | 288 |
| Cheviot | 164 | 120 | 44 |
| Ashley | 12,396 | 6,577 | 5,819 |
| Selwyn | 36,375 | 18,699 | 17,676 |
| Akaroa | 3,771 | 2,083 | 1,688 |
| Ashburton | 9,501 | 5,335 | 4,166 |
| Geraldine | 14,588 | 7,543 | 7,045 |
| Mackenzie | 1,180 | 689 | 491 |
| Waimate | 4,043 | 2,364 | 1,679 |
| Waitaki | 8,375 | 4,609 | 3,766 |
| Waihemo | 2,040 | 1,181 | 859 |
| Waikouaiti | 4,334 | 2,321 | 2,013 |
| Peninsula | 2,701 | 1,361 | 1,340 |
| Taieri | 7,079 | 3,873 | 3,206 |
| Bruce | 4,696 | 2,567 | 2,129 |
| Clutha | 5,574 | 3,246 | 2,328 |
| Tuapeka | 6,327 | 3,830 | 2,497 |
| Maniototo | 2,927 | 1,732 | 1,195 |
| Vincent | 3,718 | 2,380 | 1,338 |
| Lake | 2,919 | 1,885 | 1,034 |
| Southland | 19,373 | 10,970 | 8,403 |
| Wallace | 5,306 | 3,098 | 2,208 |
| Fiord | 71 | 65 | 6 |
| Stewart Island | 202 | 115 | 87 |
As before stated, the total county population amounted to 352,097 persons, or 56.18 per cent, of the total population.* The counties include all towns not constituted municipal boroughs, and the population in many of the boroughs partakes of a rural character. The population in boroughs, which is given in detail further on, was 270,343 persons,' or 43.14 per cent, of the whole. For every 100 persons resident in counties in 1891 there were 76 residing in boroughs. In 1886 the counties had 327,328 persons, and boroughs 245,612; or, for every 100 persons in counties, 75 were residents of the boroughs. Thus it will be seen that the proportion of the town to the county population was slightly greater in 1891 than in 1886.
For population of ridings, road districts, and localities, see census volume, pp. 11 and 31.
There were 87 municipal boroughs in existence when the census of 1891 was taken. This was an increase of 13 on the number in 1886. Some of the new boroughs were town districts in 1886. In the following comparison of populations for 1886 and 1891, the figures given, as representing the populations in 1886 of boroughs incorporated after that date, are for the areas since included within the several borough boundaries:—
| Population. | ||||
|---|---|---|---|---|
| Boroughs. | 1886. | 1891. | ||
| Birkenhead | 334 | 455 | Inc. | 121 |
| Devonport | 2,650 | 2,455 | Dec. | 195 |
| Auckland | 33,161 | 28,613 | Dec. | 4.548 |
| Newton | 1,883 | 2,087 | Inc. | 254 |
| Newmarket | 1,812 | 1,586 | Dec. | 256 |
| Parnell | 4,672 | 3,967 | Dec. | 705 |
| Onehunga | 2,866 | 2,924 | Inc. | 58 |
| Thames | 4,444 | 4,618 | Inc. | 174 |
| Hamilton | 1,201 | 1,212 | Inc. | 11 |
| Cambridge | 1,019 | 850 | Dec. | 169 |
| Tauranga | 1,148 | 1,055 | Dec. | 93 |
| Gisborne | 2,194 | 2,158 | Dec. | 36 |
| New Plymouth | 3,093 | 3,350 | Inc. | 257 |
| Hawera | 1,026 | 1,284 | Inc. | 258 |
| Patea | 728 | 676 | Dec. | 52 |
| Wanganui | 4,901 | 5,011 | Inc. | 110 |
| Marton | 908 | 976 | Inc. | 68 |
| Feilding | 1,297 | 1,583 | Inc. | 286 |
| Palmerston N. | 2,606 | 4,303 | Inc. | 1,697 |
| Foxton | 736 | 1,223 | Inc. | 487 |
| Hastings | 1,504 | 2,303 | Inc. | 799 |
| Napier | 7,680 | 8,341 | Inc. | 661 |
| Woodville | 665 | 971 | Inc. | 306 |
| Masterton | 3,160 | 3,114 | Dec. | 46 |
| Carterton | 758 | 1,112 | Inc. | 354 |
| Greytown | 1,105 | 1,141 | Inc. | 36 |
| Wellington | 25,945 | 31,021 | Inc. | 5,076 |
| Onslow | 870 | 979 | Inc. | 109 |
| Melrose | 951 | 1,224 | Inc. | 273 |
| Petone | 1,046 | 2,178 | Inc. | 1,132 |
| Lower Hutt | 852 | 1,329 | Inc. | 477 |
| Picton | 733 | 788 | Inc. | 55 |
| Blenheim | 3,094 | 3,294 | Inc. | 200 |
| Nelson | 7,315 | 6,626 | Dec. | 689 |
| Westport | 1,859 | 2,622 | Inc. | 763 |
| Greymouth | 3,133 | 3,787 | Inc. | 654 |
| Brunner | 698 | 2,231 | Inc. | 1,533 |
| Hokitika | 2,687 | 2,178 | Dec. | 509 |
| Ross | 1,054 | 822 | Dec. | 232 |
| Kumara | 1,079 | 1,176 | Inc. | 97 |
| Kaiapoi | 1,514 | 1,371 | Dec. | 143 |
| Rangiora | 1,579 | 1,783 | Inc. | 204 |
| Lyttelton | 3,996 | 4,087 | Inc. | 91 |
| Sydenham | 9,465 | 9,680 | Inc. | 215 |
| Christchurch (see remarks) | 15,265 | 16,223 | Inc. | 958 |
| St. Albans | 4,925 | 5,247 | Inc. | 322 |
| Akaroa | 662 | 571 | Dec. | 91 |
| Ashburton | 1,769 | 1,900 | Inc. | 131 |
| Timaru | 3,754 | 3,668 | Dec. | 86 |
| Waimate | 1,330 | 1,379 | Inc. | 49 |
| Oamaru | 5,330 | 5,621 | Inc. | 291 |
| Hampden | 332 | 300 | Dec. | 32 |
| Palmerston S. | 881 | 790 | Dec. | 91 |
| Hawkesbury | 764 | 743 | Dec. | 21 |
| Port Chalmers | 2,235 | 2,028 | Dec. | 207 |
| N.E. Valley | 3,221 | 3,337 | Inc. | 116 |
| Maori Hill | 1,388 | 1,426 | Inc. | 38 |
| West Harbour | 1,295 | 1,297 | Inc. | 2 |
| Dunedin | 23,243 | 22,376 | Dec. | 867 |
| Roslyn | 3,609 | 3,845 | Inc. | 236 |
| Caversham | 4,448 | 4,690 | Inc. | 242 |
| Mornington | 3,334 | 3,523 | Inc. | 189 |
| St. Hilda | 1,078 | 1,153 | Inc. | 75 |
| South Dunedin | 3,902 | 4,222 | Inc. | 320 |
| Green Island | 636 | 687 | Inc. | 51 |
| Mosgiel | 1,181 | 1,304 | Inc. | 123 |
| Milton | 1,177 | 1,158 | Dec. | 19 |
| Kaitangata | 925 | 1,145 | Inc. | 220 |
| Balclutha | 888 | 867 | Dec. | 21 |
| Lawrence | 1,084 | 1,026 | Dec. | 58 |
| Roxburgh | 328 | 410 | Inc. | 82 |
| Tapanui | 458 | 428 | Dec. | 30 |
| Naseby | 487 | 496 | Inc. | 9 |
| Cromwell | 504 | 474 | Dec. | 30 |
| Alexandra | 246 | 310 | Inc. | 64 |
| Arrowtown | 440 | 426 | Dec. | 14 |
| Queenstown | 733 | 779 | Inc. | 46 |
| Invercargill | 5,212 | 4,950 | Dec. | 262 |
| Invercargill N. | 785 | 717 | Dec. | 68 |
| Invercargill E. | 814 | 736 | Dec. | 78 |
| Invercargill S. | 1,440 | 1,559 | Inc. | 119 |
| Avenal | 364 | 302 | Dec. | 62 |
| Gladstone | 324 | 287 | Dec. | 37 |
| Campbelltown | 503 | 650 | Inc. | 147 |
| Gore | 1,114 | 1,618 | Inc. | 504 |
| Winton | 290 | 288 | Dec. | 2 |
| Riverton | 926 | 843 | Dec. | 83 |
There was an increase of population in 51 of the 87 boroughs. Of these, 23 are in the North Island, and 31 in the Middle Island. In only 5 boroughs of each Island was the increase over 500 persons. Wellington had an increase of 5,076, Palmerston North 1,697, and Petone 1,132, in the Wellington Provincial District. Hastings had an increase of 799 persons, and Napier 661, both in the Hawke's Bay District.
Of five boroughs in the Middle Island having increases over 500' persons, three are at the seats of the coal-mining industry on the West Coast—namely, Westport, increase 763; Greymouth, increase 654; and Brunner, increase 1,533. The Borough of Christchurch had an increase of 958 persons (but the Richmond Ward with 1,421 persons was added since 1886), and Gore, in Otago, an increase of 504. The number of boroughs in which there was a decrease of population between 1886 and 1891 is 33, of which 9 are in the North and 24 in the Middle Island. In only two boroughs in the North Island was the decrease in excess of 500 persons—namely, Auckland, with a decrease of 4,548; and one of its suburban boroughs, Parnell, with a decrease of 705. The boroughs in the Middle Island that suffered a decrease in excess of 500 were—Nelson, decrease 689; Hokitika, decrease 509; and Dunedin, decrease 867.
The four most populous boroughs are—
| 1881. | 1886. | 1891. | |
|---|---|---|---|
| Auckland, with a population of | 26,083 | 33,161 | 23,613 |
| Wellington, with a population of | 20,563 | 25,945 | 31,021 |
| Christchurch, with a population of | 15,213 | 15,265 | 16,223 |
| Dunedin, with a population of | 24,372 | 23,243 | 22,376 |
The Boroughs of Auckland, Christchurch, and Dunedin have considerable suburbs. The suburban population of Wellington is not very large. The following gives the names and populations of the several localities which are deemed to constitute the suburbs of the four principal boroughs:—
SUBURBS OF AUCKLAND.
| Boroughs— | Population, 1891. |
|---|---|
| Birkenhead | 455 |
| Devonport | 2,455 |
| Newmarket | 1,586 |
| Newton | 2,087 |
| Parnell | 3,967 |
| Road Districts— | |
| Arch-hill | 1,393 |
| Eden Terrace | 1,496 |
| Epsom | 578 |
| Mount Albert | 1,398 |
| Mount Eden | 3,136 |
| Mount Roskill | 391 |
| One-tree Hill | 940 |
| Point Chevalier | 549 |
| Remuera | 1,676 |
| Northcote Riding | 407 |
| Outlying portion of Parnell Riding, being land in the Domain with hospital on it | 160 |
| Total suburbs | 22,674 |
| Auckland Borough | 28,613 |
| Total Auckland and suburbs | 51,287 |
SUBURBS OF WELLINGTON.
| Boroughs— | |
| Onslow | 979 |
| Melrose | 1,224 |
| Karori (constituted a borough since the census) | 966 |
| Total suburbs | 3,169 |
| Wellington Borough | 31,021 |
| Total Wellington and suburbs | 34,190 |
SUBURBS OF CHRISTCHURCH.
| Boroughs— | Population. 1891. |
|---|---|
| St. Albans | 5,247 |
| Sydenham | 9,680 |
| Town Districts— | |
| Linwood | 4,580 |
| Woolston | 992 |
| Road Districts— | |
| Avon (part) | 2,972 |
| Heathcote (part) | 3,057 |
| Riccarton (part) | 3,932 |
| Spreydon | 1,163 |
| Total suburbs | 31,623 |
| Christchurch Borough | 16,223 |
| Total Christchurch and suburbs | 47,846 |
In laying off the suburbs of Christchurch the boundaries of the Christ-church Health District have been closely followed.
SUBURBS OF DUNEDIN.
| Boroughs— | |
| Caversham | 4,690 |
| Maori Hill | 1,426 |
| Mornington | 3,523 |
| North-east Valley | 3,337 |
| Roslyn | 3,845 |
| St. Kilda | 1,153 |
| South Dunedin | 4,222 |
| West Harbour | 1,297 |
| Total suburbs | 23,493 |
| Dunedin Borough | 22,376 |
| Total Dunedin and suburbs | 45,869 |
Classifying the 87 boroughs according to size gives the following result:—
| 1886. | 1891. | |
|---|---|---|
| 1 | 1 | having a population exceeding 30,000. |
| 1 | 1 | having a population between 25,000 and 30,000. |
| 1 | 1 | having a population between 20,000 and 25,000. |
| 1 | 1 | having a population between 10,000 and 20,000. |
| 5 | 6 | having a population between 5,000 and 10,000. |
| 20 | 25 | having a population between 2,000 and 5,000. |
| 21 | 24 | having a population between 1,000 and 2,000. |
| 15 | 17 | having a population between 500 and 1,000. |
| 9 | 11 | having a population and under 500, |
Besides the boroughs, there were in 1891 46 town districts, which are portions of the counties in which they are situated, having an aggregate population of 28,077 persons. Of these, Linwood, a suburb of Christchurch, was by far the largest, having 4,580 persons. Hampstead and Clinton had 1,076 and 1,052 respectively. Eighteen others had over 500 and under 1,000, while the remainder had each less than 500 people.
A list of the town districts with their populations is subjoined.
| Town Districts. | Pop'n. |
|---|---|
| Kamo | 369 |
| Whangarei | 746 |
| Helensville | 742 |
| Papakura | 301 |
| Te Aroha | 615 |
| Te Awamutu | 304 |
| Kihikihi | 234 |
| Ngaruawahia | 236 |
| Opotiki | 582 |
| Raleigh (Waitara) | 504 |
| Opunake | 289 |
| Inglewood | 385 |
| Stratford | 342 |
| Normanby | 333 |
| Manaia | 404 |
| Waverley | 441 |
| Lethbridge | 237 |
| Bulls | 647 |
| Halcombe | 414 |
| Clyde (Wairoa) | 424 |
| Taradale | 734 |
| Danevirke | 838 |
| Ormondville | 395 |
| Waipawa | 689 |
| Kaikora North | 301 |
| Pahiatua | 782 |
| Featherston | 668 |
| Johnsonville | 404 |
| Havelock | 319 |
| Richmond | 452 |
| Amberley | 470 |
| Woolston | 992 |
| Sumner | 614 |
| Linwood | 4,580 |
| Southbridge | 643 |
| Hampstead | 1,076 |
| Tinwald | 445 |
| Temuka | 626 |
| Arowhenua | 683 |
| Geraldine | 794 |
| Grey | 251 |
| Outram | 489 |
| Clinton | 1,052 |
| Mataura | 580 |
| Wyndham | 407 |
| Otautau | 244 |
The following places, to the number of 455, were also returned in the census as small centres of population and settlement, but, having no recognised boundaries, more or less of the country has been included by Sub-Enumerators according to their judgment and without check. The figures may be open to objection in cases, and not fit to use throughout for comparative purposes, but there is so much of what is valuable that it is deemed best to publish the information, while drawing attention to the fact that the best effort has been made to secure a proper statement of places which are either centres or becoming the centres of population, and with the reservations before given:—
| Abbotsford, Taieri Co. | 315 |
| Adair, Geraldine Co. | 116 |
| Adam's Flat, Bruce Co. | 73 |
| Addington, Selwyn Co. | 556 |
| Ahaura, Grey Co. | 307 |
| Albany, Waitemata Co. | 37 |
| Albury, Mackenzie Co. | 50 |
| Alexandra, Waipa Co. | 133 |
| Alford Forest, Ashburton Co. | 262 |
| Alfredton, Wairarapa North Co. | 71 |
| Allandale, Waihemo Co. | 32 |
| Allenton, Ashburton Co. | 698 |
| Alma, Waitaki County | 114 |
| Alton, Woodville, Patea Co. | 66 |
| Anderson's Bay, Peninsula Co. | 465 |
| Annat, Selwyn Co. | 105 |
| Aratapu, Hobson Co. | 237 |
| Arawata, Westland Co. | 36 |
| Ardgowan, Waitaki Co. | 196 |
| Argyle, Southland Co. | 25 |
| Ashley, Ashley Co. | 283 |
| Ashurst, Oroua Co. | 482 |
| Athol, Southland Co. | 80 |
| Awahuri, Manawatu Co. | 83 |
| Aylesbury, Selwyn Co. | 104 |
| Balcairn, Ashley Co. | 184 |
| Bald-hill Flat, Vincent Co. | 176 |
| Bannockburn, Vincent Co. | 362 |
| Barkly, Southland Co. | 31 |
| Bay view, Coromandel Co. | 57 |
| Beaconsfield, Geraldine Co. | 118 |
| Belfast, Selwyn Co. | 446 |
| Bellfield, Geraldine Co. | 161 |
| Berwick, Taieri Co. | 83 |
| Birmingham, Oroua Co. | 78 |
| Black's Point, Inangahua Co. | 361 |
| Bluespur, Westland Co. | 125 |
| Bluespur, Tuapeka Co. | 197 |
| Bombay, Manukau Co. | 360 |
| Brighton, Taieri Co. | 63 |
| Brightwater, Waimea Co. | 273 |
| Buffalo, Coromandel Co. | 74 |
| Bunnythorpe, Oroua Co. | 89 |
| Burke's Pass, Mackenzie Co. | 73 |
| Burnham, Selwyn Co. | 54 |
| Burnside, Taieri Co. | 355 |
| Cambrian's, Maniototo Co. | 137 |
| Cambridge West, Waipa Co. | 226 |
| Cameron, Manukau Co. | 48 |
| Campbelltown, Manawatu Co. | 497 |
| Candletown, Bruce Co. | 109 |
| Capleston, Inangahua Co. | 238 |
| Cardrona, Lake Co. | 186 |
| Castlecliff, Waitotara Co. | 98 |
| Castlepoint, Wairarapa North Co | 43 |
| Centre Bush, Southland Co. | 65 |
| Charleston, Buller Co. | 195 |
| Chinese Camp, Tuapeka Co. | 123 |
| Clareville, Wairarapa South Co. | 74 |
| Clyde, Vincent Co. | 283 |
| Clyde, Wairoa Co. | 424 |
| Coalgate, Ashley Co. | 119 |
| Coal Co.'s Lease, Bay of Islands Co. | 182 |
| Coal Creek, Tuapeka Co. | 327 |
| Cobden, Grey Co. | 282 |
| Collingwood, Collingwood Co. | 149 |
| Courtenay, Ashley Co. | 57 |
| Cranston, Peninsula Co. | 81 |
| Crofton, Rangitikei Co. | 128 |
| Crushington, Inangahua Co. | 122 |
| Cullensville, Marlborough Co. | 286 |
| Dalefield, Wairarapa South Co. | 168 |
| Danieltown, Wallace Co. | 39 |
| Dargaville, Hobson Co. | 307 |
| Deborah, Waitaki Co. | 40 |
| Denniston, Buller Co. | 802 |
| Dillmanstown, Westland Co. | 261 |
| Dipton, Southland Co. | 86 |
| Doyleston, Selwyn Co. | 227 |
| Drummond, Wallace Co. | 69 |
| Drummond South, Wallace Co. | 62 |
| Dunback, Waihemo Co. | 219 |
| Dunganville, Grey Co. | 60 |
| Dunkeld, Tuapeka Co. | 107 |
| Dunsandel, Selwyn Co. | 47 |
| Duntroon, Waitaki Co. | 227 |
| Durie Town, Wanganui Co. | 155 |
| East Clive, Hawke's Bay Co. | 177 |
| East Dipton, Southland Co. | 178 |
| East Oxford, Ashley Co. | 90 |
| East Town, Wanganui Co. | 179 |
| East Winton, Southland Co. | 73 |
| Edendale, Southland Co. | 130 |
| Egmont, Taranaki Co. | 42 |
| Eketahuna, Wairarapa North Co. | 322 |
| Ellerslie, Eden Co. | 365 |
| Enfield, Waitaki Co. | 217 |
| Epworth, Geraldine Co. | 82 |
| Ettrick, Tuapeka Co. | 75 |
| Eweburn, Maniototo Co. | 182 |
| Fairfax, Bruce Co. | 181 |
| Fairfield, Taieri Co. | 109 |
| Fairlie Creek, Mackenzie Co. | 335 |
| Farndon, Hawke's Bay Co. | 68 |
| Fendalton, Ashley Co. | 476 |
| Fernhill, Southland Co. | 66 |
| Fernside, Ashley Co. | 310 |
| Fitzroy, Taranaki Co. | 139 |
| Fordell, Wanganui Co. | 108 |
| Fortrose, Southland Co. | 299 |
| Frankton, Lake Co. | 135 |
| Frasertown, Wairoa Co. | 144 |
| Garfield, Wallace Go. | 269 |
| Garston, Lake Co. | 88 |
| Georgetown, Waitaki Co. | 70 |
| Georgetown, Geraldine Go. | 23 |
| Gibston, Lake Go. | 150 |
| Gillespie's Beach, Westland Co. | 96 |
| Gimmerburn, Maniototo Co. | 131 |
| Gladstone, Wairarapa South Co. | 26 |
| Glenary, Waimate Co. | 67 |
| Glenore, Bruce Co. | 113 |
| Glentunnel, Ashley Co. | 175 |
| Goldsborough, Westland Co. | 249 |
| Grassmere, Southland Co. | 77 |
| Greatford, Rangitikei Co. | 119 |
| Greenstone, Grey Go. | 125 |
| Greerton, Tauranga Co. | 56 |
| Gumtown, Coromandel Co. | 39 |
| Halkett, Selwyn Co. | 257 |
| Halswell, Selwyn Co. | 150 |
| Hamilton South, Maniototo Co. | 65 |
| Hampden, Waipawa Co. | 155 |
| Harrisville, Manukau Co. | 97 |
| Hastings, Thames Co. | 63 |
| Hastwell, Wairarapa North Co. | 131 |
| Hatters', Grey Co. | 176 |
| Havelock, Hawke's Bay Co. | 652 |
| Henderson, Waitemata Co. | 66 |
| Henley, Taieri Co. | 63 |
| Herbert, Waitaki Co. | 272 |
| Herbertville, Patangata Co. | 87 |
| Hercules Flat, Tuapeka Co. | 72 |
| Heriot, Tuapeka Co. | 95 |
| Hikutaia, Thames Co. | 190 |
| Hikutaia, Ohinemuri Co. | 225 |
| Hikurangi, Whangarei Co. | 155 |
| Hill Morton, Selwyn Co. | 341 |
| Hill's Creek, Maniototo Co. | 89 |
| Hilton, Geraldine Co. | 112 |
| Hindon, Taieri Co. | 152 |
| Hinds, Ashburton Co. | 38 |
| Hirstfield, Wallace Co. | 157 |
| Hobsonville(vic'ty), Waitemata Co. | 176 |
| Hodgkinson, Wallace Co. | 47 |
| Homesdale, Wallace Co. | 40 |
| Horndon, Ashley Co. | 36 |
| Howick, Manukau Co. | 240 |
| Hua, Taranaki Co. | 71 |
| Hunterville, Rangitikei Co. | 404 |
| Huntly, Waikato Co. | 573 |
| Hurunui, Ashley Co. | 34 |
| Hyde, Maniototo Co. | 90 |
| Jackeytown, Oroua Co. | 69 |
| Kaikoura, Kaikoura Co. | 374 |
| Kaitaia, Mongonui Co. | 69 |
| Kakanui North, Waitaki Co. | 147 |
| Kakanui South, Waitaki Co. | 386 |
| Kakaramea, Patea Co. | 120 |
| Kanieri, Westland Co. | 200 |
| Kapanga, Coromandel Co. | 457 |
| Kaurihohore, Whangarei Co. | 239 |
| Kawakawa (McLeod's), Bay of Islands Co | 179 |
| Kelso, Tuapeka Co. | 139 |
| Kensington, Whangarei Co. | 258 |
| Kingston, Lake Co. | 49 |
| Kirikiri, Thames Co. | 107 |
| Kirwee, Selwyn Co. | 119 |
| Kohekohe, Manukau Co. | 110 |
| Kohukohu, Hokianga Co. | 149 |
| Kuaotunu, Coromandel Co. | 145 |
| Kumeroa, Waipawa Co. | 170 |
| Kuri Bush, Taieri Co. | 92 |
| Kurow, Waitaki Co. | 140 |
| Kyeburn, Maniototo Co. | 85 |
| Lake Hayes, Lake Co. | 280 |
| Lakeside, Selwyn Co. | 285 |
| Leeston, Selwyn Co. | 901 |
| Leithfield, Ashley Co. | 231 |
| Levin, Horowhenua Co. | 184 |
| Lichfield, Piako Co. | 67 |
| Limehills, Southland Co. | 83 |
| Lincoln, Selwyn Co. | 259 |
| Lintley, Southland Co. | 53 |
| Little River, Akaroa Co. | 384 |
| Livingstone, Waitaki Co. | 149 |
| Longburn, Oroua Co. | 253 |
| Longbush, Southland Co. | 53 |
| Lower Hawea, Vincent Co. | 205 |
| Lower Kyeburn, Maniototo Co. | 126 |
| Lower Woodstock, Westland Co. | 189 |
| Lowther, Southland Co. | 25 |
| Lumsden, Southland Co. | 226 |
| Lyell, Buller Co. | 164 |
| Macetown, Lake Co. | 159 |
| Maheno, Waitaki Co. | 189 |
| Mahurangi, Rodney Co. | 37 |
| Makarewa, Southland Co. | 259 |
| Makauri, Cook Co. | 148 |
| Maketu, Tauranga Co. | 104 |
| Makotuku, Waipawa Co. | 98 |
| Mandeville, Southland Co. | 78 |
| Mangamahoe, Wairarapa North Co. | 106 |
| Mangapai, Whangarei Co. | 148 |
| Mansfordtown, Waikouaiti Co. | 381 |
| Manukau, Horowhenua Co. | 171 |
| Manutahi, Patea Co. | 58 |
| Manutahi, Taranaki Co. | 26 |
| Maori Creek, Grey Co. | 33 |
| Maori Gully, Grey Co. | 35 |
| Marowhenua, Waitaki Co. | 34 |
| Marsden, Grey Co. | 32 |
| Martinborough, Wairarapa S.Co. | 248 |
| Matamau, Waipawa Co. | 120 |
| Matata, Whakatane Co. | 62 |
| Maungakaramea, Whangarei Co. | 225 |
| Maungatua, Taieri Co. | 104 |
| Mauriceville, Wairarapa North | 601 |
| Maxwelltown, Waitotara Co. | 130 |
| Meanee, Hawke's Bay Co. | 280 |
| Mendlesham, Cook Co. | 138 |
| Menzies Ferry, Southland Co. | 122 |
| Mercer, Manukau Co. | 181 |
| Merchiston, Waikouaiti Co. | 102 |
| Mercury Bay, Coromandel Co. | 436 |
| Methven, Ashburton Co. | 413 |
| Middlemarch, Taieri Co, | 89 |
| Milburn, Bruce Co. | 131 |
| Milford, Geraldine Co. | 142 |
| Miller's Flat, Tuapeka Co. | 231 |
| Moawhango, Hawke's Bay Co. | 68 |
| Mokihinui, Buller Co. | 84 |
| Mongonui, Mongonui Co. | 206 |
| Morley, Wallace Co. | 52 |
| Morrinsville, Piako Co. | 79 |
| Motueka, Waimea Co. | 913 |
| Mount Somers, Ashburton Co. | 310 |
| Mullocky Gully, Taieri Co. | 63 |
| Muriwai, Cook Co. | 74 |
| McLaren's Gully, Taieri Co. | 33 |
| Nenthorn, Waikouaiti Co. | 97 |
| Neudorf, Waimea Co. | 176 |
| Nevis, Vincent Co. | 51 |
| Newman, Wairarapa North Co. | 72 |
| Newport, Hobson Co. | 57 |
| Ngahere, Grey Co. | 69 |
| Ngapara, Waitaki Co. | 210 |
| Nightcaps, Wallace Co. | 95 |
| Nokomai, Lake Co. | 69 |
| Normanby, Geraldine Co. | 68 |
| Norsewood, Waipawa Co. | 121 |
| North Auckland, Waitemata Co. | 84 |
| North Gisborne, Cook Co. | 438 |
| Notown, Grey Co. | 80 |
| Oaklands, Peninsula Co. | 35 |
| Oban, Stewart Island | 42 |
| Ohinemutu, Rotorua Co. | 89 |
| Okaihau, Bay of Islands Co. | 240 |
| Okarito, Westland Co. | 61 |
| Okato, Taranaki Co. | 47 |
| Ongaonga, Waipawa Co. | 49 |
| Ophir, Vincent Co. | 238 |
| Opua, Bay of Islands Co. | 103 |
| Oraka, Wallace Co. | 36 |
| Orari, Geraldine Co. | 159 |
| Ormond, Cook Co. | 183 |
| Oropi, Tauranga Co. | 39 |
| Orwell Creek, Grey Co. | 116 |
| Otahuhu, Manukau Co. | 1,008 |
| Otaki, Horowhenua Co. | 599 |
| Otiake, Waitaki Co. | 161 |
| Otokia, Taieri Co. | 137 |
| Owake, Clutha Co. | 83 |
| Oxford, Piako Co. | 27 |
| Paeroa, Ohinemuri Co. | 209 |
| Pahautanui, Hutt Co. | 281 |
| Panmure, Eden Co. | 298 |
| Papakaio, Waitaki Co. | 298 |
| Papanui, Selwyn Co, | 482 |
| Parewanui, Rangitikei Co. | 172 |
| Parkville, Wairarapa North Co. | 115 |
| Patutahi, Cook Co. | 202 |
| Peebles, Waitaki Co. | 90 |
| Peel, Geraldine Co. | 48 |
| Pembroke, Lake Co. | 194 |
| Pleasant Point, Geraldine Co. | 509 |
| Pomahaka, Tuapeka Co. | 31 |
| Porangahau, Patangata Co. | 94 |
| Port Albert, Rodney Co. | 73 |
| Port Moeraki, Waitaki Co. | 157 |
| Prebbleton, Selwyn Co. | 146 |
| Puhoi, Rodney Co. | 45 |
| Pukekohe, Manukau Co. | 41 |
| Pukerau, Southland Co. | 120 |
| Puni, Manukau Co. | 137 |
| Purakanui, Waikouaiti Co. | 153 |
| Puriri, Thames Co. | 148 |
| Raglan, Raglan Co. | 83 |
| Rakaia, Ashburton Co. | 425 |
| Rangiriri, Waikato Co. | 52 |
| Rangitata South, Geraldine Co. | 90 |
| Rata, Rangitikei Co. | 188 |
| Rawene, Hokianga Co. | 112 |
| Redcliffe, Waimate Co. | 82 |
| Redwoodtown, Marlborough Co. | 121 |
| Reefton, Inangahua Co. | 1,723 |
| Reidston, Waitaki Co. | 168 |
| Renwick, Marlborough Co. | 249 |
| Riccarton, Selwyn Co. | 413 |
| Riccarton, Taieri Co. | 86 |
| Richmond, Selwyn Co. | 169 |
| Rimu, Westland Co. | 106 |
| Riversdale, Southland Co. | 230 |
| Riwaka, Waimea Co. | 371 |
| Rolleston, Ashley Co. | 75 |
| Rosstown, Inangahua Co. | 149 |
| Rotherham, Amuri Co. | 98 |
| Rotorua, Rotorua Co. | 173 |
| Round Hill, Wallace Co. | 279 |
| Roxburgh East, Tuapeka Co. | 169 |
| Ruapekapeka, Bay of Islands Co. | 125 |
| Russell, Bay of Islands Co. | 228 |
| Rutherglen, Grey Co. | 75 |
| Salisbury, Geraldine Co. | 80 |
| Sandhurst, Waimate Co. | 78 |
| Sanson, Manawatu Co. | 242 |
| Saltwater Creek, Ashley Co, | 94 |
| Scotsburn, Geraldine Co. | 61 |
| Selwyn, Selwyn Co. | 36 |
| Shaftesbury, Piako Co. | 71 |
| Shag Point, Waihemo Co. | 154 |
| Shannon, Horowhenua Co. | 165 |
| Sheffield, Selwyn Co. | 136 |
| Sheil Hill, Peninsula Co. | 34 |
| Silverstream, Mackenzie Co. | 60 |
| Silverton, Peninsula Co. | 45 |
| Skipper's, Lake Co. | 236 |
| Southbrook and Road, Ashley Co. | 338 |
| South Malvern, Selwyn Co. | 98 |
| South Oamaru, Waitaki Co. | 401 |
| Springfield, Selwyn Co. | 480 |
| Stafford, Westland Co. | 158 |
| St. Andrews, Waimate Co. | 150 |
| St. Bathan's, Maniototo Co. | 230 |
| Stirling, Bruce Co. | 199 |
| Studholme Junction, Waimate Co. | 197 |
| Sutton, Taieri Co. | 26 |
| Tairua, Thames Co. | 260 |
| Taitapu, Selwyn Co. | 353 |
| Takapau, Waipawa Co. | 136 |
| Taupiri, Waikato Co. | 60 |
| Taupo, East Taupo Co. | 66 |
| To Arai, Cook Co. | 197 |
| Te Horo, Horowhenua Co. | 51 |
| Te Kopuru, Hobson Co. | 381 |
| Templeton, Selwyn Co. | 116 |
| Te Puke, Tauranga Co. | 331 |
| Te Taraka, Cook Co. | 48 |
| Te Waatu, West Taupo Co. | 65 |
| Thornbury, Wallace Co | 137 |
| Tiniroto, Cook Co. | 82 |
| Tinker's, Vincent Co. | 242 |
| Tinui, Wairarapa North Co. | 193 |
| Tokaanu, East Taupo Co. | 30 |
| Tologa Bay, Cook Co. | 92 |
| Totara, Whangaroa Co. | 177 |
| Try-again Terrace, Grey Co. | 80 |
| Tuakau, Manukau Co. | 404 |
| Tuamarina, Marlborough Co. | 318 |
| Tuapeka Mouth, Tuapeka Co. | 145 |
| Turua, Thames Co. | 131 |
| Upokongaro, Wanganui Co. | 57 |
| Upper Hinds River, Ashburton Co. | 81 |
| Upper Kyeburn, Maniototo Co. | 129 |
| Upper Riccarton, Selwyn Co. | 268 |
| Upper Woodstock, Westland Co | 38 |
| Urenui, Clifton Co. | 132 |
| Waddington, Selwyn Co. | 139 |
| Wade, Waitemata Co. | 268 |
| Waianiwa, Southland Co. | 66 |
| Waiau, Amuri Co. | 162 |
| Waihola, Bruce Co. | 231 |
| Waihou, Piako Co. | 69 |
| Waikaia, Southland Co | 281 |
| Waikaka, Southland Co. | 33 |
| Waikanae, Horowhenua Co. | 56 |
| Waikari, Ashley Co. | 207 |
| Waikoikoi, Clutha Co. | 429 |
| Waikuku, Ashley Co. | 82 |
| Waimate, Bay of Islands Co. | 103 |
| Wainui, Patangata Co. | 45 |
| Waiomio, Bay of Islands Co. | 106 |
| Waiorongomai, Piako Co. | 270 |
| Waiotahi, Whakatane Co. | 44 |
| Waipahi, Clutha Co. | 98 |
| Waipipi, Manukau Co. | 183 |
| Waipiro, Waiapu Co. | 67 |
| Waipori, Tuapeka Co. | 117 |
| Waipu Central, Whangarei Co. | 219 |
| Waipukurau, Waipawa Co. | 559 |
| Waipu North, Whangarei Co. | 226 |
| Wairio, Wallace Co. | 65 |
| Waitahuna, Tuapeka Co. | 256 |
| Waitaki South, Waitaki Co. | 42 |
| Waitekauri, Ohinemuri Co. | 40 |
| Waitotara, Patea Co. | 172 |
| Waiuku, Manukau Co. | 23 |
| Waiwera, Clutha Co. | 65 |
| Wakefield, Waimea Co. | 486 |
| Wallacetown, Southland Co. | 146 |
| Walton, Taieri Co. | 156 |
| Warepa, Clutha Co. | 150 |
| Warkworth, Rodney Co. | 122 |
| Washdyke, Geraldine Co. | 220 |
| Waterton, Ashburton Co. | 209 |
| Weatherstones, Tuapeka Co. | 293 |
| Weber, Patangata Co. | 55 |
| Weedon's, Selwyn Co. | 118 |
| West Eyreton, Ashley Go. | 25 |
| West Clive, Hawke's Bay Co. | 479 |
| Western Spit, Hawke's Bay Co. | 225 |
| West Melton, Selwyn Co. | 249 |
| Weston, Waitaki Co. | 208 |
| West Oxford, Ashley Co. | 139 |
| Whangarata, Manukau Co. | 62 |
| Whangarei, Wnangarei Co. | 746 |
| Whangaroa, Whangaroa Co. | 266 |
| Whakataki, Wairarapa North Co. | 59 |
| Whakatane, Whakatane Co. | 91 |
| Wharekini, Waitaki Co. | 35 |
| Whitcombe, Westland Co. | 39 |
| Whitecliff, Selwyn Co. | 65 |
| Whitmore, Oroua Co. | 63 |
| Wimbledon, Patangata Co. | 95 |
| Winchester, Geraldine Co. | 188 |
| Windsor, Waitaki Co. | 71 |
| Winslow, Ashburton Co. | 100 |
| Woodbury, Geraldine Co. | 261 |
| Woodend, Ashley Co. | 306 |
| Woodend, Southland Co. | 89 |
| Woodfield, Southland Co. | 42 |
| Woodlands, Clutha Co. | 205 |
| Woodlands, Southland Co. | 102 |
| Woodside, Waitemata Co. | 45 |
| Wrey's Bush, Wallace Co. | 80 |
The islands which are not included within the boundaries of the counties had a population of 913 persons (exclusive of Maoris), against 816 in 1886. Only 3 of the islands had a population over 100 persons at last census. The population of the Great Barrier decreased since 1886 from 293 to 262 persons; that of Waiheke shows increase from 146 to 215 persons. Europeans at the Chatham Islands increased from 199 to 258. The names and populations of the islands are,—
| Persons. | M. | F. | |
|---|---|---|---|
| Kawau | 18 | 12 | 6 |
| Mokohinau | 6 | 4 | 2 |
| Motuhora | 2 | 1 | 1 |
| Tiritiri | 5 | 2 | 3 |
| Little Barrier | 2 | 2 | .. |
| Great Barrier | 262 | 156 | 106 |
| Waiheke | 215 | 117 | 98 |
| Bean Rock | 1 | 1 | .. |
| Motuihi | 9 | 7 | 2 |
| Rakino | 11 | 9 | 2 |
| Motutapu | 10 | 8 | 2 |
| Brown's | 1 | 1 | .. |
| Rotoroa | 10 | 7 | 3 |
| Ponui | 31 | 11 | 20 |
| Ponui Lighthouse | 1 | 1 | .. |
| Cuvier | 7 | 4 | 3 |
| Mercury | 10 | 7 | 3 |
| Motiti | 8 | 8 | .. |
| Kapiti | 3 | 3 | .. |
| The Brothers | 3 | 3 | .. |
| Dog Island | 8 | 5 | 3 |
| Centre Island | 13 | 8 | 5 |
| Chatham Islands | 258 | 136 | 122 |
| Kermadec Islands | 19 | 11 | 8 |
The numbers of persons on shipboard at the various ports of the colony were as under. These do not include 1,134 persons, officers and crews of six British men-of-war, and 365 persons, officers and crew of the Austrian war-ship “ Saida.”
| Persons | M. | F. | |
|---|---|---|---|
| Mongonui | 23 | 23 | .. |
| Whangaroa | 10 | 10 | .. |
| Hokianga (Kohukohn) | 5 | 4 | l |
| Bay of Islands (Russell) | 1 | 1 | .. |
| Hobson— | |||
| Aratapu | 14 | 14 | .. |
| Wairoa River | 26 | 26 | .. |
| Whangarei— | |||
| Whangarei | 5 | 5 | .. |
| Parua Bay | 3 | 3 | .. |
| Otamatea (Te Pahi River) | 23 | 28 | .. |
| Rodney (Port Albert) | 12 | 10 | 2 |
| Waitemata (Helensville) | 26 | 26 | .. |
| Auckland | 382 | 367 | 15 |
| Onehunga | 70 | 68 | 2 |
| Manukau (Waiuku) | 2 | 2 | .. |
| Great Barrier Island | 9 | 9 | .. |
| Coromandel | 12 | 12 | .. |
| Thames, Port of | 46 | 44 | 2 |
| Tairua | 14 | 14 | .. |
| Turua and Piako Rivers | 17 | 17 | .. |
| Tauranga | 1 | 1 | .. |
| Gisborne | 14 | 14 | .. |
| Taranaki— | |||
| Waitara | 9 | 9 | .. |
| New Plymouth | 22 | 22 | .. |
| Wanganui | 63 | 62 | l |
| Napier (Port Ahuriri) | 204 | 161 | 43 |
| Wellington | 669 | 614 | 55 |
| Sounds— | |||
| Port Underwood | 7 | 7 | ... |
| Waikawa Bay | 7 | 7 | .. |
| Elmslie's Bay | 2 | 2 | .. |
| Queen Charlotte Sound | |||
| (Onapua Bay) | 1 | 1 | .. |
| Picton | 28 | 24 | 4 |
| Blenheim | 7 | 7 | .. |
| Marlborough (Havelock) | 2 | 2 | .. |
| Kaikoura | 34 | 26 | 8 |
| Collingwood | 15 | 15 | .. |
| Nelson | 58 | 46 | l2 |
| Buller (Little Wanganui) | 2 | 2 | .. |
| Westport | 157 | 152 | 5 |
| Greymouth | 25 | 25 | .. |
| Hokitika | 8 | 8 | .. |
| Lyttelton | 472 | 435 | 37 |
| Akaroa | 2 | 2 | . |
| Timaru | 93 | 90 | 3 |
| Oamaru | 103 | 88 | 15 |
| Port Chalmers | 323 | 291 | 32 |
| Dunedin | 166 | 163 | 3 |
| Queenstown | 7 | 7 | .. |
| Invercargill | 9 | 9 | .. |
| Campbelltown | 77 | 76 | 1 |
| Chatham Islands | 13 | 13 | .. |
| Totals | 3,305 | 3,064 | 241 |
In the preliminary portion of the report (page 4) the method in which the results of the census were used by the Commissioners appointed under the Representation Act to divide the colony into new electoral districts for European representation on a population basis has been described. It only remains to exhibit the results, which, are shown in the following table:—
| Name of Electoral District. | No. of Members. | Actual Population. (Census. 1891.) | Actual Total. (Census, 1891.) | Nominal Pop'n. | |
|---|---|---|---|---|---|
| Town. | Rural. | ||||
| North Island— | |||||
| Bay of Islands | 1 | .. | 8,681 | 8,681 | 11,111 |
| Marsden | 1 | .. | 8,231 | 8,231 | 10,535 |
| Waitemata | 1 | .. | 8,209 | 8,209 | 10,507 |
| Eden | 1 | 2,455 | 6,606 | 9,061 | 10,910 |
| City of Auckland | 3 | 31,082 | 362 | 31,444 | 31,545 |
| Manukau | 1 | 2,994 | 5,998 | 8,992 | 10,671 |
| Parnell | 1 | 3,967 | 5,332 | 9,299 | 10,791 |
| Thames | 1 | 4,664 | 4,583 | 9,247 | 10,530 |
| Franklin | 1 | .. | 8,720 | 8,720 | 11,161 |
| Waikato | 1 | .. | 7,880 | 7,880 | 10,086 |
| Waipa | 1 | .. | 8,240 | 8,240 | 10,547 |
| Bay of Plenty | 1 | .. | 8,283 | 8,283 | 10,602 |
| Waiapu | 1 | 2,172 | 6,578 | 8,750 | 10,591 |
| Hawke's Bay | 1 | 2,303 | 6,487 | 8,790 | 10,606 |
| Napier | 1 | 8,545 | 1,602 | 10,147 | 10,595 |
| Waipawa | 1 | .. | 8,805 | 8,805 | 11,270 |
| Masterton | 1 | 3,114 | 5,912 | 9,026 | 10,681 |
| Wairarapa | 1 | .. | 7,877 | 7,877 | 10,082 |
| New Plymouth | 1 | 3,350 | 5,753 | 9,103 | 10,713 |
| Egmont | 1 | .. | 8,080 | 8,080 | 10,342 |
| Patea | 1 | .. | 7,728 | 7,728 | 9,891 |
| Wanganui | 1 | 5,074 | 4,105 | 9,179 | 10,328 |
| Rangitikei | 1 | .. | 8,769 | 8,769 | 11,224 |
| Palmerston | 1 | 4,303 | 5,150 | 9,453 | 10,895 |
| Otaki | 1 | .. | 8,757 | 8,757 | 11,208 |
| City of Wellington | 3 | 31,690 | .. | 31,690 | 31,690 |
| Suburbs of Wellington | 1 | 2,178 | 6,827 | 9,005 | 10,916 |
| Middle Island— | |||||
| Nelson | 1 | 6,684 | 2,768 | 9,452 | 10,227 |
| Waimea-Sounds | 1 | .. | 7,724 | 7,724 | 9,886 |
| Buller | 1 | 2,779 | 5,604 | 8,383 | 9,952 |
| Inangahua | 1 | .. | 7,843 | 7,843 | 10,039 |
| Grey | 1 | 6,043 | 3,247 | 9,290 | 10,199 |
| Westland | 1 | 2,186 | 7,029 | 9,215 | 11,183 |
| Wairau | 1 | 3,301 | 5,591 | 8,892 | 10,457 |
| Ashley | 1 | .. | 8,390 | 8,390 | 10,739 |
| Kaiapoi | 1 | .. | 8,562 | 8,562 | 10,959 |
| Avon | 1 | 4,580 | 4,881 | 9,461 | 10,827 |
| Riccarton | 1 | .. | 8,665 | 8,665 | 11,091 |
| City of Christchurch | 3 | 31,150 | 304 | 31,454 | 31,539 |
| Lyttelton | 1 | 4,559 | 5,219 | 9,778 | 11,239 |
| Ellesmere | 1 | .. | 8,794 | 8,794 | 11,256 |
| Selwyn | 1 | .. | 8,160 | 8,160 | 10,444 |
| Ashburton | 1 | .. | 8,599 | 8,599 | 11,006 |
| Rangitata | 1 | .. | 7,060 | 7,060 | 9,804 |
| Pareora | 1 | .. | 7,728 | 7,728 | 9,891 |
| Timaru | 1 | 3,761 | 5,238 | 8,999 | 10,465 |
| Waitaki | 1 | .. | 7,788 | 7,788 | 9,971 |
| Oamaru | 1 | 5,724 | 3,695 | 9,419 | 10,453 |
| Waihemo | 1 | .. | 7,742 | 7,742 | 9,909 |
| Waikouaiti | 1 | .. | 7,820 | 7,820 | 10,009 |
| Port Chalmers | 1 | 6,848 | 2,945 | 9,793 | 10,617 |
| City of Dunedin | 3 | 30,004 | 1,153 | 31,157 | 31,479 |
| Caversham | 1 | 7,658 | 2,102 | 9,760 | 10,348 |
| Taieri | 1 | .. | 7,781 | 7,781 | 9,959 |
| Bruce | 1 | .. | 7,667 | 7,667 | 9,813 |
| Clutha | 1 | .. | 8,696 | 8,696 | 11,130 |
| Tuapeka | 1 | .. | 7,607 | 7,607 | 9,813 |
| Wakatipu | 1 | .. | 8,808 | 8,508 | 10,890 |
| Mataura | 1 | .. | 8,623 | 8,623 | 11,037 |
| Awarua | 1 | .. | 8,168 | 8,168 | 10,455 |
| Invercargill | 1 | 4,959 | 4,093 | 9,052 | 10,198 |
| Wallace | 1 | .. | 8,223 | 8,223 | 10,525 |
The North Island and adjacent islands includes 27 electoral districts, having 31 members and an actual population of 281,446 persons. The Middle and Stewart Islands has 35 electoral districts, 39 members, and 344,913 persons actual population.
The names and boundaries of these districts are duly proclaimed in the Gazette, and the report of the Commissioners has the force of law from the date of such Proclamation, but does not come into effect until the expiry of the existing Parliament. A table showing the population of the electoral districts (now in use) as at the date of the census, with the number of electors on the roll in 1890 and votes recorded at the general election held in that year, will be found on page 28 of the census volume.
These 62 districts with 70 members are for purposes of European representation. The House of Representatives consists, however, of 74 members, 4 of whom represent Maori constituencies, under the Maori Representation Acts of 1867. 1872, and 1876, of which, the Native population was ascertained by the Maori census of February, 1891, to be as under:—
| Electoral Districts. | Maori Population (Census, 1891). |
|---|---|
| North Island— | Persons. |
| Northern Maori | 8,970 |
| Eastern Maori | 14,440 |
| Western Maori | 16,365 |
| Middle Island— | |
| Southern Maori | 2,218 |
| 41,993 |
No less than 7,086 Maoris out of the above number voted at the election in October, 1890.
The number of the population gave an average of 6.024 persons to the square mile, an increase of 0.463 to the square mile on the proportion in 1886. The population in boroughs amounted to 270,343, being an average of 1,353.6 to every square mile of borough area. But some of the boroughs are of considerable size, embracing a mining or farming population. The most thickly peopled of the boroughs was Wellington, with 28.2 persons to the acre, or at the rate of 18,048 to the square mile. The population outside boroughs (exclusive of 3,305 persons on shipboard) amounted to 353,010, which gives an average of 3.40 to the square mile of country outside borough boundaries. In 1886 the similar average was 3.16.
There were 119,766 inhabited dwellings in April, 1891, besides 4,085 tents and dwellings with canvas roofs in occupation. Including the latter among the dwellings, the average number of persons to each dwelling was 5.06. This was a smaller proportion than in 1886 or 1881, but greater than in the previous census-years. The proportion of persons to a dwelling for each of the 7 past census-years is stated below:—
| Years | ||||||
|---|---|---|---|---|---|---|
| 1867. | 1871. | 1874. | 1878. | 1881. | 1886. | 1891. |
| 4.05 | 4.48 | 4.88 | 5.02 | 5.12 | 5.17 | 5.06 |
The increase in dwellings between the census-dates of 1886 and 1891 was 11,880, or at the rate of 10.6 per cent: This was a higher rate than that of the increase of population, which was only 8.33 per cent. The increase in number is almost entirely of houses having more than two rooms, for, although there is an increase of 1,271 in the one-room houses, including tents, there is a decrease of 1,080 in the number of houses having only two rooms. The greatest increase in any class of house was 5,650 in that having five and six rooms. The improvement in the average character of dwellings is apparent from the following table:—
| Number of Dwellings containing | ||||||
|---|---|---|---|---|---|---|
| Years. | One Room, including Tents. | Two Rooms. | Three and Four Rooms. | Five and Six Rooms. | More than Six Rooms. | No. of Rooms unstated. |
| 1878 | 9,703 | 14,331 | 29,223 | 15,258 | 12,358 | 1,715 |
| 1881 | 10,077 | 14,758 | 35,064 | 19,338 | 15,344 | 1,169 |
| 1886 | 10,257 | 12,110 | 40,090 | 27,218 | 21,037 | 1,259 |
| 1891 | 11,528 | 11,030 | 41,934 | 32,868 | 24,968 | 1,523 |
| Increase (+) or Decrease (−). | ||||||
|---|---|---|---|---|---|---|
| 1878 to 1881 | +374 | +427 | +5,841 | +4,080 | +2,986 | −546 |
| 1881 to 1886 | +180 | −2,648 | +5,026 | +7,880 | +5,693 | +90 |
| 1886 to l891 | +1,271 | −1,080 | +1,844 | +5,650 | +3,931 | +264 |
The increase of houses was greater in proportion to the increase of population, although less numerically, in the period 1886 to 1891 than in either of the two preceding census-intervals. In the three years' interval 1878 to 1881 the increase in the number of inhabited dwelling-houses was 13,162; the increase of population was 75,521, in the proportion of 5.74 persons to each additional house. In the period 1881 to 1886 the dwellings were more numerous by 16,221, the population by 88,549, a proportion of 5.46 persons to every new house. In the period 1886 to 1891 the increase in the number of houses was 11,880, with an increase of population amounting to 48,176, or 4.06 persons to each new dwelling. From this it follows that the average number of persons living in each dwelling was smaller in 1891 than at the two previous census-periods, as shown also by the statement previously given of the proportion of persons to a dwelling; and, as the increase in number of dwellings was chiefly in those of five and more rooms, it follows that the average dwelling is larger and that the population are better housed.
Of the four principal boroughs, Wellington had the largest proportion of persons to every inhabited dwelling. The next statement shows the proportion at each of the last three censuses, and exhibits the decrease that has taken place in the density of population per house:—
| Borough | Average Number of Persons to every Inhabited Dwelling. | ||
|---|---|---|---|
| 1881. | 1886. | 1891. | |
| Auckland | 5.29 | 5.36 | 5.09 |
| Wellington | 5.43 | 5.71 | 5.50 |
| Christchurch | 5.69 | 5.55 | 5.41 |
| Dunedin | 5.53 | 5.36 | 5.11 |
There was an increase since 1886 of 492 in the inhabited dwellings built of brick, stone, or concrete, the total numbers of such houses being 4,749 and 5,241; but the proportion to the full number of dwellings was the same in each year—4.38 per cent. If the number of dwellings of the same materials that were uninhabited or in course of erection when the census was taken be included, the numbers would be 5,252 in 1886, and 5,697 in 1891, an increase of 445. The following are the proportions of the population (exclusive of Chinese and Maoris) who resided in the class of buildings stated at the last four census-periods:—
| Percentage of population— | 1878. | 1881. | 1886. | 1891 |
|---|---|---|---|---|
| In houses of best material | 92.05 | 92.92 | 95.14 | 95.83 |
| In cob or sod houses, raupo, huts, &c. | 5.83 | 5.25 | 2.87 | 2.55 |
| In tents or dwellings with canvas roofs | 1.36 | 1.22 | 1.13 | 1.08 |
| On shipboard | 0.73 | 0.59 | 0.82 | 0.52 |
| Camping out | 0.03 | 0.02 | 0.04 | 0.02 |
The number of empty dwelling-houses in 1891 was 9,558, against 9,146 in 1886, and 6,737 in 1881. The increase in the number of the uninhabited dwellings is not due to a greater crowding of the population in the inhabited dwellings, as the average number to each dwelling was less in 1891 than in the previous years. It is clear that the number built has been somewhat in excess of requirements. This apparently has been realised, as there were only 425 dwellings in course of erection in 1891 against 834 in 1886.
The succeeding statement gives the number of inhabited and uninhabited dwellings at each of the four past census-dates:—
| Years. | Inhabited Dwelling, including Tents. | Uninhabited Dwelling | * Proportion of Dwellings of both Classes to 100 of Population. | Average Number of Persons to Inhabited Dwelling. | Number of Dwelling-houses being built. |
|---|---|---|---|---|---|
| * The population on board ship is excluded from the numbers used. | |||||
| 1878 | 82,588 | 5,292 | 21.36 | 5.02 | 497 |
| 1881 | 95,750 | 6,737 | 21.04 | 5.12 | 848 |
| 1886 | 111,971 | 9,146 | 21.11 | 5.17 | 834 |
| 1891 | 123,851 | 9,558 | 21.40 | 5.06 | 425 |
Here the comparison of the figures for 1886 and 1891 shows a large decrease, the greatest portion of which was in the number in the Auckland Provincial District, while in 1886 more than half of the houses being built were situated in that district. The numbers of houses in course of erection and uninhabited at each of the three last census-periods in each of the provincial districts are shown:—
| Provincial District. | Dwelling-houses being built. | Dwelling-houses uninhabited. | Proportion of Dwellings being built to every 100 uninhabited. | ||||
|---|---|---|---|---|---|---|---|
| 1881. | 1886. | 1891. | 1881. | 1886. | 1891. | 1891. | |
| Auckland | 359 | 463 | 107 | 1,260 | 2,196 | 2,505 | 4.27 |
| Taranaki | 32 | 9 | 11 | 172 | 339 | 261 | 4.21 |
| Hawke's Bay | 20 | 62 | 19 | 184 | 273 | 450 | 4.22 |
| Wellington | 67 | 81 | 112 | 1,069 | 872 | 1,125 | 9.96 |
| Marlborough | 12 | 15 | 7 | 100 | 151 | 103 | 6.80 |
| Nelson | 36 | 48 | 31 | 444 | 494 | 611 | 5.07 |
| Westland | 9 | 12 | 7 | 458 | 339 | 487 | 1.44 |
| Canterbury | 154 | 57 | 49 | 1,391 | 2,096 | 1,843 | 2.66 |
| Otago | 159 | 87 | 82 | 1,659 | 2,383 | 2,173 | 3.77 |
| Totals | 848 | 834 | 425 | 6,737 | 9,143 | 9,558 | 4.45 |
Table of Contents
OF 626,658 persons, excluding Maoris, 612,064, or 97.67 per cent., were held to be British subjects, and 14,594, or 2.33 per cent., foreign subjects. The British subjects include all persons born in British possessions, naturalised British subjects, British subjects born abroad, with such persons born at sea as had British names, and those having British names whose birthplaces were not specified. In 1886 the British subjects were 96.91 per cent., and foreign subjects 3.09 per cent., so that the foreign element in the population has diminished in the five years 1886–91.
Comparing the British and foreign subjects for the different provincial districts, it is found that the highest proportion of foreigners is in Westland (9.57 per cent.); Hawke's Bay has the next highest proportion (3.96 per cent.), while Canterbury had only 1.15 per cent. and Marlborough 0.99 per cent. of foreigners. The number of persons whose birthplaces were not specified in the census schedules amounted to 1,017, against 2,029 in 1886.
Of the population enumerated, 366,716 persons, excluding Maoris, were born in New Zealand. This is an increase of 66,526 persons on the number in 1886. The New-Zealand-born comprised 58.61 per cent. of the total population, the proportion in 1886 having been 51.89 per cent. While the New-Zealand-born increased, the proportion to the whole population in case of those born in the mother-country, in Australia, in other British possessions, and in foreign countries, all declined between 1886 and 1891. The proportions are given further on. The males born in the colony numbered 183,601, or somewhat more than the females, who numbered 183,115; but the New-Zealand-born males nevertheless comprise only 55.26 per cent. of the total male population, whereas the New-Zealand-born females comprise 62.40 per cent. of the total female population.
The number of persons in the colony in April, 1891, who were born in the United Kingdom was 218,834, amounting to 34.97 per cent. of the population. This was a decrease of 15,022 on the number and of 5.46 in the percentage since the census of 1886. The number in the colony born in England was 117,070 persons, being less than in 1886 by 8,587; the number born in Scotland was 51,916, a decrease of 2,894; and the number born in Ireland was 47,634, a decrease of 3,774 since 1886. There was an increase in the number of those born in Wales from 1,981 in 1886 to 2,214 in 1891. The proportion of females to males of Irish birth was greater than that found among those born in other parts of the United Kingdom. The following were the respective proportions of either sex in every 100 of the population of the colony born in each country of the United Kingdom:—
| 1886. | 1891. | |||
|---|---|---|---|---|
| Birthplace | Males. | Females. | Males. | Females. |
| England | 57.61 | 42.39 | 56.90 | 43.10 |
| Wales | 61.59 | 38.41 | 59.67 | 40.33 |
| Scotland | 57.93 | 42.07 | 57.36 | 42.64 |
| Ireland | 54.33 | 45.67 | 53.88 | 46.12 |
In respect of persons of each nationality the males born outside the colony are more numerous than the females, except in two instances; these are—persons born in the Australian Colonies, the males being 7,677 and the females 8,266; and persons born in Africa, males 90 and females 93. The Australian-born decreased in number since 1886 by 1,302—viz., from 17,245 to 15,943; the German-born decreased from 5,007 to 4,663, and the Danes, Swedes, and Norwegians from 4,955 to 4,755. The number born in British North America decreased from 1,656 to 1,447, and the number born in the United States and other parts of America from 1,771 to 1,683. The number of persons born in China decreased from 4,550 in 1886 to 4,470 in 1891: this last number is in excess of the number of persons of the Chinese race in the colony by 26. The number (4,444) of Chinese taken in the census includes the children born in the colony of Chinese parents.
The following were the numbers of persons according to the different principal places of birth in 1891, and the proportions per cent. in 1886 and 1891:—
| Born in | Persons. 1891. | 1886. Per Cent. | 1891. Per Cent. |
|---|---|---|---|
| New Zealand | 366,716 | 51.89 | 58.61 |
| England | 117,070 | 21.72 | 18.71 |
| Scotland | 51,916 | 9.48 | 8.30 |
| Ireland | 47,634 | 8.89 | 7.61 |
| Wales | 2,214 | 0.34 | 0.35 |
| Australia and Tasmania | 15,943 | 2.98 | 2.55 |
| Other British, possessions | 3,703 | 0.68 | 0.59 |
| Denmark, Sweden, and Norway | 4,755 | 0.86 | 0.77 |
| Germany | 4,663 | 0.87 | 0.75 |
| China | 4,470 | 0.79 | 0.71 |
| Other countries and at sea | 6,557 | 1.50 | 1.05 |
| Unspecified | 1,017 | .. | .. |
| Totals | 626,658 | 100.00 | 100.00 |
The persons returned as born in the United States amounted to 667, or 0.11 per cent., against a percentage in 1886 of 0.12; but the number, and consequently rates calculated thereon, cannot be accepted as correct, for doubtless many returned as born in America or North America were born in the States. For a similar reason the number (1,447) stated as born in British North America cannot be accepted as representing the full number born there, the term “North America” only having been probably used in many cases.
The figures, as brought out by the returns, are—
| British North America | 1,447 persons. |
| America or North America (so returned) | 1,016 persons |
| United States of America | 667 persons |
Table of Contents
Table of Contents
THE number of persons who objected to state their religious belief fell from 19,889, or 3.44 per cent., of the people in 1886, to 15,342, or 2.45 per cent., in 1891. The “unspecified,” those who, without objecting in terms, simply left the column for religion blank, amounted in the latter year to 1,288, as against 2,869 in the former. Thus, with a population more numerous by 48,176 persons, the number from whom the census inquiries failed to elicit any definite answer on this point in 1891 was smaller by 6,128, the sum-total of those whose religious belief was unascertained being 16,630 in 1891, as against 22,758 in 1886.
The subjoined table gives a summary of the results, of the census of 1891 as to the religions of the people, with the proportion of each denomination to the whole population at that and each of the three previous censuses:—
| Denominations. | Number of Adherents in 1891. | Proportions per Cent, of Population. | |||
|---|---|---|---|---|---|
| * In calculating the proportions for 1891 the “Unspecified” have not been taken into account | |||||
| 1878. | 1881. | 1886. | 1891. | ||
| Church of England, and Protestants (undefined) | 253,331 | 42.55 | 41.50 | 40.17 | 40.51 |
| Presbyterians | 141,477 | 22.95 | 23.08 | 22.59 | 22.62 |
| Wesleyan Methodists | 53,061 | 7.79 | 8.07 | 7.81 | 8.49 |
| Other Methodists | 10,354 | 1.35 | 1.46 | 1.74 | 1.65 |
| Baptists | 14,825 | 2.21 | 2.34 | 2.48 | 2.37 |
| Congregational Independents | 6,685 | 1.34 | 1.38 | 1.35 | 1.07 |
| Lutherans | 5,616 | 1.36 | 1.18 | 1.02 | 0.90 |
| Salvation Army | 9,383 | . | . | 0.91 | 1.50 |
| Society of Friends | 315 | 0.04 | 0.05 | 0.05 | 0.05 |
| Unitarians | 308 | 0.11 | 0.10 | 0.08 | 0.05 |
| Other Protestants | 11,295 | 1.08 | 1.26 | 1.55 | 1.82 |
| Roman Catholics, and Catholics (undefined) | 87,272 | 14.21 | 14.08 | 13.94 | 13.96 |
| Greek Church | 56 | 0.O2 | 00.1 | 0.01 | 0.01 |
| Hebrews | 1,463 | 0.34 | 0.31 | 0.27 | 0.23 |
| Buddhists, Confucians | 3,928 | 1.05 | 1.01 | 0.77 | 0.63 |
| Other denominations | 849 | 0.05 | O.11 | 0.10 | 0.12 |
| No denomination | 8,252 | 0.53 | 0.89 | 1.05 | 1.32 |
| No religion | 1,558 | 0.05 | 0.06 | 0.17 | 0.25 |
| Unspecified | 1,288 | 0.42 | 0.27 | 0.50 | * |
| Object to state | 15,342 | 2.55 | 2.85 | 3.44 | 2.45 |
| Totals | 626,658 | 100.00 | 100.00 | 100.00 | 100.00 |
Omitting those who objected to state their religious belief, it is found that the number returned as belonging to the various Protestant sects amounted to 506,650 persons, or 81.03 per cent. of the total specified. If those who objected be classed with the Protestants, the proportion of 81.03 per cent. previously given would be raised to 83.48. Roman Catholics, and “Catholics (undefined),” numbered 87,272, or 13.96 per cent. of the people, as against 80,667, or 13.94 per cent., in 1886. In 1867 they were 30,413, or 13.91 per cent. of the then population. The highest proportion reached by them at any census was 14.21 per cent.(March, 1878) Since the year 1867 the colony has nearly trebled its European inhabitants, but throughout that period the proportion of Roman Catholics to the total number of the population has hardly varied. This seems noteworthy, considering the degree of independence of thought and impatience of authority existing in the colony. The figures above given tend to prove that Catholicism is maintained. 253,331 persons, or 40.51 per cent. of the people, belonged to the Church of England; but this proportion is less than that which obtained in 1878, when the rate stood at 42.55 per cent. Presbyterians came next in numerical order with a strength of 141,477 adherents, the proportion being 22.62 per cent. of the whole population; but here again comparison with 1878 showed a slight fall from 22.95 per cent. in that year. Wesleyan and other Methodists numbered 63,415, or 10.14 per cent.: here there is an increase since 1878, when the proportion was 9.14 per cent. Of the total Methodists, 53,061 were Wesleyans, 2,071 Methodists not more specifically defined, 5,220 Primitive Methodists, 1,905 belonged to the United Methodist Free Churches, 1,069 were Bible Christians, and 89 otherwise described. Baptists (14,825 persons) were 2.37 per cent., and have maintained their position since 1878, when the proportion was 2.21 per cent. Congregational Independents, however, were only 6,685 persons, and the decrease since 1878 is 0.27 per cent. Lutherans, of whom there were 5,616, are also in a falling proportion to the whole, as indeed might be expected owing to the death of the older members of this denomination, who arrived here as immigrants. It is the Salvation Army that shows the largest development: the figures for 1886 were 5,276, and in 1891 9,383 persons. This denomination now forms 1.50 per cent. of the population. Unitarians number only 308 persons, and the Society of Friends 315. Under “Other Protestants” are grouped 5,241 persons belonging to the Church of Christ, 3,537 Brethren, 700 Christadelphians, 415 Seventh-day Adventists, 325 Students of Truth, 193 Believers in Christ, 178 Swedenborgians, and 706 of other denominations in small numbers. The Catholic Apostolic Church had 150 adherents, the Greek Church 56. Hebrews, who were 0.34 per cent. of the whole in 1878, are now 0.23 per cent., the number being 1,463. Buddhists, Confucians (Chinese chiefly), have fallen since 1878 from 1.05 per cent. to 0'63 percent. There were 206 Mormons or Latterday Saints, and 339 Spiritualists. The number shown under the head of “No denomination” (8,252) includes 4,475 Freethinkers. In 1886 the number stated was 3,925, and in 1881 2,422 persons. The increase between 1886 and 1891 was at the rate of 14.01 per cent; but between 1881 and 1886 the increase was 62.06 per cent., the progress not having been nearly so rapid during the last quinquennium. Agnostics in 1891 numbered 322 persons, Deists and Theists 51. 405 persons entered “Doubtful,” and 2,999 were of no denomination. Amongst 1,558 persons of “No religion” are observed 123 Atheists and 65 Secularists.
The increase or decrease since 1886 in certain denominations is given below:—
| Denomination. | Persons. March, 1886. | Persons. March, 1891. | Increase from 1886 to 1891. | |
|---|---|---|---|---|
| Numerical | Centesimal. | |||
| Church of England, and Protestants not otherwise defined | 232,369- | 253,331 | 20,962 | 9.02 |
| Presbyterians | 130,643 | 141,477 | 10,834 | 8.29 |
| Methodists, &c. | 55,292 | 63,415 | 8,123 | 14.69 |
| Baptists | 14,357 | 14,825 | 468 | 3.26 |
| Congregational Independents | 7,787 | 6,685 | −1,102 | −14.15 |
| Lutherans | 5,917 | 5,616 | −301 | −5.09 |
| Unitarians | 466 | 308 | −158 | −33.91 |
| Society of Friends | 282 | 315 | 33 | 11.70 |
| Roman Catholics, and Catholics undefined | 80,667 | 87,272 | 6,605 | 8.19 |
| Hebrews | 1,559 | 1,463 | −96 | −6.16 |
| Buddhists, Confucians | 4,472 | 3,928 | −544 | −12.16 |
| Otherwise described | 21,913 | 31,393 | 9,480 | 43.26 |
| Undescribed | 2,869 | 1,288 | −1,581 | −55.11 |
| Object to state | 19,889 | 15,342 | −4,547 | −22.86 |
| Totals | 578,482 | 626,658 | 48,176 | 8.33 |
The proportions of the sexes show that amongst persons of the Church of England, Presbyterian, and Roman Catholic denominations the males were in excess of the females; but amongst Methodists, Congregational Independents, Baptists, Church of Christ, and the Brethren the females exceed the males. Amongst the Seventh-day Adventists only 40 per cent. were males to 60 per cent. of females. Amongst those classed as of “No denomination,” “No religion,” and “Object to state,” the male element predominated greatly. The figures for these three last groups are given:—
| Proportion of the Sexes. | ||
|---|---|---|
| Males. | Females. | |
| Freethinkers | 75.62 | 24.38 |
| Agnostics | 68.63 | 31.37 |
| Deists, Theists | 78.43 | 21.57 |
| Doubtful | 60.00 | 40.00 |
| No denomination | 60.82 | 39.18 |
| No religion | 74.13 | 25.87 |
| Object to state | 62.98 | 37.02 |
Table of Contents
Table of Contents
OUT of a total population of 626,658 persons, only 968 were unspecified as to age. On comparing the population specified as to age returned in 1891 with that in 1886, it was found that the number under five years of age had decreased 4.17 per cent. At all previous census-periods an increase had been observed; but when it is borne in mind that the birth-rate fell regularly year by year from 34.35 in 1885 to 29.01 per 1,000 living in 1891, and that the actual number of births registered fell from 19,693 in 1885 to 18,273 in 1891, the results of the 1891 census are found to be just what might be expected. The number living under one year was 16,443 by the census; and the number of births in 1890, less the deaths of infants, was 16,840, thus nearly approximating to the census figures for those living under one year of age. At all other periods of age and on each sex the census of 1891 shows an increase when compared with 1886; but the increase in the males at the period 21.40 (a most valuable period for supporting the dependent population) is found to be only 2.96 per cent., and at the period 40.55 only 1.42 per cent., the increase at all ages being 6'62 per cent. on the males. The figures to which the above remarks refer are shown in the following table:—
| Ages. | Census. | Increase or Decrease, 1886 to 1891. | ||
|---|---|---|---|---|
| 1886. | 1891. | Numerical. | Centesimal. | |
| Under 5 years | 86,828 | 83,204 | D.3,624 | D.4.17 |
| 5 years and under 10 years | 84,315 | 86,080 | 1,765 | 2.09 |
| 10 years and under 15 years | 67,385 | 81,084 | 13,699 | 20.33 |
| 15 years and under 21 years | 69,581 | 77,808 | 8,227 | 11.82 |
| 21 years and under 40 years | 155,492 | 167,181 | 11,689 | 7.52 |
| 40 years and under 55 years | 81,721 | 86,743 | 5,022 | 6.15 |
| 55 years and under 65 years | 20,436 | 29,248 | 8,812 | 43.12 |
| 65 years and upwards | 10,433 | 14,342 | 3,909 | 37.47 |
| Unspecified | 2,291 | 968 | D.1,323 | D. 57.75 |
| All ages | 578,482 | 626,658 | 48,176 | 8.33 |
| Ages. | Census. | Increase or Decrease, 1886 to 1891. | ||
|---|---|---|---|---|
| 1886. | 1891. | Numerical. | Centesimal. | |
| Under 5 years | 43,820 | 42,259 | D. 1,561 | D. 3.56 |
| 5 years and under 10 years | 42,524 | 43,494 | 970 | 2.28 |
| 10 years and under 15 years | 34,065 | 40,755 | 6,690 | 19.64 |
| 15 years and under 21 years | 34,309 | 38,577 | 4,268 | 12.44 |
| 21 years and under 40 years | 86,028 | 88,577 | 2,549 | 2.96 |
| 40 years and under 55 years | 50,830 | 51,553 | 723 | 1.42 |
| 55 years and under 65 years | 12,857 | 18,660 | 5,773 | 44.90 |
| 65 years and upwards | 6,003 | 8,836 | 2,333 | 38.86 |
| Unspecified | 1,785 | 696 | D. 1,089 | D. 61.01 |
| All ages | 312,221 | 332,877 | 20,656 | 6.62 |
| Ages. | Census. | Increase or Decrease, 1886 to 1891. | ||
|---|---|---|---|---|
| 1886. | 1891. | Numerical. | Centesimal. | |
| Under 5 years | 43,008 | 40,945 | D. 2,063 | D. 4.80 |
| 5 years and under 10 years | 41,791 | 42,586 | 795 | 1.90 |
| 10 years and under 15 years | 33,320 | 40,329 | 7,009 | 21.04 |
| 15 years and under 21 years | 35,272 | 39,231 | 3,959 | 11.22 |
| 21 years and under 40 years | 69,464 | 78,604 | 9,140 | 13.16 |
| 40 years and under 55 years | 30,891 | 35,190 | 4,299 | 13.92 |
| 55 years and under 65 years | 7,579 | 10,618 | 3,039 | 40.10 |
| 65 and upwards | 4,430 | 6,006 | 1,576 | 35.58 |
| Unspecified | 506 | 272 | D. 234 | D. 46.25 |
| All ages | 266,261 | 293,781 | 27,520 | 10.34 |
In the portion of this report under the heading “Population” it has been pointed out that, had there been neither arrivals in nor departures from the colony in the period between the census of 1886 and that of 1891, the population would have amounted to 642,604 persons, the loss by excess of departures over arrivals having reduced it to 626,658. This condition of things during the quinquennium intervening between the two censuses, coupled with the fact of the continually-falling birth-rate alluded to previously, has had the effect of disturbing the comparatively regular progression of numbers hitherto shown, with small exceptions, at previous censuses in the table of persons living at each period of age (see page 37), so far as refers to the population under 15 years. These figures, instead of diminishing with each successive year of age, now have no order at all. There are only 16,443 infants under 1 year of age, but no less than 17,263 children at 2–3 years, and a further increase to 17,619 at 3–4 years. Again, at 10–11 years the figures rise to 17,426 from 16,601 at 9 to 10 years. The infants have always, previously to 1891, been in excess of the numbers at the higher ages, but there are no longer sufficient to keep up the numbers that will pass on to the ages beyond, and it would seem certain that the numbers living of children over 1 year will soon be fewer than in 1891. Not only has the birthrate declined, but there is actual numerical decrease of births in spite of increasing population, of which the following figures afford evidence:—
| Year. | No. of Births. | Proportion per 1,000 of Mean Population. |
|---|---|---|
| 1884 | 19,846 | 35.91 |
| 1885 | 19,693 | 34.35 |
| 1886 | 19,299 | 33.15 |
| 1887 | 19,135 | 32.09 |
| 1888 | 18,902 | 31.22 |
| 1889 | 18,457 | 30.12 |
| 1890 | 18,278 | 29.41 |
| 1891 | 18,273 | 29.01 |
Again referring to the population at the ages which mark the most important periods of life, the results are found to show that, whereas the proportion of children under 5 years was in 1871 as high as 18.19 per cent. of the total at all ages, the proportion had fallen in twenty years to 13.30 per cent. in 1891; but those at 5 to 15 (the school-going age) rose in proportion from 21.39 per cent. to 26.72 per cent. At 21 to 40 a fall from 38.15 per cent. to 26.72 per cent. is observed.
| Census, 1871. | Census, 1891. | |||||
|---|---|---|---|---|---|---|
| Persons | Males. | Females. | Persons | Males. | Females | |
| Under 5 years | 18.19 | 15.56 | 21.90 | 13.30 | 12.72 | 13.95 |
| 5 and under 15 years. | 21.39 | 18.53 | 25.43 | 26.72 | 25.36 | 28.25 |
| 15 and under 21 years. | 7.88 | 6.75 | 9.48 | 12.44 | 11.61 | 13.37 |
| 21 and under 40 years. | 38.15 | 43.02 | 31.26 | 26.72 | 26.67 | 26.78 |
| 40 and under 55 years. | 10.87 | 12.49 | 8.58 | 13.86 | 15.52 | 11.99 |
| 55 and under 65 years. | 2.44 | 2.54 | 2.31 | 4.67 | 5.61 | 3.62 |
| 65 and upwards | 1.08 | 1.11 | 1.04 | 2.29 | 2.51 | 2.04 |
| 100.00 | 100.00 | 100.00 | 100.00 | 100.00 | 100.00 | |
The numbers and proportions per cent. of the, legally speaking, “infant” population and the adults, are next given for 1871, 1886, and 1891 in respect of each sex:—
| Year. | Males. | Females. | |||
|---|---|---|---|---|---|
| Number. | Proportion per Cent. | Number. | Proportion per Cent. | ||
| 1871. | Under 21 years | 61,324 | 40.84 | 60,213 | 56.81 |
| Over 21 years | 89,032 | 59.16 | 45,824 | 43.19 | |
| Totals | 150,356 | 100.00 | 106,037 | 100.00 | |
| 1886. | Under 21 years | 154,718 | 49.84 | 153,391 | 57.72 |
| Over 21 years | 157,503 | 50.16 | 112,870 | 42.28 | |
| Totals | 312,221 | 100.00 | 266,261 | 100.00 | |
| 1891. | Under 21 years | 165,115 | 49.60 | 163,127 | 55.53 |
| Over 21 years | 167,762 | 50.40 | 130,654 | 44.47 | |
| Totals | 332,877 | 100.00 | 293,781 | 100.00 | |
Here the adult males, considered in proportion to minors, have fallen from 59.16 per cent. of population to 50.40 since 1871; but nevertheless the adults are in slightly higher proportion in 1891 than in 1886. The adult female population rose in proportion to the minors from 43.19 per cent. in 1871 to 44.47 per cent. in 1891, giving a result the reverse of that arrived at in case of the males.
The numbers of persons and of each sex have been tabulated and published in the detailed tables of the census volume according to single ages up to 21 years, then for the period 21–25 years, after that in quinquennial periods up to 85 years, and onwards in single ages. This has been done in conformity with the resolutions of the Census Conference; but the tendency well known to exist towards putting on ages in certain cases, and in others towards making people out to be younger than they really are, has no doubt militated against the correctness of the figures in the tables. While the numbers given for single ages or even quinquennial periods can hardly be correct, a grouping of the same into decennial periods, arranged so as to have the year which is an exact multiple of 10 in the middle, would probably absorb the errors, and give a fairly accurate result.
An abstract from the detailed tables is given, showing the numbers living at each age-period, and with it a statement of the population at and above, and under, each stated age:—
| Ages. | Population (exclusive of Maoris). | ||||||||
|---|---|---|---|---|---|---|---|---|---|
| Inclusive of Chinese. | Chinese. | Exclusive of Chinese. | |||||||
| Persons. | M. | F. | Persons. | M. | F. | Persons. | M. | F. | |
| All ages | 626,658 | 332,877 | 293,781 | 4,444 | 4,426 | 18 | 622,214 | 328,451 | 293,763 |
| Specified ages | 625,690 | 332,181 | 293,509 | 4,399 | 4,381 | 18 | 621,291 | 327,800 | 293,491 |
| Under 1 year | 16,443 | 8,386 | 8,057 | 3 | 1 | 2 | 16,440 | 8,385 | 8,055 |
| 1 year and under 2 years | 14,831 | 7,536 | 7,295 | 2 | 1 | 1 | 14,829 | 7,535 | 7,294 |
| 2 year and under 3 years | 17,263 | 8,780 | 8,483 | 2 | 1 | 1 | 17,261 | 8,779 | 8,482 |
| 3 year and under 4 years | 17,619 | 8,892 | 8,727 | 3 | 1 | 2 | 17,616 | 8,891 | 8,725 |
| 4 year and under 5 years | 17,048 | 8,665 | 8,383 | 2 | 1 | 1 | 17,046 | 8,664 | 8,382 |
| 5 year and under 6 years | 17,425 | 8,787 | 8,638 | … | … | … | 17,425 | 8,787 | 8,638 |
| 6 year and under 7 years | 17,533 | 8,793 | 8,740 | 1 | … | 1 | 17,532 | 8,793 | 8,739 |
| 7 year and under 8 years | 17,401 | 8,827 | 8,574 | 1 | 1 | … | 17,400 | 8,826 | 8,574 |
| 8 year and under 9 years | 17,120 | 8,736 | 8,384 | 1 | 1 | … | 17,119 | 8,735 | 8,384 |
| 9 year and under 10 years | 16,601 | 8,351 | 8,250 | … | … | … | 16,601 | 8,351 | 8,250 |
| 10 year and under 11 years | 17,426 | 8,802 | 8,624 | … | … | … | 17,426 | 8,802 | 8,624 |
| 11 year and under 12 years | 15,960 | 7,945 | 8,015 | … | … | … | 15,960 | 7,945 | 8,015 |
| 12 year and under 13 years | 16,527 | 8,297 | 8,230 | … | … | … | 16,527 | 8,297 | 8,230 |
| 13 year and under 14 years | 15,506 | 7,826 | 7,680 | 3 | 3 | … | 15,503 | 7,823 | 7,680 |
| 14 year and under 15 years | 15,665 | 7,885 | 7,780 | 1 | 1 | … | 15,664 | 7,884 | 7,780 |
| 15 year and under 16 years | 14,133 | 7,202 | 6,931 | 2 | 1 | 1 | 14,131 | 7,201 | 6,930 |
| 16 year and under 17 years | 13,545 | 6,728 | 6,817 | 2 | 2 | … | 13,543 | 6,726 | 6,817 |
| 17 year and under 18 years | 12,653 | 6,301 | 6,352 | 4 | 4 | … | 12,649 | 6,297 | 6,352 |
| 18 year and under 19 years | 12,429 | 6,149 | 6,280 | 15 | 13 | 2 | 12,414 | 6,136 | 6,278 |
| 19 year and under 20 years | 12,477 | 6,199 | 6,278 | 11 | 10 | 1 | 12,466 | 6,189 | 6,277 |
| 20 year and under 21 years | 12,571 | 5,998 | 6,573 | 22 | 22 | … | 12,549 | 5,976 | 6,573 |
| 21 year and under 25 years | 45,571 | 22,339 | 23,232 | 141 | 139 | 2 | 45,430 | 22,200 | 23,230 |
| 25 year and under 30 years | 46,080 | 23,704 | 22,376 | 464 | 462 | 2 | 45,616 | 23,242 | 22,374 |
| 30 year and under 35 years | 39,911 | 22,021 | 17,890 | 740 | 740 | … | 39,171 | 21,281 | 17,890 |
| 35 year and under 40 years | 35,619 | 20,513 | 15,106 | 792 | 790 | 2 | 34,827 | 19,723 | 15,104 |
| 40 year and under 45 years | 31,191 | 17,755 | 13,436 | 1,008 | 1,008 | … | 30,183 | 16,747 | 13,436 |
| 45 year and under 50 years | 28,860 | 17,028 | 11,832 | 538 | 538 | … | 28,322 | 16,490 | 11,832 |
| 50 year and under 55 years | 26,692 | 16,770 | 9,922 | 365 | 365 | … | 26,327 | 16,405 | 9,922 |
| 55 year and under 60 years | 17,095 | 10,945 | 6,150 | 155 | 155 | … | 16,940 | 10,790 | 6,150 |
| 60 year and under 65 years | 12,153 | 7,685 | 4,468 | 97 | 97 | … | 12,056 | 7,588 | 4,468 |
| 65 year and under 70 years | 6,487 | 3,923 | 2,564 | 20 | 20 | … | 6,467 | 3,903 | 2,564 |
| 70 year and under 75 years | 4,381 | 2,504 | 1,877 | 4 | 4 | … | 4,377 | 2,500 | 1,877 |
| 75 year and under 80 years | 2,127 | 1,191 | 936 | … | … | … | 2,127 | 1,191 | 936 |
| 80 year and under 85 years | 922 | 482 | 440 | … | … | … | 922 | 482 | 440 |
| 85 year and under 86 years | 163 | 88 | 75 | … | … | … | 163 | 88 | 75 |
| 86 year and under 87 years | 71 | 42 | 29 | … | … | … | 71 | 42 | 29 |
| 87 year and under 88 years | 54 | 32 | 22 | … | … | … | 54 | 32 | 22 |
| 88 year and under 89 years | 36 | 22 | 14 | … | … | … | 36 | 22 | 14 |
| 89 year and under 90 years | 29 | 16 | 13 | … | … | … | 29 | 16 | 13 |
| 90 year and under 91 years | 26 | 11 | 15 | … | … | … | 26 | 11 | 15 |
| 91 year and under 92 years | 15 | 9 | 6 | … | … | … | 15 | 9 | 6 |
| 92 year and under 93 years | 9 | 4 | 5 | … | … | … | 9 | 4 | 5 |
| 93 year and under 94 years | 8 | 4 | 4 | … | … | … | 8 | 4 | 4 |
| 94 year and under 95 years | 4 | 1 | 3 | … | … | … | 4 | 1 | 3 |
| 95 year and under 96 years | 4 | 3 | 1 | … | … | … | 4 | 3 | 1 |
| 96 year and under 97 years | 2 | 2 | … | … | … | … | 2 | 2 | … |
| 97 year and under 98 years | 1 | … | 1 | … | … | … | 1 | … | 1 |
| 98 year and under 99 years | 1 | … | 1 | … | … | … | 1 | … | 1 |
| 99 year and under 100 years | … | … | … | … | … | … | … | … | … |
| 100 year and under 101 years | 1 | 1 | … | … | … | … | 1 | 1 | … |
| 103 years | 1 | 1 | … | … | … | … | 1 | 1 | … |
| Unspecified age under 21 | 66 | 30 | 36 | … | … | … | 66 | 30 | 36 |
| Unspecified age over 21 | 902 | 666 | 236 | 45 | 45 | … | 857 | 621 | 236 |
The particulars of the proportions per cent. at each age-period and proportions of the sexes will be found in the census volume, Tables VII. and VIII, Part IV.
| Year of Age. | Population at and above each stated Age. | Population under each stated Age. | ||||
|---|---|---|---|---|---|---|
| Persons. | Males. | Females. | Persons. | Males. | Females. | |
| * This table only includes persons whose ages were specified in the census schedules. There were, in addition, 66 persons (30 males and 36 females) of unspecified age under 21, and 902 persons (666 males and 236 females) over 21 years of age. | ||||||
| 0* | 625,690 | 332,181 | 293,509 | .. | .. | .. |
| 1 | 609,247 | 323,795 | 285,452 | 16,443 | 8,386 | 8,057 |
| 2 | 594,416 | 316,259 | 278,157 | 31,274 | 15,922 | 15,352 |
| 3 | 577,153 | 307,479 | 269,674 | 48,537 | 24,702 | 23,835 |
| 4 | 559,534 | 298,587 | 260,947 | 66,156 | 33,594 | 32,562 |
| 5 | 542,486 | 289,922 | 252,564 | 83,204 | 42,259 | 40,945 |
| 6 | 525,061 | 281,135 | 243,926 | 100,629 | 51,046 | 49,583 |
| 7 | 507,528 | 272,342 | 235,186 | 118,162 | 59,839 | 58,323 |
| 8 | 490,127 | 263,515 | 226,612 | 135,563 | 68,666 | 66,897 |
| 9 | 473,007 | 254,779 | 218,228 | 152,683 | 77,402 | 75,281 |
| 10 | 450,406 | 246,428 | 209,978 | 169,284 | 85,753 | 83,531 |
| 11 | 438,980 | 237,626 | 201,354 | 186,710 | 94,555 | 92,155 |
| 12 | 423,020 | 229,681 | 193,339 | 202,670 | 102,500 | 100,170 |
| 13 | 406,493 | 221,384 | 185,109 | 219,197 | 110,797 | 108,400 |
| 14 | 390,987 | 213,558 | 177,429 | 234,703 | 118,623 | 116,080 |
| 15 | 375,322 | 205,673 | 169,649 | 250,368 | 126,508 | 123,860 |
| 16 | 361,189 | 198,471 | 162,718 | 264,501 | 133,710 | 130,791 |
| 17 | 347,644 | 191,743 | 155,901 | 278,046 | 140,438 | 137,608 |
| 18 | 334,991 | 185,442 | 149,549 | 290,699 | 146,739 | 143,960 |
| 19 | 322,562 | 179,293 | 143,269 | 303,128 | 152,888 | 150,240 |
| 20 | 310,085 | 173,094 | 136,991 | 315,605 | 159,087 | 156,518 |
| 21* | 297,514 | 167,096 | 130,418 | 328,176 | 165,085 | 163,091 |
| 25 | 251,943 | 144,757 | 107,186 | 373,747 | 187,424 | 186,323 |
| 30 | 205,863 | 121,053 | 84,810 | 419,827 | 211,128 | 208,699 |
| 35 | 165,952 | 99,032 | 66,920 | 459,738 | 233,149 | 226,589 |
| 40 | 130,333 | 78,519 | 51,814 | 495,357 | 253,662 | 241,695 |
| 45 | 99,142 | 60,764 | 38,378 | 526,548 | 271,417 | 255,131 |
| 50 | 70,282 | 43,736 | 20,546 | 555,408 | 288,445 | 266,963 |
| 55 | 43,590 | 26,966 | 16,624 | 582,100 | 305,215 | 276,885 |
| 60 | 26,495 | 16,021 | 10,474 | 599,195 | 316,160 | 283,035 |
| 65 | 14,342 | 8,336 | 6,006 | 611,348 | 323,845 | 287,503 |
| 70 | 7,855 | 4,413 | 3,442 | 617,835 | 327,768 | 290,067 |
| 75 | 3,474 | 1,909 | 1,565 | 622,216 | 330,272 | 291,944 |
| 80 | 1,347 | 718 | 629 | 624,343 | 331,463 | 292,880 |
| 85 | 425 | 236 | 189 | 625,265 | 331,945 | 293,320 |
| 86 | 262 | 148 | 114 | 625,428 | 332,033 | 293,395 |
| 87 | 191 | 106 | 85 | 625,499 | 332,075 | 293,424 |
| 88 | 137 | 74 | 63 | 625,553 | 332,107 | 293,446 |
| 89 | 101 | 52 | 49 | 625,589 | 332,129 | 293,460 |
| 90 | 72 | 36 | 36 | 625,618 | 332,145 | 293,473 |
| 91 | 46 | 25 | 21 | 625,644 | 332,156 | 293,488 |
| 92 | 31 | 16 | 15 | 625,659 | 332,165 | 293,494 |
| 93 | 22 | 12 | 10 | 625,668 | 332,169 | 293,499 |
| 94 | 14 | 8 | 6 | 625,676 | 332,173 | 293,503 |
| 95 | 10 | 7 | 3 | 625,680 | 332,174 | 293,506 |
| 96 | 6 | 4 | 2 | 625,684 | 332,177 | 293,507 |
| 97 | 4 | 2 | 2 | 625,686 | 332,179 | 293,507 |
| 98 | 3 | 2 | 1 | 625,687 | 332,179 | 293,508 |
| 100 | 2 | 2 | .. | 625,688 | 332,179 | 293,509 |
| 103 | 1 | 1 | .. | 625,689 | 332,180 | 293,509 |
| 104 | .. | .. | .. | *625,690 | 332,181 | 293,509 |
The number of males under 1 year of age was 8,386, and of females 8,057. The proportions of the sexes in every 100 children under 1 year at four census-years show that in 1891 the proportion of males was slightly higher than in 1886, but less than in 1881 or 1878. The proportion of females for 1891 is lower than in 1886, but higher than in 1881 or 1878.
| Proportions per cent. of the Sexes: Children under One Year. | |
|---|---|
| Census 1878 | 51.04 males to 48.96 females. |
| Census 1881 | 51.29 males to 48.71 females. |
| Census 1886 | 50.50 males to 49.50 females. |
| Census 1891 | 51.00 males to 49.00 females. |
At 5–15 years the males numbered 84,249, and the females 82,915, being a proportion for that age-period of 50.40 males and 49.60 females in every 100 persons. Thus, the numbers of the sexes approximated closer at this period than at under 1 year of age.
The numbers of the sexes at the periods under and over 21 years of age show that in 1891 more of the minors were males than females, and that the adult males were considerably in excess of the adult females. A comparison is given of this result with the proportions which obtained in 1886:—
| Males and Females, Adults and Minors, with Proportion of the Sexes. | ||||
|---|---|---|---|---|
| Numbers. | Proportion per Cent. of both Sexes. | |||
| Census 1886— | Males. | Females. | Males. | Females. |
| Under 21 years | 154,718 | 153,391 | 50.22 | 49.78 |
| Over 21 years | 157,503 | 112,870 | 58.25 | 41.75 |
| Census 1891— | ||||
| Under 21 years | 165,115 | 163,127 | 50.30 | 49.70 |
| Over 21 years | 167,762 | 130,654 | 56.22 | 43.78 |
Table of Contents
OF the male population of the colony, excluding the Chinese, 229,437 were unmarried, 90,487 were husbands, 7,777 were widowers, and 750 were not stated as to conjugal condition. Of the females, 190,658 were unmarried, 90,870 were wives, 12,098 widows, and 137 not described. Taking persons of both sexes, 67.62 per cent, were found to be unmarried, 29.18 per cent, married, and 3.20 widowed. A comparison of the results of three censuses shows that in case of the male sex the proportions of unmarried and married diminish, but the proportion of the widowed increases. On the female side the proportions of unmarried and widowed increase, while the married diminish. The figures are as under :—
| Census. | Proportions per Cent.: Males. | Proportions per Cent.: Females. | ||||
|---|---|---|---|---|---|---|
| Unmarried. | Married. | Widowed. | Unmarried. | Married. | Widowed. | |
| 1881 | 70.39 | 27.73 | 1.88 | 63.64 | 33.05 | 3.31 |
| 1886 | 70.35 | 27.61 | 2.04 | 64.59 | 31.74 | 3.67 |
| 1891 | 70.02 | 27.61 | 2.37 | 64.95 | 30.94 | 4.11 |
The proportions according to conjugal condition for each age-period in every 100 persons living, treating the sexes separately, are shown in the following table :—
| Proportion to every 100 living at each Age. | ||||||
|---|---|---|---|---|---|---|
| Males. | Females. | |||||
| Unmarried. | Husbands. | Widowers. | Unmarried. | Wives. | Widows. | |
| All ages | 70.02 | 27.61 | 2.37 | 64.93 | 30.95 | 4.12 |
| Specified ages | 70.02 | 27.61 | 2.37 | 64.95 | 30.94 | 4.11 |
| 14 years and upwards | 52.98 | 43.30 | 3.72 | 42.00 | 51.19 | 6.81 |
| Under 14 years | .. | .. | .. | .. | .. | .. |
| 14 to 15 years | .. | .. | .. | .. | .. | .. |
| 15 to 16 years | .. | .. | .. | 99.93 | 0.07 | .. |
| 16 to 17 years | .. | .. | .. | 99.74 | 0.26 | .. |
| 17 to 18 years | 99.94 | 0.06 | .. | 98.87 | 1.12 | 0.01 |
| 18 to 19 years | 99.90 | 0.10 | .. | 96.73 | 3.25 | 0.02 |
| 19 to 20 years | 99.50 | 0.48 | 0.02 | 92.78 | 7.20 | 0.02 |
| 20 to 21 years | 98.86 | 1.12 | 0.02 | 85.98 | 13.93 | 0.09 |
| 21 to 25 years | 89.71 | 10.13 | 0.16 | 65.41 | 34.24 | 0.35 |
| 25 to 30 years | 62.31 | 37.09 | 0.60 | 33.39 | 65.03 | 1.58 |
| 30 to 35 years | 38.95 | 59.64 | 1.41 | 15.29 | 81.50 | 3.21 |
| 35 to 40 years | 27.52 | 70.30 | 2.18 | 8.55 | 85.86 | 5.59 |
| 40 to 45 years | 23.79 | 72.51 | 3.70 | 6.12 | 85.46 | 8.42 |
| 45 to 50 years | 21.88 | 72.70 | 5.42 | 4.81 | 83.10 | 12.09 |
| 50 to 55 years | 21.70 | 71.22 | 7.08 | 4.26 | 79.06 | 16.68 |
| 55 to 60 years | 21.46 | 69.46 | 9.08 | 3.90 | 73.76 | 22.34 |
| 60 to 65 years | 20.91 | 65.28 | 13.81 | 4.01 | 63.57 | 32.42 |
| 65 to 70 years | 18.56 | 63.19 | 18.25 | 4.30 | 54.50 | 41.20 |
| 70 to 75 years | 15.60 | 56.99 | 27.41 | 3.68 | 42.71 | 53.61 |
| 75 to 80 years | 13.06 | 51.81 | 35.13 | 5.34 | 28.21 | 66.45 |
| 80 to 85 years | 11.25 | 43.54 | 45.21 | 2.98 | 16.74 | 80.28 |
| 85 and upwards | 5.55 | 35.90 | 58.55 | 6.38 | 14.36 | 79.26 |
| Unspecified | .. | .. | .. | .. | .. | .. |
Of 229,197 unmarried males of specified ages, 70,197 were over 20 years of age, and, of 190,552 unmarried females, 66,700 were found to be over 15 years. The excess of bachelors over spinsters was therefore 3,497. Accepting the above as the marriageable ages, the number of bachelors to every 100 spinsters was 105.
That a process of equalisation in the numbers of bachelors and spinsters has been going on steadily during past years is proved by the results of previous censuses.
NUMBER of BACHELORS aged 20 Years and upwards to every 100 of SPINSTERS aged 15 and upwards.
| Census 1874 | 238 |
| Census 1878 | 191 |
| Census 1881 | 162 |
| Census 1886 | 123 |
| Census 1891 | 105 |
Canterbury and Otago were the only provincial districts in which the number of spinsters exceeded that of the bachelors, the difference being most marked in Canterbury, a result similar to that observed in 1886.
The number of husbands of specified ages was 90,371, and of wives 90,765, giving an excess of wives over husbands amounting to 394. There were 100 husbands to every 100 wives in the colony, notwithstanding the small numerical excess of wives above mentioned. This is the first census of New Zealand at which the wives have been returned as in excess of the husbands. In reporting on the Victorian census of 1881, the Government Statist announced that Victoria was the only one of the Australasian Colonies in which the wives exceeded the husbands. As in the case of the bachelors and spinsters, a process of equalisation in the number of husbands and wives has also been in operation, the number of husbands to every 100 wives having fallen from 102 in 1874 to 101 in 1881, and again to 100 in 1891.
The widowers of specified ages numbered 7,75S, and the widows 12,076, being a proportion of 64 widowers to every 100 widows. At the census of 1886 the same proportion was observed to exist. As might be expected, the widows were most numerous at each age-period, but at the younger ages the differences are the greatest. At 20–25 years of age there were 25 widows to every 10 widowers; at 25–30 years the same proportion ; at 30–35 years, 19 widows to 10 widowers; while at 50 to 60 and 60 to 70 the proportion had fallen to 14 widows to 10 widowers.
The females living in the colony (excluding Chinese and Maoris) at the period 15–45 years of age, generally known as the reproductive age-period, numbered 131,261. Of these, 65,035 were unmarried, 63,165 were wives, 2,992 were widows, and 69 were of unstated condition. Out of 65,035 not married, 31,893 were under 20 years of age, and 33,142 between 20 and 45 years.
It was ascertained after the census of 1881 w-as compiled that the married women of reproductive age in the colony averaged 314 to every 100 of legitimate births, which is equal to an average of one birth to every married woman at the age for child-bearing in every 3.14 years. In 1886 the average was found, on calculation, to have been 333 wives to 100 births, or an average of one birth to each wife in 3.33 years. In 1891 there were 17,635 legitimate births, and the number of married women at the time of the census at the period 15 to 45 years was 63,165, which gives an average of 358 waves to each 100 births, or, deducting one child in each case of twins, the average becomes 362 wives to each 100 births, being a birth to each wife every 3.62 years. The vital statistics show that both numerically and in proportion to population the births have decreased since 1881. In 1882 the number registered was 19,009, and the rate 37.32 per 1,000 of the whole population, while in 1891 the number registered was only 18,273, and the rate had fallen to 29.01. This might indeed be caused partly by a diminished marriage-rate, for in 1882 the marriages were 7.07 per 1,000 of the population, and in 1891 only 6.04; but the census results prove that the average interval between each birth in the case of married women at the child-bearing ages advanced from 3.14 years in 1881 to 3.33 years in 1886, and 3.62 years in 1891; so that this factor must evidently be taken into account in consideration of the question of the causes of the falling birth-rate.
Comparing the marriage - rates for the various Australasian Colonies, it is found that the rate in New Zealand is the lowest of all, the figures for 1891 being,—
| Western Australia | 8.00 per 1,000 of mean population. |
| Victoria | 7.69 per 1,000 of mean population. |
| New South Wales | 7.39 per 1,000 of mean population. |
| South Australia | 7.31 per 1,000 of mean population. |
| Queensland | 7.18 per 1,000 of mean population. |
| Tasmania | 6.63 per 1,000 of mean population. |
| New Zealand | 6.04 per 1,000 of mean population. |
The position of New Zealand is now the reverse of what it was in the year 1874, owing to the gradual fall in the marriage-rate. In that year the figures for the Australasian Colonies stood as follow:—
| New Zealand | 8.81 per 1,000 of mean population. |
| Queensland | 8.62 per 1,000 of mean population. |
| South Australia | 8.00 per 1,000 of mean population. |
| New South Wales | 7.70 per 1,000 of mean population. |
| Western Australia | 6.96 per 1,000 of mean population. |
| Tasmania | 6.83 per 1,000 of mean population. |
| Victoria | 6.33 per 1,000 of mean population. |
The colony's position in regard to the birth-rate has been similarly reversed since the year 1880.
| Queensland | 36.35 per 1,000 of mean population. |
| Western Australia | 34.61 per 1,000 of mean population. |
| New South Wales | 34.50 per 1,000 of mean population. |
| South Australia | 33.92 per 1,000 of mean population. |
| Victoria | 33.57 per 1,000 of mean population. |
| Tasmania | 33.37 per 1,000 of mean population. |
| New Zealand | 29.01 per 1,000 of mean population. |
the figures for the year 1880 having been,—
| New Zealand | 40.78 per 1,000 of mean population. |
| South Australia | 38.94 per 1,000 of mean population. |
| New South Wales | 38.80 per 1,000 of mean population. |
| Queensland | 36.92 per 1,000 of mean population. |
| Tasmania | 32.91 per 1,000 of mean population. |
| Western Australia | 32.35 per 1,000 of mean population. |
| Victoria | 30.75 per 1,000 of mean population. |
A table given in the census report for 1886 is now reproduced with the additional figures for 1891, showing that the proportion of married women under 20 years of age is still steadily diminishing, while the proportion from 35 to 45 years is regularly increasing, this process bringing the relative proportions closer to those that obtain in England:—
| Ages. | England. | New Zealand. | |||
|---|---|---|---|---|---|
| 1881. | 1878. | 1881. | 1886. | 1891. | |
| Under 20 years | 1.10 | 2.45 | 2.16 | 1.81 | 1.19 |
| 20 and under 35 years | 59.32 | 61.90 | 60.53 | 60.03 | 60.12 |
| 35 and under 45 years | 39.58 | 35.65 | 37.31 | 38.16 | 38.69 |
| 100.00 | 100.00 | 100.00 | 100.00 | 100.00 | |
Of 4,426 male Chinese living in the colony, 63 were stated as married and 13 widowed. The instruction on the census schedule was that Chinese not having wives in this or any other Australasian Colony should be returned as unmarried. Of 18 Chinese females, 7 were returned as married, the rest being young people under 19 years of age.
Table of Contents
Table of Contents
INFORMATION as to the degree of education of the people in the colony was obtained at the time of the census under three heads: “Able to read and write,” “Read only,” and “Unable to read.” Of persons of both sexes, it was found that 478,438 were set down as “Able to read and write;” 24,606 as “Able to read only;” 116,159 as “Unable to read;” and 3,011 as “Unspecified,” or “Education unknown.” These numbers exclude the Chinese. The proportions in every 100 persons of specified education and age were 77.25 “Read and write,” 3.98 “Read only,” and 18.77 “Unable to read.” On comparison with previous censuses, and for each sex respectively, the proportion per cent, able to read and write will be found to rise steadily; while those reading only, or unable to read, diminish in number. The under-mentioned figures illustrate this:—
| Census | Proportions percent.: Males | Proportions percent.: Females | ||||
|---|---|---|---|---|---|---|
| Read and write. | Read only. | Cannot read. | Read and write. | Read only. | Cannot read. | |
| 1881 | 73.31 | 5.01 | 21.68 | 68.94 | 6.39 | 24.29 |
| 1886 | 75.40 | 4.36 | 20.24 | 72.41 | 5.31 | 22.28 |
| 1891 | 77.95 | 3.74 | 18.31 | 76.47 | 4.24 | 19.29 |
The table also shows that the male sex is still the better educated of the two, but that the difference is gradually disappearing. In 1881 73.31 percent, of males at all ages could read and write, but only 68.94 of females; while in 1891 77.95 was the proportion for males, and 76.47 that of females.
Another method of measuring the degree of ignorance, as regards writing, of the population may appropriately be referred to here, though the test is not taken from census results. It is that of comparing the number of persons who signed the marriage registers by mark with the number who were able to sign their names, for any year. A table is given showing a most satisfactory advance since the year 1881 in this respect; the decrease in the proportion signing by mark being to the extent of about one-half among the males and about three-fifths among the females. The religious denominations to which the parties belonged are also shown:—
| Denomination | 1881. | 1886. | 1890. | 1891. | ||||
|---|---|---|---|---|---|---|---|---|
| M. | F. | M. | F. | M. | F. | M. | F. | |
| Church of England | 16.59 | 27.15 | 9.33 | 12.00 | 6.08 | 4.86 | 8.23 | 10.66 |
| Presbyterians | 10.25 | 29.61 | 9.79 | 7.62 | 8.59 | 15.27 | 5.79 | 8.69 |
| Wesley an and other Methodists | 32.41 | 41.79 | 6.33 | 14.78 | 15.20 | 10.14 | 10.33 | 10.33 |
| Roman Catholics | 117.78 | 133.33 | 46.45 | 65.57 | 35.26 | 42.82 | 31.33 | 18.54 |
| Other denominations | 10.36 | 20.72 | 11.49 | 22.99 | 15.00 | 0.00 | 5.13 | 0.00 |
| By Registrars | 39.22 | 93.51 | 35.98 | 62.98 | 29.77 | 40.60 | 27.42 | 43.08 |
| Total marriages | 32.04 | 50.20 | 19.21 | 28.96 | 16.33 | 19.23 | 13.93 | 16.82 |
It will be observed that, up to 1890, the largest proportion who signed by marks was of Roman Catholics, and that the proportion of illiterates was next greatest among those married before Registrars; but in 1891 this position was reversed. No doubt many of those married by Registrars belong to the Church of England and other Protestant bodies.
Returning to the population of both sexes, the numbers living in 1891 able to read and write, read only, or unable to read, at various quinquennial periods of age, show conclusively that, whatever may be the degree of education of those who have reached the higher ages, and are passing away, the proportions of those reading only, or not able to read, at the periods when young people leave school, are very low indeed, falling to 0.38 and 0.65 percent, respectively at the age-period 15–20. A comparison with the proportions shown for the different quinquennial periods at the census of 1886 exhibits improvement, as will be seen in the next statement, where, against 0.38 percent, reading only in 1891, the figures for 1886 are as high as 0.68; and, against 0.65 percent, unable to read in 1891, the. proportion is 0.87 percent, in 1886, at the age-period 15–20. In working out the proportions for 1886, the calculations were made on the total population at each age-period, including the unspecified as to education. As the proportion of unspecified is not shown in the table, the percentages at age-periods will not add to exactly 100.
| Read and write. | Read only. | Cannot read. | ||||
|---|---|---|---|---|---|---|
| 1886. | 1891. | 1886. | 1891. | 1886. | 1891. | |
| Under 5 years | .. | .. | 0.88 | 0.81 | 99.12 | 99.19 |
| 5 to 10 years | 48.41 | 52.88 | 20.37 | 18.00 | 30.53 | 29.12 |
| 10 to 15 years | 96.36 | 97.72 | 2.02 | 1.28 | 1.20 | 1.00 |
| 15 to 20 years | 98.09 | 98.97 | 0.68 | 0.38 | 0.87 | 0.65 |
| 20 to 25 years | 97.34 | 98.81 | 0.90 | 0.39 | 1.21 | 0.80 |
| 25 to 30 years | 96.47 | 98.09 | 1.41 | 0.74 | 1.59 | 1.17 |
| 30 to 35 years | 94.87 | 96.87 | 2.07 | 1.59 | 2.39 | 1.54 |
| 35 to 40 years | 93.97 | 95.57 | 2.67 | 2.13 | 2.78 | 2.30 |
| 40 to 45 years | 92.57 | 93.98 | 3.44 | 2.83 | 3.39 | 3.19 |
| 45 to 50 years | 92.41 | 93.06 | 3.65 | 3.48 | 3.52 | 3.46 |
| 50 to 55 years | 90.87 | 92.26 | 4.62 | 3.89 | 3.96 | 3.85 |
| 55 to 60 years | 90.76 | 91.29 | 4.81 | 4.68 | 4.05 | 4.03 |
| 60 to 65 years | 87.92 | 89.56 | 6.21 | 5.37 | 5.37 | 5.07 |
| 65 to 70 years | 86.51 | 87.66 | 6.83 | 6.96 | 6.00 | 5.38 |
| 70 to 75 years | 84.73 | 85.96 | 7.87 | 7.77 | 6.51 | 6.27 |
| 75 to 80 years | 86.40 | 83.70 | 6.67 | 8.79 | 6.28 | 7.51 |
| 80 and upwards | 78.36 | 81.21 | 10.71 | 8.90 | 9.73 | 9.89 |
It may be asked whether it is any longer worth while to compile the census results under such heads of inquiry as that of being able to read and write or not, seeing that there has been in force since 1877 an Act making primary education free, and containing provisions under which parents can, if necessary, be compelled to send their children to attend school. All children in these days may be said to be taught at least to read and write. Doubtless the use of the inquiry was much greater many years ago than now. It is interesting, however, to observe the results of the compilation, and, when so much has to be extracted from the household schedule and compiled, to include the old inquiry as to degree of education does not greatly add to the cost.
In the year 185S the percentage of persons able to read and write was 63.51, while in 1891 it was 77.25. As to the male sex, the figures were 66.86 in 1858, and 77.95 in 1891. The increase in the proportion able to read and write was still greater in case of the females, the figures being 59.13 in the year 1858, and 76.47 in 1891.
Dealing with persons over 5 years of age, the proportion percent, able to read and write in 1891 is found to be 89.26, instead of 77.25 as at all ages. The proportion able to read only is 4.47 against 3.97; and of those unable to read, 6.27 against 18.76.
Of the male population at 5 years of age and upwards 89.56 per cent., and of the female population 88.92 per cent., were found able to read and write.
Dealing with the population at 5.15 years of age, 74.69 percent, of both sexes were found to be able to read and write, 9.87 could read only, and 15.44 were unable to read. Of the population aged 15 years and upwards, 95.81 percent, could read and write, 2.01 percent, could read only, and 2.15 could not read.
The proportions for the various provincial districts able to read and write are given for three censuses:—
| Proportion of Persons at 15 Years and over able to read and write. | Proportion per 100 Children between 5 and 15 Years of Age able to read and write. | |||||
|---|---|---|---|---|---|---|
| 1881. | 1886. | 1891. | 1881. | 1886. | 1891. | |
| Auckland | 69.78 | 69.54 | 73.31 | 93.30 | 93.41 | 95.63 |
| Taranaki | 67.28 | 64.39 | 69.05 | 93.55 | 93.41 | 95.76 |
| Hawke’s Bay | 65.80 | 66.76 | 71.39 | 92.88 | 93.99 | 95.60 |
| Wellington | 68.61 | 67.75 | 73.48 | 93.51 | 93.73 | 95.72 |
| Marlborough | 61.94 | 65.84 | 68.05 | 93.54 | 94.19 | 95.02 |
| Nelson | 69.36 | 71.60 | 75.76 | 94.13 | 94.39 | 95.94 |
| Westland | 73.38 | 91.97 | 77.59 | 94.07 | 94.27 | 95.29 |
| Canterbury | 68.76 | 71.83 | 78.21 | 93.56 | 94.47 | 95.43 |
| Otago | 67.57 | 69.57 | 75.07 | 95.09 | 95.41 | 76.47 |
An instruction on the census household schedule was given to the effect that Chinese should be set down as unable to read and write unless they could read and write English. The result was that 115 were returned as capable of reading and writing, and 23 as able to read only, out of a total Chinese population of 4,441 persons.
As at previous censuses, columns were inserted in the household schedule, under the head of “Education,” for entry of (1) all persons attending Government primary schools; (2) those at college, high, grammar, or private schools; and (3) all receiving tuition at home. A space was also given for insertion of teachers and scholars at Sunday-schools, under the heading “Religious Denomination.” It is only through the medium of the census schedule that information as to Sunday-school and home tuition is procured in this colony, and also more perfect information as to attendance at the private schools than it is possible to obtain from the ordinary annual statistics.
The result of the inquiry showed 124,063 scholars at the primary schools on the 5th April, 1891, 63,686 being males and 60,377 females; the proportions percent. to the total population at the age-period 5.15 years being 74.22 for both sexes, 75.60 for males and 72.82 for females.
The total number of scholars belonging to these schools on the 31st March, 1891, according to the books of the Education Department was 121,165, or 2,898 fewer than the number given in the census.
The scholars attending private, college, high, or grammar schools were 17,047 in the total, being 8,005 males and 9,042 females. The total number shows an increase of 2,099 over that given in 1886, or at the rate of 14.04 percent, for both sexes, 20.07 percent, for males and 9.19 for females.
The total number receiving tuition at home was returned at 8,178, of which 3,570 were males and 4,608 females. The increase since 1886 was at the rate of 8.07 percent, on the persons, 6.69 percent, on the males and 9.17 on the females.
Taking the three classes of scholars together, it is found that 149,288 children or young people were returned as receiving education, against 133,159 in 1886, being an increase of 16,129 or 12.11 percent.; while the population at 5.15 years of age has increased 10.20 percent.
101,975 persons were in attendance at the Sunday-schools of the colony, of whom 48,115 were males and 53,860 were females; the Sunday-school teachers to the number of 9,791 are included. The total number of scholars shows an increase of 2,091 over the number for 1886, or 2.09 per cent. This small increase in the attendance at Sunday-schools is notable, as at previous censuses far higher rates were obtained, while, on comparing the results for 1891 with 1886 as to sex, it is found that for males there is an actual decrease of 0.81 per cent., and for females an increase of only 4.84 per cent.
Table of Contents
Table of Contents
AT a Conference of Statisticians* of the Australasian Colonies, held at Hobart in March, 1890, a series of resolutions was passed and a form of schedule agreed to with the view of securing the uniformity so necessary for comparative purposes in system and heads of inquiry. A new classification of occupations was devised and adopted “as a means of overcoming the great difficulties with which the systematic grouping of the occupations of the people of a country has always been found to be attended.” The old classification of Dr. Farr purported to divide the population so as to distinguish the commercial from the industrial class; but in allotting the various occupations to the different classes the principle adopted was that of grouping all workers and dealers in different matters together according to the material dealt in or worked upon, and placing the whole in the industrial class. Thus the dealers, who are really commercial, went to swell the number of the industrial at the expense of the commercial class. General labourers were cast out of the industrial and into the indefinite class, merely because the material on which they worked was not stated, &c. The new classification, while preserving Fair’s professional class nearly intact, transfers, among other changes, a large number of women and children from the domestic to the dependent class, and completes the commercial class by including “trade and transport” along with, the agorici of Farr. The industrial class now consists of part of what was assigned to it by Farr, but includes general labourers. Miners and other primary producers are placed with the agricultural and pastoral class, as being engaged in obtaining raw materials from natural sources. The indefinite class is greatly reduced in number, and the class styled “dependent” introduced. The Conference readily agreed to a proposal for distinguishing “employers” from “employed”— a division first attempted in New Zealand at the suggestion of the writer of this report on the occasion of the census of 1886, and renewed in 1891. The importance of affording the means of distinguishing persons in business from wage-earners is obvious, besides being absolutely essential to an improved classification of occupations.
* The names of the members of the Conference are as under: H. H. Hayter, C.M.G., Government Statist (Victoria); R. M. Johnston, F.L.S., Government Statistician (Tasmania); T. A. Coghlan, A.M.I.C.E., Government Statistician (Now South Wales); H. J. Andrews, then Under-Secretary (South Australia); E. J. von Dadelszen, then Deputy Registrar-General (New Zealand). Consulting member: E. C. Nowell, formerly Government Statistician, Tasmania.
The Conference also arranged for bringing out the occupations of the people in seven groups of ages, instead of merely distinguishing the number of each sex under and over 20 years of age as formerly. (The full details will be found in the census volume.) A desire that this should be done was intimated by the Imperial authorities in the year 1889.
The full description of the arrangement of occupations in the seven classes used under the new method is as follows:—
PROFESSIONAL (Andrici, Farr).—Embracing all persons mainly engaged in the government and defence of the country, and in satisfying the higher intellectual and moral requirements and the special social wants not included in the material services rendered by other classes hereafter specified or classed.
DOMESTIC.—Embracing all persons engaged in rendering personal services, and in the supply of board and lodging for which remuneration is usually paid.
COMMERCIAL (Trade and Transport, United States Census, 1881; Agorici, Farr).—Embracing all persons directly connected with the hire, sale, transfer, distribution, storage, and security of property and materials, but who as a rule do not effect any material change in the nature of the objects which pass through their hands.
INDUSTRIAL (part of the Technici of Farr).—Embracing all persons, not otherwise classed, who are principally engaged in various works of utility or in specialties connected with the construction, modification, or alteration of materials so as to render them more available for the various uses of man, but excluding as far as possible all who are engaged mainly or solely in the service of interchange.
AGRICULTURAL, PASTORAL, MINERAL, AND OTHER PRIMARY PRODUCERS(Georgici and part of the Technici of Farr).—Embracing all persons mainly engaged in the cultivation or acquisition of food-products, and in obtaining other raw materials from natural sources.
INDEFINITE.—Embracing all persons who derive their income from services rendered, but the direction of which services cannot be exactly determined.
DEPENDENTS.—Embracing all persons dependent upon relatives or natural guardians, including wives, children, and relatives not otherwise engaged in pursuits for which remuneration is usually paid, and all persons supported by private or public charity, or dependent upon the public revenue.
It will be noticed that in the professional class are included persons classed as “officers of Government;” but the numbers given under this heading in the subsequent tables do not represent the whole number employed by the Government, the principle adopted having been to complete the other groups where the scheme of classification required it, rather than to show completely all persons paid by Government. Thus, Postal and Telegraph officers are classified in the group “Transport of Passengers, Goods, or Communications,” belonging to Class III. Railway employees are similarly dealt with. The full statement of persons paid by Government but not dealt with in Order 1 would include some or all under each of the following headings: Persons connected with defence, law-courts, penal establishments and police, charitable or benevolent institutions, hospitals and lunatic asylums, museums, education, life insurance, railways, harbours, lighthouses, post and telegraph; also civil engineers, electricians, surveyors and assistants, architects and draughtsmen, printers and binders in the Government Printing Office, and artisans in Government Railway workshops. It is highly important that persons making use of the tabulated results of the information as to occupations should be aware of and bear in mind the above facts.
The numbers under “Commerce” and “Industry” include all persons whose occupations were sufficiently defined to enable them to be classified in connection with the industry in which they are engaged. Many, chiefly those whose employment was of the nature of unskilled clerical assistance, while entering “clerk” under the heading “Occupation,” did not state in what trade or industry they were employed. These, of course, could not be allotted to any-special industry. Those engaged as agents or assistants in any occupation belonging to Classes III. to VI. have been, generally speaking, included with the principals. All persons stated as both producers and dealers or sellers have been classed as producers only, under Class V. All persons stated to be both manufacturers and dealers have been grouped as makers under Class IV. Persons out of employment are included under their ordinary or former occupations. Inmates of hospitals, asylums, industrial schools, and refuges, together with all persons in gaols, have not been classed according to their ordinary occupations, but in Class VII., as part of the dependent population.
The difficulty of tabulating the occupations of the people shown in the census is certainly lessened by the introduction of the card system; but there remains an unsatisfactoriness in the work on account of the different ways in which people return themselves when their occupation is virtually the same, and the number of instances in which unskilled labour is not defined as having to do with the industry on which it is temporarily employed. These causes prevent the published results from being what they ought to be, even with perfect care in the compilation-work. The basis of such work is often enough faulty or incomplete, and it is impossible to remedy the defect. One man may be “a carter at brewery,” and returns himself accordingly. Another omits the words “at brewery,” and thus the total number of persons employed in the brewing business becomes deficient. As continual instances of these irregularities are found, it arises that the census industrial statistics often differ materially as to “hands employed” from the results brought out under the head of “Occupation” in regard to labourers and others attached to various industries. The numbers being brought out for no less than seven groups of ages will afford evidence of what occupations the rising generation are mostly taking to.
The population of each class, and the proportion percent, of the total population, will be found in the following table, which also shows the population divided into two sections, A and 13, breadwinners and non-breadwinners or dependents:—
| Occupations | Numbers. | Proportions per Cent. | ||||
|---|---|---|---|---|---|---|
| Persons. | Males. | Females. | Persons. | Males. | Females. | |
| Total population | 626,658 | 352,877 | 293,781 | 100.00 | 100.00 | 100.00 |
| Section A.—Breadwinners | ||||||
| Class I. Professional | 15,821 | 10,082 | 5,739 | 2.52 | 3.03 | 1.95 |
| Class II.Domestic | 24,928 | 5,537 | 19,391 | 3.98 | 1.66 | 6.60 |
| Class III. Commerical— | ||||||
| Sub-cl. A. Property and finance | 3,756 | 3,414 | 342 | 0.60 | 1.03 | 0.12 |
| Sub-cl. B. Trade | 22,992 | 20,613 | 2,379 | 3.67 | 6.19 | 0.81 |
| Sub-cl. C. storage | 1,035 | 1,034 | 1 | 0.17 | 0.31 | 0.00 |
| Sub-cl. D. Transport and communication | 15,413 | 15,269 | 144 | 2.46 | 4.59 | 0.05 |
| Class IV. Industrial | 70,521 | 59,196 | 11,325 | 11.25 | 17.78 | 3.86 |
| Class V. Agricultural,pastoral,and other primary producers— | ||||||
| Sub-cl. A. Agricultural | 59,058 | 56,671 | 2,387 | 9.42 | 17.03 | 0.81 |
| Sub-cl. B. Pastoral | 9,549 | 9,279 | 270 | 1.52 | 2.79 | 0.09 |
| Sub-cl. C. Mineral | 10,929 | 10,900 | 23 | 2.70 | 5.08 | 0.01 |
| Sub-cl. D. Other primary producers | 5,010 | 5,004 | 6 | 0.80 | 1.50 | 0.00 |
| Class VI. Indefinite | 7,751 | 4,341 | 3,410 | 1.24 | 1.30 | 1.16 |
| Section B.—Dependents (Non-breadwinners). | ||||||
| Class VII. Dependents— | ||||||
| Sub-cl. A. Dependent on natural guardians | 369,178 | 122,410 | 246,768 | 58.92 | 30.77 | 84.00 |
| Sub-cl. B. Dependent upon the State, or upon public or private support | 4,717 | 3,121 | 1,596 | 0.75 | 0.94 | 0.54 |
No less than 37–71 percent, of the male population are shown to be dependent, and 84–54 percent, of the females. These consist of 122,410 males and 246,768 females dependent upon natural guardians; and 3,121 males and 1,596 females, persons dependent upon, the State or upon public or private support. The greater number of those dependent upon natural guardians are scholars and students. There are also a large number of dependent relatives who were not stated to be performing domestic duties, and, of females, a large number of persons performing domestic duties for which remuneration is not paid.
The classes are divided into 24 orders, which again are divided into 103 sub-orders. The items of the sub-orders are the specific occupations. In the full tables belonging to Part VII. of the census volume each specific occupation is given according to classification, and explanatory notes showing the unskilled assistance and other particulars included with the numbers for the various industries, &c. The whole of this detail is too long to repeat here, but the totals of the orders and sub-orders will be found following, with the figures for the most important items contained in each sub-order, and comments thereon.
The complete statement of specific occupations show in the census is drawn up in alphabetical form, and given at the end of this report.
Table of Contents
0.91 percent. of total male population.
0.01 percent. of total female population.
| Occupations, in Sub-orders. | Males. | Females. | Totals both Sexes. | ||||
|---|---|---|---|---|---|---|---|
| Under 20. | Over 20. | Totals. | Under 20. | Over 20. | Totals. | ||
| 1. Officers of General Government (not otherwise classed) | 43 | 515 | 558 | .. | 2 | 2 | 560 |
| 2. Officers of Local Government | 13 | 291 | 304 | .. | 5 | 5 | 309 |
| 3. Persons ministering to defence | 11 | 260 | 271 | .. | .. | .. | 271 |
| 4. Persons ministering to law and order | 160 | 1,734 | 1,894 | 1 | 12 | 13 | 1907 |
| Totals, Order 1 | 227 | 2,800 | 3,027 | 1 | 19 | 20 | 3,047 |
The first sub-order consists of persons occupied in connection with Government whom it was not necessary to allot to other classes in carrying out the principle of classification. Hence the total number in Sub-order 1 does not by any means represent the full number of persons employed by Government. It is a residue left after completing other groups—for instance, that of transport and communications, to which is carried the number of persons engaged in railways, telegraph, telephone, and postal service, although the employees in these services are paid by Government. Similarly with offices of local bodies, but to a less extent.
It has been asked why the full number of persons employed by Government is not given. But the classification is not intended to show any such result, and the census is not the proper source from which to look for such information. It could not be given by means of the census, for the word “Government” is constantly omitted by the householders in describing occupations. When the total number of persons employed by Government is wanted, it is found necessary in all colonies to have a special return compiled from departmental sources, distinguishing “permanent” from “temporary” employment.
The first sub-order includes the Governor, 3 Cabinet Ministers (not otherwise described), 3 members of Parliament (not otherwise described), and 553 officers of Government departments (not otherwise classed). Sub-order 2 includes 299 officers of local bodies (not otherwise classed), and 10 others connected with local government, such as Mayors and members of local bodies not otherwise described.
The total number is only 271, against 452 in 1886, the number of the local forces, now Permanent Militia, having diminished to 155 since the previous census, when the Armed Constabulary numbered 373.
In this group the barristers and solicitors numbered 571,* against 511 in 1886, an increase of 11–74 per cent. Law students, so returned, numbered 44 against 48, a decrease of 4; and law clerks were 491 against 477, an increase of 14. The remainder of the group includes Judges and other law-court officers, police, and penal officers such as prison officials.
* Had the lawyers borne the same proportion to population in 1891 as in 188G they would have numbered only 554. In 188G there was one lawyer to every 1,132 persons; in 1891 one to every 1,097.
2.12 percent, of total male population.
1.95 percent, of total female population.
| Occupations, in Sub-orders. | Males. | Females. | Totals both Sexes. | ||||
|---|---|---|---|---|---|---|---|
| Under 20. | Over 20. | Totals. | Under 20. | Over 20. | Totals. | ||
| 1. Persons ministering to religion | 5 | 969 | 974 | 8 | 153 | 161 | 1,135 |
| 2. Persons ministering to charity (exclusive of hospitals) | 1 | 41 | 42 | 11 | 133 | 144 | 186 |
| 3. Persons ministering to health | 192 | 1,224 | 1,416 | 24 | 1,284 | 1,308 | 2,724 |
| 4. Persons connected with literature | 11 | 403 | 414 | 3 | 10 | 13 | 427 |
| 5. Persons connected with science | 3 | 56 | 59 | 1 | 3 | 3 | 62 |
| 6. Persons engaged in civil and mechanical engineering, architecture, and surveying | 77 | 1,122 | 1,199 | .. | .. | .. | 1,199 |
| 7. Persons connected with education | 259 | 1,576 | 1,835 | 815 | 2,408 | 3,223 | 5,058 |
| 8. Persons connected with fine arts | 73 | 367 | 440 | 45 | 138 | 183 | 623 |
| 9. Persons connected with music | 143 | 229 | 242 | 89 | 565 | 654 | 896 |
| 10. Persons connected with amusements | 143 | 291 | 434 | 6 | 24 | 30 | 464 |
| Totals, Order 2 | 777 | 6,278 | 7,055 | 1,001 | 4,718 | 5,719 | 12,774 |
The number of the clergy is given as 732. In 1886 the number returned was 676. Besides the regular clergy, there were 19 Mormon missionaries and 176 Salvation Army officers, of whom 78 were females; also, 14 evangelists, 3 lay readers, 30 missionaries, and 1 preacher. The number of the clergy on the list of officiating ministers under the Marriage Act is 819, and the denominations to which they belong as under:—
| Denomination. | No. |
|---|---|
| Church of England | 271 |
| Presbyterian Church of New Zealand | 112 |
| Roman Catholic Church | 127 |
| Presbyterian Church of Otago and Southland | 78 |
| Wesleyan Methodist Church | 105 |
| Congregational Independents | 20 |
| Baptists | 18 |
| Primitive Methodist Connexion | 25 |
| United Methodist Free Churches | 14 |
| Lutheran Church | 10 |
| Hebrew Congregations | 7 |
| Church of Christ | 8 |
| Independent Wesleyan | 1 |
| Brethren | 1 |
| Bible Christians | 8 |
| Salvation Array | 9 |
| Catholic Apostolic Church | 1 |
| Union Church | 1 |
| Students of Truth | 1 |
| Seventh-day Adventists | 2 |
| Total | 819 |
There were 9 theological students, 64 church officers such as sextons and others, 69 members of religious orders not ministering to charity or education; and 18 others complete the group.
Of 186 persons, 134 were officers or servants of charitable institutions, and 52 females Sisters of Charity.
Included therein are 362 medical men in practice, against 341 returned in 1886. (The number of medical practitioners registered in the colony is 553, including 70 whose addresses are not known and 102 who have left New Zealand.) Medical students numbered 37. There were 58 persons who are grouped in the detailed tables as irregular medical practitioners, including, among others, 3 Chinese doctors, 23 herbalists, 3 medical electricians, 6 medical galvanists, 2 medical specialists—1 oculist and aurist and 1 ozonist. Dentists numbered 145 (including apprentices), against 99 in 1886. Pharmaceutical chemists and assistants were 530, against 450 at the previous census. The number of midwives, monthly nurses, and sick-nurses was 987, and of veterinary surgeons 55. There are also 512 hospital or asylum officers, nurses, or attendants not elsewhere included. Among 38 others were 1 corn-doctor and 1 hawker of medicines.
The numbers included are 296 authors, editors, or journalists, 61 reporters or shorthand-writers, 58 interpreters, and 12 others.
Ten analytical chemists, 10 assayers, 5 geologists or mineralogists, 5 naturalists or botanists, and 32 others compose this group. Included in the “others” are 1 anthropologist, 8 phrenologists (3 females), 1 professor of anatomy, and 1 writer on entomology.
The civil engineers numbered 223, and directing or consulting mechanical engineers 38. Eighteen electricians are found, to which 3 may be added who are included elsewhere as connected with electric-light production, making 21 altogether in the colony. The surveyors were 333, and the surveyors' assistants 277. Of architects there were 160, a decrease of 19 since 1886. 121 draughtsmen and 28 assistants to architects and civil engineers complete the sub-order. Twenty-five electrical engineers have, however, been included in order 18.
Includes 26 University professors and lecturers; 4,261 school masters, mistresses, and teachers, with pupil-teachers; 30 tutors and 494 governesses; 87 teachers of languages or accomplishments; 49 officers of Education Department; and 111 others. There were 2 instructors of the blind and 3 instructors of deaf-mutes, and 34 members of religious societies teaching. The increase in school masters, mistresses, &c, is considerable during five years, the number for 1886 being 3,075.
The principal items are—Artists to the number of 185 (133 in 1886), 9 sculptors, 49 engravers, and 357 photographers with their assistants. The photographers increased from 297 in 1886.
Musicians and vocalists amounted to 109. The music-teachers were 781, a very great increase on the previous figures (497), being at the rate of 57.14 per cent.
Table of Contents
1.66 per cent. of total male population
6.60 per cent. of total female population
| Occupations, in Sub-orders. | Males. | Females. | Totals both Sexes. | ||||
|---|---|---|---|---|---|---|---|
| Under 20. | Over 20. | Totals. | Under 20. | Over 20. | Totals. | ||
| 1. Persons engaged in the supply of board and lodging | 141 | 1,833 | 1,974 | 99 | 949 | 1,048 | 3,022 |
| 2. Persons engaged in attendance | 846 | 2,717 | 3,563 | 7,666 | 10,677 | 18,343 | 21,900 |
| Totals, Order 3 | 987 | 4,550 | 5,537 | 7,765 | 11,626 | 19,391 | 24,928 |
In this sub-order are included 1,649 hotelkeepers, 1,411 males and 238 females. The increase since 1886 is not great, the number of hotelkeepers then being 1,622 of both sexes. 396 relatives assisting in hotels, and 62 clerks or managers, were returned in 1891. Taking the hotel servants from the next sub-order, and adding others dealing in or making drinks, the total number of persons connected with hotels, or engaged in the sale or manufacture of wine, beer, spirits, cordials, &c., is found to be returned as under:—
| Males. | Females. | Persons. | |
|---|---|---|---|
* Including clerks, travellers, storemen, &c, 40. † Including managers, travellers, clerks, cellarmen, &c., 229. ‡ Including clerks, assistants, drivers, &c., 60. | |||
| Hotelkeeper | 1,411 | 238 | 1,649 |
| Relative assisting | 176 | 220 | 396 |
| Manager, clerk | 62 | .. | 62 |
| Hotel, club, &c., servant | 1,172 | 1,953 | 3,125 |
| Barman, barmaid | 199 | 195 | 394 |
| Wine, spirits, ale merchant* | 70 | .. | 70 |
| Cordial, &c., merchant, salesman | 5 | .. | 5 |
| Brewer, bottler† | 430 | 2 | 432 |
| Maltster and assistants | 105 | .. | 105 |
| Distiller, bottler | 2 | .. | 2 |
| Wine maker, bottler | 11 | .. | 11 |
| Cordial, &c., maker‡ | 250 | 8 | 258 |
The sub-order also includes 94 coffee-, restaurant-, or eating-house keepers and assistants, and 699 boarding- and lodging-house keepers, with 12 wives assisting, 52 relatives assisting, and 2 clerks. These, with 32 officers of club-houses and 24 others, complete the sub-order.
Contains 14,875 domestic servants, 1,049 males and 13,826 females. In 1886 the numbers were 1,032 males and 13,471 females. Housekeepers numbered 997, of whom 993 were females. Hotel, club, &c., servants were 3,125. The barmen numbered 199, and barmaids 195. Adding these to the hotel servants, the total is 3,519. Companions or lady-helps were 256. The lady-help is coming much into request, for in 1886 only 86 were returned. Hairdressers and assistants are stated at 367, and washerwomen and laundrymen at 860. The remainder consists of porters, charwomen, cooks (not domestic), watchmen, caretakers, office boys, and others.
Table of Contents
1.03 per cent. of total male population.
0.12 per cent. of total female population.
| Occupations, in Sub-orders. | Males. | Females. | Totals both Sexes. | ||||
|---|---|---|---|---|---|---|---|
| Under 20. | Over 20. | Totals. | Under 20. | Over 20. | Totals. | ||
| 1. Persons performing offices in connection with banking and finance | 175 | 1,394 | 1,569 | 2 | 58 | 60 | 1,629 |
| 2. Persons performing offices in connection with insurance and valuation | 127 | 819 | 940 | 1 | 1 | 2 | 948 |
| 3. Persons performing offices in connection with land and household property | 22 | 869 | 891 | .. | 280 | 280 | 1,171 |
| 4. Persons performing offices in connection with property-rights not otherwise classed | .. | 8 | 8 | .. | .. | .. | 8 |
| Totals, Order 4 | 324 | 3,090 | 3,414 | 3 | 339 | 342 | 3,756 |
The first item is 202 bankers, bank directors, managers, inspectors, which, with 870 bank officers, gives 1,072 connected with banking, against 1,018 at the previous census. Then follow 19 building-society or savings-bank officials; 98 share and stock brokers, with 27 assistants; 351 capitalists, financiers, or money-brokers, including 31 persons connected with them; 32 pawnbrokers, and 30 others.
574 persons were returned as connected with insurance companies. There were also 8 actuaries, and 4 underwriters. Auctioneers, appraisers, and valuers numbered 192; and 151 more persons were also specified as having to do with this business. 12 persons were described as official or trade assignees, who, with 7 others, complete the sub-order.
The landowners were 454, against 375 in 1886. 151 land or estate agents, factors, or rent-collectors follow, with 50 assistants. The largest item of the group is that of 482 house proprietors. Only 27 persons (including 6 assistants) were returned as house agents.
[These, it must be remembered, are dealers only, not makers. The exclusion of the latter, and compliance with the rule of grouping persons stated to be both manufacturers and dealers as makers under Class IV., leaves some very small numbers, such as watch- and clock-dealer, 3, in Sub-order 7; while the watch- and clock-makers number 431 in Class IV.]
0.40 per cent. of total male population.
0.06 per cent. of total female population.
| Occupations, in Sub-orders. | Males. | Females. | Totals both Sexes. | ||||
|---|---|---|---|---|---|---|---|
| Under 20. | Over 20. | Totals. | Under 20. | Over 20. | Totals. | ||
| 1. Persons dealing in books, publications, and advertising | 127 | 349 | 476 | 9 | 30 | 39 | 515 |
| 2. Persons dealing in musical instruments | 4 | 34 | 38 | 1 | 3 | 4 | 42 |
| 3. Persons dealing in prints, pictures, and art-materials | .. | 8 | 8 | .. | 1 | 1 | 9 |
| 4. Persons dealing in ornaments, minor art-products, and small wares | 18 | 74 | 92 | 9 | 72 | 81 | 173 |
| 7. Persons dealing in watches, clocks, and scientific instruments | .. | 3 | 3 | .. | 2 | 2 | 5 |
| 9. Persons dealing in arms and explosives | 1 | .. | 1 | .. | .. | .. | 1 |
| 10. Persons dealing in machines, tools, and implements. | 4 | 56 | 60 | 2 | 12 | 14 | 74 |
| 12. Persons dealing in harness, saddlery, and leatherware | 3 | 22 | 25 | .. | 1 | 1 | 26 |
| 13. Persons dealing in ships, boats, and marine stores | 2 | 17 | 19 | .. | .. | .. | 19 |
| 14. Persons dealing in building-materials and house-fittings | 34 | 270 | 304 | .. | 3 | 3 | 307 |
| 15. Persons dealing in furniture | 7 | 75 | 82 | 2 | 9 | 11 | 93 |
| 16. Persons dealing in chemicals and by-products | 6 | 25 | 31 | .. | 1 | 1 | 32 |
| 17. Persons dealing in paper and paper-makers' materials | 43 | 139 | 182 | 7 | 19 | 26 | 208 |
| Totals, Order 5 | 249 | 1,072 | 1,321 | 30 | 153 | 183 | 1,504 |
172 booksellers stand as the first item, with 63 others in connection with this business. There were 203 news agents or newspaper sellers, the rest being book-lenders, advertising agents, bill-stickers, and others.
7 musical-instrument dealers, with 35 assistants, compose the sub-order.
There are only 9 persons altogether, being picture-dealers, art-and photographic-material dealers, and dealers in picture-frames.
Fancy-goods dealers, numbering 80, with assistants to the number of 86, form the principal item; there remain only 7 others.
11 persons are given as agricultural implement and machinery dealers, 55 persons as sewing-machine dealers, and there remain 8 others.
Includes 30 oil- and colour-men, with 106 timber-merchants, and 171 others assisting.
0.79 per cent. of total male population.
0.17 per cent. of total female population.
| Occupations, in Sub-orders. | Males. | Females. | Totals both Sexes. | ||||
|---|---|---|---|---|---|---|---|
| Under 20. | Over 20. | Totals. | Under 20. | Over 20. | Totals. | ||
| 1. Persons engaged in the sale, hire, or exchange of textile fabrics | 576 | 1,775 | 2,351 | 110 | 324 | 434 | 2,785 |
| 2. Persons engaged in the sale, hire, or exchange of dress | 49 | 232 | 281 | 22 | 54 | 76 | 357 |
| 3. Persons engaged in the sale, hire, or exchange of fibrous materials | 1 | 1 | 2 | .. | .. | .. | 2 |
| Totals, Order 6 | 626 | 2,008 | 2,634 | 132 | 378 | 510 | 3,144 |
32 persons were returned as Manchester warehousemen. 799 males and 7 females were given as assisting in soft-goods warehouses. There were 1,938 drapers and assistants, against 1,988 in 1886; and 9 silk-dealers, mercers, and others.
1.95 per cent. of total male population.
0.19 per cent. of total female population.
| Occupations, in Sub-orders. | Males. | Females. | Totals both Sexes. | ||||
|---|---|---|---|---|---|---|---|
| Under 20. | Over 20. | Totals. | Under 20. | Over 20. | Totals. | ||
| 1. Persons engaged in dealing in animal food | 848 | 2,796 | 3,644 | 35 | 103 | 138 | 3,782 |
| 2. Persons engaged in dealing in vegetable food | 161 | 704 | 925 | 45 | 219 | 204 | 1,189 |
| 3. Persons engaged in dealing in drinks, narcotics, and stimulants | 519 | 1,390 | 1,909 | 23 | 132 | 155 | 2,064 |
| Totals, Order 7 | 1,528 | 4,950 | 6,478 | 103 | 454 | 557 | 7,035 |
Dairymen, milksellers, numbered 607; butchers, 2,891, against 2,687 in 1886. Fish-dealing has increased, the figures under the head “Fishmonger” being 234, against 165 at the previous census. The rest of the sub-order consists of cheesemongers, provision-dealers, poulterers, to the number of 35, and 15 others.
Corn and flour merchants number 251; bread- and biscuit-dealers, 134; dealers in pastry and confectionery, 236; greengrocers and fruiterers, 456: all including those assistants who were described as employed in the above businesses. 71 produce merchants with 11 assistants remain, with 30 others.
0.39 per cent. of total male population.
0.00 per cent. of total female population.
| Occupations, in Sub-orders. | Males. | Females. | Totals both Sexes. | ||||
|---|---|---|---|---|---|---|---|
| Under 20. | Over 20. | Totals. | Under 20. | Over 20. | Totals. | ||
| 1. Persons engaged in dealing in and treating living animals | 170 | 863 | 1,033 | .. | .. | .. | 1,033 |
| 2. Persons engaged in dealing in manures and animal waste products | .. | 6 | 6 | .. | .. | .. | 6 |
| 3. Persons engaged in dealing in leather, raw materials and manufactures | 7 | 38 | 45 | .. | 2 | 2 | 47 |
| 4. Persons engaged in dealing in other animal matters | 8 | 84 | 92 | .. | .. | .. | 92 |
| 5. Persons engaged in dealing in seeds, plants, fodder, &c. | 22 | 81 | 103 | 2 | 1 | 3 | 106 |
| 6. Persons engaged in dealing in other vegetable matters (not included elsewhere) | .. | 3 | 3 | .. | .. | .. | 3 |
| Totals, Order 8 | 207 | 1,075 | 1,282 | 2 | 3 | 5 | 1,287 |
207 dealers in live-stock, 302 horse-breakers and other trainers of animals, and 430 grooms not being domestic servants, with 94 others, form this group.
Hide-dealers and dealers in prepared skins and leather are included here. As the dealers only are taken into account, the numbers are insignificant.
These are wool-brokers, 41, with 48 persons assisting, and 3 tallow, fat dealers.
58 seed-merchants and 20 persons assisting, with 17 florists, 9 hay- and straw-dealers, and 2 others, make up this group.
0.12 per cent. of total male population.
0.00 per cent. of total female population.
| Occupations, in Sub-orders. | Males. | Females. | Totals both Sexes. | ||||
|---|---|---|---|---|---|---|---|
| Under 20. | Over 20. | Totals. | Under 20. | Over 20. | Totals. | ||
| 1. Persons engaged in dealing in coal, &c, for fuel and light | 29 | 362 | 391 | .. | 6 | 6 | 397 |
| Totals, Order 9 | 29 | 362 | 391 | .. | 6 | 6 | 397 |
0.25 per cent. of total male population.
0.00 per cent. of total female population.
| Occupations, in Sub-orders. | Males. | Females. | Totals both Sexes. | ||||
|---|---|---|---|---|---|---|---|
| Under 20. | Over 20. | Totals. | Under 20. | Over 20. | Totals. | ||
| 1. Persons engaged in dealing in stone, clay, earthenware, glass, &c. | 7 | 44 | 51 | 1 | 3 | 4 | 55 |
| 2. Persons engaged in dealing in gold, silver, and precious stones | .. | 1 | 1 | .. | .. | .. | 1 |
| 3. Persons engaged in dealing in metals other than gold and silver | 170 | 616 | 786 | .. | 4 | 4 | 790 |
| Totals, Order 10 | 177 | 661 | 838 | 1 | 7 | 8 | 846 |
China and crockery-ware dealers numbered 13, and 18 persons were returned as assisting these. Dealers in glassware (7), pottery (5), lime, stone, and sand (10), and bricks and tiles (2), are the other items of the sub-order.
Ironmongers and hardware dealers form the chief item. There were 320 of these, besides 324 persons described as assisting, making 644 altogether, against 515 at the previous census. Kauri-gum buyers reached the number of 123, including 87 sorters, packers, scrapers, and others assisting. There remain 15 dealers in iron (bar, plate, rod, wire, &c.), and 8 others.
2.30 per cent. of total male population.
0.38 per cent. of total female population.
| Occupations, in Sub-orders. | Males. | Females. | Totals both Sexes. | ||||
|---|---|---|---|---|---|---|---|
| Under 20. | Over 20. | Totals. | Under 20. | Over 20. | Totals. | ||
| 1. Persons engaged as general dealers (undefined) | 601 | 3,535 | 4,136 | 160 | 617 | 777 | 4,013 |
| 2. Persons engaged in other mercantile pursuits (undefined) | 731 | 2,802 | 3,533 | 93 | 240 | 333 | 3,866 |
| Totals, Order 11 | 1,332 | 6,337 | 7,669 | 253 | 857 | 1,110 | 8,770 |
Of general merchants 413 were returned, and 89 persons assisting. General shopkeepers numbered 1,545 males and 410 females; besides whom, 890 males and 302 females (wives and others) were returned as rendering various kinds of assistance: making 3,147 of both sexes, against 2,793 in 1886. General dealers were 316; hawkers and pedlers, 228; brokers, 17. There were 507 commission agents, with 173 subordinates employed in this business, and 23 others.
0.31 per cent. of total male population.
0.00 per cent. of total female population.
| Occupations, in Sub-orders. | Males. | Females. | Totals both Sexes. | ||||
|---|---|---|---|---|---|---|---|
| Under 20. | Over 20. | Totals. | Under 20. | Over 20. | Totals. | ||
| 1. Persons engaged in storage | 112 | 922 | 1,034 | .. | 1 | 1 | 1,035 |
| Totals, Order 12 | 112 | 922 | 1,034 | .. | 1 | 1 | 1,035 |
Table of Contents
4.59 per cent. of total male population.
0.05 per cent. of total female population.
| Occupations, in Sub-orders. | Males. | Females. | Totals both Sexes. | ||||
|---|---|---|---|---|---|---|---|
| Under 20. | Over 20. | Totals. | Under 20. | Over 20. | Totals. | ||
| 1. Persons engaged on railways (not railway-construction) or tramways | 478 | 3,006 | 3,484 | .. | 6 | 6 | 3,490 |
| 2. Persons engaged on roads | 504 | 3,558 | 4,062 | .. | 10 | 10 | 4,072 |
| 3. Persons engaged on seas and rivers | 158 | 5,789 | 5,927 | 2 | 58 | 60 | 5,987 |
| 4. Persons engaged on postal service | 93 | 447 | 540 | 9 | 32 | 41 | 581 |
| 5. Persons engaged on telegraph and telephone service | 256 | 490 | 746 | 6 | 17 | 23 | 759 |
| 6. Persons engaged in delivery of documents, parcels, and messages | 427 | 83 | 510 | .. | 4 | 4 | 514 |
| Totals, Order 13 | 1,946 | 13,323 | 15,269 | 17 | 127 | 144 | 15,413 |
Contained in this sub-order are 720 railway managers, officers, clerks, stationmasters, or agents; 492 railway-engine drivers, stokers, and cleaners; 806 guards, porters, pointsmen, &c.; 1,262 gangers or fettlers, platelayers, and labourers engaged in maintaining open lines; and 210 persons in tram service. The total number is 3,490, against 2,762 in 1886.
The coach, omnibus, and cab proprietors, or their agents, were 273; the servants to these numbered 459; draymen, carriers, carters, and express-drivers, 2,868; and livery-stable keepers, 204. Including 268 drivers, packers, &c, makes the total number of 4,072, against 3,875 in 1886.
This sub-order is the largest of the three, there being more persons engaged in carrying on seas and rivers than on roads and railways. The largest item is 3,055 ship-masters, officers, and sea men; next come 804 engineers, stokers, and coal-trimmers of merchant steamers; 670 stewards and stewardesses of vessels; 650 stevedores or lumpers; 286 shipowners and agents; 170 watermen; 123 harbour- and pier-service officers; 69 lighthouse-keepers; 30 pilots; and 130 others.
The number of persons describing themselves as postal officers, postmasters, postmistresses, clerks, or sorters, but not apparently having any connection with telegraph work, was 410. Forty of these were females. Letter-carriers numbered 115; mail contractors and mail-men, 56.
Telegraph officers, operators, and clerks were returned at 483, only 13 being females. Electricians and linemen (77), telephone service (45), and messengers (164) complete the total.
Table of Contents
In Sub-class B of the commercial class all persons engaged in dealing were included; the makers or manufacturers have now to be considered.
2.82 per cent. of total male population.
0.0 per cent. of total female population.
| Occupations, in Sub-orders. | Males. | Females. | Totals both Sexes. | ||||
|---|---|---|---|---|---|---|---|
| Under 20. | Over 20. | Totals. | Under 20. | Over 20. | Totals. | ||
| 1. Persons engaged in connection with the manufacture of books and publications | 752 | 1,380 | 2,132 | 102 | 80 | 182 | 2,314 |
| 2. Persons engaged in connection with the manufacture of musical instruments. | 3 | 59 | 62 | .. | .. | .. | 62 |
| 3. Persons engaged in connection with the manufacture of prints, pictures, and art-materials | 43 | 97 | 140 | .. | 2 | 2 | 142 |
ORDER 14—continued.
| Occupations, in Sub-orders. | Males. | Females. | Totals both Sexes. | ||||
|---|---|---|---|---|---|---|---|
| Under 20. | Over 20. | Totals. | Under 20. | Over 20. | Totals. | ||
| 4. Persons engaged in connection with the manufacture of ornaments, minor art-products, and small wares | 28 | 127 | 155 | 9 | 16 | 25 | 180 |
| 6. Persons engaged, in connection with the manufacture of designs, medals, type, and dies | 4 | 36 | 40 | .. | .. | .. | 40 |
| 7. Persons engaged in connection with the manufacture of watches, clocks, and scientific instruments. | 74 | 368 | 442 | .. | 2 | 2 | 444 |
| 8. Persons engaged in connection with the manufacture of surgical instruments and appliances | 1 | 3 | 4 | .. | 2 | 2 | 6 |
| 9. Persons engaged in connection with the manufacture of arms and explosives | 5 | 40 | 45 | 6 | 6 | 12 | 57 |
| 10. Persons engaged in connection with the manufacture of machines, tools, and implements | 339 | 1,373 | 1,712 | 4 | .. | 4 | 1,716 |
| 11. Persons engaged in connection with the manufacture of carriages and vehicles | 261 | 924 | 1,185 | .. | 1 | 1 | 1,186 |
| 12. Persons engaged in connection with the manufacture of harness, saddlery, leather, and leatherware | 383 | 1,049 | 1,432 | 6 | 1 | 7 | 1,439 |
| 13. Persons engaged in connection with the manufacture of ships' boats and their equipment | 61 | 636 | 697 | 3 | 1 | 4 | 701 |
| 14. Persons engaged in connection with the manufacture of furniture | 289 | 983 | 1,272 | 12 | 34 | 46 | 1,318 |
| 15. Persons engaged in connection with the manufacture of chemicals and by-products | 7 | 54 | 61 | 5 | 1 | 6 | 67 |
| Totals, Order 14 | 2,250 | 7,129 | 9,379 | 147 | 146 | 293 | 9,672 |
Printers, 1,036; compositors, 793; bookbinders, 274; publishers, 127; and 84 others. In 1886 the printers and compositors were 1,641, and the bookbinders 206.
Lithographers and lithographic printers numbered 111, against 81 in 1886. The remainder consists of 30 picture-frame makers and picture-cleaners, and 1 camera-maker.
The items are 55 carvers, 10 modellers, 8 taxidermists, 4 toy-makers, 65 basket-makers, and 38 others.
Stamp, die, and medal makers, pattern designers, and rubber-stamp makers belong to this group.
There were 431 persons returned as watch and clock makers, including 47 described as apprentices or assistants. In 1886 the number was 383. 11 opticians and 2 instrument-makers complete the number.
These persons are makers of surgical instruments and appliances, trusses, and bandages.
Includes 41 armourers or gunsmiths. 14 cartridge-makers (12 of whom were females), and 2 others.
Mechanical engineers, fitters, iron-turners, and boiler-makers come to 1,514 persons, millwrights to 75, agricultural machinery and implement makers to 35. Makers of tools and cutlery and other makers of implements complete the group with 92 persons.
Coach and carriage builders, including 180 coach-painters and all assistants, numbered 751. There were 339 wheelwrights, 23 bicycle and perambulator makers, 70 railway-carriage, &c., builders, and 3 coach-spring makers.
Saddlery and harness makers with assistants numbered 1,010, against 892 in 1886; tanners and curriers, 405, an increase of 100 since the previous census. There were only 24 others.
518 persons were given as shipwrights or shipbuilders, 171 as sailmakers, leaving 12 ship-riggers, and block, mast, or oar makers.
990 cabinet or furniture makers, 225 bed or mattress makers or upholsterers, 34 undertakers, and 69 others compose the sub-order.
2.61 per cent. of total male population.
3.66 per cent. of total female population.
| Occupations, in Sub-orders. | Males. | Females. | Totals both Sexes. | ||||
|---|---|---|---|---|---|---|---|
| Under 20. | Over 20. | Totals. | Under 20. | Over 20. | Totals. | ||
| 1. Persons engaged in connection with the manufacture, repairs, cleansing, &c, of textile fabrics | 258 | 640 | 898 | 230 | 237 | 467 | 1,365 |
| 2. Persons engaged in connection with the manufacture of dress | 1,344 | 4,016 | 5,360 | 4,314 | 5,930 | 10,244 | 15,604 |
| 3. Persons engaged in connection with the manufacture of fibrous materials | 920 | 1,520 | 2,440 | 15 | 13 | 28 | 2,468 |
| Totals, Order 15 | 2,522 | 6.176 | 8,698 | 4,559 | 6,180 | 10,739 | 19,437 |
Persons connected with woollen manufacture, all branches, numbered 1,301, of whom 459 were females. There were 58 dyers or scourers and 6 others.
Clothing manufacturers, including tailors, cutters, fitters, sewing-machinists, apprentices, and all other assistants, numbered 4,254 persons, of whom 2,550 were females. Milliners and dressmakers were 6,613 persons, of whom only 11 were males. Boot- and shoe-making engaged 3,916 persons, 411 being females. The shirt-makers were 424—13 males and 411 females; hatters 127, stocking-makers 170, leaving 40 umbrella- and parasol-menders and 60 others. The number of females employed in the occupations belonging to this sub-order is in excess of the males.
l.29 per cent. of total male population.
0.05 per cent. of total female population.
| Occupations, in Sub-orders. | Males. | Females. | Totals both Sexes. | ||||
|---|---|---|---|---|---|---|---|
| Under 20. | Over 20. | Totals. | Under 20. | Over 20. | Totals. | ||
| 1. Persons engaged in processes relating to the production of animal food | 152 | 766 | 918 | 5 | 13 | 18 | 936 |
| 2. Persons engaged in processes relating to the production of vegetable food | Gil | 1,889 | 2,500 | 41 | 46 | 87 | 2,587 |
| 3. Persons engaged in processes relating to drinks, narcotics, and stimulants | 138 | 743 | 881 | 29 | 20 | 49 | 930 |
| Totals, Order 16 | 901 | 3,398 | 4,299 | 75 | 79 | 154 | 4,453 |
There are 169 slaughtermen returned, and 193 meat-preservers and sausage-makers. Fish-curing employed 57 persons, butter- and cheese-making 136, animal-food refrigerating 378, leaving 3 others in this sub-order.
Bakers and biscuit-makers contribute 1,905 persons, millers 460, fruit-preservers 50, confectionery-making 80, the employés of the sugar-refining works 87 persons, and others 5.
432 persons were engaged in brewing, 105 in malting, and 258 were aërated-water or cordial makers. Wine-making occupied 11 persons only. Tobacco-manufacture employed 40 people, of whom 21 were females; 33 were pickle- and sauce-makers; leaving 51 others.
1.06 per cent. of total male population.
0.01 per cent. of total female population.
| Occupations, in Sub-orders. | Males. | Females. | Totals both Sexes. | ||||
|---|---|---|---|---|---|---|---|
| Under 20. | Over 20. | Totals. | Under 20. | Over 20. | Totals. | ||
| 1. Persons engaged in manufactures or other processes connected with animal matters (not otherwise classed) | 146 | 443 | 589 | 13 | 4 | 17 | 606 |
| 2. Persons engaged in working in wood | 442 | 2,401 | 2,843 | 1 | 2 | 3 | 2,846 |
| 3. Workers in vegetable produce for fodder | 17 | 46 | 63 | .. | .. | .. | 63 |
| 4. Paper-manufacturers | 12 | 16 | 28 | 14 | 6 | 20 | 48 |
| Totals, Order 17 | 617 | 2,906 | 3,523 | 28 | 12 | 40 | 3,563 |
Soap-boilers and assistants give 101 persons to this sub-order; t’fellmongers, 403; tallow-melters, 21; bone-dust manufacturers, 18; others, 60, including 38 fiddle-string makers, with 16 glue-makers.
1.72 per cent. of total male population.
0.01 per cent. of total female population.
| Occupations, in Sub-orders. | Males. | Females. | Totals both Sexes. | ||||
|---|---|---|---|---|---|---|---|
| Under 20. | Over 20. | Totals. | Under 20. | Over 20. | Totals. | ||
| 1. Persons engaged in the conversion of coal, &c, to purposes of heat, light, &c. | 17 | 238 | 255 | .. | .. | .. | 255 |
| 2. Persons engaged in manufactures and processes relating to stone, clay, earthenware, glass, &c... | 153 | 551 | 704 | 7 | 4 | 11 | 715 |
| 3. Persons engaged in manufactures relating to gold, silver, and precious stones | 60 | 167 | 227 | 1 | 9 | 10 | 237 |
| 4. Persons engaged in manufactures relating to metals other than gold and silver | 1,242 | 3,314 | 4,556 | .. | 5 | 5 | 4,561 |
| Totals, Order 18 | 1,472 | 4,270 | 5,742 | 8 | 18 | 26 | 5,768 |
191 persons were employed in gasworks service, 10 at coke-manufacture; 36 were engaged in the production of electricity, including 25 electrical engineers. There were 16 charcoal-burners, and 2 others.
The contents of this sub-order are 53 stone-cutters, 50 lime-burners, 18 plaster or cement makers, 450 brick and tile makers, 103 pottery-makers, with 6 glass manufacturers, and 35 others.
The numbers are 216 goldsmiths, silversmiths, and jewellers; 11 lapidaries; and 10 others.
Comprises 49 coppersmiths; 474 workers in tin; 130 malleable-iron manufacturers and workers, such as smelters and puddlers; 501 cast-iron founders, moulders, and workers; and 2 workers in antimony or lead. Blacksmiths, farriers, and whitesmiths, 3,236; brass founders and workers, 105; locksmiths, 13; and others, 51, complete the group.
3.81 per cent. of total male population.
0.00 per cent. of total female population.
| Occupations, in Sub-orders. | Males. | Females. | Totals both Sexes. | ||||
|---|---|---|---|---|---|---|---|
| Under 20. | Over 20. | Totals. | Under 20. | Over 20. | Totals. | ||
| 1. Persons engaged in making or repairing houses and buildings | 1,089 | 8,685 | 9,774 | 4 | 8 | 12 | 9,786 |
| 2. Persons engaged in making or repairing roads, railways, bridges, &c. | 180 | 2,635 | 2,815 | .. | .. | .. | 2,815 |
| 3. Persons employed in the disposal of dead matter or refuse | 1 | 77 | 78 | .. | .. | .. | 78 |
| Totals, Order 19 | 1,270 | 11,397 | 12,667 | 4 | 8 | 12 | 12,079 |
There were 5,468 carpenters, turners, and carpenters' assistants; 829 builders, with assistants; 322 stonemasons and labourers helping; 623 bricklayers and bricklayers' labourers; 1,573 house-painters, paperhangers, glaziers, and decorators; 700 plumbers and bellhangers; 189 plasterers; 26 slaters; and 56 others. Carpenters have decreased since 1886 from 6,776 to 5,468; bricklayers, from 792 to 623.
Of this sub-order, 2,027 persons were navvies, road or railway labourers, or excavators. In 1886 the number stated was 4,169. Platelayers engaged in maintenance of railways have been included in Order 13, Sub-order 1. There were 263 road or railway contractors, with 132 skilled assistants, such as foremen and clerks; and 151 carters, 76 engine-drivers (defined as at works). There were 33 persons engaged in breaking stones, 28 in working dredges or diving, 86 were drainers, leaving 19 others.
4.47 per cent. of total male population.
0.02 per cent. of total female population.
| Occupations, in Sub-orders. | Males. | Females. | Totals both Sexes. | ||||
|---|---|---|---|---|---|---|---|
| Under 20. | Over 20. | Totals. | Under 20. | Over 20. | Totals. | ||
| 1. Industrial workers imperfectly defined | 2,837 | 12,051 | 14,888 | 25 | 36 | 61 | 14,949 |
| Totals, Order 20 | 2,837 | 12,051 | 14,888 | 25 | 36 | 6l | 14,949 |
Table of Contents
26.39 per cent. of total male population.
0.92 per cent. of total female population.
| Occupations, in Sub-orders. | Males. | Females. | Totals both Sexes. | ||||
|---|---|---|---|---|---|---|---|
| Under 20. | Over 20. | Totals. | Under 20. | Over 20. | Totals. | ||
| 1. Persons directly engaged in agricultural pursuits | 12,657 | 44,014 | 50,671 | 808 | 1,579 | 2,387 | 59,058 |
| 2. Persons directly engaged in pastoral pursuits | 1,250 | 8,029 | 9,279 | 71 | 196 | 270 | 9,549 |
| 3. Persons directly engaged in fisheries, &c. | 377 | 1,518 | 1,895 | 4 | 1 | 5 | 1,900 |
| 4. Persons directly engaged in forestry, or the acquisition of raw products yielded by vegetation | 372 | 2,016 | 2,988 | .. | .. | .. | 2,988 |
| 5. Persons engaged in the conservancy of water | 11 | 110 | 121 | .. | 1 | 1 | 122 |
| 6. Persons engaged in mines, quarries, &c. | 1,305 | 15,601 | 16,906 | 5 | 18 | 23 | 16,929 |
| Totals, Order 21 | 15,972' | 71,888 | 87,860 | 891 | 1,795 | 2,686 | 90,546 |
Farmers and market-gardeners, taken together, increased from 22,699 persons in 1886 to 26,751 in 1891. Of the number in 1891, 761 were females. Relatives assisting on farms numbered 14,286, of whom 1,555 were females; farm servants and agricultural labourers amounted to 13,749, and farm bailiffs to 349. There were 206 fruit-growers, 2,276 gardeners or horticulturists, 800 agricultural-implement owners and workers, including ploughmen (not servants) and threshing-machine proprietors; and 641 others, 201 of whom were ploughing contractors and 150 nurserymen.
Runholders, graziers, sheep- or cattle-farmers, increased from 828 in 1886 to 1,426 in 1891; the relatives assisting were returned at 374. Station managers increased from 387 to 512; and station servants, such as stockriders, drovers, shepherds, shearers, &c., from 4,577 in 1886 to 6,429 in 1891. There were also 452 dairy-farmers, 313 milkers and others connected with dairies, and 43 others.
Against 476 fishermen in 1886 there were 567 in 1891. Rabbiters increased from 690 to 1,251. 15 persons were given as apiarists or bee-farmers.
Gold-miners numbered 12,234, against 10,892 at the previous census. Only 39 persons were engaged in silver-mining. Coal-miners were returned at 1,722, an increase of 476 on the number in 1886. 73 persons were mining for antimony, and 7 were manganese-miners. 171 persons were engaged in quarrying. Kauri-gum diggers, scrapers, pickers, packers, and sorters show a large increase, the numbers being 1,297 in 1886 and 2,558 in 1891. The others number 125.
Table of Contents
1.30 per cent. of total male population.
1.16 per cent. of total female population.
| Occupations, in Sub-orders. | Males. | Females. | Totals both Sexes. | ||||
|---|---|---|---|---|---|---|---|
| Under 20. | Over 20. | Totals. | Under 20. | Over 20. | Totals. | ||
| 1. Persons of independent means, having no specific occupation, or undefined.. | 21 | 1,598 | 1,619 | 24 | 1,460 | 1,484 | 3,103 |
| 2. Others undefined, both as regards means and particular occupation | 288 | 2,434 | 2,722 | 48 | 1,878 | 1,926 | 4,648 |
| Totals, Order 22 | 309 | 4,032 | 4,341 | 72 | 3,338 | 3,410 | 7,751 |
Of these, 145 were pensioners, 440 annuitants, 1,250 were described as “gentlemen,” and 1,268 as “ladies.”
These are 1,372 managers, assistants, apprentices, proprietors, employers, foremen, partners, and contractors not more specifically defined; with 3,276 others, amongst whom may be noticed 1,245 visitors not performing domestic duties, 1,017 “not stated” as to occupation, 277 “lodgers,” 235 “relatives” (all females), 177 of “no occupation” (all males), and 118 given as “unemployed.”
Table of Contents
36.77 percent, of total male population.
84.00 percent, of total female population.
| Occupations, in Sub-orders. | Males. | Females. | Totals both Sexes. | ||||
|---|---|---|---|---|---|---|---|
| Under 20. | Over 20. | Totals. | Under 20. | Over 20. | Totals. | ||
| 1. Persons performing domestic duties for which remuneration is not paid | 346 | 47 | 393 | 19,720 | 104,745 | 124,465 | 124,858 |
| 2. Dependent scholars and students | 72,769 | 216 | 72,985 | 73,627 | 149 | 73,776 | 146,701 |
| 3. Dependent relatives not stated to be performing domestic duties | 48,026 | 406 | 49,032 | 47,611 | 916 | 48,527 | 97,559 |
| Totals, Order 23 | 121,741 | 669 | 122,410 | 140,958 | 105,810 | 240,768 | 369,178 |
Includes 83,808 wives or widows of no specified occupation, 36,018 sons, daughters, or relatives performing domestic duties, 4,729 visitors and lodgers also engaged in domestic services, and 303 others, of whom 223 were described as “head of house.”
92 of these were relatives supported while at university, 139,253 were sons, daughters, or relatives at school, and 7,416 were children receiving tuition at home.
Sub-order 3. Dependent Relatives not performing Domestic Duties.
321 were aged parents dependent on children, 93,300 were sons, daughters, or relatives simply so described, and 3,938 were termed visitors, lodgers, or boarders.
0.94 percent, of total male population.
0.54 percent, of total female population.
| Occupations, in Sub-orders. | Males. | Females. | Totals both Sexes. | ||||
|---|---|---|---|---|---|---|---|
| Under 20. | Over 20. | Totals. | Under 20. | Over 20. | Totals. | ||
| 1. Persons supported by voluntary and State contributions | 659 | 2,041 | 2,700 | 440 | 1,097 | 1,537 | 4,237 |
| 2. Criminal class | 16 | 405 | 421 | 3 | 56 | 59 | 480 |
| Totals, Order 24 | 675 | 2,446 | 3,121 | 443 | 1,153 | 1,596 | 4,717 |
These are inmates of hospitals, benevolent, orphan, and lunatic asylums, industrial schools, and refuges, to the number of 4,017; with 2 paupers or beggars and 218 others, inmates of various institutions, or described as receiving charitable aid.
Includes 480 prisoners in gaol.
The whole order is 0.75 percent, of the population, against 0.73 percent, in 1886.
Table of Contents
Any statement of the occupations of a people must necessarily be incomplete unless something more than the mere occupation itself be given, because persons nominally of the same occupation may be of very different importance in a community. In making use of the tables of occupations, it is at once found that, unless certain broad lines of demarcation between (1) employers, (2) independent workers —persons in business on their own account but not employing others, (3) wage-earners, and (4) relatives assisting, are carefully maintained, and the results brought out accordingly, there must be such a radical defect in the work as to interfere most seriously with its value. An instruction was given in the household schedule to the effect that what has been termed the “grade” of occupation should be represented by means of an initial letter. Employers were directed to write E, persons on their own account O, wage-earners W, and relatives assisting A. The full results of the inquiry are given in the detailed tables in the census volume, pages 279 to 295. The entries on the schedules were not found altogether satisfactory, but are believed to be mainly reliable. At any rate, a beginning has been made which at future censuses will probably develop into a system of obtaining very valuable information. Amongst the males of Section A, as the breadwinners are termed in the classification of occupations, 11.98 percent. were found to be employers, 14.61 percent, in business on their own account, 58.10 were wage-earners, and 15.31 percent, relatives assisting or not described. Two other colonies have published returns by which their populations can be compared—namely, Victoria and Tasmania. In Victoria the proportions were: Employers, 10.19 percent.; independent workers, 16.12 percent.; wage-earners, 68.44 percent.; leaving 5.25 percent, who were designated as unemployed. The results for the two colonies would have probably come exceedingly close if the compilation had been made under the same heads; but in New Zealand a person temporarily out of work was still entered as a wage-earner, and no separate account was taken of the unemployed. On the other hand, relatives assisting but not receiving pay were kept apart from wage-earners, and of these there is a large number. In Tasmania the proportions for the male population are: Employers, 10.70 percent.; engaged on own account, 16.95 percent.; relatives assisting, 8.21 percent.; wage-earners, 61.41 percent.; and unemployed, 2.73 percent. Thus it is found that New Zealand has the highest proportion of male employers for the three colonies under review, but somewhat fewer persons working on their own account. The proportion of wage-earners for New Zealand also seems to be less than in the other two colonies, but this may be accounted for in the case of Victoria by the fact of relatives assisting having been differently dealt with there. On the female side of the population of New Zealand the returns of breadwinners showed 3.06 percent, of employers, 7.06 percent, employed on their own account, 61.53 percent, of wage-earners, and 28.35 percent, of relatives assisting or not described. Although it may seem strange at first that the proportion percent, of females who were wage-earners should be higher than that of the males, it must be recollected that the breadwinners only are included in the calculation, to the entire omission of the dependent population, and that in the case of females the breadwinners amounted only to 45,417 out of a total of 293,781. In Victoria the female employers were 2.68 percent, of the total breadwinners, and the wage-earners 68.88 percent., both results approximating to those obtained in New Zealand. But those employed on their own account are returned as high as 25.54 percent., a result evidently due to the inclusion of a large number of the indefinite class, which have been differently treated in New Zealand; and 2.90 percent, are given as unemployed. For Tasmania the employers are 2.98 percent., wage-earners 64.43 percent., the proportions so far agreeing with the figures for New Zealand; but 18.67 percent, have been classed as engaged on their own account, 12.09 percent, as relatives assisting, and 1.83 as unemployed. The result of the inquiry for New Zealand is shown in the following tables for the different classes of breadwinners, but the attempt to obtain the numbers in the several grades must be regarded as rather of the nature of experiment at present.
| Occupations. | Males. | Females. | ||||||||
|---|---|---|---|---|---|---|---|---|---|---|
| Employers | In Business on own account but not Employing other Persons. | Wage-earners | Relative assisting but not Receiving Wages,and other undescribed. | Total Males | Employers | In Business an open account but not Employing other Persons. | Wage-earners | Relative assisting but not Receiving Wages,and other undescribed. | Total Males | |
| Section A.—Breadwinners | ||||||||||
| I. Professional | 850 | 1,178 | 6,955 | 1.099 | 10,082 | 83 | 513 | 3,778 | 1,365 | 5,739 |
| II. Domestic | 1,125 | 609 | 3,291 | 512 | 5,537 | 256 | 532 | 15,610 | 2,993 | 19,391 |
| III. Commercial— | ||||||||||
| A. Property and Finance | 322 | 293 | 1,837 | 962 | 3,414 | 23 | 11 | 3 | 305 | 342 |
| B. Trade | 3,594 | 3,481 | 11,930 | 1,608 | 20,613 | 164 | 582 | 980 | 653 | 2,379 |
| C. Storage | 10 | 3 | 991 | 30 | 1,034 | .. | .. | 1 | .. | 1 |
| D. Transport and Communication | 623 | 1,045 | 12,647 | 954 | 15,269 | 7 | .. | 117 | 20 | 144 |
| IV. Industrial | 5,791 | 4,449 | 45,194 | 3,762 | 59,196 | 524 | 1,225 | 7,237 | 2,339 | 11,325 |
| V. Primary Producers— | ||||||||||
| A. Agricultural | 9,939 | 10,610 | 19,227 | 16,895 | 56,671 | 273 | 284 | 82 | 1,748 | 2,387 |
| B. Pastoral | 1,114 | 487 | 6,873 | 805 | 9,279 | 33 | 43 | 30 | 164 | 270 |
| C. Mineral | 623 | 7,362 | 6,736 | 2,185 | 16,906 | .. | 1 | 1 | 21 | 23 |
| D. Other Primary Producers | 268 | 465 | 3,901 | 370 | 5,004 | 2 | 1 | .. | 3 | 6 |
| VI. Indefinite | 583 | 306 | 894 | 2,558 | 4,341 | 26 | 12 | 106 | 3,266 | 3,410 |
| Totals | 24,842 | 30,288 | 120,476 | 31,740 | 207,346 | 1,391 | 3,204 | 27,945 | 12,877 | 45,417 |
| Section B.— Dependents (Non-breadwinners). | ||||||||||
| VII. Dependents— | ||||||||||
| A. On Natural Guardians | .. | .. | .. | .. | 122,410 | .. | .. | .. | .. | 246,768 |
| B. On the State or Public Charity | .. | .. | .. | .. | 3,121 | .. | .. | .. | .. | 1,596 |
| Totals | 24,842 | 30,288 | 120,476 | 31,740 | 332,877 | 1,391 | 3,204 | 27,945 | 12,877 | 293,781 |
| Occupations. | Males. | Females. | ||||||||
|---|---|---|---|---|---|---|---|---|---|---|
| Employers | In Business on own account but not Employing other Persons. | Wage-earners | Relative assisting but not Receiving Wages, and other undescribed. | Total Males | Employers | In Business an own account but not Employing other Persons. | Wage-earners | Relative assisting but not Receiving Wages,and other undescribed. | Total Males | |
| Section A.—Breadwinners. | ||||||||||
| I. Professional | 8.43 | 11.68 | 68.99 | 10.90 | 100.00 | 1.45 | 8.94 | 65.83 | 23.78 | 100.00 |
| II. Domestic | 20.32 | 11.00 | 59.43 | 9.25 | 100.00 | 1.32 | 2.74 | 80.50 | 15.44 | 100.00 |
| III. Commercial— | ||||||||||
| A. Property and Finance | 9.43 | 8.58 | 53.81 | 28.18 | 100.00 | 6.72 | 3.22 | 0.88 | 89.18 | 100.00 |
| B. Trade | 17.43 | 16.89 | 57.88 | 7.80 | 100.00 | 6.89 | 24.47 | 41.19 | 27.45 | 10000 |
| C. Storage | 0.96 | 0.29 | 95.85 | 2.90 | 100.00 | .. | .. | 100.00 | .. | 100.00 |
| D. Transport and Communication | 4.08 | 6.84 | 82.83 | 6.25 | 100.00 | 4.86 | .. | 81.25 | 13.89 | 100.00 |
| IV. Industrial | 9.78 | 7.52 | 76.35 | 6.35 | 10000 | 4.63 | 10.82 | 63.90 | 20.C5 | 100.00 |
| V. Primary Producers— | ||||||||||
| A. Agricultural | 17.54 | 18.72 | 33.93 | 29.81 | 100.00 | 11.44 | 11.90 | 3.43 | 73.23 | 100.00 |
| B. Pastoral | 12.01 | 5.25 | 74.07 | 8.67 | 100.00 | 12.22 | 15.93 | 11.11 | 60.74 | 100.00 |
| C. Mineral | 3.69 | 43.55 | 39.84 | 12.92 | 100.00 | .. | 4.35 | 4.35 | 91.30 | 100.00 |
| D. Other Primary Producers | 5.36 | 9.29 | 77.96 | 7.39 | 100.00 | 33.33 | 16.67 | .. | 50.00 | 100.00 |
| VI. Indefinite | 13.43 | 7.05 | 20.59 | 5S.93 | 100.00 | 0.76 | 0.35 | 3.11 | 95.78 | 100.00 |
| Totals | 11.98 | 14.61 | 58.10 | 15.31 | 100.00 | 3.06 | 7.00 | 61.53 | 28.35 | 100.00 |
Of the male Chinese (4,426) resident in the colony on the 5th April, 1891, 3,025 or 68.35 percent, were miners (2,943 alluvial, 82 undefined), 603 were given as market-gardeners or garden labourers, 75 as greengrocers or fruit-hawkers, 143 as merchants or storekeepers or their assistants. Cooks and other servants numbered 194, boarding-house and eating-house keepers 38. There were 45 employed on board ships, and 12 fishermen. 74 were returned as labourers undefined; 10 were clerks, and 1 a law clerk; 4 “medical men,“ and 1 a chemist; and 1 a painter in oils. Of laundrymen there were only 4, of interpreters the same number. Among others were: 25 fishmongers and fish-hawkers, 13 carpenters and cabinetmakers, 7 drapers, 5 packers, 4 butchers, 4 rabbiters, and 1 bush-labourer.
Of the 18 Chinese females, 1 was a music-teacher, 1 a domestic servant, and 1 a Government scholar. The others were described either as children or employed in domestic duties at home.
Table of Contents
Table of Contents
The entries in the census household schedule of the words “Sickness and Accident” afford the means of obtaining information which cannot be derived from any other source—that is, information as to the health of the whole adult population on a given day, accepting inability to work as a definition of illness. No notice was taken of the sickness of persons under 15 years of age, as the instruction on the schedule was that the word “sick” or “accident” was to be entered, as the case might be, opposite the name of any person who might at the time of the census be prevented from following his or her usual occupation by reason of illness. This being the case, the entries found in respect of persons under 15 years of age could not be regarded as of any value. Besides sickness and accidents, householders were desired to return all persons afflicted by certain infirmities, writing the words “Deaf-and-dumb,” “Blind,” “Insane,” “Idiotic,” “Epileptic,” “Paralytic,” “Leprous,” “Lost a limb or crippled,” as the case might be.
The number of both sexes over 15 years of age returned as sick was 3,540, and those suffering from specified complaints 590, making altogether 4,130 persons who were incapacitated from work on the census-day by reason of illness. 679 persons were also incapacitated oh account of accident, making altogether 4,809 persons disabled at the time, or a proportion of 127.80 per 10,000 of the population over 15 years of age. Of this proportion, 109.76 per 10,000 were sick or had complaints specifically mentioned, and 18.04 were suffering from the effects of accident. Comparing the proportions of sick for the sexes, they are found to be 109.56 per 10,000 of the males over 15, against 109.99 of the females; but in respect of accident the proportion for males was vastly in excess of that for the females, the figures being 28.20 and 5.71 per 10,000 over 15 years respectively.
The sickness and accidents for each quinquennial period of age are exhibited in the following table for each sex:—
| Ages. | Proportions per 10,000 living at each Age-period. | |||||
|---|---|---|---|---|---|---|
| Suffering from Sickness.* | Suffering from Accident. | Totals for Sickness and Accident. | ||||
| Males. | Females. | Males. | Females. | Males. | Females. | |
| * Including those returned with “specified complaints.” | ||||||
| 15 and under 20 years | 42.97 | 64.30 | 19.95 | 2.15 | 62.92 | 66.45 |
| 20 and under 25 years | 55.40 | 74.15 | 19.41 | 3.02 | 74.81 | 77.17 |
| 25 and under 30 years | 53.57 | 80.89 | 21.94 | 4.47 | 75.51 | 85.36 |
| 30 and under 35 years | 56.31 | 90.55 | 23.16 | 3.30 | 79.47 | 93.91 |
| 35 and under 40 years | 69.22 | 100.58 | 27.79 | 3.31 | 97.01 | 109.89 |
| 40 and under 45 years | 69.84 | 111.64 | 28.72 | 7.44 | 98.56 | 119.08 |
| 45 and under 50 years | 118.63 | 131.00 | 25.84 | 7.61 | 144.47 | 138.61 |
| 50 and under 55 years | 167.56 | 138.07 | 30.41 | 15.12 | 197.97 | 153.19 |
| 55 and under 60 years | 243.03 | 190.75 | 52.08 | 21.14 | 295.11 | 217.89 |
| 60 and under 65 years | 305.79 | 273.05 | 50.75 | 13.43 | 350.54 | 286.48 |
| 65 and under 70 years | 476.68 | 323.71 | 68.82 | 3.90 | 545.50 | 327.01 |
| 70 and under 75 years | 623.00 | 383.59 | 67.89 | 5.33 | 690.89 | 388.92 |
| 75 and under 80 years | 629.72 | 555.56 | 75.57 | 10.08 | 705.29 | 566.24 |
| 80 and upwards | 626.74 | 651.83 | 55.71 | 63.59 | 682.45 | 715.42 |
| Total, 15 years and upwards | 109.56 | 109.99 | 28.20 | 5.71 | 137.70 | 115.70 |
It will be observed that the sickness increases in proportion in the case of males, with slight exceptions, at every period of age, and in the case of females with unvarying steadiness. It is also noticeable that at the period 15.20 years the sickness of the girls is half as much again as that of the youths. This excess of sickness in the case of females is preserved at each quinquennium until the period 50.55, when the positions are reversed, the proportions being 167.56 per 10,000 of males and 138.07 of females. At the succeeding periods males are found to be subject to an increasing liability to sickness, until at the period 70.75 years the proportions are found to be: Males, 623.00; females, 383.59. After this the proportions approximate more closely, but the sickness of males is found to be still the greater of the two. At all ages the proportions for 1891 were: Males, 109.56, against 111.28 in 1886; and females, 109.99, against 91.53 in 1886.
Reference has been made already to the vastly greater liability to accident in the case of males than of females. Examining the proportions in case of each sex at the quinquennial periods, it is found that for males the proportion rises from 19.95 per 10,000 of those living at 15.20 years to 68.82 at 65.70; while the proportion of females is only 2.15 at the 15.20 period, and rises only to 21.14 at the period 55.60 years.
The proportions suffering from accident at successive censuses are stated below:—
| Persons. | Males. | Females. | |
|---|---|---|---|
| Census 1874 | 21.26 | 30.80 | 5.82 |
| Census 1878 | 20.17 | 31.19 | 3.93 |
| Census 1881 | 20.45 | 32.10 | 4.09 |
| Census 1880 | 21.74 | 34.84 | 4.72 |
| Census 1891 | 18.04 | 28.20 | 5.71 |
The number of persons in respect of whom any specified infirmity was given in the census household schedule has been shown at all ages. Included are the “Deaf-and-dumb,” “Blind,” “Lunatic,” “Idiots,” “Epileptic,” “Paralysed,” “Crippled and Deformed,” “Suffering from Debility and Infirmity,” and those “Deaf only.”
The total of both sexes under all these heads amounted to 4,587 of all ages. The males were 2,945, and females 1,642, the proportions for every 10,000 persons living being 72.35; for males 87.09, and for females 55.67., per 10,000 of each sex respectively.
The number of the deaf-and-dumb returned at the census of 1891 was 166 of both sexes, the males being 93 and females 73. Included amongst these are 26 persons described as “Dumb” only. Out of a total number of 166, 134 were under 30 years of age.
It would appear that the proportion of the deaf-and-dumb in the colony increases with time, but not to any very great degree. The figures are given for five census-periods:—
| Persons. | Males. | Females. | |
|---|---|---|---|
| Census 1874 | 1.90 | 2.05 | 1.71 |
| Census 1878 | 2.22 | 2.25 | 2.18 |
| Census 1881 | 2.33 | 2.23 | 2.45 |
| Census 1886 | 2.30 | 2.37 | 2.22 |
| Census 1891 | 2.65 | 2.80 | 2.49 |
The proportions of deaf-and-dumb males at quinquennial age-periods diminished from 5.65 per 10,000 living at the period 10 to 15 years till at 55 to 60 the proportion was nil. Of the females, 4.02 per 10,000 were found to be deaf-and-dumb at the age of 20.25 years, which is the highest proportion of the quinquennial age-periods. At the higher ages the proportions diminished with slight exception, as in case of the males, until the period 60 to 65 years. At extreme age the proportions are again higher.
The number of deaf-and-dumb under 15 years of age was 75. Referring to the report of the Hon. the Minister of Education, it is found that the Deaf-mute Institution at Sumner had 50 pupils in December, 1891, from which it may be inferred that about 25 juvenile deaf-mutes exist in the colony who do not participate in the advantage of the oral system of teaching and other benefits to be derived from that establishment.
The number of the population of the colony under 15 years of age was 250,368 at the date of the census, so that, with a total number of 75 deaf-mutes at that period of life, there was 1 deaf-mute in every 3,338 children. The proportion of deaf-mutes of all ages to the total population of the colony was 1 in every 3,775 persons.
In Victoria the proportion of deaf-mutes to the total population was at the census of 1891 found to be 1 in every 3,103 persons.
The occupations of the deaf-and-dumb were returned in the census as shown below:—
| M. | F. | ||||
|---|---|---|---|---|---|
| Persons. | Under 20. | Over 20. | Under 20. | Over 20. | |
| Domestic servant | 5 | .. | .. | 1 | 4 |
| Hotel servant | 1 | .. | 1 | .. | .. |
| Hairdresser | 1 | .. | 1 | .. | .. |
| Capitalist | 1 | .. | 1 | .. | .. |
| Proprietor of land | 1 | .. | 1 | .. | .. |
| Storeman | 1 | 1 | .. | .. | .. |
| Saddler | 2 | .. | 2 | .. | .. |
| Tanner | 1 | .. | 1 | .. | .. |
| Cabinetmaker | 1 | .. | 1 | .. | .. |
| Tailor | 2 | .. | 2 | .. | .. |
| Dressmaker | 2 | .. | .. | 1 | 1 |
| Bootmaker | 2 | .. | 1 | .. | 1 |
| Sawmiller | 1 | .. | 1 | .. | .. |
| Carpenter | 2 | .. | 2 | .. | .. |
| Labourer (undefined) | 2 | 2 | .. | .. | .. |
| Farmer | 3 | .. | 3 | .. | .. |
| Relative assisting farmer | 4 | .. | 4 | .. | .. |
| Farm labourer, ploughman | 4 | .. | 4 | .. | .. |
| Assisting in garden | 1 | .. | 1 | .. | .. |
| Fisherman | 1 | .. | 1 | .. | .. |
| Goldminer (alluvial) | 3 | 1 | 2 | .. | .. |
| Not stated | 28 | 12 | 4 | 7 | 5 |
| Domestic duties | 30 | .. | .. | 8 | 22 |
| Government scholars | 4 | 4 | .. | .. | .. |
| Dependent relatives | 17 | 8 | .. | 9 | .. |
| Inmate of benevolent asylum | 3 | 1 | 2 | .. | .. |
| Inmate of deaf-and-dumb institution | 42 | 28 | .. | 14 | .. |
| Inmate of orphan asylum | 1 | 1 | .. | .. | .. |
| Totals | 166 | 58 | 35 | 40 | 33 |
274 persons were returned as “blind” or “nearly blind.” Of these, 164 were males and 110 females. The results of five censuses are compared in the following table, which shows a steady rise in the numbers of the blind considered in proportion to population, and also that blindness amongst males is somewhat more prevalent in New Zealand than amongst females:—
| persons. | males. | females. | |
|---|---|---|---|
| Census 1874 | 2.34 | 2.45 | 2.18 |
| Census 1878 | 2.56 | 2.42 | 2.73 |
| Census 1881 | 2.82 | 2.93 | 2.68 |
| Census 1880 | 3.22 | 3.65 | 2.70 |
| Census 1891 | 4.37 | 4.91 | 3.74 |
The proportions of the blind in Victoria at the census of 1891 were 8.72, 10.24, and 7.07 in every 10,000 persons, males, and females respectively.
Of 274 blind persons, only 66 were found to be under 40 years of age, blindness being a disease more common to the later periods of life.
During the year 1891 9 blind pupils were maintained by the Government at a school in Melbourne, and 2 at a school in Sydney; but these have since been brought back to New Zealand, a new institution being now in operation at Auckland, which had received 18 pupils altogether in June last.
Blind persons are returned in the census under many heads of occupation, as might be expected, considering the fact, already alluded to above, that blindness is more common in later life than in youth. No doubt the occupations stated must be looked upon in many instances as past occupations—occupations to which the persons referred to were brought up, and which they followed before they became blind.
The occupations for 1891 are as follow:—
| M. | F. | ||||
|---|---|---|---|---|---|
| Persons. | Under 20. | Over 20. | Under 20. | Over 20. | |
| Justice of the Peace | 1 | .. | 1 | .. | .. |
| Monthly nurse | 1 | .. | .. | .. | 1 |
| School-teacher | 2 | .. | 1 | .. | 1 |
| Instructor to the blind | 1 | .. | 1 | .. | .. |
| Photographer | 1 | .. | 1 | .. | .. |
| Music-teacher | 2 | .. | 2 | .. | .. |
| Boarding-ho use keeper | 1 | .. | 1 | .. | .. |
| Housekeeper | 1 | .. | .. | .. | 1 |
| Capitalist | 3 | .. | 2 | .. | 1 |
| Proprietor of land | 1 | .. | 1 | .. | .. |
| News vendor | 1 | .. | 1 | .. | .. |
| Bootlaces and match vendor | 1 | .. | 1 | .. | .. |
| Draper | 1 | .. | 1 | .. | .. |
| Butcher | 1 | .. | 1 | .. | .. |
| Greengrocer | 1 | .. | 1 | .. | .. |
| Grocer | 1 | .. | 1 | .. | .. |
| Labourer in coal-yard | 1 | .. | 1 | .. | .. |
| Storekeeper | 2 | .. | 2 | .. | .. |
| General dealer | 2 | .. | 2 | .. | .. |
| Hawker | 1 | .. | 1 | .. | .. |
| Commission agent | 1 | .. | 1 | .. | .. |
| Clerk | 1 | .. | 1 | .. | .. |
| Assisting carrier | 1 | 1 | .. | .. | .. |
| Piano-tuner | 1 | .. | 1 | .. | .. |
| Basket-maker | 3 | .. | 3 | .. | .. |
| Coach-painter | 1 | .. | 1 | .. | .. |
| Boat builder | 1 | .. | 1 | .. | .. |
| Chair-mender | 1 | .. | 1 | .. | .. |
| Boot- and shoemaker | 1 | .. | 1 | .. | .. |
| Baker | 1 | .. | 1 | .. | .. |
| Brewer | 1 | .. | 1 | .. | .. |
| Cordial-maker | 1 | .. | 1 | .. | .. |
| Sawyer | 1 | .. | 1 | .. | .. |
| Brickmaker | 1 | .. | 1 | .. | .. |
| Tinsmith | 1 | 1 | .. | .. | .. |
| Blacksmith | 1 | .. | 1 | .. | .. |
| Moulder | 1 | .. | 1 | .. | .. |
| Carpenter | 4 | .. | 4 | .. | .. |
| Labourer on roads | 1 | .. | 1 | .. | .. |
| Engineer | 1 | .. | 1 | .. | .. |
| Labourer (undefined) | 13 | .. | 13 | .. | .. |
| Farmer | 11 | .. | 11 | .. | .. |
| Relative assisting farmer | 1 | .. | 1 | .. | .. |
| Farm labourer | 2 | .. | 2 | .. | .. |
| Gardener | 1 | .. | 1 | .. | .. |
| Dairy-farmer | 1 | .. | 1 | .. | .. |
| Gold-miner | 2 | .. | 2 | .. | .. |
| Quarry man | 1 | .. | 1 | .. | .. |
| Gum-digger | 1 | .. | 1 | .. | .. |
| Pensioner | 3 | .. | 3 | .. | .. |
| Annuitant | 2 | .. | 1 | .. | .. |
| Independent means and retired | 11 | .. | 4 | .. | 7 |
| Not stated and no occupation | 87 | 6 | 35 | 7 | 39 |
| Domestic duties | 41 | .. | .. | 2 | 39 |
| Government scholar | 1 | 1 | .. | .. | .. |
| Receiving tuition at home | 3 | 2 | .. | 1 | .. |
| Dependent relatives | 8 | 3 | .. | 5 | .. |
| Inmate of hospital | 3 | .. | 2 | .. | 1 |
| Inmate of benevolent asylum | 29 | .. | 25 | .. | 4 |
| Inmate of industrial school | 1 | 1 | .. | .. | .. |
| Receiving charitable aid | 1 | .. | 1 | .. | .. |
| Totals | 274 | 15 | 149 | 15 | 95 |
The lunatics returned in the census numbered 1,798 of both sexes, 1,088 being males, and 710 females.
As in the case of the blind, the census results exhibit continuous increase in the proportion to population, and also show that lunacy is more prevalent amongst males than females.
| Persons. | Males. | Females. | |
|---|---|---|---|
| Census 1874 | 19.93 | 23.28 | 15.48 |
| Census 1878 | 20.85 | 25.07 | 15.54 |
| Census 1881 | 22.86 | 27.30 | 17.43 |
| Census 1886 | 26.50 | 31.03 | 21.18 |
| Census 1891 | 27.82 | 31.28 | 23.92 |
Lunatics in Victoria were at the time of the census of 1891 found to be in the proportion of 33.06, 34.71, and 31.24 to every 10,000 living persons, males, and females respectively.
The number of lunatics stated in the asylum returns as for the 1st January, 1891, was 1,797, or just one fewer than the number brought out by the census. Although the asylum returns include certain idiots and inebriates not included in the census figures as lunatics, the comparison is sufficiently close to show that, with small exception, the lunatics of the colony are all cared for in the various institutions set apart for their reception, of which there are seven under Government, and one private asylum licensed by the Governor.
Referring to the proportions at age-periods, it is found that, taking both sexes, the proportion of lunatics in every 10,000 persons was only 2.61 at 15–20 years, but after that period rose rapidly to 96.67 at 45–50 years, from which time of life the proportions are somewhat less. The proportion of lunatic females of all ages to the total female population was less than that of males; nevertheless at the period 45–50 years 98.89 per 10,000 of females were lunatics, while the highest proportion shown for males is 96.85, at the period 55–60 years.
The number of idiots was 128. These are not included as lunatics in the census numbers. The proportion per 10,000 of the population was 2.03 per 10,000 of both sexes; for males 2.32, and for females 1.70, per 10,000. At the census of 1886 only 89 persons were returned as idiots,
The results of the inquiry on the subject of epilepsy are stated below, and it will be seen that the numbers for 1891 are slightly higher than those for 1886. But the inquiry must surely be objectionable to many householders, and for this reason it seems very unlikely that the figures really convey a full idea of the degree of prevalence of this disease.
| Persons. | Males. | Females. | |
|---|---|---|---|
| Census 1874 | 115 | 68 | 47 |
| Census 1878 | 164 | 101 | 63 |
| Census 1881 | 194 | 112 | 82 |
| Census 1886 | 221 | 130 | 91 |
| Census 1891 | 232 | 136 | 96 |
The proportion of epileptics in every 10,000 males was 4.09, and of females 3.27. The disease is found at every age-period up to 75 in case of each sex.
Paralytics were returned to the number of 468, or 7.48 per 10,000 of population. The proportion in case of males was 9.27, and for females 5.45, per 10,000.
The crippled and deformed numbered 979 persons. This is a great increase on the figures for 1886 (159); but the heading in the census schedule was amplified in 1891 to include persons who had lost a limb, which would seem to have resulted in a great increase in the numbers returned.
Table of Contents
THE census in New Zealand is the means of affording valuable evidence as to the progress of the occupation of the lands of the colony.
The Crown Lands Reports show lands sold, held on deferred payment, perpetual lease, or other tenure; but much land is alienated and yet not occupied; besides which, lands leased by Natives to Europeans are occupied but not alienated: so that the census figures have a value wholly their own, because the information is given by the occupier or person in charge of every property, while the unoccupied lands are stated apart from the lands in occupation.
The total extent of occupied lands returned as in occupation (exclusive of lands occupied by Maoris, but including lands leased by Maoris to Europeans) in April, 1891, was 31,867,505 acres. Of this amount, however, 12,469,976 acres were Crown lands rented for pastoral purposes only, which, definition has been held to include small grazing-runs.
A comparison with the figures for 1886 under each description of tenure shows the following results for the colony and each provincial district:—
| Provincial Districts. | Extent of Occupied Holdings over One Acre. | ||||||
|---|---|---|---|---|---|---|---|
| Number of Acres. | |||||||
| Total | Freehold. | Rented from Private Individuals. | Rented from Public Bodies. | Rented from Natives (including Native Reserves rented). | Held from Crown for other than Pastoral Purposes (including deferred Payment, Perpetual Lease, &c). | Rented from Crown for Pastoral Purposes only (including Small Grazing-runs). | |
| Auckland | 3,989,435 | 2,481,993 | 383,228 | 73,834 | 481,830 | 202,081 | 306,463 |
| Taranaki | 574,358 | 239,989 | 79,949 | 21,193 | 107,803 | 114,048 | 11,370 |
| Hawke's Bay | 2,387,106 | 1,175,569 | 224,366 | 64,712 | 624,482 | 142,530 | 155,447 |
| Wellington | 3,331,593 | 1,741,131 | 295,621 | 67,110 | 830,599 | 303,469 | 93,663 |
| Marlborough | 1,944,655 | 739,733 | 78,995 | 2,912 | 6,044 | 11,068 | 1,105,903 |
| Nelson | 1,818,920 | 805,290 | 85,428 | 33,593 | 13,357 | 117,173 | 764,079 |
| Westland | 678,225 | 31,100 | 3,153 | 4,282 | 1,789 | 4,151 | 633,750 |
| Canterbury | 6,610,210 | 2,522,287 | 469,423 | 328,426 | 11,406 | 104,673 | 3,173,995 |
| Otago | 10,377,892 | 2,625,830 | 523,859 | 580,921 | 9,399 | 412,583 | 6,225,300 |
| Chatham Islands | 155,111 | 47,320 | 2,160 | .. | 105,631 | .. | .. |
| Total census 1891 | 31,807,505 | 12,410,242 | 2,146,182 | 1,176,983 | 2,192,316 | 1,471,770 | 12,469,970 |
| Total census 1886 | 28,169,758 | 11,728,236 | 1,776,987 | 857,753 | 2,017,588 | 696,510 | 11,092,714 |
| Numerical increase since 1886 | 3,697,717 | 682,006 | 369,195 | 319,230 | 174,758 | 775,260 | 1,377,202 |
| Centesimal increase | 13.13 | 5.82 | 20.78 | 37.22 | 8.66 | 111.30 | 12.42 |
Excluding the lands rented for pastoral purposes only, by far the greatest quantity of land (12,410,242 acres) was held in 1891 as freehold of the occupiers; hut the increase on the quantity so held in 1886 was only 5.82 percent. Under Native lease 2,192,346 acres were held, or 8.66 percent, increase since the previous census. Next in order of acreage comes the land rented from private individuals, or ordinary leasehold, 2,146,182 acres, a net increase of 20.78 percent, since 1886. The land held from Crown on deferred payment, under perpetual lease, &c, amounted to 1,471,776 acres (of which, 511,346 acres were on deferred payment, and 761,886 acres on perpetual lease), but the increase on land so held in 1886 was by far the greatest of all, 111.30 percent.
A large quantity of land is shown as rented from public bodies, 1,176,983 acres, and lastly 12,469,976 acres held for pastoral purposes only from the Crown.
The extent of unoccupied and unused freehold land was returned in 1891 and 1886 as under:—
| Year. | Acres. |
|---|---|
| 1886 | 768,281 |
| 1891 | 891,846 |
Doubtless these figures are far short of the facts, as it is impossible to obtain information, for instance, about lands held by absentees; but it may at least be said that these unoccupied lands stated in the census schedules have been carefully kept apart from the occupied lands.
Excluding the Crown lands used for pastoral purposes only, the order of the provincial districts in 1891 as regards occupied lands was,—
| Acres. | |
|---|---|
| Otago | 4,152,592 |
| Auckland | 3,682,972 |
| Canterbury | 3,436,215 |
| Wellington | 3,237,930 |
| Hawke’s Bay | 2,231,659 |
| Nelson | 1,054,841 |
| Marlborough | 838,752 |
| Taranaki | 562,982 |
| Westland | 44,475 |
There were 43,777 occupied holdings over one acre in extent in April, 1891, excluding the pastoral leases; being an increase of 7,292 holdings, or 20 percent., on the number in 1886, and 12,945, or 35.43 percent., on the number in 1881.
It is highly satisfactory to observe the progress of settlement, as shown by the continually-increasing proportion of holdings to the number of grown persons of the male sex at successive census-years:—
| Holdings. | Adult Males. | Proportion percent. | |
|---|---|---|---|
| Census 1878 | 26,229 | 122,640 | 21.39 |
| Census 1881 | 30,832 | 139,564 | 22.09 |
| Census 1886 | 36,485 | 157,503 | 23.16 |
| Census 1891 | 43,777 | 167,792 | 26.09 |
A comparison of the number of holdings classified according to size, as in 1886 and 1891, is given, with the increase on each group, and the ratio of each group to the whole number of holdings at either period:—
| Sizes of Holdings (excluding Crown Pastorals). | Number of Holdings. | Numerical Increase. | Centesimal Increase. | Proportions per Cent. | ||
|---|---|---|---|---|---|---|
| 1886. | 1891. | 1886. | 1891. | |||
| Acres. | ||||||
| Over 1 to 10 inclusive | 9,172 | 11,116 | 1,944 | 21.19 | 25.14 | 25.39 |
| Over 10 to 50 inclusive | 7,507 | 8,899 | 1,392 | 18.54 | 20.58 | 20.33 |
| Over 50 to 100 inclusive | 5,014 | 5,613 | 599 | 11.95 | 13.74 | 12.82 |
| Over 100 to 200 inclusive | 5,926 | 6,851 | 925 | 15.61 | 16.24 | 15.65 |
| Over 200 to 320 inclusive | 3,161 | 3,916 | 755 | 23.88 | 8.66 | 8.95 |
| Over 320 to 640 inclusive | 2,804 | 3,802 | 998 | 35.59 | 7.68 | 8.68 |
| Over 640 to 1,000 inclusive | 977 | 1,321 | 344 | 35.21 | 2.68 | 3.02 |
| Over 1,000 to 5,000 inclusive | 1,396 | 1,675 | 279 | 19.99 | 3.83 | 3.83 |
| Over 5,000 to 10,000 inclusive | 222 | 247 | 25 | 11.26 | 0.61 | 0.50 |
| Over 10,000 to 20,000 inclusive | 170 | 189 | 19 | 11.18 | 0.47 | 0.43 |
| Over 20,000 to 50,000 inclusive | 106 | 117 | 11 | 10.38 | 0.29 | 0.27 |
| Over 50,000 to 100,000 inclusive | 26 | 24 | −2 | −7.09 | 0.07 | 0.05 |
| Upwards of 100,000 | 4 | 7 | 3 | 75.00 | 0.01 | 0.02 |
The group of holdings which shows the largest proportional growth (putting aside an increase of 3 on holdings over 100,000 acres, which may be regarded as accidental) is that from 320 to 640 acres, the percentage of increase being 35.59. Next in order come the holdings of 640 to 1,000 acres, with an increase at the rate of 35.21 percent., and then those of 200 to 320 acres, on which the increase was 23.88 percent. The largest of all the groups, that from 1 to 10 acres, advanced 21.19 percent. Although all the groups with one slight exception were numerically larger in 1891 than in 1886, yet from the proportions percent. above given it will be seen that only those already specified show an increase relatively to the whole number of holdings. The group from 1,000 to 5,000 acres remains stationary, while the others show a relative decrease. Generally speaking, the larger the holdings in size the fewer they are in number. By the census results it is shown that occupied holdings under 200 acres were in 1891 74.19 percent, of the whole, against 75.70 percent, in 1886, or a slight decrease, but that the holdings from 200 to 1,000 acres in size have attained a proportion of 20.65 percent, of the total, against a smaller percentage of 19.02 percent, in 1886.
On comparing the acreage of occupied land in classified holdings as given in 1891 with the acreage as given in 1886, an increase appears at each group, excepting that of holdings from 50,000 to 100,000 acres, where the decrease amounted to 311,310 acres, or 16.96 percent. The largest proportionate increase was at the group 320 to 640 acres, the next at the group 640 to 1,000 acres. The figures are given in the table below.
| Sizes of Holdings. | 1886. | 1891. | Numerical Increase. | Centesimal Increase. |
|---|---|---|---|---|
| * Decrease. | ||||
| Acres. | Acres. | Acres. | Acres. | |
| Over 1 to 10 inclusive | 42,566 | 52,467 | 9,901 | 23.26 |
| Over 10 to 50 inclusive | 219,418 | 254,710 | 35,298 | 16.09 |
| Over 50 to 100 inclusive | 390,743 | 435,263 | 44,520 | 11.39 |
| Over 100 to 200 inclusive | 901,350 | 1,028,751 | 124,401 | 13.76 |
| Over 200 to 320 inclusive | 826,516 | 1,013,319 | 180,803 | 22.60 |
| Over 320 to 640 inclusive | 1,276,021 | 1,717,746 | 441,725 | 34.61 |
| Over 640 to 1,000 inclusive | 787,335 | 1,058,461 | 271,126 | 34.44 |
| Over 1,000 to 5,000 inclusive | 2,975,095 | 3,425,185 | 450,090 | 15.13 |
| Over 5,000 to 10,000 inclusive | 1,617,885 | 1,768,799 | 150,914 | 9.33 |
| Over 10,000 to 20,000 inclusive | 2,519,108 | 2,699,404 | 180,236 | 7.15 |
| Over 20,000 to 50,000 inclusive | 3,070,500 | 3,340,931 | 270,371 | 8.81 |
| Over 50,000 to 100,000 inclusive | 1,835,957 | 1,524,647 | −311,310* | −16.96* |
| Upwards of 100,000 | 611,460 | 1,077,840 | 466,380 | 76.27 |
The number of live-stock as shown by the census returns for 1886 and 1891 was —
| 1886 | 1891 | Numerical Increase or Decrease. | Centesimal Increase or Decrease. | |
|---|---|---|---|---|
| Horses | 187,382 | 211,040 | 23,658 | 12.63 |
| Mules and asses | 297 | 348 | 51 | 17.17 |
| Cattle | 853,358 | 788,919 | −64,439 | −7.55 |
| Sheep | 16,564,595 | 17,865,423 | 1,300,828 | 7.85 |
| Goats | 10,220 | 9,055 | −1,165 | −11.40 |
| Pigs | 277,901 | 222,553 | −55,348 | −19.92 |
| Poultry | 1,679,031 | 1,790,070 | 111,049 | 6.61 |
Besides the above, which does not include stock belonging to Maoris, the Natives had in 1891—
| Sheep | 262,763 |
| Cattle | 42,912 |
| Pigs | 86,259 |
While the horses held by Europeans increased at the rate of 12.63 per cent., and sheep 7.85 per cent., the cattle diminished by 7.55, and the pigs 19.92 per cent.
The increase in horses at four decennial periods is as under:—
| No. of Horses. | Numerical Increase. | Centesimal Increase. | |
|---|---|---|---|
| Census 1861 | 28,275 | ||
| 52,753 | 186.57 | ||
| Census 1871 | 81,028 | ||
| 80,708 | 99.61 | ||
| Census 1881 | 161,736 | ||
| 49,304 | 30.48 | ||
| Census 1891 | 211,040 | ||
Although considerable increase is shown above, it would appear that more might have been done. Mr. M. Murphy, F.L.S., of Christchurch, states that “during the commercial depression which visited New Zealand the breeding of horse's was much neglected, but steps are now being taken to repair the loss entailed by such neglect, and it is hoped the colony will therefore soon regain its partially-lost prestige in this direction.” The colony is suited by climate for the breeding and rearing of horses of all kinds, and there is continual demand for them both for Australia and for India.
The decrease in the number of cattle since 1886 (from 853,358 to 788,9,19) is, of course, owing to the better profit derived from grazing sheep since the development of the frozen-meat industry.
Notwithstanding the decrease in the period 1886–91 in the number of cattle, a comparison of the numbers for a period of thirty years shows great increase in this class of stock.
| No. of Cattle | Numerical Increase. | Centesimal Increase. | |
|---|---|---|---|
| Census 1861 | 193,285 | ||
| 243,307 | 125.88 | ||
| Census 1871 | 436,592 | ||
| 262,045 | 60.02 | ||
| Census 1881 | 698,637 | ||
| 90,282 | 12.92 | ||
| Census 1891 | 788,919 | ||
The increase in thirty years has thus been at the rate of 308' 16 per cent.
The increase in sheep, as stated above, during the period 1886–91 (7.85 per cent.), was not nearly so large as the increase between 1881 and 1886, the latter being 21.55 per cent. Between 1878 and 1881 there was a decrease of 84,253, or 0.64 per cent., which was attributed to the rapid increase in the number of rabbits. The census report of 1886 states, “It is very satisfactory to show an increase in the number of sheep given in the census schedules of some three and a half millions, or at the average rate of about 756,000 per annum, notwithstanding the continued prevalence of the rabbit-pest.” It now is highly satisfactory to notice an increase of 1,300,828, or 7.85 per cent., in the flocks during the census - period March, 1886, to April, 1891, notwithstanding an export of rabbitskins to the number of 56,985,181 in the years 1886 to 1890, and the enormously-increased export of frozen mutton, which amounted to 4,430,780 carcases for the same years.
It will be apparent from the following table that the tendency of increase is in the direction of the multiplication of the smaller flocks, the owners of which would be better able to cope with the rabbit difficulty than the large runholders:—
| Size of Flocks. | 1882. | 1883. | 1884. | 1885. | 1886. | 1887. | 1888. | 1889. | 1890 | 1891. |
|---|---|---|---|---|---|---|---|---|---|---|
| Under 500 | 4,685 | 5,039 | 5,422 | 5,622 | 6,024 | 6,247 | 6,579 | 7,063 | 7,662 | 8,272 |
| 500 and under 1,000 | 844 | 970 | 1,033 | 1,146 | 1,189 | 1,139 | 1,182 | 1,381 | 1,528 | 1,691 |
| 1,000 and under 2,000 | 552 | 609 | 672 | 718 | 747 | 723 | 794 | 826 | 854 | 969 |
| 2,000 and under 5,000 | 416 | 467 | 473 | 505 | 532 | 531 | 524 | 597 | 586 | 666 |
| 5,000 and under 10,000 | 225 | 244 | 256 | 270 | 263 | 289 | 287 | 279 | 283 | 287 |
| 10,000 and under 20,000 | 209 | 200 | 211 | 213 | 228 | 221 | 213 | 239 | 236 | 239 |
| 20,000 and upwards | 133 | 149 | 154 | 157 | 166 | 166 | 166 | 152 | 160 | 169 |
| Total | 7,064 | 7,678 | 8,221 | 8,631 | 9,149 | 9,316 | 9,745 | 10,537 | 11,309 | 12,293 |
The number of sheep, ascertained from, the compilation of the census results, was over one and a third million more than the number returned to the Department of Agriculture nearly a month later. The returns of sheep owned by Maoris are required to be made to that department. Some allowance should be made for the number slaughtered for home use and freezing in the interval, but that would only account for a comparatively small part of the difference. The fact that no house escapes visitation at the time of the census, and that the numbers then given are not used for taxing purposes, may probably largely account for the difference, and cause the census results to be accepted as the most accurate.
The following gives the number of the principal kinds of livestock in the several Australasian Colonies for 1891:—
| Sheep. | Cattle. | Horses. | |
|---|---|---|---|
* Including those owned by Maoris. † Excluding those owned by Maoris. | |||
| Queensland | 20,289,633 | 6,192,759 | 399,364 |
| New South Wales | 61,831,416 | 2,046,347 | 459,755 |
| Victoria | 12,928,148 | 1,812,104 | 440,696 |
| South Australia | 7,646,239 | 399,077 | 188,587 |
| Western Australia | 1,962,212 | 133,690 | 40,812 |
| Tasmania | 1,664,118 | 167,788 | 31,312 |
| New Zealand | *18,128,186 | *831,831 | †211,040 |
New Zealand thus takes third place in order for number of sheep, and fourth for the number of her cattle.
The production of butter was stated in the census schedules as 16,310,0121b. The figures can be considered as only an estimate, for, although the quantities given are compiled from the returns in the household schedules, yet, as the majority of small farmers do not keep an account of all butter made, their returns cannot be considered as closely accurate. The butter made in factories was returned at 1,969,7591b.
The quantity of butter made in New Zealand in 1891 would appear to be nearly double what it was ten years previously. The increase in live years since 1886 was 4,139,0481b., or 34.01 per cent.
| Year. | Quantity of Butter made. |
|---|---|
| lb. | |
| (As per census) 1881 | 8,453,815 |
| (As per census) 1886 | 12,170,964 |
| (As per census) 1891 | 10,310,012 |
The following statement shows the order of importance of the several provincial districts in regard to butter-making:—
| lb. | |
|---|---|
| Auckland | 3,630,145 |
| Taranaki | 3,349,757 |
| Otago | 2,864,869 |
| Wellington | 2,549,858 |
| Canterbury | 2,268,758 |
| Nelson | 799,989 |
| Hawke's Bay | 484,045 |
| Marlborough | 238,602 |
| Westland | 122,509 |
| Chatham Islands | 1,480 |
Three counties stand out prominently as butter-making localities: Taranaki, with 2,041,4481b.; Manukau, with 1,777,9691b. per annum; and Selwyn, with 1,091,4241b. In all other counties the produce did not reach 1,000,0001b. More butter is made in the North Island than in the Middle Island. Cheese-making is, on the other hand, pursued far more extensively in the Middle Island than in the North.
The production of cheese for 1891 was more than double what it was ten years previously, and 2,380,9031b., or 51.82 per cent., more than in 1886.
| Year | Quantity of Cheese made. |
|---|---|
| lb. | |
| (As per census) 1881 | 3,178,694 |
| (As per census) 1886 | 4,591,795 |
| (As per census) 1891 | 6,975,698 |
Of the quantity stated for 1891, 4,390,4001b. were made in cheese-factories. Out of the total 6,975,6981b. for 1891, no less than 4,879,1771b. was made in Canterbury and Otago; but the latter provincial district stands far ahead of any other in the matter of cheese-making, as will be seen by the following figures:—
| lb | |
|---|---|
| Otago | 3,566,150 |
| Canterbury | 1,313,027 |
| Auckland | 1,057,568 |
| Wellington | 724,783 |
| Taranaki | 167,345 |
| Hawke's | 106,625 |
| Nelson | 32,716 |
| Marlborough | 6,434 |
| Westland | 1,050 |
The Counties of Akaroa and Southland are t cheese-making localities. For Akaroa the annual produce was returned at 1,006,0261b., and for Southland at 1,850,1561b. In all other counties the produce was under one million pounds. With the further development of the factory system a vast expansion of the butter- and cheese-making industry in New Zealand is confidently looked for.
The threshing-machines used in the colony in 1891 numbered 1,052, against 1,033 in 1886 and 1,019 in 18.81. The steam machines increased between 1886 and 1891 by 70, those worked by water-power by 3; but the horse-power machines decreased by 54. A similar result was shown in 1886, when the steam machines were found to have increased by 66 over the number in 1881, and the horse-power machines to have decreased by 45.
There were 9,427 reaping-machines in use in 1891, against 7,890 in 1886 and 6,595 in 1881. The steam ploughs numbered 68, and steam harrows 40, or about twice as many in each case as were shown by the census of 1886 to be in use in that year.
Table of Contents
THE number of manufactories or works returned at the census of 1891 shows an increase on the number at the previous census, but not to the extent that was anticipated. The figures are—2,570 for 1891, against 2,268 in 1886, or at the rate of 13.32 per cent. Between 1881 and 1886 the industries returned increased from 1,643 to 2,268, or at the rate of 38 per cent. Gold-quartz-mining and hydraulic mining-works are included in the above, increasing the number of industries by 209; 95 collieries are also included, with 2 antimony mines and 1 manganese, besides 9 building-stone quarries.
Important machinery and plant being used in these mining-works, they are included, the Act requiring the returns. The remarks of the Registrar-General in the report on the census of 1886 as to what are included in the returns are reprinted, as again applicable. “There is difficulty in defining what works should be included and what omitted. For example, some of the furniture factories consist of large workshops in rear of shops, in which several hands are employed in making furniture; but there are numerous cabinetmakers who also employ one or two hands in making furniture, and yet whose works can hardly be classed as manufactories. There are many industries in a similar condition, so that no hard-and-fast rule could be laid down; otherwise many industries that are in the aggregate of considerable magnitude, and are of growing importance, would have to be omitted, or the table filled up with the enumeration of what are in reality retail businesses combined with a limited amount of work done on the premises, either by way of repairs or as new work. Consequently, much discretion has been exercised in the selection for the returns, possibly causing some little roughness in the result. Much additional work to that given is no doubt being performed by these minor industries. Some small industries have been given on account of their possessing a special character, or of being the germ of what may grow to some importance.”
The hands and horse-power employed were—
| Hands employed. | Horse-power employed. | ||
|---|---|---|---|
| Males. | Females. | ||
| Census 1881 | 16,599 | 1,399 | 13,601 |
| Census 1886 | 23,161 | 2,494 | 19,315 |
| Census 1891 | 26,911 | 2,969 | 33,392 |
Here the male hands employed are shown to have increased by 10,312 or 62.12 per cent, in ten years, and by 3,750 or 16.19 per cent, in the period 1886–91. The increase in case of females is much greater for the ten-year period than in case of the males, being 112–22 per cent, for 1881–91, and in the quinquennium 1886–91 19.05 per cent.
The increase in horse-power is 145.51 per cent. for 1881–91, and 72.88 per cent. for 1886–91.
An attempt was made for the first time at the census of 1891 to obtain information as to the wages paid in the factories or large works supplying wholesale orders, and employing machinery and plant, with which the industrial returns deal. The amount for the year 1890 was £2,106,860 paid to males, and £102,999 to females, of all ages. The total value of materials operated upon was £3,471,767, so far as returned. The deficiency is not considered to be such as very materially to affect the figures given. The annual value of the manufactures and produce was obtained in 1886 as well as in 1891, and a comparison is consequently possible:—
| Annual Value of Manufactures and Produce. | ||
|---|---|---|
| £ | ||
| Census 1891 | 9,422,146 | |
| Census 1886 | 7,436,649 | |
| Increase | 1,985,497 |
or 26.70 per cent.
While the industries increased between 1886 and 1891 in number by only 13.32 per cent., as previously stated, the proportionate increase on the actual result of the work, as shown by the value of the manufactures or produce, was at the higher rate of 26.70 per cent. The hands increased at the rate of 16.19 per cent. for males, and 19.05 per cent, for females.
The approximate value of the land, buildings, machinery, and plant used in the manufactories or works can be compared for four census-periods:—
| Value of Land and Buildings used for Manufactories or Works. | Centesimal Increase or Decrease. | Value of Machinery and Plant used for Manufactories or Works. | Centesimal Increase. | |
|---|---|---|---|---|
| £ | £ | |||
| Census 1878 | 1,761,694 | 13.15 | 1,289,378 | 25.03 |
| 1881 | 1,993,330 | 46.98 | 1,612,141 | 71.65 |
| Census 1886 | 2,929,828 | −5.57 | 2,707,289 | 10.28 |
| Census 1891 | 2,775,277 | 3,051,099 |
The value of the lands used for mining is not included in the above figures, and the value of Crown lands has been omitted throughout.
The foregoing comparisons show that, viewed in relation to number, the industries of the colony only increased between 1886 and 1891 at the moderate rate of 13.32 per cent., but that, in relation to value of manufactures, the increase (26.70 per cent.) is considerably greater.
The principal industries returned at the census of 1891, and particulars relating thereto, are given in detail in the following table:—
| Nature of Industry | Total Number of Industries. | Number of Hands employed. | Wages paid. | Amount of Power employed (Horsepower). | Value of all Manufactures or Produce (including Repairs) for the Year 1890. | Approximate Value of Land, Buildings, Machinery, and Plant. | ||||
|---|---|---|---|---|---|---|---|---|---|---|
| Males | Females | Total | To Males | To Females | Total | |||||
| £ | £ | £ | £ | £ | ||||||
| Printing, &c., establishments | 142 | 2,373 | 196 | 2,569 | 207,067 | 7,118 | 214,185 | 328 | 354,559 | 341,683 |
| Machines, tools, and implements | 36 | 526 | 2 | 528 | 45,246 | 41 | 45,287 | 148 | 144,472 | 73,478 |
| Coach-building and -painting | 108 | 675 | 3 | 678 | 52,526 | 75 | 52,601 | 94 | 139,660 | 96,225 |
| Tanning, fellmongering, and wool-scouring | 104 | 1,190 | 6 | 1,196 | 92,166 | 276 | 92,442 | 474 | 1,020,349 | 153,592 |
| Ship- and boat-building | 37 | 145 | .. | 145 | 10,831 | .. | 10,831 | 28 | 35,847 | 10,172 |
| Sail and oilskin factories | 32 | 68 | 56 | 124 | 4,909 | 1,426 | 6,335 | .. | 31,083 | 16,799 |
| Furniture factories | 94 | 551 | 34 | 585 | 41,392 | 1,351 | 42,743 | 105 | 131,314 | 96,543 |
| Chemical works | 8 | 55 | .. | 55 | 5,754 | .. | 5,754 | 65 | 41,568 | 23,766 |
| Woollen-mills | 8 | 602 | 573 | 1,175 | 52,250 | 26,790 | 79,040 | 930 | 279,175 | 259,955 |
| Clothing factories | 19 | 229 | 1,001 | 1,290 | 19,489 | 33,265 | 52,754 | 7 | 106,579 | 59,735 |
| Hat and cap factories | 16 | 51 | 61 | 112 | 4,138 | 2,138 | 6,276 | .. | 21,628 | 26,005 |
| Boot and shoe factories | 47 | 1,475 | 468 | 1,943 | 107,040 | 17,950 | 124,990 | 46,403 | 736 | 82,137 |
| Rope and twine works | 24 | 222 | .. | 222 | 13,658 | .. | 13,658 | 129 | 76,711 | 36,086 |
| Flax-mills | 177 | 3,196 | 8 | 3,204 | 116,168 | .. | 116,108 | 1,994 | 234,266 | 146,792 |
| Meat-preserving, -freezing, and boiling-down works | 43 | 1,561 | 7 | 1,568 | 138,312 | 147 | 138,459 | 5,112 | 1,464,659 | 476,151 |
| Bacon-curing establishments | 33 | 83 | 1 | 84 | 6,671 | 25 | 6,696 | 7 | 83,435 | 14,180 |
| Cheese and butter factories | 74 | 218 | 51 | 269 | 13,800 | 1,128 | 14,928 | 387 | 150,957 | 100,453 |
| Grain mills | 129 | 499 | .. | 499 | 52,384 | .. | 52,384 | 2,906 | 991,812 | 391,828 |
| Biscuit factories | 22 | 284 | 47 | 331 | 16,150 | 1,049 | 17,199 | 134 | 127,147 | 48,900 |
| Fruit-preserving and jam-making works | 15 | 74 | 43 | 117 | 3,781 | 961 | 4,742 | 33 | 27,255 | 10,042 |
| Breweries | 102 | 476 | .. | 476 | 54,825 | .. | 54,825 | 409 | 300,508 | 236,825 |
| Malthouses | 27 | 87 | 2,617 | 87 | 7,875 | .. | 7,875 | 47 | 80,341 | 42,442 |
| Carried forward | 1,297 | 14,640 | 2,617 | 17,257 | 1,066,432 | 93,740 | 1,160,172 | 13,383 | 6,313,061 | 2,743,849 |
| Nature of Industry | Total Number of Industries. | Number of Hands employed. | Wages paid. | Amount of Power employed (Horsepower). | Value of all Manufactures or Produce (including Repairs) for the Year 1890. | Approximate Value of Land, Buildings, Machinery, and Plant. | ||||
|---|---|---|---|---|---|---|---|---|---|---|
| Males | Females | Total | To Males | To Females | Total | |||||
| £ | £ | £ | £ | £ | ||||||
| Brought forward | 1,297 | 14,610 | 2,617 | 17,257 | 1,066,432 | 93,740 | 1,160,172 | 13,383 | 6,313,061 | 2,743,849 |
| Aërated-water factories | 112 | 253 | 8 | 261 | 16,982 | 39 | 17,021 | 155 | 91,691 | 73,147 |
| Coffee and spice works | 17 | 79 | 2 | 81 | 6,512 | 50 | 6,562 | 93 | 64,024 | 30,850 |
| Soap and candle works | 19 | 201 | 8 | 209 | 21,194 | 200 | 21,394 | 259 | 155,714 | 74,443 |
| Saw-mills | 243 | 3,260 | 6 | 3,266 | 271,783 | 31 | 271,814 | 4,637 | 832,959 | 500,272 |
| Chaff-cutting establishments | 63 | 203 | 2 | 205 | 7,260 | 70 | 7,330 | 269 | 63,236 | 36,300 |
| Gasworks | 27 | 249 | .. | 249 | 31,700 | .. | 31,700 | 117 | 178,947 | 730,490 |
| Brick, tile, and pottery works | 106 | 484 | 10 | 494 | 24,938 | 252 | 25,190 | 459 | 56,830 | 119,780 |
| Iron and brass foundries | 79 | 1,785 | 2 | 1,787 | 157,245 | 27 | 157,272 | 954 | 403,635 | 268,887 |
| Spouting and ridging works | 12 | 100 | .. | 100 | 7,981 | .. | 7,981 | 25 | 33,140 | 29,670 |
| Gold- and quartz-mining works.. | 135 | 1,971 | .. | 1,971 | 1 183,582 | .. | 183,582 | 2,656 | 278,893 | 241,715 |
| Hydraulic gold-mining and gold-dredging | 71 | 495 | .. | 495 | 32,904 | .. | 32,904 | 7,728 | 73,713 | 154,270 |
| Collieries | 95 | 1,655 | 1,655 | 173,538 | .. | 173,538 | 1,185 | 279,777 | 155,671 | |
| Other industries | 291 | 1,536 | 314 | 1,850 | 104,809 | 8,590 | 113,399 | 1,472 | 596,526 | 667,632 |
| Totals | 2,570 | 26,911 | 2,969 | 29,880 | 2,106,860 | 102,999 | 2,209,859 | 33,392 | 9,422,146 | 5,826,976 |
The Government Printing Office and the Railway workshops have not been included in making up the preceding table (and indeed the information was not all obtained). This is in accordance with the practice observed at previous censuses in New Zealand, but it is open to question, and has, at least, the disadvantage of disturbing comparisons, as will be found further on, with other colonies where such Government establishments are included.
The provincial districts, arranged in order according to the number of industries belonging to each, are as under:—
| Number of Industries including Gold-quartz-mining Works, Collieries, &c. | Number of Industries excluding Gold-quartz-mining Works, Collieries, &c. | |
|---|---|---|
| Otago | 705 | 541 |
| Auckland | 650 | 577 |
| Canterbury | 386 | 380 |
| Wellington | 333 | 333 |
| Nelson | 204 | 142 |
| Hawke's Bay | 85 | 85 |
| Marlborough | 78 | 77 |
| Taranaki | 68 | 68 |
| Westland | 61 | 51 |
The values of the manufactures for the provincial districts were respectively as follow:—
| Value of Manufactures including Output of Gold-quartz-mining Works, Collieries, &c. | Value of Manufactures excluding Output of Gold-quartz-mining Works, Collieries, &c. | |
|---|---|---|
| Auckland | 2,396,060 | 2,184,401 |
| Otago | 2,237,246 | 2,078,365 |
| Canterbury | 2,061,921 | 2,056,412 |
| Wellington | 1,412,465 | 1,412,465 |
| Hawke's Bay | 525,894 | 525,894 |
| Nelson | 894,481 | 146,020 |
| Marlborough | 168,814 | 161,714 |
| Taranaki | 155,772 | 155,772 |
| Westland | 69,993 | 53,294 |
The following shows the most important industries arranged in order of the value of their manufactures or produce, and specifying all amounts over £100,000:—
| Total Value of all Manufactures or Produce, including Repairs. | |
|---|---|
| * Unsatisfactory returns. | |
| £ | |
| Meat-freezing, -preserving, and boiling-down works | 1,464,659 |
| Tanning, fellmongering, and wool-scouring establishments | 1,026,349 |
| Grain-mills | 991,812 |
| Saw-mills | 832,959 |
| Boot and shoe factories | 403,736 |
| Iron and brass foundries, boilermaking, machinists, and millwrights | 403,736 |
| Printing establishments | 354,559 |
| Breweries | 300,508 |
| Collieries | 279,777 |
| Woollen-mills | 279,175 |
| Gold-mining, quartz-mining and -crushing works | 278,893 |
| Flax-mills | 234,266 |
| Gasworks | 178,947 |
| Clothing factories | 166,579* |
| Soap and candle works | 155,714 |
| Cheese and butter factories | 150,957 |
| Agricultural-implement factories | 144,472 |
| Coach-building and -painting works | 139,660 |
| Furniture factories | 131,314 |
| Biscuit factories | 127,147 |
| Other industries, in which the value of manufactures was under.-£100,000 | 1,377,028 |
| £9,422,146 | |
The order of the principal industries ranged according to the number of hands employed is,—
| No. of Hands. | |
|---|---|
| Saw-mills | 3,266 |
| Flax-mills | 3,204 |
| Printing establishments | 2,569 |
| Gold-mining, quartz-mining and -crushing works | 1,971 |
| Boot and shoe factories | 1,943 |
| Iron and brass foundries, boilermaking, machinists, and millwrights | 1,787 |
| Collieries | 1,655 |
| Meat-freezing,-preserving, and boiling-down works | 1,568 |
| Clothing factories | 1,290 |
| Tanning, fellmongering, and wool-scouring establishments | 1,196 |
| Woollen-mills | 1,175 |
| Other industries | 8,256 |
| 29,880 |
Particulars respecting some of the industries in which the value of manufacture was great, and comparisons with 1886, are subjoined. Where an asterisk is given no information was procured.
These increased from 135 to 142 between 1886 and 1891. While the male hands employed increased from 1,999 to 2,373, or by 374, the increase was far greater proportionally amongst the females, being from 108 to 196, or 88 altogether. The value of the product was £273,886 in 1886, and £354,559 in 1891. The Government Printing Office is not included.
| Census-Year. | Number of Works. | Hands employed. | Machine-power used | Amount of Horse-power. | Value of Annual Produce, 1890 and 1885. | Approximate Value of | |||||||
|---|---|---|---|---|---|---|---|---|---|---|---|---|---|
| M. | F. | Steam | Water. | Gas. | Horse. | Hand. | Land. | Buildings. | Machinery and Plant. | ||||
| £ | £ | £ | £ | ||||||||||
| 1891 | 142 | 2,373 | 196 | 21 | 22 | 44 | 1 | 60 | 328 | 354,559 | 71,306 | 96,542 | 173,775 |
| 1886 | 135 | 1,999 | 108 | 16 | 26 | 36 | .. | 67 | 293 | 273,886 | 79,300 | 87,907 | 164,516 |
| Incr | 7 | 374 | 88 | 5 | .. | 8 | 1 | .. | 35 | 80,073 | .. | 8,635 | 9,259 |
| Decr | .. | .. | .. | .. | 4 | .. | .. | 7 | .. | .. | 7,934 | .. | .. |
The increase in the quinquennium was from 17 to 36 on the number of factories, from 336 to 528 on the number of hands, and from £111,823 to £144,472 on the value of the manufactured goods. The numbers show very satisfactory development.
| Census-Year. | Number of Works. | Hands employed. | Machine-power used | Amount of Horse-power. | Value of all Manufactures including Repairs,1890 and 1885 | Approximate Value of | |||||||
|---|---|---|---|---|---|---|---|---|---|---|---|---|---|
| M. | F. | Steam | Water. | Gas. | Horse. | Hand. | Land. | Buildings. | Machinery and Plant. | ||||
| £ | £ | £ | £ | £ | £ | ||||||||
| 1891 | 36 | 526 | 2 | 45,216 | 41 | 21 | 15 | 148 | 144,472 | 27,728 | 18,704 | 27,046 | |
| 1886 | 17 | 190 | .. | * | * | 14 | 3 | 142 | 111,823 | 19,126 | 14,000 | 17,079 | |
| Incr. | 19 | 190 | 2 | .. | .. | 7 | 12 | 6 | 32,649 | 8,602 | 4,704 | 9,967 | |
Against 89 of these in 1886 there were found to be 108 at last census, but the hands had increased by 14 only. The value of all manufactures, which in 1886 was £128,346, had increased by £11,314 in 1891.
| Census-Year. | Number of Factories. | Hands employed. | Wages paid. | Machine-power used. | Amount of Horse Power | ||||||
|---|---|---|---|---|---|---|---|---|---|---|---|
| M. | F. | M. | F. | Steam | Water. | Gas. | Horse. | Hand. | |||
| £ | £ | ||||||||||
| 1891 | 108 | 675 | 3 | 52,526 | 75 | 15 | 1 | 2 | 1 | 89 | 94 |
| 1886 | 89 | 662 | 2 | * | * | 12 | 1 | 1 | .. | 75 | 105 |
| Increase | 19 | 13 | 1 | .. | .. | 3 | .. | 1 | 1 | 14 | .. |
| Decrease | .. | .. | .. | .. | .. | .. | .. | .. | .. | .. | 11 |
| Census-Year. | Manufactures for the Year. | Value of Manufactures (including Repairs)1890 and 1885 | Approximate Value of | ||||||||
|---|---|---|---|---|---|---|---|---|---|---|---|
| Wagons. | Drays. | Spring-carts. | Carriages, Buggies, Wagonettes. | Coaches. | Expresses. | Vehicles, various and undescribed. | Land | Buildings. | Machinery and Plant. | ||
| No. | No. | No. | No. | No. | No. | No. | £ | £ | £ | £ | |
| 1891 | 39 | 250 | 274 | 294 | 19 | 5 | 542 | 139,660 | 45,727 | 31,646 | 18,852 |
| 1880 | 260 | 292 | 332 | 38 | 9 | 624 | 128,346 | 42,615 | 39,725 | 23,898 | |
| Increase | 29 | 29 | .. | .. | .. | .. | .. | 11,314 | 3,112 | .. | .. |
| Decrease | .. | .. | 18 | 38 | 19 | 4 | 82 | 11,314 | 3,112 | 8,079 | 5,046 |
Although the number of works increased only from 97 to 104, and the hands from 1,093 to 1,196, the value of manufactures developed very greatly, the figures being £634,915 for 1886, against £1,026,349 for 1891, or an amount of £391,434 increase.
| Census-Year. | Number of Works. | Hands Employed | Wages Paid | Machine-power used. | Amount of Horse-power. | Number of Tan-pits. | Tons of Bark used for Tanning: Kind, and where produced. | Total Tons of Bark used | |||||||||||||
|---|---|---|---|---|---|---|---|---|---|---|---|---|---|---|---|---|---|---|---|---|---|
| Wattle | Sumac, Italy | Valonia, Turkey | Extract, Canada | Ex't, Oak, England | Kind not stated | New Zealand | |||||||||||||||
| Male | Female | Male | Female | Stream | Water | Wind | Horse | Hand | Australia | Tasmania | |||||||||||
| £ | £ | ||||||||||||||||||||
| 1891 | 104 | 1,190 | 6 | 92,166 | 276 | 44 | 8 | 2 | 1 | 50 | 474 | 1,076 | 2,591 | 1,452 | 13 | 20 | 8 | 6 | 75 | 383 | 4,548 |
| 1886 | 97 | 1,087 | 6 | * | * | 36 | ... | ... | ... | 6l | 517 | 910 | * | * | * | * | * | * | * | * | 4,119 |
| Increase | 7 | 103 | ... | ... | ... | 8 | 8 | 2 | 1 | ... | ... | 166 | ... | ... | ... | ... | ... | ... | ... | ... | 429 |
| Decrease | ... | ... | ... | ... | ... | ... | ... | ... | ... | 11 | 43 | ... | ... | ... | ... | ... | ... | ... | ... | ... | |
| Census-Year. | Manufacture or Produce for the Years 1890 and 1885. | Total Value of all Manufactures or Produce for the years 1890 and 1885. | Approximate Value of | ||||||
|---|---|---|---|---|---|---|---|---|---|
| Quantity of | Land | Buildings | Machinery and Plant | ||||||
| Wool sourced | Skins Skipped of Wool | Hides tanned | Skins tanned | Pelts Stated or Preserved | |||||
| lb. | No. | No. | No. | No. | £ | £ | £ | £ | |
| 1891 | 12,024,446 | 2,478,298 | 118,925 | 426,433 | 1,411,844 | 1,026,349 | 48,753 | 66,886 | 37,953 |
| 1886 | 8,681,938 | 1,614,998 | 96,713 | 867,908 | 190,796 | 634,915 | 40,530 | 58,330 | 39,890 |
| Increase | 3,342,508 | 863,300 | 22,212 | ... | 1,221,048 | 391,434 | 8,223 | 8,556 | ... |
| Decrease | ... | ... | ... | 441,475 | ... | ... | ... | ... | 1,937 |
Includes value of 4,180 calfskins tanned, 294,000lb. sliped wool, 250 hides salted, 100 tons bonedust, 101 hales rabbitskins. and £244 worth tallow.
There were only 2 more works in 1891 than in 1886. The value of the manufactured articles, however, rose from £194,311 to £279,175, or 43.67 per cent. These mills afforded employment to 602 men and boys in 1891, against 478 in 1886, and a still greater increase is found among the women and girls, of whom 573 were employed in 1891, against 389 in 1886. The development shown by a comparison of the quantities of wool used and of the amounts of the principal articles manufactured in 1885 and 1890 respectively is very considerable:—
| Wool used. | ||
|---|---|---|
| lb. | ||
| 1890 | 2,699,219 | |
| 1885 | 1,924,932 | |
| Increase | 774,287, or 40.22 per cent. |
The tweed manufactured was 966,864 yards in 1890, an increase of 324,296 yards, or 50.47 per cent, on the quantity for 1885. Flannel-making shows an increase of 203.76 per cent., the quantity being 773,528 yards in 1890. In cloth a decrease of 81,779 yards is found; but of blankets 5,471 more pairs were made in 1890 than in 1885. The manufacture of shawls and rugs increased from 17,954 in number to 18,728. Besides all these articles the mills turned out shirting, yarn, pants, and knitted garments in various quantities.
| Census Year | Number Of Works | Hands Employed | Wages Paid | Machine Power Used | Amount of Horse Power | Wool used.1890 and 1885. | |||||
|---|---|---|---|---|---|---|---|---|---|---|---|
| M | F | M | F | Amount | Value | ||||||
| Men | Boys | Women | Girls | Steam | |||||||
| £ | £ | lb | £ | ||||||||
| 1891 | 8 | 426 | 176 | 373 | 200 | 52,250 | 26,790 | 8 | 930 | 2,699,219 | 118,081 |
| 1886 | 6 | 360 | 118 | 263 | 126 | * | * | 6 | 438 | 1,924,932, | 67,675 |
| Increase | 2 | 66 | 58 | 110 | 74 | .. | .. | 2 | 492 | 774,287, | 50,406 |
| Census-Year. | Manufactures for the Year. | Total Value of Manufactures, 1890 and 1885. | Approximate Value of | ||||||
|---|---|---|---|---|---|---|---|---|---|
| Tweed. | Cloth. | Flannel. | Blankets | Shawls and Rugs | Land | Buildings | Machinery and Plant. | ||
| †Includes value of 29,540 yards shirting, 73,784lb. yarn, 407 spindles yarn, 3,994 dozen hose and half-hose, 740 pairs pants, 4,402 knitted garments, 3,281 spindles fingering, 93,687lb. yarn, and knitted goods and yarn valued at £16,000. | |||||||||
| Yds. | Yds. | Yds. | Pairs. | No. | £ | £ | £ | £ | |
| 1891 | 966,864 | 34,840 | 773,528 | 19,829 | 18,728 | †279,175 | 24,600 | 69,067 | 166,288 |
| 1886 | 642,568 | 116,619 | 254,654 | 14,358 | 17,954 | 194,311 | 9,620 | 60,800 | 132,859 |
| Increase | 324,296 | .. | 518,874 | 5,471 | 774 | 84,864 | 14,980 | 8,267 | 33,429 |
| Decrease | .. | 81,779 | .. | .. | .. | .. | .. | .. | .. |
The returns do not show this industry as thriving. The number of establishments fell from 53 to 37 in 1891; and with this a decrease of 27 in the number of hands employed is found. The vessels built were only 11, against 54 in 1886; and boats, 273, against 403 at the previous census.
| Census-Year. | Number of Works | Hands employed. | Wages paid. | Machine-power used. | Amount of Horsepower. | Vessels built, 1890 and 1885. | ||||||
|---|---|---|---|---|---|---|---|---|---|---|---|---|
| Under 50 Tons | 50 to 100 Tons | 100 to 300 Tons | 300 Tons and Upwards | |||||||||
| M. | M. | Steam. | Hand. | Wood. | Steel. | Wood. | Wood. | Steel. | Wood. | |||
| £ | ||||||||||||
| 1891 | 37 | 145 | 10,831 | 4 | 33 | 28 | 7 | ... | 2 | 1 | ... | 1 |
| 1886 | 53 | 172 | * | 4 | 49 | 47 | 47 | 1 | 4 | 1 | 1 | ... |
| Decrease | 16 | 27 | ... | ... | 16 | 19 | 40 | 1 | 2 | ... | 1 | ... |
| Census Year | Number of Boats, Punts, &c, built. | Value of Imported Material used. | Value of Material produced in the Colony. | Value of Labour, &c | Total Value of all Manufactures | Value of Repairs executed. | Total Value of all Manufactures (including Repairs)1890 and 1885 | Approximate Value of | ||
|---|---|---|---|---|---|---|---|---|---|---|
| Land. | Buildings. | Machinery and Plant. | ||||||||
| £ | £ | £ | £ | £ | £ | £ | £ | £ | ||
| 1891 | 273 | 4,428 | 9,996 | 12,075 | 26,499 | 9,348 | 35,847 | 4,750 | 2,783 | 2,639 |
| 1886 | 403 | 12,075 | 9,396 | 25,645 | 47,116 | 9,016 | 46,132 | 7,921 | 3,683 | 5,490 |
| Increase | ... | ... | 600 | ... | ... | 332 | ... | ... | ... | ... |
| Decrease | 130 | 7,647 | ... | 13,570 | 20,617 | ... | 10,285 | 3,171 | 900 | 2,851 |
These were 47 in number, an increase of 5 on the number in 1886, but the hands increased from 1,654 to 1,943 and the value of the manufactures from £276,725 to £403,736, or at the rate of 45.90 per cent.
| Census-Year. | Number of Works | Hands employed. | Amount paid in Wages. | Machine-power used. | Amount of Horse Power | Value of Materials used,1890. | |||||
|---|---|---|---|---|---|---|---|---|---|---|---|
| M | F. | M | F. | Stream | Water | Gas | Hand | ||||
| £ | £ | £ | |||||||||
| 1891 | 47 | 1,475 | 468 | 107,040 | 17,950 | 2 | 2 | 11 | 32 | 46 | 193,251 |
| 1886 | 42 | 1,294 | 360 | * | * | .. | 5 | 7 | 30 | 32 | * |
| Incr. | 5 | 181 | 108 | .. | .. | 2 | .. | 4 | 2 | 14 | .. |
| Decr. | .. | .. | .. | .. | .. | .. | 3 | .. | .. | .. | .. |
| Census Year | Manufactures for the Years 1890 and 1885. | Total Value of all Manufactures (including Repairs), 1890 and 1885. | Approximate Value of | ||||||
|---|---|---|---|---|---|---|---|---|---|
| Boots. | Shoes. | Slippers. | Uppers. | Leggings. | Land. | Buildings. | Machinery and Plant. | ||
| † Includes value of 12,542ft. mill-belting. | |||||||||
| Pairs. | Pairs. | Pairs. | Pairs. | Pairs. | £ | £ | £ | £ | |
| 1891 | 740,196 | 92,358 | 13,796 | 10,806 | 1,000 | †403,736 | 26,010 | 37,500 | 18,627 |
| 1886 | 670,861 | * | 15,530 | 450 | 276,725 | 24,025 | 31,099 | 15,811 | |
| Incr. | 161,693 | .. | .. | 550 | 127,011 | 1,985 | 6,401 | 2,816 | |
| Decr. | .. | .. | 4,724 | .. | .. | .. | .. | .. | |
The number of works for 1891 was 24, and the number of hands employed 222. As a material used, phormium was most in request, 1,026 tons being used, against 800 tons of manilla. The value of the manufactures increased by £20,298.
| Census Year | Number of Works | Hands employed. | Wages paid. | Machine-power used. | Amount of Horse Power | Material used during the Years 1890 and 1885. | |||||||||
|---|---|---|---|---|---|---|---|---|---|---|---|---|---|---|---|
| Males | Males | Stream | Water | Horse | Hand | Phormiuna | Manilla. | Other Materials. | Total Value. | ||||||
| £ | Tons. | £ | Tons. | £ | Tons. | £ | £ | ||||||||
| 1891 | 24 | 222 | 13,658 | 3 | 3 | 6 | 11 | 129 | 1,020 | 20,444 | 800 | 35,445 | 19½ | 531 | 56,420 |
| 1886 | 21 | 212 | * | 5 | 4 | 1 | 11 | 163 | 288 | 4,696 | 725 | 27,490 | 60 | 2,310 | 34,496 |
| Increase | 3 | ... | ... | ... | ... | 5 | ... | ... | 738 | 15,748 | 75 | 7,955 | ... | ... | 21,924 |
| Decrease | ... | 20 | ... | 2 | 1 | ... | ... | 34 | ... | ... | ... | ... | 40½ | 1,779 | ... |
| Census Year | Manufactures for the Years 1890 and 1885 | Total value of Manufactures 1890 and 1885 | Approximate value of | |||||||
|---|---|---|---|---|---|---|---|---|---|---|
| Rope | Lines,& | Twine | Land | Buildings | Machinery and Plant | |||||
| † Includes value of 800 yards sheep-netting, 3 gross halters, 1 gross cart-nets, 15cwt. matting, 3 tons tarred yarn and binding twine. | ||||||||||
| Tons cwt | Tons cwt | Tons cwt | £ | £ | £ | £ | ||||
| 1891 | 624 17 | 9 1 | 1,112 10 | †76,711 | 8,467 | 10,074 | 17,545 | |||
| 1886 | 769 8 | 43 10 | 216 18 | 56,413 | 6,423 | 15,400 | 27,998 | |||
| Increase | ... | ... | 895 12 | 20,298 | 2,044 | ... | ... | |||
| Decrease | 144 11 | 34 9 | ... | ... | ... | 5,326 | 10,453 | |||
The development herein shown would indeed be most encouraging, but unfortunately its permanence is questionable. The industry must still be regarded as in a fluctuating condition, though the number of mills increased from 30 in 1886 to 177 in 1891, the number of hands also rising correspondingly from 247 to 3,204, and the approximate value of the manufactures during the same period from £20,059 to £234,266. The present level, however, of this industry can hardly be maintained without the invention of improvements in the machinery used that will result in lessening the cost of production, and improving the quality of the fibre.
The export of phormium (quantities and value) for the years 1881, 1887, 1889, 1890, 1891, was as follows:—
| Year. | Tons exported. | Value £ |
|---|---|---|
| 1881 | 1,383 | 27,097 |
| 1887 | 1,578 | 25,094 |
| 1888 | 4,042 | 75,269 |
| 1889 | 17,084 | 361,182 |
| 1890 | 21,158 | 381,789 |
| 1891 | 15,809 | 281,514 |
These are exporters' values, which would doubtless he higher than the value given by mill proprietors, quoted in the figures showing the output.
The last report of a Select Committee of the House of Representatives on the flax industry was brought up on the 26th August, 1890. The Committee were much impressed with the rapid increase of the export of the New Zealand flax fibre; and notwithstanding the serious decline in prices—a decline which was equally shared by kindred fibres—manufacturers were found to be not discouraged, but, on the contrary, were producing largely. Whilst the fibre as now exported is fit only for the manufacture of rope and twine, and for the same purposes as those for which manilla and sisal are used, the Committee were strongly of opinion that the New Zealand fibre is capable of further uses, and, with the view of promoting improvements in the industry, they recommended that the Government should offer a bonus of £10,000 for—
A process of flax-dressing which will reduce the cost of production;
A process which will improve the quality of dressed fibre, making it suitable for textile purposes; and
A mode of utilising the waste products of the industry.
As a result of their investigations the Committee urged that flax-owners should see that the flax is cut in such a manner as to leave the heart of the flax-fans uninjured, and that attention should be given to the planting and cultivation of the best varieties of flax, with a view to the production of fibre of superior quality. They found that the market price in London was prejudicially affected by the fact that the contents of a single hale, as well as the several bales of one consignment, often vary very widely; also that, although the phormium is not liable to spontaneous combustion, dampness has the effect of rotting the fibre, or so seriously discolouring it as to render it almost valueless on reaching the Home market.
| Census-Year. | Number of Mills. | Hands employed. | Wages paid. | Machine-power used. | Amount of Horsepower. | Number of Machines used. | Raw Material. | |||
|---|---|---|---|---|---|---|---|---|---|---|
| Steam. | Water. | Horse. | Quantity. | Value. | ||||||
| £ | Tons. | £ | ||||||||
| 1891 | 177 | 3,204 | 116,168 | 125 | 67 | 1 | 1,994 | 304 | 109,688 | 59,210 |
| 1886 | 30 | 247 | * | 9 | 20 | 1 | 273 | 48 | 9,173 | 6,125 |
| Incr | 147 | 2,957 | .. | 116 | 47 | .. | 1,721 | 256 | 100,515 | 53,085 |
| Census-Year. | Fibre dressed. | Tow produced. | Total Value of all Manufactures, 1890 and 1885. | Approximate Value of | ||||
|---|---|---|---|---|---|---|---|---|
| Quantity. | Value. | Quantity. | Value. | Land. | Buildings | Machinery and Plant. | ||
| Tons. | £ | Tons. | £ | £ | £ | £ | £ | |
| 1891 | 14,412 | 232,802 | 936 | 1,464 | 234,266 | 51,905 | 28,238 | 66,649 |
| 1886 | 1,397 | 20,059 | .. | .. | 20,059 | 7,080 | 3,990 | 6,940 |
| Incr | 13,015 | 212,743 | 936 | 1,464 | 214,207 | 44,819 | 24,248 | 59,709 |
One tow-hackling establishment was also in operation in 1891.
The number of works returned is actually 1 less than at the previous census, but the magnitude of the output far greater. The number of hands increased by 730, and the horse-power employed from 1,712 to 5,112. The number of carcases of sheep and lambs frozen was nearly four times as great for 1890 as for 1885, the increase being 1,267,297 in number. The beef frozen increased by 17,831,7891b. on a quantity of 1,321,6301b. frozen in 1885, or at the rate of 1,349 per cent.; besides which, in the figures for 1891 500,0001b. of chilled meat are not included. In preserved meats and tallow there were also large advances, while the total value of all produce increased by £920,781 between 1886 and 1891.
| Census-Year. | No. of Works. | Hands employed. | Wages paid. | Machine-power used. | Amount of Horse-Power. | Produce for the Years 1890 and 1885. | |||||||
|---|---|---|---|---|---|---|---|---|---|---|---|---|---|
| Sheep and Lambs frozen. | Beef frozen. | ||||||||||||
| M. | F. | M. | F. | Steam. | Water. | Hand. | Carcases. | Value. | Quantity. | Value. | |||
| £ | £ | No. | £ | lb. | £ | ||||||||
| 1891 | 43 | 1,561 | 7 | 138,312 | 147 | 39 | 1 | 4 | 5,112 | 1,730,911 | 956,036 | 19,153,419 | 195,546 |
| 1886 | 44 | 820 | 18 | * | * | 33 | 2 | 10 | 1,712 | 463,614 | 288,276 | 1,321,630 | 16,984 |
| Incr. | .. | 741 | .. | .. | 6 | .. | .. | 3,400 | 1,267,297 | 667,760 | 17,831,789 | 178,562 | |
| Decr. | 1 | .. | 11 | .. | .. | .. | 1 | 6 | .. | .. | .. | .. | .. |
| Census-Year. | Produce for the Years 1890 and 1885— continued. | |||||||||
|---|---|---|---|---|---|---|---|---|---|---|
| Preserved Meats. | Tallow. | Corned Beef. | Bonedust. | Neatsfoot and Trotter Oil. | ||||||
| Quantity. | Value. | Q | Value. | Quan. | Value. | Quan. | Value. | Quan. | Value. | |
| lb. | £ | Tons. | £ | Casks | M | Tons. | £ | Galls. | £ | |
| 1891 | 6,291,278 | 122,230 | 7,070 | 144,282 | 6,339 | 14,006 | 2,703 | 15,484 | 10,575 | 2,010 |
| 1886 | 5,526,382 | 82,640 | 5,457 | 111,195 | 6,029 | 20,108 | 2,575 | 19,419 | 3,469 | 833 |
| Incr. | 764,896 | 39,590 | 1,613 | 33,087 | 310 | .. | 128 | .. | 7,106 | 1,177 |
| Decr. | .. | .. | .. | .. | .. | 6,102 | .. | 3,935 | .. | .. |
| Census-Year. | Produce, 1890 and 1885—continued. | Approximate Value of | ||||
|---|---|---|---|---|---|---|
| Bones, Horns, Hoofs, &c. | Total Value of all Produce, 1890 and 1885. | |||||
| Quantity. | Value. | Land. | Buildings. | Machinery and Plant. | ||
| Tons. | £ | £ | £ | £ | £ | |
| 1891 | 3,059 | 6,490 | 1,464,659 | 67,206 | 229,607 | 179,338 |
| 1886 | 673 | 2,423 | 543,878 | 172,529 | 148,393 | 122,040 |
| Increase | 2,386 | 4,067 | 920,781 | .. | 81,214 | 57,298 |
| Decrease | .. | .. | .. | 105,323 | .. | .. |
Although it would seem that fish-curing has rather retrograded than advanced in the interval between 1886 and 1891, the canning of fish developed very fairly, the increase being 170,496 in the number of pounds weight on a quantity of 164,3501b. canned in 1885.
| Census-Year. | Number of Works. | Hands employed. | Wages paid. | Fish cured. | |
|---|---|---|---|---|---|
| M. | M. | Quantity. | Value. | ||
| £ | lb. | £ | |||
| 1891 | 27 | 140 | 8,645 | 835,273 | 9,448 |
| 1886 | 21 | 120 | * | 1,494,680 | 9,545 |
| Increase | 6 | 20 | .. | .. | .. |
| Decrease | .. | .. | .. | 659,407 | 97 |
| Census-Year. | Fish tinned. | Miscellaneous:Value. | Total Value, 1890 and 1885. | Approximate Value of | |||
|---|---|---|---|---|---|---|---|
| Quantity. | Value. | Land. | Buildings. | Plant. | |||
| lb. | £ | £ | £ | £ | £ | £ | |
| 1891 | 335,046 | 7,609 | 2,480 | 19,537 | 4,060 | 5,387 | 3,395 |
| 1886 | 161,550 | 2,637 | .. | 12,182 | 2,660 | 3,611 | 3,875 |
| Increase | 170,496 | 4,972 | 2,480 | 7,355 | 1,400 | 1,776 | 1,520 |
Between 1886 and 1891 these increased by 38. The number of hands was 110 in 1886, and 269 in 1891. As will be seen from the figures given below, the increase in butter, cheese, and bacon made is very great. Of the provincial districts, Taranaki produced the largest quantity of butter, 757,117lb., and Auckland came next with 679,891lb. Most of the cheese produced came from Otago.
| Census-Year. | No. of Factories | Hands employed. | Amount paid in Wages. | Machine-power used. | Amount of Horsepower. | ||||||
|---|---|---|---|---|---|---|---|---|---|---|---|
| M. | F. | M. | F. | Steam. | Water. | Gas. | Horse. | Hand. | |||
| £ | £ | ||||||||||
| 1891 | 74 | 218 | 51 | 13,800 | 1,128 | 60 | 6 | 1 | 2 | 5 | 387 |
| 1886 | 36 | 91 | 19 | * | * | 30 | ... | ... | ... | 6 | 147 |
| Increase | 38 | 127 | 32 | ... | ... | 30 | 6 | 1 | 2 | ... | 240 |
| Decrease | ... | ... | ... | ... | ... | ... | ... | ... | ... | 1 | ... |
| Census-Year. | Produce for the Years 1890 and 1885. | Approximate Value of | |||||||||
|---|---|---|---|---|---|---|---|---|---|---|---|
| Cheese. | Butter. | Bacon. | Value of other Products. | Total Value of all Produce. | |||||||
| Quantity. | Value. | Quantity. | Value. | Quantity. | Value. | Land. | Buildings. | Machinery and Plant. | |||
| Tons. | £ | lb. | £ | lb. | £ | £ | £ | £ | £ | £ | |
| 1891 | 1,960 | 68,710 | 1,969,759 | 73,340 | 85,520 | 1,707 | 7,200 | 150,957 | 41,390 | 31,648 | 27,409 |
| 1886 | 823 | 40,543 | 274,617 | 1,649 | 35,840 | 902 | ... | 43,094 | 9,517 | 20,261 | 17,735 |
| Increase | 1,137 | 28,167 | 1,695,142 | 71,691 | 49,680 | 805 | 7,200 | 107,863 | 31,879 | 11,387 | 9,074 |
The total annual production of butter for the colony is given on page 92.
With an increase of 8 mills since 1886, the produce of flour increased by 20,908 tons, and of meal by 8,445 tons. There were 10 more steam mills in 1891 than in 1886, and 4 more worked by water-power. One windmill was in use in 1886, but none are returned at last census.
| Census-Year. | Number of Mills. | Number of Hands employed. | Wages paid. | Machine-power used. | Amount of Horsepower. | Number of | |||||
|---|---|---|---|---|---|---|---|---|---|---|---|
| M. | M. | Steam | Water. | Wind. | Horse. | Wind, Steam, and Gas. | Pairs of Stones. | Sets of Rollers. | |||
| 1891 | 129 | 499 | 52,384 | 63 | 77 | .. | 3 | 1 | 2,906 | 274 | 273 |
| 1886 | 121 | 448 | * | 53 | 73 | 1 | .. | 1 | 2,140 | 324 | 9 |
| Increase | 8 | 51 | .. | 10 | 4 | .. | 3 | .. | 766 | .. | 264 |
| Decrease | .. | .. | .. | .. | .. | 1 | .. | .. | .. | 50 | .. |
| Census-Year. | Grain operated upon during the Years 1890 and 1885. | Produce for the Years 1890 and 1885. | Approximate Value of | ||||||
|---|---|---|---|---|---|---|---|---|---|
| Wheat. | Other Grain. | Value. | Flour. | Meal. | Value. | Land. | Buildings. | Machinery and Plant. | |
| Bushels. | Bushels. | £ | Tons. | Tons. | £ | £ | £ | £ | |
| 1891 | 4,406,350 | 694,945 | 739,590 | 95,133 | 27,776 | 991,812 | 77,237 | 148,410 | 166,181 |
| 1886 | 3,385,032 | 634,878 | 591,238 | 74,225 | 19,331 | 754,830 | 76,029 | 120,115 | 133,160 |
| Increase | 1,021,318 | 60,067 | 148,352 | 20,908 | 8,445 | 236,982 | 1,208 | 28,295 | 33,021 |
The number of works increased by 7 between 1886 and 1891, and the quantity of gas made also increased during the same period by 23,326,764 cubic feet. There were also made 18,758 tons of coke and 409,554 gallons of tar.
| Census-Year. | Number of Works. | Amount of Horse Power. | Value of all Materials. | Produce for the Years 1890 and 1885. | Total Value Produce. | |||
|---|---|---|---|---|---|---|---|---|
| Gas made. | Coke. | Tar. | Other Residuals: Value. | |||||
| Quantity. | Quantity. | Quantity. | ||||||
| £ | Cubic feet. | Tons. | Gals. | £ | ||||
| 1891 | 27 | 117 | 66,868 | 426,602,764 | 18,758 | 409,554 | 120 | 178,947 |
| 1886 | 20 | 111 | 64,653 | 403,276,000 | 7,097 | 179,582 | 4,359 | 194,653 |
| Increase | 7 | 6 | 1,710 | 23,326,764 | 11,661 | 229,972 | .. | .. |
| Decrease | .. | .. | .. | .. | .. | .. | 4,239 | 15,706 |
The number of establishments was only 15, against 20 at the previous census. The jam made in 1890 was also less than in 1885, but on the other hand the quantity of bottled fruit and other preserves increased.
| Census-Year. | Number of. Works. | Hands employed. | Wages paid. | Machine-power Used. | Amount of Horsepower. | Value of Materials used 1890 and 1885. | ||||
|---|---|---|---|---|---|---|---|---|---|---|
| M. | F. | M. | F. | Steam. | Water. | Hand. | ||||
| £ | £ | £ | ||||||||
| 1891 | 15 | 74 | 43 | 3,781 | 961 | 5 | .. | 10 | 33 | 13,413 |
| 1886 | 20 | 146 | 70 | * | * | 8 | 1 | 11 | 33 | 20,752 |
| Decrease | 5 | 72 | 27 | .. | .. | 3 | 1 | 1 | .. | 7,339 |
| Census-Year. | Manufactures, 1890 and 1885. | Other Preserves. | Value of all Manufactures, 1890 and 1885. | Approximate Value of | ||||||
|---|---|---|---|---|---|---|---|---|---|---|
| Fruit bottled or preserved. | Jam made. | |||||||||
| Quantity. | Value. | Quantity. | Value. | Quantity. | Value. | Land. | Buildings. | Machinery and Plant. | ||
| lb. | £ | lb. | £ | lb. | £ | £ | £ | £ | £ | |
| 1891 | 56,188 | 1,166 | 1,250,238 | 25,985 | 7,920 | 104 | 27,255 | 2,975 | 3,305 | 3,762 |
| 1886 | 32,380 | 678 | 1,563,210 | 31,539 | 1,000 | 75 | 32,292 | 5,660 | 6,975 | 7,885 |
| Increase | 23,808 | 488 | 1 | .. | 6,920 | 29 | .. | .. | .. | .. |
| Decrease | .. | .. | 312,972; | 5,554 | .. | .. | 5,037 | 2,685 | 3,670 | 4,123 |
There was no large development of this industry between 1886 and 1891. The increase in the quantity of beer made in 1890 over that for 1885 was only 286,997 gallons, or at the rate of 6–06 per cent., and the number of breweries was only 4 greater. The production of beer for 1880, 1885, and 1890, with the number of gallons per head of population, shows (when taken in connection with the quantity entered for home consumption at the Customs) a continually-lessening demand.
| year. | Beer made. | Quantity per Head of Population. | Quantity of Beer entered for Consumption. | Quantity of Beer entered for Consumption per Head of Population. |
|---|---|---|---|---|
| Gallons. | Gallons. | Gallons. | Gallons. | |
| 1880 | 4,874,754 | 10.3 | 450,226 | 0.9 |
| 1885 | 4,735,735 | 8.3 | 421,769 | 0.7 |
| 1890 | 5,022,732 | 8.0 | 264,746 | 0.4 |
The returns give the following information:—
| Census-Year. | Number of Breweries. | Hands. | Wages paid. | Motive-power employed. | Amount of Horsepower. | Number of | ||||||
|---|---|---|---|---|---|---|---|---|---|---|---|---|
| M. | M. | Steam. | Water. | Gas. | Wind | Horse. | Hand. | Horses employed. | Drays employed. | |||
| £ | ||||||||||||
| 1891 | 102 | 476 | 54,825 | 62 | 6 | 4 | 1 | 3 | 26 | 409 | 208 | 163 |
| 1886 | 98 | 475 | * | 58 | 4 | ... | 2 | 1 | 34 | 401 | 224 | 178 |
| Increase | 4 | 1 | ... | 4 | 2 | 4 | ... | 2 | ... | 8 | ... | ... |
| Decrease | ... | ... | ... | ... | ... | ... | 1 | ... | 8 | ... | 16 | 15 |
| Census-Year. | Materials used during Years 1890 and 1885. | Beer made, 1890 and 1885. | Approximate Value of | ||||||
|---|---|---|---|---|---|---|---|---|---|
| Sugar. | Malt. | Hops. | Value. | Quantity. | Value. | Land. | Buildings. | Machinery and Plant. | |
| lb. | Bush. | lb. | £ | Gal. | £ | £ | £ | £ | |
| 1891 | 1,345,935 | 348,134 | 441,364 | 134,087 | 5,022,732 | 300,508 | 60,764 | 113,565 | 56,496 |
| 1886 | 1,377,050 | 417,196 | 425,448 | 141,069 | 4,735,735 | 325,182 | 89,276 | 151,622 | 82,858 |
| Increase | ... | ... | 15,916 | ... | 286,997 | ... | ... | ... | ... |
| Decrease | 31,115 | 69,062 | ... | 6,982 | ... | 24,674 | 22,512 | 38,057 | 26,362 |
With reduced demand for beer a lessened production of barley malted is noticed, and a smaller number of malthouses in use.
| Malthouses. | Barley malted. | |
|---|---|---|
| No. | Bushels. | |
| 1891 | 27 | 326,070 |
| 1886 | 32 | 390,300 |
The returns show a decrease in the number of mills since 1886 of 25. There is also a reduction in the number of hands and horsepower employed. The output for the year 1890 was less than that for 1885 under all heads; and the total value of all the manufactures fell from £1,177,713 to £832,959, or at the rate of 4100B7;39 per cent. Nevertheless, the export of sawn timber, which was 28,439,013ft. in 1885, had increased to 42,098,863ft. in 1890.
| Census Year. | Number of Mills. | Hands employed. | Wages Paid. | Motive Power used. | Amount of Horsepower. | Produce for the Year 1890 and 1885. | ||||||||||
|---|---|---|---|---|---|---|---|---|---|---|---|---|---|---|---|---|
| Male. | Female. | Male. | Female. | Steam | Water. | Gas. | Horse. | Not stated. | Sawn Timber. | Value of Postal, Rails, &c. | Resawing, Planed Flooring, Skirting, &c. | |||||
| Quantity. | Value. | Quantity. | Value. | |||||||||||||
| £ | £ | Ft. | £ | £ | Ft | £ | ||||||||||
| 1891 | 243 | 3,260 | 6 | 271,783 | 31 | 218 | 23 | 2 | ... | 2 | 4,637 | 162,116,221 | 566,535 | 56,293 | 30,451,949 | 144,095 |
| 1886 | 268 | 5,031 | 11 | * | * | 237 | 25 | 2 | 1 | 3 | 5,556 | 200,452,885 | 812,015 | 20,971 | 45,506,790 | 235,673 |
| Increase | ... | ... | ... | ... | ... | ... | ... | ... | ... | ... | ... | ... | ... | 35,322 | ... | ... |
| Decrease | 25 | 1,771 | 5 | ... | ... | 19 | 2 | ... | 1 | 1 | 919 | 44,336,664 | 246,080 | ... | 15,054,841 | 91,578 |
| Census-Year. | Produce, 1890 and 1885—contd. | Total Value of all Manufactures for the Years 1890 and 1885. | Value of Undressed Timber resawn, &c., at Country-mill Prices. | Value of other Materials used. | Approximate Value of | |||||
|---|---|---|---|---|---|---|---|---|---|---|
| Moulding. | Doors and Sashes. | Land. | Buildings. | Machinery and Plant | ||||||
| Quantity. | Value. | Quantity. | Value. | |||||||
| Run. ft. | £ | No. | £ | £ | £ | £ | £ | £ | £ | |
| 1891 | 8,436,584 | 25,780 | 52,275 | 40,250 | 832,959 | 112,441 | 9,347 | 160,750 | 92,848 | 246,674 |
| 1886 | 12,569,953 | 43,511 | 68,929 | 64,943 | 1,177,713 | * | * | 393,079 | 118,131 | 452,885 |
| Decrease | 4,133,369 | 17,725 | 16,654 | 24,693 | 344,754 | ... | ... | 232,329 | 25,283 | 206,211 |
The collieries increased in number from 51 in the year 1881 to 79 in 1886, and 95 in 1891. The annual output was returned at 277,918 tons in 1880. It advanced to 481,358 tons in 1885, and 571,157 tons in 1890, according to the census; but the output is given as 637,397 tons for 1890 by the Mines Department, which leads to the belief that the census returns do not exhibit the full quantity of the yield. In 1891 the output, as given by the Mines Department, was 668,794 tons.
| Census-Year. | Number of Mines, &c. | Hands employed. | Wages paid. | Machine-power used. | Amount of Horsepower. | ||||
|---|---|---|---|---|---|---|---|---|---|
| M. | M. | Steam. | Water. | Compressed Air. | Horse. | Hand. | |||
| £ | |||||||||
| 1891 | 95 | 1,655 | 173,538 | 26 | 9 | 1 | 33 | 36 | 1,185 |
| 1886 | 79 | 1,448 | * | 24 | 5 | 1 | 7 | 42 | 1,038 |
| Increase | 16 | 207 | .. | 2 | 4 | .. | 26 | .. | 147 |
| Decrease | .. | .. | .. | .. | .. | .. | .. | 6 | .. |
| Census-Year. | Quantity and Description of Coal produced in the Years 1890 and 1885. | Approximate Value of Machinery and Plant. | ||||||
|---|---|---|---|---|---|---|---|---|
| Brown. | Pitch. | Lignite. | Bituminous. | Anthracite | Total produced. | |||
| Quantity. | Value. | |||||||
| Tons. | Tons. | Tons. | Tons. | Tons. | Tons. | £ | £ | |
| 1891 | 170,498 | 74,087 | 38,335 | 288,197 | 40 | 571,157 | 279,777 | 155,671 |
| 1886 | * | * | * | * | * | 481,358 | 255,326 | 148,773 |
| Increase | .. | .. | .. | .. | .. | 89,799 | 24,451 | 6,898 |
The special returns obtained for particulars of this industry show that fishing was carried on by 130 partnerships or companies in 1891, against 73 in 1886. The number of single persons, however, returned as engaged in this pursuit fell from 213 in 1886 to 123 in 1891. The number of boats used was 418, and nets 1,340. For oyster-dredging 13 boats and 22 dredges were in use in 1891, against 20 boats and 21 dredges in 1886.
| Census-Year. | Fishing, &c., carried on | Total Number of Persons employed. | Number paid by Wages (included in previous column). | Annual Amount paid in Wages. | Fishing. | ||||
|---|---|---|---|---|---|---|---|---|---|
| By single persons. | By partnership or Companies. | Total. | boats used. | ||||||
| Number. | Tonnage. | Value. | |||||||
| £ | £ | ||||||||
| 1891 | 123 | 130 | 253 | 667 | 214 | 15,769 | 418 | 788 | 8,428 |
| 1886 | 213 | 73 | 286 | * | * | * | 414 | 920 | 9,331 |
| Increase | .. | 57 | .. | .. | .. | .. | 4 | .. | .. |
| Decrease | 90 | .. | 33 | .. | .. | .. | .. | 132 | 903 |
| Census-Year. | Fishing–!continued.! | Oyster-gathering and -dredging. | Value of Buildings (if any) used for Fishing Purpose. | ||||
|---|---|---|---|---|---|---|---|
| Nets used. | Boats used. | Dredges used. | |||||
| Number. | Value. | Number. | Value. | Number. | Value. | ||
| £ | £ | £ | £ | ||||
| 1891 | 1,340 | 4,038 | 13 | 3,124 | 22 | 85 | 3,993 |
| 1886 | 1,048 | 4,621 | 20 | 3,068 | 21 | 57 | 3,818 |
| Increase | 292 | 17 | .. | 56 | 1 | 28 | 175 |
| Decrease | .. | .. | 7 | .. | .. | .. | .. |
A comparison has been made under four heads between the results of the industrial returns for New Zealand and those for Victoria and New South Wales, taken at the time of the census, excepting in each case those relating to mining works. According to the plan adopted at successive censuses in New Zealand, the Government Printing Office and Government Railway work shops for this colony have not been included in the previous tables. The figures for these are now added, and those for mining works deducted, for the sake of comparison. The figures for the two other colonies have been taken from a table published in December, 1891, by the Government Statist of Victoria.
| Colonies | Number of establishments | Hands employed | Horse-Power of Engines | Value of Machinery and Plant.£ |
|---|---|---|---|---|
| New Zealand (including Government Railway workshops and Government Printing Office, but deducting mining works) | 2,270 | 26,540 | 22,148 | 2,592,993 |
| Victoria | 3,296 | 58,175 | 30,078 | 6,604,322 |
| New South Wales | 2,619 | 46,525 | 24,909 | 4,557,022 |
The returns for New South Wales show 349 more establishments than those for New Zealand, and those for Victoria show an excess of 1,026 over the New Zealand figures. The average number of hands in New Zealand was also less than in the other two colonies, as shown below:—
| Average Number of Hands per Industrial Establishment. | |
|---|---|
| New Zealand | 11.7 |
| New South Wales | 17.8 |
| Victoria | 17.7 |
The value of the machinery and plant in New Zealand is not much more than one-half that given for New South Wales, and little over one-third of that in Victoria. But, while these facts are noted, it must be remembered that the population of each of the other colonies was over a million of persons at the time of the census, while that of New Zealand was only six hundred and twenty-six thousand persons, leaving out the Maoris. Certain details of the comparison are given in the following table. The industries having in New Zealand manufactures or produce of a value exceeding £100,000 have been specified:—
| Description of Manufactory, Works, &c. | New Zealand. | Victoria. | New South Wales. | |||||||||
|---|---|---|---|---|---|---|---|---|---|---|---|---|
| Number of Establishments. | Hands employed. | Horse-power of Engines. | Value of Machinery and Plant. | Number of Establishments. | Hands employed. | Horse-power of Engines. | Value of Machinery and Plant. | Number of Establishments. | Hands employed. | Horse-power of Engines. | Value of Machinery and Plant. | |
| * Including Government Printing Office and railway-carriage works. †Including railway-carriage works. ‡Mining works are not included in this table, though given for New Zealand in the previous tables. | ||||||||||||
| £ | £ | £ | ||||||||||
| Printing establishments, bookbinding, and paper-ruling | *143 | 2,746 | 378 | 204,775 | 175 | 5,085 | 871 | 544,346 | 131 | 4,067 | 651 | 422,930 |
| Agricultural-implement factories | 36 | 528 | 148 | 27,046 | 71 | 1,090 | 461 | 74,080 | 17 | 304 | 110 | 16,830 |
| Coach-building, &c., works | *114 | 1,373 | 444 | 84,902 | †207 | 2,791 | 351 | 96,360 | †156 | 5,632 | 1,399 | 244,936 |
| Tanning, fellmongery, and wool-scouring establishments | 104 | 1,196 | 474 | 37,953 | 132 | 1,669 | 824 | 153,055 | 125 | 1,739 | 1,084 | 112,352 |
| Furniture and bedding factories | 25 | 617 | 110 | 10,027 | 105 | 1,854 | 543 | 62,855 | 77 | 1,041 | 189 | 20,413 |
| Woollen-mills | 8 | 1,175 | 930 | 166,288 | 7 | 791 | 760 | 153,436 | 4 | 155 | 134 | 20,500 |
| Clothing factories | 19 | 1,290 | 7 | 4,535 | 105 | 5,536 | 64 | 32,602 | 21 | 2,698 | 3 | 4,550 |
| Boot and shoe factories | 47 | 1,943 | 46 | 18,627 | 92 | 3,787 | 122 | 63,201 | 60 | 2,806 | 132 | 32,248 |
| Meat-preserving, freezing, bacon, fish-curing, and boiling-down works | 103 | 1,792 | 5,119 | 183,818 | 42 | 449 | 245 | 35,780 | 34 | 603 | 439 | 44,845 |
| Flax-mills | 177 | 3,204 | 1,994 | 66,649 | .. | .. | .. | .. | .. | .. | .. | .. |
| Cheese and butter factories | 74 | 269 | 387 | 27,409 | 53 | 200 | 275 | 45,522 | 291 | 1,563 | 816 | 52,103 |
| Grain-mills | 129 | 499 | 2,906 | 166,181 | 104 | 800 | 3,617 | 368,386 | 74 | 541 | 2,022 | 200,338 |
| Biscuit factories | 22 | 331 | 1341 | 19,991 | 7 | 627 | 128 | 35,570 | 10 | 544 | 109 | 50,787 |
| Breweries | 102 | 476 | 409 | 56,496 | 68 | 1,185 | 752 | 254,206 | 41 | 784 | 656 | 190,077 |
| Soap and candle works | 19 | 209 | 259 | 47,511 | 33 | 427 | 386 | 95,710 | 27 | 194 | 257 | 27,380 |
| Saw-mills | 243 | 3,266 | 4,637 | 246,674 | 321 | 5,440 | 5,329 | 424,908 | 407 | 4,766 | 6,325 | 394,810 |
| Gasworks | 27 | 249 | 117 | 619,163 | 31 | 866 | 150 | 1,625,489 | 35 | 1,188 | 467 | 476,586 |
| Iron and brass foundries, boilermakers, machinists, and millwrights | 110 | 2,012 | 1,009 | 153,650 | 217 | 8,395 | 3,916 | 876,864 | 159 | 3,550 | 1,787 | 353,070 |
| Other industries | 768 | 3,305 | 2,640 | 450,698 | 1,526 | 17,183 | 11,284 | 1,661,952 | 950 | 14,350 | 8,329 | 1,892,267 |
| Totals‡ | *2,270 | 26,540 | 22,148 | 2,592,993 | †3,296 | 58,175 | 30,078 | 6,604,322 | †2,619 | 46,525 | 24,909 | 4,557,022 |
The number of the above institutes shown for 1891 was 298, a decrease of 5 on the number in 1886; but the membership increased in the five years by 805 persons, and the volumes in the libraries by 38,662. The figures for the provincial districts are given below:—
| Provincial Districts. | Number of | ||
|---|---|---|---|
| Institutions. | Members. | Volumes. | |
| Auckland | 71 | 2,791 | 73,086 |
| Taranaki | 5 | 348 | 5,378 |
| Hawke's Bay | 21 | 1,314 | 18,710 |
| Wellington | 22 | 1,515 | 31,682 |
| Marlborough | 5 | 234 | 5,868 |
| Nelson | 29 | 1,009 | 28,578 |
| Westland | 6 | 238 | 5,283 |
| Canterbury | 66 | 3,263 | 79,774 |
| Otago | 73 | 3,777 | 82,411 |
| Totals | 298 | 14,489 | 330,770 |
The total number of buildings returned as used for public worship in 1891 was 1,599, of which 1,197 were churches or chapels. These last increased by 134, or 12.60 per cent, on the number returned in 1886. On the other hand, the schoolhouses were not so much used for worship in 1891 as in 1886, the numbers being 241 and 290 for the respective years. 161 dwelling-houses were used as churches or chapels at last census. Sitting-accommodation was found for 278,114 persons in all buildings utilised for public worship; and the numbers attending services amounted in the aggregate to 177,055. These numbers show increase at the rate of 8–57 and 7.94 per cent, respectively since 1886; while the increase of population during the interval between the two censuses was at the rate of 8'33 per cent. The distribution of the buildings in the provincial districts of the colony used for public worship is shown in the following table:—
| Provincial Districts. | Churches and Chapels. | School houses used for Public Worship. | Dwellings or Public Buildings used for Public Worship. | Number of Persons | |
|---|---|---|---|---|---|
| For whom Accommodation. | Attending Services. | ||||
| Auckland | 288 | 68 | 43 | 66,167 | 37,650 |
| Taranaki | 46 | 17 | 11 | 8,472 | 5,322 |
| Hawke's Bay | 58 | 8 | 6 | 11,274 | 7,064 |
| Wellington | 178 | 18 | 19 | 40,192 | 25,631 |
| Marlborough | 30 | 1 | .. | 5,310 | 3,335 |
| Nelson | 76 | 6 | 10 | 15,030 | 8,879 |
| Westland | 33 | 2 | 3 | 6,705 | 4,445 |
| Canterbury | 256 | 33 | 19 | 60,755 | 41,771 |
| Otago | 232 | 88 | 50 | 64,209 | 42,958 |
| Totals | 1,197 | 241 | 161 | 278,114 | 177,055 |
The next table gives the buildings in use for purposes of public worship by the various denominations. The number of persons belonging to each denomination in the colony is stated in the previous portion of this report relating to the “Religions of the People.”
| Denominations. | Churches and Chaples. | Schoolhouses used for Public Worship. | Dwellings or Public Buildings used for Public Worship. | Number of Persons | |
|---|---|---|---|---|---|
| For whom Accommodation. | Attending Services. | ||||
| Church of England | 345 | 49 | 20 | 63,204 | 37,252 |
| Roman Catholics | 181 | 7 | 5 | 44,062 | 30,525 |
| Catholic Apostolic Church | 1 | .. | .. | 100 | 50 |
| Presbyterians | 246 | 86 | 38 | 59,839 | 40,785 |
| Methodists– | |||||
| Wesleyan Methodist | 213 | 62 | 19 | 42,599 | 27,106 |
| Primitive Methodist | 41 | 12 | 8 | 9,200 | 5,265 |
| United Free Methodist | 18 | 2 | .. | 4,365 | 2,180 |
| Independent Wesleyan | 1 | .. | .. | 150 | 90 |
| Other Denominations– | |||||
| Baptists | 32 | 1 | 2 | 8,785 | 5,011 |
| Congregational Independents | 21 | 4 | 5 | 6,975 | 3,705 |
| Lutherans | 13 | .. | 3 | 1,615 | 813 |
| Society of Friends | .. | 1 | 1 | 50 | 40 |
| Plymouth Brethren | 2 | .. | 5 | 1,650 | 785 |
| Christian Brethren | 1 | .. | 1 | 280 | 75 |
| Christian Disciples | .. | 1 | .. | 60 | 30 |
| Bible Christians | 9 | .. | 1 | 1,790 | 960 |
| Church of Christ | 15 | .. | 7 | 4,690 | 2,806 |
| Christadelphians | .. | .. | 3 | 555 | 112 |
| Seventh-day Adventists | 1 | .. | 1 | 600 | 170 |
| Students of Truth | .. | .. | 1 | 500 | 400 |
| Buildings open to more than one Protestant denomination (included in the above) | [20] | [9] | [7] | [3,450] | [1,570] |
| Salvation Army | 34 | .. | 18 | 17,420 | 14,442 |
| Hebrews | 5 | .. | .. | 1,100 | 450 |
| Undenominational | 18 | 16 | 22 | 8,275 | 3,803 |
| Freethinkers | .. | .. | 1 | 250 | 200 |
| Totals, 1891 | 1,197 | 241 | 161 | 278,114 | 177,055 |
| Totals, 1886 | 1,063 | 290 | 146 | 256,151 | 164,033 |
Table of Contents
THE system adopted in taking the census of the Maoris was the same as that made use of in 1886. The superintendence of the collection was intrusted to officers of the Native Department. Ten of these officers undertook the management for the North Island, where the bulk of the Maori population are residents (39,535 persons); and six Inspectors of Police acted for the Middle and Stewart Islands, where there are only 2,019 Natives. Half-castes living as members of Native tribes were included in the Maori census. Such of the half-castes as were living amongst Europeans and had adopted or been brought up in civilised habits were taken in the European census; but, however taken, the half-castes were specified so as to allow of their full number being arrived at. Maori women who had European husbands were also taken in the European census, but the number was afterwards added to the Maori population.
The census of Europeans is taken by visits of sub-enumerators to every dwelling, but this is not practicable in case of Maoris, and indeed the necessity for it is not so great, because selected Natives may be found who can readily give full particulars about the members of their tribes, every small event being considered of far more importance than would be the case amongst more civilised races. The names of the persons enumerated were as a rule entered in the sub-enumerators' books.
Three of the superintending officers reported that the task of eliciting the necessary information from the Maoris was a difficult one on account of their unwillingness to give any particulars. The Native Agent at Otorohanga writes that the trouble was “caused, as usual, by the King Natives or supporters of Tawhiao, wherever they were situated, with here and there an exception, refusing to give any particulars or information whatsoever to the sub-enumerators either as regards themselves, their cultivations, or their live-stock.” The Resident Magistrate of Napier stated that in some cases in his district the Natives refused to give the sub-enumerators information, but that “the feeling of distrust is not so strong now as it was in 1886. Some Natives have an idea that the census is in some way connected with taxation.” The officer superintending for the district around Wanganui reported that “very little assistance was given by the Natives themselves: indeed, in several instances they positively refused information, which was, however, eventually obtained by quiet persistence.” But, with all drawbacks, the general result is believed to be fairly reliable.
For the whole colony the proportionate strength of the two races is 1 Maori to about 15 Europeans. Omitting from the calculation the 251 Maori wives married to European husbands, it is found that in the North Island the proportion of Maoris is 1 to every 7 Europeans, in the Middle Island 1 to 183, in Stewart Island 1 to 1.5, and in the Chatham Islands 1 to 1.4; the percentage of each race to the total population being,—
| European. | Maori. | |
|---|---|---|
| Per Cent. | Per Cent. | |
| North Island | 87.68 | 12.32 |
| Middle Island | 99.46 | 0.54 |
| Stewart Island | 59.76 | 40.24 |
| Chatham Islands | 59.04 | 40.96 |
| Colony | 93.72 | 6.28 |
The total Maori population amounted to 41,993 persons, of whom 22,861 were males and 19,132 females. In 1886 the population was returned as 41,969 persons—males 22,840, females 19,129. As more than 100 Maoris lost their lives in the Tarawera eruption, which took place subsequently to the census of 1886, it would seem that the Maori population is not on the decline.
The North Island had a Maori population of 39,535 persons in 1891. The Middle Island had only 1,883, and Stewart Island 136. The Native population of the Chatham Islands was 188 persons, 40 of whom were Maoris. 251 Maori women were found to be wives of European husbands.
The half-caste population, as previously stated, consists of those half-castes who are living as members, of a Maori tribe and those living amongst and as Europeans. The numbers were as under for two censuses:—
| Census. | Half-castes living as Members of Maori Tribes. | Half-castes living as Europeans. | Total Half-castes Population. |
|---|---|---|---|
| Persons. | Persons. | Persons. | |
| 1891 | 2,681 | 2,184 | 4,865 |
| 1886 | 2,254 | 1,958 | 4,212 |
The number of half-castes here stated to be living as Maoris in 1891 does not quite agree with the number given in Table 1 of Part I. of the census volume, several errors having been disclosed in the subsequent analysis of the work necessary for the detailed tables belonging to the Maori census.
Of the principal Maori tribes, the Ngapuhi had the greatest number of members (6,314 persons); Ngatikahungunu comes next with 5,194; Waikato had 3,923; Arawa, 3,713; Ngatiporou, 3,695; Ngatiawa, 2,027; Rarawa, 2,023; and the others, under 2,000.
The following table shows the numbers and ages of the Natives according to the various tribes:—
| Numbers under and over 15 Years. | Total Population. | ||||||
|---|---|---|---|---|---|---|---|
| Under 15. | Over 15. | ||||||
| M. | F. | M. | F. | M. | F. | Persons. | |
| Arawa | 678 | 564 | 1,369 | 1,102 | 2,047 | 1,666 | 3,713 |
| Muaupoko | 6 | 2 | 45 | 36 | 51 | 38 | 89 |
| Ngatiporou | 628 | 581 | 1,348 | 1,138 | 1,976 | 1,719 | 3,695 |
| Ngatikahungunu | 938 | 796 | 1,963 | 1,497 | 2,901 | 2,293 | 5,194 |
| Ngaiterangi | 235 | 192 | 505 | 384 | 740 | 576 | 1,316 |
| Ngapuhi | 1,357 | 1,205 | 2,095 | 1,657 | 3,452 | 2,862 | 6,314 |
| Ngatimaniapoto | 284 | 256 | 527 | 464 | 811 | 720 | 1,531 |
| Ngatimaru | 203 | 188 | 542 | 416 | 745 | 604 | 1,349 |
| Ngatiawa | 326 | 280 | 800 | 615 | 1,132 | 895 | 2,027 |
| Carried forward | 14,655 | 4,064 | 9,200 | 7,309 | 13,855 | 11,373 | 25,228 |
| Numbers under and over 15 Years. | Total Population. | ||||||
|---|---|---|---|---|---|---|---|
| Under 15. | Over 15. | ||||||
| M. | F. | M. | F. | M. | F. | Persons. | |
| * Including 119 males and 118 females, ages not specified † Including 1 males and 1 females, ages not specified ‡ Including 120 males and 119 females, ages not specified | |||||||
| Brought forward | 4,655 | 4,064 | 9,200 | 7,309 | 13,855 | 11,373 | 25,228 |
| Ngatiraukawa | 291 | 248 | 576 | 484 | 867 | 732 | 1,599 |
| Ngatiruanui | 107 | 67 | 373 | 288 | 480 | 355 | 835 |
| Ngatiwhatua | 72 | 65 | 195 | 139 | 267 | 204 | 471 |
| Rangitane | 14 | 14 | 43 | 27 | 57 | 41 | 98 |
| Rarawa | 414 | 382 | 701 | 526 | 1,115 | 908 | 2,023 |
| Taranaki | 91 | 65 | 260 | 193 | 351 | 258 | 609 |
| Urewera | 204 | 245 | 418 | 344 | 622 | 589 | 1,211 |
| Waikato | 665 | 636 | 1,502 | 1,120 | 2,167 | 1,756 | 3,923 |
| Whakatohea | 101 | 99 | 179 | 167 | 280 | 266 | 546 |
| Whanau-a-Apanui | 142 | 108 | 225 | 221 | 367 | 329 | 696 |
| Whanganui | 310 | 224 | 676 | 537 | 986 | 761 | 1,747 |
| Unspecified | 40 | 26 | 87 | 53 | 246 | 197 | *443 |
| Others | 17 | 12 | 48 | 29 | 65 | 41 | 106 |
| North Island | 7,123 | 6,255 | 14,483 | 11,437 | 21,725 | 17,810 | *39,535 |
| Middle Island | 374 | 366 | 598 | 543 | 973 | 910 | †1,883 |
| Stewart Island | 31 | 34 | 41 | 30 | 72 | 64 | 136 |
| Chatham Islands— | |||||||
| Maoris | 22 | 40 | 43 | 43 | 65 | 83 | 148 |
| Morioris | 4 | 2 | 22 | 12 | 26 | 14 | 40 |
| Maori wives living with European husbands | .. | .. | .. | 251 | .. | 251 | 251 |
| Totals | 7,554 | 6,697 | 15,187 | 12,316 | 22,861 | 19,132 | ‡41,993 |
It has been stated that the comparison of the numbers of Maoris returned in 1891 and 1886 leads to the conclusion that the population is about stationary. But the males under 15 years by the above table were in the proportion of 33.04: to every 100 of the male population, and the similar proportion among the females was 35.00 per cent. In the European portion of the population the proportions were: Males under 15 years 38.08 per cent., and the females under 15 years 42'20 per cent., of the totals of the respective sexes. The variation in the proportions for the two races would seem to indicate that a low birth-rate or a high juvenile mortality obtains among the Maoris.
The enumerators were directed to report to the Native Department on the general health of the Maoris, with any other information bearing on the population question deemed to be important. Inquiry into increase or decrease in localities seemed to show that Natives move from one place to another frequently, and often depart from their usual place of abode for the purpose of gum-digging, thus swelling for a while the population of one locality at the expense of another.
As to health the enumerator for the districts north of Auckland reported that during the last five years there had been no great mortality amongst the Natives, and that the deaths had “principally occurred from old age or pulmonary complaints.” Three cases of Maori leprosy were met with, which appeared to be of recent origin. The enumerator for the country around Auckland, Waikato, &c, stated there was no epidemic sickness amongst the Natives when the census was being taken. The ailments noticed were pulmonary diseases, rheumatism, and almost universal hakihaki among the children.
Around Tauranga the general health was found to be fairly good, without serious epidemics. The mortality did not appear to be excessive, taking into consideration the irregular and careless mode of life. One case is noticed of supposed leprosy near Rotorua. The disease is termed ngerengere by the Natives.
In the Counties of Cook and Waiapu the general health is reported good, the Maoris not being given to drinking, and being much more industrious than formerly. For Hawke's Bay also the report was favourable.
For Wairarapa and the country around Wellington the diseases observed were those of the respiratory organs; and it is stated that when once the Natives are attacked they soon succumb, from which it would appear that their constitution is not so vigorous as in the past, when they lived on elevated ground instead of in low-lying places, often very wet. Around Wanganui their health is stated to be fairly good; but the enumerator at New Plymouth reported that the Natives in his district are, in his opinion, decreasing steadily in number through excessive mortality and paucity of births: probably not more than one in three Maori children living to maturity.
In reports on previous censuses it is stated that the tendency to racial decrease which is indicated by the low proportion of the number under 15 years of age to the whole population is attributable to the following causes: An excessive infantile mortality, owing to improper food, exposure, want of ordinary care and cleanliness; the constitutions of the parents debilitated by past debauchery; the practice of placing their sick in the hands of the Native doctor (tohunga), instead of applying to the medical officer of the district; the sterility induced by widespread immorality among quite young females before marriage; the partial adoption of European habits and costume, and the continual reversion to the habits and costume of barbarism with a system rendered more susceptible to external influences, especially those of a humid and changeable climate, thereby tending to promote the spread of diseases, notably those affecting the respiratory organs; and to a certain extent the continual introtribal marriages, resulting in diminished fruitfulness and enfeebled constitutions.
Comparing the proportions of males and females of the Native race living at each age-period with the proportion obtaining for the Europeans of this colony and the proportions for England in 1881, we see that the males under 40 years are only 70.93 per cent, in case of the Maori population, but 76.38 per cent, of the New Zealand European and 76.54 per cent, of the English male population. The females under 40 are 74.77 per cent, of the total Maori females, but 82.35 per cent, for New Zealand Europeans, and 75.01 per cent, in case of English.
| Age. | England. | N.Z. European. | Maori. | |||
|---|---|---|---|---|---|---|
| 1881. | 1891. | 1891. | ||||
| M. | F. | M. | F. | M. | F. | |
| Under 5 years | 13.90 | 13.22 | 12.72 | 13.95 | 11.15 | 12.42 |
| 5 and under 10 | 12.41 | 11.84 | 13.09 | 14.51 | 12.11 | 12.50 |
| 10 and under 15 | 11.09 | 10.48 | 12.27 | 13.74 | 10.42 | 11.07 |
| 15 and under 20 | 10.03 | 9.59 | 9.82 | 11.12 | 8.55 | 9.20 |
| 20 and under 30 | 16.56 | 17.12 | 15.67 | 17.78 | 16.02 | 17.10 |
| 30 and under 40 | 12.55 | 12.76 | 12.81 | 11.25 | 12.68 | 12.48 |
| 40 and under 50 | 9.68 | 9.98 | 10.47 | 8.61 | 10.45 | 10.01 |
| 50 and under 60 | 6.87 | 7.21 | 8.34 | 5.48 | 8.27 | 7.29 |
| 60 and under 70 | 4.53 | 4.93 | 3.49 | 2.39 | 6.41 | 4.77 |
| 70 upwards | 2.40 | 2.87 | 1.32 | 1.17 | 3.94 | 3.16 |
| 100.00 | 100.00 | 100.00 | 100.00 | 100.00 | 100.00 | |
To show the tendency in the interval between the census of 1886 and that of 1891, the percentages of New Zealand Europeans and Maoris under or over 20 years of age in those years are next given:—
| 1886. | 1891. | |||||||
|---|---|---|---|---|---|---|---|---|
| N.Z. Europeans. | Maoris. | N.Z. Europeans. | Maoris. | |||||
| M. | F. | M. | F. | M. | F. | M. | F. | |
| Under 20 | 48.15 | 55.67 | 39.70 | 42.29 | 47.90 | 55.52 | 42.23 | 45.19 |
| Over 20 | 51.85 | 44.33 | 60.30 | 57.71 | 52.10 | 46.68 | 57.77 | 54.81 |
Again, the population under 20 years of age is less for Maoris than for Europeans, as in the case of the proportions of those under 15 years before quoted.
I would anticipate remarks that may be made as to the date of issue of this report, by stating that the only census report yet received here from any of the Australian Colonies is that of Queensland, so that the work is finished, generally speaking, earlier in New Zealand than elsewhere.
And it may be excusable to call attention to the fact that it is only in those Australian Colonies where the population is much smaller than in New Zealand that the duties of Government Statistician are undertaken by the Registrar-General. The administration of the Marriage Act, and Registration of Births and Deaths Act, with the registration of medical practitioners and dentists, besides the duties relating to vaccination devolved upon the Registrar-General by a portion of the Public Health Act, all take time, and render an uninterrupted devotion to the census and general statistical work an impossibility.
I have the honour to be, Sir,
Your most obedient servant,
E. J. VON DADELSZEN,
Registrar-General.
TABLE Showing the Occupations of the People According to the Census of April, 1891, Arranged in Alphabetical Order
| — | Males. | Females. |
|---|---|---|
| Accountant, clerk (see clerk) | 2,356 | 42 |
| Accountant, insurance | 17 | .. |
| Accountant, shipping, newspaper, auctioneer, and other specified trade or occupation | 48 | 1 |
| Account collector (see collector) | 26 | .. |
| Actor, actress | 37 | 27 |
| Actuary, average stater | 8 | .. |
| Advertising agent, bill-sticker, bill-distributer | 18 | 2 |
| Aerated waters, cordial manufacturer and assistant | 250 | 8 |
| Agent, advertising | 1 | .. |
| Agent, book | 16 | .. |
| Agent, commission | 678 | 2 |
| Agent, forwarding | 11 | .. |
| Agent, house, factor, rent-collector | 27 | .. |
| Agent, labour | 20 | .. |
| Agent, land and estate, factor, rent-collector | 200 | 1 |
| Agent, Native-land | 8 | .. |
| Agent, news, newspaper seller | 201 | 2 |
| Agent, officer, director, manager, insurance company | 573 | 1 |
| Agent, rabbit | 33 | .. |
| Agent, sewing-machine | 16 | .. |
| Agent, stock and station | 15 | .. |
| Agent, other specified trade or occupation | 84 | 4 |
| Agent, undefined | 95 | 1 |
| Agricultural-implement and machinery dealer | 11 | .. |
| Agricultural-implement and machinery maker | 35 | .. |
| Agricultural-implement owner, worker | 800 | .. |
| Agricultural farmer | 25,084 | 742 |
| Agricultural labourer, servant | 13,716 | 33 |
| Ale and stout, wine and spirit merchant | 70 | .. |
| Alkali, salt, soda, starch, blue maker | 4 | .. |
| Amalgamator | 27 | .. |
| Analytical chemist | 10 | .. |
| Animal trainer, horsebreaker | 302 | .. |
| Animal food refrigerator | 378 | .. |
| Annuitant | 230 | 210 |
| Antimony and lead dealer | 1 | .. |
| Antimony worker | 2 | .. |
| Apiarist, bee-farmer | 15 | .. |
| Apothecary (see Chemist) | 516 | 14 |
| Appraiser, auctioneer, valuer | 342 | 1 |
| Apprentice, blacksmith | 105 | .. |
| Apprentice boilermaker | 30 | .. |
| Apprentice bootmaker | 77 | 6 |
| Apprentice carpenter | 47 | .. |
| Apprentice chemist | 39 | .. |
| Apprentice draper | 31 | .. |
| Apprentice dressmaker | .. | 162 |
| Apprentice mechanical engineer | 54 | .. |
| Apprentice printer | 82 | .. |
| Apprentice saddler | 37 | .. |
| Apprentice tailor | 63 | 20 |
| Apprentice other specified trade or occupation | 440 | .. |
| Apprentice undefined | 46 | 12 |
| Architect | 160 | .. |
| — | Males. | Females. |
|---|---|---|
| Architect, assistant to | 18 | .. |
| Armourer, gunsmith | 41 | .. |
| Arms and explosives dealer | 1 | .. |
| Artificial-flower maker | 2 | 2 |
| Artist, art-student, painter | 105 | 80 |
| Asphalte, pitch maker, worker | 26 | .. |
| Assayer, metallurgist | 10 | .. |
| Assignee, Official, trade | 12 | .. |
| Assistant, baker | 148 | 32 |
| Assistant, biscuit-factory | 24 | 3 |
| Assistant, blacksmith | 46 | .. |
| Assistant, boilermaker | 27 | .. |
| Assistant, bootmaker | 50 | 8 |
| Assistant, brewery | 33 | .. |
| Assistant, cabinetmaker | 26 | .. |
| Assistant, contractor | 60 | .. |
| Assistant, cordial-maker | 29 | .. |
| Assistant, dairy | 74 | 27 |
| Assistant, dairy factory | 27 | 6 |
| Assistant, dairy farm | 53 | .. |
| Assistant, draper | 472 | 323 |
| Assistant, dressmaker | .. | 82 |
| Assistant, fancy-goods shop | 5 | 27 |
| Assistant, farm | 48 | 10 |
| Assistant, fishmonger | 23 | 17 |
| Assistant, gardener | 43 | .. |
| Assistant, greengrocer | 58 | .. |
| Assistant, grocer | 178 | .. |
| Assistant, hardware dealer, ironmonger | 116 | 1 |
| Assistant, jam factory | 16 | 10 |
| Assistant, market-gardener | 30 | .. |
| Assistant, merchant | 31 | .. |
| Assistant, mill | 70 | 7 |
| Assistant, milliner | .. | 27 |
| Assistant, nurseryman | 26 | .. |
| Assistant, painter | 38 | 5 |
| Assistant, printer | 48 | 2 |
| Assistant, saddler | 33 | 1 |
| Assistant, shop | 225 | 151 |
| Assistant, soft-goods warehouse | 31 | 5 |
| Assistant, station | 655 | 2 |
| Assistant, stationer | 41 | 13 |
| Assistant, storeman | 41 | .. |
| Assistant, tailor | 20 | 13 |
| Assistant, other specified trade or occupation | 561 | 40 |
| Assistant, undefined | 20 | 8 |
| Attendant, caretaker, office-boy | 240 | 8 |
| Attorney, solicitor | 303 | .. |
| Auctioneer, appraiser, valuer | 342 | 1 |
| Author, editor, journalist | 289 | 7 |
| Average stater, actuary | 8 | .. |
| Bag, paper maker | 4 | 7 |
| Bag, bagging, sack maker | 4 | 6 |
| Baker, biscuit and pastry maker | 1,846 | 59 |
| Banker, manager, director | 202 | .. |
| Bank clerk, officer | 870 | .. |
| Barber, hairdresser | 356 | 11 |
| Bargeman, lighterman | 27 | .. |
| Bark dealer | 2 | .. |
| Bark-mill owner | 3 | .. |
| Barman, barmaid | 199 | 195 |
| Barrister | 268 | .. |
| — | Males. | Females. |
|---|---|---|
| Barrow and ladder maker | 2 | .. |
| Basket, wickerware maker | 65 | .. |
| Basket, wickerware dealer | .. | 1 |
| Bath-keeper, attendant | 10 | 8 |
| Bed, mattress, hammock maker, upholster. | 194 | 31 |
| Bee-farmer, apiarist | 15 | .. |
| Bellhanger, house plumber | 699 | 1 |
| Bellman | 4 | .. |
| Bellows-maker | 2 | 1 |
| Benevolent asylum, inmate of | 568 | 272 |
| Bicycle, perambulator, wheel-chair maker | 23 | .. |
| Bill sticker, distributer, advertising agent | 18 | 2 |
| Billiard-table proprietor, keeper, marker | 85 | .. |
| Biologist, botanist, naturalist | 5 | .. |
| Biscuit, bread dealer | 109 | 25 |
| Blacking, ink maker | 6 | 1 |
| Blacksmith, whitesmith, farrier, assistant | 3,234 | 2 |
| Blindmaker | 34 | 2 |
| Block, oar, mast maker | 9 | .. |
| Boarding-house keeper, wife assisting | 225 | 540 |
| Boatman, waterman | 170 | .. |
| Boat, ship builder, assistant | 518 | .. |
| Boat, ship dealer | 3 | .. |
| Boat, ship owner, manager, agent | 286 | .. |
| Boilerdown, fat, tallow melter | 20 | 1 |
| Boilermaker | 252 | .. |
| Bone-dealer | 1 | .. |
| Bone dust manure manufacturer | 18 | .. |
| Bonnet, cap maker, hatter | 56 | 71 |
| Bookbinder, machine ruler | 192 | 82 |
| Bookmaker, betting-man | 5 | .. |
| Bookseller, book-canvasser, stationer | 212 | 23 |
| Book-lender, librarian | 40 | 12 |
| Boot, shoe dealer | 137 | 35 |
| Boot, shoe maker (all branches) | 3,505 | 411 |
| Botanist, biologist, naturalist | 5 | .. |
| Box-maker | 10 | 6 |
| Brassfounder, moulder, worker, finisher, fitter | 104 | 1 |
| Bread, biscuit dealer | 109 | 25 |
| Brewer, bottler, and others engaged in connection with brewing | 430 | 2 |
| Brick, tile dealer | 2 | .. |
| Bricklayer, hodman, labourer | 623 | .. |
| Brick, tile maker | 449 | 1 |
| Bridge-builder | 7 | .. |
| Broker, grain | 5 | .. |
| Broker, share, stock speculator | 125 | .. |
| Broker, wool, dealer | 89 | .. |
| Broker, undefined | 17 | .. |
| Brush, broom maker | 43 | 14 |
| Builder, building contractor, foreman, clerk, inspector | 829 | .. |
| Building society, savings-bank director, manager, officer, clerk | 19 | .. |
| Bullock-driver (not further defined) (see also carter, waggoner) | 89 | .. |
| Bullock-driver, in bush | 10 | .. |
| Bullock-driver, on farm | 6 | .. |
| Bullock-driver, sawmill | 23 | .. |
| Bullock-driver, station | 45 | .. |
| Bush-contractor | 317 | .. |
| Bushman, axeman, grubber | 2,536 | .. |
| Butcher, meat salesman | 2,856 | 35 |
| — | Males. | Females. |
|---|---|---|
| Butcher, pork | 31 | 1 |
| Butcher, rider-out to | 124 | .. |
| Butter, cheese maker, milk-preserver | 121 | 15 |
| Cab, coach, omnibus, driver, servant | 459 | .. |
| Cab, coach, omnibus, owner, proprietor, Cab, coach, omnibus, manager | 270 | 3 |
| Cabinet, furniture maker | 987 | 3 |
| Cabinet, Minister (not otherw. described) | 3 | .. |
| Cadet, farm | 72 | .. |
| Cadet, station | 43 | .. |
| Calenderer, dyer, scourer | 55 | 3 |
| Candle, soap maker, assistant | 100 | 4 |
| Canvas, sailcloth maker | 2 | .. |
| Canvasser | 27 | 4 |
| Canvasser life insurance (see also Agent) | 2 | .. |
| Cap, bonnet maker, hatter | 56 | 71 |
| Capitalist, financier, money-broker, and assistant | 294 | 57 |
| Caretaker, attendant, office-boy | 240 | 8 |
| Caretaker, ships' | 13 | .. |
| Caretaker, tennis-court .bowling-green, &c. | 7 | .. |
| Caretaker, water-race | 8 | .. |
| Caretaker, at other specified trade or occupation | 12 | .. |
| Carpenter, joiner, turner, carpenters labourer | 5,466 | 2 |
| Carriage, waggon, cart, vehicle builder | 750 | 1 |
| Carriage, railway-waggon, trolly-maker | 70 | .. |
| Carrier, carter, express-driver | 2,864 | 4 |
| Carter, waggoner (roads and railways) | 151 | .. |
| Carter, basker | 75 | .. |
| Carter, butcher | 58 | .. |
| Carter, flax-mills | 46 | .. |
| Carter, station | 46 | .. |
| Carter, at other specified trade or occupation | 204 | .. |
| Cartridge, fuse maker | 2 | 12 |
| Carver, wood, stone, bone, ivory, other material | 55 | .. |
| Carving, figures dealer | 1 | .. |
| Case (packing) maker | 8 | .. |
| Cashier (not more specifically defined) | 14 | .. |
| Cast-iron founder, moulder, worker | 501 | .. |
| Caterer | 5 | .. |
| Cattle-, sheep-drover | 110 | .. |
| Cattle-, sheep pig-dealer | 59 | .. |
| Cattle-, sheep farmer, runholder, grazier | 1,395 | 31 |
| Cemetery-keeper, grave-digger | 10 | .. |
| Chaffcutter | 63 | .. |
| Chairmaker | 19 | .. |
| Charcoal-burner | 16 | .. |
| Charitable, benevolent institution officer, servant | 42 | 92 |
| Charitable, benevolent institution inmate | 568 | 272 |
| Charity, Sister of | .. | 52 |
| Charwoman, cleaner | 3 | 257 |
| Cheese, butter maker, milk-preserver | 121 | 15 |
| Cheesemonger | 3 | .. |
| Chemist, analytical | 10 | .. |
| Chemist, and druggist, assistant | 516 | 14 |
| Chemist, manufacturing | 20 | 4 |
| Chemical by-products dealer | 2 | .. |
| Chemical manure maker | 12 | .. |
| — | Males. | Females. |
|---|---|---|
| Chemical materials (not drugs) dealer | 1 | .. |
| Chicory, coffee roaster | 12 | .. |
| Chicory, coffee dealer | 12 | .. |
| Chief Justice | 1 | .. |
| Chimney-sweep, assistant | 41 | .. |
| China, crockeryware maker, mender | 7 | .. |
| China, crockeryware dealer | 27 | 4 |
| Chronometer, watch, and clock maker | 430 | 1 |
| Church officer | 63 | 1 |
| Cigar, cigarette, tobacco manufacturer, maker | 19 | 21 |
| Civil engineer | 223 | .. |
| Civil engineer assistant, cadet | 10 | .. |
| Cleaner, charwoman | 3 | 257 |
| Clergyman | 732 | .. |
| Clergyman irregular | 156 | 87 |
| Clerk, cashier, accountant, bookkeeper, commercial or other undefined | 2,856 | 42 |
| Clerk, cashier, to architect, builder | 5 | .. |
| Clerk, cashier, auctioneer | 95 | .. |
| Clerk, cashier, bank, officer | 870 | .. |
| Clerk, cashier, draper | 39 | 1 |
| Clerk, cashier, freezing-works | 31 | .. |
| Clerk, cashier, grain merchant | 36 | .. |
| Clerk, cashier, grocer | 62 | .. |
| Clerk, cashier, hardware dealer, ironmonger | 53 | 2 |
| Clerk, cashier, hotel, club | 13 | .. |
| Clerk, cashier, insurance | 276 | 1 |
| Clerk, cashier, saw-mill | 36 | .. |
| Clerk, cashier, shipping | 176 | .. |
| Clerk, cashier, soft-goods warehouse | 88 | 1 |
| Clerk, cashier, to station | 36 | .. |
| Clerk, cashier, stock agents | 29 | .. |
| Clerk, cashier, storekeeper | 56 | 1 |
| Clerk, cashier, timber merchant | 39 | .. |
| Clerk, cashier, other specified trade or occupation | 669 | 11 |
| Clock and watch dealer | 3 | .. |
| Clock, chronometer, watch maker | 430 | 1 |
| Clothing manufacturer | 10 | .. |
| Clothes dealer, outfitter, slopseller | 98 | 5 |
| Club-house manager, secretary, steward | 30 | 2 |
| Club, hotel, eating-house servant | 1,172 | 1,953 |
| Coach, cab, omnibus conductor, driver, servant | 459 | .. |
| Coach, cab, omnibus proprietor, owner, manager | 270 | 3 |
| Coach-body maker | 8 | .. |
| Coach-builder, painter, &c, assistant | 750 | 1 |
| Coach-painter | 180 | .. |
| Coach-trimmer | 27 | 1 |
| Coal, coke merchant, dealer | 331 | 6 |
| Coal, heaver, labourer | 22 | .. |
| Coal, mine proprietor, overseer, miner, &c. | 1,721 | 1 |
| Coffee, chicory merchant, dealer | 12 | .. |
| Coffee, chicory roaster | 12 | .. |
| Coffee, house manager | 1 | .. |
| Coffee, chicory restaurant, eating-house keeper | 48 | 46 |
| Coffee, stall owner | 4 | .. |
| Coffin-maker, undertaker | 34 | 1 |
| Coke manufacturer | 10 | .. |
| Coke coal merchant, dealer | 331 | 6 |
| — | Males. | Females. |
|---|---|---|
| Collar-maker (saddler) | 8 | .. |
| Collector, accounts | 26 | .. |
| Collector, books | 1 | .. |
| Collector, newspaper office | 5 | .. |
| Collector, sewing-machine company | 5 | 5 |
| Commercial traveller (specified trade) | 261 | .. |
| Commercial traveller sales-man, -woman | 559 | 271 |
| Commission agent | 678 | 2 |
| Companion, lady-help | 1 | 256 |
| Compositor | 739 | 54 |
| Confectioner, pastry dealer | 168 | 68 |
| Confectionery-maker | 76 | 4 |
| Contractor, bridge | 8 | .. |
| Contractor, bush | 317 | .. |
| Contractor, drainer | 3 | .. |
| Contractor, farm | 8 | .. |
| Contractor, fencing | 12 | .. |
| Contractor, firewood | 4 | .. |
| Contractor, grain | 4 | .. |
| Contractor, harvest | 7 | .. |
| Contractor, ploughing | 201 | .. |
| Contractor, railway | 13 | .. |
| Contractor, road and railway | 263 | .. |
| Contractor, sawyer | 17 | .. |
| Contractor, station | 10 | .. |
| Contractor, swamp | 3 | .. |
| Contractor, timber | 6 | .. |
| Contractor, water-race | 2 | .. |
| Contractor, undefined | 1,076 | 2 |
| Cook (not domestic servant) | 359 | 4 |
| Cook bushman | 54 | .. |
| Cook farm | 64 | .. |
| Cook, flax-mills | 64 | 1 |
| Cook, station | 189 | .. |
| Cook, other specified trade or occupation | 46 | .. |
| Cooper | 219 | .. |
| Copper worker, smith | 49 | .. |
| Cork-cutter | 5 | .. |
| Corn, flour, meal merchant | 250 | 1 |
| Cowboy, cowherd | 150 | .. |
| Crane-driver | 11 | .. |
| Crayfish, oysterman, shellfish collector | 18 | .. |
| Cropper (farm, &c.) | 36 | .. |
| Currier, tanner, leather manufacturer | 404 | 1 |
| Cutler, tool-maker | 17 | 1 |
| Cutter, tailor, tailoress, fitter | 1,704 | 2,550 |
| Dairy-farmer, assistant | 356 | 96 |
| Dairyman, milkseller | 526 | 81 |
| Daughter, relative | .. | 46,048 |
| Dealer, cattle, sheep, pig | 59 | .. |
| Dealer, general | 271 | 45 |
| Dealer, horse | 16 | .. |
| Dealer, live-stock | 207 | .. |
| Dealer, marine stores | 2 | .. |
| Dealer, rabbit | 12 | .. |
| Dealer, wool, broker | 89 | .. |
| Dealer, other specified trade or occupation | 7 | .. |
| Decorator, house-painter | 1,564 | 9 |
| Defence, magazine keeper | 3 | .. |
| Defence, storekeeper | 3 | .. |
| Dentist, apprentice, assistant | 138 | 7 |
| Dependent on children | 113 | 208 |
| — | Males. | Females. |
|---|---|---|
| Die, stamp, medal maker | 4 | .. |
| Director of museum | 1 | .. |
| Dispenser | 3 | 1 |
| Ditcher | 9 | .. |
| Diver | 7 | .. |
| Doctor, medical man | 362 | .. |
| Domestic servant | 1,049 | 13,826 |
| Door, sash maker | 14 | .. |
| Drain-pipe maker | 15 | .. |
| Drainer, pavior | 86 | .. |
| Draper, linen, woollen draper | 1,513 | 425 |
| Draughtsman (undefined) | 121 | .. |
| Drayman, carter, carrier, express-driver | 2,864 | 4 |
| Dredge-worker | 28 | .. |
| Dressmaker, milliner | 11 | 6,602 |
| Drill-instructor | 12 | .. |
| Drover | 110 | .. |
| Dyer, calenderer, scourer | 55 | 3 |
| Earthenware, potteryware maker | 93 | 10 |
| Earthenware, potteryware dealer | 5 | .. |
| Eating-house, club, hotel servant | 1,172 | 1,953 |
| Editor, author, journalist | 289 | 7 |
| Electrician (not connected with telegraph or telephone service) | 18 | .. |
| Electrician, lineman (telegraph service) | 77 | .. |
| Electrician, lineman medical | 2 | 1 |
| Electric light or energy producer, officer, clerk | 36 | .. |
| Electroplater | 6 | 2 |
| Electrotyper | 6 | .. |
| Engine-driver, battery (gold) | 19 | .. |
| Engine-driver, dredge (gold) | 7 | .. |
| Engine-driver, flax-mill | 63 | .. |
| Engine-driver, flour-mill | 14 | .. |
| Engine-driver, meat-works | 64 | .. |
| Engine-driver, mine (coal) | 38 | .. |
| Engine-driver railway (includes fireman, stoker) | 492 | .. |
| Engine-driver, saw-mill | 123 | .. |
| Engine-driver, threshing-machine | 30 | .. |
| Engine-driver, woollen-mill | 17 | .. |
| Engine-driver, other specified trade or occupation | 92 | .. |
| Engine-fitter | 203 | .. |
| Engine-maker | 1,514 | .. |
| Engineer, bridge | 2 | .. |
| Engineer, civil | 223 | .. |
| Engineer, civil assistant, cadet | 10 | .. |
| Engineer, directing or consulting (mechanical) | 38 | .. |
| Engineer, electric | 25 | .. |
| Engineer, flax-mills | 8 | .. |
| Engineer, gas office | 4 | .. |
| Engineer, mining | 48 | .. |
| Engineer, stoker, coal-trimmer (steamer, merchant service) | 804 | .. |
| Engineer, undefined (includes fireman undefined) | 848 | .. |
| Engraver | 48 | 1 |
| Errand-boy | 207 | .. |
| Errand-storekeeper | 85 | .. |
| Errand-other specified trade or occupation | 64 | .. |
| — | Males. | Females. |
|---|---|---|
| Evangelist | 14 | .. |
| Expert, agricultural machine | 1 | .. |
| Expert, butter | 2 | .. |
| Expert, cement-works | 1 | .. |
| Expert, dairy | 2 | .. |
| Expert, fruit | 1 | .. |
| Expert, grain | 2 | .. |
| Expert, insurance | 1 | .. |
| Expert, machine | 3 | .. |
| Expert, pianoforte | 1 | .. |
| Expert, reaper-and-binder | 1 | .. |
| Explosives, arms dealer | 1 | .. |
| Explosives, powder manufacturer | 2 | .. |
| Express-driver, carter, carrier | 2,864 | 4 |
| Factory-hand (so described) | 81 | 28 |
| Fancy-goods dealer | 86 | 80 |
| Farm bailiff, overseer | 349 | .. |
| Farm cadet | 72 | .. |
| Farm contractor | 8 | .. |
| Farm labourer, servant | 13,716 | 33 |
| Farm relative assisting on | 12,731 | 1,555 |
| Farmer | 25,084 | 742 |
| Farmer dairy | 356 | 96 |
| Farrier, blacksmith, whitesmith | 3,234 | 2 |
| Farrier, horseshoer | 129 | 1 |
| Fat, tallow dealer | 3 | .. |
| Father, mother dependent upon children | 113 | 208 |
| Feather-dresser, glove-cleaner | 2 | 10 |
| Fellmonger, woolscourer, assistant | 402 | 1 |
| Fencer, hurdle-maker | 237 1 | .. |
| Fencer, on farm. | 12 | .. |
| Fencer, on station | 39 | .. |
| Ferryman | 21 | .. |
| Fettler, ganger, platelayer, labourer (railway) | 1,262 | .. |
| Fiddle-string maker | 17 | 11 |
| Financier, capitalist, money-broker, and assistant | 294 | 57 |
| Fireman, flour-mills | 5 | .. |
| Fireman, steamer | 804 | .. |
| Fireman, sugar-works | 4 | .. |
| Fireman, other specified trade or occupation | 5 | .. |
| Fireman, undefined (includes engineer undefined) | 848 | .. |
| Firewood chopper, cutter | 215 | .. |
| Firewood dealer | 57 | .. |
| Fisherman, fisherwoman | 565 | 2 |
| Fish-curer | 57 | .. |
| Fish, oyster, shellfish hawker, dealer, monger | 215 | .. |
| Fishing-net maker | 2 | .. |
| Fitter, engine | 203 | .. |
| Flax manufacturer, millowner, manager, scutcher, &c. (all branches) | 2,171 | 3 |
| Floral artist, flower-painter | 1 | .. |
| Florist, flower-seller | 14 | 3 |
| Flour, corn, meal merchant | 250 | 1 |
| Flower, artificial, maker | 2 | 2 |
| Foreman, bush | 16 | .. |
| Foreman railway-works | 5 | .. |
| Foreman road-works | 6 | .. |
| — | Males. | Females. |
|---|---|---|
| Foreman, forewoman, at other specified trade, &c. | 16 | 1 |
| Forestry, d1rector, overseer, ba1l1ff, and others engaged 1n | 21 | .. |
| Forward1ng agent | 11 | .. |
| Founder, cast-iron | 501 | .. |
| Founder, brass, moulder, fitter, worker, &c. | 104 | 1 |
| French-polisher | 68 | 2 |
| Friendly, benefit society officer | 3 | .. |
| Fruiterer, greengrocer, potato-dealer | 291 | 165 |
| Fruit-grower | 198 | 8 |
| Fruit preserver, jam-maker | 34 | 16 |
| Furniture dealer, broker, hirer | 82 | 11 |
| Furniture maker, cabinetmaker | 987 | 3 |
| Furrier, rug-maker | .. | 6 |
| Fur trader, rug dealer | 2 | .. |
| Fuse, cartridge-maker | 2 | 12 |
| Game dealer, poulterer | 11 | 2 |
| Ganger, fettler, platelayer, labourer (railway) | 1,262 | .. |
| Gaoler | 14 | .. |
| Gardener, horticulturist | 2,255 | 21 |
| Gardener, market | 906 | 19 |
| Gardener, on farm | 13 | .. |
| Gardener, on station | 78 | .. |
| Gasfitter | 17 | .. |
| Gas-, water-meter maker | 4 | .. |
| Gasworks engineer | 4 | .. |
| Gasworks service | 191 | .. |
| Gatekeeper, porter | 15 | 1 |
| General dealer and assistant | 271 | 45 |
| Gentleman, lady of Independent means (so described) | 1,250 | 1,268 |
| Geologist, mineralogist | 5 | .. |
| Ginger - beer, aërated - water, cordial manufacturer | 250 | 8 |
| Ginger - beer, aërated - water, cordial merchant, salesman | 5 | .. |
| Glass, glassware dealer | 7 | .. |
| Glass, glassware manufacturer | 6 | .. |
| Glaz1er, house - painter, paperhanger, decorator | 1,564 | 9 |
| Glove-cleaner, feather-dresser | 2 | 10 |
| Glover, hosier, hatter, haberdasher | 38 | 9 |
| Glue-maker | 14 | .. |
| Gold-miner, digger, &c. (alluvial) | 10,099 | 7 |
| Gold-miner, digger, &c.(lode) | 2,128 | .. |
| Gold, silver buyer | 1 | .. |
| Goldsmith, silversmith, jeweller | 209 | 7 |
| Governess, tutor | 30 | 494 |
| Governor, the | 1 | .. |
| Government officer (not otherwise described) | 551 | 2 |
| Grass-seed sower | 39 | .. |
| Gravedigger, cemetery-keeper | 10 | .. |
| Grazier, runholder, sheep or cattle farmer | 1,395 | 31 |
| Grazing, manager, overseer, superintendent | 512 | .. |
| Greengrocer, fru1terer, potato dealer | 291 | 165 |
| Grocer, tea dealer | 1,715 | 146 |
| Groom (not domestic) | 430 | .. |
| — | Males. | Females. |
|---|---|---|
| Groom, livery stables | 50 | .. |
| Groom, farm | 14 | .. |
| Groom,station | 82 | .. |
| other specified trade or occupation | 14 | .. |
| Guard, porter, pointsman, shunter (railway) | 800 | 6 |
| Gunsmith, armourer | 41 | .. |
| Haberdasher, hosier, hatter, glover | 33 | 9 |
| Hairdresser, barber | 356 | 11 |
| Ham-curer, meat-preserver, sausagemaker | 190 | 3 |
| Harbour, pier service | 123 | .. |
| Hardware dealer, ironmonger | 640 | 4 |
| Harness, saddlery dealer | 9 | .. |
| Harness, saddlery maker, manufacturer | 1,005 | 5 |
| Harvester | 117 | .. |
| Hatter, cap, bonnet maker | 56 | 71 |
| Hawker, pedler | 213 | 15 |
| Hawker, drapery | 5 | .. |
| Hawker, tea | 2 | .. |
| Hawker, vegetables | 13 | .. |
| Hay, straw dealer | 9 | .. |
| Herbal, hop-beer manufacturer | 10 | 2 |
| Herbalist | 22 | 1 |
| Hide, skin, dealer | 15 | .. |
| Homœpathist | 2 | 1 |
| Hop grower, picker, labourer | 22 | 1 |
| Horsebreaker, animal-trainer | 302 | .. |
| Horse-driver | 80 | .. |
| Horse letter, livery-stable keeper | 201 | 3 |
| Horse-shoer, farrier | 129 | 1 |
| Horticulturist, gardener | 2,255 | 21 |
| Hosier, hatter, haberdasher, glover | 38 | 9 |
| Hospital, inmate of | 533 | 208 |
| Hospital, or asylum, officer, attendant | 228 | 284 |
| Hotelkeeper, innkeeper, manager, relative assisting | 1,649 | 458 |
| Hotel manager | 51 | .. |
| Hotel club, eating-house, servant | 1,172 | 1,953 |
| House agent, factor, rent-collector | 27 | .. |
| House agent, keeper | 4 | 993 |
| House agent, owner, proprietor | 326 | 156 |
| House agent, painter, paperhanger, glazier, decorator | 1,564 | 9 |
| House agent, plumber, bellhanger | 699 | 1 |
| Hulk-keeper | 8 | .. |
| Huntsman | 7 | .. |
| Hurdle maker, fencer | 237 | .. |
| Hydropathist | 2 | 2 |
| Image maker, modeller | 10 | .. |
| Implement (agricultural) dealer | 11 | .. |
| Implement (agricultural) machinery maker | 35 | 11 |
| Independent means, lady, gentleman (so returned) | 1,250 | 1,268 |
| Ink, blacking maker | 6 | 1 |
| Innkeeper, hotelkeeper, manager, relative assisting | 1,649 | 458 |
| Inmate, benevolent asylum | 568 | 272 |
| Inmate, gaol or penal establishment | 421 | 59 |
| Inmate, hospital | 533 | 208 |
| Inmate, industrial school | 346 | 100 |
| — | Males. | Females. |
|---|---|---|
| Inmate, lunatic asylum | 1,057 | 672 |
| Inmate, orphan asylum (includes those boarded out) | 99 | 139 |
| Inmate, refuge | 5 | 18 |
| Inspector, rabbit | 9 | .. |
| Inspector,roads | 13 | .. |
| Inspector, school | 21 | .. |
| Inspector, stock | 41 | .. |
| Inspector, works | 17 | .. |
| Inspector, other specified trade or occupation | 21 | .. |
| Insurance agent, officer, director, manager | 573 | 1 |
| Interpreter | 58 | .. |
| Iron bar, plate, rod, wire dealer | 15 | .. |
| Iron founder, moulder, worker (cast), assistant | 501 | .. |
| Ironmonger, hardware dealer and assistant | 640 | 4 |
| Iron moulder | 31 | .. |
| Iron ore, pig-iron, scrap-iron dealer | 1 | .. |
| Iron turner | 34 | .. |
| Irregular clergy | 156 | 87 |
| Irregular medical practitioner | 51 | 7 |
| Jam-maker, fruit-preserver | 34 | 16 |
| Janitor | 3 | .. |
| Jeweller, goldsmith, silversmith | 209 | 7 |
| Jockey | 231 | |
| Joiner | 195 | .. |
| Journalist, author, editor | 289 | 7 |
| Judge, Supreme, District, Native Land Court | 25 | .. |
| Justice of the Peace (not otherwise described) | 5 | .. |
| Kauri-gum dealer | 123 | .. |
| Kauri-gum digger, packer, scraper, sorter | 2,544 | 14 |
| Knitter, sock, stocking maker | 27 | 143 |
| Labourer, battery (gold) | 100 | .. |
| Labourer, bush | 431 | .. |
| Labourer, farm (see farm) | 13,716 | 33 |
| Labourer, freezing-works | 112 | .. |
| Labourer, lumper, wharf | 650 | .. |
| Labourer, road, railway (construction) | 2,027 | .. |
| Labourer, platelayer, fitter (not construction) | 1,262 | .. |
| Labourer, saw-mills | 914 | .. |
| Labourer, station | 1,608 | .. |
| Labourer, store, storeman | 1,004 | 1 |
| Labourer, surveyor, chainman, &c. | 277 | .. |
| Labourer, threshing-machine | 58 | .. |
| Labourer, timber-yard | 52 | .. |
| Labourer, other specified trade or occupation | 780 | .. |
| Labourer, undefined | 13,767 | 9 |
| Ladder, barrow maker | 2 | .. |
| Lady, gentleman of independent means (so returned) | 1,250 | 1,268 |
| Lady help, companion | 1 | 256 |
| Lamplighter | 6 | .. |
| Land, estate agent, factor, rent-collector | 200 | 1 |
| Land, owner, speculator, proprietor | 331 | 123 |
| — | Males. | Females. |
|---|---|---|
| Lapidary, precious-stones worker | 11 | .. |
| Laundry keeper, washerwoman, worker man | 30 | 830 |
| Law clerk | 490 | 1 |
| Law court officer | 115 | .. |
| Law stationer | 1 | .. |
| Law student | 44 | .. |
| Law writer | 1 | .. |
| Lawyer, barrister, solicitor, attorney | 571 | .. |
| Lay-reader | 3 | .. |
| Lead, antimony dealer | 1 | .. |
| Lead, antimony worker | 2 | .. |
| Leather belt, whip, satchel maker | 9 | .. |
| Leather cutter, designer | 3 | .. |
| Leather currier, tanner, manufacturer | 404 | 1 |
| Leather prepared-skins dealer | 26 | 2 |
| Leather ware dealer | 12 | .. |
| Letter-carrier | 114 | 1 |
| Librarian, book-lender | 40 | 12 |
| Licensed victualler (see Hotelkeeper) | 1,649 | 458 |
| Lighterman, bargeman | 27 | .. |
| Lighthouse-keeper | 69 | .. |
| Lime-burner | 50 | .. |
| Lime dealer | 7 | .. |
| Lineman, electrician (telegraph) | 77 | .. |
| Linendraper (see Draper) | 1,513 | 425 |
| Lithographer, lithographic, zincographic printer | 111 | .. |
| Live-stock dealer | 207 | .. |
| Live-stock salesman | 3 | .. |
| Livery-stable keeper, horse-letter | 201 | 3 |
| Local body, officer of | 294 | 5 |
| Local body, member of (not otherwise described) | 10 | .. |
| Locksmith | 13 | .. |
| Lodging-house keeper, wife assisting | 225 | 540 |
| Lumper, wharf labourer, stevedore | 650 | .. |
| Lunatic asylum, inmate of | 1,057 | 672 |
| Machine ruler, bookbinder | 192 | 82 |
| Machine tools, implement, machinery dealer | 6 | .. |
| Machinery, implement maker (agriculturist) | 35 | .. |
| Machinist, dressmaker | .. | 12 |
| Machinist, engine-fitter | 18 | .. |
| Machinist, sash-and-door factory | 10 | .. |
| Machinist, saw-mill | 21 | .. |
| Machinist, sewing | .. | 11 |
| Machinist, tailors' | 99 | 416 |
| Machinist, wood | 12 | .. |
| Machinist, woollen-mill | .. | 2 |
| Magistrate (not otherwise described) | 26 | .. |
| Mail contractor | 30 | .. |
| Mail guard, mailman | 26 | .. |
| Malleable - iron manufacturer, worker, roller, smelter, &c. | 130 | .. |
| Maltster | 105 | .. |
| Manager, assistant, apprentice, proprietor, employer, contractor (so returned) | 1,328 | 44 |
| Manager, battery (gold) | 23 | .. |
| Manager club (secretary, steward) | 30 | 2 |
| Manager dairy factory, company | 30 | .. |
| Manager financial company | 15 | .. |
| — | Males. | Females. |
|---|---|---|
| Manager, flax-mill | 24 | .. |
| Manager, freezing-works | 16 | .. |
| Manager, mine | 40 | .. |
| Manager, mine | 30 | .. |
| Manager, mine quartz | 81 | .. |
| Manager saw-mills | 40 | .. |
| Manager soft-goods warehouse | 16 | .. |
| Manager station (overseer) | 512 | .. |
| Manager storekeepers | 23 | 1 |
| Manager theatre, proprietor, lessee | 19 | .. |
| Manager water-race | 9 | .. |
| Manager woolbroker | 16 | .. |
| Manager woollen-mills | 11 | .. |
| Manager other specified trade or occupation | 182 | .. |
| Manager undefined | 14 | .. |
| Manchester warehouseman | 831 | 7 |
| Mantle-maker | .. | 75 |
| Manufacturer, bone-dust | 18 | .. |
| Manufacturer, clothing | 10 | .. |
| Manufacturer, temperance drink | 12 | 2 |
| Manufacturer, waterproof | 3 | 18 |
| other specified trade or occupation | 18 | 2 |
| Manufacturing chemist | 20 | 4 |
| Manure-maker (chemical) | 12 | .. |
| Marine surveyor | 6 | .. |
| Marine storekeeper, dealer | 16 | .. |
| Marker proprietor, keeper billiard-table | 85 | .. |
| Market-gardener | 906 | 19 |
| Mason,stonemason, hewer, hodman, labourer | 322 | .. |
| Mason, monumental | 5 | .. |
| Mast, oar, block maker | 9 | .. |
| Master-builder, contractor, foreman, measurer, clerk, &c. | 829 | .. |
| Mat, matting maker | 3 | 1 |
| Mattress, bed, hammock maker, upholsterer | 194 | 31 |
| Meal, flour, corn merchant | 250 | 1 |
| Meat-preserver, sausage-maker, ham-curer | 190 | 3 |
| Meat salesman, butcher | 2,856 | 35 |
| Mechanic (so defined) | 41 | .. |
| Mechanical engineer, directing or consulting | 38 | .. |
| Mechanical engine maker, fitter, iron-turner, boiler-maker | 1,514 | .. |
| Medal, die, stamp maker | 4 | .. |
| Medical practitioner | 362 | .. |
| Medical man, irregular | 51 | 7 |
| Medical student | 36 | 1 |
| Member of local body (not otherwise described) | 10 | .. |
| Member of Parliament (not otherwise described) | 3 | .. |
| Mercer, silk-dealer | 7 | .. |
| Merchant and assistant | 502 | .. |
| Merchant corn | 78 | .. |
| Merchant firewood | 57 | .. |
| Merchant seed | 78 | .. |
| Merchant timber | 276 | 1 |
| Merchant wine, spirit, ale and stout | 70 | .. |
| Merchant other specified trade or occupation | 12 | .. |
| — | Males. | Females. |
|---|---|---|
| Merchants' assistant | 31 | .. |
| Mercy, Sister of | .. | 52 |
| Messenger, porter (not railway) | 329 | 3 |
| Messenger, telegraph, telephone | 164 | .. |
| Metallurgist, assayer | 10 | .. |
| Midwife, monthly nurse | .. | 251 |
| Militia (Permanent) officer | 8 | .. |
| Militia (Permanent) private | 147 | .. |
| Milkers and others connected with dairy | 203 | 110 |
| Milk boy, milk carter | 163 | .. |
| Milk seller, dairyman | 526 | 81 |
| Milk preserver, butter, cheese maker | 121 | 15 |
| Miller, meal, flour worker | 455 | 5 |
| Milliner, dressmaker | 11 | 6,602 |
| Millwright | 75 | .. |
| Mine proprietor, overseer, clerk, and others engaged in coal-mining | 1,721 | 1 |
| Mine proprietor, overseer, clerk, and others engaged in gold-mining, alluvial | 10,099 | 7 |
| Mine proprietor, overseer, clerk, and others engaged in gold-mining, lode | 2,128 | .. |
| Mine proprietor, overseer, clerk, and others engaged in silver, lead mining | 39 | .. |
| Mine proprietor, overseer, clerk, and others engaged in mining for other kinds of minerals | 83 | .. |
| Mineralogist, geologist | 5 | .. |
| Mining engineer | 48 | .. |
| Mining manager | 181 | .. |
| Minister, Cabinet, not otherwise described | 3 | .. |
| Minister of religion | 732 | .. |
| Mission worker, missionary | 20 | 9 |
| Modeller, image-maker | 10 | .. |
| Money-broker, financier, capitalist | 294 | 57 |
| Monthly nurse, midwife | .. | 251 |
| Monumental mason, stone cutter, dresser | 53 | .. |
| Mormon missionary | 19 | .. |
| Mother, father, dependent on children | 113 | 208 |
| Moulder, cast-iron | 31 | .. |
| Music master, mistress, teacher | 159 | 622 |
| Music salesman, saleswoman | 16 | 3 |
| Music student | 1 | 1 |
| Musical-instrument dealer | 38 | 4 |
| Musical-instrument maker | 14 | .. |
| Musical-instrument tuner, repairer | 48 | .. |
| Musician, vocalist | 80 | 29 |
| Nailmaker | 7 | .. |
| Naturalist | 5 | .. |
| Navvy, road, railway labourer, excavator, ballastman | 2,027 | .. |
| Navy officer (not retired) | 12 | .. |
| Navy petty officer, sailor | 9 | .. |
| Needlewoman | .. | 101 |
| News agent, vendor | 201 | 2 |
| News boy | 35 | .. |
| News paper editor, proprietor, publisher | 125 | 2 |
| News reporter, shorthand-writer | 61 | .. |
| Nightman, nightcart-driver | 17 | .. |
| No occupation stated | 894 | 123 |
| Notary public | 2 | .. |
| — | Males. | Females. |
|---|---|---|
| Nurse (monthly), midwife | .. | 251 |
| Nurse sick | 2 | 734 |
| Nurseryman | 150 | 1 |
| Oar, block, mast maker | 9 | .. |
| Occupation not stated | 894 | 123 |
| Office boy, caretaker, attendant | 240 | 8 |
| Officer bank, clerk | 870 | .. |
| Officer charitable or benevolent institution | 42 | 92 |
| Officer church | 63 | 1 |
| Officer Education Department (including inspectors of Schools) | 49 | .. |
| Officer Government, not otherwise classed | 551 | 2 |
| Officer law-court | 115 | .. |
| Officer local body | 294 | 5 |
| Officer Militia (Permanent) | 8 | .. |
| Officer mines | 7 | .. |
| Officer navy (not retired) | 12 | .. |
| Officer penal | 110 | 12 |
| Officer public company | 60 | 1 |
| Oil and colour man; paperhangings, wallpaper, seller | 28 | 2 |
| Omnibus, coach, cab driver, conductor, servant | 459 | .. |
| Omnibus, coach, cab proprietor, owner, agent | 270 | 3 |
| Optician | 10 | 1 |
| Orphan asylum, inmate of (includes those boarded out) | 99 | 139 |
| Outfitter, clothier, slopseller | 98 | 5 |
| Oven-maker | 13 | .. |
| Overseer, manager (on station) | 512 | .. |
| Oysterman, crayfish, shrimp,shellfish capturer, collector | 18 | .. |
| Packer, gum | 38 | .. |
| Packer, in store | 23 | .. |
| Packer, on roads | 32 | .. |
| Packer, on station | 14 | .. |
| Packer, Tea | 16 | .. |
| Packer, other specified trade or occupation | 72 | 9 |
| Packing-case maker | 8 | .. |
| Paint, varnish maker | 8 | .. |
| Painter, artist, art student | 105 | 80 |
| Painter, (house), paperhanger, glazier, decorator | 1,564 | 9 |
| Paper dealer | 4 | .. |
| Paper manufacturer, labourer. | 28 | 20 |
| Paper ruler | 6 | 1 |
| Paper-bag maker | 4 | 7 |
| Parasol, umbrella maker, mender | 31 | 9 |
| Parasol, umbrella stick dealer | 2 | 3 |
| Pastoral, labourer | 1,608 | .. |
| Pastry-dealer, confectioner | 168 | 68 |
| Pastry- bread, biscuit maker | 1,846 | 59 |
| Patent, trade-marks agent | 6 | .. |
| Patentee | 2 | .. |
| Pattern-maker, designer | 20 | .. |
| Pavior, drainer | 86 | .. |
| Pawnbroker | 29 | 3 |
| Pedler, hawker | 213 | 15 |
| — | Males. | Females. |
|---|---|---|
| Penal establishment, officer | 19 | .. |
| Penal establishment, warder, matron, &c. | 71 | 12 |
| Pensioner | 139 | 6 |
| Perambulator, wheel-chair, bicycle maker | 23 | .. |
| Permanent Militia officer | 8 | .. |
| Penal establishment, private | 147 | .. |
| Petroleum, kerosene, paraffin dealer | 2 | .. |
| Pharmaceutical chemist (see Chemist) | 516 | 14 |
| Phormium manufacturer, all branches (see Flax) | 2,171 | 3 |
| Photographer, assistant | 262 | 95 |
| Photographer, materials, importer, dealer | 1 | 1 |
| Phrenologist | 5 | 3 |
| Physician, medical practitioner | 362 | .. |
| Piano-tuner, musical-instrument repairer | 48 | .. |
| Pickle, sauce, vinegar maker | 17 | 16 |
| Picture dealer | 6 | .. |
| Picture frame dealer | 1 | .. |
| Picture frame maker, restorer, cleaner | 28 | 2 |
| Pig, cattle, sheep dealer | 59 | .. |
| Pig-iron, iron-ore, scrap-iron dealer | 1 | .. |
| Pilot | 30 | .. |
| Pisciculturist | 6 | .. |
| Pitch, asphalte maker, worker | 26 | .. |
| Piaster, cement maker | 18 | .. |
| Plasterer, labourer, assistant | 189 | .. |
| Platelayer, ganger, fettler, labourer | 1,262 | .. |
| Ploughing contractor | 201 | .. |
| Ploughman on farm | 384 | .. |
| Ploughman on station | 165 | .. |
| Policeman, police officer | 489 | .. |
| Porter, messenger (not railway) | 329 | 3 |
| Porter, drapers' | 13 | .. |
| Porter, gatekeeper | 15 | 1 |
| Porter, soft-goods warehouse | 2 | .. |
| Portmanteau-maker | 9 | .. |
| Postmaster, mistress, sorter, clerk | 347 | 40 |
| Potato dealer, greengrocer, fruiterer | 291 | 165 |
| Potteryware, earthenware dealer | 5 | .. |
| Potteryware, earthenware maker | 93 | 10 |
| Poulterer, game dealer | 11 | 2 |
| Poultry keeper, farmer | 3 | 2 |
| Powder, explosives maker | 2 | .. |
| Precious-stones worker, lapidary | 11 | .. |
| Prepared skins, leather dealer | 26 | 2 |
| Press-reader | 16 | .. |
| Printer, printing-office manager | 1,031 | 5 |
| Printer, compositor | 739 | 54 |
| Printing, others employed in | 12 | 9 |
| Prisoner, in gaol | 421 | 59 |
| Produce merchant | 71 | .. |
| Professor of gymnastics | 9 | .. |
| Professor university, demonstrator | 25 | 1 |
| Proprietor billiard-table, keeper, marker | 85 | .. |
| Provision dealer | 18 | 1 |
| Public company officer | 60 | 1 |
| Publican, innkeeper (see hotelkeeper) | 1,649 | 458 |
| Publisher, newspaper proprietor | 125 | 2 |
| Pupil-teacher | 131 | 318 |
| Quarry proprietor, overseer | 37 | .. |
| Quarryman, labourer | 134 | .. |
| Quartz-mine manager | 81 | .. |
| — | Males. | Females. |
|---|---|---|
| Rabbit-catcher, trapper, fowler, beehunter | 1,296 | 3 |
| Racecourse ranger, secretary, caretaker | 10 | .. |
| Rag, waste-paper dealer | 2 | .. |
| Railways, officer, clerk, stationmaster, agent, manager | 720 | .. |
| Railways, carriage, waggon, trolly maker | 70 | .. |
| Railways,engine-driver, fireman (at works) | 76 | .. |
| Railways, engine-driver cleaner, stoker | 492 | .. |
| Railways, ganger, fettler, platelayer, labourer (not construction) | 1,262 | .. |
| Railways, guard, porter, pointsman, signalman, shunter | 800 | 6 |
| Railways, navvy, labourer, excavator (construction) | 2,027 | .. |
| Railways, road contractor | 263 | .. |
| Railways,works foreman, inspector, time-keeper, skilled assistant | 132 | .. |
| Range maker, fitter | 32 | .. |
| Ranger, caretaker, secretary (racecourse) | 10 | .. |
| Reader, press | 16 | .. |
| Refuge, inmate of | 5 | 18 |
| Registry-office keeper | .. | 14 |
| Relative, dependent | 113 | 208 |
| Rent-collector, house agent | 27 | .. |
| Reporter, shorthand-writer | 61 | .. |
| Retired | 108 | 12 |
| Road, railway contractor | 263 | .. |
| Road,waggon, carriage, cart, vehicle maker | 750 | 1 |
| Rope, cord maker, labourer, assistant | 159 | 1 |
| Rubber-stamp maker | 2 | .. |
| Rug dealer, fur trader | 2 | .. |
| Rug-maker, furrier | .. | 6 |
| Runholder, grazier, sheep, cattle farmer | 1,395 | 31 |
| Runholder, grazier,&c., relative assisting | 350 | 24 |
| Rustic-ware maker | 2 | .. |
| Sack, sacking, bag maker | 4 | 6 |
| Saddle, harness maker, dealer, &c. | 1,005 | 5 |
| Saddlers' ironmongery dealer | 4 | .. |
| Saddlery, harness dealer | 9 | .. |
| Sail-cloth, canvas maker | 2 | .. |
| Sailmaker, assistant | 167 | 4 |
| Sailor, master, officer (merchant service) | 3,054 | 1 |
| Salesman, -woman, commercial traveller | 559 | 271 |
| Salesman, -woman,boot-dealers' | 52 | 7 |
| Salesman, -woman,fancy goods | 23 | 11 |
| Salesman, -woman,furniture warehouse | 29 | 9 |
| Salesman, -woman,hardware | 71 | 1 |
| Salesman, -woman, music | 16 | 3 |
| Salesman, -woman, soft goods | 306 | .. |
| Salesman, -woman, storekeepers' | 32 | .. |
| Salesman, -woman, other specified trade or occupation | 110 | 19 |
| Salt, soda, starch, alkali, blue maker | 4 | .. |
| Salvation Army officer | 98 | 78 |
| Sash, door maker | 14 | .. |
| Sauce, pickle, vinegar maker | 17 | 16 |
| Sausage-maker, ham-curer, meat-pre-server | 190 | 3 |
| Savings-bank, building-society director, manager, officer, clerk | 19 | .. |
| Saw doctor, trimmer, sharpener | 23 | .. |
| Saw-mill owner, sawyer, worker, assistant | 2,108 | 2 |
| — | Males. | Females. |
|---|---|---|
| Saw-mill engine-driver | 123 | .. |
| Scavenger, street-cleaner | 5 | .. |
| Scientific-instrument maker | 2 | .. |
| Scholar at home | 3,025 | 4,391 |
| Scholar public, private school | 69,879 | 69,374 |
| School master, mistress, teacher | 1,644 | 2,617 |
| School inspector of | 21 | .. |
| Scourer, dyer, calenderer | 55 | 3 |
| Scrap-iron, pig-iron, iron-ore dealer | 1 | .. |
| Sculptor | 9 | .. |
| Seaman, master, officer (merchant service) | 3,054 | 1 |
| Seamstress, shirt-maker | 13 | 411 |
| Second-hand clothes-dealer | 4 | 5 |
| Secretary | 34 | .. |
| Secretary diocesan | 1 | .. |
| Secretary Education Board | .. | 10 |
| Secretary Judge | 3 | .. |
| Seed merchant, dealer | .. | 78 |
| Servant, domestic | 1,049 | 13,826 |
| Servant, charitable, benevolent institution | 42 | 92 |
| Servant, hotel, club, eating-house | 1,172 | 1,953 |
| Servants' registry office keeper | .. | 4 |
| Sewing-machine importer, dealer | 41 | 14 |
| Sewing-machine, maker | 1 | .. |
| Sewing- machinist | .. | 11 |
| Sexton, assistant | 32 | .. |
| Share, stock broker, speculator, miningagent | 125 | .. |
| Sheep, cattle, pig dealer | 59 | .. |
| Sheep, cattle farmer, grazier, runholder | 1,395 | 31 |
| relative assisting | 350 | 24 |
| Shellfish, oyster, crayfish, shrimp capturer, collector | 18 | .. |
| Shepherd, stock-rider, drover, shearer, &c. | 6,427 | 2 |
| Shingler, slater | 26 | .. |
| Ship, boat, dealer | 3 | .. |
| Ship, agent, manager, owner | .. | 286 |
| Ship, boat builder, worker, designer | 518 | .. |
| Ship, chandler | 16 | .. |
| Ship, master, officer, sailor (merchant service) | 3,034 | 1 |
| Ship rigger | 3 | .. |
| Ship, steward, stewardess, servant (merchant service) | 613 | 57 |
| Shirt-maker, seamstress | 13 | 411 |
| Shoe, boot maker, repairer | 3,505 | 411 |
| Shoe, boot maker, dealer | 137 | 35 |
| Shopkeeper, storekeeper | 2,435 | 712 |
| Shopman, -woman, grocer | 218 | .. |
| Shopman, -woman, other specified trade or occupation | 57 | 3 |
| Shorthand-writer, reporter | 61 | .. |
| Showman, lecturer | 8 | .. |
| Sick-nurse | 2 | 734 |
| Signalman, -woman (not railway) | 3 | 2 |
| Sign-writer | 55 | .. |
| Silk dealer, mercer | 7 | .. |
| Silk, dresser, manufacturer | 1 | .. |
| Silversmith, goldsmith, jeweller | 209 | 7 |
| Sister of Charity or Mercy | .. | 52 |
| Skin dealer, hide salesman | 15 | .. |
| Slater, shingler | 26 | .. |
| — | Males. | Females. |
|---|---|---|
| Slaughterman, slaughterhouse-keeper | 169 | .. |
| Soap, candle manufacturer, maker, boiler | 100 | 4 |
| Sock, stocking maker, knitter | 27 | 143 |
| Soda, alkali, starch, blue maker | 4 | .. |
| Solicitor, attorney | 303 | .. |
| Son, daughter, relative assisting in domestic duties | 365 | 35,653 |
| Son, daughter, relative at school | 69,879 | 69,374 |
| Son, daughter, relative, dependent (not engaged in domestic duties) | 47,252 | 46,048 |
| Son, daughter, relative receiving tuition at home | 3,025 | 4,391 |
| Son, daughter, relative at University | 81 | 11 |
| Spice, mustard, pepper maker | 2 | .. |
| Spirits, wine, ale and stout merchant | 70 | .. |
| Stair-builder | 10 | .. |
| Stamp, die, medal maker | 4 | .. |
| Starch, soda, alkali, blue maker | 4 | .. |
| Station owner, runholder, grazier, sheep or cattle farmer | 1,395 | 31 |
| Station, stock agent | 15 | .. |
| Station,manager, overseer | 512 | .. |
| Stationer, bookseller, book-canvasser | 212 | 23 |
| Stationer, (not bookseller) | 175 | 26 |
| Stage-carpenter | 2 | .. |
| Stay-maker | .. | 19 |
| Steamer engineer, fireman, stoker, coaltrimmer (merchant service) | 804 | .. |
| Stereotyper | 8 | .. |
| Stevedore, lumper, wharf labourer | 650 | .. |
| Steward, stewardess, servant (merchant service) | 613 | 57 |
| Stick, parasol, umbrella dealer | 2 | 3 |
| Stock, share agent, broker, speculator, mining agent | 125 | .. |
| Stock-rider, drover, shearer, shepherd, herd-feeder, labourer | 6,427 | 2 |
| Stoker, engineer, fireman, coal-trimmer (merchant service) | 804 | .. |
| Stone cutter, dresser (not mason) | 53 | .. |
| Stone -breaking machine worker | 33 | .. |
| Stone gravel dealer | 3 | .. |
| Storekeeper (not shopkeeper), clerk connected with bonded or free store | 25 | .. |
| Storekeeper, shopkeeper, assistant, wife assisting | 2,435 | 712 |
| Storeman (not shopman), store labourer, storewoman | 1,004 | 1 |
| Storeman, auctioneer | 18 | .. |
| Storeman, grain merchant | 40 | .. |
| Storeman, gum merchant | 13 | .. |
| Storeman, merchant | 24 | .. |
| Storeman, soft-goods warehouse | 20 | .. |
| Storeman, wine, spirit merchant | 13 | .. |
| Storeman, other specified trade or occupation | 88 | .. |
| Straw, hay dealer | 9 | .. |
| Street-cleaner, scavenger | 5 | .. |
| Stud-stock breeder | 2 | .. |
| Student | 22 | 2 |
| Student law | 44 | .. |
| Student medical | 36 | 1 |
| Student mining | 10 | .. |
| Student music | 1 | 1 |
| — | Males. | Females. |
|---|---|---|
| Student, normal school | 6 | .. |
| Student theological | 9 | .. |
| Student university | 81 | 11 |
| Sugar-mill owner, worker, refiner | 85 | 2 |
| Surgeon, veterinary | 55 | .. |
| Surgical-appliance, truss, bandage maker | 3 | 2 |
| Surgical-instrument maker | 1 | .. |
| Surveyor | 333 | .. |
| Surveyor chainman, cadet, labourer | 277 | .. |
| Surveyor marine | 6 | .. |
| Tailor, tailoress, cutter, fitter | 1,704 | 2,550 |
| Tallow, fat dealer | 3 | .. |
| Tallow, fat melter | 20 | 1 |
| Tanner, currier, leather manufacturer | 404 | 1 |
| Taxidermist | 7 | 1 |
| Teacher of accomplishments | 33 | 54 |
| Teacher music- | 159 | 622 |
| Teacher pupil- | 131 | 3l3 |
| Teacher (school), master, mistress | 1,644 | 2,617 |
| Tea-dealer, grocer | 1,715 | 146 |
| Tea-mixer, taster | 20 | .. |
| Telegraph service | 711 | 13 |
| Telephone service | 35 | 10 |
| Tent, tarpaulin dealer | 2 | .. |
| Tent, tarpaulin maker | 27 | 3 |
| Theatre proprietor, lessee, manager door-keeper, ticket-taker | 19 | .. |
| Theological student | 9 | .. |
| Threshing-machine labourer, worker &c. | 128 | .. |
| Tile, brick dealer | 2 | .. |
| Tile, brick maker | 449 | 1 |
| Timber contractor | 6 | .. |
| Timber labourer, yardman | 52 | .. |
| Timber measurer | 3 | .. |
| Timber merchant | 276 | 1 |
| Tin, zinc dealer | 6 | .. |
| Tin worker, tinsmith, tinker | 472 | 2 |
| Tobacco, cigar, cigarette maker, manufacturer | 19 | 21 |
| Tobacconist | 102 | 9 |
| Tool, cutlery maker | 17 | 1 |
| Torpedoman | 40 | .. |
| Torpedo instructor | 1 | .. |
| Tourist, traveller | 49 | 28 |
| Toy, minor art-products dealer | 3 | .. |
| Toy-maker | 3 | 1 |
| Trade, Official Assignee | 12 | .. |
| Trade,marks agent, patent | 6 | .. |
| Trainer, horse-breaker | 302 | .. |
| Tramway service | 210 | .. |
| Trapper, rabbit-catcher, fowler, beehunter | 1,296 | 3 |
| Traveller, commercial | 261 | .. |
| Tuner (piano), musical-instrument repairer | 48 | .. |
| Turner, wood | 94 | .. |
| Turner, iron, brass | 34 | .. |
| Tutor, governess | 30 | 494 |
| Umbrella, fan, parasol maker, mender | 31 | 9 |
| Umbrella, fan, parasol stick dealer | 2 | 3 |
| Undertaker, coffin-maker | 34 | .. |
| Underwriter | 4 | .. |
| University professor, demonstrator | 25 | 1 |
| — | Males. | Females. |
|---|---|---|
| University registrar | 2 | .. |
| University student | 81 | 11 |
| Upholsterer, bed, mattress, hammock maker | 194 | 31 |
| Valuer, auctioneer, appraiser | 342 | 1 |
| Varnish, paint maker | 8 | .. |
| Veterinary surgeon | 55 | .. |
| Vinegar, sauce, pickle maker | 17 | 16 |
| Violin-string maker | 17 | 11 |
| Visitor, lodger (stated to be performing domestic duties) | 28 | 4,701 |
| Visitor, lodger, boarder (not performing domestic duties) | 1,667 | 2,271 |
| Vocalist, musician | 80 | 29 |
| Waggon, carriage, trolly maker (railway) | 70 | .. |
| Waggon, carriage, trolly cart, vehicle builder | 750 | 1 |
| Warder, gaol, assistant | 66 | .. |
| Warehouseman, Manchester | 831 | 7 |
| Warehouseman soft-goods | 49 | .. |
| Warehouseman other specified trade or occupation | 40 | .. |
| Warehouseman undefined | 216 | .. |
| Washerwoman, laundry keeper, worker | 30 | 830 |
| Waste-paper, rag dealer | 2 | .. |
| Watch, clock, chronometer maker | 430 | 1 |
| Watch, clock,dealer | 3 | .. |
| Watchman | 102 | .. |
| Waterman, boatman | 170 | .. |
| Water-, gas-meter, maker | 4 | .. |
| Waterworks caretaker, clerk, officer, workman | 81 | 1 |
| Well-sinker | 35 | .. |
| Whaler, sealer | 5 | .. |
| Wharf labourer, lumper, stevedore | 650 | .. |
| Wheel-chair, perambulator, bicycle maker | 23 | .. |
| Wheelwright | 339 | .. |
| Whip, leather-belt, satchel maker | 9 | .. |
| Whitesmith, blacksmith, farrier | 3,234 | 2 |
| Wickerware, basketware dealer | .. | 1 |
| Wickerware, basketware maker | 65 | .. |
| Wife, widow (no specified occupation) | .. | 83,808 |
| Wine-grower, vigneron | 7 | .. |
| Wine manufacturer, bottler | 11 | .. |
| Wine spirit, ale, and stout merchant | 70 | .. |
| Wire-worker | 12 | .. |
| Wood, stone, bone, ivory carver | 55 | .. |
| Wood,cutter, chopper | 215 | .. |
| Wood,merchant, dealer | 57 | .. |
| Wood, turner | 94 | .. |
| Woodsman, bushman, axeman, grubber, timber-getter | 2,536 | .. |
| Wool broker, dealer | 89 | .. |
| Wool manufacturer (all branches) | 842 | 459 |
| Zinc, tin dealer | 6 | .. |
| Zinc, tin worker, tinsmith, tinker | 472 | 2 |
| Zincographic, lithographic printer, &c. | 111 | .. |
THEpink bars represent males and the green females. The population (excluding Maoris) for each census-year was as under:—
| Males. | Females. | Total. | |
|---|---|---|---|
| 1851 | 15,035 | 11,672 | 26,707 |
| 1858 | 33,679 | 25,734 | 59,413 |
| 1861 | 61,062 | 37,959 | 99,021 |
| 1864 | 106,580 | 65,578 | 172,158 |
| 1867 | 131,929 | 86,739 | 218,668 |
| 1871 | 150,356 | 106,037 | 256,393 |
| 1874 | 170,981 | 128,533 | 299,514 |
| 1878 | 230,998 | 183,414 | 414,412 |
| 1881 | 269,605 | 220,328 | 489,933 |
| 1886 | 312,221 | 266,261 | 578,482 |
| 1891 | 332,877 | 293,781 | 626,658 |
The Maori population in 1891 was 41,993 persons.
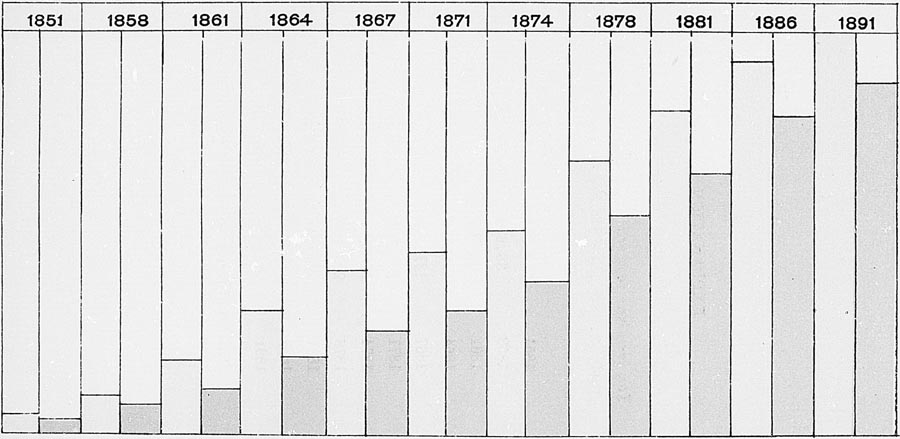
THE perfect coloured figure represents the population of the whole colony (exclusive of Maoris) and the subdivisions of it the proportions of the people according to birthplaces. Brown represents males; blue, females.
The numbers were as follow:—
| Born in | Males. | Females. | Total. |
|---|---|---|---|
| New Zealand | 183,601 | 183,115 | 366,716 |
| Australian Colonies | 7,677 | 8,266 | 15,943 |
| England | 66,611 | 50,459 | 117,070 |
| Wales | 1,321 | 893 | 2,214 |
| Scotland | 29,778 | 22,138 | 51,916 |
| Ireland | 25,665 | 21,969 | 47,634 |
| Other British Dominions and at Sea | 2,837 | 2,161 | 4,998 |
| Foreign Countries | 14,727 | 4,423 | 19,150 |
| Unspecified | 660 | 357 | 1,017 |
| Total | 332,877 | 293,781 | 626,658 |
TTH perfect coloured figure represents the population of the whole colony (exclusive of Maoris), and the subdivisions of it the numbers belonging to different denominations, &c.
THE numbers were as follow:—
| Males. | Females. | Totals. | |
|---|---|---|---|
| Church of England | 134,263 | 119,068 | 253,331 |
| Presbyterians | 74,766 | 66,711 | 141,477 |
| Methodists | 31,601 | 31,814 | 63,415 |
| Baptists | 7,113 | 7,712 | 14,825 |
| Congregational Independents | 3,249 | 3,436 | 6,685 |
| Lutherans | 3,550 | 2,066 | 5,616 |
| Other Protestants | 10,312 | 10,689 | 21,301 |
| Roman Catholics | 44,982 | 42,290 | 87,272 |
| Other Denominations | 1,333 | 1,035 | 2,368 |
| Buddhists, Confucians | 3,920 | 8 | 3,928 |
| No denomination | 5,712 | 2,540 | 8,252 |
| No Religion | 1,155 | 403 | 1,558 |
| Object to state | 9,663 | 5,679 | 15,342 |
| Unspecified | 958 | 330 | 1,288 |
| Total | 332,877 | 293,781 | 626,658 |
THE perfect figure represents the population of the whole colony (exclusive of Maoris), and the subdivisions of it the age-periods to which the table relates. Brown represents males, and blue females.
The numbers of the sexes at each age-period were as follow:—
| Males. | Females. | |
|---|---|---|
| Under 5 years | 42,259 | 40,945 |
| 5 to 10 years | 43,494 | 42,586 |
| 10 to 15 years | 40,755 | 40,329 |
| 15 to 20 years | 32,579 | 32,658 |
| 20 to 25 years | 28,337 | 29,805 |
| 25 to 30 years | 23,704 | 22,376 |
| 30 to 35 years | 22,021 | 17,890 |
| 35 to 40 years | 20,513 | 15,106 |
| 40 to 45 years | 17,755 | 13,436 |
| 45 to 50 years | 17,028 | 11,832 |
| 50 to 55 years | 16,770 | 9,922 |
| 55 to 60 years | 10,945 | 6,150 |
| 60 to 65 years | 7,685 | 4,468 |
| 65 to 70 years | 3,923 | 2,564 |
| 70 to 75 years | 2,504 | 1,877 |
| 75 to 80 years | 1,191 | 936 |
| 80 to 85 years | 482 | 440 |
| 85 and upwards | 236 | 189 |
| Unspecified | 696 | 272 |
| Totals | 332,877 | 293,781 |
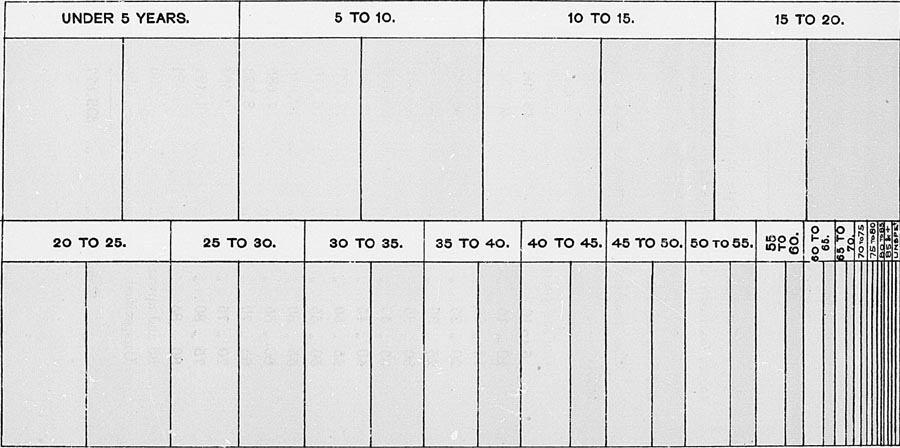
THE perfect figure represents 328,451 persons, being the total male population (exclusive of Chinese and Maoris).
The numbers were as follow:—
| MALES | ||||
|---|---|---|---|---|
| Unmarried. | Married | Widowed | Not Stated | |
| Under 15 years | 126,497 | … | … | … |
| 15 and under 21 | 38,399 | 107 | 2 | 17 |
| 21 and under 30 | 34,268 | 10,830 | 173 | 171 |
| 30 and under 40 | 13,676 | 26,480 | 727 | 121 |
| 40 and under 60 | 13,442 | 43,229 | 3,648 | 113 |
| 60 and upwards | 2,915 | 9,725 | 3,208 | 52 |
| Age not stated | 240 | 116 | 19 | 276 |
| Totals | 229,437 | 90,487 | 7,777 | 750 |
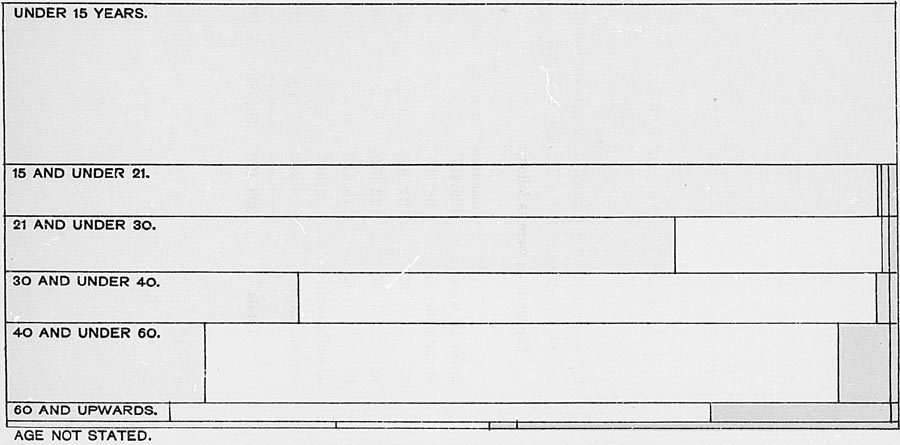
THE perfect figure represents 293,763 persons, being the total female population (exclusive of Chinese and Maoris).
The numbers were as follow:—
| FEMALES | ||||
|---|---|---|---|---|
| Unmarried. | Married | Widowed | Not Stated | |
| Under 15 years | 123,852 | … | … | … |
| 15 and under 21 | 37,539 | 1,665 | 9 | 14 |
| 21 and under 30 | 22,650 | 22,487 | 434 | 33 |
| 30 and under 40 | 4,024 | 27,535 | 1,418 | 17 |
| 40 and under 60 | 2,054 | 33,681 | 5,588 | 17 |
| 60 and upwards | 433 | 5,397 | 4,627 | 17 |
| Age not stated | 106 | 105 | 22 | 39 |
| Totals | 190,658 | 90,870 | 12,098 | 137 |
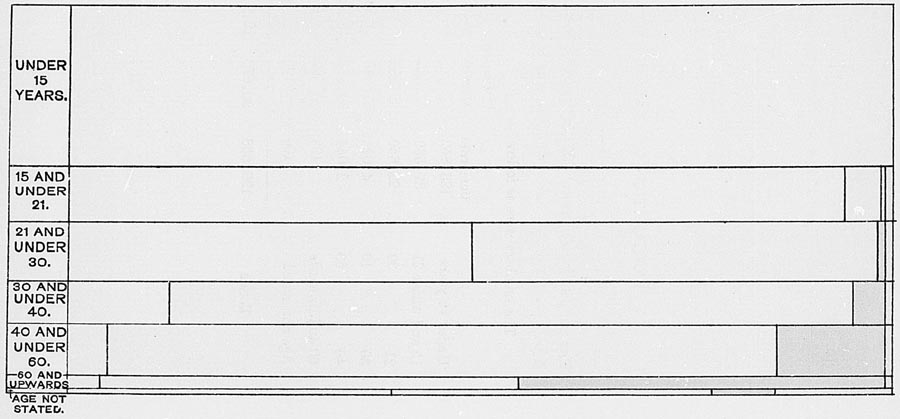
THE perfect figure represents the population of the whole colony (exclusive of Maoris and Chinese), and the subdivisions of it the numbers at different age-periods, according to degree of education.
THE NUMBERS WERE AS FOLLOW:—
| Read and write | Read only | Cannot read | Education Unknown | |
|---|---|---|---|---|
| Under 5 year | … | 670 | 82,522 | … |
| 5 and under 10 | 45,122 | 15,358 | 24,846 | 751 |
| 10 and under 15 | 78,970 | 1,032 | 807 | 271 |
| 15 and under 20 | 64,404 | 245 | 427 | 127 |
| 20 and under 30 | 101,719 | 564 | 989 | 323 |
| 30 and under 40 | 70,682 | 1,357 | 1,397 | 382 |
| 40 and under 60 | 93,868 | 3,631 | 3,618 | 655 |
| 60 and upwards, and unspecified | 23,493 | 1,749 | 1,553 | 502 |
| Totals | 278,438 | 24,606 | 166,159 | 3,011 |
622,214 persons of both sexes, total population (exclusive of Maoris and Chinese).
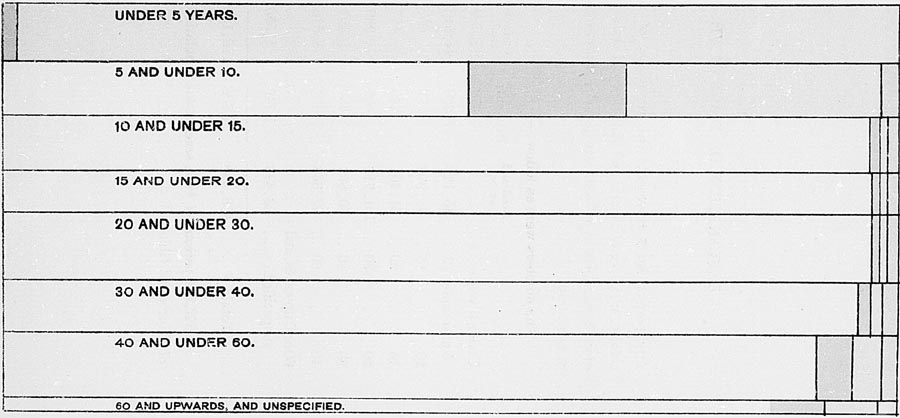
THE perfect figure represents the population of the colony (exclusive of Maoris), and the subdivisions of it the different classes.
The numbers of the sexes in each class were:—
SECTION A—BREADWINNERS.
| Males. | Females. | Total. | |
|---|---|---|---|
| Class I—Professional | 10,082 | 5,739 | 15,821 |
| Class II—Domestic | 5,537 | 19,391 | 24,928 |
| Class III—Commercial | 40,330 | 2,866 | 43,196 |
| Class IV— Industrial | 59,196 | 11,325 | 70,521 |
| Class V— Agricultural, Pastoral, Mineral,and other Primary Producers | 87,860 | 2,686 | 90,546 |
| Class VI— Indefinite | 4,341 | 3,410 | 7,751 |
| SECTION B.—NON-BREADWINNERS. | |||
| Class VII.—Dependents | 125,531 | 248,364 | 373,895 |
| Totals | 332,877 | 293,781 | 626,658 |
| European Population. | |||
|---|---|---|---|
| — | Total (including Chinese and Half-castes). | ||
| Persons. | Males. | Females. | |
| . Includes 13 on shipboard. | |||
| Counties | 352,097 | 196,979 | 155,118 |
| Boroughs | 270,343 | 132,310 | 138,033 |
| Islands adjacent to New Zealand | 636 | 377 | 259 |
| Chatham Islands | 258 | 136 | 122 |
| Kermadec Islands | 19 | 11 | 8 |
| On shipboard | 3,305 | 3,064 | 241 |
| Totals for colony | 626,658 | 332,877 | 293,781 |
| North Island | 281,455 | 149,767 | 131,688 |
| Middle Island | 344,711 | 182,835 | 161,876 |
| Stewart Island | 202 | 115 | 87 |
| Chatham Islands | 271* | 149* | 122 |
| Kermadec Islands | 19 | 11 | 8 |
| Totals for colony | 626,658 | 332,877 | 293,781 |
NOTE.—The Maori population of the colony (not Included above), according to the results of a separate census taken in February, 1891, amounted to 41,993. Of these, 39,775 persons were found to be in the North Island, 1,894 persons in the Middle Island, 136 at Stewart Island, and 188 Maoris and Morioris at the Chatham Islands. There were also 251. Maori wives of European husbands enumerated in the European census.
The total population of the colony (Including Maoris) in April, 1891, was: Persons 668,651; males 355,738, females 312,913.
| Numbers. | Proportion per Cent. | Proportions of Sexes in every 100 persons. | ||||||
|---|---|---|---|---|---|---|---|---|
| Ages. | Persons. | Males. | Females. | Persons. | Males. | Females. | Males. | Females. |
| All ages | 626,658 | 332,877 | 293,781 | .. | .. | .. | .. | .. |
| Specified ages | 625,690 | 332,181 | 293,509 | 100.00 | 100.00 | l00.00 | 53.09 | 46.91 |
| Under 1 year | 16,443 | 8,836 | 8,057 | 2.63 | 2.52 | 2.74 | 51.00 | 49.00 |
| 1 year and under 2 years | 14,831 | 7,536 | 7,295 | 2.37 | 2.27 | 2.49 | 50.81 | 49.19 |
| 2 years and under 3 years | 17,263 | 8,780 | 8,483 | 2.76 | 2.64 | 2.89 | 50.86 | 49.14 |
| 3 years and under 4 years | 17,619 | 8,892 | 9,727 | 2.82 | 2.68 | 2.97 | 50.47 | 49.53 |
| 4 years and under 5 years | 17,048 | 8,665 | 8,383 | 2.72 | 2.61 | 2.86 | 50.83 | 49.17 |
| 5 years and under 6 years | 17,425 | 8,787 | 8,638 | 2.79 | 2.64 | 2.94 | 50.43 | 49.57 |
| 6 years and under 7 years | 17,533 | 8,793 | 8,740 | 2.80 | 2.65 | 2.98 | 50.15 | 49.85 |
| 7 years and under 8 years | 17,401 | 8,827 | 8,574 | 2.78 | 2.66 | 2.92 | 50.73 | 49.27 |
| 8 years and under 9 years | 17,120 | 8,736 | 8,384 | 2.74 | 2.63 | 2.86 | 51.03 | 48.97 |
| 9 years and under 10 years | 16,601 | 8,351 | 8,250 | 2.65 | 2.51 | 2.81 | 50.30 | 49.70 |
| 10 years and under 11 years | 17,426 | 8,802 | 8,624 | 2.79 | 2.65 | 2.94 | 50.51 | 49.49 |
| 11 years and under 12 years | 15,960 | 7,945 | 8,015 | 2.55 | 2.39 | 2.73 | 49.78 | 50.22 |
| 12 years and under 13 years | 16,527 | 8,297 | 8,230 | 2.64 | 2.50 | 2.80 | 50.20 | 49.80 |
| 13 years and under 14 years | 15,500 | 7,826 | 7,680 | 2.48 | 2.36 | 2.62 | 50.47 | 49.53 |
| 14 years and under 15 years | 15,665 | 7,885 | 7,780 | 2.50 | 2.37 | 2.65 | 50.34 | 49.66 |
| 15 years and under 20 years | 65,237 | 32,579 | 32,658 | 10.42 | 9.82 | 11.12 | 49.92 | 50.08 |
| 20 years and under 21 years | 13,571 | 5,998 | 6,573 | 201 | 1.81 | 2.24 | 47.71 | 52.29 |
| 21 years and under 25 years | 45,571 | 22,339 | 23,232 | 7.28 | 6.72 | 7.92 | 49.02 | 50.98 |
| 25 years and under 30 years | 46,080 | 23,704 | 22,376 | 7.36 | 7.14 | 7.62 | 51.44 | 48.56 |
| 30 years and under 35 years | 39,911 | 22,021 | 17,890 | 6.38 | 6.63 | 6.10 | 55.18 | 44.82 |
| 35 years and under 40 years | 35,619 | 20,513 | 15,105 | 5.69 | 6.18 | 5.15 | 57.59 | 42.41 |
| 40 years and under 45 years | 31,191 | 17,755 | 13,436 | 4.99 | 5.34 | 4.58 | 56.92 | 43.08 |
| 45 years and under 50 years | 28,860 | 17,028 | 11,832 | 4.61 | 5.13 | 4.03 | 59.00 | 41.00 |
| 50 years and under 55 years | 26,692 | 16,770 | 9,922 | 4.27 | 5.05 | 3.38 | 62.83 | 37.17 |
| 55 years and under Go years | 17,095 | 10,945 | 6,150 | 2.73 | 3.29 | 2.10 | 64.02 | 35.98 |
| 60 years and under 65 years | 12,153 | 7,685 | 4,468 | 1.94 | 2.31 | 1.52 | 63.24 | 36.76 |
| 65 years and under 70 years | 6,487 | 3,923 | 2,564 | 1.04 | 1.18 | .87 | 60.47 | 39.53 |
| 70 years and under 75 years | 4,381 | 2,504 | 1,877 | .70 | .75 | .64 | 57.16 | 42.84 |
| 73 years and under So years | 2,127 | 1,191 | 9.36 | .34 | .36 | .32 | 55.99 | 44.01 |
| 80 years and under 85 years | 922 | 482 | 440 | .15 | .14 | .15 | 52.28 | 47.72 |
| 80 and upwards | 425 | 236 | 189 | .07 | .07 | .06 | 55.53 | 44.47 |
| Unspecified age, under 21 years | 66 | 30 | 36 | .. | .. | .. | .. | .. |
| Unspecified age, over 21 years | 902 | 666 | 236 | .. | .. | .. | .. | .. |
| Where born. | Numbers. | Proportion per Cent. | Proportions of Sexes in every 100 Persons. | |||||
|---|---|---|---|---|---|---|---|---|
| Persons. | Males. | Females. | Persons. | Males. | Females. | Males. | Females. | |
| * including “America” so returned | ||||||||
| Totals for all birthplaces | 626,658 | 332,877 | 293,781 | .. | .. | .. | .. | .. |
| Totals for specified birth places | 625,641 | 332,217 | 293,424 | 100.00 | 100.00 | 100.00 | 53.10 | 46.90 |
| British Possessions— | ||||||||
| New Zealand | 366,716 | 183,601 | 183,115 | 58.61 | 55.26 | 62.40 | 50.07 | 49.93 |
| Australian Colonies | 15,943 | 7,677 | 8,266 | 2.55 | 2.31 | 2.82 | 48.15 | 51.85 |
| England | 117,070 | 66,611 | 50,459 | 18.71 | 20.05 | 17.20 | 56.90 | 43.10 |
| Wales | 2,214 | 1,321 | 8.93 | .35 | .39 | .30 | 59.67 | 40.33 |
| Scotland | 51,916 | 29,778 | 22,138 | 8.30 | 8.96 | 7.54 | 57.36 | 42.64 |
| Ireland | 47,634 | 25,665 | 21,969 | 7.61 | 7.72 | 7.49 | 53.88 | 46.12 |
| Other British Possessions | 3,703 | 2,209 | 1,494 | .59 | .66 | .51 | 59.65 | 40.35 |
| Foreign Countries— | ||||||||
| Germany | 4,663 | 3,045 | 1,6l8 | .75 | .92 | .55 | 65.30 | 34.70 |
| Denmark and Possessions | 2,053 | 1,324 | 729 | .33 | .40 | .25 | 64.49 | 35.51 |
| Sweden | 1,414 | 1,217 | 197 | .23 | .37 | .07 | 86.07 | 13.93 |
| Norway | 1,288 | 883 | 405 | .21 | .27 | .14 | 68.56 | 31.44 |
| France and Possessions | 711 | 514 | 197 | .11 | .15 | .07 | 72.29 | 27.71 |
| Austria | 564 | 397 | 167 | .09 | .12 | .06 | 70.39 | 29.61 |
| Italy | 397 | 321 | 76 | .06 | .10 | .02 | 80.86 | 19.14 |
| Switzerland | 362 | 273 | 89 | .06 | .o8 | .03 | 75.41 | 24.59 |
| Russia and Possessions | 320 | 289 | 31 | .05 | .09 | .01 | 90.31 | 9.69 |
| Portugal and Possessions | 205 | 183 | 22 | .03 | .05 | .01 | 89.27 | 10.73 |
| Holland and Possessions | 143 | 123 | 20 | .02 | .04 | .01 | 86.01 | 13.99 |
| Poland | 99 | 65 | 34 | .02 | .02 | .01 | 65.66 | 34.34 |
| Greece | 94 | 73 | 21 | .02 | .02 | .01 | 77.66 | 22.34 |
| Belgium | 115 | 82 | 33 | .02 | .02 | .01 | 71.30 | 28.70 |
| Spain and Possessions | 76 | 57 | 19 | .01 | .02 | .01 | 75.00 | 25.00 |
| Other European Countries | 34 | 18 | 16 | .01 | .02 | .00 | 52.94 | 47.06 |
| China | 4,470 | 4,446 | 24 | .71 | 1.34 | .01 | 99.46 | .54 |
| America (North)* | 1,016 | 667 | 349 | .l6 | .20 | .12 | 65.65 | 34.33 |
| United States of America | 667 | 474 | 193 | .11 | .14 | .06 | 71.06 | 28.94 |
| Africa | 183 | 90 | 93 | .03 | .03 | .03 | 49.18 | 50.82 |
| Other Foreign Countries | 276 | 186 | 90 | .04 | .06 | .03 | 67.39 | 32.61 |
| At sea | 1,295 | 628 | 667 | .21 | .19 | .23 | 48.49 | 51.51 |
| Unspecified | 1,017 | 660 | 357 | .. | .. | .. | .. | .. |
| ALLEGIANCE. | ||||||||
| British subjects | 612,064 | 320,833 | 291,231 | 97.67 | 96.38 | 99.13 | 42.42 | 47.58 |
| Foreign subjects | 14,594 | 12,044 | 2,550 | 2.33 | 3.62 | 0.87 | 82.53 | 17.47 |
| Numbers. | Proportion per Cent. | Proportions of Sexes in every 100 Persons. | ||||||
|---|---|---|---|---|---|---|---|---|
| Religious Denominations. | Persons. | Males. | Females. | Persons. | Males. | Females. | Males. | Females. |
| Total for all religions | 626,658 | 332,877 | 293,781 | .. | .. | .. | .. | .. |
| Total for specified religions | 625,370 | 331,919 | 293,451 | 100.00 | l00.00 | 100.00 | 53.08 | 46.92 |
| Episcopalians— | ||||||||
| Church of England | 250,945 | 132,774 | 118,171 | 40.13 | 40.00 | 40.27 | 52.91 | 47.09 |
| Protestants (undefined) | 2,386 | 1,489 | 897 | .38 | .45 | .31 | 62.41 | 37.59 |
| Presbyterians | 141»477 | 74,766 | 66,711 | 22.62 | 22.53 | 22.73 | 52.85 | 47.15 |
| Methodists— | ||||||||
| Wesleyan Methodists | 53,061 | 26,480 | 26,581 | 8.49 | 7.98 | 9.06 | 49.90 | 50.10 |
| Methodists (undefined) | 2,071 | 1,070 | l,001 | .33 | .32 | .34 | 51.67 | 48.33 |
| Primitive Methodists | 5,220 | 2,521 | 2,699 | .84 | .76 | .92 | 48.29 | 51.71 |
| United Methodist Free Church | 1,905 | 935 | 970 | .30 | .28 | .33 | 49.08 | 50.92 |
| Bible Christians | 1,069 | 555 | 514 | .17 | .17 | .18 | 51.92 | 48.08 |
| Others | 89 | 40 | 49 | .01 | .01 | .02 | 44.94 | 55.06 |
| Other Protestants— | ||||||||
| Baptists | 14,825 | 7,113 | 7,712 | 2.37 | 2.14 | 2.63 | 47.98 | 52.02 |
| Congregational Independents | 6,685 | 3,249 | 3,436 | 1.07 | .98 | 1.17 | 48.60 | 51.40 |
| Lutherans, German Protestants | 5,616 | 3,550 | 2,066 | .90 | 1.07 | .70 | 63.21 | 56.79 |
| Unitarians | 308 | 200 | 108 | .05 | .06 | .04 | 64.94 | 35.06 |
| Society of Friends | 315 | 203 | 112 | .05 | .06 | .04 | 64.44 | 35.56 |
| Church of Christ | 5,241 | 2,494 | 2,747 | .84 | .75 | .94 | 47.59 | 52.41 |
| Brethren | 3,537 | 1,704 | 1,833 | .57 | .51 | .62 | 48.18 | 51.82 |
| Believers in Christ | 193 | 103 | 90 | .03 | .03 | .03 | 53.37 | 46.63 |
| Evangelists | 93 | 66 | 27 | .02 | .02 | .01 | 70.97 | 29.03 |
| Noncomformists | 77 | 49 | 28 | .01 | .01 | .01 | 63.64 | 30.36 |
| Salvation Army | 9,383 | 4,716 | 4,667 | 1.50 | 1.42 | 1.59 | 50.26 | 49.74 |
| Christadelphians | 700 | 358 | 342 | .11 | .11 | .12 | 51.14 | 48.86 |
| Swedenborgians | 178 | 86 | 92 | .03 | .03 | .03 | 48.31 | 51.69 |
| Seventh-day Adventists | 415 | 166 | 249 | .07 | .05 | .08 | 40.00 | 60.00 |
| Students of Truth | 325 | 174 | 151 | .05 | .05 | .05 | 53.54 | 46.46 |
| Other Protestants | 536 | 293 | 243 | .09 | .09 | .08 | 54.66 | 45.34 |
| Catholics— | ||||||||
| Roman Catholics | 85,856 | 44,218 | 41,638 | 13.73 | 13.32 | 14.19 | 51.50 | 48.50 |
| Catholics (undefined) | 1,416 | 764 | 652 | .23 | .23 | .22 | 53.95 | 46.05 |
| Greek Church | 56 | 51 | 5 | .01 | .02 | .00 | 91.07 | 8.93 |
| Catholic and Apostolic | 150 | 77 | 73 | .02 | .02 | .03 | 51.33 | 48.67 |
| Other Sects— | ||||||||
| Hebrews | 1,463 | 774 | 689 | .23 | .23 | .23 | 52.90 | 47.10 |
| Mormons, Latter-day Saints | 206 | 119 | 87 | .03 | .04 | .03 | 57.77 | 42.23 |
| Spiritualists | 339 | 187 | 152 | .05 | .06 | .05 | 55.16 | 44.84 |
| Buddists, Pagans, Confucians | 3,928 | 3,920 | 8 | .63 | 1.18 | .00 | 99.80 | .20 |
| Others | 154 | 125 | 29 | .02 | .04 | .O1 | 81.17 | 18.83 |
| No Denomination— | ||||||||
| Freethinkers | 4,475 | 3,384 | 1,091 | .72 | 1.02 | .37 | 75.62 | 24.38 |
| Agnostics | 322 | 221 | 101 | .05 | .07 | .03 | 68.63 | 31.37 |
| Deists, Theists | 51 | 40 | 11 | .01 | .01 | .00 | 78.43 | 21.57 |
| Doubtful | 405 | 243 | 162 | .06 | .07 | .06 | 60.00 | 40.00 |
| No denomination | 2,999 | 1,824 | 1,175 | .48 | .55 | .40 | 60.82 | 39.18 |
| No religion | 1,558 | 1,155 | 403 | .25 | .35 | .14 | 74.13 | 25.87 |
| Unspecified | 1,288 | 958 | 330 | .. | .. | .. | .. | .. |
| Object to state | 15,342 | 9,663 | 5,679 | 2.45 | 2.91 | 1.94 | 62.98 | 37.02 |
| Ages. | Males. | Females. | ||||||||
|---|---|---|---|---|---|---|---|---|---|---|
| Total. | Unmarried. | Husbands. | Widowers. | Not stated. | Total. | Unmarried. | Wives. | Widows. | Not stated. | |
| All ages | 328,451 | 229,437 | 90,487 | 7,777 | 750 | 293,763 | 190,658 | 90,870 | 12,098 | 137 |
| Specified ages | 327,800 | 229,197 | 90,371 | 7,758 | 474 | 293,491 | 190,552 | 90,765 | 12,076 | 98 |
| 14 years and upwards | 209,187 | 110,584 | 93,371 | 7,758 | 474 | 177,419 | 74,480 | 90,765 | 12,076 | 98 |
| Under 14 years | 118,613 | 118,613 | .. | .. | .. | 116,072 | 116,072 | .. | .. | .. |
| 14 years to 15 years | 7,884 | 7,884 | .. | .. | .. | 7,780 | 7,780 | .. | .. | .. |
| 15 years to 16 years | 7,201 | 7,201 | .. | .. | .. | 6,930 | 6,925 | 5 | .. | .. |
| 16 years to 17 years | 6,726 | 6,726 | .. | .. | .. | 6,817 | 6,799 | 18 | .. | .. |
| 17 years to 18 years | 6,297 | 6,293 | 4 | .. | .. | 6,352 | 6,277 | 71 | 1 | 3 |
| 18 years to 19 years | 6,136 | 6,130 | 6 | .. | .. | 6,278 | 6,072 | 204 | 1 | 1 |
| 19 years to 20 years | 6,189 | 6,153 | 30 | 1 | 5 | 6,277 | 5,820 | 452 | 1 | 4 |
| 20 years to 21 years | 5,976 | 5,896 | 67 | 1 | 12 | 6,573 | 5,646 | 915 | 6 | 6 |
| 21 years to 25 years | 22,200 | 19,840 | 2,241 | 34 | 85 | 23,230 | 15,184 | 7,947 | 81 | 18 |
| 25 years to 30 years | 23,242 | 14,428 | 8,589 | 139 | 86 | 22,374 | 7,466 | 14,540 | 353 | 15 |
| 30 years to 35 years | 21,281 | 8,261 | 12,650 | 298 | 72 | 17,890 | 2,734 | 14,576 | 574 | 6 |
| 35 years to 40 years | 19,723 | 5,415 | 13,830 | 429 | 49 | 15,104 | 1,290 | 12,959 | 844 | 11 |
| 40 years to 45 years | 16,747 | 3,976 | 12,118 | 618 | 35 | 13,436 | 822 | 11,478 | 1,131 | 5 |
| 45 years to 50 years | 16,490 | 3,601 | 11,965 | 892 | 32 | 11,832 | 569 | 9,830 | 1,430 | 3 |
| 50 years to 55 years | 16,405 | 3,553 | 11,662 | 1,159 | 31 | 9,922 | 423 | 7,840 | 1,654 | 5 |
| 55 years to 60 years | 10,790 | 2,312 | 7,484 | 979 | 15 | 6,150 | 240 | 4,533 | 1,373 | 4 |
| 60 years to 65 years | 7,588 | 1,583 | 4,941 | 1,045 | 19 | 4,468 | 179 | 2,839 | 1,448 | 2 |
| 65 years to 70 years | 3,903 | 722 | 2,458 | 710 | 13 | 2,564 | 110 | 1,394 | 1,054 | 6 |
| 70 years to 75 years | 2,500 | 388 | 1,4l8 | 682 | 12 | 1,877 | 69 | 800 | 1,004 | 4 |
| 75 years to 80 years | 1,191 | 155 | 615 | 417 | 4 | 936 | 50 | 264 | 622 | .. |
| 80 years to 85 years | 482 | 54 | 209 | 217 | 2 | 440 | 13 | 73 | 350 | 4 |
| 85 years and upwards | 236 | 13 | 84 | 137 | 2 | 189 | 12 | 27 | 149 | 1 |
| Unspecified | 651 | 240 | 1l6 | 19 | 276 | 272 | 106 | 105 | 22 | 39 |
| Ages. | Persons. | Males. | Females. | |||||||||
|---|---|---|---|---|---|---|---|---|---|---|---|---|
| Read and Write. | Read only. | Cannot Read. | Education Unknown. | Read and Write. | Read only. | Cannot Read. | Education Unknown. | Read and Write. | Read only. | Cannot Read. | Education Unknown. | |
| All ages | 478,438 | 24,606 | 116,159 | 3,011 | 254,710 | 12,205 | 59,753 | 1,783 | 223,728 | 12,401 | 56,406 | 1,228 |
| Specified ages | 477,877 | 24,588 | 1l6,121 | 2,705 | 254,331 | 12,196 | 59,733 | 1,540 | 223,546 | 12,392 | 56,388 | 1,165 |
| All ages above 5 years | 478,438 | 23,936 | 33,637 | 3,011 | 254,710 | 11,886 | 17,818 | 1,783 | 223,728 | 12,050 | 15,8l9 | 1,228 |
| Under 5 years | .. | 670 | 82,522 | .. | .. | 319 | 41,935 | .. | .. | 351 | 40,587 | .. |
| 5 years to 10 years | 45,122 | 15,358 | 24,846 | 751 | 22,203 | 8,039 | 12,847 | 403 | 22,919 | 7,319 | 11,999 | 348 |
| 10 years to 15 years | 78,970 | 1,032 | 807 | 271 | 39,613 | 546 | 456 | 136 | 39,357 | 486 | 351 | 135 |
| 15 years to 20 years | 64,404 | 245 | 427 | 127 | 32,060 | 160 | 267 | 62 | 32,344 | 85 | 160 | 65 |
| 20 years to 25 years | 57,136 | 226 | 460 | 157 | 27,679 | 137 | 262 | 98 | 29,457 | 89 | 198 | 59 |
| 25 years to 30 years | 44,583 | 338 | 529 | 166 | 22,685 | 166 | 280 | 111 | 21,898 | 172 | 249 | 55 |
| 30 years to 35 years | 37,759 | 618 | 600 | 194 | 20,578 | 281 | 311 | 111 | 17,181 | 337 | 289 | 83 |
| 35 years to 40 years | 33,103 | 739 | 797 | 188 | 18,846 | 326 | 440 | 111 | 14,257 | 413 | 357 | 77 |
| 40 years to 45 years | 28,183 | 848 | 957 | 195 | 15,769 | 353 | 517 | 108 | 12,414 | 495 | 440 | 87 |
| 45 years to 50 years | 26,192 | 979 | 974 | 177 | 15,479 | 383 | 531 | 97 | 10,713 | 596 | 443 | 80 |
| 50 years to 55 years | 24,124 | 1,016 | 1,008 | 179 | 15,240 | 443 | 599 | 123 | 8,884 | 573 | 409 | 56 |
| 55 years to 60 years | 15,369 | 788 | 679 | 104 | 9,986 | 354 | 384 | 66 | 5,383 | 434 | 295 | 38 |
| 60 years to 65 years | 10,727 | 643 | 608 | 78 | 6,906 | 263 | 370 | 49 | 3,821 | 380 | 238 | 29 |
| 65 years to 70 years | 5,639 | 448 | 346 | 34 | 3,488 | 186 | 212 | 17 | 2,151 | 262 | 134 | 17 |
| 70 years to 75 years | 3,728 | 337 | 272 | 40 | 2,188 | 124 | 160 | 28 | 1,540 | 213 | 112 | 12 |
| 75 years to 80 years | 1,762 | 185 | 158 | 22 | 1,010 | 75 | 96 | 10 | 752 | 110 | 62 | 12 |
| 80 years and upwards | 1,076 | 118 | 131 | 22 | 601 | 41 | 66 | 10 | 475 | 77 | 65 | 12 |
| Unspecified age, under 21 years | 17 | 3 | 27 | 19 | 9 | 1 | 11 | 9 | 8 | 2 | 16 | 10 |
| Unspecified age, over 21 years | 544 | 15 | 11 | 287 | 370 | 8 | 9 | 234 | 174 | 7 | 2 | 53 |
| Occupations (Classes and Orders). | Numbers. | Proportions per Cent. | ||||
|---|---|---|---|---|---|---|
| — | Persons. | Males. | Females. | Persons. | Males. | Females. |
| Total population | 626,658 | 332,877 | 293,781 | 100.00 | 100.00 | 100.00 |
| * Attention is called to the fact that the numbers in the various orders of the commercial class include dealers only, but not manufacturers or makers. These last are included in the orders of the industrial class. | ||||||
| Professional,— | ||||||
| Persons engaged in Government (not otherwise classed), defence, law, and protection | 3,047 | 3,027 | 20 | .49 | .91 | .01 |
| Persons ministering to religion, charity, health, science, education, and art | 12,774 | 7,055 | 5,719 | 2.04 | 2.12 | 1.95 |
| Domestic,— | ||||||
| Persons engaged in the supply of board and lodging, and in rendering personal service for which remuneration is usually paid | 24,928 | 5,537 | 19,391 | 3.98 | 1.66 | 6.60 |
| Commercial,—* | ||||||
| Persons performing offices in connection with the exchange, valuation, insurance, lease, loan, or custody of money, houses, land, or property rights | 3,756 | 3,414 | 342 | .60 | 1.03 | .12 |
| Persons dealing in art or mechanic productions in which matters of various kinds are employed in combination | 1,504 | 1,321 | 183 | .24 | .40 | .06 |
| Persons engaged in the sale, hire, or exchange of textile fabrics and dress, and of fibrous materials | 3,144 | 2,634 | 510 | .50 | .79 | .17 |
| Persons engaged in dealing in food, drinks, narcotics, and stimulants | 7,035 | 6,478 | 557 | 1.12 | 1.95 | .19 |
| Persons engaged in dealing in and treating animals, and dealing in animal and vegetable substances (excluding dealers in food) | 1,287 | 1,282 | 5 | .21 | .39 | .00 |
| Persons engaged in dealing in minerals and other materials mainly used for fuel and light | 397 | 391 | 6 | .06 | .12 | .00 |
| Persons engaged in dealing in minerals other than for fuel | 846 | 838 | 8 | .13 | .25 | .00 |
| Persons engaged as general dealers, or in undefined mercantile pursuits | 8,779 | 7,669 | 1,110 | 1.40 | 2.30 | .38 |
| Persons engaged in storage | 1,035 | 1,034 | 1 | .17 | .31 | .00 |
| Persons engaged in the transport of passengers, goods, or communications | 15,413 | 15,269 | 144 | 2.46 | 4.59 | .05 |
| Industrial,—* | ||||||
| Persons engaged in connection with the manufacture of, or in other processes relating to, art and mechanic productions in which materials of various kinds, are employed in combination | 9,672 | 9,379 | 293 | 1.54 | 2.82 | .10 |
| Persons engaged in connection with the manufacture of, or in repairs, cleansing, or in other processes relating to, textile fabrics, dress and fibrous materials | 19,437 | 8,698 | 10,739 | 3.10 | 2.6l | 3.66 |
| Persons engaged in connection with the manufacture of, or in other processes relating to, food, drink, narcotics, and stimulants | 4,453 | 4,299 | 154 | .71 | 7.29 | .05 |
| Persons (not otherwise classed) engaged in manufacture or other processes connected with animal and vegetable substances | 3,563 | 3,523 | 40 | .57 | 1.06 | .01 |
| Persons engaged in the alteration, modification, or manufacture of, or other processes relating to, metals or mineral matters | 5,768 | 5,742 | 26 | .92 | 1.72 | .01 |
| Persons engaged in the making or repairing of buildings, roads, railways, docks, earthworks, &c, in the disposal of silt, dead matter, or refuse, or in mechanical operations or labour the nature of which is undefined | 12,679 | 12,667 | 12 | 2.02 | 3.81 | .00 |
| Industrial workers imperfectly defined | 14,949 | 14,888 | 61 | 2.39 | 4.47 | .02 |
| Agricultural, Pastoral, Mineral, and other Primary Producers,— | ||||||
| Persons directly engaged in the cultivation of land, or in rearing or breeding animals, or in obtaining raw products from natural sources | 90,546 | 87,860 | 2,686 | 14.45 | 26.39 | 0.92 |
| Indefinite,— | ||||||
| Persons whose occupations are undefined or unknown, embracing those who derive incomes from sources which cannot be directly related to any other class | 7,751 | 4,341 | 3,410 | 1.24 | 1.30 | 1.16 |
| Dependents,— | ||||||
| Persons dependent upon natural guardians | 369,178 | 122,410 | 246,768 | 58.91 | 36.77 | 84.00 |
| Persons dependent upon the State, or upon public private support | 4,717 | 3,121 | 1,596 | .75 | .94 | .54 |